UNITED STATES
SECURITIES AND EXCHANGE COMMISSION
Washington, D.C. 20549
FORM N-CSR
CERTIFIED SHAREHOLDER REPORT OF REGISTERED
MANAGEMENT INVESTMENT COMPANIES
Investment Company Act file number 811-649
Fidelity Puritan Trust
(Exact name of registrant as specified in charter)
82 Devonshire St., Boston, Massachusetts 02109
(Address of principal executive offices) (Zip code)
Scott C. Goebel, Secretary
82 Devonshire St.
Boston, Massachusetts 02109
(Name and address of agent for service)
Registrant's telephone number, including area code: 617-563-7000
Date of fiscal year end: | August 31 |
| |
Date of reporting period: | August 31, 2011 |
Item 1. Reports to Stockholders
Fidelity®
Balanced
Fund
Annual Report
August 31, 2011
(2_fidelity_logos) (Registered_Trademark)
Contents
Chairman's Message | <Click Here> | The Chairman's message to shareholders. |
Notes to shareholders | <Click Here> | Important information about the fund. |
Performance | <Click Here> | How the fund has done over time. |
Management's Discussion of Fund Performance | <Click Here> | The Portfolio Manager's review of fund
performance and strategy. |
Shareholder Expense Example | <Click Here> | An example of shareholder expenses. |
Investment Changes | <Click Here> | A summary of major shifts in the fund's investments over the past six months. |
Investments | <Click Here> | A complete list of the fund's investments with their market values. |
Financial Statements | <Click Here> | Statements of assets and liabilities, operations, and changes in net assets,
as well as financial highlights. |
Notes | <Click Here> | Notes to the financial statements. |
Report of Independent Registered Public Accounting Firm | <Click Here> | |
Trustees and Officers | <Click Here> | |
Distributions | <Click Here> | |
Board Approval of Investment Advisory Contracts and Management Fees | <Click Here> | |
To view a fund's proxy voting guidelines and proxy voting record for the 12-month period ended June 30, visit http://www.fidelity.com/proxyvotingresults or visit the Securities and Exchange Commission's (SEC) web site at http://www.sec.gov. You may also call 1-800-544-8544 to request a free copy of the proxy voting guidelines.
Standard & Poor's, S&P and S&P 500 are registered service marks of The McGraw-Hill Companies, Inc. and have been licensed for use by Fidelity Distributors Corporation.
Other third party marks appearing herein are the property of their respective owners.
All other marks appearing herein are registered or unregistered trademarks or service marks of FMR LLC or an affiliated company.
Annual Report
This report and the financial statements contained herein are submitted for the general information of the shareholders of the fund. This report is not authorized for distribution to prospective investors in the fund unless preceded or accompanied by an effective prospectus.
A fund files its complete schedule of portfolio holdings with the SEC for the first and third quarters of each fiscal year on Form N-Q. Forms N-Q are available on the SEC's web site at http://www.sec.gov. A fund's Forms N-Q may be reviewed and copied at the SEC's Public Reference Room in Washington, DC. Information regarding the operation of the SEC's Public Reference Room may be obtained by calling 1-800-SEC-0330. For a complete list of a fund's portfolio holdings, view the most recent holdings listing, semiannual report, or annual report on Fidelity's web site at http://www.fidelity.com, http://www.advisor.fidelity.com, or http://www.401k.com, as applicable.
NOT FDIC INSURED • MAY LOSE VALUE • NO BANK GUARANTEE
Neither the fund nor Fidelity Distributors Corporation is a bank.
Annual Report
(photo_of_James_C_Curvey)
Dear Shareholder:
U.S. equities remained in a significant midyear downturn that began in May and intensified in the final week of July and the early part of August, when Standard & Poor's announced it was lowering its long-term sovereign credit rating of the United States. The historic downgrade followed a political stalemate in which Congress struggled to address the debt ceiling issue before an early-August deadline, resulting in heightened investor anxiety and volatility across major financial markets. Financial markets are always unpredictable, of course, but there are several time-tested investment principles that can help put the odds in your favor.
One of the basic tenets is to invest for the long term. Over time, riding out the markets' inevitable ups and downs has proven much more effective than selling into panic or chasing the hottest trend. Even missing only a few of the markets' best days can significantly diminish investor returns. Patience also affords the benefits of compounding - of earning interest on additional income or reinvested dividends and capital gains. There can be tax advantages and cost benefits to consider as well. While staying the course doesn't eliminate risk, it can considerably lessen the effect of short-term declines.
You can further manage your investing risk through diversification. And today, more than ever, geographic diversification should be taken into account. Studies indicate that asset allocation is the single most important determinant of a portfolio's long-term success. The right mix of stocks, bonds and cash - aligned to your particular risk tolerance and investment objective - is very important. Age-appropriate rebalancing is also an essential aspect of asset allocation. For younger investors, an emphasis on equities - which historically have been the best-performing asset class over time - is encouraged. As investors near their specific goal, such as retirement or sending a child to college, consideration may be given to replacing volatile assets (e.g. common stocks) with more-stable fixed investments (bonds or savings plans).
A third principle - investing regularly - can help lower the average cost of your purchases. Investing a certain amount of money each month or quarter helps ensure you won't pay for all your shares at market highs. This strategy - known as dollar cost averaging - also reduces "emotion" from investing, helping shareholders avoid selling weak performers just prior to an upswing, or chasing a hot performer just before a correction.
We invite you to contact us via the Internet, through our Investor Centers or by phone. It is our privilege to provide you the information you need to make the investments that are right for you.
Sincerely,
(The acting chairman's signature appears here.)
James C. Curvey
Acting Chairman
Annual Report
The following changes to Fidelity® Balanced Fund were effective as of March 7, 2011:
• Matthew Friedman is no longer Co-Portfolio Manager of the fund's energy sector investments, which are solely managed by Co-Portfolio Manager Nathan Strik.
• Peter Saperstone was named Co-Portfolio Manager, replacing John Roth in managing the fund's consumer discretionary sector investments.
• The Multi-Manager Group (MMG) was renamed the Stock Selector Large Cap Group, recognizing stock selection as the dominant driver of performance within the portfolios it manages. There is no change in philosophy or process. The group includes experienced portfolio managers who are specialists in one or more market sectors and manage the equity portion of the fund.
Annual Report
Average annual total return reflects the change in the value of an investment, assuming reinvestment of the class' distributions from dividend income and capital gains (the profits earned upon the sale of securities that have grown in value, if any) and assuming a constant rate of performance each year. The $10,000 table and the fund's returns do not reflect the deduction of taxes that a shareholder would pay on fund distributions or the redemption of fund shares. During periods of reimbursement by Fidelity, a fund's total return will be greater than it would be had the reimbursement not occurred. How a fund did yesterday is no guarantee of how it will do tomorrow.
Average Annual Total Returns
Periods ended August 31, 2011 | Past 1
year | Past 5
years | Past 10
years |
Fidelity® Balanced Fund | 13.88% | 3.09% | 5.97% |
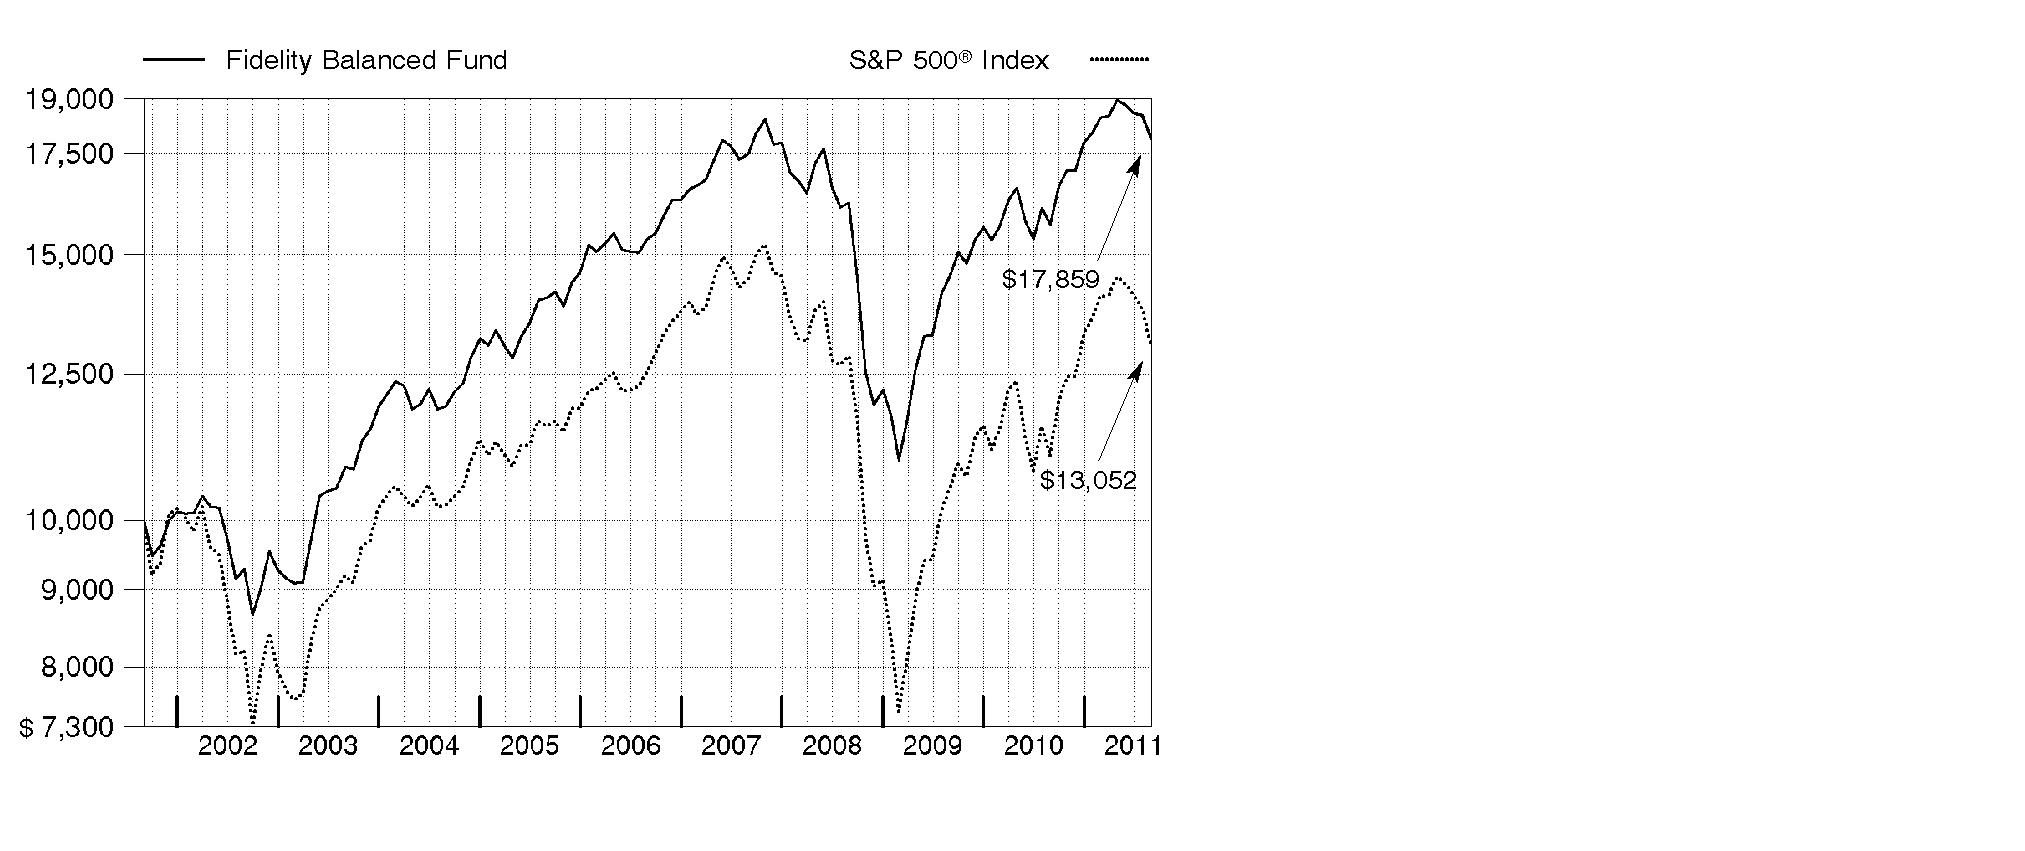
$10,000 Over 10 Years
Let's say hypothetically that $10,000 was invested in Fidelity Balanced Fund, a class of the fund, on August 31, 2001. The chart shows how the value of your investment would have changed, and also shows how the S&P 500® Index performed over the same period.
Annual Report
Market Recap: U.S. stocks registered solid double-digit gains for the year ending August 31, 2011, despite finishing in a four-month downturn that intensified in the two weeks preceding the August 5 news that Standard & Poor's had lowered its long-term sovereign credit rating of the United States. The downgrade followed a stalemate in which Congress struggled to address the debt ceiling, heightening investor anxiety. For the year, the large-cap laden S&P 500® Index gained 18.50% and the blue-chip Dow Jones Industrial AverageSM advanced 19.03%. The technology-heavy Nasdaq Composite® Index fared even better, climbing 23.19%. Small and mid-sized stocks beat their larger-cap counterparts, as the Russell 2000® and Russell Midcap® indexes added 22.19% and 21.28%, respectively. Solid returns for equities brought about more-tempered gains for fixed-income markets. The Barclays Capital® U.S. Aggregate Bond Index - a proxy for investment-grade debt - rose 4.62%. Higher-risk bond categories fared best, with The BofA Merrill LynchSM US High Yield Constrained Index gaining 8.15%. Bonds backed by the U.S. government were among the weakest performers, with the Barclays Capital® U.S. Treasury Bond Index adding 4.17%, while short-term assets fared the worst, as gauged by the 0.16% increase in the Barclays Capital U.S. 3 Month Treasury Bellwether Index.
Comments from Robert Stansky, Head of Fidelity's Stock Selector Large Cap Group, which manages Fidelity® Balanced Fund: For the year, the fund's Retail Class shares returned 13.88%, outperforming the 13.05% gain of the Fidelity Balanced Hybrid Composite Index, a hypothetical blend of the total returns of the S&P 500® Index and the Barclays Capital U.S. Aggregate Bond Index, using weightings of 60% and 40%, respectively. The fund was aided by security selection in equities and investment-grade bonds. In terms of asset allocation, overweighting equities and underweighting investment-grade bonds contributed, while a small stake in high-yield bonds nicked relative performance. On an individual security basis, limited exposure to Bank of America was beneficial, as its shares fell sharply due to concern about capital requirements. Not owning networking gear maker and index component Cisco Systems and largely avoiding computer and peripherals firm Hewlett-Packard helped, as both lost ground. Conversely, not owning IBM and underweighting integrated energy firm Chevron hurt because both stocks saw strong advances. An out-of-index position in health information services provider WebMD Health detracted, mainly because its shares plunged in July. Some stocks mentioned were not held at period end.
The views expressed above reflect those of the portfolio manager(s) only through the end of the period as stated on the cover of this report and do not necessarily represent the views of Fidelity or any other person in the Fidelity organization. Any such views are subject to change at any time based upon market or other conditions and Fidelity disclaims any responsibility to update such views. These views may not be relied on as investment advice and, because investment decisions for a Fidelity fund are based on numerous factors, may not be relied on as an indication of trading intent on behalf of any Fidelity fund.
Annual Report
Shareholder Expense Example
As a shareholder of the Fund, you incur two types of costs: (1) transaction costs, and (2) ongoing costs, including management fees and other Fund expenses. This Example is intended to help you understand your ongoing costs (in dollars) of investing in the Fund and to compare these costs with the ongoing costs of investing in other mutual funds.
The Example is based on an investment of $1,000 invested at the beginning of the period and held for the entire period (March 1, 2011 to August 31, 2011).
Actual Expenses
The first line of the accompanying table for each class of the Fund provides information about actual account values and actual expenses. You may use the information in this line, together with the amount you invested, to estimate the expenses that you paid over the period. Simply divide your account value by $1,000.00 (for example, an $8,600 account value divided by $1,000.00 = 8.6), then multiply the result by the number in the first line for a class of the Fund under the heading entitled "Expenses Paid During Period" to estimate the expenses you paid on your account during this period. A small balance maintenance fee of $12.00 that is charged once a year may apply for certain accounts with a value of less than $2,000. This fee is not included in the table below. If it was, the estimate of expenses you paid during the period would be higher, and your ending account value lower, by this amount. In addition, the Fund, as a shareholder in the underlying Fidelity Central Funds, will indirectly bear its pro-rata share of the fees and expenses incurred by the underlying Fidelity Central Funds. These fees and expenses are not included in the Fund's annualized expense ratio used to calculate the expense estimate in the table below.
Hypothetical Example for Comparison Purposes
The second line of the accompanying table for each class of the Fund provides information about hypothetical account values and hypothetical expenses based on a Class' actual expense ratio and an assumed rate of return of 5% per year before expenses, which is not the Class' actual return. The hypothetical account values and expenses may not be used to estimate the actual ending account balance or expenses you paid for the period. You may use this information to compare the ongoing costs of investing in the Fund and other funds. To do so, compare this 5% hypothetical example with the 5% hypothetical examples that appear in the shareholder reports of the other funds. A small balance maintenance fee of $12.00 that is charged once a year may apply for certain accounts with a value of less than $2,000. This fee is not included in the table below. If it was, the estimate of expenses you paid during the period would be higher, and your ending account value lower, by this amount. In addition, the Fund, as a shareholder in the underlying Fidelity Central Funds, will indirectly bear its pro-rata share of the fees and expenses incurred by the underlying Fidelity Central Funds. These fees and expenses are not included in the Fund's annualized expense ratio used to calculate the expense estimate in the table below.
Please note that the expenses shown in the table are meant to highlight your ongoing costs only and do not reflect any transaction costs. Therefore, the second line of the table is useful in comparing ongoing costs only, and will not help you determine the relative total costs of owning different funds.
Annual Report
| Annualized
Expense Ratio | Beginning
Account Value
March 1, 2011 | Ending
Account Value
August 31, 2011 | Expenses Paid
During Period*
March 1, 2011 to
August 31, 2011 |
Balanced | .60% | | | |
Actual | | $ 1,000.00 | $ 966.90 | $ 2.97 |
HypotheticalA | | $ 1,000.00 | $ 1,022.18 | $ 3.06 |
Class K | .48% | | | |
Actual | | $ 1,000.00 | $ 967.10 | $ 2.38 |
HypotheticalA | | $ 1,000.00 | $ 1,022.79 | $ 2.45 |
A 5% return per year before expenses
* Expenses are equal to each Class' annualized expense ratio, multiplied by the average account value over the period, multiplied by 184/365 (to reflect the one-half year period). The fees and expenses of the underlying Fidelity Central Funds in which the Fund invests are not included in the Fund's annualized expense ratio.
Annual Report
Investment Changes (Unaudited)
The information in the following tables is based on the combined investments of the Fund and its pro-rata share of its investments in each non-money market Fidelity Central Fund. |
Top Five Stocks as of August 31, 2011 |
| % of fund's
net assets | % of fund's net assets
6 months ago |
Apple, Inc. | 2.9 | 2.6 |
Microsoft Corp. | 1.5 | 1.0 |
Procter & Gamble Co. | 1.3 | 1.2 |
Google, Inc. Class A | 1.2 | 0.1 |
The Coca-Cola Co. | 1.2 | 1.0 |
| 8.1 | |
Top Five Bond Issuers as of August 31, 2011 |
(with maturities greater than one year) | % of fund's
net assets | % of fund's net assets
6 months ago |
Fannie Mae | 12.8 | 8.9 |
U.S. Treasury Obligations | 11.0 | 11.9 |
Freddie Mac | 3.1 | 2.2 |
Ginnie Mae | 2.4 | 2.3 |
Citigroup, Inc. | 0.5 | 0.5 |
| 29.8 | |
Top Five Market Sectors as of August 31, 2011 |
| % of fund's
net assets | % of fund's net assets
6 months ago |
Financials | 13.1 | 14.1 |
Information Technology | 11.9 | 11.8 |
Energy | 8.9 | 9.3 |
Consumer Staples | 7.4 | 6.5 |
Consumer Discretionary | 7.2 | 7.6 |
Asset Allocation (% of fund's net assets) |
As of August 31, 2011 * | As of February 28, 2011 ** |
 | Stocks and Equity
Futures 59.6% | | | Stocks and Equity
Futures 60.8% | |
 | Bonds 44.7% | | | Bonds 39.6% | |
 | Convertible
Securities 0.1% | |  | Convertible
Securities 0.0% | |
 | Other Investments 0.3% | | | Other Investments 0.3% | |
| Short-Term
Investments and
Net Other Assets† (4.7)% | | | Short-Term
Investments and
Net Other Assets† (0.7)% | |
* Foreign investments | 12.2% | | ** Foreign investments | 11.7% | |

† Short-Term Investments and Net Other Assets are not included in the pie chart. |
Percentages are adjusted for the effect of futures contracts and swap contracts, if applicable. A holdings listing for the Fund, which presents direct holdings as well as the pro-rata share of any securities and other investments held indirectly through its investment in underlying non-money market Fidelity Central Funds, is available at fidelity.com. |
Annual Report
Investments August 31, 2011
Showing Percentage of Net Assets
Common Stocks - 58.8% |
| Shares | | Value (000s) |
CONSUMER DISCRETIONARY - 6.1% |
Distributors - 0.0% |
Indiabulls Wholesale Services Ltd. | 372,748 | | $ 43 |
Hotels, Restaurants & Leisure - 1.7% |
Arcos Dorados Holdings, Inc. | 1,410,407 | | 38,885 |
Betfair Group PLC (f) | 2,135,799 | | 21,380 |
Las Vegas Sands Corp. (a) | 1,586,338 | | 73,876 |
Pinnacle Entertainment, Inc. (a) | 1,753,586 | | 24,059 |
Starbucks Corp. | 2,074,239 | | 80,107 |
Yum! Brands, Inc. | 1,732,234 | | 94,182 |
| | 332,489 |
Internet & Catalog Retail - 1.0% |
Amazon.com, Inc. (a) | 412,694 | | 88,849 |
Priceline.com, Inc. (a) | 199,124 | | 106,981 |
| | 195,830 |
Media - 1.9% |
DIRECTV (a) | 2,594,247 | | 114,069 |
Focus Media Holding Ltd. ADR (a) | 392,204 | | 12,300 |
Legend Pictures LLC (a)(r)(s) | 8,571 | | 6,428 |
The Walt Disney Co. | 3,224,327 | | 109,821 |
Time Warner, Inc. | 3,976,935 | | 125,910 |
| | 368,528 |
Multiline Retail - 0.4% |
Dollar General Corp. (a) | 2,263,260 | | 82,835 |
Specialty Retail - 0.8% |
Abercrombie & Fitch Co. Class A | 1,083,171 | | 68,901 |
Limited Brands, Inc. | 1,787,464 | | 67,459 |
TJX Companies, Inc. | 431,099 | | 23,547 |
| | 159,907 |
Textiles, Apparel & Luxury Goods - 0.3% |
Crocs, Inc. (a) | 587,177 | | 16,065 |
Under Armour, Inc. Class A (sub. vtg.) (a) | 245,997 | | 17,431 |
VF Corp. | 320,134 | | 37,475 |
| | 70,971 |
TOTAL CONSUMER DISCRETIONARY | | 1,210,603 |
CONSUMER STAPLES - 6.8% |
Beverages - 2.8% |
Anheuser-Busch InBev SA NV | 634,550 | | 35,029 |
Carlsberg A/S Series B | 44,700 | | 3,353 |
Common Stocks - continued |
| Shares | | Value (000s) |
CONSUMER STAPLES - continued |
Beverages - continued |
Coca-Cola Bottling Co. Consolidated | 97,384 | | $ 5,454 |
Coca-Cola FEMSA SAB de CV sponsored ADR | 70,725 | | 6,986 |
Coca-Cola Icecek A/S | 481,588 | | 5,982 |
Companhia de Bebidas das Americas (AmBev) (PN) sponsored ADR | 198,325 | | 7,068 |
Constellation Brands, Inc. Class A (sub. vtg.) (a) | 2,213,783 | | 43,766 |
Diageo PLC sponsored ADR | 562,302 | | 45,130 |
Embotelladora Andina SA sponsored ADR | 257,726 | | 7,059 |
Molson Coors Brewing Co. Class B | 1,042,828 | | 45,624 |
PepsiCo, Inc. | 1,124,854 | | 72,474 |
Pernod-Ricard SA | 373,450 | | 33,532 |
Remy Cointreau SA | 168,325 | | 14,826 |
The Coca-Cola Co. | 3,256,916 | | 229,450 |
| | 555,733 |
Food & Staples Retailing - 0.7% |
CVS Caremark Corp. | 3,261,896 | | 117,135 |
Drogasil SA | 391,400 | | 3,073 |
Fresh Market, Inc. | 14,100 | | 544 |
Walgreen Co. | 585,872 | | 20,629 |
| | 141,381 |
Food Products - 0.5% |
Archer Daniels Midland Co. | 185,933 | | 5,295 |
Bunge Ltd. | 319,046 | | 20,645 |
Danone | 163,400 | | 11,166 |
Green Mountain Coffee Roasters, Inc. (a) | 42,500 | | 4,451 |
Nestle SA | 307,252 | | 19,026 |
Unilever NV (NY Reg.) | 598,231 | | 20,340 |
Viterra, Inc. | 321,800 | | 3,424 |
| | 84,347 |
Household Products - 1.5% |
Colgate-Palmolive Co. | 324,967 | | 29,237 |
Procter & Gamble Co. | 4,062,395 | | 258,693 |
Spectrum Brands Holdings, Inc. (a) | 259,133 | | 6,940 |
| | 294,870 |
Personal Products - 0.3% |
Avon Products, Inc. | 1,009,261 | | 22,769 |
L'Oreal SA | 296,100 | | 32,240 |
Nu Skin Enterprises, Inc. Class A | 84,779 | | 3,585 |
| | 58,594 |
Common Stocks - continued |
| Shares | | Value (000s) |
CONSUMER STAPLES - continued |
Tobacco - 1.0% |
Altria Group, Inc. | 623,204 | | $ 16,945 |
British American Tobacco PLC sponsored ADR | 1,513,054 | | 135,585 |
Philip Morris International, Inc. | 526,872 | | 36,523 |
Souza Cruz Industria Comerico | 564,500 | | 7,049 |
| | 196,102 |
TOTAL CONSUMER STAPLES | | 1,331,027 |
ENERGY - 7.4% |
Energy Equipment & Services - 2.3% |
Aker Solutions ASA | 538,774 | | 7,030 |
Baker Hughes, Inc. | 1,382,895 | | 84,509 |
C&J Energy Services, Inc. (a)(g) | 374,800 | | 8,818 |
Discovery Offshore S.A. (a)(g) | 1,018,700 | | 1,519 |
Ensco International Ltd. ADR | 555,260 | | 26,797 |
Halliburton Co. | 2,488,898 | | 110,432 |
Kvaerner ASA (a) | 538,774 | | 1,039 |
National Oilwell Varco, Inc. | 710,055 | | 46,949 |
Noble Corp. | 1,089,708 | | 36,789 |
Ocean Rig UDW, Inc. (a) | 104,100 | | 1,552 |
Oceaneering International, Inc. | 579,698 | | 24,747 |
Saipem SpA | 341,124 | | 15,320 |
Schlumberger Ltd. | 578,124 | | 45,163 |
TETRA Technologies, Inc. (a) | 428,100 | | 4,388 |
Transocean Ltd. (United States) | 672,000 | | 37,645 |
Vantage Drilling Co. (a) | 4,677,101 | | 7,156 |
| | 459,853 |
Oil, Gas & Consumable Fuels - 5.1% |
Alpha Natural Resources, Inc. (a) | 845,697 | | 27,967 |
Anadarko Petroleum Corp. | 805,077 | | 59,374 |
Apache Corp. | 872,771 | | 89,957 |
BP PLC sponsored ADR | 905,028 | | 35,649 |
Canadian Natural Resources Ltd. | 743,700 | | 28,101 |
CVR Energy, Inc. (a) | 402,924 | | 11,471 |
Exxon Mobil Corp. | 2,037,491 | | 150,856 |
Falkland Oil & Gas Ltd. (a) | 624,364 | | 568 |
HollyFrontier Corp. | 1,013,459 | | 72,726 |
InterOil Corp. (a)(f) | 284,231 | | 18,012 |
Marathon Oil Corp. | 2,026,023 | | 54,541 |
Marathon Petroleum Corp. | 1,071,111 | | 39,695 |
Common Stocks - continued |
| Shares | | Value (000s) |
ENERGY - continued |
Oil, Gas & Consumable Fuels - continued |
Niko Resources Ltd. | 218,400 | | $ 12,432 |
Occidental Petroleum Corp. | 682,348 | | 59,187 |
Petrobank Energy & Resources Ltd. (a) | 858,290 | | 10,404 |
Petrominerales Ltd. | 407,701 | | 12,724 |
Resolute Energy Corp. (a) | 855,062 | | 11,535 |
Rockhopper Exploration PLC (a) | 202,500 | | 709 |
Rodinia Oil Corp. (a) | 449,500 | | 519 |
Royal Dutch Shell PLC: | | | |
Class A sponsored ADR (f) | 68,834 | | 4,615 |
Class B sponsored ADR | 2,730,021 | | 184,222 |
Talisman Energy, Inc. | 1,941,700 | | 32,461 |
Western Refining, Inc. (a)(f) | 711,088 | | 12,401 |
Whiting Petroleum Corp. (a) | 443,180 | | 20,878 |
Williams Companies, Inc. | 1,559,100 | | 42,080 |
| | 993,084 |
TOTAL ENERGY | | 1,452,937 |
FINANCIALS - 8.4% |
Capital Markets - 1.1% |
Ameriprise Financial, Inc. | 534,300 | | 24,418 |
E*TRADE Financial Corp. (a) | 1,352,400 | | 16,716 |
Evercore Partners, Inc. Class A | 275,200 | | 7,218 |
ICAP PLC | 913,200 | | 7,045 |
Invesco Ltd. | 761,882 | | 13,942 |
Morgan Stanley | 2,784,765 | | 48,733 |
State Street Corp. | 2,399,566 | | 85,233 |
TD Ameritrade Holding Corp. | 1,066,600 | | 16,404 |
| | 219,709 |
Commercial Banks - 2.4% |
Banco Macro SA sponsored ADR | 144,500 | | 3,913 |
BB&T Corp. | 893,853 | | 19,924 |
CIT Group, Inc. (a) | 203,194 | | 7,024 |
FirstMerit Corp. | 934,898 | | 11,649 |
Huntington Bancshares, Inc. | 5,375,934 | | 27,041 |
Regions Financial Corp. | 2,171,300 | | 9,858 |
SunTrust Banks, Inc. | 1,140,177 | | 22,690 |
Synovus Financial Corp. (f) | 6,616,120 | | 9,593 |
Common Stocks - continued |
| Shares | | Value (000s) |
FINANCIALS - continued |
Commercial Banks - continued |
U.S. Bancorp | 6,507,702 | | $ 151,044 |
Wells Fargo & Co. | 8,114,874 | | 211,798 |
| | 474,534 |
Consumer Finance - 0.5% |
Capital One Financial Corp. | 1,035,543 | | 47,687 |
Discover Financial Services | 580,742 | | 14,611 |
Green Dot Corp. Class A (a)(f) | 224,815 | | 7,351 |
Promise Co. Ltd. (a) | 1,201,300 | | 8,600 |
SLM Corp. | 1,544,400 | | 21,205 |
| | 99,454 |
Diversified Financial Services - 1.1% |
African Bank Investments Ltd. | 2,280,111 | | 11,593 |
Citigroup, Inc. | 5,181,049 | | 160,872 |
CME Group, Inc. | 109,537 | | 29,260 |
NBH Holdings Corp. Class A (a)(g) | 576,500 | | 9,801 |
| | 211,526 |
Insurance - 2.2% |
ACE Ltd. | 628,282 | | 40,574 |
Amlin PLC | 2,630,845 | | 13,324 |
Aon Corp. | 745,900 | | 34,856 |
Berkshire Hathaway, Inc.: | | | |
Class A (a) | 208 | | 22,832 |
Class B (a) | 1,994,121 | | 145,571 |
Fairfax Financial Holdings Ltd. (sub. vtg.) | 114,300 | | 46,096 |
Fidelity National Financial, Inc. Class A | 548,100 | | 9,312 |
Genworth Financial, Inc. Class A (a) | 478,496 | | 3,306 |
MetLife, Inc. | 2,436,422 | | 81,864 |
The Chubb Corp. | 475,900 | | 29,453 |
Validus Holdings Ltd. | 380,065 | | 9,813 |
| | 437,001 |
Real Estate Investment Trusts - 0.8% |
American Capital Agency Corp. | 458,500 | | 13,072 |
Annaly Capital Management, Inc. | 713,738 | | 12,940 |
Camden Property Trust (SBI) | 272,101 | | 18,182 |
Equity Lifestyle Properties, Inc. | 120,400 | | 8,298 |
Prologis, Inc. | 1,206,853 | | 32,863 |
Public Storage | 400,195 | | 49,516 |
The Macerich Co. | 334,401 | | 16,399 |
| | 151,270 |
Common Stocks - continued |
| Shares | | Value (000s) |
FINANCIALS - continued |
Real Estate Management & Development - 0.2% |
Ayala Land, Inc. | 19,944,000 | | $ 7,489 |
BR Malls Participacoes SA | 1,283,200 | | 14,307 |
CB Richard Ellis Group, Inc. Class A (a) | 80,860 | | 1,226 |
Indiabulls Real Estate Ltd. (a) | 3,224,938 | | 5,983 |
PT Lippo Karawaci Tbk | 122,587,250 | | 10,861 |
| | 39,866 |
Thrifts & Mortgage Finance - 0.1% |
Ocwen Financial Corp. (a) | 1,856,619 | | 25,621 |
TOTAL FINANCIALS | | 1,658,981 |
HEALTH CARE - 6.7% |
Biotechnology - 1.5% |
Alexion Pharmaceuticals, Inc. (a) | 283,037 | | 16,401 |
Amgen, Inc. | 2,092,949 | | 115,960 |
AVEO Pharmaceuticals, Inc. (a) | 380,100 | | 6,454 |
AVEO Pharmaceuticals, Inc. | 77,244 | | 1,312 |
Biogen Idec, Inc. (a) | 623,416 | | 58,726 |
BioMarin Pharmaceutical, Inc. (a) | 611,487 | | 18,091 |
Gilead Sciences, Inc. (a) | 1,372,644 | | 54,748 |
Medivir AB (B Shares) (a) | 325,143 | | 4,974 |
ONYX Pharmaceuticals, Inc. (a) | 245,107 | | 8,341 |
| | 285,007 |
Health Care Equipment & Supplies - 1.8% |
Baxter International, Inc. | 1,621,611 | | 90,778 |
Boston Scientific Corp. (a) | 5,415,038 | | 36,714 |
C. R. Bard, Inc. | 284,966 | | 27,146 |
Covidien PLC | 2,247,103 | | 117,254 |
Edwards Lifesciences Corp. (a) | 540,081 | | 40,749 |
Mako Surgical Corp. (a)(f) | 630,372 | | 22,630 |
Quidel Corp. (a) | 1,129,647 | | 17,261 |
Shandong Weigao Group Medical Polymer Co. Ltd. (H Shares) | 2,508,000 | | 3,160 |
William Demant Holding A/S (a) | 69,534 | | 5,745 |
| | 361,437 |
Health Care Providers & Services - 1.4% |
CIGNA Corp. | 756,788 | | 35,372 |
Express Scripts, Inc. (a) | 92,700 | | 4,351 |
Henry Schein, Inc. (a) | 674,713 | | 44,470 |
McKesson Corp. | 1,131,300 | | 90,425 |
Omnicare, Inc. | 832,251 | | 24,726 |
Common Stocks - continued |
| Shares | | Value (000s) |
HEALTH CARE - continued |
Health Care Providers & Services - continued |
Shanghai Pharma Holding Co. Ltd. (H Shares) | 70,100 | | $ 146 |
UnitedHealth Group, Inc. | 1,729,936 | | 82,207 |
| | 281,697 |
Life Sciences Tools & Services - 0.2% |
Thermo Fisher Scientific, Inc. (a) | 743,029 | | 40,815 |
Pharmaceuticals - 1.8% |
Bayer AG | 118,390 | | 7,635 |
Merck & Co., Inc. | 1,820,350 | | 60,290 |
Novo Nordisk A/S Series B | 69,031 | | 7,354 |
Pfizer, Inc. | 7,863,048 | | 149,241 |
Sanofi-Aventis sponsored ADR | 1,378,600 | | 50,415 |
Shire PLC sponsored ADR | 553,400 | | 53,735 |
Valeant Pharmaceuticals International, Inc. (Canada) | 736,491 | | 33,019 |
| | 361,689 |
TOTAL HEALTH CARE | | 1,330,645 |
INDUSTRIALS - 6.6% |
Aerospace & Defense - 2.6% |
Bombardier, Inc. Class B (sub. vtg.) | 4,552,900 | | 22,179 |
Goodrich Corp. | 661,608 | | 59,002 |
Honeywell International, Inc. | 1,328,764 | | 63,528 |
MTU Aero Engines Holdings AG | 200,864 | | 13,681 |
Precision Castparts Corp. | 451,300 | | 73,946 |
Safran SA | 785,310 | | 30,490 |
Textron, Inc. | 1,531,844 | | 25,842 |
The Boeing Co. | 1,303,389 | | 87,145 |
United Technologies Corp. | 1,749,514 | | 129,901 |
| | 505,714 |
Air Freight & Logistics - 0.1% |
C.H. Robinson Worldwide, Inc. | 310,386 | | 21,882 |
Building Products - 0.2% |
Armstrong World Industries, Inc. | 334,346 | | 13,464 |
Lennox International, Inc. | 353,458 | | 11,035 |
Owens Corning (a) | 865,708 | | 25,157 |
| | 49,656 |
Commercial Services & Supplies - 0.4% |
Republic Services, Inc. | 1,341,863 | | 40,739 |
Common Stocks - continued |
| Shares | | Value (000s) |
INDUSTRIALS - continued |
Commercial Services & Supplies - continued |
Stericycle, Inc. (a) | 260,397 | | $ 22,839 |
Swisher Hygiene, Inc. | 1,582,581 | | 7,074 |
| | 70,652 |
Construction & Engineering - 0.2% |
Fluor Corp. | 429,536 | | 26,081 |
Foster Wheeler AG (a) | 805,796 | | 19,782 |
| | 45,863 |
Electrical Equipment - 0.8% |
Acuity Brands, Inc. | 356,838 | | 16,429 |
Alstom SA | 536,074 | | 24,895 |
Cooper Industries PLC Class A | 432,401 | | 20,487 |
Emerson Electric Co. | 807,386 | | 37,584 |
GrafTech International Ltd. (a) | 946,564 | | 14,861 |
Regal-Beloit Corp. | 607,829 | | 35,734 |
| | 149,990 |
Industrial Conglomerates - 1.0% |
Danaher Corp. | 1,336,659 | | 61,232 |
General Electric Co. | 6,835,302 | | 111,484 |
Tyco International Ltd. | 740,950 | | 30,809 |
| | 203,525 |
Machinery - 0.5% |
Caterpillar, Inc. | 212,929 | | 19,377 |
Cummins, Inc. | 353,179 | | 32,817 |
Fanuc Corp. | 94,400 | | 15,712 |
Pall Corp. | 236,500 | | 12,092 |
Vallourec SA (f) | 130,679 | | 11,762 |
| | 91,760 |
Professional Services - 0.1% |
CoStar Group, Inc. (a) | 216,150 | | 11,063 |
Road & Rail - 0.7% |
CSX Corp. | 2,782,578 | | 61,050 |
Union Pacific Corp. | 948,800 | | 87,451 |
| | 148,501 |
TOTAL INDUSTRIALS | | 1,298,606 |
INFORMATION TECHNOLOGY - 11.5% |
Communications Equipment - 1.2% |
Ciena Corp. (a)(f) | 719,329 | | 8,805 |
Common Stocks - continued |
| Shares | | Value (000s) |
INFORMATION TECHNOLOGY - continued |
Communications Equipment - continued |
Meru Networks, Inc. (a)(f) | 189,492 | | $ 1,732 |
Nokia Corp. sponsored ADR (f) | 1,939,700 | | 12,492 |
QUALCOMM, Inc. | 4,307,108 | | 221,644 |
| | 244,673 |
Computers & Peripherals - 3.5% |
Apple, Inc. (a) | 1,482,029 | | 570,329 |
Dell, Inc. (a) | 1,690,985 | | 25,136 |
EMC Corp. (a) | 3,334,672 | | 75,330 |
Imagination Technologies Group PLC (a) | 188,808 | | 1,087 |
SanDisk Corp. (a) | 621,232 | | 22,768 |
| | 694,650 |
Electronic Equipment & Components - 0.0% |
TPK Holdings Co. | 31,250 | | 758 |
Internet Software & Services - 1.7% |
Baidu.com, Inc. sponsored ADR (a) | 443,896 | | 64,711 |
Dice Holdings, Inc. (a) | 863,244 | | 8,710 |
Google, Inc. Class A (a) | 428,288 | | 231,687 |
Mail.ru Group Ltd. GDR (a)(g) | 329,034 | | 11,839 |
Renren, Inc. ADR (f) | 1,137,201 | | 8,347 |
WebMD Health Corp. (a) | 259,712 | | 9,178 |
| | 334,472 |
IT Services - 0.6% |
Accenture PLC Class A | 1,266,136 | | 67,852 |
Cognizant Technology Solutions Corp. Class A (a) | 272,357 | | 17,281 |
MasterCard, Inc. Class A | 41,700 | | 13,749 |
Visa, Inc. Class A | 166,568 | | 14,638 |
| | 113,520 |
Semiconductors & Semiconductor Equipment - 2.1% |
Analog Devices, Inc. | 2,242,275 | | 74,040 |
ARM Holdings PLC sponsored ADR | 1,335,141 | | 36,823 |
ASAT Holdings Ltd. (a) | 88,719 | | 0 |
ASML Holding NV | 1,199,542 | | 42,308 |
Avago Technologies Ltd. | 1,264,654 | | 41,873 |
Inotera Memories, Inc. (a) | 30,431,880 | | 7,006 |
International Rectifier Corp. (a) | 594,784 | | 13,555 |
Intersil Corp. Class A | 1,907,025 | | 21,416 |
KLA-Tencor Corp. | 372,636 | | 13,668 |
Lam Research Corp. (a) | 217,263 | | 8,073 |
Marvell Technology Group Ltd. (a) | 4,748,332 | | 62,441 |
Common Stocks - continued |
| Shares | | Value (000s) |
INFORMATION TECHNOLOGY - continued |
Semiconductors & Semiconductor Equipment - continued |
Micron Technology, Inc. (a) | 12,132,834 | | $ 71,705 |
Nanya Technology Corp. (a) | 12,095,245 | | 2,193 |
Omnivision Technologies, Inc. (a) | 115,745 | | 2,130 |
RF Micro Devices, Inc. (a) | 906,817 | | 5,631 |
Skyworks Solutions, Inc. (a) | 745,700 | | 15,384 |
TriQuint Semiconductor, Inc. (a) | 528,200 | | 4,004 |
| | 422,250 |
Software - 2.4% |
Ariba, Inc. (a) | 946,662 | | 25,683 |
Check Point Software Technologies Ltd. (a) | 1,593,174 | | 86,732 |
Intuit, Inc. | 441,631 | | 21,786 |
Microsoft Corp. | 11,058,954 | | 294,168 |
Nuance Communications, Inc. (a) | 758,813 | | 14,084 |
Oracle Corp. | 628,258 | | 17,635 |
QLIK Technologies, Inc. (a) | 69,946 | | 1,775 |
| | 461,863 |
TOTAL INFORMATION TECHNOLOGY | | 2,272,186 |
MATERIALS - 1.9% |
Chemicals - 1.2% |
Albemarle Corp. | 233,037 | | 11,817 |
Ashland, Inc. | 473,136 | | 25,081 |
Celanese Corp. Class A | 550,272 | | 25,868 |
CF Industries Holdings, Inc. | 147,600 | | 26,984 |
Dow Chemical Co. | 530,186 | | 15,084 |
LyondellBasell Industries NV Class A | 703,777 | | 24,386 |
Monsanto Co. | 598,723 | | 41,270 |
Praxair, Inc. | 371,200 | | 36,559 |
The Mosaic Co. | 381,800 | | 27,157 |
W.R. Grace & Co. (a) | 152,400 | | 6,008 |
| | 240,214 |
Containers & Packaging - 0.2% |
Ball Corp. | 741,371 | | 26,630 |
Rock-Tenn Co. Class A | 272,951 | | 14,649 |
| | 41,279 |
Metals & Mining - 0.5% |
Anglo American PLC (United Kingdom) | 1,223,750 | | 51,018 |
Common Stocks - continued |
| Shares | | Value (000s) |
MATERIALS - continued |
Metals & Mining - continued |
Reliance Steel & Aluminum Co. | 423,900 | | $ 17,566 |
Walter Energy, Inc. | 213,595 | | 17,459 |
| | 86,043 |
TOTAL MATERIALS | | 367,536 |
TELECOMMUNICATION SERVICES - 1.2% |
Diversified Telecommunication Services - 0.7% |
CenturyLink, Inc. | 3,060,701 | | 110,644 |
Verizon Communications, Inc. | 1,032,285 | | 37,338 |
| | 147,982 |
Wireless Telecommunication Services - 0.5% |
American Tower Corp. Class A (a) | 1,380,893 | | 74,375 |
MetroPCS Communications, Inc. (a) | 948,811 | | 10,589 |
Sprint Nextel Corp. (a) | 3,156,391 | | 11,868 |
| | 96,832 |
TOTAL TELECOMMUNICATION SERVICES | | 244,814 |
UTILITIES - 2.2% |
Electric Utilities - 1.1% |
Edison International | 1,516,707 | | 56,406 |
Exelon Corp. | 962,747 | | 41,514 |
FirstEnergy Corp. | 1,007,733 | | 44,592 |
NextEra Energy, Inc. | 1,334,554 | | 75,696 |
| | 218,208 |
Independent Power Producers & Energy Traders - 0.5% |
Constellation Energy Group, Inc. | 1,233,350 | | 47,472 |
NRG Energy, Inc. (a) | 635,782 | | 14,903 |
The AES Corp. (a) | 2,530,119 | | 27,477 |
| | 89,852 |
Multi-Utilities - 0.6% |
Dominion Resources, Inc. | 125,300 | | 6,107 |
PG&E Corp. | 680,786 | | 28,831 |
Common Stocks - continued |
| Shares | | Value (000s) |
UTILITIES - continued |
Multi-Utilities - continued |
Public Service Enterprise Group, Inc. | 1,156,953 | | $ 39,487 |
Sempra Energy | 803,260 | | 42,187 |
| | 116,612 |
TOTAL UTILITIES | | 424,672 |
TOTAL COMMON STOCKS (Cost $10,989,177) | 11,592,007 |
Preferred Stocks - 0.1% |
| | | |
Convertible Preferred Stocks - 0.0% |
INFORMATION TECHNOLOGY - 0.0% |
Semiconductors & Semiconductor Equipment - 0.0% |
ASAT Holdings Ltd. 13.00% (a) | 2,416 | | 0 |
Nonconvertible Preferred Stocks - 0.1% |
CONSUMER DISCRETIONARY - 0.1% |
Automobiles - 0.1% |
Volkswagen AG | 122,399 | | 20,389 |
TOTAL PREFERRED STOCKS (Cost $21,334) | 20,389 |
Nonconvertible Bonds - 7.1% |
| Principal
Amount (000s) | | |
CONSUMER DISCRETIONARY - 0.5% |
Auto Components - 0.0% |
DaimlerChrysler NA Holding Corp. 5.75% 9/8/11 | | $ 6,570 | | 6,572 |
Household Durables - 0.1% |
Fortune Brands, Inc.: | | | | |
5.375% 1/15/16 | | 1,615 | | 1,790 |
5.875% 1/15/36 | | 7,325 | | 7,477 |
6.375% 6/15/14 | | 482 | | 538 |
| | 9,805 |
Media - 0.4% |
AOL Time Warner, Inc. 7.625% 4/15/31 | | 4,975 | | 6,100 |
Comcast Corp.: | | | | |
4.95% 6/15/16 | | 2,207 | | 2,479 |
5.15% 3/1/20 | | 644 | | 733 |
Nonconvertible Bonds - continued |
| Principal
Amount (000s) | | Value (000s) |
CONSUMER DISCRETIONARY - continued |
Media - continued |
Comcast Corp.: - continued | | | | |
6.4% 3/1/40 | | $ 4,756 | | $ 5,387 |
COX Communications, Inc. 4.625% 6/1/13 | | 3,612 | | 3,833 |
Discovery Communications LLC 3.7% 6/1/15 | | 5,116 | | 5,464 |
Liberty Media Corp. 8.25% 2/1/30 | | 1,710 | | 1,672 |
NBCUniversal Media LLC: | | | | |
3.65% 4/30/15 | | 6,489 | | 6,884 |
5.15% 4/30/20 | | 7,276 | | 8,059 |
6.4% 4/30/40 | | 6,271 | | 7,085 |
News America Holdings, Inc. 7.75% 12/1/45 | | 7,397 | | 8,711 |
News America, Inc. 6.15% 2/15/41 | | 4,393 | | 4,580 |
Time Warner Cable, Inc.: | | | | |
5.4% 7/2/12 | | 2,870 | | 2,973 |
5.85% 5/1/17 | | 3,400 | | 3,831 |
6.2% 7/1/13 | | 2,729 | | 2,968 |
6.75% 7/1/18 | | 1,378 | | 1,621 |
Time Warner, Inc.: | | | | |
3.15% 7/15/15 | | 392 | | 408 |
5.875% 11/15/16 | | 4,125 | | 4,802 |
6.2% 3/15/40 | | 3,821 | | 4,097 |
6.5% 11/15/36 | | 2,758 | | 3,077 |
| | 84,764 |
Specialty Retail - 0.0% |
Staples, Inc. 7.375% 10/1/12 | | 820 | | 874 |
TOTAL CONSUMER DISCRETIONARY | | 102,015 |
CONSUMER STAPLES - 0.4% |
Beverages - 0.1% |
Anheuser-Busch InBev Worldwide, Inc.: | | | | |
2.5% 3/26/13 | | 3,211 | | 3,298 |
5.375% 11/15/14 | | 7,113 | | 8,034 |
Diageo Capital PLC 5.2% 1/30/13 | | 4,139 | | 4,392 |
FBG Finance Ltd. 5.125% 6/15/15 (g) | | 3,447 | | 3,815 |
| | 19,539 |
Food Products - 0.1% |
Cargill, Inc. 6% 11/27/17 (g) | | 572 | | 680 |
Kraft Foods, Inc.: | | | | |
5.375% 2/10/20 | | 8,116 | | 9,208 |
Nonconvertible Bonds - continued |
| Principal
Amount (000s) | | Value (000s) |
CONSUMER STAPLES - continued |
Food Products - continued |
Kraft Foods, Inc.: - continued | | | | |
5.625% 11/1/11 | | $ 553 | | $ 557 |
6.5% 8/11/17 | | 8,854 | | 10,694 |
6.75% 2/19/14 | | 436 | | 493 |
| | 21,632 |
Tobacco - 0.2% |
Altria Group, Inc.: | | | | |
8.5% 11/10/13 | | 483 | | 554 |
9.7% 11/10/18 | | 16,451 | | 21,723 |
Reynolds American, Inc.: | | | | |
6.75% 6/15/17 | | 3,486 | | 4,104 |
7.25% 6/15/37 | | 7,569 | | 8,432 |
| | 34,813 |
TOTAL CONSUMER STAPLES | | 75,984 |
ENERGY - 1.0% |
Energy Equipment & Services - 0.1% |
DCP Midstream LLC 5.35% 3/15/20 (g) | | 6,637 | | 7,311 |
El Paso Pipeline Partners Operating Co. LLC: | | | | |
4.1% 11/15/15 | | 7,675 | | 8,077 |
6.5% 4/1/20 | | 1,091 | | 1,238 |
Noble Holding International Ltd. 3.45% 8/1/15 | | 934 | | 990 |
Weatherford International Ltd.: | | | | |
4.95% 10/15/13 | | 2,045 | | 2,174 |
5.15% 3/15/13 | | 2,673 | | 2,815 |
| | 22,605 |
Oil, Gas & Consumable Fuels - 0.9% |
Anadarko Petroleum Corp.: | | | | |
5.95% 9/15/16 | | 718 | | 807 |
6.375% 9/15/17 | | 13,514 | | 15,595 |
BW Group Ltd. 6.625% 6/28/17 (g) | | 3,472 | | 3,251 |
Canadian Natural Resources Ltd.: | | | | |
5.15% 2/1/13 | | 5,282 | | 5,570 |
5.7% 5/15/17 | | 424 | | 495 |
Duke Capital LLC 6.25% 2/15/13 | | 809 | | 861 |
Duke Energy Field Services: | | | | |
5.375% 10/15/15 (g) | | 1,435 | | 1,621 |
6.45% 11/3/36 (g) | | 6,493 | | 7,332 |
Nonconvertible Bonds - continued |
| Principal
Amount (000s) | | Value (000s) |
ENERGY - continued |
Oil, Gas & Consumable Fuels - continued |
El Paso Natural Gas Co. 5.95% 4/15/17 | | $ 1,098 | | $ 1,269 |
EnCana Holdings Finance Corp. 5.8% 5/1/14 | | 3,391 | | 3,741 |
Enterprise Products Operating LP: | | | | |
5.6% 10/15/14 | | 715 | | 785 |
5.65% 4/1/13 | | 563 | | 598 |
Gulf South Pipeline Co. LP 5.75% 8/15/12 (g) | | 4,535 | | 4,673 |
Gulfstream Natural Gas System LLC 6.95% 6/1/16 (g) | | 327 | | 390 |
Marathon Petroleum Corp. 5.125% 3/1/21 (g) | | 4,207 | | 4,486 |
Midcontinent Express Pipeline LLC 5.45% 9/15/14 (g) | | 6,234 | | 6,705 |
Motiva Enterprises LLC 6.85% 1/15/40 (g) | | 4,294 | | 5,471 |
Nakilat, Inc. 6.067% 12/31/33 (g) | | 2,490 | | 2,689 |
Nexen, Inc.: | | | | |
5.2% 3/10/15 | | 1,067 | | 1,166 |
5.875% 3/10/35 | | 1,565 | | 1,478 |
6.2% 7/30/19 | | 893 | | 1,032 |
6.4% 5/15/37 | | 5,235 | | 5,371 |
NGPL PipeCo LLC 6.514% 12/15/12 (g) | | 4,184 | | 4,329 |
Petrobras International Finance Co. Ltd.: | | | | |
3.875% 1/27/16 | | 6,946 | | 7,120 |
5.75% 1/20/20 | | 15,286 | | 16,584 |
7.875% 3/15/19 | | 7,382 | | 8,980 |
Petroleos Mexicanos: | | | | |
5.5% 1/21/21 (g) | | 7,423 | | 8,073 |
6% 3/5/20 | | 952 | | 1,073 |
Plains All American Pipeline LP/PAA Finance Corp.: | | | | |
3.95% 9/15/15 | | 149 | | 158 |
4.25% 9/1/12 | | 718 | | 741 |
5% 2/1/21 | | 2,303 | | 2,447 |
6.125% 1/15/17 | | 1,940 | | 2,223 |
Ras Laffan Liquefied Natural Gas Co. Ltd. 8.294% 3/15/14 (g) | | 2,104 | | 2,304 |
Ras Laffan Liquefied Natural Gas Co. Ltd. III: | | | | |
4.5% 9/30/12 (g) | | 3,472 | | 3,594 |
5.5% 9/30/14 (g) | | 5,137 | | 5,664 |
5.832% 9/30/16 (g) | | 1,325 | | 1,451 |
6.332% 9/30/27 (g) | | 5,910 | | 6,604 |
6.75% 9/30/19 (g) | | 3,177 | | 3,812 |
Rockies Express Pipeline LLC 6.25% 7/15/13 (g) | | 3,193 | | 3,416 |
Southeast Supply Header LLC 4.85% 8/15/14 (g) | | 543 | | 583 |
Spectra Energy Capital, LLC 5.65% 3/1/20 | | 455 | | 509 |
Nonconvertible Bonds - continued |
| Principal
Amount (000s) | | Value (000s) |
ENERGY - continued |
Oil, Gas & Consumable Fuels - continued |
Spectra Energy Partners, LP: | | | | |
2.95% 6/15/16 | | $ 1,325 | | $ 1,363 |
4.6% 6/15/21 | | 1,733 | | 1,790 |
Texas Eastern Transmission LP 6% 9/15/17 (g) | | 1,301 | | 1,558 |
Western Gas Partners LP 5.375% 6/1/21 | | 7,979 | | 8,402 |
XTO Energy, Inc.: | | | | |
4.9% 2/1/14 | | 394 | | 433 |
5% 1/31/15 | | 1,414 | | 1,607 |
5.65% 4/1/16 | | 970 | | 1,151 |
| | 171,355 |
TOTAL ENERGY | | 193,960 |
FINANCIALS - 3.4% |
Capital Markets - 0.6% |
Bear Stearns Companies, Inc. 5.3% 10/30/15 | | 11,058 | | 12,013 |
Goldman Sachs Group, Inc.: | | | | |
3.7% 8/1/15 | | 7,427 | | 7,503 |
5.95% 1/18/18 | | 4,684 | | 4,980 |
6% 6/15/20 | | 4,000 | | 4,265 |
6.15% 4/1/18 | | 1,671 | | 1,785 |
6.75% 10/1/37 | | 5,715 | | 5,411 |
Janus Capital Group, Inc. 5.875% 9/15/11 (e) | | 879 | | 880 |
JPMorgan Chase Capital XX 6.55% 9/29/36 | | 11,840 | | 11,760 |
Lazard Group LLC: | | | | |
6.85% 6/15/17 | | 4,528 | | 5,091 |
7.125% 5/15/15 | | 1,616 | | 1,822 |
Merrill Lynch & Co., Inc.: | | | | |
5.45% 2/5/13 | | 5,465 | | 5,607 |
6.4% 8/28/17 | | 4,179 | | 4,280 |
Morgan Stanley: | | | | |
4% 7/24/15 | | 956 | | 951 |
4.75% 4/1/14 | | 3,169 | | 3,213 |
5.45% 1/9/17 | | 1,800 | | 1,845 |
5.5% 7/28/21 | | 6,859 | | 6,840 |
5.625% 9/23/19 | | 1,795 | | 1,823 |
5.75% 1/25/21 | | 8,300 | | 8,538 |
5.95% 12/28/17 | | 646 | | 668 |
6% 5/13/14 | | 4,042 | | 4,243 |
6% 4/28/15 | | 2,091 | | 2,188 |
Nonconvertible Bonds - continued |
| Principal
Amount (000s) | | Value (000s) |
FINANCIALS - continued |
Capital Markets - continued |
Morgan Stanley: - continued | | | | |
6.625% 4/1/18 | | $ 1,257 | | $ 1,346 |
7.3% 5/13/19 | | 6,528 | | 7,283 |
Northern Trust Corp. 3.375% 8/23/21 | | 1,695 | | 1,692 |
UBS AG Stamford Branch 3.875% 1/15/15 | | 11,500 | | 11,925 |
| | 117,952 |
Commercial Banks - 0.7% |
Bank of America NA: | | | | |
5.3% 3/15/17 | | 15,795 | | 15,451 |
6.1% 6/15/17 | | 565 | | 559 |
Credit Suisse New York Branch 6% 2/15/18 | | 15,195 | | 16,000 |
DBS Bank Ltd. (Singapore) 0.5101% 5/16/17 (g)(o) | | 4,537 | | 4,469 |
Discover Bank: | | | | |
7% 4/15/20 | | 3,200 | | 3,478 |
8.7% 11/18/19 | | 2,425 | | 2,855 |
Export-Import Bank of Korea: | | | | |
5.25% 2/10/14 (g) | | 456 | | 486 |
5.5% 10/17/12 | | 2,649 | | 2,755 |
Fifth Third Bancorp: | | | | |
3.625% 1/25/16 | | 4,058 | | 4,112 |
4.5% 6/1/18 | | 584 | | 583 |
8.25% 3/1/38 | | 4,070 | | 4,601 |
Fifth Third Bank 4.75% 2/1/15 | | 951 | | 1,015 |
Fifth Third Capital Trust IV 6.5% 4/15/67 (o) | | 4,393 | | 4,075 |
HBOS PLC 6.75% 5/21/18 (g) | | 560 | | 518 |
Huntington Bancshares, Inc. 7% 12/15/20 | | 1,908 | | 2,183 |
JPMorgan Chase Bank 6% 10/1/17 | | 2,460 | | 2,756 |
KeyBank NA: | | | | |
5.45% 3/3/16 | | 2,765 | | 2,997 |
5.8% 7/1/14 | | 5,776 | | 6,309 |
KeyCorp. 5.1% 3/24/21 | | 3,752 | | 3,838 |
Manufacturers & Traders Trust Co. 1.7458% 4/1/13 (o) | | 791 | | 790 |
Marshall & Ilsley Bank: | | | | |
4.85% 6/16/15 | | 3,561 | | 3,894 |
5% 1/17/17 | | 9,004 | | 9,674 |
5.25% 9/4/12 | | 2,221 | | 2,284 |
Regions Bank: | | | | |
6.45% 6/26/37 | | 6,564 | | 5,596 |
7.5% 5/15/18 | | 3,852 | | 3,756 |
Nonconvertible Bonds - continued |
| Principal
Amount (000s) | | Value (000s) |
FINANCIALS - continued |
Commercial Banks - continued |
Regions Financial Corp.: | | | | |
0.4165% 6/26/12 (o) | | $ 499 | | $ 488 |
5.75% 6/15/15 | | 1,443 | | 1,364 |
7.75% 11/10/14 | | 6,740 | | 6,689 |
SunTrust Banks, Inc. 3.6% 4/15/16 | | 6,397 | | 6,422 |
UniCredit Luxembourg Finance SA 5.584% 1/13/17 (g)(o) | | 2,233 | | 1,997 |
UnionBanCal Corp. 5.25% 12/16/13 | | 777 | | 838 |
Wachovia Bank NA: | | | | |
4.8% 11/1/14 | | 551 | | 592 |
4.875% 2/1/15 | | 1,653 | | 1,762 |
Wachovia Corp.: | | | | |
5.625% 10/15/16 | | 3,991 | | 4,368 |
5.75% 6/15/17 | | 2,371 | | 2,685 |
Wells Fargo & Co.: | | | | |
3.625% 4/15/15 | | 4,435 | | 4,633 |
3.676% 6/15/16 | | 3,236 | | 3,419 |
| | 140,291 |
Consumer Finance - 0.2% |
Discover Financial Services: | | | | |
6.45% 6/12/17 | | 12,103 | | 13,612 |
10.25% 7/15/19 | | 862 | | 1,112 |
General Electric Capital Corp.: | | | | |
2.25% 11/9/15 | | 5,578 | | 5,608 |
2.95% 5/9/16 | | 1,523 | | 1,536 |
3.5% 6/29/15 | | 1,574 | | 1,646 |
5.625% 9/15/17 | | 15,752 | | 17,487 |
Household Finance Corp. 6.375% 10/15/11 | | 2,184 | | 2,196 |
HSBC Finance Corp. 5.9% 6/19/12 | | 855 | | 885 |
SLM Corp. 0.483% 10/25/11 (o) | | 6,795 | | 6,779 |
| | 50,861 |
Diversified Financial Services - 0.7% |
Bank of America Corp. 5.75% 12/1/17 | | 11,990 | | 12,455 |
BP Capital Markets PLC: | | | | |
3.125% 10/1/15 | | 968 | | 1,012 |
3.625% 5/8/14 | | 7,827 | | 8,254 |
4.5% 10/1/20 | | 961 | | 1,039 |
4.742% 3/11/21 | | 6,000 | | 6,565 |
Capital One Capital V 10.25% 8/15/39 | | 4,592 | | 4,767 |
Nonconvertible Bonds - continued |
| Principal
Amount (000s) | | Value (000s) |
FINANCIALS - continued |
Diversified Financial Services - continued |
Citigroup, Inc.: | | | | |
3.953% 6/15/16 | | $ 8,010 | | $ 8,180 |
4.75% 5/19/15 | | 11,282 | | 11,761 |
5.5% 4/11/13 | | 8,594 | | 8,953 |
6.5% 8/19/13 | | 25,586 | | 27,215 |
JPMorgan Chase & Co.: | | | | |
3.15% 7/5/16 | | 10,650 | | 10,872 |
3.4% 6/24/15 | | 949 | | 977 |
4.65% 6/1/14 | | 8,500 | | 9,068 |
ORIX Corp. 5.48% 11/22/11 | | 311 | | 313 |
Prime Property Funding, Inc.: | | | | |
5.125% 6/1/15 (g) | | 2,258 | | 2,394 |
5.5% 1/15/14 (g) | | 816 | | 872 |
5.7% 4/15/17 (g) | | 1,991 | | 2,129 |
TECO Finance, Inc.: | | | | |
4% 3/15/16 | | 1,828 | | 1,955 |
5.15% 3/15/20 | | 10,344 | | 11,523 |
TransCapitalInvest Ltd. 5.67% 3/5/14 (g) | | 4,215 | | 4,419 |
ZFS Finance USA Trust II 6.45% 12/15/65 (g)(o) | | 4,049 | | 3,968 |
ZFS Finance USA Trust IV 5.875% 5/9/62 (g)(o) | | 1,303 | | 1,226 |
| | 139,917 |
Insurance - 0.5% |
Aon Corp.: | | | | |
3.125% 5/27/16 | | 3,702 | | 3,705 |
3.5% 9/30/15 | | 3,180 | | 3,299 |
5% 9/30/20 | | 3,164 | | 3,401 |
6.25% 9/30/40 | | 2,120 | | 2,334 |
Assurant, Inc. 5.625% 2/15/14 | | 2,245 | | 2,383 |
Axis Capital Holdings Ltd. 5.75% 12/1/14 | | 452 | | 493 |
Great-West Life & Annuity Insurance Co. 7.153% 5/16/46 (g)(o) | | 1,750 | | 1,667 |
Hartford Financial Services Group, Inc. 5.375% 3/15/17 | | 287 | | 296 |
Liberty Mutual Group, Inc.: | | | | |
5% 6/1/21 (g) | | 8,005 | | 7,802 |
6.5% 3/15/35 (g) | | 698 | | 674 |
Marsh & McLennan Companies, Inc. 4.8% 7/15/21 | | 4,458 | | 4,545 |
MetLife, Inc.: | | | | |
2.375% 2/6/14 | | 1,427 | | 1,458 |
5% 6/15/15 | | 941 | | 1,039 |
Nonconvertible Bonds - continued |
| Principal
Amount (000s) | | Value (000s) |
FINANCIALS - continued |
Insurance - continued |
MetLife, Inc.: - continued | | | | |
6.125% 12/1/11 | | $ 800 | | $ 810 |
6.75% 6/1/16 | | 5,158 | | 6,042 |
Metropolitan Life Global Funding I: | | | | |
5.125% 4/10/13 (g) | | 452 | | 477 |
5.125% 6/10/14 (g) | | 4,625 | | 5,044 |
Monumental Global Funding III 5.5% 4/22/13 (g) | | 2,585 | | 2,744 |
New York Life Insurance Co. 6.75% 11/15/39 (g) | | 3,203 | | 3,776 |
Northwestern Mutual Life Insurance Co. 6.063% 3/30/40 (g) | | 4,632 | | 5,080 |
Pacific Life Global Funding 5.15% 4/15/13 (g) | | 3,976 | | 4,192 |
Pacific Life Insurance Co. 9.25% 6/15/39 (g) | | 3,353 | | 4,426 |
Pacific LifeCorp 6% 2/10/20 (g) | | 5,390 | | 6,017 |
Prudential Financial, Inc.: | | | | |
3.875% 1/14/15 | | 5,340 | | 5,537 |
5.15% 1/15/13 | | 2,934 | | 3,073 |
7.375% 6/15/19 | | 2,520 | | 3,011 |
8.875% 6/15/38 (o) | | 2,403 | | 2,619 |
QBE Insurance Group Ltd. 5.647% 7/1/23 (g)(o) | | 473 | | 449 |
Symetra Financial Corp. 6.125% 4/1/16 (g) | | 5,955 | | 6,336 |
Unum Group: | | | | |
5.625% 9/15/20 | | 3,667 | | 4,000 |
7.125% 9/30/16 | | 869 | | 1,016 |
| | 97,745 |
Real Estate Investment Trusts - 0.2% |
AvalonBay Communities, Inc.: | | | | |
4.95% 3/15/13 | | 296 | | 311 |
5.5% 1/15/12 | | 1,481 | | 1,505 |
BRE Properties, Inc. 5.5% 3/15/17 | | 977 | | 1,080 |
Camden Property Trust: | | | | |
5.375% 12/15/13 | | 3,103 | | 3,319 |
5.875% 11/30/12 | | 542 | | 566 |
Developers Diversified Realty Corp.: | | | | |
4.75% 4/15/18 | | 5,002 | | 4,747 |
5.375% 10/15/12 | | 4,036 | | 4,084 |
7.5% 4/1/17 | | 4,622 | | 5,138 |
Duke Realty LP: | | | | |
4.625% 5/15/13 | | 967 | | 1,003 |
5.875% 8/15/12 | | 98 | | 101 |
Nonconvertible Bonds - continued |
| Principal
Amount (000s) | | Value (000s) |
FINANCIALS - continued |
Real Estate Investment Trusts - continued |
Equity One, Inc.: | | | | |
5.375% 10/15/15 | | $ 948 | | $ 1,006 |
6% 9/15/17 | | 717 | | 748 |
6.25% 12/15/14 | | 1,000 | | 1,074 |
6.25% 1/15/17 | | 399 | | 429 |
Federal Realty Investment Trust: | | | | |
5.4% 12/1/13 | | 355 | | 378 |
5.9% 4/1/20 | | 1,860 | | 2,011 |
6% 7/15/12 | | 3,443 | | 3,559 |
6.2% 1/15/17 | | 501 | | 568 |
HRPT Properties Trust: | | | | |
5.75% 11/1/15 | | 1,731 | | 1,854 |
6.25% 6/15/17 | | 996 | | 1,092 |
6.65% 1/15/18 | | 676 | | 762 |
Washington (REIT) 5.25% 1/15/14 | | 476 | | 508 |
| | 35,843 |
Real Estate Management & Development - 0.4% |
AMB Property LP 5.9% 8/15/13 | | 2,086 | | 2,162 |
Arden Realty LP 5.2% 9/1/11 | | 1,573 | | 1,573 |
BioMed Realty LP: | | | | |
3.85% 4/15/16 | | 7,000 | | 7,063 |
6.125% 4/15/20 | | 2,467 | | 2,663 |
Brandywine Operating Partnership LP: | | | | |
5.7% 5/1/17 | | 129 | | 135 |
5.75% 4/1/12 | | 2,217 | | 2,259 |
Digital Realty Trust LP: | | | | |
4.5% 7/15/15 | | 3,650 | | 3,780 |
5.25% 3/15/21 | | 4,138 | | 4,139 |
Duke Realty LP: | | | | |
5.4% 8/15/14 | | 771 | | 815 |
5.5% 3/1/16 | | 3,075 | | 3,261 |
6.75% 3/15/20 | | 560 | | 600 |
8.25% 8/15/19 | | 2,489 | | 2,927 |
ERP Operating LP: | | | | |
4.75% 7/15/20 | | 5,288 | | 5,479 |
5.5% 10/1/12 | | 382 | | 399 |
5.75% 6/15/17 | | 2,042 | | 2,307 |
Liberty Property LP: | | | | |
4.75% 10/1/20 | | 7,482 | | 7,628 |
5.125% 3/2/15 | | 1,229 | | 1,348 |
Nonconvertible Bonds - continued |
| Principal
Amount (000s) | | Value (000s) |
FINANCIALS - continued |
Real Estate Management & Development - continued |
Liberty Property LP: - continued | | | | |
5.5% 12/15/16 | | $ 1,772 | | $ 1,967 |
Mack-Cali Realty LP 7.75% 8/15/19 | | 1,036 | | 1,291 |
Post Apartment Homes LP 6.3% 6/1/13 | | 3,079 | | 3,290 |
Regency Centers LP: | | | | |
4.95% 4/15/14 | | 494 | | 525 |
5.25% 8/1/15 | | 1,725 | | 1,866 |
5.875% 6/15/17 | | 877 | | 996 |
Simon Property Group LP: | | | | |
4.2% 2/1/15 | | 2,640 | | 2,815 |
6.75% 5/15/14 | | 5,698 | | 6,467 |
Tanger Properties LP: | | | | |
6.125% 6/1/20 | | 7,047 | | 7,955 |
6.15% 11/15/15 | | 1,254 | | 1,413 |
| | 77,123 |
Thrifts & Mortgage Finance - 0.1% |
Bank of America Corp.: | | | | |
3.75% 7/12/16 | | 8,200 | | 8,090 |
5.65% 5/1/18 | | 1,270 | | 1,295 |
First Niagara Financial Group, Inc. 6.75% 3/19/20 | | 5,919 | | 6,572 |
| | 15,957 |
TOTAL FINANCIALS | | 675,689 |
HEALTH CARE - 0.1% |
Biotechnology - 0.0% |
Celgene Corp. 2.45% 10/15/15 | | 907 | | 922 |
Health Care Providers & Services - 0.1% |
Coventry Health Care, Inc.: | | | | |
5.95% 3/15/17 | | 1,413 | | 1,592 |
6.3% 8/15/14 | | 2,925 | | 3,232 |
Express Scripts, Inc.: | | | | |
3.125% 5/15/16 | | 6,890 | | 7,044 |
6.25% 6/15/14 | | 1,991 | | 2,217 |
Medco Health Solutions, Inc.: | | | | |
2.75% 9/15/15 | | 1,740 | | 1,779 |
4.125% 9/15/20 | | 5,031 | | 5,042 |
| | 20,906 |
Nonconvertible Bonds - continued |
| Principal
Amount (000s) | | Value (000s) |
HEALTH CARE - continued |
Pharmaceuticals - 0.0% |
Watson Pharmaceuticals, Inc. 5% 8/15/14 | | $ 1,065 | | $ 1,164 |
TOTAL HEALTH CARE | | 22,992 |
INDUSTRIALS - 0.1% |
Aerospace & Defense - 0.0% |
BAE Systems Holdings, Inc.: | | | | |
4.95% 6/1/14 (g) | | 846 | | 914 |
6.375% 6/1/19 (g) | | 5,000 | | 5,853 |
6.4% 12/15/11 (g) | | 661 | | 671 |
| | 7,438 |
Airlines - 0.0% |
Continental Airlines, Inc.: | | | | |
6.648% 3/15/19 | | 3,058 | | 3,165 |
6.9% 7/2/19 | | 887 | | 923 |
U.S. Airways pass-thru trust certificates: | | | | |
6.85% 7/30/19 | | 1,794 | | 1,758 |
8.36% 1/20/19 | | 1,357 | | 1,357 |
| | 7,203 |
Industrial Conglomerates - 0.1% |
General Electric Co. 5.25% 12/6/17 | | 10,356 | | 11,602 |
TOTAL INDUSTRIALS | | 26,243 |
INFORMATION TECHNOLOGY - 0.1% |
Electronic Equipment & Components - 0.1% |
Tyco Electronics Group SA: | | | | |
5.95% 1/15/14 | | 3,694 | | 4,036 |
6% 10/1/12 | | 4,552 | | 4,808 |
6.55% 10/1/17 | | 1,119 | | 1,331 |
| | 10,175 |
Office Electronics - 0.0% |
Xerox Corp.: | | | | |
4.25% 2/15/15 | | 545 | | 586 |
5.5% 5/15/12 | | 1,881 | | 1,941 |
| | 2,527 |
TOTAL INFORMATION TECHNOLOGY | | 12,702 |
Nonconvertible Bonds - continued |
| Principal
Amount (000s) | | Value (000s) |
MATERIALS - 0.2% |
Chemicals - 0.1% |
Dow Chemical Co.: | | | | |
4.85% 8/15/12 | | $ 3,469 | | $ 3,596 |
7.6% 5/15/14 | | 10,939 | | 12,606 |
| | 16,202 |
Construction Materials - 0.0% |
CRH America, Inc. 6% 9/30/16 | | 2,152 | | 2,377 |
Metals & Mining - 0.1% |
Anglo American Capital PLC 9.375% 4/8/14 (g) | | 1,278 | | 1,510 |
ArcelorMittal SA 3.75% 3/1/16 | | 2,109 | | 2,086 |
BHP Billiton Financial (USA) Ltd. 5.125% 3/29/12 | | 1,597 | | 1,639 |
Corporacion Nacional del Cobre (Codelco) 6.375% 11/30/12 (g) | | 1,618 | | 1,718 |
United States Steel Corp. 6.65% 6/1/37 | | 3,989 | | 3,241 |
Vale Overseas Ltd. 6.25% 1/23/17 | | 2,726 | | 3,093 |
| | 13,287 |
TOTAL MATERIALS | | 31,866 |
TELECOMMUNICATION SERVICES - 0.5% |
Diversified Telecommunication Services - 0.3% |
AT&T, Inc.: | | | | |
2.5% 8/15/15 | | 6,691 | | 6,851 |
6.8% 5/15/36 | | 9,241 | | 10,831 |
BellSouth Capital Funding Corp. 7.875% 2/15/30 | | 1,158 | | 1,499 |
CenturyLink, Inc.: | | | | |
6.15% 9/15/19 | | 3,372 | | 3,323 |
6.45% 6/15/21 | | 8,745 | | 8,506 |
7.6% 9/15/39 | | 1,640 | | 1,508 |
Embarq Corp. 7.995% 6/1/36 | | 3,112 | | 2,952 |
Sprint Capital Corp. 6.875% 11/15/28 | | 9,000 | | 8,055 |
Telefonica Emisiones SAU: | | | | |
5.134% 4/27/20 | | 772 | | 733 |
5.462% 2/16/21 | | 4,994 | | 4,825 |
6.421% 6/20/16 | | 939 | | 986 |
Verizon Communications, Inc.: | | | | |
6.1% 4/15/18 | | 2,674 | | 3,179 |
6.25% 4/1/37 | | 4,611 | | 5,224 |
Verizon New York, Inc. 6.875% 4/1/12 | | 3,115 | | 3,219 |
| | 61,691 |
Nonconvertible Bonds - continued |
| Principal
Amount (000s) | | Value (000s) |
TELECOMMUNICATION SERVICES - continued |
Wireless Telecommunication Services - 0.2% |
America Movil SAB de CV: | | | | |
2.375% 9/8/16 (i) | | $ 4,810 | | $ 4,771 |
3.625% 3/30/15 | | 1,082 | | 1,149 |
DIRECTV Holdings LLC/DIRECTV Financing, Inc.: | | | | |
4.75% 10/1/14 | | 13,460 | | 14,800 |
5.875% 10/1/19 | | 8,810 | | 10,145 |
6.35% 3/15/40 | | 2,500 | | 2,733 |
Vodafone Group PLC 5% 12/16/13 | | 2,696 | | 2,922 |
| | 36,520 |
TOTAL TELECOMMUNICATION SERVICES | | 98,211 |
UTILITIES - 0.8% |
Electric Utilities - 0.4% |
Ameren Illinois Co. 6.125% 11/15/17 | | 333 | | 394 |
AmerenUE 6.4% 6/15/17 | | 3,507 | | 4,193 |
Cleveland Electric Illuminating Co. 5.65% 12/15/13 | | 4,829 | | 5,264 |
Commonwealth Edison Co. 1.625% 1/15/14 | | 4,248 | | 4,287 |
Duquesne Light Holdings, Inc.: | | | | |
5.9% 12/1/21 (g) | | 5,410 | | 5,477 |
6.4% 9/15/20 (g) | | 10,335 | | 10,813 |
Edison International 3.75% 9/15/17 | | 4,275 | | 4,435 |
EDP Finance BV: | | | | |
4.9% 10/1/19 (g) | | 1,900 | | 1,506 |
6% 2/2/18 (g) | | 2,801 | | 2,347 |
Enel Finance International SA 5.7% 1/15/13 (g) | | 305 | | 315 |
FirstEnergy Corp. 7.375% 11/15/31 | | 9,223 | | 10,701 |
FirstEnergy Solutions Corp.: | | | | |
4.8% 2/15/15 | | 1,798 | | 1,960 |
6.05% 8/15/21 | | 6,126 | | 6,707 |
LG&E and KU Energy LLC: | | | | |
2.125% 11/15/15 | | 4,999 | | 4,951 |
3.75% 11/15/20 | | 984 | | 974 |
Nevada Power Co.: | | | | |
6.5% 5/15/18 | | 5,290 | | 6,339 |
6.5% 8/1/18 | | 1,844 | | 2,220 |
Pennsylvania Electric Co. 6.05% 9/1/17 | | 618 | | 707 |
Pepco Holdings, Inc. 2.7% 10/1/15 | | 4,728 | | 4,835 |
Sierra Pacific Power Co. 5.45% 9/1/13 | | 1,831 | | 1,979 |
| | 80,404 |
Nonconvertible Bonds - continued |
| Principal
Amount (000s) | | Value (000s) |
UTILITIES - continued |
Gas Utilities - 0.0% |
Southern Natural Gas Co. 5.9% 4/1/17 (g) | | $ 357 | | $ 410 |
Southern Natural Gas Co. / Southern Natural Issuing Corp. 4.4% 6/15/21 (g) | | 2,360 | | 2,458 |
| | 2,868 |
Independent Power Producers & Energy Traders - 0.1% |
Duke Capital LLC 5.668% 8/15/14 | | 2,413 | | 2,681 |
Exelon Generation Co. LLC: | | | | |
4% 10/1/20 | | 8,787 | | 8,730 |
5.35% 1/15/14 | | 1,235 | | 1,332 |
| | 12,743 |
Multi-Utilities - 0.3% |
Dominion Resources, Inc.: | | | | |
6.3% 9/30/66 (o) | | 13,426 | | 12,822 |
7.5% 6/30/66 (o) | | 3,828 | | 3,924 |
MidAmerican Energy Holdings, Co.: | | | | |
5.875% 10/1/12 | | 3,227 | | 3,399 |
6.5% 9/15/37 | | 3,287 | | 3,949 |
National Grid PLC 6.3% 8/1/16 | | 407 | | 475 |
NiSource Finance Corp.: | | | | |
5.25% 9/15/17 | | 682 | | 763 |
5.4% 7/15/14 | | 6,582 | | 7,228 |
5.45% 9/15/20 | | 980 | | 1,100 |
5.95% 6/15/41 | | 8,000 | | 8,161 |
6.25% 12/15/40 | | 1,664 | | 1,830 |
6.4% 3/15/18 | | 1,557 | | 1,830 |
6.8% 1/15/19 | | 4,065 | | 4,860 |
San Diego Gas & Electric Co. 3% 8/15/21 | | 1,980 | | 1,971 |
Wisconsin Energy Corp. 6.25% 5/15/67 (o) | | 3,554 | | 3,518 |
| | 55,830 |
TOTAL UTILITIES | | 151,845 |
TOTAL NONCONVERTIBLE BONDS (Cost $1,290,753) | 1,391,507 |
U.S. Government and Government Agency Obligations - 11.7% |
| Principal
Amount (000s) | | Value (000s) |
U.S. Government Agency Obligations - 0.3% |
Fannie Mae 0.875% 8/28/14 | | $ 11,611 | | $ 11,727 |
Tennessee Valley Authority 3.875% 2/15/21 | | 39,390 | | 43,411 |
TOTAL U.S. GOVERNMENT AGENCY OBLIGATIONS | | 55,138 |
U.S. Treasury Inflation Protected Obligations - 0.9% |
U.S. Treasury Inflation-Indexed Bonds: | | | | |
2.125% 2/15/40 | | 47,968 | | 58,895 |
2.125% 2/15/41 | | 99,706 | | 123,200 |
TOTAL U.S. TREASURY INFLATION PROTECTED OBLIGATIONS | | 182,095 |
U.S. Treasury Obligations - 10.5% |
U.S. Treasury Bills, yield at date of purchase 0.01% to 0.05% 9/1/11 to 12/1/11 (k) | | 48,100 | | 48,099 |
U.S. Treasury Bonds 4.375% 5/15/41 | | 170,602 | | 194,752 |
U.S. Treasury Notes: | | | | |
0.5% 8/15/14 | | 88,000 | | 88,454 |
0.625% 7/15/14 | | 825,378 | | 832,743 |
0.75% 6/15/14 | | 27,903 | | 28,254 |
1% 10/31/11 | | 70,000 | | 70,109 |
1% 8/31/16 | | 15,416 | | 15,441 |
1.5% 7/31/16 | | 61,082 | | 62,738 |
1.5% 8/31/18 | | 25,343 | | 25,224 |
2.125% 8/15/21 (f) | | 99,140 | | 98,164 |
3.125% 4/30/17 (l) | | 259,740 | | 287,439 |
3.125% 5/15/21 | | 301,352 | | 325,930 |
TOTAL U.S. TREASURY OBLIGATIONS | | 2,077,347 |
TOTAL U.S. GOVERNMENT AND GOVERNMENT AGENCY OBLIGATIONS (Cost $2,226,945) | 2,314,580 |
U.S. Government Agency - Mortgage Securities - 9.6% |
|
Fannie Mae - 7.3% |
2.303% 6/1/36 (o) | | 186 | | 194 |
2.636% 7/1/37 (o) | | 636 | | 672 |
3% 10/1/26 (i) | | 8,000 | | 8,187 |
3.5% 1/1/21 to 3/1/41 | | 73,517 | | 74,760 |
4% 2/1/35 to 6/1/41 | | 94,527 | | 98,123 |
U.S. Government Agency - Mortgage Securities - continued |
| Principal
Amount (000s) | | Value (000s) |
Fannie Mae - continued |
4% 9/1/41 (i)(j) | | $ 44,000 | | $ 45,601 |
4% 9/1/41 (i)(j) | | 223,000 | | 231,113 |
4% 9/1/41 (i)(j) | | 34,000 | | 35,237 |
4% 9/1/41 (i)(j) | | 52,000 | | 53,892 |
4% 9/1/41 (i)(j) | | 80,000 | | 82,910 |
4% 9/1/41 (i)(j) | | 91,000 | | 94,311 |
4.5% 6/1/24 to 9/1/41 (j) | | 161,875 | | 171,881 |
4.5% 9/1/26 (i) | | 1,500 | | 1,599 |
4.5% 9/1/41 (i) | | 6,000 | | 6,343 |
4.5% 9/1/41 (i)(j) | | 80,000 | | 84,575 |
4.5% 9/1/41 (i)(j) | | 3,900 | | 4,123 |
4.5% 9/1/41 (i)(j) | | 23,000 | | 24,315 |
4.5% 9/1/41 (i)(j) | | 15,000 | | 15,858 |
5% 6/1/24 to 5/1/41 (j) | | 99,987 | | 108,010 |
5% 9/1/41 (i)(j) | | 24,000 | | 25,848 |
5.5% 9/1/24 to 3/1/40 (i) | | 90,097 | | 98,872 |
5.5% 9/1/41 (i)(j) | | 28,000 | | 30,604 |
5.5% 9/1/41 (i)(j) | | 28,000 | | 30,604 |
5.5% 9/1/41 (i)(j) | | 4,000 | | 4,372 |
5.5% 9/1/41 (i)(j) | | 9,000 | | 9,837 |
6% 6/1/35 to 2/1/40 | | 77,782 | | 86,274 |
6% 9/1/41 (i) | | 2,600 | | 2,879 |
6% 9/1/41 (i) | | 2,000 | | 2,214 |
TOTAL FANNIE MAE | | 1,433,208 |
Freddie Mac - 1.3% |
3.261% 10/1/35 (o) | | 284 | | 304 |
4% 9/1/41 (i) | | 9,000 | | 9,320 |
4.5% 7/1/25 to 8/1/41 (i) | | 38,192 | | 40,409 |
4.5% 9/1/41 (i)(j) | | 16,000 | | 16,882 |
4.5% 9/1/41 (i) | | 29,300 | | 30,916 |
5% 3/1/19 to 9/1/40 | | 46,245 | | 49,931 |
5.5% 1/1/28 to 3/1/40 | | 71,091 | | 77,591 |
5.5% 9/1/41 | | 19,200 | | 20,942 |
6% 7/1/37 to 8/1/37 | | 1,651 | | 1,833 |
6.5% 3/1/36 | | 1,588 | | 1,790 |
TOTAL FREDDIE MAC | | 249,918 |
Ginnie Mae - 1.0% |
3.5% 1/15/41 | | 14,176 | | 14,526 |
U.S. Government Agency - Mortgage Securities - continued |
| Principal
Amount (000s) | | Value (000s) |
Ginnie Mae - continued |
4% 1/15/25 to 7/15/41 | | $ 32,457 | | $ 34,664 |
4% 9/1/41 (i) | | 19,000 | | 20,106 |
4.5% 3/15/39 to 7/20/41 | | 47,375 | | 51,391 |
4.5% 9/1/41 (i) | | 9,350 | | 10,116 |
5% 5/15/34 to 11/15/40 | | 18,223 | | 20,157 |
5% 9/1/41 (i) | | 8,000 | | 8,814 |
5% 9/1/41 (i) | | 15,000 | | 16,525 |
5% 9/1/41 (i) | | 8,000 | | 8,814 |
5.5% 12/15/31 to 1/15/39 | | 1,767 | | 1,978 |
6% 2/15/34 | | 12,255 | | 13,850 |
TOTAL GINNIE MAE | | 200,941 |
TOTAL U.S. GOVERNMENT AGENCY - MORTGAGE SECURITIES (Cost $1,859,497) | 1,884,067 |
Asset-Backed Securities - 0.5% |
|
Accredited Mortgage Loan Trust Series 2005-1 Class M1, 0.6884% 4/25/35 (o) | | 1,577 | | 1,044 |
ACE Securities Corp. Home Equity Loan Trust: | | | | |
Series 2004-HE1: | | | | |
Class M1, 0.9684% 3/25/34 (o) | | 7 | | 7 |
Class M2, 1.8684% 3/25/34 (o) | | 482 | | 362 |
Series 2005-HE2 Class M2, 0.6684% 4/25/35 (o) | | 153 | | 148 |
Series 2006-OP1 Class M4, 0.5884% 4/25/36 (o) | | 121 | | 0* |
Advanta Business Card Master Trust Series 2006-C1 Class C1, 0.6758% 10/20/14 (o) | | 688 | | 7 |
Ally Master Owner Trust: | | | | |
Series 2010-3 Class A, 2.88% 4/15/15 (g) | | 3,320 | | 3,414 |
Series 2011-1 Class A2, 2.15% 1/15/16 | | 6,360 | | 6,486 |
Series 2011-3 Class A2, 1.81% 5/15/16 | | 5,770 | | 5,834 |
AmeriCredit Prime Automobile Receivables Trust Series 2007-1 Class D, 5.62% 9/8/14 | | 777 | | 784 |
Ameriquest Mortgage Securities, Inc. pass-thru certificates: | | | | |
Series 2003-10 Class M1, 0.9184% 12/25/33 (o) | | 97 | | 76 |
Series 2004-R2 Class M3, 0.7684% 4/25/34 (o) | | 147 | | 49 |
Series 2004-R8 Class M9, 4.3434% 9/25/34 (o) | | 334 | | 1 |
Series 2005-R2 Class M1, 0.6684% 4/25/35 (o) | | 2,266 | | 1,976 |
Argent Securities, Inc. pass-thru certificates: | | | | |
Series 2003-W7 Class A2, 0.9673% 3/25/34 (o) | | 53 | | 35 |
Asset-Backed Securities - continued |
| Principal
Amount (000s) | | Value (000s) |
Argent Securities, Inc. pass-thru certificates: - continued | | | | |
Series 2004-W11 Class M2, 0.9184% 11/25/34 (o) | | $ 616 | | $ 508 |
Series 2004-W7 Class M1, 0.7684% 5/25/34 (o) | | 1,600 | | 1,157 |
Series 2006-W4 Class A2C, 0.3784% 5/25/36 (o) | | 1,485 | | 377 |
Asset Backed Securities Corp. Home Equity Loan Trust: | | | | |
Series 2004-HE2 Class M1, 1.0434% 4/25/34 (o) | | 2,908 | | 2,265 |
Series 2006-HE2 Class M1, 0.5884% 3/25/36 (o) | | 181 | | 2 |
Axon Financial Funding Ltd. 0.8458% 4/4/17 (d)(g)(o) | | 6,960 | | 0 |
Brazos Higher Education Authority, Inc. Series 2006-2 Class A9, 0.2565% 12/25/24 (o) | | 1,604 | | 1,400 |
C-BASS Trust Series 2006-CB7 Class A2, 0.2784% 10/25/36 (o) | | 14 | | 14 |
Capital Auto Receivables Asset Trust Series 2007-1 Class C, 5.38% 11/15/12 | | 583 | | 598 |
Capital Trust Ltd. Series 2004-1: | | | | |
Class A2, 0.663% 7/20/39 (g)(o) | | 311 | | 224 |
Class B, 0.963% 7/20/39 (g)(o) | | 290 | | 113 |
Class C, 1.313% 7/20/39 (g)(o) | | 372 | | 15 |
Carrington Mortgage Loan Trust: | | | | |
Series 2006-FRE1 Class M1, 0.5184% 7/25/36 (o) | | 5,102 | | 256 |
Series 2006-NC4 Class M1, 0.5184% 10/25/36 (o) | | 3,478 | | 49 |
Series 2007-RFC1 Class A3, 0.3584% 12/25/36 (o) | | 1,978 | | 564 |
Citibank Credit Card Issuance Trust Series 2009-A5 Class A5, 2.25% 12/23/14 | | 13,320 | | 13,618 |
Citigroup Mortgage Loan Trust Series 2005-HE4 Class A2C, 0.4884% 10/25/35 (o) | | 1,433 | | 1,369 |
Countrywide Asset-Backed Certificates Trust: | | | | |
Series 2007-11 Class 2A1, 0.2784% 6/25/47 (o) | | 43 | | 42 |
Series 2007-4 Class A1A, 0.3073% 9/25/37 (o) | | 392 | | 374 |
Series 2007-5 Class 2A1, 0.3184% 9/25/47 (o) | | 3,766 | | 3,650 |
Countrywide Home Loan Trust Series 2006-13 Class N, 7% 8/25/37 (g) | | 363 | | 0 |
Countrywide Home Loans, Inc.: | | | | |
Series 2004-3 Class M4, 1.1884% 4/25/34 (o) | | 175 | | 87 |
Series 2004-4 Class M2, 1.0134% 6/25/34 (o) | | 645 | | 283 |
Series 2005-3 Class MV1, 0.6384% 8/25/35 (o) | | 626 | | 607 |
Series 2005-AB1 Class A2, 0.4284% 8/25/35 (o) | | 53 | | 52 |
CPS Auto Receivables Trust Series 2006-D Class A4, 5.115% 8/15/13 (FSA Insured) (g) | | 180 | | 181 |
Fannie Mae subordinate REMIC pass-thru certificates Series 2004-T5 Class AB3, 0.5908% 5/28/35 (o) | | 43 | | 28 |
Fieldstone Mortgage Investment Corp. Series 2004-3 Class M5, 2.3934% 8/25/34 (o) | | 319 | | 182 |
Asset-Backed Securities - continued |
| Principal
Amount (000s) | | Value (000s) |
First Franklin Mortgage Loan Trust: | | | | |
Series 2004-FF2 Class M3, 1.0434% 3/25/34 (o) | | $ 25 | | $ 6 |
Series 2006-FF14 Class A2, 0.2784% 10/25/36 (o) | | 1,165 | | 1,113 |
Ford Credit Floorplan Master Owner Trust Series 2010-5 Class A1, 1.5% 9/15/15 | | 7,020 | | 7,077 |
Franklin Auto Trust: | | | | |
Series 2006-1 Class B, 5.14% 7/21/14 | | 16 | | 16 |
Series 2007-1: | | | | |
Class A4, 5.03% 2/16/15 | | 43 | | 43 |
Class C, 5.43% 2/16/15 | | 613 | | 614 |
Fremont Home Loan Trust: | | | | |
Series 2005-A: | | | | |
Class M3, 0.7084% 1/25/35 (o) | | 1,041 | | 411 |
Class M4, 0.8984% 1/25/35 (o) | | 399 | | 103 |
Series 2006-D Class M1, 0.4484% 11/25/36 (o) | | 173 | | 5 |
GCO Education Loan Funding Master Trust II Series 2007-1A Class C1L, 0.6918% 2/25/47 (g)(o) | | 3,122 | | 1,842 |
GCO Slims Trust Series 2006-1A, 5.72% 3/1/22 (g) | | 1,019 | | 811 |
GE Business Loan Trust: | | | | |
Series 2003-1 Class A, 0.6372% 4/15/31 (g)(o) | | 260 | | 244 |
Series 2006-2A: | | | | |
Class A, 0.3872% 11/15/34 (g)(o) | | 1,730 | | 1,431 |
Class B, 0.4872% 11/15/34 (g)(o) | | 624 | | 403 |
Class C, 0.5872% 11/15/34 (g)(o) | | 1,038 | | 514 |
Class D, 0.9572% 11/15/34 (g)(o) | | 395 | | 95 |
Goal Capital Funding Trust Series 2007-1 Class C1, 0.6465% 6/25/42 (o) | | 566 | | 442 |
GSAMP Trust: | | | | |
Series 2004-AR1 Class M1, 0.8684% 6/25/34 (o) | | 2,938 | | 1,815 |
Series 2007-HE1 Class M1, 0.4684% 3/25/47 (o) | | 1,186 | | 54 |
Guggenheim Structured Real Estate Funding Ltd. Series 2006-3: | | | | |
Class B, 0.6184% 9/25/46 (g)(o) | | 400 | | 172 |
Class C, 0.7684% 9/25/46 (g)(o) | | 1,676 | | 268 |
Home Equity Asset Trust: | | | | |
Series 2003-2 Class M1, 1.5384% 8/25/33 (o) | | 413 | | 287 |
Series 2003-3 Class M1, 1.5084% 8/25/33 (o) | | 796 | | 630 |
Series 2003-5 Class A2, 0.9184% 12/25/33 (o) | | 36 | | 24 |
Series 2005-5 Class 2A2, 0.4684% 11/25/35 (o) | | 52 | | 51 |
Series 2006-1 Class 2A3, 0.4434% 4/25/36 (o) | | 888 | | 864 |
HSBC Home Equity Loan Trust Series 2006-2 Class M2, 0.503% 3/20/36 (o) | | 719 | | 598 |
Asset-Backed Securities - continued |
| Principal
Amount (000s) | | Value (000s) |
HSI Asset Securitization Corp. Trust Series 2007-HE1 Class 2A3, 0.4084% 1/25/37 (o) | | $ 1,642 | | $ 556 |
JPMorgan Mortgage Acquisition Trust: | | | | |
Series 2006-NC2 Class M2, 0.5184% 7/25/36 (o) | | 3,185 | | 141 |
Series 2007-CH1: | | | | |
Class AV4, 0.3484% 11/25/36 (o) | | 1,641 | | 1,297 |
Class MV1, 0.4484% 11/25/36 (o) | | 1,335 | | 856 |
Series 2007-CH3 Class M1, 0.5184% 3/25/37 (o) | | 574 | | 23 |
Keycorp Student Loan Trust: | | | | |
Series 1999-A Class A2, 0.5765% 12/27/29 (o) | | 732 | | 648 |
Series 2006-A Class 2C, 1.3965% 3/27/42 (o) | | 2,909 | | 725 |
Long Beach Auto Receivables Trust Series 2007-A Class A4, 5.025% 1/15/14 (FSA Insured) | | 964 | | 965 |
Long Beach Mortgage Loan Trust Series 2004-2 Class M2, 1.2984% 6/25/34 (o) | | 98 | | 68 |
Marriott Vacation Club Owner Trust Series 2006-2A: | | | | |
Class B, 5.442% 10/20/28 (g) | | 13 | | 13 |
Class C, 5.691% 10/20/28 (g) | | 6 | | 6 |
Class D, 6.01% 10/20/28 (g) | | 71 | | 71 |
MASTR Asset Backed Securities Trust: | | | | |
Series 2006-AM3 Class M1, 0.4784% 10/25/36 (o) | | 589 | | 26 |
Series 2007-HE1 Class M1, 0.5184% 5/25/37 (o) | | 861 | | 29 |
Meritage Mortgage Loan Trust Series 2004-1 Class M1, 0.9684% 7/25/34 (o) | | 175 | | 113 |
Merrill Lynch Mortgage Investors Trust: | | | | |
Series 2003-OPT1 Class M1, 1.1934% 7/25/34 (o) | | 605 | | 416 |
Series 2006-FM1 Class A2B, 0.3284% 4/25/37 (o) | | 2,035 | | 1,477 |
Series 2006-OPT1 Class A1A, 0.4784% 6/25/35 (o) | | 3,217 | | 2,295 |
Morgan Stanley ABS Capital I Trust: | | | | |
Series 2004-HE6 Class A2, 0.5584% 8/25/34 (o) | | 63 | | 43 |
Series 2005-NC1 Class M1, 0.6584% 1/25/35 (o) | | 439 | | 281 |
Series 2005-NC2 Class B1, 1.3884% 3/25/35 (o) | | 457 | | 59 |
Series 2007-HE2 Class M1, 0.4684% 1/25/37 (o) | | 3,956 | | 17 |
National Collegiate Student Loan Trust: | | | | |
Series 2004-2 Class A, 9.75% 10/27/14 (q) | | 1,965 | | 179 |
Series 2006-3 Class A, 7.1% 1/25/12 (q) | | 285 | | 6 |
Series 2006-4: | | | | |
Class A1, 0.2484% 3/25/25 (o) | | 8 | | 8 |
Class A, 6.35% 2/27/12 (q) | | 1,181 | | 26 |
Class D, 1.3184% 5/25/32 (o) | | 2,225 | | 5 |
Series 2007-1 Class A, 7.27% 4/25/12 (q) | | 1,587 | | 63 |
Series 2007-2 Class A, 6.7% 7/25/12 (q) | | 1,351 | | 69 |
Asset-Backed Securities - continued |
| Principal
Amount (000s) | | Value (000s) |
New Century Home Equity Loan Trust: | | | | |
Series 2005-4 Class M2, 0.7284% 9/25/35 (o) | | $ 1,566 | | $ 853 |
Series 2005-D Class M2, 0.6884% 2/25/36 (o) | | 857 | | 169 |
Ocala Funding LLC: | | | | |
Series 2005-1A Class A, 1.713% 3/20/10 (d)(g)(o) | | 621 | | 0 |
Series 2006-1A Class A, 1.613% 3/20/11 (d)(g)(o) | | 1,290 | | 0 |
Option One Mortgage Loan Trust: | | | | |
Series 2007-5 Class 2A1, 0.3084% 5/25/37 (o) | | 33 | | 32 |
Series 2007-6 Class 2A1, 0.2784% 7/25/37 (o) | | 105 | | 102 |
Park Place Securities, Inc.: | | | | |
Series 2004-WCW1: | | | | |
Class M3, 1.4684% 9/25/34 (o) | | 585 | | 342 |
Class M4, 1.6684% 9/25/34 (o) | | 750 | | 308 |
Series 2005-WCH1: | | | | |
Class M2, 0.7384% 1/25/36 (o) | | 2,624 | | 2,375 |
Class M3, 0.7784% 1/25/36 (o) | | 525 | | 336 |
Class M4, 1.0484% 1/25/36 (o) | | 1,620 | | 817 |
Series 2005-WHQ2 Class M7, 1.4684% 5/25/35 (o) | | 1,920 | | 13 |
Residential Asset Mortgage Products, Inc. Series 2006-EFC2 Class M1, 0.4484% 12/25/36 (o) | | 390 | | 9 |
Residential Asset Securities Corp. Series 2007-KS2 Class AI1, 0.2884% 2/25/37 (o) | | 1 | | 1 |
Salomon Brothers Mortgage Securities VII, Inc. Series 2003-HE1 Class A, 1.0184% 4/25/33 (o) | | 6 | | 5 |
Saxon Asset Securities Trust Series 2004-1 Class M1, 1.0134% 3/25/35 (o) | | 1,579 | | 1,236 |
Securitized Asset Backed Receivables LLC Trust Series 2005-FR4 Class B3, 1.9384% 1/25/36 (o) | | 26 | | 0* |
Sierra Receivables Funding Co. Series 2007-1A Class A2, 0.3363% 3/20/19 (FGIC Insured) (g)(o) | | 690 | | 659 |
SLM Private Credit Student Loan Trust Series 2004-A Class C, 1.197% 6/15/33 (o) | | 1,396 | | 643 |
Specialty Underwriting & Residential Finance Trust Series 2006-AB2 Class N1, 5.75% 6/25/37 (g) | | 655 | | 0 |
Structured Asset Investment Loan Trust Series 2004-8 Class M5, 1.9434% 9/25/34 (o) | | 75 | | 40 |
SVO VOI Mortgage Corp. Series 2006-AA Class A, 5.28% 2/20/24 (g) | | 698 | | 726 |
Terwin Mortgage Trust Series 2003-4HE Class A1, 1.0784% 9/25/34 (o) | | 32 | | 21 |
Trapeza CDO XII Ltd./Trapeza CDO XII, Inc. Series 2007-12A Class B, 0.8058% 4/6/42 (g)(o) | | 2,156 | | 162 |
WaMu Asset Holdings Corp. Series 2006-8 Class N1, 6.048% 10/25/46 (g) | | 974 | | 0 |
Asset-Backed Securities - continued |
| Principal
Amount (000s) | | Value (000s) |
Wells Fargo Home Equity Trust Series 2004-3 Class A, 4.5% 11/27/34 (g) | | $ 8 | | $ 0 |
Whinstone Capital Management Ltd. Series 1A Class B3, 2.053% 10/25/44 (g)(o) | | 1,964 | | 1,100 |
TOTAL ASSET-BACKED SECURITIES (Cost $91,620) | 88,601 |
Collateralized Mortgage Obligations - 0.5% |
|
Private Sponsor - 0.5% |
Banc of America Commercial Mortgage Trust Series 2007-2: | | | | |
Class B, 5.6565% 4/10/49 (o) | | 73 | | 33 |
Class C, 5.6565% 4/10/49 (o) | | 194 | | 79 |
Class D, 5.6565% 4/10/49 (o) | | 97 | | 34 |
Banc of America Funding Corp. sequential payer Series 2010-R4 Class 2A1, 4.5% 3/26/37 (g) | | 3,010 | | 3,061 |
Banc of America Mortgage Securities, Inc.: | | | | |
Series 2003-L Class 2A1, 2.9045% 1/25/34 (o) | | 1,777 | | 1,569 |
Series 2004-1 Class 2A2, 3.2303% 10/25/34 (o) | | 1,757 | | 1,502 |
Series 2004-A Class 2A2, 2.8478% 2/25/34 (o) | | 848 | | 726 |
Series 2004-B: | | | | |
Class 1A1, 2.7465% 3/25/34 (o) | | 145 | | 125 |
Class 2A2, 2.8677% 3/25/34 (o) | | 1,064 | | 951 |
Series 2004-D Class 2A2, 2.8857% 5/25/34 (o) | | 1,698 | | 1,485 |
Series 2004-G Class 2A7, 2.9352% 8/25/34 (o) | | 1,576 | | 1,343 |
Series 2004-H Class 2A1, 3.1632% 9/25/34 (o) | | 1,377 | | 1,159 |
Bayview Commercial Asset Trust Series 2006-3A, 4.2221% 10/25/36 (g)(o)(q) | | 32,431 | | 2,059 |
Bear Stearns ALT-A Trust floater Series 2005-1 Class A1, 0.7784% 1/25/35 (o) | | 2,268 | | 1,714 |
Bear Stearns Commercial Mortgage Securities Trust Series 2006-T24 Class X2, 0.4258% 10/12/41 (g)(o)(q) | | 3,688 | | 34 |
Chase Mortgage Finance Trust: | | | | |
Series 2007-A1 Class 1A5, 2.8968% 2/25/37 (o) | | 413 | | 364 |
Series 2007-A2 Class 2A1, 3.0179% 7/25/37 (o) | | 3,406 | | 3,133 |
Citigroup Commercial Mortgage Trust Series 2008-C7 Class A2B, 6.0737% 12/10/49 (o) | | 1,314 | | 1,361 |
Citigroup Mortgage Loan Trust Series 2004-UST1 Class A4, 2.2809% 8/25/34 (o) | | 998 | | 987 |
Cobalt CMBS Commercial Mortgage Trust Series 2007-C2 Class B, 5.617% 4/15/47 (o) | | 1,468 | | 411 |
Collateralized Mortgage Obligations - continued |
| Principal
Amount (000s) | | Value (000s) |
Private Sponsor - continued |
COMM pass-thru certificates floater Series 2001-J2A Class A2F, 0.7083% 7/16/34 (g)(o) | | $ 20 | | $ 20 |
Credit Suisse First Boston Mortgage Securities Corp. floater Series 2007-AR7 Class 2A1, 2.7846% 11/25/34 (o) | | 218 | | 193 |
First Horizon Mortgage pass-thru Trust Series 2004-AR5 Class 2A1, 2.858% 10/25/34 (o) | | 1,343 | | 1,194 |
Gracechurch Mortgage Financing PLC floater Series 2006-1 Class D2, 0.7678% 11/20/56 (g)(o) | | 3,161 | | 3,139 |
Granite Master Issuer PLC floater: | | | | |
Series 2005-4 Class C2, 1.313% 12/20/54 (o) | | 206 | | 94 |
Series 2006-1A Class C2, 1.413% 12/20/54 (g)(o) | | 7,110 | | 3,324 |
Series 2006-2 Class C1, 1.153% 12/20/54 (o) | | 5,920 | | 2,768 |
Series 2006-3 Class C2, 0.713% 12/20/54 (o) | | 1,233 | | 576 |
Series 2006-4: | | | | |
Class B1, 0.303% 12/20/54 (o) | | 4,556 | | 3,611 |
Class C1, 0.593% 12/20/54 (o) | | 2,785 | | 1,302 |
Class M1, 0.383% 12/20/54 (o) | | 1,198 | | 767 |
Series 2007-1: | | | | |
Class 1C1, 0.813% 12/20/54 (o) | | 2,417 | | 1,130 |
Class 1M1, 0.513% 12/20/54 (o) | | 1,611 | | 1,031 |
Class 2C1, 1.173% 12/20/54 (o) | | 1,098 | | 513 |
Class 2M1, 0.713% 12/20/54 (o) | | 2,067 | | 1,323 |
Series 2007-2 Class 2C1, 0.6402% 12/17/54 (o) | | 2,864 | | 1,339 |
Granite Mortgages PLC floater Series 2003-3 Class 1C, 2.7013% 1/20/44 (o) | | 472 | | 321 |
GSR Mortgage Loan Trust Series 2007-AR2 Class 2A1, 2.7323% 4/25/35 (o) | | 649 | | 515 |
JPMorgan Chase Commercial Mortgage Securities Trust Series 2007-CB18: | | | | |
Class A1, 5.32% 6/12/47 (o) | | 14 | | 14 |
Class A3, 5.447% 6/12/47 (o) | | 2,492 | | 2,587 |
JPMorgan Mortgage Trust: | | | | |
sequential payer Series 2006-A5 Class 3A5, 5.8639% 8/25/36 (o) | | 2,279 | | 1,734 |
Series 2004-A3 Class 4A1, 2.7486% 7/25/34 (o) | | 1,145 | | 1,096 |
Series 2004-A5 Class 2A1, 2.5513% 12/25/34 (o) | | 1,389 | | 1,206 |
Series 2006-A2 Class 5A1, 2.9458% 11/25/33 (o) | | 2,302 | | 2,098 |
LB-UBS Commercial Mortgage Trust sequential payer Series 2006-C6 Class A4, 5.372% 9/15/39 | | 591 | | 640 |
MASTR Adjustable Rate Mortgages Trust Series 2007-3 Class 22A2, 0.4284% 5/25/47 (o) | | 988 | | 636 |
Collateralized Mortgage Obligations - continued |
| Principal
Amount (000s) | | Value (000s) |
Private Sponsor - continued |
Merrill Lynch Alternative Note Asset Trust floater Series 2007-OAR1 Class A1, 0.3884% 2/25/37 (o) | | $ 1,787 | | $ 1,197 |
Merrill Lynch Floating Trust floater Series 2006-1: | | | | |
Class B, 0.377% 6/15/22 (g)(o) | | 273 | | 265 |
Class C, 0.397% 6/15/22 (g)(o) | | 1,682 | | 1,573 |
Class D, 0.407% 6/15/22 (g)(o) | | 647 | | 602 |
Class E, 0.417% 6/15/22 (g)(o) | | 1,035 | | 952 |
Class F, 0.447% 6/15/22 (g)(o) | | 1,683 | | 1,532 |
Class G, 0.517% 6/15/22 (g)(o) | | 387 | | 345 |
Class H, 0.537% 6/15/22 (g)(o) | | 778 | | 676 |
Class J, 0.577% 6/15/22 (g)(o) | | 906 | | 782 |
Merrill Lynch Mortgage Investors Trust: | | | | |
Series 2004-A4 Class A1, 2.6423% 8/25/34 (o) | | 1,581 | | 1,494 |
Series 2005-A2 Class A7, 2.6224% 2/25/35 (o) | | 1,168 | | 1,092 |
Series 2006-A6 Class A4, 3.1818% 10/25/33 (o) | | 1,320 | | 1,189 |
Merrill Lynch-CFC Commercial Mortgage Trust Series 2006-3 Class ASB, 5.382% 7/12/46 (o) | | 5,626 | | 5,853 |
Opteum Mortgage Acceptance Corp. floater Series 2005-3 Class APT, 0.5084% 7/25/35 (o) | | 2,320 | | 1,787 |
Option One Mortgage Loan Trust floater Series 2007-CP1 Class M1, 0.5184% 3/25/37 (o) | | 3,232 | | 142 |
Provident Funding Mortgage Loan Trust Series 2005-2 Class 3A, 2.6869% 10/25/35 (o) | | 807 | | 644 |
RESI Finance LP/RESI Finance DE Corp. floater Series 2003-B: | | | | |
Class B5, 2.5558% 7/10/35 (g)(o) | | 1,574 | | 1,235 |
Class B6, 3.0558% 7/10/35 (g)(o) | | 335 | | 246 |
Residential Asset Mortgage Products, Inc. sequential payer: | | | | |
Series 2003-SL1 Class A31, 7.125% 4/25/31 | | 968 | | 1,024 |
Series 2004-SL3 Class A1, 7% 8/25/16 | | 50 | | 50 |
Residential Funding Securities Corp. floater Series 2003-RP2 Class A1, 0.6684% 6/25/33 (g)(o) | | 378 | | 346 |
Salomon Brothers Mortgage Securities VII, Inc. Series 2006-C2 Class H, 6.308% 7/18/33 (g) | | 185 | | 65 |
Sequoia Mortgage Trust floater Series 2004-6 Class A3B, 1.275% 7/20/34 (o) | | 41 | | 28 |
Structured Asset Securities Corp.: | | | | |
Series 2003-15A Class 4A, 5.375% 4/25/33 (o) | | 499 | | 454 |
Series 2003-20 Class 1A1, 5.5% 7/25/33 | | 347 | | 351 |
TBW Mortgage-Backed pass-thru certificates floater Series 2006-4 Class A3, 0.3873% 9/25/36 (o) | | 3,593 | | 2,591 |
Collateralized Mortgage Obligations - continued |
| Principal
Amount (000s) | | Value (000s) |
Private Sponsor - continued |
WaMu Mortgage pass-thru certificates: | | | | |
Series 2003-AR8 Class A, 2.6863% 8/25/33 (o) | | $ 813 | | $ 749 |
Series 2005-AR3 Class A2, 2.5791% 3/25/35 (o) | | 2,190 | | 1,811 |
Wells Fargo Mortgage Backed Securities Trust: | | | | |
Series 2004-EE Class 2A2, 2.7571% 12/25/34 (o) | | 690 | | 654 |
Series 2004-H Class A1, 2.7828% 6/25/34 (o) | | 1,208 | | 1,144 |
Series 2004-W Class A9, 2.7617% 11/25/34 (o) | | 4,592 | | 4,183 |
Series 2005-AR10 Class 2A2, 2.7607% 6/25/35 (o) | | 570 | | 515 |
Series 2005-AR12: | | | | |
Class 2A5, 2.7552% 7/25/35 (o) | | 11,322 | | 10,146 |
Class 2A6, 2.7552% 7/25/35 (o) | | 489 | | 432 |
Series 2005-AR2 Class 2A2, 2.7427% 3/25/35 (o) | | 2,593 | | 2,260 |
Series 2005-AR3 Class 2A1, 2.7804% 3/25/35 (o) | | 850 | | 751 |
TOTAL COLLATERALIZED MORTGAGE OBLIGATIONS (Cost $75,128) | 104,461 |
Commercial Mortgage Securities - 2.1% |
|
Asset Securitization Corp. Series 1997-D5: | | | | |
Class A2, 6.8338% 2/14/43 (o) | | 966 | | 998 |
Class A3, 6.8838% 2/14/43 (o) | | 1,043 | | 1,099 |
Class A6, 7.2038% 2/14/43 (o) | | 1,537 | | 1,608 |
Class PS1, 1.3868% 2/14/43 (o)(q) | | 3,705 | | 65 |
Banc of America Commercial Mortgage Trust: | | | | |
sequential payer: | | | | |
Series 2006-2 Class AAB, 5.7134% 5/10/45 (o) | | 1,470 | | 1,552 |
Series 2006-5: | | | | |
Class A2, 5.317% 9/10/47 | | 4,468 | | 4,499 |
Class A3, 5.39% 9/10/47 | | 1,832 | | 1,894 |
Series 2006-6 Class A3, 5.369% 10/10/45 | | 2,628 | | 2,746 |
Series 2007-4 Class A3, 5.798% 2/10/51 (o) | | 1,310 | | 1,385 |
Series 2006-6 Class E, 5.619% 10/10/45 (g) | | 759 | | 141 |
Series 2007-3: | | | | |
Class A3, 5.6242% 6/10/49 (o) | | 2,194 | | 2,298 |
Class A4, 5.6242% 6/10/49 (o) | | 2,739 | | 2,886 |
Banc of America Commercial Mortgage, Inc.: | | | | |
sequential payer: | | | | |
Series 2001-1 Class A4, 5.451% 1/15/49 | | 2,878 | | 3,055 |
Series 2004-2: | | | | |
Class A3, 4.05% 11/10/38 | | 218 | | 220 |
Class A4, 4.153% 11/10/38 | | 1,666 | | 1,723 |
Commercial Mortgage Securities - continued |
| Principal
Amount (000s) | | Value (000s) |
Banc of America Commercial Mortgage, Inc.: - continued | | | | |
sequential payer: | | | | |
Series 2005-1 Class A3, 4.877% 11/10/42 | | $ 1,151 | | $ 1,151 |
Series 2007-1 Class A2, 5.381% 1/15/49 | | 3,611 | | 3,619 |
Series 2001-3 Class H, 6.562% 4/11/37 (g) | | 735 | | 734 |
Series 2001-PB1: | | | | |
Class J, 7.166% 5/11/35 (g) | | 329 | | 327 |
Class K, 6.15% 5/11/35 (g) | | 611 | | 605 |
Series 2005-3 Series A3B, 5.09% 7/10/43 (o) | | 4,082 | | 4,275 |
Banc of America Large Loan, Inc. floater: | | | | |
Series 2005-MIB1: | | | | |
Class C, 0.5172% 3/15/22 (g)(o) | | 564 | | 533 |
Class D, 0.5672% 3/15/22 (g)(o) | | 572 | | 535 |
Class E, 0.6072% 3/15/22 (g)(o) | | 472 | | 434 |
Class F, 0.6772% 3/15/22 (g)(o) | | 676 | | 608 |
Class G, 0.7372% 3/15/22 (g)(o) | | 438 | | 390 |
Series 2006-BIX1: | | | | |
Class C, 0.3872% 10/15/19 (g)(o) | | 561 | | 546 |
Class D, 0.4172% 10/15/19 (g)(o) | | 1,031 | | 987 |
Class E, 0.4472% 10/15/19 (g)(o) | | 956 | | 901 |
Class F, 0.5172% 10/15/19 (g)(o) | | 2,868 | | 2,689 |
Class G, 0.5372% 10/15/19 (g)(o) | | 1,350 | | 1,198 |
Bayview Commercial Asset Trust: | | | | |
floater: | | | | |
Series 2003-2 Class M1, 1.0684% 12/25/33 (g)(o) | | 79 | | 55 |
Series 2004-1: | | | | |
Class A, 0.5784% 4/25/34 (g)(o) | | 1,319 | | 1,104 |
Class B, 2.1184% 4/25/34 (g)(o) | | 148 | | 84 |
Class M1, 0.7784% 4/25/34 (g)(o) | | 119 | | 84 |
Class M2, 1.4184% 4/25/34 (g)(o) | | 109 | | 76 |
Series 2004-2: | | | | |
Class A, 0.6484% 8/25/34 (g)(o) | | 1,079 | | 882 |
Class M1, 0.7984% 8/25/34 (g)(o) | | 186 | | 135 |
Series 2004-3: | | | | |
Class A1, 0.5884% 1/25/35 (g)(o) | | 2,409 | | 1,883 |
Class A2, 0.6384% 1/25/35 (g)(o) | | 346 | | 274 |
Class M1, 0.7184% 1/25/35 (g)(o) | | 416 | | 290 |
Class M2, 1.2184% 1/25/35 (g)(o) | | 198 | | 132 |
Series 2005-2A: | | | | |
Class A1, 0.5284% 8/25/35 (g)(o) | | 1,715 | | 1,341 |
Class M1, 0.6484% 8/25/35 (g)(o) | | 93 | | 55 |
Class M2, 0.6984% 8/25/35 (g)(o) | | 154 | | 83 |
Commercial Mortgage Securities - continued |
| Principal
Amount (000s) | | Value (000s) |
Bayview Commercial Asset Trust: - continued | | | | |
floater: | | | | |
Series 2005-2A: | | | | |
Class M3, 0.7184% 8/25/35 (g)(o) | | $ 85 | | $ 45 |
Class M4, 0.8284% 8/25/35 (g)(o) | | 78 | | 39 |
Series 2005-3A: | | | | |
Class A1, 0.5384% 11/25/35 (g)(o) | | 699 | | 528 |
Class A2, 0.6184% 11/25/35 (g)(o) | | 630 | | 479 |
Class M1, 0.6584% 11/25/35 (g)(o) | | 83 | | 50 |
Class M2, 0.7084% 11/25/35 (g)(o) | | 105 | | 60 |
Class M3, 0.7284% 11/25/35 (g)(o) | | 94 | | 52 |
Class M4, 0.8184% 11/25/35 (g)(o) | | 117 | | 57 |
Series 2005-4A: | | | | |
Class A2, 0.6084% 1/25/36 (g)(o) | | 1,621 | | 1,204 |
Class B1, 1.6184% 1/25/36 (g)(o) | | 140 | | 28 |
Class M1, 0.6684% 1/25/36 (g)(o) | | 523 | | 310 |
Class M2, 0.6884% 1/25/36 (g)(o) | | 157 | | 83 |
Class M3, 0.7184% 1/25/36 (g)(o) | | 229 | | 112 |
Class M4, 0.8284% 1/25/36 (g)(o) | | 127 | | 57 |
Class M5, 0.8684% 1/25/36 (g)(o) | | 127 | | 49 |
Class M6, 0.9184% 1/25/36 (g)(o) | | 135 | | 41 |
Series 2006-1: | | | | |
Class A2, 0.5784% 4/25/36 (g)(o) | | 246 | | 183 |
Class M1, 0.5984% 4/25/36 (g)(o) | | 88 | | 52 |
Class M2, 0.6184% 4/25/36 (g)(o) | | 93 | | 51 |
Class M3, 0.6384% 4/25/36 (g)(o) | | 80 | | 41 |
Class M4, 0.7384% 4/25/36 (g)(o) | | 45 | | 21 |
Class M5, 0.7784% 4/25/36 (g)(o) | | 44 | | 18 |
Class M6, 0.8584% 4/25/36 (g)(o) | | 88 | | 33 |
Series 2006-2A: | | | | |
Class A1, 0.4484% 7/25/36 (g)(o) | | 3,708 | | 2,770 |
Class A2, 0.4984% 7/25/36 (g)(o) | | 220 | | 162 |
Class B1, 1.0884% 7/25/36 (g)(o) | | 83 | | 28 |
Class B3, 2.9184% 7/25/36 (g)(o) | | 125 | | 35 |
Class M1, 0.5284% 7/25/36 (g)(o) | | 231 | | 138 |
Class M2, 0.5484% 7/25/36 (g)(o) | | 163 | | 89 |
Class M3, 0.5684% 7/25/36 (g)(o) | | 135 | | 73 |
Class M4, 0.6384% 7/25/36 (g)(o) | | 91 | | 47 |
Class M5, 0.6884% 7/25/36 (g)(o) | | 112 | | 56 |
Class M6, 0.7584% 7/25/36 (g)(o) | | 168 | | 64 |
Series 2006-3A: | | | | |
Class B1, 1.0184% 10/25/36 (g)(o) | | 155 | | 13 |
Class B2, 1.5684% 10/25/36 (g)(o) | | 112 | | 5 |
Commercial Mortgage Securities - continued |
| Principal
Amount (000s) | | Value (000s) |
Bayview Commercial Asset Trust: - continued | | | | |
floater: | | | | |
Series 2006-3A: | | | | |
Class B3, 2.8184% 10/25/36 (g)(o) | | $ 38 | | $ 0* |
Class M4, 0.6484% 10/25/36 (g)(o) | | 171 | | 44 |
Class M5, 0.6984% 10/25/36 (g)(o) | | 205 | | 41 |
Class M6, 0.7784% 10/25/36 (g)(o) | | 401 | | 60 |
Series 2006-4A: | | | | |
Class A1, 0.4484% 12/25/36 (g)(o) | | 878 | | 624 |
Class A2, 0.4884% 12/25/36 (g)(o) | | 4,292 | | 2,919 |
Class B1, 0.9184% 12/25/36 (g)(o) | | 137 | | 18 |
Class B2, 1.4684% 12/25/36 (g)(o) | | 140 | | 14 |
Class B3, 2.6684% 12/25/36 (g)(o) | | 237 | | 15 |
Class M1, 0.5084% 12/25/36 (g)(o) | | 286 | | 119 |
Class M2, 0.5284% 12/25/36 (g)(o) | | 190 | | 71 |
Class M3, 0.5584% 12/25/36 (g)(o) | | 192 | | 64 |
Class M4, 0.6184% 12/25/36 (g)(o) | | 232 | | 65 |
Class M5, 0.6584% 12/25/36 (g)(o) | | 211 | | 47 |
Class M6, 0.7384% 12/25/36 (g)(o) | | 190 | | 34 |
Series 2007-1: | | | | |
Class A2, 0.4884% 3/25/37 (g)(o) | | 897 | | 583 |
Class B1, 0.8884% 3/25/37 (g)(o) | | 288 | | 35 |
Class B2, 1.3684% 3/25/37 (g)(o) | | 207 | | 21 |
Class B3, 3.5684% 3/25/37 (g)(o) | | 316 | | 14 |
Class M1, 0.4884% 3/25/37 (g)(o) | | 251 | | 93 |
Class M2, 0.5084% 3/25/37 (g)(o) | | 187 | | 56 |
Class M3, 0.5384% 3/25/37 (g)(o) | | 167 | | 45 |
Class M4, 0.5884% 3/25/37 (g)(o) | | 136 | | 33 |
Class M5, 0.6384% 3/25/37 (g)(o) | | 209 | | 40 |
Class M6, 0.7184% 3/25/37 (g)(o) | | 293 | | 47 |
Series 2007-2A: | | | | |
Class A1, 0.4884% 7/25/37 (g)(o) | | 820 | | 568 |
Class A2, 0.5384% 7/25/37 (g)(o) | | 769 | | 447 |
Class B1, 1.8184% 7/25/37 (g)(o) | | 238 | | 18 |
Class B2, 2.4684% 7/25/37 (g)(o) | | 206 | | 10 |
Class B3, 3.5684% 7/25/37 (g)(o) | | 232 | | 6 |
Class M1, 0.5884% 7/25/37 (g)(o) | | 269 | | 86 |
Class M2, 0.6284% 7/25/37 (g)(o) | | 148 | | 35 |
Class M3, 0.7084% 7/25/37 (g)(o) | | 149 | | 27 |
Class M4, 0.8684% 7/25/37 (g)(o) | | 295 | | 43 |
Class M5, 0.9684% 7/25/37 (g)(o) | | 261 | | 33 |
Class M6, 1.2184% 7/25/37 (g)(o) | | 331 | | 33 |
Commercial Mortgage Securities - continued |
| Principal
Amount (000s) | | Value (000s) |
Bayview Commercial Asset Trust: - continued | | | | |
floater: | | | | |
Series 2007-3: | | | | |
Class A2, 0.5084% 7/25/37 (g)(o) | | $ 918 | | $ 565 |
Class B1, 1.1684% 7/25/37 (g)(o) | | 204 | | 26 |
Class B2, 1.8184% 7/25/37 (g)(o) | | 511 | | 47 |
Class B3, 4.2184% 7/25/37 (g)(o) | | 205 | | 9 |
Class M1, 0.5284% 7/25/37 (g)(o) | | 183 | | 72 |
Class M2, 0.5584% 7/25/37 (g)(o) | | 195 | | 65 |
Class M3, 0.5884% 7/25/37 (g)(o) | | 306 | | 84 |
Class M4, 0.7184% 7/25/37 (g)(o) | | 482 | | 111 |
Class M5, 0.8184% 7/25/37 (g)(o) | | 252 | | 50 |
Class M6, 1.0184% 7/25/37 (g)(o) | | 192 | | 32 |
Series 2007-4A: | | | | |
Class B1, 2.7684% 9/25/37 (g)(o) | | 316 | | 5 |
Class B2, 3.6684% 9/25/37 (g)(o) | | 809 | | 4 |
Class M1, 1.1684% 9/25/37 (g)(o) | | 304 | | 36 |
Class M2, 1.2684% 9/25/37 (g)(o) | | 304 | | 30 |
Class M4, 1.8184% 9/25/37 (g)(o) | | 771 | | 46 |
Class M5, 1.9684% 9/25/37 (g)(o) | | 771 | | 31 |
Class M6, 2.1684% 9/25/37 (g)(o) | | 775 | | 19 |
Series 2004-1, Class IO,1.25% 4/25/34 (g)(q) | | 2,657 | | 100 |
Series 2007-5A, Class IO, 3.047% 10/25/37 (g)(o)(q) | | 6,430 | | 638 |
Bear Stearns Commercial Mortgage Securities Trust: | | | | |
floater: | | | | |
Series 2006-BBA7: | | | | |
Class H, 0.8572% 3/15/19 (g)(o) | | 476 | | 450 |
Class J, 1.0572% 3/15/19 (g)(o) | | 447 | | 376 |
Series 2007-BBA8: | | | | |
Class D, 0.4572% 3/15/22 (g)(o) | | 653 | | 610 |
Class E, 0.5072% 3/15/22 (g)(o) | | 3,391 | | 3,139 |
Class F, 0.5572% 3/15/22 (g)(o) | | 2,081 | | 1,889 |
Class G, 0.6072% 3/15/22 (g)(o) | | 534 | | 472 |
Class H, 0.7572% 3/15/22 (g)(o) | | 653 | | 564 |
Class J, 0.9072% 3/15/22 (g)(o) | | 653 | | 527 |
sequential payer: | | | | |
Series 2003-PWR2 Class A3, 4.834% 5/11/39 | | 207 | | 209 |
Series 2004-PWR3 Class A3, 4.487% 2/11/41 | | 469 | | 479 |
Series 2007-PW15 Class AAB, 5.315% 2/11/44 | | 3,555 | | 3,720 |
Series 2007-PW16: | | | | |
Class A4, 5.7154% 6/11/40 (o) | | 769 | | 831 |
Class AAB, 5.7154% 6/11/40 (o) | | 6,290 | | 6,697 |
Series 2007-PW17 Class A1, 5.282% 6/11/50 | | 458 | | 464 |
Commercial Mortgage Securities - continued |
| Principal
Amount (000s) | | Value (000s) |
Bear Stearns Commercial Mortgage Securities Trust: - continued | | | | |
sequential payer: | | | | |
Series 2007-PW18: | | | | |
Class A2, 5.613% 6/11/50 | | $ 430 | | $ 438 |
Class A4, 5.7% 6/11/50 | | 5,820 | | 6,182 |
Series 2007-T26 Class A1, 5.145% 1/12/45 | | 188 | | 189 |
Series 2003-PWR2 Class X2, 0.5275% 5/11/39 (g)(o)(q) | | 9,273 | | 0* |
Series 2006-PW13 Class A3, 5.518% 9/11/41 | | 4,638 | | 4,760 |
Series 2006-PW14 Class X2, 0.6524% 12/11/38 (g)(o)(q) | | 14,978 | | 211 |
Series 2006-T22 Class A4, 5.5338% 4/12/38 (o) | | 164 | | 182 |
Series 2007-PW16: | | | | |
Class B, 5.7154% 6/11/40 (g)(o) | | 210 | | 104 |
Class C, 5.7154% 6/11/40 (g)(o) | | 175 | | 68 |
Class D, 5.7154% 6/11/40 (g)(o) | | 175 | | 62 |
Series 2007-PW18 Class X2, 0.3152% 6/11/50 (g)(o)(q) | | 114,580 | | 1,202 |
Series 2007-T28: | | | | |
Class A1, 5.422% 9/11/42 | | 14 | | 14 |
Class X2, 0.1654% 9/11/42 (g)(o)(q) | | 56,451 | | 375 |
C-BASS Trust floater Series 2006-SC1 Class A, 0.4884% 5/25/36 (g)(o) | | 863 | | 611 |
CDC Commercial Mortgage Trust Series 2002-FX1: | | | | |
Class G, 6.625% 5/15/35 (g) | | 1,544 | | 1,614 |
Class XCL, 2.2784% 5/15/35 (g)(o)(q) | | 8,801 | | 165 |
Citigroup Commercial Mortgage Trust: | | | | |
floater Series 2006-FL2: | | | | |
Class F, 0.5202% 8/15/21 (g)(o) | | 469 | | 462 |
Class G, 0.5402% 8/15/21 (g)(o) | | 586 | | 568 |
Class H, 0.5802% 8/15/21 (g)(o) | | 468 | | 431 |
sequential payer Series 2006-C5 Class A4, 5.431% 10/15/49 | | 9,115 | | 9,800 |
Series 2006-C5 Class AMP2, 5.5005% 10/15/49 (g) | | 1,967 | | 1,924 |
Series 2007-C6: | | | | |
Class A1, 5.622% 12/10/49 (o) | | 1,506 | | 1,503 |
Class A2, 5.6978% 12/10/49 (o) | | 1,600 | | 1,627 |
Class A4, 5.6978% 12/10/49 (o) | | 4,371 | | 4,716 |
Citigroup/Deutsche Bank Commercial Mortgage Trust: | | | | |
sequential payer Series 2007-CD4: | | | | |
Class A2A, 5.237% 12/11/49 | | 439 | | 440 |
Class A4, 5.322% 12/11/49 | | 5,943 | | 6,174 |
Commercial Mortgage Securities - continued |
| Principal
Amount (000s) | | Value (000s) |
Citigroup/Deutsche Bank Commercial Mortgage Trust: - continued | | | | |
sequential payer Series 2007-CD4: | | | | |
Class A3, 5.293% 12/11/49 | | $ 1,279 | | $ 1,319 |
Class C, 5.476% 12/11/49 | | 2,474 | | 495 |
Cobalt CMBS Commercial Mortgage Trust: | | | | |
sequential payer Series 2007-C3 Class A3, 5.8158% 5/15/46 (o) | | 1,314 | | 1,398 |
Series 2006-C1 Class B, 5.359% 8/15/48 | | 3,942 | | 788 |
COMM pass-thru certificates: | | | | |
floater: | | | | |
Series 2005-F10A: | | | | |
Class B, 0.4372% 4/15/17 (g)(o) | | 6,843 | | 6,609 |
Class C, 0.4772% 4/15/17 (g)(o) | | 1,057 | | 1,021 |
Class D, 0.5172% 4/15/17 (g)(o) | | 1,043 | | 1,000 |
Class E, 0.5772% 4/15/17 (g)(o) | | 332 | | 312 |
Class F, 0.6172% 4/15/17 (g)(o) | | 188 | | 170 |
Class G, 0.7572% 4/15/17 (g)(o) | | 188 | | 170 |
Class H, 0.8272% 4/15/17 (g)(o) | | 188 | | 169 |
Class J, 1.0572% 4/15/17 (g)(o) | | 144 | | 121 |
Series 2005-FL11: | | | | |
Class C, 0.5072% 11/15/17 (g)(o) | | 1,003 | | 953 |
Class D, 0.5472% 11/15/17 (g)(o) | | 52 | | 49 |
Class E, 0.5972% 11/15/17 (g)(o) | | 185 | | 172 |
Class F, 0.6572% 11/15/17 (g)(o) | | 204 | | 186 |
Class G, 0.7072% 11/15/17 (g)(o) | | 141 | | 125 |
Series 2006-CN2A: | | | | |
Class A2FL, 0.4256% 2/5/19 (g)(o) | | 1,940 | | 1,866 |
Class AJFL, 0.4656% 2/5/19 (o) | | 890 | | 815 |
Series 2006-FL12 Class AJ, 0.3372% 12/15/20 (g)(o) | | 1,872 | | 1,713 |
sequential payer: | | | | |
Series 2005-C6 Class A2, 4.999% 6/10/44 (o) | | 13 | | 13 |
Series 2006-C8 Class A3, 5.31% 12/10/46 | | 3,744 | | 3,918 |
Series 2006-CN2A: | | | | |
Class A2FX, 5.449% 2/5/19 (g) | | 2,291 | | 2,278 |
Class AJFX, 5.478% 2/5/19 (g) | | 4,140 | | 4,170 |
Series 2007-C9 Class A4, 5.8145% 12/10/49 (o) | | 2,907 | | 3,181 |
Series 2006-C8 Class XP, 0.469% 12/10/46 (o)(q) | | 17,439 | | 190 |
Credit Suisse Commercial Mortgage Trust: | | | | |
sequential payer: | | | | |
Series 2006-C4 Class A3, 5.467% 9/15/39 | | 1,596 | | 1,669 |
Commercial Mortgage Securities - continued |
| Principal
Amount (000s) | | Value (000s) |
Credit Suisse Commercial Mortgage Trust: - continued | | | | |
sequential payer: | | | | |
Series 2007-C2: | | | | |
Class A2, 5.448% 1/15/49 (o) | | $ 9,219 | | $ 9,255 |
Class A3, 5.542% 1/15/49 (o) | | 2,628 | | 2,769 |
Series 2007-C3 Class A4, 5.702% 6/15/39 (o) | | 790 | | 824 |
Series 2006-C4 Class AAB, 5.439% 9/15/39 | | 7,354 | | 7,540 |
Series 2006-C5 Class ASP, 0.6723% 12/15/39 (o)(q) | | 12,136 | | 175 |
Series 2007-C5 Class A4, 5.695% 9/15/40 (o) | | 1,189 | | 1,255 |
Credit Suisse First Boston Mortgage Capital Certificates floater Series 2007-TF2A Class B, 0.5572% 4/15/22 (g)(o) | | 4,688 | | 3,375 |
Credit Suisse First Boston Mortgage Securities Corp.: | | | | |
sequential payer: | | | | |
Series 2001-CK6 Class B, 6.582% 8/15/36 | | 1,314 | | 1,314 |
Series 2002-CP5 Class A1, 4.106% 12/15/35 | | 64 | | 64 |
Series 2004-C1: | | | | |
Class A3, 4.321% 1/15/37 | | 134 | | 134 |
Class A4, 4.75% 1/15/37 | | 612 | | 641 |
Series 2001-CK6 Class AX, 0.837% 8/15/36 (o)(q) | | 1,545 | | 2 |
Series 2001-CKN5 Class AX, 1.9481% 9/15/34 (g)(o)(q) | | 2,641 | | 1 |
Series 2006-C1 Class A3, 5.422% 2/15/39 (o) | | 4,872 | | 5,108 |
Credit Suisse Mortgage Capital Certificates: | | | | |
floater Series 2007-TFL1: | | | | |
Class B, 0.3572% 2/15/22 (g)(o) | | 497 | | 432 |
Class C: | | | | |
0.3772% 2/15/22 (g)(o) | | 2,047 | | 1,740 |
0.4772% 2/15/22 (g)(o) | | 731 | | 585 |
Class F, 0.5272% 2/15/22 (g)(o) | | 1,462 | | 1,140 |
Series 2007-C1: | | | | |
Class ASP, 0.406% 2/15/40 (o)(q) | | 20,525 | | 192 |
Class B, 5.487% 2/15/40 (g)(o) | | 2,009 | | 301 |
First Union National Bank-Bank of America Commercial Mortgage Trust Series 2001-C1: | | | | |
Class D, 6.484% 3/15/33 | | 46 | | 46 |
Class G, 6.936% 3/15/33 (g) | | 865 | | 854 |
GE Capital Commercial Mortgage Corp.: | | | | |
sequential payer Series 2007-C1 Class A4, 5.543% 12/10/49 | | 8,890 | | 9,258 |
Series 2001-1 Class X1, 1.1681% 5/15/33 (g)(o)(q) | | 2,021 | | 12 |
Series 2007-C1 Class XP, 0.193% 12/10/49 (o)(q) | | 27,213 | | 118 |
Commercial Mortgage Securities - continued |
| Principal
Amount (000s) | | Value (000s) |
GMAC Commercial Mortgage Securities, Inc.: | | | | |
Series 2004-C3 Class X2, 0.5803% 12/10/41 (o)(q) | | $ 1,154 | | $ 2 |
Series 2005-C1 Class X2, 0.554% 5/10/43 (o)(q) | | 4,796 | | 22 |
Greenwich Capital Commercial Funding Corp.: | | | | |
floater Series 2006-FL4 Class B, 0.3956% 11/5/21 (g)(o) | | 494 | | 481 |
sequential payer: | | | | |
Series 2007-GG11 Class A2, 5.597% 12/10/49 | | 2,628 | | 2,706 |
Series 2007-GG9 Class A4, 5.444% 3/10/39 | | 3,820 | | 4,036 |
Series 2005-GG3 Class XP, 0.6673% 8/10/42 (g)(o)(q) | | 16,776 | | 58 |
Series 2006-GG7 Class A3, 5.881% 7/10/38 (o) | | 3,464 | | 3,637 |
Series 2007-GG11 Class A1, 0.2902% 12/10/49 (g)(o)(q) | | 29,309 | | 217 |
GS Mortgage Securities Corp. II: | | | | |
floater: | | | | |
Series 2006-FL8A: | | | | |
Class E, 0.5751% 6/6/20 (g)(o) | | 298 | | 275 |
Class F, 0.6451% 6/6/20 (g)(o) | | 916 | | 835 |
Series 2007-EOP: | | | | |
Class C, 2.1455% 3/6/20 (g)(o) | | 1,650 | | 1,585 |
Class D, 2.3636% 3/6/20 (g)(o) | | 3,090 | | 2,968 |
Class F, 2.8433% 3/6/20 (g)(o) | | 136 | | 131 |
Class G, 3.0177% 3/6/20 (g)(o) | | 67 | | 65 |
Class H, 3.5846% 3/6/20 (g)(o) | | 62 | | 60 |
Class J, 4.4568% 3/6/20 (g)(o) | | 85 | | 83 |
sequential payer Series 2004-GG2 Class A4, 4.964% 8/10/38 | | 402 | | 403 |
Series 2005-GG4 Class XP, 0.7109% 7/10/39 (g)(o)(q) | | 21,665 | | 121 |
Series 2006-GG6 Class A2, 5.506% 4/10/38 | | 4,412 | | 4,406 |
GS Mortgage Securities Trust sequential payer: | | | | |
Series 2006-GG8 Class A2, 5.479% 11/10/39 | | 870 | | 869 |
Series 2007-GG10 Class A2, 5.778% 8/10/45 | | 602 | | 613 |
JP Morgan Chase Commercial Mortgage Securities Trust: | | | | |
sequential payer: | | | | |
Series 2006-CB14 Class A3B, 5.4764% 12/12/44 (o) | | 3,494 | | 3,554 |
Series 2007-LDPX: | | | | |
Class A2 S, 5.305% 1/15/49 | | 2,976 | | 2,995 |
Class A3, 5.42% 1/15/49 | | 3,616 | | 3,829 |
Series 2005-CB13 Class E, 5.348% 1/12/43 (g)(o) | | 665 | | 47 |
Series 2005-LDP3 Class A3, 4.959% 8/15/42 | | 9,387 | | 9,615 |
Commercial Mortgage Securities - continued |
| Principal
Amount (000s) | | Value (000s) |
JP Morgan Chase Commercial Mortgage Securities Trust: - continued | | | | |
Series 2007-LDP10: | | | | |
Class BS, 5.437% 1/15/49 (o) | | $ 251 | | $ 48 |
Class CS, 5.466% 1/15/49 (o) | | 108 | | 18 |
Class ES, 5.5379% 1/15/49 (g)(o) | | 679 | | 47 |
JP Morgan Commercial Mortgage Finance Corp. Series 2000-C9 Class G, 6.25% 10/15/32 (g) | | 157 | | 156 |
JPMorgan Chase Commercial Mortgage Securities Trust: | | | | |
floater Series 2006-FLA2: | | | | |
Class B, 0.3772% 11/15/18 (g)(o) | | 847 | | 779 |
Class C, 0.4172% 11/15/18 (g)(o) | | 602 | | 547 |
Class D, 0.4372% 11/15/18 (g)(o) | | 267 | | 241 |
Class E, 0.4872% 11/15/18 (g)(o) | | 384 | | 342 |
Class F, 0.5372% 11/15/18 (g)(o) | | 577 | | 502 |
Class G, 0.5672% 11/15/18 (g)(o) | | 500 | | 420 |
Class H, 0.7072% 11/15/18 (g)(o) | | 384 | | 307 |
sequential payer: | | | | |
Series 2006-LDP8 Class A4, 5.399% 5/15/45 | | 837 | | 910 |
Series 2006-LDP9: | | | | |
Class A2, 5.134% 5/15/47 (o) | | 537 | | 548 |
Class A3, 5.336% 5/15/47 | | 548 | | 572 |
Series 2007-CB19 Class A4, 5.7415% 2/12/49 (o) | | 4,608 | | 4,865 |
Series 2007-LD11 Class A2, 5.8019% 6/15/49 (o) | | 3,689 | | 3,750 |
Series 2006-CB17 Class A3, 5.45% 12/12/43 | | 374 | | 378 |
Series 2007-CB19: | | | | |
Class B, 5.7415% 2/12/49 (o) | | 112 | | 50 |
Class C, 5.7415% 2/12/49 (o) | | 294 | | 120 |
Class D, 5.7415% 2/12/49 (o) | | 309 | | 105 |
LB Commercial Conduit Mortgage Trust: | | | | |
sequential payer Series 2007-C3 Class A4, 5.9407% 7/15/44 (o) | | 1,054 | | 1,124 |
Series 1998-C1 Class D, 6.98% 2/18/30 | | 293 | | 299 |
LB-UBS Commercial Mortgage Trust: | | | | |
sequential payer: | | | | |
Series 2006-C1 Class A2, 5.084% 2/15/31 | | 188 | | 191 |
Series 2006-C6 Class A2, 5.262% 9/15/39 (o) | | 735 | | 735 |
Series 2006-C7: | | | | |
Class A2, 5.3% 11/15/38 | | 1,214 | | 1,219 |
Class A3, 5.347% 11/15/38 | | 979 | | 1,026 |
Series 2007-C1: | | | | |
Class A1, 5.391% 2/15/40 (o) | | 33 | | 33 |
Class A4, 5.424% 2/15/40 | | 4,069 | | 4,336 |
Series 2007-C2 Class A3, 5.43% 2/15/40 | | 2,923 | | 3,051 |
Commercial Mortgage Securities - continued |
| Principal
Amount (000s) | | Value (000s) |
LB-UBS Commercial Mortgage Trust: - continued | | | | |
Series 2001-C3 Class B, 6.512% 6/15/36 | | $ 458 | | $ 458 |
Series 2001-C7 Class D, 6.514% 11/15/33 | | 1,445 | | 1,446 |
Series 2005-C3 Class XCP, 0.78% 7/15/40 (o)(q) | | 2,989 | | 14 |
Series 2006-C6 Class XCP, 0.6735% 9/15/39 (o)(q) | | 6,055 | | 80 |
Series 2007-C1 Class XCP, 0.472% 2/15/40 (o)(q) | | 2,256 | | 23 |
Series 2007-C6 Class A4, 5.858% 7/15/40 (o) | | 1,642 | | 1,748 |
Series 2007-C7: | | | | |
Class A3, 5.866% 9/15/45 | | 1,397 | | 1,494 |
Class XCP, 0.2822% 9/15/45 (o)(q) | | 98,605 | | 840 |
Lehman Brothers Floating Rate Commercial Mortgage Trust floater Series 2006-LLFA: | | | | |
Class D, 0.4372% 9/15/21 (g)(o) | | 421 | | 373 |
Class E, 0.4972% 9/15/21 (g)(o) | | 1,518 | | 1,328 |
Class F, 0.5472% 9/15/21 (g)(o) | | 1,255 | | 1,086 |
Class G, 0.5672% 9/15/21 (g)(o) | | 2,478 | | 2,058 |
Class H, 0.6072% 9/15/21 (g)(o) | | 639 | | 507 |
Lehman Large Loan Trust Series 1997-LLI Class E, 7.3% 10/12/34 | | 2,332 | | 2,337 |
Merrill Lynch Mortgage Trust: | | | | |
Series 2005-CKI1 Class A3, 5.2203% 11/12/37 (o) | | 1,030 | | 1,042 |
Series 2005-LC1 Class F, 5.3796% 1/12/44 (g)(o) | | 1,143 | | 582 |
Series 2006-C1 Class A2, 5.6285% 5/12/39 (o) | | 1,277 | | 1,304 |
Series 2007-C1 Class A4, 5.8267% 6/12/50 (o) | | 4,974 | | 5,276 |
Series 2008-C1 Class A4, 5.69% 2/12/51 | | 2,805 | | 3,023 |
Merrill Lynch-CFC Commercial Mortgage Trust: | | | | |
floater Series 2006-4 Class A2FL, 0.3058% 12/12/49 (o) | | 551 | | 537 |
sequential payer: | | | | |
Series 2006-1 CLass A3, 5.4804% 2/12/39 (o) | | 1,398 | | 1,424 |
Series 2006-4 Class ASB, 5.133% 12/12/49 (o) | | 1,129 | | 1,189 |
Series 2007-5: | | | | |
Class A3, 5.364% 8/12/48 | | 512 | | 520 |
Class A4, 5.378% 8/12/48 | | 53 | | 54 |
Class B, 5.479% 8/12/48 | | 3,942 | | 1,599 |
Series 2007-6: | | | | |
Class A1, 5.175% 3/12/51 | | 17 | | 17 |
Class A4, 5.485% 3/12/51 (o) | | 10,897 | | 11,437 |
Series 2007-7 Class A4, 5.7436% 6/12/50 (o) | | 4,599 | | 4,958 |
Series 2007-8 Class A1, 4.622% 8/12/49 | | 65 | | 66 |
Series 2006-4 Class XP, 0.6205% 12/12/49 (o)(q) | | 21,609 | | 408 |
Series 2007-6 Class B, 5.635% 3/12/51 (o) | | 1,314 | | 591 |
Series 2007-7 Class B, 5.7436% 6/12/50 (o) | | 114 | | 30 |
Series 2007-8 Class A3, 5.9665% 8/12/49 (o) | | 1,133 | | 1,204 |
Commercial Mortgage Securities - continued |
| Principal
Amount (000s) | | Value (000s) |
Morgan Stanley Capital I Trust: | | | | |
floater: | | | | |
Series 2006-XLF Class C, 1.407% 7/15/19 (g)(o) | | $ 393 | | $ 236 |
Series 2007-XCLA Class A1, 0.408% 7/17/17 (g)(o) | | 715 | | 651 |
Series 2007-XLFA: | | | | |
Class C, 0.368% 10/15/20 (g)(o) | | 754 | | 682 |
Class D, 0.398% 10/15/20 (g)(o) | | 732 | | 655 |
Class E, 0.458% 10/15/20 (g)(o) | | 916 | | 810 |
Class F, 0.508% 10/15/20 (g)(o) | | 550 | | 459 |
Class G, 0.548% 10/15/20 (g)(o) | | 680 | | 532 |
Class H, 0.638% 10/15/20 (g)(o) | | 428 | | 310 |
Class J, 0.788% 10/15/20 (g)(o) | | 488 | | 293 |
Class MHRO, 0.898% 10/15/20 (g)(o) | | 532 | | 447 |
Class MJPM, 1.208% 10/15/20 (g)(o) | | 25 | | 23 |
Class NHRO, 1.098% 10/15/20 (g)(o) | | 805 | | 644 |
sequential payer: | | | | |
Series 2003-IQ5 Class X2, 0.9017% 4/15/38 (g)(o)(q) | | 3,479 | | 0 |
Series 2005-IQ9 Class A3, 4.54% 7/15/56 | | 1,825 | | 1,840 |
Series 2007-HQ11 Class A31, 5.439% 2/12/44 (o) | | 666 | | 691 |
Series 2007-IQ13 Class A1, 5.05% 3/15/44 | | 166 | | 166 |
Series 2007-T25 Class A1, 5.391% 11/12/49 | | 179 | | 179 |
Series 2003-IQ6 Class X2, 0.5881% 12/15/41 (g)(o)(q) | | 7,776 | | 12 |
Series 2005-IQ9 Class X2, 1.0893% 7/15/56 (g)(o)(q) | | 11,696 | | 56 |
Series 2006-HQ10 Class X2, 0.4923% 11/12/41 (g)(o)(q) | | 9,533 | | 61 |
Series 2006-HQ8 Class A3, 5.4704% 3/12/44 (o) | | 774 | | 779 |
Series 2006-IQ11: | | | | |
Class A3, 5.694% 10/15/42 (o) | | 1,654 | | 1,703 |
Class A4, 5.73% 10/15/42 (o) | | 394 | | 433 |
Series 2006-T23 Class A3, 5.8184% 8/12/41 (o) | | 671 | | 716 |
Series 2007-IQ14: | | | | |
Class A4, 5.692% 4/15/49 (o) | | 1,971 | | 2,047 |
Class AAB, 5.654% 4/15/49 | | 3,520 | | 3,732 |
Class B, 5.7233% 4/15/49 (o) | | 323 | | 145 |
Structured Asset Securities Corp. Series 1997-LLI Class D, 7.15% 10/12/34 | | 92 | | 92 |
Wachovia Bank Commercial Mortgage Trust: | | | | |
floater: | | | | |
Series 2005-WL5A Class K, 1.4072% 1/15/18 (g)(o) | | 1,401 | | 1,345 |
Commercial Mortgage Securities - continued |
| Principal
Amount (000s) | | Value (000s) |
Wachovia Bank Commercial Mortgage Trust: - continued | | | | |
floater: | | | | |
Series 2006-WL7A: | | | | |
Class E, 0.4902% 9/15/21 (g)(o) | | $ 1,791 | | $ 1,589 |
Class F, 0.5502% 9/15/21 (g)(o) | | 2,061 | | 1,811 |
Class G, 0.5702% 9/15/21 (g)(o) | | 1,953 | | 1,639 |
Class J, 0.8072% 9/15/21 (g)(o) | | 434 | | 311 |
Series 2007-WHL8: | | | | |
Class AP1, 0.9072% 6/15/20 (g)(o) | | 142 | | 128 |
Class AP2, 1.0072% 6/15/20 (g)(o) | | 237 | | 208 |
Class F, 0.6872% 6/15/20 (g)(o) | | 4,581 | | 2,978 |
Class LXR1, 0.9072% 6/15/20 (g)(o) | | 162 | | 129 |
sequential payer: | | | | |
Series 2003-C7 Class A1, 4.241% 10/15/35 (g) | | 1,629 | | 1,633 |
Series 2003-C8 Class A3, 4.445% 11/15/35 | | 4,911 | | 4,921 |
Series 2006-C27 Class A2, 5.624% 7/15/45 | | 33 | | 33 |
Series 2006-C29 Class A3, 5.313% 11/15/48 | | 3,490 | | 3,703 |
Series 2007-C30: | | | | |
Class A3, 5.246% 12/15/43 | | 1,128 | | 1,143 |
Class A4, 5.305% 12/15/43 | | 386 | | 397 |
Class A5, 5.342% 12/15/43 | | 1,406 | | 1,464 |
Series 2007-C31 Class A4, 5.509% 4/15/47 | | 2,970 | | 3,165 |
Series 2007-C32: | | | | |
Class A2, 5.7378% 6/15/49 (o) | | 4,126 | | 4,167 |
Class A3, 5.7428% 6/15/49 (o) | | 2,231 | | 2,347 |
Series 2003-C6 Class G, 5.125% 8/15/35 (g)(o) | | 624 | | 614 |
Series 2004-C15: | | | | |
Class 180A, 5.3979% 10/15/41 (g)(o) | | 1,010 | | 1,013 |
Class 180B, 5.3979% 10/15/41 (g)(o) | | 460 | | 460 |
Series 2005-C19 Class B, 4.892% 5/15/44 | | 1,314 | | 1,212 |
Series 2005-C22: | | | | |
Class B, 5.3592% 12/15/44 (o) | | 2,914 | | 2,217 |
Class F, 5.3592% 12/15/44 (g)(o) | | 2,191 | | 972 |
Series 2006-C23 Class A5, 5.416% 1/15/45 (o) | | 7,210 | | 7,820 |
Series 2007-C30: | | | | |
Class C, 5.483% 12/15/43 (o) | | 3,942 | | 1,952 |
Class D, 5.513% 12/15/43 (o) | | 2,102 | | 829 |
Class XP, 0.4412% 12/15/43 (g)(o)(q) | | 14,039 | | 142 |
Series 2007-C31 Class C, 5.6883% 4/15/47 (o) | | 361 | | 172 |
Series 2007-C31A Class A2, 5.421% 4/15/47 | | 9,102 | | 9,471 |
Series 2007-C32: | | | | |
Class D, 5.7428% 6/15/49 (o) | | 987 | | 419 |
Commercial Mortgage Securities - continued |
| Principal
Amount (000s) | | Value (000s) |
Wachovia Bank Commercial Mortgage Trust: - continued | | | | |
Series 2007-C32: | | | | |
Class E, 5.7428% 6/15/49 (o) | | $ 1,556 | | $ 490 |
Wachovia Bank Commercial Mortgage Trust pass-thru certificates sequential payer Series 2007-C33 Class A5, 5.8992% 2/15/51 (o) | | 870 | | 936 |
TOTAL COMMERCIAL MORTGAGE SECURITIES (Cost $328,691) | 413,493 |
Municipal Securities - 0.1% |
|
Beaver County Indl. Dev. Auth. Poll. Cont. Rev. Bonds (FirstEnergy Nuclear Generation Corp. Proj.) Series 2005 A, 3.375%, tender 7/1/15 (o) | | 2,300 | | 2,385 |
California Gen. Oblig. 7.5% 4/1/34 | | 4,105 | | 4,868 |
Illinois Gen. Oblig.: | | | | |
Series 2010, 4.421% 1/1/15 | | 5,980 | | 6,260 |
Series 2011, 5.665% 3/1/18 | | 4,260 | | 4,567 |
Series 2011, 5.877% 3/1/19 | | 3,930 | | 4,202 |
TOTAL MUNICIPAL SECURITIES (Cost $20,571) | 22,282 |
Foreign Government and Government Agency Obligations - 0.0% |
|
Chilean Republic 7.125% 1/11/12 | | 2,462 | | 2,516 |
United Mexican States 6.05% 1/11/40 | | 5,648 | | 6,467 |
TOTAL FOREIGN GOVERNMENT AND GOVERNMENT AGENCY OBLIGATIONS (Cost $8,219) | 8,983 |
Supranational Obligations - 0.0% |
|
Corporacion Andina de Fomento 5.2% 5/21/13
(Cost $186) | | 196 | | 208 |
Bank Notes - 0.0% |
|
Wachovia Bank NA 6% 11/15/17
(Cost $3,631) | | 3,319 | | 3,735 |
Preferred Securities - 0.0% |
| Principal
Amount (000s) | | Value (000s) |
FINANCIALS - 0.0% |
Diversified Financial Services - 0.0% |
ING Groep NV 5.775% (h)(o) (Cost $670) | $ 1,236 | | $ 1,054 |
Fixed-Income Funds - 12.2% |
| Shares | | |
Fidelity Corporate Bond 1-10 Year Central Fund (p) | 3,538,209 | | 388,778 |
Fidelity High Income Central Fund 2 (p) | 5,029,800 | | 533,410 |
Fidelity Mortgage Backed Securities Central Fund (p) | 13,693,721 | | 1,480,565 |
TOTAL FIXED-INCOME FUNDS (Cost $2,246,617) | 2,402,753 |
Money Market Funds - 5.1% |
| | | |
Fidelity Cash Central Fund, 0.11% (b) | 946,068,192 | | 946,068 |
Fidelity Securities Lending Cash Central Fund, 0.12% (b)(c) | 50,580,435 | | 50,580 |
TOTAL MONEY MARKET FUNDS (Cost $996,648) | 996,648 |
Cash Equivalents - 0.3% |
| Maturity
Amount (000s) | | |
Investments in repurchase agreements in a joint trading account at 0.06%, dated 8/31/11 due 9/1/11 (Collateralized by U.S. Government Obligations) # (c)
(Cost $52,754) | $ 52,754 | | 52,754 |
TOTAL INVESTMENT PORTFOLIO - 108.1% (Cost $20,212,441) | | 21,297,522 |
NET OTHER ASSETS (LIABILITIES) - (8.1)% | | (1,593,778) |
NET ASSETS - 100% | $ 19,703,744 |
Futures Contracts |
| Expiration
Date | | Underlying
Face Amount
at Value (000s) | | Unrealized
Appreciation/
(Depreciation)
(000s) |
Purchased |
Equity Index Contracts |
2,308 CME E-mini S&P 500 Index Contracts | Sept. 2011 | | $ 140,523 | | $ (883) |
|
The face value of futures purchased as a percentage of net assets is 0.7% |
Swap Agreements |
| Expiration
Date | | Notional
Amount (000s) | | Value
(000s) |
Credit Default Swaps |
Receive monthly a fixed rate of .15% multiplied by the notional amount and pay to Credit Suisse First Boston upon each credit event of one of the issues of ABX AA 07-01 Index, par value of the proportional notional amount (Rating-C) (Upfront Premium Received/(Paid) $3,215,000)(n) | Sept. 2037 | | $ 9,998 | | $ (9,448) |
Receive monthly a fixed rate of .15% multiplied by the notional amount and pay to JPMorgan Chase, Inc. upon each credit event of one of the issues of ABX AA 07-01 Index, par value of the proportional notional amount (Rating-C) (Upfront Premium Received/(Paid) $2,992,000)(n) | Sept. 2037 | | 8,142 | | (7,695) |
Receive monthly a fixed rate of .15% multiplied by the notional amount and pay to JPMorgan Chase, Inc. upon each credit event of one of the issues of ABX AA 07-01 Index, par value of the proportional notional amount (Rating-C) (Upfront Premium Received/(Paid) $407,000)(n) | Sept. 2037 | | 1,078 | | (1,018) |
Receive monthly a fixed rate of .15% multiplied by the notional amount and pay to Morgan Stanley, Inc. upon each credit event of one of the issues of ABX AA 07-01 Index, par value of the proportional notional amount (Rating-C) (Upfront Premium Received/(Paid) $2,992,000)(n) | Sept. 2037 | | 8,142 | | (7,695) |
Receive monthly a fixed rate of .15% multiplied by the notional amount and pay to UBS upon each credit event of one of the issues of ABX AA 07-1 Index, par value of the proportional notional amount (Rating-C) (Upfront Premium Received/(Paid) $2,882,000)(n) | Sept. 2037 | | 7,843 | | (7,412) |
Receive monthly a fixed rate of .15% multiplied by the notional amount and pay to UBS upon each credit event of one of the issues of ABX AA 07-1 Index, par value of the proportional notional amount (Rating-C) (Upfront Premium Received/(Paid) $2,559,000)(n) | Sept. 2037 | | 6,885 | | (6,507) |
Swap Agreements - continued |
| Expiration
Date | | Notional
Amount (000s) | | Value
(000s) |
Credit Default Swaps - continued |
Receive monthly notional amount multiplied by 2.5% and pay Bank of America upon credit event of Ameriquest Mortgage Securities, Inc., par value of the notional amount of Ameriquest Mortgage Securities, Inc. Series 2004-R11 Class M9, 6.102% 11/25/34 (Rating-C)(m) | Dec. 2034 | | $ 613 | | $ (598) |
Receive monthly notional amount multiplied by 2.5% and pay Bank of America upon credit event of Ameriquest Mortgage Securities, Inc., par value of the notional amount of Ameriquest Mortgage Securities, Inc. Series 2004-R8 Class M9, 8.07% 9/25/34 (Rating-C)(m) | Oct. 2034 | | 306 | | (304) |
| | $ 43,007 | | $ (40,677) |
Legend |
(a) Non-income producing |
(b) Affiliated fund that is available only to investment companies and other accounts managed by Fidelity Investments. The rate quoted is the annualized seven-day yield of the fund at period end. A complete unaudited listing of the fund's holdings as of its most recent quarter end is available upon request. In addition, each Fidelity Central Fund's financial statements, which are not covered by the Fund's Report of Independent Registered Public Accounting Firm, are available on the SEC's website or upon request. |
(c) Investment made with cash collateral received from securities on loan. |
(d) Non-income producing - Security is in default. |
(e) Security initially issued at one coupon which converts to a higher coupon at a specified date. The rate shown is the rate at period end. |
(f) Security or a portion of the security is on loan at period end. |
(g) Security exempt from registration under Rule 144A of the Securities Act of 1933. These securities may be resold in transactions exempt from registration, normally to qualified institutional buyers. At the end of the period, the value of these securities amounted to $374,612,000 or 1.9% of net assets. |
(h) Security is perpetual in nature with no stated maturity date. |
(i) Security or a portion of the security purchased on a delayed delivery or when-issued basis. |
(j) A portion of the security is subject to a forward commitment to sell. |
(k) Security or a portion of the security was pledged to cover margin requirements for futures contracts. At the period end, the value of securities pledged amounted to $36,100,000. |
(l) Security or a portion of the security has been segregated as collateral for open swap agreements. At the period end, the value of securities pledged amounted to $44,432,000. |
(m) Represents a credit default swap contract in which the Fund has sold protection on the underlying reference entity. The value of each credit default swap and the credit rating can be measures of the current payment/performance risk. For the underlying reference entity, ratings disclosed are from Moody's Investors Service, Inc. Where Moody's ratings are not available, S&P ratings are disclosed and are indicated as such. All ratings are as of the report date and do not reflect subsequent changes. Where a credit rating is not disclosed, the value is used as the measure of the payment/performance risk. |
(n) Represents a credit default swap based on a tradable index of home equity asset-backed debt securities. The value of each credit default swap and the credit rating can be measures of the current payment/performance risk. In addition, the swap represents a contract in which the Fund has sold protection on the index of underlying securities. Ratings represent a weighted average of the ratings of all securities included in the index. Ratings used in the weighted average are from Moody's Investors Service, Inc., or S&P where Moody's ratings are not available. All ratings are as of the report date and do not reflect subsequent changes. |
(o) Coupon rates for floating and adjustable rate securities reflect the rates in effect at period end. |
(p) Affiliated fund that is available only to investment companies and other accounts managed by Fidelity Investments. A complete unaudited schedule of portfolio holdings for each Fidelity Central Fund is filed with the SEC for the first and third quarters of each fiscal year on Form N-Q and is available upon request or at the SEC's web site at www.sec.gov. An unaudited holdings listing for the Fund, which presents direct holdings as well as the pro rata share of securities and other investments held indirectly through its investment in underlying non-money market Fidelity Central Funds, is available at fidelity.com. In addition, each Fidelity Central Fund's financial statements, which are not covered by the Fund's Report of Independent Registered Public Accounting Firm, are available on the SEC's web site or upon request. |
(q) Security represents right to receive monthly interest payments on an underlying pool of mortgages or assets. Principal shown is the outstanding par amount of the pool held as of the end of the period. |
(r) Investment is owned by an entity that is treated as a corporation for U.S. tax purposes which is owned by the Fund. |
(s) Restricted securities - Investment in securities not registered under the Securities Act of 1933 (excluding 144A issues). At the end of the period, the value of restricted securities (excluding 144A issues) amounted to $6,428,000 or 0.0% of net assets. |
Additional information on each restricted holding is as follows: |
Security | Acquisition
Date | Acquisition
Cost (000s) |
Legend Pictures LLC | 9/23/10 | $ 6,428 |
* Amount represents less than $1,000 |
# Additional information on each counterparty to the repurchase agreement is as follows: |
Repurchase Agreement / Counterparty | Value
(Amounts in
thousands) |
$52,754,000 due 9/01/11 at 0.06% |
Barclays Capital, Inc. | $ 52,754 |
Affiliated Central Funds |
Information regarding fiscal year to date income earned by the Fund from investments in Fidelity Central Funds is as follows: |
Fund | Income earned
(Amounts in thousands) |
Fidelity Cash Central Fund | $ 1,436 |
Fidelity Corporate Bond 1-10 Year Central Fund | 20,862 |
Fidelity High Income Central Fund 2 | 34,384 |
Fidelity Mortgage Backed Securities Central Fund | 44,294 |
Fidelity Securities Lending Cash Central Fund | 1,318 |
Total | $ 102,294 |
Additional information regarding the Fund's fiscal year to date purchases and sales, including the ownership percentage, of the non Money Market Central Funds is as follows: |
Fund
(Amounts in thousands) | Value,
beginning of
period | Purchases | Sales
Proceeds | Value,
end of
period | % ownership,
end of
period |
Fidelity Corporate Bond 1-10 Year Central Fund | $ 647,022 | $ - | $ 258,983* | $ 388,778 | 58.3% |
Fidelity High Income Central Fund 2 | 434,289 | 134,331 | 31,017 | 533,410 | 83.0% |
Fidelity Mortgage Backed Securities Central Fund | 1,083,888 | 486,601 | 126,836 | 1,480,565 | 11.5% |
Total | $ 2,165,199 | $ 620,932 | $ 416,836 | $ 2,402,753 | |
* Includes the value of shares redeemed through in-kind transactions. See Note 7 of the Notes to Financial Statements. |
Other Information |
The following is a summary of the inputs used, as of August 31, 2011, involving the Fund's assets and liabilities carried at fair value. The inputs or methodology used for valuing securities may not be an indication of the risk associated with investing in those securities. For more information on valuation inputs, and their aggregation into the levels used in the tables below, please refer to the Security Valuation section in the accompanying Notes to Financial Statements. |
Valuation Inputs at Reporting Date: |
Description
(Amounts in thousands) | Total | Level 1 | Level 2 | Level 3 |
Investments in Securities: | | | | |
Equities: | | | | |
Consumer Discretionary | $ 1,230,992 | $ 1,224,521 | $ 43 | $ 6,428 |
Consumer Staples | 1,331,027 | 1,295,998 | 35,029 | - |
Energy | 1,452,937 | 1,444,119 | 8,818 | - |
Financials | 1,658,981 | 1,623,736 | 35,245 | - |
Health Care | 1,330,645 | 1,323,291 | 7,354 | - |
Industrials | 1,298,606 | 1,282,894 | 15,712 | - |
Information Technology | 2,272,186 | 2,272,186 | - | - |
Materials | 367,536 | 367,536 | - | - |
Telecommunication Services | 244,814 | 244,814 | - | - |
Utilities | 424,672 | 424,672 | - | - |
Corporate Bonds | 1,391,507 | - | 1,391,507 | - |
U.S. Government and Government Agency Obligations | 2,314,580 | - | 2,314,580 | - |
Valuation Inputs at Reporting Date: |
Description
(Amounts in thousands) | Total | Level 1 | Level 2 | Level 3 |
Investments in Securities: | | | | |
U.S. Government Agency - Mortgage Securities | $ 1,884,067 | $ - | $ 1,884,067 | $ - |
Asset-Backed Securities | 88,601 | - | 70,342 | 18,259 |
Collateralized Mortgage Obligations | 104,461 | - | 101,638 | 2,823 |
Commercial Mortgage Securities | 413,493 | - | 372,483 | 41,010 |
Municipal Securities | 22,282 | - | 22,282 | - |
Foreign Government and Government Agency Obligations | 8,983 | - | 8,983 | - |
Supranational Obligations | 208 | - | 208 | - |
Bank Notes | 3,735 | - | 3,735 | - |
Preferred Securities | 1,054 | - | 1,054 | - |
Fixed-Income Funds | 2,402,753 | 2,402,753 | - | - |
Money Market Funds | 996,648 | 996,648 | - | - |
Cash Equivalents | 52,754 | - | 52,754 | - |
Total Investments in Securities: | $ 21,297,522 | $ 14,903,168 | $ 6,325,834 | $ 68,520 |
Derivative Instruments: | | | | |
Liabilities | | | | |
Futures Contracts | $ (883) | $ (883) | $ - | $ - |
Swap Agreements | (40,677) | - | (39,775) | (902) |
Total Derivative Instruments: | $ (41,560) | $ (883) | $ (39,775) | $ (902) |
Other Financial Instruments: | | | | |
Forward Commitments | $ 2,740 | $ - | $ 2,740 | $ - |
The following is a reconciliation of Investments in Securities and Derivative Instruments for which Level 3 inputs were used in determining value: |
(Amounts in thousands) | |
Investments in Securities: | |
Beginning Balance | $ 96,111 |
Total Realized Gain (Loss) | 6,195 |
Total Unrealized Gain (Loss) | 6,284 |
Cost of Purchases | 6,521 |
Proceeds of Sales | (18,615) |
Amortization/Accretion | 1,804 |
Transfers in to Level 3 | 14,005 |
Transfers out of Level 3 | (43,785) |
Ending Balance | $ 68,520 |
The change in unrealized gain (loss) for the period attributable to Level 3 securities held at August 31, 2011 | $ 6,135 |
Derivative Instruments: | |
Swap Agreements | |
Beginning Balance | $ (2,278) |
Total Unrealized Gain (Loss) | 1,376 |
Transfers in to Level 3 | - |
Transfers out of Level 3 | - |
Ending Balance | $ (902) |
Realized gain (loss) on Swap Agreements for the period | $ (1,415) |
The change in unrealized gain (loss) for the period attributable to Level 3 Swap Agreements held at August 31, 2011 | $ 175 |
The information used in the above reconciliation represents fiscal year to date activity for any Investments in Securities and Derivative Instruments identified as using Level 3 inputs at either the beginning or the end of the current fiscal period, and includes the value of securities received through affiliated in-kind transactions. See Note 7 of the Notes to Financial Statements. Transfers in or out of Level 3 represent the beginning value of any Security or Instrument where a change in the pricing level occurred from the beginning to the end of the period. The cost of purchases and the proceeds of sales may include securities received or delivered through corporate actions or exchanges. Realized and unrealized gains (losses) disclosed in the reconciliation are included in Net Gain (Loss) on the Fund's Statement of Operations. |
Value of Derivative Instruments |
The following table is a summary of the Fund's value of derivative instruments by risk exposure as of August 31, 2011. For additional information on derivative instruments, please refer to the Derivative Instruments section in the accompanying Notes to Financial Statements. |
Risk Exposure /
Derivative Type
(Amounts in thousands) | Value |
| Asset | Liability |
Credit Risk | | |
Swap Agreements (b) | $ - | $ (40,677) |
Equity Risk | | |
Futures Contracts (a) | - | (883) |
Total Value of Derivatives | $ - | $ (41,560) |
(a) Reflects cumulative appreciation/(depreciation) on futures contracts as disclosed on the Schedule of Investments. Only the period end variation margin is separately disclosed on the Statement of Assets and Liabilities. |
(b) Value is disclosed on the Statement of Assets and Liabilities in the Swap agreements, at value line-items. |
Other Information |
The composition of credit quality ratings as a percentage of net assets is as follows (Unaudited): |
U.S. Government and U.S. Government Agency Obligations | 30.6% |
AAA,AA,A | 6.0% |
BBB | 4.6% |
BB | 1.8% |
B | 1.6% |
CCC,CC,C | 0.4% |
D | 0.0%* |
Not Rated | 0.0%* |
Equities | 59.7% |
Short-Term Investments and Net Other Assets | (4.7)% |
| 100.0% |
* Amount represents less than 0.1% |
We have used ratings from Moody's Investors Service, Inc. Where Moody's® ratings are not available, we have used S&P® ratings. All ratings are as of the date indicated and do not reflect subsequent changes. Percentages are adjusted for the effect of futures contracts, if applicable. |
Distribution of investments by country of issue, as a percentage of total net assets, is as follows: (Unaudited) |
United States of America | 87.8% |
United Kingdom | 3.0% |
Canada | 1.2% |
France | 1.1% |
Ireland | 1.0% |
Others (Individually Less Than 1%) | 5.9% |
| 100.0% |
Income Tax Information |
At August 31, 2011, the Fund had a capital loss carryforward of approximately $677,351,000 all of which will expire in fiscal 2018. Capital loss carryforwards are only available to offset future capital gains of the Fund to the extent provided by regulations and may be limited. |
See accompanying notes which are an integral part of the financial statements.
Annual Report
Statement of Assets and Liabilities
Amounts in thousands (except per-share amounts) | August 31, 2011 |
| | |
Assets | | |
Investment in securities, at value (including securities loaned of $99,800 and repurchase agreements of $52,754) - See accompanying schedule: Unaffiliated issuers (cost $16,969,176) | $ 17,898,121 | |
Fidelity Central Funds (cost $3,243,265) | 3,399,401 | |
Total Investments (cost $20,212,441) | | $ 21,297,522 |
Commitment to sell securities on a delayed delivery basis | (984,499) | |
Receivable for securities sold on a delayed delivery basis | 987,239 | 2,740 |
Receivable for investments sold, regular delivery | | 202,177 |
Cash | | 73 |
Foreign currency held at value (cost $972) | | 970 |
Receivable for swap agreements | | 8 |
Receivable for fund shares sold | | 10,910 |
Dividends receivable | | 28,793 |
Interest receivable | | 36,068 |
Distributions receivable from Fidelity Central Funds | | 1,729 |
Receivable for daily variation margin on futures contracts | | 4,938 |
Other receivables | | 1,406 |
Total assets | | 21,587,334 |
| | |
Liabilities | | |
Payable for investments purchased
Regular delivery | $ 197,108 | |
Delayed delivery | 996,521 | |
Payable for swap agreements | 558 | |
Payable for fund shares redeemed | 532,997 | |
Swap agreements, at value | 40,677 | |
Accrued management fee | 6,746 | |
Other affiliated payables | 2,834 | |
Other payables and accrued expenses | 2,815 | |
Collateral on securities loaned, at value | 103,334 | |
Total liabilities | | 1,883,590 |
| | |
Net Assets | | $ 19,703,744 |
Net Assets consist of: | | |
Paid in capital | | $ 19,513,591 |
Undistributed net investment income | | 89,115 |
Accumulated undistributed net realized gain (loss) on investments and foreign currency transactions | | (946,760) |
Net unrealized appreciation (depreciation) on investments and assets and liabilities in foreign currencies | | 1,047,798 |
Net Assets | | $ 19,703,744 |
See accompanying notes which are an integral part of the financial statements.
Annual Report
Statement of Assets and Liabilities - continued
Amounts in thousands (except per-share amounts) | August 31, 2011 |
| | |
Balanced:
Net Asset Value, offering price and redemption price per share ($15,601,801 ÷ 858,472 shares) | | $ 18.17 |
| | |
Class K:
Net Asset Value, offering price and redemption price per share ($4,101,943 ÷ 225,698 shares) | | $ 18.17 |
See accompanying notes which are an integral part of the financial statements.
Annual Report
Financial Statements - continued
Statement of Operations
Amounts in thousands | Year ended August 31, 2011 |
| | |
Investment Income | | |
Dividends | | $ 207,140 |
Interest | | 222,001 |
Income from Fidelity Central Funds | | 102,294 |
Total income | | 531,435 |
| | |
Expenses | | |
Management fee | $ 86,106 | |
Transfer agent fees | 33,332 | |
Accounting and security lending fees | 2,049 | |
Custodian fees and expenses | 590 | |
Independent trustees' compensation | 116 | |
Appreciation in deferred trustee compensation account | 1 | |
Registration fees | 181 | |
Audit | 164 | |
Legal | 117 | |
Miscellaneous | 237 | |
Total expenses before reductions | 122,893 | |
Expense reductions | (2,128) | 120,765 |
Net investment income (loss) | | 410,670 |
Realized and Unrealized Gain (Loss) Net realized gain (loss) on: | | |
Investment securities: | | |
Unaffiliated issuers | 2,092,650 | |
Fidelity Central Funds | 30,796 | |
Foreign currency transactions | (2,512) | |
Futures contracts | 50,072 | |
Swap agreements | (10,722) | |
Total net realized gain (loss) | | 2,160,284 |
Change in net unrealized appreciation (depreciation) on: Investment securities | 102,526 | |
Assets and liabilities in foreign currencies | 194 | |
Futures contracts | 632 | |
Swap agreements | 9,045 | |
Delayed delivery commitments | 2,837 | |
Total change in net unrealized appreciation (depreciation) | | 115,234 |
Net gain (loss) | | 2,275,518 |
Net increase (decrease) in net assets resulting from operations | | $ 2,686,188 |
See accompanying notes which are an integral part of the financial statements.
Annual Report
Statement of Changes in Net Assets
Amounts in thousands | Year ended
August 31,
2011 | Year ended
August 31,
2010 |
Increase (Decrease) in Net Assets | | |
Operations | | |
Net investment income (loss) | $ 410,670 | $ 442,485 |
Net realized gain (loss) | 2,160,284 | 1,025,577 |
Change in net unrealized appreciation (depreciation) | 115,234 | 81,659 |
Net increase (decrease) in net assets resulting
from operations | 2,686,188 | 1,549,721 |
Distributions to shareholders from net investment income | (410,590) | (443,230) |
Distributions to shareholders from net realized gain | (9,407) | (12,403) |
Total distributions | (419,997) | (455,633) |
Share transactions - net increase (decrease) | (2,018,385) | (876,720) |
Total increase (decrease) in net assets | 247,806 | 217,368 |
| | |
Net Assets | | |
Beginning of period | 19,455,938 | 19,238,570 |
End of period (including undistributed net investment income of $89,115 and undistributed net investment income of $107,158, respectively) | $ 19,703,744 | $ 19,455,938 |
See accompanying notes which are an integral part of the financial statements.
Annual Report
Financial Highlights - Balanced
Years ended August 31, | 2011 | 2010 | 2009 | 2008 | 2007 |
Selected Per-Share Data | | | | | |
Net asset value, beginning of period | $ 16.27 | $ 15.40 | $ 17.71 | $ 20.66 | $ 19.56 |
Income from Investment Operations | | | | | |
Net investment income (loss) B | .35 | .36 | .38 | .42 | .44 |
Net realized and unrealized gain (loss) | 1.91 | .88 | (2.29) | (1.76) | 2.13 |
Total from investment operations | 2.26 | 1.24 | (1.91) | (1.34) | 2.57 |
Distributions from net investment income | (.35) | (.36) | (.37) | (.43) | (.43) |
Distributions from net realized gain | (.01) | (.01) | (.03) | (1.18) | (1.04) |
Total distributions | (.36) | (.37) | (.40) | (1.61) | (1.47) |
Net asset value, end of period | $ 18.17 | $ 16.27 | $ 15.40 | $ 17.71 | $ 20.66 |
Total Return A | 13.88% | 8.06% | (10.48)% | (7.28)% | 13.96% |
Ratios to Average Net Assets C, E | | | | | |
Expenses before reductions | .61% | .62% | .68% | .61% | .61% |
Expenses net of fee waivers, if any | .61% | .62% | .68% | .61% | .61% |
Expenses net of all reductions | .60% | .61% | .68% | .61% | .60% |
Net investment income (loss) | 1.92% | 2.18% | 2.78% | 2.22% | 2.20% |
Supplemental Data | | | | | |
Net assets, end of period (in millions) | $ 15,602 | $ 16,764 | $ 17,225 | $ 25,363 | $ 26,191 |
Portfolio turnover rate D | 193% F | 122% | 198% F | 73% F | 89% F |
A Total returns would have been lower had certain expenses not been reduced during the periods shown.
B Calculated based on average shares outstanding during the period.
C Fees and expenses of the underlying Fidelity Central Funds are not included in the Fund's expense ratio. The Fund indirectly bears its proportionate share of the expenses of any underlying Fidelity Central Funds.
D Amount does not include the portfolio activity of any underlying Fidelity Central Funds.
E Expense ratios reflect operating expenses of the class. Expenses before reductions do not reflect amounts reimbursed by the investment adviser or reductions from brokerage service arrangements or reductions from other expense offset arrangements and do not represent the amount paid by the class during periods when reimbursements or reductions occur. Expenses net of fee waivers reflect expenses after reimbursement by the investment adviser but prior to reductions from brokerage service arrangements or other expense offset arrangements. Expenses net of all reductions represent the net expenses paid by the class.
F The portfolio turnover rate excludes liquidations and/or redemptions executed in-kind from Affiliated Central Funds.
See accompanying notes which are an integral part of the financial statements.
Annual Report
Financial Highlights - Class K
Years ended August 31, | 2011 | 2010 | 2009 | 2008 G |
Selected Per-Share Data | | | | |
Net asset value, beginning of period | $ 16.27 | $ 15.40 | $ 17.72 | $ 19.12 |
Income from Investment Operations | | | | |
Net investment income (loss) D | .38 | .38 | .40 | .12 |
Net realized and unrealized gain (loss) | 1.90 | .88 | (2.29) | (1.41) |
Total from investment operations | 2.28 | 1.26 | (1.89) | (1.29) |
Distributions from net investment income | (.38) | (.38) | (.40) | (.11) |
Distributions from net realized gain | (.01) | (.01) | (.03) | - |
Total distributions | (.38) J | (.39) | (.43) | (.11) |
Net asset value, end of period | $ 18.17 | $ 16.27 | $ 15.40 | $ 17.72 |
Total Return B, C | 14.04% | 8.23% | (10.33)% | (6.74)% |
Ratios to Average Net Assets E, H | | | | |
Expenses before reductions | .48% | .48% | .50% | .48% A |
Expenses net of fee waivers, if any | .48% | .48% | .50% | .48% A |
Expenses net of all reductions | .47% | .47% | .50% | .48% A |
Net investment income (loss) | 2.05% | 2.32% | 2.96% | 2.45% A |
Supplemental Data | | | | |
Net assets, end of period (in millions) | $ 4,102 | $ 2,692 | $ 2,014 | $ 17 |
Portfolio turnover rate F | 193% I | 122% | 198% I | 73% I |
A Annualized
B Total returns for periods of less than one year are not annualized.
C Total returns would have been lower had certain expenses not been reduced during the periods shown.
D Calculated based on average shares outstanding during the period.
E Fees and expenses of the underlying Fidelity Central Funds are not included in the Fund's expense ratio. The Fund indirectly bears its proportionate share of the expenses of any underlying Fidelity Central Funds.
F Amount does not include the portfolio activity of any underlying Fidelity Central Funds.
G For the period May 9, 2008 (commencement of sale of shares) to August 31, 2008.
H Expense ratios reflect operating expenses of the class. Expenses before reductions do not reflect amounts reimbursed by the investment adviser or reductions from brokerage service arrangements or reductions from other expense offset arrangements and do not represent the amount paid by the class during periods when reimbursements or reductions occur. Expense ratios before reductions for start-up periods may not be representative of longer-term operating periods. Expenses net of fee waivers reflect expenses after reimbursement by the investment adviser but prior to reductions from brokerage service arrangements or other expense offset arrangements. Expenses net of all reductions represent the net expenses paid by the class.
I The portfolio turnover rate excludes liquidations and/or redemptions executed in-kind from Affiliated Central Funds.
J Total distributions of $.38 per share is comprised of distributions from net investment income of $.376 and distributions from net realized gain of $.008 per share.
See accompanying notes which are an integral part of the financial statements.
Annual Report
Notes to Financial Statements
For the period ended August 31, 2011
(Amounts in thousands except ratios)
1. Organization.
Fidelity Balanced Fund (the Fund) is a fund of Fidelity Puritan Trust (the Trust) and is authorized to issue an unlimited number of shares. The Trust is registered under the Investment Company Act of 1940, as amended (the 1940 Act), as an open-end management investment company organized as a Massachusetts business trust. The Fund offers Balanced and Class K shares, each of which has equal rights as to assets and voting privileges. Each class has exclusive voting rights with respect to matters that affect that class. Investment income, realized and unrealized capital gains and losses, the common expenses of the Fund, and certain fund-level expense reductions, if any, are allocated on a pro-rata basis to each class based on the relative net assets of each class to the total net assets of the Fund. Each class differs with respect to transfer agent fees incurred.
2. Investments in Fidelity Central Funds.
The Fund invests in Fidelity Central Funds, which are open-end investment companies available only to other investment companies and accounts managed by Fidelity Management & Research Company (FMR) and its affiliates. The Fund's Schedule of Investments lists each of the Fidelity Central Funds held as of period end, if any, as an investment of the Fund, but does not include the underlying holdings of each Fidelity Central Fund. As an Investing Fund, the Fund indirectly bears its proportionate share of the expenses of the underlying Fidelity Central Funds.
Based on their investment objective, each Fidelity Central Fund may invest or participate in various investment vehicles or strategies that are similar to those of the Fund. These strategies are consistent with the investment objectives of the Fund and may involve certain economic risks which may cause a decline in value of each of the Fidelity Central Funds and thus a decline in the value of the Fund. The Money Market Central Funds seek preservation of capital and current income and are managed by Fidelity Investments Money Management, Inc. (FIMM), an affiliate of FMR. The following summarizes the Fund's investment in each Fidelity Central Fund.
Annual Report
2. Investments in Fidelity Central Funds - continued
Fidelity Central Fund | Investment Manager | Investment Objective | Investment Practices |
Fidelity Corporate Bond 1-10 Year Central Fund | FIMM | Seeks a high level of income by normally investing in investment-grade corporate bonds and other corporate debt securities and repurchase agreements for those securities. | Delayed Delivery & When Issued Securities Repurchase Agreements Restricted Securities Swap Agreements |
Fidelity High Income Central Fund 2 | FMR Co., Inc. (FMRC) | Seeks a high level of income and may also seek capital appreciation by investing primarily in debt securities, preferred stocks, and convertible securities, with an emphasis on lower-quality debt securities. | Loans & Direct Debt Instruments Repurchase Agreements Restricted Securities |
Fidelity Mortgage Backed Securities Central Fund | FIMM | Seeks a high level of income by normally investing in investment-grade mortgage-related securities and repurchase agreements for those securities. | Delayed Delivery & When Issued Securities Futures Repurchase Agreements Swap Agreements |
An unaudited holdings listing for the Fund, which presents direct holdings as well as the pro-rata share of any securities and other investments held indirectly through its investment in underlying non-money market Fidelity Central Funds, is available at fidelity.com. A complete unaudited list of holdings for each Fidelity Central Fund is available upon request or at the Securities and Exchange Commission (the SEC) web site at www.sec.gov. In addition, the financial statements of the Fidelity Central Funds which contain the significant accounting policies (including security valuation policies) of those funds, which are not covered by the Fund's Report of Independent Registered Public Accounting Firm, are available on the SEC web site or upon request.
Annual Report
Notes to Financial Statements - continued
(Amounts in thousands except ratios)
3. Significant Accounting Policies.
The financial statements have been prepared in conformity with accounting principles generally accepted in the United States of America (GAAP), which require management to make certain estimates and assumptions at the date of the financial statements. Actual results could differ from those estimates. Subsequent events, if any, through the date that the financial statements were issued have been evaluated in the preparation of the financial statements. The following summarizes the significant accounting policies of the Fund:
Security Valuation. Investments are valued as of 4:00 p.m. Eastern time on the last calendar day of the period. The Fund uses independent pricing services approved by the Board of Trustees to value its investments. When current market prices or quotations are not readily available or reliable, valuations may be determined in good faith in accordance with procedures adopted by the Board of Trustees. Factors used in determining value may include market or security specific events, changes in interest rates and credit quality. The frequency with which these procedures are used cannot be predicted and they may be utilized to a significant extent. The value used for net asset value (NAV) calculation under these procedures may differ from published prices for the same securities.
The Fund categorizes the inputs to valuation techniques used to value its investments into a disclosure hierarchy consisting of three levels as shown below:
Level 1 - quoted prices in active markets for identical investments
Level 2 - other significant observable inputs (including quoted prices for similar investments, interest rates, prepayment speeds, etc.)
Level 3 - unobservable inputs (including the Fund's own assumptions based on the best information available)
Changes in valuation techniques may result in transfers in or out of an assigned level within the disclosure hierarchy. The aggregate value of investments by input level, as of August 31, 2011, as well as a roll forward of Level 3 securities, is included at the end of the Fund's Schedule of Investments. Valuation techniques used to value the Fund's investments by major category are as follows:
Equity securities, including restricted securities, for which market quotations are readily available, are valued at the last reported sale price or official closing price as reported by an independent pricing service on the primary market or exchange on which they are traded and are categorized as Level 1 in the hierarchy. In the event there were no sales during the day or closing prices are not available, securities are valued at the last quoted bid price or may be valued using the last available price and are generally categorized as
Annual Report
3. Significant Accounting Policies - continued
Security Valuation - continued
Level 2 in the hierarchy. For foreign equity securities, when significant market or security specific events arise, comparisons to the valuation of American Depositary Receipts (ADRs), futures contracts, Exchange-traded funds (ETFs) and certain indexes as well as quoted prices for similar securities are used and are categorized as Level 2 in the hierarchy in these circumstances. Utilizing these techniques may result in transfers between Level 1 and Level 2. For restricted equity securities and private placements where observable inputs are limited, assumptions about market activity and risk are used and are categorized as Level 3 in the hierarchy.
Debt securities, including restricted securities, are valued based on evaluated prices received from independent pricing services or from dealers who make markets in such securities. For corporate bonds, bank notes, foreign government and government agency obligations, municipal securities, preferred securities, supranational obligations and U.S. government and government agency obligations, pricing services utilize matrix pricing which considers yield or price of bonds of comparable quality, coupon, maturity and type as well as dealer supplied prices and are generally categorized as Level 2 in the hierarchy. For asset backed securities, collateralized mortgage obligations, commercial mortgage securities and U.S. government agency mortgage securities, pricing services utilize matrix pricing which considers prepayment speed assumptions, attributes of the collateral, yield or price of bonds of comparable quality, coupon, maturity and type as well as dealer supplied prices and, accordingly, such securities are generally categorized as Level 2 in the hierarchy. Swaps are marked-to-market daily based on valuations from independent pricing services or dealer-supplied valuations and changes in value are recorded as unrealized appreciation (depreciation). Pricing services utilize matrix pricing which considers comparisons to interest rate curves, credit spread curves, default possibilities and recovery rates and, as a result, swaps are generally categorized as Level 2 in the hierarchy. When independent prices are unavailable or unreliable, debt securities and swaps may be valued utilizing pricing matrices which consider similar factors that would be used by independent pricing services. These are generally categorized as Level 2 in the hierarchy but may be Level 3 depending on the circumstances.
Futures contracts are valued at the settlement price established each day by the board of trade or exchange on which they are traded and are categorized as Level 1 in the hierarchy. Investments in open-end mutual funds, including the Fidelity Central Funds, are valued at their closing net asset value each business day and are categorized as Level 1 in the hierarchy. Short-term securities with remaining maturities of sixty days or less may be valued at amortized cost, which approximates fair value, and are categorized as Level 2 in the hierarchy.
Annual Report
Notes to Financial Statements - continued
(Amounts in thousands except ratios)
3. Significant Accounting Policies - continued
Foreign Currency. The Fund may use foreign currency contracts to facilitate transactions in foreign-denominated securities. Gains and losses from these transactions may arise from changes in the value of the foreign currency or if the counterparties do not perform under the contracts' terms.
Foreign-denominated assets, including investment securities, and liabilities are translated into U.S. dollars at the exchange rate at period end. Purchases and sales of investment securities, income and dividends received and expenses denominated in foreign currencies are translated into U.S. dollars at the exchange rate in effect on the transaction date.
The effects of exchange rate fluctuations on investments are included with the net realized and unrealized gain (loss) on investment securities. Other foreign currency transactions resulting in realized and unrealized gain (loss) are disclosed separately.
Investment Transactions and Income. For financial reporting purposes, the Fund's investment holdings and NAV include trades executed through the end of the last business day of the period. The NAV per share for processing shareholder transactions is calculated as of the close of business of the New York Stock Exchange (NYSE), normally 4:00 p.m. Eastern time and includes trades executed through the end of the prior business day. Gains and losses on securities sold are determined on the basis of identified cost and may include proceeds received from litigation. Dividend income is recorded on the ex-dividend date, except for certain dividends from foreign securities where the ex-dividend date may have passed, which are recorded as soon as the Fund is informed of the ex-dividend date. Non-cash dividends included in dividend income, if any, are recorded at the fair market value of the securities received. Distributions received on securities that represent a return of capital or capital gain are recorded as a reduction of cost of investments and/or as a realized gain. The Fund estimates the components of distributions received that may be considered return of capital distributions or capital gain distributions. Interest income and distributions from the Fidelity Central Funds are accrued as earned. Interest income includes coupon interest and amortization of premium and accretion of discount on debt securities. The principal value on inflation-indexed securities is periodically adjusted to the rate of inflation and interest is accrued based on the principal value. The adjustments to principal due to inflation are reflected as increases or decreases to interest income even though principal is not received until maturity. Investment income is recorded net of foreign taxes withheld where recovery of such taxes is uncertain. Debt obligations may be placed on non-accrual status and related interest income may be reduced by ceasing current accruals and writing off interest receivables when the collection of all or a portion of interest has become doubtful based on consistently applied procedures. A debt obligation is removed from
Annual Report
3. Significant Accounting Policies - continued
Investment Transactions and Income - continued
non-accrual status when the issuer resumes interest payments or when collectability of interest is reasonably assured.
Expenses. Expenses directly attributable to a fund are charged to that fund. Expenses attributable to more than one fund are allocated among the respective funds on the basis of relative net assets or other appropriate methods. Expense estimates are accrued in the period to which they relate and adjustments are made when actual amounts are known.
Deferred Trustee Compensation. Under a Deferred Compensation Plan (the Plan), independent Trustees may elect to defer receipt of a portion of their annual compensation. Deferred amounts are invested in a cross-section of Fidelity funds, are marked-to-market and remain in the Fund until distributed in accordance with the Plan. The investment of deferred amounts and the offsetting payable to the Trustees are included in the accompanying Statement of Assets and Liabilities.
Income Tax Information and Distributions to Shareholders. Each year, the Fund intends to qualify as a regulated investment company, including distributing substantially all of its taxable income and realized gains under Subchapter M of the Internal Revenue Code and filing its U.S. federal tax return. As a result, no provision for income taxes is required. As of August 31, 2011, the Fund did not have any unrecognized tax benefits in the financial statements. A fund's federal tax return is subject to examination by the Internal Revenue Service (IRS) for a period of three years. Foreign taxes are provided for based on the Fund's understanding of the tax rules and rates that exist in the foreign markets in which it invests.
Distributions are declared and recorded on the ex-dividend date. Income dividends and capital gain distributions are declared separately for each class. Income and capital gain distributions are determined in accordance with income tax regulations, which may differ from GAAP.
Capital accounts within the financial statements are adjusted for permanent book-tax differences. These adjustments have no impact on net assets or the results of operations. Temporary book-tax differences will reverse in a subsequent period.
Book-tax differences are primarily due to in-kind transactions, futures transactions, swap agreements, foreign currency transactions, passive foreign investment companies (PFIC), prior period premium and discount on debt securities, market discount, partnerships (including allocations from Fidelity Central Funds), deferred trustees compensation, capital loss carryforwards and losses deferred due to wash sales.
Annual Report
Notes to Financial Statements - continued
(Amounts in thousands except ratios)
3. Significant Accounting Policies - continued
Income Tax Information and Distributions to Shareholders - continued
The federal tax cost of investment securities and unrealized appreciation (depreciation) as of period end were as follows:
Gross unrealized appreciation | $ 1,692,822 |
Gross unrealized depreciation | (854,789) |
Net unrealized appreciation (depreciation) on securities and other investments | $ 838,033 |
| |
Tax Cost | $ 20,459,489 |
The tax-based components of distributable earnings as of period end were as follows:
Undistributed ordinary income | $ 66,372 |
Capital loss carryforward | $ (677,351) |
Net unrealized appreciation (depreciation) | $ 801,704 |
Under the recently enacted Regulated Investment Company Modernization Act of 2010 (the Act), the Fund will be permitted to carry forward capital losses incurred in taxable years beginning after December 22, 2010 for an unlimited period. However, any losses incurred during those future taxable years will be required to be utilized prior to any losses incurred in pre-enactment taxable years, which generally expire after eight years from when they are incurred. Additionally, post-enactment capital losses that are carried forward will retain their character as either short-term or long-term capital losses rather than being considered all short-term as under previous law. The Fund's first fiscal year end subject to the Act will be August, 31, 2012.
The tax character of distributions paid was as follows:
| August 31, 2011 | August 31, 2010 |
Ordinary Income | $ 419,997 | $ 455,633 |
New Accounting Pronouncement. In May 2011, the FASB issued Accounting Standard Update No. 2011-04, Fair Value Measurement (Topic 820) - Amendments to Achieve Common Fair Value Measurement and Disclosure Requirements in U.S. GAAP and IFRSs. The update changes the wording used to describe the requirements in GAAP for measuring fair value and for disclosing information about fair value measurements. The update is effective during interim and annual periods beginning after December 15, 2011. Management is currently evaluating the impact of the update's adoption on the Fund's financial statement disclosures.
Annual Report
4. Operating Policies.
Repurchase Agreements. FMR has received an Exemptive Order from the SEC which permits the Fund and other affiliated entities of FMR to transfer uninvested cash balances into joint trading accounts which are then invested in repurchase agreements. The Fund may also invest directly with institutions in repurchase agreements. Repurchase agreements are collateralized by government or non-government securities. Upon settlement date, collateral is held in segregated accounts with custodian banks and may be obtained in the event of a default of the counterparty. The Fund monitors, on a daily basis, the value of the collateral to ensure it is at least equal to the principal amount of the repurchase agreement (including accrued interest). In the event of a default by the counterparty, realization of the collateral proceeds could be delayed, during which time the value of the collateral may decline.
Delayed Delivery Transactions and When-Issued Securities. During the period, the Fund transacted in securities on a delayed delivery or when-issued basis. Payment and delivery may take place after the customary settlement period for that security. The price of the underlying securities and the date when the securities will be delivered and paid for are fixed at the time the transaction is negotiated. During the time a delayed delivery sell is outstanding, the contract is marked-to-market daily and equivalent deliverable securities are held for the transaction. The securities purchased on a delayed delivery or when-issued basis are identified as such in the Fund's Schedule of Investments. The Fund may receive compensation for interest forgone in the purchase of a delayed delivery or when-issued security. With respect to purchase commitments, the Fund identifies securities as segregated in its records with a value at least equal to the amount of the commitment. Losses may arise due to changes in the value of the underlying securities or if the counterparty does not perform under the contract's terms, or if the issuer does not issue the securities due to political, economic, or other factors.
Restricted Securities. The Fund may invest in securities that are subject to legal or contractual restrictions on resale. These securities generally may be resold in transactions exempt from registration or to the public if the securities are registered. Disposal of these securities may involve time-consuming negotiations and expense, and prompt sale at an acceptable price may be difficult. Information regarding restricted securities is included at the end of the Fund's Schedule of Investments.
5. Derivative Instruments.
Risk Exposures and the Use of Derivative Instruments. The Fund used derivative instruments (derivatives), including futures contracts and swap agreements, in order to meet its investment objectives. The strategy is to use derivatives to increase returns, to gain exposure to certain types of assets and to manage exposure to certain risks as defined below. The success of any strategy involving derivatives depends on analysis of
Annual Report
Notes to Financial Statements - continued
(Amounts in thousands except ratios)
5. Derivative Instruments - continued
Risk Exposures and the Use of Derivative Instruments - continued
numerous economic factors, and if the strategies for investment do not work as intended, the Fund may not achieve its objectives.
The Fund's use of derivatives increased or decreased its exposure to the following risks:
Credit Risk | Credit risk relates to the ability of the issuer of a financial instrument to make further principal or interest payments on an obligation or commitment that it has to the Fund. |
Equity Risk | Equity risk relates to the fluctuations in the value of financial instruments as a result of changes in market prices (other than those arising from interest rate risk or foreign exchange risk), whether caused by factors specific to an individual investment, its issuer, or all factors affecting all instruments traded in a market or market segment. |
Interest Rate Risk | Interest rate risk relates to the fluctuations in the value of interest-bearing securities due to changes in the prevailing levels of market interest rates. |
The Fund is also exposed to additional risks from investing in derivatives, such as liquidity risk and counterparty credit risk. Liquidity risk is the risk that the Fund will be unable to sell the derivative in the open market in a timely manner. Counterparty credit risk is the risk that the counterparty will not be able to fulfill its obligation to the Fund. Derivative counterparty credit risk is managed through formal evaluation of the creditworthiness of all potential counterparties. On certain over-the-counter derivatives, the Fund attempts to reduce its exposure to counterparty credit risk by entering into an International Swaps and Derivatives Association (ISDA) Master Agreement on a bilateral basis with each of its counterparties. The ISDA Master Agreement gives the Fund the right to terminate all transactions traded under such agreement if there is a certain deterioration in the credit quality of the counterparty. The ISDA Master Agreement gives each party the right, upon an event of default by the other party or a termination of the agreement, to close out all transactions traded under such agreement and to net amounts owed under each transaction to one net payable by one party to the other. To mitigate counterparty credit risk, the Fund offsets certain payables and/or receivables with collateral. Collateral in the form of cash or securities, if required, is held in segregated accounts with the Fund's custodian bank in accordance with the collateral agreements entered into between the Fund, the swap counterparty and the Fund's custodian bank, and is identified in the Schedule of Investments. The Fund could experience delays and costs in gaining access to the collateral even though it is held by the Fund's custodian bank. The Fund's maximum risk of loss from counterparty credit risk is generally the aggregate unrealized appreciation and unpaid counterparty payments in excess of any collateral pledged by the counterparty to the Fund. Counterparty risk related to exchange-traded futures contracts is minimal because of the protection
Annual Report
5. Derivative Instruments - continued
Risk Exposures and the Use of Derivative Instruments - continued
provided by the exchange on which they trade. Derivatives involve, to varying degrees, risk of loss in excess of the amounts recognized in the Statement of Assets and Liabilities.
Net Realized Gain (Loss) and Change in Net Unrealized Appreciation (Depreciation) on Derivatives. The table below, which reflects the impacts of derivatives on the financial performance of the Fund, summarizes the net realized gain (loss) and change in net unrealized appreciation (depreciation) for derivatives during the period.
Risk Exposure / Derivative Type | Net Realized Gain (Loss) | Change in Net Unrealized
Appreciation (Depreciation) |
Credit Risk | | |
Swap Agreements | $ (10,042) | $ 9,045 |
Equity Risk | | |
Futures Contracts | 50,072 | 632 |
Interest Rate Risk | | |
Swap Agreements | (680) | - |
Totals (a)(b)(c) | $ 39,350 | $ 9,677 |
(a) A summary of the value of derivatives by risk exposure as of period end, is included at the end of the Schedule of Investments and is representative of activity for the period.
(b) Total derivatives net realized gain (loss) included in the Statement of Operations is comprised of $50,072 for futures contracts and $(10,722) for swap agreements.
(c) Total derivatives change in net unrealized appreciation (depreciation) included in the Statement of Operations is comprised of $632 for futures contracts and $9,045 for swap agreements.
Futures Contracts. A futures contract is an agreement between two parties to buy or sell a specified underlying instrument for a fixed price at a specified future date. The Fund used futures contracts to manage its exposure to the stock market.
Upon entering into a futures contract, a fund is required to deposit either cash or securities (initial margin) with a clearing broker in an amount equal to a certain percentage of the face value of the contract. Futures contracts are marked-to-market daily and subsequent payments are made or received by a fund depending on the daily fluctuations in the value of the futures contracts and are recorded as unrealized appreciation or (depreciation). This receivable and/or payable is included in daily variation margin on futures contracts in the Statement of Assets and Liabilities. Realized gain or (loss) is recorded upon the expiration or closing of a futures contract. The net realized gain (loss) and change in net unrealized appreciation (depreciation) on futures contracts during the period is included in the Statement of Operations.
The underlying face amount at value of open futures contracts at period end is shown in the Schedule of Investments under the caption "Futures Contracts". This amount reflects
Annual Report
Notes to Financial Statements - continued
(Amounts in thousands except ratios)
5. Derivative Instruments - continued
Futures Contracts - continued
each contract's exposure to the underlying instrument at period end. Securities deposited to meet initial margin requirements are identified in the Schedule of Investments.
Certain risks arise upon entering into futures contracts, including the risk that an illiquid market limits the ability to close out a futures contract prior to settlement date.
Swap Agreements. A swap agreement (swap) is a contract between two parties to exchange future cash flows at periodic intervals based on a notional principal amount.
Details of swaps open at period end are included in the Schedule of Investments under the caption "Swap Agreements." Swaps are marked-to-market daily and changes in value are recorded as unrealized appreciation or (depreciation) and reflected in the Statement of Assets and Liabilities. Any upfront premiums paid or received upon entering a swap to compensate for differences between stated terms of the agreement and prevailing market conditions (e.g. credit spreads, interest rates or other factors) are recorded as realized gain or (loss) ratably over the term of the swap. Payments are exchanged at specified intervals, accrued daily commencing with the effective date of the contract and recorded as realized gain or (loss). Realized gain or (loss) is also recorded in the event of an early termination of a swap. The net realized gain (loss) and change in net unrealized appreciation (depreciation) on swaps during the period is included in the Statement of Operations.
Risks of loss include credit risk and interest rate risk. In addition, there is the risk of failure by the counterparty to perform under the terms of the agreement and lack of liquidity in the market.
Interest Rate Swaps. Interest rate swaps are agreements between counterparties to exchange cash flows, one based on a fixed rate, and the other on a floating rate. The Fund entered into interest rate swaps to manage its exposure to interest rate changes. Changes in interest rates can have an effect on both the value of bond holdings as well as the amount of interest income earned. In general, the value of bonds can fall when interest rates rise and can rise when interest rates fall.
Credit Default Swaps. Credit default swaps enable the Fund to buy or sell protection on a debt security or a basket of securities against a defined credit event. Under the terms of a credit default swap the buyer of protection (buyer) receives credit protection in exchange for making periodic payments to the seller of protection (seller) based on a fixed percentage applied to a notional principal amount. In return for these payments, the seller acts as a guarantor of the creditworthiness of a reference obligation. The Fund enters into credit default swaps as a seller to gain credit exposure to an issuer and/or as a buyer to provide a measure of protection against defaults of an issuer. The issuer may be
Annual Report
5. Derivative Instruments - continued
Credit Default Swaps - continued
either a single issuer or a "basket" of issuers. Periodic payments are made over the life of the contract provided that no credit event occurs.
For credit default swaps on most corporate and sovereign issuers, credit events include bankruptcy, failure to pay, obligation acceleration or repudiation/moratorium. For credit default swaps on corporate or sovereign issuers, the obligation that may be put to the seller is not limited to the specific reference obligation described in the Schedule of Investments. For credit default swaps on asset-backed securities, a credit event may be triggered by events such as failure to pay principal, maturity extension, rating downgrade or write-down. For credit default swaps on asset-backed securities, the reference obligation described represents the security that may be put to the seller.
As a seller, if an underlying credit event occurs, the Fund will either pay the buyer an amount equal to the notional amount of the swap and take delivery of the reference obligation or underlying securities comprising an index or pay a net settlement amount of cash equal to the notional amount of the swap less the recovery value of the reference obligation or underlying securities comprising an index.
As a buyer, if an underlying credit event occurs, the Fund will either receive from the seller an amount equal to the notional amount of the swap and deliver the reference obligation or underlying securities comprising an index or receive a net settlement amount of cash equal to the notional amount of the swap less the recovery value of the reference obligation or underlying securities comprising an index.
Typically, the value of each credit default swap and credit rating disclosed for each reference obligation in the Schedule of Investments, where the Fund is the seller, can be used as measures of the current payment/performance risk of the swap. As the value of the swap changes as a positive or negative percentage of the total notional amount, the payment/performance risk may decrease or increase, respectively. In addition to these measures, FMR monitors a variety of factors including cash flow assumptions, market activity and market sentiment as part of its ongoing process of assessing payment/performance risk.
The notional amount of credit default swaps is included in the Schedule of Investments and approximates the maximum potential amount of future payments that the Fund could be required to make if the Fund is the seller and a credit event were to occur. The total notional amount of all credit default swaps open at period end where the Fund is the seller amounted to $43,007 representing 0.22% of net assets.
Annual Report
Notes to Financial Statements - continued
(Amounts in thousands except ratios)
6. Purchases and Sales of Investments.
Purchases and sales of securities (including the Fixed-Income Central Funds), other than short-term securities, U.S. government securities and in-kind transactions, aggregated $17,666,854 and $19,233,208, respectively.
7. Fees and Other Transactions with Affiliates.
Management Fee. FMR and its affiliates provide the Fund with investment management related services for which the Fund pays a monthly management fee. The management fee is the sum of an individual fund fee rate that is based on an annual rate of .15% of the Fund's average net assets and a group fee rate that averaged .26% during the period. The group fee rate is based upon the average net assets of all the mutual funds advised by FMR. The group fee rate decreases as assets under management increase and increases as assets under management decrease. For the period, the total annual management fee rate was .41% of the Fund's average net assets.
Transfer Agent Fees. Fidelity Investments Institutional Operations Company, Inc. (FIIOC), an affiliate of FMR, is the transfer, dividend disbursing and shareholder servicing agent for each class of the Fund. FIIOC receives account fees and asset-based fees that vary according to the account size and type of account of the shareholders of Balanced. FIIOC receives an asset-based fee of Class K's average net assets. FIIOC pays for typesetting, printing and mailing of shareholder reports, except proxy statements. For the period, transfer agent fees for each class were as follows:
| Amount | % of
Average
Net Assets |
Balanced | $ 31,252 | .18 |
Class K | 2,080 | .05 |
| $ 33,332 | |
Accounting and Security Lending Fees. Fidelity Service Company, Inc. (FSC), an affiliate of FMR, maintains the Fund's accounting records. The accounting fee is based on the level of average net assets for the month. Under a separate contract, FSC administers the security lending program. The security lending fee is based on the number and duration of lending transactions.
Brokerage Commissions. The Fund placed a portion of its portfolio transactions with brokerage firms which are affiliates of the investment adviser. The commissions paid to these affiliated firms were $689 for the period.
Exchange In-Kind. During the period, the Fund redeemed in-kind 2,389 shares of Fidelity Corporate Bond 1-10 Year Central Fund ("1-10 Year"), a Fidelity Central Fund in which the Fund invests, valued at $258,983 in exchange for cash and securities,
Annual Report
7. Fees and Other Transactions with Affiliates - continued
Exchange In-Kind - continued
including accrued interest. Realized gain (loss) of $19,923 on the Fund's redemption of 1-10 Year shares is included in the accompanying Statement of Operations as "Realized gain (loss) on Fidelity Central Funds." Because 1-10 Year was a partnership for federal income tax purposes, the redemption generally was tax free to the Fund.
8. Committed Line of Credit.
The Fund participates with other funds managed by FMR or an affiliate in a $4.0 billion credit facility (the "line of credit") to be utilized for temporary or emergency purposes to fund shareholder redemptions or for other short-term liquidity purposes. The Fund has agreed to pay commitment fees on its pro-rata portion of the line of credit, which amounted to $71 and is reflected in Miscellaneous expenses on the Statement of Operations. During the period, there were no borrowings on this line of credit.
9. Security Lending.
The Fund lends portfolio securities from time to time in order to earn additional income. For equity securities, a lending agent is used and may loan securities to certain qualified borrowers, including Fidelity Capital Markets (FCM), a broker-dealer affiliated with the Fund. On the settlement date of the loan, the Fund receives collateral (in the form of U.S. Treasury obligations, letters of credit and/or cash) against the loaned securities and maintains collateral in an amount not less than 100% of the market value of the loaned securities during the period of the loan. The market value of the loaned securities is determined at the close of business of the Fund and any additional required collateral is delivered to the Fund on the next business day. If the borrower defaults on its obligation to return the securities loaned because of insolvency or other reasons, a fund could experience delays and costs in recovering the securities loaned or in gaining access to the collateral. Any cash collateral received is maintained at the Fund's custodian and/or invested in cash equivalents and/or the Fidelity Securities Lending Cash Central Fund. The value of loaned securities and cash collateral at period end are disclosed on the Fund's Statement of Assets and Liabilities. The value of securities loaned to FCM at period end was $2,323. Security lending income represents the income earned on investing cash collateral, less rebates paid to borrowers and any lending agent fees associated with the loan, plus any premium payments received for lending certain types of securities. Total security lending income during the period, presented in the Statement of Operations as a component of interest income, amounted to $491. Net income from the Fidelity Securities Lending Cash Central Fund during the period, presented in the Statement of Operations as a component of income from Fidelity Central Funds, amounted to $1,318 (including $11 from securities loaned to FCM).
Annual Report
Notes to Financial Statements - continued
(Amounts in thousands except ratios)
10. Expense Reductions.
Many of the brokers with whom FMR places trades on behalf of the Fund provided services to the Fund in addition to trade execution. These services included payments of certain expenses on behalf of the Fund totaling $2,128 for the period.
11. Distributions to Shareholders.
Distributions to shareholders of each class were as follows:
Years ended August 31, | 2011 | 2010 |
From net investment income | | |
Balanced | $ 328,396 | $ 388,939 |
Class K | 82,194 | 54,291 |
Total | $ 410,590 | $ 443,230 |
From net realized gain | | |
Balanced | $ 7,916 | $ 11,043 |
Class K | 1,491 | 1,360 |
Total | $ 9,407 | $ 12,403 |
12. Share Transactions.
Transactions for each class of shares were as follows:
| Shares | Dollars |
Years ended August 31, | 2011 | 2010 | 2011 | 2010 |
Balanced | | | | |
Shares sold | 117,364 | 132,638 | $ 2,150,235 | $ 2,182,039 |
Reinvestment of distributions | 17,788 | 23,996 | 325,354 | 389,758 |
Shares redeemed | (307,092) | (244,641) | (5,576,894) | (4,025,346) |
Net increase (decrease) | (171,940) | (88,007) | $ (3,101,305) | $ (1,453,549) |
Class K | | | | |
Shares sold | 127,669 | 63,190 | $ 2,316,418 | $ 1,045,364 |
Reinvestment of distributions | 4,546 | 3,419 | 83,685 | 55,651 |
Shares redeemed | (71,990) | (31,877) | (1,317,183) | (524,186) |
Net increase (decrease) | 60,225 | 34,732 | $ 1,082,920 | $ 576,829 |
Annual Report
13. Other.
The Fund's organizational documents provide former and current trustees and officers with a limited indemnification against liabilities arising in connection with the performance of their duties to the Fund. In the normal course of business, the Fund may also enter into contracts that provide general indemnifications. The Fund's maximum exposure under these arrangements is unknown as this would be dependent on future claims that may be made against the Fund. The risk of material loss from such claims is considered remote.
Annual Report
To the Trustees of Fidelity Puritan Trust and the Shareholders of Fidelity Balanced Fund:
In our opinion, the accompanying statement of assets and liabilities, including the schedule of investments, and the related statements of operations and of changes in net assets and the financial highlights present fairly, in all material respects, the financial position of Fidelity Balanced Fund (a fund of Fidelity Puritan Trust) at August 31, 2011, the results of its operations for the year then ended, the changes in its net assets for each of the two years in the period then ended and the financial highlights for each of the periods indicated, in conformity with accounting principles generally accepted in the United States of America. These financial statements and financial highlights (hereafter referred to as "financial statements") are the responsibility of the Fidelity Balanced Fund's management. Our responsibility is to express an opinion on these financial statements based on our audits. We conducted our audits of these financial statements in accordance with the standards of the Public Company Accounting Oversight Board (United States). Those standards require that we plan and perform the audit to obtain reasonable assurance about whether the financial statements are free of material misstatement. An audit includes examining, on a test basis, evidence supporting the amounts and disclosures in the financial statements, assessing the accounting principles used and significant estimates made by management, and evaluating the overall financial statement presentation. We believe that our audits, which included confirmation of securities at August 31, 2011 by correspondence with the custodian and brokers, provide a reasonable basis for our opinion.
/s/ PricewaterhouseCoopers LLP
PricewaterhouseCoopers LLP
Boston, Massachusetts
October 19, 2011
Annual Report
The Trustees, Members of the Advisory Board, and executive officers of the trust and fund, as applicable, are listed below. The Board of Trustees governs the fund and is responsible for protecting the interests of shareholders. The Trustees are experienced executives who meet periodically throughout the year to oversee the fund's activities, review contractual arrangements with companies that provide services to the fund, oversee management of the risks associated with such activities and contractual arrangements, and review the fund's performance. Except for James C. Curvey, each of the Trustees oversees 221 funds advised by FMR or an affiliate. Mr. Curvey oversees 424 funds advised by FMR or an affiliate.
The Trustees hold office without limit in time except that (a) any Trustee may resign; (b) any Trustee may be removed by written instrument, signed by at least two-thirds of the number of Trustees prior to such removal; (c) any Trustee who requests to be retired or who has become incapacitated by illness or injury may be retired by written instrument signed by a majority of the other Trustees; and (d) any Trustee may be removed at any special meeting of shareholders by a two-thirds vote of the outstanding voting securities of the trust. Each Trustee who is not an interested person (as defined in the 1940 Act) (Independent Trustee), shall retire not later than the last day of the calendar year in which his or her 75th birthday occurs. The Independent Trustees may waive this mandatory retirement age policy with respect to individual Trustees. The executive officers and Advisory Board Members hold office without limit in time, except that any officer and Advisory Board Member may resign or may be removed by a vote of a majority of the Trustees at any regular meeting or any special meeting of the Trustees. Except as indicated, each individual has held the office shown or other offices in the same company for the past five years.
Experience, Skills, Attributes, and Qualifications of the Fund's Trustees. The Governance and Nominating Committee has adopted a statement of policy that describes the experience, qualifications, attributes, and skills that are necessary and desirable for potential Independent Trustee candidates (Statement of Policy). The Board believes that each Trustee satisfied at the time he or she was initially elected or appointed a Trustee, and continues to satisfy, the standards contemplated by the Statement of Policy. The Governance and Nominating Committee also engages professional search firms to help identify potential Independent Trustee candidates who have the experience, qualifications, attributes, and skills consistent with the Statement of Policy. From time to time, additional criteria based on the composition and skills of the current Independent Trustees, as well as experience or skills that may be appropriate in light of future changes to board composition, business conditions, and regulatory or other developments, have also been considered by the professional search firms and the Governance and Nominating Committee. In addition, the Board takes into account the Trustees' commitment and participation in Board and committee meetings, as well as their leadership of standing and ad hoc committees throughout their tenure.
In determining that a particular Trustee was and continues to be qualified to serve as a Trustee, the Board has considered a variety of criteria, none of which, in isolation, was controlling. The Board believes that, collectively, the Trustees have balanced and diverse experience, qualifications, attributes, and skills, which allow the Board to operate effectively in governing the fund and protecting the interests of shareholders. Information about the specific experience, skills, attributes, and qualifications of each Trustee, which in each case led to the Board's conclusion that the Trustee should serve (or continue to serve) as a trustee of the fund, is provided below.
Annual Report
Board Structure and Oversight Function. James C. Curvey is an interested person (as defined in the 1940 Act) and currently serves as Acting Chairman. The Trustees have determined that an interested Chairman is appropriate and benefits shareholders because an interested Chairman has a personal and professional stake in the quality and continuity of services provided to the fund. Independent Trustees exercise their informed business judgment to appoint an individual of their choosing to serve as Chairman, regardless of whether the Trustee happens to be independent or a member of management. The Independent Trustees have determined that they can act independently and effectively without having an Independent Trustee serve as Chairman and that a key structural component for assuring that they are in a position to do so is for the Independent Trustees to constitute a substantial majority for the Board. The Independent Trustees also regularly meet in executive session. Ned C. Lautenbach serves as Chairman of the Independent Trustees and as such (i) acts as a liaison between the Independent Trustees and management with respect to matters important to the Independent Trustees and (ii) with management prepares agendas for Board meetings.
Fidelity funds are overseen by different Boards of Trustees. The fund's Board oversees Fidelity's equity and high income funds and another Board oversees Fidelity's investment-grade bond, money market, and asset allocation funds. The asset allocation funds may invest in Fidelity funds overseen by the fund's Board. The use of separate Boards, each with its own committee structure, allows the Trustees of each group of Fidelity funds to focus on the unique issues of the funds they oversee, including common research, investment, and operational issues. On occasion, the separate Boards establish joint committees to address issues of overlapping consequences for the Fidelity funds overseen by each Board.
The Trustees operate using a system of committees to facilitate the timely and efficient consideration of all matters of importance to the Trustees, the fund, and fund shareholders and to facilitate compliance with legal and regulatory requirements and oversight of the fund's activities and associated risks. The Board, acting through its committees, has charged FMR and its affiliates with (i) identifying events or circumstances the occurrence of which could have demonstrably adverse effects on the fund's business and/or reputation; (ii) implementing processes and controls to lessen the possibility that such events or circumstances occur or to mitigate the effects of such events or circumstances if they do occur; and (iii) creating and maintaining a system designed to evaluate continuously business and market conditions in order to facilitate the identification and implementation processes described in (i) and (ii) above. Because the day-to-day operations and activities of the fund are carried out by or through FMR, its affiliates and other service providers, the fund's exposure to risks is mitigated but not eliminated by the processes overseen by the Trustees. While each of the Board's committees has responsibility for overseeing different aspects of the fund's activities, oversight is exercised primarily through the Operations, Audit, and Compliance Committees. In addition, the Independent Trustees have worked with FMR to enhance the Board's oversight of investment and financial risks, legal and regulatory risks, technology risks, and operational risks, including the development of additional risk reporting to the Board. For example, a working group comprised of Independent Trustees and FMR has worked and continues to work to review the Fidelity funds' valuation-related activities, reporting and risk management. Appropriate personnel, including but not limited to the fund's Chief Compliance Officer (CCO), FMR's internal auditor, the independent accountants, the funds' Treasurer and portfolio management personnel, make periodic reports to the Board's committees, as appropriate, including an annual review of FMR's risk management program for the Fidelity funds. The responsibilities of each standing committee, including their oversight responsibilities, are described further under "Standing Committees of the Fund's Trustees."
Annual Report
Trustees and Officers - continued
The fund's Statement of Additional Information (SAI) includes more information about the Trustees. To request a free copy, call Fidelity at 1-800-544-8544.
Interested Trustees*:
Correspondence intended for each Trustee who is an interested person may be sent to Fidelity Investments, 82 Devonshire Street, Boston, Massachusetts 02109.
Name, Age; Principal Occupations and Other Relevant Experience+ |
James C. Curvey (76) |
| Year of Election or Appointment: 2007 Mr. Curvey is Trustee and Acting Chairman of the Board of Trustees of certain Trusts. Mr. Curvey also serves as Trustee (2007-present) of other investment companies advised by FMR. Mr. Curvey is a Director of Fidelity Investments Money Management, Inc. (2009-present), Director of Fidelity Research & Analysis Co. (2009-present) and Director of FMR and FMR Co., Inc. (2007-present). Mr. Curvey is also Vice Chairman (2007-present) and Director of FMR LLC. In addition, Mr. Curvey serves as an Overseer for the Boston Symphony Orchestra and a member of the Trustees of Villanova University. Previously, Mr. Curvey was the Vice Chairman (2006-2007) and Director (2000-2007) of FMR Corp. |
Ronald P. O'Hanley (54) |
| Year of Election or Appointment: 2011 Mr. O'Hanley is Director of FMR Co., Inc. (2010-present), Director of Fidelity Investments Money Management, Inc. (2010-present), Director of Fidelity Research & Analysis Company (2010-present), President of Fidelity Asset Management and Corporate Services and a member of Fidelity's Executive Committee (2010-present). Previously, Mr. O'Hanley served as President and Chief Executive Officer of BNY Mellon Asset Management (2007-2010). Mr. O'Hanley also served as Vice Chairman of Bank New York Mellon Corp. and a member of that firm's Executive Committee. Prior to the 2007 merger of The Bank of New York and Mellon Financial Corporation, he was Vice Chairman of Mellon Financial Corporation and President and Chief Executive Officer of Mellon Asset Management. He joined Mellon in February 1997. Mr. O'Hanley currently serves as Chairman of the Boston Public Library Foundation Board of Directors and sits on the Board of Directors of Beth Israel Deaconess Medical Center, the Board of Trustees of the Marine Biological Laboratory and the Advisory Board of the Maxwell School of Citizenship and Public Administration at Syracuse University. Mr. O'Hanley also chairs the Council on Asset Management for the Financial Services Roundtable and is a member of the Board of Directors of Institutional Investor's U.S. Institute. |
* Trustees have been determined to be "Interested Trustees" by virtue of, among other things, their affiliation with the trust or various entities under common control with FMR.
+ The information above includes each Trustee's principal occupation during the last five years and other information relating to the experience, attributes, and skills relevant to each Trustee's qualifications to serve as a Trustee, which led to the conclusion that each Trustee should serve as a Trustee for the fund.
Annual Report
Trustees and Officers - continued
Independent Trustees:
Correspondence intended for each Independent Trustee (that is, the Trustees other than the Interested Trustees) may be sent to Fidelity Investments, P.O. Box 55235, Boston, Massachusetts 02205-5235.
Name, Age; Principal Occupations and Other Relevant Experience+ |
Dennis J. Dirks (63) |
| Year of Election or Appointment: 2005 Prior to his retirement in May 2003, Mr. Dirks was Chief Operating Officer and a member of the Board of The Depository Trust & Clearing Corporation (DTCC). He also served as President, Chief Operating Officer, and Board member of The Depository Trust Company (DTC) and President and Board member of the National Securities Clearing Corporation (NSCC). In addition, Mr. Dirks served as Chief Executive Officer and Board member of the Government Securities Clearing Corporation, Chief Executive Officer and Board member of the Mortgage-Backed Securities Clearing Corporation, as a Trustee and a member of the Finance Committee of Manhattan College (2005-2008), and as a Trustee and a member of the Finance Committee of AHRC of Nassau County (2006-2008). Mr. Dirks is a member of the Independent Directors Council (IDC) Governing Council (2010-Present) and Board of Directors for The Brookville Center for Children's Services, Inc. (2009-present). |
Alan J. Lacy (57) |
| Year of Election or Appointment: 2008 Mr. Lacy serves as Senior Adviser (2007-present) of Oak Hill Capital Partners, L.P. (private equity). Mr. Lacy also served as Chief Executive Officer (2000-2005) and Vice Chairman (2005-2006) of Sears Holdings Corporation and Sears, Roebuck and Co. (retail). In addition, Mr. Lacy serves as a member of the Board of Directors of Dave & Buster's, Inc. (restaurant and entertainment complexes, 2010-present), The Hillman Companies, Inc. (hardware wholesalers, 2010-present), and Bristol-Myers Squibb Company (global pharmaceuticals, 2007-present). Mr. Lacy is a member of the Board of Trustees of The National Parks Conservation Association (2006-Present). Previously, Mr. Lacy served as Chairman of the Board of Trustees of the National Parks Conservation Association (2008-2011) and as a member of the Board of Directors for the Western Union Company (global money transfer, 2006-2011). |
Ned C. Lautenbach (67) |
| Year of Election or Appointment: 2000 Mr. Lautenbach is Chairman of the Independent Trustees of the Equity and High Income Funds (2006-present). Mr. Lautenbach currently serves as the Lead Director of the Eaton Corporation Board of Directors (diversified industrial, 1997-present). Mr. Lautenbach is also a member of the Board of Directors of the Philharmonic Center for the Arts in Naples, Florida (1999-present); a member of the Board of Trustees of Fairfield University (2005-present); and a member of the Council on Foreign Relations (1994-present). Previously, Mr. Lautenbach was a Partner/Advisory Partner at Clayton, Dubilier & Rice, LLC (private equity investment, 1998-2010), as well as a Director of Sony Corporation (2006-2007). |
Joseph Mauriello (66) |
| Year of Election or Appointment: 2008 Prior to his retirement in January 2006, Mr. Mauriello served in numerous senior management positions including Deputy Chairman and Chief Operating Officer (2004-2005), and Vice Chairman of Financial Services (2002-2004) of KPMG LLP US (professional services, 1965-2005). Mr. Mauriello currently serves as a member of the Board of Directors of XL Group plc. (global insurance and re-insurance, 2006-present) and of Arcadia Resources Inc. (health care services and products, 2007-present). Previously, Mr. Mauriello served as a Director of the Hamilton Funds of the Bank of New York (2006-2007). |
Robert W. Selander (60) |
| Year of Election or Appointment: 2011 Previously, Mr. Selander served as a Member of the Advisory Board of Fidelity's Equity and High Income Funds (2011), Executive Vice Chairman (2010), Chief Executive Officer (2009-2010), and President and Chief Executive Officer (1997-2009) of Mastercard, Inc. |
Cornelia M. Small (67) |
| Year of Election or Appointment: 2005 Ms. Small is a member of the Board of Directors of the Teagle Foundation (2009-present). Ms. Small is also a member of the Investment Committee, and Chair (2008-present) and a member of the Board of Trustees of Smith College. In addition, Ms. Small serves on the Investment Committee of the Berkshire Taconic Community Foundation (2008-present). Previously, Ms. Small served as Chairperson of the Investment Committee (2002-2008) of Smith College. In addition, Ms. Small served as Chief Investment Officer, Director of Global Equity Investments, and a member of the Board of Directors of Scudder, Stevens & Clark and Scudder Kemper Investments. |
William S. Stavropoulos (72) |
| Year of Election or Appointment: 2001 Mr. Stavropoulos is Vice Chairman of the Independent Trustees of the Equity and High Income Funds (2006-present). Mr. Stavropoulos serves as President and Founder of the Michigan Baseball Foundation, the Great Lakes Loons (2007-present). Mr. Stavropoulos is Chairman Emeritus of the Board of Directors of The Dow Chemical Company, where he previously served in numerous senior management positions, including President, CEO (1995-2000; 2002-2004), Chairman of the Executive Committee (2000-2006), and as a member of the Board of Directors (1990-2006). Currently, Mr. Stavropoulos is Chairman of Univar (global distributor of commodity and specialty chemicals, 2010-present), a Director of Teradata Corporation (data warehousing and technology solutions, 2008-present), Chemical Financial Corporation, Maersk Inc. (industrial conglomerate), Tyco International, Inc. (multinational manufacturing and services, 2007-present), and a member of the Advisory Board for Metalmark Capital (private equity investment, 2005-present). Mr. Stavropoulos is a special advisor to Clayton, Dubilier & Rice, LLC (private equity investment). In addition, Mr. Stavropoulos is a member of the University of Notre Dame Advisory Council for the College of Science. |
David M. Thomas (62) |
| Year of Election or Appointment: 2008 Previously, Mr. Thomas served as Executive Chairman (2005-2006) and Chairman and Chief Executive Officer (2000-2005) of IMS Health, Inc. (pharmaceutical and healthcare information solutions). In addition, Mr. Thomas serves as a member of the Board of Directors of Fortune Brands, Inc. (consumer products), and Interpublic Group of Companies, Inc. (marketing communication, 2004-present). |
Michael E. Wiley (60) |
| Year of Election or Appointment: 2008 Mr. Wiley also serves as a Director of Asia Pacific Exploration Consolidated (international oil and gas exploration and production, 2008-present). Mr. Wiley serves as a Director of Tesoro Corporation (independent oil refiner and marketer, 2005-present), and a Director of Bill Barrett Corporation (exploration and production, 2005-present). In addition, Mr. Wiley also serves as a Director of Post Oak Bank (privately-held bank, 2004-present). Previously, Mr. Wiley served as a member of the Board of Trustees of the University of Tulsa (2000-2006; 2007-2010), as a Senior Energy Advisor of Katzenbach Partners, LLC (consulting, 2006-2007), as an Advisory Director of Riverstone Holdings (private investment), Chairman, President, and CEO of Baker Hughes, Inc. (oilfield services, 2000-2004), and as Director of Spinnaker Exploration Company (exploration and production, 2001-2005). |
Annual Report
+ The information above includes each Trustee's principal occupation during the last five years and other information relating to the experience, attributes, and skills relevant to each Trustee's qualifications to serve as a Trustee, which led to the conclusion that each Trustee should serve as a Trustee for the fund.
Advisory Board Members and Executive Officers:
Correspondence intended for each executive officer, Mr. Edward C. Johnson 3d, and Mr. Peter S. Lynch may be sent to Fidelity Investments, 82 Devonshire Street, Boston, Massachusetts 02109.
Name, Age; Principal Occupation |
Edward C. Johnson 3d (81) |
| Year of Election or Appointment: 2011 Member of the Advisory Board of Fidelity's Equity and High Income Funds. Mr. Johnson serves as Chief Executive Officer, Chairman, and a Director of FMR LLC, and also serves as Chairman and Director of FIL Limited. Previously, Mr. Johnson served as a Trustee and Chairman of the Board of certain Fidelity Trusts, Chairman and a Director of FMR, Chairman and a Director of FMR Co., Inc., and President of FMR LLC (2006-2007). |
Peter S. Lynch (67) |
| Year of Election or Appointment: 2003 Member of the Advisory Board of Fidelity's Equity and High Income Funds. Mr. Lynch is Vice Chairman and a Director of FMR and FMR Co., Inc. In addition, Mr. Lynch serves as a Trustee of Boston College and as the Chairman of the Inner-City Scholarship Fund. Previously, Mr. Lynch served on the Special Olympics International Board of Directors (1997-2006). |
Kenneth B. Robins (42) |
| Year of Election or Appointment: 2008 President and Treasurer of Fidelity's Equity and High Income Funds. Mr. Robins also serves as President and Treasurer (2010-present) and Assistant Treasurer (2009-present) of other Fidelity funds and is an employee of Fidelity Investments (2004-present). Previously, Mr. Robins served as Deputy Treasurer of the Fidelity funds (2005-2008) and Treasurer and Chief Financial Officer of The North Carolina Capital Management Trust: Cash and Term Portfolios (2006-2008). |
Bruce T. Herring (46) |
| Year of Election or Appointment: 2006 Vice President of certain Equity Funds. Mr. Herring also serves as Chief Investment Officer and Director of Fidelity Management & Research (U.K.) Inc. (2010-present) and Group Chief Investments Officer of FMR. Previously, Mr. Herring served as Vice President (2005-2006) and Senior Vice President (2006-2007) of Fidelity Management & Research Company, Vice President of FMR Co., Inc. (2001-2007) and as a portfolio manager for Fidelity U.S. Equity Funds. |
Brian B. Hogan (46) |
| Year of Election or Appointment: 2009 Vice President of Equity and High Income Funds. Mr. Hogan also serves as President of FMR's Equity Division (2009-present). Previously, Mr. Hogan served as Senior Vice President, Equity Research of FMR (2006-2009) and as a portfolio manager. |
Scott C. Goebel (43) |
| Year of Election or Appointment: 2008 Secretary and Chief Legal Officer (CLO) of the Fidelity funds. Mr. Goebel also serves as Secretary of Fidelity Investments Money Management, Inc. (FIMM) (2010-present) and Fidelity Research and Analysis Company (FRAC) (2010-present); Secretary and CLO of The North Carolina Capital Management Trust: Cash and Term Portfolios (2008-present); General Counsel, Secretary, and Senior Vice President of FMR (2008-present) and FMR Co., Inc. (2008-present); employed by FMR LLC or an affiliate (2001-present); Chief Legal Officer of Fidelity Management & Research (Hong Kong) Limited (2008-present) and Assistant Secretary of Fidelity Management & Research (Japan) Inc. (2008-present), and Fidelity Management & Research (U.K.) Inc. (2008-present). Previously, Mr. Goebel served as Assistant Secretary of FIMM (2008-2010), FRAC (2008-2010), and the Funds (2007-2008) and as Vice President and Secretary of Fidelity Distributors Corporation (FDC) (2005-2007). |
William C. Coffey (42) |
| Year of Election or Appointment: 2009 Assistant Secretary of Fidelity's Equity and High Income Funds. Mr. Coffey also serves as Senior Vice President and Deputy General Counsel of FMR LLC (2010-present), and is an employee of Fidelity Investments. Previously, Mr. Coffey served as Vice President and Associate General Counsel of FMR LLC (2005-2009). |
Holly C. Laurent (57) |
| Year of Election or Appointment: 2008 Anti-Money Laundering (AML) Officer of the Fidelity funds. Ms. Laurent also serves as AML Officer of The North Carolina Capital Management Trust: Cash and Term Portfolios (2008-present) and is an employee of Fidelity Investments. Previously, Ms. Laurent was Senior Vice President and Head of Legal for Fidelity Business Services India Pvt. Ltd. (2006-2008), and Senior Vice President, Deputy General Counsel and Group Head for FMR LLC (2005-2006). |
Christine Reynolds (52) |
| Year of Election or Appointment: 2008 Chief Financial Officer of the Fidelity funds. Ms. Reynolds became President of Fidelity Pricing and Cash Management Services (FPCMS) in August 2008. Ms. Reynolds served as Chief Operating Officer of FPCMS (2007-2008). Previously, Ms. Reynolds served as President, Treasurer, and Anti-Money Laundering officer of the Fidelity funds (2004-2007). |
Kenneth A. Rathgeber (64) |
| Year of Election or Appointment: 2004 Chief Compliance Officer of Fidelity's Equity and High Income Funds. Mr. Rathgeber is Chief Compliance Officer of Fidelity Management & Research (Hong Kong) Limited (2008-present), Fidelity Management & Research (Japan) Inc. (2008-present), FMR (2005-present), FMR Co., Inc. (2005-present), Fidelity Management & Research (U.K.) Inc. (2005-present), Fidelity Research & Analysis Company (2005-present), Fidelity Investments Money Management, Inc. (2005-present), Pyramis Global Advisors, LLC (2005-present), and Strategic Advisers, Inc. (2005-present). |
Jeffrey S. Christian (49) |
| Year of Election or Appointment: 2009 Deputy Treasurer of the Fidelity funds. Mr. Christian is an employee of Fidelity Investments. Previously, Mr. Christian served as Chief Financial Officer (2008-2009) of certain Fidelity funds and Senior Vice President of Fidelity Pricing and Cash Management Services (FPCMS) (2004-2009). |
Bryan A. Mehrmann (50) |
| Year of Election or Appointment: 2005 Deputy Treasurer of the Fidelity funds. Mr. Mehrmann is an employee of Fidelity Investments. |
Adrien E. Deberghes (44) |
| Year of Election or Appointment: 2008 Deputy Treasurer of Fidelity's Equity and High Income Funds. Mr. Deberghes also serves as Vice President and Assistant Treasurer of Fidelity Rutland Square Trust II and Fidelity Commonwealth Trust II (2011-present), Assistant Treasurer of other Fidelity funds (2010-present), and is an employee of Fidelity Investments (2008-present). Previously, Mr. Deberghes served as Senior Vice President of Mutual Fund Administration at State Street Corporation (2007-2008), Senior Director of Mutual Fund Administration at Investors Bank & Trust (2005-2007), and Director of Finance for Dunkin' Brands (2000-2005). |
Stephanie J. Dorsey (42) |
| Year of Election or Appointment: 2010 Assistant Treasurer of Fidelity's Equity and High Income Funds. Ms. Dorsey also serves as Deputy Treasurer of other Fidelity funds (2008-present) and is an employee of Fidelity Investments (2008-present). Previously, Ms. Dorsey served as Treasurer (2004-2008) of the JPMorgan Mutual Funds and Vice President (2004-2008) of JPMorgan Chase Bank. |
John R. Hebble (53) |
| Year of Election or Appointment: 2009 Assistant Treasurer of Fidelity's Equity and High Income Funds. Mr. Hebble also serves as President (2011-present), Treasurer, and Chief Financial Officer of The North Carolina Capital Management Trust: Cash and Term Portfolios (2008-present), President and Treasurer of other Fidelity funds (2008-present) and is an employee of Fidelity Investments. |
Gary W. Ryan (53) |
| Year of Election or Appointment: 2005 Assistant Treasurer of the Fidelity funds. Mr. Ryan is an employee of Fidelity Investments. Previously, Mr. Ryan served as Vice President of Fund Reporting in Fidelity Pricing and Cash Management Services (FPCMS) (1999-2005). |
Jonathan Davis (43) |
| Year of Election or Appointment: 2010 Assistant Treasurer of the Fidelity funds. Mr. Davis is also Assistant Treasurer of Fidelity Rutland Square Trust II and Fidelity Commonwealth Trust II. Mr. Davis is an employee of Fidelity Investments. Previously, Mr. Davis served as Vice President and Associate General Counsel of FMR LLC (2003-2010). |
Annual Report
A total of 7.78% of the dividends distributed during the fiscal year was derived from interest on U.S. Government securities which is generally exempt from state income tax.
Balanced designates $178,322,424 of distributions paid during the period January 1, 2011 to August 31, 2011 as qualifying to be taxed as interest-related dividends for nonresident alien shareholders.
Balanced designates 11%, 42%, 41%, 51% and 51% of the dividends distributed in October 2010, December 17, 2010, December 30, 2010, April 2011 and July 2011, respectively during the fiscal year as qualifying for the dividends-received deduction for corporate shareholders.
Balanced designates 14%, 55%, 54%, 68% and 68% of the dividends distributed in October 2010, December 17, 2010, December 30, 2010, April 2011 and July 2011, respectively during the fiscal year as amounts which may be taken into account as a dividend for the purposes of the maximum rate under section 1(h)(11) of the Internal Revenue Code.
The fund will notify shareholders in January 2012 of amounts for use in preparing 2011 income tax returns.
Annual Report
Board Approval of Investment Advisory Contracts and Management Fees
Fidelity Balanced Fund
Each year, the Board of Trustees, including the Independent Trustees (together, the Board), votes on the renewal of the management contract and sub-advisory agreements (together, the Advisory Contracts) for the fund. The Board, assisted by the advice of fund counsel and Independent Trustees' counsel, requests and considers a broad range of information relevant to the renewal of the Advisory Contracts throughout the year.
The Board meets regularly and considers at each of its meetings factors that are relevant to its annual consideration of the renewal of the fund's Advisory Contracts, including the services and support provided to the fund and its shareholders. The Board has established various standing committees, each composed of Independent Trustees with varying backgrounds, to which the Board has assigned specific subject matter responsibilities in order to enhance effective decision-making by the Board. The Board, acting directly and through its Committees, requests and receives information concerning the annual consideration of the renewal of the fund's Advisory Contracts. The Board also meets as needed to consider matters specifically related to the Board's annual consideration of the renewal of Advisory Contracts. Members of the Board may also meet with trustees of other Fidelity funds through ad hoc joint committees to discuss certain matters relevant to the Fidelity funds.
At its July 2011 meeting, the Board of Trustees, including the Independent Trustees, unanimously determined to renew the fund's Advisory Contracts. In reaching its determination, the Board considered all factors it believed relevant, including (i) the nature, extent, and quality of the services to be provided to the fund and its shareholders (including the investment performance of the fund); (ii) the competitiveness of the fund's management fee and total expense ratio; (iii) the total costs of the services to be provided by and the profits to be realized by Fidelity from its relationship with the fund; (iv) the extent to which economies of scale would be realized as the fund grows; and (v) whether fee levels reflect these economies of scale, if any, for the benefit of fund shareholders.
In considering whether to renew the Advisory Contracts for the fund, the Board reached a determination, with the assistance of fund counsel and Independent Trustees' counsel and through the exercise of its business judgment, that the renewal of the Advisory Contracts is in the best interests of the fund and its shareholders and that the compensation payable under the Advisory Contracts is fair and reasonable. The Board's decision to renew the Advisory Contracts was not based on any single factor, but rather was based on a comprehensive consideration of all the information provided to the Board at its meetings throughout the year. The Board, in reaching its determination to renew the Advisory Contracts, is aware that shareholders in the fund have a broad range of investment choices available to them, including a wide choice among mutual funds offered by Fidelity's competitors, and that the fund's shareholders, who have the opportunity to review and weigh the disclosure provided by the fund in its prospectus and other public disclosures, have chosen to invest in this fund, managed by Fidelity.
Annual Report
Nature, Extent, and Quality of Services Provided. The Board considered the staffing within the investment adviser, FMR, and the sub-advisers (together, the Investment Advisers), including the backgrounds of the fund's investment personnel and the fund's investment objective and discipline. The Independent Trustees also had discussions with senior management of Fidelity's investment operations and investment groups. The Board considered the structure of the portfolio manager compensation program and whether this structure provides appropriate incentives to act in the best interests of the fund.
Resources Dedicated to Investment Management and Support Services. The Board and the Fund Oversight and Research Committees reviewed the general qualifications and capabilities of the Investment Advisers' investment staff, including its size, education, experience, and resources, as well as the Investment Advisers' approach to recruiting, training, managing, and compensating investment personnel. The Board also noted that FMR has devoted increased resources to non-U.S. offices. The Board noted that Fidelity's analysts have extensive resources, tools and capabilities which allow them to conduct sophisticated quantitative and fundamental analysis, as well as credit analysis of issuers, counterparties and enhancers. The Board also believes that Fidelity's investment professionals have sufficient access to global information and data so as to provide competitive investment results over time, and that those professionals also have access to sophisticated tools which permit them to assess portfolio construction and risk and performance attribution characteristics continuously, as well as to transmit new information and research conclusions rapidly around the world. Additionally, in their deliberations, the Board considered the Investment Advisers' trading capabilities and resources which are an integral part of the investment management process.
Shareholder and Administrative Services. The Board considered (i) the nature, extent, quality, and cost of advisory, administrative, and shareholder services performed by the Investment Advisers and their affiliates under the Advisory Contracts and under separate agreements covering transfer agency, pricing and bookkeeping, and securities lending services for the fund; (ii) the nature and extent of the investment adviser's supervision of third party service providers, principally custodians and subcustodians; and (iii) the resources devoted to, and the record of compliance with, the fund's compliance policies and procedures. The Board also reviewed the allocation of fund brokerage, including allocations to brokers affiliated with the Investment Advisers, the use of brokerage commissions to pay fund expenses, and the use of "soft" commission dollars to pay for research services.
The Board noted that the growth of fund assets over time across the complex allows Fidelity to reinvest in the development of services designed to enhance the value or convenience of the Fidelity funds as investment vehicles. These services include 24-hour access to account information and market information through telephone representatives and over the Internet, investor education materials and asset allocation tools, and the expanded availability of Fidelity Investor Centers, with 35 new branches opening since 2010.
Annual Report
Board Approval of Investment Advisory Contracts and
Management Fees - continued
Investment in a Large Fund Family. The Board considered the benefits to shareholders of investing in a Fidelity fund, including the benefits of investing in a fund that is part of a large family of funds offering a variety of investment disciplines and providing a large variety of mutual fund investor services. The Board noted that Fidelity had taken, or had made recommendations that resulted in the Fidelity funds taking, a number of actions over the previous year that benefited particular funds, including (i) continuing to dedicate additional resources to investment research and support of the senior management team that oversees asset management; (ii) rationalizing product lines through the mergers of six funds into other funds; (iii) continuing to migrate the Freedom Funds to dedicated lower cost underlying funds; (iv) obtaining shareholder approval to broaden the investment strategies for Fidelity Consumer Finance Portfolio, Fidelity Emerging Asia Fund, and Fidelity Environment and Alternative Energy Portfolio; (v) contractually agreeing to reduce the management fees and impose other expense limitations on Spartan 500 Index Fund and U.S. Bond Index Fund in connection with launching new institutional classes of these funds; (vi) changing the name, primary and supplemental benchmarks, and investment policies of Fidelity Global Strategies Fund to support the fund's flexible investment mandate and global orientation; and (vii) reducing the transfer agency account fee rates on certain accounts.
Investment Performance. The Board considered whether the fund has operated in accordance with its investment objective, as well as its record of compliance with its investment restrictions. It also reviewed the fund's absolute investment performance for each class, as well as the fund's relative investment performance for each class measured over multiple periods against (i) a proprietary custom index, and (ii) a peer group of mutual funds deemed appropriate by Fidelity and reviewed by the Board. The following charts considered by the Board show, over the one-, three-, and five-year periods ended December 31, 2010, as available, the cumulative total returns of Class K and the retail class of the fund, the cumulative total returns of a proprietary custom index ("benchmark"), and a range of cumulative total returns of a peer group of mutual funds identified by Lipper Inc. as having an investment objective similar to that of the fund. The box within each chart shows the 25th percentile return (bottom of box) and the 75th percentile return (top of box) of the peer group. Returns shown above the box are in the first quartile and returns shown below the box are in the fourth quartile. The percentage beaten numbers noted below each chart correspond to the percentile box and represent the percentage of funds in the peer group whose performance was equal to or lower than that of the class indicated. The fund's proprietary custom index is an index developed by FMR that represents the performance of the fund's general investment categories in both equity and bond securities.
Annual Report
Fidelity Balanced Fund
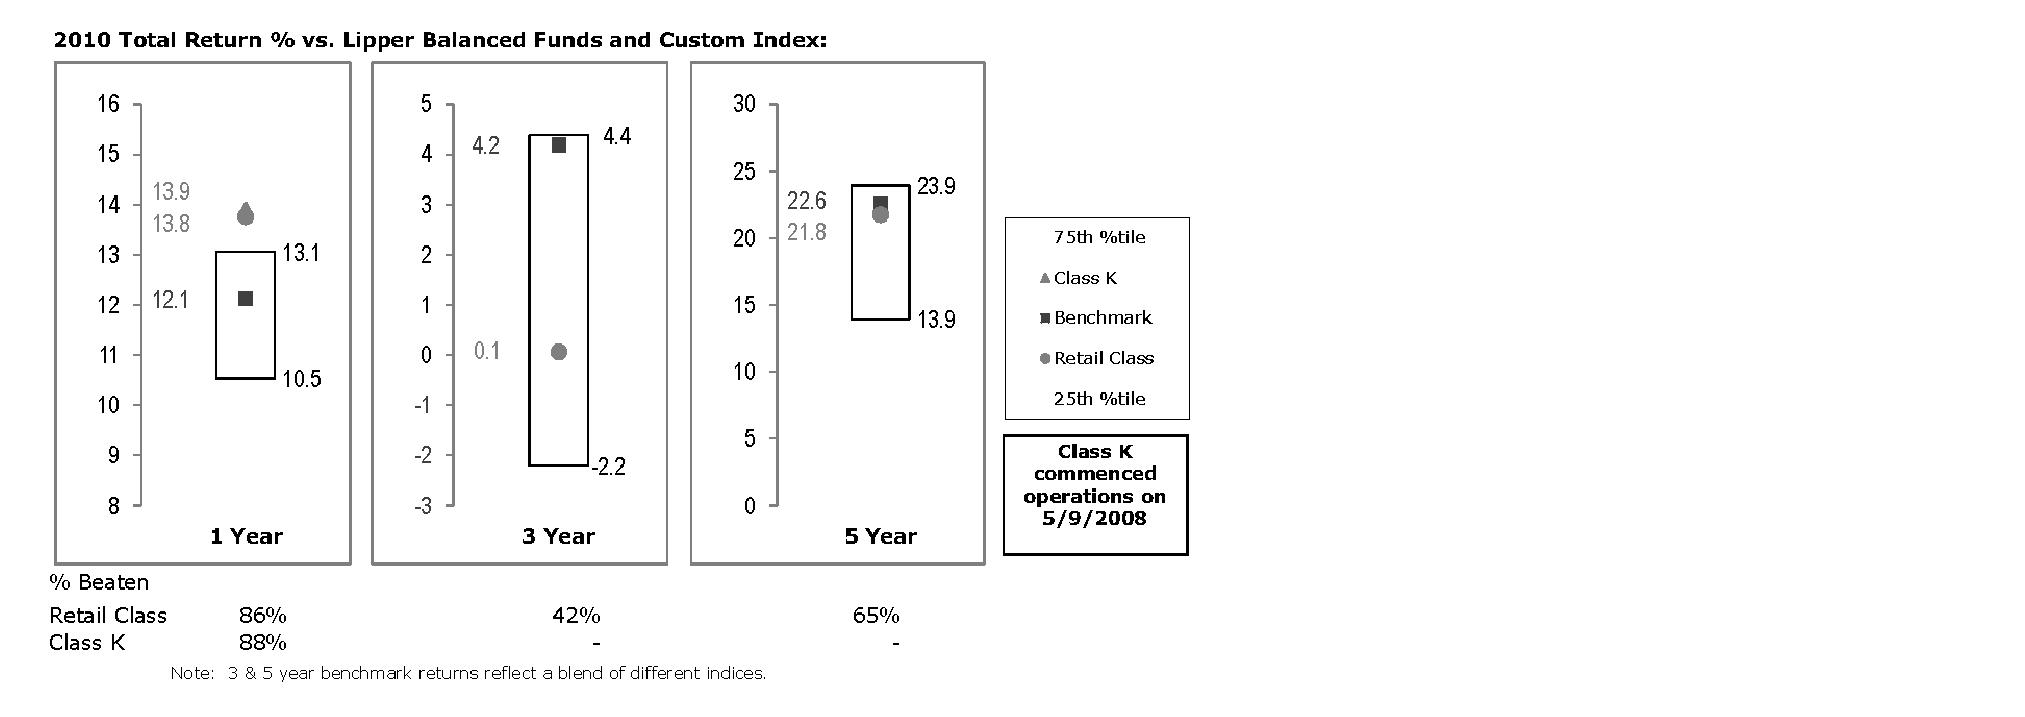
The Board reviewed the fund's relative investment performance against its peer group and noted that the performance of the retail class of the fund (the class with the longer performance record) was in the first quartile for the one-year period, the third quartile for the three-year period, and the second quartile for the five-year period. The Board also noted that the investment performance of the fund was lower than its benchmark for the three- and five-year periods, although the one-year total return of the retail class compared favorably to its benchmark. The Board considered that the variations in performance between the fund's classes reflect the variations in class expenses, which result in lower performance for the higher expense class. The Board also reviewed the fund's performance since inception as well as performance in the current year.
Based on its review, the Board concluded that the nature, extent, and quality of services provided to the fund under the Advisory Contracts should benefit the fund's shareholders.
Competitiveness of Management Fee and Total Expense Ratio. The Board considered the fund's management fee and total expense ratio compared to "mapped groups" of competitive funds and classes. Fidelity creates "mapped groups" by combining similar Lipper investment objective categories that have comparable management fee characteristics. Combining Lipper investment objective categories aids the Board's management fee and total expense ratio comparisons by broadening the competitive group used for comparison and by reducing the number of universes to which various Fidelity funds are compared.
Annual Report
Board Approval of Investment Advisory Contracts and
Management Fees - continued
Management Fee. The Board considered two proprietary management fee comparisons for the 12-month periods shown in the chart below. The group of Lipper funds used by the Board for management fee comparisons is referred to below as the "Total Mapped Group." The Total Mapped Group is broader than the Lipper peer group used by the Board for performance comparisons because the Total Mapped Group combines several Lipper investment objective categories while the Lipper peer group does not. The Total Mapped Group comparison focuses on a fund's standing relative to the total universe of comparable funds available to investors in terms of gross management fees before expense reimbursements or caps. "TMG %" represents the percentage of funds in the Total Mapped Group that had management fees that were lower than the fund's. For example, a TMG % of 10% means that 90% of the funds in the Total Mapped Group had higher management fees than the fund. The "Asset-Size Peer Group" (ASPG) comparison focuses on a fund's standing relative to non-Fidelity funds similar in size to the fund within the Total Mapped Group. The ASPG represents at least 15% of the funds in the Total Mapped Group with comparable asset size and management fee characteristics, subject to a minimum of 50 funds (or all funds in the Total Mapped Group if fewer than 50). Additional information, such as the ASPG quartile in which the fund's management fee ranked, is also included in the chart and considered by the Board.
Fidelity Balanced Fund
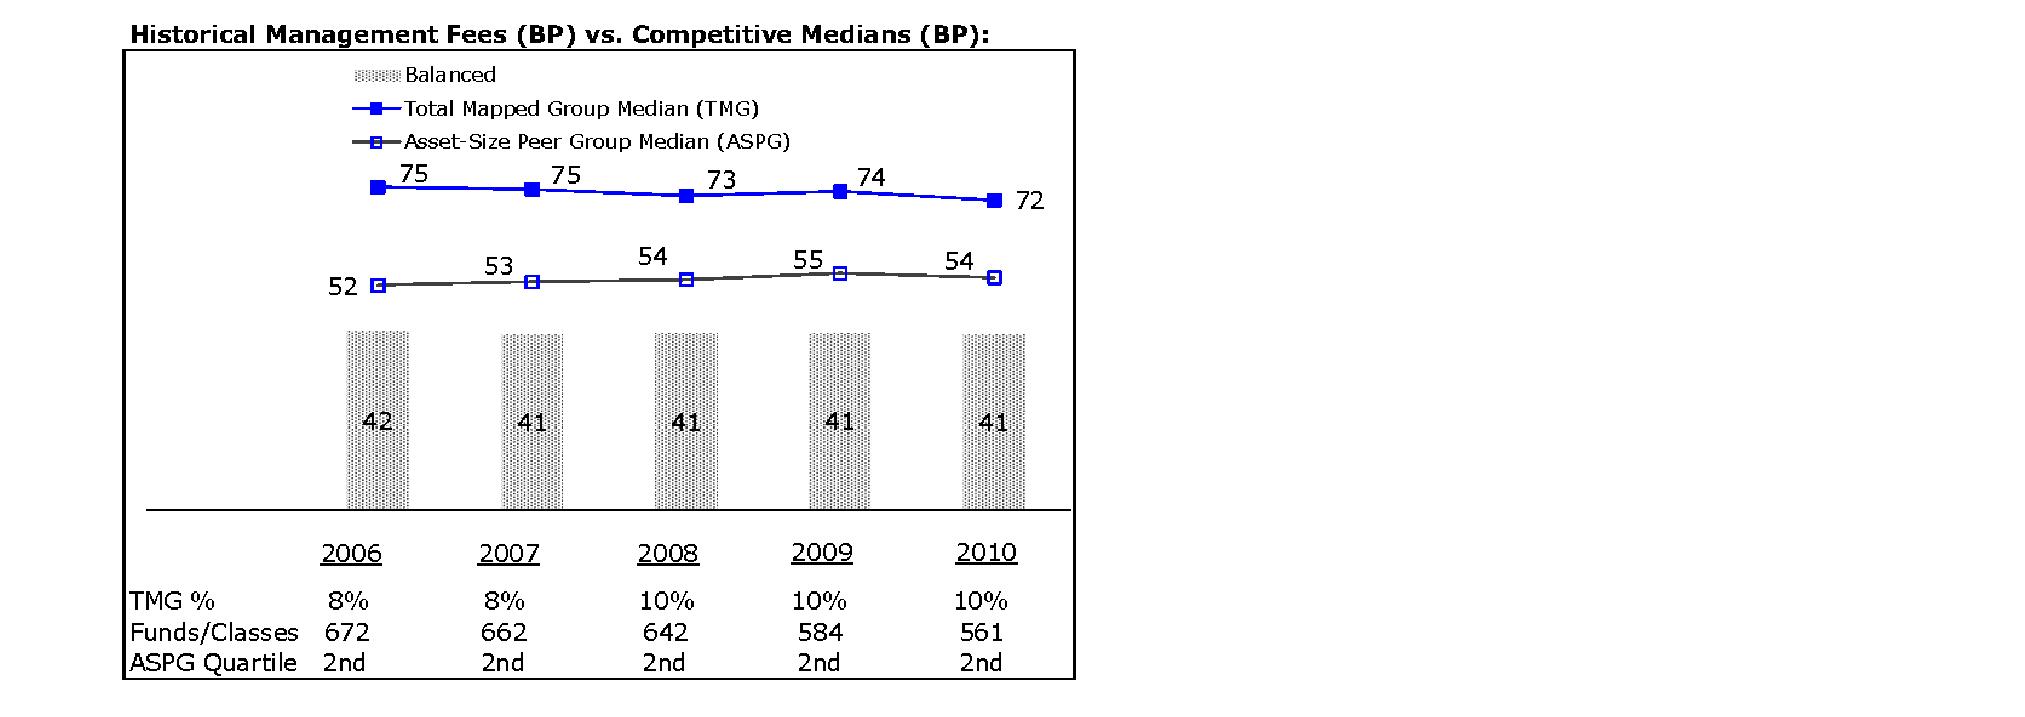
The Board noted that the fund's management fee ranked below the median of its Total Mapped Group and below the median of its ASPG for 2010.
Annual Report
Based on its review, the Board concluded that the fund's management fee is fair and reasonable in light of the services that the fund receives and the other factors considered.
Total Expense Ratio. In its review of each class's total expense ratio, the Board considered the fund's management fee as well as other fund or class expenses, as applicable, such as transfer agent fees, pricing and bookkeeping fees, and custodial, legal, and audit fees. The Board also noted the effects of any waivers and reimbursements on fees and expenses. As part of its review, the Board also considered the current and historical total expense ratios of each class of the fund compared to competitive fund median expenses. Each class of the fund is compared to those funds and classes in the Total Mapped Group (used by the Board for management fee comparisons) that have a similar sales load structure.
The Board noted that the total expense ratio of each class ranked below its competitive median for 2010. The Board considered that various factors, including 12b-1 fees, positive or negative performance adjustments, and relatively higher other expenses in the case of small fund size, can affect total expense ratios.
Fees Charged to Other Fidelity Clients. The Board also considered Fidelity fee structures and other information with respect to clients of FMR and its affiliates, such as other mutual funds advised or subadvised by FMR or its affiliates, pension plan clients, and other institutional clients. In March 2010, the Board created an ad hoc joint committee with the board of other Fidelity funds (the Committee) to review and compare Fidelity's institutional investment advisory business with its business of providing services to the Fidelity funds, including the differences in services provided, fees charged, and costs incurred, as well as competition in their respective marketplaces.
Based on its review of total expense ratios and fees charged to other Fidelity clients, the Board concluded that the total expense ratio of each class of the fund was reasonable in light of the services that the fund and its shareholders receive and the other factors considered, including the findings of the Committee.
Costs of the Services and Profitability. The Board considered the revenues earned and the expenses incurred by Fidelity in conducting the business of developing, marketing, distributing, managing, administering and servicing the fund and its shareholders. The Board also considered the level of Fidelity's profits in respect of all the Fidelity funds.
On an annual basis, FMR presents to the Board Fidelity's profitability for the fund. Fidelity calculates the profitability for each fund, as well as aggregate profitability for groups of Fidelity funds and all Fidelity funds, using a series of detailed revenue and cost allocation methodologies which originate with the books and records of Fidelity on which Fidelity's audited financial statements are based. The Audit Committee of the Board reviews any significant changes from the prior year's methodologies.
Annual Report
Board Approval of Investment Advisory Contracts and
Management Fees - continued
PricewaterhouseCoopers LLP (PwC), independent registered public accounting firm and auditor to Fidelity and certain Fidelity funds, has been engaged annually by the Board as part of the Board's assessment of Fidelity's profitability analysis. PwC's engagement includes the review and assessment of Fidelity's methodologies used in determining the revenues and expenses attributable to Fidelity's mutual fund business, and completion of agreed-upon procedures surrounding the mathematical accuracy of fund profitability and its conformity to allocation methodologies. After considering PwC's reports issued under the engagement and information provided by Fidelity, the Board concluded that while other allocation methods may also be reasonable, Fidelity's profitability methodologies are reasonable in all material respects.
The Board also reviewed Fidelity's non-fund businesses and fall-out benefits related to the mutual fund business as well as cases where Fidelity's affiliates may benefit from or be related to the fund's business.
The Board considered the costs of the services provided by and the profits realized by Fidelity in connection with the operation of the fund and was satisfied that the profitability was not excessive in the circumstances.
Economies of Scale. The Board considered whether there have been economies of scale in respect of the management of the Fidelity funds, whether the Fidelity funds (including the fund) have appropriately benefited from any such economies of scale, and whether there is potential for realization of any further economies of scale. The Board considered the extent to which the fund will benefit from economies of scale through increased services to the fund, through waivers or reimbursements, or through fee or expense reductions. The Board also noted that in 2009, it and the board of other Fidelity funds created an ad hoc committee (the Economies of Scale Committee) to analyze whether FMR attains economies of scale in respect of the management and servicing of the Fidelity funds, whether the Fidelity funds have appropriately benefited from such economies of scale, and whether there is potential for realization of any further economies of scale.
The Board recognized that the fund's management contract incorporates a "group fee" structure, which provides for lower group fee rates as total fund assets under FMR's management increase, and for higher group fee rates as total fund assets under FMR's management decrease. FMR calculates the group fee rates based on a tiered asset "breakpoint" schedule that varies based on asset class. The Board considered that the group fee is designed to deliver the benefits of economies of scale to fund shareholders when total Fidelity fund assets increase, even if assets of any particular fund are unchanged or have declined, because some portion of Fidelity's costs are attributable to services provided to all Fidelity funds, and all funds benefit if those costs can be allocated among more assets. The Board concluded that, given the group fee structure, fund shareholders will benefit from lower management fees as assets under FMR's management increase at the fund complex level, regardless of whether Fidelity achieves any such economies of scale.
Annual Report
The Board concluded, taking into account the analysis of the Economies of Scale Committee, that any potential economies of scale are being appropriately shared between fund shareholders and Fidelity.
Additional Information Requested by the Board. In order to develop fully the factual basis for consideration of the Fidelity funds' Advisory Contracts, the Board requested and received additional information on certain topics, including (i) fund performance trends, actions to be taken by FMR to improve certain funds' overall performance, and Fidelity's long-term strategies for certain funds; (ii) portfolio manager changes that have occurred during the past year and length of portfolio manager tenure for different categories of funds over time; (iii) Fidelity's compensation structure for portfolio managers and other key personnel and strategies for attracting and retaining non-investment personnel; (iv) the amount of the investment that each portfolio manager has made in the Fidelity fund(s) that he or she manages; (v) historical trends in Fidelity's realization of fall-out benefits; (vi) Fidelity's group fee structures and the rationale for the individual fee rates of certain funds; (vii) fund profitability methodology and the impact of certain factors on fund profitability results; (viii) trends regarding industry use of performance fee structures and Fidelity's compliance practices with respect to performance adjustment calculations; (ix) the fee structures in place for certain other Fidelity clients; and (x) explanations regarding the relative total expense ratios of certain funds and classes, total expense competitive trends, and actions that might be taken by FMR to reduce total expense ratios for certain funds and classes.
Based on its evaluation of all of the conclusions noted above, and after considering all factors it believed relevant, the Board ultimately concluded that the advisory fee structures are fair and reasonable, and that the fund's Advisory Contracts should be renewed.
Annual Report
Managing Your Investments
Fidelity offers several ways to conveniently manage your personal investments via your telephone or PC. You can access your account information, conduct trades and research your investments 24 hours a day.
By Phone
Fidelity Automated Service Telephone provides a single toll-free number to access account balances, positions, quotes and trading. It's easy to navigate the service, and on your first call, the system will help you create a personal identification number (PIN) for security.
(phone_graphic)
Fidelity Automated
Service Telephone (FAST®)
1-800-544-5555
Press
 For mutual fund and brokerage trading.
 For quotes.*
 For account balances and holdings.
 To review orders and mutual
fund activity.
 To change your PIN.

 To speak to a Fidelity representative.
By PC
Fidelity's web site on the Internet provides a wide range of information, including daily financial news, fund performance, interactive planning tools and news about Fidelity products and services.
(computer_graphic)
Fidelity's Web Site
www.fidelity.com
* When you call the quotes line, please remember that a fund's yield and return will vary and, except for money market funds, share price will also vary. This means that you may have a gain or loss when you sell your shares. There is no assurance that money market funds will be able to maintain a stable $1 share price; an investment in a money market fund is not insured or guaranteed by the U.S. government. Total returns are historical and include changes in share price, reinvestment of dividends and capital gains distributions, and the effects of any sales charges.
Annual Report
To Visit Fidelity
For directions and hours,
please call 1-800-544-9797.
Arizona
7001 West Ray Road
Chandler, AZ
15445 N. Scottsdale Road
Scottsdale, AZ
17550 North 75th Avenue
Glendale, AZ
5330 E. Broadway Blvd
Tucson, AZ
California
815 East Birch Street
Brea, CA
1411 Chapin Avenue
Burlingame, CA
851 East Hamilton Avenue
Campbell, CA
601 Larkspur Landing Circle
Larkspur, CA
2000 Avenue of the Stars
Los Angeles, CA
27101 Puerta Real
Mission Viejo, CA
73575 El Paseo
Palm Desert, CA
251 University Avenue
Palo Alto, CA
123 South Lake Avenue
Pasadena, CA
16656 Bernardo Ctr. Drive
Rancho Bernardo, CA
1220 Roseville Parkway
Roseville, CA
1740 Arden Way
Sacramento, CA
7676 Hazard Center Drive
San Diego, CA
11943 El Camino Real
San Diego, CA
8 Montgomery Street
San Francisco, CA
3793 State Street
Santa Barbara, CA
1200 Wilshire Boulevard
Santa Monica, CA
398 West El Camino Real
Sunnyvale, CA
111 South Westlake Blvd
Thousand Oaks, CA
21701 Hawthorne Boulevard
Torrance, CA
2001 North Main Street
Walnut Creek, CA
6326 Canoga Avenue
Woodland Hills, CA
2211 Michelson Drive
Irvine, CA
Colorado
281 East Flatiron Circle
Broomfield, CO
1625 Broadway
Denver, CO
9185 Westview Road
Lone Tree, CO
Connecticut
48 West Putnam Avenue
Greenwich, CT
265 Church Street
New Haven, CT
300 Atlantic Street
Stamford, CT
29 South Main Street
West Hartford, CT
1261 Post Road
Fairfield, CT
Delaware
400 Delaware Avenue
Wilmington, DE
Florida
175 East Altamonte Drive
Altamonte Springs, FL
1400 Glades Road
Boca Raton, FL
121 Alhambra Plaza
Coral Gables, FL
2948 N. Federal Highway
Ft. Lauderdale, FL
4671 Town Center Parkway
Jacksonville, FL
8880 Tamiami Trail, North
Naples, FL
230 Royal Palm Way
Palm Beach, FL
3501 PGA Boulevard
Palm Beach Gardens, FL
3550 Tamiami Trail, South
Sarasota, FL
1502 N. Westshore Blvd.
Tampa, FL
2465 State Road 7
Wellington, FL
Georgia
3242 Peachtree Road
Atlanta, GA
1000 Abernathy Road
Atlanta, GA
Illinois
One North LaSalle Street
Chicago, IL
401 North Michigan Avenue
Chicago, IL
One Skokie Valley Road
Highland Park, IL
1415 West 22nd Street
Oak Brook, IL
15105 S LaGrange Road
Orland Park, IL
1572 East Golf Road
Schaumburg, IL
1823 Freedom Drive
Naperville, IL
Indiana
8480 Keystone Crossing
Indianapolis, IN
Kansas
5400 College Boulevard
Overland Park, KS
Maine
Three Canal Plaza
Portland, ME
Maryland
7315 Wisconsin Avenue
Bethesda, MD
610 York Road
Towson, MD
Massachusetts
801 Boylston Street
Boston, MA
155 Congress Street
Boston, MA
300 Granite Street
Braintree, MA
44 Mall Road
Burlington, MA
238 Main Street
Cambridge, MA
200 Endicott Street
Danvers, MA
Fidelity Brokerage Services, Inc., 100 Summer St., Boston, MA 02110 Member NYSE/SIPC
Annual Report
405 Cochituate Road
Framingham, MA
551 Boston Turnpike
Shrewsbury, MA
Michigan
500 E. Eisenhower Pkwy.
Ann Arbor, MI
280 N. Old Woodward Ave.
Birmingham, MI
30200 Northwestern Hwy.
Farmington Hills, MI
43420 Grand River Avenue
Novi, MI
3480 28th Street
Grand Rapids, MI
2425 S. Linden Road STE E
Flint, MI
Minnesota
7740 France Avenue South
Edina, MN
8342 3rd Street North
Oakdale, MN
Missouri
1524 South Lindbergh Blvd.
St. Louis, MO
Nevada
2225 Village Walk Drive
Henderson, NV
New Jersey
501 Route 73 South
Marlton, NJ
150 Essex Street
Millburn, NJ
35 Morris Street
Morristown, NJ
396 Route 17, North
Paramus, NJ
3518 Route 1 North
Princeton, NJ
530 Broad Street
Shrewsbury, NJ
New Mexico
2261 Q Street NE
Albuquerque, NM
New York
1130 Franklin Avenue
Garden City, NY
37 West Jericho Turnpike
Huntington Station, NY
1271 Avenue of the Americas
New York, NY
980 Madison Avenue
New York, NY
61 Broadway
New York, NY
350 Park Avenue
New York, NY
200 Fifth Avenue
New York, NY
733 Third Avenue
New York, NY
2070 Broadway
New York, NY
1075 Northern Blvd.
Roslyn, NY
799 Central Park Avenue
Scarsdale, NY
3349 Monroe Avenue
Rochester, NY
North Carolina
4611 Sharon Road
Charlotte, NC
7011 Fayetteville Road
Durham, NC
Ohio
3805 Edwards Road
Cincinnati, OH
1324 Polaris Parkway
Columbus, OH
1800 Crocker Road
Westlake, OH
28699 Chagrin Boulevard
Woodmere Village, OH
Oregon
7493 SW Bridgeport Road
Tigard, OR
Pennsylvania
600 West DeKalb Pike
King of Prussia, PA
1735 Market Street
Philadelphia, PA
12001 Perry Highway
Wexford, PA
Rhode Island
10 Memorial Boulevard
Providence, RI
Tennessee
3018 Peoples Street
Johnson City, TN
7628 West Farmington Blvd.
Germantown, TN
2035 Mallory Lane
Franklin, TN
Texas
10000 Research Boulevard
Austin, TX
4001 Northwest Parkway
Dallas, TX
12532 Memorial Drive
Houston, TX
2701 Drexel Drive
Houston, TX
6560 Fannin Street
Houston, TX
1701 Lake Robbins Drive
The Woodlands, TX
6500 N. MacArthur Blvd.
Irving, TX
6005 West Park Boulevard
Plano, TX
1576 East Southlake Blvd.
Southlake, TX
15600 Southwest Freeway
Sugar Land, TX
139 N. Loop 1604 East
San Antonio, TX
Utah
279 West South Temple
Salt Lake City, UT
Virginia
1861 International Drive
McLean, VA
11957 Democracy Drive
Reston, VA
Washington
10500 NE 8th Street
Bellevue, WA
1518 6th Avenue
Seattle, WA
304 Strander Blvd
Tukwila, WA
Washington, DC
1900 K Street, N.W.
Washington, DC
Wisconsin
16020 West Bluemound Road
Brookfield, WI
Annual Report
Investment Adviser
Fidelity Management & Research Company
Boston, MA
Investment Sub-Advisers
FMR Co., Inc.
Fidelity Investments
Money Management, Inc.
Fidelity Management & Research
(U.K.) Inc.
Fidelity Management & Research
(Hong Kong) Limited
Fidelity Management & Research
(Japan) Inc.
General Distributor
Fidelity Distributors Corporation
Boston, MA
Transfer and Service Agents
Fidelity Investments Institutional Operations Company, Inc.
Boston, MA
Fidelity Service Company, Inc.
Boston, MA
Custodian
Citibank, N.A.
New York, NY
The Fidelity Telephone Connection
Mutual Fund 24-Hour Service
Exchanges/Redemptions
and Account Assistance 1-800-544-6666
Product Information 1-800-544-6666
Retirement Accounts 1-800-544-4774
(8 a.m. - 9 p.m.)
TDD Service 1-800-544-0118
for the deaf and hearing impaired
(9 a.m. - 9 p.m. Eastern time)
Fidelity Automated Service
Telephone (FAST®) 1-800-544-5555
Automated line for quickest service
BAL-UANN-1011
1.789243.108

Fidelity®
Balanced
Fund -
Class K
Annual Report
August 31, 2011
(2_fidelity_logos) (Registered_Trademark)
Contents
Chairman's Message | <Click Here> | The Chairman's message to shareholders. |
Notes to shareholders | <Click Here> | Important information about the fund. |
Performance | <Click Here> | How the fund has done over time. |
Management's Discussion of Fund Performance | <Click Here> | The Portfolio Manager's review of fund
performance and strategy. |
Shareholder Expense Example | <Click Here> | An example of shareholder expenses. |
Investment Changes | <Click Here> | A summary of major shifts in the fund's investments over the past six months. |
Investments | <Click Here> | A complete list of the fund's investments with their market values. |
Financial Statements | <Click Here> | Statements of assets and liabilities, operations, and changes in net assets,
as well as financial highlights. |
Notes | <Click Here> | Notes to the financial statements. |
Report of Independent Registered Public Accounting Firm | <Click Here> | |
Trustees and Officers | <Click Here> | |
Distributions | <Click Here> | |
Board Approval of Investment Advisory Contracts and Management Fees | <Click Here> | |
To view a fund's proxy voting guidelines and proxy voting record for the 12-month period ended June 30, visit http://www.fidelity.com/proxyvotingresults or visit the Securities and Exchange Commission's (SEC) web site at http://www.sec.gov. You may also call 1-800-835-5092 to request a free copy of the proxy voting guidelines.
Standard & Poor's, S&P and S&P 500 are registered service marks of The McGraw-Hill Companies, Inc. and have been licensed for use by Fidelity Distributors Corporation.
Other third party marks appearing herein are the property of their respective owners.
All other marks appearing herein are registered or unregistered trademarks or service marks of FMR LLC or an affiliated company.
Annual Report
This report and the financial statements contained herein are submitted for the general information of the shareholders of the fund. This report is not authorized for distribution to prospective investors in the fund unless preceded or accompanied by an effective prospectus.
A fund files its complete schedule of portfolio holdings with the SEC for the first and third quarters of each fiscal year on Form N-Q. Forms N-Q are available on the SEC's web site at http://www.sec.gov. A fund's Forms N-Q may be reviewed and copied at the SEC's Public Reference Room in Washington, DC. Information regarding the operation of the SEC's Public Reference Room may be obtained by calling 1-800-SEC-0330. For a complete list of a fund's portfolio holdings, view the most recent holdings listing, semiannual report, or annual report on Fidelity's web site at http://www.fidelity.com, http://www.advisor.fidelity.com, or http://www.401k.com, as applicable.
NOT FDIC INSURED • MAY LOSE VALUE • NO BANK GUARANTEE
Neither the fund nor Fidelity Distributors Corporation is a bank.
Annual Report
(photo_of_James_C_Curvey)
Dear Shareholder:
U.S. equities remained in a significant midyear downturn that began in May and intensified in the final week of July and the early part of August, when Standard & Poor's announced it was lowering its long-term sovereign credit rating of the United States. The historic downgrade followed a political stalemate in which Congress struggled to address the debt ceiling issue before an early-August deadline, resulting in heightened investor anxiety and volatility across major financial markets. Financial markets are always unpredictable, of course, but there are several time-tested investment principles that can help put the odds in your favor.
One of the basic tenets is to invest for the long term. Over time, riding out the markets' inevitable ups and downs has proven much more effective than selling into panic or chasing the hottest trend. Even missing only a few of the markets' best days can significantly diminish investor returns. Patience also affords the benefits of compounding - of earning interest on additional income or reinvested dividends and capital gains. There can be tax advantages and cost benefits to consider as well. While staying the course doesn't eliminate risk, it can considerably lessen the effect of short-term declines.
You can further manage your investing risk through diversification. And today, more than ever, geographic diversification should be taken into account. Studies indicate that asset allocation is the single most important determinant of a portfolio's long-term success. The right mix of stocks, bonds and cash - aligned to your particular risk tolerance and investment objective - is very important. Age-appropriate rebalancing is also an essential aspect of asset allocation. For younger investors, an emphasis on equities - which historically have been the best-performing asset class over time - is encouraged. As investors near their specific goal, such as retirement or sending a child to college, consideration may be given to replacing volatile assets (e.g. common stocks) with more-stable fixed investments (bonds or savings plans).
A third principle - investing regularly - can help lower the average cost of your purchases. Investing a certain amount of money each month or quarter helps ensure you won't pay for all your shares at market highs. This strategy - known as dollar cost averaging - also reduces "emotion" from investing, helping shareholders avoid selling weak performers just prior to an upswing, or chasing a hot performer just before a correction.
We invite you to contact us via the Internet, through our Investor Centers or by phone. It is our privilege to provide you the information you need to make the investments that are right for you.
Sincerely,
(The acting chairman's signature appears here.)
James C. Curvey
Acting Chairman
Annual Report
The following changes to Fidelity® Balanced Fund were effective as of March 7, 2011:
• Matthew Friedman is no longer Co-Portfolio Manager of the fund's energy sector investments, which are solely managed by Co-Portfolio Manager Nathan Strik.
• Peter Saperstone was named Co-Portfolio Manager, replacing John Roth in managing the fund's consumer discretionary sector investments.
• The Multi-Manager Group (MMG) was renamed the Stock Selector Large Cap Group, recognizing stock selection as the dominant driver of performance within the portfolios it manages. There is no change in philosophy or process. The group includes experienced portfolio managers who are specialists in one or more market sectors and manage the equity portion of the fund.
Annual Report
Average annual total return reflects the change in the value of an investment, assuming reinvestment of the class' distributions from dividend income and capital gains (the profits earned upon the sale of securities that have grown in value, if any) and assuming a constant rate of performance each year. The $10,000 table and the fund's returns do not reflect the deduction of taxes that a shareholder would pay on fund distributions or the redemption of fund shares. During periods of reimbursement by Fidelity, a fund's total return will be greater than it would be had the reimbursement not occurred. How a fund did yesterday is no guarantee of how it will do tomorrow.
Average Annual Total Returns
Periods ended August 31, 2011 | Past 1
year | Past 5
years | Past 10
years |
Class K A | 14.04% | 3.19% | 6.03% |
A The initial offering of Class K shares took place on May 9, 2008. Returns prior to May 9, 2008 are those of Fidelity Balanced Fund, the original class of the fund.
$10,000 Over 10 Years
Let's say hypothetically that $10,000 was invested in Fidelity® Balanced Fund - Class K on August 31, 2001. The chart shows how the value of your investment would have changed, and also shows how the S&P 500® Index performed over the same period. The initial offering of Class K took place on May 9, 2008. See above for additional information regarding the performance of Class K.
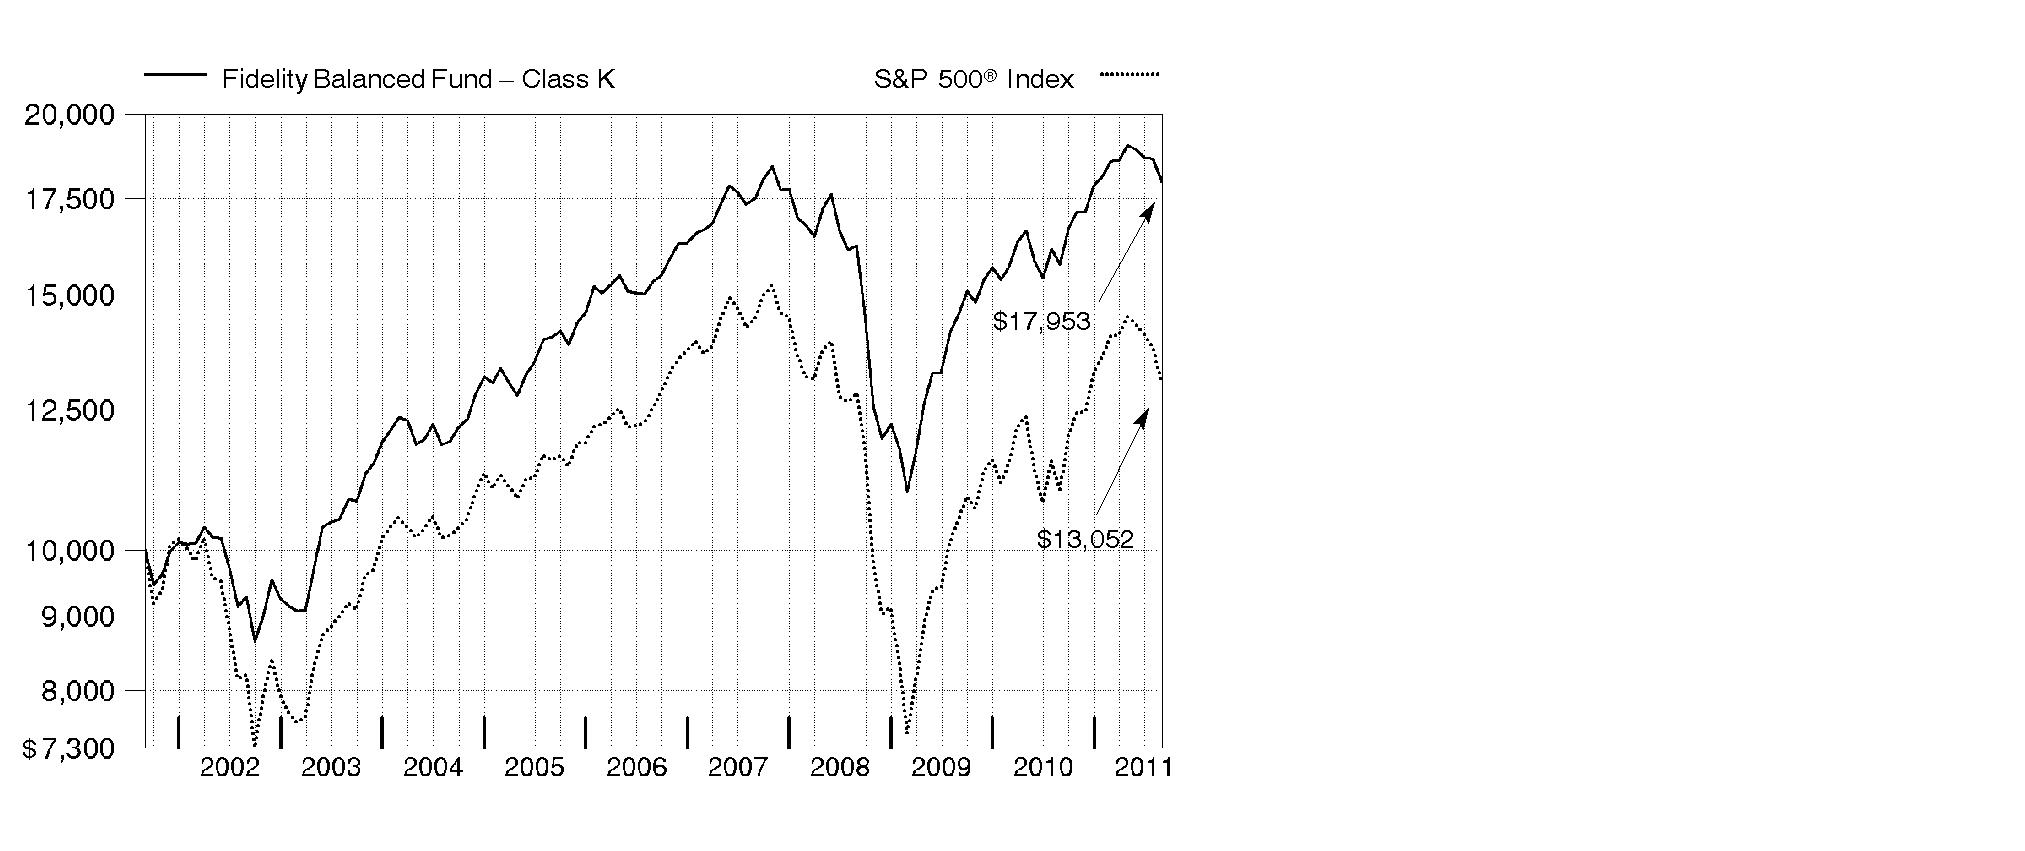
Annual Report
Market Recap: U.S. stocks registered solid double-digit gains for the year ending August 31, 2011, despite finishing in a four-month downturn that intensified in the two weeks preceding the August 5 news that Standard & Poor's had lowered its long-term sovereign credit rating of the United States. The downgrade followed a stalemate in which Congress struggled to address the debt ceiling, heightening investor anxiety. For the year, the large-cap laden S&P 500® Index gained 18.50% and the blue-chip Dow Jones Industrial AverageSM advanced 19.03%. The technology-heavy Nasdaq Composite® Index fared even better, climbing 23.19%. Small and mid-sized stocks beat their larger-cap counterparts, as the Russell 2000® and Russell Midcap® indexes added 22.19% and 21.28%, respectively. Solid returns for equities brought about more-tempered gains for fixed-income markets. The Barclays Capital® U.S. Aggregate Bond Index - a proxy for investment-grade debt - rose 4.62%. Higher-risk bond categories fared best, with The BofA Merrill LynchSM US High Yield Constrained Index gaining 8.15%. Bonds backed by the U.S. government were among the weakest performers, with the Barclays Capital® U.S. Treasury Bond Index adding 4.17%, while short-term assets fared the worst, as gauged by the 0.16% increase in the Barclays Capital U.S. 3 Month Treasury Bellwether Index.
Comments from Robert Stansky, Head of Fidelity's Stock Selector Large Cap Group, which manages Fidelity® Balanced Fund: For the year, the fund's Class K shares returned 14.04%, outperforming the 13.05% gain of the Fidelity Balanced Hybrid Composite Index, a hypothetical blend of the total returns of the S&P 500® Index and the Barclays Capital U.S. Aggregate Bond Index, using weightings of 60% and 40%, respectively. The fund was aided by security selection in equities and investment-grade bonds. In terms of asset allocation, overweighting equities and underweighting investment-grade bonds contributed, while a small stake in high-yield bonds nicked relative performance. On an individual security basis, limited exposure to Bank of America was beneficial, as its shares fell sharply due to concern about capital requirements. Not owning networking gear maker and index component Cisco Systems and largely avoiding computer and peripherals firm Hewlett-Packard helped, as both lost ground. Conversely, not owning IBM and underweighting integrated energy firm Chevron hurt because both stocks saw strong advances. An out-of-index position in health information services provider WebMD Health detracted, mainly because its shares plunged in July. Some stocks mentioned were not held at period end.
The views expressed above reflect those of the portfolio manager(s) only through the end of the period as stated on the cover of this report and do not necessarily represent the views of Fidelity or any other person in the Fidelity organization. Any such views are subject to change at any time based upon market or other conditions and Fidelity disclaims any responsibility to update such views. These views may not be relied on as investment advice and, because investment decisions for a Fidelity fund are based on numerous factors, may not be relied on as an indication of trading intent on behalf of any Fidelity fund.
Annual Report
Shareholder Expense Example
As a shareholder of the Fund, you incur two types of costs: (1) transaction costs, and (2) ongoing costs, including management fees and other Fund expenses. This Example is intended to help you understand your ongoing costs (in dollars) of investing in the Fund and to compare these costs with the ongoing costs of investing in other mutual funds.
The Example is based on an investment of $1,000 invested at the beginning of the period and held for the entire period (March 1, 2011 to August 31, 2011).
Actual Expenses
The first line of the accompanying table for each class of the Fund provides information about actual account values and actual expenses. You may use the information in this line, together with the amount you invested, to estimate the expenses that you paid over the period. Simply divide your account value by $1,000.00 (for example, an $8,600 account value divided by $1,000.00 = 8.6), then multiply the result by the number in the first line for a class of the Fund under the heading entitled "Expenses Paid During Period" to estimate the expenses you paid on your account during this period. A small balance maintenance fee of $12.00 that is charged once a year may apply for certain accounts with a value of less than $2,000. This fee is not included in the table below. If it was, the estimate of expenses you paid during the period would be higher, and your ending account value lower, by this amount. In addition, the Fund, as a shareholder in the underlying Fidelity Central Funds, will indirectly bear its pro-rata share of the fees and expenses incurred by the underlying Fidelity Central Funds. These fees and expenses are not included in the Fund's annualized expense ratio used to calculate the expense estimate in the table below.
Hypothetical Example for Comparison Purposes
The second line of the accompanying table for each class of the Fund provides information about hypothetical account values and hypothetical expenses based on a Class' actual expense ratio and an assumed rate of return of 5% per year before expenses, which is not the Class' actual return. The hypothetical account values and expenses may not be used to estimate the actual ending account balance or expenses you paid for the period. You may use this information to compare the ongoing costs of investing in the Fund and other funds. To do so, compare this 5% hypothetical example with the 5% hypothetical examples that appear in the shareholder reports of the other funds. A small balance maintenance fee of $12.00 that is charged once a year may apply for certain accounts with a value of less than $2,000. This fee is not included in the table below. If it was, the estimate of expenses you paid during the period would be higher, and your ending account value lower, by this amount. In addition, the Fund, as a shareholder in the underlying Fidelity Central Funds, will indirectly bear its pro-rata share of the fees and expenses incurred by the underlying Fidelity Central Funds. These fees and expenses are not included in the Fund's annualized expense ratio used to calculate the expense estimate in the table below.
Please note that the expenses shown in the table are meant to highlight your ongoing costs only and do not reflect any transaction costs. Therefore, the second line of the table is useful in comparing ongoing costs only, and will not help you determine the relative total costs of owning different funds.
Annual Report
Shareholder Expense Example - continued
| Annualized
Expense Ratio | Beginning
Account Value
March 1, 2011 | Ending
Account Value
August 31, 2011 | Expenses Paid
During Period*
March 1, 2011 to
August 31, 2011 |
Balanced | .60% | | | |
Actual | | $ 1,000.00 | $ 966.90 | $ 2.97 |
HypotheticalA | | $ 1,000.00 | $ 1,022.18 | $ 3.06 |
Class K | .48% | | | |
Actual | | $ 1,000.00 | $ 967.10 | $ 2.38 |
HypotheticalA | | $ 1,000.00 | $ 1,022.79 | $ 2.45 |
A 5% return per year before expenses
* Expenses are equal to each Class' annualized expense ratio, multiplied by the average account value over the period, multiplied by 184/365 (to reflect the one-half year period). The fees and expenses of the underlying Fidelity Central Funds in which the Fund invests are not included in the Fund's annualized expense ratio.
Annual Report
Investment Changes (Unaudited)
The information in the following tables is based on the combined investments of the Fund and its pro-rata share of its investments in each non-money market Fidelity Central Fund. |
Top Five Stocks as of August 31, 2011 |
| % of fund's
net assets | % of fund's net assets
6 months ago |
Apple, Inc. | 2.9 | 2.6 |
Microsoft Corp. | 1.5 | 1.0 |
Procter & Gamble Co. | 1.3 | 1.2 |
Google, Inc. Class A | 1.2 | 0.1 |
The Coca-Cola Co. | 1.2 | 1.0 |
| 8.1 | |
Top Five Bond Issuers as of August 31, 2011 |
(with maturities greater than one year) | % of fund's
net assets | % of fund's net assets
6 months ago |
Fannie Mae | 12.8 | 8.9 |
U.S. Treasury Obligations | 11.0 | 11.9 |
Freddie Mac | 3.1 | 2.2 |
Ginnie Mae | 2.4 | 2.3 |
Citigroup, Inc. | 0.5 | 0.5 |
| 29.8 | |
Top Five Market Sectors as of August 31, 2011 |
| % of fund's
net assets | % of fund's net assets
6 months ago |
Financials | 13.1 | 14.1 |
Information Technology | 11.9 | 11.8 |
Energy | 8.9 | 9.3 |
Consumer Staples | 7.4 | 6.5 |
Consumer Discretionary | 7.2 | 7.6 |
Asset Allocation (% of fund's net assets) |
As of August 31, 2011 * | As of February 28, 2011 ** |
| Stocks and Equity
Futures 59.6% | | | Stocks and Equity
Futures 60.8% | |
| Bonds 44.7% | | | Bonds 39.6% | |
| Convertible
Securities 0.1% | | | Convertible
Securities 0.0% | |
| Other Investments 0.3% | | | Other Investments 0.3% | |
| Short-Term
Investments and
Net Other Assets† (4.7)% | | | Short-Term
Investments and
Net Other Assets† (0.7)% | |
* Foreign investments | 12.2% | | ** Foreign investments | 11.7% | |

† Short-Term Investments and Net Other Assets are not included in the pie chart. |
Percentages are adjusted for the effect of futures contracts and swap contracts, if applicable. A holdings listing for the Fund, which presents direct holdings as well as the pro-rata share of any securities and other investments held indirectly through its investment in underlying non-money market Fidelity Central Funds, is available at fidelity.com. |
Annual Report
Investments August 31, 2011
Showing Percentage of Net Assets
Common Stocks - 58.8% |
| Shares | | Value (000s) |
CONSUMER DISCRETIONARY - 6.1% |
Distributors - 0.0% |
Indiabulls Wholesale Services Ltd. | 372,748 | | $ 43 |
Hotels, Restaurants & Leisure - 1.7% |
Arcos Dorados Holdings, Inc. | 1,410,407 | | 38,885 |
Betfair Group PLC (f) | 2,135,799 | | 21,380 |
Las Vegas Sands Corp. (a) | 1,586,338 | | 73,876 |
Pinnacle Entertainment, Inc. (a) | 1,753,586 | | 24,059 |
Starbucks Corp. | 2,074,239 | | 80,107 |
Yum! Brands, Inc. | 1,732,234 | | 94,182 |
| | 332,489 |
Internet & Catalog Retail - 1.0% |
Amazon.com, Inc. (a) | 412,694 | | 88,849 |
Priceline.com, Inc. (a) | 199,124 | | 106,981 |
| | 195,830 |
Media - 1.9% |
DIRECTV (a) | 2,594,247 | | 114,069 |
Focus Media Holding Ltd. ADR (a) | 392,204 | | 12,300 |
Legend Pictures LLC (a)(r)(s) | 8,571 | | 6,428 |
The Walt Disney Co. | 3,224,327 | | 109,821 |
Time Warner, Inc. | 3,976,935 | | 125,910 |
| | 368,528 |
Multiline Retail - 0.4% |
Dollar General Corp. (a) | 2,263,260 | | 82,835 |
Specialty Retail - 0.8% |
Abercrombie & Fitch Co. Class A | 1,083,171 | | 68,901 |
Limited Brands, Inc. | 1,787,464 | | 67,459 |
TJX Companies, Inc. | 431,099 | | 23,547 |
| | 159,907 |
Textiles, Apparel & Luxury Goods - 0.3% |
Crocs, Inc. (a) | 587,177 | | 16,065 |
Under Armour, Inc. Class A (sub. vtg.) (a) | 245,997 | | 17,431 |
VF Corp. | 320,134 | | 37,475 |
| | 70,971 |
TOTAL CONSUMER DISCRETIONARY | | 1,210,603 |
CONSUMER STAPLES - 6.8% |
Beverages - 2.8% |
Anheuser-Busch InBev SA NV | 634,550 | | 35,029 |
Carlsberg A/S Series B | 44,700 | | 3,353 |
Common Stocks - continued |
| Shares | | Value (000s) |
CONSUMER STAPLES - continued |
Beverages - continued |
Coca-Cola Bottling Co. Consolidated | 97,384 | | $ 5,454 |
Coca-Cola FEMSA SAB de CV sponsored ADR | 70,725 | | 6,986 |
Coca-Cola Icecek A/S | 481,588 | | 5,982 |
Companhia de Bebidas das Americas (AmBev) (PN) sponsored ADR | 198,325 | | 7,068 |
Constellation Brands, Inc. Class A (sub. vtg.) (a) | 2,213,783 | | 43,766 |
Diageo PLC sponsored ADR | 562,302 | | 45,130 |
Embotelladora Andina SA sponsored ADR | 257,726 | | 7,059 |
Molson Coors Brewing Co. Class B | 1,042,828 | | 45,624 |
PepsiCo, Inc. | 1,124,854 | | 72,474 |
Pernod-Ricard SA | 373,450 | | 33,532 |
Remy Cointreau SA | 168,325 | | 14,826 |
The Coca-Cola Co. | 3,256,916 | | 229,450 |
| | 555,733 |
Food & Staples Retailing - 0.7% |
CVS Caremark Corp. | 3,261,896 | | 117,135 |
Drogasil SA | 391,400 | | 3,073 |
Fresh Market, Inc. | 14,100 | | 544 |
Walgreen Co. | 585,872 | | 20,629 |
| | 141,381 |
Food Products - 0.5% |
Archer Daniels Midland Co. | 185,933 | | 5,295 |
Bunge Ltd. | 319,046 | | 20,645 |
Danone | 163,400 | | 11,166 |
Green Mountain Coffee Roasters, Inc. (a) | 42,500 | | 4,451 |
Nestle SA | 307,252 | | 19,026 |
Unilever NV (NY Reg.) | 598,231 | | 20,340 |
Viterra, Inc. | 321,800 | | 3,424 |
| | 84,347 |
Household Products - 1.5% |
Colgate-Palmolive Co. | 324,967 | | 29,237 |
Procter & Gamble Co. | 4,062,395 | | 258,693 |
Spectrum Brands Holdings, Inc. (a) | 259,133 | | 6,940 |
| | 294,870 |
Personal Products - 0.3% |
Avon Products, Inc. | 1,009,261 | | 22,769 |
L'Oreal SA | 296,100 | | 32,240 |
Nu Skin Enterprises, Inc. Class A | 84,779 | | 3,585 |
| | 58,594 |
Common Stocks - continued |
| Shares | | Value (000s) |
CONSUMER STAPLES - continued |
Tobacco - 1.0% |
Altria Group, Inc. | 623,204 | | $ 16,945 |
British American Tobacco PLC sponsored ADR | 1,513,054 | | 135,585 |
Philip Morris International, Inc. | 526,872 | | 36,523 |
Souza Cruz Industria Comerico | 564,500 | | 7,049 |
| | 196,102 |
TOTAL CONSUMER STAPLES | | 1,331,027 |
ENERGY - 7.4% |
Energy Equipment & Services - 2.3% |
Aker Solutions ASA | 538,774 | | 7,030 |
Baker Hughes, Inc. | 1,382,895 | | 84,509 |
C&J Energy Services, Inc. (a)(g) | 374,800 | | 8,818 |
Discovery Offshore S.A. (a)(g) | 1,018,700 | | 1,519 |
Ensco International Ltd. ADR | 555,260 | | 26,797 |
Halliburton Co. | 2,488,898 | | 110,432 |
Kvaerner ASA (a) | 538,774 | | 1,039 |
National Oilwell Varco, Inc. | 710,055 | | 46,949 |
Noble Corp. | 1,089,708 | | 36,789 |
Ocean Rig UDW, Inc. (a) | 104,100 | | 1,552 |
Oceaneering International, Inc. | 579,698 | | 24,747 |
Saipem SpA | 341,124 | | 15,320 |
Schlumberger Ltd. | 578,124 | | 45,163 |
TETRA Technologies, Inc. (a) | 428,100 | | 4,388 |
Transocean Ltd. (United States) | 672,000 | | 37,645 |
Vantage Drilling Co. (a) | 4,677,101 | | 7,156 |
| | 459,853 |
Oil, Gas & Consumable Fuels - 5.1% |
Alpha Natural Resources, Inc. (a) | 845,697 | | 27,967 |
Anadarko Petroleum Corp. | 805,077 | | 59,374 |
Apache Corp. | 872,771 | | 89,957 |
BP PLC sponsored ADR | 905,028 | | 35,649 |
Canadian Natural Resources Ltd. | 743,700 | | 28,101 |
CVR Energy, Inc. (a) | 402,924 | | 11,471 |
Exxon Mobil Corp. | 2,037,491 | | 150,856 |
Falkland Oil & Gas Ltd. (a) | 624,364 | | 568 |
HollyFrontier Corp. | 1,013,459 | | 72,726 |
InterOil Corp. (a)(f) | 284,231 | | 18,012 |
Marathon Oil Corp. | 2,026,023 | | 54,541 |
Marathon Petroleum Corp. | 1,071,111 | | 39,695 |
Common Stocks - continued |
| Shares | | Value (000s) |
ENERGY - continued |
Oil, Gas & Consumable Fuels - continued |
Niko Resources Ltd. | 218,400 | | $ 12,432 |
Occidental Petroleum Corp. | 682,348 | | 59,187 |
Petrobank Energy & Resources Ltd. (a) | 858,290 | | 10,404 |
Petrominerales Ltd. | 407,701 | | 12,724 |
Resolute Energy Corp. (a) | 855,062 | | 11,535 |
Rockhopper Exploration PLC (a) | 202,500 | | 709 |
Rodinia Oil Corp. (a) | 449,500 | | 519 |
Royal Dutch Shell PLC: | | | |
Class A sponsored ADR (f) | 68,834 | | 4,615 |
Class B sponsored ADR | 2,730,021 | | 184,222 |
Talisman Energy, Inc. | 1,941,700 | | 32,461 |
Western Refining, Inc. (a)(f) | 711,088 | | 12,401 |
Whiting Petroleum Corp. (a) | 443,180 | | 20,878 |
Williams Companies, Inc. | 1,559,100 | | 42,080 |
| | 993,084 |
TOTAL ENERGY | | 1,452,937 |
FINANCIALS - 8.4% |
Capital Markets - 1.1% |
Ameriprise Financial, Inc. | 534,300 | | 24,418 |
E*TRADE Financial Corp. (a) | 1,352,400 | | 16,716 |
Evercore Partners, Inc. Class A | 275,200 | | 7,218 |
ICAP PLC | 913,200 | | 7,045 |
Invesco Ltd. | 761,882 | | 13,942 |
Morgan Stanley | 2,784,765 | | 48,733 |
State Street Corp. | 2,399,566 | | 85,233 |
TD Ameritrade Holding Corp. | 1,066,600 | | 16,404 |
| | 219,709 |
Commercial Banks - 2.4% |
Banco Macro SA sponsored ADR | 144,500 | | 3,913 |
BB&T Corp. | 893,853 | | 19,924 |
CIT Group, Inc. (a) | 203,194 | | 7,024 |
FirstMerit Corp. | 934,898 | | 11,649 |
Huntington Bancshares, Inc. | 5,375,934 | | 27,041 |
Regions Financial Corp. | 2,171,300 | | 9,858 |
SunTrust Banks, Inc. | 1,140,177 | | 22,690 |
Synovus Financial Corp. (f) | 6,616,120 | | 9,593 |
Common Stocks - continued |
| Shares | | Value (000s) |
FINANCIALS - continued |
Commercial Banks - continued |
U.S. Bancorp | 6,507,702 | | $ 151,044 |
Wells Fargo & Co. | 8,114,874 | | 211,798 |
| | 474,534 |
Consumer Finance - 0.5% |
Capital One Financial Corp. | 1,035,543 | | 47,687 |
Discover Financial Services | 580,742 | | 14,611 |
Green Dot Corp. Class A (a)(f) | 224,815 | | 7,351 |
Promise Co. Ltd. (a) | 1,201,300 | | 8,600 |
SLM Corp. | 1,544,400 | | 21,205 |
| | 99,454 |
Diversified Financial Services - 1.1% |
African Bank Investments Ltd. | 2,280,111 | | 11,593 |
Citigroup, Inc. | 5,181,049 | | 160,872 |
CME Group, Inc. | 109,537 | | 29,260 |
NBH Holdings Corp. Class A (a)(g) | 576,500 | | 9,801 |
| | 211,526 |
Insurance - 2.2% |
ACE Ltd. | 628,282 | | 40,574 |
Amlin PLC | 2,630,845 | | 13,324 |
Aon Corp. | 745,900 | | 34,856 |
Berkshire Hathaway, Inc.: | | | |
Class A (a) | 208 | | 22,832 |
Class B (a) | 1,994,121 | | 145,571 |
Fairfax Financial Holdings Ltd. (sub. vtg.) | 114,300 | | 46,096 |
Fidelity National Financial, Inc. Class A | 548,100 | | 9,312 |
Genworth Financial, Inc. Class A (a) | 478,496 | | 3,306 |
MetLife, Inc. | 2,436,422 | | 81,864 |
The Chubb Corp. | 475,900 | | 29,453 |
Validus Holdings Ltd. | 380,065 | | 9,813 |
| | 437,001 |
Real Estate Investment Trusts - 0.8% |
American Capital Agency Corp. | 458,500 | | 13,072 |
Annaly Capital Management, Inc. | 713,738 | | 12,940 |
Camden Property Trust (SBI) | 272,101 | | 18,182 |
Equity Lifestyle Properties, Inc. | 120,400 | | 8,298 |
Prologis, Inc. | 1,206,853 | | 32,863 |
Public Storage | 400,195 | | 49,516 |
The Macerich Co. | 334,401 | | 16,399 |
| | 151,270 |
Common Stocks - continued |
| Shares | | Value (000s) |
FINANCIALS - continued |
Real Estate Management & Development - 0.2% |
Ayala Land, Inc. | 19,944,000 | | $ 7,489 |
BR Malls Participacoes SA | 1,283,200 | | 14,307 |
CB Richard Ellis Group, Inc. Class A (a) | 80,860 | | 1,226 |
Indiabulls Real Estate Ltd. (a) | 3,224,938 | | 5,983 |
PT Lippo Karawaci Tbk | 122,587,250 | | 10,861 |
| | 39,866 |
Thrifts & Mortgage Finance - 0.1% |
Ocwen Financial Corp. (a) | 1,856,619 | | 25,621 |
TOTAL FINANCIALS | | 1,658,981 |
HEALTH CARE - 6.7% |
Biotechnology - 1.5% |
Alexion Pharmaceuticals, Inc. (a) | 283,037 | | 16,401 |
Amgen, Inc. | 2,092,949 | | 115,960 |
AVEO Pharmaceuticals, Inc. (a) | 380,100 | | 6,454 |
AVEO Pharmaceuticals, Inc. | 77,244 | | 1,312 |
Biogen Idec, Inc. (a) | 623,416 | | 58,726 |
BioMarin Pharmaceutical, Inc. (a) | 611,487 | | 18,091 |
Gilead Sciences, Inc. (a) | 1,372,644 | | 54,748 |
Medivir AB (B Shares) (a) | 325,143 | | 4,974 |
ONYX Pharmaceuticals, Inc. (a) | 245,107 | | 8,341 |
| | 285,007 |
Health Care Equipment & Supplies - 1.8% |
Baxter International, Inc. | 1,621,611 | | 90,778 |
Boston Scientific Corp. (a) | 5,415,038 | | 36,714 |
C. R. Bard, Inc. | 284,966 | | 27,146 |
Covidien PLC | 2,247,103 | | 117,254 |
Edwards Lifesciences Corp. (a) | 540,081 | | 40,749 |
Mako Surgical Corp. (a)(f) | 630,372 | | 22,630 |
Quidel Corp. (a) | 1,129,647 | | 17,261 |
Shandong Weigao Group Medical Polymer Co. Ltd. (H Shares) | 2,508,000 | | 3,160 |
William Demant Holding A/S (a) | 69,534 | | 5,745 |
| | 361,437 |
Health Care Providers & Services - 1.4% |
CIGNA Corp. | 756,788 | | 35,372 |
Express Scripts, Inc. (a) | 92,700 | | 4,351 |
Henry Schein, Inc. (a) | 674,713 | | 44,470 |
McKesson Corp. | 1,131,300 | | 90,425 |
Omnicare, Inc. | 832,251 | | 24,726 |
Common Stocks - continued |
| Shares | | Value (000s) |
HEALTH CARE - continued |
Health Care Providers & Services - continued |
Shanghai Pharma Holding Co. Ltd. (H Shares) | 70,100 | | $ 146 |
UnitedHealth Group, Inc. | 1,729,936 | | 82,207 |
| | 281,697 |
Life Sciences Tools & Services - 0.2% |
Thermo Fisher Scientific, Inc. (a) | 743,029 | | 40,815 |
Pharmaceuticals - 1.8% |
Bayer AG | 118,390 | | 7,635 |
Merck & Co., Inc. | 1,820,350 | | 60,290 |
Novo Nordisk A/S Series B | 69,031 | | 7,354 |
Pfizer, Inc. | 7,863,048 | | 149,241 |
Sanofi-Aventis sponsored ADR | 1,378,600 | | 50,415 |
Shire PLC sponsored ADR | 553,400 | | 53,735 |
Valeant Pharmaceuticals International, Inc. (Canada) | 736,491 | | 33,019 |
| | 361,689 |
TOTAL HEALTH CARE | | 1,330,645 |
INDUSTRIALS - 6.6% |
Aerospace & Defense - 2.6% |
Bombardier, Inc. Class B (sub. vtg.) | 4,552,900 | | 22,179 |
Goodrich Corp. | 661,608 | | 59,002 |
Honeywell International, Inc. | 1,328,764 | | 63,528 |
MTU Aero Engines Holdings AG | 200,864 | | 13,681 |
Precision Castparts Corp. | 451,300 | | 73,946 |
Safran SA | 785,310 | | 30,490 |
Textron, Inc. | 1,531,844 | | 25,842 |
The Boeing Co. | 1,303,389 | | 87,145 |
United Technologies Corp. | 1,749,514 | | 129,901 |
| | 505,714 |
Air Freight & Logistics - 0.1% |
C.H. Robinson Worldwide, Inc. | 310,386 | | 21,882 |
Building Products - 0.2% |
Armstrong World Industries, Inc. | 334,346 | | 13,464 |
Lennox International, Inc. | 353,458 | | 11,035 |
Owens Corning (a) | 865,708 | | 25,157 |
| | 49,656 |
Commercial Services & Supplies - 0.4% |
Republic Services, Inc. | 1,341,863 | | 40,739 |
Common Stocks - continued |
| Shares | | Value (000s) |
INDUSTRIALS - continued |
Commercial Services & Supplies - continued |
Stericycle, Inc. (a) | 260,397 | | $ 22,839 |
Swisher Hygiene, Inc. | 1,582,581 | | 7,074 |
| | 70,652 |
Construction & Engineering - 0.2% |
Fluor Corp. | 429,536 | | 26,081 |
Foster Wheeler AG (a) | 805,796 | | 19,782 |
| | 45,863 |
Electrical Equipment - 0.8% |
Acuity Brands, Inc. | 356,838 | | 16,429 |
Alstom SA | 536,074 | | 24,895 |
Cooper Industries PLC Class A | 432,401 | | 20,487 |
Emerson Electric Co. | 807,386 | | 37,584 |
GrafTech International Ltd. (a) | 946,564 | | 14,861 |
Regal-Beloit Corp. | 607,829 | | 35,734 |
| | 149,990 |
Industrial Conglomerates - 1.0% |
Danaher Corp. | 1,336,659 | | 61,232 |
General Electric Co. | 6,835,302 | | 111,484 |
Tyco International Ltd. | 740,950 | | 30,809 |
| | 203,525 |
Machinery - 0.5% |
Caterpillar, Inc. | 212,929 | | 19,377 |
Cummins, Inc. | 353,179 | | 32,817 |
Fanuc Corp. | 94,400 | | 15,712 |
Pall Corp. | 236,500 | | 12,092 |
Vallourec SA (f) | 130,679 | | 11,762 |
| | 91,760 |
Professional Services - 0.1% |
CoStar Group, Inc. (a) | 216,150 | | 11,063 |
Road & Rail - 0.7% |
CSX Corp. | 2,782,578 | | 61,050 |
Union Pacific Corp. | 948,800 | | 87,451 |
| | 148,501 |
TOTAL INDUSTRIALS | | 1,298,606 |
INFORMATION TECHNOLOGY - 11.5% |
Communications Equipment - 1.2% |
Ciena Corp. (a)(f) | 719,329 | | 8,805 |
Common Stocks - continued |
| Shares | | Value (000s) |
INFORMATION TECHNOLOGY - continued |
Communications Equipment - continued |
Meru Networks, Inc. (a)(f) | 189,492 | | $ 1,732 |
Nokia Corp. sponsored ADR (f) | 1,939,700 | | 12,492 |
QUALCOMM, Inc. | 4,307,108 | | 221,644 |
| | 244,673 |
Computers & Peripherals - 3.5% |
Apple, Inc. (a) | 1,482,029 | | 570,329 |
Dell, Inc. (a) | 1,690,985 | | 25,136 |
EMC Corp. (a) | 3,334,672 | | 75,330 |
Imagination Technologies Group PLC (a) | 188,808 | | 1,087 |
SanDisk Corp. (a) | 621,232 | | 22,768 |
| | 694,650 |
Electronic Equipment & Components - 0.0% |
TPK Holdings Co. | 31,250 | | 758 |
Internet Software & Services - 1.7% |
Baidu.com, Inc. sponsored ADR (a) | 443,896 | | 64,711 |
Dice Holdings, Inc. (a) | 863,244 | | 8,710 |
Google, Inc. Class A (a) | 428,288 | | 231,687 |
Mail.ru Group Ltd. GDR (a)(g) | 329,034 | | 11,839 |
Renren, Inc. ADR (f) | 1,137,201 | | 8,347 |
WebMD Health Corp. (a) | 259,712 | | 9,178 |
| | 334,472 |
IT Services - 0.6% |
Accenture PLC Class A | 1,266,136 | | 67,852 |
Cognizant Technology Solutions Corp. Class A (a) | 272,357 | | 17,281 |
MasterCard, Inc. Class A | 41,700 | | 13,749 |
Visa, Inc. Class A | 166,568 | | 14,638 |
| | 113,520 |
Semiconductors & Semiconductor Equipment - 2.1% |
Analog Devices, Inc. | 2,242,275 | | 74,040 |
ARM Holdings PLC sponsored ADR | 1,335,141 | | 36,823 |
ASAT Holdings Ltd. (a) | 88,719 | | 0 |
ASML Holding NV | 1,199,542 | | 42,308 |
Avago Technologies Ltd. | 1,264,654 | | 41,873 |
Inotera Memories, Inc. (a) | 30,431,880 | | 7,006 |
International Rectifier Corp. (a) | 594,784 | | 13,555 |
Intersil Corp. Class A | 1,907,025 | | 21,416 |
KLA-Tencor Corp. | 372,636 | | 13,668 |
Lam Research Corp. (a) | 217,263 | | 8,073 |
Marvell Technology Group Ltd. (a) | 4,748,332 | | 62,441 |
Common Stocks - continued |
| Shares | | Value (000s) |
INFORMATION TECHNOLOGY - continued |
Semiconductors & Semiconductor Equipment - continued |
Micron Technology, Inc. (a) | 12,132,834 | | $ 71,705 |
Nanya Technology Corp. (a) | 12,095,245 | | 2,193 |
Omnivision Technologies, Inc. (a) | 115,745 | | 2,130 |
RF Micro Devices, Inc. (a) | 906,817 | | 5,631 |
Skyworks Solutions, Inc. (a) | 745,700 | | 15,384 |
TriQuint Semiconductor, Inc. (a) | 528,200 | | 4,004 |
| | 422,250 |
Software - 2.4% |
Ariba, Inc. (a) | 946,662 | | 25,683 |
Check Point Software Technologies Ltd. (a) | 1,593,174 | | 86,732 |
Intuit, Inc. | 441,631 | | 21,786 |
Microsoft Corp. | 11,058,954 | | 294,168 |
Nuance Communications, Inc. (a) | 758,813 | | 14,084 |
Oracle Corp. | 628,258 | | 17,635 |
QLIK Technologies, Inc. (a) | 69,946 | | 1,775 |
| | 461,863 |
TOTAL INFORMATION TECHNOLOGY | | 2,272,186 |
MATERIALS - 1.9% |
Chemicals - 1.2% |
Albemarle Corp. | 233,037 | | 11,817 |
Ashland, Inc. | 473,136 | | 25,081 |
Celanese Corp. Class A | 550,272 | | 25,868 |
CF Industries Holdings, Inc. | 147,600 | | 26,984 |
Dow Chemical Co. | 530,186 | | 15,084 |
LyondellBasell Industries NV Class A | 703,777 | | 24,386 |
Monsanto Co. | 598,723 | | 41,270 |
Praxair, Inc. | 371,200 | | 36,559 |
The Mosaic Co. | 381,800 | | 27,157 |
W.R. Grace & Co. (a) | 152,400 | | 6,008 |
| | 240,214 |
Containers & Packaging - 0.2% |
Ball Corp. | 741,371 | | 26,630 |
Rock-Tenn Co. Class A | 272,951 | | 14,649 |
| | 41,279 |
Metals & Mining - 0.5% |
Anglo American PLC (United Kingdom) | 1,223,750 | | 51,018 |
Common Stocks - continued |
| Shares | | Value (000s) |
MATERIALS - continued |
Metals & Mining - continued |
Reliance Steel & Aluminum Co. | 423,900 | | $ 17,566 |
Walter Energy, Inc. | 213,595 | | 17,459 |
| | 86,043 |
TOTAL MATERIALS | | 367,536 |
TELECOMMUNICATION SERVICES - 1.2% |
Diversified Telecommunication Services - 0.7% |
CenturyLink, Inc. | 3,060,701 | | 110,644 |
Verizon Communications, Inc. | 1,032,285 | | 37,338 |
| | 147,982 |
Wireless Telecommunication Services - 0.5% |
American Tower Corp. Class A (a) | 1,380,893 | | 74,375 |
MetroPCS Communications, Inc. (a) | 948,811 | | 10,589 |
Sprint Nextel Corp. (a) | 3,156,391 | | 11,868 |
| | 96,832 |
TOTAL TELECOMMUNICATION SERVICES | | 244,814 |
UTILITIES - 2.2% |
Electric Utilities - 1.1% |
Edison International | 1,516,707 | | 56,406 |
Exelon Corp. | 962,747 | | 41,514 |
FirstEnergy Corp. | 1,007,733 | | 44,592 |
NextEra Energy, Inc. | 1,334,554 | | 75,696 |
| | 218,208 |
Independent Power Producers & Energy Traders - 0.5% |
Constellation Energy Group, Inc. | 1,233,350 | | 47,472 |
NRG Energy, Inc. (a) | 635,782 | | 14,903 |
The AES Corp. (a) | 2,530,119 | | 27,477 |
| | 89,852 |
Multi-Utilities - 0.6% |
Dominion Resources, Inc. | 125,300 | | 6,107 |
PG&E Corp. | 680,786 | | 28,831 |
Common Stocks - continued |
| Shares | | Value (000s) |
UTILITIES - continued |
Multi-Utilities - continued |
Public Service Enterprise Group, Inc. | 1,156,953 | | $ 39,487 |
Sempra Energy | 803,260 | | 42,187 |
| | 116,612 |
TOTAL UTILITIES | | 424,672 |
TOTAL COMMON STOCKS (Cost $10,989,177) | 11,592,007 |
Preferred Stocks - 0.1% |
| | | |
Convertible Preferred Stocks - 0.0% |
INFORMATION TECHNOLOGY - 0.0% |
Semiconductors & Semiconductor Equipment - 0.0% |
ASAT Holdings Ltd. 13.00% (a) | 2,416 | | 0 |
Nonconvertible Preferred Stocks - 0.1% |
CONSUMER DISCRETIONARY - 0.1% |
Automobiles - 0.1% |
Volkswagen AG | 122,399 | | 20,389 |
TOTAL PREFERRED STOCKS (Cost $21,334) | 20,389 |
Nonconvertible Bonds - 7.1% |
| Principal
Amount (000s) | | |
CONSUMER DISCRETIONARY - 0.5% |
Auto Components - 0.0% |
DaimlerChrysler NA Holding Corp. 5.75% 9/8/11 | | $ 6,570 | | 6,572 |
Household Durables - 0.1% |
Fortune Brands, Inc.: | | | | |
5.375% 1/15/16 | | 1,615 | | 1,790 |
5.875% 1/15/36 | | 7,325 | | 7,477 |
6.375% 6/15/14 | | 482 | | 538 |
| | 9,805 |
Media - 0.4% |
AOL Time Warner, Inc. 7.625% 4/15/31 | | 4,975 | | 6,100 |
Comcast Corp.: | | | | |
4.95% 6/15/16 | | 2,207 | | 2,479 |
5.15% 3/1/20 | | 644 | | 733 |
Nonconvertible Bonds - continued |
| Principal
Amount (000s) | | Value (000s) |
CONSUMER DISCRETIONARY - continued |
Media - continued |
Comcast Corp.: - continued | | | | |
6.4% 3/1/40 | | $ 4,756 | | $ 5,387 |
COX Communications, Inc. 4.625% 6/1/13 | | 3,612 | | 3,833 |
Discovery Communications LLC 3.7% 6/1/15 | | 5,116 | | 5,464 |
Liberty Media Corp. 8.25% 2/1/30 | | 1,710 | | 1,672 |
NBCUniversal Media LLC: | | | | |
3.65% 4/30/15 | | 6,489 | | 6,884 |
5.15% 4/30/20 | | 7,276 | | 8,059 |
6.4% 4/30/40 | | 6,271 | | 7,085 |
News America Holdings, Inc. 7.75% 12/1/45 | | 7,397 | | 8,711 |
News America, Inc. 6.15% 2/15/41 | | 4,393 | | 4,580 |
Time Warner Cable, Inc.: | | | | |
5.4% 7/2/12 | | 2,870 | | 2,973 |
5.85% 5/1/17 | | 3,400 | | 3,831 |
6.2% 7/1/13 | | 2,729 | | 2,968 |
6.75% 7/1/18 | | 1,378 | | 1,621 |
Time Warner, Inc.: | | | | |
3.15% 7/15/15 | | 392 | | 408 |
5.875% 11/15/16 | | 4,125 | | 4,802 |
6.2% 3/15/40 | | 3,821 | | 4,097 |
6.5% 11/15/36 | | 2,758 | | 3,077 |
| | 84,764 |
Specialty Retail - 0.0% |
Staples, Inc. 7.375% 10/1/12 | | 820 | | 874 |
TOTAL CONSUMER DISCRETIONARY | | 102,015 |
CONSUMER STAPLES - 0.4% |
Beverages - 0.1% |
Anheuser-Busch InBev Worldwide, Inc.: | | | | |
2.5% 3/26/13 | | 3,211 | | 3,298 |
5.375% 11/15/14 | | 7,113 | | 8,034 |
Diageo Capital PLC 5.2% 1/30/13 | | 4,139 | | 4,392 |
FBG Finance Ltd. 5.125% 6/15/15 (g) | | 3,447 | | 3,815 |
| | 19,539 |
Food Products - 0.1% |
Cargill, Inc. 6% 11/27/17 (g) | | 572 | | 680 |
Kraft Foods, Inc.: | | | | |
5.375% 2/10/20 | | 8,116 | | 9,208 |
Nonconvertible Bonds - continued |
| Principal
Amount (000s) | | Value (000s) |
CONSUMER STAPLES - continued |
Food Products - continued |
Kraft Foods, Inc.: - continued | | | | |
5.625% 11/1/11 | | $ 553 | | $ 557 |
6.5% 8/11/17 | | 8,854 | | 10,694 |
6.75% 2/19/14 | | 436 | | 493 |
| | 21,632 |
Tobacco - 0.2% |
Altria Group, Inc.: | | | | |
8.5% 11/10/13 | | 483 | | 554 |
9.7% 11/10/18 | | 16,451 | | 21,723 |
Reynolds American, Inc.: | | | | |
6.75% 6/15/17 | | 3,486 | | 4,104 |
7.25% 6/15/37 | | 7,569 | | 8,432 |
| | 34,813 |
TOTAL CONSUMER STAPLES | | 75,984 |
ENERGY - 1.0% |
Energy Equipment & Services - 0.1% |
DCP Midstream LLC 5.35% 3/15/20 (g) | | 6,637 | | 7,311 |
El Paso Pipeline Partners Operating Co. LLC: | | | | |
4.1% 11/15/15 | | 7,675 | | 8,077 |
6.5% 4/1/20 | | 1,091 | | 1,238 |
Noble Holding International Ltd. 3.45% 8/1/15 | | 934 | | 990 |
Weatherford International Ltd.: | | | | |
4.95% 10/15/13 | | 2,045 | | 2,174 |
5.15% 3/15/13 | | 2,673 | | 2,815 |
| | 22,605 |
Oil, Gas & Consumable Fuels - 0.9% |
Anadarko Petroleum Corp.: | | | | |
5.95% 9/15/16 | | 718 | | 807 |
6.375% 9/15/17 | | 13,514 | | 15,595 |
BW Group Ltd. 6.625% 6/28/17 (g) | | 3,472 | | 3,251 |
Canadian Natural Resources Ltd.: | | | | |
5.15% 2/1/13 | | 5,282 | | 5,570 |
5.7% 5/15/17 | | 424 | | 495 |
Duke Capital LLC 6.25% 2/15/13 | | 809 | | 861 |
Duke Energy Field Services: | | | | |
5.375% 10/15/15 (g) | | 1,435 | | 1,621 |
6.45% 11/3/36 (g) | | 6,493 | | 7,332 |
Nonconvertible Bonds - continued |
| Principal
Amount (000s) | | Value (000s) |
ENERGY - continued |
Oil, Gas & Consumable Fuels - continued |
El Paso Natural Gas Co. 5.95% 4/15/17 | | $ 1,098 | | $ 1,269 |
EnCana Holdings Finance Corp. 5.8% 5/1/14 | | 3,391 | | 3,741 |
Enterprise Products Operating LP: | | | | |
5.6% 10/15/14 | | 715 | | 785 |
5.65% 4/1/13 | | 563 | | 598 |
Gulf South Pipeline Co. LP 5.75% 8/15/12 (g) | | 4,535 | | 4,673 |
Gulfstream Natural Gas System LLC 6.95% 6/1/16 (g) | | 327 | | 390 |
Marathon Petroleum Corp. 5.125% 3/1/21 (g) | | 4,207 | | 4,486 |
Midcontinent Express Pipeline LLC 5.45% 9/15/14 (g) | | 6,234 | | 6,705 |
Motiva Enterprises LLC 6.85% 1/15/40 (g) | | 4,294 | | 5,471 |
Nakilat, Inc. 6.067% 12/31/33 (g) | | 2,490 | | 2,689 |
Nexen, Inc.: | | | | |
5.2% 3/10/15 | | 1,067 | | 1,166 |
5.875% 3/10/35 | | 1,565 | | 1,478 |
6.2% 7/30/19 | | 893 | | 1,032 |
6.4% 5/15/37 | | 5,235 | | 5,371 |
NGPL PipeCo LLC 6.514% 12/15/12 (g) | | 4,184 | | 4,329 |
Petrobras International Finance Co. Ltd.: | | | | |
3.875% 1/27/16 | | 6,946 | | 7,120 |
5.75% 1/20/20 | | 15,286 | | 16,584 |
7.875% 3/15/19 | | 7,382 | | 8,980 |
Petroleos Mexicanos: | | | | |
5.5% 1/21/21 (g) | | 7,423 | | 8,073 |
6% 3/5/20 | | 952 | | 1,073 |
Plains All American Pipeline LP/PAA Finance Corp.: | | | | |
3.95% 9/15/15 | | 149 | | 158 |
4.25% 9/1/12 | | 718 | | 741 |
5% 2/1/21 | | 2,303 | | 2,447 |
6.125% 1/15/17 | | 1,940 | | 2,223 |
Ras Laffan Liquefied Natural Gas Co. Ltd. 8.294% 3/15/14 (g) | | 2,104 | | 2,304 |
Ras Laffan Liquefied Natural Gas Co. Ltd. III: | | | | |
4.5% 9/30/12 (g) | | 3,472 | | 3,594 |
5.5% 9/30/14 (g) | | 5,137 | | 5,664 |
5.832% 9/30/16 (g) | | 1,325 | | 1,451 |
6.332% 9/30/27 (g) | | 5,910 | | 6,604 |
6.75% 9/30/19 (g) | | 3,177 | | 3,812 |
Rockies Express Pipeline LLC 6.25% 7/15/13 (g) | | 3,193 | | 3,416 |
Southeast Supply Header LLC 4.85% 8/15/14 (g) | | 543 | | 583 |
Spectra Energy Capital, LLC 5.65% 3/1/20 | | 455 | | 509 |
Nonconvertible Bonds - continued |
| Principal
Amount (000s) | | Value (000s) |
ENERGY - continued |
Oil, Gas & Consumable Fuels - continued |
Spectra Energy Partners, LP: | | | | |
2.95% 6/15/16 | | $ 1,325 | | $ 1,363 |
4.6% 6/15/21 | | 1,733 | | 1,790 |
Texas Eastern Transmission LP 6% 9/15/17 (g) | | 1,301 | | 1,558 |
Western Gas Partners LP 5.375% 6/1/21 | | 7,979 | | 8,402 |
XTO Energy, Inc.: | | | | |
4.9% 2/1/14 | | 394 | | 433 |
5% 1/31/15 | | 1,414 | | 1,607 |
5.65% 4/1/16 | | 970 | | 1,151 |
| | 171,355 |
TOTAL ENERGY | | 193,960 |
FINANCIALS - 3.4% |
Capital Markets - 0.6% |
Bear Stearns Companies, Inc. 5.3% 10/30/15 | | 11,058 | | 12,013 |
Goldman Sachs Group, Inc.: | | | | |
3.7% 8/1/15 | | 7,427 | | 7,503 |
5.95% 1/18/18 | | 4,684 | | 4,980 |
6% 6/15/20 | | 4,000 | | 4,265 |
6.15% 4/1/18 | | 1,671 | | 1,785 |
6.75% 10/1/37 | | 5,715 | | 5,411 |
Janus Capital Group, Inc. 5.875% 9/15/11 (e) | | 879 | | 880 |
JPMorgan Chase Capital XX 6.55% 9/29/36 | | 11,840 | | 11,760 |
Lazard Group LLC: | | | | |
6.85% 6/15/17 | | 4,528 | | 5,091 |
7.125% 5/15/15 | | 1,616 | | 1,822 |
Merrill Lynch & Co., Inc.: | | | | |
5.45% 2/5/13 | | 5,465 | | 5,607 |
6.4% 8/28/17 | | 4,179 | | 4,280 |
Morgan Stanley: | | | | |
4% 7/24/15 | | 956 | | 951 |
4.75% 4/1/14 | | 3,169 | | 3,213 |
5.45% 1/9/17 | | 1,800 | | 1,845 |
5.5% 7/28/21 | | 6,859 | | 6,840 |
5.625% 9/23/19 | | 1,795 | | 1,823 |
5.75% 1/25/21 | | 8,300 | | 8,538 |
5.95% 12/28/17 | | 646 | | 668 |
6% 5/13/14 | | 4,042 | | 4,243 |
6% 4/28/15 | | 2,091 | | 2,188 |
Nonconvertible Bonds - continued |
| Principal
Amount (000s) | | Value (000s) |
FINANCIALS - continued |
Capital Markets - continued |
Morgan Stanley: - continued | | | | |
6.625% 4/1/18 | | $ 1,257 | | $ 1,346 |
7.3% 5/13/19 | | 6,528 | | 7,283 |
Northern Trust Corp. 3.375% 8/23/21 | | 1,695 | | 1,692 |
UBS AG Stamford Branch 3.875% 1/15/15 | | 11,500 | | 11,925 |
| | 117,952 |
Commercial Banks - 0.7% |
Bank of America NA: | | | | |
5.3% 3/15/17 | | 15,795 | | 15,451 |
6.1% 6/15/17 | | 565 | | 559 |
Credit Suisse New York Branch 6% 2/15/18 | | 15,195 | | 16,000 |
DBS Bank Ltd. (Singapore) 0.5101% 5/16/17 (g)(o) | | 4,537 | | 4,469 |
Discover Bank: | | | | |
7% 4/15/20 | | 3,200 | | 3,478 |
8.7% 11/18/19 | | 2,425 | | 2,855 |
Export-Import Bank of Korea: | | | | |
5.25% 2/10/14 (g) | | 456 | | 486 |
5.5% 10/17/12 | | 2,649 | | 2,755 |
Fifth Third Bancorp: | | | | |
3.625% 1/25/16 | | 4,058 | | 4,112 |
4.5% 6/1/18 | | 584 | | 583 |
8.25% 3/1/38 | | 4,070 | | 4,601 |
Fifth Third Bank 4.75% 2/1/15 | | 951 | | 1,015 |
Fifth Third Capital Trust IV 6.5% 4/15/67 (o) | | 4,393 | | 4,075 |
HBOS PLC 6.75% 5/21/18 (g) | | 560 | | 518 |
Huntington Bancshares, Inc. 7% 12/15/20 | | 1,908 | | 2,183 |
JPMorgan Chase Bank 6% 10/1/17 | | 2,460 | | 2,756 |
KeyBank NA: | | | | |
5.45% 3/3/16 | | 2,765 | | 2,997 |
5.8% 7/1/14 | | 5,776 | | 6,309 |
KeyCorp. 5.1% 3/24/21 | | 3,752 | | 3,838 |
Manufacturers & Traders Trust Co. 1.7458% 4/1/13 (o) | | 791 | | 790 |
Marshall & Ilsley Bank: | | | | |
4.85% 6/16/15 | | 3,561 | | 3,894 |
5% 1/17/17 | | 9,004 | | 9,674 |
5.25% 9/4/12 | | 2,221 | | 2,284 |
Regions Bank: | | | | |
6.45% 6/26/37 | | 6,564 | | 5,596 |
7.5% 5/15/18 | | 3,852 | | 3,756 |
Nonconvertible Bonds - continued |
| Principal
Amount (000s) | | Value (000s) |
FINANCIALS - continued |
Commercial Banks - continued |
Regions Financial Corp.: | | | | |
0.4165% 6/26/12 (o) | | $ 499 | | $ 488 |
5.75% 6/15/15 | | 1,443 | | 1,364 |
7.75% 11/10/14 | | 6,740 | | 6,689 |
SunTrust Banks, Inc. 3.6% 4/15/16 | | 6,397 | | 6,422 |
UniCredit Luxembourg Finance SA 5.584% 1/13/17 (g)(o) | | 2,233 | | 1,997 |
UnionBanCal Corp. 5.25% 12/16/13 | | 777 | | 838 |
Wachovia Bank NA: | | | | |
4.8% 11/1/14 | | 551 | | 592 |
4.875% 2/1/15 | | 1,653 | | 1,762 |
Wachovia Corp.: | | | | |
5.625% 10/15/16 | | 3,991 | | 4,368 |
5.75% 6/15/17 | | 2,371 | | 2,685 |
Wells Fargo & Co.: | | | | |
3.625% 4/15/15 | | 4,435 | | 4,633 |
3.676% 6/15/16 | | 3,236 | | 3,419 |
| | 140,291 |
Consumer Finance - 0.2% |
Discover Financial Services: | | | | |
6.45% 6/12/17 | | 12,103 | | 13,612 |
10.25% 7/15/19 | | 862 | | 1,112 |
General Electric Capital Corp.: | | | | |
2.25% 11/9/15 | | 5,578 | | 5,608 |
2.95% 5/9/16 | | 1,523 | | 1,536 |
3.5% 6/29/15 | | 1,574 | | 1,646 |
5.625% 9/15/17 | | 15,752 | | 17,487 |
Household Finance Corp. 6.375% 10/15/11 | | 2,184 | | 2,196 |
HSBC Finance Corp. 5.9% 6/19/12 | | 855 | | 885 |
SLM Corp. 0.483% 10/25/11 (o) | | 6,795 | | 6,779 |
| | 50,861 |
Diversified Financial Services - 0.7% |
Bank of America Corp. 5.75% 12/1/17 | | 11,990 | | 12,455 |
BP Capital Markets PLC: | | | | |
3.125% 10/1/15 | | 968 | | 1,012 |
3.625% 5/8/14 | | 7,827 | | 8,254 |
4.5% 10/1/20 | | 961 | | 1,039 |
4.742% 3/11/21 | | 6,000 | | 6,565 |
Capital One Capital V 10.25% 8/15/39 | | 4,592 | | 4,767 |
Nonconvertible Bonds - continued |
| Principal
Amount (000s) | | Value (000s) |
FINANCIALS - continued |
Diversified Financial Services - continued |
Citigroup, Inc.: | | | | |
3.953% 6/15/16 | | $ 8,010 | | $ 8,180 |
4.75% 5/19/15 | | 11,282 | | 11,761 |
5.5% 4/11/13 | | 8,594 | | 8,953 |
6.5% 8/19/13 | | 25,586 | | 27,215 |
JPMorgan Chase & Co.: | | | | |
3.15% 7/5/16 | | 10,650 | | 10,872 |
3.4% 6/24/15 | | 949 | | 977 |
4.65% 6/1/14 | | 8,500 | | 9,068 |
ORIX Corp. 5.48% 11/22/11 | | 311 | | 313 |
Prime Property Funding, Inc.: | | | | |
5.125% 6/1/15 (g) | | 2,258 | | 2,394 |
5.5% 1/15/14 (g) | | 816 | | 872 |
5.7% 4/15/17 (g) | | 1,991 | | 2,129 |
TECO Finance, Inc.: | | | | |
4% 3/15/16 | | 1,828 | | 1,955 |
5.15% 3/15/20 | | 10,344 | | 11,523 |
TransCapitalInvest Ltd. 5.67% 3/5/14 (g) | | 4,215 | | 4,419 |
ZFS Finance USA Trust II 6.45% 12/15/65 (g)(o) | | 4,049 | | 3,968 |
ZFS Finance USA Trust IV 5.875% 5/9/62 (g)(o) | | 1,303 | | 1,226 |
| | 139,917 |
Insurance - 0.5% |
Aon Corp.: | | | | |
3.125% 5/27/16 | | 3,702 | | 3,705 |
3.5% 9/30/15 | | 3,180 | | 3,299 |
5% 9/30/20 | | 3,164 | | 3,401 |
6.25% 9/30/40 | | 2,120 | | 2,334 |
Assurant, Inc. 5.625% 2/15/14 | | 2,245 | | 2,383 |
Axis Capital Holdings Ltd. 5.75% 12/1/14 | | 452 | | 493 |
Great-West Life & Annuity Insurance Co. 7.153% 5/16/46 (g)(o) | | 1,750 | | 1,667 |
Hartford Financial Services Group, Inc. 5.375% 3/15/17 | | 287 | | 296 |
Liberty Mutual Group, Inc.: | | | | |
5% 6/1/21 (g) | | 8,005 | | 7,802 |
6.5% 3/15/35 (g) | | 698 | | 674 |
Marsh & McLennan Companies, Inc. 4.8% 7/15/21 | | 4,458 | | 4,545 |
MetLife, Inc.: | | | | |
2.375% 2/6/14 | | 1,427 | | 1,458 |
5% 6/15/15 | | 941 | | 1,039 |
Nonconvertible Bonds - continued |
| Principal
Amount (000s) | | Value (000s) |
FINANCIALS - continued |
Insurance - continued |
MetLife, Inc.: - continued | | | | |
6.125% 12/1/11 | | $ 800 | | $ 810 |
6.75% 6/1/16 | | 5,158 | | 6,042 |
Metropolitan Life Global Funding I: | | | | |
5.125% 4/10/13 (g) | | 452 | | 477 |
5.125% 6/10/14 (g) | | 4,625 | | 5,044 |
Monumental Global Funding III 5.5% 4/22/13 (g) | | 2,585 | | 2,744 |
New York Life Insurance Co. 6.75% 11/15/39 (g) | | 3,203 | | 3,776 |
Northwestern Mutual Life Insurance Co. 6.063% 3/30/40 (g) | | 4,632 | | 5,080 |
Pacific Life Global Funding 5.15% 4/15/13 (g) | | 3,976 | | 4,192 |
Pacific Life Insurance Co. 9.25% 6/15/39 (g) | | 3,353 | | 4,426 |
Pacific LifeCorp 6% 2/10/20 (g) | | 5,390 | | 6,017 |
Prudential Financial, Inc.: | | | | |
3.875% 1/14/15 | | 5,340 | | 5,537 |
5.15% 1/15/13 | | 2,934 | | 3,073 |
7.375% 6/15/19 | | 2,520 | | 3,011 |
8.875% 6/15/38 (o) | | 2,403 | | 2,619 |
QBE Insurance Group Ltd. 5.647% 7/1/23 (g)(o) | | 473 | | 449 |
Symetra Financial Corp. 6.125% 4/1/16 (g) | | 5,955 | | 6,336 |
Unum Group: | | | | |
5.625% 9/15/20 | | 3,667 | | 4,000 |
7.125% 9/30/16 | | 869 | | 1,016 |
| | 97,745 |
Real Estate Investment Trusts - 0.2% |
AvalonBay Communities, Inc.: | | | | |
4.95% 3/15/13 | | 296 | | 311 |
5.5% 1/15/12 | | 1,481 | | 1,505 |
BRE Properties, Inc. 5.5% 3/15/17 | | 977 | | 1,080 |
Camden Property Trust: | | | | |
5.375% 12/15/13 | | 3,103 | | 3,319 |
5.875% 11/30/12 | | 542 | | 566 |
Developers Diversified Realty Corp.: | | | | |
4.75% 4/15/18 | | 5,002 | | 4,747 |
5.375% 10/15/12 | | 4,036 | | 4,084 |
7.5% 4/1/17 | | 4,622 | | 5,138 |
Duke Realty LP: | | | | |
4.625% 5/15/13 | | 967 | | 1,003 |
5.875% 8/15/12 | | 98 | | 101 |
Nonconvertible Bonds - continued |
| Principal
Amount (000s) | | Value (000s) |
FINANCIALS - continued |
Real Estate Investment Trusts - continued |
Equity One, Inc.: | | | | |
5.375% 10/15/15 | | $ 948 | | $ 1,006 |
6% 9/15/17 | | 717 | | 748 |
6.25% 12/15/14 | | 1,000 | | 1,074 |
6.25% 1/15/17 | | 399 | | 429 |
Federal Realty Investment Trust: | | | | |
5.4% 12/1/13 | | 355 | | 378 |
5.9% 4/1/20 | | 1,860 | | 2,011 |
6% 7/15/12 | | 3,443 | | 3,559 |
6.2% 1/15/17 | | 501 | | 568 |
HRPT Properties Trust: | | | | |
5.75% 11/1/15 | | 1,731 | | 1,854 |
6.25% 6/15/17 | | 996 | | 1,092 |
6.65% 1/15/18 | | 676 | | 762 |
Washington (REIT) 5.25% 1/15/14 | | 476 | | 508 |
| | 35,843 |
Real Estate Management & Development - 0.4% |
AMB Property LP 5.9% 8/15/13 | | 2,086 | | 2,162 |
Arden Realty LP 5.2% 9/1/11 | | 1,573 | | 1,573 |
BioMed Realty LP: | | | | |
3.85% 4/15/16 | | 7,000 | | 7,063 |
6.125% 4/15/20 | | 2,467 | | 2,663 |
Brandywine Operating Partnership LP: | | | | |
5.7% 5/1/17 | | 129 | | 135 |
5.75% 4/1/12 | | 2,217 | | 2,259 |
Digital Realty Trust LP: | | | | |
4.5% 7/15/15 | | 3,650 | | 3,780 |
5.25% 3/15/21 | | 4,138 | | 4,139 |
Duke Realty LP: | | | | |
5.4% 8/15/14 | | 771 | | 815 |
5.5% 3/1/16 | | 3,075 | | 3,261 |
6.75% 3/15/20 | | 560 | | 600 |
8.25% 8/15/19 | | 2,489 | | 2,927 |
ERP Operating LP: | | | | |
4.75% 7/15/20 | | 5,288 | | 5,479 |
5.5% 10/1/12 | | 382 | | 399 |
5.75% 6/15/17 | | 2,042 | | 2,307 |
Liberty Property LP: | | | | |
4.75% 10/1/20 | | 7,482 | | 7,628 |
5.125% 3/2/15 | | 1,229 | | 1,348 |
Nonconvertible Bonds - continued |
| Principal
Amount (000s) | | Value (000s) |
FINANCIALS - continued |
Real Estate Management & Development - continued |
Liberty Property LP: - continued | | | | |
5.5% 12/15/16 | | $ 1,772 | | $ 1,967 |
Mack-Cali Realty LP 7.75% 8/15/19 | | 1,036 | | 1,291 |
Post Apartment Homes LP 6.3% 6/1/13 | | 3,079 | | 3,290 |
Regency Centers LP: | | | | |
4.95% 4/15/14 | | 494 | | 525 |
5.25% 8/1/15 | | 1,725 | | 1,866 |
5.875% 6/15/17 | | 877 | | 996 |
Simon Property Group LP: | | | | |
4.2% 2/1/15 | | 2,640 | | 2,815 |
6.75% 5/15/14 | | 5,698 | | 6,467 |
Tanger Properties LP: | | | | |
6.125% 6/1/20 | | 7,047 | | 7,955 |
6.15% 11/15/15 | | 1,254 | | 1,413 |
| | 77,123 |
Thrifts & Mortgage Finance - 0.1% |
Bank of America Corp.: | | | | |
3.75% 7/12/16 | | 8,200 | | 8,090 |
5.65% 5/1/18 | | 1,270 | | 1,295 |
First Niagara Financial Group, Inc. 6.75% 3/19/20 | | 5,919 | | 6,572 |
| | 15,957 |
TOTAL FINANCIALS | | 675,689 |
HEALTH CARE - 0.1% |
Biotechnology - 0.0% |
Celgene Corp. 2.45% 10/15/15 | | 907 | | 922 |
Health Care Providers & Services - 0.1% |
Coventry Health Care, Inc.: | | | | |
5.95% 3/15/17 | | 1,413 | | 1,592 |
6.3% 8/15/14 | | 2,925 | | 3,232 |
Express Scripts, Inc.: | | | | |
3.125% 5/15/16 | | 6,890 | | 7,044 |
6.25% 6/15/14 | | 1,991 | | 2,217 |
Medco Health Solutions, Inc.: | | | | |
2.75% 9/15/15 | | 1,740 | | 1,779 |
4.125% 9/15/20 | | 5,031 | | 5,042 |
| | 20,906 |
Nonconvertible Bonds - continued |
| Principal
Amount (000s) | | Value (000s) |
HEALTH CARE - continued |
Pharmaceuticals - 0.0% |
Watson Pharmaceuticals, Inc. 5% 8/15/14 | | $ 1,065 | | $ 1,164 |
TOTAL HEALTH CARE | | 22,992 |
INDUSTRIALS - 0.1% |
Aerospace & Defense - 0.0% |
BAE Systems Holdings, Inc.: | | | | |
4.95% 6/1/14 (g) | | 846 | | 914 |
6.375% 6/1/19 (g) | | 5,000 | | 5,853 |
6.4% 12/15/11 (g) | | 661 | | 671 |
| | 7,438 |
Airlines - 0.0% |
Continental Airlines, Inc.: | | | | |
6.648% 3/15/19 | | 3,058 | | 3,165 |
6.9% 7/2/19 | | 887 | | 923 |
U.S. Airways pass-thru trust certificates: | | | | |
6.85% 7/30/19 | | 1,794 | | 1,758 |
8.36% 1/20/19 | | 1,357 | | 1,357 |
| | 7,203 |
Industrial Conglomerates - 0.1% |
General Electric Co. 5.25% 12/6/17 | | 10,356 | | 11,602 |
TOTAL INDUSTRIALS | | 26,243 |
INFORMATION TECHNOLOGY - 0.1% |
Electronic Equipment & Components - 0.1% |
Tyco Electronics Group SA: | | | | |
5.95% 1/15/14 | | 3,694 | | 4,036 |
6% 10/1/12 | | 4,552 | | 4,808 |
6.55% 10/1/17 | | 1,119 | | 1,331 |
| | 10,175 |
Office Electronics - 0.0% |
Xerox Corp.: | | | | |
4.25% 2/15/15 | | 545 | | 586 |
5.5% 5/15/12 | | 1,881 | | 1,941 |
| | 2,527 |
TOTAL INFORMATION TECHNOLOGY | | 12,702 |
Nonconvertible Bonds - continued |
| Principal
Amount (000s) | | Value (000s) |
MATERIALS - 0.2% |
Chemicals - 0.1% |
Dow Chemical Co.: | | | | |
4.85% 8/15/12 | | $ 3,469 | | $ 3,596 |
7.6% 5/15/14 | | 10,939 | | 12,606 |
| | 16,202 |
Construction Materials - 0.0% |
CRH America, Inc. 6% 9/30/16 | | 2,152 | | 2,377 |
Metals & Mining - 0.1% |
Anglo American Capital PLC 9.375% 4/8/14 (g) | | 1,278 | | 1,510 |
ArcelorMittal SA 3.75% 3/1/16 | | 2,109 | | 2,086 |
BHP Billiton Financial (USA) Ltd. 5.125% 3/29/12 | | 1,597 | | 1,639 |
Corporacion Nacional del Cobre (Codelco) 6.375% 11/30/12 (g) | | 1,618 | | 1,718 |
United States Steel Corp. 6.65% 6/1/37 | | 3,989 | | 3,241 |
Vale Overseas Ltd. 6.25% 1/23/17 | | 2,726 | | 3,093 |
| | 13,287 |
TOTAL MATERIALS | | 31,866 |
TELECOMMUNICATION SERVICES - 0.5% |
Diversified Telecommunication Services - 0.3% |
AT&T, Inc.: | | | | |
2.5% 8/15/15 | | 6,691 | | 6,851 |
6.8% 5/15/36 | | 9,241 | | 10,831 |
BellSouth Capital Funding Corp. 7.875% 2/15/30 | | 1,158 | | 1,499 |
CenturyLink, Inc.: | | | | |
6.15% 9/15/19 | | 3,372 | | 3,323 |
6.45% 6/15/21 | | 8,745 | | 8,506 |
7.6% 9/15/39 | | 1,640 | | 1,508 |
Embarq Corp. 7.995% 6/1/36 | | 3,112 | | 2,952 |
Sprint Capital Corp. 6.875% 11/15/28 | | 9,000 | | 8,055 |
Telefonica Emisiones SAU: | | | | |
5.134% 4/27/20 | | 772 | | 733 |
5.462% 2/16/21 | | 4,994 | | 4,825 |
6.421% 6/20/16 | | 939 | | 986 |
Verizon Communications, Inc.: | | | | |
6.1% 4/15/18 | | 2,674 | | 3,179 |
6.25% 4/1/37 | | 4,611 | | 5,224 |
Verizon New York, Inc. 6.875% 4/1/12 | | 3,115 | | 3,219 |
| | 61,691 |
Nonconvertible Bonds - continued |
| Principal
Amount (000s) | | Value (000s) |
TELECOMMUNICATION SERVICES - continued |
Wireless Telecommunication Services - 0.2% |
America Movil SAB de CV: | | | | |
2.375% 9/8/16 (i) | | $ 4,810 | | $ 4,771 |
3.625% 3/30/15 | | 1,082 | | 1,149 |
DIRECTV Holdings LLC/DIRECTV Financing, Inc.: | | | | |
4.75% 10/1/14 | | 13,460 | | 14,800 |
5.875% 10/1/19 | | 8,810 | | 10,145 |
6.35% 3/15/40 | | 2,500 | | 2,733 |
Vodafone Group PLC 5% 12/16/13 | | 2,696 | | 2,922 |
| | 36,520 |
TOTAL TELECOMMUNICATION SERVICES | | 98,211 |
UTILITIES - 0.8% |
Electric Utilities - 0.4% |
Ameren Illinois Co. 6.125% 11/15/17 | | 333 | | 394 |
AmerenUE 6.4% 6/15/17 | | 3,507 | | 4,193 |
Cleveland Electric Illuminating Co. 5.65% 12/15/13 | | 4,829 | | 5,264 |
Commonwealth Edison Co. 1.625% 1/15/14 | | 4,248 | | 4,287 |
Duquesne Light Holdings, Inc.: | | | | |
5.9% 12/1/21 (g) | | 5,410 | | 5,477 |
6.4% 9/15/20 (g) | | 10,335 | | 10,813 |
Edison International 3.75% 9/15/17 | | 4,275 | | 4,435 |
EDP Finance BV: | | | | |
4.9% 10/1/19 (g) | | 1,900 | | 1,506 |
6% 2/2/18 (g) | | 2,801 | | 2,347 |
Enel Finance International SA 5.7% 1/15/13 (g) | | 305 | | 315 |
FirstEnergy Corp. 7.375% 11/15/31 | | 9,223 | | 10,701 |
FirstEnergy Solutions Corp.: | | | | |
4.8% 2/15/15 | | 1,798 | | 1,960 |
6.05% 8/15/21 | | 6,126 | | 6,707 |
LG&E and KU Energy LLC: | | | | |
2.125% 11/15/15 | | 4,999 | | 4,951 |
3.75% 11/15/20 | | 984 | | 974 |
Nevada Power Co.: | | | | |
6.5% 5/15/18 | | 5,290 | | 6,339 |
6.5% 8/1/18 | | 1,844 | | 2,220 |
Pennsylvania Electric Co. 6.05% 9/1/17 | | 618 | | 707 |
Pepco Holdings, Inc. 2.7% 10/1/15 | | 4,728 | | 4,835 |
Sierra Pacific Power Co. 5.45% 9/1/13 | | 1,831 | | 1,979 |
| | 80,404 |
Nonconvertible Bonds - continued |
| Principal
Amount (000s) | | Value (000s) |
UTILITIES - continued |
Gas Utilities - 0.0% |
Southern Natural Gas Co. 5.9% 4/1/17 (g) | | $ 357 | | $ 410 |
Southern Natural Gas Co. / Southern Natural Issuing Corp. 4.4% 6/15/21 (g) | | 2,360 | | 2,458 |
| | 2,868 |
Independent Power Producers & Energy Traders - 0.1% |
Duke Capital LLC 5.668% 8/15/14 | | 2,413 | | 2,681 |
Exelon Generation Co. LLC: | | | | |
4% 10/1/20 | | 8,787 | | 8,730 |
5.35% 1/15/14 | | 1,235 | | 1,332 |
| | 12,743 |
Multi-Utilities - 0.3% |
Dominion Resources, Inc.: | | | | |
6.3% 9/30/66 (o) | | 13,426 | | 12,822 |
7.5% 6/30/66 (o) | | 3,828 | | 3,924 |
MidAmerican Energy Holdings, Co.: | | | | |
5.875% 10/1/12 | | 3,227 | | 3,399 |
6.5% 9/15/37 | | 3,287 | | 3,949 |
National Grid PLC 6.3% 8/1/16 | | 407 | | 475 |
NiSource Finance Corp.: | | | | |
5.25% 9/15/17 | | 682 | | 763 |
5.4% 7/15/14 | | 6,582 | | 7,228 |
5.45% 9/15/20 | | 980 | | 1,100 |
5.95% 6/15/41 | | 8,000 | | 8,161 |
6.25% 12/15/40 | | 1,664 | | 1,830 |
6.4% 3/15/18 | | 1,557 | | 1,830 |
6.8% 1/15/19 | | 4,065 | | 4,860 |
San Diego Gas & Electric Co. 3% 8/15/21 | | 1,980 | | 1,971 |
Wisconsin Energy Corp. 6.25% 5/15/67 (o) | | 3,554 | | 3,518 |
| | 55,830 |
TOTAL UTILITIES | | 151,845 |
TOTAL NONCONVERTIBLE BONDS (Cost $1,290,753) | 1,391,507 |
U.S. Government and Government Agency Obligations - 11.7% |
| Principal
Amount (000s) | | Value (000s) |
U.S. Government Agency Obligations - 0.3% |
Fannie Mae 0.875% 8/28/14 | | $ 11,611 | | $ 11,727 |
Tennessee Valley Authority 3.875% 2/15/21 | | 39,390 | | 43,411 |
TOTAL U.S. GOVERNMENT AGENCY OBLIGATIONS | | 55,138 |
U.S. Treasury Inflation Protected Obligations - 0.9% |
U.S. Treasury Inflation-Indexed Bonds: | | | | |
2.125% 2/15/40 | | 47,968 | | 58,895 |
2.125% 2/15/41 | | 99,706 | | 123,200 |
TOTAL U.S. TREASURY INFLATION PROTECTED OBLIGATIONS | | 182,095 |
U.S. Treasury Obligations - 10.5% |
U.S. Treasury Bills, yield at date of purchase 0.01% to 0.05% 9/1/11 to 12/1/11 (k) | | 48,100 | | 48,099 |
U.S. Treasury Bonds 4.375% 5/15/41 | | 170,602 | | 194,752 |
U.S. Treasury Notes: | | | | |
0.5% 8/15/14 | | 88,000 | | 88,454 |
0.625% 7/15/14 | | 825,378 | | 832,743 |
0.75% 6/15/14 | | 27,903 | | 28,254 |
1% 10/31/11 | | 70,000 | | 70,109 |
1% 8/31/16 | | 15,416 | | 15,441 |
1.5% 7/31/16 | | 61,082 | | 62,738 |
1.5% 8/31/18 | | 25,343 | | 25,224 |
2.125% 8/15/21 (f) | | 99,140 | | 98,164 |
3.125% 4/30/17 (l) | | 259,740 | | 287,439 |
3.125% 5/15/21 | | 301,352 | | 325,930 |
TOTAL U.S. TREASURY OBLIGATIONS | | 2,077,347 |
TOTAL U.S. GOVERNMENT AND GOVERNMENT AGENCY OBLIGATIONS (Cost $2,226,945) | 2,314,580 |
U.S. Government Agency - Mortgage Securities - 9.6% |
|
Fannie Mae - 7.3% |
2.303% 6/1/36 (o) | | 186 | | 194 |
2.636% 7/1/37 (o) | | 636 | | 672 |
3% 10/1/26 (i) | | 8,000 | | 8,187 |
3.5% 1/1/21 to 3/1/41 | | 73,517 | | 74,760 |
4% 2/1/35 to 6/1/41 | | 94,527 | | 98,123 |
U.S. Government Agency - Mortgage Securities - continued |
| Principal
Amount (000s) | | Value (000s) |
Fannie Mae - continued |
4% 9/1/41 (i)(j) | | $ 44,000 | | $ 45,601 |
4% 9/1/41 (i)(j) | | 223,000 | | 231,113 |
4% 9/1/41 (i)(j) | | 34,000 | | 35,237 |
4% 9/1/41 (i)(j) | | 52,000 | | 53,892 |
4% 9/1/41 (i)(j) | | 80,000 | | 82,910 |
4% 9/1/41 (i)(j) | | 91,000 | | 94,311 |
4.5% 6/1/24 to 9/1/41 (j) | | 161,875 | | 171,881 |
4.5% 9/1/26 (i) | | 1,500 | | 1,599 |
4.5% 9/1/41 (i) | | 6,000 | | 6,343 |
4.5% 9/1/41 (i)(j) | | 80,000 | | 84,575 |
4.5% 9/1/41 (i)(j) | | 3,900 | | 4,123 |
4.5% 9/1/41 (i)(j) | | 23,000 | | 24,315 |
4.5% 9/1/41 (i)(j) | | 15,000 | | 15,858 |
5% 6/1/24 to 5/1/41 (j) | | 99,987 | | 108,010 |
5% 9/1/41 (i)(j) | | 24,000 | | 25,848 |
5.5% 9/1/24 to 3/1/40 (i) | | 90,097 | | 98,872 |
5.5% 9/1/41 (i)(j) | | 28,000 | | 30,604 |
5.5% 9/1/41 (i)(j) | | 28,000 | | 30,604 |
5.5% 9/1/41 (i)(j) | | 4,000 | | 4,372 |
5.5% 9/1/41 (i)(j) | | 9,000 | | 9,837 |
6% 6/1/35 to 2/1/40 | | 77,782 | | 86,274 |
6% 9/1/41 (i) | | 2,600 | | 2,879 |
6% 9/1/41 (i) | | 2,000 | | 2,214 |
TOTAL FANNIE MAE | | 1,433,208 |
Freddie Mac - 1.3% |
3.261% 10/1/35 (o) | | 284 | | 304 |
4% 9/1/41 (i) | | 9,000 | | 9,320 |
4.5% 7/1/25 to 8/1/41 (i) | | 38,192 | | 40,409 |
4.5% 9/1/41 (i)(j) | | 16,000 | | 16,882 |
4.5% 9/1/41 (i) | | 29,300 | | 30,916 |
5% 3/1/19 to 9/1/40 | | 46,245 | | 49,931 |
5.5% 1/1/28 to 3/1/40 | | 71,091 | | 77,591 |
5.5% 9/1/41 | | 19,200 | | 20,942 |
6% 7/1/37 to 8/1/37 | | 1,651 | | 1,833 |
6.5% 3/1/36 | | 1,588 | | 1,790 |
TOTAL FREDDIE MAC | | 249,918 |
Ginnie Mae - 1.0% |
3.5% 1/15/41 | | 14,176 | | 14,526 |
U.S. Government Agency - Mortgage Securities - continued |
| Principal
Amount (000s) | | Value (000s) |
Ginnie Mae - continued |
4% 1/15/25 to 7/15/41 | | $ 32,457 | | $ 34,664 |
4% 9/1/41 (i) | | 19,000 | | 20,106 |
4.5% 3/15/39 to 7/20/41 | | 47,375 | | 51,391 |
4.5% 9/1/41 (i) | | 9,350 | | 10,116 |
5% 5/15/34 to 11/15/40 | | 18,223 | | 20,157 |
5% 9/1/41 (i) | | 8,000 | | 8,814 |
5% 9/1/41 (i) | | 15,000 | | 16,525 |
5% 9/1/41 (i) | | 8,000 | | 8,814 |
5.5% 12/15/31 to 1/15/39 | | 1,767 | | 1,978 |
6% 2/15/34 | | 12,255 | | 13,850 |
TOTAL GINNIE MAE | | 200,941 |
TOTAL U.S. GOVERNMENT AGENCY - MORTGAGE SECURITIES (Cost $1,859,497) | 1,884,067 |
Asset-Backed Securities - 0.5% |
|
Accredited Mortgage Loan Trust Series 2005-1 Class M1, 0.6884% 4/25/35 (o) | | 1,577 | | 1,044 |
ACE Securities Corp. Home Equity Loan Trust: | | | | |
Series 2004-HE1: | | | | |
Class M1, 0.9684% 3/25/34 (o) | | 7 | | 7 |
Class M2, 1.8684% 3/25/34 (o) | | 482 | | 362 |
Series 2005-HE2 Class M2, 0.6684% 4/25/35 (o) | | 153 | | 148 |
Series 2006-OP1 Class M4, 0.5884% 4/25/36 (o) | | 121 | | 0* |
Advanta Business Card Master Trust Series 2006-C1 Class C1, 0.6758% 10/20/14 (o) | | 688 | | 7 |
Ally Master Owner Trust: | | | | |
Series 2010-3 Class A, 2.88% 4/15/15 (g) | | 3,320 | | 3,414 |
Series 2011-1 Class A2, 2.15% 1/15/16 | | 6,360 | | 6,486 |
Series 2011-3 Class A2, 1.81% 5/15/16 | | 5,770 | | 5,834 |
AmeriCredit Prime Automobile Receivables Trust Series 2007-1 Class D, 5.62% 9/8/14 | | 777 | | 784 |
Ameriquest Mortgage Securities, Inc. pass-thru certificates: | | | | |
Series 2003-10 Class M1, 0.9184% 12/25/33 (o) | | 97 | | 76 |
Series 2004-R2 Class M3, 0.7684% 4/25/34 (o) | | 147 | | 49 |
Series 2004-R8 Class M9, 4.3434% 9/25/34 (o) | | 334 | | 1 |
Series 2005-R2 Class M1, 0.6684% 4/25/35 (o) | | 2,266 | | 1,976 |
Argent Securities, Inc. pass-thru certificates: | | | | |
Series 2003-W7 Class A2, 0.9673% 3/25/34 (o) | | 53 | | 35 |
Asset-Backed Securities - continued |
| Principal
Amount (000s) | | Value (000s) |
Argent Securities, Inc. pass-thru certificates: - continued | | | | |
Series 2004-W11 Class M2, 0.9184% 11/25/34 (o) | | $ 616 | | $ 508 |
Series 2004-W7 Class M1, 0.7684% 5/25/34 (o) | | 1,600 | | 1,157 |
Series 2006-W4 Class A2C, 0.3784% 5/25/36 (o) | | 1,485 | | 377 |
Asset Backed Securities Corp. Home Equity Loan Trust: | | | | |
Series 2004-HE2 Class M1, 1.0434% 4/25/34 (o) | | 2,908 | | 2,265 |
Series 2006-HE2 Class M1, 0.5884% 3/25/36 (o) | | 181 | | 2 |
Axon Financial Funding Ltd. 0.8458% 4/4/17 (d)(g)(o) | | 6,960 | | 0 |
Brazos Higher Education Authority, Inc. Series 2006-2 Class A9, 0.2565% 12/25/24 (o) | | 1,604 | | 1,400 |
C-BASS Trust Series 2006-CB7 Class A2, 0.2784% 10/25/36 (o) | | 14 | | 14 |
Capital Auto Receivables Asset Trust Series 2007-1 Class C, 5.38% 11/15/12 | | 583 | | 598 |
Capital Trust Ltd. Series 2004-1: | | | | |
Class A2, 0.663% 7/20/39 (g)(o) | | 311 | | 224 |
Class B, 0.963% 7/20/39 (g)(o) | | 290 | | 113 |
Class C, 1.313% 7/20/39 (g)(o) | | 372 | | 15 |
Carrington Mortgage Loan Trust: | | | | |
Series 2006-FRE1 Class M1, 0.5184% 7/25/36 (o) | | 5,102 | | 256 |
Series 2006-NC4 Class M1, 0.5184% 10/25/36 (o) | | 3,478 | | 49 |
Series 2007-RFC1 Class A3, 0.3584% 12/25/36 (o) | | 1,978 | | 564 |
Citibank Credit Card Issuance Trust Series 2009-A5 Class A5, 2.25% 12/23/14 | | 13,320 | | 13,618 |
Citigroup Mortgage Loan Trust Series 2005-HE4 Class A2C, 0.4884% 10/25/35 (o) | | 1,433 | | 1,369 |
Countrywide Asset-Backed Certificates Trust: | | | | |
Series 2007-11 Class 2A1, 0.2784% 6/25/47 (o) | | 43 | | 42 |
Series 2007-4 Class A1A, 0.3073% 9/25/37 (o) | | 392 | | 374 |
Series 2007-5 Class 2A1, 0.3184% 9/25/47 (o) | | 3,766 | | 3,650 |
Countrywide Home Loan Trust Series 2006-13 Class N, 7% 8/25/37 (g) | | 363 | | 0 |
Countrywide Home Loans, Inc.: | | | | |
Series 2004-3 Class M4, 1.1884% 4/25/34 (o) | | 175 | | 87 |
Series 2004-4 Class M2, 1.0134% 6/25/34 (o) | | 645 | | 283 |
Series 2005-3 Class MV1, 0.6384% 8/25/35 (o) | | 626 | | 607 |
Series 2005-AB1 Class A2, 0.4284% 8/25/35 (o) | | 53 | | 52 |
CPS Auto Receivables Trust Series 2006-D Class A4, 5.115% 8/15/13 (FSA Insured) (g) | | 180 | | 181 |
Fannie Mae subordinate REMIC pass-thru certificates Series 2004-T5 Class AB3, 0.5908% 5/28/35 (o) | | 43 | | 28 |
Fieldstone Mortgage Investment Corp. Series 2004-3 Class M5, 2.3934% 8/25/34 (o) | | 319 | | 182 |
Asset-Backed Securities - continued |
| Principal
Amount (000s) | | Value (000s) |
First Franklin Mortgage Loan Trust: | | | | |
Series 2004-FF2 Class M3, 1.0434% 3/25/34 (o) | | $ 25 | | $ 6 |
Series 2006-FF14 Class A2, 0.2784% 10/25/36 (o) | | 1,165 | | 1,113 |
Ford Credit Floorplan Master Owner Trust Series 2010-5 Class A1, 1.5% 9/15/15 | | 7,020 | | 7,077 |
Franklin Auto Trust: | | | | |
Series 2006-1 Class B, 5.14% 7/21/14 | | 16 | | 16 |
Series 2007-1: | | | | |
Class A4, 5.03% 2/16/15 | | 43 | | 43 |
Class C, 5.43% 2/16/15 | | 613 | | 614 |
Fremont Home Loan Trust: | | | | |
Series 2005-A: | | | | |
Class M3, 0.7084% 1/25/35 (o) | | 1,041 | | 411 |
Class M4, 0.8984% 1/25/35 (o) | | 399 | | 103 |
Series 2006-D Class M1, 0.4484% 11/25/36 (o) | | 173 | | 5 |
GCO Education Loan Funding Master Trust II Series 2007-1A Class C1L, 0.6918% 2/25/47 (g)(o) | | 3,122 | | 1,842 |
GCO Slims Trust Series 2006-1A, 5.72% 3/1/22 (g) | | 1,019 | | 811 |
GE Business Loan Trust: | | | | |
Series 2003-1 Class A, 0.6372% 4/15/31 (g)(o) | | 260 | | 244 |
Series 2006-2A: | | | | |
Class A, 0.3872% 11/15/34 (g)(o) | | 1,730 | | 1,431 |
Class B, 0.4872% 11/15/34 (g)(o) | | 624 | | 403 |
Class C, 0.5872% 11/15/34 (g)(o) | | 1,038 | | 514 |
Class D, 0.9572% 11/15/34 (g)(o) | | 395 | | 95 |
Goal Capital Funding Trust Series 2007-1 Class C1, 0.6465% 6/25/42 (o) | | 566 | | 442 |
GSAMP Trust: | | | | |
Series 2004-AR1 Class M1, 0.8684% 6/25/34 (o) | | 2,938 | | 1,815 |
Series 2007-HE1 Class M1, 0.4684% 3/25/47 (o) | | 1,186 | | 54 |
Guggenheim Structured Real Estate Funding Ltd. Series 2006-3: | | | | |
Class B, 0.6184% 9/25/46 (g)(o) | | 400 | | 172 |
Class C, 0.7684% 9/25/46 (g)(o) | | 1,676 | | 268 |
Home Equity Asset Trust: | | | | |
Series 2003-2 Class M1, 1.5384% 8/25/33 (o) | | 413 | | 287 |
Series 2003-3 Class M1, 1.5084% 8/25/33 (o) | | 796 | | 630 |
Series 2003-5 Class A2, 0.9184% 12/25/33 (o) | | 36 | | 24 |
Series 2005-5 Class 2A2, 0.4684% 11/25/35 (o) | | 52 | | 51 |
Series 2006-1 Class 2A3, 0.4434% 4/25/36 (o) | | 888 | | 864 |
HSBC Home Equity Loan Trust Series 2006-2 Class M2, 0.503% 3/20/36 (o) | | 719 | | 598 |
Asset-Backed Securities - continued |
| Principal
Amount (000s) | | Value (000s) |
HSI Asset Securitization Corp. Trust Series 2007-HE1 Class 2A3, 0.4084% 1/25/37 (o) | | $ 1,642 | | $ 556 |
JPMorgan Mortgage Acquisition Trust: | | | | |
Series 2006-NC2 Class M2, 0.5184% 7/25/36 (o) | | 3,185 | | 141 |
Series 2007-CH1: | | | | |
Class AV4, 0.3484% 11/25/36 (o) | | 1,641 | | 1,297 |
Class MV1, 0.4484% 11/25/36 (o) | | 1,335 | | 856 |
Series 2007-CH3 Class M1, 0.5184% 3/25/37 (o) | | 574 | | 23 |
Keycorp Student Loan Trust: | | | | |
Series 1999-A Class A2, 0.5765% 12/27/29 (o) | | 732 | | 648 |
Series 2006-A Class 2C, 1.3965% 3/27/42 (o) | | 2,909 | | 725 |
Long Beach Auto Receivables Trust Series 2007-A Class A4, 5.025% 1/15/14 (FSA Insured) | | 964 | | 965 |
Long Beach Mortgage Loan Trust Series 2004-2 Class M2, 1.2984% 6/25/34 (o) | | 98 | | 68 |
Marriott Vacation Club Owner Trust Series 2006-2A: | | | | |
Class B, 5.442% 10/20/28 (g) | | 13 | | 13 |
Class C, 5.691% 10/20/28 (g) | | 6 | | 6 |
Class D, 6.01% 10/20/28 (g) | | 71 | | 71 |
MASTR Asset Backed Securities Trust: | | | | |
Series 2006-AM3 Class M1, 0.4784% 10/25/36 (o) | | 589 | | 26 |
Series 2007-HE1 Class M1, 0.5184% 5/25/37 (o) | | 861 | | 29 |
Meritage Mortgage Loan Trust Series 2004-1 Class M1, 0.9684% 7/25/34 (o) | | 175 | | 113 |
Merrill Lynch Mortgage Investors Trust: | | | | |
Series 2003-OPT1 Class M1, 1.1934% 7/25/34 (o) | | 605 | | 416 |
Series 2006-FM1 Class A2B, 0.3284% 4/25/37 (o) | | 2,035 | | 1,477 |
Series 2006-OPT1 Class A1A, 0.4784% 6/25/35 (o) | | 3,217 | | 2,295 |
Morgan Stanley ABS Capital I Trust: | | | | |
Series 2004-HE6 Class A2, 0.5584% 8/25/34 (o) | | 63 | | 43 |
Series 2005-NC1 Class M1, 0.6584% 1/25/35 (o) | | 439 | | 281 |
Series 2005-NC2 Class B1, 1.3884% 3/25/35 (o) | | 457 | | 59 |
Series 2007-HE2 Class M1, 0.4684% 1/25/37 (o) | | 3,956 | | 17 |
National Collegiate Student Loan Trust: | | | | |
Series 2004-2 Class A, 9.75% 10/27/14 (q) | | 1,965 | | 179 |
Series 2006-3 Class A, 7.1% 1/25/12 (q) | | 285 | | 6 |
Series 2006-4: | | | | |
Class A1, 0.2484% 3/25/25 (o) | | 8 | | 8 |
Class A, 6.35% 2/27/12 (q) | | 1,181 | | 26 |
Class D, 1.3184% 5/25/32 (o) | | 2,225 | | 5 |
Series 2007-1 Class A, 7.27% 4/25/12 (q) | | 1,587 | | 63 |
Series 2007-2 Class A, 6.7% 7/25/12 (q) | | 1,351 | | 69 |
Asset-Backed Securities - continued |
| Principal
Amount (000s) | | Value (000s) |
New Century Home Equity Loan Trust: | | | | |
Series 2005-4 Class M2, 0.7284% 9/25/35 (o) | | $ 1,566 | | $ 853 |
Series 2005-D Class M2, 0.6884% 2/25/36 (o) | | 857 | | 169 |
Ocala Funding LLC: | | | | |
Series 2005-1A Class A, 1.713% 3/20/10 (d)(g)(o) | | 621 | | 0 |
Series 2006-1A Class A, 1.613% 3/20/11 (d)(g)(o) | | 1,290 | | 0 |
Option One Mortgage Loan Trust: | | | | |
Series 2007-5 Class 2A1, 0.3084% 5/25/37 (o) | | 33 | | 32 |
Series 2007-6 Class 2A1, 0.2784% 7/25/37 (o) | | 105 | | 102 |
Park Place Securities, Inc.: | | | | |
Series 2004-WCW1: | | | | |
Class M3, 1.4684% 9/25/34 (o) | | 585 | | 342 |
Class M4, 1.6684% 9/25/34 (o) | | 750 | | 308 |
Series 2005-WCH1: | | | | |
Class M2, 0.7384% 1/25/36 (o) | | 2,624 | | 2,375 |
Class M3, 0.7784% 1/25/36 (o) | | 525 | | 336 |
Class M4, 1.0484% 1/25/36 (o) | | 1,620 | | 817 |
Series 2005-WHQ2 Class M7, 1.4684% 5/25/35 (o) | | 1,920 | | 13 |
Residential Asset Mortgage Products, Inc. Series 2006-EFC2 Class M1, 0.4484% 12/25/36 (o) | | 390 | | 9 |
Residential Asset Securities Corp. Series 2007-KS2 Class AI1, 0.2884% 2/25/37 (o) | | 1 | | 1 |
Salomon Brothers Mortgage Securities VII, Inc. Series 2003-HE1 Class A, 1.0184% 4/25/33 (o) | | 6 | | 5 |
Saxon Asset Securities Trust Series 2004-1 Class M1, 1.0134% 3/25/35 (o) | | 1,579 | | 1,236 |
Securitized Asset Backed Receivables LLC Trust Series 2005-FR4 Class B3, 1.9384% 1/25/36 (o) | | 26 | | 0* |
Sierra Receivables Funding Co. Series 2007-1A Class A2, 0.3363% 3/20/19 (FGIC Insured) (g)(o) | | 690 | | 659 |
SLM Private Credit Student Loan Trust Series 2004-A Class C, 1.197% 6/15/33 (o) | | 1,396 | | 643 |
Specialty Underwriting & Residential Finance Trust Series 2006-AB2 Class N1, 5.75% 6/25/37 (g) | | 655 | | 0 |
Structured Asset Investment Loan Trust Series 2004-8 Class M5, 1.9434% 9/25/34 (o) | | 75 | | 40 |
SVO VOI Mortgage Corp. Series 2006-AA Class A, 5.28% 2/20/24 (g) | | 698 | | 726 |
Terwin Mortgage Trust Series 2003-4HE Class A1, 1.0784% 9/25/34 (o) | | 32 | | 21 |
Trapeza CDO XII Ltd./Trapeza CDO XII, Inc. Series 2007-12A Class B, 0.8058% 4/6/42 (g)(o) | | 2,156 | | 162 |
WaMu Asset Holdings Corp. Series 2006-8 Class N1, 6.048% 10/25/46 (g) | | 974 | | 0 |
Asset-Backed Securities - continued |
| Principal
Amount (000s) | | Value (000s) |
Wells Fargo Home Equity Trust Series 2004-3 Class A, 4.5% 11/27/34 (g) | | $ 8 | | $ 0 |
Whinstone Capital Management Ltd. Series 1A Class B3, 2.053% 10/25/44 (g)(o) | | 1,964 | | 1,100 |
TOTAL ASSET-BACKED SECURITIES (Cost $91,620) | 88,601 |
Collateralized Mortgage Obligations - 0.5% |
|
Private Sponsor - 0.5% |
Banc of America Commercial Mortgage Trust Series 2007-2: | | | | |
Class B, 5.6565% 4/10/49 (o) | | 73 | | 33 |
Class C, 5.6565% 4/10/49 (o) | | 194 | | 79 |
Class D, 5.6565% 4/10/49 (o) | | 97 | | 34 |
Banc of America Funding Corp. sequential payer Series 2010-R4 Class 2A1, 4.5% 3/26/37 (g) | | 3,010 | | 3,061 |
Banc of America Mortgage Securities, Inc.: | | | | |
Series 2003-L Class 2A1, 2.9045% 1/25/34 (o) | | 1,777 | | 1,569 |
Series 2004-1 Class 2A2, 3.2303% 10/25/34 (o) | | 1,757 | | 1,502 |
Series 2004-A Class 2A2, 2.8478% 2/25/34 (o) | | 848 | | 726 |
Series 2004-B: | | | | |
Class 1A1, 2.7465% 3/25/34 (o) | | 145 | | 125 |
Class 2A2, 2.8677% 3/25/34 (o) | | 1,064 | | 951 |
Series 2004-D Class 2A2, 2.8857% 5/25/34 (o) | | 1,698 | | 1,485 |
Series 2004-G Class 2A7, 2.9352% 8/25/34 (o) | | 1,576 | | 1,343 |
Series 2004-H Class 2A1, 3.1632% 9/25/34 (o) | | 1,377 | | 1,159 |
Bayview Commercial Asset Trust Series 2006-3A, 4.2221% 10/25/36 (g)(o)(q) | | 32,431 | | 2,059 |
Bear Stearns ALT-A Trust floater Series 2005-1 Class A1, 0.7784% 1/25/35 (o) | | 2,268 | | 1,714 |
Bear Stearns Commercial Mortgage Securities Trust Series 2006-T24 Class X2, 0.4258% 10/12/41 (g)(o)(q) | | 3,688 | | 34 |
Chase Mortgage Finance Trust: | | | | |
Series 2007-A1 Class 1A5, 2.8968% 2/25/37 (o) | | 413 | | 364 |
Series 2007-A2 Class 2A1, 3.0179% 7/25/37 (o) | | 3,406 | | 3,133 |
Citigroup Commercial Mortgage Trust Series 2008-C7 Class A2B, 6.0737% 12/10/49 (o) | | 1,314 | | 1,361 |
Citigroup Mortgage Loan Trust Series 2004-UST1 Class A4, 2.2809% 8/25/34 (o) | | 998 | | 987 |
Cobalt CMBS Commercial Mortgage Trust Series 2007-C2 Class B, 5.617% 4/15/47 (o) | | 1,468 | | 411 |
Collateralized Mortgage Obligations - continued |
| Principal
Amount (000s) | | Value (000s) |
Private Sponsor - continued |
COMM pass-thru certificates floater Series 2001-J2A Class A2F, 0.7083% 7/16/34 (g)(o) | | $ 20 | | $ 20 |
Credit Suisse First Boston Mortgage Securities Corp. floater Series 2007-AR7 Class 2A1, 2.7846% 11/25/34 (o) | | 218 | | 193 |
First Horizon Mortgage pass-thru Trust Series 2004-AR5 Class 2A1, 2.858% 10/25/34 (o) | | 1,343 | | 1,194 |
Gracechurch Mortgage Financing PLC floater Series 2006-1 Class D2, 0.7678% 11/20/56 (g)(o) | | 3,161 | | 3,139 |
Granite Master Issuer PLC floater: | | | | |
Series 2005-4 Class C2, 1.313% 12/20/54 (o) | | 206 | | 94 |
Series 2006-1A Class C2, 1.413% 12/20/54 (g)(o) | | 7,110 | | 3,324 |
Series 2006-2 Class C1, 1.153% 12/20/54 (o) | | 5,920 | | 2,768 |
Series 2006-3 Class C2, 0.713% 12/20/54 (o) | | 1,233 | | 576 |
Series 2006-4: | | | | |
Class B1, 0.303% 12/20/54 (o) | | 4,556 | | 3,611 |
Class C1, 0.593% 12/20/54 (o) | | 2,785 | | 1,302 |
Class M1, 0.383% 12/20/54 (o) | | 1,198 | | 767 |
Series 2007-1: | | | | |
Class 1C1, 0.813% 12/20/54 (o) | | 2,417 | | 1,130 |
Class 1M1, 0.513% 12/20/54 (o) | | 1,611 | | 1,031 |
Class 2C1, 1.173% 12/20/54 (o) | | 1,098 | | 513 |
Class 2M1, 0.713% 12/20/54 (o) | | 2,067 | | 1,323 |
Series 2007-2 Class 2C1, 0.6402% 12/17/54 (o) | | 2,864 | | 1,339 |
Granite Mortgages PLC floater Series 2003-3 Class 1C, 2.7013% 1/20/44 (o) | | 472 | | 321 |
GSR Mortgage Loan Trust Series 2007-AR2 Class 2A1, 2.7323% 4/25/35 (o) | | 649 | | 515 |
JPMorgan Chase Commercial Mortgage Securities Trust Series 2007-CB18: | | | | |
Class A1, 5.32% 6/12/47 (o) | | 14 | | 14 |
Class A3, 5.447% 6/12/47 (o) | | 2,492 | | 2,587 |
JPMorgan Mortgage Trust: | | | | |
sequential payer Series 2006-A5 Class 3A5, 5.8639% 8/25/36 (o) | | 2,279 | | 1,734 |
Series 2004-A3 Class 4A1, 2.7486% 7/25/34 (o) | | 1,145 | | 1,096 |
Series 2004-A5 Class 2A1, 2.5513% 12/25/34 (o) | | 1,389 | | 1,206 |
Series 2006-A2 Class 5A1, 2.9458% 11/25/33 (o) | | 2,302 | | 2,098 |
LB-UBS Commercial Mortgage Trust sequential payer Series 2006-C6 Class A4, 5.372% 9/15/39 | | 591 | | 640 |
MASTR Adjustable Rate Mortgages Trust Series 2007-3 Class 22A2, 0.4284% 5/25/47 (o) | | 988 | | 636 |
Collateralized Mortgage Obligations - continued |
| Principal
Amount (000s) | | Value (000s) |
Private Sponsor - continued |
Merrill Lynch Alternative Note Asset Trust floater Series 2007-OAR1 Class A1, 0.3884% 2/25/37 (o) | | $ 1,787 | | $ 1,197 |
Merrill Lynch Floating Trust floater Series 2006-1: | | | | |
Class B, 0.377% 6/15/22 (g)(o) | | 273 | | 265 |
Class C, 0.397% 6/15/22 (g)(o) | | 1,682 | | 1,573 |
Class D, 0.407% 6/15/22 (g)(o) | | 647 | | 602 |
Class E, 0.417% 6/15/22 (g)(o) | | 1,035 | | 952 |
Class F, 0.447% 6/15/22 (g)(o) | | 1,683 | | 1,532 |
Class G, 0.517% 6/15/22 (g)(o) | | 387 | | 345 |
Class H, 0.537% 6/15/22 (g)(o) | | 778 | | 676 |
Class J, 0.577% 6/15/22 (g)(o) | | 906 | | 782 |
Merrill Lynch Mortgage Investors Trust: | | | | |
Series 2004-A4 Class A1, 2.6423% 8/25/34 (o) | | 1,581 | | 1,494 |
Series 2005-A2 Class A7, 2.6224% 2/25/35 (o) | | 1,168 | | 1,092 |
Series 2006-A6 Class A4, 3.1818% 10/25/33 (o) | | 1,320 | | 1,189 |
Merrill Lynch-CFC Commercial Mortgage Trust Series 2006-3 Class ASB, 5.382% 7/12/46 (o) | | 5,626 | | 5,853 |
Opteum Mortgage Acceptance Corp. floater Series 2005-3 Class APT, 0.5084% 7/25/35 (o) | | 2,320 | | 1,787 |
Option One Mortgage Loan Trust floater Series 2007-CP1 Class M1, 0.5184% 3/25/37 (o) | | 3,232 | | 142 |
Provident Funding Mortgage Loan Trust Series 2005-2 Class 3A, 2.6869% 10/25/35 (o) | | 807 | | 644 |
RESI Finance LP/RESI Finance DE Corp. floater Series 2003-B: | | | | |
Class B5, 2.5558% 7/10/35 (g)(o) | | 1,574 | | 1,235 |
Class B6, 3.0558% 7/10/35 (g)(o) | | 335 | | 246 |
Residential Asset Mortgage Products, Inc. sequential payer: | | | | |
Series 2003-SL1 Class A31, 7.125% 4/25/31 | | 968 | | 1,024 |
Series 2004-SL3 Class A1, 7% 8/25/16 | | 50 | | 50 |
Residential Funding Securities Corp. floater Series 2003-RP2 Class A1, 0.6684% 6/25/33 (g)(o) | | 378 | | 346 |
Salomon Brothers Mortgage Securities VII, Inc. Series 2006-C2 Class H, 6.308% 7/18/33 (g) | | 185 | | 65 |
Sequoia Mortgage Trust floater Series 2004-6 Class A3B, 1.275% 7/20/34 (o) | | 41 | | 28 |
Structured Asset Securities Corp.: | | | | |
Series 2003-15A Class 4A, 5.375% 4/25/33 (o) | | 499 | | 454 |
Series 2003-20 Class 1A1, 5.5% 7/25/33 | | 347 | | 351 |
TBW Mortgage-Backed pass-thru certificates floater Series 2006-4 Class A3, 0.3873% 9/25/36 (o) | | 3,593 | | 2,591 |
Collateralized Mortgage Obligations - continued |
| Principal
Amount (000s) | | Value (000s) |
Private Sponsor - continued |
WaMu Mortgage pass-thru certificates: | | | | |
Series 2003-AR8 Class A, 2.6863% 8/25/33 (o) | | $ 813 | | $ 749 |
Series 2005-AR3 Class A2, 2.5791% 3/25/35 (o) | | 2,190 | | 1,811 |
Wells Fargo Mortgage Backed Securities Trust: | | | | |
Series 2004-EE Class 2A2, 2.7571% 12/25/34 (o) | | 690 | | 654 |
Series 2004-H Class A1, 2.7828% 6/25/34 (o) | | 1,208 | | 1,144 |
Series 2004-W Class A9, 2.7617% 11/25/34 (o) | | 4,592 | | 4,183 |
Series 2005-AR10 Class 2A2, 2.7607% 6/25/35 (o) | | 570 | | 515 |
Series 2005-AR12: | | | | |
Class 2A5, 2.7552% 7/25/35 (o) | | 11,322 | | 10,146 |
Class 2A6, 2.7552% 7/25/35 (o) | | 489 | | 432 |
Series 2005-AR2 Class 2A2, 2.7427% 3/25/35 (o) | | 2,593 | | 2,260 |
Series 2005-AR3 Class 2A1, 2.7804% 3/25/35 (o) | | 850 | | 751 |
TOTAL COLLATERALIZED MORTGAGE OBLIGATIONS (Cost $75,128) | 104,461 |
Commercial Mortgage Securities - 2.1% |
|
Asset Securitization Corp. Series 1997-D5: | | | | |
Class A2, 6.8338% 2/14/43 (o) | | 966 | | 998 |
Class A3, 6.8838% 2/14/43 (o) | | 1,043 | | 1,099 |
Class A6, 7.2038% 2/14/43 (o) | | 1,537 | | 1,608 |
Class PS1, 1.3868% 2/14/43 (o)(q) | | 3,705 | | 65 |
Banc of America Commercial Mortgage Trust: | | | | |
sequential payer: | | | | |
Series 2006-2 Class AAB, 5.7134% 5/10/45 (o) | | 1,470 | | 1,552 |
Series 2006-5: | | | | |
Class A2, 5.317% 9/10/47 | | 4,468 | | 4,499 |
Class A3, 5.39% 9/10/47 | | 1,832 | | 1,894 |
Series 2006-6 Class A3, 5.369% 10/10/45 | | 2,628 | | 2,746 |
Series 2007-4 Class A3, 5.798% 2/10/51 (o) | | 1,310 | | 1,385 |
Series 2006-6 Class E, 5.619% 10/10/45 (g) | | 759 | | 141 |
Series 2007-3: | | | | |
Class A3, 5.6242% 6/10/49 (o) | | 2,194 | | 2,298 |
Class A4, 5.6242% 6/10/49 (o) | | 2,739 | | 2,886 |
Banc of America Commercial Mortgage, Inc.: | | | | |
sequential payer: | | | | |
Series 2001-1 Class A4, 5.451% 1/15/49 | | 2,878 | | 3,055 |
Series 2004-2: | | | | |
Class A3, 4.05% 11/10/38 | | 218 | | 220 |
Class A4, 4.153% 11/10/38 | | 1,666 | | 1,723 |
Commercial Mortgage Securities - continued |
| Principal
Amount (000s) | | Value (000s) |
Banc of America Commercial Mortgage, Inc.: - continued | | | | |
sequential payer: | | | | |
Series 2005-1 Class A3, 4.877% 11/10/42 | | $ 1,151 | | $ 1,151 |
Series 2007-1 Class A2, 5.381% 1/15/49 | | 3,611 | | 3,619 |
Series 2001-3 Class H, 6.562% 4/11/37 (g) | | 735 | | 734 |
Series 2001-PB1: | | | | |
Class J, 7.166% 5/11/35 (g) | | 329 | | 327 |
Class K, 6.15% 5/11/35 (g) | | 611 | | 605 |
Series 2005-3 Series A3B, 5.09% 7/10/43 (o) | | 4,082 | | 4,275 |
Banc of America Large Loan, Inc. floater: | | | | |
Series 2005-MIB1: | | | | |
Class C, 0.5172% 3/15/22 (g)(o) | | 564 | | 533 |
Class D, 0.5672% 3/15/22 (g)(o) | | 572 | | 535 |
Class E, 0.6072% 3/15/22 (g)(o) | | 472 | | 434 |
Class F, 0.6772% 3/15/22 (g)(o) | | 676 | | 608 |
Class G, 0.7372% 3/15/22 (g)(o) | | 438 | | 390 |
Series 2006-BIX1: | | | | |
Class C, 0.3872% 10/15/19 (g)(o) | | 561 | | 546 |
Class D, 0.4172% 10/15/19 (g)(o) | | 1,031 | | 987 |
Class E, 0.4472% 10/15/19 (g)(o) | | 956 | | 901 |
Class F, 0.5172% 10/15/19 (g)(o) | | 2,868 | | 2,689 |
Class G, 0.5372% 10/15/19 (g)(o) | | 1,350 | | 1,198 |
Bayview Commercial Asset Trust: | | | | |
floater: | | | | |
Series 2003-2 Class M1, 1.0684% 12/25/33 (g)(o) | | 79 | | 55 |
Series 2004-1: | | | | |
Class A, 0.5784% 4/25/34 (g)(o) | | 1,319 | | 1,104 |
Class B, 2.1184% 4/25/34 (g)(o) | | 148 | | 84 |
Class M1, 0.7784% 4/25/34 (g)(o) | | 119 | | 84 |
Class M2, 1.4184% 4/25/34 (g)(o) | | 109 | | 76 |
Series 2004-2: | | | | |
Class A, 0.6484% 8/25/34 (g)(o) | | 1,079 | | 882 |
Class M1, 0.7984% 8/25/34 (g)(o) | | 186 | | 135 |
Series 2004-3: | | | | |
Class A1, 0.5884% 1/25/35 (g)(o) | | 2,409 | | 1,883 |
Class A2, 0.6384% 1/25/35 (g)(o) | | 346 | | 274 |
Class M1, 0.7184% 1/25/35 (g)(o) | | 416 | | 290 |
Class M2, 1.2184% 1/25/35 (g)(o) | | 198 | | 132 |
Series 2005-2A: | | | | |
Class A1, 0.5284% 8/25/35 (g)(o) | | 1,715 | | 1,341 |
Class M1, 0.6484% 8/25/35 (g)(o) | | 93 | | 55 |
Class M2, 0.6984% 8/25/35 (g)(o) | | 154 | | 83 |
Commercial Mortgage Securities - continued |
| Principal
Amount (000s) | | Value (000s) |
Bayview Commercial Asset Trust: - continued | | | | |
floater: | | | | |
Series 2005-2A: | | | | |
Class M3, 0.7184% 8/25/35 (g)(o) | | $ 85 | | $ 45 |
Class M4, 0.8284% 8/25/35 (g)(o) | | 78 | | 39 |
Series 2005-3A: | | | | |
Class A1, 0.5384% 11/25/35 (g)(o) | | 699 | | 528 |
Class A2, 0.6184% 11/25/35 (g)(o) | | 630 | | 479 |
Class M1, 0.6584% 11/25/35 (g)(o) | | 83 | | 50 |
Class M2, 0.7084% 11/25/35 (g)(o) | | 105 | | 60 |
Class M3, 0.7284% 11/25/35 (g)(o) | | 94 | | 52 |
Class M4, 0.8184% 11/25/35 (g)(o) | | 117 | | 57 |
Series 2005-4A: | | | | |
Class A2, 0.6084% 1/25/36 (g)(o) | | 1,621 | | 1,204 |
Class B1, 1.6184% 1/25/36 (g)(o) | | 140 | | 28 |
Class M1, 0.6684% 1/25/36 (g)(o) | | 523 | | 310 |
Class M2, 0.6884% 1/25/36 (g)(o) | | 157 | | 83 |
Class M3, 0.7184% 1/25/36 (g)(o) | | 229 | | 112 |
Class M4, 0.8284% 1/25/36 (g)(o) | | 127 | | 57 |
Class M5, 0.8684% 1/25/36 (g)(o) | | 127 | | 49 |
Class M6, 0.9184% 1/25/36 (g)(o) | | 135 | | 41 |
Series 2006-1: | | | | |
Class A2, 0.5784% 4/25/36 (g)(o) | | 246 | | 183 |
Class M1, 0.5984% 4/25/36 (g)(o) | | 88 | | 52 |
Class M2, 0.6184% 4/25/36 (g)(o) | | 93 | | 51 |
Class M3, 0.6384% 4/25/36 (g)(o) | | 80 | | 41 |
Class M4, 0.7384% 4/25/36 (g)(o) | | 45 | | 21 |
Class M5, 0.7784% 4/25/36 (g)(o) | | 44 | | 18 |
Class M6, 0.8584% 4/25/36 (g)(o) | | 88 | | 33 |
Series 2006-2A: | | | | |
Class A1, 0.4484% 7/25/36 (g)(o) | | 3,708 | | 2,770 |
Class A2, 0.4984% 7/25/36 (g)(o) | | 220 | | 162 |
Class B1, 1.0884% 7/25/36 (g)(o) | | 83 | | 28 |
Class B3, 2.9184% 7/25/36 (g)(o) | | 125 | | 35 |
Class M1, 0.5284% 7/25/36 (g)(o) | | 231 | | 138 |
Class M2, 0.5484% 7/25/36 (g)(o) | | 163 | | 89 |
Class M3, 0.5684% 7/25/36 (g)(o) | | 135 | | 73 |
Class M4, 0.6384% 7/25/36 (g)(o) | | 91 | | 47 |
Class M5, 0.6884% 7/25/36 (g)(o) | | 112 | | 56 |
Class M6, 0.7584% 7/25/36 (g)(o) | | 168 | | 64 |
Series 2006-3A: | | | | |
Class B1, 1.0184% 10/25/36 (g)(o) | | 155 | | 13 |
Class B2, 1.5684% 10/25/36 (g)(o) | | 112 | | 5 |
Commercial Mortgage Securities - continued |
| Principal
Amount (000s) | | Value (000s) |
Bayview Commercial Asset Trust: - continued | | | | |
floater: | | | | |
Series 2006-3A: | | | | |
Class B3, 2.8184% 10/25/36 (g)(o) | | $ 38 | | $ 0* |
Class M4, 0.6484% 10/25/36 (g)(o) | | 171 | | 44 |
Class M5, 0.6984% 10/25/36 (g)(o) | | 205 | | 41 |
Class M6, 0.7784% 10/25/36 (g)(o) | | 401 | | 60 |
Series 2006-4A: | | | | |
Class A1, 0.4484% 12/25/36 (g)(o) | | 878 | | 624 |
Class A2, 0.4884% 12/25/36 (g)(o) | | 4,292 | | 2,919 |
Class B1, 0.9184% 12/25/36 (g)(o) | | 137 | | 18 |
Class B2, 1.4684% 12/25/36 (g)(o) | | 140 | | 14 |
Class B3, 2.6684% 12/25/36 (g)(o) | | 237 | | 15 |
Class M1, 0.5084% 12/25/36 (g)(o) | | 286 | | 119 |
Class M2, 0.5284% 12/25/36 (g)(o) | | 190 | | 71 |
Class M3, 0.5584% 12/25/36 (g)(o) | | 192 | | 64 |
Class M4, 0.6184% 12/25/36 (g)(o) | | 232 | | 65 |
Class M5, 0.6584% 12/25/36 (g)(o) | | 211 | | 47 |
Class M6, 0.7384% 12/25/36 (g)(o) | | 190 | | 34 |
Series 2007-1: | | | | |
Class A2, 0.4884% 3/25/37 (g)(o) | | 897 | | 583 |
Class B1, 0.8884% 3/25/37 (g)(o) | | 288 | | 35 |
Class B2, 1.3684% 3/25/37 (g)(o) | | 207 | | 21 |
Class B3, 3.5684% 3/25/37 (g)(o) | | 316 | | 14 |
Class M1, 0.4884% 3/25/37 (g)(o) | | 251 | | 93 |
Class M2, 0.5084% 3/25/37 (g)(o) | | 187 | | 56 |
Class M3, 0.5384% 3/25/37 (g)(o) | | 167 | | 45 |
Class M4, 0.5884% 3/25/37 (g)(o) | | 136 | | 33 |
Class M5, 0.6384% 3/25/37 (g)(o) | | 209 | | 40 |
Class M6, 0.7184% 3/25/37 (g)(o) | | 293 | | 47 |
Series 2007-2A: | | | | |
Class A1, 0.4884% 7/25/37 (g)(o) | | 820 | | 568 |
Class A2, 0.5384% 7/25/37 (g)(o) | | 769 | | 447 |
Class B1, 1.8184% 7/25/37 (g)(o) | | 238 | | 18 |
Class B2, 2.4684% 7/25/37 (g)(o) | | 206 | | 10 |
Class B3, 3.5684% 7/25/37 (g)(o) | | 232 | | 6 |
Class M1, 0.5884% 7/25/37 (g)(o) | | 269 | | 86 |
Class M2, 0.6284% 7/25/37 (g)(o) | | 148 | | 35 |
Class M3, 0.7084% 7/25/37 (g)(o) | | 149 | | 27 |
Class M4, 0.8684% 7/25/37 (g)(o) | | 295 | | 43 |
Class M5, 0.9684% 7/25/37 (g)(o) | | 261 | | 33 |
Class M6, 1.2184% 7/25/37 (g)(o) | | 331 | | 33 |
Commercial Mortgage Securities - continued |
| Principal
Amount (000s) | | Value (000s) |
Bayview Commercial Asset Trust: - continued | | | | |
floater: | | | | |
Series 2007-3: | | | | |
Class A2, 0.5084% 7/25/37 (g)(o) | | $ 918 | | $ 565 |
Class B1, 1.1684% 7/25/37 (g)(o) | | 204 | | 26 |
Class B2, 1.8184% 7/25/37 (g)(o) | | 511 | | 47 |
Class B3, 4.2184% 7/25/37 (g)(o) | | 205 | | 9 |
Class M1, 0.5284% 7/25/37 (g)(o) | | 183 | | 72 |
Class M2, 0.5584% 7/25/37 (g)(o) | | 195 | | 65 |
Class M3, 0.5884% 7/25/37 (g)(o) | | 306 | | 84 |
Class M4, 0.7184% 7/25/37 (g)(o) | | 482 | | 111 |
Class M5, 0.8184% 7/25/37 (g)(o) | | 252 | | 50 |
Class M6, 1.0184% 7/25/37 (g)(o) | | 192 | | 32 |
Series 2007-4A: | | | | |
Class B1, 2.7684% 9/25/37 (g)(o) | | 316 | | 5 |
Class B2, 3.6684% 9/25/37 (g)(o) | | 809 | | 4 |
Class M1, 1.1684% 9/25/37 (g)(o) | | 304 | | 36 |
Class M2, 1.2684% 9/25/37 (g)(o) | | 304 | | 30 |
Class M4, 1.8184% 9/25/37 (g)(o) | | 771 | | 46 |
Class M5, 1.9684% 9/25/37 (g)(o) | | 771 | | 31 |
Class M6, 2.1684% 9/25/37 (g)(o) | | 775 | | 19 |
Series 2004-1, Class IO,1.25% 4/25/34 (g)(q) | | 2,657 | | 100 |
Series 2007-5A, Class IO, 3.047% 10/25/37 (g)(o)(q) | | 6,430 | | 638 |
Bear Stearns Commercial Mortgage Securities Trust: | | | | |
floater: | | | | |
Series 2006-BBA7: | | | | |
Class H, 0.8572% 3/15/19 (g)(o) | | 476 | | 450 |
Class J, 1.0572% 3/15/19 (g)(o) | | 447 | | 376 |
Series 2007-BBA8: | | | | |
Class D, 0.4572% 3/15/22 (g)(o) | | 653 | | 610 |
Class E, 0.5072% 3/15/22 (g)(o) | | 3,391 | | 3,139 |
Class F, 0.5572% 3/15/22 (g)(o) | | 2,081 | | 1,889 |
Class G, 0.6072% 3/15/22 (g)(o) | | 534 | | 472 |
Class H, 0.7572% 3/15/22 (g)(o) | | 653 | | 564 |
Class J, 0.9072% 3/15/22 (g)(o) | | 653 | | 527 |
sequential payer: | | | | |
Series 2003-PWR2 Class A3, 4.834% 5/11/39 | | 207 | | 209 |
Series 2004-PWR3 Class A3, 4.487% 2/11/41 | | 469 | | 479 |
Series 2007-PW15 Class AAB, 5.315% 2/11/44 | | 3,555 | | 3,720 |
Series 2007-PW16: | | | | |
Class A4, 5.7154% 6/11/40 (o) | | 769 | | 831 |
Class AAB, 5.7154% 6/11/40 (o) | | 6,290 | | 6,697 |
Series 2007-PW17 Class A1, 5.282% 6/11/50 | | 458 | | 464 |
Commercial Mortgage Securities - continued |
| Principal
Amount (000s) | | Value (000s) |
Bear Stearns Commercial Mortgage Securities Trust: - continued | | | | |
sequential payer: | | | | |
Series 2007-PW18: | | | | |
Class A2, 5.613% 6/11/50 | | $ 430 | | $ 438 |
Class A4, 5.7% 6/11/50 | | 5,820 | | 6,182 |
Series 2007-T26 Class A1, 5.145% 1/12/45 | | 188 | | 189 |
Series 2003-PWR2 Class X2, 0.5275% 5/11/39 (g)(o)(q) | | 9,273 | | 0* |
Series 2006-PW13 Class A3, 5.518% 9/11/41 | | 4,638 | | 4,760 |
Series 2006-PW14 Class X2, 0.6524% 12/11/38 (g)(o)(q) | | 14,978 | | 211 |
Series 2006-T22 Class A4, 5.5338% 4/12/38 (o) | | 164 | | 182 |
Series 2007-PW16: | | | | |
Class B, 5.7154% 6/11/40 (g)(o) | | 210 | | 104 |
Class C, 5.7154% 6/11/40 (g)(o) | | 175 | | 68 |
Class D, 5.7154% 6/11/40 (g)(o) | | 175 | | 62 |
Series 2007-PW18 Class X2, 0.3152% 6/11/50 (g)(o)(q) | | 114,580 | | 1,202 |
Series 2007-T28: | | | | |
Class A1, 5.422% 9/11/42 | | 14 | | 14 |
Class X2, 0.1654% 9/11/42 (g)(o)(q) | | 56,451 | | 375 |
C-BASS Trust floater Series 2006-SC1 Class A, 0.4884% 5/25/36 (g)(o) | | 863 | | 611 |
CDC Commercial Mortgage Trust Series 2002-FX1: | | | | |
Class G, 6.625% 5/15/35 (g) | | 1,544 | | 1,614 |
Class XCL, 2.2784% 5/15/35 (g)(o)(q) | | 8,801 | | 165 |
Citigroup Commercial Mortgage Trust: | | | | |
floater Series 2006-FL2: | | | | |
Class F, 0.5202% 8/15/21 (g)(o) | | 469 | | 462 |
Class G, 0.5402% 8/15/21 (g)(o) | | 586 | | 568 |
Class H, 0.5802% 8/15/21 (g)(o) | | 468 | | 431 |
sequential payer Series 2006-C5 Class A4, 5.431% 10/15/49 | | 9,115 | | 9,800 |
Series 2006-C5 Class AMP2, 5.5005% 10/15/49 (g) | | 1,967 | | 1,924 |
Series 2007-C6: | | | | |
Class A1, 5.622% 12/10/49 (o) | | 1,506 | | 1,503 |
Class A2, 5.6978% 12/10/49 (o) | | 1,600 | | 1,627 |
Class A4, 5.6978% 12/10/49 (o) | | 4,371 | | 4,716 |
Citigroup/Deutsche Bank Commercial Mortgage Trust: | | | | |
sequential payer Series 2007-CD4: | | | | |
Class A2A, 5.237% 12/11/49 | | 439 | | 440 |
Class A4, 5.322% 12/11/49 | | 5,943 | | 6,174 |
Commercial Mortgage Securities - continued |
| Principal
Amount (000s) | | Value (000s) |
Citigroup/Deutsche Bank Commercial Mortgage Trust: - continued | | | | |
sequential payer Series 2007-CD4: | | | | |
Class A3, 5.293% 12/11/49 | | $ 1,279 | | $ 1,319 |
Class C, 5.476% 12/11/49 | | 2,474 | | 495 |
Cobalt CMBS Commercial Mortgage Trust: | | | | |
sequential payer Series 2007-C3 Class A3, 5.8158% 5/15/46 (o) | | 1,314 | | 1,398 |
Series 2006-C1 Class B, 5.359% 8/15/48 | | 3,942 | | 788 |
COMM pass-thru certificates: | | | | |
floater: | | | | |
Series 2005-F10A: | | | | |
Class B, 0.4372% 4/15/17 (g)(o) | | 6,843 | | 6,609 |
Class C, 0.4772% 4/15/17 (g)(o) | | 1,057 | | 1,021 |
Class D, 0.5172% 4/15/17 (g)(o) | | 1,043 | | 1,000 |
Class E, 0.5772% 4/15/17 (g)(o) | | 332 | | 312 |
Class F, 0.6172% 4/15/17 (g)(o) | | 188 | | 170 |
Class G, 0.7572% 4/15/17 (g)(o) | | 188 | | 170 |
Class H, 0.8272% 4/15/17 (g)(o) | | 188 | | 169 |
Class J, 1.0572% 4/15/17 (g)(o) | | 144 | | 121 |
Series 2005-FL11: | | | | |
Class C, 0.5072% 11/15/17 (g)(o) | | 1,003 | | 953 |
Class D, 0.5472% 11/15/17 (g)(o) | | 52 | | 49 |
Class E, 0.5972% 11/15/17 (g)(o) | | 185 | | 172 |
Class F, 0.6572% 11/15/17 (g)(o) | | 204 | | 186 |
Class G, 0.7072% 11/15/17 (g)(o) | | 141 | | 125 |
Series 2006-CN2A: | | | | |
Class A2FL, 0.4256% 2/5/19 (g)(o) | | 1,940 | | 1,866 |
Class AJFL, 0.4656% 2/5/19 (o) | | 890 | | 815 |
Series 2006-FL12 Class AJ, 0.3372% 12/15/20 (g)(o) | | 1,872 | | 1,713 |
sequential payer: | | | | |
Series 2005-C6 Class A2, 4.999% 6/10/44 (o) | | 13 | | 13 |
Series 2006-C8 Class A3, 5.31% 12/10/46 | | 3,744 | | 3,918 |
Series 2006-CN2A: | | | | |
Class A2FX, 5.449% 2/5/19 (g) | | 2,291 | | 2,278 |
Class AJFX, 5.478% 2/5/19 (g) | | 4,140 | | 4,170 |
Series 2007-C9 Class A4, 5.8145% 12/10/49 (o) | | 2,907 | | 3,181 |
Series 2006-C8 Class XP, 0.469% 12/10/46 (o)(q) | | 17,439 | | 190 |
Credit Suisse Commercial Mortgage Trust: | | | | |
sequential payer: | | | | |
Series 2006-C4 Class A3, 5.467% 9/15/39 | | 1,596 | | 1,669 |
Commercial Mortgage Securities - continued |
| Principal
Amount (000s) | | Value (000s) |
Credit Suisse Commercial Mortgage Trust: - continued | | | | |
sequential payer: | | | | |
Series 2007-C2: | | | | |
Class A2, 5.448% 1/15/49 (o) | | $ 9,219 | | $ 9,255 |
Class A3, 5.542% 1/15/49 (o) | | 2,628 | | 2,769 |
Series 2007-C3 Class A4, 5.702% 6/15/39 (o) | | 790 | | 824 |
Series 2006-C4 Class AAB, 5.439% 9/15/39 | | 7,354 | | 7,540 |
Series 2006-C5 Class ASP, 0.6723% 12/15/39 (o)(q) | | 12,136 | | 175 |
Series 2007-C5 Class A4, 5.695% 9/15/40 (o) | | 1,189 | | 1,255 |
Credit Suisse First Boston Mortgage Capital Certificates floater Series 2007-TF2A Class B, 0.5572% 4/15/22 (g)(o) | | 4,688 | | 3,375 |
Credit Suisse First Boston Mortgage Securities Corp.: | | | | |
sequential payer: | | | | |
Series 2001-CK6 Class B, 6.582% 8/15/36 | | 1,314 | | 1,314 |
Series 2002-CP5 Class A1, 4.106% 12/15/35 | | 64 | | 64 |
Series 2004-C1: | | | | |
Class A3, 4.321% 1/15/37 | | 134 | | 134 |
Class A4, 4.75% 1/15/37 | | 612 | | 641 |
Series 2001-CK6 Class AX, 0.837% 8/15/36 (o)(q) | | 1,545 | | 2 |
Series 2001-CKN5 Class AX, 1.9481% 9/15/34 (g)(o)(q) | | 2,641 | | 1 |
Series 2006-C1 Class A3, 5.422% 2/15/39 (o) | | 4,872 | | 5,108 |
Credit Suisse Mortgage Capital Certificates: | | | | |
floater Series 2007-TFL1: | | | | |
Class B, 0.3572% 2/15/22 (g)(o) | | 497 | | 432 |
Class C: | | | | |
0.3772% 2/15/22 (g)(o) | | 2,047 | | 1,740 |
0.4772% 2/15/22 (g)(o) | | 731 | | 585 |
Class F, 0.5272% 2/15/22 (g)(o) | | 1,462 | | 1,140 |
Series 2007-C1: | | | | |
Class ASP, 0.406% 2/15/40 (o)(q) | | 20,525 | | 192 |
Class B, 5.487% 2/15/40 (g)(o) | | 2,009 | | 301 |
First Union National Bank-Bank of America Commercial Mortgage Trust Series 2001-C1: | | | | |
Class D, 6.484% 3/15/33 | | 46 | | 46 |
Class G, 6.936% 3/15/33 (g) | | 865 | | 854 |
GE Capital Commercial Mortgage Corp.: | | | | |
sequential payer Series 2007-C1 Class A4, 5.543% 12/10/49 | | 8,890 | | 9,258 |
Series 2001-1 Class X1, 1.1681% 5/15/33 (g)(o)(q) | | 2,021 | | 12 |
Series 2007-C1 Class XP, 0.193% 12/10/49 (o)(q) | | 27,213 | | 118 |
Commercial Mortgage Securities - continued |
| Principal
Amount (000s) | | Value (000s) |
GMAC Commercial Mortgage Securities, Inc.: | | | | |
Series 2004-C3 Class X2, 0.5803% 12/10/41 (o)(q) | | $ 1,154 | | $ 2 |
Series 2005-C1 Class X2, 0.554% 5/10/43 (o)(q) | | 4,796 | | 22 |
Greenwich Capital Commercial Funding Corp.: | | | | |
floater Series 2006-FL4 Class B, 0.3956% 11/5/21 (g)(o) | | 494 | | 481 |
sequential payer: | | | | |
Series 2007-GG11 Class A2, 5.597% 12/10/49 | | 2,628 | | 2,706 |
Series 2007-GG9 Class A4, 5.444% 3/10/39 | | 3,820 | | 4,036 |
Series 2005-GG3 Class XP, 0.6673% 8/10/42 (g)(o)(q) | | 16,776 | | 58 |
Series 2006-GG7 Class A3, 5.881% 7/10/38 (o) | | 3,464 | | 3,637 |
Series 2007-GG11 Class A1, 0.2902% 12/10/49 (g)(o)(q) | | 29,309 | | 217 |
GS Mortgage Securities Corp. II: | | | | |
floater: | | | | |
Series 2006-FL8A: | | | | |
Class E, 0.5751% 6/6/20 (g)(o) | | 298 | | 275 |
Class F, 0.6451% 6/6/20 (g)(o) | | 916 | | 835 |
Series 2007-EOP: | | | | |
Class C, 2.1455% 3/6/20 (g)(o) | | 1,650 | | 1,585 |
Class D, 2.3636% 3/6/20 (g)(o) | | 3,090 | | 2,968 |
Class F, 2.8433% 3/6/20 (g)(o) | | 136 | | 131 |
Class G, 3.0177% 3/6/20 (g)(o) | | 67 | | 65 |
Class H, 3.5846% 3/6/20 (g)(o) | | 62 | | 60 |
Class J, 4.4568% 3/6/20 (g)(o) | | 85 | | 83 |
sequential payer Series 2004-GG2 Class A4, 4.964% 8/10/38 | | 402 | | 403 |
Series 2005-GG4 Class XP, 0.7109% 7/10/39 (g)(o)(q) | | 21,665 | | 121 |
Series 2006-GG6 Class A2, 5.506% 4/10/38 | | 4,412 | | 4,406 |
GS Mortgage Securities Trust sequential payer: | | | | |
Series 2006-GG8 Class A2, 5.479% 11/10/39 | | 870 | | 869 |
Series 2007-GG10 Class A2, 5.778% 8/10/45 | | 602 | | 613 |
JP Morgan Chase Commercial Mortgage Securities Trust: | | | | |
sequential payer: | | | | |
Series 2006-CB14 Class A3B, 5.4764% 12/12/44 (o) | | 3,494 | | 3,554 |
Series 2007-LDPX: | | | | |
Class A2 S, 5.305% 1/15/49 | | 2,976 | | 2,995 |
Class A3, 5.42% 1/15/49 | | 3,616 | | 3,829 |
Series 2005-CB13 Class E, 5.348% 1/12/43 (g)(o) | | 665 | | 47 |
Series 2005-LDP3 Class A3, 4.959% 8/15/42 | | 9,387 | | 9,615 |
Commercial Mortgage Securities - continued |
| Principal
Amount (000s) | | Value (000s) |
JP Morgan Chase Commercial Mortgage Securities Trust: - continued | | | | |
Series 2007-LDP10: | | | | |
Class BS, 5.437% 1/15/49 (o) | | $ 251 | | $ 48 |
Class CS, 5.466% 1/15/49 (o) | | 108 | | 18 |
Class ES, 5.5379% 1/15/49 (g)(o) | | 679 | | 47 |
JP Morgan Commercial Mortgage Finance Corp. Series 2000-C9 Class G, 6.25% 10/15/32 (g) | | 157 | | 156 |
JPMorgan Chase Commercial Mortgage Securities Trust: | | | | |
floater Series 2006-FLA2: | | | | |
Class B, 0.3772% 11/15/18 (g)(o) | | 847 | | 779 |
Class C, 0.4172% 11/15/18 (g)(o) | | 602 | | 547 |
Class D, 0.4372% 11/15/18 (g)(o) | | 267 | | 241 |
Class E, 0.4872% 11/15/18 (g)(o) | | 384 | | 342 |
Class F, 0.5372% 11/15/18 (g)(o) | | 577 | | 502 |
Class G, 0.5672% 11/15/18 (g)(o) | | 500 | | 420 |
Class H, 0.7072% 11/15/18 (g)(o) | | 384 | | 307 |
sequential payer: | | | | |
Series 2006-LDP8 Class A4, 5.399% 5/15/45 | | 837 | | 910 |
Series 2006-LDP9: | | | | |
Class A2, 5.134% 5/15/47 (o) | | 537 | | 548 |
Class A3, 5.336% 5/15/47 | | 548 | | 572 |
Series 2007-CB19 Class A4, 5.7415% 2/12/49 (o) | | 4,608 | | 4,865 |
Series 2007-LD11 Class A2, 5.8019% 6/15/49 (o) | | 3,689 | | 3,750 |
Series 2006-CB17 Class A3, 5.45% 12/12/43 | | 374 | | 378 |
Series 2007-CB19: | | | | |
Class B, 5.7415% 2/12/49 (o) | | 112 | | 50 |
Class C, 5.7415% 2/12/49 (o) | | 294 | | 120 |
Class D, 5.7415% 2/12/49 (o) | | 309 | | 105 |
LB Commercial Conduit Mortgage Trust: | | | | |
sequential payer Series 2007-C3 Class A4, 5.9407% 7/15/44 (o) | | 1,054 | | 1,124 |
Series 1998-C1 Class D, 6.98% 2/18/30 | | 293 | | 299 |
LB-UBS Commercial Mortgage Trust: | | | | |
sequential payer: | | | | |
Series 2006-C1 Class A2, 5.084% 2/15/31 | | 188 | | 191 |
Series 2006-C6 Class A2, 5.262% 9/15/39 (o) | | 735 | | 735 |
Series 2006-C7: | | | | |
Class A2, 5.3% 11/15/38 | | 1,214 | | 1,219 |
Class A3, 5.347% 11/15/38 | | 979 | | 1,026 |
Series 2007-C1: | | | | |
Class A1, 5.391% 2/15/40 (o) | | 33 | | 33 |
Class A4, 5.424% 2/15/40 | | 4,069 | | 4,336 |
Series 2007-C2 Class A3, 5.43% 2/15/40 | | 2,923 | | 3,051 |
Commercial Mortgage Securities - continued |
| Principal
Amount (000s) | | Value (000s) |
LB-UBS Commercial Mortgage Trust: - continued | | | | |
Series 2001-C3 Class B, 6.512% 6/15/36 | | $ 458 | | $ 458 |
Series 2001-C7 Class D, 6.514% 11/15/33 | | 1,445 | | 1,446 |
Series 2005-C3 Class XCP, 0.78% 7/15/40 (o)(q) | | 2,989 | | 14 |
Series 2006-C6 Class XCP, 0.6735% 9/15/39 (o)(q) | | 6,055 | | 80 |
Series 2007-C1 Class XCP, 0.472% 2/15/40 (o)(q) | | 2,256 | | 23 |
Series 2007-C6 Class A4, 5.858% 7/15/40 (o) | | 1,642 | | 1,748 |
Series 2007-C7: | | | | |
Class A3, 5.866% 9/15/45 | | 1,397 | | 1,494 |
Class XCP, 0.2822% 9/15/45 (o)(q) | | 98,605 | | 840 |
Lehman Brothers Floating Rate Commercial Mortgage Trust floater Series 2006-LLFA: | | | | |
Class D, 0.4372% 9/15/21 (g)(o) | | 421 | | 373 |
Class E, 0.4972% 9/15/21 (g)(o) | | 1,518 | | 1,328 |
Class F, 0.5472% 9/15/21 (g)(o) | | 1,255 | | 1,086 |
Class G, 0.5672% 9/15/21 (g)(o) | | 2,478 | | 2,058 |
Class H, 0.6072% 9/15/21 (g)(o) | | 639 | | 507 |
Lehman Large Loan Trust Series 1997-LLI Class E, 7.3% 10/12/34 | | 2,332 | | 2,337 |
Merrill Lynch Mortgage Trust: | | | | |
Series 2005-CKI1 Class A3, 5.2203% 11/12/37 (o) | | 1,030 | | 1,042 |
Series 2005-LC1 Class F, 5.3796% 1/12/44 (g)(o) | | 1,143 | | 582 |
Series 2006-C1 Class A2, 5.6285% 5/12/39 (o) | | 1,277 | | 1,304 |
Series 2007-C1 Class A4, 5.8267% 6/12/50 (o) | | 4,974 | | 5,276 |
Series 2008-C1 Class A4, 5.69% 2/12/51 | | 2,805 | | 3,023 |
Merrill Lynch-CFC Commercial Mortgage Trust: | | | | |
floater Series 2006-4 Class A2FL, 0.3058% 12/12/49 (o) | | 551 | | 537 |
sequential payer: | | | | |
Series 2006-1 CLass A3, 5.4804% 2/12/39 (o) | | 1,398 | | 1,424 |
Series 2006-4 Class ASB, 5.133% 12/12/49 (o) | | 1,129 | | 1,189 |
Series 2007-5: | | | | |
Class A3, 5.364% 8/12/48 | | 512 | | 520 |
Class A4, 5.378% 8/12/48 | | 53 | | 54 |
Class B, 5.479% 8/12/48 | | 3,942 | | 1,599 |
Series 2007-6: | | | | |
Class A1, 5.175% 3/12/51 | | 17 | | 17 |
Class A4, 5.485% 3/12/51 (o) | | 10,897 | | 11,437 |
Series 2007-7 Class A4, 5.7436% 6/12/50 (o) | | 4,599 | | 4,958 |
Series 2007-8 Class A1, 4.622% 8/12/49 | | 65 | | 66 |
Series 2006-4 Class XP, 0.6205% 12/12/49 (o)(q) | | 21,609 | | 408 |
Series 2007-6 Class B, 5.635% 3/12/51 (o) | | 1,314 | | 591 |
Series 2007-7 Class B, 5.7436% 6/12/50 (o) | | 114 | | 30 |
Series 2007-8 Class A3, 5.9665% 8/12/49 (o) | | 1,133 | | 1,204 |
Commercial Mortgage Securities - continued |
| Principal
Amount (000s) | | Value (000s) |
Morgan Stanley Capital I Trust: | | | | |
floater: | | | | |
Series 2006-XLF Class C, 1.407% 7/15/19 (g)(o) | | $ 393 | | $ 236 |
Series 2007-XCLA Class A1, 0.408% 7/17/17 (g)(o) | | 715 | | 651 |
Series 2007-XLFA: | | | | |
Class C, 0.368% 10/15/20 (g)(o) | | 754 | | 682 |
Class D, 0.398% 10/15/20 (g)(o) | | 732 | | 655 |
Class E, 0.458% 10/15/20 (g)(o) | | 916 | | 810 |
Class F, 0.508% 10/15/20 (g)(o) | | 550 | | 459 |
Class G, 0.548% 10/15/20 (g)(o) | | 680 | | 532 |
Class H, 0.638% 10/15/20 (g)(o) | | 428 | | 310 |
Class J, 0.788% 10/15/20 (g)(o) | | 488 | | 293 |
Class MHRO, 0.898% 10/15/20 (g)(o) | | 532 | | 447 |
Class MJPM, 1.208% 10/15/20 (g)(o) | | 25 | | 23 |
Class NHRO, 1.098% 10/15/20 (g)(o) | | 805 | | 644 |
sequential payer: | | | | |
Series 2003-IQ5 Class X2, 0.9017% 4/15/38 (g)(o)(q) | | 3,479 | | 0 |
Series 2005-IQ9 Class A3, 4.54% 7/15/56 | | 1,825 | | 1,840 |
Series 2007-HQ11 Class A31, 5.439% 2/12/44 (o) | | 666 | | 691 |
Series 2007-IQ13 Class A1, 5.05% 3/15/44 | | 166 | | 166 |
Series 2007-T25 Class A1, 5.391% 11/12/49 | | 179 | | 179 |
Series 2003-IQ6 Class X2, 0.5881% 12/15/41 (g)(o)(q) | | 7,776 | | 12 |
Series 2005-IQ9 Class X2, 1.0893% 7/15/56 (g)(o)(q) | | 11,696 | | 56 |
Series 2006-HQ10 Class X2, 0.4923% 11/12/41 (g)(o)(q) | | 9,533 | | 61 |
Series 2006-HQ8 Class A3, 5.4704% 3/12/44 (o) | | 774 | | 779 |
Series 2006-IQ11: | | | | |
Class A3, 5.694% 10/15/42 (o) | | 1,654 | | 1,703 |
Class A4, 5.73% 10/15/42 (o) | | 394 | | 433 |
Series 2006-T23 Class A3, 5.8184% 8/12/41 (o) | | 671 | | 716 |
Series 2007-IQ14: | | | | |
Class A4, 5.692% 4/15/49 (o) | | 1,971 | | 2,047 |
Class AAB, 5.654% 4/15/49 | | 3,520 | | 3,732 |
Class B, 5.7233% 4/15/49 (o) | | 323 | | 145 |
Structured Asset Securities Corp. Series 1997-LLI Class D, 7.15% 10/12/34 | | 92 | | 92 |
Wachovia Bank Commercial Mortgage Trust: | | | | |
floater: | | | | |
Series 2005-WL5A Class K, 1.4072% 1/15/18 (g)(o) | | 1,401 | | 1,345 |
Commercial Mortgage Securities - continued |
| Principal
Amount (000s) | | Value (000s) |
Wachovia Bank Commercial Mortgage Trust: - continued | | | | |
floater: | | | | |
Series 2006-WL7A: | | | | |
Class E, 0.4902% 9/15/21 (g)(o) | | $ 1,791 | | $ 1,589 |
Class F, 0.5502% 9/15/21 (g)(o) | | 2,061 | | 1,811 |
Class G, 0.5702% 9/15/21 (g)(o) | | 1,953 | | 1,639 |
Class J, 0.8072% 9/15/21 (g)(o) | | 434 | | 311 |
Series 2007-WHL8: | | | | |
Class AP1, 0.9072% 6/15/20 (g)(o) | | 142 | | 128 |
Class AP2, 1.0072% 6/15/20 (g)(o) | | 237 | | 208 |
Class F, 0.6872% 6/15/20 (g)(o) | | 4,581 | | 2,978 |
Class LXR1, 0.9072% 6/15/20 (g)(o) | | 162 | | 129 |
sequential payer: | | | | |
Series 2003-C7 Class A1, 4.241% 10/15/35 (g) | | 1,629 | | 1,633 |
Series 2003-C8 Class A3, 4.445% 11/15/35 | | 4,911 | | 4,921 |
Series 2006-C27 Class A2, 5.624% 7/15/45 | | 33 | | 33 |
Series 2006-C29 Class A3, 5.313% 11/15/48 | | 3,490 | | 3,703 |
Series 2007-C30: | | | | |
Class A3, 5.246% 12/15/43 | | 1,128 | | 1,143 |
Class A4, 5.305% 12/15/43 | | 386 | | 397 |
Class A5, 5.342% 12/15/43 | | 1,406 | | 1,464 |
Series 2007-C31 Class A4, 5.509% 4/15/47 | | 2,970 | | 3,165 |
Series 2007-C32: | | | | |
Class A2, 5.7378% 6/15/49 (o) | | 4,126 | | 4,167 |
Class A3, 5.7428% 6/15/49 (o) | | 2,231 | | 2,347 |
Series 2003-C6 Class G, 5.125% 8/15/35 (g)(o) | | 624 | | 614 |
Series 2004-C15: | | | | |
Class 180A, 5.3979% 10/15/41 (g)(o) | | 1,010 | | 1,013 |
Class 180B, 5.3979% 10/15/41 (g)(o) | | 460 | | 460 |
Series 2005-C19 Class B, 4.892% 5/15/44 | | 1,314 | | 1,212 |
Series 2005-C22: | | | | |
Class B, 5.3592% 12/15/44 (o) | | 2,914 | | 2,217 |
Class F, 5.3592% 12/15/44 (g)(o) | | 2,191 | | 972 |
Series 2006-C23 Class A5, 5.416% 1/15/45 (o) | | 7,210 | | 7,820 |
Series 2007-C30: | | | | |
Class C, 5.483% 12/15/43 (o) | | 3,942 | | 1,952 |
Class D, 5.513% 12/15/43 (o) | | 2,102 | | 829 |
Class XP, 0.4412% 12/15/43 (g)(o)(q) | | 14,039 | | 142 |
Series 2007-C31 Class C, 5.6883% 4/15/47 (o) | | 361 | | 172 |
Series 2007-C31A Class A2, 5.421% 4/15/47 | | 9,102 | | 9,471 |
Series 2007-C32: | | | | |
Class D, 5.7428% 6/15/49 (o) | | 987 | | 419 |
Commercial Mortgage Securities - continued |
| Principal
Amount (000s) | | Value (000s) |
Wachovia Bank Commercial Mortgage Trust: - continued | | | | |
Series 2007-C32: | | | | |
Class E, 5.7428% 6/15/49 (o) | | $ 1,556 | | $ 490 |
Wachovia Bank Commercial Mortgage Trust pass-thru certificates sequential payer Series 2007-C33 Class A5, 5.8992% 2/15/51 (o) | | 870 | | 936 |
TOTAL COMMERCIAL MORTGAGE SECURITIES (Cost $328,691) | 413,493 |
Municipal Securities - 0.1% |
|
Beaver County Indl. Dev. Auth. Poll. Cont. Rev. Bonds (FirstEnergy Nuclear Generation Corp. Proj.) Series 2005 A, 3.375%, tender 7/1/15 (o) | | 2,300 | | 2,385 |
California Gen. Oblig. 7.5% 4/1/34 | | 4,105 | | 4,868 |
Illinois Gen. Oblig.: | | | | |
Series 2010, 4.421% 1/1/15 | | 5,980 | | 6,260 |
Series 2011, 5.665% 3/1/18 | | 4,260 | | 4,567 |
Series 2011, 5.877% 3/1/19 | | 3,930 | | 4,202 |
TOTAL MUNICIPAL SECURITIES (Cost $20,571) | 22,282 |
Foreign Government and Government Agency Obligations - 0.0% |
|
Chilean Republic 7.125% 1/11/12 | | 2,462 | | 2,516 |
United Mexican States 6.05% 1/11/40 | | 5,648 | | 6,467 |
TOTAL FOREIGN GOVERNMENT AND GOVERNMENT AGENCY OBLIGATIONS (Cost $8,219) | 8,983 |
Supranational Obligations - 0.0% |
|
Corporacion Andina de Fomento 5.2% 5/21/13
(Cost $186) | | 196 | | 208 |
Bank Notes - 0.0% |
|
Wachovia Bank NA 6% 11/15/17
(Cost $3,631) | | 3,319 | | 3,735 |
Preferred Securities - 0.0% |
| Principal
Amount (000s) | | Value (000s) |
FINANCIALS - 0.0% |
Diversified Financial Services - 0.0% |
ING Groep NV 5.775% (h)(o) (Cost $670) | $ 1,236 | | $ 1,054 |
Fixed-Income Funds - 12.2% |
| Shares | | |
Fidelity Corporate Bond 1-10 Year Central Fund (p) | 3,538,209 | | 388,778 |
Fidelity High Income Central Fund 2 (p) | 5,029,800 | | 533,410 |
Fidelity Mortgage Backed Securities Central Fund (p) | 13,693,721 | | 1,480,565 |
TOTAL FIXED-INCOME FUNDS (Cost $2,246,617) | 2,402,753 |
Money Market Funds - 5.1% |
| | | |
Fidelity Cash Central Fund, 0.11% (b) | 946,068,192 | | 946,068 |
Fidelity Securities Lending Cash Central Fund, 0.12% (b)(c) | 50,580,435 | | 50,580 |
TOTAL MONEY MARKET FUNDS (Cost $996,648) | 996,648 |
Cash Equivalents - 0.3% |
| Maturity
Amount (000s) | | |
Investments in repurchase agreements in a joint trading account at 0.06%, dated 8/31/11 due 9/1/11 (Collateralized by U.S. Government Obligations) # (c)
(Cost $52,754) | $ 52,754 | | 52,754 |
TOTAL INVESTMENT PORTFOLIO - 108.1% (Cost $20,212,441) | | 21,297,522 |
NET OTHER ASSETS (LIABILITIES) - (8.1)% | | (1,593,778) |
NET ASSETS - 100% | $ 19,703,744 |
Futures Contracts |
| Expiration
Date | | Underlying
Face Amount
at Value (000s) | | Unrealized
Appreciation/
(Depreciation)
(000s) |
Purchased |
Equity Index Contracts |
2,308 CME E-mini S&P 500 Index Contracts | Sept. 2011 | | $ 140,523 | | $ (883) |
|
The face value of futures purchased as a percentage of net assets is 0.7% |
Swap Agreements |
| Expiration
Date | | Notional
Amount (000s) | | Value
(000s) |
Credit Default Swaps |
Receive monthly a fixed rate of .15% multiplied by the notional amount and pay to Credit Suisse First Boston upon each credit event of one of the issues of ABX AA 07-01 Index, par value of the proportional notional amount (Rating-C) (Upfront Premium Received/(Paid) $3,215,000)(n) | Sept. 2037 | | $ 9,998 | | $ (9,448) |
Receive monthly a fixed rate of .15% multiplied by the notional amount and pay to JPMorgan Chase, Inc. upon each credit event of one of the issues of ABX AA 07-01 Index, par value of the proportional notional amount (Rating-C) (Upfront Premium Received/(Paid) $2,992,000)(n) | Sept. 2037 | | 8,142 | | (7,695) |
Receive monthly a fixed rate of .15% multiplied by the notional amount and pay to JPMorgan Chase, Inc. upon each credit event of one of the issues of ABX AA 07-01 Index, par value of the proportional notional amount (Rating-C) (Upfront Premium Received/(Paid) $407,000)(n) | Sept. 2037 | | 1,078 | | (1,018) |
Receive monthly a fixed rate of .15% multiplied by the notional amount and pay to Morgan Stanley, Inc. upon each credit event of one of the issues of ABX AA 07-01 Index, par value of the proportional notional amount (Rating-C) (Upfront Premium Received/(Paid) $2,992,000)(n) | Sept. 2037 | | 8,142 | | (7,695) |
Receive monthly a fixed rate of .15% multiplied by the notional amount and pay to UBS upon each credit event of one of the issues of ABX AA 07-1 Index, par value of the proportional notional amount (Rating-C) (Upfront Premium Received/(Paid) $2,882,000)(n) | Sept. 2037 | | 7,843 | | (7,412) |
Receive monthly a fixed rate of .15% multiplied by the notional amount and pay to UBS upon each credit event of one of the issues of ABX AA 07-1 Index, par value of the proportional notional amount (Rating-C) (Upfront Premium Received/(Paid) $2,559,000)(n) | Sept. 2037 | | 6,885 | | (6,507) |
Swap Agreements - continued |
| Expiration
Date | | Notional
Amount (000s) | | Value
(000s) |
Credit Default Swaps - continued |
Receive monthly notional amount multiplied by 2.5% and pay Bank of America upon credit event of Ameriquest Mortgage Securities, Inc., par value of the notional amount of Ameriquest Mortgage Securities, Inc. Series 2004-R11 Class M9, 6.102% 11/25/34 (Rating-C)(m) | Dec. 2034 | | $ 613 | | $ (598) |
Receive monthly notional amount multiplied by 2.5% and pay Bank of America upon credit event of Ameriquest Mortgage Securities, Inc., par value of the notional amount of Ameriquest Mortgage Securities, Inc. Series 2004-R8 Class M9, 8.07% 9/25/34 (Rating-C)(m) | Oct. 2034 | | 306 | | (304) |
| | $ 43,007 | | $ (40,677) |
Legend |
(a) Non-income producing |
(b) Affiliated fund that is available only to investment companies and other accounts managed by Fidelity Investments. The rate quoted is the annualized seven-day yield of the fund at period end. A complete unaudited listing of the fund's holdings as of its most recent quarter end is available upon request. In addition, each Fidelity Central Fund's financial statements, which are not covered by the Fund's Report of Independent Registered Public Accounting Firm, are available on the SEC's website or upon request. |
(c) Investment made with cash collateral received from securities on loan. |
(d) Non-income producing - Security is in default. |
(e) Security initially issued at one coupon which converts to a higher coupon at a specified date. The rate shown is the rate at period end. |
(f) Security or a portion of the security is on loan at period end. |
(g) Security exempt from registration under Rule 144A of the Securities Act of 1933. These securities may be resold in transactions exempt from registration, normally to qualified institutional buyers. At the end of the period, the value of these securities amounted to $374,612,000 or 1.9% of net assets. |
(h) Security is perpetual in nature with no stated maturity date. |
(i) Security or a portion of the security purchased on a delayed delivery or when-issued basis. |
(j) A portion of the security is subject to a forward commitment to sell. |
(k) Security or a portion of the security was pledged to cover margin requirements for futures contracts. At the period end, the value of securities pledged amounted to $36,100,000. |
(l) Security or a portion of the security has been segregated as collateral for open swap agreements. At the period end, the value of securities pledged amounted to $44,432,000. |
(m) Represents a credit default swap contract in which the Fund has sold protection on the underlying reference entity. The value of each credit default swap and the credit rating can be measures of the current payment/performance risk. For the underlying reference entity, ratings disclosed are from Moody's Investors Service, Inc. Where Moody's ratings are not available, S&P ratings are disclosed and are indicated as such. All ratings are as of the report date and do not reflect subsequent changes. Where a credit rating is not disclosed, the value is used as the measure of the payment/performance risk. |
(n) Represents a credit default swap based on a tradable index of home equity asset-backed debt securities. The value of each credit default swap and the credit rating can be measures of the current payment/performance risk. In addition, the swap represents a contract in which the Fund has sold protection on the index of underlying securities. Ratings represent a weighted average of the ratings of all securities included in the index. Ratings used in the weighted average are from Moody's Investors Service, Inc., or S&P where Moody's ratings are not available. All ratings are as of the report date and do not reflect subsequent changes. |
(o) Coupon rates for floating and adjustable rate securities reflect the rates in effect at period end. |
(p) Affiliated fund that is available only to investment companies and other accounts managed by Fidelity Investments. A complete unaudited schedule of portfolio holdings for each Fidelity Central Fund is filed with the SEC for the first and third quarters of each fiscal year on Form N-Q and is available upon request or at the SEC's web site at www.sec.gov. An unaudited holdings listing for the Fund, which presents direct holdings as well as the pro rata share of securities and other investments held indirectly through its investment in underlying non-money market Fidelity Central Funds, is available at fidelity.com. In addition, each Fidelity Central Fund's financial statements, which are not covered by the Fund's Report of Independent Registered Public Accounting Firm, are available on the SEC's web site or upon request. |
(q) Security represents right to receive monthly interest payments on an underlying pool of mortgages or assets. Principal shown is the outstanding par amount of the pool held as of the end of the period. |
(r) Investment is owned by an entity that is treated as a corporation for U.S. tax purposes which is owned by the Fund. |
(s) Restricted securities - Investment in securities not registered under the Securities Act of 1933 (excluding 144A issues). At the end of the period, the value of restricted securities (excluding 144A issues) amounted to $6,428,000 or 0.0% of net assets. |
Additional information on each restricted holding is as follows: |
Security | Acquisition
Date | Acquisition
Cost (000s) |
Legend Pictures LLC | 9/23/10 | $ 6,428 |
* Amount represents less than $1,000 |
# Additional information on each counterparty to the repurchase agreement is as follows: |
Repurchase Agreement / Counterparty | Value
(Amounts in
thousands) |
$52,754,000 due 9/01/11 at 0.06% |
Barclays Capital, Inc. | $ 52,754 |
Affiliated Central Funds |
Information regarding fiscal year to date income earned by the Fund from investments in Fidelity Central Funds is as follows: |
Fund | Income earned
(Amounts in thousands) |
Fidelity Cash Central Fund | $ 1,436 |
Fidelity Corporate Bond 1-10 Year Central Fund | 20,862 |
Fidelity High Income Central Fund 2 | 34,384 |
Fidelity Mortgage Backed Securities Central Fund | 44,294 |
Fidelity Securities Lending Cash Central Fund | 1,318 |
Total | $ 102,294 |
Additional information regarding the Fund's fiscal year to date purchases and sales, including the ownership percentage, of the non Money Market Central Funds is as follows: |
Fund
(Amounts in thousands) | Value,
beginning of
period | Purchases | Sales
Proceeds | Value,
end of
period | % ownership,
end of
period |
Fidelity Corporate Bond 1-10 Year Central Fund | $ 647,022 | $ - | $ 258,983* | $ 388,778 | 58.3% |
Fidelity High Income Central Fund 2 | 434,289 | 134,331 | 31,017 | 533,410 | 83.0% |
Fidelity Mortgage Backed Securities Central Fund | 1,083,888 | 486,601 | 126,836 | 1,480,565 | 11.5% |
Total | $ 2,165,199 | $ 620,932 | $ 416,836 | $ 2,402,753 | |
* Includes the value of shares redeemed through in-kind transactions. See Note 7 of the Notes to Financial Statements. |
Other Information |
The following is a summary of the inputs used, as of August 31, 2011, involving the Fund's assets and liabilities carried at fair value. The inputs or methodology used for valuing securities may not be an indication of the risk associated with investing in those securities. For more information on valuation inputs, and their aggregation into the levels used in the tables below, please refer to the Security Valuation section in the accompanying Notes to Financial Statements. |
Valuation Inputs at Reporting Date: |
Description
(Amounts in thousands) | Total | Level 1 | Level 2 | Level 3 |
Investments in Securities: | | | | |
Equities: | | | | |
Consumer Discretionary | $ 1,230,992 | $ 1,224,521 | $ 43 | $ 6,428 |
Consumer Staples | 1,331,027 | 1,295,998 | 35,029 | - |
Energy | 1,452,937 | 1,444,119 | 8,818 | - |
Financials | 1,658,981 | 1,623,736 | 35,245 | - |
Health Care | 1,330,645 | 1,323,291 | 7,354 | - |
Industrials | 1,298,606 | 1,282,894 | 15,712 | - |
Information Technology | 2,272,186 | 2,272,186 | - | - |
Materials | 367,536 | 367,536 | - | - |
Telecommunication Services | 244,814 | 244,814 | - | - |
Utilities | 424,672 | 424,672 | - | - |
Corporate Bonds | 1,391,507 | - | 1,391,507 | - |
U.S. Government and Government Agency Obligations | 2,314,580 | - | 2,314,580 | - |
Valuation Inputs at Reporting Date: |
Description
(Amounts in thousands) | Total | Level 1 | Level 2 | Level 3 |
Investments in Securities: | | | | |
U.S. Government Agency - Mortgage Securities | $ 1,884,067 | $ - | $ 1,884,067 | $ - |
Asset-Backed Securities | 88,601 | - | 70,342 | 18,259 |
Collateralized Mortgage Obligations | 104,461 | - | 101,638 | 2,823 |
Commercial Mortgage Securities | 413,493 | - | 372,483 | 41,010 |
Municipal Securities | 22,282 | - | 22,282 | - |
Foreign Government and Government Agency Obligations | 8,983 | - | 8,983 | - |
Supranational Obligations | 208 | - | 208 | - |
Bank Notes | 3,735 | - | 3,735 | - |
Preferred Securities | 1,054 | - | 1,054 | - |
Fixed-Income Funds | 2,402,753 | 2,402,753 | - | - |
Money Market Funds | 996,648 | 996,648 | - | - |
Cash Equivalents | 52,754 | - | 52,754 | - |
Total Investments in Securities: | $ 21,297,522 | $ 14,903,168 | $ 6,325,834 | $ 68,520 |
Derivative Instruments: | | | | |
Liabilities | | | | |
Futures Contracts | $ (883) | $ (883) | $ - | $ - |
Swap Agreements | (40,677) | - | (39,775) | (902) |
Total Derivative Instruments: | $ (41,560) | $ (883) | $ (39,775) | $ (902) |
Other Financial Instruments: | | | | |
Forward Commitments | $ 2,740 | $ - | $ 2,740 | $ - |
The following is a reconciliation of Investments in Securities and Derivative Instruments for which Level 3 inputs were used in determining value: |
(Amounts in thousands) | |
Investments in Securities: | |
Beginning Balance | $ 96,111 |
Total Realized Gain (Loss) | 6,195 |
Total Unrealized Gain (Loss) | 6,284 |
Cost of Purchases | 6,521 |
Proceeds of Sales | (18,615) |
Amortization/Accretion | 1,804 |
Transfers in to Level 3 | 14,005 |
Transfers out of Level 3 | (43,785) |
Ending Balance | $ 68,520 |
The change in unrealized gain (loss) for the period attributable to Level 3 securities held at August 31, 2011 | $ 6,135 |
Derivative Instruments: | |
Swap Agreements | |
Beginning Balance | $ (2,278) |
Total Unrealized Gain (Loss) | 1,376 |
Transfers in to Level 3 | - |
Transfers out of Level 3 | - |
Ending Balance | $ (902) |
Realized gain (loss) on Swap Agreements for the period | $ (1,415) |
The change in unrealized gain (loss) for the period attributable to Level 3 Swap Agreements held at August 31, 2011 | $ 175 |
The information used in the above reconciliation represents fiscal year to date activity for any Investments in Securities and Derivative Instruments identified as using Level 3 inputs at either the beginning or the end of the current fiscal period, and includes the value of securities received through affiliated in-kind transactions. See Note 7 of the Notes to Financial Statements. Transfers in or out of Level 3 represent the beginning value of any Security or Instrument where a change in the pricing level occurred from the beginning to the end of the period. The cost of purchases and the proceeds of sales may include securities received or delivered through corporate actions or exchanges. Realized and unrealized gains (losses) disclosed in the reconciliation are included in Net Gain (Loss) on the Fund's Statement of Operations. |
Value of Derivative Instruments |
The following table is a summary of the Fund's value of derivative instruments by risk exposure as of August 31, 2011. For additional information on derivative instruments, please refer to the Derivative Instruments section in the accompanying Notes to Financial Statements. |
Risk Exposure /
Derivative Type
(Amounts in thousands) | Value |
| Asset | Liability |
Credit Risk | | |
Swap Agreements (b) | $ - | $ (40,677) |
Equity Risk | | |
Futures Contracts (a) | - | (883) |
Total Value of Derivatives | $ - | $ (41,560) |
(a) Reflects cumulative appreciation/(depreciation) on futures contracts as disclosed on the Schedule of Investments. Only the period end variation margin is separately disclosed on the Statement of Assets and Liabilities. |
(b) Value is disclosed on the Statement of Assets and Liabilities in the Swap agreements, at value line-items. |
Other Information |
The composition of credit quality ratings as a percentage of net assets is as follows (Unaudited): |
U.S. Government and U.S. Government Agency Obligations | 30.6% |
AAA,AA,A | 6.0% |
BBB | 4.6% |
BB | 1.8% |
B | 1.6% |
CCC,CC,C | 0.4% |
D | 0.0%* |
Not Rated | 0.0%* |
Equities | 59.7% |
Short-Term Investments and Net Other Assets | (4.7)% |
| 100.0% |
* Amount represents less than 0.1% |
We have used ratings from Moody's Investors Service, Inc. Where Moody's® ratings are not available, we have used S&P® ratings. All ratings are as of the date indicated and do not reflect subsequent changes. Percentages are adjusted for the effect of futures contracts, if applicable. |
Distribution of investments by country of issue, as a percentage of total net assets, is as follows: (Unaudited) |
United States of America | 87.8% |
United Kingdom | 3.0% |
Canada | 1.2% |
France | 1.1% |
Ireland | 1.0% |
Others (Individually Less Than 1%) | 5.9% |
| 100.0% |
Income Tax Information |
At August 31, 2011, the Fund had a capital loss carryforward of approximately $677,351,000 all of which will expire in fiscal 2018. Capital loss carryforwards are only available to offset future capital gains of the Fund to the extent provided by regulations and may be limited. |
See accompanying notes which are an integral part of the financial statements.
Annual Report
Statement of Assets and Liabilities
Amounts in thousands (except per-share amounts) | August 31, 2011 |
| | |
Assets | | |
Investment in securities, at value (including securities loaned of $99,800 and repurchase agreements of $52,754) - See accompanying schedule: Unaffiliated issuers (cost $16,969,176) | $ 17,898,121 | |
Fidelity Central Funds (cost $3,243,265) | 3,399,401 | |
Total Investments (cost $20,212,441) | | $ 21,297,522 |
Commitment to sell securities on a delayed delivery basis | (984,499) | |
Receivable for securities sold on a delayed delivery basis | 987,239 | 2,740 |
Receivable for investments sold, regular delivery | | 202,177 |
Cash | | 73 |
Foreign currency held at value (cost $972) | | 970 |
Receivable for swap agreements | | 8 |
Receivable for fund shares sold | | 10,910 |
Dividends receivable | | 28,793 |
Interest receivable | | 36,068 |
Distributions receivable from Fidelity Central Funds | | 1,729 |
Receivable for daily variation margin on futures contracts | | 4,938 |
Other receivables | | 1,406 |
Total assets | | 21,587,334 |
| | |
Liabilities | | |
Payable for investments purchased
Regular delivery | $ 197,108 | |
Delayed delivery | 996,521 | |
Payable for swap agreements | 558 | |
Payable for fund shares redeemed | 532,997 | |
Swap agreements, at value | 40,677 | |
Accrued management fee | 6,746 | |
Other affiliated payables | 2,834 | |
Other payables and accrued expenses | 2,815 | |
Collateral on securities loaned, at value | 103,334 | |
Total liabilities | | 1,883,590 |
| | |
Net Assets | | $ 19,703,744 |
Net Assets consist of: | | |
Paid in capital | | $ 19,513,591 |
Undistributed net investment income | | 89,115 |
Accumulated undistributed net realized gain (loss) on investments and foreign currency transactions | | (946,760) |
Net unrealized appreciation (depreciation) on investments and assets and liabilities in foreign currencies | | 1,047,798 |
Net Assets | | $ 19,703,744 |
See accompanying notes which are an integral part of the financial statements.
Annual Report
Financial Statements - continued
Statement of Assets and Liabilities - continued
Amounts in thousands (except per-share amounts) | August 31, 2011 |
| | |
Balanced:
Net Asset Value, offering price and redemption price per share ($15,601,801 ÷ 858,472 shares) | | $ 18.17 |
| | |
Class K:
Net Asset Value, offering price and redemption price per share ($4,101,943 ÷ 225,698 shares) | | $ 18.17 |
See accompanying notes which are an integral part of the financial statements.
Annual Report
Statement of Operations
Amounts in thousands | Year ended August 31, 2011 |
| | |
Investment Income | | |
Dividends | | $ 207,140 |
Interest | | 222,001 |
Income from Fidelity Central Funds | | 102,294 |
Total income | | 531,435 |
| | |
Expenses | | |
Management fee | $ 86,106 | |
Transfer agent fees | 33,332 | |
Accounting and security lending fees | 2,049 | |
Custodian fees and expenses | 590 | |
Independent trustees' compensation | 116 | |
Appreciation in deferred trustee compensation account | 1 | |
Registration fees | 181 | |
Audit | 164 | |
Legal | 117 | |
Miscellaneous | 237 | |
Total expenses before reductions | 122,893 | |
Expense reductions | (2,128) | 120,765 |
Net investment income (loss) | | 410,670 |
Realized and Unrealized Gain (Loss) Net realized gain (loss) on: | | |
Investment securities: | | |
Unaffiliated issuers | 2,092,650 | |
Fidelity Central Funds | 30,796 | |
Foreign currency transactions | (2,512) | |
Futures contracts | 50,072 | |
Swap agreements | (10,722) | |
Total net realized gain (loss) | | 2,160,284 |
Change in net unrealized appreciation (depreciation) on: Investment securities | 102,526 | |
Assets and liabilities in foreign currencies | 194 | |
Futures contracts | 632 | |
Swap agreements | 9,045 | |
Delayed delivery commitments | 2,837 | |
Total change in net unrealized appreciation (depreciation) | | 115,234 |
Net gain (loss) | | 2,275,518 |
Net increase (decrease) in net assets resulting from operations | | $ 2,686,188 |
See accompanying notes which are an integral part of the financial statements.
Annual Report
Financial Statements - continued
Statement of Changes in Net Assets
Amounts in thousands | Year ended
August 31,
2011 | Year ended
August 31,
2010 |
Increase (Decrease) in Net Assets | | |
Operations | | |
Net investment income (loss) | $ 410,670 | $ 442,485 |
Net realized gain (loss) | 2,160,284 | 1,025,577 |
Change in net unrealized appreciation (depreciation) | 115,234 | 81,659 |
Net increase (decrease) in net assets resulting
from operations | 2,686,188 | 1,549,721 |
Distributions to shareholders from net investment income | (410,590) | (443,230) |
Distributions to shareholders from net realized gain | (9,407) | (12,403) |
Total distributions | (419,997) | (455,633) |
Share transactions - net increase (decrease) | (2,018,385) | (876,720) |
Total increase (decrease) in net assets | 247,806 | 217,368 |
| | |
Net Assets | | |
Beginning of period | 19,455,938 | 19,238,570 |
End of period (including undistributed net investment income of $89,115 and undistributed net investment income of $107,158, respectively) | $ 19,703,744 | $ 19,455,938 |
See accompanying notes which are an integral part of the financial statements.
Annual Report
Financial Highlights - Balanced
Years ended August 31, | 2011 | 2010 | 2009 | 2008 | 2007 |
Selected Per-Share Data | | | | | |
Net asset value, beginning of period | $ 16.27 | $ 15.40 | $ 17.71 | $ 20.66 | $ 19.56 |
Income from Investment Operations | | | | | |
Net investment income (loss) B | .35 | .36 | .38 | .42 | .44 |
Net realized and unrealized gain (loss) | 1.91 | .88 | (2.29) | (1.76) | 2.13 |
Total from investment operations | 2.26 | 1.24 | (1.91) | (1.34) | 2.57 |
Distributions from net investment income | (.35) | (.36) | (.37) | (.43) | (.43) |
Distributions from net realized gain | (.01) | (.01) | (.03) | (1.18) | (1.04) |
Total distributions | (.36) | (.37) | (.40) | (1.61) | (1.47) |
Net asset value, end of period | $ 18.17 | $ 16.27 | $ 15.40 | $ 17.71 | $ 20.66 |
Total Return A | 13.88% | 8.06% | (10.48)% | (7.28)% | 13.96% |
Ratios to Average Net Assets C, E | | | | | |
Expenses before reductions | .61% | .62% | .68% | .61% | .61% |
Expenses net of fee waivers, if any | .61% | .62% | .68% | .61% | .61% |
Expenses net of all reductions | .60% | .61% | .68% | .61% | .60% |
Net investment income (loss) | 1.92% | 2.18% | 2.78% | 2.22% | 2.20% |
Supplemental Data | | | | | |
Net assets, end of period (in millions) | $ 15,602 | $ 16,764 | $ 17,225 | $ 25,363 | $ 26,191 |
Portfolio turnover rate D | 193% F | 122% | 198% F | 73% F | 89% F |
A Total returns would have been lower had certain expenses not been reduced during the periods shown.
B Calculated based on average shares outstanding during the period.
C Fees and expenses of the underlying Fidelity Central Funds are not included in the Fund's expense ratio. The Fund indirectly bears its proportionate share of the expenses of any underlying Fidelity Central Funds.
D Amount does not include the portfolio activity of any underlying Fidelity Central Funds.
E Expense ratios reflect operating expenses of the class. Expenses before reductions do not reflect amounts reimbursed by the investment adviser or reductions from brokerage service arrangements or reductions from other expense offset arrangements and do not represent the amount paid by the class during periods when reimbursements or reductions occur. Expenses net of fee waivers reflect expenses after reimbursement by the investment adviser but prior to reductions from brokerage service arrangements or other expense offset arrangements. Expenses net of all reductions represent the net expenses paid by the class.
F The portfolio turnover rate excludes liquidations and/or redemptions executed in-kind from Affiliated Central Funds.
See accompanying notes which are an integral part of the financial statements.
Annual Report
Financial Highlights - Class K
Years ended August 31, | 2011 | 2010 | 2009 | 2008 G |
Selected Per-Share Data | | | | |
Net asset value, beginning of period | $ 16.27 | $ 15.40 | $ 17.72 | $ 19.12 |
Income from Investment Operations | | | | |
Net investment income (loss) D | .38 | .38 | .40 | .12 |
Net realized and unrealized gain (loss) | 1.90 | .88 | (2.29) | (1.41) |
Total from investment operations | 2.28 | 1.26 | (1.89) | (1.29) |
Distributions from net investment income | (.38) | (.38) | (.40) | (.11) |
Distributions from net realized gain | (.01) | (.01) | (.03) | - |
Total distributions | (.38) J | (.39) | (.43) | (.11) |
Net asset value, end of period | $ 18.17 | $ 16.27 | $ 15.40 | $ 17.72 |
Total Return B, C | 14.04% | 8.23% | (10.33)% | (6.74)% |
Ratios to Average Net Assets E, H | | | | |
Expenses before reductions | .48% | .48% | .50% | .48% A |
Expenses net of fee waivers, if any | .48% | .48% | .50% | .48% A |
Expenses net of all reductions | .47% | .47% | .50% | .48% A |
Net investment income (loss) | 2.05% | 2.32% | 2.96% | 2.45% A |
Supplemental Data | | | | |
Net assets, end of period (in millions) | $ 4,102 | $ 2,692 | $ 2,014 | $ 17 |
Portfolio turnover rate F | 193% I | 122% | 198% I | 73% I |
A Annualized
B Total returns for periods of less than one year are not annualized.
C Total returns would have been lower had certain expenses not been reduced during the periods shown.
D Calculated based on average shares outstanding during the period.
E Fees and expenses of the underlying Fidelity Central Funds are not included in the Fund's expense ratio. The Fund indirectly bears its proportionate share of the expenses of any underlying Fidelity Central Funds.
F Amount does not include the portfolio activity of any underlying Fidelity Central Funds.
G For the period May 9, 2008 (commencement of sale of shares) to August 31, 2008.
H Expense ratios reflect operating expenses of the class. Expenses before reductions do not reflect amounts reimbursed by the investment adviser or reductions from brokerage service arrangements or reductions from other expense offset arrangements and do not represent the amount paid by the class during periods when reimbursements or reductions occur. Expense ratios before reductions for start-up periods may not be representative of longer-term operating periods. Expenses net of fee waivers reflect expenses after reimbursement by the investment adviser but prior to reductions from brokerage service arrangements or other expense offset arrangements. Expenses net of all reductions represent the net expenses paid by the class.
I The portfolio turnover rate excludes liquidations and/or redemptions executed in-kind from Affiliated Central Funds.
J Total distributions of $.38 per share is comprised of distributions from net investment income of $.376 and distributions from net realized gain of $.008 per share.
See accompanying notes which are an integral part of the financial statements.
Annual Report
Notes to Financial Statements
For the period ended August 31, 2011
(Amounts in thousands except ratios)
1. Organization.
Fidelity Balanced Fund (the Fund) is a fund of Fidelity Puritan Trust (the Trust) and is authorized to issue an unlimited number of shares. The Trust is registered under the Investment Company Act of 1940, as amended (the 1940 Act), as an open-end management investment company organized as a Massachusetts business trust. The Fund offers Balanced and Class K shares, each of which has equal rights as to assets and voting privileges. Each class has exclusive voting rights with respect to matters that affect that class. Investment income, realized and unrealized capital gains and losses, the common expenses of the Fund, and certain fund-level expense reductions, if any, are allocated on a pro-rata basis to each class based on the relative net assets of each class to the total net assets of the Fund. Each class differs with respect to transfer agent fees incurred.
2. Investments in Fidelity Central Funds.
The Fund invests in Fidelity Central Funds, which are open-end investment companies available only to other investment companies and accounts managed by Fidelity Management & Research Company (FMR) and its affiliates. The Fund's Schedule of Investments lists each of the Fidelity Central Funds held as of period end, if any, as an investment of the Fund, but does not include the underlying holdings of each Fidelity Central Fund. As an Investing Fund, the Fund indirectly bears its proportionate share of the expenses of the underlying Fidelity Central Funds.
Based on their investment objective, each Fidelity Central Fund may invest or participate in various investment vehicles or strategies that are similar to those of the Fund. These strategies are consistent with the investment objectives of the Fund and may involve certain economic risks which may cause a decline in value of each of the Fidelity Central Funds and thus a decline in the value of the Fund. The Money Market Central Funds seek preservation of capital and current income and are managed by Fidelity Investments Money Management, Inc. (FIMM), an affiliate of FMR. The following summarizes the Fund's investment in each Fidelity Central Fund.
Annual Report
2. Investments in Fidelity Central Funds - continued
Fidelity Central Fund | Investment Manager | Investment Objective | Investment Practices |
Fidelity Corporate Bond 1-10 Year Central Fund | FIMM | Seeks a high level of income by normally investing in investment-grade corporate bonds and other corporate debt securities and repurchase agreements for those securities. | Delayed Delivery & When Issued Securities Repurchase Agreements Restricted Securities Swap Agreements |
Fidelity High Income Central Fund 2 | FMR Co., Inc. (FMRC) | Seeks a high level of income and may also seek capital appreciation by investing primarily in debt securities, preferred stocks, and convertible securities, with an emphasis on lower-quality debt securities. | Loans & Direct Debt Instruments Repurchase Agreements Restricted Securities |
Fidelity Mortgage Backed Securities Central Fund | FIMM | Seeks a high level of income by normally investing in investment-grade mortgage-related securities and repurchase agreements for those securities. | Delayed Delivery & When Issued Securities Futures Repurchase Agreements Swap Agreements |
An unaudited holdings listing for the Fund, which presents direct holdings as well as the pro-rata share of any securities and other investments held indirectly through its investment in underlying non-money market Fidelity Central Funds, is available at fidelity.com. A complete unaudited list of holdings for each Fidelity Central Fund is available upon request or at the Securities and Exchange Commission (the SEC) web site at www.sec.gov. In addition, the financial statements of the Fidelity Central Funds which contain the significant accounting policies (including security valuation policies) of those funds, which are not covered by the Fund's Report of Independent Registered Public Accounting Firm, are available on the SEC web site or upon request.
Annual Report
Notes to Financial Statements - continued
(Amounts in thousands except ratios)
3. Significant Accounting Policies.
The financial statements have been prepared in conformity with accounting principles generally accepted in the United States of America (GAAP), which require management to make certain estimates and assumptions at the date of the financial statements. Actual results could differ from those estimates. Subsequent events, if any, through the date that the financial statements were issued have been evaluated in the preparation of the financial statements. The following summarizes the significant accounting policies of the Fund:
Security Valuation. Investments are valued as of 4:00 p.m. Eastern time on the last calendar day of the period. The Fund uses independent pricing services approved by the Board of Trustees to value its investments. When current market prices or quotations are not readily available or reliable, valuations may be determined in good faith in accordance with procedures adopted by the Board of Trustees. Factors used in determining value may include market or security specific events, changes in interest rates and credit quality. The frequency with which these procedures are used cannot be predicted and they may be utilized to a significant extent. The value used for net asset value (NAV) calculation under these procedures may differ from published prices for the same securities.
The Fund categorizes the inputs to valuation techniques used to value its investments into a disclosure hierarchy consisting of three levels as shown below:
Level 1 - quoted prices in active markets for identical investments
Level 2 - other significant observable inputs (including quoted prices for similar investments, interest rates, prepayment speeds, etc.)
Level 3 - unobservable inputs (including the Fund's own assumptions based on the best information available)
Changes in valuation techniques may result in transfers in or out of an assigned level within the disclosure hierarchy. The aggregate value of investments by input level, as of August 31, 2011, as well as a roll forward of Level 3 securities, is included at the end of the Fund's Schedule of Investments. Valuation techniques used to value the Fund's investments by major category are as follows:
Equity securities, including restricted securities, for which market quotations are readily available, are valued at the last reported sale price or official closing price as reported by an independent pricing service on the primary market or exchange on which they are traded and are categorized as Level 1 in the hierarchy. In the event there were no sales during the day or closing prices are not available, securities are valued at the last quoted bid price or may be valued using the last available price and are generally categorized as
Annual Report
3. Significant Accounting Policies - continued
Security Valuation - continued
Level 2 in the hierarchy. For foreign equity securities, when significant market or security specific events arise, comparisons to the valuation of American Depositary Receipts (ADRs), futures contracts, Exchange-traded funds (ETFs) and certain indexes as well as quoted prices for similar securities are used and are categorized as Level 2 in the hierarchy in these circumstances. Utilizing these techniques may result in transfers between Level 1 and Level 2. For restricted equity securities and private placements where observable inputs are limited, assumptions about market activity and risk are used and are categorized as Level 3 in the hierarchy.
Debt securities, including restricted securities, are valued based on evaluated prices received from independent pricing services or from dealers who make markets in such securities. For corporate bonds, bank notes, foreign government and government agency obligations, municipal securities, preferred securities, supranational obligations and U.S. government and government agency obligations, pricing services utilize matrix pricing which considers yield or price of bonds of comparable quality, coupon, maturity and type as well as dealer supplied prices and are generally categorized as Level 2 in the hierarchy. For asset backed securities, collateralized mortgage obligations, commercial mortgage securities and U.S. government agency mortgage securities, pricing services utilize matrix pricing which considers prepayment speed assumptions, attributes of the collateral, yield or price of bonds of comparable quality, coupon, maturity and type as well as dealer supplied prices and, accordingly, such securities are generally categorized as Level 2 in the hierarchy. Swaps are marked-to-market daily based on valuations from independent pricing services or dealer-supplied valuations and changes in value are recorded as unrealized appreciation (depreciation). Pricing services utilize matrix pricing which considers comparisons to interest rate curves, credit spread curves, default possibilities and recovery rates and, as a result, swaps are generally categorized as Level 2 in the hierarchy. When independent prices are unavailable or unreliable, debt securities and swaps may be valued utilizing pricing matrices which consider similar factors that would be used by independent pricing services. These are generally categorized as Level 2 in the hierarchy but may be Level 3 depending on the circumstances.
Futures contracts are valued at the settlement price established each day by the board of trade or exchange on which they are traded and are categorized as Level 1 in the hierarchy. Investments in open-end mutual funds, including the Fidelity Central Funds, are valued at their closing net asset value each business day and are categorized as Level 1 in the hierarchy. Short-term securities with remaining maturities of sixty days or less may be valued at amortized cost, which approximates fair value, and are categorized as Level 2 in the hierarchy.
Annual Report
Notes to Financial Statements - continued
(Amounts in thousands except ratios)
3. Significant Accounting Policies - continued
Foreign Currency. The Fund may use foreign currency contracts to facilitate transactions in foreign-denominated securities. Gains and losses from these transactions may arise from changes in the value of the foreign currency or if the counterparties do not perform under the contracts' terms.
Foreign-denominated assets, including investment securities, and liabilities are translated into U.S. dollars at the exchange rate at period end. Purchases and sales of investment securities, income and dividends received and expenses denominated in foreign currencies are translated into U.S. dollars at the exchange rate in effect on the transaction date.
The effects of exchange rate fluctuations on investments are included with the net realized and unrealized gain (loss) on investment securities. Other foreign currency transactions resulting in realized and unrealized gain (loss) are disclosed separately.
Investment Transactions and Income. For financial reporting purposes, the Fund's investment holdings and NAV include trades executed through the end of the last business day of the period. The NAV per share for processing shareholder transactions is calculated as of the close of business of the New York Stock Exchange (NYSE), normally 4:00 p.m. Eastern time and includes trades executed through the end of the prior business day. Gains and losses on securities sold are determined on the basis of identified cost and may include proceeds received from litigation. Dividend income is recorded on the ex-dividend date, except for certain dividends from foreign securities where the ex-dividend date may have passed, which are recorded as soon as the Fund is informed of the ex-dividend date. Non-cash dividends included in dividend income, if any, are recorded at the fair market value of the securities received. Distributions received on securities that represent a return of capital or capital gain are recorded as a reduction of cost of investments and/or as a realized gain. The Fund estimates the components of distributions received that may be considered return of capital distributions or capital gain distributions. Interest income and distributions from the Fidelity Central Funds are accrued as earned. Interest income includes coupon interest and amortization of premium and accretion of discount on debt securities. The principal value on inflation-indexed securities is periodically adjusted to the rate of inflation and interest is accrued based on the principal value. The adjustments to principal due to inflation are reflected as increases or decreases to interest income even though principal is not received until maturity. Investment income is recorded net of foreign taxes withheld where recovery of such taxes is uncertain. Debt obligations may be placed on non-accrual status and related interest income may be reduced by ceasing current accruals and writing off interest receivables when the collection of all or a portion of interest has become doubtful based on consistently applied procedures. A debt obligation is removed from
Annual Report
3. Significant Accounting Policies - continued
Investment Transactions and Income - continued
non-accrual status when the issuer resumes interest payments or when collectability of interest is reasonably assured.
Expenses. Expenses directly attributable to a fund are charged to that fund. Expenses attributable to more than one fund are allocated among the respective funds on the basis of relative net assets or other appropriate methods. Expense estimates are accrued in the period to which they relate and adjustments are made when actual amounts are known.
Deferred Trustee Compensation. Under a Deferred Compensation Plan (the Plan), independent Trustees may elect to defer receipt of a portion of their annual compensation. Deferred amounts are invested in a cross-section of Fidelity funds, are marked-to-market and remain in the Fund until distributed in accordance with the Plan. The investment of deferred amounts and the offsetting payable to the Trustees are included in the accompanying Statement of Assets and Liabilities.
Income Tax Information and Distributions to Shareholders. Each year, the Fund intends to qualify as a regulated investment company, including distributing substantially all of its taxable income and realized gains under Subchapter M of the Internal Revenue Code and filing its U.S. federal tax return. As a result, no provision for income taxes is required. As of August 31, 2011, the Fund did not have any unrecognized tax benefits in the financial statements. A fund's federal tax return is subject to examination by the Internal Revenue Service (IRS) for a period of three years. Foreign taxes are provided for based on the Fund's understanding of the tax rules and rates that exist in the foreign markets in which it invests.
Distributions are declared and recorded on the ex-dividend date. Income dividends and capital gain distributions are declared separately for each class. Income and capital gain distributions are determined in accordance with income tax regulations, which may differ from GAAP.
Capital accounts within the financial statements are adjusted for permanent book-tax differences. These adjustments have no impact on net assets or the results of operations. Temporary book-tax differences will reverse in a subsequent period.
Book-tax differences are primarily due to in-kind transactions, futures transactions, swap agreements, foreign currency transactions, passive foreign investment companies (PFIC), prior period premium and discount on debt securities, market discount, partnerships (including allocations from Fidelity Central Funds), deferred trustees compensation, capital loss carryforwards and losses deferred due to wash sales.
Annual Report
Notes to Financial Statements - continued
(Amounts in thousands except ratios)
3. Significant Accounting Policies - continued
Income Tax Information and Distributions to Shareholders - continued
The federal tax cost of investment securities and unrealized appreciation (depreciation) as of period end were as follows:
Gross unrealized appreciation | $ 1,692,822 |
Gross unrealized depreciation | (854,789) |
Net unrealized appreciation (depreciation) on securities and other investments | $ 838,033 |
| |
Tax Cost | $ 20,459,489 |
The tax-based components of distributable earnings as of period end were as follows:
Undistributed ordinary income | $ 66,372 |
Capital loss carryforward | $ (677,351) |
Net unrealized appreciation (depreciation) | $ 801,704 |
Under the recently enacted Regulated Investment Company Modernization Act of 2010 (the Act), the Fund will be permitted to carry forward capital losses incurred in taxable years beginning after December 22, 2010 for an unlimited period. However, any losses incurred during those future taxable years will be required to be utilized prior to any losses incurred in pre-enactment taxable years, which generally expire after eight years from when they are incurred. Additionally, post-enactment capital losses that are carried forward will retain their character as either short-term or long-term capital losses rather than being considered all short-term as under previous law. The Fund's first fiscal year end subject to the Act will be August, 31, 2012.
The tax character of distributions paid was as follows:
| August 31, 2011 | August 31, 2010 |
Ordinary Income | $ 419,997 | $ 455,633 |
New Accounting Pronouncement. In May 2011, the FASB issued Accounting Standard Update No. 2011-04, Fair Value Measurement (Topic 820) - Amendments to Achieve Common Fair Value Measurement and Disclosure Requirements in U.S. GAAP and IFRSs. The update changes the wording used to describe the requirements in GAAP for measuring fair value and for disclosing information about fair value measurements. The update is effective during interim and annual periods beginning after December 15, 2011. Management is currently evaluating the impact of the update's adoption on the Fund's financial statement disclosures.
Annual Report
4. Operating Policies.
Repurchase Agreements. FMR has received an Exemptive Order from the SEC which permits the Fund and other affiliated entities of FMR to transfer uninvested cash balances into joint trading accounts which are then invested in repurchase agreements. The Fund may also invest directly with institutions in repurchase agreements. Repurchase agreements are collateralized by government or non-government securities. Upon settlement date, collateral is held in segregated accounts with custodian banks and may be obtained in the event of a default of the counterparty. The Fund monitors, on a daily basis, the value of the collateral to ensure it is at least equal to the principal amount of the repurchase agreement (including accrued interest). In the event of a default by the counterparty, realization of the collateral proceeds could be delayed, during which time the value of the collateral may decline.
Delayed Delivery Transactions and When-Issued Securities. During the period, the Fund transacted in securities on a delayed delivery or when-issued basis. Payment and delivery may take place after the customary settlement period for that security. The price of the underlying securities and the date when the securities will be delivered and paid for are fixed at the time the transaction is negotiated. During the time a delayed delivery sell is outstanding, the contract is marked-to-market daily and equivalent deliverable securities are held for the transaction. The securities purchased on a delayed delivery or when-issued basis are identified as such in the Fund's Schedule of Investments. The Fund may receive compensation for interest forgone in the purchase of a delayed delivery or when-issued security. With respect to purchase commitments, the Fund identifies securities as segregated in its records with a value at least equal to the amount of the commitment. Losses may arise due to changes in the value of the underlying securities or if the counterparty does not perform under the contract's terms, or if the issuer does not issue the securities due to political, economic, or other factors.
Restricted Securities. The Fund may invest in securities that are subject to legal or contractual restrictions on resale. These securities generally may be resold in transactions exempt from registration or to the public if the securities are registered. Disposal of these securities may involve time-consuming negotiations and expense, and prompt sale at an acceptable price may be difficult. Information regarding restricted securities is included at the end of the Fund's Schedule of Investments.
5. Derivative Instruments.
Risk Exposures and the Use of Derivative Instruments. The Fund used derivative instruments (derivatives), including futures contracts and swap agreements, in order to meet its investment objectives. The strategy is to use derivatives to increase returns, to gain exposure to certain types of assets and to manage exposure to certain risks as defined below. The success of any strategy involving derivatives depends on analysis of
Annual Report
Notes to Financial Statements - continued
(Amounts in thousands except ratios)
5. Derivative Instruments - continued
Risk Exposures and the Use of Derivative Instruments - continued
numerous economic factors, and if the strategies for investment do not work as intended, the Fund may not achieve its objectives.
The Fund's use of derivatives increased or decreased its exposure to the following risks:
Credit Risk | Credit risk relates to the ability of the issuer of a financial instrument to make further principal or interest payments on an obligation or commitment that it has to the Fund. |
Equity Risk | Equity risk relates to the fluctuations in the value of financial instruments as a result of changes in market prices (other than those arising from interest rate risk or foreign exchange risk), whether caused by factors specific to an individual investment, its issuer, or all factors affecting all instruments traded in a market or market segment. |
Interest Rate Risk | Interest rate risk relates to the fluctuations in the value of interest-bearing securities due to changes in the prevailing levels of market interest rates. |
The Fund is also exposed to additional risks from investing in derivatives, such as liquidity risk and counterparty credit risk. Liquidity risk is the risk that the Fund will be unable to sell the derivative in the open market in a timely manner. Counterparty credit risk is the risk that the counterparty will not be able to fulfill its obligation to the Fund. Derivative counterparty credit risk is managed through formal evaluation of the creditworthiness of all potential counterparties. On certain over-the-counter derivatives, the Fund attempts to reduce its exposure to counterparty credit risk by entering into an International Swaps and Derivatives Association (ISDA) Master Agreement on a bilateral basis with each of its counterparties. The ISDA Master Agreement gives the Fund the right to terminate all transactions traded under such agreement if there is a certain deterioration in the credit quality of the counterparty. The ISDA Master Agreement gives each party the right, upon an event of default by the other party or a termination of the agreement, to close out all transactions traded under such agreement and to net amounts owed under each transaction to one net payable by one party to the other. To mitigate counterparty credit risk, the Fund offsets certain payables and/or receivables with collateral. Collateral in the form of cash or securities, if required, is held in segregated accounts with the Fund's custodian bank in accordance with the collateral agreements entered into between the Fund, the swap counterparty and the Fund's custodian bank, and is identified in the Schedule of Investments. The Fund could experience delays and costs in gaining access to the collateral even though it is held by the Fund's custodian bank. The Fund's maximum risk of loss from counterparty credit risk is generally the aggregate unrealized appreciation and unpaid counterparty payments in excess of any collateral pledged by the counterparty to the Fund. Counterparty risk related to exchange-traded futures contracts is minimal because of the protection
Annual Report
5. Derivative Instruments - continued
Risk Exposures and the Use of Derivative Instruments - continued
provided by the exchange on which they trade. Derivatives involve, to varying degrees, risk of loss in excess of the amounts recognized in the Statement of Assets and Liabilities.
Net Realized Gain (Loss) and Change in Net Unrealized Appreciation (Depreciation) on Derivatives. The table below, which reflects the impacts of derivatives on the financial performance of the Fund, summarizes the net realized gain (loss) and change in net unrealized appreciation (depreciation) for derivatives during the period.
Risk Exposure / Derivative Type | Net Realized Gain (Loss) | Change in Net Unrealized
Appreciation (Depreciation) |
Credit Risk | | |
Swap Agreements | $ (10,042) | $ 9,045 |
Equity Risk | | |
Futures Contracts | 50,072 | 632 |
Interest Rate Risk | | |
Swap Agreements | (680) | - |
Totals (a)(b)(c) | $ 39,350 | $ 9,677 |
(a) A summary of the value of derivatives by risk exposure as of period end, is included at the end of the Schedule of Investments and is representative of activity for the period.
(b) Total derivatives net realized gain (loss) included in the Statement of Operations is comprised of $50,072 for futures contracts and $(10,722) for swap agreements.
(c) Total derivatives change in net unrealized appreciation (depreciation) included in the Statement of Operations is comprised of $632 for futures contracts and $9,045 for swap agreements.
Futures Contracts. A futures contract is an agreement between two parties to buy or sell a specified underlying instrument for a fixed price at a specified future date. The Fund used futures contracts to manage its exposure to the stock market.
Upon entering into a futures contract, a fund is required to deposit either cash or securities (initial margin) with a clearing broker in an amount equal to a certain percentage of the face value of the contract. Futures contracts are marked-to-market daily and subsequent payments are made or received by a fund depending on the daily fluctuations in the value of the futures contracts and are recorded as unrealized appreciation or (depreciation). This receivable and/or payable is included in daily variation margin on futures contracts in the Statement of Assets and Liabilities. Realized gain or (loss) is recorded upon the expiration or closing of a futures contract. The net realized gain (loss) and change in net unrealized appreciation (depreciation) on futures contracts during the period is included in the Statement of Operations.
The underlying face amount at value of open futures contracts at period end is shown in the Schedule of Investments under the caption "Futures Contracts". This amount reflects
Annual Report
Notes to Financial Statements - continued
(Amounts in thousands except ratios)
5. Derivative Instruments - continued
Futures Contracts - continued
each contract's exposure to the underlying instrument at period end. Securities deposited to meet initial margin requirements are identified in the Schedule of Investments.
Certain risks arise upon entering into futures contracts, including the risk that an illiquid market limits the ability to close out a futures contract prior to settlement date.
Swap Agreements. A swap agreement (swap) is a contract between two parties to exchange future cash flows at periodic intervals based on a notional principal amount.
Details of swaps open at period end are included in the Schedule of Investments under the caption "Swap Agreements." Swaps are marked-to-market daily and changes in value are recorded as unrealized appreciation or (depreciation) and reflected in the Statement of Assets and Liabilities. Any upfront premiums paid or received upon entering a swap to compensate for differences between stated terms of the agreement and prevailing market conditions (e.g. credit spreads, interest rates or other factors) are recorded as realized gain or (loss) ratably over the term of the swap. Payments are exchanged at specified intervals, accrued daily commencing with the effective date of the contract and recorded as realized gain or (loss). Realized gain or (loss) is also recorded in the event of an early termination of a swap. The net realized gain (loss) and change in net unrealized appreciation (depreciation) on swaps during the period is included in the Statement of Operations.
Risks of loss include credit risk and interest rate risk. In addition, there is the risk of failure by the counterparty to perform under the terms of the agreement and lack of liquidity in the market.
Interest Rate Swaps. Interest rate swaps are agreements between counterparties to exchange cash flows, one based on a fixed rate, and the other on a floating rate. The Fund entered into interest rate swaps to manage its exposure to interest rate changes. Changes in interest rates can have an effect on both the value of bond holdings as well as the amount of interest income earned. In general, the value of bonds can fall when interest rates rise and can rise when interest rates fall.
Credit Default Swaps. Credit default swaps enable the Fund to buy or sell protection on a debt security or a basket of securities against a defined credit event. Under the terms of a credit default swap the buyer of protection (buyer) receives credit protection in exchange for making periodic payments to the seller of protection (seller) based on a fixed percentage applied to a notional principal amount. In return for these payments, the seller acts as a guarantor of the creditworthiness of a reference obligation. The Fund enters into credit default swaps as a seller to gain credit exposure to an issuer and/or as a buyer to provide a measure of protection against defaults of an issuer. The issuer may be
Annual Report
5. Derivative Instruments - continued
Credit Default Swaps - continued
either a single issuer or a "basket" of issuers. Periodic payments are made over the life of the contract provided that no credit event occurs.
For credit default swaps on most corporate and sovereign issuers, credit events include bankruptcy, failure to pay, obligation acceleration or repudiation/moratorium. For credit default swaps on corporate or sovereign issuers, the obligation that may be put to the seller is not limited to the specific reference obligation described in the Schedule of Investments. For credit default swaps on asset-backed securities, a credit event may be triggered by events such as failure to pay principal, maturity extension, rating downgrade or write-down. For credit default swaps on asset-backed securities, the reference obligation described represents the security that may be put to the seller.
As a seller, if an underlying credit event occurs, the Fund will either pay the buyer an amount equal to the notional amount of the swap and take delivery of the reference obligation or underlying securities comprising an index or pay a net settlement amount of cash equal to the notional amount of the swap less the recovery value of the reference obligation or underlying securities comprising an index.
As a buyer, if an underlying credit event occurs, the Fund will either receive from the seller an amount equal to the notional amount of the swap and deliver the reference obligation or underlying securities comprising an index or receive a net settlement amount of cash equal to the notional amount of the swap less the recovery value of the reference obligation or underlying securities comprising an index.
Typically, the value of each credit default swap and credit rating disclosed for each reference obligation in the Schedule of Investments, where the Fund is the seller, can be used as measures of the current payment/performance risk of the swap. As the value of the swap changes as a positive or negative percentage of the total notional amount, the payment/performance risk may decrease or increase, respectively. In addition to these measures, FMR monitors a variety of factors including cash flow assumptions, market activity and market sentiment as part of its ongoing process of assessing payment/performance risk.
The notional amount of credit default swaps is included in the Schedule of Investments and approximates the maximum potential amount of future payments that the Fund could be required to make if the Fund is the seller and a credit event were to occur. The total notional amount of all credit default swaps open at period end where the Fund is the seller amounted to $43,007 representing 0.22% of net assets.
Annual Report
Notes to Financial Statements - continued
(Amounts in thousands except ratios)
6. Purchases and Sales of Investments.
Purchases and sales of securities (including the Fixed-Income Central Funds), other than short-term securities, U.S. government securities and in-kind transactions, aggregated $17,666,854 and $19,233,208, respectively.
7. Fees and Other Transactions with Affiliates.
Management Fee. FMR and its affiliates provide the Fund with investment management related services for which the Fund pays a monthly management fee. The management fee is the sum of an individual fund fee rate that is based on an annual rate of .15% of the Fund's average net assets and a group fee rate that averaged .26% during the period. The group fee rate is based upon the average net assets of all the mutual funds advised by FMR. The group fee rate decreases as assets under management increase and increases as assets under management decrease. For the period, the total annual management fee rate was .41% of the Fund's average net assets.
Transfer Agent Fees. Fidelity Investments Institutional Operations Company, Inc. (FIIOC), an affiliate of FMR, is the transfer, dividend disbursing and shareholder servicing agent for each class of the Fund. FIIOC receives account fees and asset-based fees that vary according to the account size and type of account of the shareholders of Balanced. FIIOC receives an asset-based fee of Class K's average net assets. FIIOC pays for typesetting, printing and mailing of shareholder reports, except proxy statements. For the period, transfer agent fees for each class were as follows:
| Amount | % of
Average
Net Assets |
Balanced | $ 31,252 | .18 |
Class K | 2,080 | .05 |
| $ 33,332 | |
Accounting and Security Lending Fees. Fidelity Service Company, Inc. (FSC), an affiliate of FMR, maintains the Fund's accounting records. The accounting fee is based on the level of average net assets for the month. Under a separate contract, FSC administers the security lending program. The security lending fee is based on the number and duration of lending transactions.
Brokerage Commissions. The Fund placed a portion of its portfolio transactions with brokerage firms which are affiliates of the investment adviser. The commissions paid to these affiliated firms were $689 for the period.
Exchange In-Kind. During the period, the Fund redeemed in-kind 2,389 shares of Fidelity Corporate Bond 1-10 Year Central Fund ("1-10 Year"), a Fidelity Central Fund in which the Fund invests, valued at $258,983 in exchange for cash and securities,
Annual Report
7. Fees and Other Transactions with Affiliates - continued
Exchange In-Kind - continued
including accrued interest. Realized gain (loss) of $19,923 on the Fund's redemption of 1-10 Year shares is included in the accompanying Statement of Operations as "Realized gain (loss) on Fidelity Central Funds." Because 1-10 Year was a partnership for federal income tax purposes, the redemption generally was tax free to the Fund.
8. Committed Line of Credit.
The Fund participates with other funds managed by FMR or an affiliate in a $4.0 billion credit facility (the "line of credit") to be utilized for temporary or emergency purposes to fund shareholder redemptions or for other short-term liquidity purposes. The Fund has agreed to pay commitment fees on its pro-rata portion of the line of credit, which amounted to $71 and is reflected in Miscellaneous expenses on the Statement of Operations. During the period, there were no borrowings on this line of credit.
9. Security Lending.
The Fund lends portfolio securities from time to time in order to earn additional income. For equity securities, a lending agent is used and may loan securities to certain qualified borrowers, including Fidelity Capital Markets (FCM), a broker-dealer affiliated with the Fund. On the settlement date of the loan, the Fund receives collateral (in the form of U.S. Treasury obligations, letters of credit and/or cash) against the loaned securities and maintains collateral in an amount not less than 100% of the market value of the loaned securities during the period of the loan. The market value of the loaned securities is determined at the close of business of the Fund and any additional required collateral is delivered to the Fund on the next business day. If the borrower defaults on its obligation to return the securities loaned because of insolvency or other reasons, a fund could experience delays and costs in recovering the securities loaned or in gaining access to the collateral. Any cash collateral received is maintained at the Fund's custodian and/or invested in cash equivalents and/or the Fidelity Securities Lending Cash Central Fund. The value of loaned securities and cash collateral at period end are disclosed on the Fund's Statement of Assets and Liabilities. The value of securities loaned to FCM at period end was $2,323. Security lending income represents the income earned on investing cash collateral, less rebates paid to borrowers and any lending agent fees associated with the loan, plus any premium payments received for lending certain types of securities. Total security lending income during the period, presented in the Statement of Operations as a component of interest income, amounted to $491. Net income from the Fidelity Securities Lending Cash Central Fund during the period, presented in the Statement of Operations as a component of income from Fidelity Central Funds, amounted to $1,318 (including $11 from securities loaned to FCM).
Annual Report
Notes to Financial Statements - continued
(Amounts in thousands except ratios)
10. Expense Reductions.
Many of the brokers with whom FMR places trades on behalf of the Fund provided services to the Fund in addition to trade execution. These services included payments of certain expenses on behalf of the Fund totaling $2,128 for the period.
11. Distributions to Shareholders.
Distributions to shareholders of each class were as follows:
Years ended August 31, | 2011 | 2010 |
From net investment income | | |
Balanced | $ 328,396 | $ 388,939 |
Class K | 82,194 | 54,291 |
Total | $ 410,590 | $ 443,230 |
From net realized gain | | |
Balanced | $ 7,916 | $ 11,043 |
Class K | 1,491 | 1,360 |
Total | $ 9,407 | $ 12,403 |
12. Share Transactions.
Transactions for each class of shares were as follows:
| Shares | Dollars |
Years ended August 31, | 2011 | 2010 | 2011 | 2010 |
Balanced | | | | |
Shares sold | 117,364 | 132,638 | $ 2,150,235 | $ 2,182,039 |
Reinvestment of distributions | 17,788 | 23,996 | 325,354 | 389,758 |
Shares redeemed | (307,092) | (244,641) | (5,576,894) | (4,025,346) |
Net increase (decrease) | (171,940) | (88,007) | $ (3,101,305) | $ (1,453,549) |
Class K | | | | |
Shares sold | 127,669 | 63,190 | $ 2,316,418 | $ 1,045,364 |
Reinvestment of distributions | 4,546 | 3,419 | 83,685 | 55,651 |
Shares redeemed | (71,990) | (31,877) | (1,317,183) | (524,186) |
Net increase (decrease) | 60,225 | 34,732 | $ 1,082,920 | $ 576,829 |
Annual Report
13. Other.
The Fund's organizational documents provide former and current trustees and officers with a limited indemnification against liabilities arising in connection with the performance of their duties to the Fund. In the normal course of business, the Fund may also enter into contracts that provide general indemnifications. The Fund's maximum exposure under these arrangements is unknown as this would be dependent on future claims that may be made against the Fund. The risk of material loss from such claims is considered remote.
Annual Report
To the Trustees of Fidelity Puritan Trust and the Shareholders of Fidelity Balanced Fund:
In our opinion, the accompanying statement of assets and liabilities, including the schedule of investments, and the related statements of operations and of changes in net assets and the financial highlights present fairly, in all material respects, the financial position of Fidelity Balanced Fund (a fund of Fidelity Puritan Trust) at August 31, 2011, the results of its operations for the year then ended, the changes in its net assets for each of the two years in the period then ended and the financial highlights for each of the periods indicated, in conformity with accounting principles generally accepted in the United States of America. These financial statements and financial highlights (hereafter referred to as "financial statements") are the responsibility of the Fidelity Balanced Fund's management. Our responsibility is to express an opinion on these financial statements based on our audits. We conducted our audits of these financial statements in accordance with the standards of the Public Company Accounting Oversight Board (United States). Those standards require that we plan and perform the audit to obtain reasonable assurance about whether the financial statements are free of material misstatement. An audit includes examining, on a test basis, evidence supporting the amounts and disclosures in the financial statements, assessing the accounting principles used and significant estimates made by management, and evaluating the overall financial statement presentation. We believe that our audits, which included confirmation of securities at August 31, 2011 by correspondence with the custodian and brokers, provide a reasonable basis for our opinion.
/s/ PricewaterhouseCoopers LLP
PricewaterhouseCoopers LLP
Boston, Massachusetts
October 19, 2011
Annual Report
The Trustees, Members of the Advisory Board, and executive officers of the trust and fund, as applicable, are listed below. The Board of Trustees governs the fund and is responsible for protecting the interests of shareholders. The Trustees are experienced executives who meet periodically throughout the year to oversee the fund's activities, review contractual arrangements with companies that provide services to the fund, oversee management of the risks associated with such activities and contractual arrangements, and review the fund's performance. Except for James C. Curvey, each of the Trustees oversees 221 funds advised by FMR or an affiliate. Mr. Curvey oversees 424 funds advised by FMR or an affiliate.
The Trustees hold office without limit in time except that (a) any Trustee may resign; (b) any Trustee may be removed by written instrument, signed by at least two-thirds of the number of Trustees prior to such removal; (c) any Trustee who requests to be retired or who has become incapacitated by illness or injury may be retired by written instrument signed by a majority of the other Trustees; and (d) any Trustee may be removed at any special meeting of shareholders by a two-thirds vote of the outstanding voting securities of the trust. Each Trustee who is not an interested person (as defined in the 1940 Act) (Independent Trustee), shall retire not later than the last day of the calendar year in which his or her 75th birthday occurs. The Independent Trustees may waive this mandatory retirement age policy with respect to individual Trustees. The executive officers and Advisory Board Members hold office without limit in time, except that any officer and Advisory Board Member may resign or may be removed by a vote of a majority of the Trustees at any regular meeting or any special meeting of the Trustees. Except as indicated, each individual has held the office shown or other offices in the same company for the past five years.
Experience, Skills, Attributes, and Qualifications of the Fund's Trustees. The Governance and Nominating Committee has adopted a statement of policy that describes the experience, qualifications, attributes, and skills that are necessary and desirable for potential Independent Trustee candidates (Statement of Policy). The Board believes that each Trustee satisfied at the time he or she was initially elected or appointed a Trustee, and continues to satisfy, the standards contemplated by the Statement of Policy. The Governance and Nominating Committee also engages professional search firms to help identify potential Independent Trustee candidates who have the experience, qualifications, attributes, and skills consistent with the Statement of Policy. From time to time, additional criteria based on the composition and skills of the current Independent Trustees, as well as experience or skills that may be appropriate in light of future changes to board composition, business conditions, and regulatory or other developments, have also been considered by the professional search firms and the Governance and Nominating Committee. In addition, the Board takes into account the Trustees' commitment and participation in Board and committee meetings, as well as their leadership of standing and ad hoc committees throughout their tenure.
In determining that a particular Trustee was and continues to be qualified to serve as a Trustee, the Board has considered a variety of criteria, none of which, in isolation, was controlling. The Board believes that, collectively, the Trustees have balanced and diverse experience, qualifications, attributes, and skills, which allow the Board to operate effectively in governing the fund and protecting the interests of shareholders. Information about the specific experience, skills, attributes, and qualifications of each Trustee, which in each case led to the Board's conclusion that the Trustee should serve (or continue to serve) as a trustee of the fund, is provided below.
Annual Report
Board Structure and Oversight Function. James C. Curvey is an interested person (as defined in the 1940 Act) and currently serves as Acting Chairman. The Trustees have determined that an interested Chairman is appropriate and benefits shareholders because an interested Chairman has a personal and professional stake in the quality and continuity of services provided to the fund. Independent Trustees exercise their informed business judgment to appoint an individual of their choosing to serve as Chairman, regardless of whether the Trustee happens to be independent or a member of management. The Independent Trustees have determined that they can act independently and effectively without having an Independent Trustee serve as Chairman and that a key structural component for assuring that they are in a position to do so is for the Independent Trustees to constitute a substantial majority for the Board. The Independent Trustees also regularly meet in executive session. Ned C. Lautenbach serves as Chairman of the Independent Trustees and as such (i) acts as a liaison between the Independent Trustees and management with respect to matters important to the Independent Trustees and (ii) with management prepares agendas for Board meetings.
Fidelity funds are overseen by different Boards of Trustees. The fund's Board oversees Fidelity's equity and high income funds and another Board oversees Fidelity's investment-grade bond, money market, and asset allocation funds. The asset allocation funds may invest in Fidelity funds overseen by the fund's Board. The use of separate Boards, each with its own committee structure, allows the Trustees of each group of Fidelity funds to focus on the unique issues of the funds they oversee, including common research, investment, and operational issues. On occasion, the separate Boards establish joint committees to address issues of overlapping consequences for the Fidelity funds overseen by each Board.
The Trustees operate using a system of committees to facilitate the timely and efficient consideration of all matters of importance to the Trustees, the fund, and fund shareholders and to facilitate compliance with legal and regulatory requirements and oversight of the fund's activities and associated risks. The Board, acting through its committees, has charged FMR and its affiliates with (i) identifying events or circumstances the occurrence of which could have demonstrably adverse effects on the fund's business and/or reputation; (ii) implementing processes and controls to lessen the possibility that such events or circumstances occur or to mitigate the effects of such events or circumstances if they do occur; and (iii) creating and maintaining a system designed to evaluate continuously business and market conditions in order to facilitate the identification and implementation processes described in (i) and (ii) above. Because the day-to-day operations and activities of the fund are carried out by or through FMR, its affiliates and other service providers, the fund's exposure to risks is mitigated but not eliminated by the processes overseen by the Trustees. While each of the Board's committees has responsibility for overseeing different aspects of the fund's activities, oversight is exercised primarily through the Operations, Audit, and Compliance Committees. In addition, the Independent Trustees have worked with FMR to enhance the Board's oversight of investment and financial risks, legal and regulatory risks, technology risks, and operational risks, including the development of additional risk reporting to the Board. For example, a working group comprised of Independent Trustees and FMR has worked and continues to work to review the Fidelity funds' valuation-related activities, reporting and risk management. Appropriate personnel, including but not limited to the fund's Chief Compliance Officer (CCO), FMR's internal auditor, the independent accountants, the funds' Treasurer and portfolio management personnel, make periodic reports to the Board's committees, as appropriate, including an annual review of FMR's risk management program for the Fidelity funds. The responsibilities of each standing committee, including their oversight responsibilities, are described further under "Standing Committees of the Fund's Trustees."
Annual Report
Trustees and Officers - continued
The fund's Statement of Additional Information (SAI) includes more information about the Trustees. To request a free copy, call Fidelity at 1-800-835-5092.
Interested Trustees*:
Correspondence intended for each Trustee who is an interested person may be sent to Fidelity Investments, 82 Devonshire Street, Boston, Massachusetts 02109.
Name, Age; Principal Occupations and Other Relevant Experience+ |
James C. Curvey (76) |
| Year of Election or Appointment: 2007 Mr. Curvey is Trustee and Acting Chairman of the Board of Trustees of certain Trusts. Mr. Curvey also serves as Trustee (2007-present) of other investment companies advised by FMR. Mr. Curvey is a Director of Fidelity Investments Money Management, Inc. (2009-present), Director of Fidelity Research & Analysis Co. (2009-present) and Director of FMR and FMR Co., Inc. (2007-present). Mr. Curvey is also Vice Chairman (2007-present) and Director of FMR LLC. In addition, Mr. Curvey serves as an Overseer for the Boston Symphony Orchestra and a member of the Trustees of Villanova University. Previously, Mr. Curvey was the Vice Chairman (2006-2007) and Director (2000-2007) of FMR Corp. |
Ronald P. O'Hanley (54) |
| Year of Election or Appointment: 2011 Mr. O'Hanley is Director of FMR Co., Inc. (2010-present), Director of Fidelity Investments Money Management, Inc. (2010-present), Director of Fidelity Research & Analysis Company (2010-present), President of Fidelity Asset Management and Corporate Services and a member of Fidelity's Executive Committee (2010-present). Previously, Mr. O'Hanley served as President and Chief Executive Officer of BNY Mellon Asset Management (2007-2010). Mr. O'Hanley also served as Vice Chairman of Bank New York Mellon Corp. and a member of that firm's Executive Committee. Prior to the 2007 merger of The Bank of New York and Mellon Financial Corporation, he was Vice Chairman of Mellon Financial Corporation and President and Chief Executive Officer of Mellon Asset Management. He joined Mellon in February 1997. Mr. O'Hanley currently serves as Chairman of the Boston Public Library Foundation Board of Directors and sits on the Board of Directors of Beth Israel Deaconess Medical Center, the Board of Trustees of the Marine Biological Laboratory and the Advisory Board of the Maxwell School of Citizenship and Public Administration at Syracuse University. Mr. O'Hanley also chairs the Council on Asset Management for the Financial Services Roundtable and is a member of the Board of Directors of Institutional Investor's U.S. Institute. |
* Trustees have been determined to be "Interested Trustees" by virtue of, among other things, their affiliation with the trust or various entities under common control with FMR.
+ The information above includes each Trustee's principal occupation during the last five years and other information relating to the experience, attributes, and skills relevant to each Trustee's qualifications to serve as a Trustee, which led to the conclusion that each Trustee should serve as a Trustee for the fund.
Annual Report
Trustees and Officers - continued
Independent Trustees:
Correspondence intended for each Independent Trustee (that is, the Trustees other than the Interested Trustees) may be sent to Fidelity Investments, P.O. Box 55235, Boston, Massachusetts 02205-5235.
Name, Age; Principal Occupations and Other Relevant Experience+ |
Dennis J. Dirks (63) |
| Year of Election or Appointment: 2005 Prior to his retirement in May 2003, Mr. Dirks was Chief Operating Officer and a member of the Board of The Depository Trust & Clearing Corporation (DTCC). He also served as President, Chief Operating Officer, and Board member of The Depository Trust Company (DTC) and President and Board member of the National Securities Clearing Corporation (NSCC). In addition, Mr. Dirks served as Chief Executive Officer and Board member of the Government Securities Clearing Corporation, Chief Executive Officer and Board member of the Mortgage-Backed Securities Clearing Corporation, as a Trustee and a member of the Finance Committee of Manhattan College (2005-2008), and as a Trustee and a member of the Finance Committee of AHRC of Nassau County (2006-2008). Mr. Dirks is a member of the Independent Directors Council (IDC) Governing Council (2010-Present) and Board of Directors for The Brookville Center for Children's Services, Inc. (2009-present). |
Alan J. Lacy (57) |
| Year of Election or Appointment: 2008 Mr. Lacy serves as Senior Adviser (2007-present) of Oak Hill Capital Partners, L.P. (private equity). Mr. Lacy also served as Chief Executive Officer (2000-2005) and Vice Chairman (2005-2006) of Sears Holdings Corporation and Sears, Roebuck and Co. (retail). In addition, Mr. Lacy serves as a member of the Board of Directors of Dave & Buster's, Inc. (restaurant and entertainment complexes, 2010-present), The Hillman Companies, Inc. (hardware wholesalers, 2010-present), and Bristol-Myers Squibb Company (global pharmaceuticals, 2007-present). Mr. Lacy is a member of the Board of Trustees of The National Parks Conservation Association (2006-Present). Previously, Mr. Lacy served as Chairman of the Board of Trustees of the National Parks Conservation Association (2008-2011) and as a member of the Board of Directors for the Western Union Company (global money transfer, 2006-2011). |
Ned C. Lautenbach (67) |
| Year of Election or Appointment: 2000 Mr. Lautenbach is Chairman of the Independent Trustees of the Equity and High Income Funds (2006-present). Mr. Lautenbach currently serves as the Lead Director of the Eaton Corporation Board of Directors (diversified industrial, 1997-present). Mr. Lautenbach is also a member of the Board of Directors of the Philharmonic Center for the Arts in Naples, Florida (1999-present); a member of the Board of Trustees of Fairfield University (2005-present); and a member of the Council on Foreign Relations (1994-present). Previously, Mr. Lautenbach was a Partner/Advisory Partner at Clayton, Dubilier & Rice, LLC (private equity investment, 1998-2010), as well as a Director of Sony Corporation (2006-2007). |
Joseph Mauriello (66) |
| Year of Election or Appointment: 2008 Prior to his retirement in January 2006, Mr. Mauriello served in numerous senior management positions including Deputy Chairman and Chief Operating Officer (2004-2005), and Vice Chairman of Financial Services (2002-2004) of KPMG LLP US (professional services, 1965-2005). Mr. Mauriello currently serves as a member of the Board of Directors of XL Group plc. (global insurance and re-insurance, 2006-present) and of Arcadia Resources Inc. (health care services and products, 2007-present). Previously, Mr. Mauriello served as a Director of the Hamilton Funds of the Bank of New York (2006-2007). |
Robert W. Selander (60) |
| Year of Election or Appointment: 2011 Previously, Mr. Selander served as a Member of the Advisory Board of Fidelity's Equity and High Income Funds (2011), Executive Vice Chairman (2010), Chief Executive Officer (2009-2010), and President and Chief Executive Officer (1997-2009) of Mastercard, Inc. |
Cornelia M. Small (67) |
| Year of Election or Appointment: 2005 Ms. Small is a member of the Board of Directors of the Teagle Foundation (2009-present). Ms. Small is also a member of the Investment Committee, and Chair (2008-present) and a member of the Board of Trustees of Smith College. In addition, Ms. Small serves on the Investment Committee of the Berkshire Taconic Community Foundation (2008-present). Previously, Ms. Small served as Chairperson of the Investment Committee (2002-2008) of Smith College. In addition, Ms. Small served as Chief Investment Officer, Director of Global Equity Investments, and a member of the Board of Directors of Scudder, Stevens & Clark and Scudder Kemper Investments. |
William S. Stavropoulos (72) |
| Year of Election or Appointment: 2001 Mr. Stavropoulos is Vice Chairman of the Independent Trustees of the Equity and High Income Funds (2006-present). Mr. Stavropoulos serves as President and Founder of the Michigan Baseball Foundation, the Great Lakes Loons (2007-present). Mr. Stavropoulos is Chairman Emeritus of the Board of Directors of The Dow Chemical Company, where he previously served in numerous senior management positions, including President, CEO (1995-2000; 2002-2004), Chairman of the Executive Committee (2000-2006), and as a member of the Board of Directors (1990-2006). Currently, Mr. Stavropoulos is Chairman of Univar (global distributor of commodity and specialty chemicals, 2010-present), a Director of Teradata Corporation (data warehousing and technology solutions, 2008-present), Chemical Financial Corporation, Maersk Inc. (industrial conglomerate), Tyco International, Inc. (multinational manufacturing and services, 2007-present), and a member of the Advisory Board for Metalmark Capital (private equity investment, 2005-present). Mr. Stavropoulos is a special advisor to Clayton, Dubilier & Rice, LLC (private equity investment). In addition, Mr. Stavropoulos is a member of the University of Notre Dame Advisory Council for the College of Science. |
David M. Thomas (62) |
| Year of Election or Appointment: 2008 Previously, Mr. Thomas served as Executive Chairman (2005-2006) and Chairman and Chief Executive Officer (2000-2005) of IMS Health, Inc. (pharmaceutical and healthcare information solutions). In addition, Mr. Thomas serves as a member of the Board of Directors of Fortune Brands, Inc. (consumer products), and Interpublic Group of Companies, Inc. (marketing communication, 2004-present). |
Michael E. Wiley (60) |
| Year of Election or Appointment: 2008 Mr. Wiley also serves as a Director of Asia Pacific Exploration Consolidated (international oil and gas exploration and production, 2008-present). Mr. Wiley serves as a Director of Tesoro Corporation (independent oil refiner and marketer, 2005-present), and a Director of Bill Barrett Corporation (exploration and production, 2005-present). In addition, Mr. Wiley also serves as a Director of Post Oak Bank (privately-held bank, 2004-present). Previously, Mr. Wiley served as a member of the Board of Trustees of the University of Tulsa (2000-2006; 2007-2010), as a Senior Energy Advisor of Katzenbach Partners, LLC (consulting, 2006-2007), as an Advisory Director of Riverstone Holdings (private investment), Chairman, President, and CEO of Baker Hughes, Inc. (oilfield services, 2000-2004), and as Director of Spinnaker Exploration Company (exploration and production, 2001-2005). |
Annual Report
+ The information above includes each Trustee's principal occupation during the last five years and other information relating to the experience, attributes, and skills relevant to each Trustee's qualifications to serve as a Trustee, which led to the conclusion that each Trustee should serve as a Trustee for the fund.
Advisory Board Members and Executive Officers:
Correspondence intended for each executive officer, Mr. Edward C. Johnson 3d, and Mr. Peter S. Lynch may be sent to Fidelity Investments, 82 Devonshire Street, Boston, Massachusetts 02109.
Name, Age; Principal Occupation |
Edward C. Johnson 3d (81) |
| Year of Election or Appointment: 2011 Member of the Advisory Board of Fidelity's Equity and High Income Funds. Mr. Johnson serves as Chief Executive Officer, Chairman, and a Director of FMR LLC, and also serves as Chairman and Director of FIL Limited. Previously, Mr. Johnson served as a Trustee and Chairman of the Board of certain Fidelity Trusts, Chairman and a Director of FMR, Chairman and a Director of FMR Co., Inc., and President of FMR LLC (2006-2007). |
Peter S. Lynch (67) |
| Year of Election or Appointment: 2003 Member of the Advisory Board of Fidelity's Equity and High Income Funds. Mr. Lynch is Vice Chairman and a Director of FMR and FMR Co., Inc. In addition, Mr. Lynch serves as a Trustee of Boston College and as the Chairman of the Inner-City Scholarship Fund. Previously, Mr. Lynch served on the Special Olympics International Board of Directors (1997-2006). |
Kenneth B. Robins (42) |
| Year of Election or Appointment: 2008 President and Treasurer of Fidelity's Equity and High Income Funds. Mr. Robins also serves as President and Treasurer (2010-present) and Assistant Treasurer (2009-present) of other Fidelity funds and is an employee of Fidelity Investments (2004-present). Previously, Mr. Robins served as Deputy Treasurer of the Fidelity funds (2005-2008) and Treasurer and Chief Financial Officer of The North Carolina Capital Management Trust: Cash and Term Portfolios (2006-2008). |
Bruce T. Herring (46) |
| Year of Election or Appointment: 2006 Vice President of certain Equity Funds. Mr. Herring also serves as Chief Investment Officer and Director of Fidelity Management & Research (U.K.) Inc. (2010-present) and Group Chief Investments Officer of FMR. Previously, Mr. Herring served as Vice President (2005-2006) and Senior Vice President (2006-2007) of Fidelity Management & Research Company, Vice President of FMR Co., Inc. (2001-2007) and as a portfolio manager for Fidelity U.S. Equity Funds. |
Brian B. Hogan (46) |
| Year of Election or Appointment: 2009 Vice President of Equity and High Income Funds. Mr. Hogan also serves as President of FMR's Equity Division (2009-present). Previously, Mr. Hogan served as Senior Vice President, Equity Research of FMR (2006-2009) and as a portfolio manager. |
Scott C. Goebel (43) |
| Year of Election or Appointment: 2008 Secretary and Chief Legal Officer (CLO) of the Fidelity funds. Mr. Goebel also serves as Secretary of Fidelity Investments Money Management, Inc. (FIMM) (2010-present) and Fidelity Research and Analysis Company (FRAC) (2010-present); Secretary and CLO of The North Carolina Capital Management Trust: Cash and Term Portfolios (2008-present); General Counsel, Secretary, and Senior Vice President of FMR (2008-present) and FMR Co., Inc. (2008-present); employed by FMR LLC or an affiliate (2001-present); Chief Legal Officer of Fidelity Management & Research (Hong Kong) Limited (2008-present) and Assistant Secretary of Fidelity Management & Research (Japan) Inc. (2008-present), and Fidelity Management & Research (U.K.) Inc. (2008-present). Previously, Mr. Goebel served as Assistant Secretary of FIMM (2008-2010), FRAC (2008-2010), and the Funds (2007-2008) and as Vice President and Secretary of Fidelity Distributors Corporation (FDC) (2005-2007). |
William C. Coffey (42) |
| Year of Election or Appointment: 2009 Assistant Secretary of Fidelity's Equity and High Income Funds. Mr. Coffey also serves as Senior Vice President and Deputy General Counsel of FMR LLC (2010-present), and is an employee of Fidelity Investments. Previously, Mr. Coffey served as Vice President and Associate General Counsel of FMR LLC (2005-2009). |
Holly C. Laurent (57) |
| Year of Election or Appointment: 2008 Anti-Money Laundering (AML) Officer of the Fidelity funds. Ms. Laurent also serves as AML Officer of The North Carolina Capital Management Trust: Cash and Term Portfolios (2008-present) and is an employee of Fidelity Investments. Previously, Ms. Laurent was Senior Vice President and Head of Legal for Fidelity Business Services India Pvt. Ltd. (2006-2008), and Senior Vice President, Deputy General Counsel and Group Head for FMR LLC (2005-2006). |
Christine Reynolds (52) |
| Year of Election or Appointment: 2008 Chief Financial Officer of the Fidelity funds. Ms. Reynolds became President of Fidelity Pricing and Cash Management Services (FPCMS) in August 2008. Ms. Reynolds served as Chief Operating Officer of FPCMS (2007-2008). Previously, Ms. Reynolds served as President, Treasurer, and Anti-Money Laundering officer of the Fidelity funds (2004-2007). |
Kenneth A. Rathgeber (64) |
| Year of Election or Appointment: 2004 Chief Compliance Officer of Fidelity's Equity and High Income Funds. Mr. Rathgeber is Chief Compliance Officer of Fidelity Management & Research (Hong Kong) Limited (2008-present), Fidelity Management & Research (Japan) Inc. (2008-present), FMR (2005-present), FMR Co., Inc. (2005-present), Fidelity Management & Research (U.K.) Inc. (2005-present), Fidelity Research & Analysis Company (2005-present), Fidelity Investments Money Management, Inc. (2005-present), Pyramis Global Advisors, LLC (2005-present), and Strategic Advisers, Inc. (2005-present). |
Jeffrey S. Christian (49) |
| Year of Election or Appointment: 2009 Deputy Treasurer of the Fidelity funds. Mr. Christian is an employee of Fidelity Investments. Previously, Mr. Christian served as Chief Financial Officer (2008-2009) of certain Fidelity funds and Senior Vice President of Fidelity Pricing and Cash Management Services (FPCMS) (2004-2009). |
Bryan A. Mehrmann (50) |
| Year of Election or Appointment: 2005 Deputy Treasurer of the Fidelity funds. Mr. Mehrmann is an employee of Fidelity Investments. |
Adrien E. Deberghes (44) |
| Year of Election or Appointment: 2008 Deputy Treasurer of Fidelity's Equity and High Income Funds. Mr. Deberghes also serves as Vice President and Assistant Treasurer of Fidelity Rutland Square Trust II and Fidelity Commonwealth Trust II (2011-present), Assistant Treasurer of other Fidelity funds (2010-present), and is an employee of Fidelity Investments (2008-present). Previously, Mr. Deberghes served as Senior Vice President of Mutual Fund Administration at State Street Corporation (2007-2008), Senior Director of Mutual Fund Administration at Investors Bank & Trust (2005-2007), and Director of Finance for Dunkin' Brands (2000-2005). |
Stephanie J. Dorsey (42) |
| Year of Election or Appointment: 2010 Assistant Treasurer of Fidelity's Equity and High Income Funds. Ms. Dorsey also serves as Deputy Treasurer of other Fidelity funds (2008-present) and is an employee of Fidelity Investments (2008-present). Previously, Ms. Dorsey served as Treasurer (2004-2008) of the JPMorgan Mutual Funds and Vice President (2004-2008) of JPMorgan Chase Bank. |
John R. Hebble (53) |
| Year of Election or Appointment: 2009 Assistant Treasurer of Fidelity's Equity and High Income Funds. Mr. Hebble also serves as President (2011-present), Treasurer, and Chief Financial Officer of The North Carolina Capital Management Trust: Cash and Term Portfolios (2008-present), President and Treasurer of other Fidelity funds (2008-present) and is an employee of Fidelity Investments. |
Gary W. Ryan (53) |
| Year of Election or Appointment: 2005 Assistant Treasurer of the Fidelity funds. Mr. Ryan is an employee of Fidelity Investments. Previously, Mr. Ryan served as Vice President of Fund Reporting in Fidelity Pricing and Cash Management Services (FPCMS) (1999-2005). |
Jonathan Davis (43) |
| Year of Election or Appointment: 2010 Assistant Treasurer of the Fidelity funds. Mr. Davis is also Assistant Treasurer of Fidelity Rutland Square Trust II and Fidelity Commonwealth Trust II. Mr. Davis is an employee of Fidelity Investments. Previously, Mr. Davis served as Vice President and Associate General Counsel of FMR LLC (2003-2010). |
Annual Report
A total of 7.78% of the dividends distributed during the fiscal year was derived from interest on U.S. Government securities which is generally exempt from state income tax.
Class K designates $178,322,424 of distributions paid during the period January 1, 2011 to August 31, 2011 as qualifying to be taxed as interest-related dividends for nonresident alien shareholders.
Class K designates 10%, 39%, 41%, 47% and 48% of the dividends distributed in October 2010, December 17, 2010, December 30, 2010, April 2011 and July 2011, respectively during the fiscal year as qualifying for the dividends-received deduction for corporate shareholders.
Class K designates 14%, 51%, 54%, 62% and 64% of the dividends distributed in October 2010, December 17, 2010, December 30, 2010, April 2011 and July 2011, respectively during the fiscal year as amounts which may be taken into account as a dividend for the purposes of the maximum rate under section 1(h)(11) of the Internal Revenue Code.
The fund will notify shareholders in January 2012 of amounts for use in preparing 2011 income tax returns.
Annual Report
Board Approval of Investment Advisory Contracts and Management Fees
Fidelity Balanced Fund
Each year, the Board of Trustees, including the Independent Trustees (together, the Board), votes on the renewal of the management contract and sub-advisory agreements (together, the Advisory Contracts) for the fund. The Board, assisted by the advice of fund counsel and Independent Trustees' counsel, requests and considers a broad range of information relevant to the renewal of the Advisory Contracts throughout the year.
The Board meets regularly and considers at each of its meetings factors that are relevant to its annual consideration of the renewal of the fund's Advisory Contracts, including the services and support provided to the fund and its shareholders. The Board has established various standing committees, each composed of Independent Trustees with varying backgrounds, to which the Board has assigned specific subject matter responsibilities in order to enhance effective decision-making by the Board. The Board, acting directly and through its Committees, requests and receives information concerning the annual consideration of the renewal of the fund's Advisory Contracts. The Board also meets as needed to consider matters specifically related to the Board's annual consideration of the renewal of Advisory Contracts. Members of the Board may also meet with trustees of other Fidelity funds through ad hoc joint committees to discuss certain matters relevant to the Fidelity funds.
At its July 2011 meeting, the Board of Trustees, including the Independent Trustees, unanimously determined to renew the fund's Advisory Contracts. In reaching its determination, the Board considered all factors it believed relevant, including (i) the nature, extent, and quality of the services to be provided to the fund and its shareholders (including the investment performance of the fund); (ii) the competitiveness of the fund's management fee and total expense ratio; (iii) the total costs of the services to be provided by and the profits to be realized by Fidelity from its relationship with the fund; (iv) the extent to which economies of scale would be realized as the fund grows; and (v) whether fee levels reflect these economies of scale, if any, for the benefit of fund shareholders.
In considering whether to renew the Advisory Contracts for the fund, the Board reached a determination, with the assistance of fund counsel and Independent Trustees' counsel and through the exercise of its business judgment, that the renewal of the Advisory Contracts is in the best interests of the fund and its shareholders and that the compensation payable under the Advisory Contracts is fair and reasonable. The Board's decision to renew the Advisory Contracts was not based on any single factor, but rather was based on a comprehensive consideration of all the information provided to the Board at its meetings throughout the year. The Board, in reaching its determination to renew the Advisory Contracts, is aware that shareholders in the fund have a broad range of investment choices available to them, including a wide choice among mutual funds offered by Fidelity's competitors, and that the fund's shareholders, who have the opportunity to review and weigh the disclosure provided by the fund in its prospectus and other public disclosures, have chosen to invest in this fund, managed by Fidelity.
Annual Report
Nature, Extent, and Quality of Services Provided. The Board considered the staffing within the investment adviser, FMR, and the sub-advisers (together, the Investment Advisers), including the backgrounds of the fund's investment personnel and the fund's investment objective and discipline. The Independent Trustees also had discussions with senior management of Fidelity's investment operations and investment groups. The Board considered the structure of the portfolio manager compensation program and whether this structure provides appropriate incentives to act in the best interests of the fund.
Resources Dedicated to Investment Management and Support Services. The Board and the Fund Oversight and Research Committees reviewed the general qualifications and capabilities of the Investment Advisers' investment staff, including its size, education, experience, and resources, as well as the Investment Advisers' approach to recruiting, training, managing, and compensating investment personnel. The Board also noted that FMR has devoted increased resources to non-U.S. offices. The Board noted that Fidelity's analysts have extensive resources, tools and capabilities which allow them to conduct sophisticated quantitative and fundamental analysis, as well as credit analysis of issuers, counterparties and enhancers. The Board also believes that Fidelity's investment professionals have sufficient access to global information and data so as to provide competitive investment results over time, and that those professionals also have access to sophisticated tools which permit them to assess portfolio construction and risk and performance attribution characteristics continuously, as well as to transmit new information and research conclusions rapidly around the world. Additionally, in their deliberations, the Board considered the Investment Advisers' trading capabilities and resources which are an integral part of the investment management process.
Shareholder and Administrative Services. The Board considered (i) the nature, extent, quality, and cost of advisory, administrative, and shareholder services performed by the Investment Advisers and their affiliates under the Advisory Contracts and under separate agreements covering transfer agency, pricing and bookkeeping, and securities lending services for the fund; (ii) the nature and extent of the investment adviser's supervision of third party service providers, principally custodians and subcustodians; and (iii) the resources devoted to, and the record of compliance with, the fund's compliance policies and procedures. The Board also reviewed the allocation of fund brokerage, including allocations to brokers affiliated with the Investment Advisers, the use of brokerage commissions to pay fund expenses, and the use of "soft" commission dollars to pay for research services.
The Board noted that the growth of fund assets over time across the complex allows Fidelity to reinvest in the development of services designed to enhance the value or convenience of the Fidelity funds as investment vehicles. These services include 24-hour access to account information and market information through telephone representatives and over the Internet, investor education materials and asset allocation tools, and the expanded availability of Fidelity Investor Centers, with 35 new branches opening since 2010.
Annual Report
Board Approval of Investment Advisory Contracts and
Management Fees - continued
Investment in a Large Fund Family. The Board considered the benefits to shareholders of investing in a Fidelity fund, including the benefits of investing in a fund that is part of a large family of funds offering a variety of investment disciplines and providing a large variety of mutual fund investor services. The Board noted that Fidelity had taken, or had made recommendations that resulted in the Fidelity funds taking, a number of actions over the previous year that benefited particular funds, including (i) continuing to dedicate additional resources to investment research and support of the senior management team that oversees asset management; (ii) rationalizing product lines through the mergers of six funds into other funds; (iii) continuing to migrate the Freedom Funds to dedicated lower cost underlying funds; (iv) obtaining shareholder approval to broaden the investment strategies for Fidelity Consumer Finance Portfolio, Fidelity Emerging Asia Fund, and Fidelity Environment and Alternative Energy Portfolio; (v) contractually agreeing to reduce the management fees and impose other expense limitations on Spartan 500 Index Fund and U.S. Bond Index Fund in connection with launching new institutional classes of these funds; (vi) changing the name, primary and supplemental benchmarks, and investment policies of Fidelity Global Strategies Fund to support the fund's flexible investment mandate and global orientation; and (vii) reducing the transfer agency account fee rates on certain accounts.
Investment Performance. The Board considered whether the fund has operated in accordance with its investment objective, as well as its record of compliance with its investment restrictions. It also reviewed the fund's absolute investment performance for each class, as well as the fund's relative investment performance for each class measured over multiple periods against (i) a proprietary custom index, and (ii) a peer group of mutual funds deemed appropriate by Fidelity and reviewed by the Board. The following charts considered by the Board show, over the one-, three-, and five-year periods ended December 31, 2010, as available, the cumulative total returns of Class K and the retail class of the fund, the cumulative total returns of a proprietary custom index ("benchmark"), and a range of cumulative total returns of a peer group of mutual funds identified by Lipper Inc. as having an investment objective similar to that of the fund. The box within each chart shows the 25th percentile return (bottom of box) and the 75th percentile return (top of box) of the peer group. Returns shown above the box are in the first quartile and returns shown below the box are in the fourth quartile. The percentage beaten numbers noted below each chart correspond to the percentile box and represent the percentage of funds in the peer group whose performance was equal to or lower than that of the class indicated. The fund's proprietary custom index is an index developed by FMR that represents the performance of the fund's general investment categories in both equity and bond securities.
Annual Report
Fidelity Balanced Fund
The Board reviewed the fund's relative investment performance against its peer group and noted that the performance of the retail class of the fund (the class with the longer performance record) was in the first quartile for the one-year period, the third quartile for the three-year period, and the second quartile for the five-year period. The Board also noted that the investment performance of the fund was lower than its benchmark for the three- and five-year periods, although the one-year total return of the retail class compared favorably to its benchmark. The Board considered that the variations in performance between the fund's classes reflect the variations in class expenses, which result in lower performance for the higher expense class. The Board also reviewed the fund's performance since inception as well as performance in the current year.
Based on its review, the Board concluded that the nature, extent, and quality of services provided to the fund under the Advisory Contracts should benefit the fund's shareholders.
Competitiveness of Management Fee and Total Expense Ratio. The Board considered the fund's management fee and total expense ratio compared to "mapped groups" of competitive funds and classes. Fidelity creates "mapped groups" by combining similar Lipper investment objective categories that have comparable management fee characteristics. Combining Lipper investment objective categories aids the Board's management fee and total expense ratio comparisons by broadening the competitive group used for comparison and by reducing the number of universes to which various Fidelity funds are compared.
Annual Report
Board Approval of Investment Advisory Contracts and
Management Fees - continued
Management Fee. The Board considered two proprietary management fee comparisons for the 12-month periods shown in the chart below. The group of Lipper funds used by the Board for management fee comparisons is referred to below as the "Total Mapped Group." The Total Mapped Group is broader than the Lipper peer group used by the Board for performance comparisons because the Total Mapped Group combines several Lipper investment objective categories while the Lipper peer group does not. The Total Mapped Group comparison focuses on a fund's standing relative to the total universe of comparable funds available to investors in terms of gross management fees before expense reimbursements or caps. "TMG %" represents the percentage of funds in the Total Mapped Group that had management fees that were lower than the fund's. For example, a TMG % of 10% means that 90% of the funds in the Total Mapped Group had higher management fees than the fund. The "Asset-Size Peer Group" (ASPG) comparison focuses on a fund's standing relative to non-Fidelity funds similar in size to the fund within the Total Mapped Group. The ASPG represents at least 15% of the funds in the Total Mapped Group with comparable asset size and management fee characteristics, subject to a minimum of 50 funds (or all funds in the Total Mapped Group if fewer than 50). Additional information, such as the ASPG quartile in which the fund's management fee ranked, is also included in the chart and considered by the Board.
Fidelity Balanced Fund
The Board noted that the fund's management fee ranked below the median of its Total Mapped Group and below the median of its ASPG for 2010.
Annual Report
Based on its review, the Board concluded that the fund's management fee is fair and reasonable in light of the services that the fund receives and the other factors considered.
Total Expense Ratio. In its review of each class's total expense ratio, the Board considered the fund's management fee as well as other fund or class expenses, as applicable, such as transfer agent fees, pricing and bookkeeping fees, and custodial, legal, and audit fees. The Board also noted the effects of any waivers and reimbursements on fees and expenses. As part of its review, the Board also considered the current and historical total expense ratios of each class of the fund compared to competitive fund median expenses. Each class of the fund is compared to those funds and classes in the Total Mapped Group (used by the Board for management fee comparisons) that have a similar sales load structure.
The Board noted that the total expense ratio of each class ranked below its competitive median for 2010. The Board considered that various factors, including 12b-1 fees, positive or negative performance adjustments, and relatively higher other expenses in the case of small fund size, can affect total expense ratios.
Fees Charged to Other Fidelity Clients. The Board also considered Fidelity fee structures and other information with respect to clients of FMR and its affiliates, such as other mutual funds advised or subadvised by FMR or its affiliates, pension plan clients, and other institutional clients. In March 2010, the Board created an ad hoc joint committee with the board of other Fidelity funds (the Committee) to review and compare Fidelity's institutional investment advisory business with its business of providing services to the Fidelity funds, including the differences in services provided, fees charged, and costs incurred, as well as competition in their respective marketplaces.
Based on its review of total expense ratios and fees charged to other Fidelity clients, the Board concluded that the total expense ratio of each class of the fund was reasonable in light of the services that the fund and its shareholders receive and the other factors considered, including the findings of the Committee.
Costs of the Services and Profitability. The Board considered the revenues earned and the expenses incurred by Fidelity in conducting the business of developing, marketing, distributing, managing, administering and servicing the fund and its shareholders. The Board also considered the level of Fidelity's profits in respect of all the Fidelity funds.
On an annual basis, FMR presents to the Board Fidelity's profitability for the fund. Fidelity calculates the profitability for each fund, as well as aggregate profitability for groups of Fidelity funds and all Fidelity funds, using a series of detailed revenue and cost allocation methodologies which originate with the books and records of Fidelity on which Fidelity's audited financial statements are based. The Audit Committee of the Board reviews any significant changes from the prior year's methodologies.
Annual Report
Board Approval of Investment Advisory Contracts and
Management Fees - continued
PricewaterhouseCoopers LLP (PwC), independent registered public accounting firm and auditor to Fidelity and certain Fidelity funds, has been engaged annually by the Board as part of the Board's assessment of Fidelity's profitability analysis. PwC's engagement includes the review and assessment of Fidelity's methodologies used in determining the revenues and expenses attributable to Fidelity's mutual fund business, and completion of agreed-upon procedures surrounding the mathematical accuracy of fund profitability and its conformity to allocation methodologies. After considering PwC's reports issued under the engagement and information provided by Fidelity, the Board concluded that while other allocation methods may also be reasonable, Fidelity's profitability methodologies are reasonable in all material respects.
The Board also reviewed Fidelity's non-fund businesses and fall-out benefits related to the mutual fund business as well as cases where Fidelity's affiliates may benefit from or be related to the fund's business.
The Board considered the costs of the services provided by and the profits realized by Fidelity in connection with the operation of the fund and was satisfied that the profitability was not excessive in the circumstances.
Economies of Scale. The Board considered whether there have been economies of scale in respect of the management of the Fidelity funds, whether the Fidelity funds (including the fund) have appropriately benefited from any such economies of scale, and whether there is potential for realization of any further economies of scale. The Board considered the extent to which the fund will benefit from economies of scale through increased services to the fund, through waivers or reimbursements, or through fee or expense reductions. The Board also noted that in 2009, it and the board of other Fidelity funds created an ad hoc committee (the Economies of Scale Committee) to analyze whether FMR attains economies of scale in respect of the management and servicing of the Fidelity funds, whether the Fidelity funds have appropriately benefited from such economies of scale, and whether there is potential for realization of any further economies of scale.
The Board recognized that the fund's management contract incorporates a "group fee" structure, which provides for lower group fee rates as total fund assets under FMR's management increase, and for higher group fee rates as total fund assets under FMR's management decrease. FMR calculates the group fee rates based on a tiered asset "breakpoint" schedule that varies based on asset class. The Board considered that the group fee is designed to deliver the benefits of economies of scale to fund shareholders when total Fidelity fund assets increase, even if assets of any particular fund are unchanged or have declined, because some portion of Fidelity's costs are attributable to services provided to all Fidelity funds, and all funds benefit if those costs can be allocated among more assets. The Board concluded that, given the group fee structure, fund shareholders will benefit from lower management fees as assets under FMR's management increase at the fund complex level, regardless of whether Fidelity achieves any such economies of scale.
Annual Report
The Board concluded, taking into account the analysis of the Economies of Scale Committee, that any potential economies of scale are being appropriately shared between fund shareholders and Fidelity.
Additional Information Requested by the Board. In order to develop fully the factual basis for consideration of the Fidelity funds' Advisory Contracts, the Board requested and received additional information on certain topics, including (i) fund performance trends, actions to be taken by FMR to improve certain funds' overall performance, and Fidelity's long-term strategies for certain funds; (ii) portfolio manager changes that have occurred during the past year and length of portfolio manager tenure for different categories of funds over time; (iii) Fidelity's compensation structure for portfolio managers and other key personnel and strategies for attracting and retaining non-investment personnel; (iv) the amount of the investment that each portfolio manager has made in the Fidelity fund(s) that he or she manages; (v) historical trends in Fidelity's realization of fall-out benefits; (vi) Fidelity's group fee structures and the rationale for the individual fee rates of certain funds; (vii) fund profitability methodology and the impact of certain factors on fund profitability results; (viii) trends regarding industry use of performance fee structures and Fidelity's compliance practices with respect to performance adjustment calculations; (ix) the fee structures in place for certain other Fidelity clients; and (x) explanations regarding the relative total expense ratios of certain funds and classes, total expense competitive trends, and actions that might be taken by FMR to reduce total expense ratios for certain funds and classes.
Based on its evaluation of all of the conclusions noted above, and after considering all factors it believed relevant, the Board ultimately concluded that the advisory fee structures are fair and reasonable, and that the fund's Advisory Contracts should be renewed.
Annual Report
Managing Your Investments
Fidelity offers several ways to conveniently manage your workplace benefits (including your workplace savings plan, investments, and additional services) via your telephone or PC. You can access your plan and account information and research your investments 24 hours a day.
By Phone
Fidelity provides a single toll-free number to access plan information, account balances, positions, and quotes*. It's easy to navigate the service, and on your first call, the system will help you create a personal identification number (PIN) for security.
(phone_graphic)
Fidelity Workplace
Investing
1-800-835-5092
By PC
Fidelity's web site on the Internet provides a wide range of information, including plan information, daily financial news, fund performance, interactive planning tools, and news about Fidelity products and services.
(computer_graphic)
Fidelity's Web Site
www.401k.com
* When you call the quotes line, please remember that a fund's yield and return will vary and, except for money market funds, share price will also vary. This means that you may have a gain or loss when you sell your shares. There is no assurance that money market funds will be able to maintain a stable $1 share price; an investment in a money market fund is not insured or guaranteed by the U.S. government. Total returns are historical and include changes in share price, reinvestment of dividends and capital gains distributions, and the effects of any sales charges.
Annual Report
To Write Fidelity
We'll give your correspondence immediate attention and send you written confirmation upon completion of your request.
(letter_graphic)
For Non-Retirement
Accounts
Buying shares
Fidelity Investments
P.O. Box 770001
Cincinnati, OH 45277-0003
Overnight Express
Fidelity Investments
Attn: Distribution Services
100 Crosby Parkway - KC1H
Covington, KY 41015
Selling shares
Fidelity Investments
P.O. Box 770001
Cincinnati, OH 45277-0035
Overnight Express
Fidelity Investments
Attn: Distribution Services
100 Crosby Parkway - KC1H
Covington, KY 41015
General Correspondence
Fidelity Investments
P.O. Box 500
Merrimack, NH 03054-0500
(letter_graphic)
For Retirement
Accounts
Buying shares
Fidelity Investments
P.O. Box 770001
Cincinnati, OH 45277-0003
Selling shares
Fidelity Investments
P.O. Box 770001
Cincinnati, OH 45277-0035
Overnight Express
Fidelity Investments
Attn: Distribution Services
100 Crosby Parkway - KC1H
Covington, KY 41015
General Correspondence
Fidelity Investments
P.O. Box 500
Merrimack, NH 03054-0500
Annual Report
Investment Adviser
Fidelity Management & Research Company
Boston, MA
Investment Sub-Advisers
FMR Co., Inc.
Fidelity Investments
Money Management, Inc.
Fidelity Management & Research
(U.K.) Inc.
Fidelity Management & Research
(Hong Kong) Limited
Fidelity Management & Research
(Japan) Inc.
General Distributor
Fidelity Distributors Corporation
Boston, MA
Transfer and Service Agents
Fidelity Investments Institutional Operations Company, Inc.
Boston, MA
Fidelity Service Company, Inc.
Boston, MA
Custodian
Citibank, N.A.
New York, NY
BAL-K-UANN-1011
1.863050.102
Fidelity®
Puritan®
Fund
Annual Report
August 31, 2011
(2_fidelity_logos) (Registered_Trademark)
Contents
Chairman's Message | <Click Here> | The Chairman's message to shareholders. |
Performance | <Click Here> | How the fund has done over time. |
Management's Discussion of Fund Performance | <Click Here> | The Portfolio Manager's review of fund
performance and strategy. |
Shareholder Expense Example | <Click Here> | An example of shareholder expenses. |
Investment Changes | <Click Here> | A summary of major shifts in the fund's investments over the past six months. |
Investments | <Click Here> | A complete list of the fund's investments with their market values. |
Financial Statements | <Click Here> | Statements of assets and liabilities, operations, and changes in net assets,
as well as financial highlights. |
Notes | <Click Here> | Notes to the financial statements. |
Report of Independent Registered Public Accounting Firm | <Click Here> | |
Trustees and Officers | <Click Here> | |
Distributions | <Click Here> | |
Board Approval of Investment Advisory Contracts and Management Fees | <Click Here> | |
To view a fund's proxy voting guidelines and proxy voting record for the 12-month period ended June 30, visit http://www.fidelity.com/proxyvotingresults or visit the Securities and Exchange Commission's (SEC) web site at http://www.sec.gov. You may also call 1-800-544-8544 to request a free copy of the proxy voting guidelines.
Standard & Poor's, S&P and S&P 500 are registered service marks of The McGraw-Hill Companies, Inc. and have been licensed for use by Fidelity Distributors Corporation.
Other third party marks appearing herein are the property of their respective owners.
All other marks appearing herein are registered or unregistered trademarks or service marks of FMR LLC or an affiliated company.
Annual Report
This report and the financial statements contained herein are submitted for the general information of the shareholders of the fund. This report is not authorized for distribution to prospective investors in the fund unless preceded or accompanied by an effective prospectus.
A fund files its complete schedule of portfolio holdings with the SEC for the first and third quarters of each fiscal year on Form N-Q. Forms N-Q are available on the SEC's web site at http://www.sec.gov. A fund's Forms N-Q may be reviewed and copied at the SEC's Public Reference Room in Washington, DC. Information regarding the operation of the SEC's Public Reference Room may be obtained by calling 1-800-SEC-0330. For a complete list of a fund's portfolio holdings, view the most recent holdings listing, semiannual report, or annual report on Fidelity's web site at http://www.fidelity.com, http://www.advisor.fidelity.com, or http://www.401k.com, as applicable.
NOT FDIC INSURED • MAY LOSE VALUE • NO BANK GUARANTEE
Neither the fund nor Fidelity Distributors Corporation is a bank.
Annual Report
(photo_of_James_C_Curvey)
Dear Shareholder:
U.S. equities remained in a significant midyear downturn that began in May and intensified in the final week of July and the early part of August, when Standard & Poor's announced it was lowering its long-term sovereign credit rating of the United States. The historic downgrade followed a political stalemate in which Congress struggled to address the debt ceiling issue before an early-August deadline, resulting in heightened investor anxiety and volatility across major financial markets. Financial markets are always unpredictable, of course, but there are several time-tested investment principles that can help put the odds in your favor.
One of the basic tenets is to invest for the long term. Over time, riding out the markets' inevitable ups and downs has proven much more effective than selling into panic or chasing the hottest trend. Even missing only a few of the markets' best days can significantly diminish investor returns. Patience also affords the benefits of compounding - of earning interest on additional income or reinvested dividends and capital gains. There can be tax advantages and cost benefits to consider as well. While staying the course doesn't eliminate risk, it can considerably lessen the effect of short-term declines.
You can further manage your investing risk through diversification. And today, more than ever, geographic diversification should be taken into account. Studies indicate that asset allocation is the single most important determinant of a portfolio's long-term success. The right mix of stocks, bonds and cash - aligned to your particular risk tolerance and investment objective - is very important. Age-appropriate rebalancing is also an essential aspect of asset allocation. For younger investors, an emphasis on equities - which historically have been the best-performing asset class over time - is encouraged. As investors near their specific goal, such as retirement or sending a child to college, consideration may be given to replacing volatile assets (e.g. common stocks) with more-stable fixed investments (bonds or savings plans).
A third principle - investing regularly - can help lower the average cost of your purchases. Investing a certain amount of money each month or quarter helps ensure you won't pay for all your shares at market highs. This strategy - known as dollar cost averaging - also reduces "emotion" from investing, helping shareholders avoid selling weak performers just prior to an upswing, or chasing a hot performer just before a correction.
We invite you to contact us via the Internet, through our Investor Centers or by phone. It is our privilege to provide you the information you need to make the investments that are right for you.
Sincerely,
(The acting chairman's signature appears here.)
James C. Curvey
Acting Chairman
Annual Report
Average annual total return reflects the change in the value of an investment, assuming reinvestment of the class' distributions from dividend income and capital gains (the profits earned upon the sale of securities that have grown in value, if any) and assuming a constant rate of performance each year. The $10,000 table and the fund's returns do not reflect the deduction of taxes that a shareholder would pay on fund distributions or the redemption of fund shares. During periods of reimbursement by Fidelity, a fund's total return will be greater than it would be had the reimbursement not occurred. How a fund did yesterday is no guarantee of how it will do tomorrow.
Average Annual Total Returns
Periods ended August 31, 2011 | Past 1
year | Past 5
years | Past 10
years |
Fidelity® Puritan® Fund | 14.38% | 3.14% | 4.91% |
$10,000 Over 10 Years
Let's say hypothetically that $10,000 was invested in Fidelity® Puritan® Fund, a class of the fund, on August 31, 2001. The chart shows how the value of your investment would have changed, and also shows how the S&P 500® Index performed over the same period.
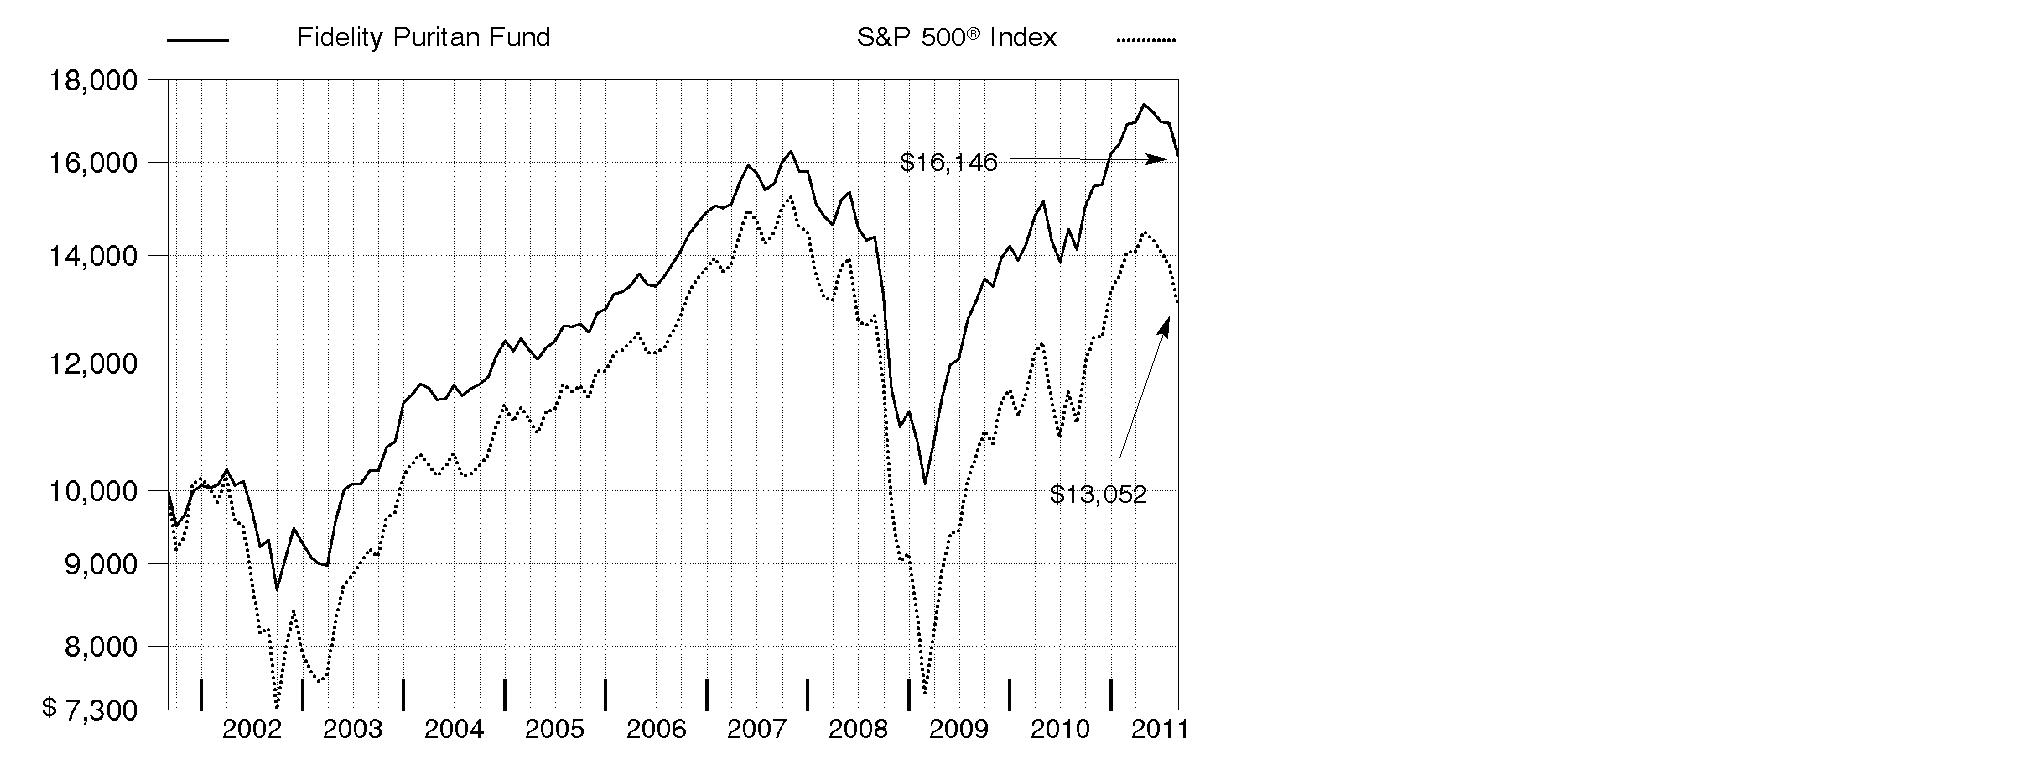
Annual Report
Market Recap: U.S. stocks registered solid double-digit gains for the year ending August 31, 2011, despite finishing in a four-month downturn that intensified in the two weeks preceding the August 5 news that Standard & Poor's had lowered its long-term sovereign credit rating of the United States. The downgrade followed a stalemate in which Congress struggled to address the debt ceiling, heightening investor anxiety. For the year, the large-cap laden S&P 500® Index gained 18.50% and the blue-chip Dow Jones Industrial AverageSM advanced 19.03%. The technology-heavy Nasdaq Composite® Index fared even better, climbing 23.19%. Small and mid-sized stocks beat their larger-cap counterparts, as the Russell 2000® and Russell Midcap® indexes added 22.19% and 21.28%, respectively. Solid returns for equities brought about more-tempered gains for fixed-income markets. The Barclays Capital® U.S. Aggregate Bond Index - a proxy for investment-grade debt - rose 4.62%. Higher-risk bond categories fared best, with The BofA Merrill LynchSM US High Yield Constrained Index gaining 8.15%. Bonds backed by the U.S. government were among the weakest performers, with the Barclays Capital® U.S. Treasury Bond Index adding 4.17%, while short-term assets fared the worst, as gauged by the 0.16% increase in the Barclays Capital U.S. 3 Month Treasury Bellwether Index.
Comments from Ramin Arani, Lead Portfolio Manager of Fidelity® Puritan® Fund. For the year, the fund's Retail Class shares returned 14.38%, outperforming the 13.05% gain of the Fidelity Puritan Composite Index. The fund was helped the most by strong security selection in the equity and investment-grade bond subportfolios. The fund's foreign holdings added value overall, aided by a weaker U.S. dollar. In terms of asset allocation, overweighting equities and underweighting investment-grade bonds provided a boost, as did an out-of-index stake in high-yield bonds. Looking at individual stocks, Green Mountain Coffee Roasters soared in March on news that it was teaming up with Starbucks to make Starbucks coffee and Tazo teas available for use in single-serving brewers. Owning a scant stake in index constituent Bank of America, which I sold in July, was the right call, as the stock fell sharply due to concern about capital requirements. Strength in sales of luxury goods and strong merchandising and operating improvement boosted the stock of Polo Ralph Lauren (renamed Ralph Lauren). Turning to detractors, the fund was hurt by a larger-than-index stake in Citigroup, which was held back by continued low interest rates and tepid loan demand. The fund did not own index component IBM, which detracted when the stock turned in a strong gain.
The views expressed above reflect those of the portfolio manager(s) only through the end of the period as stated on the cover of this report and do not necessarily represent the views of Fidelity or any other person in the Fidelity organization. Any such views are subject to change at any time based upon market or other conditions and Fidelity disclaims any responsibility to update such views. These views may not be relied on as investment advice and, because investment decisions for a Fidelity fund are based on numerous factors, may not be relied on as an indication of trading intent on behalf of any Fidelity fund.
Annual Report
Shareholder Expense Example
As a shareholder of the Fund, you incur two types of costs: (1) transaction costs, and (2) ongoing costs, including management fees and other Fund expenses. This Example is intended to help you understand your ongoing costs (in dollars) of investing in the Fund and to compare these costs with the ongoing costs of investing in other mutual funds.
The Example is based on an investment of $1,000 invested at the beginning of the period and held for the entire period (March 1, 2011 to August 31, 2011).
Actual Expenses
The first line of the accompanying table for each class of the Fund provides information about actual account values and actual expenses. You may use the information in this line, together with the amount you invested, to estimate the expenses that you paid over the period. Simply divide your account value by $1,000.00 (for example, an $8,600 account value divided by $1,000.00 = 8.6), then multiply the result by the number in the first line for a class of the Fund under the heading entitled "Expenses Paid During Period" to estimate the expenses you paid on your account during this period. A small balance maintenance fee of $12.00 that is charged once a year may apply for certain accounts with a value of less than $2,000. This fee is not included in the table below. If it was, the estimate of expenses you paid during the period would be higher, and your ending account value lower, by this amount. In addition, the Fund, as a shareholder in the underlying Fidelity Central Funds, will indirectly bear its pro-rata share of the fees and expenses incurred by the underlying Fidelity Central Funds. These fees and expenses are not included in the Fund's annualized expense ratio used to calculate the expense estimate in the table below.
Hypothetical Example for Comparison Purposes
The second line of the accompanying table for each class of the Fund provides information about hypothetical account values and hypothetical expenses based on a Class' actual expense ratio and an assumed rate of return of 5% per year before expenses, which is not the Class' actual return. The hypothetical account values and expenses may not be used to estimate the actual ending account balance or expenses you paid for the period. You may use this information to compare the ongoing costs of investing in the Fund and other funds. To do so, compare this 5% hypothetical example with the 5% hypothetical examples that appear in the shareholder reports of the other funds. A small balance maintenance fee of $12.00 that is charged once a year may apply for certain accounts with a value of less than $2,000. This fee is not included in the table below. If it was, the estimate of expenses you paid during the period would be higher, and your ending account value lower, by this amount. In addition, the Fund, as a shareholder in the underlying Fidelity Central Funds, will indirectly bear its pro-rata share of the fees and expenses incurred by the underlying Fidelity Central Funds. These fees and expenses are not included in the Fund's annualized expense ratio used to calculate the expense estimate in the table below.
Please note that the expenses shown in the table are meant to highlight your ongoing costs only and do not reflect any transaction costs. Therefore, the second line of the table is useful in comparing ongoing costs only, and will not help you determine the relative total costs of owning different funds.
Annual Report
Shareholder Expense Example - continued
| Annualized
Expense Ratio | Beginning
Account Value
March 1, 2011 | Ending
Account Value
August 31, 2011 | Expenses Paid
During Period*
March 1, 2011 to August 31, 2011 |
Puritan | .60% | | | |
Actual | | $ 1,000.00 | $ 956.00 | $ 2.96 |
HypotheticalA | | $ 1,000.00 | $ 1,022.18 | $ 3.06 |
Class K | .48% | | | |
Actual | | $ 1,000.00 | $ 956.60 | $ 2.37 |
HypotheticalA | | $ 1,000.00 | $ 1,022.79 | $ 2.45 |
A 5% return per year before expenses
* Expenses are equal to each Class' annualized expense ratio, multiplied by the average account value over the period, multiplied by 184/365 (to reflect the one-half year period). The fees and expenses of the underlying Fidelity Central Funds in which the Fund invests are not included in the Fund's annualized expense ratio.
Annual Report
Investment Changes (Unaudited)
The information in the following tables is based on the combined investments of the Fund and its pro-rata share of its investments in each non-money market Fidelity Central Fund. |
Top Five Stocks as of August 31, 2011 |
| % of fund's
net assets | % of fund's net assets
6 months ago |
Apple, Inc. | 3.1 | 2.7 |
Exxon Mobil Corp. | 1.9 | 2.1 |
The Coca-Cola Co. | 1.7 | 1.4 |
Philip Morris International, Inc. | 1.4 | 1.3 |
General Electric Co. | 1.3 | 1.6 |
| 9.4 | |
Top Five Bond Issuers as of August 31, 2011 |
(with maturities greater than one year) | % of fund's
net assets | % of fund's net assets
6 months ago |
Fannie Mae | 10.7 | 7.3 |
U.S. Treasury Obligations | 9.7 | 8.5 |
Freddie Mac | 2.5 | 1.5 |
Ginnie Mae | 2.0 | 1.7 |
Citigroup, Inc. | 0.4 | 0.4 |
| 25.3 | |
Top Five Market Sectors as of August 31, 2011 |
| % of fund's
net assets | % of fund's net assets
6 months ago |
Financials | 11.7 | 12.9 |
Information Technology | 11.4 | 12.8 |
Energy | 10.4 | 10.9 |
Consumer Discretionary | 9.1 | 9.3 |
Consumer Staples | 8.8 | 6.2 |
Asset Allocation (% of fund's net assets) |
As of August 31, 2011* | As of February 28, 2011** |
| Stocks 58.2% | | | Stocks 62.1% | |
| Bonds 40.6% | | | Bonds 34.6% | |
 | Convertible
Securities 0.6% | | | Convertible
Securities 0.5% | |
 | Other Investments 1.0% | | | Other Investments 1.0% | |
 | Short-Term
Investments and
Net Other Assets† (0.4)% | | | Short-Term
Investments and
Net Other Assets 1.8% | |

* Foreign investments | 12.4% | | ** Foreign investments | 13.3% | |
Percentages are adjusted for the effect of futures contracts and swap contracts, if applicable. |
A holdings listing for the Fund, which presents direct holdings as well as the pro-rata share of any securities and other investments held indirectly through its investment in underlying non-money market Fidelity Central Funds, is available at fidelity.com. |
† Short-Term Investments and Net Other Assets are not included in the pie chart. |
Annual Report
Investments August 31, 2011
Showing Percentage of Net Assets
Common Stocks - 57.7% |
| Shares | | Value (000s) |
CONSUMER DISCRETIONARY - 7.0% |
Auto Components - 0.0% |
Delphi Corp. Class B (a) | 249 | | $ 4,806 |
TRW Automotive Holdings Corp. (a) | 100,000 | | 4,169 |
| | 8,975 |
Automobiles - 0.4% |
Bayerische Motoren Werke AG (BMW) | 286,837 | | 23,221 |
General Motors Co.: | | | |
warrants 7/10/16 (a) | 99,968 | | 1,529 |
warrants 7/10/19 (a) | 99,968 | | 1,056 |
Honda Motor Co. Ltd. | 1,224,900 | | 39,911 |
Tesla Motors, Inc. (a) | 128,800 | | 3,187 |
| | 68,904 |
Diversified Consumer Services - 0.2% |
New Oriental Education & Technology Group, Inc. sponsored ADR (a) | 1,062,800 | | 32,415 |
Hotels, Restaurants & Leisure - 1.4% |
Arcos Dorados Holdings, Inc. | 1,368,000 | | 37,716 |
Dunkin' Brands Group, Inc. (a) | 93,400 | | 2,460 |
Las Vegas Sands Corp. (a) | 580,000 | | 27,011 |
McDonald's Corp. | 1,366,900 | | 123,650 |
Starbucks Corp. | 818,300 | | 31,603 |
Vail Resorts, Inc. | 815,227 | | 32,960 |
| | 255,400 |
Household Durables - 0.1% |
Lennar Corp. Class A | 1,800,200 | | 26,463 |
Internet & Catalog Retail - 0.4% |
Amazon.com, Inc. (a) | 340,800 | | 73,371 |
Media - 2.0% |
British Sky Broadcasting Group PLC | 2,343,500 | | 25,134 |
Comcast Corp. Class A (special) (non-vtg.) | 6,162,400 | | 130,396 |
Discovery Communications, Inc. (a) | 909,400 | | 38,449 |
HMH Holdings, Inc. (a)(r) | 149,814 | | 375 |
Kabel Deutschland Holding AG (a) | 477,639 | | 26,727 |
Legend Pictures LLC (a)(q)(r) | 46,667 | | 35,000 |
Pandora Media, Inc. (f) | 421,894 | | 5,569 |
Publicis Groupe SA | 555,600 | | 26,129 |
The Walt Disney Co. | 1,291,490 | | 43,988 |
Time Warner, Inc. | 1,532,300 | | 48,513 |
Vertis Holdings, Inc. (a) | 1,934 | | 22 |
| | 380,302 |
Common Stocks - continued |
| Shares | | Value (000s) |
CONSUMER DISCRETIONARY - continued |
Multiline Retail - 0.3% |
PPR SA | 352,200 | | $ 58,695 |
Specialty Retail - 0.7% |
Bed Bath & Beyond, Inc. (a) | 530,900 | | 30,187 |
China ZhengTong Auto Services Holdings Ltd. | 3,194,000 | | 4,406 |
Guess?, Inc. | 598,000 | | 20,398 |
Home Depot, Inc. | 1,112,200 | | 37,125 |
Tiffany & Co., Inc. | 436,400 | | 31,403 |
| | 123,519 |
Textiles, Apparel & Luxury Goods - 1.5% |
Compagnie Financiere Richemont SA Series A | 533,720 | | 30,977 |
LVMH Moet Hennessy - Louis Vuitton | 200,720 | | 34,013 |
NIKE, Inc. Class B | 568,400 | | 49,252 |
PVH Corp. | 919,700 | | 61,307 |
Ralph Lauren Corp. | 631,100 | | 86,530 |
Vera Bradley, Inc. | 605,000 | | 21,236 |
| | 283,315 |
TOTAL CONSUMER DISCRETIONARY | | 1,311,359 |
CONSUMER STAPLES - 8.3% |
Beverages - 2.6% |
Dr Pepper Snapple Group, Inc. | 1,204,175 | | 46,337 |
Grupo Modelo SAB de CV Series C | 3,197,400 | | 18,453 |
Hansen Natural Corp. (a) | 546,400 | | 46,619 |
Pernod-Ricard SA | 697,400 | | 62,620 |
The Coca-Cola Co. | 4,436,900 | | 312,580 |
| | 486,609 |
Food & Staples Retailing - 1.0% |
Costco Wholesale Corp. | 791,100 | | 62,133 |
Droga Raia SA | 902,000 | | 15,865 |
Drogasil SA | 4,059,200 | | 31,873 |
Walgreen Co. | 1,560,200 | | 54,935 |
Whole Foods Market, Inc. | 161,200 | | 10,644 |
| | 175,450 |
Food Products - 1.0% |
Diamond Foods, Inc. (f) | 374,200 | | 29,509 |
Green Mountain Coffee Roasters, Inc. (a) | 503,600 | | 52,747 |
Common Stocks - continued |
| Shares | | Value (000s) |
CONSUMER STAPLES - continued |
Food Products - continued |
Kraft Foods, Inc. Class A | 1,184,100 | | $ 41,467 |
Mead Johnson Nutrition Co. Class A | 891,600 | | 63,527 |
| | 187,250 |
Household Products - 1.1% |
Colgate-Palmolive Co. | 878,500 | | 79,039 |
Procter & Gamble Co. | 1,897,300 | | 120,820 |
| | 199,859 |
Personal Products - 0.5% |
Estee Lauder Companies, Inc. Class A | 448,400 | | 43,791 |
Nu Skin Enterprises, Inc. Class A | 669,300 | | 28,305 |
Prestige Brands Holdings, Inc. (a) | 2,182,251 | | 23,503 |
| | 95,599 |
Tobacco - 2.1% |
British American Tobacco PLC sponsored ADR | 334,000 | | 29,930 |
Japan Tobacco, Inc. | 11,209 | | 48,444 |
Lorillard, Inc. | 542,900 | | 60,490 |
Philip Morris International, Inc. | 3,717,240 | | 257,679 |
| | 396,543 |
TOTAL CONSUMER STAPLES | | 1,541,310 |
ENERGY - 8.9% |
Energy Equipment & Services - 2.3% |
Baker Hughes, Inc. | 1,131,100 | | 69,122 |
Cameron International Corp. (a) | 454,200 | | 23,600 |
Dresser-Rand Group, Inc. (a) | 315,300 | | 13,384 |
Ensco International Ltd. ADR | 479,400 | | 23,136 |
Halliburton Co. | 1,651,600 | | 73,281 |
Noble Corp. | 1,286,900 | | 43,446 |
Schlumberger Ltd. | 1,511,800 | | 118,102 |
Transocean Ltd. (United States) | 1,115,000 | | 62,462 |
| | 426,533 |
Oil, Gas & Consumable Fuels - 6.6% |
Alpha Natural Resources, Inc. (a) | 395,752 | | 13,088 |
Apache Corp. | 859,100 | | 88,547 |
Bumi PLC | 1,349,237 | | 21,251 |
Chesapeake Energy Corp. | 1,700,100 | | 55,066 |
Chevron Corp. | 1,858,500 | | 183,824 |
ConocoPhillips | 1,076,900 | | 73,305 |
Common Stocks - continued |
| Shares | | Value (000s) |
ENERGY - continued |
Oil, Gas & Consumable Fuels |
CVR Energy, Inc. (a) | 548,700 | | $ 15,621 |
Energen Corp. | 378,600 | | 18,589 |
EV Energy Partners LP | 549,800 | | 37,870 |
Exxon Mobil Corp. | 4,749,917 | | 351,684 |
Marathon Oil Corp. | 1,701,000 | | 45,791 |
Marathon Petroleum Corp. | 850,500 | | 31,520 |
OAO Gazprom sponsored ADR | 1,265,400 | | 15,375 |
Occidental Petroleum Corp. | 780,858 | | 67,732 |
Royal Dutch Shell PLC: | | | |
Class A sponsored ADR | 1,268,004 | | 85,020 |
Class B sponsored ADR | 127,600 | | 8,610 |
Valero Energy Corp. | 2,694,900 | | 61,228 |
Western Refining, Inc. (a)(f) | 1,156,363 | | 20,167 |
Williams Companies, Inc. | 1,507,400 | | 40,685 |
| | 1,234,973 |
TOTAL ENERGY | | 1,661,506 |
FINANCIALS - 7.2% |
Capital Markets - 1.2% |
Apollo Global Management LLC Class A | 1,112,300 | | 14,427 |
E*TRADE Financial Corp. (a) | 2,792,500 | | 34,515 |
Evercore Partners, Inc. Class A | 1,013,500 | | 26,584 |
Franklin Resources, Inc. | 287,900 | | 34,525 |
Goldman Sachs Group, Inc. | 172,900 | | 20,094 |
HFF, Inc. (a) | 548,100 | | 6,479 |
Invesco Ltd. | 1,478,600 | | 27,058 |
Morgan Stanley | 1,248,800 | | 21,854 |
State Street Corp. | 1,359,900 | | 48,304 |
| | 233,840 |
Commercial Banks - 2.3% |
BB&T Corp. | 1,297,300 | | 28,917 |
CIT Group, Inc. (a) | 822,600 | | 28,437 |
Comerica, Inc. | 1,147,600 | | 29,367 |
First Republic Bank (f) | 400,000 | | 10,200 |
Huntington Bancshares, Inc. | 1,825,900 | | 9,184 |
Industrial & Commercial Bank of China Ltd. (H Shares) | 34,419,000 | | 22,634 |
SunTrust Banks, Inc. | 2,041,700 | | 40,630 |
U.S. Bancorp | 4,053,900 | | 94,091 |
Common Stocks - continued |
| Shares | | Value (000s) |
FINANCIALS - continued |
Commercial Banks - continued |
Wells Fargo & Co. | 5,238,340 | | $ 136,721 |
Zions Bancorporation | 1,409,600 | | 24,583 |
| | 424,764 |
Consumer Finance - 0.5% |
Capital One Financial Corp. | 767,800 | | 35,357 |
SLM Corp. | 4,054,700 | | 55,671 |
| | 91,028 |
Diversified Financial Services - 2.0% |
Citigroup, Inc. | 6,907,240 | | 214,470 |
JPMorgan Chase & Co. | 3,723,623 | | 139,859 |
NBH Holdings Corp. Class A (a)(h) | 710,000 | | 12,070 |
Station Holdco LLC (a)(q)(r) | 1,405,198 | | 1,405 |
Station Holdco LLC warrants 6/15/18 (r) | 75,658 | | 0 |
| | 367,804 |
Insurance - 0.7% |
ACE Ltd. | 510,100 | | 32,942 |
MetLife, Inc. | 2,808,600 | | 94,369 |
| | 127,311 |
Real Estate Investment Trusts - 0.3% |
Lexington Corporate Properties Trust (f) | 4,802,167 | | 35,440 |
Prologis, Inc. | 580,900 | | 15,818 |
| | 51,258 |
Real Estate Management & Development - 0.1% |
CB Richard Ellis Group, Inc. Class A (a) | 998,500 | | 15,137 |
Iguatemi Empresa de Shopping Centers SA | 367,800 | | 7,798 |
| | 22,935 |
Thrifts & Mortgage Finance - 0.1% |
BankUnited, Inc. (f) | 769,200 | | 18,038 |
TOTAL FINANCIALS | | 1,336,978 |
HEALTH CARE - 6.9% |
Biotechnology - 1.8% |
Achillion Pharmaceuticals, Inc. (a) | 2,305,134 | | 14,177 |
Acorda Therapeutics, Inc. (a) | 590,000 | | 15,370 |
Alexion Pharmaceuticals, Inc. (a) | 384,300 | | 22,268 |
AMAG Pharmaceuticals, Inc. (a)(f) | 1,389,900 | | 19,625 |
Amgen, Inc. | 1,124,000 | | 62,275 |
Ardea Biosciences, Inc. (a) | 271,200 | | 4,402 |
Biogen Idec, Inc. (a) | 580,700 | | 54,702 |
Common Stocks - continued |
| Shares | | Value (000s) |
HEALTH CARE - continued |
Biotechnology |
BioMarin Pharmaceutical, Inc. (a) | 1,286,300 | | $ 38,055 |
Gilead Sciences, Inc. (a) | 381,000 | | 15,196 |
Neurocrine Biosciences, Inc. (a)(g) | 3,731,700 | | 22,913 |
Theravance, Inc. (a) | 1,285,600 | | 24,426 |
Vertex Pharmaceuticals, Inc. (a) | 969,800 | | 43,903 |
| | 337,312 |
Health Care Equipment & Supplies - 1.6% |
Baxter International, Inc. | 1,574,900 | | 88,163 |
Covidien PLC | 1,923,100 | | 100,347 |
Edwards Lifesciences Corp. (a) | 572,400 | | 43,188 |
The Cooper Companies, Inc. | 17,559 | | 1,322 |
William Demant Holding A/S (a) | 734,500 | | 60,681 |
| | 293,701 |
Health Care Providers & Services - 1.2% |
Aetna, Inc. | 583,700 | | 23,366 |
Apollo Hospitals Enterprise Ltd. | 250,000 | | 2,928 |
CIGNA Corp. | 1,128,300 | | 52,737 |
Express Scripts, Inc. (a) | 707,300 | | 33,201 |
Humana, Inc. | 179,800 | | 13,960 |
McKesson Corp. | 744,800 | | 59,532 |
Medco Health Solutions, Inc. (a) | 617,000 | | 33,404 |
| | 219,128 |
Health Care Technology - 0.1% |
CareView Communications, Inc. (a)(f)(g) | 10,175,300 | | 14,652 |
Life Sciences Tools & Services - 0.3% |
Agilent Technologies, Inc. (a) | 606,200 | | 22,351 |
Sequenom, Inc. (a) | 1,152,600 | | 7,065 |
Thermo Fisher Scientific, Inc. (a) | 466,500 | | 25,625 |
| | 55,041 |
Pharmaceuticals - 1.9% |
Elan Corp. PLC sponsored ADR (a) | 2,640,348 | | 28,173 |
GlaxoSmithKline PLC sponsored ADR | 1,472,200 | | 63,054 |
Perrigo Co. | 333,200 | | 31,567 |
Pfizer, Inc. | 6,084,700 | | 115,488 |
Sanofi-Aventis sponsored ADR | 1,399,900 | | 51,194 |
Common Stocks - continued |
| Shares | | Value (000s) |
HEALTH CARE - continued |
Pharmaceuticals - continued |
Shire PLC sponsored ADR | 590,300 | | $ 57,318 |
Valeant Pharmaceuticals International, Inc. (Canada) | 300,311 | | 13,464 |
| | 360,258 |
TOTAL HEALTH CARE | | 1,280,092 |
INDUSTRIALS - 6.0% |
Aerospace & Defense - 2.1% |
Esterline Technologies Corp. (a) | 420,374 | | 31,650 |
GeoEye, Inc. (a) | 491,600 | | 17,781 |
Goodrich Corp. | 593,400 | | 52,919 |
Precision Castparts Corp. | 363,600 | | 59,576 |
Textron, Inc. | 950,500 | | 16,035 |
United Technologies Corp. | 2,798,800 | | 207,811 |
| | 385,772 |
Airlines - 0.2% |
Copa Holdings SA Class A | 292,100 | | 20,190 |
Delta Air Lines, Inc. (a) | 388,219 | | 2,923 |
Southwest Airlines Co. | 2,837,800 | | 24,462 |
| | 47,575 |
Building Products - 0.1% |
A.O. Smith Corp. | 700,850 | | 27,536 |
Masonite Worldwide Holdings | 5,358 | | 153 |
Masonite Worldwide Holdings: | | | |
warrants 5/20/14 (a) | 25,981 | | 31 |
warrants 5/20/16 (a) | 19,485 | | 24 |
| | 27,744 |
Construction & Engineering - 0.4% |
Fluor Corp. | 947,300 | | 57,520 |
Foster Wheeler AG (a) | 400,000 | | 9,820 |
| | 67,340 |
Electrical Equipment - 0.4% |
AMETEK, Inc. | 925,035 | | 36,150 |
Regal-Beloit Corp. | 516,000 | | 30,336 |
| | 66,486 |
Common Stocks - continued |
| Shares | | Value (000s) |
INDUSTRIALS - continued |
Industrial Conglomerates - 1.7% |
Danaher Corp. | 1,458,000 | | $ 66,791 |
General Electric Co. | 15,083,900 | | 246,018 |
| | 312,809 |
Machinery - 0.1% |
WABCO Holdings, Inc. (a) | 581,600 | | 27,132 |
Professional Services - 0.1% |
Qualicorp SA | 1,519,000 | | 13,740 |
Road & Rail - 0.7% |
Union Pacific Corp. | 1,352,056 | | 124,619 |
Trading Companies & Distributors - 0.2% |
Air Lease Corp. Class A (f) | 2,000,000 | | 45,620 |
TOTAL INDUSTRIALS | | 1,118,837 |
INFORMATION TECHNOLOGY - 10.7% |
Communications Equipment - 1.2% |
Alcatel-Lucent SA sponsored ADR (a) | 5,198,600 | | 19,027 |
Juniper Networks, Inc. (a) | 317,500 | | 6,645 |
Motorola Mobility Holdings, Inc. | 770,025 | | 29,045 |
Polycom, Inc. (a) | 1,915,000 | | 45,577 |
QUALCOMM, Inc. | 2,423,900 | | 124,734 |
| | 225,028 |
Computers & Peripherals - 3.5% |
Apple, Inc. (a) | 1,512,100 | | 581,901 |
Dell, Inc. (a) | 2,017,500 | | 29,990 |
Hewlett-Packard Co. | 1,231,102 | | 32,046 |
| | 643,937 |
Electronic Equipment & Components - 0.2% |
Amphenol Corp. Class A | 868,900 | | 40,821 |
E Ink Holdings, Inc. GDR (a)(h) | 140,100 | | 3,013 |
| | 43,834 |
Internet Software & Services - 1.2% |
Demand Media, Inc. | 1,324,308 | | 11,455 |
Facebook, Inc. Class B (a)(r) | 881,260 | | 22,032 |
Google, Inc. Class A (a) | 209,800 | | 113,493 |
Mail.ru Group Ltd.: | | | |
GDR (a)(h) | 580,000 | | 20,868 |
GDR (Reg. S) | 289,900 | | 10,431 |
Common Stocks - continued |
| Shares | | Value (000s) |
INFORMATION TECHNOLOGY - continued |
Internet Software & Services - continued |
Rackspace Hosting, Inc. (a) | 847,000 | | $ 30,966 |
Velti PLC (a) | 1,150,000 | | 10,879 |
| | 220,124 |
IT Services - 1.9% |
Accenture PLC Class A | 1,674,100 | | 89,715 |
Atos Origin SA | 440,586 | | 22,065 |
Cognizant Technology Solutions Corp. Class A (a) | 2,266,700 | | 143,822 |
MasterCard, Inc. Class A | 216,000 | | 71,217 |
ServiceSource International, Inc. (f) | 1,292,300 | | 23,352 |
| | 350,171 |
Semiconductors & Semiconductor Equipment - 0.4% |
Avago Technologies Ltd. | 533,200 | | 17,654 |
Broadcom Corp. Class A | 431,500 | | 15,383 |
Freescale Semiconductor Holdings I Ltd. | 1,465,000 | | 16,848 |
NXP Semiconductors NV | 505,600 | | 8,236 |
PMC-Sierra, Inc. (a) | 1,372,700 | | 8,360 |
Spansion, Inc. Class A (a) | 64,824 | | 973 |
Teradyne, Inc. (a) | 1,291,200 | | 15,624 |
| | 83,078 |
Software - 2.3% |
ANSYS, Inc. (a) | 647,700 | | 34,963 |
AsiaInfo-Linkage, Inc. (a) | 498,800 | | 5,706 |
Check Point Software Technologies Ltd. (a) | 360,100 | | 19,604 |
Citrix Systems, Inc. (a) | 634,000 | | 38,313 |
CommVault Systems, Inc. (a) | 656,800 | | 22,272 |
Fortinet, Inc. (a) | 768,506 | | 14,702 |
Informatica Corp. (a) | 626,130 | | 26,160 |
Kenexa Corp. (a) | 906,494 | | 19,082 |
Oracle Corp. | 3,706,700 | | 104,047 |
Rovi Corp. (a) | 1,053,000 | | 51,481 |
salesforce.com, Inc. (a) | 332,200 | | 42,771 |
Solera Holdings, Inc. | 671,900 | | 39,407 |
VMware, Inc. Class A (a) | 94,600 | | 8,926 |
| | 427,434 |
TOTAL INFORMATION TECHNOLOGY | | 1,993,606 |
Common Stocks - continued |
| Shares | | Value (000s) |
MATERIALS - 1.7% |
Chemicals - 0.5% |
Arkema SA | 111,800 | | $ 8,681 |
Ashland, Inc. | 297,800 | | 15,786 |
Lanxess AG | 64,400 | | 4,018 |
LyondellBasell Industries NV Class A | 859,594 | | 29,785 |
The Mosaic Co. | 517,100 | | 36,781 |
Tronox, Inc. | 23,603 | | 2,954 |
| | 98,005 |
Containers & Packaging - 0.1% |
Rock-Tenn Co. Class A | 370,300 | | 19,874 |
Metals & Mining - 1.1% |
Carpenter Technology Corp. | 188,200 | | 9,498 |
Goldcorp, Inc. | 1,291,200 | | 67,250 |
Newcrest Mining Ltd. | 2,628,235 | | 113,128 |
SunCoke Energy, Inc. (a) | 109,300 | | 1,548 |
| | 191,424 |
TOTAL MATERIALS | | 309,303 |
TELECOMMUNICATION SERVICES - 0.2% |
Wireless Telecommunication Services - 0.2% |
American Tower Corp. Class A (a) | 565,300 | | 30,447 |
UTILITIES - 0.8% |
Electric Utilities - 0.3% |
PPL Corp. | 1,739,500 | | 50,237 |
Gas Utilities - 0.1% |
ONEOK, Inc. | 424,700 | | 30,111 |
Independent Power Producers & Energy Traders - 0.1% |
The AES Corp. (a) | 2,024,300 | | 21,984 |
Multi-Utilities - 0.3% |
National Grid PLC | 5,713,020 | | 57,573 |
TOTAL UTILITIES | | 159,905 |
TOTAL COMMON STOCKS (Cost $9,637,563) | 10,743,343 |
Preferred Stocks - 0.9% |
| Shares | | Value (000s) |
Convertible Preferred Stocks - 0.4% |
CONSUMER DISCRETIONARY - 0.2% |
Automobiles - 0.0% |
General Motors Co. 4.75% | 184,400 | | $ 7,352 |
Textiles, Apparel & Luxury Goods - 0.2% |
Michael Kors Holdings Ltd. (a)(r) | 651,410 | | 30,000 |
TOTAL CONSUMER DISCRETIONARY | | 37,352 |
ENERGY - 0.0% |
Oil, Gas & Consumable Fuels - 0.0% |
Apache Corp. 6.00% | 64,800 | | 3,766 |
Chesapeake Energy Corp. 5.00% | 18,580 | | 1,904 |
| | 5,670 |
FINANCIALS - 0.1% |
Diversified Financial Services - 0.1% |
2010 Swift Mandatory Common Exchange Security Trust 6.00% (h) | 214,800 | | 1,997 |
Citigroup, Inc. 7.50% | 59,300 | | 5,610 |
| | 7,607 |
Real Estate Investment Trusts - 0.0% |
Health Care REIT, Inc. Series I, 6.50% | 113,000 | | 5,544 |
TOTAL FINANCIALS | | 13,151 |
INFORMATION TECHNOLOGY - 0.0% |
Internet Software & Services - 0.0% |
wetpaint.com, Inc. Series C (a)(r) | 497,017 | | 994 |
MATERIALS - 0.0% |
Metals & Mining - 0.0% |
AngloGold Ashanti Holdings Finance PLC 6.00% | 104,600 | | 5,209 |
UTILITIES - 0.1% |
Electric Utilities - 0.1% |
AES Trust III 6.75% | 126,300 | | 6,054 |
PPL Corp. 8.75% | 108,000 | | 5,893 |
| | 11,947 |
TOTAL CONVERTIBLE PREFERRED STOCKS | | 74,323 |
Preferred Stocks - continued |
| Shares | | Value (000s) |
Nonconvertible Preferred Stocks - 0.5% |
CONSUMER DISCRETIONARY - 0.4% |
Automobiles - 0.4% |
Porsche Automobil Holding SE (Germany) | 311,350 | | $ 21,084 |
Volkswagen AG | 286,000 | | 47,642 |
| | 68,726 |
FINANCIALS - 0.1% |
Diversified Financial Services - 0.1% |
GMAC Capital Trust I Series 2, 8.125% | 377,872 | | 8,068 |
GMAC LLC 7.00% (h) | 11,951 | | 8,903 |
| | 16,971 |
TOTAL NONCONVERTIBLE PREFERRED STOCKS | | 85,697 |
TOTAL PREFERRED STOCKS (Cost $139,177) | 160,020 |
Corporate Bonds - 11.0% |
| Principal Amount (000s) | | |
Convertible Bonds - 0.2% |
CONSUMER DISCRETIONARY - 0.0% |
Leisure Equipment & Products - 0.0% |
Eastman Kodak Co. 7% 4/1/17 | | $ 5,200 | | 3,839 |
Media - 0.0% |
Liberty Media Corp.: | | | | |
3.5% 1/15/31 | | 502 | | 354 |
3.5% 1/15/31 (h) | | 3,712 | | 2,618 |
| | 2,972 |
TOTAL CONSUMER DISCRETIONARY | | 6,811 |
ENERGY - 0.1% |
Oil, Gas & Consumable Fuels - 0.1% |
Alpha Natural Resources, Inc. 2.375% 4/15/15 | | 1,350 | | 1,435 |
Peabody Energy Corp. 4.75% 12/15/66 | | 6,300 | | 7,379 |
| | 8,814 |
Corporate Bonds - continued |
| Principal Amount (000s) | | Value (000s) |
Convertible Bonds - continued |
INDUSTRIALS - 0.1% |
Electrical Equipment - 0.1% |
Aspen Aerogels, Inc. 8% 6/1/14 (r) | | $ 10,000 | | $ 10,000 |
MATERIALS - 0.0% |
Construction Materials - 0.0% |
Headwaters, Inc. 2.5% 2/1/14 | | 4,920 | | 3,942 |
TELECOMMUNICATION SERVICES - 0.0% |
Diversified Telecommunication Services - 0.0% |
Clearwire Communications LLC/Clearwire Finance, Inc. 8.25% 12/1/40 (h) | | 4,000 | | 2,813 |
TOTAL CONVERTIBLE BONDS | | 32,380 |
Nonconvertible Bonds - 10.8% |
CONSUMER DISCRETIONARY - 1.2% |
Auto Components - 0.1% |
DaimlerChrysler NA Holding Corp. 5.75% 9/8/11 | | 5,187 | | 5,188 |
Delphi Corp.: | | | | |
5.875% 5/15/19 (h) | | 1,820 | | 1,765 |
6.125% 5/15/21 (h) | | 1,690 | | 1,639 |
Exide Technologies 8.625% 2/1/18 (h) | | 825 | | 776 |
International Automotive Components Group SA 9.125% 6/1/18 (h) | | 1,930 | | 1,862 |
Tenneco, Inc. 6.875% 12/15/20 | | 2,415 | | 2,439 |
| | 13,669 |
Automobiles - 0.0% |
Ford Motor Co.: | | | | |
6.375% 2/1/29 | | 2,190 | | 2,048 |
6.625% 10/1/28 | | 2,510 | | 2,442 |
7.45% 7/16/31 | | 2,335 | | 2,554 |
General Motors Corp.: | | | | |
6.75% 5/1/28 (d) | | 390 | | 4 |
7.125% 7/15/13 (d) | | 1,135 | | 12 |
7.2% 1/15/11 (d) | | 2,855 | | 31 |
7.4% 9/1/25 (d) | | 195 | | 2 |
7.7% 4/15/16 (d) | | 705 | | 8 |
Corporate Bonds - continued |
| Principal Amount (000s) | | Value (000s) |
Nonconvertible Bonds - continued |
CONSUMER DISCRETIONARY |
Automobiles |
General Motors Corp.: | | | | |
8.25% 7/15/23 (d) | | $ 5,475 | | $ 60 |
8.375% 7/15/33 (d) | | 16,800 | | 183 |
| | 7,344 |
Distributors - 0.0% |
Ferrellgas LP/Ferrellgas Finance Corp. 6.5% 5/1/21 | | 1,745 | | 1,566 |
Diversified Consumer Services - 0.1% |
ServiceMaster Co. 10.75% 7/15/15 pay-in-kind (h)(n) | | 12,495 | | 12,870 |
Hotels, Restaurants & Leisure - 0.2% |
American Casino & Entertainment Properties LLC 11% 6/15/14 | | 2,935 | | 2,935 |
Ameristar Casinos, Inc. 7.5% 4/15/21 (h) | | 2,810 | | 2,782 |
Chukchansi Economic Development Authority: | | | | |
3.917% 11/15/12 (h)(n) | | 1,140 | | 835 |
8% 11/15/13 (h) | | 1,890 | | 1,380 |
Landry's Restaurants, Inc. 11.625% 12/1/15 | | 760 | | 798 |
MCE Finance Ltd. 10.25% 5/15/18 | | 1,695 | | 1,873 |
MGM Mirage, Inc.: | | | | |
5.875% 2/27/14 | | 2,998 | | 2,848 |
6.625% 7/15/15 | | 2,080 | | 1,903 |
6.75% 4/1/13 | | 80 | | 79 |
7.5% 6/1/16 | | 4,385 | | 3,990 |
9% 3/15/20 | | 1,770 | | 1,912 |
13% 11/15/13 | | 5,000 | | 5,800 |
MTR Gaming Group, Inc. 11.5% 8/1/19 pay-in-kind (h)(n) | | 1,975 | | 1,659 |
NAI Entertainment Holdings LLC/NAI Entertainment Finance Corp. 8.25% 12/15/17 (h) | | 1,060 | | 1,071 |
NCL Corp. Ltd. 9.5% 11/15/18 (h) | | 565 | | 585 |
San Pasqual Casino Development Group, Inc. 8% 9/15/13 (h) | | 1,080 | | 1,064 |
Seven Seas Cruises S de RL LLC 9.125% 5/15/19 (h) | | 250 | | 249 |
Shingle Springs Tribal Gaming Authority 9.375% 6/15/15 (h) | | 2,270 | | 1,544 |
Corporate Bonds - continued |
| Principal Amount (000s) | | Value (000s) |
Nonconvertible Bonds - continued |
CONSUMER DISCRETIONARY - continued |
Hotels, Restaurants & Leisure |
Sugarhouse HSP Gaming Prop Mezz LP/Sugarhouse HSP Gaming Finance Corp. 8.625% 4/15/16 (h) | | $ 220 | | $ 220 |
Waterford Gaming LLC/Waterford Gaming Finance Corp. 8.625% 9/15/14 (h) | | 1,282 | | 698 |
| | 34,225 |
Household Durables - 0.0% |
Fortune Brands, Inc.: | | | | |
5.375% 1/15/16 | | 1,682 | | 1,865 |
5.875% 1/15/36 | | 2,020 | | 2,062 |
6.375% 6/15/14 | | 446 | | 498 |
Reynolds Group Issuer, Inc./Reynolds Group Issuer LLC/Reynolds Group Issuer (Luxembourg) SA: | | | | |
7.125% 4/15/19 (h) | | 1,140 | | 1,094 |
9% 4/15/19 (h) | | 835 | | 741 |
| | 6,260 |
Leisure Equipment & Products - 0.0% |
Eastman Kodak Co.: | | | | |
9.75% 3/1/18 (h) | | 2,131 | | 1,833 |
10.625% 3/15/19 (h) | | 1,800 | | 1,566 |
| | 3,399 |
Media - 0.7% |
AMC Networks, Inc. 7.75% 7/15/21 (h) | | 340 | | 355 |
Bresnan Broadband Holdings LLC 8% 12/15/18 (h) | | 875 | | 884 |
Catalina Marketing Corp. 10.5% 10/1/15 pay-in-kind (h)(n) | | 5,995 | | 5,995 |
Cequel Communications Holdings I LLC/Cequel Capital Corp. 8.625% 11/15/17 (h) | | 630 | | 655 |
Charter Communications Holdings II LLC/Charter Communications Holdings II Capital Corp. 13.5% 11/30/16 | | 11,727 | | 13,544 |
Charter Communications Operating LLC/Charter Communications Operating Capital Corp. 8% 4/30/12 (h)(n) | | 520 | | 533 |
Checkout Holding Corp. 0% 11/15/15 (h) | | 1,290 | | 761 |
Clear Channel Communications, Inc.: | | | | |
5% 3/15/12 | | 4,405 | | 4,361 |
5.5% 9/15/14 | | 2,355 | | 1,590 |
5.5% 12/15/16 | | 1,330 | | 648 |
Corporate Bonds - continued |
| Principal Amount (000s) | | Value (000s) |
Nonconvertible Bonds - continued |
CONSUMER DISCRETIONARY |
Media |
Clear Channel Worldwide Holdings, Inc. Series A, 9.25% 12/15/17 | | $ 780 | | $ 827 |
Comcast Corp.: | | | | |
4.95% 6/15/16 | | 1,742 | | 1,957 |
5.15% 3/1/20 | | 595 | | 677 |
5.7% 5/15/18 | | 10,139 | | 11,743 |
6.4% 3/1/40 | | 2,111 | | 2,391 |
6.45% 3/15/37 | | 1,033 | | 1,145 |
COX Communications, Inc. 4.625% 6/1/13 | | 2,632 | | 2,793 |
Discovery Communications LLC: | | | | |
3.7% 6/1/15 | | 3,557 | | 3,799 |
6.35% 6/1/40 | | 3,224 | | 3,630 |
DISH DBS Corp. 6.75% 6/1/21 (h) | | 3,515 | | 3,541 |
EchoStar Communications Corp. 6.625% 10/1/14 | | 3,000 | | 3,098 |
Gray Television, Inc. 10.5% 6/29/15 | | 990 | | 975 |
Kabel BW Erste Beteiligungs GmbH/Kabel Baden-Wurttemberg GmbH & Co. KG 7.5% 3/15/19 (h) | | 480 | | 470 |
Lamar Media Corp. 7.875% 4/15/18 | | 1,400 | | 1,416 |
Liberty Media Corp. 8.25% 2/1/30 | | 889 | | 869 |
National Cinemedia LLC 7.875% 7/15/21 (h) | | 1,380 | | 1,304 |
NBCUniversal Media LLC: | | | | |
3.65% 4/30/15 | | 4,663 | | 4,947 |
5.15% 4/30/20 | | 4,917 | | 5,446 |
6.4% 4/30/40 | | 4,249 | | 4,800 |
News America Holdings, Inc. 7.75% 12/1/45 | | 6,290 | | 7,408 |
News America, Inc. 6.15% 2/15/41 | | 3,160 | | 3,295 |
Nexstar Broadcasting, Inc.: | | | | |
7% 1/15/14 | | 1,977 | | 1,937 |
7% 1/15/14 pay-in-kind | | 6,023 | | 5,903 |
Nielsen Finance LLC/Nielsen Finance Co.: | | | | |
7.75% 10/15/18 | | 3,165 | | 3,292 |
11.5% 5/1/16 | | 1,947 | | 2,210 |
11.625% 2/1/14 | | 1,171 | | 1,329 |
Radio One, Inc. 15% 5/11/16 pay-in-kind (h)(n) | | 4,272 | | 4,008 |
Satmex Escrow SA de CV 9.5% 5/15/17 (h) | | 475 | | 471 |
Sheridan Group, Inc. 12.5% 4/15/14 | | 1,825 | | 1,633 |
Time Warner Cable, Inc.: | | | | |
5.4% 7/2/12 | | 2,266 | | 2,347 |
Corporate Bonds - continued |
| Principal Amount (000s) | | Value (000s) |
Nonconvertible Bonds - continued |
CONSUMER DISCRETIONARY - continued |
Media |
Time Warner Cable, Inc.: | | | | |
5.85% 5/1/17 | | $ 2,500 | | $ 2,817 |
6.2% 7/1/13 | | 2,154 | | 2,343 |
6.75% 7/1/18 | | 1,087 | | 1,279 |
Time Warner, Inc.: | | | | |
3.15% 7/15/15 | | 362 | | 376 |
5.875% 11/15/16 | | 3,112 | | 3,623 |
6.2% 3/15/40 | | 2,618 | | 2,807 |
6.5% 11/15/36 | | 2,633 | | 2,937 |
Videotron Ltd. 9.125% 4/15/18 | | 5,565 | | 6,108 |
| | 141,277 |
Specialty Retail - 0.1% |
Asbury Automotive Group, Inc. 8.375% 11/15/20 | | 565 | | 554 |
Michaels Stores, Inc. 7.75% 11/1/18 | | 1,665 | | 1,557 |
PETCO Animal Supplies, Inc. 9.25% 12/1/18 (h) | | 3,260 | | 3,342 |
Sonic Automotive, Inc. 9% 3/15/18 | | 1,000 | | 1,020 |
Staples, Inc. 7.375% 10/1/12 | | 757 | | 806 |
Toys 'R' Us, Inc. 7.875% 4/15/13 | | 4,995 | | 5,082 |
| | 12,361 |
Textiles, Apparel & Luxury Goods - 0.0% |
Polymer Group, Inc. 7.75% 2/1/19 (h) | | 605 | | 629 |
TOTAL CONSUMER DISCRETIONARY | | 233,600 |
CONSUMER STAPLES - 0.4% |
Beverages - 0.1% |
Anheuser-Busch InBev Worldwide, Inc.: | | | | |
2.5% 3/26/13 | | 1,969 | | 2,022 |
5.375% 11/15/14 | | 5,671 | | 6,406 |
Diageo Capital PLC 5.2% 1/30/13 | | 3,201 | | 3,397 |
FBG Finance Ltd. 5.125% 6/15/15 (h) | | 2,722 | | 3,012 |
| | 14,837 |
Food & Staples Retailing - 0.1% |
CVS Caremark Corp. 4.125% 5/15/21 | | 1,950 | | 1,975 |
Corporate Bonds - continued |
| Principal Amount (000s) | | Value (000s) |
Nonconvertible Bonds - continued |
CONSUMER STAPLES |
Food & Staples Retailing |
Rite Aid Corp.: | | | | |
7.5% 3/1/17 | | $ 12,125 | | $ 11,822 |
10.375% 7/15/16 | | 5,420 | | 5,664 |
| | 19,461 |
Food Products - 0.1% |
Cargill, Inc. 6% 11/27/17 (h) | | 417 | | 496 |
Kraft Foods, Inc.: | | | | |
5.375% 2/10/20 | | 5,528 | | 6,272 |
5.625% 11/1/11 | | 437 | | 440 |
6.5% 8/11/17 | | 6,561 | | 7,924 |
6.75% 2/19/14 | | 318 | | 359 |
| | 15,491 |
Tobacco - 0.1% |
Altria Group, Inc.: | | | | |
8.5% 11/10/13 | | 446 | | 512 |
9.7% 11/10/18 | | 14,772 | | 19,506 |
Reynolds American, Inc.: | | | | |
6.75% 6/15/17 | | 2,746 | | 3,233 |
7.25% 6/15/37 | | 6,101 | | 6,796 |
| | 30,047 |
TOTAL CONSUMER STAPLES | | 79,836 |
ENERGY - 1.2% |
Energy Equipment & Services - 0.2% |
Calfrac Holdings LP 7.5% 12/1/20 (h) | | 1,435 | | 1,392 |
DCP Midstream LLC 5.35% 3/15/20 (h) | | 5,028 | | 5,539 |
El Paso Pipeline Partners Operating Co. LLC: | | | | |
4.1% 11/15/15 | | 5,488 | | 5,776 |
6.5% 4/1/20 | | 1,008 | | 1,143 |
Expro Finance Luxembourg SCA 8.5% 12/15/16 (h) | | 6,620 | | 6,289 |
Forbes Energy Services Ltd. 9% 6/15/19 (h) | | 1,385 | | 1,302 |
Frac Tech Services LLLC/Frac Tech Finance, Inc. 7.125% 11/15/18 (h) | | 860 | | 873 |
Noble Holding International Ltd. 3.45% 8/1/15 | | 863 | | 915 |
Oil States International, Inc. 6.5% 6/1/19 (h) | | 1,420 | | 1,416 |
Precision Drilling Corp.: | | | | |
6.5% 12/15/21 (h) | | 315 | | 318 |
Corporate Bonds - continued |
| Principal Amount (000s) | | Value (000s) |
Nonconvertible Bonds - continued |
ENERGY - continued |
Energy Equipment & Services |
Precision Drilling Corp.: | | | | |
6.625% 11/15/20 | | $ 1,580 | | $ 1,588 |
Pride International, Inc. 6.875% 8/15/20 | | 1,355 | | 1,619 |
Trinidad Drilling Ltd. 7.875% 1/15/19 (h) | | 630 | | 643 |
Weatherford International Ltd.: | | | | |
4.95% 10/15/13 | | 1,614 | | 1,716 |
5.15% 3/15/13 | | 2,110 | | 2,222 |
| | 32,751 |
Oil, Gas & Consumable Fuels - 1.0% |
Alpha Natural Resources, Inc.: | | | | |
6% 6/1/19 | | 2,915 | | 2,900 |
6.25% 6/1/21 | | 1,675 | | 1,658 |
Anadarko Petroleum Corp.: | | | | |
5.95% 9/15/16 | | 663 | | 745 |
6.375% 9/15/17 | | 9,475 | | 10,934 |
Antero Resources Finance Corp. 9.375% 12/1/17 | | 4,470 | | 4,738 |
ATP Oil & Gas Corp. 11.875% 5/1/15 | | 9,495 | | 8,284 |
BW Group Ltd. 6.625% 6/28/17 (h) | | 2,741 | | 2,566 |
Calumet Specialty Products Partners LP/Calumet Finance Corp. 9.375% 5/1/19 (h) | | 635 | | 610 |
Canadian Natural Resources Ltd.: | | | | |
5.15% 2/1/13 | | 1,519 | | 1,602 |
5.7% 5/15/17 | | 392 | | 458 |
Crestwood Midstream Partners LP / Finance Corp. 7.75% 4/1/19 (h) | | 860 | | 821 |
Denbury Resources, Inc. 8.25% 2/15/20 | | 1,973 | | 2,082 |
Drummond Co., Inc.: | | | | |
7.375% 2/15/16 | | 5,000 | | 5,050 |
9% 10/15/14 (h) | | 1,155 | | 1,193 |
Duke Capital LLC 6.25% 2/15/13 | | 589 | | 627 |
Duke Energy Field Services: | | | | |
5.375% 10/15/15 (h) | | 1,133 | | 1,280 |
6.45% 11/3/36 (h) | | 3,753 | | 4,238 |
El Paso Natural Gas Co. 5.95% 4/15/17 | | 867 | | 1,002 |
EnCana Holdings Finance Corp. 5.8% 5/1/14 | | 2,678 | | 2,955 |
Enterprise Products Operating LP: | | | | |
5.6% 10/15/14 | | 660 | | 724 |
5.65% 4/1/13 | | 410 | | 435 |
Corporate Bonds - continued |
| Principal Amount (000s) | | Value (000s) |
Nonconvertible Bonds - continued |
ENERGY |
Oil, Gas & Consumable Fuels |
EV Energy Partners LP/EV Energy Finance Corp. 8% 4/15/19 (h) | | $ 1,715 | | $ 1,681 |
Gulf South Pipeline Co. LP 5.75% 8/15/12 (h) | | 3,581 | | 3,690 |
Gulfstream Natural Gas System LLC 6.95% 6/1/16 (h) | | 302 | | 360 |
LINN Energy LLC/LINN Energy Finance Corp. 6.5% 5/15/19 (h) | | 1,820 | | 1,738 |
Marathon Petroleum Corp. 5.125% 3/1/21 (h) | | 3,001 | | 3,200 |
Midcontinent Express Pipeline LLC 5.45% 9/15/14 (h) | | 1,140 | | 1,226 |
Motiva Enterprises LLC: | | | | |
5.75% 1/15/20 (h) | | 2,578 | | 2,994 |
6.85% 1/15/40 (h) | | 2,906 | | 3,703 |
Nakilat, Inc. 6.067% 12/31/33 (h) | | 1,839 | | 1,986 |
Nexen, Inc.: | | | | |
5.2% 3/10/15 | | 842 | | 920 |
5.875% 3/10/35 | | 2,365 | | 2,233 |
6.2% 7/30/19 | | 825 | | 954 |
6.4% 5/15/37 | | 4,230 | | 4,340 |
NGPL PipeCo LLC 6.514% 12/15/12 (h) | | 3,302 | | 3,416 |
Petrobras International Finance Co. Ltd.: | | | | |
3.875% 1/27/16 | | 4,954 | | 5,078 |
5.75% 1/20/20 | | 10,403 | | 11,286 |
7.875% 3/15/19 | | 5,564 | | 6,769 |
Petroleos Mexicanos: | | | | |
5.5% 1/21/21 (h) | | 5,342 | | 5,809 |
6% 3/5/20 | | 879 | | 991 |
Petroleum Development Corp. 12% 2/15/18 | | 4,240 | | 4,537 |
Plains All American Pipeline LP/PAA Finance Corp.: | | | | |
3.95% 9/15/15 | | 137 | | 145 |
4.25% 9/1/12 | | 663 | | 684 |
5% 2/1/21 | | 1,642 | | 1,745 |
6.125% 1/15/17 | | 1,880 | | 2,154 |
Ras Laffan Liquefied Natural Gas Co. Ltd. 8.294% 3/15/14 (h) | | 1,661 | | 1,819 |
Ras Laffan Liquefied Natural Gas Co. Ltd. III: | | | | |
4.5% 9/30/12 (h) | | 2,588 | | 2,679 |
5.5% 9/30/14 (h) | | 3,880 | | 4,278 |
5.832% 9/30/16 (h) | | 1,046 | | 1,146 |
6.332% 9/30/27 (h) | | 5,710 | | 6,381 |
6.75% 9/30/19 (h) | | 2,367 | | 2,840 |
Corporate Bonds - continued |
| Principal Amount (000s) | | Value (000s) |
Nonconvertible Bonds - continued |
ENERGY - continued |
Oil, Gas & Consumable Fuels |
Regency Energy Partners LP/Regency Energy Finance Corp. 6.875% 12/1/18 | | $ 2,550 | | $ 2,576 |
Rockies Express Pipeline LLC 6.25% 7/15/13 (h) | | 2,522 | | 2,698 |
Ship Finance International Ltd. 8.5% 12/15/13 | | 10,070 | | 9,768 |
Southeast Supply Header LLC 4.85% 8/15/14 (h) | | 501 | | 538 |
Spectra Energy Capital, LLC 5.65% 3/1/20 | | 421 | | 471 |
Spectra Energy Partners, LP: | | | | |
2.95% 6/15/16 | | 938 | | 965 |
4.6% 6/15/21 | | 1,227 | | 1,267 |
Suncor Energy, Inc.: | | | | |
6.1% 6/1/18 | | 7,256 | | 8,409 |
6.85% 6/1/39 | | 6,550 | | 7,649 |
Talisman Energy, Inc. yankee 6.25% 2/1/38 | | 2,650 | | 2,911 |
Texas Eastern Transmission LP 6% 9/15/17 (h) | | 948 | | 1,135 |
Western Gas Partners LP 5.375% 6/1/21 | | 5,617 | | 5,915 |
XTO Energy, Inc.: | | | | |
4.9% 2/1/14 | | 364 | | 400 |
5% 1/31/15 | | 1,031 | | 1,172 |
5.65% 4/1/16 | | 707 | | 839 |
| | 192,397 |
TOTAL ENERGY | | 225,148 |
FINANCIALS - 3.7% |
Capital Markets - 0.5% |
Bear Stearns Companies, Inc. 5.3% 10/30/15 | | 8,893 | | 9,661 |
Goldman Sachs Group, Inc.: | | | | |
3.7% 8/1/15 | | 5,929 | | 5,990 |
5.25% 7/27/21 | | 5,645 | | 5,716 |
5.95% 1/18/18 | | 3,697 | | 3,931 |
6% 6/15/20 | | 1,200 | | 1,279 |
6.15% 4/1/18 | | 1,544 | | 1,649 |
6.75% 10/1/37 | | 4,509 | | 4,269 |
Janus Capital Group, Inc. 5.875% 9/15/11 (e) | | 812 | | 813 |
JPMorgan Chase Capital XX 6.55% 9/29/36 | | 7,545 | | 7,494 |
Lazard Group LLC: | | | | |
6.85% 6/15/17 | | 3,573 | | 4,018 |
7.125% 5/15/15 | | 1,276 | | 1,439 |
Corporate Bonds - continued |
| Principal Amount (000s) | | Value (000s) |
Nonconvertible Bonds - continued |
FINANCIALS |
Capital Markets |
Merrill Lynch & Co., Inc.: | | | | |
5.45% 2/5/13 | | $ 4,315 | | $ 4,427 |
6.4% 8/28/17 | | 3,463 | | 3,546 |
Morgan Stanley: | | | | |
4% 7/24/15 | | 883 | | 878 |
4.75% 4/1/14 | | 2,291 | | 2,323 |
5.45% 1/9/17 | | 1,300 | | 1,332 |
5.5% 7/28/21 | | 4,938 | | 4,924 |
5.625% 9/23/19 | | 1,659 | | 1,685 |
5.75% 1/25/21 | | 4,000 | | 4,115 |
5.95% 12/28/17 | | 510 | | 527 |
6% 5/13/14 | | 3,192 | | 3,351 |
6% 4/28/15 | | 1,932 | | 2,021 |
6.625% 4/1/18 | | 1,161 | | 1,243 |
7.3% 5/13/19 | | 4,941 | | 5,513 |
Northern Trust Corp. 3.375% 8/23/21 | | 1,280 | | 1,278 |
Penson Worldwide, Inc. 12.5% 5/15/17 (h) | | 1,765 | | 1,416 |
UBS AG Stamford Branch 3.875% 1/15/15 | | 8,000 | | 8,295 |
| | 93,133 |
Commercial Banks - 0.7% |
Bank of America NA: | | | | |
5.3% 3/15/17 | | 14,192 | | 13,883 |
6.1% 6/15/17 | | 522 | | 517 |
CIT Group, Inc.: | | | | |
7% 5/1/15 | | 1 | | 1 |
7% 5/4/15 (h) | | 14,250 | | 14,036 |
7% 5/1/16 | | 1 | | 1 |
7% 5/2/16 (h) | | 5,172 | | 5,069 |
7% 5/1/17 | | 1 | | 1 |
7% 5/2/17 (h) | | 16,669 | | 16,294 |
Credit Suisse New York Branch 6% 2/15/18 | | 10,887 | | 11,464 |
DBS Bank Ltd. (Singapore) 0.5101% 5/16/17 (h)(n) | | 3,496 | | 3,444 |
Discover Bank: | | | | |
7% 4/15/20 | | 2,178 | | 2,367 |
8.7% 11/18/19 | | 1,651 | | 1,944 |
Export-Import Bank of Korea: | | | | |
5.25% 2/10/14 (h) | | 333 | | 355 |
5.5% 10/17/12 | | 2,091 | | 2,175 |
Corporate Bonds - continued |
| Principal Amount (000s) | | Value (000s) |
Nonconvertible Bonds - continued |
FINANCIALS - continued |
Commercial Banks |
Fifth Third Bancorp: | | | | |
3.625% 1/25/16 | | $ 2,893 | | $ 2,932 |
4.5% 6/1/18 | | 418 | | 417 |
8.25% 3/1/38 | | 3,116 | | 3,523 |
Fifth Third Bank 4.75% 2/1/15 | | 680 | | 726 |
Fifth Third Capital Trust IV 6.5% 4/15/67 (n) | | 3,315 | | 3,075 |
HBOS PLC 6.75% 5/21/18 (h) | | 408 | | 377 |
Huntington Bancshares, Inc. 7% 12/15/20 | | 1,364 | | 1,560 |
JPMorgan Chase Bank 6% 10/1/17 | | 1,942 | | 2,175 |
KeyBank NA: | | | | |
5.45% 3/3/16 | | 1,877 | | 2,035 |
5.8% 7/1/14 | | 4,250 | | 4,642 |
KeyCorp. 5.1% 3/24/21 | | 2,604 | | 2,664 |
Manufacturers & Traders Trust Co. 1.7458% 4/1/13 (n) | | 547 | | 547 |
Marshall & Ilsley Bank: | | | | |
4.85% 6/16/15 | | 2,431 | | 2,658 |
5% 1/17/17 | | 6,619 | | 7,112 |
5.25% 9/4/12 | | 1,524 | | 1,568 |
Regions Bank: | | | | |
6.45% 6/26/37 | | 4,710 | | 4,015 |
7.5% 5/15/18 | | 2,851 | | 2,780 |
Regions Financial Corp.: | | | | |
0.4165% 6/26/12 (n) | | 461 | | 451 |
5.75% 6/15/15 | | 996 | | 941 |
7.75% 11/10/14 | | 4,550 | | 4,516 |
SunTrust Banks, Inc. 3.6% 4/15/16 | | 4,440 | | 4,457 |
UniCredit Luxembourg Finance SA 5.584% 1/13/17 (h)(n) | | 1,837 | | 1,643 |
UnionBanCal Corp. 5.25% 12/16/13 | | 614 | | 662 |
Wachovia Bank NA: | | | | |
4.8% 11/1/14 | | 509 | | 547 |
4.875% 2/1/15 | | 1,305 | | 1,391 |
Wachovia Corp.: | | | | |
5.625% 10/15/16 | | 3,151 | | 3,448 |
5.75% 6/15/17 | | 1,728 | | 1,957 |
Corporate Bonds - continued |
| Principal Amount (000s) | | Value (000s) |
Nonconvertible Bonds - continued |
FINANCIALS |
Commercial Banks |
Wells Fargo & Co.: | | | | |
3.625% 4/15/15 | | $ 3,029 | | $ 3,164 |
3.676% 6/15/16 | | 2,210 | | 2,335 |
| | 139,869 |
Consumer Finance - 0.6% |
Ally Financial, Inc. 6.25% 12/1/17 | | 1,800 | | 1,719 |
Discover Financial Services: | | | | |
6.45% 6/12/17 | | 9,507 | | 10,692 |
10.25% 7/15/19 | | 797 | | 1,028 |
Ford Motor Credit Co. LLC: | | | | |
5.75% 2/1/21 | | 8,630 | | 8,673 |
8.125% 1/15/20 | | 5,000 | | 5,583 |
General Electric Capital Corp.: | | | | |
2.25% 11/9/15 | | 4,296 | | 4,319 |
2.95% 5/9/16 | | 1,152 | | 1,162 |
3.5% 6/29/15 | | 1,191 | | 1,245 |
5.625% 9/15/17 | | 17,812 | | 19,774 |
General Motors Acceptance Corp.: | | | | |
6.875% 9/15/11 | | 1,360 | | 1,360 |
8% 11/1/31 | | 2,485 | | 2,385 |
GMAC LLC: | | | | |
6% 12/15/11 | | 880 | | 880 |
6.75% 12/1/14 | | 2,355 | | 2,355 |
6.875% 9/15/11 | | 1,365 | | 1,365 |
8% 12/31/18 | | 5,795 | | 5,592 |
8% 11/1/31 | | 19,161 | | 18,586 |
Household Finance Corp. 6.375% 10/15/11 | | 1,724 | | 1,734 |
HSBC Finance Corp. 5.9% 6/19/12 | | 789 | | 817 |
SLM Corp.: | | | | |
0.483% 10/25/11 (n) | | 5,381 | | 5,369 |
8% 3/25/20 | | 1,505 | | 1,565 |
8.45% 6/15/18 | | 7,220 | | 7,638 |
| | 103,841 |
Diversified Financial Services - 0.9% |
Bank of America Corp.: | | | | |
5.75% 12/1/17 | | 6,120 | | 6,357 |
8% (i)(n) | | 730 | | 690 |
Corporate Bonds - continued |
| Principal Amount (000s) | | Value (000s) |
Nonconvertible Bonds - continued |
FINANCIALS - continued |
Diversified Financial Services |
BP Capital Markets PLC: | | | | |
3.125% 10/1/15 | | $ 894 | | $ 935 |
3.625% 5/8/14 | | 5,608 | | 5,914 |
4.5% 10/1/20 | | 888 | | 960 |
4.742% 3/11/21 | | 4,210 | | 4,606 |
Calpine Construction Finance Co. LP 8% 6/1/16 (h) | | 6,880 | | 7,155 |
Capital One Capital V 10.25% 8/15/39 | | 3,798 | | 3,943 |
CCO Holdings LLC/CCO Holdings Capital Corp. 8.125% 4/30/20 | | 3,485 | | 3,685 |
CEVA Group PLC: | | | | |
8.375% 12/1/17 (h) | | 6,325 | | 5,882 |
11.5% 4/1/18 (h) | | 1,360 | | 1,278 |
CIT Group, Inc. 6.625% 4/1/18 (h) | | 3,445 | | 3,462 |
Citigroup, Inc.: | | | | |
3.953% 6/15/16 | | 5,674 | | 5,794 |
4.75% 5/19/15 | | 9,415 | | 9,815 |
5.5% 4/11/13 | | 6,263 | | 6,525 |
6.5% 8/19/13 | | 19,106 | | 20,322 |
General Motors Financial Co., Inc. 6.75% 6/1/18 (h) | | 5,070 | | 4,994 |
Icahn Enterprises LP/Icahn Enterprises Finance Corp. 7.75% 1/15/16 | | 7,625 | | 7,701 |
JPMorgan Chase & Co.: | | | | |
3.15% 7/5/16 | | 7,615 | | 7,774 |
3.4% 6/24/15 | | 877 | | 903 |
4.65% 6/1/14 | | 6,500 | | 6,934 |
NSG Holdings II, LLC 7.75% 12/15/25 (h) | | 5,023 | | 4,872 |
Offshore Group Investment Ltd.: | | | | |
11.5% 8/1/15 | | 2,905 | | 3,079 |
11.5% 8/1/15 (h) | | 640 | | 678 |
ORIX Corp. 5.48% 11/22/11 | | 227 | | 229 |
Prime Property Funding, Inc.: | | | | |
5.125% 6/1/15 (h) | | 1,703 | | 1,805 |
5.5% 1/15/14 (h) | | 644 | | 688 |
5.7% 4/15/17 (h) | | 1,572 | | 1,681 |
Reynolds Group Issuer, Inc./Reynolds Group Issuer LLC/Reynolds Group Issuer (Luxembourg) SA: | | | | |
6.875% 2/15/21 (h) | | 1,485 | | 1,370 |
8.25% 2/15/21 (h) | | 1,485 | | 1,218 |
Corporate Bonds - continued |
| Principal Amount (000s) | | Value (000s) |
Nonconvertible Bonds - continued |
FINANCIALS |
Diversified Financial Services |
Reynolds Group Issuer, Inc./Reynolds Group Issuer LLC/Reynolds Group Issuer (Luxembourg) 7.875% 8/15/19 (h) | | $ 1,285 | | $ 1,266 |
TECO Finance, Inc.: | | | | |
4% 3/15/16 | | 1,242 | | 1,329 |
5.15% 3/15/20 | | 1,894 | | 2,110 |
TransCapitalInvest Ltd. 5.67% 3/5/14 (h) | | 3,383 | | 3,547 |
Transportation Union LLC/Transportation Union Financing Corp. 11.375% 6/15/18 | | 3,930 | | 4,357 |
UPCB Finance III Ltd. 6.625% 7/1/20 (h) | | 5,000 | | 4,875 |
Wind Acquisition Holdings Finance SA 12.25% 7/15/17 pay-in-kind (h)(n) | | 6,948 | | 6,815 |
WM Finance Corp. 9.5% 6/15/16 (h) | | 515 | | 523 |
ZFS Finance USA Trust II 6.45% 12/15/65 (h)(n) | | 2,951 | | 2,892 |
ZFS Finance USA Trust IV 5.875% 5/9/62 (h)(n) | | 961 | | 904 |
| | 159,867 |
Insurance - 0.4% |
Aon Corp.: | | | | |
3.125% 5/27/16 | | 2,604 | | 2,606 |
3.5% 9/30/15 | | 2,415 | | 2,505 |
5% 9/30/20 | | 2,329 | | 2,503 |
6.25% 9/30/40 | | 1,570 | | 1,729 |
Assurant, Inc. 5.625% 2/15/14 | | 1,772 | | 1,881 |
Axis Capital Holdings Ltd. 5.75% 12/1/14 | | 329 | | 359 |
Great-West Life & Annuity Insurance Co. 7.153% 5/16/46 (h)(n) | | 1,381 | | 1,315 |
Hartford Financial Services Group, Inc. 5.375% 3/15/17 | | 265 | | 273 |
HUB International Holdings, Inc. 9% 12/15/14 (h) | | 3,710 | | 3,617 |
Liberty Mutual Group, Inc.: | | | | |
5% 6/1/21 (h) | | 5,635 | | 5,492 |
6.5% 3/15/35 (h) | | 551 | | 532 |
Marsh & McLennan Companies, Inc. 4.8% 7/15/21 | | 3,209 | | 3,272 |
MetLife, Inc.: | | | | |
2.375% 2/6/14 | | 1,319 | | 1,348 |
5% 6/15/15 | | 686 | | 757 |
5.875% 2/6/41 | | 1,540 | | 1,636 |
6.125% 12/1/11 | | 583 | | 591 |
6.75% 6/1/16 | | 3,874 | | 4,538 |
Corporate Bonds - continued |
| Principal Amount (000s) | | Value (000s) |
Nonconvertible Bonds - continued |
FINANCIALS - continued |
Insurance |
Metropolitan Life Global Funding I: | | | | |
5.125% 4/10/13 (h) | | $ 329 | | $ 348 |
5.125% 6/10/14 (h) | | 3,462 | | 3,776 |
Monumental Global Funding III 5.5% 4/22/13 (h) | | 2,041 | | 2,167 |
New York Life Insurance Co. 6.75% 11/15/39 (h) | | 2,164 | | 2,551 |
Northwestern Mutual Life Insurance Co. 6.063% 3/30/40 (h) | | 3,353 | | 3,677 |
Pacific Life Global Funding 5.15% 4/15/13 (h) | | 3,138 | | 3,309 |
Pacific Life Insurance Co. 9.25% 6/15/39 (h) | | 2,499 | | 3,299 |
Pacific LifeCorp 6% 2/10/20 (h) | | 4,423 | | 4,938 |
Prudential Financial, Inc.: | | | | |
3.875% 1/14/15 | | 2,500 | | 2,592 |
5.15% 1/15/13 | | 2,369 | | 2,481 |
7.375% 6/15/19 | | 1,880 | | 2,247 |
8.875% 6/15/38 (n) | | 1,751 | | 1,909 |
QBE Insurance Group Ltd. 5.647% 7/1/23 (h)(n) | | 437 | | 415 |
Symetra Financial Corp. 6.125% 4/1/16 (h) | | 4,684 | | 4,984 |
Unum Group: | | | | |
5.625% 9/15/20 | | 2,719 | | 2,966 |
7.125% 9/30/16 | | 803 | | 938 |
USI Holdings Corp. 4.1612% 11/15/14 (h)(n) | | 2,920 | | 2,613 |
| | 80,164 |
Real Estate Investment Trusts - 0.2% |
AvalonBay Communities, Inc.: | | | | |
4.95% 3/15/13 | | 216 | | 227 |
5.5% 1/15/12 | | 1,169 | | 1,188 |
BRE Properties, Inc. 5.5% 3/15/17 | | 903 | | 998 |
Camden Property Trust: | | | | |
5.375% 12/15/13 | | 2,150 | | 2,299 |
5.875% 11/30/12 | | 395 | | 413 |
Developers Diversified Realty Corp.: | | | | |
4.75% 4/15/18 | | 3,666 | | 3,479 |
5.375% 10/15/12 | | 2,926 | | 2,961 |
7.5% 4/1/17 | | 3,456 | | 3,842 |
Duke Realty LP: | | | | |
4.625% 5/15/13 | | 741 | | 768 |
5.875% 8/15/12 | | 71 | | 73 |
Corporate Bonds - continued |
| Principal Amount (000s) | | Value (000s) |
Nonconvertible Bonds - continued |
FINANCIALS |
Real Estate Investment Trusts |
Equity One, Inc.: | | | | |
5.375% 10/15/15 | | $ 672 | | $ 713 |
6% 9/15/17 | | 522 | | 544 |
6.25% 12/15/14 | | 924 | | 992 |
6.25% 1/15/17 | | 291 | | 313 |
Federal Realty Investment Trust: | | | | |
5.4% 12/1/13 | | 257 | | 274 |
5.9% 4/1/20 | | 1,287 | | 1,391 |
6% 7/15/12 | | 2,719 | | 2,811 |
6.2% 1/15/17 | | 365 | | 414 |
HRPT Properties Trust: | | | | |
5.75% 11/1/15 | | 1,241 | | 1,329 |
6.25% 6/15/17 | | 726 | | 796 |
6.65% 1/15/18 | | 490 | | 552 |
Omega Healthcare Investors, Inc.: | | | | |
6.75% 10/15/22 | | 1,885 | | 1,805 |
7% 1/15/16 | | 4,090 | | 4,182 |
Senior Housing Properties Trust 8.625% 1/15/12 | | 5,910 | | 6,042 |
Washington (REIT) 5.25% 1/15/14 | | 440 | | 470 |
| | 38,876 |
Real Estate Management & Development - 0.3% |
AMB Property LP 5.9% 8/15/13 | | 1,520 | | 1,575 |
Arden Realty LP 5.2% 9/1/11 | | 1,241 | | 1,241 |
BioMed Realty LP: | | | | |
3.85% 4/15/16 | | 5,000 | | 5,045 |
6.125% 4/15/20 | | 1,703 | | 1,839 |
Brandywine Operating Partnership LP: | | | | |
5.7% 5/1/17 | | 119 | | 125 |
5.75% 4/1/12 | | 1,747 | | 1,780 |
CB Richard Ellis Services, Inc. 6.625% 10/15/20 | | 900 | | 873 |
Digital Realty Trust LP: | | | | |
4.5% 7/15/15 | | 2,465 | | 2,553 |
5.25% 3/15/21 | | 2,876 | | 2,877 |
Duke Realty LP: | | | | |
5.4% 8/15/14 | | 596 | | 630 |
5.5% 3/1/16 | | 2,930 | | 3,107 |
6.75% 3/15/20 | | 517 | | 554 |
8.25% 8/15/19 | | 1,710 | | 2,011 |
Corporate Bonds - continued |
| Principal Amount (000s) | | Value (000s) |
Nonconvertible Bonds - continued |
FINANCIALS - continued |
Real Estate Management & Development |
ERP Operating LP: | | | | |
4.75% 7/15/20 | | $ 3,638 | | $ 3,769 |
5.5% 10/1/12 | | 279 | | 291 |
5.75% 6/15/17 | | 1,446 | | 1,634 |
Liberty Property LP: | | | | |
4.75% 10/1/20 | | 5,547 | | 5,655 |
5.125% 3/2/15 | | 951 | | 1,043 |
5.5% 12/15/16 | | 1,396 | | 1,549 |
Mack-Cali Realty LP 7.75% 8/15/19 | | 957 | | 1,193 |
Post Apartment Homes LP 6.3% 6/1/13 | | 2,240 | | 2,394 |
Realogy Corp. 11.5% 4/15/17 | | 4,960 | | 3,968 |
Regency Centers LP: | | | | |
4.95% 4/15/14 | | 360 | | 383 |
5.25% 8/1/15 | | 1,257 | | 1,360 |
5.875% 6/15/17 | | 639 | | 726 |
Simon Property Group LP: | | | | |
4.2% 2/1/15 | | 1,785 | | 1,903 |
6.75% 5/15/14 | | 4,302 | | 4,883 |
Tanger Properties LP: | | | | |
6.125% 6/1/20 | | 4,914 | | 5,547 |
6.15% 11/15/15 | | 873 | | 984 |
Ventas Realty LP Series 1, 6.5% 6/1/16 | | 660 | | 680 |
| | 62,172 |
Thrifts & Mortgage Finance - 0.1% |
Bank of America Corp.: | | | | |
3.75% 7/12/16 | | 5,900 | | 5,821 |
5.65% 5/1/18 | | 3,745 | | 3,818 |
7.375% 5/15/14 | | 26 | | 28 |
First Niagara Financial Group, Inc. 6.75% 3/19/20 | | 4,160 | | 4,619 |
| | 14,286 |
TOTAL FINANCIALS | | 692,208 |
HEALTH CARE - 0.7% |
Biotechnology - 0.0% |
Celgene Corp. 2.45% 10/15/15 | | 838 | | 852 |
Corporate Bonds - continued |
| Principal Amount (000s) | | Value (000s) |
Nonconvertible Bonds - continued |
HEALTH CARE |
Health Care Equipment & Supplies - 0.0% |
Aviv Healthcare Properties LP/Aviv Healthcare Capital Corp. 7.75% 2/15/19 | | $ 1,235 | | $ 1,189 |
Teleflex, Inc. 6.875% 6/1/19 | | 1,665 | | 1,653 |
| | 2,842 |
Health Care Providers & Services - 0.6% |
Coventry Health Care, Inc.: | | | | |
5.95% 3/15/17 | | 1,030 | | 1,160 |
6.3% 8/15/14 | | 2,132 | | 2,356 |
DaVita, Inc.: | | | | |
6.375% 11/1/18 | | 1,795 | | 1,750 |
6.625% 11/1/20 | | 1,555 | | 1,512 |
Express Scripts, Inc.: | | | | |
3.125% 5/15/16 | | 4,847 | | 4,955 |
6.25% 6/15/14 | | 1,491 | | 1,660 |
HCA Holdings, Inc. 7.75% 5/15/21 (h) | | 22,640 | | 21,734 |
HCA, Inc.: | | | | |
6.5% 2/15/20 | | 10,450 | | 10,502 |
7.5% 2/15/22 | | 3,250 | | 3,218 |
7.875% 2/15/20 | | 4,825 | | 5,115 |
9.875% 2/15/17 | | 551 | | 603 |
IASIS Healthcare LLC/IASIS Capital Corp. 8.375% 5/15/19 (h) | | 4,465 | | 3,918 |
Medco Health Solutions, Inc.: | | | | |
2.75% 9/15/15 | | 1,608 | | 1,644 |
4.125% 9/15/20 | | 3,728 | | 3,736 |
Multiplan, Inc. 9.875% 9/1/18 (h) | | 3,385 | | 3,427 |
Rotech Healthcare, Inc. 10.5% 3/15/18 | | 960 | | 854 |
Sabra Health Care LP/Sabra Capital Corp. 8.125% 11/1/18 | | 655 | | 626 |
Surgical Care Affiliates LLC 8.875% 7/15/15 pay-in-kind (h)(n) | | 4,790 | | 4,790 |
Tenet Healthcare Corp.: | | | | |
8.875% 7/1/19 | | 4,610 | | 4,933 |
9% 5/1/15 | | 1,002 | | 1,055 |
9.875% 7/1/14 | | 4,690 | | 4,913 |
10% 5/1/18 | | 5,002 | | 5,452 |
United Surgical Partners International, Inc. 8.875% 5/1/17 | | 10,745 | | 10,879 |
Corporate Bonds - continued |
| Principal Amount (000s) | | Value (000s) |
Nonconvertible Bonds - continued |
HEALTH CARE - continued |
Health Care Providers & Services |
Vanguard Health Holding Co. II LLC / Vanguard Holding Co. II, Inc. 7.75% 2/1/19 | | $ 1,495 | | $ 1,409 |
Vanguard Health Systems, Inc. 0% 2/1/16 | | 97 | | 63 |
| | 102,264 |
Pharmaceuticals - 0.1% |
Giant Funding Corp. 8.25% 2/1/18 (h) | | 1,900 | | 1,919 |
Valeant Pharmaceuticals International: | | | | |
6.5% 7/15/16 (h) | | 3,695 | | 3,455 |
6.75% 8/15/21 (h) | | 4,585 | | 4,081 |
7% 10/1/20 (h) | | 1,775 | | 1,633 |
7.25% 7/15/22 (h) | | 5,480 | | 4,932 |
Watson Pharmaceuticals, Inc. 5% 8/15/14 | | 984 | | 1,075 |
| | 17,095 |
TOTAL HEALTH CARE | | 123,053 |
INDUSTRIALS - 0.6% |
Aerospace & Defense - 0.0% |
BAE Systems Holdings, Inc.: | | | | |
4.95% 6/1/14 (h) | | 781 | | 844 |
6.375% 6/1/19 (h) | | 3,650 | | 4,273 |
6.4% 12/15/11 (h) | | 482 | | 490 |
Huntington Ingalls Industries, Inc. 6.875% 3/15/18 (h) | | 480 | | 449 |
| | 6,056 |
Airlines - 0.1% |
Continental Airlines, Inc.: | | | | |
pass-thru trust certificates: | | | | |
8.388% 5/1/22 | | 66 | | 64 |
9.798% 4/1/21 | | 5,502 | | 5,695 |
6.648% 3/15/19 | | 2,415 | | 2,499 |
6.9% 7/2/19 | | 701 | | 729 |
7.339% 4/19/14 | | 1,350 | | 1,317 |
Delta Air Lines, Inc. 9.5% 9/15/14 (h) | | 872 | | 889 |
Delta Air Lines, Inc. pass-thru trust certificates 7.779% 1/2/12 | | 35 | | 35 |
U.S. Airways pass-thru trust certificates: | | | | |
6.85% 7/30/19 | | 1,416 | | 1,388 |
Corporate Bonds - continued |
| Principal Amount (000s) | | Value (000s) |
Nonconvertible Bonds - continued |
INDUSTRIALS |
Airlines |
U.S. Airways pass-thru trust certificates: - continued | | | | |
8.36% 1/20/19 | | $ 1,071 | | $ 1,071 |
United Air Lines, Inc. 9.875% 8/1/13 (h) | | 999 | | 1,024 |
| | 14,711 |
Building Products - 0.0% |
Building Materials Corp. of America 6.75% 5/1/21 (h) | | 1,310 | | 1,271 |
Commercial Services & Supplies - 0.3% |
ADS Tactical, Inc. 11% 4/1/18 (h) | | 630 | | 624 |
ARAMARK Holdings Corp. 8.625% 5/1/16 pay-in-kind (h)(n) | | 2,045 | | 2,045 |
Casella Waste Systems, Inc. 11% 7/15/14 | | 1,015 | | 1,127 |
Cenveo Corp. 10.5% 8/15/16 (h) | | 2,590 | | 2,253 |
Covanta Holding Corp. 7.25% 12/1/20 | | 1,920 | | 1,954 |
International Lease Finance Corp.: | | | | |
5.625% 9/20/13 | | 5,290 | | 5,111 |
5.65% 6/1/14 | | 4,439 | | 4,212 |
5.75% 5/15/16 | | 1,840 | | 1,693 |
5.875% 5/1/13 | | 3,460 | | 3,356 |
6.25% 5/15/19 | | 3,035 | | 2,744 |
6.625% 11/15/13 | | 8,252 | | 8,046 |
7.125% 9/1/18 (h) | | 7,560 | | 7,673 |
8.25% 12/15/20 | | 3,190 | | 3,246 |
8.625% 9/15/15 | | 4,640 | | 4,756 |
WP Rocket Merger Sub, Inc. 10.125% 7/15/19 (h) | | 1,200 | | 1,188 |
| | 50,028 |
Industrial Conglomerates - 0.1% |
General Electric Co. 5.25% 12/6/17 | | 7,378 | | 8,266 |
Sequa Corp.: | | | | |
11.75% 12/1/15 (h) | | 2,355 | | 2,461 |
13.5% 12/1/15 pay-in-kind (h) | | 774 | | 823 |
| | 11,550 |
Machinery - 0.0% |
Briggs & Stratton Corp. 6.875% 12/15/20 | | 920 | | 911 |
Navistar International Corp. 8.25% 11/1/21 | | 1,735 | | 1,752 |
| | 2,663 |
Corporate Bonds - continued |
| Principal Amount (000s) | | Value (000s) |
Nonconvertible Bonds - continued |
INDUSTRIALS - continued |
Marine - 0.0% |
Navios Maritime Acquisition Corp./Navios Acquisition Finance US, Inc. 8.625% 11/1/17 | | $ 1,035 | | $ 864 |
Navios Maritime Holdings, Inc.: | | | | |
8.125% 2/15/19 (h) | | 1,625 | | 1,316 |
8.875% 11/1/17 | | 1,420 | | 1,306 |
Navios South American Logisitcs, Inc./Navios Logistics Finance U.S., Inc. 9.25% 4/15/19 (h) | | 505 | | 439 |
| | 3,925 |
Professional Services - 0.0% |
CDRT Merger Sub, Inc. 8.125% 6/1/19 (h) | | 2,305 | | 2,167 |
Road & Rail - 0.0% |
Swift Services Holdings, Inc. 10% 11/15/18 | | 2,640 | | 2,640 |
Western Express, Inc. 12.5% 4/15/15 (h) | | 3,725 | | 2,850 |
| | 5,490 |
Trading Companies & Distributors - 0.1% |
Aircastle Ltd. 9.75% 8/1/18 | | 790 | | 820 |
VWR Funding, Inc. 10.25% 7/15/15 pay-in-kind (n) | | 6,686 | | 6,686 |
| | 7,506 |
TOTAL INDUSTRIALS | | 105,367 |
INFORMATION TECHNOLOGY - 0.5% |
Communications Equipment - 0.2% |
Avaya, Inc.: | | | | |
7% 4/1/19 (h) | | 5,405 | | 4,783 |
10.125% 11/1/15 pay-in-kind (n) | | 6,798 | | 5,948 |
EH Holding Corp. 6.5% 6/15/19 (h) | | 7,595 | | 7,595 |
Lucent Technologies, Inc.: | | | | |
6.45% 3/15/29 | | 16,805 | | 14,452 |
6.5% 1/15/28 | | 1,110 | | 955 |
| | 33,733 |
Computers & Peripherals - 0.0% |
CDW Escrow Corp. 8.5% 4/1/19 (h) | | 2,015 | | 1,854 |
Electronic Equipment & Components - 0.1% |
Reddy Ice Corp. 11.25% 3/15/15 | | 3,895 | | 3,525 |
Tyco Electronics Group SA: | | | | |
5.95% 1/15/14 | | 2,947 | | 3,220 |
Corporate Bonds - continued |
| Principal Amount (000s) | | Value (000s) |
Nonconvertible Bonds - continued |
INFORMATION TECHNOLOGY |
Electronic Equipment & Components |
Tyco Electronics Group SA: | | | | |
6% 10/1/12 | | $ 3,594 | | $ 3,796 |
6.55% 10/1/17 | | 815 | | 970 |
| | 11,511 |
IT Services - 0.1% |
Audatex North America, Inc. 6.75% 6/15/18 (h) | | 1,565 | | 1,549 |
Ceridian Corp. 11.25% 11/15/15 | | 2,730 | | 2,532 |
First Data Corp. 7.375% 6/15/19 (h) | | 6,880 | | 6,502 |
SunGard Data Systems, Inc. 4.875% 1/15/14 | | 12,355 | | 12,201 |
Telcordia Technologies, Inc. 11% 5/1/18 (h) | | 1,665 | | 2,048 |
| | 24,832 |
Office Electronics - 0.0% |
Xerox Corp.: | | | | |
4.25% 2/15/15 | | 503 | | 541 |
5.5% 5/15/12 | | 1,485 | | 1,533 |
| | 2,074 |
Semiconductors & Semiconductor Equipment - 0.1% |
Freescale Semiconductor, Inc.: | | | | |
8.05% 2/1/20 | | 4,005 | | 3,805 |
9.25% 4/15/18 (h) | | 4,030 | | 4,161 |
10.125% 12/15/16 | | 7,080 | | 7,346 |
10.125% 3/15/18 (h) | | 6,887 | | 7,472 |
NXP BV/NXP Funding LLC: | | | | |
2.9993% 10/15/13 (n) | | 621 | | 602 |
9.75% 8/1/18 (h) | | 1,480 | | 1,569 |
Spansion LLC: | | | | |
7.875% 11/15/17 (h) | | 1,150 | | 1,173 |
11.25% 1/15/16 (d)(h) | | 905 | | 143 |
Viasystems, Inc. 12% 1/15/15 (h) | | 2,225 | | 2,439 |
| | 28,710 |
TOTAL INFORMATION TECHNOLOGY | | 102,714 |
MATERIALS - 0.4% |
Chemicals - 0.1% |
Dow Chemical Co.: | | | | |
4.85% 8/15/12 | | 3,205 | | 3,323 |
Corporate Bonds - continued |
| Principal Amount (000s) | | Value (000s) |
Nonconvertible Bonds - continued |
MATERIALS - continued |
Chemicals |
Dow Chemical Co.: | | | | |
7.6% 5/15/14 | | $ 7,168 | | $ 8,261 |
Kinove German Bondco GmbH 9.625% 6/15/18 (h) | | 840 | | 806 |
Lyondell Chemical Co. 11% 5/1/18 | | 675 | | 753 |
| | 13,143 |
Construction Materials - 0.0% |
CRH America, Inc. 6% 9/30/16 | | 1,699 | | 1,877 |
Containers & Packaging - 0.0% |
ARD Finance SA 11.125% 6/1/18 pay-in-kind (h) | | 1,640 | | 1,410 |
Crown Americas LLC/Crown Americas Capital Corp. III 6.25% 2/1/21 (h) | | 2,040 | | 2,091 |
Owens-Illinois, Inc. 7.8% 5/15/18 | | 350 | | 368 |
Pretium Packaging LLC/Pretium Finance, Inc. 11.5% 4/1/16 (h) | | 2,340 | | 2,305 |
Sappi Papier Holding AG 6.625% 4/15/21 (h) | | 375 | | 330 |
| | 6,504 |
Metals & Mining - 0.2% |
Anglo American Capital PLC 9.375% 4/8/14 (h) | | 1,181 | | 1,396 |
Aperam: | | | | |
7.375% 4/1/16 (h) | | 460 | | 432 |
7.75% 4/1/18 (h) | | 375 | | 349 |
ArcelorMittal SA 3.75% 3/1/16 | | 1,466 | | 1,450 |
BHP Billiton Financial (USA) Ltd. 5.125% 3/29/12 | | 1,164 | | 1,195 |
Boart Longyear Management Pty Ltd. 7% 4/1/21 (h) | | 830 | | 822 |
Calcipar SA 6.875% 5/1/18 (h) | | 720 | | 682 |
Corporacion Nacional del Cobre (Codelco) 6.375% 11/30/12 (h) | | 1,179 | | 1,252 |
Edgen Murray Corp. 12.25% 1/15/15 | | 7,385 | | 6,942 |
FMG Resources (August 2006) Pty Ltd. 6.375% 2/1/16 (h) | | 8,300 | | 8,155 |
JMC Steel Group, Inc. 8.25% 3/15/18 (h) | | 1,055 | | 997 |
McJunkin Red Man Corp. 9.5% 12/15/16 | | 5,695 | | 5,723 |
Rain CII Carbon LLC/CII Carbon Corp. 8% 12/1/18 (h) | | 1,335 | | 1,342 |
Severstal Columbus LLC 10.25% 2/15/18 | | 4,670 | | 4,833 |
SunCoke Energy, Inc. 7.625% 8/1/19 (h) | | 445 | | 436 |
United States Steel Corp. 6.65% 6/1/37 | | 3,441 | | 2,796 |
Vale Overseas Ltd. 6.25% 1/23/17 | | 2,152 | | 2,441 |
| | 41,243 |
Corporate Bonds - continued |
| Principal Amount (000s) | | Value (000s) |
Nonconvertible Bonds - continued |
MATERIALS |
Paper & Forest Products - 0.1% |
ABI Escrow Corp. 10.25% 10/15/18 (h) | | $ 6,057 | | $ 6,360 |
Clearwater Paper Corp. 7.125% 11/1/18 | | 485 | | 487 |
Mercer International, Inc. 9.5% 12/1/17 | | 1,195 | | 1,189 |
Verso Paper Holdings LLC/Verso Paper, Inc. 4.004% 8/1/14 (n) | | 1,015 | | 817 |
| | 8,853 |
TOTAL MATERIALS | | 71,620 |
TELECOMMUNICATION SERVICES - 1.1% |
Diversified Telecommunication Services - 0.6% |
AT&T, Inc.: | | | | |
2.5% 8/15/15 | | 5,016 | | 5,136 |
6.3% 1/15/38 | | 5,000 | | 5,579 |
6.8% 5/15/36 | | 8,428 | | 9,878 |
BellSouth Capital Funding Corp. 7.875% 2/15/30 | | 1,291 | | 1,671 |
CenturyLink, Inc.: | | | | |
6.15% 9/15/19 | | 2,344 | | 2,310 |
6.45% 6/15/21 | | 6,195 | | 6,026 |
7.6% 9/15/39 | | 1,148 | | 1,056 |
Clearwire Communications LLC/Clearwire Finance, Inc. 12% 12/1/15 (h) | | 14,900 | | 14,081 |
Embarq Corp. 7.995% 6/1/36 | | 2,180 | | 2,068 |
Frontier Communications Corp. 8.25% 4/15/17 | | 2,710 | | 2,805 |
Intelsat Ltd. 11.25% 6/15/16 | | 3,590 | | 3,734 |
Level 3 Escrow, Inc. 8.125% 7/1/19 (h) | | 2,575 | | 2,433 |
Sprint Capital Corp.: | | | | |
6.875% 11/15/28 | | 21,910 | | 19,609 |
6.9% 5/1/19 | | 14,150 | | 13,938 |
8.375% 3/15/12 | | 2,330 | | 2,400 |
Telefonica Emisiones SAU: | | | | |
5.134% 4/27/20 | | 713 | | 677 |
5.462% 2/16/21 | | 3,562 | | 3,441 |
6.421% 6/20/16 | | 684 | | 718 |
Verizon Communications, Inc.: | | | | |
6.1% 4/15/18 | | 1,909 | | 2,269 |
6.25% 4/1/37 | | 3,729 | | 4,225 |
Verizon New York, Inc. 6.875% 4/1/12 | | 2,460 | | 2,543 |
Corporate Bonds - continued |
| Principal Amount (000s) | | Value (000s) |
Nonconvertible Bonds - continued |
TELECOMMUNICATION SERVICES - continued |
Diversified Telecommunication Services |
Wind Acquisition Finance SA: | | | | |
7.25% 2/15/18 (h) | | $ 1,860 | | $ 1,744 |
11.75% 7/15/17 (h) | | 6,720 | | 6,938 |
Windstream Corp. 7.5% 4/1/23 | | 3,750 | | 3,628 |
| | 118,907 |
Wireless Telecommunication Services - 0.5% |
America Movil SAB de CV: | | | | |
2.375% 9/8/16 (j) | | 3,922 | | 3,890 |
3.625% 3/30/15 | | 999 | | 1,061 |
Clearwire Escrow Corp. 12% 12/1/15 (h) | | 4,000 | | 3,760 |
Crown Castle International Corp. 9% 1/15/15 | | 2,955 | | 3,132 |
Digicel Group Ltd.: | | | | |
8.875% 1/15/15 (h) | | 6,915 | | 6,880 |
12% 4/1/14 (h) | | 3,990 | | 4,429 |
DIRECTV Holdings LLC/DIRECTV Financing, Inc.: | | | | |
4.75% 10/1/14 | | 6,306 | | 6,934 |
5.875% 10/1/19 | | 6,223 | | 7,166 |
6.35% 3/15/40 | | 1,699 | | 1,858 |
Intelsat Jackson Holdings SA: | | | | |
7.25% 4/1/19 (h) | | 10,040 | | 9,588 |
7.5% 4/1/21 (h) | | 5,500 | | 5,253 |
9.5% 6/15/16 | | 4,745 | | 4,935 |
Nextel Communications, Inc.: | | | | |
5.95% 3/15/14 | | 830 | | 813 |
6.875% 10/31/13 | | 4,380 | | 4,353 |
7.375% 8/1/15 | | 11,630 | | 11,441 |
NII Capital Corp. 7.625% 4/1/21 | | 4,760 | | 4,879 |
Vodafone Group PLC 5% 12/16/13 | | 2,129 | | 2,308 |
| | 82,680 |
TOTAL TELECOMMUNICATION SERVICES | | 201,587 |
UTILITIES - 1.0% |
Electric Utilities - 0.5% |
Ameren Illinois Co. 6.125% 11/15/17 | | 243 | | 287 |
AmerenUE 6.4% 6/15/17 | | 2,769 | | 3,311 |
Cleveland Electric Illuminating Co. 5.65% 12/15/13 | | 3,812 | | 4,155 |
Commonwealth Edison Co. 1.625% 1/15/14 | | 3,030 | | 3,058 |
Corporate Bonds - continued |
| Principal Amount (000s) | | Value (000s) |
Nonconvertible Bonds - continued |
UTILITIES |
Electric Utilities |
Duquesne Light Holdings, Inc.: | | | | |
5.9% 12/1/21 (h) | | $ 3,820 | | $ 3,868 |
6.4% 9/15/20 (h) | | 7,663 | | 8,017 |
Edison International 3.75% 9/15/17 | | 3,169 | | 3,287 |
Edison Mission Energy 7% 5/15/17 | | 510 | | 357 |
EDP Finance BV: | | | | |
4.9% 10/1/19 (h) | | 1,300 | | 1,030 |
6% 2/2/18 (h) | | 2,212 | | 1,853 |
Enel Finance International SA 5.7% 1/15/13 (h) | | 282 | | 291 |
FirstEnergy Corp. 7.375% 11/15/31 | | 6,718 | | 7,794 |
FirstEnergy Solutions Corp.: | | | | |
4.8% 2/15/15 | | 1,266 | | 1,380 |
6.05% 8/15/21 | | 4,459 | | 4,882 |
Intergen NV 9% 6/30/17 (h) | | 7,015 | | 7,278 |
IPALCO Enterprises, Inc. 7.25% 4/1/16 (h) | | 3,670 | | 3,931 |
LG&E and KU Energy LLC: | | | | |
2.125% 11/15/15 | | 3,576 | | 3,542 |
3.75% 11/15/20 | | 704 | | 697 |
Mirant Americas Generation LLC 8.5% 10/1/21 | | 6,695 | | 6,327 |
Nevada Power Co.: | | | | |
6.5% 5/15/18 | | 5,100 | | 6,111 |
6.5% 8/1/18 | | 531 | | 639 |
North American Energy Alliance LLC/North American Energy Alliance Finance Corp. 10.875% 6/1/16 (h) | | 3,645 | | 3,882 |
Pennsylvania Electric Co. 6.05% 9/1/17 | | 450 | | 515 |
Pepco Holdings, Inc. 2.7% 10/1/15 | | 3,363 | | 3,439 |
Progress Energy, Inc. 6% 12/1/39 | | 3,060 | | 3,447 |
Sierra Pacific Power Co. 5.45% 9/1/13 | | 527 | | 570 |
| | 83,948 |
Gas Utilities - 0.0% |
Southern Natural Gas Co. 5.9% 4/1/17 (h) | | 260 | | 299 |
Southern Natural Gas Co. / Southern Natural Issuing Corp. 4.4% 6/15/21 (h) | | 1,660 | | 1,729 |
Star Gas Partners LP/Star Gas Finance Co. 8.875% 12/1/17 | | 950 | | 964 |
| | 2,992 |
Independent Power Producers & Energy Traders - 0.3% |
Calpine Corp. 7.875% 1/15/23 (h) | | 12,985 | | 13,017 |
Corporate Bonds - continued |
| Principal Amount (000s) | | Value (000s) |
Nonconvertible Bonds - continued |
UTILITIES - continued |
Independent Power Producers & Energy Traders - continued |
Duke Capital LLC 5.668% 8/15/14 | | $ 1,905 | | $ 2,117 |
Energy Future Holdings Corp. 10% 1/15/20 | | 8,915 | | 8,937 |
Energy Future Intermediate Holding Co. LLC/Energy Future Intermediate Holding Finance, Inc.: | | | | |
10% 12/1/20 | | 3,174 | | 3,174 |
11% 10/1/21 (h) | | 6,978 | | 6,490 |
Exelon Generation Co. LLC: | | | | |
4% 10/1/20 | | 6,689 | | 6,646 |
5.35% 1/15/14 | | 900 | | 971 |
GenOn Energy, Inc. 9.875% 10/15/20 | | 2,325 | | 2,284 |
The AES Corp.: | | | | |
7.375% 7/1/21 (h) | | 1,580 | | 1,596 |
7.75% 10/15/15 | | 4,660 | | 4,881 |
TXU Corp.: | | | | |
6.5% 11/15/24 | | 3,915 | | 1,527 |
6.55% 11/15/34 | | 2,965 | | 1,127 |
| | 52,767 |
Multi-Utilities - 0.2% |
Consolidated Edison Co. of New York, Inc. 5.7% 6/15/40 | | 1,866 | | 2,144 |
Dominion Resources, Inc.: | | | | |
6.3% 9/30/66 (n) | | 13,469 | | 12,863 |
7.5% 6/30/66 (n) | | 1,102 | | 1,130 |
MidAmerican Energy Holdings, Co.: | | | | |
5.875% 10/1/12 | | 2,521 | | 2,655 |
6.5% 9/15/37 | | 1,418 | | 1,703 |
National Grid PLC 6.3% 8/1/16 | | 376 | | 438 |
NiSource Finance Corp.: | | | | |
5.25% 9/15/17 | | 497 | | 556 |
5.4% 7/15/14 | | 1,249 | | 1,372 |
5.45% 9/15/20 | | 598 | | 671 |
5.95% 6/15/41 | | 5,667 | | 5,781 |
6.25% 12/15/40 | | 1,190 | | 1,309 |
6.4% 3/15/18 | | 1,230 | | 1,446 |
6.8% 1/15/19 | | 2,710 | | 3,240 |
Corporate Bonds - continued |
| Principal Amount (000s) | | Value (000s) |
Nonconvertible Bonds - continued |
UTILITIES |
Multi-Utilities |
San Diego Gas & Electric Co. 3% 8/15/21 | | $ 1,493 | | $ 1,486 |
Wisconsin Energy Corp. 6.25% 5/15/67 (n) | | 2,776 | | 2,748 |
| | 39,542 |
TOTAL UTILITIES | | 179,249 |
TOTAL NONCONVERTIBLE BONDS | | 2,014,382 |
TOTAL CORPORATE BONDS (Cost $1,946,822) | 2,046,762 |
U.S. Government and Government Agency Obligations - 10.2% |
|
U.S. Government Agency Obligations - 0.1% |
Tennessee Valley Authority 3.875% 2/15/21 | | 28,100 | | 30,968 |
U.S. Treasury Inflation Protected Obligations - 0.8% |
U.S. Treasury Inflation-Indexed Bonds: | | | | |
2.125% 2/15/40 | | 56,198 | | 69,000 |
2.125% 2/15/41 | | 64,537 | | 79,743 |
TOTAL U.S. TREASURY INFLATION PROTECTED OBLIGATIONS | | 148,743 |
U.S. Treasury Obligations - 9.3% |
U.S. Treasury Bonds 4.375% 5/15/41 | | 135,976 | | 155,225 |
U.S. Treasury Notes: | | | | |
0.5% 8/15/14 | | 71,220 | | 71,587 |
0.625% 7/15/14 | | 607,323 | | 612,718 |
0.75% 6/15/14 | | 94,959 | | 96,153 |
1% 10/31/11 | | 120,000 | | 120,187 |
1% 8/31/16 | | 8,529 | | 8,543 |
1.5% 7/31/16 | | 33,794 | | 34,710 |
1.5% 8/31/18 | | 20,273 | | 20,178 |
2.125% 8/15/21 (f) | | 84,560 | | 83,728 |
U.S. Government and Government Agency Obligations - continued |
| Principal Amount (000s) | | Value (000s) |
U.S. Treasury Obligations - continued |
U.S. Treasury Notes: - continued | | | | |
3.125% 4/30/17 | | $ 177,840 | | $ 196,805 |
3.125% 5/15/21 (l) | | 303,631 | | 328,395 |
TOTAL U.S. TREASURY OBLIGATIONS | | 1,728,229 |
TOTAL U.S. GOVERNMENT AND GOVERNMENT AGENCY OBLIGATIONS (Cost $1,828,067) | 1,907,940 |
U.S. Government Agency - Mortgage Securities - 8.1% |
|
Fannie Mae - 6.3% |
2.303% 6/1/36 (n) | | 151 | | 157 |
2.636% 7/1/37 (n) | | 492 | | 520 |
3% 10/1/26 (j) | | 11,000 | | 11,257 |
3.5% 11/1/25 to 1/1/41 | | 55,033 | | 55,978 |
4% 4/1/24 to 8/1/41 | | 96,931 | | 100,587 |
4% 9/1/41 (j)(k) | | 30,000 | | 31,091 |
4% 9/1/41 (j)(k) | | 167,000 | | 173,076 |
4% 9/1/41 (j)(k) | | 16,000 | | 16,582 |
4% 9/1/41 (j)(k) | | 47,000 | | 48,710 |
4% 9/1/41 (j)(k) | | 109,000 | | 112,966 |
4.5% 6/1/24 to 9/1/41 (k) | | 141,600 | | 150,276 |
4.5% 9/1/26 (j)(k) | | 1,500 | | 1,599 |
4.5% 9/1/41 (j)(k) | | 9,000 | | 9,515 |
4.5% 9/1/41 (j)(k) | | 24,000 | | 25,372 |
4.5% 9/1/41 (j)(k) | | 47,000 | | 49,688 |
4.5% 9/1/41 (j)(k) | | 16,200 | | 17,126 |
4.5% 9/1/41 (j)(k) | | 19,000 | | 20,087 |
4.5% 9/1/41 (j)(k) | | 13,000 | | 13,743 |
4.5% 9/1/41 (j)(k) | | 4,000 | | 4,229 |
4.5% 9/1/41 (j)(k) | | 9,040 | | 9,557 |
5% 6/1/24 to 8/1/40 (k) | | 74,208 | | 80,168 |
5% 9/1/41 (j) | | 15,000 | | 16,155 |
5.5% 6/1/33 to 3/1/40 (j) | | 64,392 | | 70,690 |
5.5% 9/1/41 (j)(k) | | 4,200 | | 4,591 |
5.5% 9/1/41 (j)(k) | | 4,000 | | 4,372 |
5.5% 9/1/41 (j)(k) | | 25,000 | | 27,325 |
5.5% 9/1/41 (j)(k) | | 25,000 | | 27,325 |
5.5% 9/1/41 (j)(k) | | 4,000 | | 4,372 |
U.S. Government Agency - Mortgage Securities - continued |
| Principal Amount (000s) | | Value (000s) |
Fannie Mae - continued |
5.5% 9/1/41 (j)(k) | | $ 4,200 | | $ 4,591 |
5.5% 9/1/41 (j)(k) | | 2,000 | | 2,186 |
5.5% 9/1/41 (j)(k) | | 6,000 | | 6,558 |
6% 6/1/35 to 9/1/39 | | 66,482 | | 73,725 |
6% 9/1/41 (j) | | 3,800 | | 4,207 |
6% 9/1/41 (j) | | 2,000 | | 2,214 |
TOTAL FANNIE MAE | | 1,180,595 |
Freddie Mac - 1.0% |
3.261% 10/1/35 (n) | | 228 | | 243 |
4% 9/1/41 (j) | | 2,000 | | 2,071 |
4.5% 5/1/39 to 8/1/41 (j) | | 41,912 | | 44,320 |
4.5% 9/1/41 (j) | | 8,000 | | 8,441 |
4.5% 9/1/41 (j)(k) | | 14,300 | | 15,089 |
4.5% 9/1/41 (j)(k) | | 5,000 | | 5,276 |
5% 3/1/19 to 12/1/40 | | 34,834 | | 37,615 |
5.5% 5/1/27 to 2/1/40 | | 53,075 | | 57,924 |
5.5% 9/1/41 (j) | | 4,700 | | 5,126 |
5.5% 9/1/41 (j) | | 5,600 | | 6,108 |
6% 7/1/37 to 8/1/37 | | 1,395 | | 1,549 |
6.5% 3/1/36 | | 3,970 | | 4,476 |
TOTAL FREDDIE MAC | | 188,238 |
Ginnie Mae - 0.8% |
3.5% 1/15/41 to 2/15/41 | | 10,581 | | 10,842 |
4% 1/15/25 to 7/15/41 | | 16,269 | | 17,361 |
4% 9/1/41 (j) | | 16,000 | | 16,932 |
4.5% 3/15/39 to 7/20/41 | | 34,056 | | 36,947 |
4.5% 9/1/41 (j) | | 6,550 | | 7,086 |
5% 4/15/38 to 9/15/40 | | 12,464 | | 13,787 |
5% 9/1/41 (j) | | 5,000 | | 5,508 |
5% 9/1/41 (j) | | 10,000 | | 11,017 |
5% 9/1/41 (j) | | 9,000 | | 9,915 |
5.5% 12/15/38 to 9/15/39 | | 2,249 | | 2,516 |
6% 2/15/34 | | 8,510 | | 9,618 |
TOTAL GINNIE MAE | | 141,529 |
TOTAL U.S. GOVERNMENT AGENCY - MORTGAGE SECURITIES (Cost $1,491,784) | 1,510,362 |
Asset-Backed Securities - 0.3% |
| Principal Amount (000s) | | Value (000s) |
Accredited Mortgage Loan Trust Series 2005-1 Class M1, 0.6884% 4/25/35 (n) | | $ 1,091 | | $ 722 |
ACE Securities Corp. Home Equity Loan Trust: | | | | |
Series 2004-HE1: | | | | |
Class M1, 0.9684% 3/25/34 (n) | | 5 | | 5 |
Class M2, 1.8684% 3/25/34 (n) | | 334 | | 251 |
Series 2005-HE2 Class M2, 0.6684% 4/25/35 (n) | | 106 | | 102 |
Series 2006-OP1 Class M4, 0.5884% 4/25/36 (n) | | 84 | | 0* |
Advanta Business Card Master Trust Series 2006-C1 Class C1, 0.6758% 10/20/14 (n) | | 472 | | 5 |
Ally Master Owner Trust: | | | | |
Series 2010-3 Class A, 2.88% 4/15/15 (h) | | 2,460 | | 2,530 |
Series 2011-1 Class A2, 2.15% 1/15/16 | | 4,540 | | 4,630 |
Series 2011-3 Class A2, 1.81% 5/15/16 | | 4,060 | | 4,105 |
AmeriCredit Prime Automobile Receivables Trust Series 2007-1 Class D, 5.62% 9/8/14 | | 539 | | 544 |
Ameriquest Mortgage Securities, Inc. pass-thru certificates: | | | | |
Series 2003-10 Class M1, 0.9184% 12/25/33 (n) | | 67 | | 52 |
Series 2004-R2 Class M3, 0.7684% 4/25/34 (n) | | 101 | | 34 |
Series 2005-R2 Class M1, 0.6684% 4/25/35 (n) | | 1,567 | | 1,366 |
Argent Securities, Inc. pass-thru certificates: | | | | |
Series 2003-W7 Class A2, 0.9673% 3/25/34 (n) | | 36 | | 24 |
Series 2004-W11 Class M2, 0.9184% 11/25/34 (n) | | 426 | | 352 |
Series 2004-W7 Class M1, 0.7684% 5/25/34 (n) | | 1,108 | | 801 |
Series 2006-W4 Class A2C, 0.3784% 5/25/36 (n) | | 1,027 | | 261 |
Asset Backed Securities Corp. Home Equity Loan Trust: | | | | |
Series 2004-HE2 Class M1, 1.0434% 4/25/34 (n) | | 2,011 | | 1,567 |
Series 2006-HE2 Class M1, 0.5884% 3/25/36 (n) | | 125 | | 1 |
Axon Financial Funding Ltd. 0.8458% 4/4/17 (d)(h)(n) | | 4,820 | | 0 |
Brazos Higher Education Authority, Inc. Series 2006-2 Class A9, 0.2565% 12/25/24 (n) | | 1,109 | | 968 |
C-BASS Trust Series 2006-CB7 Class A2, 0.2784% 10/25/36 (n) | | 10 | | 10 |
Capital Auto Receivables Asset Trust Series 2007-1 Class C, 5.38% 11/15/12 | | 403 | | 413 |
Capital Trust Ltd. Series 2004-1: | | | | |
Class A2, 0.663% 7/20/39 (h)(n) | | 215 | | 155 |
Class B, 0.963% 7/20/39 (h)(n) | | 200 | | 78 |
Class C, 1.313% 7/20/39 (h)(n) | | 258 | | 10 |
Carrington Mortgage Loan Trust: | | | | |
Series 2006-FRE1 Class M1, 0.5184% 7/25/36 (n) | | 4,366 | | 219 |
Series 2006-NC4 Class M1, 0.5184% 10/25/36 (n) | | 2,725 | | 38 |
Asset-Backed Securities - continued |
| Principal Amount (000s) | | Value (000s) |
Carrington Mortgage Loan Trust: - continued | | | | |
Series 2007-RFC1 Class A3, 0.3584% 12/25/36 (n) | | $ 1,368 | | $ 390 |
Citibank Credit Card Issuance Trust Series 2009-A5 Class A5, 2.25% 12/23/14 | | 9,250 | | 9,457 |
Citigroup Mortgage Loan Trust Series 2005-HE4 Class A2C, 0.4884% 10/25/35 (n) | | 1,194 | | 1,141 |
Countrywide Asset-Backed Certificates Trust: | | | | |
Series 2007-11 Class 2A1, 0.2784% 6/25/47 (n) | | 30 | | 29 |
Series 2007-4 Class A1A, 0.3073% 9/25/37 (n) | | 272 | | 259 |
Series 2007-5 Class 2A1, 0.3184% 9/25/47 (n) | | 2,794 | | 2,708 |
Countrywide Home Loan Trust Series 2006-13 Class N, 7% 8/25/37 (h) | | 251 | | 0 |
Countrywide Home Loans, Inc.: | | | | |
Series 2004-3 Class M4, 1.1884% 4/25/34 (n) | | 121 | | 60 |
Series 2004-4 Class M2, 1.0134% 6/25/34 (n) | | 446 | | 196 |
Series 2005-3 Class MV1, 0.6384% 8/25/35 (n) | | 433 | | 420 |
Series 2005-AB1 Class A2, 0.4284% 8/25/35 (n) | | 37 | | 36 |
CPS Auto Receivables Trust Series 2006-D Class A4, 5.115% 8/15/13 (FSA Insured) (h) | | 125 | | 125 |
Fannie Mae subordinate REMIC pass-thru certificates Series 2004-T5 Class AB3, 0.5908% 5/28/35 (n) | | 30 | | 19 |
Fieldstone Mortgage Investment Corp. Series 2004-3 Class M5, 2.3934% 8/25/34 (n) | | 221 | | 126 |
First Franklin Mortgage Loan Trust: | | | | |
Series 2004-FF2 Class M3, 1.0434% 3/25/34 (n) | | 17 | | 4 |
Series 2006-FF14 Class A2, 0.2784% 10/25/36 (n) | | 858 | | 820 |
Ford Credit Floorplan Master Owner Trust Series 2010-5 Class A1, 1.5% 9/15/15 | | 4,990 | | 5,031 |
Franklin Auto Trust: | | | | |
Series 2006-1 Class B, 5.14% 7/21/14 | | 12 | | 12 |
Series 2007-1: | | | | |
Class A4, 5.03% 2/16/15 | | 30 | | 30 |
Class C, 5.43% 2/16/15 | | 426 | | 426 |
Fremont Home Loan Trust: | | | | |
Series 2005-A: | | | | |
Class M3, 0.7084% 1/25/35 (n) | | 720 | | 285 |
Class M4, 0.8984% 1/25/35 (n) | | 276 | | 72 |
Series 2006-D Class M1, 0.4484% 11/25/36 (n) | | 119 | | 4 |
GCO Education Loan Funding Master Trust II Series 2007-1A Class C1L, 0.6918% 2/25/47 (h)(n) | | 2,160 | | 1,274 |
GCO Slims Trust Series 2006-1A, 5.72% 3/1/22 (h) | | 707 | | 563 |
GE Business Loan Trust: | | | | |
Series 2003-1 Class A, 0.6372% 4/15/31 (h)(n) | | 180 | | 169 |
Asset-Backed Securities - continued |
| Principal Amount (000s) | | Value (000s) |
GE Business Loan Trust: - continued | | | | |
Series 2006-2A: | | | | |
Class A, 0.3872% 11/15/34 (h)(n) | | $ 1,199 | | $ 992 |
Class B, 0.4872% 11/15/34 (h)(n) | | 434 | | 280 |
Class C, 0.5872% 11/15/34 (h)(n) | | 720 | | 356 |
Class D, 0.9572% 11/15/34 (h)(n) | | 274 | | 66 |
Goal Capital Funding Trust Series 2007-1 Class C1, 0.6465% 6/25/42 (n) | | 394 | | 307 |
GSAMP Trust: | | | | |
Series 2004-AR1 Class M1, 0.8684% 6/25/34 (n) | | 2,032 | | 1,255 |
Series 2007-HE1 Class M1, 0.4684% 3/25/47 (n) | | 820 | | 37 |
Guggenheim Structured Real Estate Funding Ltd. Series 2006-3: | | | | |
Class B, 0.6184% 9/25/46 (h)(n) | | 277 | | 119 |
Class C, 0.7684% 9/25/46 (h)(n) | | 1,159 | | 185 |
Home Equity Asset Trust: | | | | |
Series 2003-2 Class M1, 1.5384% 8/25/33 (n) | | 286 | | 199 |
Series 2003-3 Class M1, 1.5084% 8/25/33 (n) | | 550 | | 436 |
Series 2003-5 Class A2, 0.9184% 12/25/33 (n) | | 25 | | 17 |
Series 2005-5 Class 2A2, 0.4684% 11/25/35 (n) | | 36 | | 36 |
Series 2006-1 Class 2A3, 0.4434% 4/25/36 (n) | | 614 | | 598 |
HSBC Home Equity Loan Trust Series 2006-2 Class M2, 0.503% 3/20/36 (n) | | 497 | | 414 |
HSI Asset Securitization Corp. Trust Series 2007-HE1 Class 2A3, 0.4084% 1/25/37 (n) | | 1,137 | | 385 |
JPMorgan Mortgage Acquisition Trust: | | | | |
Series 2006-NC2 Class M2, 0.5184% 7/25/36 (n) | | 2,497 | | 111 |
Series 2007-CH1: | | | | |
Class AV4, 0.3484% 11/25/36 (n) | | 1,136 | | 897 |
Class MV1, 0.4484% 11/25/36 (n) | | 923 | | 591 |
Series 2007-CH3 Class M1, 0.5184% 3/25/37 (n) | | 397 | | 16 |
Keycorp Student Loan Trust: | | | | |
Series 1999-A Class A2, 0.5765% 12/27/29 (n) | | 506 | | 448 |
Series 2006-A Class 2C, 1.3965% 3/27/42 (n) | | 2,016 | | 502 |
Long Beach Auto Receivables Trust Series 2007-A Class A4, 5.025% 1/15/14 (FSA Insured) | | 669 | | 670 |
Long Beach Mortgage Loan Trust Series 2004-2 Class M2, 1.2984% 6/25/34 (n) | | 68 | | 47 |
Marriott Vacation Club Owner Trust Series 2006-2A: | | | | |
Class B, 5.442% 10/20/28 (h) | | 9 | | 9 |
Class C, 5.691% 10/20/28 (h) | | 4 | | 4 |
Class D, 6.01% 10/20/28 (h) | | 49 | | 49 |
Asset-Backed Securities - continued |
| Principal Amount (000s) | | Value (000s) |
MASTR Asset Backed Securities Trust: | | | | |
Series 2006-AM3 Class M1, 0.4784% 10/25/36 (n) | | $ 407 | | $ 18 |
Series 2007-HE1 Class M1, 0.5184% 5/25/37 (n) | | 596 | | 20 |
Meritage Mortgage Loan Trust Series 2004-1 Class M1, 0.9684% 7/25/34 (n) | | 121 | | 78 |
Merrill Lynch Mortgage Investors Trust: | | | | |
Series 2003-OPT1 Class M1, 1.1934% 7/25/34 (n) | | 420 | | 288 |
Series 2006-FM1 Class A2B, 0.3284% 4/25/37 (n) | | 1,409 | | 1,023 |
Series 2006-OPT1 Class A1A, 0.4784% 6/25/35 (n) | | 2,228 | | 1,589 |
Morgan Stanley ABS Capital I Trust: | | | | |
Series 2004-HE6 Class A2, 0.5584% 8/25/34 (n) | | 44 | | 30 |
Series 2005-NC1 Class M1, 0.6584% 1/25/35 (n) | | 303 | | 194 |
Series 2005-NC2 Class B1, 1.3884% 3/25/35 (n) | | 316 | | 41 |
Series 2007-HE2 Class M1, 0.4684% 1/25/37 (n) | | 3,110 | | 13 |
National Collegiate Student Loan Trust: | | | | |
Series 2004-2 Class A, 9.75% 10/27/14 (p) | | 1,364 | | 124 |
Series 2006-3 Class A, 7.1% 1/25/12 (p) | | 198 | | 4 |
Series 2006-4: | | | | |
Class A1, 0.2484% 3/25/25 (n) | | 5 | | 5 |
Class A, 6.35% 2/27/12 (p) | | 819 | | 18 |
Class D, 1.3184% 5/25/32 (n) | | 1,544 | | 3 |
Series 2007-1 Class A, 7.27% 4/25/12 (p) | | 1,101 | | 44 |
Series 2007-2 Class A, 6.7% 7/25/12 (p) | | 936 | | 48 |
New Century Home Equity Loan Trust: | | | | |
Series 2005-4 Class M2, 0.7284% 9/25/35 (n) | | 1,083 | | 590 |
Series 2005-D Class M2, 0.6884% 2/25/36 (n) | | 593 | | 117 |
Ocala Funding LLC: | | | | |
Series 2005-1A Class A, 1.713% 3/20/10 (d)(h)(n) | | 429 | | 0 |
Series 2006-1A Class A, 1.613% 3/20/11 (d)(h)(n) | | 892 | | 0 |
Option One Mortgage Loan Trust: | | | | |
Series 2007-5 Class 2A1, 0.3084% 5/25/37 (n) | | 25 | | 25 |
Series 2007-6 Class 2A1, 0.2784% 7/25/37 (n) | | 82 | | 79 |
Park Place Securities, Inc.: | | | | |
Series 2004-WCW1: | | | | |
Class M3, 1.4684% 9/25/34 (n) | | 405 | | 237 |
Class M4, 1.6684% 9/25/34 (n) | | 519 | | 213 |
Series 2005-WCH1: | | | | |
Class M2, 0.7384% 1/25/36 (n) | | 1,817 | | 1,644 |
Class M3, 0.7784% 1/25/36 (n) | | 363 | | 232 |
Class M4, 1.0484% 1/25/36 (n) | | 1,120 | | 565 |
Series 2005-WHQ2 Class M7, 1.4684% 5/25/35 (n) | | 1,328 | | 9 |
Residential Asset Mortgage Products, Inc. Series 2006-EFC2 Class M1, 0.4484% 12/25/36 (n) | | 271 | | 6 |
Asset-Backed Securities - continued |
| Principal Amount (000s) | | Value (000s) |
Residential Asset Securities Corp. Series 2007-KS2 Class AI1, 0.2884% 2/25/37 (n) | | $ 1 | | $ 1 |
Salomon Brothers Mortgage Securities VII, Inc. Series 2003-HE1 Class A, 1.0184% 4/25/33 (n) | | 4 | | 3 |
Saxon Asset Securities Trust Series 2004-1 Class M1, 1.0134% 3/25/35 (n) | | 1,092 | | 855 |
Securitized Asset Backed Receivables LLC Trust Series 2005-FR4 Class B3, 1.9384% 1/25/36 (n) | | 18 | | 0* |
Sierra Receivables Funding Co. Series 2007-1A Class A2, 0.3363% 3/20/19 (FGIC Insured) (h)(n) | | 478 | | 456 |
SLM Private Credit Student Loan Trust Series 2004-A Class C, 1.197% 6/15/33 (n) | | 965 | | 444 |
Specialty Underwriting & Residential Finance Trust Series 2006-AB2 Class N1, 5.75% 6/25/37 (h) | | 455 | | 0 |
Structured Asset Investment Loan Trust Series 2004-8 Class M5, 1.9434% 9/25/34 (n) | | 52 | | 28 |
SVO VOI Mortgage Corp. Series 2006-AA Class A, 5.28% 2/20/24 (h) | | 484 | | 504 |
Terwin Mortgage Trust Series 2003-4HE Class A1, 1.0784% 9/25/34 (n) | | 22 | | 15 |
Trapeza CDO XII Ltd./Trapeza CDO XII, Inc. Series 2007-12A Class B, 0.8058% 4/6/42 (h)(n) | | 1,494 | | 112 |
WaMu Asset Holdings Corp. Series 2006-8 Class N1, 6.048% 10/25/46 (h) | | 674 | | 0 |
Wells Fargo Home Equity Trust Series 2004-3 Class A, 4.5% 11/27/34 (h) | | 6 | | 0 |
Whinstone Capital Management Ltd. Series 1A Class B3, 2.053% 10/25/44 (h)(n) | | 1,358 | | 761 |
TOTAL ASSET-BACKED SECURITIES (Cost $66,007) | 62,361 |
Collateralized Mortgage Obligations - 0.4% |
|
Private Sponsor - 0.4% |
Banc of America Commercial Mortgage Trust Series 2007-2: | | | | |
Class B, 5.6565% 4/10/49 (n) | | 51 | | 23 |
Class C, 5.6565% 4/10/49 (n) | | 135 | | 55 |
Class D, 5.6565% 4/10/49 (n) | | 67 | | 23 |
Banc of America Funding Corp. sequential payer Series 2010-R4 Class 2A1, 4.5% 3/26/37 (h) | | 2,043 | | 2,078 |
Banc of America Mortgage Securities, Inc.: | | | | |
Series 2003-L Class 2A1, 2.9045% 1/25/34 (n) | | 1,305 | | 1,152 |
Collateralized Mortgage Obligations - continued |
| Principal Amount (000s) | | Value (000s) |
Private Sponsor - continued |
Banc of America Mortgage Securities, Inc.: - continued | | | | |
Series 2004-1 Class 2A2, 3.2303% 10/25/34 (n) | | $ 1,335 | | $ 1,141 |
Series 2004-A Class 2A2, 2.8478% 2/25/34 (n) | | 669 | | 572 |
Series 2004-B: | | | | |
Class 1A1, 2.7465% 3/25/34 (n) | | 100 | | 86 |
Class 2A2, 2.8677% 3/25/34 (n) | | 778 | | 696 |
Series 2004-D Class 2A2, 2.8857% 5/25/34 (n) | | 1,177 | | 1,029 |
Series 2004-G Class 2A7, 2.9352% 8/25/34 (n) | | 1,093 | | 931 |
Series 2004-H Class 2A1, 3.1632% 9/25/34 (n) | | 955 | | 804 |
Bayview Commercial Asset Trust Series 2006-3A, Class IO, 4.2221% 10/25/36 (h)(n)(p) | | 31,300 | | 1,988 |
Bear Stearns ALT-A Trust floater Series 2005-1 Class A1, 0.7784% 1/25/35 (n) | | 1,569 | | 1,186 |
Bear Stearns Commercial Mortgage Securities Trust Series 2006-T24 Class X2, 0.4258% 10/12/41 (h)(n)(p) | | 2,557 | | 23 |
Chase Mortgage Finance Trust: | | | | |
Series 2007-A1 Class 1A5, 2.8968% 2/25/37 (n) | | 334 | | 295 |
Series 2007-A2 Class 2A1, 3.0179% 7/25/37 (n) | | 3,353 | | 3,084 |
Citigroup Commercial Mortgage Trust Series 2008-C7 Class A2B, 6.0737% 12/10/49 (n) | | 912 | | 945 |
Citigroup Mortgage Loan Trust Series 2004-UST1 Class A4, 2.2809% 8/25/34 (n) | | 812 | | 803 |
Cobalt CMBS Commercial Mortgage Trust Series 2007-C2 Class B, 5.617% 4/15/47 (n) | | 1,019 | | 285 |
COMM pass-thru certificates floater Series 2001-J2A Class A2F, 0.7083% 7/16/34 (h)(n) | | 14 | | 14 |
Credit Suisse First Boston Mortgage Securities Corp. floater Series 2007-AR7 Class 2A1, 2.7846% 11/25/34 (n) | | 151 | | 134 |
First Horizon Mortgage pass-thru Trust Series 2004-AR5 Class 2A1, 2.858% 10/25/34 (n) | | 1,101 | | 979 |
Gracechurch Mortgage Financing PLC floater Series 2006-1 Class D2, 0.7678% 11/20/56 (h)(n) | | 2,161 | | 2,146 |
Granite Master Issuer PLC floater: | | | | |
Series 2005-4 Class C2, 1.313% 12/20/54 (n) | | 142 | | 65 |
Series 2006-1A Class C2, 1.413% 12/20/54 (h)(n) | | 4,917 | | 2,299 |
Series 2006-2 Class C1, 1.153% 12/20/54 (n) | | 4,095 | | 1,914 |
Series 2006-3 Class C2, 0.713% 12/20/54 (n) | | 853 | | 399 |
Series 2006-4: | | | | |
Class B1, 0.303% 12/20/54 (n) | | 3,154 | | 2,500 |
Class C1, 0.593% 12/20/54 (n) | | 1,928 | | 901 |
Class M1, 0.383% 12/20/54 (n) | | 829 | | 531 |
Collateralized Mortgage Obligations - continued |
| Principal Amount (000s) | | Value (000s) |
Private Sponsor - continued |
Granite Master Issuer PLC floater: - continued | | | | |
Series 2007-1: | | | | |
Class 1C1, 0.813% 12/20/54 (n) | | $ 1,671 | | $ 781 |
Class 1M1, 0.513% 12/20/54 (n) | | 1,114 | | 713 |
Class 2C1, 1.173% 12/20/54 (n) | | 760 | | 355 |
Class 2M1, 0.713% 12/20/54 (n) | | 1,431 | | 916 |
Series 2007-2 Class 2C1, 0.6402% 12/17/54 (n) | | 1,981 | | 926 |
Granite Mortgages PLC floater Series 2003-3 Class 1C, 2.7013% 1/20/44 (n) | | 326 | | 222 |
GSR Mortgage Loan Trust Series 2007-AR2 Class 2A1, 2.7323% 4/25/35 (n) | | 509 | | 404 |
JPMorgan Chase Commercial Mortgage Securities Trust Series 2007-CB18: | | | | |
Class A1, 5.32% 6/12/47 (n) | | 10 | | 10 |
Class A3, 5.447% 6/12/47 (n) | | 1,730 | | 1,796 |
JPMorgan Mortgage Trust: | | | | |
sequential payer Series 2006-A5 Class 3A5, 5.8639% 8/25/36 (n) | | 1,855 | | 1,411 |
Series 2004-A3 Class 4A1, 2.7486% 7/25/34 (n) | | 921 | | 881 |
Series 2004-A5 Class 2A1, 2.5513% 12/25/34 (n) | | 1,135 | | 985 |
Series 2006-A2 Class 5A1, 2.9458% 11/25/33 (n) | | 2,570 | | 2,342 |
LB-UBS Commercial Mortgage Trust sequential payer Series 2006-C6 Class A4, 5.372% 9/15/39 | | 410 | | 444 |
MASTR Adjustable Rate Mortgages Trust Series 2007-3 Class 22A2, 0.4284% 5/25/47 (n) | | 683 | | 440 |
Merrill Lynch Alternative Note Asset Trust floater Series 2007-OAR1 Class A1, 0.3884% 2/25/37 (n) | | 1,237 | | 829 |
Merrill Lynch Floating Trust floater Series 2006-1: | | | | |
Class B, 0.377% 6/15/22 (h)(n) | | 188 | | 182 |
Class C, 0.397% 6/15/22 (h)(n) | | 1,165 | | 1,089 |
Class D, 0.407% 6/15/22 (h)(n) | | 448 | | 417 |
Class E, 0.417% 6/15/22 (h)(n) | | 717 | | 660 |
Class F, 0.447% 6/15/22 (h)(n) | | 1,164 | | 1,059 |
Class G, 0.517% 6/15/22 (h)(n) | | 269 | | 239 |
Class H, 0.537% 6/15/22 (h)(n) | | 538 | | 468 |
Class J, 0.577% 6/15/22 (h)(n) | | 628 | | 542 |
Merrill Lynch Mortgage Investors Trust: | | | | |
Series 2004-A4 Class A1, 2.6423% 8/25/34 (n) | | 1,272 | | 1,202 |
Series 2005-A2 Class A7, 2.6224% 2/25/35 (n) | | 957 | | 895 |
Series 2006-A6 Class A4, 3.1818% 10/25/33 (n) | | 1,083 | | 975 |
Merrill Lynch-CFC Commercial Mortgage Trust Series 2006-3 Class ASB, 5.382% 7/12/46 (n) | | 3,905 | | 4,063 |
Collateralized Mortgage Obligations - continued |
| Principal Amount (000s) | | Value (000s) |
Private Sponsor - continued |
Opteum Mortgage Acceptance Corp. floater Series 2005-3 Class APT, 0.5084% 7/25/35 (n) | | $ 1,605 | | $ 1,236 |
Option One Mortgage Loan Trust floater Series 2007-CP1 Class M1, 0.5184% 3/25/37 (n) | | 2,236 | | 98 |
Provident Funding Mortgage Loan Trust Series 2005-2 Class 3A, 2.6869% 10/25/35 (n) | | 661 | | 528 |
RESI Finance LP/RESI Finance DE Corp. floater Series 2003-B: | | | | |
Class B5, 2.5558% 7/10/35 (h)(n) | | 1,090 | | 855 |
Class B6, 3.0558% 7/10/35 (h)(n) | | 232 | | 171 |
Residential Asset Mortgage Products, Inc. sequential payer: | | | | |
Series 2003-SL1 Class A31, 7.125% 4/25/31 | | 671 | | 710 |
Series 2004-SL3 Class A1, 7% 8/25/16 | | 35 | | 35 |
Residential Funding Securities Corp. floater Series 2003-RP2 Class A1, 0.6684% 6/25/33 (h)(n) | | 262 | | 239 |
Salomon Brothers Mortgage Securities VII, Inc. Series 2006-C2 Class H, 6.308% 7/18/33 (h) | | 129 | | 45 |
Sequoia Mortgage Trust floater Series 2004-6 Class A3B, 1.275% 7/20/34 (n) | | 29 | | 20 |
Structured Asset Securities Corp.: | | | | |
Series 2003-15A Class 4A, 5.375% 4/25/33 (n) | | 407 | | 371 |
Series 2003-20 Class 1A1, 5.5% 7/25/33 | | 283 | | 286 |
TBW Mortgage-Backed pass-thru certificates floater Series 2006-4 Class A3, 0.3873% 9/25/36 (n) | | 2,485 | | 1,792 |
WaMu Mortgage pass-thru certificates: | | | | |
Series 2003-AR8 Class A, 2.6863% 8/25/33 (n) | | 654 | | 603 |
Series 2005-AR3 Class A2, 2.5791% 3/25/35 (n) | | 1,763 | | 1,458 |
Wells Fargo Mortgage Backed Securities Trust: | | | | |
Series 2004-EE Class 2A2, 2.7571% 12/25/34 (n) | | 562 | | 533 |
Series 2004-H Class A1, 2.7828% 6/25/34 (n) | | 985 | | 932 |
Series 2004-W Class A9, 2.7617% 11/25/34 (n) | | 3,635 | | 3,311 |
Series 2005-AR10 Class 2A2, 2.7607% 6/25/35 (n) | | 470 | | 425 |
Series 2005-AR12: | | | | |
Class 2A5, 2.7552% 7/25/35 (n) | | 9,180 | | 8,226 |
Class 2A6, 2.7552% 7/25/35 (n) | | 403 | | 356 |
Series 2005-AR2 Class 2A2, 2.7427% 3/25/35 (n) | | 1,798 | | 1,567 |
Series 2005-AR3 Class 2A1, 2.7804% 3/25/35 (n) | | 706 | | 624 |
TOTAL COLLATERALIZED MORTGAGE OBLIGATIONS (Cost $57,971) | 78,748 |
Commercial Mortgage Securities - 1.6% |
| Principal Amount (000s) | | Value (000s) |
Asset Securitization Corp. Series 1997-D5: | | | | |
Class A2, 6.8338% 2/14/43 (n) | | $ 671 | | $ 694 |
Class A3, 6.8838% 2/14/43 (n) | | 724 | | 763 |
Class A6, 7.2038% 2/14/43 (n) | | 1,067 | | 1,117 |
Class PS1, 1.3868% 2/14/43 (n)(p) | | 2,572 | | 45 |
Banc of America Commercial Mortgage Trust: | | | | |
sequential payer: | | | | |
Series 2006-2 Class AAB, 5.7134% 5/10/45 (n) | | 1,020 | | 1,077 |
Series 2006-5: | | | | |
Class A2, 5.317% 9/10/47 | | 3,102 | | 3,123 |
Class A3, 5.39% 9/10/47 | | 1,272 | | 1,315 |
Series 2006-6 Class A3, 5.369% 10/10/45 | | 1,824 | | 1,906 |
Series 2007-4 Class A3, 5.798% 2/10/51 (n) | | 910 | | 962 |
Series 2006-6 Class E, 5.619% 10/10/45 (h) | | 527 | | 98 |
Series 2007-3: | | | | |
Class A3, 5.6242% 6/10/49 (n) | | 1,523 | | 1,595 |
Class A4, 5.6242% 6/10/49 (n) | | 1,901 | | 2,003 |
Banc of America Commercial Mortgage, Inc.: | | | | |
sequential payer: | | | | |
Series 2001-1 Class A4, 5.451% 1/15/49 | | 1,997 | | 2,120 |
Series 2004-2: | | | | |
Class A3, 4.05% 11/10/38 | | 151 | | 153 |
Class A4, 4.153% 11/10/38 | | 1,157 | | 1,196 |
Series 2005-1 Class A3, 4.877% 11/10/42 | | 799 | | 799 |
Series 2007-1 Class A2, 5.381% 1/15/49 | | 2,506 | | 2,512 |
Series 2001-3 Class H, 6.562% 4/11/37 (h) | | 510 | | 509 |
Series 2001-PB1: | | | | |
Class J, 7.166% 5/11/35 (h) | | 228 | | 226 |
Class K, 6.15% 5/11/35 (h) | | 424 | | 420 |
Series 2005-3 Series A3B, 5.09% 7/10/43 (n) | | 2,833 | | 2,967 |
Banc of America Large Loan, Inc. floater: | | | | |
Series 2005-MIB1: | | | | |
Class C, 0.5172% 3/15/22 (h)(n) | | 392 | | 370 |
Class D, 0.5672% 3/15/22 (h)(n) | | 397 | | 371 |
Class E, 0.6072% 3/15/22 (h)(n) | | 328 | | 302 |
Class F, 0.6772% 3/15/22 (h)(n) | | 467 | | 421 |
Class G, 0.7372% 3/15/22 (h)(n) | | 303 | | 270 |
Series 2006-BIX1: | | | | |
Class C, 0.3872% 10/15/19 (h)(n) | | 390 | | 379 |
Class D, 0.4172% 10/15/19 (h)(n) | | 716 | | 686 |
Class E, 0.4472% 10/15/19 (h)(n) | | 663 | | 625 |
Class F, 0.5172% 10/15/19 (h)(n) | | 1,987 | | 1,863 |
Class G, 0.5372% 10/15/19 (h)(n) | | 935 | | 829 |
Commercial Mortgage Securities - continued |
| Principal Amount (000s) | | Value (000s) |
Bayview Commercial Asset Trust: | | | | |
floater: | | | | |
Series 2003-2 Class M1, 1.0684% 12/25/33 (h)(n) | | $ 54 | | $ 38 |
Series 2004-1: | | | | |
Class A, 0.5784% 4/25/34 (h)(n) | | 913 | | 764 |
Class B, 2.1184% 4/25/34 (h)(n) | | 102 | | 58 |
Class M1, 0.7784% 4/25/34 (h)(n) | | 82 | | 59 |
Class M2, 1.4184% 4/25/34 (h)(n) | | 76 | | 53 |
Series 2004-2: | | | | |
Class A, 0.6484% 8/25/34 (h)(n) | | 747 | | 610 |
Class M1, 0.7984% 8/25/34 (h)(n) | | 128 | | 93 |
Series 2004-3: | | | | |
Class A1, 0.5884% 1/25/35 (h)(n) | | 1,667 | | 1,303 |
Class A2, 0.6384% 1/25/35 (h)(n) | | 239 | | 189 |
Class M1, 0.7184% 1/25/35 (h)(n) | | 288 | | 200 |
Class M2, 1.2184% 1/25/35 (h)(n) | | 137 | | 91 |
Series 2005-2A: | | | | |
Class A1, 0.5284% 8/25/35 (h)(n) | | 1,187 | | 928 |
Class M1, 0.6484% 8/25/35 (h)(n) | | 64 | | 38 |
Class M2, 0.6984% 8/25/35 (h)(n) | | 106 | | 58 |
Class M3, 0.7184% 8/25/35 (h)(n) | | 59 | | 31 |
Class M4, 0.8284% 8/25/35 (h)(n) | | 54 | | 27 |
Series 2005-3A: | | | | |
Class A1, 0.5384% 11/25/35 (h)(n) | | 483 | | 365 |
Class A2, 0.6184% 11/25/35 (h)(n) | | 436 | | 331 |
Class M1, 0.6584% 11/25/35 (h)(n) | | 57 | | 35 |
Class M2, 0.7084% 11/25/35 (h)(n) | | 73 | | 42 |
Class M3, 0.7284% 11/25/35 (h)(n) | | 65 | | 36 |
Class M4, 0.8184% 11/25/35 (h)(n) | | 81 | | 40 |
Series 2005-4A: | | | | |
Class A2, 0.6084% 1/25/36 (h)(n) | | 1,121 | | 833 |
Class B1, 1.6184% 1/25/36 (h)(n) | | 97 | | 19 |
Class M1, 0.6684% 1/25/36 (h)(n) | | 362 | | 214 |
Class M2, 0.6884% 1/25/36 (h)(n) | | 109 | | 57 |
Class M3, 0.7184% 1/25/36 (h)(n) | | 159 | | 78 |
Class M4, 0.8284% 1/25/36 (h)(n) | | 88 | | 39 |
Class M5, 0.8684% 1/25/36 (h)(n) | | 88 | | 34 |
Class M6, 0.9184% 1/25/36 (h)(n) | | 93 | | 28 |
Series 2006-1: | | | | |
Class A2, 0.5784% 4/25/36 (h)(n) | | 170 | | 127 |
Class M1, 0.5984% 4/25/36 (h)(n) | | 61 | | 36 |
Class M2, 0.6184% 4/25/36 (h)(n) | | 64 | | 35 |
Commercial Mortgage Securities - continued |
| Principal Amount (000s) | | Value (000s) |
Bayview Commercial Asset Trust: - continued | | | | |
floater: | | | | |
Series 2006-1: | | | | |
Class M3, 0.6384% 4/25/36 (h)(n) | | $ 55 | | $ 28 |
Class M4, 0.7384% 4/25/36 (h)(n) | | 31 | | 15 |
Class M5, 0.7784% 4/25/36 (h)(n) | | 30 | | 13 |
Class M6, 0.8584% 4/25/36 (h)(n) | | 61 | | 23 |
Series 2006-2A: | | | | |
Class A1, 0.4484% 7/25/36 (h)(n) | | 2,568 | | 1,918 |
Class A2, 0.4984% 7/25/36 (h)(n) | | 152 | | 112 |
Class B1, 1.0884% 7/25/36 (h)(n) | | 57 | | 19 |
Class B3, 2.9184% 7/25/36 (h)(n) | | 86 | | 25 |
Class M1, 0.5284% 7/25/36 (h)(n) | | 160 | | 96 |
Class M2, 0.5484% 7/25/36 (h)(n) | | 113 | | 62 |
Class M3, 0.5684% 7/25/36 (h)(n) | | 94 | | 50 |
Class M4, 0.6384% 7/25/36 (h)(n) | | 63 | | 33 |
Class M5, 0.6884% 7/25/36 (h)(n) | | 78 | | 39 |
Class M6, 0.7584% 7/25/36 (h)(n) | | 116 | | 44 |
Series 2006-3A: | | | | |
Class B1, 1.0184% 10/25/36 (h)(n) | | 107 | | 9 |
Class B2, 1.5684% 10/25/36 (h)(n) | | 77 | | 3 |
Class B3, 2.8184% 10/25/36 (h)(n) | | 27 | | 0* |
Class M4, 0.6484% 10/25/36 (h)(n) | | 118 | | 31 |
Class M5, 0.6984% 10/25/36 (h)(n) | | 142 | | 28 |
Class M6, 0.7784% 10/25/36 (h)(n) | | 277 | | 42 |
Series 2006-4A: | | | | |
Class A1, 0.4484% 12/25/36 (h)(n) | | 607 | | 431 |
Class A2, 0.4884% 12/25/36 (h)(n) | | 2,971 | | 2,020 |
Class B1, 0.9184% 12/25/36 (h)(n) | | 95 | | 13 |
Class B2, 1.4684% 12/25/36 (h)(n) | | 97 | | 10 |
Class B3, 2.6684% 12/25/36 (h)(n) | | 164 | | 11 |
Class M1, 0.5084% 12/25/36 (h)(n) | | 197 | | 82 |
Class M2, 0.5284% 12/25/36 (h)(n) | | 131 | | 49 |
Class M3, 0.5584% 12/25/36 (h)(n) | | 134 | | 45 |
Class M4, 0.6184% 12/25/36 (h)(n) | | 160 | | 44 |
Class M5, 0.6584% 12/25/36 (h)(n) | | 147 | | 33 |
Class M6, 0.7384% 12/25/36 (h)(n) | | 131 | | 24 |
Series 2007-1: | | | | |
Class A2, 0.4884% 3/25/37 (h)(n) | | 621 | | 404 |
Class B1, 0.8884% 3/25/37 (h)(n) | | 198 | | 24 |
Class B2, 1.3684% 3/25/37 (h)(n) | | 144 | | 14 |
Class B3, 3.5684% 3/25/37 (h)(n) | | 219 | | 10 |
Class M1, 0.4884% 3/25/37 (h)(n) | | 174 | | 64 |
Class M2, 0.5084% 3/25/37 (h)(n) | | 131 | | 39 |
Class M3, 0.5384% 3/25/37 (h)(n) | | 116 | | 31 |
Commercial Mortgage Securities - continued |
| Principal Amount (000s) | | Value (000s) |
Bayview Commercial Asset Trust: - continued | | | | |
floater: | | | | |
Series 2007-1: | | | | |
Class M4, 0.5884% 3/25/37 (h)(n) | | $ 94 | | $ 23 |
Class M5, 0.6384% 3/25/37 (h)(n) | | 145 | | 28 |
Class M6, 0.7184% 3/25/37 (h)(n) | | 203 | | 33 |
Series 2007-2A: | | | | |
Class A1, 0.4884% 7/25/37 (h)(n) | | 568 | | 393 |
Class A2, 0.5384% 7/25/37 (h)(n) | | 533 | | 310 |
Class B1, 1.8184% 7/25/37 (h)(n) | | 165 | | 12 |
Class B2, 2.4684% 7/25/37 (h)(n) | | 143 | | 7 |
Class B3, 3.5684% 7/25/37 (h)(n) | | 159 | | 4 |
Class M1, 0.5884% 7/25/37 (h)(n) | | 187 | | 60 |
Class M2, 0.6284% 7/25/37 (h)(n) | | 102 | | 24 |
Class M3, 0.7084% 7/25/37 (h)(n) | | 103 | | 19 |
Class M4, 0.8684% 7/25/37 (h)(n) | | 205 | | 30 |
Class M5, 0.9684% 7/25/37 (h)(n) | | 180 | | 23 |
Class M6, 1.2184% 7/25/37 (h)(n) | | 229 | | 23 |
Series 2007-3: | | | | |
Class A2, 0.5084% 7/25/37 (h)(n) | | 635 | | 390 |
Class B1, 1.1684% 7/25/37 (h)(n) | | 142 | | 18 |
Class B2, 1.8184% 7/25/37 (h)(n) | | 354 | | 32 |
Class B3, 4.2184% 7/25/37 (h)(n) | | 142 | | 6 |
Class M1, 0.5284% 7/25/37 (h)(n) | | 127 | | 50 |
Class M2, 0.5584% 7/25/37 (h)(n) | | 135 | | 45 |
Class M3, 0.5884% 7/25/37 (h)(n) | | 212 | | 58 |
Class M4, 0.7184% 7/25/37 (h)(n) | | 333 | | 77 |
Class M5, 0.8184% 7/25/37 (h)(n) | | 174 | | 35 |
Class M6, 1.0184% 7/25/37 (h)(n) | | 132 | | 22 |
Series 2007-4A: | | | | |
Class B1, 2.7684% 9/25/37 (h)(n) | | 219 | | 3 |
Class B2, 3.6684% 9/25/37 (h)(n) | | 560 | | 3 |
Class M1, 1.1684% 9/25/37 (h)(n) | | 210 | | 25 |
Class M2, 1.2684% 9/25/37 (h)(n) | | 210 | | 21 |
Class M4, 1.8184% 9/25/37 (h)(n) | | 535 | | 32 |
Class M5, 1.9684% 9/25/37 (h)(n) | | 535 | | 21 |
Class M6, 2.1684% 9/25/37 (h)(n) | | 535 | | 13 |
Series 2004-1, Class IO, 1.25% 4/25/34 (h)(p) | | 1,844 | | 70 |
Series 2007-5A, Class IO, 3.047% 10/25/37 (h)(n)(p) | | 4,463 | | 443 |
Bear Stearns Commercial Mortgage Securities Trust: | | | | |
floater: | | | | |
Series 2006-BBA7: | | | | |
Class H, 0.8572% 3/15/19 (h)(n) | | 329 | | 311 |
Class J, 1.0572% 3/15/19 (h)(n) | | 309 | | 260 |
Commercial Mortgage Securities - continued |
| Principal Amount (000s) | | Value (000s) |
Bear Stearns Commercial Mortgage Securities Trust: - continued | | | | |
floater: | | | | |
Series 2007-BBA8: | | | | |
Class D, 0.4572% 3/15/22 (h)(n) | | $ 452 | | $ 422 |
Class E, 0.5072% 3/15/22 (h)(n) | | 2,347 | | 2,173 |
Class F, 0.5572% 3/15/22 (h)(n) | | 1,440 | | 1,308 |
Class G, 0.6072% 3/15/22 (h)(n) | | 369 | | 326 |
Class H, 0.7572% 3/15/22 (h)(n) | | 452 | | 390 |
Class J, 0.9072% 3/15/22 (h)(n) | | 452 | | 365 |
sequential payer: | | | | |
Series 2003-PWR2 Class A3, 4.834% 5/11/39 | | 144 | | 145 |
Series 2004-PWR3 Class A3, 4.487% 2/11/41 | | 326 | | 333 |
Series 2007-PW15 Class AAB, 5.315% 2/11/44 | | 2,680 | | 2,804 |
Series 2007-PW16: | | | | |
Class A4, 5.7154% 6/11/40 (n) | | 534 | | 577 |
Class AAB, 5.7154% 6/11/40 (n) | | 4,740 | | 5,047 |
Series 2007-PW17 Class A1, 5.282% 6/11/50 | | 318 | | 322 |
Series 2007-PW18: | | | | |
Class A2, 5.613% 6/11/50 | | 320 | | 326 |
Class A4, 5.7% 6/11/50 | | 4,380 | | 4,652 |
Series 2007-T26 Class A1, 5.145% 1/12/45 | | 130 | | 131 |
Series 2003-PWR2 Class X2, 0.5275% 5/11/39 (h)(n)(p) | | 6,436 | | 0 |
Series 2006-PW13 Class A3, 5.518% 9/11/41 | | 3,219 | | 3,304 |
Series 2006-PW14 Class X2, 0.6524% 12/11/38 (h)(n)(p) | | 10,396 | | 147 |
Series 2006-T22 Class A4, 5.5338% 4/12/38 (n) | | 114 | | 127 |
Series 2007-PW16: | | | | |
Class B, 5.7154% 6/11/40 (h)(n) | | 146 | | 72 |
Class C, 5.7154% 6/11/40 (h)(n) | | 122 | | 48 |
Class D, 5.7154% 6/11/40 (h)(n) | | 122 | | 43 |
Series 2007-PW18 Class X2, 0.3152% 6/11/50 (h)(n)(p) | | 79,526 | | 834 |
Series 2007-T28: | | | | |
Class A1, 5.422% 9/11/42 | | 10 | | 10 |
Class X2, 0.1654% 9/11/42 (h)(n)(p) | | 39,180 | | 260 |
Berkeley Federal Bank & Trust FSB Series 1994-1 Class B, 0% 8/1/24 (h)(n) | | 518 | | 225 |
C-BASS Trust floater Series 2006-SC1 Class A, 0.4884% 5/25/36 (h)(n) | | 597 | | 423 |
CDC Commercial Mortgage Trust Series 2002-FX1: | | | | |
Class G, 6.625% 5/15/35 (h) | | 1,072 | | 1,120 |
Class XCL, 2.2784% 5/15/35 (h)(n)(p) | | 6,108 | | 114 |
Commercial Mortgage Securities - continued |
| Principal Amount (000s) | | Value (000s) |
Citigroup Commercial Mortgage Trust: | | | | |
floater Series 2006-FL2: | | | | |
Class F, 0.5202% 8/15/21 (h)(n) | | $ 326 | | $ 321 |
Class G, 0.5402% 8/15/21 (h)(n) | | 405 | | 393 |
Class H, 0.5802% 8/15/21 (h)(n) | | 324 | | 298 |
sequential payer Series 2006-C5 Class A4, 5.431% 10/15/49 | | 6,330 | | 6,806 |
Series 2006-C5 Class AMP2, 5.5005% 10/15/49 (h) | | 1,365 | | 1,335 |
Series 2007-C6: | | | | |
Class A1, 5.622% 12/10/49 (n) | | 1,045 | | 1,043 |
Class A2, 5.6978% 12/10/49 (n) | | 1,210 | | 1,230 |
Class A4, 5.6978% 12/10/49 (n) | | 3,035 | | 3,274 |
Citigroup/Deutsche Bank Commercial Mortgage Trust: | | | | |
sequential payer Series 2007-CD4: | | | | |
Class A2A, 5.237% 12/11/49 | | 305 | | 306 |
Class A4, 5.322% 12/11/49 | | 4,053 | | 4,211 |
Series 2007-CD4: | | | | |
Class A3, 5.293% 12/11/49 | | 888 | | 915 |
Class C, 5.476% 12/11/49 | | 1,717 | | 343 |
Cobalt CMBS Commercial Mortgage Trust: | | | | |
sequential payer Series 2007-C3 Class A3, 5.8158% 5/15/46 (n) | | 912 | | 970 |
Series 2006-C1 Class B, 5.359% 8/15/48 | | 2,736 | | 547 |
COMM pass-thru certificates: | | | | |
floater: | | | | |
Series 2005-F10A: | | | | |
Class B, 0.4372% 4/15/17 (h)(n) | | 4,783 | | 4,620 |
Class C, 0.4772% 4/15/17 (h)(n) | | 734 | | 709 |
Class D, 0.5172% 4/15/17 (h)(n) | | 721 | | 692 |
Class E, 0.5772% 4/15/17 (h)(n) | | 230 | | 216 |
Class F, 0.6172% 4/15/17 (h)(n) | | 130 | | 118 |
Class G, 0.7572% 4/15/17 (h)(n) | | 130 | | 117 |
Class H, 0.8272% 4/15/17 (h)(n) | | 130 | | 117 |
Class J, 1.0572% 4/15/17 (h)(n) | | 100 | | 84 |
Series 2005-FL11: | | | | |
Class C, 0.5072% 11/15/17 (h)(n) | | 696 | | 661 |
Class D, 0.5472% 11/15/17 (h)(n) | | 36 | | 34 |
Class E, 0.5972% 11/15/17 (h)(n) | | 128 | | 119 |
Class F, 0.6572% 11/15/17 (h)(n) | | 141 | | 128 |
Class G, 0.7072% 11/15/17 (h)(n) | | 98 | | 87 |
Series 2006-CN2A: | | | | |
Class A2FL, 0.4256% 2/5/19 (h)(n) | | 1,390 | | 1,337 |
Class AJFL, 0.4656% 2/5/19 (n) | | 640 | | 586 |
Commercial Mortgage Securities - continued |
| Principal Amount (000s) | | Value (000s) |
COMM pass-thru certificates: - continued | | | | |
floater: | | | | |
Series 2006-FL12 Class AJ, 0.3372% 12/15/20 (h)(n) | | $ 1,300 | | $ 1,190 |
sequential payer: | | | | |
Series 2005-C6 Class A2, 4.999% 6/10/44 (n) | | 9 | | 9 |
Series 2006-C8 Class A3, 5.31% 12/10/46 | | 2,599 | | 2,720 |
Series 2006-CN2A: | | | | |
Class A2FX, 5.449% 2/5/19 (h) | | 1,592 | | 1,583 |
Class AJFX, 5.478% 2/5/19 (h) | | 2,940 | | 2,962 |
Series 2007-C9 Class A4, 5.8145% 12/10/49 (n) | | 2,018 | | 2,208 |
Series 2006-C8 Class XP, 0.469% 12/10/46 (n)(p) | | 12,088 | | 132 |
Credit Suisse Commercial Mortgage Trust: | | | | |
sequential payer: | | | | |
Series 2006-C4 Class A3, 5.467% 9/15/39 | | 1,107 | | 1,158 |
Series 2007-C2: | | | | |
Class A2, 5.448% 1/15/49 (n) | | 6,402 | | 6,427 |
Class A3, 5.542% 1/15/49 (n) | | 1,824 | | 1,922 |
Series 2007-C3 Class A4, 5.702% 6/15/39 (n) | | 549 | | 573 |
Series 2006-C4 Class AAB, 5.439% 9/15/39 | | 5,104 | | 5,233 |
Series 2006-C5 Class ASP, 0.6723% 12/15/39 (n)(p) | | 8,413 | | 121 |
Series 2007-C5 Class A4, 5.695% 9/15/40 (n) | | 825 | | 871 |
Credit Suisse First Boston Mortgage Capital Certificates floater Series 2007-TF2A Class B, 0.5572% 4/15/22 (h)(n) | | 3,254 | | 2,343 |
Credit Suisse First Boston Mortgage Securities Corp.: | | | | |
sequential payer: | | | | |
Series 2001-CK6 Class B, 6.582% 8/15/36 | | 912 | | 912 |
Series 2002-CP5 Class A1, 4.106% 12/15/35 | | 44 | | 44 |
Series 2004-C1: | | | | |
Class A3, 4.321% 1/15/37 | | 93 | | 93 |
Class A4, 4.75% 1/15/37 | | 425 | | 445 |
Series 2001-CK6 Class AX, 0.837% 8/15/36 (n)(p) | | 1,073 | | 1 |
Series 2001-CKN5 Class AX, 1.9481% 9/15/34 (h)(n)(p) | | 1,833 | | 1 |
Series 2006-C1 Class A3, 5.422% 2/15/39 (n) | | 3,381 | | 3,545 |
Credit Suisse Mortgage Capital Certificates: | | | | |
floater Series 2007-TFL1: | | | | |
Class B, 0.3572% 2/15/22 (h)(n) | | 345 | | 300 |
Class C: | | | | |
0.3772% 2/15/22 (h)(n) | | 1,416 | | 1,203 |
0.4772% 2/15/22 (h)(n) | | 506 | | 404 |
Class F, 0.5272% 2/15/22 (h)(n) | | 1,011 | | 789 |
Commercial Mortgage Securities - continued |
| Principal Amount (000s) | | Value (000s) |
Credit Suisse Mortgage Capital Certificates: - continued | | | | |
Series 2007-C1: | | | | |
Class ASP, 0.406% 2/15/40 (n)(p) | | $ 14,245 | | $ 133 |
Class B, 5.487% 2/15/40 (h)(n) | | 1,394 | | 209 |
First Union National Bank-Bank of America Commercial Mortgage Trust Series 2001-C1: | | | | |
Class D, 6.484% 3/15/33 | | 32 | | 32 |
Class G, 6.936% 3/15/33 (h) | | 600 | | 592 |
GE Capital Commercial Mortgage Corp.: | | | | |
sequential payer Series 2007-C1 Class A4, 5.543% 12/10/49 | | 5,514 | | 5,742 |
Series 2001-1 Class X1, 1.1681% 5/15/33 (h)(n)(p) | | 1,403 | | 8 |
Series 2007-C1 Class XP, 0.193% 12/10/49 (n)(p) | | 18,874 | | 82 |
GMAC Commercial Mortgage Securities, Inc.: | | | | |
Series 2004-C3 Class X2, 0.5803% 12/10/41 (n)(p) | | 1,978 | | 3 |
Series 2005-C1 Class X2, 0.554% 5/10/43 (n)(p) | | 3,329 | | 15 |
Greenwich Capital Commercial Funding Corp.: | | | | |
floater Series 2006-FL4 Class B, 0.3956% 11/5/21 (h)(n) | | 343 | | 334 |
sequential payer: | | | | |
Series 2007-GG11 Class A2, 5.597% 12/10/49 | | 1,824 | | 1,878 |
Series 2007-GG9 Class A4, 5.444% 3/10/39 | | 2,652 | | 2,802 |
Series 2005-GG3 Class XP, 0.6673% 8/10/42 (h)(n)(p) | | 11,644 | | 40 |
Series 2006-GG7 Class A3, 5.881% 7/10/38 (n) | | 2,404 | | 2,524 |
Series 2007-GG11 Class A1, 0.2902% 12/10/49 (h)(n)(p) | | 20,343 | | 151 |
GS Mortgage Securities Corp. II: | | | | |
floater: | | | | |
Series 2006-FL8A: | | | | |
Class E, 0.5751% 6/6/20 (h)(n) | | 207 | | 191 |
Class F, 0.6451% 6/6/20 (h)(n) | | 634 | | 578 |
Series 2007-EOP: | | | | |
Class C, 2.1455% 3/6/20 (h)(n) | | 1,144 | | 1,099 |
Class D, 2.3636% 3/6/20 (h)(n) | | 2,144 | | 2,059 |
Class F, 2.8433% 3/6/20 (h)(n) | | 94 | | 91 |
Class G, 3.0177% 3/6/20 (h)(n) | | 47 | | 45 |
Class H, 3.5846% 3/6/20 (h)(n) | | 42 | | 41 |
Class J, 4.4568% 3/6/20 (h)(n) | | 60 | | 59 |
sequential payer Series 2004-GG2 Class A4, 4.964% 8/10/38 | | 280 | | 280 |
Series 2005-GG4 Class XP, 0.7109% 7/10/39 (h)(n)(p) | | 15,037 | | 84 |
Commercial Mortgage Securities - continued |
| Principal Amount (000s) | | Value (000s) |
GS Mortgage Securities Corp. II: - continued | | | | |
Series 2006-GG6 Class A2, 5.506% 4/10/38 | | $ 3,063 | | $ 3,058 |
GS Mortgage Securities Trust sequential payer: | | | | |
Series 2006-GG8 Class A2, 5.479% 11/10/39 | | 604 | | 603 |
Series 2007-GG10 Class A2, 5.778% 8/10/45 | | 418 | | 426 |
JP Morgan Chase Commercial Mortgage Securities Trust: | | | | |
sequential payer: | | | | |
Series 2006-CB14 Class A3B, 5.4764% 12/12/44 (n) | | 2,425 | | 2,467 |
Series 2007-LDPX: | | | | |
Class A2 S, 5.305% 1/15/49 | | 2,063 | | 2,076 |
Class A3, 5.42% 1/15/49 | | 2,510 | | 2,658 |
Series 2005-CB13 Class E, 5.348% 1/12/43 (h)(n) | | 461 | | 32 |
Series 2005-LDP3 Class A3, 4.959% 8/15/42 | | 6,519 | | 6,677 |
Series 2007-LDP10: | | | | |
Class BS, 5.437% 1/15/49 (n) | | 174 | | 33 |
Class CS, 5.466% 1/15/49 (n) | | 75 | | 13 |
Class ES, 5.5379% 1/15/49 (h)(n) | | 472 | | 33 |
JP Morgan Commercial Mortgage Finance Corp. Series 2000-C9 Class G, 6.25% 10/15/32 (h) | | 109 | | 109 |
JPMorgan Chase Commercial Mortgage Securities Trust: | | | | |
floater Series 2006-FLA2: | | | | |
Class B, 0.3772% 11/15/18 (h)(n) | | 588 | | 541 |
Class C, 0.4172% 11/15/18 (h)(n) | | 418 | | 380 |
Class D, 0.4372% 11/15/18 (h)(n) | | 184 | | 166 |
Class E, 0.4872% 11/15/18 (h)(n) | | 265 | | 236 |
Class F, 0.5372% 11/15/18 (h)(n) | | 398 | | 346 |
Class G, 0.5672% 11/15/18 (h)(n) | | 346 | | 291 |
Class H, 0.7072% 11/15/18 (h)(n) | | 265 | | 212 |
sequential payer: | | | | |
Series 2006-LDP8 Class A4, 5.399% 5/15/45 | | 581 | | 632 |
Series 2006-LDP9: | | | | |
Class A2, 5.134% 5/15/47 (n) | | 373 | | 380 |
Class A3, 5.336% 5/15/47 | | 380 | | 397 |
Series 2007-CB19 Class A4, 5.7415% 2/12/49 (n) | | 3,198 | | 3,376 |
Series 2007-LD11 Class A2, 5.8019% 6/15/49 (n) | | 2,560 | | 2,603 |
Series 2006-CB17 Class A3, 5.45% 12/12/43 | | 260 | | 263 |
Series 2007-CB19: | | | | |
Class B, 5.7415% 2/12/49 (n) | | 78 | | 35 |
Class C, 5.7415% 2/12/49 (n) | | 204 | | 83 |
Class D, 5.7415% 2/12/49 (n) | | 214 | | 73 |
Commercial Mortgage Securities - continued |
| Principal Amount (000s) | | Value (000s) |
LB Commercial Conduit Mortgage Trust: | | | | |
sequential payer Series 2007-C3 Class A4, 5.9407% 7/15/44 (n) | | $ 743 | | $ 792 |
Series 1998-C1 Class D, 6.98% 2/18/30 | | 203 | | 207 |
LB Multi-family Mortgage Trust Series 1991-4 Class A1, 7.1064% 4/25/21 (n) | | 30 | | 21 |
LB-UBS Commercial Mortgage Trust: | | | | |
sequential payer: | | | | |
Series 2006-C1 Class A2, 5.084% 2/15/31 | | 131 | | 132 |
Series 2006-C6 Class A2, 5.262% 9/15/39 (n) | | 510 | | 510 |
Series 2006-C7: | | | | |
Class A2, 5.3% 11/15/38 | | 842 | | 846 |
Class A3, 5.347% 11/15/38 | | 679 | | 711 |
Series 2007-C1: | | | | |
Class A1, 5.391% 2/15/40 (n) | | 23 | | 23 |
Class A4, 5.424% 2/15/40 | | 2,738 | | 2,918 |
Series 2007-C2 Class A3, 5.43% 2/15/40 | | 1,980 | | 2,067 |
Series 2001-C3 Class B, 6.512% 6/15/36 | | 318 | | 318 |
Series 2001-C7 Class D, 6.514% 11/15/33 | | 1,003 | | 1,004 |
Series 2005-C3 Class XCP, 0.78% 7/15/40 (n)(p) | | 2,075 | | 10 |
Series 2006-C6 Class XCP, 0.6735% 9/15/39 (n)(p) | | 4,202 | | 56 |
Series 2007-C1 Class XCP, 0.472% 2/15/40 (n)(p) | | 1,566 | | 16 |
Series 2007-C6 Class A4, 5.858% 7/15/40 (n) | | 1,140 | | 1,214 |
Series 2007-C7: | | | | |
Class A3, 5.866% 9/15/45 | | 972 | | 1,039 |
Class XCP, 0.2822% 9/15/45 (n)(p) | | 68,438 | | 583 |
Lehman Brothers Floating Rate Commercial Mortgage Trust floater Series 2006-LLFA: | | | | |
Class D, 0.4372% 9/15/21 (h)(n) | | 292 | | 259 |
Class E, 0.4972% 9/15/21 (h)(n) | | 1,054 | | 922 |
Class F, 0.5472% 9/15/21 (h)(n) | | 868 | | 751 |
Class G, 0.5672% 9/15/21 (h)(n) | | 1,714 | | 1,424 |
Class H, 0.6072% 9/15/21 (h)(n) | | 442 | | 350 |
Lehman Large Loan Trust Series 1997-LLI Class E, 7.3% 10/12/34 | | 1,619 | | 1,623 |
Merrill Lynch Mortgage Trust: | | | | |
Series 2005-CKI1 Class A3, 5.2203% 11/12/37 (n) | | 715 | | 724 |
Series 2005-LC1 Class F, 5.3796% 1/12/44 (h)(n) | | 793 | | 404 |
Series 2006-C1 Class A2, 5.6285% 5/12/39 (n) | | 886 | | 905 |
Series 2007-C1 Class A4, 5.8267% 6/12/50 (n) | | 3,452 | | 3,662 |
Series 2008-C1 Class A4, 5.69% 2/12/51 | | 1,947 | | 2,098 |
Commercial Mortgage Securities - continued |
| Principal Amount (000s) | | Value (000s) |
Merrill Lynch-CFC Commercial Mortgage Trust: | | | | |
floater Series 2006-4 Class A2FL, 0.3058% 12/12/49 (n) | | $ 382 | | $ 373 |
sequential payer: | | | | |
Series 2006-1 CLass A3, 5.4804% 2/12/39 (n) | | 970 | | 988 |
Series 2006-4 Class ASB, 5.133% 12/12/49 (n) | | 784 | | 826 |
Series 2007-5: | | | | |
Class A3, 5.364% 8/12/48 | | 356 | | 361 |
Class A4, 5.378% 8/12/48 | | 36 | | 37 |
Class B, 5.479% 8/12/48 | | 2,736 | | 1,110 |
Series 2007-6: | | | | |
Class A1, 5.175% 3/12/51 | | 12 | | 12 |
Class A4, 5.485% 3/12/51 (n) | | 7,400 | | 7,766 |
Series 2007-7 Class A4, 5.7436% 6/12/50 (n) | | 3,192 | | 3,441 |
Series 2007-8 Class A1, 4.622% 8/12/49 | | 45 | | 46 |
Series 2006-4 Class XP, 0.6205% 12/12/49 (n)(p) | | 14,993 | | 283 |
Series 2007-6 Class B, 5.635% 3/12/51 (n) | | 912 | | 410 |
Series 2007-7 Class B, 5.7436% 6/12/50 (n) | | 79 | | 21 |
Series 2007-8 Class A3, 5.9665% 8/12/49 (n) | | 787 | | 836 |
Morgan Stanley Capital I Trust: | | | | |
floater: | | | | |
Series 2006-XLF Class C, 1.407% 7/15/19 (h)(n) | | 272 | | 163 |
Series 2007-XCLA Class A1, 0.408% 7/17/17 (h)(n) | | 495 | | 450 |
Series 2007-XLFA: | | | | |
Class C, 0.368% 10/15/20 (h)(n) | | 523 | | 473 |
Class D, 0.398% 10/15/20 (h)(n) | | 507 | | 453 |
Class E, 0.458% 10/15/20 (h)(n) | | 634 | | 560 |
Class F, 0.508% 10/15/20 (h)(n) | | 380 | | 318 |
Class G, 0.548% 10/15/20 (h)(n) | | 470 | | 368 |
Class H, 0.638% 10/15/20 (h)(n) | | 296 | | 214 |
Class J, 0.788% 10/15/20 (h)(n) | | 338 | | 203 |
Class MHRO, 0.898% 10/15/20 (h)(n) | | 369 | | 310 |
Class MJPM, 1.208% 10/15/20 (h)(n) | | 18 | | 16 |
Class NHRO, 1.098% 10/15/20 (h)(n) | | 558 | | 446 |
sequential payer: | | | | |
Series 2003-IQ5 Class X2, 0.9017% 4/15/38 (h)(n)(p) | | 2,407 | | 0 |
Series 2005-IQ9 Class A3, 4.54% 7/15/56 | | 1,266 | | 1,277 |
Series 2007-HQ11 Class A31, 5.439% 2/12/44 (n) | | 462 | | 480 |
Series 2007-IQ13 Class A1, 5.05% 3/15/44 | | 115 | | 115 |
Series 2007-T25 Class A1, 5.391% 11/12/49 | | 124 | | 124 |
Commercial Mortgage Securities - continued |
| Principal Amount (000s) | | Value (000s) |
Morgan Stanley Capital I Trust: - continued | | | | |
Series 2003-IQ6 Class X2, 0.5881% 12/15/41 (h)(n)(p) | | $ 5,397 | | $ 8 |
Series 2005-IQ9 Class X2, 1.0893% 7/15/56 (h)(n)(p) | | 8,118 | | 39 |
Series 2006-HQ10 Class X2, 0.4923% 11/12/41 (h)(n)(p) | | 6,608 | | 42 |
Series 2006-HQ8 Class A3, 5.4704% 3/12/44 (n) | | 538 | | 541 |
Series 2006-IQ11: | | | | |
Class A3, 5.694% 10/15/42 (n) | | 1,147 | | 1,181 |
Class A4, 5.73% 10/15/42 (n) | | 274 | | 301 |
Series 2006-T23 Class A3, 5.8184% 8/12/41 (n) | | 466 | | 497 |
Series 2007-IQ14: | | | | |
Class A4, 5.692% 4/15/49 (n) | | 1,368 | | 1,421 |
Class AAB, 5.654% 4/15/49 | | 2,650 | | 2,810 |
Class B, 5.7233% 4/15/49 (n) | | 224 | | 101 |
Structured Asset Securities Corp. Series 1997-LLI Class D, 7.15% 10/12/34 | | 64 | | 64 |
Wachovia Bank Commercial Mortgage Trust: | | | | |
floater: | | | | |
Series 2005-WL5A Class K, 1.4072% 1/15/18 (h)(n) | | 969 | | 930 |
Series 2006-WL7A: | | | | |
Class E, 0.4902% 9/15/21 (h)(n) | | 1,239 | | 1,100 |
Class F, 0.5502% 9/15/21 (h)(n) | | 1,426 | | 1,253 |
Class G, 0.5702% 9/15/21 (h)(n) | | 1,351 | | 1,134 |
Class J, 0.8072% 9/15/21 (h)(n) | | 300 | | 215 |
Series 2007-WHL8: | | | | |
Class AP1, 0.9072% 6/15/20 (h)(n) | | 98 | | 88 |
Class AP2, 1.0072% 6/15/20 (h)(n) | | 163 | | 144 |
Class F, 0.6872% 6/15/20 (h)(n) | | 3,171 | | 2,061 |
Class LXR1, 0.9072% 6/15/20 (h)(n) | | 112 | | 90 |
sequential payer: | | | | |
Series 2003-C7 Class A1, 4.241% 10/15/35 (h) | | 1,130 | | 1,133 |
Series 2003-C8 Class A3, 4.445% 11/15/35 | | 3,409 | | 3,416 |
Series 2006-C27 Class A2, 5.624% 7/15/45 | | 23 | | 23 |
Series 2006-C29 Class A3, 5.313% 11/15/48 | | 2,422 | | 2,570 |
Series 2007-C30: | | | | |
Class A3, 5.246% 12/15/43 | | 783 | | 793 |
Class A4, 5.305% 12/15/43 | | 268 | | 276 |
Class A5, 5.342% 12/15/43 | | 976 | | 1,016 |
Series 2007-C31 Class A4, 5.509% 4/15/47 | | 2,061 | | 2,196 |
Commercial Mortgage Securities - continued |
| Principal Amount (000s) | | Value (000s) |
Wachovia Bank Commercial Mortgage Trust: - continued | | | | |
sequential payer: | | | | |
Series 2007-C32: | | | | |
Class A2, 5.7378% 6/15/49 (n) | | $ 2,867 | | $ 2,896 |
Class A3, 5.7428% 6/15/49 (n) | | 1,548 | | 1,628 |
Series 2003-C6 Class G, 5.125% 8/15/35 (h)(n) | | 433 | | 426 |
Series 2004-C15: | | | | |
Class 180A, 5.3979% 10/15/41 (h)(n) | | 701 | | 703 |
Class 180B, 5.3979% 10/15/41 (h)(n) | | 319 | | 319 |
Series 2005-C19 Class B, 4.892% 5/15/44 | | 912 | | 842 |
Series 2005-C22: | | | | |
Class B, 5.3592% 12/15/44 (n) | | 2,022 | | 1,539 |
Class F, 5.3592% 12/15/44 (h)(n) | | 1,521 | | 675 |
Series 2006-C23 Class A5, 5.416% 1/15/45 (n) | | 5,005 | | 5,429 |
Series 2007-C30: | | | | |
Class C, 5.483% 12/15/43 (n) | | 2,736 | | 1,354 |
Class D, 5.513% 12/15/43 (n) | | 1,459 | | 575 |
Class XP, 0.4412% 12/15/43 (h)(n)(p) | | 9,744 | | 98 |
Series 2007-C31 Class C, 5.6883% 4/15/47 (n) | | 251 | | 119 |
Series 2007-C31A Class A2, 5.421% 4/15/47 | | 6,763 | | 7,037 |
Series 2007-C32: | | | | |
Class D, 5.7428% 6/15/49 (n) | | 685 | | 291 |
Class E, 5.7428% 6/15/49 (n) | | 1,080 | | 340 |
Wachovia Bank Commercial Mortgage Trust pass-thru certificates sequential payer Series 2007-C33 Class A5, 5.8992% 2/15/51 (n) | | 604 | | 650 |
TOTAL COMMERCIAL MORTGAGE SECURITIES (Cost $229,227) | 288,025 |
Municipal Securities - 0.1% |
|
Beaver County Indl. Dev. Auth. Poll. Cont. Rev. Bonds (FirstEnergy Nuclear Generation Corp. Proj.) Series 2005 A, 3.375%, tender 7/1/15 (n) | | 1,700 | | 1,763 |
California Gen. Oblig. 7.5% 4/1/34 | | 3,275 | | 3,884 |
Illinois Gen. Oblig.: | | | | |
Series 2010, 4.421% 1/1/15 | | 4,050 | | 4,240 |
Series 2011: | | | | |
5.665% 3/1/18 | | 3,000 | | 3,216 |
5.877% 3/1/19 | | 2,915 | | 3,117 |
TOTAL MUNICIPAL SECURITIES (Cost $14,931) | 16,220 |
Foreign Government and Government Agency Obligations - 0.0% |
| Principal Amount (000s) | | Value (000s) |
Chilean Republic 7.125% 1/11/12 | | $ 1,794 | | $ 1,833 |
United Mexican States 6.05% 1/11/40 | | 3,926 | | 4,495 |
TOTAL FOREIGN GOVERNMENT AND GOVERNMENT AGENCY OBLIGATIONS (Cost $5,796) | 6,328 |
Supranational Obligations - 0.0% |
|
Corporacion Andina de Fomento 5.2% 5/21/13
(Cost $136) | | 143 | | 152 |
Floating Rate Loans - 1.0% |
|
CONSUMER DISCRETIONARY - 0.2% |
Hotels, Restaurants & Leisure - 0.0% |
Fantasy Springs Resort Casino term loan 12% 8/6/12 (n) | | 8,305 | | 6,146 |
Town Sports International LLC Tranche B, term loan 7% 5/11/18 (n) | | 3,531 | | 3,390 |
| | 9,536 |
Media - 0.1% |
Hicks Sports Group LLC Tranche 2LN, term loan 12/22/11 (d)(n) | | 2,750 | | 3 |
Newsday LLC term loan 10.5% 8/1/13 | | 7,000 | | 7,210 |
Tribune Co. Tranche X, term loan 3/17/09 (d)(n) | | 1,188 | | 701 |
Univision Communications, Inc. term loan 4.4709% 3/31/17 (n) | | 11,193 | | 9,626 |
| | 17,540 |
Specialty Retail - 0.1% |
Michaels Stores, Inc.: | | | | |
Tranche B1, term loan 2.5% 10/31/13 (n) | | 4,256 | | 4,022 |
Tranche B2, term loan 4.75% 7/31/16 (n) | | 1,495 | | 1,413 |
Sports Authority, Inc. Tranche B, term loan 7.5% 11/16/17 (n) | | 4,940 | | 4,607 |
| | 10,042 |
TOTAL CONSUMER DISCRETIONARY | | 37,118 |
CONSUMER STAPLES - 0.0% |
Food & Staples Retailing - 0.0% |
Sprouts Farmers Market LLC Tranche B, term loan 6% 4/18/18 (n) | | 5,990 | | 5,840 |
Floating Rate Loans - continued |
| Principal Amount (000s) | | Value (000s) |
ENERGY - 0.0% |
Oil, Gas & Consumable Fuels - 0.0% |
Frac Tech Holdings LLC Tranche B, term loan 6.25% 5/6/16 (n) | | $ 3,924 | | $ 3,767 |
FINANCIALS - 0.0% |
Diversified Financial Services - 0.0% |
CEVA Group PLC: | | | | |
Credit-Linked Deposit 3.2458% 11/4/13 (n) | | 222 | | 200 |
EGL term loan 3.2529% 11/4/13 (n) | | 2,202 | | 1,981 |
term loan 3.2529% 11/4/13 (n) | | 266 | | 240 |
| | 2,421 |
Real Estate Management & Development - 0.0% |
Realogy Corp.: | | | | |
Credit-Linked Deposit 4.4411% 10/10/16 (n) | | 930 | | 765 |
term loan 4.5217% 10/10/16 (n) | | 6,221 | | 5,117 |
| | 5,882 |
TOTAL FINANCIALS | | 8,303 |
HEALTH CARE - 0.2% |
Health Care Providers & Services - 0.2% |
Genoa Healthcare Group LLC Tranche 2, term loan 11.5% 2/4/13 (n) | | 2,500 | | 1,888 |
National Renal Institutes, Inc. Tranche B, term loan 9.25% 3/31/13 (n) | | 11,411 | | 11,639 |
Sheridan Healthcare, Inc. Tranche 2LN, term loan 6.0728% 6/15/15 (n) | | 17,840 | | 16,145 |
Sunquest Information Systems, Inc. Tranche 2 LN, term loan 9.75% 6/16/17 (n) | | 2,250 | | 2,183 |
| | 31,855 |
INDUSTRIALS - 0.0% |
Airlines - 0.0% |
US Airways Group, Inc. term loan 2.7208% 3/23/14 (n) | | 4,529 | | 3,782 |
Commercial Services & Supplies - 0.0% |
Brand Energy & Infrastructure Services, Inc. Tranche 2LN, term loan 6.3% 2/7/15 (n) | | 985 | | 749 |
Floating Rate Loans - continued |
| Principal Amount (000s) | | Value (000s) |
INDUSTRIALS - continued |
Machinery - 0.0% |
Husky Intermediate, Inc. Tranche B, term loan 6.5% 6/30/18 (n) | | $ 4,485 | | $ 4,300 |
TOTAL INDUSTRIALS | | 8,831 |
INFORMATION TECHNOLOGY - 0.2% |
Communications Equipment - 0.1% |
Avaya, Inc.: | | | | |
term loan 3.0643% 10/27/14 (n) | | 1,798 | | 1,627 |
Tranche B 3LN, term loan 4.8143% 10/26/17 (n) | | 3,611 | | 3,160 |
SafeNet, Inc. Tranche 2LN, term loan 6.2208% 4/12/15 (n) | | 7,500 | | 7,200 |
| | 11,987 |
Internet Software & Services - 0.0% |
Airvana Networks Solutions, Inc. term loan 10% 3/25/15 (n) | | 2,711 | | 2,711 |
Software - 0.1% |
Kronos, Inc. Tranche 2LN, term loan 5.9958% 6/11/15 (n) | | 23,730 | | 23,018 |
SS&C Technologies, Inc. term loan 2.2384% 11/23/12 (n) | | 267 | | 265 |
| | 23,283 |
TOTAL INFORMATION TECHNOLOGY | | 37,981 |
TELECOMMUNICATION SERVICES - 0.2% |
Wireless Telecommunication Services - 0.2% |
Asurion LLC: | | | | |
term loan 9% 5/24/19 (n) | | 6,210 | | 5,946 |
Tranche B, term loan 5.5% 5/24/18 (n) | | 10,050 | | 9,422 |
Vodafone Americas Finance 2, Inc.: | | | | |
2nd LN, term loan 6.25% 6/24/16 pay-in-kind | | 12,355 | | 12,205 |
term loan 6.875% 8/11/15 | | 1,702 | | 1,706 |
| | 29,279 |
Floating Rate Loans - continued |
| Principal Amount (000s) | | Value (000s) |
UTILITIES - 0.2% |
Electric Utilities - 0.1% |
Bicent Power LLC Tranche 2LN, term loan 4.25% 12/31/14 (n) | | $ 810 | | $ 24 |
Texas Competitive Electric Holdings Co. LLC/Texas Competitive Electric Holdings Finance, Inc. Tranche B, term loan 4.7396% 10/10/17 (n) | | 25,196 | | 18,361 |
| | 18,385 |
Independent Power Producers & Energy Traders - 0.1% |
Dynegy, Inc. Tranche B, term loan: | | | | |
9.25% 8/5/16 (n) | | 397 | | 389 |
9.25% 8/5/16 (n) | | 214 | | 207 |
Nebraska Energy, Inc. Tranche 2LN, term loan 4.75% 5/1/14 (n) | | 12,400 | | 11,408 |
| | 12,004 |
TOTAL UTILITIES | | 30,389 |
TOTAL FLOATING RATE LOANS (Cost $201,527) | 193,363 |
Bank Notes - 0.0% |
|
Wachovia Bank NA 6% 11/15/17
(Cost $3,354) | | 3,066 | | 3,450 |
Preferred Securities - 0.0% |
| | | |
FINANCIALS - 0.0% |
Diversified Financial Services - 0.0% |
ING Groep NV 5.775% (i)(n) (Cost $554) | 975 | | 832 |
Fixed-Income Funds - 7.7% |
| Shares | | |
Fidelity Corporate Bond 1-10 Year Central Fund (o) | 2,529,627 | | 277,955 |
Fidelity Mortgage Backed Securities Central Fund (o) | 10,607,350 | | 1,146,867 |
TOTAL FIXED-INCOME FUNDS (Cost $1,331,811) | 1,424,822 |
Money Market Funds - 6.1% |
| Shares | | Value (000s) |
Fidelity Cash Central Fund, 0.11% (b) | 1,081,243,929 | | $ 1,081,244 |
Fidelity Securities Lending Cash Central Fund, 0.12% (b)(c) | 63,030,730 | | 63,031 |
TOTAL MONEY MARKET FUNDS (Cost $1,144,275) | 1,144,275 |
Cash Equivalents - 0.3% |
| Maturity Amount (000s) | | |
Investments in repurchase agreements in a joint trading account at 0.06%, dated 8/31/11 due 9/1/11 (Collateralized by U.S. Government Obligations) # (c)
(Cost $46,667) | $ 46,667 | | 46,667 |
TOTAL INVESTMENT PORTFOLIO - 105.4% (Cost $18,145,669) | | 19,633,670 |
NET OTHER ASSETS (LIABILITIES) - (5.4)% | | (1,003,480) |
NET ASSETS - 100% | $ 18,630,190 |
Swap Agreements |
| Expiration Date | | Notional Amount (000s) | | Value (000s) |
Credit Default Swaps |
Receive monthly a fixed rate of .15% multiplied by the notional amount and pay to Credit Suisse First Boston upon each credit event of one of the issues of ABX AA 07-01 Index, par value of the proportional notional amount (Rating-C) (Upfront Premium Received/(Paid) $2,560,000) (m) | Sept. 2037 | | $ 7,962 | | $ (7,525) |
Receive monthly a fixed rate of .15% multiplied by the notional amount and pay to JPMorgan Chase, Inc. upon each credit event of one of the issues of ABX AA 07-01 Index, par value of the proportional notional amount (Rating-C) (Upfront Premium Received/(Paid) $2,398,000) (m) | Sept. 2037 | | 6,526 | | (6,167) |
Receive monthly a fixed rate of .15% multiplied by the notional amount and pay to JPMorgan Chase, Inc. upon each credit event of one of the issues of ABX AA 07-01 Index, par value of the proportional notional amount (Rating-C) (Upfront Premium Received/(Paid) $566,000) (m) | Sept. 2037 | | 1,497 | | (1,415) |
Receive monthly a fixed rate of .15% multiplied by the notional amount and pay to Morgan Stanley, Inc. upon each credit event of one of the issues of ABX AA 07-01 Index, par value of the proportional notional amount (Rating-C) (Upfront Premium Received/(Paid) $2,398,000) (m) | Sept. 2037 | | 6,526 | | (6,167) |
Receive monthly a fixed rate of .15% multiplied by the notional amount and pay to UBS upon each credit event of one of the issues of ABX AA 07-1 Index, par value of the proportional notional amount (Rating-C) (Upfront Premium Received/(Paid) $2,332,000) (m) | Sept. 2037 | | 6,346 | | (5,997) |
Receive monthly a fixed rate of .15% multiplied by the notional amount and pay to UBS upon each credit event of one of the issues of ABX AA 07-1 Index, par value of the proportional notional amount (Rating-C) (Upfront Premium Received/(Paid) $2,025,000) (m) | Sept. 2037 | | 5,448 | | (5,149) |
| | $ 34,305 | | $ (32,420) |
Legend |
(a) Non-income producing |
(b) Affiliated fund that is available only to investment companies and other accounts managed by Fidelity Investments. The rate quoted is the annualized seven-day yield of the fund at period end. A complete unaudited listing of the fund's holdings as of its most recent quarter end is available upon request. In addition, each Fidelity Central Fund's financial statements, which are not covered by the Fund's Report of Independent Registered Public Accounting Firm, are available on the SEC's website or upon request. |
(c) Investment made with cash collateral received from securities on loan. |
(d) Non-income producing - Security is in default. |
(e) Security initially issued at one coupon which converts to a higher coupon at a specified date. The rate shown is the rate at period end. |
(f) Security or a portion of the security is on loan at period end. |
(g) Affiliated company |
(h) Security exempt from registration under Rule 144A of the Securities Act of 1933. These securities may be resold in transactions exempt from registration, normally to qualified institutional buyers. At the end of the period, the value of these securities amounted to $703,479,000 or 3.8% of net assets. |
(i) Security is perpetual in nature with no stated maturity date. |
(j) Security or a portion of the security purchased on a delayed delivery or when-issued basis. |
(k) A portion of the security is subject to a forward commitment to sell. |
(l) Security or a portion of the security has been segregated as collateral for open swap agreements. At the period end, the value of securities pledged amounted to $34,395,000. |
(m) Represents a credit default swap based on a tradable index of home equity asset-backed debt securities. The value of each credit default swap and the credit rating can be measures of the current payment/performance risk. In addition, the swap represents a contract in which the Fund has sold protection on the index of underlying securities. Ratings represent a weighted average of the ratings of all securities included in the index. Ratings used in the weighted average are from Moody's Investors Service, Inc., or S&P where Moody's ratings are not available. All ratings are as of the report date and do not reflect subsequent changes. |
(n) Coupon rates for floating and adjustable rate securities reflect the rates in effect at period end. |
(o) Affiliated fund that is available only to investment companies and other accounts managed by Fidelity Investments. A complete unaudited schedule of portfolio holdings for each Fidelity Central Fund is filed with the SEC for the first and third quarters of each fiscal year on Form N-Q and is available upon request or at the SEC's web site at www.sec.gov. An unaudited holdings listing for the Fund, which presents direct holdings as well as the pro rata share of securities and other investments held indirectly through its investment in underlying non-money market Fidelity Central Funds, is available at fidelity.com. In addition, each Fidelity Central Fund's financial statements, which are not covered by the Fund's Report of Independent Registered Public Accounting Firm, are available on the SEC's web site or upon request. |
(p) Security represents right to receive monthly interest payments on an underlying pool of mortgages or assets. Principal shown is the outstanding par amount of the pool held as of the end of the period. |
(q) Investment is owned by an entity that is treated as a corporation for U.S. tax purposes which is owned by the Fund. |
(r) Restricted securities - Investment in securities not registered under the Securities Act of 1933 (excluding 144A issues). At the end of the period, the value of restricted securities (excluding 144A issues) amounted to $99,806,000 or 0.5% of net assets. |
Additional information on each restricted holding is as follows: |
Security | Acquisition Date | Acquisition Cost (000s) |
Aspen Aerogels, Inc. 8% 6/1/14 | 6/1/11 | $ 10,000 |
Facebook, Inc. Class B | 3/31/11 - 5/19/11 | $ 22,038 |
HMH Holdings, Inc. | 3/9/10 | $ 633 |
Legend Pictures LLC | 9/23/10 | $ 35,000 |
Michael Kors Holdings Ltd. | 7/8/11 | $ 30,000 |
Station Holdco LLC | 6/17/11 | $ 1,331 |
Station Holdco LLC Warrants 6/15/18 | 8/11/08 - 8/15/08 | $ 6,358 |
wetpaint.com, Inc. Series C | 5/14/08 | $ 5,000 |
* Amount represents less than $1,000.
# Additional information on each counterparty to the repurchase agreement is as follows: |
Repurchase Agreement / Counterparty | Value
(000s) |
$46,667,000 due 9/01/11 at 0.06% |
Barclays Capital, Inc. | $ 46,667 |
Affiliated Central Funds |
Information regarding fiscal year to date income earned by the Fund from investments in Fidelity Central Funds is as follows: |
Fund | Income earned
(Amounts in thousands) |
Fidelity Cash Central Fund | $ 1,324 |
Fidelity Corporate Bond 1-10 Year Central Fund | 15,591 |
Fidelity Mortgage Backed Securities Central Fund | 32,186 |
Fidelity Securities Lending Cash Central Fund | 3,599 |
Total | $ 52,700 |
Additional information regarding the Fund's fiscal year to date purchases and sales, including the ownership percentage, of the non Money Market Central Funds is as follows: |
Fund
(Amounts in thousands) | Value, beginning of period | Purchases | Sales Proceeds | Value,
end of
period | % ownership, end of
period |
Fidelity Corporate Bond 1-10 Year Central Fund | $ 517,102 | $ - | $ 239,305* | $ 277,955 | 41.7% |
Fidelity Mortgage Backed Securities Central Fund | 818,951 | 302,387 | - | 1,146,867 | 8.9% |
Total | $ 1,336,053 | $ 302,387 | $ 239,305 | $ 1,424,822 | |
* Includes the value of shares redeemed through in-kind transactions. See Note 7 of the Notes to Financial Statements. |
Other Affiliated Issuers |
An affiliated company is a company in which the Fund has ownership of at least 5% of the voting securities. Fiscal year to date transactions with companies which are or were affiliates are as follows: |
Affiliate
(Amounts in thousands) | Value, beginning of period | Purchases | Sales Proceeds | Dividend Income | Value,
end of
period |
CareView Communications, Inc. | $ 16,382 | $ - | $ - | $ - | $ 14,652 |
Neurocrine Biosciences, Inc. | 12,570 | 13,417 | 5,422 | - | 22,913 |
Total | $ 28,952 | $ 13,417 | $ 5,422 | $ - | $ 37,565 |
Other Information |
The following is a summary of the inputs used, as of August 31, 2011, involving the Fund's assets and liabilities carried at fair value. The inputs or methodology used for valuing securities may not be an indication of the risk associated with investing in those securities. For more information on valuation inputs, and their aggregation into the levels used in the tables below, please refer to the Security Valuation section in the accompanying Notes to Financial Statements. |
Valuation Inputs at Reporting Date: |
Description
(Amounts in thousands) | Total | Level 1 | Level 2 | Level 3 |
Investments in Securities: | | | | |
Equities: | | | | |
Consumer Discretionary | $ 1,417,437 | $ 1,307,323 | $ 45,092 | $ 65,022 |
Consumer Staples | 1,541,310 | 1,492,866 | 48,444 | - |
Energy | 1,667,176 | 1,667,176 | - | - |
Financials | 1,367,100 | 1,337,181 | 28,514 | 1,405 |
Health Care | 1,280,092 | 1,277,164 | 2,928 | - |
Industrials | 1,118,837 | 1,118,629 | - | 208 |
Information Technology | 1,994,600 | 1,971,574 | - | 23,026 |
Materials | 314,512 | 311,558 | 2,954 | - |
Telecommunication Services | 30,447 | 30,447 | - | - |
Utilities | 171,852 | 108,386 | 63,466 | - |
Corporate Bonds | 2,046,762 | - | 2,035,621 | 11,141 |
U.S. Government and Government Agency Obligations | 1,907,940 | - | 1,907,940 | - |
U.S. Government Agency - Mortgage Securities | 1,510,362 | - | 1,510,362 | - |
Asset-Backed Securities | 62,361 | - | 49,661 | 12,700 |
Collateralized Mortgage Obligations | 78,748 | - | 76,231 | 2,517 |
Commercial Mortgage Securities | 288,025 | - | 259,369 | 28,656 |
Municipal Securities | 16,220 | - | 16,220 | - |
Foreign Government and Government Agency Obligations | 6,328 | - | 6,328 | - |
Supranational Obligations | 152 | - | 152 | - |
Floating Rate Loans | 193,363 | - | 193,363 | - |
Bank Notes | 3,450 | - | 3,450 | - |
Preferred Securities | 832 | - | 832 | - |
Fixed-Income Funds | 1,424,822 | 1,424,822 | - | - |
Money Market Funds | 1,144,275 | 1,144,275 | - | - |
Cash Equivalents | 46,667 | - | 46,667 | - |
Total Investments in Securities: | $ 19,633,670 | $ 13,191,401 | $ 6,297,594 | $ 144,675 |
Derivative Instruments: | | | | |
Liabilities | | | | |
Swap Agreements | $ (32,420) | $ - | $ (32,420) | $ - |
Other Financial Instruments: | | | | |
Forward Commitments | $ 1,898 | $ - | $ 1,898 | $ - |
The following is a reconciliation of Investments in Securities for which Level 3 inputs were used in determining value: |
(Amounts in thousands) | |
Investments in Securities: | |
Beginning Balance | $ 78,422 |
Total Realized Gain (Loss) | 4,655 |
Total Unrealized Gain (Loss) | 4,051 |
Cost of Purchases | 108,190 |
Proceeds of Sales | (22,975) |
Amortization/Accretion | 1,116 |
Transfers in to Level 3 | 9,955 |
Transfers out of Level 3 | (38,739) |
Ending Balance | $ 144,675 |
The change in unrealized gain (loss) for the period attributable to Level 3 securities held at August 31, 2011 | $ 3,684 |
The information used in the above reconciliation represents fiscal year to date activity for any Investments in Securities identified as using Level 3 inputs at either the beginning or the end of the current fiscal period, and includes the value of securities received through affiliated in-kind transactions. See Note 7 of the Notes to Financial Statements. Transfers in or out of Level 3 represent the beginning value of any Security or Instrument where a change in the pricing level occurred from the beginning to the end of the period. The cost of purchases and the proceeds of sales may include securities received or delivered through corporate actions or exchanges. Realized and unrealized gains (losses) disclosed in the reconciliation are included in Net Gain (Loss) on the Fund's Statement of Operations. |
Value of Derivative Instruments |
The following table is a summary of the Fund's value of derivative instruments by risk exposure as of August 31, 2011. For additional information on derivative instruments, please refer to the Derivative Instruments section in the accompanying Notes to Financial Statements. |
Risk Exposure /
Derivative Type
(Amounts in thousands) | Value |
| Asset | Liability |
Credit Risk | | |
Swap Agreements (a) | $ - | $ (32,420) |
Total Value of Derivatives | $ - | $ (32,420) |
(a) Value is disclosed on the Statement of Assets and Liabilities in the Swap agreements, at value line-items. |
The composition of credit quality ratings as a percentage of net assets is as follows (Unaudited): |
U.S. Government and U.S. Government Agency Obligations | 26.2% |
AAA,AA,A | 5.1% |
BBB | 3.5% |
BB | 2.1% |
B | 3.4% |
CCC,CC,C | 1.2% |
D | 0.0% |
Not Rated | 0.3% |
Equities | 58.6% |
Short-Term Investments and Net Other Assets | (0.4)% |
| 100.0% |
We have used ratings from Moody's Investors Service, Inc. Where Moody's® ratings are not available, we have used S&P® ratings. All ratings are as of the date indicated and do not reflect subsequent changes. |
Distribution of investments by country of issue, as a percentage of total net assets, is as follows: (Unaudited) |
United States of America | 87.6% |
United Kingdom | 1.5% |
France | 1.4% |
Ireland | 1.2% |
Switzerland | 1.1% |
Others (Individually Less Than 1%) | 7.2% |
| 100.0% |
The information in the above tables is based on the combined investments of the Fund and its pro-rata share of its investments in each non-money market Fidelity Central Fund. |
Income Tax Information |
At August 31, 2011, the Fund had a capital loss carryforward of approximately $38,013,000 all of which will expire in fiscal 2018. Capital loss carryforwards are only available to offset future capital gains of the Fund to the extent provided by regulations and may be limited. |
See accompanying notes which are an integral part of the financial statements.
Annual Report
Statement of Assets and Liabilities
Amounts in thousands (except per-share amounts) | August 31, 2011 |
| | |
Assets | | |
Investment in securities, at value (including securities loaned of $106,513 and repurchase agreements of $46,667) - See accompanying schedule: Unaffiliated issuers (cost $15,633,004) | $ 17,027,008 | |
Fidelity Central Funds (cost $2,476,086) | 2,569,097 | |
Other affiliated issuers (cost $36,579) | 37,565 | |
Total Investments (cost $18,145,669) | | $ 19,633,670 |
Commitment to sell securities on a delayed delivery basis | (736,185) | |
Receivable for securities sold on a delayed delivery basis | 738,083 | 1,898 |
Receivable for investments sold | | 28,244 |
Cash | | 578 |
Receivable for swap agreements | | 4 |
Receivable for fund shares sold | | 8,809 |
Dividends receivable | | 18,631 |
Interest receivable | | 50,277 |
Distributions receivable from Fidelity Central Funds | | 1,297 |
Other receivables | | 1,013 |
Total assets | | 19,744,421 |
| | |
Liabilities | | |
Payable for investments purchased
Regular delivery | $ 139,461 | |
Delayed delivery | 812,246 | |
Payable for swap agreements | 455 | |
Payable for fund shares redeemed | 10,057 | |
Swap agreements, at value | 32,420 | |
Accrued management fee | 6,230 | |
Other affiliated payables | 2,655 | |
Other payables and accrued expenses | 1,009 | |
Collateral on securities loaned, at value | 109,698 | |
Total liabilities | | 1,114,231 |
| | |
Net Assets | | $ 18,630,190 |
Net Assets consist of: | | |
Paid in capital | | $ 17,295,087 |
Undistributed net investment income | | 87,615 |
Accumulated undistributed net realized gain (loss) on investments and foreign currency transactions | | (212,578) |
Net unrealized appreciation (depreciation) on investments and assets and liabilities in foreign currencies | | 1,460,066 |
Net Assets | | $ 18,630,190 |
See accompanying notes which are an integral part of the financial statements.
Annual Report
Financial Statements - continued
Statement of Assets and Liabilities - continued
Amounts in thousands (except per-share amounts) | August 31, 2011 |
| | |
Puritan:
Net Asset Value, offering price and redemption price per share ($15,419,589 ÷ 870,109 shares) | | $ 17.72 |
| | |
Class K:
Net Asset Value, offering price and redemption price per share ($3,210,601 ÷ 181,174 shares) | | $ 17.72 |
See accompanying notes which are an integral part of the financial statements.
Annual Report
Statement of Operations
Amounts in thousands | Year ended August 31, 2011 |
| | |
Investment Income | | |
Dividends | | $ 165,972 |
Interest | | 278,156 |
Income from Fidelity Central Funds | | 52,700 |
Total income | | 496,828 |
| | |
Expenses | | |
Management fee | $ 79,094 | |
Transfer agent fees | 30,323 | |
Accounting and security lending fees | 1,982 | |
Custodian fees and expenses | 460 | |
Independent trustees' compensation | 107 | |
Appreciation in deferred trustee compensation account | 2 | |
Registration fees | 133 | |
Audit | 249 | |
Legal | 146 | |
Miscellaneous | 214 | |
Total expenses before reductions | 112,710 | |
Expense reductions | (1,112) | 111,598 |
Net investment income (loss) | | 385,230 |
Realized and Unrealized Gain (Loss) Net realized gain (loss) on: | | |
Investment securities: | | |
Unaffiliated issuers | 1,637,295 | |
Fidelity Central Funds | 18,783 | |
Other affiliated issuers | 601 | |
Foreign currency transactions | (4,968) | |
Swap agreements | (7,503) | |
Total net realized gain (loss) | | 1,644,208 |
Change in net unrealized appreciation (depreciation) on: Investment securities (net of increase in deferred foreign taxes of $33) | 474,601 | |
Assets and liabilities in foreign currencies | 1 | |
Swap agreements | 6,248 | |
Delayed delivery commitments | 1,818 | |
Total change in net unrealized appreciation (depreciation) | | 482,668 |
Net gain (loss) | | 2,126,876 |
Net increase (decrease) in net assets resulting from operations | | $ 2,512,106 |
See accompanying notes which are an integral part of the financial statements.
Annual Report
Financial Statements - continued
Statement of Changes in Net Assets
Amounts in thousands | Year ended
August 31,
2011 | Year ended
August 31,
2010 |
Increase (Decrease) in Net Assets | | |
Operations | | |
Net investment income (loss) | $ 385,230 | $ 457,109 |
Net realized gain (loss) | 1,644,208 | 1,031,992 |
Change in net unrealized appreciation (depreciation) | 482,668 | (142,516) |
Net increase (decrease) in net assets resulting
from operations | 2,512,106 | 1,346,585 |
Distributions to shareholders from net investment income | (395,907) | (441,719) |
Distributions to shareholders from net realized gain | (3,264) | (11,495) |
Total distributions | (399,171) | (453,214) |
Share transactions - net increase (decrease) | (816,545) | (1,140,096) |
Total increase (decrease) in net assets | 1,296,390 | (246,725) |
| | |
Net Assets | | |
Beginning of period | 17,333,800 | 17,580,525 |
End of period (including undistributed net investment income of $87,615 and undistributed net investment income of $124,277, respectively) | $ 18,630,190 | $ 17,333,800 |
See accompanying notes which are an integral part of the financial statements.
Annual Report
Financial Highlights - Puritan
Years ended August 31, | 2011 | 2010 | 2009 | 2008 | 2007 |
Selected Per-Share Data | | | | | |
Net asset value, beginning of period | $ 15.81 | $ 15.06 | $ 17.07 | $ 20.54 | $ 19.69 |
Income from Investment Operations | | | | | |
Net investment income (loss)B | .35 | .40 | .45 | .50 | .59 |
Net realized and unrealized gain (loss) | 1.93 | .75 | (2.00) | (1.80) | 1.70 |
Total from investment operations | 2.28 | 1.15 | (1.55) | (1.30) | 2.29 |
Distributions from net investment income | (.36) | (.39) | (.44) | (.55) | (.59) |
Distributions from net realized gain | -F | (.01) | (.02) | (1.62) | (.85) |
Total distributions | (.37)H | (.40) | (.46)G | (2.17) | (1.44) |
Net asset value, end of period | $ 17.72 | $ 15.81 | $ 15.06 | $ 17.07 | $ 20.54 |
Total ReturnA | 14.38% | 7.61% | (8.76)% | (7.35)% | 12.18% |
Ratios to Average Net AssetsC,E | | | | | |
Expenses before reductions | .60% | .61% | .67% | .61% | .60% |
Expenses net of fee waivers, if any | .60% | .61% | .67% | .61% | .60% |
Expenses net of all reductions | .59% | .61% | .67% | .60% | .59% |
Net investment income (loss) | 1.96% | 2.48% | 3.30% | 2.72% | 2.91% |
Supplemental Data | | | | | |
Net assets, end of period (in millions) | $ 15,420 | $ 15,054 | $ 16,111 | $ 21,427 | $ 25,719 |
Portfolio turnover rateD | 154%I | 104% | 116%I | 115% | 70%I |
A Total returns would have been lower had certain expenses not been reduced during the periods shown.
B Calculated based on average shares outstanding during the period.
C Fees and expenses of the underlying Fidelity Central Funds are not included in the Fund's expense ratio. The Fund indirectly bears its proportionate share of the expenses of any underlying Fidelity Central Funds.
D Amount does not include the portfolio activity of any underlying Fidelity Central Funds.
E Expense ratios reflect operating expenses of the class. Expenses before reductions do not reflect amounts reimbursed by the investment adviser or reductions from brokerage service arrangements or reductions from other expense offset arrangements and do not represent the amount paid by the class during periods when reimbursements or reductions occur. Expenses net of fee waivers reflect expenses after reimbursement by the investment adviser but prior to reductions from brokerage service arrangements or other expense offset arrangements. Expenses net of all reductions represent the net expenses paid by the class.
F Amount represents less than $.01 per share.
G Total distributions of $.46 per share is comprised of distributions from net investment income of $.442 and distributions from net realized gain of $.015 per share.
H Total distributions of $.37 per share is comprised of distributions from net investment income of $.364 and distributions from net realized gain of $.003 per share.
I The portfolio turnover rate excludes liquidations and/or redemptions executed in-kind from Affiliated Central Funds.
See accompanying notes which are an integral part of the financial statements.
Annual Report
Financial Highlights - Class K
Years ended August 31, | 2011 | 2010 | 2009 | 2008G |
Selected Per-Share Data | | | | |
Net asset value, beginning of period | $ 15.80 | $ 15.06 | $ 17.07 | $ 18.22 |
Income from Investment Operations | | | | |
Net investment income (loss)D | .38 | .42 | .46 | .14 |
Net realized and unrealized gain (loss) | 1.93 | .74 | (1.99) | (1.16) |
Total from investment operations | 2.31 | 1.16 | (1.53) | (1.02) |
Distributions from net investment income | (.39) | (.41) | (.47) | (.13) |
Distributions from net realized gain | -I | (.01) | (.02) | - |
Total distributions | (.39) | (.42) | (.48)J | (.13) |
Net asset value, end of period | $ 17.72 | $ 15.80 | $ 15.06 | $ 17.07 |
Total ReturnB,C | 14.59% | 7.69% | (8.59)% | (5.60)% |
Ratios to Average Net AssetsE,H | | | | |
Expenses before reductions | .48% | .48% | .50% | .48%A |
Expenses net of fee waivers, if any | .48% | .48% | .50% | .48%A |
Expenses net of all reductions | .47% | .47% | .50% | .48%A |
Net investment income (loss) | 2.09% | 2.61% | 3.47% | 3.21%A |
Supplemental Data | | | | |
Net assets, end of period (in millions) | $ 3,211 | $ 2,280 | $ 1,469 | $ 9 |
Portfolio turnover rateF | 154%K | 104% | 116%K | 115% |
A Annualized
B Total returns for periods of less than one year are not annualized.
C Total returns would have been lower had certain expenses not been reduced during the periods shown.
D Calculated based on average shares outstanding during the period.
E Fees and expenses of the underlying Fidelity Central Funds are not included in the Fund's expense ratio. The Fund indirectly bears its proportionate share of the expenses of any underlying Fidelity Central Funds.
F Amount does not include the portfolio activity of any underlying Fidelity Central Funds.
G For the period May 9, 2008 (commencement of sale of shares) to August 31, 2008.
H Expense ratios reflect operating expenses of the class. Expenses before reductions do not reflect amounts reimbursed by the investment adviser or reductions from brokerage service arrangements or reductions from other expense offset arrangements and do not represent the amount paid by the class during periods when reimbursements or reductions occur. Expense ratios before reductions for start-up periods may not be representative of longer-term operating periods. Expenses net of fee waivers reflect expenses after reimbursement by the investment adviser but prior to reductions from brokerage service arrangements or other expense offset arrangements. Expenses net of all reductions represent the net expenses paid by the class.
I Amount represents less than $.01 per share.
J Total distributions of $.48 per share is comprised of distributions from net investment income of $.468 and distributions from net realized gain of $.015 per share.
K The portfolio turnover rate excludes liquidations and/or redemptions executed in-kind from Affiliated Central Funds.
See accompanying notes which are an integral part of the financial statements.
Annual Report
Notes to Financial Statements
For the period ended August 31, 2011
(Amounts in thousands except ratios)
1. Organization.
Fidelity Puritan Fund (the Fund) is a fund of Fidelity Puritan Trust (the Trust) and is authorized to issue an unlimited number of shares. The Trust is registered under the Investment Company Act of 1940, as amended (the 1940 Act), as an open-end management investment company organized as a Massachusetts business trust. The Fund offers Puritan and Class K shares, each of which has equal rights as to assets and voting privileges. Each class has exclusive voting rights with respect to matters that affect that class. Investment income, realized and unrealized capital gains and losses, the common expenses of the Fund, and certain fund-level expense reductions, if any, are allocated on a pro-rata basis to each class based on the relative net assets of each class to the total net assets of the Fund. Each class differs with respect to transfer agent fees incurred. Certain expense reductions may also differ by class.
2. Investments in Fidelity Central Funds.
The Fund invests in Fidelity Central Funds, which are open-end investment companies available only to other investment companies and accounts managed by Fidelity Management & Research Company (FMR) and its affiliates. The Fund's Schedule of Investments lists each of the Fidelity Central Funds held as of period end, if any, as an investment of the Fund, but does not include the underlying holdings of each Fidelity Central Fund. As an Investing Fund, the Fund indirectly bears its proportionate share of the expenses of the underlying Fidelity Central Funds.
Based on their investment objective, each Fidelity Central Fund may invest or participate in various investment vehicles or strategies that are similar to those of the Fund. These strategies are consistent with the investment objectives of the Fund and may involve certain economic risks which may cause a decline in value of each of the Fidelity Central Funds and thus a decline in the value of the Fund. The Money Market Central Funds seek preservation of capital and current income and are managed by Fidelity Investments Money Management, Inc. (FIMM), an affiliate of FMR. The following summarizes the Fund's investment in each Fidelity Central Fund.
Fidelity
Central Fund | Investment Manager | Investment Objective | Investment Practices |
Fidelity Corporate Bond 1-10 Year Central Fund | FIMM | Seeks a high level of income by normally investing in investment-grade corporate bonds and other corporate debt securities and repurchase agreements for those securities. | Delayed Delivery & When Issued Securities Repurchase Agreements Restricted Securities Swap Agreements |
Fidelity Mortgage Backed Securities Central Fund | FIMM | Seeks a high level of income by normally investing in investment-grade mortgage-related securities and repurchase agreements for those securities. | Delayed Delivery & When Issued Securities Futures Repurchase Agreements Swap Agreements |
Annual Report
Notes to Financial Statements - continued
(Amounts in thousands except ratios)
2. Investments in Fidelity Central Funds - continued
An unaudited holdings listing for the Fund, which presents direct holdings as well as the pro-rata share of any securities and other investments held indirectly through its investment in underlying non-money market Fidelity Central Funds, is available at fidelity.com. A complete unaudited list of holdings for each Fidelity Central Fund is available upon request or at the Securities and Exchange Commission (the SEC) web site at www.sec.gov. In addition, the financial statements of the Fidelity Central Funds which contain the significant accounting policies (including security valuation policies) of those funds, which are not covered by the Fund's Report of Independent Registered Public Accounting Firm are available on the SEC web site or upon request.
3. Significant Accounting Policies.
The financial statements have been prepared in conformity with accounting principles generally accepted in the United States of America (GAAP), which require management to make certain estimates and assumptions at the date of the financial statements. Actual results could differ from those estimates. Subsequent events, if any, through the date that the financial statements were issued have been evaluated in the preparation of the financial statements. The following summarizes the significant accounting policies of the Fund:
Security Valuation. Investments are valued as of 4:00 p.m. Eastern time on the last calendar day of the period. The Fund uses independent pricing services approved by the Board of Trustees to value its investments. When current market prices or quotations are not readily available or reliable, valuations may be determined in good faith in accordance with procedures adopted by the Board of Trustees. Factors used in determining value may include market or security specific events, changes in interest rates and credit quality. The frequency with which these procedures are used cannot be predicted and they may be utilized to a significant extent. The value used for net asset value (NAV) calculation under these procedures may differ from published prices for the same securities.
The Fund categorizes the inputs to valuation techniques used to value its investments into a disclosure hierarchy consisting of three levels as shown below:
Level 1 - quoted prices in active markets for identical investments
Level 2 - other significant observable inputs (including quoted prices for similar investments, interest rates, prepayment speeds, etc.)
Level 3 - unobservable inputs (including the Fund's own assumptions based on the best information available)
Annual Report
3. Significant Accounting Policies - continued
Security Valuation - continued
Changes in valuation techniques may result in transfers in or out of an assigned level within the disclosure hierarchy. The aggregate value of investments by input level, as of August 31, 2011, as well as a roll forward of Level 3 securities, is included at the end of the Fund's Schedule of Investments. Valuation techniques used to value the Fund's investments by major category are as follows:
Equity securities, including restricted securities, for which market quotations are readily available, are valued at the last reported sale price or official closing price as reported by an independent pricing service on the primary market or exchange on which they are traded and are categorized as Level 1 in the hierarchy. In the event there were no sales during the day or closing prices are not available, securities are valued at the last quoted bid price or may be valued using the last available price and are generally categorized as Level 2 in the hierarchy. For foreign equity securities, when significant market or security specific events arise, comparisons to the valuation of American Depositary Receipts (ADRs), futures contracts, Exchange-traded funds (ETFs) and certain indexes as well as quoted prices for similar securities are used and are categorized as Level 2 in the hierarchy in these circumstances. Utilizing these techniques may result in transfers between Level 1 and Level 2. For restricted equity securities and private placements where observable inputs are limited, assumptions about market activity and risk are used and are categorized as Level 3 in the hierarchy.
Debt securities, including restricted securities, are valued based on evaluated prices received from independent pricing services or from dealers who make markets in such securities. For corporate bonds, bank notes, floating rate loans, foreign government and government agency obligations, municipal securities, preferred securities, supranational obligations, and U.S. government and government agency obligations, pricing services utilize matrix pricing which considers yield or price of bonds of comparable quality, coupon, maturity and type as well as dealer supplied prices and are generally categorized as Level 2 in the hierarchy. For asset backed securities, collateralized mortgage obligations, commercial mortgage securities, and U.S. government agency mortgage securities, pricing services utilize matrix pricing which considers prepayment speed assumptions, attributes of the collateral, yield or price of bonds of comparable quality, coupon, maturity and type as well as dealer supplied prices and, accordingly, such securities are generally categorized as Level 2 in the hierarchy. Swaps are marked-to-market daily based on valuations from independent pricing services or dealer-supplied valuations and changes in value are recorded as unrealized appreciation (depreciation). Pricing services utilize matrix pricing which considers comparisons to interest rate curves, credit spread curves, default possibilities and recovery rates and, as a result, swaps are generally categorized as Level 2 in the hierarchy. When independent prices are unavailable or unreliable, debt
Annual Report
Notes to Financial Statements - continued
(Amounts in thousands except ratios)
3. Significant Accounting Policies - continued
Security Valuation - continued
securities and swaps may be valued utilizing pricing matrices which consider similar factors that would be used by independent pricing services. These are generally categorized as Level 2 in the hierarchy but may be Level 3 depending on the circumstances.
Investments in open-end mutual funds, including the Fidelity Central Funds, are valued at their closing net asset value each business day and are categorized as Level 1 in the hierarchy. Short-term securities with remaining maturities of sixty days or less may be valued at amortized cost, which approximates fair value, and are categorized as Level 2 in the hierarchy.
Foreign Currency. The Fund may use foreign currency contracts to facilitate transactions in foreign-denominated securities. Gains and losses from these transactions may arise from changes in the value of the foreign currency or if the counterparties do not perform under the contracts' terms.
Foreign-denominated assets, including investment securities, and liabilities are translated into U.S. dollars at the exchange rate at period end. Purchases and sales of investment securities, income and dividends received and expenses denominated in foreign currencies are translated into U.S. dollars at the exchange rate in effect on the transaction date.
The effects of exchange rate fluctuations on investments are included with the net realized and unrealized gain (loss) on investment securities. Other foreign currency transactions resulting in realized and unrealized gain (loss) are disclosed separately.
Investment Transactions and Income. For financial reporting purposes, the Fund's investment holdings and NAV include trades executed through the end of the last business day of the period. The NAV per share for processing shareholder transactions is calculated as of the close of business of the New York Stock Exchange (NYSE), normally 4:00 p.m. Eastern time and includes trades executed through the end of the prior business day. Gains and losses on securities sold are determined on the basis of identified cost and may include proceeds received from litigation. Dividend income is recorded on the ex-dividend date, except for certain dividends from foreign securities where the ex-dividend date may have passed, which are recorded as soon as the Fund is informed of the ex-dividend date. Non-cash dividends included in dividend income, if any, are recorded at the fair market value of the securities received. Distributions received on securities that represent a return of capital or capital gain are recorded as a reduction of cost of investments and/or as a realized gain. The Fund estimates the components of distributions received that may be considered return of capital distributions or capital gain distributions. Interest income and distributions from the Fidelity Central Funds are
Annual Report
3. Significant Accounting Policies - continued
Investment Transactions and Income - continued
accrued as earned. Interest income includes coupon interest and amortization of premium and accretion of discount on debt securities. The principal value on inflation-indexed securities is periodically adjusted to the rate of inflation and interest is accrued based on the principal value. The adjustments to principal due to inflation are reflected as increases or decreases to interest income even though principal is not received until maturity. Investment income is recorded net of foreign taxes withheld where recovery of such taxes is uncertain. Debt obligations may be placed on non-accrual status and related interest income may be reduced by ceasing current accruals and writing off interest receivables when the collection of all or a portion of interest has become doubtful based on consistently applied procedures. A debt obligation is removed from non-accrual status when the issuer resumes interest payments or when collectability of interest is reasonably assured.
Expenses. Expenses directly attributable to a fund are charged to that fund. Expenses attributable to more than one fund are allocated among the respective funds on the basis of relative net assets or other appropriate methods. Expense estimates are accrued in the period to which they relate and adjustments are made when actual amounts are known.
Deferred Trustee Compensation. Under a Deferred Compensation Plan (the Plan), independent Trustees may elect to defer receipt of a portion of their annual compensation. Deferred amounts are invested in a cross-section of Fidelity funds, are marked-to-market and remain in the Fund until distributed in accordance with the Plan. The investment of deferred amounts and the offsetting payable to the Trustees are included in the accompanying Statement of Assets and Liabilities.
Income Tax Information and Distributions to Shareholders. Each year, the Fund intends to qualify as a regulated investment company, including distributing substantially all of its taxable income and realized gains under Subchapter M of the Internal Revenue Code and filing its U.S. federal tax return. As a result, no provision for income taxes is required. As of August 31, 2011, the Fund did not have any unrecognized tax benefits in the financial statements. A fund's federal tax return is subject to examination by the Internal Revenue Service (IRS) for a period of three years. Foreign taxes are provided for based on the Fund's understanding of the tax rules and rates that exist in the foreign markets in which it invests. The Fund is subject to a tax imposed on realized short term capital gains on securities of certain issuers domiciled in India. An estimated deferred tax liability for net unrealized gains on these securities is included in Other payables and accrued expenses on the Statement of Assets & Liabilities.
Annual Report
Notes to Financial Statements - continued
(Amounts in thousands except ratios)
3. Significant Accounting Policies - continued
Income Tax Information and Distributions to Shareholders - continued
Distributions are declared and recorded on the ex-dividend date. Income dividends and capital gain distributions are declared separately for each class. Income and capital gain distributions are determined in accordance with income tax regulations, which may differ from GAAP.
Capital accounts within the financial statements are adjusted for permanent book-tax differences. These adjustments have no impact on net assets or the results of operations. Temporary book-tax differences will reverse in a subsequent period.
Book-tax differences are primarily due to in-kind transactions, swap agreements, foreign currency transactions, passive foreign investment companies (PFIC), market discount, equity-debt classifications, partnerships (including allocations from Fidelity Central Funds), deferred trustees compensation, capital loss carryforwards and losses deferred due to wash sales.
The federal tax cost of investment securities and unrealized appreciation (depreciation) as of period end were as follows:
Gross unrealized appreciation | $ 2,120,098 |
Gross unrealized depreciation | (772,927) |
Net unrealized appreciation (depreciation) on securities and other investments | $ 1,347,171 |
| |
Tax Cost | $ 18,286,499 |
The tax-based components of distributable earnings as of period end were as follows:
Undistributed ordinary income | $ 54,551 |
Capital loss carryforward | $ (38,013) |
Net unrealized appreciation (depreciation) | $ 1,319,236 |
Under the recently enacted Regulated Investment Company Modernization Act of 2010 (the Act), the Fund will be permitted to carry forward capital losses incurred in taxable years beginning after December 22, 2010 for an unlimited period. However, any losses incurred during those future taxable years will be required to be utilized prior to any losses incurred in pre-enactment taxable years, which generally expire after eight years from when they are incurred. Additionally, post-enactment capital losses that are carried forward will retain their character as either short-term or long-term capital losses rather than being considered all short-term as under previous law. The Fund's first fiscal year end subject to the Act will be August 31, 2012.
Annual Report
3. Significant Accounting Policies - continued
Income Tax Information and Distributions to Shareholders - continued
The tax character of distributions paid was as follows:
| August 31, 2011 | August 31, 2010 |
Ordinary Income | $ 399,171 | $ 453,214 |
New Accounting Pronouncement. In May 2011, the Financial Accounting Standards Board issued Accounting Standard Update No. 2011-04, Fair Value Measurement (Topic 820) - Amendments to Achieve Common Fair Value Measurement and Disclosure Requirements in U.S. GAAP and IFRSs. The update changes the wording used to describe the requirements in GAAP for measuring fair value and for disclosing information about fair value measurements. The update is effective during interim and annual periods beginning after December 15, 2011. Management is currently evaluating the impact of the update's adoption on the Fund's financial statement disclosures.
4. Operating Policies.
Repurchase Agreements. FMR has received an Exemptive Order from the SEC which permits the Fund and other affiliated entities of FMR to transfer uninvested cash balances into joint trading accounts which are then invested in repurchase agreements. The Fund may also invest directly with institutions in repurchase agreements. Repurchase agreements are collateralized by government or non-government securities. Upon settlement date, collateral is held in segregated accounts with custodian banks and may be obtained in the event of a default of the counterparty. The Fund monitors, on a daily basis, the value of the collateral to ensure it is at least equal to the principal amount of the repurchase agreement (including accrued interest). In the event of a default by the counterparty, realization of the collateral proceeds could be delayed, during which time the value of the collateral may decline.
Delayed Delivery Transactions and When-Issued Securities. During the period, the Fund transacted in securities on a delayed delivery or when-issued basis. Payment and delivery may take place after the customary settlement period for that security. The price of the underlying securities and the date when the securities will be delivered and paid for are fixed at the time the transaction is negotiated. During the time a delayed delivery sell is outstanding, the contract is marked-to-market daily and equivalent deliverable securities are held for the transaction. The securities purchased on a delayed delivery or when-issued basis are identified as such in the Fund's Schedule of Investments. The Fund may receive compensation for interest forgone in the purchase of a delayed delivery or when-issued security. With respect to purchase commitments, the Fund identifies securities as segregated in its records with a value at least equal to the
Annual Report
Notes to Financial Statements - continued
(Amounts in thousands except ratios)
4. Operating Policies - continued
Delayed Delivery Transactions and When-Issued Securities - continued
amount of the commitment. Losses may arise due to changes in the value of the underlying securities or if the counterparty does not perform under the contract's terms, or if the issuer does not issue the securities due to political, economic, or other factors.
Restricted Securities. The Fund may invest in securities that are subject to legal or contractual restrictions on resale. These securities generally may be resold in transactions exempt from registration or to the public if the securities are registered. Disposal of these securities may involve time-consuming negotiations and expense, and prompt sale at an acceptable price may be difficult. Information regarding restricted securities is included at the end of the Fund's Schedule of Investments.
Loans and Other Direct Debt Instruments. The Fund may invest in loans and loan participations, trade claims or other receivables. These investments may include standby financing commitments, including revolving credit facilities, that obligate the Fund to supply additional cash to the borrower on demand. Loan participations involve a risk of insolvency of the lending bank or other financial intermediary. The Fund may be contractually obligated to receive approval from the agent bank and/or borrower prior to the sale of these investments.
5. Derivative Instruments.
Risk Exposures and the Use of Derivative Instruments. The Fund used derivative instruments (derivatives), including swap agreements, in order to meet its investment objectives. The strategy is to use derivatives to increase returns, to gain exposure to certain types of assets and to manage exposure to certain risks as defined below. The success of any strategy involving derivatives depends on analysis of numerous economic factors, and if the strategies for investment do not work as intended, the Fund may not achieve its objectives.
The Fund's use of derivatives increased or decreased its exposure to the following risks:
Credit Risk | Credit risk relates to the ability of the issuer of a financial instrument to make further principal or interest payments on an obligation or commitment that it has to the Fund. |
Interest
Rate Risk | Interest rate risk relates to the fluctuations in the value of interest-bearing securities due to changes in the prevailing levels of market interest rates. |
The Fund is also exposed to additional risks from investing in derivatives, such as liquidity risk and counterparty credit risk. Liquidity risk is the risk that the Fund will be unable to sell the derivative in the open market in a timely manner. Counterparty credit risk is the risk that the counterparty will not be able to fulfill its obligation to the Fund.
Annual Report
5. Derivative Instruments - continued
Risk Exposures and the Use of Derivative Instruments - continued
Derivative counterparty credit risk is managed through formal evaluation of the creditworthiness of all potential counterparties. On certain over-the-counter derivatives, the Fund attempts to reduce its exposure to counterparty credit risk by entering into an International Swaps and Derivatives Association (ISDA) Master Agreement on a bilateral basis with each of its counterparties. The ISDA Master Agreement gives the Fund the right to terminate all transactions traded under such agreement if there is a certain deterioration in the credit quality of the counterparty. The ISDA Master Agreement gives each party the right, upon an event of default by the other party or a termination of the agreement, to close out all transactions traded under such agreement and to net amounts owed under each transaction to one net payable by one party to the other. To mitigate counterparty credit risk, the Fund offsets certain payables and/or receivables with collateral. Collateral in the form of cash or securities, if required, is held in segregated accounts with the Fund's custodian bank in accordance with the collateral agreements entered into between the Fund, the swap counterparty and the Fund's custodian bank, and is identified in the Schedule of Investments. The Fund could experience delays and costs in gaining access to the collateral even though it is held by the Fund's custodian bank. The Fund's maximum risk of loss from counterparty credit risk is generally the aggregate unrealized appreciation and unpaid counterparty payments in excess of any collateral pledged by the counterparty to the Fund. Derivatives involve, to varying degrees, risk of loss in excess of the amounts recognized in the Statement of Assets and Liabilities.
Net Realized Gain (Loss) and Change in Net Unrealized Appreciation (Depreciation) on Derivatives. The table below, which reflects the impacts of derivatives on the financial performance of the Fund, summarizes the net realized gain (loss) and change in net unrealized appreciation (depreciation) for derivatives during the period.
Risk Exposure / Derivative Type | Net Realized
Gain (Loss) | Change in Net Unrealized Appreciation (Depreciation) |
Credit Risk | | |
Swap Agreements | (7,029) | 6,248 |
Interest Rate Risk | | |
Swap Agreements | (474) | - |
Totals (a) | $ (7,503) | $ 6,248 |
(a) A summary of the value of derivatives by risk exposure as of period end, is included at the end of the Schedule of Investments and is
representative of activity for the period.
Annual Report
Notes to Financial Statements - continued
(Amounts in thousands except ratios)
5. Derivative Instruments - continued
Swap Agreements. A swap agreement (swap) is a contract between two parties to exchange future cash flows at periodic intervals based on a notional principal amount.
Details of swaps open at period end are included in the Schedule of Investments under the caption "Swap Agreements." Swaps are marked-to-market daily and changes in value are recorded as unrealized appreciation or (depreciation) and reflected in the Statement of Assets and Liabilities. Any upfront premiums paid or received upon entering a swap to compensate for differences between stated terms of the agreement and prevailing market conditions (e.g. credit spreads, interest rates or other factors) are recorded as realized gain or (loss) ratably over the term of the swap. Payments are exchanged at specified intervals, accrued daily commencing with the effective date of the contract and recorded as realized gain or (loss). Realized gain or (loss) is also recorded in the event of an early termination of a swap. The net realized gain (loss) and change in net unrealized appreciation (depreciation) on swaps during the period is included in the Statement of Operations.
Risks of loss include credit risk and interest rate risk. In addition, there is the risk of failure by the counterparty to perform under the terms of the agreement and lack of liquidity in the market.
Interest Rate Swaps. Interest rate swaps are agreements between counterparties to exchange cash flows, one based on a fixed rate, and the other on a floating rate. The Fund entered into interest rate swaps to manage its exposure to interest rate changes. Changes in interest rates can have an effect on both the value of bond holdings as well as the amount of interest income earned. In general, the value of bonds can fall when interest rates rise and can rise when interest rates fall.
Credit Default Swaps. Credit default swaps enable the Fund to buy or sell protection on a debt security or a basket of securities against a defined credit event. Under the terms of a credit default swap the buyer of protection (buyer) receives credit protection in exchange for making periodic payments to the seller of protection (seller) based on a fixed percentage applied to a notional principal amount. In return for these payments, the seller acts as a guarantor of the creditworthiness of a reference obligation. The Fund enters into credit default swaps as a seller to gain credit exposure to an issuer and/or as a buyer to provide a measure of protection against defaults of an issuer. The issuer may be either a single issuer or a "basket" of issuers. Periodic payments are made over the life of the contract provided that no credit event occurs.
For credit default swaps on most corporate and sovereign issuers, credit events include bankruptcy, failure to pay, obligation acceleration or repudiation/moratorium. For credit default swaps on corporate or sovereign issuers, the obligation that may be put to the seller is not limited to the specific reference obligation described in the Schedule of
Annual Report
5. Derivative Instruments - continued
Credit Default Swaps - continued
Investments. For credit default swaps on asset-backed securities, a credit event may be triggered by events such as failure to pay principal, maturity extension, rating downgrade or write-down. For credit default swaps on asset-backed securities, the reference obligation described represents the security that may be put to the seller.
As a seller, if an underlying credit event occurs, the Fund will either pay the buyer an amount equal to the notional amount of the swap and take delivery of the reference obligation or underlying securities comprising an index or pay a net settlement amount of cash equal to the notional amount of the swap less the recovery value of the reference obligation or underlying securities comprising an index.
As a buyer, if an underlying credit event occurs, the Fund will either receive from the seller an amount equal to the notional amount of the swap and deliver the reference obligation or underlying securities comprising an index or receive a net settlement amount of cash equal to the notional amount of the swap less the recovery value of the reference obligation or underlying securities comprising an index.
Typically, the value of each credit default swap and credit rating disclosed for each reference obligation in the Schedule of Investments, where the Fund is the seller, can be used as measures of the current payment/performance risk of the swap. As the value of the swap changes as a positive or negative percentage of the total notional amount, the payment/performance risk may decrease or increase, respectively. In addition to these measures, FMR monitors a variety of factors including cash flow assumptions, market activity and market sentiment as part of its ongoing process of assessing payment/performance risk.
The notional amount of credit default swaps is included in the Schedule of Investments and approximates the maximum potential amount of future payments that the Fund could be required to make if the Fund is the seller and a credit event were to occur. The total notional amount of all credit default swaps open at period end where the Fund is the seller amounted to $34,305 representing 0.18% of net assets.
6. Purchases and Sales of Investments.
Purchases and sales of securities, including the Fixed-Income Central Funds, other than short-term securities, U.S. government securities and in-kind transactions, aggregated $13,681,540 and $14,936,836, respectively.
Annual Report
Notes to Financial Statements - continued
(Amounts in thousands except ratios)
7. Fees and Other Transactions with Affiliates.
Management Fee. FMR and its affiliates provide the Fund with investment management related services for which the Fund pays a monthly management fee. The management fee is the sum of an individual fund fee rate that is based on an annual rate of .15% of the Fund's average net assets and a group fee rate that averaged .26% during the period. The group fee rate is based upon the average net assets of all the mutual funds advised by FMR. The group fee rate decreases as assets under management increase and increases as assets under management decrease. For the period, the total annual management fee rate was .41% of the Fund's average net assets.
Transfer Agent Fees. Fidelity Investments Institutional Operations Company, Inc. (FIIOC), an affiliate of FMR, is the transfer, dividend disbursing and shareholder servicing agent for each class of the Fund. FIIOC receives account fees and asset-based fees that vary according to the account size and type of account of the shareholders of Puritan. FIIOC receives an asset-based fee of Class K's average net assets. FIIOC pays for typesetting, printing and mailing of shareholder reports, except proxy statements. For the period, transfer agent fees for each class were as follows:
| Amount | % of
Average
Net Assets |
Puritan | 28,791 | .17 |
Class K | 1,532 | .05 |
| $ 30,323 | |
Accounting and Security Lending Fees. Fidelity Service Company, Inc. (FSC), an affiliate of FMR, maintains the Fund's accounting records. The accounting fee is based on the level of average net assets for the month. Under a separate contract, FSC administers the security lending program. The security lending fee is based on the number and duration of lending transactions.
Brokerage Commissions. The Fund placed a portion of its portfolio transactions with brokerage firms which are affiliates of the investment adviser. The commissions paid to these affiliated firms were $266 for the period.
Exchange In-Kind. During the period, the Fund redeemed in-kind 2,207 shares of Fidelity Corporate Bond 1-10 Year Central Fund ("1-10 Year"), a Fidelity Central Fund in which the Fund invests, valued at $239,305 in exchange for cash and securities, including accrued interest. Realized gain (loss) of $18,783 on the Fund's redemption of 1-10 Year shares is included in the accompanying Statement of Operations as "Realized gain (loss) on Fidelity Central Funds." Because 1-10 Year was a partnership for federal income tax purposes, the redemption generally was tax free to the Fund.
Annual Report
8. Committed Line of Credit.
The Fund participates with other funds managed by FMR or an affiliate in a $4.0 billion credit facility (the "line of credit") to be utilized for temporary or emergency purposes to fund shareholder redemptions or for other short-term liquidity purposes. The Fund has agreed to pay commitment fees on its pro-rata portion of the line of credit, which amounted to $65 and is reflected in Miscellaneous expenses on the Statement of Operations. During the period, there were no borrowings on this line of credit.
9. Security Lending.
The Fund lends portfolio securities from time to time in order to earn additional income. For equity securities, a lending agent is used and may loan securities to certain qualified borrowers, including Fidelity Capital Markets (FCM), a broker-dealer affiliated with the Fund. On the settlement date of the loan, the Fund receives collateral (in the form of U.S. Treasury obligations, letters of credit and/or cash) against the loaned securities and maintains collateral in an amount not less than 100% of the market value of the loaned securities during the period of the loan. The market value of the loaned securities is determined at the close of business of the Fund and any additional required collateral is delivered to the Fund on the next business day. If the borrower defaults on its obligation to return the securities loaned because of insolvency or other reasons, a fund could experience delays and costs in recovering the securities loaned or in gaining access to the collateral. Any cash collateral received is maintained at the Fund's custodian and/or invested in cash equivalents and/or the Fidelity Securities Lending Cash Central Fund. The value of loaned securities and cash collateral at period end are disclosed on the Fund's Statement of Assets and Liabilities. The value of securities loaned to FCM at period end was $251. Security lending income represents the income earned on investing cash collateral, less rebates paid to borrowers and any lending agent fees associated with the loan, plus any premium payments received for lending certain types of securities. Total security lending income during the period, presented in the Statement of Operations as a component of interest income, amounted to $258. Net income from the Fidelity Securities Lending Cash Central Fund during the period, presented in the Statement of Operations as a component of income from Fidelity Central Funds, amounted to $3,599 (including $117 from securities loaned to FCM).
10. Expense Reductions.
Many of the brokers with whom FMR places trades on behalf of the Fund provided services to the Fund in addition to trade execution. These services included payments of certain expenses on behalf of the Fund totaling $1,107 for the period. In addition, through arrangements with the Fund's custodian, credits realized as a result of uninvested cash balances were used to reduce the Fund's expenses. During the period, these credits reduced the Fund's expenses by $5.
Annual Report
Notes to Financial Statements - continued
(Amounts in thousands except ratios)
11. Distributions to Shareholders.
Distributions to shareholders of each class were as follows:
Years ended August 31, | 2011 | 2010 |
From net investment income | | |
Puritan | $ 333,862 | $ 395,626 |
Class K | 62,045 | 46,093 |
Total | $ 395,907 | $ 441,719 |
From net realized gain | | |
Puritan | $ 2,823 | $ 10,418 |
Class K | 441 | 1,077 |
Total | $ 3,264 | $ 11,495 |
12. Share Transactions.
Transactions for each class of shares were as follows:
| Shares | Dollars |
Years ended August 31, | 2011 | 2010 | 2011 | 2010 |
Puritan | | | | |
Shares sold | 80,583 | 76,931 | $ 1,457,491 | $ 1,241,703 |
Reinvestment of distributions | 17,715 | 24,218 | 318,717 | 385,575 |
Shares redeemed | (180,664) | (218,263) | (3,262,008) | (3,516,873) |
Net increase (decrease) | (82,366) | (117,114) | $ (1,485,800) | $ (1,889,595) |
Class K | | | | |
Shares sold | 63,847 | 67,219 | $ 1,155,980 | $ 1,078,159 |
Reinvestment of distributions | 3,457 | 2,954 | 62,486 | 47,170 |
Shares redeemed | (30,388) | (23,457) | (549,211) | (375,830) |
Net increase (decrease) | 36,916 | 46,716 | $ 669,255 | $ 749,499 |
13. Other.
The Fund's organizational documents provide former and current trustees and officers with a limited indemnification against liabilities arising in connection with the performance of their duties to the Fund. In the normal course of business, the Fund may also enter into contracts that provide general indemnifications. The Fund's maximum exposure under these arrangements is unknown as this would be dependent on future claims that may be made against the Fund. The risk of material loss from such claims is considered remote.
Annual Report
To the Trustees of Fidelity Puritan Trust and the Shareholders of Fidelity Puritan Fund:
In our opinion, the accompanying statement of assets and liabilities, including the schedule of investments, and the related statements of operations and of changes in net assets and the financial highlights present fairly, in all material respects, the financial position of Fidelity Puritan Fund (a fund of Fidelity Puritan Trust) at August 31, 2011, the results of its operations for the year then ended, the changes in its net assets for each of the two years in the period then ended and the financial highlights for each of the periods indicated, in conformity with accounting principles generally accepted in the United States of America. These financial statements and financial highlights (hereafter referred to as "financial statements") are the responsibility of the Fidelity Puritan Fund's management. Our responsibility is to express an opinion on these financial statements based on our audits. We conducted our audits of these financial statements in accordance with the standards of the Public Company Accounting Oversight Board (United States). Those standards require that we plan and perform the audit to obtain reasonable assurance about whether the financial statements are free of material misstatement. An audit includes examining, on a test basis, evidence supporting the amounts and disclosures in the financial statements, assessing the accounting principles used and significant estimates made by management, and evaluating the overall financial statement presentation. We believe that our audits, which included confirmation of securities at August 31, 2011 by correspondence with the custodian and brokers, provide a reasonable basis for our opinion.
/s/ PricewaterhouseCoopers LLP
PricewaterhouseCoopers LLP
Boston, Massachusetts
October 19, 2011
Annual Report
The Trustees, Members of the Advisory Board, and executive officers of the trust and fund, as applicable, are listed below. The Board of Trustees governs the fund and is responsible for protecting the interests of shareholders. The Trustees are experienced executives who meet periodically throughout the year to oversee the fund's activities, review contractual arrangements with companies that provide services to the fund, oversee management of the risks associated with such activities and contractual arrangements, and review the fund's performance. Except for James C. Curvey, each of the Trustees oversees 221 funds advised by FMR or an affiliate. Mr. Curvey oversees 424 funds advised by FMR or an affiliate.
The Trustees hold office without limit in time except that (a) any Trustee may resign; (b) any Trustee may be removed by written instrument, signed by at least two-thirds of the number of Trustees prior to such removal; (c) any Trustee who requests to be retired or who has become incapacitated by illness or injury may be retired by written instrument signed by a majority of the other Trustees; and (d) any Trustee may be removed at any special meeting of shareholders by a two-thirds vote of the outstanding voting securities of the trust. Each Trustee who is not an interested person (as defined in the 1940 Act) (Independent Trustee), shall retire not later than the last day of the calendar year in which his or her 75th birthday occurs. The Independent Trustees may waive this mandatory retirement age policy with respect to individual Trustees. The executive officers and Advisory Board Members hold office without limit in time, except that any officer and Advisory Board Member may resign or may be removed by a vote of a majority of the Trustees at any regular meeting or any special meeting of the Trustees. Except as indicated, each individual has held the office shown or other offices in the same company for the past five years.
Experience, Skills, Attributes, and Qualifications of the Fund's Trustees. The Governance and Nominating Committee has adopted a statement of policy that describes the experience, qualifications, attributes, and skills that are necessary and desirable for potential Independent Trustee candidates (Statement of Policy). The Board believes that each Trustee satisfied at the time he or she was initially elected or appointed a Trustee, and continues to satisfy, the standards contemplated by the Statement of Policy. The Governance and Nominating Committee also engages professional search firms to help identify potential Independent Trustee candidates who have the experience, qualifications, attributes, and skills consistent with the Statement of Policy. From time to time, additional criteria based on the composition and skills of the current Independent Trustees, as well as experience or skills that may be appropriate in light of future changes to board composition, business conditions, and regulatory or other developments, have also been considered by the professional search firms and the Governance and Nominating Committee. In addition, the Board takes into account the Trustees' commitment and participation in Board and committee meetings, as well as their leadership of standing and ad hoc committees throughout their tenure.
In determining that a particular Trustee was and continues to be qualified to serve as a Trustee, the Board has considered a variety of criteria, none of which, in isolation, was controlling. The Board believes that, collectively, the Trustees have balanced and diverse experience, qualifications, attributes, and skills, which allow the Board to operate effectively in governing the fund and protecting the interests of shareholders. Information about the specific experience, skills, attributes, and qualifications of each Trustee, which in each case led to the Board's conclusion that the Trustee should serve (or continue to serve) as a trustee of the fund, is provided below.
Annual Report
Trustees and Officers - continued
Board Structure and Oversight Function. James C. Curvey is an interested person (as defined in the 1940 Act) and currently serves as Acting Chairman. The Trustees have determined that an interested Chairman is appropriate and benefits shareholders because an interested Chairman has a personal and professional stake in the quality and continuity of services provided to the fund. Independent Trustees exercise their informed business judgment to appoint an individual of their choosing to serve as Chairman, regardless of whether the Trustee happens to be independent or a member of management. The Independent Trustees have determined that they can act independently and effectively without having an Independent Trustee serve as Chairman and that a key structural component for assuring that they are in a position to do so is for the Independent Trustees to constitute a substantial majority for the Board. The Independent Trustees also regularly meet in executive session. Ned C. Lautenbach serves as Chairman of the Independent Trustees and as such (i) acts as a liaison between the Independent Trustees and management with respect to matters important to the Independent Trustees and (ii) with management prepares agendas for Board meetings.
Fidelity funds are overseen by different Boards of Trustees. The fund's Board oversees Fidelity's equity and high income funds and another Board oversees Fidelity's investment-grade bond, money market, and asset allocation funds. The asset allocation funds may invest in Fidelity funds overseen by the fund's Board. The use of separate Boards, each with its own committee structure, allows the Trustees of each group of Fidelity funds to focus on the unique issues of the funds they oversee, including common research, investment, and operational issues. On occasion, the separate Boards establish joint committees to address issues of overlapping consequences for the Fidelity funds overseen by each Board.
The Trustees operate using a system of committees to facilitate the timely and efficient consideration of all matters of importance to the Trustees, the fund, and fund shareholders and to facilitate compliance with legal and regulatory requirements and oversight of the fund's activities and associated risks. The Board, acting through its committees, has charged FMR and its affiliates with (i) identifying events or circumstances the occurrence of which could have demonstrably adverse effects on the fund's business and/or reputation; (ii) implementing processes and controls to lessen the possibility that such events or circumstances occur or to mitigate the effects of such events or circumstances if they do occur; and (iii) creating and maintaining a system designed to evaluate continuously business and market conditions in order to facilitate the identification and implementation processes described in (i) and (ii) above. Because the day-to-day operations and activities of the fund are carried out by or through FMR, its affiliates and other service providers, the fund's exposure to risks is mitigated but not eliminated by the processes overseen by the Trustees. While each of the Board's committees has responsibility for overseeing different aspects of the fund's activities, oversight is exercised primarily through the Operations, Audit, and Compliance Committees. In addition, the Independent Trustees have worked with FMR to enhance the Board's oversight of investment and financial risks, legal and regulatory risks, technology risks, and operational risks, including the development of additional risk reporting to the Board. For example, a working group comprised of Independent Trustees and FMR has worked and continues to work to review the Fidelity funds' valuation-related activities, reporting and risk management. Appropriate personnel, including but not limited to the fund's Chief Compliance Officer (CCO), FMR's internal auditor, the independent accountants, the fund's Treasurer and portfolio management personnel, make periodic reports to the Board's committees, as appropriate, including an annual review of FMR's risk management program for the Fidelity funds. The responsibilities of each standing committee, including their oversight responsibilities, are described further under "Standing Committees of the Fund's Trustees."
Annual Report
The fund's Statement of Additional Information (SAI) includes more information about the Trustees. To request a free copy, call Fidelity at 1-800-544-8544.
Interested Trustees*:
Correspondence intended for each Trustee who is an interested person may be sent to Fidelity Investments, 82 Devonshire Street, Boston, Massachusetts 02109.
Name, Age; Principal Occupations and Other Relevant Experience+ |
James C. Curvey (76) |
| Year of Election or Appointment: 2007 Mr. Curvey is Trustee and Acting Chairman of the Board of Trustees of certain Trusts. Mr. Curvey also serves as Trustee (2007-present) of other investment companies advised by FMR. Mr. Curvey is a Director of Fidelity Investments Money Management, Inc. (2009-present), Director of Fidelity Research & Analysis Co. (2009-present) and Director of FMR and FMR Co., Inc. (2007-present). Mr. Curvey is also Vice Chairman (2007-present) and Director of FMR LLC. In addition, Mr. Curvey serves as an Overseer for the Boston Symphony Orchestra and a member of the Trustees of Villanova University. Previously, Mr. Curvey was the Vice Chairman (2006-2007) and Director (2000-2007) of FMR Corp. |
Ronald P. O'Hanley (54) |
| Year of Election or Appointment: 2011 Mr. O'Hanley is Director of FMR Co., Inc. (2010-present), Director of Fidelity Investments Money Management, Inc. (2010-present), Director of Fidelity Research & Analysis Company (2010-present), President of Fidelity Asset Management and Corporate Services and a member of Fidelity's Executive Committee (2010-present). Previously, Mr. O'Hanley served as President and Chief Executive Officer of BNY Mellon Asset Management (2007-2010). Mr. O'Hanley also served as Vice Chairman of Bank New York Mellon Corp. and a member of that firm's Executive Committee. Prior to the 2007 merger of The Bank of New York and Mellon Financial Corporation, he was Vice Chairman of Mellon Financial Corporation and President and Chief Executive Officer of Mellon Asset Management. He joined Mellon in February 1997. Mr. O'Hanley currently serves as Chairman of the Boston Public Library Foundation Board of Directors and sits on the Board of Directors of Beth Israel Deaconess Medical Center, the Board of Trustees of the Marine Biological Laboratory and the Advisory Board of the Maxwell School of Citizenship and Public Administration at Syracuse University. Mr. O'Hanley also chairs the Council on Asset Management for the Financial Services Roundtable and is a member of the Board of Directors of Institutional Investor's U.S. Institute. |
* Trustees have been determined to be "Interested Trustees" by virtue of, among other things, their affiliation with the trust or various entities under common control with FMR.
+ The information above includes each Trustee's principal occupation during the last five years and other information relating to the experience, attributes, and skills relevant to each Trustee's qualifications to serve as a Trustee, which led to the conclusion that each Trustee should serve as a Trustee for the fund.
Annual Report
Independent Trustees:
Correspondence intended for each Independent Trustee (that is, the Trustees other than the Interested Trustees) may be sent to Fidelity Investments, P.O. Box 55235, Boston, Massachusetts 02205-5235.
Name, Age; Principal Occupations and Other Relevant Experience+ |
Dennis J. Dirks (63) |
| Year of Election or Appointment: 2005 Prior to his retirement in May 2003, Mr. Dirks was Chief Operating Officer and a member of the Board of The Depository Trust & Clearing Corporation (DTCC). He also served as President, Chief Operating Officer, and Board member of The Depository Trust Company (DTC) and President and Board member of the National Securities Clearing Corporation (NSCC). In addition, Mr. Dirks served as Chief Executive Officer and Board member of the Government Securities Clearing Corporation, Chief Executive Officer and Board member of the Mortgage-Backed Securities Clearing Corporation, as a Trustee and a member of the Finance Committee of Manhattan College (2005-2008), and as a Trustee and a member of the Finance Committee of AHRC of Nassau County (2006-2008). Mr. Dirks is a member of the Independent Directors Council (IDC) Governing Council (2010-Present) and Board of Directors for The Brookville Center for Children's Services, Inc. (2009-present). |
Alan J. Lacy (57) |
| Year of Election or Appointment: 2008 Mr. Lacy serves as Senior Adviser (2007-present) of Oak Hill Capital Partners, L.P. (private equity). Mr. Lacy also served as Chief Executive Officer (2000-2005) and Vice Chairman (2005-2006) of Sears Holdings Corporation and Sears, Roebuck and Co. (retail). In addition, Mr. Lacy serves as a member of the Board of Directors of Dave & Buster's, Inc. (restaurant and entertainment complexes, 2010-present), The Hillman Companies, Inc. (hardware wholesalers, 2010-present), and Bristol-Myers Squibb Company (global pharmaceuticals, 2007-present). Mr. Lacy is a member of the Board of Trustees of The National Parks Conservation Association (2006-Present). Previously, Mr. Lacy served as Chairman of the Board of Trustees of the National Parks Conservation Association (2008-2011) and as a member of the Board of Directors for the Western Union Company (global money transfer, 2006-2011). |
Ned C. Lautenbach (67) |
| Year of Election or Appointment: 2000 Mr. Lautenbach is Chairman of the Independent Trustees of the Equity and High Income Funds (2006-present). Mr. Lautenbach currently serves as the Lead Director of the Eaton Corporation Board of Directors (diversified industrial, 1997-present). Mr. Lautenbach is also a member of the Board of Directors of the Philharmonic Center for the Arts in Naples, Florida (1999-present); a member of the Board of Trustees of Fairfield University (2005-present); and a member of the Council on Foreign Relations (1994-present). Previously, Mr. Lautenbach was a Partner/Advisory Partner at Clayton, Dubilier & Rice, LLC (private equity investment, 1998-2010), as well as a Director of Sony Corporation (2006-2007). |
Joseph Mauriello (66) |
| Year of Election or Appointment: 2008 Prior to his retirement in January 2006, Mr. Mauriello served in numerous senior management positions including Deputy Chairman and Chief Operating Officer (2004-2005), and Vice Chairman of Financial Services (2002-2004) of KPMG LLP US (professional services, 1965-2005). Mr. Mauriello currently serves as a member of the Board of Directors of XL Group plc. (global insurance and re-insurance, 2006-present) and of Arcadia Resources Inc. (health care services and products, 2007-present). Previously, Mr. Mauriello served as a Director of the Hamilton Funds of the Bank of New York (2006-2007). |
Robert W. Selander (60) |
| Year of Election or Appointment: 2011 Previously, Mr. Selander served as a Member of the Advisory Board of Fidelity's Equity and High Income Funds (2011), Executive Vice Chairman (2010), Chief Executive Officer (2009-2010), and President and Chief Executive Officer (1997-2009) of Mastercard, Inc. |
Cornelia M. Small (67) |
| Year of Election or Appointment: 2005 Ms. Small is a member of the Board of Directors of the Teagle Foundation (2009-present). Ms. Small is also a member of the Investment Committee, and Chair (2008-present) and a member of the Board of Trustees of Smith College. In addition, Ms. Small serves on the Investment Committee of the Berkshire Taconic Community Foundation (2008-present). Previously, Ms. Small served as Chairperson of the Investment Committee (2002-2008) of Smith College. In addition, Ms. Small served as Chief Investment Officer, Director of Global Equity Investments, and a member of the Board of Directors of Scudder, Stevens & Clark and Scudder Kemper Investments. |
William S. Stavropoulos (72) |
| Year of Election or Appointment: 2001 Mr. Stavropoulos is Vice Chairman of the Independent Trustees of the Equity and High Income Funds (2006-present). Mr. Stavropoulos serves as President and Founder of the Michigan Baseball Foundation, the Great Lakes Loons (2007-present). Mr. Stavropoulos is Chairman Emeritus of the Board of Directors of The Dow Chemical Company, where he previously served in numerous senior management positions, including President, CEO (1995-2000; 2002-2004), Chairman of the Executive Committee (2000-2006), and as a member of the Board of Directors (1990-2006). Currently, Mr. Stavropoulos is Chairman of Univar (global distributor of commodity and specialty chemicals, 2010-present), a Director of Teradata Corporation (data warehousing and technology solutions, 2008-present), Chemical Financial Corporation, Maersk Inc. (industrial conglomerate), Tyco International, Inc. (multinational manufacturing and services, 2007-present), and a member of the Advisory Board for Metalmark Capital (private equity investment, 2005-present). Mr. Stavropoulos is a special advisor to Clayton, Dubilier & Rice, LLC (private equity investment). In addition, Mr. Stavropoulos is a member of the University of Notre Dame Advisory Council for the College of Science. |
David M. Thomas (62) |
| Year of Election or Appointment: 2008 Previously, Mr. Thomas served as Executive Chairman (2005-2006) and Chairman and Chief Executive Officer (2000-2005) of IMS Health, Inc. (pharmaceutical and healthcare information solutions). In addition, Mr. Thomas serves as a member of the Board of Directors of Fortune Brands, Inc. (consumer products), and Interpublic Group of Companies, Inc. (marketing communication, 2004-present). |
Michael E. Wiley (60) |
| Year of Election or Appointment: 2008 Mr. Wiley also serves as a Director of Asia Pacific Exploration Consolidated (international oil and gas exploration and production, 2008-present). Mr. Wiley serves as a Director of Tesoro Corporation (independent oil refiner and marketer, 2005-present), and a Director of Bill Barrett Corporation (exploration and production, 2005-present). In addition, Mr. Wiley also serves as a Director of Post Oak Bank (privately-held bank, 2004-present). Previously, Mr. Wiley served as a member of the Board of Trustees of the University of Tulsa (2000-2006; 2007-2010), as a Senior Energy Advisor of Katzenbach Partners, LLC (consulting, 2006-2007), as an Advisory Director of Riverstone Holdings (private investment), Chairman, President, and CEO of Baker Hughes, Inc. (oilfield services, 2000-2004), and as Director of Spinnaker Exploration Company (exploration and production, 2001-2005). |
Annual Report
Trustees and Officers - continued
+ The information above includes each Trustee's principal occupation during the last five years and other information relating to the experience, attributes, and skills relevant to each Trustee's qualifications to serve as a Trustee, which led to the conclusion that each Trustee should serve as a Trustee for the fund.
Advisory Board Members and Executive Officers:
Correspondence intended for each executive officer Edward C. Johnson 3d and Peter S. Lynch may be sent to Fidelity Investments, 82 Devonshire Street, Boston, Massachusetts 02109.
Name, Age; Principal Occupation |
Edward C. Johnson 3d (81) |
| Year of Election or Appointment: 2011 Member of the Advisory Board of Fidelity's Equity and High Income Funds. Mr. Johnson serves as Chief Executive Officer, Chairman, and a Director of FMR LLC, and also serves as Chairman and Director of FIL Limited. Previously, Mr. Johnson served as a Trustee and Chairman of the Board of certain Fidelity Trusts, Chairman and a Director of FMR, Chairman and a Director of FMR Co., Inc., and President of FMR LLC (2006-2007). |
Peter S. Lynch (67) |
| Year of Election or Appointment: 2003 Member of the Advisory Board of Fidelity's Equity and High Income Funds. Mr. Lynch is Vice Chairman and a Director of FMR and FMR Co., Inc. In addition, Mr. Lynch serves as a Trustee of Boston College and as the Chairman of the Inner-City Scholarship Fund. Previously, Mr. Lynch served on the Special Olympics International Board of Directors (1997-2006). |
Kenneth B. Robins (42) |
| Year of Election or Appointment: 2008 President and Treasurer of Fidelity's Equity and High Income Funds. Mr. Robins also serves as President and Treasurer (2010-present) and Assistant Treasurer (2009-present) of other Fidelity funds and is an employee of Fidelity Investments (2004-present). Previously, Mr. Robins served as Deputy Treasurer of the Fidelity funds (2005-2008) and Treasurer and Chief Financial Officer of The North Carolina Capital Management Trust: Cash and Term Portfolios (2006-2008). |
Bruce T. Herring (46) |
| Year of Election or Appointment: 2006 Vice President of certain Equity Funds. Mr. Herring also serves as Chief Investment Officer and Director of Fidelity Management & Research (U.K.) Inc. (2010-present) and Group Chief Investments Officer of FMR. Previously, Mr. Herring served as Vice President (2005-2006) and Senior Vice President (2006-2007) of Fidelity Management & Research Company, Vice President of FMR Co., Inc. (2001-2007) and as a portfolio manager for Fidelity U.S. Equity Funds. |
Brian B. Hogan (46) |
| Year of Election or Appointment: 2009 Vice President of Equity and High Income Funds. Mr. Hogan also serves as President of FMR's Equity Division (2009-present). Previously, Mr. Hogan served as Senior Vice President, Equity Research of FMR (2006-2009) and as a portfolio manager. |
Scott C. Goebel (43) |
| Year of Election or Appointment: 2008 Secretary and Chief Legal Officer (CLO) of the Fidelity funds. Mr. Goebel also serves as Secretary of Fidelity Investments Money Management, Inc. (FIMM) (2010-present) and Fidelity Research and Analysis Company (FRAC) (2010-present); Secretary and CLO of The North Carolina Capital Management Trust: Cash and Term Portfolios (2008-present); General Counsel, Secretary, and Senior Vice President of FMR (2008-present) and FMR Co., Inc. (2008-present); employed by FMR LLC or an affiliate (2001-present); Chief Legal Officer of Fidelity Management & Research (Hong Kong) Limited (2008-present) and Assistant Secretary of Fidelity Management & Research (Japan) Inc. (2008-present), and Fidelity Management & Research (U.K.) Inc. (2008-present). Previously, Mr. Goebel served as Assistant Secretary of FIMM (2008-2010), FRAC (2008-2010), and the Funds (2007-2008) and as Vice President and Secretary of Fidelity Distributors Corporation (FDC) (2005-2007). |
William C. Coffey (42) |
| Year of Election or Appointment: 2009 Assistant Secretary of Fidelity's Equity and High Income Funds. Mr. Coffey also serves as Senior Vice President and Deputy General Counsel of FMR LLC (2010-present), and is an employee of Fidelity Investments. Previously, Mr. Coffey served as Vice President and Associate General Counsel of FMR LLC (2005-2009). |
Holly C. Laurent (57) |
| Year of Election or Appointment: 2008 Anti-Money Laundering (AML) Officer of the Fidelity funds. Ms. Laurent also serves as AML Officer of The North Carolina Capital Management Trust: Cash and Term Portfolios (2008-present) and is an employee of Fidelity Investments. Previously, Ms. Laurent was Senior Vice President and Head of Legal for Fidelity Business Services India Pvt. Ltd. (2006-2008), and Senior Vice President, Deputy General Counsel and Group Head for FMR LLC (2005-2006). |
Christine Reynolds (52) |
| Year of Election or Appointment: 2008 Chief Financial Officer of the Fidelity funds. Ms. Reynolds became President of Fidelity Pricing and Cash Management Services (FPCMS) in August 2008. Ms. Reynolds served as Chief Operating Officer of FPCMS (2007-2008). Previously, Ms. Reynolds served as President, Treasurer, and Anti-Money Laundering officer of the Fidelity funds (2004-2007). |
Kenneth A. Rathgeber (64) |
| Year of Election or Appointment: 2004 Chief Compliance Officer of Fidelity's Equity and High Income Funds. Mr. Rathgeber is Chief Compliance Officer of Fidelity Management & Research (Hong Kong) Limited (2008-present), Fidelity Management & Research (Japan) Inc. (2008-present), FMR (2005-present), FMR Co., Inc. (2005-present), Fidelity Management & Research (U.K.) Inc. (2005-present), Fidelity Research & Analysis Company (2005-present), Fidelity Investments Money Management, Inc. (2005-present), Pyramis Global Advisors, LLC (2005-present), and Strategic Advisers, Inc. (2005-present). |
Jeffrey S. Christian (49) |
| Year of Election or Appointment: 2009 Deputy Treasurer of the Fidelity funds. Mr. Christian is an employee of Fidelity Investments. Previously, Mr. Christian served as Chief Financial Officer (2008-2009) of certain Fidelity funds and Senior Vice President of Fidelity Pricing and Cash Management Services (FPCMS) (2004-2009). |
Bryan A. Mehrmann (50) |
| Year of Election or Appointment: 2005 Deputy Treasurer of the Fidelity funds. Mr. Mehrmann is an employee of Fidelity Investments. |
Adrien E. Deberghes (44) |
| Year of Election or Appointment: 2008 Deputy Treasurer of Fidelity's Equity and High Income Funds. Mr. Deberghes also serves as Vice President and Assistant Treasurer of Fidelity Rutland Square Trust II and Fidelity Commonwealth Trust II (2011-present), Assistant Treasurer of other Fidelity funds (2010-present), and is an employee of Fidelity Investments (2008-present). Previously, Mr. Deberghes served as Senior Vice President of Mutual Fund Administration at State Street Corporation (2007-2008), Senior Director of Mutual Fund Administration at Investors Bank & Trust (2005-2007), and Director of Finance for Dunkin' Brands (2000-2005). |
Stephanie J. Dorsey (42) |
| Year of Election or Appointment: 2010 Assistant Treasurer of Fidelity's Equity and High Income Funds. Ms. Dorsey also serves as Deputy Treasurer of other Fidelity funds (2008-present) and is an employee of Fidelity Investments (2008-present). Previously, Ms. Dorsey served as Treasurer (2004-2008) of the JPMorgan Mutual Funds and Vice President (2004-2008) of JPMorgan Chase Bank. |
John R. Hebble (53) |
| Year of Election or Appointment: 2009 Assistant Treasurer of Fidelity's Equity and High Income Funds. Mr. Hebble also serves as President (2011-present), Treasurer, and Chief Financial Officer of The North Carolina Capital Management Trust: Cash and Term Portfolios (2008-present), President and Treasurer of other Fidelity funds (2008-present) and is an employee of Fidelity Investments. |
Gary W. Ryan (53) |
| Year of Election or Appointment: 2005 Assistant Treasurer of the Fidelity funds. Mr. Ryan is an employee of Fidelity Investments. Previously, Mr. Ryan served as Vice President of Fund Reporting in Fidelity Pricing and Cash Management Services (FPCMS) (1999-2005). |
Jonathan Davis (43) |
| Year of Election or Appointment: 2010 Assistant Treasurer of the Fidelity funds. Mr. Davis is also Assistant Treasurer of Fidelity Rutland Square Trust II and Fidelity Commonwealth Trust II. Mr. Davis is an employee of Fidelity Investments. Previously, Mr. Davis served as Vice President and Associate General Counsel of FMR LLC (2003-2010). |
Annual Report
A total of 6.24% of the dividends distributed during the fiscal year was derived from interest on U.S. Government securities which is generally exempt from state income tax.
The fund designates $147,068,243 of distributions paid during the period January 1, 2011 to August 31, 2011 as qualifying to be taxed as interest-related dividends for nonresident alien shareholders.
Puritan designates 12%, 43%, 41% and 41% of the dividends distributed in October, December, April and July, respectively during the fiscal year as qualifying for the dividends-received deduction for corporate shareholders.
Puritan designates 12%, 40%, 55% and 55% of the dividends distributed in October, December, April and July, respectively during the fiscal year as amounts which may be taken into account as a dividend for the purposes of the maximum rate under section 1(h)(11) of the Internal Revenue Code.
The fund will notify shareholders in January 2012 of amounts for use in preparing 2011 income tax returns.
Annual Report
Board Approval of Investment Advisory Contracts and Management Fees
Fidelity Puritan Fund
Each year, the Board of Trustees, including the Independent Trustees (together, the Board), votes on the renewal of the management contract and sub-advisory agreements (together, the Advisory Contracts) for the fund. The Board, assisted by the advice of fund counsel and Independent Trustees' counsel, requests and considers a broad range of information relevant to the renewal of the Advisory Contracts throughout the year.
The Board meets regularly and considers at each of its meetings factors that are relevant to its annual consideration of the renewal of the fund's Advisory Contracts, including the services and support provided to the fund and its shareholders. The Board has established various standing committees, each composed of Independent Trustees with varying backgrounds, to which the Board has assigned specific subject matter responsibilities in order to enhance effective decision-making by the Board. The Board, acting directly and through its Committees, requests and receives information concerning the annual consideration of the renewal of the fund's Advisory Contracts. The Board also meets as needed to consider matters specifically related to the Board's annual consideration of the renewal of Advisory Contracts. Members of the Board may also meet with trustees of other Fidelity funds through ad hoc joint committees to discuss certain matters relevant to the Fidelity funds.
At its July 2011 meeting, the Board of Trustees, including the Independent Trustees, unanimously determined to renew the fund's Advisory Contracts. In reaching its determination, the Board considered all factors it believed relevant, including (i) the nature, extent, and quality of the services to be provided to the fund and its shareholders (including the investment performance of the fund); (ii) the competitiveness of the fund's management fee and total expense ratio; (iii) the total costs of the services to be provided by and the profits to be realized by Fidelity from its relationship with the fund; (iv) the extent to which economies of scale would be realized as the fund grows; and (v) whether fee levels reflect these economies of scale, if any, for the benefit of fund shareholders.
In considering whether to renew the Advisory Contracts for the fund, the Board reached a determination, with the assistance of fund counsel and Independent Trustees' counsel and through the exercise of its business judgment, that the renewal of the Advisory Contracts is in the best interests of the fund and its shareholders and that the compensation payable under the Advisory Contracts is fair and reasonable. The Board's decision to renew the Advisory Contracts was not based on any single factor, but rather was based on a comprehensive consideration of all the information provided to the Board at its meetings throughout the year. The Board, in reaching its determination to renew the Advisory Contracts, is aware that shareholders in the fund have a broad range of investment choices available to them, including a wide choice among mutual funds offered by Fidelity's competitors, and that the fund's shareholders, who have the opportunity to review and weigh the disclosure provided by the fund in its prospectus and other public disclosures, have chosen to invest in this fund, managed by Fidelity.
Annual Report
Board Approval of Investment Advisory Contracts and
Management Fees - continued
Nature, Extent, and Quality of Services Provided. The Board considered the staffing within the investment adviser, FMR, and the sub-advisers (together, the Investment Advisers), including the backgrounds of the fund's investment personnel and the fund's investment objective and discipline. The Independent Trustees also had discussions with senior management of Fidelity's investment operations and investment groups. The Board considered the structure of the portfolio manager compensation program and whether this structure provides appropriate incentives to act in the best interests of the fund.
Resources Dedicated to Investment Management and Support Services. The Board and the Fund Oversight and Research Committees reviewed the general qualifications and capabilities of the Investment Advisers' investment staff, including its size, education, experience, and resources, as well as the Investment Advisers' approach to recruiting, training, managing, and compensating investment personnel. The Board also noted that FMR has devoted increased resources to non-U.S. offices. The Board noted that Fidelity's analysts have extensive resources, tools and capabilities which allow them to conduct sophisticated quantitative and fundamental analysis, as well as credit analysis of issuers, counterparties and enhancers. The Board also believes that Fidelity's investment professionals have sufficient access to global information and data so as to provide competitive investment results over time, and that those professionals also have access to sophisticated tools which permit them to assess portfolio construction and risk and performance attribution characteristics continuously, as well as to transmit new information and research conclusions rapidly around the world. Additionally, in their deliberations, the Board considered the Investment Advisers' trading capabilities and resources which are an integral part of the investment management process.
Shareholder and Administrative Services. The Board considered (i) the nature, extent, quality, and cost of advisory, administrative, and shareholder services performed by the Investment Advisers and their affiliates under the Advisory Contracts and under separate agreements covering transfer agency, pricing and bookkeeping, and securities lending services for the fund; (ii) the nature and extent of the investment adviser's supervision of third party service providers, principally custodians and subcustodians; and (iii) the resources devoted to, and the record of compliance with, the fund's compliance policies and procedures. The Board also reviewed the allocation of fund brokerage, including allocations to brokers affiliated with the Investment Advisers, the use of brokerage commissions to pay fund expenses, and the use of "soft" commission dollars to pay for research services.
The Board noted that the growth of fund assets over time across the complex allows Fidelity to reinvest in the development of services designed to enhance the value or convenience of the Fidelity funds as investment vehicles. These services include 24-hour access to account information and market information through telephone representatives and over the Internet, investor education materials and asset allocation tools, and the expanded availability of Fidelity Investor Centers, with 35 new branches opening since 2010.
Annual Report
Investment in a Large Fund Family. The Board considered the benefits to shareholders of investing in a Fidelity fund, including the benefits of investing in a fund that is part of a large family of funds offering a variety of investment disciplines and providing a large variety of mutual fund investor services. The Board noted that Fidelity had taken, or had made recommendations that resulted in the Fidelity funds taking, a number of actions over the previous year that benefited particular funds, including (i) continuing to dedicate additional resources to investment research and support of the senior management team that oversees asset management; (ii) rationalizing product lines through the mergers of six funds into other funds; (iii) continuing to migrate the Freedom Funds to dedicated lower cost underlying funds; (iv) obtaining shareholder approval to broaden the investment strategies for Fidelity Consumer Finance Portfolio, Fidelity Emerging Asia Fund, and Fidelity Environment and Alternative Energy Portfolio; (v) contractually agreeing to reduce the management fees and impose other expense limitations on Spartan 500 Index Fund and U.S. Bond Index Fund in connection with launching new institutional classes of these funds; (vi) changing the name, primary and supplemental benchmarks, and investment policies of Fidelity Global Strategies Fund to support the fund's flexible investment mandate and global orientation; and (vii) reducing the transfer agency account fee rates on certain accounts.
Investment Performance. The Board considered whether the fund has operated in accordance with its investment objective, as well as its record of compliance with its investment restrictions. It also reviewed the fund's absolute investment performance for each class, as well as the fund's relative investment performance for each class measured over multiple periods against (i) a proprietary custom index, and (ii) a peer group of mutual funds deemed appropriate by Fidelity and reviewed by the Board. The following charts considered by the Board show, over the one-, three-, and five-year periods ended December 31, 2010, as available, the cumulative total returns of Class K and the retail class of the fund, the cumulative total returns of a proprietary custom index ("benchmark"), and a range of cumulative total returns of a peer group of mutual funds identified by Lipper Inc. as having an investment objective similar to that of the fund. The box within each chart shows the 25th percentile return (bottom of box) and the 75th percentile return (top of box) of the peer group. Returns shown above the box are in the first quartile and returns shown below the box are in the fourth quartile. The percentage beaten numbers noted below each chart correspond to the percentile box and represent the percentage of funds in the peer group whose performance was equal to or lower than that of the class indicated. The fund's proprietary custom index is an index developed by FMR that represents the performance of the fund's general investment categories in both equity and bond securities.
Annual Report
Board Approval of Investment Advisory Contracts and
Management Fees - continued
Fidelity Puritan Fund

The Board reviewed the fund's relative investment performance against its peer group and noted that the performance of the retail class of the fund (the class with the longer performance record) was in the first quartile for the one- and five-year periods and the second quartile for the three-year period. The Board also noted that the investment performance of the retail class of the fund compared favorably to its benchmark for the one- and five-year periods, although the fund's three-year cumulative total return was lower than its benchmark. The Board considered that the variations in performance between the fund's classes reflect the variations in class expenses, which result in lower performance for the higher expense class. The Board also reviewed the fund's performance since inception as well as performance in the current year.
Based on its review, the Board concluded that the nature, extent, and quality of services provided to the fund under the Advisory Contracts should benefit the fund's shareholders.
Competitiveness of Management Fee and Total Expense Ratio. The Board considered the fund's management fee and total expense ratio compared to "mapped groups" of competitive funds and classes. Fidelity creates "mapped groups" by combining similar Lipper investment objective categories that have comparable management fee characteristics. Combining Lipper investment objective categories aids the Board's management fee and total expense ratio comparisons by broadening the competitive group used for comparison and by reducing the number of universes to which various Fidelity funds are compared.
Annual Report
Management Fee. The Board considered two proprietary management fee comparisons for the 12-month periods shown in the chart below. The group of Lipper funds used by the Board for management fee comparisons is referred to below as the "Total Mapped Group." The Total Mapped Group is broader than the Lipper peer group used by the Board for performance comparisons because the Total Mapped Group combines several Lipper investment objective categories while the Lipper peer group does not. The Total Mapped Group comparison focuses on a fund's standing relative to the total universe of comparable funds available to investors in terms of gross management fees before expense reimbursements or caps. "TMG %" represents the percentage of funds in the Total Mapped Group that had management fees that were lower than the fund's. For example, a TMG % of 10% means that 90% of the funds in the Total Mapped Group had higher management fees than the fund. The "Asset-Size Peer Group" (ASPG) comparison focuses on a fund's standing relative to non-Fidelity funds similar in size to the fund within the Total Mapped Group. The ASPG represents at least 15% of the funds in the Total Mapped Group with comparable asset size and management fee characteristics, subject to a minimum of 50 funds (or all funds in the Total Mapped Group if fewer than 50). Additional information, such as the ASPG quartile in which the fund's management fee ranked, is also included in the chart and considered by the Board.
Fidelity Puritan Fund
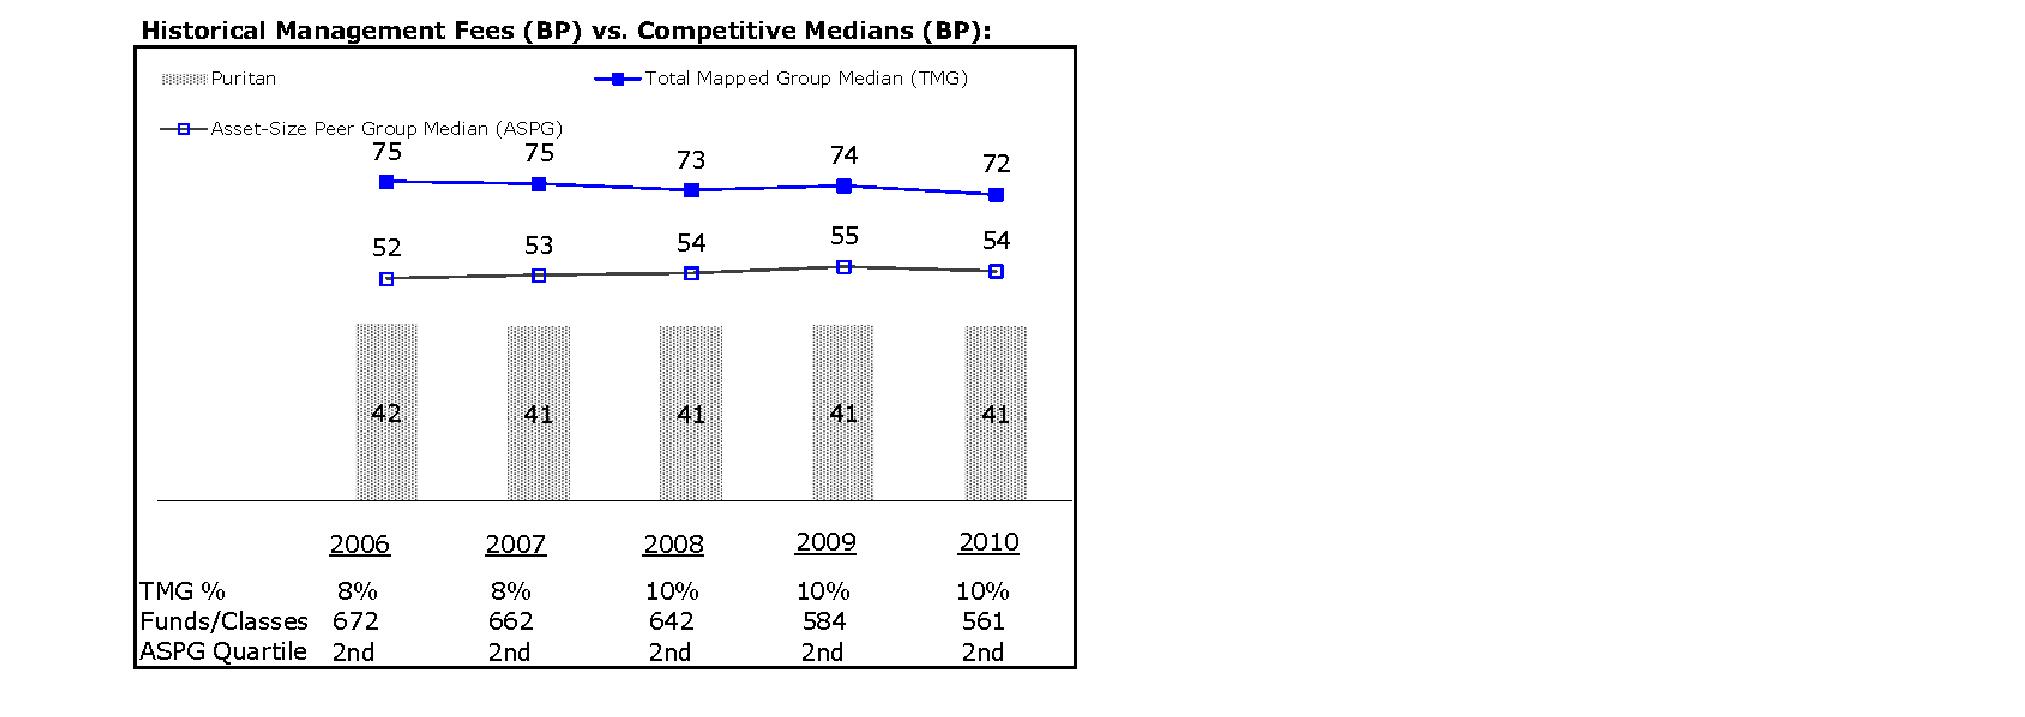
The Board noted that the fund's management fee ranked below the median of its Total Mapped Group and below the median of its ASPG for 2010.
Annual Report
Board Approval of Investment Advisory Contracts and
Management Fees - continued
Based on its review, the Board concluded that the fund's management fee is fair and reasonable in light of the services that the fund receives and the other factors considered.
Total Expense Ratio. In its review of each class's total expense ratio, the Board considered the fund's management fee as well as other fund or class expenses, as applicable, such as transfer agent fees, pricing and bookkeeping fees, and custodial, legal, and audit fees. The Board also noted the effects of any waivers and reimbursements on fees and expenses. As part of its review, the Board also considered the current and historical total expense ratios of each class of the fund compared to competitive fund median expenses. Each class of the fund is compared to those funds and classes in the Total Mapped Group (used by the Board for management fee comparisons) that have a similar sales load structure.
The Board noted that the total expense ratio of each class ranked below its competitive median for 2010. The Board considered that various factors, including 12b-1 fees, positive or negative performance adjustments, and relatively higher other expenses in the case of small fund size, can affect total expense ratios.
Fees Charged to Other Fidelity Clients. The Board also considered Fidelity fee structures and other information with respect to clients of FMR and its affiliates, such as other mutual funds advised or subadvised by FMR or its affiliates, pension plan clients, and other institutional clients. In March 2010, the Board created an ad hoc joint committee with the board of other Fidelity funds (the Committee) to review and compare Fidelity's institutional investment advisory business with its business of providing services to the Fidelity funds, including the differences in services provided, fees charged, and costs incurred, as well as competition in their respective marketplaces.
Based on its review of total expense ratios and fees charged to other Fidelity clients, the Board concluded that the total expense ratio of each class of the fund was reasonable in light of the services that the fund and its shareholders receive and the other factors considered, including the findings of the Committee.
Costs of the Services and Profitability. The Board considered the revenues earned and the expenses incurred by Fidelity in conducting the business of developing, marketing, distributing, managing, administering and servicing the fund and its shareholders. The Board also considered the level of Fidelity's profits in respect of all the Fidelity funds.
On an annual basis, FMR presents to the Board Fidelity's profitability for the fund. Fidelity calculates the profitability for each fund, as well as aggregate profitability for groups of Fidelity funds and all Fidelity funds, using a series of detailed revenue and cost allocation methodologies which originate with the books and records of Fidelity on which Fidelity's audited financial statements are based. The Audit Committee of the Board reviews any significant changes from the prior year's methodologies.
Annual Report
PricewaterhouseCoopers LLP (PwC), independent registered public accounting firm and auditor to Fidelity and certain Fidelity funds, has been engaged annually by the Board as part of the Board's assessment of Fidelity's profitability analysis. PwC's engagement includes the review and assessment of Fidelity's methodologies used in determining the revenues and expenses attributable to Fidelity's mutual fund business, and completion of agreed-upon procedures surrounding the mathematical accuracy of fund profitability and its conformity to allocation methodologies. After considering PwC's reports issued under the engagement and information provided by Fidelity, the Board concluded that while other allocation methods may also be reasonable, Fidelity's profitability methodologies are reasonable in all material respects.
The Board also reviewed Fidelity's non-fund businesses and fall-out benefits related to the mutual fund business as well as cases where Fidelity's affiliates may benefit from or be related to the fund's business.
The Board considered the costs of the services provided by and the profits realized by Fidelity in connection with the operation of the fund and was satisfied that the profitability was not excessive in the circumstances.
Economies of Scale. The Board considered whether there have been economies of scale in respect of the management of the Fidelity funds, whether the Fidelity funds (including the fund) have appropriately benefited from any such economies of scale, and whether there is potential for realization of any further economies of scale. The Board considered the extent to which the fund will benefit from economies of scale through increased services to the fund, through waivers or reimbursements, or through fee or expense reductions. The Board also noted that in 2009, it and the board of other Fidelity funds created an ad hoc committee (the Economies of Scale Committee) to analyze whether FMR attains economies of scale in respect of the management and servicing of the Fidelity funds, whether the Fidelity funds have appropriately benefited from such economies of scale, and whether there is potential for realization of any further economies of scale.
The Board recognized that the fund's management contract incorporates a "group fee" structure, which provides for lower group fee rates as total fund assets under FMR's management increase, and for higher group fee rates as total fund assets under FMR's management decrease. FMR calculates the group fee rates based on a tiered asset "breakpoint" schedule that varies based on asset class. The Board considered that the group fee is designed to deliver the benefits of economies of scale to fund shareholders when total Fidelity fund assets increase, even if assets of any particular fund are unchanged or have declined, because some portion of Fidelity's costs are attributable to services provided to all Fidelity funds, and all funds benefit if those costs can be allocated among more assets. The Board concluded that, given the group fee structure, fund shareholders will benefit from lower management fees as assets under FMR's management increase at the fund complex level, regardless of whether Fidelity achieves any such economies of scale.
Annual Report
Board Approval of Investment Advisory Contracts and
Management Fees - continued
The Board concluded, taking into account the analysis of the Economies of Scale Committee, that any potential economies of scale are being appropriately shared between fund shareholders and Fidelity.
Additional Information Requested by the Board. In order to develop fully the factual basis for consideration of the Fidelity funds' Advisory Contracts, the Board requested and received additional information on certain topics, including (i) fund performance trends, actions to be taken by FMR to improve certain funds' overall performance, and Fidelity's long-term strategies for certain funds; (ii) portfolio manager changes that have occurred during the past year and length of portfolio manager tenure for different categories of funds over time; (iii) Fidelity's compensation structure for portfolio managers and other key personnel and strategies for attracting and retaining non-investment personnel; (iv) the amount of the investment that each portfolio manager has made in the Fidelity fund(s) that he or she manages; (v) historical trends in Fidelity's realization of fall-out benefits; (vi) Fidelity's group fee structures and the rationale for the individual fee rates of certain funds; (vii) fund profitability methodology and the impact of certain factors on fund profitability results; (viii) trends regarding industry use of performance fee structures and Fidelity's compliance practices with respect to performance adjustment calculations; (ix) the fee structures in place for certain other Fidelity clients; and (x) explanations regarding the relative total expense ratios of certain funds and classes, total expense competitive trends, and actions that might be taken by FMR to reduce total expense ratios for certain funds and classes.
Based on its evaluation of all of the conclusions noted above, and after considering all factors it believed relevant, the Board ultimately concluded that the advisory fee structures are fair and reasonable, and that the fund's Advisory Contracts should be renewed.
Annual Report
Managing Your Investments
Fidelity offers several ways to conveniently manage your personal investments via your telephone or PC. You can access your account information, conduct trades and research your investments 24 hours a day.
By Phone
Fidelity Automated Service Telephone provides a single toll-free number to access account balances, positions, quotes and trading. It's easy to navigate the service, and on your first call, the system will help you create a personal identification number (PIN) for security.
(phone_graphic)
Fidelity Automated
Service Telephone (FAST®)
1-800-544-5555
Press
For mutual fund and brokerage trading.
For quotes.*
For account balances and holdings.
To review orders and mutual
fund activity.
To change your PIN.
To speak to a Fidelity representative.
By PC
Fidelity's web site on the Internet provides a wide range of information, including daily financial news, fund performance, interactive planning tools and news about Fidelity products and services.
(computer_graphic)
Fidelity's Web Site
www.fidelity.com
* When you call the quotes line, please remember that a fund's yield and return will vary and, except for money market funds, share price will also vary. This means that you may have a gain or loss when you sell your shares. There is no assurance that money market funds will be able to maintain a stable $1 share price; an investment in a money market fund is not insured or guaranteed by the U.S. government. Total returns are historical and include changes in share price, reinvestment of dividends and capital gains distributions, and the effects of any sales charges.
Annual Report
To Write Fidelity
We'll give your correspondence immediate attention and send you written confirmation upon completion of your request.
(letter_graphic)
Making Changes
To Your Account
(such as changing name, address, bank, etc.)
Fidelity Investments
P.O. Box 770001
Cincinnati, OH 45277-0002
(letter_graphic)
For Non-Retirement
Accounts
Buying shares
Fidelity Investments
P.O. Box 770001
Cincinnati, OH 45277-0003
Overnight Express
Fidelity Investments
Attn: Distribution Services
100 Crosby Parkway - KC1H
Covington, KY 41015
Selling shares
Fidelity Investments
P.O. Box 770001
Cincinnati, OH 45277-0035
Overnight Express
Fidelity Investments
Attn: Distribution Services
100 Crosby Parkway - KC1H
Covington, KY 41015
General Correspondence
Fidelity Investments
P.O. Box 500
Merrimack, NH 03054-0500
(letter_graphic)
For Retirement
Accounts
Buying shares
Fidelity Investments
P.O. Box 770001
Cincinnati, OH 45277-0003
Selling shares
Fidelity Investments
P.O. Box 770001
Cincinnati, OH 45277-0035
Overnight Express
Fidelity Investments
Attn: Distribution Services
100 Crosby Parkway - KC1H
Covington, KY 41015
General Correspondence
Fidelity Investments
P.O. Box 500
Merrimack, NH 03054-0500
Annual Report
Investment Adviser
Fidelity Management & Research Company
Boston, MA
Investment Sub-Advisers
FMR Co., Inc.
Fidelity Management & Research
(U.K.) Inc.
Fidelity Investments Money Management, Inc.
Fidelity Management & Research
(Hong Kong) Limited
Fidelity Management & Research
(Japan), Inc.
General Distributor
Fidelity Distributors Corporation
Boston, MA
Transfer and Service Agents
Fidelity Investments Institutional
Operations Company, Inc.
Boston, MA
Fidelity Service Company, Inc.
Boston, MA
Custodian
JP Morgan Chase Bank
New York, NY
The Fidelity Telephone Connection
Mutual Fund 24-Hour Service
Exchanges/Redemptions
and Account Assistance 1-800-544-6666
Product Information 1-800-544-6666
Retirement Accounts 1-800-544-4774 (8 a.m. - 9 p.m.)
TDD Service 1-800-544-0118
for the deaf and hearing impaired
(9 a.m. - 9 p.m. Eastern time)
Fidelity Automated Service
Telephone (FAST®) 1-800-544-5555
Automated line for quickest service
PUR-UANN-1011
1.789251.108
Fidelity®
Puritan®
Fund -
Class K
Annual Report
August 31, 2011
(2_fidelity_logos) (Registered_Trademark)
Contents
Chairman's Message | <Click Here> | The Chairman's message to shareholders. |
Performance | <Click Here> | How the fund has done over time. |
Management's Discussion of Fund Performance | <Click Here> | The Portfolio Manager's review of fund
performance and strategy. |
Shareholder Expense Example | <Click Here> | An example of shareholder expenses. |
Investment Changes | <Click Here> | A summary of major shifts in the fund's investments over the past six months. |
Investments | <Click Here> | A complete list of the fund's investments with their market values. |
Financial Statements | <Click Here> | Statements of assets and liabilities, operations, and changes in net assets,
as well as financial highlights. |
Notes | <Click Here> | Notes to the financial statements. |
Report of Independent Registered Public Accounting Firm | <Click Here> | |
Trustees and Officers | <Click Here> | |
Distributions | <Click Here> | |
Board Approval of Investment Advisory Contracts and Management Fees | <Click Here> | |
To view a fund's proxy voting guidelines and proxy voting record for the 12-month period ended June 30, visit http://www.fidelity.com/proxyvotingresults or visit the Securities and Exchange Commission's (SEC) web site at http://www.sec.gov. You may also call 1-800-835-5092 to request a free copy of the proxy voting guidelines.
Standard & Poor's, S&P and S&P 500 are registered service marks of The McGraw-Hill Companies, Inc. and have been licensed for use by Fidelity Distributors Corporation.
Other third party marks appearing herein are the property of their respective owners.
All other marks appearing herein are registered or unregistered trademarks or service marks of FMR LLC or an affiliated company.
Annual Report
This report and the financial statements contained herein are submitted for the general information of the shareholders of the fund. This report is not authorized for distribution to prospective investors in the fund unless preceded or accompanied by an effective prospectus.
A fund files its complete schedule of portfolio holdings with the SEC for the first and third quarters of each fiscal year on Form N-Q. Forms N-Q are available on the SEC's web site at http://www.sec.gov. A fund's Forms N-Q may be reviewed and copied at the SEC's Public Reference Room in Washington, DC. Information regarding the operation of the SEC's Public Reference Room may be obtained by calling 1-800-SEC-0330. For a complete list of a fund's portfolio holdings, view the most recent holdings listing, semiannual report, or annual report on Fidelity's web site at http://www.fidelity.com, http://www.advisor.fidelity.com, or http://www.401k.com, as applicable.
NOT FDIC INSURED • MAY LOSE VALUE • NO BANK GUARANTEE
Neither the fund nor Fidelity Distributors Corporation is a bank.
Annual Report
(photo_of_James_C_Curvey)
Dear Shareholder:
U.S. equities remained in a significant midyear downturn that began in May and intensified in the final week of July and the early part of August, when Standard & Poor's announced it was lowering its long-term sovereign credit rating of the United States. The historic downgrade followed a political stalemate in which Congress struggled to address the debt ceiling issue before an early-August deadline, resulting in heightened investor anxiety and volatility across major financial markets. Financial markets are always unpredictable, of course, but there are several time-tested investment principles that can help put the odds in your favor.
One of the basic tenets is to invest for the long term. Over time, riding out the markets' inevitable ups and downs has proven much more effective than selling into panic or chasing the hottest trend. Even missing only a few of the markets' best days can significantly diminish investor returns. Patience also affords the benefits of compounding - of earning interest on additional income or reinvested dividends and capital gains. There can be tax advantages and cost benefits to consider as well. While staying the course doesn't eliminate risk, it can considerably lessen the effect of short-term declines.
You can further manage your investing risk through diversification. And today, more than ever, geographic diversification should be taken into account. Studies indicate that asset allocation is the single most important determinant of a portfolio's long-term success. The right mix of stocks, bonds and cash - aligned to your particular risk tolerance and investment objective - is very important. Age-appropriate rebalancing is also an essential aspect of asset allocation. For younger investors, an emphasis on equities - which historically have been the best-performing asset class over time - is encouraged. As investors near their specific goal, such as retirement or sending a child to college, consideration may be given to replacing volatile assets (e.g. common stocks) with more-stable fixed investments (bonds or savings plans).
A third principle - investing regularly - can help lower the average cost of your purchases. Investing a certain amount of money each month or quarter helps ensure you won't pay for all your shares at market highs. This strategy - known as dollar cost averaging - also reduces "emotion" from investing, helping shareholders avoid selling weak performers just prior to an upswing, or chasing a hot performer just before a correction.
We invite you to contact us via the Internet, through our Investor Centers or by phone. It is our privilege to provide you the information you need to make the investments that are right for you.
Sincerely,
(The acting chairman's signature appears here.)
James C. Curvey
Acting Chairman
Annual Report
Average annual total return reflects the change in the value of an investment, assuming reinvestment of the class' distributions from dividend income and capital gains (the profits earned upon the sale of securities that have grown in value, if any) and assuming a constant rate of performance each year. The $10,000 table and the fund's returns do not reflect the deduction of taxes that a shareholder would pay on fund distributions or the redemption of fund shares. During periods of reimbursement by Fidelity, a fund's total return will be greater than it would be had the reimbursement not occurred. How a fund did yesterday is no guarantee of how it will do tomorrow.
Average Annual Total Returns
Periods ended August 31, 2011 | Past 1
year | Past 5
years | Past 10
years |
Class K A | 14.59% | 3.23% | 4.96% |
A The initial offering of Class K shares took place on May 9, 2008. Returns prior to May 9, 2008 are those of Fidelity® Puritan® Fund, the original class of the fund.
$10,000 Over 10 Years
Let's say hypothetically that $10,000 was invested in Fidelity® Puritan® Fund - Class K,
on August 31, 2001. The chart shows how the value of your investment would have changed, and also shows how the S&P 500® Index performed over the same period. The initial offering of Class K took place on May 9, 2008. See above for additional information regarding the performance of Class K.
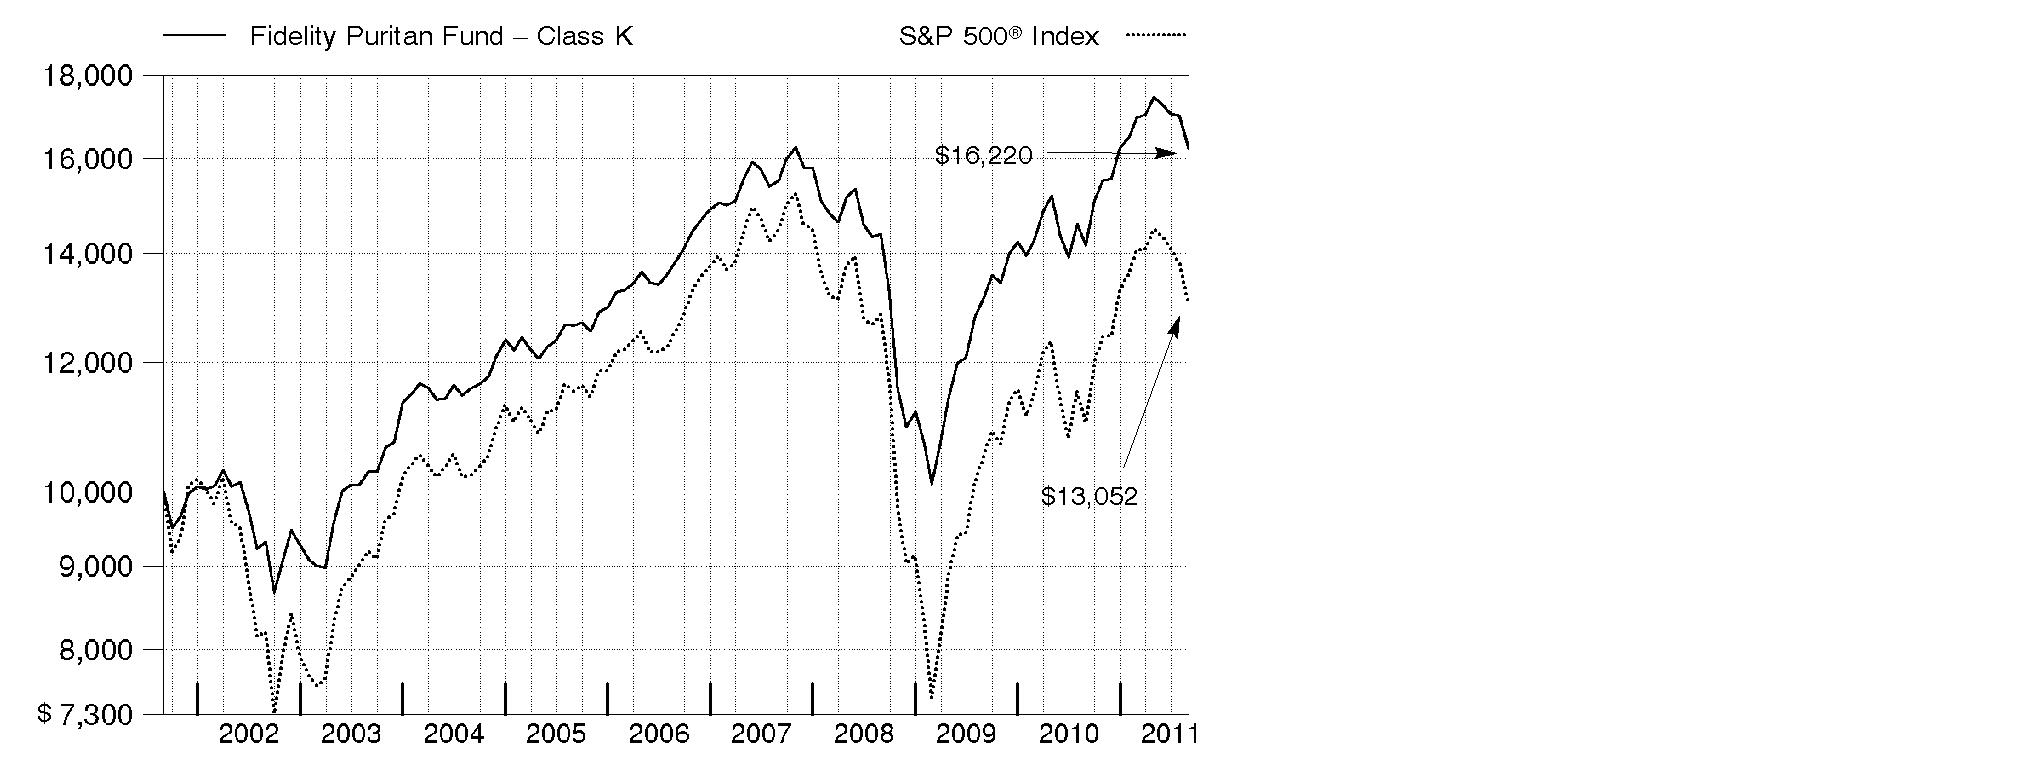
Annual Report
Market Recap: U.S. stocks registered solid double-digit gains for the year ending August 31, 2011, despite finishing in a four-month downturn that intensified in the two weeks preceding the August 5 news that Standard & Poor's had lowered its long-term sovereign credit rating of the United States. The downgrade followed a stalemate in which Congress struggled to address the debt ceiling, heightening investor anxiety. For the year, the large-cap laden S&P 500® Index gained 18.50% and the blue-chip Dow Jones Industrial AverageSM advanced 19.03%. The technology-heavy Nasdaq Composite® Index fared even better, climbing 23.19%. Small and mid-sized stocks beat their larger-cap counterparts, as the Russell 2000® and Russell Midcap® indexes added 22.19% and 21.28%, respectively. Solid returns for equities brought about more-tempered gains for fixed-income markets. The Barclays Capital® U.S. Aggregate Bond Index - a proxy for investment-grade debt - rose 4.62%. Higher-risk bond categories fared best, with The BofA Merrill LynchSM US High Yield Constrained Index gaining 8.15%. Bonds backed by the U.S. government were among the weakest performers, with the Barclays Capital® U.S. Treasury Bond Index adding 4.17%, while short-term assets fared the worst, as gauged by the 0.16% increase in the Barclays Capital U.S. 3 Month Treasury Bellwether Index.
Comments from Ramin Arani, Lead Portfolio Manager of Fidelity® Puritan® Fund. For the year, the fund's Class K shares returned 14.59%, outperforming the 13.05% gain of the Fidelity Puritan Composite Index. The fund was helped the most by strong security selection in the equity and investment-grade bond subportfolios. The fund's foreign holdings added value overall, aided by a weaker U.S. dollar. In terms of asset allocation, overweighting equities and underweighting investment-grade bonds provided a boost, as did an out-of-index stake in high-yield bonds. Looking at individual stocks, Green Mountain Coffee Roasters soared in March on news that it was teaming up with Starbucks to make Starbucks coffee and Tazo teas available for use in single-serving brewers. Owning a scant stake in index constituent Bank of America, which I sold in July, was the right call, as the stock fell sharply due to concern about capital requirements. Strength in sales of luxury goods and strong merchandising and operating improvement boosted the stock of Polo Ralph Lauren (renamed Ralph Lauren). Turning to detractors, the fund was hurt by a larger-than-index stake in Citigroup, which was held back by continued low interest rates and tepid loan demand. The fund did not own index component IBM, which detracted when the stock turned in a strong gain.
The views expressed above reflect those of the portfolio manager(s) only through the end of the period as stated on the cover of this report and do not necessarily represent the views of Fidelity or any other person in the Fidelity organization. Any such views are subject to change at any time based upon market or other conditions and Fidelity disclaims any responsibility to update such views. These views may not be relied on as investment advice and, because investment decisions for a Fidelity fund are based on numerous factors, may not be relied on as an indication of trading intent on behalf of any Fidelity fund.
Annual Report
Shareholder Expense Example
As a shareholder of the Fund, you incur two types of costs: (1) transaction costs, and (2) ongoing costs, including management fees and other Fund expenses. This Example is intended to help you understand your ongoing costs (in dollars) of investing in the Fund and to compare these costs with the ongoing costs of investing in other mutual funds.
The Example is based on an investment of $1,000 invested at the beginning of the period and held for the entire period (March 1, 2011 to August 31, 2011).
Actual Expenses
The first line of the accompanying table for each class of the Fund provides information about actual account values and actual expenses. You may use the information in this line, together with the amount you invested, to estimate the expenses that you paid over the period. Simply divide your account value by $1,000.00 (for example, an $8,600 account value divided by $1,000.00 = 8.6), then multiply the result by the number in the first line for a class of the Fund under the heading entitled "Expenses Paid During Period" to estimate the expenses you paid on your account during this period. A small balance maintenance fee of $12.00 that is charged once a year may apply for certain accounts with a value of less than $2,000. This fee is not included in the table below. If it was, the estimate of expenses you paid during the period would be higher, and your ending account value lower, by this amount. In addition, the Fund, as a shareholder in the underlying Fidelity Central Funds, will indirectly bear its pro-rata share of the fees and expenses incurred by the underlying Fidelity Central Funds. These fees and expenses are not included in the Fund's annualized expense ratio used to calculate the expense estimate in the table below.
Hypothetical Example for Comparison Purposes
The second line of the accompanying table for each class of the Fund provides information about hypothetical account values and hypothetical expenses based on a Class' actual expense ratio and an assumed rate of return of 5% per year before expenses, which is not the Class' actual return. The hypothetical account values and expenses may not be used to estimate the actual ending account balance or expenses you paid for the period. You may use this information to compare the ongoing costs of investing in the Fund and other funds. To do so, compare this 5% hypothetical example with the 5% hypothetical examples that appear in the shareholder reports of the other funds. A small balance maintenance fee of $12.00 that is charged once a year may apply for certain accounts with a value of less than $2,000. This fee is not included in the table below. If it was, the estimate of expenses you paid during the period would be higher, and your ending account value lower, by this amount. In addition, the Fund, as a shareholder in the underlying Fidelity Central Funds, will indirectly bear its pro-rata share of the fees and expenses incurred by the underlying Fidelity Central Funds. These fees and expenses are not included in the Fund's annualized expense ratio used to calculate the expense estimate in the table below.
Please note that the expenses shown in the table are meant to highlight your ongoing costs only and do not reflect any transaction costs. Therefore, the second line of the table is useful in comparing ongoing costs only, and will not help you determine the relative total costs of owning different funds.
Annual Report
| Annualized
Expense Ratio | Beginning
Account Value
March 1, 2011 | Ending
Account Value
August 31, 2011 | Expenses Paid
During Period*
March 1, 2011 to August 31, 2011 |
Puritan | .60% | | | |
Actual | | $ 1,000.00 | $ 956.00 | $ 2.96 |
HypotheticalA | | $ 1,000.00 | $ 1,022.18 | $ 3.06 |
Class K | .48% | | | |
Actual | | $ 1,000.00 | $ 956.60 | $ 2.37 |
HypotheticalA | | $ 1,000.00 | $ 1,022.79 | $ 2.45 |
A 5% return per year before expenses
* Expenses are equal to each Class' annualized expense ratio, multiplied by the average account value over the period, multiplied by 184/365 (to reflect the one-half year period). The fees and expenses of the underlying Fidelity Central Funds in which the Fund invests are not included in the Fund's annualized expense ratio.
Annual Report
Investment Changes (Unaudited)
The information in the following tables is based on the combined investments of the Fund and its pro-rata share of its investments in each non-money market Fidelity Central Fund. |
Top Five Stocks as of August 31, 2011 |
| % of fund's
net assets | % of fund's net assets
6 months ago |
Apple, Inc. | 3.1 | 2.7 |
Exxon Mobil Corp. | 1.9 | 2.1 |
The Coca-Cola Co. | 1.7 | 1.4 |
Philip Morris International, Inc. | 1.4 | 1.3 |
General Electric Co. | 1.3 | 1.6 |
| 9.4 | |
Top Five Bond Issuers as of August 31, 2011 |
(with maturities greater than one year) | % of fund's
net assets | % of fund's net assets
6 months ago |
Fannie Mae | 10.7 | 7.3 |
U.S. Treasury Obligations | 9.7 | 8.5 |
Freddie Mac | 2.5 | 1.5 |
Ginnie Mae | 2.0 | 1.7 |
Citigroup, Inc. | 0.4 | 0.4 |
| 25.3 | |
Top Five Market Sectors as of August 31, 2011 |
| % of fund's
net assets | % of fund's net assets
6 months ago |
Financials | 11.7 | 12.9 |
Information Technology | 11.4 | 12.8 |
Energy | 10.4 | 10.9 |
Consumer Discretionary | 9.1 | 9.3 |
Consumer Staples | 8.8 | 6.2 |
Asset Allocation (% of fund's net assets) |
As of August 31, 2011* | As of February 28, 2011** |
| Stocks 58.2% | | | Stocks 62.1% | |
| Bonds 40.6% | | | Bonds 34.6% | |
| Convertible
Securities 0.6% | | | Convertible
Securities 0.5% | |
| Other Investments 1.0% | | | Other Investments 1.0% | |
| Short-Term
Investments and
Net Other Assets† (0.4)% | | | Short-Term
Investments and
Net Other Assets 1.8% | |

* Foreign investments | 12.4% | | ** Foreign investments | 13.3% | |
Percentages are adjusted for the effect of futures contracts and swap contracts, if applicable. |
A holdings listing for the Fund, which presents direct holdings as well as the pro-rata share of any securities and other investments held indirectly through its investment in underlying non-money market Fidelity Central Funds, is available at fidelity.com. |
† Short-Term Investments and Net Other Assets are not included in the pie chart. |
Annual Report
Investments August 31, 2011
Showing Percentage of Net Assets
Common Stocks - 57.7% |
| Shares | | Value (000s) |
CONSUMER DISCRETIONARY - 7.0% |
Auto Components - 0.0% |
Delphi Corp. Class B (a) | 249 | | $ 4,806 |
TRW Automotive Holdings Corp. (a) | 100,000 | | 4,169 |
| | 8,975 |
Automobiles - 0.4% |
Bayerische Motoren Werke AG (BMW) | 286,837 | | 23,221 |
General Motors Co.: | | | |
warrants 7/10/16 (a) | 99,968 | | 1,529 |
warrants 7/10/19 (a) | 99,968 | | 1,056 |
Honda Motor Co. Ltd. | 1,224,900 | | 39,911 |
Tesla Motors, Inc. (a) | 128,800 | | 3,187 |
| | 68,904 |
Diversified Consumer Services - 0.2% |
New Oriental Education & Technology Group, Inc. sponsored ADR (a) | 1,062,800 | | 32,415 |
Hotels, Restaurants & Leisure - 1.4% |
Arcos Dorados Holdings, Inc. | 1,368,000 | | 37,716 |
Dunkin' Brands Group, Inc. (a) | 93,400 | | 2,460 |
Las Vegas Sands Corp. (a) | 580,000 | | 27,011 |
McDonald's Corp. | 1,366,900 | | 123,650 |
Starbucks Corp. | 818,300 | | 31,603 |
Vail Resorts, Inc. | 815,227 | | 32,960 |
| | 255,400 |
Household Durables - 0.1% |
Lennar Corp. Class A | 1,800,200 | | 26,463 |
Internet & Catalog Retail - 0.4% |
Amazon.com, Inc. (a) | 340,800 | | 73,371 |
Media - 2.0% |
British Sky Broadcasting Group PLC | 2,343,500 | | 25,134 |
Comcast Corp. Class A (special) (non-vtg.) | 6,162,400 | | 130,396 |
Discovery Communications, Inc. (a) | 909,400 | | 38,449 |
HMH Holdings, Inc. (a)(r) | 149,814 | | 375 |
Kabel Deutschland Holding AG (a) | 477,639 | | 26,727 |
Legend Pictures LLC (a)(q)(r) | 46,667 | | 35,000 |
Pandora Media, Inc. (f) | 421,894 | | 5,569 |
Publicis Groupe SA | 555,600 | | 26,129 |
The Walt Disney Co. | 1,291,490 | | 43,988 |
Time Warner, Inc. | 1,532,300 | | 48,513 |
Vertis Holdings, Inc. (a) | 1,934 | | 22 |
| | 380,302 |
Common Stocks - continued |
| Shares | | Value (000s) |
CONSUMER DISCRETIONARY - continued |
Multiline Retail - 0.3% |
PPR SA | 352,200 | | $ 58,695 |
Specialty Retail - 0.7% |
Bed Bath & Beyond, Inc. (a) | 530,900 | | 30,187 |
China ZhengTong Auto Services Holdings Ltd. | 3,194,000 | | 4,406 |
Guess?, Inc. | 598,000 | | 20,398 |
Home Depot, Inc. | 1,112,200 | | 37,125 |
Tiffany & Co., Inc. | 436,400 | | 31,403 |
| | 123,519 |
Textiles, Apparel & Luxury Goods - 1.5% |
Compagnie Financiere Richemont SA Series A | 533,720 | | 30,977 |
LVMH Moet Hennessy - Louis Vuitton | 200,720 | | 34,013 |
NIKE, Inc. Class B | 568,400 | | 49,252 |
PVH Corp. | 919,700 | | 61,307 |
Ralph Lauren Corp. | 631,100 | | 86,530 |
Vera Bradley, Inc. | 605,000 | | 21,236 |
| | 283,315 |
TOTAL CONSUMER DISCRETIONARY | | 1,311,359 |
CONSUMER STAPLES - 8.3% |
Beverages - 2.6% |
Dr Pepper Snapple Group, Inc. | 1,204,175 | | 46,337 |
Grupo Modelo SAB de CV Series C | 3,197,400 | | 18,453 |
Hansen Natural Corp. (a) | 546,400 | | 46,619 |
Pernod-Ricard SA | 697,400 | | 62,620 |
The Coca-Cola Co. | 4,436,900 | | 312,580 |
| | 486,609 |
Food & Staples Retailing - 1.0% |
Costco Wholesale Corp. | 791,100 | | 62,133 |
Droga Raia SA | 902,000 | | 15,865 |
Drogasil SA | 4,059,200 | | 31,873 |
Walgreen Co. | 1,560,200 | | 54,935 |
Whole Foods Market, Inc. | 161,200 | | 10,644 |
| | 175,450 |
Food Products - 1.0% |
Diamond Foods, Inc. (f) | 374,200 | | 29,509 |
Green Mountain Coffee Roasters, Inc. (a) | 503,600 | | 52,747 |
Common Stocks - continued |
| Shares | | Value (000s) |
CONSUMER STAPLES - continued |
Food Products - continued |
Kraft Foods, Inc. Class A | 1,184,100 | | $ 41,467 |
Mead Johnson Nutrition Co. Class A | 891,600 | | 63,527 |
| | 187,250 |
Household Products - 1.1% |
Colgate-Palmolive Co. | 878,500 | | 79,039 |
Procter & Gamble Co. | 1,897,300 | | 120,820 |
| | 199,859 |
Personal Products - 0.5% |
Estee Lauder Companies, Inc. Class A | 448,400 | | 43,791 |
Nu Skin Enterprises, Inc. Class A | 669,300 | | 28,305 |
Prestige Brands Holdings, Inc. (a) | 2,182,251 | | 23,503 |
| | 95,599 |
Tobacco - 2.1% |
British American Tobacco PLC sponsored ADR | 334,000 | | 29,930 |
Japan Tobacco, Inc. | 11,209 | | 48,444 |
Lorillard, Inc. | 542,900 | | 60,490 |
Philip Morris International, Inc. | 3,717,240 | | 257,679 |
| | 396,543 |
TOTAL CONSUMER STAPLES | | 1,541,310 |
ENERGY - 8.9% |
Energy Equipment & Services - 2.3% |
Baker Hughes, Inc. | 1,131,100 | | 69,122 |
Cameron International Corp. (a) | 454,200 | | 23,600 |
Dresser-Rand Group, Inc. (a) | 315,300 | | 13,384 |
Ensco International Ltd. ADR | 479,400 | | 23,136 |
Halliburton Co. | 1,651,600 | | 73,281 |
Noble Corp. | 1,286,900 | | 43,446 |
Schlumberger Ltd. | 1,511,800 | | 118,102 |
Transocean Ltd. (United States) | 1,115,000 | | 62,462 |
| | 426,533 |
Oil, Gas & Consumable Fuels - 6.6% |
Alpha Natural Resources, Inc. (a) | 395,752 | | 13,088 |
Apache Corp. | 859,100 | | 88,547 |
Bumi PLC | 1,349,237 | | 21,251 |
Chesapeake Energy Corp. | 1,700,100 | | 55,066 |
Chevron Corp. | 1,858,500 | | 183,824 |
ConocoPhillips | 1,076,900 | | 73,305 |
Common Stocks - continued |
| Shares | | Value (000s) |
ENERGY - continued |
Oil, Gas & Consumable Fuels |
CVR Energy, Inc. (a) | 548,700 | | $ 15,621 |
Energen Corp. | 378,600 | | 18,589 |
EV Energy Partners LP | 549,800 | | 37,870 |
Exxon Mobil Corp. | 4,749,917 | | 351,684 |
Marathon Oil Corp. | 1,701,000 | | 45,791 |
Marathon Petroleum Corp. | 850,500 | | 31,520 |
OAO Gazprom sponsored ADR | 1,265,400 | | 15,375 |
Occidental Petroleum Corp. | 780,858 | | 67,732 |
Royal Dutch Shell PLC: | | | |
Class A sponsored ADR | 1,268,004 | | 85,020 |
Class B sponsored ADR | 127,600 | | 8,610 |
Valero Energy Corp. | 2,694,900 | | 61,228 |
Western Refining, Inc. (a)(f) | 1,156,363 | | 20,167 |
Williams Companies, Inc. | 1,507,400 | | 40,685 |
| | 1,234,973 |
TOTAL ENERGY | | 1,661,506 |
FINANCIALS - 7.2% |
Capital Markets - 1.2% |
Apollo Global Management LLC Class A | 1,112,300 | | 14,427 |
E*TRADE Financial Corp. (a) | 2,792,500 | | 34,515 |
Evercore Partners, Inc. Class A | 1,013,500 | | 26,584 |
Franklin Resources, Inc. | 287,900 | | 34,525 |
Goldman Sachs Group, Inc. | 172,900 | | 20,094 |
HFF, Inc. (a) | 548,100 | | 6,479 |
Invesco Ltd. | 1,478,600 | | 27,058 |
Morgan Stanley | 1,248,800 | | 21,854 |
State Street Corp. | 1,359,900 | | 48,304 |
| | 233,840 |
Commercial Banks - 2.3% |
BB&T Corp. | 1,297,300 | | 28,917 |
CIT Group, Inc. (a) | 822,600 | | 28,437 |
Comerica, Inc. | 1,147,600 | | 29,367 |
First Republic Bank (f) | 400,000 | | 10,200 |
Huntington Bancshares, Inc. | 1,825,900 | | 9,184 |
Industrial & Commercial Bank of China Ltd. (H Shares) | 34,419,000 | | 22,634 |
SunTrust Banks, Inc. | 2,041,700 | | 40,630 |
U.S. Bancorp | 4,053,900 | | 94,091 |
Common Stocks - continued |
| Shares | | Value (000s) |
FINANCIALS - continued |
Commercial Banks - continued |
Wells Fargo & Co. | 5,238,340 | | $ 136,721 |
Zions Bancorporation | 1,409,600 | | 24,583 |
| | 424,764 |
Consumer Finance - 0.5% |
Capital One Financial Corp. | 767,800 | | 35,357 |
SLM Corp. | 4,054,700 | | 55,671 |
| | 91,028 |
Diversified Financial Services - 2.0% |
Citigroup, Inc. | 6,907,240 | | 214,470 |
JPMorgan Chase & Co. | 3,723,623 | | 139,859 |
NBH Holdings Corp. Class A (a)(h) | 710,000 | | 12,070 |
Station Holdco LLC (a)(q)(r) | 1,405,198 | | 1,405 |
Station Holdco LLC warrants 6/15/18 (r) | 75,658 | | 0 |
| | 367,804 |
Insurance - 0.7% |
ACE Ltd. | 510,100 | | 32,942 |
MetLife, Inc. | 2,808,600 | | 94,369 |
| | 127,311 |
Real Estate Investment Trusts - 0.3% |
Lexington Corporate Properties Trust (f) | 4,802,167 | | 35,440 |
Prologis, Inc. | 580,900 | | 15,818 |
| | 51,258 |
Real Estate Management & Development - 0.1% |
CB Richard Ellis Group, Inc. Class A (a) | 998,500 | | 15,137 |
Iguatemi Empresa de Shopping Centers SA | 367,800 | | 7,798 |
| | 22,935 |
Thrifts & Mortgage Finance - 0.1% |
BankUnited, Inc. (f) | 769,200 | | 18,038 |
TOTAL FINANCIALS | | 1,336,978 |
HEALTH CARE - 6.9% |
Biotechnology - 1.8% |
Achillion Pharmaceuticals, Inc. (a) | 2,305,134 | | 14,177 |
Acorda Therapeutics, Inc. (a) | 590,000 | | 15,370 |
Alexion Pharmaceuticals, Inc. (a) | 384,300 | | 22,268 |
AMAG Pharmaceuticals, Inc. (a)(f) | 1,389,900 | | 19,625 |
Amgen, Inc. | 1,124,000 | | 62,275 |
Ardea Biosciences, Inc. (a) | 271,200 | | 4,402 |
Biogen Idec, Inc. (a) | 580,700 | | 54,702 |
Common Stocks - continued |
| Shares | | Value (000s) |
HEALTH CARE - continued |
Biotechnology |
BioMarin Pharmaceutical, Inc. (a) | 1,286,300 | | $ 38,055 |
Gilead Sciences, Inc. (a) | 381,000 | | 15,196 |
Neurocrine Biosciences, Inc. (a)(g) | 3,731,700 | | 22,913 |
Theravance, Inc. (a) | 1,285,600 | | 24,426 |
Vertex Pharmaceuticals, Inc. (a) | 969,800 | | 43,903 |
| | 337,312 |
Health Care Equipment & Supplies - 1.6% |
Baxter International, Inc. | 1,574,900 | | 88,163 |
Covidien PLC | 1,923,100 | | 100,347 |
Edwards Lifesciences Corp. (a) | 572,400 | | 43,188 |
The Cooper Companies, Inc. | 17,559 | | 1,322 |
William Demant Holding A/S (a) | 734,500 | | 60,681 |
| | 293,701 |
Health Care Providers & Services - 1.2% |
Aetna, Inc. | 583,700 | | 23,366 |
Apollo Hospitals Enterprise Ltd. | 250,000 | | 2,928 |
CIGNA Corp. | 1,128,300 | | 52,737 |
Express Scripts, Inc. (a) | 707,300 | | 33,201 |
Humana, Inc. | 179,800 | | 13,960 |
McKesson Corp. | 744,800 | | 59,532 |
Medco Health Solutions, Inc. (a) | 617,000 | | 33,404 |
| | 219,128 |
Health Care Technology - 0.1% |
CareView Communications, Inc. (a)(f)(g) | 10,175,300 | | 14,652 |
Life Sciences Tools & Services - 0.3% |
Agilent Technologies, Inc. (a) | 606,200 | | 22,351 |
Sequenom, Inc. (a) | 1,152,600 | | 7,065 |
Thermo Fisher Scientific, Inc. (a) | 466,500 | | 25,625 |
| | 55,041 |
Pharmaceuticals - 1.9% |
Elan Corp. PLC sponsored ADR (a) | 2,640,348 | | 28,173 |
GlaxoSmithKline PLC sponsored ADR | 1,472,200 | | 63,054 |
Perrigo Co. | 333,200 | | 31,567 |
Pfizer, Inc. | 6,084,700 | | 115,488 |
Sanofi-Aventis sponsored ADR | 1,399,900 | | 51,194 |
Common Stocks - continued |
| Shares | | Value (000s) |
HEALTH CARE - continued |
Pharmaceuticals - continued |
Shire PLC sponsored ADR | 590,300 | | $ 57,318 |
Valeant Pharmaceuticals International, Inc. (Canada) | 300,311 | | 13,464 |
| | 360,258 |
TOTAL HEALTH CARE | | 1,280,092 |
INDUSTRIALS - 6.0% |
Aerospace & Defense - 2.1% |
Esterline Technologies Corp. (a) | 420,374 | | 31,650 |
GeoEye, Inc. (a) | 491,600 | | 17,781 |
Goodrich Corp. | 593,400 | | 52,919 |
Precision Castparts Corp. | 363,600 | | 59,576 |
Textron, Inc. | 950,500 | | 16,035 |
United Technologies Corp. | 2,798,800 | | 207,811 |
| | 385,772 |
Airlines - 0.2% |
Copa Holdings SA Class A | 292,100 | | 20,190 |
Delta Air Lines, Inc. (a) | 388,219 | | 2,923 |
Southwest Airlines Co. | 2,837,800 | | 24,462 |
| | 47,575 |
Building Products - 0.1% |
A.O. Smith Corp. | 700,850 | | 27,536 |
Masonite Worldwide Holdings | 5,358 | | 153 |
Masonite Worldwide Holdings: | | | |
warrants 5/20/14 (a) | 25,981 | | 31 |
warrants 5/20/16 (a) | 19,485 | | 24 |
| | 27,744 |
Construction & Engineering - 0.4% |
Fluor Corp. | 947,300 | | 57,520 |
Foster Wheeler AG (a) | 400,000 | | 9,820 |
| | 67,340 |
Electrical Equipment - 0.4% |
AMETEK, Inc. | 925,035 | | 36,150 |
Regal-Beloit Corp. | 516,000 | | 30,336 |
| | 66,486 |
Common Stocks - continued |
| Shares | | Value (000s) |
INDUSTRIALS - continued |
Industrial Conglomerates - 1.7% |
Danaher Corp. | 1,458,000 | | $ 66,791 |
General Electric Co. | 15,083,900 | | 246,018 |
| | 312,809 |
Machinery - 0.1% |
WABCO Holdings, Inc. (a) | 581,600 | | 27,132 |
Professional Services - 0.1% |
Qualicorp SA | 1,519,000 | | 13,740 |
Road & Rail - 0.7% |
Union Pacific Corp. | 1,352,056 | | 124,619 |
Trading Companies & Distributors - 0.2% |
Air Lease Corp. Class A (f) | 2,000,000 | | 45,620 |
TOTAL INDUSTRIALS | | 1,118,837 |
INFORMATION TECHNOLOGY - 10.7% |
Communications Equipment - 1.2% |
Alcatel-Lucent SA sponsored ADR (a) | 5,198,600 | | 19,027 |
Juniper Networks, Inc. (a) | 317,500 | | 6,645 |
Motorola Mobility Holdings, Inc. | 770,025 | | 29,045 |
Polycom, Inc. (a) | 1,915,000 | | 45,577 |
QUALCOMM, Inc. | 2,423,900 | | 124,734 |
| | 225,028 |
Computers & Peripherals - 3.5% |
Apple, Inc. (a) | 1,512,100 | | 581,901 |
Dell, Inc. (a) | 2,017,500 | | 29,990 |
Hewlett-Packard Co. | 1,231,102 | | 32,046 |
| | 643,937 |
Electronic Equipment & Components - 0.2% |
Amphenol Corp. Class A | 868,900 | | 40,821 |
E Ink Holdings, Inc. GDR (a)(h) | 140,100 | | 3,013 |
| | 43,834 |
Internet Software & Services - 1.2% |
Demand Media, Inc. | 1,324,308 | | 11,455 |
Facebook, Inc. Class B (a)(r) | 881,260 | | 22,032 |
Google, Inc. Class A (a) | 209,800 | | 113,493 |
Mail.ru Group Ltd.: | | | |
GDR (a)(h) | 580,000 | | 20,868 |
GDR (Reg. S) | 289,900 | | 10,431 |
Common Stocks - continued |
| Shares | | Value (000s) |
INFORMATION TECHNOLOGY - continued |
Internet Software & Services - continued |
Rackspace Hosting, Inc. (a) | 847,000 | | $ 30,966 |
Velti PLC (a) | 1,150,000 | | 10,879 |
| | 220,124 |
IT Services - 1.9% |
Accenture PLC Class A | 1,674,100 | | 89,715 |
Atos Origin SA | 440,586 | | 22,065 |
Cognizant Technology Solutions Corp. Class A (a) | 2,266,700 | | 143,822 |
MasterCard, Inc. Class A | 216,000 | | 71,217 |
ServiceSource International, Inc. (f) | 1,292,300 | | 23,352 |
| | 350,171 |
Semiconductors & Semiconductor Equipment - 0.4% |
Avago Technologies Ltd. | 533,200 | | 17,654 |
Broadcom Corp. Class A | 431,500 | | 15,383 |
Freescale Semiconductor Holdings I Ltd. | 1,465,000 | | 16,848 |
NXP Semiconductors NV | 505,600 | | 8,236 |
PMC-Sierra, Inc. (a) | 1,372,700 | | 8,360 |
Spansion, Inc. Class A (a) | 64,824 | | 973 |
Teradyne, Inc. (a) | 1,291,200 | | 15,624 |
| | 83,078 |
Software - 2.3% |
ANSYS, Inc. (a) | 647,700 | | 34,963 |
AsiaInfo-Linkage, Inc. (a) | 498,800 | | 5,706 |
Check Point Software Technologies Ltd. (a) | 360,100 | | 19,604 |
Citrix Systems, Inc. (a) | 634,000 | | 38,313 |
CommVault Systems, Inc. (a) | 656,800 | | 22,272 |
Fortinet, Inc. (a) | 768,506 | | 14,702 |
Informatica Corp. (a) | 626,130 | | 26,160 |
Kenexa Corp. (a) | 906,494 | | 19,082 |
Oracle Corp. | 3,706,700 | | 104,047 |
Rovi Corp. (a) | 1,053,000 | | 51,481 |
salesforce.com, Inc. (a) | 332,200 | | 42,771 |
Solera Holdings, Inc. | 671,900 | | 39,407 |
VMware, Inc. Class A (a) | 94,600 | | 8,926 |
| | 427,434 |
TOTAL INFORMATION TECHNOLOGY | | 1,993,606 |
Common Stocks - continued |
| Shares | | Value (000s) |
MATERIALS - 1.7% |
Chemicals - 0.5% |
Arkema SA | 111,800 | | $ 8,681 |
Ashland, Inc. | 297,800 | | 15,786 |
Lanxess AG | 64,400 | | 4,018 |
LyondellBasell Industries NV Class A | 859,594 | | 29,785 |
The Mosaic Co. | 517,100 | | 36,781 |
Tronox, Inc. | 23,603 | | 2,954 |
| | 98,005 |
Containers & Packaging - 0.1% |
Rock-Tenn Co. Class A | 370,300 | | 19,874 |
Metals & Mining - 1.1% |
Carpenter Technology Corp. | 188,200 | | 9,498 |
Goldcorp, Inc. | 1,291,200 | | 67,250 |
Newcrest Mining Ltd. | 2,628,235 | | 113,128 |
SunCoke Energy, Inc. (a) | 109,300 | | 1,548 |
| | 191,424 |
TOTAL MATERIALS | | 309,303 |
TELECOMMUNICATION SERVICES - 0.2% |
Wireless Telecommunication Services - 0.2% |
American Tower Corp. Class A (a) | 565,300 | | 30,447 |
UTILITIES - 0.8% |
Electric Utilities - 0.3% |
PPL Corp. | 1,739,500 | | 50,237 |
Gas Utilities - 0.1% |
ONEOK, Inc. | 424,700 | | 30,111 |
Independent Power Producers & Energy Traders - 0.1% |
The AES Corp. (a) | 2,024,300 | | 21,984 |
Multi-Utilities - 0.3% |
National Grid PLC | 5,713,020 | | 57,573 |
TOTAL UTILITIES | | 159,905 |
TOTAL COMMON STOCKS (Cost $9,637,563) | 10,743,343 |
Preferred Stocks - 0.9% |
| Shares | | Value (000s) |
Convertible Preferred Stocks - 0.4% |
CONSUMER DISCRETIONARY - 0.2% |
Automobiles - 0.0% |
General Motors Co. 4.75% | 184,400 | | $ 7,352 |
Textiles, Apparel & Luxury Goods - 0.2% |
Michael Kors Holdings Ltd. (a)(r) | 651,410 | | 30,000 |
TOTAL CONSUMER DISCRETIONARY | | 37,352 |
ENERGY - 0.0% |
Oil, Gas & Consumable Fuels - 0.0% |
Apache Corp. 6.00% | 64,800 | | 3,766 |
Chesapeake Energy Corp. 5.00% | 18,580 | | 1,904 |
| | 5,670 |
FINANCIALS - 0.1% |
Diversified Financial Services - 0.1% |
2010 Swift Mandatory Common Exchange Security Trust 6.00% (h) | 214,800 | | 1,997 |
Citigroup, Inc. 7.50% | 59,300 | | 5,610 |
| | 7,607 |
Real Estate Investment Trusts - 0.0% |
Health Care REIT, Inc. Series I, 6.50% | 113,000 | | 5,544 |
TOTAL FINANCIALS | | 13,151 |
INFORMATION TECHNOLOGY - 0.0% |
Internet Software & Services - 0.0% |
wetpaint.com, Inc. Series C (a)(r) | 497,017 | | 994 |
MATERIALS - 0.0% |
Metals & Mining - 0.0% |
AngloGold Ashanti Holdings Finance PLC 6.00% | 104,600 | | 5,209 |
UTILITIES - 0.1% |
Electric Utilities - 0.1% |
AES Trust III 6.75% | 126,300 | | 6,054 |
PPL Corp. 8.75% | 108,000 | | 5,893 |
| | 11,947 |
TOTAL CONVERTIBLE PREFERRED STOCKS | | 74,323 |
Preferred Stocks - continued |
| Shares | | Value (000s) |
Nonconvertible Preferred Stocks - 0.5% |
CONSUMER DISCRETIONARY - 0.4% |
Automobiles - 0.4% |
Porsche Automobil Holding SE (Germany) | 311,350 | | $ 21,084 |
Volkswagen AG | 286,000 | | 47,642 |
| | 68,726 |
FINANCIALS - 0.1% |
Diversified Financial Services - 0.1% |
GMAC Capital Trust I Series 2, 8.125% | 377,872 | | 8,068 |
GMAC LLC 7.00% (h) | 11,951 | | 8,903 |
| | 16,971 |
TOTAL NONCONVERTIBLE PREFERRED STOCKS | | 85,697 |
TOTAL PREFERRED STOCKS (Cost $139,177) | 160,020 |
Corporate Bonds - 11.0% |
| Principal Amount (000s) | | |
Convertible Bonds - 0.2% |
CONSUMER DISCRETIONARY - 0.0% |
Leisure Equipment & Products - 0.0% |
Eastman Kodak Co. 7% 4/1/17 | | $ 5,200 | | 3,839 |
Media - 0.0% |
Liberty Media Corp.: | | | | |
3.5% 1/15/31 | | 502 | | 354 |
3.5% 1/15/31 (h) | | 3,712 | | 2,618 |
| | 2,972 |
TOTAL CONSUMER DISCRETIONARY | | 6,811 |
ENERGY - 0.1% |
Oil, Gas & Consumable Fuels - 0.1% |
Alpha Natural Resources, Inc. 2.375% 4/15/15 | | 1,350 | | 1,435 |
Peabody Energy Corp. 4.75% 12/15/66 | | 6,300 | | 7,379 |
| | 8,814 |
Corporate Bonds - continued |
| Principal Amount (000s) | | Value (000s) |
Convertible Bonds - continued |
INDUSTRIALS - 0.1% |
Electrical Equipment - 0.1% |
Aspen Aerogels, Inc. 8% 6/1/14 (r) | | $ 10,000 | | $ 10,000 |
MATERIALS - 0.0% |
Construction Materials - 0.0% |
Headwaters, Inc. 2.5% 2/1/14 | | 4,920 | | 3,942 |
TELECOMMUNICATION SERVICES - 0.0% |
Diversified Telecommunication Services - 0.0% |
Clearwire Communications LLC/Clearwire Finance, Inc. 8.25% 12/1/40 (h) | | 4,000 | | 2,813 |
TOTAL CONVERTIBLE BONDS | | 32,380 |
Nonconvertible Bonds - 10.8% |
CONSUMER DISCRETIONARY - 1.2% |
Auto Components - 0.1% |
DaimlerChrysler NA Holding Corp. 5.75% 9/8/11 | | 5,187 | | 5,188 |
Delphi Corp.: | | | | |
5.875% 5/15/19 (h) | | 1,820 | | 1,765 |
6.125% 5/15/21 (h) | | 1,690 | | 1,639 |
Exide Technologies 8.625% 2/1/18 (h) | | 825 | | 776 |
International Automotive Components Group SA 9.125% 6/1/18 (h) | | 1,930 | | 1,862 |
Tenneco, Inc. 6.875% 12/15/20 | | 2,415 | | 2,439 |
| | 13,669 |
Automobiles - 0.0% |
Ford Motor Co.: | | | | |
6.375% 2/1/29 | | 2,190 | | 2,048 |
6.625% 10/1/28 | | 2,510 | | 2,442 |
7.45% 7/16/31 | | 2,335 | | 2,554 |
General Motors Corp.: | | | | |
6.75% 5/1/28 (d) | | 390 | | 4 |
7.125% 7/15/13 (d) | | 1,135 | | 12 |
7.2% 1/15/11 (d) | | 2,855 | | 31 |
7.4% 9/1/25 (d) | | 195 | | 2 |
7.7% 4/15/16 (d) | | 705 | | 8 |
Corporate Bonds - continued |
| Principal Amount (000s) | | Value (000s) |
Nonconvertible Bonds - continued |
CONSUMER DISCRETIONARY |
Automobiles |
General Motors Corp.: | | | | |
8.25% 7/15/23 (d) | | $ 5,475 | | $ 60 |
8.375% 7/15/33 (d) | | 16,800 | | 183 |
| | 7,344 |
Distributors - 0.0% |
Ferrellgas LP/Ferrellgas Finance Corp. 6.5% 5/1/21 | | 1,745 | | 1,566 |
Diversified Consumer Services - 0.1% |
ServiceMaster Co. 10.75% 7/15/15 pay-in-kind (h)(n) | | 12,495 | | 12,870 |
Hotels, Restaurants & Leisure - 0.2% |
American Casino & Entertainment Properties LLC 11% 6/15/14 | | 2,935 | | 2,935 |
Ameristar Casinos, Inc. 7.5% 4/15/21 (h) | | 2,810 | | 2,782 |
Chukchansi Economic Development Authority: | | | | |
3.917% 11/15/12 (h)(n) | | 1,140 | | 835 |
8% 11/15/13 (h) | | 1,890 | | 1,380 |
Landry's Restaurants, Inc. 11.625% 12/1/15 | | 760 | | 798 |
MCE Finance Ltd. 10.25% 5/15/18 | | 1,695 | | 1,873 |
MGM Mirage, Inc.: | | | | |
5.875% 2/27/14 | | 2,998 | | 2,848 |
6.625% 7/15/15 | | 2,080 | | 1,903 |
6.75% 4/1/13 | | 80 | | 79 |
7.5% 6/1/16 | | 4,385 | | 3,990 |
9% 3/15/20 | | 1,770 | | 1,912 |
13% 11/15/13 | | 5,000 | | 5,800 |
MTR Gaming Group, Inc. 11.5% 8/1/19 pay-in-kind (h)(n) | | 1,975 | | 1,659 |
NAI Entertainment Holdings LLC/NAI Entertainment Finance Corp. 8.25% 12/15/17 (h) | | 1,060 | | 1,071 |
NCL Corp. Ltd. 9.5% 11/15/18 (h) | | 565 | | 585 |
San Pasqual Casino Development Group, Inc. 8% 9/15/13 (h) | | 1,080 | | 1,064 |
Seven Seas Cruises S de RL LLC 9.125% 5/15/19 (h) | | 250 | | 249 |
Shingle Springs Tribal Gaming Authority 9.375% 6/15/15 (h) | | 2,270 | | 1,544 |
Corporate Bonds - continued |
| Principal Amount (000s) | | Value (000s) |
Nonconvertible Bonds - continued |
CONSUMER DISCRETIONARY - continued |
Hotels, Restaurants & Leisure |
Sugarhouse HSP Gaming Prop Mezz LP/Sugarhouse HSP Gaming Finance Corp. 8.625% 4/15/16 (h) | | $ 220 | | $ 220 |
Waterford Gaming LLC/Waterford Gaming Finance Corp. 8.625% 9/15/14 (h) | | 1,282 | | 698 |
| | 34,225 |
Household Durables - 0.0% |
Fortune Brands, Inc.: | | | | |
5.375% 1/15/16 | | 1,682 | | 1,865 |
5.875% 1/15/36 | | 2,020 | | 2,062 |
6.375% 6/15/14 | | 446 | | 498 |
Reynolds Group Issuer, Inc./Reynolds Group Issuer LLC/Reynolds Group Issuer (Luxembourg) SA: | | | | |
7.125% 4/15/19 (h) | | 1,140 | | 1,094 |
9% 4/15/19 (h) | | 835 | | 741 |
| | 6,260 |
Leisure Equipment & Products - 0.0% |
Eastman Kodak Co.: | | | | |
9.75% 3/1/18 (h) | | 2,131 | | 1,833 |
10.625% 3/15/19 (h) | | 1,800 | | 1,566 |
| | 3,399 |
Media - 0.7% |
AMC Networks, Inc. 7.75% 7/15/21 (h) | | 340 | | 355 |
Bresnan Broadband Holdings LLC 8% 12/15/18 (h) | | 875 | | 884 |
Catalina Marketing Corp. 10.5% 10/1/15 pay-in-kind (h)(n) | | 5,995 | | 5,995 |
Cequel Communications Holdings I LLC/Cequel Capital Corp. 8.625% 11/15/17 (h) | | 630 | | 655 |
Charter Communications Holdings II LLC/Charter Communications Holdings II Capital Corp. 13.5% 11/30/16 | | 11,727 | | 13,544 |
Charter Communications Operating LLC/Charter Communications Operating Capital Corp. 8% 4/30/12 (h)(n) | | 520 | | 533 |
Checkout Holding Corp. 0% 11/15/15 (h) | | 1,290 | | 761 |
Clear Channel Communications, Inc.: | | | | |
5% 3/15/12 | | 4,405 | | 4,361 |
5.5% 9/15/14 | | 2,355 | | 1,590 |
5.5% 12/15/16 | | 1,330 | | 648 |
Corporate Bonds - continued |
| Principal Amount (000s) | | Value (000s) |
Nonconvertible Bonds - continued |
CONSUMER DISCRETIONARY |
Media |
Clear Channel Worldwide Holdings, Inc. Series A, 9.25% 12/15/17 | | $ 780 | | $ 827 |
Comcast Corp.: | | | | |
4.95% 6/15/16 | | 1,742 | | 1,957 |
5.15% 3/1/20 | | 595 | | 677 |
5.7% 5/15/18 | | 10,139 | | 11,743 |
6.4% 3/1/40 | | 2,111 | | 2,391 |
6.45% 3/15/37 | | 1,033 | | 1,145 |
COX Communications, Inc. 4.625% 6/1/13 | | 2,632 | | 2,793 |
Discovery Communications LLC: | | | | |
3.7% 6/1/15 | | 3,557 | | 3,799 |
6.35% 6/1/40 | | 3,224 | | 3,630 |
DISH DBS Corp. 6.75% 6/1/21 (h) | | 3,515 | | 3,541 |
EchoStar Communications Corp. 6.625% 10/1/14 | | 3,000 | | 3,098 |
Gray Television, Inc. 10.5% 6/29/15 | | 990 | | 975 |
Kabel BW Erste Beteiligungs GmbH/Kabel Baden-Wurttemberg GmbH & Co. KG 7.5% 3/15/19 (h) | | 480 | | 470 |
Lamar Media Corp. 7.875% 4/15/18 | | 1,400 | | 1,416 |
Liberty Media Corp. 8.25% 2/1/30 | | 889 | | 869 |
National Cinemedia LLC 7.875% 7/15/21 (h) | | 1,380 | | 1,304 |
NBCUniversal Media LLC: | | | | |
3.65% 4/30/15 | | 4,663 | | 4,947 |
5.15% 4/30/20 | | 4,917 | | 5,446 |
6.4% 4/30/40 | | 4,249 | | 4,800 |
News America Holdings, Inc. 7.75% 12/1/45 | | 6,290 | | 7,408 |
News America, Inc. 6.15% 2/15/41 | | 3,160 | | 3,295 |
Nexstar Broadcasting, Inc.: | | | | |
7% 1/15/14 | | 1,977 | | 1,937 |
7% 1/15/14 pay-in-kind | | 6,023 | | 5,903 |
Nielsen Finance LLC/Nielsen Finance Co.: | | | | |
7.75% 10/15/18 | | 3,165 | | 3,292 |
11.5% 5/1/16 | | 1,947 | | 2,210 |
11.625% 2/1/14 | | 1,171 | | 1,329 |
Radio One, Inc. 15% 5/11/16 pay-in-kind (h)(n) | | 4,272 | | 4,008 |
Satmex Escrow SA de CV 9.5% 5/15/17 (h) | | 475 | | 471 |
Sheridan Group, Inc. 12.5% 4/15/14 | | 1,825 | | 1,633 |
Time Warner Cable, Inc.: | | | | |
5.4% 7/2/12 | | 2,266 | | 2,347 |
Corporate Bonds - continued |
| Principal Amount (000s) | | Value (000s) |
Nonconvertible Bonds - continued |
CONSUMER DISCRETIONARY - continued |
Media |
Time Warner Cable, Inc.: | | | | |
5.85% 5/1/17 | | $ 2,500 | | $ 2,817 |
6.2% 7/1/13 | | 2,154 | | 2,343 |
6.75% 7/1/18 | | 1,087 | | 1,279 |
Time Warner, Inc.: | | | | |
3.15% 7/15/15 | | 362 | | 376 |
5.875% 11/15/16 | | 3,112 | | 3,623 |
6.2% 3/15/40 | | 2,618 | | 2,807 |
6.5% 11/15/36 | | 2,633 | | 2,937 |
Videotron Ltd. 9.125% 4/15/18 | | 5,565 | | 6,108 |
| | 141,277 |
Specialty Retail - 0.1% |
Asbury Automotive Group, Inc. 8.375% 11/15/20 | | 565 | | 554 |
Michaels Stores, Inc. 7.75% 11/1/18 | | 1,665 | | 1,557 |
PETCO Animal Supplies, Inc. 9.25% 12/1/18 (h) | | 3,260 | | 3,342 |
Sonic Automotive, Inc. 9% 3/15/18 | | 1,000 | | 1,020 |
Staples, Inc. 7.375% 10/1/12 | | 757 | | 806 |
Toys 'R' Us, Inc. 7.875% 4/15/13 | | 4,995 | | 5,082 |
| | 12,361 |
Textiles, Apparel & Luxury Goods - 0.0% |
Polymer Group, Inc. 7.75% 2/1/19 (h) | | 605 | | 629 |
TOTAL CONSUMER DISCRETIONARY | | 233,600 |
CONSUMER STAPLES - 0.4% |
Beverages - 0.1% |
Anheuser-Busch InBev Worldwide, Inc.: | | | | |
2.5% 3/26/13 | | 1,969 | | 2,022 |
5.375% 11/15/14 | | 5,671 | | 6,406 |
Diageo Capital PLC 5.2% 1/30/13 | | 3,201 | | 3,397 |
FBG Finance Ltd. 5.125% 6/15/15 (h) | | 2,722 | | 3,012 |
| | 14,837 |
Food & Staples Retailing - 0.1% |
CVS Caremark Corp. 4.125% 5/15/21 | | 1,950 | | 1,975 |
Corporate Bonds - continued |
| Principal Amount (000s) | | Value (000s) |
Nonconvertible Bonds - continued |
CONSUMER STAPLES |
Food & Staples Retailing |
Rite Aid Corp.: | | | | |
7.5% 3/1/17 | | $ 12,125 | | $ 11,822 |
10.375% 7/15/16 | | 5,420 | | 5,664 |
| | 19,461 |
Food Products - 0.1% |
Cargill, Inc. 6% 11/27/17 (h) | | 417 | | 496 |
Kraft Foods, Inc.: | | | | |
5.375% 2/10/20 | | 5,528 | | 6,272 |
5.625% 11/1/11 | | 437 | | 440 |
6.5% 8/11/17 | | 6,561 | | 7,924 |
6.75% 2/19/14 | | 318 | | 359 |
| | 15,491 |
Tobacco - 0.1% |
Altria Group, Inc.: | | | | |
8.5% 11/10/13 | | 446 | | 512 |
9.7% 11/10/18 | | 14,772 | | 19,506 |
Reynolds American, Inc.: | | | | |
6.75% 6/15/17 | | 2,746 | | 3,233 |
7.25% 6/15/37 | | 6,101 | | 6,796 |
| | 30,047 |
TOTAL CONSUMER STAPLES | | 79,836 |
ENERGY - 1.2% |
Energy Equipment & Services - 0.2% |
Calfrac Holdings LP 7.5% 12/1/20 (h) | | 1,435 | | 1,392 |
DCP Midstream LLC 5.35% 3/15/20 (h) | | 5,028 | | 5,539 |
El Paso Pipeline Partners Operating Co. LLC: | | | | |
4.1% 11/15/15 | | 5,488 | | 5,776 |
6.5% 4/1/20 | | 1,008 | | 1,143 |
Expro Finance Luxembourg SCA 8.5% 12/15/16 (h) | | 6,620 | | 6,289 |
Forbes Energy Services Ltd. 9% 6/15/19 (h) | | 1,385 | | 1,302 |
Frac Tech Services LLLC/Frac Tech Finance, Inc. 7.125% 11/15/18 (h) | | 860 | | 873 |
Noble Holding International Ltd. 3.45% 8/1/15 | | 863 | | 915 |
Oil States International, Inc. 6.5% 6/1/19 (h) | | 1,420 | | 1,416 |
Precision Drilling Corp.: | | | | |
6.5% 12/15/21 (h) | | 315 | | 318 |
Corporate Bonds - continued |
| Principal Amount (000s) | | Value (000s) |
Nonconvertible Bonds - continued |
ENERGY - continued |
Energy Equipment & Services |
Precision Drilling Corp.: | | | | |
6.625% 11/15/20 | | $ 1,580 | | $ 1,588 |
Pride International, Inc. 6.875% 8/15/20 | | 1,355 | | 1,619 |
Trinidad Drilling Ltd. 7.875% 1/15/19 (h) | | 630 | | 643 |
Weatherford International Ltd.: | | | | |
4.95% 10/15/13 | | 1,614 | | 1,716 |
5.15% 3/15/13 | | 2,110 | | 2,222 |
| | 32,751 |
Oil, Gas & Consumable Fuels - 1.0% |
Alpha Natural Resources, Inc.: | | | | |
6% 6/1/19 | | 2,915 | | 2,900 |
6.25% 6/1/21 | | 1,675 | | 1,658 |
Anadarko Petroleum Corp.: | | | | |
5.95% 9/15/16 | | 663 | | 745 |
6.375% 9/15/17 | | 9,475 | | 10,934 |
Antero Resources Finance Corp. 9.375% 12/1/17 | | 4,470 | | 4,738 |
ATP Oil & Gas Corp. 11.875% 5/1/15 | | 9,495 | | 8,284 |
BW Group Ltd. 6.625% 6/28/17 (h) | | 2,741 | | 2,566 |
Calumet Specialty Products Partners LP/Calumet Finance Corp. 9.375% 5/1/19 (h) | | 635 | | 610 |
Canadian Natural Resources Ltd.: | | | | |
5.15% 2/1/13 | | 1,519 | | 1,602 |
5.7% 5/15/17 | | 392 | | 458 |
Crestwood Midstream Partners LP / Finance Corp. 7.75% 4/1/19 (h) | | 860 | | 821 |
Denbury Resources, Inc. 8.25% 2/15/20 | | 1,973 | | 2,082 |
Drummond Co., Inc.: | | | | |
7.375% 2/15/16 | | 5,000 | | 5,050 |
9% 10/15/14 (h) | | 1,155 | | 1,193 |
Duke Capital LLC 6.25% 2/15/13 | | 589 | | 627 |
Duke Energy Field Services: | | | | |
5.375% 10/15/15 (h) | | 1,133 | | 1,280 |
6.45% 11/3/36 (h) | | 3,753 | | 4,238 |
El Paso Natural Gas Co. 5.95% 4/15/17 | | 867 | | 1,002 |
EnCana Holdings Finance Corp. 5.8% 5/1/14 | | 2,678 | | 2,955 |
Enterprise Products Operating LP: | | | | |
5.6% 10/15/14 | | 660 | | 724 |
5.65% 4/1/13 | | 410 | | 435 |
Corporate Bonds - continued |
| Principal Amount (000s) | | Value (000s) |
Nonconvertible Bonds - continued |
ENERGY |
Oil, Gas & Consumable Fuels |
EV Energy Partners LP/EV Energy Finance Corp. 8% 4/15/19 (h) | | $ 1,715 | | $ 1,681 |
Gulf South Pipeline Co. LP 5.75% 8/15/12 (h) | | 3,581 | | 3,690 |
Gulfstream Natural Gas System LLC 6.95% 6/1/16 (h) | | 302 | | 360 |
LINN Energy LLC/LINN Energy Finance Corp. 6.5% 5/15/19 (h) | | 1,820 | | 1,738 |
Marathon Petroleum Corp. 5.125% 3/1/21 (h) | | 3,001 | | 3,200 |
Midcontinent Express Pipeline LLC 5.45% 9/15/14 (h) | | 1,140 | | 1,226 |
Motiva Enterprises LLC: | | | | |
5.75% 1/15/20 (h) | | 2,578 | | 2,994 |
6.85% 1/15/40 (h) | | 2,906 | | 3,703 |
Nakilat, Inc. 6.067% 12/31/33 (h) | | 1,839 | | 1,986 |
Nexen, Inc.: | | | | |
5.2% 3/10/15 | | 842 | | 920 |
5.875% 3/10/35 | | 2,365 | | 2,233 |
6.2% 7/30/19 | | 825 | | 954 |
6.4% 5/15/37 | | 4,230 | | 4,340 |
NGPL PipeCo LLC 6.514% 12/15/12 (h) | | 3,302 | | 3,416 |
Petrobras International Finance Co. Ltd.: | | | | |
3.875% 1/27/16 | | 4,954 | | 5,078 |
5.75% 1/20/20 | | 10,403 | | 11,286 |
7.875% 3/15/19 | | 5,564 | | 6,769 |
Petroleos Mexicanos: | | | | |
5.5% 1/21/21 (h) | | 5,342 | | 5,809 |
6% 3/5/20 | | 879 | | 991 |
Petroleum Development Corp. 12% 2/15/18 | | 4,240 | | 4,537 |
Plains All American Pipeline LP/PAA Finance Corp.: | | | | |
3.95% 9/15/15 | | 137 | | 145 |
4.25% 9/1/12 | | 663 | | 684 |
5% 2/1/21 | | 1,642 | | 1,745 |
6.125% 1/15/17 | | 1,880 | | 2,154 |
Ras Laffan Liquefied Natural Gas Co. Ltd. 8.294% 3/15/14 (h) | | 1,661 | | 1,819 |
Ras Laffan Liquefied Natural Gas Co. Ltd. III: | | | | |
4.5% 9/30/12 (h) | | 2,588 | | 2,679 |
5.5% 9/30/14 (h) | | 3,880 | | 4,278 |
5.832% 9/30/16 (h) | | 1,046 | | 1,146 |
6.332% 9/30/27 (h) | | 5,710 | | 6,381 |
6.75% 9/30/19 (h) | | 2,367 | | 2,840 |
Corporate Bonds - continued |
| Principal Amount (000s) | | Value (000s) |
Nonconvertible Bonds - continued |
ENERGY - continued |
Oil, Gas & Consumable Fuels |
Regency Energy Partners LP/Regency Energy Finance Corp. 6.875% 12/1/18 | | $ 2,550 | | $ 2,576 |
Rockies Express Pipeline LLC 6.25% 7/15/13 (h) | | 2,522 | | 2,698 |
Ship Finance International Ltd. 8.5% 12/15/13 | | 10,070 | | 9,768 |
Southeast Supply Header LLC 4.85% 8/15/14 (h) | | 501 | | 538 |
Spectra Energy Capital, LLC 5.65% 3/1/20 | | 421 | | 471 |
Spectra Energy Partners, LP: | | | | |
2.95% 6/15/16 | | 938 | | 965 |
4.6% 6/15/21 | | 1,227 | | 1,267 |
Suncor Energy, Inc.: | | | | |
6.1% 6/1/18 | | 7,256 | | 8,409 |
6.85% 6/1/39 | | 6,550 | | 7,649 |
Talisman Energy, Inc. yankee 6.25% 2/1/38 | | 2,650 | | 2,911 |
Texas Eastern Transmission LP 6% 9/15/17 (h) | | 948 | | 1,135 |
Western Gas Partners LP 5.375% 6/1/21 | | 5,617 | | 5,915 |
XTO Energy, Inc.: | | | | |
4.9% 2/1/14 | | 364 | | 400 |
5% 1/31/15 | | 1,031 | | 1,172 |
5.65% 4/1/16 | | 707 | | 839 |
| | 192,397 |
TOTAL ENERGY | | 225,148 |
FINANCIALS - 3.7% |
Capital Markets - 0.5% |
Bear Stearns Companies, Inc. 5.3% 10/30/15 | | 8,893 | | 9,661 |
Goldman Sachs Group, Inc.: | | | | |
3.7% 8/1/15 | | 5,929 | | 5,990 |
5.25% 7/27/21 | | 5,645 | | 5,716 |
5.95% 1/18/18 | | 3,697 | | 3,931 |
6% 6/15/20 | | 1,200 | | 1,279 |
6.15% 4/1/18 | | 1,544 | | 1,649 |
6.75% 10/1/37 | | 4,509 | | 4,269 |
Janus Capital Group, Inc. 5.875% 9/15/11 (e) | | 812 | | 813 |
JPMorgan Chase Capital XX 6.55% 9/29/36 | | 7,545 | | 7,494 |
Lazard Group LLC: | | | | |
6.85% 6/15/17 | | 3,573 | | 4,018 |
7.125% 5/15/15 | | 1,276 | | 1,439 |
Corporate Bonds - continued |
| Principal Amount (000s) | | Value (000s) |
Nonconvertible Bonds - continued |
FINANCIALS |
Capital Markets |
Merrill Lynch & Co., Inc.: | | | | |
5.45% 2/5/13 | | $ 4,315 | | $ 4,427 |
6.4% 8/28/17 | | 3,463 | | 3,546 |
Morgan Stanley: | | | | |
4% 7/24/15 | | 883 | | 878 |
4.75% 4/1/14 | | 2,291 | | 2,323 |
5.45% 1/9/17 | | 1,300 | | 1,332 |
5.5% 7/28/21 | | 4,938 | | 4,924 |
5.625% 9/23/19 | | 1,659 | | 1,685 |
5.75% 1/25/21 | | 4,000 | | 4,115 |
5.95% 12/28/17 | | 510 | | 527 |
6% 5/13/14 | | 3,192 | | 3,351 |
6% 4/28/15 | | 1,932 | | 2,021 |
6.625% 4/1/18 | | 1,161 | | 1,243 |
7.3% 5/13/19 | | 4,941 | | 5,513 |
Northern Trust Corp. 3.375% 8/23/21 | | 1,280 | | 1,278 |
Penson Worldwide, Inc. 12.5% 5/15/17 (h) | | 1,765 | | 1,416 |
UBS AG Stamford Branch 3.875% 1/15/15 | | 8,000 | | 8,295 |
| | 93,133 |
Commercial Banks - 0.7% |
Bank of America NA: | | | | |
5.3% 3/15/17 | | 14,192 | | 13,883 |
6.1% 6/15/17 | | 522 | | 517 |
CIT Group, Inc.: | | | | |
7% 5/1/15 | | 1 | | 1 |
7% 5/4/15 (h) | | 14,250 | | 14,036 |
7% 5/1/16 | | 1 | | 1 |
7% 5/2/16 (h) | | 5,172 | | 5,069 |
7% 5/1/17 | | 1 | | 1 |
7% 5/2/17 (h) | | 16,669 | | 16,294 |
Credit Suisse New York Branch 6% 2/15/18 | | 10,887 | | 11,464 |
DBS Bank Ltd. (Singapore) 0.5101% 5/16/17 (h)(n) | | 3,496 | | 3,444 |
Discover Bank: | | | | |
7% 4/15/20 | | 2,178 | | 2,367 |
8.7% 11/18/19 | | 1,651 | | 1,944 |
Export-Import Bank of Korea: | | | | |
5.25% 2/10/14 (h) | | 333 | | 355 |
5.5% 10/17/12 | | 2,091 | | 2,175 |
Corporate Bonds - continued |
| Principal Amount (000s) | | Value (000s) |
Nonconvertible Bonds - continued |
FINANCIALS - continued |
Commercial Banks |
Fifth Third Bancorp: | | | | |
3.625% 1/25/16 | | $ 2,893 | | $ 2,932 |
4.5% 6/1/18 | | 418 | | 417 |
8.25% 3/1/38 | | 3,116 | | 3,523 |
Fifth Third Bank 4.75% 2/1/15 | | 680 | | 726 |
Fifth Third Capital Trust IV 6.5% 4/15/67 (n) | | 3,315 | | 3,075 |
HBOS PLC 6.75% 5/21/18 (h) | | 408 | | 377 |
Huntington Bancshares, Inc. 7% 12/15/20 | | 1,364 | | 1,560 |
JPMorgan Chase Bank 6% 10/1/17 | | 1,942 | | 2,175 |
KeyBank NA: | | | | |
5.45% 3/3/16 | | 1,877 | | 2,035 |
5.8% 7/1/14 | | 4,250 | | 4,642 |
KeyCorp. 5.1% 3/24/21 | | 2,604 | | 2,664 |
Manufacturers & Traders Trust Co. 1.7458% 4/1/13 (n) | | 547 | | 547 |
Marshall & Ilsley Bank: | | | | |
4.85% 6/16/15 | | 2,431 | | 2,658 |
5% 1/17/17 | | 6,619 | | 7,112 |
5.25% 9/4/12 | | 1,524 | | 1,568 |
Regions Bank: | | | | |
6.45% 6/26/37 | | 4,710 | | 4,015 |
7.5% 5/15/18 | | 2,851 | | 2,780 |
Regions Financial Corp.: | | | | |
0.4165% 6/26/12 (n) | | 461 | | 451 |
5.75% 6/15/15 | | 996 | | 941 |
7.75% 11/10/14 | | 4,550 | | 4,516 |
SunTrust Banks, Inc. 3.6% 4/15/16 | | 4,440 | | 4,457 |
UniCredit Luxembourg Finance SA 5.584% 1/13/17 (h)(n) | | 1,837 | | 1,643 |
UnionBanCal Corp. 5.25% 12/16/13 | | 614 | | 662 |
Wachovia Bank NA: | | | | |
4.8% 11/1/14 | | 509 | | 547 |
4.875% 2/1/15 | | 1,305 | | 1,391 |
Wachovia Corp.: | | | | |
5.625% 10/15/16 | | 3,151 | | 3,448 |
5.75% 6/15/17 | | 1,728 | | 1,957 |
Corporate Bonds - continued |
| Principal Amount (000s) | | Value (000s) |
Nonconvertible Bonds - continued |
FINANCIALS |
Commercial Banks |
Wells Fargo & Co.: | | | | |
3.625% 4/15/15 | | $ 3,029 | | $ 3,164 |
3.676% 6/15/16 | | 2,210 | | 2,335 |
| | 139,869 |
Consumer Finance - 0.6% |
Ally Financial, Inc. 6.25% 12/1/17 | | 1,800 | | 1,719 |
Discover Financial Services: | | | | |
6.45% 6/12/17 | | 9,507 | | 10,692 |
10.25% 7/15/19 | | 797 | | 1,028 |
Ford Motor Credit Co. LLC: | | | | |
5.75% 2/1/21 | | 8,630 | | 8,673 |
8.125% 1/15/20 | | 5,000 | | 5,583 |
General Electric Capital Corp.: | | | | |
2.25% 11/9/15 | | 4,296 | | 4,319 |
2.95% 5/9/16 | | 1,152 | | 1,162 |
3.5% 6/29/15 | | 1,191 | | 1,245 |
5.625% 9/15/17 | | 17,812 | | 19,774 |
General Motors Acceptance Corp.: | | | | |
6.875% 9/15/11 | | 1,360 | | 1,360 |
8% 11/1/31 | | 2,485 | | 2,385 |
GMAC LLC: | | | | |
6% 12/15/11 | | 880 | | 880 |
6.75% 12/1/14 | | 2,355 | | 2,355 |
6.875% 9/15/11 | | 1,365 | | 1,365 |
8% 12/31/18 | | 5,795 | | 5,592 |
8% 11/1/31 | | 19,161 | | 18,586 |
Household Finance Corp. 6.375% 10/15/11 | | 1,724 | | 1,734 |
HSBC Finance Corp. 5.9% 6/19/12 | | 789 | | 817 |
SLM Corp.: | | | | |
0.483% 10/25/11 (n) | | 5,381 | | 5,369 |
8% 3/25/20 | | 1,505 | | 1,565 |
8.45% 6/15/18 | | 7,220 | | 7,638 |
| | 103,841 |
Diversified Financial Services - 0.9% |
Bank of America Corp.: | | | | |
5.75% 12/1/17 | | 6,120 | | 6,357 |
8% (i)(n) | | 730 | | 690 |
Corporate Bonds - continued |
| Principal Amount (000s) | | Value (000s) |
Nonconvertible Bonds - continued |
FINANCIALS - continued |
Diversified Financial Services |
BP Capital Markets PLC: | | | | |
3.125% 10/1/15 | | $ 894 | | $ 935 |
3.625% 5/8/14 | | 5,608 | | 5,914 |
4.5% 10/1/20 | | 888 | | 960 |
4.742% 3/11/21 | | 4,210 | | 4,606 |
Calpine Construction Finance Co. LP 8% 6/1/16 (h) | | 6,880 | | 7,155 |
Capital One Capital V 10.25% 8/15/39 | | 3,798 | | 3,943 |
CCO Holdings LLC/CCO Holdings Capital Corp. 8.125% 4/30/20 | | 3,485 | | 3,685 |
CEVA Group PLC: | | | | |
8.375% 12/1/17 (h) | | 6,325 | | 5,882 |
11.5% 4/1/18 (h) | | 1,360 | | 1,278 |
CIT Group, Inc. 6.625% 4/1/18 (h) | | 3,445 | | 3,462 |
Citigroup, Inc.: | | | | |
3.953% 6/15/16 | | 5,674 | | 5,794 |
4.75% 5/19/15 | | 9,415 | | 9,815 |
5.5% 4/11/13 | | 6,263 | | 6,525 |
6.5% 8/19/13 | | 19,106 | | 20,322 |
General Motors Financial Co., Inc. 6.75% 6/1/18 (h) | | 5,070 | | 4,994 |
Icahn Enterprises LP/Icahn Enterprises Finance Corp. 7.75% 1/15/16 | | 7,625 | | 7,701 |
JPMorgan Chase & Co.: | | | | |
3.15% 7/5/16 | | 7,615 | | 7,774 |
3.4% 6/24/15 | | 877 | | 903 |
4.65% 6/1/14 | | 6,500 | | 6,934 |
NSG Holdings II, LLC 7.75% 12/15/25 (h) | | 5,023 | | 4,872 |
Offshore Group Investment Ltd.: | | | | |
11.5% 8/1/15 | | 2,905 | | 3,079 |
11.5% 8/1/15 (h) | | 640 | | 678 |
ORIX Corp. 5.48% 11/22/11 | | 227 | | 229 |
Prime Property Funding, Inc.: | | | | |
5.125% 6/1/15 (h) | | 1,703 | | 1,805 |
5.5% 1/15/14 (h) | | 644 | | 688 |
5.7% 4/15/17 (h) | | 1,572 | | 1,681 |
Reynolds Group Issuer, Inc./Reynolds Group Issuer LLC/Reynolds Group Issuer (Luxembourg) SA: | | | | |
6.875% 2/15/21 (h) | | 1,485 | | 1,370 |
8.25% 2/15/21 (h) | | 1,485 | | 1,218 |
Corporate Bonds - continued |
| Principal Amount (000s) | | Value (000s) |
Nonconvertible Bonds - continued |
FINANCIALS |
Diversified Financial Services |
Reynolds Group Issuer, Inc./Reynolds Group Issuer LLC/Reynolds Group Issuer (Luxembourg) 7.875% 8/15/19 (h) | | $ 1,285 | | $ 1,266 |
TECO Finance, Inc.: | | | | |
4% 3/15/16 | | 1,242 | | 1,329 |
5.15% 3/15/20 | | 1,894 | | 2,110 |
TransCapitalInvest Ltd. 5.67% 3/5/14 (h) | | 3,383 | | 3,547 |
Transportation Union LLC/Transportation Union Financing Corp. 11.375% 6/15/18 | | 3,930 | | 4,357 |
UPCB Finance III Ltd. 6.625% 7/1/20 (h) | | 5,000 | | 4,875 |
Wind Acquisition Holdings Finance SA 12.25% 7/15/17 pay-in-kind (h)(n) | | 6,948 | | 6,815 |
WM Finance Corp. 9.5% 6/15/16 (h) | | 515 | | 523 |
ZFS Finance USA Trust II 6.45% 12/15/65 (h)(n) | | 2,951 | | 2,892 |
ZFS Finance USA Trust IV 5.875% 5/9/62 (h)(n) | | 961 | | 904 |
| | 159,867 |
Insurance - 0.4% |
Aon Corp.: | | | | |
3.125% 5/27/16 | | 2,604 | | 2,606 |
3.5% 9/30/15 | | 2,415 | | 2,505 |
5% 9/30/20 | | 2,329 | | 2,503 |
6.25% 9/30/40 | | 1,570 | | 1,729 |
Assurant, Inc. 5.625% 2/15/14 | | 1,772 | | 1,881 |
Axis Capital Holdings Ltd. 5.75% 12/1/14 | | 329 | | 359 |
Great-West Life & Annuity Insurance Co. 7.153% 5/16/46 (h)(n) | | 1,381 | | 1,315 |
Hartford Financial Services Group, Inc. 5.375% 3/15/17 | | 265 | | 273 |
HUB International Holdings, Inc. 9% 12/15/14 (h) | | 3,710 | | 3,617 |
Liberty Mutual Group, Inc.: | | | | |
5% 6/1/21 (h) | | 5,635 | | 5,492 |
6.5% 3/15/35 (h) | | 551 | | 532 |
Marsh & McLennan Companies, Inc. 4.8% 7/15/21 | | 3,209 | | 3,272 |
MetLife, Inc.: | | | | |
2.375% 2/6/14 | | 1,319 | | 1,348 |
5% 6/15/15 | | 686 | | 757 |
5.875% 2/6/41 | | 1,540 | | 1,636 |
6.125% 12/1/11 | | 583 | | 591 |
6.75% 6/1/16 | | 3,874 | | 4,538 |
Corporate Bonds - continued |
| Principal Amount (000s) | | Value (000s) |
Nonconvertible Bonds - continued |
FINANCIALS - continued |
Insurance |
Metropolitan Life Global Funding I: | | | | |
5.125% 4/10/13 (h) | | $ 329 | | $ 348 |
5.125% 6/10/14 (h) | | 3,462 | | 3,776 |
Monumental Global Funding III 5.5% 4/22/13 (h) | | 2,041 | | 2,167 |
New York Life Insurance Co. 6.75% 11/15/39 (h) | | 2,164 | | 2,551 |
Northwestern Mutual Life Insurance Co. 6.063% 3/30/40 (h) | | 3,353 | | 3,677 |
Pacific Life Global Funding 5.15% 4/15/13 (h) | | 3,138 | | 3,309 |
Pacific Life Insurance Co. 9.25% 6/15/39 (h) | | 2,499 | | 3,299 |
Pacific LifeCorp 6% 2/10/20 (h) | | 4,423 | | 4,938 |
Prudential Financial, Inc.: | | | | |
3.875% 1/14/15 | | 2,500 | | 2,592 |
5.15% 1/15/13 | | 2,369 | | 2,481 |
7.375% 6/15/19 | | 1,880 | | 2,247 |
8.875% 6/15/38 (n) | | 1,751 | | 1,909 |
QBE Insurance Group Ltd. 5.647% 7/1/23 (h)(n) | | 437 | | 415 |
Symetra Financial Corp. 6.125% 4/1/16 (h) | | 4,684 | | 4,984 |
Unum Group: | | | | |
5.625% 9/15/20 | | 2,719 | | 2,966 |
7.125% 9/30/16 | | 803 | | 938 |
USI Holdings Corp. 4.1612% 11/15/14 (h)(n) | | 2,920 | | 2,613 |
| | 80,164 |
Real Estate Investment Trusts - 0.2% |
AvalonBay Communities, Inc.: | | | | |
4.95% 3/15/13 | | 216 | | 227 |
5.5% 1/15/12 | | 1,169 | | 1,188 |
BRE Properties, Inc. 5.5% 3/15/17 | | 903 | | 998 |
Camden Property Trust: | | | | |
5.375% 12/15/13 | | 2,150 | | 2,299 |
5.875% 11/30/12 | | 395 | | 413 |
Developers Diversified Realty Corp.: | | | | |
4.75% 4/15/18 | | 3,666 | | 3,479 |
5.375% 10/15/12 | | 2,926 | | 2,961 |
7.5% 4/1/17 | | 3,456 | | 3,842 |
Duke Realty LP: | | | | |
4.625% 5/15/13 | | 741 | | 768 |
5.875% 8/15/12 | | 71 | | 73 |
Corporate Bonds - continued |
| Principal Amount (000s) | | Value (000s) |
Nonconvertible Bonds - continued |
FINANCIALS |
Real Estate Investment Trusts |
Equity One, Inc.: | | | | |
5.375% 10/15/15 | | $ 672 | | $ 713 |
6% 9/15/17 | | 522 | | 544 |
6.25% 12/15/14 | | 924 | | 992 |
6.25% 1/15/17 | | 291 | | 313 |
Federal Realty Investment Trust: | | | | |
5.4% 12/1/13 | | 257 | | 274 |
5.9% 4/1/20 | | 1,287 | | 1,391 |
6% 7/15/12 | | 2,719 | | 2,811 |
6.2% 1/15/17 | | 365 | | 414 |
HRPT Properties Trust: | | | | |
5.75% 11/1/15 | | 1,241 | | 1,329 |
6.25% 6/15/17 | | 726 | | 796 |
6.65% 1/15/18 | | 490 | | 552 |
Omega Healthcare Investors, Inc.: | | | | |
6.75% 10/15/22 | | 1,885 | | 1,805 |
7% 1/15/16 | | 4,090 | | 4,182 |
Senior Housing Properties Trust 8.625% 1/15/12 | | 5,910 | | 6,042 |
Washington (REIT) 5.25% 1/15/14 | | 440 | | 470 |
| | 38,876 |
Real Estate Management & Development - 0.3% |
AMB Property LP 5.9% 8/15/13 | | 1,520 | | 1,575 |
Arden Realty LP 5.2% 9/1/11 | | 1,241 | | 1,241 |
BioMed Realty LP: | | | | |
3.85% 4/15/16 | | 5,000 | | 5,045 |
6.125% 4/15/20 | | 1,703 | | 1,839 |
Brandywine Operating Partnership LP: | | | | |
5.7% 5/1/17 | | 119 | | 125 |
5.75% 4/1/12 | | 1,747 | | 1,780 |
CB Richard Ellis Services, Inc. 6.625% 10/15/20 | | 900 | | 873 |
Digital Realty Trust LP: | | | | |
4.5% 7/15/15 | | 2,465 | | 2,553 |
5.25% 3/15/21 | | 2,876 | | 2,877 |
Duke Realty LP: | | | | |
5.4% 8/15/14 | | 596 | | 630 |
5.5% 3/1/16 | | 2,930 | | 3,107 |
6.75% 3/15/20 | | 517 | | 554 |
8.25% 8/15/19 | | 1,710 | | 2,011 |
Corporate Bonds - continued |
| Principal Amount (000s) | | Value (000s) |
Nonconvertible Bonds - continued |
FINANCIALS - continued |
Real Estate Management & Development |
ERP Operating LP: | | | | |
4.75% 7/15/20 | | $ 3,638 | | $ 3,769 |
5.5% 10/1/12 | | 279 | | 291 |
5.75% 6/15/17 | | 1,446 | | 1,634 |
Liberty Property LP: | | | | |
4.75% 10/1/20 | | 5,547 | | 5,655 |
5.125% 3/2/15 | | 951 | | 1,043 |
5.5% 12/15/16 | | 1,396 | | 1,549 |
Mack-Cali Realty LP 7.75% 8/15/19 | | 957 | | 1,193 |
Post Apartment Homes LP 6.3% 6/1/13 | | 2,240 | | 2,394 |
Realogy Corp. 11.5% 4/15/17 | | 4,960 | | 3,968 |
Regency Centers LP: | | | | |
4.95% 4/15/14 | | 360 | | 383 |
5.25% 8/1/15 | | 1,257 | | 1,360 |
5.875% 6/15/17 | | 639 | | 726 |
Simon Property Group LP: | | | | |
4.2% 2/1/15 | | 1,785 | | 1,903 |
6.75% 5/15/14 | | 4,302 | | 4,883 |
Tanger Properties LP: | | | | |
6.125% 6/1/20 | | 4,914 | | 5,547 |
6.15% 11/15/15 | | 873 | | 984 |
Ventas Realty LP Series 1, 6.5% 6/1/16 | | 660 | | 680 |
| | 62,172 |
Thrifts & Mortgage Finance - 0.1% |
Bank of America Corp.: | | | | |
3.75% 7/12/16 | | 5,900 | | 5,821 |
5.65% 5/1/18 | | 3,745 | | 3,818 |
7.375% 5/15/14 | | 26 | | 28 |
First Niagara Financial Group, Inc. 6.75% 3/19/20 | | 4,160 | | 4,619 |
| | 14,286 |
TOTAL FINANCIALS | | 692,208 |
HEALTH CARE - 0.7% |
Biotechnology - 0.0% |
Celgene Corp. 2.45% 10/15/15 | | 838 | | 852 |
Corporate Bonds - continued |
| Principal Amount (000s) | | Value (000s) |
Nonconvertible Bonds - continued |
HEALTH CARE |
Health Care Equipment & Supplies - 0.0% |
Aviv Healthcare Properties LP/Aviv Healthcare Capital Corp. 7.75% 2/15/19 | | $ 1,235 | | $ 1,189 |
Teleflex, Inc. 6.875% 6/1/19 | | 1,665 | | 1,653 |
| | 2,842 |
Health Care Providers & Services - 0.6% |
Coventry Health Care, Inc.: | | | | |
5.95% 3/15/17 | | 1,030 | | 1,160 |
6.3% 8/15/14 | | 2,132 | | 2,356 |
DaVita, Inc.: | | | | |
6.375% 11/1/18 | | 1,795 | | 1,750 |
6.625% 11/1/20 | | 1,555 | | 1,512 |
Express Scripts, Inc.: | | | | |
3.125% 5/15/16 | | 4,847 | | 4,955 |
6.25% 6/15/14 | | 1,491 | | 1,660 |
HCA Holdings, Inc. 7.75% 5/15/21 (h) | | 22,640 | | 21,734 |
HCA, Inc.: | | | | |
6.5% 2/15/20 | | 10,450 | | 10,502 |
7.5% 2/15/22 | | 3,250 | | 3,218 |
7.875% 2/15/20 | | 4,825 | | 5,115 |
9.875% 2/15/17 | | 551 | | 603 |
IASIS Healthcare LLC/IASIS Capital Corp. 8.375% 5/15/19 (h) | | 4,465 | | 3,918 |
Medco Health Solutions, Inc.: | | | | |
2.75% 9/15/15 | | 1,608 | | 1,644 |
4.125% 9/15/20 | | 3,728 | | 3,736 |
Multiplan, Inc. 9.875% 9/1/18 (h) | | 3,385 | | 3,427 |
Rotech Healthcare, Inc. 10.5% 3/15/18 | | 960 | | 854 |
Sabra Health Care LP/Sabra Capital Corp. 8.125% 11/1/18 | | 655 | | 626 |
Surgical Care Affiliates LLC 8.875% 7/15/15 pay-in-kind (h)(n) | | 4,790 | | 4,790 |
Tenet Healthcare Corp.: | | | | |
8.875% 7/1/19 | | 4,610 | | 4,933 |
9% 5/1/15 | | 1,002 | | 1,055 |
9.875% 7/1/14 | | 4,690 | | 4,913 |
10% 5/1/18 | | 5,002 | | 5,452 |
United Surgical Partners International, Inc. 8.875% 5/1/17 | | 10,745 | | 10,879 |
Corporate Bonds - continued |
| Principal Amount (000s) | | Value (000s) |
Nonconvertible Bonds - continued |
HEALTH CARE - continued |
Health Care Providers & Services |
Vanguard Health Holding Co. II LLC / Vanguard Holding Co. II, Inc. 7.75% 2/1/19 | | $ 1,495 | | $ 1,409 |
Vanguard Health Systems, Inc. 0% 2/1/16 | | 97 | | 63 |
| | 102,264 |
Pharmaceuticals - 0.1% |
Giant Funding Corp. 8.25% 2/1/18 (h) | | 1,900 | | 1,919 |
Valeant Pharmaceuticals International: | | | | |
6.5% 7/15/16 (h) | | 3,695 | | 3,455 |
6.75% 8/15/21 (h) | | 4,585 | | 4,081 |
7% 10/1/20 (h) | | 1,775 | | 1,633 |
7.25% 7/15/22 (h) | | 5,480 | | 4,932 |
Watson Pharmaceuticals, Inc. 5% 8/15/14 | | 984 | | 1,075 |
| | 17,095 |
TOTAL HEALTH CARE | | 123,053 |
INDUSTRIALS - 0.6% |
Aerospace & Defense - 0.0% |
BAE Systems Holdings, Inc.: | | | | |
4.95% 6/1/14 (h) | | 781 | | 844 |
6.375% 6/1/19 (h) | | 3,650 | | 4,273 |
6.4% 12/15/11 (h) | | 482 | | 490 |
Huntington Ingalls Industries, Inc. 6.875% 3/15/18 (h) | | 480 | | 449 |
| | 6,056 |
Airlines - 0.1% |
Continental Airlines, Inc.: | | | | |
pass-thru trust certificates: | | | | |
8.388% 5/1/22 | | 66 | | 64 |
9.798% 4/1/21 | | 5,502 | | 5,695 |
6.648% 3/15/19 | | 2,415 | | 2,499 |
6.9% 7/2/19 | | 701 | | 729 |
7.339% 4/19/14 | | 1,350 | | 1,317 |
Delta Air Lines, Inc. 9.5% 9/15/14 (h) | | 872 | | 889 |
Delta Air Lines, Inc. pass-thru trust certificates 7.779% 1/2/12 | | 35 | | 35 |
U.S. Airways pass-thru trust certificates: | | | | |
6.85% 7/30/19 | | 1,416 | | 1,388 |
Corporate Bonds - continued |
| Principal Amount (000s) | | Value (000s) |
Nonconvertible Bonds - continued |
INDUSTRIALS |
Airlines |
U.S. Airways pass-thru trust certificates: - continued | | | | |
8.36% 1/20/19 | | $ 1,071 | | $ 1,071 |
United Air Lines, Inc. 9.875% 8/1/13 (h) | | 999 | | 1,024 |
| | 14,711 |
Building Products - 0.0% |
Building Materials Corp. of America 6.75% 5/1/21 (h) | | 1,310 | | 1,271 |
Commercial Services & Supplies - 0.3% |
ADS Tactical, Inc. 11% 4/1/18 (h) | | 630 | | 624 |
ARAMARK Holdings Corp. 8.625% 5/1/16 pay-in-kind (h)(n) | | 2,045 | | 2,045 |
Casella Waste Systems, Inc. 11% 7/15/14 | | 1,015 | | 1,127 |
Cenveo Corp. 10.5% 8/15/16 (h) | | 2,590 | | 2,253 |
Covanta Holding Corp. 7.25% 12/1/20 | | 1,920 | | 1,954 |
International Lease Finance Corp.: | | | | |
5.625% 9/20/13 | | 5,290 | | 5,111 |
5.65% 6/1/14 | | 4,439 | | 4,212 |
5.75% 5/15/16 | | 1,840 | | 1,693 |
5.875% 5/1/13 | | 3,460 | | 3,356 |
6.25% 5/15/19 | | 3,035 | | 2,744 |
6.625% 11/15/13 | | 8,252 | | 8,046 |
7.125% 9/1/18 (h) | | 7,560 | | 7,673 |
8.25% 12/15/20 | | 3,190 | | 3,246 |
8.625% 9/15/15 | | 4,640 | | 4,756 |
WP Rocket Merger Sub, Inc. 10.125% 7/15/19 (h) | | 1,200 | | 1,188 |
| | 50,028 |
Industrial Conglomerates - 0.1% |
General Electric Co. 5.25% 12/6/17 | | 7,378 | | 8,266 |
Sequa Corp.: | | | | |
11.75% 12/1/15 (h) | | 2,355 | | 2,461 |
13.5% 12/1/15 pay-in-kind (h) | | 774 | | 823 |
| | 11,550 |
Machinery - 0.0% |
Briggs & Stratton Corp. 6.875% 12/15/20 | | 920 | | 911 |
Navistar International Corp. 8.25% 11/1/21 | | 1,735 | | 1,752 |
| | 2,663 |
Corporate Bonds - continued |
| Principal Amount (000s) | | Value (000s) |
Nonconvertible Bonds - continued |
INDUSTRIALS - continued |
Marine - 0.0% |
Navios Maritime Acquisition Corp./Navios Acquisition Finance US, Inc. 8.625% 11/1/17 | | $ 1,035 | | $ 864 |
Navios Maritime Holdings, Inc.: | | | | |
8.125% 2/15/19 (h) | | 1,625 | | 1,316 |
8.875% 11/1/17 | | 1,420 | | 1,306 |
Navios South American Logisitcs, Inc./Navios Logistics Finance U.S., Inc. 9.25% 4/15/19 (h) | | 505 | | 439 |
| | 3,925 |
Professional Services - 0.0% |
CDRT Merger Sub, Inc. 8.125% 6/1/19 (h) | | 2,305 | | 2,167 |
Road & Rail - 0.0% |
Swift Services Holdings, Inc. 10% 11/15/18 | | 2,640 | | 2,640 |
Western Express, Inc. 12.5% 4/15/15 (h) | | 3,725 | | 2,850 |
| | 5,490 |
Trading Companies & Distributors - 0.1% |
Aircastle Ltd. 9.75% 8/1/18 | | 790 | | 820 |
VWR Funding, Inc. 10.25% 7/15/15 pay-in-kind (n) | | 6,686 | | 6,686 |
| | 7,506 |
TOTAL INDUSTRIALS | | 105,367 |
INFORMATION TECHNOLOGY - 0.5% |
Communications Equipment - 0.2% |
Avaya, Inc.: | | | | |
7% 4/1/19 (h) | | 5,405 | | 4,783 |
10.125% 11/1/15 pay-in-kind (n) | | 6,798 | | 5,948 |
EH Holding Corp. 6.5% 6/15/19 (h) | | 7,595 | | 7,595 |
Lucent Technologies, Inc.: | | | | |
6.45% 3/15/29 | | 16,805 | | 14,452 |
6.5% 1/15/28 | | 1,110 | | 955 |
| | 33,733 |
Computers & Peripherals - 0.0% |
CDW Escrow Corp. 8.5% 4/1/19 (h) | | 2,015 | | 1,854 |
Electronic Equipment & Components - 0.1% |
Reddy Ice Corp. 11.25% 3/15/15 | | 3,895 | | 3,525 |
Tyco Electronics Group SA: | | | | |
5.95% 1/15/14 | | 2,947 | | 3,220 |
Corporate Bonds - continued |
| Principal Amount (000s) | | Value (000s) |
Nonconvertible Bonds - continued |
INFORMATION TECHNOLOGY |
Electronic Equipment & Components |
Tyco Electronics Group SA: | | | | |
6% 10/1/12 | | $ 3,594 | | $ 3,796 |
6.55% 10/1/17 | | 815 | | 970 |
| | 11,511 |
IT Services - 0.1% |
Audatex North America, Inc. 6.75% 6/15/18 (h) | | 1,565 | | 1,549 |
Ceridian Corp. 11.25% 11/15/15 | | 2,730 | | 2,532 |
First Data Corp. 7.375% 6/15/19 (h) | | 6,880 | | 6,502 |
SunGard Data Systems, Inc. 4.875% 1/15/14 | | 12,355 | | 12,201 |
Telcordia Technologies, Inc. 11% 5/1/18 (h) | | 1,665 | | 2,048 |
| | 24,832 |
Office Electronics - 0.0% |
Xerox Corp.: | | | | |
4.25% 2/15/15 | | 503 | | 541 |
5.5% 5/15/12 | | 1,485 | | 1,533 |
| | 2,074 |
Semiconductors & Semiconductor Equipment - 0.1% |
Freescale Semiconductor, Inc.: | | | | |
8.05% 2/1/20 | | 4,005 | | 3,805 |
9.25% 4/15/18 (h) | | 4,030 | | 4,161 |
10.125% 12/15/16 | | 7,080 | | 7,346 |
10.125% 3/15/18 (h) | | 6,887 | | 7,472 |
NXP BV/NXP Funding LLC: | | | | |
2.9993% 10/15/13 (n) | | 621 | | 602 |
9.75% 8/1/18 (h) | | 1,480 | | 1,569 |
Spansion LLC: | | | | |
7.875% 11/15/17 (h) | | 1,150 | | 1,173 |
11.25% 1/15/16 (d)(h) | | 905 | | 143 |
Viasystems, Inc. 12% 1/15/15 (h) | | 2,225 | | 2,439 |
| | 28,710 |
TOTAL INFORMATION TECHNOLOGY | | 102,714 |
MATERIALS - 0.4% |
Chemicals - 0.1% |
Dow Chemical Co.: | | | | |
4.85% 8/15/12 | | 3,205 | | 3,323 |
Corporate Bonds - continued |
| Principal Amount (000s) | | Value (000s) |
Nonconvertible Bonds - continued |
MATERIALS - continued |
Chemicals |
Dow Chemical Co.: | | | | |
7.6% 5/15/14 | | $ 7,168 | | $ 8,261 |
Kinove German Bondco GmbH 9.625% 6/15/18 (h) | | 840 | | 806 |
Lyondell Chemical Co. 11% 5/1/18 | | 675 | | 753 |
| | 13,143 |
Construction Materials - 0.0% |
CRH America, Inc. 6% 9/30/16 | | 1,699 | | 1,877 |
Containers & Packaging - 0.0% |
ARD Finance SA 11.125% 6/1/18 pay-in-kind (h) | | 1,640 | | 1,410 |
Crown Americas LLC/Crown Americas Capital Corp. III 6.25% 2/1/21 (h) | | 2,040 | | 2,091 |
Owens-Illinois, Inc. 7.8% 5/15/18 | | 350 | | 368 |
Pretium Packaging LLC/Pretium Finance, Inc. 11.5% 4/1/16 (h) | | 2,340 | | 2,305 |
Sappi Papier Holding AG 6.625% 4/15/21 (h) | | 375 | | 330 |
| | 6,504 |
Metals & Mining - 0.2% |
Anglo American Capital PLC 9.375% 4/8/14 (h) | | 1,181 | | 1,396 |
Aperam: | | | | |
7.375% 4/1/16 (h) | | 460 | | 432 |
7.75% 4/1/18 (h) | | 375 | | 349 |
ArcelorMittal SA 3.75% 3/1/16 | | 1,466 | | 1,450 |
BHP Billiton Financial (USA) Ltd. 5.125% 3/29/12 | | 1,164 | | 1,195 |
Boart Longyear Management Pty Ltd. 7% 4/1/21 (h) | | 830 | | 822 |
Calcipar SA 6.875% 5/1/18 (h) | | 720 | | 682 |
Corporacion Nacional del Cobre (Codelco) 6.375% 11/30/12 (h) | | 1,179 | | 1,252 |
Edgen Murray Corp. 12.25% 1/15/15 | | 7,385 | | 6,942 |
FMG Resources (August 2006) Pty Ltd. 6.375% 2/1/16 (h) | | 8,300 | | 8,155 |
JMC Steel Group, Inc. 8.25% 3/15/18 (h) | | 1,055 | | 997 |
McJunkin Red Man Corp. 9.5% 12/15/16 | | 5,695 | | 5,723 |
Rain CII Carbon LLC/CII Carbon Corp. 8% 12/1/18 (h) | | 1,335 | | 1,342 |
Severstal Columbus LLC 10.25% 2/15/18 | | 4,670 | | 4,833 |
SunCoke Energy, Inc. 7.625% 8/1/19 (h) | | 445 | | 436 |
United States Steel Corp. 6.65% 6/1/37 | | 3,441 | | 2,796 |
Vale Overseas Ltd. 6.25% 1/23/17 | | 2,152 | | 2,441 |
| | 41,243 |
Corporate Bonds - continued |
| Principal Amount (000s) | | Value (000s) |
Nonconvertible Bonds - continued |
MATERIALS |
Paper & Forest Products - 0.1% |
ABI Escrow Corp. 10.25% 10/15/18 (h) | | $ 6,057 | | $ 6,360 |
Clearwater Paper Corp. 7.125% 11/1/18 | | 485 | | 487 |
Mercer International, Inc. 9.5% 12/1/17 | | 1,195 | | 1,189 |
Verso Paper Holdings LLC/Verso Paper, Inc. 4.004% 8/1/14 (n) | | 1,015 | | 817 |
| | 8,853 |
TOTAL MATERIALS | | 71,620 |
TELECOMMUNICATION SERVICES - 1.1% |
Diversified Telecommunication Services - 0.6% |
AT&T, Inc.: | | | | |
2.5% 8/15/15 | | 5,016 | | 5,136 |
6.3% 1/15/38 | | 5,000 | | 5,579 |
6.8% 5/15/36 | | 8,428 | | 9,878 |
BellSouth Capital Funding Corp. 7.875% 2/15/30 | | 1,291 | | 1,671 |
CenturyLink, Inc.: | | | | |
6.15% 9/15/19 | | 2,344 | | 2,310 |
6.45% 6/15/21 | | 6,195 | | 6,026 |
7.6% 9/15/39 | | 1,148 | | 1,056 |
Clearwire Communications LLC/Clearwire Finance, Inc. 12% 12/1/15 (h) | | 14,900 | | 14,081 |
Embarq Corp. 7.995% 6/1/36 | | 2,180 | | 2,068 |
Frontier Communications Corp. 8.25% 4/15/17 | | 2,710 | | 2,805 |
Intelsat Ltd. 11.25% 6/15/16 | | 3,590 | | 3,734 |
Level 3 Escrow, Inc. 8.125% 7/1/19 (h) | | 2,575 | | 2,433 |
Sprint Capital Corp.: | | | | |
6.875% 11/15/28 | | 21,910 | | 19,609 |
6.9% 5/1/19 | | 14,150 | | 13,938 |
8.375% 3/15/12 | | 2,330 | | 2,400 |
Telefonica Emisiones SAU: | | | | |
5.134% 4/27/20 | | 713 | | 677 |
5.462% 2/16/21 | | 3,562 | | 3,441 |
6.421% 6/20/16 | | 684 | | 718 |
Verizon Communications, Inc.: | | | | |
6.1% 4/15/18 | | 1,909 | | 2,269 |
6.25% 4/1/37 | | 3,729 | | 4,225 |
Verizon New York, Inc. 6.875% 4/1/12 | | 2,460 | | 2,543 |
Corporate Bonds - continued |
| Principal Amount (000s) | | Value (000s) |
Nonconvertible Bonds - continued |
TELECOMMUNICATION SERVICES - continued |
Diversified Telecommunication Services |
Wind Acquisition Finance SA: | | | | |
7.25% 2/15/18 (h) | | $ 1,860 | | $ 1,744 |
11.75% 7/15/17 (h) | | 6,720 | | 6,938 |
Windstream Corp. 7.5% 4/1/23 | | 3,750 | | 3,628 |
| | 118,907 |
Wireless Telecommunication Services - 0.5% |
America Movil SAB de CV: | | | | |
2.375% 9/8/16 (j) | | 3,922 | | 3,890 |
3.625% 3/30/15 | | 999 | | 1,061 |
Clearwire Escrow Corp. 12% 12/1/15 (h) | | 4,000 | | 3,760 |
Crown Castle International Corp. 9% 1/15/15 | | 2,955 | | 3,132 |
Digicel Group Ltd.: | | | | |
8.875% 1/15/15 (h) | | 6,915 | | 6,880 |
12% 4/1/14 (h) | | 3,990 | | 4,429 |
DIRECTV Holdings LLC/DIRECTV Financing, Inc.: | | | | |
4.75% 10/1/14 | | 6,306 | | 6,934 |
5.875% 10/1/19 | | 6,223 | | 7,166 |
6.35% 3/15/40 | | 1,699 | | 1,858 |
Intelsat Jackson Holdings SA: | | | | |
7.25% 4/1/19 (h) | | 10,040 | | 9,588 |
7.5% 4/1/21 (h) | | 5,500 | | 5,253 |
9.5% 6/15/16 | | 4,745 | | 4,935 |
Nextel Communications, Inc.: | | | | |
5.95% 3/15/14 | | 830 | | 813 |
6.875% 10/31/13 | | 4,380 | | 4,353 |
7.375% 8/1/15 | | 11,630 | | 11,441 |
NII Capital Corp. 7.625% 4/1/21 | | 4,760 | | 4,879 |
Vodafone Group PLC 5% 12/16/13 | | 2,129 | | 2,308 |
| | 82,680 |
TOTAL TELECOMMUNICATION SERVICES | | 201,587 |
UTILITIES - 1.0% |
Electric Utilities - 0.5% |
Ameren Illinois Co. 6.125% 11/15/17 | | 243 | | 287 |
AmerenUE 6.4% 6/15/17 | | 2,769 | | 3,311 |
Cleveland Electric Illuminating Co. 5.65% 12/15/13 | | 3,812 | | 4,155 |
Commonwealth Edison Co. 1.625% 1/15/14 | | 3,030 | | 3,058 |
Corporate Bonds - continued |
| Principal Amount (000s) | | Value (000s) |
Nonconvertible Bonds - continued |
UTILITIES |
Electric Utilities |
Duquesne Light Holdings, Inc.: | | | | |
5.9% 12/1/21 (h) | | $ 3,820 | | $ 3,868 |
6.4% 9/15/20 (h) | | 7,663 | | 8,017 |
Edison International 3.75% 9/15/17 | | 3,169 | | 3,287 |
Edison Mission Energy 7% 5/15/17 | | 510 | | 357 |
EDP Finance BV: | | | | |
4.9% 10/1/19 (h) | | 1,300 | | 1,030 |
6% 2/2/18 (h) | | 2,212 | | 1,853 |
Enel Finance International SA 5.7% 1/15/13 (h) | | 282 | | 291 |
FirstEnergy Corp. 7.375% 11/15/31 | | 6,718 | | 7,794 |
FirstEnergy Solutions Corp.: | | | | |
4.8% 2/15/15 | | 1,266 | | 1,380 |
6.05% 8/15/21 | | 4,459 | | 4,882 |
Intergen NV 9% 6/30/17 (h) | | 7,015 | | 7,278 |
IPALCO Enterprises, Inc. 7.25% 4/1/16 (h) | | 3,670 | | 3,931 |
LG&E and KU Energy LLC: | | | | |
2.125% 11/15/15 | | 3,576 | | 3,542 |
3.75% 11/15/20 | | 704 | | 697 |
Mirant Americas Generation LLC 8.5% 10/1/21 | | 6,695 | | 6,327 |
Nevada Power Co.: | | | | |
6.5% 5/15/18 | | 5,100 | | 6,111 |
6.5% 8/1/18 | | 531 | | 639 |
North American Energy Alliance LLC/North American Energy Alliance Finance Corp. 10.875% 6/1/16 (h) | | 3,645 | | 3,882 |
Pennsylvania Electric Co. 6.05% 9/1/17 | | 450 | | 515 |
Pepco Holdings, Inc. 2.7% 10/1/15 | | 3,363 | | 3,439 |
Progress Energy, Inc. 6% 12/1/39 | | 3,060 | | 3,447 |
Sierra Pacific Power Co. 5.45% 9/1/13 | | 527 | | 570 |
| | 83,948 |
Gas Utilities - 0.0% |
Southern Natural Gas Co. 5.9% 4/1/17 (h) | | 260 | | 299 |
Southern Natural Gas Co. / Southern Natural Issuing Corp. 4.4% 6/15/21 (h) | | 1,660 | | 1,729 |
Star Gas Partners LP/Star Gas Finance Co. 8.875% 12/1/17 | | 950 | | 964 |
| | 2,992 |
Independent Power Producers & Energy Traders - 0.3% |
Calpine Corp. 7.875% 1/15/23 (h) | | 12,985 | | 13,017 |
Corporate Bonds - continued |
| Principal Amount (000s) | | Value (000s) |
Nonconvertible Bonds - continued |
UTILITIES - continued |
Independent Power Producers & Energy Traders - continued |
Duke Capital LLC 5.668% 8/15/14 | | $ 1,905 | | $ 2,117 |
Energy Future Holdings Corp. 10% 1/15/20 | | 8,915 | | 8,937 |
Energy Future Intermediate Holding Co. LLC/Energy Future Intermediate Holding Finance, Inc.: | | | | |
10% 12/1/20 | | 3,174 | | 3,174 |
11% 10/1/21 (h) | | 6,978 | | 6,490 |
Exelon Generation Co. LLC: | | | | |
4% 10/1/20 | | 6,689 | | 6,646 |
5.35% 1/15/14 | | 900 | | 971 |
GenOn Energy, Inc. 9.875% 10/15/20 | | 2,325 | | 2,284 |
The AES Corp.: | | | | |
7.375% 7/1/21 (h) | | 1,580 | | 1,596 |
7.75% 10/15/15 | | 4,660 | | 4,881 |
TXU Corp.: | | | | |
6.5% 11/15/24 | | 3,915 | | 1,527 |
6.55% 11/15/34 | | 2,965 | | 1,127 |
| | 52,767 |
Multi-Utilities - 0.2% |
Consolidated Edison Co. of New York, Inc. 5.7% 6/15/40 | | 1,866 | | 2,144 |
Dominion Resources, Inc.: | | | | |
6.3% 9/30/66 (n) | | 13,469 | | 12,863 |
7.5% 6/30/66 (n) | | 1,102 | | 1,130 |
MidAmerican Energy Holdings, Co.: | | | | |
5.875% 10/1/12 | | 2,521 | | 2,655 |
6.5% 9/15/37 | | 1,418 | | 1,703 |
National Grid PLC 6.3% 8/1/16 | | 376 | | 438 |
NiSource Finance Corp.: | | | | |
5.25% 9/15/17 | | 497 | | 556 |
5.4% 7/15/14 | | 1,249 | | 1,372 |
5.45% 9/15/20 | | 598 | | 671 |
5.95% 6/15/41 | | 5,667 | | 5,781 |
6.25% 12/15/40 | | 1,190 | | 1,309 |
6.4% 3/15/18 | | 1,230 | | 1,446 |
6.8% 1/15/19 | | 2,710 | | 3,240 |
Corporate Bonds - continued |
| Principal Amount (000s) | | Value (000s) |
Nonconvertible Bonds - continued |
UTILITIES |
Multi-Utilities |
San Diego Gas & Electric Co. 3% 8/15/21 | | $ 1,493 | | $ 1,486 |
Wisconsin Energy Corp. 6.25% 5/15/67 (n) | | 2,776 | | 2,748 |
| | 39,542 |
TOTAL UTILITIES | | 179,249 |
TOTAL NONCONVERTIBLE BONDS | | 2,014,382 |
TOTAL CORPORATE BONDS (Cost $1,946,822) | 2,046,762 |
U.S. Government and Government Agency Obligations - 10.2% |
|
U.S. Government Agency Obligations - 0.1% |
Tennessee Valley Authority 3.875% 2/15/21 | | 28,100 | | 30,968 |
U.S. Treasury Inflation Protected Obligations - 0.8% |
U.S. Treasury Inflation-Indexed Bonds: | | | | |
2.125% 2/15/40 | | 56,198 | | 69,000 |
2.125% 2/15/41 | | 64,537 | | 79,743 |
TOTAL U.S. TREASURY INFLATION PROTECTED OBLIGATIONS | | 148,743 |
U.S. Treasury Obligations - 9.3% |
U.S. Treasury Bonds 4.375% 5/15/41 | | 135,976 | | 155,225 |
U.S. Treasury Notes: | | | | |
0.5% 8/15/14 | | 71,220 | | 71,587 |
0.625% 7/15/14 | | 607,323 | | 612,718 |
0.75% 6/15/14 | | 94,959 | | 96,153 |
1% 10/31/11 | | 120,000 | | 120,187 |
1% 8/31/16 | | 8,529 | | 8,543 |
1.5% 7/31/16 | | 33,794 | | 34,710 |
1.5% 8/31/18 | | 20,273 | | 20,178 |
2.125% 8/15/21 (f) | | 84,560 | | 83,728 |
U.S. Government and Government Agency Obligations - continued |
| Principal Amount (000s) | | Value (000s) |
U.S. Treasury Obligations - continued |
U.S. Treasury Notes: - continued | | | | |
3.125% 4/30/17 | | $ 177,840 | | $ 196,805 |
3.125% 5/15/21 (l) | | 303,631 | | 328,395 |
TOTAL U.S. TREASURY OBLIGATIONS | | 1,728,229 |
TOTAL U.S. GOVERNMENT AND GOVERNMENT AGENCY OBLIGATIONS (Cost $1,828,067) | 1,907,940 |
U.S. Government Agency - Mortgage Securities - 8.1% |
|
Fannie Mae - 6.3% |
2.303% 6/1/36 (n) | | 151 | | 157 |
2.636% 7/1/37 (n) | | 492 | | 520 |
3% 10/1/26 (j) | | 11,000 | | 11,257 |
3.5% 11/1/25 to 1/1/41 | | 55,033 | | 55,978 |
4% 4/1/24 to 8/1/41 | | 96,931 | | 100,587 |
4% 9/1/41 (j)(k) | | 30,000 | | 31,091 |
4% 9/1/41 (j)(k) | | 167,000 | | 173,076 |
4% 9/1/41 (j)(k) | | 16,000 | | 16,582 |
4% 9/1/41 (j)(k) | | 47,000 | | 48,710 |
4% 9/1/41 (j)(k) | | 109,000 | | 112,966 |
4.5% 6/1/24 to 9/1/41 (k) | | 141,600 | | 150,276 |
4.5% 9/1/26 (j)(k) | | 1,500 | | 1,599 |
4.5% 9/1/41 (j)(k) | | 9,000 | | 9,515 |
4.5% 9/1/41 (j)(k) | | 24,000 | | 25,372 |
4.5% 9/1/41 (j)(k) | | 47,000 | | 49,688 |
4.5% 9/1/41 (j)(k) | | 16,200 | | 17,126 |
4.5% 9/1/41 (j)(k) | | 19,000 | | 20,087 |
4.5% 9/1/41 (j)(k) | | 13,000 | | 13,743 |
4.5% 9/1/41 (j)(k) | | 4,000 | | 4,229 |
4.5% 9/1/41 (j)(k) | | 9,040 | | 9,557 |
5% 6/1/24 to 8/1/40 (k) | | 74,208 | | 80,168 |
5% 9/1/41 (j) | | 15,000 | | 16,155 |
5.5% 6/1/33 to 3/1/40 (j) | | 64,392 | | 70,690 |
5.5% 9/1/41 (j)(k) | | 4,200 | | 4,591 |
5.5% 9/1/41 (j)(k) | | 4,000 | | 4,372 |
5.5% 9/1/41 (j)(k) | | 25,000 | | 27,325 |
5.5% 9/1/41 (j)(k) | | 25,000 | | 27,325 |
5.5% 9/1/41 (j)(k) | | 4,000 | | 4,372 |
U.S. Government Agency - Mortgage Securities - continued |
| Principal Amount (000s) | | Value (000s) |
Fannie Mae - continued |
5.5% 9/1/41 (j)(k) | | $ 4,200 | | $ 4,591 |
5.5% 9/1/41 (j)(k) | | 2,000 | | 2,186 |
5.5% 9/1/41 (j)(k) | | 6,000 | | 6,558 |
6% 6/1/35 to 9/1/39 | | 66,482 | | 73,725 |
6% 9/1/41 (j) | | 3,800 | | 4,207 |
6% 9/1/41 (j) | | 2,000 | | 2,214 |
TOTAL FANNIE MAE | | 1,180,595 |
Freddie Mac - 1.0% |
3.261% 10/1/35 (n) | | 228 | | 243 |
4% 9/1/41 (j) | | 2,000 | | 2,071 |
4.5% 5/1/39 to 8/1/41 (j) | | 41,912 | | 44,320 |
4.5% 9/1/41 (j) | | 8,000 | | 8,441 |
4.5% 9/1/41 (j)(k) | | 14,300 | | 15,089 |
4.5% 9/1/41 (j)(k) | | 5,000 | | 5,276 |
5% 3/1/19 to 12/1/40 | | 34,834 | | 37,615 |
5.5% 5/1/27 to 2/1/40 | | 53,075 | | 57,924 |
5.5% 9/1/41 (j) | | 4,700 | | 5,126 |
5.5% 9/1/41 (j) | | 5,600 | | 6,108 |
6% 7/1/37 to 8/1/37 | | 1,395 | | 1,549 |
6.5% 3/1/36 | | 3,970 | | 4,476 |
TOTAL FREDDIE MAC | | 188,238 |
Ginnie Mae - 0.8% |
3.5% 1/15/41 to 2/15/41 | | 10,581 | | 10,842 |
4% 1/15/25 to 7/15/41 | | 16,269 | | 17,361 |
4% 9/1/41 (j) | | 16,000 | | 16,932 |
4.5% 3/15/39 to 7/20/41 | | 34,056 | | 36,947 |
4.5% 9/1/41 (j) | | 6,550 | | 7,086 |
5% 4/15/38 to 9/15/40 | | 12,464 | | 13,787 |
5% 9/1/41 (j) | | 5,000 | | 5,508 |
5% 9/1/41 (j) | | 10,000 | | 11,017 |
5% 9/1/41 (j) | | 9,000 | | 9,915 |
5.5% 12/15/38 to 9/15/39 | | 2,249 | | 2,516 |
6% 2/15/34 | | 8,510 | | 9,618 |
TOTAL GINNIE MAE | | 141,529 |
TOTAL U.S. GOVERNMENT AGENCY - MORTGAGE SECURITIES (Cost $1,491,784) | 1,510,362 |
Asset-Backed Securities - 0.3% |
| Principal Amount (000s) | | Value (000s) |
Accredited Mortgage Loan Trust Series 2005-1 Class M1, 0.6884% 4/25/35 (n) | | $ 1,091 | | $ 722 |
ACE Securities Corp. Home Equity Loan Trust: | | | | |
Series 2004-HE1: | | | | |
Class M1, 0.9684% 3/25/34 (n) | | 5 | | 5 |
Class M2, 1.8684% 3/25/34 (n) | | 334 | | 251 |
Series 2005-HE2 Class M2, 0.6684% 4/25/35 (n) | | 106 | | 102 |
Series 2006-OP1 Class M4, 0.5884% 4/25/36 (n) | | 84 | | 0* |
Advanta Business Card Master Trust Series 2006-C1 Class C1, 0.6758% 10/20/14 (n) | | 472 | | 5 |
Ally Master Owner Trust: | | | | |
Series 2010-3 Class A, 2.88% 4/15/15 (h) | | 2,460 | | 2,530 |
Series 2011-1 Class A2, 2.15% 1/15/16 | | 4,540 | | 4,630 |
Series 2011-3 Class A2, 1.81% 5/15/16 | | 4,060 | | 4,105 |
AmeriCredit Prime Automobile Receivables Trust Series 2007-1 Class D, 5.62% 9/8/14 | | 539 | | 544 |
Ameriquest Mortgage Securities, Inc. pass-thru certificates: | | | | |
Series 2003-10 Class M1, 0.9184% 12/25/33 (n) | | 67 | | 52 |
Series 2004-R2 Class M3, 0.7684% 4/25/34 (n) | | 101 | | 34 |
Series 2005-R2 Class M1, 0.6684% 4/25/35 (n) | | 1,567 | | 1,366 |
Argent Securities, Inc. pass-thru certificates: | | | | |
Series 2003-W7 Class A2, 0.9673% 3/25/34 (n) | | 36 | | 24 |
Series 2004-W11 Class M2, 0.9184% 11/25/34 (n) | | 426 | | 352 |
Series 2004-W7 Class M1, 0.7684% 5/25/34 (n) | | 1,108 | | 801 |
Series 2006-W4 Class A2C, 0.3784% 5/25/36 (n) | | 1,027 | | 261 |
Asset Backed Securities Corp. Home Equity Loan Trust: | | | | |
Series 2004-HE2 Class M1, 1.0434% 4/25/34 (n) | | 2,011 | | 1,567 |
Series 2006-HE2 Class M1, 0.5884% 3/25/36 (n) | | 125 | | 1 |
Axon Financial Funding Ltd. 0.8458% 4/4/17 (d)(h)(n) | | 4,820 | | 0 |
Brazos Higher Education Authority, Inc. Series 2006-2 Class A9, 0.2565% 12/25/24 (n) | | 1,109 | | 968 |
C-BASS Trust Series 2006-CB7 Class A2, 0.2784% 10/25/36 (n) | | 10 | | 10 |
Capital Auto Receivables Asset Trust Series 2007-1 Class C, 5.38% 11/15/12 | | 403 | | 413 |
Capital Trust Ltd. Series 2004-1: | | | | |
Class A2, 0.663% 7/20/39 (h)(n) | | 215 | | 155 |
Class B, 0.963% 7/20/39 (h)(n) | | 200 | | 78 |
Class C, 1.313% 7/20/39 (h)(n) | | 258 | | 10 |
Carrington Mortgage Loan Trust: | | | | |
Series 2006-FRE1 Class M1, 0.5184% 7/25/36 (n) | | 4,366 | | 219 |
Series 2006-NC4 Class M1, 0.5184% 10/25/36 (n) | | 2,725 | | 38 |
Asset-Backed Securities - continued |
| Principal Amount (000s) | | Value (000s) |
Carrington Mortgage Loan Trust: - continued | | | | |
Series 2007-RFC1 Class A3, 0.3584% 12/25/36 (n) | | $ 1,368 | | $ 390 |
Citibank Credit Card Issuance Trust Series 2009-A5 Class A5, 2.25% 12/23/14 | | 9,250 | | 9,457 |
Citigroup Mortgage Loan Trust Series 2005-HE4 Class A2C, 0.4884% 10/25/35 (n) | | 1,194 | | 1,141 |
Countrywide Asset-Backed Certificates Trust: | | | | |
Series 2007-11 Class 2A1, 0.2784% 6/25/47 (n) | | 30 | | 29 |
Series 2007-4 Class A1A, 0.3073% 9/25/37 (n) | | 272 | | 259 |
Series 2007-5 Class 2A1, 0.3184% 9/25/47 (n) | | 2,794 | | 2,708 |
Countrywide Home Loan Trust Series 2006-13 Class N, 7% 8/25/37 (h) | | 251 | | 0 |
Countrywide Home Loans, Inc.: | | | | |
Series 2004-3 Class M4, 1.1884% 4/25/34 (n) | | 121 | | 60 |
Series 2004-4 Class M2, 1.0134% 6/25/34 (n) | | 446 | | 196 |
Series 2005-3 Class MV1, 0.6384% 8/25/35 (n) | | 433 | | 420 |
Series 2005-AB1 Class A2, 0.4284% 8/25/35 (n) | | 37 | | 36 |
CPS Auto Receivables Trust Series 2006-D Class A4, 5.115% 8/15/13 (FSA Insured) (h) | | 125 | | 125 |
Fannie Mae subordinate REMIC pass-thru certificates Series 2004-T5 Class AB3, 0.5908% 5/28/35 (n) | | 30 | | 19 |
Fieldstone Mortgage Investment Corp. Series 2004-3 Class M5, 2.3934% 8/25/34 (n) | | 221 | | 126 |
First Franklin Mortgage Loan Trust: | | | | |
Series 2004-FF2 Class M3, 1.0434% 3/25/34 (n) | | 17 | | 4 |
Series 2006-FF14 Class A2, 0.2784% 10/25/36 (n) | | 858 | | 820 |
Ford Credit Floorplan Master Owner Trust Series 2010-5 Class A1, 1.5% 9/15/15 | | 4,990 | | 5,031 |
Franklin Auto Trust: | | | | |
Series 2006-1 Class B, 5.14% 7/21/14 | | 12 | | 12 |
Series 2007-1: | | | | |
Class A4, 5.03% 2/16/15 | | 30 | | 30 |
Class C, 5.43% 2/16/15 | | 426 | | 426 |
Fremont Home Loan Trust: | | | | |
Series 2005-A: | | | | |
Class M3, 0.7084% 1/25/35 (n) | | 720 | | 285 |
Class M4, 0.8984% 1/25/35 (n) | | 276 | | 72 |
Series 2006-D Class M1, 0.4484% 11/25/36 (n) | | 119 | | 4 |
GCO Education Loan Funding Master Trust II Series 2007-1A Class C1L, 0.6918% 2/25/47 (h)(n) | | 2,160 | | 1,274 |
GCO Slims Trust Series 2006-1A, 5.72% 3/1/22 (h) | | 707 | | 563 |
GE Business Loan Trust: | | | | |
Series 2003-1 Class A, 0.6372% 4/15/31 (h)(n) | | 180 | | 169 |
Asset-Backed Securities - continued |
| Principal Amount (000s) | | Value (000s) |
GE Business Loan Trust: - continued | | | | |
Series 2006-2A: | | | | |
Class A, 0.3872% 11/15/34 (h)(n) | | $ 1,199 | | $ 992 |
Class B, 0.4872% 11/15/34 (h)(n) | | 434 | | 280 |
Class C, 0.5872% 11/15/34 (h)(n) | | 720 | | 356 |
Class D, 0.9572% 11/15/34 (h)(n) | | 274 | | 66 |
Goal Capital Funding Trust Series 2007-1 Class C1, 0.6465% 6/25/42 (n) | | 394 | | 307 |
GSAMP Trust: | | | | |
Series 2004-AR1 Class M1, 0.8684% 6/25/34 (n) | | 2,032 | | 1,255 |
Series 2007-HE1 Class M1, 0.4684% 3/25/47 (n) | | 820 | | 37 |
Guggenheim Structured Real Estate Funding Ltd. Series 2006-3: | | | | |
Class B, 0.6184% 9/25/46 (h)(n) | | 277 | | 119 |
Class C, 0.7684% 9/25/46 (h)(n) | | 1,159 | | 185 |
Home Equity Asset Trust: | | | | |
Series 2003-2 Class M1, 1.5384% 8/25/33 (n) | | 286 | | 199 |
Series 2003-3 Class M1, 1.5084% 8/25/33 (n) | | 550 | | 436 |
Series 2003-5 Class A2, 0.9184% 12/25/33 (n) | | 25 | | 17 |
Series 2005-5 Class 2A2, 0.4684% 11/25/35 (n) | | 36 | | 36 |
Series 2006-1 Class 2A3, 0.4434% 4/25/36 (n) | | 614 | | 598 |
HSBC Home Equity Loan Trust Series 2006-2 Class M2, 0.503% 3/20/36 (n) | | 497 | | 414 |
HSI Asset Securitization Corp. Trust Series 2007-HE1 Class 2A3, 0.4084% 1/25/37 (n) | | 1,137 | | 385 |
JPMorgan Mortgage Acquisition Trust: | | | | |
Series 2006-NC2 Class M2, 0.5184% 7/25/36 (n) | | 2,497 | | 111 |
Series 2007-CH1: | | | | |
Class AV4, 0.3484% 11/25/36 (n) | | 1,136 | | 897 |
Class MV1, 0.4484% 11/25/36 (n) | | 923 | | 591 |
Series 2007-CH3 Class M1, 0.5184% 3/25/37 (n) | | 397 | | 16 |
Keycorp Student Loan Trust: | | | | |
Series 1999-A Class A2, 0.5765% 12/27/29 (n) | | 506 | | 448 |
Series 2006-A Class 2C, 1.3965% 3/27/42 (n) | | 2,016 | | 502 |
Long Beach Auto Receivables Trust Series 2007-A Class A4, 5.025% 1/15/14 (FSA Insured) | | 669 | | 670 |
Long Beach Mortgage Loan Trust Series 2004-2 Class M2, 1.2984% 6/25/34 (n) | | 68 | | 47 |
Marriott Vacation Club Owner Trust Series 2006-2A: | | | | |
Class B, 5.442% 10/20/28 (h) | | 9 | | 9 |
Class C, 5.691% 10/20/28 (h) | | 4 | | 4 |
Class D, 6.01% 10/20/28 (h) | | 49 | | 49 |
Asset-Backed Securities - continued |
| Principal Amount (000s) | | Value (000s) |
MASTR Asset Backed Securities Trust: | | | | |
Series 2006-AM3 Class M1, 0.4784% 10/25/36 (n) | | $ 407 | | $ 18 |
Series 2007-HE1 Class M1, 0.5184% 5/25/37 (n) | | 596 | | 20 |
Meritage Mortgage Loan Trust Series 2004-1 Class M1, 0.9684% 7/25/34 (n) | | 121 | | 78 |
Merrill Lynch Mortgage Investors Trust: | | | | |
Series 2003-OPT1 Class M1, 1.1934% 7/25/34 (n) | | 420 | | 288 |
Series 2006-FM1 Class A2B, 0.3284% 4/25/37 (n) | | 1,409 | | 1,023 |
Series 2006-OPT1 Class A1A, 0.4784% 6/25/35 (n) | | 2,228 | | 1,589 |
Morgan Stanley ABS Capital I Trust: | | | | |
Series 2004-HE6 Class A2, 0.5584% 8/25/34 (n) | | 44 | | 30 |
Series 2005-NC1 Class M1, 0.6584% 1/25/35 (n) | | 303 | | 194 |
Series 2005-NC2 Class B1, 1.3884% 3/25/35 (n) | | 316 | | 41 |
Series 2007-HE2 Class M1, 0.4684% 1/25/37 (n) | | 3,110 | | 13 |
National Collegiate Student Loan Trust: | | | | |
Series 2004-2 Class A, 9.75% 10/27/14 (p) | | 1,364 | | 124 |
Series 2006-3 Class A, 7.1% 1/25/12 (p) | | 198 | | 4 |
Series 2006-4: | | | | |
Class A1, 0.2484% 3/25/25 (n) | | 5 | | 5 |
Class A, 6.35% 2/27/12 (p) | | 819 | | 18 |
Class D, 1.3184% 5/25/32 (n) | | 1,544 | | 3 |
Series 2007-1 Class A, 7.27% 4/25/12 (p) | | 1,101 | | 44 |
Series 2007-2 Class A, 6.7% 7/25/12 (p) | | 936 | | 48 |
New Century Home Equity Loan Trust: | | | | |
Series 2005-4 Class M2, 0.7284% 9/25/35 (n) | | 1,083 | | 590 |
Series 2005-D Class M2, 0.6884% 2/25/36 (n) | | 593 | | 117 |
Ocala Funding LLC: | | | | |
Series 2005-1A Class A, 1.713% 3/20/10 (d)(h)(n) | | 429 | | 0 |
Series 2006-1A Class A, 1.613% 3/20/11 (d)(h)(n) | | 892 | | 0 |
Option One Mortgage Loan Trust: | | | | |
Series 2007-5 Class 2A1, 0.3084% 5/25/37 (n) | | 25 | | 25 |
Series 2007-6 Class 2A1, 0.2784% 7/25/37 (n) | | 82 | | 79 |
Park Place Securities, Inc.: | | | | |
Series 2004-WCW1: | | | | |
Class M3, 1.4684% 9/25/34 (n) | | 405 | | 237 |
Class M4, 1.6684% 9/25/34 (n) | | 519 | | 213 |
Series 2005-WCH1: | | | | |
Class M2, 0.7384% 1/25/36 (n) | | 1,817 | | 1,644 |
Class M3, 0.7784% 1/25/36 (n) | | 363 | | 232 |
Class M4, 1.0484% 1/25/36 (n) | | 1,120 | | 565 |
Series 2005-WHQ2 Class M7, 1.4684% 5/25/35 (n) | | 1,328 | | 9 |
Residential Asset Mortgage Products, Inc. Series 2006-EFC2 Class M1, 0.4484% 12/25/36 (n) | | 271 | | 6 |
Asset-Backed Securities - continued |
| Principal Amount (000s) | | Value (000s) |
Residential Asset Securities Corp. Series 2007-KS2 Class AI1, 0.2884% 2/25/37 (n) | | $ 1 | | $ 1 |
Salomon Brothers Mortgage Securities VII, Inc. Series 2003-HE1 Class A, 1.0184% 4/25/33 (n) | | 4 | | 3 |
Saxon Asset Securities Trust Series 2004-1 Class M1, 1.0134% 3/25/35 (n) | | 1,092 | | 855 |
Securitized Asset Backed Receivables LLC Trust Series 2005-FR4 Class B3, 1.9384% 1/25/36 (n) | | 18 | | 0* |
Sierra Receivables Funding Co. Series 2007-1A Class A2, 0.3363% 3/20/19 (FGIC Insured) (h)(n) | | 478 | | 456 |
SLM Private Credit Student Loan Trust Series 2004-A Class C, 1.197% 6/15/33 (n) | | 965 | | 444 |
Specialty Underwriting & Residential Finance Trust Series 2006-AB2 Class N1, 5.75% 6/25/37 (h) | | 455 | | 0 |
Structured Asset Investment Loan Trust Series 2004-8 Class M5, 1.9434% 9/25/34 (n) | | 52 | | 28 |
SVO VOI Mortgage Corp. Series 2006-AA Class A, 5.28% 2/20/24 (h) | | 484 | | 504 |
Terwin Mortgage Trust Series 2003-4HE Class A1, 1.0784% 9/25/34 (n) | | 22 | | 15 |
Trapeza CDO XII Ltd./Trapeza CDO XII, Inc. Series 2007-12A Class B, 0.8058% 4/6/42 (h)(n) | | 1,494 | | 112 |
WaMu Asset Holdings Corp. Series 2006-8 Class N1, 6.048% 10/25/46 (h) | | 674 | | 0 |
Wells Fargo Home Equity Trust Series 2004-3 Class A, 4.5% 11/27/34 (h) | | 6 | | 0 |
Whinstone Capital Management Ltd. Series 1A Class B3, 2.053% 10/25/44 (h)(n) | | 1,358 | | 761 |
TOTAL ASSET-BACKED SECURITIES (Cost $66,007) | 62,361 |
Collateralized Mortgage Obligations - 0.4% |
|
Private Sponsor - 0.4% |
Banc of America Commercial Mortgage Trust Series 2007-2: | | | | |
Class B, 5.6565% 4/10/49 (n) | | 51 | | 23 |
Class C, 5.6565% 4/10/49 (n) | | 135 | | 55 |
Class D, 5.6565% 4/10/49 (n) | | 67 | | 23 |
Banc of America Funding Corp. sequential payer Series 2010-R4 Class 2A1, 4.5% 3/26/37 (h) | | 2,043 | | 2,078 |
Banc of America Mortgage Securities, Inc.: | | | | |
Series 2003-L Class 2A1, 2.9045% 1/25/34 (n) | | 1,305 | | 1,152 |
Collateralized Mortgage Obligations - continued |
| Principal Amount (000s) | | Value (000s) |
Private Sponsor - continued |
Banc of America Mortgage Securities, Inc.: - continued | | | | |
Series 2004-1 Class 2A2, 3.2303% 10/25/34 (n) | | $ 1,335 | | $ 1,141 |
Series 2004-A Class 2A2, 2.8478% 2/25/34 (n) | | 669 | | 572 |
Series 2004-B: | | | | |
Class 1A1, 2.7465% 3/25/34 (n) | | 100 | | 86 |
Class 2A2, 2.8677% 3/25/34 (n) | | 778 | | 696 |
Series 2004-D Class 2A2, 2.8857% 5/25/34 (n) | | 1,177 | | 1,029 |
Series 2004-G Class 2A7, 2.9352% 8/25/34 (n) | | 1,093 | | 931 |
Series 2004-H Class 2A1, 3.1632% 9/25/34 (n) | | 955 | | 804 |
Bayview Commercial Asset Trust Series 2006-3A, Class IO, 4.2221% 10/25/36 (h)(n)(p) | | 31,300 | | 1,988 |
Bear Stearns ALT-A Trust floater Series 2005-1 Class A1, 0.7784% 1/25/35 (n) | | 1,569 | | 1,186 |
Bear Stearns Commercial Mortgage Securities Trust Series 2006-T24 Class X2, 0.4258% 10/12/41 (h)(n)(p) | | 2,557 | | 23 |
Chase Mortgage Finance Trust: | | | | |
Series 2007-A1 Class 1A5, 2.8968% 2/25/37 (n) | | 334 | | 295 |
Series 2007-A2 Class 2A1, 3.0179% 7/25/37 (n) | | 3,353 | | 3,084 |
Citigroup Commercial Mortgage Trust Series 2008-C7 Class A2B, 6.0737% 12/10/49 (n) | | 912 | | 945 |
Citigroup Mortgage Loan Trust Series 2004-UST1 Class A4, 2.2809% 8/25/34 (n) | | 812 | | 803 |
Cobalt CMBS Commercial Mortgage Trust Series 2007-C2 Class B, 5.617% 4/15/47 (n) | | 1,019 | | 285 |
COMM pass-thru certificates floater Series 2001-J2A Class A2F, 0.7083% 7/16/34 (h)(n) | | 14 | | 14 |
Credit Suisse First Boston Mortgage Securities Corp. floater Series 2007-AR7 Class 2A1, 2.7846% 11/25/34 (n) | | 151 | | 134 |
First Horizon Mortgage pass-thru Trust Series 2004-AR5 Class 2A1, 2.858% 10/25/34 (n) | | 1,101 | | 979 |
Gracechurch Mortgage Financing PLC floater Series 2006-1 Class D2, 0.7678% 11/20/56 (h)(n) | | 2,161 | | 2,146 |
Granite Master Issuer PLC floater: | | | | |
Series 2005-4 Class C2, 1.313% 12/20/54 (n) | | 142 | | 65 |
Series 2006-1A Class C2, 1.413% 12/20/54 (h)(n) | | 4,917 | | 2,299 |
Series 2006-2 Class C1, 1.153% 12/20/54 (n) | | 4,095 | | 1,914 |
Series 2006-3 Class C2, 0.713% 12/20/54 (n) | | 853 | | 399 |
Series 2006-4: | | | | |
Class B1, 0.303% 12/20/54 (n) | | 3,154 | | 2,500 |
Class C1, 0.593% 12/20/54 (n) | | 1,928 | | 901 |
Class M1, 0.383% 12/20/54 (n) | | 829 | | 531 |
Collateralized Mortgage Obligations - continued |
| Principal Amount (000s) | | Value (000s) |
Private Sponsor - continued |
Granite Master Issuer PLC floater: - continued | | | | |
Series 2007-1: | | | | |
Class 1C1, 0.813% 12/20/54 (n) | | $ 1,671 | | $ 781 |
Class 1M1, 0.513% 12/20/54 (n) | | 1,114 | | 713 |
Class 2C1, 1.173% 12/20/54 (n) | | 760 | | 355 |
Class 2M1, 0.713% 12/20/54 (n) | | 1,431 | | 916 |
Series 2007-2 Class 2C1, 0.6402% 12/17/54 (n) | | 1,981 | | 926 |
Granite Mortgages PLC floater Series 2003-3 Class 1C, 2.7013% 1/20/44 (n) | | 326 | | 222 |
GSR Mortgage Loan Trust Series 2007-AR2 Class 2A1, 2.7323% 4/25/35 (n) | | 509 | | 404 |
JPMorgan Chase Commercial Mortgage Securities Trust Series 2007-CB18: | | | | |
Class A1, 5.32% 6/12/47 (n) | | 10 | | 10 |
Class A3, 5.447% 6/12/47 (n) | | 1,730 | | 1,796 |
JPMorgan Mortgage Trust: | | | | |
sequential payer Series 2006-A5 Class 3A5, 5.8639% 8/25/36 (n) | | 1,855 | | 1,411 |
Series 2004-A3 Class 4A1, 2.7486% 7/25/34 (n) | | 921 | | 881 |
Series 2004-A5 Class 2A1, 2.5513% 12/25/34 (n) | | 1,135 | | 985 |
Series 2006-A2 Class 5A1, 2.9458% 11/25/33 (n) | | 2,570 | | 2,342 |
LB-UBS Commercial Mortgage Trust sequential payer Series 2006-C6 Class A4, 5.372% 9/15/39 | | 410 | | 444 |
MASTR Adjustable Rate Mortgages Trust Series 2007-3 Class 22A2, 0.4284% 5/25/47 (n) | | 683 | | 440 |
Merrill Lynch Alternative Note Asset Trust floater Series 2007-OAR1 Class A1, 0.3884% 2/25/37 (n) | | 1,237 | | 829 |
Merrill Lynch Floating Trust floater Series 2006-1: | | | | |
Class B, 0.377% 6/15/22 (h)(n) | | 188 | | 182 |
Class C, 0.397% 6/15/22 (h)(n) | | 1,165 | | 1,089 |
Class D, 0.407% 6/15/22 (h)(n) | | 448 | | 417 |
Class E, 0.417% 6/15/22 (h)(n) | | 717 | | 660 |
Class F, 0.447% 6/15/22 (h)(n) | | 1,164 | | 1,059 |
Class G, 0.517% 6/15/22 (h)(n) | | 269 | | 239 |
Class H, 0.537% 6/15/22 (h)(n) | | 538 | | 468 |
Class J, 0.577% 6/15/22 (h)(n) | | 628 | | 542 |
Merrill Lynch Mortgage Investors Trust: | | | | |
Series 2004-A4 Class A1, 2.6423% 8/25/34 (n) | | 1,272 | | 1,202 |
Series 2005-A2 Class A7, 2.6224% 2/25/35 (n) | | 957 | | 895 |
Series 2006-A6 Class A4, 3.1818% 10/25/33 (n) | | 1,083 | | 975 |
Merrill Lynch-CFC Commercial Mortgage Trust Series 2006-3 Class ASB, 5.382% 7/12/46 (n) | | 3,905 | | 4,063 |
Collateralized Mortgage Obligations - continued |
| Principal Amount (000s) | | Value (000s) |
Private Sponsor - continued |
Opteum Mortgage Acceptance Corp. floater Series 2005-3 Class APT, 0.5084% 7/25/35 (n) | | $ 1,605 | | $ 1,236 |
Option One Mortgage Loan Trust floater Series 2007-CP1 Class M1, 0.5184% 3/25/37 (n) | | 2,236 | | 98 |
Provident Funding Mortgage Loan Trust Series 2005-2 Class 3A, 2.6869% 10/25/35 (n) | | 661 | | 528 |
RESI Finance LP/RESI Finance DE Corp. floater Series 2003-B: | | | | |
Class B5, 2.5558% 7/10/35 (h)(n) | | 1,090 | | 855 |
Class B6, 3.0558% 7/10/35 (h)(n) | | 232 | | 171 |
Residential Asset Mortgage Products, Inc. sequential payer: | | | | |
Series 2003-SL1 Class A31, 7.125% 4/25/31 | | 671 | | 710 |
Series 2004-SL3 Class A1, 7% 8/25/16 | | 35 | | 35 |
Residential Funding Securities Corp. floater Series 2003-RP2 Class A1, 0.6684% 6/25/33 (h)(n) | | 262 | | 239 |
Salomon Brothers Mortgage Securities VII, Inc. Series 2006-C2 Class H, 6.308% 7/18/33 (h) | | 129 | | 45 |
Sequoia Mortgage Trust floater Series 2004-6 Class A3B, 1.275% 7/20/34 (n) | | 29 | | 20 |
Structured Asset Securities Corp.: | | | | |
Series 2003-15A Class 4A, 5.375% 4/25/33 (n) | | 407 | | 371 |
Series 2003-20 Class 1A1, 5.5% 7/25/33 | | 283 | | 286 |
TBW Mortgage-Backed pass-thru certificates floater Series 2006-4 Class A3, 0.3873% 9/25/36 (n) | | 2,485 | | 1,792 |
WaMu Mortgage pass-thru certificates: | | | | |
Series 2003-AR8 Class A, 2.6863% 8/25/33 (n) | | 654 | | 603 |
Series 2005-AR3 Class A2, 2.5791% 3/25/35 (n) | | 1,763 | | 1,458 |
Wells Fargo Mortgage Backed Securities Trust: | | | | |
Series 2004-EE Class 2A2, 2.7571% 12/25/34 (n) | | 562 | | 533 |
Series 2004-H Class A1, 2.7828% 6/25/34 (n) | | 985 | | 932 |
Series 2004-W Class A9, 2.7617% 11/25/34 (n) | | 3,635 | | 3,311 |
Series 2005-AR10 Class 2A2, 2.7607% 6/25/35 (n) | | 470 | | 425 |
Series 2005-AR12: | | | | |
Class 2A5, 2.7552% 7/25/35 (n) | | 9,180 | | 8,226 |
Class 2A6, 2.7552% 7/25/35 (n) | | 403 | | 356 |
Series 2005-AR2 Class 2A2, 2.7427% 3/25/35 (n) | | 1,798 | | 1,567 |
Series 2005-AR3 Class 2A1, 2.7804% 3/25/35 (n) | | 706 | | 624 |
TOTAL COLLATERALIZED MORTGAGE OBLIGATIONS (Cost $57,971) | 78,748 |
Commercial Mortgage Securities - 1.6% |
| Principal Amount (000s) | | Value (000s) |
Asset Securitization Corp. Series 1997-D5: | | | | |
Class A2, 6.8338% 2/14/43 (n) | | $ 671 | | $ 694 |
Class A3, 6.8838% 2/14/43 (n) | | 724 | | 763 |
Class A6, 7.2038% 2/14/43 (n) | | 1,067 | | 1,117 |
Class PS1, 1.3868% 2/14/43 (n)(p) | | 2,572 | | 45 |
Banc of America Commercial Mortgage Trust: | | | | |
sequential payer: | | | | |
Series 2006-2 Class AAB, 5.7134% 5/10/45 (n) | | 1,020 | | 1,077 |
Series 2006-5: | | | | |
Class A2, 5.317% 9/10/47 | | 3,102 | | 3,123 |
Class A3, 5.39% 9/10/47 | | 1,272 | | 1,315 |
Series 2006-6 Class A3, 5.369% 10/10/45 | | 1,824 | | 1,906 |
Series 2007-4 Class A3, 5.798% 2/10/51 (n) | | 910 | | 962 |
Series 2006-6 Class E, 5.619% 10/10/45 (h) | | 527 | | 98 |
Series 2007-3: | | | | |
Class A3, 5.6242% 6/10/49 (n) | | 1,523 | | 1,595 |
Class A4, 5.6242% 6/10/49 (n) | | 1,901 | | 2,003 |
Banc of America Commercial Mortgage, Inc.: | | | | |
sequential payer: | | | | |
Series 2001-1 Class A4, 5.451% 1/15/49 | | 1,997 | | 2,120 |
Series 2004-2: | | | | |
Class A3, 4.05% 11/10/38 | | 151 | | 153 |
Class A4, 4.153% 11/10/38 | | 1,157 | | 1,196 |
Series 2005-1 Class A3, 4.877% 11/10/42 | | 799 | | 799 |
Series 2007-1 Class A2, 5.381% 1/15/49 | | 2,506 | | 2,512 |
Series 2001-3 Class H, 6.562% 4/11/37 (h) | | 510 | | 509 |
Series 2001-PB1: | | | | |
Class J, 7.166% 5/11/35 (h) | | 228 | | 226 |
Class K, 6.15% 5/11/35 (h) | | 424 | | 420 |
Series 2005-3 Series A3B, 5.09% 7/10/43 (n) | | 2,833 | | 2,967 |
Banc of America Large Loan, Inc. floater: | | | | |
Series 2005-MIB1: | | | | |
Class C, 0.5172% 3/15/22 (h)(n) | | 392 | | 370 |
Class D, 0.5672% 3/15/22 (h)(n) | | 397 | | 371 |
Class E, 0.6072% 3/15/22 (h)(n) | | 328 | | 302 |
Class F, 0.6772% 3/15/22 (h)(n) | | 467 | | 421 |
Class G, 0.7372% 3/15/22 (h)(n) | | 303 | | 270 |
Series 2006-BIX1: | | | | |
Class C, 0.3872% 10/15/19 (h)(n) | | 390 | | 379 |
Class D, 0.4172% 10/15/19 (h)(n) | | 716 | | 686 |
Class E, 0.4472% 10/15/19 (h)(n) | | 663 | | 625 |
Class F, 0.5172% 10/15/19 (h)(n) | | 1,987 | | 1,863 |
Class G, 0.5372% 10/15/19 (h)(n) | | 935 | | 829 |
Commercial Mortgage Securities - continued |
| Principal Amount (000s) | | Value (000s) |
Bayview Commercial Asset Trust: | | | | |
floater: | | | | |
Series 2003-2 Class M1, 1.0684% 12/25/33 (h)(n) | | $ 54 | | $ 38 |
Series 2004-1: | | | | |
Class A, 0.5784% 4/25/34 (h)(n) | | 913 | | 764 |
Class B, 2.1184% 4/25/34 (h)(n) | | 102 | | 58 |
Class M1, 0.7784% 4/25/34 (h)(n) | | 82 | | 59 |
Class M2, 1.4184% 4/25/34 (h)(n) | | 76 | | 53 |
Series 2004-2: | | | | |
Class A, 0.6484% 8/25/34 (h)(n) | | 747 | | 610 |
Class M1, 0.7984% 8/25/34 (h)(n) | | 128 | | 93 |
Series 2004-3: | | | | |
Class A1, 0.5884% 1/25/35 (h)(n) | | 1,667 | | 1,303 |
Class A2, 0.6384% 1/25/35 (h)(n) | | 239 | | 189 |
Class M1, 0.7184% 1/25/35 (h)(n) | | 288 | | 200 |
Class M2, 1.2184% 1/25/35 (h)(n) | | 137 | | 91 |
Series 2005-2A: | | | | |
Class A1, 0.5284% 8/25/35 (h)(n) | | 1,187 | | 928 |
Class M1, 0.6484% 8/25/35 (h)(n) | | 64 | | 38 |
Class M2, 0.6984% 8/25/35 (h)(n) | | 106 | | 58 |
Class M3, 0.7184% 8/25/35 (h)(n) | | 59 | | 31 |
Class M4, 0.8284% 8/25/35 (h)(n) | | 54 | | 27 |
Series 2005-3A: | | | | |
Class A1, 0.5384% 11/25/35 (h)(n) | | 483 | | 365 |
Class A2, 0.6184% 11/25/35 (h)(n) | | 436 | | 331 |
Class M1, 0.6584% 11/25/35 (h)(n) | | 57 | | 35 |
Class M2, 0.7084% 11/25/35 (h)(n) | | 73 | | 42 |
Class M3, 0.7284% 11/25/35 (h)(n) | | 65 | | 36 |
Class M4, 0.8184% 11/25/35 (h)(n) | | 81 | | 40 |
Series 2005-4A: | | | | |
Class A2, 0.6084% 1/25/36 (h)(n) | | 1,121 | | 833 |
Class B1, 1.6184% 1/25/36 (h)(n) | | 97 | | 19 |
Class M1, 0.6684% 1/25/36 (h)(n) | | 362 | | 214 |
Class M2, 0.6884% 1/25/36 (h)(n) | | 109 | | 57 |
Class M3, 0.7184% 1/25/36 (h)(n) | | 159 | | 78 |
Class M4, 0.8284% 1/25/36 (h)(n) | | 88 | | 39 |
Class M5, 0.8684% 1/25/36 (h)(n) | | 88 | | 34 |
Class M6, 0.9184% 1/25/36 (h)(n) | | 93 | | 28 |
Series 2006-1: | | | | |
Class A2, 0.5784% 4/25/36 (h)(n) | | 170 | | 127 |
Class M1, 0.5984% 4/25/36 (h)(n) | | 61 | | 36 |
Class M2, 0.6184% 4/25/36 (h)(n) | | 64 | | 35 |
Commercial Mortgage Securities - continued |
| Principal Amount (000s) | | Value (000s) |
Bayview Commercial Asset Trust: - continued | | | | |
floater: | | | | |
Series 2006-1: | | | | |
Class M3, 0.6384% 4/25/36 (h)(n) | | $ 55 | | $ 28 |
Class M4, 0.7384% 4/25/36 (h)(n) | | 31 | | 15 |
Class M5, 0.7784% 4/25/36 (h)(n) | | 30 | | 13 |
Class M6, 0.8584% 4/25/36 (h)(n) | | 61 | | 23 |
Series 2006-2A: | | | | |
Class A1, 0.4484% 7/25/36 (h)(n) | | 2,568 | | 1,918 |
Class A2, 0.4984% 7/25/36 (h)(n) | | 152 | | 112 |
Class B1, 1.0884% 7/25/36 (h)(n) | | 57 | | 19 |
Class B3, 2.9184% 7/25/36 (h)(n) | | 86 | | 25 |
Class M1, 0.5284% 7/25/36 (h)(n) | | 160 | | 96 |
Class M2, 0.5484% 7/25/36 (h)(n) | | 113 | | 62 |
Class M3, 0.5684% 7/25/36 (h)(n) | | 94 | | 50 |
Class M4, 0.6384% 7/25/36 (h)(n) | | 63 | | 33 |
Class M5, 0.6884% 7/25/36 (h)(n) | | 78 | | 39 |
Class M6, 0.7584% 7/25/36 (h)(n) | | 116 | | 44 |
Series 2006-3A: | | | | |
Class B1, 1.0184% 10/25/36 (h)(n) | | 107 | | 9 |
Class B2, 1.5684% 10/25/36 (h)(n) | | 77 | | 3 |
Class B3, 2.8184% 10/25/36 (h)(n) | | 27 | | 0* |
Class M4, 0.6484% 10/25/36 (h)(n) | | 118 | | 31 |
Class M5, 0.6984% 10/25/36 (h)(n) | | 142 | | 28 |
Class M6, 0.7784% 10/25/36 (h)(n) | | 277 | | 42 |
Series 2006-4A: | | | | |
Class A1, 0.4484% 12/25/36 (h)(n) | | 607 | | 431 |
Class A2, 0.4884% 12/25/36 (h)(n) | | 2,971 | | 2,020 |
Class B1, 0.9184% 12/25/36 (h)(n) | | 95 | | 13 |
Class B2, 1.4684% 12/25/36 (h)(n) | | 97 | | 10 |
Class B3, 2.6684% 12/25/36 (h)(n) | | 164 | | 11 |
Class M1, 0.5084% 12/25/36 (h)(n) | | 197 | | 82 |
Class M2, 0.5284% 12/25/36 (h)(n) | | 131 | | 49 |
Class M3, 0.5584% 12/25/36 (h)(n) | | 134 | | 45 |
Class M4, 0.6184% 12/25/36 (h)(n) | | 160 | | 44 |
Class M5, 0.6584% 12/25/36 (h)(n) | | 147 | | 33 |
Class M6, 0.7384% 12/25/36 (h)(n) | | 131 | | 24 |
Series 2007-1: | | | | |
Class A2, 0.4884% 3/25/37 (h)(n) | | 621 | | 404 |
Class B1, 0.8884% 3/25/37 (h)(n) | | 198 | | 24 |
Class B2, 1.3684% 3/25/37 (h)(n) | | 144 | | 14 |
Class B3, 3.5684% 3/25/37 (h)(n) | | 219 | | 10 |
Class M1, 0.4884% 3/25/37 (h)(n) | | 174 | | 64 |
Class M2, 0.5084% 3/25/37 (h)(n) | | 131 | | 39 |
Class M3, 0.5384% 3/25/37 (h)(n) | | 116 | | 31 |
Commercial Mortgage Securities - continued |
| Principal Amount (000s) | | Value (000s) |
Bayview Commercial Asset Trust: - continued | | | | |
floater: | | | | |
Series 2007-1: | | | | |
Class M4, 0.5884% 3/25/37 (h)(n) | | $ 94 | | $ 23 |
Class M5, 0.6384% 3/25/37 (h)(n) | | 145 | | 28 |
Class M6, 0.7184% 3/25/37 (h)(n) | | 203 | | 33 |
Series 2007-2A: | | | | |
Class A1, 0.4884% 7/25/37 (h)(n) | | 568 | | 393 |
Class A2, 0.5384% 7/25/37 (h)(n) | | 533 | | 310 |
Class B1, 1.8184% 7/25/37 (h)(n) | | 165 | | 12 |
Class B2, 2.4684% 7/25/37 (h)(n) | | 143 | | 7 |
Class B3, 3.5684% 7/25/37 (h)(n) | | 159 | | 4 |
Class M1, 0.5884% 7/25/37 (h)(n) | | 187 | | 60 |
Class M2, 0.6284% 7/25/37 (h)(n) | | 102 | | 24 |
Class M3, 0.7084% 7/25/37 (h)(n) | | 103 | | 19 |
Class M4, 0.8684% 7/25/37 (h)(n) | | 205 | | 30 |
Class M5, 0.9684% 7/25/37 (h)(n) | | 180 | | 23 |
Class M6, 1.2184% 7/25/37 (h)(n) | | 229 | | 23 |
Series 2007-3: | | | | |
Class A2, 0.5084% 7/25/37 (h)(n) | | 635 | | 390 |
Class B1, 1.1684% 7/25/37 (h)(n) | | 142 | | 18 |
Class B2, 1.8184% 7/25/37 (h)(n) | | 354 | | 32 |
Class B3, 4.2184% 7/25/37 (h)(n) | | 142 | | 6 |
Class M1, 0.5284% 7/25/37 (h)(n) | | 127 | | 50 |
Class M2, 0.5584% 7/25/37 (h)(n) | | 135 | | 45 |
Class M3, 0.5884% 7/25/37 (h)(n) | | 212 | | 58 |
Class M4, 0.7184% 7/25/37 (h)(n) | | 333 | | 77 |
Class M5, 0.8184% 7/25/37 (h)(n) | | 174 | | 35 |
Class M6, 1.0184% 7/25/37 (h)(n) | | 132 | | 22 |
Series 2007-4A: | | | | |
Class B1, 2.7684% 9/25/37 (h)(n) | | 219 | | 3 |
Class B2, 3.6684% 9/25/37 (h)(n) | | 560 | | 3 |
Class M1, 1.1684% 9/25/37 (h)(n) | | 210 | | 25 |
Class M2, 1.2684% 9/25/37 (h)(n) | | 210 | | 21 |
Class M4, 1.8184% 9/25/37 (h)(n) | | 535 | | 32 |
Class M5, 1.9684% 9/25/37 (h)(n) | | 535 | | 21 |
Class M6, 2.1684% 9/25/37 (h)(n) | | 535 | | 13 |
Series 2004-1, Class IO, 1.25% 4/25/34 (h)(p) | | 1,844 | | 70 |
Series 2007-5A, Class IO, 3.047% 10/25/37 (h)(n)(p) | | 4,463 | | 443 |
Bear Stearns Commercial Mortgage Securities Trust: | | | | |
floater: | | | | |
Series 2006-BBA7: | | | | |
Class H, 0.8572% 3/15/19 (h)(n) | | 329 | | 311 |
Class J, 1.0572% 3/15/19 (h)(n) | | 309 | | 260 |
Commercial Mortgage Securities - continued |
| Principal Amount (000s) | | Value (000s) |
Bear Stearns Commercial Mortgage Securities Trust: - continued | | | | |
floater: | | | | |
Series 2007-BBA8: | | | | |
Class D, 0.4572% 3/15/22 (h)(n) | | $ 452 | | $ 422 |
Class E, 0.5072% 3/15/22 (h)(n) | | 2,347 | | 2,173 |
Class F, 0.5572% 3/15/22 (h)(n) | | 1,440 | | 1,308 |
Class G, 0.6072% 3/15/22 (h)(n) | | 369 | | 326 |
Class H, 0.7572% 3/15/22 (h)(n) | | 452 | | 390 |
Class J, 0.9072% 3/15/22 (h)(n) | | 452 | | 365 |
sequential payer: | | | | |
Series 2003-PWR2 Class A3, 4.834% 5/11/39 | | 144 | | 145 |
Series 2004-PWR3 Class A3, 4.487% 2/11/41 | | 326 | | 333 |
Series 2007-PW15 Class AAB, 5.315% 2/11/44 | | 2,680 | | 2,804 |
Series 2007-PW16: | | | | |
Class A4, 5.7154% 6/11/40 (n) | | 534 | | 577 |
Class AAB, 5.7154% 6/11/40 (n) | | 4,740 | | 5,047 |
Series 2007-PW17 Class A1, 5.282% 6/11/50 | | 318 | | 322 |
Series 2007-PW18: | | | | |
Class A2, 5.613% 6/11/50 | | 320 | | 326 |
Class A4, 5.7% 6/11/50 | | 4,380 | | 4,652 |
Series 2007-T26 Class A1, 5.145% 1/12/45 | | 130 | | 131 |
Series 2003-PWR2 Class X2, 0.5275% 5/11/39 (h)(n)(p) | | 6,436 | | 0 |
Series 2006-PW13 Class A3, 5.518% 9/11/41 | | 3,219 | | 3,304 |
Series 2006-PW14 Class X2, 0.6524% 12/11/38 (h)(n)(p) | | 10,396 | | 147 |
Series 2006-T22 Class A4, 5.5338% 4/12/38 (n) | | 114 | | 127 |
Series 2007-PW16: | | | | |
Class B, 5.7154% 6/11/40 (h)(n) | | 146 | | 72 |
Class C, 5.7154% 6/11/40 (h)(n) | | 122 | | 48 |
Class D, 5.7154% 6/11/40 (h)(n) | | 122 | | 43 |
Series 2007-PW18 Class X2, 0.3152% 6/11/50 (h)(n)(p) | | 79,526 | | 834 |
Series 2007-T28: | | | | |
Class A1, 5.422% 9/11/42 | | 10 | | 10 |
Class X2, 0.1654% 9/11/42 (h)(n)(p) | | 39,180 | | 260 |
Berkeley Federal Bank & Trust FSB Series 1994-1 Class B, 0% 8/1/24 (h)(n) | | 518 | | 225 |
C-BASS Trust floater Series 2006-SC1 Class A, 0.4884% 5/25/36 (h)(n) | | 597 | | 423 |
CDC Commercial Mortgage Trust Series 2002-FX1: | | | | |
Class G, 6.625% 5/15/35 (h) | | 1,072 | | 1,120 |
Class XCL, 2.2784% 5/15/35 (h)(n)(p) | | 6,108 | | 114 |
Commercial Mortgage Securities - continued |
| Principal Amount (000s) | | Value (000s) |
Citigroup Commercial Mortgage Trust: | | | | |
floater Series 2006-FL2: | | | | |
Class F, 0.5202% 8/15/21 (h)(n) | | $ 326 | | $ 321 |
Class G, 0.5402% 8/15/21 (h)(n) | | 405 | | 393 |
Class H, 0.5802% 8/15/21 (h)(n) | | 324 | | 298 |
sequential payer Series 2006-C5 Class A4, 5.431% 10/15/49 | | 6,330 | | 6,806 |
Series 2006-C5 Class AMP2, 5.5005% 10/15/49 (h) | | 1,365 | | 1,335 |
Series 2007-C6: | | | | |
Class A1, 5.622% 12/10/49 (n) | | 1,045 | | 1,043 |
Class A2, 5.6978% 12/10/49 (n) | | 1,210 | | 1,230 |
Class A4, 5.6978% 12/10/49 (n) | | 3,035 | | 3,274 |
Citigroup/Deutsche Bank Commercial Mortgage Trust: | | | | |
sequential payer Series 2007-CD4: | | | | |
Class A2A, 5.237% 12/11/49 | | 305 | | 306 |
Class A4, 5.322% 12/11/49 | | 4,053 | | 4,211 |
Series 2007-CD4: | | | | |
Class A3, 5.293% 12/11/49 | | 888 | | 915 |
Class C, 5.476% 12/11/49 | | 1,717 | | 343 |
Cobalt CMBS Commercial Mortgage Trust: | | | | |
sequential payer Series 2007-C3 Class A3, 5.8158% 5/15/46 (n) | | 912 | | 970 |
Series 2006-C1 Class B, 5.359% 8/15/48 | | 2,736 | | 547 |
COMM pass-thru certificates: | | | | |
floater: | | | | |
Series 2005-F10A: | | | | |
Class B, 0.4372% 4/15/17 (h)(n) | | 4,783 | | 4,620 |
Class C, 0.4772% 4/15/17 (h)(n) | | 734 | | 709 |
Class D, 0.5172% 4/15/17 (h)(n) | | 721 | | 692 |
Class E, 0.5772% 4/15/17 (h)(n) | | 230 | | 216 |
Class F, 0.6172% 4/15/17 (h)(n) | | 130 | | 118 |
Class G, 0.7572% 4/15/17 (h)(n) | | 130 | | 117 |
Class H, 0.8272% 4/15/17 (h)(n) | | 130 | | 117 |
Class J, 1.0572% 4/15/17 (h)(n) | | 100 | | 84 |
Series 2005-FL11: | | | | |
Class C, 0.5072% 11/15/17 (h)(n) | | 696 | | 661 |
Class D, 0.5472% 11/15/17 (h)(n) | | 36 | | 34 |
Class E, 0.5972% 11/15/17 (h)(n) | | 128 | | 119 |
Class F, 0.6572% 11/15/17 (h)(n) | | 141 | | 128 |
Class G, 0.7072% 11/15/17 (h)(n) | | 98 | | 87 |
Series 2006-CN2A: | | | | |
Class A2FL, 0.4256% 2/5/19 (h)(n) | | 1,390 | | 1,337 |
Class AJFL, 0.4656% 2/5/19 (n) | | 640 | | 586 |
Commercial Mortgage Securities - continued |
| Principal Amount (000s) | | Value (000s) |
COMM pass-thru certificates: - continued | | | | |
floater: | | | | |
Series 2006-FL12 Class AJ, 0.3372% 12/15/20 (h)(n) | | $ 1,300 | | $ 1,190 |
sequential payer: | | | | |
Series 2005-C6 Class A2, 4.999% 6/10/44 (n) | | 9 | | 9 |
Series 2006-C8 Class A3, 5.31% 12/10/46 | | 2,599 | | 2,720 |
Series 2006-CN2A: | | | | |
Class A2FX, 5.449% 2/5/19 (h) | | 1,592 | | 1,583 |
Class AJFX, 5.478% 2/5/19 (h) | | 2,940 | | 2,962 |
Series 2007-C9 Class A4, 5.8145% 12/10/49 (n) | | 2,018 | | 2,208 |
Series 2006-C8 Class XP, 0.469% 12/10/46 (n)(p) | | 12,088 | | 132 |
Credit Suisse Commercial Mortgage Trust: | | | | |
sequential payer: | | | | |
Series 2006-C4 Class A3, 5.467% 9/15/39 | | 1,107 | | 1,158 |
Series 2007-C2: | | | | |
Class A2, 5.448% 1/15/49 (n) | | 6,402 | | 6,427 |
Class A3, 5.542% 1/15/49 (n) | | 1,824 | | 1,922 |
Series 2007-C3 Class A4, 5.702% 6/15/39 (n) | | 549 | | 573 |
Series 2006-C4 Class AAB, 5.439% 9/15/39 | | 5,104 | | 5,233 |
Series 2006-C5 Class ASP, 0.6723% 12/15/39 (n)(p) | | 8,413 | | 121 |
Series 2007-C5 Class A4, 5.695% 9/15/40 (n) | | 825 | | 871 |
Credit Suisse First Boston Mortgage Capital Certificates floater Series 2007-TF2A Class B, 0.5572% 4/15/22 (h)(n) | | 3,254 | | 2,343 |
Credit Suisse First Boston Mortgage Securities Corp.: | | | | |
sequential payer: | | | | |
Series 2001-CK6 Class B, 6.582% 8/15/36 | | 912 | | 912 |
Series 2002-CP5 Class A1, 4.106% 12/15/35 | | 44 | | 44 |
Series 2004-C1: | | | | |
Class A3, 4.321% 1/15/37 | | 93 | | 93 |
Class A4, 4.75% 1/15/37 | | 425 | | 445 |
Series 2001-CK6 Class AX, 0.837% 8/15/36 (n)(p) | | 1,073 | | 1 |
Series 2001-CKN5 Class AX, 1.9481% 9/15/34 (h)(n)(p) | | 1,833 | | 1 |
Series 2006-C1 Class A3, 5.422% 2/15/39 (n) | | 3,381 | | 3,545 |
Credit Suisse Mortgage Capital Certificates: | | | | |
floater Series 2007-TFL1: | | | | |
Class B, 0.3572% 2/15/22 (h)(n) | | 345 | | 300 |
Class C: | | | | |
0.3772% 2/15/22 (h)(n) | | 1,416 | | 1,203 |
0.4772% 2/15/22 (h)(n) | | 506 | | 404 |
Class F, 0.5272% 2/15/22 (h)(n) | | 1,011 | | 789 |
Commercial Mortgage Securities - continued |
| Principal Amount (000s) | | Value (000s) |
Credit Suisse Mortgage Capital Certificates: - continued | | | | |
Series 2007-C1: | | | | |
Class ASP, 0.406% 2/15/40 (n)(p) | | $ 14,245 | | $ 133 |
Class B, 5.487% 2/15/40 (h)(n) | | 1,394 | | 209 |
First Union National Bank-Bank of America Commercial Mortgage Trust Series 2001-C1: | | | | |
Class D, 6.484% 3/15/33 | | 32 | | 32 |
Class G, 6.936% 3/15/33 (h) | | 600 | | 592 |
GE Capital Commercial Mortgage Corp.: | | | | |
sequential payer Series 2007-C1 Class A4, 5.543% 12/10/49 | | 5,514 | | 5,742 |
Series 2001-1 Class X1, 1.1681% 5/15/33 (h)(n)(p) | | 1,403 | | 8 |
Series 2007-C1 Class XP, 0.193% 12/10/49 (n)(p) | | 18,874 | | 82 |
GMAC Commercial Mortgage Securities, Inc.: | | | | |
Series 2004-C3 Class X2, 0.5803% 12/10/41 (n)(p) | | 1,978 | | 3 |
Series 2005-C1 Class X2, 0.554% 5/10/43 (n)(p) | | 3,329 | | 15 |
Greenwich Capital Commercial Funding Corp.: | | | | |
floater Series 2006-FL4 Class B, 0.3956% 11/5/21 (h)(n) | | 343 | | 334 |
sequential payer: | | | | |
Series 2007-GG11 Class A2, 5.597% 12/10/49 | | 1,824 | | 1,878 |
Series 2007-GG9 Class A4, 5.444% 3/10/39 | | 2,652 | | 2,802 |
Series 2005-GG3 Class XP, 0.6673% 8/10/42 (h)(n)(p) | | 11,644 | | 40 |
Series 2006-GG7 Class A3, 5.881% 7/10/38 (n) | | 2,404 | | 2,524 |
Series 2007-GG11 Class A1, 0.2902% 12/10/49 (h)(n)(p) | | 20,343 | | 151 |
GS Mortgage Securities Corp. II: | | | | |
floater: | | | | |
Series 2006-FL8A: | | | | |
Class E, 0.5751% 6/6/20 (h)(n) | | 207 | | 191 |
Class F, 0.6451% 6/6/20 (h)(n) | | 634 | | 578 |
Series 2007-EOP: | | | | |
Class C, 2.1455% 3/6/20 (h)(n) | | 1,144 | | 1,099 |
Class D, 2.3636% 3/6/20 (h)(n) | | 2,144 | | 2,059 |
Class F, 2.8433% 3/6/20 (h)(n) | | 94 | | 91 |
Class G, 3.0177% 3/6/20 (h)(n) | | 47 | | 45 |
Class H, 3.5846% 3/6/20 (h)(n) | | 42 | | 41 |
Class J, 4.4568% 3/6/20 (h)(n) | | 60 | | 59 |
sequential payer Series 2004-GG2 Class A4, 4.964% 8/10/38 | | 280 | | 280 |
Series 2005-GG4 Class XP, 0.7109% 7/10/39 (h)(n)(p) | | 15,037 | | 84 |
Commercial Mortgage Securities - continued |
| Principal Amount (000s) | | Value (000s) |
GS Mortgage Securities Corp. II: - continued | | | | |
Series 2006-GG6 Class A2, 5.506% 4/10/38 | | $ 3,063 | | $ 3,058 |
GS Mortgage Securities Trust sequential payer: | | | | |
Series 2006-GG8 Class A2, 5.479% 11/10/39 | | 604 | | 603 |
Series 2007-GG10 Class A2, 5.778% 8/10/45 | | 418 | | 426 |
JP Morgan Chase Commercial Mortgage Securities Trust: | | | | |
sequential payer: | | | | |
Series 2006-CB14 Class A3B, 5.4764% 12/12/44 (n) | | 2,425 | | 2,467 |
Series 2007-LDPX: | | | | |
Class A2 S, 5.305% 1/15/49 | | 2,063 | | 2,076 |
Class A3, 5.42% 1/15/49 | | 2,510 | | 2,658 |
Series 2005-CB13 Class E, 5.348% 1/12/43 (h)(n) | | 461 | | 32 |
Series 2005-LDP3 Class A3, 4.959% 8/15/42 | | 6,519 | | 6,677 |
Series 2007-LDP10: | | | | |
Class BS, 5.437% 1/15/49 (n) | | 174 | | 33 |
Class CS, 5.466% 1/15/49 (n) | | 75 | | 13 |
Class ES, 5.5379% 1/15/49 (h)(n) | | 472 | | 33 |
JP Morgan Commercial Mortgage Finance Corp. Series 2000-C9 Class G, 6.25% 10/15/32 (h) | | 109 | | 109 |
JPMorgan Chase Commercial Mortgage Securities Trust: | | | | |
floater Series 2006-FLA2: | | | | |
Class B, 0.3772% 11/15/18 (h)(n) | | 588 | | 541 |
Class C, 0.4172% 11/15/18 (h)(n) | | 418 | | 380 |
Class D, 0.4372% 11/15/18 (h)(n) | | 184 | | 166 |
Class E, 0.4872% 11/15/18 (h)(n) | | 265 | | 236 |
Class F, 0.5372% 11/15/18 (h)(n) | | 398 | | 346 |
Class G, 0.5672% 11/15/18 (h)(n) | | 346 | | 291 |
Class H, 0.7072% 11/15/18 (h)(n) | | 265 | | 212 |
sequential payer: | | | | |
Series 2006-LDP8 Class A4, 5.399% 5/15/45 | | 581 | | 632 |
Series 2006-LDP9: | | | | |
Class A2, 5.134% 5/15/47 (n) | | 373 | | 380 |
Class A3, 5.336% 5/15/47 | | 380 | | 397 |
Series 2007-CB19 Class A4, 5.7415% 2/12/49 (n) | | 3,198 | | 3,376 |
Series 2007-LD11 Class A2, 5.8019% 6/15/49 (n) | | 2,560 | | 2,603 |
Series 2006-CB17 Class A3, 5.45% 12/12/43 | | 260 | | 263 |
Series 2007-CB19: | | | | |
Class B, 5.7415% 2/12/49 (n) | | 78 | | 35 |
Class C, 5.7415% 2/12/49 (n) | | 204 | | 83 |
Class D, 5.7415% 2/12/49 (n) | | 214 | | 73 |
Commercial Mortgage Securities - continued |
| Principal Amount (000s) | | Value (000s) |
LB Commercial Conduit Mortgage Trust: | | | | |
sequential payer Series 2007-C3 Class A4, 5.9407% 7/15/44 (n) | | $ 743 | | $ 792 |
Series 1998-C1 Class D, 6.98% 2/18/30 | | 203 | | 207 |
LB Multi-family Mortgage Trust Series 1991-4 Class A1, 7.1064% 4/25/21 (n) | | 30 | | 21 |
LB-UBS Commercial Mortgage Trust: | | | | |
sequential payer: | | | | |
Series 2006-C1 Class A2, 5.084% 2/15/31 | | 131 | | 132 |
Series 2006-C6 Class A2, 5.262% 9/15/39 (n) | | 510 | | 510 |
Series 2006-C7: | | | | |
Class A2, 5.3% 11/15/38 | | 842 | | 846 |
Class A3, 5.347% 11/15/38 | | 679 | | 711 |
Series 2007-C1: | | | | |
Class A1, 5.391% 2/15/40 (n) | | 23 | | 23 |
Class A4, 5.424% 2/15/40 | | 2,738 | | 2,918 |
Series 2007-C2 Class A3, 5.43% 2/15/40 | | 1,980 | | 2,067 |
Series 2001-C3 Class B, 6.512% 6/15/36 | | 318 | | 318 |
Series 2001-C7 Class D, 6.514% 11/15/33 | | 1,003 | | 1,004 |
Series 2005-C3 Class XCP, 0.78% 7/15/40 (n)(p) | | 2,075 | | 10 |
Series 2006-C6 Class XCP, 0.6735% 9/15/39 (n)(p) | | 4,202 | | 56 |
Series 2007-C1 Class XCP, 0.472% 2/15/40 (n)(p) | | 1,566 | | 16 |
Series 2007-C6 Class A4, 5.858% 7/15/40 (n) | | 1,140 | | 1,214 |
Series 2007-C7: | | | | |
Class A3, 5.866% 9/15/45 | | 972 | | 1,039 |
Class XCP, 0.2822% 9/15/45 (n)(p) | | 68,438 | | 583 |
Lehman Brothers Floating Rate Commercial Mortgage Trust floater Series 2006-LLFA: | | | | |
Class D, 0.4372% 9/15/21 (h)(n) | | 292 | | 259 |
Class E, 0.4972% 9/15/21 (h)(n) | | 1,054 | | 922 |
Class F, 0.5472% 9/15/21 (h)(n) | | 868 | | 751 |
Class G, 0.5672% 9/15/21 (h)(n) | | 1,714 | | 1,424 |
Class H, 0.6072% 9/15/21 (h)(n) | | 442 | | 350 |
Lehman Large Loan Trust Series 1997-LLI Class E, 7.3% 10/12/34 | | 1,619 | | 1,623 |
Merrill Lynch Mortgage Trust: | | | | |
Series 2005-CKI1 Class A3, 5.2203% 11/12/37 (n) | | 715 | | 724 |
Series 2005-LC1 Class F, 5.3796% 1/12/44 (h)(n) | | 793 | | 404 |
Series 2006-C1 Class A2, 5.6285% 5/12/39 (n) | | 886 | | 905 |
Series 2007-C1 Class A4, 5.8267% 6/12/50 (n) | | 3,452 | | 3,662 |
Series 2008-C1 Class A4, 5.69% 2/12/51 | | 1,947 | | 2,098 |
Commercial Mortgage Securities - continued |
| Principal Amount (000s) | | Value (000s) |
Merrill Lynch-CFC Commercial Mortgage Trust: | | | | |
floater Series 2006-4 Class A2FL, 0.3058% 12/12/49 (n) | | $ 382 | | $ 373 |
sequential payer: | | | | |
Series 2006-1 CLass A3, 5.4804% 2/12/39 (n) | | 970 | | 988 |
Series 2006-4 Class ASB, 5.133% 12/12/49 (n) | | 784 | | 826 |
Series 2007-5: | | | | |
Class A3, 5.364% 8/12/48 | | 356 | | 361 |
Class A4, 5.378% 8/12/48 | | 36 | | 37 |
Class B, 5.479% 8/12/48 | | 2,736 | | 1,110 |
Series 2007-6: | | | | |
Class A1, 5.175% 3/12/51 | | 12 | | 12 |
Class A4, 5.485% 3/12/51 (n) | | 7,400 | | 7,766 |
Series 2007-7 Class A4, 5.7436% 6/12/50 (n) | | 3,192 | | 3,441 |
Series 2007-8 Class A1, 4.622% 8/12/49 | | 45 | | 46 |
Series 2006-4 Class XP, 0.6205% 12/12/49 (n)(p) | | 14,993 | | 283 |
Series 2007-6 Class B, 5.635% 3/12/51 (n) | | 912 | | 410 |
Series 2007-7 Class B, 5.7436% 6/12/50 (n) | | 79 | | 21 |
Series 2007-8 Class A3, 5.9665% 8/12/49 (n) | | 787 | | 836 |
Morgan Stanley Capital I Trust: | | | | |
floater: | | | | |
Series 2006-XLF Class C, 1.407% 7/15/19 (h)(n) | | 272 | | 163 |
Series 2007-XCLA Class A1, 0.408% 7/17/17 (h)(n) | | 495 | | 450 |
Series 2007-XLFA: | | | | |
Class C, 0.368% 10/15/20 (h)(n) | | 523 | | 473 |
Class D, 0.398% 10/15/20 (h)(n) | | 507 | | 453 |
Class E, 0.458% 10/15/20 (h)(n) | | 634 | | 560 |
Class F, 0.508% 10/15/20 (h)(n) | | 380 | | 318 |
Class G, 0.548% 10/15/20 (h)(n) | | 470 | | 368 |
Class H, 0.638% 10/15/20 (h)(n) | | 296 | | 214 |
Class J, 0.788% 10/15/20 (h)(n) | | 338 | | 203 |
Class MHRO, 0.898% 10/15/20 (h)(n) | | 369 | | 310 |
Class MJPM, 1.208% 10/15/20 (h)(n) | | 18 | | 16 |
Class NHRO, 1.098% 10/15/20 (h)(n) | | 558 | | 446 |
sequential payer: | | | | |
Series 2003-IQ5 Class X2, 0.9017% 4/15/38 (h)(n)(p) | | 2,407 | | 0 |
Series 2005-IQ9 Class A3, 4.54% 7/15/56 | | 1,266 | | 1,277 |
Series 2007-HQ11 Class A31, 5.439% 2/12/44 (n) | | 462 | | 480 |
Series 2007-IQ13 Class A1, 5.05% 3/15/44 | | 115 | | 115 |
Series 2007-T25 Class A1, 5.391% 11/12/49 | | 124 | | 124 |
Commercial Mortgage Securities - continued |
| Principal Amount (000s) | | Value (000s) |
Morgan Stanley Capital I Trust: - continued | | | | |
Series 2003-IQ6 Class X2, 0.5881% 12/15/41 (h)(n)(p) | | $ 5,397 | | $ 8 |
Series 2005-IQ9 Class X2, 1.0893% 7/15/56 (h)(n)(p) | | 8,118 | | 39 |
Series 2006-HQ10 Class X2, 0.4923% 11/12/41 (h)(n)(p) | | 6,608 | | 42 |
Series 2006-HQ8 Class A3, 5.4704% 3/12/44 (n) | | 538 | | 541 |
Series 2006-IQ11: | | | | |
Class A3, 5.694% 10/15/42 (n) | | 1,147 | | 1,181 |
Class A4, 5.73% 10/15/42 (n) | | 274 | | 301 |
Series 2006-T23 Class A3, 5.8184% 8/12/41 (n) | | 466 | | 497 |
Series 2007-IQ14: | | | | |
Class A4, 5.692% 4/15/49 (n) | | 1,368 | | 1,421 |
Class AAB, 5.654% 4/15/49 | | 2,650 | | 2,810 |
Class B, 5.7233% 4/15/49 (n) | | 224 | | 101 |
Structured Asset Securities Corp. Series 1997-LLI Class D, 7.15% 10/12/34 | | 64 | | 64 |
Wachovia Bank Commercial Mortgage Trust: | | | | |
floater: | | | | |
Series 2005-WL5A Class K, 1.4072% 1/15/18 (h)(n) | | 969 | | 930 |
Series 2006-WL7A: | | | | |
Class E, 0.4902% 9/15/21 (h)(n) | | 1,239 | | 1,100 |
Class F, 0.5502% 9/15/21 (h)(n) | | 1,426 | | 1,253 |
Class G, 0.5702% 9/15/21 (h)(n) | | 1,351 | | 1,134 |
Class J, 0.8072% 9/15/21 (h)(n) | | 300 | | 215 |
Series 2007-WHL8: | | | | |
Class AP1, 0.9072% 6/15/20 (h)(n) | | 98 | | 88 |
Class AP2, 1.0072% 6/15/20 (h)(n) | | 163 | | 144 |
Class F, 0.6872% 6/15/20 (h)(n) | | 3,171 | | 2,061 |
Class LXR1, 0.9072% 6/15/20 (h)(n) | | 112 | | 90 |
sequential payer: | | | | |
Series 2003-C7 Class A1, 4.241% 10/15/35 (h) | | 1,130 | | 1,133 |
Series 2003-C8 Class A3, 4.445% 11/15/35 | | 3,409 | | 3,416 |
Series 2006-C27 Class A2, 5.624% 7/15/45 | | 23 | | 23 |
Series 2006-C29 Class A3, 5.313% 11/15/48 | | 2,422 | | 2,570 |
Series 2007-C30: | | | | |
Class A3, 5.246% 12/15/43 | | 783 | | 793 |
Class A4, 5.305% 12/15/43 | | 268 | | 276 |
Class A5, 5.342% 12/15/43 | | 976 | | 1,016 |
Series 2007-C31 Class A4, 5.509% 4/15/47 | | 2,061 | | 2,196 |
Commercial Mortgage Securities - continued |
| Principal Amount (000s) | | Value (000s) |
Wachovia Bank Commercial Mortgage Trust: - continued | | | | |
sequential payer: | | | | |
Series 2007-C32: | | | | |
Class A2, 5.7378% 6/15/49 (n) | | $ 2,867 | | $ 2,896 |
Class A3, 5.7428% 6/15/49 (n) | | 1,548 | | 1,628 |
Series 2003-C6 Class G, 5.125% 8/15/35 (h)(n) | | 433 | | 426 |
Series 2004-C15: | | | | |
Class 180A, 5.3979% 10/15/41 (h)(n) | | 701 | | 703 |
Class 180B, 5.3979% 10/15/41 (h)(n) | | 319 | | 319 |
Series 2005-C19 Class B, 4.892% 5/15/44 | | 912 | | 842 |
Series 2005-C22: | | | | |
Class B, 5.3592% 12/15/44 (n) | | 2,022 | | 1,539 |
Class F, 5.3592% 12/15/44 (h)(n) | | 1,521 | | 675 |
Series 2006-C23 Class A5, 5.416% 1/15/45 (n) | | 5,005 | | 5,429 |
Series 2007-C30: | | | | |
Class C, 5.483% 12/15/43 (n) | | 2,736 | | 1,354 |
Class D, 5.513% 12/15/43 (n) | | 1,459 | | 575 |
Class XP, 0.4412% 12/15/43 (h)(n)(p) | | 9,744 | | 98 |
Series 2007-C31 Class C, 5.6883% 4/15/47 (n) | | 251 | | 119 |
Series 2007-C31A Class A2, 5.421% 4/15/47 | | 6,763 | | 7,037 |
Series 2007-C32: | | | | |
Class D, 5.7428% 6/15/49 (n) | | 685 | | 291 |
Class E, 5.7428% 6/15/49 (n) | | 1,080 | | 340 |
Wachovia Bank Commercial Mortgage Trust pass-thru certificates sequential payer Series 2007-C33 Class A5, 5.8992% 2/15/51 (n) | | 604 | | 650 |
TOTAL COMMERCIAL MORTGAGE SECURITIES (Cost $229,227) | 288,025 |
Municipal Securities - 0.1% |
|
Beaver County Indl. Dev. Auth. Poll. Cont. Rev. Bonds (FirstEnergy Nuclear Generation Corp. Proj.) Series 2005 A, 3.375%, tender 7/1/15 (n) | | 1,700 | | 1,763 |
California Gen. Oblig. 7.5% 4/1/34 | | 3,275 | | 3,884 |
Illinois Gen. Oblig.: | | | | |
Series 2010, 4.421% 1/1/15 | | 4,050 | | 4,240 |
Series 2011: | | | | |
5.665% 3/1/18 | | 3,000 | | 3,216 |
5.877% 3/1/19 | | 2,915 | | 3,117 |
TOTAL MUNICIPAL SECURITIES (Cost $14,931) | 16,220 |
Foreign Government and Government Agency Obligations - 0.0% |
| Principal Amount (000s) | | Value (000s) |
Chilean Republic 7.125% 1/11/12 | | $ 1,794 | | $ 1,833 |
United Mexican States 6.05% 1/11/40 | | 3,926 | | 4,495 |
TOTAL FOREIGN GOVERNMENT AND GOVERNMENT AGENCY OBLIGATIONS (Cost $5,796) | 6,328 |
Supranational Obligations - 0.0% |
|
Corporacion Andina de Fomento 5.2% 5/21/13
(Cost $136) | | 143 | | 152 |
Floating Rate Loans - 1.0% |
|
CONSUMER DISCRETIONARY - 0.2% |
Hotels, Restaurants & Leisure - 0.0% |
Fantasy Springs Resort Casino term loan 12% 8/6/12 (n) | | 8,305 | | 6,146 |
Town Sports International LLC Tranche B, term loan 7% 5/11/18 (n) | | 3,531 | | 3,390 |
| | 9,536 |
Media - 0.1% |
Hicks Sports Group LLC Tranche 2LN, term loan 12/22/11 (d)(n) | | 2,750 | | 3 |
Newsday LLC term loan 10.5% 8/1/13 | | 7,000 | | 7,210 |
Tribune Co. Tranche X, term loan 3/17/09 (d)(n) | | 1,188 | | 701 |
Univision Communications, Inc. term loan 4.4709% 3/31/17 (n) | | 11,193 | | 9,626 |
| | 17,540 |
Specialty Retail - 0.1% |
Michaels Stores, Inc.: | | | | |
Tranche B1, term loan 2.5% 10/31/13 (n) | | 4,256 | | 4,022 |
Tranche B2, term loan 4.75% 7/31/16 (n) | | 1,495 | | 1,413 |
Sports Authority, Inc. Tranche B, term loan 7.5% 11/16/17 (n) | | 4,940 | | 4,607 |
| | 10,042 |
TOTAL CONSUMER DISCRETIONARY | | 37,118 |
CONSUMER STAPLES - 0.0% |
Food & Staples Retailing - 0.0% |
Sprouts Farmers Market LLC Tranche B, term loan 6% 4/18/18 (n) | | 5,990 | | 5,840 |
Floating Rate Loans - continued |
| Principal Amount (000s) | | Value (000s) |
ENERGY - 0.0% |
Oil, Gas & Consumable Fuels - 0.0% |
Frac Tech Holdings LLC Tranche B, term loan 6.25% 5/6/16 (n) | | $ 3,924 | | $ 3,767 |
FINANCIALS - 0.0% |
Diversified Financial Services - 0.0% |
CEVA Group PLC: | | | | |
Credit-Linked Deposit 3.2458% 11/4/13 (n) | | 222 | | 200 |
EGL term loan 3.2529% 11/4/13 (n) | | 2,202 | | 1,981 |
term loan 3.2529% 11/4/13 (n) | | 266 | | 240 |
| | 2,421 |
Real Estate Management & Development - 0.0% |
Realogy Corp.: | | | | |
Credit-Linked Deposit 4.4411% 10/10/16 (n) | | 930 | | 765 |
term loan 4.5217% 10/10/16 (n) | | 6,221 | | 5,117 |
| | 5,882 |
TOTAL FINANCIALS | | 8,303 |
HEALTH CARE - 0.2% |
Health Care Providers & Services - 0.2% |
Genoa Healthcare Group LLC Tranche 2, term loan 11.5% 2/4/13 (n) | | 2,500 | | 1,888 |
National Renal Institutes, Inc. Tranche B, term loan 9.25% 3/31/13 (n) | | 11,411 | | 11,639 |
Sheridan Healthcare, Inc. Tranche 2LN, term loan 6.0728% 6/15/15 (n) | | 17,840 | | 16,145 |
Sunquest Information Systems, Inc. Tranche 2 LN, term loan 9.75% 6/16/17 (n) | | 2,250 | | 2,183 |
| | 31,855 |
INDUSTRIALS - 0.0% |
Airlines - 0.0% |
US Airways Group, Inc. term loan 2.7208% 3/23/14 (n) | | 4,529 | | 3,782 |
Commercial Services & Supplies - 0.0% |
Brand Energy & Infrastructure Services, Inc. Tranche 2LN, term loan 6.3% 2/7/15 (n) | | 985 | | 749 |
Floating Rate Loans - continued |
| Principal Amount (000s) | | Value (000s) |
INDUSTRIALS - continued |
Machinery - 0.0% |
Husky Intermediate, Inc. Tranche B, term loan 6.5% 6/30/18 (n) | | $ 4,485 | | $ 4,300 |
TOTAL INDUSTRIALS | | 8,831 |
INFORMATION TECHNOLOGY - 0.2% |
Communications Equipment - 0.1% |
Avaya, Inc.: | | | | |
term loan 3.0643% 10/27/14 (n) | | 1,798 | | 1,627 |
Tranche B 3LN, term loan 4.8143% 10/26/17 (n) | | 3,611 | | 3,160 |
SafeNet, Inc. Tranche 2LN, term loan 6.2208% 4/12/15 (n) | | 7,500 | | 7,200 |
| | 11,987 |
Internet Software & Services - 0.0% |
Airvana Networks Solutions, Inc. term loan 10% 3/25/15 (n) | | 2,711 | | 2,711 |
Software - 0.1% |
Kronos, Inc. Tranche 2LN, term loan 5.9958% 6/11/15 (n) | | 23,730 | | 23,018 |
SS&C Technologies, Inc. term loan 2.2384% 11/23/12 (n) | | 267 | | 265 |
| | 23,283 |
TOTAL INFORMATION TECHNOLOGY | | 37,981 |
TELECOMMUNICATION SERVICES - 0.2% |
Wireless Telecommunication Services - 0.2% |
Asurion LLC: | | | | |
term loan 9% 5/24/19 (n) | | 6,210 | | 5,946 |
Tranche B, term loan 5.5% 5/24/18 (n) | | 10,050 | | 9,422 |
Vodafone Americas Finance 2, Inc.: | | | | |
2nd LN, term loan 6.25% 6/24/16 pay-in-kind | | 12,355 | | 12,205 |
term loan 6.875% 8/11/15 | | 1,702 | | 1,706 |
| | 29,279 |
Floating Rate Loans - continued |
| Principal Amount (000s) | | Value (000s) |
UTILITIES - 0.2% |
Electric Utilities - 0.1% |
Bicent Power LLC Tranche 2LN, term loan 4.25% 12/31/14 (n) | | $ 810 | | $ 24 |
Texas Competitive Electric Holdings Co. LLC/Texas Competitive Electric Holdings Finance, Inc. Tranche B, term loan 4.7396% 10/10/17 (n) | | 25,196 | | 18,361 |
| | 18,385 |
Independent Power Producers & Energy Traders - 0.1% |
Dynegy, Inc. Tranche B, term loan: | | | | |
9.25% 8/5/16 (n) | | 397 | | 389 |
9.25% 8/5/16 (n) | | 214 | | 207 |
Nebraska Energy, Inc. Tranche 2LN, term loan 4.75% 5/1/14 (n) | | 12,400 | | 11,408 |
| | 12,004 |
TOTAL UTILITIES | | 30,389 |
TOTAL FLOATING RATE LOANS (Cost $201,527) | 193,363 |
Bank Notes - 0.0% |
|
Wachovia Bank NA 6% 11/15/17
(Cost $3,354) | | 3,066 | | 3,450 |
Preferred Securities - 0.0% |
| | | |
FINANCIALS - 0.0% |
Diversified Financial Services - 0.0% |
ING Groep NV 5.775% (i)(n) (Cost $554) | 975 | | 832 |
Fixed-Income Funds - 7.7% |
| Shares | | |
Fidelity Corporate Bond 1-10 Year Central Fund (o) | 2,529,627 | | 277,955 |
Fidelity Mortgage Backed Securities Central Fund (o) | 10,607,350 | | 1,146,867 |
TOTAL FIXED-INCOME FUNDS (Cost $1,331,811) | 1,424,822 |
Money Market Funds - 6.1% |
| Shares | | Value (000s) |
Fidelity Cash Central Fund, 0.11% (b) | 1,081,243,929 | | $ 1,081,244 |
Fidelity Securities Lending Cash Central Fund, 0.12% (b)(c) | 63,030,730 | | 63,031 |
TOTAL MONEY MARKET FUNDS (Cost $1,144,275) | 1,144,275 |
Cash Equivalents - 0.3% |
| Maturity Amount (000s) | | |
Investments in repurchase agreements in a joint trading account at 0.06%, dated 8/31/11 due 9/1/11 (Collateralized by U.S. Government Obligations) # (c)
(Cost $46,667) | $ 46,667 | | 46,667 |
TOTAL INVESTMENT PORTFOLIO - 105.4% (Cost $18,145,669) | | 19,633,670 |
NET OTHER ASSETS (LIABILITIES) - (5.4)% | | (1,003,480) |
NET ASSETS - 100% | $ 18,630,190 |
Swap Agreements |
| Expiration Date | | Notional Amount (000s) | | Value (000s) |
Credit Default Swaps |
Receive monthly a fixed rate of .15% multiplied by the notional amount and pay to Credit Suisse First Boston upon each credit event of one of the issues of ABX AA 07-01 Index, par value of the proportional notional amount (Rating-C) (Upfront Premium Received/(Paid) $2,560,000) (m) | Sept. 2037 | | $ 7,962 | | $ (7,525) |
Receive monthly a fixed rate of .15% multiplied by the notional amount and pay to JPMorgan Chase, Inc. upon each credit event of one of the issues of ABX AA 07-01 Index, par value of the proportional notional amount (Rating-C) (Upfront Premium Received/(Paid) $2,398,000) (m) | Sept. 2037 | | 6,526 | | (6,167) |
Receive monthly a fixed rate of .15% multiplied by the notional amount and pay to JPMorgan Chase, Inc. upon each credit event of one of the issues of ABX AA 07-01 Index, par value of the proportional notional amount (Rating-C) (Upfront Premium Received/(Paid) $566,000) (m) | Sept. 2037 | | 1,497 | | (1,415) |
Receive monthly a fixed rate of .15% multiplied by the notional amount and pay to Morgan Stanley, Inc. upon each credit event of one of the issues of ABX AA 07-01 Index, par value of the proportional notional amount (Rating-C) (Upfront Premium Received/(Paid) $2,398,000) (m) | Sept. 2037 | | 6,526 | | (6,167) |
Receive monthly a fixed rate of .15% multiplied by the notional amount and pay to UBS upon each credit event of one of the issues of ABX AA 07-1 Index, par value of the proportional notional amount (Rating-C) (Upfront Premium Received/(Paid) $2,332,000) (m) | Sept. 2037 | | 6,346 | | (5,997) |
Receive monthly a fixed rate of .15% multiplied by the notional amount and pay to UBS upon each credit event of one of the issues of ABX AA 07-1 Index, par value of the proportional notional amount (Rating-C) (Upfront Premium Received/(Paid) $2,025,000) (m) | Sept. 2037 | | 5,448 | | (5,149) |
| | $ 34,305 | | $ (32,420) |
Legend |
(a) Non-income producing |
(b) Affiliated fund that is available only to investment companies and other accounts managed by Fidelity Investments. The rate quoted is the annualized seven-day yield of the fund at period end. A complete unaudited listing of the fund's holdings as of its most recent quarter end is available upon request. In addition, each Fidelity Central Fund's financial statements, which are not covered by the Fund's Report of Independent Registered Public Accounting Firm, are available on the SEC's website or upon request. |
(c) Investment made with cash collateral received from securities on loan. |
(d) Non-income producing - Security is in default. |
(e) Security initially issued at one coupon which converts to a higher coupon at a specified date. The rate shown is the rate at period end. |
(f) Security or a portion of the security is on loan at period end. |
(g) Affiliated company |
(h) Security exempt from registration under Rule 144A of the Securities Act of 1933. These securities may be resold in transactions exempt from registration, normally to qualified institutional buyers. At the end of the period, the value of these securities amounted to $703,479,000 or 3.8% of net assets. |
(i) Security is perpetual in nature with no stated maturity date. |
(j) Security or a portion of the security purchased on a delayed delivery or when-issued basis. |
(k) A portion of the security is subject to a forward commitment to sell. |
(l) Security or a portion of the security has been segregated as collateral for open swap agreements. At the period end, the value of securities pledged amounted to $34,395,000. |
(m) Represents a credit default swap based on a tradable index of home equity asset-backed debt securities. The value of each credit default swap and the credit rating can be measures of the current payment/performance risk. In addition, the swap represents a contract in which the Fund has sold protection on the index of underlying securities. Ratings represent a weighted average of the ratings of all securities included in the index. Ratings used in the weighted average are from Moody's Investors Service, Inc., or S&P where Moody's ratings are not available. All ratings are as of the report date and do not reflect subsequent changes. |
(n) Coupon rates for floating and adjustable rate securities reflect the rates in effect at period end. |
(o) Affiliated fund that is available only to investment companies and other accounts managed by Fidelity Investments. A complete unaudited schedule of portfolio holdings for each Fidelity Central Fund is filed with the SEC for the first and third quarters of each fiscal year on Form N-Q and is available upon request or at the SEC's web site at www.sec.gov. An unaudited holdings listing for the Fund, which presents direct holdings as well as the pro rata share of securities and other investments held indirectly through its investment in underlying non-money market Fidelity Central Funds, is available at fidelity.com. In addition, each Fidelity Central Fund's financial statements, which are not covered by the Fund's Report of Independent Registered Public Accounting Firm, are available on the SEC's web site or upon request. |
(p) Security represents right to receive monthly interest payments on an underlying pool of mortgages or assets. Principal shown is the outstanding par amount of the pool held as of the end of the period. |
(q) Investment is owned by an entity that is treated as a corporation for U.S. tax purposes which is owned by the Fund. |
(r) Restricted securities - Investment in securities not registered under the Securities Act of 1933 (excluding 144A issues). At the end of the period, the value of restricted securities (excluding 144A issues) amounted to $99,806,000 or 0.5% of net assets. |
Additional information on each restricted holding is as follows: |
Security | Acquisition Date | Acquisition Cost (000s) |
Aspen Aerogels, Inc. 8% 6/1/14 | 6/1/11 | $ 10,000 |
Facebook, Inc. Class B | 3/31/11 - 5/19/11 | $ 22,038 |
HMH Holdings, Inc. | 3/9/10 | $ 633 |
Legend Pictures LLC | 9/23/10 | $ 35,000 |
Michael Kors Holdings Ltd. | 7/8/11 | $ 30,000 |
Station Holdco LLC | 6/17/11 | $ 1,331 |
Station Holdco LLC Warrants 6/15/18 | 8/11/08 - 8/15/08 | $ 6,358 |
wetpaint.com, Inc. Series C | 5/14/08 | $ 5,000 |
* Amount represents less than $1,000.
# Additional information on each counterparty to the repurchase agreement is as follows: |
Repurchase Agreement / Counterparty | Value
(000s) |
$46,667,000 due 9/01/11 at 0.06% |
Barclays Capital, Inc. | $ 46,667 |
Affiliated Central Funds |
Information regarding fiscal year to date income earned by the Fund from investments in Fidelity Central Funds is as follows: |
Fund | Income earned
(Amounts in thousands) |
Fidelity Cash Central Fund | $ 1,324 |
Fidelity Corporate Bond 1-10 Year Central Fund | 15,591 |
Fidelity Mortgage Backed Securities Central Fund | 32,186 |
Fidelity Securities Lending Cash Central Fund | 3,599 |
Total | $ 52,700 |
Additional information regarding the Fund's fiscal year to date purchases and sales, including the ownership percentage, of the non Money Market Central Funds is as follows: |
Fund
(Amounts in thousands) | Value, beginning of period | Purchases | Sales Proceeds | Value,
end of
period | % ownership, end of
period |
Fidelity Corporate Bond 1-10 Year Central Fund | $ 517,102 | $ - | $ 239,305* | $ 277,955 | 41.7% |
Fidelity Mortgage Backed Securities Central Fund | 818,951 | 302,387 | - | 1,146,867 | 8.9% |
Total | $ 1,336,053 | $ 302,387 | $ 239,305 | $ 1,424,822 | |
* Includes the value of shares redeemed through in-kind transactions. See Note 7 of the Notes to Financial Statements. |
Other Affiliated Issuers |
An affiliated company is a company in which the Fund has ownership of at least 5% of the voting securities. Fiscal year to date transactions with companies which are or were affiliates are as follows: |
Affiliate
(Amounts in thousands) | Value, beginning of period | Purchases | Sales Proceeds | Dividend Income | Value,
end of
period |
CareView Communications, Inc. | $ 16,382 | $ - | $ - | $ - | $ 14,652 |
Neurocrine Biosciences, Inc. | 12,570 | 13,417 | 5,422 | - | 22,913 |
Total | $ 28,952 | $ 13,417 | $ 5,422 | $ - | $ 37,565 |
Other Information |
The following is a summary of the inputs used, as of August 31, 2011, involving the Fund's assets and liabilities carried at fair value. The inputs or methodology used for valuing securities may not be an indication of the risk associated with investing in those securities. For more information on valuation inputs, and their aggregation into the levels used in the tables below, please refer to the Security Valuation section in the accompanying Notes to Financial Statements. |
Valuation Inputs at Reporting Date: |
Description
(Amounts in thousands) | Total | Level 1 | Level 2 | Level 3 |
Investments in Securities: | | | | |
Equities: | | | | |
Consumer Discretionary | $ 1,417,437 | $ 1,307,323 | $ 45,092 | $ 65,022 |
Consumer Staples | 1,541,310 | 1,492,866 | 48,444 | - |
Energy | 1,667,176 | 1,667,176 | - | - |
Financials | 1,367,100 | 1,337,181 | 28,514 | 1,405 |
Health Care | 1,280,092 | 1,277,164 | 2,928 | - |
Industrials | 1,118,837 | 1,118,629 | - | 208 |
Information Technology | 1,994,600 | 1,971,574 | - | 23,026 |
Materials | 314,512 | 311,558 | 2,954 | - |
Telecommunication Services | 30,447 | 30,447 | - | - |
Utilities | 171,852 | 108,386 | 63,466 | - |
Corporate Bonds | 2,046,762 | - | 2,035,621 | 11,141 |
U.S. Government and Government Agency Obligations | 1,907,940 | - | 1,907,940 | - |
U.S. Government Agency - Mortgage Securities | 1,510,362 | - | 1,510,362 | - |
Asset-Backed Securities | 62,361 | - | 49,661 | 12,700 |
Collateralized Mortgage Obligations | 78,748 | - | 76,231 | 2,517 |
Commercial Mortgage Securities | 288,025 | - | 259,369 | 28,656 |
Municipal Securities | 16,220 | - | 16,220 | - |
Foreign Government and Government Agency Obligations | 6,328 | - | 6,328 | - |
Supranational Obligations | 152 | - | 152 | - |
Floating Rate Loans | 193,363 | - | 193,363 | - |
Bank Notes | 3,450 | - | 3,450 | - |
Preferred Securities | 832 | - | 832 | - |
Fixed-Income Funds | 1,424,822 | 1,424,822 | - | - |
Money Market Funds | 1,144,275 | 1,144,275 | - | - |
Cash Equivalents | 46,667 | - | 46,667 | - |
Total Investments in Securities: | $ 19,633,670 | $ 13,191,401 | $ 6,297,594 | $ 144,675 |
Derivative Instruments: | | | | |
Liabilities | | | | |
Swap Agreements | $ (32,420) | $ - | $ (32,420) | $ - |
Other Financial Instruments: | | | | |
Forward Commitments | $ 1,898 | $ - | $ 1,898 | $ - |
The following is a reconciliation of Investments in Securities for which Level 3 inputs were used in determining value: |
(Amounts in thousands) | |
Investments in Securities: | |
Beginning Balance | $ 78,422 |
Total Realized Gain (Loss) | 4,655 |
Total Unrealized Gain (Loss) | 4,051 |
Cost of Purchases | 108,190 |
Proceeds of Sales | (22,975) |
Amortization/Accretion | 1,116 |
Transfers in to Level 3 | 9,955 |
Transfers out of Level 3 | (38,739) |
Ending Balance | $ 144,675 |
The change in unrealized gain (loss) for the period attributable to Level 3 securities held at August 31, 2011 | $ 3,684 |
The information used in the above reconciliation represents fiscal year to date activity for any Investments in Securities identified as using Level 3 inputs at either the beginning or the end of the current fiscal period, and includes the value of securities received through affiliated in-kind transactions. See Note 7 of the Notes to Financial Statements. Transfers in or out of Level 3 represent the beginning value of any Security or Instrument where a change in the pricing level occurred from the beginning to the end of the period. The cost of purchases and the proceeds of sales may include securities received or delivered through corporate actions or exchanges. Realized and unrealized gains (losses) disclosed in the reconciliation are included in Net Gain (Loss) on the Fund's Statement of Operations. |
Value of Derivative Instruments |
The following table is a summary of the Fund's value of derivative instruments by risk exposure as of August 31, 2011. For additional information on derivative instruments, please refer to the Derivative Instruments section in the accompanying Notes to Financial Statements. |
Risk Exposure /
Derivative Type
(Amounts in thousands) | Value |
| Asset | Liability |
Credit Risk | | |
Swap Agreements (a) | $ - | $ (32,420) |
Total Value of Derivatives | $ - | $ (32,420) |
(a) Value is disclosed on the Statement of Assets and Liabilities in the Swap agreements, at value line-items. |
The composition of credit quality ratings as a percentage of net assets is as follows (Unaudited): |
U.S. Government and U.S. Government Agency Obligations | 26.2% |
AAA,AA,A | 5.1% |
BBB | 3.5% |
BB | 2.1% |
B | 3.4% |
CCC,CC,C | 1.2% |
D | 0.0% |
Not Rated | 0.3% |
Equities | 58.6% |
Short-Term Investments and Net Other Assets | (0.4)% |
| 100.0% |
We have used ratings from Moody's Investors Service, Inc. Where Moody's® ratings are not available, we have used S&P® ratings. All ratings are as of the date indicated and do not reflect subsequent changes. |
Distribution of investments by country of issue, as a percentage of total net assets, is as follows: (Unaudited) |
United States of America | 87.6% |
United Kingdom | 1.5% |
France | 1.4% |
Ireland | 1.2% |
Switzerland | 1.1% |
Others (Individually Less Than 1%) | 7.2% |
| 100.0% |
The information in the above tables is based on the combined investments of the Fund and its pro-rata share of its investments in each non-money market Fidelity Central Fund. |
Income Tax Information |
At August 31, 2011, the Fund had a capital loss carryforward of approximately $38,013,000 all of which will expire in fiscal 2018. Capital loss carryforwards are only available to offset future capital gains of the Fund to the extent provided by regulations and may be limited. |
See accompanying notes which are an integral part of the financial statements.
Annual Report
Statement of Assets and Liabilities
Amounts in thousands (except per-share amounts) | August 31, 2011 |
| | |
Assets | | |
Investment in securities, at value (including securities loaned of $106,513 and repurchase agreements of $46,667) - See accompanying schedule: Unaffiliated issuers (cost $15,633,004) | $ 17,027,008 | |
Fidelity Central Funds (cost $2,476,086) | 2,569,097 | |
Other affiliated issuers (cost $36,579) | 37,565 | |
Total Investments (cost $18,145,669) | | $ 19,633,670 |
Commitment to sell securities on a delayed delivery basis | (736,185) | |
Receivable for securities sold on a delayed delivery basis | 738,083 | 1,898 |
Receivable for investments sold | | 28,244 |
Cash | | 578 |
Receivable for swap agreements | | 4 |
Receivable for fund shares sold | | 8,809 |
Dividends receivable | | 18,631 |
Interest receivable | | 50,277 |
Distributions receivable from Fidelity Central Funds | | 1,297 |
Other receivables | | 1,013 |
Total assets | | 19,744,421 |
| | |
Liabilities | | |
Payable for investments purchased
Regular delivery | $ 139,461 | |
Delayed delivery | 812,246 | |
Payable for swap agreements | 455 | |
Payable for fund shares redeemed | 10,057 | |
Swap agreements, at value | 32,420 | |
Accrued management fee | 6,230 | |
Other affiliated payables | 2,655 | |
Other payables and accrued expenses | 1,009 | |
Collateral on securities loaned, at value | 109,698 | |
Total liabilities | | 1,114,231 |
| | |
Net Assets | | $ 18,630,190 |
Net Assets consist of: | | |
Paid in capital | | $ 17,295,087 |
Undistributed net investment income | | 87,615 |
Accumulated undistributed net realized gain (loss) on investments and foreign currency transactions | | (212,578) |
Net unrealized appreciation (depreciation) on investments and assets and liabilities in foreign currencies | | 1,460,066 |
Net Assets | | $ 18,630,190 |
See accompanying notes which are an integral part of the financial statements.
Annual Report
Statement of Assets and Liabilities - continued
Amounts in thousands (except per-share amounts) | August 31, 2011 |
| | |
Puritan:
Net Asset Value, offering price and redemption price per share ($15,419,589 ÷ 870,109 shares) | | $ 17.72 |
| | |
Class K:
Net Asset Value, offering price and redemption price per share ($3,210,601 ÷ 181,174 shares) | | $ 17.72 |
See accompanying notes which are an integral part of the financial statements.
Annual Report
Financial Statements - continued
Statement of Operations
Amounts in thousands | Year ended August 31, 2011 |
| | |
Investment Income | | |
Dividends | | $ 165,972 |
Interest | | 278,156 |
Income from Fidelity Central Funds | | 52,700 |
Total income | | 496,828 |
| | |
Expenses | | |
Management fee | $ 79,094 | |
Transfer agent fees | 30,323 | |
Accounting and security lending fees | 1,982 | |
Custodian fees and expenses | 460 | |
Independent trustees' compensation | 107 | |
Appreciation in deferred trustee compensation account | 2 | |
Registration fees | 133 | |
Audit | 249 | |
Legal | 146 | |
Miscellaneous | 214 | |
Total expenses before reductions | 112,710 | |
Expense reductions | (1,112) | 111,598 |
Net investment income (loss) | | 385,230 |
Realized and Unrealized Gain (Loss) Net realized gain (loss) on: | | |
Investment securities: | | |
Unaffiliated issuers | 1,637,295 | |
Fidelity Central Funds | 18,783 | |
Other affiliated issuers | 601 | |
Foreign currency transactions | (4,968) | |
Swap agreements | (7,503) | |
Total net realized gain (loss) | | 1,644,208 |
Change in net unrealized appreciation (depreciation) on: Investment securities (net of increase in deferred foreign taxes of $33) | 474,601 | |
Assets and liabilities in foreign currencies | 1 | |
Swap agreements | 6,248 | |
Delayed delivery commitments | 1,818 | |
Total change in net unrealized appreciation (depreciation) | | 482,668 |
Net gain (loss) | | 2,126,876 |
Net increase (decrease) in net assets resulting from operations | | $ 2,512,106 |
See accompanying notes which are an integral part of the financial statements.
Annual Report
Statement of Changes in Net Assets
Amounts in thousands | Year ended
August 31,
2011 | Year ended
August 31,
2010 |
Increase (Decrease) in Net Assets | | |
Operations | | |
Net investment income (loss) | $ 385,230 | $ 457,109 |
Net realized gain (loss) | 1,644,208 | 1,031,992 |
Change in net unrealized appreciation (depreciation) | 482,668 | (142,516) |
Net increase (decrease) in net assets resulting
from operations | 2,512,106 | 1,346,585 |
Distributions to shareholders from net investment income | (395,907) | (441,719) |
Distributions to shareholders from net realized gain | (3,264) | (11,495) |
Total distributions | (399,171) | (453,214) |
Share transactions - net increase (decrease) | (816,545) | (1,140,096) |
Total increase (decrease) in net assets | 1,296,390 | (246,725) |
| | |
Net Assets | | |
Beginning of period | 17,333,800 | 17,580,525 |
End of period (including undistributed net investment income of $87,615 and undistributed net investment income of $124,277, respectively) | $ 18,630,190 | $ 17,333,800 |
See accompanying notes which are an integral part of the financial statements.
Annual Report
Financial Highlights - Puritan
Years ended August 31, | 2011 | 2010 | 2009 | 2008 | 2007 |
Selected Per-Share Data | | | | | |
Net asset value, beginning of period | $ 15.81 | $ 15.06 | $ 17.07 | $ 20.54 | $ 19.69 |
Income from Investment Operations | | | | | |
Net investment income (loss)B | .35 | .40 | .45 | .50 | .59 |
Net realized and unrealized gain (loss) | 1.93 | .75 | (2.00) | (1.80) | 1.70 |
Total from investment operations | 2.28 | 1.15 | (1.55) | (1.30) | 2.29 |
Distributions from net investment income | (.36) | (.39) | (.44) | (.55) | (.59) |
Distributions from net realized gain | -F | (.01) | (.02) | (1.62) | (.85) |
Total distributions | (.37)H | (.40) | (.46)G | (2.17) | (1.44) |
Net asset value, end of period | $ 17.72 | $ 15.81 | $ 15.06 | $ 17.07 | $ 20.54 |
Total ReturnA | 14.38% | 7.61% | (8.76)% | (7.35)% | 12.18% |
Ratios to Average Net AssetsC,E | | | | | |
Expenses before reductions | .60% | .61% | .67% | .61% | .60% |
Expenses net of fee waivers, if any | .60% | .61% | .67% | .61% | .60% |
Expenses net of all reductions | .59% | .61% | .67% | .60% | .59% |
Net investment income (loss) | 1.96% | 2.48% | 3.30% | 2.72% | 2.91% |
Supplemental Data | | | | | |
Net assets, end of period (in millions) | $ 15,420 | $ 15,054 | $ 16,111 | $ 21,427 | $ 25,719 |
Portfolio turnover rateD | 154%I | 104% | 116%I | 115% | 70%I |
A Total returns would have been lower had certain expenses not been reduced during the periods shown.
B Calculated based on average shares outstanding during the period.
C Fees and expenses of the underlying Fidelity Central Funds are not included in the Fund's expense ratio. The Fund indirectly bears its proportionate share of the expenses of any underlying Fidelity Central Funds.
D Amount does not include the portfolio activity of any underlying Fidelity Central Funds.
E Expense ratios reflect operating expenses of the class. Expenses before reductions do not reflect amounts reimbursed by the investment adviser or reductions from brokerage service arrangements or reductions from other expense offset arrangements and do not represent the amount paid by the class during periods when reimbursements or reductions occur. Expenses net of fee waivers reflect expenses after reimbursement by the investment adviser but prior to reductions from brokerage service arrangements or other expense offset arrangements. Expenses net of all reductions represent the net expenses paid by the class.
F Amount represents less than $.01 per share.
G Total distributions of $.46 per share is comprised of distributions from net investment income of $.442 and distributions from net realized gain of $.015 per share.
H Total distributions of $.37 per share is comprised of distributions from net investment income of $.364 and distributions from net realized gain of $.003 per share.
I The portfolio turnover rate excludes liquidations and/or redemptions executed in-kind from Affiliated Central Funds.
See accompanying notes which are an integral part of the financial statements.
Annual Report
Financial Highlights - Class K
Years ended August 31, | 2011 | 2010 | 2009 | 2008G |
Selected Per-Share Data | | | | |
Net asset value, beginning of period | $ 15.80 | $ 15.06 | $ 17.07 | $ 18.22 |
Income from Investment Operations | | | | |
Net investment income (loss)D | .38 | .42 | .46 | .14 |
Net realized and unrealized gain (loss) | 1.93 | .74 | (1.99) | (1.16) |
Total from investment operations | 2.31 | 1.16 | (1.53) | (1.02) |
Distributions from net investment income | (.39) | (.41) | (.47) | (.13) |
Distributions from net realized gain | -I | (.01) | (.02) | - |
Total distributions | (.39) | (.42) | (.48)J | (.13) |
Net asset value, end of period | $ 17.72 | $ 15.80 | $ 15.06 | $ 17.07 |
Total ReturnB,C | 14.59% | 7.69% | (8.59)% | (5.60)% |
Ratios to Average Net AssetsE,H | | | | |
Expenses before reductions | .48% | .48% | .50% | .48%A |
Expenses net of fee waivers, if any | .48% | .48% | .50% | .48%A |
Expenses net of all reductions | .47% | .47% | .50% | .48%A |
Net investment income (loss) | 2.09% | 2.61% | 3.47% | 3.21%A |
Supplemental Data | | | | |
Net assets, end of period (in millions) | $ 3,211 | $ 2,280 | $ 1,469 | $ 9 |
Portfolio turnover rateF | 154%K | 104% | 116%K | 115% |
A Annualized
B Total returns for periods of less than one year are not annualized.
C Total returns would have been lower had certain expenses not been reduced during the periods shown.
D Calculated based on average shares outstanding during the period.
E Fees and expenses of the underlying Fidelity Central Funds are not included in the Fund's expense ratio. The Fund indirectly bears its proportionate share of the expenses of any underlying Fidelity Central Funds.
F Amount does not include the portfolio activity of any underlying Fidelity Central Funds.
G For the period May 9, 2008 (commencement of sale of shares) to August 31, 2008.
H Expense ratios reflect operating expenses of the class. Expenses before reductions do not reflect amounts reimbursed by the investment adviser or reductions from brokerage service arrangements or reductions from other expense offset arrangements and do not represent the amount paid by the class during periods when reimbursements or reductions occur. Expense ratios before reductions for start-up periods may not be representative of longer-term operating periods. Expenses net of fee waivers reflect expenses after reimbursement by the investment adviser but prior to reductions from brokerage service arrangements or other expense offset arrangements. Expenses net of all reductions represent the net expenses paid by the class.
I Amount represents less than $.01 per share.
J Total distributions of $.48 per share is comprised of distributions from net investment income of $.468 and distributions from net realized gain of $.015 per share.
K The portfolio turnover rate excludes liquidations and/or redemptions executed in-kind from Affiliated Central Funds.
See accompanying notes which are an integral part of the financial statements.
Annual Report
Notes to Financial Statements
For the period ended August 31, 2011
(Amounts in thousands except ratios)
1. Organization.
Fidelity Puritan Fund (the Fund) is a fund of Fidelity Puritan Trust (the Trust) and is authorized to issue an unlimited number of shares. The Trust is registered under the Investment Company Act of 1940, as amended (the 1940 Act), as an open-end management investment company organized as a Massachusetts business trust. The Fund offers Puritan and Class K shares, each of which has equal rights as to assets and voting privileges. Each class has exclusive voting rights with respect to matters that affect that class. Investment income, realized and unrealized capital gains and losses, the common expenses of the Fund, and certain fund-level expense reductions, if any, are allocated on a pro-rata basis to each class based on the relative net assets of each class to the total net assets of the Fund. Each class differs with respect to transfer agent fees incurred. Certain expense reductions may also differ by class.
2. Investments in Fidelity Central Funds.
The Fund invests in Fidelity Central Funds, which are open-end investment companies available only to other investment companies and accounts managed by Fidelity Management & Research Company (FMR) and its affiliates. The Fund's Schedule of Investments lists each of the Fidelity Central Funds held as of period end, if any, as an investment of the Fund, but does not include the underlying holdings of each Fidelity Central Fund. As an Investing Fund, the Fund indirectly bears its proportionate share of the expenses of the underlying Fidelity Central Funds.
Based on their investment objective, each Fidelity Central Fund may invest or participate in various investment vehicles or strategies that are similar to those of the Fund. These strategies are consistent with the investment objectives of the Fund and may involve certain economic risks which may cause a decline in value of each of the Fidelity Central Funds and thus a decline in the value of the Fund. The Money Market Central Funds seek preservation of capital and current income and are managed by Fidelity Investments Money Management, Inc. (FIMM), an affiliate of FMR. The following summarizes the Fund's investment in each Fidelity Central Fund.
Fidelity
Central Fund | Investment Manager | Investment Objective | Investment Practices |
Fidelity Corporate Bond 1-10 Year Central Fund | FIMM | Seeks a high level of income by normally investing in investment-grade corporate bonds and other corporate debt securities and repurchase agreements for those securities. | Delayed Delivery & When Issued Securities Repurchase Agreements Restricted Securities Swap Agreements |
Fidelity Mortgage Backed Securities Central Fund | FIMM | Seeks a high level of income by normally investing in investment-grade mortgage-related securities and repurchase agreements for those securities. | Delayed Delivery & When Issued Securities Futures Repurchase Agreements Swap Agreements |
Annual Report
2. Investments in Fidelity Central Funds - continued
An unaudited holdings listing for the Fund, which presents direct holdings as well as the pro-rata share of any securities and other investments held indirectly through its investment in underlying non-money market Fidelity Central Funds, is available at fidelity.com. A complete unaudited list of holdings for each Fidelity Central Fund is available upon request or at the Securities and Exchange Commission (the SEC) web site at www.sec.gov. In addition, the financial statements of the Fidelity Central Funds which contain the significant accounting policies (including security valuation policies) of those funds, which are not covered by the Fund's Report of Independent Registered Public Accounting Firm are available on the SEC web site or upon request.
3. Significant Accounting Policies.
The financial statements have been prepared in conformity with accounting principles generally accepted in the United States of America (GAAP), which require management to make certain estimates and assumptions at the date of the financial statements. Actual results could differ from those estimates. Subsequent events, if any, through the date that the financial statements were issued have been evaluated in the preparation of the financial statements. The following summarizes the significant accounting policies of the Fund:
Security Valuation. Investments are valued as of 4:00 p.m. Eastern time on the last calendar day of the period. The Fund uses independent pricing services approved by the Board of Trustees to value its investments. When current market prices or quotations are not readily available or reliable, valuations may be determined in good faith in accordance with procedures adopted by the Board of Trustees. Factors used in determining value may include market or security specific events, changes in interest rates and credit quality. The frequency with which these procedures are used cannot be predicted and they may be utilized to a significant extent. The value used for net asset value (NAV) calculation under these procedures may differ from published prices for the same securities.
The Fund categorizes the inputs to valuation techniques used to value its investments into a disclosure hierarchy consisting of three levels as shown below:
Level 1 - quoted prices in active markets for identical investments
Level 2 - other significant observable inputs (including quoted prices for similar investments, interest rates, prepayment speeds, etc.)
Level 3 - unobservable inputs (including the Fund's own assumptions based on the best information available)
Annual Report
Notes to Financial Statements - continued
(Amounts in thousands except ratios)
3. Significant Accounting Policies - continued
Security Valuation - continued
Changes in valuation techniques may result in transfers in or out of an assigned level within the disclosure hierarchy. The aggregate value of investments by input level, as of August 31, 2011, as well as a roll forward of Level 3 securities, is included at the end of the Fund's Schedule of Investments. Valuation techniques used to value the Fund's investments by major category are as follows:
Equity securities, including restricted securities, for which market quotations are readily available, are valued at the last reported sale price or official closing price as reported by an independent pricing service on the primary market or exchange on which they are traded and are categorized as Level 1 in the hierarchy. In the event there were no sales during the day or closing prices are not available, securities are valued at the last quoted bid price or may be valued using the last available price and are generally categorized as Level 2 in the hierarchy. For foreign equity securities, when significant market or security specific events arise, comparisons to the valuation of American Depositary Receipts (ADRs), futures contracts, Exchange-traded funds (ETFs) and certain indexes as well as quoted prices for similar securities are used and are categorized as Level 2 in the hierarchy in these circumstances. Utilizing these techniques may result in transfers between Level 1 and Level 2. For restricted equity securities and private placements where observable inputs are limited, assumptions about market activity and risk are used and are categorized as Level 3 in the hierarchy.
Debt securities, including restricted securities, are valued based on evaluated prices received from independent pricing services or from dealers who make markets in such securities. For corporate bonds, bank notes, floating rate loans, foreign government and government agency obligations, municipal securities, preferred securities, supranational obligations, and U.S. government and government agency obligations, pricing services utilize matrix pricing which considers yield or price of bonds of comparable quality, coupon, maturity and type as well as dealer supplied prices and are generally categorized as Level 2 in the hierarchy. For asset backed securities, collateralized mortgage obligations, commercial mortgage securities, and U.S. government agency mortgage securities, pricing services utilize matrix pricing which considers prepayment speed assumptions, attributes of the collateral, yield or price of bonds of comparable quality, coupon, maturity and type as well as dealer supplied prices and, accordingly, such securities are generally categorized as Level 2 in the hierarchy. Swaps are marked-to-market daily based on valuations from independent pricing services or dealer-supplied valuations and changes in value are recorded as unrealized appreciation (depreciation). Pricing services utilize matrix pricing which considers comparisons to interest rate curves, credit spread curves, default possibilities and recovery rates and, as a result, swaps are generally categorized as Level 2 in the hierarchy. When independent prices are unavailable or unreliable, debt
Annual Report
3. Significant Accounting Policies - continued
Security Valuation - continued
securities and swaps may be valued utilizing pricing matrices which consider similar factors that would be used by independent pricing services. These are generally categorized as Level 2 in the hierarchy but may be Level 3 depending on the circumstances.
Investments in open-end mutual funds, including the Fidelity Central Funds, are valued at their closing net asset value each business day and are categorized as Level 1 in the hierarchy. Short-term securities with remaining maturities of sixty days or less may be valued at amortized cost, which approximates fair value, and are categorized as Level 2 in the hierarchy.
Foreign Currency. The Fund may use foreign currency contracts to facilitate transactions in foreign-denominated securities. Gains and losses from these transactions may arise from changes in the value of the foreign currency or if the counterparties do not perform under the contracts' terms.
Foreign-denominated assets, including investment securities, and liabilities are translated into U.S. dollars at the exchange rate at period end. Purchases and sales of investment securities, income and dividends received and expenses denominated in foreign currencies are translated into U.S. dollars at the exchange rate in effect on the transaction date.
The effects of exchange rate fluctuations on investments are included with the net realized and unrealized gain (loss) on investment securities. Other foreign currency transactions resulting in realized and unrealized gain (loss) are disclosed separately.
Investment Transactions and Income. For financial reporting purposes, the Fund's investment holdings and NAV include trades executed through the end of the last business day of the period. The NAV per share for processing shareholder transactions is calculated as of the close of business of the New York Stock Exchange (NYSE), normally 4:00 p.m. Eastern time and includes trades executed through the end of the prior business day. Gains and losses on securities sold are determined on the basis of identified cost and may include proceeds received from litigation. Dividend income is recorded on the ex-dividend date, except for certain dividends from foreign securities where the ex-dividend date may have passed, which are recorded as soon as the Fund is informed of the ex-dividend date. Non-cash dividends included in dividend income, if any, are recorded at the fair market value of the securities received. Distributions received on securities that represent a return of capital or capital gain are recorded as a reduction of cost of investments and/or as a realized gain. The Fund estimates the components of distributions received that may be considered return of capital distributions or capital gain distributions. Interest income and distributions from the Fidelity Central Funds are
Annual Report
Notes to Financial Statements - continued
(Amounts in thousands except ratios)
3. Significant Accounting Policies - continued
Investment Transactions and Income - continued
accrued as earned. Interest income includes coupon interest and amortization of premium and accretion of discount on debt securities. The principal value on inflation-indexed securities is periodically adjusted to the rate of inflation and interest is accrued based on the principal value. The adjustments to principal due to inflation are reflected as increases or decreases to interest income even though principal is not received until maturity. Investment income is recorded net of foreign taxes withheld where recovery of such taxes is uncertain. Debt obligations may be placed on non-accrual status and related interest income may be reduced by ceasing current accruals and writing off interest receivables when the collection of all or a portion of interest has become doubtful based on consistently applied procedures. A debt obligation is removed from non-accrual status when the issuer resumes interest payments or when collectability of interest is reasonably assured.
Expenses. Expenses directly attributable to a fund are charged to that fund. Expenses attributable to more than one fund are allocated among the respective funds on the basis of relative net assets or other appropriate methods. Expense estimates are accrued in the period to which they relate and adjustments are made when actual amounts are known.
Deferred Trustee Compensation. Under a Deferred Compensation Plan (the Plan), independent Trustees may elect to defer receipt of a portion of their annual compensation. Deferred amounts are invested in a cross-section of Fidelity funds, are marked-to-market and remain in the Fund until distributed in accordance with the Plan. The investment of deferred amounts and the offsetting payable to the Trustees are included in the accompanying Statement of Assets and Liabilities.
Income Tax Information and Distributions to Shareholders. Each year, the Fund intends to qualify as a regulated investment company, including distributing substantially all of its taxable income and realized gains under Subchapter M of the Internal Revenue Code and filing its U.S. federal tax return. As a result, no provision for income taxes is required. As of August 31, 2011, the Fund did not have any unrecognized tax benefits in the financial statements. A fund's federal tax return is subject to examination by the Internal Revenue Service (IRS) for a period of three years. Foreign taxes are provided for based on the Fund's understanding of the tax rules and rates that exist in the foreign markets in which it invests. The Fund is subject to a tax imposed on realized short term capital gains on securities of certain issuers domiciled in India. An estimated deferred tax liability for net unrealized gains on these securities is included in Other payables and accrued expenses on the Statement of Assets & Liabilities.
Annual Report
3. Significant Accounting Policies - continued
Income Tax Information and Distributions to Shareholders - continued
Distributions are declared and recorded on the ex-dividend date. Income dividends and capital gain distributions are declared separately for each class. Income and capital gain distributions are determined in accordance with income tax regulations, which may differ from GAAP.
Capital accounts within the financial statements are adjusted for permanent book-tax differences. These adjustments have no impact on net assets or the results of operations. Temporary book-tax differences will reverse in a subsequent period.
Book-tax differences are primarily due to in-kind transactions, swap agreements, foreign currency transactions, passive foreign investment companies (PFIC), market discount, equity-debt classifications, partnerships (including allocations from Fidelity Central Funds), deferred trustees compensation, capital loss carryforwards and losses deferred due to wash sales.
The federal tax cost of investment securities and unrealized appreciation (depreciation) as of period end were as follows:
Gross unrealized appreciation | $ 2,120,098 |
Gross unrealized depreciation | (772,927) |
Net unrealized appreciation (depreciation) on securities and other investments | $ 1,347,171 |
| |
Tax Cost | $ 18,286,499 |
The tax-based components of distributable earnings as of period end were as follows:
Undistributed ordinary income | $ 54,551 |
Capital loss carryforward | $ (38,013) |
Net unrealized appreciation (depreciation) | $ 1,319,236 |
Under the recently enacted Regulated Investment Company Modernization Act of 2010 (the Act), the Fund will be permitted to carry forward capital losses incurred in taxable years beginning after December 22, 2010 for an unlimited period. However, any losses incurred during those future taxable years will be required to be utilized prior to any losses incurred in pre-enactment taxable years, which generally expire after eight years from when they are incurred. Additionally, post-enactment capital losses that are carried forward will retain their character as either short-term or long-term capital losses rather than being considered all short-term as under previous law. The Fund's first fiscal year end subject to the Act will be August 31, 2012.
Annual Report
Notes to Financial Statements - continued
(Amounts in thousands except ratios)
3. Significant Accounting Policies - continued
Income Tax Information and Distributions to Shareholders - continued
The tax character of distributions paid was as follows:
| August 31, 2011 | August 31, 2010 |
Ordinary Income | $ 399,171 | $ 453,214 |
New Accounting Pronouncement. In May 2011, the Financial Accounting Standards Board issued Accounting Standard Update No. 2011-04, Fair Value Measurement (Topic 820) - Amendments to Achieve Common Fair Value Measurement and Disclosure Requirements in U.S. GAAP and IFRSs. The update changes the wording used to describe the requirements in GAAP for measuring fair value and for disclosing information about fair value measurements. The update is effective during interim and annual periods beginning after December 15, 2011. Management is currently evaluating the impact of the update's adoption on the Fund's financial statement disclosures.
4. Operating Policies.
Repurchase Agreements. FMR has received an Exemptive Order from the SEC which permits the Fund and other affiliated entities of FMR to transfer uninvested cash balances into joint trading accounts which are then invested in repurchase agreements. The Fund may also invest directly with institutions in repurchase agreements. Repurchase agreements are collateralized by government or non-government securities. Upon settlement date, collateral is held in segregated accounts with custodian banks and may be obtained in the event of a default of the counterparty. The Fund monitors, on a daily basis, the value of the collateral to ensure it is at least equal to the principal amount of the repurchase agreement (including accrued interest). In the event of a default by the counterparty, realization of the collateral proceeds could be delayed, during which time the value of the collateral may decline.
Delayed Delivery Transactions and When-Issued Securities. During the period, the Fund transacted in securities on a delayed delivery or when-issued basis. Payment and delivery may take place after the customary settlement period for that security. The price of the underlying securities and the date when the securities will be delivered and paid for are fixed at the time the transaction is negotiated. During the time a delayed delivery sell is outstanding, the contract is marked-to-market daily and equivalent deliverable securities are held for the transaction. The securities purchased on a delayed delivery or when-issued basis are identified as such in the Fund's Schedule of Investments. The Fund may receive compensation for interest forgone in the purchase of a delayed delivery or when-issued security. With respect to purchase commitments, the Fund identifies securities as segregated in its records with a value at least equal to the
Annual Report
4. Operating Policies - continued
Delayed Delivery Transactions and When-Issued Securities - continued
amount of the commitment. Losses may arise due to changes in the value of the underlying securities or if the counterparty does not perform under the contract's terms, or if the issuer does not issue the securities due to political, economic, or other factors.
Restricted Securities. The Fund may invest in securities that are subject to legal or contractual restrictions on resale. These securities generally may be resold in transactions exempt from registration or to the public if the securities are registered. Disposal of these securities may involve time-consuming negotiations and expense, and prompt sale at an acceptable price may be difficult. Information regarding restricted securities is included at the end of the Fund's Schedule of Investments.
Loans and Other Direct Debt Instruments. The Fund may invest in loans and loan participations, trade claims or other receivables. These investments may include standby financing commitments, including revolving credit facilities, that obligate the Fund to supply additional cash to the borrower on demand. Loan participations involve a risk of insolvency of the lending bank or other financial intermediary. The Fund may be contractually obligated to receive approval from the agent bank and/or borrower prior to the sale of these investments.
5. Derivative Instruments.
Risk Exposures and the Use of Derivative Instruments. The Fund used derivative instruments (derivatives), including swap agreements, in order to meet its investment objectives. The strategy is to use derivatives to increase returns, to gain exposure to certain types of assets and to manage exposure to certain risks as defined below. The success of any strategy involving derivatives depends on analysis of numerous economic factors, and if the strategies for investment do not work as intended, the Fund may not achieve its objectives.
The Fund's use of derivatives increased or decreased its exposure to the following risks:
Credit Risk | Credit risk relates to the ability of the issuer of a financial instrument to make further principal or interest payments on an obligation or commitment that it has to the Fund. |
Interest
Rate Risk | Interest rate risk relates to the fluctuations in the value of interest-bearing securities due to changes in the prevailing levels of market interest rates. |
The Fund is also exposed to additional risks from investing in derivatives, such as liquidity risk and counterparty credit risk. Liquidity risk is the risk that the Fund will be unable to sell the derivative in the open market in a timely manner. Counterparty credit risk is the risk that the counterparty will not be able to fulfill its obligation to the Fund.
Annual Report
Notes to Financial Statements - continued
(Amounts in thousands except ratios)
5. Derivative Instruments - continued
Risk Exposures and the Use of Derivative Instruments - continued
Derivative counterparty credit risk is managed through formal evaluation of the creditworthiness of all potential counterparties. On certain over-the-counter derivatives, the Fund attempts to reduce its exposure to counterparty credit risk by entering into an International Swaps and Derivatives Association (ISDA) Master Agreement on a bilateral basis with each of its counterparties. The ISDA Master Agreement gives the Fund the right to terminate all transactions traded under such agreement if there is a certain deterioration in the credit quality of the counterparty. The ISDA Master Agreement gives each party the right, upon an event of default by the other party or a termination of the agreement, to close out all transactions traded under such agreement and to net amounts owed under each transaction to one net payable by one party to the other. To mitigate counterparty credit risk, the Fund offsets certain payables and/or receivables with collateral. Collateral in the form of cash or securities, if required, is held in segregated accounts with the Fund's custodian bank in accordance with the collateral agreements entered into between the Fund, the swap counterparty and the Fund's custodian bank, and is identified in the Schedule of Investments. The Fund could experience delays and costs in gaining access to the collateral even though it is held by the Fund's custodian bank. The Fund's maximum risk of loss from counterparty credit risk is generally the aggregate unrealized appreciation and unpaid counterparty payments in excess of any collateral pledged by the counterparty to the Fund. Derivatives involve, to varying degrees, risk of loss in excess of the amounts recognized in the Statement of Assets and Liabilities.
Net Realized Gain (Loss) and Change in Net Unrealized Appreciation (Depreciation) on Derivatives. The table below, which reflects the impacts of derivatives on the financial performance of the Fund, summarizes the net realized gain (loss) and change in net unrealized appreciation (depreciation) for derivatives during the period.
Risk Exposure / Derivative Type | Net Realized
Gain (Loss) | Change in Net Unrealized Appreciation (Depreciation) |
Credit Risk | | |
Swap Agreements | (7,029) | 6,248 |
Interest Rate Risk | | |
Swap Agreements | (474) | - |
Totals (a) | $ (7,503) | $ 6,248 |
(a) A summary of the value of derivatives by risk exposure as of period end, is included at the end of the Schedule of Investments and is
representative of activity for the period.
Annual Report
5. Derivative Instruments - continued
Swap Agreements. A swap agreement (swap) is a contract between two parties to exchange future cash flows at periodic intervals based on a notional principal amount.
Details of swaps open at period end are included in the Schedule of Investments under the caption "Swap Agreements." Swaps are marked-to-market daily and changes in value are recorded as unrealized appreciation or (depreciation) and reflected in the Statement of Assets and Liabilities. Any upfront premiums paid or received upon entering a swap to compensate for differences between stated terms of the agreement and prevailing market conditions (e.g. credit spreads, interest rates or other factors) are recorded as realized gain or (loss) ratably over the term of the swap. Payments are exchanged at specified intervals, accrued daily commencing with the effective date of the contract and recorded as realized gain or (loss). Realized gain or (loss) is also recorded in the event of an early termination of a swap. The net realized gain (loss) and change in net unrealized appreciation (depreciation) on swaps during the period is included in the Statement of Operations.
Risks of loss include credit risk and interest rate risk. In addition, there is the risk of failure by the counterparty to perform under the terms of the agreement and lack of liquidity in the market.
Interest Rate Swaps. Interest rate swaps are agreements between counterparties to exchange cash flows, one based on a fixed rate, and the other on a floating rate. The Fund entered into interest rate swaps to manage its exposure to interest rate changes. Changes in interest rates can have an effect on both the value of bond holdings as well as the amount of interest income earned. In general, the value of bonds can fall when interest rates rise and can rise when interest rates fall.
Credit Default Swaps. Credit default swaps enable the Fund to buy or sell protection on a debt security or a basket of securities against a defined credit event. Under the terms of a credit default swap the buyer of protection (buyer) receives credit protection in exchange for making periodic payments to the seller of protection (seller) based on a fixed percentage applied to a notional principal amount. In return for these payments, the seller acts as a guarantor of the creditworthiness of a reference obligation. The Fund enters into credit default swaps as a seller to gain credit exposure to an issuer and/or as a buyer to provide a measure of protection against defaults of an issuer. The issuer may be either a single issuer or a "basket" of issuers. Periodic payments are made over the life of the contract provided that no credit event occurs.
For credit default swaps on most corporate and sovereign issuers, credit events include bankruptcy, failure to pay, obligation acceleration or repudiation/moratorium. For credit default swaps on corporate or sovereign issuers, the obligation that may be put to the seller is not limited to the specific reference obligation described in the Schedule of
Annual Report
Notes to Financial Statements - continued
(Amounts in thousands except ratios)
5. Derivative Instruments - continued
Credit Default Swaps - continued
Investments. For credit default swaps on asset-backed securities, a credit event may be triggered by events such as failure to pay principal, maturity extension, rating downgrade or write-down. For credit default swaps on asset-backed securities, the reference obligation described represents the security that may be put to the seller.
As a seller, if an underlying credit event occurs, the Fund will either pay the buyer an amount equal to the notional amount of the swap and take delivery of the reference obligation or underlying securities comprising an index or pay a net settlement amount of cash equal to the notional amount of the swap less the recovery value of the reference obligation or underlying securities comprising an index.
As a buyer, if an underlying credit event occurs, the Fund will either receive from the seller an amount equal to the notional amount of the swap and deliver the reference obligation or underlying securities comprising an index or receive a net settlement amount of cash equal to the notional amount of the swap less the recovery value of the reference obligation or underlying securities comprising an index.
Typically, the value of each credit default swap and credit rating disclosed for each reference obligation in the Schedule of Investments, where the Fund is the seller, can be used as measures of the current payment/performance risk of the swap. As the value of the swap changes as a positive or negative percentage of the total notional amount, the payment/performance risk may decrease or increase, respectively. In addition to these measures, FMR monitors a variety of factors including cash flow assumptions, market activity and market sentiment as part of its ongoing process of assessing payment/performance risk.
The notional amount of credit default swaps is included in the Schedule of Investments and approximates the maximum potential amount of future payments that the Fund could be required to make if the Fund is the seller and a credit event were to occur. The total notional amount of all credit default swaps open at period end where the Fund is the seller amounted to $34,305 representing 0.18% of net assets.
6. Purchases and Sales of Investments.
Purchases and sales of securities, including the Fixed-Income Central Funds, other than short-term securities, U.S. government securities and in-kind transactions, aggregated $13,681,540 and $14,936,836, respectively.
Annual Report
7. Fees and Other Transactions with Affiliates.
Management Fee. FMR and its affiliates provide the Fund with investment management related services for which the Fund pays a monthly management fee. The management fee is the sum of an individual fund fee rate that is based on an annual rate of .15% of the Fund's average net assets and a group fee rate that averaged .26% during the period. The group fee rate is based upon the average net assets of all the mutual funds advised by FMR. The group fee rate decreases as assets under management increase and increases as assets under management decrease. For the period, the total annual management fee rate was .41% of the Fund's average net assets.
Transfer Agent Fees. Fidelity Investments Institutional Operations Company, Inc. (FIIOC), an affiliate of FMR, is the transfer, dividend disbursing and shareholder servicing agent for each class of the Fund. FIIOC receives account fees and asset-based fees that vary according to the account size and type of account of the shareholders of Puritan. FIIOC receives an asset-based fee of Class K's average net assets. FIIOC pays for typesetting, printing and mailing of shareholder reports, except proxy statements. For the period, transfer agent fees for each class were as follows:
| Amount | % of
Average
Net Assets |
Puritan | 28,791 | .17 |
Class K | 1,532 | .05 |
| $ 30,323 | |
Accounting and Security Lending Fees. Fidelity Service Company, Inc. (FSC), an affiliate of FMR, maintains the Fund's accounting records. The accounting fee is based on the level of average net assets for the month. Under a separate contract, FSC administers the security lending program. The security lending fee is based on the number and duration of lending transactions.
Brokerage Commissions. The Fund placed a portion of its portfolio transactions with brokerage firms which are affiliates of the investment adviser. The commissions paid to these affiliated firms were $266 for the period.
Exchange In-Kind. During the period, the Fund redeemed in-kind 2,207 shares of Fidelity Corporate Bond 1-10 Year Central Fund ("1-10 Year"), a Fidelity Central Fund in which the Fund invests, valued at $239,305 in exchange for cash and securities, including accrued interest. Realized gain (loss) of $18,783 on the Fund's redemption of 1-10 Year shares is included in the accompanying Statement of Operations as "Realized gain (loss) on Fidelity Central Funds." Because 1-10 Year was a partnership for federal income tax purposes, the redemption generally was tax free to the Fund.
Annual Report
Notes to Financial Statements - continued
(Amounts in thousands except ratios)
8. Committed Line of Credit.
The Fund participates with other funds managed by FMR or an affiliate in a $4.0 billion credit facility (the "line of credit") to be utilized for temporary or emergency purposes to fund shareholder redemptions or for other short-term liquidity purposes. The Fund has agreed to pay commitment fees on its pro-rata portion of the line of credit, which amounted to $65 and is reflected in Miscellaneous expenses on the Statement of Operations. During the period, there were no borrowings on this line of credit.
9. Security Lending.
The Fund lends portfolio securities from time to time in order to earn additional income. For equity securities, a lending agent is used and may loan securities to certain qualified borrowers, including Fidelity Capital Markets (FCM), a broker-dealer affiliated with the Fund. On the settlement date of the loan, the Fund receives collateral (in the form of U.S. Treasury obligations, letters of credit and/or cash) against the loaned securities and maintains collateral in an amount not less than 100% of the market value of the loaned securities during the period of the loan. The market value of the loaned securities is determined at the close of business of the Fund and any additional required collateral is delivered to the Fund on the next business day. If the borrower defaults on its obligation to return the securities loaned because of insolvency or other reasons, a fund could experience delays and costs in recovering the securities loaned or in gaining access to the collateral. Any cash collateral received is maintained at the Fund's custodian and/or invested in cash equivalents and/or the Fidelity Securities Lending Cash Central Fund. The value of loaned securities and cash collateral at period end are disclosed on the Fund's Statement of Assets and Liabilities. The value of securities loaned to FCM at period end was $251. Security lending income represents the income earned on investing cash collateral, less rebates paid to borrowers and any lending agent fees associated with the loan, plus any premium payments received for lending certain types of securities. Total security lending income during the period, presented in the Statement of Operations as a component of interest income, amounted to $258. Net income from the Fidelity Securities Lending Cash Central Fund during the period, presented in the Statement of Operations as a component of income from Fidelity Central Funds, amounted to $3,599 (including $117 from securities loaned to FCM).
10. Expense Reductions.
Many of the brokers with whom FMR places trades on behalf of the Fund provided services to the Fund in addition to trade execution. These services included payments of certain expenses on behalf of the Fund totaling $1,107 for the period. In addition, through arrangements with the Fund's custodian, credits realized as a result of uninvested cash balances were used to reduce the Fund's expenses. During the period, these credits reduced the Fund's expenses by $5.
Annual Report
11. Distributions to Shareholders.
Distributions to shareholders of each class were as follows:
Years ended August 31, | 2011 | 2010 |
From net investment income | | |
Puritan | $ 333,862 | $ 395,626 |
Class K | 62,045 | 46,093 |
Total | $ 395,907 | $ 441,719 |
From net realized gain | | |
Puritan | $ 2,823 | $ 10,418 |
Class K | 441 | 1,077 |
Total | $ 3,264 | $ 11,495 |
12. Share Transactions.
Transactions for each class of shares were as follows:
| Shares | Dollars |
Years ended August 31, | 2011 | 2010 | 2011 | 2010 |
Puritan | | | | |
Shares sold | 80,583 | 76,931 | $ 1,457,491 | $ 1,241,703 |
Reinvestment of distributions | 17,715 | 24,218 | 318,717 | 385,575 |
Shares redeemed | (180,664) | (218,263) | (3,262,008) | (3,516,873) |
Net increase (decrease) | (82,366) | (117,114) | $ (1,485,800) | $ (1,889,595) |
Class K | | | | |
Shares sold | 63,847 | 67,219 | $ 1,155,980 | $ 1,078,159 |
Reinvestment of distributions | 3,457 | 2,954 | 62,486 | 47,170 |
Shares redeemed | (30,388) | (23,457) | (549,211) | (375,830) |
Net increase (decrease) | 36,916 | 46,716 | $ 669,255 | $ 749,499 |
13. Other.
The Fund's organizational documents provide former and current trustees and officers with a limited indemnification against liabilities arising in connection with the performance of their duties to the Fund. In the normal course of business, the Fund may also enter into contracts that provide general indemnifications. The Fund's maximum exposure under these arrangements is unknown as this would be dependent on future claims that may be made against the Fund. The risk of material loss from such claims is considered remote.
Annual Report
To the Trustees of Fidelity Puritan Trust and the Shareholders of Fidelity Puritan Fund:
In our opinion, the accompanying statement of assets and liabilities, including the schedule of investments, and the related statements of operations and of changes in net assets and the financial highlights present fairly, in all material respects, the financial position of Fidelity Puritan Fund (a fund of Fidelity Puritan Trust) at August 31, 2011, the results of its operations for the year then ended, the changes in its net assets for each of the two years in the period then ended and the financial highlights for each of the periods indicated, in conformity with accounting principles generally accepted in the United States of America. These financial statements and financial highlights (hereafter referred to as "financial statements") are the responsibility of the Fidelity Puritan Fund's management. Our responsibility is to express an opinion on these financial statements based on our audits. We conducted our audits of these financial statements in accordance with the standards of the Public Company Accounting Oversight Board (United States). Those standards require that we plan and perform the audit to obtain reasonable assurance about whether the financial statements are free of material misstatement. An audit includes examining, on a test basis, evidence supporting the amounts and disclosures in the financial statements, assessing the accounting principles used and significant estimates made by management, and evaluating the overall financial statement presentation. We believe that our audits, which included confirmation of securities at August 31, 2011 by correspondence with the custodian and brokers, provide a reasonable basis for our opinion.
/s/ PricewaterhouseCoopers LLP
PricewaterhouseCoopers LLP
Boston, Massachusetts
October 19, 2011
Annual Report
The Trustees, Members of the Advisory Board, and executive officers of the trust and fund, as applicable, are listed below. The Board of Trustees governs the fund and is responsible for protecting the interests of shareholders. The Trustees are experienced executives who meet periodically throughout the year to oversee the fund's activities, review contractual arrangements with companies that provide services to the fund, oversee management of the risks associated with such activities and contractual arrangements, and review the fund's performance. Except for James C. Curvey, each of the Trustees oversees 221 funds advised by FMR or an affiliate. Mr. Curvey oversees 424 funds advised by FMR or an affiliate.
The Trustees hold office without limit in time except that (a) any Trustee may resign; (b) any Trustee may be removed by written instrument, signed by at least two-thirds of the number of Trustees prior to such removal; (c) any Trustee who requests to be retired or who has become incapacitated by illness or injury may be retired by written instrument signed by a majority of the other Trustees; and (d) any Trustee may be removed at any special meeting of shareholders by a two-thirds vote of the outstanding voting securities of the trust. Each Trustee who is not an interested person (as defined in the 1940 Act) (Independent Trustee), shall retire not later than the last day of the calendar year in which his or her 75th birthday occurs. The Independent Trustees may waive this mandatory retirement age policy with respect to individual Trustees. The executive officers and Advisory Board Members hold office without limit in time, except that any officer and Advisory Board Member may resign or may be removed by a vote of a majority of the Trustees at any regular meeting or any special meeting of the Trustees. Except as indicated, each individual has held the office shown or other offices in the same company for the past five years.
Experience, Skills, Attributes, and Qualifications of the Fund's Trustees. The Governance and Nominating Committee has adopted a statement of policy that describes the experience, qualifications, attributes, and skills that are necessary and desirable for potential Independent Trustee candidates (Statement of Policy). The Board believes that each Trustee satisfied at the time he or she was initially elected or appointed a Trustee, and continues to satisfy, the standards contemplated by the Statement of Policy. The Governance and Nominating Committee also engages professional search firms to help identify potential Independent Trustee candidates who have the experience, qualifications, attributes, and skills consistent with the Statement of Policy. From time to time, additional criteria based on the composition and skills of the current Independent Trustees, as well as experience or skills that may be appropriate in light of future changes to board composition, business conditions, and regulatory or other developments, have also been considered by the professional search firms and the Governance and Nominating Committee. In addition, the Board takes into account the Trustees' commitment and participation in Board and committee meetings, as well as their leadership of standing and ad hoc committees throughout their tenure.
In determining that a particular Trustee was and continues to be qualified to serve as a Trustee, the Board has considered a variety of criteria, none of which, in isolation, was controlling. The Board believes that, collectively, the Trustees have balanced and diverse experience, qualifications, attributes, and skills, which allow the Board to operate effectively in governing the fund and protecting the interests of shareholders. Information about the specific experience, skills, attributes, and qualifications of each Trustee, which in each case led to the Board's conclusion that the Trustee should serve (or continue to serve) as a trustee of the fund, is provided below.
Annual Report
Board Structure and Oversight Function. James C. Curvey is an interested person (as defined in the 1940 Act) and currently serves as Acting Chairman. The Trustees have determined that an interested Chairman is appropriate and benefits shareholders because an interested Chairman has a personal and professional stake in the quality and continuity of services provided to the fund. Independent Trustees exercise their informed business judgment to appoint an individual of their choosing to serve as Chairman, regardless of whether the Trustee happens to be independent or a member of management. The Independent Trustees have determined that they can act independently and effectively without having an Independent Trustee serve as Chairman and that a key structural component for assuring that they are in a position to do so is for the Independent Trustees to constitute a substantial majority for the Board. The Independent Trustees also regularly meet in executive session. Ned C. Lautenbach serves as Chairman of the Independent Trustees and as such (i) acts as a liaison between the Independent Trustees and management with respect to matters important to the Independent Trustees and (ii) with management prepares agendas for Board meetings.
Fidelity funds are overseen by different Boards of Trustees. The fund's Board oversees Fidelity's equity and high income funds and another Board oversees Fidelity's investment-grade bond, money market, and asset allocation funds. The asset allocation funds may invest in Fidelity funds overseen by the fund's Board. The use of separate Boards, each with its own committee structure, allows the Trustees of each group of Fidelity funds to focus on the unique issues of the funds they oversee, including common research, investment, and operational issues. On occasion, the separate Boards establish joint committees to address issues of overlapping consequences for the Fidelity funds overseen by each Board.
The Trustees operate using a system of committees to facilitate the timely and efficient consideration of all matters of importance to the Trustees, the fund, and fund shareholders and to facilitate compliance with legal and regulatory requirements and oversight of the fund's activities and associated risks. The Board, acting through its committees, has charged FMR and its affiliates with (i) identifying events or circumstances the occurrence of which could have demonstrably adverse effects on the fund's business and/or reputation; (ii) implementing processes and controls to lessen the possibility that such events or circumstances occur or to mitigate the effects of such events or circumstances if they do occur; and (iii) creating and maintaining a system designed to evaluate continuously business and market conditions in order to facilitate the identification and implementation processes described in (i) and (ii) above. Because the day-to-day operations and activities of the fund are carried out by or through FMR, its affiliates and other service providers, the fund's exposure to risks is mitigated but not eliminated by the processes overseen by the Trustees. While each of the Board's committees has responsibility for overseeing different aspects of the fund's activities, oversight is exercised primarily through the Operations, Audit, and Compliance Committees. In addition, the Independent Trustees have worked with FMR to enhance the Board's oversight of investment and financial risks, legal and regulatory risks, technology risks, and operational risks, including the development of additional risk reporting to the Board. For example, a working group comprised of Independent Trustees and FMR has worked and continues to work to review the Fidelity funds' valuation-related activities, reporting and risk management. Appropriate personnel, including but not limited to the fund's Chief Compliance Officer (CCO), FMR's internal auditor, the independent accountants, the fund's Treasurer and portfolio management personnel, make periodic reports to the Board's committees, as appropriate, including an annual review of FMR's risk management program for the Fidelity funds. The responsibilities of each standing committee, including their oversight responsibilities, are described further under "Standing Committees of the Fund's Trustees."
Annual Report
Trustees and Officers - continued
The fund's Statement of Additional Information (SAI) includes more information about the Trustees. To request a free copy, call Fidelity at 1-800-835-5092.
Interested Trustees*:
Correspondence intended for each Trustee who is an interested person may be sent to Fidelity Investments, 82 Devonshire Street, Boston, Massachusetts 02109.
Name, Age; Principal Occupations and Other Relevant Experience+ |
James C. Curvey (76) |
| Year of Election or Appointment: 2007 Mr. Curvey is Trustee and Acting Chairman of the Board of Trustees of certain Trusts. Mr. Curvey also serves as Trustee (2007-present) of other investment companies advised by FMR. Mr. Curvey is a Director of Fidelity Investments Money Management, Inc. (2009-present), Director of Fidelity Research & Analysis Co. (2009-present) and Director of FMR and FMR Co., Inc. (2007-present). Mr. Curvey is also Vice Chairman (2007-present) and Director of FMR LLC. In addition, Mr. Curvey serves as an Overseer for the Boston Symphony Orchestra and a member of the Trustees of Villanova University. Previously, Mr. Curvey was the Vice Chairman (2006-2007) and Director (2000-2007) of FMR Corp. |
Ronald P. O'Hanley (54) |
| Year of Election or Appointment: 2011 Mr. O'Hanley is Director of FMR Co., Inc. (2010-present), Director of Fidelity Investments Money Management, Inc. (2010-present), Director of Fidelity Research & Analysis Company (2010-present), President of Fidelity Asset Management and Corporate Services and a member of Fidelity's Executive Committee (2010-present). Previously, Mr. O'Hanley served as President and Chief Executive Officer of BNY Mellon Asset Management (2007-2010). Mr. O'Hanley also served as Vice Chairman of Bank New York Mellon Corp. and a member of that firm's Executive Committee. Prior to the 2007 merger of The Bank of New York and Mellon Financial Corporation, he was Vice Chairman of Mellon Financial Corporation and President and Chief Executive Officer of Mellon Asset Management. He joined Mellon in February 1997. Mr. O'Hanley currently serves as Chairman of the Boston Public Library Foundation Board of Directors and sits on the Board of Directors of Beth Israel Deaconess Medical Center, the Board of Trustees of the Marine Biological Laboratory and the Advisory Board of the Maxwell School of Citizenship and Public Administration at Syracuse University. Mr. O'Hanley also chairs the Council on Asset Management for the Financial Services Roundtable and is a member of the Board of Directors of Institutional Investor's U.S. Institute. |
* Trustees have been determined to be "Interested Trustees" by virtue of, among other things, their affiliation with the trust or various entities under common control with FMR.
+ The information above includes each Trustee's principal occupation during the last five years and other information relating to the experience, attributes, and skills relevant to each Trustee's qualifications to serve as a Trustee, which led to the conclusion that each Trustee should serve as a Trustee for the fund.
Annual Report
Trustees and Officers - continued
Independent Trustees:
Correspondence intended for each Independent Trustee (that is, the Trustees other than the Interested Trustees) may be sent to Fidelity Investments, P.O. Box 55235, Boston, Massachusetts 02205-5235.
Name, Age; Principal Occupations and Other Relevant Experience+ |
Dennis J. Dirks (63) |
| Year of Election or Appointment: 2005 Prior to his retirement in May 2003, Mr. Dirks was Chief Operating Officer and a member of the Board of The Depository Trust & Clearing Corporation (DTCC). He also served as President, Chief Operating Officer, and Board member of The Depository Trust Company (DTC) and President and Board member of the National Securities Clearing Corporation (NSCC). In addition, Mr. Dirks served as Chief Executive Officer and Board member of the Government Securities Clearing Corporation, Chief Executive Officer and Board member of the Mortgage-Backed Securities Clearing Corporation, as a Trustee and a member of the Finance Committee of Manhattan College (2005-2008), and as a Trustee and a member of the Finance Committee of AHRC of Nassau County (2006-2008). Mr. Dirks is a member of the Independent Directors Council (IDC) Governing Council (2010-Present) and Board of Directors for The Brookville Center for Children's Services, Inc. (2009-present). |
Alan J. Lacy (57) |
| Year of Election or Appointment: 2008 Mr. Lacy serves as Senior Adviser (2007-present) of Oak Hill Capital Partners, L.P. (private equity). Mr. Lacy also served as Chief Executive Officer (2000-2005) and Vice Chairman (2005-2006) of Sears Holdings Corporation and Sears, Roebuck and Co. (retail). In addition, Mr. Lacy serves as a member of the Board of Directors of Dave & Buster's, Inc. (restaurant and entertainment complexes, 2010-present), The Hillman Companies, Inc. (hardware wholesalers, 2010-present), and Bristol-Myers Squibb Company (global pharmaceuticals, 2007-present). Mr. Lacy is a member of the Board of Trustees of The National Parks Conservation Association (2006-Present). Previously, Mr. Lacy served as Chairman of the Board of Trustees of the National Parks Conservation Association (2008-2011) and as a member of the Board of Directors for the Western Union Company (global money transfer, 2006-2011). |
Ned C. Lautenbach (67) |
| Year of Election or Appointment: 2000 Mr. Lautenbach is Chairman of the Independent Trustees of the Equity and High Income Funds (2006-present). Mr. Lautenbach currently serves as the Lead Director of the Eaton Corporation Board of Directors (diversified industrial, 1997-present). Mr. Lautenbach is also a member of the Board of Directors of the Philharmonic Center for the Arts in Naples, Florida (1999-present); a member of the Board of Trustees of Fairfield University (2005-present); and a member of the Council on Foreign Relations (1994-present). Previously, Mr. Lautenbach was a Partner/Advisory Partner at Clayton, Dubilier & Rice, LLC (private equity investment, 1998-2010), as well as a Director of Sony Corporation (2006-2007). |
Joseph Mauriello (66) |
| Year of Election or Appointment: 2008 Prior to his retirement in January 2006, Mr. Mauriello served in numerous senior management positions including Deputy Chairman and Chief Operating Officer (2004-2005), and Vice Chairman of Financial Services (2002-2004) of KPMG LLP US (professional services, 1965-2005). Mr. Mauriello currently serves as a member of the Board of Directors of XL Group plc. (global insurance and re-insurance, 2006-present) and of Arcadia Resources Inc. (health care services and products, 2007-present). Previously, Mr. Mauriello served as a Director of the Hamilton Funds of the Bank of New York (2006-2007). |
Robert W. Selander (60) |
| Year of Election or Appointment: 2011 Previously, Mr. Selander served as a Member of the Advisory Board of Fidelity's Equity and High Income Funds (2011), Executive Vice Chairman (2010), Chief Executive Officer (2009-2010), and President and Chief Executive Officer (1997-2009) of Mastercard, Inc. |
Cornelia M. Small (67) |
| Year of Election or Appointment: 2005 Ms. Small is a member of the Board of Directors of the Teagle Foundation (2009-present). Ms. Small is also a member of the Investment Committee, and Chair (2008-present) and a member of the Board of Trustees of Smith College. In addition, Ms. Small serves on the Investment Committee of the Berkshire Taconic Community Foundation (2008-present). Previously, Ms. Small served as Chairperson of the Investment Committee (2002-2008) of Smith College. In addition, Ms. Small served as Chief Investment Officer, Director of Global Equity Investments, and a member of the Board of Directors of Scudder, Stevens & Clark and Scudder Kemper Investments. |
William S. Stavropoulos (72) |
| Year of Election or Appointment: 2001 Mr. Stavropoulos is Vice Chairman of the Independent Trustees of the Equity and High Income Funds (2006-present). Mr. Stavropoulos serves as President and Founder of the Michigan Baseball Foundation, the Great Lakes Loons (2007-present). Mr. Stavropoulos is Chairman Emeritus of the Board of Directors of The Dow Chemical Company, where he previously served in numerous senior management positions, including President, CEO (1995-2000; 2002-2004), Chairman of the Executive Committee (2000-2006), and as a member of the Board of Directors (1990-2006). Currently, Mr. Stavropoulos is Chairman of Univar (global distributor of commodity and specialty chemicals, 2010-present), a Director of Teradata Corporation (data warehousing and technology solutions, 2008-present), Chemical Financial Corporation, Maersk Inc. (industrial conglomerate), Tyco International, Inc. (multinational manufacturing and services, 2007-present), and a member of the Advisory Board for Metalmark Capital (private equity investment, 2005-present). Mr. Stavropoulos is a special advisor to Clayton, Dubilier & Rice, LLC (private equity investment). In addition, Mr. Stavropoulos is a member of the University of Notre Dame Advisory Council for the College of Science. |
David M. Thomas (62) |
| Year of Election or Appointment: 2008 Previously, Mr. Thomas served as Executive Chairman (2005-2006) and Chairman and Chief Executive Officer (2000-2005) of IMS Health, Inc. (pharmaceutical and healthcare information solutions). In addition, Mr. Thomas serves as a member of the Board of Directors of Fortune Brands, Inc. (consumer products), and Interpublic Group of Companies, Inc. (marketing communication, 2004-present). |
Michael E. Wiley (60) |
| Year of Election or Appointment: 2008 Mr. Wiley also serves as a Director of Asia Pacific Exploration Consolidated (international oil and gas exploration and production, 2008-present). Mr. Wiley serves as a Director of Tesoro Corporation (independent oil refiner and marketer, 2005-present), and a Director of Bill Barrett Corporation (exploration and production, 2005-present). In addition, Mr. Wiley also serves as a Director of Post Oak Bank (privately-held bank, 2004-present). Previously, Mr. Wiley served as a member of the Board of Trustees of the University of Tulsa (2000-2006; 2007-2010), as a Senior Energy Advisor of Katzenbach Partners, LLC (consulting, 2006-2007), as an Advisory Director of Riverstone Holdings (private investment), Chairman, President, and CEO of Baker Hughes, Inc. (oilfield services, 2000-2004), and as Director of Spinnaker Exploration Company (exploration and production, 2001-2005). |
Annual Report
+ The information above includes each Trustee's principal occupation during the last five years and other information relating to the experience, attributes, and skills relevant to each Trustee's qualifications to serve as a Trustee, which led to the conclusion that each Trustee should serve as a Trustee for the fund.
Advisory Board Members and Executive Officers:
Correspondence intended for each executive officer Edward C. Johnson 3d and Peter S. Lynch may be sent to Fidelity Investments, 82 Devonshire Street, Boston, Massachusetts 02109.
Name, Age; Principal Occupation |
Edward C. Johnson 3d (81) |
| Year of Election or Appointment: 2011 Member of the Advisory Board of Fidelity's Equity and High Income Funds. Mr. Johnson serves as Chief Executive Officer, Chairman, and a Director of FMR LLC, and also serves as Chairman and Director of FIL Limited. Previously, Mr. Johnson served as a Trustee and Chairman of the Board of certain Fidelity Trusts, Chairman and a Director of FMR, Chairman and a Director of FMR Co., Inc., and President of FMR LLC (2006-2007). |
Peter S. Lynch (67) |
| Year of Election or Appointment: 2003 Member of the Advisory Board of Fidelity's Equity and High Income Funds. Mr. Lynch is Vice Chairman and a Director of FMR and FMR Co., Inc. In addition, Mr. Lynch serves as a Trustee of Boston College and as the Chairman of the Inner-City Scholarship Fund. Previously, Mr. Lynch served on the Special Olympics International Board of Directors (1997-2006). |
Kenneth B. Robins (42) |
| Year of Election or Appointment: 2008 President and Treasurer of Fidelity's Equity and High Income Funds. Mr. Robins also serves as President and Treasurer (2010-present) and Assistant Treasurer (2009-present) of other Fidelity funds and is an employee of Fidelity Investments (2004-present). Previously, Mr. Robins served as Deputy Treasurer of the Fidelity funds (2005-2008) and Treasurer and Chief Financial Officer of The North Carolina Capital Management Trust: Cash and Term Portfolios (2006-2008). |
Bruce T. Herring (46) |
| Year of Election or Appointment: 2006 Vice President of certain Equity Funds. Mr. Herring also serves as Chief Investment Officer and Director of Fidelity Management & Research (U.K.) Inc. (2010-present) and Group Chief Investments Officer of FMR. Previously, Mr. Herring served as Vice President (2005-2006) and Senior Vice President (2006-2007) of Fidelity Management & Research Company, Vice President of FMR Co., Inc. (2001-2007) and as a portfolio manager for Fidelity U.S. Equity Funds. |
Brian B. Hogan (46) |
| Year of Election or Appointment: 2009 Vice President of Equity and High Income Funds. Mr. Hogan also serves as President of FMR's Equity Division (2009-present). Previously, Mr. Hogan served as Senior Vice President, Equity Research of FMR (2006-2009) and as a portfolio manager. |
Scott C. Goebel (43) |
| Year of Election or Appointment: 2008 Secretary and Chief Legal Officer (CLO) of the Fidelity funds. Mr. Goebel also serves as Secretary of Fidelity Investments Money Management, Inc. (FIMM) (2010-present) and Fidelity Research and Analysis Company (FRAC) (2010-present); Secretary and CLO of The North Carolina Capital Management Trust: Cash and Term Portfolios (2008-present); General Counsel, Secretary, and Senior Vice President of FMR (2008-present) and FMR Co., Inc. (2008-present); employed by FMR LLC or an affiliate (2001-present); Chief Legal Officer of Fidelity Management & Research (Hong Kong) Limited (2008-present) and Assistant Secretary of Fidelity Management & Research (Japan) Inc. (2008-present), and Fidelity Management & Research (U.K.) Inc. (2008-present). Previously, Mr. Goebel served as Assistant Secretary of FIMM (2008-2010), FRAC (2008-2010), and the Funds (2007-2008) and as Vice President and Secretary of Fidelity Distributors Corporation (FDC) (2005-2007). |
William C. Coffey (42) |
| Year of Election or Appointment: 2009 Assistant Secretary of Fidelity's Equity and High Income Funds. Mr. Coffey also serves as Senior Vice President and Deputy General Counsel of FMR LLC (2010-present), and is an employee of Fidelity Investments. Previously, Mr. Coffey served as Vice President and Associate General Counsel of FMR LLC (2005-2009). |
Holly C. Laurent (57) |
| Year of Election or Appointment: 2008 Anti-Money Laundering (AML) Officer of the Fidelity funds. Ms. Laurent also serves as AML Officer of The North Carolina Capital Management Trust: Cash and Term Portfolios (2008-present) and is an employee of Fidelity Investments. Previously, Ms. Laurent was Senior Vice President and Head of Legal for Fidelity Business Services India Pvt. Ltd. (2006-2008), and Senior Vice President, Deputy General Counsel and Group Head for FMR LLC (2005-2006). |
Christine Reynolds (52) |
| Year of Election or Appointment: 2008 Chief Financial Officer of the Fidelity funds. Ms. Reynolds became President of Fidelity Pricing and Cash Management Services (FPCMS) in August 2008. Ms. Reynolds served as Chief Operating Officer of FPCMS (2007-2008). Previously, Ms. Reynolds served as President, Treasurer, and Anti-Money Laundering officer of the Fidelity funds (2004-2007). |
Kenneth A. Rathgeber (64) |
| Year of Election or Appointment: 2004 Chief Compliance Officer of Fidelity's Equity and High Income Funds. Mr. Rathgeber is Chief Compliance Officer of Fidelity Management & Research (Hong Kong) Limited (2008-present), Fidelity Management & Research (Japan) Inc. (2008-present), FMR (2005-present), FMR Co., Inc. (2005-present), Fidelity Management & Research (U.K.) Inc. (2005-present), Fidelity Research & Analysis Company (2005-present), Fidelity Investments Money Management, Inc. (2005-present), Pyramis Global Advisors, LLC (2005-present), and Strategic Advisers, Inc. (2005-present). |
Jeffrey S. Christian (49) |
| Year of Election or Appointment: 2009 Deputy Treasurer of the Fidelity funds. Mr. Christian is an employee of Fidelity Investments. Previously, Mr. Christian served as Chief Financial Officer (2008-2009) of certain Fidelity funds and Senior Vice President of Fidelity Pricing and Cash Management Services (FPCMS) (2004-2009). |
Bryan A. Mehrmann (50) |
| Year of Election or Appointment: 2005 Deputy Treasurer of the Fidelity funds. Mr. Mehrmann is an employee of Fidelity Investments. |
Adrien E. Deberghes (44) |
| Year of Election or Appointment: 2008 Deputy Treasurer of Fidelity's Equity and High Income Funds. Mr. Deberghes also serves as Vice President and Assistant Treasurer of Fidelity Rutland Square Trust II and Fidelity Commonwealth Trust II (2011-present), Assistant Treasurer of other Fidelity funds (2010-present), and is an employee of Fidelity Investments (2008-present). Previously, Mr. Deberghes served as Senior Vice President of Mutual Fund Administration at State Street Corporation (2007-2008), Senior Director of Mutual Fund Administration at Investors Bank & Trust (2005-2007), and Director of Finance for Dunkin' Brands (2000-2005). |
Stephanie J. Dorsey (42) |
| Year of Election or Appointment: 2010 Assistant Treasurer of Fidelity's Equity and High Income Funds. Ms. Dorsey also serves as Deputy Treasurer of other Fidelity funds (2008-present) and is an employee of Fidelity Investments (2008-present). Previously, Ms. Dorsey served as Treasurer (2004-2008) of the JPMorgan Mutual Funds and Vice President (2004-2008) of JPMorgan Chase Bank. |
John R. Hebble (53) |
| Year of Election or Appointment: 2009 Assistant Treasurer of Fidelity's Equity and High Income Funds. Mr. Hebble also serves as President (2011-present), Treasurer, and Chief Financial Officer of The North Carolina Capital Management Trust: Cash and Term Portfolios (2008-present), President and Treasurer of other Fidelity funds (2008-present) and is an employee of Fidelity Investments. |
Gary W. Ryan (53) |
| Year of Election or Appointment: 2005 Assistant Treasurer of the Fidelity funds. Mr. Ryan is an employee of Fidelity Investments. Previously, Mr. Ryan served as Vice President of Fund Reporting in Fidelity Pricing and Cash Management Services (FPCMS) (1999-2005). |
Jonathan Davis (43) |
| Year of Election or Appointment: 2010 Assistant Treasurer of the Fidelity funds. Mr. Davis is also Assistant Treasurer of Fidelity Rutland Square Trust II and Fidelity Commonwealth Trust II. Mr. Davis is an employee of Fidelity Investments. Previously, Mr. Davis served as Vice President and Associate General Counsel of FMR LLC (2003-2010). |
Annual Report
A total of 6.24% of the dividends distributed during the fiscal year was derived from interest on U.S. Government securities which is generally exempt from state income tax.
Class K designates $147,068,243 of distributions paid during the period January 1, 2011 to August 31, 2011 as qualifying to be taxed as interest-related dividends for nonresident alien shareholders.
Class K designates 12%, 40%, 38% and 39% of the dividends distributed in October, December, April and July, respectively during the fiscal year as qualifying for the dividends-received deduction for corporate shareholders.
Class K designates 11%, 38%, 51% and 52% of the dividends distributed in October, December, April and July, respectively during the fiscal year as amounts which may be taken into account as a dividend for the purposes of the maximum rate under section 1(h)(11) of the Internal Revenue Code.
The fund will notify shareholders in January 2012 of amounts for use in preparing 2011 income tax returns.
Annual Report
Board Approval of Investment Advisory Contracts and Management Fees
Fidelity Puritan Fund
Each year, the Board of Trustees, including the Independent Trustees (together, the Board), votes on the renewal of the management contract and sub-advisory agreements (together, the Advisory Contracts) for the fund. The Board, assisted by the advice of fund counsel and Independent Trustees' counsel, requests and considers a broad range of information relevant to the renewal of the Advisory Contracts throughout the year.
The Board meets regularly and considers at each of its meetings factors that are relevant to its annual consideration of the renewal of the fund's Advisory Contracts, including the services and support provided to the fund and its shareholders. The Board has established various standing committees, each composed of Independent Trustees with varying backgrounds, to which the Board has assigned specific subject matter responsibilities in order to enhance effective decision-making by the Board. The Board, acting directly and through its Committees, requests and receives information concerning the annual consideration of the renewal of the fund's Advisory Contracts. The Board also meets as needed to consider matters specifically related to the Board's annual consideration of the renewal of Advisory Contracts. Members of the Board may also meet with trustees of other Fidelity funds through ad hoc joint committees to discuss certain matters relevant to the Fidelity funds.
At its July 2011 meeting, the Board of Trustees, including the Independent Trustees, unanimously determined to renew the fund's Advisory Contracts. In reaching its determination, the Board considered all factors it believed relevant, including (i) the nature, extent, and quality of the services to be provided to the fund and its shareholders (including the investment performance of the fund); (ii) the competitiveness of the fund's management fee and total expense ratio; (iii) the total costs of the services to be provided by and the profits to be realized by Fidelity from its relationship with the fund; (iv) the extent to which economies of scale would be realized as the fund grows; and (v) whether fee levels reflect these economies of scale, if any, for the benefit of fund shareholders.
In considering whether to renew the Advisory Contracts for the fund, the Board reached a determination, with the assistance of fund counsel and Independent Trustees' counsel and through the exercise of its business judgment, that the renewal of the Advisory Contracts is in the best interests of the fund and its shareholders and that the compensation payable under the Advisory Contracts is fair and reasonable. The Board's decision to renew the Advisory Contracts was not based on any single factor, but rather was based on a comprehensive consideration of all the information provided to the Board at its meetings throughout the year. The Board, in reaching its determination to renew the Advisory Contracts, is aware that shareholders in the fund have a broad range of investment choices available to them, including a wide choice among mutual funds offered by Fidelity's competitors, and that the fund's shareholders, who have the opportunity to review and weigh the disclosure provided by the fund in its prospectus and other public disclosures, have chosen to invest in this fund, managed by Fidelity.
Annual Report
Nature, Extent, and Quality of Services Provided. The Board considered the staffing within the investment adviser, FMR, and the sub-advisers (together, the Investment Advisers), including the backgrounds of the fund's investment personnel and the fund's investment objective and discipline. The Independent Trustees also had discussions with senior management of Fidelity's investment operations and investment groups. The Board considered the structure of the portfolio manager compensation program and whether this structure provides appropriate incentives to act in the best interests of the fund.
Resources Dedicated to Investment Management and Support Services. The Board and the Fund Oversight and Research Committees reviewed the general qualifications and capabilities of the Investment Advisers' investment staff, including its size, education, experience, and resources, as well as the Investment Advisers' approach to recruiting, training, managing, and compensating investment personnel. The Board also noted that FMR has devoted increased resources to non-U.S. offices. The Board noted that Fidelity's analysts have extensive resources, tools and capabilities which allow them to conduct sophisticated quantitative and fundamental analysis, as well as credit analysis of issuers, counterparties and enhancers. The Board also believes that Fidelity's investment professionals have sufficient access to global information and data so as to provide competitive investment results over time, and that those professionals also have access to sophisticated tools which permit them to assess portfolio construction and risk and performance attribution characteristics continuously, as well as to transmit new information and research conclusions rapidly around the world. Additionally, in their deliberations, the Board considered the Investment Advisers' trading capabilities and resources which are an integral part of the investment management process.
Shareholder and Administrative Services. The Board considered (i) the nature, extent, quality, and cost of advisory, administrative, and shareholder services performed by the Investment Advisers and their affiliates under the Advisory Contracts and under separate agreements covering transfer agency, pricing and bookkeeping, and securities lending services for the fund; (ii) the nature and extent of the investment adviser's supervision of third party service providers, principally custodians and subcustodians; and (iii) the resources devoted to, and the record of compliance with, the fund's compliance policies and procedures. The Board also reviewed the allocation of fund brokerage, including allocations to brokers affiliated with the Investment Advisers, the use of brokerage commissions to pay fund expenses, and the use of "soft" commission dollars to pay for research services.
The Board noted that the growth of fund assets over time across the complex allows Fidelity to reinvest in the development of services designed to enhance the value or convenience of the Fidelity funds as investment vehicles. These services include 24-hour access to account information and market information through telephone representatives and over the Internet, investor education materials and asset allocation tools, and the expanded availability of Fidelity Investor Centers, with 35 new branches opening since 2010.
Annual Report
Board Approval of Investment Advisory Contracts and
Management Fees - continued
Investment in a Large Fund Family. The Board considered the benefits to shareholders of investing in a Fidelity fund, including the benefits of investing in a fund that is part of a large family of funds offering a variety of investment disciplines and providing a large variety of mutual fund investor services. The Board noted that Fidelity had taken, or had made recommendations that resulted in the Fidelity funds taking, a number of actions over the previous year that benefited particular funds, including (i) continuing to dedicate additional resources to investment research and support of the senior management team that oversees asset management; (ii) rationalizing product lines through the mergers of six funds into other funds; (iii) continuing to migrate the Freedom Funds to dedicated lower cost underlying funds; (iv) obtaining shareholder approval to broaden the investment strategies for Fidelity Consumer Finance Portfolio, Fidelity Emerging Asia Fund, and Fidelity Environment and Alternative Energy Portfolio; (v) contractually agreeing to reduce the management fees and impose other expense limitations on Spartan 500 Index Fund and U.S. Bond Index Fund in connection with launching new institutional classes of these funds; (vi) changing the name, primary and supplemental benchmarks, and investment policies of Fidelity Global Strategies Fund to support the fund's flexible investment mandate and global orientation; and (vii) reducing the transfer agency account fee rates on certain accounts.
Investment Performance. The Board considered whether the fund has operated in accordance with its investment objective, as well as its record of compliance with its investment restrictions. It also reviewed the fund's absolute investment performance for each class, as well as the fund's relative investment performance for each class measured over multiple periods against (i) a proprietary custom index, and (ii) a peer group of mutual funds deemed appropriate by Fidelity and reviewed by the Board. The following charts considered by the Board show, over the one-, three-, and five-year periods ended December 31, 2010, as available, the cumulative total returns of Class K and the retail class of the fund, the cumulative total returns of a proprietary custom index ("benchmark"), and a range of cumulative total returns of a peer group of mutual funds identified by Lipper Inc. as having an investment objective similar to that of the fund. The box within each chart shows the 25th percentile return (bottom of box) and the 75th percentile return (top of box) of the peer group. Returns shown above the box are in the first quartile and returns shown below the box are in the fourth quartile. The percentage beaten numbers noted below each chart correspond to the percentile box and represent the percentage of funds in the peer group whose performance was equal to or lower than that of the class indicated. The fund's proprietary custom index is an index developed by FMR that represents the performance of the fund's general investment categories in both equity and bond securities.
Annual Report
Fidelity Puritan Fund
The Board reviewed the fund's relative investment performance against its peer group and noted that the performance of the retail class of the fund (the class with the longer performance record) was in the first quartile for the one- and five-year periods and the second quartile for the three-year period. The Board also noted that the investment performance of the retail class of the fund compared favorably to its benchmark for the one- and five-year periods, although the fund's three-year cumulative total return was lower than its benchmark. The Board considered that the variations in performance between the fund's classes reflect the variations in class expenses, which result in lower performance for the higher expense class. The Board also reviewed the fund's performance since inception as well as performance in the current year.
Based on its review, the Board concluded that the nature, extent, and quality of services provided to the fund under the Advisory Contracts should benefit the fund's shareholders.
Competitiveness of Management Fee and Total Expense Ratio. The Board considered the fund's management fee and total expense ratio compared to "mapped groups" of competitive funds and classes. Fidelity creates "mapped groups" by combining similar Lipper investment objective categories that have comparable management fee characteristics. Combining Lipper investment objective categories aids the Board's management fee and total expense ratio comparisons by broadening the competitive group used for comparison and by reducing the number of universes to which various Fidelity funds are compared.
Annual Report
Board Approval of Investment Advisory Contracts and
Management Fees - continued
Management Fee. The Board considered two proprietary management fee comparisons for the 12-month periods shown in the chart below. The group of Lipper funds used by the Board for management fee comparisons is referred to below as the "Total Mapped Group." The Total Mapped Group is broader than the Lipper peer group used by the Board for performance comparisons because the Total Mapped Group combines several Lipper investment objective categories while the Lipper peer group does not. The Total Mapped Group comparison focuses on a fund's standing relative to the total universe of comparable funds available to investors in terms of gross management fees before expense reimbursements or caps. "TMG %" represents the percentage of funds in the Total Mapped Group that had management fees that were lower than the fund's. For example, a TMG % of 10% means that 90% of the funds in the Total Mapped Group had higher management fees than the fund. The "Asset-Size Peer Group" (ASPG) comparison focuses on a fund's standing relative to non-Fidelity funds similar in size to the fund within the Total Mapped Group. The ASPG represents at least 15% of the funds in the Total Mapped Group with comparable asset size and management fee characteristics, subject to a minimum of 50 funds (or all funds in the Total Mapped Group if fewer than 50). Additional information, such as the ASPG quartile in which the fund's management fee ranked, is also included in the chart and considered by the Board.
Fidelity Puritan Fund
The Board noted that the fund's management fee ranked below the median of its Total Mapped Group and below the median of its ASPG for 2010.
Annual Report
Based on its review, the Board concluded that the fund's management fee is fair and reasonable in light of the services that the fund receives and the other factors considered.
Total Expense Ratio. In its review of each class's total expense ratio, the Board considered the fund's management fee as well as other fund or class expenses, as applicable, such as transfer agent fees, pricing and bookkeeping fees, and custodial, legal, and audit fees. The Board also noted the effects of any waivers and reimbursements on fees and expenses. As part of its review, the Board also considered the current and historical total expense ratios of each class of the fund compared to competitive fund median expenses. Each class of the fund is compared to those funds and classes in the Total Mapped Group (used by the Board for management fee comparisons) that have a similar sales load structure.
The Board noted that the total expense ratio of each class ranked below its competitive median for 2010. The Board considered that various factors, including 12b-1 fees, positive or negative performance adjustments, and relatively higher other expenses in the case of small fund size, can affect total expense ratios.
Fees Charged to Other Fidelity Clients. The Board also considered Fidelity fee structures and other information with respect to clients of FMR and its affiliates, such as other mutual funds advised or subadvised by FMR or its affiliates, pension plan clients, and other institutional clients. In March 2010, the Board created an ad hoc joint committee with the board of other Fidelity funds (the Committee) to review and compare Fidelity's institutional investment advisory business with its business of providing services to the Fidelity funds, including the differences in services provided, fees charged, and costs incurred, as well as competition in their respective marketplaces.
Based on its review of total expense ratios and fees charged to other Fidelity clients, the Board concluded that the total expense ratio of each class of the fund was reasonable in light of the services that the fund and its shareholders receive and the other factors considered, including the findings of the Committee.
Costs of the Services and Profitability. The Board considered the revenues earned and the expenses incurred by Fidelity in conducting the business of developing, marketing, distributing, managing, administering and servicing the fund and its shareholders. The Board also considered the level of Fidelity's profits in respect of all the Fidelity funds.
On an annual basis, FMR presents to the Board Fidelity's profitability for the fund. Fidelity calculates the profitability for each fund, as well as aggregate profitability for groups of Fidelity funds and all Fidelity funds, using a series of detailed revenue and cost allocation methodologies which originate with the books and records of Fidelity on which Fidelity's audited financial statements are based. The Audit Committee of the Board reviews any significant changes from the prior year's methodologies.
Annual Report
Board Approval of Investment Advisory Contracts and
Management Fees - continued
PricewaterhouseCoopers LLP (PwC), independent registered public accounting firm and auditor to Fidelity and certain Fidelity funds, has been engaged annually by the Board as part of the Board's assessment of Fidelity's profitability analysis. PwC's engagement includes the review and assessment of Fidelity's methodologies used in determining the revenues and expenses attributable to Fidelity's mutual fund business, and completion of agreed-upon procedures surrounding the mathematical accuracy of fund profitability and its conformity to allocation methodologies. After considering PwC's reports issued under the engagement and information provided by Fidelity, the Board concluded that while other allocation methods may also be reasonable, Fidelity's profitability methodologies are reasonable in all material respects.
The Board also reviewed Fidelity's non-fund businesses and fall-out benefits related to the mutual fund business as well as cases where Fidelity's affiliates may benefit from or be related to the fund's business.
The Board considered the costs of the services provided by and the profits realized by Fidelity in connection with the operation of the fund and was satisfied that the profitability was not excessive in the circumstances.
Economies of Scale. The Board considered whether there have been economies of scale in respect of the management of the Fidelity funds, whether the Fidelity funds (including the fund) have appropriately benefited from any such economies of scale, and whether there is potential for realization of any further economies of scale. The Board considered the extent to which the fund will benefit from economies of scale through increased services to the fund, through waivers or reimbursements, or through fee or expense reductions. The Board also noted that in 2009, it and the board of other Fidelity funds created an ad hoc committee (the Economies of Scale Committee) to analyze whether FMR attains economies of scale in respect of the management and servicing of the Fidelity funds, whether the Fidelity funds have appropriately benefited from such economies of scale, and whether there is potential for realization of any further economies of scale.
The Board recognized that the fund's management contract incorporates a "group fee" structure, which provides for lower group fee rates as total fund assets under FMR's management increase, and for higher group fee rates as total fund assets under FMR's management decrease. FMR calculates the group fee rates based on a tiered asset "breakpoint" schedule that varies based on asset class. The Board considered that the group fee is designed to deliver the benefits of economies of scale to fund shareholders when total Fidelity fund assets increase, even if assets of any particular fund are unchanged or have declined, because some portion of Fidelity's costs are attributable to services provided to all Fidelity funds, and all funds benefit if those costs can be allocated among more assets. The Board concluded that, given the group fee structure, fund shareholders will benefit from lower management fees as assets under FMR's management increase at the fund complex level, regardless of whether Fidelity achieves any such economies of scale.
Annual Report
The Board concluded, taking into account the analysis of the Economies of Scale Committee, that any potential economies of scale are being appropriately shared between fund shareholders and Fidelity.
Additional Information Requested by the Board. In order to develop fully the factual basis for consideration of the Fidelity funds' Advisory Contracts, the Board requested and received additional information on certain topics, including (i) fund performance trends, actions to be taken by FMR to improve certain funds' overall performance, and Fidelity's long-term strategies for certain funds; (ii) portfolio manager changes that have occurred during the past year and length of portfolio manager tenure for different categories of funds over time; (iii) Fidelity's compensation structure for portfolio managers and other key personnel and strategies for attracting and retaining non-investment personnel; (iv) the amount of the investment that each portfolio manager has made in the Fidelity fund(s) that he or she manages; (v) historical trends in Fidelity's realization of fall-out benefits; (vi) Fidelity's group fee structures and the rationale for the individual fee rates of certain funds; (vii) fund profitability methodology and the impact of certain factors on fund profitability results; (viii) trends regarding industry use of performance fee structures and Fidelity's compliance practices with respect to performance adjustment calculations; (ix) the fee structures in place for certain other Fidelity clients; and (x) explanations regarding the relative total expense ratios of certain funds and classes, total expense competitive trends, and actions that might be taken by FMR to reduce total expense ratios for certain funds and classes.
Based on its evaluation of all of the conclusions noted above, and after considering all factors it believed relevant, the Board ultimately concluded that the advisory fee structures are fair and reasonable, and that the fund's Advisory Contracts should be renewed.
Annual Report
Managing Your Investments
Fidelity offers several ways to conveniently manage your workplace benefits (including your workplace savings plan, investments, and additional services) via your telephone or PC. You can access your plan and account information and research your investments 24 hours a day.
By Phone
Fidelity provides a single toll-free number to access plan information, account balances, positions, and quotes*. It's easy to navigate the service, and on your first call, the system will help you create a personal identification number (PIN) for security.
(phone_graphic)
Fidelity Workplace
Investing
1-800-835-5092
By PC
Fidelity's web site on the Internet provides a wide range of information, including plan information, daily financial news, fund performance, interactive planning tools, and news about Fidelity products and services.
(computer_graphic)
Fidelity's Web Site
www.401k.com
* When you call the quotes line, please remember that a fund's yield and return will vary and, except for money market funds, share price will also vary. This means that you may have a gain or loss when you sell your shares. There is no assurance that money market funds will be able to maintain a stable $1 share price; an investment in a money market fund is not insured or guaranteed by the U.S. government. Total returns are historical and include changes in share price, reinvestment of dividends and capital gains distributions, and the effects of any sales charges.
Annual Report
To Write Fidelity
We'll give your correspondence immediate attention and send you written confirmation upon completion of your request.
(letter_graphic)
For Non-Retirement
Accounts
Buying shares
Fidelity Investments
P.O. Box 770001
Cincinnati, OH 45277-0003
Overnight Express
Fidelity Investments
Attn: Distribution Services
100 Crosby Parkway - KC1H
Covington, KY 41015
Selling shares
Fidelity Investments
P.O. Box 770001
Cincinnati, OH 45277-0035
Overnight Express
Fidelity Investments
Attn: Distribution Services
100 Crosby Parkway - KC1H
Covington, KY 41015
General Correspondence
Fidelity Investments
P.O. Box 500
Merrimack, NH 03054-0500
(letter_graphic)
For Retirement
Accounts
Buying shares
Fidelity Investments
P.O. Box 770001
Cincinnati, OH 45277-0003
Selling shares
Fidelity Investments
P.O. Box 770001
Cincinnati, OH 45277-0035
Overnight Express
Fidelity Investments
Attn: Distribution Services
100 Crosby Parkway - KC1H
Covington, KY 41015
General Correspondence
Fidelity Investments
P.O. Box 500
Merrimack, NH 03054-0500
Annual Report
Investment Adviser
Fidelity Management & Research Company
Boston, MA
Investment Sub-Advisers
FMR Co., Inc.
Fidelity Management & Research
(U.K.) Inc.
Fidelity Investments Money Management, Inc.
Fidelity Management & Research
(Hong Kong) Limited
Fidelity Management & Research
(Japan), Inc.
General Distributor
Fidelity Distributors Corporation
Boston, MA
Transfer and Service Agents
Fidelity Investments Institutional
Operations Company, Inc.
Boston, MA
Fidelity Service Company, Inc.
Boston, MA
Custodian
JP Morgan Chase Bank
New York, NY
PUR-K-UANN-1011
1.863164.102
Item 2. Code of Ethics
As of the end of the period, August 31, 2011, Fidelity Puritan Trust (the trust) has adopted a code of ethics, as defined in Item 2 of Form N-CSR, that applies to its President and Treasurer and its Chief Financial Officer. A copy of the code of ethics is filed as an exhibit to this Form N-CSR.
Item 3. Audit Committee Financial Expert
The Board of Trustees of the trust has determined that Joseph Mauriello is an audit committee financial expert, as defined in Item 3 of Form N-CSR. Mr. Mauriello is independent for purposes of Item 3 of Form N-CSR.
Item 4. Principal Accountant Fees and Services
Fees and Services
The following table presents fees billed by PricewaterhouseCoopers LLP ("PwC") in each of the last two fiscal years for services rendered to Fidelity Balanced Fund and Fidelity Puritan Fund (the "Funds"):
Services Billed by PwC
August 31, 2011 FeesA
| Audit Fees | Audit-Related Fees | Tax Fees | All Other Fees |
Fidelity Balanced Fund | $122,000 | $- | $5,300 | $12,200 |
Fidelity Puritan Fund | $231,000 | $- | $5,300 | $11,300 |
August 31, 2010 FeesA
| Audit Fees | Audit-Related Fees | Tax Fees | All Other Fees |
Fidelity Balanced Fund | $138,000 | $- | $5,100 | $12,400 |
Fidelity Puritan Fund | $244,000 | $- | $5,100 | $11,400 |
A Amounts may reflect rounding.
The following table presents fees billed by PwC that were required to be approved by the Audit Committee for services that relate directly to the operations and financial reporting of the Funds and that are rendered on behalf of Fidelity Management & Research Company ("FMR") and entities controlling, controlled by, or under common control with FMR (not including any sub-adviser whose role is primarily portfolio management and is subcontracted with or overseen by another investment adviser) that provide ongoing services to the Funds ("Fund Service Providers"):
Services Billed by PwC
| August 31, 2011A | August 31, 2010A |
Audit-Related Fees | $1,860,000 | $2,130,000 |
Tax Fees | $- | $- |
All Other Fees | $- | $510,000 |
A Amounts may reflect rounding.
"Audit-Related Fees" represent fees billed for assurance and related services that are reasonably related to the performance of the fund audit or the review of the fund's financial statements and that are not reported under Audit Fees.
"Tax Fees" represent fees billed for tax compliance, tax advice or tax planning that relate directly to the operations and financial reporting of the fund.
"All Other Fees" represent fees billed for services provided to the fund or Fund Service Provider, a significant portion of which are assurance related, that relate directly to the operations and financial reporting of the fund, excluding those services that are reported under Audit Fees, Audit-Related Fees or Tax Fees.
Assurance services must be performed by an independent public accountant.
* * *
The aggregate non-audit fees billed by PwC for services rendered to the Funds, FMR (not including any sub-adviser whose role is primarily portfolio management and is subcontracted with or overseen by another investment adviser), and any Fund Service Provider for each of the last two fiscal years of the Funds are as follows:
Billed By | August 31, 2011 A | August 31, 2010 A |
PwC | $3,330,000 | $5,170,000 |
A Amounts may reflect rounding.
The trust's Audit Committee has considered non-audit services that were not pre-approved that were provided by PwC to Fund Service Providers to be compatible with maintaining the independence of PwC in its audit of the Funds, taking into account representations from PwC, in accordance with Public Company Accounting Oversight Board rules, regarding its independence from the Funds and their related entities and FMR's review of the appropriateness and permissibility under applicable law of such non-audit services prior to their provision to the Fund Service Providers.
Audit Committee Pre-Approval Policies and Procedures
The trust's Audit Committee must pre-approve all audit and non-audit services provided by a fund's independent registered public accounting firm relating to the operations or financial reporting of the fund. Prior to the commencement of any audit or non-audit services to a fund, the Audit Committee reviews the services to determine whether they are appropriate and permissible under applicable law.
The Audit Committee has adopted policies and procedures to, among other purposes, provide a framework for the Committee's consideration of non-audit services by the audit firms that audit the Fidelity funds. The policies and procedures require that any non-audit service provided by a fund audit firm to a Fidelity fund and any non-audit service provided by a fund auditor to a Fund Service Provider that relates directly to the operations and financial reporting of a Fidelity fund ("Covered Service") are subject to approval by the Audit Committee before such service is provided.
All Covered Services must be approved in advance of provision of the service either: (i) by formal resolution of the Audit Committee, or (ii) by oral or written approval of the service by the Chair of the Audit Committee (or if the Chair is unavailable, such other member of the Audit Committee as may be designated by the Chair to act in the Chair's absence). The approval contemplated by (ii) above is permitted where the Treasurer determines that action on such an engagement is necessary before the next meeting of the Audit Committee.
Non-audit services provided by a fund audit firm to a Fund Service Provider that do not relate directly to the operations and financial reporting of a Fidelity fund are reported to the Audit Committee on a periodic basis.
Non-Audit Services Approved Pursuant to Rule 2-01(c)(7)(i)(C) and (ii) of Regulation S-X ("De Minimis Exception")
There were no non-audit services approved or required to be approved by the Audit Committee pursuant to the De Minimis Exception during the Funds' last two fiscal years relating to services provided to (i) the Funds or (ii) any Fund Service Provider that relate directly to the operations and financial reporting of the Funds.
Item 5. Audit Committee of Listed Registrants
Not applicable.
Item 6. Investments
(a) Not applicable.
(b) Not applicable
Item 7. Disclosure of Proxy Voting Policies and Procedures for Closed-End Management Investment Companies
Not applicable.
Item 8. Portfolio Managers of Closed-End Management Investment Companies
Not applicable.
Item 9. Purchase of Equity Securities by Closed-End Management Investment Company and Affiliated Purchasers
Not applicable.
Item 10. Submission of Matters to a Vote of Security Holders
There were no material changes to the procedures by which shareholders may recommend nominees to the trust's Board of Trustees.
Item 11. Controls and Procedures
(a)(i) The President and Treasurer and the Chief Financial Officer have concluded that the trust's disclosure controls and procedures (as defined in Rule 30a-3(c) under the Investment Company Act) provide reasonable assurances that material information relating to the trust is made known to them by the appropriate persons, based on their evaluation of these controls and procedures as of a date within 90 days of the filing date of this report.
(a)(ii) There was no change in the trust's internal control over financial reporting (as defined in Rule 30a-3(d) under the Investment Company Act) that occurred during the second fiscal quarter of the period covered by this report that has materially affected, or is reasonably likely to materially affect, the trust's internal control over financial reporting.
Item 12. Exhibits
(a) | (1) | Code of Ethics pursuant to Item 2 of Form N-CSR is filed and attached hereto as EX-99.CODE ETH. |
(a) | (2) | Certification pursuant to Rule 30a-2(a) under the Investment Company Act of 1940 (17 CFR 270.30a-2(a)) is filed and attached hereto as Exhibit 99.CERT. |
(a) | (3) | Not applicable. |
(b) | | Certification pursuant to Rule 30a-2(b) under the Investment Company Act of 1940 (17 CFR 270.30a-2(b)) is furnished and attached hereto as Exhibit 99.906CERT. |
SIGNATURES
Pursuant to the requirements of the Securities Exchange Act of 1934 and the Investment Company Act of 1940, the registrant has duly caused this report to be signed on its behalf by the undersigned, thereunto duly authorized.
Fidelity Puritan Trust
By: | /s/Kenneth B. Robins |
| Kenneth B. Robins |
| President and Treasurer |
| |
Date: | October 26, 2011 |
Pursuant to the requirements of the Securities Exchange Act of 1934 and the Investment Company Act of 1940, this report has been signed below by the following persons on behalf of the registrant and in the capacities and on the dates indicated.
By: | /s/Kenneth B. Robins |
| Kenneth B. Robins |
| President and Treasurer |
| |
Date: | October 26, 2011 |
By: | /s/Christine Reynolds |
| Christine Reynolds |
| Chief Financial Officer |
| |
Date: | October 26, 2011 |