UNITED STATES
SECURITIES AND EXCHANGE COMMISSION
Washington, D.C. 20549
FORM N-CSR
CERTIFIED SHAREHOLDER REPORT OF REGISTERED
MANAGEMENT INVESTMENT COMPANIES
Investment Company Act file number 811-649
Fidelity Puritan Trust
(Exact name of registrant as specified in charter)
245 Summer St., Boston, Massachusetts 02210
(Address of principal executive offices) (Zip code)
Marc Bryant, Secretary
245 Summer St.
Boston, Massachusetts 02210
(Name and address of agent for service)
Registrant's telephone number, including area code: 617-563-7000
Date of fiscal year end: | July 31 |
| |
Date of reporting period: | July 31, 2015 |
Item 1. Reports to Stockholders
ContentsPerformance: The Bottom LineManagement's Discussion of Fund PerformanceShareholder Expense ExampleInvestment Changes (Unaudited)Investments July 31, 2015Financial StatementsNotes to Financial StatementsReport of Independent Registered Public Accounting FirmTrustees and OfficersDistributions (Unaudited)Board Approval of Investment Advisory Contracts and Management FeesContentsPerformance: The Bottom LineManagement's Discussion of Fund PerformanceShareholder Expense ExampleInvestment Changes (Unaudited)Investments July 31, 2015Financial StatementsNotes to Financial StatementsReport of Independent Registered Public Accounting FirmTrustees and OfficersDistributions (Unaudited)Board Approval of Investment Advisory Contracts and Management FeesContentsPerformance: The Bottom LineManagement's Discussion of Fund PerformanceShareholder Expense ExampleInvestment Changes (Unaudited)Investments July 31, 2015Financial StatementsNotes to Financial StatementsReport of Independent Registered Public Accounting FirmTrustees and OfficersDistributions (Unaudited)Board Approval of Investment Advisory Contracts and Management FeesContentsPerformance: The Bottom LineManagement's Discussion of Fund PerformanceShareholder Expense ExampleInvestment Changes (Unaudited)Investments July 31, 2015Financial StatementsNotes to Financial StatementsReport of Independent Registered Public Accounting FirmTrustees and OfficersDistributions (Unaudited)Board Approval of Investment Advisory Contracts and Management FeesContentsPerformance: The Bottom LineManagement's Discussion of Fund PerformanceShareholder Expense ExampleInvestment Changes (Unaudited)Investments July 31, 2015Financial StatementsNotes to Financial StatementsReport of Independent Registered Public Accounting FirmTrustees and OfficersDistributions (Unaudited)Board Approval of Investment Advisory Contracts and Management Fees
Fidelity®
Value Discovery
Fund
Annual Report
July 31, 2015
(Fidelity Cover Art)
Contents
Performance | (Click Here) | How the fund has done over time. |
Management's Discussion of Fund Performance | (Click Here) | The Portfolio Manager's review of fund performance and strategy. |
Shareholder Expense Example | (Click Here) | An example of shareholder expenses. |
Investment Changes | (Click Here) | A summary of major shifts in the fund's investments over the past six months. |
Investments | (Click Here) | A complete list of the fund's investments with their market values. |
Financial Statements | (Click Here) | Statements of assets and liabilities, operations, and changes in net assets, as well as financial highlights. |
Notes | (Click Here) | Notes to the financial statements. |
Report of Independent Registered Public Accounting Firm | (Click Here) | |
Trustees and Officers | (Click Here) | |
Distributions | (Click Here) | |
Board Approval of Investment Advisory Contracts and Management Fees | (Click Here) | |
To view a fund's proxy voting guidelines and proxy voting record for the 12-month period ended June 30, visit http://www.fidelity.com/proxyvotingresults or visit the Securities and Exchange Commission's (SEC) web site at http://www.sec.gov. You may also call 1-800-544-8544 to request a free copy of the proxy voting guidelines.
Standard & Poor's, S&P and S&P 500 are registered service marks of The McGraw-Hill Companies, Inc. and have been licensed for use by Fidelity Distributors Corporation.
Other third-party marks appearing herein are the property of their respective owners.
All other marks appearing herein are registered or unregistered trademarks or service marks of FMR LLC or an affiliated company. © 2015 FMR LLC. All rights reserved.
Annual Report
This report and the financial statements contained herein are submitted for the general information of the shareholders of the fund. This report is not authorized for distribution to prospective investors in the fund unless preceded or accompanied by an effective prospectus.
A fund files its complete schedule of portfolio holdings with the SEC for the first and third quarters of each fiscal year on Form N-Q. Forms N-Q are available on the SEC's web site at http://www.sec.gov. A fund's Forms N-Q may be reviewed and copied at the SEC's Public Reference Room in Washington, DC. Information regarding the operation of the SEC's Public Reference Room may be obtained by calling 1-800-SEC-0330. For a complete list of a fund's portfolio holdings, view the most recent holdings listing, semiannual report, or annual report on Fidelity's web site at http://www.fidelity.com, http://www.advisor.fidelity.com, or http://www.401k.com, as applicable.
NOT FDIC INSURED • MAY LOSE VALUE • NO BANK GUARANTEE
Neither the fund nor Fidelity Distributors Corporation is a bank.
Annual Report
Average annual total return reflects the change in the value of an investment, assuming reinvestment of the class' distributions from dividend income and capital gains (the profits earned upon the sale of securities that have grown in value, if any) and assuming a constant rate of performance each year. The $10,000 table and the fund's returns do not reflect the deduction of taxes that a shareholder would pay on fund distributions or the redemption of fund shares. During periods of reimbursement by Fidelity, a fund's total return will be greater than it would be had the reimbursement not occurred. How a fund did yesterday is no guarantee of how it will do tomorrow.
Average Annual Total Returns
Periods ended July 31, 2015 | Past 1
year | Past 5
years | Past 10
years |
Fidelity® Value Discovery Fund | 8.68% | 15.70% | 7.55% |
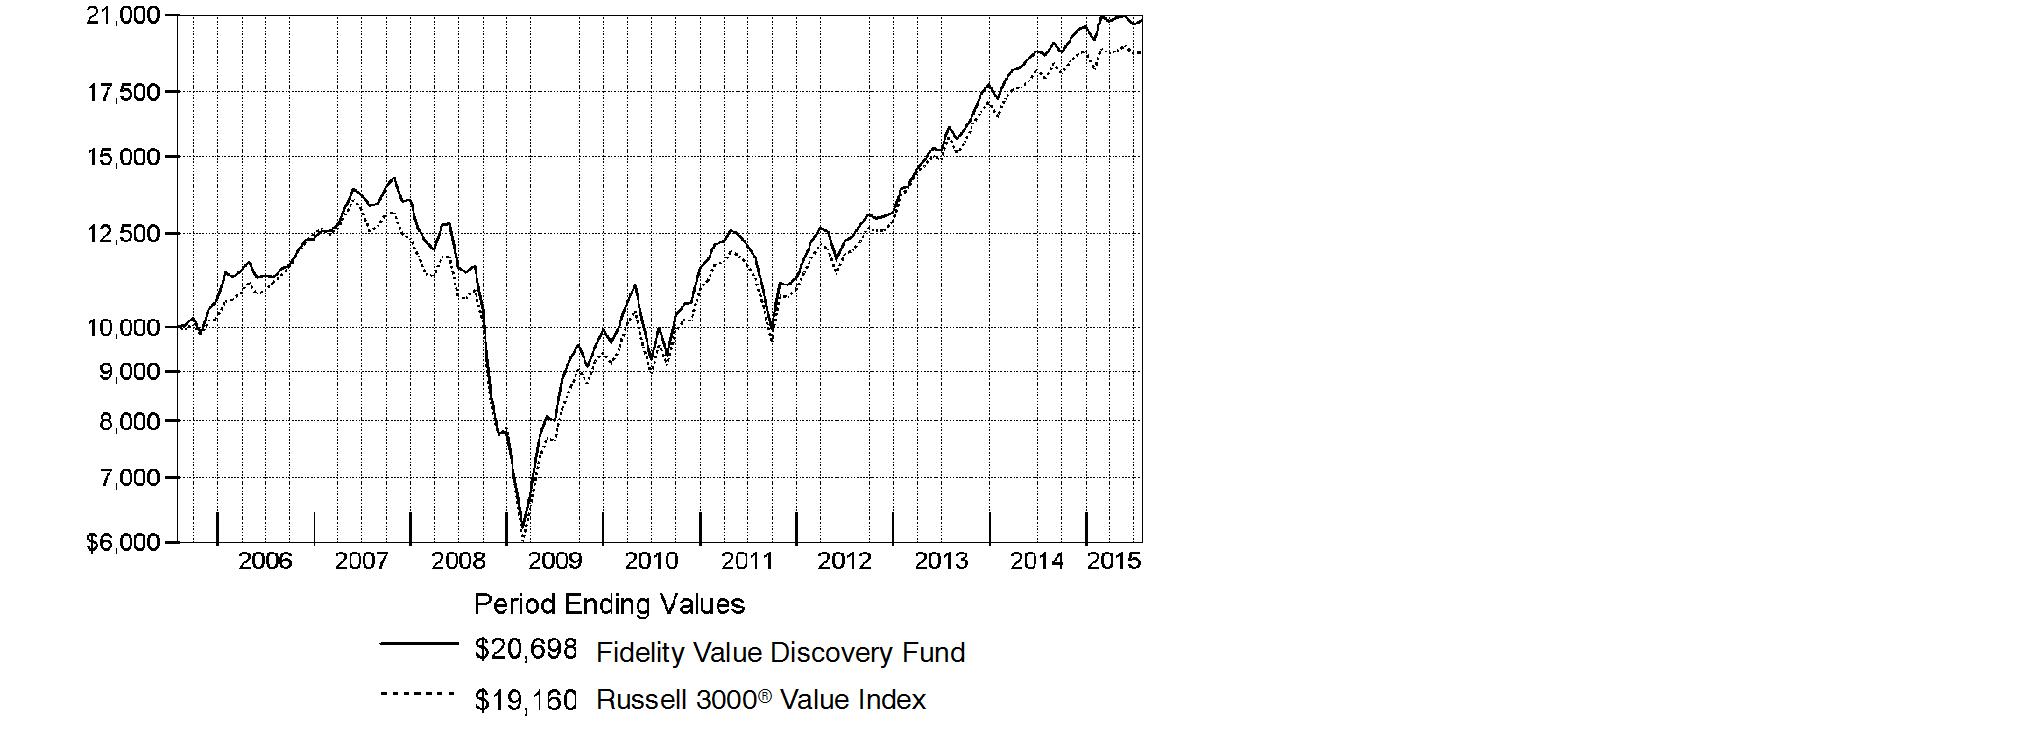
$10,000 Over 10 Years
Let's say hypothetically that $10,000 was invested in Fidelity® Value Discovery Fund, a class of the fund, on July 31, 2005. The chart shows how the value of your investment would have changed, and also shows how the Russell 3000® Value Index performed over the same period.
Annual Report
Market Recap: The U.S. equity market gained strongly for the 12 months ending July 31, 2015, as stocks recovered from volatility in late 2014 and early 2015, supported by a still-positive economic backdrop. The S&P 500® Index returned 11.21%, with growth stocks in the index far outpacing value-oriented names on prospects for continued U.S. economic growth. Consequently, the growth-oriented Nasdaq Composite Index® rose 18.71%, outpacing the broader S&P 500®, as well as the 12.03% advance of the smaller-cap Russell 2000® Index. Within the S&P 500®, seven of 10 sectors notched a gain, with significant performance variation. Health care (+27%) led the way, aided by merger activity. Consumer discretionary (+24%) benefited from spending linked to a seven-year low in unemployment. Strong first halves for the consumer staples sector and the real estate segment of financials yielded above-market returns (19% and 12%, respectively) for the full-year period. Conversely, energy (-26%) significantly lagged, due to a roughly 55% decline for U.S. crude-oil prices. Materials (-4%) also lost ground. At period end, investors remained focused on the slowing rate of U.S. earnings growth, the possible effect of a relatively stronger U.S. dollar on exports and inflation, and whether an economic slowdown in China would create ripples for the global economy.
Comments from Portfolio Manager Sean Gavin: For the year, the fund's share classes substantially outpaced the benchmark Russell 3000® Value Index return of 6.23%, benefiting most from a combination of good stock picking and productive industry positioning. (For specific class-level results, please see the Performance section of this report.) The energy sector led the way, with help good stock picks. That said, several of the fund's biggest individual detractors were energy stocks hampered by the difficult environment for oil prices, including BW Offshore and Suncor Energy. The fund's positioning also was helpful in the health care sector. Here, a non-benchmark stake in Teva Pharmaceuticals - among our largest holdings - was a big contributor, as was health insurance provider Cigna, which in June agreed to be purchased for a substantial premium by a larger competitor. I sold the position soon afterwards. Conversely, subpar stock picking in the media group hampered the fund's relative performance, especially Viacom. This non-benchmark stock continued to meet my valuation and quality criteria as of period end. However, it encountered a number of business challenges - all of them short term, in my view - that caused the stock to return -30% this period. Currency effects also hurt performance, as a relatively strong U.S. dollar sapped the fund's non-U.S. investments, including Canada's Suncor.
The views expressed above reflect those of the portfolio manager(s) only through the end of the period as stated on the cover of this report and do not necessarily represent the views of Fidelity or any other person in the Fidelity organization. Any such views are subject to change at any time based upon market or other conditions and Fidelity disclaims any responsibility to update such views. These views may not be relied on as investment advice and, because investment decisions for a Fidelity fund are based on numerous factors, may not be relied on as an indication of trading intent on behalf of any Fidelity fund.
Annual Report
Shareholder Expense Example
As a shareholder of the Fund, you incur two types of costs: (1) transaction costs and (2) ongoing costs, including management fees and other Fund expenses. This Example is intended to help you understand your ongoing costs (in dollars) of investing in the Fund and to compare these costs with the ongoing costs of investing in other mutual funds.
The Example is based on an investment of $1,000 invested at the beginning of the period and held for the entire period (February 1, 2015 to July 31, 2015).
Actual Expenses
The first line of the accompanying table for each class of the Fund provides information about actual account values and actual expenses. You may use the information in this line, together with the amount you invested, to estimate the expenses that you paid over the period. Simply divide your account value by $1,000.00 (for example, an $8,600 account value divided by $1,000.00 = 8.6), then multiply the result by the number in the first line for a class of the Fund under the heading entitled "Expenses Paid During Period" to estimate the expenses you paid on your account during this period. A small balance maintenance fee of $12.00 that is charged once a year may apply for certain accounts with a value of less than $2,000. This fee is not included in the table below. If it was, the estimate of expenses you paid during the period would be higher, and your ending account value lower, by this amount. In addition, the Fund, as a shareholder in the underlying Fidelity Central Funds, will indirectly bear its pro-rata share of the fees and expenses incurred by the underlying Fidelity Central Funds. These fees and expenses are not included in the Fund's annualized expense ratio used to calculate the expense estimate in the table below.
Hypothetical Example for Comparison Purposes
The second line of the accompanying table for each class of the Fund provides information about hypothetical account values and hypothetical expenses based on a Class' actual expense ratio and an assumed rate of return of 5% per year before expenses, which is not the Class' actual return. The hypothetical account values and expenses may not be used to estimate the actual ending account balance or expenses you paid for the period. You may use this information to compare the ongoing costs of investing in the Fund and other funds. To do so, compare this 5% hypothetical example with the 5% hypothetical examples that appear in the shareholder reports of the other funds. A small balance maintenance fee of $12.00 that is charged once a year may apply for certain accounts with a value of less than $2,000. This fee is not included in the table below. If it was, the estimate of expenses you paid during the period would be higher, and your ending account value lower, by this amount. In addition, the Fund, as a shareholder in the underlying Fidelity Central Funds, will indirectly bear its pro-rata share of the fees and expenses incurred by the underlying Fidelity Central Funds. These fees and expenses are not included in the Fund's annualized expense ratio used to calculate the expense estimate in the table below.
Please note that the expenses shown in the table are meant to highlight your ongoing costs only and do not reflect any transaction costs. Therefore, the second line of the table is useful in comparing ongoing costs only, and will not help you determine the relative total costs of owning different funds.
Annual Report
Shareholder Expense Example - continued
| Annualized Expense RatioB | Beginning
Account Value
February 1, 2015 | Ending
Account Value
July 31, 2015 | Expenses Paid
During Period*
February 1, 2015
to July 31, 2015 |
Value Discovery | .84% | | | |
Actual | | $ 1,000.00 | $ 1,047.40 | $ 4.26 |
HypotheticalA | | $ 1,000.00 | $ 1,020.63 | $ 4.21 |
Class K | .71% | | | |
Actual | | $ 1,000.00 | $ 1,047.80 | $ 3.60 |
HypotheticalA | | $ 1,000.00 | $ 1,021.27 | $ 3.56 |
A 5% return per year before expenses
B Annualized expense ratio reflects expenses net of applicable fee waivers.
* Expenses are equal to each Class' annualized expense ratio, multiplied by the average account value over the period, multiplied by 181/365 (to reflect the one-half year period).
Annual Report
Investment Changes (Unaudited)
Top Ten Stocks as of July 31, 2015 |
| % of fund's
net assets | % of fund's net assets
6 months ago |
JPMorgan Chase & Co. | 4.2 | 2.8 |
Wells Fargo & Co. | 3.5 | 2.9 |
Johnson & Johnson | 3.2 | 2.7 |
Berkshire Hathaway, Inc. Class B | 2.9 | 2.9 |
General Electric Co. | 2.8 | 0.0 |
Oracle Corp. | 2.7 | 1.7 |
Teva Pharmaceutical Industries Ltd. sponsored ADR | 2.5 | 2.1 |
Chevron Corp. | 2.4 | 2.9 |
U.S. Bancorp | 2.0 | 1.6 |
Wal-Mart Stores, Inc. | 1.8 | 1.3 |
| 28.0 | |
Top Five Market Sectors as of July 31, 2015 |
| % of fund's
net assets | % of fund's net assets
6 months ago |
Financials | 28.4 | 25.3 |
Information Technology | 16.4 | 15.1 |
Health Care | 12.1 | 13.8 |
Consumer Discretionary | 10.1 | 14.2 |
Energy | 8.2 | 9.0 |
Asset Allocation (% of fund's net assets) |
As of July 31, 2015* | As of January 31, 2015** |
 | Stocks 92.7% | |  | Stocks 93.2% | |
 | Short-Term
Investments and
Net Other Assets (Liabilities) 7.3% | |  | Short-Term
Investments and
Net Other Assets (Liabilities) 6.8% | |
* Foreign investments | 15.7% | | ** Foreign investments | 18.4% | |

Annual Report
Investments July 31, 2015
Showing Percentage of Net Assets
Common Stocks - 92.7% |
| Shares | | Value |
CONSUMER DISCRETIONARY - 10.1% |
Auto Components - 0.5% |
Hyundai Mobis | 37,163 | | $ 6,804,484 |
Automobiles - 0.7% |
Harley-Davidson, Inc. | 164,900 | | 9,613,670 |
Diversified Consumer Services - 0.2% |
Steiner Leisure Ltd. (a) | 40,168 | | 2,317,694 |
Leisure Products - 0.8% |
Mattel, Inc. | 482,900 | | 11,208,109 |
Media - 3.5% |
Corus Entertainment, Inc. Class B (non-vtg.) (d) | 470,600 | | 5,055,572 |
John Wiley & Sons, Inc. Class A | 172,885 | | 9,164,634 |
Starz Series A (a) | 402,600 | | 16,285,170 |
Viacom, Inc. Class B (non-vtg.) | 341,600 | | 19,471,200 |
| | 49,976,576 |
Multiline Retail - 1.0% |
Macy's, Inc. | 197,853 | | 13,663,728 |
Specialty Retail - 2.4% |
AutoZone, Inc. (a) | 17,585 | | 12,326,030 |
Bed Bath & Beyond, Inc. (a) | 157,400 | | 10,267,202 |
GNC Holdings, Inc. | 232,600 | | 11,446,246 |
| | 34,039,478 |
Textiles, Apparel & Luxury Goods - 1.0% |
Coach, Inc. | 228,835 | | 7,139,652 |
Michael Kors Holdings Ltd. (a) | 161,600 | | 6,785,584 |
| | 13,925,236 |
TOTAL CONSUMER DISCRETIONARY | | 141,548,975 |
CONSUMER STAPLES - 4.4% |
Beverages - 0.6% |
C&C Group PLC | 2,075,536 | | 8,087,515 |
Food & Staples Retailing - 2.4% |
Tesco PLC | 2,249,700 | | 7,565,607 |
Wal-Mart Stores, Inc. | 352,800 | | 25,394,544 |
| | 32,960,151 |
Food Products - 0.9% |
Seaboard Corp. (a) | 1,360 | | 4,726,000 |
The J.M. Smucker Co. | 76,721 | | 8,568,968 |
| | 13,294,968 |
Common Stocks - continued |
| Shares | | Value |
CONSUMER STAPLES - continued |
Tobacco - 0.5% |
British American Tobacco PLC sponsored ADR | 62,445 | | $ 7,430,955 |
TOTAL CONSUMER STAPLES | | 61,773,589 |
ENERGY - 8.2% |
Energy Equipment & Services - 0.9% |
BW Offshore Ltd. | 11,724,400 | | 7,033,104 |
National Oilwell Varco, Inc. | 130,700 | | 5,506,391 |
| | 12,539,495 |
Oil, Gas & Consumable Fuels - 7.3% |
Chevron Corp. | 376,481 | | 33,311,039 |
Exxon Mobil Corp. | 249,228 | | 19,741,350 |
Marathon Petroleum Corp. | 223,200 | | 12,202,344 |
Phillips 66 Co. | 137,200 | | 10,907,400 |
Suncor Energy, Inc. | 724,400 | | 20,405,166 |
Woodside Petroleum Ltd. | 201,727 | | 5,256,676 |
| | 101,823,975 |
TOTAL ENERGY | | 114,363,470 |
FINANCIALS - 28.4% |
Banks - 11.2% |
JPMorgan Chase & Co. | 857,341 | | 58,753,579 |
Regions Financial Corp. | 977,700 | | 10,158,303 |
SunTrust Banks, Inc. | 261,000 | | 11,572,740 |
U.S. Bancorp | 625,500 | | 28,278,855 |
Wells Fargo & Co. | 831,137 | | 48,097,898 |
| | 156,861,375 |
Capital Markets - 2.2% |
Fortress Investment Group LLC | 1,852,000 | | 12,667,680 |
GP Investments Ltd. Class A (depositary receipt) (a) | 1,380,300 | | 2,632,445 |
The Blackstone Group LP | 405,900 | | 15,931,575 |
| | 31,231,700 |
Consumer Finance - 2.9% |
American Express Co. | 90,300 | | 6,868,218 |
Capital One Financial Corp. | 257,382 | | 20,925,157 |
Discover Financial Services | 231,100 | | 12,897,691 |
| | 40,691,066 |
Common Stocks - continued |
| Shares | | Value |
FINANCIALS - continued |
Diversified Financial Services - 2.9% |
Berkshire Hathaway, Inc. Class B (a) | 284,631 | | $ 40,628,229 |
Insurance - 5.5% |
ACE Ltd. | 129,200 | | 14,053,084 |
Allied World Assur Co. Holdings AG | 209,700 | | 8,861,922 |
Allstate Corp. | 201,100 | | 13,865,845 |
FNF Group | 278,920 | | 10,902,983 |
FNFV Group (a) | 369,133 | | 5,374,576 |
Prudential PLC | 307,501 | | 7,234,091 |
The Travelers Companies, Inc. | 158,313 | | 16,800,176 |
| | 77,092,677 |
Real Estate Investment Trusts - 3.7% |
American Capital Agency Corp. | 868,299 | | 16,723,439 |
Annaly Capital Management, Inc. | 1,790,095 | | 17,811,445 |
MFA Financial, Inc. | 2,305,964 | | 17,363,909 |
| | 51,898,793 |
TOTAL FINANCIALS | | 398,403,840 |
HEALTH CARE - 12.1% |
Biotechnology - 1.3% |
Amgen, Inc. | 105,400 | | 18,612,586 |
Health Care Providers & Services - 2.4% |
Express Scripts Holding Co. (a) | 196,001 | | 17,653,810 |
Laboratory Corp. of America Holdings (a) | 127,900 | | 16,280,391 |
| | 33,934,201 |
Pharmaceuticals - 8.4% |
GlaxoSmithKline PLC sponsored ADR | 238,576 | | 10,363,741 |
Johnson & Johnson | 455,108 | | 45,606,373 |
Mylan N.V. | 63,695 | | 3,566,283 |
Sanofi SA sponsored ADR | 430,800 | | 23,258,892 |
Teva Pharmaceutical Industries Ltd. sponsored ADR | 498,668 | | 34,418,065 |
| | 117,213,354 |
TOTAL HEALTH CARE | | 169,760,141 |
INDUSTRIALS - 7.3% |
Aerospace & Defense - 1.2% |
United Technologies Corp. | 170,200 | | 17,072,762 |
Common Stocks - continued |
| Shares | | Value |
INDUSTRIALS - continued |
Electrical Equipment - 1.0% |
Babcock & Wilcox Enterprises, Inc. (a) | 199,900 | | $ 3,942,028 |
BWX Technologies, Inc. | 399,800 | | 9,819,088 |
| | 13,761,116 |
Industrial Conglomerates - 2.8% |
General Electric Co. | 1,518,600 | | 39,635,460 |
Machinery - 2.2% |
Deere & Co. | 264,090 | | 24,974,991 |
Valmont Industries, Inc. | 57,600 | | 6,406,848 |
| | 31,381,839 |
Professional Services - 0.1% |
VSE Corp. | 18,900 | | 895,860 |
TOTAL INDUSTRIALS | | 102,747,037 |
INFORMATION TECHNOLOGY - 16.4% |
Communications Equipment - 3.3% |
Cisco Systems, Inc. | 864,918 | | 24,580,970 |
Harris Corp. | 253,600 | | 21,033,584 |
| | 45,614,554 |
Electronic Equipment & Components - 1.1% |
Keysight Technologies, Inc. (a) | 239,100 | | 7,302,114 |
TE Connectivity Ltd. | 136,402 | | 8,309,610 |
| | 15,611,724 |
Internet Software & Services - 1.4% |
Google, Inc. Class A (a) | 30,300 | | 19,922,250 |
IT Services - 2.9% |
Fiserv, Inc. (a) | 102,400 | | 8,894,464 |
IBM Corp. | 118,760 | | 19,237,932 |
The Western Union Co. | 633,400 | | 12,820,016 |
| | 40,952,412 |
Software - 4.4% |
Microsoft Corp. | 494,424 | | 23,089,601 |
Oracle Corp. | 963,513 | | 38,482,709 |
| | 61,572,310 |
Technology Hardware, Storage & Peripherals - 3.3% |
EMC Corp. | 614,700 | | 16,529,283 |
Common Stocks - continued |
| Shares | | Value |
INFORMATION TECHNOLOGY - continued |
Technology Hardware, Storage & Peripherals - continued |
Hewlett-Packard Co. | 447,912 | | $ 13,670,274 |
Samsung Electronics Co. Ltd. | 15,584 | | 15,837,398 |
| | 46,036,955 |
TOTAL INFORMATION TECHNOLOGY | | 229,710,205 |
MATERIALS - 2.7% |
Chemicals - 2.2% |
Agrium, Inc. | 130,700 | | 13,371,304 |
CF Industries Holdings, Inc. | 291,945 | | 17,283,144 |
| | 30,654,448 |
Paper & Forest Products - 0.5% |
Schweitzer-Mauduit International, Inc. | 173,800 | | 6,899,860 |
TOTAL MATERIALS | | 37,554,308 |
UTILITIES - 3.1% |
Electric Utilities - 3.1% |
American Electric Power Co., Inc. | 186,600 | | 10,555,962 |
Edison International | 97,000 | | 5,820,970 |
Exelon Corp. | 546,500 | | 17,537,185 |
Xcel Energy, Inc. | 267,200 | | 9,263,824 |
| | 43,177,941 |
TOTAL COMMON STOCKS (Cost $1,218,497,748) |
1,299,039,506
|
Money Market Funds - 7.6% |
| Shares | | Value |
Fidelity Cash Central Fund, 0.17% (b) | 102,717,974 | | $ 102,717,974 |
Fidelity Securities Lending Cash Central Fund, 0.18% (b)(c) | 4,373,134 | | 4,373,134 |
TOTAL MONEY MARKET FUNDS (Cost $107,091,108) |
107,091,108
|
TOTAL INVESTMENT PORTFOLIO - 100.3% (Cost $1,325,588,856) | | 1,406,130,614 |
NET OTHER ASSETS (LIABILITIES) - (0.3)% | | (4,247,907) |
NET ASSETS - 100% | $ 1,401,882,707 |
Legend |
(a) Non-income producing |
(b) Affiliated fund that is generally available only to investment companies and other accounts managed by Fidelity Investments. The rate quoted is the annualized seven-day yield of the fund at period end. A complete unaudited listing of the fund's holdings as of its most recent quarter end is available upon request. In addition, each Fidelity Central Fund's financial statements, which are not covered by the Fund's Report of Independent Registered Public Accounting Firm, are available on the SEC's website or upon request. |
(c) Investment made with cash collateral received from securities on loan. |
(d) Security or a portion of the security is on loan at period end. |
Affiliated Central Funds |
Information regarding fiscal year to date income earned by the Fund from investments in Fidelity Central Funds is as follows: |
Fund | Income earned |
Fidelity Cash Central Fund | $ 92,793 |
Fidelity Securities Lending Cash Central Fund | 92,437 |
Total | $ 185,230 |
Other Information |
The following is a summary of the inputs used, as of July 31, 2015, involving the Fund's assets and liabilities carried at fair value. The inputs or methodology used for valuing securities may not be an indication of the risk associated with investing in those securities. For more information on valuation inputs, and their aggregation into the levels used in the table below, please refer to the Investment Valuation section in the accompanying Notes to Financial Statements. |
Valuation Inputs at Reporting Date: |
Description | Total | Level 1 | Level 2 | Level 3 |
Investments in Securities: | | | | |
Equities: | | | | |
Consumer Discretionary | $ 141,548,975 | $ 141,548,975 | $ - | $ - |
Consumer Staples | 61,773,589 | 54,207,982 | 7,565,607 | - |
Energy | 114,363,470 | 114,363,470 | - | - |
Financials | 398,403,840 | 391,169,749 | 7,234,091 | - |
Health Care | 169,760,141 | 169,760,141 | - | - |
Industrials | 102,747,037 | 102,747,037 | - | - |
Information Technology | 229,710,205 | 229,710,205 | - | - |
Materials | 37,554,308 | 37,554,308 | - | - |
Utilities | 43,177,941 | 43,177,941 | - | - |
Money Market Funds | 107,091,108 | 107,091,108 | - | - |
Total Investments in Securities: | $ 1,406,130,614 | $ 1,391,330,916 | $ 14,799,698 | $ - |
Distribution of investments by country or territory of incorporation, as a percentage of total net assets, is as follows (Unaudited): |
United States of America | 84.3% |
Canada | 2.7% |
Israel | 2.5% |
United Kingdom | 2.3% |
Switzerland | 2.2% |
France | 1.7% |
Korea (South) | 1.6% |
Others (Individually Less Than 1%) | 2.7% |
| 100.0% |
See accompanying notes which are an integral part of the financial statements.
Annual Report
Statement of Assets and Liabilities
| | July 31, 2015 |
| | |
Assets | | |
Investment in securities, at value (including securities loaned of $4,179,555) - See accompanying schedule: Unaffiliated issuers (cost $1,218,497,748) | $ 1,299,039,506 | |
Fidelity Central Funds (cost $107,091,108) | 107,091,108 | |
Total Investments (cost $1,325,588,856) | | $ 1,406,130,614 |
Receivable for fund shares sold | | 3,157,853 |
Dividends receivable | | 674,260 |
Distributions receivable from Fidelity Central Funds | | 18,755 |
Other receivables | | 11,219 |
Total assets | | 1,409,992,701 |
| | |
Liabilities | | |
Payable to custodian bank | $ 108,241 | |
Payable for investments purchased | 1,167,116 | |
Payable for fund shares redeemed | 1,481,280 | |
Accrued management fee | 715,817 | |
Other affiliated payables | 216,905 | |
Other payables and accrued expenses | 47,501 | |
Collateral on securities loaned, at value | 4,373,134 | |
Total liabilities | | 8,109,994 |
| | |
Net Assets | | $ 1,401,882,707 |
Net Assets consist of: | | |
Paid in capital | | $ 1,287,373,404 |
Undistributed net investment income | | 17,518,540 |
Accumulated undistributed net realized gain (loss) on investments and foreign currency transactions | | 16,449,772 |
Net unrealized appreciation (depreciation) on investments and assets and liabilities in foreign currencies | | 80,540,991 |
Net Assets | | $ 1,401,882,707 |
See accompanying notes which are an integral part of the financial statements.
Annual Report
Statement of Assets and Liabilities - continued
| | July 31, 2015 |
| | |
Value Discovery:
Net Asset Value, offering price and redemption price per share ($1,205,423,050 ÷ 48,238,738 shares) | | $ 24.99 |
| | |
Class K:
Net Asset Value, offering price and redemption price per share ($196,459,657 ÷ 7,860,751 shares) | | $ 24.99 |
See accompanying notes which are an integral part of the financial statements.
Annual Report
Financial Statements - continued
Statement of Operations
| Year ended July 31, 2015 |
| | |
Investment Income | | |
Dividends | | $ 27,806,528 |
Special dividends | | 12,191,436 |
Interest | | 76 |
Income from Fidelity Central Funds | | 185,230 |
Total income | | 40,183,270 |
| | |
Expenses | | |
Management fee | | |
Basic fee | $ 6,254,808 | |
Performance adjustment | 695,946 | |
Transfer agent fees | 1,837,519 | |
Accounting and security lending fees | 372,615 | |
Custodian fees and expenses | 29,149 | |
Independent trustees' compensation | 4,511 | |
Registration fees | 131,082 | |
Audit | 50,354 | |
Legal | 3,474 | |
Miscellaneous | 6,137 | |
Total expenses before reductions | 9,385,595 | |
Expense reductions | (44,645) | 9,340,950 |
Net investment income (loss) | | 30,842,320 |
Realized and Unrealized Gain (Loss) Net realized gain (loss) on: | | |
Investment securities: | | |
Unaffiliated issuers | 81,321,918 | |
Foreign currency transactions | 5,860 | |
Futures contracts | (388,481) | |
Total net realized gain (loss) | | 80,939,297 |
Change in net unrealized appreciation (depreciation) on: Investment securities | (29,762,093) | |
Assets and liabilities in foreign currencies | 153 | |
Futures contracts | 200,164 | |
Total change in net unrealized appreciation (depreciation) | | (29,561,776) |
Net gain (loss) | | 51,377,521 |
Net increase (decrease) in net assets resulting from operations | | $ 82,219,841 |
See accompanying notes which are an integral part of the financial statements.
Annual Report
Statement of Changes in Net Assets
| Year ended
July 31,
2015 | Year ended
July 31,
2014 |
Increase (Decrease) in Net Assets | | |
Operations | | |
Net investment income (loss) | $ 30,842,320 | $ 8,849,312 |
Net realized gain (loss) | 80,939,297 | 79,442,705 |
Change in net unrealized appreciation (depreciation) | (29,561,776) | 10,858,809 |
Net increase (decrease) in net assets resulting from operations | 82,219,841 | 99,150,826 |
Distributions to shareholders from net investment income | (12,741,013) | (6,964,725) |
Distributions to shareholders from net realized gain | (667,082) | - |
Total distributions | (13,408,095) | (6,964,725) |
Share transactions - net increase (decrease) | 532,057,756 | 182,641,981 |
Total increase (decrease) in net assets | 600,869,502 | 274,828,082 |
| | |
Net Assets | | |
Beginning of period | 801,013,205 | 526,185,123 |
End of period (including undistributed net investment income of $17,518,540 and undistributed net investment income of $6,167,040, respectively) | $ 1,401,882,707 | $ 801,013,205 |
See accompanying notes which are an integral part of the financial statements.
Annual Report
Financial Highlights - Value Discovery
Years ended July 31, | 2015 | 2014 | 2013 | 2012 | 2011 |
Selected Per-Share Data | | | | | |
Net asset value, beginning of period | $ 23.32 | $ 19.93 | $ 15.62 | $ 14.98 | $ 12.91 |
Income from Investment Operations | | | | | |
Net investment income (loss) B | .66E | .31 | .29 | .22 | .13 |
Net realized and unrealized gain (loss) | 1.35 | 3.34 | 4.29 | .57 | 2.13 |
Total from investment operations | 2.01 | 3.65 | 4.58 | .79 | 2.26 |
Distributions from net investment income | (.32) | (.26) | (.27) | (.15) | (.19) |
Distributions from net realized gain | (.02) | - | - | - | - |
Total distributions | (.34) | (.26) | (.27) | (.15) | (.19) |
Net asset value, end of period | $ 24.99 | $ 23.32 | $ 19.93 | $ 15.62 | $ 14.98 |
Total ReturnA | 8.68% | 18.52% | 29.72% | 5.43% | 17.69% |
Ratios to Average Net Assets C, F | | | | |
Expenses before reductions | .84% | .80% | .74% | .87% | .80% |
Expenses net of fee waivers, if any | .84% | .80% | .74% | .87% | .80% |
Expenses net of all reductions | .84% | .80% | .73% | .87% | .79% |
Net investment income (loss) | 2.69% E | 1.44% | 1.66% | 1.49% | .88% |
Supplemental Data | | | | | |
Net assets, end of period (000 omitted) | $ 1,205,423 | $ 686,767 | $ 454,974 | $ 412,499 | $ 540,644 |
Portfolio turnover rateD | 45% | 58% | 55% | 92% | 59% |
A Total returns would have been lower if certain expenses had not been reduced during the applicable periods shown.
B Calculated based on average shares outstanding during the period.
C Fees and expenses of any underlying Fidelity Central Funds are not included in the Fund's expense ratio. The Fund indirectly bears its proportionate share of the expenses of any underlying Fidelity Central Funds.
D Amount does not include the portfolio activity of any underlying Fidelity Central Funds.
E Investment income per share reflects a large, non-recurring dividend which amounted to $.26 per share. Excluding this non-recurring dividend, the ratio of net investment income (loss) to average net assets would have been 1.62%.
F Expense ratios reflect operating expenses of the class. Expenses before reductions do not reflect amounts reimbursed by the investment adviser or reductions from brokerage service arrangements or reductions from other expense offset arrangements and do not represent the amount paid by the class during periods when reimbursements or reductions occur. Expenses net of fee waivers reflect expenses after reimbursement by the investment adviser but prior to reductions from brokerage service arrangements or other expense offset arrangements. Expenses net of all reductions represent the net expenses paid by the class.
See accompanying notes which are an integral part of the financial statements.
Annual Report
Financial Highlights - Class K
Years ended July 31, | 2015 | 2014 | 2013 | 2012 | 2011 |
Selected Per-Share Data | | | | | |
Net asset value, beginning of period | $ 23.32 | $ 19.93 | $ 15.62 | $ 14.99 | $ 12.92 |
Income from Investment Operations | | | | | |
Net investment income (loss) B | .69E | .34 | .32 | .25 | .15 |
Net realized and unrealized gain (loss) | 1.34 | 3.34 | 4.29 | .56 | 2.14 |
Total from investment operations | 2.03 | 3.68 | 4.61 | .81 | 2.29 |
Distributions from net investment income | (.34) | (.29) | (.30) | (.18) | (.22) |
Distributions from net realized gain | (.02) | - | - | - | - |
Total distributions | (.36) | (.29) | (.30) | (.18) | (.22) |
Net asset value, end of period | $ 24.99 | $ 23.32 | $ 19.93 | $ 15.62 | $ 14.99 |
Total ReturnA | 8.80% | 18.71% | 29.97% | 5.59% | 17.93% |
Ratios to Average Net Assets C, F | | | | | |
Expenses before reductions | .71% | .66% | .57% | .68% | .61% |
Expenses net of fee waivers, if any | .71% | .66% | .57% | .68% | .61% |
Expenses net of all reductions | .71% | .66% | .56% | .68% | .60% |
Net investment income (loss) | 2.82% E | 1.58% | 1.83% | 1.68% | 1.07% |
Supplemental Data | | | | | |
Net assets, end of period (000 omitted) | $ 196,460 | $ 114,246 | $ 71,212 | $ 53,794 | $ 41,562 |
Portfolio turnover rateD | 45% | 58% | 55% | 92% | 59% |
A Total returns would have been lower if certain expenses had not been reduced during the applicable periods shown.
B Calculated based on average shares outstanding during the period.
C Fees and expenses of any underlying Fidelity Central Funds are not included in the Fund's expense ratio. The Fund indirectly bears its proportionate share of the expenses of any underlying Fidelity Central Funds.
D Amount does not include the portfolio activity of any underlying Fidelity Central Funds.
E Investment income per share reflects a large, non-recurring dividend which amounted to $.26 per share. Excluding this non-recurring dividend, the ratio of net investment income (loss) to average net assets would have been 1.75%.
F Expense ratios reflect operating expenses of the class. Expenses before reductions do not reflect amounts reimbursed by the investment adviser or reductions from brokerage service arrangements or reductions from other expense offset arrangements and do not represent the amount paid by the class during periods when reimbursements or reductions occur. Expenses net of fee waivers reflect expenses after reimbursement by the investment adviser but prior to reductions from brokerage service arrangements or other expense offset arrangements. Expenses net of all reductions represent the net expenses paid by the class.
See accompanying notes which are an integral part of the financial statements.
Annual Report
For the period ended July 31, 2015
1. Organization.
Fidelity Value Discovery Fund (the Fund) is a fund of Fidelity Puritan Trust (the Trust) and is authorized to issue an unlimited number of shares. The Trust is registered under the Investment Company Act of 1940, as amended (the 1940 Act), as an open-end management investment company organized as a Massachusetts business trust. The Fund offers Value Discovery and Class K shares, each of which has equal rights as to assets and voting privileges. Each class has exclusive voting rights with respect to matters that affect that class.
2. Investments in Fidelity Central Funds.
The Fund invests in Fidelity Central Funds, which are open-end investment companies generally available only to other investment companies and accounts managed by the investment adviser and its affiliates. The Fund's Schedule of Investments lists each of the Fidelity Central Funds held as of period end, if any, as an investment of the Fund, but does not include the underlying holdings of each Fidelity Central Fund. As an Investing Fund, the Fund indirectly bears its proportionate share of the expenses of the underlying Fidelity Central Funds.
The Money Market Central Funds seek preservation of capital and current income and are managed by Fidelity Investments Money Management, Inc. (FIMM), an affiliate of the investment adviser. Annualized expenses of the Money Market Central Funds as of their most recent shareholder report date are less than .01%.
A complete unaudited list of holdings for each Fidelity Central Fund is available upon request or at the Securities and Exchange Commission (the SEC) website at www.sec.gov. In addition, the financial statements of the Fidelity Central Funds, which are not covered by the Fund's Report of Independent Registered Public Accounting Firm, are available on the SEC website or upon request.
3. Significant Accounting Policies.
The financial statements have been prepared in conformity with accounting principles generally accepted in the United States of America (GAAP), which require management to make certain estimates and assumptions at the date of the financial statements. Actual results could differ from those estimates. Subsequent events, if any, through the date that the financial statements were issued have been evaluated in the preparation of the financial statements. The following summarizes the significant accounting policies of the Fund:
Investment Valuation. Investments are valued as of 4:00 p.m. Eastern time on the last calendar day of the period. The Board of Trustees (the Board) has delegated the day to
Annual Report
Notes to Financial Statements - continued
3. Significant Accounting Policies - continued
Investment Valuation - continued
day responsibility for the valuation of the Fund's investments to the Fidelity Management & Research Company (FMR) Fair Value Committee (the Committee). In accordance with valuation policies and procedures approved by the Board, the Fund attempts to obtain prices from one or more third party pricing vendors or brokers to value its investments. When current market prices, quotations or currency exchange rates are not readily available or reliable, investments will be fair valued in good faith by the Committee, in accordance with procedures adopted by the Board. Factors used in determining fair value vary by investment type and may include market or investment specific events. The frequency with which these procedures are used cannot be predicted and they may be utilized to a significant extent. The Committee oversees the Fund's valuation policies and procedures and reports to the Board on the Committee's activities and fair value determinations. The Board monitors the appropriateness of the procedures used in valuing the Fund's investments and ratifies the fair value determinations of the Committee.
The Fund categorizes the inputs to valuation techniques used to value its investments into a disclosure hierarchy consisting of three levels as shown below:
Level 1 - quoted prices in active markets for identical investments
Level 2 - other significant observable inputs (including quoted prices for similar investments, interest rates, prepayment speeds, etc.)
Level 3 - unobservable inputs (including the Fund's own assumptions based on the best information available)
Valuation techniques used to value the Fund's investments by major category are as follows:
Equity securities, including restricted securities, for which market quotations are readily available, are valued at the last reported sale price or official closing price as reported by a third party pricing vendor on the primary market or exchange on which they are traded and are categorized as Level 1 in the hierarchy. In the event there were no sales during the day or closing prices are not available, securities are valued at the last quoted bid price or may be valued using the last available price and are generally categorized as Level 2 in the hierarchy. For foreign equity securities, when market or security specific events arise, comparisons to the valuation of American Depositary Receipts (ADRs), futures contracts, Exchange-Traded Funds (ETFs) and certain indexes as well as quoted prices for similar securities may be used and would be categorized as Level 2 in the hierarchy. Utilizing these techniques may result in transfers between Level 1 and Level 2. For equity securities, including restricted securities, where observable inputs are
Annual Report
3. Significant Accounting Policies - continued
Investment Valuation - continued
limited, assumptions about market activity and risk are used and these securities may be categorized as Level 3 in the hierarchy.
Investments in open-end mutual funds, including the Fidelity Central Funds, are valued at their closing net asset value (NAV) each business day and are categorized as Level 1 in the hierarchy.
Changes in valuation techniques may result in transfers in or out of an assigned level within the disclosure hierarchy. The aggregate value of investments by input level as of July 31, 2015 is included at the end of the Fund's Schedule of Investments.
Foreign Currency. The Fund may use foreign currency contracts to facilitate transactions in foreign-denominated securities. Gains and losses from these transactions may arise from changes in the value of the foreign currency or if the counterparties do not perform under the contracts' terms.
Foreign-denominated assets, including investment securities, and liabilities are translated into U.S. dollars at the exchange rates at period end. Purchases and sales of investment securities, income and dividends received and expenses denominated in foreign currencies are translated into U.S. dollars at the exchange rate in effect on the transaction date.
The effects of exchange rate fluctuations on investments are included with the net realized and unrealized gain (loss) on investment securities. Other foreign currency transactions resulting in realized and unrealized gain (loss) are disclosed separately.
Investment Transactions and Income. For financial reporting purposes, the Fund's investment holdings and NAV include trades executed through the end of the last business day of the period. The NAV per share for processing shareholder transactions is calculated as of the close of business of the New York Stock Exchange (NYSE), normally 4:00 p.m. Eastern time and includes trades executed through the end of the prior business day. Gains and losses on securities sold are determined on the basis of identified cost and may include proceeds received from litigation. Dividend income is recorded on the ex-dividend date, except for certain dividends from foreign securities where the ex-dividend date may have passed, which are recorded as soon as the Fund is informed of the ex-dividend date. Non-cash dividends included in dividend income, if any, are recorded at the fair market value of the securities received. Income and capital gain distributions from Fidelity Central Funds, if any, are recorded on the ex-dividend date. Distributions received on securities that represent a return of capital or capital gain are recorded as a reduction of cost of investments and/or as a realized gain. Subsequent to ex-dividend date the Fund determines the components of these distributions, based
Annual Report
Notes to Financial Statements - continued
3. Significant Accounting Policies - continued
Investment Transactions and Income - continued
upon receipt of tax filings or other correspondence relating to the underlying investment. Large, non-recurring dividends recognized by the Fund are presented separately on the Statement of Operations as "Special Dividends" and the impact of these dividends is presented in the Financial Highlights. Interest income is accrued as earned and includes coupon interest and amortization of premium and accretion of discount on debt securities as applicable. Investment income is recorded net of foreign taxes withheld where recovery of such taxes is uncertain.
Class Allocations and Expenses. Investment income, realized and unrealized capital gains and losses, common expenses of the Fund, and certain fund-level expense reductions, if any, are allocated daily on a pro-rata basis to each class based on the relative net assets of each class to the total net assets of the Fund. Each class differs with respect to transfer agent fees incurred. Certain expense reductions may also differ by class. For the reporting period, the allocated portion of income and expenses to each class as a percent of its average net assets may vary due to the timing of recording these transactions in relation to fluctuating net assets of the classes. Expenses directly attributable to a fund are charged to that fund. Expenses attributable to more than one fund are allocated among the respective funds on the basis of relative net assets or other appropriate methods. Expense estimates are accrued in the period to which they relate and adjustments are made when actual amounts are known.
Income Tax Information and Distributions to Shareholders. Each year, the Fund intends to qualify as a regulated investment company under Subchapter M of the Internal Revenue Code, including distributing substantially all of its taxable income and realized gains. As a result, no provision for U.S. Federal income taxes is required. As of July 31, 2015, the Fund did not have any unrecognized tax benefits in the financial statements; nor is the Fund aware of any tax positions for which it is reasonably possible that the total amounts of unrecognized tax benefits will significantly change in the next twelve months. The Fund files a U.S. federal tax return, in addition to state and local tax returns as required. The Fund's federal income tax returns are subject to examination by the Internal Revenue Service (IRS) for a period of three fiscal years after they are filed. State and local tax returns may be subject to examination for an additional fiscal year depending on the jurisdiction. Foreign taxes are provided for based on the Fund's understanding of the tax rules and rates that exist in the foreign markets in which it invests.
Distributions are declared and recorded on the ex-dividend date. Income dividends and capital gain distributions are declared separately for each class. Income and capital gain distributions are determined in accordance with income tax regulations, which may
Annual Report
3. Significant Accounting Policies - continued
Income Tax Information and Distributions to Shareholders - continued
differ from GAAP. In addition, the Fund claimed a portion of the payment made to redeeming shareholders as a distribution for income tax purposes.
Capital accounts within the financial statements are adjusted for permanent book-tax differences. These adjustments have no impact on net assets or the results of operations. Capital accounts are not adjusted for temporary book-tax differences which will reverse in a subsequent period.
Book-tax differences are primarily due to foreign currency transactions, futures contracts, market discount, passive foreign investment companies (PFIC), partnerships, capital loss carryforwards and losses deferred due to wash sales.
The federal tax cost of investment securities and unrealized appreciation (depreciation) as of period end were as follows:
Gross unrealized appreciation | $ 147,721,022 |
Gross unrealized depreciation | (68,717,309) |
Net unrealized appreciation (depreciation) on securities | $ 79,003,713 |
| |
Tax Cost | $ 1,327,126,901 |
The tax-based components of distributable earnings as of period end were as follows:
Undistributed ordinary income | $ 17,518,540 |
Undistributed long-term capital gain | $ 17,987,817 |
Net unrealized appreciation (depreciation) on securities and other investments | $ 79,002,946 |
The tax character of distributions paid was as follows:
| July 31, 2015 | July 31, 2014 |
Ordinary Income | $ 13,408,095 | $ 6,964,725 |
4. Derivative Instruments.
Risk Exposures and the Use of Derivative Instruments. The Fund's investment objective allows the Fund to enter into various types of derivative contracts, including futures contracts. Derivatives are investments whose value is primarily derived from underlying assets, indices or reference rates and may be transacted on an exchange or over-the-counter (OTC). Derivatives may involve a future commitment to buy or sell a specified asset based on specified terms, to exchange future cash flows at periodic intervals based on a notional principal amount, or for one party to make one or more
Annual Report
Notes to Financial Statements - continued
4. Derivative Instruments - continued
Risk Exposures and the Use of Derivative Instruments - continued
payments upon the occurrence of specified events in exchange for periodic payments from the other party.
The Fund used derivatives to increase returns and to manage exposure to certain risks as defined below. The success of any strategy involving derivatives depends on analysis of numerous economic factors, and if the strategies for investment do not work as intended, the Fund may not achieve its objectives.
The Fund's use of derivatives increased or decreased its exposure to the following risk:
Equity Risk | Equity risk relates to the fluctuations in the value of financial instruments as a result of changes in market prices (other than those arising from interest rate risk or foreign exchange risk), whether caused by factors specific to an individual investment, its issuer, or all factors affecting all instruments traded in a market or market segment. |
The Fund is also exposed to additional risks from investing in derivatives, such as liquidity risk and counterparty credit risk. Liquidity risk is the risk that the Fund will be unable to close out the derivative in the open market in a timely manner. Counterparty credit risk is the risk that the counterparty will not be able to fulfill its obligation to the Fund. Counterparty credit risk related to exchange-traded futures contracts may be mitigated by the protection provided by the exchange on which they trade.
Investing in derivatives may involve greater risks than investing in the underlying assets directly and, to varying degrees, may involve risk of loss in excess of any initial investment and collateral received and amounts recognized in the Statement of Assets and Liabilities. In addition, there may be the risk that the change in value of the derivative contract does not correspond to the change in value of the underlying instrument.
Futures Contracts. A futures contract is an agreement between two parties to buy or sell a specified underlying instrument for a fixed price at a specified future date. The Fund used futures contracts to manage its exposure to the stock market.
Upon entering into a futures contract, a fund is required to deposit either cash or securities (initial margin) with a clearing broker in an amount equal to a certain percentage of the face value of the contract. Futures contracts are marked-to-market daily and subsequent daily payments (variation margin) are made or received by a fund depending on the daily fluctuations in the value of the futures contracts and are recorded as unrealized appreciation or (depreciation). This receivable and/or payable, if any, is included in daily variation margin for derivative instruments in the Statement of Assets and Liabilities. Realized gain or (loss) is recorded upon the expiration or closing of a futures contract.
Annual Report
4. Derivative Instruments - continued
Futures Contracts - continued
Any open futures contracts at period end are presented in the Schedule of Investments under the caption "Futures Contracts." The underlying face amount at value reflects each contract's exposure to the underlying instrument or index at period end.
During the period the Fund recognized net realized gain (loss) of $(388,481) and a change in net unrealized appreciation (depreciation) of $200,164 related to its investment in futures contracts. These amounts are included in the Statement of Operations.
5. Purchases and Sales of Investments.
Purchases and sales of securities, other than short-term securities, aggregated $959,251,208 and $486,500,887, respectively.
6. Fees and Other Transactions with Affiliates.
Management Fee. Fidelity Management & Research Company (the investment adviser) and its affiliates provide the Fund with investment management related services for which the Fund pays a monthly management fee. The management fee is the sum of an individual fund fee rate that is based on an annual rate of .30% of the Fund's average net assets and an annualized group fee rate that averaged .25% during the period. The group fee rate is based upon the average net assets of all the mutual funds advised by the investment adviser, including any mutual funds previously advised by the investment adviser that are currently advised by Fidelity SelectCo, LLC, an affiliate of the investment adviser. The group fee rate decreases as assets under management increase and increases as assets under management decrease. In addition, the management fee is subject to a performance adjustment (up to a maximum of ± .20% of the Fund's average net assets over a 36 month performance period). The upward or downward adjustment to the management fee is based on the relative investment performance of Value Discovery as compared to its benchmark index, the Russell 3000 Value Index, over the same 36 month performance period. For the reporting period, the total annual management fee rate, including the performance adjustment, was .61% of the Fund's average net assets. The performance adjustment included in the management fee rate may be higher or lower than the maximum performance adjustment rate due to the difference between the average net assets for the reporting and performance periods.
Transfer Agent Fees. Fidelity Investments Institutional Operations Company, Inc., (FIIOC), an affiliate of the investment adviser, is the transfer, dividend disbursing and shareholder servicing agent for each class of the Fund. FIIOC receives account fees and asset-based fees that vary according to the account size and type of account of the shareholders of Value Discovery. FIIOC receives an asset-based fee of Class K's average
Annual Report
Notes to Financial Statements - continued
6. Fees and Other Transactions with Affiliates - continued
Transfer Agent Fees - continued
net assets. FIIOC pays for typesetting, printing and mailing of shareholder reports, except proxy statements.
For the period, transfer agent fees for each applicable class were as follows:
| Amount | % of
Class-Level Average
Net Assets |
Value Discovery | $ 1,764,655 | .18 |
Class K | 72,864 | .05 |
| $ 1,837,519 | |
Accounting and Security Lending Fees. Fidelity Service Company, Inc. (FSC), an affiliate of the investment adviser, maintains the Fund's accounting records. The accounting fee is based on the level of average net assets for each month. Under a separate contract, FSC administers the security lending program. The security lending fee is based on the number and duration of lending transactions.
Brokerage Commissions. The Fund placed a portion of its portfolio transactions with brokerage firms which are affiliates of the investment adviser. Brokerage commissions are included in net realized gain (loss) and change in net unrealized appreciation (depreciation) in the Statement of Operations. The commissions paid to these affiliated firms were $12,832 for the period.
Other. During the period, the investment adviser reimbursed the Fund for certain losses in the amount of $5,591.
7. Committed Line of Credit.
The Fund participates with other funds managed by the investment adviser or an affiliate in a $4.25 billion credit facility (the "line of credit") to be utilized for temporary or emergency purposes to fund shareholder redemptions or for other short-term liquidity purposes. The Fund has agreed to pay commitment fees on its pro-rata portion of the line of credit, which amounted to $1,568 and is reflected in Miscellaneous expenses on the Statement of Operations. During the period, the Fund did not borrow on this line of credit.
8. Security Lending.
The Fund lends portfolio securities through a lending agent from time to time in order to earn additional income. For equity securities, a lending agent is used and may loan securities to certain qualified borrowers, including Fidelity Capital Markets (FCM), a broker-dealer affiliated with the Fund. On the settlement date of the loan, the Fund
Annual Report
8. Security Lending - continued
receives collateral (in the form of U.S. Treasury obligations, letters of credit and/or cash) against the loaned securities and maintains collateral in an amount not less than 100% of the market value of the loaned securities during the period of the loan. The market value of the loaned securities is determined at the close of business of the Fund and any additional required collateral is delivered to the Fund on the next business day. If the borrower defaults on its obligation to return the securities loaned because of insolvency or other reasons, the Fund may apply collateral received from the borrower against the obligation. The Fund may experience delays and costs in recovering the securities loaned. Any cash collateral received is invested in the Fidelity Securities Lending Cash Central Fund. The value of loaned securities and cash collateral at period end are disclosed on the Fund's Statement of Assets and Liabilities. Security lending income represents the income earned on investing cash collateral, less rebates paid to borrowers and any lending agent fees associated with the loan, plus any premium payments received for lending certain types of securities. Security lending income is presented in the Statement of Operations as a component of income from Fidelity Central Funds. Total security lending income during the period amounted to $92,437. During the period, there were no securities loaned to FCM.
9. Expense Reductions.
Commissions paid to certain brokers with whom the investment adviser, or its affiliates, places trades on behalf of the Fund include an amount in addition to trade execution, which may be rebated back to the Fund to offset certain expenses. This amount totaled $22,956 for the period. In addition, through arrangements with the Fund's custodian, credits realized as a result of uninvested cash balances were used to reduce the Fund's expenses. During the period, these credits reduced the Fund's expenses by $337.
In addition, during the period the investment adviser reimbursed/waived a portion of fund-level operating expenses in the amount of $5,522 and a portion of class-level operating expenses as follows:
| Amount |
Value Discovery | $ 15,830 |
Annual Report
Notes to Financial Statements - continued
10. Distributions to Shareholders.
Distributions to shareholders of each class were as follows:
Years ended July 31, | 2015 | 2014 |
From net investment income | | |
Value Discovery | $ 10,957,309 | $ 5,880,680 |
Class K | 1,783,704 | 1,084,045 |
Total | $ 12,741,013 | $ 6,964,725 |
From net realized gain | | |
Value Discovery | $ 578,732 | $ - |
Class K | 88,350 | - |
Total | $ 667,082 | $ - |
11. Share Transactions.
Share transactions for each class were as follows and may contain automatic conversions between classes or exchanges between funds:
| Shares | Dollars |
Years ended July 31, | 2015 | 2014 | 2015 | 2014 |
Value Discovery | | | | |
Shares sold | 26,910,446 | 9,957,139 | $ 658,668,681 | $ 226,028,010 |
Reinvestment of distributions | 467,074 | 278,378 | 11,066,789 | 5,640,307 |
Shares redeemed | (8,583,679) | (3,617,186) | (211,736,756) | (78,363,112) |
Net increase (decrease) | 18,793,841 | 6,618,331 | $ 457,998,714 | $ 153,305,205 |
Class K | | | | |
Shares sold | 5,745,415 | 2,344,329 | $ 143,155,226 | $ 51,734,186 |
Reinvestment of distributions | 79,062 | 53,522 | 1,872,054 | 1,084,045 |
Shares redeemed | (2,862,594) | (1,071,695) | (70,968,238) | (23,481,455) |
Net increase (decrease) | 2,961,883 | 1,326,156 | $ 74,059,042 | $ 29,336,776 |
12. Other.
The Fund's organizational documents provide former and current trustees and officers with a limited indemnification against liabilities arising in connection with the performance of their duties to the Fund. In the normal course of business, the Fund may also enter into contracts that provide general indemnifications. The Fund's maximum exposure under these arrangements is unknown as this would be dependent on future claims that may be made against the Fund. The risk of material loss from such claims is considered remote.
Annual Report
To the Trustees of Fidelity Puritan Trust and Shareholders of Fidelity Value Discovery Fund:
We have audited the accompanying statement of assets and liabilities of Fidelity Value Discovery Fund (the Fund), a fund of Fidelity Puritan Trust, including the schedule of investments, as of July 31, 2015, and the related statement of operations for the year then ended, the statement of changes in net assets for each of the two years in the period then ended, and the financial highlights for each of the five years in the period then ended. These financial statements and financial highlights are the responsibility of the Fund's management. Our responsibility is to express an opinion on these financial statements and financial highlights based on our audits.
We conducted our audits in accordance with the standards of the Public Company Accounting Oversight Board (United States). Those standards require that we plan and perform the audit to obtain reasonable assurance about whether the financial statements and financial highlights are free of material misstatement. The Fund is not required to have, nor were we engaged to perform, an audit of its internal control over financial reporting. Our audits included consideration of internal control over financial reporting as a basis for designing audit procedures that are appropriate in the circumstances, but not for the purpose of expressing an opinion on the effectiveness of the Fund's internal control over financial reporting. Accordingly, we express no such opinion. An audit also includes examining, on a test basis, evidence supporting the amounts and disclosures in the financial statements, assessing the accounting principles used and significant estimates made by management, as well as evaluating the overall financial statement presentation. Our procedures included confirmation of securities owned as of July 31, 2015, by correspondence with the custodians and brokers; when replies were not received from brokers, we performed other auditing procedures. We believe that our audits provide a reasonable basis for our opinion.
In our opinion, such financial statements and financial highlights referred to above present fairly, in all material respects, the financial position of Fidelity Value Discovery Fund as of July 31, 2015, the results of its operations for the year then ended, the changes in its net assets for each of the two years in the period then ended, and the financial highlights for each of the five years in the period then ended, in conformity with accounting principles generally accepted in the United States of America.
DELOITTE & TOUCHE LLP
Boston, Massachusetts
September 17, 2015
Annual Report
The Trustees, Member of the Advisory Board, and officers of the trust and fund, as applicable, are listed below. The Board of Trustees governs the fund and is responsible for protecting the interests of shareholders. The Trustees are experienced executives who meet periodically throughout the year to oversee the fund's activities, review contractual arrangements with companies that provide services to the fund, oversee management of the risks associated with such activities and contractual arrangements, and review the fund's performance. Each of the Trustees oversees 170 funds.
The Trustees hold office without limit in time except that (a) any Trustee may resign; (b) any Trustee may be removed by written instrument, signed by at least two-thirds of the number of Trustees prior to such removal; (c) any Trustee who requests to be retired or who has become incapacitated by illness or injury may be retired by written instrument signed by a majority of the other Trustees; and (d) any Trustee may be removed at any special meeting of shareholders by a two-thirds vote of the outstanding voting securities of the trust. Each Trustee who is not an interested person (as defined in the 1940 Act) of the trust and the fund (Independent Trustee), shall retire not later than the last day of the calendar year in which his or her 75th birthday occurs. The Independent Trustees may waive this mandatory retirement age policy with respect to individual Trustees. The officers and Advisory Board Member hold office without limit in time, except that any officer and Advisory Board Member may resign or may be removed by a vote of a majority of the Trustees at any regular meeting or any special meeting of the Trustees. Except as indicated, each individual has held the office shown or other offices in the same company for the past five years.
Experience, Skills, Attributes, and Qualifications of the Fund's Trustees. The Governance and Nominating Committee has adopted a statement of policy that describes the experience, qualifications, attributes, and skills that are necessary and desirable for potential Independent Trustee candidates (Statement of Policy). The Board believes that each Trustee satisfied at the time he or she was initially elected or appointed a Trustee, and continues to satisfy, the standards contemplated by the Statement of Policy. The Governance and Nominating Committee also engages professional search firms to help identify potential Independent Trustee candidates who have the experience, qualifications, attributes, and skills consistent with the Statement of Policy. From time to time, additional criteria based on the composition and skills of the current Independent Trustees, as well as experience or skills that may be appropriate in light of future changes to board composition, business conditions, and regulatory or other developments, have also been considered by the professional search firms and the Governance and Nominating Committee. In addition, the Board takes into account the Trustees' commitment and participation in Board and committee meetings, as well as their leadership of standing and ad hoc committees throughout their tenure.
In determining that a particular Trustee was and continues to be qualified to serve as a Trustee, the Board has considered a variety of criteria, none of which, in isolation, was controlling. The Board believes that, collectively, the Trustees have balanced and diverse experience, qualifications, attributes, and skills, which allow the Board to operate effectively in governing the fund and protecting the interests of shareholders. Information about the specific experience, skills, attributes, and qualifications of each Trustee, which in each case led to the Board's conclusion that the Trustee should serve (or continue to serve) as a trustee of the fund, is provided below.
Annual Report
Board Structure and Oversight Function. James C. Curvey is an interested person (as defined in the 1940 Act) and currently serves as Chairman. The Trustees have determined that an interested Chairman is appropriate and benefits shareholders because an interested Chairman has a personal and professional stake in the quality and continuity of services provided to the fund. Independent Trustees exercise their informed business judgment to appoint an individual of their choosing to serve as Chairman, regardless of whether the Trustee happens to be independent or a member of management. The Independent Trustees have determined that they can act independently and effectively without having an Independent Trustee serve as Chairman and that a key structural component for assuring that they are in a position to do so is for the Independent Trustees to constitute a substantial majority for the Board. The Independent Trustees also regularly meet in executive session. Ned C. Lautenbach serves as Chairman of the Independent Trustees and as such (i) acts as a liaison between the Independent Trustees and management with respect to matters important to the Independent Trustees and (ii) with management prepares agendas for Board meetings.
Fidelity funds are overseen by different Boards of Trustees. The fund's Board oversees Fidelity's high income and certain equity funds and other Boards oversee Fidelity's investment-grade bond, money market, asset allocation, and sector funds. The asset allocation funds may invest in Fidelity funds overseen by the fund's Board. The use of separate Boards, each with its own committee structure, allows the Trustees of each group of Fidelity funds to focus on the unique issues of the funds they oversee, including common research, investment, and operational issues. On occasion, the separate Boards establish joint committees to address issues of overlapping consequences for the Fidelity funds overseen by each Board.
The Trustees operate using a system of committees to facilitate the timely and efficient consideration of all matters of importance to the Trustees, the fund, and fund shareholders and to facilitate compliance with legal and regulatory requirements and oversight of the fund's activities and associated risks. The Board, acting through its committees, has charged FMR and its affiliates with (i) identifying events or circumstances the occurrence of which could have demonstrably adverse effects on the fund's business and/or reputation; (ii) implementing processes and controls to lessen the possibility that such events or circumstances occur or to mitigate the effects of such events or circumstances if they do occur; and (iii) creating and maintaining a system designed to evaluate continuously business and market conditions in order to facilitate the identification and implementation processes described in (i) and (ii) above. Because the day-to-day operations and activities of the fund are carried out by or through FMR, its affiliates and other service providers, the fund's exposure to risks is mitigated but not eliminated by the processes overseen by the Trustees. While each of the Board's committees has responsibility for overseeing different aspects of the fund's activities, oversight is exercised primarily through the Operations, Audit, and Compliance Committees. In addition, the Independent Trustees have worked with FMR to enhance the Board's oversight of investment and financial risks, legal and regulatory risks, technology risks, and operational risks, including the development of additional risk reporting to the Board. For example, a working group comprised of Independent Trustees and FMR has worked and continues to work to review the Fidelity funds' valuation-related activities, reporting and risk management. Appropriate personnel, including but not limited to the fund's Chief Compliance Officer (CCO), FMR's internal auditor, the independent accountants, the fund's Treasurer and portfolio management personnel, make periodic reports to the Board's committees, as appropriate, including an annual review of FMR's risk management program for the Fidelity funds. The responsibilities of each standing committee, including their oversight responsibilities, are described further under "Standing Committees of the Fund's Trustees."
Annual Report
Trustees and Officers - continued
The fund's Statement of Additional Information (SAI) includes more information about the Trustees. To request a free copy, call Fidelity at 1-800-544-8544.
Interested Trustees*:
Correspondence intended for each Trustee who is an interested person may be sent to Fidelity Investments, 245 Summer Street, Boston, Massachusetts 02210.
Name, Year of Birth; Principal Occupations and Other Relevant Experience+ |
James C. Curvey (1935) |
Year of Election or Appointment: 2007 Trustee Chairman of the Board of Trustees |
| Mr. Curvey also serves as Trustee of other Fidelity funds. Mr. Curvey is a Director of Fidelity Research & Analysis Co. (investment adviser firm, 2009-present), and Vice Chairman (2007-present) and Director of FMR LLC (diversified financial services company). In addition, Mr. Curvey serves as an Overseer for the Boston Symphony Orchestra and a member of the board of Artis-Naples, Naples, Florida, and as a Trustee for Brewster Academy, Wolfeboro, New Hampshire. Previously, Mr. Curvey served as a Director of Fidelity Investments Money Management, Inc. (investment adviser firm, 2009-2014), a Director of FMR (investment adviser firm, 2007-2014), and a Director of FMR Co., Inc. (investment adviser firm, 2007-2014). |
Charles S. Morrison (1960) |
Year of Election or Appointment: 2014 Trustee |
| Mr. Morrison also serves as Trustee of other funds. He serves as a Director of Fidelity Investments Money Management, Inc. (FIMM) (investment adviser firm, 2014-present), Director of Fidelity SelectCo, LLC (investment adviser firm, 2014-present), President, Asset Management (2014-present), and is an employee of Fidelity Investments. Previously, Mr. Morrison served as Vice President of Fidelity's Fixed Income and Asset Allocation Funds (2012-2014), President, Fixed Income (2011-2014), Vice President of Fidelity's Money Market Funds (2005-2009), President, Money Market Group Leader of FMR (investment adviser firm, 2009), and Senior Vice President, Money Market Group of FMR (2004-2009). Mr. Morrison also served as Vice President of Fidelity's Bond Funds (2002-2005), certain Balanced Funds (2002-2005), and certain Asset Allocation Funds (2002-2007), and as Senior Vice President (2002-2005) of Fidelity's Bond Division. |
* Trustees have been determined to be "Interested Trustees" by virtue of, among other things, their affiliation with the trust or various entities under common control with FMR.
+ The information above includes each Trustee's principal occupation during the last five years and other information relating to the experience, attributes, and skills relevant to each Trustee's qualifications to serve as a Trustee, which led to the conclusion that each Trustee should serve as a Trustee for the fund.
Annual Report
Trustees and Officers - continued
Independent Trustees:
Correspondence intended for each Independent Trustee (that is, the Trustees other than the Interested Trustees) may be sent to Fidelity Investments, P.O. Box 55235, Boston, Massachusetts 02205-5235.
Name, Year of Birth; Principal Occupations and Other Relevant Experience+ |
Dennis J. Dirks (1948) |
Year of Election or Appointment: 2005 Trustee |
| Mr. Dirks also serves as Trustee of other Fidelity funds. Prior to his retirement in May 2003, Mr. Dirks was Chief Operating Officer and a member of the Board of The Depository Trust & Clearing Corporation (DTCC). He also served as President, Chief Operating Officer, and Board member of The Depository Trust Company (DTC) and President and Board member of the National Securities Clearing Corporation (NSCC). In addition, Mr. Dirks served as Chief Executive Officer and Board member of the Government Securities Clearing Corporation, Chief Executive Officer and Board member of the Mortgage-Backed Securities Clearing Corporation, as a Trustee and a member of the Finance Committee of Manhattan College (2005-2008), and as a Trustee and a member of the Finance Committee of AHRC of Nassau County (2006-2008). Mr. Dirks is a member of the Independent Directors Council (IDC) Governing Council (2010-present) and Board of Directors for The Brookville Center for Children's Services, Inc. (2009-present). |
Alan J. Lacy (1953) |
Year of Election or Appointment: 2008 Trustee |
| Mr. Lacy also serves as Trustee of other Fidelity funds. Mr. Lacy serves as a member of the Board of Directors of Dave & Buster's Entertainment, Inc. (restaurant and entertainment complexes, 2010-present) and Bristol-Myers Squibb Company (global pharmaceuticals, 2008-present). In addition, Mr. Lacy served as Senior Adviser (2007-2014) of Oak Hill Capital Partners, L.P. (private equity) and also served as Chief Executive Officer (2000-2005) and Vice Chairman (2005-2006) of Sears Holdings Corporation and Sears, Roebuck and Co. (retail). Mr. Lacy is a member of the Board of Trustees of The National Parks Conservation Association (2006-present). Previously, Mr. Lacy served as Chairman of the Board of Trustees of the National Parks Conservation Association (2008-2011) and as a member of the Board of Directors for The Western Union Company (global money transfer, 2006-2011), The Hillman Companies, Inc. (hardware wholesalers, 2010-2014), and Earth Fare, Inc. (retail grocery, 2010-2014). |
Ned C. Lautenbach (1944) |
Year of Election or Appointment: 2000 Trustee Chairman of the Independent Trustees |
| Mr. Lautenbach also serves as Trustee of other Fidelity funds. Mr. Lautenbach currently serves as the Lead Director of the Eaton Corporation Board of Directors (diversified industrial, 1997-present). Mr. Lautenbach is Chairman of the Board of Directors of Artis-Naples in Naples, Florida (2012-present), a member of the Council on Foreign Relations (1994-present), and a member of the Board of Governors, State University System of Florida (2013-present). Previously, Mr. Lautenbach was a Partner/Advisory Partner at Clayton, Dubilier & Rice, LLC (private equity investment, 1998-2010), as well as a Director of Sony Corporation (2006-2007). |
Joseph Mauriello (1944) |
Year of Election or Appointment: 2008 Trustee |
| Mr. Mauriello also serves as Trustee of other Fidelity funds. Prior to his retirement in January 2006, Mr. Mauriello served in numerous senior management positions including Deputy Chairman and Chief Operating Officer (2004-2005), and Vice Chairman of Financial Services (2002-2004) of KPMG LLP US (professional services, 1965-2005). Mr. Mauriello currently serves as a member of the Board of Directors of XL Group plc. (global insurance and re-insurance, 2006-present). Previously, Mr. Mauriello served as a Director of the Hamilton Funds of the Bank of New York (2006-2007) and of Arcadia Resources Inc. (health care services and products, 2007-2012). |
Robert W. Selander (1950) |
Year of Election or Appointment: 2011 Trustee |
| Mr. Selander also serves as Trustee of other Fidelity funds. Mr. Selander serves as a Director of The Western Union Company (global money transfer, 2014-present). Previously, Mr. Selander served as a Member of the Advisory Board of other Fidelity funds (2011), and Executive Vice Chairman (2010), Chief Executive Officer (2009-2010), and President and Chief Executive Officer (1997-2009) of Mastercard, Inc. |
Cornelia M. Small (1944) |
Year of Election or Appointment: 2005 Trustee |
| Ms. Small also serves as Trustee of other Fidelity funds. Ms. Small is a member of the Board of Directors (2009-present) and Chair of the Investment Committee (2010-present) of the Teagle Foundation. Ms. Small also serves on the Investment Committee of the Berkshire Taconic Community Foundation (2008-present). Previously, Ms. Small served as Chairperson (2002-2008) and a member of the Investment Committee and Chairperson (2008-2012) and a member of the Board of Trustees of Smith College. In addition, Ms. Small served as Chief Investment Officer, Director of Global Equity Investments, and a member of the Board of Directors of Scudder, Stevens & Clark and Scudder Kemper Investments. |
William S. Stavropoulos (1939) |
Year of Election or Appointment: 2001 Trustee Vice Chairman of the Independent Trustees |
| Mr. Stavropoulos also serves as Trustee of other Fidelity funds. Mr. Stavropoulos serves as President and Founder of the Michigan Baseball Foundation, the Great Lakes Loons (2007-present). Mr. Stavropoulos is Chairman Emeritus of the Board of Directors of The Dow Chemical Company, where he previously served in numerous senior management positions, including President, CEO (1995-2000; 2002-2004), Chairman of the Executive Committee (2000-2006), and as a member of the Board of Directors (1990-2006). Currently, Mr. Stavropoulos is Chairman of the Board of Directors of Univar Inc. (global distributor of commodity and specialty chemicals), a Director of Teradata Corporation (data warehousing and technology solutions), and Maersk Inc. (industrial conglomerate), and a member of the Advisory Board for Metalmark Capital LLC (private equity investment, 2005-present). Mr. Stavropoulos is an operating advisor to Clayton, Dubilier & Rice, LLC (private equity investment). In addition, Mr. Stavropoulos is a member of the University of Notre Dame Advisory Council for the College of Science, a Trustee of the Rollin L. Gerstacker Foundation, and a Director of the Naples Philharmonic Center for the Arts. Previously, Mr. Stavropoulos served as a Director of Chemical Financial Corporation (bank holding company, 1993-2012) and Tyco International, Ltd. (multinational manufacturing and services, 2007-2012). |
David M. Thomas (1949) |
Year of Election or Appointment: 2008 Trustee |
| Mr. Thomas also serves as Trustee of other Fidelity funds. Mr. Thomas serves as Non-Executive Chairman of the Board of Directors of Fortune Brands Home and Security (home and security products, 2011-present), as a member of the Board of Directors (2004-present) and Presiding Director (2013-present) of Interpublic Group of Companies, Inc. (marketing communication), and as a member of the Board of Trustees of the University of Florida (2013-present). Previously, Mr. Thomas served as Executive Chairman (2005-2006) and Chairman and Chief Executive Officer (2000-2005) of IMS Health, Inc. (pharmaceutical and healthcare information solutions), and a Director of Fortune Brands, Inc. (consumer products, 2000-2011). |
+ The information above includes each Trustee's principal occupation during the last five years and other information relating to the experience, attributes, and skills relevant to each Trustee's qualifications to serve as a Trustee, which led to the conclusion that each Trustee should serve as a Trustee for the fund.
Advisory Board Member and Officers:
Correspondence intended for each officer and Peter S. Lynch may be sent to Fidelity Investments, 245 Summer Street, Boston, Massachusetts 02210. Officers appear below in alphabetical order.
Name, Year of Birth; Principal Occupation |
Peter S. Lynch (1944) |
Year of Election or Appointment: 2003 Member of the Advisory Board |
| Mr. Lynch also serves as Member of the Advisory Board of other Fidelity funds. Mr. Lynch is Vice Chairman and a Director of FMR (investment adviser firm) and FMR Co., Inc. (investment adviser firm). In addition, Mr. Lynch serves as a Trustee of Boston College and as the Chairman of the Inner-City Scholarship Fund. Previously, Mr. Lynch served on the Special Olympics International Board of Directors (1997-2006). |
Elizabeth Paige Baumann (1968) |
Year of Election or Appointment: 2012 Anti-Money Laundering (AML) Officer |
| Ms. Baumann also serves as AML Officer of other funds. She is Chief AML Officer of FMR LLC (diversified financial services company, 2012-present) and is an employee of Fidelity Investments. Previously, Ms. Baumann served as Vice President and Deputy Anti-Money Laundering Officer (2007-2012). |
Marc Bryant (1966) |
Year of Election or Appointment: 2015 Secretary and Chief Legal Officer (CLO) |
| Mr. Bryant also serves as Secretary and Chief Legal Officer (CLO) of other funds. He is Senior Vice President and Deputy General Counsel of FMR LLC (diversified financial services company). Previously, Mr. Bryant served as Secretary and Chief Legal Officer of Fidelity Rutland Square Trust II (2010-2014) and Assistant Secretary of Fidelity's Fixed Income and Asset Allocation Funds (2013-2015). Prior to joining Fidelity Investments, Mr. Bryant served as a Senior Vice President and the Head of Global Retail Legal for AllianceBernstein L.P. (2006-2010), and as the General Counsel for ProFund Advisors LLC (2001-2006). |
William C. Coffey (1969) |
Year of Election or Appointment: 2009 Assistant Secretary |
| Mr. Coffey also serves as Assistant Secretary of other funds. He is Senior Vice President and Deputy General Counsel of FMR LLC (diversified financial services company, 2010-present), and is an employee of Fidelity Investments. Previously, Mr. Coffey served as Vice President and Associate General Counsel of FMR LLC (2005-2009). |
Jonathan Davis (1968) |
Year of Election or Appointment: 2010 Assistant Treasurer |
| Mr. Davis also serves as Assistant Treasurer of other funds. Mr. Davis is an employee of Fidelity Investments. Previously, Mr. Davis served as Vice President and Associate General Counsel of FMR LLC (diversified financial services company, 2003-2010). |
Adrien E. Deberghes (1967) |
Year of Election or Appointment: 2008 Deputy Treasurer |
| Mr. Deberghes also serves as an officer of other funds. He is an employee of Fidelity Investments (2008-present). Prior to joining Fidelity Investments, Mr. Deberghes was Senior Vice President of Mutual Fund Administration at State Street Corporation (2007-2008), Senior Director of Mutual Fund Administration at Investors Bank & Trust (2005-2007), and Director of Finance for Dunkin' Brands (2000-2005). |
Stephanie J. Dorsey (1969) |
Year of Election or Appointment: 2010 Assistant Treasurer |
| Ms. Dorsey also serves as an officer of other funds. She is an employee of Fidelity Investments (2008-present) and has served in other fund officer roles. Prior to joining Fidelity Investments, Ms. Dorsey served as Treasurer (2004-2008) of the JPMorgan Mutual Funds and Vice President (2004-2008) of JPMorgan Chase Bank. |
Howard J. Galligan III (1966) |
Year of Election or Appointment: 2014 Chief Financial Officer |
| Mr. Galligan also serves as Chief Financial Officer of other funds. Mr. Galligan serves as President of Fidelity Pricing and Cash Management Services (FPCMS) (2014-present) and as a Director of Strategic Advisers, Inc. (investment adviser firm, 2008-present). Previously, Mr. Galligan served as Chief Administrative Officer of Asset Management (2011-2014) and Chief Operating Officer and Senior Vice President of Investment Support for Strategic Advisers, Inc. (2003-2011). |
Scott C. Goebel (1968) |
Year of Election or Appointment: 2015 Vice President |
| Mr. Goebel serves as an officer of other funds. Mr. Goebel also serves as Secretary of Fidelity SelectCo, LLC (investment adviser firm, 2013-present), Fidelity Investments Money Management, Inc. (FIMM) (investment adviser firm, 2010-present) and Fidelity Research and Analysis Company (FRAC) (investment adviser firm, 2010-present); General Counsel, Secretary, and Senior Vice President of FMR (investment adviser firm, 2008-present) and FMR Co., Inc. (investment adviser firm, 2008-present); Chief Legal Officer of Fidelity Management & Research (Hong Kong) Limited (investment adviser firm, 2008-present); and Assistant Secretary of Fidelity Management & Research (Japan) Limited (investment adviser firm, 2008-present) and FMR Investment Management (U.K.) Limited (investment adviser firm, 2008-present). Previously, Mr. Goebel served as Secretary and CLO of certain Fidelity funds (2008-2015), Assistant Secretary of FIMM (2008-2010), FRAC (2008-2010), and certain funds (2007-2008); and as Vice President and Secretary of Fidelity Distributors Corporation (FDC) (2005-2007). Mr. Goebel has been employed by FMR LLC (diversified financial services company) or an affiliate since 2001. |
Thomas C. Hense (1964) |
Year of Election or Appointment: 2008/2010/2015 Vice President |
| Mr. Hense serves as Vice President of Fidelity Advisor Multi-Asset Income Fund (2015) and other funds (High Income (2008), Small Cap (2008), and Value (2010) funds). Previously, Mr. Hense served as a portfolio manager for Fidelity's Institutional Money Management Group (Pyramis) (2003-2008). |
Brian B. Hogan (1964) |
Year of Election or Appointment: 2009 Vice President |
| Mr. Hogan also serves as Trustee or Vice President of other funds. Mr. Hogan serves as a Director of Fidelity SelectCo, LLC (investment adviser firm, 2014-present) and President of the Equity Division of FMR (investment adviser firm, 2009-present). Previously, Mr. Hogan served as Senior Vice President, Equity Research of FMR (2006-2009) and as a portfolio manager. |
Chris Maher (1972) |
Year of Election or Appointment: 2013 Assistant Treasurer |
| Mr. Maher serves as Assistant Treasurer of other funds. Mr. Maher is Vice President of Valuation Oversight and is an employee of Fidelity Investments. Previously, Mr. Maher served as Vice President of Asset Management Compliance (2013), Vice President of the Program Management Group of FMR (investment adviser firm, 2010-2013), and Vice President of Valuation Oversight (2008-2010). |
Kenneth B. Robins (1969) |
Year of Election or Appointment: 2008 President and Treasurer |
| Mr. Robins also serves as an officer of other funds. Mr. Robins serves as Executive Vice President of Fidelity Investments Money Management, Inc. (FIMM) (investment adviser firm, 2013-present) and is an employee of Fidelity Investments (2004-present). Previously, Mr. Robins served in other fund officer roles. |
Stephen Sadoski (1971) |
Year of Election or Appointment: 2012 Deputy Treasurer |
| Mr. Sadoski also serves as Deputy Treasurer of other funds. He is an employee of Fidelity Investments (2012-present) and has served in another fund officer role. Prior to joining Fidelity Investments, Mr. Sadoski served as an assistant chief accountant in the Division of Investment Management of the Securities and Exchange Commission (SEC) (2009-2012) and as a senior manager at Deloitte & Touche LLP (1997-2009). |
Stacie M. Smith (1974) |
Year of Election or Appointment: 2013 Deputy Treasurer |
| Ms. Smith also serves as an officer of other funds. She is an employee of Fidelity Investments (2009-present) and has served in other fund officer roles. Prior to joining Fidelity Investments, Ms. Smith served as Senior Audit Manager of Ernst & Young LLP (1996-2009). |
Renee Stagnone (1975) |
Year of Election or Appointment: 2013 Deputy Treasurer |
| Ms. Stagnone also serves as Deputy Treasurer of other funds. Ms. Stagnone is an employee of Fidelity Investments. |
Linda J. Wondrack (1964) |
Year of Election or Appointment: 2014 Chief Compliance Officer |
| Ms. Wondrack also serves as Chief Compliance Officer of other funds. Ms. Wondrack is Executive Vice President and head of the Ethics Office and Asset Management Compliance for Fidelity Investments (2012-present). Ms. Wondrack also serves as Chief Compliance Officer of Fidelity SelectCo, LLC (investment adviser firm, 2014-present); Chief Compliance Officer of Impresa Management LLC (2013-present); and Chief Compliance Officer of FMR Co., Inc. (investment adviser firm), Fidelity Investments Money Management, Inc. (investment adviser firm), Fidelity Management & Research (Japan) Limited (investment adviser firm), FMR Investment Management (U.K.) Limited (investment adviser firm), Fidelity Management & Research (Hong Kong) (investment adviser firm), Fidelity Management & Research Company (investment adviser firm), Pyramis Global Advisors, LLC (investment adviser firm), and Strategic Advisers, Inc. (investment adviser firm), Ballyrock Investment Advisors LLC, and Northern Neck Investors LLC (2012-present). Previously, Ms. Wondrack served as Senior Vice President and Chief Compliance Officer for Columbia Management Investment Advisers, LLC (2005-2012); Chief Compliance Officer for certain funds within the Columbia Family of Funds (2007-2012); and Senior Vice President of Compliance Risk Management at Bank of America (2005-2010). |
Joseph F. Zambello (1957) |
Year of Election or Appointment: 2011 Deputy Treasurer |
| Mr. Zambello also serves as Deputy Treasurer of other funds. Mr. Zambello is an employee of Fidelity Investments. Previously, Mr. Zambello served as Vice President of the Program Management Group of FMR (investment adviser firm, 2009-2011) and Vice President of the Transfer Agent Oversight Group (2005-2009). |
Annual Report
The Board of Trustees of Fidelity Value Discovery Fund voted to pay on September 14, 2015, to shareholders of record at the opening of business on September 11, 2015, a distribution of $0.306 per share derived from capital gains realized from sales of portfolio securities and a dividend of $0.297 per share from net investment income.
The fund hereby designates as a capital gain dividend with respect to the taxable year ended July 31, 2015, $22,678,687, or, if subsequently determined to be different, the net capital gain of such year.
Value Discovery fund designates 96% of the dividends distributed during the fiscal year as qualifying for the dividends-received deduction for corporate shareholders.
Value Discovery fund designates 100% of the dividends distributed during the fiscal year as amounts which may be taken into account as a dividend for the purposes of the maximum rate under section 1(h)(11) of the Internal Revenue Code.
The fund will notify shareholders in January 2016 of amounts for use in preparing 2015 income tax returns.
Annual Report
Fidelity Value Discovery Fund
Each year, the Board of Trustees, including the Independent Trustees (together, the Board), votes on the renewal of the management contract with Fidelity Management & Research Company (FMR) and the sub-advisory agreements (together, the Advisory Contracts) for the fund. The Board, assisted by the advice of fund counsel and Independent Trustees' counsel, requests and considers a broad range of information relevant to the renewal of the Advisory Contracts throughout the year.
The Board meets regularly and, at each of its meetings, covers an extensive agenda of topics and materials and considers factors that are relevant to its annual consideration of the renewal of the fund's Advisory Contracts, including the services and support provided to the fund and its shareholders. The Board has established various standing committees (Committees), each composed of and chaired by Independent Trustees with varying backgrounds, to which the Board has assigned specific subject matter responsibilities in order to enhance effective decision-making by the Board. The Board, acting directly and through its Committees, requests and receives information concerning the annual consideration of the renewal of the fund's Advisory Contracts. The Board also meets as needed to consider matters specifically related to the Board's annual consideration of the renewal of the Advisory Contracts. Members of the Board may also meet with trustees of other Fidelity funds through ad hoc joint committees to discuss certain matters relevant to all of the Fidelity funds.
At its July 2015 meeting, the Board unanimously determined to renew the fund's Advisory Contracts. In reaching its determination, the Board considered all factors it believed relevant, including (i) the nature, extent, and quality of the services to be provided to the fund and its shareholders (including the investment performance of the fund); (ii) the competitiveness of the fund's management fee and total expense ratio relative to peer funds; (iii) the total costs of the services to be provided by and the profits to be realized by Fidelity from its relationship with the fund; and (iv) the extent to which (if any) economies of scale exist and would be realized as the fund grows, and whether any economies of scale are appropriately shared with fund shareholders.
In considering whether to renew the Advisory Contracts for the fund, the Board reached a determination, with the assistance of fund counsel and Independent Trustees' counsel and through the exercise of its business judgment, that the renewal of the Advisory Contracts was in the best interests of the fund and its shareholders and that the compensation payable under the Advisory Contracts was fair and reasonable. The Board's decision to renew the Advisory Contracts was not based on any single factor, but rather was based on a comprehensive consideration of all the information provided to the Board at its meetings throughout the year. The Board, in reaching its determination to renew the Advisory Contracts, was aware that shareholders of the fund have a broad range of investment choices available to them, including a wide choice among funds offered by Fidelity's competitors, and that the fund's shareholders, who have the opportunity to review and weigh the disclosure provided by the fund in its prospectus and other public disclosures, have chosen to invest in this fund, which is part of the Fidelity family of funds.
Annual Report
Nature, Extent, and Quality of Services Provided. The Board considered Fidelity's staffing as it relates to the fund, including the backgrounds of investment personnel of Fidelity, and also considered the fund's investment objective, strategies, and related investment philosophy. The Independent Trustees also had discussions with senior management of Fidelity's investment operations and investment groups. The Board considered the structure of the portfolio manager compensation program and whether this structure provides appropriate incentives to act in the best interests of the fund. Additionally, the Board considered the portfolio managers' investments, if any, in the funds that they manage.
Resources Dedicated to Investment Management and Support Services. The Board and the Fund Oversight and Research Committees reviewed the general qualifications and capabilities of Fidelity's investment staff, including its size, education, experience, and resources, as well as Fidelity's approach to recruiting, training, managing, and compensating investment personnel. The Board noted that Fidelity has continued to increase the resources devoted to non-U.S. offices, including expansion of Fidelity's global investment organization. The Board also noted that Fidelity's analysts have extensive resources, tools and capabilities that allow them to conduct sophisticated quantitative and fundamental analysis, as well as credit analysis of issuers, counterparties and guarantors. Further, the Board considered that Fidelity's investment professionals have sufficient access to global information and data so as to provide competitive investment results over time, and that those professionals also have access to sophisticated tools that permit them to assess portfolio construction and risk and performance attribution characteristics continuously, as well as to transmit new information and research conclusions rapidly around the world. Additionally, in its deliberations, the Board considered Fidelity's trading, risk management, and compliance capabilities and resources, which are integral parts of the investment management process.
Shareholder and Administrative Services. The Board considered (i) the nature, extent, quality, and cost of advisory, administrative, and shareholder services performed by FMR, the sub-advisers (together with FMR, the Investment Advisers), and their affiliates under the Advisory Contracts and under separate agreements covering transfer agency, pricing and bookkeeping, and securities lending services for the fund; (ii) the nature and extent of the supervision of third party service providers, principally custodians and subcustodians; and (iii) the resources devoted to, and the record of compliance with, the fund's compliance policies and procedures. The Board also reviewed the allocation of fund brokerage, including allocations to brokers affiliated with the Investment Advisers, the use of brokerage commissions to pay fund expenses, and the use of "soft" commission dollars to pay for research services.
Annual Report
Board Approval of Investment Advisory Contracts and
Management Fees - continued
The Board noted that the growth of fund assets over time across the complex allows Fidelity to reinvest in the development of services designed to enhance the value or convenience of the Fidelity funds as investment vehicles. These services include 24-hour access to account information and market information through telephone representatives and over the Internet, investor education materials and asset allocation tools, and the expanded availability of Fidelity Investor Centers.
In 2014, the Board formed an ad hoc Committee on Transfer Agency Fees to review the variety of transfer agency fee structures throughout the industry and Fidelity's competitive positioning with respect to industry participants.
Investment in a Large Fund Family. The Board considered the benefits to shareholders of investing in a Fidelity fund, including the benefits of investing in a fund that is part of a large family of funds offering a variety of investment disciplines and providing a large variety of mutual fund investor services. The Board noted that Fidelity had taken, or had made recommendations that resulted in the Fidelity funds taking, a number of actions over the previous year that benefited particular funds, including (i) continuing to dedicate additional resources to investment research and to the support of the senior management team that oversees asset management; (ii) continuing efforts to enhance Fidelity's global research capabilities; (iii) launching new funds and making other enhancements to meet client needs; (iv) reducing management fees and total expenses for certain index funds and diversified international funds; (v) continuing to launch dedicated lower cost underlying funds to meet portfolio construction needs related to expanding underlying fund options for Fidelity funds of funds, specifically for the Freedom Fund product lines; (vi) rationalizing product lines and gaining increased efficiencies through fund mergers; (vii) launching active fixed-income exchange-traded funds; (viii) continuing to develop, acquire and implement systems and technology to improve services to the funds and information security and to increase efficiency; (ix) implementing investment enhancements to further strengthen Fidelity's target date product line to increase investors' probability of success in achieving their goals; (x) modifying the eligibility criteria for certain share classes to accommodate roll-over assets from employer-sponsored retirement plans; (xi) launching a new Class W of the Freedom Index Funds to attract and retain Fidelity record-kept retirement plan assets; and (xii) implementing changes to Fidelity's money market product line in response to recent money market regulatory reforms.
Investment Performance. The Board considered whether the fund has operated in accordance with its investment objective, as well as its record of compliance with its investment restrictions and its performance history.
Annual Report
The Board took into account discussions with representatives of the Investment Advisers about fund investment performance that occur at Board meetings throughout the year. In this regard the Board noted that as part of regularly scheduled fund reviews and other reports to the Board on fund performance, the Board considers annualized return information for the fund, for different time periods, measured against a securities market index ("benchmark index") and a peer group of funds with similar objectives ("peer group"), if any. In its evaluation of fund investment performance, the Board gave particular attention to information indicating changes in performance of certain Fidelity funds for specific time periods and discussed with the Investment Advisers the reasons for any overperformance or underperformance.
In addition to reviewing absolute and relative fund performance, the Independent Trustees periodically consider the appropriateness of fund performance metrics in evaluating the results achieved. In general, the Independent Trustees believe that fund performance should be evaluated based on net performance (after fees and expenses) of both the highest performing and lowest performing fund share classes, where applicable, compared to appropriate benchmark indices, over appropriate time periods that may include full market cycles, and compared to peer groups, as applicable, over the same periods, taking into account relevant factors including the following: general market conditions; issuer-specific information; and fund cash flows and other factors.
The Independent Trustees recognize that shareholders evaluate performance on a net basis over their own holding periods, for which one-, three-, and five-year periods are often used as a proxy. For this reason, the performance information reviewed by the Board also included net cumulative calendar year total return information for the fund and an appropriate benchmark index and peer group for the most recent one-, three-, and five-year periods, as shown below. Returns are shown compared to the 25th percentile (top of box, 75% beaten) and 75th percentile (bottom of box, 25% beaten) of the peer universe.
Annual Report
Board Approval of Investment Advisory Contracts and
Management Fees - continued
Fidelity Value Discovery Fund

The Board also considered that the fund's management fee is subject to upward or downward adjustment depending upon whether, and to what extent, the fund's investment performance for the performance period exceeds, or is exceeded by, a securities index, thus leading to a performance adjustment for the same period. The Board noted that the performance adjustment provides FMR with a strong economic incentive to seek to achieve superior performance for the fund's shareholders and helps to more closely align the interests of FMR and the shareholders of the fund.
Based on its review, the Board concluded that the nature, extent, and quality of services provided to the fund under the Advisory Contracts should benefit the shareholders of the fund.
Competitiveness of Management Fee and Total Expense Ratio. The Board considered the fund's management fee and total expense ratio compared to "mapped groups" of competitive funds and classes created for the purpose of facilitating the Trustees' competitive analysis of management fees and total expenses. Fidelity creates "mapped groups" by combining similar Lipper investment objective categories that have comparable investment mandates. Combining Lipper investment objective categories aids the Board's management fee and total expense ratio comparisons by broadening the competitive group used for comparison.
Management Fee. The Board considered two proprietary management fee comparisons for the 12-month periods shown in basis points (BP) in the chart below. The group of Lipper funds used by the Board for management fee comparisons is referred to below as the "Total Mapped Group." The Total Mapped Group comparison focuses on a fund's standing in terms of gross management fees before expense reimbursements or caps, and without giving effect to the fund's performance adjustment, relative to the total universe of funds with comparable investment mandates, regardless of whether their management fee structures also are comparable. Funds with comparable investment mandates offer exposure to similar types of securities. Funds with comparable management fee structures have similar management fee contractual arrangements (e.g., flat rate charged for advisory services, all-inclusive fee rate, etc.). "TMG %" represents the percentage of funds in the Total Mapped Group that had management fees that were lower than the fund's. For example, a hypothetical TMG % of 20% would mean that 80% of the funds in the Total Mapped Group had higher, and 20% had lower, management fees than the fund. The fund's actual TMG %s and the number of funds in the Total Mapped Group are in the chart below. The "Asset-Size Peer Group" (ASPG) comparison focuses on a fund's standing relative to a subset of non-Fidelity funds within the Total Mapped Group that are similar in size and management fee structure without taking into account performance adjustments, if any. For example, if a fund is in the first quartile of the ASPG, the fund's management fee ranks in the least expensive or lowest 25% of funds in the ASPG. The ASPG represents at least 15% of the funds in the Total Mapped Group with comparable asset size and management fee structures, subject to a minimum of 50 funds (or all funds in the Total Mapped Group if fewer than 50). Additional information, such as the ASPG quartile in which the fund's management fee rate ranked and the impact of the fund's performance adjustment, is also included in the chart and considered by the Board.
Annual Report
Fidelity Value Discovery Fund

Annual Report
Board Approval of Investment Advisory Contracts and
Management Fees - continued
The Board noted that the fund's management fee rate ranked below the median of its Total Mapped Group and below the median of its ASPG for 2014. The Board also noted the effect of the fund's performance adjustment, if any, on the fund's management fee ranking.
The Board noted that, in 2014, the ad hoc Committee on Group Fee was formed by it and other Fidelity fund boards to conduct an in-depth review of the "group fee" component of the management fee of funds with such management fee structures. Committee focus included the mechanics of the group fee, the competitive landscape of group fee structures, Fidelity funds with no group fee component and investment products not included in group fee assets. The Board also considered that, for funds subject to the group fee, FMR agreed to voluntarily waive fees over a specified period of time in amounts designed to account for assets converted from certain funds to certain collective investment trusts.
The Board also noted that, in 2013, the ad hoc Committee on Management Fees was formed to conduct an in-depth review of the management fee rates of Fidelity's active equity mutual funds. The Committee focused on the following areas: (i) standard fee structures; (ii) research consumption and trading evolution; (iii) management fee competitiveness/profitability by category; and (iv) factors that drive institutional pricing.
Based on its review, the Board concluded that the fund's management fee is fair and reasonable in light of the services that the fund receives and the other factors considered.
Total Expense Ratio. In its review of each class's total expense ratio, the Board considered the fund's management fee as well as other fund or class expenses, as applicable, such as transfer agent fees, pricing and bookkeeping fees, and custodial, legal, and audit fees. The Board noted the impact of the fund's performance adjustment. The Board also noted that Fidelity may agree to waive fees and expenses from time to time, and the extent to which, if any, it has done so for the fund. As part of its review, the Board also considered the current and historical total expense ratios of each class of the fund compared to competitive fund median expenses. Each class of the fund is compared to those funds and classes in the Total Mapped Group (used by the Board for management fee comparisons) that have a similar sales load structure.
The Board noted that the total expense ratio of each class ranked below its competitive median for 2014.
Fees Charged to Other Fidelity Clients. The Board also considered Fidelity fee structures and other information with respect to clients of Fidelity, such as other funds advised or subadvised by Fidelity, pension plan clients, and other institutional clients with similar mandates. The Board noted the findings of the 2013 ad hoc joint committee (created with the board of other Fidelity funds), which reviewed and compared Fidelity's institutional investment advisory business with its business of providing services to the Fidelity funds, including the differences in services provided, fees charged, and costs incurred, as well as competition in their respective marketplaces.
Annual Report
Based on its review of total expense ratios and fees charged to other Fidelity clients, the Board concluded that the total expense ratio of each class of the fund was reasonable in light of the services that the fund and its shareholders receive and the other factors considered.
Costs of the Services and Profitability. The Board considered the revenues earned and the expenses incurred by Fidelity in conducting the business of developing, marketing, distributing, managing, administering and servicing the fund and servicing the fund's shareholders. The Board also considered the level of Fidelity's profits in respect of all the Fidelity funds.
On an annual basis, Fidelity presents to the Board information about the profitability of its relationship with the fund. Fidelity calculates profitability information for each fund, as well as aggregate profitability information for groups of Fidelity funds and all Fidelity funds, using a series of detailed revenue and cost allocation methodologies which originate with the books and records of Fidelity on which Fidelity's audited financial statements are based. The Audit Committee of the Board reviews any significant changes from the prior year's methodologies.
PricewaterhouseCoopers LLP (PwC), independent registered public accounting firm and auditor to Fidelity and certain Fidelity funds, has been engaged annually by the Board as part of the Board's assessment of Fidelity's profitability analysis. PwC's engagement includes the review and assessment of the methodologies used by Fidelity in determining the revenues and expenses attributable to Fidelity's mutual fund business, and completion of agreed-upon procedures in respect of the mathematical accuracy of fund profitability and its conformity to established allocation methodologies. After considering PwC's reports issued under the engagement and information provided by Fidelity, the Board concluded that while other allocation methods may also be reasonable, Fidelity's profitability methodologies are reasonable in all material respects.
The Board also reviewed Fidelity's non-fund businesses and fall-out benefits related to the mutual fund business as well as cases where Fidelity's affiliates may benefit from or be related to the fund's business.
The Board considered the costs of the services provided by and the profits realized by Fidelity in connection with the operation of the fund and was satisfied that the profitability was not excessive.
Economies of Scale. The Board considered whether there have been economies of scale in respect of the management of the Fidelity funds, whether the Fidelity funds (including the fund) have appropriately benefited from any such economies of scale, and whether there is potential for realization of any further economies of scale. The Board considered the extent to which the fund will benefit from economies of scale as assets grow through increased services to the fund, through waivers or reimbursements, or through fee or expense ratio reductions. The Board also noted that in 2013, it and the boards of other Fidelity funds created an ad hoc committee (the Economies of Scale Committee) to analyze whether Fidelity attains economies of scale in respect of the management and servicing of the Fidelity funds, whether the Fidelity funds have appropriately benefited from such economies of scale, and whether there is potential for realization of any further economies of scale.
Annual Report
Board Approval of Investment Advisory Contracts and
Management Fees - continued
The Board recognized that the fund's management contract incorporates a "group fee" structure, which provides for lower group fee rates as total group assets increase, and for higher group fee rates as total group assets decrease (with "group assets" defined to include fund assets under FMR's management plus sector fund assets previously under FMR's management and currently managed by Fidelity SelectCo, LLC). FMR calculates the group fee rates based on a tiered asset "breakpoint" schedule that varies based on asset class. The Board considered that the group fee is designed to deliver the benefits of economies of scale to fund shareholders when total Fidelity fund assets increase, even if assets of any particular fund are unchanged or have declined, because some portion of Fidelity's costs are attributable to services provided to all Fidelity funds, and all funds benefit if those costs can be allocated among more assets. The Board concluded that, given the group fee structure, fund shareholders will benefit from lower management fees as group assets increase at the fund complex level, regardless of whether Fidelity achieves any such economies of scale.
The Board concluded, taking into account the analysis of the Economies of Scale Committee, that economies of scale, if any, are being appropriately shared between fund shareholders and Fidelity.
Additional Information Requested by the Board. In order to develop fully the factual basis for consideration of the Fidelity funds' Advisory Contracts, the Board requested and received additional information on certain topics, including: (i) fund performance trends and Fidelity's long-term strategies for certain funds; (ii) the various share classes employed by Fidelity and the attributes of each class, together with similar information on the distribution and servicing payments made by Fidelity or the funds to third-party participants in the distribution channels; (iii) fund profitability, and fund performance in relation to fund profitability; (iv) the methodology with respect to evaluating competitive fund data and peer group classifications and fee comparisons; (v) annual fund profitability margins, with particular focus on certain funds with negative margins; (vi) the realization of fall-out benefits in certain Fidelity business units; (vii) economies of scale and the way in which they are shared with fund shareholders; (viii) Fidelity's group fee structures, including the group fee schedule of breakpoints; (ix) the impact of cost containment measures on the funds; and (x) the transfer agent fee structure.
Annual Report
Based on its evaluation of all of the conclusions noted above, and after considering all factors it believed relevant, the Board concluded that the advisory fee structures are fair and reasonable, and that the fund's Advisory Contracts should be renewed.
Annual Report
Investment Adviser
Fidelity Management & Research Company
Boston, MA
Investment Sub-Advisers
FMR Co., Inc.
FMR Investment Management
(U.K.) Limited
Fidelity Management & Research
(Hong Kong) Limited
Fidelity Management & Research
(Japan) Limited
General Distributor
Fidelity Distributors Corporation
Smithfield, RI
Transfer and Service Agents
Fidelity Investments Institutional
Operations Company, Inc.
Boston, MA
Fidelity Service Company, Inc.
Boston, MA
Custodian
Brown Brothers Harriman
Boston, MA
The Fidelity Telephone Connection
Mutual Fund 24-Hour Service
Exchanges/Redemptions
and Account Assistance 1-800-544-6666
Product Information 1-800-544-6666
Retirement Accounts 1-800-544-4774
(8 a.m. - 9 p.m.)
TDD Service 1-800-544-0118
for the deaf and hearing impaired
(9 a.m. - 9 p.m. Eastern time)
Fidelity Automated Service
Telephone (FAST®)
1-800-544-5555

Automated line for quickest service
(Fidelity Investment logo)(registered trademark)
Corporate Headquarters
245 Summer St., Boston, MA 02210
www.fidelity.com
FVD-UANN-0915
1.789714.112
Fidelity®
Value Discovery
Fund-
Class K
Annual Report
July 31, 2015
(Fidelity Cover Art)
Contents
Performance | (Click Here) | How the fund has done over time. |
Management's Discussion of Fund Performance | (Click Here) | The Portfolio Manager's review of fund performance and strategy. |
Shareholder Expense Example | (Click Here) | An example of shareholder expenses. |
Investment Changes | (Click Here) | A summary of major shifts in the fund's investments over the past six months. |
Investments | (Click Here) | A complete list of the fund's investments with their market values. |
Financial Statements | (Click Here) | Statements of assets and liabilities, operations, and changes in net assets, as well as financial highlights. |
Notes | (Click Here) | Notes to the financial statements. |
Report of Independent Registered Public Accounting Firm | (Click Here) | |
Trustees and Officers | (Click Here) | |
Distributions | (Click Here) | |
Board Approval of Investment Advisory Contracts and Management Fees | (Click Here) | |
To view a fund's proxy voting guidelines and proxy voting record for the 12-month period ended June 30, visit http://www.fidelity.com/proxyvotingresults or visit the Securities and Exchange Commission's (SEC) web site at http://www.sec.gov. You may also call 1-800-835-5092 to request a free copy of the proxy voting guidelines.
Standard & Poor's, S&P and S&P 500 are registered service marks of The McGraw-Hill Companies, Inc. and have been licensed for use by Fidelity Distributors Corporation.
Other third-party marks appearing herein are the property of their respective owners.
All other marks appearing herein are registered or unregistered trademarks or service marks of FMR LLC or an affiliated company. © 2015 FMR LLC. All rights reserved.
Annual Report
This report and the financial statements contained herein are submitted for the general information of the shareholders of the fund. This report is not authorized for distribution to prospective investors in the fund unless preceded or accompanied by an effective prospectus.
A fund files its complete schedule of portfolio holdings with the SEC for the first and third quarters of each fiscal year on Form N-Q. Forms N-Q are available on the SEC's web site at http://www.sec.gov. A fund's Forms N-Q may be reviewed and copied at the SEC's Public Reference Room in Washington, DC. Information regarding the operation of the SEC's Public Reference Room may be obtained by calling 1-800-SEC-0330. For a complete list of a fund's portfolio holdings, view the most recent holdings listing, semiannual report, or annual report on Fidelity's web site at http://www.fidelity.com, http://www.advisor.fidelity.com, or http://www.401k.com, as applicable.
NOT FDIC INSURED • MAY LOSE VALUE • NO BANK GUARANTEE
Neither the fund nor Fidelity Distributors Corporation is a bank.
Annual Report
Average annual total return reflects the change in the value of an investment, assuming reinvestment of the class' distributions from dividend income and capital gains (the profits earned upon the sale of securities that have grown in value, if any) and assuming a constant rate of performance each year. The $10,000 table and the fund's returns do not reflect the deduction of taxes that a shareholder would pay on fund distributions or the redemption of fund shares. During periods of reimbursement by Fidelity, a fund's total return will be greater than it would be had the reimbursement not occurred. How a fund did yesterday is no guarantee of how it will do tomorrow.
Average Annual Total Returns
Periods ended July 31, 2015 | Past 1
year | Past 5
years | Past 10
years |
Class K A | 8.80% | 15.89% | 7.69% |
A The initial offering of Class K shares took place on May 9, 2008. Returns prior to May 9, 2008 are those of Fidelity® Value Discovery Fund, the original class of the fund.
$10,000 Over 10 Years
Let's say hypothetically that $10,000 was invested in Fidelity® Value Discovery Fund - Class K on July 31, 2005. The chart shows how the value of your investment would have changed, and also shows how the Russell 3000® Value Index performed over the same period. The initial offering of Class K took place on May 9, 2008. See above for additional information regarding the performance of Class K.
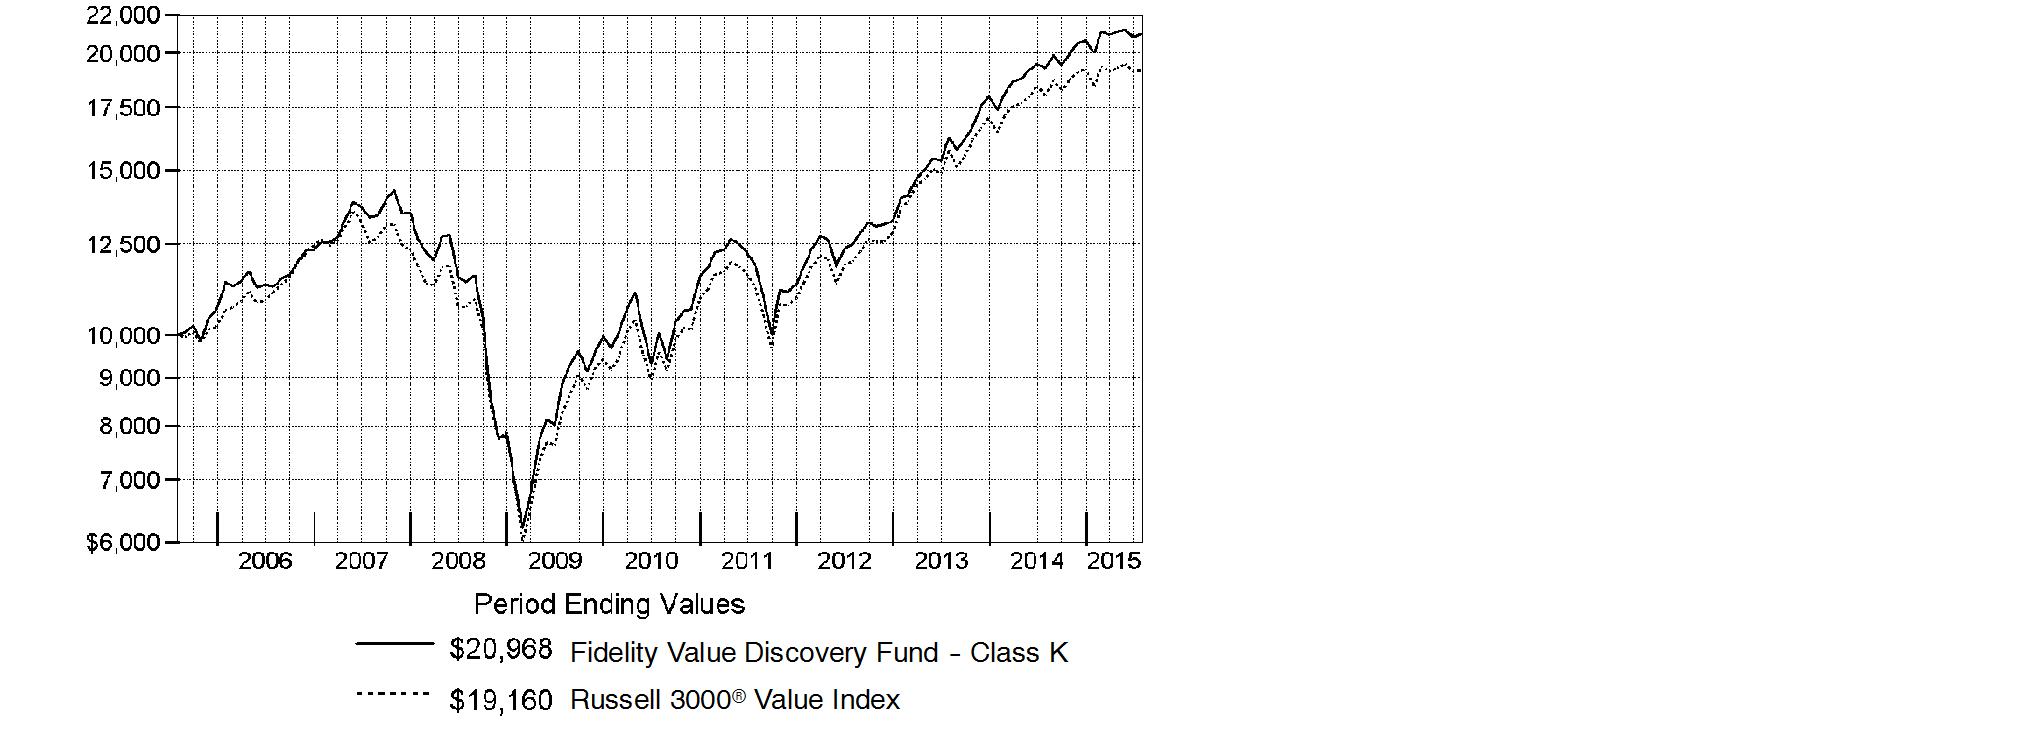
Annual Report
Market Recap: The U.S. equity market gained strongly for the 12 months ending July 31, 2015, as stocks recovered from volatility in late 2014 and early 2015, supported by a still-positive economic backdrop. The S&P 500® Index returned 11.21%, with growth stocks in the index far outpacing value-oriented names on prospects for continued U.S. economic growth. Consequently, the growth-oriented Nasdaq Composite Index® rose 18.71%, outpacing the broader S&P 500®, as well as the 12.03% advance of the smaller-cap Russell 2000® Index. Within the S&P 500®, seven of 10 sectors notched a gain, with significant performance variation. Health care (+27%) led the way, aided by merger activity. Consumer discretionary (+24%) benefited from spending linked to a seven-year low in unemployment. Strong first halves for the consumer staples sector and the real estate segment of financials yielded above-market returns (19% and 12%, respectively) for the full-year period. Conversely, energy (-26%) significantly lagged, due to a roughly 55% decline for U.S. crude-oil prices. Materials (-4%) also lost ground. At period end, investors remained focused on the slowing rate of U.S. earnings growth, the possible effect of a relatively stronger U.S. dollar on exports and inflation, and whether an economic slowdown in China would create ripples for the global economy.
Comments from Portfolio Manager Sean Gavin: For the year, the fund's share classes substantially outpaced the benchmark Russell 3000® Value Index return of 6.23%, benefiting most from a combination of good stock picking and productive industry positioning. (For specific class-level results, please see the Performance section of this report.) The energy sector led the way, with help good stock picks. That said, several of the fund's biggest individual detractors were energy stocks hampered by the difficult environment for oil prices, including BW Offshore and Suncor Energy. The fund's positioning also was helpful in the health care sector. Here, a non-benchmark stake in Teva Pharmaceuticals - among our largest holdings - was a big contributor, as was health insurance provider Cigna, which in June agreed to be purchased for a substantial premium by a larger competitor. I sold the position soon afterwards. Conversely, subpar stock picking in the media group hampered the fund's relative performance, especially Viacom. This non-benchmark stock continued to meet my valuation and quality criteria as of period end. However, it encountered a number of business challenges - all of them short term, in my view - that caused the stock to return -30% this period. Currency effects also hurt performance, as a relatively strong U.S. dollar sapped the fund's non-U.S. investments, including Canada's Suncor.
The views expressed above reflect those of the portfolio manager(s) only through the end of the period as stated on the cover of this report and do not necessarily represent the views of Fidelity or any other person in the Fidelity organization. Any such views are subject to change at any time based upon market or other conditions and Fidelity disclaims any responsibility to update such views. These views may not be relied on as investment advice and, because investment decisions for a Fidelity fund are based on numerous factors, may not be relied on as an indication of trading intent on behalf of any Fidelity fund.
Annual Report
Shareholder Expense Example
As a shareholder of the Fund, you incur two types of costs: (1) transaction costs and (2) ongoing costs, including management fees and other Fund expenses. This Example is intended to help you understand your ongoing costs (in dollars) of investing in the Fund and to compare these costs with the ongoing costs of investing in other mutual funds.
The Example is based on an investment of $1,000 invested at the beginning of the period and held for the entire period (February 1, 2015 to July 31, 2015).
Actual Expenses
The first line of the accompanying table for each class of the Fund provides information about actual account values and actual expenses. You may use the information in this line, together with the amount you invested, to estimate the expenses that you paid over the period. Simply divide your account value by $1,000.00 (for example, an $8,600 account value divided by $1,000.00 = 8.6), then multiply the result by the number in the first line for a class of the Fund under the heading entitled "Expenses Paid During Period" to estimate the expenses you paid on your account during this period. A small balance maintenance fee of $12.00 that is charged once a year may apply for certain accounts with a value of less than $2,000. This fee is not included in the table below. If it was, the estimate of expenses you paid during the period would be higher, and your ending account value lower, by this amount. In addition, the Fund, as a shareholder in the underlying Fidelity Central Funds, will indirectly bear its pro-rata share of the fees and expenses incurred by the underlying Fidelity Central Funds. These fees and expenses are not included in the Fund's annualized expense ratio used to calculate the expense estimate in the table below.
Hypothetical Example for Comparison Purposes
The second line of the accompanying table for each class of the Fund provides information about hypothetical account values and hypothetical expenses based on a Class' actual expense ratio and an assumed rate of return of 5% per year before expenses, which is not the Class' actual return. The hypothetical account values and expenses may not be used to estimate the actual ending account balance or expenses you paid for the period. You may use this information to compare the ongoing costs of investing in the Fund and other funds. To do so, compare this 5% hypothetical example with the 5% hypothetical examples that appear in the shareholder reports of the other funds. A small balance maintenance fee of $12.00 that is charged once a year may apply for certain accounts with a value of less than $2,000. This fee is not included in the table below. If it was, the estimate of expenses you paid during the period would be higher, and your ending account value lower, by this amount. In addition, the Fund, as a shareholder in the underlying Fidelity Central Funds, will indirectly bear its pro-rata share of the fees and expenses incurred by the underlying Fidelity Central Funds. These fees and expenses are not included in the Fund's annualized expense ratio used to calculate the expense estimate in the table below.
Please note that the expenses shown in the table are meant to highlight your ongoing costs only and do not reflect any transaction costs. Therefore, the second line of the table is useful in comparing ongoing costs only, and will not help you determine the relative total costs of owning different funds.
Annual Report
Shareholder Expense Example - continued
| Annualized Expense RatioB | Beginning
Account Value
February 1, 2015 | Ending
Account Value
July 31, 2015 | Expenses Paid
During Period*
February 1, 2015
to July 31, 2015 |
Value Discovery | .84% | | | |
Actual | | $ 1,000.00 | $ 1,047.40 | $ 4.26 |
HypotheticalA | | $ 1,000.00 | $ 1,020.63 | $ 4.21 |
Class K | .71% | | | |
Actual | | $ 1,000.00 | $ 1,047.80 | $ 3.60 |
HypotheticalA | | $ 1,000.00 | $ 1,021.27 | $ 3.56 |
A 5% return per year before expenses
B Annualized expense ratio reflects expenses net of applicable fee waivers.
* Expenses are equal to each Class' annualized expense ratio, multiplied by the average account value over the period, multiplied by 181/365 (to reflect the one-half year period).
Annual Report
Investment Changes (Unaudited)
Top Ten Stocks as of July 31, 2015 |
| % of fund's
net assets | % of fund's net assets
6 months ago |
JPMorgan Chase & Co. | 4.2 | 2.8 |
Wells Fargo & Co. | 3.5 | 2.9 |
Johnson & Johnson | 3.2 | 2.7 |
Berkshire Hathaway, Inc. Class B | 2.9 | 2.9 |
General Electric Co. | 2.8 | 0.0 |
Oracle Corp. | 2.7 | 1.7 |
Teva Pharmaceutical Industries Ltd. sponsored ADR | 2.5 | 2.1 |
Chevron Corp. | 2.4 | 2.9 |
U.S. Bancorp | 2.0 | 1.6 |
Wal-Mart Stores, Inc. | 1.8 | 1.3 |
| 28.0 | |
Top Five Market Sectors as of July 31, 2015 |
| % of fund's
net assets | % of fund's net assets
6 months ago |
Financials | 28.4 | 25.3 |
Information Technology | 16.4 | 15.1 |
Health Care | 12.1 | 13.8 |
Consumer Discretionary | 10.1 | 14.2 |
Energy | 8.2 | 9.0 |
Asset Allocation (% of fund's net assets) |
As of July 31, 2015* | As of January 31, 2015** |
 | Stocks 92.7% | |  | Stocks 93.2% | |
 | Short-Term
Investments and
Net Other Assets (Liabilities) 7.3% | |  | Short-Term
Investments and
Net Other Assets (Liabilities) 6.8% | |
* Foreign investments | 15.7% | | ** Foreign investments | 18.4% | |

Annual Report
Investments July 31, 2015
Showing Percentage of Net Assets
Common Stocks - 92.7% |
| Shares | | Value |
CONSUMER DISCRETIONARY - 10.1% |
Auto Components - 0.5% |
Hyundai Mobis | 37,163 | | $ 6,804,484 |
Automobiles - 0.7% |
Harley-Davidson, Inc. | 164,900 | | 9,613,670 |
Diversified Consumer Services - 0.2% |
Steiner Leisure Ltd. (a) | 40,168 | | 2,317,694 |
Leisure Products - 0.8% |
Mattel, Inc. | 482,900 | | 11,208,109 |
Media - 3.5% |
Corus Entertainment, Inc. Class B (non-vtg.) (d) | 470,600 | | 5,055,572 |
John Wiley & Sons, Inc. Class A | 172,885 | | 9,164,634 |
Starz Series A (a) | 402,600 | | 16,285,170 |
Viacom, Inc. Class B (non-vtg.) | 341,600 | | 19,471,200 |
| | 49,976,576 |
Multiline Retail - 1.0% |
Macy's, Inc. | 197,853 | | 13,663,728 |
Specialty Retail - 2.4% |
AutoZone, Inc. (a) | 17,585 | | 12,326,030 |
Bed Bath & Beyond, Inc. (a) | 157,400 | | 10,267,202 |
GNC Holdings, Inc. | 232,600 | | 11,446,246 |
| | 34,039,478 |
Textiles, Apparel & Luxury Goods - 1.0% |
Coach, Inc. | 228,835 | | 7,139,652 |
Michael Kors Holdings Ltd. (a) | 161,600 | | 6,785,584 |
| | 13,925,236 |
TOTAL CONSUMER DISCRETIONARY | | 141,548,975 |
CONSUMER STAPLES - 4.4% |
Beverages - 0.6% |
C&C Group PLC | 2,075,536 | | 8,087,515 |
Food & Staples Retailing - 2.4% |
Tesco PLC | 2,249,700 | | 7,565,607 |
Wal-Mart Stores, Inc. | 352,800 | | 25,394,544 |
| | 32,960,151 |
Food Products - 0.9% |
Seaboard Corp. (a) | 1,360 | | 4,726,000 |
The J.M. Smucker Co. | 76,721 | | 8,568,968 |
| | 13,294,968 |
Common Stocks - continued |
| Shares | | Value |
CONSUMER STAPLES - continued |
Tobacco - 0.5% |
British American Tobacco PLC sponsored ADR | 62,445 | | $ 7,430,955 |
TOTAL CONSUMER STAPLES | | 61,773,589 |
ENERGY - 8.2% |
Energy Equipment & Services - 0.9% |
BW Offshore Ltd. | 11,724,400 | | 7,033,104 |
National Oilwell Varco, Inc. | 130,700 | | 5,506,391 |
| | 12,539,495 |
Oil, Gas & Consumable Fuels - 7.3% |
Chevron Corp. | 376,481 | | 33,311,039 |
Exxon Mobil Corp. | 249,228 | | 19,741,350 |
Marathon Petroleum Corp. | 223,200 | | 12,202,344 |
Phillips 66 Co. | 137,200 | | 10,907,400 |
Suncor Energy, Inc. | 724,400 | | 20,405,166 |
Woodside Petroleum Ltd. | 201,727 | | 5,256,676 |
| | 101,823,975 |
TOTAL ENERGY | | 114,363,470 |
FINANCIALS - 28.4% |
Banks - 11.2% |
JPMorgan Chase & Co. | 857,341 | | 58,753,579 |
Regions Financial Corp. | 977,700 | | 10,158,303 |
SunTrust Banks, Inc. | 261,000 | | 11,572,740 |
U.S. Bancorp | 625,500 | | 28,278,855 |
Wells Fargo & Co. | 831,137 | | 48,097,898 |
| | 156,861,375 |
Capital Markets - 2.2% |
Fortress Investment Group LLC | 1,852,000 | | 12,667,680 |
GP Investments Ltd. Class A (depositary receipt) (a) | 1,380,300 | | 2,632,445 |
The Blackstone Group LP | 405,900 | | 15,931,575 |
| | 31,231,700 |
Consumer Finance - 2.9% |
American Express Co. | 90,300 | | 6,868,218 |
Capital One Financial Corp. | 257,382 | | 20,925,157 |
Discover Financial Services | 231,100 | | 12,897,691 |
| | 40,691,066 |
Common Stocks - continued |
| Shares | | Value |
FINANCIALS - continued |
Diversified Financial Services - 2.9% |
Berkshire Hathaway, Inc. Class B (a) | 284,631 | | $ 40,628,229 |
Insurance - 5.5% |
ACE Ltd. | 129,200 | | 14,053,084 |
Allied World Assur Co. Holdings AG | 209,700 | | 8,861,922 |
Allstate Corp. | 201,100 | | 13,865,845 |
FNF Group | 278,920 | | 10,902,983 |
FNFV Group (a) | 369,133 | | 5,374,576 |
Prudential PLC | 307,501 | | 7,234,091 |
The Travelers Companies, Inc. | 158,313 | | 16,800,176 |
| | 77,092,677 |
Real Estate Investment Trusts - 3.7% |
American Capital Agency Corp. | 868,299 | | 16,723,439 |
Annaly Capital Management, Inc. | 1,790,095 | | 17,811,445 |
MFA Financial, Inc. | 2,305,964 | | 17,363,909 |
| | 51,898,793 |
TOTAL FINANCIALS | | 398,403,840 |
HEALTH CARE - 12.1% |
Biotechnology - 1.3% |
Amgen, Inc. | 105,400 | | 18,612,586 |
Health Care Providers & Services - 2.4% |
Express Scripts Holding Co. (a) | 196,001 | | 17,653,810 |
Laboratory Corp. of America Holdings (a) | 127,900 | | 16,280,391 |
| | 33,934,201 |
Pharmaceuticals - 8.4% |
GlaxoSmithKline PLC sponsored ADR | 238,576 | | 10,363,741 |
Johnson & Johnson | 455,108 | | 45,606,373 |
Mylan N.V. | 63,695 | | 3,566,283 |
Sanofi SA sponsored ADR | 430,800 | | 23,258,892 |
Teva Pharmaceutical Industries Ltd. sponsored ADR | 498,668 | | 34,418,065 |
| | 117,213,354 |
TOTAL HEALTH CARE | | 169,760,141 |
INDUSTRIALS - 7.3% |
Aerospace & Defense - 1.2% |
United Technologies Corp. | 170,200 | | 17,072,762 |
Common Stocks - continued |
| Shares | | Value |
INDUSTRIALS - continued |
Electrical Equipment - 1.0% |
Babcock & Wilcox Enterprises, Inc. (a) | 199,900 | | $ 3,942,028 |
BWX Technologies, Inc. | 399,800 | | 9,819,088 |
| | 13,761,116 |
Industrial Conglomerates - 2.8% |
General Electric Co. | 1,518,600 | | 39,635,460 |
Machinery - 2.2% |
Deere & Co. | 264,090 | | 24,974,991 |
Valmont Industries, Inc. | 57,600 | | 6,406,848 |
| | 31,381,839 |
Professional Services - 0.1% |
VSE Corp. | 18,900 | | 895,860 |
TOTAL INDUSTRIALS | | 102,747,037 |
INFORMATION TECHNOLOGY - 16.4% |
Communications Equipment - 3.3% |
Cisco Systems, Inc. | 864,918 | | 24,580,970 |
Harris Corp. | 253,600 | | 21,033,584 |
| | 45,614,554 |
Electronic Equipment & Components - 1.1% |
Keysight Technologies, Inc. (a) | 239,100 | | 7,302,114 |
TE Connectivity Ltd. | 136,402 | | 8,309,610 |
| | 15,611,724 |
Internet Software & Services - 1.4% |
Google, Inc. Class A (a) | 30,300 | | 19,922,250 |
IT Services - 2.9% |
Fiserv, Inc. (a) | 102,400 | | 8,894,464 |
IBM Corp. | 118,760 | | 19,237,932 |
The Western Union Co. | 633,400 | | 12,820,016 |
| | 40,952,412 |
Software - 4.4% |
Microsoft Corp. | 494,424 | | 23,089,601 |
Oracle Corp. | 963,513 | | 38,482,709 |
| | 61,572,310 |
Technology Hardware, Storage & Peripherals - 3.3% |
EMC Corp. | 614,700 | | 16,529,283 |
Common Stocks - continued |
| Shares | | Value |
INFORMATION TECHNOLOGY - continued |
Technology Hardware, Storage & Peripherals - continued |
Hewlett-Packard Co. | 447,912 | | $ 13,670,274 |
Samsung Electronics Co. Ltd. | 15,584 | | 15,837,398 |
| | 46,036,955 |
TOTAL INFORMATION TECHNOLOGY | | 229,710,205 |
MATERIALS - 2.7% |
Chemicals - 2.2% |
Agrium, Inc. | 130,700 | | 13,371,304 |
CF Industries Holdings, Inc. | 291,945 | | 17,283,144 |
| | 30,654,448 |
Paper & Forest Products - 0.5% |
Schweitzer-Mauduit International, Inc. | 173,800 | | 6,899,860 |
TOTAL MATERIALS | | 37,554,308 |
UTILITIES - 3.1% |
Electric Utilities - 3.1% |
American Electric Power Co., Inc. | 186,600 | | 10,555,962 |
Edison International | 97,000 | | 5,820,970 |
Exelon Corp. | 546,500 | | 17,537,185 |
Xcel Energy, Inc. | 267,200 | | 9,263,824 |
| | 43,177,941 |
TOTAL COMMON STOCKS (Cost $1,218,497,748) |
1,299,039,506
|
Money Market Funds - 7.6% |
| Shares | | Value |
Fidelity Cash Central Fund, 0.17% (b) | 102,717,974 | | $ 102,717,974 |
Fidelity Securities Lending Cash Central Fund, 0.18% (b)(c) | 4,373,134 | | 4,373,134 |
TOTAL MONEY MARKET FUNDS (Cost $107,091,108) |
107,091,108
|
TOTAL INVESTMENT PORTFOLIO - 100.3% (Cost $1,325,588,856) | | 1,406,130,614 |
NET OTHER ASSETS (LIABILITIES) - (0.3)% | | (4,247,907) |
NET ASSETS - 100% | $ 1,401,882,707 |
Legend |
(a) Non-income producing |
(b) Affiliated fund that is generally available only to investment companies and other accounts managed by Fidelity Investments. The rate quoted is the annualized seven-day yield of the fund at period end. A complete unaudited listing of the fund's holdings as of its most recent quarter end is available upon request. In addition, each Fidelity Central Fund's financial statements, which are not covered by the Fund's Report of Independent Registered Public Accounting Firm, are available on the SEC's website or upon request. |
(c) Investment made with cash collateral received from securities on loan. |
(d) Security or a portion of the security is on loan at period end. |
Affiliated Central Funds |
Information regarding fiscal year to date income earned by the Fund from investments in Fidelity Central Funds is as follows: |
Fund | Income earned |
Fidelity Cash Central Fund | $ 92,793 |
Fidelity Securities Lending Cash Central Fund | 92,437 |
Total | $ 185,230 |
Other Information |
The following is a summary of the inputs used, as of July 31, 2015, involving the Fund's assets and liabilities carried at fair value. The inputs or methodology used for valuing securities may not be an indication of the risk associated with investing in those securities. For more information on valuation inputs, and their aggregation into the levels used in the table below, please refer to the Investment Valuation section in the accompanying Notes to Financial Statements. |
Valuation Inputs at Reporting Date: |
Description | Total | Level 1 | Level 2 | Level 3 |
Investments in Securities: | | | | |
Equities: | | | | |
Consumer Discretionary | $ 141,548,975 | $ 141,548,975 | $ - | $ - |
Consumer Staples | 61,773,589 | 54,207,982 | 7,565,607 | - |
Energy | 114,363,470 | 114,363,470 | - | - |
Financials | 398,403,840 | 391,169,749 | 7,234,091 | - |
Health Care | 169,760,141 | 169,760,141 | - | - |
Industrials | 102,747,037 | 102,747,037 | - | - |
Information Technology | 229,710,205 | 229,710,205 | - | - |
Materials | 37,554,308 | 37,554,308 | - | - |
Utilities | 43,177,941 | 43,177,941 | - | - |
Money Market Funds | 107,091,108 | 107,091,108 | - | - |
Total Investments in Securities: | $ 1,406,130,614 | $ 1,391,330,916 | $ 14,799,698 | $ - |
Distribution of investments by country or territory of incorporation, as a percentage of total net assets, is as follows (Unaudited): |
United States of America | 84.3% |
Canada | 2.7% |
Israel | 2.5% |
United Kingdom | 2.3% |
Switzerland | 2.2% |
France | 1.7% |
Korea (South) | 1.6% |
Others (Individually Less Than 1%) | 2.7% |
| 100.0% |
See accompanying notes which are an integral part of the financial statements.
Annual Report
Statement of Assets and Liabilities
| | July 31, 2015 |
| | |
Assets | | |
Investment in securities, at value (including securities loaned of $4,179,555) - See accompanying schedule: Unaffiliated issuers (cost $1,218,497,748) | $ 1,299,039,506 | |
Fidelity Central Funds (cost $107,091,108) | 107,091,108 | |
Total Investments (cost $1,325,588,856) | | $ 1,406,130,614 |
Receivable for fund shares sold | | 3,157,853 |
Dividends receivable | | 674,260 |
Distributions receivable from Fidelity Central Funds | | 18,755 |
Other receivables | | 11,219 |
Total assets | | 1,409,992,701 |
| | |
Liabilities | | |
Payable to custodian bank | $ 108,241 | |
Payable for investments purchased | 1,167,116 | |
Payable for fund shares redeemed | 1,481,280 | |
Accrued management fee | 715,817 | |
Other affiliated payables | 216,905 | |
Other payables and accrued expenses | 47,501 | |
Collateral on securities loaned, at value | 4,373,134 | |
Total liabilities | | 8,109,994 |
| | |
Net Assets | | $ 1,401,882,707 |
Net Assets consist of: | | |
Paid in capital | | $ 1,287,373,404 |
Undistributed net investment income | | 17,518,540 |
Accumulated undistributed net realized gain (loss) on investments and foreign currency transactions | | 16,449,772 |
Net unrealized appreciation (depreciation) on investments and assets and liabilities in foreign currencies | | 80,540,991 |
Net Assets | | $ 1,401,882,707 |
See accompanying notes which are an integral part of the financial statements.
Annual Report
Statement of Assets and Liabilities - continued
| | July 31, 2015 |
| | |
Value Discovery:
Net Asset Value, offering price and redemption price per share ($1,205,423,050 ÷ 48,238,738 shares) | | $ 24.99 |
| | |
Class K:
Net Asset Value, offering price and redemption price per share ($196,459,657 ÷ 7,860,751 shares) | | $ 24.99 |
See accompanying notes which are an integral part of the financial statements.
Annual Report
Financial Statements - continued
Statement of Operations
| Year ended July 31, 2015 |
| | |
Investment Income | | |
Dividends | | $ 27,806,528 |
Special dividends | | 12,191,436 |
Interest | | 76 |
Income from Fidelity Central Funds | | 185,230 |
Total income | | 40,183,270 |
| | |
Expenses | | |
Management fee | | |
Basic fee | $ 6,254,808 | |
Performance adjustment | 695,946 | |
Transfer agent fees | 1,837,519 | |
Accounting and security lending fees | 372,615 | |
Custodian fees and expenses | 29,149 | |
Independent trustees' compensation | 4,511 | |
Registration fees | 131,082 | |
Audit | 50,354 | |
Legal | 3,474 | |
Miscellaneous | 6,137 | |
Total expenses before reductions | 9,385,595 | |
Expense reductions | (44,645) | 9,340,950 |
Net investment income (loss) | | 30,842,320 |
Realized and Unrealized Gain (Loss) Net realized gain (loss) on: | | |
Investment securities: | | |
Unaffiliated issuers | 81,321,918 | |
Foreign currency transactions | 5,860 | |
Futures contracts | (388,481) | |
Total net realized gain (loss) | | 80,939,297 |
Change in net unrealized appreciation (depreciation) on: Investment securities | (29,762,093) | |
Assets and liabilities in foreign currencies | 153 | |
Futures contracts | 200,164 | |
Total change in net unrealized appreciation (depreciation) | | (29,561,776) |
Net gain (loss) | | 51,377,521 |
Net increase (decrease) in net assets resulting from operations | | $ 82,219,841 |
See accompanying notes which are an integral part of the financial statements.
Annual Report
Statement of Changes in Net Assets
| Year ended
July 31,
2015 | Year ended
July 31,
2014 |
Increase (Decrease) in Net Assets | | |
Operations | | |
Net investment income (loss) | $ 30,842,320 | $ 8,849,312 |
Net realized gain (loss) | 80,939,297 | 79,442,705 |
Change in net unrealized appreciation (depreciation) | (29,561,776) | 10,858,809 |
Net increase (decrease) in net assets resulting from operations | 82,219,841 | 99,150,826 |
Distributions to shareholders from net investment income | (12,741,013) | (6,964,725) |
Distributions to shareholders from net realized gain | (667,082) | - |
Total distributions | (13,408,095) | (6,964,725) |
Share transactions - net increase (decrease) | 532,057,756 | 182,641,981 |
Total increase (decrease) in net assets | 600,869,502 | 274,828,082 |
| | |
Net Assets | | |
Beginning of period | 801,013,205 | 526,185,123 |
End of period (including undistributed net investment income of $17,518,540 and undistributed net investment income of $6,167,040, respectively) | $ 1,401,882,707 | $ 801,013,205 |
See accompanying notes which are an integral part of the financial statements.
Annual Report
Financial Highlights - Value Discovery
Years ended July 31, | 2015 | 2014 | 2013 | 2012 | 2011 |
Selected Per-Share Data | | | | | |
Net asset value, beginning of period | $ 23.32 | $ 19.93 | $ 15.62 | $ 14.98 | $ 12.91 |
Income from Investment Operations | | | | | |
Net investment income (loss) B | .66E | .31 | .29 | .22 | .13 |
Net realized and unrealized gain (loss) | 1.35 | 3.34 | 4.29 | .57 | 2.13 |
Total from investment operations | 2.01 | 3.65 | 4.58 | .79 | 2.26 |
Distributions from net investment income | (.32) | (.26) | (.27) | (.15) | (.19) |
Distributions from net realized gain | (.02) | - | - | - | - |
Total distributions | (.34) | (.26) | (.27) | (.15) | (.19) |
Net asset value, end of period | $ 24.99 | $ 23.32 | $ 19.93 | $ 15.62 | $ 14.98 |
Total ReturnA | 8.68% | 18.52% | 29.72% | 5.43% | 17.69% |
Ratios to Average Net Assets C, F | | | | |
Expenses before reductions | .84% | .80% | .74% | .87% | .80% |
Expenses net of fee waivers, if any | .84% | .80% | .74% | .87% | .80% |
Expenses net of all reductions | .84% | .80% | .73% | .87% | .79% |
Net investment income (loss) | 2.69% E | 1.44% | 1.66% | 1.49% | .88% |
Supplemental Data | | | | | |
Net assets, end of period (000 omitted) | $ 1,205,423 | $ 686,767 | $ 454,974 | $ 412,499 | $ 540,644 |
Portfolio turnover rateD | 45% | 58% | 55% | 92% | 59% |
A Total returns would have been lower if certain expenses had not been reduced during the applicable periods shown.
B Calculated based on average shares outstanding during the period.
C Fees and expenses of any underlying Fidelity Central Funds are not included in the Fund's expense ratio. The Fund indirectly bears its proportionate share of the expenses of any underlying Fidelity Central Funds.
D Amount does not include the portfolio activity of any underlying Fidelity Central Funds.
E Investment income per share reflects a large, non-recurring dividend which amounted to $.26 per share. Excluding this non-recurring dividend, the ratio of net investment income (loss) to average net assets would have been 1.62%.
F Expense ratios reflect operating expenses of the class. Expenses before reductions do not reflect amounts reimbursed by the investment adviser or reductions from brokerage service arrangements or reductions from other expense offset arrangements and do not represent the amount paid by the class during periods when reimbursements or reductions occur. Expenses net of fee waivers reflect expenses after reimbursement by the investment adviser but prior to reductions from brokerage service arrangements or other expense offset arrangements. Expenses net of all reductions represent the net expenses paid by the class.
See accompanying notes which are an integral part of the financial statements.
Annual Report
Financial Highlights - Class K
Years ended July 31, | 2015 | 2014 | 2013 | 2012 | 2011 |
Selected Per-Share Data | | | | | |
Net asset value, beginning of period | $ 23.32 | $ 19.93 | $ 15.62 | $ 14.99 | $ 12.92 |
Income from Investment Operations | | | | | |
Net investment income (loss) B | .69E | .34 | .32 | .25 | .15 |
Net realized and unrealized gain (loss) | 1.34 | 3.34 | 4.29 | .56 | 2.14 |
Total from investment operations | 2.03 | 3.68 | 4.61 | .81 | 2.29 |
Distributions from net investment income | (.34) | (.29) | (.30) | (.18) | (.22) |
Distributions from net realized gain | (.02) | - | - | - | - |
Total distributions | (.36) | (.29) | (.30) | (.18) | (.22) |
Net asset value, end of period | $ 24.99 | $ 23.32 | $ 19.93 | $ 15.62 | $ 14.99 |
Total ReturnA | 8.80% | 18.71% | 29.97% | 5.59% | 17.93% |
Ratios to Average Net Assets C, F | | | | | |
Expenses before reductions | .71% | .66% | .57% | .68% | .61% |
Expenses net of fee waivers, if any | .71% | .66% | .57% | .68% | .61% |
Expenses net of all reductions | .71% | .66% | .56% | .68% | .60% |
Net investment income (loss) | 2.82% E | 1.58% | 1.83% | 1.68% | 1.07% |
Supplemental Data | | | | | |
Net assets, end of period (000 omitted) | $ 196,460 | $ 114,246 | $ 71,212 | $ 53,794 | $ 41,562 |
Portfolio turnover rateD | 45% | 58% | 55% | 92% | 59% |
A Total returns would have been lower if certain expenses had not been reduced during the applicable periods shown.
B Calculated based on average shares outstanding during the period.
C Fees and expenses of any underlying Fidelity Central Funds are not included in the Fund's expense ratio. The Fund indirectly bears its proportionate share of the expenses of any underlying Fidelity Central Funds.
D Amount does not include the portfolio activity of any underlying Fidelity Central Funds.
E Investment income per share reflects a large, non-recurring dividend which amounted to $.26 per share. Excluding this non-recurring dividend, the ratio of net investment income (loss) to average net assets would have been 1.75%.
F Expense ratios reflect operating expenses of the class. Expenses before reductions do not reflect amounts reimbursed by the investment adviser or reductions from brokerage service arrangements or reductions from other expense offset arrangements and do not represent the amount paid by the class during periods when reimbursements or reductions occur. Expenses net of fee waivers reflect expenses after reimbursement by the investment adviser but prior to reductions from brokerage service arrangements or other expense offset arrangements. Expenses net of all reductions represent the net expenses paid by the class.
See accompanying notes which are an integral part of the financial statements.
Annual Report
For the period ended July 31, 2015
1. Organization.
Fidelity Value Discovery Fund (the Fund) is a fund of Fidelity Puritan Trust (the Trust) and is authorized to issue an unlimited number of shares. The Trust is registered under the Investment Company Act of 1940, as amended (the 1940 Act), as an open-end management investment company organized as a Massachusetts business trust. The Fund offers Value Discovery and Class K shares, each of which has equal rights as to assets and voting privileges. Each class has exclusive voting rights with respect to matters that affect that class.
2. Investments in Fidelity Central Funds.
The Fund invests in Fidelity Central Funds, which are open-end investment companies generally available only to other investment companies and accounts managed by the investment adviser and its affiliates. The Fund's Schedule of Investments lists each of the Fidelity Central Funds held as of period end, if any, as an investment of the Fund, but does not include the underlying holdings of each Fidelity Central Fund. As an Investing Fund, the Fund indirectly bears its proportionate share of the expenses of the underlying Fidelity Central Funds.
The Money Market Central Funds seek preservation of capital and current income and are managed by Fidelity Investments Money Management, Inc. (FIMM), an affiliate of the investment adviser. Annualized expenses of the Money Market Central Funds as of their most recent shareholder report date are less than .01%.
A complete unaudited list of holdings for each Fidelity Central Fund is available upon request or at the Securities and Exchange Commission (the SEC) website at www.sec.gov. In addition, the financial statements of the Fidelity Central Funds, which are not covered by the Fund's Report of Independent Registered Public Accounting Firm, are available on the SEC website or upon request.
3. Significant Accounting Policies.
The financial statements have been prepared in conformity with accounting principles generally accepted in the United States of America (GAAP), which require management to make certain estimates and assumptions at the date of the financial statements. Actual results could differ from those estimates. Subsequent events, if any, through the date that the financial statements were issued have been evaluated in the preparation of the financial statements. The following summarizes the significant accounting policies of the Fund:
Investment Valuation. Investments are valued as of 4:00 p.m. Eastern time on the last calendar day of the period. The Board of Trustees (the Board) has delegated the day to
Annual Report
Notes to Financial Statements - continued
3. Significant Accounting Policies - continued
Investment Valuation - continued
day responsibility for the valuation of the Fund's investments to the Fidelity Management & Research Company (FMR) Fair Value Committee (the Committee). In accordance with valuation policies and procedures approved by the Board, the Fund attempts to obtain prices from one or more third party pricing vendors or brokers to value its investments. When current market prices, quotations or currency exchange rates are not readily available or reliable, investments will be fair valued in good faith by the Committee, in accordance with procedures adopted by the Board. Factors used in determining fair value vary by investment type and may include market or investment specific events. The frequency with which these procedures are used cannot be predicted and they may be utilized to a significant extent. The Committee oversees the Fund's valuation policies and procedures and reports to the Board on the Committee's activities and fair value determinations. The Board monitors the appropriateness of the procedures used in valuing the Fund's investments and ratifies the fair value determinations of the Committee.
The Fund categorizes the inputs to valuation techniques used to value its investments into a disclosure hierarchy consisting of three levels as shown below:
Level 1 - quoted prices in active markets for identical investments
Level 2 - other significant observable inputs (including quoted prices for similar investments, interest rates, prepayment speeds, etc.)
Level 3 - unobservable inputs (including the Fund's own assumptions based on the best information available)
Valuation techniques used to value the Fund's investments by major category are as follows:
Equity securities, including restricted securities, for which market quotations are readily available, are valued at the last reported sale price or official closing price as reported by a third party pricing vendor on the primary market or exchange on which they are traded and are categorized as Level 1 in the hierarchy. In the event there were no sales during the day or closing prices are not available, securities are valued at the last quoted bid price or may be valued using the last available price and are generally categorized as Level 2 in the hierarchy. For foreign equity securities, when market or security specific events arise, comparisons to the valuation of American Depositary Receipts (ADRs), futures contracts, Exchange-Traded Funds (ETFs) and certain indexes as well as quoted prices for similar securities may be used and would be categorized as Level 2 in the hierarchy. Utilizing these techniques may result in transfers between Level 1 and Level 2. For equity securities, including restricted securities, where observable inputs are
Annual Report
3. Significant Accounting Policies - continued
Investment Valuation - continued
limited, assumptions about market activity and risk are used and these securities may be categorized as Level 3 in the hierarchy.
Investments in open-end mutual funds, including the Fidelity Central Funds, are valued at their closing net asset value (NAV) each business day and are categorized as Level 1 in the hierarchy.
Changes in valuation techniques may result in transfers in or out of an assigned level within the disclosure hierarchy. The aggregate value of investments by input level as of July 31, 2015 is included at the end of the Fund's Schedule of Investments.
Foreign Currency. The Fund may use foreign currency contracts to facilitate transactions in foreign-denominated securities. Gains and losses from these transactions may arise from changes in the value of the foreign currency or if the counterparties do not perform under the contracts' terms.
Foreign-denominated assets, including investment securities, and liabilities are translated into U.S. dollars at the exchange rates at period end. Purchases and sales of investment securities, income and dividends received and expenses denominated in foreign currencies are translated into U.S. dollars at the exchange rate in effect on the transaction date.
The effects of exchange rate fluctuations on investments are included with the net realized and unrealized gain (loss) on investment securities. Other foreign currency transactions resulting in realized and unrealized gain (loss) are disclosed separately.
Investment Transactions and Income. For financial reporting purposes, the Fund's investment holdings and NAV include trades executed through the end of the last business day of the period. The NAV per share for processing shareholder transactions is calculated as of the close of business of the New York Stock Exchange (NYSE), normally 4:00 p.m. Eastern time and includes trades executed through the end of the prior business day. Gains and losses on securities sold are determined on the basis of identified cost and may include proceeds received from litigation. Dividend income is recorded on the ex-dividend date, except for certain dividends from foreign securities where the ex-dividend date may have passed, which are recorded as soon as the Fund is informed of the ex-dividend date. Non-cash dividends included in dividend income, if any, are recorded at the fair market value of the securities received. Income and capital gain distributions from Fidelity Central Funds, if any, are recorded on the ex-dividend date. Distributions received on securities that represent a return of capital or capital gain are recorded as a reduction of cost of investments and/or as a realized gain. Subsequent to ex-dividend date the Fund determines the components of these distributions, based
Annual Report
Notes to Financial Statements - continued
3. Significant Accounting Policies - continued
Investment Transactions and Income - continued
upon receipt of tax filings or other correspondence relating to the underlying investment. Large, non-recurring dividends recognized by the Fund are presented separately on the Statement of Operations as "Special Dividends" and the impact of these dividends is presented in the Financial Highlights. Interest income is accrued as earned and includes coupon interest and amortization of premium and accretion of discount on debt securities as applicable. Investment income is recorded net of foreign taxes withheld where recovery of such taxes is uncertain.
Class Allocations and Expenses. Investment income, realized and unrealized capital gains and losses, common expenses of the Fund, and certain fund-level expense reductions, if any, are allocated daily on a pro-rata basis to each class based on the relative net assets of each class to the total net assets of the Fund. Each class differs with respect to transfer agent fees incurred. Certain expense reductions may also differ by class. For the reporting period, the allocated portion of income and expenses to each class as a percent of its average net assets may vary due to the timing of recording these transactions in relation to fluctuating net assets of the classes. Expenses directly attributable to a fund are charged to that fund. Expenses attributable to more than one fund are allocated among the respective funds on the basis of relative net assets or other appropriate methods. Expense estimates are accrued in the period to which they relate and adjustments are made when actual amounts are known.
Income Tax Information and Distributions to Shareholders. Each year, the Fund intends to qualify as a regulated investment company under Subchapter M of the Internal Revenue Code, including distributing substantially all of its taxable income and realized gains. As a result, no provision for U.S. Federal income taxes is required. As of July 31, 2015, the Fund did not have any unrecognized tax benefits in the financial statements; nor is the Fund aware of any tax positions for which it is reasonably possible that the total amounts of unrecognized tax benefits will significantly change in the next twelve months. The Fund files a U.S. federal tax return, in addition to state and local tax returns as required. The Fund's federal income tax returns are subject to examination by the Internal Revenue Service (IRS) for a period of three fiscal years after they are filed. State and local tax returns may be subject to examination for an additional fiscal year depending on the jurisdiction. Foreign taxes are provided for based on the Fund's understanding of the tax rules and rates that exist in the foreign markets in which it invests.
Distributions are declared and recorded on the ex-dividend date. Income dividends and capital gain distributions are declared separately for each class. Income and capital gain distributions are determined in accordance with income tax regulations, which may
Annual Report
3. Significant Accounting Policies - continued
Income Tax Information and Distributions to Shareholders - continued
differ from GAAP. In addition, the Fund claimed a portion of the payment made to redeeming shareholders as a distribution for income tax purposes.
Capital accounts within the financial statements are adjusted for permanent book-tax differences. These adjustments have no impact on net assets or the results of operations. Capital accounts are not adjusted for temporary book-tax differences which will reverse in a subsequent period.
Book-tax differences are primarily due to foreign currency transactions, futures contracts, market discount, passive foreign investment companies (PFIC), partnerships, capital loss carryforwards and losses deferred due to wash sales.
The federal tax cost of investment securities and unrealized appreciation (depreciation) as of period end were as follows:
Gross unrealized appreciation | $ 147,721,022 |
Gross unrealized depreciation | (68,717,309) |
Net unrealized appreciation (depreciation) on securities | $ 79,003,713 |
| |
Tax Cost | $ 1,327,126,901 |
The tax-based components of distributable earnings as of period end were as follows:
Undistributed ordinary income | $ 17,518,540 |
Undistributed long-term capital gain | $ 17,987,817 |
Net unrealized appreciation (depreciation) on securities and other investments | $ 79,002,946 |
The tax character of distributions paid was as follows:
| July 31, 2015 | July 31, 2014 |
Ordinary Income | $ 13,408,095 | $ 6,964,725 |
4. Derivative Instruments.
Risk Exposures and the Use of Derivative Instruments. The Fund's investment objective allows the Fund to enter into various types of derivative contracts, including futures contracts. Derivatives are investments whose value is primarily derived from underlying assets, indices or reference rates and may be transacted on an exchange or over-the-counter (OTC). Derivatives may involve a future commitment to buy or sell a specified asset based on specified terms, to exchange future cash flows at periodic intervals based on a notional principal amount, or for one party to make one or more
Annual Report
Notes to Financial Statements - continued
4. Derivative Instruments - continued
Risk Exposures and the Use of Derivative Instruments - continued
payments upon the occurrence of specified events in exchange for periodic payments from the other party.
The Fund used derivatives to increase returns and to manage exposure to certain risks as defined below. The success of any strategy involving derivatives depends on analysis of numerous economic factors, and if the strategies for investment do not work as intended, the Fund may not achieve its objectives.
The Fund's use of derivatives increased or decreased its exposure to the following risk:
Equity Risk | Equity risk relates to the fluctuations in the value of financial instruments as a result of changes in market prices (other than those arising from interest rate risk or foreign exchange risk), whether caused by factors specific to an individual investment, its issuer, or all factors affecting all instruments traded in a market or market segment. |
The Fund is also exposed to additional risks from investing in derivatives, such as liquidity risk and counterparty credit risk. Liquidity risk is the risk that the Fund will be unable to close out the derivative in the open market in a timely manner. Counterparty credit risk is the risk that the counterparty will not be able to fulfill its obligation to the Fund. Counterparty credit risk related to exchange-traded futures contracts may be mitigated by the protection provided by the exchange on which they trade.
Investing in derivatives may involve greater risks than investing in the underlying assets directly and, to varying degrees, may involve risk of loss in excess of any initial investment and collateral received and amounts recognized in the Statement of Assets and Liabilities. In addition, there may be the risk that the change in value of the derivative contract does not correspond to the change in value of the underlying instrument.
Futures Contracts. A futures contract is an agreement between two parties to buy or sell a specified underlying instrument for a fixed price at a specified future date. The Fund used futures contracts to manage its exposure to the stock market.
Upon entering into a futures contract, a fund is required to deposit either cash or securities (initial margin) with a clearing broker in an amount equal to a certain percentage of the face value of the contract. Futures contracts are marked-to-market daily and subsequent daily payments (variation margin) are made or received by a fund depending on the daily fluctuations in the value of the futures contracts and are recorded as unrealized appreciation or (depreciation). This receivable and/or payable, if any, is included in daily variation margin for derivative instruments in the Statement of Assets and Liabilities. Realized gain or (loss) is recorded upon the expiration or closing of a futures contract.
Annual Report
4. Derivative Instruments - continued
Futures Contracts - continued
Any open futures contracts at period end are presented in the Schedule of Investments under the caption "Futures Contracts." The underlying face amount at value reflects each contract's exposure to the underlying instrument or index at period end.
During the period the Fund recognized net realized gain (loss) of $(388,481) and a change in net unrealized appreciation (depreciation) of $200,164 related to its investment in futures contracts. These amounts are included in the Statement of Operations.
5. Purchases and Sales of Investments.
Purchases and sales of securities, other than short-term securities, aggregated $959,251,208 and $486,500,887, respectively.
6. Fees and Other Transactions with Affiliates.
Management Fee. Fidelity Management & Research Company (the investment adviser) and its affiliates provide the Fund with investment management related services for which the Fund pays a monthly management fee. The management fee is the sum of an individual fund fee rate that is based on an annual rate of .30% of the Fund's average net assets and an annualized group fee rate that averaged .25% during the period. The group fee rate is based upon the average net assets of all the mutual funds advised by the investment adviser, including any mutual funds previously advised by the investment adviser that are currently advised by Fidelity SelectCo, LLC, an affiliate of the investment adviser. The group fee rate decreases as assets under management increase and increases as assets under management decrease. In addition, the management fee is subject to a performance adjustment (up to a maximum of ± .20% of the Fund's average net assets over a 36 month performance period). The upward or downward adjustment to the management fee is based on the relative investment performance of Value Discovery as compared to its benchmark index, the Russell 3000 Value Index, over the same 36 month performance period. For the reporting period, the total annual management fee rate, including the performance adjustment, was .61% of the Fund's average net assets. The performance adjustment included in the management fee rate may be higher or lower than the maximum performance adjustment rate due to the difference between the average net assets for the reporting and performance periods.
Transfer Agent Fees. Fidelity Investments Institutional Operations Company, Inc., (FIIOC), an affiliate of the investment adviser, is the transfer, dividend disbursing and shareholder servicing agent for each class of the Fund. FIIOC receives account fees and asset-based fees that vary according to the account size and type of account of the shareholders of Value Discovery. FIIOC receives an asset-based fee of Class K's average
Annual Report
Notes to Financial Statements - continued
6. Fees and Other Transactions with Affiliates - continued
Transfer Agent Fees - continued
net assets. FIIOC pays for typesetting, printing and mailing of shareholder reports, except proxy statements.
For the period, transfer agent fees for each applicable class were as follows:
| Amount | % of
Class-Level Average
Net Assets |
Value Discovery | $ 1,764,655 | .18 |
Class K | 72,864 | .05 |
| $ 1,837,519 | |
Accounting and Security Lending Fees. Fidelity Service Company, Inc. (FSC), an affiliate of the investment adviser, maintains the Fund's accounting records. The accounting fee is based on the level of average net assets for each month. Under a separate contract, FSC administers the security lending program. The security lending fee is based on the number and duration of lending transactions.
Brokerage Commissions. The Fund placed a portion of its portfolio transactions with brokerage firms which are affiliates of the investment adviser. Brokerage commissions are included in net realized gain (loss) and change in net unrealized appreciation (depreciation) in the Statement of Operations. The commissions paid to these affiliated firms were $12,832 for the period.
Other. During the period, the investment adviser reimbursed the Fund for certain losses in the amount of $5,591.
7. Committed Line of Credit.
The Fund participates with other funds managed by the investment adviser or an affiliate in a $4.25 billion credit facility (the "line of credit") to be utilized for temporary or emergency purposes to fund shareholder redemptions or for other short-term liquidity purposes. The Fund has agreed to pay commitment fees on its pro-rata portion of the line of credit, which amounted to $1,568 and is reflected in Miscellaneous expenses on the Statement of Operations. During the period, the Fund did not borrow on this line of credit.
8. Security Lending.
The Fund lends portfolio securities through a lending agent from time to time in order to earn additional income. For equity securities, a lending agent is used and may loan securities to certain qualified borrowers, including Fidelity Capital Markets (FCM), a broker-dealer affiliated with the Fund. On the settlement date of the loan, the Fund
Annual Report
8. Security Lending - continued
receives collateral (in the form of U.S. Treasury obligations, letters of credit and/or cash) against the loaned securities and maintains collateral in an amount not less than 100% of the market value of the loaned securities during the period of the loan. The market value of the loaned securities is determined at the close of business of the Fund and any additional required collateral is delivered to the Fund on the next business day. If the borrower defaults on its obligation to return the securities loaned because of insolvency or other reasons, the Fund may apply collateral received from the borrower against the obligation. The Fund may experience delays and costs in recovering the securities loaned. Any cash collateral received is invested in the Fidelity Securities Lending Cash Central Fund. The value of loaned securities and cash collateral at period end are disclosed on the Fund's Statement of Assets and Liabilities. Security lending income represents the income earned on investing cash collateral, less rebates paid to borrowers and any lending agent fees associated with the loan, plus any premium payments received for lending certain types of securities. Security lending income is presented in the Statement of Operations as a component of income from Fidelity Central Funds. Total security lending income during the period amounted to $92,437. During the period, there were no securities loaned to FCM.
9. Expense Reductions.
Commissions paid to certain brokers with whom the investment adviser, or its affiliates, places trades on behalf of the Fund include an amount in addition to trade execution, which may be rebated back to the Fund to offset certain expenses. This amount totaled $22,956 for the period. In addition, through arrangements with the Fund's custodian, credits realized as a result of uninvested cash balances were used to reduce the Fund's expenses. During the period, these credits reduced the Fund's expenses by $337.
In addition, during the period the investment adviser reimbursed/waived a portion of fund-level operating expenses in the amount of $5,522 and a portion of class-level operating expenses as follows:
| Amount |
Value Discovery | $ 15,830 |
Annual Report
Notes to Financial Statements - continued
10. Distributions to Shareholders.
Distributions to shareholders of each class were as follows:
Years ended July 31, | 2015 | 2014 |
From net investment income | | |
Value Discovery | $ 10,957,309 | $ 5,880,680 |
Class K | 1,783,704 | 1,084,045 |
Total | $ 12,741,013 | $ 6,964,725 |
From net realized gain | | |
Value Discovery | $ 578,732 | $ - |
Class K | 88,350 | - |
Total | $ 667,082 | $ - |
11. Share Transactions.
Share transactions for each class were as follows and may contain automatic conversions between classes or exchanges between funds:
| Shares | Dollars |
Years ended July 31, | 2015 | 2014 | 2015 | 2014 |
Value Discovery | | | | |
Shares sold | 26,910,446 | 9,957,139 | $ 658,668,681 | $ 226,028,010 |
Reinvestment of distributions | 467,074 | 278,378 | 11,066,789 | 5,640,307 |
Shares redeemed | (8,583,679) | (3,617,186) | (211,736,756) | (78,363,112) |
Net increase (decrease) | 18,793,841 | 6,618,331 | $ 457,998,714 | $ 153,305,205 |
Class K | | | | |
Shares sold | 5,745,415 | 2,344,329 | $ 143,155,226 | $ 51,734,186 |
Reinvestment of distributions | 79,062 | 53,522 | 1,872,054 | 1,084,045 |
Shares redeemed | (2,862,594) | (1,071,695) | (70,968,238) | (23,481,455) |
Net increase (decrease) | 2,961,883 | 1,326,156 | $ 74,059,042 | $ 29,336,776 |
12. Other.
The Fund's organizational documents provide former and current trustees and officers with a limited indemnification against liabilities arising in connection with the performance of their duties to the Fund. In the normal course of business, the Fund may also enter into contracts that provide general indemnifications. The Fund's maximum exposure under these arrangements is unknown as this would be dependent on future claims that may be made against the Fund. The risk of material loss from such claims is considered remote.
Annual Report
To the Trustees of Fidelity Puritan Trust and Shareholders of Fidelity Value Discovery Fund:
We have audited the accompanying statement of assets and liabilities of Fidelity Value Discovery Fund (the Fund), a fund of Fidelity Puritan Trust, including the schedule of investments, as of July 31, 2015, and the related statement of operations for the year then ended, the statement of changes in net assets for each of the two years in the period then ended, and the financial highlights for each of the five years in the period then ended. These financial statements and financial highlights are the responsibility of the Fund's management. Our responsibility is to express an opinion on these financial statements and financial highlights based on our audits.
We conducted our audits in accordance with the standards of the Public Company Accounting Oversight Board (United States). Those standards require that we plan and perform the audit to obtain reasonable assurance about whether the financial statements and financial highlights are free of material misstatement. The Fund is not required to have, nor were we engaged to perform, an audit of its internal control over financial reporting. Our audits included consideration of internal control over financial reporting as a basis for designing audit procedures that are appropriate in the circumstances, but not for the purpose of expressing an opinion on the effectiveness of the Fund's internal control over financial reporting. Accordingly, we express no such opinion. An audit also includes examining, on a test basis, evidence supporting the amounts and disclosures in the financial statements, assessing the accounting principles used and significant estimates made by management, as well as evaluating the overall financial statement presentation. Our procedures included confirmation of securities owned as of July 31, 2015, by correspondence with the custodians and brokers; when replies were not received from brokers, we performed other auditing procedures. We believe that our audits provide a reasonable basis for our opinion.
In our opinion, such financial statements and financial highlights referred to above present fairly, in all material respects, the financial position of Fidelity Value Discovery Fund as of July 31, 2015, the results of its operations for the year then ended, the changes in its net assets for each of the two years in the period then ended, and the financial highlights for each of the five years in the period then ended, in conformity with accounting principles generally accepted in the United States of America.
DELOITTE & TOUCHE LLP
Boston, Massachusetts
September 17, 2015
Annual Report
The Trustees, Member of the Advisory Board, and officers of the trust and fund, as applicable, are listed below. The Board of Trustees governs the fund and is responsible for protecting the interests of shareholders. The Trustees are experienced executives who meet periodically throughout the year to oversee the fund's activities, review contractual arrangements with companies that provide services to the fund, oversee management of the risks associated with such activities and contractual arrangements, and review the fund's performance. Each of the Trustees oversees 170 funds.
The Trustees hold office without limit in time except that (a) any Trustee may resign; (b) any Trustee may be removed by written instrument, signed by at least two-thirds of the number of Trustees prior to such removal; (c) any Trustee who requests to be retired or who has become incapacitated by illness or injury may be retired by written instrument signed by a majority of the other Trustees; and (d) any Trustee may be removed at any special meeting of shareholders by a two-thirds vote of the outstanding voting securities of the trust. Each Trustee who is not an interested person (as defined in the 1940 Act) of the trust and the fund (Independent Trustee), shall retire not later than the last day of the calendar year in which his or her 75th birthday occurs. The Independent Trustees may waive this mandatory retirement age policy with respect to individual Trustees. The officers and Advisory Board Member hold office without limit in time, except that any officer and Advisory Board Member may resign or may be removed by a vote of a majority of the Trustees at any regular meeting or any special meeting of the Trustees. Except as indicated, each individual has held the office shown or other offices in the same company for the past five years.
Experience, Skills, Attributes, and Qualifications of the Fund's Trustees. The Governance and Nominating Committee has adopted a statement of policy that describes the experience, qualifications, attributes, and skills that are necessary and desirable for potential Independent Trustee candidates (Statement of Policy). The Board believes that each Trustee satisfied at the time he or she was initially elected or appointed a Trustee, and continues to satisfy, the standards contemplated by the Statement of Policy. The Governance and Nominating Committee also engages professional search firms to help identify potential Independent Trustee candidates who have the experience, qualifications, attributes, and skills consistent with the Statement of Policy. From time to time, additional criteria based on the composition and skills of the current Independent Trustees, as well as experience or skills that may be appropriate in light of future changes to board composition, business conditions, and regulatory or other developments, have also been considered by the professional search firms and the Governance and Nominating Committee. In addition, the Board takes into account the Trustees' commitment and participation in Board and committee meetings, as well as their leadership of standing and ad hoc committees throughout their tenure.
In determining that a particular Trustee was and continues to be qualified to serve as a Trustee, the Board has considered a variety of criteria, none of which, in isolation, was controlling. The Board believes that, collectively, the Trustees have balanced and diverse experience, qualifications, attributes, and skills, which allow the Board to operate effectively in governing the fund and protecting the interests of shareholders. Information about the specific experience, skills, attributes, and qualifications of each Trustee, which in each case led to the Board's conclusion that the Trustee should serve (or continue to serve) as a trustee of the fund, is provided below.
Annual Report
Board Structure and Oversight Function. James C. Curvey is an interested person (as defined in the 1940 Act) and currently serves as Chairman. The Trustees have determined that an interested Chairman is appropriate and benefits shareholders because an interested Chairman has a personal and professional stake in the quality and continuity of services provided to the fund. Independent Trustees exercise their informed business judgment to appoint an individual of their choosing to serve as Chairman, regardless of whether the Trustee happens to be independent or a member of management. The Independent Trustees have determined that they can act independently and effectively without having an Independent Trustee serve as Chairman and that a key structural component for assuring that they are in a position to do so is for the Independent Trustees to constitute a substantial majority for the Board. The Independent Trustees also regularly meet in executive session. Ned C. Lautenbach serves as Chairman of the Independent Trustees and as such (i) acts as a liaison between the Independent Trustees and management with respect to matters important to the Independent Trustees and (ii) with management prepares agendas for Board meetings.
Fidelity funds are overseen by different Boards of Trustees. The fund's Board oversees Fidelity's high income and certain equity funds and other Boards oversee Fidelity's investment-grade bond, money market, asset allocation, and sector funds. The asset allocation funds may invest in Fidelity funds overseen by the fund's Board. The use of separate Boards, each with its own committee structure, allows the Trustees of each group of Fidelity funds to focus on the unique issues of the funds they oversee, including common research, investment, and operational issues. On occasion, the separate Boards establish joint committees to address issues of overlapping consequences for the Fidelity funds overseen by each Board.
The Trustees operate using a system of committees to facilitate the timely and efficient consideration of all matters of importance to the Trustees, the fund, and fund shareholders and to facilitate compliance with legal and regulatory requirements and oversight of the fund's activities and associated risks. The Board, acting through its committees, has charged FMR and its affiliates with (i) identifying events or circumstances the occurrence of which could have demonstrably adverse effects on the fund's business and/or reputation; (ii) implementing processes and controls to lessen the possibility that such events or circumstances occur or to mitigate the effects of such events or circumstances if they do occur; and (iii) creating and maintaining a system designed to evaluate continuously business and market conditions in order to facilitate the identification and implementation processes described in (i) and (ii) above. Because the day-to-day operations and activities of the fund are carried out by or through FMR, its affiliates and other service providers, the fund's exposure to risks is mitigated but not eliminated by the processes overseen by the Trustees. While each of the Board's committees has responsibility for overseeing different aspects of the fund's activities, oversight is exercised primarily through the Operations, Audit, and Compliance Committees. In addition, the Independent Trustees have worked with FMR to enhance the Board's oversight of investment and financial risks, legal and regulatory risks, technology risks, and operational risks, including the development of additional risk reporting to the Board. For example, a working group comprised of Independent Trustees and FMR has worked and continues to work to review the Fidelity funds' valuation-related activities, reporting and risk management. Appropriate personnel, including but not limited to the fund's Chief Compliance Officer (CCO), FMR's internal auditor, the independent accountants, the fund's Treasurer and portfolio management personnel, make periodic reports to the Board's committees, as appropriate, including an annual review of FMR's risk management program for the Fidelity funds. The responsibilities of each standing committee, including their oversight responsibilities, are described further under "Standing Committees of the Fund's Trustees."
Annual Report
Trustees and Officers - continued
The fund's Statement of Additional Information (SAI) includes more information about the Trustees. To request a free copy, call Fidelity at 1-800-835-5092.
Interested Trustees*:
Correspondence intended for each Trustee who is an interested person may be sent to Fidelity Investments, 245 Summer Street, Boston, Massachusetts 02210.
Name, Year of Birth; Principal Occupations and Other Relevant Experience+ |
James C. Curvey (1935) |
Year of Election or Appointment: 2007 Trustee Chairman of the Board of Trustees |
| Mr. Curvey also serves as Trustee of other Fidelity funds. Mr. Curvey is a Director of Fidelity Research & Analysis Co. (investment adviser firm, 2009-present), and Vice Chairman (2007-present) and Director of FMR LLC (diversified financial services company). In addition, Mr. Curvey serves as an Overseer for the Boston Symphony Orchestra and a member of the board of Artis-Naples, Naples, Florida, and as a Trustee for Brewster Academy, Wolfeboro, New Hampshire. Previously, Mr. Curvey served as a Director of Fidelity Investments Money Management, Inc. (investment adviser firm, 2009-2014), a Director of FMR (investment adviser firm, 2007-2014), and a Director of FMR Co., Inc. (investment adviser firm, 2007-2014). |
Charles S. Morrison (1960) |
Year of Election or Appointment: 2014 Trustee |
| Mr. Morrison also serves as Trustee of other funds. He serves as a Director of Fidelity Investments Money Management, Inc. (FIMM) (investment adviser firm, 2014-present), Director of Fidelity SelectCo, LLC (investment adviser firm, 2014-present), President, Asset Management (2014-present), and is an employee of Fidelity Investments. Previously, Mr. Morrison served as Vice President of Fidelity's Fixed Income and Asset Allocation Funds (2012-2014), President, Fixed Income (2011-2014), Vice President of Fidelity's Money Market Funds (2005-2009), President, Money Market Group Leader of FMR (investment adviser firm, 2009), and Senior Vice President, Money Market Group of FMR (2004-2009). Mr. Morrison also served as Vice President of Fidelity's Bond Funds (2002-2005), certain Balanced Funds (2002-2005), and certain Asset Allocation Funds (2002-2007), and as Senior Vice President (2002-2005) of Fidelity's Bond Division. |
* Trustees have been determined to be "Interested Trustees" by virtue of, among other things, their affiliation with the trust or various entities under common control with FMR.
+ The information above includes each Trustee's principal occupation during the last five years and other information relating to the experience, attributes, and skills relevant to each Trustee's qualifications to serve as a Trustee, which led to the conclusion that each Trustee should serve as a Trustee for the fund.
Annual Report
Trustees and Officers - continued
Independent Trustees:
Correspondence intended for each Independent Trustee (that is, the Trustees other than the Interested Trustees) may be sent to Fidelity Investments, P.O. Box 55235, Boston, Massachusetts 02205-5235.
Name, Year of Birth; Principal Occupations and Other Relevant Experience+ |
Dennis J. Dirks (1948) |
Year of Election or Appointment: 2005 Trustee |
| Mr. Dirks also serves as Trustee of other Fidelity funds. Prior to his retirement in May 2003, Mr. Dirks was Chief Operating Officer and a member of the Board of The Depository Trust & Clearing Corporation (DTCC). He also served as President, Chief Operating Officer, and Board member of The Depository Trust Company (DTC) and President and Board member of the National Securities Clearing Corporation (NSCC). In addition, Mr. Dirks served as Chief Executive Officer and Board member of the Government Securities Clearing Corporation, Chief Executive Officer and Board member of the Mortgage-Backed Securities Clearing Corporation, as a Trustee and a member of the Finance Committee of Manhattan College (2005-2008), and as a Trustee and a member of the Finance Committee of AHRC of Nassau County (2006-2008). Mr. Dirks is a member of the Independent Directors Council (IDC) Governing Council (2010-present) and Board of Directors for The Brookville Center for Children's Services, Inc. (2009-present). |
Alan J. Lacy (1953) |
Year of Election or Appointment: 2008 Trustee |
| Mr. Lacy also serves as Trustee of other Fidelity funds. Mr. Lacy serves as a member of the Board of Directors of Dave & Buster's Entertainment, Inc. (restaurant and entertainment complexes, 2010-present) and Bristol-Myers Squibb Company (global pharmaceuticals, 2008-present). In addition, Mr. Lacy served as Senior Adviser (2007-2014) of Oak Hill Capital Partners, L.P. (private equity) and also served as Chief Executive Officer (2000-2005) and Vice Chairman (2005-2006) of Sears Holdings Corporation and Sears, Roebuck and Co. (retail). Mr. Lacy is a member of the Board of Trustees of The National Parks Conservation Association (2006-present). Previously, Mr. Lacy served as Chairman of the Board of Trustees of the National Parks Conservation Association (2008-2011) and as a member of the Board of Directors for The Western Union Company (global money transfer, 2006-2011), The Hillman Companies, Inc. (hardware wholesalers, 2010-2014), and Earth Fare, Inc. (retail grocery, 2010-2014). |
Ned C. Lautenbach (1944) |
Year of Election or Appointment: 2000 Trustee Chairman of the Independent Trustees |
| Mr. Lautenbach also serves as Trustee of other Fidelity funds. Mr. Lautenbach currently serves as the Lead Director of the Eaton Corporation Board of Directors (diversified industrial, 1997-present). Mr. Lautenbach is Chairman of the Board of Directors of Artis-Naples in Naples, Florida (2012-present), a member of the Council on Foreign Relations (1994-present), and a member of the Board of Governors, State University System of Florida (2013-present). Previously, Mr. Lautenbach was a Partner/Advisory Partner at Clayton, Dubilier & Rice, LLC (private equity investment, 1998-2010), as well as a Director of Sony Corporation (2006-2007). |
Joseph Mauriello (1944) |
Year of Election or Appointment: 2008 Trustee |
| Mr. Mauriello also serves as Trustee of other Fidelity funds. Prior to his retirement in January 2006, Mr. Mauriello served in numerous senior management positions including Deputy Chairman and Chief Operating Officer (2004-2005), and Vice Chairman of Financial Services (2002-2004) of KPMG LLP US (professional services, 1965-2005). Mr. Mauriello currently serves as a member of the Board of Directors of XL Group plc. (global insurance and re-insurance, 2006-present). Previously, Mr. Mauriello served as a Director of the Hamilton Funds of the Bank of New York (2006-2007) and of Arcadia Resources Inc. (health care services and products, 2007-2012). |
Robert W. Selander (1950) |
Year of Election or Appointment: 2011 Trustee |
| Mr. Selander also serves as Trustee of other Fidelity funds. Mr. Selander serves as a Director of The Western Union Company (global money transfer, 2014-present). Previously, Mr. Selander served as a Member of the Advisory Board of other Fidelity funds (2011), and Executive Vice Chairman (2010), Chief Executive Officer (2009-2010), and President and Chief Executive Officer (1997-2009) of Mastercard, Inc. |
Cornelia M. Small (1944) |
Year of Election or Appointment: 2005 Trustee |
| Ms. Small also serves as Trustee of other Fidelity funds. Ms. Small is a member of the Board of Directors (2009-present) and Chair of the Investment Committee (2010-present) of the Teagle Foundation. Ms. Small also serves on the Investment Committee of the Berkshire Taconic Community Foundation (2008-present). Previously, Ms. Small served as Chairperson (2002-2008) and a member of the Investment Committee and Chairperson (2008-2012) and a member of the Board of Trustees of Smith College. In addition, Ms. Small served as Chief Investment Officer, Director of Global Equity Investments, and a member of the Board of Directors of Scudder, Stevens & Clark and Scudder Kemper Investments. |
William S. Stavropoulos (1939) |
Year of Election or Appointment: 2001 Trustee Vice Chairman of the Independent Trustees |
| Mr. Stavropoulos also serves as Trustee of other Fidelity funds. Mr. Stavropoulos serves as President and Founder of the Michigan Baseball Foundation, the Great Lakes Loons (2007-present). Mr. Stavropoulos is Chairman Emeritus of the Board of Directors of The Dow Chemical Company, where he previously served in numerous senior management positions, including President, CEO (1995-2000; 2002-2004), Chairman of the Executive Committee (2000-2006), and as a member of the Board of Directors (1990-2006). Currently, Mr. Stavropoulos is Chairman of the Board of Directors of Univar Inc. (global distributor of commodity and specialty chemicals), a Director of Teradata Corporation (data warehousing and technology solutions), and Maersk Inc. (industrial conglomerate), and a member of the Advisory Board for Metalmark Capital LLC (private equity investment, 2005-present). Mr. Stavropoulos is an operating advisor to Clayton, Dubilier & Rice, LLC (private equity investment). In addition, Mr. Stavropoulos is a member of the University of Notre Dame Advisory Council for the College of Science, a Trustee of the Rollin L. Gerstacker Foundation, and a Director of the Naples Philharmonic Center for the Arts. Previously, Mr. Stavropoulos served as a Director of Chemical Financial Corporation (bank holding company, 1993-2012) and Tyco International, Ltd. (multinational manufacturing and services, 2007-2012). |
David M. Thomas (1949) |
Year of Election or Appointment: 2008 Trustee |
| Mr. Thomas also serves as Trustee of other Fidelity funds. Mr. Thomas serves as Non-Executive Chairman of the Board of Directors of Fortune Brands Home and Security (home and security products, 2011-present), as a member of the Board of Directors (2004-present) and Presiding Director (2013-present) of Interpublic Group of Companies, Inc. (marketing communication), and as a member of the Board of Trustees of the University of Florida (2013-present). Previously, Mr. Thomas served as Executive Chairman (2005-2006) and Chairman and Chief Executive Officer (2000-2005) of IMS Health, Inc. (pharmaceutical and healthcare information solutions), and a Director of Fortune Brands, Inc. (consumer products, 2000-2011). |
+ The information above includes each Trustee's principal occupation during the last five years and other information relating to the experience, attributes, and skills relevant to each Trustee's qualifications to serve as a Trustee, which led to the conclusion that each Trustee should serve as a Trustee for the fund.
Advisory Board Member and Officers:
Correspondence intended for each officer and Peter S. Lynch may be sent to Fidelity Investments, 245 Summer Street, Boston, Massachusetts 02210. Officers appear below in alphabetical order.
Name, Year of Birth; Principal Occupation |
Peter S. Lynch (1944) |
Year of Election or Appointment: 2003 Member of the Advisory Board |
| Mr. Lynch also serves as Member of the Advisory Board of other Fidelity funds. Mr. Lynch is Vice Chairman and a Director of FMR (investment adviser firm) and FMR Co., Inc. (investment adviser firm). In addition, Mr. Lynch serves as a Trustee of Boston College and as the Chairman of the Inner-City Scholarship Fund. Previously, Mr. Lynch served on the Special Olympics International Board of Directors (1997-2006). |
Elizabeth Paige Baumann (1968) |
Year of Election or Appointment: 2012 Anti-Money Laundering (AML) Officer |
| Ms. Baumann also serves as AML Officer of other funds. She is Chief AML Officer of FMR LLC (diversified financial services company, 2012-present) and is an employee of Fidelity Investments. Previously, Ms. Baumann served as Vice President and Deputy Anti-Money Laundering Officer (2007-2012). |
Marc Bryant (1966) |
Year of Election or Appointment: 2015 Secretary and Chief Legal Officer (CLO) |
| Mr. Bryant also serves as Secretary and Chief Legal Officer (CLO) of other funds. He is Senior Vice President and Deputy General Counsel of FMR LLC (diversified financial services company). Previously, Mr. Bryant served as Secretary and Chief Legal Officer of Fidelity Rutland Square Trust II (2010-2014) and Assistant Secretary of Fidelity's Fixed Income and Asset Allocation Funds (2013-2015). Prior to joining Fidelity Investments, Mr. Bryant served as a Senior Vice President and the Head of Global Retail Legal for AllianceBernstein L.P. (2006-2010), and as the General Counsel for ProFund Advisors LLC (2001-2006). |
William C. Coffey (1969) |
Year of Election or Appointment: 2009 Assistant Secretary |
| Mr. Coffey also serves as Assistant Secretary of other funds. He is Senior Vice President and Deputy General Counsel of FMR LLC (diversified financial services company, 2010-present), and is an employee of Fidelity Investments. Previously, Mr. Coffey served as Vice President and Associate General Counsel of FMR LLC (2005-2009). |
Jonathan Davis (1968) |
Year of Election or Appointment: 2010 Assistant Treasurer |
| Mr. Davis also serves as Assistant Treasurer of other funds. Mr. Davis is an employee of Fidelity Investments. Previously, Mr. Davis served as Vice President and Associate General Counsel of FMR LLC (diversified financial services company, 2003-2010). |
Adrien E. Deberghes (1967) |
Year of Election or Appointment: 2008 Deputy Treasurer |
| Mr. Deberghes also serves as an officer of other funds. He is an employee of Fidelity Investments (2008-present). Prior to joining Fidelity Investments, Mr. Deberghes was Senior Vice President of Mutual Fund Administration at State Street Corporation (2007-2008), Senior Director of Mutual Fund Administration at Investors Bank & Trust (2005-2007), and Director of Finance for Dunkin' Brands (2000-2005). |
Stephanie J. Dorsey (1969) |
Year of Election or Appointment: 2010 Assistant Treasurer |
| Ms. Dorsey also serves as an officer of other funds. She is an employee of Fidelity Investments (2008-present) and has served in other fund officer roles. Prior to joining Fidelity Investments, Ms. Dorsey served as Treasurer (2004-2008) of the JPMorgan Mutual Funds and Vice President (2004-2008) of JPMorgan Chase Bank. |
Howard J. Galligan III (1966) |
Year of Election or Appointment: 2014 Chief Financial Officer |
| Mr. Galligan also serves as Chief Financial Officer of other funds. Mr. Galligan serves as President of Fidelity Pricing and Cash Management Services (FPCMS) (2014-present) and as a Director of Strategic Advisers, Inc. (investment adviser firm, 2008-present). Previously, Mr. Galligan served as Chief Administrative Officer of Asset Management (2011-2014) and Chief Operating Officer and Senior Vice President of Investment Support for Strategic Advisers, Inc. (2003-2011). |
Scott C. Goebel (1968) |
Year of Election or Appointment: 2015 Vice President |
| Mr. Goebel serves as an officer of other funds. Mr. Goebel also serves as Secretary of Fidelity SelectCo, LLC (investment adviser firm, 2013-present), Fidelity Investments Money Management, Inc. (FIMM) (investment adviser firm, 2010-present) and Fidelity Research and Analysis Company (FRAC) (investment adviser firm, 2010-present); General Counsel, Secretary, and Senior Vice President of FMR (investment adviser firm, 2008-present) and FMR Co., Inc. (investment adviser firm, 2008-present); Chief Legal Officer of Fidelity Management & Research (Hong Kong) Limited (investment adviser firm, 2008-present); and Assistant Secretary of Fidelity Management & Research (Japan) Limited (investment adviser firm, 2008-present) and FMR Investment Management (U.K.) Limited (investment adviser firm, 2008-present). Previously, Mr. Goebel served as Secretary and CLO of certain Fidelity funds (2008-2015), Assistant Secretary of FIMM (2008-2010), FRAC (2008-2010), and certain funds (2007-2008); and as Vice President and Secretary of Fidelity Distributors Corporation (FDC) (2005-2007). Mr. Goebel has been employed by FMR LLC (diversified financial services company) or an affiliate since 2001. |
Thomas C. Hense (1964) |
Year of Election or Appointment: 2008/2010/2015 Vice President |
| Mr. Hense serves as Vice President of Fidelity Advisor Multi-Asset Income Fund (2015) and other funds (High Income (2008), Small Cap (2008), and Value (2010) funds). Previously, Mr. Hense served as a portfolio manager for Fidelity's Institutional Money Management Group (Pyramis) (2003-2008). |
Brian B. Hogan (1964) |
Year of Election or Appointment: 2009 Vice President |
| Mr. Hogan also serves as Trustee or Vice President of other funds. Mr. Hogan serves as a Director of Fidelity SelectCo, LLC (investment adviser firm, 2014-present) and President of the Equity Division of FMR (investment adviser firm, 2009-present). Previously, Mr. Hogan served as Senior Vice President, Equity Research of FMR (2006-2009) and as a portfolio manager. |
Chris Maher (1972) |
Year of Election or Appointment: 2013 Assistant Treasurer |
| Mr. Maher serves as Assistant Treasurer of other funds. Mr. Maher is Vice President of Valuation Oversight and is an employee of Fidelity Investments. Previously, Mr. Maher served as Vice President of Asset Management Compliance (2013), Vice President of the Program Management Group of FMR (investment adviser firm, 2010-2013), and Vice President of Valuation Oversight (2008-2010). |
Kenneth B. Robins (1969) |
Year of Election or Appointment: 2008 President and Treasurer |
| Mr. Robins also serves as an officer of other funds. Mr. Robins serves as Executive Vice President of Fidelity Investments Money Management, Inc. (FIMM) (investment adviser firm, 2013-present) and is an employee of Fidelity Investments (2004-present). Previously, Mr. Robins served in other fund officer roles. |
Stephen Sadoski (1971) |
Year of Election or Appointment: 2012 Deputy Treasurer |
| Mr. Sadoski also serves as Deputy Treasurer of other funds. He is an employee of Fidelity Investments (2012-present) and has served in another fund officer role. Prior to joining Fidelity Investments, Mr. Sadoski served as an assistant chief accountant in the Division of Investment Management of the Securities and Exchange Commission (SEC) (2009-2012) and as a senior manager at Deloitte & Touche LLP (1997-2009). |
Stacie M. Smith (1974) |
Year of Election or Appointment: 2013 Deputy Treasurer |
| Ms. Smith also serves as an officer of other funds. She is an employee of Fidelity Investments (2009-present) and has served in other fund officer roles. Prior to joining Fidelity Investments, Ms. Smith served as Senior Audit Manager of Ernst & Young LLP (1996-2009). |
Renee Stagnone (1975) |
Year of Election or Appointment: 2013 Deputy Treasurer |
| Ms. Stagnone also serves as Deputy Treasurer of other funds. Ms. Stagnone is an employee of Fidelity Investments. |
Linda J. Wondrack (1964) |
Year of Election or Appointment: 2014 Chief Compliance Officer |
| Ms. Wondrack also serves as Chief Compliance Officer of other funds. Ms. Wondrack is Executive Vice President and head of the Ethics Office and Asset Management Compliance for Fidelity Investments (2012-present). Ms. Wondrack also serves as Chief Compliance Officer of Fidelity SelectCo, LLC (investment adviser firm, 2014-present); Chief Compliance Officer of Impresa Management LLC (2013-present); and Chief Compliance Officer of FMR Co., Inc. (investment adviser firm), Fidelity Investments Money Management, Inc. (investment adviser firm), Fidelity Management & Research (Japan) Limited (investment adviser firm), FMR Investment Management (U.K.) Limited (investment adviser firm), Fidelity Management & Research (Hong Kong) (investment adviser firm), Fidelity Management & Research Company (investment adviser firm), Pyramis Global Advisors, LLC (investment adviser firm), and Strategic Advisers, Inc. (investment adviser firm), Ballyrock Investment Advisors LLC, and Northern Neck Investors LLC (2012-present). Previously, Ms. Wondrack served as Senior Vice President and Chief Compliance Officer for Columbia Management Investment Advisers, LLC (2005-2012); Chief Compliance Officer for certain funds within the Columbia Family of Funds (2007-2012); and Senior Vice President of Compliance Risk Management at Bank of America (2005-2010). |
Joseph F. Zambello (1957) |
Year of Election or Appointment: 2011 Deputy Treasurer |
| Mr. Zambello also serves as Deputy Treasurer of other funds. Mr. Zambello is an employee of Fidelity Investments. Previously, Mr. Zambello served as Vice President of the Program Management Group of FMR (investment adviser firm, 2009-2011) and Vice President of the Transfer Agent Oversight Group (2005-2009). |
Annual Report
The Board of Trustees of Fidelity Value Discovery Fund voted to pay shareholders of record at the opening of business on record date, the following distributions per share derived from capital gains realized from sales of portfolio securities, and dividends derived from net investment income:
| Pay Date | Record Date | Dividends | Capital Gains |
Class K | 09/14/15 | 09/11/15 | $0.316 | $0.306 |
The fund hereby designates as a capital gain dividend with respect to the taxable year ended July 31, 2015, $22,678,687, or, if subsequently determined to be different, the net capital gain of such year.
Class K designates 90% and 89% of the dividends distributed in September and December, respectively during the fiscal year as qualifying for the dividends-received deduction for corporate shareholders.
Class K designates 100% of the dividends distributed during the fiscal year as amounts which may be taken into account as a dividend for the purposes of the maximum rate under section 1(h)(11) of the Internal Revenue Code.
The fund will notify shareholders in January 2016 of amounts for use in preparing 2015 income tax returns.
Annual Report
Fidelity Value Discovery Fund
Each year, the Board of Trustees, including the Independent Trustees (together, the Board), votes on the renewal of the management contract with Fidelity Management & Research Company (FMR) and the sub-advisory agreements (together, the Advisory Contracts) for the fund. The Board, assisted by the advice of fund counsel and Independent Trustees' counsel, requests and considers a broad range of information relevant to the renewal of the Advisory Contracts throughout the year.
The Board meets regularly and, at each of its meetings, covers an extensive agenda of topics and materials and considers factors that are relevant to its annual consideration of the renewal of the fund's Advisory Contracts, including the services and support provided to the fund and its shareholders. The Board has established various standing committees (Committees), each composed of and chaired by Independent Trustees with varying backgrounds, to which the Board has assigned specific subject matter responsibilities in order to enhance effective decision-making by the Board. The Board, acting directly and through its Committees, requests and receives information concerning the annual consideration of the renewal of the fund's Advisory Contracts. The Board also meets as needed to consider matters specifically related to the Board's annual consideration of the renewal of the Advisory Contracts. Members of the Board may also meet with trustees of other Fidelity funds through ad hoc joint committees to discuss certain matters relevant to all of the Fidelity funds.
At its July 2015 meeting, the Board unanimously determined to renew the fund's Advisory Contracts. In reaching its determination, the Board considered all factors it believed relevant, including (i) the nature, extent, and quality of the services to be provided to the fund and its shareholders (including the investment performance of the fund); (ii) the competitiveness of the fund's management fee and total expense ratio relative to peer funds; (iii) the total costs of the services to be provided by and the profits to be realized by Fidelity from its relationship with the fund; and (iv) the extent to which (if any) economies of scale exist and would be realized as the fund grows, and whether any economies of scale are appropriately shared with fund shareholders.
In considering whether to renew the Advisory Contracts for the fund, the Board reached a determination, with the assistance of fund counsel and Independent Trustees' counsel and through the exercise of its business judgment, that the renewal of the Advisory Contracts was in the best interests of the fund and its shareholders and that the compensation payable under the Advisory Contracts was fair and reasonable. The Board's decision to renew the Advisory Contracts was not based on any single factor, but rather was based on a comprehensive consideration of all the information provided to the Board at its meetings throughout the year. The Board, in reaching its determination to renew the Advisory Contracts, was aware that shareholders of the fund have a broad range of investment choices available to them, including a wide choice among funds offered by Fidelity's competitors, and that the fund's shareholders, who have the opportunity to review and weigh the disclosure provided by the fund in its prospectus and other public disclosures, have chosen to invest in this fund, which is part of the Fidelity family of funds.
Annual Report
Nature, Extent, and Quality of Services Provided. The Board considered Fidelity's staffing as it relates to the fund, including the backgrounds of investment personnel of Fidelity, and also considered the fund's investment objective, strategies, and related investment philosophy. The Independent Trustees also had discussions with senior management of Fidelity's investment operations and investment groups. The Board considered the structure of the portfolio manager compensation program and whether this structure provides appropriate incentives to act in the best interests of the fund. Additionally, the Board considered the portfolio managers' investments, if any, in the funds that they manage.
Resources Dedicated to Investment Management and Support Services. The Board and the Fund Oversight and Research Committees reviewed the general qualifications and capabilities of Fidelity's investment staff, including its size, education, experience, and resources, as well as Fidelity's approach to recruiting, training, managing, and compensating investment personnel. The Board noted that Fidelity has continued to increase the resources devoted to non-U.S. offices, including expansion of Fidelity's global investment organization. The Board also noted that Fidelity's analysts have extensive resources, tools and capabilities that allow them to conduct sophisticated quantitative and fundamental analysis, as well as credit analysis of issuers, counterparties and guarantors. Further, the Board considered that Fidelity's investment professionals have sufficient access to global information and data so as to provide competitive investment results over time, and that those professionals also have access to sophisticated tools that permit them to assess portfolio construction and risk and performance attribution characteristics continuously, as well as to transmit new information and research conclusions rapidly around the world. Additionally, in its deliberations, the Board considered Fidelity's trading, risk management, and compliance capabilities and resources, which are integral parts of the investment management process.
Shareholder and Administrative Services. The Board considered (i) the nature, extent, quality, and cost of advisory, administrative, and shareholder services performed by FMR, the sub-advisers (together with FMR, the Investment Advisers), and their affiliates under the Advisory Contracts and under separate agreements covering transfer agency, pricing and bookkeeping, and securities lending services for the fund; (ii) the nature and extent of the supervision of third party service providers, principally custodians and subcustodians; and (iii) the resources devoted to, and the record of compliance with, the fund's compliance policies and procedures. The Board also reviewed the allocation of fund brokerage, including allocations to brokers affiliated with the Investment Advisers, the use of brokerage commissions to pay fund expenses, and the use of "soft" commission dollars to pay for research services.
Annual Report
Board Approval of Investment Advisory Contracts and
Management Fees - continued
The Board noted that the growth of fund assets over time across the complex allows Fidelity to reinvest in the development of services designed to enhance the value or convenience of the Fidelity funds as investment vehicles. These services include 24-hour access to account information and market information through telephone representatives and over the Internet, investor education materials and asset allocation tools, and the expanded availability of Fidelity Investor Centers.
In 2014, the Board formed an ad hoc Committee on Transfer Agency Fees to review the variety of transfer agency fee structures throughout the industry and Fidelity's competitive positioning with respect to industry participants.
Investment in a Large Fund Family. The Board considered the benefits to shareholders of investing in a Fidelity fund, including the benefits of investing in a fund that is part of a large family of funds offering a variety of investment disciplines and providing a large variety of mutual fund investor services. The Board noted that Fidelity had taken, or had made recommendations that resulted in the Fidelity funds taking, a number of actions over the previous year that benefited particular funds, including (i) continuing to dedicate additional resources to investment research and to the support of the senior management team that oversees asset management; (ii) continuing efforts to enhance Fidelity's global research capabilities; (iii) launching new funds and making other enhancements to meet client needs; (iv) reducing management fees and total expenses for certain index funds and diversified international funds; (v) continuing to launch dedicated lower cost underlying funds to meet portfolio construction needs related to expanding underlying fund options for Fidelity funds of funds, specifically for the Freedom Fund product lines; (vi) rationalizing product lines and gaining increased efficiencies through fund mergers; (vii) launching active fixed-income exchange-traded funds; (viii) continuing to develop, acquire and implement systems and technology to improve services to the funds and information security and to increase efficiency; (ix) implementing investment enhancements to further strengthen Fidelity's target date product line to increase investors' probability of success in achieving their goals; (x) modifying the eligibility criteria for certain share classes to accommodate roll-over assets from employer-sponsored retirement plans; (xi) launching a new Class W of the Freedom Index Funds to attract and retain Fidelity record-kept retirement plan assets; and (xii) implementing changes to Fidelity's money market product line in response to recent money market regulatory reforms.
Investment Performance. The Board considered whether the fund has operated in accordance with its investment objective, as well as its record of compliance with its investment restrictions and its performance history.
Annual Report
The Board took into account discussions with representatives of the Investment Advisers about fund investment performance that occur at Board meetings throughout the year. In this regard the Board noted that as part of regularly scheduled fund reviews and other reports to the Board on fund performance, the Board considers annualized return information for the fund, for different time periods, measured against a securities market index ("benchmark index") and a peer group of funds with similar objectives ("peer group"), if any. In its evaluation of fund investment performance, the Board gave particular attention to information indicating changes in performance of certain Fidelity funds for specific time periods and discussed with the Investment Advisers the reasons for any overperformance or underperformance.
In addition to reviewing absolute and relative fund performance, the Independent Trustees periodically consider the appropriateness of fund performance metrics in evaluating the results achieved. In general, the Independent Trustees believe that fund performance should be evaluated based on net performance (after fees and expenses) of both the highest performing and lowest performing fund share classes, where applicable, compared to appropriate benchmark indices, over appropriate time periods that may include full market cycles, and compared to peer groups, as applicable, over the same periods, taking into account relevant factors including the following: general market conditions; issuer-specific information; and fund cash flows and other factors.
The Independent Trustees recognize that shareholders evaluate performance on a net basis over their own holding periods, for which one-, three-, and five-year periods are often used as a proxy. For this reason, the performance information reviewed by the Board also included net cumulative calendar year total return information for the fund and an appropriate benchmark index and peer group for the most recent one-, three-, and five-year periods, as shown below. Returns are shown compared to the 25th percentile (top of box, 75% beaten) and 75th percentile (bottom of box, 25% beaten) of the peer universe.
Annual Report
Board Approval of Investment Advisory Contracts and
Management Fees - continued
Fidelity Value Discovery Fund
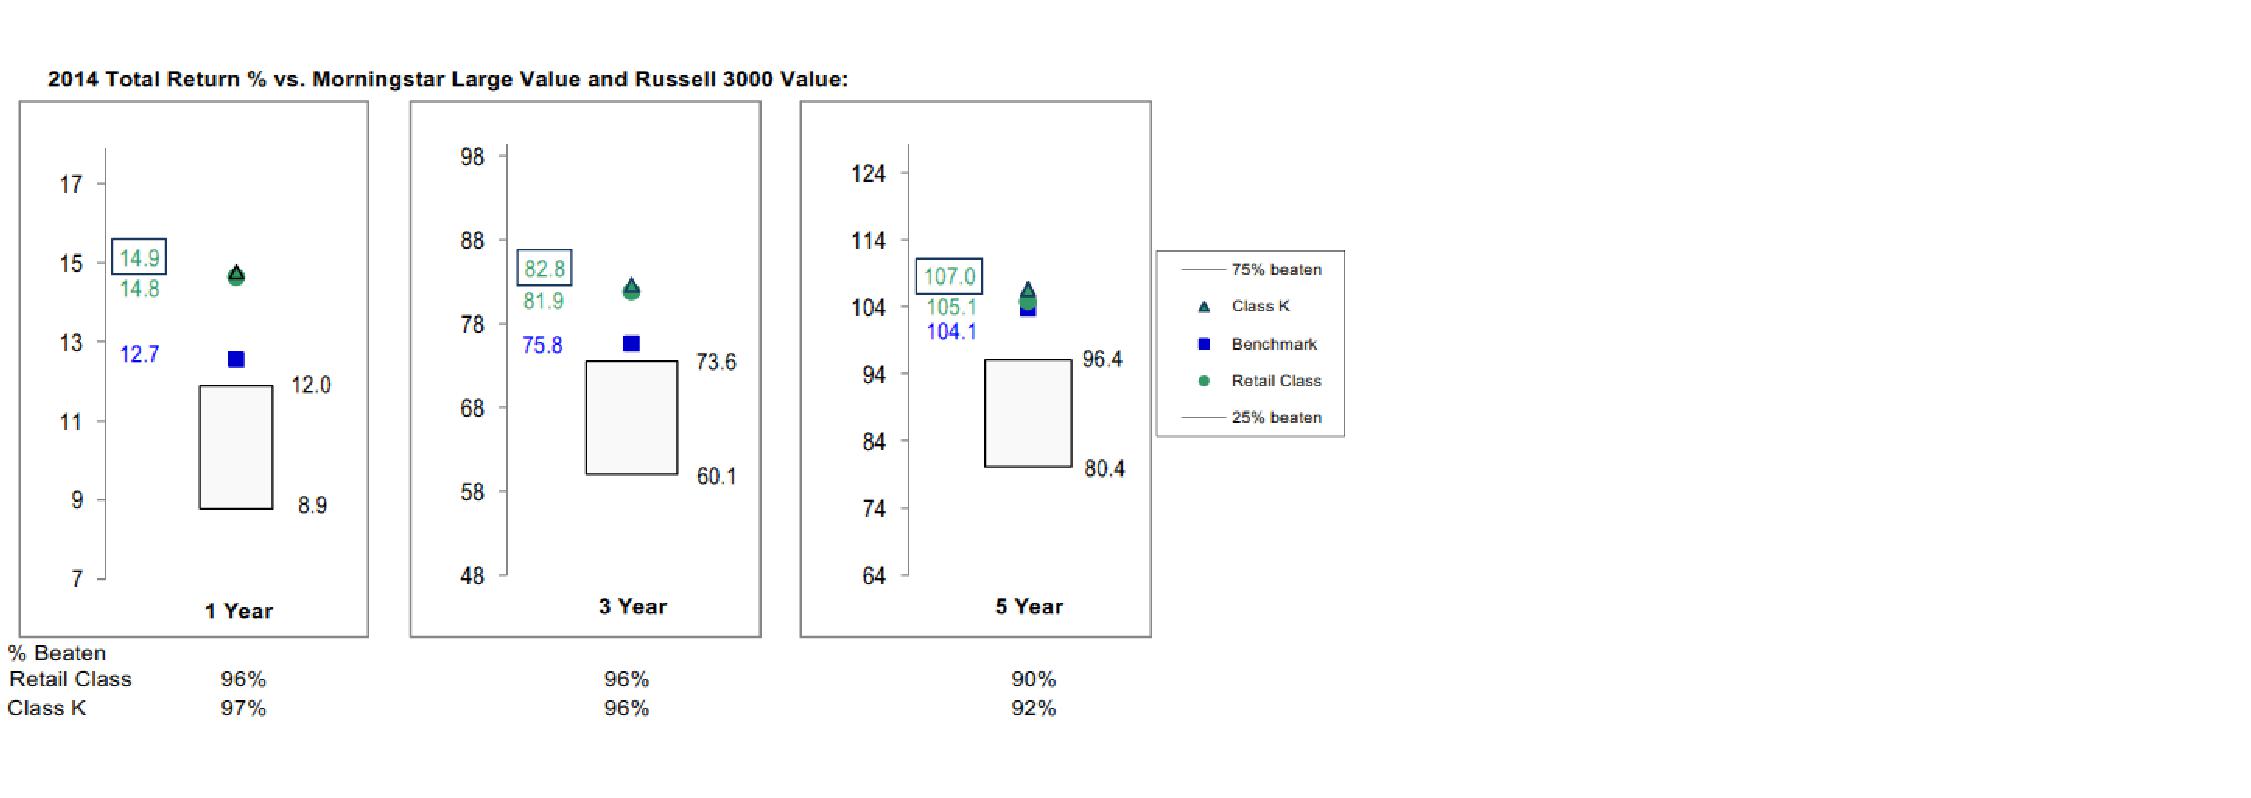
The Board also considered that the fund's management fee is subject to upward or downward adjustment depending upon whether, and to what extent, the fund's investment performance for the performance period exceeds, or is exceeded by, a securities index, thus leading to a performance adjustment for the same period. The Board noted that the performance adjustment provides FMR with a strong economic incentive to seek to achieve superior performance for the fund's shareholders and helps to more closely align the interests of FMR and the shareholders of the fund.
Based on its review, the Board concluded that the nature, extent, and quality of services provided to the fund under the Advisory Contracts should benefit the shareholders of the fund.
Competitiveness of Management Fee and Total Expense Ratio. The Board considered the fund's management fee and total expense ratio compared to "mapped groups" of competitive funds and classes created for the purpose of facilitating the Trustees' competitive analysis of management fees and total expenses. Fidelity creates "mapped groups" by combining similar Lipper investment objective categories that have comparable investment mandates. Combining Lipper investment objective categories aids the Board's management fee and total expense ratio comparisons by broadening the competitive group used for comparison.
Management Fee. The Board considered two proprietary management fee comparisons for the 12-month periods shown in basis points (BP) in the chart below. The group of Lipper funds used by the Board for management fee comparisons is referred to below as the "Total Mapped Group." The Total Mapped Group comparison focuses on a fund's standing in terms of gross management fees before expense reimbursements or caps, and without giving effect to the fund's performance adjustment, relative to the total universe of funds with comparable investment mandates, regardless of whether their management fee structures also are comparable. Funds with comparable investment mandates offer exposure to similar types of securities. Funds with comparable management fee structures have similar management fee contractual arrangements (e.g., flat rate charged for advisory services, all-inclusive fee rate, etc.). "TMG %" represents the percentage of funds in the Total Mapped Group that had management fees that were lower than the fund's. For example, a hypothetical TMG % of 20% would mean that 80% of the funds in the Total Mapped Group had higher, and 20% had lower, management fees than the fund. The fund's actual TMG %s and the number of funds in the Total Mapped Group are in the chart below. The "Asset-Size Peer Group" (ASPG) comparison focuses on a fund's standing relative to a subset of non-Fidelity funds within the Total Mapped Group that are similar in size and management fee structure without taking into account performance adjustments, if any. For example, if a fund is in the first quartile of the ASPG, the fund's management fee ranks in the least expensive or lowest 25% of funds in the ASPG. The ASPG represents at least 15% of the funds in the Total Mapped Group with comparable asset size and management fee structures, subject to a minimum of 50 funds (or all funds in the Total Mapped Group if fewer than 50). Additional information, such as the ASPG quartile in which the fund's management fee rate ranked and the impact of the fund's performance adjustment, is also included in the chart and considered by the Board.
Annual Report
Fidelity Value Discovery Fund
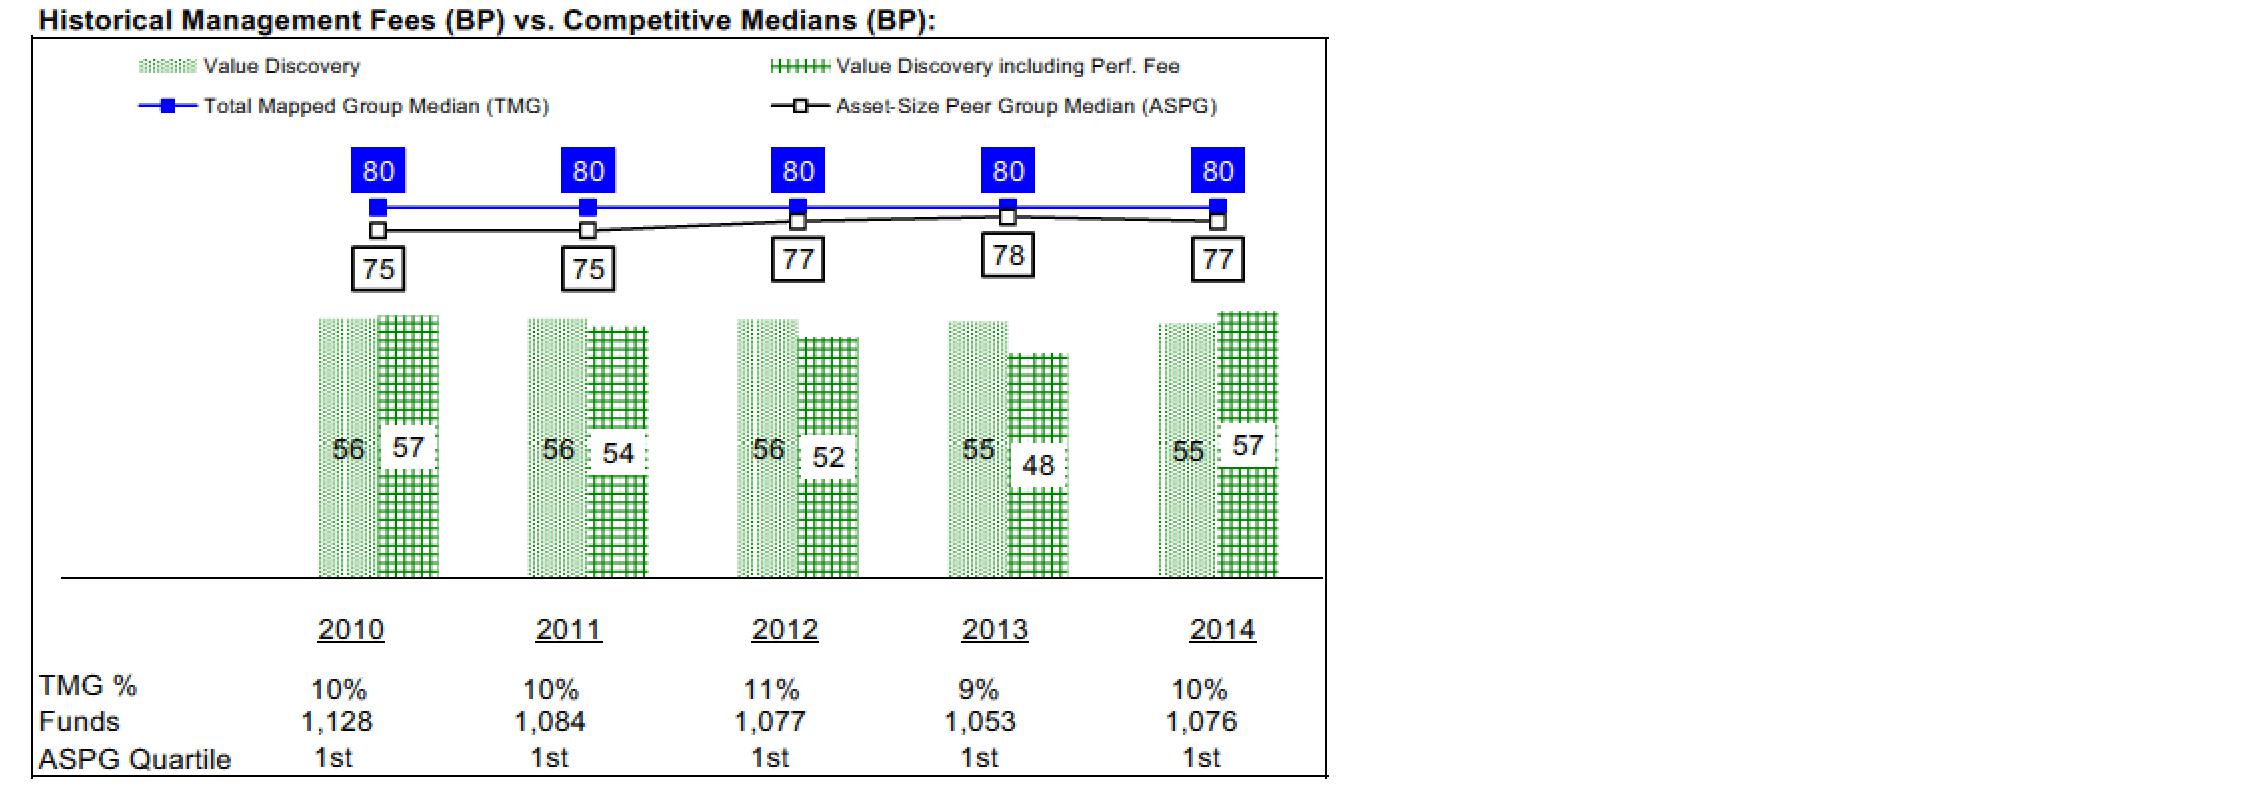
Annual Report
Board Approval of Investment Advisory Contracts and
Management Fees - continued
The Board noted that the fund's management fee rate ranked below the median of its Total Mapped Group and below the median of its ASPG for 2014. The Board also noted the effect of the fund's performance adjustment, if any, on the fund's management fee ranking.
The Board noted that, in 2014, the ad hoc Committee on Group Fee was formed by it and other Fidelity fund boards to conduct an in-depth review of the "group fee" component of the management fee of funds with such management fee structures. Committee focus included the mechanics of the group fee, the competitive landscape of group fee structures, Fidelity funds with no group fee component and investment products not included in group fee assets. The Board also considered that, for funds subject to the group fee, FMR agreed to voluntarily waive fees over a specified period of time in amounts designed to account for assets converted from certain funds to certain collective investment trusts.
The Board also noted that, in 2013, the ad hoc Committee on Management Fees was formed to conduct an in-depth review of the management fee rates of Fidelity's active equity mutual funds. The Committee focused on the following areas: (i) standard fee structures; (ii) research consumption and trading evolution; (iii) management fee competitiveness/profitability by category; and (iv) factors that drive institutional pricing.
Based on its review, the Board concluded that the fund's management fee is fair and reasonable in light of the services that the fund receives and the other factors considered.
Total Expense Ratio. In its review of each class's total expense ratio, the Board considered the fund's management fee as well as other fund or class expenses, as applicable, such as transfer agent fees, pricing and bookkeeping fees, and custodial, legal, and audit fees. The Board noted the impact of the fund's performance adjustment. The Board also noted that Fidelity may agree to waive fees and expenses from time to time, and the extent to which, if any, it has done so for the fund. As part of its review, the Board also considered the current and historical total expense ratios of each class of the fund compared to competitive fund median expenses. Each class of the fund is compared to those funds and classes in the Total Mapped Group (used by the Board for management fee comparisons) that have a similar sales load structure.
The Board noted that the total expense ratio of each class ranked below its competitive median for 2014.
Fees Charged to Other Fidelity Clients. The Board also considered Fidelity fee structures and other information with respect to clients of Fidelity, such as other funds advised or subadvised by Fidelity, pension plan clients, and other institutional clients with similar mandates. The Board noted the findings of the 2013 ad hoc joint committee (created with the board of other Fidelity funds), which reviewed and compared Fidelity's institutional investment advisory business with its business of providing services to the Fidelity funds, including the differences in services provided, fees charged, and costs incurred, as well as competition in their respective marketplaces.
Annual Report
Based on its review of total expense ratios and fees charged to other Fidelity clients, the Board concluded that the total expense ratio of each class of the fund was reasonable in light of the services that the fund and its shareholders receive and the other factors considered.
Costs of the Services and Profitability. The Board considered the revenues earned and the expenses incurred by Fidelity in conducting the business of developing, marketing, distributing, managing, administering and servicing the fund and servicing the fund's shareholders. The Board also considered the level of Fidelity's profits in respect of all the Fidelity funds.
On an annual basis, Fidelity presents to the Board information about the profitability of its relationship with the fund. Fidelity calculates profitability information for each fund, as well as aggregate profitability information for groups of Fidelity funds and all Fidelity funds, using a series of detailed revenue and cost allocation methodologies which originate with the books and records of Fidelity on which Fidelity's audited financial statements are based. The Audit Committee of the Board reviews any significant changes from the prior year's methodologies.
PricewaterhouseCoopers LLP (PwC), independent registered public accounting firm and auditor to Fidelity and certain Fidelity funds, has been engaged annually by the Board as part of the Board's assessment of Fidelity's profitability analysis. PwC's engagement includes the review and assessment of the methodologies used by Fidelity in determining the revenues and expenses attributable to Fidelity's mutual fund business, and completion of agreed-upon procedures in respect of the mathematical accuracy of fund profitability and its conformity to established allocation methodologies. After considering PwC's reports issued under the engagement and information provided by Fidelity, the Board concluded that while other allocation methods may also be reasonable, Fidelity's profitability methodologies are reasonable in all material respects.
The Board also reviewed Fidelity's non-fund businesses and fall-out benefits related to the mutual fund business as well as cases where Fidelity's affiliates may benefit from or be related to the fund's business.
The Board considered the costs of the services provided by and the profits realized by Fidelity in connection with the operation of the fund and was satisfied that the profitability was not excessive.
Economies of Scale. The Board considered whether there have been economies of scale in respect of the management of the Fidelity funds, whether the Fidelity funds (including the fund) have appropriately benefited from any such economies of scale, and whether there is potential for realization of any further economies of scale. The Board considered the extent to which the fund will benefit from economies of scale as assets grow through increased services to the fund, through waivers or reimbursements, or through fee or expense ratio reductions. The Board also noted that in 2013, it and the boards of other Fidelity funds created an ad hoc committee (the Economies of Scale Committee) to analyze whether Fidelity attains economies of scale in respect of the management and servicing of the Fidelity funds, whether the Fidelity funds have appropriately benefited from such economies of scale, and whether there is potential for realization of any further economies of scale.
Annual Report
Board Approval of Investment Advisory Contracts and
Management Fees - continued
The Board recognized that the fund's management contract incorporates a "group fee" structure, which provides for lower group fee rates as total group assets increase, and for higher group fee rates as total group assets decrease (with "group assets" defined to include fund assets under FMR's management plus sector fund assets previously under FMR's management and currently managed by Fidelity SelectCo, LLC). FMR calculates the group fee rates based on a tiered asset "breakpoint" schedule that varies based on asset class. The Board considered that the group fee is designed to deliver the benefits of economies of scale to fund shareholders when total Fidelity fund assets increase, even if assets of any particular fund are unchanged or have declined, because some portion of Fidelity's costs are attributable to services provided to all Fidelity funds, and all funds benefit if those costs can be allocated among more assets. The Board concluded that, given the group fee structure, fund shareholders will benefit from lower management fees as group assets increase at the fund complex level, regardless of whether Fidelity achieves any such economies of scale.
The Board concluded, taking into account the analysis of the Economies of Scale Committee, that economies of scale, if any, are being appropriately shared between fund shareholders and Fidelity.
Additional Information Requested by the Board. In order to develop fully the factual basis for consideration of the Fidelity funds' Advisory Contracts, the Board requested and received additional information on certain topics, including: (i) fund performance trends and Fidelity's long-term strategies for certain funds; (ii) the various share classes employed by Fidelity and the attributes of each class, together with similar information on the distribution and servicing payments made by Fidelity or the funds to third-party participants in the distribution channels; (iii) fund profitability, and fund performance in relation to fund profitability; (iv) the methodology with respect to evaluating competitive fund data and peer group classifications and fee comparisons; (v) annual fund profitability margins, with particular focus on certain funds with negative margins; (vi) the realization of fall-out benefits in certain Fidelity business units; (vii) economies of scale and the way in which they are shared with fund shareholders; (viii) Fidelity's group fee structures, including the group fee schedule of breakpoints; (ix) the impact of cost containment measures on the funds; and (x) the transfer agent fee structure.
Annual Report
Based on its evaluation of all of the conclusions noted above, and after considering all factors it believed relevant, the Board concluded that the advisory fee structures are fair and reasonable, and that the fund's Advisory Contracts should be renewed.
Annual Report
Investment Adviser
Fidelity Management & Research Company
Boston, MA
Investment Sub-Advisers
FMR Co., Inc.
FMR Investment Management
(U.K.) Limited
Fidelity Management & Research
(Hong Kong) Limited
Fidelity Management & Research
(Japan) Limited
General Distributor
Fidelity Distributors Corporation
Smithfield, RI
Transfer and Service Agents
Fidelity Investments Institutional
Operations Company, Inc.
Boston, MA
Fidelity Service Company, Inc.
Boston, MA
Custodian
Brown Brothers Harriman
Boston, MA
(Fidelity Investment logo)(registered trademark)
Corporate Headquarters
245 Summer St., Boston, MA 02210
www.fidelity.com
FVD-K-UANN-0915
1.863358.106
Fidelity®
Series Intrinsic Opportunities
Fund
Fidelity Series Intrinsic Opportunities
Fund
Class F
Annual Report
July 31, 2015
(Fidelity Cover Art)
Contents
Performance | (Click Here) | How the fund has done over time. |
Management's Discussion of Fund Performance | (Click Here) | The Portfolio Manager's review of fund performance and strategy. |
Shareholder Expense Example | (Click Here) | An example of shareholder expenses. |
Investment Changes | (Click Here) | A summary of major shifts in the fund's investments over the past six months. |
Investments | (Click Here) | A complete list of the fund's investments with their market values. |
Financial Statements | (Click Here) | Statements of assets and liabilities, operations, and changes in net assets, as well as financial highlights. |
Notes | (Click Here) | Notes to the financial statements. |
Report of Independent Registered Public Accounting Firm | (Click Here) | |
Trustees and Officers | (Click Here) | |
Distributions | (Click Here) | |
Board Approval of Investment Advisory Contracts and Management Fees | (Click Here) | |
To view a fund's proxy voting guidelines and proxy voting record for the 12-month period ended June 30, visit http://www.fidelity.com/proxyvotingresults or visit the Securities and Exchange Commission's (SEC) web site at http://www.sec.gov. You may also call 1-800-544-8544 for Fidelity® Series Intrinsic Opportunities Fund or 1-800-835-5092 for Class F of the fund to request a free copy of the proxy voting guidelines.
Standard & Poor's, S&P and S&P 500 are registered service marks of The McGraw-Hill Companies, Inc. and have been licensed for use by Fidelity Distributors Corporation.
Other third-party marks appearing herein are the property of their respective owners.
All other marks appearing herein are registered or unregistered trademarks or service marks of FMR LLC or an affiliated company. © 2015 FMR LLC. All rights reserved.
Annual Report
This report and the financial statements contained herein are submitted for the general information of the shareholders of the fund. This report is not authorized for distribution to prospective investors in the fund unless preceded or accompanied by an effective prospectus.
A fund files its complete schedule of portfolio holdings with the SEC for the first and third quarters of each fiscal year on Form N-Q. Forms N-Q are available on the SEC's web site at http://www.sec.gov. A fund's Forms N-Q may be reviewed and copied at the SEC's Public Reference Room in Washington, DC. Information regarding the operation of the SEC's Public Reference Room may be obtained by calling 1-800-SEC-0330. For a complete list of a fund's portfolio holdings, view the most recent holdings listing, semiannual report, or annual report on Fidelity's web site at http://www.fidelity.com, http://www.advisor.fidelity.com, or http://www.401k.com, as applicable.
NOT FDIC INSURED • MAY LOSE VALUE • NO BANK GUARANTEE
Neither the fund nor Fidelity Distributors Corporation is a bank.
Annual Report
Average annual total return reflects the change in the value of an investment, assuming reinvestment of the class' distributions from dividend income and capital gains (the profits earned upon the sale of securities that have grown in value, if any) and assuming a constant rate of performance each year. The $10,000 table and the fund's returns do not reflect the deduction of taxes that a shareholder would pay on fund distributions or the redemption of fund shares. During periods of reimbursement by Fidelity, a fund's total return will be greater than it would be had the reimbursement not occurred. How a fund did yesterday is no guarantee of how it will do tomorrow.
Average Annual Total Returns
Periods ended July 31, 2015 | Past 1
year | Life of
fund A |
Fidelity® Series Intrinsic Opportunities Fund | 12.35% | 21.52% |
Class F | 12.52% | 21.71% |
A From December 6, 2012.
$10,000 Over Life of Fund
Let's say hypothetically that $10,000 was invested in Fidelity ® Series Intrinsic Opportunities Fund, a class of the fund, on December 6, 2012, when the fund started. The chart shows how the value of your investment would have changed, and also shows how the Russell 3000® Index performed over the same period.
Annual Report
Market Recap: The U.S. equity market gained strongly for the 12 months ending July 31, 2015, as stocks recovered from volatility in late 2014 and early 2015, supported by a still-positive economic backdrop. The S&P 500® Index returned 11.21%, with growth stocks in the index far outpacing value-oriented names on prospects for continued U.S. economic growth. Consequently, the growth-oriented Nasdaq Composite Index® rose 18.71%, outpacing the broader S&P 500®, as well as the 12.03% advance of the smaller-cap Russell 2000® Index. Within the S&P 500®, seven of 10 sectors notched a gain, with significant performance variation. Health care (+27%) led the way, aided by merger activity. Consumer discretionary (+24%) benefited from spending linked to a seven-year low in unemployment. Strong first halves for the consumer staples sector and the real estate segment of financials yielded above-market returns (19% and 12%, respectively) for the full-year period. Conversely, energy (-26%) significantly lagged, due to a roughly 55% decline for U.S. crude-oil prices. Materials (-4%) also lost ground. At period end, investors remained focused on the slowing rate of U.S. earnings growth, the possible effect of a relatively stronger U.S. dollar on exports and inflation, and whether an economic slowdown in China would create ripples for the global economy.
Comments from Portfolio Manager Joel Tillinghast: For the year, the fund's share classes outperformed the 11.28% return of the benchmark Russell 3000® Index. (For specific class-level results, please see the Performance section of this report.) Relative results were boosted by positioning in health care - the best performing sector in the Russell index this period. Four of the five top relative contributors hailed from health care, which accounted for about 26% of the fund's assets, on average. Biotechnology firm United Therapeutics led the way, rising roughly 86% after an August 2014 court ruling halted a rival's release of a generic hypertension drug. Insurers UnitedHealth Group and Humana also contributed, along with home health care provider Amedisys. Stock picking in consumer staples also added value. Elsewhere, an underweighting in the weak energy sector and our emphasis on the strong retailing segment helped, but picks in both dampened overall results. The biggest detractor by far was coal-mining firm Peabody Energy, whose shares returned -92% amid lower demand for the commodity due to environmental regulations and fewer coal-fired plants. An overweighting in computer maker Hewlett-Packard also curbed results, as its share price fell on disappointing revenue, due partly to a stronger dollar. The fund's foreign holdings also detracted overall, hampered in part by a strong U.S. dollar.
The views expressed above reflect those of the portfolio manager(s) only through the end of the period as stated on the cover of this report and do not necessarily represent the views of Fidelity or any other person in the Fidelity organization. Any such views are subject to change at any time based upon market or other conditions and Fidelity disclaims any responsibility to update such views. These views may not be relied on as investment advice and, because investment decisions for a Fidelity fund are based on numerous factors, may not be relied on as an indication of trading intent on behalf of any Fidelity fund.
Annual Report
Shareholder Expense Example
As a shareholder of the Fund, you incur two types of costs: (1) transaction costs and (2) ongoing costs, including management fees and other Fund expenses. This Example is intended to help you understand your ongoing costs (in dollars) of investing in the Fund and to compare these costs with the ongoing costs of investing in other mutual funds.
The Example is based on an investment of $1,000 invested at the beginning of the period and held for the entire period (February 1, 2015 to July 31, 2015).
Actual Expenses
The first line of the accompanying table for each class of the Fund provides information about actual account values and actual expenses. You may use the information in this line, together with the amount you invested, to estimate the expenses that you paid over the period. Simply divide your account value by $1,000.00 (for example, an $8,600 account value divided by $1,000.00 = 8.6), then multiply the result by the number in the first line for a class of the Fund under the heading entitled "Expenses Paid During Period" to estimate the expenses you paid on your account during this period. In addition, the Fund, as a shareholder in the underlying Fidelity Central Funds, will indirectly bear its pro-rata share of the fees and expenses incurred by the underlying Fidelity Central Funds. These fees and expenses are not included in the Fund's annualized expense ratio used to calculate the expense estimate in the table below.
Hypothetical Example for Comparison Purposes
The second line of the accompanying table for each class of the Fund provides information about hypothetical account values and hypothetical expenses based on a Class' actual expense ratio and an assumed rate of return of 5% per year before expenses, which is not the Class' actual return. The hypothetical account values and expenses may not be used to estimate the actual ending account balance or expenses you paid for the period. You may use this information to compare the ongoing costs of investing in the Fund and other funds. To do so, compare this 5% hypothetical example with the 5% hypothetical examples that appear in the shareholder reports of the other funds. In addition, the Fund, as a shareholder in the underlying Fidelity Central Funds, will indirectly bear its pro-rata share of the fees and expenses incurred by the underlying Fidelity Central Funds. These fees and expenses are not included in the Fund's annualized expense ratio used to calculate the expense estimate in the table below.
Please note that the expenses shown in the table are meant to highlight your ongoing costs only and do not reflect any transaction costs. Therefore, the second line of the table is useful in comparing ongoing costs only, and will not help you determine the relative total costs of owning different funds.
Annual Report
Shareholder Expense Example - continued
| Annualized Expense RatioB | Beginning
Account Value
February 1, 2015 | Ending
Account Value
July 31, 2015 | Expenses Paid
During Period*
February 1, 2015
to July 31, 2015 |
Series Intrinsic Opportunities | .85% | | | |
Actual | | $ 1,000.00 | $ 1,103.40 | $ 4.43 |
HypotheticalA | | $ 1,000.00 | $ 1,020.58 | $ 4.26 |
Class F | .69% | | | |
Actual | | $ 1,000.00 | $ 1,104.00 | $ 3.60 |
HypotheticalA | | $ 1,000.00 | $ 1,021.37 | $ 3.46 |
A 5% return per year before expenses
B Annualized expense ratio reflects expenses net of applicable fee waivers.
* Expenses are equal to each Class' annualized expense ratio, multiplied by the average account value over the period, multiplied by 181/365 (to reflect the one-half year period).
Annual Report
Investment Changes (Unaudited)
Top Ten Stocks as of July 31, 2015 |
| % of fund's
net assets | % of fund's net assets
6 months ago |
Anthem, Inc. | 6.6 | 6.2 |
UnitedHealth Group, Inc. | 4.6 | 4.8 |
The Western Union Co. | 4.5 | 4.0 |
United Therapeutics Corp. | 3.3 | 3.2 |
Hewlett-Packard Co. | 3.2 | 4.1 |
Nitori Holdings Co. Ltd. | 3.0 | 2.4 |
Best Buy Co., Inc. | 3.0 | 3.7 |
Aetna, Inc. | 2.2 | 1.9 |
AFLAC, Inc. | 2.2 | 1.7 |
Dun & Bradstreet Corp. | 2.0 | 1.9 |
| 34.6 | |
Top Five Market Sectors as of July 31, 2015 |
| % of fund's
net assets | % of fund's net assets
6 months ago |
Health Care | 27.3 | 26.8 |
Consumer Discretionary | 25.8 | 25.5 |
Information Technology | 16.5 | 18.8 |
Financials | 8.6 | 8.0 |
Industrials | 7.5 | 7.7 |
Asset Allocation (% of fund's net assets) |
As of July 31, 2015* | As of January 31, 2015** |
 | Stocks 98.2% | |  | Stocks 99.0% | |
 | Other Investments 0.3% | |  | Other Investments 0.4% | |
 | Short-Term
Investments and
Net Other Assets (Liabilities) 1.5% | |  | Short-Term
Investments and
Net Other Assets (Liabilities) 0.6% | |
* Foreign investments | 43.2% | | ** Foreign investments | 41.1% | |

Annual Report
Investments July 31, 2015
Showing Percentage of Net Assets
Common Stocks - 98.1% |
| Shares | | Value |
CONSUMER DISCRETIONARY - 25.8% |
Auto Components - 3.3% |
Cooper Tire & Rubber Co. | 300,000 | | $ 9,879,000 |
G-Tekt Corp. (f) | 2,250,000 | | 20,859,725 |
Gentex Corp. | 50,000 | | 804,000 |
Harada Industries Co. Ltd. | 200,000 | | 458,305 |
Hyundai Mobis | 460,000 | | 84,225,241 |
IJT Technology Holdings Co. Ltd. | 1,100,000 | | 4,393,432 |
INFAC Corp. | 221,129 | | 1,098,021 |
Kinugawa Rubber Industrial Co. Ltd. | 550,000 | | 3,031,024 |
Piolax, Inc. | 308,000 | | 15,880,260 |
Seoyeon Co. Ltd. | 685,725 | | 7,233,386 |
Seoyon Co. Ltd. | 314,275 | | 3,193,852 |
TBK Co. Ltd. (f) | 1,800,000 | | 8,278,533 |
TPR Co. Ltd. | 650,000 | | 19,064,429 |
Yorozu Corp. (e)(f) | 1,500,000 | | 30,996,087 |
| | 209,395,295 |
Automobiles - 0.3% |
Audi AG | 21,000 | | 19,327,004 |
Distributors - 0.8% |
Chori Co. Ltd. (f) | 1,300,000 | | 20,076,653 |
Doshisha Co. Ltd. | 500,000 | | 9,279,058 |
Nakayamafuku Co. Ltd. | 150,000 | | 1,055,392 |
Uni-Select, Inc. | 300,000 | | 13,490,079 |
Yagi & Co. Ltd. | 300,000 | | 4,030,338 |
| | 47,931,520 |
Diversified Consumer Services - 0.6% |
Heian Ceremony Service Co. Ltd. (e) | 100,000 | | 583,370 |
Lincoln Educational Services Corp. | 25,000 | | 36,750 |
MegaStudy Co. Ltd. (f) | 362,315 | | 11,310,303 |
MegaStudyEdu Co. Ltd. (a)(f) | 209,684 | | 13,289,122 |
Step Co. Ltd. | 217,000 | | 1,873,482 |
Strayer Education, Inc. (a) | 5,000 | | 278,050 |
Tsukada Global Holdings, Inc. | 1,050,000 | | 6,633,719 |
Weight Watchers International, Inc. (a)(e) | 1,150,000 | | 4,600,000 |
| | 38,604,796 |
Hotels, Restaurants & Leisure - 0.7% |
Del Frisco's Restaurant Group, Inc. (a) | 25,000 | | 398,750 |
Fairwood Holdings Ltd. | 1,000,000 | | 2,960,412 |
Hiday Hidaka Corp. | 180,000 | | 4,386,170 |
Hiramatsu, Inc. | 25,000 | | 159,156 |
Koshidaka Holdings Co. Ltd. | 350,000 | | 7,865,010 |
Common Stocks - continued |
| Shares | | Value |
CONSUMER DISCRETIONARY - continued |
Hotels, Restaurants & Leisure - continued |
Kura Corp. Ltd. | 150,000 | | $ 4,623,391 |
Ohsho Food Service Corp. | 350,000 | | 11,748,094 |
Toridoll.corporation | 900,000 | | 12,926,131 |
| | 45,067,114 |
Household Durables - 1.6% |
Ace Bed Co. Ltd. | 40,029 | | 5,317,564 |
Desarrolladora Homex S.A.B. de CV sponsored ADR (a) | 1,100,000 | | 220,110 |
FJ Next Co. Ltd. (e) | 1,050,000 | | 5,184,976 |
Fuji Corp. Ltd. (e) | 50,000 | | 281,196 |
Helen of Troy Ltd. (a) | 710,400 | | 62,358,912 |
Iida Group Holdings Co. Ltd. | 500,000 | | 8,778,795 |
Q.E.P. Co., Inc. (a) | 34,998 | | 612,115 |
SABAF SpA | 400,000 | | 5,535,180 |
Sanei Architecture Planning Co. Ltd. | 660,000 | | 7,727,115 |
Sanyo Housing Nagoya Co. Ltd. | 700,000 | | 6,421,915 |
| | 102,437,878 |
Internet & Catalog Retail - 0.0% |
N Brown Group PLC | 100,000 | | 497,229 |
Trade Maine Group Ltd. | 50,000 | | 111,887 |
Webjet Ltd. | 100,000 | | 303,344 |
| | 912,460 |
Leisure Products - 0.2% |
Accell Group NV | 701,944 | | 15,379,655 |
Media - 0.9% |
Avex Group Holdings, Inc. | 10,000 | | 168,153 |
Cheil Worldwide, Inc. (a) | 50,000 | | 819,011 |
Crown Media Holdings, Inc. Class A (a) | 50,000 | | 223,500 |
Daiichikosho Co. Ltd. | 5,000 | | 196,676 |
Gendai Agency, Inc. (f) | 850,000 | | 4,732,319 |
Hyundai HCN | 1,053,349 | | 3,658,591 |
Ipsos SA | 10,000 | | 250,730 |
ITE Group PLC | 200,000 | | 576,249 |
Liberty LiLac Group Class A (a) | 6,871 | | 293,804 |
Omnicom Group, Inc. | 50,000 | | 3,654,000 |
Pico Far East Holdings Ltd. | 8,000,000 | | 2,363,170 |
Proto Corp. (e) | 125,000 | | 1,956,671 |
SMG PLC | 10,000 | | 74,491 |
Starz Series A (a) | 700,000 | | 28,315,000 |
Television Broadcasts Ltd. | 1,800,000 | | 9,519,755 |
Tribune Media Co. Class A | 25,000 | | 1,262,250 |
Common Stocks - continued |
| Shares | | Value |
CONSUMER DISCRETIONARY - continued |
Media - continued |
Tribune Publishing Co. | 6,250 | | $ 93,063 |
Weborama (a) | 10,000 | | 98,843 |
| | 58,256,276 |
Multiline Retail - 1.1% |
Grazziotin SA | 50,000 | | 204,296 |
Gwangju Shinsegae Co. Ltd. (f) | 96,902 | | 26,593,119 |
Hanwha Galleria Timeworld Co. Ltd. | 255,000 | | 32,803,334 |
Lifestyle International Holdings Ltd. | 2,251,500 | | 3,665,226 |
Macy's, Inc. | 5,000 | | 345,300 |
Treasure Factory Co. Ltd. | 450,000 | | 5,384,677 |
Watts Co. Ltd. | 448,800 | | 3,776,967 |
| | 72,772,919 |
Specialty Retail - 14.5% |
Adastria Co. Ltd. | 502,700 | | 24,296,389 |
Arc Land Sakamoto Co. Ltd. | 200,000 | | 4,849,316 |
Asahi Co. Ltd. | 40,000 | | 479,284 |
AT-Group Co. Ltd. | 469,000 | | 10,028,241 |
Bed Bath & Beyond, Inc. (a) | 1,850,000 | | 120,675,500 |
Best Buy Co., Inc. | 5,900,000 | | 190,511,000 |
DCM Japan Holdings Co. Ltd. | 5,000 | | 45,588 |
Folli Follie SA | 325,000 | | 8,091,248 |
Formosa Optical Technology Co. Ltd. | 227,000 | | 516,235 |
Fuji Corp. (f) | 595,990 | | 10,353,544 |
Goldlion Holdings Ltd. | 195,000 | | 86,529 |
Guess?, Inc. (e) | 3,300,000 | | 72,237,000 |
Handsman Co. Ltd. | 250,000 | | 6,029,370 |
Hibbett Sports, Inc. (a) | 15,000 | | 683,250 |
Hour Glass Ltd. | 9,045,300 | | 5,736,349 |
IA Group Corp. | 112,000 | | 726,574 |
JB Hi-Fi Ltd. (e) | 625,000 | | 8,821,653 |
John David Group PLC | 7,100,000 | | 89,256,106 |
Jumbo SA | 1,750,000 | | 12,705,729 |
K's Denki Corp. (e) | 1,300,000 | | 41,380,562 |
Ku Holdings Co. Ltd. (e) | 500,000 | | 3,187,155 |
Leon's Furniture Ltd. | 22,500 | | 252,896 |
Mandarake, Inc. (e) | 180,000 | | 1,077,662 |
Mr. Bricolage SA | 311,600 | | 4,561,722 |
Nafco Co. Ltd. | 640,400 | | 10,644,483 |
Nitori Holdings Co. Ltd. | 2,150,000 | | 193,081,051 |
Nojima Co. Ltd. | 50,000 | | 564,812 |
Common Stocks - continued |
| Shares | | Value |
CONSUMER DISCRETIONARY - continued |
Specialty Retail - continued |
Oriental Watch Holdings Ltd. | 6,000,000 | | $ 913,277 |
Outerwall, Inc. (e) | 25,000 | | 1,770,500 |
Padini Holdings Bhd | 1,500,000 | | 526,316 |
RONA, Inc. | 1,000,000 | | 11,721,528 |
Sacs Bar Holdings, Inc. | 30,000 | | 560,132 |
Samse SA | 35,000 | | 4,574,211 |
Shimamura Co. Ltd. | 5,000 | | 516,400 |
Silvano Fashion Group A/S | 9,800 | | 13,666 |
Staples, Inc. | 5,650,000 | | 83,111,500 |
Super Retail Group Ltd. | 200,000 | | 1,349,334 |
The Buckle, Inc. | 10,000 | | 442,300 |
Tokatsu Holdings Co. Ltd. | 150,000 | | 416,347 |
Truworths International Ltd. | 100,000 | | 676,271 |
United Arrows Ltd. | 5,000 | | 199,701 |
| | 927,670,731 |
Textiles, Apparel & Luxury Goods - 1.8% |
Belle International Holdings Ltd. | 100,000 | | 103,969 |
Best Pacific International Holdings Ltd. | 1,500,000 | | 743,005 |
Coach, Inc. | 1,325,000 | | 41,340,000 |
Fossil Group, Inc. (a) | 150,000 | | 10,312,500 |
Geox SpA (a)(e) | 7,000,000 | | 28,444,675 |
Gerry Weber International AG (Bearer) (e) | 89,225 | | 2,197,946 |
Magni-Tech Industries Bhd | 100,000 | | 113,642 |
Michael Kors Holdings Ltd. (a) | 100,000 | | 4,199,000 |
Movado Group, Inc. | 5,000 | | 126,650 |
Portico International Holdings (a) | 12,000,000 | | 5,882,125 |
Sitoy Group Holdings Ltd. | 2,000,000 | | 1,070,650 |
Swatch Group AG (Bearer) | 1,000 | | 430,612 |
Texwinca Holdings Ltd. | 1,800,000 | | 2,177,934 |
Van de Velde | 100,000 | | 6,225,979 |
Youngone Holdings Co. Ltd. | 30,000 | | 2,261,500 |
Yue Yuen Industrial (Holdings) Ltd. | 3,000,000 | | 9,751,945 |
| | 115,382,132 |
TOTAL CONSUMER DISCRETIONARY | | 1,653,137,780 |
CONSUMER STAPLES - 6.1% |
Beverages - 0.6% |
C&C Group PLC | 300,000 | | 1,168,977 |
Common Stocks - continued |
| Shares | | Value |
CONSUMER STAPLES - continued |
Beverages - continued |
Jinro Distillers Co. Ltd. | 350,000 | | $ 13,057,013 |
Kweichow Moutai Co. Ltd. | 6,500 | | 216,497 |
Lucas Bols BV | 60,000 | | 1,120,215 |
Muhak Co. Ltd. (a) | 338,382 | | 15,554,591 |
Yantai Changyu Pioneer Wine Co. Ltd. (B Shares) | 1,099,961 | | 3,561,397 |
| | 34,678,690 |
Food & Staples Retailing - 2.9% |
Ain Pharmaciez, Inc. | 500,000 | | 23,762,456 |
Amsterdam Commodities NV | 525,000 | | 13,549,659 |
Create SD Holdings Co. Ltd. | 310,000 | | 18,859,886 |
Dong Suh Companies, Inc. | 928,317 | | 33,118,921 |
Genky Stores, Inc. (e) | 106,700 | | 13,258,402 |
Halows Co. Ltd. | 63,700 | | 1,067,535 |
Majestic Wine PLC | 500,000 | | 3,396,589 |
MARR SpA | 850,000 | | 15,739,021 |
Retail Partners Co. Ltd. (e) | 443,700 | | 4,260,322 |
San-A Co. Ltd. | 200,000 | | 10,376,407 |
Sapporo Drug Store Co. Ltd. (e)(f) | 400,000 | | 5,780,449 |
Tesco PLC | 11,500,000 | | 38,673,813 |
Woolworths Ltd. | 5,000 | | 104,526 |
Yaoko Co. Ltd. | 100,000 | | 4,946,141 |
| | 186,894,127 |
Food Products - 1.5% |
Ajinomoto Malaysia Bhd | 1,531,100 | | 2,545,820 |
Astral Foods Ltd. | 100,000 | | 1,319,342 |
Blue Buffalo Pet Products, Inc. | 25,000 | | 698,500 |
Cranswick PLC | 749,981 | | 19,324,929 |
Dairy Crest Group PLC | 10,000 | | 90,263 |
Fresh Del Monte Produce, Inc. | 1,199,900 | | 47,420,048 |
Kaveri Seed Co. Ltd. | 10,000 | | 116,396 |
Kawan Food Bhd | 150,000 | | 109,191 |
Lassonde Industries, Inc. Class A (sub. vtg.) | 50,000 | | 5,352,296 |
London Biscuits Bhd (a) | 2,000,000 | | 429,432 |
London Biscuits Bhd warrants (a) | 400,000 | | 25,137 |
Pickles Corp. | 50,000 | | 484,528 |
President Bakery PCL | 16,500 | | 20,754 |
Prima Meat Packers Ltd. | 100,000 | | 328,398 |
Saputo, Inc. | 5,000 | | 114,577 |
Select Harvests Ltd. | 1,250,000 | | 12,051,538 |
Synear Food Holdings Ltd. (a) | 1,000,000 | | 7 |
Common Stocks - continued |
| Shares | | Value |
CONSUMER STAPLES - continued |
Food Products - continued |
TER Beke SA | 5,000 | | $ 438,916 |
Toyo Sugar Refining Co. Ltd. | 1,200,000 | | 1,200,629 |
| | 92,070,701 |
Personal Products - 1.1% |
Cyanotech Corp. (a)(e) | 10,000 | | 80,800 |
Herbalife Ltd. (a) | 5,000 | | 252,450 |
Natura Cosmeticos SA | 10,000 | | 74,359 |
Sarantis SA | 1,200,000 | | 9,350,342 |
USANA Health Sciences, Inc. (a) | 500,000 | | 62,325,000 |
| | 72,082,951 |
Tobacco - 0.0% |
Universal Corp. | 25,000 | | 1,426,250 |
TOTAL CONSUMER STAPLES | | 387,152,719 |
ENERGY - 3.9% |
Energy Equipment & Services - 1.4% |
AKITA Drilling Ltd. Class A (non-vtg.) | 250,000 | | 1,768,169 |
Atwood Oceanics, Inc. | 250,000 | | 5,200,000 |
Boustead Singapore Ltd. | 4,199,997 | | 3,673,868 |
Fugro NV (Certificaten Van Aandelen) (a) | 140,000 | | 2,932,877 |
Geospace Technologies Corp. (a)(e) | 580,000 | | 10,115,200 |
Gulfmark Offshore, Inc. Class A (e) | 497,300 | | 4,684,566 |
National Oilwell Varco, Inc. | 100,000 | | 4,213,000 |
Noble Corp. (e) | 1,350,000 | | 16,132,500 |
Oceaneering International, Inc. | 280,000 | | 11,205,600 |
Oil States International, Inc. (a) | 500,000 | | 15,055,000 |
Paragon Offshore PLC (e) | 1,000,000 | | 745,000 |
RPC, Inc. (e) | 25,000 | | 307,500 |
Shinko Plantech Co. Ltd. | 1,700,000 | | 14,032,356 |
| | 90,065,636 |
Oil, Gas & Consumable Fuels - 2.5% |
Alvopetro Energy Ltd. (a) | 2,900,000 | | 776,083 |
Bonavista Energy Corp. (e) | 50,000 | | 187,330 |
Denbury Resources, Inc. (e) | 1,300,000 | | 5,122,000 |
Eni SpA | 3,800,000 | | 66,502,327 |
Fuji Kosan Co. Ltd. | 105,000 | | 475,289 |
Motor Oil (HELLAS) Corinth Refineries SA | 300,000 | | 2,724,288 |
Newfield Exploration Co. (a) | 1,000,000 | | 32,790,000 |
Nordic American Tanker Shipping Ltd. (e) | 750,000 | | 11,265,000 |
Common Stocks - continued |
| Shares | | Value |
ENERGY - continued |
Oil, Gas & Consumable Fuels - continued |
Peabody Energy Corp. (e) | 5,500,000 | | $ 6,600,000 |
Petronet LNG Ltd. (a) | 100,000 | | 302,087 |
San-Ai Oil Co. Ltd. | 200,000 | | 1,395,893 |
Swift Energy Co. (a)(e) | 1,700,000 | | 1,243,040 |
Tsakos Energy Navigation Ltd. | 650,000 | | 5,928,000 |
Ultra Petroleum Corp. (a)(e) | 1,900,000 | | 14,782,000 |
W&T Offshore, Inc. (e) | 2,650,000 | | 9,990,500 |
| | 160,083,837 |
TOTAL ENERGY | | 250,149,473 |
FINANCIALS - 8.3% |
Banks - 0.1% |
Central Valley Community Bancorp | 25,000 | | 283,250 |
Citizens Financial Services, Inc. | 12,000 | | 580,200 |
Erste Group Bank AG (a) | 5,000 | | 149,856 |
F Van Lanschot Bankiers NV (Certificaten Van Aandelen) unit | 5,000 | | 136,183 |
Gree Electric Applicances, Inc. ELS (BNP Paribas Arbitrage Warrant Program) warrants 12/10/15 (g) | 325,000 | | 1,167,640 |
Merchants Bancshares, Inc. | 10,000 | | 316,000 |
Prosperity Bancshares, Inc. | 15,000 | | 818,850 |
Spar Nord Bank A/S | 10,000 | | 117,736 |
| | 3,569,715 |
Capital Markets - 1.1% |
ABG Sundal Collier ASA | 1,000,000 | | 918,167 |
Edify SA (a) | 10,068 | | 557,171 |
Goldman Sachs Group, Inc. | 300,000 | | 61,521,000 |
MLP AG | 2,340,000 | | 10,742,203 |
| | 73,738,541 |
Consumer Finance - 0.1% |
Discover Financial Services | 25,000 | | 1,395,250 |
EZCORP, Inc. (non-vtg.) Class A (a) | 200,000 | | 1,418,000 |
Synchrony Financial | 100,000 | | 3,436,000 |
| | 6,249,250 |
Diversified Financial Services - 1.2% |
Century Tokyo Leasing Corp. | 650,000 | | 22,053,899 |
Fuyo General Lease Co. Ltd. | 375,000 | | 15,734,054 |
Common Stocks - continued |
| Shares | | Value |
FINANCIALS - continued |
Diversified Financial Services - continued |
NICE Information Service Co. Ltd. | 200,000 | | $ 2,101,129 |
Ricoh Leasing Co. Ltd. | 1,070,000 | | 34,102,554 |
| | 73,991,636 |
Insurance - 5.4% |
AFLAC, Inc. | 2,175,000 | | 139,308,750 |
Amlin PLC | 100,000 | | 797,222 |
AmTrust Financial Services, Inc. | 5,000 | | 347,550 |
April | 1,129,000 | | 15,251,068 |
Assurant, Inc. | 300,000 | | 22,380,000 |
Delta Lloyd NV | 50,000 | | 887,661 |
Dongbu Insurance Co. Ltd. | 750,000 | | 35,697,746 |
MetLife, Inc. | 1,600,000 | | 89,184,000 |
NN Group NV | 1,400,000 | | 43,197,467 |
The Chubb Corp. | 5,000 | | 621,650 |
| | 347,673,114 |
Real Estate Management & Development - 0.2% |
Lai Sun Garment (International) Ltd. | 1,010,956 | | 133,015 |
Leopalace21 Corp. (a) | 500,000 | | 2,735,305 |
Nisshin Fudosan Co. Ltd. (f) | 2,600,000 | | 8,957,921 |
Tai Cheung Holdings Ltd. | 100,000 | | 88,103 |
| | 11,914,344 |
Thrifts & Mortgage Finance - 0.2% |
ASAX Co. Ltd. | 100,000 | | 1,311,978 |
Genworth MI Canada, Inc. | 25,000 | | 591,620 |
Genworth Mortgage Insurance Ltd. (e) | 4,000,000 | | 10,467,204 |
Hingham Institution for Savings | 10,100 | | 1,222,201 |
| | 13,593,003 |
TOTAL FINANCIALS | | 530,729,603 |
HEALTH CARE - 27.3% |
Biotechnology - 3.6% |
Baxalta, Inc. | 50,000 | | 1,641,500 |
Gilead Sciences, Inc. | 125,000 | | 14,732,500 |
United Therapeutics Corp. (a) | 1,250,000 | | 211,700,000 |
| | 228,074,000 |
Health Care Equipment & Supplies - 0.6% |
Audika SA (f) | 500,000 | | 9,692,056 |
Fukuda Denshi Co. Ltd. | 138,700 | | 7,296,760 |
Common Stocks - continued |
| Shares | | Value |
HEALTH CARE - continued |
Health Care Equipment & Supplies - continued |
Medikit Co. Ltd. | 10,000 | | $ 315,488 |
Nakanishi, Inc. | 250,000 | | 9,964,901 |
Paramount Bed Holdings Co. Ltd. | 35,000 | | 1,046,315 |
St.Shine Optical Co. Ltd. | 515,000 | | 6,685,565 |
TaiDoc Technology Corp. | 100,000 | | 218,572 |
| | 35,219,657 |
Health Care Providers & Services - 19.3% |
Aetna, Inc. | 1,250,000 | | 141,212,500 |
Almost Family, Inc. (a) | 286,000 | | 12,515,360 |
Amedisys, Inc. (a)(f) | 2,750,000 | | 119,982,500 |
Anthem, Inc. | 2,750,000 | | 424,242,507 |
Chemed Corp. (e) | 475,000 | | 70,518,500 |
EBOS Group Ltd. | 484,577 | | 3,486,575 |
Humana, Inc. | 625,000 | | 113,806,250 |
LHC Group, Inc. (a) | 250,000 | | 10,072,500 |
Lifco AB | 127,900 | | 2,493,729 |
Life Healthcare Group Ltd. | 10,000 | | 25,803 |
Magellan Health Services, Inc. (a) | 200,000 | | 12,118,000 |
National Healthcare Corp. | 27,300 | | 1,725,360 |
Pelion SA | 317,200 | | 5,885,535 |
Quest Diagnostics, Inc. | 300,000 | | 22,143,000 |
Uchiyama Holdings Co. Ltd. (e) | 600,000 | | 2,469,036 |
UnitedHealth Group, Inc. | 2,400,000 | | 291,360,000 |
| | 1,234,057,155 |
Health Care Technology - 0.1% |
Cegedim SA (a) | 25,000 | | 1,097,975 |
Computer Programs & Systems, Inc. (e) | 5,000 | | 233,850 |
Pharmagest Interactive | 55,000 | | 6,922,270 |
| | 8,254,095 |
Pharmaceuticals - 3.7% |
AbbVie, Inc. | 1,300,000 | | 91,013,000 |
Apex Healthcare Bhd | 200,000 | | 227,808 |
AstraZeneca PLC sponsored ADR | 2,200,000 | | 74,338,000 |
Biofermin Pharmaceutical Co. Ltd. | 17,412 | | 421,479 |
Bliss Gvs Pharma Ltd. (a) | 100,000 | | 304,822 |
Genomma Lab Internacional SA de CV (a) | 1,000,000 | | 927,851 |
Indivior PLC | 2,500,000 | | 10,299,082 |
Kwang Dong Pharmaceutical Co. Ltd. | 2,400,000 | | 29,844,602 |
Nippon Chemiphar Co. Ltd. | 100,000 | | 604,349 |
Common Stocks - continued |
| Shares | | Value |
HEALTH CARE - continued |
Pharmaceuticals - continued |
PT Tempo Scan Pacific Tbk | 100,000 | | $ 14,526 |
Recordati SpA | 350,000 | | 8,721,752 |
Stallergenes | 101,776 | | 6,422,620 |
Towa Pharmaceutical Co. Ltd. | 10,000 | | 765,724 |
Tsumura & Co. (e) | 650,000 | | 13,646,670 |
| | 237,552,285 |
TOTAL HEALTH CARE | | 1,743,157,192 |
INDUSTRIALS - 7.5% |
Aerospace & Defense - 0.0% |
Kongsberg Gruppen ASA | 10,000 | | 167,106 |
Air Freight & Logistics - 0.3% |
AIT Corp. (e) | 800,000 | | 7,081,131 |
Atlas Air Worldwide Holdings, Inc. (a) | 200,000 | | 9,830,000 |
CTI Logistics Ltd. | 206,153 | | 195,894 |
Onelogix Group Ltd. | 3,100,000 | | 1,188,514 |
SBS Co. Ltd. | 150,000 | | 1,275,669 |
| | 19,571,208 |
Airlines - 0.0% |
Copa Holdings SA Class A | 5,000 | | 377,650 |
Building Products - 0.0% |
InnoTec TSS AG | 25,000 | | 314,511 |
Nihon Dengi Co. Ltd. | 150,000 | | 1,452,374 |
Noda Corp. | 100,000 | | 302,578 |
Sekisui Jushi Corp. | 61,500 | | 835,151 |
| | 2,904,614 |
Commercial Services & Supplies - 0.6% |
Asia File Corp. Bhd | 3,525,600 | | 3,166,485 |
Civeo Corp. | 2,100,000 | | 4,494,000 |
Credit Corp. Group Ltd. | 50,000 | | 493,391 |
Fursys, Inc. | 200,000 | | 5,977,496 |
Matsuda Sangyo Co. Ltd. | 150,000 | | 1,740,428 |
Mitie Group PLC | 3,200,000 | | 16,091,242 |
Moleskine SpA (e) | 500,000 | | 877,502 |
Nippon Kanzai Co. Ltd. | 10,000 | | 247,710 |
Prestige International, Inc. | 905,700 | | 8,192,114 |
| | 41,280,368 |
Common Stocks - continued |
| Shares | | Value |
INDUSTRIALS - continued |
Construction & Engineering - 0.5% |
AECOM Technology Corp. (a) | 199,979 | | $ 6,165,353 |
Ausdrill Ltd. (e) | 8,400,000 | | 1,841,994 |
Boart Longyear Ltd. (a) | 3,959,600 | | 332,841 |
Boustead Projects Pte Ltd. (a) | 1,215,269 | | 766,270 |
Daiichi Kensetsu Corp. | 275,000 | | 2,915,641 |
Heijmans NV (Certificaten Van Aandelen) (a) | 250,000 | | 3,061,372 |
Jacobs Engineering Group, Inc. (a) | 5,000 | | 210,600 |
Joban Kaihatsu Co. Ltd. | 25,000 | | 96,825 |
Meisei Industrial Co. Ltd. | 100,000 | | 488,966 |
Nippon Rietec Co. Ltd. | 599,800 | | 4,186,283 |
Sedgman Ltd. | 2,000,000 | | 1,125,663 |
Vianini Lavori SpA | 1,500,000 | | 11,926,995 |
| | 33,118,803 |
Electrical Equipment - 0.4% |
Aros Quality Group AB (e) | 853,205 | | 11,868,270 |
GrafTech International Ltd. (a) | 999,951 | | 5,029,754 |
Hammond Power Solutions, Inc. Class A | 450,000 | | 2,511,756 |
Somfy SA | 10,068 | | 3,140,239 |
| | 22,550,019 |
Industrial Conglomerates - 0.0% |
Reunert Ltd. | 300,000 | | 1,501,156 |
Machinery - 1.2% |
Austal Ltd. | 100,000 | | 144,728 |
Daihatsu Diesel Manufacturing Co. Ltd. (e)(f) | 3,184,000 | | 19,679,219 |
Daiwa Industries Ltd. | 900,000 | | 5,925,687 |
Fujimak Corp. | 175,000 | | 1,193,166 |
Global Brass & Copper Holdings, Inc. | 435,298 | | 7,334,771 |
Haitian International Holdings Ltd. | 37,000 | | 76,651 |
Hitachi Zosen Fukui Corp. | 10,000 | | 109,574 |
Hy-Lok Corp. | 75,000 | | 2,151,513 |
Ihara Science Corp. | 142,900 | | 1,153,024 |
Jaya Holdings Ltd. | 23,150,000 | | 624,376 |
Koike Sanso Kogyo Co. Ltd. | 100,000 | | 319,522 |
Kokusai Co. Ltd. | 10,000 | | 146,448 |
Luxfer Holdings PLC sponsored ADR | 5,000 | | 65,100 |
Metka SA | 250,000 | | 1,988,080 |
Mitsuboshi Belting Ltd. | 25,000 | | 199,096 |
Nakano Refrigerators Co. Ltd. (e) | 10,000 | | 289,265 |
Samyoung M-Tek Co. Ltd. (f) | 1,050,000 | | 3,255,249 |
Sansei Co. Ltd. (f) | 500,000 | | 855,287 |
Common Stocks - continued |
| Shares | | Value |
INDUSTRIALS - continued |
Machinery - continued |
Semperit AG Holding | 110,000 | | $ 4,568,336 |
SIMPAC, Inc. (f) | 2,325,000 | | 12,162,962 |
Teikoku Sen-I Co. Ltd. | 800,000 | | 11,386,614 |
Tocalo Co. Ltd. | 100,000 | | 2,055,110 |
Zuiko Corp. (e) | 10,000 | | 371,969 |
| | 76,055,747 |
Marine - 0.1% |
Golden Ocean Group Ltd. (e) | 1,350,000 | | 5,251,500 |
Professional Services - 3.1% |
Akka Technologies SA (f) | 1,051,406 | | 34,987,611 |
CBIZ, Inc. (a)(f) | 2,900,000 | | 28,420,000 |
Dun & Bradstreet Corp. | 1,000,000 | | 124,770,000 |
Exova Group Ltd. PLC | 498,200 | | 1,309,009 |
Harvey Nash Group PLC | 300,000 | | 486,064 |
McMillan Shakespeare Ltd. | 138,784 | | 1,445,579 |
VSE Corp. | 120,000 | | 5,688,000 |
| | 197,106,263 |
Road & Rail - 0.6% |
Autohellas SA (a) | 596,174 | | 7,389,160 |
Daqin Railway Co. Ltd. (A Shares) | 11,999,941 | | 19,749,490 |
Hamakyorex Co. Ltd. | 46,000 | | 1,764,877 |
Higashi Twenty One Co. Ltd. | 100,000 | | 371,162 |
Tohbu Network Co. Ltd. | 125,000 | | 1,160,891 |
Utoc Corp. | 1,200,000 | | 5,344,737 |
| | 35,780,317 |
Trading Companies & Distributors - 0.7% |
AerCap Holdings NV (a) | 300,000 | | 14,052,000 |
Bergman & Beving AB (B Shares) | 525,000 | | 7,820,152 |
Canox Corp. | 420,000 | | 1,233,550 |
Green Cross Co. Ltd. | 50,000 | | 576,915 |
HERIGE | 60,000 | | 1,765,986 |
Kamei Corp. | 565,800 | | 5,295,744 |
Meiwa Corp. | 400,000 | | 1,287,772 |
Mitani Shoji Co. Ltd. | 475,000 | | 12,436,963 |
Shinsho Corp. | 300,000 | | 670,513 |
Yuasa Trading Co. Ltd. | 25,000 | | 589,624 |
| | 45,729,219 |
TOTAL INDUSTRIALS | | 481,393,970 |
Common Stocks - continued |
| Shares | | Value |
INFORMATION TECHNOLOGY - 16.5% |
Communications Equipment - 2.1% |
Cisco Systems, Inc. | 2,000,000 | | $ 56,840,000 |
HF Co. (f) | 225,000 | | 2,347,509 |
NETGEAR, Inc. (a) | 1,500,000 | | 50,235,000 |
QUALCOMM, Inc. | 350,000 | | 22,536,500 |
| | 131,959,009 |
Electronic Equipment & Components - 1.8% |
Daido Signal Co. Ltd. | 50,000 | | 151,289 |
Elematec Corp. | 400,000 | | 9,330,698 |
Ingram Micro, Inc. Class A | 375,000 | | 10,211,250 |
Insight Enterprises, Inc. (a) | 1,100,000 | | 29,689,000 |
Intelligent Digital Integrated Security Co. Ltd. | 129,285 | | 2,112,174 |
Lacroix SA (f) | 372,493 | | 9,388,626 |
Macnica Fuji Electronics Holdings, Inc. | 2,520,000 | | 31,211,522 |
Multi-Fineline Electronix, Inc. (a) | 200,000 | | 3,572,000 |
Redington India Ltd. (a) | 500,000 | | 921,264 |
Riken Kieki Co. Ltd. | 500,000 | | 5,865,978 |
Shibaura Electronics Co. Ltd. | 233,200 | | 3,667,300 |
Simplo Technology Co. Ltd. | 100,000 | | 410,613 |
VST Holdings Ltd. | 20,985,400 | | 7,173,524 |
| | 113,705,238 |
Internet Software & Services - 0.3% |
AuFeminin.com SA (a) | 104,604 | | 2,998,403 |
DeNA Co. Ltd. | 350,000 | | 6,961,310 |
F@N Communications, Inc. (e) | 25,000 | | 190,221 |
GMO Pepabo, Inc. (e)(f) | 147,300 | | 6,762,714 |
Zappallas, Inc. (f) | 1,100,000 | | 5,280,994 |
| | 22,193,642 |
IT Services - 7.8% |
Amdocs Ltd. | 1,500,000 | | 87,975,000 |
Bit-isle, Inc. | 100,000 | | 382,459 |
Calian Technologies Ltd. | 300,900 | | 4,339,163 |
Cognizant Technology Solutions Corp. Class A (a) | 10,000 | | 631,000 |
Data#3 Ltd. | 358,301 | | 248,805 |
DOCdata NV (e) | 65,000 | | 1,417,731 |
eClerx Services Ltd. | 100,000 | | 2,320,740 |
Econocom Group SA | 75,000 | | 694,369 |
Estore Corp. | 240,000 | | 2,358,656 |
ManTech International Corp. Class A | 600,000 | | 17,886,000 |
Neurones | 10,000 | | 179,015 |
Nice Information & Telecom, Inc. | 100,000 | | 3,460,430 |
Common Stocks - continued |
| Shares | | Value |
INFORMATION TECHNOLOGY - continued |
IT Services - continued |
Persistent Systems Ltd. | 100,000 | | $ 1,039,410 |
Shinsegae Information & Communication Co. Ltd. | 53,749 | | 8,158,874 |
Societe Pour L'Informatique Industrielle SA | 180,500 | | 1,466,933 |
Sopra Steria Group | 570,000 | | 54,462,218 |
Syntel, Inc. (a) | 5,000 | | 218,450 |
Tessi SA (f) | 199,798 | | 21,697,056 |
The Western Union Co. | 14,200,000 | | 287,408,000 |
TravelSky Technology Ltd. (H Shares) | 350,000 | | 423,036 |
Wipro Ltd. | 300,000 | | 2,672,426 |
| | 499,439,771 |
Semiconductors & Semiconductor Equipment - 0.3% |
Alpha & Omega Semiconductor Ltd. (a) | 900,000 | | 7,065,000 |
e-LITECOM Co. Ltd. | 50,000 | | 806,147 |
MagnaChip Semiconductor Corp. (a) | 208,100 | | 1,781,336 |
Miraial Co. Ltd. (e)(f) | 631,900 | | 6,495,668 |
| | 16,148,151 |
Software - 0.4% |
CEGID SA | 50,000 | | 2,161,356 |
Ebix, Inc. (e) | 357,700 | | 11,085,123 |
Globo PLC (a)(e) | 500,000 | | 304,522 |
InfoVine Co. Ltd. | 63,600 | | 1,854,482 |
Justplanning, Inc. | 20,000 | | 140,396 |
KPIT Cummins Infosystems Ltd. (a) | 500,000 | | 862,659 |
KSK Co., Ltd. | 121,900 | | 1,085,872 |
Oracle Corp. | 150,000 | | 5,991,000 |
Uchida Esco Co. Ltd. (f) | 295,900 | | 2,936,676 |
Vitec Software Group AB | 20,000 | | 697,829 |
| | 27,119,915 |
Technology Hardware, Storage & Peripherals - 3.8% |
Hewlett-Packard Co. | 6,800,000 | | 207,536,000 |
Lexmark International, Inc. Class A | 350,000 | | 11,896,500 |
Seagate Technology LLC | 450,000 | | 22,770,000 |
TPV Technology Ltd. | 25,000,000 | | 4,256,801 |
| | 246,459,301 |
TOTAL INFORMATION TECHNOLOGY | | 1,057,025,027 |
Common Stocks - continued |
| Shares | | Value |
MATERIALS - 1.7% |
Chemicals - 1.1% |
C. Uyemura & Co. Ltd. | 100,000 | | $ 5,317,303 |
Chugoku Marine Paints Ltd. | 350,000 | | 2,536,007 |
Daishin-Chemical Co. Ltd. | 150,000 | | 1,161,899 |
Fuso Chemical Co. Ltd. | 500,000 | | 6,216,969 |
Hannong Chemicals, Inc. (f) | 1,288,000 | | 4,578,539 |
Huabao International Holdings Ltd. | 1,250,000 | | 607,884 |
Kimoto Co. Ltd. (e) | 25,000 | | 58,700 |
Robertet SA | 1,000 | | 246,019 |
Scientex Bhd | 1,020,000 | | 1,896,308 |
Soda Aromatic Co. Ltd. | 100,000 | | 858,515 |
T&K Toka Co. Ltd. | 75,000 | | 1,388,228 |
Tae Kyung Industrial Co. Ltd. | 900,000 | | 4,847,175 |
Toho Acetylene Co. Ltd. | 200,000 | | 340,501 |
Yara International ASA | 850,000 | | 42,310,353 |
| | 72,364,400 |
Construction Materials - 0.1% |
Buzzi Unicem SpA | 150,000 | | 2,561,668 |
Mitani Sekisan Co. Ltd. | 274,900 | | 3,919,380 |
| | 6,481,048 |
Containers & Packaging - 0.0% |
Chuoh Pack Industry Co. Ltd. | 12,000 | | 125,485 |
Owens-Illinois, Inc. (a) | 5,000 | | 106,750 |
| | 232,235 |
Metals & Mining - 0.5% |
Compania de Minas Buenaventura SA sponsored ADR | 350,000 | | 2,492,000 |
Handy & Harman Ltd. (a) | 5,000 | | 148,000 |
Nippon Steel & Sumitomo Metal Corp. | 525,000 | | 1,241,598 |
Pacific Metals Co. Ltd. (a)(e) | 7,000,000 | | 21,236,939 |
Sherritt International Corp. | 1,800,000 | | 1,844,248 |
Tokyo Kohtetsu Co. Ltd. | 307,900 | | 986,294 |
| | 27,949,079 |
TOTAL MATERIALS | | 107,026,762 |
UTILITIES - 1.0% |
Electric Utilities - 0.0% |
Public Power Corp. of Greece | 25,000 | | 114,175 |
Gas Utilities - 1.0% |
GAIL India Ltd. | 6,350,000 | | 35,224,190 |
Common Stocks - continued |
| Shares | | Value |
UTILITIES - continued |
Gas Utilities - continued |
Hokuriku Gas Co. | 100,000 | | $ 235,607 |
K&O Energy Group, Inc. | 200,000 | | 2,870,860 |
Kyungnam Energy Co. Ltd. | 1,500,000 | | 9,004,837 |
Seoul City Gas Co. Ltd. | 75,000 | | 8,844,036 |
YESCO Co. Ltd. | 235,000 | | 8,313,394 |
| | 64,492,924 |
Independent Power and Renewable Electricity Producers - 0.0% |
8Point3 Energy Partners LP | 20,000 | | 318,400 |
Talen Energy Corp. (a) | 25,000 | | 393,250 |
| | 711,650 |
Water Utilities - 0.0% |
Manila Water Co., Inc. | 200,000 | | 109,250 |
TOTAL UTILITIES | | 65,427,999 |
TOTAL COMMON STOCKS (Cost $4,780,234,695) |
6,275,200,525
|
Nonconvertible Preferred Stocks - 0.1% |
| | | |
INDUSTRIALS - 0.0% |
Machinery - 0.0% |
Danieli & C. Officine Meccaniche SpA | 10,000 | | 157,819 |
MATERIALS - 0.1% |
Construction Materials - 0.1% |
Buzzi Unicem SpA (Risparmio Shares) | 550,000 | | 5,738,356 |
TOTAL NONCONVERTIBLE PREFERRED STOCKS (Cost $4,509,708) |
5,896,175
|
Preferred Securities - 0.3% |
| Principal Amount (d) | | |
FINANCIALS - 0.3% |
Diversified Financial Services - 0.3% |
Baggot Securities Ltd. 10.24% (g)(h) (Cost $27,257,357) | EUR | 17,587,000 | |
20,790,935
|
Money Market Funds - 4.3% |
| Shares | | Value |
Fidelity Cash Central Fund, 0.17% (b) | 85,939,222 | | $ 85,939,222 |
Fidelity Securities Lending Cash Central Fund, 0.18% (b)(c) | 187,122,749 | | 187,122,749 |
TOTAL MONEY MARKET FUNDS (Cost $273,061,971) |
273,061,971
|
TOTAL INVESTMENT PORTFOLIO - 102.8% (Cost $5,085,063,731) | | 6,574,949,606 |
NET OTHER ASSETS (LIABILITIES) - (2.8)% | | (176,916,093) |
NET ASSETS - 100% | $ 6,398,033,513 |
Currency Abbreviations |
EUR | - | European Monetary Unit |
Security Type Abbreviations |
ELS | - | Equity-Linked Security |
Legend |
(a) Non-income producing |
(b) Affiliated fund that is generally available only to investment companies and other accounts managed by Fidelity Investments. The rate quoted is the annualized seven-day yield of the fund at period end. A complete unaudited listing of the fund's holdings as of its most recent quarter end is available upon request. In addition, each Fidelity Central Fund's financial statements, which are not covered by the Fund's Report of Independent Registered Public Accounting Firm, are available on the SEC's website or upon request. |
(c) Investment made with cash collateral received from securities on loan. |
(d) Amount is stated in United States dollars unless otherwise noted. |
(e) Security or a portion of the security is on loan at period end. |
(f) Affiliated company |
(g) Security exempt from registration under Rule 144A of the Securities Act of 1933. These securities may be resold in transactions exempt from registration, normally to qualified institutional buyers. At the end of the period, the value of these securities amounted to $21,958,575 or 0.3% of net assets. |
(h) Security is perpetual in nature with no stated maturity date. |
Affiliated Central Funds |
Information regarding fiscal year to date income earned by the Fund from investments in Fidelity Central Funds is as follows: |
Fund | Income earned |
Fidelity Cash Central Fund | $ 71,181 |
Fidelity Securities Lending Cash Central Fund | 8,049,018 |
Total | $ 8,120,199 |
Other Affiliated Issuers |
An affiliated company is a company in which the Fund has ownership of at least 5% of the voting securities. Fiscal year to date transactions with companies which are or were affiliates are as follows: |
Affiliate | Value,
beginning of
period | Purchases | Sales
Proceeds | Dividend
Income | Value,
end of
period |
Akka Technologies SA | $ 33,341,294 | $ - | $ - | $ 495,442 | $ 34,987,611 |
Amedisys, Inc. | 58,865,060 | - | 6,272,047 | - | 119,982,500 |
Audika SA | 8,815,716 | 26,246 | - | 119,737 | 9,692,056 |
CBIZ, Inc. | 23,664,000 | 45,994 | 49,252 | - | 28,420,000 |
Chori Co. Ltd. | 11,373,099 | 5,817,270 | - | 321,145 | 20,076,653 |
Daihatsu Diesel Manufacturing Co. Ltd. | 20,031,545 | - | - | 192,476 | 19,679,219 |
Emori Group Holdings Co. Ltd. | 10,070,289 | 1,164,269 | 1,778,742 | 102,932 | - |
Fuji Corp. | 7,145,883 | - | - | 96,899 | 10,353,544 |
G-Tekt Corp. | 15,433,957 | 7,580,459 | - | 352,365 | 20,859,725 |
Gendai Agency, Inc. | 5,268,500 | 292,704 | - | 195,159 | 4,732,319 |
GMO Pepabo, Inc. | 2,464,798 | 355,065 | 125,427 | 65,564 | 6,762,714 |
Gwangju Shinsegae Co. Ltd. | 18,115,139 | 6,192,306 | - | 81,325 | 26,593,119 |
Hannong Chemicals, Inc. | 5,219,952 | - | - | 87,909 | 4,578,539 |
HF Co. | 2,467,534 | - | - | 140,932 | 2,347,509 |
Lacroix SA | 10,524,742 | 617,503 | - | 223,729 | 9,388,626 |
Macnica, Inc. | 35,289,211 | - | - | 509,258 | - |
MegaStudy Co. Ltd. | 33,391,212 | - | - | 26,992,763 | 11,310,303 |
MegaStudyEdu Co. Ltd. | - | 26,160,359 | - | - | 13,289,122 |
Miraial Co. Ltd. | 10,637,992 | - | - | 94,286 | 6,495,668 |
Nisshin Fudosan Co. Ltd. | 9,951,367 | 395,509 | - | 117,879 | 8,957,921 |
Samyoung M-Tek Co. Ltd. | 3,541,780 | - | - | 22,517 | 3,255,249 |
Sansei Co. Ltd. | 930,984 | - | - | 26,447 | 855,287 |
Sapporo Drug Store Co. Ltd. | 7,094,927 | - | - | 92,953 | 5,780,449 |
SIMPAC, Inc. | 16,188,533 | - | - | 141,085 | 12,162,962 |
TBK Co. Ltd. | 9,118,281 | - | - | 227,390 | 8,278,533 |
Tessi SA | 26,647,095 | - | 21,811 | 378,666 | 21,697,056 |
Treasure Factory Co. Ltd. | 4,717,743 | - | 1,589,704 | 34,071 | - |
Uchida Esco Co. Ltd. | 1,694,979 | 935,291 | - | 61,557 | 2,936,676 |
Yorozu Corp. | 23,381,400 | 6,680,849 | - | 568,493 | 30,996,087 |
Zappallas, Inc. | 6,656,813 | - | - | 83,124 | 5,280,994 |
Total | $ 422,043,825 | $ 56,263,824 | $ 9,836,983 | $ 31,826,103 | $ 449,750,441 |
Other Information |
The following is a summary of the inputs used, as of July 31, 2015, involving the Fund's assets and liabilities carried at fair value. The inputs or methodology used for valuing securities may not be an indication of the risk associated with investing in those securities. For more information on valuation inputs, and their aggregation into the levels used in the table below, please refer to the Investment Valuation section in the accompanying Notes to Financial Statements. |
Valuation Inputs at Reporting Date: |
Description | Total | Level 1 | Level 2 | Level 3 |
Investments in Securities: | | | | |
Equities: | | | | |
Consumer Discretionary | $ 1,653,137,780 | $ 1,632,340,803 | $ - | $ 20,796,977 |
Consumer Staples | 387,152,719 | 339,128,557 | 38,673,813 | 9,350,349 |
Energy | 250,149,473 | 180,922,858 | 66,502,327 | 2,724,288 |
Financials | 530,729,603 | 529,561,963 | 1,167,640 | - |
Health Care | 1,743,157,192 | 1,743,157,192 | - | - |
Industrials | 481,551,789 | 472,174,549 | - | 9,377,240 |
Information Technology | 1,057,025,027 | 1,054,352,601 | 2,672,426 | - |
Materials | 112,765,118 | 112,765,118 | - | - |
Utilities | 65,427,999 | 65,313,824 | - | 114,175 |
Preferred Securities | 20,790,935 | - | 20,790,935 | - |
Money Market Funds | 273,061,971 | 273,061,971 | - | - |
Total Investments in Securities: | $ 6,574,949,606 | $ 6,402,779,436 | $ 129,807,141 | $ 42,363,029 |
The following is a summary of transfers between Level 1 and Level 2 for the period ended July 31, 2015. Transfers are assumed to have occurred at the beginning of the period, and are primarily attributable to the valuation techniques used for foreign equity securities, as discussed in the accompanying Notes to Financial Statements: |
Transfers | Total |
Level 1 to Level 2 | $ 0 |
Level 2 to Level 1 | $ 1,264,485,571 |
Valuation Inputs at Reporting Date: |
The following is a reconciliation of Investments in Securities for which Level 3 inputs were used in determining value: |
Investments in Securities: | |
Beginning Balance | $ 20,809,709 |
Net Realized Gain (Loss) on Investment Securities | (5,553,005) |
Net Unrealized Gain (Loss) on Investment Securities | (19,404,893) |
Cost of Purchases | 1,742,187 |
Proceeds of Sales | - |
Amortization/Accretion | - |
Transfers into Level 3 | 65,342,961 |
Transfers out of Level 3 | (20,573,930) |
Ending Balance | $ 42,363,029 |
The change in unrealized gain (loss) for the period attributable to Level 3 securities held at July 31, 2015 | $ (24,722,127) |
The information used in the above reconciliations represents fiscal year to date activity for any Investments in Securities identified as using Level 3 inputs at either the beginning or the end of the current fiscal period. Transfers into Level 3 were attributable to a lack of observable market data resulting from decreases in market activity, decreases in liquidity, security restructurings or corporate actions. Transfers out of Level 3 were attributable to observable market data becoming available for those securities. Transfers in or out of Level 3 represent the beginning value of any Security or Instrument where a change in the pricing level occurred from the beginning to the end of the period. The cost of purchases and the proceeds of sales may include securities received or delivered through corporate actions or exchanges. Realized and unrealized gains (losses) disclosed in the reconciliation are included in Net Gain (Loss) on the Fund's Statement of Operations. |
Distribution of investments by country or territory of incorporation, as a percentage of total net assets, is as follows (Unaudited): |
United States of America | 56.8% |
Japan | 15.6% |
Korea (South) | 6.3% |
United Kingdom | 4.2% |
France | 2.9% |
Italy | 2.1% |
Bermuda | 1.9% |
Netherlands | 1.5% |
Bailiwick of Guernsey | 1.4% |
Others (Individually Less Than 1%) | 7.3% |
| 100.0% |
See accompanying notes which are an integral part of the financial statements.
Annual Report
Statement of Assets and Liabilities
| | July 31, 2015 |
| | |
Assets | | |
Investment in securities, at value (including securities loaned of $176,870,497) - See accompanying schedule: Unaffiliated issuers (cost $4,437,876,972) | $ 5,852,137,194 | |
Fidelity Central Funds (cost $273,061,971) | 273,061,971 | |
Other affiliated issuers (cost $374,124,788) | 449,750,441 | |
Total Investments (cost $5,085,063,731) | | $ 6,574,949,606 |
Cash | | 1,070,228 |
Foreign currency held at value (cost $1,545,675) | | 1,545,675 |
Receivable for investments sold | | 20,137,894 |
Receivable for fund shares sold | | 1,143,918 |
Dividends receivable | | 3,881,336 |
Distributions receivable from Fidelity Central Funds | | 457,587 |
Other receivables | | 36,958 |
Total assets | | 6,603,223,202 |
| | |
Liabilities | | |
Payable for investments purchased | $ 13,963,851 | |
Accrued management fee | 3,518,798 | |
Other affiliated payables | 444,939 | |
Other payables and accrued expenses | 139,352 | |
Collateral on securities loaned, at value | 187,122,749 | |
Total liabilities | | 205,189,689 |
| | |
Net Assets | | $ 6,398,033,513 |
Net Assets consist of: | | |
Paid in capital | | $ 4,619,316,740 |
Undistributed net investment income | | 70,191,467 |
Accumulated undistributed net realized gain (loss) on investments and foreign currency transactions | | 218,705,375 |
Net unrealized appreciation (depreciation) on investments and assets and liabilities in foreign currencies | | 1,489,819,931 |
Net Assets | | $ 6,398,033,513 |
See accompanying notes which are an integral part of the financial statements.
Annual Report
Financial Statements - continued
Statement of Assets and Liabilities - continued
| | July 31, 2015 |
| | |
Series Intrinsic Opportunities:
Net Asset Value, offering price and redemption price per share ($2,619,363,222 ÷ 168,111,634 shares) | | $ 15.58 |
| | |
Class F:
Net Asset Value, offering price and redemption price per share ($3,778,670,291 ÷ 242,152,346 shares) | | $ 15.60 |
See accompanying notes which are an integral part of the financial statements.
Annual Report
Statement of Operations
| Year ended July 31, 2015 |
| | |
Investment Income | | |
Dividends (including $31,826,103 earned from other affiliated issuers) | | $ 116,639,039 |
Special dividends | | 26,160,359 |
Interest | | 269,272 |
Income from Fidelity Central Funds (including $8,049,018 from security lending) | | 8,120,199 |
Total income | | 151,188,869 |
| | |
Expenses | | |
Management fee | | |
Basic fee | $ 34,325,709 | |
Performance adjustment | 5,167,077 | |
Transfer agent fees | 4,204,112 | |
Accounting and security lending fees | 1,189,958 | |
Custodian fees and expenses | 451,901 | |
Independent trustees' compensation | 26,099 | |
Registration fees | (12,074) | |
Audit | 90,784 | |
Legal | 14,582 | |
Interest | 5,431 | |
Miscellaneous | 38,801 | |
Total expenses before reductions | 45,502,380 | |
Expense reductions | (164,966) | 45,337,414 |
Net investment income (loss) | | 105,851,455 |
Realized and Unrealized Gain (Loss) Net realized gain (loss) on: | | |
Investment securities: | | |
Unaffiliated issuers | 270,959,983 | |
Other affiliated issuers | (3,299,302) | |
Foreign currency transactions | (1,202,261) | |
Total net realized gain (loss) | | 266,458,420 |
Change in net unrealized appreciation (depreciation) on: Investment securities (net of decrease in deferred foreign taxes of $341,523) | 365,270,946 | |
Assets and liabilities in foreign currencies | (45,501) | |
Total change in net unrealized appreciation (depreciation) | | 365,225,445 |
Net gain (loss) | | 631,683,865 |
Net increase (decrease) in net assets resulting from operations | | $ 737,535,320 |
See accompanying notes which are an integral part of the financial statements.
Annual Report
Financial Statements - continued
Statement of Changes in Net Assets
| Year ended
July 31,
2015 | Year ended
July 31,
2014 |
Increase (Decrease) in Net Assets | | |
Operations | | |
Net investment income (loss) | $ 105,851,455 | $ 89,757,443 |
Net realized gain (loss) | 266,458,420 | 165,693,862 |
Change in net unrealized appreciation (depreciation) | 365,225,445 | 546,994,529 |
Net increase (decrease) in net assets resulting from operations | 737,535,320 | 802,445,834 |
Distributions to shareholders from net investment income | (92,830,534) | (61,872,801) |
Distributions to shareholders from net realized gain | (174,368,638) | (79,158,464) |
Total distributions | (267,199,172) | (141,031,265) |
Share transactions - net increase (decrease) | (27,470,226) | 812,348,626 |
Total increase (decrease) in net assets | 442,865,922 | 1,473,763,195 |
| | |
Net Assets | | |
Beginning of period | 5,955,167,591 | 4,481,404,396 |
End of period (including undistributed net investment income of $70,191,467 and undistributed net investment income of $57,170,546, respectively) | $ 6,398,033,513 | $ 5,955,167,591 |
See accompanying notes which are an integral part of the financial statements.
Annual Report
Financial Highlights - Series Intrinsic Opportunities
Years ended July 31, | 2015 | 2014 | 2013 H |
Selected Per-Share Data | | | |
Net asset value, beginning of period | $ 14.47 | $ 12.78 | $ 10.00 |
Income from Investment Operations | | | |
Net investment income (loss) D | .24G | .21 | .12 |
Net realized and unrealized gain (loss) | 1.49 | 1.84 | 2.69 |
Total from investment operations | 1.73 | 2.05 | 2.81 |
Distributions from net investment income | (.21) | (.15) | (.03) |
Distributions from net realized gain | (.42) | (.21) | - |
Total distributions | (.62) J | (.36) | (.03) |
Net asset value, end of period | $ 15.58 | $ 14.47 | $ 12.78 |
Total ReturnB, C | 12.35% | 16.35% | 28.19% |
Ratios to Average Net Assets E, I | | | |
Expenses before reductions | .82% | .81% | .81%A |
Expenses net of fee waivers, if any | .82% | .81% | .81%A |
Expenses net of all reductions | .82% | .81% | .79%A |
Net investment income (loss) | 1.60% G | 1.55% | 1.58%A |
Supplemental Data | | | |
Net assets, end of period (000 omitted) | $ 2,619,363 | $ 2,479,629 | $ 1,995,564 |
Portfolio turnover rateF | 10% | 16% | 7%A |
A Annualized
B Total returns for periods of less than one year are not annualized.
C Total returns would have been lower if certain expenses had not been reduced during the applicable periods shown.
D Calculated based on average shares outstanding during the period.
E Fees and expenses of any underlying Fidelity Central Funds are not included in the Fund's expense ratio. The Fund indirectly bears its proportionate share of the expenses of any underlying Fidelity Central Funds.
F Amount does not include the portfolio activity of any underlying Fidelity Central Funds.
G Investment income per share reflects a large, non-recurring dividend which amounted to $.06 per share. Excluding this non-recurring dividend, the ratio of net investment income (loss) to average net assets would have been 1.18%.
H For the period December 6, 2012 (commencement of operations) to July 31, 2013.
I Expense ratios reflect operating expenses of the class. Expenses before reductions do not reflect amounts reimbursed by the investment adviser or reductions from brokerage service arrangements or reductions from other expense offset arrangements and do not represent the amount paid by the class during periods when reimbursements or reductions occur. Expense ratios before reductions for start-up periods may not be representative of longer-term operating periods. Expenses net of fee waivers reflect expenses after reimbursement by the investment adviser but prior to reductions from brokerage service arrangements or other expense offset arrangements. Expenses net of all reductions represent the net expenses paid by the class.
J Total distributions of $.62 per share is comprised of distributions from net investment income of $.206 and distributions from net realized gain of $.416 per share.
See accompanying notes which are an integral part of the financial statements.
Annual Report
Financial Highlights - Class F
Years ended July 31, | 2015 | 2014 | 2013 H |
Selected Per-Share Data | | | |
Net asset value, beginning of period | $ 14.49 | $ 12.80 | $ 10.00 |
Income from Investment Operations | | | |
Net investment income (loss) D | .26G | .24 | .13 |
Net realized and unrealized gain (loss) | 1.50 | 1.83 | 2.70 |
Total from investment operations | 1.76 | 2.07 | 2.83 |
Distributions from net investment income | (.23) | (.17) | (.03) |
Distributions from net realized gain | (.42) | (.21) | - |
Total distributions | (.65) | (.38) | (.03) |
Net asset value, end of period | $ 15.60 | $ 14.49 | $ 12.80 |
Total ReturnB, C | 12.52% | 16.48% | 28.40% |
Ratios to Average Net Assets E, I | | | |
Expenses before reductions | .66% | .64% | .62%A |
Expenses net of fee waivers, if any | .66% | .64% | .62%A |
Expenses net of all reductions | .66% | .64% | .60%A |
Net investment income (loss) | 1.76% G | 1.72% | 1.77%A |
Supplemental Data | | | |
Net assets, end of period (000 omitted) | $ 3,778,670 | $ 3,475,538 | $ 2,485,841 |
Portfolio turnover rateF | 10% | 16% | 7%A |
A Annualized
B Total returns for periods of less than one year are not annualized.
C Total returns would have been lower if certain expenses had not been reduced during the applicable periods shown.
D Calculated based on average shares outstanding during the period.
E Fees and expenses of any underlying Fidelity Central Funds are not included in the Fund's expense ratio. The Fund indirectly bears its proportionate share of the expenses of any underlying Fidelity Central Funds.
F Amount does not include the portfolio activity of any underlying Fidelity Central Funds.
G Investment income per share reflects a large, non-recurring dividend which amounted to $.06 per share. Excluding this non-recurring dividend, the ratio of net investment income (loss) to average net assets would have been 1.34%.
H For the period December 6, 2012 (commencement of operations) to July 31, 2013.
I Expense ratios reflect operating expenses of the class. Expenses before reductions do not reflect amounts reimbursed by the investment adviser or reductions from brokerage service arrangements or reductions from other expense offset arrangements and do not represent the amount paid by the class during periods when reimbursements or reductions occur. Expense ratios before reductions for start-up periods may not be representative of longer-term operating periods. Expenses net of fee waivers reflect expenses after reimbursement by the investment adviser but prior to reductions from brokerage service arrangements or other expense offset arrangements. Expenses net of all reductions represent the net expenses paid by the class.
See accompanying notes which are an integral part of the financial statements.
Annual Report
For the period ended July 31, 2015
1. Organization.
Fidelity Series Intrinsic Opportunities Fund (the Fund) is a fund of Fidelity Puritan Trust (the Trust) and is authorized to issue an unlimited number of shares. Shares of the Fund are only available for purchase by mutual funds for which Fidelity Management & Research Company (FMR) or an affiliate serves as an investment manager. The Trust is registered under the Investment Company Act of 1940, as amended (the 1940 Act), as an open-end management investment company organized as a Massachusetts business trust. The Fund offers Series Intrinsic Opportunities and Class F shares, each of which has equal rights as to assets and voting privileges. Each class has exclusive voting rights with respect to matters that affect that class. The Fund's investments in emerging markets can be subject to social, economic, regulatory, and political uncertainties and can be extremely volatile.
2. Investments in Fidelity Central Funds.
The Fund invests in Fidelity Central Funds, which are open-end investment companies generally available only to other investment companies and accounts managed by the investment adviser and its affiliates. The Fund's Schedule of Investments lists each of the Fidelity Central Funds held as of period end, if any, as an investment of the Fund, but does not include the underlying holdings of each Fidelity Central Fund. As an Investing Fund, the Fund indirectly bears its proportionate share of the expenses of the underlying Fidelity Central Funds.
The Money Market Central Funds seek preservation of capital and current income and are managed by Fidelity Investments Money Management, Inc. (FIMM), an affiliate of the investment adviser. Annualized expenses of the Money Market Central Funds as of their most recent shareholder report date are less than .01%.
A complete unaudited list of holdings for each Fidelity Central Fund is available upon request or at the Securities and Exchange Commission (the SEC) website at www.sec.gov. In addition, the financial statements of the Fidelity Central Funds, which are not covered by the Fund's Report of Independent Registered Public Accounting Firm, are available on the SEC website or upon request.
3. Significant Accounting Policies.
The financial statements have been prepared in conformity with accounting principles generally accepted in the United States of America (GAAP), which require management to make certain estimates and assumptions at the date of the financial statements. Actual results could differ from those estimates. Subsequent events, if any, through the date that the financial statements were issued have been evaluated in the preparation of
Annual Report
3. Significant Accounting Policies - continued
the financial statements. The following summarizes the significant accounting policies of the Fund:
Investment Valuation. Investments are valued as of 4:00 p.m. Eastern time on the last calendar day of the period. The Board of Trustees (the Board) has delegated the day to day responsibility for the valuation of the Fund's investments to the FMR Fair Value Committee (the Committee). In accordance with valuation policies and procedures approved by the Board, the Fund attempts to obtain prices from one or more third party pricing vendors or brokers to value its investments. When current market prices, quotations or currency exchange rates are not readily available or reliable, investments will be fair valued in good faith by the Committee, in accordance with procedures adopted by the Board. Factors used in determining fair value vary by investment type and may include market or investment specific events, changes in interest rates and credit quality. The frequency with which these procedures are used cannot be predicted and they may be utilized to a significant extent. The Committee oversees the Fund's valuation policies and procedures and reports to the Board on the Committee's activities and fair value determinations. The Board monitors the appropriateness of the procedures used in valuing the Fund's investments and ratifies the fair value determinations of the Committee.
The Fund categorizes the inputs to valuation techniques used to value its investments into a disclosure hierarchy consisting of three levels as shown below:
Level 1 - quoted prices in active markets for identical investments
Level 2 - other significant observable inputs (including quoted prices for similar investments, interest rates, prepayment speeds, etc.)
Level 3 - unobservable inputs (including the Fund's own assumptions based on the best information available)
Valuation techniques used to value the Fund's investments by major category are as follows:
Equity securities, including restricted securities, for which market quotations are readily available, are valued at the last reported sale price or official closing price as reported by a third party pricing vendor on the primary market or exchange on which they are traded and are categorized as Level 1 in the hierarchy. In the event there were no sales during the day or closing prices are not available, securities are valued at the last quoted bid price or may be valued using the last available price and are generally categorized as Level 2 in the hierarchy. For foreign equity securities, when market or security specific events arise, comparisons to the valuation of American Depositary Receipts (ADRs),
Annual Report
Notes to Financial Statements - continued
3. Significant Accounting Policies - continued
Investment Valuation - continued
futures contracts, Exchange-Traded Funds (ETFs) and certain indexes as well as quoted prices for similar securities may be used and would be categorized as Level 2 in the hierarchy. Utilizing these techniques may result in transfers between Level 1 and Level 2. For equity securities, including restricted securities, where observable inputs are limited, assumptions about market activity and risk are used and these securities may be categorized as Level 3 in the hierarchy.
Debt securities, including restricted securities, are valued based on evaluated prices received from third party pricing vendors or from brokers who make markets in such securities. Preferred securities are valued by pricing vendors who utilize matrix pricing which considers yield or price of bonds of comparable quality, coupon, maturity and type or by broker-supplied prices. When independent prices are unavailable or unreliable, debt securities may be valued utilizing pricing methodologies which consider similar factors that would be used by third party pricing vendors. Debt securities are generally categorized as Level 2 in the hierarchy but may be Level 3 depending on the circumstances.
Investments in open-end mutual funds, including the Fidelity Central Funds, are valued at their closing net asset value (NAV) each business day and are categorized as Level 1 in the hierarchy.
Changes in valuation techniques may result in transfers in or out of an assigned level within the disclosure hierarchy. The aggregate value of investments by input level as of July 31, 2015, including information on transfers between Levels 1 and 2, as well as a roll forward of Level 3 investments, is included at the end of the Fund's Schedule of Investments.
Foreign Currency. The Fund may use foreign currency contracts to facilitate transactions in foreign-denominated securities. Gains and losses from these transactions may arise from changes in the value of the foreign currency or if the counterparties do not perform under the contracts' terms.
Foreign-denominated assets, including investment securities, and liabilities are translated into U.S. dollars at the exchange rates at period end. Purchases and sales of investment securities, income and dividends received and expenses denominated in foreign currencies are translated into U.S. dollars at the exchange rate in effect on the transaction date.
The effects of exchange rate fluctuations on investments are included with the net realized and unrealized gain (loss) on investment securities. Other foreign currency transactions resulting in realized and unrealized gain (loss) are disclosed separately.
Annual Report
3. Significant Accounting Policies - continued
Investment Transactions and Income. For financial reporting purposes, the Fund's investment holdings and NAV include trades executed through the end of the last business day of the period. The NAV per share for processing shareholder transactions is calculated as of the close of business of the New York Stock Exchange (NYSE), normally 4:00 p.m. Eastern time and includes trades executed through the end of the prior business day. Gains and losses on securities sold are determined on the basis of identified cost. Dividend income is recorded on the ex-dividend date, except for certain dividends from foreign securities where the ex-dividend date may have passed, which are recorded as soon as the Fund is informed of the ex-dividend date. Non-cash dividends included in dividend income, if any, are recorded at the fair market value of the securities received. Income and capital gain distributions from Fidelity Central Funds, if any, are recorded on the ex-dividend date. Distributions received on securities that represent a return of capital or capital gain are recorded as a reduction of cost of investments and/or as a realized gain. Subsequent to ex-dividend date the Fund determines the components of these distributions, based upon receipt of tax filings or other correspondence relating to the underlying investment. Large, non-recurring dividends recognized by the Fund are presented separately on the Statement of Operations as "Special Dividends" and the impact of these dividends is presented in the Financial Highlights. Interest income is accrued as earned and includes coupon interest and amortization of premium and accretion of discount on debt securities as applicable. Investment income is recorded net of foreign taxes withheld where recovery of such taxes is uncertain.
Class Allocations and Expenses. Investment income, realized and unrealized capital gains and losses, common expenses of the Fund, and certain fund-level expense reductions, if any, are allocated daily on a pro-rata basis to each class based on the relative net assets of each class to the total net assets of the Fund. Each class differs with respect to transfer agent fees incurred. Certain expense reductions may also differ by class. For the reporting period, the allocated portion of income and expenses to each class as a percent of its average net assets may vary due to the timing of recording these transactions in relation to fluctuating net assets of the classes. Expenses directly attributable to a fund are charged to that fund. Expenses attributable to more than one fund are allocated among the respective funds on the basis of relative net assets or other appropriate methods. Expense estimates are accrued in the period to which they relate and adjustments are made when actual amounts are known.
Income Tax Information and Distributions to Shareholders. Each year, the Fund intends to qualify as a regulated investment company under Subchapter M of the Internal Revenue Code, including distributing substantially all of its taxable income and realized gains. As a result, no provision for U.S. Federal income taxes is required. As of July 31, 2015, the Fund did not have any unrecognized tax benefits in the financial statements; nor is the Fund aware of any tax positions for which it is reasonably possible
Annual Report
Notes to Financial Statements - continued
3. Significant Accounting Policies - continued
Income Tax Information and Distributions to Shareholders - continued
that the total amounts of unrecognized tax benefits will significantly change in the next twelve months. The Fund files a U.S. federal tax return, in addition to state and local tax returns as required. The Fund's federal income tax returns are subject to examination by the Internal Revenue Service (IRS) for a period of three fiscal years after they are filed. State and local tax returns may be subject to examination for an additional fiscal year depending on the jurisdiction. Foreign taxes are provided for based on the Fund's understanding of the tax rules and rates that exist in the foreign markets in which it invests. The Fund is subject to a tax imposed on capital gains by certain countries in which it invests. An estimated deferred tax liability for net unrealized appreciation on the applicable securities is included in Other payables and accrued expenses on the Statement of Assets & Liabilities.
Distributions are declared and recorded on the ex-dividend date. Income dividends and capital gain distributions are declared separately for each class. Income and capital gain distributions are determined in accordance with income tax regulations, which may differ from GAAP.
Capital accounts within the financial statements are adjusted for permanent book-tax differences. These adjustments have no impact on net assets or the results of operations. Capital accounts are not adjusted for temporary book-tax differences which will reverse in a subsequent period.
Book-tax differences are primarily due to foreign currency transactions, passive foreign investment companies (PFIC).
The federal tax cost of investment securities and unrealized appreciation (depreciation) as of period end were as follows:
Gross unrealized appreciation | $ 2,063,211,048 |
Gross unrealized depreciation | (592,887,855) |
Net unrealized appreciation (depreciation) on securities | $ 1,470,323,193 |
| |
Tax Cost | $ 5,104,626,413 |
The tax-based components of distributable earnings as of period end were as follows:
Undistributed Ordinary Income | $ 71,784,721 |
Undistributed Long Term Capital Gain | $ 236,690,374 |
Net unrealized appreciation (depreciation) on securities and other investments | $ 1,470,241,678 |
Annual Report
3. Significant Accounting Policies - continued
Income Tax Information and Distributions to Shareholders - continued
The tax character of distributions paid was as follows:
| July 31, 2015 | July 31, 2014 |
Ordinary Income | $ 132,682,574 | $ 128,437,795 |
Long-term Capital Gains | 134,516,598 | 12,593,470 |
Total | $ 267,199,172 | $ 141,031,265 |
Restricted Securities. The Fund may invest in securities that are subject to legal or contractual restrictions on resale. These securities generally may be resold in transactions exempt from registration or to the public if the securities are registered. Disposal of these securities may involve time-consuming negotiations and expense, and prompt sale at an acceptable price may be difficult. Information regarding restricted securities is included at the end of the Fund's Schedule of Investments.
4. Purchases and Sales of Investments.
Purchases and sales of securities, other than short-term securities, aggregated $644,968,344 and $921,317,824, respectively.
5. Fees and Other Transactions with Affiliates.
Management Fee. Fidelity Management & Research Company (the investment adviser) and its affiliates provide the Fund with investment management related services for which the Fund pays a monthly management fee. The management fee is the sum of an individual fund fee rate that is based on an annual rate of .30% of the Fund's average net assets and an annualized group fee rate that averaged .25% during the period. The group fee rate is based upon the average net assets of all the mutual funds advised by the investment adviser, including any mutual funds previously advised by the investment adviser that are currently advised by Fidelity SelectCo, LLC, an affiliate of the investment adviser. The group fee rate decreases as assets under management increase and increases as assets under management decrease. In addition, the management fee is subject to a performance adjustment (up to a maximum of ± .20% of the Fund's average net assets over a 36 month performance period). The upward or downward adjustment to the management fee is based on the relative investment performance of Series Intrinsic Opportunities as compared to its benchmark index, the Russell 3000 Index, over the same 36 month performance period. For the reporting period, the total annual management fee rate, including the performance adjustment, was .63% of the Fund's average net assets. The performance adjustment included in the management fee rate may be higher or lower than the maximum performance adjustment rate due to the difference between the average net assets for the reporting and performance periods.
Annual Report
Notes to Financial Statements - continued
5. Fees and Other Transactions with Affiliates - continued
Transfer Agent Fees. Fidelity Investments Institutional Operations Company, Inc., (FIIOC), an affiliate of the investment adviser, is the transfer, dividend disbursing and shareholder servicing agent for each class of the Fund. FIIOC receives account fees and asset-based fees that vary according to the account size and type of account of the shareholders of Series Intrinsic Opportunities. FIIOC receives no fees for providing transfer agency services to Class F. FIIOC pays for typesetting, printing and mailing of shareholder reports, except proxy statements.
For the period, transfer agent fees for each applicable class were as follows:
| Amount | % of
Class-Level Average
Net Assets |
Series Intrinsic Opportunities | $ 4,204,112 | .16 |
Accounting and Security Lending Fees. Fidelity Service Company, Inc. (FSC), an affiliate of the investment adviser, maintains the Fund's accounting records. The accounting fee is based on the level of average net assets for each month. Under a separate contract, FSC administers the security lending program. The security lending fee is based on the number and duration of lending transactions.
Brokerage Commissions. The Fund placed a portion of its portfolio transactions with brokerage firms which are affiliates of the investment adviser. Brokerage commissions are included in net realized gain (loss) and change in net unrealized appreciation (depreciation) in the Statement of Operations. The commissions paid to these affiliated firms were $7,621 for the period.
Interfund Lending Program. Pursuant to an Exemptive Order issued by the SEC, the Fund, along with other registered investment companies having management contracts with FMR or other affiliated entities of FMR, may participate in an interfund lending program. This program provides an alternative credit facility allowing the funds to borrow from, or lend money to, other participating affiliated funds. At period end, there were no interfund loans outstanding. The Fund's activity in this program during the period for which loans were outstanding was as follows:
Borrower or Lender | Average Loan
Balance | Weighted Average
Interest Rate | Interest Expense |
Borrower | $ 27,376,000 | .34% | $ 5,431 |
6. Committed Line of Credit.
The Fund participates with other funds managed by the investment adviser or an affiliate in a $4.25 billion credit facility (the "line of credit") to be utilized for temporary or emergency purposes to fund shareholder redemptions or for other short-term liquidity
Annual Report
6. Committed Line of Credit - continued
purposes. The Fund has agreed to pay commitment fees on its pro-rata portion of the line of credit, which amounted to $9,018 and is reflected in Miscellaneous expenses on the Statement of Operations. During the period, the Fund did not borrow on this line of credit.
7. Security Lending.
The Fund lends portfolio securities through a lending agent from time to time in order to earn additional income. For equity securities, a lending agent is used and may loan securities to certain qualified borrowers, including Fidelity Capital Markets (FCM), a broker-dealer affiliated with the Fund. On the settlement date of the loan, the Fund receives collateral (in the form of U.S. Treasury obligations, letters of credit and/or cash) against the loaned securities and maintains collateral in an amount not less than 100% of the market value of the loaned securities during the period of the loan. The market value of the loaned securities is determined at the close of business of the Fund and any additional required collateral is delivered to the Fund on the next business day. If the borrower defaults on its obligation to return the securities loaned because of insolvency or other reasons, the Fund may apply collateral received from the borrower against the obligation. The Fund may experience delays and costs in recovering the securities loaned. Any cash collateral received is invested in the Fidelity Securities Lending Cash Central Fund. The value of loaned securities and cash collateral at period end are disclosed on the Fund's Statement of Assets and Liabilities. The value of securities loaned to FCM at period end was $2,391,433. Security lending income represents the income earned on investing cash collateral, less rebates paid to borrowers and any lending agent fees associated with the loan, plus any premium payments received for lending certain types of securities. Security lending income is presented in the Statement of Operations as a component of income from Fidelity Central Funds and includes $162,073 from securities loaned to FCM.
8. Expense Reductions.
Commissions paid to certain brokers with whom the investment adviser, or its affiliates, places trades on behalf of the Fund include an amount in addition to trade execution, which may be rebated back to the Fund to offset certain expenses. This amount totaled $87,664 for the period. In addition, through arrangements with the Fund's custodian, credits realized as a result of uninvested cash balances were used to reduce the Fund's expenses. During the period, these credits reduced the Fund's custody expenses by $72.
Annual Report
Notes to Financial Statements - continued
8. Expense Reductions - continued
In addition, during the period the investment adviser reimbursed/waived a portion of fund-level operating expenses in the amount of $25,435 and a portion of class-level operating expenses as follows:
| Amount |
Series Intrinsic Opportunities | $ 51,795 |
9. Distributions to Shareholders.
Distributions to shareholders of each class were as follows:
Years ended July 31, | 2015 | 2014 |
From net investment income | | |
Series Intrinsic Opportunities | $ 35,754,449 | $ 25,386,331 |
Class F | 57,076,085 | 36,486,470 |
Total | $ 92,830,534 | $ 61,872,801 |
From net realized gain | | |
Series Intrinsic Opportunities | $ 71,956,781 | $ 34,641,059 |
Class F | 102,411,857 | 44,517,405 |
Total | $ 174,368,638 | $ 79,158,464 |
10. Share Transactions.
Transactions for each class of shares were as follows:
| Shares | Dollars |
Years ended July 31, | 2015 | 2014 | 2015 | 2014 |
Series Intrinsic Opportunities | | | | |
Shares sold | 13,476,821 | 41,466,082 | $ 199,935,766 | $ 563,346,615 |
Reinvestment of distributions | 7,472,157 | 4,548,297 | 107,711,230 | 60,027,390 |
Shares redeemed | (24,232,245) | (30,743,763) | (359,199,380) | (424,014,291) |
Net increase (decrease) | (3,283,267) | 15,270,616 | $ (51,552,384) | $ 199,359,714 |
Class F | | | | |
Shares sold | 33,246,823 | 70,982,567 | $ 491,760,653 | $ 970,462,717 |
Reinvestment of distributions | 11,056,180 | 6,134,277 | 159,487,942 | 81,003,875 |
Shares redeemed | (42,029,736) | (31,506,620) | (627,166,437) | (438,477,680) |
Net increase (decrease) | 2,273,267 | 45,610,224 | $ 24,082,158 | $ 612,988,912 |
Annual Report
11. Other.
The Fund's organizational documents provide former and current trustees and officers with a limited indemnification against liabilities arising in connection with the performance of their duties to the Fund. In the normal course of business, the Fund may also enter into contracts that provide general indemnifications. The Fund's maximum exposure under these arrangements is unknown as this would be dependent on future claims that may be made against the Fund. The risk of material loss from such claims is considered remote.
At the end of the period, mutual funds managed by the investment adviser or its affiliates were the owners of record of all of the outstanding shares of the Fund.
Annual Report
To the Trustees of Fidelity Puritan Trust and Shareholders of Fidelity Series Intrinsic Opportunities Fund:
We have audited the accompanying statement of assets and liabilities of Fidelity Series Intrinsic Opportunities Fund (the Fund), a fund of Fidelity Puritan Trust, including the schedule of investments, as of July 31, 2015, and the related statement of operations for the year then ended, the statement of changes in net assets for each of the two years in the period then ended, and the financial highlights for each of the periods presented. These financial statements and financial highlights are the responsibility of the Fund's management. Our responsibility is to express an opinion on these financial statements and financial highlights based on our audits.
We conducted our audits in accordance with the standards of the Public Company Accounting Oversight Board (United States). Those standards require that we plan and perform the audit to obtain reasonable assurance about whether the financial statements and financial highlights are free of material misstatement. The Fund is not required to have, nor were we engaged to perform, an audit of its internal control over financial reporting. Our audits included consideration of internal control over financial reporting as a basis for designing audit procedures that are appropriate in the circumstances, but not for the purpose of expressing an opinion on the effectiveness of the Fund's internal control over financial reporting. Accordingly, we express no such opinion. An audit also includes examining, on a test basis, evidence supporting the amounts and disclosures in the financial statements, assessing the accounting principles used and significant estimates made by management, as well as evaluating the overall financial statement presentation. Our procedures included confirmation of securities owned as of July 31, 2015, by correspondence with the custodians and brokers; when replies were not received from brokers, we performed other auditing procedures. We believe that our audits provide a reasonable basis for our opinion.
In our opinion, such financial statements and financial highlights referred to above present fairly, in all material respects, the financial position of Fidelity Series Intrinsic Opportunities Fund as of July 31, 2015, the results of its operations for the year then ended, the changes in its net assets for each of the two years in the period then ended, and the financial highlights for each of the periods presented, in conformity with accounting principles generally accepted in the United States of America.
DELOITTE & TOUCHE LLP
Boston, Massachusetts
September 21, 2015
Annual Report
The Trustees, Member of the Advisory Board, and officers of the trust and fund, as applicable, are listed below. The Board of Trustees governs the fund and is responsible for protecting the interests of shareholders. The Trustees are experienced executives who meet periodically throughout the year to oversee the fund's activities, review contractual arrangements with companies that provide services to the fund, oversee management of the risks associated with such activities and contractual arrangements, and review the fund's performance. Each of the Trustees oversees 170 funds.
The Trustees hold office without limit in time except that (a) any Trustee may resign; (b) any Trustee may be removed by written instrument, signed by at least two-thirds of the number of Trustees prior to such removal; (c) any Trustee who requests to be retired or who has become incapacitated by illness or injury may be retired by written instrument signed by a majority of the other Trustees; and (d) any Trustee may be removed at any special meeting of shareholders by a two-thirds vote of the outstanding voting securities of the trust. Each Trustee who is not an interested person (as defined in the 1940 Act) of the trust and the fund (Independent Trustee), shall retire not later than the last day of the calendar year in which his or her 75th birthday occurs. The Independent Trustees may waive this mandatory retirement age policy with respect to individual Trustees. The officers and Advisory Board Member hold office without limit in time, except that any officer and Advisory Board Member may resign or may be removed by a vote of a majority of the Trustees at any regular meeting or any special meeting of the Trustees. Except as indicated, each individual has held the office shown or other offices in the same company for the past five years.
Experience, Skills, Attributes, and Qualifications of the Fund's Trustees. The Governance and Nominating Committee has adopted a statement of policy that describes the experience, qualifications, attributes, and skills that are necessary and desirable for potential Independent Trustee candidates (Statement of Policy). The Board believes that each Trustee satisfied at the time he or she was initially elected or appointed a Trustee, and continues to satisfy, the standards contemplated by the Statement of Policy. The Governance and Nominating Committee also engages professional search firms to help identify potential Independent Trustee candidates who have the experience, qualifications, attributes, and skills consistent with the Statement of Policy. From time to time, additional criteria based on the composition and skills of the current Independent Trustees, as well as experience or skills that may be appropriate in light of future changes to board composition, business conditions, and regulatory or other developments, have also been considered by the professional search firms and the Governance and Nominating Committee. In addition, the Board takes into account the Trustees' commitment and participation in Board and committee meetings, as well as their leadership of standing and ad hoc committees throughout their tenure.
In determining that a particular Trustee was and continues to be qualified to serve as a Trustee, the Board has considered a variety of criteria, none of which, in isolation, was controlling. The Board believes that, collectively, the Trustees have balanced and diverse experience, qualifications, attributes, and skills, which allow the Board to operate effectively in governing the fund and protecting the interests of shareholders. Information about the specific experience, skills, attributes, and qualifications of each Trustee, which in each case led to the Board's conclusion that the Trustee should serve (or continue to serve) as a trustee of the fund, is provided below.
Annual Report
Board Structure and Oversight Function. James C. Curvey is an interested person (as defined in the 1940 Act) and currently serves as Chairman. The Trustees have determined that an interested Chairman is appropriate and benefits shareholders because an interested Chairman has a personal and professional stake in the quality and continuity of services provided to the fund. Independent Trustees exercise their informed business judgment to appoint an individual of their choosing to serve as Chairman, regardless of whether the Trustee happens to be independent or a member of management. The Independent Trustees have determined that they can act independently and effectively without having an Independent Trustee serve as Chairman and that a key structural component for assuring that they are in a position to do so is for the Independent Trustees to constitute a substantial majority for the Board. The Independent Trustees also regularly meet in executive session. Ned C. Lautenbach serves as Chairman of the Independent Trustees and as such (i) acts as a liaison between the Independent Trustees and management with respect to matters important to the Independent Trustees and (ii) with management prepares agendas for Board meetings.
Fidelity funds are overseen by different Boards of Trustees. The fund's Board oversees Fidelity's high income and certain equity funds and other Boards oversee Fidelity's investment-grade bond, money market, asset allocation, and sector funds. The asset allocation funds may invest in Fidelity funds overseen by the fund's Board. The use of separate Boards, each with its own committee structure, allows the Trustees of each group of Fidelity funds to focus on the unique issues of the funds they oversee, including common research, investment, and operational issues. On occasion, the separate Boards establish joint committees to address issues of overlapping consequences for the Fidelity funds overseen by each Board.
The Trustees operate using a system of committees to facilitate the timely and efficient consideration of all matters of importance to the Trustees, the fund, and fund shareholders and to facilitate compliance with legal and regulatory requirements and oversight of the fund's activities and associated risks. The Board, acting through its committees, has charged FMR and its affiliates with (i) identifying events or circumstances the occurrence of which could have demonstrably adverse effects on the fund's business and/or reputation; (ii) implementing processes and controls to lessen the possibility that such events or circumstances occur or to mitigate the effects of such events or circumstances if they do occur; and (iii) creating and maintaining a system designed to evaluate continuously business and market conditions in order to facilitate the identification and implementation processes described in (i) and (ii) above. Because the day-to-day operations and activities of the fund are carried out by or through FMR, its affiliates and other service providers, the fund's exposure to risks is mitigated but not eliminated by the processes overseen by the Trustees. While each of the Board's committees has responsibility for overseeing different aspects of the fund's activities, oversight is exercised primarily through the Operations, Audit, and Compliance Committees. In addition, the Independent Trustees have worked with FMR to enhance the Board's oversight of investment and financial risks, legal and regulatory risks, technology risks, and operational risks, including the development of additional risk reporting to the Board. For example, a working group comprised of Independent Trustees and FMR has worked and continues to work to review the Fidelity funds' valuation-related activities, reporting and risk management. Appropriate personnel, including but not limited to the fund's Chief Compliance Officer (CCO), FMR's internal auditor, the independent accountants, the fund's Treasurer and portfolio management personnel, make periodic reports to the Board's committees, as appropriate, including an annual review of FMR's risk management program for the Fidelity funds. The responsibilities of each standing committee, including their oversight responsibilities, are described further under "Standing Committees of the Fund's Trustees."
Annual Report
Trustees and Officers - continued
The fund's Statement of Additional Information (SAI) includes more information about the Trustees. To request a free copy, call Fidelity at 1-800-544-8544 for Fidelity Series Intrinsic Opportunities Fund, or 1-800-835-5092 for Class F.
Interested Trustees*:
Correspondence intended for each Trustee who is an interested person may be sent to Fidelity Investments, 245 Summer Street, Boston, Massachusetts 02210.
Name, Year of Birth; Principal Occupations and Other Relevant Experience+ |
James C. Curvey (1935) |
Year of Election or Appointment: 2007 Trustee Chairman of the Board of Trustees |
| Mr. Curvey also serves as Trustee of other Fidelity funds. Mr. Curvey is a Director of Fidelity Research & Analysis Co. (investment adviser firm, 2009-present), and Vice Chairman (2007-present) and Director of FMR LLC (diversified financial services company). In addition, Mr. Curvey serves as an Overseer for the Boston Symphony Orchestra and a member of the board of Artis-Naples, Naples, Florida, and as a Trustee for Brewster Academy, Wolfeboro, New Hampshire. Previously, Mr. Curvey served as a Director of Fidelity Investments Money Management, Inc. (investment adviser firm, 2009-2014), a Director of FMR (investment adviser firm, 2007-2014), and a Director of FMR Co., Inc. (investment adviser firm, 2007-2014). |
Charles S. Morrison (1960) |
Year of Election or Appointment: 2014 Trustee |
| Mr. Morrison also serves as Trustee of other funds. He serves as a Director of Fidelity Investments Money Management, Inc. (FIMM) (investment adviser firm, 2014-present), Director of Fidelity SelectCo, LLC (investment adviser firm, 2014-present), President, Asset Management (2014-present), and is an employee of Fidelity Investments. Previously, Mr. Morrison served as Vice President of Fidelity's Fixed Income and Asset Allocation Funds (2012-2014), President, Fixed Income (2011-2014), Vice President of Fidelity's Money Market Funds (2005-2009), President, Money Market Group Leader of FMR (investment adviser firm, 2009), and Senior Vice President, Money Market Group of FMR (2004-2009). Mr. Morrison also served as Vice President of Fidelity's Bond Funds (2002-2005), certain Balanced Funds (2002-2005), and certain Asset Allocation Funds (2002-2007), and as Senior Vice President (2002-2005) of Fidelity's Bond Division. |
* Trustees have been determined to be "Interested Trustees" by virtue of, among other things, their affiliation with the trust or various entities under common control with FMR.
+ The information above includes each Trustee's principal occupation during the last five years and other information relating to the experience, attributes, and skills relevant to each Trustee's qualifications to serve as a Trustee, which led to the conclusion that each Trustee should serve as a Trustee for the fund.
Annual Report
Trustees and Officers - continued
Independent Trustees:
Correspondence intended for each Independent Trustee (that is, the Trustees other than the Interested Trustees) may be sent to Fidelity Investments, P.O. Box 55235, Boston, Massachusetts 02205-5235.
Name, Year of Birth; Principal Occupations and Other Relevant Experience+ |
Dennis J. Dirks (1948) |
Year of Election or Appointment: 2005 Trustee |
| Mr. Dirks also serves as Trustee of other Fidelity funds. Prior to his retirement in May 2003, Mr. Dirks was Chief Operating Officer and a member of the Board of The Depository Trust & Clearing Corporation (DTCC). He also served as President, Chief Operating Officer, and Board member of The Depository Trust Company (DTC) and President and Board member of the National Securities Clearing Corporation (NSCC). In addition, Mr. Dirks served as Chief Executive Officer and Board member of the Government Securities Clearing Corporation, Chief Executive Officer and Board member of the Mortgage-Backed Securities Clearing Corporation, as a Trustee and a member of the Finance Committee of Manhattan College (2005-2008), and as a Trustee and a member of the Finance Committee of AHRC of Nassau County (2006-2008). Mr. Dirks is a member of the Independent Directors Council (IDC) Governing Council (2010-present) and Board of Directors for The Brookville Center for Children's Services, Inc. (2009-present). |
Alan J. Lacy (1953) |
Year of Election or Appointment: 2008 Trustee |
| Mr. Lacy also serves as Trustee of other Fidelity funds. Mr. Lacy serves as a member of the Board of Directors of Dave & Buster's Entertainment, Inc. (restaurant and entertainment complexes, 2010-present) and Bristol-Myers Squibb Company (global pharmaceuticals, 2008-present). In addition, Mr. Lacy served as Senior Adviser (2007-2014) of Oak Hill Capital Partners, L.P. (private equity) and also served as Chief Executive Officer (2000-2005) and Vice Chairman (2005-2006) of Sears Holdings Corporation and Sears, Roebuck and Co. (retail). Mr. Lacy is a member of the Board of Trustees of The National Parks Conservation Association (2006-present). Previously, Mr. Lacy served as Chairman of the Board of Trustees of the National Parks Conservation Association (2008-2011) and as a member of the Board of Directors for The Western Union Company (global money transfer, 2006-2011), The Hillman Companies, Inc. (hardware wholesalers, 2010-2014), and Earth Fare, Inc. (retail grocery, 2010-2014). |
Ned C. Lautenbach (1944) |
Year of Election or Appointment: 2000 Trustee Chairman of the Independent Trustees |
| Mr. Lautenbach also serves as Trustee of other Fidelity funds. Mr. Lautenbach currently serves as the Lead Director of the Eaton Corporation Board of Directors (diversified industrial, 1997-present). Mr. Lautenbach is Chairman of the Board of Directors of Artis-Naples in Naples, Florida (2012-present), a member of the Council on Foreign Relations (1994-present), and a member of the Board of Governors, State University System of Florida (2013-present). Previously, Mr. Lautenbach was a Partner/Advisory Partner at Clayton, Dubilier & Rice, LLC (private equity investment, 1998-2010), as well as a Director of Sony Corporation (2006-2007). |
Joseph Mauriello (1944) |
Year of Election or Appointment: 2008 Trustee |
| Mr. Mauriello also serves as Trustee of other Fidelity funds. Prior to his retirement in January 2006, Mr. Mauriello served in numerous senior management positions including Deputy Chairman and Chief Operating Officer (2004-2005), and Vice Chairman of Financial Services (2002-2004) of KPMG LLP US (professional services, 1965-2005). Mr. Mauriello currently serves as a member of the Board of Directors of XL Group plc. (global insurance and re-insurance, 2006-present). Previously, Mr. Mauriello served as a Director of the Hamilton Funds of the Bank of New York (2006-2007) and of Arcadia Resources Inc. (health care services and products, 2007-2012). |
Robert W. Selander (1950) |
Year of Election or Appointment: 2011 Trustee |
| Mr. Selander also serves as Trustee of other Fidelity funds. Mr. Selander serves as a Director of The Western Union Company (global money transfer, 2014-present). Previously, Mr. Selander served as a Member of the Advisory Board of other Fidelity funds (2011), and Executive Vice Chairman (2010), Chief Executive Officer (2009-2010), and President and Chief Executive Officer (1997-2009) of Mastercard, Inc. |
Cornelia M. Small (1944) |
Year of Election or Appointment: 2005 Trustee |
| Ms. Small also serves as Trustee of other Fidelity funds. Ms. Small is a member of the Board of Directors (2009-present) and Chair of the Investment Committee (2010-present) of the Teagle Foundation. Ms. Small also serves on the Investment Committee of the Berkshire Taconic Community Foundation (2008-present). Previously, Ms. Small served as Chairperson (2002-2008) and a member of the Investment Committee and Chairperson (2008-2012) and a member of the Board of Trustees of Smith College. In addition, Ms. Small served as Chief Investment Officer, Director of Global Equity Investments, and a member of the Board of Directors of Scudder, Stevens & Clark and Scudder Kemper Investments. |
William S. Stavropoulos (1939) |
Year of Election or Appointment: 2001 Trustee Vice Chairman of the Independent Trustees |
| Mr. Stavropoulos also serves as Trustee of other Fidelity funds. Mr. Stavropoulos serves as President and Founder of the Michigan Baseball Foundation, the Great Lakes Loons (2007-present). Mr. Stavropoulos is Chairman Emeritus of the Board of Directors of The Dow Chemical Company, where he previously served in numerous senior management positions, including President, CEO (1995-2000; 2002-2004), Chairman of the Executive Committee (2000-2006), and as a member of the Board of Directors (1990-2006). Currently, Mr. Stavropoulos is Chairman of the Board of Directors of Univar Inc. (global distributor of commodity and specialty chemicals), a Director of Teradata Corporation (data warehousing and technology solutions), and Maersk Inc. (industrial conglomerate), and a member of the Advisory Board for Metalmark Capital LLC (private equity investment, 2005-present). Mr. Stavropoulos is an operating advisor to Clayton, Dubilier & Rice, LLC (private equity investment). In addition, Mr. Stavropoulos is a member of the University of Notre Dame Advisory Council for the College of Science, a Trustee of the Rollin L. Gerstacker Foundation, and a Director of the Naples Philharmonic Center for the Arts. Previously, Mr. Stavropoulos served as a Director of Chemical Financial Corporation (bank holding company, 1993-2012) and Tyco International, Ltd. (multinational manufacturing and services, 2007-2012). |
David M. Thomas (1949) |
Year of Election or Appointment: 2008 Trustee |
| Mr. Thomas also serves as Trustee of other Fidelity funds. Mr. Thomas serves as Non-Executive Chairman of the Board of Directors of Fortune Brands Home and Security (home and security products, 2011-present), as a member of the Board of Directors (2004-present) and Presiding Director (2013-present) of Interpublic Group of Companies, Inc. (marketing communication), and as a member of the Board of Trustees of the University of Florida (2013-present). Previously, Mr. Thomas served as Executive Chairman (2005-2006) and Chairman and Chief Executive Officer (2000-2005) of IMS Health, Inc. (pharmaceutical and healthcare information solutions), and a Director of Fortune Brands, Inc. (consumer products, 2000-2011). |
+ The information above includes each Trustee's principal occupation during the last five years and other information relating to the experience, attributes, and skills relevant to each Trustee's qualifications to serve as a Trustee, which led to the conclusion that each Trustee should serve as a Trustee for the fund.
Advisory Board Member and Officers:
Correspondence intended for each officer and Peter S. Lynch may be sent to Fidelity Investments, 245 Summer Street, Boston, Massachusetts 02210. Officers appear below in alphabetical order.
Name, Year of Birth; Principal Occupation |
Peter S. Lynch (1944) |
Year of Election or Appointment: 2003 Member of the Advisory Board |
| Mr. Lynch also serves as Member of the Advisory Board of other Fidelity funds. Mr. Lynch is Vice Chairman and a Director of FMR (investment adviser firm) and FMR Co., Inc. (investment adviser firm). In addition, Mr. Lynch serves as a Trustee of Boston College and as the Chairman of the Inner-City Scholarship Fund. Previously, Mr. Lynch served on the Special Olympics International Board of Directors (1997-2006). |
Elizabeth Paige Baumann (1968) |
Year of Election or Appointment: 2012 Anti-Money Laundering (AML) Officer |
| Ms. Baumann also serves as AML Officer of other funds. She is Chief AML Officer of FMR LLC (diversified financial services company, 2012-present) and is an employee of Fidelity Investments. Previously, Ms. Baumann served as Vice President and Deputy Anti-Money Laundering Officer (2007-2012). |
Marc Bryant (1966) |
Year of Election or Appointment: 2015 Secretary and Chief Legal Officer (CLO) |
| Mr. Bryant also serves as Secretary and Chief Legal Officer (CLO) of other funds. He is Senior Vice President and Deputy General Counsel of FMR LLC (diversified financial services company). Previously, Mr. Bryant served as Secretary and Chief Legal Officer of Fidelity Rutland Square Trust II (2010-2014) and Assistant Secretary of Fidelity's Fixed Income and Asset Allocation Funds (2013-2015). Prior to joining Fidelity Investments, Mr. Bryant served as a Senior Vice President and the Head of Global Retail Legal for AllianceBernstein L.P. (2006-2010), and as the General Counsel for ProFund Advisors LLC (2001-2006). |
William C. Coffey (1969) |
Year of Election or Appointment: 2009 Assistant Secretary |
| Mr. Coffey also serves as Assistant Secretary of other funds. He is Senior Vice President and Deputy General Counsel of FMR LLC (diversified financial services company, 2010-present), and is an employee of Fidelity Investments. Previously, Mr. Coffey served as Vice President and Associate General Counsel of FMR LLC (2005-2009). |
Jonathan Davis (1968) |
Year of Election or Appointment: 2010 Assistant Treasurer |
| Mr. Davis also serves as Assistant Treasurer of other funds. Mr. Davis is an employee of Fidelity Investments. Previously, Mr. Davis served as Vice President and Associate General Counsel of FMR LLC (diversified financial services company, 2003-2010). |
Adrien E. Deberghes (1967) |
Year of Election or Appointment: 2008 Deputy Treasurer |
| Mr. Deberghes also serves as an officer of other funds. He is an employee of Fidelity Investments (2008-present). Prior to joining Fidelity Investments, Mr. Deberghes was Senior Vice President of Mutual Fund Administration at State Street Corporation (2007-2008), Senior Director of Mutual Fund Administration at Investors Bank & Trust (2005-2007), and Director of Finance for Dunkin' Brands (2000-2005). |
Stephanie J. Dorsey (1969) |
Year of Election or Appointment: 2010 Assistant Treasurer |
| Ms. Dorsey also serves as an officer of other funds. She is an employee of Fidelity Investments (2008-present) and has served in other fund officer roles. Prior to joining Fidelity Investments, Ms. Dorsey served as Treasurer (2004-2008) of the JPMorgan Mutual Funds and Vice President (2004-2008) of JPMorgan Chase Bank. |
Howard J. Galligan III (1966) |
Year of Election or Appointment: 2014 Chief Financial Officer |
| Mr. Galligan also serves as Chief Financial Officer of other funds. Mr. Galligan serves as President of Fidelity Pricing and Cash Management Services (FPCMS) (2014-present) and as a Director of Strategic Advisers, Inc. (investment adviser firm, 2008-present). Previously, Mr. Galligan served as Chief Administrative Officer of Asset Management (2011-2014) and Chief Operating Officer and Senior Vice President of Investment Support for Strategic Advisers, Inc. (2003-2011). |
Scott C. Goebel (1968) |
Year of Election or Appointment: 2015 Vice President |
| Mr. Goebel serves as an officer of other funds. Mr. Goebel also serves as Secretary of Fidelity SelectCo, LLC (investment adviser firm, 2013-present), Fidelity Investments Money Management, Inc. (FIMM) (investment adviser firm, 2010-present) and Fidelity Research and Analysis Company (FRAC) (investment adviser firm, 2010-present); General Counsel, Secretary, and Senior Vice President of FMR (investment adviser firm, 2008-present) and FMR Co., Inc. (investment adviser firm, 2008-present); Chief Legal Officer of Fidelity Management & Research (Hong Kong) Limited (investment adviser firm, 2008-present); and Assistant Secretary of Fidelity Management & Research (Japan) Limited (investment adviser firm, 2008-present) and FMR Investment Management (U.K.) Limited (investment adviser firm, 2008-present). Previously, Mr. Goebel served as Secretary and CLO of certain Fidelity funds (2008-2015), Assistant Secretary of FIMM (2008-2010), FRAC (2008-2010), and certain funds (2007-2008); and as Vice President and Secretary of Fidelity Distributors Corporation (FDC) (2005-2007). Mr. Goebel has been employed by FMR LLC (diversified financial services company) or an affiliate since 2001. |
Thomas C. Hense (1964) |
Year of Election or Appointment: 2008/2010/2015 Vice President |
| Mr. Hense serves as Vice President of Fidelity Advisor Multi-Asset Income Fund (2015) and other funds (High Income (2008), Small Cap (2008), and Value (2010) funds). Previously, Mr. Hense served as a portfolio manager for Fidelity's Institutional Money Management Group (Pyramis) (2003-2008). |
Brian B. Hogan (1964) |
Year of Election or Appointment: 2009 Vice President |
| Mr. Hogan also serves as Trustee or Vice President of other funds. Mr. Hogan serves as a Director of Fidelity SelectCo, LLC (investment adviser firm, 2014-present) and President of the Equity Division of FMR (investment adviser firm, 2009-present). Previously, Mr. Hogan served as Senior Vice President, Equity Research of FMR (2006-2009) and as a portfolio manager. |
Chris Maher (1972) |
Year of Election or Appointment: 2013 Assistant Treasurer |
| Mr. Maher serves as Assistant Treasurer of other funds. Mr. Maher is Vice President of Valuation Oversight and is an employee of Fidelity Investments. Previously, Mr. Maher served as Vice President of Asset Management Compliance (2013), Vice President of the Program Management Group of FMR (investment adviser firm, 2010-2013), and Vice President of Valuation Oversight (2008-2010). |
Kenneth B. Robins (1969) |
Year of Election or Appointment: 2008 President and Treasurer |
| Mr. Robins also serves as an officer of other funds. Mr. Robins serves as Executive Vice President of Fidelity Investments Money Management, Inc. (FIMM) (investment adviser firm, 2013-present) and is an employee of Fidelity Investments (2004-present). Previously, Mr. Robins served in other fund officer roles. |
Stephen Sadoski (1971) |
Year of Election or Appointment: 2012 Deputy Treasurer |
| Mr. Sadoski also serves as Deputy Treasurer of other funds. He is an employee of Fidelity Investments (2012-present) and has served in another fund officer role. Prior to joining Fidelity Investments, Mr. Sadoski served as an assistant chief accountant in the Division of Investment Management of the Securities and Exchange Commission (SEC) (2009-2012) and as a senior manager at Deloitte & Touche LLP (1997-2009). |
Stacie M. Smith (1974) |
Year of Election or Appointment: 2013 Deputy Treasurer |
| Ms. Smith also serves as an officer of other funds. She is an employee of Fidelity Investments (2009-present) and has served in other fund officer roles. Prior to joining Fidelity Investments, Ms. Smith served as Senior Audit Manager of Ernst & Young LLP (1996-2009). |
Renee Stagnone (1975) |
Year of Election or Appointment: 2013 Deputy Treasurer |
| Ms. Stagnone also serves as Deputy Treasurer of other funds. Ms. Stagnone is an employee of Fidelity Investments. |
Linda J. Wondrack (1964) |
Year of Election or Appointment: 2014 Chief Compliance Officer |
| Ms. Wondrack also serves as Chief Compliance Officer of other funds. Ms. Wondrack is Executive Vice President and head of the Ethics Office and Asset Management Compliance for Fidelity Investments (2012-present). Ms. Wondrack also serves as Chief Compliance Officer of Fidelity SelectCo, LLC (investment adviser firm, 2014-present); Chief Compliance Officer of Impresa Management LLC (2013-present); and Chief Compliance Officer of FMR Co., Inc. (investment adviser firm), Fidelity Investments Money Management, Inc. (investment adviser firm), Fidelity Management & Research (Japan) Limited (investment adviser firm), FMR Investment Management (U.K.) Limited (investment adviser firm), Fidelity Management & Research (Hong Kong) (investment adviser firm), Fidelity Management & Research Company (investment adviser firm), Pyramis Global Advisors, LLC (investment adviser firm), and Strategic Advisers, Inc. (investment adviser firm), Ballyrock Investment Advisors LLC, and Northern Neck Investors LLC (2012-present). Previously, Ms. Wondrack served as Senior Vice President and Chief Compliance Officer for Columbia Management Investment Advisers, LLC (2005-2012); Chief Compliance Officer for certain funds within the Columbia Family of Funds (2007-2012); and Senior Vice President of Compliance Risk Management at Bank of America (2005-2010). |
Joseph F. Zambello (1957) |
Year of Election or Appointment: 2011 Deputy Treasurer |
| Mr. Zambello also serves as Deputy Treasurer of other funds. Mr. Zambello is an employee of Fidelity Investments. Previously, Mr. Zambello served as Vice President of the Program Management Group of FMR (investment adviser firm, 2009-2011) and Vice President of the Transfer Agent Oversight Group (2005-2009). |
Annual Report
The Board of Trustees of Fidelity Series Intrinsic Opportunities Fund voted to pay to shareholders of record at the opening of business on record date, the following distributions per share derived from capital gains realized from sales of portfolio securities; and dividends derived from net investment income:
| Pay Date | Record Date | Dividends | Capital Gains |
Series Intrinsic Opportunities | 09/14/15 | 09/11/15 | $0.1600 | $0.5760 |
Class F | 09/14/15 | 09/11/15 | $0.1750 | $0.5760 |
Series Intrinsic Opportunities and Class F hereby designate as a capital gain dividend with respect to the taxable year ended July 31, 2015, $261,166,024, or, if subsequently determined to be different, the net capital gain of such year.
Series Intrinsic Opportunities designates 34% and 57%; Class F designates 31% and 52%; of the dividends distributed in September and December, 2015, respectively during the fiscal year as qualifying for the dividends-received deduction for corporate shareholders.
Series Intrinsic Opportunities designates 62% and 99%; Class F designates 58% and 90%; of the dividends distributed in September and December, 2015, respectively during the fiscal year as amounts which can be taken into account as a dividend for the purposes of the maximum rate under section 1(h)(11) of the Internal Revenue Code.
The fund will notify shareholders in January 2016 of amounts for use in preparing 2015 income tax returns.
Annual Report
Fidelity Series Intrinsic Opportunities Fund
Each year, the Board of Trustees, including the Independent Trustees (together, the Board), votes on the renewal of the management contract with Fidelity Management & Research Company (FMR) and the sub-advisory agreements (together, the Advisory Contracts) for the fund. The Board, assisted by the advice of fund counsel and Independent Trustees' counsel, requests and considers a broad range of information relevant to the renewal of the Advisory Contracts throughout the year.
The Board meets regularly and, at each of its meetings, covers an extensive agenda of topics and materials and considers factors that are relevant to its annual consideration of the renewal of the fund's Advisory Contracts, including the services and support provided to the fund and its shareholders. The Board has established various standing committees (Committees), each composed of and chaired by Independent Trustees with varying backgrounds, to which the Board has assigned specific subject matter responsibilities in order to enhance effective decision-making by the Board. The Board, acting directly and through its Committees, requests and receives information concerning the annual consideration of the renewal of the fund's Advisory Contracts. The Board also meets as needed to consider matters specifically related to the Board's annual consideration of the renewal of the Advisory Contracts. Members of the Board may also meet with trustees of other Fidelity funds through ad hoc joint committees to discuss certain matters relevant to all of the Fidelity funds.
At its July 2015 meeting, the Board unanimously determined to renew the fund's Advisory Contracts. In reaching its determination, the Board considered all factors it believed relevant, including (i) the nature, extent, and quality of the services to be provided to the fund and its shareholders (including the investment performance of the fund); (ii) the competitiveness of the fund's management fee and total expense ratio relative to peer funds; (iii) the total costs of the services to be provided by and the profits to be realized by Fidelity from its relationship with the fund; and (iv) the extent to which (if any) economies of scale exist and would be realized as the fund grows, and whether any economies of scale are appropriately shared with fund shareholders.
In considering whether to renew the Advisory Contracts for the fund, the Board reached a determination, with the assistance of fund counsel and Independent Trustees' counsel and through the exercise of its business judgment, that the renewal of the Advisory Contracts was in the best interests of the fund and its shareholders and that the compensation payable under the Advisory Contracts was fair and reasonable. The Board's decision to renew the Advisory Contracts was not based on any single factor, but rather was based on a comprehensive consideration of all the information provided to the Board at its meetings throughout the year. The Board, in reaching its determination to renew the Advisory Contracts, was aware that shareholders of the fund have a broad range of investment choices available to them, including a wide choice among funds offered by Fidelity's competitors, and that the fund's shareholders, who have the opportunity to review and weigh the disclosure provided by the fund in its prospectus and other public disclosures, have chosen to invest in this fund, which is part of the Fidelity family of funds.
Annual Report
Nature, Extent, and Quality of Services Provided. The Board considered Fidelity's staffing as it relates to the fund, including the backgrounds of investment personnel of Fidelity, and also considered the fund's investment objective, strategies, and related investment philosophy. The Independent Trustees also had discussions with senior management of Fidelity's investment operations and investment groups. The Board considered the structure of the portfolio manager compensation program and whether this structure provides appropriate incentives to act in the best interests of the fund. Additionally, the Board considered the portfolio managers' investments, if any, in the funds that they manage.
Resources Dedicated to Investment Management and Support Services. The Board and the Fund Oversight and Research Committees reviewed the general qualifications and capabilities of Fidelity's investment staff, including its size, education, experience, and resources, as well as Fidelity's approach to recruiting, training, managing, and compensating investment personnel. The Board noted that Fidelity has continued to increase the resources devoted to non-U.S. offices, including expansion of Fidelity's global investment organization. The Board also noted that Fidelity's analysts have extensive resources, tools and capabilities that allow them to conduct sophisticated quantitative and fundamental analysis, as well as credit analysis of issuers, counterparties and guarantors. Further, the Board considered that Fidelity's investment professionals have sufficient access to global information and data so as to provide competitive investment results over time, and that those professionals also have access to sophisticated tools that permit them to assess portfolio construction and risk and performance attribution characteristics continuously, as well as to transmit new information and research conclusions rapidly around the world. Additionally, in its deliberations, the Board considered Fidelity's trading, risk management, and compliance capabilities and resources, which are integral parts of the investment management process.
Shareholder and Administrative Services. The Board considered (i) the nature, extent, quality, and cost of advisory, administrative, and shareholder services performed by FMR, the sub-advisers (together with FMR, the Investment Advisers), and their affiliates under the Advisory Contracts and under separate agreements covering transfer agency, pricing and bookkeeping, and securities lending services for the fund; (ii) the nature and extent of the supervision of third party service providers, principally custodians and subcustodians; and (iii) the resources devoted to, and the record of compliance with, the fund's compliance policies and procedures. The Board also reviewed the allocation of fund brokerage, including allocations to brokers affiliated with the Investment Advisers, the use of brokerage commissions to pay fund expenses, and the use of "soft" commission dollars to pay for research services.
Annual Report
Board Approval of Investment Advisory Contracts and
Management Fees - continued
The Board noted that the growth of fund assets over time across the complex allows Fidelity to reinvest in the development of services designed to enhance the value or convenience of the Fidelity funds as investment vehicles. These services include 24-hour access to account information and market information through telephone representatives and over the Internet, investor education materials and asset allocation tools, and the expanded availability of Fidelity Investor Centers.
In 2014, the Board formed an ad hoc Committee on Transfer Agency Fees to review the variety of transfer agency fee structures throughout the industry and Fidelity's competitive positioning with respect to industry participants.
Investment in a Large Fund Family. The Board considered the benefits to shareholders of investing in a Fidelity fund, including the benefits of investing in a fund that is part of a large family of funds offering a variety of investment disciplines and providing a large variety of mutual fund investor services. The Board noted that Fidelity had taken, or had made recommendations that resulted in the Fidelity funds taking, a number of actions over the previous year that benefited particular funds, including (i) continuing to dedicate additional resources to investment research and to the support of the senior management team that oversees asset management; (ii) continuing efforts to enhance Fidelity's global research capabilities; (iii) launching new funds and making other enhancements to meet client needs; (iv) reducing management fees and total expenses for certain index funds and diversified international funds; (v) continuing to launch dedicated lower cost underlying funds to meet portfolio construction needs related to expanding underlying fund options for Fidelity funds of funds, specifically for the Freedom Fund product lines; (vi) rationalizing product lines and gaining increased efficiencies through fund mergers; (vii) launching active fixed-income exchange-traded funds; (viii) continuing to develop, acquire and implement systems and technology to improve services to the funds and information security and to increase efficiency; (ix) implementing investment enhancements to further strengthen Fidelity's target date product line to increase investors' probability of success in achieving their goals; (x) modifying the eligibility criteria for certain share classes to accommodate roll-over assets from employer-sponsored retirement plans; (xi) launching a new Class W of the Freedom Index Funds to attract and retain Fidelity record-kept retirement plan assets; and (xii) implementing changes to Fidelity's money market product line in response to recent money market regulatory reforms.
Investment Performance. The Board considered whether the fund has operated in accordance with its investment objective, as well as its record of compliance with its investment restrictions and its performance history.
Annual Report
The Board took into account discussions with representatives of the Investment Advisers about fund investment performance that occur at Board meetings throughout the year. In this regard the Board noted that as part of regularly scheduled fund reviews and other reports to the Board on fund performance, the Board considers annualized return information for the fund, for different time periods, measured against a securities market index ("benchmark index") and a peer group of funds with similar objectives ("peer group"), if any. In its evaluation of fund investment performance, the Board gave particular attention to information indicating changes in performance of certain Fidelity funds for specific time periods and discussed with the Investment Advisers the reasons for any overperformance or underperformance.
In addition to reviewing absolute and relative fund performance, the Independent Trustees periodically consider the appropriateness of fund performance metrics in evaluating the results achieved. In general, the Independent Trustees believe that fund performance should be evaluated based on net performance (after fees and expenses) of both the highest performing and lowest performing fund share classes, where applicable, compared to appropriate benchmark indices, over appropriate time periods that may include full market cycles, and compared to peer groups, as applicable, over the same periods, taking into account relevant factors including the following: general market conditions; issuer-specific information; and fund cash flows and other factors.
The Independent Trustees recognize that shareholders evaluate performance on a net basis over their own holding periods, for which one-, three-, and five-year periods are often used as a proxy. For this reason, the performance information reviewed by the Board also included net cumulative calendar year total return information for the fund and an appropriate benchmark index and peer group for the most recent one-year period, as shown below. Returns are shown compared to the 25th percentile (top of box, 75% beaten) and 75th percentile (bottom of box, 25% beaten) of the peer universe.
Annual Report
Board Approval of Investment Advisory Contracts and
Management Fees - continued
Fidelity Series Intrinsic Opportunities Fund
The Board also considered that the fund's management fee is subject to upward or downward adjustment depending upon whether, and to what extent, the fund's investment performance for the performance period exceeds, or is exceeded by, a securities index, thus leading to a performance adjustment for the same period. The Board noted that the performance adjustment provides FMR with a strong economic incentive to seek to achieve superior performance for the fund's shareholders and helps to more closely align the interests of FMR and the shareholders of the fund.
Based on its review, the Board concluded that the nature, extent, and quality of services provided to the fund under the Advisory Contracts should benefit the shareholders of the fund.
Competitiveness of Management Fee and Total Expense Ratio. The Board considered the fund's management fee and total expense ratio compared to "mapped groups" of competitive funds and classes created for the purpose of facilitating the Trustees' competitive analysis of management fees and total expenses. Fidelity creates "mapped groups" by combining similar Lipper investment objective categories that have comparable investment mandates. Combining Lipper investment objective categories aids the Board's management fee and total expense ratio comparisons by broadening the competitive group used for comparison.
Management Fee. The Board considered two proprietary management fee comparisons for the 12-month periods shown in basis points (BP) in the chart below. The group of Lipper funds used by the Board for management fee comparisons is referred to below as the "Total Mapped Group." The Total Mapped Group comparison focuses on a fund's standing in terms of gross management fees before expense reimbursements or caps, and without giving effect to the fund's performance adjustment, relative to the total universe of funds with comparable investment mandates, regardless of whether their management fee structures also are comparable. Funds with comparable investment mandates offer exposure to similar types of securities. Funds with comparable management fee structures have similar management fee contractual arrangements (e.g., flat rate charged for advisory services, all-inclusive fee rate, etc.). "TMG %" represents the percentage of funds in the Total Mapped Group that had management fees that were lower than the fund's. For example, a hypothetical TMG % of 20% would mean that 80% of the funds in the Total Mapped Group had higher, and 20% had lower, management fees than the fund. The fund's actual TMG %s and the number of funds in the Total Mapped Group are in the chart below. The "Asset-Size Peer Group" (ASPG) comparison focuses on a fund's standing relative to a subset of non-Fidelity funds within the Total Mapped Group that are similar in size and management fee structure without taking into account performance adjustments, if any. For example, if a fund is in the first quartile of the ASPG, the fund's management fee ranks in the least expensive or lowest 25% of funds in the ASPG. The ASPG represents at least 15% of the funds in the Total Mapped Group with comparable asset size and management fee structures, subject to a minimum of 50 funds (or all funds in the Total Mapped Group if fewer than 50). Additional information, such as the ASPG quartile in which the fund's management fee rate ranked and the impact of the fund's performance adjustment, is also included in the chart and considered by the Board.
Annual Report
Fidelity Series Intrinsic Opportunities Fund
Annual Report
Board Approval of Investment Advisory Contracts and
Management Fees - continued
The Board noted that the fund's management fee rate ranked below the median of its Total Mapped Group and below the median of its ASPG for 2014. The Board also noted the effect of the fund's performance adjustment, if any, on the fund's management fee ranking.
The Board noted that, in 2014, the ad hoc Committee on Group Fee was formed by it and other Fidelity fund boards to conduct an in-depth review of the "group fee" component of the management fee of funds with such management fee structures. Committee focus included the mechanics of the group fee, the competitive landscape of group fee structures, Fidelity funds with no group fee component and investment products not included in group fee assets. The Board also considered that, for funds subject to the group fee, FMR agreed to voluntarily waive fees over a specified period of time in amounts designed to account for assets converted from certain funds to certain collective investment trusts.
The Board also noted that, in 2013, the ad hoc Committee on Management Fees was formed to conduct an in-depth review of the management fee rates of Fidelity's active equity mutual funds. The Committee focused on the following areas: (i) standard fee structures; (ii) research consumption and trading evolution; (iii) management fee competitiveness/profitability by category; and (iv) factors that drive institutional pricing.
Based on its review, the Board concluded that the fund's management fee is fair and reasonable in light of the services that the fund receives and the other factors considered.
Total Expense Ratio. In its review of each class's total expense ratio, the Board considered the fund's management fee as well as other fund or class expenses, as applicable, such as transfer agent fees, pricing and bookkeeping fees, and custodial, legal, and audit fees. The Board noted the impact of the fund's performance adjustment. The Board also noted that Fidelity may agree to waive fees and expenses from time to time, and the extent to which, if any, it has done so for the fund. As part of its review, the Board also considered the current and historical total expense ratios of each class of the fund compared to competitive fund median expenses. Each class of the fund is compared to those funds and classes in the Total Mapped Group (used by the Board for management fee comparisons) that have a similar sales load structure.
The Board noted that the total expense ratio of each class ranked below its competitive median for 2014.
Fees Charged to Other Fidelity Clients. The Board also considered Fidelity fee structures and other information with respect to clients of Fidelity, such as other funds advised or subadvised by Fidelity, pension plan clients, and other institutional clients with similar mandates. The Board noted the findings of the 2013 ad hoc joint committee (created with the board of other Fidelity funds), which reviewed and compared Fidelity's institutional investment advisory business with its business of providing services to the Fidelity funds, including the differences in services provided, fees charged, and costs incurred, as well as competition in their respective marketplaces.
Annual Report
Based on its review of total expense ratios and fees charged to other Fidelity clients, the Board concluded that the total expense ratio of each class of the fund was reasonable in light of the services that the fund and its shareholders receive and the other factors considered.
Costs of the Services and Profitability. The Board considered the revenues earned and the expenses incurred by Fidelity in conducting the business of developing, marketing, distributing, managing, administering and servicing the fund and servicing the fund's shareholders. The Board also considered the level of Fidelity's profits in respect of all the Fidelity funds.
On an annual basis, Fidelity presents to the Board information about the profitability of its relationship with the fund. Fidelity calculates profitability information for each fund, as well as aggregate profitability information for groups of Fidelity funds and all Fidelity funds, using a series of detailed revenue and cost allocation methodologies which originate with the books and records of Fidelity on which Fidelity's audited financial statements are based. The Audit Committee of the Board reviews any significant changes from the prior year's methodologies.
PricewaterhouseCoopers LLP (PwC), independent registered public accounting firm and auditor to Fidelity and certain Fidelity funds, has been engaged annually by the Board as part of the Board's assessment of Fidelity's profitability analysis. PwC's engagement includes the review and assessment of the methodologies used by Fidelity in determining the revenues and expenses attributable to Fidelity's mutual fund business, and completion of agreed-upon procedures in respect of the mathematical accuracy of fund profitability and its conformity to established allocation methodologies. After considering PwC's reports issued under the engagement and information provided by Fidelity, the Board concluded that while other allocation methods may also be reasonable, Fidelity's profitability methodologies are reasonable in all material respects.
The Board also reviewed Fidelity's non-fund businesses and fall-out benefits related to the mutual fund business as well as cases where Fidelity's affiliates may benefit from or be related to the fund's business.
The Board considered the costs of the services provided by and the profits realized by Fidelity in connection with the operation of the fund and was satisfied that the profitability was not excessive.
Economies of Scale. The Board considered whether there have been economies of scale in respect of the management of the Fidelity funds, whether the Fidelity funds (including the fund) have appropriately benefited from any such economies of scale, and whether there is potential for realization of any further economies of scale. The Board considered the extent to which the fund will benefit from economies of scale as assets grow through increased services to the fund, through waivers or reimbursements, or through fee or expense ratio reductions. The Board also noted that in 2013, it and the boards of other Fidelity funds created an ad hoc committee (the Economies of Scale Committee) to analyze whether Fidelity attains economies of scale in respect of the management and servicing of the Fidelity funds, whether the Fidelity funds have appropriately benefited from such economies of scale, and whether there is potential for realization of any further economies of scale.
Annual Report
Board Approval of Investment Advisory Contracts and
Management Fees - continued
The Board recognized that the fund's management contract incorporates a "group fee" structure, which provides for lower group fee rates as total group assets increase, and for higher group fee rates as total group assets decrease (with "group assets" defined to include fund assets under FMR's management plus sector fund assets previously under FMR's management and currently managed by Fidelity SelectCo, LLC). FMR calculates the group fee rates based on a tiered asset "breakpoint" schedule that varies based on asset class. The Board considered that the group fee is designed to deliver the benefits of economies of scale to fund shareholders when total Fidelity fund assets increase, even if assets of any particular fund are unchanged or have declined, because some portion of Fidelity's costs are attributable to services provided to all Fidelity funds, and all funds benefit if those costs can be allocated among more assets. The Board also considered that although the fund is offered only to other Fidelity funds, it continues to incur investment management expenses. The Board further noted that the fund may continue to realize benefits from the group fee structure, even though assets may not be expected to grow significantly at the fund level. The Board concluded that, given the group fee structure, fund shareholders will benefit from lower management fees as group assets increase at the fund complex level, regardless of whether Fidelity achieves any such economies of scale.
The Board concluded, taking into account the analysis of the Economies of Scale Committee, that economies of scale, if any, are being appropriately shared between fund shareholders and Fidelity.
Additional Information Requested by the Board. In order to develop fully the factual basis for consideration of the Fidelity funds' Advisory Contracts, the Board requested and received additional information on certain topics, including: (i) fund performance trends and Fidelity's long-term strategies for certain funds; (ii) the various share classes employed by Fidelity and the attributes of each class, together with similar information on the distribution and servicing payments made by Fidelity or the funds to third-party participants in the distribution channels; (iii) fund profitability, and fund performance in relation to fund profitability; (iv) the methodology with respect to evaluating competitive fund data and peer group classifications and fee comparisons; (v) annual fund profitability margins, with particular focus on certain funds with negative margins; (vi) the realization of fall-out benefits in certain Fidelity business units; (vii) economies of scale and the way in which they are shared with fund shareholders; (viii) Fidelity's group fee structures, including the group fee schedule of breakpoints; (ix) the impact of cost containment measures on the funds; and (x) the transfer agent fee structure.
Annual Report
Based on its evaluation of all of the conclusions noted above, and after considering all factors it believed relevant, the Board concluded that the advisory fee structures are fair and reasonable, and that the fund's Advisory Contracts should be renewed.
Annual Report
Investment Adviser
Fidelity Management & Research Company
Boston, MA
Investment Sub-Advisers
FMR Co., Inc.
FMR Investment Management
(U.K.) Limited
Fidelity Management & Research
(Hong Kong) Limited
Fidelity Management & Research
(Japan) Limited
General Distributor
Fidelity Distributors Corporation
Smithfield, RI
Transfer and Service Agents
Fidelity Investments Institutional Operations Company, Inc.
Boston, MA
Fidelity Service Company, Inc.
Boston, MA
Custodian
Brown Brothers Harriman & Co.
Boston, MA
(Fidelity Investment logo)(registered trademark)
Corporate Headquarters
245 Summer St., Boston, MA 02210
www.fidelity.com
O2T-ANN-0915
1.951012.102
Fidelity®
Low-Priced Stock Fund
Annual Report
July 31, 2015
(Fidelity Cover Art)
Contents
Performance | (Click Here) | How the fund has done over time. |
Management's Discussion of Fund Performance | (Click Here) | The Portfolio Manager's review of fund performance and strategy. |
Shareholder Expense Example | (Click Here) | An example of shareholder expenses. |
Investment Changes | (Click Here) | A summary of major shifts in the fund's investments over the past six months. |
Investments | (Click Here) | A complete list of the fund's investments with their market values. |
Financial Statements | (Click Here) | Statements of assets and liabilities, operations, and changes in net assets, as well as financial highlights. |
Notes | (Click Here) | Notes to the financial statements. |
Report of Independent Registered Public Accounting Firm | (Click Here) | |
Trustees and Officers | (Click Here) | |
Distributions | (Click Here) | |
Board Approval of Investment Advisory Contracts and Management Fees | (Click Here) | |
To view a fund's proxy voting guidelines and proxy voting record for the 12-month period ended June 30, visit http://www.fidelity.com/proxyvotingresults or visit the Securities and Exchange Commission's (SEC) web site at http://www.sec.gov. You may also call 1-800-544-8544 to request a free copy of the proxy voting guidelines.
Standard & Poor's, S&P and S&P 500 are registered service marks of The McGraw-Hill Companies, Inc. and have been licensed for use by Fidelity Distributors Corporation.
Other third-party marks appearing herein are the property of their respective owners.
All other marks appearing herein are registered or unregistered trademarks or service marks of FMR LLC or an affiliated company. © 2015 FMR LLC. All rights reserved.
Annual Report
This report and the financial statements contained herein are submitted for the general information of the shareholders of the fund. This report is not authorized for distribution to prospective investors in the fund unless preceded or accompanied by an effective prospectus.
A fund files its complete schedule of portfolio holdings with the SEC for the first and third quarters of each fiscal year on Form N-Q. Forms N-Q are available on the SEC's web site at http://www.sec.gov. A fund's Forms N-Q may be reviewed and copied at the SEC's Public Reference Room in Washington, DC. Information regarding the operation of the SEC's Public Reference Room may be obtained by calling 1-800-SEC-0330. For a complete list of a fund's portfolio holdings, view the most recent holdings listing, semiannual report, or annual report on Fidelity's web site at http://www.fidelity.com, http://www.advisor.fidelity.com, or http://www.401k.com, as applicable.
NOT FDIC INSURED • MAY LOSE VALUE • NO BANK GUARANTEE
Neither the fund nor Fidelity Distributors Corporation is a bank.
Annual Report
Average annual total return reflects the change in the value of an investment, assuming reinvestment of the class' distributions from dividend income and capital gains (the profits earned upon the sale of securities that have grown in value, if any) and assuming a constant rate of performance each year. The $10,000 table and the fund's returns do not reflect the deduction of taxes that a shareholder would pay on fund distributions or the redemption of fund shares. During periods of reimbursement by Fidelity, a fund's total return will be greater than it would be had the reimbursement not occurred. How a fund did yesterday is no guarantee of how it will do tomorrow.
Average Annual Total Returns
Periods ended July 31, 2015 | Past 1
year | Past 5
years | Past 10
years |
Fidelity® Low-Priced Stock Fund | 9.32% | 15.90% | 9.12% |
$10,000 Over 10 Years
Let's say hypothetically that $10,000 was invested in Fidelity® Low-Priced Stock Fund, a class of the fund, on July 31, 2005. The chart shows how the value of your investment would have changed, and also shows how the Russell 2000® Index performed over the same period.
Annual Report
Market Recap: The U.S. equity market gained strongly for the 12 months ending July 31, 2015, as stocks recovered from volatility in late 2014 and early 2015, supported by a still-positive economic backdrop. The S&P 500® Index returned 11.21%, with growth stocks in the index far outpacing value-oriented names on prospects for continued U.S. economic growth. Consequently, the growth-oriented Nasdaq Composite Index® rose 18.71%, outpacing the broader S&P 500®, as well as the 12.03% advance of the smaller-cap Russell 2000® Index. Within the S&P 500®, seven of 10 sectors notched a gain, with significant performance variation. Health care (+27%) led the way, aided by merger activity. Consumer discretionary (+24%) benefited from spending linked to a seven-year low in unemployment. Strong first halves for the consumer staples sector and the real estate segment of financials yielded above-market returns (19% and 12%, respectively) for the full-year period. Conversely, energy (-26%) significantly lagged, due to a roughly 55% decline for U.S. crude-oil prices. Materials (-4%) also lost ground. At period end, investors remained focused on the slowing rate of U.S. earnings growth, the possible effect of a relatively stronger U.S. dollar on exports and inflation, and whether an economic slowdown in China would create ripples for the global economy.
Comments from Lead Portfolio Manager Joel Tillinghast: For the year, the fund's share classes fell short of the benchmark Russell 2000® Index. (For specific class-level results, please see the Performance section of this report.) Relative results were hurt in part by the fund's roughly 11% average cash stake in a rising market, weak stock picks in information technology and a general avoidance of biotechnology stocks, a category that soared during the period. The fund's biggest individual detractor was Seagate Technology, a top holding. The computer hard-drive maker returned roughly -11% for the year on a waning market for PCs, pricing pressure in disk drives and a headwind from a stronger U.S. dollar. The fund's foreign holdings also were hurt by the dollar's gain. Contributing to results were stock picks in consumer staples and an average underweighting in the hard-hit energy sector. Among individual stocks, the top-performer by far was our biggest position, UnitedHealth Group. Shares of the health insurer hit record highs over the period, as the company posted solid earnings growth and better-than-expected results in its services business.
The views expressed above reflect those of the portfolio manager(s) only through the end of the period as stated on the cover of this report and do not necessarily represent the views of Fidelity or any other person in the Fidelity organization. Any such views are subject to change at any time based upon market or other conditions and Fidelity disclaims any responsibility to update such views. These views may not be relied on as investment advice and, because investment decisions for a Fidelity fund are based on numerous factors, may not be relied on as an indication of trading intent on behalf of any Fidelity fund.
Annual Report
Shareholder Expense Example
As a shareholder of the Fund, you incur two types of costs: (1) transaction costs, including redemption fees and (2) ongoing costs, including management fees and other Fund expenses. This Example is intended to help you understand your ongoing costs (in dollars) of investing in the Fund and to compare these costs with the ongoing costs of investing in other mutual funds.
The Example is based on an investment of $1,000 invested at the beginning of the period and held for the entire period (February 1, 2015 to July 31, 2015).
Actual Expenses
The first line of the accompanying table for each class of the Fund provides information about actual account values and actual expenses. You may use the information in this line, together with the amount you invested, to estimate the expenses that you paid over the period. Simply divide your account value by $1,000.00 (for example, an $8,600 account value divided by $1,000.00 = 8.6), then multiply the result by the number in the first line for a class of the Fund under the heading entitled "Expenses Paid During Period" to estimate the expenses you paid on your account during this period. A small balance maintenance fee of $12.00 that is charged once a year may apply for certain accounts with a value of less than $2,000. This fee is not included in the table below. If it was, the estimate of expenses you paid during the period would be higher, and your ending account value lower, by this amount. In addition, the Fund, as a shareholder in the underlying Fidelity Central Funds, will indirectly bear its pro-rata share of the fees and expenses incurred by the underlying Fidelity Central Funds. These fees and expenses are not included in the Fund's annualized expense ratio used to calculate the expense estimate in the table below.
Hypothetical Example for Comparison Purposes
The second line of the accompanying table for each class of the Fund provides information about hypothetical account values and hypothetical expenses based on a Class' actual expense ratio and an assumed rate of return of 5% per year before expenses, which is not the Class' actual return. The hypothetical account values and expenses may not be used to estimate the actual ending account balance or expenses you paid for the period. You may use this information to compare the ongoing costs of investing in the Fund and other funds. To do so, compare this 5% hypothetical example with the 5% hypothetical examples that appear in the shareholder reports of the other funds. A small balance maintenance fee of $12.00 that is charged once a year may apply for certain accounts with a value of less than $2,000. This fee is not included in the table below. If it was, the estimate of expenses you paid during the period would be higher, and your ending account value lower, by this amount. In addition, the Fund, as a shareholder in the underlying Fidelity Central Funds, will indirectly bear its pro-rata share of the fees and expenses incurred by the underlying Fidelity Central Funds. These fees and expenses are not included in the Fund's annualized expense ratio used to calculate the expense estimate in the table below.
Please note that the expenses shown in the table are meant to highlight your ongoing costs only and do not reflect any transaction costs. Therefore, the second line of the table is useful in comparing ongoing costs only, and will not help you determine the relative total costs of owning different funds. In addition, if these transactional costs were included, your costs would have been higher.
Annual Report
Shareholder Expense Example - continued
| Annualized
Expense Ratio B | Beginning
Account Value
February 1, 2015 | Ending
Account Value
July 31, 2015 | Expenses Paid
During Period*
February 1, 2015
to July 31, 2015 |
Low-Priced Stock | .78% | | | |
Actual | | $ 1,000.00 | $ 1,081.10 | $ 4.02 |
Hypothetical A | | $ 1,000.00 | $ 1,020.93 | $ 3.91 |
Class K | .68% | | | |
Actual | | $ 1,000.00 | $ 1,081.80 | $ 3.51 |
HypotheticalA | | $ 1,000.00 | $ 1,021.42 | $ 3.41 |
A 5% return per year before expenses
B Annualized expense ratio reflects expenses net of applicable fee waivers.
* Expenses are equal to each Class' annualized expense ratio, multiplied by the average account value over the period, multiplied by 181/365 (to reflect the one-half year period).
Annual Report
Investment Changes (Unaudited)
Top Ten Stocks as of July 31, 2015 |
| % of fund's
net assets | % of fund's net assets
6 months ago |
UnitedHealth Group, Inc. | 5.1 | 4.8 |
Next PLC | 4.3 | 3.9 |
Seagate Technology LLC | 3.2 | 3.7 |
Best Buy Co., Inc. | 2.3 | 2.6 |
Microsoft Corp. | 2.2 | 2.4 |
Ross Stores, Inc. | 2.2 | 2.0 |
Metro, Inc. Class A (sub. vtg.) | 1.8 | 1.8 |
Barratt Developments PLC | 1.7 | 1.3 |
Unum Group | 1.5 | 1.4 |
DCC PLC (United Kingdom) | 1.4 | 0.9 |
| 25.7 | |
Top Five Market Sectors as of July 31, 2015 |
| % of fund's
net assets | % of fund's net assets
6 months ago |
Consumer Discretionary | 26.4 | 26.1 |
Information Technology | 18.9 | 19.2 |
Financials | 12.4 | 11.8 |
Health Care | 11.7 | 10.8 |
Industrials | 7.8 | 7.5 |
Asset Allocation (% of fund's net assets) |
As of July 31, 2015* | As of January 31, 2015** |
 | Stocks 90.7% | |  | Stocks 89.3% | |
 | Bonds 0.0%† | |  | Bonds 0.0%† | |
 | Short-Term
Investments and
Net Other Assets (Liabilities) 9.3% | |  | Short-Term
Investments and
Net Other Assets (Liabilities) 10.7% | |
* Foreign investments | 43.2% | | ** Foreign investments | 41.5% | |
† Amount represents less than 0.1% |

Annual Report
Investments July 31, 2015
Showing Percentage of Net Assets
Common Stocks - 90.6% |
| Shares | | Value (000s) |
CONSUMER DISCRETIONARY - 26.4% |
Auto Components - 1.5% |
ASTI Corp. (e) | 1,206,000 | | $ 2,228 |
ATLASBX Co. Ltd. | 270,000 | | 8,255 |
Gentex Corp. | 300,000 | | 4,824 |
Hi-Lex Corp. | 1,237,100 | | 39,728 |
Horizon Global Corp. (a) | 630,877 | | 7,899 |
INFAC Corp. | 325,139 | | 1,614 |
INZI Controls Co. Ltd. (e) | 1,516,000 | | 6,514 |
Johnson Controls, Inc. | 6,606,900 | | 301,010 |
Motonic Corp. (e) | 3,250,000 | | 32,471 |
Murakami Corp. (e) | 838,000 | | 14,734 |
Nippon Seiki Co. Ltd. | 2,931,500 | | 58,637 |
Piolax, Inc. (e) | 920,900 | | 47,481 |
S&T Holdings Co. Ltd. (e) | 834,300 | | 16,528 |
Samsung Climate Control Co. Ltd. (e) | 499,950 | | 4,502 |
Sewon Precision Industries Co. Ltd. (a)(e) | 500,000 | | 10,763 |
Shoei Co. Ltd. | 363,900 | | 6,433 |
SJM Co. Ltd. (e) | 1,282,000 | | 7,201 |
SJM Holdings Co. Ltd. (e) | 1,332,974 | | 5,807 |
Strattec Security Corp. | 162,600 | | 11,429 |
Sungwoo Hitech Co. Ltd. | 1,888,517 | | 14,593 |
TBK Co. Ltd. | 1,028,800 | | 4,732 |
The Goodyear Tire & Rubber Co. | 444,127 | | 13,382 |
Yachiyo Industry Co. Ltd. | 944,500 | | 8,124 |
Yutaka Giken Co. Ltd. (e) | 1,364,800 | | 28,522 |
| | 657,411 |
Distributors - 0.3% |
Chori Co. Ltd. | 478,200 | | 7,385 |
Doshisha Co. Ltd. | 1,051,400 | | 19,512 |
Educational Development Corp. (e) | 356,392 | | 1,700 |
Nakayamafuku Co. Ltd. (e) | 1,118,600 | | 7,870 |
SPK Corp. | 236,200 | | 4,477 |
Uni-Select, Inc. (e) | 1,785,900 | | 80,306 |
| | 121,250 |
Diversified Consumer Services - 0.4% |
American Public Education, Inc. (a) | 47,879 | | 1,239 |
Career Education Corp. (a) | 1,234,300 | | 3,925 |
Clip Corp. (e) | 302,600 | | 2,669 |
Cross-Harbour Holdings Ltd. | 596,400 | | 762 |
DeVry, Inc. | 730,100 | | 22,180 |
Houghton Mifflin Harcourt Co. (a) | 1,350,000 | | 35,276 |
Common Stocks - continued |
| Shares | | Value (000s) |
CONSUMER DISCRETIONARY - continued |
Diversified Consumer Services - continued |
Meiko Network Japan Co. Ltd. | 920,900 | | $ 10,217 |
Novarese, Inc. (d) | 237,800 | | 1,754 |
Regis Corp. (a) | 535,000 | | 7,827 |
Shingakukai Co. Ltd. | 175,300 | | 900 |
Steiner Leisure Ltd. (a)(e) | 1,285,452 | | 74,171 |
Step Co. Ltd. (e) | 1,197,100 | | 10,335 |
Weight Watchers International, Inc. (a)(d)(e) | 4,489,100 | | 17,956 |
YBM Sisa.com, Inc. | 808,655 | | 2,906 |
| | 192,117 |
Hotels, Restaurants & Leisure - 0.5% |
Ambassadors Group, Inc. (a)(e) | 1,225,000 | | 2,842 |
Ark Restaurants Corp. (e) | 194,400 | | 4,734 |
BRONCO BILLY Co. Ltd. (d) | 97,200 | | 1,977 |
Create Restaurants Holdings, Inc. | 453,300 | | 10,706 |
Flanigan's Enterprises, Inc. | 46,500 | | 1,351 |
Hiday Hidaka Corp. (e) | 1,661,271 | | 40,481 |
Ibersol SGPS SA | 529,500 | | 5,030 |
Interval Leisure Group, Inc. | 850,000 | | 18,122 |
Intralot SA (a) | 1,457,500 | | 2,657 |
Koshidaka Holdings Co. Ltd. | 655,180 | | 14,723 |
Kura Corp. Ltd. | 193,800 | | 5,973 |
Nathan's Famous, Inc. (a) | 5,000 | | 154 |
Ohsho Food Service Corp. | 576,200 | | 19,341 |
Ruby Tuesday, Inc. (a)(e) | 3,735,000 | | 27,415 |
Sportscene Group, Inc. Class A (e) | 368,500 | | 1,550 |
St. Marc Holdings Co. Ltd. | 750,000 | | 26,143 |
The Monogatari Corp. (e) | 495,400 | | 17,928 |
Toridoll.corporation | 1,050,000 | | 15,080 |
| | 216,207 |
Household Durables - 3.6% |
Abbey PLC (e) | 1,973,500 | | 31,427 |
Barratt Developments PLC (e) | 77,445,600 | | 767,988 |
Bellway PLC | 4,533,400 | | 170,689 |
Blyth, Inc. (a) | 414,400 | | 1,910 |
D.R. Horton, Inc. | 4,859,600 | | 144,282 |
Dorel Industries, Inc. Class B (sub. vtg.) | 2,992,900 | | 76,319 |
Emak SpA | 4,876,400 | | 4,734 |
First Juken Co. Ltd. (e) | 1,556,300 | | 17,668 |
Helen of Troy Ltd. (a)(e) | 2,604,700 | | 228,641 |
Henry Boot PLC | 3,727,300 | | 13,853 |
Common Stocks - continued |
| Shares | | Value (000s) |
CONSUMER DISCRETIONARY - continued |
Household Durables - continued |
HTL International Holdings Ltd. (e) | 26,704,700 | | $ 4,283 |
Libbey, Inc. | 690,000 | | 25,675 |
NACCO Industries, Inc. Class A | 285,500 | | 14,495 |
P&F Industries, Inc. Class A (a)(e) | 349,000 | | 2,998 |
Panasonic Corp. | 1,326,000 | | 15,493 |
Sanei Architecture Planning Co. Ltd. (e) | 1,345,300 | | 15,750 |
Stanley Furniture Co., Inc. (a) | 449,766 | | 1,376 |
Steinhoff International Holdings Ltd. | 3,330,946 | | 20,162 |
Token Corp. (e) | 830,000 | | 54,313 |
| | 1,612,056 |
Internet & Catalog Retail - 0.2% |
Belluna Co. Ltd. (e) | 9,539,100 | | 57,188 |
Liberty Interactive Corp. Qvc G Series A (a) | 876,000 | | 25,448 |
PetMed Express, Inc. (d) | 48,600 | | 819 |
| | 83,455 |
Leisure Products - 0.3% |
Accell Group NV (e) | 2,226,400 | | 48,781 |
Arctic Cat, Inc. | 350,000 | | 10,014 |
Fenix Outdoor AB Class B | 32,298 | | 0 |
JAKKS Pacific, Inc. (a)(d) | 701,000 | | 6,905 |
Kabe Husvagnar AB (B Shares) | 307,998 | | 3,642 |
Mars Engineering Corp. | 519,500 | | 8,907 |
Mattel, Inc. | 890,300 | | 20,664 |
Miroku Corp. (e) | 780,000 | | 2,045 |
Smith & Wesson Holding Corp. (a)(d) | 1,109,300 | | 17,993 |
Trigano SA | 52,509 | | 2,307 |
| | 121,258 |
Media - 1.0% |
Chime Communications PLC | 4,061,100 | | 22,895 |
Cinderella Media Group Ltd. (e) | 17,670,000 | | 5,949 |
Corus Entertainment, Inc. Class B (non-vtg.) (d) | 651,000 | | 6,994 |
Crown Media Holdings, Inc. Class A (a) | 1,022,330 | | 4,570 |
Discovery Communications, Inc. Class A (a)(d) | 325,000 | | 10,732 |
DreamWorks Animation SKG, Inc. Class A (a) | 2,356,600 | | 56,818 |
Gannett Co., Inc. | 1,900,000 | | 24,035 |
GfK AG | 161,200 | | 6,869 |
Harte-Hanks, Inc. | 823,500 | | 3,862 |
Hyundai HCN | 2,723,979 | | 9,461 |
Intage Holdings, Inc. (e) | 1,852,300 | | 31,087 |
Ipsos SA | 9,787 | | 245 |
Common Stocks - continued |
| Shares | | Value (000s) |
CONSUMER DISCRETIONARY - continued |
Media - continued |
ITE Group PLC | 95,600 | | $ 275 |
Live Nation Entertainment, Inc. (a) | 1,220,000 | | 31,988 |
Pico Far East Holdings Ltd. | 20,598,000 | | 6,085 |
Proto Corp. | 459,000 | | 7,185 |
RKB Mainichi Broadcasting Corp. | 236,000 | | 1,809 |
Saga Communications, Inc. Class A | 424,800 | | 17,204 |
Sky Network Television Ltd. | 6,498,384 | | 26,252 |
Starz Series A (a) | 1,864,900 | | 75,435 |
STW Group Ltd. | 4,557,505 | | 2,515 |
Tegna, Inc. | 708,300 | | 20,633 |
Television Broadcasts Ltd. | 3,829,000 | | 20,251 |
TOW Co. Ltd. (e) | 2,252,700 | | 11,251 |
TVA Group, Inc. Class B (non-vtg.) (a) | 3,435,303 | | 13,449 |
WOWOW INC. | 94,700 | | 2,781 |
| | 420,630 |
Multiline Retail - 4.5% |
Hanwha Galleria Timeworld Co. Ltd. (e) | 305,000 | | 39,235 |
Lifestyle International Holdings Ltd. | 37,828,500 | | 61,581 |
Next PLC (e) | 15,164,200 | | 1,892,126 |
Watts Co. Ltd. (e) | 1,284,800 | | 10,812 |
| | 2,003,754 |
Specialty Retail - 11.8% |
Aarons, Inc. Class A | 462,300 | | 17,096 |
ABC-MART, Inc. | 124,200 | | 7,466 |
Abercrombie & Fitch Co. Class A (d)(e) | 6,988,500 | | 140,399 |
Adastria Co. Ltd. | 350,000 | | 16,916 |
Aeropostale, Inc. (a)(d)(e) | 7,829,900 | | 11,823 |
AT-Group Co. Ltd. | 1,190,000 | | 25,445 |
AutoZone, Inc. (a) | 828,865 | | 580,985 |
Bed Bath & Beyond, Inc. (a) | 6,077,700 | | 396,448 |
Best Buy Co., Inc. (e) | 31,558,400 | | 1,019,021 |
BMTC Group, Inc. (e) | 5,155,500 | | 60,706 |
Bonia Corp. Bhd | 2,503,000 | | 632 |
Bonjour Holdings Ltd. | 4,315,000 | | 262 |
Buffalo Co. Ltd. (e) | 103,500 | | 731 |
Cash Converters International Ltd. | 22,897,710 | | 11,716 |
Chico's FAS, Inc. | 1,980,000 | | 30,136 |
CST Brands, Inc. | 2,652,300 | | 100,469 |
Delek Automotive Systems Ltd. | 719,800 | | 8,013 |
Destination Maternity Corp. | 290,000 | | 2,862 |
Common Stocks - continued |
| Shares | | Value (000s) |
CONSUMER DISCRETIONARY - continued |
Specialty Retail - continued |
DSW, Inc. Class A | 189,700 | | $ 6,169 |
Folli Follie SA (e) | 4,089,700 | | 101,818 |
Formosa Optical Technology Co. Ltd. | 659,000 | | 1,499 |
Fourlis Holdings SA (a) | 485,800 | | 1,408 |
Francesca's Holdings Corp. (a) | 150,000 | | 1,824 |
GameStop Corp. Class A (d)(e) | 7,561,800 | | 346,709 |
GNC Holdings, Inc. | 1,138,300 | | 56,016 |
Goldlion Holdings Ltd. | 18,444,000 | | 8,184 |
Guess?, Inc. (e) | 7,569,200 | | 165,690 |
Halfords Group PLC | 1,243,300 | | 10,562 |
Hour Glass Ltd. | 8,307,200 | | 5,268 |
IA Group Corp. (e) | 804,000 | | 5,216 |
John David Group PLC | 2,644,500 | | 33,245 |
Jumbo SA (e) | 11,143,968 | | 80,910 |
K's Denki Corp. | 2,819,400 | | 89,745 |
Ku Holdings Co. Ltd. | 945,400 | | 6,026 |
Kyoto Kimono Yuzen Co. Ltd. (e) | 1,432,800 | | 11,861 |
Le Chateau, Inc. Class A (sub. vtg.) (a) | 1,862,700 | | 641 |
Leon's Furniture Ltd. | 289,200 | | 3,251 |
Lewis Group Ltd. | 1,197,200 | | 5,446 |
Mr. Bricolage SA (e) | 956,575 | | 14,004 |
Nafco Co. Ltd. (e) | 2,154,300 | | 35,808 |
Nishimatsuya Chain Co. Ltd. | 1,420,000 | | 13,669 |
Office Depot, Inc. (a) | 1,552,100 | | 12,417 |
Pal Co. Ltd. (e) | 1,200,000 | | 37,955 |
Party City Holdco, Inc. | 180,600 | | 3,724 |
Ross Stores, Inc. | 18,125,400 | | 963,546 |
Sally Beauty Holdings, Inc. (a) | 580,600 | | 17,296 |
Second Chance Properties Ltd. | 2,403,500 | | 534 |
Second Chance Properties Ltd. warrants 7/24/17 (a) | 8,528,200 | | 12 |
Select Comfort Corp. (a) | 958,400 | | 24,957 |
Silvano Fashion Group A/S | 7,460 | | 10 |
Sonic Automotive, Inc. Class A (sub. vtg.) | 964,700 | | 22,468 |
Staples, Inc. | 23,139,500 | | 340,382 |
Super Retail Group Ltd. | 1,448,164 | | 9,770 |
The Buckle, Inc. (d) | 782,800 | | 34,623 |
The Men's Wearhouse, Inc. | 184,900 | | 11,005 |
The Stanley Gibbons Group PLC | 1,038,900 | | 3,959 |
Urban Outfitters, Inc. (a) | 75,000 | | 2,447 |
USS Co. Ltd. | 9,713,700 | | 170,784 |
Williams-Sonoma, Inc. | 184,900 | | 15,654 |
Common Stocks - continued |
| Shares | | Value (000s) |
CONSUMER DISCRETIONARY - continued |
Specialty Retail - continued |
Workman Co. Ltd. (e) | 1,354,800 | | $ 85,485 |
Zumiez, Inc. (a) | 390,000 | | 10,179 |
| | 5,203,302 |
Textiles, Apparel & Luxury Goods - 2.3% |
Bijou Brigitte Modische Accessoires AG | 41,500 | | 2,396 |
Coach, Inc. | 2,170,300 | | 67,713 |
Daphne International Holdings Ltd. | 924,000 | | 184 |
Deckers Outdoor Corp. (a) | 38,300 | | 2,791 |
Embry Holdings Ltd. | 1,500,000 | | 793 |
F&F Co. Ltd. | 306,793 | | 4,512 |
Fossil Group, Inc. (a) | 2,164,200 | | 148,789 |
Geox SpA (a)(d) | 2,280,000 | | 9,265 |
Gildan Activewear, Inc. (e) | 12,969,700 | | 418,291 |
Hampshire Group Ltd. (a)(e) | 847,200 | | 212 |
Handsome Co. Ltd. (e) | 2,436,150 | | 83,048 |
JLM Couture, Inc. (a)(e) | 181,500 | | 472 |
Movado Group, Inc. | 75,090 | | 1,902 |
Portico International Holdings (a) | 11,334,500 | | 5,556 |
Steven Madden Ltd. (a) | 840,600 | | 35,036 |
Sun Hing Vision Group Holdings Ltd. (e) | 22,045,000 | | 8,958 |
Texwinca Holdings Ltd. | 56,174,000 | | 67,968 |
Tungtex Holdings Co. Ltd. | 12,412,000 | | 1,873 |
Van de Velde | 66,319 | | 4,129 |
Vera Bradley, Inc. (a)(d) | 1,090,900 | | 11,847 |
Victory City International Holdings Ltd. | 61,142,150 | | 9,464 |
Youngone Corp. | 500,000 | | 24,999 |
Youngone Holdings Co. Ltd. (e) | 889,600 | | 67,061 |
Yue Yuen Industrial (Holdings) Ltd. | 12,111,000 | | 39,369 |
| | 1,016,628 |
TOTAL CONSUMER DISCRETIONARY | | 11,648,068 |
CONSUMER STAPLES - 7.5% |
Beverages - 1.3% |
Baron de Ley SA (a) | 147,300 | | 14,616 |
C&C Group PLC | 3,334,666 | | 12,994 |
Kweichow Moutai Co. Ltd. | 275,110 | | 9,163 |
Monster Beverage Corp. (a) | 2,486,400 | | 381,787 |
Muhak Co. Ltd. (a)(e) | 2,759,180 | | 126,833 |
Olvi PLC (A Shares) | 26,469 | | 769 |
Common Stocks - continued |
| Shares | | Value (000s) |
CONSUMER STAPLES - continued |
Beverages - continued |
Spritzer Bhd | 2,350,100 | | $ 1,157 |
Synergy Co. (a) | 94,388 | | 882 |
Yantai Changyu Pioneer Wine Co. Ltd. (B Shares) | 494,860 | | 1,602 |
| | 549,803 |
Food & Staples Retailing - 4.6% |
Aoki Super Co. Ltd. | 189,000 | | 2,059 |
Belc Co. Ltd. (e) | 1,882,600 | | 66,533 |
Cosmos Pharmaceutical Corp. (e) | 1,453,300 | | 187,035 |
Create SD Holdings Co. Ltd. (e) | 2,050,900 | | 124,773 |
Daikokutenbussan Co. Ltd. | 644,500 | | 24,909 |
Dong Suh Companies, Inc. | 4,786,599 | | 170,768 |
Fyffes PLC (Ireland) (e) | 27,158,200 | | 41,727 |
Genky Stores, Inc. (d)(e) | 221,000 | | 27,461 |
Greggs PLC | 2,850,000 | | 60,307 |
Halows Co. Ltd. (e) | 1,497,100 | | 25,090 |
Jeronimo Martins SGPS SA | 1,840,800 | | 27,353 |
Kusuri No Aoki Co. Ltd. | 923,300 | | 47,903 |
Majestic Wine PLC (d)(e) | 3,875,095 | | 26,324 |
MARR SpA | 378,000 | | 6,999 |
Metro, Inc. Class A (sub. vtg.) (e) | 29,305,999 | | 797,492 |
Qol Co. Ltd. (e) | 1,856,100 | | 31,465 |
Retail Partners Co. Ltd. | 428,200 | | 4,111 |
Safeway, Inc.: | | | |
rights (a) | 16,069,900 | | 0 |
rights (a) | 16,069,900 | | 2,893 |
Sligro Food Group NV | 1,206,400 | | 46,373 |
Sundrug Co. Ltd. | 1,944,000 | | 113,407 |
Tesco PLC | 12,051,600 | | 40,529 |
Total Produce PLC | 9,917,100 | | 14,050 |
Valor Co. Ltd. | 215,200 | | 5,287 |
Walgreens Boots Alliance, Inc. | 145,600 | | 14,069 |
Welcia Holdings Co. Ltd. (d) | 486,000 | | 24,862 |
Yaoko Co. Ltd. | 1,535,400 | | 75,943 |
| | 2,009,722 |
Food Products - 1.5% |
Aryzta AG | 1,642,800 | | 83,424 |
Blue Buffalo Pet Products, Inc. | 92,600 | | 2,587 |
Cranswick PLC | 996,864 | | 25,686 |
Dean Foods Co. (d) | 1,900,000 | | 33,820 |
Devro PLC | 2,748,800 | | 13,018 |
Common Stocks - continued |
| Shares | | Value (000s) |
CONSUMER STAPLES - continued |
Food Products - continued |
Dutch Lady Milk Industries Bhd | 100,000 | | $ 1,226 |
Food Empire Holdings Ltd. (a)(e) | 48,347,000 | | 8,282 |
Fresh Del Monte Produce, Inc. (e) | 5,566,700 | | 219,996 |
Hilton Food Group PLC | 661,300 | | 4,549 |
Inventure Foods, Inc. (a) | 332,500 | | 3,268 |
Lifeway Foods, Inc. (a) | 60,000 | | 883 |
Nam Yang Dairy Products | 11,000 | | 6,953 |
Omega Protein Corp. (a) | 648,000 | | 9,215 |
Pacific Andes International Holdings Ltd. (a) | 114,542,500 | | 3,842 |
Pacific Andes Resources Development Ltd. (a) | 214,494,393 | | 8,443 |
Patties Food Ltd. | 3,448,534 | | 2,899 |
President Rice Products PCL | 1,183,000 | | 1,681 |
Rocky Mountain Chocolate Factory, Inc. (e) | 411,082 | | 5,336 |
Samyang Genex Co. Ltd. | 76,173 | | 12,314 |
Seaboard Corp. (a) | 43,928 | | 152,650 |
Select Harvests Ltd. (e) | 4,979,628 | | 48,010 |
Sunjin Co. Ltd. (e) | 813,630 | | 22,678 |
Synear Food Holdings Ltd. (a) | 38,027,000 | | 0 |
United Food Holdings Ltd. | 2,062,850 | | 301 |
| | 671,061 |
Household Products - 0.0% |
Energizer Holdings, Inc. | 218,700 | | 8,422 |
Personal Products - 0.1% |
Grape King Bio Ltd. | 1,748,000 | | 11,705 |
Nutraceutical International Corp. (a)(e) | 1,053,104 | | 25,454 |
Oriflame Cosmetics SA SDR (a) | 18,897 | | 278 |
Sarantis SA (e) | 2,225,700 | | 17,343 |
| | 54,780 |
Tobacco - 0.0% |
Karelia Tobacco Co., Inc. | 1,786 | | 427 |
TOTAL CONSUMER STAPLES | | 3,294,215 |
ENERGY - 3.1% |
Energy Equipment & Services - 1.3% |
AKITA Drilling Ltd. Class A (non-vtg.) | 1,636,500 | | 11,574 |
Atwood Oceanics, Inc. (d)(e) | 5,625,000 | | 117,000 |
Boustead Singapore Ltd. | 3,827,625 | | 3,348 |
Cal Dive International, Inc. (a)(e) | 5,572,400 | | 33 |
Carbo Ceramics, Inc. (d)(e) | 2,181,900 | | 71,675 |
Common Stocks - continued |
| Shares | | Value (000s) |
ENERGY - continued |
Energy Equipment & Services - continued |
Cathedral Energy Services Ltd. | 1,474,700 | | $ 2,176 |
Divestco, Inc. (a) | 3,222,500 | | 123 |
Farstad Shipping ASA (e) | 2,946,600 | | 8,658 |
Fugro NV (Certificaten Van Aandelen) (a)(d) | 1,760,800 | | 36,887 |
Geospace Technologies Corp. (a)(e) | 1,276,800 | | 22,267 |
Gulfmark Offshore, Inc. Class A (d)(e) | 2,525,430 | | 23,790 |
Nabors Industries Ltd. | 661,223 | | 7,677 |
Noble Corp. (d) | 2,251,800 | | 26,909 |
Oil States International, Inc. (a) | 1,841,700 | | 55,454 |
Paragon Offshore PLC (d) | 764,900 | | 570 |
Petrofac Ltd. | 523,500 | | 7,194 |
PHX Energy Services Corp. | 143,500 | | 500 |
Precision Drilling Corp. | 1,529,900 | | 7,779 |
ProSafe ASA | 8,972,300 | | 26,142 |
Shinko Plantech Co. Ltd. | 1,414,000 | | 11,672 |
Solstad Offshore ASA | 1,062,400 | | 4,344 |
Total Energy Services, Inc. (e) | 2,284,800 | | 25,838 |
Unit Corp. (a)(e) | 4,803,600 | | 94,775 |
| | 566,385 |
Oil, Gas & Consumable Fuels - 1.8% |
Adams Resources & Energy, Inc. | 146,451 | | 6,996 |
Beach Energy Ltd. (d) | 14,639,149 | | 10,433 |
Boardwalk Pipeline Partners, LP | 615,000 | | 8,561 |
Bonavista Energy Corp. (d) | 385,700 | | 1,445 |
Denbury Resources, Inc. (d) | 7,436,000 | | 29,298 |
Eni SpA | 17,377,900 | | 304,124 |
Fuji Kosan Co. Ltd. (e) | 708,300 | | 3,206 |
Fuji Oil Co. Ltd. | 3,304,500 | | 12,452 |
Great Eastern Shipping Co. Ltd. | 4,800,000 | | 26,056 |
Hankook Shell Oil Co. Ltd. | 60,000 | | 23,721 |
HollyFrontier Corp. | 293,600 | | 14,169 |
Marathon Oil Corp. | 645,162 | | 13,555 |
Michang Oil Industrial Co. Ltd. (e) | 173,900 | | 10,693 |
Newfield Exploration Co. (a) | 1,994,741 | | 65,408 |
Statoil ASA sponsored ADR (d) | 337,400 | | 5,705 |
Stone Energy Corp. (a) | 2,430,167 | | 14,071 |
Swift Energy Co. (a)(d)(e) | 4,137,100 | | 3,025 |
Tesoro Corp. | 1,409,278 | | 137,179 |
Tsakos Energy Navigation Ltd. | 800,000 | | 7,296 |
Uehara Sei Shoji Co. Ltd. | 899,000 | | 3,866 |
Common Stocks - continued |
| Shares | | Value (000s) |
ENERGY - continued |
Oil, Gas & Consumable Fuels - continued |
W&T Offshore, Inc. (d)(e) | 5,842,300 | | $ 22,025 |
Whiting Petroleum Corp. (a) | 328,300 | | 6,727 |
World Fuel Services Corp. | 2,100,622 | | 85,390 |
WPX Energy, Inc. (a) | 893,071 | | 7,770 |
| | 823,171 |
TOTAL ENERGY | | 1,389,556 |
FINANCIALS - 12.4% |
Banks - 1.6% |
ACNB Corp. | 121,700 | | 2,497 |
Bank of Ireland (a) | 381,749,000 | | 160,690 |
BBCN Bancorp, Inc. | 2,358,900 | | 36,209 |
Camden National Corp. | 44,468 | | 1,790 |
Cathay General Bancorp | 2,850,000 | | 91,514 |
Codorus Valley Bancorp, Inc. (e) | 481,920 | | 9,961 |
ConnectOne Bancorp, Inc. | 762,800 | | 16,293 |
Customers Bancorp, Inc. | 144,800 | | 3,642 |
Dimeco, Inc. | 26,938 | | 1,028 |
Eagle Bancorp, Inc. (a) | 508,500 | | 22,577 |
East West Bancorp, Inc. | 1,990,000 | | 89,072 |
EFG Eurobank Ergasias SA (a) | 311,404,200 | | 39,856 |
Farmers & Merchants Bancorp, Inc. | 42,600 | | 1,161 |
First Bancorp, Puerto Rico (a) | 7,428,572 | | 32,017 |
First NBC Bank Holding Co. (a) | 436,800 | | 16,686 |
First Niagara Financial Group, Inc. | 989,104 | | 9,604 |
First West Virginia Bancorp, Inc. | 52,771 | | 1,071 |
Investors Bancorp, Inc. | 2,163,700 | | 26,354 |
LCNB Corp. (e) | 706,726 | | 11,315 |
Norwood Financial Corp. (e) | 192,710 | | 5,907 |
OFG Bancorp (d)(e) | 2,478,342 | | 19,975 |
Pacific Premier Bancorp, Inc. (a) | 866,200 | | 16,466 |
Popular, Inc. (a) | 1,657,600 | | 50,756 |
SpareBank 1 SR-Bank ASA (primary capital certificate) | 1,370,900 | | 8,140 |
Sparebanken More (primary capital certificate) | 231,634 | | 6,465 |
Sparebanken Nord-Norge | 2,170,100 | | 10,786 |
Stock Yards Bancorp, Inc. | 72,300 | | 2,665 |
Trico Bancshares | 369,184 | | 9,152 |
Wilshire Bancorp, Inc. | 1,263,400 | | 14,681 |
| | 718,330 |
Common Stocks - continued |
| Shares | | Value (000s) |
FINANCIALS - continued |
Capital Markets - 0.1% |
AllianceBernstein Holding LP | 665,000 | | $ 18,268 |
Federated Investors, Inc. Class B (non-vtg.) | 347,200 | | 11,704 |
State Street Corp. | 348,800 | | 26,704 |
| | 56,676 |
Consumer Finance - 0.7% |
Aeon Credit Service (Asia) Co. Ltd. | 14,166,000 | | 10,489 |
EZCORP, Inc. (non-vtg.) Class A (a) | 917,100 | | 6,502 |
Green Dot Corp. Class A (a) | 2,378,100 | | 49,274 |
H&T Group PLC | 598,700 | | 1,889 |
Nicholas Financial, Inc. (a) | 240,900 | | 3,153 |
Santander Consumer U.S.A. Holdings, Inc. (a) | 3,594,907 | | 86,925 |
SLM Corp. (a) | 1,807,500 | | 16,502 |
Synchrony Financial (d) | 3,428,200 | | 117,793 |
| | 292,527 |
Diversified Financial Services - 0.4% |
Credit Analysis & Research Ltd. | 50,000 | | 1,111 |
Newship Ltd. (a) | 2,500 | | 976 |
NICE Holdings Co. Ltd. | 900,000 | | 17,174 |
NICE Information Service Co. Ltd. | 1,700,000 | | 17,860 |
Ricoh Leasing Co. Ltd. | 850,900 | | 27,119 |
The NASDAQ OMX Group, Inc. | 83,300 | | 4,251 |
Voya Financial, Inc. | 2,000,000 | | 93,900 |
| | 162,391 |
Insurance - 8.3% |
Admiral Group PLC | 508,500 | | 11,761 |
AEGON NV | 52,951,000 | | 407,285 |
AFLAC, Inc. | 330,700 | | 21,181 |
Amlin PLC | 1,997,400 | | 15,924 |
April (e) | 2,555,400 | | 34,520 |
Assurant, Inc. (e) | 4,834,600 | | 360,661 |
Axis Capital Holdings Ltd. (e) | 7,028,300 | | 404,549 |
CNO Financial Group, Inc. | 1,109,300 | | 19,790 |
Endurance Specialty Holdings Ltd. (e) | 2,394,300 | | 166,380 |
FBD Holdings PLC | 161,200 | | 1,354 |
Genworth Financial, Inc. Class A (a)(e) | 26,337,700 | | 184,627 |
Hartford Financial Services Group, Inc. | 6,300,000 | | 299,565 |
HCC Insurance Holdings, Inc. | 410,500 | | 31,674 |
Hiscox Ltd. | 1,175,128 | | 16,984 |
James River Group Holdings Ltd. | 243,228 | | 6,677 |
Lincoln National Corp. | 7,240,800 | | 407,802 |
Common Stocks - continued |
| Shares | | Value (000s) |
FINANCIALS - continued |
Insurance - continued |
MBIA, Inc. (a) | 380,900 | | $ 2,266 |
MetLife, Inc. | 828,800 | | 46,197 |
National Interstate Corp. | 850,000 | | 21,471 |
National Western Life Insurance Co. Class A | 137,070 | | 33,032 |
NN Group NV | 1,237,630 | | 38,187 |
Primerica, Inc. | 499,700 | | 22,601 |
Progressive Corp. | 601,700 | | 18,352 |
RenaissanceRe Holdings Ltd. (e) | 2,854,900 | | 306,331 |
Torchmark Corp. | 783,350 | | 48,262 |
Unum Group (e) | 18,545,000 | | 664,653 |
Validus Holdings Ltd. | 1,747,200 | | 80,983 |
| | 3,673,069 |
Real Estate Investment Trusts - 0.5% |
Annaly Capital Management, Inc. | 14,650,000 | | 145,768 |
Corrections Corp. of America | 462,300 | | 16,259 |
Nsi NV | 74,103 | | 332 |
VEREIT, Inc. | 4,306,900 | | 37,728 |
| | 200,087 |
Real Estate Management & Development - 0.4% |
Anabuki Kosan, Inc. | 477,500 | | 905 |
Century21 Real Estate Japan Ltd. (d) | 108,100 | | 1,055 |
Devine Ltd. (a) | 1,956,888 | | 930 |
Leopalace21 Corp. (a) | 4,722,200 | | 25,833 |
Relo Holdings Corp. (e) | 1,214,600 | | 130,540 |
Tejon Ranch Co. (a) | 195,100 | | 4,842 |
| | 164,105 |
Thrifts & Mortgage Finance - 0.4% |
ASAX Co. Ltd. | 89,000 | | 1,168 |
BofI Holding, Inc. (a) | 184,900 | | 22,715 |
Farmer Mac Class C (non-vtg.) | 630,900 | | 16,877 |
Genworth MI Canada, Inc. | 4,446,200 | | 105,218 |
Genworth Mortgage Insurance Ltd. (d) | 8,027,905 | | 21,007 |
Lake Sunapee Bank Group | 194,800 | | 2,903 |
Meridian Bancorp, Inc. (a) | 1,046,300 | | 13,644 |
| | 183,532 |
TOTAL FINANCIALS | | 5,450,717 |
Common Stocks - continued |
| Shares | | Value (000s) |
HEALTH CARE - 11.7% |
Biotechnology - 1.2% |
Amgen, Inc. | 2,762,700 | | $ 487,865 |
Baxalta, Inc. | 925,000 | | 30,368 |
| | 518,233 |
Health Care Equipment & Supplies - 1.2% |
Apex Biotechnology Corp. | 1,400,000 | | 1,791 |
Arts Optical International Holdings Ltd. (e) | 31,282,640 | | 12,106 |
Atrion Corp. | 9,296 | | 3,755 |
Audika SA | 287,200 | | 5,567 |
Boston Scientific Corp. (a) | 1,109,300 | | 19,235 |
Exactech, Inc. (a) | 46,200 | | 923 |
Hoshiiryou Sanki Co. Ltd. (e) | 331,400 | | 8,771 |
Huvitz Co. Ltd. (e) | 700,000 | | 12,997 |
Microlife Corp. | 3,130,500 | | 7,465 |
Mindray Medical International Ltd. sponsored ADR | 1,062,200 | | 28,987 |
Nakanishi, Inc. | 626,700 | | 24,980 |
Pacific Hospital Supply Co. Ltd. | 400,000 | | 686 |
Prim SA (e) | 1,597,100 | | 17,873 |
ResMed, Inc. | 218,300 | | 12,650 |
Span-America Medical System, Inc. (e) | 266,100 | | 4,705 |
St. Jude Medical, Inc. | 2,265,700 | | 167,254 |
St.Shine Optical Co. Ltd. | 2,224,000 | | 28,871 |
Supermax Corp. Bhd | 26,193,300 | | 16,872 |
Techno Medica Co. Ltd. | 42,800 | | 1,024 |
Top Glove Corp. Bhd | 1,000,000 | | 1,995 |
Utah Medical Products, Inc. (e) | 391,300 | | 21,392 |
Zimmer Biomet Holdings, Inc. | 1,149,044 | | 119,581 |
| | 519,480 |
Health Care Providers & Services - 8.2% |
A/S One Corp. | 236,100 | | 7,792 |
Aetna, Inc. | 4,722,200 | | 533,467 |
Almost Family, Inc. (a)(e) | 862,614 | | 37,748 |
Amedisys, Inc. (a) | 557,700 | | 24,332 |
Anthem, Inc. | 2,072,000 | | 319,647 |
Diversicare Healthcare Services, Inc. | 48,100 | | 586 |
DVx, Inc. (e) | 775,800 | | 8,933 |
Farmacol SA | 47,800 | | 636 |
Grupo Casa Saba SA de CV (a) | 11,937,000 | | 0 |
Hanger, Inc. (a)(e) | 2,674,510 | | 57,876 |
Hi-Clearance, Inc. | 1,489,000 | | 4,256 |
LHC Group, Inc. (a)(e) | 1,700,900 | | 68,529 |
Common Stocks - continued |
| Shares | | Value (000s) |
HEALTH CARE - continued |
Health Care Providers & Services - continued |
Lifco AB | 915,900 | | $ 17,858 |
Medica Sur SA de CV | 378,000 | | 1,262 |
MEDNAX, Inc. (a) | 184,200 | | 15,591 |
National Healthcare Corp. | 6,164 | | 390 |
Pelion SA (e) | 584,200 | | 10,840 |
The Ensign Group, Inc. | 605,700 | | 30,963 |
Triple-S Management Corp. (a)(e) | 2,210,134 | | 47,695 |
Tsukui Corp. (d)(e) | 2,462,100 | | 19,071 |
U.S. Physical Therapy, Inc. | 140,700 | | 7,437 |
United Drug PLC (United Kingdom) | 9,700,419 | | 75,971 |
UnitedHealth Group, Inc. | 18,343,500 | | 2,226,898 |
Wellcare Health Plans, Inc. (a) | 733,800 | | 59,291 |
WIN-Partners Co. Ltd. (e) | 1,404,500 | | 20,387 |
| | 3,597,456 |
Health Care Technology - 0.0% |
Arrhythmia Research Technology, Inc. (a) | 84,000 | | 535 |
ND Software Co. Ltd. (e) | 1,338,700 | | 16,181 |
Quality Systems, Inc. | 194,400 | | 2,479 |
| | 19,195 |
Pharmaceuticals - 1.1% |
Biofermin Pharmaceutical Co. Ltd. | 25,500 | | 617 |
Bliss Gvs Pharma Ltd. (a) | 4,570,530 | | 13,932 |
Daewon Pharmaceutical Co. Ltd. (e) | 1,679,963 | | 34,578 |
Daewoong Co. Ltd. | 90,000 | | 6,306 |
DongKook Pharmaceutical Co. Ltd. (e) | 650,000 | | 34,394 |
FDC Ltd. | 3,600,000 | | 9,331 |
Fuji Pharma Co. Ltd. | 285,200 | | 5,097 |
Genomma Lab Internacional SA de CV (a) | 1,399,124 | | 1,298 |
Indivior PLC | 17,266,100 | | 71,130 |
Jeil Pharmaceutical Co. (e) | 861,300 | | 18,836 |
Kwang Dong Pharmaceutical Co. Ltd. (e) | 3,100,000 | | 38,549 |
Kyung Dong Pharmaceutical Co. Ltd. | 48,531 | | 1,013 |
Mylan N.V. | 416,000 | | 23,292 |
Pharmstandard OJSC (a) | 18,897 | | 313 |
Phibro Animal Health Corp. Class A | 337,400 | | 13,253 |
Recordati SpA | 6,226,000 | | 155,148 |
Torrent Pharmaceuticals Ltd. | 150,000 | | 3,379 |
Common Stocks - continued |
| Shares | | Value (000s) |
HEALTH CARE - continued |
Pharmaceuticals - continued |
Tsumura & Co. | 1,125,600 | | $ 23,632 |
Whanin Pharmaceutical Co. Ltd. (e) | 1,750,000 | | 36,620 |
| | 490,718 |
TOTAL HEALTH CARE | | 5,145,082 |
INDUSTRIALS - 7.8% |
Aerospace & Defense - 0.2% |
AAR Corp. | 383,900 | | 10,346 |
Aerojet Rocketdyne Holdings, Inc. (a) | 1,399,901 | | 32,772 |
Engility Holdings, Inc. (d) | 862,400 | | 18,895 |
Magellan Aerospace Corp. | 360,900 | | 5,083 |
Textron, Inc. | 378,550 | | 16,543 |
| | 83,639 |
Air Freight & Logistics - 0.3% |
Air T, Inc. (a)(e) | 225,400 | | 5,035 |
Atlas Air Worldwide Holdings, Inc. (a)(e) | 1,675,000 | | 82,326 |
Hub Group, Inc. Class A (a) | 486,922 | | 20,514 |
Yusen Logistics Co. Ltd. (e) | 3,407,400 | | 37,858 |
| | 145,733 |
Airlines - 0.0% |
Republic Airways Holdings, Inc. (a) | 760,000 | | 3,830 |
SkyWest, Inc. | 241,819 | | 4,005 |
| | 7,835 |
Building Products - 0.0% |
Kondotec, Inc. (e) | 1,654,600 | | 10,267 |
Commercial Services & Supplies - 0.8% |
1010 Printing Group Ltd. | 21,363,640 | | 3,417 |
ABM Industries, Inc. | 10,767 | | 355 |
AJIS Co. Ltd. (e) | 496,100 | | 14,551 |
Asia File Corp. Bhd | 4,480,000 | | 4,024 |
CECO Environmental Corp. | 739,500 | | 6,656 |
Civeo Corp. (e) | 9,560,200 | | 20,459 |
Essendant, Inc. (e) | 2,191,644 | | 80,696 |
Fursys, Inc. (e) | 950,000 | | 28,393 |
Kruk SA | 9,544 | | 439 |
Matthews International Corp. Class A | 200,000 | | 10,770 |
Mears Group PLC | 1,578,015 | | 9,611 |
Mitie Group PLC (e) | 20,487,405 | | 103,021 |
Common Stocks - continued |
| Shares | | Value (000s) |
INDUSTRIALS - continued |
Commercial Services & Supplies - continued |
Moleskine SpA | 330,500 | | $ 580 |
Moshi Moshi Hotline, Inc. | 97,200 | | 993 |
Multi-Color Corp. | 192,900 | | 12,319 |
Nac Co. Ltd. (e) | 1,151,200 | | 9,298 |
NICE Total Cash Management Co., Ltd. (e) | 2,601,400 | | 8,924 |
Prestige International, Inc. | 764,300 | | 6,913 |
RPS Group PLC | 566,700 | | 1,894 |
The Brink's Co. | 10,900 | | 340 |
VICOM Ltd. | 3,131,500 | | 14,221 |
West Corp. | 1,080,600 | | 31,175 |
| | 369,049 |
Construction & Engineering - 1.0% |
AECOM Technology Corp. (a)(e) | 8,224,496 | | 253,561 |
Arcadis NV | 1,180,600 | | 30,989 |
Astaldi SpA (d) | 2,635,300 | | 25,353 |
Ausdrill Ltd. | 2,328,844 | | 511 |
Boustead Projects Pte Ltd. (a) | 1,148,287 | | 724 |
C-Cube Corp. | 358,600 | | 1,447 |
Daiichi Kensetsu Corp. (e) | 1,920,900 | | 20,366 |
Engineers India Ltd. | 2,100,000 | | 7,932 |
EPCO Co. Ltd. (d) | 49,100 | | 812 |
Geumhwa PSC Co. Ltd. (e) | 325,000 | | 13,184 |
Heijmans NV (Certificaten Van Aandelen) (a) | 27,364 | | 335 |
Jacobs Engineering Group, Inc. (a) | 215,400 | | 9,073 |
Kyeryong Construction Industrial Co. Ltd. (a)(e) | 880,000 | | 8,226 |
Meisei Industrial Co. Ltd. | 1,227,300 | | 6,001 |
Mirait Holdings Corp. | 1,713,200 | | 19,671 |
Nippon Rietec Co. Ltd. (e) | 1,300,000 | | 9,073 |
Sanyo Engineering & Construction, Inc. | 413,000 | | 2,033 |
Severfield PLC | 3,069,633 | | 3,451 |
Shinnihon Corp. | 1,749,700 | | 8,400 |
ShoLodge, Inc. (a)(e) | 461,027 | | 0 |
Sterling Construction Co., Inc. (a)(e) | 1,760,800 | | 8,258 |
Tutor Perini Corp. (a) | 629,800 | | 13,182 |
United Integration Services Co. Ltd. | 5,143,500 | | 5,069 |
Vianini Lavori SpA | 661,300 | | 5,258 |
| | 452,909 |
Electrical Equipment - 1.0% |
Aichi Electric Co. Ltd. | 1,702,000 | | 5,946 |
Aros Quality Group AB | 806,000 | | 11,212 |
Common Stocks - continued |
| Shares | | Value (000s) |
INDUSTRIALS - continued |
Electrical Equipment - continued |
AZZ, Inc. (e) | 1,381,400 | | $ 71,487 |
Bharat Heavy Electricals Ltd. | 21,000,000 | | 91,350 |
BWX Technologies, Inc. | 1,519,822 | | 37,327 |
Chiyoda Integre Co. Ltd. | 484,000 | | 10,740 |
EnerSys | 277,300 | | 17,317 |
FW Thorpe PLC | 4,858,700 | | 14,227 |
GrafTech International Ltd. (a) | 92,100 | | 463 |
Graphite India Ltd. | 1,427,257 | | 1,769 |
Hammond Power Solutions, Inc. Class A | 407,100 | | 2,272 |
I-Sheng Electric Wire & Cable Co. Ltd. (e) | 12,500,000 | | 13,148 |
Jinpan International Ltd. | 95,600 | | 435 |
Korea Electric Terminal Co. Ltd. (e) | 700,000 | | 61,233 |
Servotronics, Inc. (e) | 151,100 | | 907 |
TKH Group NV unit | 1,749,400 | | 75,122 |
| | 414,955 |
Industrial Conglomerates - 1.4% |
DCC PLC (United Kingdom) (e) | 7,514,100 | | 593,760 |
Reunert Ltd. | 1,889,000 | | 9,452 |
| | 603,212 |
Machinery - 1.5% |
Aalberts Industries NV (e) | 8,748,500 | | 274,598 |
Allison Transmission Holdings, Inc. | 392,130 | | 11,442 |
ASL Marine Holdings Ltd. (e) | 31,217,300 | | 8,533 |
CKD Corp. | 1,473,300 | | 14,622 |
Foremost Income Fund (a)(e) | 2,141,103 | | 8,325 |
Gencor Industries, Inc. (a)(e) | 420,200 | | 4,030 |
Global Brass & Copper Holdings, Inc. (e) | 1,149,837 | | 19,375 |
Hillenbrand, Inc. | 485,300 | | 13,763 |
Hurco Companies, Inc. (e) | 521,400 | | 16,320 |
Hwacheon Machine Tool Co. Ltd. (e) | 219,900 | | 12,522 |
Hyster-Yale Materials Handling: | | | |
Class A | 230,400 | | 15,591 |
Class B (a) | 310,000 | | 20,978 |
Ihara Science Corp. (e) | 1,094,900 | | 8,834 |
Jaya Holdings Ltd. (e) | 68,762,300 | | 1,855 |
Joy Global, Inc. (d) | 101,600 | | 2,683 |
Kyowakogyosyo Co. Ltd. (e) | 347,000 | | 2,066 |
Maruzen Co. Ltd. (e) | 1,765,000 | | 16,235 |
Metka SA | 801,700 | | 6,375 |
Mincon Group PLC | 2,263,257 | | 1,740 |
Common Stocks - continued |
| Shares | | Value (000s) |
INDUSTRIALS - continued |
Machinery - continued |
Mirle Automation Corp. | 4,200,000 | | $ 3,436 |
Nadex Co. Ltd. (e) | 884,000 | | 5,599 |
Nakano Refrigerators Co. Ltd. | 18,900 | | 547 |
Nitchitsu Co. Ltd. | 426,000 | | 808 |
Oshkosh Corp. | 2,172,400 | | 79,379 |
Semperit AG Holding | 497,300 | | 20,653 |
SIMPAC, Inc. | 583,000 | | 3,050 |
Takamatsu Machinery Co. Ltd. | 391,300 | | 3,419 |
Techno Smart Corp. (e) | 996,000 | | 3,673 |
Terex Corp. | 1,166,300 | | 25,845 |
Tocalo Co. Ltd. (e) | 874,900 | | 17,980 |
TriMas Corp. (a) | 1,558,335 | | 36,621 |
Trinity Industrial Corp. | 801,000 | | 3,154 |
Valmet Corp. | 665,517 | | 7,865 |
| | 671,916 |
Marine - 0.0% |
Tokyo Kisen Co. Ltd. (e) | 921,000 | | 5,573 |
Professional Services - 0.5% |
Akka Technologies SA (e) | 1,228,555 | | 40,883 |
Boardroom Ltd. | 2,860,542 | | 1,116 |
CBIZ, Inc. (a) | 1,046,900 | | 10,260 |
Clarius Group Ltd. (a) | 3,584,803 | | 655 |
CRA International, Inc. (a) | 175,000 | | 4,085 |
Exova Group Ltd. PLC | 4,444,933 | | 11,679 |
ICF International, Inc. (a) | 357,466 | | 13,105 |
McMillan Shakespeare Ltd. | 94,778 | | 987 |
Sporton International, Inc. | 300,000 | | 1,834 |
Stantec, Inc. | 3,872,200 | | 107,682 |
Synergie SA | 141,600 | | 3,880 |
TrueBlue, Inc. (a) | 679,400 | | 17,501 |
VSE Corp. (e) | 458,500 | | 21,733 |
| | 235,400 |
Road & Rail - 0.6% |
Alps Logistics Co. Ltd. (e) | 1,587,300 | | 20,415 |
CSX Corp. | 794,880 | | 24,864 |
Daqin Railway Co. Ltd. (A Shares) | 26,000,000 | | 42,791 |
Hamakyorex Co. Ltd. (e) | 696,300 | | 26,715 |
Higashi Twenty One Co. Ltd. | 278,100 | | 1,032 |
Hutech Norin Co. Ltd. (e) | 961,100 | | 8,174 |
Roadrunner Transportation Systems, Inc. (a) | 630,900 | | 16,517 |
Common Stocks - continued |
| Shares | | Value (000s) |
INDUSTRIALS - continued |
Road & Rail - continued |
Sakai Moving Service Co. Ltd. (e) | 723,700 | | $ 34,043 |
Trancom Co. Ltd. (e) | 950,600 | | 54,381 |
Universal Truckload Services, Inc. | 1,265,000 | | 26,729 |
| | 255,661 |
Trading Companies & Distributors - 0.4% |
AddTech AB (B Shares) | 1,369,600 | | 20,322 |
AerCap Holdings NV (a) | 411,236 | | 19,262 |
Goodfellow, Inc. (e) | 803,500 | | 5,591 |
Hanwa Co. Ltd. | 599,000 | | 2,605 |
HERIGE | 67,853 | | 1,997 |
Houston Wire & Cable Co. (e) | 1,161,700 | | 10,734 |
KS Energy Services Ltd. (a) | 14,640,200 | | 2,988 |
Meiwa Corp. | 1,437,400 | | 4,628 |
Mitani Shoji Co. Ltd. | 755,600 | | 19,784 |
MRC Global, Inc. (a) | 1,270,530 | | 16,326 |
Otec Corp. | 138,200 | | 1,114 |
Parker Corp. (e) | 2,469,000 | | 8,347 |
Richelieu Hardware Ltd. (d) | 322,300 | | 16,758 |
Senshu Electric Co. Ltd. (e) | 994,600 | | 17,070 |
Strongco Corp. (a)(e) | 944,188 | | 1,733 |
Tanaka Co. Ltd. | 40,600 | | 253 |
TECHNO ASSOCIE Co. Ltd. | 283,500 | | 2,841 |
Titan Machinery, Inc. (a) | 1,067,404 | | 14,997 |
Totech Corp. (e) | 991,900 | | 7,147 |
Willis Lease Finance Corp. (a) | 9,249 | | 154 |
| | 174,651 |
Transportation Infrastructure - 0.1% |
Isewan Terminal Service Co. Ltd. (e) | 1,436,500 | | 8,195 |
Meiko Transportation Co. Ltd. | 921,000 | | 7,580 |
Sinwa Ltd. (e) | 22,670,400 | | 3,883 |
Wesco Aircraft Holdings, Inc. (a) | 742,800 | | 10,689 |
| | 30,347 |
TOTAL INDUSTRIALS | | 3,461,147 |
INFORMATION TECHNOLOGY - 18.9% |
Communications Equipment - 0.3% |
Bel Fuse, Inc. Class A (e) | 213,567 | | 4,111 |
Black Box Corp. (e) | 1,658,340 | | 25,970 |
ClearOne, Inc. | 193,400 | | 2,454 |
Common Stocks - continued |
| Shares | | Value (000s) |
INFORMATION TECHNOLOGY - continued |
Communications Equipment - continued |
Ixia (a) | 1,130,852 | | $ 14,927 |
Juniper Networks, Inc. | 375,290 | | 10,666 |
NETGEAR, Inc. (a)(e) | 1,933,900 | | 64,766 |
Tessco Technologies, Inc. (e) | 582,200 | | 14,363 |
| | 137,257 |
Electronic Equipment & Components - 3.4% |
A&D Co. Ltd. (e) | 1,142,400 | | 4,590 |
AAC Technology Holdings, Inc. | 378,000 | | 2,145 |
Beijer Electronics AB | 119,100 | | 756 |
CDW Corp. | 891,600 | | 32,035 |
DigiTech Systems Co., Ltd. (a) | 725,000 | | 0 |
Dynapack International Technology Corp. | 3,200,000 | | 5,155 |
Elec & Eltek International Co. Ltd. | 1,657,300 | | 1,384 |
Elematec Corp. (e) | 1,105,000 | | 25,776 |
Excel Co. Ltd. (d)(e) | 837,900 | | 13,278 |
Fabrinet (a) | 380,200 | | 7,057 |
Hi-P International Ltd. | 19,407,800 | | 7,003 |
Hon Hai Precision Industry Co. Ltd. (Foxconn) | 157,988,000 | | 452,606 |
Huan Hsin Holdings Ltd. (a) | 4,704,000 | | 134 |
IDIS Holdings Co. Ltd. (e) | 800,000 | | 12,624 |
Image Sensing Systems, Inc. (a) | 95,900 | | 418 |
Insight Enterprises, Inc. (a) | 1,165,500 | | 31,457 |
Intelligent Digital Integrated Security Co. Ltd. (e) | 941,210 | | 15,377 |
INTOPS Co. Ltd. (e) | 859,900 | | 11,689 |
Isra Vision AG (e) | 403,200 | | 23,885 |
Keysight Technologies, Inc. (a) | 3,280,000 | | 100,171 |
Kingboard Chemical Holdings Ltd. (e) | 87,079,000 | | 146,025 |
Kingboard Laminates Holdings Ltd. | 8,288,000 | | 3,646 |
Lumax International Corp. Ltd. | 1,800,000 | | 2,428 |
Mesa Laboratories, Inc. (e) | 285,500 | | 29,561 |
Multi-Fineline Electronix, Inc. (a) | 1,128,244 | | 20,150 |
Muramoto Electronic Thailand PCL (For. Reg.) (e) | 1,416,600 | | 9,302 |
Neonode, Inc. (a)(d)(e) | 3,107,951 | | 7,987 |
Nippo Ltd. (e) | 840,021 | | 3,050 |
Orbotech Ltd. (a) | 920,900 | | 17,534 |
Pinnacle Technology Holdings Ltd. (a)(e) | 8,783,900 | | 8,437 |
Redington India Ltd. (a) | 4,700,000 | | 8,660 |
ScanSource, Inc. (a)(e) | 2,188,900 | | 82,806 |
Shibaura Electronics Co. Ltd. (e) | 716,300 | | 11,265 |
Sigmatron International, Inc. (a)(e) | 239,000 | | 1,539 |
Common Stocks - continued |
| Shares | | Value (000s) |
INFORMATION TECHNOLOGY - continued |
Electronic Equipment & Components - continued |
Simplo Technology Co. Ltd. | 9,000,000 | | $ 36,955 |
SYNNEX Corp. (e) | 3,227,483 | | 244,095 |
Taitron Components, Inc. Class A (sub. vtg.) (a) | 130,000 | | 128 |
Tomen Devices Corp. (e) | 626,200 | | 11,055 |
Tripod Technology Corp. | 600,000 | | 940 |
TTM Technologies, Inc. (a) | 1,518,733 | | 13,866 |
UKC Holdings Corp. (e) | 1,445,800 | | 30,529 |
Universal Security Instruments, Inc. (a)(e) | 177,204 | | 1,063 |
VST Holdings Ltd. (e) | 137,481,800 | | 46,996 |
Wireless Telecom Group, Inc. (a) | 462,800 | | 949 |
| | 1,486,506 |
Internet Software & Services - 0.2% |
Bankrate, Inc. (a) | 1,110,040 | | 10,124 |
Blucora, Inc. (a) | 489,260 | | 6,933 |
DeNA Co. Ltd. | 566,700 | | 11,271 |
Gabia, Inc. (e) | 1,255,000 | | 6,135 |
Liquidity Services, Inc. (a)(d) | 472,200 | | 4,240 |
Melbourne IT Ltd. (e) | 7,500,000 | | 10,855 |
NetGem SA | 944,500 | | 2,448 |
Rentabiliweb Group SA (a) | 84,900 | | 624 |
Softbank Technology Corp. | 142,800 | | 1,594 |
Stamps.com, Inc. (a) | 373,600 | | 25,629 |
UANGEL Corp. | 375,000 | | 1,775 |
| | 81,628 |
IT Services - 5.0% |
ALTEN | 815,900 | | 41,111 |
Amdocs Ltd. | 7,531,050 | | 441,696 |
Argo Graphics, Inc. | 424,800 | | 6,269 |
Blackhawk Network Holdings, Inc. (a) | 1,897,386 | | 87,147 |
Calian Technologies Ltd. (e) | 717,000 | | 10,340 |
Cardtronics, Inc. (a) | 291,537 | | 10,807 |
CGI Group, Inc. Class A (sub. vtg.) (a) | 315,400 | | 11,783 |
Computer Sciences Corp. | 4,269,800 | | 279,373 |
Computer Services, Inc. | 259,700 | | 10,492 |
CSE Global Ltd. (e) | 45,206,800 | | 17,630 |
Data#3 Ltd. | 3,116,716 | | 2,164 |
Dimerco Data System Corp. | 600,000 | | 388 |
eClerx Services Ltd. | 1,350,000 | | 31,330 |
EOH Holdings Ltd. (e) | 7,366,700 | | 100,360 |
EPAM Systems, Inc. (a) | 114,500 | | 8,486 |
Common Stocks - continued |
| Shares | | Value (000s) |
INFORMATION TECHNOLOGY - continued |
IT Services - continued |
Estore Corp. | 157,700 | | $ 1,550 |
EVERTEC, Inc. | 1,793,300 | | 33,750 |
ExlService Holdings, Inc. (a) | 327,006 | | 12,678 |
Genpact Ltd. (a) | 436,800 | | 9,701 |
Heartland Payment Systems, Inc. | 1,802,300 | | 112,283 |
HIQ International AB | 723,100 | | 3,713 |
Indra Sistemas (d)(e) | 15,111,400 | | 169,695 |
Know IT AB (e) | 1,590,300 | | 10,231 |
Leidos Holdings, Inc. | 1,151,200 | | 46,969 |
Luxoft Holding, Inc. (a) | 115,100 | | 7,224 |
ManTech International Corp. Class A | 1,162,600 | | 34,657 |
Mastek Ltd. (a)(e) | 1,650,000 | | 4,763 |
MoneyGram International, Inc. (a) | 484,700 | | 4,944 |
NCI, Inc. Class A (e) | 826,430 | | 9,297 |
Net 1 UEPS Technologies, Inc. (a) | 661,300 | | 12,842 |
Neustar, Inc. Class A (a)(d) | 1,270,000 | | 39,205 |
Rolta India Ltd. (a) | 2,699,942 | | 4,789 |
Science Applications International Corp. | 550,000 | | 29,524 |
Societe Pour L'Informatique Industrielle SA (e) | 1,841,800 | | 14,968 |
Softcreate Co. Ltd. | 411,100 | | 3,101 |
Sopra Steria Group | 17,606 | | 1,682 |
The Western Union Co. | 20,005,500 | | 404,911 |
Total System Services, Inc. | 247,800 | | 11,453 |
TravelSky Technology Ltd. (H Shares) | 1,944,000 | | 2,350 |
Unisys Corp. (a) | 627,770 | | 9,963 |
Vantiv, Inc. (a) | 554,800 | | 24,411 |
Xerox Corp. | 9,159,100 | | 100,933 |
| | 2,180,963 |
Semiconductors & Semiconductor Equipment - 0.6% |
Alpha & Omega Semiconductor Ltd. (a)(e) | 1,918,700 | | 15,062 |
Axell Corp. (e) | 850,000 | | 11,995 |
Lasertec Corp. | 472,200 | | 5,978 |
Leeno Industrial, Inc. | 676,331 | | 26,739 |
Marvell Technology Group Ltd. | 512,330 | | 6,373 |
Melexis NV (e) | 2,775,600 | | 148,117 |
Micron Technology, Inc. (a) | 369,800 | | 6,845 |
Miraial Co. Ltd. | 199,800 | | 2,054 |
Nextchip Co. Ltd. (a)(e) | 975,000 | | 5,920 |
Phison Electronics Corp. | 1,900,000 | | 13,653 |
Powertech Technology, Inc. | 9,000,000 | | 16,829 |
Common Stocks - continued |
| Shares | | Value (000s) |
INFORMATION TECHNOLOGY - continued |
Semiconductors & Semiconductor Equipment - continued |
Telechips, Inc. (e) | 1,058,800 | | $ 6,347 |
Trio-Tech International (a)(e) | 264,400 | | 785 |
Varitronix International Ltd. | 8,029,000 | | 6,100 |
Y.A.C. Co., Ltd. | 425,600 | | 3,204 |
| | 276,001 |
Software - 5.2% |
Activision Blizzard, Inc. | 257,260 | | 6,635 |
AdaptIT Holdings Ltd. | 2,921,600 | | 2,275 |
ANSYS, Inc. (a)(e) | 4,604,400 | | 433,504 |
AVG Technologies NV (a) | 338,800 | | 9,737 |
Axway Software SA | 46,200 | | 1,162 |
Cybernet Systems Co. Ltd. | 1,355,100 | | 4,920 |
Ebix, Inc. (d)(e) | 3,131,278 | | 97,038 |
Geodesic Ltd. (a)(e) | 4,873,000 | | 0 |
ICT Automatisering NV (e) | 778,100 | | 5,896 |
IGE + XAO SA | 36,800 | | 2,617 |
InfoVine Co. Ltd. (e) | 175,000 | | 5,103 |
init innovation in traffic systems AG | 38,313 | | 1,087 |
Jorudan Co. Ltd. (e) | 483,500 | | 4,190 |
King Digital Entertainment PLC (d) | 283,900 | | 4,409 |
KPIT Cummins Infosystems Ltd. (a) | 9,000,000 | | 15,528 |
KSK Co., Ltd. (e) | 590,500 | | 5,260 |
Micro Focus International PLC | 350,943 | | 7,662 |
Microsoft Corp. | 21,000,000 | | 980,700 |
Minefield Computers Ltd. (a) | 1,650,000 | | 7,428 |
NIIT Technologies Ltd. (a) | 2,018,000 | | 15,209 |
Nuance Communications, Inc. (a) | 656,240 | | 11,898 |
Nucleus Software Exports Ltd. (e) | 2,200,000 | | 9,754 |
Oracle Corp. | 12,198,820 | | 487,221 |
Parametric Technology Corp. (a) | 665,828 | | 24,203 |
Pro-Ship, Inc. | 140,200 | | 2,772 |
Reckon Ltd. (d) | 95,614 | | 148 |
Rovi Corp. (a) | 690,100 | | 7,584 |
RS Software (India) Ltd. | 600,000 | | 1,658 |
Software AG (Bearer) | 3,220,000 | | 96,348 |
Sword Group (e) | 558,425 | | 13,247 |
Symantec Corp. | 563,160 | | 12,806 |
Synopsys, Inc. (a) | 323,700 | | 16,457 |
Common Stocks - continued |
| Shares | | Value (000s) |
INFORMATION TECHNOLOGY - continued |
Software - continued |
Vitec Software Group AB | 193,400 | | $ 6,748 |
Zensar Technologies Ltd. (a) | 800,000 | | 11,943 |
| | 2,313,147 |
Technology Hardware, Storage & Peripherals - 4.2% |
Avid Technology, Inc. (a)(d) | 1,164,900 | | 14,282 |
Compal Electronics, Inc. | 72,000,000 | | 48,440 |
EMC Corp. | 511,030 | | 13,742 |
Hewlett-Packard Co. | 6,421,900 | | 195,996 |
Lexmark International, Inc. Class A | 1,920,000 | | 65,261 |
Logitech International SA (Reg.) (d) | 3,107,500 | | 44,701 |
NCR Corp. (a) | 147,830 | | 4,071 |
QLogic Corp. (a) | 1,609,466 | | 14,276 |
Quantum Corp. (a) | 6,224,100 | | 6,598 |
Seagate Technology LLC (e) | 27,625,400 | | 1,397,845 |
Silicon Graphics International Corp. (a) | 903,150 | | 4,615 |
Super Micro Computer, Inc. (a) | 1,314,200 | | 35,050 |
TPV Technology Ltd. | 77,350,000 | | 13,171 |
| | 1,858,048 |
TOTAL INFORMATION TECHNOLOGY | | 8,333,550 |
MATERIALS - 2.4% |
Chemicals - 1.7% |
Aditya Birla Chemicals India Ltd. (e) | 2,300,000 | | 8,172 |
American Vanguard Corp. | 48,600 | | 623 |
C. Uyemura & Co. Ltd. | 461,700 | | 24,550 |
Chase Corp. (e) | 837,500 | | 32,018 |
Core Molding Technologies, Inc. (a) | 340,200 | | 6,491 |
Deepak Fertilisers and Petrochemicals Corp. Ltd. (e) | 7,569,000 | | 16,720 |
Deepak Nitrite Ltd. | 5,000,000 | | 5,571 |
EcoGreen International Group Ltd. (e) | 46,424,400 | | 12,396 |
FMC Corp. | 2,762,600 | | 134,097 |
Fujikura Kasei Co., Ltd. (e) | 3,012,800 | | 13,516 |
Fuso Chemical Co. Ltd. | 1,244,700 | | 15,477 |
Gujarat Narmada Valley Fertilizers Co. (a)(e) | 13,541,878 | | 13,618 |
Gujarat State Fertilizers & Chemicals Ltd. (a)(e) | 31,500,000 | | 35,961 |
Honshu Chemical Industry Co. Ltd. (e) | 876,000 | | 10,002 |
Huabao International Holdings Ltd. | 4,782,000 | | 2,326 |
Innospec, Inc. | 799,400 | | 34,574 |
Intrepid Potash, Inc. (a) | 847,182 | | 7,235 |
Common Stocks - continued |
| Shares | | Value (000s) |
MATERIALS - continued |
Chemicals - continued |
KPC Holdings Corp. | 43,478 | | $ 2,752 |
KPX Chemical Co. Ltd. | 163,083 | | 7,930 |
KPX Green Chemical Co. Ltd. | 369,165 | | 1,517 |
Kraton Performance Polymers, Inc. (a) | 266,400 | | 5,467 |
Miwon Chemicals Co. Ltd. | 55,095 | | 2,230 |
Miwon Commercial Co. Ltd. (a) | 13,819 | | 2,139 |
Muto Seiko Co. Ltd. | 276,200 | | 1,495 |
Nano Chem Tech, Inc. | 125,000 | | 310 |
Nuplex Industries Ltd. | 4,594,135 | | 13,798 |
PolyOne Corp. | 318,900 | | 10,929 |
RPM International, Inc. | 145,600 | | 6,824 |
SK Kaken Co. Ltd. | 359,000 | | 37,657 |
Soda Aromatic Co. Ltd. | 277,300 | | 2,381 |
Soken Chemical & Engineer Co. Ltd. (e) | 741,200 | | 7,392 |
T&K Toka Co. Ltd. (e) | 755,500 | | 13,984 |
Thai Carbon Black PCL (For. Reg.) (a) | 12,750,300 | | 8,191 |
Thai Rayon PCL: | | | |
unit | 95,200 | | 62 |
(For. Reg.) | 3,022,200 | | 1,967 |
The Chemours Co. LLC | 275,000 | | 3,003 |
Tronox Ltd. Class A | 702,657 | | 7,715 |
UPL Ltd. | 1,000,000 | | 8,372 |
Yara International ASA | 4,191,500 | | 208,640 |
Yip's Chemical Holdings Ltd. (e) | 28,550,000 | | 14,805 |
| | 742,907 |
Construction Materials - 0.1% |
Brampton Brick Ltd. Class A (sub. vtg.) (a) | 783,500 | | 4,194 |
Mitani Sekisan Co. Ltd. (e) | 1,652,800 | | 23,565 |
Titan Cement Co. SA (Reg.) | 728,800 | | 16,362 |
| | 44,121 |
Containers & Packaging - 0.4% |
AMVIG Holdings Ltd. | 2,120,600 | | 1,001 |
Ball Corp. | 230,778 | | 15,656 |
Chuoh Pack Industry Co. Ltd. (e) | 469,000 | | 4,904 |
Kohsoku Corp. (e) | 1,931,400 | | 14,026 |
Samhwa Crown & Closure Co. Ltd. | 50,000 | | 1,972 |
Sealed Air Corp. | 462,300 | | 24,580 |
Silgan Holdings, Inc. | 828,800 | | 44,316 |
Sonoco Products Co. | 354,333 | | 14,627 |
Common Stocks - continued |
| Shares | | Value (000s) |
MATERIALS - continued |
Containers & Packaging - continued |
Starlite Holdings Ltd. | 354,000 | | $ 21 |
The Pack Corp. (e) | 1,832,600 | | 37,618 |
| | 158,721 |
Metals & Mining - 0.2% |
Alconix Corp. (e) | 1,176,900 | | 18,299 |
Blue Earth Refineries, Inc. (a) | 262,009 | | 0 |
Chubu Steel Plate Co. Ltd. | 460,400 | | 1,939 |
Compania de Minas Buenaventura SA sponsored ADR | 2,507,500 | | 17,853 |
Freeport-McMoRan, Inc. | 474,175 | | 5,572 |
Hill & Smith Holdings PLC | 1,983,300 | | 21,479 |
Orosur Mining, Inc. (a) | 3,305,600 | | 354 |
Orvana Minerals Corp. (a) | 850,013 | | 146 |
Pacific Metals Co. Ltd. (a) | 4,235,000 | | 12,848 |
Tohoku Steel Co. Ltd. (e) | 695,400 | | 7,715 |
Tokyo Kohtetsu Co. Ltd. (e) | 1,322,200 | | 4,235 |
Tokyo Tekko Co. Ltd. (e) | 4,235,000 | | 20,674 |
Webco Industries, Inc. (a) | 8,463 | | 542 |
| | 111,656 |
Paper & Forest Products - 0.0% |
Cardinal Co. Ltd. (d) | 70,900 | | 521 |
Stella-Jones, Inc. (a) | 600,000 | | 20,365 |
| | 20,886 |
TOTAL MATERIALS | | 1,078,291 |
TELECOMMUNICATION SERVICES - 0.0% |
Diversified Telecommunication Services - 0.0% |
APT Satellite Holdings Ltd. | 1,429,500 | | 1,333 |
Asia Satellite Telecommunications Holdings Ltd. | 379,500 | | 837 |
| | 2,170 |
UTILITIES - 0.4% |
Electric Utilities - 0.1% |
Exelon Corp. | 1,355,000 | | 43,482 |
Gas Utilities - 0.2% |
GAIL India Ltd. | 6,108,283 | | 33,883 |
Hokuriku Gas Co. | 1,700,000 | | 4,005 |
K&O Energy Group, Inc. | 596,900 | | 8,568 |
Keiyo Gas Co. Ltd. | 574,000 | | 2,895 |
KyungDong City Gas Co. Ltd. | 153,670 | | 14,563 |
Common Stocks - continued |
| Shares | | Value (000s) |
UTILITIES - continued |
Gas Utilities - continued |
Kyungnam Energy Co. Ltd. | 200,000 | | $ 1,201 |
Star Gas Partners LP | 1,000,000 | | 9,980 |
| | 75,095 |
Independent Power and Renewable Electricity Producers - 0.1% |
Mega First Corp. Bhd (e) | 22,630,800 | | 13,926 |
Talen Energy Corp. (a) | 2,225,000 | | 34,999 |
| | 48,925 |
Multi-Utilities - 0.0% |
CMS Energy Corp. | 775,880 | | 26,582 |
Water Utilities - 0.0% |
Manila Water Co., Inc. | 5,745,500 | | 3,138 |
TOTAL UTILITIES | | 197,222 |
TOTAL COMMON STOCKS (Cost $20,806,088) |
40,000,018
|
Nonconvertible Preferred Stocks - 0.1% |
| | | |
CONSUMER STAPLES - 0.0% |
Food Products - 0.0% |
Nam Yang Dairy Products | 4,917 | | 1,210 |
MATERIALS - 0.1% |
Construction Materials - 0.1% |
Buzzi Unicem SpA (Risparmio Shares) | 1,888,900 | | 19,708 |
TOTAL NONCONVERTIBLE PREFERRED STOCKS (Cost $16,526) |
20,918
|
Nonconvertible Bonds - 0.0% |
| Principal Amount (000s) | | |
ENERGY - 0.0% |
Oil, Gas & Consumable Fuels - 0.0% |
Centrus Energy Corp. 8% 9/30/19 pay-in-kind (Cost $21,367) | | $ 13,103 | |
4,455
|
Money Market Funds - 10.4% |
| Shares | | Value (000s) |
Fidelity Cash Central Fund, 0.17% (b) | 4,068,860,157 | | $ 4,068,860 |
Fidelity Securities Lending Cash Central Fund, 0.18% (b)(c) | 533,239,390 | | 533,239 |
TOTAL MONEY MARKET FUNDS (Cost $4,602,099) |
4,602,099
|
TOTAL INVESTMENT PORTFOLIO - 101.1% (Cost $25,446,080) | | 44,627,490 |
NET OTHER ASSETS (LIABILITIES) - (1.1)% | | (488,537) |
NET ASSETS - 100% | $ 44,138,953 |
Legend |
(a) Non-income producing |
(b) Affiliated fund that is generally available only to investment companies and other accounts managed by Fidelity Investments. The rate quoted is the annualized seven-day yield of the fund at period end. A complete unaudited listing of the fund's holdings as of its most recent quarter end is available upon request. In addition, each Fidelity Central Fund's financial statements, which are not covered by the Fund's Report of Independent Registered Public Accounting Firm, are available on the SEC's website or upon request. |
(c) Investment made with cash collateral received from securities on loan. |
(d) Security or a portion of the security is on loan at period end. |
(e) Affiliated company |
Affiliated Central Funds |
Information regarding fiscal year to date income earned by the Fund from investments in Fidelity Central Funds is as follows: |
Fund | Income earned
(Amounts in thousands) |
Fidelity Cash Central Fund | $ 7,011 |
Fidelity Securities Lending Cash Central Fund | 16,764 |
Total | $ 23,775 |
Other Affiliated Issuers |
An affiliated company is a company in which the Fund has ownership of at least 5% of the voting securities. Fiscal year to date transactions with companies which are or were affiliates are as follows: |
Affiliate
(Amounts in thousands) | Value, beginning of period | Purchases | Sales Proceeds* | Dividend Income | Value,
end of
period |
A&D Co. Ltd. | $ 5,682 | $ 499 | $ 252 | $ 108 | $ 4,590 |
Aalberts Industries NV | 281,757 | - | 14,286 | 3,822 | 274,598 |
Abbey PLC | 30,448 | - | 1,670 | 268 | 31,427 |
Abercrombie & Fitch Co. Class A | 289,830 | - | 9,299 | 5,823 | 140,399 |
Accell Group NV | 43,386 | - | 2,174 | 1,297 | 48,781 |
Aditya Birla Chemicals India Ltd. | 7,838 | - | 172 | 58 | 8,172 |
AECOM Technology Corp. | 258,543 | 46,827 | 49,314 | - | 253,561 |
Aeropostale, Inc. | 27,148 | - | 770 | - | 11,823 |
Air T, Inc. | 2,753 | - | 284 | - | 5,035 |
AJIS Co. Ltd. | 8,540 | - | 556 | 175 | 14,551 |
Akka Technologies SA | 41,030 | - | 2,253 | 595 | 40,883 |
Albemarle & Bond Holdings PLC | 356 | - | - | - | - |
Alconix Corp. | 18,564 | 94 | 986 | 385 | 18,299 |
Almost Family, Inc. | 21,317 | - | 1,782 | - | 37,748 |
Alpha & Omega Semiconductor Ltd. | 22,652 | - | 5,122 | - | 15,062 |
Alps Logistics Co. Ltd. | 17,922 | - | 1,046 | 526 | 20,415 |
Ambassadors Group, Inc. | 7,390 | - | 1,077 | - | 2,842 |
Amdocs Ltd. | 361,958 | - | 23,933 | 5,105 | - |
ANSYS, Inc. | 373,459 | - | 22,007 | - | 433,504 |
April | 60,280 | - | 1,961 | 1,061 | 34,520 |
Ark Restaurants Corp. | 4,456 | - | 354 | 206 | 4,734 |
Arts Optical International Holdings Ltd. | 10,016 | - | 666 | 319 | 12,106 |
ASL Marine Holdings Ltd. | 16,853 | 823 | 557 | 245 | 8,533 |
Assurant, Inc. | 322,933 | - | 17,768 | 5,588 | 360,661 |
ASTI Corp. | 2,661 | - | 189 | 19 | 2,228 |
Atlas Air Worldwide Holdings, Inc. | 69,191 | 2,370 | 22,413 | - | 82,326 |
Atwood Oceanics, Inc. | - | 173,917 | 5,141 | 2,562 | 117,000 |
Axell Corp. | 14,165 | - | 634 | 383 | 11,995 |
Axis Capital Holdings Ltd. | 325,726 | - | 27,429 | 8,411 | 404,549 |
Affiliate
(Amounts in thousands) | Value, beginning of period | Purchases | Sales Proceeds* | Dividend Income | Value,
end of
period |
AZZ, Inc. | $ 63,553 | $ - | $ 3,601 | $ 860 | $ 71,487 |
Barratt Developments PLC | 481,338 | - | 35,915 | 15,020 | 767,988 |
Bel Fuse, Inc. Class A | 5,387 | - | 407 | 55 | 4,111 |
Belc Co. Ltd. | 56,050 | - | 4,228 | 733 | 66,533 |
Belluna Co. Ltd. | 48,790 | - | 2,586 | 982 | 57,188 |
Best Buy Co., Inc. | 1,021,017 | 13,332 | 112,287 | 44,593 | 1,019,021 |
Black Box Corp. | 36,191 | - | 1,873 | 707 | 25,970 |
BMTC Group, Inc. (formerly BMTC Group, Inc. Class A (sub. vtg.)) | 67,542 | - | 3,689 | 981 | 60,706 |
Buffalo Co. Ltd. | 290 | 517 | 36 | 16 | 731 |
C. Uyemura & Co. Ltd. | 34,020 | - | 8,221 | 415 | - |
Cal Dive International, Inc. | 6,403 | - | 23 | - | 33 |
Calian Technologies Ltd. | 14,688 | - | 586 | 611 | 10,340 |
Carbo Ceramics, Inc. | - | 75,231 | 2,990 | 724 | 71,675 |
Career Education Corp. | 33,337 | - | 21,380 | - | - |
Cash Converters International Ltd. | 24,558 | 415 | 834 | 791 | - |
Centrus Energy Corp. Class A | - | 8,493 | 2,306 | - | - |
Chase Corp. | 29,652 | 137 | 1,750 | 528 | 32,018 |
Chuoh Pack Industry Co. Ltd. | 6,250 | - | 285 | 155 | 4,904 |
Cinderella Media Group Ltd. | 2,725 | 472 | 262 | 258 | 5,949 |
Civeo Corp. | 127,754 | 73,191 | 51,268 | 1,427 | 20,459 |
Clip Corp. | 3,253 | - | 148 | 118 | 2,669 |
Codorus Valley Bancorp, Inc. | 9,462 | 677 | 546 | 247 | 9,961 |
Core Molding Technologies, Inc. | 5,277 | - | 1,260 | - | - |
Cosmos Pharmaceutical Corp. | 220,093 | - | 50,488 | 728 | 187,035 |
CRA International, Inc. | 23,464 | 704 | 25,669 | - | - |
Create SD Holdings Co. Ltd. | 78,557 | - | 4,918 | 1,029 | 124,773 |
CSE Global Ltd. | 27,687 | - | 1,104 | 997 | 17,630 |
Cybernet Systems Co. Ltd. | 7,278 | - | 3,017 | 167 | - |
Daewon Pharmaceutical Co. Ltd. | 17,803 | - | 548 | 182 | 34,578 |
Affiliate
(Amounts in thousands) | Value, beginning of period | Purchases | Sales Proceeds* | Dividend Income | Value,
end of
period |
Daiichi Kensetsu Corp. | $ 28,865 | $ - | $ 1,201 | $ 361 | $ 20,366 |
DCC PLC (United Kingdom) | 455,343 | - | 30,538 | 10,208 | 593,760 |
Deepak Fertilisers and Petrochemicals Corp. Ltd. | 20,290 | - | - | 475 | 16,720 |
Deepak Nitrite Ltd. | 7,934 | - | 1,268 | 78 | - |
Divestco, Inc. | 514 | - | 12 | - | - |
Dong Suh Companies, Inc. | 98,054 | 302 | 14,512 | 2,389 | - |
DongKook Pharmaceutical Co. Ltd. | 23,113 | - | 7,051 | 170 | 34,394 |
Doshisha Co. Ltd. | 36,672 | - | 16,273 | 562 | - |
DVx, Inc. | 7,461 | - | 408 | 109 | 8,933 |
Ebix, Inc. | 32,550 | 17,575 | 9,935 | 899 | 97,038 |
EcoGreen International Group Ltd. | 13,710 | 181 | 663 | 390 | 12,396 |
Educational Development Corp. | 1,803 | - | 86 | 119 | 1,700 |
Elematec Corp. | 21,667 | - | 1,349 | 676 | 25,776 |
Endurance Specialty Holdings Ltd. | 133,500 | - | 8,274 | 3,441 | 166,380 |
EOH Holdings Ltd. | 68,225 | - | 4,741 | 721 | 100,360 |
Essendant, Inc. (formerly United Stationers, Inc.) | 91,070 | - | 6,708 | 1,298 | 80,696 |
Excel Co. Ltd. | 17,995 | - | 548 | 235 | 13,278 |
Farstad Shipping ASA | 56,831 | - | 809 | 927 | 8,658 |
First Juken Co. Ltd. | 21,501 | - | 943 | 475 | 17,668 |
Folli Follie SA | 175,629 | - | 3,198 | 4,027 | 101,818 |
Food Empire Holdings Ltd. | 15,401 | - | 548 | - | 8,282 |
Foremost Income Fund | 11,488 | - | - | 503 | 8,325 |
Fresh Del Monte Produce, Inc. | 183,119 | - | 20,797 | 3,027 | 219,996 |
Fuji Kosan Co. Ltd. | 4,721 | - | 187 | 89 | 3,206 |
Fuji Oil Co. Ltd. | 18,497 | - | 7,142 | 119 | - |
Fujikura Kasei Co., Ltd. | 16,414 | - | 762 | 348 | 13,516 |
Fursys, Inc. | 30,525 | - | - | 504 | 28,393 |
Fyffes PLC (Ireland) | 40,978 | - | 2,444 | 787 | 41,727 |
Gabia, Inc. | 6,631 | - | 537 | 20 | 6,135 |
GameStop Corp.
Class A | 244,471 | 75,001 | 21,973 | 9,470 | 346,709 |
Gencor Industries, Inc. | 4,833 | - | 273 | - | 4,030 |
Genky Stores, Inc. | 9,170 | - | 886 | 102 | 27,461 |
Genworth Financial, Inc. Class A | 287,527 | 55,421 | 10,994 | - | 184,627 |
Affiliate
(Amounts in thousands) | Value, beginning of period | Purchases | Sales Proceeds* | Dividend Income | Value,
end of
period |
Genworth MI Canada, Inc. | $ 173,311 | $ - | $ 9,875 | $ 6,706 | $ - |
Geodesic Ltd. | 141 | - | - | - | 0 |
Geospace Technologies Corp. | - | 32,582 | 984 | - | 22,267 |
Geumhwa PSC Co. Ltd. | 13,551 | - | - | 222 | 13,184 |
Gildan Activewear, Inc. | 416,798 | - | 39,339 | 2,950 | 418,291 |
Glentel, Inc. | 21,636 | - | 47,021 | 216 | - |
Global Brass & Copper Holdings, Inc. | 17,018 | 2,881 | 3,044 | 181 | 19,375 |
Goodfellow, Inc. | 7,612 | - | 340 | 238 | 5,591 |
Green Dot Corp.
Class A | 35,823 | 9,636 | 4,801 | - | - |
Greggs PLC | 85,359 | - | 111,833 | 3,977 | - |
Guess?, Inc. | 220,700 | 1,360 | 19,005 | 7,434 | 165,690 |
Gujarat Narmada Valley Fertilizers Co. | 17,956 | 2,627 | - | 678 | 13,618 |
Gujarat State Fertilizers & Chemicals Ltd. | 39,198 | 849 | - | - | 35,961 |
Gulfmark Offshore, Inc. Class A | - | 66,448 | 1,766 | 363 | 23,790 |
Gulliver International Co. Ltd. | 52,416 | - | 48,562 | 458 | - |
Halows Co. Ltd. | 17,545 | - | 1,083 | 188 | 25,090 |
Hamakyorex Co. Ltd. | 22,785 | - | 1,345 | 252 | 26,715 |
Hampshire Group Ltd. | 3,215 | - | 41 | - | 212 |
Handsome Co. Ltd. | 64,893 | - | - | 554 | 83,048 |
Hanger, Inc. | 3,076 | 59,861 | 2,830 | - | 57,876 |
Hankook Shell Oil Co. Ltd. | 32,938 | - | 3,151 | 935 | - |
Hanwha Galleria Timeworld Co. Ltd. | 15,301 | - | 4,843 | 259 | 39,235 |
Heartland Payment Systems, Inc. | 92,227 | - | 7,194 | 698 | - |
Helen of Troy Ltd. | 148,105 | - | 12,334 | - | 228,641 |
Hiday Hidaka Corp. | 33,700 | - | 2,637 | 426 | 40,481 |
Honshu Chemical Industry Co. Ltd. | 7,278 | - | 479 | 185 | 10,002 |
Hoshiiryou Sanki Co. Ltd. | 10,695 | - | 466 | 109 | 8,771 |
Houston Wire & Cable Co. | 14,709 | - | 669 | 582 | 10,734 |
HTL International Holdings Ltd. | 6,374 | - | 264 | 225 | 4,283 |
Hurco Companies, Inc. | 20,014 | - | 3,596 | 168 | 16,320 |
Hutech Norin Co. Ltd. | 10,027 | - | 454 | 222 | 8,174 |
Affiliate
(Amounts in thousands) | Value, beginning of period | Purchases | Sales Proceeds* | Dividend Income | Value,
end of
period |
Huvitz Co. Ltd. | $ 12,665 | $ - | $ 5,430 | $ 76 | $ 12,997 |
Hwacheon Machine Tool Co. Ltd. | 13,316 | - | - | 250 | 12,522 |
Hyster-Yale Materials Handling Class B | 24,831 | - | - | 344 | - |
I-Sheng Electric Wire & Cable Co. Ltd. | 17,949 | - | - | 1,154 | 13,148 |
IA Group Corp. | 6,654 | - | 299 | 159 | 5,216 |
ICT Automatisering NV | 5,754 | - | 504 | 180 | 5,896 |
IDIS Holdings Co. Ltd. | 10,574 | - | - | 61 | 12,624 |
Ihara Science Corp. | 9,965 | 334 | 452 | 188 | 8,834 |
Il Dong Holdings Co. Ltd. | 33,888 | - | 64,872 | 349 | - |
Image Sensing Systems, Inc. | 902 | - | 1,440 | - | - |
Indra Sistemas | 246,916 | - | 9,318 | - | 169,695 |
InfoVine Co. Ltd. | 4,567 | - | - | 114 | 5,103 |
Intage Holdings, Inc. | 28,886 | - | 2,039 | 435 | 31,087 |
Intelligent Digital Integrated Security Co. Ltd. | 14,181 | - | - | 214 | 15,377 |
INTOPS Co. Ltd. | 15,300 | - | - | 193 | 11,689 |
INZI Controls Co. Ltd. | 7,865 | - | - | 115 | 6,514 |
Isewan Terminal Service Co. Ltd. | 9,659 | 112 | 624 | 261 | 8,195 |
Isra Vision AG | 26,613 | - | 1,392 | 150 | 23,885 |
Jaya Holdings Ltd. | 3,588 | - | 104 | - | 1,855 |
Jeil Pharmaceutical Co. | 41,772 | - | 15,771 | 63 | 18,836 |
JLM Couture, Inc. | 480 | - | 29 | - | 472 |
Jorudan Co. Ltd. | 3,396 | - | 200 | 54 | 4,190 |
Jumbo SA | 171,244 | - | 2,990 | 4,565 | 80,910 |
Kingboard Chemical Holdings Ltd. | 192,634 | - | 8,183 | 5,836 | 146,025 |
Knoll, Inc. | 50,211 | - | 67,961 | 1,060 | - |
Know IT AB | 14,765 | - | 582 | 544 | 10,231 |
Kohsoku Corp. | 18,643 | - | 783 | 358 | 14,026 |
Kondotec, Inc. | 11,235 | 324 | 578 | 268 | 10,267 |
Korea Electric Terminal Co. Ltd. | 30,276 | - | - | 263 | 61,233 |
KSK Co., Ltd. | 4,659 | - | 249 | 116 | 5,260 |
Kwang Dong Pharmaceutical Co. Ltd. | 28,744 | - | - | 188 | 38,549 |
Kyeryong Construction Industrial Co. Ltd. | 14,021 | - | 117 | - | 8,226 |
Affiliate
(Amounts in thousands) | Value, beginning of period | Purchases | Sales Proceeds* | Dividend Income | Value,
end of
period |
Kyoto Kimono Yuzen Co. Ltd. | $ 15,644 | $ - | $ 1,331 | $ 502 | $ 11,861 |
Kyowakogyosyo Co. Ltd. | 2,650 | - | 105 | 41 | 2,066 |
LCNB Corp. | 11,296 | - | 565 | 470 | 11,315 |
Leeno Industrial, Inc. | 29,484 | - | 6,753 | 411 | - |
LHC Group, Inc. | 43,196 | - | 4,865 | - | 68,529 |
Liquidity Services, Inc. | 21,496 | - | 9,182 | - | - |
Majestic Wine PLC | 11,599 | 19,797 | 1,120 | 126 | 26,324 |
Maruzen Co. Ltd. | 17,696 | - | 863 | 300 | 16,235 |
Mastek Ltd. | 6,384 | - | 2,503 | 49 | 4,763 |
Mega First Corp. Bhd | 16,087 | - | 21 | 514 | 13,926 |
Melbourne IT Ltd. | 11,855 | - | 524 | 299 | 10,855 |
Melcor Real Estate Investment Trust | 7,956 | - | 5,964 | 230 | - |
Melexis NV | 138,271 | - | 11,396 | 3,218 | 148,117 |
Mesa Laboratories, Inc. | 23,017 | - | 1,288 | 187 | 29,561 |
Metro, Inc. Class A (sub. vtg.) | 683,831 | - | 54,235 | 9,627 | 797,492 |
Michang Oil Industrial Co. Ltd. | 12,084 | - | - | 237 | 10,693 |
Miroku Corp. | 2,570 | - | 120 | 52 | 2,045 |
Mitani Sekisan Co. Ltd. | 26,116 | - | 1,297 | 243 | 23,565 |
Mitie Group PLC | 116,293 | - | 9,945 | 4,028 | 103,021 |
Motonic Corp. | 47,265 | - | - | 616 | 32,471 |
Mr. Bricolage SA | 19,662 | - | 796 | 374 | 14,004 |
Muhak Co. Ltd. | 91,496 | - | - | - | 126,833 |
Multi-Fineline Electronix, Inc. | 23,457 | - | 26,799 | - | - |
Murakami Corp. | 11,394 | 809 | 752 | 147 | 14,734 |
Muramoto Electronic Thailand PCL (For. Reg.) | 9,776 | - | 534 | 365 | 9,302 |
Nac Co. Ltd. | 16,765 | - | 536 | 361 | 9,298 |
Nadex Co. Ltd. | 5,729 | - | 313 | 115 | 5,599 |
Nafco Co. Ltd. | 38,984 | - | 1,722 | 675 | 35,808 |
Nakayamafuku Co. Ltd. | 8,185 | 968 | 423 | 253 | 7,870 |
NCI, Inc. Class A | 7,824 | - | 479 | 103 | 9,297 |
ND Software Co. Ltd. | 14,791 | 32 | 755 | 183 | 16,181 |
Neonode, Inc. | - | 7,687 | 3,673 | - | 7,987 |
NETGEAR, Inc. | 77,282 | - | 17,333 | - | 64,766 |
Next PLC | 1,843,594 | - | 108,175 | 76,641 | 1,892,126 |
Nextchip Co. Ltd. | 2,932 | - | 533 | - | 5,920 |
Affiliate
(Amounts in thousands) | Value, beginning of period | Purchases | Sales Proceeds* | Dividend Income | Value,
end of
period |
NICE Total Cash Management Co., Ltd. | $ 6,502 | $ - | $ - | $ 109 | $ 8,924 |
Nippo Ltd. | 3,637 | - | 158 | 99 | 3,050 |
Nippon Rietec Co. Ltd. | 8,888 | 1,591 | 504 | 92 | 9,073 |
Nishimatsuya Chain Co. Ltd. | 37,519 | - | 29,704 | 710 | - |
North Valley Bancorp | 8,681 | - | 31 | - | - |
Northrim Bancorp, Inc. | 11,905 | - | 11,081 | 174 | - |
Norwood Financial Corp. | 3,924 | 1,960 | 292 | 217 | 5,907 |
Nucleus Software Exports Ltd. | 7,468 | - | - | 173 | 9,754 |
Nutraceutical International Corp. | 25,624 | - | 1,299 | - | 25,454 |
OFG Bancorp | 39,972 | - | 372 | 907 | 19,975 |
OM Group, Inc. | 54,889 | - | 58,160 | 405 | - |
P&F Industries, Inc. Class A | 2,962 | - | 156 | - | 2,998 |
Pacific Premier Bancorp, Inc. | 13,189 | - | 914 | - | - |
Pal Co. Ltd. | 43,884 | - | 9,963 | 656 | 37,955 |
Panasonic Information Systems Co. | 16,217 | - | 2,771 | 314 | - |
Parker Corp. | 10,561 | 14 | 523 | 122 | 8,347 |
Pelion SA | 14,467 | - | 1,080 | 285 | 10,840 |
Pinnacle Technology Holdings Ltd. | 11,606 | - | 449 | - | 8,437 |
Piolax, Inc. | 37,494 | - | 2,524 | 453 | 47,481 |
Prim SA | 14,023 | - | 861 | 798 | 17,873 |
Qol Co. Ltd. | 11,928 | 237 | 2,720 | 316 | 31,465 |
Relo Holdings Corp. | 92,610 | - | 13,282 | 1,247 | 130,540 |
RenaissanceRe Holdings Ltd. | 294,359 | - | 15,722 | 3,508 | 306,331 |
Rocky Mountain Chocolate Factory, Inc. | 6,174 | - | 972 | 214 | 5,336 |
Ruby Tuesday, Inc. | 31,434 | - | 11,247 | - | 27,415 |
S&T Holdings Co. Ltd. | 13,996 | - | - | 121 | 16,528 |
Safeway, Inc. | 489,018 | 74,344 | 570,236 | 7,214 | - |
Sakai Moving Service Co. Ltd. | 28,310 | - | 1,409 | 414 | 34,043 |
Samsung Climate Control Co. Ltd. | 4,792 | - | - | 30 | 4,502 |
Affiliate
(Amounts in thousands) | Value, beginning of period | Purchases | Sales Proceeds* | Dividend Income | Value,
end of
period |
Sanei Architecture Planning Co. Ltd. | $ 12,065 | $ - | $ 606 | $ 240 | $ 15,750 |
Sarantis SA | 24,399 | - | 485 | 345 | 17,343 |
ScanSource, Inc. | 71,308 | 10,672 | 4,488 | - | 82,806 |
Seagate Technology LLC | 1,706,620 | - | 78,782 | 59,067 | 1,397,845 |
Select Harvests Ltd. | 25,659 | 416 | 2,339 | 890 | 48,010 |
Senshu Electric Co. Ltd. | 15,708 | - | 847 | 295 | 17,070 |
Servotronics, Inc. | 1,053 | - | 53 | 23 | 907 |
Sewon Precision Industries Co. Ltd. | 14,512 | - | - | - | 10,763 |
Shibaura Electronics Co. Ltd. | 15,062 | - | 674 | 280 | 11,265 |
Shinsegae Engineering & Construction Co. Ltd. | 4,744 | - | 5,596 | - | - |
ShoLodge, Inc. | 2 | - | - | - | 0 |
Sigmatron International, Inc. | 2,230 | 448 | 184 | - | 1,539 |
Sinwa Ltd. | 4,865 | 95 | 217 | 416 | 3,883 |
SJM Co. Ltd. | 11,967 | 95 | - | 194 | 7,201 |
SJM Holdings Co. Ltd. | 6,085 | - | - | 202 | 5,807 |
Societe Pour L'Informatique Industrielle SA | 18,979 | - | 807 | 169 | 14,968 |
Soken Chemical & Engineer Co. Ltd. | 8,865 | - | 405 | 203 | 7,392 |
Sonic Corp. | 83,339 | - | 104,218 | 252 | - |
Span-America Medical System, Inc. | 5,472 | - | 269 | 445 | 4,705 |
Sportscene Group, Inc. Class A | 3,027 | - | 105 | - | 1,550 |
Stanley Furniture Co., Inc. | 2,988 | - | 2,191 | - | - |
Steiner Leisure Ltd. | 61,992 | - | 12,294 | - | 74,171 |
Step Co. Ltd. | 9,870 | - | 514 | 237 | 10,335 |
Sterling Construction Co., Inc. | 15,563 | 769 | 458 | - | 8,258 |
Strattec Security Corp. | 13,458 | - | 5,101 | 86 | - |
Strongco Corp. | 3,296 | - | 105 | - | 1,733 |
Sun Hing Vision Group Holdings Ltd. | 7,647 | - | 448 | 628 | 8,958 |
Sunjin Co. Ltd. | 29,546 | - | - | 62 | 22,678 |
Super Micro Computer, Inc. | 58,812 | 17,962 | 47,567 | - | - |
Swift Energy Co. | 48,193 | - | 624 | - | 3,025 |
Affiliate
(Amounts in thousands) | Value, beginning of period | Purchases | Sales Proceeds* | Dividend Income | Value,
end of
period |
Sword Group | $ 14,347 | $ - | $ 680 | $ 656 | $ 13,247 |
SYNNEX Corp. | 219,474 | - | 12,933 | 1,665 | 244,095 |
T&K Toka Co. Ltd. | 16,827 | - | 770 | 216 | 13,984 |
Techno Smart Corp. | 5,246 | - | 205 | 97 | 3,673 |
Telechips, Inc. | 4,533 | - | - | 56 | 6,347 |
Tessco Technologies, Inc. | 15,558 | 1,915 | 630 | 520 | 14,363 |
The Monogatari Corp. | 15,496 | - | 907 | 189 | 17,928 |
The Pack Corp. | 38,239 | - | 1,920 | 701 | 37,618 |
Titan Machinery, Inc. | 16,490 | 17 | 840 | - | - |
TKH Group NV unit | 65,799 | - | 12,212 | 1,745 | - |
Tocalo Co. Ltd. | 15,754 | - | 953 | 429 | 17,980 |
Tohoku Steel Co. Ltd. | 9,460 | - | 437 | 80 | 7,715 |
Token Corp. | 44,843 | - | 8,546 | 646 | 54,313 |
Tokyo Kisen Co. Ltd. | 5,487 | - | 274 | 158 | 5,573 |
Tokyo Kohtetsu Co. Ltd. | 5,646 | - | 241 | 129 | 4,235 |
Tokyo Tekko Co. Ltd. | 23,726 | - | 1,055 | 404 | 20,674 |
Tomen Devices Corp. | 11,462 | - | 557 | 196 | 11,055 |
Tomen Electronics Corp. | 23,083 | - | 19,858 | - | - |
Total Energy Services, Inc. | 48,493 | - | 1,794 | 410 | 25,838 |
Totech Corp. | 7,537 | 190 | 388 | 177 | 7,147 |
TOW Co. Ltd. | 7,918 | - | 503 | 284 | 11,251 |
Trancom Co. Ltd. | 39,830 | - | 2,410 | 517 | 54,381 |
Trio-Tech International | 1,032 | - | 45 | - | 785 |
Triple-S Management Corp. | 41,913 | - | 4,639 | - | 47,695 |
Tsukui Corp. | 21,377 | 2,556 | 1,034 | 193 | 19,071 |
UANGEL Corp. | 2,764 | - | 1,734 | 57 | - |
UKC Holdings Corp. | 23,792 | - | 1,405 | 477 | 30,529 |
Uni-Select, Inc. | 50,376 | - | 6,166 | 835 | 80,306 |
Unit Corp. | 214,459 | 52,975 | 7,180 | - | 94,775 |
Universal Security Instruments, Inc. | 857 | - | 349 | - | 1,063 |
Unum Group | 571,080 | 98,368 | 36,516 | 12,832 | 664,653 |
Utah Medical Products, Inc. | 21,459 | - | 1,250 | 413 | 21,392 |
VSE Corp. | 30,705 | - | 4,089 | 200 | 21,733 |
VST Holdings Ltd. | 37,074 | - | 2,605 | 2,153 | 46,996 |
W&T Offshore, Inc. | 65,425 | 9,424 | 1,758 | 988 | 22,025 |
Watts Co. Ltd. | 13,030 | - | 554 | 199 | 10,812 |
Weight Watchers International, Inc. | 100,767 | 1,782 | 2,482 | - | 17,956 |
Affiliate
(Amounts in thousands) | Value, beginning of period | Purchases | Sales Proceeds* | Dividend Income | Value,
end of
period |
Whanin Pharmaceutical Co. Ltd. | $ 27,350 | $ - | $ 2,616 | $ 332 | $ 36,620 |
WIN-Partners Co. Ltd. | 17,424 | - | 966 | 418 | 20,387 |
Workman Co. Ltd. | 70,306 | - | 3,975 | 923 | 85,485 |
YBM Sisa.com, Inc. | 3,758 | - | 343 | 143 | - |
Yip's Chemical Holdings Ltd. | 19,617 | - | 873 | 957 | 14,805 |
Youngone Holdings Co. Ltd. | 70,566 | - | 3,168 | 352 | 67,061 |
Yusen Logistics Co. Ltd. | 43,703 | - | 4,183 | 557 | 37,858 |
Yutaka Giken Co. Ltd. | 32,940 | - | 1,585 | 450 | 28,522 |
Total | $ 19,153,371 | $ 1,028,316 | $ 2,681,588 | $ 412,326 | $ 17,233,360 |
* Includes the value of securities delivered through in-kind transactions, if applicable.
Other Information |
The following is a summary of the inputs used, as of July 31, 2015, involving the Fund's assets and liabilities carried at fair value. The inputs or methodology used for valuing securities may not be an indication of the risk associated with investing in those securities. For more information on valuation inputs, and their aggregation into the levels used in the tables below, please refer to the Investment Valuation section in the accompanying Notes to Financial Statements. |
Valuation Inputs at Reporting Date: |
Description
(Amounts in thousands) | Total | Level 1 | Level 2 | Level 3 |
Investments in Securities: | | | | |
Equities: | | | | |
Consumer Discretionary | $ 11,648,068 | $ 11,434,066 | $ 27,209 | $ 186,793 |
Consumer Staples | 3,295,425 | 3,233,955 | 40,529 | 20,941 |
Energy | 1,389,556 | 1,085,432 | 304,124 | - |
Financials | 5,450,717 | 4,841,910 | 567,975 | 40,832 |
Health Care | 5,145,082 | 5,145,082 | - | - |
Industrials | 3,461,147 | 3,446,447 | 8,325 | 6,375 |
Information Technology | 8,333,550 | 8,326,122 | - | 7,428 |
Materials | 1,097,999 | 1,081,095 | - | 16,904 |
Telecommunication Services | 2,170 | 2,170 | - | - |
Utilities | 197,222 | 197,222 | - | - |
Corporate Bonds | 4,455 | - | 4,455 | - |
Money Market Funds | 4,602,099 | 4,602,099 | - | - |
Total Investments in Securities: | $ 44,627,490 | $ 43,395,600 | $ 952,617 | $ 279,273 |
The following is a summary of transfers between Level 1 and Level 2 for the period ended July 31, 2015. Transfers are assumed to have occurred at the beginning of the period, and are primarily attributable to the valuation techniques used for foreign equity securities, as discussed in the accompanying Notes to Financial Statements: |
Transfers | Total (000s) |
Level 1 to Level 2 | $ 0 |
Level 2 to Level 1 | $ 6,080,595 |
Valuation Inputs at Reporting Date: |
The following is a reconciliation of Investments in Securities for which Level 3 inputs were used in determining value: |
(Amounts in thousands) | |
Investments in Securities: | |
Beginning Balance | $ 11,080 |
Net Realized Gain (Loss) on Investment Securities | (12,710) |
Net Unrealized Gain (Loss) on Investment Securities | (278,480) |
Cost of Purchases | 12,140 |
Proceeds of Sales | (11,104) |
Amortization/Accretion | - |
Transfers into Level 3 | 558,827 |
Transfers out of Level 3 | (480) |
Ending Balance | $ 279,273 |
The change in unrealized gain (loss) for the period attributable to Level 3 securities held at July 31, 2015 | $ (291,614) |
The information used in the above reconciliation represents fiscal year to date activity for any Investments in Securities identified as using Level 3 inputs at either the beginning or the end of the current fiscal period, and proceeds of sales includes securities delivered through in-kind transactions. See Note 4 of the Notes to Financial Statements.Transfers into Level 3 were attributable to a lack of observable market data resulting from decreases in market activity, decreases in liquidity, security restructurings or corporate actions. Transfers out of Level 3 were attributable to observable market data becoming available for those securities. Transfers in or out of Level 3 represent the beginning value of any Security or Instrument where a change in the pricing level occurred from the beginning to the end of the period. The cost of purchases and the proceeds of sales may include securities received or delivered through corporate actions or exchanges. Realized and unrealized gains (losses) disclosed in the reconciliation are included in Net Gain (Loss) on the Fund's Statement of Operations. |
Distribution of investments by country or territory of incorporation, as a percentage of total net assets, is as follows (Unaudited): |
United States of America | 56.8% |
United Kingdom | 7.7% |
Japan | 7.1% |
Ireland | 5.4% |
Canada | 4.0% |
Bermuda | 3.0% |
Korea (South) | 2.9% |
Netherlands | 2.4% |
Taiwan | 1.4% |
Cayman Islands | 1.2% |
Italy | 1.2% |
Bailiwick of Guernsey | 1.0% |
Others (Individually Less Than 1%) | 5.9% |
| 100.0% |
See accompanying notes which are an integral part of the financial statements.
Annual Report
Statement of Assets and Liabilities
Amounts in thousands (except per-share amounts) | | July 31, 2015 |
| | |
Assets | | |
Investment in securities, at value (including securities loaned of $508,666) - See accompanying schedule: Unaffiliated issuers (cost $11,930,193) | $ 22,792,031 | |
Fidelity Central Funds (cost $4,602,099) | 4,602,099 | |
Other affiliated issuers (cost $8,913,788) | 17,233,360 | |
Total Investments (cost $25,446,080) | | $ 44,627,490 |
Cash | | 1,326 |
Foreign currency held at value (cost $899) | | 899 |
Receivable for investments sold | | 72,737 |
Receivable for fund shares sold | | 25,676 |
Dividends receivable | | 63,589 |
Interest receivable | | 183 |
Distributions receivable from Fidelity Central Funds | | 1,573 |
Other receivables | | 1,813 |
Total assets | | 44,795,286 |
| | |
Liabilities | | |
Payable for investments purchased | $ 24,659 | |
Payable for fund shares redeemed | 67,574 | |
Accrued management fee | 24,309 | |
Other affiliated payables | 4,486 | |
Other payables and accrued expenses | 2,066 | |
Collateral on securities loaned, at value | 533,239 | |
Total liabilities | | 656,333 |
| | |
Net Assets | | $ 44,138,953 |
Net Assets consist of: | | |
Paid in capital | | $ 23,582,023 |
Undistributed net investment income | | 254,596 |
Accumulated undistributed net realized gain (loss) on investments and foreign currency transactions | | 1,120,672 |
Net unrealized appreciation (depreciation) on investments and assets and liabilities in foreign currencies | | 19,181,662 |
Net Assets | | $ 44,138,953 |
See accompanying notes which are an integral part of the financial statements.
Annual Report
Financial Statements - continued
Statement of Assets and Liabilities - continued
Amounts in thousands (except per-share amounts) | | July 31, 2015 |
| | |
Low-Priced Stock:
Net Asset Value, offering price and redemption price per share ($30,149,887 ÷ 572,608 shares) | | $ 52.65 |
| | |
Class K:
Net Asset Value, offering price and redemption price per share ($13,989,066 ÷ 265,773 shares) | | $ 52.64 |
See accompanying notes which are an integral part of the financial statements.
Annual Report
Statement of Operations
Amounts in thousands | Year ended July 31, 2015 |
| | |
Investment Income | | |
Dividends (including $412,326 earned from other affiliated issuers) | | $ 804,688 |
Interest | | 252 |
Income from Fidelity Central Funds | | 23,775 |
Total income | | 828,715 |
| | |
Expenses | | |
Management fee | | |
Basic fee | $ 275,296 | |
Performance adjustment | 14,689 | |
Transfer agent fees | 52,004 | |
Accounting and security lending fees | 2,424 | |
Custodian fees and expenses | 2,942 | |
Independent trustees' compensation | 198 | |
Registration fees | 224 | |
Audit | 232 | |
Legal | 132 | |
Miscellaneous | 325 | |
Total expenses before reductions | 348,466 | |
Expense reductions | (1,711) | 346,755 |
Net investment income (loss) | | 481,960 |
Realized and Unrealized Gain (Loss) Net realized gain (loss) on: | | |
Investment securities: | | |
Unaffiliated issuers | 1,851,835 | |
Other affiliated issuers | 1,136,238 | |
Foreign currency transactions | (5,144) | |
Total net realized gain (loss) | | 2,982,929 |
Change in net unrealized appreciation (depreciation) on: Investment securities (net of decrease in deferred foreign taxes of $7,220) | 641,564 | |
Assets and liabilities in foreign currencies | 1,220 | |
Total change in net unrealized appreciation (depreciation) | | 642,784 |
Net gain (loss) | | 3,625,713 |
Net increase (decrease) in net assets resulting from operations | | $ 4,107,673 |
See accompanying notes which are an integral part of the financial statements.
Annual Report
Financial Statements - continued
Statement of Changes in Net Assets
Amounts in thousands | Year ended
July 31,
2015 | Year ended
July 31,
2014 |
Increase (Decrease) in Net Assets | | |
Operations | | |
Net investment income (loss) | $ 481,960 | $ 513,196 |
Net realized gain (loss) | 2,982,929 | 3,427,430 |
Change in net unrealized appreciation (depreciation) | 642,784 | 2,225,261 |
Net increase (decrease) in net assets resulting from operations | 4,107,673 | 6,165,887 |
Distributions to shareholders from net investment income | (489,296) | (372,615) |
Distributions to shareholders from net realized gain | (2,217,917) | (2,653,754) |
Total distributions | (2,707,213) | (3,026,369) |
Share transactions - net increase (decrease) | (4,036,455) | 768,382 |
Redemption fees | 1,697 | 2,996 |
Total increase (decrease) in net assets | (2,634,298) | 3,910,896 |
| | |
Net Assets | | |
Beginning of period | 46,773,251 | 42,862,355 |
End of period (including undistributed net investment income of $254,596 and undistributed net investment income of $303,889, respectively) | $ 44,138,953 | $ 46,773,251 |
See accompanying notes which are an integral part of the financial statements.
Annual Report
Financial Highlights - Low-Priced Stock
Years ended July 31, | 2015 | 2014 | 2013 | 2012 | 2011 |
Selected Per-Share Data | | | | | |
Net asset value, beginning of period | $ 51.03 | $ 47.84 | $ 38.52 | $ 40.67 | $ 33.07 |
Income from Investment Operations | | | | | |
Net investment income (loss) B | .52 | .53 | .48 | .37 | .23 |
Net realized and unrealized gain (loss) | 4.06 | 5.96 | 11.61 | (.03) | 7.53 |
Total from investment operations | 4.58 | 6.49 | 12.09 | .34 | 7.76 |
Distributions from net investment income | (.52) | (.39) | (.49) | (.28) | (.15) |
Distributions from net realized gain | (2.44) | (2.91) | (2.28) | (2.21) | (.01) |
Total distributions | (2.96) | (3.30) | (2.77) | (2.49) | (.16) |
Redemption fees added to paid in capital B, F | - | - | - | - | - |
Net asset value, end of period | $ 52.65 | $ 51.03 | $ 47.84 | $ 38.52 | $ 40.67 |
Total Return A | 9.32% | 14.42% | 33.12% | 1.68% | 23.53% |
Ratios to Average Net Assets C, E | | | | | |
Expenses before reductions | .79% | .82% | .79% | .88% | .83% |
Expenses net of fee waivers, if any | .79% | .82% | .79% | .88% | .83% |
Expenses net of all reductions | .79% | .82% | .79% | .88% | .83% |
Net investment income (loss) | 1.02% | 1.07% | 1.14% | 1.00% | .61% |
Supplemental Data | | | | | |
Net assets, end of period (in millions) | $ 30,150 | $ 30,576 | $ 28,171 | $ 22,999 | $ 26,762 |
Portfolio turnover rate D | 9% G | 12% G | 11% | 19% | 15% |
A Total returns would have been lower if certain expenses had not been reduced during the applicable periods shown.
B Calculated based on average shares outstanding during the period.
C Fees and expenses of any underlying Fidelity Central Funds are not included in the Fund's expense ratio. The Fund indirectly bears its proportionate share of the expenses of any underlying Fidelity Central Funds.
D Amount does not include the portfolio activity of any underlying Fidelity Central Funds.
E Expense ratios reflect operating expenses of the class. Expenses before reductions do not reflect amounts reimbursed by the investment adviser or reductions from brokerage service arrangements or reductions from other expense offset arrangements and do not represent the amount paid by the class during periods when reimbursements or reductions occur. Expenses net of fee waivers reflect expenses after reimbursement by the investment adviser but prior to reductions from brokerage service arrangements or other expense offset arrangements. Expenses net of all reductions represent the net expenses paid by the class.
F Amount represents less than $.01 per share.
G Portfolio turnover rate excludes securities received or delivered in-kind.
See accompanying notes which are an integral part of the financial statements.
Annual Report
Financial Highlights - Class K
Years ended July 31, | 2015 | 2014 | 2013 | 2012 | 2011 |
Selected Per-Share Data | | | | | |
Net asset value, beginning of period | $ 51.02 | $ 47.83 | $ 38.52 | $ 40.67 | $ 33.11 |
Income from Investment Operations | | | | | |
Net investment income (loss) B | .57 | .58 | .53 | .42 | .28 |
Net realized and unrealized gain (loss) | 4.06 | 5.96 | 11.60 | (.03) | 7.51 |
Total from investment operations | 4.63 | 6.54 | 12.13 | .39 | 7.79 |
Distributions from net investment income | (.57) | (.44) | (.54) | (.33) | (.23) |
Distributions from net realized gain | (2.44) | (2.91) | (2.28) | (2.21) | (.01) |
Total distributions | (3.01) | (3.35) | (2.82) | (2.54) | (.23) H |
Redemption fees added to paid in capital B, F | - | - | - | - | - |
Net asset value, end of period | $ 52.64 | $ 51.02 | $ 47.83 | $ 38.52 | $ 40.67 |
Total Return A | 9.44% | 14.55% | 33.27% | 1.83% | 23.66% |
Ratios to Average Net AssetsC, E | | | | | |
Expenses before reductions | .69% | .72% | .68% | .76% | .71% |
Expenses net of fee waivers, if any | .69% | .72% | .68% | .76% | .71% |
Expenses net of all reductions | .69% | .72% | .68% | .76% | .70% |
Net investment income (loss) | 1.11% | 1.17% | 1.26% | 1.12% | .74% |
Supplemental Data | | | | | |
Net assets, end of period (in millions) | $ 13,989 | $ 16,198 | $ 14,691 | $ 9,985 | $ 8,031 |
Portfolio turnover rate D | 9% G | 12% G | 11% | 19% | 15% |
A Total returns would have been lower if certain expenses had not been reduced during the applicable periods shown.
B Calculated based on average shares outstanding during the period.
C Fees and expenses of any underlying Fidelity Central Funds are not included in the Fund's expense ratio. The Fund indirectly bears its proportionate share of the expenses of any underlying Fidelity Central Funds.
D Amount does not include the portfolio activity of any underlying Fidelity Central Funds.
E Expense ratios reflect operating expenses of the class. Expenses before reductions do not reflect amounts reimbursed by the investment adviser or reductions from brokerage service arrangements or reductions from other expense offset arrangements and do not represent the amount paid by the class during periods when reimbursements or reductions occur. Expenses net of fee waivers reflect expenses after reimbursement by the investment adviser but prior to reductions from brokerage service arrangements or other expense offset arrangements. Expenses net of all reductions represent the net expenses paid by the class.
F Amount represents less than $.01 per share.
G Portfolio turnover rate excludes securities received or delivered in-kind.
H Total distributions of $.23 per share is comprised of distributions from net investment income of $.226 and distributions from net realized gain of $.008 per share.
See accompanying notes which are an integral part of the financial statements.
Annual Report
For the period ended July 31, 2015
(Amounts in thousands except percentages)
1. Organization.
Fidelity Low-Priced Stock Fund (the Fund) is a fund of Fidelity Puritan Trust (the Trust) and is authorized to issue an unlimited number of shares. The Trust is registered under the Investment Company Act of 1940, as amended (the 1940 Act), as an open-end management investment company organized as a Massachusetts business trust. The Fund offers Low-Priced Stock and Class K shares, each of which has equal rights as to assets and voting privileges. Each class has exclusive voting rights with respect to matters that affect that class.
2. Investments in Fidelity Central Funds.
The Fund invests in Fidelity Central Funds, which are open-end investment companies generally available only to other investment companies and accounts managed by the investment adviser and its affiliates. The Fund's Schedule of Investments lists each of the Fidelity Central Funds held as of period end, if any, as an investment of the Fund, but does not include the underlying holdings of each Fidelity Central Fund. As an Investing Fund, the Fund indirectly bears its proportionate share of the expenses of the underlying Fidelity Central Funds.
The Money Market Central Funds seek preservation of capital and current income and are managed by Fidelity Investments Money Management, Inc. (FIMM), an affiliate of the investment adviser. Annualized expenses of the Money Market Central Funds as of their most recent shareholder report date are less than .01%.
A complete unaudited list of holdings for each Fidelity Central Fund is available upon request or at the Securities and Exchange Commission (the SEC) website at www.sec.gov. In addition, the financial statements of the Fidelity Central Funds, which are not covered by the Fund's Report of Independent Registered Public Accounting Firm, are available on the SEC website or upon request.
3. Significant Accounting Policies.
The financial statements have been prepared in conformity with accounting principles generally accepted in the United States of America (GAAP), which require management to make certain estimates and assumptions at the date of the financial statements. Actual results could differ from those estimates. Subsequent events, if any, through the date that the financial statements were issued have been evaluated in the preparation of the financial statements. The following summarizes the significant accounting policies of the Fund:
Investment Valuation. Investments are valued as of 4:00 p.m. Eastern time on the last calendar day of the period. The Board of Trustees (the Board) has delegated the day to
Annual Report
3. Significant Accounting Policies - continued
Investment Valuation - continued
day responsibility for the valuation of the Fund's investments to the Fidelity Management & Research Company (FMR) Fair Value Committee (the Committee). In accordance with valuation policies and procedures approved by the Board, the Fund attempts to obtain prices from one or more third party pricing vendors or brokers to value its investments. When current market prices, quotations or currency exchange rates are not readily available or reliable, investments will be fair valued in good faith by the Committee, in accordance with procedures adopted by the Board. Factors used in determining fair value vary by investment type and may include market or investment specific events, changes in interest rates and credit quality. The frequency with which these procedures are used cannot be predicted and they may be utilized to a significant extent. The Committee oversees the Fund's valuation policies and procedures and reports to the Board on the Committee's activities and fair value determinations. The Board monitors the appropriateness of the procedures used in valuing the Fund's investments and ratifies the fair value determinations of the Committee.
The Fund categorizes the inputs to valuation techniques used to value its investments into a disclosure hierarchy consisting of three levels as shown below:
Level 1 - quoted prices in active markets for identical investments
Level 2 - other significant observable inputs (including quoted prices for similar investments, interest rates, prepayment speeds, etc.)
Level 3 - unobservable inputs (including the Fund's own assumptions based on the best information available)
Valuation techniques used to value the Fund's investments by major category are as follows:
Equity securities, including restricted securities, for which market quotations are readily available, are valued at the last reported sale price or official closing price as reported by a third party pricing vendor on the primary market or exchange on which they are traded and are categorized as Level 1 in the hierarchy. In the event there were no sales during the day or closing prices are not available, securities are valued at the last quoted bid price or may be valued using the last available price and are generally categorized as Level 2 in the hierarchy. For foreign equity securities, when market or security specific events arise, comparisons to the valuation of American Depositary Receipts (ADRs), futures contracts, Exchange-Traded Funds (ETFs) and certain indexes as well as quoted prices for similar securities may be used and would be categorized as Level 2 in the hierarchy. Utilizing these techniques may result in transfers between Level 1 and Level 2. For equity securities, including restricted securities, where observable inputs are
Annual Report
Notes to Financial Statements - continued
(Amounts in thousands except percentages)
3. Significant Accounting Policies - continued
Investment Valuation - continued
limited, assumptions about market activity and risk are used and these securities may be categorized as Level 3 in the hierarchy.
Debt securities, including restricted securities, are valued based on evaluated prices received from third party pricing vendors or from brokers who make markets in such securities. Corporate bonds are valued by pricing vendors who utilize matrix pricing which considers yield or price of bonds of comparable quality, coupon, maturity and type or by broker-supplied prices. When independent prices are unavailable or unreliable, debt securities may be valued utilizing pricing methodologies which consider similar factors that would be used by third party pricing vendors. Debt securities are generally categorized as Level 2 in the hierarchy but may be Level 3 depending on the circumstances.
Investments in open-end mutual funds, including the Fidelity Central Funds, are valued at their closing net asset value (NAV) each business day and are categorized as Level 1 in the hierarchy.
Changes in valuation techniques may result in transfers in or out of an assigned level within the disclosure hierarchy. The aggregate value of investments by input level as of July 31, 2015, including information on transfers between Levels 1 and 2, is included at the end of the Fund's Schedule of Investments.
Foreign Currency. The Fund may use foreign currency contracts to facilitate transactions in foreign-denominated securities. Gains and losses from these transactions may arise from changes in the value of the foreign currency or if the counterparties do not perform under the contracts' terms.
Foreign-denominated assets, including investment securities, and liabilities are translated into U.S. dollars at the exchange rates at period end. Purchases and sales of investment securities, income and dividends received and expenses denominated in foreign currencies are translated into U.S. dollars at the exchange rate in effect on the transaction date.
The effects of exchange rate fluctuations on investments are included with the net realized and unrealized gain (loss) on investment securities. Other foreign currency transactions resulting in realized and unrealized gain (loss) are disclosed separately.
Investment Transactions and Income. For financial reporting purposes, the Fund's investment holdings and NAV include trades executed through the end of the last business day of the period. The NAV per share for processing shareholder transactions is calculated as of the close of business of the New York Stock Exchange (NYSE), normally
Annual Report
3. Significant Accounting Policies - continued
Investment Transactions and Income - continued
4:00 p.m. Eastern time and includes trades executed through the end of the prior business day. Gains and losses on securities sold are determined on the basis of identified cost and may include proceeds received from litigation. Dividend income is recorded on the ex-dividend date, except for certain dividends from foreign securities where the ex-dividend date may have passed, which are recorded as soon as the Fund is informed of the ex-dividend date. Non-cash dividends included in dividend income, if any, are recorded at the fair market value of the securities received. Income and capital gain distributions from Fidelity Central Funds, if any, are recorded on the ex-dividend date. Distributions received on securities that represent a return of capital or capital gain are recorded as a reduction of cost of investments and/or as a realized gain. Subsequent to ex-dividend date the Fund determines the components of these distributions, based upon receipt of tax filings or other correspondence relating to the underlying investment. Interest income is accrued as earned and includes coupon interest and amortization of premium and accretion of discount on debt securities as applicable. Investment income is recorded net of foreign taxes withheld where recovery of such taxes is uncertain.
Class Allocations and Expenses. Investment income, realized and unrealized capital gains and losses, common expenses of the Fund, and certain fund-level expense reductions, if any, are allocated daily on a pro-rata basis to each class based on the relative net assets of each class to the total net assets of the Fund. Each class differs with respect to transfer agent fees incurred. Certain expense reductions may also differ by class. For the reporting period, the allocated portion of income and expenses to each class as a percent of its average net assets may vary due to the timing of recording these transactions in relation to fluctuating net assets of the classes. Expenses directly attributable to a fund are charged to that fund. Expenses attributable to more than one fund are allocated among the respective funds on the basis of relative net assets or other appropriate methods. Expense estimates are accrued in the period to which they relate and adjustments are made when actual amounts are known.
Deferred Trustee Compensation. Under a Deferred Compensation Plan (the Plan), independent Trustees may elect to defer receipt of a portion of their annual compensation. Deferred amounts are invested in a cross-section of Fidelity funds, are marked-to-market and remain in the Fund until distributed in accordance with the Plan. The investment of deferred amounts and the offsetting payable to the Trustees are included in the accompanying Statement of Assets and Liabilities.
Income Tax Information and Distributions to Shareholders. Each year, the Fund intends to qualify as a regulated investment company under Subchapter M of the Internal Revenue Code, including distributing substantially all of its taxable income and realized gains. As a result, no provision for U.S. Federal income taxes is required. As of
Annual Report
Notes to Financial Statements - continued
(Amounts in thousands except percentages)
3. Significant Accounting Policies - continued
Income Tax Information and Distributions to Shareholders - continued
July 31, 2015, the Fund did not have any unrecognized tax benefits in the financial statements; nor is the Fund aware of any tax positions for which it is reasonably possible that the total amounts of unrecognized tax benefits will significantly change in the next twelve months. The Fund files a U.S. federal tax return, in addition to state and local tax returns as required. The Fund's federal income tax returns are subject to examination by the Internal Revenue Service (IRS) for a period of three fiscal years after they are filed. State and local tax returns may be subject to examination for an additional fiscal year depending on the jurisdiction. Foreign taxes are provided for based on the Fund's understanding of the tax rules and rates that exist in the foreign markets in which it invests.
Distributions are declared and recorded on the ex-dividend date. Income dividends and capital gain distributions are declared separately for each class. Income and capital gain distributions are determined in accordance with income tax regulations, which may differ from GAAP. In addition, the Fund claimed a portion of the payment made to redeeming shareholders as a distribution for income tax purposes.
Capital accounts within the financial statements are adjusted for permanent book-tax differences. These adjustments have no impact on net assets or the results of operations. Capital accounts are not adjusted for temporary book-tax differences which will reverse in a subsequent period.
Book-tax differences are primarily due to foreign currency transactions, passive foreign investment companies (PFIC), market discount, redemptions in-kind, partnerships, deferred trustees compensation and losses deferred due to wash sales.
The federal tax cost of investment securities and unrealized appreciation (depreciation) as of period end were as follows:
Gross unrealized appreciation | $ 21,658,184 |
Gross unrealized depreciation | (2,635,801) |
Net unrealized appreciation (depreciation) on securities | $ 19,022,383 |
| |
Tax Cost | $ 25,605,107 |
Annual Report
3. Significant Accounting Policies - continued
Income Tax Information and Distributions to Shareholders - continued
The tax-based components of distributable earnings as of period end were as follows:
Undistributed ordinary income | $ 256,107 |
Undistributed long-term capital gain | $ 1,279,698 |
Net unrealized appreciation (depreciation) on securities and other investments | $ 19,022,803 |
The tax character of distributions paid was as follows:
| July 31, 2015 | July 31, 2014 |
Ordinary Income | $ 550,274 | $ 502,790 |
Long-term Capital Gains | 2,156,939 | 2,523,579 |
Total | $ 2,707,213 | $ 3,026,369 |
Short-Term Trading (Redemption) Fees. Shares held by investors in the Fund less than 90 days may have been subject to a redemption fee equal to 1.50% of the NAV of shares redeemed. All redemption fees, which reduce the proceeds of the shareholder redemption, are retained by the Fund and accounted for as an addition to paid in capital.
4. Purchases and Sales of Investments.
Purchases and sales of securities, other than short-term securities and in-kind transactions, aggregated $3,529,104 and $5,351,533, respectively.
Redemptions In-Kind. During the period, 43,165 shares of the Fund held by unaffiliated entities were redeemed for cash and investments, including accrued interest, with a value of $2,214,623. The net realized gain of $1,228,379 on investments delivered through in-kind redemptions is included in the accompanying Statement of Operations. The amount of in-kind redemptions is included in share transactions in the accompanying Statement of Changes in Net Assets as well as Note 10: Share Transactions. The Fund recognized no gain or loss for federal income tax purposes.
5. Fees and Other Transactions with Affiliates.
Management Fee. Fidelity Management & Research Company (the investment adviser) and its affiliates provide the Fund with investment management related services for which the Fund pays a monthly management fee. The management fee is the sum of an individual fund fee rate that is based on an annual rate of .35% of the Fund's average net assets and an annualized group fee rate that averaged .25% during the period. The group fee rate is based upon the average net assets of all the mutual funds advised by the investment adviser, including any mutual funds previously advised by the
Annual Report
Notes to Financial Statements - continued
(Amounts in thousands except percentages)
5. Fees and Other Transactions with Affiliates - continued
Management Fee - continued
investment adviser that are currently advised by Fidelity SelectCo, LLC, an affiliate of the investment adviser. The group fee rate decreases as assets under management increase and increases as assets under management decrease. In addition, the management fee is subject to a performance adjustment (up to a maximum of ± .20% of the Fund's average net assets over a 36 month performance period). The upward or downward adjustment to the management fee is based on the relative investment performance of Low-Priced Stock as compared to its benchmark index, the Russell 2000 Index, over the same 36 month performance period. For the reporting period, the total annual management fee rate, including the performance adjustment, was .63% of the Fund's average net assets. The performance adjustment included in the management fee rate may be higher or lower than the maximum performance adjustment rate due to the difference between the average net assets for the reporting and performance periods.
Transfer Agent Fees. Fidelity Investments Institutional Operations Company, Inc., (FIIOC), an affiliate of the investment adviser, is the transfer, dividend disbursing and shareholder servicing agent for each class of the Fund. FIIOC receives account fees and asset-based fees that vary according to the account size and type of account of the shareholders of Low-Priced Stock. FIIOC receives an asset-based fee of Class K's average net assets. FIIOC pays for typesetting, printing and mailing of shareholder reports, except proxy statements.
For the period, transfer agent fees for each class were as follows:
| Amount | % of
Class-Level Average
Net Assets |
Low-Priced Stock | $ 44,661 | .15 |
Class K | 7,343 | .05 |
| $ 52,004 | |
Accounting and Security Lending Fees. Fidelity Service Company, Inc. (FSC), an affiliate of the investment adviser, maintains the Fund's accounting records. The accounting fee is based on the level of average net assets for each month. Under a separate contract, FSC administers the security lending program. The security lending fee is based on the number and duration of lending transactions.
Brokerage Commissions. The Fund placed a portion of its portfolio transactions with brokerage firms which are affiliates of the investment adviser. Brokerage commissions are included in net realized gain (loss) and change in net unrealized appreciation (depreciation) in the Statement of Operations. The commissions paid to these affiliated firms were $142 for the period.
Annual Report
5. Fees and Other Transactions with Affiliates - continued
Other. During the period, the investment adviser reimbursed the Fund for certain losses in the amount of $32.
6. Committed Line of Credit.
The Fund participates with other funds managed by the investment adviser or an affiliate in a $4.25 billion credit facility (the "line of credit") to be utilized for temporary or emergency purposes to fund shareholder redemptions or for other short-term liquidity purposes. The Fund has agreed to pay commitment fees on its pro-rata portion of the line of credit, which amounted to $67 and is reflected in Miscellaneous expenses on the Statement of Operations. During the period, the Fund did not borrow on this line of credit.
7. Security Lending.
The Fund lends portfolio securities through a lending agent from time to time in order to earn additional income. For equity securities, a lending agent is used and may loan securities to certain qualified borrowers, including Fidelity Capital Markets (FCM), a broker-dealer affiliated with the Fund. On the settlement date of the loan, the Fund receives collateral (in the form of U.S. Treasury obligations, letters of credit and/or cash) against the loaned securities and maintains collateral in an amount not less than 100% of the market value of the loaned securities during the period of the loan. The market value of the loaned securities is determined at the close of business of the Fund and any additional required collateral is delivered to the Fund on the next business day. If the borrower defaults on its obligation to return the securities loaned because of insolvency or other reasons, the Fund may apply collateral received from the borrower against the obligation. The Fund may experience delays and costs in recovering the securities loaned. Any cash collateral received is invested in the Fidelity Securities Lending Cash Central Fund. The value of loaned securities and cash collateral at period end are disclosed on the Fund's Statement of Assets and Liabilities. The value of securities loaned to FCM at period end was $18,291. Security lending income represents the income earned on investing cash collateral, less rebates paid to borrowers and any lending agent fees associated with the loan, plus any premium payments received for lending certain types of securities. Security lending income is presented in the Statement of Operations as a component of income from Fidelity Central Funds. Total security lending income during the period amounted to $16,764, including $1,439 from securities loaned to FCM.
8. Expense Reductions.
Commissions paid to certain brokers with whom the investment adviser, or its affiliates, places trades on behalf of the Fund include an amount in addition to trade execution, which may be rebated back to the Fund to offset certain expenses. This amount totaled
Annual Report
Notes to Financial Statements - continued
(Amounts in thousands except percentages)
8. Expense Reductions - continued
$433 for the period. In addition, through arrangements with the Fund's custodian, credits realized as a result of uninvested cash balances were used to reduce the Fund's expenses. During the period, these credits reduced the Fund's custody expenses by $6.
In addition, during the period the investment adviser reimbursed/waived a portion of fund-level operating expenses in the amount of $182 and a portion of class-level operating expenses as follows:
| Amount |
Low-Priced Stock | $ 1,090 |
9. Distributions to Shareholders.
Distributions to shareholders of each class were as follows:
Years ended July 31, | 2015 | 2014 |
From net investment income | | |
Low-Priced Stock | $ 308,914 | $ 232,537 |
Class K | 180,382 | 140,078 |
Total | $ 489,296 | $ 372,615 |
From net realized gain | | |
Low-Priced Stock | $ 1,447,788 | $ 1,731,108 |
Class K | 770,129 | 922,646 |
Total | $ 2,217,917 | $ 2,653,754 |
10. Share Transactions.
Share transactions for each class were as follows and may contain automatic conversions between classes or exchanges between funds:
| Shares | Dollars |
Years ended July 31, | 2015 | 2014 | 2015 | 2014 |
Low-Priced Stock | | | | |
Shares sold | 49,502 | 85,303 | $ 2,521,927 | $ 4,180,051 |
Reinvestment of distributions | 32,942 | 39,938 | 1,647,856 | 1,842,708 |
Shares redeemed | (108,975) A | (114,924) B | (5,539,766) A | (5,671,216) B |
Net increase (decrease) | (26,531) | 10,317 | $ (1,369,983) | $ 351,543 |
Class K | | | | |
Shares sold | 55,038 | 69,134 | $ 2,806,178 | $ 3,397,015 |
Reinvestment of distributions | 19,018 | 23,051 | 950,511 | 1,062,724 |
Shares redeemed | (125,754) A | (81,847) B | (6,423,161) A | (4,042,900) B |
Net increase (decrease) | (51,698) | 10,338 | $ (2,666,472) | $ 416,839 |
A Amount includes in-kind redemptions (see Note 4: Redemptions In-Kind).
B Amount includes in-kind redemptions.
Annual Report
11. Other.
The Fund's organizational documents provide former and current trustees and officers with a limited indemnification against liabilities arising in connection with the performance of their duties to the Fund. In the normal course of business, the Fund may also enter into contracts that provide general indemnifications. The Fund's maximum exposure under these arrangements is unknown as this would be dependent on future claims that may be made against the Fund. The risk of material loss from such claims is considered remote.
Annual Report
To the Trustees of Fidelity Puritan Trust and the Shareholders of Fidelity Low-Priced Stock Fund:
In our opinion, the accompanying statement of assets and liabilities, including the schedule of investments, and the related statements of operations and of changes in net assets and the financial highlights present fairly, in all material respects, the financial position of Fidelity Low-Priced Stock Fund (a fund of Fidelity Puritan Trust) at July 31, 2015, the results of its operations for the year then ended, the changes in its net assets for each of the two years in the period then ended and the financial highlights for each of the five years in the period then ended, in conformity with accounting principles generally accepted in the United States of America. These financial statements and financial highlights (hereafter referred to as "financial statements") are the responsibility of the Fidelity Low-Priced Stock Fund's management. Our responsibility is to express an opinion on these financial statements based on our audits. We conducted our audits of these financial statements in accordance with the standards of the Public Company Accounting Oversight Board (United States). Those standards require that we plan and perform the audit to obtain reasonable assurance about whether the financial statements are free of material misstatement. An audit includes examining, on a test basis, evidence supporting the amounts and disclosures in the financial statements, assessing the accounting principles used and significant estimates made by management, and evaluating the overall financial statement presentation. We believe that our audits, which included confirmation of securities at July 31, 2015 by correspondence with the custodian and brokers, provide a reasonable basis for our opinion.
PricewaterhouseCoopers LLP
Boston, Massachusetts
September 22, 2015
Annual Report
The Trustees, Member of the Advisory Board, and officers of the trust and fund, as applicable, are listed below. The Board of Trustees governs the fund and is responsible for protecting the interests of shareholders. The Trustees are experienced executives who meet periodically throughout the year to oversee the fund's activities, review contractual arrangements with companies that provide services to the fund, oversee management of the risks associated with such activities and contractual arrangements, and review the fund's performance. Each of the Trustees oversees 170 funds.
The Trustees hold office without limit in time except that (a) any Trustee may resign; (b) any Trustee may be removed by written instrument, signed by at least two-thirds of the number of Trustees prior to such removal; (c) any Trustee who requests to be retired or who has become incapacitated by illness or injury may be retired by written instrument signed by a majority of the other Trustees; and (d) any Trustee may be removed at any special meeting of shareholders by a two-thirds vote of the outstanding voting securities of the trust. Each Trustee who is not an interested person (as defined in the 1940 Act) of the trust and the fund (Independent Trustee), shall retire not later than the last day of the calendar year in which his or her 75th birthday occurs. The Independent Trustees may waive this mandatory retirement age policy with respect to individual Trustees. The officers and Advisory Board Member hold office without limit in time, except that any officer and Advisory Board Member may resign or may be removed by a vote of a majority of the Trustees at any regular meeting or any special meeting of the Trustees. Except as indicated, each individual has held the office shown or other offices in the same company for the past five years.
Experience, Skills, Attributes, and Qualifications of the Fund's Trustees. The Governance and Nominating Committee has adopted a statement of policy that describes the experience, qualifications, attributes, and skills that are necessary and desirable for potential Independent Trustee candidates (Statement of Policy). The Board believes that each Trustee satisfied at the time he or she was initially elected or appointed a Trustee, and continues to satisfy, the standards contemplated by the Statement of Policy. The Governance and Nominating Committee also engages professional search firms to help identify potential Independent Trustee candidates who have the experience, qualifications, attributes, and skills consistent with the Statement of Policy. From time to time, additional criteria based on the composition and skills of the current Independent Trustees, as well as experience or skills that may be appropriate in light of future changes to board composition, business conditions, and regulatory or other developments, have also been considered by the professional search firms and the Governance and Nominating Committee. In addition, the Board takes into account the Trustees' commitment and participation in Board and committee meetings, as well as their leadership of standing and ad hoc committees throughout their tenure.
In determining that a particular Trustee was and continues to be qualified to serve as a Trustee, the Board has considered a variety of criteria, none of which, in isolation, was controlling. The Board believes that, collectively, the Trustees have balanced and diverse experience, qualifications, attributes, and skills, which allow the Board to operate effectively in governing the fund and protecting the interests of shareholders. Information about the specific experience, skills, attributes, and qualifications of each Trustee, which in each case led to the Board's conclusion that the Trustee should serve (or continue to serve) as a trustee of the fund, is provided below.
Annual Report
Board Structure and Oversight Function. James C. Curvey is an interested person (as defined in the 1940 Act) and currently serves as Chairman. The Trustees have determined that an interested Chairman is appropriate and benefits shareholders because an interested Chairman has a personal and professional stake in the quality and continuity of services provided to the fund. Independent Trustees exercise their informed business judgment to appoint an individual of their choosing to serve as Chairman, regardless of whether the Trustee happens to be independent or a member of management. The Independent Trustees have determined that they can act independently and effectively without having an Independent Trustee serve as Chairman and that a key structural component for assuring that they are in a position to do so is for the Independent Trustees to constitute a substantial majority for the Board. The Independent Trustees also regularly meet in executive session. Ned C. Lautenbach serves as Chairman of the Independent Trustees and as such (i) acts as a liaison between the Independent Trustees and management with respect to matters important to the Independent Trustees and (ii) with management prepares agendas for Board meetings.
Fidelity funds are overseen by different Boards of Trustees. The fund's Board oversees Fidelity's high income and certain equity funds and other Boards oversee Fidelity's investment-grade bond, money market, asset allocation, and sector funds. The asset allocation funds may invest in Fidelity funds overseen by the fund's Board. The use of separate Boards, each with its own committee structure, allows the Trustees of each group of Fidelity funds to focus on the unique issues of the funds they oversee, including common research, investment, and operational issues. On occasion, the separate Boards establish joint committees to address issues of overlapping consequences for the Fidelity funds overseen by each Board.
The Trustees operate using a system of committees to facilitate the timely and efficient consideration of all matters of importance to the Trustees, the fund, and fund shareholders and to facilitate compliance with legal and regulatory requirements and oversight of the fund's activities and associated risks. The Board, acting through its committees, has charged FMR and its affiliates with (i) identifying events or circumstances the occurrence of which could have demonstrably adverse effects on the fund's business and/or reputation; (ii) implementing processes and controls to lessen the possibility that such events or circumstances occur or to mitigate the effects of such events or circumstances if they do occur; and (iii) creating and maintaining a system designed to evaluate continuously business and market conditions in order to facilitate the identification and implementation processes described in (i) and (ii) above. Because the day-to-day operations and activities of the fund are carried out by or through FMR, its affiliates and other service providers, the fund's exposure to risks is mitigated but not eliminated by the processes overseen by the Trustees. While each of the Board's committees has responsibility for overseeing different aspects of the fund's activities, oversight is exercised primarily through the Operations, Audit, and Compliance Committees. In addition, the Independent Trustees have worked with FMR to enhance the Board's oversight of investment and financial risks, legal and regulatory risks, technology risks, and operational risks, including the development of additional risk reporting to the Board. For example, a working group comprised of Independent Trustees and FMR has worked and continues to work to review the Fidelity funds' valuation-related activities, reporting and risk management. Appropriate personnel, including but not limited to the fund's Chief Compliance Officer (CCO), FMR's internal auditor, the independent accountants, the fund's Treasurer and portfolio management personnel, make periodic reports to the Board's committees, as appropriate, including an annual review of FMR's risk management program for the Fidelity funds. The responsibilities of each standing committee, including their oversight responsibilities, are described further under "Standing Committees of the Fund's Trustees."
Annual Report
Trustees and Officers - continued
The fund's Statement of Additional Information (SAI) includes more information about the Trustees. To request a free copy, call Fidelity at 1-800-544-8544.
Interested Trustees*:
Correspondence intended for each Trustee who is an interested person may be sent to Fidelity Investments, 245 Summer Street, Boston, Massachusetts 02210.
Name, Year of Birth; Principal Occupations and Other Relevant Experience+ |
James C. Curvey (1935) |
Year of Election or Appointment: 2007 Trustee Chairman of the Board of Trustees |
| Mr. Curvey also serves as Trustee of other Fidelity funds. Mr. Curvey is a Director of Fidelity Research & Analysis Co. (investment adviser firm, 2009-present), and Vice Chairman (2007-present) and Director of FMR LLC (diversified financial services company). In addition, Mr. Curvey serves as an Overseer for the Boston Symphony Orchestra and a member of the board of Artis-Naples, Naples, Florida, and as a Trustee for Brewster Academy, Wolfeboro, New Hampshire. Previously, Mr. Curvey served as a Director of Fidelity Investments Money Management, Inc. (investment adviser firm, 2009-2014), a Director of FMR (investment adviser firm, 2007-2014), and a Director of FMR Co., Inc. (investment adviser firm, 2007-2014). |
Charles S. Morrison (1960) |
Year of Election or Appointment: 2014 Trustee |
| Mr. Morrison also serves as Trustee of other funds. He serves as a Director of Fidelity Investments Money Management, Inc. (FIMM) (investment adviser firm, 2014-present), Director of Fidelity SelectCo, LLC (investment adviser firm, 2014-present), President, Asset Management (2014-present), and is an employee of Fidelity Investments. Previously, Mr. Morrison served as Vice President of Fidelity's Fixed Income and Asset Allocation Funds (2012-2014), President, Fixed Income (2011-2014), Vice President of Fidelity's Money Market Funds (2005-2009), President, Money Market Group Leader of FMR (investment adviser firm, 2009), and Senior Vice President, Money Market Group of FMR (2004-2009). Mr. Morrison also served as Vice President of Fidelity's Bond Funds (2002-2005), certain Balanced Funds (2002-2005), and certain Asset Allocation Funds (2002-2007), and as Senior Vice President (2002-2005) of Fidelity's Bond Division. |
* Trustees have been determined to be "Interested Trustees" by virtue of, among other things, their affiliation with the trust or various entities under common control with FMR.
+ The information above includes each Trustee's principal occupation during the last five years and other information relating to the experience, attributes, and skills relevant to each Trustee's qualifications to serve as a Trustee, which led to the conclusion that each Trustee should serve as a Trustee for the fund.
Annual Report
Trustees and Officers - continued
Independent Trustees:
Correspondence intended for each Independent Trustee (that is, the Trustees other than the Interested Trustees) may be sent to Fidelity Investments, P.O. Box 55235, Boston, Massachusetts 02205-5235.
Name, Year of Birth; Principal Occupations and Other Relevant Experience+ |
Dennis J. Dirks (1948) |
Year of Election or Appointment: 2005 Trustee |
| Mr. Dirks also serves as Trustee of other Fidelity funds. Prior to his retirement in May 2003, Mr. Dirks was Chief Operating Officer and a member of the Board of The Depository Trust & Clearing Corporation (DTCC). He also served as President, Chief Operating Officer, and Board member of The Depository Trust Company (DTC) and President and Board member of the National Securities Clearing Corporation (NSCC). In addition, Mr. Dirks served as Chief Executive Officer and Board member of the Government Securities Clearing Corporation, Chief Executive Officer and Board member of the Mortgage-Backed Securities Clearing Corporation, as a Trustee and a member of the Finance Committee of Manhattan College (2005-2008), and as a Trustee and a member of the Finance Committee of AHRC of Nassau County (2006-2008). Mr. Dirks is a member of the Independent Directors Council (IDC) Governing Council (2010-present) and Board of Directors for The Brookville Center for Children's Services, Inc. (2009-present). |
Alan J. Lacy (1953) |
Year of Election or Appointment: 2008 Trustee |
| Mr. Lacy also serves as Trustee of other Fidelity funds. Mr. Lacy serves as a member of the Board of Directors of Dave & Buster's Entertainment, Inc. (restaurant and entertainment complexes, 2010-present) and Bristol-Myers Squibb Company (global pharmaceuticals, 2008-present). In addition, Mr. Lacy served as Senior Adviser (2007-2014) of Oak Hill Capital Partners, L.P. (private equity) and also served as Chief Executive Officer (2000-2005) and Vice Chairman (2005-2006) of Sears Holdings Corporation and Sears, Roebuck and Co. (retail). Mr. Lacy is a member of the Board of Trustees of The National Parks Conservation Association (2006-present). Previously, Mr. Lacy served as Chairman of the Board of Trustees of the National Parks Conservation Association (2008-2011) and as a member of the Board of Directors for The Western Union Company (global money transfer, 2006-2011), The Hillman Companies, Inc. (hardware wholesalers, 2010-2014), and Earth Fare, Inc. (retail grocery, 2010-2014). |
Ned C. Lautenbach (1944) |
Year of Election or Appointment: 2000 Trustee Chairman of the Independent Trustees |
| Mr. Lautenbach also serves as Trustee of other Fidelity funds. Mr. Lautenbach currently serves as the Lead Director of the Eaton Corporation Board of Directors (diversified industrial, 1997-present). Mr. Lautenbach is Chairman of the Board of Directors of Artis-Naples in Naples, Florida (2012-present), a member of the Council on Foreign Relations (1994-present), and a member of the Board of Governors, State University System of Florida (2013-present). Previously, Mr. Lautenbach was a Partner/Advisory Partner at Clayton, Dubilier & Rice, LLC (private equity investment, 1998-2010), as well as a Director of Sony Corporation (2006-2007). |
Joseph Mauriello (1944) |
Year of Election or Appointment: 2008 Trustee |
| Mr. Mauriello also serves as Trustee of other Fidelity funds. Prior to his retirement in January 2006, Mr. Mauriello served in numerous senior management positions including Deputy Chairman and Chief Operating Officer (2004-2005), and Vice Chairman of Financial Services (2002-2004) of KPMG LLP US (professional services, 1965-2005). Mr. Mauriello currently serves as a member of the Board of Directors of XL Group plc. (global insurance and re-insurance, 2006-present). Previously, Mr. Mauriello served as a Director of the Hamilton Funds of the Bank of New York (2006-2007) and of Arcadia Resources Inc. (health care services and products, 2007-2012). |
Robert W. Selander (1950) |
Year of Election or Appointment: 2011 Trustee |
| Mr. Selander also serves as Trustee of other Fidelity funds. Mr. Selander serves as a Director of The Western Union Company (global money transfer, 2014-present). Previously, Mr. Selander served as a Member of the Advisory Board of other Fidelity funds (2011), and Executive Vice Chairman (2010), Chief Executive Officer (2009-2010), and President and Chief Executive Officer (1997-2009) of Mastercard, Inc. |
Cornelia M. Small (1944) |
Year of Election or Appointment: 2005 Trustee |
| Ms. Small also serves as Trustee of other Fidelity funds. Ms. Small is a member of the Board of Directors (2009-present) and Chair of the Investment Committee (2010-present) of the Teagle Foundation. Ms. Small also serves on the Investment Committee of the Berkshire Taconic Community Foundation (2008-present). Previously, Ms. Small served as Chairperson (2002-2008) and a member of the Investment Committee and Chairperson (2008-2012) and a member of the Board of Trustees of Smith College. In addition, Ms. Small served as Chief Investment Officer, Director of Global Equity Investments, and a member of the Board of Directors of Scudder, Stevens & Clark and Scudder Kemper Investments. |
William S. Stavropoulos (1939) |
Year of Election or Appointment: 2002 Trustee Vice Chairman of the Independent Trustees |
| Mr. Stavropoulos also serves as Trustee of other Fidelity funds. Mr. Stavropoulos serves as President and Founder of the Michigan Baseball Foundation, the Great Lakes Loons (2007-present). Mr. Stavropoulos is Chairman Emeritus of the Board of Directors of The Dow Chemical Company, where he previously served in numerous senior management positions, including President, CEO (1995-2000; 2002-2004), Chairman of the Executive Committee (2000-2006), and as a member of the Board of Directors (1990-2006). Currently, Mr. Stavropoulos is Chairman of the Board of Directors of Univar Inc. (global distributor of commodity and specialty chemicals), a Director of Teradata Corporation (data warehousing and technology solutions), and Maersk Inc. (industrial conglomerate), and a member of the Advisory Board for Metalmark Capital LLC (private equity investment, 2005-present). Mr. Stavropoulos is an operating advisor to Clayton, Dubilier & Rice, LLC (private equity investment). In addition, Mr. Stavropoulos is a member of the University of Notre Dame Advisory Council for the College of Science, a Trustee of the Rollin L. Gerstacker Foundation, and a Director of the Naples Philharmonic Center for the Arts. Previously, Mr. Stavropoulos served as a Director of Chemical Financial Corporation (bank holding company, 1993-2012) and Tyco International, Ltd. (multinational manufacturing and services, 2007-2012). |
David M. Thomas (1949) |
Year of Election or Appointment: 2008 Trustee |
| Mr. Thomas also serves as Trustee of other Fidelity funds. Mr. Thomas serves as Non-Executive Chairman of the Board of Directors of Fortune Brands Home and Security (home and security products, 2011-present), as a member of the Board of Directors (2004-present) and Presiding Director (2013-present) of Interpublic Group of Companies, Inc. (marketing communication), and as a member of the Board of Trustees of the University of Florida (2013-present). Previously, Mr. Thomas served as Executive Chairman (2005-2006) and Chairman and Chief Executive Officer (2000-2005) of IMS Health, Inc. (pharmaceutical and healthcare information solutions), and a Director of Fortune Brands, Inc. (consumer products, 2000-2011). |
+ The information above includes each Trustee's principal occupation during the last five years and other information relating to the experience, attributes, and skills relevant to each Trustee's qualifications to serve as a Trustee, which led to the conclusion that each Trustee should serve as a Trustee for the fund.
Advisory Board Member and Officers:
Correspondence intended for each officer and Peter S. Lynch may be sent to Fidelity Investments, 245 Summer Street, Boston, Massachusetts 02210. Officers appear below in alphabetical order.
Name, Year of Birth; Principal Occupation |
Peter S. Lynch (1944) |
Year of Election or Appointment: 2003 Member of the Advisory Board |
| Mr. Lynch also serves as Member of the Advisory Board of other Fidelity funds. Mr. Lynch is Vice Chairman and a Director of FMR (investment adviser firm) and FMR Co., Inc. (investment adviser firm). In addition, Mr. Lynch serves as a Trustee of Boston College and as the Chairman of the Inner-City Scholarship Fund. Previously, Mr. Lynch served on the Special Olympics International Board of Directors (1997-2006). |
Name, Year of Birth; Principal Occupation |
Elizabeth Paige Baumann (1968) |
Year of Election or Appointment: 2012 Anti-Money Laundering (AML) Officer |
| Ms. Baumann also serves as AML Officer of other funds. She is Chief AML Officer of FMR LLC (diversified financial services company, 2012-present) and is an employee of Fidelity Investments. Previously, Ms. Baumann served as Vice President and Deputy Anti-Money Laundering Officer (2007-2012). |
Marc Bryant (1966) |
Year of Election or Appointment: 2015 Secretary and Chief Legal Officer (CLO) |
| Mr. Bryant also serves as Secretary and Chief Legal Officer (CLO) of other funds. He is Senior Vice President and Deputy General Counsel of FMR LLC (diversified financial services company). Previously, Mr. Bryant served as Secretary and Chief Legal Officer of Fidelity Rutland Square Trust II (2010-2014) and Assistant Secretary of Fidelity's Fixed Income and Asset Allocation Funds (2013-2015). Prior to joining Fidelity Investments, Mr. Bryant served as a Senior Vice President and the Head of Global Retail Legal for AllianceBernstein L.P. 2006-2010), and as the General Counsel for ProFund Advisors LLC (2001-2006). |
William C. Coffey (1969) |
Year of Election or Appointment: 2009 Assistant Secretary |
| Mr. Coffey also serves as Assistant Secretary of other funds. He is Senior Vice President and Deputy General Counsel of FMR LLC (diversified financial services company, 2010-present), and is an employee of Fidelity Investments. Previously, Mr. Coffey served as Vice President and Associate General Counsel of FMR LLC (2005-2009). |
Jonathan Davis (1968) |
Year of Election or Appointment: 2010 Assistant Treasurer |
| Mr. Davis also serves as Assistant Treasurer of other funds. Mr. Davis is an employee of Fidelity Investments. Previously, Mr. Davis served as Vice President and Associate General Counsel of FMR LLC (diversified financial services company, 2003-2010). |
Adrien E. Deberghes (1967) |
Year of Election or Appointment: 2008 Deputy Treasurer |
| Mr. Deberghes also serves as an officer of other funds. He is an employee of Fidelity Investments (2008-present). Prior to joining Fidelity Investments, Mr. Deberghes was Senior Vice President of Mutual Fund Administration at State Street Corporation (2007-2008), Senior Director of Mutual Fund Administration at Investors Bank & Trust (2005-2007), and Director of Finance for Dunkin' Brands (2000-2005). |
Stephanie J. Dorsey (1969) |
Year of Election or Appointment: 2010 Assistant Treasurer |
| Ms. Dorsey also serves as an officer of other funds. She is an employee of Fidelity Investments (2008-present) and has served in other fund officer roles. Prior to joining Fidelity Investments, Ms. Dorsey served as Treasurer (2004-2008) of the JPMorgan Mutual Funds and Vice President (2004-2008) of JPMorgan Chase Bank. |
Howard J. Galligan III (1966) |
Year of Election or Appointment: 2014 Chief Financial Officer |
| Mr. Galligan also serves as Chief Financial Officer of other funds. Mr. Galligan serves as President of Fidelity Pricing and Cash Management Services (FPCMS) (2014-present) and as a Director of Strategic Advisers, Inc. (investment adviser firm, 2008-present). Previously, Mr. Galligan served as Chief Administrative Officer of Asset Management (2011-2014) and Chief Operating Officer and Senior Vice President of Investment Support for Strategic Advisers, Inc. (2003-2011). |
Scott C. Goebel (1968) |
Year of Election or Appointment: 2015 Vice President |
| Mr. Goebel serves as Vice President of other funds. Mr. Goebel also serves as Secretary of Fidelity SelectCo, LLC (investment adviser firm, 2013-present), Fidelity Investments Money Management, Inc. (FIMM) (investment adviser firm, 2010-present) and Fidelity Research and Analysis Company (FRAC) (investment adviser firm, 2010-present); General Counsel, Secretary, and Senior Vice President of FMR (investment adviser firm, 2008-present) and FMR Co., Inc. (investment adviser firm, 2008-present); Chief Legal Officer of Fidelity Management & Research (Hong Kong) Limited (investment adviser firm, 2008-present); and Assistant Secretary of Fidelity Management & Research (Japan) Limited (investment adviser firm, 2008-present) and FMR Investment Management (U.K.) Limited (investment adviser firm, 2008-present). Previously, Mr. Goebel served as Secretary and CLO of certain Fidelity funds (2008-2015), Assistant Secretary of FIMM (2008-2010), FRAC (2008-2010), and certain funds (2007-2008); and as Vice President and Secretary of Fidelity Distributors Corporation (FDC) (2005-2007). Mr. Goebel has been employed by FMR LLC (diversified financial services company) or an affiliate since 2001. |
Brian B. Hogan (1964) |
Year of Election or Appointment: 2009 Vice President |
| Mr. Hogan also serves as Trustee or Vice President of other funds. Mr. Hogan serves as a Director of Fidelity SelectCo, LLC (investment adviser firm, 2014-present) and President of the Equity Division of FMR (investment adviser firm, 2009-present). Previously, Mr. Hogan served as Senior Vice President, Equity Research of FMR (2006-2009) and as a portfolio manager. |
Chris Maher (1972) |
Year of Election or Appointment: 2013 Assistant Treasurer |
| Mr. Maher serves as Assistant Treasurer of other funds. Mr. Maher is Vice President of Valuation Oversight and is an employee of Fidelity Investments. Previously, Mr. Maher served as Vice President of Asset Management Compliance (2013), Vice President of the Program Management Group of FMR (investment adviser firm, 2010-2013), and Vice President of Valuation Oversight (2008-2010). |
Melissa M. Reilly (1971) |
Year of Election or Appointment: 2014 Vice President of certain Equity Funds |
| Ms. Reilly also serves as Vice President of other funds. Ms. Reilly is an employee of Fidelity Investments (2004-present). |
Kenneth B. Robins (1969) |
Year of Election or Appointment: 2008 President and Treasurer |
| Mr. Robins also serves as an officer of other funds. Mr. Robins serves as Executive Vice President of Fidelity Investments Money Management, Inc. (FIMM) (investment adviser firm, 2013-present) and is an employee of Fidelity Investments (2004-present). Previously, Mr. Robins served in other fund officer roles. |
Stephen Sadoski (1971) |
Year of Election or Appointment: 2012 Deputy Treasurer |
| Mr. Sadoski also serves as Deputy Treasurer of other funds. He is an employee of Fidelity Investments (2012-present) and has served in another fund officer role. Prior to joining Fidelity Investments, Mr. Sadoski served as an assistant chief accountant in the Division of Investment Management of the Securities and Exchange Commission (SEC) (2009-2012) and as a senior manager at Deloitte & Touche LLP (1997-2009). |
Stacie M. Smith (1974) |
Year of Election or Appointment: 2013 Deputy Treasurer |
| Ms. Smith also serves as an officer of other funds. She is an employee of Fidelity Investments (2009-present) and has served in other fund officer roles. Prior to joining Fidelity Investments, Ms. Smith served as Senior Audit Manager of Ernst & Young LLP (1996-2009). |
Renee Stagnone (1975) |
Year of Election or Appointment: 2013 Deputy Treasurer |
| Ms. Stagnone also serves as Deputy Treasurer of other funds. Ms. Stagnone is an employee of Fidelity Investments. |
Linda J. Wondrack (1964) |
Year of Election or Appointment: 2014 Chief Compliance Officer |
| Ms. Wondrack also serves as Chief Compliance Officer of other funds. Ms. Wondrack is Executive Vice President and head of the Ethics Office and Asset Management Compliance for Fidelity Investments (2012-present). Ms. Wondrack also serves as Chief Compliance Officer of Fidelity SelectCo, LLC (investment adviser firm, 2014-present); Chief Compliance Officer of Impresa Management LLC (2013-present); and Chief Compliance Officer of FMR Co., Inc. (investment adviser firm), Fidelity Investments Money Management, Inc. (investment adviser firm), Fidelity Management & Research (Japan) Limited (investment adviser firm), FMR Investment Management (U.K.) Limited (investment adviser firm), Fidelity Management & Research (Hong Kong) (investment adviser firm), Fidelity Management & Research Company (investment adviser firm), Pyramis Global Advisors, LLC (investment adviser firm), and Strategic Advisers, Inc. (investment adviser firm), Ballyrock Investment Advisors LLC, and Northern Neck Investors LLC (2012-present). Previously, Ms. Wondrack served as Senior Vice President and Chief Compliance Officer for Columbia Management Investment Advisers, LLC (2005-2012); Chief Compliance Officer for certain funds within the Columbia Family of Funds (2007-2012); and Senior Vice President of Compliance Risk Management at Bank of America (2005-2010). |
Joseph F. Zambello (1957) |
Year of Election or Appointment: 2011 Deputy Treasurer |
| Mr. Zambello also serves as Deputy Treasurer of other funds. Mr. Zambello is an employee of Fidelity Investments. Previously, Mr. Zambello served as Vice President of the Program Management Group of FMR (investment adviser firm, 2009-2011) and Vice President of the Transfer Agent Oversight Group (2005-2009). |
Annual Report
The Board of Trustees of Fidelity Low-Priced Stock Fund voted to pay on record date, the following distributions per share derived from capital gains realized from sales of portfolio securities, and dividends derived from net investment income:
| Pay Date | Record Date | Dividends | Capital Gains |
Low-Priced Stock | 09/14/15 | 09/11/15 | $0.301 | $1.540 |
The fund hereby designates as a capital gain dividend with respect to the taxable year ended July 31, 2015, $1,706,397,202, or, if subsequently determined to be different, the net capital gain of such year.
Low-Priced Stock designates 57% and 74% of the dividends distributed in September and December, respectively during the fiscal year as qualifying for the dividends-received deduction for corporate shareholders.
Low-Priced Stock designates 100% of the dividends distributed during the fiscal year as amounts which may be taken into account as a dividend for the purposes of the maximum rate under section 1(h)(11) of the Internal Revenue Code.
The fund will notify shareholders in January 2016 of amounts for use in preparing 2015 income tax returns.
Annual Report
Fidelity Low-Priced Stock Fund
Each year, the Board of Trustees, including the Independent Trustees (together, the Board), votes on the renewal of the management contract with Fidelity Management & Research Company (FMR) and the sub-advisory agreements (together, the Advisory Contracts) for the fund. The Board, assisted by the advice of fund counsel and Independent Trustees' counsel, requests and considers a broad range of information relevant to the renewal of the Advisory Contracts throughout the year.
The Board meets regularly and, at each of its meetings, covers an extensive agenda of topics and materials and considers factors that are relevant to its annual consideration of the renewal of the fund's Advisory Contracts, including the services and support provided to the fund and its shareholders. The Board has established various standing committees (Committees), each composed of and chaired by Independent Trustees with varying backgrounds, to which the Board has assigned specific subject matter responsibilities in order to enhance effective decision-making by the Board. The Board, acting directly and through its Committees, requests and receives information concerning the annual consideration of the renewal of the fund's Advisory Contracts. The Board also meets as needed to consider matters specifically related to the Board's annual consideration of the renewal of the Advisory Contracts. Members of the Board may also meet with trustees of other Fidelity funds through ad hoc joint committees to discuss certain matters relevant to all of the Fidelity funds.
At its July 2015 meeting, the Board unanimously determined to renew the fund's Advisory Contracts. In reaching its determination, the Board considered all factors it believed relevant, including (i) the nature, extent, and quality of the services to be provided to the fund and its shareholders (including the investment performance of the fund); (ii) the competitiveness of the fund's management fee and total expense ratio relative to peer funds; (iii) the total costs of the services to be provided by and the profits to be realized by Fidelity from its relationship with the fund; and (iv) the extent to which (if any) economies of scale exist and would be realized as the fund grows, and whether any economies of scale are appropriately shared with fund shareholders.
In considering whether to renew the Advisory Contracts for the fund, the Board reached a determination, with the assistance of fund counsel and Independent Trustees' counsel and through the exercise of its business judgment, that the renewal of the Advisory Contracts was in the best interests of the fund and its shareholders and that the compensation payable under the Advisory Contracts was fair and reasonable. The Board's decision to renew the Advisory Contracts was not based on any single factor, but rather was based on a comprehensive consideration of all the information provided to the Board at its meetings throughout the year. The Board, in reaching its determination to renew the Advisory Contracts, was aware that shareholders of the fund have a broad range of investment choices available to them, including a wide choice among funds offered by Fidelity's competitors, and that the fund's shareholders, who have the opportunity to review and weigh the disclosure provided by the fund in its prospectus and other public disclosures, have chosen to invest in this fund, which is part of the Fidelity family of funds.
Annual Report
Nature, Extent, and Quality of Services Provided. The Board considered Fidelity's staffing as it relates to the fund, including the backgrounds of investment personnel of Fidelity, and also considered the fund's investment objective, strategies, and related investment philosophy. The Independent Trustees also had discussions with senior management of Fidelity's investment operations and investment groups. The Board considered the structure of the portfolio manager compensation program and whether this structure provides appropriate incentives to act in the best interests of the fund. Additionally, the Board considered the portfolio managers' investments, if any, in the funds that they manage.
Resources Dedicated to Investment Management and Support Services. The Board and the Fund Oversight and Research Committees reviewed the general qualifications and capabilities of Fidelity's investment staff, including its size, education, experience, and resources, as well as Fidelity's approach to recruiting, training, managing, and compensating investment personnel. The Board noted that Fidelity has continued to increase the resources devoted to non-U.S. offices, including expansion of Fidelity's global investment organization. The Board also noted that Fidelity's analysts have extensive resources, tools and capabilities that allow them to conduct sophisticated quantitative and fundamental analysis, as well as credit analysis of issuers, counterparties and guarantors. Further, the Board considered that Fidelity's investment professionals have sufficient access to global information and data so as to provide competitive investment results over time, and that those professionals also have access to sophisticated tools that permit them to assess portfolio construction and risk and performance attribution characteristics continuously, as well as to transmit new information and research conclusions rapidly around the world. Additionally, in its deliberations, the Board considered Fidelity's trading, risk management, and compliance capabilities and resources, which are integral parts of the investment management process.
Shareholder and Administrative Services. The Board considered (i) the nature, extent, quality, and cost of advisory, administrative, and shareholder services performed by FMR, the sub-advisers (together with FMR, the Investment Advisers), and their affiliates under the Advisory Contracts and under separate agreements covering transfer agency, pricing and bookkeeping, and securities lending services for the fund; (ii) the nature and extent of the supervision of third party service providers, principally custodians and subcustodians; and (iii) the resources devoted to, and the record of compliance with, the fund's compliance policies and procedures. The Board also reviewed the allocation of fund brokerage, including allocations to brokers affiliated with the Investment Advisers, the use of brokerage commissions to pay fund expenses, and the use of "soft" commission dollars to pay for research services.
Annual Report
Board Approval of Investment Advisory Contracts and
Management Fees - continued
The Board noted that the growth of fund assets over time across the complex allows Fidelity to reinvest in the development of services designed to enhance the value or convenience of the Fidelity funds as investment vehicles. These services include 24-hour access to account information and market information through telephone representatives and over the Internet, investor education materials and asset allocation tools, and the expanded availability of Fidelity Investor Centers.
In 2014, the Board formed an ad hoc Committee on Transfer Agency Fees to review the variety of transfer agency fee structures throughout the industry and Fidelity's competitive positioning with respect to industry participants.
Investment in a Large Fund Family. The Board considered the benefits to shareholders of investing in a Fidelity fund, including the benefits of investing in a fund that is part of a large family of funds offering a variety of investment disciplines and providing a large variety of mutual fund investor services. The Board noted that Fidelity had taken, or had made recommendations that resulted in the Fidelity funds taking, a number of actions over the previous year that benefited particular funds, including (i) continuing to dedicate additional resources to investment research and to the support of the senior management team that oversees asset management; (ii) continuing efforts to enhance Fidelity's global research capabilities; (iii) launching new funds and making other enhancements to meet client needs; (iv) reducing management fees and total expenses for certain index funds and diversified international funds; (v) continuing to launch dedicated lower cost underlying funds to meet portfolio construction needs related to expanding underlying fund options for Fidelity funds of funds, specifically for the Freedom Fund product lines; (vi) rationalizing product lines and gaining increased efficiencies through fund mergers; (vii) launching active fixed-income exchange-traded funds; (viii) continuing to develop, acquire and implement systems and technology to improve services to the funds and information security and to increase efficiency; (ix) implementing investment enhancements to further strengthen Fidelity's target date product line to increase investors' probability of success in achieving their goals; (x) modifying the eligibility criteria for certain share classes to accommodate roll-over assets from employer-sponsored retirement plans; (xi) launching a new Class W of the Freedom Index Funds to attract and retain Fidelity record-kept retirement plan assets; and (xii) implementing changes to Fidelity's money market product line in response to recent money market regulatory reforms.
Investment Performance. The Board considered whether the fund has operated in accordance with its investment objective, as well as its record of compliance with its investment restrictions and its performance history.
Annual Report
The Board took into account discussions with representatives of the Investment Advisers about fund investment performance that occur at Board meetings throughout the year. In this regard the Board noted that as part of regularly scheduled fund reviews and other reports to the Board on fund performance, the Board considers annualized return information for the fund, for different time periods, measured against a securities market index ("benchmark index") and a peer group of funds with similar objectives ("peer group"), if any. In its evaluation of fund investment performance, the Board gave particular attention to information indicating changes in performance of certain Fidelity funds for specific time periods and discussed with the Investment Advisers the reasons for any overperformance or underperformance.
In addition to reviewing absolute and relative fund performance, the Independent Trustees periodically consider the appropriateness of fund performance metrics in evaluating the results achieved. In general, the Independent Trustees believe that fund performance should be evaluated based on net performance (after fees and expenses) of both the highest performing and lowest performing fund share classes, where applicable, compared to appropriate benchmark indices, over appropriate time periods that may include full market cycles, and compared to peer groups, as applicable, over the same periods, taking into account relevant factors including the following: general market conditions; issuer-specific information; and fund cash flows and other factors.
The Independent Trustees recognize that shareholders evaluate performance on a net basis over their own holding periods, for which one-, three-, and five-year periods are often used as a proxy. For this reason, the performance information reviewed by the Board also included net cumulative calendar year total return information for the fund and an appropriate benchmark index and peer group for the most recent one-, three-, and five-year periods, as shown below. Returns are shown compared to the 25th percentile (top of box, 75% beaten) and 75th percentile (bottom of box, 25% beaten) of the peer universe.
Annual Report
Board Approval of Investment Advisory Contracts and
Management Fees - continued
Fidelity Low-Priced Stock Fund
The Board also considered that the fund's management fee is subject to upward or downward adjustment depending upon whether, and to what extent, the fund's investment performance for the performance period exceeds, or is exceeded by, a securities index, thus leading to a performance adjustment for the same period. The Board noted that the performance adjustment provides FMR with a strong economic incentive to seek to achieve superior performance for the fund's shareholders and helps to more closely align the interests of FMR and the shareholders of the fund.
Based on its review, the Board concluded that the nature, extent, and quality of services provided to the fund under the Advisory Contracts should benefit the shareholders of the fund.
Competitiveness of Management Fee and Total Expense Ratio. The Board considered the fund's management fee and total expense ratio compared to "mapped groups" of competitive funds and classes created for the purpose of facilitating the Trustees' competitive analysis of management fees and total expenses. Fidelity creates "mapped groups" by combining similar Lipper investment objective categories that have comparable investment mandates. Combining Lipper investment objective categories aids the Board's management fee and total expense ratio comparisons by broadening the competitive group used for comparison.
Management Fee. The Board considered two proprietary management fee comparisons for the 12-month periods shown in basis points (BP) in the chart below. The group of Lipper funds used by the Board for management fee comparisons is referred to below as the "Total Mapped Group." The Total Mapped Group comparison focuses on a fund's standing in terms of gross management fees before expense reimbursements or caps, and without giving effect to the fund's performance adjustment, relative to the total universe of funds with comparable investment mandates, regardless of whether their management fee structures also are comparable. Funds with comparable investment mandates offer exposure to similar types of securities. Funds with comparable management fee structures have similar management fee contractual arrangements (e.g., flat rate charged for advisory services, all-inclusive fee rate, etc.). "TMG %" represents the percentage of funds in the Total Mapped Group that had management fees that were lower than the fund's. For example, a hypothetical TMG % of 20% would mean that 80% of the funds in the Total Mapped Group had higher, and 20% had lower, management fees than the fund. The fund's actual TMG %s and the number of funds in the Total Mapped Group are in the chart below. The "Asset-Size Peer Group" (ASPG) comparison focuses on a fund's standing relative to a subset of non-Fidelity funds within the Total Mapped Group that are similar in size and management fee structure without taking into account performance adjustments, if any. For example, if a fund is in the first quartile of the ASPG, the fund's management fee ranks in the least expensive or lowest 25% of funds in the ASPG. The ASPG represents at least 15% of the funds in the Total Mapped Group with comparable asset size and management fee structures, subject to a minimum of 50 funds (or all funds in the Total Mapped Group if fewer than 50). Additional information, such as the ASPG quartile in which the fund's management fee rate ranked and the impact of the fund's performance adjustment, is also included in the chart and considered by the Board.
Annual Report
Fidelity Low-Priced Stock Fund

Annual Report
Board Approval of Investment Advisory Contracts and
Management Fees - continued
The Board noted that the fund's management fee rate ranked below the median of its Total Mapped Group and below the median of its ASPG for 2014. The Board also noted the effect of the fund's performance adjustment, if any, on the fund's management fee ranking.
The Board noted that, in 2014, the ad hoc Committee on Group Fee was formed by it and other Fidelity fund boards to conduct an in-depth review of the "group fee" component of the management fee of funds with such management fee structures. Committee focus included the mechanics of the group fee, the competitive landscape of group fee structures, Fidelity funds with no group fee component and investment products not included in group fee assets. The Board also considered that, for funds subject to the group fee, FMR agreed to voluntarily waive fees over a specified period of time in amounts designed to account for assets converted from certain funds to certain collective investment trusts.
The Board also noted that, in 2013, the ad hoc Committee on Management Fees was formed to conduct an in-depth review of the management fee rates of Fidelity's active equity mutual funds. The Committee focused on the following areas: (i) standard fee structures; (ii) research consumption and trading evolution; (iii) management fee competitiveness/profitability by category; and (iv) factors that drive institutional pricing.
Based on its review, the Board concluded that the fund's management fee is fair and reasonable in light of the services that the fund receives and the other factors considered.
Total Expense Ratio. In its review of each class's total expense ratio, the Board considered the fund's management fee as well as other fund or class expenses, as applicable, such as transfer agent fees, pricing and bookkeeping fees, and custodial, legal, and audit fees. The Board noted the impact of the fund's performance adjustment. The Board also noted that Fidelity may agree to waive fees and expenses from time to time, and the extent to which, if any, it has done so for the fund. As part of its review, the Board also considered the current and historical total expense ratios of each class of the fund compared to competitive fund median expenses. Each class of the fund is compared to those funds and classes in the Total Mapped Group (used by the Board for management fee comparisons) that have a similar sales load structure.
The Board noted that the total expense ratio of each class ranked below its competitive median for 2014.
Fees Charged to Other Fidelity Clients. The Board also considered Fidelity fee structures and other information with respect to clients of Fidelity, such as other funds advised or subadvised by Fidelity, pension plan clients, and other institutional clients with similar mandates. The Board noted the findings of the 2013 ad hoc joint committee (created with the board of other Fidelity funds), which reviewed and compared Fidelity's institutional investment advisory business with its business of providing services to the Fidelity funds, including the differences in services provided, fees charged, and costs incurred, as well as competition in their respective marketplaces.
Annual Report
Based on its review of total expense ratios and fees charged to other Fidelity clients, the Board concluded that the total expense ratio of each class of the fund was reasonable in light of the services that the fund and its shareholders receive and the other factors considered.
Costs of the Services and Profitability. The Board considered the revenues earned and the expenses incurred by Fidelity in conducting the business of developing, marketing, distributing, managing, administering and servicing the fund and servicing the fund's shareholders. The Board also considered the level of Fidelity's profits in respect of all the Fidelity funds.
On an annual basis, Fidelity presents to the Board information about the profitability of its relationship with the fund. Fidelity calculates profitability information for each fund, as well as aggregate profitability information for groups of Fidelity funds and all Fidelity funds, using a series of detailed revenue and cost allocation methodologies which originate with the books and records of Fidelity on which Fidelity's audited financial statements are based. The Audit Committee of the Board reviews any significant changes from the prior year's methodologies.
PricewaterhouseCoopers LLP (PwC), independent registered public accounting firm and auditor to Fidelity and certain Fidelity funds, has been engaged annually by the Board as part of the Board's assessment of Fidelity's profitability analysis. PwC's engagement includes the review and assessment of the methodologies used by Fidelity in determining the revenues and expenses attributable to Fidelity's mutual fund business, and completion of agreed-upon procedures in respect of the mathematical accuracy of fund profitability and its conformity to established allocation methodologies. After considering PwC's reports issued under the engagement and information provided by Fidelity, the Board concluded that while other allocation methods may also be reasonable, Fidelity's profitability methodologies are reasonable in all material respects.
The Board also reviewed Fidelity's non-fund businesses and fall-out benefits related to the mutual fund business as well as cases where Fidelity's affiliates may benefit from or be related to the fund's business.
The Board considered the costs of the services provided by and the profits realized by Fidelity in connection with the operation of the fund and was satisfied that the profitability was not excessive.
Economies of Scale. The Board considered whether there have been economies of scale in respect of the management of the Fidelity funds, whether the Fidelity funds (including the fund) have appropriately benefited from any such economies of scale, and whether there is potential for realization of any further economies of scale. The Board considered the extent to which the fund will benefit from economies of scale as assets grow through increased services to the fund, through waivers or reimbursements, or through fee or expense ratio reductions. The Board also noted that in 2013, it and the boards of other Fidelity funds created an ad hoc committee (the Economies of Scale Committee) to analyze whether Fidelity attains economies of scale in respect of the management and servicing of the Fidelity funds, whether the Fidelity funds have appropriately benefited from such economies of scale, and whether there is potential for realization of any further economies of scale.
Annual Report
Board Approval of Investment Advisory Contracts and
Management Fees - continued
The Board recognized that the fund's management contract incorporates a "group fee" structure, which provides for lower group fee rates as total group assets increase, and for higher group fee rates as total group assets decrease (with "group assets" defined to include fund assets under FMR's management plus sector fund assets previously under FMR's management and currently managed by Fidelity SelectCo, LLC). FMR calculates the group fee rates based on a tiered asset "breakpoint" schedule that varies based on asset class. The Board considered that the group fee is designed to deliver the benefits of economies of scale to fund shareholders when total Fidelity fund assets increase, even if assets of any particular fund are unchanged or have declined, because some portion of Fidelity's costs are attributable to services provided to all Fidelity funds, and all funds benefit if those costs can be allocated among more assets. The Board concluded that, given the group fee structure, fund shareholders will benefit from lower management fees as group assets increase at the fund complex level, regardless of whether Fidelity achieves any such economies of scale.
The Board concluded, taking into account the analysis of the Economies of Scale Committee, that economies of scale, if any, are being appropriately shared between fund shareholders and Fidelity.
Additional Information Requested by the Board. In order to develop fully the factual basis for consideration of the Fidelity funds' Advisory Contracts, the Board requested and received additional information on certain topics, including: (i) fund performance trends and Fidelity's long-term strategies for certain funds; (ii) the various share classes employed by Fidelity and the attributes of each class, together with similar information on the distribution and servicing payments made by Fidelity or the funds to third-party participants in the distribution channels; (iii) fund profitability, and fund performance in relation to fund profitability; (iv) the methodology with respect to evaluating competitive fund data and peer group classifications and fee comparisons; (v) annual fund profitability margins, with particular focus on certain funds with negative margins; (vi) the realization of fall-out benefits in certain Fidelity business units; (vii) economies of scale and the way in which they are shared with fund shareholders; (viii) Fidelity's group fee structures, including the group fee schedule of breakpoints; (ix) the impact of cost containment measures on the funds; and (x) the transfer agent fee structure.
Annual Report
Based on its evaluation of all of the conclusions noted above, and after considering all factors it believed relevant, the Board concluded that the advisory fee structures are fair and reasonable, and that the fund's Advisory Contracts should be renewed.
Annual Report
Investment Adviser
Fidelity Management & Research Company
Boston, MA
Investment Sub-Advisers
FMR Co., Inc.
FMR Investment Management
(U.K.) Limited
Fidelity Management & Research
(Hong Kong) Limited
Fidelity Management & Research
(Japan) Limited
General Distributor
Fidelity Distributors Corporation
Smithfield, RI
Transfer and Service Agents
Fidelity Investments Institutional Operations Company, Inc.
Boston, MA
Fidelity Service Company, Inc.
Boston, MA
Custodian
Brown Brothers Harriman & Co.
Boston, M A
The Fidelity Telephone Connection
Mutual Fund 24-Hour Service
Exchanges/Redemptions
and Account Assistance 1-800-544-6666
Product Information 1-800-544-6666
Retirement Accounts 1-800-544-4774
(8 a.m. - 9 p.m.)
TDD Service 1-800-544-0118
for the deaf and hearing impaired
(9 a.m. - 9 p.m. Eastern time)
Fidelity Automated Service
Telephone (FAST®)
1-800-544-5555

Automated line for quickest service
(Fidelity Investment logo)(registered trademark)
Corporate Headquarters
245 Summer St., Boston, MA 02210
www.fidelity.com
LPS-UANN-0915
1.789249.112
Fidelity®
Low-Priced Stock Fund -
Class K
Annual Report
July 31, 2015
(Fidelity Cover Art)
Contents
Performance | (Click Here) | How the fund has done over time. |
Management's Discussion of Fund Performance | (Click Here) | The Portfolio Manager's review of fund performance and strategy. |
Shareholder Expense Example | (Click Here) | An example of shareholder expenses. |
Investment Changes | (Click Here) | A summary of major shifts in the fund's investments over the past six months. |
Investments | (Click Here) | A complete list of the fund's investments with their market values. |
Financial Statements | (Click Here) | Statements of assets and liabilities, operations, and changes in net assets, as well as financial highlights. |
Notes | (Click Here) | Notes to the financial statements. |
Report of Independent Registered Public Accounting Firm | (Click Here) | |
Trustees and Officers | (Click Here) | |
Distributions | (Click Here) | |
Board Approval of Investment Advisory Contracts and Management Fees | (Click Here) | |
To view a fund's proxy voting guidelines and proxy voting record for the 12-month period ended June 30, visit http://www.fidelity.com/proxyvotingresults or visit the Securities and Exchange Commission's (SEC) web site at http://www.sec.gov. You may also call 1-800-835-5092 to request a free copy of the proxy voting guidelines.
Standard & Poor's, S&P and S&P 500 are registered service marks of The McGraw-Hill Companies, Inc. and have been licensed for use by Fidelity Distributors Corporation.
Other third-party marks appearing herein are the property of their respective owners.
All other marks appearing herein are registered or unregistered trademarks or service marks of FMR LLC or an affiliated company. © 2015 FMR LLC. All rights reserved.
Annual Report
This report and the financial statements contained herein are submitted for the general information of the shareholders of the fund. This report is not authorized for distribution to prospective investors in the fund unless preceded or accompanied by an effective prospectus.
A fund files its complete schedule of portfolio holdings with the SEC for the first and third quarters of each fiscal year on Form N-Q. Forms N-Q are available on the SEC's web site at http://www.sec.gov. A fund's Forms N-Q may be reviewed and copied at the SEC's Public Reference Room in Washington, DC. Information regarding the operation of the SEC's Public Reference Room may be obtained by calling 1-800-SEC-0330. For a complete list of a fund's portfolio holdings, view the most recent holdings listing, semiannual report, or annual report on Fidelity's web site at http://www.fidelity.com, http://www.advisor.fidelity.com, or http://www.401k.com, as applicable.
NOT FDIC INSURED • MAY LOSE VALUE • NO BANK GUARANTEE
Neither the fund nor Fidelity Distributors Corporation is a bank.
Annual Report
Average annual total return reflects the change in the value of an investment, assuming reinvestment of the class' distributions from dividend income and capital gains (the profits earned upon the sale of securities that have grown in value, if any) and assuming a constant rate of performance each year. The $10,000 table and the fund's returns do not reflect the deduction of taxes that a shareholder would pay on fund distributions or the redemption of fund shares. During periods of reimbursement by Fidelity, a fund's total return will be greater than it would be had the reimbursement not occurred. How a fund did yesterday is no guarantee of how it will do tomorrow.
Average Annual Total Returns
Periods ended July 31, 2015 | Past 1
year | Past 5
years | Past 10
years |
Class K A | 9.44% | 16.04% | 9.22% |
A The initial offering of Class K shares took place on May 9, 2008. Returns prior to May 9, 2008 are those of Fidelity® Low-Priced Stock Fund, the original class of the fund.
$10,000 Over 10 Years
Let's say hypothetically that $10,000 was invested in Fidelity® Low-Priced Stock Fund - Class K on July 31, 2005. The chart shows how the value of your investment would have changed, and also shows how the Russell 2000® Index performed over the same period. See footnote A above for additional information regarding the performance of Class K.
Annual Report
Market Recap: The U.S. equity market gained strongly for the 12 months ending July 31, 2015, as stocks recovered from volatility in late 2014 and early 2015, supported by a still-positive economic backdrop. The S&P 500® Index returned 11.21%, with growth stocks in the index far outpacing value-oriented names on prospects for continued U.S. economic growth. Consequently, the growth-oriented Nasdaq Composite Index® rose 18.71%, outpacing the broader S&P 500®, as well as the 12.03% advance of the smaller-cap Russell 2000® Index. Within the S&P 500®, seven of 10 sectors notched a gain, with significant performance variation. Health care (+27%) led the way, aided by merger activity. Consumer discretionary (+24%) benefited from spending linked to a seven-year low in unemployment. Strong first halves for the consumer staples sector and the real estate segment of financials yielded above-market returns (19% and 12%, respectively) for the full-year period. Conversely, energy (-26%) significantly lagged, due to a roughly 55% decline for U.S. crude-oil prices. Materials (-4%) also lost ground. At period end, investors remained focused on the slowing rate of U.S. earnings growth, the possible effect of a relatively stronger U.S. dollar on exports and inflation, and whether an economic slowdown in China would create ripples for the global economy.
Comments from Lead Portfolio Manager Joel Tillinghast: For the year, the fund's share classes fell short of the benchmark Russell 2000® Index. (For specific class-level results, please see the Performance section of this report.) Relative results were hurt in part by the fund's roughly 11% average cash stake in a rising market, weak stock picks in information technology and a general avoidance of biotechnology stocks, a category that soared during the period. The fund's biggest individual detractor was Seagate Technology, a top holding. The computer hard-drive maker returned roughly -11% for the year on a waning market for PCs, pricing pressure in disk drives and a headwind from a stronger U.S. dollar. The fund's foreign holdings also were hurt by the dollar's gain. Contributing to results were stock picks in consumer staples and an average underweighting in the hard-hit energy sector. Among individual stocks, the top-performer by far was our biggest position, UnitedHealth Group. Shares of the health insurer hit record highs over the period, as the company posted solid earnings growth and better-than-expected results in its services business.
The views expressed above reflect those of the portfolio manager(s) only through the end of the period as stated on the cover of this report and do not necessarily represent the views of Fidelity or any other person in the Fidelity organization. Any such views are subject to change at any time based upon market or other conditions and Fidelity disclaims any responsibility to update such views. These views may not be relied on as investment advice and, because investment decisions for a Fidelity fund are based on numerous factors, may not be relied on as an indication of trading intent on behalf of any Fidelity fund.
Annual Report
Shareholder Expense Example
As a shareholder of the Fund, you incur two types of costs: (1) transaction costs, including redemption fees and (2) ongoing costs, including management fees and other Fund expenses. This Example is intended to help you understand your ongoing costs (in dollars) of investing in the Fund and to compare these costs with the ongoing costs of investing in other mutual funds.
The Example is based on an investment of $1,000 invested at the beginning of the period and held for the entire period (February 1, 2015 to July 31, 2015).
Actual Expenses
The first line of the accompanying table for each class of the Fund provides information about actual account values and actual expenses. You may use the information in this line, together with the amount you invested, to estimate the expenses that you paid over the period. Simply divide your account value by $1,000.00 (for example, an $8,600 account value divided by $1,000.00 = 8.6), then multiply the result by the number in the first line for a class of the Fund under the heading entitled "Expenses Paid During Period" to estimate the expenses you paid on your account during this period. A small balance maintenance fee of $12.00 that is charged once a year may apply for certain accounts with a value of less than $2,000. This fee is not included in the table below. If it was, the estimate of expenses you paid during the period would be higher, and your ending account value lower, by this amount. In addition, the Fund, as a shareholder in the underlying Fidelity Central Funds, will indirectly bear its pro-rata share of the fees and expenses incurred by the underlying Fidelity Central Funds. These fees and expenses are not included in the Fund's annualized expense ratio used to calculate the expense estimate in the table below.
Hypothetical Example for Comparison Purposes
The second line of the accompanying table for each class of the Fund provides information about hypothetical account values and hypothetical expenses based on a Class' actual expense ratio and an assumed rate of return of 5% per year before expenses, which is not the Class' actual return. The hypothetical account values and expenses may not be used to estimate the actual ending account balance or expenses you paid for the period. You may use this information to compare the ongoing costs of investing in the Fund and other funds. To do so, compare this 5% hypothetical example with the 5% hypothetical examples that appear in the shareholder reports of the other funds. A small balance maintenance fee of $12.00 that is charged once a year may apply for certain accounts with a value of less than $2,000. This fee is not included in the table below. If it was, the estimate of expenses you paid during the period would be higher, and your ending account value lower, by this amount. In addition, the Fund, as a shareholder in the underlying Fidelity Central Funds, will indirectly bear its pro-rata share of the fees and expenses incurred by the underlying Fidelity Central Funds. These fees and expenses are not included in the Fund's annualized expense ratio used to calculate the expense estimate in the table below.
Please note that the expenses shown in the table are meant to highlight your ongoing costs only and do not reflect any transaction costs. Therefore, the second line of the table is useful in comparing ongoing costs only, and will not help you determine the relative total costs of owning different funds. In addition, if these transactional costs were included, your costs would have been higher.
Annual Report
| Annualized
Expense Ratio B | Beginning
Account Value
February 1, 2015 | Ending
Account Value
July 31, 2015 | Expenses Paid
During Period*
February 1, 2015
to July 31, 2015 |
Low-Priced Stock | .78% | | | |
Actual | | $ 1,000.00 | $ 1,081.10 | $ 4.02 |
Hypothetical A | | $ 1,000.00 | $ 1,020.93 | $ 3.91 |
Class K | .68% | | | |
Actual | | $ 1,000.00 | $ 1,081.80 | $ 3.51 |
HypotheticalA | | $ 1,000.00 | $ 1,021.42 | $ 3.41 |
A 5% return per year before expenses
B Annualized expense ratio reflects expenses net of applicable fee waivers.
* Expenses are equal to each Class' annualized expense ratio, multiplied by the average account value over the period, multiplied by 181/365 (to reflect the one-half year period).
Annual Report
Investment Changes (Unaudited)
Top Ten Stocks as of July 31, 2015 |
| % of fund's
net assets | % of fund's net assets
6 months ago |
UnitedHealth Group, Inc. | 5.1 | 4.8 |
Next PLC | 4.3 | 3.9 |
Seagate Technology LLC | 3.2 | 3.7 |
Best Buy Co., Inc. | 2.3 | 2.6 |
Microsoft Corp. | 2.2 | 2.4 |
Ross Stores, Inc. | 2.2 | 2.0 |
Metro, Inc. Class A (sub. vtg.) | 1.8 | 1.8 |
Barratt Developments PLC | 1.7 | 1.3 |
Unum Group | 1.5 | 1.4 |
DCC PLC (United Kingdom) | 1.4 | 0.9 |
| 25.7 | |
Top Five Market Sectors as of July 31, 2015 |
| % of fund's
net assets | % of fund's net assets
6 months ago |
Consumer Discretionary | 26.4 | 26.1 |
Information Technology | 18.9 | 19.2 |
Financials | 12.4 | 11.8 |
Health Care | 11.7 | 10.8 |
Industrials | 7.8 | 7.5 |
Asset Allocation (% of fund's net assets) |
As of July 31, 2015* | As of January 31, 2015** |
 | Stocks 90.7% | |  | Stocks 89.3% | |
 | Bonds 0.0%† | |  | Bonds 0.0%† | |
 | Short-Term
Investments and
Net Other Assets (Liabilities) 9.3% | |  | Short-Term
Investments and
Net Other Assets (Liabilities) 10.7% | |
* Foreign investments | 43.2% | | ** Foreign investments | 41.5% | |
† Amount represents less than 0.1% |

Annual Report
Investments July 31, 2015
Showing Percentage of Net Assets
Common Stocks - 90.6% |
| Shares | | Value (000s) |
CONSUMER DISCRETIONARY - 26.4% |
Auto Components - 1.5% |
ASTI Corp. (e) | 1,206,000 | | $ 2,228 |
ATLASBX Co. Ltd. | 270,000 | | 8,255 |
Gentex Corp. | 300,000 | | 4,824 |
Hi-Lex Corp. | 1,237,100 | | 39,728 |
Horizon Global Corp. (a) | 630,877 | | 7,899 |
INFAC Corp. | 325,139 | | 1,614 |
INZI Controls Co. Ltd. (e) | 1,516,000 | | 6,514 |
Johnson Controls, Inc. | 6,606,900 | | 301,010 |
Motonic Corp. (e) | 3,250,000 | | 32,471 |
Murakami Corp. (e) | 838,000 | | 14,734 |
Nippon Seiki Co. Ltd. | 2,931,500 | | 58,637 |
Piolax, Inc. (e) | 920,900 | | 47,481 |
S&T Holdings Co. Ltd. (e) | 834,300 | | 16,528 |
Samsung Climate Control Co. Ltd. (e) | 499,950 | | 4,502 |
Sewon Precision Industries Co. Ltd. (a)(e) | 500,000 | | 10,763 |
Shoei Co. Ltd. | 363,900 | | 6,433 |
SJM Co. Ltd. (e) | 1,282,000 | | 7,201 |
SJM Holdings Co. Ltd. (e) | 1,332,974 | | 5,807 |
Strattec Security Corp. | 162,600 | | 11,429 |
Sungwoo Hitech Co. Ltd. | 1,888,517 | | 14,593 |
TBK Co. Ltd. | 1,028,800 | | 4,732 |
The Goodyear Tire & Rubber Co. | 444,127 | | 13,382 |
Yachiyo Industry Co. Ltd. | 944,500 | | 8,124 |
Yutaka Giken Co. Ltd. (e) | 1,364,800 | | 28,522 |
| | 657,411 |
Distributors - 0.3% |
Chori Co. Ltd. | 478,200 | | 7,385 |
Doshisha Co. Ltd. | 1,051,400 | | 19,512 |
Educational Development Corp. (e) | 356,392 | | 1,700 |
Nakayamafuku Co. Ltd. (e) | 1,118,600 | | 7,870 |
SPK Corp. | 236,200 | | 4,477 |
Uni-Select, Inc. (e) | 1,785,900 | | 80,306 |
| | 121,250 |
Diversified Consumer Services - 0.4% |
American Public Education, Inc. (a) | 47,879 | | 1,239 |
Career Education Corp. (a) | 1,234,300 | | 3,925 |
Clip Corp. (e) | 302,600 | | 2,669 |
Cross-Harbour Holdings Ltd. | 596,400 | | 762 |
DeVry, Inc. | 730,100 | | 22,180 |
Houghton Mifflin Harcourt Co. (a) | 1,350,000 | | 35,276 |
Common Stocks - continued |
| Shares | | Value (000s) |
CONSUMER DISCRETIONARY - continued |
Diversified Consumer Services - continued |
Meiko Network Japan Co. Ltd. | 920,900 | | $ 10,217 |
Novarese, Inc. (d) | 237,800 | | 1,754 |
Regis Corp. (a) | 535,000 | | 7,827 |
Shingakukai Co. Ltd. | 175,300 | | 900 |
Steiner Leisure Ltd. (a)(e) | 1,285,452 | | 74,171 |
Step Co. Ltd. (e) | 1,197,100 | | 10,335 |
Weight Watchers International, Inc. (a)(d)(e) | 4,489,100 | | 17,956 |
YBM Sisa.com, Inc. | 808,655 | | 2,906 |
| | 192,117 |
Hotels, Restaurants & Leisure - 0.5% |
Ambassadors Group, Inc. (a)(e) | 1,225,000 | | 2,842 |
Ark Restaurants Corp. (e) | 194,400 | | 4,734 |
BRONCO BILLY Co. Ltd. (d) | 97,200 | | 1,977 |
Create Restaurants Holdings, Inc. | 453,300 | | 10,706 |
Flanigan's Enterprises, Inc. | 46,500 | | 1,351 |
Hiday Hidaka Corp. (e) | 1,661,271 | | 40,481 |
Ibersol SGPS SA | 529,500 | | 5,030 |
Interval Leisure Group, Inc. | 850,000 | | 18,122 |
Intralot SA (a) | 1,457,500 | | 2,657 |
Koshidaka Holdings Co. Ltd. | 655,180 | | 14,723 |
Kura Corp. Ltd. | 193,800 | | 5,973 |
Nathan's Famous, Inc. (a) | 5,000 | | 154 |
Ohsho Food Service Corp. | 576,200 | | 19,341 |
Ruby Tuesday, Inc. (a)(e) | 3,735,000 | | 27,415 |
Sportscene Group, Inc. Class A (e) | 368,500 | | 1,550 |
St. Marc Holdings Co. Ltd. | 750,000 | | 26,143 |
The Monogatari Corp. (e) | 495,400 | | 17,928 |
Toridoll.corporation | 1,050,000 | | 15,080 |
| | 216,207 |
Household Durables - 3.6% |
Abbey PLC (e) | 1,973,500 | | 31,427 |
Barratt Developments PLC (e) | 77,445,600 | | 767,988 |
Bellway PLC | 4,533,400 | | 170,689 |
Blyth, Inc. (a) | 414,400 | | 1,910 |
D.R. Horton, Inc. | 4,859,600 | | 144,282 |
Dorel Industries, Inc. Class B (sub. vtg.) | 2,992,900 | | 76,319 |
Emak SpA | 4,876,400 | | 4,734 |
First Juken Co. Ltd. (e) | 1,556,300 | | 17,668 |
Helen of Troy Ltd. (a)(e) | 2,604,700 | | 228,641 |
Henry Boot PLC | 3,727,300 | | 13,853 |
Common Stocks - continued |
| Shares | | Value (000s) |
CONSUMER DISCRETIONARY - continued |
Household Durables - continued |
HTL International Holdings Ltd. (e) | 26,704,700 | | $ 4,283 |
Libbey, Inc. | 690,000 | | 25,675 |
NACCO Industries, Inc. Class A | 285,500 | | 14,495 |
P&F Industries, Inc. Class A (a)(e) | 349,000 | | 2,998 |
Panasonic Corp. | 1,326,000 | | 15,493 |
Sanei Architecture Planning Co. Ltd. (e) | 1,345,300 | | 15,750 |
Stanley Furniture Co., Inc. (a) | 449,766 | | 1,376 |
Steinhoff International Holdings Ltd. | 3,330,946 | | 20,162 |
Token Corp. (e) | 830,000 | | 54,313 |
| | 1,612,056 |
Internet & Catalog Retail - 0.2% |
Belluna Co. Ltd. (e) | 9,539,100 | | 57,188 |
Liberty Interactive Corp. Qvc G Series A (a) | 876,000 | | 25,448 |
PetMed Express, Inc. (d) | 48,600 | | 819 |
| | 83,455 |
Leisure Products - 0.3% |
Accell Group NV (e) | 2,226,400 | | 48,781 |
Arctic Cat, Inc. | 350,000 | | 10,014 |
Fenix Outdoor AB Class B | 32,298 | | 0 |
JAKKS Pacific, Inc. (a)(d) | 701,000 | | 6,905 |
Kabe Husvagnar AB (B Shares) | 307,998 | | 3,642 |
Mars Engineering Corp. | 519,500 | | 8,907 |
Mattel, Inc. | 890,300 | | 20,664 |
Miroku Corp. (e) | 780,000 | | 2,045 |
Smith & Wesson Holding Corp. (a)(d) | 1,109,300 | | 17,993 |
Trigano SA | 52,509 | | 2,307 |
| | 121,258 |
Media - 1.0% |
Chime Communications PLC | 4,061,100 | | 22,895 |
Cinderella Media Group Ltd. (e) | 17,670,000 | | 5,949 |
Corus Entertainment, Inc. Class B (non-vtg.) (d) | 651,000 | | 6,994 |
Crown Media Holdings, Inc. Class A (a) | 1,022,330 | | 4,570 |
Discovery Communications, Inc. Class A (a)(d) | 325,000 | | 10,732 |
DreamWorks Animation SKG, Inc. Class A (a) | 2,356,600 | | 56,818 |
Gannett Co., Inc. | 1,900,000 | | 24,035 |
GfK AG | 161,200 | | 6,869 |
Harte-Hanks, Inc. | 823,500 | | 3,862 |
Hyundai HCN | 2,723,979 | | 9,461 |
Intage Holdings, Inc. (e) | 1,852,300 | | 31,087 |
Ipsos SA | 9,787 | | 245 |
Common Stocks - continued |
| Shares | | Value (000s) |
CONSUMER DISCRETIONARY - continued |
Media - continued |
ITE Group PLC | 95,600 | | $ 275 |
Live Nation Entertainment, Inc. (a) | 1,220,000 | | 31,988 |
Pico Far East Holdings Ltd. | 20,598,000 | | 6,085 |
Proto Corp. | 459,000 | | 7,185 |
RKB Mainichi Broadcasting Corp. | 236,000 | | 1,809 |
Saga Communications, Inc. Class A | 424,800 | | 17,204 |
Sky Network Television Ltd. | 6,498,384 | | 26,252 |
Starz Series A (a) | 1,864,900 | | 75,435 |
STW Group Ltd. | 4,557,505 | | 2,515 |
Tegna, Inc. | 708,300 | | 20,633 |
Television Broadcasts Ltd. | 3,829,000 | | 20,251 |
TOW Co. Ltd. (e) | 2,252,700 | | 11,251 |
TVA Group, Inc. Class B (non-vtg.) (a) | 3,435,303 | | 13,449 |
WOWOW INC. | 94,700 | | 2,781 |
| | 420,630 |
Multiline Retail - 4.5% |
Hanwha Galleria Timeworld Co. Ltd. (e) | 305,000 | | 39,235 |
Lifestyle International Holdings Ltd. | 37,828,500 | | 61,581 |
Next PLC (e) | 15,164,200 | | 1,892,126 |
Watts Co. Ltd. (e) | 1,284,800 | | 10,812 |
| | 2,003,754 |
Specialty Retail - 11.8% |
Aarons, Inc. Class A | 462,300 | | 17,096 |
ABC-MART, Inc. | 124,200 | | 7,466 |
Abercrombie & Fitch Co. Class A (d)(e) | 6,988,500 | | 140,399 |
Adastria Co. Ltd. | 350,000 | | 16,916 |
Aeropostale, Inc. (a)(d)(e) | 7,829,900 | | 11,823 |
AT-Group Co. Ltd. | 1,190,000 | | 25,445 |
AutoZone, Inc. (a) | 828,865 | | 580,985 |
Bed Bath & Beyond, Inc. (a) | 6,077,700 | | 396,448 |
Best Buy Co., Inc. (e) | 31,558,400 | | 1,019,021 |
BMTC Group, Inc. (e) | 5,155,500 | | 60,706 |
Bonia Corp. Bhd | 2,503,000 | | 632 |
Bonjour Holdings Ltd. | 4,315,000 | | 262 |
Buffalo Co. Ltd. (e) | 103,500 | | 731 |
Cash Converters International Ltd. | 22,897,710 | | 11,716 |
Chico's FAS, Inc. | 1,980,000 | | 30,136 |
CST Brands, Inc. | 2,652,300 | | 100,469 |
Delek Automotive Systems Ltd. | 719,800 | | 8,013 |
Destination Maternity Corp. | 290,000 | | 2,862 |
Common Stocks - continued |
| Shares | | Value (000s) |
CONSUMER DISCRETIONARY - continued |
Specialty Retail - continued |
DSW, Inc. Class A | 189,700 | | $ 6,169 |
Folli Follie SA (e) | 4,089,700 | | 101,818 |
Formosa Optical Technology Co. Ltd. | 659,000 | | 1,499 |
Fourlis Holdings SA (a) | 485,800 | | 1,408 |
Francesca's Holdings Corp. (a) | 150,000 | | 1,824 |
GameStop Corp. Class A (d)(e) | 7,561,800 | | 346,709 |
GNC Holdings, Inc. | 1,138,300 | | 56,016 |
Goldlion Holdings Ltd. | 18,444,000 | | 8,184 |
Guess?, Inc. (e) | 7,569,200 | | 165,690 |
Halfords Group PLC | 1,243,300 | | 10,562 |
Hour Glass Ltd. | 8,307,200 | | 5,268 |
IA Group Corp. (e) | 804,000 | | 5,216 |
John David Group PLC | 2,644,500 | | 33,245 |
Jumbo SA (e) | 11,143,968 | | 80,910 |
K's Denki Corp. | 2,819,400 | | 89,745 |
Ku Holdings Co. Ltd. | 945,400 | | 6,026 |
Kyoto Kimono Yuzen Co. Ltd. (e) | 1,432,800 | | 11,861 |
Le Chateau, Inc. Class A (sub. vtg.) (a) | 1,862,700 | | 641 |
Leon's Furniture Ltd. | 289,200 | | 3,251 |
Lewis Group Ltd. | 1,197,200 | | 5,446 |
Mr. Bricolage SA (e) | 956,575 | | 14,004 |
Nafco Co. Ltd. (e) | 2,154,300 | | 35,808 |
Nishimatsuya Chain Co. Ltd. | 1,420,000 | | 13,669 |
Office Depot, Inc. (a) | 1,552,100 | | 12,417 |
Pal Co. Ltd. (e) | 1,200,000 | | 37,955 |
Party City Holdco, Inc. | 180,600 | | 3,724 |
Ross Stores, Inc. | 18,125,400 | | 963,546 |
Sally Beauty Holdings, Inc. (a) | 580,600 | | 17,296 |
Second Chance Properties Ltd. | 2,403,500 | | 534 |
Second Chance Properties Ltd. warrants 7/24/17 (a) | 8,528,200 | | 12 |
Select Comfort Corp. (a) | 958,400 | | 24,957 |
Silvano Fashion Group A/S | 7,460 | | 10 |
Sonic Automotive, Inc. Class A (sub. vtg.) | 964,700 | | 22,468 |
Staples, Inc. | 23,139,500 | | 340,382 |
Super Retail Group Ltd. | 1,448,164 | | 9,770 |
The Buckle, Inc. (d) | 782,800 | | 34,623 |
The Men's Wearhouse, Inc. | 184,900 | | 11,005 |
The Stanley Gibbons Group PLC | 1,038,900 | | 3,959 |
Urban Outfitters, Inc. (a) | 75,000 | | 2,447 |
USS Co. Ltd. | 9,713,700 | | 170,784 |
Williams-Sonoma, Inc. | 184,900 | | 15,654 |
Common Stocks - continued |
| Shares | | Value (000s) |
CONSUMER DISCRETIONARY - continued |
Specialty Retail - continued |
Workman Co. Ltd. (e) | 1,354,800 | | $ 85,485 |
Zumiez, Inc. (a) | 390,000 | | 10,179 |
| | 5,203,302 |
Textiles, Apparel & Luxury Goods - 2.3% |
Bijou Brigitte Modische Accessoires AG | 41,500 | | 2,396 |
Coach, Inc. | 2,170,300 | | 67,713 |
Daphne International Holdings Ltd. | 924,000 | | 184 |
Deckers Outdoor Corp. (a) | 38,300 | | 2,791 |
Embry Holdings Ltd. | 1,500,000 | | 793 |
F&F Co. Ltd. | 306,793 | | 4,512 |
Fossil Group, Inc. (a) | 2,164,200 | | 148,789 |
Geox SpA (a)(d) | 2,280,000 | | 9,265 |
Gildan Activewear, Inc. (e) | 12,969,700 | | 418,291 |
Hampshire Group Ltd. (a)(e) | 847,200 | | 212 |
Handsome Co. Ltd. (e) | 2,436,150 | | 83,048 |
JLM Couture, Inc. (a)(e) | 181,500 | | 472 |
Movado Group, Inc. | 75,090 | | 1,902 |
Portico International Holdings (a) | 11,334,500 | | 5,556 |
Steven Madden Ltd. (a) | 840,600 | | 35,036 |
Sun Hing Vision Group Holdings Ltd. (e) | 22,045,000 | | 8,958 |
Texwinca Holdings Ltd. | 56,174,000 | | 67,968 |
Tungtex Holdings Co. Ltd. | 12,412,000 | | 1,873 |
Van de Velde | 66,319 | | 4,129 |
Vera Bradley, Inc. (a)(d) | 1,090,900 | | 11,847 |
Victory City International Holdings Ltd. | 61,142,150 | | 9,464 |
Youngone Corp. | 500,000 | | 24,999 |
Youngone Holdings Co. Ltd. (e) | 889,600 | | 67,061 |
Yue Yuen Industrial (Holdings) Ltd. | 12,111,000 | | 39,369 |
| | 1,016,628 |
TOTAL CONSUMER DISCRETIONARY | | 11,648,068 |
CONSUMER STAPLES - 7.5% |
Beverages - 1.3% |
Baron de Ley SA (a) | 147,300 | | 14,616 |
C&C Group PLC | 3,334,666 | | 12,994 |
Kweichow Moutai Co. Ltd. | 275,110 | | 9,163 |
Monster Beverage Corp. (a) | 2,486,400 | | 381,787 |
Muhak Co. Ltd. (a)(e) | 2,759,180 | | 126,833 |
Olvi PLC (A Shares) | 26,469 | | 769 |
Common Stocks - continued |
| Shares | | Value (000s) |
CONSUMER STAPLES - continued |
Beverages - continued |
Spritzer Bhd | 2,350,100 | | $ 1,157 |
Synergy Co. (a) | 94,388 | | 882 |
Yantai Changyu Pioneer Wine Co. Ltd. (B Shares) | 494,860 | | 1,602 |
| | 549,803 |
Food & Staples Retailing - 4.6% |
Aoki Super Co. Ltd. | 189,000 | | 2,059 |
Belc Co. Ltd. (e) | 1,882,600 | | 66,533 |
Cosmos Pharmaceutical Corp. (e) | 1,453,300 | | 187,035 |
Create SD Holdings Co. Ltd. (e) | 2,050,900 | | 124,773 |
Daikokutenbussan Co. Ltd. | 644,500 | | 24,909 |
Dong Suh Companies, Inc. | 4,786,599 | | 170,768 |
Fyffes PLC (Ireland) (e) | 27,158,200 | | 41,727 |
Genky Stores, Inc. (d)(e) | 221,000 | | 27,461 |
Greggs PLC | 2,850,000 | | 60,307 |
Halows Co. Ltd. (e) | 1,497,100 | | 25,090 |
Jeronimo Martins SGPS SA | 1,840,800 | | 27,353 |
Kusuri No Aoki Co. Ltd. | 923,300 | | 47,903 |
Majestic Wine PLC (d)(e) | 3,875,095 | | 26,324 |
MARR SpA | 378,000 | | 6,999 |
Metro, Inc. Class A (sub. vtg.) (e) | 29,305,999 | | 797,492 |
Qol Co. Ltd. (e) | 1,856,100 | | 31,465 |
Retail Partners Co. Ltd. | 428,200 | | 4,111 |
Safeway, Inc.: | | | |
rights (a) | 16,069,900 | | 0 |
rights (a) | 16,069,900 | | 2,893 |
Sligro Food Group NV | 1,206,400 | | 46,373 |
Sundrug Co. Ltd. | 1,944,000 | | 113,407 |
Tesco PLC | 12,051,600 | | 40,529 |
Total Produce PLC | 9,917,100 | | 14,050 |
Valor Co. Ltd. | 215,200 | | 5,287 |
Walgreens Boots Alliance, Inc. | 145,600 | | 14,069 |
Welcia Holdings Co. Ltd. (d) | 486,000 | | 24,862 |
Yaoko Co. Ltd. | 1,535,400 | | 75,943 |
| | 2,009,722 |
Food Products - 1.5% |
Aryzta AG | 1,642,800 | | 83,424 |
Blue Buffalo Pet Products, Inc. | 92,600 | | 2,587 |
Cranswick PLC | 996,864 | | 25,686 |
Dean Foods Co. (d) | 1,900,000 | | 33,820 |
Devro PLC | 2,748,800 | | 13,018 |
Common Stocks - continued |
| Shares | | Value (000s) |
CONSUMER STAPLES - continued |
Food Products - continued |
Dutch Lady Milk Industries Bhd | 100,000 | | $ 1,226 |
Food Empire Holdings Ltd. (a)(e) | 48,347,000 | | 8,282 |
Fresh Del Monte Produce, Inc. (e) | 5,566,700 | | 219,996 |
Hilton Food Group PLC | 661,300 | | 4,549 |
Inventure Foods, Inc. (a) | 332,500 | | 3,268 |
Lifeway Foods, Inc. (a) | 60,000 | | 883 |
Nam Yang Dairy Products | 11,000 | | 6,953 |
Omega Protein Corp. (a) | 648,000 | | 9,215 |
Pacific Andes International Holdings Ltd. (a) | 114,542,500 | | 3,842 |
Pacific Andes Resources Development Ltd. (a) | 214,494,393 | | 8,443 |
Patties Food Ltd. | 3,448,534 | | 2,899 |
President Rice Products PCL | 1,183,000 | | 1,681 |
Rocky Mountain Chocolate Factory, Inc. (e) | 411,082 | | 5,336 |
Samyang Genex Co. Ltd. | 76,173 | | 12,314 |
Seaboard Corp. (a) | 43,928 | | 152,650 |
Select Harvests Ltd. (e) | 4,979,628 | | 48,010 |
Sunjin Co. Ltd. (e) | 813,630 | | 22,678 |
Synear Food Holdings Ltd. (a) | 38,027,000 | | 0 |
United Food Holdings Ltd. | 2,062,850 | | 301 |
| | 671,061 |
Household Products - 0.0% |
Energizer Holdings, Inc. | 218,700 | | 8,422 |
Personal Products - 0.1% |
Grape King Bio Ltd. | 1,748,000 | | 11,705 |
Nutraceutical International Corp. (a)(e) | 1,053,104 | | 25,454 |
Oriflame Cosmetics SA SDR (a) | 18,897 | | 278 |
Sarantis SA (e) | 2,225,700 | | 17,343 |
| | 54,780 |
Tobacco - 0.0% |
Karelia Tobacco Co., Inc. | 1,786 | | 427 |
TOTAL CONSUMER STAPLES | | 3,294,215 |
ENERGY - 3.1% |
Energy Equipment & Services - 1.3% |
AKITA Drilling Ltd. Class A (non-vtg.) | 1,636,500 | | 11,574 |
Atwood Oceanics, Inc. (d)(e) | 5,625,000 | | 117,000 |
Boustead Singapore Ltd. | 3,827,625 | | 3,348 |
Cal Dive International, Inc. (a)(e) | 5,572,400 | | 33 |
Carbo Ceramics, Inc. (d)(e) | 2,181,900 | | 71,675 |
Common Stocks - continued |
| Shares | | Value (000s) |
ENERGY - continued |
Energy Equipment & Services - continued |
Cathedral Energy Services Ltd. | 1,474,700 | | $ 2,176 |
Divestco, Inc. (a) | 3,222,500 | | 123 |
Farstad Shipping ASA (e) | 2,946,600 | | 8,658 |
Fugro NV (Certificaten Van Aandelen) (a)(d) | 1,760,800 | | 36,887 |
Geospace Technologies Corp. (a)(e) | 1,276,800 | | 22,267 |
Gulfmark Offshore, Inc. Class A (d)(e) | 2,525,430 | | 23,790 |
Nabors Industries Ltd. | 661,223 | | 7,677 |
Noble Corp. (d) | 2,251,800 | | 26,909 |
Oil States International, Inc. (a) | 1,841,700 | | 55,454 |
Paragon Offshore PLC (d) | 764,900 | | 570 |
Petrofac Ltd. | 523,500 | | 7,194 |
PHX Energy Services Corp. | 143,500 | | 500 |
Precision Drilling Corp. | 1,529,900 | | 7,779 |
ProSafe ASA | 8,972,300 | | 26,142 |
Shinko Plantech Co. Ltd. | 1,414,000 | | 11,672 |
Solstad Offshore ASA | 1,062,400 | | 4,344 |
Total Energy Services, Inc. (e) | 2,284,800 | | 25,838 |
Unit Corp. (a)(e) | 4,803,600 | | 94,775 |
| | 566,385 |
Oil, Gas & Consumable Fuels - 1.8% |
Adams Resources & Energy, Inc. | 146,451 | | 6,996 |
Beach Energy Ltd. (d) | 14,639,149 | | 10,433 |
Boardwalk Pipeline Partners, LP | 615,000 | | 8,561 |
Bonavista Energy Corp. (d) | 385,700 | | 1,445 |
Denbury Resources, Inc. (d) | 7,436,000 | | 29,298 |
Eni SpA | 17,377,900 | | 304,124 |
Fuji Kosan Co. Ltd. (e) | 708,300 | | 3,206 |
Fuji Oil Co. Ltd. | 3,304,500 | | 12,452 |
Great Eastern Shipping Co. Ltd. | 4,800,000 | | 26,056 |
Hankook Shell Oil Co. Ltd. | 60,000 | | 23,721 |
HollyFrontier Corp. | 293,600 | | 14,169 |
Marathon Oil Corp. | 645,162 | | 13,555 |
Michang Oil Industrial Co. Ltd. (e) | 173,900 | | 10,693 |
Newfield Exploration Co. (a) | 1,994,741 | | 65,408 |
Statoil ASA sponsored ADR (d) | 337,400 | | 5,705 |
Stone Energy Corp. (a) | 2,430,167 | | 14,071 |
Swift Energy Co. (a)(d)(e) | 4,137,100 | | 3,025 |
Tesoro Corp. | 1,409,278 | | 137,179 |
Tsakos Energy Navigation Ltd. | 800,000 | | 7,296 |
Uehara Sei Shoji Co. Ltd. | 899,000 | | 3,866 |
Common Stocks - continued |
| Shares | | Value (000s) |
ENERGY - continued |
Oil, Gas & Consumable Fuels - continued |
W&T Offshore, Inc. (d)(e) | 5,842,300 | | $ 22,025 |
Whiting Petroleum Corp. (a) | 328,300 | | 6,727 |
World Fuel Services Corp. | 2,100,622 | | 85,390 |
WPX Energy, Inc. (a) | 893,071 | | 7,770 |
| | 823,171 |
TOTAL ENERGY | | 1,389,556 |
FINANCIALS - 12.4% |
Banks - 1.6% |
ACNB Corp. | 121,700 | | 2,497 |
Bank of Ireland (a) | 381,749,000 | | 160,690 |
BBCN Bancorp, Inc. | 2,358,900 | | 36,209 |
Camden National Corp. | 44,468 | | 1,790 |
Cathay General Bancorp | 2,850,000 | | 91,514 |
Codorus Valley Bancorp, Inc. (e) | 481,920 | | 9,961 |
ConnectOne Bancorp, Inc. | 762,800 | | 16,293 |
Customers Bancorp, Inc. | 144,800 | | 3,642 |
Dimeco, Inc. | 26,938 | | 1,028 |
Eagle Bancorp, Inc. (a) | 508,500 | | 22,577 |
East West Bancorp, Inc. | 1,990,000 | | 89,072 |
EFG Eurobank Ergasias SA (a) | 311,404,200 | | 39,856 |
Farmers & Merchants Bancorp, Inc. | 42,600 | | 1,161 |
First Bancorp, Puerto Rico (a) | 7,428,572 | | 32,017 |
First NBC Bank Holding Co. (a) | 436,800 | | 16,686 |
First Niagara Financial Group, Inc. | 989,104 | | 9,604 |
First West Virginia Bancorp, Inc. | 52,771 | | 1,071 |
Investors Bancorp, Inc. | 2,163,700 | | 26,354 |
LCNB Corp. (e) | 706,726 | | 11,315 |
Norwood Financial Corp. (e) | 192,710 | | 5,907 |
OFG Bancorp (d)(e) | 2,478,342 | | 19,975 |
Pacific Premier Bancorp, Inc. (a) | 866,200 | | 16,466 |
Popular, Inc. (a) | 1,657,600 | | 50,756 |
SpareBank 1 SR-Bank ASA (primary capital certificate) | 1,370,900 | | 8,140 |
Sparebanken More (primary capital certificate) | 231,634 | | 6,465 |
Sparebanken Nord-Norge | 2,170,100 | | 10,786 |
Stock Yards Bancorp, Inc. | 72,300 | | 2,665 |
Trico Bancshares | 369,184 | | 9,152 |
Wilshire Bancorp, Inc. | 1,263,400 | | 14,681 |
| | 718,330 |
Common Stocks - continued |
| Shares | | Value (000s) |
FINANCIALS - continued |
Capital Markets - 0.1% |
AllianceBernstein Holding LP | 665,000 | | $ 18,268 |
Federated Investors, Inc. Class B (non-vtg.) | 347,200 | | 11,704 |
State Street Corp. | 348,800 | | 26,704 |
| | 56,676 |
Consumer Finance - 0.7% |
Aeon Credit Service (Asia) Co. Ltd. | 14,166,000 | | 10,489 |
EZCORP, Inc. (non-vtg.) Class A (a) | 917,100 | | 6,502 |
Green Dot Corp. Class A (a) | 2,378,100 | | 49,274 |
H&T Group PLC | 598,700 | | 1,889 |
Nicholas Financial, Inc. (a) | 240,900 | | 3,153 |
Santander Consumer U.S.A. Holdings, Inc. (a) | 3,594,907 | | 86,925 |
SLM Corp. (a) | 1,807,500 | | 16,502 |
Synchrony Financial (d) | 3,428,200 | | 117,793 |
| | 292,527 |
Diversified Financial Services - 0.4% |
Credit Analysis & Research Ltd. | 50,000 | | 1,111 |
Newship Ltd. (a) | 2,500 | | 976 |
NICE Holdings Co. Ltd. | 900,000 | | 17,174 |
NICE Information Service Co. Ltd. | 1,700,000 | | 17,860 |
Ricoh Leasing Co. Ltd. | 850,900 | | 27,119 |
The NASDAQ OMX Group, Inc. | 83,300 | | 4,251 |
Voya Financial, Inc. | 2,000,000 | | 93,900 |
| | 162,391 |
Insurance - 8.3% |
Admiral Group PLC | 508,500 | | 11,761 |
AEGON NV | 52,951,000 | | 407,285 |
AFLAC, Inc. | 330,700 | | 21,181 |
Amlin PLC | 1,997,400 | | 15,924 |
April (e) | 2,555,400 | | 34,520 |
Assurant, Inc. (e) | 4,834,600 | | 360,661 |
Axis Capital Holdings Ltd. (e) | 7,028,300 | | 404,549 |
CNO Financial Group, Inc. | 1,109,300 | | 19,790 |
Endurance Specialty Holdings Ltd. (e) | 2,394,300 | | 166,380 |
FBD Holdings PLC | 161,200 | | 1,354 |
Genworth Financial, Inc. Class A (a)(e) | 26,337,700 | | 184,627 |
Hartford Financial Services Group, Inc. | 6,300,000 | | 299,565 |
HCC Insurance Holdings, Inc. | 410,500 | | 31,674 |
Hiscox Ltd. | 1,175,128 | | 16,984 |
James River Group Holdings Ltd. | 243,228 | | 6,677 |
Lincoln National Corp. | 7,240,800 | | 407,802 |
Common Stocks - continued |
| Shares | | Value (000s) |
FINANCIALS - continued |
Insurance - continued |
MBIA, Inc. (a) | 380,900 | | $ 2,266 |
MetLife, Inc. | 828,800 | | 46,197 |
National Interstate Corp. | 850,000 | | 21,471 |
National Western Life Insurance Co. Class A | 137,070 | | 33,032 |
NN Group NV | 1,237,630 | | 38,187 |
Primerica, Inc. | 499,700 | | 22,601 |
Progressive Corp. | 601,700 | | 18,352 |
RenaissanceRe Holdings Ltd. (e) | 2,854,900 | | 306,331 |
Torchmark Corp. | 783,350 | | 48,262 |
Unum Group (e) | 18,545,000 | | 664,653 |
Validus Holdings Ltd. | 1,747,200 | | 80,983 |
| | 3,673,069 |
Real Estate Investment Trusts - 0.5% |
Annaly Capital Management, Inc. | 14,650,000 | | 145,768 |
Corrections Corp. of America | 462,300 | | 16,259 |
Nsi NV | 74,103 | | 332 |
VEREIT, Inc. | 4,306,900 | | 37,728 |
| | 200,087 |
Real Estate Management & Development - 0.4% |
Anabuki Kosan, Inc. | 477,500 | | 905 |
Century21 Real Estate Japan Ltd. (d) | 108,100 | | 1,055 |
Devine Ltd. (a) | 1,956,888 | | 930 |
Leopalace21 Corp. (a) | 4,722,200 | | 25,833 |
Relo Holdings Corp. (e) | 1,214,600 | | 130,540 |
Tejon Ranch Co. (a) | 195,100 | | 4,842 |
| | 164,105 |
Thrifts & Mortgage Finance - 0.4% |
ASAX Co. Ltd. | 89,000 | | 1,168 |
BofI Holding, Inc. (a) | 184,900 | | 22,715 |
Farmer Mac Class C (non-vtg.) | 630,900 | | 16,877 |
Genworth MI Canada, Inc. | 4,446,200 | | 105,218 |
Genworth Mortgage Insurance Ltd. (d) | 8,027,905 | | 21,007 |
Lake Sunapee Bank Group | 194,800 | | 2,903 |
Meridian Bancorp, Inc. (a) | 1,046,300 | | 13,644 |
| | 183,532 |
TOTAL FINANCIALS | | 5,450,717 |
Common Stocks - continued |
| Shares | | Value (000s) |
HEALTH CARE - 11.7% |
Biotechnology - 1.2% |
Amgen, Inc. | 2,762,700 | | $ 487,865 |
Baxalta, Inc. | 925,000 | | 30,368 |
| | 518,233 |
Health Care Equipment & Supplies - 1.2% |
Apex Biotechnology Corp. | 1,400,000 | | 1,791 |
Arts Optical International Holdings Ltd. (e) | 31,282,640 | | 12,106 |
Atrion Corp. | 9,296 | | 3,755 |
Audika SA | 287,200 | | 5,567 |
Boston Scientific Corp. (a) | 1,109,300 | | 19,235 |
Exactech, Inc. (a) | 46,200 | | 923 |
Hoshiiryou Sanki Co. Ltd. (e) | 331,400 | | 8,771 |
Huvitz Co. Ltd. (e) | 700,000 | | 12,997 |
Microlife Corp. | 3,130,500 | | 7,465 |
Mindray Medical International Ltd. sponsored ADR | 1,062,200 | | 28,987 |
Nakanishi, Inc. | 626,700 | | 24,980 |
Pacific Hospital Supply Co. Ltd. | 400,000 | | 686 |
Prim SA (e) | 1,597,100 | | 17,873 |
ResMed, Inc. | 218,300 | | 12,650 |
Span-America Medical System, Inc. (e) | 266,100 | | 4,705 |
St. Jude Medical, Inc. | 2,265,700 | | 167,254 |
St.Shine Optical Co. Ltd. | 2,224,000 | | 28,871 |
Supermax Corp. Bhd | 26,193,300 | | 16,872 |
Techno Medica Co. Ltd. | 42,800 | | 1,024 |
Top Glove Corp. Bhd | 1,000,000 | | 1,995 |
Utah Medical Products, Inc. (e) | 391,300 | | 21,392 |
Zimmer Biomet Holdings, Inc. | 1,149,044 | | 119,581 |
| | 519,480 |
Health Care Providers & Services - 8.2% |
A/S One Corp. | 236,100 | | 7,792 |
Aetna, Inc. | 4,722,200 | | 533,467 |
Almost Family, Inc. (a)(e) | 862,614 | | 37,748 |
Amedisys, Inc. (a) | 557,700 | | 24,332 |
Anthem, Inc. | 2,072,000 | | 319,647 |
Diversicare Healthcare Services, Inc. | 48,100 | | 586 |
DVx, Inc. (e) | 775,800 | | 8,933 |
Farmacol SA | 47,800 | | 636 |
Grupo Casa Saba SA de CV (a) | 11,937,000 | | 0 |
Hanger, Inc. (a)(e) | 2,674,510 | | 57,876 |
Hi-Clearance, Inc. | 1,489,000 | | 4,256 |
LHC Group, Inc. (a)(e) | 1,700,900 | | 68,529 |
Common Stocks - continued |
| Shares | | Value (000s) |
HEALTH CARE - continued |
Health Care Providers & Services - continued |
Lifco AB | 915,900 | | $ 17,858 |
Medica Sur SA de CV | 378,000 | | 1,262 |
MEDNAX, Inc. (a) | 184,200 | | 15,591 |
National Healthcare Corp. | 6,164 | | 390 |
Pelion SA (e) | 584,200 | | 10,840 |
The Ensign Group, Inc. | 605,700 | | 30,963 |
Triple-S Management Corp. (a)(e) | 2,210,134 | | 47,695 |
Tsukui Corp. (d)(e) | 2,462,100 | | 19,071 |
U.S. Physical Therapy, Inc. | 140,700 | | 7,437 |
United Drug PLC (United Kingdom) | 9,700,419 | | 75,971 |
UnitedHealth Group, Inc. | 18,343,500 | | 2,226,898 |
Wellcare Health Plans, Inc. (a) | 733,800 | | 59,291 |
WIN-Partners Co. Ltd. (e) | 1,404,500 | | 20,387 |
| | 3,597,456 |
Health Care Technology - 0.0% |
Arrhythmia Research Technology, Inc. (a) | 84,000 | | 535 |
ND Software Co. Ltd. (e) | 1,338,700 | | 16,181 |
Quality Systems, Inc. | 194,400 | | 2,479 |
| | 19,195 |
Pharmaceuticals - 1.1% |
Biofermin Pharmaceutical Co. Ltd. | 25,500 | | 617 |
Bliss Gvs Pharma Ltd. (a) | 4,570,530 | | 13,932 |
Daewon Pharmaceutical Co. Ltd. (e) | 1,679,963 | | 34,578 |
Daewoong Co. Ltd. | 90,000 | | 6,306 |
DongKook Pharmaceutical Co. Ltd. (e) | 650,000 | | 34,394 |
FDC Ltd. | 3,600,000 | | 9,331 |
Fuji Pharma Co. Ltd. | 285,200 | | 5,097 |
Genomma Lab Internacional SA de CV (a) | 1,399,124 | | 1,298 |
Indivior PLC | 17,266,100 | | 71,130 |
Jeil Pharmaceutical Co. (e) | 861,300 | | 18,836 |
Kwang Dong Pharmaceutical Co. Ltd. (e) | 3,100,000 | | 38,549 |
Kyung Dong Pharmaceutical Co. Ltd. | 48,531 | | 1,013 |
Mylan N.V. | 416,000 | | 23,292 |
Pharmstandard OJSC (a) | 18,897 | | 313 |
Phibro Animal Health Corp. Class A | 337,400 | | 13,253 |
Recordati SpA | 6,226,000 | | 155,148 |
Torrent Pharmaceuticals Ltd. | 150,000 | | 3,379 |
Common Stocks - continued |
| Shares | | Value (000s) |
HEALTH CARE - continued |
Pharmaceuticals - continued |
Tsumura & Co. | 1,125,600 | | $ 23,632 |
Whanin Pharmaceutical Co. Ltd. (e) | 1,750,000 | | 36,620 |
| | 490,718 |
TOTAL HEALTH CARE | | 5,145,082 |
INDUSTRIALS - 7.8% |
Aerospace & Defense - 0.2% |
AAR Corp. | 383,900 | | 10,346 |
Aerojet Rocketdyne Holdings, Inc. (a) | 1,399,901 | | 32,772 |
Engility Holdings, Inc. (d) | 862,400 | | 18,895 |
Magellan Aerospace Corp. | 360,900 | | 5,083 |
Textron, Inc. | 378,550 | | 16,543 |
| | 83,639 |
Air Freight & Logistics - 0.3% |
Air T, Inc. (a)(e) | 225,400 | | 5,035 |
Atlas Air Worldwide Holdings, Inc. (a)(e) | 1,675,000 | | 82,326 |
Hub Group, Inc. Class A (a) | 486,922 | | 20,514 |
Yusen Logistics Co. Ltd. (e) | 3,407,400 | | 37,858 |
| | 145,733 |
Airlines - 0.0% |
Republic Airways Holdings, Inc. (a) | 760,000 | | 3,830 |
SkyWest, Inc. | 241,819 | | 4,005 |
| | 7,835 |
Building Products - 0.0% |
Kondotec, Inc. (e) | 1,654,600 | | 10,267 |
Commercial Services & Supplies - 0.8% |
1010 Printing Group Ltd. | 21,363,640 | | 3,417 |
ABM Industries, Inc. | 10,767 | | 355 |
AJIS Co. Ltd. (e) | 496,100 | | 14,551 |
Asia File Corp. Bhd | 4,480,000 | | 4,024 |
CECO Environmental Corp. | 739,500 | | 6,656 |
Civeo Corp. (e) | 9,560,200 | | 20,459 |
Essendant, Inc. (e) | 2,191,644 | | 80,696 |
Fursys, Inc. (e) | 950,000 | | 28,393 |
Kruk SA | 9,544 | | 439 |
Matthews International Corp. Class A | 200,000 | | 10,770 |
Mears Group PLC | 1,578,015 | | 9,611 |
Mitie Group PLC (e) | 20,487,405 | | 103,021 |
Common Stocks - continued |
| Shares | | Value (000s) |
INDUSTRIALS - continued |
Commercial Services & Supplies - continued |
Moleskine SpA | 330,500 | | $ 580 |
Moshi Moshi Hotline, Inc. | 97,200 | | 993 |
Multi-Color Corp. | 192,900 | | 12,319 |
Nac Co. Ltd. (e) | 1,151,200 | | 9,298 |
NICE Total Cash Management Co., Ltd. (e) | 2,601,400 | | 8,924 |
Prestige International, Inc. | 764,300 | | 6,913 |
RPS Group PLC | 566,700 | | 1,894 |
The Brink's Co. | 10,900 | | 340 |
VICOM Ltd. | 3,131,500 | | 14,221 |
West Corp. | 1,080,600 | | 31,175 |
| | 369,049 |
Construction & Engineering - 1.0% |
AECOM Technology Corp. (a)(e) | 8,224,496 | | 253,561 |
Arcadis NV | 1,180,600 | | 30,989 |
Astaldi SpA (d) | 2,635,300 | | 25,353 |
Ausdrill Ltd. | 2,328,844 | | 511 |
Boustead Projects Pte Ltd. (a) | 1,148,287 | | 724 |
C-Cube Corp. | 358,600 | | 1,447 |
Daiichi Kensetsu Corp. (e) | 1,920,900 | | 20,366 |
Engineers India Ltd. | 2,100,000 | | 7,932 |
EPCO Co. Ltd. (d) | 49,100 | | 812 |
Geumhwa PSC Co. Ltd. (e) | 325,000 | | 13,184 |
Heijmans NV (Certificaten Van Aandelen) (a) | 27,364 | | 335 |
Jacobs Engineering Group, Inc. (a) | 215,400 | | 9,073 |
Kyeryong Construction Industrial Co. Ltd. (a)(e) | 880,000 | | 8,226 |
Meisei Industrial Co. Ltd. | 1,227,300 | | 6,001 |
Mirait Holdings Corp. | 1,713,200 | | 19,671 |
Nippon Rietec Co. Ltd. (e) | 1,300,000 | | 9,073 |
Sanyo Engineering & Construction, Inc. | 413,000 | | 2,033 |
Severfield PLC | 3,069,633 | | 3,451 |
Shinnihon Corp. | 1,749,700 | | 8,400 |
ShoLodge, Inc. (a)(e) | 461,027 | | 0 |
Sterling Construction Co., Inc. (a)(e) | 1,760,800 | | 8,258 |
Tutor Perini Corp. (a) | 629,800 | | 13,182 |
United Integration Services Co. Ltd. | 5,143,500 | | 5,069 |
Vianini Lavori SpA | 661,300 | | 5,258 |
| | 452,909 |
Electrical Equipment - 1.0% |
Aichi Electric Co. Ltd. | 1,702,000 | | 5,946 |
Aros Quality Group AB | 806,000 | | 11,212 |
Common Stocks - continued |
| Shares | | Value (000s) |
INDUSTRIALS - continued |
Electrical Equipment - continued |
AZZ, Inc. (e) | 1,381,400 | | $ 71,487 |
Bharat Heavy Electricals Ltd. | 21,000,000 | | 91,350 |
BWX Technologies, Inc. | 1,519,822 | | 37,327 |
Chiyoda Integre Co. Ltd. | 484,000 | | 10,740 |
EnerSys | 277,300 | | 17,317 |
FW Thorpe PLC | 4,858,700 | | 14,227 |
GrafTech International Ltd. (a) | 92,100 | | 463 |
Graphite India Ltd. | 1,427,257 | | 1,769 |
Hammond Power Solutions, Inc. Class A | 407,100 | | 2,272 |
I-Sheng Electric Wire & Cable Co. Ltd. (e) | 12,500,000 | | 13,148 |
Jinpan International Ltd. | 95,600 | | 435 |
Korea Electric Terminal Co. Ltd. (e) | 700,000 | | 61,233 |
Servotronics, Inc. (e) | 151,100 | | 907 |
TKH Group NV unit | 1,749,400 | | 75,122 |
| | 414,955 |
Industrial Conglomerates - 1.4% |
DCC PLC (United Kingdom) (e) | 7,514,100 | | 593,760 |
Reunert Ltd. | 1,889,000 | | 9,452 |
| | 603,212 |
Machinery - 1.5% |
Aalberts Industries NV (e) | 8,748,500 | | 274,598 |
Allison Transmission Holdings, Inc. | 392,130 | | 11,442 |
ASL Marine Holdings Ltd. (e) | 31,217,300 | | 8,533 |
CKD Corp. | 1,473,300 | | 14,622 |
Foremost Income Fund (a)(e) | 2,141,103 | | 8,325 |
Gencor Industries, Inc. (a)(e) | 420,200 | | 4,030 |
Global Brass & Copper Holdings, Inc. (e) | 1,149,837 | | 19,375 |
Hillenbrand, Inc. | 485,300 | | 13,763 |
Hurco Companies, Inc. (e) | 521,400 | | 16,320 |
Hwacheon Machine Tool Co. Ltd. (e) | 219,900 | | 12,522 |
Hyster-Yale Materials Handling: | | | |
Class A | 230,400 | | 15,591 |
Class B (a) | 310,000 | | 20,978 |
Ihara Science Corp. (e) | 1,094,900 | | 8,834 |
Jaya Holdings Ltd. (e) | 68,762,300 | | 1,855 |
Joy Global, Inc. (d) | 101,600 | | 2,683 |
Kyowakogyosyo Co. Ltd. (e) | 347,000 | | 2,066 |
Maruzen Co. Ltd. (e) | 1,765,000 | | 16,235 |
Metka SA | 801,700 | | 6,375 |
Mincon Group PLC | 2,263,257 | | 1,740 |
Common Stocks - continued |
| Shares | | Value (000s) |
INDUSTRIALS - continued |
Machinery - continued |
Mirle Automation Corp. | 4,200,000 | | $ 3,436 |
Nadex Co. Ltd. (e) | 884,000 | | 5,599 |
Nakano Refrigerators Co. Ltd. | 18,900 | | 547 |
Nitchitsu Co. Ltd. | 426,000 | | 808 |
Oshkosh Corp. | 2,172,400 | | 79,379 |
Semperit AG Holding | 497,300 | | 20,653 |
SIMPAC, Inc. | 583,000 | | 3,050 |
Takamatsu Machinery Co. Ltd. | 391,300 | | 3,419 |
Techno Smart Corp. (e) | 996,000 | | 3,673 |
Terex Corp. | 1,166,300 | | 25,845 |
Tocalo Co. Ltd. (e) | 874,900 | | 17,980 |
TriMas Corp. (a) | 1,558,335 | | 36,621 |
Trinity Industrial Corp. | 801,000 | | 3,154 |
Valmet Corp. | 665,517 | | 7,865 |
| | 671,916 |
Marine - 0.0% |
Tokyo Kisen Co. Ltd. (e) | 921,000 | | 5,573 |
Professional Services - 0.5% |
Akka Technologies SA (e) | 1,228,555 | | 40,883 |
Boardroom Ltd. | 2,860,542 | | 1,116 |
CBIZ, Inc. (a) | 1,046,900 | | 10,260 |
Clarius Group Ltd. (a) | 3,584,803 | | 655 |
CRA International, Inc. (a) | 175,000 | | 4,085 |
Exova Group Ltd. PLC | 4,444,933 | | 11,679 |
ICF International, Inc. (a) | 357,466 | | 13,105 |
McMillan Shakespeare Ltd. | 94,778 | | 987 |
Sporton International, Inc. | 300,000 | | 1,834 |
Stantec, Inc. | 3,872,200 | | 107,682 |
Synergie SA | 141,600 | | 3,880 |
TrueBlue, Inc. (a) | 679,400 | | 17,501 |
VSE Corp. (e) | 458,500 | | 21,733 |
| | 235,400 |
Road & Rail - 0.6% |
Alps Logistics Co. Ltd. (e) | 1,587,300 | | 20,415 |
CSX Corp. | 794,880 | | 24,864 |
Daqin Railway Co. Ltd. (A Shares) | 26,000,000 | | 42,791 |
Hamakyorex Co. Ltd. (e) | 696,300 | | 26,715 |
Higashi Twenty One Co. Ltd. | 278,100 | | 1,032 |
Hutech Norin Co. Ltd. (e) | 961,100 | | 8,174 |
Roadrunner Transportation Systems, Inc. (a) | 630,900 | | 16,517 |
Common Stocks - continued |
| Shares | | Value (000s) |
INDUSTRIALS - continued |
Road & Rail - continued |
Sakai Moving Service Co. Ltd. (e) | 723,700 | | $ 34,043 |
Trancom Co. Ltd. (e) | 950,600 | | 54,381 |
Universal Truckload Services, Inc. | 1,265,000 | | 26,729 |
| | 255,661 |
Trading Companies & Distributors - 0.4% |
AddTech AB (B Shares) | 1,369,600 | | 20,322 |
AerCap Holdings NV (a) | 411,236 | | 19,262 |
Goodfellow, Inc. (e) | 803,500 | | 5,591 |
Hanwa Co. Ltd. | 599,000 | | 2,605 |
HERIGE | 67,853 | | 1,997 |
Houston Wire & Cable Co. (e) | 1,161,700 | | 10,734 |
KS Energy Services Ltd. (a) | 14,640,200 | | 2,988 |
Meiwa Corp. | 1,437,400 | | 4,628 |
Mitani Shoji Co. Ltd. | 755,600 | | 19,784 |
MRC Global, Inc. (a) | 1,270,530 | | 16,326 |
Otec Corp. | 138,200 | | 1,114 |
Parker Corp. (e) | 2,469,000 | | 8,347 |
Richelieu Hardware Ltd. (d) | 322,300 | | 16,758 |
Senshu Electric Co. Ltd. (e) | 994,600 | | 17,070 |
Strongco Corp. (a)(e) | 944,188 | | 1,733 |
Tanaka Co. Ltd. | 40,600 | | 253 |
TECHNO ASSOCIE Co. Ltd. | 283,500 | | 2,841 |
Titan Machinery, Inc. (a) | 1,067,404 | | 14,997 |
Totech Corp. (e) | 991,900 | | 7,147 |
Willis Lease Finance Corp. (a) | 9,249 | | 154 |
| | 174,651 |
Transportation Infrastructure - 0.1% |
Isewan Terminal Service Co. Ltd. (e) | 1,436,500 | | 8,195 |
Meiko Transportation Co. Ltd. | 921,000 | | 7,580 |
Sinwa Ltd. (e) | 22,670,400 | | 3,883 |
Wesco Aircraft Holdings, Inc. (a) | 742,800 | | 10,689 |
| | 30,347 |
TOTAL INDUSTRIALS | | 3,461,147 |
INFORMATION TECHNOLOGY - 18.9% |
Communications Equipment - 0.3% |
Bel Fuse, Inc. Class A (e) | 213,567 | | 4,111 |
Black Box Corp. (e) | 1,658,340 | | 25,970 |
ClearOne, Inc. | 193,400 | | 2,454 |
Common Stocks - continued |
| Shares | | Value (000s) |
INFORMATION TECHNOLOGY - continued |
Communications Equipment - continued |
Ixia (a) | 1,130,852 | | $ 14,927 |
Juniper Networks, Inc. | 375,290 | | 10,666 |
NETGEAR, Inc. (a)(e) | 1,933,900 | | 64,766 |
Tessco Technologies, Inc. (e) | 582,200 | | 14,363 |
| | 137,257 |
Electronic Equipment & Components - 3.4% |
A&D Co. Ltd. (e) | 1,142,400 | | 4,590 |
AAC Technology Holdings, Inc. | 378,000 | | 2,145 |
Beijer Electronics AB | 119,100 | | 756 |
CDW Corp. | 891,600 | | 32,035 |
DigiTech Systems Co., Ltd. (a) | 725,000 | | 0 |
Dynapack International Technology Corp. | 3,200,000 | | 5,155 |
Elec & Eltek International Co. Ltd. | 1,657,300 | | 1,384 |
Elematec Corp. (e) | 1,105,000 | | 25,776 |
Excel Co. Ltd. (d)(e) | 837,900 | | 13,278 |
Fabrinet (a) | 380,200 | | 7,057 |
Hi-P International Ltd. | 19,407,800 | | 7,003 |
Hon Hai Precision Industry Co. Ltd. (Foxconn) | 157,988,000 | | 452,606 |
Huan Hsin Holdings Ltd. (a) | 4,704,000 | | 134 |
IDIS Holdings Co. Ltd. (e) | 800,000 | | 12,624 |
Image Sensing Systems, Inc. (a) | 95,900 | | 418 |
Insight Enterprises, Inc. (a) | 1,165,500 | | 31,457 |
Intelligent Digital Integrated Security Co. Ltd. (e) | 941,210 | | 15,377 |
INTOPS Co. Ltd. (e) | 859,900 | | 11,689 |
Isra Vision AG (e) | 403,200 | | 23,885 |
Keysight Technologies, Inc. (a) | 3,280,000 | | 100,171 |
Kingboard Chemical Holdings Ltd. (e) | 87,079,000 | | 146,025 |
Kingboard Laminates Holdings Ltd. | 8,288,000 | | 3,646 |
Lumax International Corp. Ltd. | 1,800,000 | | 2,428 |
Mesa Laboratories, Inc. (e) | 285,500 | | 29,561 |
Multi-Fineline Electronix, Inc. (a) | 1,128,244 | | 20,150 |
Muramoto Electronic Thailand PCL (For. Reg.) (e) | 1,416,600 | | 9,302 |
Neonode, Inc. (a)(d)(e) | 3,107,951 | | 7,987 |
Nippo Ltd. (e) | 840,021 | | 3,050 |
Orbotech Ltd. (a) | 920,900 | | 17,534 |
Pinnacle Technology Holdings Ltd. (a)(e) | 8,783,900 | | 8,437 |
Redington India Ltd. (a) | 4,700,000 | | 8,660 |
ScanSource, Inc. (a)(e) | 2,188,900 | | 82,806 |
Shibaura Electronics Co. Ltd. (e) | 716,300 | | 11,265 |
Sigmatron International, Inc. (a)(e) | 239,000 | | 1,539 |
Common Stocks - continued |
| Shares | | Value (000s) |
INFORMATION TECHNOLOGY - continued |
Electronic Equipment & Components - continued |
Simplo Technology Co. Ltd. | 9,000,000 | | $ 36,955 |
SYNNEX Corp. (e) | 3,227,483 | | 244,095 |
Taitron Components, Inc. Class A (sub. vtg.) (a) | 130,000 | | 128 |
Tomen Devices Corp. (e) | 626,200 | | 11,055 |
Tripod Technology Corp. | 600,000 | | 940 |
TTM Technologies, Inc. (a) | 1,518,733 | | 13,866 |
UKC Holdings Corp. (e) | 1,445,800 | | 30,529 |
Universal Security Instruments, Inc. (a)(e) | 177,204 | | 1,063 |
VST Holdings Ltd. (e) | 137,481,800 | | 46,996 |
Wireless Telecom Group, Inc. (a) | 462,800 | | 949 |
| | 1,486,506 |
Internet Software & Services - 0.2% |
Bankrate, Inc. (a) | 1,110,040 | | 10,124 |
Blucora, Inc. (a) | 489,260 | | 6,933 |
DeNA Co. Ltd. | 566,700 | | 11,271 |
Gabia, Inc. (e) | 1,255,000 | | 6,135 |
Liquidity Services, Inc. (a)(d) | 472,200 | | 4,240 |
Melbourne IT Ltd. (e) | 7,500,000 | | 10,855 |
NetGem SA | 944,500 | | 2,448 |
Rentabiliweb Group SA (a) | 84,900 | | 624 |
Softbank Technology Corp. | 142,800 | | 1,594 |
Stamps.com, Inc. (a) | 373,600 | | 25,629 |
UANGEL Corp. | 375,000 | | 1,775 |
| | 81,628 |
IT Services - 5.0% |
ALTEN | 815,900 | | 41,111 |
Amdocs Ltd. | 7,531,050 | | 441,696 |
Argo Graphics, Inc. | 424,800 | | 6,269 |
Blackhawk Network Holdings, Inc. (a) | 1,897,386 | | 87,147 |
Calian Technologies Ltd. (e) | 717,000 | | 10,340 |
Cardtronics, Inc. (a) | 291,537 | | 10,807 |
CGI Group, Inc. Class A (sub. vtg.) (a) | 315,400 | | 11,783 |
Computer Sciences Corp. | 4,269,800 | | 279,373 |
Computer Services, Inc. | 259,700 | | 10,492 |
CSE Global Ltd. (e) | 45,206,800 | | 17,630 |
Data#3 Ltd. | 3,116,716 | | 2,164 |
Dimerco Data System Corp. | 600,000 | | 388 |
eClerx Services Ltd. | 1,350,000 | | 31,330 |
EOH Holdings Ltd. (e) | 7,366,700 | | 100,360 |
EPAM Systems, Inc. (a) | 114,500 | | 8,486 |
Common Stocks - continued |
| Shares | | Value (000s) |
INFORMATION TECHNOLOGY - continued |
IT Services - continued |
Estore Corp. | 157,700 | | $ 1,550 |
EVERTEC, Inc. | 1,793,300 | | 33,750 |
ExlService Holdings, Inc. (a) | 327,006 | | 12,678 |
Genpact Ltd. (a) | 436,800 | | 9,701 |
Heartland Payment Systems, Inc. | 1,802,300 | | 112,283 |
HIQ International AB | 723,100 | | 3,713 |
Indra Sistemas (d)(e) | 15,111,400 | | 169,695 |
Know IT AB (e) | 1,590,300 | | 10,231 |
Leidos Holdings, Inc. | 1,151,200 | | 46,969 |
Luxoft Holding, Inc. (a) | 115,100 | | 7,224 |
ManTech International Corp. Class A | 1,162,600 | | 34,657 |
Mastek Ltd. (a)(e) | 1,650,000 | | 4,763 |
MoneyGram International, Inc. (a) | 484,700 | | 4,944 |
NCI, Inc. Class A (e) | 826,430 | | 9,297 |
Net 1 UEPS Technologies, Inc. (a) | 661,300 | | 12,842 |
Neustar, Inc. Class A (a)(d) | 1,270,000 | | 39,205 |
Rolta India Ltd. (a) | 2,699,942 | | 4,789 |
Science Applications International Corp. | 550,000 | | 29,524 |
Societe Pour L'Informatique Industrielle SA (e) | 1,841,800 | | 14,968 |
Softcreate Co. Ltd. | 411,100 | | 3,101 |
Sopra Steria Group | 17,606 | | 1,682 |
The Western Union Co. | 20,005,500 | | 404,911 |
Total System Services, Inc. | 247,800 | | 11,453 |
TravelSky Technology Ltd. (H Shares) | 1,944,000 | | 2,350 |
Unisys Corp. (a) | 627,770 | | 9,963 |
Vantiv, Inc. (a) | 554,800 | | 24,411 |
Xerox Corp. | 9,159,100 | | 100,933 |
| | 2,180,963 |
Semiconductors & Semiconductor Equipment - 0.6% |
Alpha & Omega Semiconductor Ltd. (a)(e) | 1,918,700 | | 15,062 |
Axell Corp. (e) | 850,000 | | 11,995 |
Lasertec Corp. | 472,200 | | 5,978 |
Leeno Industrial, Inc. | 676,331 | | 26,739 |
Marvell Technology Group Ltd. | 512,330 | | 6,373 |
Melexis NV (e) | 2,775,600 | | 148,117 |
Micron Technology, Inc. (a) | 369,800 | | 6,845 |
Miraial Co. Ltd. | 199,800 | | 2,054 |
Nextchip Co. Ltd. (a)(e) | 975,000 | | 5,920 |
Phison Electronics Corp. | 1,900,000 | | 13,653 |
Powertech Technology, Inc. | 9,000,000 | | 16,829 |
Common Stocks - continued |
| Shares | | Value (000s) |
INFORMATION TECHNOLOGY - continued |
Semiconductors & Semiconductor Equipment - continued |
Telechips, Inc. (e) | 1,058,800 | | $ 6,347 |
Trio-Tech International (a)(e) | 264,400 | | 785 |
Varitronix International Ltd. | 8,029,000 | | 6,100 |
Y.A.C. Co., Ltd. | 425,600 | | 3,204 |
| | 276,001 |
Software - 5.2% |
Activision Blizzard, Inc. | 257,260 | | 6,635 |
AdaptIT Holdings Ltd. | 2,921,600 | | 2,275 |
ANSYS, Inc. (a)(e) | 4,604,400 | | 433,504 |
AVG Technologies NV (a) | 338,800 | | 9,737 |
Axway Software SA | 46,200 | | 1,162 |
Cybernet Systems Co. Ltd. | 1,355,100 | | 4,920 |
Ebix, Inc. (d)(e) | 3,131,278 | | 97,038 |
Geodesic Ltd. (a)(e) | 4,873,000 | | 0 |
ICT Automatisering NV (e) | 778,100 | | 5,896 |
IGE + XAO SA | 36,800 | | 2,617 |
InfoVine Co. Ltd. (e) | 175,000 | | 5,103 |
init innovation in traffic systems AG | 38,313 | | 1,087 |
Jorudan Co. Ltd. (e) | 483,500 | | 4,190 |
King Digital Entertainment PLC (d) | 283,900 | | 4,409 |
KPIT Cummins Infosystems Ltd. (a) | 9,000,000 | | 15,528 |
KSK Co., Ltd. (e) | 590,500 | | 5,260 |
Micro Focus International PLC | 350,943 | | 7,662 |
Microsoft Corp. | 21,000,000 | | 980,700 |
Minefield Computers Ltd. (a) | 1,650,000 | | 7,428 |
NIIT Technologies Ltd. (a) | 2,018,000 | | 15,209 |
Nuance Communications, Inc. (a) | 656,240 | | 11,898 |
Nucleus Software Exports Ltd. (e) | 2,200,000 | | 9,754 |
Oracle Corp. | 12,198,820 | | 487,221 |
Parametric Technology Corp. (a) | 665,828 | | 24,203 |
Pro-Ship, Inc. | 140,200 | | 2,772 |
Reckon Ltd. (d) | 95,614 | | 148 |
Rovi Corp. (a) | 690,100 | | 7,584 |
RS Software (India) Ltd. | 600,000 | | 1,658 |
Software AG (Bearer) | 3,220,000 | | 96,348 |
Sword Group (e) | 558,425 | | 13,247 |
Symantec Corp. | 563,160 | | 12,806 |
Synopsys, Inc. (a) | 323,700 | | 16,457 |
Common Stocks - continued |
| Shares | | Value (000s) |
INFORMATION TECHNOLOGY - continued |
Software - continued |
Vitec Software Group AB | 193,400 | | $ 6,748 |
Zensar Technologies Ltd. (a) | 800,000 | | 11,943 |
| | 2,313,147 |
Technology Hardware, Storage & Peripherals - 4.2% |
Avid Technology, Inc. (a)(d) | 1,164,900 | | 14,282 |
Compal Electronics, Inc. | 72,000,000 | | 48,440 |
EMC Corp. | 511,030 | | 13,742 |
Hewlett-Packard Co. | 6,421,900 | | 195,996 |
Lexmark International, Inc. Class A | 1,920,000 | | 65,261 |
Logitech International SA (Reg.) (d) | 3,107,500 | | 44,701 |
NCR Corp. (a) | 147,830 | | 4,071 |
QLogic Corp. (a) | 1,609,466 | | 14,276 |
Quantum Corp. (a) | 6,224,100 | | 6,598 |
Seagate Technology LLC (e) | 27,625,400 | | 1,397,845 |
Silicon Graphics International Corp. (a) | 903,150 | | 4,615 |
Super Micro Computer, Inc. (a) | 1,314,200 | | 35,050 |
TPV Technology Ltd. | 77,350,000 | | 13,171 |
| | 1,858,048 |
TOTAL INFORMATION TECHNOLOGY | | 8,333,550 |
MATERIALS - 2.4% |
Chemicals - 1.7% |
Aditya Birla Chemicals India Ltd. (e) | 2,300,000 | | 8,172 |
American Vanguard Corp. | 48,600 | | 623 |
C. Uyemura & Co. Ltd. | 461,700 | | 24,550 |
Chase Corp. (e) | 837,500 | | 32,018 |
Core Molding Technologies, Inc. (a) | 340,200 | | 6,491 |
Deepak Fertilisers and Petrochemicals Corp. Ltd. (e) | 7,569,000 | | 16,720 |
Deepak Nitrite Ltd. | 5,000,000 | | 5,571 |
EcoGreen International Group Ltd. (e) | 46,424,400 | | 12,396 |
FMC Corp. | 2,762,600 | | 134,097 |
Fujikura Kasei Co., Ltd. (e) | 3,012,800 | | 13,516 |
Fuso Chemical Co. Ltd. | 1,244,700 | | 15,477 |
Gujarat Narmada Valley Fertilizers Co. (a)(e) | 13,541,878 | | 13,618 |
Gujarat State Fertilizers & Chemicals Ltd. (a)(e) | 31,500,000 | | 35,961 |
Honshu Chemical Industry Co. Ltd. (e) | 876,000 | | 10,002 |
Huabao International Holdings Ltd. | 4,782,000 | | 2,326 |
Innospec, Inc. | 799,400 | | 34,574 |
Intrepid Potash, Inc. (a) | 847,182 | | 7,235 |
Common Stocks - continued |
| Shares | | Value (000s) |
MATERIALS - continued |
Chemicals - continued |
KPC Holdings Corp. | 43,478 | | $ 2,752 |
KPX Chemical Co. Ltd. | 163,083 | | 7,930 |
KPX Green Chemical Co. Ltd. | 369,165 | | 1,517 |
Kraton Performance Polymers, Inc. (a) | 266,400 | | 5,467 |
Miwon Chemicals Co. Ltd. | 55,095 | | 2,230 |
Miwon Commercial Co. Ltd. (a) | 13,819 | | 2,139 |
Muto Seiko Co. Ltd. | 276,200 | | 1,495 |
Nano Chem Tech, Inc. | 125,000 | | 310 |
Nuplex Industries Ltd. | 4,594,135 | | 13,798 |
PolyOne Corp. | 318,900 | | 10,929 |
RPM International, Inc. | 145,600 | | 6,824 |
SK Kaken Co. Ltd. | 359,000 | | 37,657 |
Soda Aromatic Co. Ltd. | 277,300 | | 2,381 |
Soken Chemical & Engineer Co. Ltd. (e) | 741,200 | | 7,392 |
T&K Toka Co. Ltd. (e) | 755,500 | | 13,984 |
Thai Carbon Black PCL (For. Reg.) (a) | 12,750,300 | | 8,191 |
Thai Rayon PCL: | | | |
unit | 95,200 | | 62 |
(For. Reg.) | 3,022,200 | | 1,967 |
The Chemours Co. LLC | 275,000 | | 3,003 |
Tronox Ltd. Class A | 702,657 | | 7,715 |
UPL Ltd. | 1,000,000 | | 8,372 |
Yara International ASA | 4,191,500 | | 208,640 |
Yip's Chemical Holdings Ltd. (e) | 28,550,000 | | 14,805 |
| | 742,907 |
Construction Materials - 0.1% |
Brampton Brick Ltd. Class A (sub. vtg.) (a) | 783,500 | | 4,194 |
Mitani Sekisan Co. Ltd. (e) | 1,652,800 | | 23,565 |
Titan Cement Co. SA (Reg.) | 728,800 | | 16,362 |
| | 44,121 |
Containers & Packaging - 0.4% |
AMVIG Holdings Ltd. | 2,120,600 | | 1,001 |
Ball Corp. | 230,778 | | 15,656 |
Chuoh Pack Industry Co. Ltd. (e) | 469,000 | | 4,904 |
Kohsoku Corp. (e) | 1,931,400 | | 14,026 |
Samhwa Crown & Closure Co. Ltd. | 50,000 | | 1,972 |
Sealed Air Corp. | 462,300 | | 24,580 |
Silgan Holdings, Inc. | 828,800 | | 44,316 |
Sonoco Products Co. | 354,333 | | 14,627 |
Common Stocks - continued |
| Shares | | Value (000s) |
MATERIALS - continued |
Containers & Packaging - continued |
Starlite Holdings Ltd. | 354,000 | | $ 21 |
The Pack Corp. (e) | 1,832,600 | | 37,618 |
| | 158,721 |
Metals & Mining - 0.2% |
Alconix Corp. (e) | 1,176,900 | | 18,299 |
Blue Earth Refineries, Inc. (a) | 262,009 | | 0 |
Chubu Steel Plate Co. Ltd. | 460,400 | | 1,939 |
Compania de Minas Buenaventura SA sponsored ADR | 2,507,500 | | 17,853 |
Freeport-McMoRan, Inc. | 474,175 | | 5,572 |
Hill & Smith Holdings PLC | 1,983,300 | | 21,479 |
Orosur Mining, Inc. (a) | 3,305,600 | | 354 |
Orvana Minerals Corp. (a) | 850,013 | | 146 |
Pacific Metals Co. Ltd. (a) | 4,235,000 | | 12,848 |
Tohoku Steel Co. Ltd. (e) | 695,400 | | 7,715 |
Tokyo Kohtetsu Co. Ltd. (e) | 1,322,200 | | 4,235 |
Tokyo Tekko Co. Ltd. (e) | 4,235,000 | | 20,674 |
Webco Industries, Inc. (a) | 8,463 | | 542 |
| | 111,656 |
Paper & Forest Products - 0.0% |
Cardinal Co. Ltd. (d) | 70,900 | | 521 |
Stella-Jones, Inc. (a) | 600,000 | | 20,365 |
| | 20,886 |
TOTAL MATERIALS | | 1,078,291 |
TELECOMMUNICATION SERVICES - 0.0% |
Diversified Telecommunication Services - 0.0% |
APT Satellite Holdings Ltd. | 1,429,500 | | 1,333 |
Asia Satellite Telecommunications Holdings Ltd. | 379,500 | | 837 |
| | 2,170 |
UTILITIES - 0.4% |
Electric Utilities - 0.1% |
Exelon Corp. | 1,355,000 | | 43,482 |
Gas Utilities - 0.2% |
GAIL India Ltd. | 6,108,283 | | 33,883 |
Hokuriku Gas Co. | 1,700,000 | | 4,005 |
K&O Energy Group, Inc. | 596,900 | | 8,568 |
Keiyo Gas Co. Ltd. | 574,000 | | 2,895 |
KyungDong City Gas Co. Ltd. | 153,670 | | 14,563 |
Common Stocks - continued |
| Shares | | Value (000s) |
UTILITIES - continued |
Gas Utilities - continued |
Kyungnam Energy Co. Ltd. | 200,000 | | $ 1,201 |
Star Gas Partners LP | 1,000,000 | | 9,980 |
| | 75,095 |
Independent Power and Renewable Electricity Producers - 0.1% |
Mega First Corp. Bhd (e) | 22,630,800 | | 13,926 |
Talen Energy Corp. (a) | 2,225,000 | | 34,999 |
| | 48,925 |
Multi-Utilities - 0.0% |
CMS Energy Corp. | 775,880 | | 26,582 |
Water Utilities - 0.0% |
Manila Water Co., Inc. | 5,745,500 | | 3,138 |
TOTAL UTILITIES | | 197,222 |
TOTAL COMMON STOCKS (Cost $20,806,088) |
40,000,018
|
Nonconvertible Preferred Stocks - 0.1% |
| | | |
CONSUMER STAPLES - 0.0% |
Food Products - 0.0% |
Nam Yang Dairy Products | 4,917 | | 1,210 |
MATERIALS - 0.1% |
Construction Materials - 0.1% |
Buzzi Unicem SpA (Risparmio Shares) | 1,888,900 | | 19,708 |
TOTAL NONCONVERTIBLE PREFERRED STOCKS (Cost $16,526) |
20,918
|
Nonconvertible Bonds - 0.0% |
| Principal Amount (000s) | | |
ENERGY - 0.0% |
Oil, Gas & Consumable Fuels - 0.0% |
Centrus Energy Corp. 8% 9/30/19 pay-in-kind (Cost $21,367) | | $ 13,103 | |
4,455
|
Money Market Funds - 10.4% |
| Shares | | Value (000s) |
Fidelity Cash Central Fund, 0.17% (b) | 4,068,860,157 | | $ 4,068,860 |
Fidelity Securities Lending Cash Central Fund, 0.18% (b)(c) | 533,239,390 | | 533,239 |
TOTAL MONEY MARKET FUNDS (Cost $4,602,099) |
4,602,099
|
TOTAL INVESTMENT PORTFOLIO - 101.1% (Cost $25,446,080) | | 44,627,490 |
NET OTHER ASSETS (LIABILITIES) - (1.1)% | | (488,537) |
NET ASSETS - 100% | $ 44,138,953 |
Legend |
(a) Non-income producing |
(b) Affiliated fund that is generally available only to investment companies and other accounts managed by Fidelity Investments. The rate quoted is the annualized seven-day yield of the fund at period end. A complete unaudited listing of the fund's holdings as of its most recent quarter end is available upon request. In addition, each Fidelity Central Fund's financial statements, which are not covered by the Fund's Report of Independent Registered Public Accounting Firm, are available on the SEC's website or upon request. |
(c) Investment made with cash collateral received from securities on loan. |
(d) Security or a portion of the security is on loan at period end. |
(e) Affiliated company |
Affiliated Central Funds |
Information regarding fiscal year to date income earned by the Fund from investments in Fidelity Central Funds is as follows: |
Fund | Income earned
(Amounts in thousands) |
Fidelity Cash Central Fund | $ 7,011 |
Fidelity Securities Lending Cash Central Fund | 16,764 |
Total | $ 23,775 |
Other Affiliated Issuers |
An affiliated company is a company in which the Fund has ownership of at least 5% of the voting securities. Fiscal year to date transactions with companies which are or were affiliates are as follows: |
Affiliate
(Amounts in thousands) | Value, beginning of period | Purchases | Sales Proceeds* | Dividend Income | Value,
end of
period |
A&D Co. Ltd. | $ 5,682 | $ 499 | $ 252 | $ 108 | $ 4,590 |
Aalberts Industries NV | 281,757 | - | 14,286 | 3,822 | 274,598 |
Abbey PLC | 30,448 | - | 1,670 | 268 | 31,427 |
Abercrombie & Fitch Co. Class A | 289,830 | - | 9,299 | 5,823 | 140,399 |
Accell Group NV | 43,386 | - | 2,174 | 1,297 | 48,781 |
Aditya Birla Chemicals India Ltd. | 7,838 | - | 172 | 58 | 8,172 |
AECOM Technology Corp. | 258,543 | 46,827 | 49,314 | - | 253,561 |
Aeropostale, Inc. | 27,148 | - | 770 | - | 11,823 |
Air T, Inc. | 2,753 | - | 284 | - | 5,035 |
AJIS Co. Ltd. | 8,540 | - | 556 | 175 | 14,551 |
Akka Technologies SA | 41,030 | - | 2,253 | 595 | 40,883 |
Albemarle & Bond Holdings PLC | 356 | - | - | - | - |
Alconix Corp. | 18,564 | 94 | 986 | 385 | 18,299 |
Almost Family, Inc. | 21,317 | - | 1,782 | - | 37,748 |
Alpha & Omega Semiconductor Ltd. | 22,652 | - | 5,122 | - | 15,062 |
Alps Logistics Co. Ltd. | 17,922 | - | 1,046 | 526 | 20,415 |
Ambassadors Group, Inc. | 7,390 | - | 1,077 | - | 2,842 |
Amdocs Ltd. | 361,958 | - | 23,933 | 5,105 | - |
ANSYS, Inc. | 373,459 | - | 22,007 | - | 433,504 |
April | 60,280 | - | 1,961 | 1,061 | 34,520 |
Ark Restaurants Corp. | 4,456 | - | 354 | 206 | 4,734 |
Arts Optical International Holdings Ltd. | 10,016 | - | 666 | 319 | 12,106 |
ASL Marine Holdings Ltd. | 16,853 | 823 | 557 | 245 | 8,533 |
Assurant, Inc. | 322,933 | - | 17,768 | 5,588 | 360,661 |
ASTI Corp. | 2,661 | - | 189 | 19 | 2,228 |
Atlas Air Worldwide Holdings, Inc. | 69,191 | 2,370 | 22,413 | - | 82,326 |
Atwood Oceanics, Inc. | - | 173,917 | 5,141 | 2,562 | 117,000 |
Axell Corp. | 14,165 | - | 634 | 383 | 11,995 |
Axis Capital Holdings Ltd. | 325,726 | - | 27,429 | 8,411 | 404,549 |
Affiliate
(Amounts in thousands) | Value, beginning of period | Purchases | Sales Proceeds* | Dividend Income | Value,
end of
period |
AZZ, Inc. | $ 63,553 | $ - | $ 3,601 | $ 860 | $ 71,487 |
Barratt Developments PLC | 481,338 | - | 35,915 | 15,020 | 767,988 |
Bel Fuse, Inc. Class A | 5,387 | - | 407 | 55 | 4,111 |
Belc Co. Ltd. | 56,050 | - | 4,228 | 733 | 66,533 |
Belluna Co. Ltd. | 48,790 | - | 2,586 | 982 | 57,188 |
Best Buy Co., Inc. | 1,021,017 | 13,332 | 112,287 | 44,593 | 1,019,021 |
Black Box Corp. | 36,191 | - | 1,873 | 707 | 25,970 |
BMTC Group, Inc. (formerly BMTC Group, Inc. Class A (sub. vtg.)) | 67,542 | - | 3,689 | 981 | 60,706 |
Buffalo Co. Ltd. | 290 | 517 | 36 | 16 | 731 |
C. Uyemura & Co. Ltd. | 34,020 | - | 8,221 | 415 | - |
Cal Dive International, Inc. | 6,403 | - | 23 | - | 33 |
Calian Technologies Ltd. | 14,688 | - | 586 | 611 | 10,340 |
Carbo Ceramics, Inc. | - | 75,231 | 2,990 | 724 | 71,675 |
Career Education Corp. | 33,337 | - | 21,380 | - | - |
Cash Converters International Ltd. | 24,558 | 415 | 834 | 791 | - |
Centrus Energy Corp. Class A | - | 8,493 | 2,306 | - | - |
Chase Corp. | 29,652 | 137 | 1,750 | 528 | 32,018 |
Chuoh Pack Industry Co. Ltd. | 6,250 | - | 285 | 155 | 4,904 |
Cinderella Media Group Ltd. | 2,725 | 472 | 262 | 258 | 5,949 |
Civeo Corp. | 127,754 | 73,191 | 51,268 | 1,427 | 20,459 |
Clip Corp. | 3,253 | - | 148 | 118 | 2,669 |
Codorus Valley Bancorp, Inc. | 9,462 | 677 | 546 | 247 | 9,961 |
Core Molding Technologies, Inc. | 5,277 | - | 1,260 | - | - |
Cosmos Pharmaceutical Corp. | 220,093 | - | 50,488 | 728 | 187,035 |
CRA International, Inc. | 23,464 | 704 | 25,669 | - | - |
Create SD Holdings Co. Ltd. | 78,557 | - | 4,918 | 1,029 | 124,773 |
CSE Global Ltd. | 27,687 | - | 1,104 | 997 | 17,630 |
Cybernet Systems Co. Ltd. | 7,278 | - | 3,017 | 167 | - |
Daewon Pharmaceutical Co. Ltd. | 17,803 | - | 548 | 182 | 34,578 |
Affiliate
(Amounts in thousands) | Value, beginning of period | Purchases | Sales Proceeds* | Dividend Income | Value,
end of
period |
Daiichi Kensetsu Corp. | $ 28,865 | $ - | $ 1,201 | $ 361 | $ 20,366 |
DCC PLC (United Kingdom) | 455,343 | - | 30,538 | 10,208 | 593,760 |
Deepak Fertilisers and Petrochemicals Corp. Ltd. | 20,290 | - | - | 475 | 16,720 |
Deepak Nitrite Ltd. | 7,934 | - | 1,268 | 78 | - |
Divestco, Inc. | 514 | - | 12 | - | - |
Dong Suh Companies, Inc. | 98,054 | 302 | 14,512 | 2,389 | - |
DongKook Pharmaceutical Co. Ltd. | 23,113 | - | 7,051 | 170 | 34,394 |
Doshisha Co. Ltd. | 36,672 | - | 16,273 | 562 | - |
DVx, Inc. | 7,461 | - | 408 | 109 | 8,933 |
Ebix, Inc. | 32,550 | 17,575 | 9,935 | 899 | 97,038 |
EcoGreen International Group Ltd. | 13,710 | 181 | 663 | 390 | 12,396 |
Educational Development Corp. | 1,803 | - | 86 | 119 | 1,700 |
Elematec Corp. | 21,667 | - | 1,349 | 676 | 25,776 |
Endurance Specialty Holdings Ltd. | 133,500 | - | 8,274 | 3,441 | 166,380 |
EOH Holdings Ltd. | 68,225 | - | 4,741 | 721 | 100,360 |
Essendant, Inc. (formerly United Stationers, Inc.) | 91,070 | - | 6,708 | 1,298 | 80,696 |
Excel Co. Ltd. | 17,995 | - | 548 | 235 | 13,278 |
Farstad Shipping ASA | 56,831 | - | 809 | 927 | 8,658 |
First Juken Co. Ltd. | 21,501 | - | 943 | 475 | 17,668 |
Folli Follie SA | 175,629 | - | 3,198 | 4,027 | 101,818 |
Food Empire Holdings Ltd. | 15,401 | - | 548 | - | 8,282 |
Foremost Income Fund | 11,488 | - | - | 503 | 8,325 |
Fresh Del Monte Produce, Inc. | 183,119 | - | 20,797 | 3,027 | 219,996 |
Fuji Kosan Co. Ltd. | 4,721 | - | 187 | 89 | 3,206 |
Fuji Oil Co. Ltd. | 18,497 | - | 7,142 | 119 | - |
Fujikura Kasei Co., Ltd. | 16,414 | - | 762 | 348 | 13,516 |
Fursys, Inc. | 30,525 | - | - | 504 | 28,393 |
Fyffes PLC (Ireland) | 40,978 | - | 2,444 | 787 | 41,727 |
Gabia, Inc. | 6,631 | - | 537 | 20 | 6,135 |
GameStop Corp.
Class A | 244,471 | 75,001 | 21,973 | 9,470 | 346,709 |
Gencor Industries, Inc. | 4,833 | - | 273 | - | 4,030 |
Genky Stores, Inc. | 9,170 | - | 886 | 102 | 27,461 |
Genworth Financial, Inc. Class A | 287,527 | 55,421 | 10,994 | - | 184,627 |
Affiliate
(Amounts in thousands) | Value, beginning of period | Purchases | Sales Proceeds* | Dividend Income | Value,
end of
period |
Genworth MI Canada, Inc. | $ 173,311 | $ - | $ 9,875 | $ 6,706 | $ - |
Geodesic Ltd. | 141 | - | - | - | 0 |
Geospace Technologies Corp. | - | 32,582 | 984 | - | 22,267 |
Geumhwa PSC Co. Ltd. | 13,551 | - | - | 222 | 13,184 |
Gildan Activewear, Inc. | 416,798 | - | 39,339 | 2,950 | 418,291 |
Glentel, Inc. | 21,636 | - | 47,021 | 216 | - |
Global Brass & Copper Holdings, Inc. | 17,018 | 2,881 | 3,044 | 181 | 19,375 |
Goodfellow, Inc. | 7,612 | - | 340 | 238 | 5,591 |
Green Dot Corp.
Class A | 35,823 | 9,636 | 4,801 | - | - |
Greggs PLC | 85,359 | - | 111,833 | 3,977 | - |
Guess?, Inc. | 220,700 | 1,360 | 19,005 | 7,434 | 165,690 |
Gujarat Narmada Valley Fertilizers Co. | 17,956 | 2,627 | - | 678 | 13,618 |
Gujarat State Fertilizers & Chemicals Ltd. | 39,198 | 849 | - | - | 35,961 |
Gulfmark Offshore, Inc. Class A | - | 66,448 | 1,766 | 363 | 23,790 |
Gulliver International Co. Ltd. | 52,416 | - | 48,562 | 458 | - |
Halows Co. Ltd. | 17,545 | - | 1,083 | 188 | 25,090 |
Hamakyorex Co. Ltd. | 22,785 | - | 1,345 | 252 | 26,715 |
Hampshire Group Ltd. | 3,215 | - | 41 | - | 212 |
Handsome Co. Ltd. | 64,893 | - | - | 554 | 83,048 |
Hanger, Inc. | 3,076 | 59,861 | 2,830 | - | 57,876 |
Hankook Shell Oil Co. Ltd. | 32,938 | - | 3,151 | 935 | - |
Hanwha Galleria Timeworld Co. Ltd. | 15,301 | - | 4,843 | 259 | 39,235 |
Heartland Payment Systems, Inc. | 92,227 | - | 7,194 | 698 | - |
Helen of Troy Ltd. | 148,105 | - | 12,334 | - | 228,641 |
Hiday Hidaka Corp. | 33,700 | - | 2,637 | 426 | 40,481 |
Honshu Chemical Industry Co. Ltd. | 7,278 | - | 479 | 185 | 10,002 |
Hoshiiryou Sanki Co. Ltd. | 10,695 | - | 466 | 109 | 8,771 |
Houston Wire & Cable Co. | 14,709 | - | 669 | 582 | 10,734 |
HTL International Holdings Ltd. | 6,374 | - | 264 | 225 | 4,283 |
Hurco Companies, Inc. | 20,014 | - | 3,596 | 168 | 16,320 |
Hutech Norin Co. Ltd. | 10,027 | - | 454 | 222 | 8,174 |
Affiliate
(Amounts in thousands) | Value, beginning of period | Purchases | Sales Proceeds* | Dividend Income | Value,
end of
period |
Huvitz Co. Ltd. | $ 12,665 | $ - | $ 5,430 | $ 76 | $ 12,997 |
Hwacheon Machine Tool Co. Ltd. | 13,316 | - | - | 250 | 12,522 |
Hyster-Yale Materials Handling Class B | 24,831 | - | - | 344 | - |
I-Sheng Electric Wire & Cable Co. Ltd. | 17,949 | - | - | 1,154 | 13,148 |
IA Group Corp. | 6,654 | - | 299 | 159 | 5,216 |
ICT Automatisering NV | 5,754 | - | 504 | 180 | 5,896 |
IDIS Holdings Co. Ltd. | 10,574 | - | - | 61 | 12,624 |
Ihara Science Corp. | 9,965 | 334 | 452 | 188 | 8,834 |
Il Dong Holdings Co. Ltd. | 33,888 | - | 64,872 | 349 | - |
Image Sensing Systems, Inc. | 902 | - | 1,440 | - | - |
Indra Sistemas | 246,916 | - | 9,318 | - | 169,695 |
InfoVine Co. Ltd. | 4,567 | - | - | 114 | 5,103 |
Intage Holdings, Inc. | 28,886 | - | 2,039 | 435 | 31,087 |
Intelligent Digital Integrated Security Co. Ltd. | 14,181 | - | - | 214 | 15,377 |
INTOPS Co. Ltd. | 15,300 | - | - | 193 | 11,689 |
INZI Controls Co. Ltd. | 7,865 | - | - | 115 | 6,514 |
Isewan Terminal Service Co. Ltd. | 9,659 | 112 | 624 | 261 | 8,195 |
Isra Vision AG | 26,613 | - | 1,392 | 150 | 23,885 |
Jaya Holdings Ltd. | 3,588 | - | 104 | - | 1,855 |
Jeil Pharmaceutical Co. | 41,772 | - | 15,771 | 63 | 18,836 |
JLM Couture, Inc. | 480 | - | 29 | - | 472 |
Jorudan Co. Ltd. | 3,396 | - | 200 | 54 | 4,190 |
Jumbo SA | 171,244 | - | 2,990 | 4,565 | 80,910 |
Kingboard Chemical Holdings Ltd. | 192,634 | - | 8,183 | 5,836 | 146,025 |
Knoll, Inc. | 50,211 | - | 67,961 | 1,060 | - |
Know IT AB | 14,765 | - | 582 | 544 | 10,231 |
Kohsoku Corp. | 18,643 | - | 783 | 358 | 14,026 |
Kondotec, Inc. | 11,235 | 324 | 578 | 268 | 10,267 |
Korea Electric Terminal Co. Ltd. | 30,276 | - | - | 263 | 61,233 |
KSK Co., Ltd. | 4,659 | - | 249 | 116 | 5,260 |
Kwang Dong Pharmaceutical Co. Ltd. | 28,744 | - | - | 188 | 38,549 |
Kyeryong Construction Industrial Co. Ltd. | 14,021 | - | 117 | - | 8,226 |
Affiliate
(Amounts in thousands) | Value, beginning of period | Purchases | Sales Proceeds* | Dividend Income | Value,
end of
period |
Kyoto Kimono Yuzen Co. Ltd. | $ 15,644 | $ - | $ 1,331 | $ 502 | $ 11,861 |
Kyowakogyosyo Co. Ltd. | 2,650 | - | 105 | 41 | 2,066 |
LCNB Corp. | 11,296 | - | 565 | 470 | 11,315 |
Leeno Industrial, Inc. | 29,484 | - | 6,753 | 411 | - |
LHC Group, Inc. | 43,196 | - | 4,865 | - | 68,529 |
Liquidity Services, Inc. | 21,496 | - | 9,182 | - | - |
Majestic Wine PLC | 11,599 | 19,797 | 1,120 | 126 | 26,324 |
Maruzen Co. Ltd. | 17,696 | - | 863 | 300 | 16,235 |
Mastek Ltd. | 6,384 | - | 2,503 | 49 | 4,763 |
Mega First Corp. Bhd | 16,087 | - | 21 | 514 | 13,926 |
Melbourne IT Ltd. | 11,855 | - | 524 | 299 | 10,855 |
Melcor Real Estate Investment Trust | 7,956 | - | 5,964 | 230 | - |
Melexis NV | 138,271 | - | 11,396 | 3,218 | 148,117 |
Mesa Laboratories, Inc. | 23,017 | - | 1,288 | 187 | 29,561 |
Metro, Inc. Class A (sub. vtg.) | 683,831 | - | 54,235 | 9,627 | 797,492 |
Michang Oil Industrial Co. Ltd. | 12,084 | - | - | 237 | 10,693 |
Miroku Corp. | 2,570 | - | 120 | 52 | 2,045 |
Mitani Sekisan Co. Ltd. | 26,116 | - | 1,297 | 243 | 23,565 |
Mitie Group PLC | 116,293 | - | 9,945 | 4,028 | 103,021 |
Motonic Corp. | 47,265 | - | - | 616 | 32,471 |
Mr. Bricolage SA | 19,662 | - | 796 | 374 | 14,004 |
Muhak Co. Ltd. | 91,496 | - | - | - | 126,833 |
Multi-Fineline Electronix, Inc. | 23,457 | - | 26,799 | - | - |
Murakami Corp. | 11,394 | 809 | 752 | 147 | 14,734 |
Muramoto Electronic Thailand PCL (For. Reg.) | 9,776 | - | 534 | 365 | 9,302 |
Nac Co. Ltd. | 16,765 | - | 536 | 361 | 9,298 |
Nadex Co. Ltd. | 5,729 | - | 313 | 115 | 5,599 |
Nafco Co. Ltd. | 38,984 | - | 1,722 | 675 | 35,808 |
Nakayamafuku Co. Ltd. | 8,185 | 968 | 423 | 253 | 7,870 |
NCI, Inc. Class A | 7,824 | - | 479 | 103 | 9,297 |
ND Software Co. Ltd. | 14,791 | 32 | 755 | 183 | 16,181 |
Neonode, Inc. | - | 7,687 | 3,673 | - | 7,987 |
NETGEAR, Inc. | 77,282 | - | 17,333 | - | 64,766 |
Next PLC | 1,843,594 | - | 108,175 | 76,641 | 1,892,126 |
Nextchip Co. Ltd. | 2,932 | - | 533 | - | 5,920 |
Affiliate
(Amounts in thousands) | Value, beginning of period | Purchases | Sales Proceeds* | Dividend Income | Value,
end of
period |
NICE Total Cash Management Co., Ltd. | $ 6,502 | $ - | $ - | $ 109 | $ 8,924 |
Nippo Ltd. | 3,637 | - | 158 | 99 | 3,050 |
Nippon Rietec Co. Ltd. | 8,888 | 1,591 | 504 | 92 | 9,073 |
Nishimatsuya Chain Co. Ltd. | 37,519 | - | 29,704 | 710 | - |
North Valley Bancorp | 8,681 | - | 31 | - | - |
Northrim Bancorp, Inc. | 11,905 | - | 11,081 | 174 | - |
Norwood Financial Corp. | 3,924 | 1,960 | 292 | 217 | 5,907 |
Nucleus Software Exports Ltd. | 7,468 | - | - | 173 | 9,754 |
Nutraceutical International Corp. | 25,624 | - | 1,299 | - | 25,454 |
OFG Bancorp | 39,972 | - | 372 | 907 | 19,975 |
OM Group, Inc. | 54,889 | - | 58,160 | 405 | - |
P&F Industries, Inc. Class A | 2,962 | - | 156 | - | 2,998 |
Pacific Premier Bancorp, Inc. | 13,189 | - | 914 | - | - |
Pal Co. Ltd. | 43,884 | - | 9,963 | 656 | 37,955 |
Panasonic Information Systems Co. | 16,217 | - | 2,771 | 314 | - |
Parker Corp. | 10,561 | 14 | 523 | 122 | 8,347 |
Pelion SA | 14,467 | - | 1,080 | 285 | 10,840 |
Pinnacle Technology Holdings Ltd. | 11,606 | - | 449 | - | 8,437 |
Piolax, Inc. | 37,494 | - | 2,524 | 453 | 47,481 |
Prim SA | 14,023 | - | 861 | 798 | 17,873 |
Qol Co. Ltd. | 11,928 | 237 | 2,720 | 316 | 31,465 |
Relo Holdings Corp. | 92,610 | - | 13,282 | 1,247 | 130,540 |
RenaissanceRe Holdings Ltd. | 294,359 | - | 15,722 | 3,508 | 306,331 |
Rocky Mountain Chocolate Factory, Inc. | 6,174 | - | 972 | 214 | 5,336 |
Ruby Tuesday, Inc. | 31,434 | - | 11,247 | - | 27,415 |
S&T Holdings Co. Ltd. | 13,996 | - | - | 121 | 16,528 |
Safeway, Inc. | 489,018 | 74,344 | 570,236 | 7,214 | - |
Sakai Moving Service Co. Ltd. | 28,310 | - | 1,409 | 414 | 34,043 |
Samsung Climate Control Co. Ltd. | 4,792 | - | - | 30 | 4,502 |
Affiliate
(Amounts in thousands) | Value, beginning of period | Purchases | Sales Proceeds* | Dividend Income | Value,
end of
period |
Sanei Architecture Planning Co. Ltd. | $ 12,065 | $ - | $ 606 | $ 240 | $ 15,750 |
Sarantis SA | 24,399 | - | 485 | 345 | 17,343 |
ScanSource, Inc. | 71,308 | 10,672 | 4,488 | - | 82,806 |
Seagate Technology LLC | 1,706,620 | - | 78,782 | 59,067 | 1,397,845 |
Select Harvests Ltd. | 25,659 | 416 | 2,339 | 890 | 48,010 |
Senshu Electric Co. Ltd. | 15,708 | - | 847 | 295 | 17,070 |
Servotronics, Inc. | 1,053 | - | 53 | 23 | 907 |
Sewon Precision Industries Co. Ltd. | 14,512 | - | - | - | 10,763 |
Shibaura Electronics Co. Ltd. | 15,062 | - | 674 | 280 | 11,265 |
Shinsegae Engineering & Construction Co. Ltd. | 4,744 | - | 5,596 | - | - |
ShoLodge, Inc. | 2 | - | - | - | 0 |
Sigmatron International, Inc. | 2,230 | 448 | 184 | - | 1,539 |
Sinwa Ltd. | 4,865 | 95 | 217 | 416 | 3,883 |
SJM Co. Ltd. | 11,967 | 95 | - | 194 | 7,201 |
SJM Holdings Co. Ltd. | 6,085 | - | - | 202 | 5,807 |
Societe Pour L'Informatique Industrielle SA | 18,979 | - | 807 | 169 | 14,968 |
Soken Chemical & Engineer Co. Ltd. | 8,865 | - | 405 | 203 | 7,392 |
Sonic Corp. | 83,339 | - | 104,218 | 252 | - |
Span-America Medical System, Inc. | 5,472 | - | 269 | 445 | 4,705 |
Sportscene Group, Inc. Class A | 3,027 | - | 105 | - | 1,550 |
Stanley Furniture Co., Inc. | 2,988 | - | 2,191 | - | - |
Steiner Leisure Ltd. | 61,992 | - | 12,294 | - | 74,171 |
Step Co. Ltd. | 9,870 | - | 514 | 237 | 10,335 |
Sterling Construction Co., Inc. | 15,563 | 769 | 458 | - | 8,258 |
Strattec Security Corp. | 13,458 | - | 5,101 | 86 | - |
Strongco Corp. | 3,296 | - | 105 | - | 1,733 |
Sun Hing Vision Group Holdings Ltd. | 7,647 | - | 448 | 628 | 8,958 |
Sunjin Co. Ltd. | 29,546 | - | - | 62 | 22,678 |
Super Micro Computer, Inc. | 58,812 | 17,962 | 47,567 | - | - |
Swift Energy Co. | 48,193 | - | 624 | - | 3,025 |
Affiliate
(Amounts in thousands) | Value, beginning of period | Purchases | Sales Proceeds* | Dividend Income | Value,
end of
period |
Sword Group | $ 14,347 | $ - | $ 680 | $ 656 | $ 13,247 |
SYNNEX Corp. | 219,474 | - | 12,933 | 1,665 | 244,095 |
T&K Toka Co. Ltd. | 16,827 | - | 770 | 216 | 13,984 |
Techno Smart Corp. | 5,246 | - | 205 | 97 | 3,673 |
Telechips, Inc. | 4,533 | - | - | 56 | 6,347 |
Tessco Technologies, Inc. | 15,558 | 1,915 | 630 | 520 | 14,363 |
The Monogatari Corp. | 15,496 | - | 907 | 189 | 17,928 |
The Pack Corp. | 38,239 | - | 1,920 | 701 | 37,618 |
Titan Machinery, Inc. | 16,490 | 17 | 840 | - | - |
TKH Group NV unit | 65,799 | - | 12,212 | 1,745 | - |
Tocalo Co. Ltd. | 15,754 | - | 953 | 429 | 17,980 |
Tohoku Steel Co. Ltd. | 9,460 | - | 437 | 80 | 7,715 |
Token Corp. | 44,843 | - | 8,546 | 646 | 54,313 |
Tokyo Kisen Co. Ltd. | 5,487 | - | 274 | 158 | 5,573 |
Tokyo Kohtetsu Co. Ltd. | 5,646 | - | 241 | 129 | 4,235 |
Tokyo Tekko Co. Ltd. | 23,726 | - | 1,055 | 404 | 20,674 |
Tomen Devices Corp. | 11,462 | - | 557 | 196 | 11,055 |
Tomen Electronics Corp. | 23,083 | - | 19,858 | - | - |
Total Energy Services, Inc. | 48,493 | - | 1,794 | 410 | 25,838 |
Totech Corp. | 7,537 | 190 | 388 | 177 | 7,147 |
TOW Co. Ltd. | 7,918 | - | 503 | 284 | 11,251 |
Trancom Co. Ltd. | 39,830 | - | 2,410 | 517 | 54,381 |
Trio-Tech International | 1,032 | - | 45 | - | 785 |
Triple-S Management Corp. | 41,913 | - | 4,639 | - | 47,695 |
Tsukui Corp. | 21,377 | 2,556 | 1,034 | 193 | 19,071 |
UANGEL Corp. | 2,764 | - | 1,734 | 57 | - |
UKC Holdings Corp. | 23,792 | - | 1,405 | 477 | 30,529 |
Uni-Select, Inc. | 50,376 | - | 6,166 | 835 | 80,306 |
Unit Corp. | 214,459 | 52,975 | 7,180 | - | 94,775 |
Universal Security Instruments, Inc. | 857 | - | 349 | - | 1,063 |
Unum Group | 571,080 | 98,368 | 36,516 | 12,832 | 664,653 |
Utah Medical Products, Inc. | 21,459 | - | 1,250 | 413 | 21,392 |
VSE Corp. | 30,705 | - | 4,089 | 200 | 21,733 |
VST Holdings Ltd. | 37,074 | - | 2,605 | 2,153 | 46,996 |
W&T Offshore, Inc. | 65,425 | 9,424 | 1,758 | 988 | 22,025 |
Watts Co. Ltd. | 13,030 | - | 554 | 199 | 10,812 |
Weight Watchers International, Inc. | 100,767 | 1,782 | 2,482 | - | 17,956 |
Affiliate
(Amounts in thousands) | Value, beginning of period | Purchases | Sales Proceeds* | Dividend Income | Value,
end of
period |
Whanin Pharmaceutical Co. Ltd. | $ 27,350 | $ - | $ 2,616 | $ 332 | $ 36,620 |
WIN-Partners Co. Ltd. | 17,424 | - | 966 | 418 | 20,387 |
Workman Co. Ltd. | 70,306 | - | 3,975 | 923 | 85,485 |
YBM Sisa.com, Inc. | 3,758 | - | 343 | 143 | - |
Yip's Chemical Holdings Ltd. | 19,617 | - | 873 | 957 | 14,805 |
Youngone Holdings Co. Ltd. | 70,566 | - | 3,168 | 352 | 67,061 |
Yusen Logistics Co. Ltd. | 43,703 | - | 4,183 | 557 | 37,858 |
Yutaka Giken Co. Ltd. | 32,940 | - | 1,585 | 450 | 28,522 |
Total | $ 19,153,371 | $ 1,028,316 | $ 2,681,588 | $ 412,326 | $ 17,233,360 |
* Includes the value of securities delivered through in-kind transactions, if applicable.
Other Information |
The following is a summary of the inputs used, as of July 31, 2015, involving the Fund's assets and liabilities carried at fair value. The inputs or methodology used for valuing securities may not be an indication of the risk associated with investing in those securities. For more information on valuation inputs, and their aggregation into the levels used in the tables below, please refer to the Investment Valuation section in the accompanying Notes to Financial Statements. |
Valuation Inputs at Reporting Date: |
Description
(Amounts in thousands) | Total | Level 1 | Level 2 | Level 3 |
Investments in Securities: | | | | |
Equities: | | | | |
Consumer Discretionary | $ 11,648,068 | $ 11,434,066 | $ 27,209 | $ 186,793 |
Consumer Staples | 3,295,425 | 3,233,955 | 40,529 | 20,941 |
Energy | 1,389,556 | 1,085,432 | 304,124 | - |
Financials | 5,450,717 | 4,841,910 | 567,975 | 40,832 |
Health Care | 5,145,082 | 5,145,082 | - | - |
Industrials | 3,461,147 | 3,446,447 | 8,325 | 6,375 |
Information Technology | 8,333,550 | 8,326,122 | - | 7,428 |
Materials | 1,097,999 | 1,081,095 | - | 16,904 |
Telecommunication Services | 2,170 | 2,170 | - | - |
Utilities | 197,222 | 197,222 | - | - |
Corporate Bonds | 4,455 | - | 4,455 | - |
Money Market Funds | 4,602,099 | 4,602,099 | - | - |
Total Investments in Securities: | $ 44,627,490 | $ 43,395,600 | $ 952,617 | $ 279,273 |
The following is a summary of transfers between Level 1 and Level 2 for the period ended July 31, 2015. Transfers are assumed to have occurred at the beginning of the period, and are primarily attributable to the valuation techniques used for foreign equity securities, as discussed in the accompanying Notes to Financial Statements: |
Transfers | Total (000s) |
Level 1 to Level 2 | $ 0 |
Level 2 to Level 1 | $ 6,080,595 |
Valuation Inputs at Reporting Date: |
The following is a reconciliation of Investments in Securities for which Level 3 inputs were used in determining value: |
(Amounts in thousands) | |
Investments in Securities: | |
Beginning Balance | $ 11,080 |
Net Realized Gain (Loss) on Investment Securities | (12,710) |
Net Unrealized Gain (Loss) on Investment Securities | (278,480) |
Cost of Purchases | 12,140 |
Proceeds of Sales | (11,104) |
Amortization/Accretion | - |
Transfers into Level 3 | 558,827 |
Transfers out of Level 3 | (480) |
Ending Balance | $ 279,273 |
The change in unrealized gain (loss) for the period attributable to Level 3 securities held at July 31, 2015 | $ (291,614) |
The information used in the above reconciliation represents fiscal year to date activity for any Investments in Securities identified as using Level 3 inputs at either the beginning or the end of the current fiscal period, and proceeds of sales includes securities delivered through in-kind transactions. See Note 4 of the Notes to Financial Statements.Transfers into Level 3 were attributable to a lack of observable market data resulting from decreases in market activity, decreases in liquidity, security restructurings or corporate actions. Transfers out of Level 3 were attributable to observable market data becoming available for those securities. Transfers in or out of Level 3 represent the beginning value of any Security or Instrument where a change in the pricing level occurred from the beginning to the end of the period. The cost of purchases and the proceeds of sales may include securities received or delivered through corporate actions or exchanges. Realized and unrealized gains (losses) disclosed in the reconciliation are included in Net Gain (Loss) on the Fund's Statement of Operations. |
Distribution of investments by country or territory of incorporation, as a percentage of total net assets, is as follows (Unaudited): |
United States of America | 56.8% |
United Kingdom | 7.7% |
Japan | 7.1% |
Ireland | 5.4% |
Canada | 4.0% |
Bermuda | 3.0% |
Korea (South) | 2.9% |
Netherlands | 2.4% |
Taiwan | 1.4% |
Cayman Islands | 1.2% |
Italy | 1.2% |
Bailiwick of Guernsey | 1.0% |
Others (Individually Less Than 1%) | 5.9% |
| 100.0% |
See accompanying notes which are an integral part of the financial statements.
Annual Report
Statement of Assets and Liabilities
Amounts in thousands (except per-share amounts) | | July 31, 2015 |
| | |
Assets | | |
Investment in securities, at value (including securities loaned of $508,666) - See accompanying schedule: Unaffiliated issuers (cost $11,930,193) | $ 22,792,031 | |
Fidelity Central Funds (cost $4,602,099) | 4,602,099 | |
Other affiliated issuers (cost $8,913,788) | 17,233,360 | |
Total Investments (cost $25,446,080) | | $ 44,627,490 |
Cash | | 1,326 |
Foreign currency held at value (cost $899) | | 899 |
Receivable for investments sold | | 72,737 |
Receivable for fund shares sold | | 25,676 |
Dividends receivable | | 63,589 |
Interest receivable | | 183 |
Distributions receivable from Fidelity Central Funds | | 1,573 |
Other receivables | | 1,813 |
Total assets | | 44,795,286 |
| | |
Liabilities | | |
Payable for investments purchased | $ 24,659 | |
Payable for fund shares redeemed | 67,574 | |
Accrued management fee | 24,309 | |
Other affiliated payables | 4,486 | |
Other payables and accrued expenses | 2,066 | |
Collateral on securities loaned, at value | 533,239 | |
Total liabilities | | 656,333 |
| | |
Net Assets | | $ 44,138,953 |
Net Assets consist of: | | |
Paid in capital | | $ 23,582,023 |
Undistributed net investment income | | 254,596 |
Accumulated undistributed net realized gain (loss) on investments and foreign currency transactions | | 1,120,672 |
Net unrealized appreciation (depreciation) on investments and assets and liabilities in foreign currencies | | 19,181,662 |
Net Assets | | $ 44,138,953 |
See accompanying notes which are an integral part of the financial statements.
Annual Report
Statement of Assets and Liabilities - continued
Amounts in thousands (except per-share amounts) | | July 31, 2015 |
| | |
Low-Priced Stock:
Net Asset Value, offering price and redemption price per share ($30,149,887 ÷ 572,608 shares) | | $ 52.65 |
| | |
Class K:
Net Asset Value, offering price and redemption price per share ($13,989,066 ÷ 265,773 shares) | | $ 52.64 |
See accompanying notes which are an integral part of the financial statements.
Annual Report
Financial Statements - continued
Statement of Operations
Amounts in thousands | Year ended July 31, 2015 |
| | |
Investment Income | | |
Dividends (including $412,326 earned from other affiliated issuers) | | $ 804,688 |
Interest | | 252 |
Income from Fidelity Central Funds | | 23,775 |
Total income | | 828,715 |
| | |
Expenses | | |
Management fee | | |
Basic fee | $ 275,296 | |
Performance adjustment | 14,689 | |
Transfer agent fees | 52,004 | |
Accounting and security lending fees | 2,424 | |
Custodian fees and expenses | 2,942 | |
Independent trustees' compensation | 198 | |
Registration fees | 224 | |
Audit | 232 | |
Legal | 132 | |
Miscellaneous | 325 | |
Total expenses before reductions | 348,466 | |
Expense reductions | (1,711) | 346,755 |
Net investment income (loss) | | 481,960 |
Realized and Unrealized Gain (Loss) Net realized gain (loss) on: | | |
Investment securities: | | |
Unaffiliated issuers | 1,851,835 | |
Other affiliated issuers | 1,136,238 | |
Foreign currency transactions | (5,144) | |
Total net realized gain (loss) | | 2,982,929 |
Change in net unrealized appreciation (depreciation) on: Investment securities (net of decrease in deferred foreign taxes of $7,220) | 641,564 | |
Assets and liabilities in foreign currencies | 1,220 | |
Total change in net unrealized appreciation (depreciation) | | 642,784 |
Net gain (loss) | | 3,625,713 |
Net increase (decrease) in net assets resulting from operations | | $ 4,107,673 |
See accompanying notes which are an integral part of the financial statements.
Annual Report
Statement of Changes in Net Assets
Amounts in thousands | Year ended
July 31,
2015 | Year ended
July 31,
2014 |
Increase (Decrease) in Net Assets | | |
Operations | | |
Net investment income (loss) | $ 481,960 | $ 513,196 |
Net realized gain (loss) | 2,982,929 | 3,427,430 |
Change in net unrealized appreciation (depreciation) | 642,784 | 2,225,261 |
Net increase (decrease) in net assets resulting from operations | 4,107,673 | 6,165,887 |
Distributions to shareholders from net investment income | (489,296) | (372,615) |
Distributions to shareholders from net realized gain | (2,217,917) | (2,653,754) |
Total distributions | (2,707,213) | (3,026,369) |
Share transactions - net increase (decrease) | (4,036,455) | 768,382 |
Redemption fees | 1,697 | 2,996 |
Total increase (decrease) in net assets | (2,634,298) | 3,910,896 |
| | |
Net Assets | | |
Beginning of period | 46,773,251 | 42,862,355 |
End of period (including undistributed net investment income of $254,596 and undistributed net investment income of $303,889, respectively) | $ 44,138,953 | $ 46,773,251 |
See accompanying notes which are an integral part of the financial statements.
Annual Report
Financial Highlights - Low-Priced Stock
Years ended July 31, | 2015 | 2014 | 2013 | 2012 | 2011 |
Selected Per-Share Data | | | | | |
Net asset value, beginning of period | $ 51.03 | $ 47.84 | $ 38.52 | $ 40.67 | $ 33.07 |
Income from Investment Operations | | | | | |
Net investment income (loss) B | .52 | .53 | .48 | .37 | .23 |
Net realized and unrealized gain (loss) | 4.06 | 5.96 | 11.61 | (.03) | 7.53 |
Total from investment operations | 4.58 | 6.49 | 12.09 | .34 | 7.76 |
Distributions from net investment income | (.52) | (.39) | (.49) | (.28) | (.15) |
Distributions from net realized gain | (2.44) | (2.91) | (2.28) | (2.21) | (.01) |
Total distributions | (2.96) | (3.30) | (2.77) | (2.49) | (.16) |
Redemption fees added to paid in capital B, F | - | - | - | - | - |
Net asset value, end of period | $ 52.65 | $ 51.03 | $ 47.84 | $ 38.52 | $ 40.67 |
Total Return A | 9.32% | 14.42% | 33.12% | 1.68% | 23.53% |
Ratios to Average Net Assets C, E | | | | | |
Expenses before reductions | .79% | .82% | .79% | .88% | .83% |
Expenses net of fee waivers, if any | .79% | .82% | .79% | .88% | .83% |
Expenses net of all reductions | .79% | .82% | .79% | .88% | .83% |
Net investment income (loss) | 1.02% | 1.07% | 1.14% | 1.00% | .61% |
Supplemental Data | | | | | |
Net assets, end of period (in millions) | $ 30,150 | $ 30,576 | $ 28,171 | $ 22,999 | $ 26,762 |
Portfolio turnover rate D | 9% G | 12% G | 11% | 19% | 15% |
A Total returns would have been lower if certain expenses had not been reduced during the applicable periods shown.
B Calculated based on average shares outstanding during the period.
C Fees and expenses of any underlying Fidelity Central Funds are not included in the Fund's expense ratio. The Fund indirectly bears its proportionate share of the expenses of any underlying Fidelity Central Funds.
D Amount does not include the portfolio activity of any underlying Fidelity Central Funds.
E Expense ratios reflect operating expenses of the class. Expenses before reductions do not reflect amounts reimbursed by the investment adviser or reductions from brokerage service arrangements or reductions from other expense offset arrangements and do not represent the amount paid by the class during periods when reimbursements or reductions occur. Expenses net of fee waivers reflect expenses after reimbursement by the investment adviser but prior to reductions from brokerage service arrangements or other expense offset arrangements. Expenses net of all reductions represent the net expenses paid by the class.
F Amount represents less than $.01 per share.
G Portfolio turnover rate excludes securities received or delivered in-kind.
See accompanying notes which are an integral part of the financial statements.
Annual Report
Financial Highlights - Class K
Years ended July 31, | 2015 | 2014 | 2013 | 2012 | 2011 |
Selected Per-Share Data | | | | | |
Net asset value, beginning of period | $ 51.02 | $ 47.83 | $ 38.52 | $ 40.67 | $ 33.11 |
Income from Investment Operations | | | | | |
Net investment income (loss) B | .57 | .58 | .53 | .42 | .28 |
Net realized and unrealized gain (loss) | 4.06 | 5.96 | 11.60 | (.03) | 7.51 |
Total from investment operations | 4.63 | 6.54 | 12.13 | .39 | 7.79 |
Distributions from net investment income | (.57) | (.44) | (.54) | (.33) | (.23) |
Distributions from net realized gain | (2.44) | (2.91) | (2.28) | (2.21) | (.01) |
Total distributions | (3.01) | (3.35) | (2.82) | (2.54) | (.23) H |
Redemption fees added to paid in capital B, F | - | - | - | - | - |
Net asset value, end of period | $ 52.64 | $ 51.02 | $ 47.83 | $ 38.52 | $ 40.67 |
Total Return A | 9.44% | 14.55% | 33.27% | 1.83% | 23.66% |
Ratios to Average Net AssetsC, E | | | | | |
Expenses before reductions | .69% | .72% | .68% | .76% | .71% |
Expenses net of fee waivers, if any | .69% | .72% | .68% | .76% | .71% |
Expenses net of all reductions | .69% | .72% | .68% | .76% | .70% |
Net investment income (loss) | 1.11% | 1.17% | 1.26% | 1.12% | .74% |
Supplemental Data | | | | | |
Net assets, end of period (in millions) | $ 13,989 | $ 16,198 | $ 14,691 | $ 9,985 | $ 8,031 |
Portfolio turnover rate D | 9% G | 12% G | 11% | 19% | 15% |
A Total returns would have been lower if certain expenses had not been reduced during the applicable periods shown.
B Calculated based on average shares outstanding during the period.
C Fees and expenses of any underlying Fidelity Central Funds are not included in the Fund's expense ratio. The Fund indirectly bears its proportionate share of the expenses of any underlying Fidelity Central Funds.
D Amount does not include the portfolio activity of any underlying Fidelity Central Funds.
E Expense ratios reflect operating expenses of the class. Expenses before reductions do not reflect amounts reimbursed by the investment adviser or reductions from brokerage service arrangements or reductions from other expense offset arrangements and do not represent the amount paid by the class during periods when reimbursements or reductions occur. Expenses net of fee waivers reflect expenses after reimbursement by the investment adviser but prior to reductions from brokerage service arrangements or other expense offset arrangements. Expenses net of all reductions represent the net expenses paid by the class.
F Amount represents less than $.01 per share.
G Portfolio turnover rate excludes securities received or delivered in-kind.
H Total distributions of $.23 per share is comprised of distributions from net investment income of $.226 and distributions from net realized gain of $.008 per share.
See accompanying notes which are an integral part of the financial statements.
Annual Report
For the period ended July 31, 2015
(Amounts in thousands except percentages)
1. Organization.
Fidelity Low-Priced Stock Fund (the Fund) is a fund of Fidelity Puritan Trust (the Trust) and is authorized to issue an unlimited number of shares. The Trust is registered under the Investment Company Act of 1940, as amended (the 1940 Act), as an open-end management investment company organized as a Massachusetts business trust. The Fund offers Low-Priced Stock and Class K shares, each of which has equal rights as to assets and voting privileges. Each class has exclusive voting rights with respect to matters that affect that class.
2. Investments in Fidelity Central Funds.
The Fund invests in Fidelity Central Funds, which are open-end investment companies generally available only to other investment companies and accounts managed by the investment adviser and its affiliates. The Fund's Schedule of Investments lists each of the Fidelity Central Funds held as of period end, if any, as an investment of the Fund, but does not include the underlying holdings of each Fidelity Central Fund. As an Investing Fund, the Fund indirectly bears its proportionate share of the expenses of the underlying Fidelity Central Funds.
The Money Market Central Funds seek preservation of capital and current income and are managed by Fidelity Investments Money Management, Inc. (FIMM), an affiliate of the investment adviser. Annualized expenses of the Money Market Central Funds as of their most recent shareholder report date are less than .01%.
A complete unaudited list of holdings for each Fidelity Central Fund is available upon request or at the Securities and Exchange Commission (the SEC) website at www.sec.gov. In addition, the financial statements of the Fidelity Central Funds, which are not covered by the Fund's Report of Independent Registered Public Accounting Firm, are available on the SEC website or upon request.
3. Significant Accounting Policies.
The financial statements have been prepared in conformity with accounting principles generally accepted in the United States of America (GAAP), which require management to make certain estimates and assumptions at the date of the financial statements. Actual results could differ from those estimates. Subsequent events, if any, through the date that the financial statements were issued have been evaluated in the preparation of the financial statements. The following summarizes the significant accounting policies of the Fund:
Investment Valuation. Investments are valued as of 4:00 p.m. Eastern time on the last calendar day of the period. The Board of Trustees (the Board) has delegated the day to
Annual Report
3. Significant Accounting Policies - continued
Investment Valuation - continued
day responsibility for the valuation of the Fund's investments to the Fidelity Management & Research Company (FMR) Fair Value Committee (the Committee). In accordance with valuation policies and procedures approved by the Board, the Fund attempts to obtain prices from one or more third party pricing vendors or brokers to value its investments. When current market prices, quotations or currency exchange rates are not readily available or reliable, investments will be fair valued in good faith by the Committee, in accordance with procedures adopted by the Board. Factors used in determining fair value vary by investment type and may include market or investment specific events, changes in interest rates and credit quality. The frequency with which these procedures are used cannot be predicted and they may be utilized to a significant extent. The Committee oversees the Fund's valuation policies and procedures and reports to the Board on the Committee's activities and fair value determinations. The Board monitors the appropriateness of the procedures used in valuing the Fund's investments and ratifies the fair value determinations of the Committee.
The Fund categorizes the inputs to valuation techniques used to value its investments into a disclosure hierarchy consisting of three levels as shown below:
Level 1 - quoted prices in active markets for identical investments
Level 2 - other significant observable inputs (including quoted prices for similar investments, interest rates, prepayment speeds, etc.)
Level 3 - unobservable inputs (including the Fund's own assumptions based on the best information available)
Valuation techniques used to value the Fund's investments by major category are as follows:
Equity securities, including restricted securities, for which market quotations are readily available, are valued at the last reported sale price or official closing price as reported by a third party pricing vendor on the primary market or exchange on which they are traded and are categorized as Level 1 in the hierarchy. In the event there were no sales during the day or closing prices are not available, securities are valued at the last quoted bid price or may be valued using the last available price and are generally categorized as Level 2 in the hierarchy. For foreign equity securities, when market or security specific events arise, comparisons to the valuation of American Depositary Receipts (ADRs), futures contracts, Exchange-Traded Funds (ETFs) and certain indexes as well as quoted prices for similar securities may be used and would be categorized as Level 2 in the hierarchy. Utilizing these techniques may result in transfers between Level 1 and Level 2. For equity securities, including restricted securities, where observable inputs are
Annual Report
Notes to Financial Statements - continued
(Amounts in thousands except percentages)
3. Significant Accounting Policies - continued
Investment Valuation - continued
limited, assumptions about market activity and risk are used and these securities may be categorized as Level 3 in the hierarchy.
Debt securities, including restricted securities, are valued based on evaluated prices received from third party pricing vendors or from brokers who make markets in such securities. Corporate bonds are valued by pricing vendors who utilize matrix pricing which considers yield or price of bonds of comparable quality, coupon, maturity and type or by broker-supplied prices. When independent prices are unavailable or unreliable, debt securities may be valued utilizing pricing methodologies which consider similar factors that would be used by third party pricing vendors. Debt securities are generally categorized as Level 2 in the hierarchy but may be Level 3 depending on the circumstances.
Investments in open-end mutual funds, including the Fidelity Central Funds, are valued at their closing net asset value (NAV) each business day and are categorized as Level 1 in the hierarchy.
Changes in valuation techniques may result in transfers in or out of an assigned level within the disclosure hierarchy. The aggregate value of investments by input level as of July 31, 2015, including information on transfers between Levels 1 and 2, is included at the end of the Fund's Schedule of Investments.
Foreign Currency. The Fund may use foreign currency contracts to facilitate transactions in foreign-denominated securities. Gains and losses from these transactions may arise from changes in the value of the foreign currency or if the counterparties do not perform under the contracts' terms.
Foreign-denominated assets, including investment securities, and liabilities are translated into U.S. dollars at the exchange rates at period end. Purchases and sales of investment securities, income and dividends received and expenses denominated in foreign currencies are translated into U.S. dollars at the exchange rate in effect on the transaction date.
The effects of exchange rate fluctuations on investments are included with the net realized and unrealized gain (loss) on investment securities. Other foreign currency transactions resulting in realized and unrealized gain (loss) are disclosed separately.
Investment Transactions and Income. For financial reporting purposes, the Fund's investment holdings and NAV include trades executed through the end of the last business day of the period. The NAV per share for processing shareholder transactions is calculated as of the close of business of the New York Stock Exchange (NYSE), normally
Annual Report
3. Significant Accounting Policies - continued
Investment Transactions and Income - continued
4:00 p.m. Eastern time and includes trades executed through the end of the prior business day. Gains and losses on securities sold are determined on the basis of identified cost and may include proceeds received from litigation. Dividend income is recorded on the ex-dividend date, except for certain dividends from foreign securities where the ex-dividend date may have passed, which are recorded as soon as the Fund is informed of the ex-dividend date. Non-cash dividends included in dividend income, if any, are recorded at the fair market value of the securities received. Income and capital gain distributions from Fidelity Central Funds, if any, are recorded on the ex-dividend date. Distributions received on securities that represent a return of capital or capital gain are recorded as a reduction of cost of investments and/or as a realized gain. Subsequent to ex-dividend date the Fund determines the components of these distributions, based upon receipt of tax filings or other correspondence relating to the underlying investment. Interest income is accrued as earned and includes coupon interest and amortization of premium and accretion of discount on debt securities as applicable. Investment income is recorded net of foreign taxes withheld where recovery of such taxes is uncertain.
Class Allocations and Expenses. Investment income, realized and unrealized capital gains and losses, common expenses of the Fund, and certain fund-level expense reductions, if any, are allocated daily on a pro-rata basis to each class based on the relative net assets of each class to the total net assets of the Fund. Each class differs with respect to transfer agent fees incurred. Certain expense reductions may also differ by class. For the reporting period, the allocated portion of income and expenses to each class as a percent of its average net assets may vary due to the timing of recording these transactions in relation to fluctuating net assets of the classes. Expenses directly attributable to a fund are charged to that fund. Expenses attributable to more than one fund are allocated among the respective funds on the basis of relative net assets or other appropriate methods. Expense estimates are accrued in the period to which they relate and adjustments are made when actual amounts are known.
Deferred Trustee Compensation. Under a Deferred Compensation Plan (the Plan), independent Trustees may elect to defer receipt of a portion of their annual compensation. Deferred amounts are invested in a cross-section of Fidelity funds, are marked-to-market and remain in the Fund until distributed in accordance with the Plan. The investment of deferred amounts and the offsetting payable to the Trustees are included in the accompanying Statement of Assets and Liabilities.
Income Tax Information and Distributions to Shareholders. Each year, the Fund intends to qualify as a regulated investment company under Subchapter M of the Internal Revenue Code, including distributing substantially all of its taxable income and realized gains. As a result, no provision for U.S. Federal income taxes is required. As of
Annual Report
Notes to Financial Statements - continued
(Amounts in thousands except percentages)
3. Significant Accounting Policies - continued
Income Tax Information and Distributions to Shareholders - continued
July 31, 2015, the Fund did not have any unrecognized tax benefits in the financial statements; nor is the Fund aware of any tax positions for which it is reasonably possible that the total amounts of unrecognized tax benefits will significantly change in the next twelve months. The Fund files a U.S. federal tax return, in addition to state and local tax returns as required. The Fund's federal income tax returns are subject to examination by the Internal Revenue Service (IRS) for a period of three fiscal years after they are filed. State and local tax returns may be subject to examination for an additional fiscal year depending on the jurisdiction. Foreign taxes are provided for based on the Fund's understanding of the tax rules and rates that exist in the foreign markets in which it invests.
Distributions are declared and recorded on the ex-dividend date. Income dividends and capital gain distributions are declared separately for each class. Income and capital gain distributions are determined in accordance with income tax regulations, which may differ from GAAP. In addition, the Fund claimed a portion of the payment made to redeeming shareholders as a distribution for income tax purposes.
Capital accounts within the financial statements are adjusted for permanent book-tax differences. These adjustments have no impact on net assets or the results of operations. Capital accounts are not adjusted for temporary book-tax differences which will reverse in a subsequent period.
Book-tax differences are primarily due to foreign currency transactions, passive foreign investment companies (PFIC), market discount, redemptions in-kind, partnerships, deferred trustees compensation and losses deferred due to wash sales.
The federal tax cost of investment securities and unrealized appreciation (depreciation) as of period end were as follows:
Gross unrealized appreciation | $ 21,658,184 |
Gross unrealized depreciation | (2,635,801) |
Net unrealized appreciation (depreciation) on securities | $ 19,022,383 |
| |
Tax Cost | $ 25,605,107 |
Annual Report
3. Significant Accounting Policies - continued
Income Tax Information and Distributions to Shareholders - continued
The tax-based components of distributable earnings as of period end were as follows:
Undistributed ordinary income | $ 256,107 |
Undistributed long-term capital gain | $ 1,279,698 |
Net unrealized appreciation (depreciation) on securities and other investments | $ 19,022,803 |
The tax character of distributions paid was as follows:
| July 31, 2015 | July 31, 2014 |
Ordinary Income | $ 550,274 | $ 502,790 |
Long-term Capital Gains | 2,156,939 | 2,523,579 |
Total | $ 2,707,213 | $ 3,026,369 |
Short-Term Trading (Redemption) Fees. Shares held by investors in the Fund less than 90 days may have been subject to a redemption fee equal to 1.50% of the NAV of shares redeemed. All redemption fees, which reduce the proceeds of the shareholder redemption, are retained by the Fund and accounted for as an addition to paid in capital.
4. Purchases and Sales of Investments.
Purchases and sales of securities, other than short-term securities and in-kind transactions, aggregated $3,529,104 and $5,351,533, respectively.
Redemptions In-Kind. During the period, 43,165 shares of the Fund held by unaffiliated entities were redeemed for cash and investments, including accrued interest, with a value of $2,214,623. The net realized gain of $1,228,379 on investments delivered through in-kind redemptions is included in the accompanying Statement of Operations. The amount of in-kind redemptions is included in share transactions in the accompanying Statement of Changes in Net Assets as well as Note 10: Share Transactions. The Fund recognized no gain or loss for federal income tax purposes.
5. Fees and Other Transactions with Affiliates.
Management Fee. Fidelity Management & Research Company (the investment adviser) and its affiliates provide the Fund with investment management related services for which the Fund pays a monthly management fee. The management fee is the sum of an individual fund fee rate that is based on an annual rate of .35% of the Fund's average net assets and an annualized group fee rate that averaged .25% during the period. The group fee rate is based upon the average net assets of all the mutual funds advised by the investment adviser, including any mutual funds previously advised by the
Annual Report
Notes to Financial Statements - continued
(Amounts in thousands except percentages)
5. Fees and Other Transactions with Affiliates - continued
Management Fee - continued
investment adviser that are currently advised by Fidelity SelectCo, LLC, an affiliate of the investment adviser. The group fee rate decreases as assets under management increase and increases as assets under management decrease. In addition, the management fee is subject to a performance adjustment (up to a maximum of ± .20% of the Fund's average net assets over a 36 month performance period). The upward or downward adjustment to the management fee is based on the relative investment performance of Low-Priced Stock as compared to its benchmark index, the Russell 2000 Index, over the same 36 month performance period. For the reporting period, the total annual management fee rate, including the performance adjustment, was .63% of the Fund's average net assets. The performance adjustment included in the management fee rate may be higher or lower than the maximum performance adjustment rate due to the difference between the average net assets for the reporting and performance periods.
Transfer Agent Fees. Fidelity Investments Institutional Operations Company, Inc., (FIIOC), an affiliate of the investment adviser, is the transfer, dividend disbursing and shareholder servicing agent for each class of the Fund. FIIOC receives account fees and asset-based fees that vary according to the account size and type of account of the shareholders of Low-Priced Stock. FIIOC receives an asset-based fee of Class K's average net assets. FIIOC pays for typesetting, printing and mailing of shareholder reports, except proxy statements.
For the period, transfer agent fees for each class were as follows:
| Amount | % of
Class-Level Average
Net Assets |
Low-Priced Stock | $ 44,661 | .15 |
Class K | 7,343 | .05 |
| $ 52,004 | |
Accounting and Security Lending Fees. Fidelity Service Company, Inc. (FSC), an affiliate of the investment adviser, maintains the Fund's accounting records. The accounting fee is based on the level of average net assets for each month. Under a separate contract, FSC administers the security lending program. The security lending fee is based on the number and duration of lending transactions.
Brokerage Commissions. The Fund placed a portion of its portfolio transactions with brokerage firms which are affiliates of the investment adviser. Brokerage commissions are included in net realized gain (loss) and change in net unrealized appreciation (depreciation) in the Statement of Operations. The commissions paid to these affiliated firms were $142 for the period.
Annual Report
5. Fees and Other Transactions with Affiliates - continued
Other. During the period, the investment adviser reimbursed the Fund for certain losses in the amount of $32.
6. Committed Line of Credit.
The Fund participates with other funds managed by the investment adviser or an affiliate in a $4.25 billion credit facility (the "line of credit") to be utilized for temporary or emergency purposes to fund shareholder redemptions or for other short-term liquidity purposes. The Fund has agreed to pay commitment fees on its pro-rata portion of the line of credit, which amounted to $67 and is reflected in Miscellaneous expenses on the Statement of Operations. During the period, the Fund did not borrow on this line of credit.
7. Security Lending.
The Fund lends portfolio securities through a lending agent from time to time in order to earn additional income. For equity securities, a lending agent is used and may loan securities to certain qualified borrowers, including Fidelity Capital Markets (FCM), a broker-dealer affiliated with the Fund. On the settlement date of the loan, the Fund receives collateral (in the form of U.S. Treasury obligations, letters of credit and/or cash) against the loaned securities and maintains collateral in an amount not less than 100% of the market value of the loaned securities during the period of the loan. The market value of the loaned securities is determined at the close of business of the Fund and any additional required collateral is delivered to the Fund on the next business day. If the borrower defaults on its obligation to return the securities loaned because of insolvency or other reasons, the Fund may apply collateral received from the borrower against the obligation. The Fund may experience delays and costs in recovering the securities loaned. Any cash collateral received is invested in the Fidelity Securities Lending Cash Central Fund. The value of loaned securities and cash collateral at period end are disclosed on the Fund's Statement of Assets and Liabilities. The value of securities loaned to FCM at period end was $18,291. Security lending income represents the income earned on investing cash collateral, less rebates paid to borrowers and any lending agent fees associated with the loan, plus any premium payments received for lending certain types of securities. Security lending income is presented in the Statement of Operations as a component of income from Fidelity Central Funds. Total security lending income during the period amounted to $16,764, including $1,439 from securities loaned to FCM.
8. Expense Reductions.
Commissions paid to certain brokers with whom the investment adviser, or its affiliates, places trades on behalf of the Fund include an amount in addition to trade execution, which may be rebated back to the Fund to offset certain expenses. This amount totaled
Annual Report
Notes to Financial Statements - continued
(Amounts in thousands except percentages)
8. Expense Reductions - continued
$433 for the period. In addition, through arrangements with the Fund's custodian, credits realized as a result of uninvested cash balances were used to reduce the Fund's expenses. During the period, these credits reduced the Fund's custody expenses by $6.
In addition, during the period the investment adviser reimbursed/waived a portion of fund-level operating expenses in the amount of $182 and a portion of class-level operating expenses as follows:
| Amount |
Low-Priced Stock | $ 1,090 |
9. Distributions to Shareholders.
Distributions to shareholders of each class were as follows:
Years ended July 31, | 2015 | 2014 |
From net investment income | | |
Low-Priced Stock | $ 308,914 | $ 232,537 |
Class K | 180,382 | 140,078 |
Total | $ 489,296 | $ 372,615 |
From net realized gain | | |
Low-Priced Stock | $ 1,447,788 | $ 1,731,108 |
Class K | 770,129 | 922,646 |
Total | $ 2,217,917 | $ 2,653,754 |
10. Share Transactions.
Share transactions for each class were as follows and may contain automatic conversions between classes or exchanges between funds:
| Shares | Dollars |
Years ended July 31, | 2015 | 2014 | 2015 | 2014 |
Low-Priced Stock | | | | |
Shares sold | 49,502 | 85,303 | $ 2,521,927 | $ 4,180,051 |
Reinvestment of distributions | 32,942 | 39,938 | 1,647,856 | 1,842,708 |
Shares redeemed | (108,975) A | (114,924) B | (5,539,766) A | (5,671,216) B |
Net increase (decrease) | (26,531) | 10,317 | $ (1,369,983) | $ 351,543 |
Class K | | | | |
Shares sold | 55,038 | 69,134 | $ 2,806,178 | $ 3,397,015 |
Reinvestment of distributions | 19,018 | 23,051 | 950,511 | 1,062,724 |
Shares redeemed | (125,754) A | (81,847) B | (6,423,161) A | (4,042,900) B |
Net increase (decrease) | (51,698) | 10,338 | $ (2,666,472) | $ 416,839 |
A Amount includes in-kind redemptions (see Note 4: Redemptions In-Kind).
B Amount includes in-kind redemptions.
Annual Report
11. Other.
The Fund's organizational documents provide former and current trustees and officers with a limited indemnification against liabilities arising in connection with the performance of their duties to the Fund. In the normal course of business, the Fund may also enter into contracts that provide general indemnifications. The Fund's maximum exposure under these arrangements is unknown as this would be dependent on future claims that may be made against the Fund. The risk of material loss from such claims is considered remote.
Annual Report
To the Trustees of Fidelity Puritan Trust and the Shareholders of Fidelity Low-Priced Stock Fund:
In our opinion, the accompanying statement of assets and liabilities, including the schedule of investments, and the related statements of operations and of changes in net assets and the financial highlights present fairly, in all material respects, the financial position of Fidelity Low-Priced Stock Fund (a fund of Fidelity Puritan Trust) at July 31, 2015, the results of its operations for the year then ended, the changes in its net assets for each of the two years in the period then ended and the financial highlights for each of the five years in the period then ended, in conformity with accounting principles generally accepted in the United States of America. These financial statements and financial highlights (hereafter referred to as "financial statements") are the responsibility of the Fidelity Low-Priced Stock Fund's management. Our responsibility is to express an opinion on these financial statements based on our audits. We conducted our audits of these financial statements in accordance with the standards of the Public Company Accounting Oversight Board (United States). Those standards require that we plan and perform the audit to obtain reasonable assurance about whether the financial statements are free of material misstatement. An audit includes examining, on a test basis, evidence supporting the amounts and disclosures in the financial statements, assessing the accounting principles used and significant estimates made by management, and evaluating the overall financial statement presentation. We believe that our audits, which included confirmation of securities at July 31, 2015 by correspondence with the custodian and brokers, provide a reasonable basis for our opinion.
PricewaterhouseCoopers LLP
Boston, Massachusetts
September 22, 2015
Annual Report
The Trustees, Member of the Advisory Board, and officers of the trust and fund, as applicable, are listed below. The Board of Trustees governs the fund and is responsible for protecting the interests of shareholders. The Trustees are experienced executives who meet periodically throughout the year to oversee the fund's activities, review contractual arrangements with companies that provide services to the fund, oversee management of the risks associated with such activities and contractual arrangements, and review the fund's performance. Each of the Trustees oversees 170 funds.
The Trustees hold office without limit in time except that (a) any Trustee may resign; (b) any Trustee may be removed by written instrument, signed by at least two-thirds of the number of Trustees prior to such removal; (c) any Trustee who requests to be retired or who has become incapacitated by illness or injury may be retired by written instrument signed by a majority of the other Trustees; and (d) any Trustee may be removed at any special meeting of shareholders by a two-thirds vote of the outstanding voting securities of the trust. Each Trustee who is not an interested person (as defined in the 1940 Act) of the trust and the fund (Independent Trustee), shall retire not later than the last day of the calendar year in which his or her 75th birthday occurs. The Independent Trustees may waive this mandatory retirement age policy with respect to individual Trustees. The officers and Advisory Board Member hold office without limit in time, except that any officer and Advisory Board Member may resign or may be removed by a vote of a majority of the Trustees at any regular meeting or any special meeting of the Trustees. Except as indicated, each individual has held the office shown or other offices in the same company for the past five years.
Experience, Skills, Attributes, and Qualifications of the Fund's Trustees. The Governance and Nominating Committee has adopted a statement of policy that describes the experience, qualifications, attributes, and skills that are necessary and desirable for potential Independent Trustee candidates (Statement of Policy). The Board believes that each Trustee satisfied at the time he or she was initially elected or appointed a Trustee, and continues to satisfy, the standards contemplated by the Statement of Policy. The Governance and Nominating Committee also engages professional search firms to help identify potential Independent Trustee candidates who have the experience, qualifications, attributes, and skills consistent with the Statement of Policy. From time to time, additional criteria based on the composition and skills of the current Independent Trustees, as well as experience or skills that may be appropriate in light of future changes to board composition, business conditions, and regulatory or other developments, have also been considered by the professional search firms and the Governance and Nominating Committee. In addition, the Board takes into account the Trustees' commitment and participation in Board and committee meetings, as well as their leadership of standing and ad hoc committees throughout their tenure.
In determining that a particular Trustee was and continues to be qualified to serve as a Trustee, the Board has considered a variety of criteria, none of which, in isolation, was controlling. The Board believes that, collectively, the Trustees have balanced and diverse experience, qualifications, attributes, and skills, which allow the Board to operate effectively in governing the fund and protecting the interests of shareholders. Information about the specific experience, skills, attributes, and qualifications of each Trustee, which in each case led to the Board's conclusion that the Trustee should serve (or continue to serve) as a trustee of the fund, is provided below.
Annual Report
Board Structure and Oversight Function. James C. Curvey is an interested person (as defined in the 1940 Act) and currently serves as Chairman. The Trustees have determined that an interested Chairman is appropriate and benefits shareholders because an interested Chairman has a personal and professional stake in the quality and continuity of services provided to the fund. Independent Trustees exercise their informed business judgment to appoint an individual of their choosing to serve as Chairman, regardless of whether the Trustee happens to be independent or a member of management. The Independent Trustees have determined that they can act independently and effectively without having an Independent Trustee serve as Chairman and that a key structural component for assuring that they are in a position to do so is for the Independent Trustees to constitute a substantial majority for the Board. The Independent Trustees also regularly meet in executive session. Ned C. Lautenbach serves as Chairman of the Independent Trustees and as such (i) acts as a liaison between the Independent Trustees and management with respect to matters important to the Independent Trustees and (ii) with management prepares agendas for Board meetings.
Fidelity funds are overseen by different Boards of Trustees. The fund's Board oversees Fidelity's high income and certain equity funds and other Boards oversee Fidelity's investment-grade bond, money market, asset allocation, and sector funds. The asset allocation funds may invest in Fidelity funds overseen by the fund's Board. The use of separate Boards, each with its own committee structure, allows the Trustees of each group of Fidelity funds to focus on the unique issues of the funds they oversee, including common research, investment, and operational issues. On occasion, the separate Boards establish joint committees to address issues of overlapping consequences for the Fidelity funds overseen by each Board.
The Trustees operate using a system of committees to facilitate the timely and efficient consideration of all matters of importance to the Trustees, the fund, and fund shareholders and to facilitate compliance with legal and regulatory requirements and oversight of the fund's activities and associated risks. The Board, acting through its committees, has charged FMR and its affiliates with (i) identifying events or circumstances the occurrence of which could have demonstrably adverse effects on the fund's business and/or reputation; (ii) implementing processes and controls to lessen the possibility that such events or circumstances occur or to mitigate the effects of such events or circumstances if they do occur; and (iii) creating and maintaining a system designed to evaluate continuously business and market conditions in order to facilitate the identification and implementation processes described in (i) and (ii) above. Because the day-to-day operations and activities of the fund are carried out by or through FMR, its affiliates and other service providers, the fund's exposure to risks is mitigated but not eliminated by the processes overseen by the Trustees. While each of the Board's committees has responsibility for overseeing different aspects of the fund's activities, oversight is exercised primarily through the Operations, Audit, and Compliance Committees. In addition, the Independent Trustees have worked with FMR to enhance the Board's oversight of investment and financial risks, legal and regulatory risks, technology risks, and operational risks, including the development of additional risk reporting to the Board. For example, a working group comprised of Independent Trustees and FMR has worked and continues to work to review the Fidelity funds' valuation-related activities, reporting and risk management. Appropriate personnel, including but not limited to the fund's Chief Compliance Officer (CCO), FMR's internal auditor, the independent accountants, the fund's Treasurer and portfolio management personnel, make periodic reports to the Board's committees, as appropriate, including an annual review of FMR's risk management program for the Fidelity funds. The responsibilities of each standing committee, including their oversight responsibilities, are described further under "Standing Committees of the Fund's Trustees."
Annual Report
Trustees and Officers - continued
The fund's Statement of Additional Information (SAI) includes more information about the Trustees. To request a free copy, call Fidelity at 1-800-835-5092.
Interested Trustees*:
Correspondence intended for each Trustee who is an interested person may be sent to Fidelity Investments, 245 Summer Street, Boston, Massachusetts 02210.
Name, Year of Birth; Principal Occupations and Other Relevant Experience+ |
James C. Curvey (1935) |
Year of Election or Appointment: 2007 Trustee Chairman of the Board of Trustees |
| Mr. Curvey also serves as Trustee of other Fidelity funds. Mr. Curvey is a Director of Fidelity Research & Analysis Co. (investment adviser firm, 2009-present), and Vice Chairman (2007-present) and Director of FMR LLC (diversified financial services company). In addition, Mr. Curvey serves as an Overseer for the Boston Symphony Orchestra and a member of the board of Artis-Naples, Naples, Florida, and as a Trustee for Brewster Academy, Wolfeboro, New Hampshire. Previously, Mr. Curvey served as a Director of Fidelity Investments Money Management, Inc. (investment adviser firm, 2009-2014), a Director of FMR (investment adviser firm, 2007-2014), and a Director of FMR Co., Inc. (investment adviser firm, 2007-2014). |
Charles S. Morrison (1960) |
Year of Election or Appointment: 2014 Trustee |
| Mr. Morrison also serves as Trustee of other funds. He serves as a Director of Fidelity Investments Money Management, Inc. (FIMM) (investment adviser firm, 2014-present), Director of Fidelity SelectCo, LLC (investment adviser firm, 2014-present), President, Asset Management (2014-present), and is an employee of Fidelity Investments. Previously, Mr. Morrison served as Vice President of Fidelity's Fixed Income and Asset Allocation Funds (2012-2014), President, Fixed Income (2011-2014), Vice President of Fidelity's Money Market Funds (2005-2009), President, Money Market Group Leader of FMR (investment adviser firm, 2009), and Senior Vice President, Money Market Group of FMR (2004-2009). Mr. Morrison also served as Vice President of Fidelity's Bond Funds (2002-2005), certain Balanced Funds (2002-2005), and certain Asset Allocation Funds (2002-2007), and as Senior Vice President (2002-2005) of Fidelity's Bond Division. |
* Trustees have been determined to be "Interested Trustees" by virtue of, among other things, their affiliation with the trust or various entities under common control with FMR.
+ The information above includes each Trustee's principal occupation during the last five years and other information relating to the experience, attributes, and skills relevant to each Trustee's qualifications to serve as a Trustee, which led to the conclusion that each Trustee should serve as a Trustee for the fund.
Annual Report
Trustees and Officers - continued
Independent Trustees:
Correspondence intended for each Independent Trustee (that is, the Trustees other than the Interested Trustees) may be sent to Fidelity Investments, P.O. Box 55235, Boston, Massachusetts 02205-5235.
Name, Year of Birth; Principal Occupations and Other Relevant Experience+ |
Dennis J. Dirks (1948) |
Year of Election or Appointment: 2005 Trustee |
| Mr. Dirks also serves as Trustee of other Fidelity funds. Prior to his retirement in May 2003, Mr. Dirks was Chief Operating Officer and a member of the Board of The Depository Trust & Clearing Corporation (DTCC). He also served as President, Chief Operating Officer, and Board member of The Depository Trust Company (DTC) and President and Board member of the National Securities Clearing Corporation (NSCC). In addition, Mr. Dirks served as Chief Executive Officer and Board member of the Government Securities Clearing Corporation, Chief Executive Officer and Board member of the Mortgage-Backed Securities Clearing Corporation, as a Trustee and a member of the Finance Committee of Manhattan College (2005-2008), and as a Trustee and a member of the Finance Committee of AHRC of Nassau County (2006-2008). Mr. Dirks is a member of the Independent Directors Council (IDC) Governing Council (2010-present) and Board of Directors for The Brookville Center for Children's Services, Inc. (2009-present). |
Alan J. Lacy (1953) |
Year of Election or Appointment: 2008 Trustee |
| Mr. Lacy also serves as Trustee of other Fidelity funds. Mr. Lacy serves as a member of the Board of Directors of Dave & Buster's Entertainment, Inc. (restaurant and entertainment complexes, 2010-present) and Bristol-Myers Squibb Company (global pharmaceuticals, 2008-present). In addition, Mr. Lacy served as Senior Adviser (2007-2014) of Oak Hill Capital Partners, L.P. (private equity) and also served as Chief Executive Officer (2000-2005) and Vice Chairman (2005-2006) of Sears Holdings Corporation and Sears, Roebuck and Co. (retail). Mr. Lacy is a member of the Board of Trustees of The National Parks Conservation Association (2006-present). Previously, Mr. Lacy served as Chairman of the Board of Trustees of the National Parks Conservation Association (2008-2011) and as a member of the Board of Directors for The Western Union Company (global money transfer, 2006-2011), The Hillman Companies, Inc. (hardware wholesalers, 2010-2014), and Earth Fare, Inc. (retail grocery, 2010-2014). |
Ned C. Lautenbach (1944) |
Year of Election or Appointment: 2000 Trustee Chairman of the Independent Trustees |
| Mr. Lautenbach also serves as Trustee of other Fidelity funds. Mr. Lautenbach currently serves as the Lead Director of the Eaton Corporation Board of Directors (diversified industrial, 1997-present). Mr. Lautenbach is Chairman of the Board of Directors of Artis-Naples in Naples, Florida (2012-present), a member of the Council on Foreign Relations (1994-present), and a member of the Board of Governors, State University System of Florida (2013-present). Previously, Mr. Lautenbach was a Partner/Advisory Partner at Clayton, Dubilier & Rice, LLC (private equity investment, 1998-2010), as well as a Director of Sony Corporation (2006-2007). |
Joseph Mauriello (1944) |
Year of Election or Appointment: 2008 Trustee |
| Mr. Mauriello also serves as Trustee of other Fidelity funds. Prior to his retirement in January 2006, Mr. Mauriello served in numerous senior management positions including Deputy Chairman and Chief Operating Officer (2004-2005), and Vice Chairman of Financial Services (2002-2004) of KPMG LLP US (professional services, 1965-2005). Mr. Mauriello currently serves as a member of the Board of Directors of XL Group plc. (global insurance and re-insurance, 2006-present). Previously, Mr. Mauriello served as a Director of the Hamilton Funds of the Bank of New York (2006-2007) and of Arcadia Resources Inc. (health care services and products, 2007-2012). |
Robert W. Selander (1950) |
Year of Election or Appointment: 2011 Trustee |
| Mr. Selander also serves as Trustee of other Fidelity funds. Mr. Selander serves as a Director of The Western Union Company (global money transfer, 2014-present). Previously, Mr. Selander served as a Member of the Advisory Board of other Fidelity funds (2011), and Executive Vice Chairman (2010), Chief Executive Officer (2009-2010), and President and Chief Executive Officer (1997-2009) of Mastercard, Inc. |
Cornelia M. Small (1944) |
Year of Election or Appointment: 2005 Trustee |
| Ms. Small also serves as Trustee of other Fidelity funds. Ms. Small is a member of the Board of Directors (2009-present) and Chair of the Investment Committee (2010-present) of the Teagle Foundation. Ms. Small also serves on the Investment Committee of the Berkshire Taconic Community Foundation (2008-present). Previously, Ms. Small served as Chairperson (2002-2008) and a member of the Investment Committee and Chairperson (2008-2012) and a member of the Board of Trustees of Smith College. In addition, Ms. Small served as Chief Investment Officer, Director of Global Equity Investments, and a member of the Board of Directors of Scudder, Stevens & Clark and Scudder Kemper Investments. |
William S. Stavropoulos (1939) |
Year of Election or Appointment: 2002 Trustee Vice Chairman of the Independent Trustees |
| Mr. Stavropoulos also serves as Trustee of other Fidelity funds. Mr. Stavropoulos serves as President and Founder of the Michigan Baseball Foundation, the Great Lakes Loons (2007-present). Mr. Stavropoulos is Chairman Emeritus of the Board of Directors of The Dow Chemical Company, where he previously served in numerous senior management positions, including President, CEO (1995-2000; 2002-2004), Chairman of the Executive Committee (2000-2006), and as a member of the Board of Directors (1990-2006). Currently, Mr. Stavropoulos is Chairman of the Board of Directors of Univar Inc. (global distributor of commodity and specialty chemicals), a Director of Teradata Corporation (data warehousing and technology solutions), and Maersk Inc. (industrial conglomerate), and a member of the Advisory Board for Metalmark Capital LLC (private equity investment, 2005-present). Mr. Stavropoulos is an operating advisor to Clayton, Dubilier & Rice, LLC (private equity investment). In addition, Mr. Stavropoulos is a member of the University of Notre Dame Advisory Council for the College of Science, a Trustee of the Rollin L. Gerstacker Foundation, and a Director of the Naples Philharmonic Center for the Arts. Previously, Mr. Stavropoulos served as a Director of Chemical Financial Corporation (bank holding company, 1993-2012) and Tyco International, Ltd. (multinational manufacturing and services, 2007-2012). |
David M. Thomas (1949) |
Year of Election or Appointment: 2008 Trustee |
| Mr. Thomas also serves as Trustee of other Fidelity funds. Mr. Thomas serves as Non-Executive Chairman of the Board of Directors of Fortune Brands Home and Security (home and security products, 2011-present), as a member of the Board of Directors (2004-present) and Presiding Director (2013-present) of Interpublic Group of Companies, Inc. (marketing communication), and as a member of the Board of Trustees of the University of Florida (2013-present). Previously, Mr. Thomas served as Executive Chairman (2005-2006) and Chairman and Chief Executive Officer (2000-2005) of IMS Health, Inc. (pharmaceutical and healthcare information solutions), and a Director of Fortune Brands, Inc. (consumer products, 2000-2011). |
+ The information above includes each Trustee's principal occupation during the last five years and other information relating to the experience, attributes, and skills relevant to each Trustee's qualifications to serve as a Trustee, which led to the conclusion that each Trustee should serve as a Trustee for the fund.
Advisory Board Member and Officers:
Correspondence intended for each officer and Peter S. Lynch may be sent to Fidelity Investments, 245 Summer Street, Boston, Massachusetts 02210. Officers appear below in alphabetical order.
Name, Year of Birth; Principal Occupation |
Peter S. Lynch (1944) |
Year of Election or Appointment: 2003 Member of the Advisory Board |
| Mr. Lynch also serves as Member of the Advisory Board of other Fidelity funds. Mr. Lynch is Vice Chairman and a Director of FMR (investment adviser firm) and FMR Co., Inc. (investment adviser firm). In addition, Mr. Lynch serves as a Trustee of Boston College and as the Chairman of the Inner-City Scholarship Fund. Previously, Mr. Lynch served on the Special Olympics International Board of Directors (1997-2006). |
Elizabeth Paige Baumann (1968) |
Year of Election or Appointment: 2012 Anti-Money Laundering (AML) Officer |
| Ms. Baumann also serves as AML Officer of other funds. She is Chief AML Officer of FMR LLC (diversified financial services company, 2012-present) and is an employee of Fidelity Investments. Previously, Ms. Baumann served as Vice President and Deputy Anti-Money Laundering Officer (2007-2012). |
Marc Bryant (1966) |
Year of Election or Appointment: 2015 Secretary and Chief Legal Officer (CLO) |
| Mr. Bryant also serves as Secretary and Chief Legal Officer (CLO) of other funds. He is Senior Vice President and Deputy General Counsel of FMR LLC (diversified financial services company). Previously, Mr. Bryant served as Secretary and Chief Legal Officer of Fidelity Rutland Square Trust II (2010-2014) and Assistant Secretary of Fidelity's Fixed Income and Asset Allocation Funds (2013-2015). Prior to joining Fidelity Investments, Mr. Bryant served as a Senior Vice President and the Head of Global Retail Legal for AllianceBernstein L.P. 2006-2010), and as the General Counsel for ProFund Advisors LLC (2001-2006). |
William C. Coffey (1969) |
Year of Election or Appointment: 2009 Assistant Secretary |
| Mr. Coffey also serves as Assistant Secretary of other funds. He is Senior Vice President and Deputy General Counsel of FMR LLC (diversified financial services company, 2010-present), and is an employee of Fidelity Investments. Previously, Mr. Coffey served as Vice President and Associate General Counsel of FMR LLC (2005-2009). |
Jonathan Davis (1968) |
Year of Election or Appointment: 2010 Assistant Treasurer |
| Mr. Davis also serves as Assistant Treasurer of other funds. Mr. Davis is an employee of Fidelity Investments. Previously, Mr. Davis served as Vice President and Associate General Counsel of FMR LLC (diversified financial services company, 2003-2010). |
Adrien E. Deberghes (1967) |
Year of Election or Appointment: 2008 Deputy Treasurer |
| Mr. Deberghes also serves as an officer of other funds. He is an employee of Fidelity Investments (2008-present). Prior to joining Fidelity Investments, Mr. Deberghes was Senior Vice President of Mutual Fund Administration at State Street Corporation (2007-2008), Senior Director of Mutual Fund Administration at Investors Bank & Trust (2005-2007), and Director of Finance for Dunkin' Brands (2000-2005). |
Stephanie J. Dorsey (1969) |
Year of Election or Appointment: 2010 Assistant Treasurer |
| Ms. Dorsey also serves as an officer of other funds. She is an employee of Fidelity Investments (2008-present) and has served in other fund officer roles. Prior to joining Fidelity Investments, Ms. Dorsey served as Treasurer (2004-2008) of the JPMorgan Mutual Funds and Vice President (2004-2008) of JPMorgan Chase Bank. |
Howard J. Galligan III (1966) |
Year of Election or Appointment: 2014 Chief Financial Officer |
| Mr. Galligan also serves as Chief Financial Officer of other funds. Mr. Galligan serves as President of Fidelity Pricing and Cash Management Services (FPCMS) (2014-present) and as a Director of Strategic Advisers, Inc. (investment adviser firm, 2008-present). Previously, Mr. Galligan served as Chief Administrative Officer of Asset Management (2011-2014) and Chief Operating Officer and Senior Vice President of Investment Support for Strategic Advisers, Inc. (2003-2011). |
Scott C. Goebel (1968) |
Year of Election or Appointment: 2015 Vice President |
| Mr. Goebel serves as Vice President of other funds. Mr. Goebel also serves as Secretary of Fidelity SelectCo, LLC (investment adviser firm, 2013-present), Fidelity Investments Money Management, Inc. (FIMM) (investment adviser firm, 2010-present) and Fidelity Research and Analysis Company (FRAC) (investment adviser firm, 2010-present); General Counsel, Secretary, and Senior Vice President of FMR (investment adviser firm, 2008-present) and FMR Co., Inc. (investment adviser firm, 2008-present); Chief Legal Officer of Fidelity Management & Research (Hong Kong) Limited (investment adviser firm, 2008-present); and Assistant Secretary of Fidelity Management & Research (Japan) Limited (investment adviser firm, 2008-present) and FMR Investment Management (U.K.) Limited (investment adviser firm, 2008-present). Previously, Mr. Goebel served as Secretary and CLO of certain Fidelity funds (2008-2015), Assistant Secretary of FIMM (2008-2010), FRAC (2008-2010), and certain funds (2007-2008); and as Vice President and Secretary of Fidelity Distributors Corporation (FDC) (2005-2007). Mr. Goebel has been employed by FMR LLC (diversified financial services company) or an affiliate since 2001. |
Brian B. Hogan (1964) |
Year of Election or Appointment: 2009 Vice President |
| Mr. Hogan also serves as Trustee or Vice President of other funds. Mr. Hogan serves as a Director of Fidelity SelectCo, LLC (investment adviser firm, 2014-present) and President of the Equity Division of FMR (investment adviser firm, 2009-present). Previously, Mr. Hogan served as Senior Vice President, Equity Research of FMR (2006-2009) and as a portfolio manager. |
Chris Maher (1972) |
Year of Election or Appointment: 2013 Assistant Treasurer |
| Mr. Maher serves as Assistant Treasurer of other funds. Mr. Maher is Vice President of Valuation Oversight and is an employee of Fidelity Investments. Previously, Mr. Maher served as Vice President of Asset Management Compliance (2013), Vice President of the Program Management Group of FMR (investment adviser firm, 2010-2013), and Vice President of Valuation Oversight (2008-2010). |
Melissa M. Reilly (1971) |
Year of Election or Appointment: 2014 Vice President of certain Equity Funds |
| Ms. Reilly also serves as Vice President of other funds. Ms. Reilly is an employee of Fidelity Investments (2004-present). |
Kenneth B. Robins (1969) |
Year of Election or Appointment: 2008 President and Treasurer |
| Mr. Robins also serves as an officer of other funds. Mr. Robins serves as Executive Vice President of Fidelity Investments Money Management, Inc. (FIMM) (investment adviser firm, 2013-present) and is an employee of Fidelity Investments (2004-present). Previously, Mr. Robins served in other fund officer roles. |
Stephen Sadoski (1971) |
Year of Election or Appointment: 2012 Deputy Treasurer |
| Mr. Sadoski also serves as Deputy Treasurer of other funds. He is an employee of Fidelity Investments (2012-present) and has served in another fund officer role. Prior to joining Fidelity Investments, Mr. Sadoski served as an assistant chief accountant in the Division of Investment Management of the Securities and Exchange Commission (SEC) (2009-2012) and as a senior manager at Deloitte & Touche LLP (1997-2009). |
Stacie M. Smith (1974) |
Year of Election or Appointment: 2013 Deputy Treasurer |
| Ms. Smith also serves as an officer of other funds. She is an employee of Fidelity Investments (2009-present) and has served in other fund officer roles. Prior to joining Fidelity Investments, Ms. Smith served as Senior Audit Manager of Ernst & Young LLP (1996-2009). |
Renee Stagnone (1975) |
Year of Election or Appointment: 2013 Deputy Treasurer |
| Ms. Stagnone also serves as Deputy Treasurer of other funds. Ms. Stagnone is an employee of Fidelity Investments. |
Linda J. Wondrack (1964) |
Year of Election or Appointment: 2014 Chief Compliance Officer |
| Ms. Wondrack also serves as Chief Compliance Officer of other funds. Ms. Wondrack is Executive Vice President and head of the Ethics Office and Asset Management Compliance for Fidelity Investments (2012-present). Ms. Wondrack also serves as Chief Compliance Officer of Fidelity SelectCo, LLC (investment adviser firm, 2014-present); Chief Compliance Officer of Impresa Management LLC (2013-present); and Chief Compliance Officer of FMR Co., Inc. (investment adviser firm), Fidelity Investments Money Management, Inc. (investment adviser firm), Fidelity Management & Research (Japan) Limited (investment adviser firm), FMR Investment Management (U.K.) Limited (investment adviser firm), Fidelity Management & Research (Hong Kong) (investment adviser firm), Fidelity Management & Research Company (investment adviser firm), Pyramis Global Advisors, LLC (investment adviser firm), and Strategic Advisers, Inc. (investment adviser firm), Ballyrock Investment Advisors LLC, and Northern Neck Investors LLC (2012-present). Previously, Ms. Wondrack served as Senior Vice President and Chief Compliance Officer for Columbia Management Investment Advisers, LLC (2005-2012); Chief Compliance Officer for certain funds within the Columbia Family of Funds (2007-2012); and Senior Vice President of Compliance Risk Management at Bank of America (2005-2010). |
Joseph F. Zambello (1957) |
Year of Election or Appointment: 2011 Deputy Treasurer |
| Mr. Zambello also serves as Deputy Treasurer of other funds. Mr. Zambello is an employee of Fidelity Investments. Previously, Mr. Zambello served as Vice President of the Program Management Group of FMR (investment adviser firm, 2009-2011) and Vice President of the Transfer Agent Oversight Group (2005-2009). |
Annual Report
The Board of Trustees of Fidelity Low-Priced Stock Fund voted to pay on record date, the following distributions per share derived from capital gains realized from sales of portfolio securities, and dividends derived from net investment income:
| Pay Date | Record Date | Dividends | Capital Gains |
Class K | 09/14/15 | 09/11/15 | $0.329 | $1.540 |
The fund hereby designates as a capital gain dividend with respect to the taxable year ended July 31, 2015, $1,706,397,202, or, if subsequently determined to be different, the net capital gain of such year.
Class K designates 53% and 67% of the dividends distributed in September and December, respectively during the fiscal year as qualifying for the dividends-received deduction for corporate shareholders.
Class K designates 100% of the dividends distributed during the fiscal year as amounts which may be taken into account as a dividend for the purposes of the maximum rate under section 1(h)(11) of the Internal Revenue Code.
The fund will notify shareholders in January 2016 of amounts for use in preparing 2015 income tax returns.
Annual Report
Fidelity Low-Priced Stock Fund
Each year, the Board of Trustees, including the Independent Trustees (together, the Board), votes on the renewal of the management contract with Fidelity Management & Research Company (FMR) and the sub-advisory agreements (together, the Advisory Contracts) for the fund. The Board, assisted by the advice of fund counsel and Independent Trustees' counsel, requests and considers a broad range of information relevant to the renewal of the Advisory Contracts throughout the year.
The Board meets regularly and, at each of its meetings, covers an extensive agenda of topics and materials and considers factors that are relevant to its annual consideration of the renewal of the fund's Advisory Contracts, including the services and support provided to the fund and its shareholders. The Board has established various standing committees (Committees), each composed of and chaired by Independent Trustees with varying backgrounds, to which the Board has assigned specific subject matter responsibilities in order to enhance effective decision-making by the Board. The Board, acting directly and through its Committees, requests and receives information concerning the annual consideration of the renewal of the fund's Advisory Contracts. The Board also meets as needed to consider matters specifically related to the Board's annual consideration of the renewal of the Advisory Contracts. Members of the Board may also meet with trustees of other Fidelity funds through ad hoc joint committees to discuss certain matters relevant to all of the Fidelity funds.
At its July 2015 meeting, the Board unanimously determined to renew the fund's Advisory Contracts. In reaching its determination, the Board considered all factors it believed relevant, including (i) the nature, extent, and quality of the services to be provided to the fund and its shareholders (including the investment performance of the fund); (ii) the competitiveness of the fund's management fee and total expense ratio relative to peer funds; (iii) the total costs of the services to be provided by and the profits to be realized by Fidelity from its relationship with the fund; and (iv) the extent to which (if any) economies of scale exist and would be realized as the fund grows, and whether any economies of scale are appropriately shared with fund shareholders.
In considering whether to renew the Advisory Contracts for the fund, the Board reached a determination, with the assistance of fund counsel and Independent Trustees' counsel and through the exercise of its business judgment, that the renewal of the Advisory Contracts was in the best interests of the fund and its shareholders and that the compensation payable under the Advisory Contracts was fair and reasonable. The Board's decision to renew the Advisory Contracts was not based on any single factor, but rather was based on a comprehensive consideration of all the information provided to the Board at its meetings throughout the year. The Board, in reaching its determination to renew the Advisory Contracts, was aware that shareholders of the fund have a broad range of investment choices available to them, including a wide choice among funds offered by Fidelity's competitors, and that the fund's shareholders, who have the opportunity to review and weigh the disclosure provided by the fund in its prospectus and other public disclosures, have chosen to invest in this fund, which is part of the Fidelity family of funds.
Annual Report
Nature, Extent, and Quality of Services Provided. The Board considered Fidelity's staffing as it relates to the fund, including the backgrounds of investment personnel of Fidelity, and also considered the fund's investment objective, strategies, and related investment philosophy. The Independent Trustees also had discussions with senior management of Fidelity's investment operations and investment groups. The Board considered the structure of the portfolio manager compensation program and whether this structure provides appropriate incentives to act in the best interests of the fund. Additionally, the Board considered the portfolio managers' investments, if any, in the funds that they manage.
Resources Dedicated to Investment Management and Support Services. The Board and the Fund Oversight and Research Committees reviewed the general qualifications and capabilities of Fidelity's investment staff, including its size, education, experience, and resources, as well as Fidelity's approach to recruiting, training, managing, and compensating investment personnel. The Board noted that Fidelity has continued to increase the resources devoted to non-U.S. offices, including expansion of Fidelity's global investment organization. The Board also noted that Fidelity's analysts have extensive resources, tools and capabilities that allow them to conduct sophisticated quantitative and fundamental analysis, as well as credit analysis of issuers, counterparties and guarantors. Further, the Board considered that Fidelity's investment professionals have sufficient access to global information and data so as to provide competitive investment results over time, and that those professionals also have access to sophisticated tools that permit them to assess portfolio construction and risk and performance attribution characteristics continuously, as well as to transmit new information and research conclusions rapidly around the world. Additionally, in its deliberations, the Board considered Fidelity's trading, risk management, and compliance capabilities and resources, which are integral parts of the investment management process.
Shareholder and Administrative Services. The Board considered (i) the nature, extent, quality, and cost of advisory, administrative, and shareholder services performed by FMR, the sub-advisers (together with FMR, the Investment Advisers), and their affiliates under the Advisory Contracts and under separate agreements covering transfer agency, pricing and bookkeeping, and securities lending services for the fund; (ii) the nature and extent of the supervision of third party service providers, principally custodians and subcustodians; and (iii) the resources devoted to, and the record of compliance with, the fund's compliance policies and procedures. The Board also reviewed the allocation of fund brokerage, including allocations to brokers affiliated with the Investment Advisers, the use of brokerage commissions to pay fund expenses, and the use of "soft" commission dollars to pay for research services.
Annual Report
Board Approval of Investment Advisory Contracts and
Management Fees - continued
The Board noted that the growth of fund assets over time across the complex allows Fidelity to reinvest in the development of services designed to enhance the value or convenience of the Fidelity funds as investment vehicles. These services include 24-hour access to account information and market information through telephone representatives and over the Internet, investor education materials and asset allocation tools, and the expanded availability of Fidelity Investor Centers.
In 2014, the Board formed an ad hoc Committee on Transfer Agency Fees to review the variety of transfer agency fee structures throughout the industry and Fidelity's competitive positioning with respect to industry participants.
Investment in a Large Fund Family. The Board considered the benefits to shareholders of investing in a Fidelity fund, including the benefits of investing in a fund that is part of a large family of funds offering a variety of investment disciplines and providing a large variety of mutual fund investor services. The Board noted that Fidelity had taken, or had made recommendations that resulted in the Fidelity funds taking, a number of actions over the previous year that benefited particular funds, including (i) continuing to dedicate additional resources to investment research and to the support of the senior management team that oversees asset management; (ii) continuing efforts to enhance Fidelity's global research capabilities; (iii) launching new funds and making other enhancements to meet client needs; (iv) reducing management fees and total expenses for certain index funds and diversified international funds; (v) continuing to launch dedicated lower cost underlying funds to meet portfolio construction needs related to expanding underlying fund options for Fidelity funds of funds, specifically for the Freedom Fund product lines; (vi) rationalizing product lines and gaining increased efficiencies through fund mergers; (vii) launching active fixed-income exchange-traded funds; (viii) continuing to develop, acquire and implement systems and technology to improve services to the funds and information security and to increase efficiency; (ix) implementing investment enhancements to further strengthen Fidelity's target date product line to increase investors' probability of success in achieving their goals; (x) modifying the eligibility criteria for certain share classes to accommodate roll-over assets from employer-sponsored retirement plans; (xi) launching a new Class W of the Freedom Index Funds to attract and retain Fidelity record-kept retirement plan assets; and (xii) implementing changes to Fidelity's money market product line in response to recent money market regulatory reforms.
Investment Performance. The Board considered whether the fund has operated in accordance with its investment objective, as well as its record of compliance with its investment restrictions and its performance history.
Annual Report
The Board took into account discussions with representatives of the Investment Advisers about fund investment performance that occur at Board meetings throughout the year. In this regard the Board noted that as part of regularly scheduled fund reviews and other reports to the Board on fund performance, the Board considers annualized return information for the fund, for different time periods, measured against a securities market index ("benchmark index") and a peer group of funds with similar objectives ("peer group"), if any. In its evaluation of fund investment performance, the Board gave particular attention to information indicating changes in performance of certain Fidelity funds for specific time periods and discussed with the Investment Advisers the reasons for any overperformance or underperformance.
In addition to reviewing absolute and relative fund performance, the Independent Trustees periodically consider the appropriateness of fund performance metrics in evaluating the results achieved. In general, the Independent Trustees believe that fund performance should be evaluated based on net performance (after fees and expenses) of both the highest performing and lowest performing fund share classes, where applicable, compared to appropriate benchmark indices, over appropriate time periods that may include full market cycles, and compared to peer groups, as applicable, over the same periods, taking into account relevant factors including the following: general market conditions; issuer-specific information; and fund cash flows and other factors.
The Independent Trustees recognize that shareholders evaluate performance on a net basis over their own holding periods, for which one-, three-, and five-year periods are often used as a proxy. For this reason, the performance information reviewed by the Board also included net cumulative calendar year total return information for the fund and an appropriate benchmark index and peer group for the most recent one-, three-, and five-year periods, as shown below. Returns are shown compared to the 25th percentile (top of box, 75% beaten) and 75th percentile (bottom of box, 25% beaten) of the peer universe.
Annual Report
Board Approval of Investment Advisory Contracts and
Management Fees - continued
Fidelity Low-Priced Stock Fund
The Board also considered that the fund's management fee is subject to upward or downward adjustment depending upon whether, and to what extent, the fund's investment performance for the performance period exceeds, or is exceeded by, a securities index, thus leading to a performance adjustment for the same period. The Board noted that the performance adjustment provides FMR with a strong economic incentive to seek to achieve superior performance for the fund's shareholders and helps to more closely align the interests of FMR and the shareholders of the fund.
Based on its review, the Board concluded that the nature, extent, and quality of services provided to the fund under the Advisory Contracts should benefit the shareholders of the fund.
Competitiveness of Management Fee and Total Expense Ratio. The Board considered the fund's management fee and total expense ratio compared to "mapped groups" of competitive funds and classes created for the purpose of facilitating the Trustees' competitive analysis of management fees and total expenses. Fidelity creates "mapped groups" by combining similar Lipper investment objective categories that have comparable investment mandates. Combining Lipper investment objective categories aids the Board's management fee and total expense ratio comparisons by broadening the competitive group used for comparison.
Management Fee. The Board considered two proprietary management fee comparisons for the 12-month periods shown in basis points (BP) in the chart below. The group of Lipper funds used by the Board for management fee comparisons is referred to below as the "Total Mapped Group." The Total Mapped Group comparison focuses on a fund's standing in terms of gross management fees before expense reimbursements or caps, and without giving effect to the fund's performance adjustment, relative to the total universe of funds with comparable investment mandates, regardless of whether their management fee structures also are comparable. Funds with comparable investment mandates offer exposure to similar types of securities. Funds with comparable management fee structures have similar management fee contractual arrangements (e.g., flat rate charged for advisory services, all-inclusive fee rate, etc.). "TMG %" represents the percentage of funds in the Total Mapped Group that had management fees that were lower than the fund's. For example, a hypothetical TMG % of 20% would mean that 80% of the funds in the Total Mapped Group had higher, and 20% had lower, management fees than the fund. The fund's actual TMG %s and the number of funds in the Total Mapped Group are in the chart below. The "Asset-Size Peer Group" (ASPG) comparison focuses on a fund's standing relative to a subset of non-Fidelity funds within the Total Mapped Group that are similar in size and management fee structure without taking into account performance adjustments, if any. For example, if a fund is in the first quartile of the ASPG, the fund's management fee ranks in the least expensive or lowest 25% of funds in the ASPG. The ASPG represents at least 15% of the funds in the Total Mapped Group with comparable asset size and management fee structures, subject to a minimum of 50 funds (or all funds in the Total Mapped Group if fewer than 50). Additional information, such as the ASPG quartile in which the fund's management fee rate ranked and the impact of the fund's performance adjustment, is also included in the chart and considered by the Board.
Annual Report
Fidelity Low-Priced Stock Fund
Annual Report
Board Approval of Investment Advisory Contracts and
Management Fees - continued
The Board noted that the fund's management fee rate ranked below the median of its Total Mapped Group and below the median of its ASPG for 2014. The Board also noted the effect of the fund's performance adjustment, if any, on the fund's management fee ranking.
The Board noted that, in 2014, the ad hoc Committee on Group Fee was formed by it and other Fidelity fund boards to conduct an in-depth review of the "group fee" component of the management fee of funds with such management fee structures. Committee focus included the mechanics of the group fee, the competitive landscape of group fee structures, Fidelity funds with no group fee component and investment products not included in group fee assets. The Board also considered that, for funds subject to the group fee, FMR agreed to voluntarily waive fees over a specified period of time in amounts designed to account for assets converted from certain funds to certain collective investment trusts.
The Board also noted that, in 2013, the ad hoc Committee on Management Fees was formed to conduct an in-depth review of the management fee rates of Fidelity's active equity mutual funds. The Committee focused on the following areas: (i) standard fee structures; (ii) research consumption and trading evolution; (iii) management fee competitiveness/profitability by category; and (iv) factors that drive institutional pricing.
Based on its review, the Board concluded that the fund's management fee is fair and reasonable in light of the services that the fund receives and the other factors considered.
Total Expense Ratio. In its review of each class's total expense ratio, the Board considered the fund's management fee as well as other fund or class expenses, as applicable, such as transfer agent fees, pricing and bookkeeping fees, and custodial, legal, and audit fees. The Board noted the impact of the fund's performance adjustment. The Board also noted that Fidelity may agree to waive fees and expenses from time to time, and the extent to which, if any, it has done so for the fund. As part of its review, the Board also considered the current and historical total expense ratios of each class of the fund compared to competitive fund median expenses. Each class of the fund is compared to those funds and classes in the Total Mapped Group (used by the Board for management fee comparisons) that have a similar sales load structure.
The Board noted that the total expense ratio of each class ranked below its competitive median for 2014.
Fees Charged to Other Fidelity Clients. The Board also considered Fidelity fee structures and other information with respect to clients of Fidelity, such as other funds advised or subadvised by Fidelity, pension plan clients, and other institutional clients with similar mandates. The Board noted the findings of the 2013 ad hoc joint committee (created with the board of other Fidelity funds), which reviewed and compared Fidelity's institutional investment advisory business with its business of providing services to the Fidelity funds, including the differences in services provided, fees charged, and costs incurred, as well as competition in their respective marketplaces.
Annual Report
Based on its review of total expense ratios and fees charged to other Fidelity clients, the Board concluded that the total expense ratio of each class of the fund was reasonable in light of the services that the fund and its shareholders receive and the other factors considered.
Costs of the Services and Profitability. The Board considered the revenues earned and the expenses incurred by Fidelity in conducting the business of developing, marketing, distributing, managing, administering and servicing the fund and servicing the fund's shareholders. The Board also considered the level of Fidelity's profits in respect of all the Fidelity funds.
On an annual basis, Fidelity presents to the Board information about the profitability of its relationship with the fund. Fidelity calculates profitability information for each fund, as well as aggregate profitability information for groups of Fidelity funds and all Fidelity funds, using a series of detailed revenue and cost allocation methodologies which originate with the books and records of Fidelity on which Fidelity's audited financial statements are based. The Audit Committee of the Board reviews any significant changes from the prior year's methodologies.
PricewaterhouseCoopers LLP (PwC), independent registered public accounting firm and auditor to Fidelity and certain Fidelity funds, has been engaged annually by the Board as part of the Board's assessment of Fidelity's profitability analysis. PwC's engagement includes the review and assessment of the methodologies used by Fidelity in determining the revenues and expenses attributable to Fidelity's mutual fund business, and completion of agreed-upon procedures in respect of the mathematical accuracy of fund profitability and its conformity to established allocation methodologies. After considering PwC's reports issued under the engagement and information provided by Fidelity, the Board concluded that while other allocation methods may also be reasonable, Fidelity's profitability methodologies are reasonable in all material respects.
The Board also reviewed Fidelity's non-fund businesses and fall-out benefits related to the mutual fund business as well as cases where Fidelity's affiliates may benefit from or be related to the fund's business.
The Board considered the costs of the services provided by and the profits realized by Fidelity in connection with the operation of the fund and was satisfied that the profitability was not excessive.
Economies of Scale. The Board considered whether there have been economies of scale in respect of the management of the Fidelity funds, whether the Fidelity funds (including the fund) have appropriately benefited from any such economies of scale, and whether there is potential for realization of any further economies of scale. The Board considered the extent to which the fund will benefit from economies of scale as assets grow through increased services to the fund, through waivers or reimbursements, or through fee or expense ratio reductions. The Board also noted that in 2013, it and the boards of other Fidelity funds created an ad hoc committee (the Economies of Scale Committee) to analyze whether Fidelity attains economies of scale in respect of the management and servicing of the Fidelity funds, whether the Fidelity funds have appropriately benefited from such economies of scale, and whether there is potential for realization of any further economies of scale.
Annual Report
Board Approval of Investment Advisory Contracts and
Management Fees - continued
The Board recognized that the fund's management contract incorporates a "group fee" structure, which provides for lower group fee rates as total group assets increase, and for higher group fee rates as total group assets decrease (with "group assets" defined to include fund assets under FMR's management plus sector fund assets previously under FMR's management and currently managed by Fidelity SelectCo, LLC). FMR calculates the group fee rates based on a tiered asset "breakpoint" schedule that varies based on asset class. The Board considered that the group fee is designed to deliver the benefits of economies of scale to fund shareholders when total Fidelity fund assets increase, even if assets of any particular fund are unchanged or have declined, because some portion of Fidelity's costs are attributable to services provided to all Fidelity funds, and all funds benefit if those costs can be allocated among more assets. The Board concluded that, given the group fee structure, fund shareholders will benefit from lower management fees as group assets increase at the fund complex level, regardless of whether Fidelity achieves any such economies of scale.
The Board concluded, taking into account the analysis of the Economies of Scale Committee, that economies of scale, if any, are being appropriately shared between fund shareholders and Fidelity.
Additional Information Requested by the Board. In order to develop fully the factual basis for consideration of the Fidelity funds' Advisory Contracts, the Board requested and received additional information on certain topics, including: (i) fund performance trends and Fidelity's long-term strategies for certain funds; (ii) the various share classes employed by Fidelity and the attributes of each class, together with similar information on the distribution and servicing payments made by Fidelity or the funds to third-party participants in the distribution channels; (iii) fund profitability, and fund performance in relation to fund profitability; (iv) the methodology with respect to evaluating competitive fund data and peer group classifications and fee comparisons; (v) annual fund profitability margins, with particular focus on certain funds with negative margins; (vi) the realization of fall-out benefits in certain Fidelity business units; (vii) economies of scale and the way in which they are shared with fund shareholders; (viii) Fidelity's group fee structures, including the group fee schedule of breakpoints; (ix) the impact of cost containment measures on the funds; and (x) the transfer agent fee structure.
Annual Report
Based on its evaluation of all of the conclusions noted above, and after considering all factors it believed relevant, the Board concluded that the advisory fee structures are fair and reasonable, and that the fund's Advisory Contracts should be renewed.
Annual Report
Investment Adviser
Fidelity Management & Research Company
Boston, MA
Investment Sub-Advisers
FMR Co., Inc.
FMR Investment Management
(U.K.) Limited
Fidelity Management & Research
(Hong Kong) Limited
Fidelity Management & Research
(Japan.) Limited
General Distributor
Fidelity Distributors Corporation
Smithfield, RI
Transfer and Service Agents
Fidelity Investments Institutional Operations Company, Inc.
Boston, MA
Fidelity Service Company, Inc.
Boston, MA
Custodian
Brown Brothers Harriman & Co.
Boston, MA
(Fidelity Investment logo)(registered trademark)
Corporate Headquarters
245 Summer St., Boston, MA 02210
www.fidelity.com
LPS-K-UANN-0915
1.863394.106
Item 2. Code of Ethics
As of the end of the period, July 31, 2015, Fidelity Puritan Trust (the trust) has adopted a code of ethics, as defined in Item 2 of Form N-CSR, that applies to its President and Treasurer and its Chief Financial Officer. A copy of the code of ethics is filed as an exhibit to this Form N-CSR.
Item 3. Audit Committee Financial Expert
The Board of Trustees of the trust has determined that Joseph Mauriello is an audit committee financial expert, as defined in Item 3 of Form N-CSR. Mr. Mauriello is independent for purposes of Item 3 of Form N-CSR.
Item 4. Principal Accountant Fees and Services
Fees and Services
The following table presents fees billed by Deloitte & Touche LLP, the member firms of Deloitte Touche Tohmatsu, and their respective affiliates (collectively, "Deloitte Entities") in each of the last two fiscal years for services rendered to Fidelity Series Intrinsic Opportunities Fund and Fidelity Value Discovery Fund (the "Funds"):
Services Billed by Deloitte Entities
July 31, 2015 FeesA
| Audit Fees | Audit-Related Fees | Tax Fees | All Other Fees |
Fidelity Series Intrinsic Opportunities Fund | $58,000 | $- | $6,200 | $2,000 |
Fidelity Value Discovery Fund | $38,000 | $- | $5,100 | $900 |
July 31, 2014 FeesA
| Audit Fees | Audit-Related Fees | Tax Fees | All Other Fees |
Fidelity Series Intrinsic Opportunities Fund | $56,000 | $- | $6,200 | $1,700 |
Fidelity Value Discovery Fund | $37,000 | $- | $5,100 | $700 |
A Amounts may reflect rounding.
The following table presents fees billed by PricewaterhouseCoopers LLP ("PwC") in each of the last two fiscal years for services rendered to Fidelity Low-Priced Stock Fund (the "Fund"):
Services Billed by PwC
July 31, 2015 FeesA
| Audit Fees | Audit-Related Fees | Tax Fees | All Other Fees |
Fidelity Low-Priced Stock Fund | $157,000 | $- | $14,600 | $18,100 |
July 31, 2014 FeesA
| Audit Fees | Audit-Related Fees | Tax Fees | All Other Fees |
Fidelity Low-Priced Stock Fund | $159,000 | $- | $5,500 | $17,700 |
A Amounts may reflect rounding.
The following table presents fees billed by PwC and Deloitte Entities that were required to be approved by the Audit Committee for services that relate directly to the operations and financial reporting of the Funds and that are rendered on behalf of Fidelity Management & Research Company ("FMR") and entities controlling, controlled by, or under common control with FMR (not including any sub-adviser whose role is primarily portfolio management and is subcontracted with or overseen by another investment adviser) that provide ongoing services to the Funds ("Fund Service Providers"):
Services Billed by Deloitte Entities
| July 31, 2015A | July 31, 2014A |
Audit-Related Fees | $- | $355,000 |
Tax Fees | $- | $- |
All Other Fees | $175,000 | $745,000 |
A Amounts may reflect rounding.
Services Billed by PwC
| July 31, 2015A | July 31, 2014A |
Audit-Related Fees | $4,480,000 | $5,975,000 |
Tax Fees | $- | $50,000 |
All Other Fees | $- | $- |
A Amounts may reflect rounding.
"Audit-Related Fees" represent fees billed for assurance and related services that are reasonably related to the performance of the fund audit or the review of the fund's financial statements and that are not reported under Audit Fees.
"Tax Fees" represent fees billed for tax compliance, tax advice or tax planning that relate directly to the operations and financial reporting of the fund.
"All Other Fees" represent fees billed for services provided to the fund or Fund Service Provider, a significant portion of which are assurance related, that relate directly to the operations and financial reporting of the fund, excluding those services that are reported under Audit Fees, Audit-Related Fees or Tax Fees.
Assurance services must be performed by an independent public accountant.
* * *
The aggregate non-audit fees billed by PwC and Deloitte Entities for services rendered to the Funds, FMR (not including any sub-adviser whose role is primarily portfolio management and is subcontracted with or overseen by another investment adviser), and any Fund Service Provider for each of the last two fiscal years of the Funds are as follows:
Billed By | July 31, 2015 A | July 31, 2014 A |
PwC | $5,790,000 | $7,210,000 |
Deloitte Entities | $550,000 | $1,950,000 |
A Amounts may reflect rounding.
The trust's Audit Committee has considered non-audit services that were not pre-approved that were provided by PwC and Deloitte Entities to Fund Service Providers to be compatible with maintaining the independence of PwC and Deloitte Entities in their audits of the Funds, taking into account representations from PwC and Deloitte Entities, in accordance with Public Company Accounting Oversight Board rules, regarding their independence from the Funds and their related entities and FMR's review of the appropriateness and permissibility under applicable law of such non-audit services prior to their provision to the Fund Service Providers.
Audit Committee Pre-Approval Policies and Procedures
The trust's Audit Committee must pre-approve all audit and non-audit services provided by a fund's independent registered public accounting firm relating to the operations or financial reporting of the fund. Prior to the commencement of any audit or non-audit services to a fund, the Audit Committee reviews the services to determine whether they are appropriate and permissible under applicable law.
The Audit Committee has adopted policies and procedures to, among other purposes, provide a framework for the Committee's consideration of non-audit services by the audit firms that audit the Fidelity funds. The policies and procedures require that any non-audit service provided by a fund audit firm to a Fidelity fund and any non-audit service provided by a fund auditor to a Fund Service Provider that relates directly to the operations and financial reporting of a Fidelity fund ("Covered Service") are subject to approval by the Audit Committee before such service is provided.
All Covered Services must be approved in advance of provision of the service either: (i) by formal resolution of the Audit Committee, or (ii) by oral or written approval of the service by the Chair of the Audit Committee (or if the Chair is unavailable, such other member of the Audit Committee as may be designated by the Chair to act in the Chair's absence). The approval contemplated by (ii) above is permitted where the Treasurer determines that action on such an engagement is necessary before the next meeting of the Audit Committee.
Non-audit services provided by a fund audit firm to a Fund Service Provider that do not relate directly to the operations and financial reporting of a Fidelity fund are reported to the Audit Committee on a periodic basis.
Non-Audit Services Approved Pursuant to Rule 2-01(c)(7)(i)(C) and (ii) of Regulation S-X ("De Minimis Exception")
There were no non-audit services approved or required to be approved by the Audit Committee pursuant to the De Minimis Exception during the Funds' last two fiscal years relating to services provided to (i) the Funds or (ii) any Fund Service Provider that relate directly to the operations and financial reporting of the Funds.
Item 5. Audit Committee of Listed Registrants
Not applicable.
Item 6. Investments
(a) Not applicable.
(b) Not applicable
Item 7. Disclosure of Proxy Voting Policies and Procedures for Closed-End Management Investment Companies
Not applicable.
Item 8. Portfolio Managers of Closed-End Management Investment Companies
Not applicable.
Item 9. Purchase of Equity Securities by Closed-End Management Investment Company and Affiliated Purchasers
Not applicable.
Item 10. Submission of Matters to a Vote of Security Holders
There were no material changes to the procedures by which shareholders may recommend nominees to the trust's Board of Trustees.
Item 11. Controls and Procedures
(a)(i) The President and Treasurer and the Chief Financial Officer have concluded that the trust's disclosure controls and procedures (as defined in Rule 30a-3(c) under the Investment Company Act) provide reasonable assurances that material information relating to the trust is made known to them by the appropriate persons, based on their evaluation of these controls and procedures as of a date within 90 days of the filing date of this report.
(a)(ii) There was no change in the trust's internal control over financial reporting (as defined in Rule 30a-3(d) under the Investment Company Act) that occurred during the second fiscal quarter of the period covered by this report that has materially affected, or is reasonably likely to materially affect, the trust's internal control over financial reporting.
Item 12. Exhibits
(a) | (1) | Code of Ethics pursuant to Item 2 of Form N-CSR is filed and attached hereto as EX-99.CODE ETH. |
(a) | (2) | Certification pursuant to Rule 30a-2(a) under the Investment Company Act of 1940 (17 CFR 270.30a-2(a)) is filed and attached hereto as Exhibit 99.CERT. |
(a) | (3) | Not applicable. |
(b) | | Certification pursuant to Rule 30a-2(b) under the Investment Company Act of 1940 (17 CFR 270.30a-2(b)) is furnished and attached hereto as Exhibit 99.906CERT. |
SIGNATURES
Pursuant to the requirements of the Securities Exchange Act of 1934 and the Investment Company Act of 1940, the registrant has duly caused this report to be signed on its behalf by the undersigned, thereunto duly authorized.
Fidelity Puritan Trust
By: | /s/Kenneth B. Robins |
| Kenneth B. Robins |
| President and Treasurer |
| |
Date: | September 25, 2015 |
Pursuant to the requirements of the Securities Exchange Act of 1934 and the Investment Company Act of 1940, this report has been signed below by the following persons on behalf of the registrant and in the capacities and on the dates indicated.
By: | /s/Kenneth B. Robins |
| Kenneth B. Robins |
| President and Treasurer |
| |
Date: | September 25, 2015 |
By: | /s/Howard J. Galligan III |
| Howard J. Galligan III |
| Chief Financial Officer |
| |
Date: | September 25, 2015 |