UNITED STATES
SECURITIES AND EXCHANGE COMMISSION
Washington, D.C. 20549
FORM N-CSR
CERTIFIED SHAREHOLDER REPORT OF REGISTERED
MANAGEMENT INVESTMENT COMPANIES
Investment Company Act file number 811-649
Fidelity Puritan Trust
(Exact name of registrant as specified in charter)
245 Summer St., Boston, Massachusetts 02210
(Address of principal executive offices) (Zip code)
Scott C. Goebel, Secretary
245 Summer St.
Boston, Massachusetts 02210
(Name and address of agent for service)
Registrant's telephone number, including area code: 617-563-7000
Date of fiscal year end: | August 31 |
| |
Date of reporting period: | August 31, 2014 |
Item 1. Reports to Stockholders
Fidelity®
Balanced
Fund
Annual Report
August 31, 2014
(Fidelity Cover Art)
Contents
Performance | (Click Here) | How the fund has done over time. |
Management's Discussion of Fund Performance | (Click Here) | The Portfolio Manager's review of fund performance and strategy. |
Shareholder Expense Example | (Click Here) | An example of shareholder expenses. |
Investment Changes | (Click Here) | A summary of major shifts in the fund's investments over the past six months. |
Investments | (Click Here) | A complete list of the fund's investments with their market values. |
Financial Statements | (Click Here) | Statements of assets and liabilities, operations, and changes in net assets, as well as financial highlights. |
Notes | (Click Here) | Notes to the financial statements. |
Report of Independent Registered Public Accounting Firm | (Click Here) | |
Trustees and Officers | (Click Here) | |
Distributions | (Click Here) | |
Board Approval of Investment Advisory Contracts and Management Fees | (Click Here) | |
To view a fund's proxy voting guidelines and proxy voting record for the 12-month period ended June 30, visit http://www.fidelity.com/proxyvotingresults or visit the Securities and Exchange Commission's (SEC) web site at http://www.sec.gov. You may also call 1-800-544-8544 to request a free copy of the proxy voting guidelines.
Standard & Poor's, S&P and S&P 500 are registered service marks of The McGraw-Hill Companies, Inc. and have been licensed for use by Fidelity Distributors Corporation.
Other third-party marks appearing herein are the property of their respective owners.
All other marks appearing herein are registered or unregistered trademarks or service marks of FMR LLC or an affiliated company. © 2014 FMR LLC. All rights reserved.
Annual Report
This report and the financial statements contained herein are submitted for the general information of the shareholders of the fund. This report is not authorized for distribution to prospective investors in the fund unless preceded or accompanied by an effective prospectus.
A fund files its complete schedule of portfolio holdings with the SEC for the first and third quarters of each fiscal year on Form N-Q. Forms N-Q are available on the SEC's web site at http://www.sec.gov. A fund's Forms N-Q may be reviewed and copied at the SEC's Public Reference Room in Washington, DC. Information regarding the operation of the SEC's Public Reference Room may be obtained by calling 1-800-SEC-0330. For a complete list of a fund's portfolio holdings, view the most recent holdings listing, semiannual report, or annual report on Fidelity's web site at http://www.fidelity.com, http://www.advisor.fidelity.com, or http://www.401k.com, as applicable.
NOT FDIC INSURED • MAY LOSE VALUE • NO BANK GUARANTEE
Neither the fund nor Fidelity Distributors Corporation is a bank.
Annual Report
Average annual total return reflects the change in the value of an investment, assuming reinvestment of the class' distributions from dividend income and capital gains (the profits earned upon the sale of securities that have grown in value, if any) and assuming a constant rate of performance each year. The $10,000 table and the fund's returns do not reflect the deduction of taxes that a shareholder would pay on fund distributions or the redemption of fund shares. During periods of reimbursement by Fidelity, a fund's total return will be greater than it would be had the reimbursement not occurred. How a fund did yesterday is no guarantee of how it will do tomorrow.
Average Annual Total Returns
Periods ended August 31, 2014 | Past 1
year | Past 5
years | Past 10
years |
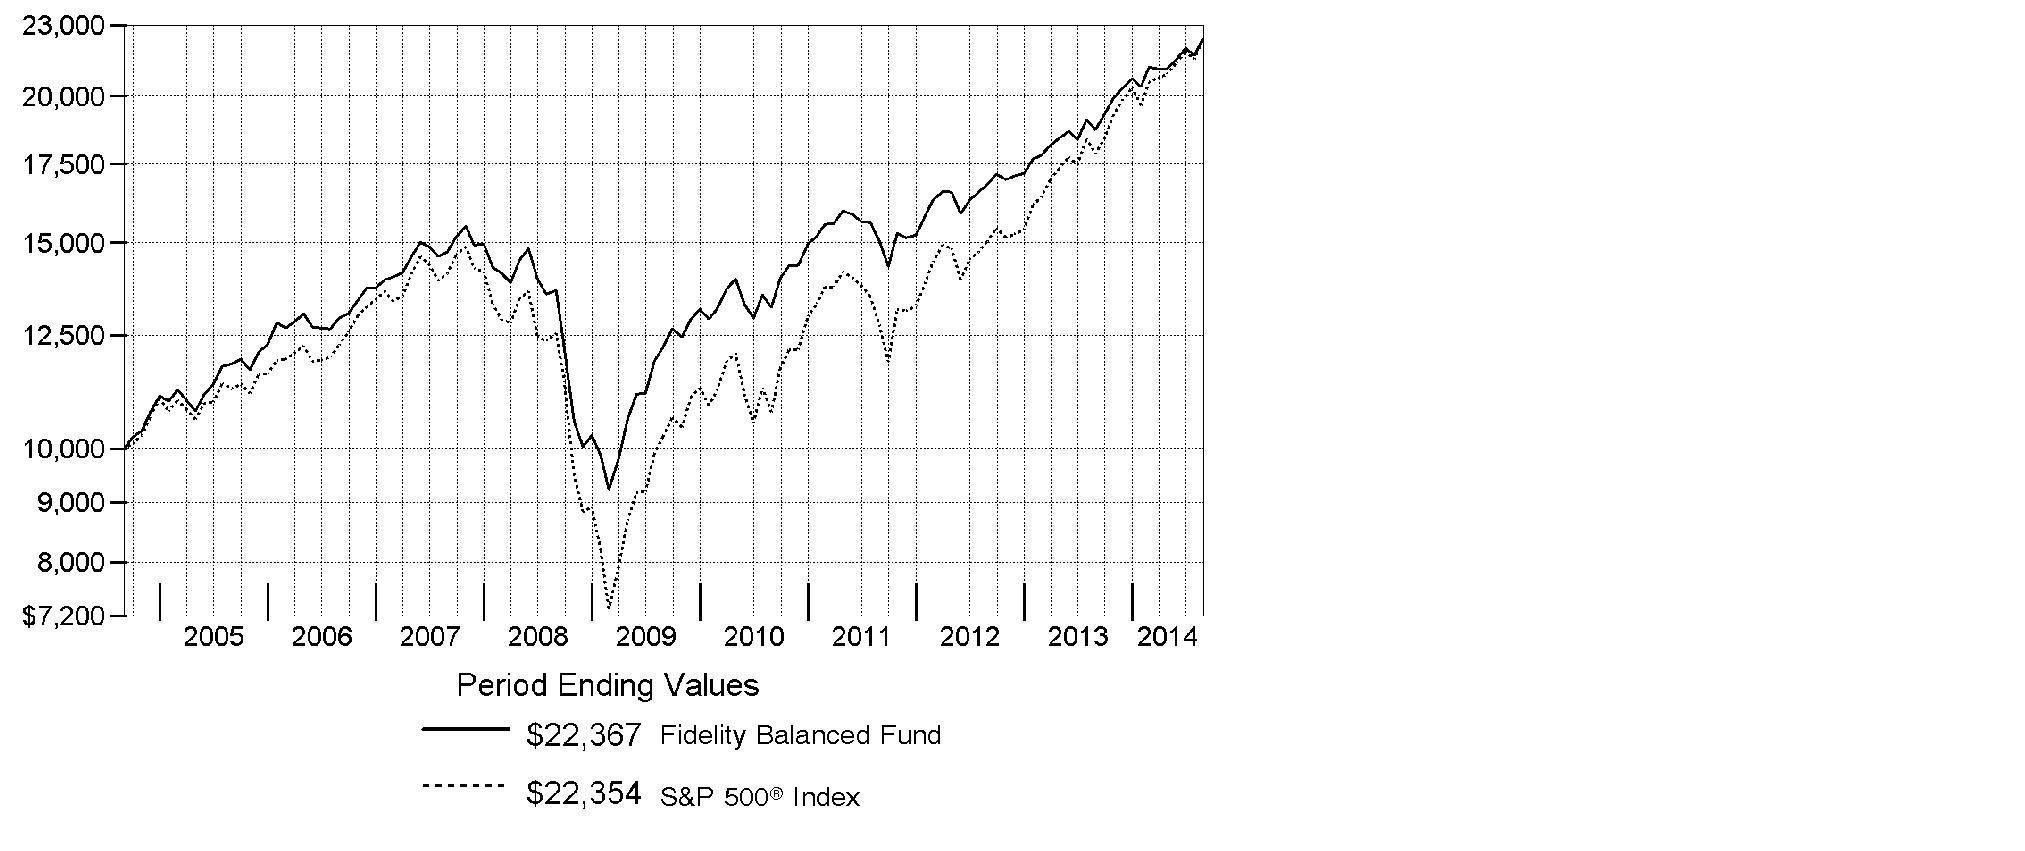
Fidelity® Balanced Fund | 19.46% | 12.86% | 8.38% |
$10,000 Over 10 Years
Let's say hypothetically that $10,000 was invested in Fidelity® Balanced Fund, a class of the fund, on August 31, 2004. The chart shows how the value of your investment would have changed, and also shows how the S&P 500® Index performed over the same period.
Annual Report
Market Recap: U.S. stocks overcame a slowing economy early in 2014 to post a solid gain for the 12 months ending August 31, 2014, supported at home by low interest rates and globally by new stimulus efforts in Europe and China. The broad-market S&P 500® Index rose 25.25%, reaching an all-time high during the period. The tech-heavy Nasdaq Composite Index® gained 29.15%, while the small-cap Russell 2000® Index returned 17.68%. Information technology (+34%) was the top sector in the S&P 500®, driven by strong results among semiconductor and hardware/equipment stocks. Health care (+32%) rose broadly, driven by biotechnology and life sciences names. Conversely, traditionally defensive sectors - consumer staples, utilities and telecommunication services - lagged the advance. Volatility was generally tame, with markets supported by declining unemployment, near-record corporate profits, muted inflation and fairly low company debt levels. Meanwhile, U.S. taxable bonds notched gains for the 12-month period, driven by yield-advantaged-sectors. The Barclays® U.S. Aggregate Bond Index rose 5.66% on the strength of longer-maturity bonds, which benefited from a decline in long-term interest rates. Lower-quality corporate issues attracted some of the strongest buying interest, reflected by the 10.61% gain of The BofA Merrill LynchSM US High Yield Constrained Index.
Comments from Co-Portfolio Manager Robert Stansky, Head of FMR's Stock Selector Large Cap Group, which manages Fidelity® Balanced Fund: For the year, the fund's Retail Class shares gained 19.46%, outperforming the 17.14% advance of the Fidelity Balanced Hybrid Composite IndexSM. Overweighting stocks and underweighting investment-grade bonds notably boosted the fund's result versus the Composite index. Security selection in the investment-grade sleeve also helped, while a small non-index stake in high-yield bonds modestly detracted. Looking at fixed income, we had favorable overweightings in corporate bonds and taxable municipal bonds, and underweightings in mortgage-backed securities and U.S. Treasuries. Yield-curve positioning modestly helped. In terms of individual stocks, choices in health care added the most value by far, including a non-index stake in genetic analysis toolmaker Illumina. We liked Illumina's innovation and accelerating end markets, but we sold the fund's stake to help manage risk and lock in profits. In information technology, we had some hits and misses. NXP Semiconductors helped, as the Netherlands-based chipmaker reported consecutive quarters of strong financial results, and the non-index stock moved sharply higher. Conversely, it hurt the most to avoid chipmaker and outperforming index name Intel, a slower-growth legacy tech stock.
The views expressed above reflect those of the portfolio manager(s) only through the end of the period as stated on the cover of this report and do not necessarily represent the views of Fidelity or any other person in the Fidelity organization. Any such views are subject to change at any time based upon market or other conditions and Fidelity disclaims any responsibility to update such views. These views may not be relied on as investment advice and, because investment decisions for a Fidelity fund are based on numerous factors, may not be relied on as an indication of trading intent on behalf of any Fidelity fund.
Annual Report
Shareholder Expense Example
As a shareholder of the Fund, you incur two types of costs: (1) transaction costs, and (2) ongoing costs, including management fees and other Fund expenses. This Example is intended to help you understand your ongoing costs (in dollars) of investing in the Fund and to compare these costs with the ongoing costs of investing in other mutual funds.
The Example is based on an investment of $1,000 invested at the beginning of the period and held for the entire period (March 1, 2014 to August 31, 2014).
Actual Expenses
The first line of the accompanying table for each class of the Fund provides information about actual account values and actual expenses. You may use the information in this line, together with the amount you invested, to estimate the expenses that you paid over the period. Simply divide your account value by $1,000.00 (for example, an $8,600 account value divided by $1,000.00 = 8.6), then multiply the result by the number in the first line for a class of the Fund under the heading entitled "Expenses Paid During Period" to estimate the expenses you paid on your account during this period. A small balance maintenance fee of $12.00 that is charged once a year may apply for certain accounts with a value of less than $2,000. This fee is not included in the table below. If it was, the estimate of expenses you paid during the period would be higher, and your ending account value lower, by this amount. In addition, the Fund, as a shareholder in the underlying Fidelity Central Funds, will indirectly bear its pro-rata share of the fees and expenses incurred by the underlying Fidelity Central Funds. These fees and expenses are not included in the Fund's annualized expense ratio used to calculate the expense estimate in the table below.
Hypothetical Example for Comparison Purposes
The second line of the accompanying table for each class of the Fund provides information about hypothetical account values and hypothetical expenses based on a Class' actual expense ratio and an assumed rate of return of 5% per year before expenses, which is not the Class' actual return. The hypothetical account values and expenses may not be used to estimate the actual ending account balance or expenses you paid for the period. You may use this information to compare the ongoing costs of investing in the Fund and other funds. To do so, compare this 5% hypothetical example with the 5% hypothetical examples that appear in the shareholder reports of the other funds. A small balance maintenance fee of $12.00 that is charged once a year may apply for certain accounts with a value of less than $2,000. This fee is not included in the table below. If it was, the estimate of expenses you paid during the period would be higher, and your ending account value lower, by this amount. In addition, the Fund, as a shareholder in the underlying Fidelity Central Funds, will indirectly bear its pro-rata share of the fees and expenses incurred by the underlying Fidelity Central Funds. These fees and expenses are not included in the Fund's annualized expense ratio used to calculate the expense estimate in the table below.
Please note that the expenses shown in the table are meant to highlight your ongoing costs only and do not reflect any transaction costs. Therefore, the second line of the table is useful in comparing ongoing costs only, and will not help you determine the relative total costs of owning different funds.
Annual Report
| Annualized
Expense RatioB | Beginning
Account Value
March 1, 2014 | Ending
Account Value
August 31, 2014 | Expenses Paid
During Period*
March 1, 2014 to August 31, 2014 |
Balanced | .56% | | | |
Actual | | $ 1,000.00 | $ 1,057.50 | $ 2.90 |
HypotheticalA | | $ 1,000.00 | $ 1,022.38 | $ 2.85 |
Class K | .46% | | | |
Actual | | $ 1,000.00 | $ 1,058.50 | $ 2.39 |
HypotheticalA | | $ 1,000.00 | $ 1,022.89 | $ 2.35 |
A 5% return per year before expenses
B Annualized expense ratio reflects expenses net of applicable fee waivers.
* Expenses are equal to each Class' annualized expense ratio, multiplied by the average account value over the period, multiplied by 184/365 (to reflect the one-half year period). The fees and expenses of the underlying Fidelity Central Funds in which the Fund invests are not included in each Class' annualized expense ratio.
In addition to the expenses noted above, the Fund also indirectly bears its proportional share of the expenses of the underlying Fidelity Central Funds. Annualized expenses of the underlying non-money market Fidelity Central Funds as of their most recent fiscal half year were less than .01%.
Annual Report
Investment Changes (Unaudited)
The information in the following tables is based on the combined investments of the Fund and its pro-rata share of the investments of Fidelity's fixed-income central funds.
Top Five Stocks as of August 31, 2014 |
| % of fund's
net assets | % of fund's net assets
6 months ago |
Apple, Inc. | 2.6 | 2.0 |
Chevron Corp. | 1.6 | 0.6 |
Google, Inc. Class C | 1.3 | 0.0 |
Procter & Gamble Co. | 1.2 | 1.3 |
Capital One Financial Corp. | 1.2 | 1.2 |
| 7.9 | |
Top Five Bond Issuers as of August 31, 2014 |
(with maturities greater than one year) | % of fund's
net assets | % of fund's net assets
6 months ago |
Fannie Mae | 4.5 | 4.4 |
U.S. Treasury Obligations | 3.2 | 5.4 |
Ginnie Mae | 1.1 | 0.9 |
Freddie Mac | 0.9 | 1.0 |
Verizon Communications, Inc. | 0.7 | 0.8 |
| 10.4 | |
Top Five Market Sectors as of August 31, 2014 |
| % of fund's
net assets | % of fund's net assets
6 months ago |
Financials | 17.4 | 16.5 |
Information Technology | 13.2 | 13.3 |
Health Care | 10.8 | 10.5 |
Consumer Discretionary | 9.9 | 9.4 |
Energy | 9.2 | 8.3 |
Asset Allocation (% of fund's net assets) |
As of August 31, 2014* | As of February 28, 2014** |
 | Stocks and
Equity Futures 72.0% | | | Stocks and
Equity Futures 71.1% | |
 | Bonds 26.6% | | | Bonds 27.5% | |
 | Convertible
Securities 0.0% | | | Convertible
Securities 0.1% | |
 | Other Investments 0.4% | | | Other Investments 0.3% | |
 | Short-Term
Investments and
Net Other Assets (Liabilities) 1.0% | | | Short-Term
Investments and
Net Other Assets (Liabilities) 1.0% | |
* Foreign investments | 9.7% | | ** Foreign investments | 11.0% | |

Percentages are adjusted for the effect of futures contracts and swaps, if applicable. |
An unaudited holdings listing for the Fund, which presents direct holdings as well as the pro-rata share of any securities and other investments held indirectly through its investment in underlying non-money market Fidelity Central Funds, is available at fidelity.com. |
Percentages in the above tables are adjusted for the effect of TBA Sale Commitments. |
Annual Report
Investments August 31, 2014
Showing Percentage of Net Assets
Common Stocks - 71.2% |
| Shares | | Value (000s) |
CONSUMER DISCRETIONARY - 9.1% |
Diversified Consumer Services - 0.3% |
H&R Block, Inc. | 2,745,577 | | $ 92,059 |
Hotels, Restaurants & Leisure - 3.1% |
ARAMARK Holdings Corp. | 323,036 | | 8,367 |
Extended Stay America, Inc. unit | 6,093,170 | | 145,383 |
Hilton Worldwide Holdings, Inc. | 2,656,100 | | 67,252 |
Marriott International, Inc. Class A | 907,267 | | 62,964 |
McDonald's Corp. | 1,347,474 | | 126,285 |
Panera Bread Co. Class A (a) | 790,600 | | 118,543 |
Starbucks Corp. | 1,944,800 | | 151,325 |
Yum! Brands, Inc. | 2,009,752 | | 145,566 |
| | 825,685 |
Internet & Catalog Retail - 0.7% |
Ctrip.com International Ltd. sponsored ADR (a) | 537,000 | | 34,459 |
Liberty Interactive Corp. Series A (a) | 3,909,835 | | 115,418 |
Qunar Cayman Islands Ltd. sponsored ADR (d) | 1,022,699 | | 30,701 |
| | 180,578 |
Media - 3.2% |
CBS Outdoor Americas, Inc. | 414,000 | | 14,229 |
Comcast Corp. Class A | 847,042 | | 46,359 |
DIRECTV (a) | 1,297,018 | | 112,127 |
DreamWorks Animation SKG, Inc. Class A (a) | 514,800 | | 11,241 |
Legend Pictures LLC (a)(n)(o) | 8,571 | | 15,454 |
Liberty Media Corp.: | | | |
Class A (a) | 561,300 | | 27,633 |
Class C (a) | 1,284,300 | | 62,250 |
Manchester United PLC (a) | 1,838,000 | | 31,356 |
The Madison Square Garden Co. Class A (a) | 1,794,085 | | 119,953 |
Time Warner Cable, Inc. | 156,100 | | 23,092 |
Twenty-First Century Fox, Inc. Class A | 6,810,241 | | 241,219 |
Viacom, Inc. Class B (non-vtg.) | 1,947,992 | | 158,080 |
| | 862,993 |
Multiline Retail - 0.5% |
Dollar General Corp. (a) | 2,216,112 | | 141,809 |
Specialty Retail - 0.5% |
TJX Companies, Inc. | 2,287,933 | | 136,384 |
Common Stocks - continued |
| Shares | | Value (000s) |
CONSUMER DISCRETIONARY - continued |
Textiles, Apparel & Luxury Goods - 0.8% |
lululemon athletica, Inc. (a) | 889,252 | | $ 35,508 |
NIKE, Inc. Class B | 2,205,000 | | 173,203 |
| | 208,711 |
TOTAL CONSUMER DISCRETIONARY | | 2,448,219 |
CONSUMER STAPLES - 6.6% |
Beverages - 1.4% |
Anheuser-Busch InBev SA NV | 202,344 | | 22,572 |
Coca-Cola Icecek Sanayi A/S | 298,728 | | 7,048 |
Diageo PLC sponsored ADR | 250,787 | | 30,062 |
Embotelladora Andina SA sponsored ADR | 332,973 | | 6,496 |
Monster Beverage Corp. (a) | 469,100 | | 41,473 |
Pernod Ricard SA | 303,550 | | 35,793 |
Remy Cointreau SA | 269,186 | | 21,395 |
The Coca-Cola Co. | 5,347,661 | | 223,104 |
| | 387,943 |
Food & Staples Retailing - 1.5% |
CVS Caremark Corp. | 1,953,385 | | 155,196 |
Kroger Co. | 2,149,554 | | 109,584 |
Sysco Corp. | 954,112 | | 36,094 |
Wal-Mart Stores, Inc. | 909,567 | | 68,672 |
Whole Foods Market, Inc. | 1,005,800 | | 39,367 |
| | 408,913 |
Food Products - 0.8% |
Bunge Ltd. | 435,098 | | 36,831 |
ConAgra Foods, Inc. | 513,481 | | 16,534 |
Keurig Green Mountain, Inc. | 303,400 | | 40,449 |
Mead Johnson Nutrition Co. Class A | 762,431 | | 72,888 |
Nestle SA | 345,647 | | 26,811 |
The Hershey Co. | 69,000 | | 6,308 |
| | 199,821 |
Household Products - 1.2% |
Procter & Gamble Co. | 3,969,493 | | 329,905 |
Personal Products - 0.1% |
L'Oreal SA | 105,800 | | 17,516 |
Nu Skin Enterprises, Inc. Class A | 162,175 | | 7,252 |
| | 24,768 |
Common Stocks - continued |
| Shares | | Value (000s) |
CONSUMER STAPLES - continued |
Tobacco - 1.6% |
Altria Group, Inc. | 3,791,613 | | $ 163,343 |
British American Tobacco PLC sponsored ADR | 1,817,610 | | 215,241 |
Philip Morris International, Inc. | 390,734 | | 33,439 |
Souza Cruz SA | 912,700 | | 8,546 |
| | 420,569 |
TOTAL CONSUMER STAPLES | | 1,771,919 |
ENERGY - 7.6% |
Energy Equipment & Services - 1.2% |
C&J Energy Services, Inc. (a) | 830,051 | | 23,814 |
Dril-Quip, Inc. (a) | 286,169 | | 29,038 |
FMC Technologies, Inc. (a) | 798,771 | | 49,396 |
Halliburton Co. | 2,144,911 | | 145,017 |
Independence Contract Drilling (e) | 1,226,834 | | 14,109 |
Ocean Rig UDW, Inc. (United States) | 725,596 | | 13,445 |
Oceaneering International, Inc. | 640,391 | | 44,546 |
| | 319,365 |
Oil, Gas & Consumable Fuels - 6.4% |
Anadarko Petroleum Corp. | 1,436,131 | | 161,838 |
BG Group PLC | 1,846,464 | | 36,807 |
Cabot Oil & Gas Corp. | 1,881,450 | | 63,104 |
Carrizo Oil & Gas, Inc. (a) | 330,798 | | 20,748 |
Chevron Corp. | 3,232,605 | | 418,461 |
Cimarex Energy Co. | 429,002 | | 62,274 |
EOG Resources, Inc. | 918,416 | | 100,916 |
Exxon Mobil Corp. | 2,526,378 | | 251,274 |
Gulfport Energy Corp. (a) | 343,900 | | 20,118 |
Kinder Morgan Holding Co. LLC (d) | 2,006,800 | | 80,794 |
Kinder Morgan Management LLC | 428,800 | | 41,902 |
Memorial Resource Development Corp. | 945,471 | | 27,863 |
Noble Energy, Inc. | 1,418,730 | | 102,347 |
ONEOK, Inc. | 168,515 | | 11,830 |
Peabody Energy Corp. | 608,908 | | 9,669 |
Phillips 66 Co. | 1,272,517 | | 110,734 |
Phillips 66 Partners LP | 300,022 | | 22,202 |
PrairieSky Royalty Ltd. | 112,500 | | 4,087 |
Suncor Energy, Inc. | 667,500 | | 27,399 |
Valero Energy Partners LP | 823,031 | | 43,876 |
Common Stocks - continued |
| Shares | | Value (000s) |
ENERGY - continued |
Oil, Gas & Consumable Fuels - continued |
Whiting Petroleum Corp. (a) | 961,277 | | $ 89,072 |
YPF SA Class D sponsored ADR | 681,700 | | 22,523 |
| | 1,729,838 |
TOTAL ENERGY | | 2,049,203 |
FINANCIALS - 11.4% |
Banks - 4.4% |
Bank of America Corp. | 18,665,808 | | 300,333 |
Citigroup, Inc. | 3,382,212 | | 174,691 |
Huntington Bancshares, Inc. | 8,012,800 | | 78,886 |
JPMorgan Chase & Co. | 5,407,854 | | 321,497 |
Societe Generale Series A | 580,802 | | 29,423 |
SunTrust Banks, Inc. | 1,283,148 | | 48,862 |
Synovus Financial Corp. | 778,720 | | 18,806 |
U.S. Bancorp | 5,100,347 | | 215,643 |
| | 1,188,141 |
Capital Markets - 1.6% |
Ameriprise Financial, Inc. | 665,862 | | 83,739 |
BlackRock, Inc. Class A | 433,776 | | 143,376 |
Carlyle Group LP | 286,400 | | 9,526 |
E*TRADE Financial Corp. (a) | 1,804,949 | | 40,178 |
Invesco Ltd. | 841,213 | | 34,355 |
Northern Trust Corp. | 427,519 | | 29,648 |
Oaktree Capital Group LLC Class A | 286,697 | | 14,398 |
State Street Corp. | 512,700 | | 36,930 |
The Blackstone Group LP | 755,407 | | 25,329 |
| | 417,479 |
Consumer Finance - 1.7% |
Capital One Financial Corp. | 3,999,501 | | 328,199 |
Discover Financial Services | 671,810 | | 41,901 |
Navient Corp. | 2,313,334 | | 41,501 |
SLM Corp. | 4,624,534 | | 40,973 |
Springleaf Holdings, Inc. | 243,300 | | 8,097 |
| | 460,671 |
Diversified Financial Services - 0.9% |
Berkshire Hathaway, Inc.: | | | |
Class A (a) | 129 | | 26,559 |
Class B (a) | 1,188,800 | | 163,163 |
Common Stocks - continued |
| Shares | | Value (000s) |
FINANCIALS - continued |
Diversified Financial Services - continued |
IntercontinentalExchange Group, Inc. | 204,062 | | $ 38,568 |
KBC Ancora (a) | 343,174 | | 11,250 |
| | 239,540 |
Insurance - 1.6% |
AFLAC, Inc. | 229,800 | | 14,073 |
Direct Line Insurance Group PLC | 8,517,030 | | 42,263 |
esure Group PLC | 1,382,886 | | 6,084 |
Fairfax Financial Holdings Ltd. (sub. vtg.) | 101,000 | | 46,539 |
Marsh & McLennan Companies, Inc. | 1,923,477 | | 102,137 |
MetLife, Inc. | 2,192,647 | | 120,025 |
Principal Financial Group, Inc. | 303,600 | | 16,482 |
The Travelers Companies, Inc. | 768,540 | | 72,788 |
Unum Group | 609,200 | | 22,096 |
| | 442,487 |
Real Estate Investment Trusts - 0.9% |
Altisource Residential Corp. Class B | 1,899,017 | | 46,602 |
American Tower Corp. | 209,731 | | 20,679 |
Boston Properties, Inc. | 524,397 | | 63,672 |
Digital Realty Trust, Inc. (d) | 613,500 | | 40,031 |
Piedmont Office Realty Trust, Inc. Class A | 1,099,538 | | 21,430 |
Senior Housing Properties Trust (SBI) | 545,407 | | 12,724 |
Sun Communities, Inc. | 584,915 | | 31,369 |
| | 236,507 |
Real Estate Management & Development - 0.3% |
CBRE Group, Inc. (a) | 2,335,503 | | 74,222 |
TOTAL FINANCIALS | | 3,059,047 |
HEALTH CARE - 10.2% |
Biotechnology - 3.1% |
Actelion Ltd. | 250,276 | | 30,724 |
Alexion Pharmaceuticals, Inc. (a) | 691,204 | | 117,014 |
Amgen, Inc. | 1,367,358 | | 190,582 |
Biogen Idec, Inc. (a) | 440,985 | | 151,275 |
Celgene Corp. (a) | 326,500 | | 31,024 |
Gilead Sciences, Inc. (a) | 2,461,428 | | 264,800 |
Puma Biotechnology, Inc. (a) | 37,300 | | 9,717 |
Vertex Pharmaceuticals, Inc. (a) | 598,700 | | 56,020 |
| | 851,156 |
Common Stocks - continued |
| Shares | | Value (000s) |
HEALTH CARE - continued |
Health Care Equipment & Supplies - 1.4% |
Boston Scientific Corp. (a) | 7,892,502 | | $ 100,077 |
Covidien PLC | 1,370,944 | | 119,039 |
Edwards Lifesciences Corp. (a) | 316,482 | | 31,414 |
Medtronic, Inc. | 698,900 | | 44,625 |
Quidel Corp. (a)(d) | 399,590 | | 9,430 |
The Cooper Companies, Inc. | 384,937 | | 62,756 |
| | 367,341 |
Health Care Providers & Services - 1.5% |
Brookdale Senior Living, Inc. (a) | 722,803 | | 25,262 |
Cigna Corp. | 1,067,660 | | 101,001 |
HCA Holdings, Inc. (a) | 1,356,679 | | 94,723 |
Henry Schein, Inc. (a) | 333,004 | | 39,857 |
McKesson Corp. | 819,148 | | 159,758 |
| | 420,601 |
Health Care Technology - 0.1% |
Veeva Systems, Inc. Class A | 720,734 | | 21,600 |
Life Sciences Tools & Services - 0.8% |
Agilent Technologies, Inc. | 1,681,100 | | 96,092 |
Thermo Fisher Scientific, Inc. | 953,797 | | 114,656 |
| | 210,748 |
Pharmaceuticals - 3.3% |
AbbVie, Inc. | 2,724,768 | | 150,625 |
Actavis PLC (a) | 693,243 | | 157,352 |
Allergan, Inc. | 410,500 | | 67,191 |
Bristol-Myers Squibb Co. | 2,558,841 | | 129,605 |
Merck & Co., Inc. | 1,519,296 | | 91,325 |
Pfizer, Inc. | 2,103,834 | | 61,832 |
Roche Holding AG (participation certificate) | 193,869 | | 56,621 |
Salix Pharmaceuticals Ltd. (a) | 258,384 | | 41,111 |
Shire PLC | 806,788 | | 65,735 |
Teva Pharmaceutical Industries Ltd. sponsored ADR | 1,177,400 | | 61,837 |
| | 883,234 |
TOTAL HEALTH CARE | | 2,754,680 |
INDUSTRIALS - 6.6% |
Aerospace & Defense - 1.4% |
Honeywell International, Inc. | 1,689,809 | | 160,921 |
Meggitt PLC | 7,670,800 | | 60,057 |
Common Stocks - continued |
| Shares | | Value (000s) |
INDUSTRIALS - continued |
Aerospace & Defense - continued |
TransDigm Group, Inc. | 579,269 | | $ 108,897 |
United Technologies Corp. | 395,393 | | 42,695 |
| | 372,570 |
Air Freight & Logistics - 0.4% |
FedEx Corp. | 683,827 | | 101,124 |
Commercial Services & Supplies - 0.2% |
KAR Auction Services, Inc. | 1,515,967 | | 45,722 |
Electrical Equipment - 1.3% |
Acuity Brands, Inc. | 723,869 | | 89,673 |
AMETEK, Inc. | 3,339,448 | | 176,790 |
Hubbell, Inc. Class B | 811,092 | | 98,061 |
| | 364,524 |
Industrial Conglomerates - 1.5% |
Danaher Corp. | 2,811,066 | | 215,356 |
Roper Industries, Inc. | 1,231,039 | | 185,345 |
| | 400,701 |
Machinery - 0.2% |
Deere & Co. | 713,500 | | 59,998 |
Professional Services - 0.5% |
Verisk Analytics, Inc. (a) | 2,242,905 | | 143,972 |
WageWorks, Inc. (a) | 120,932 | | 4,990 |
| | 148,962 |
Road & Rail - 0.6% |
J.B. Hunt Transport Services, Inc. | 2,164,495 | | 163,528 |
Trading Companies & Distributors - 0.5% |
W.W. Grainger, Inc. | 503,669 | | 124,003 |
TOTAL INDUSTRIALS | | 1,781,132 |
INFORMATION TECHNOLOGY - 13.0% |
Communications Equipment - 0.9% |
Cisco Systems, Inc. | 2,172,699 | | 54,296 |
Juniper Networks, Inc. | 892,755 | | 20,703 |
QUALCOMM, Inc. | 2,097,451 | | 159,616 |
| | 234,615 |
Electronic Equipment & Components - 0.3% |
TE Connectivity Ltd. | 1,479,765 | | 92,752 |
Internet Software & Services - 3.7% |
58.com, Inc. ADR | 327,589 | | 13,644 |
Common Stocks - continued |
| Shares | | Value (000s) |
INFORMATION TECHNOLOGY - continued |
Internet Software & Services - continued |
Benefitfocus, Inc. | 270,404 | | $ 8,929 |
ChannelAdvisor Corp. (a) | 809,306 | | 13,111 |
Cvent, Inc. | 1,753,646 | | 44,052 |
Demandware, Inc. (a) | 437,635 | | 23,260 |
eBay, Inc. (a) | 1,208,400 | | 67,066 |
Endurance International Group Holdings, Inc. (d) | 1,249,016 | | 16,812 |
Facebook, Inc. Class A (a) | 1,382,107 | | 103,409 |
Five9, Inc. (d) | 1,838,400 | | 10,791 |
Google, Inc.: | | | |
Class A (a) | 354,969 | | 206,720 |
Class C (a) | 589,769 | | 337,112 |
Millennial Media, Inc. | 173,845 | | 331 |
NAVER Corp. | 29,452 | | 22,305 |
Opower, Inc. (d) | 1,166,993 | | 18,252 |
Wix.com Ltd. (a)(d) | 392,937 | | 6,468 |
Yahoo!, Inc. (a) | 2,327,060 | | 89,615 |
Zoopla Property Group PLC (d) | 4,633,297 | | 19,326 |
| | 1,001,203 |
IT Services - 0.8% |
Cognizant Technology Solutions Corp. Class A (a) | 78,922 | | 3,609 |
Fidelity National Information Services, Inc. | 1,504,071 | | 85,356 |
Lionbridge Technologies, Inc. (a) | 739,645 | | 3,432 |
Quindell PLC (d) | 3,077,687 | | 8,686 |
Sapient Corp. (a) | 451,061 | | 6,545 |
Total System Services, Inc. | 1,135,600 | | 35,726 |
Visa, Inc. Class A | 317,722 | | 67,522 |
| | 210,876 |
Semiconductors & Semiconductor Equipment - 1.2% |
Micron Technology, Inc. (a) | 2,378,000 | | 77,523 |
NVIDIA Corp. | 2,004,517 | | 38,988 |
NXP Semiconductors NV (a) | 3,115,624 | | 213,483 |
RF Micro Devices, Inc. (a) | 948,000 | | 11,822 |
| | 341,816 |
Software - 2.8% |
Activision Blizzard, Inc. | 499,000 | | 11,746 |
Adobe Systems, Inc. (a) | 1,149,557 | | 82,653 |
Autodesk, Inc. (a) | 804,100 | | 43,132 |
CommVault Systems, Inc. (a) | 485,009 | | 26,743 |
Concur Technologies, Inc. (a) | 57,457 | | 5,768 |
Covisint Corp. (d) | 369,400 | | 1,777 |
Common Stocks - continued |
| Shares | | Value (000s) |
INFORMATION TECHNOLOGY - continued |
Software - continued |
Fleetmatics Group PLC (a) | 250,503 | | $ 8,222 |
Imperva, Inc. (a) | 880,290 | | 25,625 |
Intuit, Inc. | 372,200 | | 30,960 |
Microsoft Corp. | 5,776,032 | | 262,405 |
Oracle Corp. | 2,609,625 | | 108,378 |
Qlik Technologies, Inc. (a) | 293,817 | | 8,294 |
salesforce.com, Inc. (a) | 2,082,396 | | 123,049 |
Xero Ltd. (o) | 468,513 | | 8,888 |
| | 747,640 |
Technology Hardware, Storage & Peripherals - 3.3% |
Apple, Inc. | 6,797,614 | | 696,754 |
Electronics for Imaging, Inc. (a) | 554,205 | | 24,407 |
Hewlett-Packard Co. | 4,339,100 | | 164,886 |
| | 886,047 |
TOTAL INFORMATION TECHNOLOGY | | 3,514,949 |
MATERIALS - 3.2% |
Chemicals - 2.6% |
Airgas, Inc. | 1,788,970 | | 197,467 |
Cabot Corp. | 270,371 | | 14,811 |
Eastman Chemical Co. | 622,382 | | 51,328 |
Ecolab, Inc. | 698,700 | | 80,225 |
FMC Corp. | 760,773 | | 50,318 |
LyondellBasell Industries NV Class A | 766,922 | | 87,698 |
Methanex Corp. | 300,200 | | 20,072 |
Monsanto Co. | 807,646 | | 93,404 |
Potash Corp. of Saskatchewan, Inc. (d) | 1,044,785 | | 36,697 |
Sigma Aldrich Corp. | 457,510 | | 47,581 |
W.R. Grace & Co. (a) | 331,001 | | 32,779 |
| | 712,380 |
Construction Materials - 0.2% |
Eagle Materials, Inc. | 94,700 | | 9,651 |
Vulcan Materials Co. | 536,143 | | 33,981 |
| | 43,632 |
Containers & Packaging - 0.2% |
Graphic Packaging Holding Co. (a) | 2,269,877 | | 29,032 |
Rock-Tenn Co. Class A | 706,578 | | 34,735 |
| | 63,767 |
Common Stocks - continued |
| Shares | | Value (000s) |
MATERIALS - continued |
Metals & Mining - 0.2% |
Carpenter Technology Corp. | 44,400 | | $ 2,430 |
Freeport-McMoRan Copper & Gold, Inc. | 367,400 | | 13,362 |
Nucor Corp. | 498,767 | | 27,093 |
| | 42,885 |
TOTAL MATERIALS | | 862,664 |
TELECOMMUNICATION SERVICES - 1.4% |
Diversified Telecommunication Services - 1.2% |
CenturyLink, Inc. | 422,800 | | 17,331 |
inContact, Inc. (a) | 1,324,987 | | 12,137 |
Level 3 Communications, Inc. (a) | 647,709 | | 29,121 |
Verizon Communications, Inc. | 5,553,301 | | 276,665 |
| | 335,254 |
Wireless Telecommunication Services - 0.2% |
T-Mobile U.S., Inc. (a) | 1,366,600 | | 41,107 |
Telephone & Data Systems, Inc. | 189,300 | | 4,986 |
| | 46,093 |
TOTAL TELECOMMUNICATION SERVICES | | 381,347 |
UTILITIES - 2.1% |
Electric Utilities - 0.9% |
American Electric Power Co., Inc. | 372,132 | | 19,983 |
Edison International | 542,827 | | 32,103 |
Exelon Corp. | 1,380,800 | | 46,146 |
NextEra Energy, Inc. | 949,100 | | 93,439 |
PPL Corp. | 1,475,400 | | 51,093 |
| | 242,764 |
Gas Utilities - 0.2% |
National Fuel Gas Co. | 618,189 | | 47,254 |
Independent Power and Renewable Electricity Producers - 0.0% |
Abengoa Yield PLC | 101,300 | | 4,063 |
NextEra Energy Partners LP | 122,200 | | 4,290 |
| | 8,353 |
Independent Power Producers & Energy Traders - 0.1% |
NRG Energy, Inc. | 1,242,072 | | 38,231 |
Multi-Utilities - 0.9% |
Dominion Resources, Inc. | 1,199,800 | | 84,250 |
Common Stocks - continued |
| Shares | | Value (000s) |
UTILITIES - continued |
Multi-Utilities - continued |
NiSource, Inc. | 1,076,482 | | $ 42,704 |
PG&E Corp. | 578,429 | | 26,885 |
Sempra Energy | 706,531 | | 74,871 |
| | 228,710 |
TOTAL UTILITIES | | 565,312 |
TOTAL COMMON STOCKS (Cost $14,380,948) |
19,188,472
|
Preferred Stocks - 0.1% |
| | | |
Convertible Preferred Stocks - 0.0% |
INFORMATION TECHNOLOGY - 0.0% |
Software - 0.0% |
MongoDB, Inc. Series F, 8.00% (o) | 281,270 | | 3,446 |
Nonconvertible Preferred Stocks - 0.1% |
CONSUMER STAPLES - 0.1% |
Beverages - 0.1% |
Ambev SA sponsored ADR | 1,207,025 | | 8,799 |
TOTAL PREFERRED STOCKS (Cost $9,180) |
12,245
|
Corporate Bonds - 10.1% |
| Principal Amount (000s) | | |
Convertible Bonds - 0.0% |
ENERGY - 0.0% |
Oil, Gas & Consumable Fuels - 0.0% |
Cobalt International Energy, Inc. 2.625% 12/1/19 | | $ 1,740 | | 1,529 |
Nonconvertible Bonds - 10.1% |
CONSUMER DISCRETIONARY - 0.3% |
Automobiles - 0.0% |
Volkswagen International Finance NV 2.375% 3/22/17 (f) | | 1,830 | | 1,885 |
Corporate Bonds - continued |
| Principal Amount (000s) | | Value (000s) |
Nonconvertible Bonds - continued |
CONSUMER DISCRETIONARY - continued |
Diversified Consumer Services - 0.0% |
Ingersoll-Rand Global Holding Co. Ltd.: | | | | |
2.875% 1/15/19 | | $ 617 | | $ 633 |
4.25% 6/15/23 | | 4,350 | | 4,639 |
| | 5,272 |
Media - 0.3% |
COX Communications, Inc. 3.25% 12/15/22 (f) | | 2,422 | | 2,380 |
Discovery Communications LLC 5.05% 6/1/20 | | 204 | | 228 |
NBCUniversal, Inc. 5.15% 4/30/20 | | 7,276 | | 8,329 |
News America Holdings, Inc. 7.75% 12/1/45 | | 9,421 | | 14,056 |
Thomson Reuters Corp. 1.3% 2/23/17 | | 2,082 | | 2,084 |
Time Warner Cable, Inc.: | | | | |
4% 9/1/21 | | 10,989 | | 11,794 |
5.85% 5/1/17 | | 1,829 | | 2,042 |
6.75% 7/1/18 | | 1,974 | | 2,320 |
8.25% 4/1/19 | | 11,974 | | 15,064 |
Time Warner, Inc.: | | | | |
2.1% 6/1/19 | | 13,219 | | 13,111 |
5.875% 11/15/16 | | 4,882 | | 5,386 |
Viacom, Inc.: | | | | |
1.25% 2/27/15 | | 456 | | 458 |
2.5% 9/1/18 | | 809 | | 823 |
3.5% 4/1/17 | | 264 | | 279 |
| | 78,354 |
TOTAL CONSUMER DISCRETIONARY | | 85,511 |
CONSUMER STAPLES - 0.3% |
Beverages - 0.0% |
SABMiller Holdings, Inc.: | | | | |
1.85% 1/15/15 (f) | | 2,353 | | 2,364 |
2.45% 1/15/17 (f) | | 2,353 | | 2,424 |
| | 4,788 |
Food & Staples Retailing - 0.0% |
CVS Caremark Corp. 2.25% 12/5/18 | | 4,798 | | 4,847 |
Kroger Co. 3.3% 1/15/21 | | 6,190 | | 6,363 |
| | 11,210 |
Corporate Bonds - continued |
| Principal Amount (000s) | | Value (000s) |
Nonconvertible Bonds - continued |
CONSUMER STAPLES - continued |
Food Products - 0.1% |
Cargill, Inc. 6% 11/27/17 (f) | | $ 572 | | $ 648 |
ConAgra Foods, Inc.: | | | | |
1.9% 1/25/18 | | 2,279 | | 2,279 |
3.2% 1/25/23 | | 1,917 | | 1,889 |
Tyson Foods, Inc. 3.95% 8/15/24 | | 9,560 | | 9,767 |
William Wrigley Jr. Co.: | | | | |
1.4% 10/21/16 (f) | | 3,710 | | 3,735 |
2% 10/20/17 (f) | | 5,313 | | 5,383 |
| | 23,701 |
Tobacco - 0.2% |
Altria Group, Inc.: | | | | |
2.85% 8/9/22 | | 4,604 | | 4,504 |
4% 1/31/24 | | 3,615 | | 3,761 |
9.7% 11/10/18 | | 6,258 | | 8,120 |
Reynolds American, Inc.: | | | | |
3.25% 11/1/22 | | 3,376 | | 3,305 |
4.85% 9/15/23 | | 8,000 | | 8,629 |
6.75% 6/15/17 | | 4,975 | | 5,657 |
7.25% 6/15/37 | | 7,569 | | 9,655 |
| | 43,631 |
TOTAL CONSUMER STAPLES | | 83,330 |
ENERGY - 1.4% |
Energy Equipment & Services - 0.1% |
DCP Midstream LLC: | | | | |
4.75% 9/30/21 (f) | | 6,909 | | 7,386 |
5.35% 3/15/20 (f) | | 6,814 | | 7,531 |
El Paso Pipeline Partners Operating Co. LLC: | | | | |
4.1% 11/15/15 | | 7,675 | | 7,956 |
5% 10/1/21 | | 2,791 | | 3,048 |
6.5% 4/1/20 | | 2,608 | | 3,034 |
Noble Holding International Ltd. 3.05% 3/1/16 | | 914 | | 942 |
Transocean, Inc. 5.05% 12/15/16 | | 4,522 | | 4,878 |
| | 34,775 |
Oil, Gas & Consumable Fuels - 1.3% |
Anadarko Petroleum Corp. 6.375% 9/15/17 | | 15,653 | | 17,846 |
Corporate Bonds - continued |
| Principal Amount (000s) | | Value (000s) |
Nonconvertible Bonds - continued |
ENERGY - continued |
Oil, Gas & Consumable Fuels - continued |
DCP Midstream Operating LP: | | | | |
2.5% 12/1/17 | | $ 3,027 | | $ 3,102 |
2.7% 4/1/19 | | 616 | | 624 |
3.875% 3/15/23 | | 1,823 | | 1,865 |
4.95% 4/1/22 | | 1,267 | | 1,399 |
Duke Energy Field Services: | | | | |
5.375% 10/15/15 (f) | | 2,055 | | 2,137 |
6.45% 11/3/36 (f) | | 6,493 | | 7,724 |
El Paso Natural Gas Co. 5.95% 4/15/17 | | 1,572 | | 1,745 |
Enable Midstream Partners LP: | | | | |
2.4% 5/15/19 (f) | | 1,957 | | 1,951 |
3.9% 5/15/24 (f) | | 2,064 | | 2,085 |
Enbridge Energy Partners LP 4.2% 9/15/21 | | 8,103 | | 8,671 |
Gulfstream Natural Gas System LLC 6.95% 6/1/16 (f) | | 780 | | 849 |
Marathon Petroleum Corp. 5.125% 3/1/21 | | 4,415 | | 5,000 |
Midcontinent Express Pipeline LLC 5.45% 9/15/14 (f) | | 7,948 | | 7,956 |
Motiva Enterprises LLC 5.75% 1/15/20 (f) | | 1,252 | | 1,418 |
Nakilat, Inc. 6.067% 12/31/33 (f) | | 2,490 | | 2,801 |
Nexen, Inc.: | | | | |
5.2% 3/10/15 | | 1,528 | | 1,564 |
6.2% 7/30/19 | | 2,252 | | 2,627 |
Pemex Project Funding Master Trust 5.75% 3/1/18 | | 25,063 | | 28,121 |
Petrobras Global Finance BV: | | | | |
3% 1/15/19 | | 29,822 | | 29,386 |
3.25% 3/17/17 | | 12,657 | | 12,946 |
4.375% 5/20/23 | | 4,137 | | 4,082 |
4.875% 3/17/20 | | 12,657 | | 13,146 |
Petrobras International Finance Co. Ltd.: | | | | |
3.875% 1/27/16 | | 7,288 | | 7,492 |
5.375% 1/27/21 | | 12,572 | | 13,255 |
5.75% 1/20/20 | | 17,949 | | 19,348 |
7.875% 3/15/19 | | 7,382 | | 8,600 |
Petroleos Mexicanos: | | | | |
3.5% 7/18/18 | | 8,047 | | 8,409 |
3.5% 1/30/23 | | 5,005 | | 4,960 |
4.875% 1/24/22 | | 1,430 | | 1,554 |
4.875% 1/18/24 | | 2,251 | | 2,449 |
4.875% 1/18/24 (f) | | 4,770 | | 5,190 |
5.5% 1/21/21 | | 7,423 | | 8,351 |
Corporate Bonds - continued |
| Principal Amount (000s) | | Value (000s) |
Nonconvertible Bonds - continued |
ENERGY - continued |
Oil, Gas & Consumable Fuels - continued |
Petroleos Mexicanos: - continued | | | | |
5.5% 6/27/44 | | $ 19,723 | | $ 21,395 |
6% 3/5/20 | | 3,327 | | 3,818 |
6.375% 1/23/45 (f) | | 7,506 | | 9,082 |
6.5% 6/2/41 | | 8,420 | | 10,272 |
Phillips 66 Co.: | | | | |
1.95% 3/5/15 | | 1,844 | | 1,857 |
2.95% 5/1/17 | | 1,844 | | 1,926 |
4.3% 4/1/22 | | 6,383 | | 6,918 |
Plains All American Pipeline LP/PAA Finance Corp. 6.125% 1/15/17 | | 1,940 | | 2,162 |
Southeast Supply Header LLC 4.25% 6/15/24 (f) | | 5,790 | | 5,977 |
Spectra Energy Capital, LLC 5.65% 3/1/20 | | 1,087 | | 1,225 |
Spectra Energy Partners, LP: | | | | |
2.95% 6/15/16 | | 1,472 | | 1,524 |
4.6% 6/15/21 | | 1,816 | | 1,993 |
Suncor Energy, Inc. 6.1% 6/1/18 | | 623 | | 718 |
The Williams Companies, Inc.: | | | | |
3.7% 1/15/23 | | 1,899 | | 1,822 |
4.55% 6/24/24 | | 17,216 | | 17,340 |
Western Gas Partners LP 5.375% 6/1/21 | | 10,614 | | 12,064 |
Williams Partners LP 4.3% 3/4/24 | | 4,754 | | 4,973 |
| | 343,719 |
TOTAL ENERGY | | 378,494 |
FINANCIALS - 5.8% |
Banks - 2.6% |
Associated Banc Corp. 5.125% 3/28/16 | | 2,238 | | 2,366 |
Banco Nacional de Desenvolvimento Economico e Social: | | | | |
4% 4/14/19 (f) | | 16,318 | | 16,726 |
5.5% 7/12/20 (f) | | 20,348 | | 22,205 |
6.5% 6/10/19 (f) | | 2,097 | | 2,362 |
Bank of America Corp.: | | | | |
1.35% 11/21/16 | | 5,398 | | 5,415 |
2.6% 1/15/19 | | 43,489 | | 43,913 |
2.65% 4/1/19 | | 14,468 | | 14,615 |
3.875% 3/22/17 | | 944 | | 1,002 |
Corporate Bonds - continued |
| Principal Amount (000s) | | Value (000s) |
Nonconvertible Bonds - continued |
FINANCIALS - continued |
Banks - continued |
Bank of America Corp.: - continued | | | | |
4.2% 8/26/24 | | $ 7,745 | | $ 7,863 |
6.5% 8/1/16 | | 1,220 | | 1,341 |
Bank of America NA 5.3% 3/15/17 | | 16,651 | | 18,158 |
Barclays Bank PLC 2.5% 2/20/19 | | 4,000 | | 4,065 |
BB&T Corp. 3.95% 3/22/22 | | 1,805 | | 1,922 |
Capital One NA 2.95% 7/23/21 | | 8,837 | | 8,851 |
Citigroup, Inc.: | | | | |
1.3% 11/15/16 | | 663 | | 665 |
1.75% 5/1/18 | | 21,658 | | 21,556 |
2.5% 7/29/19 | | 22,812 | | 22,903 |
2.55% 4/8/19 | | 24,266 | | 24,504 |
4.05% 7/30/22 | | 17,500 | | 18,039 |
4.45% 1/10/17 | | 15,842 | | 16,984 |
5.3% 5/6/44 | | 12,873 | | 13,817 |
6% 8/15/17 | | 15,053 | | 16,922 |
6.125% 11/21/17 | | 17,419 | | 19,758 |
Comerica, Inc. 4.8% 5/1/15 | | 1,223 | | 1,258 |
Credit Suisse AG 6% 2/15/18 | | 17,158 | | 19,376 |
Credit Suisse New York Branch 5.4% 1/14/20 | | 1,450 | | 1,633 |
Discover Bank: | | | | |
7% 4/15/20 | | 4,144 | | 4,965 |
8.7% 11/18/19 | | 745 | | 938 |
Fifth Third Bancorp: | | | | |
3.5% 3/15/22 | | 638 | | 662 |
4.5% 6/1/18 | | 584 | | 635 |
5.45% 1/15/17 | | 4,032 | | 4,403 |
HBOS PLC 6.75% 5/21/18 (f) | | 560 | | 642 |
HSBC Holdings PLC 4.25% 3/14/24 | | 3,415 | | 3,546 |
Huntington Bancshares, Inc. 7% 12/15/20 | | 3,353 | | 4,038 |
Huntington National Bank: | | | | |
1.3% 11/20/16 | | 4,131 | | 4,148 |
2.2% 4/1/19 | | 3,200 | | 3,202 |
Intesa Sanpaolo SpA: | | | | |
2.375% 1/13/17 | | 18,700 | | 18,945 |
3.125% 1/15/16 | | 20,275 | | 20,800 |
JPMorgan Chase & Co.: | | | | |
2% 8/15/17 | | 27,274 | | 27,718 |
2.35% 1/28/19 | | 49,249 | | 49,726 |
Corporate Bonds - continued |
| Principal Amount (000s) | | Value (000s) |
Nonconvertible Bonds - continued |
FINANCIALS - continued |
Banks - continued |
JPMorgan Chase & Co.: - continued | | | | |
3.15% 7/5/16 | | $ 1,641 | | $ 1,706 |
JPMorgan Chase Bank 6% 10/1/17 | | 2,460 | | 2,778 |
KeyBank NA 5.45% 3/3/16 | | 3,278 | | 3,500 |
KeyCorp. 5.1% 3/24/21 | | 628 | | 714 |
Marshall & Ilsley Bank: | | | | |
4.85% 6/16/15 | | 5,313 | | 5,480 |
5% 1/17/17 | | 10,492 | | 11,217 |
Regions Bank: | | | | |
6.45% 6/26/37 | | 12,100 | | 14,426 |
7.5% 5/15/18 | | 13,814 | | 16,300 |
Regions Financial Corp.: | | | | |
2% 5/15/18 | | 7,953 | | 7,918 |
5.75% 6/15/15 | | 1,528 | | 1,587 |
7.75% 11/10/14 | | 7,190 | | 7,280 |
Royal Bank of Scotland Group PLC: | | | | |
5.125% 5/28/24 | | 35,482 | | 36,193 |
6% 12/19/23 | | 12,648 | | 13,751 |
6.1% 6/10/23 | | 8,213 | | 8,967 |
6.125% 12/15/22 | | 39,429 | | 43,121 |
Sumitomo Mitsui Banking Corp. 1.3% 1/10/17 | | 6,500 | | 6,513 |
SunTrust Banks, Inc.: | | | | |
2.35% 11/1/18 | | 3,112 | | 3,146 |
3.5% 1/20/17 | | 4,862 | | 5,119 |
Wachovia Bank NA 6% 11/15/17 | | 8,083 | | 9,191 |
Wells Fargo & Co.: | | | | |
4.1% 6/3/26 | | 15,000 | | 15,375 |
4.48% 1/16/24 | | 6,481 | | 6,950 |
| | 693,819 |
Capital Markets - 0.8% |
Affiliated Managers Group, Inc. 4.25% 2/15/24 | | 2,464 | | 2,575 |
Bear Stearns Companies, Inc. 5.3% 10/30/15 | | 1,060 | | 1,116 |
Goldman Sachs Group, Inc.: | | | | |
1.748% 9/15/17 | | 24,600 | | 24,596 |
2.625% 1/31/19 | | 23,560 | | 23,846 |
2.9% 7/19/18 | | 10,319 | | 10,612 |
5.95% 1/18/18 | | 5,343 | | 6,029 |
6.15% 4/1/18 | | 3,993 | | 4,550 |
6.25% 9/1/17 | | 23,534 | | 26,623 |
Corporate Bonds - continued |
| Principal Amount (000s) | | Value (000s) |
Nonconvertible Bonds - continued |
FINANCIALS - continued |
Capital Markets - continued |
Lazard Group LLC: | | | | |
4.25% 11/14/20 | | $ 3,149 | | $ 3,319 |
6.85% 6/15/17 | | 6,480 | | 7,348 |
Merrill Lynch & Co., Inc. 6.4% 8/28/17 | | 5,074 | | 5,764 |
Morgan Stanley: | | | | |
2.125% 4/25/18 | | 18,100 | | 18,209 |
2.375% 7/23/19 | | 13,004 | | 12,976 |
2.5% 1/24/19 | | 43,150 | | 43,646 |
4% 7/24/15 | | 1,373 | | 1,416 |
4.875% 11/1/22 | | 3,413 | | 3,687 |
5.625% 9/23/19 | | 547 | | 625 |
5.95% 12/28/17 | | 301 | | 340 |
6.625% 4/1/18 | | 1,804 | | 2,089 |
State Street Corp. 3.1% 5/15/23 | | 7,500 | | 7,408 |
UBS AG Stamford Branch 2.375% 8/14/19 | | 13,000 | | 13,043 |
| | 219,817 |
Consumer Finance - 0.7% |
Capital One Financial Corp. 2.45% 4/24/19 | | 5,260 | | 5,290 |
Discover Financial Services: | | | | |
3.85% 11/21/22 | | 2,701 | | 2,766 |
5.2% 4/27/22 | | 2,488 | | 2,765 |
6.45% 6/12/17 | | 13,316 | | 14,997 |
Ford Motor Credit Co. LLC: | | | | |
1.5% 1/17/17 | | 19,067 | | 19,107 |
2.375% 3/12/19 | | 19,600 | | 19,618 |
2.5% 1/15/16 | | 16,000 | | 16,348 |
2.875% 10/1/18 | | 11,000 | | 11,325 |
3% 6/12/17 | | 6,246 | | 6,477 |
4.375% 8/6/23 | | 15,332 | | 16,385 |
5% 5/15/18 | | 10,000 | | 11,040 |
5.875% 8/2/21 | | 12,574 | | 14,778 |
General Electric Capital Corp. 4.625% 1/7/21 | | 849 | | 950 |
Hyundai Capital America: | | | | |
1.45% 2/6/17 (f) | | 6,312 | | 6,317 |
1.625% 10/2/15 (f) | | 2,131 | | 2,147 |
1.875% 8/9/16 (f) | | 1,605 | | 1,627 |
2.125% 10/2/17 (f) | | 2,357 | | 2,389 |
2.55% 2/6/19 (f) | | 6,671 | | 6,759 |
Corporate Bonds - continued |
| Principal Amount (000s) | | Value (000s) |
Nonconvertible Bonds - continued |
FINANCIALS - continued |
Consumer Finance - continued |
Hyundai Capital America: - continued | | | | |
2.875% 8/9/18 (f) | | $ 2,848 | | $ 2,938 |
Synchrony Financial: | | | | |
1.875% 8/15/17 | | 1,554 | | 1,566 |
3% 8/15/19 | | 2,283 | | 2,316 |
3.75% 8/15/21 | | 8,466 | | 8,640 |
4.25% 8/15/24 | | 3,469 | | 3,551 |
| | 180,096 |
Diversified Financial Services - 0.1% |
BP Capital Markets PLC: | | | | |
4.5% 10/1/20 | | 1,336 | | 1,474 |
4.742% 3/11/21 | | 6,000 | | 6,726 |
Five Corners Funding Trust 4.419% 11/15/23 (f) | | 9,345 | | 9,975 |
RBS Citizens Financial Group, Inc. 4.15% 9/28/22 (f) | | 6,485 | | 6,585 |
TECO Finance, Inc.: | | | | |
4% 3/15/16 | | 1,828 | | 1,916 |
5.15% 3/15/20 | | 164 | | 185 |
| | 26,861 |
Insurance - 0.6% |
AIA Group Ltd. 2.25% 3/11/19 (f) | | 1,416 | | 1,416 |
American International Group, Inc.: | | | | |
2.375% 8/24/15 | | 16,000 | | 16,317 |
4.875% 6/1/22 | | 4,860 | | 5,455 |
5.6% 10/18/16 | | 5,560 | | 6,077 |
Aon Corp.: | | | | |
3.125% 5/27/16 | | 4,743 | | 4,915 |
3.5% 9/30/15 | | 4,875 | | 5,026 |
5% 9/30/20 | | 129 | | 145 |
Axis Capital Holdings Ltd. 5.75% 12/1/14 | | 452 | | 458 |
Great-West Life & Annuity Insurance Co. 7.153% 5/16/46 (f)(k) | | 2,508 | | 2,596 |
Hartford Financial Services Group, Inc.: | | | | |
4% 10/15/17 | | 1,308 | | 1,406 |
5.125% 4/15/22 | | 1,066 | | 1,218 |
5.375% 3/15/17 | | 685 | | 752 |
Liberty Mutual Group, Inc.: | | | | |
4.25% 6/15/23 (f) | | 6,498 | | 6,762 |
Corporate Bonds - continued |
| Principal Amount (000s) | | Value (000s) |
Nonconvertible Bonds - continued |
FINANCIALS - continued |
Insurance - continued |
Liberty Mutual Group, Inc.: - continued | | | | |
5% 6/1/21 (f) | | $ 8,525 | | $ 9,425 |
Marsh & McLennan Companies, Inc. 4.8% 7/15/21 | | 5,569 | | 6,208 |
Massachusetts Mutual Life Insurance Co. 5.375% 12/1/41 (f) | | 3,576 | | 4,125 |
MetLife, Inc. 6.75% 6/1/16 | | 5,158 | | 5,689 |
Metropolitan Life Global Funding I 1.875% 6/22/18 (f) | | 7,500 | | 7,506 |
Northwestern Mutual Life Insurance Co. 6.063% 3/30/40 (f) | | 4,915 | | 6,240 |
Pacific Life Insurance Co. 9.25% 6/15/39 (f) | | 3,967 | | 6,251 |
Pacific LifeCorp: | | | | |
5.125% 1/30/43 (f) | | 7,709 | | 8,217 |
6% 2/10/20 (f) | | 9,721 | | 11,161 |
Prudential Financial, Inc.: | | | | |
2.3% 8/15/18 | | 888 | | 902 |
4.5% 11/16/21 | | 1,764 | | 1,939 |
7.375% 6/15/19 | | 2,520 | | 3,099 |
Symetra Financial Corp. 6.125% 4/1/16 (f) | | 8,408 | | 8,967 |
Unum Group: | | | | |
5.625% 9/15/20 | | 3,860 | | 4,421 |
5.75% 8/15/42 | | 8,065 | | 9,656 |
7.125% 9/30/16 | | 2,076 | | 2,331 |
| | 148,680 |
Real Estate Investment Trusts - 0.5% |
Alexandria Real Estate Equities, Inc.: | | | | |
2.75% 1/15/20 | | 1,369 | | 1,372 |
4.6% 4/1/22 | | 2,035 | | 2,167 |
American Campus Communities Operating Partnership LP 3.75% 4/15/23 | | 1,759 | | 1,764 |
AvalonBay Communities, Inc. 3.625% 10/1/20 | | 2,800 | | 2,951 |
Boston Properties, Inc. 3.85% 2/1/23 | | 8,081 | | 8,413 |
Camden Property Trust 2.95% 12/15/22 | | 2,417 | | 2,357 |
CommonWealth REIT 5.875% 9/15/20 | | 1,166 | | 1,268 |
DDR Corp.: | | | | |
4.75% 4/15/18 | | 6,131 | | 6,644 |
7.5% 4/1/17 | | 8,836 | | 10,106 |
9.625% 3/15/16 | | 1,851 | | 2,093 |
Developers Diversified Realty Corp. 4.625% 7/15/22 | | 4,470 | | 4,792 |
Corporate Bonds - continued |
| Principal Amount (000s) | | Value (000s) |
Nonconvertible Bonds - continued |
FINANCIALS - continued |
Real Estate Investment Trusts - continued |
Duke Realty LP: | | | | |
3.625% 4/15/23 | | $ 3,152 | | $ 3,141 |
3.875% 10/15/22 | | 5,452 | | 5,594 |
4.375% 6/15/22 | | 3,753 | | 3,970 |
5.5% 3/1/16 | | 3,075 | | 3,272 |
5.95% 2/15/17 | | 3,767 | | 4,155 |
6.75% 3/15/20 | | 1,339 | | 1,594 |
8.25% 8/15/19 | | 2,643 | | 3,315 |
Equity One, Inc.: | | | | |
3.75% 11/15/22 | | 8,200 | | 8,238 |
5.375% 10/15/15 | | 948 | | 994 |
6% 9/15/17 | | 876 | | 974 |
6.25% 1/15/17 | | 663 | | 731 |
Federal Realty Investment Trust: | | | | |
5.9% 4/1/20 | | 1,971 | | 2,293 |
6.2% 1/15/17 | | 501 | | 559 |
HCP, Inc.: | | | | |
3.15% 8/1/22 | | 7,000 | | 6,845 |
3.875% 8/15/24 | | 13,000 | | 13,118 |
4.25% 11/15/23 | | 5,582 | | 5,800 |
Health Care REIT, Inc.: | | | | |
2.25% 3/15/18 | | 2,600 | | 2,634 |
4.125% 4/1/19 | | 13,700 | | 14,769 |
4.7% 9/15/17 | | 843 | | 919 |
HRPT Properties Trust: | | | | |
5.75% 11/1/15 | | 1,731 | | 1,777 |
6.25% 6/15/17 | | 996 | | 1,066 |
6.65% 1/15/18 | | 676 | | 750 |
Lexington Corporate Properties Trust 4.4% 6/15/24 | | 2,249 | | 2,289 |
Omega Healthcare Investors, Inc. 4.95% 4/1/24 (f) | | 2,101 | | 2,170 |
Retail Opportunity Investments Partnership LP 5% 12/15/23 | | 1,140 | | 1,227 |
Weingarten Realty Investors 3.375% 10/15/22 | | 1,228 | | 1,236 |
| | 137,357 |
Real Estate Management & Development - 0.5% |
BioMed Realty LP: | | | | |
2.625% 5/1/19 | | 2,206 | | 2,207 |
3.85% 4/15/16 | | 8,775 | | 9,174 |
Corporate Bonds - continued |
| Principal Amount (000s) | | Value (000s) |
Nonconvertible Bonds - continued |
FINANCIALS - continued |
Real Estate Management & Development - continued |
BioMed Realty LP: - continued | | | | |
4.25% 7/15/22 | | $ 2,970 | | $ 3,089 |
6.125% 4/15/20 | | 2,611 | | 3,019 |
Brandywine Operating Partnership LP: | | | | |
3.95% 2/15/23 | | 7,304 | | 7,405 |
4.95% 4/15/18 | | 4,846 | | 5,250 |
5.7% 5/1/17 | | 309 | | 338 |
6% 4/1/16 | | 2,770 | | 2,965 |
7.5% 5/15/15 | | 776 | | 811 |
Corporate Office Properties LP 3.7% 6/15/21 | | 4,267 | | 4,276 |
Digital Realty Trust LP: | | | | |
4.5% 7/15/15 | | 3,650 | | 3,732 |
5.25% 3/15/21 | | 4,138 | | 4,521 |
ERP Operating LP 5.75% 6/15/17 | | 2,042 | | 2,286 |
Essex Portfolio LP 5.5% 3/15/17 | | 3,921 | | 4,316 |
Liberty Property LP: | | | | |
3.375% 6/15/23 | | 3,313 | | 3,254 |
4.125% 6/15/22 | | 3,219 | | 3,377 |
4.75% 10/1/20 | | 8,747 | | 9,475 |
5.125% 3/2/15 | | 1,672 | | 1,708 |
5.5% 12/15/16 | | 2,529 | | 2,753 |
Mack-Cali Realty LP: | | | | |
2.5% 12/15/17 | | 4,556 | | 4,603 |
3.15% 5/15/23 | | 7,438 | | 6,756 |
4.5% 4/18/22 | | 2,016 | | 2,048 |
5.8% 1/15/16 | | 5,020 | | 5,315 |
7.75% 8/15/19 | | 2,476 | | 2,972 |
Mid-America Apartments LP 4.3% 10/15/23 | | 1,248 | | 1,317 |
Post Apartment Homes LP 3.375% 12/1/22 | | 1,364 | | 1,342 |
Prime Property Funding, Inc. 5.7% 4/15/17 (f) | | 4,226 | | 4,544 |
Reckson Operating Partnership LP 6% 3/31/16 | | 1,949 | | 2,084 |
Regency Centers LP: | | | | |
5.25% 8/1/15 | | 3,893 | | 4,052 |
5.875% 6/15/17 | | 1,771 | | 1,971 |
Tanger Properties LP: | | | | |
3.875% 12/1/23 | | 2,716 | | 2,785 |
6.125% 6/1/20 | | 9,597 | | 11,182 |
Ventas Realty LP: | | | | |
1.25% 4/17/17 | | 3,126 | | 3,122 |
Corporate Bonds - continued |
| Principal Amount (000s) | | Value (000s) |
Nonconvertible Bonds - continued |
FINANCIALS - continued |
Real Estate Management & Development - continued |
Ventas Realty LP: - continued | | | | |
1.55% 9/26/16 | | $ 1,068 | | $ 1,079 |
3.75% 5/1/24 | | 7,900 | | 7,910 |
Ventas Realty LP/Ventas Capital Corp.: | | | | |
2% 2/15/18 | | 4,056 | | 4,084 |
4% 4/30/19 | | 1,999 | | 2,143 |
| | 143,265 |
TOTAL FINANCIALS | | 1,549,895 |
HEALTH CARE - 0.4% |
Biotechnology - 0.2% |
Amgen, Inc.: | | | | |
1.25% 5/22/17 | | 13,051 | | 13,048 |
2.2% 5/22/19 | | 32,376 | | 32,342 |
| | 45,390 |
Health Care Providers & Services - 0.1% |
Coventry Health Care, Inc. 5.95% 3/15/17 | | 1,413 | | 1,573 |
Express Scripts Holding Co.: | | | | |
3.9% 2/15/22 | | 1,915 | | 2,024 |
4.75% 11/15/21 | | 17,355 | | 19,304 |
McKesson Corp. 2.284% 3/15/19 | | 6,400 | | 6,403 |
Medco Health Solutions, Inc.: | | | | |
2.75% 9/15/15 | | 4,158 | | 4,250 |
4.125% 9/15/20 | | 5,031 | | 5,392 |
WellPoint, Inc. 1.875% 1/15/18 | | 195 | | 196 |
| | 39,142 |
Life Sciences Tools & Services - 0.0% |
Thermo Fisher Scientific, Inc.: | | | | |
1.3% 2/1/17 | | 1,745 | | 1,746 |
2.4% 2/1/19 | | 1,100 | | 1,111 |
| | 2,857 |
Pharmaceuticals - 0.1% |
AbbVie, Inc. 1.75% 11/6/17 | | 6,470 | | 6,503 |
Actavis Funding SCS: | | | | |
1.3% 6/15/17 (f) | | 12,949 | | 12,917 |
2.45% 6/15/19 (f) | | 3,839 | | 3,826 |
Corporate Bonds - continued |
| Principal Amount (000s) | | Value (000s) |
Nonconvertible Bonds - continued |
HEALTH CARE - continued |
Pharmaceuticals - continued |
Mylan, Inc. 1.35% 11/29/16 | | $ 2,039 | | $ 2,041 |
Perrigo Co. PLC: | | | | |
1.3% 11/8/16 (f) | | 1,664 | | 1,662 |
2.3% 11/8/18 (f) | | 1,780 | | 1,777 |
Watson Pharmaceuticals, Inc. 1.875% 10/1/17 | | 2,149 | | 2,158 |
Zoetis, Inc. 1.875% 2/1/18 | | 992 | | 992 |
| | 31,876 |
TOTAL HEALTH CARE | | 119,265 |
INDUSTRIALS - 0.1% |
Aerospace & Defense - 0.0% |
BAE Systems Holdings, Inc. 6.375% 6/1/19 (f) | | 5,000 | | 5,855 |
Airlines - 0.0% |
Continental Airlines, Inc.: | | | | |
6.648% 3/15/19 | | 2,117 | | 2,255 |
6.9% 7/2/19 | | 814 | | 871 |
U.S. Airways pass-thru trust certificates: | | | | |
6.85% 1/30/18 | | 1,887 | | 2,040 |
8.36% 1/20/19 | | 1,419 | | 1,575 |
| | 6,741 |
Trading Companies & Distributors - 0.1% |
Air Lease Corp.: | | | | |
3.875% 4/1/21 | | 6,320 | | 6,383 |
4.75% 3/1/20 | | 5,518 | | 5,877 |
| | 12,260 |
TOTAL INDUSTRIALS | | 24,856 |
INFORMATION TECHNOLOGY - 0.0% |
Electronic Equipment & Components - 0.0% |
Tyco Electronics Group SA: | | | | |
1.6% 2/3/15 | | 188 | | 189 |
2.375% 12/17/18 | | 1,262 | | 1,273 |
6.55% 10/1/17 | | 1,119 | | 1,282 |
| | 2,744 |
Corporate Bonds - continued |
| Principal Amount (000s) | | Value (000s) |
Nonconvertible Bonds - continued |
INFORMATION TECHNOLOGY - continued |
IT Services - 0.0% |
Xerox Corp.: | | | | |
2.95% 3/15/17 | | $ 1,143 | | $ 1,189 |
4.25% 2/15/15 | | 1,302 | | 1,324 |
| | 2,513 |
TOTAL INFORMATION TECHNOLOGY | | 5,257 |
MATERIALS - 0.1% |
Construction Materials - 0.0% |
CRH America, Inc. 6% 9/30/16 | | 3,083 | | 3,384 |
Metals & Mining - 0.1% |
Corporacion Nacional del Cobre de Chile (Codelco): | | | | |
3.875% 11/3/21 (f) | | 8,722 | | 9,131 |
4.25% 7/17/42 (f) | | 1,402 | | 1,323 |
5.625% 10/18/43 (f) | | 2,722 | | 3,143 |
| | 13,597 |
TOTAL MATERIALS | | 16,981 |
TELECOMMUNICATION SERVICES - 0.9% |
Diversified Telecommunication Services - 0.9% |
BellSouth Capital Funding Corp. 7.875% 2/15/30 | | 61 | | 83 |
CenturyLink, Inc.: | | | | |
5.15% 6/15/17 | | 487 | | 520 |
6% 4/1/17 | | 3,467 | | 3,753 |
6.15% 9/15/19 | | 4,463 | | 4,876 |
Embarq Corp.: | | | | |
7.082% 6/1/16 | | 4,190 | | 4,609 |
7.995% 6/1/36 | | 36,001 | | 40,497 |
Verizon Communications, Inc.: | | | | |
2.5% 9/15/16 | | 97,018 | | 100,024 |
4.5% 9/15/20 | | 45,631 | | 50,138 |
5.012% 8/21/54 (f) | | 23,143 | | 24,173 |
6.25% 4/1/37 | | 4,611 | | 5,701 |
6.4% 9/15/33 | | 6,073 | | 7,671 |
6.55% 9/15/43 | | 8,436 | | 10,875 |
| | 252,920 |
Corporate Bonds - continued |
| Principal Amount (000s) | | Value (000s) |
Nonconvertible Bonds - continued |
TELECOMMUNICATION SERVICES - continued |
Wireless Telecommunication Services - 0.0% |
America Movil S.A.B. de CV: | | | | |
2.375% 9/8/16 | | $ 371 | | $ 380 |
3.625% 3/30/15 | | 3,102 | | 3,152 |
| | 3,532 |
TOTAL TELECOMMUNICATION SERVICES | | 256,452 |
UTILITIES - 0.8% |
Electric Utilities - 0.6% |
AmerenUE 6.4% 6/15/17 | | 1,518 | | 1,713 |
Duquesne Light Holdings, Inc.: | | | | |
5.9% 12/1/21 (f) | | 5,539 | | 6,513 |
6.4% 9/15/20 (f) | | 11,856 | | 14,030 |
Edison International 3.75% 9/15/17 | | 4,499 | | 4,785 |
FirstEnergy Corp.: | | | | |
2.75% 3/15/18 | | 8,307 | | 8,401 |
4.25% 3/15/23 | | 22,159 | | 22,343 |
7.375% 11/15/31 | | 40,870 | | 49,669 |
FirstEnergy Solutions Corp. 6.05% 8/15/21 | | 12,120 | | 13,472 |
LG&E and KU Energy LLC: | | | | |
2.125% 11/15/15 | | 5,251 | | 5,320 |
3.75% 11/15/20 | | 1,034 | | 1,088 |
Nevada Power Co. 6.5% 8/1/18 | | 2,642 | | 3,106 |
Northeast Utilities 1.45% 5/1/18 | | 1,676 | | 1,660 |
NV Energy, Inc. 6.25% 11/15/20 | | 1,957 | | 2,327 |
Pennsylvania Electric Co. 6.05% 9/1/17 | | 618 | | 695 |
Pepco Holdings, Inc. 2.7% 10/1/15 | | 5,263 | | 5,362 |
Progress Energy, Inc. 4.4% 1/15/21 | | 405 | | 448 |
West Penn Power Co. 5.95% 12/15/17 (f) | | 6,500 | | 7,301 |
| | 148,233 |
Gas Utilities - 0.0% |
Southern Natural Gas Co. 5.9% 4/1/17 (f) | | 357 | | 396 |
Southern Natural Gas Co./Southern Natural Issuing Corp. 4.4% 6/15/21 | | 2,473 | | 2,648 |
Texas Eastern Transmission LP 6% 9/15/17 (f) | | 1,301 | | 1,456 |
| | 4,500 |
Corporate Bonds - continued |
| Principal Amount (000s) | | Value (000s) |
Nonconvertible Bonds - continued |
UTILITIES - continued |
Multi-Utilities - 0.2% |
Dominion Resources, Inc.: | | | | |
2.5341% 9/30/66 (k) | | $ 17,454 | | $ 16,125 |
7.5% 6/30/66 (k) | | 5,485 | | 5,935 |
MidAmerican Energy Holdings, Co. 2% 11/15/18 | | 6,853 | | 6,860 |
National Grid PLC 6.3% 8/1/16 | | 973 | | 1,070 |
NiSource Finance Corp.: | | | | |
4.45% 12/1/21 | | 2,934 | | 3,183 |
5.25% 9/15/17 | | 1,414 | | 1,568 |
5.45% 9/15/20 | | 6,455 | | 7,348 |
6.4% 3/15/18 | | 3,029 | | 3,490 |
6.8% 1/15/19 | | 4,065 | | 4,820 |
PG&E Corp. 2.4% 3/1/19 | | 931 | | 940 |
Puget Energy, Inc. 6% 9/1/21 | | 813 | | 955 |
Wisconsin Energy Corp. 6.25% 5/15/67 (k) | | 4,882 | | 5,071 |
| | 57,365 |
TOTAL UTILITIES | | 210,098 |
TOTAL NONCONVERTIBLE BONDS | | 2,730,139 |
TOTAL CORPORATE BONDS (Cost $2,614,480) |
2,731,668
|
U.S. Treasury Obligations - 3.2% |
|
U.S. Treasury Bills, yield at date of purchase 0.02% to 0.03% 10/23/14 to 11/13/14 (i) | | 8,770 | | 8,770 |
U.S. Treasury Bonds: | | | | |
3.125% 8/15/44 | | 107,581 | | 108,573 |
3.375% 5/15/44 (i)(j) | | 170,942 | | 180,985 |
U.S. Treasury Notes: | | | | |
0.25% 9/30/15 | | 274,803 | | 275,125 |
0.875% 7/15/17 | | 295,900 | | 295,553 |
TOTAL U.S. TREASURY OBLIGATIONS (Cost $855,474) |
869,006
|
U.S. Government Agency - Mortgage Securities - 3.7% |
| Principal Amount (000s) | | Value (000s) |
Fannie Mae - 3.2% |
2.053% 6/1/36 (k) | | $ 155 | | $ 167 |
2.458% 7/1/37 (k) | | 333 | | 357 |
2.5% 11/1/42 to 4/1/43 | | 1,309 | | 1,258 |
3% 9/1/29 (h) | | 6,600 | | 6,841 |
3% 10/1/42 to 10/1/43 | | 37,379 | | 37,269 |
3% 9/1/44 (h) | | 15,200 | | 15,128 |
3% 9/1/44 (h) | | 72,900 | | 72,553 |
3.5% 1/1/34 to 1/1/44 | | 267,795 | | 275,390 |
3.5% 9/1/44 (h) | | 1,500 | | 1,544 |
3.5% 9/1/44 (h) | | 600 | | 618 |
3.5% 9/1/44 (h) | | 54,300 | | 55,893 |
4% 2/1/35 to 11/1/42 | | 27,623 | | 29,374 |
4% 9/1/44 (h) | | 12,300 | | 13,031 |
4% 9/1/44 (h) | | 53,600 | | 56,785 |
4% 9/1/44 (h) | | 17,000 | | 18,010 |
4% 9/1/44 (h) | | 17,100 | | 18,116 |
4% 9/1/44 (h) | | 3,700 | | 3,920 |
4% 10/1/44 (h) | | 5,000 | | 5,280 |
4% 10/1/44 (h) | | 10,800 | | 11,404 |
4% 10/1/44 (h) | | 16,000 | | 16,894 |
4% 10/1/44 (h) | | 17,000 | | 17,950 |
4% 10/1/44 (h) | | 17,100 | | 18,056 |
4.5% 12/1/23 to 8/1/44 (h) | | 29,366 | | 31,761 |
4.5% 9/1/44 (h) | | 33,100 | | 35,740 |
4.5% 10/1/44 (h) | | 26,600 | | 28,651 |
5% 10/1/41 | | 4,305 | | 4,754 |
5% 9/1/44 (h) | | 10,900 | | 12,020 |
5% 9/1/44 (h) | | 16,100 | | 17,755 |
5.5% 9/1/24 to 8/1/37 | | 7,144 | | 7,893 |
5.5% 9/1/44 (h) | | 30,200 | | 33,589 |
5.5% 10/1/44 (h) | | 15,300 | | 16,991 |
6% 6/1/35 to 8/1/37 | | 5,694 | | 6,451 |
6.5% 7/1/32 to 8/1/36 | | 1,139 | | 1,314 |
TOTAL FANNIE MAE | | 872,757 |
Freddie Mac - 0.1% |
3.068% 10/1/35 (k) | | 198 | | 213 |
3.5% 6/1/42 to 10/1/43 | | 16,992 | | 17,427 |
4% 6/1/24 to 11/1/43 | | 4,941 | | 5,253 |
4.5% 7/1/25 to 12/1/40 | | 705 | | 758 |
5% 3/1/19 | | 1,494 | | 1,583 |
U.S. Government Agency - Mortgage Securities - continued |
| Principal Amount (000s) | | Value (000s) |
Freddie Mac - continued |
5.5% 1/1/34 to 3/1/40 | | $ 1,296 | | $ 1,445 |
6% 7/1/37 to 8/1/37 | | 385 | | 433 |
6.5% 3/1/36 | | 838 | | 969 |
TOTAL FREDDIE MAC | | 28,081 |
Ginnie Mae - 0.4% |
3.5% 9/1/44 (h) | | 14,400 | | 14,973 |
3.5% 9/1/44 (h) | | 15,500 | | 16,117 |
4% 9/20/40 to 2/20/41 | | 4,425 | | 4,725 |
4% 9/1/44 (h) | | 3,000 | | 3,196 |
4% 9/1/44 (h) | | 14,900 | | 15,872 |
4.5% 9/1/44 (h) | | 16,600 | | 18,046 |
4.5% 9/1/44 (h) | | 8,500 | | 9,239 |
5% 5/15/39 | | 1,391 | | 1,533 |
5.5% 12/15/31 to 1/15/39 | | 2,818 | | 3,157 |
6% 2/15/34 | | 6,477 | | 7,413 |
TOTAL GINNIE MAE | | 94,271 |
TOTAL U.S. GOVERNMENT AGENCY - MORTGAGE SECURITIES (Cost $985,518) |
995,109
|
Asset-Backed Securities - 0.3% |
|
Accredited Mortgage Loan Trust Series 2005-1 Class M1, 0.625% 4/25/35 (k) | | 729 | | 634 |
ACE Securities Corp. Home Equity Loan Trust Series 2004-HE1 Class M2, 1.805% 3/25/34 (k) | | 328 | | 326 |
AmeriCredit Auto Receivables Trust Series 2013-4: | | | | |
Class C, 2.72% 9/9/19 | | 1,410 | | 1,440 |
Class D, 3.31% 10/8/19 | | 880 | | 897 |
Ameriquest Mortgage Securities, Inc. pass-thru certificates: | | | | |
Series 2003-10 Class M1, 1.205% 12/25/33 (k) | | 63 | | 58 |
Series 2004-R2 Class M3, 0.98% 4/25/34 (k) | | 99 | | 63 |
Series 2005-R2 Class M1, 0.605% 4/25/35 (k) | | 584 | | 582 |
Argent Securities, Inc. pass-thru certificates: | | | | |
Series 2003-W7 Class A2, 0.935% 3/25/34 (k) | | 53 | | 50 |
Series 2004-W11 Class M2, 1.205% 11/25/34 (k) | | 616 | | 592 |
Series 2004-W7 Class M1, 0.98% 5/25/34 (k) | | 1,600 | | 1,550 |
Series 2006-W4 Class A2C, 0.315% 5/25/36 (k) | | 1,314 | | 460 |
Asset-Backed Securities - continued |
| Principal Amount (000s) | | Value (000s) |
Asset Backed Securities Corp. Home Equity Loan Trust: | | | | |
Series 2004-HE2 Class M1, 0.98% 4/25/34 (k) | | $ 2,070 | | $ 1,901 |
Series 2006-HE2 Class M1, 0.525% 3/25/36 (k) | | 29 | | 3 |
Carrington Mortgage Loan Trust Series 2007-RFC1 Class A3, 0.295% 12/25/36 (k) | | 1,978 | | 1,341 |
CFC LLC Series 2013-1A Class A, 1.65% 7/17/17 (f) | | 574 | | 576 |
Countrywide Home Loans, Inc.: | | | | |
Series 2004-3 Class M4, 1.61% 4/25/34 (k) | | 87 | | 62 |
Series 2004-4 Class M2, 0.95% 6/25/34 (k) | | 231 | | 219 |
Series 2004-7 Class AF5, 5.868% 1/25/35 | | 2,173 | | 2,229 |
Fannie Mae Series 2004-T5 Class AB3, 0.9829% 5/28/35 (k) | | 43 | | 40 |
Fieldstone Mortgage Investment Corp. Series 2004-3 Class M5, 2.327% 8/25/34 (k) | | 319 | | 283 |
First Franklin Mortgage Loan Trust Series 2004-FF2 Class M3, 0.98% 3/25/34 (k) | | 16 | | 15 |
Fremont Home Loan Trust Series 2005-A: | | | | |
Class M3, 0.89% 1/25/35 (k) | | 1,041 | | 861 |
Class M4, 1.175% 1/25/35 (k) | | 381 | | 214 |
GCO Education Loan Funding Master Trust II Series 2007-1A Class C1L, 0.6149% 2/25/47 (f)(k) | | 2,028 | | 1,732 |
GE Business Loan Trust: | | | | |
Series 2003-1 Class A, 0.585% 4/15/31 (f)(k) | | 57 | | 55 |
Series 2006-2A: | | | | |
Class A, 0.335% 11/15/34 (f)(k) | | 1,030 | | 979 |
Class B, 0.435% 11/15/34 (f)(k) | | 372 | | 342 |
Class C, 0.535% 11/15/34 (f)(k) | | 618 | | 539 |
Class D, 0.905% 11/15/34 (f)(k) | | 235 | | 202 |
Home Equity Asset Trust: | | | | |
Series 2003-2 Class M1, 1.475% 8/25/33 (k) | | 297 | | 282 |
Series 2003-3 Class M1, 1.445% 8/25/33 (k) | | 558 | | 540 |
Series 2003-5 Class A2, 0.855% 12/25/33 (k) | | 36 | | 34 |
HSI Asset Securitization Corp. Trust Series 2007-HE1 Class 2A3, 0.345% 1/25/37 (k) | | 1,642 | | 1,021 |
JPMorgan Mortgage Acquisition Trust: | | | | |
Series 2006-NC2 Class M2, 0.452% 7/25/36 (k) | | 3,185 | | 548 |
Series 2007-CH1 Class AV4, 0.285% 11/25/36 (k) | | 1,078 | | 1,067 |
KeyCorp Student Loan Trust: | | | | |
Series 1999-A Class A2, 0.5639% 12/27/29 (k) | | 277 | | 276 |
Series 2006-A Class 2C, 1.3839% 3/27/42 (k) | | 2,909 | | 485 |
MASTR Asset Backed Securities Trust Series 2007-HE1 Class M1, 0.455% 5/25/37 (k) | | 508 | | 5 |
Asset-Backed Securities - continued |
| Principal Amount (000s) | | Value (000s) |
Meritage Mortgage Loan Trust Series 2004-1 Class M1, 0.905% 7/25/34 (k) | | $ 131 | | $ 104 |
Merrill Lynch Mortgage Investors Trust: | | | | |
Series 2003-OPT1 Class M1, 1.13% 7/25/34 (k) | | 505 | | 462 |
Series 2006-FM1 Class A2B, 0.265% 4/25/37 (k) | | 775 | | 698 |
Series 2006-OPT1 Class A1A, 0.675% 6/25/35 (k) | | 2,130 | | 2,034 |
Morgan Stanley ABS Capital I Trust: | | | | |
Series 2004-HE6 Class A2, 0.835% 8/25/34 (k) | | 63 | | 58 |
Series 2005-NC1 Class M1, 0.815% 1/25/35 (k) | | 438 | | 416 |
Series 2005-NC2 Class B1, 1.91% 3/25/35 (k) | | 268 | | 9 |
New Century Home Equity Loan Trust Series 2005-4 Class M2, 0.665% 9/25/35 (k) | | 1,566 | | 1,452 |
Park Place Securities, Inc.: | | | | |
Series 2004-WCW1: | | | | |
Class M3, 2.03% 9/25/34 (k) | | 585 | | 524 |
Class M4, 2.33% 9/25/34 (k) | | 750 | | 460 |
Series 2005-WCH1 Class M4, 0.985% 1/25/36 (k) | | 1,620 | | 1,423 |
Salomon Brothers Mortgage Securities VII, Inc. Series 2003-HE1 Class A, 0.955% 4/25/33 (k) | | 6 | | 5 |
Santander Drive Auto Receivables Trust: | | | | |
Series 2014-2 Class C, 2.33% 11/15/19 | | 6,409 | | 6,440 |
Series 2014-3: | | | | |
Class B, 1.45% 5/15/19 | | 22,594 | | 22,537 |
Class C, 2.13% 8/17/20 | | 22,594 | | 22,520 |
Saxon Asset Securities Trust Series 2004-1 Class M1, 0.95% 3/25/35 (k) | | 1,037 | | 948 |
SLM Private Credit Student Loan Trust Series 2004-A Class C, 1.1806% 6/15/33 (k) | | 1,000 | | 964 |
Structured Asset Investment Loan Trust Series 2004-8 Class M5, 1.88% 9/25/34 (k) | | 53 | | 43 |
Terwin Mortgage Trust Series 2003-4HE Class A1, 1.015% 9/25/34 (k) | | 32 | | 28 |
Trapeza CDO XII Ltd./Trapeza CDO XII, Inc. Series 2007-12A Class B, 0.7921% 4/6/42 (f)(k) | | 2,206 | | 993 |
Whinstone Capital Management Ltd. Series 1A Class B3, 2.0341% 10/25/44 (f)(k) | | 1,964 | | 1,983 |
TOTAL ASSET-BACKED SECURITIES (Cost $76,194) |
86,604
|
Collateralized Mortgage Obligations - 0.2% |
| Principal Amount (000s) | | Value (000s) |
Private Sponsor - 0.2% |
Bear Stearns ALT-A Trust floater Series 2005-1 Class A1, 0.715% 1/25/35 (k) | | $ 1,467 | | $ 1,461 |
Citigroup Mortgage Loan Trust sequential payer Series 2012-A Class A, 2.5% 6/25/51 (f) | | 3,521 | | 3,417 |
First Horizon Mortgage pass-thru Trust Series 2004-AR5 Class 2A1, 2.5706% 10/25/34 (k) | | 690 | | 690 |
Granite Master Issuer PLC: | | | | |
floater: | | | | |
Series 2006-1A: | | | | |
Class A1, 0.2255% 12/20/54 (f)(k) | | 4,788 | | 4,745 |
Class A5, 0.2955% 12/20/54 (f)(k) | | 3,856 | | 3,825 |
Series 2006-2 Class A4, 0.2355% 12/20/54 (k) | | 1,429 | | 1,402 |
Series 2006-3: | | | | |
Class A3, 0.2355% 12/20/54 (k) | | 688 | | 682 |
Class A7, 0.3555% 12/20/54 (k) | | 748 | | 742 |
Class M2, 0.7155% 12/20/54 (k) | | 5,460 | | 5,347 |
Series 2006-4: | | | | |
Class A4, 0.2555% 12/20/54 (k) | | 2,193 | | 2,174 |
Class B1, 0.3355% 12/20/54 (k) | | 4,556 | | 4,418 |
Class M1, 0.4955% 12/20/54 (k) | | 1,198 | | 1,159 |
Series 2007-1: | | | | |
Class 1B1, 0.2955% 12/20/54 (k) | | 5,806 | | 5,627 |
Class 1M1, 0.4555% 12/20/54 (k) | | 1,611 | | 1,563 |
Class 2A1, 0.2955% 12/20/54 (k) | | 1,721 | | 1,707 |
Class 2M1, 0.6555% 12/20/54 (k) | | 2,067 | | 2,018 |
Series 2007-2: | | | | |
Class 1B1, 0.315% 12/17/54 (k) | | 767 | | 744 |
Class 2C1, 1.015% 12/17/54 (k) | | 2,864 | | 2,780 |
Class 3A1, 0.335% 12/17/54 (k) | | 307 | | 304 |
sequential payer Series 2006-3 Class B2, 0.4955% 12/20/54 (k) | | 5,461 | | 5,336 |
Granite Mortgages PLC floater Series 2003-3 Class 1C, 2.6836% 1/20/44 (k) | | 472 | | 499 |
JPMorgan Mortgage Trust sequential payer Series 2006-A5 Class 3A5, 2.4718% 8/25/36 (k) | | 1,350 | | 1,155 |
MASTR Adjustable Rate Mortgages Trust Series 2007-3 Class 22A2, 0.365% 5/25/47 (k) | | 559 | | 465 |
Merrill Lynch Alternative Note Asset Trust floater Series 2007-OAR1 Class A1, 0.325% 2/25/37 (k) | | 1,019 | | 924 |
Opteum Mortgage Acceptance Corp. floater Series 2005-3 Class APT, 0.445% 7/25/35 (k) | | 1,463 | | 1,396 |
Collateralized Mortgage Obligations - continued |
| Principal Amount (000s) | | Value (000s) |
Private Sponsor - continued |
RESI Finance LP/RESI Finance DE Corp. floater Series 2003-B: | | | | |
Class B5, 2.507% 6/10/35 (f)(k) | | $ 553 | | $ 507 |
Class B6, 3.007% 6/10/35 (f)(k) | | 118 | | 109 |
Sequoia Mortgage Trust floater Series 2004-6 Class A3B, 1.2054% 7/20/34 (k) | | 29 | | 28 |
Structured Asset Securities Corp. Series 2003-15A Class 4A, 2.5124% 4/25/33 (k) | | 168 | | 169 |
TBW Mortgage-Backed pass-thru certificates floater Series 2006-4 Class A3, 0.355% 9/25/36 (k) | | 2,197 | | 1,975 |
Thornburg Mortgage Securities Trust floater Series 2003-4 Class A1, 0.795% 9/25/43 (k) | | 2,609 | | 2,563 |
TOTAL COLLATERALIZED MORTGAGE OBLIGATIONS (Cost $44,942) |
59,931
|
Commercial Mortgage Securities - 1.9% |
|
Asset Securitization Corp. Series 1997-D5 Class PS1, 1.4206% 2/14/43 (k)(m) | | 421 | | 9 |
Banc of America Commercial Mortgage Trust: | | | | |
sequential payer: | | | | |
Series 2006-2 Class AAB, 5.7129% 5/10/45 (k) | | 368 | | 373 |
Series 2006-3 Class A4, 5.889% 7/10/44 | | 9,288 | | 9,929 |
Series 2006-5 Class A2, 5.317% 9/10/47 | | 2,088 | | 2,095 |
Series 2006-6 Class A3, 5.369% 10/10/45 | | 2,628 | | 2,678 |
Series 2005-3 Class A3B, 5.09% 7/10/43 (k) | | 4,082 | | 4,153 |
Series 2006-6 Class E, 5.619% 10/10/45 (f) | | 759 | | 96 |
Series 2007-3: | | | | |
Class A3, 5.5647% 6/10/49 (k) | | 1,577 | | 1,575 |
Class A4, 5.5647% 6/10/49 (k) | | 2,739 | | 2,986 |
Banc of America Commercial Mortgage, Inc. sequential payer Series 2001-1 Class A4, 5.451% 1/15/49 | | 4,718 | | 5,059 |
Bayview Commercial Asset Trust: | | | | |
floater: | | | | |
Series 2003-2 Class M1, 1.43% 12/25/33 (f)(k) | | 44 | | 39 |
Series 2005-3A: | | | | |
Class A2, 0.555% 11/25/35 (f)(k) | | 395 | | 350 |
Class M1, 0.595% 11/25/35 (f)(k) | | 52 | | 38 |
Class M2, 0.645% 11/25/35 (f)(k) | | 66 | | 48 |
Class M3, 0.665% 11/25/35 (f)(k) | | 59 | | 42 |
Class M4, 0.755% 11/25/35 (f)(k) | | 73 | | 50 |
Commercial Mortgage Securities - continued |
| Principal Amount (000s) | | Value (000s) |
Bayview Commercial Asset Trust: - continued | | | | |
floater: | | | | |
Series 2005-4A: | | | | |
Class A2, 0.545% 1/25/36 (f)(k) | | $ 1,010 | | $ 886 |
Class B1, 1.555% 1/25/36 (f)(k) | | 47 | | 8 |
Class M1, 0.605% 1/25/36 (f)(k) | | 326 | | 192 |
Class M2, 0.625% 1/25/36 (f)(k) | | 98 | | 55 |
Class M3, 0.655% 1/25/36 (f)(k) | | 143 | | 77 |
Class M4, 0.765% 1/25/36 (f)(k) | | 79 | | 41 |
Class M5, 0.805% 1/25/36 (f)(k) | | 79 | | 31 |
Class M6, 0.855% 1/25/36 (f)(k) | | 84 | | 26 |
Series 2006-1: | | | | |
Class A2, 0.515% 4/25/36 (f)(k) | | 160 | | 140 |
Class M1, 0.535% 4/25/36 (f)(k) | | 57 | | 40 |
Class M2, 0.555% 4/25/36 (f)(k) | | 60 | | 41 |
Class M3, 0.575% 4/25/36 (f)(k) | | 52 | | 38 |
Class M4, 0.675% 4/25/36 (f)(k) | | 29 | | 21 |
Class M5, 0.715% 4/25/36 (f)(k) | | 29 | | 18 |
Class M6, 0.795% 4/25/36 (f)(k) | | 57 | | 39 |
Series 2006-2A: | | | | |
Class M1, 0.465% 7/25/36 (f)(k) | | 144 | | 112 |
Class M2, 0.485% 7/25/36 (f)(k) | | 102 | | 76 |
Class M3, 0.505% 7/25/36 (f)(k) | | 85 | | 59 |
Class M4, 0.575% 7/25/36 (f)(k) | | 57 | | 38 |
Class M5, 0.625% 7/25/36 (f)(k) | | 70 | | 32 |
Series 2006-3A Class M4, 0.585% 10/25/36 (f)(k) | | 66 | | 10 |
Series 2006-4A: | | | | |
Class A2, 0.425% 12/25/36 (f)(k) | | 3,013 | | 2,481 |
Class M1, 0.445% 12/25/36 (f)(k) | | 201 | | 137 |
Class M2, 0.465% 12/25/36 (f)(k) | | 134 | | 58 |
Class M3, 0.495% 12/25/36 (f)(k) | | 135 | | 57 |
Series 2007-1 Class A2, 0.425% 3/25/37 (f)(k) | | 629 | | 459 |
Series 2007-2A: | | | | |
Class A1, 0.425% 7/25/37 (f)(k) | | 648 | | 562 |
Class A2, 0.475% 7/25/37 (f)(k) | | 607 | | 442 |
Class M1, 0.525% 7/25/37 (f)(k) | | 212 | | 64 |
Class M2, 0.565% 7/25/37 (f)(k) | | 117 | | 15 |
Class M3, 0.645% 7/25/37 (f)(k) | | 118 | | 8 |
Class M4, 0.805% 7/25/37 (f)(k) | | 4 | | 0 * |
Series 2007-3: | | | | |
Class A2, 0.445% 7/25/37 (f)(k) | | 625 | | 454 |
Class M1, 0.465% 7/25/37 (f)(k) | | 125 | | 80 |
Class M2, 0.495% 7/25/37 (f)(k) | | 133 | | 76 |
Class M3, 0.525% 7/25/37 (f)(k) | | 209 | | 78 |
Commercial Mortgage Securities - continued |
| Principal Amount (000s) | | Value (000s) |
Bayview Commercial Asset Trust: - continued | | | | |
floater: | | | | |
Series 2007-3: | | | | |
Class M4, 0.655% 7/25/37 (f)(k) | | $ 328 | | $ 71 |
Class M5, 0.755% 7/25/37 (f)(k) | | 164 | | 27 |
Series 2007-4A: | | | | |
Class M1, 1.102% 9/25/37 (f)(k) | | 253 | | 52 |
Class M2, 1.202% 9/25/37 (f)(k) | | 207 | | 18 |
Series 2004-1, Class IO, 1.25% 4/25/34 (f)(m) | | 1,491 | | 61 |
Series 2006-3A, Class IO, 0% 10/25/36 (f)(k)(m) | | 19,644 | | 0 |
Series 2007-5A, Class IO, 4.186% 10/25/37 (f)(k)(m) | | 4,053 | | 168 |
Bear Stearns Commercial Mortgage Securities Trust: | | | | |
floater Series 2007-BBA8: | | | | |
Class H, 0.705% 3/15/22 (f)(k) | | 197 | | 197 |
Class J, 0.855% 3/15/22 (f)(k) | | 653 | | 641 |
sequential payer: | | | | |
Series 2007-PW16: | | | | |
Class A4, 5.7071% 6/11/40 (k) | | 769 | | 844 |
Class AAB, 5.8973% 6/11/40 (k) | | 3,634 | | 3,735 |
Series 2007-PW18 Class A4, 5.7% 6/11/50 | | 5,820 | | 6,444 |
Series 2006-T22 Class A4, 5.5723% 4/12/38 (k) | | 158 | | 166 |
Series 2007-PW18 Class X2, 0.2917% 6/11/50 (f)(k)(m) | | 66,684 | | 318 |
Series 2007-T28 Class X2, 0.1374% 9/11/42 (f)(k)(m) | | 40,940 | | 82 |
C-BASS Trust floater Series 2006-SC1 Class A, 0.425% 5/25/36 (f)(k) | | 509 | | 495 |
CDC Commercial Mortgage Trust Series 2002-FX1 Class XCL, 1.4379% 5/15/35 (f)(k)(m) | | 2,765 | | 16 |
Citigroup Commercial Mortgage Trust Series 2007-C6 Class A4, 5.7096% 12/10/49 (k) | | 4,371 | | 4,818 |
Citigroup/Deutsche Bank Commercial Mortgage Trust sequential payer Series 2007-CD4: | | | | |
Class A3, 5.293% 12/11/49 | | 854 | | 867 |
Class A4, 5.322% 12/11/49 | | 19,611 | | 21,144 |
Cobalt CMBS Commercial Mortgage Trust Series 2007-C2 Class B, 5.617% 4/15/47 (k) | | 1,468 | | 1,419 |
COMM Mortgage Trust pass-thru certificates: | | | | |
floater Series 2005-F10A Class J, 1.005% 4/15/17 (f)(k) | | 138 | | 139 |
sequential payer Series 2007-C9 Class A4, 5.7961% 12/10/49 (k) | | 2,907 | | 3,220 |
Credit Suisse Commercial Mortgage Trust: | | | | |
sequential payer: | | | | |
Series 2006-C4 Class A3, 5.467% 9/15/39 | | 1,382 | | 1,476 |
Commercial Mortgage Securities - continued |
| Principal Amount (000s) | | Value (000s) |
Credit Suisse Commercial Mortgage Trust: - continued | | | | |
sequential payer: | | | | |
Series 2007-C2 Class A2, 5.448% 1/15/49 (k) | | $ 25 | | $ 25 |
Series 2007-C3 Class A4, 5.7022% 6/15/39 (k) | | 498 | | 536 |
Series 2007-C5 Class A4, 5.695% 9/15/40 (k) | | 1,189 | | 1,302 |
Credit Suisse First Boston Mortgage Capital Certificates floater Series 2007-TF2A Class B, 0.505% 4/15/22 (f)(k) | | 4,688 | | 4,595 |
Credit Suisse First Boston Mortgage Securities Corp.: | | | | |
Series 2001-CK6 Class AX, 1.463% 8/15/36 (k)(m) | | 55 | | 0 * |
Series 2001-CKN5 Class AX, 0% 9/15/34 (f)(k)(m) | | 5 | | 0 * |
Credit Suisse Mortgage Capital Certificates: | | | | |
floater Series 2007-TFL1 Class F, 0.475% 2/15/22 (f)(k) | | 60 | | 60 |
Series 2007-C1 Class B, 5.487% 2/15/40 (f)(k) | | 2,009 | | 251 |
Extended Stay America Trust floater Series 2013-ESFL: | | | | |
Class A1FL, 0.956% 12/5/31 (f)(k) | | 1,416 | | 1,416 |
Class A2FL, 0.856% 12/5/31 (f)(k) | | 1,520 | | 1,520 |
Class BFL, 1.256% 12/5/31 (f)(k) | | 5,610 | | 5,614 |
Class CFL, 1.656% 12/5/31 (f)(k) | | 3,980 | | 3,984 |
GE Capital Commercial Mortgage Corp.: | | | | |
sequential payer Series 2007-C1 Class A4, 5.543% 12/10/49 | | 16,649 | | 17,952 |
Series 2001-1 Class X1, 1.6605% 5/15/33 (f)(k)(m) | | 117 | | 0 * |
Greenwich Capital Commercial Funding Corp.: | | | | |
sequential payer Series 2007-GG9 Class A4, 5.444% 3/10/39 | | 33,895 | | 36,673 |
Series 2006-GG7 Class A4, 5.8189% 7/10/38 (k) | | 4,417 | | 4,705 |
Series 2007-GG11 Class A1, 0.2924% 12/10/49 (f)(k)(m) | | 18,573 | | 0 * |
GS Mortgage Securities Trust sequential payer Series 2006-GG8: | | | | |
Class A1A, 5.547% 11/10/39 | | 2,591 | | 2,787 |
Class A4, 5.56% 11/10/39 (k) | | 4,713 | | 5,059 |
Hilton U.S.A. Trust Series 2013-HLT: | | | | |
Class CFX, 3.7141% 11/5/30 (f) | | 1,380 | | 1,406 |
Class DFX, 4.4065% 11/5/30 (f) | | 12,899 | | 13,206 |
JPMorgan Chase Commercial Mortgage Securities Trust: | | | | |
floater: | | | | |
Series 2006-FL2A: | | | | |
Class E, 0.435% 11/15/18 (f)(k) | | 164 | | 163 |
Class F, 0.485% 11/15/18 (f)(k) | | 383 | | 372 |
Class G, 0.515% 11/15/18 (f)(k) | | 332 | | 314 |
Class H, 0.655% 11/15/18 (f)(k) | | 255 | | 239 |
Commercial Mortgage Securities - continued |
| Principal Amount (000s) | | Value (000s) |
JPMorgan Chase Commercial Mortgage Securities Trust: - continued | | | | |
floater: | | | | |
Series 2014-BXH: | | | | |
Class C, 1.806% 4/15/27 (f)(k) | | $ 2,117 | | $ 2,117 |
Class D, 2.406% 4/15/27 (f)(k) | | 4,512 | | 4,512 |
sequential payer: | | | | |
Series 2006-CB17: | | | | |
Class A3, 5.45% 12/12/43 | | 63 | | 63 |
Class A4, 5.429% 12/12/43 | | 8,980 | | 9,589 |
Series 2006-LDP8: | | | | |
Class A1A, 5.397% 5/15/45 | | 11,427 | | 12,271 |
Class A4, 5.399% 5/15/45 | | 810 | | 864 |
Series 2006-LDP9 Class A3, 5.336% 5/15/47 | | 11,113 | | 11,952 |
Series 2007-CB18 Class A4, 5.44% 6/12/47 | | 688 | | 744 |
Series 2007-CB19 Class A4, 5.7029% 2/12/49 (k) | | 4,648 | | 5,084 |
Series 2007-LD11: | | | | |
Class A2, 5.79% 6/15/49 (k) | | 130 | | 130 |
Class A4, 5.805% 6/15/49 (k) | | 34,884 | | 37,932 |
Series 2007-LDPX Class A3, 5.42% 1/15/49 | | 17,495 | | 18,937 |
Series 2006-LDP7 Class A4, 5.8657% 4/15/45 (k) | | 1,740 | | 1,855 |
Series 2007-LDP10 Class CS, 5.466% 1/15/49 (k) | | 108 | | 13 |
LB Commercial Conduit Mortgage Trust sequential payer Series 2007-C3 Class A4, 5.8927% 7/15/44 (k) | | 1,054 | | 1,158 |
LB-UBS Commercial Mortgage Trust: | | | | |
sequential payer: | | | | |
Series 2006-C6 Class A4, 5.372% 9/15/39 | | 591 | | 634 |
Series 2006-C7 Class A2, 5.3% 11/15/38 | | 678 | | 698 |
Series 2007-C1 Class A4, 5.424% 2/15/40 | | 4,021 | | 4,356 |
Series 2007-C2 Class A3, 5.43% 2/15/40 | | 2,394 | | 2,607 |
Series 2007-C6 Class A4, 5.858% 7/15/40 (k) | | 1,546 | | 1,645 |
Series 2007-C7: | | | | |
Class A3, 5.866% 9/15/45 | | 2,975 | | 3,309 |
Class XCP, 0.2789% 9/15/45 (k)(m) | | 74,046 | | 53 |
Merrill Lynch Mortgage Trust: | | | | |
Series 2005-LC1 Class F, 5.4208% 1/12/44 (f)(k) | | 1,143 | | 1,088 |
Series 2007-C1 Class A4, 5.8385% 6/12/50 (k) | | 4,974 | | 5,500 |
Series 2008-C1 Class A4, 5.69% 2/12/51 | | 2,735 | | 3,029 |
Merrill Lynch-CFC Commercial Mortgage Trust: | | | | |
floater Series 2006-4 Class A2FL, 0.276% 12/12/49 (k) | | 65 | | 65 |
sequential payer: | | | | |
Series 2006-4 Class ASB, 5.133% 12/12/49 (k) | | 438 | | 450 |
Commercial Mortgage Securities - continued |
| Principal Amount (000s) | | Value (000s) |
Merrill Lynch-CFC Commercial Mortgage Trust: - continued | | | | |
sequential payer: | | | | |
Series 2007-5: | | | | |
Class A4, 5.378% 8/12/48 | | $ 8,179 | | $ 8,759 |
Class B, 5.479% 8/12/48 | | 3,942 | | 1,883 |
Series 2007-6 Class A4, 5.485% 3/12/51 (k) | | 10,897 | | 11,837 |
Series 2007-7 Class A4, 5.7432% 6/12/50 (k) | | 4,599 | | 5,027 |
Series 2006-4 Class XP, 0.6181% 12/12/49 (k)(m) | | 17,362 | | 30 |
Series 2007-6 Class B, 5.635% 3/12/51 (k) | | 1,314 | | 406 |
Series 2007-7 Class B, 5.7432% 6/12/50 (k) | | 114 | | 5 |
Series 2007-8 Class A3, 5.8831% 8/12/49 (k) | | 1,133 | | 1,247 |
Morgan Stanley Capital I Trust: | | | | |
floater: | | | | |
Series 2006-XLF Class C, 1.355% 7/15/19 (f)(k) | | 393 | | 353 |
Series 2007-XLFA: | | | | |
Class C, 0.315% 10/15/20 (f)(k) | | 754 | | 751 |
Class D, 0.345% 10/15/20 (f)(k) | | 732 | | 727 |
Class E, 0.405% 10/15/20 (f)(k) | | 916 | | 906 |
Class F, 0.455% 10/15/20 (f)(k) | | 550 | | 541 |
Class G, 0.495% 10/15/20 (f)(k) | | 680 | | 662 |
Class H, 0.585% 10/15/20 (f)(k) | | 428 | | 395 |
Class J, 0.735% 10/15/20 (f)(k) | | 247 | | 203 |
sequential payer Series 2007-HQ11 Class A31, 5.439% 2/12/44 (k) | | 137 | | 137 |
Series 2006-IQ11 Class A4, 5.6554% 10/15/42 (k) | | 330 | | 346 |
Series 2006-T23 Class A3, 5.8054% 8/12/41 (k) | | 578 | | 578 |
Series 2007-IQ14: | | | | |
Class A4, 5.692% 4/15/49 (k) | | 10,971 | | 11,986 |
Class AAB, 5.654% 4/15/49 | | 1,892 | | 1,949 |
Class B, 5.722% 4/15/49 (k) | | 323 | | 69 |
Salomon Brothers Mortgage Securities VII, Inc. Series 2006-C2 Class H, 6.308% 7/18/33 (f) | | 185 | | 66 |
Wachovia Bank Commercial Mortgage Trust: | | | | |
floater: | | | | |
Series 2006-WL7A: | | | | |
Class G, 0.515% 9/15/21 (f)(k) | | 977 | | 957 |
Class J, 0.755% 9/15/21 (f)(k) | | 434 | | 417 |
Series 2007-WHL8: | | | | |
Class F, 0.635% 6/15/20 (f)(k) | | 4,581 | | 4,401 |
Class LXR1, 0.855% 6/15/20 (f)(k) | | 162 | | 158 |
sequential payer: | | | | |
Series 2007-C30 Class A5, 5.342% 12/15/43 | | 19,766 | | 21,372 |
Series 2007-C31 Class A4, 5.509% 4/15/47 | | 46,948 | | 50,411 |
Commercial Mortgage Securities - continued |
| Principal Amount (000s) | | Value (000s) |
Wachovia Bank Commercial Mortgage Trust: - continued | | | | |
sequential payer: | | | | |
Series 2007-C33: | | | | |
Class A4, 5.9414% 2/15/51 (k) | | $ 25,300 | | $ 27,439 |
Class A5, 5.9414% 2/15/51 (k) | | 870 | | 960 |
Series 2005-C19 Class B, 4.892% 5/15/44 | | 1,314 | | 1,339 |
Series 2005-C22: | | | | |
Class B, 5.3703% 12/15/44 (k) | | 2,914 | | 2,908 |
Class F, 5.3703% 12/15/44 (f)(k) | | 2,191 | | 600 |
Series 2006-C23 Class A5, 5.416% 1/15/45 (k) | | 7,210 | | 7,587 |
Series 2006-C27 Class A1A, 5.749% 7/15/45 (k) | | 12,088 | | 13,026 |
Series 2007-C30: | | | | |
Class C, 5.483% 12/15/43 (k) | | 3,942 | | 3,760 |
Class D, 5.513% 12/15/43 (k) | | 2,102 | | 1,885 |
Series 2007-C31 Class C, 5.6724% 4/15/47 (k) | | 361 | | 348 |
Series 2007-C31A Class A2, 5.421% 4/15/47 | | 947 | | 947 |
TOTAL COMMERCIAL MORTGAGE SECURITIES (Cost $468,756) |
503,101
|
Municipal Securities - 1.3% |
|
Beaver County Indl. Dev. Auth. Poll. Cont. Rev. Bonds (FirstEnergy Nuclear Generation Corp. Proj.) Series 2005 A, 3.375%, tender 7/1/15 (k) | | 2,300 | | 2,341 |
California Gen. Oblig.: | | | | |
Series 2009, 7.35% 11/1/39 | | 1,255 | | 1,840 |
7.3% 10/1/39 | | 18,960 | | 27,416 |
7.5% 4/1/34 | | 8,780 | | 12,833 |
7.55% 4/1/39 | | 16,130 | | 24,466 |
7.6% 11/1/40 | | 24,550 | | 37,674 |
7.625% 3/1/40 | | 2,920 | | 4,429 |
Chicago Gen. Oblig.: | | | | |
(Taxable Proj.): | | | | |
Series 2008 B, 5.63% 1/1/22 | | 1,360 | | 1,472 |
Series 2010 C1, 7.781% 1/1/35 | | 7,055 | | 8,583 |
Series 2012 B, 5.432% 1/1/42 | | 1,845 | | 1,742 |
6.05% 1/1/29 | | 475 | | 497 |
6.314% 1/1/44 | | 12,665 | | 13,420 |
Illinois Fin. Auth. Rev. Series 2013 A, 4.545% 10/1/18 (o) | | 38,500 | | 39,584 |
Illinois Gen. Oblig.: | | | | |
Series 2003: | | | | |
4.35% 6/1/18 | | 695 | | 730 |
Municipal Securities - continued |
| Principal Amount (000s) | | Value (000s) |
Illinois Gen. Oblig.: - continued | | | | |
Series 2003: | | | | |
5.1% 6/1/33 | | $ 87,365 | | $ 86,749 |
Series 2010, 4.421% 1/1/15 | | 5,980 | | 6,046 |
Series 2010-1, 6.63% 2/1/35 | | 17,960 | | 19,999 |
Series 2010-3: | | | | |
5.547% 4/1/19 | | 185 | | 203 |
6.725% 4/1/35 | | 8,580 | | 9,643 |
7.35% 7/1/35 | | 5,140 | | 6,013 |
Series 2011: | | | | |
4.961% 3/1/16 | | 580 | | 612 |
5.365% 3/1/17 | | 215 | | 233 |
5.665% 3/1/18 | | 8,220 | | 9,108 |
5.877% 3/1/19 | | 18,220 | | 20,379 |
Series 2013: | | | | |
1.28% 12/1/15 | | 4,975 | | 4,983 |
4% 12/1/20 | | 7,040 | | 7,197 |
TOTAL MUNICIPAL SECURITIES (Cost $329,775) |
348,192
|
Foreign Government and Government Agency Obligations - 0.4% |
|
Banco Nacional de Desenvolvimento Economico e Social: | | | | |
3.375% 9/26/16 (f) | | 6,350 | | 6,528 |
5.75% 9/26/23 (f) | | 5,809 | | 6,317 |
6.369% 6/16/18 (f) | | 12,537 | | 13,975 |
Brazilian Federative Republic: | | | | |
4.25% 1/7/25 | | 12,300 | | 12,792 |
5.625% 1/7/41 | | 6,113 | | 6,877 |
Italian Republic: | | | | |
3.125% 1/26/15 | | 10,287 | | 10,391 |
4.5% 1/21/15 | | 7,717 | | 7,835 |
4.75% 1/25/16 | | 7,716 | | 8,124 |
5.375% 6/12/17 | | 4,630 | | 5,107 |
United Mexican States: | | | | |
3.5% 1/21/21 | | 6,500 | | 6,760 |
4% 10/2/23 | | 14,090 | | 14,935 |
4.75% 3/8/44 | | 6,152 | | 6,453 |
TOTAL FOREIGN GOVERNMENT AND GOVERNMENT AGENCY OBLIGATIONS (Cost $101,892) |
106,094
|
Bank Notes - 0.1% |
| Principal Amount (000s) | | Value (000s) |
Discover Bank (Delaware) 3.2% 8/9/21 | | $ 9,774 | | $ 9,806 |
Fifth Third Bank 4.75% 2/1/15 | | 951 | | 967 |
TOTAL BANK NOTES (Cost $10,705) | 10,773 |
Preferred Securities - 0.0% |
|
FINANCIALS - 0.0% |
Diversified Financial Services - 0.0% |
MUFG Capital Finance 1 Ltd. 6.346% (g)(k) (Cost $1,362) | | 1,204 | |
1,309
|
Fixed-Income Funds - 6.1% |
| Shares | | |
Fidelity High Income Central Fund 2 (l) | 6,093,687 | | 721,797 |
Fidelity Mortgage Backed Securities Central Fund (l) | 8,586,627 | | 931,563 |
TOTAL FIXED-INCOME FUNDS (Cost $1,496,732) |
1,653,360
|
Money Market Funds - 3.5% |
| | | |
Fidelity Cash Central Fund, 0.11% (b) | 844,994,639 | | 844,995 |
Fidelity Securities Lending Cash Central Fund, 0.11% (b)(c) | 103,404,572 | | 103,405 |
TOTAL MONEY MARKET FUNDS (Cost $948,400) |
948,400
|
TOTAL INVESTMENT PORTFOLIO - 102.1% (Cost $22,324,358) | 27,514,264 |
NET OTHER ASSETS (LIABILITIES) - (2.1)% | (567,962) |
NET ASSETS - 100% | $ 26,946,302 |
TBA Sale Commitments |
| Principal Amount (000s) | | Value (000s) |
Fannie Mae |
4% 9/1/44 | $ (5,000) | | $ (5,297) |
4% 9/1/44 | (10,800) | | (11,442) |
4% 9/1/44 | (16,000) | | (16,951) |
4% 9/1/44 | (17,000) | | (18,010) |
4% 9/1/44 | (17,100) | | (18,116) |
4% 9/1/44 | (17,000) | | (18,010) |
4% 9/1/44 | (17,100) | | (18,116) |
4% 9/1/44 | (3,700) | | (3,920) |
4.5% 9/1/44 | (26,600) | | (28,721) |
5% 9/1/44 | (4,300) | | (4,742) |
5.5% 9/1/44 | (15,300) | | (17,017) |
TOTAL TBA SALE COMMITMENTS (Proceeds $160,254) | $ (160,342) |
Futures Contracts |
| Expiration Date | | Underlying Face Amount at Value (000s) | | Unrealized Appreciation/
(Depreciation) (000s) |
Purchased |
Equity Index Contracts |
1,810 CME E-mini S&P 500 Index Contracts (United States) | Sept. 2014 | | $ 181,127 | | $ 7,076 |
Sold |
Treasury Contracts |
631 CBOT 5 Year U.S. Treasury Note Contracts | Dec. 2014 | | $ 74,985 | | $ (139) |
| | $ 256,112 | | $ 6,937 |
|
The face value of futures purchased as a percentage of net assets is 0.7% |
The face value of futures sold as a percentage of net assets is 0.3% |
Swaps |
Credit Default Swaps |
Underlying Reference | Rating(1) | Expiration Date | Clearinghouse/Counterparty | Fixed Payment Received/(Paid) | Notional Amount
(2) (000s) | Value (1) (000s) | Upfront Premium Received/(Paid) (000s) | Unrealized Appreciation/(Depreciation)(000s) |
Sell Protection |
Ameriquest Mortgage Securities Inc Series 2004-R11 Class M9 | C | Dec. 2034 | Bank of America | 4.25% | $ 120 | $ (117) | $ 0 | $ (117) |
|
(1) Ratings are presented for credit default swaps in which the Fund has sold protection on the underlying referenced debt. Ratings for an underlying index represent a weighted average of the ratings of all securities included in the index. The credit rating or value can be measures of the current payment/performance risk. Ratings are from Moody's Investors Service, Inc. Where Moody's® ratings are not available, S&P® ratings are disclosed and are indicated as such. All ratings are as of the report date and do not reflect subsequent changes. |
|
(2) The notional amount of each credit default swap where the Fund has sold protection approximates the maximum potential amount of future payments that the Fund could be required to make if a credit event were to occur. |
Legend |
(a) Non-income producing |
(b) Affiliated fund that is generally available only to investment companies and other accounts managed by Fidelity Investments. The rate quoted is the annualized seven-day yield of the fund at period end. A complete unaudited listing of the fund's holdings as of its most recent quarter end is available upon request. In addition, each Fidelity Central Fund's financial statements, which are not covered by the Fund's Report of Independent Registered Public Accounting Firm, are available on the SEC's website or upon request. |
(c) Investment made with cash collateral received from securities on loan. |
(d) Security or a portion of the security is on loan at period end. |
(e) Affiliated company |
(f) Security exempt from registration under Rule 144A of the Securities Act of 1933. These securities may be resold in transactions exempt from registration, normally to qualified institutional buyers. At the end of the period, the value of these securities amounted to $443,178,000 or 1.6% of net assets. |
(g) Security is perpetual in nature with no stated maturity date. |
(h) Security or a portion of the security purchased on a delayed delivery or when-issued basis. |
(i) Security or a portion of the security was pledged to cover margin requirements for futures contracts. At period end, the value of securities pledged amounted to $9,410,000. |
(j) Security or a portion of the security has been segregated as collateral for open bi-lateral over-the-counter (OTC) swaps. At period end, the value of securities pledged amounted to $1,119,000. |
(k) Coupon rates for floating and adjustable rate securities reflect the rates in effect at period end. |
(l) Affiliated fund that is generally available only to investment companies and other accounts managed by Fidelity Investments. A complete unaudited schedule of portfolio holdings for each Fidelity Central Fund is filed with the SEC for the first and third quarters of each fiscal year on Form N-Q and is available upon request or at the SEC's website at www.sec.gov. An unaudited holdings listing for the Fund, which presents direct holdings as well as the pro-rata share of securities and other investments held indirectly through its investment in underlying non-money market Fidelity Central Funds, is available at fidelity.com. In addition, each Fidelity Central Fund's financial statements, which are not covered by the Fund's Report of Independent Registered Public Accounting Firm, are available on the SEC's website or upon request. |
(m) Security represents right to receive monthly interest payments on an underlying pool of mortgages or assets. Principal shown is the outstanding par amount of the pool as of the end of the period. |
(n) Investment is owned by an entity that is treated as a corporation for U.S. tax purposes and is owned by the Fund. |
(o) Restricted securities - Investment in securities not registered under the Securities Act of 1933 (excluding 144A issues). At the end of the period, the value of restricted securities (excluding 144A issues) amounted to $67,372,000 or 0.3% of net assets. |
Additional information on each restricted holding is as follows: |
Security | Acquisition Date | Acquisition Cost (000s) |
Illinois Fin. Auth. Rev. Series 2013 A, 4.545% 10/1/18 | 10/24/13 | $ 38,500 |
Legend Pictures LLC | 9/23/10 | $ 6,428 |
MongoDB, Inc. Series F, 8.00% | 10/2/13 | $ 4,704 |
Xero Ltd. | 10/14/13 | $ 7,124 |
* Amount represents less than $1,000. |
Affiliated Central Funds |
Information regarding fiscal year to date income earned by the Fund from investments in Fidelity Central Funds is as follows: |
Fund | Income earned
(Amounts in thousands) |
Fidelity Cash Central Fund | $ 696 |
Fidelity High Income Central Fund 2 | 41,648 |
Fidelity Mortgage Backed Securities Central Fund | 25,762 |
Fidelity Securities Lending Cash Central Fund | 876 |
Total | $ 68,982 |
Additional information regarding the Fund's fiscal year to date purchases and sales, including the ownership percentage, of the non Money Market Central Funds is as follows: |
Fund
(Amounts in thousands) | Value, beginning of period | Purchases | Sales Proceeds | Value,
end of
period | % ownership, end of
period |
Fidelity High Income Central Fund 2 | $ 656,337 | $ 41,648 | $ - | $ 721,797 | 82.8% |
Fidelity Mortgage Backed Securities Central Fund | 1,402,181 | 25,762 | 530,217 | 931,563 | 8.7% |
Total | $ 2,058,518 | $ 67,410 | $ 530,217 | $ 1,653,360 | |
Other Affiliated Issuers |
An affiliated company is a company in which the Fund has ownership of at least 5% of the voting securities. Fiscal year to date transactions with companies which are or were affiliates are as follows: |
Affiliate
(Amounts in thousands) | Value, beginning of period | Purchases | Sales Proceeds | Dividend Income | Value,
end of
period |
Independence Contract Drilling | $ - | $ 15,015 | $ 1,518 | $ - | $ 14,109 |
Other Information |
The following is a summary of the inputs used, as of August 31, 2014, involving the Fund's assets and liabilities carried at fair value. The inputs or methodology used for valuing securities may not be an indication of the risk associated with investing in those securities. For more information on valuation inputs, and their aggregation into the levels used in the table below, please refer to the Investment Valuation section in the accompanying Notes to Financial Statements. |
Valuation Inputs at Reporting Date: |
Description
(Amounts in thousands) | Total | Level 1 | Level 2 | Level 3 |
Investments in Securities: | | | | |
Equities: | | | | |
Consumer Discretionary | $ 2,448,219 | $ 2,432,765 | $ - | $ 15,454 |
Consumer Staples | 1,780,718 | 1,731,335 | 49,383 | - |
Energy | 2,049,203 | 2,012,396 | 36,807 | - |
Financials | 3,059,047 | 3,059,047 | - | - |
Health Care | 2,754,680 | 2,632,324 | 122,356 | - |
Industrials | 1,781,132 | 1,781,132 | - | - |
Information Technology | 3,518,395 | 3,505,730 | 9,219 | 3,446 |
Materials | 862,664 | 862,664 | - | - |
Telecommunication Services | 381,347 | 381,347 | - | - |
Utilities | 565,312 | 565,312 | - | - |
Corporate Bonds | 2,731,668 | - | 2,731,668 | - |
U.S. Government and Government Agency Obligations | 869,006 | - | 869,006 | - |
U.S. Government Agency - Mortgage Securities | 995,109 | - | 995,109 | - |
Asset-Backed Securities | 86,604 | - | 85,602 | 1,002 |
Collateralized Mortgage Obligations | 59,931 | - | 59,315 | 616 |
Commercial Mortgage Securities | 503,101 | - | 502,479 | 622 |
Municipal Securities | 348,192 | - | 348,192 | - |
Foreign Government and Government Agency Obligations | 106,094 | - | 106,094 | - |
Bank Notes | 10,773 | - | 10,773 | - |
Preferred Securities | 1,309 | - | 1,309 | - |
Fixed-Income Funds | 1,653,360 | 1,653,360 | - | - |
Money Market Funds | 948,400 | 948,400 | - | - |
Total Investments in Securities: | $ 27,514,264 | $ 21,565,812 | $ 5,927,312 | $ 21,140 |
Valuation Inputs at Reporting Date: |
Description
(Amounts in thousands) | Total | Level 1 | Level 2 | Level 3 |
Derivative Instruments: | | | | |
Assets | | | | |
Futures Contracts | $ 7,076 | $ 7,076 | $ - | $ - |
Liabilities | | | | |
Futures Contracts | $ (139) | $ (139) | $ - | $ - |
Swaps | (117) | - | (117) | - |
Total Liabilities | $ (256) | $ (139) | $ (117) | $ - |
Total Derivative Instruments: | $ 6,820 | $ 6,937 | $ (117) | $ - |
Other Financial Instruments: | | | | |
TBA Sale Commitments | $ (160,342) | $ - | $ (160,342) | $ - |
Value of Derivative Instruments |
The following table is a summary of the Fund's value of derivative instruments by primary risk exposure as of August 31, 2014. For additional information on derivative instruments, please refer to the Derivative Instruments section in the accompanying Notes to Financial Statements. |
Primary Risk Exposure /
Derivative Type
(Amounts in thousands) | Value |
| Asset | Liability |
Credit Risk | | |
Swaps (b) | $ - | $ (117) |
Equity Risk | | |
Futures Contracts (a) | 7,076 | - |
Interest Rate Risk | | |
Futures Contracts (a) | - | (139) |
Total Value of Derivatives | $ 7,076 | $ (256) |
(a) Reflects gross cumulative appreciation (depreciation) on futures contracts as presented in the Schedule of Investments. Only the period end receivable or payable for daily variation margin and net unrealized appreciation (depreciation) are presented in the Statement of Assets and Liabilities. |
(b) For bi-lateral OTC swaps, reflects gross value which is presented in the Statement of Assets and Liabilities in the bi-lateral OTC swaps, at value line-items. |
Other Information |
The composition of credit quality ratings as a percentage of net assets is as follows (Unaudited): |
U.S. Government and U.S. Government Agency Obligations | 10.0% |
AAA,AA,A | 4.3% |
BBB | 9.2% |
BB | 1.2% |
B | 1.5% |
CCC,CC,C | 0.4% |
D | 0.0%* |
Not Rated | 0.1% |
Equities | 71.3% |
Short-Term Investments and Net Other Assets | 2.0% |
| 100.0% |
* Amount represents less than 0.1% |
We have used ratings from Moody's Investors Service, Inc. Where Moody's® ratings are not available, we have used S&P® ratings. All ratings are as of the date indicated and do not reflect subsequent changes. |
The information in the above tables is based on the combined investments of the Fund and its pro-rata share of the investments of Fidelity's fixed-income central funds. |
See accompanying notes which are an integral part of the financial statements.
Annual Report
Statement of Assets and Liabilities
Amounts in thousands (except per-share amounts) | August 31, 2014 |
Assets | | |
Investment in securities, at value (including securities loaned of $101,039) - See accompanying schedule: Unaffiliated issuers (cost $19,865,731) | $ 24,898,395 | |
Fidelity Central Funds (cost $2,445,132) | 2,601,760 | |
Other affiliated issuers (cost $13,495) | 14,109 | |
Total Investments (cost $22,324,358) | | $ 27,514,264 |
Cash | | 1,058 |
Foreign currency held at value (cost $220) | | 220 |
Receivable for investments sold, regular delivery | | 161,539 |
Receivable for TBA sale commitments | | 160,254 |
Receivable for fund shares sold | | 18,374 |
Dividends receivable | | 30,305 |
Interest receivable | | 42,744 |
Distributions receivable from Fidelity Central Funds | | 198 |
Receivable for daily variation margin for derivative instruments | | 406 |
Receivable from investment adviser for expense reductions | | 6 |
Other receivables | | 1,264 |
Total assets | | 27,930,632 |
| | |
Liabilities | | |
Payable for investments purchased
Regular delivery | $ 136,813 | |
Delayed delivery | 553,896 | |
TBA sale commitments, at value | 160,342 | |
Payable for fund shares redeemed | 16,933 | |
Bi-lateral OTC swaps, at value | 117 | |
Accrued management fee | 8,814 | |
Other affiliated payables | 2,812 | |
Other payables and accrued expenses | 1,198 | |
Collateral on securities loaned, at value | 103,405 | |
Total liabilities | | 984,330 |
| | |
Net Assets | | $ 26,946,302 |
Net Assets consist of: | | |
Paid in capital | | $ 20,289,722 |
Undistributed net investment income | | 91,293 |
Accumulated undistributed net realized gain (loss) on investments and foreign currency transactions | | 1,368,742 |
Net unrealized appreciation (depreciation) on investments and assets and liabilities in foreign currencies | | 5,196,545 |
Net Assets | | $ 26,946,302 |
See accompanying notes which are an integral part of the financial statements.
Annual Report
Financial Statements - continued
Statement of Assets and Liabilities - continued
Amounts in thousands (except per-share amounts) | August 31, 2014 |
| | |
Balanced:
Net Asset Value, offering price and redemption price per share ($19,574,425 ÷ 802,242 shares) | | $ 24.40 |
| | |
Class K:
Net Asset Value, offering price and redemption price per share ($7,371,877 ÷ 302,133 shares) | | $ 24.40 |
See accompanying notes which are an integral part of the financial statements.
Annual Report
Statement of Operations
Amounts in thousands | Year ended August 31, 2014 |
| | |
Investment Income | | |
Dividends | | $ 299,899 |
Interest | | 183,690 |
Income from Fidelity Central Funds | | 68,982 |
Total income | | 552,571 |
| | |
Expenses | | |
Management fee | $ 100,330 | |
Transfer agent fees | 29,885 | |
Accounting and security lending fees | 2,191 | |
Custodian fees and expenses | 426 | |
Independent trustees' compensation | 104 | |
Appreciation in deferred trustee compensation account | 1 | |
Registration fees | 317 | |
Audit | 162 | |
Legal | 109 | |
Miscellaneous | 192 | |
Total expenses before reductions | 133,717 | |
Expense reductions | (672) | 133,045 |
Net investment income (loss) | | 419,526 |
Realized and Unrealized Gain (Loss) Net realized gain (loss) on: | | |
Investment securities: | | |
Unaffiliated issuers | 1,941,516 | |
Fidelity Central Funds | 1,986 | |
Other affiliated issuers | (2) | |
Foreign currency transactions | (139) | |
Futures contracts | 34,067 | |
Swaps | (8,292) | |
Total net realized gain (loss) | | 1,969,136 |
Change in net unrealized appreciation (depreciation) on: Investment securities | 1,984,504 | |
Assets and liabilities in foreign currencies | (64) | |
Futures contracts | 5,168 | |
Swaps | 9,889 | |
Delayed delivery commitments | (2,238) | |
Total change in net unrealized appreciation (depreciation) | | 1,997,259 |
Net gain (loss) | | 3,966,395 |
Net increase (decrease) in net assets resulting from operations | | $ 4,385,921 |
See accompanying notes which are an integral part of the financial statements.
Annual Report
Financial Statements - continued
Statement of Changes in Net Assets
Amounts in thousands | Year ended
August 31,
2014 | Year ended
August 31,
2013 |
Increase (Decrease) in Net Assets | | |
Operations | | |
Net investment income (loss) | $ 419,526 | $ 379,768 |
Net realized gain (loss) | 1,969,136 | 1,617,924 |
Change in net unrealized appreciation (depreciation) | 1,997,259 | 309,252 |
Net increase (decrease) in net assets resulting
from operations | 4,385,921 | 2,306,944 |
Distributions to shareholders from net investment income | (412,435) | (352,712) |
Distributions to shareholders from net realized gain | (1,179,420) | - |
Total distributions | (1,591,855) | (352,712) |
Share transactions - net increase (decrease) | 1,479,644 | 99,632 |
Total increase (decrease) in net assets | 4,273,710 | 2,053,864 |
| | |
Net Assets | | |
Beginning of period | 22,672,592 | 20,618,728 |
End of period (including undistributed net investment income of $91,293 and undistributed net investment income of $97,655, respectively) | $ 26,946,302 | $ 22,672,592 |
See accompanying notes which are an integral part of the financial statements.
Annual Report
Financial Highlights - Balanced
Years ended August 31, | 2014 | 2013 | 2012 | 2011 | 2010 |
Selected Per-Share Data | | | | | |
Net asset value, beginning of period | $ 21.85 | $ 19.95 | $ 18.17 | $ 16.27 | $ 15.40 |
Income from Investment Operations | | | | | |
Net investment income (loss) B | .38 | .36 | .37 | .35 | .36 |
Net realized and unrealized gain (loss) | 3.68 | 1.88 | 1.76 | 1.91 | .88 |
Total from investment operations | 4.06 | 2.24 | 2.13 | 2.26 | 1.24 |
Distributions from net investment income | (.38) | (.34) | (.35) | (.35) | (.36) |
Distributions from net realized gain | (1.13) | - | - | (.01) | (.01) |
Total distributions | (1.51) | (.34) | (.35) | (.36) | (.37) |
Net asset value, end of period | $ 24.40 | $ 21.85 | $ 19.95 | $ 18.17 | $ 16.27 |
Total ReturnA | 19.46% | 11.32% | 11.89% | 13.88% | 8.06% |
Ratios to Average Net Assets C, E | | | | | |
Expenses before reductions | .56% | .58% | .60% | .61% | .62% |
Expenses net of fee waivers, if any | .56% | .58% | .60% | .61% | .62% |
Expenses net of all reductions | .56% | .57% | .59% | .60% | .61% |
Net investment income (loss) | 1.65% | 1.72% | 1.98% | 1.92% | 2.18% |
Supplemental Data | | | | | |
Net assets, end of period (in millions) | $ 19,574 | $ 16,342 | $ 15,016 | $ 15,602 | $ 16,764 |
Portfolio turnover rateD | 176% | 244%F | 155% | 193%F | 122% |
A Total returns would have been lower if certain expenses had not been reduced during the applicable periods shown.
B Calculated based on average shares outstanding during the period.
C Fees and expenses of any underlying Fidelity Central Funds are not included in the Fund's expense ratio. The Fund indirectly bears its proportionate share of the expenses of any underlying Fidelity Central Funds. Based on their most recent shareholder report date, the expenses of any underlying non-money market Fidelity Central Funds were less than .01%.
D Amount does not include the portfolio activity of any underlying Fidelity Central Funds.
E Expense ratios reflect operating expenses of the class. Expenses before reductions do not reflect amounts reimbursed by the investment adviser or reductions from brokerage service arrangements or reductions from other expense offset arrangements and do not represent the amount paid by the class during periods when reimbursements or reductions occur. Expenses net of fee waivers reflect expenses after reimbursement by the investment adviser but prior to reductions from brokerage service arrangements or other expense offset arrangements. Expenses net of all reductions represent the net expenses paid by the class.
F The portfolio turnover rate excludes liquidations and/or redemptions executed in-kind from Affiliated Central Funds.
See accompanying notes which are an integral part of the financial statements.
Annual Report
Financial Highlights - Class K
Years ended August 31, | 2014 | 2013 | 2012 | 2011 | 2010 |
Selected Per-Share Data | | | | | |
Net asset value, beginning of period | $ 21.85 | $ 19.95 | $ 18.17 | $ 16.27 | $ 15.40 |
Income from Investment Operations | | | | | |
Net investment income (loss) B | .40 | .39 | .40 | .38 | .38 |
Net realized and unrealized gain (loss) | 3.69 | 1.87 | 1.76 | 1.90 | .88 |
Total from investment operations | 4.09 | 2.26 | 2.16 | 2.28 | 1.26 |
Distributions from net investment income | (.40) | (.36) | (.38) | (.38) | (.38) |
Distributions from net realized gain | (1.13) | - | - | (.01) | (.01) |
Total distributions | (1.54)G | (.36) | (.38) | (.38)F | (.39) |
Net asset value, end of period | $ 24.40 | $ 21.85 | $ 19.95 | $ 18.17 | $ 16.27 |
Total ReturnA | 19.59% | 11.45% | 12.03% | 14.04% | 8.23% |
Ratios to Average Net Assets C, E | | | | | |
Expenses before reductions | .46% | .47% | .48% | .48% | .48% |
Expenses net of fee waivers, if any | .46% | .47% | .48% | .48% | .48% |
Expenses net of all reductions | .46% | .46% | .47% | .47% | .47% |
Net investment income (loss) | 1.75% | 1.83% | 2.10% | 2.05% | 2.32% |
Supplemental Data | | | | | |
Net assets, end of period (in millions) | $ 7,372 | $ 6,330 | $ 5,603 | $ 4,102 | $ 2,692 |
Portfolio turnover rateD | 176% | 244% H | 155% | 193%H | 122% |
A Total returns would have been lower if certain expenses had not been reduced during the applicable periods shown.
B Calculated based on average shares outstanding during the period.
C Fees and expenses of any underlying Fidelity Central Funds are not included in the Fund's expense ratio. The Fund indirectly bears its proportionate share of the expenses of any underlying Fidelity Central Funds. Based on their most recent shareholder report date, the expenses of any underlying non-money market Fidelity Central Funds were less than .01%.
D Amount does not include the portfolio activity of any underlying Fidelity Central Funds.
E Expense ratios reflect operating expenses of the class. Expenses before reductions do not reflect amounts reimbursed by the investment adviser or reductions from brokerage service arrangements or reductions from other expense offset arrangements and do not represent the amount paid by the class during periods when reimbursements or reductions occur. Expenses net of fee waivers reflect expenses after reimbursement by the investment adviser but prior to reductions from brokerage service arrangements or other expense offset arrangements. Expenses net of all reductions represent the net expenses paid by the class.
F Total distributions of $.38 per share is comprised of distributions from net investment income of $.376 and distributions from net realized gain of $.008 per share.
G Total distributions of $1.54 per share is comprised of distributions from net investment income of $.401 and distributions from net realized gain of $1.134 per share.
H The portfolio turnover rate excludes liquidations and/or redemptions executed in-kind from Affiliated Central Funds.
See accompanying notes which are an integral part of the financial statements.
Annual Report
Notes to Financial Statements
For the period ended August 31, 2014
(Amounts in thousands except percentages)
1. Organization.
Fidelity Balanced Fund (the Fund) is a fund of Fidelity Puritan Trust (the Trust) and is authorized to issue an unlimited number of shares. The Trust is registered under the Investment Company Act of 1940, as amended (the 1940 Act), as an open-end management investment company organized as a Massachusetts business trust. The Fund offers Balanced and Class K shares, each of which has equal rights as to assets and voting privileges. Each class has exclusive voting rights with respect to matters that affect that class.
2. Investments in Fidelity Central Funds.
The Fund invests in Fidelity Central Funds, which are open-end investment companies generally available only to other investment companies and accounts managed by the investment adviser and its affiliates. The Fund's Schedule of Investments lists each of the Fidelity Central Funds held as of period end, if any, as an investment of the Fund, but does not include the underlying holdings of each Fidelity Central Fund. As an Investing Fund, the Fund indirectly bears its proportionate share of the expenses of the underlying Fidelity Central Funds.
Based on its investment objective, each Fidelity Central Fund may invest or participate in various investment vehicles or strategies that are similar to those of the Fund. These strategies are consistent with the investment objectives of the Fund and may involve certain economic risks which may cause a decline in value of each of the Fidelity Central Funds and thus a decline in the value of the Fund. The Money Market Central Funds seek preservation of capital and current income and are managed by Fidelity Investments Money Management, Inc. (FIMM), an affiliate of the investment adviser. Annualized expenses of the Money Market Central Funds as of their most recent shareholder report date are less than .01%. The following summarizes the Fund's investment in each non-money market Fidelity Central Fund.
Annual Report
2. Investments in Fidelity Central Funds - continued
Fidelity Central Fund | Investment
Manager | Investment
Objective | Investment
Practices | Expense
Ratio* |
Fidelity High Income Central Fund 2 | FMR Co., Inc. (FMRC) | Seeks a high level of income and may also seek capital appreciation by investing primarily in debt securities, preferred stocks, and convertible securities, with an emphasis on lower-quality debt securities. | Loans & Direct Debt Instruments Repurchase Agreements Restricted Securities | less than 0.01% |
Fidelity Mortgage Backed Securities Central Fund | FIMM | Seeks a high level of income by normally investing in investment-grade mortgage-related securities and repurchase agreements for those securities. | Delayed Delivery & When Issued Securities Repurchase Agreements Swaps | less than 0.01% |
* Expenses expressed as a percentage of average net assets and are as of each underlying Central Fund's most recent annual or semi-annual shareholder report.
An unaudited holdings listing for the Fund, which presents direct holdings as well as the pro-rata share of any securities and other investments held indirectly through its investment in underlying non-money market Fidelity Central Funds, is available at fidelity.com. A complete unaudited list of holdings for each Fidelity Central Fund is available upon request or at the Securities and Exchange Commission (the SEC) website at www.sec.gov. In addition, the financial statements of the Fidelity Central Funds which contain the significant accounting policies (including investment valuation policies) of those funds, which are not covered by the Fund's Report of Independent Registered Public Accounting Firm, are available on the SEC website or upon request.
3. Significant Accounting Policies.
The financial statements have been prepared in conformity with accounting principles generally accepted in the United States of America (GAAP), which require management to make certain estimates and assumptions at the date of the financial statements. Actual results could differ from those estimates. Subsequent events, if any, through the date that the financial statements were issued have been evaluated in the preparation of the financial statements. The following summarizes the significant accounting policies of the Fund:
Annual Report
Notes to Financial Statements - continued
(Amounts in thousands except percentages)
3. Significant Accounting Policies - continued
Investment Valuation. Investments are valued as of 4:00 p.m. Eastern time on the last calendar day of the period. In accordance with valuation policies and procedures approved by the Board of Trustees (the Board), the Fund attempts to obtain prices from one or more third party pricing vendors or brokers to value its investments. When current market prices, quotations or currency exchange rates are not readily available or reliable, investments will be fair valued in good faith by the Fidelity Management & Research Company (FMR) Fair Value Committee (the Committee), in accordance with procedures adopted by the Board. Factors used in determining fair value vary by investment type and may include market or investment specific events, changes in interest rates and credit quality. The frequency with which these procedures are used cannot be predicted and they may be utilized to a significant extent. The Committee oversees the Fund's valuation policies and procedures and is responsible for approving and reporting to the Board all fair value determinations.
The Fund categorizes the inputs to valuation techniques used to value its investments into a disclosure hierarchy consisting of three levels as shown below:
Level 1 - quoted prices in active markets for identical investments
Level 2 - other significant observable inputs (including quoted prices for similar investments, interest rates, prepayment speeds, etc.)
Level 3 - unobservable inputs (including the Fund's own assumptions based on the best information available)
Valuation techniques used to value the Fund's investments by major category are as follows:
Equity securities, including restricted securities, for which market quotations are readily available, are valued at the last reported sale price or official closing price as reported by a third party pricing vendor on the primary market or exchange on which they are traded and are categorized as Level 1 in the hierarchy. In the event there were no sales during the day or closing prices are not available, securities are valued at the last quoted bid price or may be valued using the last available price and are generally categorized as Level 2 in the hierarchy. For foreign equity securities, when market or security specific events arise, comparisons to the valuation of American Depositary Receipts (ADRs), futures contracts, Exchange-Traded Funds (ETFs) and certain indexes as well as quoted prices for similar securities may be used and would be categorized as Level 2 in the hierarchy. Utilizing these techniques may result in transfers between Level 1 and Level 2. For equity securities, including restricted securities, where observable inputs are limited, assumptions about market activity and risk are used and these securities may be categorized as Level 3 in the hierarchy.
Annual Report
3. Significant Accounting Policies - continued
Investment Valuation - continued
Debt securities, including restricted securities, are valued based on evaluated prices received from third party pricing vendors or from brokers who make markets in such securities. Corporate bonds, bank notes, foreign government and government agency obligations, municipal securities, preferred securities and U.S. government and government agency obligations are valued by pricing vendors who utilize matrix pricing which considers yield or price of bonds of comparable quality, coupon, maturity and type or by broker-supplied prices. Asset backed securities, collateralized mortgage obligations, commercial mortgage securities and U.S. government agency mortgage securities are valued by pricing vendors who utilize matrix pricing which considers prepayment speed assumptions, attributes of the collateral, yield or price of bonds of comparable quality, coupon, maturity and type or by broker-supplied prices. Swaps are marked-to-market daily based on valuations from third party pricing vendors, registered derivatives clearing organizations (clearinghouses) or broker-supplied valuations. These pricing sources may utilize inputs such as interest rate curves, credit spread curves, default possibilities and recovery rates. When independent prices are unavailable or unreliable, debt securities and swaps may be valued utilizing pricing methodologies which consider similar factors that would be used by third party pricing vendors. Debt securities and swaps are generally categorized as Level 2 in the hierarchy but may be Level 3 depending on the circumstances.
Futures contracts are valued at the settlement price established each day by the board of trade or exchange on which they are traded and are categorized as Level 1 in the hierarchy. Investments in open-end mutual funds, including the Fidelity Central Funds, are valued at their closing net asset value (NAV) each business day and are categorized as Level 1 in the hierarchy. Short-term securities with remaining maturities of sixty days or less may be valued at amortized cost, which approximates fair value, and are categorized as Level 2 in the hierarchy.
Changes in valuation techniques may result in transfers in or out of an assigned level within the disclosure hierarchy. The aggregate value of investments by input level, as of August 31, 2014, is included at the end of the Fund's Schedule of Investments.
Annual Report
Notes to Financial Statements - continued
(Amounts in thousands except percentages)
3. Significant Accounting Policies - continued
Foreign Currency. The Fund may use foreign currency contracts to facilitate transactions in foreign-denominated securities. Gains and losses from these transactions may arise from changes in the value of the foreign currency or if the counterparties do not perform under the contracts' terms.
Foreign-denominated assets, including investment securities, and liabilities are translated into U.S. dollars at the exchange rates at period end. Purchases and sales of investment securities, income and dividends received and expenses denominated in foreign currencies are translated into U.S. dollars at the exchange rate in effect on the transaction date.
The effects of exchange rate fluctuations on investments are included with the net realized and unrealized gain (loss) on investment securities. Other foreign currency transactions resulting in realized and unrealized gain (loss) are disclosed separately.
Investment Transactions and Income. For financial reporting purposes, the Fund's investment holdings and NAV include trades executed through the end of the last business day of the period. The NAV per share for processing shareholder transactions is calculated as of the close of business of the New York Stock Exchange (NYSE), normally 4:00 p.m. Eastern time and includes trades executed through the end of the prior business day. Gains and losses on securities sold are determined on the basis of identified cost and may include proceeds received from litigation. Dividend income is recorded on the ex-dividend date, except for certain dividends from foreign securities where the ex-dividend date may have passed, which are recorded as soon as the Fund is informed of the ex-dividend date. Non-cash dividends included in dividend income, if any, are recorded at the fair market value of the securities received. Income and capital gain distributions from Fidelity Central Funds, if any, are recorded on the ex-dividend date. Distributions received on securities that represent a return of capital or capital gain are recorded as a reduction of cost of investments and/or as a realized gain. Subsequent to ex-dividend date the Fund determines the components of these distributions, based upon receipt of tax filings or other correspondence relating to the underlying investment. Interest income is accrued as earned and includes coupon interest and amortization of premium and accretion of discount on debt securities as applicable. Investment income is recorded net of foreign taxes withheld where recovery of such taxes is uncertain.
Class Allocations and Expenses. Investment income, realized and unrealized capital gains and losses, common expenses of the Fund, and certain fund-level expense reductions, if any, are allocated daily on a pro-rata basis to each class based on the relative net assets of each class to the total net assets of the Fund. Each class differs with respect to transfer agent fees incurred. Certain expense reductions may also differ by class. For the reporting period, the allocated portion of income and expenses to each class as a percent
Annual Report
3. Significant Accounting Policies - continued
Class Allocations and Expenses - continued
of its average net assets may vary due to the timing of recording these transactions in relation to fluctuating net assets of the classes. Expenses directly attributable to a fund are charged to that fund. Expenses attributable to more than one fund are allocated among the respective funds on the basis of relative net assets or other appropriate methods. Expense estimates are accrued in the period to which they relate and adjustments are made when actual amounts are known.
Deferred Trustee Compensation. Under a Deferred Compensation Plan (the Plan), independent Trustees may elect to defer receipt of a portion of their annual compensation. Deferred amounts are invested in a cross-section of Fidelity funds, are marked-to-market and remain in the Fund until distributed in accordance with the Plan. The investment of deferred amounts and the offsetting payable to the Trustees are included in the accompanying Statement of Assets and Liabilities.
Income Tax Information and Distributions to Shareholders. Each year, the Fund intends to qualify as a regulated investment company under Subchapter M of the Internal Revenue Code, including distributing substantially all of its taxable income and realized gains. As a result, no provision for U.S. Federal income taxes is required. As of August 31, 2014, the Fund did not have any unrecognized tax benefits in the financial statements; nor is the Fund aware of any tax positions for which it is reasonably possible that the total amounts of unrecognized tax benefits will significantly change in the next twelve months. The Fund files a U.S. federal tax return, in addition to state and local tax returns as required. The Fund's federal income tax returns are subject to examination by the Internal Revenue Service (IRS) for a period of three fiscal years after they are filed. State and local tax returns may be subject to examination for an additional fiscal year depending on the jurisdiction. Foreign taxes are provided for based on the Fund's understanding of the tax rules and rates that exist in the foreign markets in which it invests.
Distributions are declared and recorded on the ex-dividend date. Income dividends and capital gain distributions are declared separately for each class. Income and capital gain distributions are determined in accordance with income tax regulations, which may differ from GAAP. In addition, the Fund claimed a portion of the payment made to redeeming shareholders as a distribution for income tax purposes.
Capital accounts within the financial statements are adjusted for permanent book-tax differences. These adjustments have no impact on net assets or the results of operations. Capital accounts are not adjusted for temporary book-tax differences which will reverse in a subsequent period.
Annual Report
Notes to Financial Statements - continued
(Amounts in thousands except percentages)
3. Significant Accounting Policies - continued
Income Tax Information and Distributions to Shareholders - continued
Book-tax differences are primarily due to futures contracts, swap agreements, foreign currency transactions, passive foreign investment companies (PFIC), market discount, partnerships (including allocations from Fidelity Central Funds), deferred trustees compensation, and losses deferred due to wash sales.
The federal tax cost of investment securities and unrealized appreciation (depreciation) as of period end were as follows:
Gross unrealized appreciation | $ 5,219,190 |
Gross unrealized depreciation | (199,524) |
Net unrealized appreciation (depreciation) on securities | $ 5,019,666 |
| |
Tax Cost | $ 22,494,598 |
The tax-based components of distributable earnings as of period end were as follows:
Undistributed ordinary income | $ 589,943 |
Undistributed long-term capital gain | $ 1,048,100 |
Net unrealized appreciation (depreciation) on securities and other investments | $ 5,019,368 |
The tax character of distributions paid was as follows:
| August 31, 2014 | August 31, 2013 |
Ordinary Income | $ 496,048 | $ 352,712 |
Long-term Capital Gains | 1,095,807 | - |
Total | $ 1,591,855 | $ 352,712 |
Delayed Delivery Transactions and When-Issued Securities. During the period, the Fund transacted in securities on a delayed delivery or when-issued basis. Payment and delivery may take place after the customary settlement period for that security. The price of the underlying securities and the date when the securities will be delivered and paid for are fixed at the time the transaction is negotiated. The securities purchased on a delayed delivery or when-issued basis are identified as such in the Fund's Schedule of Investments. The Fund may receive compensation for interest forgone in the purchase of
Annual Report
3. Significant Accounting Policies - continued
Delayed Delivery Transactions and When-Issued Securities - continued
a delayed delivery or when-issued security. With respect to purchase commitments, the Fund identifies securities as segregated in its records with a value at least equal to the amount of the commitment. Losses may arise due to changes in the value of the underlying securities or if the counterparty does not perform under the contract's terms, or if the issuer does not issue the securities due to political, economic, or other factors.
To-Be-Announced (TBA) Securities and Mortgage Dollar Rolls. During the period, the Fund transacted in TBA securities that involved buying or selling mortgage-backed securities (MBS) on a forward commitment basis. A TBA transaction typically does not designate the actual security to be delivered and only includes an approximate principal amount; however delivered securities must meet specified terms defined by industry guidelines, including issuer, rate and current principal amount outstanding on underlying mortgage pools. The Fund may enter into a TBA transaction with the intent to take possession of or deliver the underlying MBS, or the Fund may elect to extend the settlement by entering into either a mortgage or reverse mortgage dollar roll. Mortgage dollar rolls are transactions where a fund sells TBA securities and simultaneously agrees to repurchase MBS on a later date at a lower price and with the same counterparty. Reverse mortgage dollar rolls involve the purchase and simultaneous agreement to sell TBA securities on a later date at a lower price. Transactions in mortgage dollar rolls and reverse mortgage dollar rolls are accounted for as purchases and sales and may result in an increase to the Fund's portfolio turnover rate.
Purchases and sales of TBA securities involve risks similar to those discussed above for delayed delivery and when-issued securities. Also, if the counterparty in a mortgage dollar roll or a reverse mortgage dollar roll transaction files for bankruptcy or becomes insolvent, the Fund's right to repurchase or sell securities may be limited. Additionally, when a fund sells TBA securities without already owning or having the right to obtain the deliverable securities (an uncovered forward commitment to sell), it incurs a risk of loss because it could have to purchase the securities at a price that is higher than the price at which it sold them. A fund may be unable to purchase the deliverable securities if the corresponding market is illiquid.
TBA securities subject to a forward commitment to sell at period end are included at the end of the Fund's Schedule of Investments under the caption "TBA Sale Commitments." The proceeds and value of these commitments are reflected in the Fund's Statement of Assets and Liabilities as Receivable for TBA sale commitments and TBA sale commitments, at value, respectively.
Annual Report
Notes to Financial Statements - continued
(Amounts in thousands except percentages)
3. Significant Accounting Policies - continued
Restricted Securities. The Fund may invest in securities that are subject to legal or contractual restrictions on resale. These securities generally may be resold in transactions exempt from registration or to the public if the securities are registered. Disposal of these securities may involve time-consuming negotiations and expense, and prompt sale at an acceptable price may be difficult. Information regarding restricted securities is included at the end of the Fund's Schedule of Investments.
4. Derivative Instruments.
Risk Exposures and the Use of Derivative Instruments. The Fund's investment objective allows the Fund to enter into various types of derivative contracts, including futures contracts and swaps. Derivatives are investments whose value is primarily derived from underlying assets, indices or reference rates and may be transacted on an exchange or over-the-counter (OTC). Derivatives may involve a future commitment to buy or sell a specified asset based on specified terms, to exchange future cash flows at periodic intervals based on a notional principal amount, or for one party to make one or more payments upon the occurrence of specified events in exchange for periodic payments from the other party.
The Fund used derivatives to increase returns, to gain exposure to certain types of assets and to manage exposure to certain risks as defined below. The success of any strategy involving derivatives depends on analysis of numerous economic factors, and if the strategies for investment do not work as intended, the Fund may not achieve its objectives.
The Fund's use of derivatives increased or decreased its exposure to the following risks:
Credit Risk | Credit risk relates to the ability of the issuer of a financial instrument to make further principal or interest payments on an obligation or commitment that it has to the Fund. |
Equity Risk | Equity risk relates to the fluctuations in the value of financial instruments as a result of changes in market prices (other than those arising from interest rate risk or foreign exchange risk), whether caused by factors specific to an individual investment, its issuer, or all factors affecting all instruments traded in a market or market segment. |
Interest Rate Risk | Interest rate risk relates to the fluctuations in the value of interest-bearing securities due to changes in the prevailing levels of market interest rates. |
Annual Report
4. Derivative Instruments - continued
Risk Exposures and the Use of Derivative Instruments - continued
The Fund is also exposed to additional risks from investing in derivatives, such as liquidity risk and counterparty credit risk. Liquidity risk is the risk that the Fund will be unable to close out the derivative in the open market in a timely manner. Counterparty credit risk is the risk that the counterparty will not be able to fulfill its obligation to the Fund. Derivative counterparty credit risk is managed through formal evaluation of the creditworthiness of all potential counterparties. On certain OTC derivatives such as bi-lateral swaps, the Fund attempts to reduce its exposure to counterparty credit risk by entering into an International Swaps and Derivatives Association, Inc. (ISDA) Master Agreement with each of its counterparties. The ISDA Master Agreement gives the Fund the right to terminate all transactions traded under such agreement upon the deterioration in the credit quality of the counterparty beyond specified levels. The ISDA Master Agreement gives each party the right, upon an event of default by the other party or a termination of the agreement, to close out all transactions traded under such agreement and to net amounts owed under each transaction to one net payable by one party to the other. To mitigate counterparty credit risk on bi-lateral OTC derivatives, the Fund receives collateral in the form of cash or securities once the Fund's net unrealized appreciation on outstanding derivative contracts under an ISDA Master Agreement exceeds certain applicable thresholds, subject to certain minimum transfer provisions. The collateral received is held in segregated accounts with the Fund's custodian bank in accordance with the collateral agreements entered into between the Fund, the counterparty and the Fund's custodian bank. The Fund could experience delays and costs in gaining access to the collateral even though it is held by the Fund's custodian bank. The Fund's maximum risk of loss from counterparty credit risk related to bi-lateral OTC derivatives is generally the aggregate unrealized appreciation and unpaid counterparty payments in excess of any collateral pledged by the counterparty to the Fund. The Fund may be required to pledge collateral for the benefit of the counterparties on bi-lateral OTC derivatives in an amount not less than each counterparty's unrealized appreciation on outstanding derivative contracts, subject to certain minimum transfer provisions, and any such pledged collateral is identified in the Schedule of Investments. Exchange-traded futures contracts are not covered by the ISDA Master Agreement; however counterparty credit risk related to exchange-traded futures contracts may be mitigated by the protection provided by the exchange on which they trade.
Investing in derivatives may involve greater risks than investing in the underlying assets directly and, to varying degrees, may involve risk of loss in excess of any initial investment and collateral received and amounts recognized in the Statement of Assets and Liabilities. In addition, there may be the risk that the change in value of the derivative contract does not correspond to the change in value of the underlying instrument.
Annual Report
Notes to Financial Statements - continued
(Amounts in thousands except percentages)
4. Derivative Instruments - continued
Net Realized Gain (Loss) and Change in Net Unrealized Appreciation (Depreciation) on Derivatives. The table below, which reflects the impacts of derivatives on the financial performance of the Fund, summarizes the net realized gain (loss) and change in net unrealized appreciation (depreciation) for derivatives during the period as presented in the Statement of Operations.
Primary Risk Exposure / Derivative Type | Net Realized Gain (Loss) | Change in Net Unrealized Appreciation (Depreciation) |
Credit Risk | | |
Swaps | $ (8,292) | $ 9,889 |
Equity Risk | | |
Futures Contracts | 33,030 | 5,307 |
Interest Rate Risk | | |
Futures Contracts | 1,037 | (139) |
Totals (a) | $ 25,775 | $ 15,057 |
(a) A summary of the value of derivatives by primary risk exposure as of period end is included at the end of the Schedule of Investments.
Futures Contracts. A futures contract is an agreement between two parties to buy or sell a specified underlying instrument for a fixed price at a specified future date. The Fund used futures contracts to manage its exposure to the stock market, bond market and fluctuations in interest rates.
Upon entering into a futures contract, a fund is required to deposit either cash or securities (initial margin) with a clearing broker in an amount equal to a certain percentage of the face value of the contract. Futures contracts are marked-to-market daily and subsequent daily payments (variation margin) are made or received by a fund depending on the daily fluctuations in the value of the futures contracts and are recorded as unrealized appreciation or (depreciation). This receivable and/or payable, if any, is included in daily variation margin for derivative instruments in the Statement of Assets and Liabilities. Realized gain or (loss) is recorded upon the expiration or closing of a futures contract. The net realized gain (loss) and change in net unrealized appreciation (depreciation) on futures contracts during the period is included in the Statement of Operations.
Any open futures contracts at period end are presented in the Schedule of Investments under the caption "Futures Contracts." The underlying face amount at value reflects each contract's exposure to the underlying instrument or index at period end and is representative of volume of activity during the period. Securities deposited to meet initial margin requirements are identified in the Schedule of Investments.
Annual Report
4. Derivative Instruments - continued
Swaps. A swap is a contract between two parties to exchange future cash flows at periodic intervals based on a notional principal amount. A bi-lateral OTC swap is a transaction between a fund and a dealer counterparty where cash flows are exchanged between the two parties for the life of the swap.
Bi-lateral OTC swaps are marked-to-market daily and changes in value are reflected in the Statement of Assets and Liabilities in the bi-lateral OTC swaps at value line items. Any upfront premiums paid or received upon entering a bi-lateral OTC swap to compensate for differences between stated terms of the swap and prevailing market conditions (e.g. credit spreads, interest rates or other factors) are recorded in net unrealized appreciation (depreciation) in the Statement of Assets and Liabilities and amortized to realized gain or (loss) ratably over the term of the swap. Any unamortized upfront premiums are presented in the Schedule of Investments.
Payments are exchanged at specified intervals, accrued daily commencing with the effective date of the contract and recorded as realized gain or (loss). Some swaps may be terminated prior to the effective date and realize a gain or loss upon termination. The net realized gain (loss) and change in net unrealized appreciation (depreciation) on swaps during the period is included in the Statement of Operations.
Any open swaps at period end are included in the Schedule of Investments under the caption "Swaps" and are representative of volume of activity during the period.
Credit Default Swaps. Credit default swaps enable the Fund to buy or sell protection against specified credit events on a single-name issuer or a traded credit index. Under the terms of a credit default swap the buyer of protection (buyer) receives credit protection in exchange for making periodic payments to the seller of protection (seller) based on a fixed percentage applied to a notional principal amount. In return for these payments, the seller will be required to make a payment upon the occurrence of one or more specified credit events. The Fund enters into credit default swaps as a seller to gain credit exposure to an issuer and/or as a buyer to obtain a measure of protection against defaults of an issuer. Periodic payments are made over the life of the contract by the buyer provided that no credit event occurs.
For credit default swaps on most corporate and sovereign issuers, credit events include bankruptcy, failure to pay or repudiation/moratorium. For credit default swaps on corporate or sovereign issuers, the obligation that may be put to the seller is not limited to the specific reference obligation described in the Schedule of Investments. For credit default swaps on asset-backed securities, a credit event may be triggered by events such as failure to pay principal, maturity extension, rating downgrade or write-down. For credit default swaps on asset-backed securities, the reference obligation described
Annual Report
Notes to Financial Statements - continued
(Amounts in thousands except percentages)
4. Derivative Instruments - continued
Credit Default Swaps - continued
represents the security that may be put to the seller. For credit default swaps on a traded credit index, a specified credit event may affect all or individual underlying securities included in the index.
As a seller, if an underlying credit event occurs, the Fund will pay a net settlement amount of cash equal to the notional amount of the swap less the recovery value of the reference obligation or underlying securities comprising an index. Only in the event of the industry's inability to value the underlying asset will the Fund be required to take delivery of the reference obligation or underlying securities comprising an index and pay an amount equal to the notional amount of the swap.
As a buyer, if an underlying credit event occurs, the Fund will receive a net settlement amount of cash equal to the notional amount of the swap less the recovery value of the reference obligation or underlying securities comprising an index. Only in the event of the industry's inability to value the underlying asset will the Fund be required to deliver the reference obligation or underlying securities comprising an index in exchange for payment of an amount equal to the notional amount of the swap.
Typically, the value of each credit default swap and credit rating disclosed for each reference obligation in the Schedule of Investments, where the Fund is the seller, can be used as measures of the current payment/performance risk of the swap. As the value of the swap changes as a positive or negative percentage of the total notional amount, the payment/performance risk may decrease or increase, respectively. In addition to these measures, the investment adviser monitors a variety of factors including cash flow assumptions, market activity and market sentiment as part of its ongoing process of assessing payment/performance risk.
5. Purchases and Sales of Investments.
Purchases and sales of securities (including the Fixed-Income Central Funds), other than short-term securities and U.S. government securities, aggregated $15,280,351 and $14,825,305, respectively.
6. Fees and Other Transactions with Affiliates.
Management Fee. Fidelity Management & Research Company (the investment adviser) and its affiliates provide the Fund with investment management related services for which the Fund pays a monthly management fee. The management fee is the sum of an individual fund fee rate that is based on an annual rate of .15% of the Fund's average net assets and an annualized group fee rate that averaged .25% during the
Annual Report
6. Fees and Other Transactions with Affiliates - continued
Management Fee - continued
period. The group fee rate is based upon the average net assets of all the mutual funds advised by the investment adviser, including any mutual funds previously advised by the investment adviser that are currently advised by Fidelity SelectCo, LLC, an affiliate of the investment adviser. The group fee rate decreases as assets under management increase and increases as assets under management decrease. For the reporting period, the total annual management fee rate was .40% of the Fund's average net assets.
Transfer Agent Fees. Fidelity Investments Institutional Operations Company, Inc., (FIIOC), an affiliate of the investment adviser, is the transfer, dividend disbursing and shareholder servicing agent for each class of the Fund. FIIOC receives account fees and asset-based fees that vary according to the account size and type of account of the shareholders of Balanced. FIIOC receives an asset-based fee of Class K's average net assets. FIIOC pays for typesetting, printing and mailing of shareholder reports, except proxy statements.
For the period, transfer agent fees for each class were as follows:
| Amount | % of
Average
Net Assets |
Balanced | $ 26,694 | .15 |
Class K | 3,191 | .05 |
| $ 29,885 | |
Accounting and Security Lending Fees. Fidelity Service Company, Inc. (FSC), an affiliate of the investment adviser, maintains the Fund's accounting records. The accounting fee is based on the level of average net assets for each month. Under a separate contract, FSC administers the security lending program. The security lending fee is based on the number and duration of lending transactions.
Brokerage Commissions. The Fund placed a portion of its portfolio transactions with brokerage firms which are affiliates of the investment adviser. Brokerage commissions are included in net realized gain (loss) and change in net unrealized appreciation (depreciation) in the Statement of Operations. The commissions paid to these affiliated firms were $216 for the period.
Other. During the period, the investment adviser reimbursed the Fund for certain losses in the amount of $3.
Annual Report
Notes to Financial Statements - continued
(Amounts in thousands except percentages)
7. Committed Line of Credit.
The Fund participates with other funds managed by the investment adviser or an affiliate in a $4.25 billion credit facility (the "line of credit") to be utilized for temporary or emergency purposes to fund shareholder redemptions or for other short-term liquidity purposes. The Fund has agreed to pay commitment fees on its pro-rata portion of the line of credit, which amounted to $42 and is reflected in Miscellaneous expenses on the Statement of Operations. During the period, the Fund did not borrow on this line of credit.
8. Security Lending.
The Fund lends portfolio securities from time to time in order to earn additional income. For equity securities, a lending agent is used and may loan securities to certain qualified borrowers, including Fidelity Capital Markets (FCM), a broker-dealer affiliated with the Fund. On the settlement date of the loan, the Fund receives collateral (in the form of U.S. Treasury obligations, letters of credit and/or cash) against the loaned securities and maintains collateral in an amount not less than 100% of the market value of the loaned securities during the period of the loan. The market value of the loaned securities is determined at the close of business of the Fund and any additional required collateral is delivered to the Fund on the next business day. If the borrower defaults on its obligation to return the securities loaned because of insolvency or other reasons, the Fund may apply collateral received from the borrower against the obligation. The Fund may experience delays and costs in recovering the securities loaned. Any cash collateral received is maintained at the Fund's custodian and/or invested in cash equivalents and/or the Fidelity Securities Lending Cash Central Fund. The value of loaned securities and cash collateral at period end are disclosed on the Fund's Statement of Assets and Liabilities. The value of securities loaned to FCM at period end was $7,336. Security lending income represents the income earned on investing cash collateral, less rebates paid to borrowers, plus any premium payments received for lending certain types of securities. Total security lending income during the period, presented in the Statement of Operations as a component of interest income, amounted to $678. Net income from the Fidelity Securities Lending Cash Central Fund during the period, presented in the Statement of Operations as a component of income from Fidelity Central Funds, amounted to $876 (including $41 from securities loaned to FCM).
9. Expense Reductions.
Commissions paid to certain brokers with whom the investment adviser, or its affiliates, places trades on behalf of the Fund include an amount in addition to trade execution, which may be rebated back to the Fund to offset certain expenses. This amount totaled $551 for the period.
In addition, the investment adviser reimbursed a portion of the Fund's operating expenses during the period in the amount of $121.
Annual Report
10. Distributions to Shareholders.
Distributions to shareholders of each class were as follows:
Years ended August 31, | 2014 | 2013 |
From net investment income | | |
Balanced | $ 293,979 | $ 249,039 |
Class K | 118,456 | 103,673 |
Total | $ 412,435 | $ 352,712 |
From net realized gain | | |
Balanced | $ 854,324 | $ - |
Class K | 325,096 | - |
Total | $ 1,179,420 | $ - |
11. Share Transactions.
Transactions for each class of shares were as follows:
| Shares | Dollars |
Years ended August 31, | 2014 | 2013 | 2014 | 2013 |
Balanced | | | | |
Shares sold | 131,812 | 125,541 | $ 3,033,218 | $ 2,652,879 |
Reinvestment of distributions | 49,953 | 11,563 | 1,102,403 | 238,686 |
Shares redeemed | (127,309) | (141,860) | (2,927,201) | (2,965,223) |
Net increase (decrease) | 54,456 | (4,756) | $ 1,208,420 | $ (73,658) |
Class K | | | | |
Shares sold | 59,821 | 69,664 | $ 1,378,995 | $ 1,451,163 |
Reinvestment of distributions | 20,098 | 5,019 | 443,552 | 103,673 |
Shares redeemed | (67,456) | (65,784) | (1,551,323) | (1,381,546) |
Net increase (decrease) | 12,463 | 8,899 | $ 271,224 | $ 173,290 |
12. Other.
The Fund's organizational documents provide former and current trustees and officers with a limited indemnification against liabilities arising in connection with the performance of their duties to the Fund. In the normal course of business, the Fund may also enter into contracts that provide general indemnifications. The Fund's maximum exposure under these arrangements is unknown as this would be dependent on future claims that may be made against the Fund. The risk of material loss from such claims is considered remote.
Annual Report
To the Trustees of Fidelity Puritan Trust and the Shareholders of Fidelity Balanced Fund:
In our opinion, the accompanying statement of assets and liabilities, including the schedule of investments, and the related statements of operations and of changes in net assets and the financial highlights present fairly, in all material respects, the financial position of Fidelity Balanced Fund (a fund of Fidelity Puritan Trust) at August 31, 2014, the results of its operations for the year then ended, the changes in its net assets for each of the two years in the period then ended and the financial highlights for each of the five years in the period then ended, in conformity with accounting principles generally accepted in the United States of America. These financial statements and financial highlights (hereafter referred to as "financial statements") are the responsibility of the Fidelity Balanced Fund's management. Our responsibility is to express an opinion on these financial statements based on our audits. We conducted our audits of these financial statements in accordance with the standards of the Public Company Accounting Oversight Board (United States). Those standards require that we plan and perform the audit to obtain reasonable assurance about whether the financial statements are free of material misstatement. An audit includes examining, on a test basis, evidence supporting the amounts and disclosures in the financial statements, assessing the accounting principles used and significant estimates made by management, and evaluating the overall financial statement presentation. We believe that our audits, which included confirmation of securities at August 31, 2014 by correspondence with the custodian and brokers, provide a reasonable basis for our opinion.
PricewaterhouseCoopers LLP
Boston, Massachusetts
October 21, 2014
Annual Report
The Trustees, Member of the Advisory Board, and officers of the trust and fund, as applicable, are listed below. The Board of Trustees governs the fund and is responsible for protecting the interests of shareholders. The Trustees are experienced executives who meet periodically throughout the year to oversee the fund's activities, review contractual arrangements with companies that provide services to the fund, oversee management of the risks associated with such activities and contractual arrangements, and review the fund's performance. Except for James C. Curvey, each of the Trustees oversees 173 funds. Mr. Curvey oversees 406 funds.
The Trustees hold office without limit in time except that (a) any Trustee may resign; (b) any Trustee may be removed by written instrument, signed by at least two-thirds of the number of Trustees prior to such removal; (c) any Trustee who requests to be retired or who has become incapacitated by illness or injury may be retired by written instrument signed by a majority of the other Trustees; and (d) any Trustee may be removed at any special meeting of shareholders by a two-thirds vote of the outstanding voting securities of the trust. Each Trustee who is not an interested person (as defined in the 1940 Act) of the trust and the fund (Independent Trustee), shall retire not later than the last day of the calendar year in which his or her 75th birthday occurs. The Independent Trustees may waive this mandatory retirement age policy with respect to individual Trustees. The officers and Advisory Board Member hold office without limit in time, except that any officer and Advisory Board Member may resign or may be removed by a vote of a majority of the Trustees at any regular meeting or any special meeting of the Trustees. Except as indicated, each individual has held the office shown or other offices in the same company for the past five years.
Experience, Skills, Attributes, and Qualifications of the Fund's Trustees. The Governance and Nominating Committee has adopted a statement of policy that describes the experience, qualifications, attributes, and skills that are necessary and desirable for potential Independent Trustee candidates (Statement of Policy). The Board believes that each Trustee satisfied at the time he or she was initially elected or appointed a Trustee, and continues to satisfy, the standards contemplated by the Statement of Policy. The Governance and Nominating Committee also engages professional search firms to help identify potential Independent Trustee candidates who have the experience, qualifications, attributes, and skills consistent with the Statement of Policy. From time to time, additional criteria based on the composition and skills of the current Independent Trustees, as well as experience or skills that may be appropriate in light of future changes to board composition, business conditions, and regulatory or other developments, have also been considered by the professional search firms and the Governance and Nominating Committee. In addition, the Board takes into account the Trustees' commitment and participation in Board and committee meetings, as well as their leadership of standing and ad hoc committees throughout their tenure.
In determining that a particular Trustee was and continues to be qualified to serve as a Trustee, the Board has considered a variety of criteria, none of which, in isolation, was controlling. The Board believes that, collectively, the Trustees have balanced and diverse experience, qualifications, attributes, and skills, which allow the Board to operate effectively in governing the fund and protecting the interests of shareholders. Information about the specific experience, skills, attributes, and qualifications of each Trustee, which in each case led to the Board's conclusion that the Trustee should serve (or continue to serve) as a trustee of the fund, is provided below.
Annual Report
Trustees and Officers - continued
Board Structure and Oversight Function. James C. Curvey is an interested person (as defined in the 1940 Act) and currently serves as Chairman. The Trustees have determined that an interested Chairman is appropriate and benefits shareholders because an interested Chairman has a personal and professional stake in the quality and continuity of services provided to the fund. Independent Trustees exercise their informed business judgment to appoint an individual of their choosing to serve as Chairman, regardless of whether the Trustee happens to be independent or a member of management. The Independent Trustees have determined that they can act independently and effectively without having an Independent Trustee serve as Chairman and that a key structural component for assuring that they are in a position to do so is for the Independent Trustees to constitute a substantial majority for the Board. The Independent Trustees also regularly meet in executive session. Ned C. Lautenbach serves as Chairman of the Independent Trustees and as such (i) acts as a liaison between the Independent Trustees and management with respect to matters important to the Independent Trustees and (ii) with management prepares agendas for Board meetings.
Fidelity funds are overseen by different Boards of Trustees. The fund's Board oversees Fidelity's equity and high income funds and another Board oversees Fidelity's investment-grade bond, money market, and asset allocation funds. The asset allocation funds may invest in Fidelity funds overseen by the fund's Board. The use of separate Boards, each with its own committee structure, allows the Trustees of each group of Fidelity funds to focus on the unique issues of the funds they oversee, including common research, investment, and operational issues. On occasion, the separate Boards establish joint committees to address issues of overlapping consequences for the Fidelity funds overseen by each Board.
The Trustees operate using a system of committees to facilitate the timely and efficient consideration of all matters of importance to the Trustees, the fund, and fund shareholders and to facilitate compliance with legal and regulatory requirements and oversight of the fund's activities and associated risks. The Board, acting through its committees, has charged FMR and its affiliates with (i) identifying events or circumstances the occurrence of which could have demonstrably adverse effects on the fund's business and/or reputation; (ii) implementing processes and controls to lessen the possibility that such events or circumstances occur or to mitigate the effects of such events or circumstances if they do occur; and (iii) creating and maintaining a system designed to evaluate continuously business and market conditions in order to facilitate the identification and implementation processes described in (i) and (ii) above. Because the day-to-day operations and activities of the fund are carried out by or through FMR, its affiliates and other service providers, the fund's exposure to risks is mitigated but not eliminated by the processes overseen by the Trustees. While each of the Board's committees has responsibility for overseeing different aspects of the fund's activities, oversight is exercised primarily through the Operations, Audit, and Compliance Committees. In addition, the Independent Trustees have worked with FMR to enhance the Board's oversight of investment and financial risks, legal and regulatory risks, technology risks, and operational risks, including the development of additional risk reporting to the Board. For example, a working group comprised of Independent Trustees and FMR has worked and continues to work to review the Fidelity funds' valuation-related activities, reporting and risk management. Appropriate personnel, including but not limited to the fund's Chief Compliance Officer (CCO), FMR's internal auditor, the independent accountants, the fund's Treasurer and portfolio management personnel, make periodic reports to the Board's committees, as appropriate, including an annual review of FMR's risk management program for the Fidelity funds. The responsibilities of each standing committee, including their oversight responsibilities, are described further under "Standing Committees of the Fund's Trustees."
Annual Report
The fund's Statement of Additional Information (SAI) includes more information about the Trustees. To request a free copy, call Fidelity at 1-800-544-8544.
Interested Trustees*:
Correspondence intended for each Trustee who is an interested person may be sent to Fidelity Investments, 245 Summer Street, Boston, Massachusetts 02210.
Name, Year of Birth; Principal Occupations and Other Relevant Experience+ |
James C. Curvey (1935) |
Year of Election or Appointment: 2007 Trustee Chairman of the Board of Trustees |
| Mr. Curvey also serves as Trustee of other Fidelity funds. Mr. Curvey is a Director of Fidelity Research & Analysis Co. (2009-present), and Vice Chairman (2007-present) and Director of FMR LLC. In addition, Mr. Curvey serves as an Overseer for the Boston Symphony Orchestra and a member of the Trustees of Villanova University. Previously, Mr. Curvey served as a Director of Fidelity Investments Money Management, Inc. (2009-2014), a Director of FMR (2007-2014), a Director of FMR Co., Inc. (2007-2014) and was the Vice Chairman (2006-2007) and Director (2000-2007) of FMR Corp. |
Charles S. Morrison (1960) |
Year of Election or Appointment: 2014 Trustee |
| Mr. Morrison also serves as Trustee of other funds. He serves as President, Asset Management (2014-present) and is an employee of Fidelity Investments. Previously, Mr. Morrison served as Vice President of Fidelity's Fixed Income and Asset Allocation Funds (2012-2014), President, Fixed Income (2011-2014), Vice President of Fidelity's Money Market Funds (2005-2009), President, Money Market Group Leader of FMR (2009), and Senior Vice President, Money Market Group of FMR (2004-2009). Mr. Morrison also served as Vice President of Fidelity's Bond Funds (2002-2005), certain Balanced Funds (2002-2005), and certain Asset Allocation Funds (2002-2007), and as Senior Vice President (2002-2005) of Fidelity's Bond Division. |
* Trustees have been determined to be "Interested Trustees" by virtue of, among other things, their affiliation with the trust or various entities under common control with FMR.
+ The information above includes each Trustee's principal occupation during the last five years and other information relating to the experience, attributes, and skills relevant to each Trustee's qualifications to serve as a Trustee, which led to the conclusion that each Trustee should serve as a Trustee for the fund.
Annual Report
Independent Trustees:
Correspondence intended for each Independent Trustee (that is, the Trustees other than the Interested Trustees) may be sent to Fidelity Investments, P.O. Box 55235, Boston, Massachusetts 02205-5235.
Name, Year of Birth; Principal Occupations and Other Relevant Experience+ |
Dennis J. Dirks (1948) |
Year of Election or Appointment: 2005 Trustee |
| Mr. Dirks also serves as Trustee of other Fidelity funds. Prior to his retirement in May 2003, Mr. Dirks was Chief Operating Officer and a member of the Board of The Depository Trust & Clearing Corporation (DTCC). He also served as President, Chief Operating Officer, and Board member of The Depository Trust Company (DTC) and President and Board member of the National Securities Clearing Corporation (NSCC). In addition, Mr. Dirks served as Chief Executive Officer and Board member of the Government Securities Clearing Corporation, Chief Executive Officer and Board member of the Mortgage-Backed Securities Clearing Corporation, as a Trustee and a member of the Finance Committee of Manhattan College (2005-2008), and as a Trustee and a member of the Finance Committee of AHRC of Nassau County (2006-2008). Mr. Dirks is a member of the Independent Directors Council (IDC) Governing Council (2010-present) and Board of Directors for The Brookville Center for Children's Services, Inc. (2009-present). |
Alan J. Lacy (1953) |
Year of Election or Appointment: 2008 Trustee |
| Mr. Lacy also serves as Trustee of other Fidelity funds. Mr. Lacy serves as Senior Adviser (2007-present) of Oak Hill Capital Partners, L.P. (private equity). Mr. Lacy also served as Chief Executive Officer (2000-2005) and Vice Chairman (2005-2006) of Sears Holdings Corporation and Sears, Roebuck and Co. (retail). In addition, Mr. Lacy serves as a member of the Board of Directors of Dave & Buster's Entertainment, Inc. (restaurant and entertainment complexes, 2010-present), Earth Fare, Inc. (retail grocery, 2012-present), The Hillman Companies, Inc. (hardware wholesalers, 2010-present), and Bristol-Myers Squibb Company (global pharmaceuticals, 2008-present). Mr. Lacy is a member of the Board of Trustees of The National Parks Conservation Association (2006-present). Previously, Mr. Lacy served as Chairman of the Board of Trustees of the National Parks Conservation Association (2008-2011) and as a member of the Board of Directors for the Western Union Company (global money transfer, 2006-2011). |
Ned C. Lautenbach (1944) |
Year of Election or Appointment: 2000 Trustee Chairman of the Independent Trustees |
| Mr. Lautenbach also serves as Trustee of other Fidelity funds. Mr. Lautenbach currently serves as the Lead Director of the Eaton Corporation Board of Directors (diversified industrial, 1997-present). Mr. Lautenbach is Chairman of the Board of Directors of the Philharmonic Center for the Arts in Naples, Florida (2012-present) and a member of the Council on Foreign Relations (1994-present). Previously, Mr. Lautenbach was a Partner/Advisory Partner at Clayton, Dubilier & Rice, LLC (private equity investment, 1998-2010), as well as a Director of Sony Corporation (2006-2007). |
Joseph Mauriello (1944) |
Year of Election or Appointment: 2008 Trustee |
| Mr. Mauriello also serves as Trustee of other Fidelity funds. Prior to his retirement in January 2006, Mr. Mauriello served in numerous senior management positions including Deputy Chairman and Chief Operating Officer (2004-2005), and Vice Chairman of Financial Services (2002-2004) of KPMG LLP US (professional services, 1965-2005). Mr. Mauriello currently serves as a member of the Board of Directors of XL Group plc. (global insurance and re-insurance, 2006-present). Previously, Mr. Mauriello served as a Director of the Hamilton Funds of the Bank of New York (2006-2007) and of Arcadia Resources Inc. (health care services and products, 2007-2012). |
Robert W. Selander (1950) |
Year of Election or Appointment: 2011 Trustee |
| Mr. Selander also serves as Trustee of other Fidelity funds. Previously, Mr. Selander served as a Member of the Advisory Board of other Fidelity funds (2011), and Executive Vice Chairman (2010), Chief Executive Officer (2009-2010), and President and Chief Executive Officer (1997-2009) of Mastercard, Inc. |
Cornelia M. Small (1944) |
Year of Election or Appointment: 2005 Trustee |
| Ms. Small also serves as Trustee of other Fidelity funds. Ms. Small is a member of the Board of Directors (2009-present) and Chair of the Investment Committee (2010-present) of the Teagle Foundation. Ms. Small also serves on the Investment Committee of the Berkshire Taconic Community Foundation (2008-present). Previously, Ms. Small served as Chairperson (2002-2008) and a member of the Investment Committee and Chairperson (2008-2012) and a member of the Board of Trustees of Smith College. In addition, Ms. Small served as Chief Investment Officer, Director of Global Equity Investments, and a member of the Board of Directors of Scudder, Stevens & Clark and Scudder Kemper Investments. |
William S. Stavropoulos (1939) |
Year of Election or Appointment: 2001 Trustee Vice Chairman of the Independent Trustees |
| Mr. Stavropoulos also serves as Trustee of other Fidelity funds. Mr. Stavropoulos serves as President and Founder of the Michigan Baseball Foundation, the Great Lakes Loons (2007-present). Mr. Stavropoulos is Chairman Emeritus of the Board of Directors of The Dow Chemical Company, where he previously served in numerous senior management positions, including President, CEO (1995-2000; 2002-2004), Chairman of the Executive Committee (2000-2006), and as a member of the Board of Directors (1990-2006). Currently, Mr. Stavropoulos is Chairman of the Board of Directors of Univar Inc. (global distributor of commodity and specialty chemicals), a Director of Teradata Corporation (data warehousing and technology solutions), and Maersk Inc. (industrial conglomerate), and a member of the Advisory Board for Metalmark Capital LLC (private equity investment, 2005-present). Mr. Stavropoulos is an operating advisor to Clayton, Dubilier & Rice, LLC (private equity investment). In addition, Mr. Stavropoulos is a member of the University of Notre Dame Advisory Council for the College of Science, a Trustee of the Rollin L. Gerstacker Foundation, and a Director of the Naples Philharmonic Center for the Arts. Previously, Mr. Stavropoulos served as a Director of Chemical Financial Corporation (bank holding company, 1993-2012) and Tyco International, Ltd. (multinational manufacturing and services, 2007-2012). |
David M. Thomas (1949) |
Year of Election or Appointment: 2008 Trustee |
| Mr. Thomas also serves as Trustee of other Fidelity funds. Mr. Thomas serves as Non-Executive Chairman of the Board of Directors of Fortune Brands Home and Security (home and security products, 2011-present), and as a member of the Board of Directors of Interpublic Group of Companies, Inc. (marketing communication, 2004-present). Previously, Mr. Thomas served as Executive Chairman (2005-2006) and Chairman and Chief Executive Officer (2000-2005) of IMS Health, Inc. (pharmaceutical and healthcare information solutions), and a Director of Fortune Brands, Inc. (consumer products, 2000-2011). |
+ The information above includes each Trustee's principal occupation during the last five years and other information relating to the experience, attributes, and skills relevant to each Trustee's qualifications to serve as a Trustee, which led to the conclusion that each Trustee should serve as a Trustee for the fund.
Advisory Board Member and Officers:
Correspondence intended for each officer and Peter S. Lynch may be sent to Fidelity Investments, 245 Summer Street, Boston, Massachusetts 02210. Officers appear below in alphabetical order.
Name, Year of Birth; Principal Occupation |
Peter S. Lynch (1944) |
Year of Election or Appointment: 2003 Member of the Advisory Board |
| Mr. Lynch also serves as Member of the Advisory Board of other Fidelity funds. Mr. Lynch is Vice Chairman and a Director of FMR and FMR Co., Inc. In addition, Mr. Lynch serves as a Trustee of Boston College and as the Chairman of the Inner-City Scholarship Fund. Previously, Mr. Lynch served on the Special Olympics International Board of Directors (1997-2006). |
Elizabeth Paige Baumann (1968) |
Year of Election or Appointment: 2012 Anti-Money Laundering (AML) Officer |
| Ms. Baumann also serves as AML Officer of other funds. She is Chief AML Officer of FMR LLC (2012-present) and is an employee of Fidelity Investments. Previously, Ms. Baumann served as Vice President and Deputy Anti-Money Laundering Officer (2007-2012). |
William C. Coffey (1969) |
Year of Election or Appointment: 2009 Assistant Secretary |
| Mr. Coffey also serves as Assistant Secretary of other funds. He is Senior Vice President and Deputy General Counsel of FMR LLC (2010-present), and is an employee of Fidelity Investments. Previously, Mr. Coffey served as Vice President and Associate General Counsel of FMR LLC (2005-2009). |
Jonathan Davis (1968) |
Year of Election or Appointment: 2010 Assistant Treasurer |
| Mr. Davis also serves as Assistant Treasurer of other funds. Mr. Davis is an employee of Fidelity Investments. Previously, Mr. Davis served as Vice President and Associate General Counsel of FMR LLC (2003-2010). |
Adrien E. Deberghes (1967) |
Year of Election or Appointment: 2008 Deputy Treasurer |
| Mr. Deberghes also serves as an officer of other funds. He is an employee of Fidelity Investments (2008-present). Prior to joining Fidelity Investments, Mr. Deberghes was Senior Vice President of Mutual Fund Administration at State Street Corporation (2007-2008), Senior Director of Mutual Fund Administration at Investors Bank & Trust (2005-2007), and Director of Finance for Dunkin' Brands (2000-2005). |
Stephanie J. Dorsey (1969) |
Year of Election or Appointment: 2010 Assistant Treasurer |
| Ms. Dorsey also serves as an officer of other funds. She is an employee of Fidelity Investments (2008-present) and has served in other fund officer roles. Prior to joining Fidelity Investments, Ms. Dorsey served as Treasurer (2004-2008) of the JPMorgan Mutual Funds and Vice President (2004-2008) of JPMorgan Chase Bank. |
Howard J. Galligan III (1966) |
Year of Election or Appointment: 2014 Chief Financial Officer |
| Mr. Galligan also serves as Chief Financial Officer of other funds. Mr. Galligan serves as President of Fidelity Pricing and Cash Management Services (FPCMS) (2014-present) and as a Director of Strategic Advisers, Inc. (2008-present). Previously, Mr. Galligan served as Chief Administrative Officer of Asset Management (2011-2014) and Chief Operating Officer and Senior Vice President of Investment Support for Strategic Advisers, Inc. (2003-2011). |
Scott C. Goebel (1968) |
Year of Election or Appointment: 2008 Secretary and Chief Legal Officer (CLO) |
| Mr. Goebel serves as Secretary and CLO of other funds. Mr. Goebel also serves as Secretary of Fidelity SelectCo, LLC (2013-present), Fidelity Investments Money Management, Inc. (FIMM) (2010-present) and Fidelity Research and Analysis Company (FRAC) (2010-present); General Counsel, Secretary, and Senior Vice President of FMR (2008-present) and FMR Co., Inc. (2008-present); Chief Legal Officer of Fidelity Management & Research (Hong Kong) Limited (2008-present); and Assistant Secretary of Fidelity Management & Research (Japan) Inc. (2008-present) and Fidelity Management & Research (U.K.) Inc. (2008-present). Previously, Mr. Goebel served as Secretary and CLO of other Fidelity funds (2008-2013), Assistant Secretary of FIMM (2008-2010), FRAC (2008-2010), and certain funds (2007-2008); and as Vice President and Secretary of Fidelity Distributors Corporation (FDC) (2005-2007). Mr. Goebel has been employed by FMR LLC or an affiliate since 2001. |
Brian B. Hogan (1964) |
Year of Election or Appointment: 2009 Vice President |
| Mr. Hogan also serves as Trustee or Vice President of other funds. Mr. Hogan serves as President of FMR's Equity Division (2009-present). Previously, Mr. Hogan served as Senior Vice President, Equity Research of FMR (2006-2009) and as a portfolio manager. |
Chris Maher (1972) |
Year of Election or Appointment: 2013 Assistant Treasurer |
| Mr. Maher serves as Assistant Treasurer of other funds. Mr. Maher is Vice President of Valuation Oversight and is an employee of Fidelity Investments. Previously, Mr. Maher served as Vice President of Asset Management Compliance (2013), Vice President of FMR's Program Management Group (2010-2013), and Vice President of Valuation Oversight (2008-2010). |
Melissa M. Reilly (1971) |
Year of Election or Appointment: 2014 Vice President of certain Equity Funds |
| Ms. Reilly also serves as Vice President of other funds. Ms. Reilly is an employee of Fidelity Investments (2004-present). |
Kenneth B. Robins (1969) |
Year of Election or Appointment: 2008 President and Treasurer |
| Mr. Robins also serves as an officer of other funds. Mr. Robins serves as Executive Vice President of Fidelity Investments Money Management, Inc. (FIMM) (2013-present) and is an employee of Fidelity Investments (2004-present). Previously, Mr. Robins served in other fund officer roles. |
Stephen Sadoski (1971) |
Year of Election or Appointment: 2012 Deputy Treasurer |
| Mr. Sadoski also serves as Deputy Treasurer of other funds. He is an employee of Fidelity Investments (2012-present) and has served in another fund officer role. Prior to joining Fidelity Investments, Mr. Sadoski served as an assistant chief accountant in the Division of Investment Management of the Securities and Exchange Commission (SEC) (2009-2012) and as a senior manager at Deloitte & Touche LLP (1997-2009). |
Stacie M. Smith (1974) |
Year of Election or Appointment: 2013 Deputy Treasurer |
| Ms. Smith also serves as an officer of other funds. She is an employee of Fidelity Investments (2009-present) and has served in other fund officer roles. Prior to joining Fidelity Investments, Ms. Smith served as Senior Audit Manager of Ernst & Young LLP (1996-2009). |
Renee Stagnone (1975) |
Year of Election or Appointment: 2013 Deputy Treasurer |
| Ms. Stagnone also serves as Deputy Treasurer of other funds. Ms. Stagnone is an employee of Fidelity Investments. |
Linda J. Wondrack (1964) |
Year of Election or Appointment: 2014 Chief Compliance Officer |
| Ms. Wondrack also serves as Chief Compliance Officer of other funds. Ms. Wondrack is Executive Vice President and head of the Ethics Office and Asset Management Compliance for Fidelity Investments (2012-present). Ms. Wondrack also serves as Chief Compliance Officer of Fidelity SelectCo, LLC (2014-present); Chief Compliance Officer of Impresa Management LLC (2013-present); and Chief Compliance Officer of FMR Co., Inc., Fidelity Investments Money Management, Inc., Fidelity Management & Research (Japan) Inc., Fidelity Management & Research (U.K.) Inc., Fidelity Management & Research (Hong Kong), Fidelity Management & Research Company, Pyramis Global Advisors, LLC, and Strategic Advisers, Inc., Ballyrock Investment Advisors LLC, and Northern Neck Investors LLC (2012-present). Previously, Ms. Wondrack served as Senior Vice President and Chief Compliance Officer for Columbia Management Investment Advisers, LLC (2005-2012); Chief Compliance Officer for certain funds within the Columbia Family of Funds (2007-2012); and Senior Vice President of Compliance Risk Management at Bank of America (2005-2010). |
Joseph F. Zambello (1957) |
Year of Election or Appointment: 2011 Deputy Treasurer |
| Mr. Zambello also serves as Deputy Treasurer of other funds. Mr. Zambello is an employee of Fidelity Investments. Previously, Mr. Zambello served as Vice President of FMR's Program Management Group (2009-2011) and Vice President of the Transfer Agent Oversight Group (2005-2009). |
Annual Report
The Board of Trustees of Fidelity Balanced Fund voted to pay to the shareholders of record at the opening of business on record date, the following distributions per share derived from capital gains realized from sales of portfolio securities, and dividends derived from net investment income:
| Pay Date | Record Date | Dividends | Capital Gains |
Balanced | 10/13/14 | 10/10/14 | $0.093 | $1.420 |
The fund hereby designates as a capital gain dividend with respect to the taxable year ended August 31, 2014, $1,266,885,376 or, if subsequently determined to be different, the net capital gain of such year.
A total of 2.53% of the dividends distributed during the fiscal year was derived from interest on U.S. Government securities which is generally exempt from state income tax.
The fund designates $136,007,095 of distributions paid during the period January 1, 2014 to August 31, 2014 as qualifying to be taxed as interest-related dividends for nonresident alien shareholders.
Balanced designates 11%, 35%, 78% and 78% of the dividends distributed in October, December, April and July, respectively during the fiscal year as qualifying for the dividends-received deduction for corporate shareholders.
Balanced designates 16%, 40%, 98% and 99% of the dividends distributed in October, December, April and July, respectively during the fiscal year as amounts which may be taken into account as a dividend for the purposes of the maximum rate under section 1(h)(11) of the Internal Revenue Code.
The fund will notify shareholders in January 2015 of amounts for use in preparing 2014 income tax returns.
Annual Report
Board Approval of Investment Advisory Contracts and Management Fees
Fidelity Balanced Fund
Each year, the Board of Trustees, including the Independent Trustees (together, the Board), votes on the renewal of the management contract with Fidelity Management & Research Company (FMR) and the sub-advisory agreements (together, the Advisory Contracts) for the fund. The Board, assisted by the advice of fund counsel and Independent Trustees' counsel, requests and considers a broad range of information relevant to the renewal of the Advisory Contracts throughout the year.
The Board meets regularly and, at each of its meetings, covers an extensive agenda of topics and materials and considers factors that are relevant to its annual consideration of the renewal of the fund's Advisory Contracts, including the services and support provided to the fund and its shareholders. The Board has established various standing committees (Committees), each composed of and chaired by Independent Trustees with varying backgrounds, to which the Board has assigned specific subject matter responsibilities in order to enhance effective decision-making by the Board. The Board, acting directly and through its Committees, requests and receives information concerning the annual consideration of the renewal of the fund's Advisory Contracts. The Board also meets as needed to consider matters specifically related to the Board's annual consideration of the renewal of the Advisory Contracts. Members of the Board may also meet with trustees of other Fidelity funds through ad hoc joint committees to discuss certain matters relevant to the Fidelity funds.
At its July 2014 meeting, the Board, including the Independent Trustees, unanimously determined to renew the fund's Advisory Contracts. In reaching its determination, the Board considered all factors it believed relevant, including (i) the nature, extent, and quality of the services to be provided to the fund and its shareholders (including the investment performance of the fund); (ii) the competitiveness of the fund's management fee and total expense ratio relative to peer funds; (iii) the total costs of the services to be provided by and the profits to be realized by Fidelity from its relationship with the fund; (iv) the extent to which economies of scale exist and would be realized as the fund grows; and (v) whether fee levels reflect these economies of scale, if any, for the benefit of fund shareholders. In connection with separate internal corporate reorganizations involving Fidelity Management & Research (U.K.) Inc. (FMR U.K.) and Fidelity Management & Research (Japan) Inc. (FMR Japan), the Board approved certain non-material amendments to the fund's sub-advisory agreements with FMR U.K. and FMR Japan to reflect that, after these reorganizations, FMR Investment Management (UK) Limited and Fidelity Management & Research (Japan) Limited will carry on the business of FMR U.K. and FMR Japan, respectively. The Board noted that no changes to the portfolio managers or to the foreign research or investment advisory services provided to the fund were expected in connection with either reorganization and that the same personnel and resources would continue to be available to the fund at the new entities.
Annual Report
In considering whether to renew the Advisory Contracts for the fund, the Board reached a determination, with the assistance of fund counsel and Independent Trustees' counsel and through the exercise of its business judgment, that the renewal of the Advisory Contracts was in the best interests of the fund and its shareholders and that the compensation payable under the Advisory Contracts was fair and reasonable. The Board's decision to renew the Advisory Contracts was not based on any single factor, but rather was based on a comprehensive consideration of all the information provided to the Board at its meetings throughout the year. The Board, in reaching its determination to renew the Advisory Contracts, was aware that shareholders of the fund have a broad range of investment choices available to them, including a wide choice among funds offered by Fidelity's competitors, and that the fund's shareholders, who have the opportunity to review and weigh the disclosure provided by the fund in its prospectus and other public disclosures, have chosen to invest in this fund, which is part of the Fidelity family of funds.
Nature, Extent, and Quality of Services Provided. The Board considered Fidelity's staffing as it relates to the fund, including the backgrounds of investment personnel of FMR and the sub-advisers (together, the Investment Advisers), and also considered the fund's investment objective, strategies, and related investment philosophy. The Independent Trustees also had discussions with senior management of Fidelity's investment operations and investment groups. The Board considered the structure of the portfolio manager compensation program and whether this structure provides appropriate incentives to act in the best interests of the fund. Additionally, the Board considered the portfolio managers' investments, if any, in the funds that they manage.
Resources Dedicated to Investment Management and Support Services. The Board and the Fund Oversight and Research Committees reviewed the general qualifications and capabilities of Fidelity's investment staff, including its size, education, experience, and resources, as well as Fidelity's approach to recruiting, training, managing, and compensating investment personnel. The Board noted that Fidelity has continued to increase the resources devoted to non-U.S. offices, including expansion of Fidelity's global investment organization. The Board also noted that Fidelity's analysts have extensive resources, tools and capabilities that allow them to conduct sophisticated quantitative and fundamental analysis, as well as credit analysis of issuers, counterparties and guarantors. Further, the Board believes that Fidelity's investment professionals have sufficient access to global information and data so as to provide competitive investment results over time, and that those professionals also have access to sophisticated tools that permit them to assess portfolio construction and risk and performance attribution characteristics continuously, as well as to transmit new information and research conclusions rapidly around the world. Additionally, in its deliberations, the Board considered Fidelity's trading and risk management capabilities and resources and global compliance infrastructure, which are an integral part of the investment management process.
Annual Report
Board Approval of Investment Advisory Contracts and
Management Fees - continued
Shareholder and Administrative Services. The Board considered (i) the nature, extent, quality, and cost of advisory, administrative, and shareholder services performed by the Investment Advisers and their affiliates under the Advisory Contracts and under separate agreements covering transfer agency, pricing and bookkeeping, and securities lending services for the fund; (ii) the nature and extent of the supervision of third party service providers, principally custodians and subcustodians; and (iii) the resources devoted to, and the record of compliance with, the fund's compliance policies and procedures. The Board also reviewed the allocation of fund brokerage, including allocations to brokers affiliated with the Investment Advisers, the use of brokerage commissions to pay fund expenses, and the use of "soft" commission dollars to pay for research services.
The Board noted that the growth of fund assets over time across the complex allows Fidelity to reinvest in the development of services designed to enhance the value or convenience of the Fidelity funds as investment vehicles. These services include 24-hour access to account information and market information through telephone representatives and over the Internet, investor education materials and asset allocation tools, and the expanded availability of Fidelity Investor Centers.
In 2014, the Board formed an ad hoc Committee on Transfer Agency Fees to review the variety of transfer agency fee structures throughout the industry and Fidelity's competitive positioning with respect to industry participants.
Investment in a Large Fund Family. The Board considered the benefits to shareholders of investing in a Fidelity fund, including the benefits of investing in a fund that is part of a large family of funds offering a variety of investment disciplines and providing a large variety of mutual fund investor services. The Board noted that Fidelity had taken, or had made recommendations that resulted in the Fidelity funds taking, a number of actions over the previous year that benefited particular funds, including (i) continuing to dedicate additional resources to investment research and to the support of the senior management team that oversees asset management; (ii) persisting in efforts to enhance Fidelity's global research capabilities; (iii) launching new funds and making other enhancements to meet client needs for income-oriented solutions; (iv) reducing fund expenses for certain index funds; (v) continuing to launch dedicated lower cost underlying funds to meet portfolio construction needs related to expanding underlying fund options for Fidelity funds of funds, specifically for the Freedom Fund product lines; (vi) rationalizing product lines and gaining increased efficiencies through fund mergers; (vii) launching sector-based exchange-traded funds and establishing a new Fidelity adviser to manage sector-based funds and products; (viii) continuing to develop and implement technology to improve security and increase efficiency; (ix) modifying the eligibility criteria for certain share classes to increase their marketability to a portion of the defined contribution plan market; (x) waiving redemption fees for certain qualified fund-of-fund and wrap programs and certain retirement plan transactions; and (xi) launching new Institutional Class shares of certain money market funds to attract and retain assets and to fill a gap in the money market fund lineup.
Annual Report
Investment Performance. The Board considered whether the fund has operated in accordance with its investment objective, as well as its record of compliance with its investment restrictions and its performance history. The Board noted that there were portfolio management changes for a sleeve of the fund in April 2013 and June 2013.
The Board took into account discussions with the Investment Advisers about fund investment performance that occur at Board meetings throughout the year. In this regard the Board noted that as part of regularly scheduled fund reviews and other reports to the Board on fund performance, the Board periodically considers annualized return information for the fund, for different time periods, measured against a securities market index ("benchmark index") and a peer group of funds with similar objectives ("peer group"). In its evaluation of fund investment performance, the Board gave particular attention to information indicating changes in performance of certain Fidelity funds for specific time periods and the Investment Advisers' explanations for any overperformance or underperformance.
In addition to reviewing absolute and relative fund performance, the Independent Trustees periodically consider the appropriateness of fund performance metrics in evaluating the results achieved. In general, the Independent Trustees believe that fund performance should be evaluated based on net performance (after fees and expenses) of both the highest performing and lowest performing classes, where applicable, compared to appropriate benchmark indices, over appropriate time periods which may include full market cycles, and compared to peer groups, as applicable, over the same periods, taking into account relevant factors including the following: general market conditions; issuer-specific information; tactical opportunities for investment; and fund cash flows and other factors.
The Independent Trustees recognize that shareholders evaluate performance on a net basis over their own holding periods, for which one-, three-, and five-year periods are often used as a proxy. For this reason, the performance information reviewed by the Board also included net cumulative calendar year total return information for the fund and an appropriate benchmark index and peer group for the most recent one-, three-, and five-year periods, as shown below. Returns are shown compared to the 25th percentile (top of box, 75% beaten) and 75th percentile (bottom of box, 25% beaten) of the peer universe.
Annual Report
Board Approval of Investment Advisory Contracts and
Management Fees - continued
Fidelity Balanced Fund

Based on its review, the Board concluded that the nature, extent, and quality of services provided to the fund under the Advisory Contracts should benefit the fund's shareholders.
Competitiveness of Management Fee and Total Expense Ratio. The Board considered the fund's management fee and total expense ratio compared to "mapped groups" of competitive funds and classes. Fidelity creates "mapped groups" by combining similar Lipper investment objective categories that have comparable investment mandates. Combining Lipper investment objective categories aids the Board's management fee and total expense ratio comparisons by broadening the competitive group used for comparison and by reducing the number of universes to which various Fidelity funds are compared.
Management Fee. The Board considered two proprietary management fee comparisons for the 12-month periods shown in the chart below. The group of Lipper funds used by the Board for management fee comparisons is referred to below as the "Total Mapped Group." The Total Mapped Group is broader than the Lipper peer group used by the Board for performance comparisons because the Total Mapped Group combines several Lipper investment objective categories while the Lipper peer group does not. The Total Mapped Group comparison focuses on a fund's standing in terms of gross management fees before expense reimbursements or caps relative to the total universe of funds with comparable investment mandates, regardless of whether their management fee structures also are comparable. Funds with comparable investment mandates offer exposure to similar types of securities. Funds with comparable management fee structures have similar management fee contractual arrangements (e.g., flat rate charged for advisory services, all-inclusive fee rate, etc.). "TMG %" represents the percentage of funds in the Total Mapped Group that had management fees that were lower than the fund's. For example, a hypothetical TMG % of 20% would mean that 80% of the funds in the Total Mapped Group had higher, and 20% had lower, management fees than the fund. The fund's actual TMG %s are in the chart below. The "Asset-Size Peer Group" (ASPG) comparison focuses on a fund's standing relative to a subset of non-Fidelity funds within the Total Mapped Group that are similar in size and management fee structure. For example, if a fund is in the first quartile of the ASPG, the fund's management fee ranks in the least expensive or lowest 25% of funds in the ASPG. The ASPG represents at least 15% of the funds in the Total Mapped Group with comparable asset size and management fee structures, subject to a minimum of 50 funds (or all funds in the Total Mapped Group if fewer than 50). Additional information, such as the ASPG quartile in which the fund's management fee rate ranked, is also included in the chart and considered by the Board.
Annual Report
Fidelity Balanced Fund

The Board noted that the fund's management fee rate ranked below the median of its Total Mapped Group and below the median of its ASPG for 2013.
The Board also noted that, in August 2013, the ad hoc Committee on Management Fees was formed to conduct an in-depth review of the management fee rates of Fidelity's active equity mutual funds. The Committee focused on the following areas: (i) standard fee structures; (ii) research consumption and trading evolution; (iii) management fee competitiveness/profitability by category; and (iv) factors that drive institutional pricing.
Based on its review, the Board concluded that the fund's management fee is fair and reasonable in light of the services that the fund receives and the other factors considered.
Annual Report
Board Approval of Investment Advisory Contracts and
Management Fees - continued
Total Expense Ratio. In its review of each class's total expense ratio, the Board considered the fund's management fee as well as other fund or class expenses, as applicable, such as transfer agent fees, pricing and bookkeeping fees, and custodial, legal, and audit fees. The Board also noted the effects of any waivers and reimbursements on fees and expenses. As part of its review, the Board also considered the current and historical total expense ratios of each class of the fund compared to competitive fund median expenses. Each class of the fund is compared to those funds and classes in the Total Mapped Group (used by the Board for management fee comparisons) that have a similar sales load structure.
The Board noted that the total expense ratio of each class ranked below its competitive median for 2013.
Fees Charged to Other Fidelity Clients. The Board also considered Fidelity fee structures and other information with respect to clients of Fidelity, such as other funds advised or subadvised by Fidelity, pension plan clients, and other institutional clients. The Board noted the findings of the 2013 ad hoc joint committee (created with the board of other Fidelity funds), which reviewed and compared Fidelity's institutional investment advisory business with its business of providing services to the Fidelity funds, including the differences in services provided, fees charged, and costs incurred, as well as competition in their respective marketplaces.
Based on its review of total expense ratios and fees charged to other Fidelity clients, the Board concluded that the total expense ratio of each class of the fund was reasonable in light of the services that the fund and its shareholders receive and the other factors considered.
Costs of the Services and Profitability. The Board considered the revenues earned and the expenses incurred by Fidelity in conducting the business of developing, marketing, distributing, managing, administering and servicing the fund and servicing the fund's shareholders. The Board also considered the level of Fidelity's profits in respect of all the Fidelity funds.
On an annual basis, Fidelity presents to the Board Fidelity's profitability for the fund. Fidelity calculates the profitability for each fund, as well as aggregate profitability for groups of Fidelity funds and all Fidelity funds, using a series of detailed revenue and cost allocation methodologies which originate with the books and records of Fidelity on which Fidelity's audited financial statements are based. The Audit Committee of the Board reviews any significant changes from the prior year's methodologies.
PricewaterhouseCoopers LLP (PwC), independent registered public accounting firm and auditor to Fidelity and certain Fidelity funds, has been engaged annually by the Board as part of the Board's assessment of Fidelity's profitability analysis. PwC's engagement includes the review and assessment of the methodologies used by Fidelity in determining the revenues and expenses attributable to Fidelity's mutual fund business, and completion of agreed-upon procedures in respect of the mathematical accuracy of fund profitability and its conformity to established allocation methodologies. After considering PwC's reports issued under the engagement and information provided by Fidelity, the Board concluded that while other allocation methods may also be reasonable, Fidelity's profitability methodologies are reasonable in all material respects.
Annual Report
The Board also reviewed Fidelity's non-fund businesses and fall-out benefits related to the mutual fund business as well as cases where Fidelity's affiliates may benefit from or be related to the fund's business.
The Board considered the costs of the services provided by and the profits realized by Fidelity in connection with the operation of the fund and was satisfied that the profitability was not excessive in the circumstances.
Economies of Scale. The Board considered whether there have been economies of scale in respect of the management of the Fidelity funds, whether the Fidelity funds (including the fund) have appropriately benefited from any such economies of scale, and whether there is potential for realization of any further economies of scale. The Board considered the extent to which the fund will benefit from economies of scale through increased services to the fund, through waivers or reimbursements, or through fee or expense ratio reductions. The Board also noted that in 2013, it and the boards of other Fidelity funds created an ad hoc committee (the Economies of Scale Committee) to analyze whether Fidelity attains economies of scale in respect of the management and servicing of the Fidelity funds, whether the Fidelity funds have appropriately benefited from such economies of scale, and whether there is potential for realization of any further economies of scale.
The Board recognized that the fund's management contract incorporates a "group fee" structure, which provides for lower group fee rates as total group assets increase, and for higher group fee rates as total group assets decrease (with "group assets" defined to include fund assets under FMR's management plus sector fund assets previously under FMR's management and currently managed by Fidelity SelectCo, LLC). FMR calculates the group fee rates based on a tiered asset "breakpoint" schedule that varies based on asset class. The Board considered that the group fee is designed to deliver the benefits of economies of scale to fund shareholders when total Fidelity fund assets increase, even if assets of any particular fund are unchanged or have declined, because some portion of Fidelity's costs are attributable to services provided to all Fidelity funds, and all funds benefit if those costs can be allocated among more assets. The Board concluded that, given the group fee structure, fund shareholders will benefit from lower management fees as group assets increase at the fund complex level, regardless of whether Fidelity achieves any such economies of scale.
Annual Report
Board Approval of Investment Advisory Contracts and
Management Fees - continued
The Board concluded, taking into account the analysis of the Economies of Scale Committee, that economies of scale, if any, are being appropriately shared between fund shareholders and Fidelity.
Additional Information Requested by the Board. In order to develop fully the factual basis for consideration of the Fidelity funds' Advisory Contracts, the Board requested and received additional information on certain topics, including: (i) fund performance trends and Fidelity's long-term strategies for certain funds; (ii) Fidelity's strategic marketing and product lineup goals; (iii) the methodology with respect to competitive fund data and peer group classifications; (iv) the arrangements with, and performance of, certain sub-advisers on behalf of the Fidelity funds, as well as certain proposed participating affiliate arrangements; (v) the realization of fall-out benefits in certain Fidelity business units; (vi) Fidelity's group fee structures, including the rationale for the individual fee rates of certain categories of funds and the definition of group assets; (vii) trends regarding industry use of performance fee structures and the performance adjustment methodologies applicable to the Fidelity funds; (viii) additional competitive analysis regarding the total expenses for certain classes; (ix) fund profitability methodology, including Fidelity's cost allocation methodology, and the impact of certain factors on fund profitability results; and (x) the process by which Fidelity determines sub-advisory fees for funds it advises.
Based on its evaluation of all of the conclusions noted above, and after considering all factors it believed relevant, the Board ultimately concluded that the advisory fee structures are fair and reasonable, and that the fund's Advisory Contracts should be renewed.
Annual Report
Investment Adviser
Fidelity Management & Research Company
Boston, MA
Investment Sub-Advisers
FMR Co., Inc.
Fidelity Investments
Money Management, Inc.
Fidelity Management & Research
(U.K.) Inc.
Fidelity Management & Research
(Hong Kong) Limited
Fidelity Management & Research
(Japan) Inc.
General Distributor
Fidelity Distributors Corporation
Smithfield, RI
Transfer and Service Agents
Fidelity Investments Institutional Operations Company, Inc.
Boston, MA
Fidelity Service Company, Inc.
Boston, MA
Custodian
Citibank, N.A.
New York, NY
The Fidelity Telephone Connection
Mutual Fund 24-Hour Service
Exchanges/Redemptions
and Account Assistance 1-800-544-6666
Product Information 1-800-544-6666
Retirement Accounts 1-800-544-4774
(8 a.m. - 9 p.m.)
TDD Service 1-800-544-0118
for the deaf and hearing impaired
(9 a.m. - 9 p.m. Eastern time)
Fidelity Automated Service
Telephone (FAST®)
1-800-544-5555
Automated line for quickest service
(Fidelity Investment logo)(registered trademark)
Corporate Headquarters
245 Summer St., Boston, MA 02210
www.fidelity.com
BAL-UANN-1014
1.789243.111
Fidelity®
Balanced
Fund -
Class K
Annual Report
August 31, 2014
(Fidelity Cover Art)
Contents
Performance | (Click Here) | How the fund has done over time. |
Management's Discussion of Fund Performance | (Click Here) | The Portfolio Manager's review of fund performance and strategy. |
Shareholder Expense Example | (Click Here) | An example of shareholder expenses. |
Investment Changes | (Click Here) | A summary of major shifts in the fund's investments over the past six months. |
Investments | (Click Here) | A complete list of the fund's investments with their market values. |
Financial Statements | (Click Here) | Statements of assets and liabilities, operations, and changes in net assets, as well as financial highlights. |
Notes | (Click Here) | Notes to the financial statements. |
Report of Independent Registered Public Accounting Firm | (Click Here) | |
Trustees and Officers | (Click Here) | |
Distributions | (Click Here) | |
Board Approval of Investment Advisory Contracts and Management Fees | (Click Here) | |
To view a fund's proxy voting guidelines and proxy voting record for the 12-month period ended June 30, visit http://www.fidelity.com/proxyvotingresults or visit the Securities and Exchange Commission's (SEC) web site at http://www.sec.gov. You may also call 1-800-835-5092 to request a free copy of the proxy voting guidelines.
Standard & Poor's, S&P and S&P 500 are registered service marks of The McGraw-Hill Companies, Inc. and have been licensed for use by Fidelity Distributors Corporation.
Other third-party marks appearing herein are the property of their respective owners.
All other marks appearing herein are registered or unregistered trademarks or service marks of FMR LLC or an affiliated company. © 2014 FMR LLC. All rights reserved.
Annual Report
This report and the financial statements contained herein are submitted for the general information of the shareholders of the fund. This report is not authorized for distribution to prospective investors in the fund unless preceded or accompanied by an effective prospectus.
A fund files its complete schedule of portfolio holdings with the SEC for the first and third quarters of each fiscal year on Form N-Q. Forms N-Q are available on the SEC's web site at http://www.sec.gov. A fund's Forms N-Q may be reviewed and copied at the SEC's Public Reference Room in Washington, DC. Information regarding the operation of the SEC's Public Reference Room may be obtained by calling 1-800-SEC-0330. For a complete list of a fund's portfolio holdings, view the most recent holdings listing, semiannual report, or annual report on Fidelity's web site at http://www.fidelity.com, http://www.advisor.fidelity.com, or http://www.401k.com, as applicable.
NOT FDIC INSURED • MAY LOSE VALUE • NO BANK GUARANTEE
Neither the fund nor Fidelity Distributors Corporation is a bank.
Annual Report
Average annual total return reflects the change in the value of an investment, assuming reinvestment of the class' distributions from dividend income and capital gains (the profits earned upon the sale of securities that have grown in value, if any) and assuming a constant rate of performance each year. The $10,000 table and the fund's returns do not reflect the deduction of taxes that a shareholder would pay on fund distributions or the redemption of fund shares. During periods of reimbursement by Fidelity, a fund's total return will be greater than it would be had the reimbursement not occurred. How a fund did yesterday is no guarantee of how it will do tomorrow.
Average Annual Total Returns
Periods ended August 31, 2014 | Past 1
year | Past 5
years | Past 10
years |
Class K A | 19.59% | 13.00% | 8.48% |
A The initial offering of Class K shares took place on May 9, 2008. Returns prior to May 9, 2008 are those of Fidelity® Balanced Fund, the original class of the fund.
$10,000 Over 10 Years
Let's say hypothetically that $10,000 was invested in Fidelity® Balanced Fund - Class K on August 31, 2004. The chart shows how the value of your investment would have changed, and also shows how the S&P 500® Index performed over the same period. See footnote A above for additional information regarding the performance of Class K.
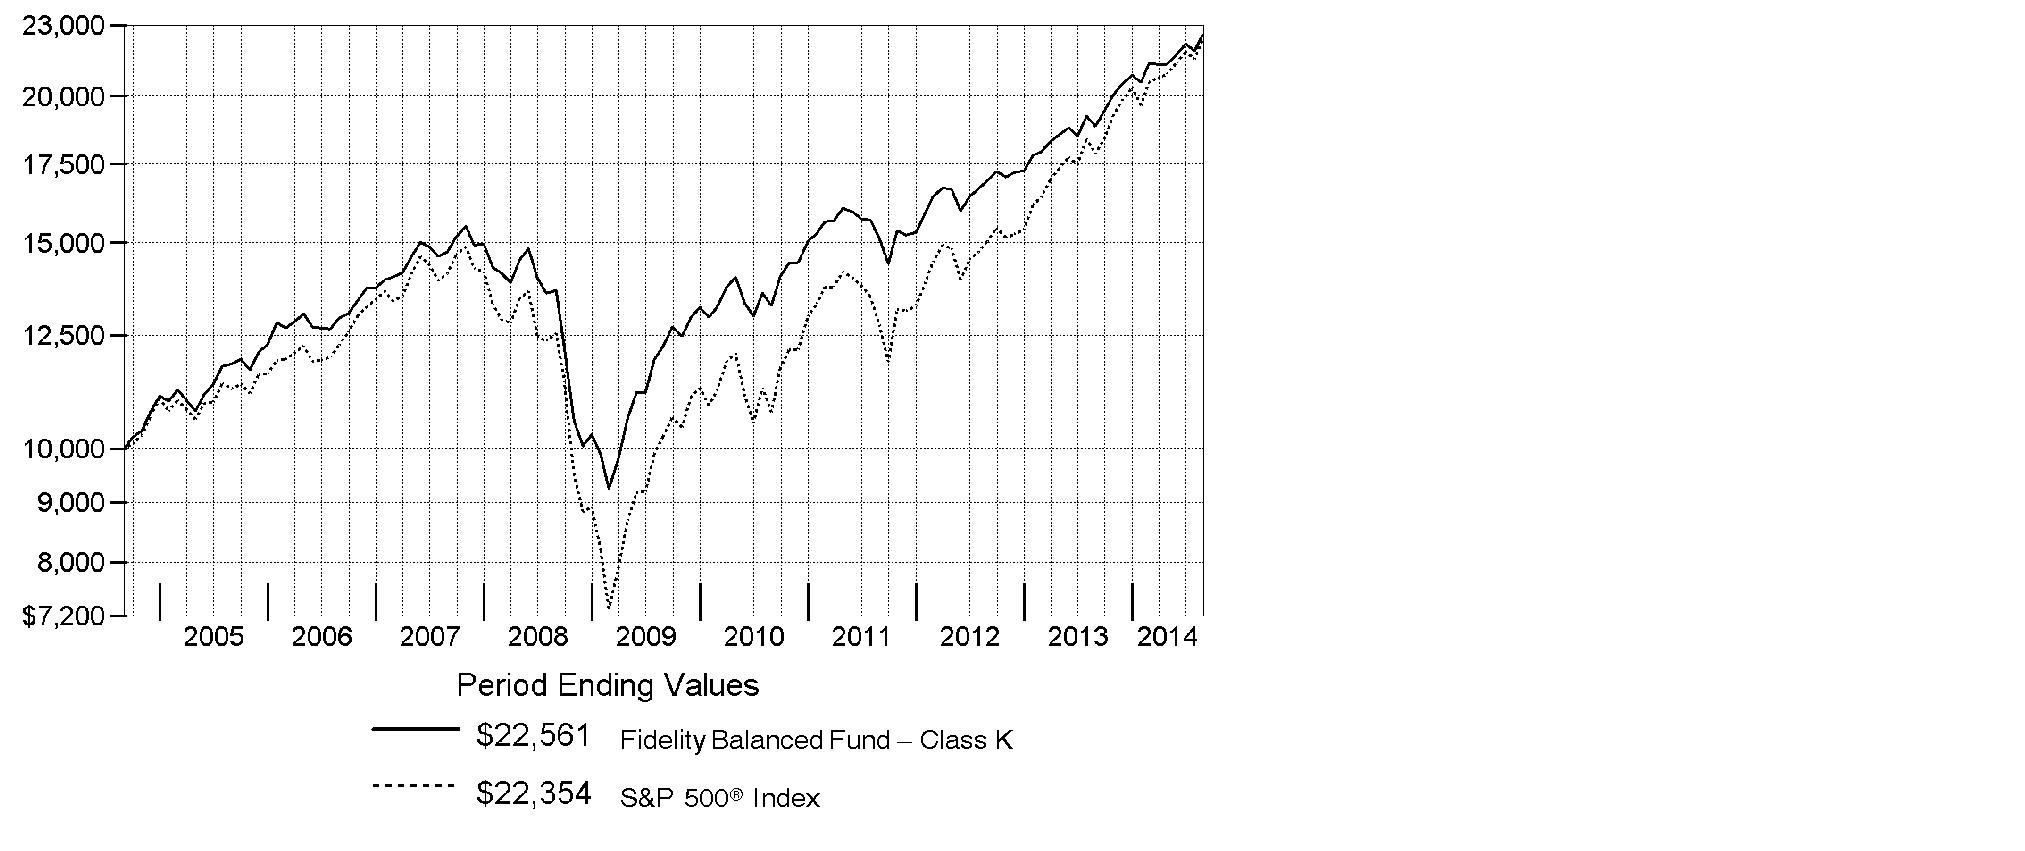
Annual Report
Market Recap: U.S. stocks overcame a slowing economy early in 2014 to post a solid gain for the 12 months ending August 31, 2014, supported at home by low interest rates and globally by new stimulus efforts in Europe and China. The broad-market S&P 500® Index rose 25.25%, reaching an all-time high during the period. The tech-heavy Nasdaq Composite Index® gained 29.15%, while the small-cap Russell 2000® Index returned 17.68%. Information technology (+34%) was the top sector in the S&P 500®, driven by strong results among semiconductor and hardware/equipment stocks. Health care (+32%) rose broadly, driven by biotechnology and life sciences names. Conversely, traditionally defensive sectors - consumer staples, utilities and telecommunication services - lagged the advance. Volatility was generally tame, with markets supported by declining unemployment, near-record corporate profits, muted inflation and fairly low company debt levels. Meanwhile, U.S. taxable bonds notched gains for the 12-month period, driven by yield-advantaged-sectors. The Barclays® U.S. Aggregate Bond Index rose 5.66% on the strength of longer-maturity bonds, which benefited from a decline in long-term interest rates. Lower-quality corporate issues attracted some of the strongest buying interest, reflected by the 10.61% gain of The BofA Merrill LynchSM US High Yield Constrained Index.
Comments from Co-Portfolio Manager Robert Stansky, Head of FMR's Stock Selector Large Cap Group, which manages Fidelity® Balanced Fund: For the year, the fund's Class K shares gained 19.59%, outperforming the 17.14% advance of the Fidelity Balanced Hybrid Composite IndexSM. Overweighting stocks and underweighting investment-grade bonds notably boosted the fund's result versus the Composite index. Security selection in the investment-grade sleeve also helped, while a small non-index stake in high-yield bonds modestly detracted. Looking at fixed income, we had favorable overweightings in corporate bonds and taxable municipal bonds, and underweightings in mortgage-backed securities and U.S. Treasuries. Yield-curve positioning modestly helped. In terms of individual stocks, choices in health care added the most value by far, including a non-index stake in genetic analysis toolmaker Illumina. We liked Illumina's innovation and accelerating end markets, but we sold the fund's stake to help manage risk and lock in profits. In information technology, we had some hits and misses. NXP Semiconductors helped, as the Netherlands-based chipmaker reported consecutive quarters of strong financial results, and the non-index stock moved sharply higher. Conversely, it hurt the most to avoid chipmaker and outperforming index name Intel, a slower-growth legacy tech stock.
The views expressed above reflect those of the portfolio manager(s) only through the end of the period as stated on the cover of this report and do not necessarily represent the views of Fidelity or any other person in the Fidelity organization. Any such views are subject to change at any time based upon market or other conditions and Fidelity disclaims any responsibility to update such views. These views may not be relied on as investment advice and, because investment decisions for a Fidelity fund are based on numerous factors, may not be relied on as an indication of trading intent on behalf of any Fidelity fund.
Annual Report
Shareholder Expense Example
As a shareholder of the Fund, you incur two types of costs: (1) transaction costs, and (2) ongoing costs, including management fees and other Fund expenses. This Example is intended to help you understand your ongoing costs (in dollars) of investing in the Fund and to compare these costs with the ongoing costs of investing in other mutual funds.
The Example is based on an investment of $1,000 invested at the beginning of the period and held for the entire period (March 1, 2014 to August 31, 2014).
Actual Expenses
The first line of the accompanying table for each class of the Fund provides information about actual account values and actual expenses. You may use the information in this line, together with the amount you invested, to estimate the expenses that you paid over the period. Simply divide your account value by $1,000.00 (for example, an $8,600 account value divided by $1,000.00 = 8.6), then multiply the result by the number in the first line for a class of the Fund under the heading entitled "Expenses Paid During Period" to estimate the expenses you paid on your account during this period. A small balance maintenance fee of $12.00 that is charged once a year may apply for certain accounts with a value of less than $2,000. This fee is not included in the table below. If it was, the estimate of expenses you paid during the period would be higher, and your ending account value lower, by this amount. In addition, the Fund, as a shareholder in the underlying Fidelity Central Funds, will indirectly bear its pro-rata share of the fees and expenses incurred by the underlying Fidelity Central Funds. These fees and expenses are not included in the Fund's annualized expense ratio used to calculate the expense estimate in the table below.
Hypothetical Example for Comparison Purposes
The second line of the accompanying table for each class of the Fund provides information about hypothetical account values and hypothetical expenses based on a Class' actual expense ratio and an assumed rate of return of 5% per year before expenses, which is not the Class' actual return. The hypothetical account values and expenses may not be used to estimate the actual ending account balance or expenses you paid for the period. You may use this information to compare the ongoing costs of investing in the Fund and other funds. To do so, compare this 5% hypothetical example with the 5% hypothetical examples that appear in the shareholder reports of the other funds. A small balance maintenance fee of $12.00 that is charged once a year may apply for certain accounts with a value of less than $2,000. This fee is not included in the table below. If it was, the estimate of expenses you paid during the period would be higher, and your ending account value lower, by this amount. In addition, the Fund, as a shareholder in the underlying Fidelity Central Funds, will indirectly bear its pro-rata share of the fees and expenses incurred by the underlying Fidelity Central Funds. These fees and expenses are not included in the Fund's annualized expense ratio used to calculate the expense estimate in the table below.
Please note that the expenses shown in the table are meant to highlight your ongoing costs only and do not reflect any transaction costs. Therefore, the second line of the table is useful in comparing ongoing costs only, and will not help you determine the relative total costs of owning different funds.
Annual Report
| Annualized
Expense RatioB | Beginning
Account Value
March 1, 2014 | Ending
Account Value
August 31, 2014 | Expenses Paid
During Period*
March 1, 2014 to August 31, 2014 |
Balanced | .56% | | | |
Actual | | $ 1,000.00 | $ 1,057.50 | $ 2.90 |
HypotheticalA | | $ 1,000.00 | $ 1,022.38 | $ 2.85 |
Class K | .46% | | | |
Actual | | $ 1,000.00 | $ 1,058.50 | $ 2.39 |
HypotheticalA | | $ 1,000.00 | $ 1,022.89 | $ 2.35 |
A 5% return per year before expenses
B Annualized expense ratio reflects expenses net of applicable fee waivers.
* Expenses are equal to each Class' annualized expense ratio, multiplied by the average account value over the period, multiplied by 184/365 (to reflect the one-half year period). The fees and expenses of the underlying Fidelity Central Funds in which the Fund invests are not included in each Class' annualized expense ratio.
In addition to the expenses noted above, the Fund also indirectly bears its proportional share of the expenses of the underlying Fidelity Central Funds. Annualized expenses of the underlying non-money market Fidelity Central Funds as of their most recent fiscal half year were less than .01%.
Annual Report
Investment Changes (Unaudited)
The information in the following tables is based on the combined investments of the Fund and its pro-rata share of the investments of Fidelity's fixed-income central funds.
Top Five Stocks as of August 31, 2014 |
| % of fund's
net assets | % of fund's net assets
6 months ago |
Apple, Inc. | 2.6 | 2.0 |
Chevron Corp. | 1.6 | 0.6 |
Google, Inc. Class C | 1.3 | 0.0 |
Procter & Gamble Co. | 1.2 | 1.3 |
Capital One Financial Corp. | 1.2 | 1.2 |
| 7.9 | |
Top Five Bond Issuers as of August 31, 2014 |
(with maturities greater than one year) | % of fund's
net assets | % of fund's net assets
6 months ago |
Fannie Mae | 4.5 | 4.4 |
U.S. Treasury Obligations | 3.2 | 5.4 |
Ginnie Mae | 1.1 | 0.9 |
Freddie Mac | 0.9 | 1.0 |
Verizon Communications, Inc. | 0.7 | 0.8 |
| 10.4 | |
Top Five Market Sectors as of August 31, 2014 |
| % of fund's
net assets | % of fund's net assets
6 months ago |
Financials | 17.4 | 16.5 |
Information Technology | 13.2 | 13.3 |
Health Care | 10.8 | 10.5 |
Consumer Discretionary | 9.9 | 9.4 |
Energy | 9.2 | 8.3 |
Asset Allocation (% of fund's net assets) |
As of August 31, 2014* | As of February 28, 2014** |
 | Stocks and
Equity Futures 72.0% | | | Stocks and
Equity Futures 71.1% | |
 | Bonds 26.6% | | | Bonds 27.5% | |
 | Convertible
Securities 0.0% | | | Convertible
Securities 0.1% | |
 | Other Investments 0.4% | | | Other Investments 0.3% | |
 | Short-Term
Investments and
Net Other Assets (Liabilities) 1.0% | | | Short-Term
Investments and
Net Other Assets (Liabilities) 1.0% | |
* Foreign investments | 9.7% | | ** Foreign investments | 11.0% | |

Percentages are adjusted for the effect of futures contracts and swaps, if applicable. |
An unaudited holdings listing for the Fund, which presents direct holdings as well as the pro-rata share of any securities and other investments held indirectly through its investment in underlying non-money market Fidelity Central Funds, is available at fidelity.com. |
Percentages in the above tables are adjusted for the effect of TBA Sale Commitments. |
Annual Report
Investments August 31, 2014
Showing Percentage of Net Assets
Common Stocks - 71.2% |
| Shares | | Value (000s) |
CONSUMER DISCRETIONARY - 9.1% |
Diversified Consumer Services - 0.3% |
H&R Block, Inc. | 2,745,577 | | $ 92,059 |
Hotels, Restaurants & Leisure - 3.1% |
ARAMARK Holdings Corp. | 323,036 | | 8,367 |
Extended Stay America, Inc. unit | 6,093,170 | | 145,383 |
Hilton Worldwide Holdings, Inc. | 2,656,100 | | 67,252 |
Marriott International, Inc. Class A | 907,267 | | 62,964 |
McDonald's Corp. | 1,347,474 | | 126,285 |
Panera Bread Co. Class A (a) | 790,600 | | 118,543 |
Starbucks Corp. | 1,944,800 | | 151,325 |
Yum! Brands, Inc. | 2,009,752 | | 145,566 |
| | 825,685 |
Internet & Catalog Retail - 0.7% |
Ctrip.com International Ltd. sponsored ADR (a) | 537,000 | | 34,459 |
Liberty Interactive Corp. Series A (a) | 3,909,835 | | 115,418 |
Qunar Cayman Islands Ltd. sponsored ADR (d) | 1,022,699 | | 30,701 |
| | 180,578 |
Media - 3.2% |
CBS Outdoor Americas, Inc. | 414,000 | | 14,229 |
Comcast Corp. Class A | 847,042 | | 46,359 |
DIRECTV (a) | 1,297,018 | | 112,127 |
DreamWorks Animation SKG, Inc. Class A (a) | 514,800 | | 11,241 |
Legend Pictures LLC (a)(n)(o) | 8,571 | | 15,454 |
Liberty Media Corp.: | | | |
Class A (a) | 561,300 | | 27,633 |
Class C (a) | 1,284,300 | | 62,250 |
Manchester United PLC (a) | 1,838,000 | | 31,356 |
The Madison Square Garden Co. Class A (a) | 1,794,085 | | 119,953 |
Time Warner Cable, Inc. | 156,100 | | 23,092 |
Twenty-First Century Fox, Inc. Class A | 6,810,241 | | 241,219 |
Viacom, Inc. Class B (non-vtg.) | 1,947,992 | | 158,080 |
| | 862,993 |
Multiline Retail - 0.5% |
Dollar General Corp. (a) | 2,216,112 | | 141,809 |
Specialty Retail - 0.5% |
TJX Companies, Inc. | 2,287,933 | | 136,384 |
Common Stocks - continued |
| Shares | | Value (000s) |
CONSUMER DISCRETIONARY - continued |
Textiles, Apparel & Luxury Goods - 0.8% |
lululemon athletica, Inc. (a) | 889,252 | | $ 35,508 |
NIKE, Inc. Class B | 2,205,000 | | 173,203 |
| | 208,711 |
TOTAL CONSUMER DISCRETIONARY | | 2,448,219 |
CONSUMER STAPLES - 6.6% |
Beverages - 1.4% |
Anheuser-Busch InBev SA NV | 202,344 | | 22,572 |
Coca-Cola Icecek Sanayi A/S | 298,728 | | 7,048 |
Diageo PLC sponsored ADR | 250,787 | | 30,062 |
Embotelladora Andina SA sponsored ADR | 332,973 | | 6,496 |
Monster Beverage Corp. (a) | 469,100 | | 41,473 |
Pernod Ricard SA | 303,550 | | 35,793 |
Remy Cointreau SA | 269,186 | | 21,395 |
The Coca-Cola Co. | 5,347,661 | | 223,104 |
| | 387,943 |
Food & Staples Retailing - 1.5% |
CVS Caremark Corp. | 1,953,385 | | 155,196 |
Kroger Co. | 2,149,554 | | 109,584 |
Sysco Corp. | 954,112 | | 36,094 |
Wal-Mart Stores, Inc. | 909,567 | | 68,672 |
Whole Foods Market, Inc. | 1,005,800 | | 39,367 |
| | 408,913 |
Food Products - 0.8% |
Bunge Ltd. | 435,098 | | 36,831 |
ConAgra Foods, Inc. | 513,481 | | 16,534 |
Keurig Green Mountain, Inc. | 303,400 | | 40,449 |
Mead Johnson Nutrition Co. Class A | 762,431 | | 72,888 |
Nestle SA | 345,647 | | 26,811 |
The Hershey Co. | 69,000 | | 6,308 |
| | 199,821 |
Household Products - 1.2% |
Procter & Gamble Co. | 3,969,493 | | 329,905 |
Personal Products - 0.1% |
L'Oreal SA | 105,800 | | 17,516 |
Nu Skin Enterprises, Inc. Class A | 162,175 | | 7,252 |
| | 24,768 |
Common Stocks - continued |
| Shares | | Value (000s) |
CONSUMER STAPLES - continued |
Tobacco - 1.6% |
Altria Group, Inc. | 3,791,613 | | $ 163,343 |
British American Tobacco PLC sponsored ADR | 1,817,610 | | 215,241 |
Philip Morris International, Inc. | 390,734 | | 33,439 |
Souza Cruz SA | 912,700 | | 8,546 |
| | 420,569 |
TOTAL CONSUMER STAPLES | | 1,771,919 |
ENERGY - 7.6% |
Energy Equipment & Services - 1.2% |
C&J Energy Services, Inc. (a) | 830,051 | | 23,814 |
Dril-Quip, Inc. (a) | 286,169 | | 29,038 |
FMC Technologies, Inc. (a) | 798,771 | | 49,396 |
Halliburton Co. | 2,144,911 | | 145,017 |
Independence Contract Drilling (e) | 1,226,834 | | 14,109 |
Ocean Rig UDW, Inc. (United States) | 725,596 | | 13,445 |
Oceaneering International, Inc. | 640,391 | | 44,546 |
| | 319,365 |
Oil, Gas & Consumable Fuels - 6.4% |
Anadarko Petroleum Corp. | 1,436,131 | | 161,838 |
BG Group PLC | 1,846,464 | | 36,807 |
Cabot Oil & Gas Corp. | 1,881,450 | | 63,104 |
Carrizo Oil & Gas, Inc. (a) | 330,798 | | 20,748 |
Chevron Corp. | 3,232,605 | | 418,461 |
Cimarex Energy Co. | 429,002 | | 62,274 |
EOG Resources, Inc. | 918,416 | | 100,916 |
Exxon Mobil Corp. | 2,526,378 | | 251,274 |
Gulfport Energy Corp. (a) | 343,900 | | 20,118 |
Kinder Morgan Holding Co. LLC (d) | 2,006,800 | | 80,794 |
Kinder Morgan Management LLC | 428,800 | | 41,902 |
Memorial Resource Development Corp. | 945,471 | | 27,863 |
Noble Energy, Inc. | 1,418,730 | | 102,347 |
ONEOK, Inc. | 168,515 | | 11,830 |
Peabody Energy Corp. | 608,908 | | 9,669 |
Phillips 66 Co. | 1,272,517 | | 110,734 |
Phillips 66 Partners LP | 300,022 | | 22,202 |
PrairieSky Royalty Ltd. | 112,500 | | 4,087 |
Suncor Energy, Inc. | 667,500 | | 27,399 |
Valero Energy Partners LP | 823,031 | | 43,876 |
Common Stocks - continued |
| Shares | | Value (000s) |
ENERGY - continued |
Oil, Gas & Consumable Fuels - continued |
Whiting Petroleum Corp. (a) | 961,277 | | $ 89,072 |
YPF SA Class D sponsored ADR | 681,700 | | 22,523 |
| | 1,729,838 |
TOTAL ENERGY | | 2,049,203 |
FINANCIALS - 11.4% |
Banks - 4.4% |
Bank of America Corp. | 18,665,808 | | 300,333 |
Citigroup, Inc. | 3,382,212 | | 174,691 |
Huntington Bancshares, Inc. | 8,012,800 | | 78,886 |
JPMorgan Chase & Co. | 5,407,854 | | 321,497 |
Societe Generale Series A | 580,802 | | 29,423 |
SunTrust Banks, Inc. | 1,283,148 | | 48,862 |
Synovus Financial Corp. | 778,720 | | 18,806 |
U.S. Bancorp | 5,100,347 | | 215,643 |
| | 1,188,141 |
Capital Markets - 1.6% |
Ameriprise Financial, Inc. | 665,862 | | 83,739 |
BlackRock, Inc. Class A | 433,776 | | 143,376 |
Carlyle Group LP | 286,400 | | 9,526 |
E*TRADE Financial Corp. (a) | 1,804,949 | | 40,178 |
Invesco Ltd. | 841,213 | | 34,355 |
Northern Trust Corp. | 427,519 | | 29,648 |
Oaktree Capital Group LLC Class A | 286,697 | | 14,398 |
State Street Corp. | 512,700 | | 36,930 |
The Blackstone Group LP | 755,407 | | 25,329 |
| | 417,479 |
Consumer Finance - 1.7% |
Capital One Financial Corp. | 3,999,501 | | 328,199 |
Discover Financial Services | 671,810 | | 41,901 |
Navient Corp. | 2,313,334 | | 41,501 |
SLM Corp. | 4,624,534 | | 40,973 |
Springleaf Holdings, Inc. | 243,300 | | 8,097 |
| | 460,671 |
Diversified Financial Services - 0.9% |
Berkshire Hathaway, Inc.: | | | |
Class A (a) | 129 | | 26,559 |
Class B (a) | 1,188,800 | | 163,163 |
Common Stocks - continued |
| Shares | | Value (000s) |
FINANCIALS - continued |
Diversified Financial Services - continued |
IntercontinentalExchange Group, Inc. | 204,062 | | $ 38,568 |
KBC Ancora (a) | 343,174 | | 11,250 |
| | 239,540 |
Insurance - 1.6% |
AFLAC, Inc. | 229,800 | | 14,073 |
Direct Line Insurance Group PLC | 8,517,030 | | 42,263 |
esure Group PLC | 1,382,886 | | 6,084 |
Fairfax Financial Holdings Ltd. (sub. vtg.) | 101,000 | | 46,539 |
Marsh & McLennan Companies, Inc. | 1,923,477 | | 102,137 |
MetLife, Inc. | 2,192,647 | | 120,025 |
Principal Financial Group, Inc. | 303,600 | | 16,482 |
The Travelers Companies, Inc. | 768,540 | | 72,788 |
Unum Group | 609,200 | | 22,096 |
| | 442,487 |
Real Estate Investment Trusts - 0.9% |
Altisource Residential Corp. Class B | 1,899,017 | | 46,602 |
American Tower Corp. | 209,731 | | 20,679 |
Boston Properties, Inc. | 524,397 | | 63,672 |
Digital Realty Trust, Inc. (d) | 613,500 | | 40,031 |
Piedmont Office Realty Trust, Inc. Class A | 1,099,538 | | 21,430 |
Senior Housing Properties Trust (SBI) | 545,407 | | 12,724 |
Sun Communities, Inc. | 584,915 | | 31,369 |
| | 236,507 |
Real Estate Management & Development - 0.3% |
CBRE Group, Inc. (a) | 2,335,503 | | 74,222 |
TOTAL FINANCIALS | | 3,059,047 |
HEALTH CARE - 10.2% |
Biotechnology - 3.1% |
Actelion Ltd. | 250,276 | | 30,724 |
Alexion Pharmaceuticals, Inc. (a) | 691,204 | | 117,014 |
Amgen, Inc. | 1,367,358 | | 190,582 |
Biogen Idec, Inc. (a) | 440,985 | | 151,275 |
Celgene Corp. (a) | 326,500 | | 31,024 |
Gilead Sciences, Inc. (a) | 2,461,428 | | 264,800 |
Puma Biotechnology, Inc. (a) | 37,300 | | 9,717 |
Vertex Pharmaceuticals, Inc. (a) | 598,700 | | 56,020 |
| | 851,156 |
Common Stocks - continued |
| Shares | | Value (000s) |
HEALTH CARE - continued |
Health Care Equipment & Supplies - 1.4% |
Boston Scientific Corp. (a) | 7,892,502 | | $ 100,077 |
Covidien PLC | 1,370,944 | | 119,039 |
Edwards Lifesciences Corp. (a) | 316,482 | | 31,414 |
Medtronic, Inc. | 698,900 | | 44,625 |
Quidel Corp. (a)(d) | 399,590 | | 9,430 |
The Cooper Companies, Inc. | 384,937 | | 62,756 |
| | 367,341 |
Health Care Providers & Services - 1.5% |
Brookdale Senior Living, Inc. (a) | 722,803 | | 25,262 |
Cigna Corp. | 1,067,660 | | 101,001 |
HCA Holdings, Inc. (a) | 1,356,679 | | 94,723 |
Henry Schein, Inc. (a) | 333,004 | | 39,857 |
McKesson Corp. | 819,148 | | 159,758 |
| | 420,601 |
Health Care Technology - 0.1% |
Veeva Systems, Inc. Class A | 720,734 | | 21,600 |
Life Sciences Tools & Services - 0.8% |
Agilent Technologies, Inc. | 1,681,100 | | 96,092 |
Thermo Fisher Scientific, Inc. | 953,797 | | 114,656 |
| | 210,748 |
Pharmaceuticals - 3.3% |
AbbVie, Inc. | 2,724,768 | | 150,625 |
Actavis PLC (a) | 693,243 | | 157,352 |
Allergan, Inc. | 410,500 | | 67,191 |
Bristol-Myers Squibb Co. | 2,558,841 | | 129,605 |
Merck & Co., Inc. | 1,519,296 | | 91,325 |
Pfizer, Inc. | 2,103,834 | | 61,832 |
Roche Holding AG (participation certificate) | 193,869 | | 56,621 |
Salix Pharmaceuticals Ltd. (a) | 258,384 | | 41,111 |
Shire PLC | 806,788 | | 65,735 |
Teva Pharmaceutical Industries Ltd. sponsored ADR | 1,177,400 | | 61,837 |
| | 883,234 |
TOTAL HEALTH CARE | | 2,754,680 |
INDUSTRIALS - 6.6% |
Aerospace & Defense - 1.4% |
Honeywell International, Inc. | 1,689,809 | | 160,921 |
Meggitt PLC | 7,670,800 | | 60,057 |
Common Stocks - continued |
| Shares | | Value (000s) |
INDUSTRIALS - continued |
Aerospace & Defense - continued |
TransDigm Group, Inc. | 579,269 | | $ 108,897 |
United Technologies Corp. | 395,393 | | 42,695 |
| | 372,570 |
Air Freight & Logistics - 0.4% |
FedEx Corp. | 683,827 | | 101,124 |
Commercial Services & Supplies - 0.2% |
KAR Auction Services, Inc. | 1,515,967 | | 45,722 |
Electrical Equipment - 1.3% |
Acuity Brands, Inc. | 723,869 | | 89,673 |
AMETEK, Inc. | 3,339,448 | | 176,790 |
Hubbell, Inc. Class B | 811,092 | | 98,061 |
| | 364,524 |
Industrial Conglomerates - 1.5% |
Danaher Corp. | 2,811,066 | | 215,356 |
Roper Industries, Inc. | 1,231,039 | | 185,345 |
| | 400,701 |
Machinery - 0.2% |
Deere & Co. | 713,500 | | 59,998 |
Professional Services - 0.5% |
Verisk Analytics, Inc. (a) | 2,242,905 | | 143,972 |
WageWorks, Inc. (a) | 120,932 | | 4,990 |
| | 148,962 |
Road & Rail - 0.6% |
J.B. Hunt Transport Services, Inc. | 2,164,495 | | 163,528 |
Trading Companies & Distributors - 0.5% |
W.W. Grainger, Inc. | 503,669 | | 124,003 |
TOTAL INDUSTRIALS | | 1,781,132 |
INFORMATION TECHNOLOGY - 13.0% |
Communications Equipment - 0.9% |
Cisco Systems, Inc. | 2,172,699 | | 54,296 |
Juniper Networks, Inc. | 892,755 | | 20,703 |
QUALCOMM, Inc. | 2,097,451 | | 159,616 |
| | 234,615 |
Electronic Equipment & Components - 0.3% |
TE Connectivity Ltd. | 1,479,765 | | 92,752 |
Internet Software & Services - 3.7% |
58.com, Inc. ADR | 327,589 | | 13,644 |
Common Stocks - continued |
| Shares | | Value (000s) |
INFORMATION TECHNOLOGY - continued |
Internet Software & Services - continued |
Benefitfocus, Inc. | 270,404 | | $ 8,929 |
ChannelAdvisor Corp. (a) | 809,306 | | 13,111 |
Cvent, Inc. | 1,753,646 | | 44,052 |
Demandware, Inc. (a) | 437,635 | | 23,260 |
eBay, Inc. (a) | 1,208,400 | | 67,066 |
Endurance International Group Holdings, Inc. (d) | 1,249,016 | | 16,812 |
Facebook, Inc. Class A (a) | 1,382,107 | | 103,409 |
Five9, Inc. (d) | 1,838,400 | | 10,791 |
Google, Inc.: | | | |
Class A (a) | 354,969 | | 206,720 |
Class C (a) | 589,769 | | 337,112 |
Millennial Media, Inc. | 173,845 | | 331 |
NAVER Corp. | 29,452 | | 22,305 |
Opower, Inc. (d) | 1,166,993 | | 18,252 |
Wix.com Ltd. (a)(d) | 392,937 | | 6,468 |
Yahoo!, Inc. (a) | 2,327,060 | | 89,615 |
Zoopla Property Group PLC (d) | 4,633,297 | | 19,326 |
| | 1,001,203 |
IT Services - 0.8% |
Cognizant Technology Solutions Corp. Class A (a) | 78,922 | | 3,609 |
Fidelity National Information Services, Inc. | 1,504,071 | | 85,356 |
Lionbridge Technologies, Inc. (a) | 739,645 | | 3,432 |
Quindell PLC (d) | 3,077,687 | | 8,686 |
Sapient Corp. (a) | 451,061 | | 6,545 |
Total System Services, Inc. | 1,135,600 | | 35,726 |
Visa, Inc. Class A | 317,722 | | 67,522 |
| | 210,876 |
Semiconductors & Semiconductor Equipment - 1.2% |
Micron Technology, Inc. (a) | 2,378,000 | | 77,523 |
NVIDIA Corp. | 2,004,517 | | 38,988 |
NXP Semiconductors NV (a) | 3,115,624 | | 213,483 |
RF Micro Devices, Inc. (a) | 948,000 | | 11,822 |
| | 341,816 |
Software - 2.8% |
Activision Blizzard, Inc. | 499,000 | | 11,746 |
Adobe Systems, Inc. (a) | 1,149,557 | | 82,653 |
Autodesk, Inc. (a) | 804,100 | | 43,132 |
CommVault Systems, Inc. (a) | 485,009 | | 26,743 |
Concur Technologies, Inc. (a) | 57,457 | | 5,768 |
Covisint Corp. (d) | 369,400 | | 1,777 |
Common Stocks - continued |
| Shares | | Value (000s) |
INFORMATION TECHNOLOGY - continued |
Software - continued |
Fleetmatics Group PLC (a) | 250,503 | | $ 8,222 |
Imperva, Inc. (a) | 880,290 | | 25,625 |
Intuit, Inc. | 372,200 | | 30,960 |
Microsoft Corp. | 5,776,032 | | 262,405 |
Oracle Corp. | 2,609,625 | | 108,378 |
Qlik Technologies, Inc. (a) | 293,817 | | 8,294 |
salesforce.com, Inc. (a) | 2,082,396 | | 123,049 |
Xero Ltd. (o) | 468,513 | | 8,888 |
| | 747,640 |
Technology Hardware, Storage & Peripherals - 3.3% |
Apple, Inc. | 6,797,614 | | 696,754 |
Electronics for Imaging, Inc. (a) | 554,205 | | 24,407 |
Hewlett-Packard Co. | 4,339,100 | | 164,886 |
| | 886,047 |
TOTAL INFORMATION TECHNOLOGY | | 3,514,949 |
MATERIALS - 3.2% |
Chemicals - 2.6% |
Airgas, Inc. | 1,788,970 | | 197,467 |
Cabot Corp. | 270,371 | | 14,811 |
Eastman Chemical Co. | 622,382 | | 51,328 |
Ecolab, Inc. | 698,700 | | 80,225 |
FMC Corp. | 760,773 | | 50,318 |
LyondellBasell Industries NV Class A | 766,922 | | 87,698 |
Methanex Corp. | 300,200 | | 20,072 |
Monsanto Co. | 807,646 | | 93,404 |
Potash Corp. of Saskatchewan, Inc. (d) | 1,044,785 | | 36,697 |
Sigma Aldrich Corp. | 457,510 | | 47,581 |
W.R. Grace & Co. (a) | 331,001 | | 32,779 |
| | 712,380 |
Construction Materials - 0.2% |
Eagle Materials, Inc. | 94,700 | | 9,651 |
Vulcan Materials Co. | 536,143 | | 33,981 |
| | 43,632 |
Containers & Packaging - 0.2% |
Graphic Packaging Holding Co. (a) | 2,269,877 | | 29,032 |
Rock-Tenn Co. Class A | 706,578 | | 34,735 |
| | 63,767 |
Common Stocks - continued |
| Shares | | Value (000s) |
MATERIALS - continued |
Metals & Mining - 0.2% |
Carpenter Technology Corp. | 44,400 | | $ 2,430 |
Freeport-McMoRan Copper & Gold, Inc. | 367,400 | | 13,362 |
Nucor Corp. | 498,767 | | 27,093 |
| | 42,885 |
TOTAL MATERIALS | | 862,664 |
TELECOMMUNICATION SERVICES - 1.4% |
Diversified Telecommunication Services - 1.2% |
CenturyLink, Inc. | 422,800 | | 17,331 |
inContact, Inc. (a) | 1,324,987 | | 12,137 |
Level 3 Communications, Inc. (a) | 647,709 | | 29,121 |
Verizon Communications, Inc. | 5,553,301 | | 276,665 |
| | 335,254 |
Wireless Telecommunication Services - 0.2% |
T-Mobile U.S., Inc. (a) | 1,366,600 | | 41,107 |
Telephone & Data Systems, Inc. | 189,300 | | 4,986 |
| | 46,093 |
TOTAL TELECOMMUNICATION SERVICES | | 381,347 |
UTILITIES - 2.1% |
Electric Utilities - 0.9% |
American Electric Power Co., Inc. | 372,132 | | 19,983 |
Edison International | 542,827 | | 32,103 |
Exelon Corp. | 1,380,800 | | 46,146 |
NextEra Energy, Inc. | 949,100 | | 93,439 |
PPL Corp. | 1,475,400 | | 51,093 |
| | 242,764 |
Gas Utilities - 0.2% |
National Fuel Gas Co. | 618,189 | | 47,254 |
Independent Power and Renewable Electricity Producers - 0.0% |
Abengoa Yield PLC | 101,300 | | 4,063 |
NextEra Energy Partners LP | 122,200 | | 4,290 |
| | 8,353 |
Independent Power Producers & Energy Traders - 0.1% |
NRG Energy, Inc. | 1,242,072 | | 38,231 |
Multi-Utilities - 0.9% |
Dominion Resources, Inc. | 1,199,800 | | 84,250 |
Common Stocks - continued |
| Shares | | Value (000s) |
UTILITIES - continued |
Multi-Utilities - continued |
NiSource, Inc. | 1,076,482 | | $ 42,704 |
PG&E Corp. | 578,429 | | 26,885 |
Sempra Energy | 706,531 | | 74,871 |
| | 228,710 |
TOTAL UTILITIES | | 565,312 |
TOTAL COMMON STOCKS (Cost $14,380,948) |
19,188,472
|
Preferred Stocks - 0.1% |
| | | |
Convertible Preferred Stocks - 0.0% |
INFORMATION TECHNOLOGY - 0.0% |
Software - 0.0% |
MongoDB, Inc. Series F, 8.00% (o) | 281,270 | | 3,446 |
Nonconvertible Preferred Stocks - 0.1% |
CONSUMER STAPLES - 0.1% |
Beverages - 0.1% |
Ambev SA sponsored ADR | 1,207,025 | | 8,799 |
TOTAL PREFERRED STOCKS (Cost $9,180) |
12,245
|
Corporate Bonds - 10.1% |
| Principal Amount (000s) | | |
Convertible Bonds - 0.0% |
ENERGY - 0.0% |
Oil, Gas & Consumable Fuels - 0.0% |
Cobalt International Energy, Inc. 2.625% 12/1/19 | | $ 1,740 | | 1,529 |
Nonconvertible Bonds - 10.1% |
CONSUMER DISCRETIONARY - 0.3% |
Automobiles - 0.0% |
Volkswagen International Finance NV 2.375% 3/22/17 (f) | | 1,830 | | 1,885 |
Corporate Bonds - continued |
| Principal Amount (000s) | | Value (000s) |
Nonconvertible Bonds - continued |
CONSUMER DISCRETIONARY - continued |
Diversified Consumer Services - 0.0% |
Ingersoll-Rand Global Holding Co. Ltd.: | | | | |
2.875% 1/15/19 | | $ 617 | | $ 633 |
4.25% 6/15/23 | | 4,350 | | 4,639 |
| | 5,272 |
Media - 0.3% |
COX Communications, Inc. 3.25% 12/15/22 (f) | | 2,422 | | 2,380 |
Discovery Communications LLC 5.05% 6/1/20 | | 204 | | 228 |
NBCUniversal, Inc. 5.15% 4/30/20 | | 7,276 | | 8,329 |
News America Holdings, Inc. 7.75% 12/1/45 | | 9,421 | | 14,056 |
Thomson Reuters Corp. 1.3% 2/23/17 | | 2,082 | | 2,084 |
Time Warner Cable, Inc.: | | | | |
4% 9/1/21 | | 10,989 | | 11,794 |
5.85% 5/1/17 | | 1,829 | | 2,042 |
6.75% 7/1/18 | | 1,974 | | 2,320 |
8.25% 4/1/19 | | 11,974 | | 15,064 |
Time Warner, Inc.: | | | | |
2.1% 6/1/19 | | 13,219 | | 13,111 |
5.875% 11/15/16 | | 4,882 | | 5,386 |
Viacom, Inc.: | | | | |
1.25% 2/27/15 | | 456 | | 458 |
2.5% 9/1/18 | | 809 | | 823 |
3.5% 4/1/17 | | 264 | | 279 |
| | 78,354 |
TOTAL CONSUMER DISCRETIONARY | | 85,511 |
CONSUMER STAPLES - 0.3% |
Beverages - 0.0% |
SABMiller Holdings, Inc.: | | | | |
1.85% 1/15/15 (f) | | 2,353 | | 2,364 |
2.45% 1/15/17 (f) | | 2,353 | | 2,424 |
| | 4,788 |
Food & Staples Retailing - 0.0% |
CVS Caremark Corp. 2.25% 12/5/18 | | 4,798 | | 4,847 |
Kroger Co. 3.3% 1/15/21 | | 6,190 | | 6,363 |
| | 11,210 |
Corporate Bonds - continued |
| Principal Amount (000s) | | Value (000s) |
Nonconvertible Bonds - continued |
CONSUMER STAPLES - continued |
Food Products - 0.1% |
Cargill, Inc. 6% 11/27/17 (f) | | $ 572 | | $ 648 |
ConAgra Foods, Inc.: | | | | |
1.9% 1/25/18 | | 2,279 | | 2,279 |
3.2% 1/25/23 | | 1,917 | | 1,889 |
Tyson Foods, Inc. 3.95% 8/15/24 | | 9,560 | | 9,767 |
William Wrigley Jr. Co.: | | | | |
1.4% 10/21/16 (f) | | 3,710 | | 3,735 |
2% 10/20/17 (f) | | 5,313 | | 5,383 |
| | 23,701 |
Tobacco - 0.2% |
Altria Group, Inc.: | | | | |
2.85% 8/9/22 | | 4,604 | | 4,504 |
4% 1/31/24 | | 3,615 | | 3,761 |
9.7% 11/10/18 | | 6,258 | | 8,120 |
Reynolds American, Inc.: | | | | |
3.25% 11/1/22 | | 3,376 | | 3,305 |
4.85% 9/15/23 | | 8,000 | | 8,629 |
6.75% 6/15/17 | | 4,975 | | 5,657 |
7.25% 6/15/37 | | 7,569 | | 9,655 |
| | 43,631 |
TOTAL CONSUMER STAPLES | | 83,330 |
ENERGY - 1.4% |
Energy Equipment & Services - 0.1% |
DCP Midstream LLC: | | | | |
4.75% 9/30/21 (f) | | 6,909 | | 7,386 |
5.35% 3/15/20 (f) | | 6,814 | | 7,531 |
El Paso Pipeline Partners Operating Co. LLC: | | | | |
4.1% 11/15/15 | | 7,675 | | 7,956 |
5% 10/1/21 | | 2,791 | | 3,048 |
6.5% 4/1/20 | | 2,608 | | 3,034 |
Noble Holding International Ltd. 3.05% 3/1/16 | | 914 | | 942 |
Transocean, Inc. 5.05% 12/15/16 | | 4,522 | | 4,878 |
| | 34,775 |
Oil, Gas & Consumable Fuels - 1.3% |
Anadarko Petroleum Corp. 6.375% 9/15/17 | | 15,653 | | 17,846 |
Corporate Bonds - continued |
| Principal Amount (000s) | | Value (000s) |
Nonconvertible Bonds - continued |
ENERGY - continued |
Oil, Gas & Consumable Fuels - continued |
DCP Midstream Operating LP: | | | | |
2.5% 12/1/17 | | $ 3,027 | | $ 3,102 |
2.7% 4/1/19 | | 616 | | 624 |
3.875% 3/15/23 | | 1,823 | | 1,865 |
4.95% 4/1/22 | | 1,267 | | 1,399 |
Duke Energy Field Services: | | | | |
5.375% 10/15/15 (f) | | 2,055 | | 2,137 |
6.45% 11/3/36 (f) | | 6,493 | | 7,724 |
El Paso Natural Gas Co. 5.95% 4/15/17 | | 1,572 | | 1,745 |
Enable Midstream Partners LP: | | | | |
2.4% 5/15/19 (f) | | 1,957 | | 1,951 |
3.9% 5/15/24 (f) | | 2,064 | | 2,085 |
Enbridge Energy Partners LP 4.2% 9/15/21 | | 8,103 | | 8,671 |
Gulfstream Natural Gas System LLC 6.95% 6/1/16 (f) | | 780 | | 849 |
Marathon Petroleum Corp. 5.125% 3/1/21 | | 4,415 | | 5,000 |
Midcontinent Express Pipeline LLC 5.45% 9/15/14 (f) | | 7,948 | | 7,956 |
Motiva Enterprises LLC 5.75% 1/15/20 (f) | | 1,252 | | 1,418 |
Nakilat, Inc. 6.067% 12/31/33 (f) | | 2,490 | | 2,801 |
Nexen, Inc.: | | | | |
5.2% 3/10/15 | | 1,528 | | 1,564 |
6.2% 7/30/19 | | 2,252 | | 2,627 |
Pemex Project Funding Master Trust 5.75% 3/1/18 | | 25,063 | | 28,121 |
Petrobras Global Finance BV: | | | | |
3% 1/15/19 | | 29,822 | | 29,386 |
3.25% 3/17/17 | | 12,657 | | 12,946 |
4.375% 5/20/23 | | 4,137 | | 4,082 |
4.875% 3/17/20 | | 12,657 | | 13,146 |
Petrobras International Finance Co. Ltd.: | | | | |
3.875% 1/27/16 | | 7,288 | | 7,492 |
5.375% 1/27/21 | | 12,572 | | 13,255 |
5.75% 1/20/20 | | 17,949 | | 19,348 |
7.875% 3/15/19 | | 7,382 | | 8,600 |
Petroleos Mexicanos: | | | | |
3.5% 7/18/18 | | 8,047 | | 8,409 |
3.5% 1/30/23 | | 5,005 | | 4,960 |
4.875% 1/24/22 | | 1,430 | | 1,554 |
4.875% 1/18/24 | | 2,251 | | 2,449 |
4.875% 1/18/24 (f) | | 4,770 | | 5,190 |
5.5% 1/21/21 | | 7,423 | | 8,351 |
Corporate Bonds - continued |
| Principal Amount (000s) | | Value (000s) |
Nonconvertible Bonds - continued |
ENERGY - continued |
Oil, Gas & Consumable Fuels - continued |
Petroleos Mexicanos: - continued | | | | |
5.5% 6/27/44 | | $ 19,723 | | $ 21,395 |
6% 3/5/20 | | 3,327 | | 3,818 |
6.375% 1/23/45 (f) | | 7,506 | | 9,082 |
6.5% 6/2/41 | | 8,420 | | 10,272 |
Phillips 66 Co.: | | | | |
1.95% 3/5/15 | | 1,844 | | 1,857 |
2.95% 5/1/17 | | 1,844 | | 1,926 |
4.3% 4/1/22 | | 6,383 | | 6,918 |
Plains All American Pipeline LP/PAA Finance Corp. 6.125% 1/15/17 | | 1,940 | | 2,162 |
Southeast Supply Header LLC 4.25% 6/15/24 (f) | | 5,790 | | 5,977 |
Spectra Energy Capital, LLC 5.65% 3/1/20 | | 1,087 | | 1,225 |
Spectra Energy Partners, LP: | | | | |
2.95% 6/15/16 | | 1,472 | | 1,524 |
4.6% 6/15/21 | | 1,816 | | 1,993 |
Suncor Energy, Inc. 6.1% 6/1/18 | | 623 | | 718 |
The Williams Companies, Inc.: | | | | |
3.7% 1/15/23 | | 1,899 | | 1,822 |
4.55% 6/24/24 | | 17,216 | | 17,340 |
Western Gas Partners LP 5.375% 6/1/21 | | 10,614 | | 12,064 |
Williams Partners LP 4.3% 3/4/24 | | 4,754 | | 4,973 |
| | 343,719 |
TOTAL ENERGY | | 378,494 |
FINANCIALS - 5.8% |
Banks - 2.6% |
Associated Banc Corp. 5.125% 3/28/16 | | 2,238 | | 2,366 |
Banco Nacional de Desenvolvimento Economico e Social: | | | | |
4% 4/14/19 (f) | | 16,318 | | 16,726 |
5.5% 7/12/20 (f) | | 20,348 | | 22,205 |
6.5% 6/10/19 (f) | | 2,097 | | 2,362 |
Bank of America Corp.: | | | | |
1.35% 11/21/16 | | 5,398 | | 5,415 |
2.6% 1/15/19 | | 43,489 | | 43,913 |
2.65% 4/1/19 | | 14,468 | | 14,615 |
3.875% 3/22/17 | | 944 | | 1,002 |
Corporate Bonds - continued |
| Principal Amount (000s) | | Value (000s) |
Nonconvertible Bonds - continued |
FINANCIALS - continued |
Banks - continued |
Bank of America Corp.: - continued | | | | |
4.2% 8/26/24 | | $ 7,745 | | $ 7,863 |
6.5% 8/1/16 | | 1,220 | | 1,341 |
Bank of America NA 5.3% 3/15/17 | | 16,651 | | 18,158 |
Barclays Bank PLC 2.5% 2/20/19 | | 4,000 | | 4,065 |
BB&T Corp. 3.95% 3/22/22 | | 1,805 | | 1,922 |
Capital One NA 2.95% 7/23/21 | | 8,837 | | 8,851 |
Citigroup, Inc.: | | | | |
1.3% 11/15/16 | | 663 | | 665 |
1.75% 5/1/18 | | 21,658 | | 21,556 |
2.5% 7/29/19 | | 22,812 | | 22,903 |
2.55% 4/8/19 | | 24,266 | | 24,504 |
4.05% 7/30/22 | | 17,500 | | 18,039 |
4.45% 1/10/17 | | 15,842 | | 16,984 |
5.3% 5/6/44 | | 12,873 | | 13,817 |
6% 8/15/17 | | 15,053 | | 16,922 |
6.125% 11/21/17 | | 17,419 | | 19,758 |
Comerica, Inc. 4.8% 5/1/15 | | 1,223 | | 1,258 |
Credit Suisse AG 6% 2/15/18 | | 17,158 | | 19,376 |
Credit Suisse New York Branch 5.4% 1/14/20 | | 1,450 | | 1,633 |
Discover Bank: | | | | |
7% 4/15/20 | | 4,144 | | 4,965 |
8.7% 11/18/19 | | 745 | | 938 |
Fifth Third Bancorp: | | | | |
3.5% 3/15/22 | | 638 | | 662 |
4.5% 6/1/18 | | 584 | | 635 |
5.45% 1/15/17 | | 4,032 | | 4,403 |
HBOS PLC 6.75% 5/21/18 (f) | | 560 | | 642 |
HSBC Holdings PLC 4.25% 3/14/24 | | 3,415 | | 3,546 |
Huntington Bancshares, Inc. 7% 12/15/20 | | 3,353 | | 4,038 |
Huntington National Bank: | | | | |
1.3% 11/20/16 | | 4,131 | | 4,148 |
2.2% 4/1/19 | | 3,200 | | 3,202 |
Intesa Sanpaolo SpA: | | | | |
2.375% 1/13/17 | | 18,700 | | 18,945 |
3.125% 1/15/16 | | 20,275 | | 20,800 |
JPMorgan Chase & Co.: | | | | |
2% 8/15/17 | | 27,274 | | 27,718 |
2.35% 1/28/19 | | 49,249 | | 49,726 |
Corporate Bonds - continued |
| Principal Amount (000s) | | Value (000s) |
Nonconvertible Bonds - continued |
FINANCIALS - continued |
Banks - continued |
JPMorgan Chase & Co.: - continued | | | | |
3.15% 7/5/16 | | $ 1,641 | | $ 1,706 |
JPMorgan Chase Bank 6% 10/1/17 | | 2,460 | | 2,778 |
KeyBank NA 5.45% 3/3/16 | | 3,278 | | 3,500 |
KeyCorp. 5.1% 3/24/21 | | 628 | | 714 |
Marshall & Ilsley Bank: | | | | |
4.85% 6/16/15 | | 5,313 | | 5,480 |
5% 1/17/17 | | 10,492 | | 11,217 |
Regions Bank: | | | | |
6.45% 6/26/37 | | 12,100 | | 14,426 |
7.5% 5/15/18 | | 13,814 | | 16,300 |
Regions Financial Corp.: | | | | |
2% 5/15/18 | | 7,953 | | 7,918 |
5.75% 6/15/15 | | 1,528 | | 1,587 |
7.75% 11/10/14 | | 7,190 | | 7,280 |
Royal Bank of Scotland Group PLC: | | | | |
5.125% 5/28/24 | | 35,482 | | 36,193 |
6% 12/19/23 | | 12,648 | | 13,751 |
6.1% 6/10/23 | | 8,213 | | 8,967 |
6.125% 12/15/22 | | 39,429 | | 43,121 |
Sumitomo Mitsui Banking Corp. 1.3% 1/10/17 | | 6,500 | | 6,513 |
SunTrust Banks, Inc.: | | | | |
2.35% 11/1/18 | | 3,112 | | 3,146 |
3.5% 1/20/17 | | 4,862 | | 5,119 |
Wachovia Bank NA 6% 11/15/17 | | 8,083 | | 9,191 |
Wells Fargo & Co.: | | | | |
4.1% 6/3/26 | | 15,000 | | 15,375 |
4.48% 1/16/24 | | 6,481 | | 6,950 |
| | 693,819 |
Capital Markets - 0.8% |
Affiliated Managers Group, Inc. 4.25% 2/15/24 | | 2,464 | | 2,575 |
Bear Stearns Companies, Inc. 5.3% 10/30/15 | | 1,060 | | 1,116 |
Goldman Sachs Group, Inc.: | | | | |
1.748% 9/15/17 | | 24,600 | | 24,596 |
2.625% 1/31/19 | | 23,560 | | 23,846 |
2.9% 7/19/18 | | 10,319 | | 10,612 |
5.95% 1/18/18 | | 5,343 | | 6,029 |
6.15% 4/1/18 | | 3,993 | | 4,550 |
6.25% 9/1/17 | | 23,534 | | 26,623 |
Corporate Bonds - continued |
| Principal Amount (000s) | | Value (000s) |
Nonconvertible Bonds - continued |
FINANCIALS - continued |
Capital Markets - continued |
Lazard Group LLC: | | | | |
4.25% 11/14/20 | | $ 3,149 | | $ 3,319 |
6.85% 6/15/17 | | 6,480 | | 7,348 |
Merrill Lynch & Co., Inc. 6.4% 8/28/17 | | 5,074 | | 5,764 |
Morgan Stanley: | | | | |
2.125% 4/25/18 | | 18,100 | | 18,209 |
2.375% 7/23/19 | | 13,004 | | 12,976 |
2.5% 1/24/19 | | 43,150 | | 43,646 |
4% 7/24/15 | | 1,373 | | 1,416 |
4.875% 11/1/22 | | 3,413 | | 3,687 |
5.625% 9/23/19 | | 547 | | 625 |
5.95% 12/28/17 | | 301 | | 340 |
6.625% 4/1/18 | | 1,804 | | 2,089 |
State Street Corp. 3.1% 5/15/23 | | 7,500 | | 7,408 |
UBS AG Stamford Branch 2.375% 8/14/19 | | 13,000 | | 13,043 |
| | 219,817 |
Consumer Finance - 0.7% |
Capital One Financial Corp. 2.45% 4/24/19 | | 5,260 | | 5,290 |
Discover Financial Services: | | | | |
3.85% 11/21/22 | | 2,701 | | 2,766 |
5.2% 4/27/22 | | 2,488 | | 2,765 |
6.45% 6/12/17 | | 13,316 | | 14,997 |
Ford Motor Credit Co. LLC: | | | | |
1.5% 1/17/17 | | 19,067 | | 19,107 |
2.375% 3/12/19 | | 19,600 | | 19,618 |
2.5% 1/15/16 | | 16,000 | | 16,348 |
2.875% 10/1/18 | | 11,000 | | 11,325 |
3% 6/12/17 | | 6,246 | | 6,477 |
4.375% 8/6/23 | | 15,332 | | 16,385 |
5% 5/15/18 | | 10,000 | | 11,040 |
5.875% 8/2/21 | | 12,574 | | 14,778 |
General Electric Capital Corp. 4.625% 1/7/21 | | 849 | | 950 |
Hyundai Capital America: | | | | |
1.45% 2/6/17 (f) | | 6,312 | | 6,317 |
1.625% 10/2/15 (f) | | 2,131 | | 2,147 |
1.875% 8/9/16 (f) | | 1,605 | | 1,627 |
2.125% 10/2/17 (f) | | 2,357 | | 2,389 |
2.55% 2/6/19 (f) | | 6,671 | | 6,759 |
Corporate Bonds - continued |
| Principal Amount (000s) | | Value (000s) |
Nonconvertible Bonds - continued |
FINANCIALS - continued |
Consumer Finance - continued |
Hyundai Capital America: - continued | | | | |
2.875% 8/9/18 (f) | | $ 2,848 | | $ 2,938 |
Synchrony Financial: | | | | |
1.875% 8/15/17 | | 1,554 | | 1,566 |
3% 8/15/19 | | 2,283 | | 2,316 |
3.75% 8/15/21 | | 8,466 | | 8,640 |
4.25% 8/15/24 | | 3,469 | | 3,551 |
| | 180,096 |
Diversified Financial Services - 0.1% |
BP Capital Markets PLC: | | | | |
4.5% 10/1/20 | | 1,336 | | 1,474 |
4.742% 3/11/21 | | 6,000 | | 6,726 |
Five Corners Funding Trust 4.419% 11/15/23 (f) | | 9,345 | | 9,975 |
RBS Citizens Financial Group, Inc. 4.15% 9/28/22 (f) | | 6,485 | | 6,585 |
TECO Finance, Inc.: | | | | |
4% 3/15/16 | | 1,828 | | 1,916 |
5.15% 3/15/20 | | 164 | | 185 |
| | 26,861 |
Insurance - 0.6% |
AIA Group Ltd. 2.25% 3/11/19 (f) | | 1,416 | | 1,416 |
American International Group, Inc.: | | | | |
2.375% 8/24/15 | | 16,000 | | 16,317 |
4.875% 6/1/22 | | 4,860 | | 5,455 |
5.6% 10/18/16 | | 5,560 | | 6,077 |
Aon Corp.: | | | | |
3.125% 5/27/16 | | 4,743 | | 4,915 |
3.5% 9/30/15 | | 4,875 | | 5,026 |
5% 9/30/20 | | 129 | | 145 |
Axis Capital Holdings Ltd. 5.75% 12/1/14 | | 452 | | 458 |
Great-West Life & Annuity Insurance Co. 7.153% 5/16/46 (f)(k) | | 2,508 | | 2,596 |
Hartford Financial Services Group, Inc.: | | | | |
4% 10/15/17 | | 1,308 | | 1,406 |
5.125% 4/15/22 | | 1,066 | | 1,218 |
5.375% 3/15/17 | | 685 | | 752 |
Liberty Mutual Group, Inc.: | | | | |
4.25% 6/15/23 (f) | | 6,498 | | 6,762 |
Corporate Bonds - continued |
| Principal Amount (000s) | | Value (000s) |
Nonconvertible Bonds - continued |
FINANCIALS - continued |
Insurance - continued |
Liberty Mutual Group, Inc.: - continued | | | | |
5% 6/1/21 (f) | | $ 8,525 | | $ 9,425 |
Marsh & McLennan Companies, Inc. 4.8% 7/15/21 | | 5,569 | | 6,208 |
Massachusetts Mutual Life Insurance Co. 5.375% 12/1/41 (f) | | 3,576 | | 4,125 |
MetLife, Inc. 6.75% 6/1/16 | | 5,158 | | 5,689 |
Metropolitan Life Global Funding I 1.875% 6/22/18 (f) | | 7,500 | | 7,506 |
Northwestern Mutual Life Insurance Co. 6.063% 3/30/40 (f) | | 4,915 | | 6,240 |
Pacific Life Insurance Co. 9.25% 6/15/39 (f) | | 3,967 | | 6,251 |
Pacific LifeCorp: | | | | |
5.125% 1/30/43 (f) | | 7,709 | | 8,217 |
6% 2/10/20 (f) | | 9,721 | | 11,161 |
Prudential Financial, Inc.: | | | | |
2.3% 8/15/18 | | 888 | | 902 |
4.5% 11/16/21 | | 1,764 | | 1,939 |
7.375% 6/15/19 | | 2,520 | | 3,099 |
Symetra Financial Corp. 6.125% 4/1/16 (f) | | 8,408 | | 8,967 |
Unum Group: | | | | |
5.625% 9/15/20 | | 3,860 | | 4,421 |
5.75% 8/15/42 | | 8,065 | | 9,656 |
7.125% 9/30/16 | | 2,076 | | 2,331 |
| | 148,680 |
Real Estate Investment Trusts - 0.5% |
Alexandria Real Estate Equities, Inc.: | | | | |
2.75% 1/15/20 | | 1,369 | | 1,372 |
4.6% 4/1/22 | | 2,035 | | 2,167 |
American Campus Communities Operating Partnership LP 3.75% 4/15/23 | | 1,759 | | 1,764 |
AvalonBay Communities, Inc. 3.625% 10/1/20 | | 2,800 | | 2,951 |
Boston Properties, Inc. 3.85% 2/1/23 | | 8,081 | | 8,413 |
Camden Property Trust 2.95% 12/15/22 | | 2,417 | | 2,357 |
CommonWealth REIT 5.875% 9/15/20 | | 1,166 | | 1,268 |
DDR Corp.: | | | | |
4.75% 4/15/18 | | 6,131 | | 6,644 |
7.5% 4/1/17 | | 8,836 | | 10,106 |
9.625% 3/15/16 | | 1,851 | | 2,093 |
Developers Diversified Realty Corp. 4.625% 7/15/22 | | 4,470 | | 4,792 |
Corporate Bonds - continued |
| Principal Amount (000s) | | Value (000s) |
Nonconvertible Bonds - continued |
FINANCIALS - continued |
Real Estate Investment Trusts - continued |
Duke Realty LP: | | | | |
3.625% 4/15/23 | | $ 3,152 | | $ 3,141 |
3.875% 10/15/22 | | 5,452 | | 5,594 |
4.375% 6/15/22 | | 3,753 | | 3,970 |
5.5% 3/1/16 | | 3,075 | | 3,272 |
5.95% 2/15/17 | | 3,767 | | 4,155 |
6.75% 3/15/20 | | 1,339 | | 1,594 |
8.25% 8/15/19 | | 2,643 | | 3,315 |
Equity One, Inc.: | | | | |
3.75% 11/15/22 | | 8,200 | | 8,238 |
5.375% 10/15/15 | | 948 | | 994 |
6% 9/15/17 | | 876 | | 974 |
6.25% 1/15/17 | | 663 | | 731 |
Federal Realty Investment Trust: | | | | |
5.9% 4/1/20 | | 1,971 | | 2,293 |
6.2% 1/15/17 | | 501 | | 559 |
HCP, Inc.: | | | | |
3.15% 8/1/22 | | 7,000 | | 6,845 |
3.875% 8/15/24 | | 13,000 | | 13,118 |
4.25% 11/15/23 | | 5,582 | | 5,800 |
Health Care REIT, Inc.: | | | | |
2.25% 3/15/18 | | 2,600 | | 2,634 |
4.125% 4/1/19 | | 13,700 | | 14,769 |
4.7% 9/15/17 | | 843 | | 919 |
HRPT Properties Trust: | | | | |
5.75% 11/1/15 | | 1,731 | | 1,777 |
6.25% 6/15/17 | | 996 | | 1,066 |
6.65% 1/15/18 | | 676 | | 750 |
Lexington Corporate Properties Trust 4.4% 6/15/24 | | 2,249 | | 2,289 |
Omega Healthcare Investors, Inc. 4.95% 4/1/24 (f) | | 2,101 | | 2,170 |
Retail Opportunity Investments Partnership LP 5% 12/15/23 | | 1,140 | | 1,227 |
Weingarten Realty Investors 3.375% 10/15/22 | | 1,228 | | 1,236 |
| | 137,357 |
Real Estate Management & Development - 0.5% |
BioMed Realty LP: | | | | |
2.625% 5/1/19 | | 2,206 | | 2,207 |
3.85% 4/15/16 | | 8,775 | | 9,174 |
Corporate Bonds - continued |
| Principal Amount (000s) | | Value (000s) |
Nonconvertible Bonds - continued |
FINANCIALS - continued |
Real Estate Management & Development - continued |
BioMed Realty LP: - continued | | | | |
4.25% 7/15/22 | | $ 2,970 | | $ 3,089 |
6.125% 4/15/20 | | 2,611 | | 3,019 |
Brandywine Operating Partnership LP: | | | | |
3.95% 2/15/23 | | 7,304 | | 7,405 |
4.95% 4/15/18 | | 4,846 | | 5,250 |
5.7% 5/1/17 | | 309 | | 338 |
6% 4/1/16 | | 2,770 | | 2,965 |
7.5% 5/15/15 | | 776 | | 811 |
Corporate Office Properties LP 3.7% 6/15/21 | | 4,267 | | 4,276 |
Digital Realty Trust LP: | | | | |
4.5% 7/15/15 | | 3,650 | | 3,732 |
5.25% 3/15/21 | | 4,138 | | 4,521 |
ERP Operating LP 5.75% 6/15/17 | | 2,042 | | 2,286 |
Essex Portfolio LP 5.5% 3/15/17 | | 3,921 | | 4,316 |
Liberty Property LP: | | | | |
3.375% 6/15/23 | | 3,313 | | 3,254 |
4.125% 6/15/22 | | 3,219 | | 3,377 |
4.75% 10/1/20 | | 8,747 | | 9,475 |
5.125% 3/2/15 | | 1,672 | | 1,708 |
5.5% 12/15/16 | | 2,529 | | 2,753 |
Mack-Cali Realty LP: | | | | |
2.5% 12/15/17 | | 4,556 | | 4,603 |
3.15% 5/15/23 | | 7,438 | | 6,756 |
4.5% 4/18/22 | | 2,016 | | 2,048 |
5.8% 1/15/16 | | 5,020 | | 5,315 |
7.75% 8/15/19 | | 2,476 | | 2,972 |
Mid-America Apartments LP 4.3% 10/15/23 | | 1,248 | | 1,317 |
Post Apartment Homes LP 3.375% 12/1/22 | | 1,364 | | 1,342 |
Prime Property Funding, Inc. 5.7% 4/15/17 (f) | | 4,226 | | 4,544 |
Reckson Operating Partnership LP 6% 3/31/16 | | 1,949 | | 2,084 |
Regency Centers LP: | | | | |
5.25% 8/1/15 | | 3,893 | | 4,052 |
5.875% 6/15/17 | | 1,771 | | 1,971 |
Tanger Properties LP: | | | | |
3.875% 12/1/23 | | 2,716 | | 2,785 |
6.125% 6/1/20 | | 9,597 | | 11,182 |
Ventas Realty LP: | | | | |
1.25% 4/17/17 | | 3,126 | | 3,122 |
Corporate Bonds - continued |
| Principal Amount (000s) | | Value (000s) |
Nonconvertible Bonds - continued |
FINANCIALS - continued |
Real Estate Management & Development - continued |
Ventas Realty LP: - continued | | | | |
1.55% 9/26/16 | | $ 1,068 | | $ 1,079 |
3.75% 5/1/24 | | 7,900 | | 7,910 |
Ventas Realty LP/Ventas Capital Corp.: | | | | |
2% 2/15/18 | | 4,056 | | 4,084 |
4% 4/30/19 | | 1,999 | | 2,143 |
| | 143,265 |
TOTAL FINANCIALS | | 1,549,895 |
HEALTH CARE - 0.4% |
Biotechnology - 0.2% |
Amgen, Inc.: | | | | |
1.25% 5/22/17 | | 13,051 | | 13,048 |
2.2% 5/22/19 | | 32,376 | | 32,342 |
| | 45,390 |
Health Care Providers & Services - 0.1% |
Coventry Health Care, Inc. 5.95% 3/15/17 | | 1,413 | | 1,573 |
Express Scripts Holding Co.: | | | | |
3.9% 2/15/22 | | 1,915 | | 2,024 |
4.75% 11/15/21 | | 17,355 | | 19,304 |
McKesson Corp. 2.284% 3/15/19 | | 6,400 | | 6,403 |
Medco Health Solutions, Inc.: | | | | |
2.75% 9/15/15 | | 4,158 | | 4,250 |
4.125% 9/15/20 | | 5,031 | | 5,392 |
WellPoint, Inc. 1.875% 1/15/18 | | 195 | | 196 |
| | 39,142 |
Life Sciences Tools & Services - 0.0% |
Thermo Fisher Scientific, Inc.: | | | | |
1.3% 2/1/17 | | 1,745 | | 1,746 |
2.4% 2/1/19 | | 1,100 | | 1,111 |
| | 2,857 |
Pharmaceuticals - 0.1% |
AbbVie, Inc. 1.75% 11/6/17 | | 6,470 | | 6,503 |
Actavis Funding SCS: | | | | |
1.3% 6/15/17 (f) | | 12,949 | | 12,917 |
2.45% 6/15/19 (f) | | 3,839 | | 3,826 |
Corporate Bonds - continued |
| Principal Amount (000s) | | Value (000s) |
Nonconvertible Bonds - continued |
HEALTH CARE - continued |
Pharmaceuticals - continued |
Mylan, Inc. 1.35% 11/29/16 | | $ 2,039 | | $ 2,041 |
Perrigo Co. PLC: | | | | |
1.3% 11/8/16 (f) | | 1,664 | | 1,662 |
2.3% 11/8/18 (f) | | 1,780 | | 1,777 |
Watson Pharmaceuticals, Inc. 1.875% 10/1/17 | | 2,149 | | 2,158 |
Zoetis, Inc. 1.875% 2/1/18 | | 992 | | 992 |
| | 31,876 |
TOTAL HEALTH CARE | | 119,265 |
INDUSTRIALS - 0.1% |
Aerospace & Defense - 0.0% |
BAE Systems Holdings, Inc. 6.375% 6/1/19 (f) | | 5,000 | | 5,855 |
Airlines - 0.0% |
Continental Airlines, Inc.: | | | | |
6.648% 3/15/19 | | 2,117 | | 2,255 |
6.9% 7/2/19 | | 814 | | 871 |
U.S. Airways pass-thru trust certificates: | | | | |
6.85% 1/30/18 | | 1,887 | | 2,040 |
8.36% 1/20/19 | | 1,419 | | 1,575 |
| | 6,741 |
Trading Companies & Distributors - 0.1% |
Air Lease Corp.: | | | | |
3.875% 4/1/21 | | 6,320 | | 6,383 |
4.75% 3/1/20 | | 5,518 | | 5,877 |
| | 12,260 |
TOTAL INDUSTRIALS | | 24,856 |
INFORMATION TECHNOLOGY - 0.0% |
Electronic Equipment & Components - 0.0% |
Tyco Electronics Group SA: | | | | |
1.6% 2/3/15 | | 188 | | 189 |
2.375% 12/17/18 | | 1,262 | | 1,273 |
6.55% 10/1/17 | | 1,119 | | 1,282 |
| | 2,744 |
Corporate Bonds - continued |
| Principal Amount (000s) | | Value (000s) |
Nonconvertible Bonds - continued |
INFORMATION TECHNOLOGY - continued |
IT Services - 0.0% |
Xerox Corp.: | | | | |
2.95% 3/15/17 | | $ 1,143 | | $ 1,189 |
4.25% 2/15/15 | | 1,302 | | 1,324 |
| | 2,513 |
TOTAL INFORMATION TECHNOLOGY | | 5,257 |
MATERIALS - 0.1% |
Construction Materials - 0.0% |
CRH America, Inc. 6% 9/30/16 | | 3,083 | | 3,384 |
Metals & Mining - 0.1% |
Corporacion Nacional del Cobre de Chile (Codelco): | | | | |
3.875% 11/3/21 (f) | | 8,722 | | 9,131 |
4.25% 7/17/42 (f) | | 1,402 | | 1,323 |
5.625% 10/18/43 (f) | | 2,722 | | 3,143 |
| | 13,597 |
TOTAL MATERIALS | | 16,981 |
TELECOMMUNICATION SERVICES - 0.9% |
Diversified Telecommunication Services - 0.9% |
BellSouth Capital Funding Corp. 7.875% 2/15/30 | | 61 | | 83 |
CenturyLink, Inc.: | | | | |
5.15% 6/15/17 | | 487 | | 520 |
6% 4/1/17 | | 3,467 | | 3,753 |
6.15% 9/15/19 | | 4,463 | | 4,876 |
Embarq Corp.: | | | | |
7.082% 6/1/16 | | 4,190 | | 4,609 |
7.995% 6/1/36 | | 36,001 | | 40,497 |
Verizon Communications, Inc.: | | | | |
2.5% 9/15/16 | | 97,018 | | 100,024 |
4.5% 9/15/20 | | 45,631 | | 50,138 |
5.012% 8/21/54 (f) | | 23,143 | | 24,173 |
6.25% 4/1/37 | | 4,611 | | 5,701 |
6.4% 9/15/33 | | 6,073 | | 7,671 |
6.55% 9/15/43 | | 8,436 | | 10,875 |
| | 252,920 |
Corporate Bonds - continued |
| Principal Amount (000s) | | Value (000s) |
Nonconvertible Bonds - continued |
TELECOMMUNICATION SERVICES - continued |
Wireless Telecommunication Services - 0.0% |
America Movil S.A.B. de CV: | | | | |
2.375% 9/8/16 | | $ 371 | | $ 380 |
3.625% 3/30/15 | | 3,102 | | 3,152 |
| | 3,532 |
TOTAL TELECOMMUNICATION SERVICES | | 256,452 |
UTILITIES - 0.8% |
Electric Utilities - 0.6% |
AmerenUE 6.4% 6/15/17 | | 1,518 | | 1,713 |
Duquesne Light Holdings, Inc.: | | | | |
5.9% 12/1/21 (f) | | 5,539 | | 6,513 |
6.4% 9/15/20 (f) | | 11,856 | | 14,030 |
Edison International 3.75% 9/15/17 | | 4,499 | | 4,785 |
FirstEnergy Corp.: | | | | |
2.75% 3/15/18 | | 8,307 | | 8,401 |
4.25% 3/15/23 | | 22,159 | | 22,343 |
7.375% 11/15/31 | | 40,870 | | 49,669 |
FirstEnergy Solutions Corp. 6.05% 8/15/21 | | 12,120 | | 13,472 |
LG&E and KU Energy LLC: | | | | |
2.125% 11/15/15 | | 5,251 | | 5,320 |
3.75% 11/15/20 | | 1,034 | | 1,088 |
Nevada Power Co. 6.5% 8/1/18 | | 2,642 | | 3,106 |
Northeast Utilities 1.45% 5/1/18 | | 1,676 | | 1,660 |
NV Energy, Inc. 6.25% 11/15/20 | | 1,957 | | 2,327 |
Pennsylvania Electric Co. 6.05% 9/1/17 | | 618 | | 695 |
Pepco Holdings, Inc. 2.7% 10/1/15 | | 5,263 | | 5,362 |
Progress Energy, Inc. 4.4% 1/15/21 | | 405 | | 448 |
West Penn Power Co. 5.95% 12/15/17 (f) | | 6,500 | | 7,301 |
| | 148,233 |
Gas Utilities - 0.0% |
Southern Natural Gas Co. 5.9% 4/1/17 (f) | | 357 | | 396 |
Southern Natural Gas Co./Southern Natural Issuing Corp. 4.4% 6/15/21 | | 2,473 | | 2,648 |
Texas Eastern Transmission LP 6% 9/15/17 (f) | | 1,301 | | 1,456 |
| | 4,500 |
Corporate Bonds - continued |
| Principal Amount (000s) | | Value (000s) |
Nonconvertible Bonds - continued |
UTILITIES - continued |
Multi-Utilities - 0.2% |
Dominion Resources, Inc.: | | | | |
2.5341% 9/30/66 (k) | | $ 17,454 | | $ 16,125 |
7.5% 6/30/66 (k) | | 5,485 | | 5,935 |
MidAmerican Energy Holdings, Co. 2% 11/15/18 | | 6,853 | | 6,860 |
National Grid PLC 6.3% 8/1/16 | | 973 | | 1,070 |
NiSource Finance Corp.: | | | | |
4.45% 12/1/21 | | 2,934 | | 3,183 |
5.25% 9/15/17 | | 1,414 | | 1,568 |
5.45% 9/15/20 | | 6,455 | | 7,348 |
6.4% 3/15/18 | | 3,029 | | 3,490 |
6.8% 1/15/19 | | 4,065 | | 4,820 |
PG&E Corp. 2.4% 3/1/19 | | 931 | | 940 |
Puget Energy, Inc. 6% 9/1/21 | | 813 | | 955 |
Wisconsin Energy Corp. 6.25% 5/15/67 (k) | | 4,882 | | 5,071 |
| | 57,365 |
TOTAL UTILITIES | | 210,098 |
TOTAL NONCONVERTIBLE BONDS | | 2,730,139 |
TOTAL CORPORATE BONDS (Cost $2,614,480) |
2,731,668
|
U.S. Treasury Obligations - 3.2% |
|
U.S. Treasury Bills, yield at date of purchase 0.02% to 0.03% 10/23/14 to 11/13/14 (i) | | 8,770 | | 8,770 |
U.S. Treasury Bonds: | | | | |
3.125% 8/15/44 | | 107,581 | | 108,573 |
3.375% 5/15/44 (i)(j) | | 170,942 | | 180,985 |
U.S. Treasury Notes: | | | | |
0.25% 9/30/15 | | 274,803 | | 275,125 |
0.875% 7/15/17 | | 295,900 | | 295,553 |
TOTAL U.S. TREASURY OBLIGATIONS (Cost $855,474) |
869,006
|
U.S. Government Agency - Mortgage Securities - 3.7% |
| Principal Amount (000s) | | Value (000s) |
Fannie Mae - 3.2% |
2.053% 6/1/36 (k) | | $ 155 | | $ 167 |
2.458% 7/1/37 (k) | | 333 | | 357 |
2.5% 11/1/42 to 4/1/43 | | 1,309 | | 1,258 |
3% 9/1/29 (h) | | 6,600 | | 6,841 |
3% 10/1/42 to 10/1/43 | | 37,379 | | 37,269 |
3% 9/1/44 (h) | | 15,200 | | 15,128 |
3% 9/1/44 (h) | | 72,900 | | 72,553 |
3.5% 1/1/34 to 1/1/44 | | 267,795 | | 275,390 |
3.5% 9/1/44 (h) | | 1,500 | | 1,544 |
3.5% 9/1/44 (h) | | 600 | | 618 |
3.5% 9/1/44 (h) | | 54,300 | | 55,893 |
4% 2/1/35 to 11/1/42 | | 27,623 | | 29,374 |
4% 9/1/44 (h) | | 12,300 | | 13,031 |
4% 9/1/44 (h) | | 53,600 | | 56,785 |
4% 9/1/44 (h) | | 17,000 | | 18,010 |
4% 9/1/44 (h) | | 17,100 | | 18,116 |
4% 9/1/44 (h) | | 3,700 | | 3,920 |
4% 10/1/44 (h) | | 5,000 | | 5,280 |
4% 10/1/44 (h) | | 10,800 | | 11,404 |
4% 10/1/44 (h) | | 16,000 | | 16,894 |
4% 10/1/44 (h) | | 17,000 | | 17,950 |
4% 10/1/44 (h) | | 17,100 | | 18,056 |
4.5% 12/1/23 to 8/1/44 (h) | | 29,366 | | 31,761 |
4.5% 9/1/44 (h) | | 33,100 | | 35,740 |
4.5% 10/1/44 (h) | | 26,600 | | 28,651 |
5% 10/1/41 | | 4,305 | | 4,754 |
5% 9/1/44 (h) | | 10,900 | | 12,020 |
5% 9/1/44 (h) | | 16,100 | | 17,755 |
5.5% 9/1/24 to 8/1/37 | | 7,144 | | 7,893 |
5.5% 9/1/44 (h) | | 30,200 | | 33,589 |
5.5% 10/1/44 (h) | | 15,300 | | 16,991 |
6% 6/1/35 to 8/1/37 | | 5,694 | | 6,451 |
6.5% 7/1/32 to 8/1/36 | | 1,139 | | 1,314 |
TOTAL FANNIE MAE | | 872,757 |
Freddie Mac - 0.1% |
3.068% 10/1/35 (k) | | 198 | | 213 |
3.5% 6/1/42 to 10/1/43 | | 16,992 | | 17,427 |
4% 6/1/24 to 11/1/43 | | 4,941 | | 5,253 |
4.5% 7/1/25 to 12/1/40 | | 705 | | 758 |
5% 3/1/19 | | 1,494 | | 1,583 |
U.S. Government Agency - Mortgage Securities - continued |
| Principal Amount (000s) | | Value (000s) |
Freddie Mac - continued |
5.5% 1/1/34 to 3/1/40 | | $ 1,296 | | $ 1,445 |
6% 7/1/37 to 8/1/37 | | 385 | | 433 |
6.5% 3/1/36 | | 838 | | 969 |
TOTAL FREDDIE MAC | | 28,081 |
Ginnie Mae - 0.4% |
3.5% 9/1/44 (h) | | 14,400 | | 14,973 |
3.5% 9/1/44 (h) | | 15,500 | | 16,117 |
4% 9/20/40 to 2/20/41 | | 4,425 | | 4,725 |
4% 9/1/44 (h) | | 3,000 | | 3,196 |
4% 9/1/44 (h) | | 14,900 | | 15,872 |
4.5% 9/1/44 (h) | | 16,600 | | 18,046 |
4.5% 9/1/44 (h) | | 8,500 | | 9,239 |
5% 5/15/39 | | 1,391 | | 1,533 |
5.5% 12/15/31 to 1/15/39 | | 2,818 | | 3,157 |
6% 2/15/34 | | 6,477 | | 7,413 |
TOTAL GINNIE MAE | | 94,271 |
TOTAL U.S. GOVERNMENT AGENCY - MORTGAGE SECURITIES (Cost $985,518) |
995,109
|
Asset-Backed Securities - 0.3% |
|
Accredited Mortgage Loan Trust Series 2005-1 Class M1, 0.625% 4/25/35 (k) | | 729 | | 634 |
ACE Securities Corp. Home Equity Loan Trust Series 2004-HE1 Class M2, 1.805% 3/25/34 (k) | | 328 | | 326 |
AmeriCredit Auto Receivables Trust Series 2013-4: | | | | |
Class C, 2.72% 9/9/19 | | 1,410 | | 1,440 |
Class D, 3.31% 10/8/19 | | 880 | | 897 |
Ameriquest Mortgage Securities, Inc. pass-thru certificates: | | | | |
Series 2003-10 Class M1, 1.205% 12/25/33 (k) | | 63 | | 58 |
Series 2004-R2 Class M3, 0.98% 4/25/34 (k) | | 99 | | 63 |
Series 2005-R2 Class M1, 0.605% 4/25/35 (k) | | 584 | | 582 |
Argent Securities, Inc. pass-thru certificates: | | | | |
Series 2003-W7 Class A2, 0.935% 3/25/34 (k) | | 53 | | 50 |
Series 2004-W11 Class M2, 1.205% 11/25/34 (k) | | 616 | | 592 |
Series 2004-W7 Class M1, 0.98% 5/25/34 (k) | | 1,600 | | 1,550 |
Series 2006-W4 Class A2C, 0.315% 5/25/36 (k) | | 1,314 | | 460 |
Asset-Backed Securities - continued |
| Principal Amount (000s) | | Value (000s) |
Asset Backed Securities Corp. Home Equity Loan Trust: | | | | |
Series 2004-HE2 Class M1, 0.98% 4/25/34 (k) | | $ 2,070 | | $ 1,901 |
Series 2006-HE2 Class M1, 0.525% 3/25/36 (k) | | 29 | | 3 |
Carrington Mortgage Loan Trust Series 2007-RFC1 Class A3, 0.295% 12/25/36 (k) | | 1,978 | | 1,341 |
CFC LLC Series 2013-1A Class A, 1.65% 7/17/17 (f) | | 574 | | 576 |
Countrywide Home Loans, Inc.: | | | | |
Series 2004-3 Class M4, 1.61% 4/25/34 (k) | | 87 | | 62 |
Series 2004-4 Class M2, 0.95% 6/25/34 (k) | | 231 | | 219 |
Series 2004-7 Class AF5, 5.868% 1/25/35 | | 2,173 | | 2,229 |
Fannie Mae Series 2004-T5 Class AB3, 0.9829% 5/28/35 (k) | | 43 | | 40 |
Fieldstone Mortgage Investment Corp. Series 2004-3 Class M5, 2.327% 8/25/34 (k) | | 319 | | 283 |
First Franklin Mortgage Loan Trust Series 2004-FF2 Class M3, 0.98% 3/25/34 (k) | | 16 | | 15 |
Fremont Home Loan Trust Series 2005-A: | | | | |
Class M3, 0.89% 1/25/35 (k) | | 1,041 | | 861 |
Class M4, 1.175% 1/25/35 (k) | | 381 | | 214 |
GCO Education Loan Funding Master Trust II Series 2007-1A Class C1L, 0.6149% 2/25/47 (f)(k) | | 2,028 | | 1,732 |
GE Business Loan Trust: | | | | |
Series 2003-1 Class A, 0.585% 4/15/31 (f)(k) | | 57 | | 55 |
Series 2006-2A: | | | | |
Class A, 0.335% 11/15/34 (f)(k) | | 1,030 | | 979 |
Class B, 0.435% 11/15/34 (f)(k) | | 372 | | 342 |
Class C, 0.535% 11/15/34 (f)(k) | | 618 | | 539 |
Class D, 0.905% 11/15/34 (f)(k) | | 235 | | 202 |
Home Equity Asset Trust: | | | | |
Series 2003-2 Class M1, 1.475% 8/25/33 (k) | | 297 | | 282 |
Series 2003-3 Class M1, 1.445% 8/25/33 (k) | | 558 | | 540 |
Series 2003-5 Class A2, 0.855% 12/25/33 (k) | | 36 | | 34 |
HSI Asset Securitization Corp. Trust Series 2007-HE1 Class 2A3, 0.345% 1/25/37 (k) | | 1,642 | | 1,021 |
JPMorgan Mortgage Acquisition Trust: | | | | |
Series 2006-NC2 Class M2, 0.452% 7/25/36 (k) | | 3,185 | | 548 |
Series 2007-CH1 Class AV4, 0.285% 11/25/36 (k) | | 1,078 | | 1,067 |
KeyCorp Student Loan Trust: | | | | |
Series 1999-A Class A2, 0.5639% 12/27/29 (k) | | 277 | | 276 |
Series 2006-A Class 2C, 1.3839% 3/27/42 (k) | | 2,909 | | 485 |
MASTR Asset Backed Securities Trust Series 2007-HE1 Class M1, 0.455% 5/25/37 (k) | | 508 | | 5 |
Asset-Backed Securities - continued |
| Principal Amount (000s) | | Value (000s) |
Meritage Mortgage Loan Trust Series 2004-1 Class M1, 0.905% 7/25/34 (k) | | $ 131 | | $ 104 |
Merrill Lynch Mortgage Investors Trust: | | | | |
Series 2003-OPT1 Class M1, 1.13% 7/25/34 (k) | | 505 | | 462 |
Series 2006-FM1 Class A2B, 0.265% 4/25/37 (k) | | 775 | | 698 |
Series 2006-OPT1 Class A1A, 0.675% 6/25/35 (k) | | 2,130 | | 2,034 |
Morgan Stanley ABS Capital I Trust: | | | | |
Series 2004-HE6 Class A2, 0.835% 8/25/34 (k) | | 63 | | 58 |
Series 2005-NC1 Class M1, 0.815% 1/25/35 (k) | | 438 | | 416 |
Series 2005-NC2 Class B1, 1.91% 3/25/35 (k) | | 268 | | 9 |
New Century Home Equity Loan Trust Series 2005-4 Class M2, 0.665% 9/25/35 (k) | | 1,566 | | 1,452 |
Park Place Securities, Inc.: | | | | |
Series 2004-WCW1: | | | | |
Class M3, 2.03% 9/25/34 (k) | | 585 | | 524 |
Class M4, 2.33% 9/25/34 (k) | | 750 | | 460 |
Series 2005-WCH1 Class M4, 0.985% 1/25/36 (k) | | 1,620 | | 1,423 |
Salomon Brothers Mortgage Securities VII, Inc. Series 2003-HE1 Class A, 0.955% 4/25/33 (k) | | 6 | | 5 |
Santander Drive Auto Receivables Trust: | | | | |
Series 2014-2 Class C, 2.33% 11/15/19 | | 6,409 | | 6,440 |
Series 2014-3: | | | | |
Class B, 1.45% 5/15/19 | | 22,594 | | 22,537 |
Class C, 2.13% 8/17/20 | | 22,594 | | 22,520 |
Saxon Asset Securities Trust Series 2004-1 Class M1, 0.95% 3/25/35 (k) | | 1,037 | | 948 |
SLM Private Credit Student Loan Trust Series 2004-A Class C, 1.1806% 6/15/33 (k) | | 1,000 | | 964 |
Structured Asset Investment Loan Trust Series 2004-8 Class M5, 1.88% 9/25/34 (k) | | 53 | | 43 |
Terwin Mortgage Trust Series 2003-4HE Class A1, 1.015% 9/25/34 (k) | | 32 | | 28 |
Trapeza CDO XII Ltd./Trapeza CDO XII, Inc. Series 2007-12A Class B, 0.7921% 4/6/42 (f)(k) | | 2,206 | | 993 |
Whinstone Capital Management Ltd. Series 1A Class B3, 2.0341% 10/25/44 (f)(k) | | 1,964 | | 1,983 |
TOTAL ASSET-BACKED SECURITIES (Cost $76,194) |
86,604
|
Collateralized Mortgage Obligations - 0.2% |
| Principal Amount (000s) | | Value (000s) |
Private Sponsor - 0.2% |
Bear Stearns ALT-A Trust floater Series 2005-1 Class A1, 0.715% 1/25/35 (k) | | $ 1,467 | | $ 1,461 |
Citigroup Mortgage Loan Trust sequential payer Series 2012-A Class A, 2.5% 6/25/51 (f) | | 3,521 | | 3,417 |
First Horizon Mortgage pass-thru Trust Series 2004-AR5 Class 2A1, 2.5706% 10/25/34 (k) | | 690 | | 690 |
Granite Master Issuer PLC: | | | | |
floater: | | | | |
Series 2006-1A: | | | | |
Class A1, 0.2255% 12/20/54 (f)(k) | | 4,788 | | 4,745 |
Class A5, 0.2955% 12/20/54 (f)(k) | | 3,856 | | 3,825 |
Series 2006-2 Class A4, 0.2355% 12/20/54 (k) | | 1,429 | | 1,402 |
Series 2006-3: | | | | |
Class A3, 0.2355% 12/20/54 (k) | | 688 | | 682 |
Class A7, 0.3555% 12/20/54 (k) | | 748 | | 742 |
Class M2, 0.7155% 12/20/54 (k) | | 5,460 | | 5,347 |
Series 2006-4: | | | | |
Class A4, 0.2555% 12/20/54 (k) | | 2,193 | | 2,174 |
Class B1, 0.3355% 12/20/54 (k) | | 4,556 | | 4,418 |
Class M1, 0.4955% 12/20/54 (k) | | 1,198 | | 1,159 |
Series 2007-1: | | | | |
Class 1B1, 0.2955% 12/20/54 (k) | | 5,806 | | 5,627 |
Class 1M1, 0.4555% 12/20/54 (k) | | 1,611 | | 1,563 |
Class 2A1, 0.2955% 12/20/54 (k) | | 1,721 | | 1,707 |
Class 2M1, 0.6555% 12/20/54 (k) | | 2,067 | | 2,018 |
Series 2007-2: | | | | |
Class 1B1, 0.315% 12/17/54 (k) | | 767 | | 744 |
Class 2C1, 1.015% 12/17/54 (k) | | 2,864 | | 2,780 |
Class 3A1, 0.335% 12/17/54 (k) | | 307 | | 304 |
sequential payer Series 2006-3 Class B2, 0.4955% 12/20/54 (k) | | 5,461 | | 5,336 |
Granite Mortgages PLC floater Series 2003-3 Class 1C, 2.6836% 1/20/44 (k) | | 472 | | 499 |
JPMorgan Mortgage Trust sequential payer Series 2006-A5 Class 3A5, 2.4718% 8/25/36 (k) | | 1,350 | | 1,155 |
MASTR Adjustable Rate Mortgages Trust Series 2007-3 Class 22A2, 0.365% 5/25/47 (k) | | 559 | | 465 |
Merrill Lynch Alternative Note Asset Trust floater Series 2007-OAR1 Class A1, 0.325% 2/25/37 (k) | | 1,019 | | 924 |
Opteum Mortgage Acceptance Corp. floater Series 2005-3 Class APT, 0.445% 7/25/35 (k) | | 1,463 | | 1,396 |
Collateralized Mortgage Obligations - continued |
| Principal Amount (000s) | | Value (000s) |
Private Sponsor - continued |
RESI Finance LP/RESI Finance DE Corp. floater Series 2003-B: | | | | |
Class B5, 2.507% 6/10/35 (f)(k) | | $ 553 | | $ 507 |
Class B6, 3.007% 6/10/35 (f)(k) | | 118 | | 109 |
Sequoia Mortgage Trust floater Series 2004-6 Class A3B, 1.2054% 7/20/34 (k) | | 29 | | 28 |
Structured Asset Securities Corp. Series 2003-15A Class 4A, 2.5124% 4/25/33 (k) | | 168 | | 169 |
TBW Mortgage-Backed pass-thru certificates floater Series 2006-4 Class A3, 0.355% 9/25/36 (k) | | 2,197 | | 1,975 |
Thornburg Mortgage Securities Trust floater Series 2003-4 Class A1, 0.795% 9/25/43 (k) | | 2,609 | | 2,563 |
TOTAL COLLATERALIZED MORTGAGE OBLIGATIONS (Cost $44,942) |
59,931
|
Commercial Mortgage Securities - 1.9% |
|
Asset Securitization Corp. Series 1997-D5 Class PS1, 1.4206% 2/14/43 (k)(m) | | 421 | | 9 |
Banc of America Commercial Mortgage Trust: | | | | |
sequential payer: | | | | |
Series 2006-2 Class AAB, 5.7129% 5/10/45 (k) | | 368 | | 373 |
Series 2006-3 Class A4, 5.889% 7/10/44 | | 9,288 | | 9,929 |
Series 2006-5 Class A2, 5.317% 9/10/47 | | 2,088 | | 2,095 |
Series 2006-6 Class A3, 5.369% 10/10/45 | | 2,628 | | 2,678 |
Series 2005-3 Class A3B, 5.09% 7/10/43 (k) | | 4,082 | | 4,153 |
Series 2006-6 Class E, 5.619% 10/10/45 (f) | | 759 | | 96 |
Series 2007-3: | | | | |
Class A3, 5.5647% 6/10/49 (k) | | 1,577 | | 1,575 |
Class A4, 5.5647% 6/10/49 (k) | | 2,739 | | 2,986 |
Banc of America Commercial Mortgage, Inc. sequential payer Series 2001-1 Class A4, 5.451% 1/15/49 | | 4,718 | | 5,059 |
Bayview Commercial Asset Trust: | | | | |
floater: | | | | |
Series 2003-2 Class M1, 1.43% 12/25/33 (f)(k) | | 44 | | 39 |
Series 2005-3A: | | | | |
Class A2, 0.555% 11/25/35 (f)(k) | | 395 | | 350 |
Class M1, 0.595% 11/25/35 (f)(k) | | 52 | | 38 |
Class M2, 0.645% 11/25/35 (f)(k) | | 66 | | 48 |
Class M3, 0.665% 11/25/35 (f)(k) | | 59 | | 42 |
Class M4, 0.755% 11/25/35 (f)(k) | | 73 | | 50 |
Commercial Mortgage Securities - continued |
| Principal Amount (000s) | | Value (000s) |
Bayview Commercial Asset Trust: - continued | | | | |
floater: | | | | |
Series 2005-4A: | | | | |
Class A2, 0.545% 1/25/36 (f)(k) | | $ 1,010 | | $ 886 |
Class B1, 1.555% 1/25/36 (f)(k) | | 47 | | 8 |
Class M1, 0.605% 1/25/36 (f)(k) | | 326 | | 192 |
Class M2, 0.625% 1/25/36 (f)(k) | | 98 | | 55 |
Class M3, 0.655% 1/25/36 (f)(k) | | 143 | | 77 |
Class M4, 0.765% 1/25/36 (f)(k) | | 79 | | 41 |
Class M5, 0.805% 1/25/36 (f)(k) | | 79 | | 31 |
Class M6, 0.855% 1/25/36 (f)(k) | | 84 | | 26 |
Series 2006-1: | | | | |
Class A2, 0.515% 4/25/36 (f)(k) | | 160 | | 140 |
Class M1, 0.535% 4/25/36 (f)(k) | | 57 | | 40 |
Class M2, 0.555% 4/25/36 (f)(k) | | 60 | | 41 |
Class M3, 0.575% 4/25/36 (f)(k) | | 52 | | 38 |
Class M4, 0.675% 4/25/36 (f)(k) | | 29 | | 21 |
Class M5, 0.715% 4/25/36 (f)(k) | | 29 | | 18 |
Class M6, 0.795% 4/25/36 (f)(k) | | 57 | | 39 |
Series 2006-2A: | | | | |
Class M1, 0.465% 7/25/36 (f)(k) | | 144 | | 112 |
Class M2, 0.485% 7/25/36 (f)(k) | | 102 | | 76 |
Class M3, 0.505% 7/25/36 (f)(k) | | 85 | | 59 |
Class M4, 0.575% 7/25/36 (f)(k) | | 57 | | 38 |
Class M5, 0.625% 7/25/36 (f)(k) | | 70 | | 32 |
Series 2006-3A Class M4, 0.585% 10/25/36 (f)(k) | | 66 | | 10 |
Series 2006-4A: | | | | |
Class A2, 0.425% 12/25/36 (f)(k) | | 3,013 | | 2,481 |
Class M1, 0.445% 12/25/36 (f)(k) | | 201 | | 137 |
Class M2, 0.465% 12/25/36 (f)(k) | | 134 | | 58 |
Class M3, 0.495% 12/25/36 (f)(k) | | 135 | | 57 |
Series 2007-1 Class A2, 0.425% 3/25/37 (f)(k) | | 629 | | 459 |
Series 2007-2A: | | | | |
Class A1, 0.425% 7/25/37 (f)(k) | | 648 | | 562 |
Class A2, 0.475% 7/25/37 (f)(k) | | 607 | | 442 |
Class M1, 0.525% 7/25/37 (f)(k) | | 212 | | 64 |
Class M2, 0.565% 7/25/37 (f)(k) | | 117 | | 15 |
Class M3, 0.645% 7/25/37 (f)(k) | | 118 | | 8 |
Class M4, 0.805% 7/25/37 (f)(k) | | 4 | | 0 * |
Series 2007-3: | | | | |
Class A2, 0.445% 7/25/37 (f)(k) | | 625 | | 454 |
Class M1, 0.465% 7/25/37 (f)(k) | | 125 | | 80 |
Class M2, 0.495% 7/25/37 (f)(k) | | 133 | | 76 |
Class M3, 0.525% 7/25/37 (f)(k) | | 209 | | 78 |
Commercial Mortgage Securities - continued |
| Principal Amount (000s) | | Value (000s) |
Bayview Commercial Asset Trust: - continued | | | | |
floater: | | | | |
Series 2007-3: | | | | |
Class M4, 0.655% 7/25/37 (f)(k) | | $ 328 | | $ 71 |
Class M5, 0.755% 7/25/37 (f)(k) | | 164 | | 27 |
Series 2007-4A: | | | | |
Class M1, 1.102% 9/25/37 (f)(k) | | 253 | | 52 |
Class M2, 1.202% 9/25/37 (f)(k) | | 207 | | 18 |
Series 2004-1, Class IO, 1.25% 4/25/34 (f)(m) | | 1,491 | | 61 |
Series 2006-3A, Class IO, 0% 10/25/36 (f)(k)(m) | | 19,644 | | 0 |
Series 2007-5A, Class IO, 4.186% 10/25/37 (f)(k)(m) | | 4,053 | | 168 |
Bear Stearns Commercial Mortgage Securities Trust: | | | | |
floater Series 2007-BBA8: | | | | |
Class H, 0.705% 3/15/22 (f)(k) | | 197 | | 197 |
Class J, 0.855% 3/15/22 (f)(k) | | 653 | | 641 |
sequential payer: | | | | |
Series 2007-PW16: | | | | |
Class A4, 5.7071% 6/11/40 (k) | | 769 | | 844 |
Class AAB, 5.8973% 6/11/40 (k) | | 3,634 | | 3,735 |
Series 2007-PW18 Class A4, 5.7% 6/11/50 | | 5,820 | | 6,444 |
Series 2006-T22 Class A4, 5.5723% 4/12/38 (k) | | 158 | | 166 |
Series 2007-PW18 Class X2, 0.2917% 6/11/50 (f)(k)(m) | | 66,684 | | 318 |
Series 2007-T28 Class X2, 0.1374% 9/11/42 (f)(k)(m) | | 40,940 | | 82 |
C-BASS Trust floater Series 2006-SC1 Class A, 0.425% 5/25/36 (f)(k) | | 509 | | 495 |
CDC Commercial Mortgage Trust Series 2002-FX1 Class XCL, 1.4379% 5/15/35 (f)(k)(m) | | 2,765 | | 16 |
Citigroup Commercial Mortgage Trust Series 2007-C6 Class A4, 5.7096% 12/10/49 (k) | | 4,371 | | 4,818 |
Citigroup/Deutsche Bank Commercial Mortgage Trust sequential payer Series 2007-CD4: | | | | |
Class A3, 5.293% 12/11/49 | | 854 | | 867 |
Class A4, 5.322% 12/11/49 | | 19,611 | | 21,144 |
Cobalt CMBS Commercial Mortgage Trust Series 2007-C2 Class B, 5.617% 4/15/47 (k) | | 1,468 | | 1,419 |
COMM Mortgage Trust pass-thru certificates: | | | | |
floater Series 2005-F10A Class J, 1.005% 4/15/17 (f)(k) | | 138 | | 139 |
sequential payer Series 2007-C9 Class A4, 5.7961% 12/10/49 (k) | | 2,907 | | 3,220 |
Credit Suisse Commercial Mortgage Trust: | | | | |
sequential payer: | | | | |
Series 2006-C4 Class A3, 5.467% 9/15/39 | | 1,382 | | 1,476 |
Commercial Mortgage Securities - continued |
| Principal Amount (000s) | | Value (000s) |
Credit Suisse Commercial Mortgage Trust: - continued | | | | |
sequential payer: | | | | |
Series 2007-C2 Class A2, 5.448% 1/15/49 (k) | | $ 25 | | $ 25 |
Series 2007-C3 Class A4, 5.7022% 6/15/39 (k) | | 498 | | 536 |
Series 2007-C5 Class A4, 5.695% 9/15/40 (k) | | 1,189 | | 1,302 |
Credit Suisse First Boston Mortgage Capital Certificates floater Series 2007-TF2A Class B, 0.505% 4/15/22 (f)(k) | | 4,688 | | 4,595 |
Credit Suisse First Boston Mortgage Securities Corp.: | | | | |
Series 2001-CK6 Class AX, 1.463% 8/15/36 (k)(m) | | 55 | | 0 * |
Series 2001-CKN5 Class AX, 0% 9/15/34 (f)(k)(m) | | 5 | | 0 * |
Credit Suisse Mortgage Capital Certificates: | | | | |
floater Series 2007-TFL1 Class F, 0.475% 2/15/22 (f)(k) | | 60 | | 60 |
Series 2007-C1 Class B, 5.487% 2/15/40 (f)(k) | | 2,009 | | 251 |
Extended Stay America Trust floater Series 2013-ESFL: | | | | |
Class A1FL, 0.956% 12/5/31 (f)(k) | | 1,416 | | 1,416 |
Class A2FL, 0.856% 12/5/31 (f)(k) | | 1,520 | | 1,520 |
Class BFL, 1.256% 12/5/31 (f)(k) | | 5,610 | | 5,614 |
Class CFL, 1.656% 12/5/31 (f)(k) | | 3,980 | | 3,984 |
GE Capital Commercial Mortgage Corp.: | | | | |
sequential payer Series 2007-C1 Class A4, 5.543% 12/10/49 | | 16,649 | | 17,952 |
Series 2001-1 Class X1, 1.6605% 5/15/33 (f)(k)(m) | | 117 | | 0 * |
Greenwich Capital Commercial Funding Corp.: | | | | |
sequential payer Series 2007-GG9 Class A4, 5.444% 3/10/39 | | 33,895 | | 36,673 |
Series 2006-GG7 Class A4, 5.8189% 7/10/38 (k) | | 4,417 | | 4,705 |
Series 2007-GG11 Class A1, 0.2924% 12/10/49 (f)(k)(m) | | 18,573 | | 0 * |
GS Mortgage Securities Trust sequential payer Series 2006-GG8: | | | | |
Class A1A, 5.547% 11/10/39 | | 2,591 | | 2,787 |
Class A4, 5.56% 11/10/39 (k) | | 4,713 | | 5,059 |
Hilton U.S.A. Trust Series 2013-HLT: | | | | |
Class CFX, 3.7141% 11/5/30 (f) | | 1,380 | | 1,406 |
Class DFX, 4.4065% 11/5/30 (f) | | 12,899 | | 13,206 |
JPMorgan Chase Commercial Mortgage Securities Trust: | | | | |
floater: | | | | |
Series 2006-FL2A: | | | | |
Class E, 0.435% 11/15/18 (f)(k) | | 164 | | 163 |
Class F, 0.485% 11/15/18 (f)(k) | | 383 | | 372 |
Class G, 0.515% 11/15/18 (f)(k) | | 332 | | 314 |
Class H, 0.655% 11/15/18 (f)(k) | | 255 | | 239 |
Commercial Mortgage Securities - continued |
| Principal Amount (000s) | | Value (000s) |
JPMorgan Chase Commercial Mortgage Securities Trust: - continued | | | | |
floater: | | | | |
Series 2014-BXH: | | | | |
Class C, 1.806% 4/15/27 (f)(k) | | $ 2,117 | | $ 2,117 |
Class D, 2.406% 4/15/27 (f)(k) | | 4,512 | | 4,512 |
sequential payer: | | | | |
Series 2006-CB17: | | | | |
Class A3, 5.45% 12/12/43 | | 63 | | 63 |
Class A4, 5.429% 12/12/43 | | 8,980 | | 9,589 |
Series 2006-LDP8: | | | | |
Class A1A, 5.397% 5/15/45 | | 11,427 | | 12,271 |
Class A4, 5.399% 5/15/45 | | 810 | | 864 |
Series 2006-LDP9 Class A3, 5.336% 5/15/47 | | 11,113 | | 11,952 |
Series 2007-CB18 Class A4, 5.44% 6/12/47 | | 688 | | 744 |
Series 2007-CB19 Class A4, 5.7029% 2/12/49 (k) | | 4,648 | | 5,084 |
Series 2007-LD11: | | | | |
Class A2, 5.79% 6/15/49 (k) | | 130 | | 130 |
Class A4, 5.805% 6/15/49 (k) | | 34,884 | | 37,932 |
Series 2007-LDPX Class A3, 5.42% 1/15/49 | | 17,495 | | 18,937 |
Series 2006-LDP7 Class A4, 5.8657% 4/15/45 (k) | | 1,740 | | 1,855 |
Series 2007-LDP10 Class CS, 5.466% 1/15/49 (k) | | 108 | | 13 |
LB Commercial Conduit Mortgage Trust sequential payer Series 2007-C3 Class A4, 5.8927% 7/15/44 (k) | | 1,054 | | 1,158 |
LB-UBS Commercial Mortgage Trust: | | | | |
sequential payer: | | | | |
Series 2006-C6 Class A4, 5.372% 9/15/39 | | 591 | | 634 |
Series 2006-C7 Class A2, 5.3% 11/15/38 | | 678 | | 698 |
Series 2007-C1 Class A4, 5.424% 2/15/40 | | 4,021 | | 4,356 |
Series 2007-C2 Class A3, 5.43% 2/15/40 | | 2,394 | | 2,607 |
Series 2007-C6 Class A4, 5.858% 7/15/40 (k) | | 1,546 | | 1,645 |
Series 2007-C7: | | | | |
Class A3, 5.866% 9/15/45 | | 2,975 | | 3,309 |
Class XCP, 0.2789% 9/15/45 (k)(m) | | 74,046 | | 53 |
Merrill Lynch Mortgage Trust: | | | | |
Series 2005-LC1 Class F, 5.4208% 1/12/44 (f)(k) | | 1,143 | | 1,088 |
Series 2007-C1 Class A4, 5.8385% 6/12/50 (k) | | 4,974 | | 5,500 |
Series 2008-C1 Class A4, 5.69% 2/12/51 | | 2,735 | | 3,029 |
Merrill Lynch-CFC Commercial Mortgage Trust: | | | | |
floater Series 2006-4 Class A2FL, 0.276% 12/12/49 (k) | | 65 | | 65 |
sequential payer: | | | | |
Series 2006-4 Class ASB, 5.133% 12/12/49 (k) | | 438 | | 450 |
Commercial Mortgage Securities - continued |
| Principal Amount (000s) | | Value (000s) |
Merrill Lynch-CFC Commercial Mortgage Trust: - continued | | | | |
sequential payer: | | | | |
Series 2007-5: | | | | |
Class A4, 5.378% 8/12/48 | | $ 8,179 | | $ 8,759 |
Class B, 5.479% 8/12/48 | | 3,942 | | 1,883 |
Series 2007-6 Class A4, 5.485% 3/12/51 (k) | | 10,897 | | 11,837 |
Series 2007-7 Class A4, 5.7432% 6/12/50 (k) | | 4,599 | | 5,027 |
Series 2006-4 Class XP, 0.6181% 12/12/49 (k)(m) | | 17,362 | | 30 |
Series 2007-6 Class B, 5.635% 3/12/51 (k) | | 1,314 | | 406 |
Series 2007-7 Class B, 5.7432% 6/12/50 (k) | | 114 | | 5 |
Series 2007-8 Class A3, 5.8831% 8/12/49 (k) | | 1,133 | | 1,247 |
Morgan Stanley Capital I Trust: | | | | |
floater: | | | | |
Series 2006-XLF Class C, 1.355% 7/15/19 (f)(k) | | 393 | | 353 |
Series 2007-XLFA: | | | | |
Class C, 0.315% 10/15/20 (f)(k) | | 754 | | 751 |
Class D, 0.345% 10/15/20 (f)(k) | | 732 | | 727 |
Class E, 0.405% 10/15/20 (f)(k) | | 916 | | 906 |
Class F, 0.455% 10/15/20 (f)(k) | | 550 | | 541 |
Class G, 0.495% 10/15/20 (f)(k) | | 680 | | 662 |
Class H, 0.585% 10/15/20 (f)(k) | | 428 | | 395 |
Class J, 0.735% 10/15/20 (f)(k) | | 247 | | 203 |
sequential payer Series 2007-HQ11 Class A31, 5.439% 2/12/44 (k) | | 137 | | 137 |
Series 2006-IQ11 Class A4, 5.6554% 10/15/42 (k) | | 330 | | 346 |
Series 2006-T23 Class A3, 5.8054% 8/12/41 (k) | | 578 | | 578 |
Series 2007-IQ14: | | | | |
Class A4, 5.692% 4/15/49 (k) | | 10,971 | | 11,986 |
Class AAB, 5.654% 4/15/49 | | 1,892 | | 1,949 |
Class B, 5.722% 4/15/49 (k) | | 323 | | 69 |
Salomon Brothers Mortgage Securities VII, Inc. Series 2006-C2 Class H, 6.308% 7/18/33 (f) | | 185 | | 66 |
Wachovia Bank Commercial Mortgage Trust: | | | | |
floater: | | | | |
Series 2006-WL7A: | | | | |
Class G, 0.515% 9/15/21 (f)(k) | | 977 | | 957 |
Class J, 0.755% 9/15/21 (f)(k) | | 434 | | 417 |
Series 2007-WHL8: | | | | |
Class F, 0.635% 6/15/20 (f)(k) | | 4,581 | | 4,401 |
Class LXR1, 0.855% 6/15/20 (f)(k) | | 162 | | 158 |
sequential payer: | | | | |
Series 2007-C30 Class A5, 5.342% 12/15/43 | | 19,766 | | 21,372 |
Series 2007-C31 Class A4, 5.509% 4/15/47 | | 46,948 | | 50,411 |
Commercial Mortgage Securities - continued |
| Principal Amount (000s) | | Value (000s) |
Wachovia Bank Commercial Mortgage Trust: - continued | | | | |
sequential payer: | | | | |
Series 2007-C33: | | | | |
Class A4, 5.9414% 2/15/51 (k) | | $ 25,300 | | $ 27,439 |
Class A5, 5.9414% 2/15/51 (k) | | 870 | | 960 |
Series 2005-C19 Class B, 4.892% 5/15/44 | | 1,314 | | 1,339 |
Series 2005-C22: | | | | |
Class B, 5.3703% 12/15/44 (k) | | 2,914 | | 2,908 |
Class F, 5.3703% 12/15/44 (f)(k) | | 2,191 | | 600 |
Series 2006-C23 Class A5, 5.416% 1/15/45 (k) | | 7,210 | | 7,587 |
Series 2006-C27 Class A1A, 5.749% 7/15/45 (k) | | 12,088 | | 13,026 |
Series 2007-C30: | | | | |
Class C, 5.483% 12/15/43 (k) | | 3,942 | | 3,760 |
Class D, 5.513% 12/15/43 (k) | | 2,102 | | 1,885 |
Series 2007-C31 Class C, 5.6724% 4/15/47 (k) | | 361 | | 348 |
Series 2007-C31A Class A2, 5.421% 4/15/47 | | 947 | | 947 |
TOTAL COMMERCIAL MORTGAGE SECURITIES (Cost $468,756) |
503,101
|
Municipal Securities - 1.3% |
|
Beaver County Indl. Dev. Auth. Poll. Cont. Rev. Bonds (FirstEnergy Nuclear Generation Corp. Proj.) Series 2005 A, 3.375%, tender 7/1/15 (k) | | 2,300 | | 2,341 |
California Gen. Oblig.: | | | | |
Series 2009, 7.35% 11/1/39 | | 1,255 | | 1,840 |
7.3% 10/1/39 | | 18,960 | | 27,416 |
7.5% 4/1/34 | | 8,780 | | 12,833 |
7.55% 4/1/39 | | 16,130 | | 24,466 |
7.6% 11/1/40 | | 24,550 | | 37,674 |
7.625% 3/1/40 | | 2,920 | | 4,429 |
Chicago Gen. Oblig.: | | | | |
(Taxable Proj.): | | | | |
Series 2008 B, 5.63% 1/1/22 | | 1,360 | | 1,472 |
Series 2010 C1, 7.781% 1/1/35 | | 7,055 | | 8,583 |
Series 2012 B, 5.432% 1/1/42 | | 1,845 | | 1,742 |
6.05% 1/1/29 | | 475 | | 497 |
6.314% 1/1/44 | | 12,665 | | 13,420 |
Illinois Fin. Auth. Rev. Series 2013 A, 4.545% 10/1/18 (o) | | 38,500 | | 39,584 |
Illinois Gen. Oblig.: | | | | |
Series 2003: | | | | |
4.35% 6/1/18 | | 695 | | 730 |
Municipal Securities - continued |
| Principal Amount (000s) | | Value (000s) |
Illinois Gen. Oblig.: - continued | | | | |
Series 2003: | | | | |
5.1% 6/1/33 | | $ 87,365 | | $ 86,749 |
Series 2010, 4.421% 1/1/15 | | 5,980 | | 6,046 |
Series 2010-1, 6.63% 2/1/35 | | 17,960 | | 19,999 |
Series 2010-3: | | | | |
5.547% 4/1/19 | | 185 | | 203 |
6.725% 4/1/35 | | 8,580 | | 9,643 |
7.35% 7/1/35 | | 5,140 | | 6,013 |
Series 2011: | | | | |
4.961% 3/1/16 | | 580 | | 612 |
5.365% 3/1/17 | | 215 | | 233 |
5.665% 3/1/18 | | 8,220 | | 9,108 |
5.877% 3/1/19 | | 18,220 | | 20,379 |
Series 2013: | | | | |
1.28% 12/1/15 | | 4,975 | | 4,983 |
4% 12/1/20 | | 7,040 | | 7,197 |
TOTAL MUNICIPAL SECURITIES (Cost $329,775) |
348,192
|
Foreign Government and Government Agency Obligations - 0.4% |
|
Banco Nacional de Desenvolvimento Economico e Social: | | | | |
3.375% 9/26/16 (f) | | 6,350 | | 6,528 |
5.75% 9/26/23 (f) | | 5,809 | | 6,317 |
6.369% 6/16/18 (f) | | 12,537 | | 13,975 |
Brazilian Federative Republic: | | | | |
4.25% 1/7/25 | | 12,300 | | 12,792 |
5.625% 1/7/41 | | 6,113 | | 6,877 |
Italian Republic: | | | | |
3.125% 1/26/15 | | 10,287 | | 10,391 |
4.5% 1/21/15 | | 7,717 | | 7,835 |
4.75% 1/25/16 | | 7,716 | | 8,124 |
5.375% 6/12/17 | | 4,630 | | 5,107 |
United Mexican States: | | | | |
3.5% 1/21/21 | | 6,500 | | 6,760 |
4% 10/2/23 | | 14,090 | | 14,935 |
4.75% 3/8/44 | | 6,152 | | 6,453 |
TOTAL FOREIGN GOVERNMENT AND GOVERNMENT AGENCY OBLIGATIONS (Cost $101,892) |
106,094
|
Bank Notes - 0.1% |
| Principal Amount (000s) | | Value (000s) |
Discover Bank (Delaware) 3.2% 8/9/21 | | $ 9,774 | | $ 9,806 |
Fifth Third Bank 4.75% 2/1/15 | | 951 | | 967 |
TOTAL BANK NOTES (Cost $10,705) | 10,773 |
Preferred Securities - 0.0% |
|
FINANCIALS - 0.0% |
Diversified Financial Services - 0.0% |
MUFG Capital Finance 1 Ltd. 6.346% (g)(k) (Cost $1,362) | | 1,204 | |
1,309
|
Fixed-Income Funds - 6.1% |
| Shares | | |
Fidelity High Income Central Fund 2 (l) | 6,093,687 | | 721,797 |
Fidelity Mortgage Backed Securities Central Fund (l) | 8,586,627 | | 931,563 |
TOTAL FIXED-INCOME FUNDS (Cost $1,496,732) |
1,653,360
|
Money Market Funds - 3.5% |
| | | |
Fidelity Cash Central Fund, 0.11% (b) | 844,994,639 | | 844,995 |
Fidelity Securities Lending Cash Central Fund, 0.11% (b)(c) | 103,404,572 | | 103,405 |
TOTAL MONEY MARKET FUNDS (Cost $948,400) |
948,400
|
TOTAL INVESTMENT PORTFOLIO - 102.1% (Cost $22,324,358) | 27,514,264 |
NET OTHER ASSETS (LIABILITIES) - (2.1)% | (567,962) |
NET ASSETS - 100% | $ 26,946,302 |
TBA Sale Commitments |
| Principal Amount (000s) | | Value (000s) |
Fannie Mae |
4% 9/1/44 | $ (5,000) | | $ (5,297) |
4% 9/1/44 | (10,800) | | (11,442) |
4% 9/1/44 | (16,000) | | (16,951) |
4% 9/1/44 | (17,000) | | (18,010) |
4% 9/1/44 | (17,100) | | (18,116) |
4% 9/1/44 | (17,000) | | (18,010) |
4% 9/1/44 | (17,100) | | (18,116) |
4% 9/1/44 | (3,700) | | (3,920) |
4.5% 9/1/44 | (26,600) | | (28,721) |
5% 9/1/44 | (4,300) | | (4,742) |
5.5% 9/1/44 | (15,300) | | (17,017) |
TOTAL TBA SALE COMMITMENTS (Proceeds $160,254) | $ (160,342) |
Futures Contracts |
| Expiration Date | | Underlying Face Amount at Value (000s) | | Unrealized Appreciation/
(Depreciation) (000s) |
Purchased |
Equity Index Contracts |
1,810 CME E-mini S&P 500 Index Contracts (United States) | Sept. 2014 | | $ 181,127 | | $ 7,076 |
Sold |
Treasury Contracts |
631 CBOT 5 Year U.S. Treasury Note Contracts | Dec. 2014 | | $ 74,985 | | $ (139) |
| | $ 256,112 | | $ 6,937 |
|
The face value of futures purchased as a percentage of net assets is 0.7% |
The face value of futures sold as a percentage of net assets is 0.3% |
Swaps |
Credit Default Swaps |
Underlying Reference | Rating(1) | Expiration Date | Clearinghouse/Counterparty | Fixed Payment Received/(Paid) | Notional Amount
(2) (000s) | Value (1) (000s) | Upfront Premium Received/(Paid) (000s) | Unrealized Appreciation/(Depreciation)(000s) |
Sell Protection |
Ameriquest Mortgage Securities Inc Series 2004-R11 Class M9 | C | Dec. 2034 | Bank of America | 4.25% | $ 120 | $ (117) | $ 0 | $ (117) |
|
(1) Ratings are presented for credit default swaps in which the Fund has sold protection on the underlying referenced debt. Ratings for an underlying index represent a weighted average of the ratings of all securities included in the index. The credit rating or value can be measures of the current payment/performance risk. Ratings are from Moody's Investors Service, Inc. Where Moody's® ratings are not available, S&P® ratings are disclosed and are indicated as such. All ratings are as of the report date and do not reflect subsequent changes. |
|
(2) The notional amount of each credit default swap where the Fund has sold protection approximates the maximum potential amount of future payments that the Fund could be required to make if a credit event were to occur. |
Legend |
(a) Non-income producing |
(b) Affiliated fund that is generally available only to investment companies and other accounts managed by Fidelity Investments. The rate quoted is the annualized seven-day yield of the fund at period end. A complete unaudited listing of the fund's holdings as of its most recent quarter end is available upon request. In addition, each Fidelity Central Fund's financial statements, which are not covered by the Fund's Report of Independent Registered Public Accounting Firm, are available on the SEC's website or upon request. |
(c) Investment made with cash collateral received from securities on loan. |
(d) Security or a portion of the security is on loan at period end. |
(e) Affiliated company |
(f) Security exempt from registration under Rule 144A of the Securities Act of 1933. These securities may be resold in transactions exempt from registration, normally to qualified institutional buyers. At the end of the period, the value of these securities amounted to $443,178,000 or 1.6% of net assets. |
(g) Security is perpetual in nature with no stated maturity date. |
(h) Security or a portion of the security purchased on a delayed delivery or when-issued basis. |
(i) Security or a portion of the security was pledged to cover margin requirements for futures contracts. At period end, the value of securities pledged amounted to $9,410,000. |
(j) Security or a portion of the security has been segregated as collateral for open bi-lateral over-the-counter (OTC) swaps. At period end, the value of securities pledged amounted to $1,119,000. |
(k) Coupon rates for floating and adjustable rate securities reflect the rates in effect at period end. |
(l) Affiliated fund that is generally available only to investment companies and other accounts managed by Fidelity Investments. A complete unaudited schedule of portfolio holdings for each Fidelity Central Fund is filed with the SEC for the first and third quarters of each fiscal year on Form N-Q and is available upon request or at the SEC's website at www.sec.gov. An unaudited holdings listing for the Fund, which presents direct holdings as well as the pro-rata share of securities and other investments held indirectly through its investment in underlying non-money market Fidelity Central Funds, is available at fidelity.com. In addition, each Fidelity Central Fund's financial statements, which are not covered by the Fund's Report of Independent Registered Public Accounting Firm, are available on the SEC's website or upon request. |
(m) Security represents right to receive monthly interest payments on an underlying pool of mortgages or assets. Principal shown is the outstanding par amount of the pool as of the end of the period. |
(n) Investment is owned by an entity that is treated as a corporation for U.S. tax purposes and is owned by the Fund. |
(o) Restricted securities - Investment in securities not registered under the Securities Act of 1933 (excluding 144A issues). At the end of the period, the value of restricted securities (excluding 144A issues) amounted to $67,372,000 or 0.3% of net assets. |
Additional information on each restricted holding is as follows: |
Security | Acquisition Date | Acquisition Cost (000s) |
Illinois Fin. Auth. Rev. Series 2013 A, 4.545% 10/1/18 | 10/24/13 | $ 38,500 |
Legend Pictures LLC | 9/23/10 | $ 6,428 |
MongoDB, Inc. Series F, 8.00% | 10/2/13 | $ 4,704 |
Xero Ltd. | 10/14/13 | $ 7,124 |
* Amount represents less than $1,000. |
Affiliated Central Funds |
Information regarding fiscal year to date income earned by the Fund from investments in Fidelity Central Funds is as follows: |
Fund | Income earned
(Amounts in thousands) |
Fidelity Cash Central Fund | $ 696 |
Fidelity High Income Central Fund 2 | 41,648 |
Fidelity Mortgage Backed Securities Central Fund | 25,762 |
Fidelity Securities Lending Cash Central Fund | 876 |
Total | $ 68,982 |
Additional information regarding the Fund's fiscal year to date purchases and sales, including the ownership percentage, of the non Money Market Central Funds is as follows: |
Fund
(Amounts in thousands) | Value, beginning of period | Purchases | Sales Proceeds | Value,
end of
period | % ownership, end of
period |
Fidelity High Income Central Fund 2 | $ 656,337 | $ 41,648 | $ - | $ 721,797 | 82.8% |
Fidelity Mortgage Backed Securities Central Fund | 1,402,181 | 25,762 | 530,217 | 931,563 | 8.7% |
Total | $ 2,058,518 | $ 67,410 | $ 530,217 | $ 1,653,360 | |
Other Affiliated Issuers |
An affiliated company is a company in which the Fund has ownership of at least 5% of the voting securities. Fiscal year to date transactions with companies which are or were affiliates are as follows: |
Affiliate
(Amounts in thousands) | Value, beginning of period | Purchases | Sales Proceeds | Dividend Income | Value,
end of
period |
Independence Contract Drilling | $ - | $ 15,015 | $ 1,518 | $ - | $ 14,109 |
Other Information |
The following is a summary of the inputs used, as of August 31, 2014, involving the Fund's assets and liabilities carried at fair value. The inputs or methodology used for valuing securities may not be an indication of the risk associated with investing in those securities. For more information on valuation inputs, and their aggregation into the levels used in the table below, please refer to the Investment Valuation section in the accompanying Notes to Financial Statements. |
Valuation Inputs at Reporting Date: |
Description
(Amounts in thousands) | Total | Level 1 | Level 2 | Level 3 |
Investments in Securities: | | | | |
Equities: | | | | |
Consumer Discretionary | $ 2,448,219 | $ 2,432,765 | $ - | $ 15,454 |
Consumer Staples | 1,780,718 | 1,731,335 | 49,383 | - |
Energy | 2,049,203 | 2,012,396 | 36,807 | - |
Financials | 3,059,047 | 3,059,047 | - | - |
Health Care | 2,754,680 | 2,632,324 | 122,356 | - |
Industrials | 1,781,132 | 1,781,132 | - | - |
Information Technology | 3,518,395 | 3,505,730 | 9,219 | 3,446 |
Materials | 862,664 | 862,664 | - | - |
Telecommunication Services | 381,347 | 381,347 | - | - |
Utilities | 565,312 | 565,312 | - | - |
Corporate Bonds | 2,731,668 | - | 2,731,668 | - |
U.S. Government and Government Agency Obligations | 869,006 | - | 869,006 | - |
U.S. Government Agency - Mortgage Securities | 995,109 | - | 995,109 | - |
Asset-Backed Securities | 86,604 | - | 85,602 | 1,002 |
Collateralized Mortgage Obligations | 59,931 | - | 59,315 | 616 |
Commercial Mortgage Securities | 503,101 | - | 502,479 | 622 |
Municipal Securities | 348,192 | - | 348,192 | - |
Foreign Government and Government Agency Obligations | 106,094 | - | 106,094 | - |
Bank Notes | 10,773 | - | 10,773 | - |
Preferred Securities | 1,309 | - | 1,309 | - |
Fixed-Income Funds | 1,653,360 | 1,653,360 | - | - |
Money Market Funds | 948,400 | 948,400 | - | - |
Total Investments in Securities: | $ 27,514,264 | $ 21,565,812 | $ 5,927,312 | $ 21,140 |
Valuation Inputs at Reporting Date: |
Description
(Amounts in thousands) | Total | Level 1 | Level 2 | Level 3 |
Derivative Instruments: | | | | |
Assets | | | | |
Futures Contracts | $ 7,076 | $ 7,076 | $ - | $ - |
Liabilities | | | | |
Futures Contracts | $ (139) | $ (139) | $ - | $ - |
Swaps | (117) | - | (117) | - |
Total Liabilities | $ (256) | $ (139) | $ (117) | $ - |
Total Derivative Instruments: | $ 6,820 | $ 6,937 | $ (117) | $ - |
Other Financial Instruments: | | | | |
TBA Sale Commitments | $ (160,342) | $ - | $ (160,342) | $ - |
Value of Derivative Instruments |
The following table is a summary of the Fund's value of derivative instruments by primary risk exposure as of August 31, 2014. For additional information on derivative instruments, please refer to the Derivative Instruments section in the accompanying Notes to Financial Statements. |
Primary Risk Exposure /
Derivative Type
(Amounts in thousands) | Value |
| Asset | Liability |
Credit Risk | | |
Swaps (b) | $ - | $ (117) |
Equity Risk | | |
Futures Contracts (a) | 7,076 | - |
Interest Rate Risk | | |
Futures Contracts (a) | - | (139) |
Total Value of Derivatives | $ 7,076 | $ (256) |
(a) Reflects gross cumulative appreciation (depreciation) on futures contracts as presented in the Schedule of Investments. Only the period end receivable or payable for daily variation margin and net unrealized appreciation (depreciation) are presented in the Statement of Assets and Liabilities. |
(b) For bi-lateral OTC swaps, reflects gross value which is presented in the Statement of Assets and Liabilities in the bi-lateral OTC swaps, at value line-items. |
Other Information |
The composition of credit quality ratings as a percentage of net assets is as follows (Unaudited): |
U.S. Government and U.S. Government Agency Obligations | 10.0% |
AAA,AA,A | 4.3% |
BBB | 9.2% |
BB | 1.2% |
B | 1.5% |
CCC,CC,C | 0.4% |
D | 0.0%* |
Not Rated | 0.1% |
Equities | 71.3% |
Short-Term Investments and Net Other Assets | 2.0% |
| 100.0% |
* Amount represents less than 0.1% |
We have used ratings from Moody's Investors Service, Inc. Where Moody's® ratings are not available, we have used S&P® ratings. All ratings are as of the date indicated and do not reflect subsequent changes. |
The information in the above tables is based on the combined investments of the Fund and its pro-rata share of the investments of Fidelity's fixed-income central funds. |
See accompanying notes which are an integral part of the financial statements.
Annual Report
Statement of Assets and Liabilities
Amounts in thousands (except per-share amounts) | August 31, 2014 |
Assets | | |
Investment in securities, at value (including securities loaned of $101,039) - See accompanying schedule: Unaffiliated issuers (cost $19,865,731) | $ 24,898,395 | |
Fidelity Central Funds (cost $2,445,132) | 2,601,760 | |
Other affiliated issuers (cost $13,495) | 14,109 | |
Total Investments (cost $22,324,358) | | $ 27,514,264 |
Cash | | 1,058 |
Foreign currency held at value (cost $220) | | 220 |
Receivable for investments sold, regular delivery | | 161,539 |
Receivable for TBA sale commitments | | 160,254 |
Receivable for fund shares sold | | 18,374 |
Dividends receivable | | 30,305 |
Interest receivable | | 42,744 |
Distributions receivable from Fidelity Central Funds | | 198 |
Receivable for daily variation margin for derivative instruments | | 406 |
Receivable from investment adviser for expense reductions | | 6 |
Other receivables | | 1,264 |
Total assets | | 27,930,632 |
| | |
Liabilities | | |
Payable for investments purchased
Regular delivery | $ 136,813 | |
Delayed delivery | 553,896 | |
TBA sale commitments, at value | 160,342 | |
Payable for fund shares redeemed | 16,933 | |
Bi-lateral OTC swaps, at value | 117 | |
Accrued management fee | 8,814 | |
Other affiliated payables | 2,812 | |
Other payables and accrued expenses | 1,198 | |
Collateral on securities loaned, at value | 103,405 | |
Total liabilities | | 984,330 |
| | |
Net Assets | | $ 26,946,302 |
Net Assets consist of: | | |
Paid in capital | | $ 20,289,722 |
Undistributed net investment income | | 91,293 |
Accumulated undistributed net realized gain (loss) on investments and foreign currency transactions | | 1,368,742 |
Net unrealized appreciation (depreciation) on investments and assets and liabilities in foreign currencies | | 5,196,545 |
Net Assets | | $ 26,946,302 |
See accompanying notes which are an integral part of the financial statements.
Annual Report
Financial Statements - continued
Statement of Assets and Liabilities - continued
Amounts in thousands (except per-share amounts) | August 31, 2014 |
| | |
Balanced:
Net Asset Value, offering price and redemption price per share ($19,574,425 ÷ 802,242 shares) | | $ 24.40 |
| | |
Class K:
Net Asset Value, offering price and redemption price per share ($7,371,877 ÷ 302,133 shares) | | $ 24.40 |
See accompanying notes which are an integral part of the financial statements.
Annual Report
Statement of Operations
Amounts in thousands | Year ended August 31, 2014 |
| | |
Investment Income | | |
Dividends | | $ 299,899 |
Interest | | 183,690 |
Income from Fidelity Central Funds | | 68,982 |
Total income | | 552,571 |
| | |
Expenses | | |
Management fee | $ 100,330 | |
Transfer agent fees | 29,885 | |
Accounting and security lending fees | 2,191 | |
Custodian fees and expenses | 426 | |
Independent trustees' compensation | 104 | |
Appreciation in deferred trustee compensation account | 1 | |
Registration fees | 317 | |
Audit | 162 | |
Legal | 109 | |
Miscellaneous | 192 | |
Total expenses before reductions | 133,717 | |
Expense reductions | (672) | 133,045 |
Net investment income (loss) | | 419,526 |
Realized and Unrealized Gain (Loss) Net realized gain (loss) on: | | |
Investment securities: | | |
Unaffiliated issuers | 1,941,516 | |
Fidelity Central Funds | 1,986 | |
Other affiliated issuers | (2) | |
Foreign currency transactions | (139) | |
Futures contracts | 34,067 | |
Swaps | (8,292) | |
Total net realized gain (loss) | | 1,969,136 |
Change in net unrealized appreciation (depreciation) on: Investment securities | 1,984,504 | |
Assets and liabilities in foreign currencies | (64) | |
Futures contracts | 5,168 | |
Swaps | 9,889 | |
Delayed delivery commitments | (2,238) | |
Total change in net unrealized appreciation (depreciation) | | 1,997,259 |
Net gain (loss) | | 3,966,395 |
Net increase (decrease) in net assets resulting from operations | | $ 4,385,921 |
See accompanying notes which are an integral part of the financial statements.
Annual Report
Financial Statements - continued
Statement of Changes in Net Assets
Amounts in thousands | Year ended
August 31,
2014 | Year ended
August 31,
2013 |
Increase (Decrease) in Net Assets | | |
Operations | | |
Net investment income (loss) | $ 419,526 | $ 379,768 |
Net realized gain (loss) | 1,969,136 | 1,617,924 |
Change in net unrealized appreciation (depreciation) | 1,997,259 | 309,252 |
Net increase (decrease) in net assets resulting
from operations | 4,385,921 | 2,306,944 |
Distributions to shareholders from net investment income | (412,435) | (352,712) |
Distributions to shareholders from net realized gain | (1,179,420) | - |
Total distributions | (1,591,855) | (352,712) |
Share transactions - net increase (decrease) | 1,479,644 | 99,632 |
Total increase (decrease) in net assets | 4,273,710 | 2,053,864 |
| | |
Net Assets | | |
Beginning of period | 22,672,592 | 20,618,728 |
End of period (including undistributed net investment income of $91,293 and undistributed net investment income of $97,655, respectively) | $ 26,946,302 | $ 22,672,592 |
See accompanying notes which are an integral part of the financial statements.
Annual Report
Financial Highlights - Balanced
Years ended August 31, | 2014 | 2013 | 2012 | 2011 | 2010 |
Selected Per-Share Data | | | | | |
Net asset value, beginning of period | $ 21.85 | $ 19.95 | $ 18.17 | $ 16.27 | $ 15.40 |
Income from Investment Operations | | | | | |
Net investment income (loss) B | .38 | .36 | .37 | .35 | .36 |
Net realized and unrealized gain (loss) | 3.68 | 1.88 | 1.76 | 1.91 | .88 |
Total from investment operations | 4.06 | 2.24 | 2.13 | 2.26 | 1.24 |
Distributions from net investment income | (.38) | (.34) | (.35) | (.35) | (.36) |
Distributions from net realized gain | (1.13) | - | - | (.01) | (.01) |
Total distributions | (1.51) | (.34) | (.35) | (.36) | (.37) |
Net asset value, end of period | $ 24.40 | $ 21.85 | $ 19.95 | $ 18.17 | $ 16.27 |
Total ReturnA | 19.46% | 11.32% | 11.89% | 13.88% | 8.06% |
Ratios to Average Net Assets C, E | | | | | |
Expenses before reductions | .56% | .58% | .60% | .61% | .62% |
Expenses net of fee waivers, if any | .56% | .58% | .60% | .61% | .62% |
Expenses net of all reductions | .56% | .57% | .59% | .60% | .61% |
Net investment income (loss) | 1.65% | 1.72% | 1.98% | 1.92% | 2.18% |
Supplemental Data | | | | | |
Net assets, end of period (in millions) | $ 19,574 | $ 16,342 | $ 15,016 | $ 15,602 | $ 16,764 |
Portfolio turnover rateD | 176% | 244%F | 155% | 193%F | 122% |
A Total returns would have been lower if certain expenses had not been reduced during the applicable periods shown.
B Calculated based on average shares outstanding during the period.
C Fees and expenses of any underlying Fidelity Central Funds are not included in the Fund's expense ratio. The Fund indirectly bears its proportionate share of the expenses of any underlying Fidelity Central Funds. Based on their most recent shareholder report date, the expenses of any underlying non-money market Fidelity Central Funds were less than .01%.
D Amount does not include the portfolio activity of any underlying Fidelity Central Funds.
E Expense ratios reflect operating expenses of the class. Expenses before reductions do not reflect amounts reimbursed by the investment adviser or reductions from brokerage service arrangements or reductions from other expense offset arrangements and do not represent the amount paid by the class during periods when reimbursements or reductions occur. Expenses net of fee waivers reflect expenses after reimbursement by the investment adviser but prior to reductions from brokerage service arrangements or other expense offset arrangements. Expenses net of all reductions represent the net expenses paid by the class.
F The portfolio turnover rate excludes liquidations and/or redemptions executed in-kind from Affiliated Central Funds.
See accompanying notes which are an integral part of the financial statements.
Annual Report
Financial Highlights - Class K
Years ended August 31, | 2014 | 2013 | 2012 | 2011 | 2010 |
Selected Per-Share Data | | | | | |
Net asset value, beginning of period | $ 21.85 | $ 19.95 | $ 18.17 | $ 16.27 | $ 15.40 |
Income from Investment Operations | | | | | |
Net investment income (loss) B | .40 | .39 | .40 | .38 | .38 |
Net realized and unrealized gain (loss) | 3.69 | 1.87 | 1.76 | 1.90 | .88 |
Total from investment operations | 4.09 | 2.26 | 2.16 | 2.28 | 1.26 |
Distributions from net investment income | (.40) | (.36) | (.38) | (.38) | (.38) |
Distributions from net realized gain | (1.13) | - | - | (.01) | (.01) |
Total distributions | (1.54)G | (.36) | (.38) | (.38)F | (.39) |
Net asset value, end of period | $ 24.40 | $ 21.85 | $ 19.95 | $ 18.17 | $ 16.27 |
Total ReturnA | 19.59% | 11.45% | 12.03% | 14.04% | 8.23% |
Ratios to Average Net Assets C, E | | | | | |
Expenses before reductions | .46% | .47% | .48% | .48% | .48% |
Expenses net of fee waivers, if any | .46% | .47% | .48% | .48% | .48% |
Expenses net of all reductions | .46% | .46% | .47% | .47% | .47% |
Net investment income (loss) | 1.75% | 1.83% | 2.10% | 2.05% | 2.32% |
Supplemental Data | | | | | |
Net assets, end of period (in millions) | $ 7,372 | $ 6,330 | $ 5,603 | $ 4,102 | $ 2,692 |
Portfolio turnover rateD | 176% | 244% H | 155% | 193%H | 122% |
A Total returns would have been lower if certain expenses had not been reduced during the applicable periods shown.
B Calculated based on average shares outstanding during the period.
C Fees and expenses of any underlying Fidelity Central Funds are not included in the Fund's expense ratio. The Fund indirectly bears its proportionate share of the expenses of any underlying Fidelity Central Funds. Based on their most recent shareholder report date, the expenses of any underlying non-money market Fidelity Central Funds were less than .01%.
D Amount does not include the portfolio activity of any underlying Fidelity Central Funds.
E Expense ratios reflect operating expenses of the class. Expenses before reductions do not reflect amounts reimbursed by the investment adviser or reductions from brokerage service arrangements or reductions from other expense offset arrangements and do not represent the amount paid by the class during periods when reimbursements or reductions occur. Expenses net of fee waivers reflect expenses after reimbursement by the investment adviser but prior to reductions from brokerage service arrangements or other expense offset arrangements. Expenses net of all reductions represent the net expenses paid by the class.
F Total distributions of $.38 per share is comprised of distributions from net investment income of $.376 and distributions from net realized gain of $.008 per share.
G Total distributions of $1.54 per share is comprised of distributions from net investment income of $.401 and distributions from net realized gain of $1.134 per share.
H The portfolio turnover rate excludes liquidations and/or redemptions executed in-kind from Affiliated Central Funds.
See accompanying notes which are an integral part of the financial statements.
Annual Report
Notes to Financial Statements
For the period ended August 31, 2014
(Amounts in thousands except percentages)
1. Organization.
Fidelity Balanced Fund (the Fund) is a fund of Fidelity Puritan Trust (the Trust) and is authorized to issue an unlimited number of shares. The Trust is registered under the Investment Company Act of 1940, as amended (the 1940 Act), as an open-end management investment company organized as a Massachusetts business trust. The Fund offers Balanced and Class K shares, each of which has equal rights as to assets and voting privileges. Each class has exclusive voting rights with respect to matters that affect that class.
2. Investments in Fidelity Central Funds.
The Fund invests in Fidelity Central Funds, which are open-end investment companies generally available only to other investment companies and accounts managed by the investment adviser and its affiliates. The Fund's Schedule of Investments lists each of the Fidelity Central Funds held as of period end, if any, as an investment of the Fund, but does not include the underlying holdings of each Fidelity Central Fund. As an Investing Fund, the Fund indirectly bears its proportionate share of the expenses of the underlying Fidelity Central Funds.
Based on its investment objective, each Fidelity Central Fund may invest or participate in various investment vehicles or strategies that are similar to those of the Fund. These strategies are consistent with the investment objectives of the Fund and may involve certain economic risks which may cause a decline in value of each of the Fidelity Central Funds and thus a decline in the value of the Fund. The Money Market Central Funds seek preservation of capital and current income and are managed by Fidelity Investments Money Management, Inc. (FIMM), an affiliate of the investment adviser. Annualized expenses of the Money Market Central Funds as of their most recent shareholder report date are less than .01%. The following summarizes the Fund's investment in each non-money market Fidelity Central Fund.
Annual Report
2. Investments in Fidelity Central Funds - continued
Fidelity Central Fund | Investment
Manager | Investment
Objective | Investment
Practices | Expense
Ratio* |
Fidelity High Income Central Fund 2 | FMR Co., Inc. (FMRC) | Seeks a high level of income and may also seek capital appreciation by investing primarily in debt securities, preferred stocks, and convertible securities, with an emphasis on lower-quality debt securities. | Loans & Direct Debt Instruments Repurchase Agreements Restricted Securities | less than 0.01% |
Fidelity Mortgage Backed Securities Central Fund | FIMM | Seeks a high level of income by normally investing in investment-grade mortgage-related securities and repurchase agreements for those securities. | Delayed Delivery & When Issued Securities Repurchase Agreements Swaps | less than 0.01% |
* Expenses expressed as a percentage of average net assets and are as of each underlying Central Fund's most recent annual or semi-annual shareholder report.
An unaudited holdings listing for the Fund, which presents direct holdings as well as the pro-rata share of any securities and other investments held indirectly through its investment in underlying non-money market Fidelity Central Funds, is available at fidelity.com. A complete unaudited list of holdings for each Fidelity Central Fund is available upon request or at the Securities and Exchange Commission (the SEC) website at www.sec.gov. In addition, the financial statements of the Fidelity Central Funds which contain the significant accounting policies (including investment valuation policies) of those funds, which are not covered by the Fund's Report of Independent Registered Public Accounting Firm, are available on the SEC website or upon request.
3. Significant Accounting Policies.
The financial statements have been prepared in conformity with accounting principles generally accepted in the United States of America (GAAP), which require management to make certain estimates and assumptions at the date of the financial statements. Actual results could differ from those estimates. Subsequent events, if any, through the date that the financial statements were issued have been evaluated in the preparation of the financial statements. The following summarizes the significant accounting policies of the Fund:
Annual Report
Notes to Financial Statements - continued
(Amounts in thousands except percentages)
3. Significant Accounting Policies - continued
Investment Valuation. Investments are valued as of 4:00 p.m. Eastern time on the last calendar day of the period. In accordance with valuation policies and procedures approved by the Board of Trustees (the Board), the Fund attempts to obtain prices from one or more third party pricing vendors or brokers to value its investments. When current market prices, quotations or currency exchange rates are not readily available or reliable, investments will be fair valued in good faith by the Fidelity Management & Research Company (FMR) Fair Value Committee (the Committee), in accordance with procedures adopted by the Board. Factors used in determining fair value vary by investment type and may include market or investment specific events, changes in interest rates and credit quality. The frequency with which these procedures are used cannot be predicted and they may be utilized to a significant extent. The Committee oversees the Fund's valuation policies and procedures and is responsible for approving and reporting to the Board all fair value determinations.
The Fund categorizes the inputs to valuation techniques used to value its investments into a disclosure hierarchy consisting of three levels as shown below:
Level 1 - quoted prices in active markets for identical investments
Level 2 - other significant observable inputs (including quoted prices for similar investments, interest rates, prepayment speeds, etc.)
Level 3 - unobservable inputs (including the Fund's own assumptions based on the best information available)
Valuation techniques used to value the Fund's investments by major category are as follows:
Equity securities, including restricted securities, for which market quotations are readily available, are valued at the last reported sale price or official closing price as reported by a third party pricing vendor on the primary market or exchange on which they are traded and are categorized as Level 1 in the hierarchy. In the event there were no sales during the day or closing prices are not available, securities are valued at the last quoted bid price or may be valued using the last available price and are generally categorized as Level 2 in the hierarchy. For foreign equity securities, when market or security specific events arise, comparisons to the valuation of American Depositary Receipts (ADRs), futures contracts, Exchange-Traded Funds (ETFs) and certain indexes as well as quoted prices for similar securities may be used and would be categorized as Level 2 in the hierarchy. Utilizing these techniques may result in transfers between Level 1 and Level 2. For equity securities, including restricted securities, where observable inputs are limited, assumptions about market activity and risk are used and these securities may be categorized as Level 3 in the hierarchy.
Annual Report
3. Significant Accounting Policies - continued
Investment Valuation - continued
Debt securities, including restricted securities, are valued based on evaluated prices received from third party pricing vendors or from brokers who make markets in such securities. Corporate bonds, bank notes, foreign government and government agency obligations, municipal securities, preferred securities and U.S. government and government agency obligations are valued by pricing vendors who utilize matrix pricing which considers yield or price of bonds of comparable quality, coupon, maturity and type or by broker-supplied prices. Asset backed securities, collateralized mortgage obligations, commercial mortgage securities and U.S. government agency mortgage securities are valued by pricing vendors who utilize matrix pricing which considers prepayment speed assumptions, attributes of the collateral, yield or price of bonds of comparable quality, coupon, maturity and type or by broker-supplied prices. Swaps are marked-to-market daily based on valuations from third party pricing vendors, registered derivatives clearing organizations (clearinghouses) or broker-supplied valuations. These pricing sources may utilize inputs such as interest rate curves, credit spread curves, default possibilities and recovery rates. When independent prices are unavailable or unreliable, debt securities and swaps may be valued utilizing pricing methodologies which consider similar factors that would be used by third party pricing vendors. Debt securities and swaps are generally categorized as Level 2 in the hierarchy but may be Level 3 depending on the circumstances.
Futures contracts are valued at the settlement price established each day by the board of trade or exchange on which they are traded and are categorized as Level 1 in the hierarchy. Investments in open-end mutual funds, including the Fidelity Central Funds, are valued at their closing net asset value (NAV) each business day and are categorized as Level 1 in the hierarchy. Short-term securities with remaining maturities of sixty days or less may be valued at amortized cost, which approximates fair value, and are categorized as Level 2 in the hierarchy.
Changes in valuation techniques may result in transfers in or out of an assigned level within the disclosure hierarchy. The aggregate value of investments by input level, as of August 31, 2014, is included at the end of the Fund's Schedule of Investments.
Annual Report
Notes to Financial Statements - continued
(Amounts in thousands except percentages)
3. Significant Accounting Policies - continued
Foreign Currency. The Fund may use foreign currency contracts to facilitate transactions in foreign-denominated securities. Gains and losses from these transactions may arise from changes in the value of the foreign currency or if the counterparties do not perform under the contracts' terms.
Foreign-denominated assets, including investment securities, and liabilities are translated into U.S. dollars at the exchange rates at period end. Purchases and sales of investment securities, income and dividends received and expenses denominated in foreign currencies are translated into U.S. dollars at the exchange rate in effect on the transaction date.
The effects of exchange rate fluctuations on investments are included with the net realized and unrealized gain (loss) on investment securities. Other foreign currency transactions resulting in realized and unrealized gain (loss) are disclosed separately.
Investment Transactions and Income. For financial reporting purposes, the Fund's investment holdings and NAV include trades executed through the end of the last business day of the period. The NAV per share for processing shareholder transactions is calculated as of the close of business of the New York Stock Exchange (NYSE), normally 4:00 p.m. Eastern time and includes trades executed through the end of the prior business day. Gains and losses on securities sold are determined on the basis of identified cost and may include proceeds received from litigation. Dividend income is recorded on the ex-dividend date, except for certain dividends from foreign securities where the ex-dividend date may have passed, which are recorded as soon as the Fund is informed of the ex-dividend date. Non-cash dividends included in dividend income, if any, are recorded at the fair market value of the securities received. Income and capital gain distributions from Fidelity Central Funds, if any, are recorded on the ex-dividend date. Distributions received on securities that represent a return of capital or capital gain are recorded as a reduction of cost of investments and/or as a realized gain. Subsequent to ex-dividend date the Fund determines the components of these distributions, based upon receipt of tax filings or other correspondence relating to the underlying investment. Interest income is accrued as earned and includes coupon interest and amortization of premium and accretion of discount on debt securities as applicable. Investment income is recorded net of foreign taxes withheld where recovery of such taxes is uncertain.
Class Allocations and Expenses. Investment income, realized and unrealized capital gains and losses, common expenses of the Fund, and certain fund-level expense reductions, if any, are allocated daily on a pro-rata basis to each class based on the relative net assets of each class to the total net assets of the Fund. Each class differs with respect to transfer agent fees incurred. Certain expense reductions may also differ by class. For the reporting period, the allocated portion of income and expenses to each class as a percent
Annual Report
3. Significant Accounting Policies - continued
Class Allocations and Expenses - continued
of its average net assets may vary due to the timing of recording these transactions in relation to fluctuating net assets of the classes. Expenses directly attributable to a fund are charged to that fund. Expenses attributable to more than one fund are allocated among the respective funds on the basis of relative net assets or other appropriate methods. Expense estimates are accrued in the period to which they relate and adjustments are made when actual amounts are known.
Deferred Trustee Compensation. Under a Deferred Compensation Plan (the Plan), independent Trustees may elect to defer receipt of a portion of their annual compensation. Deferred amounts are invested in a cross-section of Fidelity funds, are marked-to-market and remain in the Fund until distributed in accordance with the Plan. The investment of deferred amounts and the offsetting payable to the Trustees are included in the accompanying Statement of Assets and Liabilities.
Income Tax Information and Distributions to Shareholders. Each year, the Fund intends to qualify as a regulated investment company under Subchapter M of the Internal Revenue Code, including distributing substantially all of its taxable income and realized gains. As a result, no provision for U.S. Federal income taxes is required. As of August 31, 2014, the Fund did not have any unrecognized tax benefits in the financial statements; nor is the Fund aware of any tax positions for which it is reasonably possible that the total amounts of unrecognized tax benefits will significantly change in the next twelve months. The Fund files a U.S. federal tax return, in addition to state and local tax returns as required. The Fund's federal income tax returns are subject to examination by the Internal Revenue Service (IRS) for a period of three fiscal years after they are filed. State and local tax returns may be subject to examination for an additional fiscal year depending on the jurisdiction. Foreign taxes are provided for based on the Fund's understanding of the tax rules and rates that exist in the foreign markets in which it invests.
Distributions are declared and recorded on the ex-dividend date. Income dividends and capital gain distributions are declared separately for each class. Income and capital gain distributions are determined in accordance with income tax regulations, which may differ from GAAP. In addition, the Fund claimed a portion of the payment made to redeeming shareholders as a distribution for income tax purposes.
Capital accounts within the financial statements are adjusted for permanent book-tax differences. These adjustments have no impact on net assets or the results of operations. Capital accounts are not adjusted for temporary book-tax differences which will reverse in a subsequent period.
Annual Report
Notes to Financial Statements - continued
(Amounts in thousands except percentages)
3. Significant Accounting Policies - continued
Income Tax Information and Distributions to Shareholders - continued
Book-tax differences are primarily due to futures contracts, swap agreements, foreign currency transactions, passive foreign investment companies (PFIC), market discount, partnerships (including allocations from Fidelity Central Funds), deferred trustees compensation, and losses deferred due to wash sales.
The federal tax cost of investment securities and unrealized appreciation (depreciation) as of period end were as follows:
Gross unrealized appreciation | $ 5,219,190 |
Gross unrealized depreciation | (199,524) |
Net unrealized appreciation (depreciation) on securities | $ 5,019,666 |
| |
Tax Cost | $ 22,494,598 |
The tax-based components of distributable earnings as of period end were as follows:
Undistributed ordinary income | $ 589,943 |
Undistributed long-term capital gain | $ 1,048,100 |
Net unrealized appreciation (depreciation) on securities and other investments | $ 5,019,368 |
The tax character of distributions paid was as follows:
| August 31, 2014 | August 31, 2013 |
Ordinary Income | $ 496,048 | $ 352,712 |
Long-term Capital Gains | 1,095,807 | - |
Total | $ 1,591,855 | $ 352,712 |
Delayed Delivery Transactions and When-Issued Securities. During the period, the Fund transacted in securities on a delayed delivery or when-issued basis. Payment and delivery may take place after the customary settlement period for that security. The price of the underlying securities and the date when the securities will be delivered and paid for are fixed at the time the transaction is negotiated. The securities purchased on a delayed delivery or when-issued basis are identified as such in the Fund's Schedule of Investments. The Fund may receive compensation for interest forgone in the purchase of
Annual Report
3. Significant Accounting Policies - continued
Delayed Delivery Transactions and When-Issued Securities - continued
a delayed delivery or when-issued security. With respect to purchase commitments, the Fund identifies securities as segregated in its records with a value at least equal to the amount of the commitment. Losses may arise due to changes in the value of the underlying securities or if the counterparty does not perform under the contract's terms, or if the issuer does not issue the securities due to political, economic, or other factors.
To-Be-Announced (TBA) Securities and Mortgage Dollar Rolls. During the period, the Fund transacted in TBA securities that involved buying or selling mortgage-backed securities (MBS) on a forward commitment basis. A TBA transaction typically does not designate the actual security to be delivered and only includes an approximate principal amount; however delivered securities must meet specified terms defined by industry guidelines, including issuer, rate and current principal amount outstanding on underlying mortgage pools. The Fund may enter into a TBA transaction with the intent to take possession of or deliver the underlying MBS, or the Fund may elect to extend the settlement by entering into either a mortgage or reverse mortgage dollar roll. Mortgage dollar rolls are transactions where a fund sells TBA securities and simultaneously agrees to repurchase MBS on a later date at a lower price and with the same counterparty. Reverse mortgage dollar rolls involve the purchase and simultaneous agreement to sell TBA securities on a later date at a lower price. Transactions in mortgage dollar rolls and reverse mortgage dollar rolls are accounted for as purchases and sales and may result in an increase to the Fund's portfolio turnover rate.
Purchases and sales of TBA securities involve risks similar to those discussed above for delayed delivery and when-issued securities. Also, if the counterparty in a mortgage dollar roll or a reverse mortgage dollar roll transaction files for bankruptcy or becomes insolvent, the Fund's right to repurchase or sell securities may be limited. Additionally, when a fund sells TBA securities without already owning or having the right to obtain the deliverable securities (an uncovered forward commitment to sell), it incurs a risk of loss because it could have to purchase the securities at a price that is higher than the price at which it sold them. A fund may be unable to purchase the deliverable securities if the corresponding market is illiquid.
TBA securities subject to a forward commitment to sell at period end are included at the end of the Fund's Schedule of Investments under the caption "TBA Sale Commitments." The proceeds and value of these commitments are reflected in the Fund's Statement of Assets and Liabilities as Receivable for TBA sale commitments and TBA sale commitments, at value, respectively.
Annual Report
Notes to Financial Statements - continued
(Amounts in thousands except percentages)
3. Significant Accounting Policies - continued
Restricted Securities. The Fund may invest in securities that are subject to legal or contractual restrictions on resale. These securities generally may be resold in transactions exempt from registration or to the public if the securities are registered. Disposal of these securities may involve time-consuming negotiations and expense, and prompt sale at an acceptable price may be difficult. Information regarding restricted securities is included at the end of the Fund's Schedule of Investments.
4. Derivative Instruments.
Risk Exposures and the Use of Derivative Instruments. The Fund's investment objective allows the Fund to enter into various types of derivative contracts, including futures contracts and swaps. Derivatives are investments whose value is primarily derived from underlying assets, indices or reference rates and may be transacted on an exchange or over-the-counter (OTC). Derivatives may involve a future commitment to buy or sell a specified asset based on specified terms, to exchange future cash flows at periodic intervals based on a notional principal amount, or for one party to make one or more payments upon the occurrence of specified events in exchange for periodic payments from the other party.
The Fund used derivatives to increase returns, to gain exposure to certain types of assets and to manage exposure to certain risks as defined below. The success of any strategy involving derivatives depends on analysis of numerous economic factors, and if the strategies for investment do not work as intended, the Fund may not achieve its objectives.
The Fund's use of derivatives increased or decreased its exposure to the following risks:
Credit Risk | Credit risk relates to the ability of the issuer of a financial instrument to make further principal or interest payments on an obligation or commitment that it has to the Fund. |
Equity Risk | Equity risk relates to the fluctuations in the value of financial instruments as a result of changes in market prices (other than those arising from interest rate risk or foreign exchange risk), whether caused by factors specific to an individual investment, its issuer, or all factors affecting all instruments traded in a market or market segment. |
Interest Rate Risk | Interest rate risk relates to the fluctuations in the value of interest-bearing securities due to changes in the prevailing levels of market interest rates. |
Annual Report
4. Derivative Instruments - continued
Risk Exposures and the Use of Derivative Instruments - continued
The Fund is also exposed to additional risks from investing in derivatives, such as liquidity risk and counterparty credit risk. Liquidity risk is the risk that the Fund will be unable to close out the derivative in the open market in a timely manner. Counterparty credit risk is the risk that the counterparty will not be able to fulfill its obligation to the Fund. Derivative counterparty credit risk is managed through formal evaluation of the creditworthiness of all potential counterparties. On certain OTC derivatives such as bi-lateral swaps, the Fund attempts to reduce its exposure to counterparty credit risk by entering into an International Swaps and Derivatives Association, Inc. (ISDA) Master Agreement with each of its counterparties. The ISDA Master Agreement gives the Fund the right to terminate all transactions traded under such agreement upon the deterioration in the credit quality of the counterparty beyond specified levels. The ISDA Master Agreement gives each party the right, upon an event of default by the other party or a termination of the agreement, to close out all transactions traded under such agreement and to net amounts owed under each transaction to one net payable by one party to the other. To mitigate counterparty credit risk on bi-lateral OTC derivatives, the Fund receives collateral in the form of cash or securities once the Fund's net unrealized appreciation on outstanding derivative contracts under an ISDA Master Agreement exceeds certain applicable thresholds, subject to certain minimum transfer provisions. The collateral received is held in segregated accounts with the Fund's custodian bank in accordance with the collateral agreements entered into between the Fund, the counterparty and the Fund's custodian bank. The Fund could experience delays and costs in gaining access to the collateral even though it is held by the Fund's custodian bank. The Fund's maximum risk of loss from counterparty credit risk related to bi-lateral OTC derivatives is generally the aggregate unrealized appreciation and unpaid counterparty payments in excess of any collateral pledged by the counterparty to the Fund. The Fund may be required to pledge collateral for the benefit of the counterparties on bi-lateral OTC derivatives in an amount not less than each counterparty's unrealized appreciation on outstanding derivative contracts, subject to certain minimum transfer provisions, and any such pledged collateral is identified in the Schedule of Investments. Exchange-traded futures contracts are not covered by the ISDA Master Agreement; however counterparty credit risk related to exchange-traded futures contracts may be mitigated by the protection provided by the exchange on which they trade.
Investing in derivatives may involve greater risks than investing in the underlying assets directly and, to varying degrees, may involve risk of loss in excess of any initial investment and collateral received and amounts recognized in the Statement of Assets and Liabilities. In addition, there may be the risk that the change in value of the derivative contract does not correspond to the change in value of the underlying instrument.
Annual Report
Notes to Financial Statements - continued
(Amounts in thousands except percentages)
4. Derivative Instruments - continued
Net Realized Gain (Loss) and Change in Net Unrealized Appreciation (Depreciation) on Derivatives. The table below, which reflects the impacts of derivatives on the financial performance of the Fund, summarizes the net realized gain (loss) and change in net unrealized appreciation (depreciation) for derivatives during the period as presented in the Statement of Operations.
Primary Risk Exposure / Derivative Type | Net Realized Gain (Loss) | Change in Net Unrealized Appreciation (Depreciation) |
Credit Risk | | |
Swaps | $ (8,292) | $ 9,889 |
Equity Risk | | |
Futures Contracts | 33,030 | 5,307 |
Interest Rate Risk | | |
Futures Contracts | 1,037 | (139) |
Totals (a) | $ 25,775 | $ 15,057 |
(a) A summary of the value of derivatives by primary risk exposure as of period end is included at the end of the Schedule of Investments.
Futures Contracts. A futures contract is an agreement between two parties to buy or sell a specified underlying instrument for a fixed price at a specified future date. The Fund used futures contracts to manage its exposure to the stock market, bond market and fluctuations in interest rates.
Upon entering into a futures contract, a fund is required to deposit either cash or securities (initial margin) with a clearing broker in an amount equal to a certain percentage of the face value of the contract. Futures contracts are marked-to-market daily and subsequent daily payments (variation margin) are made or received by a fund depending on the daily fluctuations in the value of the futures contracts and are recorded as unrealized appreciation or (depreciation). This receivable and/or payable, if any, is included in daily variation margin for derivative instruments in the Statement of Assets and Liabilities. Realized gain or (loss) is recorded upon the expiration or closing of a futures contract. The net realized gain (loss) and change in net unrealized appreciation (depreciation) on futures contracts during the period is included in the Statement of Operations.
Any open futures contracts at period end are presented in the Schedule of Investments under the caption "Futures Contracts." The underlying face amount at value reflects each contract's exposure to the underlying instrument or index at period end and is representative of volume of activity during the period. Securities deposited to meet initial margin requirements are identified in the Schedule of Investments.
Annual Report
4. Derivative Instruments - continued
Swaps. A swap is a contract between two parties to exchange future cash flows at periodic intervals based on a notional principal amount. A bi-lateral OTC swap is a transaction between a fund and a dealer counterparty where cash flows are exchanged between the two parties for the life of the swap.
Bi-lateral OTC swaps are marked-to-market daily and changes in value are reflected in the Statement of Assets and Liabilities in the bi-lateral OTC swaps at value line items. Any upfront premiums paid or received upon entering a bi-lateral OTC swap to compensate for differences between stated terms of the swap and prevailing market conditions (e.g. credit spreads, interest rates or other factors) are recorded in net unrealized appreciation (depreciation) in the Statement of Assets and Liabilities and amortized to realized gain or (loss) ratably over the term of the swap. Any unamortized upfront premiums are presented in the Schedule of Investments.
Payments are exchanged at specified intervals, accrued daily commencing with the effective date of the contract and recorded as realized gain or (loss). Some swaps may be terminated prior to the effective date and realize a gain or loss upon termination. The net realized gain (loss) and change in net unrealized appreciation (depreciation) on swaps during the period is included in the Statement of Operations.
Any open swaps at period end are included in the Schedule of Investments under the caption "Swaps" and are representative of volume of activity during the period.
Credit Default Swaps. Credit default swaps enable the Fund to buy or sell protection against specified credit events on a single-name issuer or a traded credit index. Under the terms of a credit default swap the buyer of protection (buyer) receives credit protection in exchange for making periodic payments to the seller of protection (seller) based on a fixed percentage applied to a notional principal amount. In return for these payments, the seller will be required to make a payment upon the occurrence of one or more specified credit events. The Fund enters into credit default swaps as a seller to gain credit exposure to an issuer and/or as a buyer to obtain a measure of protection against defaults of an issuer. Periodic payments are made over the life of the contract by the buyer provided that no credit event occurs.
For credit default swaps on most corporate and sovereign issuers, credit events include bankruptcy, failure to pay or repudiation/moratorium. For credit default swaps on corporate or sovereign issuers, the obligation that may be put to the seller is not limited to the specific reference obligation described in the Schedule of Investments. For credit default swaps on asset-backed securities, a credit event may be triggered by events such as failure to pay principal, maturity extension, rating downgrade or write-down. For credit default swaps on asset-backed securities, the reference obligation described
Annual Report
Notes to Financial Statements - continued
(Amounts in thousands except percentages)
4. Derivative Instruments - continued
Credit Default Swaps - continued
represents the security that may be put to the seller. For credit default swaps on a traded credit index, a specified credit event may affect all or individual underlying securities included in the index.
As a seller, if an underlying credit event occurs, the Fund will pay a net settlement amount of cash equal to the notional amount of the swap less the recovery value of the reference obligation or underlying securities comprising an index. Only in the event of the industry's inability to value the underlying asset will the Fund be required to take delivery of the reference obligation or underlying securities comprising an index and pay an amount equal to the notional amount of the swap.
As a buyer, if an underlying credit event occurs, the Fund will receive a net settlement amount of cash equal to the notional amount of the swap less the recovery value of the reference obligation or underlying securities comprising an index. Only in the event of the industry's inability to value the underlying asset will the Fund be required to deliver the reference obligation or underlying securities comprising an index in exchange for payment of an amount equal to the notional amount of the swap.
Typically, the value of each credit default swap and credit rating disclosed for each reference obligation in the Schedule of Investments, where the Fund is the seller, can be used as measures of the current payment/performance risk of the swap. As the value of the swap changes as a positive or negative percentage of the total notional amount, the payment/performance risk may decrease or increase, respectively. In addition to these measures, the investment adviser monitors a variety of factors including cash flow assumptions, market activity and market sentiment as part of its ongoing process of assessing payment/performance risk.
5. Purchases and Sales of Investments.
Purchases and sales of securities (including the Fixed-Income Central Funds), other than short-term securities and U.S. government securities, aggregated $15,280,351 and $14,825,305, respectively.
6. Fees and Other Transactions with Affiliates.
Management Fee. Fidelity Management & Research Company (the investment adviser) and its affiliates provide the Fund with investment management related services for which the Fund pays a monthly management fee. The management fee is the sum of an individual fund fee rate that is based on an annual rate of .15% of the Fund's average net assets and an annualized group fee rate that averaged .25% during the
Annual Report
6. Fees and Other Transactions with Affiliates - continued
Management Fee - continued
period. The group fee rate is based upon the average net assets of all the mutual funds advised by the investment adviser, including any mutual funds previously advised by the investment adviser that are currently advised by Fidelity SelectCo, LLC, an affiliate of the investment adviser. The group fee rate decreases as assets under management increase and increases as assets under management decrease. For the reporting period, the total annual management fee rate was .40% of the Fund's average net assets.
Transfer Agent Fees. Fidelity Investments Institutional Operations Company, Inc., (FIIOC), an affiliate of the investment adviser, is the transfer, dividend disbursing and shareholder servicing agent for each class of the Fund. FIIOC receives account fees and asset-based fees that vary according to the account size and type of account of the shareholders of Balanced. FIIOC receives an asset-based fee of Class K's average net assets. FIIOC pays for typesetting, printing and mailing of shareholder reports, except proxy statements.
For the period, transfer agent fees for each class were as follows:
| Amount | % of
Average
Net Assets |
Balanced | $ 26,694 | .15 |
Class K | 3,191 | .05 |
| $ 29,885 | |
Accounting and Security Lending Fees. Fidelity Service Company, Inc. (FSC), an affiliate of the investment adviser, maintains the Fund's accounting records. The accounting fee is based on the level of average net assets for each month. Under a separate contract, FSC administers the security lending program. The security lending fee is based on the number and duration of lending transactions.
Brokerage Commissions. The Fund placed a portion of its portfolio transactions with brokerage firms which are affiliates of the investment adviser. Brokerage commissions are included in net realized gain (loss) and change in net unrealized appreciation (depreciation) in the Statement of Operations. The commissions paid to these affiliated firms were $216 for the period.
Other. During the period, the investment adviser reimbursed the Fund for certain losses in the amount of $3.
Annual Report
Notes to Financial Statements - continued
(Amounts in thousands except percentages)
7. Committed Line of Credit.
The Fund participates with other funds managed by the investment adviser or an affiliate in a $4.25 billion credit facility (the "line of credit") to be utilized for temporary or emergency purposes to fund shareholder redemptions or for other short-term liquidity purposes. The Fund has agreed to pay commitment fees on its pro-rata portion of the line of credit, which amounted to $42 and is reflected in Miscellaneous expenses on the Statement of Operations. During the period, the Fund did not borrow on this line of credit.
8. Security Lending.
The Fund lends portfolio securities from time to time in order to earn additional income. For equity securities, a lending agent is used and may loan securities to certain qualified borrowers, including Fidelity Capital Markets (FCM), a broker-dealer affiliated with the Fund. On the settlement date of the loan, the Fund receives collateral (in the form of U.S. Treasury obligations, letters of credit and/or cash) against the loaned securities and maintains collateral in an amount not less than 100% of the market value of the loaned securities during the period of the loan. The market value of the loaned securities is determined at the close of business of the Fund and any additional required collateral is delivered to the Fund on the next business day. If the borrower defaults on its obligation to return the securities loaned because of insolvency or other reasons, the Fund may apply collateral received from the borrower against the obligation. The Fund may experience delays and costs in recovering the securities loaned. Any cash collateral received is maintained at the Fund's custodian and/or invested in cash equivalents and/or the Fidelity Securities Lending Cash Central Fund. The value of loaned securities and cash collateral at period end are disclosed on the Fund's Statement of Assets and Liabilities. The value of securities loaned to FCM at period end was $7,336. Security lending income represents the income earned on investing cash collateral, less rebates paid to borrowers, plus any premium payments received for lending certain types of securities. Total security lending income during the period, presented in the Statement of Operations as a component of interest income, amounted to $678. Net income from the Fidelity Securities Lending Cash Central Fund during the period, presented in the Statement of Operations as a component of income from Fidelity Central Funds, amounted to $876 (including $41 from securities loaned to FCM).
9. Expense Reductions.
Commissions paid to certain brokers with whom the investment adviser, or its affiliates, places trades on behalf of the Fund include an amount in addition to trade execution, which may be rebated back to the Fund to offset certain expenses. This amount totaled $551 for the period.
In addition, the investment adviser reimbursed a portion of the Fund's operating expenses during the period in the amount of $121.
Annual Report
10. Distributions to Shareholders.
Distributions to shareholders of each class were as follows:
Years ended August 31, | 2014 | 2013 |
From net investment income | | |
Balanced | $ 293,979 | $ 249,039 |
Class K | 118,456 | 103,673 |
Total | $ 412,435 | $ 352,712 |
From net realized gain | | |
Balanced | $ 854,324 | $ - |
Class K | 325,096 | - |
Total | $ 1,179,420 | $ - |
11. Share Transactions.
Transactions for each class of shares were as follows:
| Shares | Dollars |
Years ended August 31, | 2014 | 2013 | 2014 | 2013 |
Balanced | | | | |
Shares sold | 131,812 | 125,541 | $ 3,033,218 | $ 2,652,879 |
Reinvestment of distributions | 49,953 | 11,563 | 1,102,403 | 238,686 |
Shares redeemed | (127,309) | (141,860) | (2,927,201) | (2,965,223) |
Net increase (decrease) | 54,456 | (4,756) | $ 1,208,420 | $ (73,658) |
Class K | | | | |
Shares sold | 59,821 | 69,664 | $ 1,378,995 | $ 1,451,163 |
Reinvestment of distributions | 20,098 | 5,019 | 443,552 | 103,673 |
Shares redeemed | (67,456) | (65,784) | (1,551,323) | (1,381,546) |
Net increase (decrease) | 12,463 | 8,899 | $ 271,224 | $ 173,290 |
12. Other.
The Fund's organizational documents provide former and current trustees and officers with a limited indemnification against liabilities arising in connection with the performance of their duties to the Fund. In the normal course of business, the Fund may also enter into contracts that provide general indemnifications. The Fund's maximum exposure under these arrangements is unknown as this would be dependent on future claims that may be made against the Fund. The risk of material loss from such claims is considered remote.
Annual Report
To the Trustees of Fidelity Puritan Trust and the Shareholders of Fidelity Balanced Fund:
In our opinion, the accompanying statement of assets and liabilities, including the schedule of investments, and the related statements of operations and of changes in net assets and the financial highlights present fairly, in all material respects, the financial position of Fidelity Balanced Fund (a fund of Fidelity Puritan Trust) at August 31, 2014, the results of its operations for the year then ended, the changes in its net assets for each of the two years in the period then ended and the financial highlights for each of the five years in the period then ended, in conformity with accounting principles generally accepted in the United States of America. These financial statements and financial highlights (hereafter referred to as "financial statements") are the responsibility of the Fidelity Balanced Fund's management. Our responsibility is to express an opinion on these financial statements based on our audits. We conducted our audits of these financial statements in accordance with the standards of the Public Company Accounting Oversight Board (United States). Those standards require that we plan and perform the audit to obtain reasonable assurance about whether the financial statements are free of material misstatement. An audit includes examining, on a test basis, evidence supporting the amounts and disclosures in the financial statements, assessing the accounting principles used and significant estimates made by management, and evaluating the overall financial statement presentation. We believe that our audits, which included confirmation of securities at August 31, 2014 by correspondence with the custodian and brokers, provide a reasonable basis for our opinion.
PricewaterhouseCoopers LLP
Boston, Massachusetts
October 21, 2014
Annual Report
The Trustees, Member of the Advisory Board, and officers of the trust and fund, as applicable, are listed below. The Board of Trustees governs the fund and is responsible for protecting the interests of shareholders. The Trustees are experienced executives who meet periodically throughout the year to oversee the fund's activities, review contractual arrangements with companies that provide services to the fund, oversee management of the risks associated with such activities and contractual arrangements, and review the fund's performance. Except for James C. Curvey, each of the Trustees oversees 173 funds. Mr. Curvey oversees 406 funds.
The Trustees hold office without limit in time except that (a) any Trustee may resign; (b) any Trustee may be removed by written instrument, signed by at least two-thirds of the number of Trustees prior to such removal; (c) any Trustee who requests to be retired or who has become incapacitated by illness or injury may be retired by written instrument signed by a majority of the other Trustees; and (d) any Trustee may be removed at any special meeting of shareholders by a two-thirds vote of the outstanding voting securities of the trust. Each Trustee who is not an interested person (as defined in the 1940 Act) of the trust and the fund (Independent Trustee), shall retire not later than the last day of the calendar year in which his or her 75th birthday occurs. The Independent Trustees may waive this mandatory retirement age policy with respect to individual Trustees. The officers and Advisory Board Member hold office without limit in time, except that any officer and Advisory Board Member may resign or may be removed by a vote of a majority of the Trustees at any regular meeting or any special meeting of the Trustees. Except as indicated, each individual has held the office shown or other offices in the same company for the past five years.
Experience, Skills, Attributes, and Qualifications of the Fund's Trustees. The Governance and Nominating Committee has adopted a statement of policy that describes the experience, qualifications, attributes, and skills that are necessary and desirable for potential Independent Trustee candidates (Statement of Policy). The Board believes that each Trustee satisfied at the time he or she was initially elected or appointed a Trustee, and continues to satisfy, the standards contemplated by the Statement of Policy. The Governance and Nominating Committee also engages professional search firms to help identify potential Independent Trustee candidates who have the experience, qualifications, attributes, and skills consistent with the Statement of Policy. From time to time, additional criteria based on the composition and skills of the current Independent Trustees, as well as experience or skills that may be appropriate in light of future changes to board composition, business conditions, and regulatory or other developments, have also been considered by the professional search firms and the Governance and Nominating Committee. In addition, the Board takes into account the Trustees' commitment and participation in Board and committee meetings, as well as their leadership of standing and ad hoc committees throughout their tenure.
In determining that a particular Trustee was and continues to be qualified to serve as a Trustee, the Board has considered a variety of criteria, none of which, in isolation, was controlling. The Board believes that, collectively, the Trustees have balanced and diverse experience, qualifications, attributes, and skills, which allow the Board to operate effectively in governing the fund and protecting the interests of shareholders. Information about the specific experience, skills, attributes, and qualifications of each Trustee, which in each case led to the Board's conclusion that the Trustee should serve (or continue to serve) as a trustee of the fund, is provided below.
Annual Report
Trustees and Officers - continued
Board Structure and Oversight Function. James C. Curvey is an interested person (as defined in the 1940 Act) and currently serves as Chairman. The Trustees have determined that an interested Chairman is appropriate and benefits shareholders because an interested Chairman has a personal and professional stake in the quality and continuity of services provided to the fund. Independent Trustees exercise their informed business judgment to appoint an individual of their choosing to serve as Chairman, regardless of whether the Trustee happens to be independent or a member of management. The Independent Trustees have determined that they can act independently and effectively without having an Independent Trustee serve as Chairman and that a key structural component for assuring that they are in a position to do so is for the Independent Trustees to constitute a substantial majority for the Board. The Independent Trustees also regularly meet in executive session. Ned C. Lautenbach serves as Chairman of the Independent Trustees and as such (i) acts as a liaison between the Independent Trustees and management with respect to matters important to the Independent Trustees and (ii) with management prepares agendas for Board meetings.
Fidelity funds are overseen by different Boards of Trustees. The fund's Board oversees Fidelity's equity and high income funds and another Board oversees Fidelity's investment-grade bond, money market, and asset allocation funds. The asset allocation funds may invest in Fidelity funds overseen by the fund's Board. The use of separate Boards, each with its own committee structure, allows the Trustees of each group of Fidelity funds to focus on the unique issues of the funds they oversee, including common research, investment, and operational issues. On occasion, the separate Boards establish joint committees to address issues of overlapping consequences for the Fidelity funds overseen by each Board.
The Trustees operate using a system of committees to facilitate the timely and efficient consideration of all matters of importance to the Trustees, the fund, and fund shareholders and to facilitate compliance with legal and regulatory requirements and oversight of the fund's activities and associated risks. The Board, acting through its committees, has charged FMR and its affiliates with (i) identifying events or circumstances the occurrence of which could have demonstrably adverse effects on the fund's business and/or reputation; (ii) implementing processes and controls to lessen the possibility that such events or circumstances occur or to mitigate the effects of such events or circumstances if they do occur; and (iii) creating and maintaining a system designed to evaluate continuously business and market conditions in order to facilitate the identification and implementation processes described in (i) and (ii) above. Because the day-to-day operations and activities of the fund are carried out by or through FMR, its affiliates and other service providers, the fund's exposure to risks is mitigated but not eliminated by the processes overseen by the Trustees. While each of the Board's committees has responsibility for overseeing different aspects of the fund's activities, oversight is exercised primarily through the Operations, Audit, and Compliance Committees. In addition, the Independent Trustees have worked with FMR to enhance the Board's oversight of investment and financial risks, legal and regulatory risks, technology risks, and operational risks, including the development of additional risk reporting to the Board. For example, a working group comprised of Independent Trustees and FMR has worked and continues to work to review the Fidelity funds' valuation-related activities, reporting and risk management. Appropriate personnel, including but not limited to the fund's Chief Compliance Officer (CCO), FMR's internal auditor, the independent accountants, the fund's Treasurer and portfolio management personnel, make periodic reports to the Board's committees, as appropriate, including an annual review of FMR's risk management program for the Fidelity funds. The responsibilities of each standing committee, including their oversight responsibilities, are described further under "Standing Committees of the Fund's Trustees."
Annual Report
The fund's Statement of Additional Information (SAI) includes more information about the Trustees. To request a free copy, call Fidelity at 1-800-835-5092.
Interested Trustees*:
Correspondence intended for each Trustee who is an interested person may be sent to Fidelity Investments, 245 Summer Street, Boston, Massachusetts 02210.
Name, Year of Birth; Principal Occupations and Other Relevant Experience+ |
James C. Curvey (1935) |
Year of Election or Appointment: 2007 Trustee Chairman of the Board of Trustees |
| Mr. Curvey also serves as Trustee of other Fidelity funds. Mr. Curvey is a Director of Fidelity Research & Analysis Co. (2009-present), and Vice Chairman (2007-present) and Director of FMR LLC. In addition, Mr. Curvey serves as an Overseer for the Boston Symphony Orchestra and a member of the Trustees of Villanova University. Previously, Mr. Curvey served as a Director of Fidelity Investments Money Management, Inc. (2009-2014), a Director of FMR (2007-2014), a Director of FMR Co., Inc. (2007-2014) and was the Vice Chairman (2006-2007) and Director (2000-2007) of FMR Corp. |
Charles S. Morrison (1960) |
Year of Election or Appointment: 2014 Trustee |
| Mr. Morrison also serves as Trustee of other funds. He serves as President, Asset Management (2014-present) and is an employee of Fidelity Investments. Previously, Mr. Morrison served as Vice President of Fidelity's Fixed Income and Asset Allocation Funds (2012-2014), President, Fixed Income (2011-2014), Vice President of Fidelity's Money Market Funds (2005-2009), President, Money Market Group Leader of FMR (2009), and Senior Vice President, Money Market Group of FMR (2004-2009). Mr. Morrison also served as Vice President of Fidelity's Bond Funds (2002-2005), certain Balanced Funds (2002-2005), and certain Asset Allocation Funds (2002-2007), and as Senior Vice President (2002-2005) of Fidelity's Bond Division. |
* Trustees have been determined to be "Interested Trustees" by virtue of, among other things, their affiliation with the trust or various entities under common control with FMR.
+ The information above includes each Trustee's principal occupation during the last five years and other information relating to the experience, attributes, and skills relevant to each Trustee's qualifications to serve as a Trustee, which led to the conclusion that each Trustee should serve as a Trustee for the fund.
Annual Report
Independent Trustees:
Correspondence intended for each Independent Trustee (that is, the Trustees other than the Interested Trustees) may be sent to Fidelity Investments, P.O. Box 55235, Boston, Massachusetts 02205-5235.
Name, Year of Birth; Principal Occupations and Other Relevant Experience+ |
Dennis J. Dirks (1948) |
Year of Election or Appointment: 2005 Trustee |
| Mr. Dirks also serves as Trustee of other Fidelity funds. Prior to his retirement in May 2003, Mr. Dirks was Chief Operating Officer and a member of the Board of The Depository Trust & Clearing Corporation (DTCC). He also served as President, Chief Operating Officer, and Board member of The Depository Trust Company (DTC) and President and Board member of the National Securities Clearing Corporation (NSCC). In addition, Mr. Dirks served as Chief Executive Officer and Board member of the Government Securities Clearing Corporation, Chief Executive Officer and Board member of the Mortgage-Backed Securities Clearing Corporation, as a Trustee and a member of the Finance Committee of Manhattan College (2005-2008), and as a Trustee and a member of the Finance Committee of AHRC of Nassau County (2006-2008). Mr. Dirks is a member of the Independent Directors Council (IDC) Governing Council (2010-present) and Board of Directors for The Brookville Center for Children's Services, Inc. (2009-present). |
Alan J. Lacy (1953) |
Year of Election or Appointment: 2008 Trustee |
| Mr. Lacy also serves as Trustee of other Fidelity funds. Mr. Lacy serves as Senior Adviser (2007-present) of Oak Hill Capital Partners, L.P. (private equity). Mr. Lacy also served as Chief Executive Officer (2000-2005) and Vice Chairman (2005-2006) of Sears Holdings Corporation and Sears, Roebuck and Co. (retail). In addition, Mr. Lacy serves as a member of the Board of Directors of Dave & Buster's Entertainment, Inc. (restaurant and entertainment complexes, 2010-present), Earth Fare, Inc. (retail grocery, 2012-present), The Hillman Companies, Inc. (hardware wholesalers, 2010-present), and Bristol-Myers Squibb Company (global pharmaceuticals, 2008-present). Mr. Lacy is a member of the Board of Trustees of The National Parks Conservation Association (2006-present). Previously, Mr. Lacy served as Chairman of the Board of Trustees of the National Parks Conservation Association (2008-2011) and as a member of the Board of Directors for the Western Union Company (global money transfer, 2006-2011). |
Ned C. Lautenbach (1944) |
Year of Election or Appointment: 2000 Trustee Chairman of the Independent Trustees |
| Mr. Lautenbach also serves as Trustee of other Fidelity funds. Mr. Lautenbach currently serves as the Lead Director of the Eaton Corporation Board of Directors (diversified industrial, 1997-present). Mr. Lautenbach is Chairman of the Board of Directors of the Philharmonic Center for the Arts in Naples, Florida (2012-present) and a member of the Council on Foreign Relations (1994-present). Previously, Mr. Lautenbach was a Partner/Advisory Partner at Clayton, Dubilier & Rice, LLC (private equity investment, 1998-2010), as well as a Director of Sony Corporation (2006-2007). |
Joseph Mauriello (1944) |
Year of Election or Appointment: 2008 Trustee |
| Mr. Mauriello also serves as Trustee of other Fidelity funds. Prior to his retirement in January 2006, Mr. Mauriello served in numerous senior management positions including Deputy Chairman and Chief Operating Officer (2004-2005), and Vice Chairman of Financial Services (2002-2004) of KPMG LLP US (professional services, 1965-2005). Mr. Mauriello currently serves as a member of the Board of Directors of XL Group plc. (global insurance and re-insurance, 2006-present). Previously, Mr. Mauriello served as a Director of the Hamilton Funds of the Bank of New York (2006-2007) and of Arcadia Resources Inc. (health care services and products, 2007-2012). |
Robert W. Selander (1950) |
Year of Election or Appointment: 2011 Trustee |
| Mr. Selander also serves as Trustee of other Fidelity funds. Previously, Mr. Selander served as a Member of the Advisory Board of other Fidelity funds (2011), and Executive Vice Chairman (2010), Chief Executive Officer (2009-2010), and President and Chief Executive Officer (1997-2009) of Mastercard, Inc. |
Cornelia M. Small (1944) |
Year of Election or Appointment: 2005 Trustee |
| Ms. Small also serves as Trustee of other Fidelity funds. Ms. Small is a member of the Board of Directors (2009-present) and Chair of the Investment Committee (2010-present) of the Teagle Foundation. Ms. Small also serves on the Investment Committee of the Berkshire Taconic Community Foundation (2008-present). Previously, Ms. Small served as Chairperson (2002-2008) and a member of the Investment Committee and Chairperson (2008-2012) and a member of the Board of Trustees of Smith College. In addition, Ms. Small served as Chief Investment Officer, Director of Global Equity Investments, and a member of the Board of Directors of Scudder, Stevens & Clark and Scudder Kemper Investments. |
William S. Stavropoulos (1939) |
Year of Election or Appointment: 2001 Trustee Vice Chairman of the Independent Trustees |
| Mr. Stavropoulos also serves as Trustee of other Fidelity funds. Mr. Stavropoulos serves as President and Founder of the Michigan Baseball Foundation, the Great Lakes Loons (2007-present). Mr. Stavropoulos is Chairman Emeritus of the Board of Directors of The Dow Chemical Company, where he previously served in numerous senior management positions, including President, CEO (1995-2000; 2002-2004), Chairman of the Executive Committee (2000-2006), and as a member of the Board of Directors (1990-2006). Currently, Mr. Stavropoulos is Chairman of the Board of Directors of Univar Inc. (global distributor of commodity and specialty chemicals), a Director of Teradata Corporation (data warehousing and technology solutions), and Maersk Inc. (industrial conglomerate), and a member of the Advisory Board for Metalmark Capital LLC (private equity investment, 2005-present). Mr. Stavropoulos is an operating advisor to Clayton, Dubilier & Rice, LLC (private equity investment). In addition, Mr. Stavropoulos is a member of the University of Notre Dame Advisory Council for the College of Science, a Trustee of the Rollin L. Gerstacker Foundation, and a Director of the Naples Philharmonic Center for the Arts. Previously, Mr. Stavropoulos served as a Director of Chemical Financial Corporation (bank holding company, 1993-2012) and Tyco International, Ltd. (multinational manufacturing and services, 2007-2012). |
David M. Thomas (1949) |
Year of Election or Appointment: 2008 Trustee |
| Mr. Thomas also serves as Trustee of other Fidelity funds. Mr. Thomas serves as Non-Executive Chairman of the Board of Directors of Fortune Brands Home and Security (home and security products, 2011-present), and as a member of the Board of Directors of Interpublic Group of Companies, Inc. (marketing communication, 2004-present). Previously, Mr. Thomas served as Executive Chairman (2005-2006) and Chairman and Chief Executive Officer (2000-2005) of IMS Health, Inc. (pharmaceutical and healthcare information solutions), and a Director of Fortune Brands, Inc. (consumer products, 2000-2011). |
+ The information above includes each Trustee's principal occupation during the last five years and other information relating to the experience, attributes, and skills relevant to each Trustee's qualifications to serve as a Trustee, which led to the conclusion that each Trustee should serve as a Trustee for the fund.
Advisory Board Member and Officers:
Correspondence intended for each officer and Peter S. Lynch may be sent to Fidelity Investments, 245 Summer Street, Boston, Massachusetts 02210. Officers appear below in alphabetical order.
Name, Year of Birth; Principal Occupation |
Peter S. Lynch (1944) |
Year of Election or Appointment: 2003 Member of the Advisory Board |
| Mr. Lynch also serves as Member of the Advisory Board of other Fidelity funds. Mr. Lynch is Vice Chairman and a Director of FMR and FMR Co., Inc. In addition, Mr. Lynch serves as a Trustee of Boston College and as the Chairman of the Inner-City Scholarship Fund. Previously, Mr. Lynch served on the Special Olympics International Board of Directors (1997-2006). |
Elizabeth Paige Baumann (1968) |
Year of Election or Appointment: 2012 Anti-Money Laundering (AML) Officer |
| Ms. Baumann also serves as AML Officer of other funds. She is Chief AML Officer of FMR LLC (2012-present) and is an employee of Fidelity Investments. Previously, Ms. Baumann served as Vice President and Deputy Anti-Money Laundering Officer (2007-2012). |
William C. Coffey (1969) |
Year of Election or Appointment: 2009 Assistant Secretary |
| Mr. Coffey also serves as Assistant Secretary of other funds. He is Senior Vice President and Deputy General Counsel of FMR LLC (2010-present), and is an employee of Fidelity Investments. Previously, Mr. Coffey served as Vice President and Associate General Counsel of FMR LLC (2005-2009). |
Jonathan Davis (1968) |
Year of Election or Appointment: 2010 Assistant Treasurer |
| Mr. Davis also serves as Assistant Treasurer of other funds. Mr. Davis is an employee of Fidelity Investments. Previously, Mr. Davis served as Vice President and Associate General Counsel of FMR LLC (2003-2010). |
Adrien E. Deberghes (1967) |
Year of Election or Appointment: 2008 Deputy Treasurer |
| Mr. Deberghes also serves as an officer of other funds. He is an employee of Fidelity Investments (2008-present). Prior to joining Fidelity Investments, Mr. Deberghes was Senior Vice President of Mutual Fund Administration at State Street Corporation (2007-2008), Senior Director of Mutual Fund Administration at Investors Bank & Trust (2005-2007), and Director of Finance for Dunkin' Brands (2000-2005). |
Stephanie J. Dorsey (1969) |
Year of Election or Appointment: 2010 Assistant Treasurer |
| Ms. Dorsey also serves as an officer of other funds. She is an employee of Fidelity Investments (2008-present) and has served in other fund officer roles. Prior to joining Fidelity Investments, Ms. Dorsey served as Treasurer (2004-2008) of the JPMorgan Mutual Funds and Vice President (2004-2008) of JPMorgan Chase Bank. |
Howard J. Galligan III (1966) |
Year of Election or Appointment: 2014 Chief Financial Officer |
| Mr. Galligan also serves as Chief Financial Officer of other funds. Mr. Galligan serves as President of Fidelity Pricing and Cash Management Services (FPCMS) (2014-present) and as a Director of Strategic Advisers, Inc. (2008-present). Previously, Mr. Galligan served as Chief Administrative Officer of Asset Management (2011-2014) and Chief Operating Officer and Senior Vice President of Investment Support for Strategic Advisers, Inc. (2003-2011). |
Scott C. Goebel (1968) |
Year of Election or Appointment: 2008 Secretary and Chief Legal Officer (CLO) |
| Mr. Goebel serves as Secretary and CLO of other funds. Mr. Goebel also serves as Secretary of Fidelity SelectCo, LLC (2013-present), Fidelity Investments Money Management, Inc. (FIMM) (2010-present) and Fidelity Research and Analysis Company (FRAC) (2010-present); General Counsel, Secretary, and Senior Vice President of FMR (2008-present) and FMR Co., Inc. (2008-present); Chief Legal Officer of Fidelity Management & Research (Hong Kong) Limited (2008-present); and Assistant Secretary of Fidelity Management & Research (Japan) Inc. (2008-present) and Fidelity Management & Research (U.K.) Inc. (2008-present). Previously, Mr. Goebel served as Secretary and CLO of other Fidelity funds (2008-2013), Assistant Secretary of FIMM (2008-2010), FRAC (2008-2010), and certain funds (2007-2008); and as Vice President and Secretary of Fidelity Distributors Corporation (FDC) (2005-2007). Mr. Goebel has been employed by FMR LLC or an affiliate since 2001. |
Brian B. Hogan (1964) |
Year of Election or Appointment: 2009 Vice President |
| Mr. Hogan also serves as Trustee or Vice President of other funds. Mr. Hogan serves as President of FMR's Equity Division (2009-present). Previously, Mr. Hogan served as Senior Vice President, Equity Research of FMR (2006-2009) and as a portfolio manager. |
Chris Maher (1972) |
Year of Election or Appointment: 2013 Assistant Treasurer |
| Mr. Maher serves as Assistant Treasurer of other funds. Mr. Maher is Vice President of Valuation Oversight and is an employee of Fidelity Investments. Previously, Mr. Maher served as Vice President of Asset Management Compliance (2013), Vice President of FMR's Program Management Group (2010-2013), and Vice President of Valuation Oversight (2008-2010). |
Melissa M. Reilly (1971) |
Year of Election or Appointment: 2014 Vice President of certain Equity Funds |
| Ms. Reilly also serves as Vice President of other funds. Ms. Reilly is an employee of Fidelity Investments (2004-present). |
Kenneth B. Robins (1969) |
Year of Election or Appointment: 2008 President and Treasurer |
| Mr. Robins also serves as an officer of other funds. Mr. Robins serves as Executive Vice President of Fidelity Investments Money Management, Inc. (FIMM) (2013-present) and is an employee of Fidelity Investments (2004-present). Previously, Mr. Robins served in other fund officer roles. |
Stephen Sadoski (1971) |
Year of Election or Appointment: 2012 Deputy Treasurer |
| Mr. Sadoski also serves as Deputy Treasurer of other funds. He is an employee of Fidelity Investments (2012-present) and has served in another fund officer role. Prior to joining Fidelity Investments, Mr. Sadoski served as an assistant chief accountant in the Division of Investment Management of the Securities and Exchange Commission (SEC) (2009-2012) and as a senior manager at Deloitte & Touche LLP (1997-2009). |
Stacie M. Smith (1974) |
Year of Election or Appointment: 2013 Deputy Treasurer |
| Ms. Smith also serves as an officer of other funds. She is an employee of Fidelity Investments (2009-present) and has served in other fund officer roles. Prior to joining Fidelity Investments, Ms. Smith served as Senior Audit Manager of Ernst & Young LLP (1996-2009). |
Renee Stagnone (1975) |
Year of Election or Appointment: 2013 Deputy Treasurer |
| Ms. Stagnone also serves as Deputy Treasurer of other funds. Ms. Stagnone is an employee of Fidelity Investments. |
Linda J. Wondrack (1964) |
Year of Election or Appointment: 2014 Chief Compliance Officer |
| Ms. Wondrack also serves as Chief Compliance Officer of other funds. Ms. Wondrack is Executive Vice President and head of the Ethics Office and Asset Management Compliance for Fidelity Investments (2012-present). Ms. Wondrack also serves as Chief Compliance Officer of Fidelity SelectCo, LLC (2014-present); Chief Compliance Officer of Impresa Management LLC (2013-present); and Chief Compliance Officer of FMR Co., Inc., Fidelity Investments Money Management, Inc., Fidelity Management & Research (Japan) Inc., Fidelity Management & Research (U.K.) Inc., Fidelity Management & Research (Hong Kong), Fidelity Management & Research Company, Pyramis Global Advisors, LLC, and Strategic Advisers, Inc., Ballyrock Investment Advisors LLC, and Northern Neck Investors LLC (2012-present). Previously, Ms. Wondrack served as Senior Vice President and Chief Compliance Officer for Columbia Management Investment Advisers, LLC (2005-2012); Chief Compliance Officer for certain funds within the Columbia Family of Funds (2007-2012); and Senior Vice President of Compliance Risk Management at Bank of America (2005-2010). |
Joseph F. Zambello (1957) |
Year of Election or Appointment: 2011 Deputy Treasurer |
| Mr. Zambello also serves as Deputy Treasurer of other funds. Mr. Zambello is an employee of Fidelity Investments. Previously, Mr. Zambello served as Vice President of FMR's Program Management Group (2009-2011) and Vice President of the Transfer Agent Oversight Group (2005-2009). |
Annual Report
The Board of Trustees of Fidelity Balanced Fund voted to pay to shareholders of record at the opening of business on record date, the following distributions per share derived from capital gains realized from sales of portfolio securities and a dividend derived from net investment income:
| Pay Date | Record Date | Dividends | Capital Gains |
Class K | 10/13/14 | 10/10/14 | $0.099 | $1.420 |
The fund hereby designates as a capital gain dividend with respect to the taxable year ended August 31, 2014, $1,266,885,376 or, if subsequently determined to be different, the net capital gain of such year.
A total of 2.53% of the dividends distributed during the fiscal year was derived from interest on U.S. Government securities which is generally exempt from state income tax.
The fund designates $136,007,095 of distributions paid during the period January 1, 2014 to August 31, 2014 as qualifying to be taxed as interest-related dividends for nonresident alien shareholders.
Class K designates 10%, 34%, 74% and 73% of the dividends distributed in October, December, April and July, respectively during the fiscal year as qualifying for the dividends-received deduction for corporate shareholders.
Class K designates 15%, 39%, 94% and 92% of the dividends distributed in October, December, April and July, respectively during the fiscal year as amounts which may be taken into account as a dividend for the purposes of the maximum rate under section 1(h)(11) of the Internal Revenue Code.
The fund will notify shareholders in January 2015 of amounts for use in preparing 2014 income tax returns.
Annual Report
Board Approval of Investment Advisory Contracts and Management Fees
Fidelity Balanced Fund
Each year, the Board of Trustees, including the Independent Trustees (together, the Board), votes on the renewal of the management contract with Fidelity Management & Research Company (FMR) and the sub-advisory agreements (together, the Advisory Contracts) for the fund. The Board, assisted by the advice of fund counsel and Independent Trustees' counsel, requests and considers a broad range of information relevant to the renewal of the Advisory Contracts throughout the year.
The Board meets regularly and, at each of its meetings, covers an extensive agenda of topics and materials and considers factors that are relevant to its annual consideration of the renewal of the fund's Advisory Contracts, including the services and support provided to the fund and its shareholders. The Board has established various standing committees (Committees), each composed of and chaired by Independent Trustees with varying backgrounds, to which the Board has assigned specific subject matter responsibilities in order to enhance effective decision-making by the Board. The Board, acting directly and through its Committees, requests and receives information concerning the annual consideration of the renewal of the fund's Advisory Contracts. The Board also meets as needed to consider matters specifically related to the Board's annual consideration of the renewal of the Advisory Contracts. Members of the Board may also meet with trustees of other Fidelity funds through ad hoc joint committees to discuss certain matters relevant to the Fidelity funds.
At its July 2014 meeting, the Board, including the Independent Trustees, unanimously determined to renew the fund's Advisory Contracts. In reaching its determination, the Board considered all factors it believed relevant, including (i) the nature, extent, and quality of the services to be provided to the fund and its shareholders (including the investment performance of the fund); (ii) the competitiveness of the fund's management fee and total expense ratio relative to peer funds; (iii) the total costs of the services to be provided by and the profits to be realized by Fidelity from its relationship with the fund; (iv) the extent to which economies of scale exist and would be realized as the fund grows; and (v) whether fee levels reflect these economies of scale, if any, for the benefit of fund shareholders. In connection with separate internal corporate reorganizations involving Fidelity Management & Research (U.K.) Inc. (FMR U.K.) and Fidelity Management & Research (Japan) Inc. (FMR Japan), the Board approved certain non-material amendments to the fund's sub-advisory agreements with FMR U.K. and FMR Japan to reflect that, after these reorganizations, FMR Investment Management (UK) Limited and Fidelity Management & Research (Japan) Limited will carry on the business of FMR U.K. and FMR Japan, respectively. The Board noted that no changes to the portfolio managers or to the foreign research or investment advisory services provided to the fund were expected in connection with either reorganization and that the same personnel and resources would continue to be available to the fund at the new entities.
Annual Report
In considering whether to renew the Advisory Contracts for the fund, the Board reached a determination, with the assistance of fund counsel and Independent Trustees' counsel and through the exercise of its business judgment, that the renewal of the Advisory Contracts was in the best interests of the fund and its shareholders and that the compensation payable under the Advisory Contracts was fair and reasonable. The Board's decision to renew the Advisory Contracts was not based on any single factor, but rather was based on a comprehensive consideration of all the information provided to the Board at its meetings throughout the year. The Board, in reaching its determination to renew the Advisory Contracts, was aware that shareholders of the fund have a broad range of investment choices available to them, including a wide choice among funds offered by Fidelity's competitors, and that the fund's shareholders, who have the opportunity to review and weigh the disclosure provided by the fund in its prospectus and other public disclosures, have chosen to invest in this fund, which is part of the Fidelity family of funds.
Nature, Extent, and Quality of Services Provided. The Board considered Fidelity's staffing as it relates to the fund, including the backgrounds of investment personnel of FMR and the sub-advisers (together, the Investment Advisers), and also considered the fund's investment objective, strategies, and related investment philosophy. The Independent Trustees also had discussions with senior management of Fidelity's investment operations and investment groups. The Board considered the structure of the portfolio manager compensation program and whether this structure provides appropriate incentives to act in the best interests of the fund. Additionally, the Board considered the portfolio managers' investments, if any, in the funds that they manage.
Resources Dedicated to Investment Management and Support Services. The Board and the Fund Oversight and Research Committees reviewed the general qualifications and capabilities of Fidelity's investment staff, including its size, education, experience, and resources, as well as Fidelity's approach to recruiting, training, managing, and compensating investment personnel. The Board noted that Fidelity has continued to increase the resources devoted to non-U.S. offices, including expansion of Fidelity's global investment organization. The Board also noted that Fidelity's analysts have extensive resources, tools and capabilities that allow them to conduct sophisticated quantitative and fundamental analysis, as well as credit analysis of issuers, counterparties and guarantors. Further, the Board believes that Fidelity's investment professionals have sufficient access to global information and data so as to provide competitive investment results over time, and that those professionals also have access to sophisticated tools that permit them to assess portfolio construction and risk and performance attribution characteristics continuously, as well as to transmit new information and research conclusions rapidly around the world. Additionally, in its deliberations, the Board considered Fidelity's trading and risk management capabilities and resources and global compliance infrastructure, which are an integral part of the investment management process.
Annual Report
Board Approval of Investment Advisory Contracts and
Management Fees - continued
Shareholder and Administrative Services. The Board considered (i) the nature, extent, quality, and cost of advisory, administrative, and shareholder services performed by the Investment Advisers and their affiliates under the Advisory Contracts and under separate agreements covering transfer agency, pricing and bookkeeping, and securities lending services for the fund; (ii) the nature and extent of the supervision of third party service providers, principally custodians and subcustodians; and (iii) the resources devoted to, and the record of compliance with, the fund's compliance policies and procedures. The Board also reviewed the allocation of fund brokerage, including allocations to brokers affiliated with the Investment Advisers, the use of brokerage commissions to pay fund expenses, and the use of "soft" commission dollars to pay for research services.
The Board noted that the growth of fund assets over time across the complex allows Fidelity to reinvest in the development of services designed to enhance the value or convenience of the Fidelity funds as investment vehicles. These services include 24-hour access to account information and market information through telephone representatives and over the Internet, investor education materials and asset allocation tools, and the expanded availability of Fidelity Investor Centers.
In 2014, the Board formed an ad hoc Committee on Transfer Agency Fees to review the variety of transfer agency fee structures throughout the industry and Fidelity's competitive positioning with respect to industry participants.
Investment in a Large Fund Family. The Board considered the benefits to shareholders of investing in a Fidelity fund, including the benefits of investing in a fund that is part of a large family of funds offering a variety of investment disciplines and providing a large variety of mutual fund investor services. The Board noted that Fidelity had taken, or had made recommendations that resulted in the Fidelity funds taking, a number of actions over the previous year that benefited particular funds, including (i) continuing to dedicate additional resources to investment research and to the support of the senior management team that oversees asset management; (ii) persisting in efforts to enhance Fidelity's global research capabilities; (iii) launching new funds and making other enhancements to meet client needs for income-oriented solutions; (iv) reducing fund expenses for certain index funds; (v) continuing to launch dedicated lower cost underlying funds to meet portfolio construction needs related to expanding underlying fund options for Fidelity funds of funds, specifically for the Freedom Fund product lines; (vi) rationalizing product lines and gaining increased efficiencies through fund mergers; (vii) launching sector-based exchange-traded funds and establishing a new Fidelity adviser to manage sector-based funds and products; (viii) continuing to develop and implement technology to improve security and increase efficiency; (ix) modifying the eligibility criteria for certain share classes to increase their marketability to a portion of the defined contribution plan market; (x) waiving redemption fees for certain qualified fund-of-fund and wrap programs and certain retirement plan transactions; and (xi) launching new Institutional Class shares of certain money market funds to attract and retain assets and to fill a gap in the money market fund lineup.
Annual Report
Investment Performance. The Board considered whether the fund has operated in accordance with its investment objective, as well as its record of compliance with its investment restrictions and its performance history. The Board noted that there were portfolio management changes for a sleeve of the fund in April 2013 and June 2013.
The Board took into account discussions with the Investment Advisers about fund investment performance that occur at Board meetings throughout the year. In this regard the Board noted that as part of regularly scheduled fund reviews and other reports to the Board on fund performance, the Board periodically considers annualized return information for the fund, for different time periods, measured against a securities market index ("benchmark index") and a peer group of funds with similar objectives ("peer group"). In its evaluation of fund investment performance, the Board gave particular attention to information indicating changes in performance of certain Fidelity funds for specific time periods and the Investment Advisers' explanations for any overperformance or underperformance.
In addition to reviewing absolute and relative fund performance, the Independent Trustees periodically consider the appropriateness of fund performance metrics in evaluating the results achieved. In general, the Independent Trustees believe that fund performance should be evaluated based on net performance (after fees and expenses) of both the highest performing and lowest performing classes, where applicable, compared to appropriate benchmark indices, over appropriate time periods which may include full market cycles, and compared to peer groups, as applicable, over the same periods, taking into account relevant factors including the following: general market conditions; issuer-specific information; tactical opportunities for investment; and fund cash flows and other factors.
The Independent Trustees recognize that shareholders evaluate performance on a net basis over their own holding periods, for which one-, three-, and five-year periods are often used as a proxy. For this reason, the performance information reviewed by the Board also included net cumulative calendar year total return information for the fund and an appropriate benchmark index and peer group for the most recent one-, three-, and five-year periods, as shown below. Returns are shown compared to the 25th percentile (top of box, 75% beaten) and 75th percentile (bottom of box, 25% beaten) of the peer universe.
Annual Report
Board Approval of Investment Advisory Contracts and
Management Fees - continued
Fidelity Balanced Fund

Based on its review, the Board concluded that the nature, extent, and quality of services provided to the fund under the Advisory Contracts should benefit the fund's shareholders.
Competitiveness of Management Fee and Total Expense Ratio. The Board considered the fund's management fee and total expense ratio compared to "mapped groups" of competitive funds and classes. Fidelity creates "mapped groups" by combining similar Lipper investment objective categories that have comparable investment mandates. Combining Lipper investment objective categories aids the Board's management fee and total expense ratio comparisons by broadening the competitive group used for comparison and by reducing the number of universes to which various Fidelity funds are compared.
Management Fee. The Board considered two proprietary management fee comparisons for the 12-month periods shown in the chart below. The group of Lipper funds used by the Board for management fee comparisons is referred to below as the "Total Mapped Group." The Total Mapped Group is broader than the Lipper peer group used by the Board for performance comparisons because the Total Mapped Group combines several Lipper investment objective categories while the Lipper peer group does not. The Total Mapped Group comparison focuses on a fund's standing in terms of gross management fees before expense reimbursements or caps relative to the total universe of funds with comparable investment mandates, regardless of whether their management fee structures also are comparable. Funds with comparable investment mandates offer exposure to similar types of securities. Funds with comparable management fee structures have similar management fee contractual arrangements (e.g., flat rate charged for advisory services, all-inclusive fee rate, etc.). "TMG %" represents the percentage of funds in the Total Mapped Group that had management fees that were lower than the fund's. For example, a hypothetical TMG % of 20% would mean that 80% of the funds in the Total Mapped Group had higher, and 20% had lower, management fees than the fund. The fund's actual TMG %s are in the chart below. The "Asset-Size Peer Group" (ASPG) comparison focuses on a fund's standing relative to a subset of non-Fidelity funds within the Total Mapped Group that are similar in size and management fee structure. For example, if a fund is in the first quartile of the ASPG, the fund's management fee ranks in the least expensive or lowest 25% of funds in the ASPG. The ASPG represents at least 15% of the funds in the Total Mapped Group with comparable asset size and management fee structures, subject to a minimum of 50 funds (or all funds in the Total Mapped Group if fewer than 50). Additional information, such as the ASPG quartile in which the fund's management fee rate ranked, is also included in the chart and considered by the Board.
Annual Report
Fidelity Balanced Fund
The Board noted that the fund's management fee rate ranked below the median of its Total Mapped Group and below the median of its ASPG for 2013.
The Board also noted that, in August 2013, the ad hoc Committee on Management Fees was formed to conduct an in-depth review of the management fee rates of Fidelity's active equity mutual funds. The Committee focused on the following areas: (i) standard fee structures; (ii) research consumption and trading evolution; (iii) management fee competitiveness/profitability by category; and (iv) factors that drive institutional pricing.
Based on its review, the Board concluded that the fund's management fee is fair and reasonable in light of the services that the fund receives and the other factors considered.
Annual Report
Board Approval of Investment Advisory Contracts and
Management Fees - continued
Total Expense Ratio. In its review of each class's total expense ratio, the Board considered the fund's management fee as well as other fund or class expenses, as applicable, such as transfer agent fees, pricing and bookkeeping fees, and custodial, legal, and audit fees. The Board also noted the effects of any waivers and reimbursements on fees and expenses. As part of its review, the Board also considered the current and historical total expense ratios of each class of the fund compared to competitive fund median expenses. Each class of the fund is compared to those funds and classes in the Total Mapped Group (used by the Board for management fee comparisons) that have a similar sales load structure.
The Board noted that the total expense ratio of each class ranked below its competitive median for 2013.
Fees Charged to Other Fidelity Clients. The Board also considered Fidelity fee structures and other information with respect to clients of Fidelity, such as other funds advised or subadvised by Fidelity, pension plan clients, and other institutional clients. The Board noted the findings of the 2013 ad hoc joint committee (created with the board of other Fidelity funds), which reviewed and compared Fidelity's institutional investment advisory business with its business of providing services to the Fidelity funds, including the differences in services provided, fees charged, and costs incurred, as well as competition in their respective marketplaces.
Based on its review of total expense ratios and fees charged to other Fidelity clients, the Board concluded that the total expense ratio of each class of the fund was reasonable in light of the services that the fund and its shareholders receive and the other factors considered.
Costs of the Services and Profitability. The Board considered the revenues earned and the expenses incurred by Fidelity in conducting the business of developing, marketing, distributing, managing, administering and servicing the fund and servicing the fund's shareholders. The Board also considered the level of Fidelity's profits in respect of all the Fidelity funds.
On an annual basis, Fidelity presents to the Board Fidelity's profitability for the fund. Fidelity calculates the profitability for each fund, as well as aggregate profitability for groups of Fidelity funds and all Fidelity funds, using a series of detailed revenue and cost allocation methodologies which originate with the books and records of Fidelity on which Fidelity's audited financial statements are based. The Audit Committee of the Board reviews any significant changes from the prior year's methodologies.
PricewaterhouseCoopers LLP (PwC), independent registered public accounting firm and auditor to Fidelity and certain Fidelity funds, has been engaged annually by the Board as part of the Board's assessment of Fidelity's profitability analysis. PwC's engagement includes the review and assessment of the methodologies used by Fidelity in determining the revenues and expenses attributable to Fidelity's mutual fund business, and completion of agreed-upon procedures in respect of the mathematical accuracy of fund profitability and its conformity to established allocation methodologies. After considering PwC's reports issued under the engagement and information provided by Fidelity, the Board concluded that while other allocation methods may also be reasonable, Fidelity's profitability methodologies are reasonable in all material respects.
Annual Report
The Board also reviewed Fidelity's non-fund businesses and fall-out benefits related to the mutual fund business as well as cases where Fidelity's affiliates may benefit from or be related to the fund's business.
The Board considered the costs of the services provided by and the profits realized by Fidelity in connection with the operation of the fund and was satisfied that the profitability was not excessive in the circumstances.
Economies of Scale. The Board considered whether there have been economies of scale in respect of the management of the Fidelity funds, whether the Fidelity funds (including the fund) have appropriately benefited from any such economies of scale, and whether there is potential for realization of any further economies of scale. The Board considered the extent to which the fund will benefit from economies of scale through increased services to the fund, through waivers or reimbursements, or through fee or expense ratio reductions. The Board also noted that in 2013, it and the boards of other Fidelity funds created an ad hoc committee (the Economies of Scale Committee) to analyze whether Fidelity attains economies of scale in respect of the management and servicing of the Fidelity funds, whether the Fidelity funds have appropriately benefited from such economies of scale, and whether there is potential for realization of any further economies of scale.
The Board recognized that the fund's management contract incorporates a "group fee" structure, which provides for lower group fee rates as total group assets increase, and for higher group fee rates as total group assets decrease (with "group assets" defined to include fund assets under FMR's management plus sector fund assets previously under FMR's management and currently managed by Fidelity SelectCo, LLC). FMR calculates the group fee rates based on a tiered asset "breakpoint" schedule that varies based on asset class. The Board considered that the group fee is designed to deliver the benefits of economies of scale to fund shareholders when total Fidelity fund assets increase, even if assets of any particular fund are unchanged or have declined, because some portion of Fidelity's costs are attributable to services provided to all Fidelity funds, and all funds benefit if those costs can be allocated among more assets. The Board concluded that, given the group fee structure, fund shareholders will benefit from lower management fees as group assets increase at the fund complex level, regardless of whether Fidelity achieves any such economies of scale.
Annual Report
Board Approval of Investment Advisory Contracts and
Management Fees - continued
The Board concluded, taking into account the analysis of the Economies of Scale Committee, that economies of scale, if any, are being appropriately shared between fund shareholders and Fidelity.
Additional Information Requested by the Board. In order to develop fully the factual basis for consideration of the Fidelity funds' Advisory Contracts, the Board requested and received additional information on certain topics, including: (i) fund performance trends and Fidelity's long-term strategies for certain funds; (ii) Fidelity's strategic marketing and product lineup goals; (iii) the methodology with respect to competitive fund data and peer group classifications; (iv) the arrangements with, and performance of, certain sub-advisers on behalf of the Fidelity funds, as well as certain proposed participating affiliate arrangements; (v) the realization of fall-out benefits in certain Fidelity business units; (vi) Fidelity's group fee structures, including the rationale for the individual fee rates of certain categories of funds and the definition of group assets; (vii) trends regarding industry use of performance fee structures and the performance adjustment methodologies applicable to the Fidelity funds; (viii) additional competitive analysis regarding the total expenses for certain classes; (ix) fund profitability methodology, including Fidelity's cost allocation methodology, and the impact of certain factors on fund profitability results; and (x) the process by which Fidelity determines sub-advisory fees for funds it advises.
Based on its evaluation of all of the conclusions noted above, and after considering all factors it believed relevant, the Board ultimately concluded that the advisory fee structures are fair and reasonable, and that the fund's Advisory Contracts should be renewed.
Annual Report
Investment Adviser
Fidelity Management & Research Company
Boston, MA
Investment Sub-Advisers
FMR Co., Inc.
Fidelity Investments
Money Management, Inc.
Fidelity Management & Research
(U.K.) Inc.
Fidelity Management & Research
(Hong Kong) Limited
Fidelity Management & Research
(Japan) Inc.
General Distributor
Fidelity Distributors Corporation
Smithfield, RI
Transfer and Service Agents
Fidelity Investments Institutional Operations Company, Inc.
Boston, MA
Fidelity Service Company, Inc.
Boston, MA
Custodian
Citibank, N.A.
New York, NY
(Fidelity Investment logo)(registered trademark)
Corporate Headquarters
245 Summer St., Boston, MA 02210
www.fidelity.com
BAL-K-UANN-1014
1.863050.105
Fidelity®
Puritan®
Fund
Annual Report
August 31, 2014
(Fidelity Cover Art)
Contents
Performance | (Click Here) | How the fund has done over time. |
Management's Discussion of Fund Performance | (Click Here) | The Portfolio Manager's review of fund performance and strategy. |
Shareholder Expense Example | (Click Here) | An example of shareholder expenses. |
Investment Changes | (Click Here) | A summary of major shifts in the fund's investments over the past six months. |
Investments | (Click Here) | A complete list of the fund's investments with their market values. |
Financial Statements | (Click Here) | Statements of assets and liabilities, operations, and changes in net assets, as well as financial highlights. |
Notes | (Click Here) | Notes to the financial statements. |
Report of Independent Registered Public Accounting Firm | (Click Here) | |
Trustees and Officers | (Click Here) | |
Distributions | (Click Here) | |
Board Approval of Investment Advisory Contracts and Management Fees | (Click Here) | |
To view a fund's proxy voting guidelines and proxy voting record for the 12-month period ended June 30, visit http://www.fidelity.com/proxyvotingresults or visit the Securities and Exchange Commission's (SEC) web site at http://www.sec.gov. You may also call 1-800-544-8544 to request a free copy of the proxy voting guidelines.
Standard & Poor's, S&P and S&P 500 are registered service marks of The McGraw-Hill Companies, Inc. and have been licensed for use by Fidelity Distributors Corporation.
Other third-party marks appearing herein are the property of their respective owners.
All other marks appearing herein are registered or unregistered trademarks or service marks of FMR LLC or an affiliated company. © 2014 FMR LLC. All rights reserved.
Annual Report
This report and the financial statements contained herein are submitted for the general information of the shareholders of the fund. This report is not authorized for distribution to prospective investors in the fund unless preceded or accompanied by an effective prospectus.
A fund files its complete schedule of portfolio holdings with the SEC for the first and third quarters of each fiscal year on Form N-Q. Forms N-Q are available on the SEC's web site at http://www.sec.gov. A fund's Forms N-Q may be reviewed and copied at the SEC's Public Reference Room in Washington, DC. Information regarding the operation of the SEC's Public Reference Room may be obtained by calling 1-800-SEC-0330. For a complete list of a fund's portfolio holdings, view the most recent holdings listing, semiannual report, or annual report on Fidelity's web site at http://www.fidelity.com, http://www.advisor.fidelity.com, or http://www.401k.com, as applicable.
NOT FDIC INSURED • MAY LOSE VALUE • NO BANK GUARANTEE
Neither the fund nor Fidelity Distributors Corporation is a bank.
Annual Report
Average annual total return reflects the change in the value of an investment, assuming reinvestment of the class' distributions from dividend income and capital gains (the profits earned upon the sale of securities that have grown in value, if any) and assuming a constant rate of performance each year. The $10,000 table and the fund's returns do not reflect the deduction of taxes that a shareholder would pay on fund distributions or the redemption of fund shares. During periods of reimbursement by Fidelity, a fund's total return will be greater than it would be had the reimbursement not occurred. How a fund did yesterday is no guarantee of how it will do tomorrow.
Average Annual Total Returns
Periods ended August 31, 2014 | Past 1
year | Past 5
years | Past 10
years |
Fidelity® Puritan® Fund | 20.17% | 13.09% | 7.68% |
$10,000 Over 10 Years
Let's say hypothetically that $10,000 was invested in Fidelity® Puritan® Fund, a class of the fund, on August 31, 2004. The chart shows how the value of your investment would have changed, and also shows how the S&P 500® Index performed over the same period.
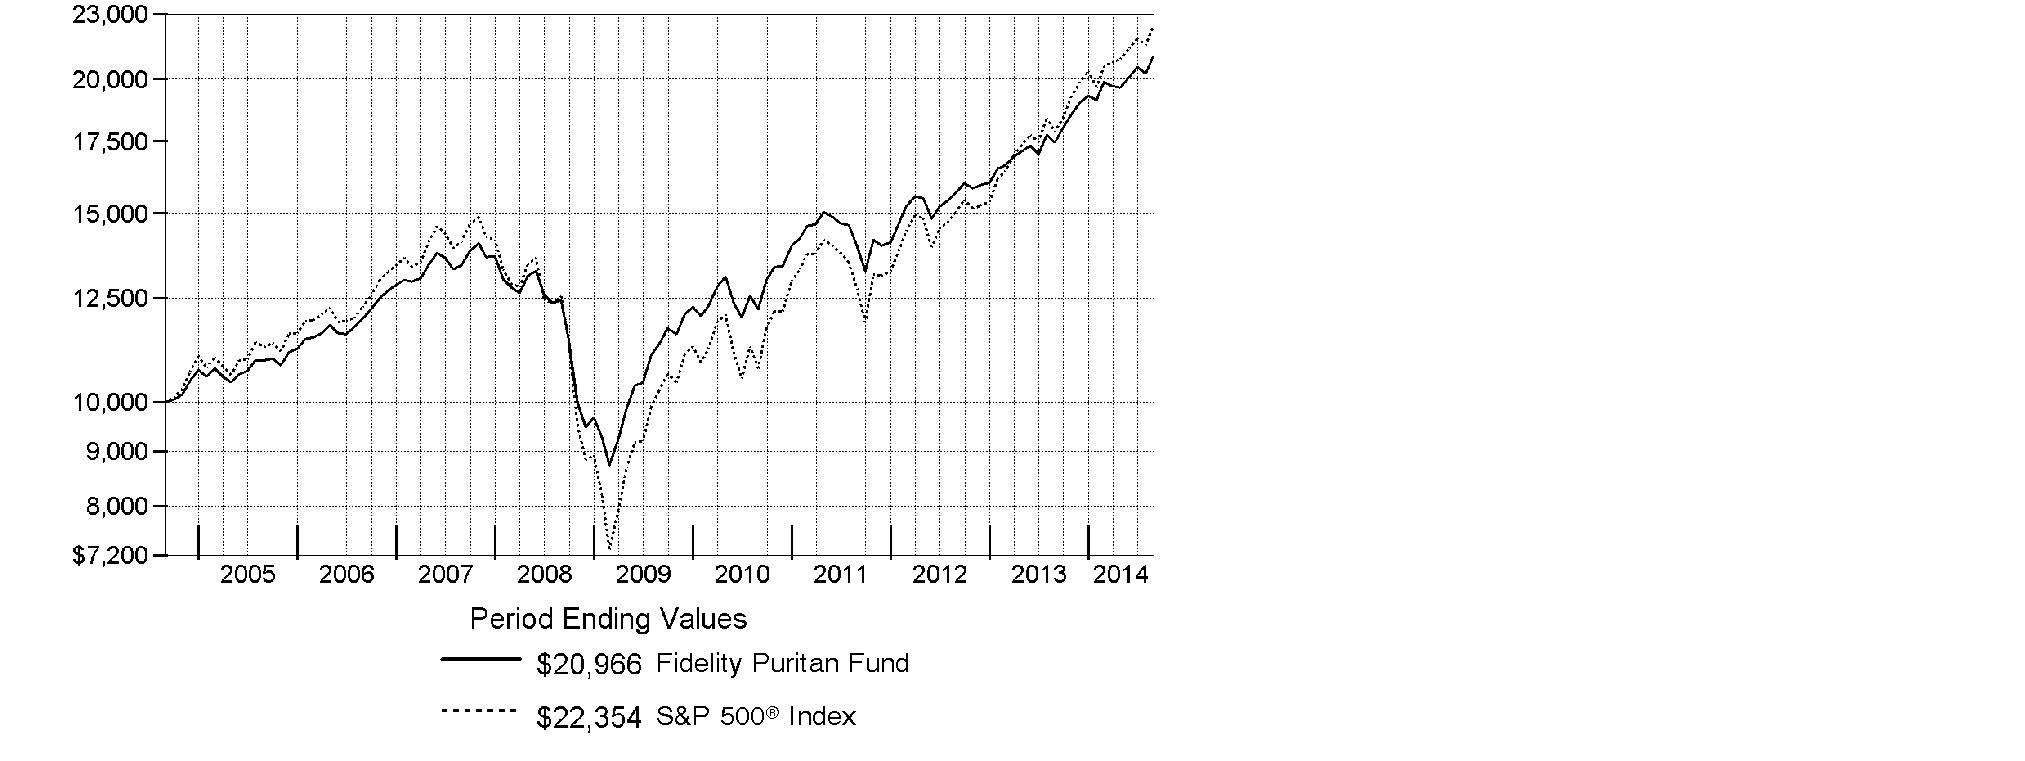
Annual Report
Market Recap: U.S. stocks overcame a slowing economy early in 2014 to post a solid gain for the 12 months ending August 31, 2014, supported at home by low interest rates and globally by new stimulus efforts in Europe and China. The broad-market S&P 500® Index rose 25.25%, reaching an all-time high during the period. The tech-heavy Nasdaq Composite Index® gained 29.15%, while the small-cap Russell 2000® Index returned 17.68%. Information technology (+34%) was the top sector in the S&P 500®, driven by strong results among semiconductor and hardware/equipment stocks. Health care (+32%) rose broadly, driven by biotechnology and life sciences names. Conversely, traditionally defensive sectors - consumer staples, utilities and telecommunication services - lagged the advance. Volatility was generally tame, with markets supported by declining unemployment, near-record corporate profits, muted inflation and fairly low company debt levels. Meanwhile, U.S. taxable bonds notched gains for the 12-month period, driven by yield-advantaged sectors. The Barclays® U.S. Aggregate Bond Index rose 5.66% on the strength of longer-maturity bonds, which benefited from a decline in long-term interest rates. Lower-quality corporate issues attracted some of the strongest buying interest, reflected by the 10.61% gain of The BofA Merrill LynchSM US High Yield Constrained Index.
Comments from Ramin Arani, Lead Portfolio Manager of Fidelity® Puritan® Fund: For the year, the fund's Retail Class shares gained 20.17%, versus 17.14% for the Fidelity Puritan Composite IndexSM. Asset allocation significantly boosted performance versus the Composite index: a substantial overweighting in equities, below-neutral exposure to investment-grade bonds and a small out-of-index stake in high-yield bonds. Security selection in all three sleeves helped. Among equities, a non-index stake in Illumina was the top relative contributor, as orders and earnings far exceeded expectations. Conversely, the biggest detractor was a non-index investment in Japan Tobacco, as shares declined amid a tumultuous period for the Japanese stock market. I sold it in April. In fixed income, the largest contributor was our overweighting in corporate bonds. We also got a lift from overweighting municipal Build America Bonds and underweighting mortgage-backed securities. Security selection was beneficial, highlighted by our investments in bonds from Time Warner Cable and Verizon Communications on the corporate side, and the states of California and Illinois on the municipal side. There were few notable detractors, although we were modestly hurt by underweighting sovereign debt and certain industrial corporate bonds.
The views expressed above reflect those of the portfolio manager(s) only through the end of the period as stated on the cover of this report and do not necessarily represent the views of Fidelity or any other person in the Fidelity organization. Any such views are subject to change at any time based upon market or other conditions and Fidelity disclaims any responsibility to update such views. These views may not be relied on as investment advice and, because investment decisions for a Fidelity fund are based on numerous factors, may not be relied on as an indication of trading intent on behalf of any Fidelity fund.
Annual Report
Shareholder Expense Example
As a shareholder of the Fund, you incur two types of costs: (1) transaction costs, and (2) ongoing costs, including management fees and other Fund expenses. This Example is intended to help you understand your ongoing costs (in dollars) of investing in the Fund and to compare these costs with the ongoing costs of investing in other mutual funds.
The Example is based on an investment of $1,000 invested at the beginning of the period and held for the entire period (March 1, 2014 to August 31, 2014).
Actual Expenses
The first line of the accompanying table for each class of the Fund provides information about actual account values and actual expenses. You may use the information in this line, together with the amount you invested, to estimate the expenses that you paid over the period. Simply divide your account value by $1,000.00 (for example, an $8,600 account value divided by $1,000.00 = 8.6), then multiply the result by the number in the first line for a class of the Fund under the heading entitled "Expenses Paid During Period" to estimate the expenses you paid on your account during this period. A small balance maintenance fee of $12.00 that is charged once a year may apply for certain accounts with a value of less than $2,000. This fee is not included in the table below. If it was, the estimate of expenses you paid during the period would be higher, and your ending account value lower, by this amount. In addition, the Fund, as a shareholder in the underlying Fidelity Central Funds, will indirectly bear its pro-rata share of the fees and expenses incurred by the underlying Fidelity Central Funds. These fees and expenses are not included in the Fund's annualized expense ratio used to calculate the expense estimate in the table below.
Hypothetical Example for Comparison Purposes
The second line of the accompanying table for each class of the Fund provides information about hypothetical account values and hypothetical expenses based on a Class' actual expense ratio and an assumed rate of return of 5% per year before expenses, which is not the Class' actual return. The hypothetical account values and expenses may not be used to estimate the actual ending account balance or expenses you paid for the period. You may use this information to compare the ongoing costs of investing in the Fund and other funds. To do so, compare this 5% hypothetical example with the 5% hypothetical examples that appear in the shareholder reports of the other funds. A small balance maintenance fee of $12.00 that is charged once a year may apply for certain accounts with a value of less than $2,000. This fee is not included in the table below. If it was, the estimate of expenses you paid during the period would be higher, and your ending account value lower, by this amount. In addition, the Fund, as a shareholder in the underlying Fidelity Central Funds, will indirectly bear its pro-rata share of the fees and expenses incurred by the underlying Fidelity Central Funds. These fees and expenses are not included in the Fund's annualized expense ratio used to calculate the expense estimate in the table below.
Please note that the expenses shown in the table are meant to highlight your ongoing costs only and do not reflect any transaction costs. Therefore, the second line of the table is useful in comparing ongoing costs only, and will not help you determine the relative total costs of owning different funds.
Annual Report
Shareholder Expense Example - continued
| Annualized
Expense Ratio B | Beginning
Account Value
March 1, 2014 | Ending
Account Value
August 31, 2014 | Expenses Paid
During Period*
March 1, 2014
to August 31, 2014 |
Puritan | .56% | | | |
Actual | | $ 1,000.00 | $ 1,055.70 | $ 2.90 |
HypotheticalA | | $ 1,000.00 | $ 1,022.38 | $ 2.85 |
Class K | .46% | | | |
Actual | | $ 1,000.00 | $ 1,056.30 | $ 2.38 |
HypotheticalA | | $ 1,000.00 | $ 1,022.89 | $ 2.35 |
A 5% return per year before expenses
B Annualized expense ratio reflects expenses net of applicable fee waivers.
* Expenses are equal to each Class' annualized expense ratio, multiplied by the average account value over the period, multiplied by 184/365 (to reflect the one-half year period). The fees and expenses of the underlying Fidelity Central Funds in which the Fund invests are not included in each Class' annualized expense ratio.
In addition to the expenses noted above, the Fund also indirectly bears its proportional share of the expenses of the underlying Fidelity Central Funds. Annualized expenses of the underlying non-money market Fidelity Central Funds as of their most recent fiscal half year were less than .01%.
Annual Report
Investment Changes (Unaudited)
The information in the following tables is based on the combined investments of the Fund and its pro-rata share of the investments of Fidelity's fixed-income central funds.
Top Five Stocks as of August 31, 2014 |
| % of fund's
net assets | % of fund's net assets
6 months ago |
Apple, Inc. | 2.7 | 2.2 |
Bank of America Corp. | 1.5 | 1.5 |
Microsoft Corp. | 1.3 | 1.1 |
Wells Fargo & Co. | 1.3 | 1.2 |
Johnson & Johnson | 1.2 | 0.0 |
| 8.0 | |
Top Five Bond Issuers as of August 31, 2014 |
(with maturities greater than one year) | % of fund's
net assets | % of fund's net assets
6 months ago |
Fannie Mae | 4.3 | 4.0 |
U.S. Treasury Obligations | 2.9 | 4.8 |
Ginnie Mae | 1.0 | 0.8 |
Freddie Mac | 0.9 | 1.0 |
Verizon Communications, Inc. | 0.8 | 0.8 |
| 9.9 | |
Top Five Market Sectors as of August 31, 2014 |
| % of fund's
net assets | % of fund's net assets
6 months ago |
Financials | 16.4 | 16.1 |
Information Technology | 14.5 | 15.5 |
Health Care | 12.7 | 12.9 |
Consumer Discretionary | 10.4 | 11.1 |
Energy | 9.5 | 6.6 |
Asset Allocation (% of fund's net assets) |
As of August 31, 2014 * | As of February 28, 2014 ** |
 | Stocks 69.4% | | | Stocks 70.2% | |
 | Bonds 26.5% | | | Bonds 27.1% | |
 | Convertible
Securities 0.6% | | | Convertible
Securities 0.4% | |
 | Other Investments 0.6% | | | Other Investments 0.6% | |
 | Short-Term
Investments and
Net Other Assets (Liabilities) 2.9% | | | Short-Term
Investments and
Net Other Assets (Liabilities) 1.7% | |
* Foreign investments | 11.8% | | ** Foreign investments | 11.6% | |

Percentages are adjusted for the effect of futures contracts and swaps, if applicable. |
An unaudited holdings listing for the Fund, which presents direct holdings as well as the pro-rata share of any securities and other investments held indirectly through its investments in underlying non-money market Fidelity Central Funds, is available at fidelity.com. |
Percentages in the above tables are adjusted for the effect of TBA Sale Commitments. |
Annual Report
Investments August 31, 2014
Showing Percentage of Net Assets
Common Stocks - 69.2% |
| Shares | | Value (000s) |
CONSUMER DISCRETIONARY - 8.5% |
Auto Components - 0.5% |
Delphi Automotive PLC | 26,293 | | $ 1,829 |
Johnson Controls, Inc. | 1,000,800 | | 48,849 |
Mobileye NV | 1,859,840 | | 72,344 |
| | 123,022 |
Automobiles - 0.1% |
General Motors Co. | 193,833 | | 6,745 |
General Motors Co.: | | | |
warrants 7/10/16 (a) | 5,412 | | 134 |
warrants 7/10/19 (a) | 5,412 | | 91 |
Motors Liquidation Co. GUC Trust (a) | 28,150 | | 718 |
Tesla Motors, Inc. (a) | 40,500 | | 10,923 |
| | 18,611 |
Diversified Consumer Services - 0.0% |
Houghton Mifflin Harcourt Co. warrants 6/22/19 (a)(o) | 1,945 | | 3 |
Hotels, Restaurants & Leisure - 1.2% |
ARAMARK Holdings Corp. | 150,000 | | 3,885 |
Domino's Pizza, Inc. | 473,500 | | 35,726 |
Dunkin' Brands Group, Inc. | 139,600 | | 6,078 |
Extended Stay America, Inc. unit | 150,000 | | 3,579 |
Las Vegas Sands Corp. | 111,100 | | 7,389 |
PB Investor I LLC (a) | 9,088 | | 24 |
Starbucks Corp. | 1,651,300 | | 128,488 |
Station Holdco LLC (a)(n)(o) | 1,194,419 | | 3,153 |
Station Holdco LLC: | | | |
unit (a)(n)(o) | 2,660 | | 1 |
warrants 6/15/18 (a)(n)(o) | 75,658 | | 30 |
Vail Resorts, Inc. | 713,827 | | 56,742 |
Wyndham Worldwide Corp. | 531,500 | | 43,020 |
| | 288,115 |
Household Durables - 0.2% |
PulteGroup, Inc. | 2,422,900 | | 46,568 |
| | |
Internet & Catalog Retail - 0.7% |
Amazon.com, Inc. (a) | 210,600 | | 71,402 |
JD.com, Inc. sponsored ADR (e) | 177,000 | | 5,650 |
Jumei International Holding Ltd. sponsored ADR (e) | 50,400 | | 1,541 |
Netflix, Inc. (a) | 23,900 | | 11,416 |
Common Stocks - continued |
| Shares | | Value (000s) |
CONSUMER DISCRETIONARY - continued |
Internet & Catalog Retail - continued |
priceline.com, Inc. (a) | 59,800 | | $ 74,410 |
Spotify Technology SA (o) | 15,765 | | 18,275 |
| | 182,694 |
Media - 3.8% |
CBS Corp. Class B | 1,977,400 | | 117,240 |
Charter Communications, Inc. Class A (a) | 225,900 | | 35,437 |
Comcast Corp. Class A (special) (non-vtg.) | 5,146,600 | | 281,004 |
Cumulus Media, Inc. Class A (a) | 398,000 | | 1,827 |
DIRECTV (a) | 238,100 | | 20,584 |
Legend Pictures LLC (a)(n)(o) | 49,141 | | 88,601 |
Lions Gate Entertainment Corp. (e) | 1,339,600 | | 43,416 |
Publicis Groupe SA (a) | 319,372 | | 23,794 |
The Walt Disney Co. | 284,190 | | 25,543 |
Time Warner Cable, Inc. | 771,500 | | 114,128 |
Time Warner, Inc. | 1,026,300 | | 79,056 |
Tribune Media Co. Class A (a) | 13,773 | | 1,051 |
Tribune Publishing Co. (a) | 3,443 | | 66 |
Twenty-First Century Fox, Inc. Class A | 1,899,700 | | 67,287 |
Vertis Holdings, Inc. (a) | 1,934 | | 0 |
Vice Holding, Inc. (o) | 2,172 | | 32,899 |
| | 931,933 |
Multiline Retail - 0.1% |
Family Dollar Stores, Inc. | 188,300 | | 15,032 |
Specialty Retail - 0.9% |
Home Depot, Inc. | 1,938,200 | | 181,222 |
TJX Companies, Inc. | 773,100 | | 46,084 |
| | 227,306 |
Textiles, Apparel & Luxury Goods - 1.0% |
Brunello Cucinelli SpA | 1,331,100 | | 33,231 |
lululemon athletica, Inc. (a) | 537,200 | | 21,450 |
Luxottica Group SpA | 153,851 | | 8,215 |
Michael Kors Holdings Ltd. (a) | 379,061 | | 30,370 |
NIKE, Inc. Class B | 1,162,000 | | 91,275 |
Ralph Lauren Corp. | 218,400 | | 36,953 |
Tory Burch LLC (a)(n)(o) | 324,840 | | 23,111 |
| | 244,605 |
TOTAL CONSUMER DISCRETIONARY | | 2,077,889 |
Common Stocks - continued |
| Shares | | Value (000s) |
CONSUMER STAPLES - 5.3% |
Beverages - 1.1% |
Coca-Cola Enterprises, Inc. | 1,680,900 | | $ 80,313 |
Monster Beverage Corp. (a) | 836,400 | | 73,946 |
The Coca-Cola Co. | 2,476,100 | | 103,303 |
| | 257,562 |
Food & Staples Retailing - 1.6% |
Costco Wholesale Corp. | 578,500 | | 70,045 |
CVS Caremark Corp. | 1,991,700 | | 158,241 |
Kroger Co. | 2,351,500 | | 119,879 |
Walgreen Co. | 881,700 | | 53,360 |
| | 401,525 |
Food Products - 1.3% |
Bunge Ltd. | 833,000 | | 70,513 |
Keurig Green Mountain, Inc. | 431,800 | | 57,568 |
Mead Johnson Nutrition Co. Class A | 1,136,000 | | 108,602 |
Mondelez International, Inc. | 790,700 | | 28,615 |
The Hershey Co. | 135,900 | | 12,424 |
WhiteWave Foods Co. (a) | 1,319,100 | | 46,195 |
| | 323,917 |
Household Products - 0.2% |
Procter & Gamble Co. | 649,200 | | 53,955 |
Personal Products - 0.5% |
Estee Lauder Companies, Inc. Class A | 1,033,500 | | 79,404 |
L'Oreal SA | 235,600 | | 39,005 |
| | 118,409 |
Tobacco - 0.6% |
Lorillard, Inc. | 1,347,000 | | 80,416 |
Reynolds American, Inc. | 992,600 | | 58,037 |
| | 138,453 |
TOTAL CONSUMER STAPLES | | 1,293,821 |
ENERGY - 7.8% |
Energy Equipment & Services - 1.9% |
Aspen Aerogels, Inc. (a)(f) | 2,373,088 | | 22,703 |
Cameron International Corp. (a) | 389,500 | | 28,952 |
Halliburton Co. | 2,664,700 | | 180,160 |
Ocean Rig UDW, Inc. (United States) | 944,200 | | 17,496 |
Schlumberger Ltd. | 1,852,800 | | 203,141 |
| | 452,452 |
Common Stocks - continued |
| Shares | | Value (000s) |
ENERGY - continued |
Oil, Gas & Consumable Fuels - 5.9% |
Anadarko Petroleum Corp. | 2,586,100 | | $ 291,428 |
Cabot Oil & Gas Corp. | 2,122,500 | | 71,189 |
Chevron Corp. | 2,116,100 | | 273,929 |
Cimarex Energy Co. | 179,500 | | 26,056 |
ConocoPhillips Co. | 619,800 | | 50,340 |
EOG Resources, Inc. | 1,158,800 | | 127,329 |
EP Energy Corp. | 110,000 | | 2,126 |
EQT Corp. | 217,900 | | 21,585 |
Golar LNG Ltd. | 545,000 | | 34,335 |
Kinder Morgan Holding Co. LLC | 644,800 | | 25,960 |
Marathon Petroleum Corp. | 836,200 | | 76,103 |
MPLX LP | 464,900 | | 28,359 |
Noble Energy, Inc. | 547,099 | | 39,468 |
Phillips 66 Co. | 1,129,400 | | 98,280 |
Phillips 66 Partners LP | 396,901 | | 29,371 |
Pioneer Natural Resources Co. | 138,700 | | 28,940 |
PrairieSky Royalty Ltd. | 161,500 | | 5,867 |
Southwestern Energy Co. (a) | 657,200 | | 27,063 |
Suncor Energy, Inc. | 1,333,600 | | 54,740 |
The Williams Companies, Inc. | 1,010,000 | | 60,034 |
Valero Energy Corp. | 1,400,000 | | 75,796 |
Valero Energy Partners LP | 50,000 | | 2,666 |
| | 1,450,964 |
TOTAL ENERGY | | 1,903,416 |
FINANCIALS - 10.4% |
Banks - 5.3% |
Bank of America Corp. | 22,200,600 | | 357,208 |
Citigroup, Inc. | 478,740 | | 24,727 |
First Republic Bank | 50,000 | | 2,445 |
JPMorgan Chase & Co. | 4,885,423 | | 290,438 |
M&T Bank Corp. (e) | 457,400 | | 56,548 |
Prosperity Bancshares, Inc. | 547,627 | | 33,077 |
SunTrust Banks, Inc. | 2,158,500 | | 82,196 |
TCF Financial Corp. | 1,258,400 | | 19,883 |
U.S. Bancorp | 3,095,400 | | 130,874 |
Wells Fargo & Co. | 6,041,940 | | 310,797 |
| | 1,308,193 |
Common Stocks - continued |
| Shares | | Value (000s) |
FINANCIALS - continued |
Capital Markets - 1.3% |
BlackRock, Inc. Class A | 210,200 | | $ 69,477 |
Carlyle Group LP | 331,900 | | 11,039 |
E*TRADE Financial Corp. (a) | 2,255,500 | | 50,207 |
Invesco Ltd. | 1,732,800 | | 70,768 |
Morgan Stanley | 1,278,300 | | 43,858 |
The Blackstone Group LP | 1,833,300 | | 61,471 |
| | 306,820 |
Consumer Finance - 1.2% |
American Express Co. | 1,420,800 | | 127,233 |
Capital One Financial Corp. | 1,371,600 | | 112,553 |
Navient Corp. | 2,315,700 | | 41,544 |
SLM Corp. | 1,133,700 | | 10,045 |
| | 291,375 |
Diversified Financial Services - 0.6% |
Berkshire Hathaway, Inc. Class B (a) | 1,093,400 | | 150,069 |
Insurance - 1.4% |
ACE Ltd. | 1,130,600 | | 120,217 |
American International Group, Inc. | 541,600 | | 30,362 |
MetLife, Inc. | 1,852,600 | | 101,411 |
The Travelers Companies, Inc. | 975,000 | | 92,342 |
| | 344,332 |
Real Estate Investment Trusts - 0.5% |
Altisource Residential Corp. Class B | 297,800 | | 7,308 |
American Tower Corp. | 1,135,500 | | 111,960 |
| | 119,268 |
Real Estate Management & Development - 0.1% |
CBRE Group, Inc. (a) | 695,835 | | 22,114 |
Realogy Holdings Corp. (a) | 48,000 | | 1,957 |
| | 24,071 |
TOTAL FINANCIALS | | 2,544,128 |
HEALTH CARE - 11.9% |
Biotechnology - 3.5% |
ACADIA Pharmaceuticals, Inc. (a)(e) | 2,068,004 | | 49,591 |
Acceleron Pharma, Inc. | 130,400 | | 3,504 |
Actelion Ltd. | 247,330 | | 30,362 |
Alexion Pharmaceuticals, Inc. (a) | 524,600 | | 88,810 |
Common Stocks - continued |
| Shares | | Value (000s) |
HEALTH CARE - continued |
Biotechnology - continued |
Amgen, Inc. | 1,886,800 | | $ 262,982 |
Asterias Biotherapeutics, Inc. (a)(e) | 130,874 | | 467 |
Biogen Idec, Inc. (a) | 501,300 | | 171,966 |
Cubist Pharmaceuticals, Inc. | 570,200 | | 39,361 |
Cubist Pharmaceuticals, Inc. rights (a) | 635,000 | | 54 |
Dicerna Pharmaceuticals, Inc. (e) | 384,600 | | 5,300 |
Genmab A/S (a) | 466,200 | | 18,610 |
Geron Corp. (a)(e) | 3,141,000 | | 7,476 |
Gilead Sciences, Inc. (a) | 1,014,500 | | 109,140 |
Grifols SA ADR | 45,780 | | 1,838 |
Macrogenics, Inc. | 226,200 | | 4,832 |
Neurocrine Biosciences, Inc. (a) | 918,100 | | 14,974 |
Vertex Pharmaceuticals, Inc. (a) | 400,300 | | 37,456 |
XOMA Corp. (a) | 1,530,200 | | 6,702 |
| | 853,425 |
Health Care Equipment & Supplies - 1.1% |
Boston Scientific Corp. (a) | 6,240,700 | | 79,132 |
Covidien PLC | 1,371,800 | | 119,113 |
Medtronic, Inc. | 887,500 | | 56,667 |
The Cooper Companies, Inc. | 162,559 | | 26,502 |
| | 281,414 |
Health Care Providers & Services - 1.3% |
Cigna Corp. | 566,400 | | 53,581 |
Express Scripts Holding Co. (a) | 38,400 | | 2,839 |
HCA Holdings, Inc. (a) | 1,087,800 | | 75,950 |
Legend Acquisition Sub, Inc. | 2,509 | | 38 |
Legend Acquisition Sub, Inc.: | | | |
Class A warrants (a) | 17,259 | | 0 |
Class B warrants (a) | 22,759 | | 0 |
McKesson Corp. | 877,800 | | 171,197 |
Qualicorp SA (a) | 975,500 | | 12,202 |
| | 315,807 |
Health Care Technology - 0.2% |
CareView Communications, Inc. (a)(f) | 10,425,300 | | 5,890 |
Castlight Health, Inc. Class B (a)(e) | 199,000 | | 2,370 |
Cerner Corp. (a) | 593,000 | | 34,192 |
| | 42,452 |
Common Stocks - continued |
| Shares | | Value (000s) |
HEALTH CARE - continued |
Life Sciences Tools & Services - 0.6% |
Agilent Technologies, Inc. | 1,275,455 | | $ 72,905 |
Illumina, Inc. (a) | 453,962 | | 81,423 |
| | 154,328 |
Pharmaceuticals - 5.2% |
AbbVie, Inc. | 2,188,300 | | 120,969 |
Actavis PLC (a) | 1,107,056 | | 251,280 |
Akorn, Inc. (a) | 162,893 | | 6,356 |
Allergan, Inc. | 347,500 | | 56,879 |
Bristol-Myers Squibb Co. | 1,054,700 | | 53,421 |
Jazz Pharmaceuticals PLC (a) | 114,600 | | 18,671 |
Johnson & Johnson | 2,916,600 | | 302,539 |
Merck & Co., Inc. | 3,532,300 | | 212,327 |
Pfizer, Inc. | 89,200 | | 2,622 |
Prestige Brands Holdings, Inc. (a) | 581,402 | | 20,122 |
Salix Pharmaceuticals Ltd. (a) | 381,300 | | 60,669 |
Shire PLC sponsored ADR | 404,500 | | 98,840 |
Teva Pharmaceutical Industries Ltd. sponsored ADR | 760,800 | | 39,957 |
TherapeuticsMD, Inc. (a) | 5,996,914 | | 33,283 |
| | 1,277,935 |
TOTAL HEALTH CARE | | 2,925,361 |
INDUSTRIALS - 5.8% |
Aerospace & Defense - 1.5% |
General Dynamics Corp. | 557,100 | | 68,663 |
Honeywell International, Inc. | 1,165,300 | | 110,972 |
The Boeing Co. | 784,100 | | 99,424 |
United Technologies Corp. | 818,279 | | 88,358 |
| | 367,417 |
Air Freight & Logistics - 0.5% |
FedEx Corp. | 791,300 | | 117,017 |
Airlines - 0.4% |
American Airlines Group, Inc. | 836,900 | | 32,564 |
Delta Air Lines, Inc. | 1,560,900 | | 61,780 |
| | 94,344 |
Building Products - 0.0% |
Masonite International Corp. (a) | 5,358 | | 306 |
Masonite International Corp. warrants 6/9/16 (a) | 19,485 | | 188 |
| | 494 |
Common Stocks - continued |
| Shares | | Value (000s) |
INDUSTRIALS - continued |
Commercial Services & Supplies - 0.0% |
WP Rocket Holdings, Inc. | 1,314,154 | | $ 263 |
Electrical Equipment - 0.0% |
Acuity Brands, Inc. | 17,200 | | 2,131 |
Generac Holdings, Inc. (a) | 55,200 | | 2,568 |
SolarCity Corp. (a)(e) | 89,800 | | 6,167 |
| | 10,866 |
Industrial Conglomerates - 1.0% |
3M Co. | 903,100 | | 130,046 |
Danaher Corp. | 980,200 | | 75,093 |
General Electric Co. | 1,696,200 | | 44,067 |
| | 249,206 |
Machinery - 1.3% |
Caterpillar, Inc. | 1,240,300 | | 135,280 |
Cummins, Inc. | 379,700 | | 55,098 |
Deere & Co. | 170,200 | | 14,312 |
Ingersoll-Rand PLC | 531,400 | | 31,990 |
Manitowoc Co., Inc. | 2,150,600 | | 63,271 |
PACCAR, Inc. | 313,600 | | 19,697 |
| | 319,648 |
Professional Services - 0.1% |
Towers Watson & Co. | 340,800 | | 37,362 |
Road & Rail - 1.0% |
J.B. Hunt Transport Services, Inc. | 437,700 | | 33,068 |
Norfolk Southern Corp. | 744,400 | | 79,651 |
Union Pacific Corp. | 1,172,712 | | 123,451 |
| | 236,170 |
TOTAL INDUSTRIALS | | 1,432,787 |
INFORMATION TECHNOLOGY - 14.0% |
Communications Equipment - 0.8% |
Cisco Systems, Inc. | 2,873,700 | | 71,814 |
QUALCOMM, Inc. | 1,764,500 | | 134,278 |
| | 206,092 |
Electronic Equipment & Components - 0.6% |
Amphenol Corp. Class A | 737,800 | | 76,001 |
Arrow Electronics, Inc. (a) | 388,800 | | 24,203 |
Common Stocks - continued |
| Shares | | Value (000s) |
INFORMATION TECHNOLOGY - continued |
Electronic Equipment & Components - continued |
E Ink Holdings, Inc. GDR (a)(g) | 140,100 | | $ 853 |
TE Connectivity Ltd. | 551,400 | | 34,562 |
| | 135,619 |
Internet Software & Services - 3.6% |
Facebook, Inc. Class A (a) | 3,537,960 | | 264,710 |
Google, Inc.: | | | |
Class A (a) | 458,700 | | 267,129 |
Class C (a) | 486,200 | | 277,912 |
Mail.Ru Group Ltd.: | | | |
GDR (a)(g) | 77,400 | | 2,078 |
GDR (Reg. S) (a) | 289,900 | | 7,784 |
NAVER Corp. | 13,744 | | 10,409 |
Pandora Media, Inc. (a) | 23,894 | | 646 |
Tencent Holdings Ltd. | 528,500 | | 8,602 |
Viggle, Inc. | 56,268 | | 156 |
Yahoo!, Inc. (a) | 1,001,900 | | 38,583 |
| | 878,009 |
IT Services - 0.9% |
Cognizant Technology Solutions Corp. Class A (a) | 1,616,800 | | 73,936 |
MasterCard, Inc. Class A | 410,900 | | 31,150 |
VeriFone Systems, Inc. (a) | 591,400 | | 20,652 |
Visa, Inc. Class A | 471,100 | | 100,118 |
| | 225,856 |
Semiconductors & Semiconductor Equipment - 1.9% |
Altera Corp. | 1,312,700 | | 46,391 |
Broadcom Corp. Class A | 1,023,900 | | 40,321 |
Cree, Inc. (a) | 592,700 | | 27,003 |
Freescale Semiconductor, Inc. (a) | 2,679,900 | | 56,412 |
Intel Corp. | 3,279,300 | | 114,513 |
KLA-Tencor Corp. | 408,900 | | 31,248 |
Micron Technology, Inc. (a) | 1,068,600 | | 34,836 |
NXP Semiconductors NV (a) | 1,515,400 | | 103,835 |
Spansion, Inc. Class A (a) | 657 | | 15 |
| | 454,574 |
Software - 3.0% |
Activision Blizzard, Inc. | 1,712,100 | | 40,303 |
Adobe Systems, Inc. (a) | 1,417,100 | | 101,889 |
Autodesk, Inc. (a) | 568,600 | | 30,500 |
Microsoft Corp. | 6,893,400 | | 313,167 |
Common Stocks - continued |
| Shares | | Value (000s) |
INFORMATION TECHNOLOGY - continued |
Software - continued |
Oracle Corp. | 3,308,300 | | $ 137,394 |
Red Hat, Inc. (a) | 798,000 | | 48,614 |
salesforce.com, Inc. (a) | 1,078,200 | | 63,711 |
Workday, Inc. Class A (a) | 53,900 | | 4,909 |
| | 740,487 |
Technology Hardware, Storage & Peripherals - 3.2% |
Apple, Inc. | 6,441,900 | | 660,285 |
EMC Corp. | 1,548,700 | | 45,733 |
Hewlett-Packard Co. | 2,097,200 | | 79,694 |
| | 785,712 |
TOTAL INFORMATION TECHNOLOGY | | 3,426,349 |
MATERIALS - 3.0% |
Chemicals - 2.6% |
Air Products & Chemicals, Inc. | 164,500 | | 21,913 |
Ashland, Inc. | 24 | | 3 |
Celanese Corp. Class A | 402,667 | | 25,183 |
CF Industries Holdings, Inc. | 149,406 | | 38,497 |
E.I. du Pont de Nemours & Co. | 1,315,175 | | 86,946 |
Ferro Corp. (a) | 3,408,200 | | 45,943 |
Huntsman Corp. | 1,939,120 | | 52,143 |
Intrepid Potash, Inc. (a)(e) | 1,669,800 | | 25,598 |
LyondellBasell Industries NV Class A | 778,498 | | 89,021 |
Methanex Corp. | 539,800 | | 36,093 |
Monsanto Co. | 508,800 | | 58,843 |
Potash Corp. of Saskatchewan, Inc. (e) | 1,282,400 | | 45,043 |
Trinseo SA | 99,300 | | 1,952 |
W.R. Grace & Co. (a) | 238,200 | | 23,589 |
Wacker Chemie AG (e) | 228,300 | | 27,115 |
Westlake Chemical Corp. | 545,100 | | 52,946 |
Westlake Chemical Partners LP (a) | 44,800 | | 1,360 |
| | 632,188 |
Construction Materials - 0.2% |
Eagle Materials, Inc. | 226,300 | | 23,062 |
Vulcan Materials Co. | 581,500 | | 36,855 |
| | 59,917 |
Metals & Mining - 0.2% |
Alcoa, Inc. | 768,200 | | 12,760 |
Common Stocks - continued |
| Shares | | Value (000s) |
MATERIALS - continued |
Metals & Mining - continued |
AngloGold Ashanti Ltd. sponsored ADR (a) | 57,230 | | $ 983 |
Freeport-McMoRan Copper & Gold, Inc. | 902,100 | | 32,809 |
| | 46,552 |
TOTAL MATERIALS | | 738,657 |
TELECOMMUNICATION SERVICES - 1.0% |
Diversified Telecommunication Services - 0.9% |
Broadview Networks Holdings, Inc. (a) | 123,987 | | 254 |
Iliad SA | 106,588 | | 23,417 |
Verizon Communications, Inc. | 3,860,348 | | 192,323 |
| | 215,994 |
Wireless Telecommunication Services - 0.1% |
SoftBank Corp. | 446,800 | | 32,284 |
TOTAL TELECOMMUNICATION SERVICES | | 248,278 |
UTILITIES - 1.5% |
Electric Utilities - 1.1% |
Edison International | 1,504,007 | | 88,947 |
NextEra Energy, Inc. | 1,041,900 | | 102,575 |
PPL Corp. | 1,863,900 | | 64,547 |
| | 256,069 |
Independent Power and Renewable Electricity Producers - 0.2% |
Abengoa Yield PLC | 812,400 | | 32,585 |
NextEra Energy Partners LP | 722,600 | | 25,370 |
| | 57,955 |
Independent Power Producers & Energy Traders - 0.1% |
Dynegy, Inc. (a) | 991,400 | | 32,399 |
Multi-Utilities - 0.1% |
Sempra Energy | 184,400 | | 19,541 |
TOTAL UTILITIES | | 365,964 |
TOTAL COMMON STOCKS (Cost $12,096,987) |
16,956,650
|
Preferred Stocks - 0.8% |
| Shares | | Value (000s) |
Convertible Preferred Stocks - 0.6% |
CONSUMER DISCRETIONARY - 0.5% |
Household Durables - 0.1% |
Blu Homes, Inc. Series A, 5.00% (a)(o) | 1,082,251 | | $ 5,390 |
Roku, Inc. 8.00% (a)(o) | 5,520,836 | | 7,453 |
Wayfair LLC Series B (n)(o) | 266,909 | | 9,758 |
| | 22,601 |
Media - 0.4% |
Vice Holding, Inc. Series A (a)(o) | 6,701 | | 101,500 |
TOTAL CONSUMER DISCRETIONARY | | 124,101 |
FINANCIALS - 0.0% |
Diversified Financial Services - 0.0% |
Deem, Inc. (o) | 159,864,334 | | 11,191 |
INFORMATION TECHNOLOGY - 0.1% |
Internet Software & Services - 0.1% |
Uber Technologies, Inc. 8.00% (o) | 402,887 | | 25,000 |
TOTAL CONVERTIBLE PREFERRED STOCKS | | 160,292 |
Nonconvertible Preferred Stocks - 0.2% |
CONSUMER DISCRETIONARY - 0.1% |
Textiles, Apparel & Luxury Goods - 0.1% |
C. Wonder LLC Class A-1 (a)(n)(o) | 619,047 | | 19,500 |
FINANCIALS - 0.1% |
Consumer Finance - 0.0% |
Ally Financial, Inc. 7.00% (g) | 8,853 | | 8,901 |
Diversified Financial Services - 0.1% |
GMAC Capital Trust I Series 2, 8.125% | 377,872 | | 10,157 |
TOTAL FINANCIALS | | 19,058 |
INDUSTRIALS - 0.0% |
Commercial Services & Supplies - 0.0% |
WP Rocket Holdings, Inc. 15.00% | 961,655 | | 789 |
TOTAL NONCONVERTIBLE PREFERRED STOCKS | | 39,347 |
TOTAL PREFERRED STOCKS (Cost $117,508) |
199,639
|
Corporate Bonds - 13.0% |
| Principal Amount (000s) | | Value (000s) |
Convertible Bonds - 0.0% |
CONSUMER DISCRETIONARY - 0.0% |
Media - 0.0% |
Liberty Media Corp.: | | | | |
3.5% 1/15/31 | | $ 620 | | $ 336 |
3.5% 1/15/31 (g) | | 4,584 | | 2,481 |
Mood Media Corp. 10% 10/31/15 (g) | | 32 | | 29 |
| | 2,846 |
Nonconvertible Bonds - 13.0% |
CONSUMER DISCRETIONARY - 1.1% |
Auto Components - 0.0% |
Chassix, Inc. 9.25% 8/1/18 (g) | | 470 | | 486 |
Dana Holding Corp.: | | | | |
5.375% 9/15/21 | | 880 | | 913 |
6% 9/15/23 | | 880 | | 937 |
Gates Global LLC / Gates Global Co. 6% 7/15/22 (g) | | 1,260 | | 1,247 |
Schaeffler Holding Finance BV 6.875% 8/15/18 pay-in-kind (g)(k) | | 1,565 | | 1,649 |
Tenneco, Inc. 6.875% 12/15/20 | | 2,415 | | 2,611 |
| | 7,843 |
Automobiles - 0.0% |
Volkswagen International Finance NV 2.375% 3/22/17 (g) | | 1,515 | | 1,561 |
Distributors - 0.0% |
American Builders & Contractors Supply Co., Inc. 5.625% 4/15/21 (g) | | 365 | | 371 |
LKQ Corp. 4.75% 5/15/23 | | 265 | | 259 |
| | 630 |
Diversified Consumer Services - 0.1% |
Ingersoll-Rand Global Holding Co. Ltd.: | | | | |
2.875% 1/15/19 | | 554 | | 568 |
4.25% 6/15/23 | | 3,903 | | 4,163 |
Laureate Education, Inc. 9.25% 9/1/19 (g) | | 4,040 | | 4,141 |
Service Corp. International 5.375% 1/15/22 | | 505 | | 523 |
| | 9,395 |
Hotels, Restaurants & Leisure - 0.2% |
24 Hour Holdings III LLC 8% 6/1/22 (g) | | 510 | | 495 |
Caesars Growth Propeties Holdings LLC/Caesars Growth Properties Finance, Inc. 9.375% 5/1/22 (g) | | 2,095 | | 2,027 |
Corporate Bonds - continued |
| Principal Amount (000s) | | Value (000s) |
Nonconvertible Bonds - continued |
CONSUMER DISCRETIONARY - continued |
Hotels, Restaurants & Leisure - continued |
Choice Hotels International, Inc. 5.75% 7/1/22 | | $ 390 | | $ 425 |
Chukchansi Economic Development Authority 9.75% 5/30/20 (d)(g) | | 2,861 | | 1,988 |
GLP Capital LP/GLP Financing II, Inc.: | | | | |
4.375% 11/1/18 | | 480 | | 498 |
4.875% 11/1/20 | | 1,255 | | 1,311 |
5.375% 11/1/23 | | 1,000 | | 1,058 |
Golden Nugget Escrow, Inc. 8.5% 12/1/21 (g) | | 680 | | 711 |
Graton Economic Development Authority 9.625% 9/1/19 (g) | | 1,065 | | 1,193 |
Hilton Worldwide Finance LLC/Hilton Worldwide Finance Corp. 5.625% 10/15/21 (g) | | 5,854 | | 6,205 |
Landry's Holdings II, Inc. 10.25% 1/1/18 (g) | | 900 | | 938 |
MCE Finance Ltd. 5% 2/15/21 (g) | | 1,290 | | 1,284 |
MGM Mirage, Inc.: | | | | |
6.625% 12/15/21 | | 1,115 | | 1,240 |
7.5% 6/1/16 | | 2,855 | | 3,105 |
NAI Entertainment Holdings LLC/NAI Entertainment Finance Corp. 5% 8/1/18 (g) | | 865 | | 889 |
Paris Las Vegas Holding LLC/Harrah's Las Vegas LLC/Flamingo Las Vegas Holdings, Inc.: | | | | |
8% 10/1/20 (g) | | 3,205 | | 3,181 |
11% 10/1/21 (g) | | 1,560 | | 1,581 |
Pinnacle Entertainment, Inc. 7.75% 4/1/22 | | 450 | | 486 |
Studio City Finance Ltd. 8.5% 12/1/20 (g) | | 5,600 | | 6,160 |
Waterford Gaming LLC/Waterford Gaming Finance Corp. 8.625% 9/15/14 (g) | | 715 | | 81 |
| | 34,856 |
Household Durables - 0.1% |
Beazer Homes U.S.A., Inc. 7.25% 2/1/23 | | 775 | | 796 |
Brookfield Residential Properties, Inc./Brookfield Residential U.S. Corp. 6.125% 7/1/22 (g) | | 785 | | 813 |
Brookfield Residential Properties, Inc. 6.5% 12/15/20 (g) | | 620 | | 658 |
D.R. Horton, Inc.: | | | | |
4.75% 2/15/23 | | 515 | | 509 |
5.75% 8/15/23 | | 425 | | 452 |
KB Home 4.75% 5/15/19 | | 2,355 | | 2,355 |
Corporate Bonds - continued |
| Principal Amount (000s) | | Value (000s) |
Nonconvertible Bonds - continued |
CONSUMER DISCRETIONARY - continued |
Household Durables - continued |
Reynolds Group Issuer, Inc./Reynolds Group Issuer LLC/Reynolds Group Issuer (Luxembourg) SA: | | | | |
5.75% 10/15/20 | | $ 6,420 | | $ 6,709 |
7.875% 8/15/19 | | 8,325 | | 9,012 |
8.25% 2/15/21 | | 1,485 | | 1,621 |
9% 4/15/19 | | 835 | | 877 |
William Lyon Homes, Inc.: | | | | |
5.75% 4/15/19 | | 470 | | 475 |
7% 8/15/22 (g) | | 1,255 | | 1,290 |
8.5% 11/15/20 | | 1,310 | | 1,448 |
Woodside Homes Co. LLC/Woodside Homes Finance, Inc. 6.75% 12/15/21 (g) | | 1,350 | | 1,360 |
| | 28,375 |
Media - 0.7% |
Altice S.A. 7.75% 5/15/22 (g) | | 10,065 | | 10,694 |
AMC Networks, Inc. 7.75% 7/15/21 | | 340 | | 375 |
CBS Outdoor Americas Capital LLC/CBS Outdoor Americas Capital Corp.: | | | | |
5.25% 2/15/22 (g) | | 275 | | 281 |
5.625% 2/15/24 (g) | | 295 | | 304 |
CCO Holdings LLC/CCO Holdings Capital Corp.: | | | | |
5.125% 2/15/23 | | 1,580 | | 1,572 |
5.25% 3/15/21 | | 1,375 | | 1,406 |
5.75% 9/1/23 | | 945 | | 971 |
5.75% 1/15/24 | | 4,235 | | 4,330 |
Cequel Communications Escrow I LLC/Cequel Communications Escrow Capital Corp. 6.375% 9/15/20 (g) | | 325 | | 341 |
Cequel Communications Holdings I LLC/Cequel Capital Corp. 5.125% 12/15/21 (g) | | 3,345 | | 3,316 |
Cinemark U.S.A., Inc.: | | | | |
4.875% 6/1/23 | | 1,275 | | 1,265 |
5.125% 12/15/22 | | 355 | | 361 |
Clear Channel Communications, Inc. 5.5% 12/15/16 | | 1,440 | | 1,426 |
Clear Channel Worldwide Holdings, Inc.: | | | | |
Series A: | | | | |
6.5% 11/15/22 | | 755 | | 804 |
7.625% 3/15/20 | | 585 | | 624 |
Series B, 6.5% 11/15/22 | | 2,040 | | 2,183 |
7.625% 3/15/20 | | 4,105 | | 4,392 |
Corporate Bonds - continued |
| Principal Amount (000s) | | Value (000s) |
Nonconvertible Bonds - continued |
CONSUMER DISCRETIONARY - continued |
Media - continued |
Columbus International, Inc. 7.375% 3/30/21 (g) | | $ 5,655 | | $ 6,157 |
COX Communications, Inc. 3.25% 12/15/22 (g) | | 2,162 | | 2,124 |
Darling Escrow Corp. 5.375% 1/15/22 (g) | | 745 | | 773 |
Discovery Communications LLC 5.05% 6/1/20 | | 168 | | 188 |
DISH DBS Corp.: | | | | |
5% 3/15/23 | | 2,675 | | 2,662 |
5.875% 7/15/22 | | 2,655 | | 2,817 |
6.75% 6/1/21 | | 3,515 | | 3,932 |
EchoStar Communications Corp. 6.625% 10/1/14 | | 3,000 | | 3,011 |
Griffey Intermediate, Inc./Griffey Finance Sub LLC 7% 10/15/20 (g) | | 2,640 | | 2,218 |
Lamar Media Corp.: | | | | |
5.375% 1/15/24 (g) | | 630 | | 649 |
5.875% 2/1/22 | | 525 | | 551 |
Lions Gate Entertainment Corp. 5.25% 8/1/18 (g) | | 3,730 | | 3,851 |
McGraw-Hill Global Education Holdings LLC/McGraw-Hill Global Education Finance 9.75% 4/1/21 | | 6,635 | | 7,498 |
MHGE Parent LLC / MHGE Parent Finance, Inc. 8.5% 8/1/19 pay-in-kind (g)(k) | | 1,915 | | 1,881 |
National CineMedia LLC: | | | | |
6% 4/15/22 | | 2,600 | | 2,704 |
7.875% 7/15/21 | | 1,380 | | 1,490 |
NBCUniversal, Inc. 5.15% 4/30/20 | | 4,917 | | 5,628 |
News America Holdings, Inc. 7.75% 12/1/45 | | 8,012 | | 11,954 |
Nielsen Finance LLC/Nielsen Finance Co. 5% 4/15/22 (g) | | 685 | | 692 |
Numericable Group SA: | | | | |
4.875% 5/15/19 (g) | | 4,535 | | 4,592 |
6% 5/15/22 (g) | | 8,815 | | 9,079 |
6.25% 5/15/24 (g) | | 660 | | 681 |
RCN Telecom Services LLC/RCN Capital Corp. 8.5% 8/15/20 (g) | | 850 | | 907 |
Regal Entertainment Group: | | | | |
5.75% 3/15/22 | | 1,230 | | 1,261 |
5.75% 6/15/23 | | 2,270 | | 2,298 |
5.75% 2/1/25 | | 340 | | 341 |
Sirius XM Radio, Inc. 5.75% 8/1/21 (g) | | 2,580 | | 2,683 |
Thomson Reuters Corp. 1.3% 2/23/17 | | 1,794 | | 1,796 |
Corporate Bonds - continued |
| Principal Amount (000s) | | Value (000s) |
Nonconvertible Bonds - continued |
CONSUMER DISCRETIONARY - continued |
Media - continued |
Time Warner Cable, Inc.: | | | | |
4% 9/1/21 | | $ 9,654 | | $ 10,361 |
5.85% 5/1/17 | | 1,621 | | 1,810 |
6.75% 7/1/18 | | 1,581 | | 1,858 |
8.25% 4/1/19 | | 10,176 | | 12,802 |
Time Warner, Inc.: | | | | |
2.1% 6/1/19 | | 10,950 | | 10,860 |
5.875% 11/15/16 | | 3,738 | | 4,124 |
Time, Inc. 5.75% 4/15/22 (g) | | 1,300 | | 1,297 |
Unitymedia Hessen GmbH & Co. KG/Unitymedia NRW GmbH: | | | | |
5.5% 1/15/23 (g) | | 1,340 | | 1,370 |
7.5% 3/15/19 (g) | | 480 | | 508 |
UPCB Finance VI Ltd. 6.875% 1/15/22 (g) | | 1,250 | | 1,353 |
Viacom, Inc.: | | | | |
1.25% 2/27/15 | | 377 | | 378 |
2.5% 9/1/18 | | 714 | | 727 |
3.5% 4/1/17 | | 219 | | 231 |
Videotron Ltd. 9.125% 4/15/18 | | 570 | | 589 |
WideOpenWest Finance LLC/WideOpenWest Capital Corp.: | | | | |
10.25% 7/15/19 | | 3,505 | | 3,908 |
13.375% 10/15/19 | | 1,780 | | 2,056 |
WMG Acquisition Corp.: | | | | |
5.625% 4/15/22 (g) | | 275 | | 282 |
6% 1/15/21 (g) | | 423 | | 440 |
| | 174,017 |
Multiline Retail - 0.0% |
JC Penney Corp., Inc.: | | | | |
5.65% 6/1/20 | | 1,357 | | 1,238 |
5.75% 2/15/18 | | 400 | | 384 |
7.4% 4/1/37 | | 440 | | 394 |
| | 2,016 |
Specialty Retail - 0.0% |
Asbury Automotive Group, Inc. 8.375% 11/15/20 | | 565 | | 619 |
CST Brands, Inc. 5% 5/1/23 | | 320 | | 320 |
PETCO Animal Supplies, Inc. 9.25% 12/1/18 (g) | | 3,260 | | 3,468 |
Corporate Bonds - continued |
| Principal Amount (000s) | | Value (000s) |
Nonconvertible Bonds - continued |
CONSUMER DISCRETIONARY - continued |
Specialty Retail - continued |
Sonic Automotive, Inc.: | | | | |
5% 5/15/23 | | $ 195 | | $ 193 |
7% 7/15/22 | | 885 | | 967 |
| | 5,567 |
Textiles, Apparel & Luxury Goods - 0.0% |
Polymer Group, Inc. 6.875% 6/1/19 (g) | | 505 | | 511 |
TOTAL CONSUMER DISCRETIONARY | | 264,771 |
CONSUMER STAPLES - 0.4% |
Beverages - 0.0% |
SABMiller Holdings, Inc.: | | | | |
1.85% 1/15/15 (g) | | 1,947 | | 1,956 |
2.45% 1/15/17 (g) | | 1,947 | | 2,006 |
| | 3,962 |
Food & Staples Retailing - 0.1% |
C&S Group Enterprises LLC 5.375% 7/15/22 (g) | | 1,440 | | 1,440 |
CVS Caremark Corp. 2.25% 12/5/18 | | 4,123 | | 4,165 |
ESAL GmbH 6.25% 2/5/23 (g) | | 3,005 | | 3,013 |
Kroger Co. 3.3% 1/15/21 | | 6,000 | | 6,167 |
Minerva Luxmbourg SA 7.75% 1/31/23 (g) | | 365 | | 387 |
Rite Aid Corp.: | | | | |
6.75% 6/15/21 | | 7,375 | | 7,827 |
6.875% 12/15/28 (g) | | 3,505 | | 3,610 |
7.7% 2/15/27 | | 3,220 | | 3,574 |
9.25% 3/15/20 | | 1,330 | | 1,490 |
| | 31,673 |
Food Products - 0.1% |
Cargill, Inc. 6% 11/27/17 (g) | | 417 | | 473 |
ConAgra Foods, Inc.: | | | | |
1.9% 1/25/18 | | 2,064 | | 2,064 |
3.2% 1/25/23 | | 1,737 | | 1,712 |
FAGE Dairy Industry SA/FAGE U.S.A. Dairy Industry, Inc. 9.875% 2/1/20 (g) | | 1,377 | | 1,470 |
H.J. Heinz Co. 4.25% 10/15/20 | | 6,030 | | 6,113 |
JBS Investments GmbH: | | | | |
7.25% 4/3/24 (g) | | 1,090 | | 1,146 |
7.75% 10/28/20 (g) | | 2,850 | | 3,078 |
Corporate Bonds - continued |
| Principal Amount (000s) | | Value (000s) |
Nonconvertible Bonds - continued |
CONSUMER STAPLES - continued |
Food Products - continued |
JBS U.S.A. LLC/JBS U.S.A. Finance, Inc. 5.875% 7/15/24 (g) | | $ 1,370 | | $ 1,370 |
Post Holdings, Inc.: | | | | |
6% 12/15/22 (g) | | 675 | | 665 |
6.75% 12/1/21 (g) | | 1,900 | | 1,936 |
Tyson Foods, Inc. 3.95% 8/15/24 | | 8,400 | | 8,581 |
William Wrigley Jr. Co.: | | | | |
1.4% 10/21/16 (g) | | 3,217 | | 3,239 |
2% 10/20/17 (g) | | 4,607 | | 4,668 |
| | 36,515 |
Household Products - 0.0% |
Spectrum Brands Holdings, Inc.: | | | | |
6.375% 11/15/20 | | 350 | | 376 |
6.625% 11/15/22 | | 415 | | 449 |
| | 825 |
Personal Products - 0.0% |
First Quality Finance Co., Inc. 4.625% 5/15/21 (g) | | 300 | | 284 |
Prestige Brands, Inc.: | | | | |
5.375% 12/15/21 (g) | | 1,660 | | 1,648 |
8.125% 2/1/20 | | 220 | | 239 |
Revlon Consumer Products Corp. 5.75% 2/15/21 | | 1,105 | | 1,122 |
| | 3,293 |
Tobacco - 0.2% |
Altria Group, Inc.: | | | | |
2.85% 8/9/22 | | 4,020 | | 3,932 |
4% 1/31/24 | | 3,123 | | 3,249 |
9.7% 11/10/18 | | 5,570 | | 7,228 |
Reynolds American, Inc.: | | | | |
3.25% 11/1/22 | | 2,999 | | 2,936 |
4.85% 9/15/23 | | 7,000 | | 7,550 |
6.75% 6/15/17 | | 3,979 | | 4,524 |
7.25% 6/15/37 | | 6,101 | | 7,783 |
| | 37,202 |
TOTAL CONSUMER STAPLES | | 113,470 |
Corporate Bonds - continued |
| Principal Amount (000s) | | Value (000s) |
Nonconvertible Bonds - continued |
ENERGY - 1.6% |
Energy Equipment & Services - 0.2% |
DCP Midstream LLC: | | | | |
4.75% 9/30/21 (g) | | $ 5,634 | | $ 6,023 |
5.35% 3/15/20 (g) | | 5,174 | | 5,719 |
El Paso Pipeline Partners Operating Co. LLC: | | | | |
4.1% 11/15/15 | | 5,488 | | 5,689 |
5% 10/1/21 | | 2,280 | | 2,490 |
6.5% 4/1/20 | | 2,264 | | 2,633 |
Forum Energy Technologies, Inc. 6.25% 10/1/21 (g) | | 655 | | 694 |
Gulfmark Offshore, Inc. 6.375% 3/15/22 | | 365 | | 368 |
Noble Holding International Ltd. 3.05% 3/1/16 | | 756 | | 779 |
Offshore Group Investment Ltd.: | | | | |
7.125% 4/1/23 | | 1,500 | | 1,489 |
7.5% 11/1/19 | | 4,935 | | 5,046 |
Pacific Drilling V Ltd. 7.25% 12/1/17 (g) | | 1,215 | | 1,273 |
Pride International, Inc. 6.875% 8/15/20 | | 1,355 | | 1,633 |
Rose Rock Midstream LP/ Rose Rock Finance Corp. 5.625% 7/15/22 (g) | | 635 | | 648 |
Summit Midstream Holdings LLC 7.5% 7/1/21 | | 500 | | 550 |
Transocean, Inc. 5.05% 12/15/16 | | 3,719 | | 4,012 |
Unit Corp. 6.625% 5/15/21 | | 4,515 | | 4,696 |
| | 43,742 |
Oil, Gas & Consumable Fuels - 1.4% |
Access Midstream Partners LP/ACMP Finance Corp. 4.875% 5/15/23 | | 1,680 | | 1,768 |
Alpha Natural Resources, Inc.: | | | | |
6% 6/1/19 | | 2,410 | | 1,717 |
6.25% 6/1/21 | | 2,725 | | 1,867 |
9.75% 4/15/18 | | 1,099 | | 986 |
American Energy-Permian Basin LLC/ AEPB Finance Corp.: | | | | |
6.7412% 8/1/19 (g)(k) | | 1,265 | | 1,237 |
7.125% 11/1/20 (g) | | 1,030 | | 999 |
7.375% 11/1/21 (g) | | 915 | | 892 |
Anadarko Petroleum Corp. 6.375% 9/15/17 | | 20,246 | | 23,082 |
Antero Resources Corp. 5.125% 12/1/22 (g) | | 2,155 | | 2,187 |
Atlas Pipeline Partners LP/Atlas Pipeline Finance Corp. 5.875% 8/1/23 | | 1,155 | | 1,172 |
Chesapeake Energy Corp.: | | | | |
4.875% 4/15/22 | | 1,080 | | 1,130 |
Corporate Bonds - continued |
| Principal Amount (000s) | | Value (000s) |
Nonconvertible Bonds - continued |
ENERGY - continued |
Oil, Gas & Consumable Fuels - continued |
Chesapeake Energy Corp.: - continued | | | | |
5.375% 6/15/21 | | $ 1,340 | | $ 1,417 |
5.75% 3/15/23 | | 1,330 | | 1,485 |
6.125% 2/15/21 | | 805 | | 912 |
6.875% 11/15/20 | | 100 | | 116 |
Concho Resources, Inc. 5.5% 4/1/23 | | 1,155 | | 1,233 |
Crestwood Midstream Partners LP/Crestwood Midstream Finance Corp.: | | | | |
6.125% 3/1/22 | | 895 | | 926 |
7.75% 4/1/19 | | 1,990 | | 2,114 |
DCP Midstream Operating LP: | | | | |
2.5% 12/1/17 | | 2,677 | | 2,743 |
2.7% 4/1/19 | | 523 | | 530 |
3.875% 3/15/23 | | 1,647 | | 1,685 |
4.95% 4/1/22 | | 1,048 | | 1,157 |
Denbury Resources, Inc. 4.625% 7/15/23 | | 4,625 | | 4,463 |
Diamondback Energy, Inc. 7.625% 10/1/21 (g) | | 935 | | 1,024 |
Duke Energy Field Services: | | | | |
5.375% 10/15/15 (g) | | 1,647 | | 1,713 |
6.45% 11/3/36 (g) | | 3,753 | | 4,464 |
El Paso Natural Gas Co. 5.95% 4/15/17 | | 1,260 | | 1,399 |
Enable Midstream Partners LP: | | | | |
2.4% 5/15/19 (g) | | 1,656 | | 1,651 |
3.9% 5/15/24 (g) | | 1,746 | | 1,764 |
Enbridge Energy Partners LP 4.2% 9/15/21 | | 6,629 | | 7,094 |
EP Energy LLC/Everest Acquisition Finance, Inc. 7.75% 9/1/22 | | 885 | | 993 |
Everest Acquisition LLC/Everest Acquisition Finance, Inc.: | | | | |
6.875% 5/1/19 | | 1,540 | | 1,625 |
9.375% 5/1/20 | | 4,780 | | 5,389 |
Genesis Energy LP/Genesis Energy Finance Corp. 5.75% 2/15/21 | | 520 | | 537 |
Gibson Energy, Inc. 6.75% 7/15/21 (g) | | 160 | | 173 |
Global Partners LP/GLP Finance Corp. 6.25% 7/15/22 (g) | | 305 | | 307 |
Gulfstream Natural Gas System LLC 6.95% 6/1/16 (g) | | 677 | | 737 |
Kodiak Oil & Gas Corp.: | | | | |
5.5% 1/15/21 | | 485 | | 512 |
8.125% 12/1/19 | | 1,325 | | 1,458 |
Corporate Bonds - continued |
| Principal Amount (000s) | | Value (000s) |
Nonconvertible Bonds - continued |
ENERGY - continued |
Oil, Gas & Consumable Fuels - continued |
Laredo Petroleum Holdings, Inc. 5.625% 1/15/22 | | $ 1,740 | | $ 1,788 |
LINN Energy LLC/LINN Energy Finance Corp. 6.5% 5/15/19 | | 1,820 | | 1,873 |
Marathon Petroleum Corp. 5.125% 3/1/21 | | 3,173 | | 3,593 |
Markwest Energy Partners LP/Markwest Energy Finance Corp. 5.5% 2/15/23 | | 610 | | 644 |
Midcontinent Express Pipeline LLC 5.45% 9/15/14 (g) | | 2,559 | | 2,561 |
Motiva Enterprises LLC 5.75% 1/15/20 (g) | | 3,614 | | 4,095 |
Nakilat, Inc. 6.067% 12/31/33 (g) | | 1,839 | | 2,069 |
Nexen, Inc.: | | | | |
5.2% 3/10/15 | | 1,224 | | 1,253 |
6.2% 7/30/19 | | 1,865 | | 2,176 |
Pemex Project Funding Master Trust 5.75% 3/1/18 | | 21,220 | | 23,809 |
Petrobras Global Finance BV: | | | | |
3% 1/15/19 | | 25,963 | | 25,583 |
3.25% 3/17/17 | | 10,749 | | 10,995 |
4.375% 5/20/23 | | 3,648 | | 3,599 |
4.875% 3/17/20 | | 10,749 | | 11,165 |
Petrobras International Finance Co. Ltd.: | | | | |
3.875% 1/27/16 | | 5,238 | | 5,385 |
5.375% 1/27/21 | | 10,725 | | 11,307 |
5.75% 1/20/20 | | 16,310 | | 17,581 |
7.875% 3/15/19 | | 5,564 | | 6,482 |
Petroleos Mexicanos: | | | | |
3.5% 7/18/18 | | 7,105 | | 7,425 |
3.5% 1/30/23 | | 4,530 | | 4,489 |
4.875% 1/24/22 | | 2,315 | | 2,515 |
4.875% 1/18/24 | | 1,916 | | 2,085 |
4.875% 1/18/24 (g) | | 4,058 | | 4,415 |
5.5% 1/21/21 | | 5,342 | | 6,010 |
5.5% 6/27/44 | | 17,702 | | 19,202 |
6% 3/5/20 | | 2,852 | | 3,273 |
6.375% 1/23/45 (g) | | 5,324 | | 6,442 |
6.5% 6/2/41 | | 7,783 | | 9,495 |
Phillips 66 Co.: | | | | |
1.95% 3/5/15 | | 1,526 | | 1,537 |
2.95% 5/1/17 | | 1,527 | | 1,595 |
4.3% 4/1/22 | | 5,338 | | 5,785 |
Corporate Bonds - continued |
| Principal Amount (000s) | | Value (000s) |
Nonconvertible Bonds - continued |
ENERGY - continued |
Oil, Gas & Consumable Fuels - continued |
Plains All American Pipeline LP/PAA Finance Corp. 6.125% 1/15/17 | | $ 1,880 | | $ 2,095 |
Rosetta Resources, Inc. 5.875% 6/1/24 | | 700 | | 712 |
Sabine Pass Liquefaction LLC: | | | | |
5.625% 4/15/23 (g) | | 2,585 | | 2,688 |
5.75% 5/15/24 (g) | | 1,830 | | 1,903 |
SemGroup Corp. 7.5% 6/15/21 | | 1,000 | | 1,080 |
Southeast Supply Header LLC 4.25% 6/15/24 (g) | | 4,893 | | 5,051 |
Spectra Energy Capital, LLC 5.65% 3/1/20 | | 944 | | 1,064 |
Spectra Energy Partners, LP: | | | | |
2.95% 6/15/16 | | 1,059 | | 1,096 |
4.6% 6/15/21 | | 1,296 | | 1,422 |
Suncor Energy, Inc. 6.1% 6/1/18 | | 7,771 | | 8,961 |
Targa Resources Partners LP/Targa Resources Partners Finance Corp. 6.375% 8/1/22 | | 570 | | 618 |
Teekay Corp. 8.5% 1/15/20 | | 120 | | 136 |
The Williams Companies, Inc.: | | | | |
3.7% 1/15/23 | | 1,598 | | 1,533 |
4.55% 6/24/24 | | 14,442 | | 14,546 |
Western Gas Partners LP 5.375% 6/1/21 | | 7,807 | | 8,874 |
Western Refining, Inc. 6.25% 4/1/21 | | 550 | | 572 |
Williams Partners LP 4.3% 3/4/24 | | 4,038 | | 4,224 |
| | 353,459 |
TOTAL ENERGY | | 397,201 |
FINANCIALS - 5.8% |
Banks - 2.4% |
Associated Banc Corp. 5.125% 3/28/16 | | 1,852 | | 1,958 |
Banco Nacional de Desenvolvimento Economico e Social: | | | | |
4% 4/14/19 (g) | | 13,750 | | 14,094 |
5.5% 7/12/20 (g) | | 16,673 | | 18,194 |
6.5% 6/10/19 (g) | | 1,763 | | 1,986 |
Bank of America Corp.: | | | | |
1.35% 11/21/16 | | 4,652 | | 4,667 |
2.6% 1/15/19 | | 37,410 | | 37,775 |
2.65% 4/1/19 | | 12,287 | | 12,412 |
3.875% 3/22/17 | | 781 | | 829 |
Corporate Bonds - continued |
| Principal Amount (000s) | | Value (000s) |
Nonconvertible Bonds - continued |
FINANCIALS - continued |
Banks - continued |
Bank of America Corp.: - continued | | | | |
4.2% 8/26/24 | | $ 6,463 | | $ 6,561 |
6.5% 8/1/16 | | 1,010 | | 1,110 |
Bank of America NA 5.3% 3/15/17 | | 14,681 | | 16,010 |
Barclays Bank PLC 2.5% 2/20/19 | | 3,400 | | 3,455 |
BB&T Corp. 3.95% 3/22/22 | | 1,495 | | 1,592 |
Capital One NA 2.95% 7/23/21 | | 7,402 | | 7,414 |
CIT Group, Inc.: | | | | |
5% 8/15/22 | | 2,195 | | 2,316 |
5% 8/1/23 | | 2,755 | | 2,876 |
5.25% 3/15/18 | | 3,215 | | 3,432 |
5.375% 5/15/20 | | 2,805 | | 3,036 |
5.5% 2/15/19 (g) | | 5,285 | | 5,701 |
Citigroup, Inc.: | | | | |
1.3% 11/15/16 | | 5,354 | | 5,370 |
1.75% 5/1/18 | | 18,342 | | 18,256 |
2.5% 7/29/19 | | 32,442 | | 32,571 |
2.55% 4/8/19 | | 14,645 | | 14,789 |
4.05% 7/30/22 | | 14,700 | | 15,153 |
4.45% 1/10/17 | | 14,158 | | 15,178 |
5.3% 5/6/44 | | 10,932 | | 11,734 |
6% 8/15/17 | | 12,747 | | 14,330 |
Comerica, Inc. 4.8% 5/1/15 | | 1,013 | | 1,042 |
Credit Suisse AG 6% 2/15/18 | | 12,547 | | 14,169 |
Credit Suisse New York Branch 5.4% 1/14/20 | | 1,200 | | 1,352 |
Discover Bank: | | | | |
7% 4/15/20 | | 3,075 | | 3,684 |
8.7% 11/18/19 | | 532 | | 670 |
Fifth Third Bancorp: | | | | |
3.5% 3/15/22 | | 529 | | 549 |
4.5% 6/1/18 | | 418 | | 455 |
5.45% 1/15/17 | | 1,848 | | 2,018 |
HBOS PLC 6.75% 5/21/18 (g) | | 408 | | 468 |
HSBC Holdings PLC 4.25% 3/14/24 | | 2,900 | | 3,011 |
Huntington Bancshares, Inc. 7% 12/15/20 | | 2,561 | | 3,084 |
Huntington National Bank: | | | | |
1.3% 11/20/16 | | 3,560 | | 3,574 |
2.2% 4/1/19 | | 2,700 | | 2,702 |
Corporate Bonds - continued |
| Principal Amount (000s) | | Value (000s) |
Nonconvertible Bonds - continued |
FINANCIALS - continued |
Banks - continued |
Intesa Sanpaolo SpA: | | | | |
2.375% 1/13/17 | | $ 5,300 | | $ 5,369 |
3.125% 1/15/16 | | 18,292 | | 18,765 |
JPMorgan Chase & Co.: | | | | |
2% 8/15/17 | | 4,900 | | 4,980 |
2.35% 1/28/19 | | 32,891 | | 33,209 |
3.15% 7/5/16 | | 8,974 | | 9,330 |
JPMorgan Chase Bank 6% 10/1/17 | | 1,942 | | 2,193 |
KeyBank NA 5.45% 3/3/16 | | 2,302 | | 2,458 |
KeyCorp. 5.1% 3/24/21 | | 519 | | 590 |
Marshall & Ilsley Bank: | | | | |
4.85% 6/16/15 | | 3,881 | | 4,003 |
5% 1/17/17 | | 7,888 | | 8,433 |
Regions Bank: | | | | |
6.45% 6/26/37 | | 10,147 | | 12,097 |
7.5% 5/15/18 | | 11,552 | | 13,631 |
Regions Financial Corp.: | | | | |
2% 5/15/18 | | 7,154 | | 7,123 |
5.75% 6/15/15 | | 1,067 | | 1,108 |
7.75% 11/10/14 | | 4,922 | | 4,983 |
Royal Bank of Scotland Group PLC: | | | | |
5.125% 5/28/24 | | 37,329 | | 38,077 |
6% 12/19/23 | | 13,834 | | 15,041 |
6.1% 6/10/23 | | 7,367 | | 8,043 |
6.125% 12/15/22 | | 35,362 | | 38,673 |
Sumitomo Mitsui Banking Corp. 1.3% 1/10/17 | | 5,250 | | 5,260 |
SunTrust Banks, Inc.: | | | | |
2.35% 11/1/18 | | 2,607 | | 2,635 |
3.5% 1/20/17 | | 4,123 | | 4,341 |
Wachovia Bank NA 6% 11/15/17 | | 7,010 | | 7,971 |
Wells Fargo & Co.: | | | | |
4.1% 6/3/26 | | 13,000 | | 13,325 |
4.48% 1/16/24 | | 5,192 | | 5,568 |
| | 576,783 |
Capital Markets - 0.7% |
Affiliated Managers Group, Inc. 4.25% 2/15/24 | | 2,095 | | 2,189 |
Bear Stearns Companies, Inc. 5.3% 10/30/15 | | 878 | | 924 |
Goldman Sachs Group, Inc.: | | | | |
1.748% 9/15/17 | | 16,000 | | 15,998 |
Corporate Bonds - continued |
| Principal Amount (000s) | | Value (000s) |
Nonconvertible Bonds - continued |
FINANCIALS - continued |
Capital Markets - continued |
Goldman Sachs Group, Inc.: - continued | | | | |
2.375% 1/22/18 | | $ 10,000 | | $ 10,160 |
2.625% 1/31/19 | | 19,690 | | 19,929 |
5.95% 1/18/18 | | 4,242 | | 4,787 |
6.15% 4/1/18 | | 3,466 | | 3,949 |
6.25% 9/1/17 | | 19,047 | | 21,547 |
Lazard Group LLC: | | | | |
4.25% 11/14/20 | | 2,719 | | 2,866 |
6.85% 6/15/17 | | 5,189 | | 5,884 |
Merrill Lynch & Co., Inc. 6.4% 8/28/17 | | 4,204 | | 4,776 |
Morgan Stanley: | | | | |
2.125% 4/25/18 | | 16,388 | | 16,486 |
2.375% 7/23/19 | | 10,891 | | 10,868 |
2.5% 1/24/19 | | 36,150 | | 36,566 |
4% 7/24/15 | | 1,137 | | 1,172 |
4.875% 11/1/22 | | 2,855 | | 3,084 |
5.625% 9/23/19 | | 453 | | 518 |
5.95% 12/28/17 | | 250 | | 283 |
6.625% 4/1/18 | | 1,494 | | 1,730 |
State Street Corp. 3.1% 5/15/23 | | 6,500 | | 6,420 |
UBS AG Stamford Branch 2.375% 8/14/19 | | 11,000 | | 11,037 |
| | 181,173 |
Consumer Finance - 0.9% |
Ally Financial, Inc.: | | | | |
3.5% 1/27/19 | | 2,025 | | 2,033 |
4.625% 6/26/15 | | 2,540 | | 2,607 |
4.75% 9/10/18 | | 4,295 | | 4,520 |
6.25% 12/1/17 | | 1,800 | | 1,982 |
Capital One Financial Corp. 2.45% 4/24/19 | | 4,470 | | 4,496 |
Discover Financial Services: | | | | |
3.85% 11/21/22 | | 1,983 | | 2,031 |
5.2% 4/27/22 | | 2,146 | | 2,385 |
6.45% 6/12/17 | | 10,512 | | 11,839 |
Ford Motor Credit Co. LLC: | | | | |
1.5% 1/17/17 | | 16,012 | | 16,046 |
2.375% 3/12/19 | | 17,400 | | 17,416 |
2.5% 1/15/16 | | 14,000 | | 14,305 |
2.875% 10/1/18 | | 8,500 | | 8,751 |
Corporate Bonds - continued |
| Principal Amount (000s) | | Value (000s) |
Nonconvertible Bonds - continued |
FINANCIALS - continued |
Consumer Finance - continued |
Ford Motor Credit Co. LLC: - continued | | | | |
3% 6/12/17 | | $ 5,430 | | $ 5,631 |
4.375% 8/6/23 | | 13,241 | | 14,150 |
5% 5/15/18 | | 8,500 | | 9,384 |
5.875% 8/2/21 | | 10,438 | | 12,268 |
General Electric Capital Corp. 4.625% 1/7/21 | | 703 | | 787 |
General Motors Acceptance Corp. 8% 11/1/31 | | 3,115 | | 4,018 |
GMAC LLC: | | | | |
6.75% 12/1/14 | | 2,355 | | 2,387 |
8% 12/31/18 | | 6,035 | | 7,042 |
8% 11/1/31 | | 16,726 | | 21,639 |
Hyundai Capital America: | | | | |
1.45% 2/6/17 (g) | | 5,366 | | 5,371 |
1.625% 10/2/15 (g) | | 1,867 | | 1,881 |
1.875% 8/9/16 (g) | | 1,416 | | 1,435 |
2.125% 10/2/17 (g) | | 2,063 | | 2,091 |
2.55% 2/6/19 (g) | | 5,366 | | 5,437 |
2.875% 8/9/18 (g) | | 2,511 | | 2,590 |
SLM Corp.: | | | | |
4.875% 6/17/19 | | 5,315 | | 5,562 |
5.5% 1/15/19 | | 2,150 | | 2,284 |
5.5% 1/25/23 | | 1,365 | | 1,372 |
6.125% 3/25/24 | | 2,195 | | 2,255 |
8% 3/25/20 | | 5,930 | | 6,849 |
8.45% 6/15/18 | | 2,980 | | 3,468 |
Synchrony Financial: | | | | |
1.875% 8/15/17 | | 1,300 | | 1,310 |
3% 8/15/19 | | 1,910 | | 1,937 |
3.75% 8/15/21 | | 7,084 | | 7,230 |
4.25% 8/15/24 | | 2,903 | | 2,972 |
| | 219,761 |
Diversified Financial Services - 0.2% |
AerCap Ireland Capital Ltd./AerCap Global Aviation Trust: | | | | |
2.75% 5/15/17 (g) | | 2,625 | | 2,625 |
3.75% 5/15/19 (g) | | 2,125 | | 2,141 |
4.5% 5/15/21 (g) | | 2,325 | | 2,374 |
Corporate Bonds - continued |
| Principal Amount (000s) | | Value (000s) |
Nonconvertible Bonds - continued |
FINANCIALS - continued |
Diversified Financial Services - continued |
BP Capital Markets PLC: | | | | |
4.5% 10/1/20 | | $ 1,106 | | $ 1,221 |
4.742% 3/11/21 | | 4,210 | | 4,719 |
Five Corners Funding Trust 4.419% 11/15/23 (g) | | 8,055 | | 8,598 |
General Motors Financial Co., Inc.: | | | | |
3.25% 5/15/18 | | 700 | | 705 |
4.25% 5/15/23 | | 615 | | 628 |
4.75% 8/15/17 | | 4,295 | | 4,516 |
6.75% 6/1/18 | | 6,765 | | 7,602 |
Icahn Enterprises LP/Icahn Enterprises Finance Corp.: | | | | |
4.875% 3/15/19 | | 2,280 | | 2,343 |
5.875% 2/1/22 | | 2,725 | | 2,841 |
6% 8/1/20 | | 2,230 | | 2,381 |
Landry's Acquisition Co. 9.375% 5/1/20 (g) | | 875 | | 941 |
NSG Holdings II, LLC 7.75% 12/15/25 (g) | | 5,023 | | 5,425 |
RBS Citizens Financial Group, Inc. 4.15% 9/28/22 (g) | | 5,782 | | 5,872 |
TECO Finance, Inc.: | | | | |
4% 3/15/16 | | 1,242 | | 1,302 |
5.15% 3/15/20 | | 2,029 | | 2,285 |
TransUnion Holding Co., Inc.: | | | | |
8.125% 6/15/18 pay-in-kind (k) | | 1,155 | | 1,201 |
9.625% 6/15/18 pay-in-kind (k) | | 810 | | 845 |
UPCB Finance III Ltd. 6.625% 7/1/20 (g) | | 1,150 | | 1,216 |
| | 61,781 |
Insurance - 0.6% |
AIA Group Ltd. 2.25% 3/11/19 (g) | | 1,203 | | 1,203 |
American International Group, Inc.: | | | | |
2.375% 8/24/15 | | 14,000 | | 14,278 |
4.875% 6/1/22 | | 5,467 | | 6,137 |
5.6% 10/18/16 | | 4,975 | | 5,437 |
5.85% 1/16/18 | | 12,000 | | 13,617 |
Aon Corp.: | | | | |
3.125% 5/27/16 | | 3,402 | | 3,525 |
3.5% 9/30/15 | | 3,819 | | 3,937 |
5% 9/30/20 | | 107 | | 120 |
Axis Capital Holdings Ltd. 5.75% 12/1/14 | | 329 | | 333 |
Corporate Bonds - continued |
| Principal Amount (000s) | | Value (000s) |
Nonconvertible Bonds - continued |
FINANCIALS - continued |
Insurance - continued |
Great-West Life & Annuity Insurance Co. 7.153% 5/16/46 (g)(k) | | $ 2,008 | | $ 2,078 |
Hartford Financial Services Group, Inc.: | | | | |
4% 10/15/17 | | 1,082 | | 1,163 |
5.125% 4/15/22 | | 956 | | 1,092 |
5.375% 3/15/17 | | 595 | | 653 |
Hockey Merger Sub 2, Inc. 7.875% 10/1/21 (g) | | 1,675 | | 1,763 |
Liberty Mutual Group, Inc.: | | | | |
4.25% 6/15/23 (g) | | 2,655 | | 2,763 |
5% 6/1/21 (g) | | 6,063 | | 6,703 |
Marsh & McLennan Companies, Inc. 4.8% 7/15/21 | | 4,128 | | 4,601 |
Massachusetts Mutual Life Insurance Co. 5.375% 12/1/41 (g) | | 2,993 | | 3,453 |
MetLife, Inc. 6.75% 6/1/16 | | 3,874 | | 4,273 |
Metropolitan Life Global Funding I 1.875% 6/22/18 (g) | | 6,760 | | 6,765 |
Northwestern Mutual Life Insurance Co. 6.063% 3/30/40 (g) | | 3,585 | | 4,552 |
Pacific Life Insurance Co. 9.25% 6/15/39 (g) | | 3,048 | | 4,803 |
Pacific LifeCorp: | | | | |
5.125% 1/30/43 (g) | | 6,960 | | 7,419 |
6% 2/10/20 (g) | | 8,215 | | 9,432 |
Prudential Financial, Inc.: | | | | |
2.3% 8/15/18 | | 783 | | 796 |
4.5% 11/16/21 | | 1,461 | | 1,606 |
7.375% 6/15/19 | | 1,880 | | 2,312 |
Symetra Financial Corp. 6.125% 4/1/16 (g) | | 6,715 | | 7,162 |
Unum Group: | | | | |
5.625% 9/15/20 | | 2,879 | | 3,298 |
5.75% 8/15/42 | | 7,108 | | 8,510 |
7.125% 9/30/16 | | 1,802 | | 2,023 |
| | 135,807 |
Real Estate Investment Trusts - 0.5% |
Alexandria Real Estate Equities, Inc.: | | | | |
2.75% 1/15/20 | | 1,148 | | 1,151 |
4.6% 4/1/22 | | 1,705 | | 1,816 |
American Campus Communities Operating Partnership LP 3.75% 4/15/23 | | 1,587 | | 1,591 |
AvalonBay Communities, Inc. 3.625% 10/1/20 | | 2,452 | | 2,584 |
Boston Properties, Inc. 3.85% 2/1/23 | | 6,720 | | 6,996 |
Corporate Bonds - continued |
| Principal Amount (000s) | | Value (000s) |
Nonconvertible Bonds - continued |
FINANCIALS - continued |
Real Estate Investment Trusts - continued |
Camden Property Trust 2.95% 12/15/22 | | $ 2,154 | | $ 2,101 |
CommonWealth REIT 5.875% 9/15/20 | | 991 | | 1,077 |
CTR Partnership LP/CareTrust Capital Corp. 5.875% 6/1/21 (g) | | 205 | | 208 |
DDR Corp.: | | | | |
4.75% 4/15/18 | | 4,595 | | 4,979 |
7.5% 4/1/17 | | 4,966 | | 5,680 |
9.625% 3/15/16 | | 1,675 | | 1,894 |
Developers Diversified Realty Corp. 4.625% 7/15/22 | | 3,877 | | 4,156 |
Duke Realty LP: | | | | |
3.625% 4/15/23 | | 2,844 | | 2,834 |
3.875% 10/15/22 | | 4,799 | | 4,924 |
4.375% 6/15/22 | | 3,202 | | 3,388 |
5.5% 3/1/16 | | 2,930 | | 3,118 |
5.95% 2/15/17 | | 3,166 | | 3,492 |
6.75% 3/15/20 | | 1,161 | | 1,382 |
8.25% 8/15/19 | | 1,838 | | 2,305 |
Equity One, Inc.: | | | | |
3.75% 11/15/22 | | 7,300 | | 7,333 |
5.375% 10/15/15 | | 672 | | 705 |
6% 9/15/17 | | 666 | | 740 |
6.25% 1/15/17 | | 530 | | 584 |
Federal Realty Investment Trust: | | | | |
5.9% 4/1/20 | | 1,379 | | 1,604 |
6.2% 1/15/17 | | 365 | | 407 |
HCP, Inc.: | | | | |
3.15% 8/1/22 | | 8,000 | | 7,823 |
3.875% 8/15/24 | | 11,000 | | 11,099 |
4.25% 11/15/23 | | 3,213 | | 3,338 |
Health Care REIT, Inc.: | | | | |
2.25% 3/15/18 | | 12,327 | | 12,489 |
4.125% 4/1/19 | | 11,300 | | 12,182 |
4.7% 9/15/17 | | 744 | | 811 |
HRPT Properties Trust: | | | | |
5.75% 11/1/15 | | 1,241 | | 1,274 |
6.25% 6/15/17 | | 726 | | 777 |
6.65% 1/15/18 | | 490 | | 543 |
Lexington Corporate Properties Trust 4.4% 6/15/24 | | 1,905 | | 1,939 |
Corporate Bonds - continued |
| Principal Amount (000s) | | Value (000s) |
Nonconvertible Bonds - continued |
FINANCIALS - continued |
Real Estate Investment Trusts - continued |
Omega Healthcare Investors, Inc.: | | | | |
4.95% 4/1/24 (g) | | $ 1,785 | | $ 1,844 |
5.875% 3/15/24 | | 3,200 | | 3,360 |
6.75% 10/15/22 | | 1,885 | | 2,031 |
Retail Opportunity Investments Partnership LP 5% 12/15/23 | | 980 | | 1,055 |
Weingarten Realty Investors 3.375% 10/15/22 | | 1,098 | | 1,105 |
| | 128,719 |
Real Estate Management & Development - 0.5% |
BioMed Realty LP: | | | | |
2.625% 5/1/19 | | 1,861 | | 1,862 |
3.85% 4/15/16 | | 6,469 | | 6,763 |
4.25% 7/15/22 | | 2,511 | | 2,612 |
6.125% 4/15/20 | | 1,822 | | 2,107 |
Brandywine Operating Partnership LP: | | | | |
3.95% 2/15/23 | | 6,445 | | 6,534 |
4.95% 4/15/18 | | 4,256 | | 4,610 |
5.7% 5/1/17 | | 268 | | 293 |
6% 4/1/16 | | 2,467 | | 2,641 |
7.5% 5/15/15 | | 698 | | 730 |
CBRE Group, Inc.: | | | | |
5% 3/15/23 | | 3,990 | | 4,045 |
6.625% 10/15/20 | | 900 | | 947 |
Corporate Office Properties LP 3.7% 6/15/21 | | 3,614 | | 3,622 |
Digital Realty Trust LP: | | | | |
4.5% 7/15/15 | | 2,465 | | 2,520 |
5.25% 3/15/21 | | 2,876 | | 3,142 |
ERP Operating LP 5.75% 6/15/17 | | 1,446 | | 1,619 |
Essex Portfolio LP 5.5% 3/15/17 | | 3,414 | | 3,758 |
Howard Hughes Corp. 6.875% 10/1/21 (g) | | 2,115 | | 2,239 |
Kennedy-Wilson, Inc. 5.875% 4/1/24 | | 795 | | 808 |
Liberty Property LP: | | | | |
3.375% 6/15/23 | | 2,951 | | 2,898 |
4.125% 6/15/22 | | 2,746 | | 2,880 |
4.75% 10/1/20 | | 6,595 | | 7,144 |
5.125% 3/2/15 | | 1,317 | | 1,345 |
5.5% 12/15/16 | | 2,022 | | 2,201 |
Corporate Bonds - continued |
| Principal Amount (000s) | | Value (000s) |
Nonconvertible Bonds - continued |
FINANCIALS - continued |
Real Estate Management & Development - continued |
Mack-Cali Realty LP: | | | | |
2.5% 12/15/17 | | $ 4,037 | | $ 4,079 |
3.15% 5/15/23 | | 6,708 | | 6,093 |
4.5% 4/18/22 | | 1,689 | | 1,716 |
5.8% 1/15/16 | | 4,250 | | 4,500 |
7.75% 8/15/19 | | 2,149 | | 2,580 |
Mid-America Apartments LP 4.3% 10/15/23 | | 1,086 | | 1,146 |
Post Apartment Homes LP 3.375% 12/1/22 | | 1,196 | | 1,177 |
Prime Property Funding, Inc. 5.7% 4/15/17 (g) | | 3,471 | | 3,732 |
Realogy Corp. 9% 1/15/20 (g) | | 1,170 | | 1,307 |
Realogy Group LLC/Realogy Co.-Issuer Corp. 4.5% 4/15/19 (g) | | 1,760 | | 1,760 |
Realogy Group LLC/Sunshine Group Florida Ltd. 3.375% 5/1/16 (g) | | 2,125 | | 2,152 |
Reckson Operating Partnership LP 6% 3/31/16 | | 1,675 | | 1,791 |
Regency Centers LP: | | | | |
5.25% 8/1/15 | | 3,216 | | 3,348 |
5.875% 6/15/17 | | 1,447 | | 1,610 |
Tanger Properties LP: | | | | |
3.875% 12/1/23 | | 2,341 | | 2,400 |
6.125% 6/1/20 | | 7,035 | | 8,197 |
Taylor Morrison Communities, Inc./Monarch Communities, Inc. 5.625% 3/1/24 (g) | | 515 | | 514 |
Ventas Realty LP: | | | | |
1.25% 4/17/17 | | 2,655 | | 2,651 |
1.55% 9/26/16 | | 921 | | 931 |
Ventas Realty LP/Ventas Capital Corp.: | | | | |
2% 2/15/18 | | 3,611 | | 3,636 |
4% 4/30/19 | | 1,771 | | 1,899 |
Weekley Homes LLC/Weekley Finance Corp. 6% 2/1/23 | | 510 | | 505 |
Weyerhaeuser Real Estate Co.: | | | | |
4.375% 6/15/19 (g) | | 745 | | 745 |
5.875% 6/15/24 (g) | | 540 | | 551 |
| | 126,340 |
TOTAL FINANCIALS | | 1,430,364 |
Corporate Bonds - continued |
| Principal Amount (000s) | | Value (000s) |
Nonconvertible Bonds - continued |
HEALTH CARE - 0.8% |
Biotechnology - 0.2% |
Amgen, Inc.: | | | | |
1.25% 5/22/17 | | $ 11,041 | | $ 11,038 |
2.2% 5/22/19 | | 27,392 | | 27,363 |
| | 38,401 |
Health Care Equipment & Supplies - 0.0% |
Aviv Healthcare Properties LP/Aviv Healthcare Capital Corp.: | | | | |
6% 10/15/21 | | 410 | | 433 |
7.75% 2/15/19 | | 2,945 | | 3,114 |
Teleflex, Inc. 6.875% 6/1/19 | | 1,665 | | 1,761 |
| | 5,308 |
Health Care Providers & Services - 0.4% |
Catamaran Corp. 4.75% 3/15/21 (Reg. S) | | 1,120 | | 1,128 |
Community Health Systems, Inc.: | | | | |
5.125% 8/1/21 (g) | | 840 | | 861 |
6.875% 2/1/22 (g) | | 1,115 | | 1,185 |
Coventry Health Care, Inc. 5.95% 3/15/17 | | 1,030 | | 1,146 |
DaVita HealthCare Partners, Inc.: | | | | |
5.125% 7/15/24 | | 2,535 | | 2,571 |
5.75% 8/15/22 | | 1,215 | | 1,295 |
6.625% 11/1/20 | | 1,555 | | 1,641 |
Envision Healthcare Corp. 5.125% 7/1/22 (g) | | 1,040 | | 1,050 |
Express Scripts Holding Co.: | | | | |
3.9% 2/15/22 | | 1,585 | | 1,675 |
4.75% 11/15/21 | | 14,348 | | 15,959 |
HCA Holdings, Inc.: | | | | |
4.75% 5/1/23 | | 2,715 | | 2,739 |
5% 3/15/24 | | 1,755 | | 1,788 |
5.875% 3/15/22 | | 9,745 | | 10,598 |
5.875% 5/1/23 | | 2,555 | | 2,721 |
6.25% 2/15/21 | | 1,415 | | 1,539 |
6.5% 2/15/20 | | 10,450 | | 11,691 |
7.5% 2/15/22 | | 3,250 | | 3,786 |
7.75% 5/15/21 | | 5,585 | | 6,088 |
HealthSouth Corp. 5.75% 11/1/24 | | 780 | | 819 |
McKesson Corp. 2.284% 3/15/19 | | 5,400 | | 5,402 |
Medco Health Solutions, Inc.: | | | | |
2.75% 9/15/15 | | 3,610 | | 3,690 |
Corporate Bonds - continued |
| Principal Amount (000s) | | Value (000s) |
Nonconvertible Bonds - continued |
HEALTH CARE - continued |
Health Care Providers & Services - continued |
Medco Health Solutions, Inc.: - continued | | | | |
4.125% 9/15/20 | | $ 3,728 | | $ 3,995 |
Sabra Health Care LP/Sabra Capital Corp. 5.5% 2/1/21 | | 625 | | 651 |
Tenet Healthcare Corp.: | | | | |
4.375% 10/1/21 | | 5,470 | | 5,429 |
4.5% 4/1/21 | | 1,030 | | 1,033 |
5% 3/1/19 (g) | | 1,690 | | 1,711 |
6% 10/1/20 | | 1,145 | | 1,242 |
8.125% 4/1/22 | | 4,590 | | 5,284 |
WellPoint, Inc. 1.875% 1/15/18 | | 161 | | 162 |
| | 98,879 |
Health Care Technology - 0.0% |
IMS Health, Inc. 6% 11/1/20 (g) | | 715 | | 752 |
Life Sciences Tools & Services - 0.0% |
Thermo Fisher Scientific, Inc.: | | | | |
1.3% 2/1/17 | | 1,499 | | 1,500 |
2.4% 2/1/19 | | 945 | | 955 |
| | 2,455 |
Pharmaceuticals - 0.2% |
AbbVie, Inc. 1.75% 11/6/17 | | 5,738 | | 5,767 |
Actavis Funding SCS: | | | | |
1.3% 6/15/17 (g) | | 10,935 | | 10,908 |
2.45% 6/15/19 (g) | | 3,241 | | 3,230 |
Forest Laboratories, Inc. 4.375% 2/1/19 (g) | | 2,160 | | 2,327 |
Grifols Worldwide Operations Ltd. 5.25% 4/1/22 (g) | | 1,665 | | 1,711 |
Mylan, Inc. 1.35% 11/29/16 | | 1,757 | | 1,759 |
Perrigo Co. PLC: | | | | |
1.3% 11/8/16 (g) | | 1,437 | | 1,435 |
2.3% 11/8/18 (g) | | 1,537 | | 1,534 |
Pinnacle Merger Sub, Inc. 9.5% 10/1/23 (g) | | 830 | | 911 |
Salix Pharmaceuticals Ltd. 6% 1/15/21 (g) | | 360 | | 391 |
Valeant Pharmaceuticals International: | | | | |
5.625% 12/1/21 (g) | | 810 | | 824 |
6.75% 8/15/18 (g) | | 3,620 | | 3,873 |
7.5% 7/15/21 (g) | | 2,320 | | 2,529 |
VPI Escrow Corp. 6.375% 10/15/20 (g) | | 1,445 | | 1,512 |
Corporate Bonds - continued |
| Principal Amount (000s) | | Value (000s) |
Nonconvertible Bonds - continued |
HEALTH CARE - continued |
Pharmaceuticals - continued |
Watson Pharmaceuticals, Inc. 1.875% 10/1/17 | | $ 1,940 | | $ 1,948 |
Zoetis, Inc. 1.875% 2/1/18 | | 898 | | 898 |
| | 41,557 |
TOTAL HEALTH CARE | | 187,352 |
INDUSTRIALS - 0.5% |
Aerospace & Defense - 0.1% |
BAE Systems Holdings, Inc. 6.375% 6/1/19 (g) | | 3,650 | | 4,274 |
DigitalGlobe, Inc. 5.25% 2/1/21 (g) | | 425 | | 421 |
GenCorp, Inc. 7.125% 3/15/21 | | 2,250 | | 2,424 |
TransDigm, Inc.: | | | | |
6% 7/15/22 (g) | | 1,155 | | 1,175 |
6.5% 7/15/24 (g) | | 1,135 | | 1,163 |
Triumph Group, Inc. 5.25% 6/1/22 (g) | | 490 | | 489 |
| | 9,946 |
Airlines - 0.0% |
Continental Airlines, Inc.: | | | | |
pass-thru trust certificates: | | | | |
8.388% 5/1/22 | | 30 | | 32 |
9.798% 4/1/21 | | 2,413 | | 2,763 |
6.125% 4/29/18 | | 415 | | 440 |
6.648% 3/15/19 | | 1,696 | | 1,807 |
6.9% 7/2/19 | | 652 | | 698 |
U.S. Airways pass-thru trust certificates: | | | | |
6.85% 1/30/18 | | 1,511 | | 1,634 |
8.36% 1/20/19 | | 1,137 | | 1,262 |
| | 8,636 |
Building Products - 0.0% |
HMAN Finance Sub Corp. 6.375% 7/15/22 (g) | | 510 | | 509 |
Nortek, Inc. 8.5% 4/15/21 | | 925 | | 1,006 |
USG Corp.: | | | | |
5.875% 11/1/21 (g) | | 255 | | 266 |
6.3% 11/15/16 | | 170 | | 181 |
7.875% 3/30/20 (g) | | 905 | | 986 |
9.75% 1/15/18 | | 975 | | 1,148 |
| | 4,096 |
Corporate Bonds - continued |
| Principal Amount (000s) | | Value (000s) |
Nonconvertible Bonds - continued |
INDUSTRIALS - continued |
Commercial Services & Supplies - 0.1% |
ADT Corp. 6.25% 10/15/21 | | $ 1,140 | | $ 1,206 |
APX Group, Inc.: | | | | |
6.375% 12/1/19 | | 5,170 | | 5,248 |
8.75% 12/1/20 | | 5,670 | | 5,642 |
ARAMARK Corp. 5.75% 3/15/20 | | 1,345 | | 1,409 |
Cenveo Corp. 6% 8/1/19 (g) | | 730 | | 721 |
Clean Harbors, Inc. 5.125% 6/1/21 | | 740 | | 751 |
Covanta Holding Corp.: | | | | |
6.375% 10/1/22 | | 875 | | 938 |
7.25% 12/1/20 | | 775 | | 837 |
Garda World Security Corp.: | | | | |
7.25% 11/15/21 (g) | | 200 | | 205 |
7.25% 11/15/21 (g) | | 525 | | 537 |
LBC Tank Terminals Holding Netherlands BV 6.875% 5/15/23 (g) | | 215 | | 230 |
Quad/Graphics, Inc. 7% 5/1/22 (g) | | 385 | | 380 |
R.R. Donnelley & Sons Co.: | | | | |
6% 4/1/24 | | 550 | | 551 |
6.5% 11/15/23 | | 1,685 | | 1,740 |
TMS International Corp. 7.625% 10/15/21 (g) | | 255 | | 271 |
| | 20,666 |
Electrical Equipment - 0.0% |
Anixter International, Inc. 5.625% 5/1/19 | | 705 | | 744 |
Machinery - 0.0% |
Blueline Rent Finance Corp./Volvo 7% 2/1/19 (g) | | 475 | | 502 |
Briggs & Stratton Corp. 6.875% 12/15/20 | | 920 | | 1,024 |
Schaeffler Finance BV: | | | | |
4.25% 5/15/21 (g) | | 1,760 | | 1,756 |
4.75% 5/15/21 (g) | | 3,160 | | 3,223 |
Shale-Inland Holdings LLC/Shale-Inland Finance Corp. 8.75% 11/15/19 (g) | | 950 | | 988 |
TRAC Intermodal LLC/TRAC Intermodal Corp. 11% 8/15/19 | | 910 | | 1,019 |
| | 8,512 |
Marine - 0.1% |
Navios Maritime Acquisition Corp./Navios Acquisition Finance U.S., Inc. 8.125% 11/15/21 (g) | | 1,360 | | 1,414 |
Corporate Bonds - continued |
| Principal Amount (000s) | | Value (000s) |
Nonconvertible Bonds - continued |
INDUSTRIALS - continued |
Marine - continued |
Navios Maritime Holdings, Inc.: | | | | |
7.375% 1/15/22 (g) | | $ 4,630 | | $ 4,792 |
8.125% 2/15/19 | | 1,725 | | 1,792 |
Navios South American Logistics, Inc./Navios Logistics Finance U.S., Inc. 7.25% 5/1/22 (g) | | 1,160 | | 1,202 |
Ultrapetrol (Bahamas) Ltd. 8.875% 6/15/21 | | 785 | | 837 |
| | 10,037 |
Professional Services - 0.0% |
FTI Consulting, Inc. 6% 11/15/22 | | 1,515 | | 1,566 |
Road & Rail - 0.0% |
Hertz Corp.: | | | | |
5.875% 10/15/20 | | 1,120 | | 1,152 |
6.25% 10/15/22 | | 800 | | 834 |
Jurassic Holdings III, Inc. 6.875% 2/15/21 (Reg. S) (g) | | 1,115 | | 1,140 |
Western Express, Inc. 12.5% 4/15/15 (g) | | 3,725 | | 3,204 |
| | 6,330 |
Trading Companies & Distributors - 0.2% |
Ahern Rentals, Inc. 9.5% 6/15/18 (g) | | 285 | | 313 |
Air Lease Corp.: | | | | |
3.875% 4/1/21 | | 5,301 | | 5,354 |
4.75% 3/1/20 | | 4,617 | | 4,917 |
International Lease Finance Corp.: | | | | |
3.875% 4/15/18 | | 4,400 | | 4,472 |
5.75% 5/15/16 | | 1,840 | | 1,950 |
5.875% 8/15/22 | | 4,385 | | 4,791 |
6.25% 5/15/19 | | 3,035 | | 3,365 |
7.125% 9/1/18 (g) | | 5,560 | | 6,380 |
8.25% 12/15/20 | | 4,165 | | 5,092 |
8.625% 9/15/15 | | 4,640 | | 4,974 |
8.625% 1/15/22 | | 3,910 | | 4,907 |
NES Rentals Holdings, Inc. 7.875% 5/1/18 (g) | | 365 | | 386 |
VWR Funding, Inc. 7.25% 9/15/17 | | 2,695 | | 2,843 |
| | 49,744 |
TOTAL INDUSTRIALS | | 120,277 |
Corporate Bonds - continued |
| Principal Amount (000s) | | Value (000s) |
Nonconvertible Bonds - continued |
INFORMATION TECHNOLOGY - 0.3% |
Communications Equipment - 0.1% |
Alcatel-Lucent U.S.A., Inc.: | | | | |
4.625% 7/1/17 (g) | | $ 835 | | $ 848 |
6.75% 11/15/20 (g) | | 1,980 | | 2,094 |
Avaya, Inc. 7% 4/1/19 (g) | | 1,245 | | 1,239 |
Hughes Satellite Systems Corp. 6.5% 6/15/19 | | 7,595 | | 8,355 |
Lucent Technologies, Inc.: | | | | |
6.45% 3/15/29 | | 10,451 | | 10,216 |
6.5% 1/15/28 | | 1,110 | | 1,088 |
| | 23,840 |
Electronic Equipment & Components - 0.0% |
Infor U.S., Inc. 9.375% 4/1/19 | | 755 | | 831 |
Sanmina Corp. 4.375% 6/1/19 (g) | | 1,295 | | 1,305 |
Tyco Electronics Group SA: | | | | |
1.6% 2/3/15 | | 156 | | 157 |
2.375% 12/17/18 | | 1,087 | | 1,097 |
6.55% 10/1/17 | | 815 | | 934 |
| | 4,324 |
Internet Software & Services - 0.0% |
CyrusOne LP/CyrusOne Finance Corp. 6.375% 11/15/22 | | 885 | | 936 |
VeriSign, Inc. 4.625% 5/1/23 | | 3,395 | | 3,336 |
| | 4,272 |
IT Services - 0.1% |
Audatex North America, Inc. 6% 6/15/21 (g) | | 4,565 | | 4,839 |
CDW LLC/CDW Finance Corp. 6% 8/15/22 | | 1,670 | | 1,760 |
Ceridian Corp. 8.875% 7/15/19 (g) | | 1,110 | | 1,243 |
Ceridian LLC / Comdata, Inc. 8.125% 11/15/17 (g) | | 1,395 | | 1,414 |
Compiler Finance Sub, Inc. 7% 5/1/21 (g) | | 710 | | 678 |
First Data Corp.: | | | | |
6.75% 11/1/20 (g) | | 4,035 | | 4,368 |
11.25% 1/15/21 | | 1,918 | | 2,230 |
11.75% 8/15/21 | | 497 | | 588 |
SunGard Data Systems, Inc. 6.625% 11/1/19 | | 2,205 | | 2,310 |
Xerox Corp.: | | | | |
2.95% 3/15/17 | | 947 | | 985 |
4.25% 2/15/15 | | 1,130 | | 1,149 |
| | 21,564 |
Corporate Bonds - continued |
| Principal Amount (000s) | | Value (000s) |
Nonconvertible Bonds - continued |
INFORMATION TECHNOLOGY - continued |
Semiconductors & Semiconductor Equipment - 0.0% |
Entegris, Inc. 6% 4/1/22 (g) | | $ 365 | | $ 376 |
Micron Technology, Inc. 5.875% 2/15/22 (g) | | 880 | | 943 |
NXP BV/NXP Funding LLC 5.75% 2/15/21 (g) | | 1,595 | | 1,675 |
| | 2,994 |
Software - 0.1% |
Activision Blizzard, Inc. 6.125% 9/15/23 (g) | | 1,255 | | 1,381 |
BMC Software Finance, Inc. 8.125% 7/15/21 (g) | | 2,645 | | 2,671 |
Boxer Parent Co., Inc. 9% 10/15/19 pay-in-kind (g)(k) | | 1,720 | | 1,651 |
Infor Software Parent LLC/Infor Software Parent, Inc. 7.125% 5/1/21 pay-in-kind (g)(k) | | 545 | | 555 |
| | 6,258 |
Technology Hardware, Storage & Peripherals - 0.0% |
Seagate HDD Cayman 4.75% 1/1/25 (g) | | 1,815 | | 1,851 |
TOTAL INFORMATION TECHNOLOGY | | 65,103 |
MATERIALS - 0.2% |
Chemicals - 0.1% |
Hexion U.S. Finance Corp. 6.625% 4/15/20 | | 2,810 | | 2,958 |
LSB Industries, Inc. 7.75% 8/1/19 | | 425 | | 464 |
PolyOne Corp. 5.25% 3/15/23 | | 1,360 | | 1,404 |
SPCM SA 6% 1/15/22 (g) | | 555 | | 594 |
Trinseo Materials Operating SCA/Trinseo Materials Finance, Inc. 8.75% 2/1/19 | | 5,963 | | 6,395 |
U.S. Coatings Acquisition, Inc./Flash Dutch 2 BV 7.375% 5/1/21 (g) | | 585 | | 638 |
| | 12,453 |
Construction Materials - 0.0% |
Calcipar SA 6.875% 5/1/18 (g) | | 720 | | 749 |
CEMEX Finance LLC 6% 4/1/24 (g) | | 1,600 | | 1,664 |
CEMEX S.A.B. de CV 5.2341% 9/30/15 (g)(k) | | 2,815 | | 2,898 |
CRH America, Inc. 6% 9/30/16 | | 2,470 | | 2,711 |
Prince Mineral Holding Corp. 12% 12/15/19 (g) | | 405 | | 454 |
| | 8,476 |
Containers & Packaging - 0.0% |
Ardagh Finance Holdings SA 8.625% 6/15/19 pay-in-kind (g)(k) | | 805 | | 820 |
Ardagh Packaging Finance PLC 9.125% 10/15/20 (g) | | 685 | | 750 |
Corporate Bonds - continued |
| Principal Amount (000s) | | Value (000s) |
Nonconvertible Bonds - continued |
MATERIALS - continued |
Containers & Packaging - continued |
Ardagh Packaging Finance PLC/Ardagh MP Holdings U.S.A., Inc.: | | | | |
6% 6/30/21 (g) | | $ 495 | | $ 490 |
6.25% 1/31/19 (g) | | 680 | | 687 |
6.75% 1/31/21 (g) | | 785 | | 801 |
7% 11/15/20 (g) | | 126 | | 128 |
9.125% 10/15/20 (g) | | 690 | | 752 |
Consolidated Container Co. LLC/Consolidated Container Capital, Inc. 10.125% 7/15/20 (g) | | 555 | | 552 |
Crown Americas LLC/Crown Americas Capital Corp. III 6.25% 2/1/21 | | 2,040 | | 2,178 |
Owens-Illinois, Inc. 7.8% 5/15/18 | | 350 | | 403 |
Sealed Air Corp. 6.5% 12/1/20 (g) | | 1,065 | | 1,172 |
Tekni-Plex, Inc. 9.75% 6/1/19 (g) | | 724 | | 795 |
| | 9,528 |
Metals & Mining - 0.1% |
Bluescope Steel Ltd./Bluescope Steel Finance 7.125% 5/1/18 (g) | | 255 | | 268 |
Corporacion Nacional del Cobre de Chile (Codelco): | | | | |
3.875% 11/3/21 (g) | | 7,189 | | 7,526 |
4.25% 7/17/42 (g) | | 1,226 | | 1,157 |
5.625% 10/18/43 (g) | | 2,382 | | 2,750 |
Edgen Murray Corp. 8.75% 11/1/20 (g) | | 737 | | 825 |
FMG Resources (August 2006) Pty Ltd. 6% 4/1/17 (g) | | 340 | | 354 |
JMC Steel Group, Inc. 8.25% 3/15/18 (g) | | 5,635 | | 5,705 |
New Gold, Inc.: | | | | |
6.25% 11/15/22 (g) | | 615 | | 646 |
7% 4/15/20 (g) | | 345 | | 367 |
Ryerson, Inc./Joseph T Ryerson & Son, Inc.: | | | | |
9% 10/15/17 | | 3,375 | | 3,594 |
11.25% 10/15/18 | | 1,130 | | 1,254 |
Signode Industrial Group Lux SA/Signode Industrial Group U.S., Inc. 6.375% 5/1/22 (g) | | 595 | | 592 |
Steel Dynamics, Inc. 6.375% 8/15/22 | | 990 | | 1,059 |
Walter Energy, Inc.: | | | | |
9.5% 10/15/19 (g) | | 1,115 | | 1,112 |
11% 4/1/20 pay-in-kind (g)(k) | | 885 | | 666 |
| | 27,875 |
Corporate Bonds - continued |
| Principal Amount (000s) | | Value (000s) |
Nonconvertible Bonds - continued |
MATERIALS - continued |
Paper & Forest Products - 0.0% |
Clearwater Paper Corp. 4.5% 2/1/23 | | $ 1,250 | | $ 1,213 |
TOTAL MATERIALS | | 59,545 |
TELECOMMUNICATION SERVICES - 1.3% |
Diversified Telecommunication Services - 1.0% |
Altice Financing SA: | | | | |
6.5% 1/15/22 (g) | | 2,300 | | 2,421 |
7.875% 12/15/19 (g) | | 550 | | 595 |
Altice Finco SA: | | | | |
8.125% 1/15/24 (g) | | 315 | | 343 |
9.875% 12/15/20 (g) | | 585 | | 664 |
BellSouth Capital Funding Corp. 7.875% 2/15/30 | | 68 | | 93 |
Broadview Networks Holdings, Inc. 10.5% 11/15/17 | | 1,908 | | 1,874 |
CenturyLink, Inc.: | | | | |
5.15% 6/15/17 | | 440 | | 470 |
6% 4/1/17 | | 3,101 | | 3,357 |
6.15% 9/15/19 | | 3,331 | | 3,639 |
Eileme 2 AB 11.625% 1/31/20 (g) | | 1,725 | | 2,010 |
Embarq Corp.: | | | | |
7.082% 6/1/16 | | 3,728 | | 4,101 |
7.995% 6/1/36 | | 30,321 | | 34,108 |
FairPoint Communications, Inc. 8.75% 8/15/19 (g) | | 1,340 | | 1,430 |
Intelsat Luxembourg SA: | | | | |
7.75% 6/1/21 | | 4,960 | | 5,233 |
8.125% 6/1/23 | | 1,090 | | 1,180 |
Level 3 Communications, Inc. 8.875% 6/1/19 | | 435 | | 470 |
Level 3 Escrow II, Inc. 5.375% 8/15/22 (g) | | 2,110 | | 2,121 |
Level 3 Financing, Inc.: | | | | |
6.125% 1/15/21 (g) | | 1,405 | | 1,482 |
7% 6/1/20 | | 1,460 | | 1,573 |
Lynx I Corp. 5.375% 4/15/21 (g) | | 770 | | 801 |
Lynx II Corp. 6.375% 4/15/23 (g) | | 435 | | 463 |
Sprint Capital Corp.: | | | | |
6.875% 11/15/28 | | 1,055 | | 1,029 |
6.9% 5/1/19 | | 3,975 | | 4,268 |
8.75% 3/15/32 | | 1,985 | | 2,213 |
Verizon Communications, Inc.: | | | | |
2.5% 9/15/16 | | 77,224 | | 79,617 |
Corporate Bonds - continued |
| Principal Amount (000s) | | Value (000s) |
Nonconvertible Bonds - continued |
TELECOMMUNICATION SERVICES - continued |
Diversified Telecommunication Services - continued |
Verizon Communications, Inc.: - continued | | | | |
4.5% 9/15/20 | | $ 38,502 | | $ 42,305 |
5.012% 8/21/54 (g) | | 19,396 | | 20,259 |
6.1% 4/15/18 | | 1,909 | | 2,195 |
6.25% 4/1/37 | | 3,729 | | 4,610 |
6.4% 9/15/33 | | 5,323 | | 6,724 |
6.55% 9/15/43 | | 6,925 | | 8,927 |
Wind Acquisition Finance SA 4.75% 7/15/20 (g) | | 3,135 | | 3,143 |
| | 243,718 |
Wireless Telecommunication Services - 0.3% |
America Movil S.A.B. de CV: | | | | |
2.375% 9/8/16 | | 307 | | 314 |
3.625% 3/30/15 | | 2,672 | | 2,715 |
Clearwire Communications LLC/Clearwire Finance, Inc. 14.75% 12/1/16 (g) | | 3,050 | | 3,851 |
Digicel Group Ltd.: | | | | |
6% 4/15/21 (g) | | 2,805 | | 2,889 |
7% 2/15/20 (g) | | 275 | | 289 |
7.125% 4/1/22 (g) | | 2,200 | | 2,283 |
8.25% 9/30/20 (g) | | 6,270 | | 6,772 |
Intelsat Jackson Holdings SA: | | | | |
5.5% 8/1/23 | | 3,415 | | 3,402 |
6.625% 12/15/22 (Reg. S) | | 5,045 | | 5,272 |
7.5% 4/1/21 | | 3,895 | | 4,216 |
SBA Communications Corp. 5.625% 10/1/19 | | 1,870 | | 1,961 |
Sprint Communications, Inc.: | | | | |
6% 11/15/22 | | 9,365 | | 9,342 |
9% 11/15/18 (g) | | 6,595 | | 7,840 |
Sprint Corp.: | | | | |
7.125% 6/15/24 (g) | | 1,500 | | 1,530 |
7.25% 9/15/21 (g) | | 2,575 | | 2,730 |
7.875% 9/15/23 (g) | | 2,575 | | 2,762 |
T-Mobile U.S.A., Inc.: | | | | |
5.25% 9/1/18 | | 940 | | 969 |
6.25% 4/1/21 | | 2,010 | | 2,085 |
6.464% 4/28/19 | | 420 | | 438 |
6.542% 4/28/20 | | 1,475 | | 1,549 |
6.625% 4/1/23 | | 3,005 | | 3,163 |
Corporate Bonds - continued |
| Principal Amount (000s) | | Value (000s) |
Nonconvertible Bonds - continued |
TELECOMMUNICATION SERVICES - continued |
Wireless Telecommunication Services - continued |
T-Mobile U.S.A., Inc.: - continued | | | | |
6.633% 4/28/21 | | $ 1,335 | | $ 1,405 |
6.731% 4/28/22 | | 985 | | 1,039 |
6.836% 4/28/23 | | 385 | | 409 |
| | 69,225 |
TOTAL TELECOMMUNICATION SERVICES | | 312,943 |
UTILITIES - 1.0% |
Electric Utilities - 0.6% |
AmerenUE 6.4% 6/15/17 | | 4,026 | | 4,542 |
Duquesne Light Holdings, Inc.: | | | | |
5.9% 12/1/21 (g) | | 3,934 | | 4,626 |
6.4% 9/15/20 (g) | | 8,922 | | 10,558 |
Edison International 3.75% 9/15/17 | | 3,355 | | 3,568 |
FirstEnergy Corp.: | | | | |
2.75% 3/15/18 | | 7,307 | | 7,390 |
4.25% 3/15/23 | | 19,274 | | 19,434 |
7.375% 11/15/31 | | 29,278 | | 35,581 |
FirstEnergy Solutions Corp. 6.05% 8/15/21 | | 9,830 | | 10,926 |
IPALCO Enterprises, Inc. 7.25% 4/1/16 (g) | | 3,670 | | 3,954 |
LG&E and KU Energy LLC: | | | | |
2.125% 11/15/15 | | 3,785 | | 3,834 |
3.75% 11/15/20 | | 745 | | 784 |
Mirant Americas Generation LLC 9.125% 5/1/31 | | 460 | | 447 |
Nevada Power Co.: | | | | |
6.5% 5/15/18 | | 5,100 | | 5,947 |
6.5% 8/1/18 | | 1,191 | | 1,400 |
Northeast Utilities 1.45% 5/1/18 | | 1,511 | | 1,496 |
NV Energy, Inc. 6.25% 11/15/20 | | 1,666 | | 1,981 |
Pennsylvania Electric Co. 6.05% 9/1/17 | | 450 | | 506 |
Pepco Holdings, Inc. 2.7% 10/1/15 | | 3,805 | | 3,877 |
Progress Energy, Inc. 4.4% 1/15/21 | | 336 | | 372 |
RJS Power Holdings LLC 5.125% 7/15/19 (g) | | 2,235 | | 2,255 |
West Penn Power Co. 5.95% 12/15/17 (g) | | 10,500 | | 11,795 |
| | 135,273 |
Corporate Bonds - continued |
| Principal Amount (000s) | | Value (000s) |
Nonconvertible Bonds - continued |
UTILITIES - continued |
Gas Utilities - 0.0% |
AmeriGas Finance LLC/AmeriGas Finance Corp.: | | | | |
6.75% 5/20/20 | | $ 830 | | $ 884 |
7% 5/20/22 | | 1,785 | | 1,937 |
Southern Natural Gas Co. 5.9% 4/1/17 (g) | | 260 | | 289 |
Southern Natural Gas Co./Southern Natural Issuing Corp. 4.4% 6/15/21 | | 1,753 | | 1,877 |
Star Gas Partners LP/Star Gas Finance Co. 8.875% 12/1/17 | | 950 | | 990 |
Texas Eastern Transmission LP 6% 9/15/17 (g) | | 948 | | 1,061 |
| | 7,038 |
Independent Power Producers & Energy Traders - 0.2% |
Calpine Corp.: | | | | |
5.375% 1/15/23 | | 1,475 | | 1,490 |
5.75% 1/15/25 | | 635 | | 641 |
6% 1/15/22 (g) | | 1,115 | | 1,201 |
7.875% 1/15/23 (g) | | 2,827 | | 3,138 |
Energy Future Intermediate Holding Co. LLC/Energy Future Intermediate Holding Finance, Inc.: | | | | |
11% 10/1/21 | | 4,208 | | 4,566 |
12.25% 12/1/18 pay-in-kind (d)(g)(k) | | 571 | | 674 |
12.25% 3/1/22 (g) | | 13,655 | | 15,464 |
GenOn Energy, Inc. 9.875% 10/15/20 | | 1,743 | | 1,839 |
NRG Energy, Inc. 6.625% 3/15/23 | | 2,550 | | 2,703 |
The AES Corp.: | | | | |
4.875% 5/15/23 | | 445 | | 437 |
5.5% 3/15/24 | | 745 | | 758 |
7.375% 7/1/21 | | 1,580 | | 1,809 |
7.75% 10/15/15 | | 1,439 | | 1,529 |
TXU Corp.: | | | | |
5.55% 11/15/14 | | 61 | | 54 |
6.5% 11/15/24 | | 3,550 | | 3,160 |
6.55% 11/15/34 | | 7,200 | | 6,408 |
| | 45,871 |
Multi-Utilities - 0.2% |
Dominion Resources, Inc.: | | | | |
2.5341% 9/30/66 (k) | | 16,925 | | 15,636 |
7.5% 6/30/66 (k) | | 2,474 | | 2,677 |
MidAmerican Energy Holdings, Co. 2% 11/15/18 | | 5,919 | | 5,925 |
Corporate Bonds - continued |
| Principal Amount (000s) | | Value (000s) |
Nonconvertible Bonds - continued |
UTILITIES - continued |
Multi-Utilities - continued |
National Grid PLC 6.3% 8/1/16 | | $ 845 | | $ 929 |
NiSource Finance Corp.: | | | | |
4.45% 12/1/21 | | 2,441 | | 2,648 |
5.25% 9/15/17 | | 1,120 | | 1,242 |
5.45% 9/15/20 | | 5,259 | | 5,986 |
6.4% 3/15/18 | | 2,468 | | 2,843 |
6.8% 1/15/19 | | 2,710 | | 3,213 |
PG&E Corp. 2.4% 3/1/19 | | 791 | | 799 |
Puget Energy, Inc. 6% 9/1/21 | | 691 | | 812 |
Sempra Energy 2.3% 4/1/17 | | 5,903 | | 6,049 |
Wisconsin Energy Corp. 6.25% 5/15/67 (k) | | 3,876 | | 4,026 |
| | 52,785 |
TOTAL UTILITIES | | 240,967 |
TOTAL NONCONVERTIBLE BONDS | | 3,191,993 |
TOTAL CORPORATE BONDS (Cost $3,042,087) |
3,194,839
|
U.S. Treasury Obligations - 2.9% |
|
U.S. Treasury Bonds: | | | | |
3.125% 8/15/44 | | 93,875 | | 94,740 |
3.375% 5/15/44 (j) | | 138,435 | | 146,568 |
U.S. Treasury Notes: | | | | |
0.25% 9/30/15 | | 216,401 | | 216,655 |
0.875% 7/15/17 | | 247,000 | | 246,711 |
TOTAL U.S. TREASURY OBLIGATIONS (Cost $693,697) |
704,674
|
U.S. Government Agency - Mortgage Securities - 3.4% |
|
Fannie Mae - 3.0% |
2.053% 6/1/36 (k) | | 126 | | 135 |
2.458% 7/1/37 (k) | | 258 | | 276 |
2.5% 1/1/43 to 4/1/43 | | 1,095 | | 1,052 |
3% 5/1/27 to 3/1/44 | | 29,262 | | 29,175 |
U.S. Government Agency - Mortgage Securities - continued |
| Principal Amount (000s) | | Value (000s) |
Fannie Mae - continued |
3% 9/1/29 (i) | | $ 6,000 | | $ 6,219 |
3% 9/1/44 (i) | | 12,100 | | 12,042 |
3% 9/1/44 (i) | | 60,800 | | 60,510 |
3.5% 1/1/34 to 1/1/44 | | 232,937 | | 239,527 |
3.5% 9/1/44 (i) | | 1,100 | | 1,132 |
3.5% 9/1/44 (i) | | 500 | | 515 |
3.5% 9/1/44 (i) | | 45,400 | | 46,732 |
4% 2/1/35 to 11/1/42 | | 21,400 | | 22,761 |
4% 9/1/44 (i) | | 10,400 | | 11,018 |
4% 9/1/44 (i) | | 44,300 | | 46,932 |
4% 9/1/44 (i) | | 14,100 | | 14,938 |
4% 9/1/44 (i) | | 14,300 | | 15,150 |
4% 9/1/44 (i) | | 2,900 | | 3,072 |
4% 10/1/44 (i) | | 4,000 | | 4,224 |
4% 10/1/44 (i) | | 9,000 | | 9,503 |
4% 10/1/44 (i) | | 13,300 | | 14,044 |
4% 10/1/44 (i) | | 14,100 | | 14,888 |
4% 10/1/44 (i) | | 14,300 | | 15,099 |
4.5% 11/1/19 to 8/1/44 | | 22,159 | | 23,947 |
4.5% 9/1/44 (i) | | 29,600 | | 31,961 |
4.5% 10/1/44 (i) | | 22,200 | | 23,912 |
5% 10/1/41 | | 3,404 | | 3,759 |
5% 9/1/44 (i) | | 7,900 | | 8,712 |
5% 9/1/44 (i) | | 14,100 | | 15,549 |
5.5% 8/1/37 | | 3,264 | | 3,657 |
5.5% 9/1/44 (i) | | 25,000 | | 27,806 |
5.5% 10/1/44 (i) | | 12,600 | | 13,992 |
6% 7/1/35 to 8/1/37 | | 3,385 | | 3,839 |
6.5% 7/1/32 to 8/1/36 | | 569 | | 657 |
TOTAL FANNIE MAE | | 726,735 |
Freddie Mac - 0.1% |
3.068% 10/1/35 (k) | | 159 | | 171 |
3.5% 6/1/42 to 10/1/43 | | 10,804 | | 11,080 |
4% 6/1/24 to 11/1/43 | | 5,407 | | 5,749 |
5% 3/1/19 | | 1,245 | | 1,319 |
5.5% 1/1/38 | | 686 | | 764 |
U.S. Government Agency - Mortgage Securities - continued |
| Principal Amount (000s) | | Value (000s) |
Freddie Mac - continued |
6% 7/1/37 to 8/1/37 | | $ 325 | | $ 366 |
6.5% 3/1/36 | | 2,095 | | 2,423 |
TOTAL FREDDIE MAC | | 21,872 |
Ginnie Mae - 0.3% |
3.5% 9/1/44 (i) | | 11,500 | | 11,958 |
3.5% 9/1/44 (i) | | 12,800 | | 13,309 |
4% 8/15/39 to 5/15/43 | | 5,627 | | 6,011 |
4% 9/1/44 (i) | | 12,500 | | 13,315 |
4.5% 9/1/44 (i) | | 11,900 | | 12,936 |
4.5% 9/1/44 (i) | | 8,500 | | 9,239 |
5% 2/15/39 to 5/15/39 | | 1,034 | | 1,140 |
5.5% 6/15/35 to 9/15/39 | | 3,096 | | 3,475 |
6% 2/15/34 | | 4,498 | | 5,148 |
TOTAL GINNIE MAE | | 76,531 |
TOTAL U.S. GOVERNMENT AGENCY - MORTGAGE SECURITIES (Cost $817,188) |
825,138
|
Asset-Backed Securities - 0.3% |
|
Accredited Mortgage Loan Trust Series 2005-1 Class M1, 0.625% 4/25/35 (k) | | 504 | | 438 |
ACE Securities Corp. Home Equity Loan Trust Series 2004-HE1 Class M2, 1.805% 3/25/34 (k) | | 227 | | 226 |
AmeriCredit Auto Receivables Trust Series 2013-4: | | | | |
Class C, 2.72% 9/9/19 | | 1,240 | | 1,266 |
Class D, 3.31% 10/8/19 | | 770 | | 785 |
Ameriquest Mortgage Securities, Inc. pass-thru certificates: | | | | |
Series 2003-10 Class M1, 1.205% 12/25/33 (k) | | 44 | | 40 |
Series 2004-R2 Class M3, 0.98% 4/25/34 (k) | | 68 | | 44 |
Series 2005-R2 Class M1, 0.605% 4/25/35 (k) | | 404 | | 403 |
Argent Securities, Inc. pass-thru certificates: | | | | |
Series 2003-W7 Class A2, 0.935% 3/25/34 (k) | | 36 | | 35 |
Series 2004-W11 Class M2, 1.205% 11/25/34 (k) | | 426 | | 409 |
Series 2004-W7 Class M1, 0.98% 5/25/34 (k) | | 1,108 | | 1,073 |
Series 2006-W4 Class A2C, 0.315% 5/25/36 (k) | | 909 | | 318 |
Asset Backed Securities Corp. Home Equity Loan Trust: | | | | |
Series 2004-HE2 Class M1, 0.98% 4/25/34 (k) | | 1,432 | | 1,315 |
Asset-Backed Securities - continued |
| Principal Amount (000s) | | Value (000s) |
Asset Backed Securities Corp. Home Equity Loan Trust: - continued | | | | |
Series 2006-HE2 Class M1, 0.525% 3/25/36 (k) | | $ 20 | | $ 2 |
Carrington Mortgage Loan Trust Series 2007-RFC1 Class A3, 0.295% 12/25/36 (k) | | 1,368 | | 928 |
CFC LLC Series 2013-1A Class A, 1.65% 7/17/17 (g) | | 518 | | 519 |
Countrywide Home Loans, Inc.: | | | | |
Series 2004-3 Class M4, 1.61% 4/25/34 (k) | | 60 | | 43 |
Series 2004-4 Class M2, 0.95% 6/25/34 (k) | | 160 | | 151 |
Series 2004-7 Class AF5, 5.868% 1/25/35 | | 1,888 | | 1,937 |
Fannie Mae Series 2004-T5 Class AB3, 0.9829% 5/28/35 (k) | | 30 | | 28 |
Fieldstone Mortgage Investment Corp. Series 2004-3 Class M5, 2.327% 8/25/34 (k) | | 221 | | 196 |
First Franklin Mortgage Loan Trust Series 2004-FF2 Class M3, 0.98% 3/25/34 (k) | | 11 | | 10 |
Fremont Home Loan Trust Series 2005-A: | | | | |
Class M3, 0.89% 1/25/35 (k) | | 720 | | 596 |
Class M4, 1.175% 1/25/35 (k) | | 264 | | 148 |
GCO Education Loan Funding Master Trust II Series 2007-1A Class C1L, 0.6149% 2/25/47 (g)(k) | | 1,403 | | 1,198 |
GE Business Loan Trust: | | | | |
Series 2003-1 Class A, 0.585% 4/15/31 (g)(k) | | 40 | | 38 |
Series 2006-2A: | | | | |
Class A, 0.335% 11/15/34 (g)(k) | | 714 | | 679 |
Class B, 0.435% 11/15/34 (g)(k) | | 258 | | 238 |
Class C, 0.535% 11/15/34 (g)(k) | | 429 | | 374 |
Class D, 0.905% 11/15/34 (g)(k) | | 163 | | 140 |
Home Equity Asset Trust: | | | | |
Series 2003-2 Class M1, 1.475% 8/25/33 (k) | | 206 | | 195 |
Series 2003-3 Class M1, 1.445% 8/25/33 (k) | | 386 | | 373 |
Series 2003-5 Class A2, 0.855% 12/25/33 (k) | | 25 | | 24 |
HSI Asset Securitization Corp. Trust Series 2007-HE1 Class 2A3, 0.345% 1/25/37 (k) | | 1,137 | | 707 |
JPMorgan Mortgage Acquisition Trust: | | | | |
Series 2006-NC2 Class M2, 0.452% 7/25/36 (k) | | 2,497 | | 429 |
Series 2007-CH1 Class AV4, 0.285% 11/25/36 (k) | | 746 | | 738 |
KeyCorp Student Loan Trust: | | | | |
Series 1999-A Class A2, 0.5639% 12/27/29 (k) | | 192 | | 191 |
Series 2006-A Class 2C, 1.3839% 3/27/42 (k) | | 2,016 | | 336 |
MASTR Asset Backed Securities Trust Series 2007-HE1 Class M1, 0.455% 5/25/37 (k) | | 351 | | 3 |
Meritage Mortgage Loan Trust Series 2004-1 Class M1, 0.905% 7/25/34 (k) | | 90 | | 72 |
Asset-Backed Securities - continued |
| Principal Amount (000s) | | Value (000s) |
Merrill Lynch Mortgage Investors Trust: | | | | |
Series 2003-OPT1 Class M1, 1.13% 7/25/34 (k) | | $ 350 | | $ 321 |
Series 2006-FM1 Class A2B, 0.265% 4/25/37 (k) | | 537 | | 483 |
Series 2006-OPT1 Class A1A, 0.675% 6/25/35 (k) | | 1,475 | | 1,408 |
Morgan Stanley ABS Capital I Trust: | | | | |
Series 2004-HE6 Class A2, 0.835% 8/25/34 (k) | | 44 | | 40 |
Series 2005-NC1 Class M1, 0.815% 1/25/35 (k) | | 303 | | 288 |
Series 2005-NC2 Class B1, 1.91% 3/25/35 (k) | | 185 | | 6 |
New Century Home Equity Loan Trust Series 2005-4 Class M2, 0.665% 9/25/35 (k) | | 1,083 | | 1,005 |
Park Place Securities, Inc.: | | | | |
Series 2004-WCW1: | | | | |
Class M3, 2.03% 9/25/34 (k) | | 405 | | 362 |
Class M4, 2.33% 9/25/34 (k) | | 519 | | 318 |
Series 2005-WCH1 Class M4, 0.985% 1/25/36 (k) | | 1,120 | | 984 |
Salomon Brothers Mortgage Securities VII, Inc. Series 2003-HE1 Class A, 0.955% 4/25/33 (k) | | 4 | | 4 |
Santander Drive Auto Receivables Trust: | | | | |
Series 2014-2 Class C, 2.33% 11/15/19 | | 5,443 | | 5,469 |
Series 2014-3: | | | | |
Class B, 1.45% 5/15/19 | | 19,055 | | 19,007 |
Class C, 2.13% 8/17/20 | | 19,051 | | 18,988 |
Saxon Asset Securities Trust Series 2004-1 Class M1, 0.95% 3/25/35 (k) | | 717 | | 656 |
SLM Private Credit Student Loan Trust Series 2004-A Class C, 1.1806% 6/15/33 (k) | | 691 | | 666 |
Structured Asset Investment Loan Trust Series 2004-8 Class M5, 1.88% 9/25/34 (k) | | 37 | | 30 |
Terwin Mortgage Trust Series 2003-4HE Class A1, 1.015% 9/25/34 (k) | | 22 | | 20 |
Trapeza CDO XII Ltd./Trapeza CDO XII, Inc. Series 2007-12A Class B, 0.7921% 4/6/42 (g)(k) | | 1,530 | | 688 |
Whinstone Capital Management Ltd. Series 1A Class B3, 2.0341% 10/25/44 (g)(k) | | 1,358 | | 1,372 |
TOTAL ASSET-BACKED SECURITIES (Cost $61,758) |
68,760
|
Collateralized Mortgage Obligations - 0.2% |
| Principal Amount (000s) | | Value (000s) |
Private Sponsor - 0.2% |
Bear Stearns ALT-A Trust floater Series 2005-1 Class A1, 0.715% 1/25/35 (k) | | $ 1,015 | | $ 1,010 |
Citigroup Mortgage Loan Trust sequential payer Series 2012-A Class A, 2.5% 6/25/51 (g) | | 3,026 | | 2,936 |
First Horizon Mortgage pass-thru Trust Series 2004-AR5 Class 2A1, 2.5706% 10/25/34 (k) | | 566 | | 566 |
Granite Master Issuer PLC: | | | | |
floater: | | | | |
Series 2006-1A: | | | | |
Class A1, 0.2255% 12/20/54 (g)(k) | | 4,295 | | 4,256 |
Class A5, 0.2955% 12/20/54 (g)(k) | | 3,198 | | 3,171 |
Series 2006-2 Class A4, 0.2355% 12/20/54 (k) | | 1,282 | | 1,257 |
Series 2006-3: | | | | |
Class A3, 0.2355% 12/20/54 (k) | | 617 | | 612 |
Class A7, 0.3555% 12/20/54 (k) | | 671 | | 665 |
Class M2, 0.7155% 12/20/54 (k) | | 4,540 | | 4,446 |
Series 2006-4: | | | | |
Class A4, 0.2555% 12/20/54 (k) | | 13,533 | | 13,414 |
Class B1, 0.3355% 12/20/54 (k) | | 3,154 | | 3,058 |
Class M1, 0.4955% 12/20/54 (k) | | 829 | | 802 |
Series 2007-1: | | | | |
Class 1B1, 0.2955% 12/20/54 (k) | | 5,012 | | 4,857 |
Class 1M1, 0.4555% 12/20/54 (k) | | 1,114 | | 1,081 |
Class 2A1, 0.2955% 12/20/54 (k) | | 1,544 | | 1,531 |
Class 2M1, 0.6555% 12/20/54 (k) | | 1,431 | | 1,397 |
Series 2007-2: | | | | |
Class 1B1, 0.315% 12/17/54 (k) | | 767 | | 744 |
Class 2C1, 1.015% 12/17/54 (k) | | 1,981 | | 1,923 |
Class 3A1, 0.335% 12/17/54 (k) | | 275 | | 273 |
sequential payer Series 2006-3 Class B2, 0.4955% 12/20/54 (k) | | 4,550 | | 4,446 |
Granite Mortgages PLC floater Series 2003-3 Class 1C, 2.6836% 1/20/44 (k) | | 326 | | 345 |
JPMorgan Mortgage Trust sequential payer Series 2006-A5 Class 3A5, 2.4718% 8/25/36 (k) | | 1,099 | | 940 |
MASTR Adjustable Rate Mortgages Trust Series 2007-3 Class 22A2, 0.365% 5/25/47 (k) | | 386 | | 322 |
Merrill Lynch Alternative Note Asset Trust floater Series 2007-OAR1 Class A1, 0.325% 2/25/37 (k) | | 705 | | 639 |
Opteum Mortgage Acceptance Corp. floater Series 2005-3 Class APT, 0.445% 7/25/35 (k) | | 1,012 | | 966 |
Collateralized Mortgage Obligations - continued |
| Principal Amount (000s) | | Value (000s) |
Private Sponsor - continued |
RESI Finance LP/RESI Finance DE Corp. floater Series 2003-B: | | | | |
Class B5, 2.507% 6/10/35 (g)(k) | | $ 383 | | $ 351 |
Class B6, 3.007% 6/10/35 (g)(k) | | 82 | | 76 |
Sequoia Mortgage Trust floater Series 2004-6 Class A3B, 1.2054% 7/20/34 (k) | | 20 | | 19 |
Structured Asset Securities Corp. Series 2003-15A Class 4A, 2.5124% 4/25/33 (k) | | 137 | | 138 |
TBW Mortgage-Backed pass-thru certificates floater Series 2006-4 Class A3, 0.355% 9/25/36 (k) | | 1,520 | | 1,366 |
Thornburg Mortgage Securities Trust floater Series 2003-4 Class A1, 0.795% 9/25/43 (k) | | 2,353 | | 2,311 |
TOTAL COLLATERALIZED MORTGAGE OBLIGATIONS (Cost $49,017) |
59,918
|
Commercial Mortgage Securities - 1.7% |
|
Asset Securitization Corp. Series 1997-D5 Class PS1, 1.4206% 2/14/43 (k)(m) | | 292 | | 6 |
Banc of America Commercial Mortgage Trust: | | | | |
sequential payer: | | | | |
Series 2006-2 Class AAB, 5.7129% 5/10/45 (k) | | 255 | | 259 |
Series 2006-3 Class A4, 5.889% 7/10/44 | | 7,407 | | 7,918 |
Series 2006-5 Class A2, 5.317% 9/10/47 | | 1,450 | | 1,454 |
Series 2006-6 Class A3, 5.369% 10/10/45 | | 1,824 | | 1,859 |
Series 2005-3 Class A3B, 5.09% 7/10/43 (k) | | 2,833 | | 2,883 |
Series 2006-6 Class E, 5.619% 10/10/45 (g) | | 527 | | 67 |
Series 2007-3: | | | | |
Class A3, 5.5647% 6/10/49 (k) | | 1,095 | | 1,093 |
Class A4, 5.5647% 6/10/49 (k) | | 1,901 | | 2,072 |
Banc of America Commercial Mortgage, Inc. sequential payer Series 2001-1 Class A4, 5.451% 1/15/49 | | 1,997 | | 2,141 |
Bayview Commercial Asset Trust: | | | | |
floater: | | | | |
Series 2003-2 Class M1, 1.43% 12/25/33 (g)(k) | | 30 | | 27 |
Series 2005-3A: | | | | |
Class A2, 0.555% 11/25/35 (g)(k) | | 273 | | 242 |
Class M1, 0.595% 11/25/35 (g)(k) | | 36 | | 26 |
Class M2, 0.645% 11/25/35 (g)(k) | | 45 | | 33 |
Class M3, 0.665% 11/25/35 (g)(k) | | 41 | | 29 |
Class M4, 0.755% 11/25/35 (g)(k) | | 51 | | 35 |
Commercial Mortgage Securities - continued |
| Principal Amount (000s) | | Value (000s) |
Bayview Commercial Asset Trust: - continued | | | | |
floater: | | | | |
Series 2005-4A: | | | | |
Class A2, 0.545% 1/25/36 (g)(k) | | $ 698 | | $ 613 |
Class B1, 1.555% 1/25/36 (g)(k) | | 32 | | 6 |
Class M1, 0.605% 1/25/36 (g)(k) | | 225 | | 132 |
Class M2, 0.625% 1/25/36 (g)(k) | | 68 | | 38 |
Class M3, 0.655% 1/25/36 (g)(k) | | 99 | | 53 |
Class M4, 0.765% 1/25/36 (g)(k) | | 55 | | 28 |
Class M5, 0.805% 1/25/36 (g)(k) | | 55 | | 22 |
Class M6, 0.855% 1/25/36 (g)(k) | | 58 | | 18 |
Series 2006-1: | | | | |
Class A2, 0.515% 4/25/36 (g)(k) | | 111 | | 97 |
Class M1, 0.535% 4/25/36 (g)(k) | | 40 | | 28 |
Class M2, 0.555% 4/25/36 (g)(k) | | 42 | | 28 |
Class M3, 0.575% 4/25/36 (g)(k) | | 36 | | 26 |
Class M4, 0.675% 4/25/36 (g)(k) | | 20 | | 15 |
Class M5, 0.715% 4/25/36 (g)(k) | | 20 | | 12 |
Class M6, 0.795% 4/25/36 (g)(k) | | 39 | | 27 |
Series 2006-2A: | | | | |
Class M1, 0.465% 7/25/36 (g)(k) | | 100 | | 77 |
Class M2, 0.485% 7/25/36 (g)(k) | | 71 | | 53 |
Class M3, 0.505% 7/25/36 (g)(k) | | 58 | | 41 |
Class M4, 0.575% 7/25/36 (g)(k) | | 39 | | 26 |
Class M5, 0.625% 7/25/36 (g)(k) | | 49 | | 22 |
Series 2006-3A Class M4, 0.585% 10/25/36 (g)(k) | | 46 | | 7 |
Series 2006-4A: | | | | |
Class A2, 0.425% 12/25/36 (g)(k) | | 2,085 | | 1,717 |
Class M1, 0.445% 12/25/36 (g)(k) | | 138 | | 94 |
Class M2, 0.465% 12/25/36 (g)(k) | | 92 | | 40 |
Class M3, 0.495% 12/25/36 (g)(k) | | 94 | | 40 |
Series 2007-1 Class A2, 0.425% 3/25/37 (g)(k) | | 436 | | 318 |
Series 2007-2A: | | | | |
Class A1, 0.425% 7/25/37 (g)(k) | | 449 | | 389 |
Class A2, 0.475% 7/25/37 (g)(k) | | 420 | | 306 |
Class M1, 0.525% 7/25/37 (g)(k) | | 148 | | 44 |
Class M2, 0.565% 7/25/37 (g)(k) | | 81 | | 10 |
Class M3, 0.645% 7/25/37 (g)(k) | | 82 | | 6 |
Class M4, 0.805% 7/25/37 (g)(k) | | 3 | | 0* |
Series 2007-3: | | | | |
Class A2, 0.445% 7/25/37 (g)(k) | | 433 | | 314 |
Class M1, 0.465% 7/25/37 (g)(k) | | 86 | | 55 |
Class M2, 0.495% 7/25/37 (g)(k) | | 92 | | 53 |
Commercial Mortgage Securities - continued |
| Principal Amount (000s) | | Value (000s) |
Bayview Commercial Asset Trust: - continued | | | | |
floater: | | | | |
Series 2007-3: | | | | |
Class M3, 0.525% 7/25/37 (g)(k) | | $ 144 | | $ 54 |
Class M4, 0.655% 7/25/37 (g)(k) | | 227 | | 49 |
Class M5, 0.755% 7/25/37 (g)(k) | | 113 | | 18 |
Series 2007-4A: | | | | |
Class M1, 1.102% 9/25/37 (g)(k) | | 175 | | 36 |
Class M2, 1.202% 9/25/37 (g)(k) | | 142 | | 12 |
Series 2004-1, Class IO, 1.25% 4/25/34 (g)(m) | | 1,035 | | 42 |
Series 2006-3A, Class IO, 0% 10/25/36 (g)(k)(m) | | 18,959 | | 0 |
Series 2007-5A, Class IO, 4.186% 10/25/37 (g)(k)(m) | | 2,813 | | 116 |
Bear Stearns Commercial Mortgage Securities Trust: | | | | |
floater Series 2007-BBA8: | | | | |
Class H, 0.705% 3/15/22 (g)(k) | | 136 | | 136 |
Class J, 0.855% 3/15/22 (g)(k) | | 452 | | 443 |
sequential payer: | | | | |
Series 2007-PW16: | | | | |
Class A4, 5.7071% 6/11/40 (k) | | 534 | | 586 |
Class AAB, 5.8973% 6/11/40 (k) | | 2,738 | | 2,814 |
Series 2007-PW18 Class A4, 5.7% 6/11/50 | | 4,380 | | 4,850 |
Series 2006-T22 Class A4, 5.5723% 4/12/38 (k) | | 110 | | 116 |
Series 2007-PW18 Class X2, 0.2917% 6/11/50 (g)(k)(m) | | 46,283 | | 221 |
Series 2007-T28 Class X2, 0.1374% 9/11/42 (g)(k)(m) | | 28,415 | | 57 |
Berkeley Federal Bank & Trust FSB Series 1994-1 Class B, 0% 8/1/24 (g)(k) | | 218 | | 143 |
C-BASS Trust floater Series 2006-SC1 Class A, 0.425% 5/25/36 (g)(k) | | 352 | | 343 |
CDC Commercial Mortgage Trust Series 2002-FX1 Class XCL, 1.4379% 5/15/35 (g)(k)(m) | | 1,919 | | 11 |
Citigroup Commercial Mortgage Trust Series 2007-C6 Class A4, 5.7096% 12/10/49 (k) | | 3,035 | | 3,346 |
Citigroup/Deutsche Bank Commercial Mortgage Trust sequential payer Series 2007-CD4: | | | | |
Class A3, 5.293% 12/11/49 | | 593 | | 602 |
Class A4, 5.322% 12/11/49 | | 12,448 | | 13,421 |
Cobalt CMBS Commercial Mortgage Trust Series 2007-C2 Class B, 5.617% 4/15/47 (k) | | 1,019 | | 985 |
COMM Mortgage Trust pass-thru certificates: | | | | |
floater Series 2005-F10A Class J, 1.005% 4/15/17 (g)(k) | | 96 | | 96 |
Commercial Mortgage Securities - continued |
| Principal Amount (000s) | | Value (000s) |
COMM Mortgage Trust pass-thru certificates: - continued | | | | |
sequential payer Series 2007-C9 Class A4, 5.7961% 12/10/49 (k) | | $ 2,018 | | $ 2,235 |
Credit Suisse Commercial Mortgage Trust: | | | | |
sequential payer: | | | | |
Series 2006-C4 Class A3, 5.467% 9/15/39 | | 959 | | 1,024 |
Series 2007-C2 Class A2, 5.448% 1/15/49 (k) | | 18 | | 17 |
Series 2007-C3 Class A4, 5.7022% 6/15/39 (k) | | 347 | | 373 |
Series 2007-C5 Class A4, 5.695% 9/15/40 (k) | | 825 | | 903 |
Credit Suisse First Boston Mortgage Capital Certificates floater Series 2007-TF2A Class B, 0.505% 4/15/22 (g)(k) | | 3,254 | | 3,190 |
Credit Suisse First Boston Mortgage Securities Corp.: | | | | |
Series 2001-CK6 Class AX, 1.463% 8/15/36 (k)(m) | | 38 | | 0* |
Series 2001-CKN5 Class AX, 0% 9/15/34 (g)(k)(m) | | 3 | | 0* |
Credit Suisse Mortgage Capital Certificates: | | | | |
floater Series 2007-TFL1 Class F, 0.475% 2/15/22 (g)(k) | | 42 | | 42 |
Series 2007-C1 Class B, 5.487% 2/15/40 (g)(k) | | 1,394 | | 174 |
Extended Stay America Trust floater Series 2013-ESFL: | | | | |
Class A1FL, 0.956% 12/5/31 (g)(k) | | 1,376 | | 1,376 |
Class A2FL, 0.856% 12/5/31 (g)(k) | | 1,380 | | 1,380 |
Class BFL, 1.256% 12/5/31 (g)(k) | | 5,070 | | 5,074 |
Class CFL, 1.656% 12/5/31 (g)(k) | | 3,690 | | 3,694 |
GE Capital Commercial Mortgage Corp.: | | | | |
sequential payer Series 2007-C1 Class A4, 5.543% 12/10/49 | | 10,052 | | 10,839 |
Series 2001-1 Class X1, 1.6605% 5/15/33 (g)(k)(m) | | 81 | | 0* |
Greenwich Capital Commercial Funding Corp.: | | | | |
sequential payer Series 2007-GG9 Class A4, 5.444% 3/10/39 | | 28,618 | | 30,964 |
Series 2006-GG7 Class A4, 5.8189% 7/10/38 (k) | | 3,713 | | 3,955 |
Series 2007-GG11 Class A1, 0.2924% 12/10/49 (g)(k)(m) | | 12,891 | | 0* |
GS Mortgage Securities Trust sequential payer Series 2006-GG8: | | | | |
Class A1A, 5.547% 11/10/39 | | 2,224 | | 2,393 |
Class A4, 5.56% 11/10/39 (k) | | 3,933 | | 4,222 |
Hilton U.S.A. Trust Series 2013-HLT: | | | | |
Class CFX, 3.7141% 11/5/30 (g) | | 1,180 | | 1,203 |
Class DFX, 4.4065% 11/5/30 (g) | | 11,029 | | 11,292 |
Commercial Mortgage Securities - continued |
| Principal Amount (000s) | | Value (000s) |
JPMorgan Chase Commercial Mortgage Securities Trust: | | | | |
floater: | | | | |
Series 2006-FL2A: | | | | |
Class E, 0.435% 11/15/18 (g)(k) | | $ 114 | | $ 113 |
Class F, 0.485% 11/15/18 (g)(k) | | 265 | | 257 |
Class G, 0.515% 11/15/18 (g)(k) | | 230 | | 218 |
Class H, 0.655% 11/15/18 (g)(k) | | 176 | | 166 |
Series 2014-BXH: | | | | |
Class C, 1.806% 4/15/27 (g)(k) | | 1,775 | | 1,775 |
Class D, 2.406% 4/15/27 (g)(k) | | 3,781 | | 3,781 |
sequential payer: | | | | |
Series 2006-CB17: | | | | |
Class A3, 5.45% 12/12/43 | | 44 | | 44 |
Class A4, 5.429% 12/12/43 | | 2,200 | | 2,349 |
Series 2006-LDP8: | | | | |
Class A1A, 5.397% 5/15/45 | | 7,505 | | 8,060 |
Class A4, 5.399% 5/15/45 | | 562 | | 600 |
Series 2006-LDP9 Class A3, 5.336% 5/15/47 | | 14,845 | | 15,966 |
Series 2007-CB19 Class A4, 5.7029% 2/12/49 (k) | | 3,228 | | 3,531 |
Series 2007-LD11: | | | | |
Class A2, 5.79% 6/15/49 (k) | | 90 | | 91 |
Class A4, 5.805% 6/15/49 (k) | | 31,964 | | 34,757 |
Series 2007-LDPX Class A3, 5.42% 1/15/49 | | 14,045 | | 15,203 |
Series 2006-LDP7 Class A4, 5.8657% 4/15/45 (k) | | 1,505 | | 1,604 |
Series 2007-LDP10 Class CS, 5.466% 1/15/49 (k) | | 75 | | 9 |
LB Commercial Conduit Mortgage Trust sequential payer Series 2007-C3 Class A4, 5.8927% 7/15/44 (k) | | 743 | | 817 |
LB Multi-family Mortgage Trust Series 1991-4 Class A1, 7.125% 4/25/21 (k) | | 8 | | 6 |
LB-UBS Commercial Mortgage Trust: | | | | |
sequential payer: | | | | |
Series 2006-C6 Class A4, 5.372% 9/15/39 | | 410 | | 440 |
Series 2006-C7 Class A2, 5.3% 11/15/38 | | 471 | | 485 |
Series 2007-C1 Class A4, 5.424% 2/15/40 | | 2,706 | | 2,931 |
Series 2007-C2 Class A3, 5.43% 2/15/40 | | 1,622 | | 1,766 |
Series 2007-C6 Class A4, 5.858% 7/15/40 (k) | | 1,074 | | 1,142 |
Series 2007-C7: | | | | |
Class A3, 5.866% 9/15/45 | | 1,390 | | 1,546 |
Class XCP, 0.2789% 9/15/45 (k)(m) | | 51,392 | | 37 |
Merrill Lynch Mortgage Trust: | | | | |
Series 2005-LC1 Class F, 5.4208% 1/12/44 (g)(k) | | 793 | | 755 |
Series 2007-C1 Class A4, 5.8385% 6/12/50 (k) | | 3,452 | | 3,817 |
Series 2008-C1 Class A4, 5.69% 2/12/51 | | 1,898 | | 2,102 |
Commercial Mortgage Securities - continued |
| Principal Amount (000s) | | Value (000s) |
Merrill Lynch-CFC Commercial Mortgage Trust: | | | | |
floater Series 2006-4 Class A2FL, 0.276% 12/12/49 (k) | | $ 45 | | $ 45 |
sequential payer: | | | | |
Series 2006-4 Class ASB, 5.133% 12/12/49 (k) | | 304 | | 313 |
Series 2007-5: | | | | |
Class A4, 5.378% 8/12/48 | | 7,276 | | 7,792 |
Class B, 5.479% 8/12/48 | | 2,736 | | 1,307 |
Series 2007-6 Class A4, 5.485% 3/12/51 (k) | | 7,400 | | 8,038 |
Series 2007-7 Class A4, 5.7432% 6/12/50 (k) | | 3,192 | | 3,489 |
Series 2006-4 Class XP, 0.6181% 12/12/49 (k)(m) | | 12,046 | | 21 |
Series 2007-6 Class B, 5.635% 3/12/51 (k) | | 912 | | 282 |
Series 2007-7 Class B, 5.7432% 6/12/50 (k) | | 79 | | 3 |
Series 2007-8 Class A3, 5.8831% 8/12/49 (k) | | 787 | | 866 |
Morgan Stanley Capital I Trust: | | | | |
floater: | | | | |
Series 2006-XLF Class C, 1.355% 7/15/19 (g)(k) | | 272 | | 244 |
Series 2007-XLFA: | | | | |
Class C, 0.315% 10/15/20 (g)(k) | | 523 | | 521 |
Class D, 0.345% 10/15/20 (g)(k) | | 507 | | 503 |
Class E, 0.405% 10/15/20 (g)(k) | | 634 | | 627 |
Class F, 0.455% 10/15/20 (g)(k) | | 380 | | 374 |
Class G, 0.495% 10/15/20 (g)(k) | | 470 | | 458 |
Class H, 0.585% 10/15/20 (g)(k) | | 296 | | 273 |
Class J, 0.735% 10/15/20 (g)(k) | | 171 | | 141 |
sequential payer Series 2007-HQ11 Class A31, 5.439% 2/12/44 (k) | | 95 | | 95 |
Series 2006-IQ11 Class A4, 5.6554% 10/15/42 (k) | | 230 | | 240 |
Series 2006-T23 Class A3, 5.8054% 8/12/41 (k) | | 402 | | 402 |
Series 2007-IQ14: | | | | |
Class A4, 5.692% 4/15/49 (k) | | 1,368 | | 1,495 |
Class AAB, 5.654% 4/15/49 | | 1,425 | | 1,467 |
Class B, 5.722% 4/15/49 (k) | | 224 | | 48 |
Salomon Brothers Mortgage Securities VII, Inc. Series 2006-C2 Class H, 6.308% 7/18/33 (g) | | 129 | | 46 |
Wachovia Bank Commercial Mortgage Trust: | | | | |
floater: | | | | |
Series 2006-WL7A: | | | | |
Class G, 0.515% 9/15/21 (g)(k) | | 676 | | 662 |
Class J, 0.755% 9/15/21 (g)(k) | | 300 | | 288 |
Series 2007-WHL8: | | | | |
Class F, 0.635% 6/15/20 (g)(k) | | 3,171 | | 3,046 |
Class LXR1, 0.855% 6/15/20 (g)(k) | | 112 | | 110 |
Commercial Mortgage Securities - continued |
| Principal Amount (000s) | | Value (000s) |
Wachovia Bank Commercial Mortgage Trust: - continued | | | | |
sequential payer: | | | | |
Series 2007-C30 Class A5, 5.342% 12/15/43 | | $ 15,721 | | $ 16,998 |
Series 2007-C31: | | | | |
Class A4, 5.509% 4/15/47 | | 47,617 | | 51,130 |
Class A5, 5.5% 4/15/47 | | 16,000 | | 17,518 |
Series 2007-C33: | | | | |
Class A4, 5.9414% 2/15/51 (k) | | 23,618 | | 25,615 |
Class A5, 5.9414% 2/15/51 (k) | | 10,259 | | 11,319 |
Series 2005-C19 Class B, 4.892% 5/15/44 | | 912 | | 929 |
Series 2005-C22: | | | | |
Class B, 5.3703% 12/15/44 (k) | | 2,022 | | 2,018 |
Class F, 5.3703% 12/15/44 (g)(k) | | 1,521 | | 416 |
Series 2006-C23 Class A5, 5.416% 1/15/45 (k) | | 5,005 | | 5,266 |
Series 2006-C27 Class A1A, 5.749% 7/15/45 (k) | | 7,939 | | 8,555 |
Series 2007-C30: | | | | |
Class C, 5.483% 12/15/43 (k) | | 2,736 | | 2,610 |
Class D, 5.513% 12/15/43 (k) | | 1,459 | | 1,308 |
Series 2007-C31 Class C, 5.6724% 4/15/47 (k) | | 251 | | 242 |
Series 2007-C31A Class A2, 5.421% 4/15/47 | | 703 | | 704 |
TOTAL COMMERCIAL MORTGAGE SECURITIES (Cost $397,820) |
419,938
|
Municipal Securities - 1.2% |
|
Beaver County Indl. Dev. Auth. Poll. Cont. Rev. Bonds (FirstEnergy Nuclear Generation Corp. Proj.) Series 2005 A, 3.375%, tender 7/1/15 (k) | | 1,700 | | 1,730 |
California Gen. Oblig.: | | | | |
Series 2009, 7.35% 11/1/39 | | 1,095 | | 1,605 |
7.3% 10/1/39 | | 16,765 | | 24,242 |
7.5% 4/1/34 | | 7,195 | | 10,517 |
7.55% 4/1/39 | | 18,865 | | 28,614 |
7.6% 11/1/40 | | 16,125 | | 24,745 |
7.625% 3/1/40 | | 2,445 | | 3,709 |
Chicago Gen. Oblig.: | | | | |
(Taxable Proj.): | | | | |
Series 2008 B, 5.63% 1/1/22 | | 1,170 | | 1,266 |
Series 2010 C1, 7.781% 1/1/35 | | 6,325 | | 7,695 |
Series 2012 B, 5.432% 1/1/42 | | 1,595 | | 1,506 |
6.05% 1/1/29 | | 400 | | 418 |
6.314% 1/1/44 | | 10,755 | | 11,396 |
Municipal Securities - continued |
| Principal Amount (000s) | | Value (000s) |
Illinois Fin. Auth. Rev. Series 2013 A, 4.545% 10/1/18 (o) | | $ 32,000 | | $ 32,901 |
Illinois Gen. Oblig.: | | | | |
Series 2003: | | | | |
4.35% 6/1/18 | | 585 | | 614 |
5.1% 6/1/33 | | 70,725 | | 70,226 |
Series 2010, 4.421% 1/1/15 | | 4,050 | | 4,095 |
Series 2010-1, 6.63% 2/1/35 | | 15,425 | | 17,177 |
Series 2010-3: | | | | |
5.547% 4/1/19 | | 155 | | 170 |
6.725% 4/1/35 | | 7,505 | | 8,435 |
7.35% 7/1/35 | | 4,495 | | 5,258 |
Series 2011: | | | | |
4.961% 3/1/16 | | 495 | | 523 |
5.365% 3/1/17 | | 185 | | 201 |
5.665% 3/1/18 | | 7,760 | | 8,598 |
5.877% 3/1/19 | | 16,035 | | 17,935 |
Series 2013: | | | | |
1.28% 12/1/15 | | 4,270 | | 4,277 |
4% 12/1/20 | | 6,040 | | 6,174 |
TOTAL MUNICIPAL SECURITIES (Cost $279,265) |
294,027
|
Foreign Government and Government Agency Obligations - 0.4% |
|
Banco Nacional de Desenvolvimento Economico e Social: | | | | |
3.375% 9/26/16 (g) | | 5,555 | | 5,711 |
5.75% 9/26/23 (g) | | 5,082 | | 5,527 |
6.369% 6/16/18 (g) | | 10,462 | | 11,662 |
Brazilian Federative Republic: | | | | |
4.25% 1/7/25 | | 10,600 | | 11,024 |
5.625% 1/7/41 | | 5,390 | | 6,064 |
Italian Republic: | | | | |
3.125% 1/26/15 | | 9,149 | | 9,242 |
4.5% 1/21/15 | | 6,859 | | 6,964 |
4.75% 1/25/16 | | 6,870 | | 7,233 |
5.375% 6/12/17 | | 4,115 | | 4,539 |
United Mexican States: | | | | |
3.5% 1/21/21 | | 5,500 | | 5,720 |
Foreign Government and Government Agency Obligations - continued |
| Principal Amount (000s) | | Value (000s) |
United Mexican States: - continued | | | | |
4% 10/2/23 | | $ 12,328 | | $ 13,068 |
4.75% 3/8/44 | | 5,572 | | 5,845 |
TOTAL FOREIGN GOVERNMENT AND GOVERNMENT AGENCY OBLIGATIONS (Cost $88,934) |
92,599
|
Bank Loan Obligations - 0.5% |
|
CONSUMER DISCRETIONARY - 0.2% |
Auto Components - 0.0% |
Tower Automotive Holdings U.S.A. LLC term loan 4% 4/23/20 (k) | | 321 | | 319 |
Diversified Consumer Services - 0.0% |
Laureate Education, Inc. Tranche B, term loan 5% 6/16/18 (k) | | 2,243 | | 2,175 |
Hotels, Restaurants & Leisure - 0.1% |
Caesars Entertainment Resort Properties LLC Tranche B 1LN, term loan 7% 10/11/20 (k) | | 3,471 | | 3,406 |
Caesars Growth Properties Holdings, LLC Tranche 1LN, term loan 6.25% 5/8/21 (k) | | 445 | | 436 |
Fantasy Springs Resort Casino term loan 0% 8/6/49 (d)(k) | | 8,755 | | 6,916 |
Graton Economic Development Authority Tranche B, term loan 9% 8/22/18 (k) | | 558 | | 574 |
Hilton Worldwide Finance, LLC Tranche B, term loan 3.5% 10/25/20 (k) | | 1,086 | | 1,082 |
Landry's Restaurants, Inc. Tranche B, term loan 4% 4/24/18 (k) | | 7,890 | | 7,875 |
MGM Mirage, Inc. Tranche B, term loan 3.5% 12/20/19 (k) | | 630 | | 626 |
Red Lobster Hospitality LLC Tranche B, term loan 6.25% 7/28/21 (k) | | 215 | | 216 |
Station Casinos LLC Tranche B, term loan 4.25% 3/1/20 (k) | | 1,646 | | 1,636 |
| | 22,767 |
Household Durables - 0.0% |
Serta Simmons Holdings, LLC Tranche B, term loan 4.25% 10/1/19 (k) | | 1,702 | | 1,700 |
Bank Loan Obligations - continued |
| Principal Amount (000s) | | Value (000s) |
CONSUMER DISCRETIONARY - continued |
Leisure Products - 0.0% |
Bauer Performance Sports Ltd. Tranche B, term loan 4% 4/15/21 (k) | | $ 731 | | $ 727 |
Media - 0.1% |
CBS Outdoor Americas Capital LLC/CBS Outdoor Americas Capital Corp. Tranche B, term loan 3% 1/31/21 (k) | | 190 | | 189 |
Checkout Holding Corp.: | | | | |
Tranche 2LN, term loan 7.75% 4/9/22 (k) | | 615 | | 604 |
Tranche B 1LN, term loan 4.5% 4/9/21 (k) | | 1,305 | | 1,279 |
Cumulus Media Holdings, Inc. Tranch B 1LN, term loan 4.25% 12/23/20 (k) | | 3,338 | | 3,330 |
Houghton Mifflin Harcourt Publishing, Inc. Tranche B, term loan 4.25% 5/22/18 (k) | | 171 | | 171 |
ION Media Networks, Inc. Tranche B, term loan 5% 12/18/20 (k) | | 430 | | 430 |
Karman Buyer Corp. Tranche 2LN, term loan 7.5% 7/25/22 (k) | | 85 | | 85 |
Liberty Cablevision of Puerto Rico: | | | | |
Tranche 1LN, term loan 4.5% 1/7/22 (k) | | 110 | | 110 |
Tranche 2LN, term loan 7.75% 7/7/23 (k) | | 435 | | 436 |
McGraw-Hill School Education Tranche B, term loan 6.25% 12/18/19 (k) | | 3,622 | | 3,626 |
Univision Communications, Inc. Tranche C 4LN, term loan 4% 3/1/20 (k) | | 736 | | 733 |
| | 10,993 |
Specialty Retail - 0.0% |
J. Crew Group, Inc. Tranche B LN, term loan 4% 3/5/21 (k) | | 314 | | 308 |
TOTAL CONSUMER DISCRETIONARY | | 38,989 |
CONSUMER STAPLES - 0.0% |
Food & Staples Retailing - 0.0% |
Rite Aid Corp. Tranche B 7LN, term loan 3.5% 2/21/20 (k) | | 797 | | 793 |
Sprouts Farmers Market LLC Tranche B, term loan 4% 4/23/20 (k) | | 165 | | 165 |
| | 958 |
Household Products - 0.0% |
Spectrum Brands Holdings, Inc. Tranche C, term loan 3.5% 9/4/19 (k) | | 233 | | 232 |
Bank Loan Obligations - continued |
| Principal Amount (000s) | | Value (000s) |
CONSUMER STAPLES - continued |
Personal Products - 0.0% |
Revlon Consumer Products Corp. term loan 4% 8/19/19 (k) | | $ 1,950 | | $ 1,945 |
TOTAL CONSUMER STAPLES | | 3,135 |
ENERGY - 0.1% |
Energy Equipment & Services - 0.0% |
Drillships Ocean Ventures, Inc. Tranche B, term loan 5.5% 7/25/21 (k) | | 420 | | 422 |
Oil, Gas & Consumable Fuels - 0.1% |
American Energy-Marcellus LLC: | | | | |
Tranche 2LN, term loan 8.5% 8/4/21 (k) | | 1,195 | | 1,201 |
Tranche B 1LN, term loan 5.25% 8/4/20 (k) | | 2,395 | | 2,401 |
Fieldwood Energy, LLC Tranche 2LN, term loan 8.375% 9/30/20 (k) | | 7,740 | | 7,895 |
TPF II LC LLC Tranche B, term loan 6.5% 8/21/19 (k) | | 1,695 | | 1,727 |
| | 13,224 |
TOTAL ENERGY | | 13,646 |
FINANCIALS - 0.0% |
Diversified Financial Services - 0.0% |
Calpine Construction Finance Co. LP Tranche B 2LN, term loan 3.25% 1/31/22 (k) | | 3,388 | | 3,329 |
HarbourVest Partners LLC Tranche B, term loan 3.25% 2/4/21 (k) | | 224 | | 221 |
MPH Acquisition Holdings LLC Tranche B, term loan 4% 3/31/21 (k) | | 438 | | 435 |
Sheridan Investment Partners I term loan 4.25% 12/16/20 (k) | | 393 | | 391 |
Sheridan Production Partners I: | | | | |
Tranche A, term loan 4.25% 12/16/20 (k) | | 55 | | 54 |
Tranche M, term loan 4.25% 12/16/20 (k) | | 20 | | 20 |
TransUnion LLC Tranche B, term loan 4% 4/9/21 (k) | | 3,047 | | 3,044 |
| | 7,494 |
Real Estate Management & Development - 0.0% |
Realogy Corp. Credit-Linked Deposit 4.4463% 10/10/16 (k) | | 570 | | 564 |
TOTAL FINANCIALS | | 8,058 |
Bank Loan Obligations - continued |
| Principal Amount (000s) | | Value (000s) |
HEALTH CARE - 0.0% |
Health Care Equipment & Supplies - 0.0% |
American Renal Holdings, Inc.: | | | | |
Tranche 2LN, term loan 8.5% 2/20/20 (k) | | $ 2,260 | | $ 2,252 |
Tranche B 1LN, term loan 4.5% 8/20/19 (k) | | 2,029 | | 2,022 |
| | 4,274 |
Health Care Providers & Services - 0.0% |
DaVita HealthCare Partners, Inc. Tranche B, term loan 3.5% 6/24/21 (k) | | 3,190 | | 3,178 |
Dialysis Newco, Inc.: | | | | |
Tranche 2LN, term loan 7.75% 10/22/21 (k) | | 665 | | 667 |
Tranche B 1LN, term loan 4.50% 4/23/21 (k) | | 770 | | 770 |
U.S. Renal Care, Inc.: | | | | |
Tranche 2LN, term loan 8.5% 1/3/20 (k) | | 70 | | 71 |
Tranche B 2LN, term loan 4.25% 7/3/19 (k) | | 1,793 | | 1,791 |
| | 6,477 |
Life Sciences Tools & Services - 0.0% |
Patheon, Inc. Tranche B, term loan 4.25% 3/11/21 (k) | | 1,350 | | 1,338 |
Pharmaceuticals - 0.0% |
Jazz Pharmaceuticals, Inc. Tranche B 2LN, term loan 3.25% 6/12/18 (k) | | 65 | | 64 |
Pharmedium Healthcare Corp. Tranche B 1LN, term loan 4.25% 1/28/21 (k) | | 267 | | 263 |
Salix Pharmaceuticals Ltd. Tranche B, term loan 4.25% 1/2/20 (k) | | 117 | | 117 |
| | 444 |
TOTAL HEALTH CARE | | 12,533 |
INDUSTRIALS - 0.0% |
Aerospace & Defense - 0.0% |
TransDigm, Inc. Tranche D, term loan 3.75% 6/4/21 (k) | | 1,320 | | 1,312 |
Commercial Services & Supplies - 0.0% |
Arysta Lifescience SPC LLC: | | | | |
Tranche B 1LN, term loan 4.5% 5/29/20 (k) | | 416 | | 415 |
Tranche B 2LN, term loan 8.25% 11/30/20 (k) | | 355 | | 359 |
The Brickman Group, Ltd. Tranche B 1LN, term loan 4% 12/18/20 (k) | | 4,105 | | 4,043 |
| | 4,817 |
Bank Loan Obligations - continued |
| Principal Amount (000s) | | Value (000s) |
INDUSTRIALS - continued |
Electrical Equipment - 0.0% |
Atlantic Power Ltd. Partnership Tranche B LN, term loan 4.75% 2/24/21 (k) | | $ 234 | | $ 236 |
Machinery - 0.0% |
INA Beteiligungsgesellschaft MBH Tranche E, term loan 3.75% 5/15/20 (k) | | 560 | | 559 |
Professional Services - 0.0% |
AlixPartners LLP: | | | | |
Tranche 2LN, term loan 9% 7/10/21 (k) | | 2,210 | | 2,243 |
Tranche B 2LN, term loan 4% 7/10/20 (k) | | 795 | | 795 |
| | 3,038 |
TOTAL INDUSTRIALS | | 9,962 |
INFORMATION TECHNOLOGY - 0.1% |
Electronic Equipment & Components - 0.0% |
Atkore International, Inc.: | | | | |
Tranche 2LN, term loan 7.75% 10/9/21 (k) | | 750 | | 748 |
Tranche B 1LN, term loan 4.5% 4/9/21 (k) | | 1,350 | | 1,343 |
Infor U.S., Inc. Tranche B 5LN, term loan 3.75% 6/3/20 (k) | | 634 | | 628 |
| | 2,719 |
IT Services - 0.1% |
First Data Corp. Tranche B, term loan 3.655% 3/24/18 (k) | | 7,260 | | 7,115 |
Semiconductors & Semiconductor Equipment - 0.0% |
Avago Technologies, Inc. Tranche B, term loan 3.75% 5/6/21 (k) | | 2,675 | | 2,675 |
Freescale Semiconductor, Inc. Tranche B 4LN, term loan 4.25% 3/1/20 (k) | | 2,328 | | 2,322 |
| | 4,997 |
Software - 0.0% |
Kronos, Inc.: | | | | |
Tranche 2LN, term loan 9.75% 4/30/20 (k) | | 2,250 | | 2,318 |
Tranche B 1LN, term loan 4.5% 10/30/19 (k) | | 1,168 | | 1,168 |
Bank Loan Obligations - continued |
| Principal Amount (000s) | | Value (000s) |
INFORMATION TECHNOLOGY - continued |
Software - continued |
Renaissance Learning, Inc.: | | | | |
Tranche 1LN, term loan 4.5% 4/9/21 (k) | | $ 584 | | $ 579 |
Tranche 2LN, term loan 8% 4/9/22 (k) | | 495 | | 490 |
| | 4,555 |
TOTAL INFORMATION TECHNOLOGY | | 19,386 |
MATERIALS - 0.0% |
Chemicals - 0.0% |
American Rock Salt Co. LLC Tranche B 1LN, term loan 4.75% 5/20/21 (k) | | 1,430 | | 1,423 |
Arizona Chem U.S., Inc.: | | | | |
Tranche 2LN, term loan 7.5% 6/12/22 (k) | | 50 | | 50 |
Tranche B 1LN, term loan 4.5% 6/12/21 (k) | | 153 | | 153 |
Royal Adhesives & Sealants LLC Tranche 2LN, term loan 9.75% 1/31/19 (k) | | 1,190 | | 1,214 |
| | 2,840 |
Containers & Packaging - 0.0% |
Anchor Glass Container Corp. Tranche B, term loan 4.25% 6/30/21 (k) | | 385 | | 384 |
Berry Plastics Corp. Tranche E, term loan 3.75% 1/6/21 (k) | | 1,177 | | 1,161 |
| | 1,545 |
TOTAL MATERIALS | | 4,385 |
TELECOMMUNICATION SERVICES - 0.0% |
Diversified Telecommunication Services - 0.0% |
Altice Financing SA Tranche B, term loan 5.5% 6/24/19 (k) | | 5,751 | | 5,859 |
LTS Buyer LLC Tranche 2LN, term loan 8% 4/11/21 (k) | | 41 | | 42 |
| | 5,901 |
Wireless Telecommunication Services - 0.0% |
Intelsat Jackson Holdings SA Tranche B 2LN, term loan 3.75% 6/30/19 (k) | | 950 | | 944 |
TOTAL TELECOMMUNICATION SERVICES | | 6,845 |
Bank Loan Obligations - continued |
| Principal Amount (000s) | | Value (000s) |
UTILITIES - 0.1% |
Gas Utilities - 0.0% |
Everest Acquisition LLC Tranche B 3LN, term loan 3.5% 5/24/18 (k) | | $ 487 | | $ 482 |
Independent Power Producers & Energy Traders - 0.1% |
Energy Future Holdings Corp. Tranche 1LN, term loan 4.25% 6/19/16 (k) | | 15,472 | | 15,472 |
TOTAL UTILITIES | | 15,954 |
TOTAL BANK LOAN OBLIGATIONS (Cost $132,986) |
132,893
|
Bank Notes - 0.0% |
|
Discover Bank (Delaware) 3.2% 8/9/21 | | 8,178 | | 8,205 |
Fifth Third Bank 4.75% 2/1/15 | | 680 | | 692 |
TOTAL BANK NOTES (Cost $8,840) | 8,897 |
Preferred Securities - 0.1% |
|
FINANCIALS - 0.1% |
Banks - 0.1% |
Bank of America Corp. 5.2% (h)(k) | | 1,665 | | 1,626 |
Barclays Bank PLC 7.625% 11/21/22 | | 5,205 | | 5,956 |
Citigroup, Inc.: | | | | |
5.35% (h)(k) | | 11,740 | | 11,395 |
5.9% (h)(k) | | 920 | | 925 |
5.95% (h)(k) | | 1,325 | | 1,343 |
JPMorgan Chase & Co. 5.15% (h)(k) | | 5,940 | | 5,886 |
| | 27,131 |
Diversified Financial Services - 0.0% |
MUFG Capital Finance 1 Ltd. 6.346% (h)(k) | | 996 | | 1,083 |
TOTAL PREFERRED SECURITIES (Cost $28,313) |
28,214
|
Fixed-Income Funds - 3.2% |
| Shares | | Value (000s) |
Fidelity Mortgage Backed Securities Central Fund (l)
(Cost $729,582) | 7,218,055 | | $ 783,087 |
Other - 0.0% |
| | | |
Other - 0.0% |
Tribune Co. Claim (a)
(Cost $11) | 11,084 | |
11
|
Money Market Funds - 4.7% |
| | | |
Fidelity Cash Central Fund, 0.11% (b) | 1,101,689,528 | | 1,101,690 |
Fidelity Securities Lending Cash Central Fund, 0.11% (b)(c) | 41,925,827 | | 41,926 |
TOTAL MONEY MARKET FUNDS (Cost $1,143,616) |
1,143,616
|
TOTAL INVESTMENT PORTFOLIO - 101.6% (Cost $19,687,609) | | 24,912,900 |
NET OTHER ASSETS (LIABILITIES) - (1.6)% | | (399,322) |
NET ASSETS - 100% | $ 24,513,578 |
TBA Sale Commitments |
| Principal
Amount (000s) | | |
Fannie Mae |
4% 9/1/44 | $ (4,000) | | (4,238) |
4% 9/1/44 | (9,000) | | (9,535) |
4% 9/1/44 | (13,300) | | (14,089) |
4% 9/1/44 | (14,100) | | (14,938) |
4% 9/1/44 | (14,300) | | (15,150) |
4% 9/1/44 | (14,100) | | (14,938) |
4% 9/1/44 | (14,300) | | (15,150) |
4% 9/1/44 | (2,900) | | (3,072) |
4.5% 9/1/44 | (22,200) | | (23,971) |
5% 9/1/44 | (3,400) | | (3,749) |
5.5% 9/1/44 | (12,600) | | (14,014) |
TOTAL TBA SALE COMMITMENTS (Proceeds $132,772) | $ (132,844) |
Futures Contracts |
| Expiration
Date | | Underlying
Face Amount
at Value (000s) | | Unrealized
Appreciation/
(Depreciation)
(000s) |
Sold |
Treasury Contracts |
737 CBOT 5 Year U.S. Treasury Note Contracts | Dec. 2014 | | $ 87,582 | | $ (163) |
|
The face value of futures sold as a percentage of net assets is 0.4% |
Legend |
(a) Non-income producing |
(b) Affiliated fund that is generally available only to investment companies and other accounts managed by Fidelity Investments. The rate quoted is the annualized seven-day yield of the fund at period end. A complete unaudited listing of the fund's holdings as of its most recent quarter end is available upon request. In addition, each Fidelity Central Fund's financial statements, which are not covered by the Fund's Report of Independent Registered Public Accounting Firm, are available on the SEC's website or upon request. |
(c) Investment made with cash collateral received from securities on loan. |
(d) Non-income producing - Security is in default. |
(e) Security or a portion of the security is on loan at period end. |
(f) Affiliated company |
(g) Security exempt from registration under Rule 144A of the Securities Act of 1933. These securities may be resold in transactions exempt from registration, normally to qualified institutional buyers. At the end of the period, the value of these securities amounted to $718,342,000 or 2.9% of net assets. |
(h) Security is perpetual in nature with no stated maturity date. |
(i) Security or a portion of the security purchased on a delayed delivery or when-issued basis. |
(j) Security or a portion of the security was pledged to cover margin requirements for futures contracts. At period end, the value of securities pledged amounted to $746,000. |
(k) Coupon rates for floating and adjustable rate securities reflect the rates in effect at period end. |
(l) Affiliated fund that is generally available only to investment companies and other accounts managed by Fidelity Investments. A complete unaudited schedule of portfolio holdings for each Fidelity Central Fund is filed with the SEC for the first and third quarters of each fiscal year on Form N-Q and is available upon request or at the SEC's website at www.sec.gov. An unaudited holdings listing for the Fund, which presents direct holdings as well as the pro-rata share of securities and other investments held indirectly through its investment in underlying non-money market Fidelity Central Funds, is available at fidelity.com. In addition, each Fidelity Central Fund's financial statements, which are not covered by the Fund's Report of Independent Registered Public Accounting Firm, are available on the SEC's website or upon request. |
(m) Security represents right to receive monthly interest payments on an underlying pool of mortgages or assets. Principal shown is the outstanding par amount of the pool as of the end of the period. |
(n) Investment is owned by an entity that is treated as a corporation for U.S. tax purposes and is owned by the Fund. |
(o) Restricted securities - Investment in securities not registered under the Securities Act of 1933 (excluding 144A issues). At the end of the period, the value of restricted securities (excluding 144A issues) amounted to $378,766,000 or 1.5% of net assets. |
Additional information on each restricted holding is as follows: |
Security | Acquisition
Date | Acquisition
Cost (000s) |
Blu Homes, Inc. Series A, 5.00% | 6/10/13 | $ 5,000 |
Security | Acquisition
Date | Acquisition
Cost (000s) |
C. Wonder LLC | 12/27/12 - 6/25/13 | $ 19,500 |
Deem, Inc. | 9/19/13 | $ 8,065 |
Houghton Mifflin Harcourt Co. warrants 6/22/19 | 6/22/12 | $ 4 |
Illinois Fin. Auth. Rev. Series 2013 A, 4.545% 10/1/18 | 10/24/13 | $ 32,000 |
Legend Pictures LLC | 9/23/10 - 3/30/12 | $ 37,645 |
Roku, Inc. 8.00% | 5/7/13 | $ 5,000 |
Spotify Technology SA | 11/14/12 | $ 15,028 |
Station Holdco LLC | 6/17/11 | $ 1,131 |
Station Holdco LLC unit | 4/1/13 | $ 0* |
Station Holdco LLC warrants 6/15/18 | 8/11/08 - 8/15/08 | $ 6,416 |
Tory Burch LLC | 12/31/12 | $ 17,505 |
Uber Technologies, Inc. 8.00% | 6/6/14 | $ 25,000 |
Vice Holding, Inc. | 7/18/14 | $ 29,997 |
Vice Holding, Inc. Series A | 8/3/12 | $ 34,999 |
Wayfair LLC Series B | 3/5/14 | $ 7,000 |
* Amount represents less than $1,000. |
Affiliated Central Funds |
Information regarding fiscal year to date income earned by the Fund from investments in Fidelity Central Funds is as follows: |
Fund | Income earned
(Amounts in thousands) |
Fidelity Cash Central Fund | $ 520 |
Fidelity Mortgage Backed Securities Central Fund | 22,421 |
Fidelity Securities Lending Cash Central Fund | 1,075 |
Total | $ 24,016 |
Additional information regarding the Fund's fiscal year to date purchases and sales, including the ownership percentage, of the non Money Market Central Funds is as follows: |
Fund
(Amounts in thousands) | Value,
beginning of
period | Purchases | Sales
Proceeds | Value,
end of
period | % ownership,
end of
period |
Fidelity Mortgage Backed Securities Central Fund | $ 1,242,061 | $ 22,421 | $ 511,133 | $ 783,087 | 7.3% |
Other Affiliated Issuers |
An affiliated company is a company in which the Fund has ownership of at least 5% of the voting securities. Fiscal year to date transactions with companies which are or were affiliates are as follows: |
Affiliate
(Amounts in thousands) | Value,
beginning of
period | Purchases | Sales
Proceeds | Dividend
Income | Value,
end of
period |
Aspen Aerogels, Inc. | $ - | $ 1,224 | $ - | $ - | $ 22,703 |
CareView Communications, Inc. | 6,724 | - | - | - | 5,890 |
TherapeuticsMD, Inc. | 17,941 | - | 15,235 | - | - |
Total | $ 24,665 | $ 1,224 | $ 15,235 | $ - | $ 28,593 |
Other Information |
The following is a summary of the inputs used, as of August 31, 2014, involving the Fund's assets and liabilities carried at fair value. The inputs or methodology used for valuing securities may not be an indication of the risk associated with investing in those securities. For more information on valuation inputs, and their aggregation into the levels used in the tables below, please refer to the Investment Valuation section in the accompanying Notes to Financial Statements. |
Valuation Inputs at Reporting Date: |
Description
(Amounts in thousands) | Total | Level 1 | Level 2 | Level 3 |
Investments in Securities: | | | | |
Equities: | | | | |
Consumer Discretionary | $ 2,221,490 | $ 1,831,233 | $ 80,559 | $ 309,698 |
Consumer Staples | 1,293,821 | 1,293,821 | - | - |
Energy | 1,903,416 | 1,880,713 | 22,703 | - |
Financials | 2,574,377 | 2,554,285 | 8,901 | 11,191 |
Health Care | 2,925,361 | 2,925,323 | - | 38 |
Industrials | 1,433,576 | 1,432,336 | - | 1,240 |
Information Technology | 3,451,349 | 3,417,591 | 8,758 | 25,000 |
Materials | 738,657 | 738,657 | - | - |
Telecommunication Services | 248,278 | 215,994 | 32,284 | - |
Utilities | 365,964 | 365,964 | - | - |
Corporate Bonds | 3,194,839 | - | 3,194,758 | 81 |
U.S. Government and Government Agency Obligations | 704,674 | - | 704,674 | - |
U.S. Government Agency - Mortgage Securities | 825,138 | - | 825,138 | - |
Asset-Backed Securities | 68,760 | - | 68,066 | 694 |
Collateralized Mortgage Obligations | 59,918 | - | 59,491 | 427 |
Commercial Mortgage Securities | 419,938 | - | 419,364 | 574 |
Municipal Securities | 294,027 | - | 294,027 | - |
Foreign Government and Government Agency Obligations | 92,599 | - | 92,599 | - |
Bank Loan Obligations | 132,893 | - | 125,310 | 7,583 |
Bank Notes | 8,897 | - | 8,897 | - |
Preferred Securities | 28,214 | - | 28,214 | - |
Fixed-Income Funds | 783,087 | 783,087 | - | - |
Other | 11 | - | - | 11 |
Money Market Funds | 1,143,616 | 1,143,616 | - | - |
Total Investments in Securities: | $ 24,912,900 | $ 18,582,620 | $ 5,973,743 | $ 356,537 |
Derivative Instruments: | | | | |
Liabilities | | | | |
Futures Contracts | $ (163) | $ (163) | $ - | $ - |
Other Financial Instruments: | | | | |
TBA Sale Commitments | $ (132,844) | $ - | $ (132,844) | $ - |
Valuation Inputs at Reporting Date: |
The following is a reconciliation of Investments in Securities for which Level 3 inputs were used in determining value: |
(Amounts in thousands) | |
Investments in Securities: | |
Equities - Consumer Discretionary | |
Beginning Balance | $ 196,744 |
Net Realized Gain (Loss) on Investment Securities | - |
Net Unrealized Gain (Loss) on Investment Securities | 75,614 |
Cost of Purchases | 37,340 |
Proceeds of Sales | - |
Amortization/Accretion | - |
Transfers into Level 3 | - |
Transfers out of Level 3 | - |
Ending Balance | $ 309,698 |
The change in unrealized gain (loss) for the period attributable to Level 3 securities held at August 31, 2014 | $ 75,614 |
Other Investments in Securities | |
Beginning Balance | $ 48,332 |
Net Realized Gain (Loss) on Investment Securities | (500) |
Net Unrealized Gain (Loss) on Investment Securities | 4,453 |
Cost of Purchases | 39,996 |
Proceeds of Sales | (38,565) |
Amortization/Accretion | 305 |
Transfers into Level 3 | 705 |
Transfers out of Level 3 | (7,887) |
Ending Balance | $ 46,839 |
The change in unrealized gain (loss) for the period attributable to Level 3 securities held at August 31, 2014 | $ (484) |
The information used in the above reconciliations represents fiscal year to date activity for any Investments in Securities identified as using Level 3 inputs at either the beginning or the end of the current fiscal period. Transfers in or out of Level 3 represent the beginning value of any Security or Instrument where a change in the pricing level occurred from the beginning to the end of the period. The cost of purchases and the proceeds of sales may include securities received or delivered through corporate actions or exchanges. Realized and unrealized gains (losses) disclosed in the reconciliations are included in Net Gain (Loss) on the Fund's Statement of Operations. |
Value of Derivative Instruments |
The following table is a summary of the Fund's value of derivative instruments by primary risk exposure as of August 31, 2014. For additional information on derivative instruments, please refer to the Derivative Instruments section in the accompanying Notes to Financial Statements. |
Primary Risk Exposure /
Derivative Type
(Amounts in thousands) | Value |
| Asset | Liability |
Interest Rate Risk | | |
Futures Contracts (a) | $ - | $ (163) |
Total Value of Derivatives | $ - | $ (163) |
(a) Reflects gross cumulative appreciation (depreciation) on futures contracts as presented in the Schedule of Investments. Only the period end receivable or payable for daily variation margin and net unrealized appreciation (depreciation) are presented in the Statement of Assets and Liabilities. |
Other Information |
The composition of credit quality ratings as a percentage of net assets is as follows (Unaudited): |
U.S. Government and U.S. Government Agency Obligations | 9.3% |
AAA,AA,A | 4.2% |
BBB | 9.3% |
BB | 1.8% |
B | 1.3% |
CCC,CC,C | 0.4% |
D | 0.0%* |
Not Rated | 0.4% |
Other Investments | 70.0% |
Short-Term Investments and Net Other Assets | 3.3% |
| 100.0% |
We have used ratings from Moody's Investors Service, Inc. Where Moody's® ratings are not available, we have used S&P® ratings. All ratings are as of the date indicated and do not reflect subsequent changes. |
* Amount represents less than 0.1%.
See accompanying notes which are an integral part of the financial statements.
Annual Report
Distribution of investments by country or territory of incorporation, as a percentage of total net assets, is as follows (Unaudited): |
United States of America | 88.2% |
Ireland | 1.7% |
Netherlands | 1.4% |
Canada | 1.3% |
Bermuda | 1.2% |
Others (Individually Less Than 1%) | 6.2% |
| 100.0% |
The information in the tables is based on the combined investments of the Fund and its pro-rata share of the investments of Fidelity's fixed-income central funds. |
See accompanying notes which are an integral part of the financial statements.
Annual Report
Statement of Assets and Liabilities
Amounts in thousands (except per-share amounts) | August 31, 2014 |
| | |
Assets | | |
Investment in securities, at value (including securities loaned of $40,631) - See accompanying schedule: Unaffiliated issuers (cost $17,782,338) | $ 22,957,604 | |
Fidelity Central Funds (cost $1,873,198) | 1,926,703 | |
Other affiliated issuers (cost $32,073) | 28,593 | |
Total Investments (cost $19,687,609) | | $ 24,912,900 |
Cash | | 47,659 |
Receivable for investments sold, regular delivery | | 86,050 |
Receivable for TBA sale commitments | | 132,772 |
Receivable for fund shares sold | | 14,709 |
Dividends receivable | | 27,469 |
Interest receivable | | 53,487 |
Distributions receivable from Fidelity Central Funds | | 155 |
Receivable from investment adviser for expense reductions | | 5 |
Other receivables | | 1,107 |
Total assets | | 25,276,313 |
| | |
Liabilities | | |
Payable for investments purchased
Regular delivery | $ 72,814 | |
Delayed delivery | 458,226 | |
TBA sale commitments, at value | 132,844 | |
Payable for fund shares redeemed | 44,995 | |
Accrued management fee | 8,012 | |
Payable for daily variation margin for derivative instruments | 23 | |
Other affiliated payables | 2,622 | |
Other payables and accrued expenses | 1,273 | |
Collateral on securities loaned, at value | 41,926 | |
Total liabilities | | 762,735 |
| | |
Net Assets | | $ 24,513,578 |
Net Assets consist of: | | |
Paid in capital | | $ 17,882,584 |
Undistributed net investment income | | 89,501 |
Accumulated undistributed net realized gain (loss) on investments and foreign currency transactions | | 1,316,487 |
Net unrealized appreciation (depreciation) on investments and assets and liabilities in foreign currencies | | 5,225,006 |
Net Assets | | $ 24,513,578 |
See accompanying notes which are an integral part of the financial statements.
Annual Report
Statement of Assets and Liabilities - continued
Amounts in thousands (except per-share amounts) | August 31, 2014 |
| | |
Puritan:
Net Asset Value, offering price and redemption price per share ($18,351,198 ÷ 801,155 shares) | | $ 22.91 |
| | |
Class K:
Net Asset Value, offering price and redemption price per share ($6,162,380 ÷ 269,115 shares) | | $ 22.90 |
See accompanying notes which are an integral part of the financial statements.
Annual Report
Financial Statements - continued
Statement of Operations
Amounts in thousands | Year ended August 31, 2014 |
| | |
Investment Income | | |
Dividends | | $ 262,669 |
Interest | | 230,673 |
Income from Fidelity Central Funds | | 24,016 |
Total income | | 517,358 |
| | |
Expenses | | |
Management fee | $ 92,514 | |
Transfer agent fees | 28,068 | |
Accounting and security lending fees | 2,124 | |
Custodian fees and expenses | 381 | |
Independent trustees' compensation | 98 | |
Appreciation in deferred trustee compensation account | 2 | |
Registration fees | 185 | |
Audit | 291 | |
Legal | 129 | |
Miscellaneous | 181 | |
Total expenses before reductions | 123,973 | |
Expense reductions | (411) | 123,562 |
Net investment income (loss) | | 393,796 |
Realized and Unrealized Gain (Loss) Net realized gain (loss) on: | | |
Investment securities: | | |
Unaffiliated issuers | 1,897,949 | |
Fidelity Central Funds | 3,180 | |
Other affiliated issuers | 9,369 | |
Foreign currency transactions | (946) | |
Futures contracts | 771 | |
Swaps | (6,476) | |
Total net realized gain (loss) | | 1,903,847 |
Change in net unrealized appreciation (depreciation) on: Investment securities | 1,888,669 | |
Assets and liabilities in foreign currencies | (48) | |
Futures contracts | (163) | |
Swaps | 7,794 | |
Delayed delivery commitments | (2,100) | |
Total change in net unrealized appreciation (depreciation) | | 1,894,152 |
Net gain (loss) | | 3,797,999 |
Net increase (decrease) in net assets resulting from operations | | $ 4,191,795 |
See accompanying notes which are an integral part of the financial statements.
Annual Report
Statement of Changes in Net Assets
Amounts in thousands | Year ended
August 31,
2014 | Year ended
August 31,
2013 |
Increase (Decrease) in Net Assets | | |
Operations | | |
Net investment income (loss) | $ 393,796 | $ 372,321 |
Net realized gain (loss) | 1,903,847 | 1,511,084 |
Change in net unrealized appreciation (depreciation) | 1,894,152 | 305,097 |
Net increase (decrease) in net assets resulting
from operations | 4,191,795 | 2,188,502 |
Distributions to shareholders from net investment income | (374,472) | (353,018) |
Distributions to shareholders from net realized gain | (1,699,060) | (355,229) |
Total distributions | (2,073,532) | (708,247) |
Share transactions - net increase (decrease) | 1,231,634 | (49,273) |
Total increase (decrease) in net assets | 3,349,897 | 1,430,982 |
| | |
Net Assets | | |
Beginning of period | 21,163,681 | 19,732,699 |
End of period (including undistributed net investment income of $89,501 and undistributed net investment income of $80,612, respectively) | $ 24,513,578 | $ 21,163,681 |
See accompanying notes which are an integral part of the financial statements.
Annual Report
Financial Highlights - Puritan
Years ended August 31, | 2014 | 2013 | 2012 | 2011 | 2010 |
Selected Per-Share Data | | | | | |
Net asset value, beginning of period | $ 20.98 | $ 19.53 | $ 17.72 | $ 15.81 | $ 15.06 |
Income from Investment Operations | | | | | |
Net investment income (loss) B | .36 | .36 | .38 | .35 | .40 |
Net realized and unrealized gain (loss) | 3.60 | 1.79 | 1.78 | 1.93 | .75 |
Total from investment operations | 3.96 | 2.15 | 2.16 | 2.28 | 1.15 |
Distributions from net investment income | (.35) | (.35) | (.35) | (.36) | (.39) |
Distributions from net realized gain | (1.68) | (.35) | - | - F | (.01) |
Total distributions | (2.03) | (.70) | (.35) | (.37) G | (.40) |
Net asset value, end of period | $ 22.91 | $ 20.98 | $ 19.53 | $ 17.72 | $ 15.81 |
Total Return A | 20.17% | 11.29% | 12.35% | 14.38% | 7.61% |
Ratios to Average Net Assets C, E | | | | | |
Expenses before reductions | .56% | .58% | .59% | .60% | .61% |
Expenses net of fee waivers, if any | .56% | .58% | .59% | .60% | .61% |
Expenses net of all reductions | .56% | .57% | .59% | .59% | .61% |
Net investment income (loss) | 1.68% | 1.79% | 2.03% | 1.96% | 2.48% |
Supplemental Data | | | | | |
Net assets, end of period (in millions) | $ 18,351 | $ 15,934 | $ 15,472 | $ 15,420 | $ 15,054 |
Portfolio turnover rate D | 160% | 229% H | 141% | 154% H | 104% |
A Total returns would have been lower if certain expenses had not been reduced during the applicable periods shown.
B Calculated based on average shares outstanding during the period.
C Fees and expenses of any underlying Fidelity Central Funds are not included in the Fund's expense ratio. The Fund indirectly bears its proportionate share of the expenses of any underlying Fidelity Central Funds. Based on their most recent shareholder report date, the expenses of any underlying non-money market Fidelity Central Funds were less than .01%.
D Amount does not include the portfolio activity of any underlying Fidelity Central Funds.
E Expense ratios reflect operating expenses of the class. Expenses before reductions do not reflect amounts reimbursed by the investment adviser or reductions from brokerage service arrangements or reductions from other expense offset arrangements and do not represent the amount paid by the class during periods when reimbursements or reductions occur. Expenses net of fee waivers reflect expenses after reimbursement by the investment adviser but prior to reductions from brokerage service arrangements or other expense offset arrangements. Expenses net of all reductions represent the net expenses paid by the class.
F Amount represents less than $.01 per share.
G Total distributions of $.37 per share is comprised of distributions from net investment income of $.364 and distributions from net realized gain of $.003 per share.
H The portfolio turnover rate excludes liquidations and/or redemptions executed in-kind from Affiliated Central Funds.
See accompanying notes which are an integral part of the financial statements.
Annual Report
Financial Highlights - Class K
Years ended August 31, | 2014 | 2013 | 2012 | 2011 | 2010 |
Selected Per-Share Data | | | | | |
Net asset value, beginning of period | $ 20.98 | $ 19.52 | $ 17.72 | $ 15.80 | $ 15.06 |
Income from Investment Operations | | | | | |
Net investment income (loss) B | .39 | .39 | .40 | .38 | .42 |
Net realized and unrealized gain (loss) | 3.58 | 1.79 | 1.77 | 1.93 | .74 |
Total from investment operations | 3.97 | 2.18 | 2.17 | 2.31 | 1.16 |
Distributions from net investment income | (.37) | (.37) | (.37) | (.39) | (.41) |
Distributions from net realized gain | (1.68) | (.35) | - | - F | (.01) |
Total distributions | (2.05) | (.72) | (.37) | (.39) | (.42) |
Net asset value, end of period | $ 22.90 | $ 20.98 | $ 19.52 | $ 17.72 | $ 15.80 |
Total ReturnA | 20.25% | 11.48% | 12.43% | 14.59% | 7.69% |
Ratios to Average Net Assets C, E | | | | | |
Expenses before reductions | .46% | .47% | .48% | .48% | .48% |
Expenses net of fee waivers, if any | .46% | .47% | .48% | .48% | .48% |
Expenses net of all reductions | .46% | .46% | .47% | .47% | .47% |
Net investment income (loss) | 1.78% | 1.90% | 2.15% | 2.09% | 2.61% |
Supplemental Data | | | | | |
Net assets, end of period (in millions) | $ 6,162 | $ 5,230 | $ 4,261 | $ 3,211 | $ 2,280 |
Portfolio turnover rate D | 160% | 229% G | 141% | 154% G | 104% |
A Total returns would have been lower if certain expenses had not been reduced during the applicable periods shown.
B Calculated based on average shares outstanding during the period.
C Fees and expenses of any underlying Fidelity Central Funds are not included in the Fund's expense ratio. The Fund indirectly bears its proportionate share of the expenses of any underlying Fidelity Central Funds. Based on their most recent shareholder report date, the expenses of any underlying non-money market Fidelity Central Funds were less than .01%.
D Amount does not include the portfolio activity of any underlying Fidelity Central Funds.
E Expense ratios reflect operating expenses of the class. Expenses before reductions do not reflect amounts reimbursed by the investment adviser or reductions from brokerage service arrangements or reductions from other expense offset arrangements and do not represent the amount paid by the class during periods when reimbursements or reductions occur. Expenses net of fee waivers reflect expenses after reimbursement by the investment adviser but prior to reductions from brokerage service arrangements or other expense offset arrangements. Expenses net of all reductions represent the net expenses paid by the class.
F Amount represents less than $.01 per share.
G The portfolio turnover rate excludes liquidations and/or redemptions executed in-kind from Affiliated Central Funds.
See accompanying notes which are an integral part of the financial statements.
Annual Report
Notes to Financial Statements
For the period ended August 31, 2014
(Amounts in thousands except percentages)
1. Organization.
Fidelity Puritan Fund (the Fund) is a fund of Fidelity Puritan Trust (the Trust) and is authorized to issue an unlimited number of shares. The Trust is registered under the Investment Company Act of 1940, as amended (the 1940 Act), as an open-end management investment company organized as a Massachusetts business trust. The Fund offers Puritan and Class K shares, each of which has equal rights as to assets and voting privileges. Each class has exclusive voting rights with respect to matters that affect that class.
2. Investments in Fidelity Central Funds.
The Fund invests in Fidelity Central Funds, which are open-end investment companies generally available only to other investment companies and accounts managed by the investment adviser and its affiliates. The Fund's Schedule of Investments lists each of the Fidelity Central Funds held as of period end, if any, as an investment of the Fund, but does not include the underlying holdings of each Fidelity Central Fund. As an Investing Fund, the Fund indirectly bears its proportionate share of the expenses of the underlying Fidelity Central Funds.
Based on its investment objective, each Fidelity Central Fund may invest or participate in various investment vehicles or strategies that are similar to those of the Fund. These strategies are consistent with the investment objectives of the Fund and may involve certain economic risks which may cause a decline in value of each of the Fidelity Central Funds and thus a decline in the value of the Fund. The Money Market Central Funds seek preservation of capital and current income and are managed by Fidelity Investments Money Management, Inc. (FIMM), an affiliate of the investment adviser. Annualized expenses of the Money Market Central Funds as of their most recent shareholder report date are less than .01%. The following summarizes the Fund's investment in each non-money market Fidelity Central Fund.
Fidelity
Central Fund | Investment
Manager | Investment
Objective | Investment
Practices | Expense
Ratio* |
Fidelity Mortgage Backed Securities Central Fund | FIMM | Seeks a high level of income by normally investing in investment-grade mortgage-related securities and repurchase agreements for those securities. | Delayed Delivery & When Issued Securities Repurchase Agreements Swaps | Less than
..01% |
* Expenses expressed as a percentage of average net assets and are as of each underlying Central Fund's most recent annual or semi-annual shareholder report.
An unaudited holdings listing for the Fund, which presents direct holdings as well as the pro-rata share of any securities and other investments held indirectly through its
Annual Report
2. Investments in Fidelity Central Funds - continued
investment in underlying non-money market Fidelity Central Funds, is available at fidelity.com. A complete unaudited list of holdings for each Fidelity Central Fund is available upon request or at the Securities and Exchange Commission (the SEC) website at www.sec.gov. In addition, the financial statements of the Fidelity Central Funds which contain the significant accounting policies (including investment valuation policies) of those funds, which are not covered by the Fund's Report of Independent Registered Public Accounting Firm, are available on the SEC website or upon request.
3. Significant Accounting Policies.
The financial statements have been prepared in conformity with accounting principles generally accepted in the United States of America (GAAP), which require management to make certain estimates and assumptions at the date of the financial statements. Actual results could differ from those estimates. Subsequent events, if any, through the date that the financial statements were issued have been evaluated in the preparation of the financial statements. The following summarizes the significant accounting policies of the Fund:
Investment Valuation. Investments are valued as of 4:00 p.m. Eastern time on the last calendar day of the period. In accordance with valuation policies and procedures approved by the Board of Trustees (the Board), the Fund attempts to obtain prices from one or more third party pricing vendors or brokers to value its investments. When current market prices, quotations or currency exchange rates are not readily available or reliable, investments will be fair valued in good faith by the Fidelity Management & Research Company (FMR) Fair Value Committee (the Committee), in accordance with procedures adopted by the Board. Factors used in determining fair value vary by investment type and may include market or investment specific events, changes in interest rates and credit quality. The frequency with which these procedures are used cannot be predicted and they may be utilized to a significant extent. The Committee oversees the Fund's valuation policies and procedures and is responsible for approving and reporting to the Board all fair value determinations.
The Fund categorizes the inputs to valuation techniques used to value its investments into a disclosure hierarchy consisting of three levels as shown below:
Level 1 - quoted prices in active markets for identical investments
Level 2 - other significant observable inputs (including quoted prices for similar investments, interest rates, prepayment speeds, etc.)
Level 3 - unobservable inputs (including the Fund's own assumptions based on the best information available)
Annual Report
Notes to Financial Statements - continued
(Amounts in thousands except percentages)
3. Significant Accounting Policies - continued
Investment Valuation - continued
Valuation techniques used to value the Fund's investments by major category are as follows:
Equity securities, including restricted securities, for which market quotations are readily available, are valued at the last reported sale price or official closing price as reported by a third party pricing vendor on the primary market or exchange on which they are traded and are categorized as Level 1 in the hierarchy. In the event there were no sales during the day or closing prices are not available, securities are valued at the last quoted bid price or may be valued using the last available price and are generally categorized as Level 2 in the hierarchy. For foreign equity securities, when market or security specific events arise, comparisons to the valuation of American Depositary Receipts (ADRs), futures contracts, Exchange-Traded Funds (ETFs) and certain indexes as well as quoted prices for similar securities may be used and would be categorized as Level 2 in the hierarchy. Utilizing these techniques may result in transfers between Level 1 and Level 2. For equity securities, including restricted securities, where observable inputs are limited, assumptions about market activity and risk are used and these securities may be categorized as Level 3 in the hierarchy. Equity securities, including restricted securities, for which observable inputs are not available are valued using alternate valuation approaches, including the market approach and the income approach and are categorized as Level 3 in the hierarchy. The market approach generally consists of using comparable market transactions while the income approach generally consists of using the net present value of estimated future cash flows, adjusted as appropriate for liquidity, credit, market and/or other risk factors.
Debt securities, including restricted securities, are valued based on evaluated prices received from third party pricing vendors or from brokers who make markets in such securities. Corporate bonds, bank notes, bank loan obligations, foreign government and government agency obligations, municipal securities, preferred securities and U.S. government and government agency obligations, are valued by pricing vendors who utilize matrix pricing which considers yield or price of bonds of comparable quality, coupon, maturity and type or by broker-supplied prices. Asset backed securities, collateralized mortgage obligations, commercial mortgage securities and U.S. government agency mortgage securities, are valued by pricing vendors who utilize matrix pricing which considers prepayment speed assumptions, attributes of the collateral, yield or price of bonds of comparable quality, coupon, maturity and type or by broker-supplied prices. When independent prices are unavailable or unreliable, debt securities may be valued utilizing pricing methodologies which consider similar factors that would be used by third party pricing vendors. Debt securities are generally categorized as Level 2 in the hierarchy but may be Level 3 depending on the circumstances.
Annual Report
3. Significant Accounting Policies - continued
Investment Valuation - continued
Futures contracts are valued at the settlement price established each day by the board of trade or exchange on which they are traded and are categorized as Level 1 in the hierarchy. Investments in open-end mutual funds, including the Fidelity Central Funds, are valued at their closing net asset value (NAV) each business day and are categorized as Level 1 in the hierarchy.
The following provides information on Level 3 securities held by the Fund that were valued at period end based on unobservable inputs. These amounts exclude valuations provided by a broker.
Asset Type | Fair Value at
08/31/14
(000s) | Valuation
Technique(s) | Unobservable
Input | Amount or
Range /
Weighted
Average | Impact to
Valuation
from an
Increase in
Input* |
Asset-Backed Securities | $ 694 | Discounted cash flow | Yield | 3.3% - 9.0% / 9.0% | Decrease |
Bank Loan Obligations | $ 6,916 | Market comparable | Discount rate | 15.0% | Decrease |
| | | EV/EBITDA multiple | 6.5 | Increase |
Collateralized Mortgage Obligations | $ 427 | Discounted cash flow | Yield | 7.5% | Decrease |
Commercial Mortgage Securities | $ 574 | Discounted cash flow | Yield | 0.0% - 10.0% / 2.1% | Decrease |
| | | Discount rate | 20.0% | Decrease |
| | Market comparable | Spread | 59.7% - 212.6% / 97.2% | Decrease |
Common Stocks | $ 166,356 | Discounted cash flow | Discount rate | 10.0% | Decrease |
| | Expected distribution | Recovery rate | 0.0% | Increase |
| | Last transaction price | Transaction price | $0.20 - $15,147.05 / $6,923.01 | Increase |
| | Market comparable | Discount rate | 10.0% | Decrease |
| | | EV/EBITDA multiple | 8.0 - 12.9 / 12.7 | Increase |
| | Stern warrant model | Discount rate | 20.0% | Decrease |
Corporate Bonds | $ 81 | Discounted cash flow | Discount rate | 25.0% | Decrease |
Annual Report
Notes to Financial Statements - continued
(Amounts in thousands except percentages)
3. Significant Accounting Policies - continued
Investment Valuation - continued
Asset Type | Fair Value at
08/31/14
(000s) | Valuation
Technique(s) | Unobservable
Input | Amount or
Range /
Weighted
Average | Impact to
Valuation
from an
Increase in
Input* |
Other | $ 11 | Expected distribution | Recovery rate | 1.0% | Increase |
Preferred Stocks | $ 180,581 | Last transaction price | Transaction price | $0.07 - $15,147.05 / $11,113.45 | Increase |
| | Market comparable | Discount rate | 20.0% | Decrease |
| | | Weighted earnings multiple | 3.1 - 9.8 / 6.5 | Increase |
| | | EV/EBITDA multiple | 11.1 | Increase |
| | | EV/Sales multiple | 1.3 - 2.8 / 1.9 | Increase |
* Represents the expected directional change in the fair value of the Level 3 investments that would result from an increase in the corresponding input. A decrease to the unobservable input would have the opposite effect. Significant changes in these inputs could result in significantly higher or lower fair value measurements.
Changes in valuation techniques may result in transfers in or out of an assigned level within the disclosure hierarchy. The aggregate value of investments by input level, as of August 31, 2014, as well as a roll forward of Level 3 investments, is included at the end of the Fund's Schedule of Investments.
Foreign Currency. The Fund may use foreign currency contracts to facilitate transactions in foreign-denominated securities. Gains and losses from these transactions may arise from changes in the value of the foreign currency or if the counterparties do not perform under the contracts' terms.
Foreign-denominated assets, including investment securities, and liabilities are translated into U.S. dollars at the exchange rates at period end. Purchases and sales of investment securities, income and dividends received and expenses denominated in foreign currencies are translated into U.S. dollars at the exchange rate in effect on the transaction date.
Annual Report
3. Significant Accounting Policies - continued
Foreign Currency - continued
The effects of exchange rate fluctuations on investments are included with the net realized and unrealized gain (loss) on investment securities. Other foreign currency transactions resulting in realized and unrealized gain (loss) are disclosed separately.
Investment Transactions and Income. For financial reporting purposes, the Fund's investment holdings and NAV include trades executed through the end of the last business day of the period. The NAV per share for processing shareholder transactions is calculated as of the close of business of the New York Stock Exchange (NYSE), normally 4:00 p.m. Eastern time and includes trades executed through the end of the prior business day. Gains and losses on securities sold are determined on the basis of identified cost and may include proceeds received from litigation. Dividend income is recorded on the ex-dividend date, except for certain dividends from foreign securities where the ex-dividend date may have passed, which are recorded as soon as the Fund is informed of the ex-dividend date. Non-cash dividends included in dividend income, if any, are recorded at the fair market value of the securities received. Income and capital gain distributions from Fidelity Central Funds, if any, are recorded on the ex-dividend date. Distributions received on securities that represent a return of capital or capital gain are recorded as a reduction of cost of investments and/or as a realized gain. Subsequent to ex-dividend date the Fund determines the components of these distributions, based upon receipt of tax filings or other correspondence relating to the underlying investment. Interest income is accrued as earned and includes coupon interest and amortization of premium and accretion of discount on debt securities as applicable. Investment income is recorded net of foreign taxes withheld where recovery of such taxes is uncertain. Debt obligations may be placed on non-accrual status and related interest income may be reduced by ceasing current accruals and writing off interest receivables when the collection of all or a portion of interest has become doubtful based on consistently applied procedures. A debt obligation is removed from non-accrual status when the issuer resumes interest payments or when collectability of interest is reasonably assured.
Class Allocations and Expenses. Investment income, realized and unrealized capital gains and losses, common expenses of the Fund, and certain fund-level expense reductions, if any, are allocated daily on a pro-rata basis to each class based on the relative net assets of each class to the total net assets of the Fund. Each class differs with respect to transfer agent fees incurred. Certain expense reductions may also differ by class. For the reporting period, the allocated portion of income and expenses to each class as a percent of its average net assets may vary due to the timing of recording these transactions in relation to fluctuating net assets of the classes. Expenses directly attributable to a fund are charged to that fund. Expenses attributable to more than one fund are allocated among the respective funds on the basis of relative net assets or other appropriate
Annual Report
Notes to Financial Statements - continued
(Amounts in thousands except percentages)
3. Significant Accounting Policies - continued
Class Allocations and Expenses - continued
methods. Expense estimates are accrued in the period to which they relate and adjustments are made when actual amounts are known.
Deferred Trustee Compensation. Under a Deferred Compensation Plan (the Plan), independent Trustees may elect to defer receipt of a portion of their annual compensation. Deferred amounts are invested in a cross-section of Fidelity funds, are marked-to-market and remain in the Fund until distributed in accordance with the Plan. The investment of deferred amounts and the offsetting payable to the Trustees are included in the accompanying Statement of Assets and Liabilities.
Income Tax Information and Distributions to Shareholders. Each year, the Fund intends to qualify as a regulated investment company under Subchapter M of the Internal Revenue Code, including distributing substantially all of its taxable income and realized gains. As a result, no provision for U.S. Federal income taxes is required. As of August 31, 2014, the Fund did not have any unrecognized tax benefits in the financial statements; nor is the Fund aware of any tax positions for which it is reasonably possible that the total amounts of unrecognized tax benefits will significantly change in the next twelve months. The Fund files a U.S. federal tax return, in addition to state and local tax returns as required. The Fund's federal income tax returns are subject to examination by the Internal Revenue Service (IRS) for a period of three fiscal years after they are filed. State and local tax returns may be subject to examination for an additional fiscal year depending on the jurisdiction. Foreign taxes are provided for based on the Fund's understanding of the tax rules and rates that exist in the foreign markets in which it invests.
Distributions are declared and recorded on the ex-dividend date. Income dividends and capital gain distributions are declared separately for each class. Income and capital gain distributions are determined in accordance with income tax regulations, which may differ from GAAP. In addition, the Fund claimed a portion of the payment made to redeeming shareholders as a distribution for income tax purposes.
Capital accounts within the financial statements are adjusted for permanent book-tax differences. These adjustments have no impact on net assets or the results of operations. Capital accounts are not adjusted for temporary book-tax differences which will reverse in a subsequent period.
Book-tax differences are primarily due to futures contracts, swaps, foreign currency transactions, market discount, partnerships (including allocations from Fidelity Central Funds), original issue discount, contingent interest, equity-debt classifications, deferred trustees compensation and losses deferred due to wash sales.
Annual Report
3. Significant Accounting Policies - continued
Income Tax Information and Distributions to Shareholders - continued
The federal tax cost of investment securities and unrealized appreciation (depreciation) as of period end were as follows:
Gross unrealized appreciation | $ 5,308,082 |
Gross unrealized depreciation | (177,214) |
Net unrealized appreciation (depreciation) on securities | $ 5,130,868 |
| |
Tax Cost | $ 19,782,032 |
The tax-based components of distributable earnings as of period end were as follows:
Undistributed ordinary income | $ 272,204 |
Undistributed long-term capital gain | $ 1,229,077 |
Net unrealized appreciation (depreciation) on securities and other investments | $ 5,130,746 |
The tax character of distributions paid was as follows:
| August 31, 2014 | August 31, 2013 |
Ordinary Income | $ 502,578 | $ 381,222 |
Long-term Capital Gains | 1,570,954 | 327,025 |
Total | $ 2,073,532 | $ 708,247 |
Delayed Delivery Transactions and When-Issued Securities. During the period, the Fund transacted in securities on a delayed delivery or when-issued basis. Payment and delivery may take place after the customary settlement period for that security. The price of the underlying securities and the date when the securities will be delivered and paid for are fixed at the time the transaction is negotiated. The securities purchased on a delayed delivery or when-issued basis are identified as such in the Fund's Schedule of Investments. The Fund may receive compensation for interest forgone in the purchase of a delayed delivery or when-issued security. With respect to purchase commitments, the Fund identifies securities as segregated in its records with a value at least equal to the amount of the commitment. The payables and receivables associated with the purchases and sales of delayed delivery securities having the same coupon, settlement date and broker are offset. Delayed delivery or when-issued securities that have been purchased from and sold to different brokers are reflected as both payables and receivables in the fund's Statement of Assets and Liabilities under the caption "Delayed delivery." Losses may arise due to changes in the value of the underlying securities or if the counterparty does not perform under the contract's terms, or if the issuer does not issue the securities due to political, economic, or other factors.
Annual Report
Notes to Financial Statements - continued
(Amounts in thousands except percentages)
3. Significant Accounting Policies - continued
To-Be-Announced (TBA) Securities and Mortgage Dollar Rolls. During the period, the Fund transacted in TBA securities that involved buying or selling mortgage-backed securities (MBS) on a forward commitment basis. A TBA transaction typically does not designate the actual security to be delivered and only includes an approximate principal amount; however delivered securities must meet specified terms defined by industry guidelines, including issuer, rate and current principal amount outstanding on underlying mortgage pools. The Fund may enter into a TBA transaction with the intent to take possession of or deliver the underlying MBS, or the Fund may elect to extend the settlement by entering into either a mortgage or reverse mortgage dollar roll. Mortgage dollar rolls are transactions where a fund sells TBA securities and simultaneously agrees to repurchase MBS on a later date at a lower price and with the same counterparty. Reverse mortgage dollar rolls involve the purchase and simultaneous agreement to sell TBA securities on a later date at a lower price. Transactions in mortgage dollar rolls and reverse mortgage dollar rolls are accounted for as purchases and sales and may result in an increase to the Fund's portfolio turnover rate.
Purchases and sales of TBA securities involve risks similar to those discussed above for delayed delivery and when-issued securities. Also, if the counterparty in a mortgage dollar roll or a reverse mortgage dollar roll transaction files for bankruptcy or becomes insolvent, the Fund's right to repurchase or sell securities may be limited. Additionally, when a fund sells TBA securities without already owning or having the right to obtain the deliverable securities (an uncovered forward commitment to sell), it incurs a risk of loss because it could have to purchase the securities at a price that is higher than the price at which it sold them. A fund may be unable to purchase the deliverable securities if the corresponding market is illiquid.
TBA securities subject to a forward commitment to sell at period end are included at the end of the Fund's Schedule of Investments under the caption "TBA Sale Commitments." The proceeds and value of these commitments are reflected in the Fund's Statement of Assets and Liabilities as Receivable for TBA sale commitments and TBA sale commitments, at value, respectively.
Restricted Securities. The Fund may invest in securities that are subject to legal or contractual restrictions on resale. These securities generally may be resold in transactions exempt from registration or to the public if the securities are registered. Disposal of these securities may involve time-consuming negotiations and expense, and prompt sale at an acceptable price may be difficult. Information regarding restricted securities is included at the end of the Fund's Schedule of Investments.
Loans and Other Direct Debt Instruments. The Fund invests in direct debt instruments which are interests in amounts owed to lenders by corporate or other borrowers. These instruments may be in the form of loans, trade claims or other receivables and may
Annual Report
3. Significant Accounting Policies - continued
Loans and Other Direct Debt Instruments - continued
include standby financing commitments such as revolving credit facilities that obligate the Fund to supply additional cash to the borrower on demand. Loans may be acquired through assignment or participation, or may be made directly to a borrower. The Fund did not have any unfunded loan commitments, which are contractual obligations for future funding, at period end.
4. Derivative Instruments.
Risk Exposures and the Use of Derivative Instruments. The Fund's investment objective allows the Fund to enter into various types of derivative contracts, including futures contracts and swaps. Derivatives are investments whose value is primarily derived from underlying assets, indices or reference rates and may be transacted on an exchange or over-the-counter (OTC). Derivatives may involve a future commitment to buy or sell a specified asset based on specified terms, to exchange future cash flows at periodic intervals based on a notional principal amount, or for one party to make one or more payments upon the occurrence of specified events in exchange for periodic payments from the other party.
The Fund used derivatives to increase returns, to gain exposure to certain types of assets and to manage exposure to certain risks as defined below. The success of any strategy involving derivatives depends on analysis of numerous economic factors, and if the strategies for investment do not work as intended, the Fund may not achieve its objectives.
The Fund's use of derivatives increased or decreased its exposure to the following risks:
Credit Risk | Credit risk relates to the ability of the issuer of a financial instrument to make further principal or interest payments on an obligation or commitment that it has to the Fund. |
Interest Rate Risk | Interest rate risk relates to the fluctuations in the value of interest-bearing securities due to changes in the prevailing levels of market interest rates. |
The Fund is also exposed to additional risks from investing in derivatives, such as liquidity risk and counterparty credit risk. Liquidity risk is the risk that the Fund will be unable to close out the derivative in the open market in a timely manner. Counterparty credit risk is the risk that the counterparty will not be able to fulfill its obligation to the Fund. Derivative counterparty credit risk is managed through formal evaluation of the creditworthiness of all potential counterparties. On certain OTC derivatives such as bi-lateral swaps, the Fund attempts to reduce its exposure to counterparty credit risk by entering into an International Swaps and Derivatives Association, Inc. (ISDA) Master Agreement with each of its counterparties. The ISDA Master Agreement gives the Fund
Annual Report
Notes to Financial Statements - continued
(Amounts in thousands except percentages)
4. Derivative Instruments - continued
Risk Exposures and the Use of Derivative Instruments - continued
the right to terminate all transactions traded under such agreement upon the deterioration in the credit quality of the counterparty beyond specified levels. The ISDA Master Agreement gives each party the right, upon an event of default by the other party or a termination of the agreement, to close out all transactions traded under such agreement and to net amounts owed under each transaction to one net payable by one party to the other. To mitigate counterparty credit risk on bi-lateral OTC derivatives, the Fund receives collateral in the form of cash or securities once the Fund's net unrealized appreciation on outstanding derivative contracts under an ISDA Master Agreement exceeds certain applicable thresholds, subject to certain minimum transfer provisions. The collateral received is held in segregated accounts with the Fund's custodian bank in accordance with the collateral agreements entered into between the Fund, the counterparty and the Fund's custodian bank. The Fund could experience delays and costs in gaining access to the collateral even though it is held by the Fund's custodian bank. The Fund's maximum risk of loss from counterparty credit risk related to bi-lateral OTC derivatives is generally the aggregate unrealized appreciation and unpaid counterparty payments in excess of any collateral pledged by the counterparty to the Fund. The Fund may be required to pledge collateral for the benefit of the counterparties on bi-lateral OTC derivatives in an amount not less than each counterparty's unrealized appreciation on outstanding derivative contracts, subject to certain minimum transfer provisions, and any such pledged collateral is identified in the Schedule of Investments. Exchange-traded futures contracts are not covered by the ISDA Master Agreement; however counterparty credit risk related to exchange-traded futures contracts may be mitigated by the protection provided by the exchange on which they trade.
Investing in derivatives may involve greater risks than investing in the underlying assets directly and, to varying degrees, may involve risk of loss in excess of any initial investment and collateral received and amounts recognized in the Statement of Assets and Liabilities. In addition, there may be the risk that the change in value of the derivative contract does not correspond to the change in value of the underlying instrument.
Annual Report
4. Derivative Instruments - continued
Net Realized Gain (Loss) and Change in Net Unrealized Appreciation (Depreciation) on Derivatives. The table below, which reflects the impacts of derivatives on the financial performance of the Fund, summarizes the net realized gain (loss) and change in net unrealized appreciation (depreciation) for derivatives during the period as presented in the Statement of Operations.
Primary Risk Exposure /
Derivative Type | Net Realized
Gain (Loss) | Change in Net
Unrealized Appreciation
(Depreciation) |
Credit Risk | | |
Swaps | $ (6,476) | $ 7,794 |
| | |
Interest Rate Risk | | |
Futures Contracts | $ 771 | $ (163) |
Totals (a) | $ (5,705) | $ 7,631 |
(a) A summary of the value of derivatives by primary risk exposure as of period end, if any, is included at the end of the Schedule of Investments.
Futures Contracts. A futures contract is an agreement between two parties to buy or sell a specified underlying instrument for a fixed price at a specified future date. The Fund used futures contracts to manage its exposure to the bond market and fluctuations in interest rates.
Upon entering into a futures contract, a fund is required to deposit either cash or securities (initial margin) with a clearing broker in an amount equal to a certain percentage of the face value of the contract. Futures contracts are marked-to-market daily and subsequent daily payments (variation margin) are made or received by a fund depending on the daily fluctuations in the value of the futures contracts and are recorded as unrealized appreciation or (depreciation). This receivable and/or payable, if any, is included in daily variation margin for derivative instruments in the Statement of Assets and Liabilities. Realized gain or (loss) is recorded upon the expiration or closing of a futures contract. The net realized gain (loss) and change in net unrealized appreciation (depreciation) on futures contracts during the period is included in the Statement of Operations.
Any open futures contracts at period end are presented in the Schedule of Investments under the caption "Futures Contracts." The underlying face amount at value reflects each contract's exposure to the underlying instrument or index at period end and is representative of volume of activity during the period. Securities deposited to meet initial margin requirements are identified in the Schedule of Investments.
Swaps. A swap is a contract between two parties to exchange future cash flows at periodic intervals based on a notional principal amount. A bi-lateral OTC swap is a transaction between a fund and a dealer counterparty where cash flows are exchanged between the two parties for the life of the swap.
Bi-lateral OTC swaps are marked-to-market daily and changes in value are reflected in the Statement of Assets and Liabilities in the bi-lateral OTC swaps at value line items.
Annual Report
Notes to Financial Statements - continued
(Amounts in thousands except percentages)
4. Derivative Instruments - continued
Swaps - continued
Any upfront premiums paid or received upon entering a bi-lateral OTC swap to compensate for differences between stated terms of the swap and prevailing market conditions (e.g. credit spreads, interest rates or other factors) are recorded in net unrealized appreciation (depreciation) in the Statement of Assets and Liabilities and amortized to realized gain or (loss) ratably over the term of the swap. Any unamortized upfront premiums are presented in the Schedule of Investments.
Payments are exchanged at specified intervals, accrued daily commencing with the effective date of the contract and recorded as realized gain or (loss). Some swaps may be terminated prior to the effective date and realize a gain or loss upon termination. The net realized gain (loss) and change in net unrealized appreciation (depreciation) on swaps during the period is included in the Statement of Operations.
Any open swaps at period end are included in the Schedule of Investments under the caption "Swaps."
Credit Default Swaps. Credit default swaps enable the Fund to buy or sell protection against specified credit events on a single-name issuer or a traded credit index. Under the terms of a credit default swap the buyer of protection (buyer) receives credit protection in exchange for making periodic payments to the seller of protection (seller) based on a fixed percentage applied to a notional principal amount. In return for these payments, the seller will be required to make a payment upon the occurrence of one or more specified credit events. The Fund enters into credit default swaps as a seller to gain credit exposure to an issuer and/or as a buyer to obtain a measure of protection against defaults of an issuer. Periodic payments are made over the life of the contract by the buyer provided that no credit event occurs.
For credit default swaps on most corporate and sovereign issuers, credit events include bankruptcy, failure to pay or repudiation/moratorium. For credit default swaps on corporate or sovereign issuers, the obligation that may be put to the seller is not limited to the specific reference obligation described in the Schedule of Investments. For credit default swaps on asset-backed securities, a credit event may be triggered by events such as failure to pay principal, maturity extension, rating downgrade or write-down. For credit default swaps on asset-backed securities, the reference obligation described represents the security that may be put to the seller. For credit default swaps on a traded credit index, a specified credit event may affect all or individual underlying securities included in the index.
As a seller, if an underlying credit event occurs, the Fund will pay a net settlement amount of cash equal to the notional amount of the swap less the recovery value of the reference obligation or underlying securities comprising an index. Only in the event of
Annual Report
4. Derivative Instruments - continued
Credit Default Swaps - continued
the industry's inability to value the underlying asset will the Fund be required to take delivery of the reference obligation or underlying securities comprising an index and pay an amount equal to the notional amount of the swap.
As a buyer, if an underlying credit event occurs, the Fund will receive a net settlement amount of cash equal to the notional amount of the swap less the recovery value of the reference obligation or underlying securities comprising an index. Only in the event of the industry's inability to value the underlying asset will the Fund be required to deliver the reference obligation or underlying securities comprising an index in exchange for payment of an amount equal to the notional amount of the swap.
Typically, the value of each credit default swap and credit rating disclosed for each reference obligation in the Schedule of Investments, where the Fund is the seller, can be used as measures of the current payment/performance risk of the swap. As the value of the swap changes as a positive or negative percentage of the total notional amount, the payment/performance risk may decrease or increase, respectively. In addition to these measures, the investment adviser monitors a variety of factors including cash flow assumptions, market activity and market sentiment as part of its ongoing process of assessing payment/performance risk.
5. Purchases and Sales of Investments.
Purchases and sales of securities (including the Fixed-Income Central Funds), other than short-term securities and U.S. government securities, aggregated $12,931,986 and $13,917,855, respectively.
6. Fees and Other Transactions with Affiliates.
Management Fee. Fidelity Management & Research Company (the investment adviser) and its affiliates provide the Fund with investment management related services for which the Fund pays a monthly management fee. The management fee is the sum of an individual fund fee rate that is based on an annual rate of .15% of the Fund's average net assets and an annualized group fee rate that averaged .25% during the period. The group fee rate is based upon the average net assets of all the mutual funds advised by the investment adviser, including any mutual funds previously advised by the investment adviser that are currently advised by Fidelity SelectCo, LLC, an affiliate of the investment adviser. The group fee rate decreases as assets under management increase and increases as assets under management decrease. For the reporting period, the total annual management fee rate was .40% of the Fund's average net assets.
Annual Report
Notes to Financial Statements - continued
(Amounts in thousands except percentages)
6. Fees and Other Transactions with Affiliates - continued
Transfer Agent Fees. Fidelity Investments Institutional Operations Company, Inc., (FIIOC), an affiliate of the investment adviser, is the transfer, dividend disbursing and shareholder servicing agent for each class of the Fund. FIIOC receives account fees and asset-based fees that vary according to the account size and type of account of the shareholders of Puritan. FIIOC receives an asset-based fee of Class K's average net assets. FIIOC pays for typesetting, printing and mailing of shareholder reports, except proxy statements.
For the period, transfer agent fees for each class were as follows:
| Amount | % of
Average
Net Assets |
Puritan | $ 25,425 | .15 |
Class K | 2,643 | .05 |
| $ 28,068 | |
Accounting and Security Lending Fees. Fidelity Service Company, Inc. (FSC), an affiliate of the investment adviser, maintains the Fund's accounting records. The accounting fee is based on the level of average net assets for each month. Under a separate contract, FSC administers the security lending program. The security lending fee is based on the number and duration of lending transactions.
Brokerage Commissions. The Fund placed a portion of its portfolio transactions with brokerage firms which are affiliates of the investment adviser. Brokerage commissions are included in net realized gain (loss) and change in net unrealized appreciation (depreciation) in the Statement of Operations. The commissions paid to these affiliated firms were $177 for the period.
Other. During the period, the investment adviser reimbursed the Fund for certain losses in the amount of $17.
7. Committed Line of Credit.
The Fund participates with other funds managed by the investment adviser or an affiliate in a $4.25 billion credit facility (the "line of credit") to be utilized for temporary or emergency purposes to fund shareholder redemptions or for other short-term liquidity purposes. The Fund has agreed to pay commitment fees on its pro-rata portion of the line of credit, which amounted to $38 and is reflected in Miscellaneous expenses on the Statement of Operations. During the period, the Fund did not borrow on this line of credit.
Annual Report
8. Security Lending.
The Fund lends portfolio securities from time to time in order to earn additional income. For equity securities, a lending agent is used and may loan securities to certain qualified borrowers, including Fidelity Capital Markets (FCM), a broker-dealer affiliated with the Fund. On the settlement date of the loan, the Fund receives collateral (in the form of U.S. Treasury obligations, letters of credit and/or cash) against the loaned securities and maintains collateral in an amount not less than 100% of the market value of the loaned securities during the period of the loan. The market value of the loaned securities is determined at the close of business of the Fund and any additional required collateral is delivered to the Fund on the next business day. If the borrower defaults on its obligation to return the securities loaned because of insolvency or other reasons, the Fund may apply collateral received from the borrower against the obligation. The Fund may experience delays and costs in recovering the securities loaned. Any cash collateral received is maintained at the Fund's custodian and/or invested in cash equivalents and/or the Fidelity Securities Lending Cash Central Fund. The value of loaned securities and cash collateral at period end are disclosed on the Fund's Statement of Assets and Liabilities. The value of securities loaned to FCM at period end was $1,954. Security lending income represents the income earned on investing cash collateral, less rebates paid to borrowers, plus any premium payments received for lending certain types of securities. Total security lending income during the period, presented in the Statement of Operations as a component of interest income, amounted to $547. Net income from the Fidelity Securities Lending Cash Central Fund during the period, presented in the Statement of Operations as a component of income from Fidelity Central Funds, amounted to $1,075 (including $254 from securities loaned to FCM).
9. Expense Reductions.
Commissions paid to certain brokers with whom the investment adviser, or its affiliates, places trades on behalf of the Fund include an amount in addition to trade execution, which may be rebated back to the Fund to offset certain expenses. This amount totaled $296 for the period. In addition, through arrangements with the Fund's custodian, credits realized as a result of uninvested cash balances were used to reduce the Fund's expenses. During the period, these credits reduced the Fund's custody expenses by $1.
In addition, the investment adviser reimbursed a portion of the Fund's operating expenses during the period in the amount of $114.
Annual Report
Notes to Financial Statements - continued
(Amounts in thousands except percentages)
10. Distributions to Shareholders.
Distributions to shareholders of each class were as follows:
Years ended August 31, | 2014 | 2013 |
From net investment income | | |
Puritan | $ 277,059 | $ 267,070 |
Class K | 97,413 | 85,948 |
Total | $ 374,472 | $ 353,018 |
From net realized gain | | |
Puritan | $ 1,279,703 | $ 276,687 |
Class K | 419,357 | 78,542 |
Total | $ 1,699,060 | $ 355,229 |
11. Share Transactions.
Transactions for each class of shares were as follows:
| Shares | Dollars |
Years ended August 31, | 2014 | 2013 | 2014 | 2013 |
Puritan | | | | |
Shares sold | 83,240 | 78,846 | $ 1,795,083 | $ 1,597,567 |
Reinvestment of distributions | 71,802 | 26,262 | 1,481,284 | 515,763 |
Shares redeemed | (113,337) | (138,032) | (2,452,014) | (2,782,293) |
Net increase (decrease) | 41,705 | (32,924) | $ 824,353 | $ (668,963) |
Class K | | | | |
Shares sold | 47,633 | 68,604 | $ 1,032,662 | $ 1,385,671 |
Reinvestment of distributions | 25,049 | 8,366 | 516,770 | 164,490 |
Shares redeemed | (52,889) | (45,907) | (1,142,151) | (930,471) |
Net increase (decrease) | 19,793 | 31,063 | $ 407,281 | $ 619,690 |
12. Other.
The Fund's organizational documents provide former and current trustees and officers with a limited indemnification against liabilities arising in connection with the performance of their duties to the Fund. In the normal course of business, the Fund may also enter into contracts that provide general indemnifications. The Fund's maximum exposure under these arrangements is unknown as this would be dependent on future claims that may be made against the Fund. The risk of material loss from such claims is considered remote.
Annual Report
To the Trustees of Fidelity Puritan Trust and the Shareholders of Fidelity Puritan Fund:
In our opinion, the accompanying statement of assets and liabilities, including the schedule of investments, and the related statements of operations and of changes in net assets and the financial highlights present fairly, in all material respects, the financial position of Fidelity Puritan Fund (a fund of Fidelity Puritan Trust) at August 31, 2014, the results of its operations for the year then ended, the changes in its net assets for each of the two years in the period then ended and the financial highlights for each of the five years in the period then ended, in conformity with accounting principles generally accepted in the United States of America. These financial statements and financial highlights (hereafter referred to as "financial statements") are the responsibility of the Fidelity Puritan Fund's management. Our responsibility is to express an opinion on these financial statements based on our audits. We conducted our audits of these financial statements in accordance with the standards of the Public Company Accounting Oversight Board (United States). Those standards require that we plan and perform the audit to obtain reasonable assurance about whether the financial statements are free of material misstatement. An audit includes examining, on a test basis, evidence supporting the amounts and disclosures in the financial statements, assessing the accounting principles used and significant estimates made by management, and evaluating the overall financial statement presentation. We believe that our audits, which included confirmation of securities at August 31, 2014 by correspondence with the custodian, agent banks and brokers, provide a reasonable basis for our opinion.
PricewaterhouseCoopers LLP
Boston, Massachusetts
October 23, 2014
Annual Report
The Trustees, Member of the Advisory Board, and officers of the trust and fund, as applicable, are listed below. The Board of Trustees governs the fund and is responsible for protecting the interests of shareholders. The Trustees are experienced executives who meet periodically throughout the year to oversee the fund's activities, review contractual arrangements with companies that provide services to the fund, oversee management of the risks associated with such activities and contractual arrangements, and review the fund's performance. Except for James C. Curvey, each of the Trustees oversees 173 funds. Mr. Curvey oversees 406 funds.
The Trustees hold office without limit in time except that (a) any Trustee may resign; (b) any Trustee may be removed by written instrument, signed by at least two-thirds of the number of Trustees prior to such removal; (c) any Trustee who requests to be retired or who has become incapacitated by illness or injury may be retired by written instrument signed by a majority of the other Trustees; and (d) any Trustee may be removed at any special meeting of shareholders by a two-thirds vote of the outstanding voting securities of the trust. Each Trustee who is not an interested person (as defined in the 1940 Act) of the trust and the fund (Independent Trustee), shall retire not later than the last day of the calendar year in which his or her 75th birthday occurs. The Independent Trustees may waive this mandatory retirement age policy with respect to individual Trustees. The officers and Advisory Board Member hold office without limit in time, except that any officer and Advisory Board Member may resign or may be removed by a vote of a majority of the Trustees at any regular meeting or any special meeting of the Trustees. Except as indicated, each individual has held the office shown or other offices in the same company for the past five years.
Experience, Skills, Attributes, and Qualifications of the Fund's Trustees. The Governance and Nominating Committee has adopted a statement of policy that describes the experience, qualifications, attributes, and skills that are necessary and desirable for potential Independent Trustee candidates (Statement of Policy). The Board believes that each Trustee satisfied at the time he or she was initially elected or appointed a Trustee, and continues to satisfy, the standards contemplated by the Statement of Policy. The Governance and Nominating Committee also engages professional search firms to help identify potential Independent Trustee candidates who have the experience, qualifications, attributes, and skills consistent with the Statement of Policy. From time to time, additional criteria based on the composition and skills of the current Independent Trustees, as well as experience or skills that may be appropriate in light of future changes to board composition, business conditions, and regulatory or other developments, have also been considered by the professional search firms and the Governance and Nominating Committee. In addition, the Board takes into account the Trustees' commitment and participation in Board and committee meetings, as well as their leadership of standing and ad hoc committees throughout their tenure.
In determining that a particular Trustee was and continues to be qualified to serve as a Trustee, the Board has considered a variety of criteria, none of which, in isolation, was controlling. The Board believes that, collectively, the Trustees have balanced and diverse experience, qualifications, attributes, and skills, which allow the Board to operate effectively in governing the fund and protecting the interests of shareholders. Information about the specific experience, skills, attributes, and qualifications of each Trustee, which in each case led to the Board's conclusion that the Trustee should serve (or continue to serve) as a trustee of the fund, is provided below.
Annual Report
Board Structure and Oversight Function. James C. Curvey is an interested person (as defined in the 1940 Act) and currently serves as Chairman. The Trustees have determined that an interested Chairman is appropriate and benefits shareholders because an interested Chairman has a personal and professional stake in the quality and continuity of services provided to the fund. Independent Trustees exercise their informed business judgment to appoint an individual of their choosing to serve as Chairman, regardless of whether the Trustee happens to be independent or a member of management. The Independent Trustees have determined that they can act independently and effectively without having an Independent Trustee serve as Chairman and that a key structural component for assuring that they are in a position to do so is for the Independent Trustees to constitute a substantial majority for the Board. The Independent Trustees also regularly meet in executive session. Ned C. Lautenbach serves as Chairman of the Independent Trustees and as such (i) acts as a liaison between the Independent Trustees and management with respect to matters important to the Independent Trustees and (ii) with management prepares agendas for Board meetings.
Fidelity funds are overseen by different Boards of Trustees. The fund's Board oversees Fidelity's equity and high income funds and another Board oversees Fidelity's investment-grade bond, money market, and asset allocation funds. The asset allocation funds may invest in Fidelity funds overseen by the fund's Board. The use of separate Boards, each with its own committee structure, allows the Trustees of each group of Fidelity funds to focus on the unique issues of the funds they oversee, including common research, investment, and operational issues. On occasion, the separate Boards establish joint committees to address issues of overlapping consequences for the Fidelity funds overseen by each Board.
The Trustees operate using a system of committees to facilitate the timely and efficient consideration of all matters of importance to the Trustees, the fund, and fund shareholders and to facilitate compliance with legal and regulatory requirements and oversight of the fund's activities and associated risks. The Board, acting through its committees, has charged FMR and its affiliates with (i) identifying events or circumstances the occurrence of which could have demonstrably adverse effects on the fund's business and/or reputation; (ii) implementing processes and controls to lessen the possibility that such events or circumstances occur or to mitigate the effects of such events or circumstances if they do occur; and (iii) creating and maintaining a system designed to evaluate continuously business and market conditions in order to facilitate the identification and implementation processes described in (i) and (ii) above. Because the day-to-day operations and activities of the fund are carried out by or through FMR, its affiliates and other service providers, the fund's exposure to risks is mitigated but not eliminated by the processes overseen by the Trustees. While each of the Board's committees has responsibility for overseeing different aspects of the fund's activities, oversight is exercised primarily through the Operations, Audit, and Compliance Committees. In addition, the Independent Trustees have worked with FMR to enhance the Board's oversight of investment and financial risks, legal and regulatory risks, technology risks, and operational risks, including the development of additional risk reporting to the Board. For example, a working group comprised of Independent Trustees and FMR has worked and continues to work to review the Fidelity funds' valuation-related activities, reporting and risk management. Appropriate personnel, including but not limited to the fund's Chief Compliance Officer (CCO), FMR's internal auditor, the independent accountants, the fund's Treasurer and portfolio management personnel, make periodic reports to the Board's committees, as appropriate, including an annual review of FMR's risk management program for the Fidelity funds. The responsibilities of each standing committee, including their oversight responsibilities, are described further under "Standing Committees of the Fund's Trustees."
Annual Report
Trustees and Officers - continued
The fund's Statement of Additional Information (SAI) includes more information about the Trustees. To request a free copy, call Fidelity at 1-800-544-8544.
Interested Trustees*:
Correspondence intended for each Trustee who is an interested person may be sent to Fidelity Investments, 245 Summer Street, Boston, Massachusetts 02210.
Name, Year of Birth; Principal Occupations and Other Relevant Experience+ |
James C. Curvey (1935) |
Year of Election or Appointment: 2007 Trustee Chairman of the Board of Trustees |
| Mr. Curvey also serves as Trustee of other Fidelity funds. Mr. Curvey is a Director of Fidelity Research & Analysis Co. (2009-present), and Vice Chairman (2007-present) and Director of FMR LLC. In addition, Mr. Curvey serves as an Overseer for the Boston Symphony Orchestra and a member of the Trustees of Villanova University. Previously, Mr. Curvey served as a Director of Fidelity Investments Money Management, Inc. (2009-2014), a Director of FMR (2007-2014), a Director of FMR Co., Inc. (2007-2014) and was the Vice Chairman (2006-2007) and Director (2000-2007) of FMR Corp. |
Charles S. Morrison (1960) |
Year of Election or Appointment: 2014 Trustee |
| Mr. Morrison also serves as Trustee of other funds. He serves as President, Asset Management (2014-present) and is an employee of Fidelity Investments. Previously, Mr. Morrison served as Vice President of Fidelity's Fixed Income and Asset Allocation Funds (2012-2014), President, Fixed Income (2011-2014), Vice President of Fidelity's Money Market Funds (2005-2009), President, Money Market Group Leader of FMR (2009), and Senior Vice President, Money Market Group of FMR (2004-2009). Mr. Morrison also served as Vice President of Fidelity's Bond Funds (2002-2005), certain Balanced Funds (2002-2005), and certain Asset Allocation Funds (2002-2007), and as Senior Vice President (2002-2005) of Fidelity's Bond Division. |
* Trustees have been determined to be "Interested Trustees" by virtue of, among other things, their affiliation with the trust or various entities under common control with FMR.
+ The information above includes each Trustee's principal occupation during the last five years and other information relating to the experience, attributes, and skills relevant to each Trustee's qualifications to serve as a Trustee, which led to the conclusion that each Trustee should serve as a Trustee for the fund.
Annual Report
Trustees and Officers - continued
Independent Trustees:
Correspondence intended for each Independent Trustee (that is, the Trustees other than the Interested Trustees) may be sent to Fidelity Investments, P.O. Box 55235, Boston, Massachusetts 02205-5235.
Name, Year of Birth; Principal Occupations and Other Relevant Experience+ |
Dennis J. Dirks (1948) |
Year of Election or Appointment: 2005 Trustee |
| Mr. Dirks also serves as Trustee of other Fidelity funds. Prior to his retirement in May 2003, Mr. Dirks was Chief Operating Officer and a member of the Board of The Depository Trust & Clearing Corporation (DTCC). He also served as President, Chief Operating Officer, and Board member of The Depository Trust Company (DTC) and President and Board member of the National Securities Clearing Corporation (NSCC). In addition, Mr. Dirks served as Chief Executive Officer and Board member of the Government Securities Clearing Corporation, Chief Executive Officer and Board member of the Mortgage-Backed Securities Clearing Corporation, as a Trustee and a member of the Finance Committee of Manhattan College (2005-2008), and as a Trustee and a member of the Finance Committee of AHRC of Nassau County (2006-2008). Mr. Dirks is a member of the Independent Directors Council (IDC) Governing Council (2010-present) and Board of Directors for The Brookville Center for Children's Services, Inc. (2009-present). |
Alan J. Lacy (1953) |
Year of Election or Appointment: 2008 Trustee |
| Mr. Lacy also serves as Trustee of other Fidelity funds. Mr. Lacy serves as Senior Adviser (2007-present) of Oak Hill Capital Partners, L.P. (private equity). Mr. Lacy also served as Chief Executive Officer (2000-2005) and Vice Chairman (2005-2006) of Sears Holdings Corporation and Sears, Roebuck and Co. (retail). In addition, Mr. Lacy serves as a member of the Board of Directors of Dave & Buster's Entertainment, Inc. (restaurant and entertainment complexes, 2010-present), Earth Fare, Inc. (retail grocery, 2012-present), The Hillman Companies, Inc. (hardware wholesalers, 2010-present), and Bristol-Myers Squibb Company (global pharmaceuticals, 2008-present). Mr. Lacy is a member of the Board of Trustees of The National Parks Conservation Association (2006-present). Previously, Mr. Lacy served as Chairman of the Board of Trustees of the National Parks Conservation Association (2008-2011) and as a member of the Board of Directors for the Western Union Company (global money transfer, 2006-2011). |
Ned C. Lautenbach (1944) |
Year of Election or Appointment: 2000 Trustee Chairman of the Independent Trustees |
| Mr. Lautenbach also serves as Trustee of other Fidelity funds. Mr. Lautenbach currently serves as the Lead Director of the Eaton Corporation Board of Directors (diversified industrial, 1997-present). Mr. Lautenbach is Chairman of the Board of Directors of the Philharmonic Center for the Arts in Naples, Florida (2012-present) and a member of the Council on Foreign Relations (1994-present). Previously, Mr. Lautenbach was a Partner/Advisory Partner at Clayton, Dubilier & Rice, LLC (private equity investment, 1998-2010), as well as a Director of Sony Corporation (2006-2007). |
Joseph Mauriello (1944) |
Year of Election or Appointment: 2008 Trustee |
| Mr. Mauriello also serves as Trustee of other Fidelity funds. Prior to his retirement in January 2006, Mr. Mauriello served in numerous senior management positions including Deputy Chairman and Chief Operating Officer (2004-2005), and Vice Chairman of Financial Services (2002-2004) of KPMG LLP US (professional services, 1965-2005). Mr. Mauriello currently serves as a member of the Board of Directors of XL Group plc. (global insurance and re-insurance, 2006-present). Previously, Mr. Mauriello served as a Director of the Hamilton Funds of the Bank of New York (2006-2007) and of Arcadia Resources Inc. (health care services and products, 2007-2012). |
Robert W. Selander (1950) |
Year of Election or Appointment: 2011 Trustee |
| Mr. Selander also serves as Trustee of other Fidelity funds. Previously, Mr. Selander served as a Member of the Advisory Board of other Fidelity funds (2011), and Executive Vice Chairman (2010), Chief Executive Officer (2009-2010), and President and Chief Executive Officer (1997-2009) of Mastercard, Inc. |
Cornelia M. Small (1944) |
Year of Election or Appointment: 2005 Trustee |
| Ms. Small also serves as Trustee of other Fidelity funds. Ms. Small is a member of the Board of Directors (2009-present) and Chair of the Investment Committee (2010-present) of the Teagle Foundation. Ms. Small also serves on the Investment Committee of the Berkshire Taconic Community Foundation (2008-present). Previously, Ms. Small served as Chairperson (2002-2008) and a member of the Investment Committee and Chairperson (2008-2012) and a member of the Board of Trustees of Smith College. In addition, Ms. Small served as Chief Investment Officer, Director of Global Equity Investments, and a member of the Board of Directors of Scudder, Stevens & Clark and Scudder Kemper Investments. |
William S. Stavropoulos (1939) |
Year of Election or Appointment: 2001 Trustee Vice Chairman of the Independent Trustees |
| Mr. Stavropoulos also serves as Trustee of other Fidelity funds. Mr. Stavropoulos serves as President and Founder of the Michigan Baseball Foundation, the Great Lakes Loons (2007-present). Mr. Stavropoulos is Chairman Emeritus of the Board of Directors of The Dow Chemical Company, where he previously served in numerous senior management positions, including President, CEO (1995-2000; 2002-2004), Chairman of the Executive Committee (2000-2006), and as a member of the Board of Directors (1990-2006). Currently, Mr. Stavropoulos is Chairman of the Board of Directors of Univar Inc. (global distributor of commodity and specialty chemicals), a Director of Teradata Corporation (data warehousing and technology solutions), and Maersk Inc. (industrial conglomerate), and a member of the Advisory Board for Metalmark Capital LLC (private equity investment, 2005-present). Mr. Stavropoulos is an operating advisor to Clayton, Dubilier & Rice, LLC (private equity investment). In addition, Mr. Stavropoulos is a member of the University of Notre Dame Advisory Council for the College of Science, a Trustee of the Rollin L. Gerstacker Foundation, and a Director of the Naples Philharmonic Center for the Arts. Previously, Mr. Stavropoulos served as a Director of Chemical Financial Corporation (bank holding company, 1993-2012) and Tyco International, Ltd. (multinational manufacturing and services, 2007-2012). |
David M. Thomas (1949) |
Year of Election or Appointment: 2008 Trustee |
| Mr. Thomas also serves as Trustee of other Fidelity funds. Mr. Thomas serves as Non-Executive Chairman of the Board of Directors of Fortune Brands Home and Security (home and security products, 2011-present), and as a member of the Board of Directors of Interpublic Group of Companies, Inc. (marketing communication, 2004-present). Previously, Mr. Thomas served as Executive Chairman (2005-2006) and Chairman and Chief Executive Officer (2000-2005) of IMS Health, Inc. (pharmaceutical and healthcare information solutions), and a Director of Fortune Brands, Inc. (consumer products, 2000-2011). |
+ The information above includes each Trustee's principal occupation during the last five years and other information relating to the experience, attributes, and skills relevant to each Trustee's qualifications to serve as a Trustee, which led to the conclusion that each Trustee should serve as a Trustee for the fund.
Advisory Board Member and Officers:
Correspondence intended for each officer and Peter S. Lynch may be sent to Fidelity Investments, 245 Summer Street, Boston, Massachusetts 02210. Officers appear below in alphabetical order.
Name, Year of Birth; Principal Occupation |
Peter S. Lynch (1944) |
Year of Election or Appointment: 2003 Member of the Advisory Board |
| Mr. Lynch also serves as Member of the Advisory Board of other Fidelity funds. Mr. Lynch is Vice Chairman and a Director of FMR and FMR Co., Inc. In addition, Mr. Lynch serves as a Trustee of Boston College and as the Chairman of the Inner-City Scholarship Fund. Previously, Mr. Lynch served on the Special Olympics International Board of Directors (1997-2006). |
Elizabeth Paige Baumann (1968) |
Year of Election or Appointment: 2012 Anti-Money Laundering (AML) Officer |
| Ms. Baumann also serves as AML Officer of other funds. She is Chief AML Officer of FMR LLC (2012-present) and is an employee of Fidelity Investments. Previously, Ms. Baumann served as Vice President and Deputy Anti-Money Laundering Officer (2007-2012). |
William C. Coffey (1969) |
Year of Election or Appointment: 2009 Assistant Secretary |
| Mr. Coffey also serves as Assistant Secretary of other funds. He is Senior Vice President and Deputy General Counsel of FMR LLC (2010-present), and is an employee of Fidelity Investments. Previously, Mr. Coffey served as Vice President and Associate General Counsel of FMR LLC (2005-2009). |
Jonathan Davis (1968) |
Year of Election or Appointment: 2010 Assistant Treasurer |
| Mr. Davis also serves as Assistant Treasurer of other funds. Mr. Davis is an employee of Fidelity Investments. Previously, Mr. Davis served as Vice President and Associate General Counsel of FMR LLC (2003-2010). |
Adrien E. Deberghes (1967) |
Year of Election or Appointment: 2008 Deputy Treasurer |
| Mr. Deberghes also serves as an officer of other funds. He is an employee of Fidelity Investments (2008-present). Prior to joining Fidelity Investments, Mr. Deberghes was Senior Vice President of Mutual Fund Administration at State Street Corporation (2007-2008), Senior Director of Mutual Fund Administration at Investors Bank & Trust (2005-2007), and Director of Finance for Dunkin' Brands (2000-2005). |
Stephanie J. Dorsey (1969) |
Year of Election or Appointment: 2010 Assistant Treasurer |
| Ms. Dorsey also serves as an officer of other funds. She is an employee of Fidelity Investments (2008-present) and has served in other fund officer roles. Prior to joining Fidelity Investments, Ms. Dorsey served as Treasurer (2004-2008) of the JPMorgan Mutual Funds and Vice President (2004-2008) of JPMorgan Chase Bank. |
Howard J. Galligan III (1966) |
Year of Election or Appointment: 2014 Chief Financial Officer |
| Mr. Galligan also serves as Chief Financial Officer of other funds. Mr. Galligan serves as President of Fidelity Pricing and Cash Management Services (FPCMS) (2014-present) and as a Director of Strategic Advisers, Inc. (2008-present). Previously, Mr. Galligan served as Chief Administrative Officer of Asset Management (2011-2014) and Chief Operating Officer and Senior Vice President of Investment Support for Strategic Advisers, Inc. (2003-2011). |
Scott C. Goebel (1968) |
Year of Election or Appointment: 2008 Secretary and Chief Legal Officer (CLO) |
| Mr. Goebel serves as Secretary and CLO of other funds. Mr. Goebel also serves as Secretary of Fidelity SelectCo, LLC (2013-present), Fidelity Investments Money Management, Inc. (FIMM) (2010-present) and Fidelity Research and Analysis Company (FRAC) (2010-present); General Counsel, Secretary, and Senior Vice President of FMR (2008-present) and FMR Co., Inc. (2008-present); Chief Legal Officer of Fidelity Management & Research (Hong Kong) Limited (2008-present); and Assistant Secretary of Fidelity Management & Research (Japan) Inc. (2008-present) and Fidelity Management & Research (U.K.) Inc. (2008-present). Previously, Mr. Goebel served as Secretary and CLO of other Fidelity funds (2008-2013), Assistant Secretary of FIMM (2008-2010), FRAC (2008-2010), and certain funds (2007-2008); and as Vice President and Secretary of Fidelity Distributors Corporation (FDC) (2005-2007). Mr. Goebel has been employed by FMR LLC or an affiliate since 2001. |
Brian B. Hogan (1964) |
Year of Election or Appointment: 2009 Vice President |
| Mr. Hogan also serves as Trustee or Vice President of other funds. Mr. Hogan serves as President of FMR's Equity Division (2009-present). Previously, Mr. Hogan served as Senior Vice President, Equity Research of FMR (2006-2009) and as a portfolio manager. |
Chris Maher (1972) |
Year of Election or Appointment: 2013 Assistant Treasurer |
| Mr. Maher serves as Assistant Treasurer of other funds. Mr. Maher is Vice President of Valuation Oversight and is an employee of Fidelity Investments. Previously, Mr. Maher served as Vice President of Asset Management Compliance (2013), Vice President of FMR's Program Management Group (2010-2013), and Vice President of Valuation Oversight (2008-2010). |
Melissa M. Reilly (1971) |
Year of Election or Appointment: 2014 Vice President of certain Equity Funds |
| Ms. Reilly also serves as Vice President of other funds. Ms. Reilly is an employee of Fidelity Investments (2004-present). |
Kenneth B. Robins (1969) |
Year of Election or Appointment: 2008 President and Treasurer |
| Mr. Robins also serves as an officer of other funds. Mr. Robins serves as Executive Vice President of Fidelity Investments Money Management, Inc. (FIMM) (2013-present) and is an employee of Fidelity Investments (2004-present). Previously, Mr. Robins served in other fund officer roles. |
Stephen Sadoski (1971) |
Year of Election or Appointment: 2012 Deputy Treasurer |
| Mr. Sadoski also serves as Deputy Treasurer of other funds. He is an employee of Fidelity Investments (2012-present) and has served in another fund officer role. Prior to joining Fidelity Investments, Mr. Sadoski served as an assistant chief accountant in the Division of Investment Management of the Securities and Exchange Commission (SEC) (2009-2012) and as a senior manager at Deloitte & Touche LLP (1997-2009). |
Stacie M. Smith (1974) |
Year of Election or Appointment: 2013 Deputy Treasurer |
| Ms. Smith also serves as an officer of other funds. She is an employee of Fidelity Investments (2009-present) and has served in other fund officer roles. Prior to joining Fidelity Investments, Ms. Smith served as Senior Audit Manager of Ernst & Young LLP (1996-2009). |
Renee Stagnone (1975) |
Year of Election or Appointment: 2013 Deputy Treasurer |
| Ms. Stagnone also serves as Deputy Treasurer of other funds. Ms. Stagnone is an employee of Fidelity Investments. |
Linda J. Wondrack (1964) |
Year of Election or Appointment: 2014 Chief Compliance Officer |
| Ms. Wondrack also serves as Chief Compliance Officer of other funds. Ms. Wondrack is Executive Vice President and head of the Ethics Office and Asset Management Compliance for Fidelity Investments (2012-present). Ms. Wondrack also serves as Chief Compliance Officer of Fidelity SelectCo, LLC (2014-present); Chief Compliance Officer of Impresa Management LLC (2013-present); and Chief Compliance Officer of FMR Co., Inc., Fidelity Investments Money Management, Inc., Fidelity Management & Research (Japan) Inc., Fidelity Management & Research (U.K.) Inc., Fidelity Management & Research (Hong Kong), Fidelity Management & Research Company, Pyramis Global Advisors, LLC, and Strategic Advisers, Inc., Ballyrock Investment Advisors LLC, and Northern Neck Investors LLC (2012-present). Previously, Ms. Wondrack served as Senior Vice President and Chief Compliance Officer for Columbia Management Investment Advisers, LLC (2005-2012); Chief Compliance Officer for certain funds within the Columbia Family of Funds (2007-2012); and Senior Vice President of Compliance Risk Management at Bank of America (2005-2010). |
Joseph F. Zambello (1957) |
Year of Election or Appointment: 2011 Deputy Treasurer |
| Mr. Zambello also serves as Deputy Treasurer of other funds. Mr. Zambello is an employee of Fidelity Investments. Previously, Mr. Zambello served as Vice President of FMR's Program Management Group (2009-2011) and Vice President of the Transfer Agent Oversight Group (2005-2009). |
Annual Report
The Board of Trustees of Fidelity Puritan Fund voted to pay on October 13, 2014, to shareholders of record at the opening of business on October 10, 2014, a distribution of $1.340 per share derived from capital gains realized from sales of portfolio securities and a dividend of $0.096 per share from net investment income.
The fund hereby designates as a capital gain dividend with respect to the taxable year ended August 31, 2014 $1,528,514,665, or, if subsequently determined to be different, the net capital gain of such year.
A total of 2.25% of the dividends distributed during the fiscal year was derived from interest on U.S. Government securities which is generally exempt from state income tax.
The Fund designates $125,447,201 of distributions paid during the period January 1, 2014 to August 31, 2014 as qualifying to be taxed as interest-related dividends for nonresident alien shareholders.
Puritan designates 8%, 26%, 73% and 73% of the dividends distributed in October, December, April and July, respectively during the fiscal year as qualifying for the dividends-received deduction for corporate shareholders.
Puritan designates 10%, 32%, 93% and 94% of the dividends distributed in October, December, April and July, respectively during the fiscal year as amounts which may be taken into account as a dividend for the purposes of the maximum rate under section 1(h)(11) of the Internal Revenue Code.
The fund will notify shareholders in January 2015 of amounts for use in preparing 2014 income tax returns.
Annual Report
Board Approval of Investment Advisory Contracts and Management Fees
Fidelity Puritan Fund
Each year, the Board of Trustees, including the Independent Trustees (together, the Board), votes on the renewal of the management contract with Fidelity Management & Research Company (FMR) and the sub-advisory agreements (together, the Advisory Contracts) for the fund. The Board, assisted by the advice of fund counsel and Independent Trustees' counsel, requests and considers a broad range of information relevant to the renewal of the Advisory Contracts throughout the year.
The Board meets regularly and, at each of its meetings, covers an extensive agenda of topics and materials and considers factors that are relevant to its annual consideration of the renewal of the fund's Advisory Contracts, including the services and support provided to the fund and its shareholders. The Board has established various standing committees (Committees), each composed of and chaired by Independent Trustees with varying backgrounds, to which the Board has assigned specific subject matter responsibilities in order to enhance effective decision-making by the Board. The Board, acting directly and through its Committees, requests and receives information concerning the annual consideration of the renewal of the fund's Advisory Contracts. The Board also meets as needed to consider matters specifically related to the Board's annual consideration of the renewal of the Advisory Contracts. Members of the Board may also meet with trustees of other Fidelity funds through ad hoc joint committees to discuss certain matters relevant to the Fidelity funds.
At its July 2014 meeting, the Board, including the Independent Trustees, unanimously determined to renew the fund's Advisory Contracts. In reaching its determination, the Board considered all factors it believed relevant, including (i) the nature, extent, and quality of the services to be provided to the fund and its shareholders (including the investment performance of the fund); (ii) the competitiveness of the fund's management fee and total expense ratio relative to peer funds; (iii) the total costs of the services to be provided by and the profits to be realized by Fidelity from its relationship with the fund; (iv) the extent to which economies of scale exist and would be realized as the fund grows; and (v) whether fee levels reflect these economies of scale, if any, for the benefit of fund shareholders. In connection with separate internal corporate reorganizations involving Fidelity Management & Research (U.K.) Inc. (FMR U.K.) and Fidelity Management & Research (Japan) Inc. (FMR Japan), the Board approved certain non-material amendments to the fund's sub-advisory agreements with FMR U.K. and FMR Japan to reflect that, after these reorganizations, FMR Investment Management (UK) Limited and Fidelity Management & Research (Japan) Limited will carry on the business of FMR U.K. and FMR Japan, respectively. The Board noted that no changes to the portfolio managers or to the foreign research or investment advisory services provided to the fund were expected in connection with either reorganization and that the same personnel and resources would continue to be available to the fund at the new entities.
Annual Report
Board Approval of Investment Advisory Contracts and
Management Fees - continued
In considering whether to renew the Advisory Contracts for the fund, the Board reached a determination, with the assistance of fund counsel and Independent Trustees' counsel and through the exercise of its business judgment, that the renewal of the Advisory Contracts was in the best interests of the fund and its shareholders and that the compensation payable under the Advisory Contracts was fair and reasonable. The Board's decision to renew the Advisory Contracts was not based on any single factor, but rather was based on a comprehensive consideration of all the information provided to the Board at its meetings throughout the year. The Board, in reaching its determination to renew the Advisory Contracts, was aware that shareholders of the fund have a broad range of investment choices available to them, including a wide choice among funds offered by Fidelity's competitors, and that the fund's shareholders, who have the opportunity to review and weigh the disclosure provided by the fund in its prospectus and other public disclosures, have chosen to invest in this fund, which is part of the Fidelity family of funds.
Nature, Extent, and Quality of Services Provided. The Board considered Fidelity's staffing as it relates to the fund, including the backgrounds of investment personnel of FMR and the sub-advisers (together, the Investment Advisers), and also considered the fund's investment objective, strategies, and related investment philosophy. The Independent Trustees also had discussions with senior management of Fidelity's investment operations and investment groups. The Board considered the structure of the portfolio manager compensation program and whether this structure provides appropriate incentives to act in the best interests of the fund. Additionally, the Board considered the portfolio managers' investments, if any, in the funds that they manage.
Resources Dedicated to Investment Management and Support Services. The Board and the Fund Oversight and Research Committees reviewed the general qualifications and capabilities of Fidelity's investment staff, including its size, education, experience, and resources, as well as Fidelity's approach to recruiting, training, managing, and compensating investment personnel. The Board noted that Fidelity has continued to increase the resources devoted to non-U.S. offices, including expansion of Fidelity's global investment organization. The Board also noted that Fidelity's analysts have extensive resources, tools and capabilities that allow them to conduct sophisticated quantitative and fundamental analysis, as well as credit analysis of issuers, counterparties and guarantors. Further, the Board believes that Fidelity's investment professionals have sufficient access to global information and data so as to provide competitive investment results over time, and that those professionals also have access to sophisticated tools that permit them to assess portfolio construction and risk and performance attribution characteristics continuously, as well as to transmit new information and research conclusions rapidly around the world. Additionally, in its deliberations, the Board considered Fidelity's trading and risk management capabilities and resources and global compliance infrastructure, which are an integral part of the investment management process.
Annual Report
Shareholder and Administrative Services. The Board considered (i) the nature, extent, quality, and cost of advisory, administrative, and shareholder services performed by the Investment Advisers and their affiliates under the Advisory Contracts and under separate agreements covering transfer agency, pricing and bookkeeping, and securities lending services for the fund; (ii) the nature and extent of the supervision of third party service providers, principally custodians and subcustodians; and (iii) the resources devoted to, and the record of compliance with, the fund's compliance policies and procedures. The Board also reviewed the allocation of fund brokerage, including allocations to brokers affiliated with the Investment Advisers, the use of brokerage commissions to pay fund expenses, and the use of "soft" commission dollars to pay for research services.
The Board noted that the growth of fund assets over time across the complex allows Fidelity to reinvest in the development of services designed to enhance the value or convenience of the Fidelity funds as investment vehicles. These services include 24-hour access to account information and market information through telephone representatives and over the Internet, investor education materials and asset allocation tools, and the expanded availability of Fidelity Investor Centers.
In 2014, the Board formed an ad hoc Committee on Transfer Agency Fees to review the variety of transfer agency fee structures throughout the industry and Fidelity's competitive positioning with respect to industry participants.
Investment in a Large Fund Family. The Board considered the benefits to shareholders of investing in a Fidelity fund, including the benefits of investing in a fund that is part of a large family of funds offering a variety of investment disciplines and providing a large variety of mutual fund investor services. The Board noted that Fidelity had taken, or had made recommendations that resulted in the Fidelity funds taking, a number of actions over the previous year that benefited particular funds, including (i) continuing to dedicate additional resources to investment research and to the support of the senior management team that oversees asset management; (ii) persisting in efforts to enhance Fidelity's global research capabilities; (iii) launching new funds and making other enhancements to meet client needs for income-oriented solutions; (iv) reducing fund expenses for certain index funds; (v) continuing to launch dedicated lower cost underlying funds to meet portfolio construction needs related to expanding underlying fund options for Fidelity funds of funds, specifically for the Freedom Fund product lines; (vi) rationalizing product lines and gaining increased efficiencies through fund mergers; (vii) launching sector-based exchange-traded funds and establishing a new Fidelity adviser to manage sector-based funds and products; (viii) continuing to develop and implement technology to improve security and increase efficiency; (ix) modifying the eligibility criteria for certain share classes to increase their marketability to a portion of the defined contribution plan market; (x) waiving redemption fees for certain qualified fund-of-fund and wrap programs and certain retirement plan transactions; and (xi) launching new Institutional Class shares of certain money market funds to attract and retain assets and to fill a gap in the money market fund lineup.
Annual Report
Board Approval of Investment Advisory Contracts and
Management Fees - continued
Investment Performance. The Board considered whether the fund has operated in accordance with its investment objective, as well as its record of compliance with its investment restrictions and its performance history.
The Board took into account discussions with the Investment Advisers about fund investment performance that occur at Board meetings throughout the year. In this regard the Board noted that as part of regularly scheduled fund reviews and other reports to the Board on fund performance, the Board periodically considers annualized return information for the fund, for different time periods, measured against a securities market index ("benchmark index") and a peer group of funds with similar objectives ("peer group"). In its evaluation of fund investment performance, the Board gave particular attention to information indicating changes in performance of certain Fidelity funds for specific time periods and the Investment Advisers' explanations for any overperformance or underperformance.
In addition to reviewing absolute and relative fund performance, the Independent Trustees periodically consider the appropriateness of fund performance metrics in evaluating the results achieved. In general, the Independent Trustees believe that fund performance should be evaluated based on net performance (after fees and expenses) of both the highest performing and lowest performing classes, where applicable, compared to appropriate benchmark indices, over appropriate time periods which may include full market cycles, and compared to peer groups, as applicable, over the same periods, taking into account relevant factors including the following: general market conditions; issuer-specific information; tactical opportunities for investment; and fund cash flows and other factors.
The Independent Trustees recognize that shareholders evaluate performance on a net basis over their own holding periods, for which one-, three-, and five-year periods are often used as a proxy. For this reason, the performance information reviewed by the Board also included net cumulative calendar year total return information for the fund and an appropriate benchmark index and peer group for the most recent one-, three-, and five-year periods, as shown below. Returns are shown compared to the 25th percentile (top of box, 75% beaten) and 75th percentile (bottom of box, 25% beaten) of the peer universe.
Annual Report
Fidelity Puritan Fund
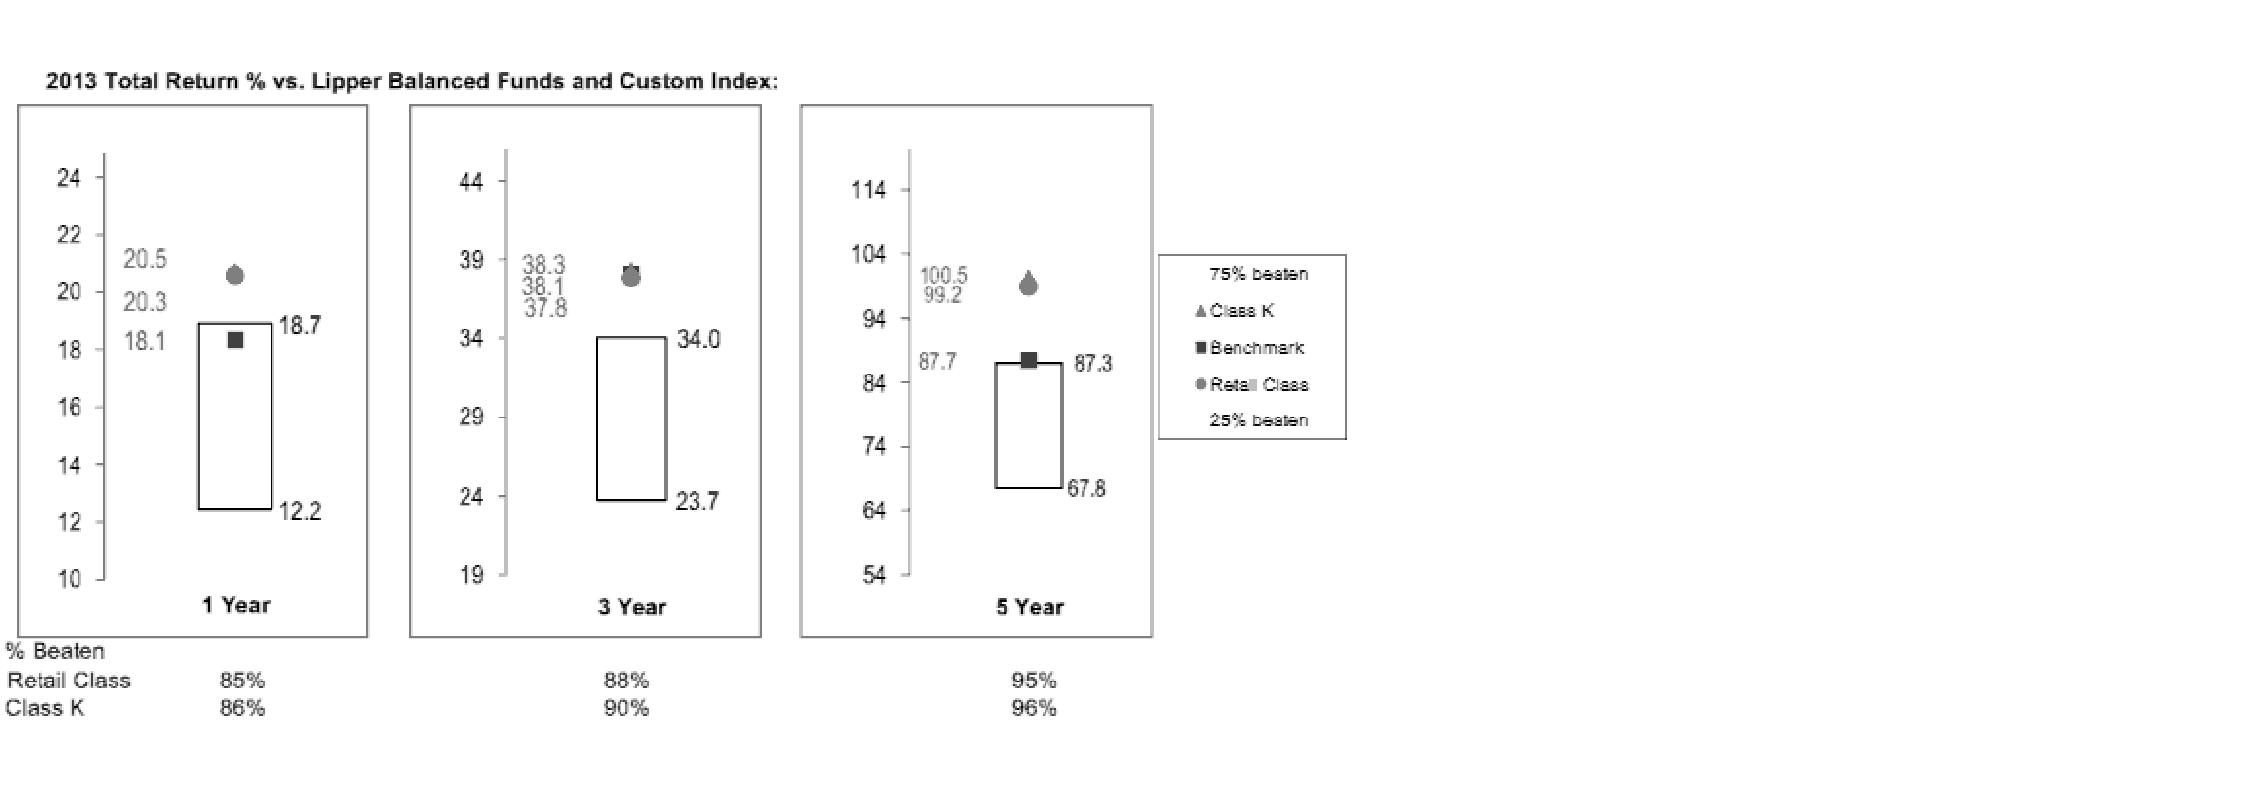
Based on its review, the Board concluded that the nature, extent, and quality of services provided to the fund under the Advisory Contracts should benefit the fund's shareholders.
Competitiveness of Management Fee and Total Expense Ratio. The Board considered the fund's management fee and total expense ratio compared to "mapped groups" of competitive funds and classes. Fidelity creates "mapped groups" by combining similar Lipper investment objective categories that have comparable investment mandates. Combining Lipper investment objective categories aids the Board's management fee and total expense ratio comparisons by broadening the competitive group used for comparison and by reducing the number of universes to which various Fidelity funds are compared.
Management Fee. The Board considered two proprietary management fee comparisons for the 12-month periods shown in the chart below. The group of Lipper funds used by the Board for management fee comparisons is referred to below as the "Total Mapped Group." The Total Mapped Group is broader than the Lipper peer group used by the Board for performance comparisons because the Total Mapped Group combines several Lipper investment objective categories while the Lipper peer group does not. The Total Mapped Group comparison focuses on a fund's standing in terms of gross management fees before expense reimbursements or caps relative to the total universe of funds with comparable investment mandates, regardless of whether their management fee structures also are comparable. Funds with comparable investment mandates offer exposure to similar types of securities. Funds with comparable management fee structures have similar management fee contractual arrangements (e.g., flat rate charged for advisory services, all-inclusive fee rate, etc.). "TMG %" represents the percentage of funds in the Total Mapped Group that had management fees that were lower than the fund's. For example, a hypothetical TMG % of 20% would mean that 80% of the funds in the Total Mapped Group had higher, and 20% had lower, management fees than the fund. The fund's actual TMG %s are in the chart below. The "Asset-Size Peer Group" (ASPG) comparison focuses on a fund's standing relative to a subset of non-Fidelity funds within the Total Mapped Group that are similar in size and management fee structure. For example, if a fund is in the first quartile of the ASPG, the fund's management fee ranks in the least expensive or lowest 25% of funds in the ASPG. The ASPG represents at least 15% of the funds in the Total Mapped Group with comparable asset size and management fee structures, subject to a minimum of 50 funds (or all funds in the Total Mapped Group if fewer than 50). Additional information, such as the ASPG quartile in which the fund's management fee rate ranked, is also included in the chart and considered by the Board.
Annual Report
Board Approval of Investment Advisory Contracts and
Management Fees - continued
Fidelity Puritan Fund
The Board noted that the fund's management fee rate ranked below the median of its Total Mapped Group and below the median of its ASPG for 2013.
The Board also noted that, in August 2013, the ad hoc Committee on Management Fees was formed to conduct an in-depth review of the management fee rates of Fidelity's active equity mutual funds. The Committee focused on the following areas: (i) standard fee structures; (ii) research consumption and trading evolution; (iii) management fee competitiveness/profitability by category; and (iv) factors that drive institutional pricing.
Annual Report
Based on its review, the Board concluded that the fund's management fee is fair and reasonable in light of the services that the fund receives and the other factors considered.
Total Expense Ratio. In its review of each class's total expense ratio, the Board considered the fund's management fee as well as other fund or class expenses, as applicable, such as transfer agent fees, pricing and bookkeeping fees, and custodial, legal, and audit fees. The Board also noted the effects of any waivers and reimbursements on fees and expenses. As part of its review, the Board also considered the current and historical total expense ratios of each class of the fund compared to competitive fund median expenses. Each class of the fund is compared to those funds and classes in the Total Mapped Group (used by the Board for management fee comparisons) that have a similar sales load structure.
The Board noted that the total expense ratio of each class ranked below its competitive median for 2013.
Fees Charged to Other Fidelity Clients. The Board also considered Fidelity fee structures and other information with respect to clients of Fidelity, such as other funds advised or subadvised by Fidelity, pension plan clients, and other institutional clients. The Board noted the findings of the 2013 ad hoc joint committee (created with the board of other Fidelity funds), which reviewed and compared Fidelity's institutional investment advisory business with its business of providing services to the Fidelity funds, including the differences in services provided, fees charged, and costs incurred, as well as competition in their respective marketplaces.
Based on its review of total expense ratios and fees charged to other Fidelity clients, the Board concluded that the total expense ratio of each class of the fund was reasonable in light of the services that the fund and its shareholders receive and the other factors considered.
Costs of the Services and Profitability. The Board considered the revenues earned and the expenses incurred by Fidelity in conducting the business of developing, marketing, distributing, managing, administering and servicing the fund and servicing the fund's shareholders. The Board also considered the level of Fidelity's profits in respect of all the Fidelity funds.
On an annual basis, Fidelity presents to the Board Fidelity's profitability for the fund. Fidelity calculates the profitability for each fund, as well as aggregate profitability for groups of Fidelity funds and all Fidelity funds, using a series of detailed revenue and cost allocation methodologies which originate with the books and records of Fidelity on which Fidelity's audited financial statements are based. The Audit Committee of the Board reviews any significant changes from the prior year's methodologies.
Annual Report
Board Approval of Investment Advisory Contracts and
Management Fees - continued
PricewaterhouseCoopers LLP (PwC), independent registered public accounting firm and auditor to Fidelity and certain Fidelity funds, has been engaged annually by the Board as part of the Board's assessment of Fidelity's profitability analysis. PwC's engagement includes the review and assessment of the methodologies used by Fidelity in determining the revenues and expenses attributable to Fidelity's mutual fund business, and completion of agreed-upon procedures in respect of the mathematical accuracy of fund profitability and its conformity to established allocation methodologies. After considering PwC's reports issued under the engagement and information provided by Fidelity, the Board concluded that while other allocation methods may also be reasonable, Fidelity's profitability methodologies are reasonable in all material respects.
The Board also reviewed Fidelity's non-fund businesses and fall-out benefits related to the mutual fund business as well as cases where Fidelity's affiliates may benefit from or be related to the fund's business.
The Board considered the costs of the services provided by and the profits realized by Fidelity in connection with the operation of the fund and was satisfied that the profitability was not excessive in the circumstances.
Economies of Scale. The Board considered whether there have been economies of scale in respect of the management of the Fidelity funds, whether the Fidelity funds (including the fund) have appropriately benefited from any such economies of scale, and whether there is potential for realization of any further economies of scale. The Board considered the extent to which the fund will benefit from economies of scale through increased services to the fund, through waivers or reimbursements, or through fee or expense ratio reductions. The Board also noted that in 2013, it and the boards of other Fidelity funds created an ad hoc committee (the Economies of Scale Committee) to analyze whether Fidelity attains economies of scale in respect of the management and servicing of the Fidelity funds, whether the Fidelity funds have appropriately benefited from such economies of scale, and whether there is potential for realization of any further economies of scale.
The Board recognized that the fund's management contract incorporates a "group fee" structure, which provides for lower group fee rates as total group assets increase, and for higher group fee rates as total group assets decrease (with "group assets" defined to include fund assets under FMR's management plus sector fund assets previously under FMR's management and currently managed by Fidelity SelectCo, LLC). FMR calculates the group fee rates based on a tiered asset "breakpoint" schedule that varies based on asset class. The Board considered that the group fee is designed to deliver the benefits of economies of scale to fund shareholders when total Fidelity fund assets increase, even if assets of any particular fund are unchanged or have declined, because some portion of Fidelity's costs are attributable to services provided to all Fidelity funds, and all funds benefit if those costs can be allocated among more assets. The Board concluded that, given the group fee structure, fund shareholders will benefit from lower management fees as group assets increase at the fund complex level, regardless of whether Fidelity achieves any such economies of scale.
Annual Report
The Board concluded, taking into account the analysis of the Economies of Scale Committee, that economies of scale, if any, are being appropriately shared between fund shareholders and Fidelity.
Additional Information Requested by the Board. In order to develop fully the factual basis for consideration of the Fidelity funds' Advisory Contracts, the Board requested and received additional information on certain topics, including: (i) fund performance trends and Fidelity's long-term strategies for certain funds; (ii) Fidelity's strategic marketing and product lineup goals; (iii) the methodology with respect to competitive fund data and peer group classifications; (iv) the arrangements with, and performance of, certain sub-advisers on behalf of the Fidelity funds, as well as certain proposed participating affiliate arrangements; (v) the realization of fall-out benefits in certain Fidelity business units; (vi) Fidelity's group fee structures, including the rationale for the individual fee rates of certain categories of funds and the definition of group assets; (vii) trends regarding industry use of performance fee structures and the performance adjustment methodologies applicable to the Fidelity funds; (viii) additional competitive analysis regarding the total expenses for certain classes; (ix) fund profitability methodology, including Fidelity's cost allocation methodology, and the impact of certain factors on fund profitability results; and (x) the process by which Fidelity determines sub-advisory fees for funds it advises.
Based on its evaluation of all of the conclusions noted above, and after considering all factors it believed relevant, the Board ultimately concluded that the advisory fee structures are fair and reasonable, and that the fund's Advisory Contracts should be renewed.
Annual Report
Investment Adviser
Fidelity Management & Research Company
Boston, MA
Investment Sub-Advisers
FMR Co., Inc.
Fidelity Management & Research
(U.K.) Inc.
Fidelity Investments Money Management, Inc.
Fidelity Management & Research
(Hong Kong) Limited
Fidelity Management & Research
(Japan) Inc.
General Distributor
Fidelity Distributors Corporation
Smithfield, RI
Transfer and Service Agents
Fidelity Investments Institutional
Operations Company, Inc.
Boston, MA
Fidelity Service Company, Inc.
Boston, MA
Custodian
JP Morgan Chase Bank
New York, NY
The Fidelity Telephone Connection
Mutual Fund 24-Hour Service
Exchanges/Redemptions
and Account Assistance 1-800-544-6666
Product Information 1-800-544-6666
Retirement Accounts 1-800-544-4774 (8 a.m. - 9 p.m.)
TDD Service 1-800-544-0118
for the deaf and hearing impaired
(9 a.m. - 9 p.m. Eastern time)
Fidelity Automated Service
Telephone (FAST®)
1-800-544-5555
Automated line for quickest service
(Fidelity Investment logo)(registered trademark)
Corporate Headquarters
245 Summer St., Boston, MA 02210
www.fidelity.com
PUR-UANN-1014
1.789251.111
Fidelity®
Puritan®
Fund -
Class K
Annual Report
August 31, 2014
(Fidelity Cover Art)
Contents
Performance | (Click Here) | How the fund has done over time. |
Management's Discussion of Fund Performance | (Click Here) | The Portfolio Manager's review of fund performance and strategy. |
Shareholder Expense Example | (Click Here) | An example of shareholder expenses. |
Investment Changes | (Click Here) | A summary of major shifts in the fund's investments over the past six months. |
Investments | (Click Here) | A complete list of the fund's investments with their market values. |
Financial Statements | (Click Here) | Statements of assets and liabilities, operations, and changes in net assets, as well as financial highlights. |
Notes | (Click Here) | Notes to the financial statements. |
Report of Independent Registered Public Accounting Firm | (Click Here) | |
Trustees and Officers | (Click Here) | |
Distributions | (Click Here) | |
Board Approval of Investment Advisory Contracts and Management Fees | (Click Here) | |
To view a fund's proxy voting guidelines and proxy voting record for the 12-month period ended June 30, visit http://www.fidelity.com/proxyvotingresults or visit the Securities and Exchange Commission's (SEC) web site at http://www.sec.gov. You may also call 1-800-835-5092 to request a free copy of the proxy voting guidelines.
Standard & Poor's, S&P and S&P 500 are registered service marks of The McGraw-Hill Companies, Inc. and have been licensed for use by Fidelity Distributors Corporation.
Other third-party marks appearing herein are the property of their respective owners.
All other marks appearing herein are registered or unregistered trademarks or service marks of FMR LLC or an affiliated company. © 2014 FMR LLC. All rights reserved.
Annual Report
This report and the financial statements contained herein are submitted for the general information of the shareholders of the fund. This report is not authorized for distribution to prospective investors in the fund unless preceded or accompanied by an effective prospectus.
A fund files its complete schedule of portfolio holdings with the SEC for the first and third quarters of each fiscal year on Form N-Q. Forms N-Q are available on the SEC's web site at http://www.sec.gov. A fund's Forms N-Q may be reviewed and copied at the SEC's Public Reference Room in Washington, DC. Information regarding the operation of the SEC's Public Reference Room may be obtained by calling 1-800-SEC-0330. For a complete list of a fund's portfolio holdings, view the most recent holdings listing, semiannual report, or annual report on Fidelity's web site at http://www.fidelity.com, http://www.advisor.fidelity.com, or http://www.401k.com, as applicable.
NOT FDIC INSURED • MAY LOSE VALUE • NO BANK GUARANTEE
Neither the fund nor Fidelity Distributors Corporation is a bank.
Annual Report
Average annual total return reflects the change in the value of an investment, assuming reinvestment of the class' distributions from dividend income and capital gains (the profits earned upon the sale of securities that have grown in value, if any) and assuming a constant rate of performance each year. The $10,000 table and the fund's returns do not reflect the deduction of taxes that a shareholder would pay on fund distributions or the redemption of fund shares. During periods of reimbursement by Fidelity, a fund's total return will be greater than it would be had the reimbursement not occurred. How a fund did yesterday is no guarantee of how it will do tomorrow.
Average Annual Total Returns
Periods ended August 31, 2014 | Past 1
year | Past 5
years | Past 10
years |
Class K A | 20.25% | 13.21% | 7.77% |
A The initial offering of Class K shares took place on May 9, 2008. Returns prior to May 9, 2008, are those of Fidelity® Puritan® Fund, the original class of the fund.
$10,000 Over 10 Years
Let's say hypothetically that $10,000 was invested in Fidelity® Puritan® Fund - Class K, on August 31, 2004. The chart shows how the value of your investment would have changed, and also shows how the S&P 500® Index performed over the same period. See footnote A above for additional information regarding the performance of Class K.
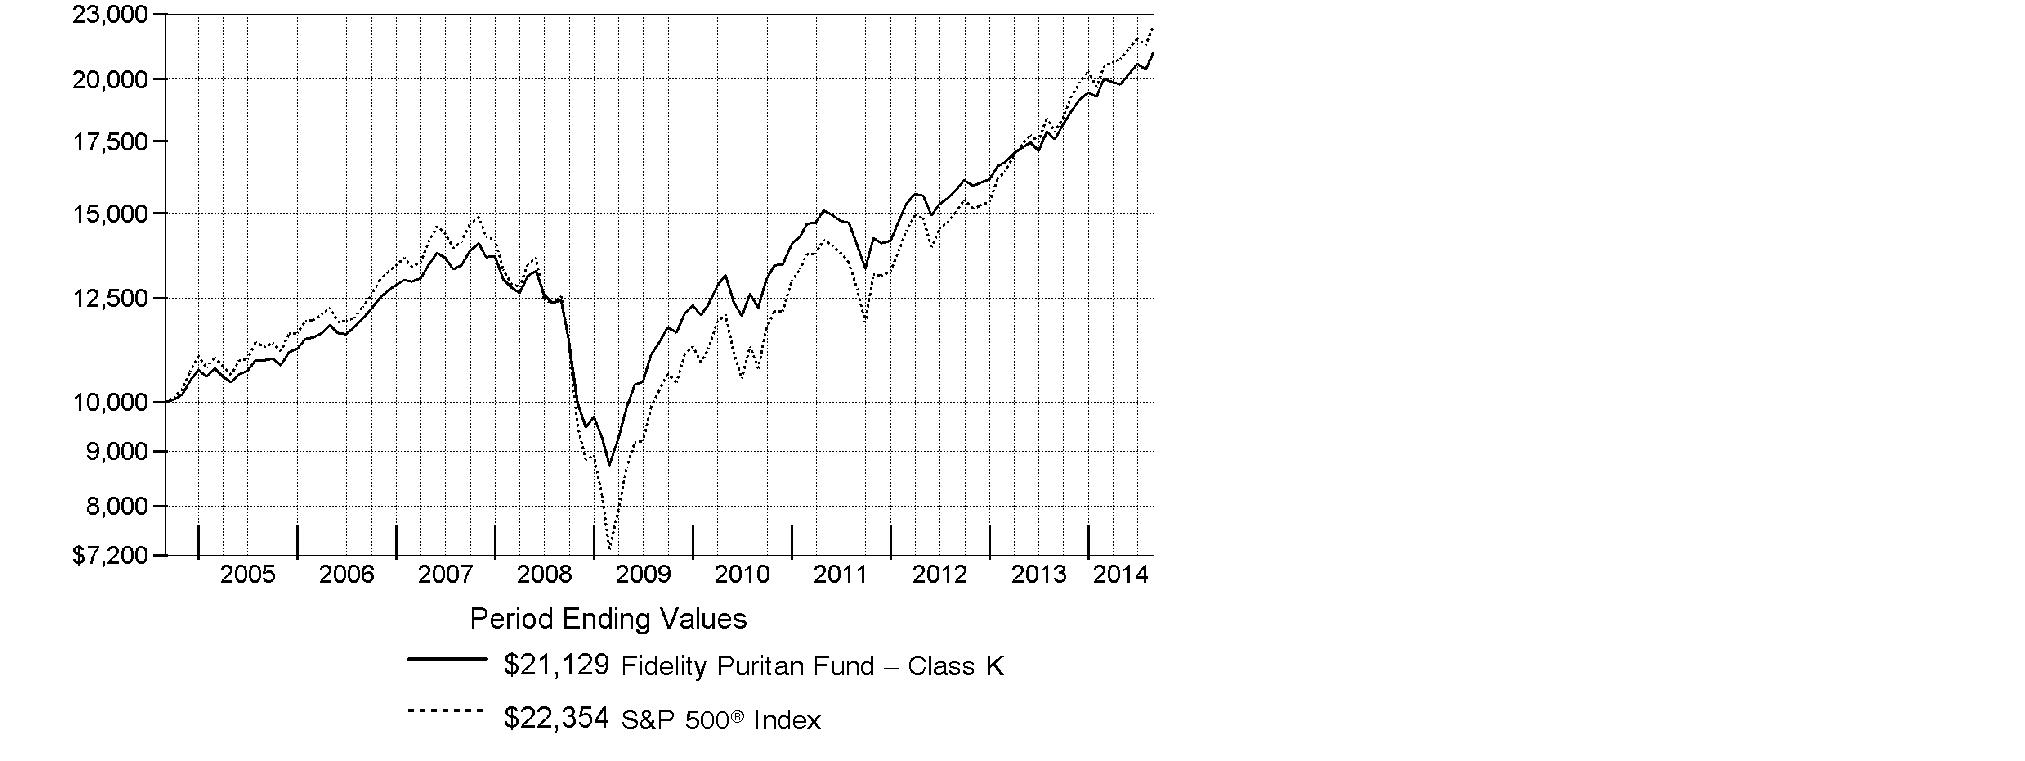
Annual Report
Market Recap: U.S. stocks overcame a slowing economy early in 2014 to post a solid gain for the 12 months ending August 31, 2014, supported at home by low interest rates and globally by new stimulus efforts in Europe and China. The broad-market S&P 500® Index rose 25.25%, reaching an all-time high during the period. The tech-heavy Nasdaq Composite Index® gained 29.15%, while the small-cap Russell 2000® Index returned 17.68%. Information technology (+34%) was the top sector in the S&P 500®, driven by strong results among semiconductor and hardware/equipment stocks. Health care (+32%) rose broadly, driven by biotechnology and life sciences names. Conversely, traditionally defensive sectors - consumer staples, utilities and telecommunication services - lagged the advance. Volatility was generally tame, with markets supported by declining unemployment, near-record corporate profits, muted inflation and fairly low company debt levels. Meanwhile, U.S. taxable bonds notched gains for the 12-month period, driven by yield-advantaged sectors. The Barclays® U.S. Aggregate Bond Index rose 5.66% on the strength of longer-maturity bonds, which benefited from a decline in long-term interest rates. Lower-quality corporate issues attracted some of the strongest buying interest, reflected by the 10.61% gain of The BofA Merrill LynchSM US High Yield Constrained Index.
Comments from Ramin Arani, Lead Portfolio Manager of Fidelity® Puritan® Fund: For the year, the fund's Class K shares gained 20.25%, versus 17.14% for the Fidelity Puritan Composite IndexSM. Asset allocation significantly boosted performance versus the Composite index: a substantial overweighting in equities, below-neutral exposure to investment-grade bonds and a small out-of-index stake in high-yield bonds. Security selection in all three sleeves helped. Among equities, a non-index stake in Illumina was the top relative contributor, as orders and earnings far exceeded expectations. Conversely, the biggest detractor was a non-index investment in Japan Tobacco, as shares declined amid a tumultuous period for the Japanese stock market. I sold it in April. In fixed income, the largest contributor was our overweighting in corporate bonds. We also got a lift from overweighting municipal Build America Bonds and underweighting mortgage-backed securities. Security selection was beneficial, highlighted by our investments in bonds from Time Warner Cable and Verizon Communications on the corporate side, and the states of California and Illinois on the municipal side. There were few notable detractors, although we were modestly hurt by underweighting sovereign debt and certain industrial corporate bonds.
The views expressed above reflect those of the portfolio manager(s) only through the end of the period as stated on the cover of this report and do not necessarily represent the views of Fidelity or any other person in the Fidelity organization. Any such views are subject to change at any time based upon market or other conditions and Fidelity disclaims any responsibility to update such views. These views may not be relied on as investment advice and, because investment decisions for a Fidelity fund are based on numerous factors, may not be relied on as an indication of trading intent on behalf of any Fidelity fund.
Annual Report
Shareholder Expense Example
As a shareholder of the Fund, you incur two types of costs: (1) transaction costs, and (2) ongoing costs, including management fees and other Fund expenses. This Example is intended to help you understand your ongoing costs (in dollars) of investing in the Fund and to compare these costs with the ongoing costs of investing in other mutual funds.
The Example is based on an investment of $1,000 invested at the beginning of the period and held for the entire period (March 1, 2014 to August 31, 2014).
Actual Expenses
The first line of the accompanying table for each class of the Fund provides information about actual account values and actual expenses. You may use the information in this line, together with the amount you invested, to estimate the expenses that you paid over the period. Simply divide your account value by $1,000.00 (for example, an $8,600 account value divided by $1,000.00 = 8.6), then multiply the result by the number in the first line for a class of the Fund under the heading entitled "Expenses Paid During Period" to estimate the expenses you paid on your account during this period. A small balance maintenance fee of $12.00 that is charged once a year may apply for certain accounts with a value of less than $2,000. This fee is not included in the table below. If it was, the estimate of expenses you paid during the period would be higher, and your ending account value lower, by this amount. In addition, the Fund, as a shareholder in the underlying Fidelity Central Funds, will indirectly bear its pro-rata share of the fees and expenses incurred by the underlying Fidelity Central Funds. These fees and expenses are not included in the Fund's annualized expense ratio used to calculate the expense estimate in the table below.
Hypothetical Example for Comparison Purposes
The second line of the accompanying table for each class of the Fund provides information about hypothetical account values and hypothetical expenses based on a Class' actual expense ratio and an assumed rate of return of 5% per year before expenses, which is not the Class' actual return. The hypothetical account values and expenses may not be used to estimate the actual ending account balance or expenses you paid for the period. You may use this information to compare the ongoing costs of investing in the Fund and other funds. To do so, compare this 5% hypothetical example with the 5% hypothetical examples that appear in the shareholder reports of the other funds. A small balance maintenance fee of $12.00 that is charged once a year may apply for certain accounts with a value of less than $2,000. This fee is not included in the table below. If it was, the estimate of expenses you paid during the period would be higher, and your ending account value lower, by this amount. In addition, the Fund, as a shareholder in the underlying Fidelity Central Funds, will indirectly bear its pro-rata share of the fees and expenses incurred by the underlying Fidelity Central Funds. These fees and expenses are not included in the Fund's annualized expense ratio used to calculate the expense estimate in the table below.
Please note that the expenses shown in the table are meant to highlight your ongoing costs only and do not reflect any transaction costs. Therefore, the second line of the table is useful in comparing ongoing costs only, and will not help you determine the relative total costs of owning different funds.
Annual Report
| Annualized
Expense Ratio B | Beginning
Account Value
March 1, 2014 | Ending
Account Value
August 31, 2014 | Expenses Paid
During Period*
March 1, 2014
to August 31, 2014 |
Puritan | .56% | | | |
Actual | | $ 1,000.00 | $ 1,055.70 | $ 2.90 |
HypotheticalA | | $ 1,000.00 | $ 1,022.38 | $ 2.85 |
Class K | .46% | | | |
Actual | | $ 1,000.00 | $ 1,056.30 | $ 2.38 |
HypotheticalA | | $ 1,000.00 | $ 1,022.89 | $ 2.35 |
A 5% return per year before expenses
B Annualized expense ratio reflects expenses net of applicable fee waivers.
* Expenses are equal to each Class' annualized expense ratio, multiplied by the average account value over the period, multiplied by 184/365 (to reflect the one-half year period). The fees and expenses of the underlying Fidelity Central Funds in which the Fund invests are not included in each Class' annualized expense ratio.
In addition to the expenses noted above, the Fund also indirectly bears its proportional share of the expenses of the underlying Fidelity Central Funds. Annualized expenses of the underlying non-money market Fidelity Central Funds as of their most recent fiscal half year were less than .01%.
Annual Report
Investment Changes (Unaudited)
The information in the following tables is based on the combined investments of the Fund and its pro-rata share of the investments of Fidelity's fixed-income central funds.
Top Five Stocks as of August 31, 2014 |
| % of fund's
net assets | % of fund's net assets
6 months ago |
Apple, Inc. | 2.7 | 2.2 |
Bank of America Corp. | 1.5 | 1.5 |
Microsoft Corp. | 1.3 | 1.1 |
Wells Fargo & Co. | 1.3 | 1.2 |
Johnson & Johnson | 1.2 | 0.0 |
| 8.0 | |
Top Five Bond Issuers as of August 31, 2014 |
(with maturities greater than one year) | % of fund's
net assets | % of fund's net assets
6 months ago |
Fannie Mae | 4.3 | 4.0 |
U.S. Treasury Obligations | 2.9 | 4.8 |
Ginnie Mae | 1.0 | 0.8 |
Freddie Mac | 0.9 | 1.0 |
Verizon Communications, Inc. | 0.8 | 0.8 |
| 9.9 | |
Top Five Market Sectors as of August 31, 2014 |
| % of fund's
net assets | % of fund's net assets
6 months ago |
Financials | 16.4 | 16.1 |
Information Technology | 14.5 | 15.5 |
Health Care | 12.7 | 12.9 |
Consumer Discretionary | 10.4 | 11.1 |
Energy | 9.5 | 6.6 |
Asset Allocation (% of fund's net assets) |
As of August 31, 2014 * | As of February 28, 2014 ** |
 | Stocks 69.4% | | | Stocks 70.2% | |
 | Bonds 26.5% | | | Bonds 27.1% | |
 | Convertible
Securities 0.6% | | | Convertible
Securities 0.4% | |
 | Other Investments 0.6% | | | Other Investments 0.6% | |
 | Short-Term
Investments and
Net Other Assets (Liabilities) 2.9% | | | Short-Term
Investments and
Net Other Assets (Liabilities) 1.7% | |
* Foreign investments | 11.8% | | ** Foreign investments | 11.6% | |

Percentages are adjusted for the effect of futures contracts and swaps, if applicable. |
An unaudited holdings listing for the Fund, which presents direct holdings as well as the pro-rata share of any securities and other investments held indirectly through its investments in underlying non-money market Fidelity Central Funds, is available at fidelity.com. |
Percentages in the above tables are adjusted for the effect of TBA Sale Commitments. |
Annual Report
Investments August 31, 2014
Showing Percentage of Net Assets
Common Stocks - 69.2% |
| Shares | | Value (000s) |
CONSUMER DISCRETIONARY - 8.5% |
Auto Components - 0.5% |
Delphi Automotive PLC | 26,293 | | $ 1,829 |
Johnson Controls, Inc. | 1,000,800 | | 48,849 |
Mobileye NV | 1,859,840 | | 72,344 |
| | 123,022 |
Automobiles - 0.1% |
General Motors Co. | 193,833 | | 6,745 |
General Motors Co.: | | | |
warrants 7/10/16 (a) | 5,412 | | 134 |
warrants 7/10/19 (a) | 5,412 | | 91 |
Motors Liquidation Co. GUC Trust (a) | 28,150 | | 718 |
Tesla Motors, Inc. (a) | 40,500 | | 10,923 |
| | 18,611 |
Diversified Consumer Services - 0.0% |
Houghton Mifflin Harcourt Co. warrants 6/22/19 (a)(o) | 1,945 | | 3 |
Hotels, Restaurants & Leisure - 1.2% |
ARAMARK Holdings Corp. | 150,000 | | 3,885 |
Domino's Pizza, Inc. | 473,500 | | 35,726 |
Dunkin' Brands Group, Inc. | 139,600 | | 6,078 |
Extended Stay America, Inc. unit | 150,000 | | 3,579 |
Las Vegas Sands Corp. | 111,100 | | 7,389 |
PB Investor I LLC (a) | 9,088 | | 24 |
Starbucks Corp. | 1,651,300 | | 128,488 |
Station Holdco LLC (a)(n)(o) | 1,194,419 | | 3,153 |
Station Holdco LLC: | | | |
unit (a)(n)(o) | 2,660 | | 1 |
warrants 6/15/18 (a)(n)(o) | 75,658 | | 30 |
Vail Resorts, Inc. | 713,827 | | 56,742 |
Wyndham Worldwide Corp. | 531,500 | | 43,020 |
| | 288,115 |
Household Durables - 0.2% |
PulteGroup, Inc. | 2,422,900 | | 46,568 |
| | |
Internet & Catalog Retail - 0.7% |
Amazon.com, Inc. (a) | 210,600 | | 71,402 |
JD.com, Inc. sponsored ADR (e) | 177,000 | | 5,650 |
Jumei International Holding Ltd. sponsored ADR (e) | 50,400 | | 1,541 |
Netflix, Inc. (a) | 23,900 | | 11,416 |
Common Stocks - continued |
| Shares | | Value (000s) |
CONSUMER DISCRETIONARY - continued |
Internet & Catalog Retail - continued |
priceline.com, Inc. (a) | 59,800 | | $ 74,410 |
Spotify Technology SA (o) | 15,765 | | 18,275 |
| | 182,694 |
Media - 3.8% |
CBS Corp. Class B | 1,977,400 | | 117,240 |
Charter Communications, Inc. Class A (a) | 225,900 | | 35,437 |
Comcast Corp. Class A (special) (non-vtg.) | 5,146,600 | | 281,004 |
Cumulus Media, Inc. Class A (a) | 398,000 | | 1,827 |
DIRECTV (a) | 238,100 | | 20,584 |
Legend Pictures LLC (a)(n)(o) | 49,141 | | 88,601 |
Lions Gate Entertainment Corp. (e) | 1,339,600 | | 43,416 |
Publicis Groupe SA (a) | 319,372 | | 23,794 |
The Walt Disney Co. | 284,190 | | 25,543 |
Time Warner Cable, Inc. | 771,500 | | 114,128 |
Time Warner, Inc. | 1,026,300 | | 79,056 |
Tribune Media Co. Class A (a) | 13,773 | | 1,051 |
Tribune Publishing Co. (a) | 3,443 | | 66 |
Twenty-First Century Fox, Inc. Class A | 1,899,700 | | 67,287 |
Vertis Holdings, Inc. (a) | 1,934 | | 0 |
Vice Holding, Inc. (o) | 2,172 | | 32,899 |
| | 931,933 |
Multiline Retail - 0.1% |
Family Dollar Stores, Inc. | 188,300 | | 15,032 |
Specialty Retail - 0.9% |
Home Depot, Inc. | 1,938,200 | | 181,222 |
TJX Companies, Inc. | 773,100 | | 46,084 |
| | 227,306 |
Textiles, Apparel & Luxury Goods - 1.0% |
Brunello Cucinelli SpA | 1,331,100 | | 33,231 |
lululemon athletica, Inc. (a) | 537,200 | | 21,450 |
Luxottica Group SpA | 153,851 | | 8,215 |
Michael Kors Holdings Ltd. (a) | 379,061 | | 30,370 |
NIKE, Inc. Class B | 1,162,000 | | 91,275 |
Ralph Lauren Corp. | 218,400 | | 36,953 |
Tory Burch LLC (a)(n)(o) | 324,840 | | 23,111 |
| | 244,605 |
TOTAL CONSUMER DISCRETIONARY | | 2,077,889 |
Common Stocks - continued |
| Shares | | Value (000s) |
CONSUMER STAPLES - 5.3% |
Beverages - 1.1% |
Coca-Cola Enterprises, Inc. | 1,680,900 | | $ 80,313 |
Monster Beverage Corp. (a) | 836,400 | | 73,946 |
The Coca-Cola Co. | 2,476,100 | | 103,303 |
| | 257,562 |
Food & Staples Retailing - 1.6% |
Costco Wholesale Corp. | 578,500 | | 70,045 |
CVS Caremark Corp. | 1,991,700 | | 158,241 |
Kroger Co. | 2,351,500 | | 119,879 |
Walgreen Co. | 881,700 | | 53,360 |
| | 401,525 |
Food Products - 1.3% |
Bunge Ltd. | 833,000 | | 70,513 |
Keurig Green Mountain, Inc. | 431,800 | | 57,568 |
Mead Johnson Nutrition Co. Class A | 1,136,000 | | 108,602 |
Mondelez International, Inc. | 790,700 | | 28,615 |
The Hershey Co. | 135,900 | | 12,424 |
WhiteWave Foods Co. (a) | 1,319,100 | | 46,195 |
| | 323,917 |
Household Products - 0.2% |
Procter & Gamble Co. | 649,200 | | 53,955 |
Personal Products - 0.5% |
Estee Lauder Companies, Inc. Class A | 1,033,500 | | 79,404 |
L'Oreal SA | 235,600 | | 39,005 |
| | 118,409 |
Tobacco - 0.6% |
Lorillard, Inc. | 1,347,000 | | 80,416 |
Reynolds American, Inc. | 992,600 | | 58,037 |
| | 138,453 |
TOTAL CONSUMER STAPLES | | 1,293,821 |
ENERGY - 7.8% |
Energy Equipment & Services - 1.9% |
Aspen Aerogels, Inc. (a)(f) | 2,373,088 | | 22,703 |
Cameron International Corp. (a) | 389,500 | | 28,952 |
Halliburton Co. | 2,664,700 | | 180,160 |
Ocean Rig UDW, Inc. (United States) | 944,200 | | 17,496 |
Schlumberger Ltd. | 1,852,800 | | 203,141 |
| | 452,452 |
Common Stocks - continued |
| Shares | | Value (000s) |
ENERGY - continued |
Oil, Gas & Consumable Fuels - 5.9% |
Anadarko Petroleum Corp. | 2,586,100 | | $ 291,428 |
Cabot Oil & Gas Corp. | 2,122,500 | | 71,189 |
Chevron Corp. | 2,116,100 | | 273,929 |
Cimarex Energy Co. | 179,500 | | 26,056 |
ConocoPhillips Co. | 619,800 | | 50,340 |
EOG Resources, Inc. | 1,158,800 | | 127,329 |
EP Energy Corp. | 110,000 | | 2,126 |
EQT Corp. | 217,900 | | 21,585 |
Golar LNG Ltd. | 545,000 | | 34,335 |
Kinder Morgan Holding Co. LLC | 644,800 | | 25,960 |
Marathon Petroleum Corp. | 836,200 | | 76,103 |
MPLX LP | 464,900 | | 28,359 |
Noble Energy, Inc. | 547,099 | | 39,468 |
Phillips 66 Co. | 1,129,400 | | 98,280 |
Phillips 66 Partners LP | 396,901 | | 29,371 |
Pioneer Natural Resources Co. | 138,700 | | 28,940 |
PrairieSky Royalty Ltd. | 161,500 | | 5,867 |
Southwestern Energy Co. (a) | 657,200 | | 27,063 |
Suncor Energy, Inc. | 1,333,600 | | 54,740 |
The Williams Companies, Inc. | 1,010,000 | | 60,034 |
Valero Energy Corp. | 1,400,000 | | 75,796 |
Valero Energy Partners LP | 50,000 | | 2,666 |
| | 1,450,964 |
TOTAL ENERGY | | 1,903,416 |
FINANCIALS - 10.4% |
Banks - 5.3% |
Bank of America Corp. | 22,200,600 | | 357,208 |
Citigroup, Inc. | 478,740 | | 24,727 |
First Republic Bank | 50,000 | | 2,445 |
JPMorgan Chase & Co. | 4,885,423 | | 290,438 |
M&T Bank Corp. (e) | 457,400 | | 56,548 |
Prosperity Bancshares, Inc. | 547,627 | | 33,077 |
SunTrust Banks, Inc. | 2,158,500 | | 82,196 |
TCF Financial Corp. | 1,258,400 | | 19,883 |
U.S. Bancorp | 3,095,400 | | 130,874 |
Wells Fargo & Co. | 6,041,940 | | 310,797 |
| | 1,308,193 |
Common Stocks - continued |
| Shares | | Value (000s) |
FINANCIALS - continued |
Capital Markets - 1.3% |
BlackRock, Inc. Class A | 210,200 | | $ 69,477 |
Carlyle Group LP | 331,900 | | 11,039 |
E*TRADE Financial Corp. (a) | 2,255,500 | | 50,207 |
Invesco Ltd. | 1,732,800 | | 70,768 |
Morgan Stanley | 1,278,300 | | 43,858 |
The Blackstone Group LP | 1,833,300 | | 61,471 |
| | 306,820 |
Consumer Finance - 1.2% |
American Express Co. | 1,420,800 | | 127,233 |
Capital One Financial Corp. | 1,371,600 | | 112,553 |
Navient Corp. | 2,315,700 | | 41,544 |
SLM Corp. | 1,133,700 | | 10,045 |
| | 291,375 |
Diversified Financial Services - 0.6% |
Berkshire Hathaway, Inc. Class B (a) | 1,093,400 | | 150,069 |
Insurance - 1.4% |
ACE Ltd. | 1,130,600 | | 120,217 |
American International Group, Inc. | 541,600 | | 30,362 |
MetLife, Inc. | 1,852,600 | | 101,411 |
The Travelers Companies, Inc. | 975,000 | | 92,342 |
| | 344,332 |
Real Estate Investment Trusts - 0.5% |
Altisource Residential Corp. Class B | 297,800 | | 7,308 |
American Tower Corp. | 1,135,500 | | 111,960 |
| | 119,268 |
Real Estate Management & Development - 0.1% |
CBRE Group, Inc. (a) | 695,835 | | 22,114 |
Realogy Holdings Corp. (a) | 48,000 | | 1,957 |
| | 24,071 |
TOTAL FINANCIALS | | 2,544,128 |
HEALTH CARE - 11.9% |
Biotechnology - 3.5% |
ACADIA Pharmaceuticals, Inc. (a)(e) | 2,068,004 | | 49,591 |
Acceleron Pharma, Inc. | 130,400 | | 3,504 |
Actelion Ltd. | 247,330 | | 30,362 |
Alexion Pharmaceuticals, Inc. (a) | 524,600 | | 88,810 |
Common Stocks - continued |
| Shares | | Value (000s) |
HEALTH CARE - continued |
Biotechnology - continued |
Amgen, Inc. | 1,886,800 | | $ 262,982 |
Asterias Biotherapeutics, Inc. (a)(e) | 130,874 | | 467 |
Biogen Idec, Inc. (a) | 501,300 | | 171,966 |
Cubist Pharmaceuticals, Inc. | 570,200 | | 39,361 |
Cubist Pharmaceuticals, Inc. rights (a) | 635,000 | | 54 |
Dicerna Pharmaceuticals, Inc. (e) | 384,600 | | 5,300 |
Genmab A/S (a) | 466,200 | | 18,610 |
Geron Corp. (a)(e) | 3,141,000 | | 7,476 |
Gilead Sciences, Inc. (a) | 1,014,500 | | 109,140 |
Grifols SA ADR | 45,780 | | 1,838 |
Macrogenics, Inc. | 226,200 | | 4,832 |
Neurocrine Biosciences, Inc. (a) | 918,100 | | 14,974 |
Vertex Pharmaceuticals, Inc. (a) | 400,300 | | 37,456 |
XOMA Corp. (a) | 1,530,200 | | 6,702 |
| | 853,425 |
Health Care Equipment & Supplies - 1.1% |
Boston Scientific Corp. (a) | 6,240,700 | | 79,132 |
Covidien PLC | 1,371,800 | | 119,113 |
Medtronic, Inc. | 887,500 | | 56,667 |
The Cooper Companies, Inc. | 162,559 | | 26,502 |
| | 281,414 |
Health Care Providers & Services - 1.3% |
Cigna Corp. | 566,400 | | 53,581 |
Express Scripts Holding Co. (a) | 38,400 | | 2,839 |
HCA Holdings, Inc. (a) | 1,087,800 | | 75,950 |
Legend Acquisition Sub, Inc. | 2,509 | | 38 |
Legend Acquisition Sub, Inc.: | | | |
Class A warrants (a) | 17,259 | | 0 |
Class B warrants (a) | 22,759 | | 0 |
McKesson Corp. | 877,800 | | 171,197 |
Qualicorp SA (a) | 975,500 | | 12,202 |
| | 315,807 |
Health Care Technology - 0.2% |
CareView Communications, Inc. (a)(f) | 10,425,300 | | 5,890 |
Castlight Health, Inc. Class B (a)(e) | 199,000 | | 2,370 |
Cerner Corp. (a) | 593,000 | | 34,192 |
| | 42,452 |
Common Stocks - continued |
| Shares | | Value (000s) |
HEALTH CARE - continued |
Life Sciences Tools & Services - 0.6% |
Agilent Technologies, Inc. | 1,275,455 | | $ 72,905 |
Illumina, Inc. (a) | 453,962 | | 81,423 |
| | 154,328 |
Pharmaceuticals - 5.2% |
AbbVie, Inc. | 2,188,300 | | 120,969 |
Actavis PLC (a) | 1,107,056 | | 251,280 |
Akorn, Inc. (a) | 162,893 | | 6,356 |
Allergan, Inc. | 347,500 | | 56,879 |
Bristol-Myers Squibb Co. | 1,054,700 | | 53,421 |
Jazz Pharmaceuticals PLC (a) | 114,600 | | 18,671 |
Johnson & Johnson | 2,916,600 | | 302,539 |
Merck & Co., Inc. | 3,532,300 | | 212,327 |
Pfizer, Inc. | 89,200 | | 2,622 |
Prestige Brands Holdings, Inc. (a) | 581,402 | | 20,122 |
Salix Pharmaceuticals Ltd. (a) | 381,300 | | 60,669 |
Shire PLC sponsored ADR | 404,500 | | 98,840 |
Teva Pharmaceutical Industries Ltd. sponsored ADR | 760,800 | | 39,957 |
TherapeuticsMD, Inc. (a) | 5,996,914 | | 33,283 |
| | 1,277,935 |
TOTAL HEALTH CARE | | 2,925,361 |
INDUSTRIALS - 5.8% |
Aerospace & Defense - 1.5% |
General Dynamics Corp. | 557,100 | | 68,663 |
Honeywell International, Inc. | 1,165,300 | | 110,972 |
The Boeing Co. | 784,100 | | 99,424 |
United Technologies Corp. | 818,279 | | 88,358 |
| | 367,417 |
Air Freight & Logistics - 0.5% |
FedEx Corp. | 791,300 | | 117,017 |
Airlines - 0.4% |
American Airlines Group, Inc. | 836,900 | | 32,564 |
Delta Air Lines, Inc. | 1,560,900 | | 61,780 |
| | 94,344 |
Building Products - 0.0% |
Masonite International Corp. (a) | 5,358 | | 306 |
Masonite International Corp. warrants 6/9/16 (a) | 19,485 | | 188 |
| | 494 |
Common Stocks - continued |
| Shares | | Value (000s) |
INDUSTRIALS - continued |
Commercial Services & Supplies - 0.0% |
WP Rocket Holdings, Inc. | 1,314,154 | | $ 263 |
Electrical Equipment - 0.0% |
Acuity Brands, Inc. | 17,200 | | 2,131 |
Generac Holdings, Inc. (a) | 55,200 | | 2,568 |
SolarCity Corp. (a)(e) | 89,800 | | 6,167 |
| | 10,866 |
Industrial Conglomerates - 1.0% |
3M Co. | 903,100 | | 130,046 |
Danaher Corp. | 980,200 | | 75,093 |
General Electric Co. | 1,696,200 | | 44,067 |
| | 249,206 |
Machinery - 1.3% |
Caterpillar, Inc. | 1,240,300 | | 135,280 |
Cummins, Inc. | 379,700 | | 55,098 |
Deere & Co. | 170,200 | | 14,312 |
Ingersoll-Rand PLC | 531,400 | | 31,990 |
Manitowoc Co., Inc. | 2,150,600 | | 63,271 |
PACCAR, Inc. | 313,600 | | 19,697 |
| | 319,648 |
Professional Services - 0.1% |
Towers Watson & Co. | 340,800 | | 37,362 |
Road & Rail - 1.0% |
J.B. Hunt Transport Services, Inc. | 437,700 | | 33,068 |
Norfolk Southern Corp. | 744,400 | | 79,651 |
Union Pacific Corp. | 1,172,712 | | 123,451 |
| | 236,170 |
TOTAL INDUSTRIALS | | 1,432,787 |
INFORMATION TECHNOLOGY - 14.0% |
Communications Equipment - 0.8% |
Cisco Systems, Inc. | 2,873,700 | | 71,814 |
QUALCOMM, Inc. | 1,764,500 | | 134,278 |
| | 206,092 |
Electronic Equipment & Components - 0.6% |
Amphenol Corp. Class A | 737,800 | | 76,001 |
Arrow Electronics, Inc. (a) | 388,800 | | 24,203 |
Common Stocks - continued |
| Shares | | Value (000s) |
INFORMATION TECHNOLOGY - continued |
Electronic Equipment & Components - continued |
E Ink Holdings, Inc. GDR (a)(g) | 140,100 | | $ 853 |
TE Connectivity Ltd. | 551,400 | | 34,562 |
| | 135,619 |
Internet Software & Services - 3.6% |
Facebook, Inc. Class A (a) | 3,537,960 | | 264,710 |
Google, Inc.: | | | |
Class A (a) | 458,700 | | 267,129 |
Class C (a) | 486,200 | | 277,912 |
Mail.Ru Group Ltd.: | | | |
GDR (a)(g) | 77,400 | | 2,078 |
GDR (Reg. S) (a) | 289,900 | | 7,784 |
NAVER Corp. | 13,744 | | 10,409 |
Pandora Media, Inc. (a) | 23,894 | | 646 |
Tencent Holdings Ltd. | 528,500 | | 8,602 |
Viggle, Inc. | 56,268 | | 156 |
Yahoo!, Inc. (a) | 1,001,900 | | 38,583 |
| | 878,009 |
IT Services - 0.9% |
Cognizant Technology Solutions Corp. Class A (a) | 1,616,800 | | 73,936 |
MasterCard, Inc. Class A | 410,900 | | 31,150 |
VeriFone Systems, Inc. (a) | 591,400 | | 20,652 |
Visa, Inc. Class A | 471,100 | | 100,118 |
| | 225,856 |
Semiconductors & Semiconductor Equipment - 1.9% |
Altera Corp. | 1,312,700 | | 46,391 |
Broadcom Corp. Class A | 1,023,900 | | 40,321 |
Cree, Inc. (a) | 592,700 | | 27,003 |
Freescale Semiconductor, Inc. (a) | 2,679,900 | | 56,412 |
Intel Corp. | 3,279,300 | | 114,513 |
KLA-Tencor Corp. | 408,900 | | 31,248 |
Micron Technology, Inc. (a) | 1,068,600 | | 34,836 |
NXP Semiconductors NV (a) | 1,515,400 | | 103,835 |
Spansion, Inc. Class A (a) | 657 | | 15 |
| | 454,574 |
Software - 3.0% |
Activision Blizzard, Inc. | 1,712,100 | | 40,303 |
Adobe Systems, Inc. (a) | 1,417,100 | | 101,889 |
Autodesk, Inc. (a) | 568,600 | | 30,500 |
Microsoft Corp. | 6,893,400 | | 313,167 |
Common Stocks - continued |
| Shares | | Value (000s) |
INFORMATION TECHNOLOGY - continued |
Software - continued |
Oracle Corp. | 3,308,300 | | $ 137,394 |
Red Hat, Inc. (a) | 798,000 | | 48,614 |
salesforce.com, Inc. (a) | 1,078,200 | | 63,711 |
Workday, Inc. Class A (a) | 53,900 | | 4,909 |
| | 740,487 |
Technology Hardware, Storage & Peripherals - 3.2% |
Apple, Inc. | 6,441,900 | | 660,285 |
EMC Corp. | 1,548,700 | | 45,733 |
Hewlett-Packard Co. | 2,097,200 | | 79,694 |
| | 785,712 |
TOTAL INFORMATION TECHNOLOGY | | 3,426,349 |
MATERIALS - 3.0% |
Chemicals - 2.6% |
Air Products & Chemicals, Inc. | 164,500 | | 21,913 |
Ashland, Inc. | 24 | | 3 |
Celanese Corp. Class A | 402,667 | | 25,183 |
CF Industries Holdings, Inc. | 149,406 | | 38,497 |
E.I. du Pont de Nemours & Co. | 1,315,175 | | 86,946 |
Ferro Corp. (a) | 3,408,200 | | 45,943 |
Huntsman Corp. | 1,939,120 | | 52,143 |
Intrepid Potash, Inc. (a)(e) | 1,669,800 | | 25,598 |
LyondellBasell Industries NV Class A | 778,498 | | 89,021 |
Methanex Corp. | 539,800 | | 36,093 |
Monsanto Co. | 508,800 | | 58,843 |
Potash Corp. of Saskatchewan, Inc. (e) | 1,282,400 | | 45,043 |
Trinseo SA | 99,300 | | 1,952 |
W.R. Grace & Co. (a) | 238,200 | | 23,589 |
Wacker Chemie AG (e) | 228,300 | | 27,115 |
Westlake Chemical Corp. | 545,100 | | 52,946 |
Westlake Chemical Partners LP (a) | 44,800 | | 1,360 |
| | 632,188 |
Construction Materials - 0.2% |
Eagle Materials, Inc. | 226,300 | | 23,062 |
Vulcan Materials Co. | 581,500 | | 36,855 |
| | 59,917 |
Metals & Mining - 0.2% |
Alcoa, Inc. | 768,200 | | 12,760 |
Common Stocks - continued |
| Shares | | Value (000s) |
MATERIALS - continued |
Metals & Mining - continued |
AngloGold Ashanti Ltd. sponsored ADR (a) | 57,230 | | $ 983 |
Freeport-McMoRan Copper & Gold, Inc. | 902,100 | | 32,809 |
| | 46,552 |
TOTAL MATERIALS | | 738,657 |
TELECOMMUNICATION SERVICES - 1.0% |
Diversified Telecommunication Services - 0.9% |
Broadview Networks Holdings, Inc. (a) | 123,987 | | 254 |
Iliad SA | 106,588 | | 23,417 |
Verizon Communications, Inc. | 3,860,348 | | 192,323 |
| | 215,994 |
Wireless Telecommunication Services - 0.1% |
SoftBank Corp. | 446,800 | | 32,284 |
TOTAL TELECOMMUNICATION SERVICES | | 248,278 |
UTILITIES - 1.5% |
Electric Utilities - 1.1% |
Edison International | 1,504,007 | | 88,947 |
NextEra Energy, Inc. | 1,041,900 | | 102,575 |
PPL Corp. | 1,863,900 | | 64,547 |
| | 256,069 |
Independent Power and Renewable Electricity Producers - 0.2% |
Abengoa Yield PLC | 812,400 | | 32,585 |
NextEra Energy Partners LP | 722,600 | | 25,370 |
| | 57,955 |
Independent Power Producers & Energy Traders - 0.1% |
Dynegy, Inc. (a) | 991,400 | | 32,399 |
Multi-Utilities - 0.1% |
Sempra Energy | 184,400 | | 19,541 |
TOTAL UTILITIES | | 365,964 |
TOTAL COMMON STOCKS (Cost $12,096,987) |
16,956,650
|
Preferred Stocks - 0.8% |
| Shares | | Value (000s) |
Convertible Preferred Stocks - 0.6% |
CONSUMER DISCRETIONARY - 0.5% |
Household Durables - 0.1% |
Blu Homes, Inc. Series A, 5.00% (a)(o) | 1,082,251 | | $ 5,390 |
Roku, Inc. 8.00% (a)(o) | 5,520,836 | | 7,453 |
Wayfair LLC Series B (n)(o) | 266,909 | | 9,758 |
| | 22,601 |
Media - 0.4% |
Vice Holding, Inc. Series A (a)(o) | 6,701 | | 101,500 |
TOTAL CONSUMER DISCRETIONARY | | 124,101 |
FINANCIALS - 0.0% |
Diversified Financial Services - 0.0% |
Deem, Inc. (o) | 159,864,334 | | 11,191 |
INFORMATION TECHNOLOGY - 0.1% |
Internet Software & Services - 0.1% |
Uber Technologies, Inc. 8.00% (o) | 402,887 | | 25,000 |
TOTAL CONVERTIBLE PREFERRED STOCKS | | 160,292 |
Nonconvertible Preferred Stocks - 0.2% |
CONSUMER DISCRETIONARY - 0.1% |
Textiles, Apparel & Luxury Goods - 0.1% |
C. Wonder LLC Class A-1 (a)(n)(o) | 619,047 | | 19,500 |
FINANCIALS - 0.1% |
Consumer Finance - 0.0% |
Ally Financial, Inc. 7.00% (g) | 8,853 | | 8,901 |
Diversified Financial Services - 0.1% |
GMAC Capital Trust I Series 2, 8.125% | 377,872 | | 10,157 |
TOTAL FINANCIALS | | 19,058 |
INDUSTRIALS - 0.0% |
Commercial Services & Supplies - 0.0% |
WP Rocket Holdings, Inc. 15.00% | 961,655 | | 789 |
TOTAL NONCONVERTIBLE PREFERRED STOCKS | | 39,347 |
TOTAL PREFERRED STOCKS (Cost $117,508) |
199,639
|
Corporate Bonds - 13.0% |
| Principal Amount (000s) | | Value (000s) |
Convertible Bonds - 0.0% |
CONSUMER DISCRETIONARY - 0.0% |
Media - 0.0% |
Liberty Media Corp.: | | | | |
3.5% 1/15/31 | | $ 620 | | $ 336 |
3.5% 1/15/31 (g) | | 4,584 | | 2,481 |
Mood Media Corp. 10% 10/31/15 (g) | | 32 | | 29 |
| | 2,846 |
Nonconvertible Bonds - 13.0% |
CONSUMER DISCRETIONARY - 1.1% |
Auto Components - 0.0% |
Chassix, Inc. 9.25% 8/1/18 (g) | | 470 | | 486 |
Dana Holding Corp.: | | | | |
5.375% 9/15/21 | | 880 | | 913 |
6% 9/15/23 | | 880 | | 937 |
Gates Global LLC / Gates Global Co. 6% 7/15/22 (g) | | 1,260 | | 1,247 |
Schaeffler Holding Finance BV 6.875% 8/15/18 pay-in-kind (g)(k) | | 1,565 | | 1,649 |
Tenneco, Inc. 6.875% 12/15/20 | | 2,415 | | 2,611 |
| | 7,843 |
Automobiles - 0.0% |
Volkswagen International Finance NV 2.375% 3/22/17 (g) | | 1,515 | | 1,561 |
Distributors - 0.0% |
American Builders & Contractors Supply Co., Inc. 5.625% 4/15/21 (g) | | 365 | | 371 |
LKQ Corp. 4.75% 5/15/23 | | 265 | | 259 |
| | 630 |
Diversified Consumer Services - 0.1% |
Ingersoll-Rand Global Holding Co. Ltd.: | | | | |
2.875% 1/15/19 | | 554 | | 568 |
4.25% 6/15/23 | | 3,903 | | 4,163 |
Laureate Education, Inc. 9.25% 9/1/19 (g) | | 4,040 | | 4,141 |
Service Corp. International 5.375% 1/15/22 | | 505 | | 523 |
| | 9,395 |
Hotels, Restaurants & Leisure - 0.2% |
24 Hour Holdings III LLC 8% 6/1/22 (g) | | 510 | | 495 |
Caesars Growth Propeties Holdings LLC/Caesars Growth Properties Finance, Inc. 9.375% 5/1/22 (g) | | 2,095 | | 2,027 |
Corporate Bonds - continued |
| Principal Amount (000s) | | Value (000s) |
Nonconvertible Bonds - continued |
CONSUMER DISCRETIONARY - continued |
Hotels, Restaurants & Leisure - continued |
Choice Hotels International, Inc. 5.75% 7/1/22 | | $ 390 | | $ 425 |
Chukchansi Economic Development Authority 9.75% 5/30/20 (d)(g) | | 2,861 | | 1,988 |
GLP Capital LP/GLP Financing II, Inc.: | | | | |
4.375% 11/1/18 | | 480 | | 498 |
4.875% 11/1/20 | | 1,255 | | 1,311 |
5.375% 11/1/23 | | 1,000 | | 1,058 |
Golden Nugget Escrow, Inc. 8.5% 12/1/21 (g) | | 680 | | 711 |
Graton Economic Development Authority 9.625% 9/1/19 (g) | | 1,065 | | 1,193 |
Hilton Worldwide Finance LLC/Hilton Worldwide Finance Corp. 5.625% 10/15/21 (g) | | 5,854 | | 6,205 |
Landry's Holdings II, Inc. 10.25% 1/1/18 (g) | | 900 | | 938 |
MCE Finance Ltd. 5% 2/15/21 (g) | | 1,290 | | 1,284 |
MGM Mirage, Inc.: | | | | |
6.625% 12/15/21 | | 1,115 | | 1,240 |
7.5% 6/1/16 | | 2,855 | | 3,105 |
NAI Entertainment Holdings LLC/NAI Entertainment Finance Corp. 5% 8/1/18 (g) | | 865 | | 889 |
Paris Las Vegas Holding LLC/Harrah's Las Vegas LLC/Flamingo Las Vegas Holdings, Inc.: | | | | |
8% 10/1/20 (g) | | 3,205 | | 3,181 |
11% 10/1/21 (g) | | 1,560 | | 1,581 |
Pinnacle Entertainment, Inc. 7.75% 4/1/22 | | 450 | | 486 |
Studio City Finance Ltd. 8.5% 12/1/20 (g) | | 5,600 | | 6,160 |
Waterford Gaming LLC/Waterford Gaming Finance Corp. 8.625% 9/15/14 (g) | | 715 | | 81 |
| | 34,856 |
Household Durables - 0.1% |
Beazer Homes U.S.A., Inc. 7.25% 2/1/23 | | 775 | | 796 |
Brookfield Residential Properties, Inc./Brookfield Residential U.S. Corp. 6.125% 7/1/22 (g) | | 785 | | 813 |
Brookfield Residential Properties, Inc. 6.5% 12/15/20 (g) | | 620 | | 658 |
D.R. Horton, Inc.: | | | | |
4.75% 2/15/23 | | 515 | | 509 |
5.75% 8/15/23 | | 425 | | 452 |
KB Home 4.75% 5/15/19 | | 2,355 | | 2,355 |
Corporate Bonds - continued |
| Principal Amount (000s) | | Value (000s) |
Nonconvertible Bonds - continued |
CONSUMER DISCRETIONARY - continued |
Household Durables - continued |
Reynolds Group Issuer, Inc./Reynolds Group Issuer LLC/Reynolds Group Issuer (Luxembourg) SA: | | | | |
5.75% 10/15/20 | | $ 6,420 | | $ 6,709 |
7.875% 8/15/19 | | 8,325 | | 9,012 |
8.25% 2/15/21 | | 1,485 | | 1,621 |
9% 4/15/19 | | 835 | | 877 |
William Lyon Homes, Inc.: | | | | |
5.75% 4/15/19 | | 470 | | 475 |
7% 8/15/22 (g) | | 1,255 | | 1,290 |
8.5% 11/15/20 | | 1,310 | | 1,448 |
Woodside Homes Co. LLC/Woodside Homes Finance, Inc. 6.75% 12/15/21 (g) | | 1,350 | | 1,360 |
| | 28,375 |
Media - 0.7% |
Altice S.A. 7.75% 5/15/22 (g) | | 10,065 | | 10,694 |
AMC Networks, Inc. 7.75% 7/15/21 | | 340 | | 375 |
CBS Outdoor Americas Capital LLC/CBS Outdoor Americas Capital Corp.: | | | | |
5.25% 2/15/22 (g) | | 275 | | 281 |
5.625% 2/15/24 (g) | | 295 | | 304 |
CCO Holdings LLC/CCO Holdings Capital Corp.: | | | | |
5.125% 2/15/23 | | 1,580 | | 1,572 |
5.25% 3/15/21 | | 1,375 | | 1,406 |
5.75% 9/1/23 | | 945 | | 971 |
5.75% 1/15/24 | | 4,235 | | 4,330 |
Cequel Communications Escrow I LLC/Cequel Communications Escrow Capital Corp. 6.375% 9/15/20 (g) | | 325 | | 341 |
Cequel Communications Holdings I LLC/Cequel Capital Corp. 5.125% 12/15/21 (g) | | 3,345 | | 3,316 |
Cinemark U.S.A., Inc.: | | | | |
4.875% 6/1/23 | | 1,275 | | 1,265 |
5.125% 12/15/22 | | 355 | | 361 |
Clear Channel Communications, Inc. 5.5% 12/15/16 | | 1,440 | | 1,426 |
Clear Channel Worldwide Holdings, Inc.: | | | | |
Series A: | | | | |
6.5% 11/15/22 | | 755 | | 804 |
7.625% 3/15/20 | | 585 | | 624 |
Series B, 6.5% 11/15/22 | | 2,040 | | 2,183 |
7.625% 3/15/20 | | 4,105 | | 4,392 |
Corporate Bonds - continued |
| Principal Amount (000s) | | Value (000s) |
Nonconvertible Bonds - continued |
CONSUMER DISCRETIONARY - continued |
Media - continued |
Columbus International, Inc. 7.375% 3/30/21 (g) | | $ 5,655 | | $ 6,157 |
COX Communications, Inc. 3.25% 12/15/22 (g) | | 2,162 | | 2,124 |
Darling Escrow Corp. 5.375% 1/15/22 (g) | | 745 | | 773 |
Discovery Communications LLC 5.05% 6/1/20 | | 168 | | 188 |
DISH DBS Corp.: | | | | |
5% 3/15/23 | | 2,675 | | 2,662 |
5.875% 7/15/22 | | 2,655 | | 2,817 |
6.75% 6/1/21 | | 3,515 | | 3,932 |
EchoStar Communications Corp. 6.625% 10/1/14 | | 3,000 | | 3,011 |
Griffey Intermediate, Inc./Griffey Finance Sub LLC 7% 10/15/20 (g) | | 2,640 | | 2,218 |
Lamar Media Corp.: | | | | |
5.375% 1/15/24 (g) | | 630 | | 649 |
5.875% 2/1/22 | | 525 | | 551 |
Lions Gate Entertainment Corp. 5.25% 8/1/18 (g) | | 3,730 | | 3,851 |
McGraw-Hill Global Education Holdings LLC/McGraw-Hill Global Education Finance 9.75% 4/1/21 | | 6,635 | | 7,498 |
MHGE Parent LLC / MHGE Parent Finance, Inc. 8.5% 8/1/19 pay-in-kind (g)(k) | | 1,915 | | 1,881 |
National CineMedia LLC: | | | | |
6% 4/15/22 | | 2,600 | | 2,704 |
7.875% 7/15/21 | | 1,380 | | 1,490 |
NBCUniversal, Inc. 5.15% 4/30/20 | | 4,917 | | 5,628 |
News America Holdings, Inc. 7.75% 12/1/45 | | 8,012 | | 11,954 |
Nielsen Finance LLC/Nielsen Finance Co. 5% 4/15/22 (g) | | 685 | | 692 |
Numericable Group SA: | | | | |
4.875% 5/15/19 (g) | | 4,535 | | 4,592 |
6% 5/15/22 (g) | | 8,815 | | 9,079 |
6.25% 5/15/24 (g) | | 660 | | 681 |
RCN Telecom Services LLC/RCN Capital Corp. 8.5% 8/15/20 (g) | | 850 | | 907 |
Regal Entertainment Group: | | | | |
5.75% 3/15/22 | | 1,230 | | 1,261 |
5.75% 6/15/23 | | 2,270 | | 2,298 |
5.75% 2/1/25 | | 340 | | 341 |
Sirius XM Radio, Inc. 5.75% 8/1/21 (g) | | 2,580 | | 2,683 |
Thomson Reuters Corp. 1.3% 2/23/17 | | 1,794 | | 1,796 |
Corporate Bonds - continued |
| Principal Amount (000s) | | Value (000s) |
Nonconvertible Bonds - continued |
CONSUMER DISCRETIONARY - continued |
Media - continued |
Time Warner Cable, Inc.: | | | | |
4% 9/1/21 | | $ 9,654 | | $ 10,361 |
5.85% 5/1/17 | | 1,621 | | 1,810 |
6.75% 7/1/18 | | 1,581 | | 1,858 |
8.25% 4/1/19 | | 10,176 | | 12,802 |
Time Warner, Inc.: | | | | |
2.1% 6/1/19 | | 10,950 | | 10,860 |
5.875% 11/15/16 | | 3,738 | | 4,124 |
Time, Inc. 5.75% 4/15/22 (g) | | 1,300 | | 1,297 |
Unitymedia Hessen GmbH & Co. KG/Unitymedia NRW GmbH: | | | | |
5.5% 1/15/23 (g) | | 1,340 | | 1,370 |
7.5% 3/15/19 (g) | | 480 | | 508 |
UPCB Finance VI Ltd. 6.875% 1/15/22 (g) | | 1,250 | | 1,353 |
Viacom, Inc.: | | | | |
1.25% 2/27/15 | | 377 | | 378 |
2.5% 9/1/18 | | 714 | | 727 |
3.5% 4/1/17 | | 219 | | 231 |
Videotron Ltd. 9.125% 4/15/18 | | 570 | | 589 |
WideOpenWest Finance LLC/WideOpenWest Capital Corp.: | | | | |
10.25% 7/15/19 | | 3,505 | | 3,908 |
13.375% 10/15/19 | | 1,780 | | 2,056 |
WMG Acquisition Corp.: | | | | |
5.625% 4/15/22 (g) | | 275 | | 282 |
6% 1/15/21 (g) | | 423 | | 440 |
| | 174,017 |
Multiline Retail - 0.0% |
JC Penney Corp., Inc.: | | | | |
5.65% 6/1/20 | | 1,357 | | 1,238 |
5.75% 2/15/18 | | 400 | | 384 |
7.4% 4/1/37 | | 440 | | 394 |
| | 2,016 |
Specialty Retail - 0.0% |
Asbury Automotive Group, Inc. 8.375% 11/15/20 | | 565 | | 619 |
CST Brands, Inc. 5% 5/1/23 | | 320 | | 320 |
PETCO Animal Supplies, Inc. 9.25% 12/1/18 (g) | | 3,260 | | 3,468 |
Corporate Bonds - continued |
| Principal Amount (000s) | | Value (000s) |
Nonconvertible Bonds - continued |
CONSUMER DISCRETIONARY - continued |
Specialty Retail - continued |
Sonic Automotive, Inc.: | | | | |
5% 5/15/23 | | $ 195 | | $ 193 |
7% 7/15/22 | | 885 | | 967 |
| | 5,567 |
Textiles, Apparel & Luxury Goods - 0.0% |
Polymer Group, Inc. 6.875% 6/1/19 (g) | | 505 | | 511 |
TOTAL CONSUMER DISCRETIONARY | | 264,771 |
CONSUMER STAPLES - 0.4% |
Beverages - 0.0% |
SABMiller Holdings, Inc.: | | | | |
1.85% 1/15/15 (g) | | 1,947 | | 1,956 |
2.45% 1/15/17 (g) | | 1,947 | | 2,006 |
| | 3,962 |
Food & Staples Retailing - 0.1% |
C&S Group Enterprises LLC 5.375% 7/15/22 (g) | | 1,440 | | 1,440 |
CVS Caremark Corp. 2.25% 12/5/18 | | 4,123 | | 4,165 |
ESAL GmbH 6.25% 2/5/23 (g) | | 3,005 | | 3,013 |
Kroger Co. 3.3% 1/15/21 | | 6,000 | | 6,167 |
Minerva Luxmbourg SA 7.75% 1/31/23 (g) | | 365 | | 387 |
Rite Aid Corp.: | | | | |
6.75% 6/15/21 | | 7,375 | | 7,827 |
6.875% 12/15/28 (g) | | 3,505 | | 3,610 |
7.7% 2/15/27 | | 3,220 | | 3,574 |
9.25% 3/15/20 | | 1,330 | | 1,490 |
| | 31,673 |
Food Products - 0.1% |
Cargill, Inc. 6% 11/27/17 (g) | | 417 | | 473 |
ConAgra Foods, Inc.: | | | | |
1.9% 1/25/18 | | 2,064 | | 2,064 |
3.2% 1/25/23 | | 1,737 | | 1,712 |
FAGE Dairy Industry SA/FAGE U.S.A. Dairy Industry, Inc. 9.875% 2/1/20 (g) | | 1,377 | | 1,470 |
H.J. Heinz Co. 4.25% 10/15/20 | | 6,030 | | 6,113 |
JBS Investments GmbH: | | | | |
7.25% 4/3/24 (g) | | 1,090 | | 1,146 |
7.75% 10/28/20 (g) | | 2,850 | | 3,078 |
Corporate Bonds - continued |
| Principal Amount (000s) | | Value (000s) |
Nonconvertible Bonds - continued |
CONSUMER STAPLES - continued |
Food Products - continued |
JBS U.S.A. LLC/JBS U.S.A. Finance, Inc. 5.875% 7/15/24 (g) | | $ 1,370 | | $ 1,370 |
Post Holdings, Inc.: | | | | |
6% 12/15/22 (g) | | 675 | | 665 |
6.75% 12/1/21 (g) | | 1,900 | | 1,936 |
Tyson Foods, Inc. 3.95% 8/15/24 | | 8,400 | | 8,581 |
William Wrigley Jr. Co.: | | | | |
1.4% 10/21/16 (g) | | 3,217 | | 3,239 |
2% 10/20/17 (g) | | 4,607 | | 4,668 |
| | 36,515 |
Household Products - 0.0% |
Spectrum Brands Holdings, Inc.: | | | | |
6.375% 11/15/20 | | 350 | | 376 |
6.625% 11/15/22 | | 415 | | 449 |
| | 825 |
Personal Products - 0.0% |
First Quality Finance Co., Inc. 4.625% 5/15/21 (g) | | 300 | | 284 |
Prestige Brands, Inc.: | | | | |
5.375% 12/15/21 (g) | | 1,660 | | 1,648 |
8.125% 2/1/20 | | 220 | | 239 |
Revlon Consumer Products Corp. 5.75% 2/15/21 | | 1,105 | | 1,122 |
| | 3,293 |
Tobacco - 0.2% |
Altria Group, Inc.: | | | | |
2.85% 8/9/22 | | 4,020 | | 3,932 |
4% 1/31/24 | | 3,123 | | 3,249 |
9.7% 11/10/18 | | 5,570 | | 7,228 |
Reynolds American, Inc.: | | | | |
3.25% 11/1/22 | | 2,999 | | 2,936 |
4.85% 9/15/23 | | 7,000 | | 7,550 |
6.75% 6/15/17 | | 3,979 | | 4,524 |
7.25% 6/15/37 | | 6,101 | | 7,783 |
| | 37,202 |
TOTAL CONSUMER STAPLES | | 113,470 |
Corporate Bonds - continued |
| Principal Amount (000s) | | Value (000s) |
Nonconvertible Bonds - continued |
ENERGY - 1.6% |
Energy Equipment & Services - 0.2% |
DCP Midstream LLC: | | | | |
4.75% 9/30/21 (g) | | $ 5,634 | | $ 6,023 |
5.35% 3/15/20 (g) | | 5,174 | | 5,719 |
El Paso Pipeline Partners Operating Co. LLC: | | | | |
4.1% 11/15/15 | | 5,488 | | 5,689 |
5% 10/1/21 | | 2,280 | | 2,490 |
6.5% 4/1/20 | | 2,264 | | 2,633 |
Forum Energy Technologies, Inc. 6.25% 10/1/21 (g) | | 655 | | 694 |
Gulfmark Offshore, Inc. 6.375% 3/15/22 | | 365 | | 368 |
Noble Holding International Ltd. 3.05% 3/1/16 | | 756 | | 779 |
Offshore Group Investment Ltd.: | | | | |
7.125% 4/1/23 | | 1,500 | | 1,489 |
7.5% 11/1/19 | | 4,935 | | 5,046 |
Pacific Drilling V Ltd. 7.25% 12/1/17 (g) | | 1,215 | | 1,273 |
Pride International, Inc. 6.875% 8/15/20 | | 1,355 | | 1,633 |
Rose Rock Midstream LP/ Rose Rock Finance Corp. 5.625% 7/15/22 (g) | | 635 | | 648 |
Summit Midstream Holdings LLC 7.5% 7/1/21 | | 500 | | 550 |
Transocean, Inc. 5.05% 12/15/16 | | 3,719 | | 4,012 |
Unit Corp. 6.625% 5/15/21 | | 4,515 | | 4,696 |
| | 43,742 |
Oil, Gas & Consumable Fuels - 1.4% |
Access Midstream Partners LP/ACMP Finance Corp. 4.875% 5/15/23 | | 1,680 | | 1,768 |
Alpha Natural Resources, Inc.: | | | | |
6% 6/1/19 | | 2,410 | | 1,717 |
6.25% 6/1/21 | | 2,725 | | 1,867 |
9.75% 4/15/18 | | 1,099 | | 986 |
American Energy-Permian Basin LLC/ AEPB Finance Corp.: | | | | |
6.7412% 8/1/19 (g)(k) | | 1,265 | | 1,237 |
7.125% 11/1/20 (g) | | 1,030 | | 999 |
7.375% 11/1/21 (g) | | 915 | | 892 |
Anadarko Petroleum Corp. 6.375% 9/15/17 | | 20,246 | | 23,082 |
Antero Resources Corp. 5.125% 12/1/22 (g) | | 2,155 | | 2,187 |
Atlas Pipeline Partners LP/Atlas Pipeline Finance Corp. 5.875% 8/1/23 | | 1,155 | | 1,172 |
Chesapeake Energy Corp.: | | | | |
4.875% 4/15/22 | | 1,080 | | 1,130 |
Corporate Bonds - continued |
| Principal Amount (000s) | | Value (000s) |
Nonconvertible Bonds - continued |
ENERGY - continued |
Oil, Gas & Consumable Fuels - continued |
Chesapeake Energy Corp.: - continued | | | | |
5.375% 6/15/21 | | $ 1,340 | | $ 1,417 |
5.75% 3/15/23 | | 1,330 | | 1,485 |
6.125% 2/15/21 | | 805 | | 912 |
6.875% 11/15/20 | | 100 | | 116 |
Concho Resources, Inc. 5.5% 4/1/23 | | 1,155 | | 1,233 |
Crestwood Midstream Partners LP/Crestwood Midstream Finance Corp.: | | | | |
6.125% 3/1/22 | | 895 | | 926 |
7.75% 4/1/19 | | 1,990 | | 2,114 |
DCP Midstream Operating LP: | | | | |
2.5% 12/1/17 | | 2,677 | | 2,743 |
2.7% 4/1/19 | | 523 | | 530 |
3.875% 3/15/23 | | 1,647 | | 1,685 |
4.95% 4/1/22 | | 1,048 | | 1,157 |
Denbury Resources, Inc. 4.625% 7/15/23 | | 4,625 | | 4,463 |
Diamondback Energy, Inc. 7.625% 10/1/21 (g) | | 935 | | 1,024 |
Duke Energy Field Services: | | | | |
5.375% 10/15/15 (g) | | 1,647 | | 1,713 |
6.45% 11/3/36 (g) | | 3,753 | | 4,464 |
El Paso Natural Gas Co. 5.95% 4/15/17 | | 1,260 | | 1,399 |
Enable Midstream Partners LP: | | | | |
2.4% 5/15/19 (g) | | 1,656 | | 1,651 |
3.9% 5/15/24 (g) | | 1,746 | | 1,764 |
Enbridge Energy Partners LP 4.2% 9/15/21 | | 6,629 | | 7,094 |
EP Energy LLC/Everest Acquisition Finance, Inc. 7.75% 9/1/22 | | 885 | | 993 |
Everest Acquisition LLC/Everest Acquisition Finance, Inc.: | | | | |
6.875% 5/1/19 | | 1,540 | | 1,625 |
9.375% 5/1/20 | | 4,780 | | 5,389 |
Genesis Energy LP/Genesis Energy Finance Corp. 5.75% 2/15/21 | | 520 | | 537 |
Gibson Energy, Inc. 6.75% 7/15/21 (g) | | 160 | | 173 |
Global Partners LP/GLP Finance Corp. 6.25% 7/15/22 (g) | | 305 | | 307 |
Gulfstream Natural Gas System LLC 6.95% 6/1/16 (g) | | 677 | | 737 |
Kodiak Oil & Gas Corp.: | | | | |
5.5% 1/15/21 | | 485 | | 512 |
8.125% 12/1/19 | | 1,325 | | 1,458 |
Corporate Bonds - continued |
| Principal Amount (000s) | | Value (000s) |
Nonconvertible Bonds - continued |
ENERGY - continued |
Oil, Gas & Consumable Fuels - continued |
Laredo Petroleum Holdings, Inc. 5.625% 1/15/22 | | $ 1,740 | | $ 1,788 |
LINN Energy LLC/LINN Energy Finance Corp. 6.5% 5/15/19 | | 1,820 | | 1,873 |
Marathon Petroleum Corp. 5.125% 3/1/21 | | 3,173 | | 3,593 |
Markwest Energy Partners LP/Markwest Energy Finance Corp. 5.5% 2/15/23 | | 610 | | 644 |
Midcontinent Express Pipeline LLC 5.45% 9/15/14 (g) | | 2,559 | | 2,561 |
Motiva Enterprises LLC 5.75% 1/15/20 (g) | | 3,614 | | 4,095 |
Nakilat, Inc. 6.067% 12/31/33 (g) | | 1,839 | | 2,069 |
Nexen, Inc.: | | | | |
5.2% 3/10/15 | | 1,224 | | 1,253 |
6.2% 7/30/19 | | 1,865 | | 2,176 |
Pemex Project Funding Master Trust 5.75% 3/1/18 | | 21,220 | | 23,809 |
Petrobras Global Finance BV: | | | | |
3% 1/15/19 | | 25,963 | | 25,583 |
3.25% 3/17/17 | | 10,749 | | 10,995 |
4.375% 5/20/23 | | 3,648 | | 3,599 |
4.875% 3/17/20 | | 10,749 | | 11,165 |
Petrobras International Finance Co. Ltd.: | | | | |
3.875% 1/27/16 | | 5,238 | | 5,385 |
5.375% 1/27/21 | | 10,725 | | 11,307 |
5.75% 1/20/20 | | 16,310 | | 17,581 |
7.875% 3/15/19 | | 5,564 | | 6,482 |
Petroleos Mexicanos: | | | | |
3.5% 7/18/18 | | 7,105 | | 7,425 |
3.5% 1/30/23 | | 4,530 | | 4,489 |
4.875% 1/24/22 | | 2,315 | | 2,515 |
4.875% 1/18/24 | | 1,916 | | 2,085 |
4.875% 1/18/24 (g) | | 4,058 | | 4,415 |
5.5% 1/21/21 | | 5,342 | | 6,010 |
5.5% 6/27/44 | | 17,702 | | 19,202 |
6% 3/5/20 | | 2,852 | | 3,273 |
6.375% 1/23/45 (g) | | 5,324 | | 6,442 |
6.5% 6/2/41 | | 7,783 | | 9,495 |
Phillips 66 Co.: | | | | |
1.95% 3/5/15 | | 1,526 | | 1,537 |
2.95% 5/1/17 | | 1,527 | | 1,595 |
4.3% 4/1/22 | | 5,338 | | 5,785 |
Corporate Bonds - continued |
| Principal Amount (000s) | | Value (000s) |
Nonconvertible Bonds - continued |
ENERGY - continued |
Oil, Gas & Consumable Fuels - continued |
Plains All American Pipeline LP/PAA Finance Corp. 6.125% 1/15/17 | | $ 1,880 | | $ 2,095 |
Rosetta Resources, Inc. 5.875% 6/1/24 | | 700 | | 712 |
Sabine Pass Liquefaction LLC: | | | | |
5.625% 4/15/23 (g) | | 2,585 | | 2,688 |
5.75% 5/15/24 (g) | | 1,830 | | 1,903 |
SemGroup Corp. 7.5% 6/15/21 | | 1,000 | | 1,080 |
Southeast Supply Header LLC 4.25% 6/15/24 (g) | | 4,893 | | 5,051 |
Spectra Energy Capital, LLC 5.65% 3/1/20 | | 944 | | 1,064 |
Spectra Energy Partners, LP: | | | | |
2.95% 6/15/16 | | 1,059 | | 1,096 |
4.6% 6/15/21 | | 1,296 | | 1,422 |
Suncor Energy, Inc. 6.1% 6/1/18 | | 7,771 | | 8,961 |
Targa Resources Partners LP/Targa Resources Partners Finance Corp. 6.375% 8/1/22 | | 570 | | 618 |
Teekay Corp. 8.5% 1/15/20 | | 120 | | 136 |
The Williams Companies, Inc.: | | | | |
3.7% 1/15/23 | | 1,598 | | 1,533 |
4.55% 6/24/24 | | 14,442 | | 14,546 |
Western Gas Partners LP 5.375% 6/1/21 | | 7,807 | | 8,874 |
Western Refining, Inc. 6.25% 4/1/21 | | 550 | | 572 |
Williams Partners LP 4.3% 3/4/24 | | 4,038 | | 4,224 |
| | 353,459 |
TOTAL ENERGY | | 397,201 |
FINANCIALS - 5.8% |
Banks - 2.4% |
Associated Banc Corp. 5.125% 3/28/16 | | 1,852 | | 1,958 |
Banco Nacional de Desenvolvimento Economico e Social: | | | | |
4% 4/14/19 (g) | | 13,750 | | 14,094 |
5.5% 7/12/20 (g) | | 16,673 | | 18,194 |
6.5% 6/10/19 (g) | | 1,763 | | 1,986 |
Bank of America Corp.: | | | | |
1.35% 11/21/16 | | 4,652 | | 4,667 |
2.6% 1/15/19 | | 37,410 | | 37,775 |
2.65% 4/1/19 | | 12,287 | | 12,412 |
3.875% 3/22/17 | | 781 | | 829 |
Corporate Bonds - continued |
| Principal Amount (000s) | | Value (000s) |
Nonconvertible Bonds - continued |
FINANCIALS - continued |
Banks - continued |
Bank of America Corp.: - continued | | | | |
4.2% 8/26/24 | | $ 6,463 | | $ 6,561 |
6.5% 8/1/16 | | 1,010 | | 1,110 |
Bank of America NA 5.3% 3/15/17 | | 14,681 | | 16,010 |
Barclays Bank PLC 2.5% 2/20/19 | | 3,400 | | 3,455 |
BB&T Corp. 3.95% 3/22/22 | | 1,495 | | 1,592 |
Capital One NA 2.95% 7/23/21 | | 7,402 | | 7,414 |
CIT Group, Inc.: | | | | |
5% 8/15/22 | | 2,195 | | 2,316 |
5% 8/1/23 | | 2,755 | | 2,876 |
5.25% 3/15/18 | | 3,215 | | 3,432 |
5.375% 5/15/20 | | 2,805 | | 3,036 |
5.5% 2/15/19 (g) | | 5,285 | | 5,701 |
Citigroup, Inc.: | | | | |
1.3% 11/15/16 | | 5,354 | | 5,370 |
1.75% 5/1/18 | | 18,342 | | 18,256 |
2.5% 7/29/19 | | 32,442 | | 32,571 |
2.55% 4/8/19 | | 14,645 | | 14,789 |
4.05% 7/30/22 | | 14,700 | | 15,153 |
4.45% 1/10/17 | | 14,158 | | 15,178 |
5.3% 5/6/44 | | 10,932 | | 11,734 |
6% 8/15/17 | | 12,747 | | 14,330 |
Comerica, Inc. 4.8% 5/1/15 | | 1,013 | | 1,042 |
Credit Suisse AG 6% 2/15/18 | | 12,547 | | 14,169 |
Credit Suisse New York Branch 5.4% 1/14/20 | | 1,200 | | 1,352 |
Discover Bank: | | | | |
7% 4/15/20 | | 3,075 | | 3,684 |
8.7% 11/18/19 | | 532 | | 670 |
Fifth Third Bancorp: | | | | |
3.5% 3/15/22 | | 529 | | 549 |
4.5% 6/1/18 | | 418 | | 455 |
5.45% 1/15/17 | | 1,848 | | 2,018 |
HBOS PLC 6.75% 5/21/18 (g) | | 408 | | 468 |
HSBC Holdings PLC 4.25% 3/14/24 | | 2,900 | | 3,011 |
Huntington Bancshares, Inc. 7% 12/15/20 | | 2,561 | | 3,084 |
Huntington National Bank: | | | | |
1.3% 11/20/16 | | 3,560 | | 3,574 |
2.2% 4/1/19 | | 2,700 | | 2,702 |
Corporate Bonds - continued |
| Principal Amount (000s) | | Value (000s) |
Nonconvertible Bonds - continued |
FINANCIALS - continued |
Banks - continued |
Intesa Sanpaolo SpA: | | | | |
2.375% 1/13/17 | | $ 5,300 | | $ 5,369 |
3.125% 1/15/16 | | 18,292 | | 18,765 |
JPMorgan Chase & Co.: | | | | |
2% 8/15/17 | | 4,900 | | 4,980 |
2.35% 1/28/19 | | 32,891 | | 33,209 |
3.15% 7/5/16 | | 8,974 | | 9,330 |
JPMorgan Chase Bank 6% 10/1/17 | | 1,942 | | 2,193 |
KeyBank NA 5.45% 3/3/16 | | 2,302 | | 2,458 |
KeyCorp. 5.1% 3/24/21 | | 519 | | 590 |
Marshall & Ilsley Bank: | | | | |
4.85% 6/16/15 | | 3,881 | | 4,003 |
5% 1/17/17 | | 7,888 | | 8,433 |
Regions Bank: | | | | |
6.45% 6/26/37 | | 10,147 | | 12,097 |
7.5% 5/15/18 | | 11,552 | | 13,631 |
Regions Financial Corp.: | | | | |
2% 5/15/18 | | 7,154 | | 7,123 |
5.75% 6/15/15 | | 1,067 | | 1,108 |
7.75% 11/10/14 | | 4,922 | | 4,983 |
Royal Bank of Scotland Group PLC: | | | | |
5.125% 5/28/24 | | 37,329 | | 38,077 |
6% 12/19/23 | | 13,834 | | 15,041 |
6.1% 6/10/23 | | 7,367 | | 8,043 |
6.125% 12/15/22 | | 35,362 | | 38,673 |
Sumitomo Mitsui Banking Corp. 1.3% 1/10/17 | | 5,250 | | 5,260 |
SunTrust Banks, Inc.: | | | | |
2.35% 11/1/18 | | 2,607 | | 2,635 |
3.5% 1/20/17 | | 4,123 | | 4,341 |
Wachovia Bank NA 6% 11/15/17 | | 7,010 | | 7,971 |
Wells Fargo & Co.: | | | | |
4.1% 6/3/26 | | 13,000 | | 13,325 |
4.48% 1/16/24 | | 5,192 | | 5,568 |
| | 576,783 |
Capital Markets - 0.7% |
Affiliated Managers Group, Inc. 4.25% 2/15/24 | | 2,095 | | 2,189 |
Bear Stearns Companies, Inc. 5.3% 10/30/15 | | 878 | | 924 |
Goldman Sachs Group, Inc.: | | | | |
1.748% 9/15/17 | | 16,000 | | 15,998 |
Corporate Bonds - continued |
| Principal Amount (000s) | | Value (000s) |
Nonconvertible Bonds - continued |
FINANCIALS - continued |
Capital Markets - continued |
Goldman Sachs Group, Inc.: - continued | | | | |
2.375% 1/22/18 | | $ 10,000 | | $ 10,160 |
2.625% 1/31/19 | | 19,690 | | 19,929 |
5.95% 1/18/18 | | 4,242 | | 4,787 |
6.15% 4/1/18 | | 3,466 | | 3,949 |
6.25% 9/1/17 | | 19,047 | | 21,547 |
Lazard Group LLC: | | | | |
4.25% 11/14/20 | | 2,719 | | 2,866 |
6.85% 6/15/17 | | 5,189 | | 5,884 |
Merrill Lynch & Co., Inc. 6.4% 8/28/17 | | 4,204 | | 4,776 |
Morgan Stanley: | | | | |
2.125% 4/25/18 | | 16,388 | | 16,486 |
2.375% 7/23/19 | | 10,891 | | 10,868 |
2.5% 1/24/19 | | 36,150 | | 36,566 |
4% 7/24/15 | | 1,137 | | 1,172 |
4.875% 11/1/22 | | 2,855 | | 3,084 |
5.625% 9/23/19 | | 453 | | 518 |
5.95% 12/28/17 | | 250 | | 283 |
6.625% 4/1/18 | | 1,494 | | 1,730 |
State Street Corp. 3.1% 5/15/23 | | 6,500 | | 6,420 |
UBS AG Stamford Branch 2.375% 8/14/19 | | 11,000 | | 11,037 |
| | 181,173 |
Consumer Finance - 0.9% |
Ally Financial, Inc.: | | | | |
3.5% 1/27/19 | | 2,025 | | 2,033 |
4.625% 6/26/15 | | 2,540 | | 2,607 |
4.75% 9/10/18 | | 4,295 | | 4,520 |
6.25% 12/1/17 | | 1,800 | | 1,982 |
Capital One Financial Corp. 2.45% 4/24/19 | | 4,470 | | 4,496 |
Discover Financial Services: | | | | |
3.85% 11/21/22 | | 1,983 | | 2,031 |
5.2% 4/27/22 | | 2,146 | | 2,385 |
6.45% 6/12/17 | | 10,512 | | 11,839 |
Ford Motor Credit Co. LLC: | | | | |
1.5% 1/17/17 | | 16,012 | | 16,046 |
2.375% 3/12/19 | | 17,400 | | 17,416 |
2.5% 1/15/16 | | 14,000 | | 14,305 |
2.875% 10/1/18 | | 8,500 | | 8,751 |
Corporate Bonds - continued |
| Principal Amount (000s) | | Value (000s) |
Nonconvertible Bonds - continued |
FINANCIALS - continued |
Consumer Finance - continued |
Ford Motor Credit Co. LLC: - continued | | | | |
3% 6/12/17 | | $ 5,430 | | $ 5,631 |
4.375% 8/6/23 | | 13,241 | | 14,150 |
5% 5/15/18 | | 8,500 | | 9,384 |
5.875% 8/2/21 | | 10,438 | | 12,268 |
General Electric Capital Corp. 4.625% 1/7/21 | | 703 | | 787 |
General Motors Acceptance Corp. 8% 11/1/31 | | 3,115 | | 4,018 |
GMAC LLC: | | | | |
6.75% 12/1/14 | | 2,355 | | 2,387 |
8% 12/31/18 | | 6,035 | | 7,042 |
8% 11/1/31 | | 16,726 | | 21,639 |
Hyundai Capital America: | | | | |
1.45% 2/6/17 (g) | | 5,366 | | 5,371 |
1.625% 10/2/15 (g) | | 1,867 | | 1,881 |
1.875% 8/9/16 (g) | | 1,416 | | 1,435 |
2.125% 10/2/17 (g) | | 2,063 | | 2,091 |
2.55% 2/6/19 (g) | | 5,366 | | 5,437 |
2.875% 8/9/18 (g) | | 2,511 | | 2,590 |
SLM Corp.: | | | | |
4.875% 6/17/19 | | 5,315 | | 5,562 |
5.5% 1/15/19 | | 2,150 | | 2,284 |
5.5% 1/25/23 | | 1,365 | | 1,372 |
6.125% 3/25/24 | | 2,195 | | 2,255 |
8% 3/25/20 | | 5,930 | | 6,849 |
8.45% 6/15/18 | | 2,980 | | 3,468 |
Synchrony Financial: | | | | |
1.875% 8/15/17 | | 1,300 | | 1,310 |
3% 8/15/19 | | 1,910 | | 1,937 |
3.75% 8/15/21 | | 7,084 | | 7,230 |
4.25% 8/15/24 | | 2,903 | | 2,972 |
| | 219,761 |
Diversified Financial Services - 0.2% |
AerCap Ireland Capital Ltd./AerCap Global Aviation Trust: | | | | |
2.75% 5/15/17 (g) | | 2,625 | | 2,625 |
3.75% 5/15/19 (g) | | 2,125 | | 2,141 |
4.5% 5/15/21 (g) | | 2,325 | | 2,374 |
Corporate Bonds - continued |
| Principal Amount (000s) | | Value (000s) |
Nonconvertible Bonds - continued |
FINANCIALS - continued |
Diversified Financial Services - continued |
BP Capital Markets PLC: | | | | |
4.5% 10/1/20 | | $ 1,106 | | $ 1,221 |
4.742% 3/11/21 | | 4,210 | | 4,719 |
Five Corners Funding Trust 4.419% 11/15/23 (g) | | 8,055 | | 8,598 |
General Motors Financial Co., Inc.: | | | | |
3.25% 5/15/18 | | 700 | | 705 |
4.25% 5/15/23 | | 615 | | 628 |
4.75% 8/15/17 | | 4,295 | | 4,516 |
6.75% 6/1/18 | | 6,765 | | 7,602 |
Icahn Enterprises LP/Icahn Enterprises Finance Corp.: | | | | |
4.875% 3/15/19 | | 2,280 | | 2,343 |
5.875% 2/1/22 | | 2,725 | | 2,841 |
6% 8/1/20 | | 2,230 | | 2,381 |
Landry's Acquisition Co. 9.375% 5/1/20 (g) | | 875 | | 941 |
NSG Holdings II, LLC 7.75% 12/15/25 (g) | | 5,023 | | 5,425 |
RBS Citizens Financial Group, Inc. 4.15% 9/28/22 (g) | | 5,782 | | 5,872 |
TECO Finance, Inc.: | | | | |
4% 3/15/16 | | 1,242 | | 1,302 |
5.15% 3/15/20 | | 2,029 | | 2,285 |
TransUnion Holding Co., Inc.: | | | | |
8.125% 6/15/18 pay-in-kind (k) | | 1,155 | | 1,201 |
9.625% 6/15/18 pay-in-kind (k) | | 810 | | 845 |
UPCB Finance III Ltd. 6.625% 7/1/20 (g) | | 1,150 | | 1,216 |
| | 61,781 |
Insurance - 0.6% |
AIA Group Ltd. 2.25% 3/11/19 (g) | | 1,203 | | 1,203 |
American International Group, Inc.: | | | | |
2.375% 8/24/15 | | 14,000 | | 14,278 |
4.875% 6/1/22 | | 5,467 | | 6,137 |
5.6% 10/18/16 | | 4,975 | | 5,437 |
5.85% 1/16/18 | | 12,000 | | 13,617 |
Aon Corp.: | | | | |
3.125% 5/27/16 | | 3,402 | | 3,525 |
3.5% 9/30/15 | | 3,819 | | 3,937 |
5% 9/30/20 | | 107 | | 120 |
Axis Capital Holdings Ltd. 5.75% 12/1/14 | | 329 | | 333 |
Corporate Bonds - continued |
| Principal Amount (000s) | | Value (000s) |
Nonconvertible Bonds - continued |
FINANCIALS - continued |
Insurance - continued |
Great-West Life & Annuity Insurance Co. 7.153% 5/16/46 (g)(k) | | $ 2,008 | | $ 2,078 |
Hartford Financial Services Group, Inc.: | | | | |
4% 10/15/17 | | 1,082 | | 1,163 |
5.125% 4/15/22 | | 956 | | 1,092 |
5.375% 3/15/17 | | 595 | | 653 |
Hockey Merger Sub 2, Inc. 7.875% 10/1/21 (g) | | 1,675 | | 1,763 |
Liberty Mutual Group, Inc.: | | | | |
4.25% 6/15/23 (g) | | 2,655 | | 2,763 |
5% 6/1/21 (g) | | 6,063 | | 6,703 |
Marsh & McLennan Companies, Inc. 4.8% 7/15/21 | | 4,128 | | 4,601 |
Massachusetts Mutual Life Insurance Co. 5.375% 12/1/41 (g) | | 2,993 | | 3,453 |
MetLife, Inc. 6.75% 6/1/16 | | 3,874 | | 4,273 |
Metropolitan Life Global Funding I 1.875% 6/22/18 (g) | | 6,760 | | 6,765 |
Northwestern Mutual Life Insurance Co. 6.063% 3/30/40 (g) | | 3,585 | | 4,552 |
Pacific Life Insurance Co. 9.25% 6/15/39 (g) | | 3,048 | | 4,803 |
Pacific LifeCorp: | | | | |
5.125% 1/30/43 (g) | | 6,960 | | 7,419 |
6% 2/10/20 (g) | | 8,215 | | 9,432 |
Prudential Financial, Inc.: | | | | |
2.3% 8/15/18 | | 783 | | 796 |
4.5% 11/16/21 | | 1,461 | | 1,606 |
7.375% 6/15/19 | | 1,880 | | 2,312 |
Symetra Financial Corp. 6.125% 4/1/16 (g) | | 6,715 | | 7,162 |
Unum Group: | | | | |
5.625% 9/15/20 | | 2,879 | | 3,298 |
5.75% 8/15/42 | | 7,108 | | 8,510 |
7.125% 9/30/16 | | 1,802 | | 2,023 |
| | 135,807 |
Real Estate Investment Trusts - 0.5% |
Alexandria Real Estate Equities, Inc.: | | | | |
2.75% 1/15/20 | | 1,148 | | 1,151 |
4.6% 4/1/22 | | 1,705 | | 1,816 |
American Campus Communities Operating Partnership LP 3.75% 4/15/23 | | 1,587 | | 1,591 |
AvalonBay Communities, Inc. 3.625% 10/1/20 | | 2,452 | | 2,584 |
Boston Properties, Inc. 3.85% 2/1/23 | | 6,720 | | 6,996 |
Corporate Bonds - continued |
| Principal Amount (000s) | | Value (000s) |
Nonconvertible Bonds - continued |
FINANCIALS - continued |
Real Estate Investment Trusts - continued |
Camden Property Trust 2.95% 12/15/22 | | $ 2,154 | | $ 2,101 |
CommonWealth REIT 5.875% 9/15/20 | | 991 | | 1,077 |
CTR Partnership LP/CareTrust Capital Corp. 5.875% 6/1/21 (g) | | 205 | | 208 |
DDR Corp.: | | | | |
4.75% 4/15/18 | | 4,595 | | 4,979 |
7.5% 4/1/17 | | 4,966 | | 5,680 |
9.625% 3/15/16 | | 1,675 | | 1,894 |
Developers Diversified Realty Corp. 4.625% 7/15/22 | | 3,877 | | 4,156 |
Duke Realty LP: | | | | |
3.625% 4/15/23 | | 2,844 | | 2,834 |
3.875% 10/15/22 | | 4,799 | | 4,924 |
4.375% 6/15/22 | | 3,202 | | 3,388 |
5.5% 3/1/16 | | 2,930 | | 3,118 |
5.95% 2/15/17 | | 3,166 | | 3,492 |
6.75% 3/15/20 | | 1,161 | | 1,382 |
8.25% 8/15/19 | | 1,838 | | 2,305 |
Equity One, Inc.: | | | | |
3.75% 11/15/22 | | 7,300 | | 7,333 |
5.375% 10/15/15 | | 672 | | 705 |
6% 9/15/17 | | 666 | | 740 |
6.25% 1/15/17 | | 530 | | 584 |
Federal Realty Investment Trust: | | | | |
5.9% 4/1/20 | | 1,379 | | 1,604 |
6.2% 1/15/17 | | 365 | | 407 |
HCP, Inc.: | | | | |
3.15% 8/1/22 | | 8,000 | | 7,823 |
3.875% 8/15/24 | | 11,000 | | 11,099 |
4.25% 11/15/23 | | 3,213 | | 3,338 |
Health Care REIT, Inc.: | | | | |
2.25% 3/15/18 | | 12,327 | | 12,489 |
4.125% 4/1/19 | | 11,300 | | 12,182 |
4.7% 9/15/17 | | 744 | | 811 |
HRPT Properties Trust: | | | | |
5.75% 11/1/15 | | 1,241 | | 1,274 |
6.25% 6/15/17 | | 726 | | 777 |
6.65% 1/15/18 | | 490 | | 543 |
Lexington Corporate Properties Trust 4.4% 6/15/24 | | 1,905 | | 1,939 |
Corporate Bonds - continued |
| Principal Amount (000s) | | Value (000s) |
Nonconvertible Bonds - continued |
FINANCIALS - continued |
Real Estate Investment Trusts - continued |
Omega Healthcare Investors, Inc.: | | | | |
4.95% 4/1/24 (g) | | $ 1,785 | | $ 1,844 |
5.875% 3/15/24 | | 3,200 | | 3,360 |
6.75% 10/15/22 | | 1,885 | | 2,031 |
Retail Opportunity Investments Partnership LP 5% 12/15/23 | | 980 | | 1,055 |
Weingarten Realty Investors 3.375% 10/15/22 | | 1,098 | | 1,105 |
| | 128,719 |
Real Estate Management & Development - 0.5% |
BioMed Realty LP: | | | | |
2.625% 5/1/19 | | 1,861 | | 1,862 |
3.85% 4/15/16 | | 6,469 | | 6,763 |
4.25% 7/15/22 | | 2,511 | | 2,612 |
6.125% 4/15/20 | | 1,822 | | 2,107 |
Brandywine Operating Partnership LP: | | | | |
3.95% 2/15/23 | | 6,445 | | 6,534 |
4.95% 4/15/18 | | 4,256 | | 4,610 |
5.7% 5/1/17 | | 268 | | 293 |
6% 4/1/16 | | 2,467 | | 2,641 |
7.5% 5/15/15 | | 698 | | 730 |
CBRE Group, Inc.: | | | | |
5% 3/15/23 | | 3,990 | | 4,045 |
6.625% 10/15/20 | | 900 | | 947 |
Corporate Office Properties LP 3.7% 6/15/21 | | 3,614 | | 3,622 |
Digital Realty Trust LP: | | | | |
4.5% 7/15/15 | | 2,465 | | 2,520 |
5.25% 3/15/21 | | 2,876 | | 3,142 |
ERP Operating LP 5.75% 6/15/17 | | 1,446 | | 1,619 |
Essex Portfolio LP 5.5% 3/15/17 | | 3,414 | | 3,758 |
Howard Hughes Corp. 6.875% 10/1/21 (g) | | 2,115 | | 2,239 |
Kennedy-Wilson, Inc. 5.875% 4/1/24 | | 795 | | 808 |
Liberty Property LP: | | | | |
3.375% 6/15/23 | | 2,951 | | 2,898 |
4.125% 6/15/22 | | 2,746 | | 2,880 |
4.75% 10/1/20 | | 6,595 | | 7,144 |
5.125% 3/2/15 | | 1,317 | | 1,345 |
5.5% 12/15/16 | | 2,022 | | 2,201 |
Corporate Bonds - continued |
| Principal Amount (000s) | | Value (000s) |
Nonconvertible Bonds - continued |
FINANCIALS - continued |
Real Estate Management & Development - continued |
Mack-Cali Realty LP: | | | | |
2.5% 12/15/17 | | $ 4,037 | | $ 4,079 |
3.15% 5/15/23 | | 6,708 | | 6,093 |
4.5% 4/18/22 | | 1,689 | | 1,716 |
5.8% 1/15/16 | | 4,250 | | 4,500 |
7.75% 8/15/19 | | 2,149 | | 2,580 |
Mid-America Apartments LP 4.3% 10/15/23 | | 1,086 | | 1,146 |
Post Apartment Homes LP 3.375% 12/1/22 | | 1,196 | | 1,177 |
Prime Property Funding, Inc. 5.7% 4/15/17 (g) | | 3,471 | | 3,732 |
Realogy Corp. 9% 1/15/20 (g) | | 1,170 | | 1,307 |
Realogy Group LLC/Realogy Co.-Issuer Corp. 4.5% 4/15/19 (g) | | 1,760 | | 1,760 |
Realogy Group LLC/Sunshine Group Florida Ltd. 3.375% 5/1/16 (g) | | 2,125 | | 2,152 |
Reckson Operating Partnership LP 6% 3/31/16 | | 1,675 | | 1,791 |
Regency Centers LP: | | | | |
5.25% 8/1/15 | | 3,216 | | 3,348 |
5.875% 6/15/17 | | 1,447 | | 1,610 |
Tanger Properties LP: | | | | |
3.875% 12/1/23 | | 2,341 | | 2,400 |
6.125% 6/1/20 | | 7,035 | | 8,197 |
Taylor Morrison Communities, Inc./Monarch Communities, Inc. 5.625% 3/1/24 (g) | | 515 | | 514 |
Ventas Realty LP: | | | | |
1.25% 4/17/17 | | 2,655 | | 2,651 |
1.55% 9/26/16 | | 921 | | 931 |
Ventas Realty LP/Ventas Capital Corp.: | | | | |
2% 2/15/18 | | 3,611 | | 3,636 |
4% 4/30/19 | | 1,771 | | 1,899 |
Weekley Homes LLC/Weekley Finance Corp. 6% 2/1/23 | | 510 | | 505 |
Weyerhaeuser Real Estate Co.: | | | | |
4.375% 6/15/19 (g) | | 745 | | 745 |
5.875% 6/15/24 (g) | | 540 | | 551 |
| | 126,340 |
TOTAL FINANCIALS | | 1,430,364 |
Corporate Bonds - continued |
| Principal Amount (000s) | | Value (000s) |
Nonconvertible Bonds - continued |
HEALTH CARE - 0.8% |
Biotechnology - 0.2% |
Amgen, Inc.: | | | | |
1.25% 5/22/17 | | $ 11,041 | | $ 11,038 |
2.2% 5/22/19 | | 27,392 | | 27,363 |
| | 38,401 |
Health Care Equipment & Supplies - 0.0% |
Aviv Healthcare Properties LP/Aviv Healthcare Capital Corp.: | | | | |
6% 10/15/21 | | 410 | | 433 |
7.75% 2/15/19 | | 2,945 | | 3,114 |
Teleflex, Inc. 6.875% 6/1/19 | | 1,665 | | 1,761 |
| | 5,308 |
Health Care Providers & Services - 0.4% |
Catamaran Corp. 4.75% 3/15/21 (Reg. S) | | 1,120 | | 1,128 |
Community Health Systems, Inc.: | | | | |
5.125% 8/1/21 (g) | | 840 | | 861 |
6.875% 2/1/22 (g) | | 1,115 | | 1,185 |
Coventry Health Care, Inc. 5.95% 3/15/17 | | 1,030 | | 1,146 |
DaVita HealthCare Partners, Inc.: | | | | |
5.125% 7/15/24 | | 2,535 | | 2,571 |
5.75% 8/15/22 | | 1,215 | | 1,295 |
6.625% 11/1/20 | | 1,555 | | 1,641 |
Envision Healthcare Corp. 5.125% 7/1/22 (g) | | 1,040 | | 1,050 |
Express Scripts Holding Co.: | | | | |
3.9% 2/15/22 | | 1,585 | | 1,675 |
4.75% 11/15/21 | | 14,348 | | 15,959 |
HCA Holdings, Inc.: | | | | |
4.75% 5/1/23 | | 2,715 | | 2,739 |
5% 3/15/24 | | 1,755 | | 1,788 |
5.875% 3/15/22 | | 9,745 | | 10,598 |
5.875% 5/1/23 | | 2,555 | | 2,721 |
6.25% 2/15/21 | | 1,415 | | 1,539 |
6.5% 2/15/20 | | 10,450 | | 11,691 |
7.5% 2/15/22 | | 3,250 | | 3,786 |
7.75% 5/15/21 | | 5,585 | | 6,088 |
HealthSouth Corp. 5.75% 11/1/24 | | 780 | | 819 |
McKesson Corp. 2.284% 3/15/19 | | 5,400 | | 5,402 |
Medco Health Solutions, Inc.: | | | | |
2.75% 9/15/15 | | 3,610 | | 3,690 |
Corporate Bonds - continued |
| Principal Amount (000s) | | Value (000s) |
Nonconvertible Bonds - continued |
HEALTH CARE - continued |
Health Care Providers & Services - continued |
Medco Health Solutions, Inc.: - continued | | | | |
4.125% 9/15/20 | | $ 3,728 | | $ 3,995 |
Sabra Health Care LP/Sabra Capital Corp. 5.5% 2/1/21 | | 625 | | 651 |
Tenet Healthcare Corp.: | | | | |
4.375% 10/1/21 | | 5,470 | | 5,429 |
4.5% 4/1/21 | | 1,030 | | 1,033 |
5% 3/1/19 (g) | | 1,690 | | 1,711 |
6% 10/1/20 | | 1,145 | | 1,242 |
8.125% 4/1/22 | | 4,590 | | 5,284 |
WellPoint, Inc. 1.875% 1/15/18 | | 161 | | 162 |
| | 98,879 |
Health Care Technology - 0.0% |
IMS Health, Inc. 6% 11/1/20 (g) | | 715 | | 752 |
Life Sciences Tools & Services - 0.0% |
Thermo Fisher Scientific, Inc.: | | | | |
1.3% 2/1/17 | | 1,499 | | 1,500 |
2.4% 2/1/19 | | 945 | | 955 |
| | 2,455 |
Pharmaceuticals - 0.2% |
AbbVie, Inc. 1.75% 11/6/17 | | 5,738 | | 5,767 |
Actavis Funding SCS: | | | | |
1.3% 6/15/17 (g) | | 10,935 | | 10,908 |
2.45% 6/15/19 (g) | | 3,241 | | 3,230 |
Forest Laboratories, Inc. 4.375% 2/1/19 (g) | | 2,160 | | 2,327 |
Grifols Worldwide Operations Ltd. 5.25% 4/1/22 (g) | | 1,665 | | 1,711 |
Mylan, Inc. 1.35% 11/29/16 | | 1,757 | | 1,759 |
Perrigo Co. PLC: | | | | |
1.3% 11/8/16 (g) | | 1,437 | | 1,435 |
2.3% 11/8/18 (g) | | 1,537 | | 1,534 |
Pinnacle Merger Sub, Inc. 9.5% 10/1/23 (g) | | 830 | | 911 |
Salix Pharmaceuticals Ltd. 6% 1/15/21 (g) | | 360 | | 391 |
Valeant Pharmaceuticals International: | | | | |
5.625% 12/1/21 (g) | | 810 | | 824 |
6.75% 8/15/18 (g) | | 3,620 | | 3,873 |
7.5% 7/15/21 (g) | | 2,320 | | 2,529 |
VPI Escrow Corp. 6.375% 10/15/20 (g) | | 1,445 | | 1,512 |
Corporate Bonds - continued |
| Principal Amount (000s) | | Value (000s) |
Nonconvertible Bonds - continued |
HEALTH CARE - continued |
Pharmaceuticals - continued |
Watson Pharmaceuticals, Inc. 1.875% 10/1/17 | | $ 1,940 | | $ 1,948 |
Zoetis, Inc. 1.875% 2/1/18 | | 898 | | 898 |
| | 41,557 |
TOTAL HEALTH CARE | | 187,352 |
INDUSTRIALS - 0.5% |
Aerospace & Defense - 0.1% |
BAE Systems Holdings, Inc. 6.375% 6/1/19 (g) | | 3,650 | | 4,274 |
DigitalGlobe, Inc. 5.25% 2/1/21 (g) | | 425 | | 421 |
GenCorp, Inc. 7.125% 3/15/21 | | 2,250 | | 2,424 |
TransDigm, Inc.: | | | | |
6% 7/15/22 (g) | | 1,155 | | 1,175 |
6.5% 7/15/24 (g) | | 1,135 | | 1,163 |
Triumph Group, Inc. 5.25% 6/1/22 (g) | | 490 | | 489 |
| | 9,946 |
Airlines - 0.0% |
Continental Airlines, Inc.: | | | | |
pass-thru trust certificates: | | | | |
8.388% 5/1/22 | | 30 | | 32 |
9.798% 4/1/21 | | 2,413 | | 2,763 |
6.125% 4/29/18 | | 415 | | 440 |
6.648% 3/15/19 | | 1,696 | | 1,807 |
6.9% 7/2/19 | | 652 | | 698 |
U.S. Airways pass-thru trust certificates: | | | | |
6.85% 1/30/18 | | 1,511 | | 1,634 |
8.36% 1/20/19 | | 1,137 | | 1,262 |
| | 8,636 |
Building Products - 0.0% |
HMAN Finance Sub Corp. 6.375% 7/15/22 (g) | | 510 | | 509 |
Nortek, Inc. 8.5% 4/15/21 | | 925 | | 1,006 |
USG Corp.: | | | | |
5.875% 11/1/21 (g) | | 255 | | 266 |
6.3% 11/15/16 | | 170 | | 181 |
7.875% 3/30/20 (g) | | 905 | | 986 |
9.75% 1/15/18 | | 975 | | 1,148 |
| | 4,096 |
Corporate Bonds - continued |
| Principal Amount (000s) | | Value (000s) |
Nonconvertible Bonds - continued |
INDUSTRIALS - continued |
Commercial Services & Supplies - 0.1% |
ADT Corp. 6.25% 10/15/21 | | $ 1,140 | | $ 1,206 |
APX Group, Inc.: | | | | |
6.375% 12/1/19 | | 5,170 | | 5,248 |
8.75% 12/1/20 | | 5,670 | | 5,642 |
ARAMARK Corp. 5.75% 3/15/20 | | 1,345 | | 1,409 |
Cenveo Corp. 6% 8/1/19 (g) | | 730 | | 721 |
Clean Harbors, Inc. 5.125% 6/1/21 | | 740 | | 751 |
Covanta Holding Corp.: | | | | |
6.375% 10/1/22 | | 875 | | 938 |
7.25% 12/1/20 | | 775 | | 837 |
Garda World Security Corp.: | | | | |
7.25% 11/15/21 (g) | | 200 | | 205 |
7.25% 11/15/21 (g) | | 525 | | 537 |
LBC Tank Terminals Holding Netherlands BV 6.875% 5/15/23 (g) | | 215 | | 230 |
Quad/Graphics, Inc. 7% 5/1/22 (g) | | 385 | | 380 |
R.R. Donnelley & Sons Co.: | | | | |
6% 4/1/24 | | 550 | | 551 |
6.5% 11/15/23 | | 1,685 | | 1,740 |
TMS International Corp. 7.625% 10/15/21 (g) | | 255 | | 271 |
| | 20,666 |
Electrical Equipment - 0.0% |
Anixter International, Inc. 5.625% 5/1/19 | | 705 | | 744 |
Machinery - 0.0% |
Blueline Rent Finance Corp./Volvo 7% 2/1/19 (g) | | 475 | | 502 |
Briggs & Stratton Corp. 6.875% 12/15/20 | | 920 | | 1,024 |
Schaeffler Finance BV: | | | | |
4.25% 5/15/21 (g) | | 1,760 | | 1,756 |
4.75% 5/15/21 (g) | | 3,160 | | 3,223 |
Shale-Inland Holdings LLC/Shale-Inland Finance Corp. 8.75% 11/15/19 (g) | | 950 | | 988 |
TRAC Intermodal LLC/TRAC Intermodal Corp. 11% 8/15/19 | | 910 | | 1,019 |
| | 8,512 |
Marine - 0.1% |
Navios Maritime Acquisition Corp./Navios Acquisition Finance U.S., Inc. 8.125% 11/15/21 (g) | | 1,360 | | 1,414 |
Corporate Bonds - continued |
| Principal Amount (000s) | | Value (000s) |
Nonconvertible Bonds - continued |
INDUSTRIALS - continued |
Marine - continued |
Navios Maritime Holdings, Inc.: | | | | |
7.375% 1/15/22 (g) | | $ 4,630 | | $ 4,792 |
8.125% 2/15/19 | | 1,725 | | 1,792 |
Navios South American Logistics, Inc./Navios Logistics Finance U.S., Inc. 7.25% 5/1/22 (g) | | 1,160 | | 1,202 |
Ultrapetrol (Bahamas) Ltd. 8.875% 6/15/21 | | 785 | | 837 |
| | 10,037 |
Professional Services - 0.0% |
FTI Consulting, Inc. 6% 11/15/22 | | 1,515 | | 1,566 |
Road & Rail - 0.0% |
Hertz Corp.: | | | | |
5.875% 10/15/20 | | 1,120 | | 1,152 |
6.25% 10/15/22 | | 800 | | 834 |
Jurassic Holdings III, Inc. 6.875% 2/15/21 (Reg. S) (g) | | 1,115 | | 1,140 |
Western Express, Inc. 12.5% 4/15/15 (g) | | 3,725 | | 3,204 |
| | 6,330 |
Trading Companies & Distributors - 0.2% |
Ahern Rentals, Inc. 9.5% 6/15/18 (g) | | 285 | | 313 |
Air Lease Corp.: | | | | |
3.875% 4/1/21 | | 5,301 | | 5,354 |
4.75% 3/1/20 | | 4,617 | | 4,917 |
International Lease Finance Corp.: | | | | |
3.875% 4/15/18 | | 4,400 | | 4,472 |
5.75% 5/15/16 | | 1,840 | | 1,950 |
5.875% 8/15/22 | | 4,385 | | 4,791 |
6.25% 5/15/19 | | 3,035 | | 3,365 |
7.125% 9/1/18 (g) | | 5,560 | | 6,380 |
8.25% 12/15/20 | | 4,165 | | 5,092 |
8.625% 9/15/15 | | 4,640 | | 4,974 |
8.625% 1/15/22 | | 3,910 | | 4,907 |
NES Rentals Holdings, Inc. 7.875% 5/1/18 (g) | | 365 | | 386 |
VWR Funding, Inc. 7.25% 9/15/17 | | 2,695 | | 2,843 |
| | 49,744 |
TOTAL INDUSTRIALS | | 120,277 |
Corporate Bonds - continued |
| Principal Amount (000s) | | Value (000s) |
Nonconvertible Bonds - continued |
INFORMATION TECHNOLOGY - 0.3% |
Communications Equipment - 0.1% |
Alcatel-Lucent U.S.A., Inc.: | | | | |
4.625% 7/1/17 (g) | | $ 835 | | $ 848 |
6.75% 11/15/20 (g) | | 1,980 | | 2,094 |
Avaya, Inc. 7% 4/1/19 (g) | | 1,245 | | 1,239 |
Hughes Satellite Systems Corp. 6.5% 6/15/19 | | 7,595 | | 8,355 |
Lucent Technologies, Inc.: | | | | |
6.45% 3/15/29 | | 10,451 | | 10,216 |
6.5% 1/15/28 | | 1,110 | | 1,088 |
| | 23,840 |
Electronic Equipment & Components - 0.0% |
Infor U.S., Inc. 9.375% 4/1/19 | | 755 | | 831 |
Sanmina Corp. 4.375% 6/1/19 (g) | | 1,295 | | 1,305 |
Tyco Electronics Group SA: | | | | |
1.6% 2/3/15 | | 156 | | 157 |
2.375% 12/17/18 | | 1,087 | | 1,097 |
6.55% 10/1/17 | | 815 | | 934 |
| | 4,324 |
Internet Software & Services - 0.0% |
CyrusOne LP/CyrusOne Finance Corp. 6.375% 11/15/22 | | 885 | | 936 |
VeriSign, Inc. 4.625% 5/1/23 | | 3,395 | | 3,336 |
| | 4,272 |
IT Services - 0.1% |
Audatex North America, Inc. 6% 6/15/21 (g) | | 4,565 | | 4,839 |
CDW LLC/CDW Finance Corp. 6% 8/15/22 | | 1,670 | | 1,760 |
Ceridian Corp. 8.875% 7/15/19 (g) | | 1,110 | | 1,243 |
Ceridian LLC / Comdata, Inc. 8.125% 11/15/17 (g) | | 1,395 | | 1,414 |
Compiler Finance Sub, Inc. 7% 5/1/21 (g) | | 710 | | 678 |
First Data Corp.: | | | | |
6.75% 11/1/20 (g) | | 4,035 | | 4,368 |
11.25% 1/15/21 | | 1,918 | | 2,230 |
11.75% 8/15/21 | | 497 | | 588 |
SunGard Data Systems, Inc. 6.625% 11/1/19 | | 2,205 | | 2,310 |
Xerox Corp.: | | | | |
2.95% 3/15/17 | | 947 | | 985 |
4.25% 2/15/15 | | 1,130 | | 1,149 |
| | 21,564 |
Corporate Bonds - continued |
| Principal Amount (000s) | | Value (000s) |
Nonconvertible Bonds - continued |
INFORMATION TECHNOLOGY - continued |
Semiconductors & Semiconductor Equipment - 0.0% |
Entegris, Inc. 6% 4/1/22 (g) | | $ 365 | | $ 376 |
Micron Technology, Inc. 5.875% 2/15/22 (g) | | 880 | | 943 |
NXP BV/NXP Funding LLC 5.75% 2/15/21 (g) | | 1,595 | | 1,675 |
| | 2,994 |
Software - 0.1% |
Activision Blizzard, Inc. 6.125% 9/15/23 (g) | | 1,255 | | 1,381 |
BMC Software Finance, Inc. 8.125% 7/15/21 (g) | | 2,645 | | 2,671 |
Boxer Parent Co., Inc. 9% 10/15/19 pay-in-kind (g)(k) | | 1,720 | | 1,651 |
Infor Software Parent LLC/Infor Software Parent, Inc. 7.125% 5/1/21 pay-in-kind (g)(k) | | 545 | | 555 |
| | 6,258 |
Technology Hardware, Storage & Peripherals - 0.0% |
Seagate HDD Cayman 4.75% 1/1/25 (g) | | 1,815 | | 1,851 |
TOTAL INFORMATION TECHNOLOGY | | 65,103 |
MATERIALS - 0.2% |
Chemicals - 0.1% |
Hexion U.S. Finance Corp. 6.625% 4/15/20 | | 2,810 | | 2,958 |
LSB Industries, Inc. 7.75% 8/1/19 | | 425 | | 464 |
PolyOne Corp. 5.25% 3/15/23 | | 1,360 | | 1,404 |
SPCM SA 6% 1/15/22 (g) | | 555 | | 594 |
Trinseo Materials Operating SCA/Trinseo Materials Finance, Inc. 8.75% 2/1/19 | | 5,963 | | 6,395 |
U.S. Coatings Acquisition, Inc./Flash Dutch 2 BV 7.375% 5/1/21 (g) | | 585 | | 638 |
| | 12,453 |
Construction Materials - 0.0% |
Calcipar SA 6.875% 5/1/18 (g) | | 720 | | 749 |
CEMEX Finance LLC 6% 4/1/24 (g) | | 1,600 | | 1,664 |
CEMEX S.A.B. de CV 5.2341% 9/30/15 (g)(k) | | 2,815 | | 2,898 |
CRH America, Inc. 6% 9/30/16 | | 2,470 | | 2,711 |
Prince Mineral Holding Corp. 12% 12/15/19 (g) | | 405 | | 454 |
| | 8,476 |
Containers & Packaging - 0.0% |
Ardagh Finance Holdings SA 8.625% 6/15/19 pay-in-kind (g)(k) | | 805 | | 820 |
Ardagh Packaging Finance PLC 9.125% 10/15/20 (g) | | 685 | | 750 |
Corporate Bonds - continued |
| Principal Amount (000s) | | Value (000s) |
Nonconvertible Bonds - continued |
MATERIALS - continued |
Containers & Packaging - continued |
Ardagh Packaging Finance PLC/Ardagh MP Holdings U.S.A., Inc.: | | | | |
6% 6/30/21 (g) | | $ 495 | | $ 490 |
6.25% 1/31/19 (g) | | 680 | | 687 |
6.75% 1/31/21 (g) | | 785 | | 801 |
7% 11/15/20 (g) | | 126 | | 128 |
9.125% 10/15/20 (g) | | 690 | | 752 |
Consolidated Container Co. LLC/Consolidated Container Capital, Inc. 10.125% 7/15/20 (g) | | 555 | | 552 |
Crown Americas LLC/Crown Americas Capital Corp. III 6.25% 2/1/21 | | 2,040 | | 2,178 |
Owens-Illinois, Inc. 7.8% 5/15/18 | | 350 | | 403 |
Sealed Air Corp. 6.5% 12/1/20 (g) | | 1,065 | | 1,172 |
Tekni-Plex, Inc. 9.75% 6/1/19 (g) | | 724 | | 795 |
| | 9,528 |
Metals & Mining - 0.1% |
Bluescope Steel Ltd./Bluescope Steel Finance 7.125% 5/1/18 (g) | | 255 | | 268 |
Corporacion Nacional del Cobre de Chile (Codelco): | | | | |
3.875% 11/3/21 (g) | | 7,189 | | 7,526 |
4.25% 7/17/42 (g) | | 1,226 | | 1,157 |
5.625% 10/18/43 (g) | | 2,382 | | 2,750 |
Edgen Murray Corp. 8.75% 11/1/20 (g) | | 737 | | 825 |
FMG Resources (August 2006) Pty Ltd. 6% 4/1/17 (g) | | 340 | | 354 |
JMC Steel Group, Inc. 8.25% 3/15/18 (g) | | 5,635 | | 5,705 |
New Gold, Inc.: | | | | |
6.25% 11/15/22 (g) | | 615 | | 646 |
7% 4/15/20 (g) | | 345 | | 367 |
Ryerson, Inc./Joseph T Ryerson & Son, Inc.: | | | | |
9% 10/15/17 | | 3,375 | | 3,594 |
11.25% 10/15/18 | | 1,130 | | 1,254 |
Signode Industrial Group Lux SA/Signode Industrial Group U.S., Inc. 6.375% 5/1/22 (g) | | 595 | | 592 |
Steel Dynamics, Inc. 6.375% 8/15/22 | | 990 | | 1,059 |
Walter Energy, Inc.: | | | | |
9.5% 10/15/19 (g) | | 1,115 | | 1,112 |
11% 4/1/20 pay-in-kind (g)(k) | | 885 | | 666 |
| | 27,875 |
Corporate Bonds - continued |
| Principal Amount (000s) | | Value (000s) |
Nonconvertible Bonds - continued |
MATERIALS - continued |
Paper & Forest Products - 0.0% |
Clearwater Paper Corp. 4.5% 2/1/23 | | $ 1,250 | | $ 1,213 |
TOTAL MATERIALS | | 59,545 |
TELECOMMUNICATION SERVICES - 1.3% |
Diversified Telecommunication Services - 1.0% |
Altice Financing SA: | | | | |
6.5% 1/15/22 (g) | | 2,300 | | 2,421 |
7.875% 12/15/19 (g) | | 550 | | 595 |
Altice Finco SA: | | | | |
8.125% 1/15/24 (g) | | 315 | | 343 |
9.875% 12/15/20 (g) | | 585 | | 664 |
BellSouth Capital Funding Corp. 7.875% 2/15/30 | | 68 | | 93 |
Broadview Networks Holdings, Inc. 10.5% 11/15/17 | | 1,908 | | 1,874 |
CenturyLink, Inc.: | | | | |
5.15% 6/15/17 | | 440 | | 470 |
6% 4/1/17 | | 3,101 | | 3,357 |
6.15% 9/15/19 | | 3,331 | | 3,639 |
Eileme 2 AB 11.625% 1/31/20 (g) | | 1,725 | | 2,010 |
Embarq Corp.: | | | | |
7.082% 6/1/16 | | 3,728 | | 4,101 |
7.995% 6/1/36 | | 30,321 | | 34,108 |
FairPoint Communications, Inc. 8.75% 8/15/19 (g) | | 1,340 | | 1,430 |
Intelsat Luxembourg SA: | | | | |
7.75% 6/1/21 | | 4,960 | | 5,233 |
8.125% 6/1/23 | | 1,090 | | 1,180 |
Level 3 Communications, Inc. 8.875% 6/1/19 | | 435 | | 470 |
Level 3 Escrow II, Inc. 5.375% 8/15/22 (g) | | 2,110 | | 2,121 |
Level 3 Financing, Inc.: | | | | |
6.125% 1/15/21 (g) | | 1,405 | | 1,482 |
7% 6/1/20 | | 1,460 | | 1,573 |
Lynx I Corp. 5.375% 4/15/21 (g) | | 770 | | 801 |
Lynx II Corp. 6.375% 4/15/23 (g) | | 435 | | 463 |
Sprint Capital Corp.: | | | | |
6.875% 11/15/28 | | 1,055 | | 1,029 |
6.9% 5/1/19 | | 3,975 | | 4,268 |
8.75% 3/15/32 | | 1,985 | | 2,213 |
Verizon Communications, Inc.: | | | | |
2.5% 9/15/16 | | 77,224 | | 79,617 |
Corporate Bonds - continued |
| Principal Amount (000s) | | Value (000s) |
Nonconvertible Bonds - continued |
TELECOMMUNICATION SERVICES - continued |
Diversified Telecommunication Services - continued |
Verizon Communications, Inc.: - continued | | | | |
4.5% 9/15/20 | | $ 38,502 | | $ 42,305 |
5.012% 8/21/54 (g) | | 19,396 | | 20,259 |
6.1% 4/15/18 | | 1,909 | | 2,195 |
6.25% 4/1/37 | | 3,729 | | 4,610 |
6.4% 9/15/33 | | 5,323 | | 6,724 |
6.55% 9/15/43 | | 6,925 | | 8,927 |
Wind Acquisition Finance SA 4.75% 7/15/20 (g) | | 3,135 | | 3,143 |
| | 243,718 |
Wireless Telecommunication Services - 0.3% |
America Movil S.A.B. de CV: | | | | |
2.375% 9/8/16 | | 307 | | 314 |
3.625% 3/30/15 | | 2,672 | | 2,715 |
Clearwire Communications LLC/Clearwire Finance, Inc. 14.75% 12/1/16 (g) | | 3,050 | | 3,851 |
Digicel Group Ltd.: | | | | |
6% 4/15/21 (g) | | 2,805 | | 2,889 |
7% 2/15/20 (g) | | 275 | | 289 |
7.125% 4/1/22 (g) | | 2,200 | | 2,283 |
8.25% 9/30/20 (g) | | 6,270 | | 6,772 |
Intelsat Jackson Holdings SA: | | | | |
5.5% 8/1/23 | | 3,415 | | 3,402 |
6.625% 12/15/22 (Reg. S) | | 5,045 | | 5,272 |
7.5% 4/1/21 | | 3,895 | | 4,216 |
SBA Communications Corp. 5.625% 10/1/19 | | 1,870 | | 1,961 |
Sprint Communications, Inc.: | | | | |
6% 11/15/22 | | 9,365 | | 9,342 |
9% 11/15/18 (g) | | 6,595 | | 7,840 |
Sprint Corp.: | | | | |
7.125% 6/15/24 (g) | | 1,500 | | 1,530 |
7.25% 9/15/21 (g) | | 2,575 | | 2,730 |
7.875% 9/15/23 (g) | | 2,575 | | 2,762 |
T-Mobile U.S.A., Inc.: | | | | |
5.25% 9/1/18 | | 940 | | 969 |
6.25% 4/1/21 | | 2,010 | | 2,085 |
6.464% 4/28/19 | | 420 | | 438 |
6.542% 4/28/20 | | 1,475 | | 1,549 |
6.625% 4/1/23 | | 3,005 | | 3,163 |
Corporate Bonds - continued |
| Principal Amount (000s) | | Value (000s) |
Nonconvertible Bonds - continued |
TELECOMMUNICATION SERVICES - continued |
Wireless Telecommunication Services - continued |
T-Mobile U.S.A., Inc.: - continued | | | | |
6.633% 4/28/21 | | $ 1,335 | | $ 1,405 |
6.731% 4/28/22 | | 985 | | 1,039 |
6.836% 4/28/23 | | 385 | | 409 |
| | 69,225 |
TOTAL TELECOMMUNICATION SERVICES | | 312,943 |
UTILITIES - 1.0% |
Electric Utilities - 0.6% |
AmerenUE 6.4% 6/15/17 | | 4,026 | | 4,542 |
Duquesne Light Holdings, Inc.: | | | | |
5.9% 12/1/21 (g) | | 3,934 | | 4,626 |
6.4% 9/15/20 (g) | | 8,922 | | 10,558 |
Edison International 3.75% 9/15/17 | | 3,355 | | 3,568 |
FirstEnergy Corp.: | | | | |
2.75% 3/15/18 | | 7,307 | | 7,390 |
4.25% 3/15/23 | | 19,274 | | 19,434 |
7.375% 11/15/31 | | 29,278 | | 35,581 |
FirstEnergy Solutions Corp. 6.05% 8/15/21 | | 9,830 | | 10,926 |
IPALCO Enterprises, Inc. 7.25% 4/1/16 (g) | | 3,670 | | 3,954 |
LG&E and KU Energy LLC: | | | | |
2.125% 11/15/15 | | 3,785 | | 3,834 |
3.75% 11/15/20 | | 745 | | 784 |
Mirant Americas Generation LLC 9.125% 5/1/31 | | 460 | | 447 |
Nevada Power Co.: | | | | |
6.5% 5/15/18 | | 5,100 | | 5,947 |
6.5% 8/1/18 | | 1,191 | | 1,400 |
Northeast Utilities 1.45% 5/1/18 | | 1,511 | | 1,496 |
NV Energy, Inc. 6.25% 11/15/20 | | 1,666 | | 1,981 |
Pennsylvania Electric Co. 6.05% 9/1/17 | | 450 | | 506 |
Pepco Holdings, Inc. 2.7% 10/1/15 | | 3,805 | | 3,877 |
Progress Energy, Inc. 4.4% 1/15/21 | | 336 | | 372 |
RJS Power Holdings LLC 5.125% 7/15/19 (g) | | 2,235 | | 2,255 |
West Penn Power Co. 5.95% 12/15/17 (g) | | 10,500 | | 11,795 |
| | 135,273 |
Corporate Bonds - continued |
| Principal Amount (000s) | | Value (000s) |
Nonconvertible Bonds - continued |
UTILITIES - continued |
Gas Utilities - 0.0% |
AmeriGas Finance LLC/AmeriGas Finance Corp.: | | | | |
6.75% 5/20/20 | | $ 830 | | $ 884 |
7% 5/20/22 | | 1,785 | | 1,937 |
Southern Natural Gas Co. 5.9% 4/1/17 (g) | | 260 | | 289 |
Southern Natural Gas Co./Southern Natural Issuing Corp. 4.4% 6/15/21 | | 1,753 | | 1,877 |
Star Gas Partners LP/Star Gas Finance Co. 8.875% 12/1/17 | | 950 | | 990 |
Texas Eastern Transmission LP 6% 9/15/17 (g) | | 948 | | 1,061 |
| | 7,038 |
Independent Power Producers & Energy Traders - 0.2% |
Calpine Corp.: | | | | |
5.375% 1/15/23 | | 1,475 | | 1,490 |
5.75% 1/15/25 | | 635 | | 641 |
6% 1/15/22 (g) | | 1,115 | | 1,201 |
7.875% 1/15/23 (g) | | 2,827 | | 3,138 |
Energy Future Intermediate Holding Co. LLC/Energy Future Intermediate Holding Finance, Inc.: | | | | |
11% 10/1/21 | | 4,208 | | 4,566 |
12.25% 12/1/18 pay-in-kind (d)(g)(k) | | 571 | | 674 |
12.25% 3/1/22 (g) | | 13,655 | | 15,464 |
GenOn Energy, Inc. 9.875% 10/15/20 | | 1,743 | | 1,839 |
NRG Energy, Inc. 6.625% 3/15/23 | | 2,550 | | 2,703 |
The AES Corp.: | | | | |
4.875% 5/15/23 | | 445 | | 437 |
5.5% 3/15/24 | | 745 | | 758 |
7.375% 7/1/21 | | 1,580 | | 1,809 |
7.75% 10/15/15 | | 1,439 | | 1,529 |
TXU Corp.: | | | | |
5.55% 11/15/14 | | 61 | | 54 |
6.5% 11/15/24 | | 3,550 | | 3,160 |
6.55% 11/15/34 | | 7,200 | | 6,408 |
| | 45,871 |
Multi-Utilities - 0.2% |
Dominion Resources, Inc.: | | | | |
2.5341% 9/30/66 (k) | | 16,925 | | 15,636 |
7.5% 6/30/66 (k) | | 2,474 | | 2,677 |
MidAmerican Energy Holdings, Co. 2% 11/15/18 | | 5,919 | | 5,925 |
Corporate Bonds - continued |
| Principal Amount (000s) | | Value (000s) |
Nonconvertible Bonds - continued |
UTILITIES - continued |
Multi-Utilities - continued |
National Grid PLC 6.3% 8/1/16 | | $ 845 | | $ 929 |
NiSource Finance Corp.: | | | | |
4.45% 12/1/21 | | 2,441 | | 2,648 |
5.25% 9/15/17 | | 1,120 | | 1,242 |
5.45% 9/15/20 | | 5,259 | | 5,986 |
6.4% 3/15/18 | | 2,468 | | 2,843 |
6.8% 1/15/19 | | 2,710 | | 3,213 |
PG&E Corp. 2.4% 3/1/19 | | 791 | | 799 |
Puget Energy, Inc. 6% 9/1/21 | | 691 | | 812 |
Sempra Energy 2.3% 4/1/17 | | 5,903 | | 6,049 |
Wisconsin Energy Corp. 6.25% 5/15/67 (k) | | 3,876 | | 4,026 |
| | 52,785 |
TOTAL UTILITIES | | 240,967 |
TOTAL NONCONVERTIBLE BONDS | | 3,191,993 |
TOTAL CORPORATE BONDS (Cost $3,042,087) |
3,194,839
|
U.S. Treasury Obligations - 2.9% |
|
U.S. Treasury Bonds: | | | | |
3.125% 8/15/44 | | 93,875 | | 94,740 |
3.375% 5/15/44 (j) | | 138,435 | | 146,568 |
U.S. Treasury Notes: | | | | |
0.25% 9/30/15 | | 216,401 | | 216,655 |
0.875% 7/15/17 | | 247,000 | | 246,711 |
TOTAL U.S. TREASURY OBLIGATIONS (Cost $693,697) |
704,674
|
U.S. Government Agency - Mortgage Securities - 3.4% |
|
Fannie Mae - 3.0% |
2.053% 6/1/36 (k) | | 126 | | 135 |
2.458% 7/1/37 (k) | | 258 | | 276 |
2.5% 1/1/43 to 4/1/43 | | 1,095 | | 1,052 |
3% 5/1/27 to 3/1/44 | | 29,262 | | 29,175 |
U.S. Government Agency - Mortgage Securities - continued |
| Principal Amount (000s) | | Value (000s) |
Fannie Mae - continued |
3% 9/1/29 (i) | | $ 6,000 | | $ 6,219 |
3% 9/1/44 (i) | | 12,100 | | 12,042 |
3% 9/1/44 (i) | | 60,800 | | 60,510 |
3.5% 1/1/34 to 1/1/44 | | 232,937 | | 239,527 |
3.5% 9/1/44 (i) | | 1,100 | | 1,132 |
3.5% 9/1/44 (i) | | 500 | | 515 |
3.5% 9/1/44 (i) | | 45,400 | | 46,732 |
4% 2/1/35 to 11/1/42 | | 21,400 | | 22,761 |
4% 9/1/44 (i) | | 10,400 | | 11,018 |
4% 9/1/44 (i) | | 44,300 | | 46,932 |
4% 9/1/44 (i) | | 14,100 | | 14,938 |
4% 9/1/44 (i) | | 14,300 | | 15,150 |
4% 9/1/44 (i) | | 2,900 | | 3,072 |
4% 10/1/44 (i) | | 4,000 | | 4,224 |
4% 10/1/44 (i) | | 9,000 | | 9,503 |
4% 10/1/44 (i) | | 13,300 | | 14,044 |
4% 10/1/44 (i) | | 14,100 | | 14,888 |
4% 10/1/44 (i) | | 14,300 | | 15,099 |
4.5% 11/1/19 to 8/1/44 | | 22,159 | | 23,947 |
4.5% 9/1/44 (i) | | 29,600 | | 31,961 |
4.5% 10/1/44 (i) | | 22,200 | | 23,912 |
5% 10/1/41 | | 3,404 | | 3,759 |
5% 9/1/44 (i) | | 7,900 | | 8,712 |
5% 9/1/44 (i) | | 14,100 | | 15,549 |
5.5% 8/1/37 | | 3,264 | | 3,657 |
5.5% 9/1/44 (i) | | 25,000 | | 27,806 |
5.5% 10/1/44 (i) | | 12,600 | | 13,992 |
6% 7/1/35 to 8/1/37 | | 3,385 | | 3,839 |
6.5% 7/1/32 to 8/1/36 | | 569 | | 657 |
TOTAL FANNIE MAE | | 726,735 |
Freddie Mac - 0.1% |
3.068% 10/1/35 (k) | | 159 | | 171 |
3.5% 6/1/42 to 10/1/43 | | 10,804 | | 11,080 |
4% 6/1/24 to 11/1/43 | | 5,407 | | 5,749 |
5% 3/1/19 | | 1,245 | | 1,319 |
5.5% 1/1/38 | | 686 | | 764 |
U.S. Government Agency - Mortgage Securities - continued |
| Principal Amount (000s) | | Value (000s) |
Freddie Mac - continued |
6% 7/1/37 to 8/1/37 | | $ 325 | | $ 366 |
6.5% 3/1/36 | | 2,095 | | 2,423 |
TOTAL FREDDIE MAC | | 21,872 |
Ginnie Mae - 0.3% |
3.5% 9/1/44 (i) | | 11,500 | | 11,958 |
3.5% 9/1/44 (i) | | 12,800 | | 13,309 |
4% 8/15/39 to 5/15/43 | | 5,627 | | 6,011 |
4% 9/1/44 (i) | | 12,500 | | 13,315 |
4.5% 9/1/44 (i) | | 11,900 | | 12,936 |
4.5% 9/1/44 (i) | | 8,500 | | 9,239 |
5% 2/15/39 to 5/15/39 | | 1,034 | | 1,140 |
5.5% 6/15/35 to 9/15/39 | | 3,096 | | 3,475 |
6% 2/15/34 | | 4,498 | | 5,148 |
TOTAL GINNIE MAE | | 76,531 |
TOTAL U.S. GOVERNMENT AGENCY - MORTGAGE SECURITIES (Cost $817,188) |
825,138
|
Asset-Backed Securities - 0.3% |
|
Accredited Mortgage Loan Trust Series 2005-1 Class M1, 0.625% 4/25/35 (k) | | 504 | | 438 |
ACE Securities Corp. Home Equity Loan Trust Series 2004-HE1 Class M2, 1.805% 3/25/34 (k) | | 227 | | 226 |
AmeriCredit Auto Receivables Trust Series 2013-4: | | | | |
Class C, 2.72% 9/9/19 | | 1,240 | | 1,266 |
Class D, 3.31% 10/8/19 | | 770 | | 785 |
Ameriquest Mortgage Securities, Inc. pass-thru certificates: | | | | |
Series 2003-10 Class M1, 1.205% 12/25/33 (k) | | 44 | | 40 |
Series 2004-R2 Class M3, 0.98% 4/25/34 (k) | | 68 | | 44 |
Series 2005-R2 Class M1, 0.605% 4/25/35 (k) | | 404 | | 403 |
Argent Securities, Inc. pass-thru certificates: | | | | |
Series 2003-W7 Class A2, 0.935% 3/25/34 (k) | | 36 | | 35 |
Series 2004-W11 Class M2, 1.205% 11/25/34 (k) | | 426 | | 409 |
Series 2004-W7 Class M1, 0.98% 5/25/34 (k) | | 1,108 | | 1,073 |
Series 2006-W4 Class A2C, 0.315% 5/25/36 (k) | | 909 | | 318 |
Asset Backed Securities Corp. Home Equity Loan Trust: | | | | |
Series 2004-HE2 Class M1, 0.98% 4/25/34 (k) | | 1,432 | | 1,315 |
Asset-Backed Securities - continued |
| Principal Amount (000s) | | Value (000s) |
Asset Backed Securities Corp. Home Equity Loan Trust: - continued | | | | |
Series 2006-HE2 Class M1, 0.525% 3/25/36 (k) | | $ 20 | | $ 2 |
Carrington Mortgage Loan Trust Series 2007-RFC1 Class A3, 0.295% 12/25/36 (k) | | 1,368 | | 928 |
CFC LLC Series 2013-1A Class A, 1.65% 7/17/17 (g) | | 518 | | 519 |
Countrywide Home Loans, Inc.: | | | | |
Series 2004-3 Class M4, 1.61% 4/25/34 (k) | | 60 | | 43 |
Series 2004-4 Class M2, 0.95% 6/25/34 (k) | | 160 | | 151 |
Series 2004-7 Class AF5, 5.868% 1/25/35 | | 1,888 | | 1,937 |
Fannie Mae Series 2004-T5 Class AB3, 0.9829% 5/28/35 (k) | | 30 | | 28 |
Fieldstone Mortgage Investment Corp. Series 2004-3 Class M5, 2.327% 8/25/34 (k) | | 221 | | 196 |
First Franklin Mortgage Loan Trust Series 2004-FF2 Class M3, 0.98% 3/25/34 (k) | | 11 | | 10 |
Fremont Home Loan Trust Series 2005-A: | | | | |
Class M3, 0.89% 1/25/35 (k) | | 720 | | 596 |
Class M4, 1.175% 1/25/35 (k) | | 264 | | 148 |
GCO Education Loan Funding Master Trust II Series 2007-1A Class C1L, 0.6149% 2/25/47 (g)(k) | | 1,403 | | 1,198 |
GE Business Loan Trust: | | | | |
Series 2003-1 Class A, 0.585% 4/15/31 (g)(k) | | 40 | | 38 |
Series 2006-2A: | | | | |
Class A, 0.335% 11/15/34 (g)(k) | | 714 | | 679 |
Class B, 0.435% 11/15/34 (g)(k) | | 258 | | 238 |
Class C, 0.535% 11/15/34 (g)(k) | | 429 | | 374 |
Class D, 0.905% 11/15/34 (g)(k) | | 163 | | 140 |
Home Equity Asset Trust: | | | | |
Series 2003-2 Class M1, 1.475% 8/25/33 (k) | | 206 | | 195 |
Series 2003-3 Class M1, 1.445% 8/25/33 (k) | | 386 | | 373 |
Series 2003-5 Class A2, 0.855% 12/25/33 (k) | | 25 | | 24 |
HSI Asset Securitization Corp. Trust Series 2007-HE1 Class 2A3, 0.345% 1/25/37 (k) | | 1,137 | | 707 |
JPMorgan Mortgage Acquisition Trust: | | | | |
Series 2006-NC2 Class M2, 0.452% 7/25/36 (k) | | 2,497 | | 429 |
Series 2007-CH1 Class AV4, 0.285% 11/25/36 (k) | | 746 | | 738 |
KeyCorp Student Loan Trust: | | | | |
Series 1999-A Class A2, 0.5639% 12/27/29 (k) | | 192 | | 191 |
Series 2006-A Class 2C, 1.3839% 3/27/42 (k) | | 2,016 | | 336 |
MASTR Asset Backed Securities Trust Series 2007-HE1 Class M1, 0.455% 5/25/37 (k) | | 351 | | 3 |
Meritage Mortgage Loan Trust Series 2004-1 Class M1, 0.905% 7/25/34 (k) | | 90 | | 72 |
Asset-Backed Securities - continued |
| Principal Amount (000s) | | Value (000s) |
Merrill Lynch Mortgage Investors Trust: | | | | |
Series 2003-OPT1 Class M1, 1.13% 7/25/34 (k) | | $ 350 | | $ 321 |
Series 2006-FM1 Class A2B, 0.265% 4/25/37 (k) | | 537 | | 483 |
Series 2006-OPT1 Class A1A, 0.675% 6/25/35 (k) | | 1,475 | | 1,408 |
Morgan Stanley ABS Capital I Trust: | | | | |
Series 2004-HE6 Class A2, 0.835% 8/25/34 (k) | | 44 | | 40 |
Series 2005-NC1 Class M1, 0.815% 1/25/35 (k) | | 303 | | 288 |
Series 2005-NC2 Class B1, 1.91% 3/25/35 (k) | | 185 | | 6 |
New Century Home Equity Loan Trust Series 2005-4 Class M2, 0.665% 9/25/35 (k) | | 1,083 | | 1,005 |
Park Place Securities, Inc.: | | | | |
Series 2004-WCW1: | | | | |
Class M3, 2.03% 9/25/34 (k) | | 405 | | 362 |
Class M4, 2.33% 9/25/34 (k) | | 519 | | 318 |
Series 2005-WCH1 Class M4, 0.985% 1/25/36 (k) | | 1,120 | | 984 |
Salomon Brothers Mortgage Securities VII, Inc. Series 2003-HE1 Class A, 0.955% 4/25/33 (k) | | 4 | | 4 |
Santander Drive Auto Receivables Trust: | | | | |
Series 2014-2 Class C, 2.33% 11/15/19 | | 5,443 | | 5,469 |
Series 2014-3: | | | | |
Class B, 1.45% 5/15/19 | | 19,055 | | 19,007 |
Class C, 2.13% 8/17/20 | | 19,051 | | 18,988 |
Saxon Asset Securities Trust Series 2004-1 Class M1, 0.95% 3/25/35 (k) | | 717 | | 656 |
SLM Private Credit Student Loan Trust Series 2004-A Class C, 1.1806% 6/15/33 (k) | | 691 | | 666 |
Structured Asset Investment Loan Trust Series 2004-8 Class M5, 1.88% 9/25/34 (k) | | 37 | | 30 |
Terwin Mortgage Trust Series 2003-4HE Class A1, 1.015% 9/25/34 (k) | | 22 | | 20 |
Trapeza CDO XII Ltd./Trapeza CDO XII, Inc. Series 2007-12A Class B, 0.7921% 4/6/42 (g)(k) | | 1,530 | | 688 |
Whinstone Capital Management Ltd. Series 1A Class B3, 2.0341% 10/25/44 (g)(k) | | 1,358 | | 1,372 |
TOTAL ASSET-BACKED SECURITIES (Cost $61,758) |
68,760
|
Collateralized Mortgage Obligations - 0.2% |
| Principal Amount (000s) | | Value (000s) |
Private Sponsor - 0.2% |
Bear Stearns ALT-A Trust floater Series 2005-1 Class A1, 0.715% 1/25/35 (k) | | $ 1,015 | | $ 1,010 |
Citigroup Mortgage Loan Trust sequential payer Series 2012-A Class A, 2.5% 6/25/51 (g) | | 3,026 | | 2,936 |
First Horizon Mortgage pass-thru Trust Series 2004-AR5 Class 2A1, 2.5706% 10/25/34 (k) | | 566 | | 566 |
Granite Master Issuer PLC: | | | | |
floater: | | | | |
Series 2006-1A: | | | | |
Class A1, 0.2255% 12/20/54 (g)(k) | | 4,295 | | 4,256 |
Class A5, 0.2955% 12/20/54 (g)(k) | | 3,198 | | 3,171 |
Series 2006-2 Class A4, 0.2355% 12/20/54 (k) | | 1,282 | | 1,257 |
Series 2006-3: | | | | |
Class A3, 0.2355% 12/20/54 (k) | | 617 | | 612 |
Class A7, 0.3555% 12/20/54 (k) | | 671 | | 665 |
Class M2, 0.7155% 12/20/54 (k) | | 4,540 | | 4,446 |
Series 2006-4: | | | | |
Class A4, 0.2555% 12/20/54 (k) | | 13,533 | | 13,414 |
Class B1, 0.3355% 12/20/54 (k) | | 3,154 | | 3,058 |
Class M1, 0.4955% 12/20/54 (k) | | 829 | | 802 |
Series 2007-1: | | | | |
Class 1B1, 0.2955% 12/20/54 (k) | | 5,012 | | 4,857 |
Class 1M1, 0.4555% 12/20/54 (k) | | 1,114 | | 1,081 |
Class 2A1, 0.2955% 12/20/54 (k) | | 1,544 | | 1,531 |
Class 2M1, 0.6555% 12/20/54 (k) | | 1,431 | | 1,397 |
Series 2007-2: | | | | |
Class 1B1, 0.315% 12/17/54 (k) | | 767 | | 744 |
Class 2C1, 1.015% 12/17/54 (k) | | 1,981 | | 1,923 |
Class 3A1, 0.335% 12/17/54 (k) | | 275 | | 273 |
sequential payer Series 2006-3 Class B2, 0.4955% 12/20/54 (k) | | 4,550 | | 4,446 |
Granite Mortgages PLC floater Series 2003-3 Class 1C, 2.6836% 1/20/44 (k) | | 326 | | 345 |
JPMorgan Mortgage Trust sequential payer Series 2006-A5 Class 3A5, 2.4718% 8/25/36 (k) | | 1,099 | | 940 |
MASTR Adjustable Rate Mortgages Trust Series 2007-3 Class 22A2, 0.365% 5/25/47 (k) | | 386 | | 322 |
Merrill Lynch Alternative Note Asset Trust floater Series 2007-OAR1 Class A1, 0.325% 2/25/37 (k) | | 705 | | 639 |
Opteum Mortgage Acceptance Corp. floater Series 2005-3 Class APT, 0.445% 7/25/35 (k) | | 1,012 | | 966 |
Collateralized Mortgage Obligations - continued |
| Principal Amount (000s) | | Value (000s) |
Private Sponsor - continued |
RESI Finance LP/RESI Finance DE Corp. floater Series 2003-B: | | | | |
Class B5, 2.507% 6/10/35 (g)(k) | | $ 383 | | $ 351 |
Class B6, 3.007% 6/10/35 (g)(k) | | 82 | | 76 |
Sequoia Mortgage Trust floater Series 2004-6 Class A3B, 1.2054% 7/20/34 (k) | | 20 | | 19 |
Structured Asset Securities Corp. Series 2003-15A Class 4A, 2.5124% 4/25/33 (k) | | 137 | | 138 |
TBW Mortgage-Backed pass-thru certificates floater Series 2006-4 Class A3, 0.355% 9/25/36 (k) | | 1,520 | | 1,366 |
Thornburg Mortgage Securities Trust floater Series 2003-4 Class A1, 0.795% 9/25/43 (k) | | 2,353 | | 2,311 |
TOTAL COLLATERALIZED MORTGAGE OBLIGATIONS (Cost $49,017) |
59,918
|
Commercial Mortgage Securities - 1.7% |
|
Asset Securitization Corp. Series 1997-D5 Class PS1, 1.4206% 2/14/43 (k)(m) | | 292 | | 6 |
Banc of America Commercial Mortgage Trust: | | | | |
sequential payer: | | | | |
Series 2006-2 Class AAB, 5.7129% 5/10/45 (k) | | 255 | | 259 |
Series 2006-3 Class A4, 5.889% 7/10/44 | | 7,407 | | 7,918 |
Series 2006-5 Class A2, 5.317% 9/10/47 | | 1,450 | | 1,454 |
Series 2006-6 Class A3, 5.369% 10/10/45 | | 1,824 | | 1,859 |
Series 2005-3 Class A3B, 5.09% 7/10/43 (k) | | 2,833 | | 2,883 |
Series 2006-6 Class E, 5.619% 10/10/45 (g) | | 527 | | 67 |
Series 2007-3: | | | | |
Class A3, 5.5647% 6/10/49 (k) | | 1,095 | | 1,093 |
Class A4, 5.5647% 6/10/49 (k) | | 1,901 | | 2,072 |
Banc of America Commercial Mortgage, Inc. sequential payer Series 2001-1 Class A4, 5.451% 1/15/49 | | 1,997 | | 2,141 |
Bayview Commercial Asset Trust: | | | | |
floater: | | | | |
Series 2003-2 Class M1, 1.43% 12/25/33 (g)(k) | | 30 | | 27 |
Series 2005-3A: | | | | |
Class A2, 0.555% 11/25/35 (g)(k) | | 273 | | 242 |
Class M1, 0.595% 11/25/35 (g)(k) | | 36 | | 26 |
Class M2, 0.645% 11/25/35 (g)(k) | | 45 | | 33 |
Class M3, 0.665% 11/25/35 (g)(k) | | 41 | | 29 |
Class M4, 0.755% 11/25/35 (g)(k) | | 51 | | 35 |
Commercial Mortgage Securities - continued |
| Principal Amount (000s) | | Value (000s) |
Bayview Commercial Asset Trust: - continued | | | | |
floater: | | | | |
Series 2005-4A: | | | | |
Class A2, 0.545% 1/25/36 (g)(k) | | $ 698 | | $ 613 |
Class B1, 1.555% 1/25/36 (g)(k) | | 32 | | 6 |
Class M1, 0.605% 1/25/36 (g)(k) | | 225 | | 132 |
Class M2, 0.625% 1/25/36 (g)(k) | | 68 | | 38 |
Class M3, 0.655% 1/25/36 (g)(k) | | 99 | | 53 |
Class M4, 0.765% 1/25/36 (g)(k) | | 55 | | 28 |
Class M5, 0.805% 1/25/36 (g)(k) | | 55 | | 22 |
Class M6, 0.855% 1/25/36 (g)(k) | | 58 | | 18 |
Series 2006-1: | | | | |
Class A2, 0.515% 4/25/36 (g)(k) | | 111 | | 97 |
Class M1, 0.535% 4/25/36 (g)(k) | | 40 | | 28 |
Class M2, 0.555% 4/25/36 (g)(k) | | 42 | | 28 |
Class M3, 0.575% 4/25/36 (g)(k) | | 36 | | 26 |
Class M4, 0.675% 4/25/36 (g)(k) | | 20 | | 15 |
Class M5, 0.715% 4/25/36 (g)(k) | | 20 | | 12 |
Class M6, 0.795% 4/25/36 (g)(k) | | 39 | | 27 |
Series 2006-2A: | | | | |
Class M1, 0.465% 7/25/36 (g)(k) | | 100 | | 77 |
Class M2, 0.485% 7/25/36 (g)(k) | | 71 | | 53 |
Class M3, 0.505% 7/25/36 (g)(k) | | 58 | | 41 |
Class M4, 0.575% 7/25/36 (g)(k) | | 39 | | 26 |
Class M5, 0.625% 7/25/36 (g)(k) | | 49 | | 22 |
Series 2006-3A Class M4, 0.585% 10/25/36 (g)(k) | | 46 | | 7 |
Series 2006-4A: | | | | |
Class A2, 0.425% 12/25/36 (g)(k) | | 2,085 | | 1,717 |
Class M1, 0.445% 12/25/36 (g)(k) | | 138 | | 94 |
Class M2, 0.465% 12/25/36 (g)(k) | | 92 | | 40 |
Class M3, 0.495% 12/25/36 (g)(k) | | 94 | | 40 |
Series 2007-1 Class A2, 0.425% 3/25/37 (g)(k) | | 436 | | 318 |
Series 2007-2A: | | | | |
Class A1, 0.425% 7/25/37 (g)(k) | | 449 | | 389 |
Class A2, 0.475% 7/25/37 (g)(k) | | 420 | | 306 |
Class M1, 0.525% 7/25/37 (g)(k) | | 148 | | 44 |
Class M2, 0.565% 7/25/37 (g)(k) | | 81 | | 10 |
Class M3, 0.645% 7/25/37 (g)(k) | | 82 | | 6 |
Class M4, 0.805% 7/25/37 (g)(k) | | 3 | | 0* |
Series 2007-3: | | | | |
Class A2, 0.445% 7/25/37 (g)(k) | | 433 | | 314 |
Class M1, 0.465% 7/25/37 (g)(k) | | 86 | | 55 |
Class M2, 0.495% 7/25/37 (g)(k) | | 92 | | 53 |
Commercial Mortgage Securities - continued |
| Principal Amount (000s) | | Value (000s) |
Bayview Commercial Asset Trust: - continued | | | | |
floater: | | | | |
Series 2007-3: | | | | |
Class M3, 0.525% 7/25/37 (g)(k) | | $ 144 | | $ 54 |
Class M4, 0.655% 7/25/37 (g)(k) | | 227 | | 49 |
Class M5, 0.755% 7/25/37 (g)(k) | | 113 | | 18 |
Series 2007-4A: | | | | |
Class M1, 1.102% 9/25/37 (g)(k) | | 175 | | 36 |
Class M2, 1.202% 9/25/37 (g)(k) | | 142 | | 12 |
Series 2004-1, Class IO, 1.25% 4/25/34 (g)(m) | | 1,035 | | 42 |
Series 2006-3A, Class IO, 0% 10/25/36 (g)(k)(m) | | 18,959 | | 0 |
Series 2007-5A, Class IO, 4.186% 10/25/37 (g)(k)(m) | | 2,813 | | 116 |
Bear Stearns Commercial Mortgage Securities Trust: | | | | |
floater Series 2007-BBA8: | | | | |
Class H, 0.705% 3/15/22 (g)(k) | | 136 | | 136 |
Class J, 0.855% 3/15/22 (g)(k) | | 452 | | 443 |
sequential payer: | | | | |
Series 2007-PW16: | | | | |
Class A4, 5.7071% 6/11/40 (k) | | 534 | | 586 |
Class AAB, 5.8973% 6/11/40 (k) | | 2,738 | | 2,814 |
Series 2007-PW18 Class A4, 5.7% 6/11/50 | | 4,380 | | 4,850 |
Series 2006-T22 Class A4, 5.5723% 4/12/38 (k) | | 110 | | 116 |
Series 2007-PW18 Class X2, 0.2917% 6/11/50 (g)(k)(m) | | 46,283 | | 221 |
Series 2007-T28 Class X2, 0.1374% 9/11/42 (g)(k)(m) | | 28,415 | | 57 |
Berkeley Federal Bank & Trust FSB Series 1994-1 Class B, 0% 8/1/24 (g)(k) | | 218 | | 143 |
C-BASS Trust floater Series 2006-SC1 Class A, 0.425% 5/25/36 (g)(k) | | 352 | | 343 |
CDC Commercial Mortgage Trust Series 2002-FX1 Class XCL, 1.4379% 5/15/35 (g)(k)(m) | | 1,919 | | 11 |
Citigroup Commercial Mortgage Trust Series 2007-C6 Class A4, 5.7096% 12/10/49 (k) | | 3,035 | | 3,346 |
Citigroup/Deutsche Bank Commercial Mortgage Trust sequential payer Series 2007-CD4: | | | | |
Class A3, 5.293% 12/11/49 | | 593 | | 602 |
Class A4, 5.322% 12/11/49 | | 12,448 | | 13,421 |
Cobalt CMBS Commercial Mortgage Trust Series 2007-C2 Class B, 5.617% 4/15/47 (k) | | 1,019 | | 985 |
COMM Mortgage Trust pass-thru certificates: | | | | |
floater Series 2005-F10A Class J, 1.005% 4/15/17 (g)(k) | | 96 | | 96 |
Commercial Mortgage Securities - continued |
| Principal Amount (000s) | | Value (000s) |
COMM Mortgage Trust pass-thru certificates: - continued | | | | |
sequential payer Series 2007-C9 Class A4, 5.7961% 12/10/49 (k) | | $ 2,018 | | $ 2,235 |
Credit Suisse Commercial Mortgage Trust: | | | | |
sequential payer: | | | | |
Series 2006-C4 Class A3, 5.467% 9/15/39 | | 959 | | 1,024 |
Series 2007-C2 Class A2, 5.448% 1/15/49 (k) | | 18 | | 17 |
Series 2007-C3 Class A4, 5.7022% 6/15/39 (k) | | 347 | | 373 |
Series 2007-C5 Class A4, 5.695% 9/15/40 (k) | | 825 | | 903 |
Credit Suisse First Boston Mortgage Capital Certificates floater Series 2007-TF2A Class B, 0.505% 4/15/22 (g)(k) | | 3,254 | | 3,190 |
Credit Suisse First Boston Mortgage Securities Corp.: | | | | |
Series 2001-CK6 Class AX, 1.463% 8/15/36 (k)(m) | | 38 | | 0* |
Series 2001-CKN5 Class AX, 0% 9/15/34 (g)(k)(m) | | 3 | | 0* |
Credit Suisse Mortgage Capital Certificates: | | | | |
floater Series 2007-TFL1 Class F, 0.475% 2/15/22 (g)(k) | | 42 | | 42 |
Series 2007-C1 Class B, 5.487% 2/15/40 (g)(k) | | 1,394 | | 174 |
Extended Stay America Trust floater Series 2013-ESFL: | | | | |
Class A1FL, 0.956% 12/5/31 (g)(k) | | 1,376 | | 1,376 |
Class A2FL, 0.856% 12/5/31 (g)(k) | | 1,380 | | 1,380 |
Class BFL, 1.256% 12/5/31 (g)(k) | | 5,070 | | 5,074 |
Class CFL, 1.656% 12/5/31 (g)(k) | | 3,690 | | 3,694 |
GE Capital Commercial Mortgage Corp.: | | | | |
sequential payer Series 2007-C1 Class A4, 5.543% 12/10/49 | | 10,052 | | 10,839 |
Series 2001-1 Class X1, 1.6605% 5/15/33 (g)(k)(m) | | 81 | | 0* |
Greenwich Capital Commercial Funding Corp.: | | | | |
sequential payer Series 2007-GG9 Class A4, 5.444% 3/10/39 | | 28,618 | | 30,964 |
Series 2006-GG7 Class A4, 5.8189% 7/10/38 (k) | | 3,713 | | 3,955 |
Series 2007-GG11 Class A1, 0.2924% 12/10/49 (g)(k)(m) | | 12,891 | | 0* |
GS Mortgage Securities Trust sequential payer Series 2006-GG8: | | | | |
Class A1A, 5.547% 11/10/39 | | 2,224 | | 2,393 |
Class A4, 5.56% 11/10/39 (k) | | 3,933 | | 4,222 |
Hilton U.S.A. Trust Series 2013-HLT: | | | | |
Class CFX, 3.7141% 11/5/30 (g) | | 1,180 | | 1,203 |
Class DFX, 4.4065% 11/5/30 (g) | | 11,029 | | 11,292 |
Commercial Mortgage Securities - continued |
| Principal Amount (000s) | | Value (000s) |
JPMorgan Chase Commercial Mortgage Securities Trust: | | | | |
floater: | | | | |
Series 2006-FL2A: | | | | |
Class E, 0.435% 11/15/18 (g)(k) | | $ 114 | | $ 113 |
Class F, 0.485% 11/15/18 (g)(k) | | 265 | | 257 |
Class G, 0.515% 11/15/18 (g)(k) | | 230 | | 218 |
Class H, 0.655% 11/15/18 (g)(k) | | 176 | | 166 |
Series 2014-BXH: | | | | |
Class C, 1.806% 4/15/27 (g)(k) | | 1,775 | | 1,775 |
Class D, 2.406% 4/15/27 (g)(k) | | 3,781 | | 3,781 |
sequential payer: | | | | |
Series 2006-CB17: | | | | |
Class A3, 5.45% 12/12/43 | | 44 | | 44 |
Class A4, 5.429% 12/12/43 | | 2,200 | | 2,349 |
Series 2006-LDP8: | | | | |
Class A1A, 5.397% 5/15/45 | | 7,505 | | 8,060 |
Class A4, 5.399% 5/15/45 | | 562 | | 600 |
Series 2006-LDP9 Class A3, 5.336% 5/15/47 | | 14,845 | | 15,966 |
Series 2007-CB19 Class A4, 5.7029% 2/12/49 (k) | | 3,228 | | 3,531 |
Series 2007-LD11: | | | | |
Class A2, 5.79% 6/15/49 (k) | | 90 | | 91 |
Class A4, 5.805% 6/15/49 (k) | | 31,964 | | 34,757 |
Series 2007-LDPX Class A3, 5.42% 1/15/49 | | 14,045 | | 15,203 |
Series 2006-LDP7 Class A4, 5.8657% 4/15/45 (k) | | 1,505 | | 1,604 |
Series 2007-LDP10 Class CS, 5.466% 1/15/49 (k) | | 75 | | 9 |
LB Commercial Conduit Mortgage Trust sequential payer Series 2007-C3 Class A4, 5.8927% 7/15/44 (k) | | 743 | | 817 |
LB Multi-family Mortgage Trust Series 1991-4 Class A1, 7.125% 4/25/21 (k) | | 8 | | 6 |
LB-UBS Commercial Mortgage Trust: | | | | |
sequential payer: | | | | |
Series 2006-C6 Class A4, 5.372% 9/15/39 | | 410 | | 440 |
Series 2006-C7 Class A2, 5.3% 11/15/38 | | 471 | | 485 |
Series 2007-C1 Class A4, 5.424% 2/15/40 | | 2,706 | | 2,931 |
Series 2007-C2 Class A3, 5.43% 2/15/40 | | 1,622 | | 1,766 |
Series 2007-C6 Class A4, 5.858% 7/15/40 (k) | | 1,074 | | 1,142 |
Series 2007-C7: | | | | |
Class A3, 5.866% 9/15/45 | | 1,390 | | 1,546 |
Class XCP, 0.2789% 9/15/45 (k)(m) | | 51,392 | | 37 |
Merrill Lynch Mortgage Trust: | | | | |
Series 2005-LC1 Class F, 5.4208% 1/12/44 (g)(k) | | 793 | | 755 |
Series 2007-C1 Class A4, 5.8385% 6/12/50 (k) | | 3,452 | | 3,817 |
Series 2008-C1 Class A4, 5.69% 2/12/51 | | 1,898 | | 2,102 |
Commercial Mortgage Securities - continued |
| Principal Amount (000s) | | Value (000s) |
Merrill Lynch-CFC Commercial Mortgage Trust: | | | | |
floater Series 2006-4 Class A2FL, 0.276% 12/12/49 (k) | | $ 45 | | $ 45 |
sequential payer: | | | | |
Series 2006-4 Class ASB, 5.133% 12/12/49 (k) | | 304 | | 313 |
Series 2007-5: | | | | |
Class A4, 5.378% 8/12/48 | | 7,276 | | 7,792 |
Class B, 5.479% 8/12/48 | | 2,736 | | 1,307 |
Series 2007-6 Class A4, 5.485% 3/12/51 (k) | | 7,400 | | 8,038 |
Series 2007-7 Class A4, 5.7432% 6/12/50 (k) | | 3,192 | | 3,489 |
Series 2006-4 Class XP, 0.6181% 12/12/49 (k)(m) | | 12,046 | | 21 |
Series 2007-6 Class B, 5.635% 3/12/51 (k) | | 912 | | 282 |
Series 2007-7 Class B, 5.7432% 6/12/50 (k) | | 79 | | 3 |
Series 2007-8 Class A3, 5.8831% 8/12/49 (k) | | 787 | | 866 |
Morgan Stanley Capital I Trust: | | | | |
floater: | | | | |
Series 2006-XLF Class C, 1.355% 7/15/19 (g)(k) | | 272 | | 244 |
Series 2007-XLFA: | | | | |
Class C, 0.315% 10/15/20 (g)(k) | | 523 | | 521 |
Class D, 0.345% 10/15/20 (g)(k) | | 507 | | 503 |
Class E, 0.405% 10/15/20 (g)(k) | | 634 | | 627 |
Class F, 0.455% 10/15/20 (g)(k) | | 380 | | 374 |
Class G, 0.495% 10/15/20 (g)(k) | | 470 | | 458 |
Class H, 0.585% 10/15/20 (g)(k) | | 296 | | 273 |
Class J, 0.735% 10/15/20 (g)(k) | | 171 | | 141 |
sequential payer Series 2007-HQ11 Class A31, 5.439% 2/12/44 (k) | | 95 | | 95 |
Series 2006-IQ11 Class A4, 5.6554% 10/15/42 (k) | | 230 | | 240 |
Series 2006-T23 Class A3, 5.8054% 8/12/41 (k) | | 402 | | 402 |
Series 2007-IQ14: | | | | |
Class A4, 5.692% 4/15/49 (k) | | 1,368 | | 1,495 |
Class AAB, 5.654% 4/15/49 | | 1,425 | | 1,467 |
Class B, 5.722% 4/15/49 (k) | | 224 | | 48 |
Salomon Brothers Mortgage Securities VII, Inc. Series 2006-C2 Class H, 6.308% 7/18/33 (g) | | 129 | | 46 |
Wachovia Bank Commercial Mortgage Trust: | | | | |
floater: | | | | |
Series 2006-WL7A: | | | | |
Class G, 0.515% 9/15/21 (g)(k) | | 676 | | 662 |
Class J, 0.755% 9/15/21 (g)(k) | | 300 | | 288 |
Series 2007-WHL8: | | | | |
Class F, 0.635% 6/15/20 (g)(k) | | 3,171 | | 3,046 |
Class LXR1, 0.855% 6/15/20 (g)(k) | | 112 | | 110 |
Commercial Mortgage Securities - continued |
| Principal Amount (000s) | | Value (000s) |
Wachovia Bank Commercial Mortgage Trust: - continued | | | | |
sequential payer: | | | | |
Series 2007-C30 Class A5, 5.342% 12/15/43 | | $ 15,721 | | $ 16,998 |
Series 2007-C31: | | | | |
Class A4, 5.509% 4/15/47 | | 47,617 | | 51,130 |
Class A5, 5.5% 4/15/47 | | 16,000 | | 17,518 |
Series 2007-C33: | | | | |
Class A4, 5.9414% 2/15/51 (k) | | 23,618 | | 25,615 |
Class A5, 5.9414% 2/15/51 (k) | | 10,259 | | 11,319 |
Series 2005-C19 Class B, 4.892% 5/15/44 | | 912 | | 929 |
Series 2005-C22: | | | | |
Class B, 5.3703% 12/15/44 (k) | | 2,022 | | 2,018 |
Class F, 5.3703% 12/15/44 (g)(k) | | 1,521 | | 416 |
Series 2006-C23 Class A5, 5.416% 1/15/45 (k) | | 5,005 | | 5,266 |
Series 2006-C27 Class A1A, 5.749% 7/15/45 (k) | | 7,939 | | 8,555 |
Series 2007-C30: | | | | |
Class C, 5.483% 12/15/43 (k) | | 2,736 | | 2,610 |
Class D, 5.513% 12/15/43 (k) | | 1,459 | | 1,308 |
Series 2007-C31 Class C, 5.6724% 4/15/47 (k) | | 251 | | 242 |
Series 2007-C31A Class A2, 5.421% 4/15/47 | | 703 | | 704 |
TOTAL COMMERCIAL MORTGAGE SECURITIES (Cost $397,820) |
419,938
|
Municipal Securities - 1.2% |
|
Beaver County Indl. Dev. Auth. Poll. Cont. Rev. Bonds (FirstEnergy Nuclear Generation Corp. Proj.) Series 2005 A, 3.375%, tender 7/1/15 (k) | | 1,700 | | 1,730 |
California Gen. Oblig.: | | | | |
Series 2009, 7.35% 11/1/39 | | 1,095 | | 1,605 |
7.3% 10/1/39 | | 16,765 | | 24,242 |
7.5% 4/1/34 | | 7,195 | | 10,517 |
7.55% 4/1/39 | | 18,865 | | 28,614 |
7.6% 11/1/40 | | 16,125 | | 24,745 |
7.625% 3/1/40 | | 2,445 | | 3,709 |
Chicago Gen. Oblig.: | | | | |
(Taxable Proj.): | | | | |
Series 2008 B, 5.63% 1/1/22 | | 1,170 | | 1,266 |
Series 2010 C1, 7.781% 1/1/35 | | 6,325 | | 7,695 |
Series 2012 B, 5.432% 1/1/42 | | 1,595 | | 1,506 |
6.05% 1/1/29 | | 400 | | 418 |
6.314% 1/1/44 | | 10,755 | | 11,396 |
Municipal Securities - continued |
| Principal Amount (000s) | | Value (000s) |
Illinois Fin. Auth. Rev. Series 2013 A, 4.545% 10/1/18 (o) | | $ 32,000 | | $ 32,901 |
Illinois Gen. Oblig.: | | | | |
Series 2003: | | | | |
4.35% 6/1/18 | | 585 | | 614 |
5.1% 6/1/33 | | 70,725 | | 70,226 |
Series 2010, 4.421% 1/1/15 | | 4,050 | | 4,095 |
Series 2010-1, 6.63% 2/1/35 | | 15,425 | | 17,177 |
Series 2010-3: | | | | |
5.547% 4/1/19 | | 155 | | 170 |
6.725% 4/1/35 | | 7,505 | | 8,435 |
7.35% 7/1/35 | | 4,495 | | 5,258 |
Series 2011: | | | | |
4.961% 3/1/16 | | 495 | | 523 |
5.365% 3/1/17 | | 185 | | 201 |
5.665% 3/1/18 | | 7,760 | | 8,598 |
5.877% 3/1/19 | | 16,035 | | 17,935 |
Series 2013: | | | | |
1.28% 12/1/15 | | 4,270 | | 4,277 |
4% 12/1/20 | | 6,040 | | 6,174 |
TOTAL MUNICIPAL SECURITIES (Cost $279,265) |
294,027
|
Foreign Government and Government Agency Obligations - 0.4% |
|
Banco Nacional de Desenvolvimento Economico e Social: | | | | |
3.375% 9/26/16 (g) | | 5,555 | | 5,711 |
5.75% 9/26/23 (g) | | 5,082 | | 5,527 |
6.369% 6/16/18 (g) | | 10,462 | | 11,662 |
Brazilian Federative Republic: | | | | |
4.25% 1/7/25 | | 10,600 | | 11,024 |
5.625% 1/7/41 | | 5,390 | | 6,064 |
Italian Republic: | | | | |
3.125% 1/26/15 | | 9,149 | | 9,242 |
4.5% 1/21/15 | | 6,859 | | 6,964 |
4.75% 1/25/16 | | 6,870 | | 7,233 |
5.375% 6/12/17 | | 4,115 | | 4,539 |
United Mexican States: | | | | |
3.5% 1/21/21 | | 5,500 | | 5,720 |
Foreign Government and Government Agency Obligations - continued |
| Principal Amount (000s) | | Value (000s) |
United Mexican States: - continued | | | | |
4% 10/2/23 | | $ 12,328 | | $ 13,068 |
4.75% 3/8/44 | | 5,572 | | 5,845 |
TOTAL FOREIGN GOVERNMENT AND GOVERNMENT AGENCY OBLIGATIONS (Cost $88,934) |
92,599
|
Bank Loan Obligations - 0.5% |
|
CONSUMER DISCRETIONARY - 0.2% |
Auto Components - 0.0% |
Tower Automotive Holdings U.S.A. LLC term loan 4% 4/23/20 (k) | | 321 | | 319 |
Diversified Consumer Services - 0.0% |
Laureate Education, Inc. Tranche B, term loan 5% 6/16/18 (k) | | 2,243 | | 2,175 |
Hotels, Restaurants & Leisure - 0.1% |
Caesars Entertainment Resort Properties LLC Tranche B 1LN, term loan 7% 10/11/20 (k) | | 3,471 | | 3,406 |
Caesars Growth Properties Holdings, LLC Tranche 1LN, term loan 6.25% 5/8/21 (k) | | 445 | | 436 |
Fantasy Springs Resort Casino term loan 0% 8/6/49 (d)(k) | | 8,755 | | 6,916 |
Graton Economic Development Authority Tranche B, term loan 9% 8/22/18 (k) | | 558 | | 574 |
Hilton Worldwide Finance, LLC Tranche B, term loan 3.5% 10/25/20 (k) | | 1,086 | | 1,082 |
Landry's Restaurants, Inc. Tranche B, term loan 4% 4/24/18 (k) | | 7,890 | | 7,875 |
MGM Mirage, Inc. Tranche B, term loan 3.5% 12/20/19 (k) | | 630 | | 626 |
Red Lobster Hospitality LLC Tranche B, term loan 6.25% 7/28/21 (k) | | 215 | | 216 |
Station Casinos LLC Tranche B, term loan 4.25% 3/1/20 (k) | | 1,646 | | 1,636 |
| | 22,767 |
Household Durables - 0.0% |
Serta Simmons Holdings, LLC Tranche B, term loan 4.25% 10/1/19 (k) | | 1,702 | | 1,700 |
Bank Loan Obligations - continued |
| Principal Amount (000s) | | Value (000s) |
CONSUMER DISCRETIONARY - continued |
Leisure Products - 0.0% |
Bauer Performance Sports Ltd. Tranche B, term loan 4% 4/15/21 (k) | | $ 731 | | $ 727 |
Media - 0.1% |
CBS Outdoor Americas Capital LLC/CBS Outdoor Americas Capital Corp. Tranche B, term loan 3% 1/31/21 (k) | | 190 | | 189 |
Checkout Holding Corp.: | | | | |
Tranche 2LN, term loan 7.75% 4/9/22 (k) | | 615 | | 604 |
Tranche B 1LN, term loan 4.5% 4/9/21 (k) | | 1,305 | | 1,279 |
Cumulus Media Holdings, Inc. Tranch B 1LN, term loan 4.25% 12/23/20 (k) | | 3,338 | | 3,330 |
Houghton Mifflin Harcourt Publishing, Inc. Tranche B, term loan 4.25% 5/22/18 (k) | | 171 | | 171 |
ION Media Networks, Inc. Tranche B, term loan 5% 12/18/20 (k) | | 430 | | 430 |
Karman Buyer Corp. Tranche 2LN, term loan 7.5% 7/25/22 (k) | | 85 | | 85 |
Liberty Cablevision of Puerto Rico: | | | | |
Tranche 1LN, term loan 4.5% 1/7/22 (k) | | 110 | | 110 |
Tranche 2LN, term loan 7.75% 7/7/23 (k) | | 435 | | 436 |
McGraw-Hill School Education Tranche B, term loan 6.25% 12/18/19 (k) | | 3,622 | | 3,626 |
Univision Communications, Inc. Tranche C 4LN, term loan 4% 3/1/20 (k) | | 736 | | 733 |
| | 10,993 |
Specialty Retail - 0.0% |
J. Crew Group, Inc. Tranche B LN, term loan 4% 3/5/21 (k) | | 314 | | 308 |
TOTAL CONSUMER DISCRETIONARY | | 38,989 |
CONSUMER STAPLES - 0.0% |
Food & Staples Retailing - 0.0% |
Rite Aid Corp. Tranche B 7LN, term loan 3.5% 2/21/20 (k) | | 797 | | 793 |
Sprouts Farmers Market LLC Tranche B, term loan 4% 4/23/20 (k) | | 165 | | 165 |
| | 958 |
Household Products - 0.0% |
Spectrum Brands Holdings, Inc. Tranche C, term loan 3.5% 9/4/19 (k) | | 233 | | 232 |
Bank Loan Obligations - continued |
| Principal Amount (000s) | | Value (000s) |
CONSUMER STAPLES - continued |
Personal Products - 0.0% |
Revlon Consumer Products Corp. term loan 4% 8/19/19 (k) | | $ 1,950 | | $ 1,945 |
TOTAL CONSUMER STAPLES | | 3,135 |
ENERGY - 0.1% |
Energy Equipment & Services - 0.0% |
Drillships Ocean Ventures, Inc. Tranche B, term loan 5.5% 7/25/21 (k) | | 420 | | 422 |
Oil, Gas & Consumable Fuels - 0.1% |
American Energy-Marcellus LLC: | | | | |
Tranche 2LN, term loan 8.5% 8/4/21 (k) | | 1,195 | | 1,201 |
Tranche B 1LN, term loan 5.25% 8/4/20 (k) | | 2,395 | | 2,401 |
Fieldwood Energy, LLC Tranche 2LN, term loan 8.375% 9/30/20 (k) | | 7,740 | | 7,895 |
TPF II LC LLC Tranche B, term loan 6.5% 8/21/19 (k) | | 1,695 | | 1,727 |
| | 13,224 |
TOTAL ENERGY | | 13,646 |
FINANCIALS - 0.0% |
Diversified Financial Services - 0.0% |
Calpine Construction Finance Co. LP Tranche B 2LN, term loan 3.25% 1/31/22 (k) | | 3,388 | | 3,329 |
HarbourVest Partners LLC Tranche B, term loan 3.25% 2/4/21 (k) | | 224 | | 221 |
MPH Acquisition Holdings LLC Tranche B, term loan 4% 3/31/21 (k) | | 438 | | 435 |
Sheridan Investment Partners I term loan 4.25% 12/16/20 (k) | | 393 | | 391 |
Sheridan Production Partners I: | | | | |
Tranche A, term loan 4.25% 12/16/20 (k) | | 55 | | 54 |
Tranche M, term loan 4.25% 12/16/20 (k) | | 20 | | 20 |
TransUnion LLC Tranche B, term loan 4% 4/9/21 (k) | | 3,047 | | 3,044 |
| | 7,494 |
Real Estate Management & Development - 0.0% |
Realogy Corp. Credit-Linked Deposit 4.4463% 10/10/16 (k) | | 570 | | 564 |
TOTAL FINANCIALS | | 8,058 |
Bank Loan Obligations - continued |
| Principal Amount (000s) | | Value (000s) |
HEALTH CARE - 0.0% |
Health Care Equipment & Supplies - 0.0% |
American Renal Holdings, Inc.: | | | | |
Tranche 2LN, term loan 8.5% 2/20/20 (k) | | $ 2,260 | | $ 2,252 |
Tranche B 1LN, term loan 4.5% 8/20/19 (k) | | 2,029 | | 2,022 |
| | 4,274 |
Health Care Providers & Services - 0.0% |
DaVita HealthCare Partners, Inc. Tranche B, term loan 3.5% 6/24/21 (k) | | 3,190 | | 3,178 |
Dialysis Newco, Inc.: | | | | |
Tranche 2LN, term loan 7.75% 10/22/21 (k) | | 665 | | 667 |
Tranche B 1LN, term loan 4.50% 4/23/21 (k) | | 770 | | 770 |
U.S. Renal Care, Inc.: | | | | |
Tranche 2LN, term loan 8.5% 1/3/20 (k) | | 70 | | 71 |
Tranche B 2LN, term loan 4.25% 7/3/19 (k) | | 1,793 | | 1,791 |
| | 6,477 |
Life Sciences Tools & Services - 0.0% |
Patheon, Inc. Tranche B, term loan 4.25% 3/11/21 (k) | | 1,350 | | 1,338 |
Pharmaceuticals - 0.0% |
Jazz Pharmaceuticals, Inc. Tranche B 2LN, term loan 3.25% 6/12/18 (k) | | 65 | | 64 |
Pharmedium Healthcare Corp. Tranche B 1LN, term loan 4.25% 1/28/21 (k) | | 267 | | 263 |
Salix Pharmaceuticals Ltd. Tranche B, term loan 4.25% 1/2/20 (k) | | 117 | | 117 |
| | 444 |
TOTAL HEALTH CARE | | 12,533 |
INDUSTRIALS - 0.0% |
Aerospace & Defense - 0.0% |
TransDigm, Inc. Tranche D, term loan 3.75% 6/4/21 (k) | | 1,320 | | 1,312 |
Commercial Services & Supplies - 0.0% |
Arysta Lifescience SPC LLC: | | | | |
Tranche B 1LN, term loan 4.5% 5/29/20 (k) | | 416 | | 415 |
Tranche B 2LN, term loan 8.25% 11/30/20 (k) | | 355 | | 359 |
The Brickman Group, Ltd. Tranche B 1LN, term loan 4% 12/18/20 (k) | | 4,105 | | 4,043 |
| | 4,817 |
Bank Loan Obligations - continued |
| Principal Amount (000s) | | Value (000s) |
INDUSTRIALS - continued |
Electrical Equipment - 0.0% |
Atlantic Power Ltd. Partnership Tranche B LN, term loan 4.75% 2/24/21 (k) | | $ 234 | | $ 236 |
Machinery - 0.0% |
INA Beteiligungsgesellschaft MBH Tranche E, term loan 3.75% 5/15/20 (k) | | 560 | | 559 |
Professional Services - 0.0% |
AlixPartners LLP: | | | | |
Tranche 2LN, term loan 9% 7/10/21 (k) | | 2,210 | | 2,243 |
Tranche B 2LN, term loan 4% 7/10/20 (k) | | 795 | | 795 |
| | 3,038 |
TOTAL INDUSTRIALS | | 9,962 |
INFORMATION TECHNOLOGY - 0.1% |
Electronic Equipment & Components - 0.0% |
Atkore International, Inc.: | | | | |
Tranche 2LN, term loan 7.75% 10/9/21 (k) | | 750 | | 748 |
Tranche B 1LN, term loan 4.5% 4/9/21 (k) | | 1,350 | | 1,343 |
Infor U.S., Inc. Tranche B 5LN, term loan 3.75% 6/3/20 (k) | | 634 | | 628 |
| | 2,719 |
IT Services - 0.1% |
First Data Corp. Tranche B, term loan 3.655% 3/24/18 (k) | | 7,260 | | 7,115 |
Semiconductors & Semiconductor Equipment - 0.0% |
Avago Technologies, Inc. Tranche B, term loan 3.75% 5/6/21 (k) | | 2,675 | | 2,675 |
Freescale Semiconductor, Inc. Tranche B 4LN, term loan 4.25% 3/1/20 (k) | | 2,328 | | 2,322 |
| | 4,997 |
Software - 0.0% |
Kronos, Inc.: | | | | |
Tranche 2LN, term loan 9.75% 4/30/20 (k) | | 2,250 | | 2,318 |
Tranche B 1LN, term loan 4.5% 10/30/19 (k) | | 1,168 | | 1,168 |
Bank Loan Obligations - continued |
| Principal Amount (000s) | | Value (000s) |
INFORMATION TECHNOLOGY - continued |
Software - continued |
Renaissance Learning, Inc.: | | | | |
Tranche 1LN, term loan 4.5% 4/9/21 (k) | | $ 584 | | $ 579 |
Tranche 2LN, term loan 8% 4/9/22 (k) | | 495 | | 490 |
| | 4,555 |
TOTAL INFORMATION TECHNOLOGY | | 19,386 |
MATERIALS - 0.0% |
Chemicals - 0.0% |
American Rock Salt Co. LLC Tranche B 1LN, term loan 4.75% 5/20/21 (k) | | 1,430 | | 1,423 |
Arizona Chem U.S., Inc.: | | | | |
Tranche 2LN, term loan 7.5% 6/12/22 (k) | | 50 | | 50 |
Tranche B 1LN, term loan 4.5% 6/12/21 (k) | | 153 | | 153 |
Royal Adhesives & Sealants LLC Tranche 2LN, term loan 9.75% 1/31/19 (k) | | 1,190 | | 1,214 |
| | 2,840 |
Containers & Packaging - 0.0% |
Anchor Glass Container Corp. Tranche B, term loan 4.25% 6/30/21 (k) | | 385 | | 384 |
Berry Plastics Corp. Tranche E, term loan 3.75% 1/6/21 (k) | | 1,177 | | 1,161 |
| | 1,545 |
TOTAL MATERIALS | | 4,385 |
TELECOMMUNICATION SERVICES - 0.0% |
Diversified Telecommunication Services - 0.0% |
Altice Financing SA Tranche B, term loan 5.5% 6/24/19 (k) | | 5,751 | | 5,859 |
LTS Buyer LLC Tranche 2LN, term loan 8% 4/11/21 (k) | | 41 | | 42 |
| | 5,901 |
Wireless Telecommunication Services - 0.0% |
Intelsat Jackson Holdings SA Tranche B 2LN, term loan 3.75% 6/30/19 (k) | | 950 | | 944 |
TOTAL TELECOMMUNICATION SERVICES | | 6,845 |
Bank Loan Obligations - continued |
| Principal Amount (000s) | | Value (000s) |
UTILITIES - 0.1% |
Gas Utilities - 0.0% |
Everest Acquisition LLC Tranche B 3LN, term loan 3.5% 5/24/18 (k) | | $ 487 | | $ 482 |
Independent Power Producers & Energy Traders - 0.1% |
Energy Future Holdings Corp. Tranche 1LN, term loan 4.25% 6/19/16 (k) | | 15,472 | | 15,472 |
TOTAL UTILITIES | | 15,954 |
TOTAL BANK LOAN OBLIGATIONS (Cost $132,986) |
132,893
|
Bank Notes - 0.0% |
|
Discover Bank (Delaware) 3.2% 8/9/21 | | 8,178 | | 8,205 |
Fifth Third Bank 4.75% 2/1/15 | | 680 | | 692 |
TOTAL BANK NOTES (Cost $8,840) | 8,897 |
Preferred Securities - 0.1% |
|
FINANCIALS - 0.1% |
Banks - 0.1% |
Bank of America Corp. 5.2% (h)(k) | | 1,665 | | 1,626 |
Barclays Bank PLC 7.625% 11/21/22 | | 5,205 | | 5,956 |
Citigroup, Inc.: | | | | |
5.35% (h)(k) | | 11,740 | | 11,395 |
5.9% (h)(k) | | 920 | | 925 |
5.95% (h)(k) | | 1,325 | | 1,343 |
JPMorgan Chase & Co. 5.15% (h)(k) | | 5,940 | | 5,886 |
| | 27,131 |
Diversified Financial Services - 0.0% |
MUFG Capital Finance 1 Ltd. 6.346% (h)(k) | | 996 | | 1,083 |
TOTAL PREFERRED SECURITIES (Cost $28,313) |
28,214
|
Fixed-Income Funds - 3.2% |
| Shares | | Value (000s) |
Fidelity Mortgage Backed Securities Central Fund (l)
(Cost $729,582) | 7,218,055 | | $ 783,087 |
Other - 0.0% |
| | | |
Other - 0.0% |
Tribune Co. Claim (a)
(Cost $11) | 11,084 | |
11
|
Money Market Funds - 4.7% |
| | | |
Fidelity Cash Central Fund, 0.11% (b) | 1,101,689,528 | | 1,101,690 |
Fidelity Securities Lending Cash Central Fund, 0.11% (b)(c) | 41,925,827 | | 41,926 |
TOTAL MONEY MARKET FUNDS (Cost $1,143,616) |
1,143,616
|
TOTAL INVESTMENT PORTFOLIO - 101.6% (Cost $19,687,609) | | 24,912,900 |
NET OTHER ASSETS (LIABILITIES) - (1.6)% | | (399,322) |
NET ASSETS - 100% | $ 24,513,578 |
TBA Sale Commitments |
| Principal
Amount (000s) | | |
Fannie Mae |
4% 9/1/44 | $ (4,000) | | (4,238) |
4% 9/1/44 | (9,000) | | (9,535) |
4% 9/1/44 | (13,300) | | (14,089) |
4% 9/1/44 | (14,100) | | (14,938) |
4% 9/1/44 | (14,300) | | (15,150) |
4% 9/1/44 | (14,100) | | (14,938) |
4% 9/1/44 | (14,300) | | (15,150) |
4% 9/1/44 | (2,900) | | (3,072) |
4.5% 9/1/44 | (22,200) | | (23,971) |
5% 9/1/44 | (3,400) | | (3,749) |
5.5% 9/1/44 | (12,600) | | (14,014) |
TOTAL TBA SALE COMMITMENTS (Proceeds $132,772) | $ (132,844) |
Futures Contracts |
| Expiration
Date | | Underlying
Face Amount
at Value (000s) | | Unrealized
Appreciation/
(Depreciation)
(000s) |
Sold |
Treasury Contracts |
737 CBOT 5 Year U.S. Treasury Note Contracts | Dec. 2014 | | $ 87,582 | | $ (163) |
|
The face value of futures sold as a percentage of net assets is 0.4% |
Legend |
(a) Non-income producing |
(b) Affiliated fund that is generally available only to investment companies and other accounts managed by Fidelity Investments. The rate quoted is the annualized seven-day yield of the fund at period end. A complete unaudited listing of the fund's holdings as of its most recent quarter end is available upon request. In addition, each Fidelity Central Fund's financial statements, which are not covered by the Fund's Report of Independent Registered Public Accounting Firm, are available on the SEC's website or upon request. |
(c) Investment made with cash collateral received from securities on loan. |
(d) Non-income producing - Security is in default. |
(e) Security or a portion of the security is on loan at period end. |
(f) Affiliated company |
(g) Security exempt from registration under Rule 144A of the Securities Act of 1933. These securities may be resold in transactions exempt from registration, normally to qualified institutional buyers. At the end of the period, the value of these securities amounted to $718,342,000 or 2.9% of net assets. |
(h) Security is perpetual in nature with no stated maturity date. |
(i) Security or a portion of the security purchased on a delayed delivery or when-issued basis. |
(j) Security or a portion of the security was pledged to cover margin requirements for futures contracts. At period end, the value of securities pledged amounted to $746,000. |
(k) Coupon rates for floating and adjustable rate securities reflect the rates in effect at period end. |
(l) Affiliated fund that is generally available only to investment companies and other accounts managed by Fidelity Investments. A complete unaudited schedule of portfolio holdings for each Fidelity Central Fund is filed with the SEC for the first and third quarters of each fiscal year on Form N-Q and is available upon request or at the SEC's website at www.sec.gov. An unaudited holdings listing for the Fund, which presents direct holdings as well as the pro-rata share of securities and other investments held indirectly through its investment in underlying non-money market Fidelity Central Funds, is available at fidelity.com. In addition, each Fidelity Central Fund's financial statements, which are not covered by the Fund's Report of Independent Registered Public Accounting Firm, are available on the SEC's website or upon request. |
(m) Security represents right to receive monthly interest payments on an underlying pool of mortgages or assets. Principal shown is the outstanding par amount of the pool as of the end of the period. |
(n) Investment is owned by an entity that is treated as a corporation for U.S. tax purposes and is owned by the Fund. |
(o) Restricted securities - Investment in securities not registered under the Securities Act of 1933 (excluding 144A issues). At the end of the period, the value of restricted securities (excluding 144A issues) amounted to $378,766,000 or 1.5% of net assets. |
Additional information on each restricted holding is as follows: |
Security | Acquisition
Date | Acquisition
Cost (000s) |
Blu Homes, Inc. Series A, 5.00% | 6/10/13 | $ 5,000 |
Security | Acquisition
Date | Acquisition
Cost (000s) |
C. Wonder LLC | 12/27/12 - 6/25/13 | $ 19,500 |
Deem, Inc. | 9/19/13 | $ 8,065 |
Houghton Mifflin Harcourt Co. warrants 6/22/19 | 6/22/12 | $ 4 |
Illinois Fin. Auth. Rev. Series 2013 A, 4.545% 10/1/18 | 10/24/13 | $ 32,000 |
Legend Pictures LLC | 9/23/10 - 3/30/12 | $ 37,645 |
Roku, Inc. 8.00% | 5/7/13 | $ 5,000 |
Spotify Technology SA | 11/14/12 | $ 15,028 |
Station Holdco LLC | 6/17/11 | $ 1,131 |
Station Holdco LLC unit | 4/1/13 | $ 0* |
Station Holdco LLC warrants 6/15/18 | 8/11/08 - 8/15/08 | $ 6,416 |
Tory Burch LLC | 12/31/12 | $ 17,505 |
Uber Technologies, Inc. 8.00% | 6/6/14 | $ 25,000 |
Vice Holding, Inc. | 7/18/14 | $ 29,997 |
Vice Holding, Inc. Series A | 8/3/12 | $ 34,999 |
Wayfair LLC Series B | 3/5/14 | $ 7,000 |
* Amount represents less than $1,000. |
Affiliated Central Funds |
Information regarding fiscal year to date income earned by the Fund from investments in Fidelity Central Funds is as follows: |
Fund | Income earned
(Amounts in thousands) |
Fidelity Cash Central Fund | $ 520 |
Fidelity Mortgage Backed Securities Central Fund | 22,421 |
Fidelity Securities Lending Cash Central Fund | 1,075 |
Total | $ 24,016 |
Additional information regarding the Fund's fiscal year to date purchases and sales, including the ownership percentage, of the non Money Market Central Funds is as follows: |
Fund
(Amounts in thousands) | Value,
beginning of
period | Purchases | Sales
Proceeds | Value,
end of
period | % ownership,
end of
period |
Fidelity Mortgage Backed Securities Central Fund | $ 1,242,061 | $ 22,421 | $ 511,133 | $ 783,087 | 7.3% |
Other Affiliated Issuers |
An affiliated company is a company in which the Fund has ownership of at least 5% of the voting securities. Fiscal year to date transactions with companies which are or were affiliates are as follows: |
Affiliate
(Amounts in thousands) | Value,
beginning of
period | Purchases | Sales
Proceeds | Dividend
Income | Value,
end of
period |
Aspen Aerogels, Inc. | $ - | $ 1,224 | $ - | $ - | $ 22,703 |
CareView Communications, Inc. | 6,724 | - | - | - | 5,890 |
TherapeuticsMD, Inc. | 17,941 | - | 15,235 | - | - |
Total | $ 24,665 | $ 1,224 | $ 15,235 | $ - | $ 28,593 |
Other Information |
The following is a summary of the inputs used, as of August 31, 2014, involving the Fund's assets and liabilities carried at fair value. The inputs or methodology used for valuing securities may not be an indication of the risk associated with investing in those securities. For more information on valuation inputs, and their aggregation into the levels used in the tables below, please refer to the Investment Valuation section in the accompanying Notes to Financial Statements. |
Valuation Inputs at Reporting Date: |
Description
(Amounts in thousands) | Total | Level 1 | Level 2 | Level 3 |
Investments in Securities: | | | | |
Equities: | | | | |
Consumer Discretionary | $ 2,221,490 | $ 1,831,233 | $ 80,559 | $ 309,698 |
Consumer Staples | 1,293,821 | 1,293,821 | - | - |
Energy | 1,903,416 | 1,880,713 | 22,703 | - |
Financials | 2,574,377 | 2,554,285 | 8,901 | 11,191 |
Health Care | 2,925,361 | 2,925,323 | - | 38 |
Industrials | 1,433,576 | 1,432,336 | - | 1,240 |
Information Technology | 3,451,349 | 3,417,591 | 8,758 | 25,000 |
Materials | 738,657 | 738,657 | - | - |
Telecommunication Services | 248,278 | 215,994 | 32,284 | - |
Utilities | 365,964 | 365,964 | - | - |
Corporate Bonds | 3,194,839 | - | 3,194,758 | 81 |
U.S. Government and Government Agency Obligations | 704,674 | - | 704,674 | - |
U.S. Government Agency - Mortgage Securities | 825,138 | - | 825,138 | - |
Asset-Backed Securities | 68,760 | - | 68,066 | 694 |
Collateralized Mortgage Obligations | 59,918 | - | 59,491 | 427 |
Commercial Mortgage Securities | 419,938 | - | 419,364 | 574 |
Municipal Securities | 294,027 | - | 294,027 | - |
Foreign Government and Government Agency Obligations | 92,599 | - | 92,599 | - |
Bank Loan Obligations | 132,893 | - | 125,310 | 7,583 |
Bank Notes | 8,897 | - | 8,897 | - |
Preferred Securities | 28,214 | - | 28,214 | - |
Fixed-Income Funds | 783,087 | 783,087 | - | - |
Other | 11 | - | - | 11 |
Money Market Funds | 1,143,616 | 1,143,616 | - | - |
Total Investments in Securities: | $ 24,912,900 | $ 18,582,620 | $ 5,973,743 | $ 356,537 |
Derivative Instruments: | | | | |
Liabilities | | | | |
Futures Contracts | $ (163) | $ (163) | $ - | $ - |
Other Financial Instruments: | | | | |
TBA Sale Commitments | $ (132,844) | $ - | $ (132,844) | $ - |
Valuation Inputs at Reporting Date: |
The following is a reconciliation of Investments in Securities for which Level 3 inputs were used in determining value: |
(Amounts in thousands) | |
Investments in Securities: | |
Equities - Consumer Discretionary | |
Beginning Balance | $ 196,744 |
Net Realized Gain (Loss) on Investment Securities | - |
Net Unrealized Gain (Loss) on Investment Securities | 75,614 |
Cost of Purchases | 37,340 |
Proceeds of Sales | - |
Amortization/Accretion | - |
Transfers into Level 3 | - |
Transfers out of Level 3 | - |
Ending Balance | $ 309,698 |
The change in unrealized gain (loss) for the period attributable to Level 3 securities held at August 31, 2014 | $ 75,614 |
Other Investments in Securities | |
Beginning Balance | $ 48,332 |
Net Realized Gain (Loss) on Investment Securities | (500) |
Net Unrealized Gain (Loss) on Investment Securities | 4,453 |
Cost of Purchases | 39,996 |
Proceeds of Sales | (38,565) |
Amortization/Accretion | 305 |
Transfers into Level 3 | 705 |
Transfers out of Level 3 | (7,887) |
Ending Balance | $ 46,839 |
The change in unrealized gain (loss) for the period attributable to Level 3 securities held at August 31, 2014 | $ (484) |
The information used in the above reconciliations represents fiscal year to date activity for any Investments in Securities identified as using Level 3 inputs at either the beginning or the end of the current fiscal period. Transfers in or out of Level 3 represent the beginning value of any Security or Instrument where a change in the pricing level occurred from the beginning to the end of the period. The cost of purchases and the proceeds of sales may include securities received or delivered through corporate actions or exchanges. Realized and unrealized gains (losses) disclosed in the reconciliations are included in Net Gain (Loss) on the Fund's Statement of Operations. |
Value of Derivative Instruments |
The following table is a summary of the Fund's value of derivative instruments by primary risk exposure as of August 31, 2014. For additional information on derivative instruments, please refer to the Derivative Instruments section in the accompanying Notes to Financial Statements. |
Primary Risk Exposure /
Derivative Type
(Amounts in thousands) | Value |
| Asset | Liability |
Interest Rate Risk | | |
Futures Contracts (a) | $ - | $ (163) |
Total Value of Derivatives | $ - | $ (163) |
(a) Reflects gross cumulative appreciation (depreciation) on futures contracts as presented in the Schedule of Investments. Only the period end receivable or payable for daily variation margin and net unrealized appreciation (depreciation) are presented in the Statement of Assets and Liabilities. |
Other Information |
The composition of credit quality ratings as a percentage of net assets is as follows (Unaudited): |
U.S. Government and U.S. Government Agency Obligations | 9.3% |
AAA,AA,A | 4.2% |
BBB | 9.3% |
BB | 1.8% |
B | 1.3% |
CCC,CC,C | 0.4% |
D | 0.0%* |
Not Rated | 0.4% |
Other Investments | 70.0% |
Short-Term Investments and Net Other Assets | 3.3% |
| 100.0% |
We have used ratings from Moody's Investors Service, Inc. Where Moody's® ratings are not available, we have used S&P® ratings. All ratings are as of the date indicated and do not reflect subsequent changes. |
* Amount represents less than 0.1%.
See accompanying notes which are an integral part of the financial statements.
Annual Report
Investments - continued
Distribution of investments by country or territory of incorporation, as a percentage of total net assets, is as follows (Unaudited): |
United States of America | 88.2% |
Ireland | 1.7% |
Netherlands | 1.4% |
Canada | 1.3% |
Bermuda | 1.2% |
Others (Individually Less Than 1%) | 6.2% |
| 100.0% |
The information in the tables is based on the combined investments of the Fund and its pro-rata share of the investments of Fidelity's fixed-income central funds. |
See accompanying notes which are an integral part of the financial statements.
Annual Report
Statement of Assets and Liabilities
Amounts in thousands (except per-share amounts) | August 31, 2014 |
| | |
Assets | | |
Investment in securities, at value (including securities loaned of $40,631) - See accompanying schedule: Unaffiliated issuers (cost $17,782,338) | $ 22,957,604 | |
Fidelity Central Funds (cost $1,873,198) | 1,926,703 | |
Other affiliated issuers (cost $32,073) | 28,593 | |
Total Investments (cost $19,687,609) | | $ 24,912,900 |
Cash | | 47,659 |
Receivable for investments sold, regular delivery | | 86,050 |
Receivable for TBA sale commitments | | 132,772 |
Receivable for fund shares sold | | 14,709 |
Dividends receivable | | 27,469 |
Interest receivable | | 53,487 |
Distributions receivable from Fidelity Central Funds | | 155 |
Receivable from investment adviser for expense reductions | | 5 |
Other receivables | | 1,107 |
Total assets | | 25,276,313 |
| | |
Liabilities | | |
Payable for investments purchased
Regular delivery | $ 72,814 | |
Delayed delivery | 458,226 | |
TBA sale commitments, at value | 132,844 | |
Payable for fund shares redeemed | 44,995 | |
Accrued management fee | 8,012 | |
Payable for daily variation margin for derivative instruments | 23 | |
Other affiliated payables | 2,622 | |
Other payables and accrued expenses | 1,273 | |
Collateral on securities loaned, at value | 41,926 | |
Total liabilities | | 762,735 |
| | |
Net Assets | | $ 24,513,578 |
Net Assets consist of: | | |
Paid in capital | | $ 17,882,584 |
Undistributed net investment income | | 89,501 |
Accumulated undistributed net realized gain (loss) on investments and foreign currency transactions | | 1,316,487 |
Net unrealized appreciation (depreciation) on investments and assets and liabilities in foreign currencies | | 5,225,006 |
Net Assets | | $ 24,513,578 |
See accompanying notes which are an integral part of the financial statements.
Annual Report
Financial Statements - continued
Statement of Assets and Liabilities - continued
Amounts in thousands (except per-share amounts) | August 31, 2014 |
| | |
Puritan:
Net Asset Value, offering price and redemption price per share ($18,351,198 ÷ 801,155 shares) | | $ 22.91 |
| | |
Class K:
Net Asset Value, offering price and redemption price per share ($6,162,380 ÷ 269,115 shares) | | $ 22.90 |
See accompanying notes which are an integral part of the financial statements.
Annual Report
Statement of Operations
Amounts in thousands | Year ended August 31, 2014 |
| | |
Investment Income | | |
Dividends | | $ 262,669 |
Interest | | 230,673 |
Income from Fidelity Central Funds | | 24,016 |
Total income | | 517,358 |
| | |
Expenses | | |
Management fee | $ 92,514 | |
Transfer agent fees | 28,068 | |
Accounting and security lending fees | 2,124 | |
Custodian fees and expenses | 381 | |
Independent trustees' compensation | 98 | |
Appreciation in deferred trustee compensation account | 2 | |
Registration fees | 185 | |
Audit | 291 | |
Legal | 129 | |
Miscellaneous | 181 | |
Total expenses before reductions | 123,973 | |
Expense reductions | (411) | 123,562 |
Net investment income (loss) | | 393,796 |
Realized and Unrealized Gain (Loss) Net realized gain (loss) on: | | |
Investment securities: | | |
Unaffiliated issuers | 1,897,949 | |
Fidelity Central Funds | 3,180 | |
Other affiliated issuers | 9,369 | |
Foreign currency transactions | (946) | |
Futures contracts | 771 | |
Swaps | (6,476) | |
Total net realized gain (loss) | | 1,903,847 |
Change in net unrealized appreciation (depreciation) on: Investment securities | 1,888,669 | |
Assets and liabilities in foreign currencies | (48) | |
Futures contracts | (163) | |
Swaps | 7,794 | |
Delayed delivery commitments | (2,100) | |
Total change in net unrealized appreciation (depreciation) | | 1,894,152 |
Net gain (loss) | | 3,797,999 |
Net increase (decrease) in net assets resulting from operations | | $ 4,191,795 |
See accompanying notes which are an integral part of the financial statements.
Annual Report
Financial Statements - continued
Statement of Changes in Net Assets
Amounts in thousands | Year ended
August 31,
2014 | Year ended
August 31,
2013 |
Increase (Decrease) in Net Assets | | |
Operations | | |
Net investment income (loss) | $ 393,796 | $ 372,321 |
Net realized gain (loss) | 1,903,847 | 1,511,084 |
Change in net unrealized appreciation (depreciation) | 1,894,152 | 305,097 |
Net increase (decrease) in net assets resulting
from operations | 4,191,795 | 2,188,502 |
Distributions to shareholders from net investment income | (374,472) | (353,018) |
Distributions to shareholders from net realized gain | (1,699,060) | (355,229) |
Total distributions | (2,073,532) | (708,247) |
Share transactions - net increase (decrease) | 1,231,634 | (49,273) |
Total increase (decrease) in net assets | 3,349,897 | 1,430,982 |
| | |
Net Assets | | |
Beginning of period | 21,163,681 | 19,732,699 |
End of period (including undistributed net investment income of $89,501 and undistributed net investment income of $80,612, respectively) | $ 24,513,578 | $ 21,163,681 |
See accompanying notes which are an integral part of the financial statements.
Annual Report
Financial Highlights - Puritan
Years ended August 31, | 2014 | 2013 | 2012 | 2011 | 2010 |
Selected Per-Share Data | | | | | |
Net asset value, beginning of period | $ 20.98 | $ 19.53 | $ 17.72 | $ 15.81 | $ 15.06 |
Income from Investment Operations | | | | | |
Net investment income (loss) B | .36 | .36 | .38 | .35 | .40 |
Net realized and unrealized gain (loss) | 3.60 | 1.79 | 1.78 | 1.93 | .75 |
Total from investment operations | 3.96 | 2.15 | 2.16 | 2.28 | 1.15 |
Distributions from net investment income | (.35) | (.35) | (.35) | (.36) | (.39) |
Distributions from net realized gain | (1.68) | (.35) | - | - F | (.01) |
Total distributions | (2.03) | (.70) | (.35) | (.37) G | (.40) |
Net asset value, end of period | $ 22.91 | $ 20.98 | $ 19.53 | $ 17.72 | $ 15.81 |
Total Return A | 20.17% | 11.29% | 12.35% | 14.38% | 7.61% |
Ratios to Average Net Assets C, E | | | | | |
Expenses before reductions | .56% | .58% | .59% | .60% | .61% |
Expenses net of fee waivers, if any | .56% | .58% | .59% | .60% | .61% |
Expenses net of all reductions | .56% | .57% | .59% | .59% | .61% |
Net investment income (loss) | 1.68% | 1.79% | 2.03% | 1.96% | 2.48% |
Supplemental Data | | | | | |
Net assets, end of period (in millions) | $ 18,351 | $ 15,934 | $ 15,472 | $ 15,420 | $ 15,054 |
Portfolio turnover rate D | 160% | 229% H | 141% | 154% H | 104% |
A Total returns would have been lower if certain expenses had not been reduced during the applicable periods shown.
B Calculated based on average shares outstanding during the period.
C Fees and expenses of any underlying Fidelity Central Funds are not included in the Fund's expense ratio. The Fund indirectly bears its proportionate share of the expenses of any underlying Fidelity Central Funds. Based on their most recent shareholder report date, the expenses of any underlying non-money market Fidelity Central Funds were less than .01%.
D Amount does not include the portfolio activity of any underlying Fidelity Central Funds.
E Expense ratios reflect operating expenses of the class. Expenses before reductions do not reflect amounts reimbursed by the investment adviser or reductions from brokerage service arrangements or reductions from other expense offset arrangements and do not represent the amount paid by the class during periods when reimbursements or reductions occur. Expenses net of fee waivers reflect expenses after reimbursement by the investment adviser but prior to reductions from brokerage service arrangements or other expense offset arrangements. Expenses net of all reductions represent the net expenses paid by the class.
F Amount represents less than $.01 per share.
G Total distributions of $.37 per share is comprised of distributions from net investment income of $.364 and distributions from net realized gain of $.003 per share.
H The portfolio turnover rate excludes liquidations and/or redemptions executed in-kind from Affiliated Central Funds.
See accompanying notes which are an integral part of the financial statements.
Annual Report
Financial Highlights - Class K
Years ended August 31, | 2014 | 2013 | 2012 | 2011 | 2010 |
Selected Per-Share Data | | | | | |
Net asset value, beginning of period | $ 20.98 | $ 19.52 | $ 17.72 | $ 15.80 | $ 15.06 |
Income from Investment Operations | | | | | |
Net investment income (loss) B | .39 | .39 | .40 | .38 | .42 |
Net realized and unrealized gain (loss) | 3.58 | 1.79 | 1.77 | 1.93 | .74 |
Total from investment operations | 3.97 | 2.18 | 2.17 | 2.31 | 1.16 |
Distributions from net investment income | (.37) | (.37) | (.37) | (.39) | (.41) |
Distributions from net realized gain | (1.68) | (.35) | - | - F | (.01) |
Total distributions | (2.05) | (.72) | (.37) | (.39) | (.42) |
Net asset value, end of period | $ 22.90 | $ 20.98 | $ 19.52 | $ 17.72 | $ 15.80 |
Total ReturnA | 20.25% | 11.48% | 12.43% | 14.59% | 7.69% |
Ratios to Average Net Assets C, E | | | | | |
Expenses before reductions | .46% | .47% | .48% | .48% | .48% |
Expenses net of fee waivers, if any | .46% | .47% | .48% | .48% | .48% |
Expenses net of all reductions | .46% | .46% | .47% | .47% | .47% |
Net investment income (loss) | 1.78% | 1.90% | 2.15% | 2.09% | 2.61% |
Supplemental Data | | | | | |
Net assets, end of period (in millions) | $ 6,162 | $ 5,230 | $ 4,261 | $ 3,211 | $ 2,280 |
Portfolio turnover rate D | 160% | 229% G | 141% | 154% G | 104% |
A Total returns would have been lower if certain expenses had not been reduced during the applicable periods shown.
B Calculated based on average shares outstanding during the period.
C Fees and expenses of any underlying Fidelity Central Funds are not included in the Fund's expense ratio. The Fund indirectly bears its proportionate share of the expenses of any underlying Fidelity Central Funds. Based on their most recent shareholder report date, the expenses of any underlying non-money market Fidelity Central Funds were less than .01%.
D Amount does not include the portfolio activity of any underlying Fidelity Central Funds.
E Expense ratios reflect operating expenses of the class. Expenses before reductions do not reflect amounts reimbursed by the investment adviser or reductions from brokerage service arrangements or reductions from other expense offset arrangements and do not represent the amount paid by the class during periods when reimbursements or reductions occur. Expenses net of fee waivers reflect expenses after reimbursement by the investment adviser but prior to reductions from brokerage service arrangements or other expense offset arrangements. Expenses net of all reductions represent the net expenses paid by the class.
F Amount represents less than $.01 per share.
G The portfolio turnover rate excludes liquidations and/or redemptions executed in-kind from Affiliated Central Funds.
See accompanying notes which are an integral part of the financial statements.
Annual Report
Notes to Financial Statements
For the period ended August 31, 2014
(Amounts in thousands except percentages)
1. Organization.
Fidelity Puritan Fund (the Fund) is a fund of Fidelity Puritan Trust (the Trust) and is authorized to issue an unlimited number of shares. The Trust is registered under the Investment Company Act of 1940, as amended (the 1940 Act), as an open-end management investment company organized as a Massachusetts business trust. The Fund offers Puritan and Class K shares, each of which has equal rights as to assets and voting privileges. Each class has exclusive voting rights with respect to matters that affect that class.
2. Investments in Fidelity Central Funds.
The Fund invests in Fidelity Central Funds, which are open-end investment companies generally available only to other investment companies and accounts managed by the investment adviser and its affiliates. The Fund's Schedule of Investments lists each of the Fidelity Central Funds held as of period end, if any, as an investment of the Fund, but does not include the underlying holdings of each Fidelity Central Fund. As an Investing Fund, the Fund indirectly bears its proportionate share of the expenses of the underlying Fidelity Central Funds.
Based on its investment objective, each Fidelity Central Fund may invest or participate in various investment vehicles or strategies that are similar to those of the Fund. These strategies are consistent with the investment objectives of the Fund and may involve certain economic risks which may cause a decline in value of each of the Fidelity Central Funds and thus a decline in the value of the Fund. The Money Market Central Funds seek preservation of capital and current income and are managed by Fidelity Investments Money Management, Inc. (FIMM), an affiliate of the investment adviser. Annualized expenses of the Money Market Central Funds as of their most recent shareholder report date are less than .01%. The following summarizes the Fund's investment in each non-money market Fidelity Central Fund.
Fidelity
Central Fund | Investment
Manager | Investment
Objective | Investment
Practices | Expense
Ratio* |
Fidelity Mortgage Backed Securities Central Fund | FIMM | Seeks a high level of income by normally investing in investment-grade mortgage-related securities and repurchase agreements for those securities. | Delayed Delivery & When Issued Securities Repurchase Agreements Swaps | Less than
..01% |
* Expenses expressed as a percentage of average net assets and are as of each underlying Central Fund's most recent annual or semi-annual shareholder report.
An unaudited holdings listing for the Fund, which presents direct holdings as well as the pro-rata share of any securities and other investments held indirectly through its
Annual Report
Notes to Financial Statements - continued
(Amounts in thousands except percentages)
2. Investments in Fidelity Central Funds - continued
investment in underlying non-money market Fidelity Central Funds, is available at fidelity.com. A complete unaudited list of holdings for each Fidelity Central Fund is available upon request or at the Securities and Exchange Commission (the SEC) website at www.sec.gov. In addition, the financial statements of the Fidelity Central Funds which contain the significant accounting policies (including investment valuation policies) of those funds, which are not covered by the Fund's Report of Independent Registered Public Accounting Firm, are available on the SEC website or upon request.
3. Significant Accounting Policies.
The financial statements have been prepared in conformity with accounting principles generally accepted in the United States of America (GAAP), which require management to make certain estimates and assumptions at the date of the financial statements. Actual results could differ from those estimates. Subsequent events, if any, through the date that the financial statements were issued have been evaluated in the preparation of the financial statements. The following summarizes the significant accounting policies of the Fund:
Investment Valuation. Investments are valued as of 4:00 p.m. Eastern time on the last calendar day of the period. In accordance with valuation policies and procedures approved by the Board of Trustees (the Board), the Fund attempts to obtain prices from one or more third party pricing vendors or brokers to value its investments. When current market prices, quotations or currency exchange rates are not readily available or reliable, investments will be fair valued in good faith by the Fidelity Management & Research Company (FMR) Fair Value Committee (the Committee), in accordance with procedures adopted by the Board. Factors used in determining fair value vary by investment type and may include market or investment specific events, changes in interest rates and credit quality. The frequency with which these procedures are used cannot be predicted and they may be utilized to a significant extent. The Committee oversees the Fund's valuation policies and procedures and is responsible for approving and reporting to the Board all fair value determinations.
The Fund categorizes the inputs to valuation techniques used to value its investments into a disclosure hierarchy consisting of three levels as shown below:
Level 1 - quoted prices in active markets for identical investments
Level 2 - other significant observable inputs (including quoted prices for similar investments, interest rates, prepayment speeds, etc.)
Level 3 - unobservable inputs (including the Fund's own assumptions based on the best information available)
Annual Report
3. Significant Accounting Policies - continued
Investment Valuation - continued
Valuation techniques used to value the Fund's investments by major category are as follows:
Equity securities, including restricted securities, for which market quotations are readily available, are valued at the last reported sale price or official closing price as reported by a third party pricing vendor on the primary market or exchange on which they are traded and are categorized as Level 1 in the hierarchy. In the event there were no sales during the day or closing prices are not available, securities are valued at the last quoted bid price or may be valued using the last available price and are generally categorized as Level 2 in the hierarchy. For foreign equity securities, when market or security specific events arise, comparisons to the valuation of American Depositary Receipts (ADRs), futures contracts, Exchange-Traded Funds (ETFs) and certain indexes as well as quoted prices for similar securities may be used and would be categorized as Level 2 in the hierarchy. Utilizing these techniques may result in transfers between Level 1 and Level 2. For equity securities, including restricted securities, where observable inputs are limited, assumptions about market activity and risk are used and these securities may be categorized as Level 3 in the hierarchy. Equity securities, including restricted securities, for which observable inputs are not available are valued using alternate valuation approaches, including the market approach and the income approach and are categorized as Level 3 in the hierarchy. The market approach generally consists of using comparable market transactions while the income approach generally consists of using the net present value of estimated future cash flows, adjusted as appropriate for liquidity, credit, market and/or other risk factors.
Debt securities, including restricted securities, are valued based on evaluated prices received from third party pricing vendors or from brokers who make markets in such securities. Corporate bonds, bank notes, bank loan obligations, foreign government and government agency obligations, municipal securities, preferred securities and U.S. government and government agency obligations, are valued by pricing vendors who utilize matrix pricing which considers yield or price of bonds of comparable quality, coupon, maturity and type or by broker-supplied prices. Asset backed securities, collateralized mortgage obligations, commercial mortgage securities and U.S. government agency mortgage securities, are valued by pricing vendors who utilize matrix pricing which considers prepayment speed assumptions, attributes of the collateral, yield or price of bonds of comparable quality, coupon, maturity and type or by broker-supplied prices. When independent prices are unavailable or unreliable, debt securities may be valued utilizing pricing methodologies which consider similar factors that would be used by third party pricing vendors. Debt securities are generally categorized as Level 2 in the hierarchy but may be Level 3 depending on the circumstances.
Annual Report
Notes to Financial Statements - continued
(Amounts in thousands except percentages)
3. Significant Accounting Policies - continued
Investment Valuation - continued
Futures contracts are valued at the settlement price established each day by the board of trade or exchange on which they are traded and are categorized as Level 1 in the hierarchy. Investments in open-end mutual funds, including the Fidelity Central Funds, are valued at their closing net asset value (NAV) each business day and are categorized as Level 1 in the hierarchy.
The following provides information on Level 3 securities held by the Fund that were valued at period end based on unobservable inputs. These amounts exclude valuations provided by a broker.
Asset Type | Fair Value at
08/31/14
(000s) | Valuation
Technique(s) | Unobservable
Input | Amount or
Range /
Weighted
Average | Impact to
Valuation
from an
Increase in
Input* |
Asset-Backed Securities | $ 694 | Discounted cash flow | Yield | 3.3% - 9.0% / 9.0% | Decrease |
Bank Loan Obligations | $ 6,916 | Market comparable | Discount rate | 15.0% | Decrease |
| | | EV/EBITDA multiple | 6.5 | Increase |
Collateralized Mortgage Obligations | $ 427 | Discounted cash flow | Yield | 7.5% | Decrease |
Commercial Mortgage Securities | $ 574 | Discounted cash flow | Yield | 0.0% - 10.0% / 2.1% | Decrease |
| | | Discount rate | 20.0% | Decrease |
| | Market comparable | Spread | 59.7% - 212.6% / 97.2% | Decrease |
Common Stocks | $ 166,356 | Discounted cash flow | Discount rate | 10.0% | Decrease |
| | Expected distribution | Recovery rate | 0.0% | Increase |
| | Last transaction price | Transaction price | $0.20 - $15,147.05 / $6,923.01 | Increase |
| | Market comparable | Discount rate | 10.0% | Decrease |
| | | EV/EBITDA multiple | 8.0 - 12.9 / 12.7 | Increase |
| | Stern warrant model | Discount rate | 20.0% | Decrease |
Corporate Bonds | $ 81 | Discounted cash flow | Discount rate | 25.0% | Decrease |
Annual Report
3. Significant Accounting Policies - continued
Investment Valuation - continued
Asset Type | Fair Value at
08/31/14
(000s) | Valuation
Technique(s) | Unobservable
Input | Amount or
Range /
Weighted
Average | Impact to
Valuation
from an
Increase in
Input* |
Other | $ 11 | Expected distribution | Recovery rate | 1.0% | Increase |
Preferred Stocks | $ 180,581 | Last transaction price | Transaction price | $0.07 - $15,147.05 / $11,113.45 | Increase |
| | Market comparable | Discount rate | 20.0% | Decrease |
| | | Weighted earnings multiple | 3.1 - 9.8 / 6.5 | Increase |
| | | EV/EBITDA multiple | 11.1 | Increase |
| | | EV/Sales multiple | 1.3 - 2.8 / 1.9 | Increase |
* Represents the expected directional change in the fair value of the Level 3 investments that would result from an increase in the corresponding input. A decrease to the unobservable input would have the opposite effect. Significant changes in these inputs could result in significantly higher or lower fair value measurements.
Changes in valuation techniques may result in transfers in or out of an assigned level within the disclosure hierarchy. The aggregate value of investments by input level, as of August 31, 2014, as well as a roll forward of Level 3 investments, is included at the end of the Fund's Schedule of Investments.
Foreign Currency. The Fund may use foreign currency contracts to facilitate transactions in foreign-denominated securities. Gains and losses from these transactions may arise from changes in the value of the foreign currency or if the counterparties do not perform under the contracts' terms.
Foreign-denominated assets, including investment securities, and liabilities are translated into U.S. dollars at the exchange rates at period end. Purchases and sales of investment securities, income and dividends received and expenses denominated in foreign currencies are translated into U.S. dollars at the exchange rate in effect on the transaction date.
Annual Report
Notes to Financial Statements - continued
(Amounts in thousands except percentages)
3. Significant Accounting Policies - continued
Foreign Currency - continued
The effects of exchange rate fluctuations on investments are included with the net realized and unrealized gain (loss) on investment securities. Other foreign currency transactions resulting in realized and unrealized gain (loss) are disclosed separately.
Investment Transactions and Income. For financial reporting purposes, the Fund's investment holdings and NAV include trades executed through the end of the last business day of the period. The NAV per share for processing shareholder transactions is calculated as of the close of business of the New York Stock Exchange (NYSE), normally 4:00 p.m. Eastern time and includes trades executed through the end of the prior business day. Gains and losses on securities sold are determined on the basis of identified cost and may include proceeds received from litigation. Dividend income is recorded on the ex-dividend date, except for certain dividends from foreign securities where the ex-dividend date may have passed, which are recorded as soon as the Fund is informed of the ex-dividend date. Non-cash dividends included in dividend income, if any, are recorded at the fair market value of the securities received. Income and capital gain distributions from Fidelity Central Funds, if any, are recorded on the ex-dividend date. Distributions received on securities that represent a return of capital or capital gain are recorded as a reduction of cost of investments and/or as a realized gain. Subsequent to ex-dividend date the Fund determines the components of these distributions, based upon receipt of tax filings or other correspondence relating to the underlying investment. Interest income is accrued as earned and includes coupon interest and amortization of premium and accretion of discount on debt securities as applicable. Investment income is recorded net of foreign taxes withheld where recovery of such taxes is uncertain. Debt obligations may be placed on non-accrual status and related interest income may be reduced by ceasing current accruals and writing off interest receivables when the collection of all or a portion of interest has become doubtful based on consistently applied procedures. A debt obligation is removed from non-accrual status when the issuer resumes interest payments or when collectability of interest is reasonably assured.
Class Allocations and Expenses. Investment income, realized and unrealized capital gains and losses, common expenses of the Fund, and certain fund-level expense reductions, if any, are allocated daily on a pro-rata basis to each class based on the relative net assets of each class to the total net assets of the Fund. Each class differs with respect to transfer agent fees incurred. Certain expense reductions may also differ by class. For the reporting period, the allocated portion of income and expenses to each class as a percent of its average net assets may vary due to the timing of recording these transactions in relation to fluctuating net assets of the classes. Expenses directly attributable to a fund are charged to that fund. Expenses attributable to more than one fund are allocated among the respective funds on the basis of relative net assets or other appropriate
Annual Report
3. Significant Accounting Policies - continued
Class Allocations and Expenses - continued
methods. Expense estimates are accrued in the period to which they relate and adjustments are made when actual amounts are known.
Deferred Trustee Compensation. Under a Deferred Compensation Plan (the Plan), independent Trustees may elect to defer receipt of a portion of their annual compensation. Deferred amounts are invested in a cross-section of Fidelity funds, are marked-to-market and remain in the Fund until distributed in accordance with the Plan. The investment of deferred amounts and the offsetting payable to the Trustees are included in the accompanying Statement of Assets and Liabilities.
Income Tax Information and Distributions to Shareholders. Each year, the Fund intends to qualify as a regulated investment company under Subchapter M of the Internal Revenue Code, including distributing substantially all of its taxable income and realized gains. As a result, no provision for U.S. Federal income taxes is required. As of August 31, 2014, the Fund did not have any unrecognized tax benefits in the financial statements; nor is the Fund aware of any tax positions for which it is reasonably possible that the total amounts of unrecognized tax benefits will significantly change in the next twelve months. The Fund files a U.S. federal tax return, in addition to state and local tax returns as required. The Fund's federal income tax returns are subject to examination by the Internal Revenue Service (IRS) for a period of three fiscal years after they are filed. State and local tax returns may be subject to examination for an additional fiscal year depending on the jurisdiction. Foreign taxes are provided for based on the Fund's understanding of the tax rules and rates that exist in the foreign markets in which it invests.
Distributions are declared and recorded on the ex-dividend date. Income dividends and capital gain distributions are declared separately for each class. Income and capital gain distributions are determined in accordance with income tax regulations, which may differ from GAAP. In addition, the Fund claimed a portion of the payment made to redeeming shareholders as a distribution for income tax purposes.
Capital accounts within the financial statements are adjusted for permanent book-tax differences. These adjustments have no impact on net assets or the results of operations. Capital accounts are not adjusted for temporary book-tax differences which will reverse in a subsequent period.
Book-tax differences are primarily due to futures contracts, swaps, foreign currency transactions, market discount, partnerships (including allocations from Fidelity Central Funds), original issue discount, contingent interest, equity-debt classifications, deferred trustees compensation and losses deferred due to wash sales.
Annual Report
Notes to Financial Statements - continued
(Amounts in thousands except percentages)
3. Significant Accounting Policies - continued
Income Tax Information and Distributions to Shareholders - continued
The federal tax cost of investment securities and unrealized appreciation (depreciation) as of period end were as follows:
Gross unrealized appreciation | $ 5,308,082 |
Gross unrealized depreciation | (177,214) |
Net unrealized appreciation (depreciation) on securities | $ 5,130,868 |
| |
Tax Cost | $ 19,782,032 |
The tax-based components of distributable earnings as of period end were as follows:
Undistributed ordinary income | $ 272,204 |
Undistributed long-term capital gain | $ 1,229,077 |
Net unrealized appreciation (depreciation) on securities and other investments | $ 5,130,746 |
The tax character of distributions paid was as follows:
| August 31, 2014 | August 31, 2013 |
Ordinary Income | $ 502,578 | $ 381,222 |
Long-term Capital Gains | 1,570,954 | 327,025 |
Total | $ 2,073,532 | $ 708,247 |
Delayed Delivery Transactions and When-Issued Securities. During the period, the Fund transacted in securities on a delayed delivery or when-issued basis. Payment and delivery may take place after the customary settlement period for that security. The price of the underlying securities and the date when the securities will be delivered and paid for are fixed at the time the transaction is negotiated. The securities purchased on a delayed delivery or when-issued basis are identified as such in the Fund's Schedule of Investments. The Fund may receive compensation for interest forgone in the purchase of a delayed delivery or when-issued security. With respect to purchase commitments, the Fund identifies securities as segregated in its records with a value at least equal to the amount of the commitment. The payables and receivables associated with the purchases and sales of delayed delivery securities having the same coupon, settlement date and broker are offset. Delayed delivery or when-issued securities that have been purchased from and sold to different brokers are reflected as both payables and receivables in the fund's Statement of Assets and Liabilities under the caption "Delayed delivery." Losses may arise due to changes in the value of the underlying securities or if the counterparty does not perform under the contract's terms, or if the issuer does not issue the securities due to political, economic, or other factors.
Annual Report
3. Significant Accounting Policies - continued
To-Be-Announced (TBA) Securities and Mortgage Dollar Rolls. During the period, the Fund transacted in TBA securities that involved buying or selling mortgage-backed securities (MBS) on a forward commitment basis. A TBA transaction typically does not designate the actual security to be delivered and only includes an approximate principal amount; however delivered securities must meet specified terms defined by industry guidelines, including issuer, rate and current principal amount outstanding on underlying mortgage pools. The Fund may enter into a TBA transaction with the intent to take possession of or deliver the underlying MBS, or the Fund may elect to extend the settlement by entering into either a mortgage or reverse mortgage dollar roll. Mortgage dollar rolls are transactions where a fund sells TBA securities and simultaneously agrees to repurchase MBS on a later date at a lower price and with the same counterparty. Reverse mortgage dollar rolls involve the purchase and simultaneous agreement to sell TBA securities on a later date at a lower price. Transactions in mortgage dollar rolls and reverse mortgage dollar rolls are accounted for as purchases and sales and may result in an increase to the Fund's portfolio turnover rate.
Purchases and sales of TBA securities involve risks similar to those discussed above for delayed delivery and when-issued securities. Also, if the counterparty in a mortgage dollar roll or a reverse mortgage dollar roll transaction files for bankruptcy or becomes insolvent, the Fund's right to repurchase or sell securities may be limited. Additionally, when a fund sells TBA securities without already owning or having the right to obtain the deliverable securities (an uncovered forward commitment to sell), it incurs a risk of loss because it could have to purchase the securities at a price that is higher than the price at which it sold them. A fund may be unable to purchase the deliverable securities if the corresponding market is illiquid.
TBA securities subject to a forward commitment to sell at period end are included at the end of the Fund's Schedule of Investments under the caption "TBA Sale Commitments." The proceeds and value of these commitments are reflected in the Fund's Statement of Assets and Liabilities as Receivable for TBA sale commitments and TBA sale commitments, at value, respectively.
Restricted Securities. The Fund may invest in securities that are subject to legal or contractual restrictions on resale. These securities generally may be resold in transactions exempt from registration or to the public if the securities are registered. Disposal of these securities may involve time-consuming negotiations and expense, and prompt sale at an acceptable price may be difficult. Information regarding restricted securities is included at the end of the Fund's Schedule of Investments.
Loans and Other Direct Debt Instruments. The Fund invests in direct debt instruments which are interests in amounts owed to lenders by corporate or other borrowers. These instruments may be in the form of loans, trade claims or other receivables and may
Annual Report
Notes to Financial Statements - continued
(Amounts in thousands except percentages)
3. Significant Accounting Policies - continued
Loans and Other Direct Debt Instruments - continued
include standby financing commitments such as revolving credit facilities that obligate the Fund to supply additional cash to the borrower on demand. Loans may be acquired through assignment or participation, or may be made directly to a borrower. The Fund did not have any unfunded loan commitments, which are contractual obligations for future funding, at period end.
4. Derivative Instruments.
Risk Exposures and the Use of Derivative Instruments. The Fund's investment objective allows the Fund to enter into various types of derivative contracts, including futures contracts and swaps. Derivatives are investments whose value is primarily derived from underlying assets, indices or reference rates and may be transacted on an exchange or over-the-counter (OTC). Derivatives may involve a future commitment to buy or sell a specified asset based on specified terms, to exchange future cash flows at periodic intervals based on a notional principal amount, or for one party to make one or more payments upon the occurrence of specified events in exchange for periodic payments from the other party.
The Fund used derivatives to increase returns, to gain exposure to certain types of assets and to manage exposure to certain risks as defined below. The success of any strategy involving derivatives depends on analysis of numerous economic factors, and if the strategies for investment do not work as intended, the Fund may not achieve its objectives.
The Fund's use of derivatives increased or decreased its exposure to the following risks:
Credit Risk | Credit risk relates to the ability of the issuer of a financial instrument to make further principal or interest payments on an obligation or commitment that it has to the Fund. |
Interest Rate Risk | Interest rate risk relates to the fluctuations in the value of interest-bearing securities due to changes in the prevailing levels of market interest rates. |
The Fund is also exposed to additional risks from investing in derivatives, such as liquidity risk and counterparty credit risk. Liquidity risk is the risk that the Fund will be unable to close out the derivative in the open market in a timely manner. Counterparty credit risk is the risk that the counterparty will not be able to fulfill its obligation to the Fund. Derivative counterparty credit risk is managed through formal evaluation of the creditworthiness of all potential counterparties. On certain OTC derivatives such as bi-lateral swaps, the Fund attempts to reduce its exposure to counterparty credit risk by entering into an International Swaps and Derivatives Association, Inc. (ISDA) Master Agreement with each of its counterparties. The ISDA Master Agreement gives the Fund
Annual Report
4. Derivative Instruments - continued
Risk Exposures and the Use of Derivative Instruments - continued
the right to terminate all transactions traded under such agreement upon the deterioration in the credit quality of the counterparty beyond specified levels. The ISDA Master Agreement gives each party the right, upon an event of default by the other party or a termination of the agreement, to close out all transactions traded under such agreement and to net amounts owed under each transaction to one net payable by one party to the other. To mitigate counterparty credit risk on bi-lateral OTC derivatives, the Fund receives collateral in the form of cash or securities once the Fund's net unrealized appreciation on outstanding derivative contracts under an ISDA Master Agreement exceeds certain applicable thresholds, subject to certain minimum transfer provisions. The collateral received is held in segregated accounts with the Fund's custodian bank in accordance with the collateral agreements entered into between the Fund, the counterparty and the Fund's custodian bank. The Fund could experience delays and costs in gaining access to the collateral even though it is held by the Fund's custodian bank. The Fund's maximum risk of loss from counterparty credit risk related to bi-lateral OTC derivatives is generally the aggregate unrealized appreciation and unpaid counterparty payments in excess of any collateral pledged by the counterparty to the Fund. The Fund may be required to pledge collateral for the benefit of the counterparties on bi-lateral OTC derivatives in an amount not less than each counterparty's unrealized appreciation on outstanding derivative contracts, subject to certain minimum transfer provisions, and any such pledged collateral is identified in the Schedule of Investments. Exchange-traded futures contracts are not covered by the ISDA Master Agreement; however counterparty credit risk related to exchange-traded futures contracts may be mitigated by the protection provided by the exchange on which they trade.
Investing in derivatives may involve greater risks than investing in the underlying assets directly and, to varying degrees, may involve risk of loss in excess of any initial investment and collateral received and amounts recognized in the Statement of Assets and Liabilities. In addition, there may be the risk that the change in value of the derivative contract does not correspond to the change in value of the underlying instrument.
Annual Report
Notes to Financial Statements - continued
(Amounts in thousands except percentages)
4. Derivative Instruments - continued
Net Realized Gain (Loss) and Change in Net Unrealized Appreciation (Depreciation) on Derivatives. The table below, which reflects the impacts of derivatives on the financial performance of the Fund, summarizes the net realized gain (loss) and change in net unrealized appreciation (depreciation) for derivatives during the period as presented in the Statement of Operations.
Primary Risk Exposure /
Derivative Type | Net Realized
Gain (Loss) | Change in Net
Unrealized Appreciation
(Depreciation) |
Credit Risk | | |
Swaps | $ (6,476) | $ 7,794 |
| | |
Interest Rate Risk | | |
Futures Contracts | $ 771 | $ (163) |
Totals (a) | $ (5,705) | $ 7,631 |
(a) A summary of the value of derivatives by primary risk exposure as of period end, if any, is included at the end of the Schedule of Investments.
Futures Contracts. A futures contract is an agreement between two parties to buy or sell a specified underlying instrument for a fixed price at a specified future date. The Fund used futures contracts to manage its exposure to the bond market and fluctuations in interest rates.
Upon entering into a futures contract, a fund is required to deposit either cash or securities (initial margin) with a clearing broker in an amount equal to a certain percentage of the face value of the contract. Futures contracts are marked-to-market daily and subsequent daily payments (variation margin) are made or received by a fund depending on the daily fluctuations in the value of the futures contracts and are recorded as unrealized appreciation or (depreciation). This receivable and/or payable, if any, is included in daily variation margin for derivative instruments in the Statement of Assets and Liabilities. Realized gain or (loss) is recorded upon the expiration or closing of a futures contract. The net realized gain (loss) and change in net unrealized appreciation (depreciation) on futures contracts during the period is included in the Statement of Operations.
Any open futures contracts at period end are presented in the Schedule of Investments under the caption "Futures Contracts." The underlying face amount at value reflects each contract's exposure to the underlying instrument or index at period end and is representative of volume of activity during the period. Securities deposited to meet initial margin requirements are identified in the Schedule of Investments.
Swaps. A swap is a contract between two parties to exchange future cash flows at periodic intervals based on a notional principal amount. A bi-lateral OTC swap is a transaction between a fund and a dealer counterparty where cash flows are exchanged between the two parties for the life of the swap.
Bi-lateral OTC swaps are marked-to-market daily and changes in value are reflected in the Statement of Assets and Liabilities in the bi-lateral OTC swaps at value line items.
Annual Report
4. Derivative Instruments - continued
Swaps - continued
Any upfront premiums paid or received upon entering a bi-lateral OTC swap to compensate for differences between stated terms of the swap and prevailing market conditions (e.g. credit spreads, interest rates or other factors) are recorded in net unrealized appreciation (depreciation) in the Statement of Assets and Liabilities and amortized to realized gain or (loss) ratably over the term of the swap. Any unamortized upfront premiums are presented in the Schedule of Investments.
Payments are exchanged at specified intervals, accrued daily commencing with the effective date of the contract and recorded as realized gain or (loss). Some swaps may be terminated prior to the effective date and realize a gain or loss upon termination. The net realized gain (loss) and change in net unrealized appreciation (depreciation) on swaps during the period is included in the Statement of Operations.
Any open swaps at period end are included in the Schedule of Investments under the caption "Swaps."
Credit Default Swaps. Credit default swaps enable the Fund to buy or sell protection against specified credit events on a single-name issuer or a traded credit index. Under the terms of a credit default swap the buyer of protection (buyer) receives credit protection in exchange for making periodic payments to the seller of protection (seller) based on a fixed percentage applied to a notional principal amount. In return for these payments, the seller will be required to make a payment upon the occurrence of one or more specified credit events. The Fund enters into credit default swaps as a seller to gain credit exposure to an issuer and/or as a buyer to obtain a measure of protection against defaults of an issuer. Periodic payments are made over the life of the contract by the buyer provided that no credit event occurs.
For credit default swaps on most corporate and sovereign issuers, credit events include bankruptcy, failure to pay or repudiation/moratorium. For credit default swaps on corporate or sovereign issuers, the obligation that may be put to the seller is not limited to the specific reference obligation described in the Schedule of Investments. For credit default swaps on asset-backed securities, a credit event may be triggered by events such as failure to pay principal, maturity extension, rating downgrade or write-down. For credit default swaps on asset-backed securities, the reference obligation described represents the security that may be put to the seller. For credit default swaps on a traded credit index, a specified credit event may affect all or individual underlying securities included in the index.
As a seller, if an underlying credit event occurs, the Fund will pay a net settlement amount of cash equal to the notional amount of the swap less the recovery value of the reference obligation or underlying securities comprising an index. Only in the event of
Annual Report
Notes to Financial Statements - continued
(Amounts in thousands except percentages)
4. Derivative Instruments - continued
Credit Default Swaps - continued
the industry's inability to value the underlying asset will the Fund be required to take delivery of the reference obligation or underlying securities comprising an index and pay an amount equal to the notional amount of the swap.
As a buyer, if an underlying credit event occurs, the Fund will receive a net settlement amount of cash equal to the notional amount of the swap less the recovery value of the reference obligation or underlying securities comprising an index. Only in the event of the industry's inability to value the underlying asset will the Fund be required to deliver the reference obligation or underlying securities comprising an index in exchange for payment of an amount equal to the notional amount of the swap.
Typically, the value of each credit default swap and credit rating disclosed for each reference obligation in the Schedule of Investments, where the Fund is the seller, can be used as measures of the current payment/performance risk of the swap. As the value of the swap changes as a positive or negative percentage of the total notional amount, the payment/performance risk may decrease or increase, respectively. In addition to these measures, the investment adviser monitors a variety of factors including cash flow assumptions, market activity and market sentiment as part of its ongoing process of assessing payment/performance risk.
5. Purchases and Sales of Investments.
Purchases and sales of securities (including the Fixed-Income Central Funds), other than short-term securities and U.S. government securities, aggregated $12,931,986 and $13,917,855, respectively.
6. Fees and Other Transactions with Affiliates.
Management Fee. Fidelity Management & Research Company (the investment adviser) and its affiliates provide the Fund with investment management related services for which the Fund pays a monthly management fee. The management fee is the sum of an individual fund fee rate that is based on an annual rate of .15% of the Fund's average net assets and an annualized group fee rate that averaged .25% during the period. The group fee rate is based upon the average net assets of all the mutual funds advised by the investment adviser, including any mutual funds previously advised by the investment adviser that are currently advised by Fidelity SelectCo, LLC, an affiliate of the investment adviser. The group fee rate decreases as assets under management increase and increases as assets under management decrease. For the reporting period, the total annual management fee rate was .40% of the Fund's average net assets.
Annual Report
6. Fees and Other Transactions with Affiliates - continued
Transfer Agent Fees. Fidelity Investments Institutional Operations Company, Inc., (FIIOC), an affiliate of the investment adviser, is the transfer, dividend disbursing and shareholder servicing agent for each class of the Fund. FIIOC receives account fees and asset-based fees that vary according to the account size and type of account of the shareholders of Puritan. FIIOC receives an asset-based fee of Class K's average net assets. FIIOC pays for typesetting, printing and mailing of shareholder reports, except proxy statements.
For the period, transfer agent fees for each class were as follows:
| Amount | % of
Average
Net Assets |
Puritan | $ 25,425 | .15 |
Class K | 2,643 | .05 |
| $ 28,068 | |
Accounting and Security Lending Fees. Fidelity Service Company, Inc. (FSC), an affiliate of the investment adviser, maintains the Fund's accounting records. The accounting fee is based on the level of average net assets for each month. Under a separate contract, FSC administers the security lending program. The security lending fee is based on the number and duration of lending transactions.
Brokerage Commissions. The Fund placed a portion of its portfolio transactions with brokerage firms which are affiliates of the investment adviser. Brokerage commissions are included in net realized gain (loss) and change in net unrealized appreciation (depreciation) in the Statement of Operations. The commissions paid to these affiliated firms were $177 for the period.
Other. During the period, the investment adviser reimbursed the Fund for certain losses in the amount of $17.
7. Committed Line of Credit.
The Fund participates with other funds managed by the investment adviser or an affiliate in a $4.25 billion credit facility (the "line of credit") to be utilized for temporary or emergency purposes to fund shareholder redemptions or for other short-term liquidity purposes. The Fund has agreed to pay commitment fees on its pro-rata portion of the line of credit, which amounted to $38 and is reflected in Miscellaneous expenses on the Statement of Operations. During the period, the Fund did not borrow on this line of credit.
Annual Report
Notes to Financial Statements - continued
(Amounts in thousands except percentages)
8. Security Lending.
The Fund lends portfolio securities from time to time in order to earn additional income. For equity securities, a lending agent is used and may loan securities to certain qualified borrowers, including Fidelity Capital Markets (FCM), a broker-dealer affiliated with the Fund. On the settlement date of the loan, the Fund receives collateral (in the form of U.S. Treasury obligations, letters of credit and/or cash) against the loaned securities and maintains collateral in an amount not less than 100% of the market value of the loaned securities during the period of the loan. The market value of the loaned securities is determined at the close of business of the Fund and any additional required collateral is delivered to the Fund on the next business day. If the borrower defaults on its obligation to return the securities loaned because of insolvency or other reasons, the Fund may apply collateral received from the borrower against the obligation. The Fund may experience delays and costs in recovering the securities loaned. Any cash collateral received is maintained at the Fund's custodian and/or invested in cash equivalents and/or the Fidelity Securities Lending Cash Central Fund. The value of loaned securities and cash collateral at period end are disclosed on the Fund's Statement of Assets and Liabilities. The value of securities loaned to FCM at period end was $1,954. Security lending income represents the income earned on investing cash collateral, less rebates paid to borrowers, plus any premium payments received for lending certain types of securities. Total security lending income during the period, presented in the Statement of Operations as a component of interest income, amounted to $547. Net income from the Fidelity Securities Lending Cash Central Fund during the period, presented in the Statement of Operations as a component of income from Fidelity Central Funds, amounted to $1,075 (including $254 from securities loaned to FCM).
9. Expense Reductions.
Commissions paid to certain brokers with whom the investment adviser, or its affiliates, places trades on behalf of the Fund include an amount in addition to trade execution, which may be rebated back to the Fund to offset certain expenses. This amount totaled $296 for the period. In addition, through arrangements with the Fund's custodian, credits realized as a result of uninvested cash balances were used to reduce the Fund's expenses. During the period, these credits reduced the Fund's custody expenses by $1.
In addition, the investment adviser reimbursed a portion of the Fund's operating expenses during the period in the amount of $114.
Annual Report
10. Distributions to Shareholders.
Distributions to shareholders of each class were as follows:
Years ended August 31, | 2014 | 2013 |
From net investment income | | |
Puritan | $ 277,059 | $ 267,070 |
Class K | 97,413 | 85,948 |
Total | $ 374,472 | $ 353,018 |
From net realized gain | | |
Puritan | $ 1,279,703 | $ 276,687 |
Class K | 419,357 | 78,542 |
Total | $ 1,699,060 | $ 355,229 |
11. Share Transactions.
Transactions for each class of shares were as follows:
| Shares | Dollars |
Years ended August 31, | 2014 | 2013 | 2014 | 2013 |
Puritan | | | | |
Shares sold | 83,240 | 78,846 | $ 1,795,083 | $ 1,597,567 |
Reinvestment of distributions | 71,802 | 26,262 | 1,481,284 | 515,763 |
Shares redeemed | (113,337) | (138,032) | (2,452,014) | (2,782,293) |
Net increase (decrease) | 41,705 | (32,924) | $ 824,353 | $ (668,963) |
Class K | | | | |
Shares sold | 47,633 | 68,604 | $ 1,032,662 | $ 1,385,671 |
Reinvestment of distributions | 25,049 | 8,366 | 516,770 | 164,490 |
Shares redeemed | (52,889) | (45,907) | (1,142,151) | (930,471) |
Net increase (decrease) | 19,793 | 31,063 | $ 407,281 | $ 619,690 |
12. Other.
The Fund's organizational documents provide former and current trustees and officers with a limited indemnification against liabilities arising in connection with the performance of their duties to the Fund. In the normal course of business, the Fund may also enter into contracts that provide general indemnifications. The Fund's maximum exposure under these arrangements is unknown as this would be dependent on future claims that may be made against the Fund. The risk of material loss from such claims is considered remote.
Annual Report
To the Trustees of Fidelity Puritan Trust and the Shareholders of Fidelity Puritan Fund:
In our opinion, the accompanying statement of assets and liabilities, including the schedule of investments, and the related statements of operations and of changes in net assets and the financial highlights present fairly, in all material respects, the financial position of Fidelity Puritan Fund (a fund of Fidelity Puritan Trust) at August 31, 2014, the results of its operations for the year then ended, the changes in its net assets for each of the two years in the period then ended and the financial highlights for each of the five years in the period then ended, in conformity with accounting principles generally accepted in the United States of America. These financial statements and financial highlights (hereafter referred to as "financial statements") are the responsibility of the Fidelity Puritan Fund's management. Our responsibility is to express an opinion on these financial statements based on our audits. We conducted our audits of these financial statements in accordance with the standards of the Public Company Accounting Oversight Board (United States). Those standards require that we plan and perform the audit to obtain reasonable assurance about whether the financial statements are free of material misstatement. An audit includes examining, on a test basis, evidence supporting the amounts and disclosures in the financial statements, assessing the accounting principles used and significant estimates made by management, and evaluating the overall financial statement presentation. We believe that our audits, which included confirmation of securities at August 31, 2014 by correspondence with the custodian, agent banks and brokers, provide a reasonable basis for our opinion.
PricewaterhouseCoopers LLP
Boston, Massachusetts
October 23, 2014
Annual Report
The Trustees, Member of the Advisory Board, and officers of the trust and fund, as applicable, are listed below. The Board of Trustees governs the fund and is responsible for protecting the interests of shareholders. The Trustees are experienced executives who meet periodically throughout the year to oversee the fund's activities, review contractual arrangements with companies that provide services to the fund, oversee management of the risks associated with such activities and contractual arrangements, and review the fund's performance. Except for James C. Curvey, each of the Trustees oversees 173 funds. Mr. Curvey oversees 406 funds.
The Trustees hold office without limit in time except that (a) any Trustee may resign; (b) any Trustee may be removed by written instrument, signed by at least two-thirds of the number of Trustees prior to such removal; (c) any Trustee who requests to be retired or who has become incapacitated by illness or injury may be retired by written instrument signed by a majority of the other Trustees; and (d) any Trustee may be removed at any special meeting of shareholders by a two-thirds vote of the outstanding voting securities of the trust. Each Trustee who is not an interested person (as defined in the 1940 Act) of the trust and the fund (Independent Trustee), shall retire not later than the last day of the calendar year in which his or her 75th birthday occurs. The Independent Trustees may waive this mandatory retirement age policy with respect to individual Trustees. The officers and Advisory Board Member hold office without limit in time, except that any officer and Advisory Board Member may resign or may be removed by a vote of a majority of the Trustees at any regular meeting or any special meeting of the Trustees. Except as indicated, each individual has held the office shown or other offices in the same company for the past five years.
Experience, Skills, Attributes, and Qualifications of the Fund's Trustees. The Governance and Nominating Committee has adopted a statement of policy that describes the experience, qualifications, attributes, and skills that are necessary and desirable for potential Independent Trustee candidates (Statement of Policy). The Board believes that each Trustee satisfied at the time he or she was initially elected or appointed a Trustee, and continues to satisfy, the standards contemplated by the Statement of Policy. The Governance and Nominating Committee also engages professional search firms to help identify potential Independent Trustee candidates who have the experience, qualifications, attributes, and skills consistent with the Statement of Policy. From time to time, additional criteria based on the composition and skills of the current Independent Trustees, as well as experience or skills that may be appropriate in light of future changes to board composition, business conditions, and regulatory or other developments, have also been considered by the professional search firms and the Governance and Nominating Committee. In addition, the Board takes into account the Trustees' commitment and participation in Board and committee meetings, as well as their leadership of standing and ad hoc committees throughout their tenure.
In determining that a particular Trustee was and continues to be qualified to serve as a Trustee, the Board has considered a variety of criteria, none of which, in isolation, was controlling. The Board believes that, collectively, the Trustees have balanced and diverse experience, qualifications, attributes, and skills, which allow the Board to operate effectively in governing the fund and protecting the interests of shareholders. Information about the specific experience, skills, attributes, and qualifications of each Trustee, which in each case led to the Board's conclusion that the Trustee should serve (or continue to serve) as a trustee of the fund, is provided below.
Annual Report
Trustees and Officers - continued
Board Structure and Oversight Function. James C. Curvey is an interested person (as defined in the 1940 Act) and currently serves as Chairman. The Trustees have determined that an interested Chairman is appropriate and benefits shareholders because an interested Chairman has a personal and professional stake in the quality and continuity of services provided to the fund. Independent Trustees exercise their informed business judgment to appoint an individual of their choosing to serve as Chairman, regardless of whether the Trustee happens to be independent or a member of management. The Independent Trustees have determined that they can act independently and effectively without having an Independent Trustee serve as Chairman and that a key structural component for assuring that they are in a position to do so is for the Independent Trustees to constitute a substantial majority for the Board. The Independent Trustees also regularly meet in executive session. Ned C. Lautenbach serves as Chairman of the Independent Trustees and as such (i) acts as a liaison between the Independent Trustees and management with respect to matters important to the Independent Trustees and (ii) with management prepares agendas for Board meetings.
Fidelity funds are overseen by different Boards of Trustees. The fund's Board oversees Fidelity's equity and high income funds and another Board oversees Fidelity's investment-grade bond, money market, and asset allocation funds. The asset allocation funds may invest in Fidelity funds overseen by the fund's Board. The use of separate Boards, each with its own committee structure, allows the Trustees of each group of Fidelity funds to focus on the unique issues of the funds they oversee, including common research, investment, and operational issues. On occasion, the separate Boards establish joint committees to address issues of overlapping consequences for the Fidelity funds overseen by each Board.
The Trustees operate using a system of committees to facilitate the timely and efficient consideration of all matters of importance to the Trustees, the fund, and fund shareholders and to facilitate compliance with legal and regulatory requirements and oversight of the fund's activities and associated risks. The Board, acting through its committees, has charged FMR and its affiliates with (i) identifying events or circumstances the occurrence of which could have demonstrably adverse effects on the fund's business and/or reputation; (ii) implementing processes and controls to lessen the possibility that such events or circumstances occur or to mitigate the effects of such events or circumstances if they do occur; and (iii) creating and maintaining a system designed to evaluate continuously business and market conditions in order to facilitate the identification and implementation processes described in (i) and (ii) above. Because the day-to-day operations and activities of the fund are carried out by or through FMR, its affiliates and other service providers, the fund's exposure to risks is mitigated but not eliminated by the processes overseen by the Trustees. While each of the Board's committees has responsibility for overseeing different aspects of the fund's activities, oversight is exercised primarily through the Operations, Audit, and Compliance Committees. In addition, the Independent Trustees have worked with FMR to enhance the Board's oversight of investment and financial risks, legal and regulatory risks, technology risks, and operational risks, including the development of additional risk reporting to the Board. For example, a working group comprised of Independent Trustees and FMR has worked and continues to work to review the Fidelity funds' valuation-related activities, reporting and risk management. Appropriate personnel, including but not limited to the fund's Chief Compliance Officer (CCO), FMR's internal auditor, the independent accountants, the fund's Treasurer and portfolio management personnel, make periodic reports to the Board's committees, as appropriate, including an annual review of FMR's risk management program for the Fidelity funds. The responsibilities of each standing committee, including their oversight responsibilities, are described further under "Standing Committees of the Fund's Trustees."
Annual Report
The fund's Statement of Additional Information (SAI) includes more information about the Trustees. To request a free copy, call Fidelity at 1-800-835-5092.
Interested Trustees*:
Correspondence intended for each Trustee who is an interested person may be sent to Fidelity Investments, 245 Summer Street, Boston, Massachusetts 02210.
Name, Year of Birth; Principal Occupations and Other Relevant Experience+ |
James C. Curvey (1935) |
Year of Election or Appointment: 2007 Trustee Chairman of the Board of Trustees |
| Mr. Curvey also serves as Trustee of other Fidelity funds. Mr. Curvey is a Director of Fidelity Research & Analysis Co. (2009-present), and Vice Chairman (2007-present) and Director of FMR LLC. In addition, Mr. Curvey serves as an Overseer for the Boston Symphony Orchestra and a member of the Trustees of Villanova University. Previously, Mr. Curvey served as a Director of Fidelity Investments Money Management, Inc. (2009-2014), a Director of FMR (2007-2014), a Director of FMR Co., Inc. (2007-2014) and was the Vice Chairman (2006-2007) and Director (2000-2007) of FMR Corp. |
Charles S. Morrison (1960) |
Year of Election or Appointment: 2014 Trustee |
| Mr. Morrison also serves as Trustee of other funds. He serves as President, Asset Management (2014-present) and is an employee of Fidelity Investments. Previously, Mr. Morrison served as Vice President of Fidelity's Fixed Income and Asset Allocation Funds (2012-2014), President, Fixed Income (2011-2014), Vice President of Fidelity's Money Market Funds (2005-2009), President, Money Market Group Leader of FMR (2009), and Senior Vice President, Money Market Group of FMR (2004-2009). Mr. Morrison also served as Vice President of Fidelity's Bond Funds (2002-2005), certain Balanced Funds (2002-2005), and certain Asset Allocation Funds (2002-2007), and as Senior Vice President (2002-2005) of Fidelity's Bond Division. |
* Trustees have been determined to be "Interested Trustees" by virtue of, among other things, their affiliation with the trust or various entities under common control with FMR.
+ The information above includes each Trustee's principal occupation during the last five years and other information relating to the experience, attributes, and skills relevant to each Trustee's qualifications to serve as a Trustee, which led to the conclusion that each Trustee should serve as a Trustee for the fund.
Annual Report
Independent Trustees:
Correspondence intended for each Independent Trustee (that is, the Trustees other than the Interested Trustees) may be sent to Fidelity Investments, P.O. Box 55235, Boston, Massachusetts 02205-5235.
Name, Year of Birth; Principal Occupations and Other Relevant Experience+ |
Dennis J. Dirks (1948) |
Year of Election or Appointment: 2005 Trustee |
| Mr. Dirks also serves as Trustee of other Fidelity funds. Prior to his retirement in May 2003, Mr. Dirks was Chief Operating Officer and a member of the Board of The Depository Trust & Clearing Corporation (DTCC). He also served as President, Chief Operating Officer, and Board member of The Depository Trust Company (DTC) and President and Board member of the National Securities Clearing Corporation (NSCC). In addition, Mr. Dirks served as Chief Executive Officer and Board member of the Government Securities Clearing Corporation, Chief Executive Officer and Board member of the Mortgage-Backed Securities Clearing Corporation, as a Trustee and a member of the Finance Committee of Manhattan College (2005-2008), and as a Trustee and a member of the Finance Committee of AHRC of Nassau County (2006-2008). Mr. Dirks is a member of the Independent Directors Council (IDC) Governing Council (2010-present) and Board of Directors for The Brookville Center for Children's Services, Inc. (2009-present). |
Alan J. Lacy (1953) |
Year of Election or Appointment: 2008 Trustee |
| Mr. Lacy also serves as Trustee of other Fidelity funds. Mr. Lacy serves as Senior Adviser (2007-present) of Oak Hill Capital Partners, L.P. (private equity). Mr. Lacy also served as Chief Executive Officer (2000-2005) and Vice Chairman (2005-2006) of Sears Holdings Corporation and Sears, Roebuck and Co. (retail). In addition, Mr. Lacy serves as a member of the Board of Directors of Dave & Buster's Entertainment, Inc. (restaurant and entertainment complexes, 2010-present), Earth Fare, Inc. (retail grocery, 2012-present), The Hillman Companies, Inc. (hardware wholesalers, 2010-present), and Bristol-Myers Squibb Company (global pharmaceuticals, 2008-present). Mr. Lacy is a member of the Board of Trustees of The National Parks Conservation Association (2006-present). Previously, Mr. Lacy served as Chairman of the Board of Trustees of the National Parks Conservation Association (2008-2011) and as a member of the Board of Directors for the Western Union Company (global money transfer, 2006-2011). |
Ned C. Lautenbach (1944) |
Year of Election or Appointment: 2000 Trustee Chairman of the Independent Trustees |
| Mr. Lautenbach also serves as Trustee of other Fidelity funds. Mr. Lautenbach currently serves as the Lead Director of the Eaton Corporation Board of Directors (diversified industrial, 1997-present). Mr. Lautenbach is Chairman of the Board of Directors of the Philharmonic Center for the Arts in Naples, Florida (2012-present) and a member of the Council on Foreign Relations (1994-present). Previously, Mr. Lautenbach was a Partner/Advisory Partner at Clayton, Dubilier & Rice, LLC (private equity investment, 1998-2010), as well as a Director of Sony Corporation (2006-2007). |
Joseph Mauriello (1944) |
Year of Election or Appointment: 2008 Trustee |
| Mr. Mauriello also serves as Trustee of other Fidelity funds. Prior to his retirement in January 2006, Mr. Mauriello served in numerous senior management positions including Deputy Chairman and Chief Operating Officer (2004-2005), and Vice Chairman of Financial Services (2002-2004) of KPMG LLP US (professional services, 1965-2005). Mr. Mauriello currently serves as a member of the Board of Directors of XL Group plc. (global insurance and re-insurance, 2006-present). Previously, Mr. Mauriello served as a Director of the Hamilton Funds of the Bank of New York (2006-2007) and of Arcadia Resources Inc. (health care services and products, 2007-2012). |
Robert W. Selander (1950) |
Year of Election or Appointment: 2011 Trustee |
| Mr. Selander also serves as Trustee of other Fidelity funds. Previously, Mr. Selander served as a Member of the Advisory Board of other Fidelity funds (2011), and Executive Vice Chairman (2010), Chief Executive Officer (2009-2010), and President and Chief Executive Officer (1997-2009) of Mastercard, Inc. |
Cornelia M. Small (1944) |
Year of Election or Appointment: 2005 Trustee |
| Ms. Small also serves as Trustee of other Fidelity funds. Ms. Small is a member of the Board of Directors (2009-present) and Chair of the Investment Committee (2010-present) of the Teagle Foundation. Ms. Small also serves on the Investment Committee of the Berkshire Taconic Community Foundation (2008-present). Previously, Ms. Small served as Chairperson (2002-2008) and a member of the Investment Committee and Chairperson (2008-2012) and a member of the Board of Trustees of Smith College. In addition, Ms. Small served as Chief Investment Officer, Director of Global Equity Investments, and a member of the Board of Directors of Scudder, Stevens & Clark and Scudder Kemper Investments. |
William S. Stavropoulos (1939) |
Year of Election or Appointment: 2001 Trustee Vice Chairman of the Independent Trustees |
| Mr. Stavropoulos also serves as Trustee of other Fidelity funds. Mr. Stavropoulos serves as President and Founder of the Michigan Baseball Foundation, the Great Lakes Loons (2007-present). Mr. Stavropoulos is Chairman Emeritus of the Board of Directors of The Dow Chemical Company, where he previously served in numerous senior management positions, including President, CEO (1995-2000; 2002-2004), Chairman of the Executive Committee (2000-2006), and as a member of the Board of Directors (1990-2006). Currently, Mr. Stavropoulos is Chairman of the Board of Directors of Univar Inc. (global distributor of commodity and specialty chemicals), a Director of Teradata Corporation (data warehousing and technology solutions), and Maersk Inc. (industrial conglomerate), and a member of the Advisory Board for Metalmark Capital LLC (private equity investment, 2005-present). Mr. Stavropoulos is an operating advisor to Clayton, Dubilier & Rice, LLC (private equity investment). In addition, Mr. Stavropoulos is a member of the University of Notre Dame Advisory Council for the College of Science, a Trustee of the Rollin L. Gerstacker Foundation, and a Director of the Naples Philharmonic Center for the Arts. Previously, Mr. Stavropoulos served as a Director of Chemical Financial Corporation (bank holding company, 1993-2012) and Tyco International, Ltd. (multinational manufacturing and services, 2007-2012). |
David M. Thomas (1949) |
Year of Election or Appointment: 2008 Trustee |
| Mr. Thomas also serves as Trustee of other Fidelity funds. Mr. Thomas serves as Non-Executive Chairman of the Board of Directors of Fortune Brands Home and Security (home and security products, 2011-present), and as a member of the Board of Directors of Interpublic Group of Companies, Inc. (marketing communication, 2004-present). Previously, Mr. Thomas served as Executive Chairman (2005-2006) and Chairman and Chief Executive Officer (2000-2005) of IMS Health, Inc. (pharmaceutical and healthcare information solutions), and a Director of Fortune Brands, Inc. (consumer products, 2000-2011). |
+ The information above includes each Trustee's principal occupation during the last five years and other information relating to the experience, attributes, and skills relevant to each Trustee's qualifications to serve as a Trustee, which led to the conclusion that each Trustee should serve as a Trustee for the fund.
Advisory Board Member and Officers:
Correspondence intended for each officer and Peter S. Lynch may be sent to Fidelity Investments, 245 Summer Street, Boston, Massachusetts 02210. Officers appear below in alphabetical order.
Name, Year of Birth; Principal Occupation |
Peter S. Lynch (1944) |
Year of Election or Appointment: 2003 Member of the Advisory Board |
| Mr. Lynch also serves as Member of the Advisory Board of other Fidelity funds. Mr. Lynch is Vice Chairman and a Director of FMR and FMR Co., Inc. In addition, Mr. Lynch serves as a Trustee of Boston College and as the Chairman of the Inner-City Scholarship Fund. Previously, Mr. Lynch served on the Special Olympics International Board of Directors (1997-2006). |
Elizabeth Paige Baumann (1968) |
Year of Election or Appointment: 2012 Anti-Money Laundering (AML) Officer |
| Ms. Baumann also serves as AML Officer of other funds. She is Chief AML Officer of FMR LLC (2012-present) and is an employee of Fidelity Investments. Previously, Ms. Baumann served as Vice President and Deputy Anti-Money Laundering Officer (2007-2012). |
William C. Coffey (1969) |
Year of Election or Appointment: 2009 Assistant Secretary |
| Mr. Coffey also serves as Assistant Secretary of other funds. He is Senior Vice President and Deputy General Counsel of FMR LLC (2010-present), and is an employee of Fidelity Investments. Previously, Mr. Coffey served as Vice President and Associate General Counsel of FMR LLC (2005-2009). |
Jonathan Davis (1968) |
Year of Election or Appointment: 2010 Assistant Treasurer |
| Mr. Davis also serves as Assistant Treasurer of other funds. Mr. Davis is an employee of Fidelity Investments. Previously, Mr. Davis served as Vice President and Associate General Counsel of FMR LLC (2003-2010). |
Adrien E. Deberghes (1967) |
Year of Election or Appointment: 2008 Deputy Treasurer |
| Mr. Deberghes also serves as an officer of other funds. He is an employee of Fidelity Investments (2008-present). Prior to joining Fidelity Investments, Mr. Deberghes was Senior Vice President of Mutual Fund Administration at State Street Corporation (2007-2008), Senior Director of Mutual Fund Administration at Investors Bank & Trust (2005-2007), and Director of Finance for Dunkin' Brands (2000-2005). |
Stephanie J. Dorsey (1969) |
Year of Election or Appointment: 2010 Assistant Treasurer |
| Ms. Dorsey also serves as an officer of other funds. She is an employee of Fidelity Investments (2008-present) and has served in other fund officer roles. Prior to joining Fidelity Investments, Ms. Dorsey served as Treasurer (2004-2008) of the JPMorgan Mutual Funds and Vice President (2004-2008) of JPMorgan Chase Bank. |
Howard J. Galligan III (1966) |
Year of Election or Appointment: 2014 Chief Financial Officer |
| Mr. Galligan also serves as Chief Financial Officer of other funds. Mr. Galligan serves as President of Fidelity Pricing and Cash Management Services (FPCMS) (2014-present) and as a Director of Strategic Advisers, Inc. (2008-present). Previously, Mr. Galligan served as Chief Administrative Officer of Asset Management (2011-2014) and Chief Operating Officer and Senior Vice President of Investment Support for Strategic Advisers, Inc. (2003-2011). |
Scott C. Goebel (1968) |
Year of Election or Appointment: 2008 Secretary and Chief Legal Officer (CLO) |
| Mr. Goebel serves as Secretary and CLO of other funds. Mr. Goebel also serves as Secretary of Fidelity SelectCo, LLC (2013-present), Fidelity Investments Money Management, Inc. (FIMM) (2010-present) and Fidelity Research and Analysis Company (FRAC) (2010-present); General Counsel, Secretary, and Senior Vice President of FMR (2008-present) and FMR Co., Inc. (2008-present); Chief Legal Officer of Fidelity Management & Research (Hong Kong) Limited (2008-present); and Assistant Secretary of Fidelity Management & Research (Japan) Inc. (2008-present) and Fidelity Management & Research (U.K.) Inc. (2008-present). Previously, Mr. Goebel served as Secretary and CLO of other Fidelity funds (2008-2013), Assistant Secretary of FIMM (2008-2010), FRAC (2008-2010), and certain funds (2007-2008); and as Vice President and Secretary of Fidelity Distributors Corporation (FDC) (2005-2007). Mr. Goebel has been employed by FMR LLC or an affiliate since 2001. |
Brian B. Hogan (1964) |
Year of Election or Appointment: 2009 Vice President |
| Mr. Hogan also serves as Trustee or Vice President of other funds. Mr. Hogan serves as President of FMR's Equity Division (2009-present). Previously, Mr. Hogan served as Senior Vice President, Equity Research of FMR (2006-2009) and as a portfolio manager. |
Chris Maher (1972) |
Year of Election or Appointment: 2013 Assistant Treasurer |
| Mr. Maher serves as Assistant Treasurer of other funds. Mr. Maher is Vice President of Valuation Oversight and is an employee of Fidelity Investments. Previously, Mr. Maher served as Vice President of Asset Management Compliance (2013), Vice President of FMR's Program Management Group (2010-2013), and Vice President of Valuation Oversight (2008-2010). |
Melissa M. Reilly (1971) |
Year of Election or Appointment: 2014 Vice President of certain Equity Funds |
| Ms. Reilly also serves as Vice President of other funds. Ms. Reilly is an employee of Fidelity Investments (2004-present). |
Kenneth B. Robins (1969) |
Year of Election or Appointment: 2008 President and Treasurer |
| Mr. Robins also serves as an officer of other funds. Mr. Robins serves as Executive Vice President of Fidelity Investments Money Management, Inc. (FIMM) (2013-present) and is an employee of Fidelity Investments (2004-present). Previously, Mr. Robins served in other fund officer roles. |
Stephen Sadoski (1971) |
Year of Election or Appointment: 2012 Deputy Treasurer |
| Mr. Sadoski also serves as Deputy Treasurer of other funds. He is an employee of Fidelity Investments (2012-present) and has served in another fund officer role. Prior to joining Fidelity Investments, Mr. Sadoski served as an assistant chief accountant in the Division of Investment Management of the Securities and Exchange Commission (SEC) (2009-2012) and as a senior manager at Deloitte & Touche LLP (1997-2009). |
Stacie M. Smith (1974) |
Year of Election or Appointment: 2013 Deputy Treasurer |
| Ms. Smith also serves as an officer of other funds. She is an employee of Fidelity Investments (2009-present) and has served in other fund officer roles. Prior to joining Fidelity Investments, Ms. Smith served as Senior Audit Manager of Ernst & Young LLP (1996-2009). |
Renee Stagnone (1975) |
Year of Election or Appointment: 2013 Deputy Treasurer |
| Ms. Stagnone also serves as Deputy Treasurer of other funds. Ms. Stagnone is an employee of Fidelity Investments. |
Linda J. Wondrack (1964) |
Year of Election or Appointment: 2014 Chief Compliance Officer |
| Ms. Wondrack also serves as Chief Compliance Officer of other funds. Ms. Wondrack is Executive Vice President and head of the Ethics Office and Asset Management Compliance for Fidelity Investments (2012-present). Ms. Wondrack also serves as Chief Compliance Officer of Fidelity SelectCo, LLC (2014-present); Chief Compliance Officer of Impresa Management LLC (2013-present); and Chief Compliance Officer of FMR Co., Inc., Fidelity Investments Money Management, Inc., Fidelity Management & Research (Japan) Inc., Fidelity Management & Research (U.K.) Inc., Fidelity Management & Research (Hong Kong), Fidelity Management & Research Company, Pyramis Global Advisors, LLC, and Strategic Advisers, Inc., Ballyrock Investment Advisors LLC, and Northern Neck Investors LLC (2012-present). Previously, Ms. Wondrack served as Senior Vice President and Chief Compliance Officer for Columbia Management Investment Advisers, LLC (2005-2012); Chief Compliance Officer for certain funds within the Columbia Family of Funds (2007-2012); and Senior Vice President of Compliance Risk Management at Bank of America (2005-2010). |
Joseph F. Zambello (1957) |
Year of Election or Appointment: 2011 Deputy Treasurer |
| Mr. Zambello also serves as Deputy Treasurer of other funds. Mr. Zambello is an employee of Fidelity Investments. Previously, Mr. Zambello served as Vice President of FMR's Program Management Group (2009-2011) and Vice President of the Transfer Agent Oversight Group (2005-2009). |
Annual Report
The Board of Trustees of Fidelity Puritan Fund voted to pay to shareholders of record at the opening of business on record date, the following distributions per share derived from capital gains realized from sales of portfolio securities and a dividend derived from net investment income:
| Pay Date | Record Date | Dividends | Capital Gains |
Class K | 10/13/14 | 10/10/14 | $0.102 | $1.340 |
The fund hereby designates as a capital gain dividend with respect to the taxable year ended August 31, 2014 $1,528,514,665, or, if subsequently determined to be different, the net capital gain of such year.
A total of 2.25% of the dividends distributed during the fiscal year was derived from interest on U.S. Government securities which is generally exempt from state income tax.
The Fund designates $125,447,201 of distributions paid during the period January 1, 2014 to August 31, 2014 as qualifying to be taxed as interest-related dividends for nonresident alien shareholders.
Class K designates 7%, 26%, 69% and 69% of the dividends distributed in October, December, April and July, respectively during the fiscal year as qualifying for the dividends-received deduction for corporate shareholders.
Class K designates 9%, 31%, 89% and 88% of the dividends distributed in October, December, April and July, respectively during the fiscal year as amounts which may be taken into account as a dividend for the purposes of the maximum rate under section 1(h)(11) of the Internal Revenue Code.
The fund will notify shareholders in January 2015 of amounts for use in preparing 2014 income tax returns.
Annual Report
Board Approval of Investment Advisory Contracts and Management Fees
Fidelity Puritan Fund
Each year, the Board of Trustees, including the Independent Trustees (together, the Board), votes on the renewal of the management contract with Fidelity Management & Research Company (FMR) and the sub-advisory agreements (together, the Advisory Contracts) for the fund. The Board, assisted by the advice of fund counsel and Independent Trustees' counsel, requests and considers a broad range of information relevant to the renewal of the Advisory Contracts throughout the year.
The Board meets regularly and, at each of its meetings, covers an extensive agenda of topics and materials and considers factors that are relevant to its annual consideration of the renewal of the fund's Advisory Contracts, including the services and support provided to the fund and its shareholders. The Board has established various standing committees (Committees), each composed of and chaired by Independent Trustees with varying backgrounds, to which the Board has assigned specific subject matter responsibilities in order to enhance effective decision-making by the Board. The Board, acting directly and through its Committees, requests and receives information concerning the annual consideration of the renewal of the fund's Advisory Contracts. The Board also meets as needed to consider matters specifically related to the Board's annual consideration of the renewal of the Advisory Contracts. Members of the Board may also meet with trustees of other Fidelity funds through ad hoc joint committees to discuss certain matters relevant to the Fidelity funds.
At its July 2014 meeting, the Board, including the Independent Trustees, unanimously determined to renew the fund's Advisory Contracts. In reaching its determination, the Board considered all factors it believed relevant, including (i) the nature, extent, and quality of the services to be provided to the fund and its shareholders (including the investment performance of the fund); (ii) the competitiveness of the fund's management fee and total expense ratio relative to peer funds; (iii) the total costs of the services to be provided by and the profits to be realized by Fidelity from its relationship with the fund; (iv) the extent to which economies of scale exist and would be realized as the fund grows; and (v) whether fee levels reflect these economies of scale, if any, for the benefit of fund shareholders. In connection with separate internal corporate reorganizations involving Fidelity Management & Research (U.K.) Inc. (FMR U.K.) and Fidelity Management & Research (Japan) Inc. (FMR Japan), the Board approved certain non-material amendments to the fund's sub-advisory agreements with FMR U.K. and FMR Japan to reflect that, after these reorganizations, FMR Investment Management (UK) Limited and Fidelity Management & Research (Japan) Limited will carry on the business of FMR U.K. and FMR Japan, respectively. The Board noted that no changes to the portfolio managers or to the foreign research or investment advisory services provided to the fund were expected in connection with either reorganization and that the same personnel and resources would continue to be available to the fund at the new entities.
Annual Report
In considering whether to renew the Advisory Contracts for the fund, the Board reached a determination, with the assistance of fund counsel and Independent Trustees' counsel and through the exercise of its business judgment, that the renewal of the Advisory Contracts was in the best interests of the fund and its shareholders and that the compensation payable under the Advisory Contracts was fair and reasonable. The Board's decision to renew the Advisory Contracts was not based on any single factor, but rather was based on a comprehensive consideration of all the information provided to the Board at its meetings throughout the year. The Board, in reaching its determination to renew the Advisory Contracts, was aware that shareholders of the fund have a broad range of investment choices available to them, including a wide choice among funds offered by Fidelity's competitors, and that the fund's shareholders, who have the opportunity to review and weigh the disclosure provided by the fund in its prospectus and other public disclosures, have chosen to invest in this fund, which is part of the Fidelity family of funds.
Nature, Extent, and Quality of Services Provided. The Board considered Fidelity's staffing as it relates to the fund, including the backgrounds of investment personnel of FMR and the sub-advisers (together, the Investment Advisers), and also considered the fund's investment objective, strategies, and related investment philosophy. The Independent Trustees also had discussions with senior management of Fidelity's investment operations and investment groups. The Board considered the structure of the portfolio manager compensation program and whether this structure provides appropriate incentives to act in the best interests of the fund. Additionally, the Board considered the portfolio managers' investments, if any, in the funds that they manage.
Resources Dedicated to Investment Management and Support Services. The Board and the Fund Oversight and Research Committees reviewed the general qualifications and capabilities of Fidelity's investment staff, including its size, education, experience, and resources, as well as Fidelity's approach to recruiting, training, managing, and compensating investment personnel. The Board noted that Fidelity has continued to increase the resources devoted to non-U.S. offices, including expansion of Fidelity's global investment organization. The Board also noted that Fidelity's analysts have extensive resources, tools and capabilities that allow them to conduct sophisticated quantitative and fundamental analysis, as well as credit analysis of issuers, counterparties and guarantors. Further, the Board believes that Fidelity's investment professionals have sufficient access to global information and data so as to provide competitive investment results over time, and that those professionals also have access to sophisticated tools that permit them to assess portfolio construction and risk and performance attribution characteristics continuously, as well as to transmit new information and research conclusions rapidly around the world. Additionally, in its deliberations, the Board considered Fidelity's trading and risk management capabilities and resources and global compliance infrastructure, which are an integral part of the investment management process.
Annual Report
Board Approval of Investment Advisory Contracts and
Management Fees - continued
Shareholder and Administrative Services. The Board considered (i) the nature, extent, quality, and cost of advisory, administrative, and shareholder services performed by the Investment Advisers and their affiliates under the Advisory Contracts and under separate agreements covering transfer agency, pricing and bookkeeping, and securities lending services for the fund; (ii) the nature and extent of the supervision of third party service providers, principally custodians and subcustodians; and (iii) the resources devoted to, and the record of compliance with, the fund's compliance policies and procedures. The Board also reviewed the allocation of fund brokerage, including allocations to brokers affiliated with the Investment Advisers, the use of brokerage commissions to pay fund expenses, and the use of "soft" commission dollars to pay for research services.
The Board noted that the growth of fund assets over time across the complex allows Fidelity to reinvest in the development of services designed to enhance the value or convenience of the Fidelity funds as investment vehicles. These services include 24-hour access to account information and market information through telephone representatives and over the Internet, investor education materials and asset allocation tools, and the expanded availability of Fidelity Investor Centers.
In 2014, the Board formed an ad hoc Committee on Transfer Agency Fees to review the variety of transfer agency fee structures throughout the industry and Fidelity's competitive positioning with respect to industry participants.
Investment in a Large Fund Family. The Board considered the benefits to shareholders of investing in a Fidelity fund, including the benefits of investing in a fund that is part of a large family of funds offering a variety of investment disciplines and providing a large variety of mutual fund investor services. The Board noted that Fidelity had taken, or had made recommendations that resulted in the Fidelity funds taking, a number of actions over the previous year that benefited particular funds, including (i) continuing to dedicate additional resources to investment research and to the support of the senior management team that oversees asset management; (ii) persisting in efforts to enhance Fidelity's global research capabilities; (iii) launching new funds and making other enhancements to meet client needs for income-oriented solutions; (iv) reducing fund expenses for certain index funds; (v) continuing to launch dedicated lower cost underlying funds to meet portfolio construction needs related to expanding underlying fund options for Fidelity funds of funds, specifically for the Freedom Fund product lines; (vi) rationalizing product lines and gaining increased efficiencies through fund mergers; (vii) launching sector-based exchange-traded funds and establishing a new Fidelity adviser to manage sector-based funds and products; (viii) continuing to develop and implement technology to improve security and increase efficiency; (ix) modifying the eligibility criteria for certain share classes to increase their marketability to a portion of the defined contribution plan market; (x) waiving redemption fees for certain qualified fund-of-fund and wrap programs and certain retirement plan transactions; and (xi) launching new Institutional Class shares of certain money market funds to attract and retain assets and to fill a gap in the money market fund lineup.
Annual Report
Investment Performance. The Board considered whether the fund has operated in accordance with its investment objective, as well as its record of compliance with its investment restrictions and its performance history.
The Board took into account discussions with the Investment Advisers about fund investment performance that occur at Board meetings throughout the year. In this regard the Board noted that as part of regularly scheduled fund reviews and other reports to the Board on fund performance, the Board periodically considers annualized return information for the fund, for different time periods, measured against a securities market index ("benchmark index") and a peer group of funds with similar objectives ("peer group"). In its evaluation of fund investment performance, the Board gave particular attention to information indicating changes in performance of certain Fidelity funds for specific time periods and the Investment Advisers' explanations for any overperformance or underperformance.
In addition to reviewing absolute and relative fund performance, the Independent Trustees periodically consider the appropriateness of fund performance metrics in evaluating the results achieved. In general, the Independent Trustees believe that fund performance should be evaluated based on net performance (after fees and expenses) of both the highest performing and lowest performing classes, where applicable, compared to appropriate benchmark indices, over appropriate time periods which may include full market cycles, and compared to peer groups, as applicable, over the same periods, taking into account relevant factors including the following: general market conditions; issuer-specific information; tactical opportunities for investment; and fund cash flows and other factors.
The Independent Trustees recognize that shareholders evaluate performance on a net basis over their own holding periods, for which one-, three-, and five-year periods are often used as a proxy. For this reason, the performance information reviewed by the Board also included net cumulative calendar year total return information for the fund and an appropriate benchmark index and peer group for the most recent one-, three-, and five-year periods, as shown below. Returns are shown compared to the 25th percentile (top of box, 75% beaten) and 75th percentile (bottom of box, 25% beaten) of the peer universe.
Annual Report
Board Approval of Investment Advisory Contracts and
Management Fees - continued
Fidelity Puritan Fund

Based on its review, the Board concluded that the nature, extent, and quality of services provided to the fund under the Advisory Contracts should benefit the fund's shareholders.
Competitiveness of Management Fee and Total Expense Ratio. The Board considered the fund's management fee and total expense ratio compared to "mapped groups" of competitive funds and classes. Fidelity creates "mapped groups" by combining similar Lipper investment objective categories that have comparable investment mandates. Combining Lipper investment objective categories aids the Board's management fee and total expense ratio comparisons by broadening the competitive group used for comparison and by reducing the number of universes to which various Fidelity funds are compared.
Management Fee. The Board considered two proprietary management fee comparisons for the 12-month periods shown in the chart below. The group of Lipper funds used by the Board for management fee comparisons is referred to below as the "Total Mapped Group." The Total Mapped Group is broader than the Lipper peer group used by the Board for performance comparisons because the Total Mapped Group combines several Lipper investment objective categories while the Lipper peer group does not. The Total Mapped Group comparison focuses on a fund's standing in terms of gross management fees before expense reimbursements or caps relative to the total universe of funds with comparable investment mandates, regardless of whether their management fee structures also are comparable. Funds with comparable investment mandates offer exposure to similar types of securities. Funds with comparable management fee structures have similar management fee contractual arrangements (e.g., flat rate charged for advisory services, all-inclusive fee rate, etc.). "TMG %" represents the percentage of funds in the Total Mapped Group that had management fees that were lower than the fund's. For example, a hypothetical TMG % of 20% would mean that 80% of the funds in the Total Mapped Group had higher, and 20% had lower, management fees than the fund. The fund's actual TMG %s are in the chart below. The "Asset-Size Peer Group" (ASPG) comparison focuses on a fund's standing relative to a subset of non-Fidelity funds within the Total Mapped Group that are similar in size and management fee structure. For example, if a fund is in the first quartile of the ASPG, the fund's management fee ranks in the least expensive or lowest 25% of funds in the ASPG. The ASPG represents at least 15% of the funds in the Total Mapped Group with comparable asset size and management fee structures, subject to a minimum of 50 funds (or all funds in the Total Mapped Group if fewer than 50). Additional information, such as the ASPG quartile in which the fund's management fee rate ranked, is also included in the chart and considered by the Board.
Annual Report
Fidelity Puritan Fund

The Board noted that the fund's management fee rate ranked below the median of its Total Mapped Group and below the median of its ASPG for 2013.
The Board also noted that, in August 2013, the ad hoc Committee on Management Fees was formed to conduct an in-depth review of the management fee rates of Fidelity's active equity mutual funds. The Committee focused on the following areas: (i) standard fee structures; (ii) research consumption and trading evolution; (iii) management fee competitiveness/profitability by category; and (iv) factors that drive institutional pricing.
Annual Report
Board Approval of Investment Advisory Contracts and
Management Fees - continued
Based on its review, the Board concluded that the fund's management fee is fair and reasonable in light of the services that the fund receives and the other factors considered.
Total Expense Ratio. In its review of each class's total expense ratio, the Board considered the fund's management fee as well as other fund or class expenses, as applicable, such as transfer agent fees, pricing and bookkeeping fees, and custodial, legal, and audit fees. The Board also noted the effects of any waivers and reimbursements on fees and expenses. As part of its review, the Board also considered the current and historical total expense ratios of each class of the fund compared to competitive fund median expenses. Each class of the fund is compared to those funds and classes in the Total Mapped Group (used by the Board for management fee comparisons) that have a similar sales load structure.
The Board noted that the total expense ratio of each class ranked below its competitive median for 2013.
Fees Charged to Other Fidelity Clients. The Board also considered Fidelity fee structures and other information with respect to clients of Fidelity, such as other funds advised or subadvised by Fidelity, pension plan clients, and other institutional clients. The Board noted the findings of the 2013 ad hoc joint committee (created with the board of other Fidelity funds), which reviewed and compared Fidelity's institutional investment advisory business with its business of providing services to the Fidelity funds, including the differences in services provided, fees charged, and costs incurred, as well as competition in their respective marketplaces.
Based on its review of total expense ratios and fees charged to other Fidelity clients, the Board concluded that the total expense ratio of each class of the fund was reasonable in light of the services that the fund and its shareholders receive and the other factors considered.
Costs of the Services and Profitability. The Board considered the revenues earned and the expenses incurred by Fidelity in conducting the business of developing, marketing, distributing, managing, administering and servicing the fund and servicing the fund's shareholders. The Board also considered the level of Fidelity's profits in respect of all the Fidelity funds.
On an annual basis, Fidelity presents to the Board Fidelity's profitability for the fund. Fidelity calculates the profitability for each fund, as well as aggregate profitability for groups of Fidelity funds and all Fidelity funds, using a series of detailed revenue and cost allocation methodologies which originate with the books and records of Fidelity on which Fidelity's audited financial statements are based. The Audit Committee of the Board reviews any significant changes from the prior year's methodologies.
Annual Report
PricewaterhouseCoopers LLP (PwC), independent registered public accounting firm and auditor to Fidelity and certain Fidelity funds, has been engaged annually by the Board as part of the Board's assessment of Fidelity's profitability analysis. PwC's engagement includes the review and assessment of the methodologies used by Fidelity in determining the revenues and expenses attributable to Fidelity's mutual fund business, and completion of agreed-upon procedures in respect of the mathematical accuracy of fund profitability and its conformity to established allocation methodologies. After considering PwC's reports issued under the engagement and information provided by Fidelity, the Board concluded that while other allocation methods may also be reasonable, Fidelity's profitability methodologies are reasonable in all material respects.
The Board also reviewed Fidelity's non-fund businesses and fall-out benefits related to the mutual fund business as well as cases where Fidelity's affiliates may benefit from or be related to the fund's business.
The Board considered the costs of the services provided by and the profits realized by Fidelity in connection with the operation of the fund and was satisfied that the profitability was not excessive in the circumstances.
Economies of Scale. The Board considered whether there have been economies of scale in respect of the management of the Fidelity funds, whether the Fidelity funds (including the fund) have appropriately benefited from any such economies of scale, and whether there is potential for realization of any further economies of scale. The Board considered the extent to which the fund will benefit from economies of scale through increased services to the fund, through waivers or reimbursements, or through fee or expense ratio reductions. The Board also noted that in 2013, it and the boards of other Fidelity funds created an ad hoc committee (the Economies of Scale Committee) to analyze whether Fidelity attains economies of scale in respect of the management and servicing of the Fidelity funds, whether the Fidelity funds have appropriately benefited from such economies of scale, and whether there is potential for realization of any further economies of scale.
The Board recognized that the fund's management contract incorporates a "group fee" structure, which provides for lower group fee rates as total group assets increase, and for higher group fee rates as total group assets decrease (with "group assets" defined to include fund assets under FMR's management plus sector fund assets previously under FMR's management and currently managed by Fidelity SelectCo, LLC). FMR calculates the group fee rates based on a tiered asset "breakpoint" schedule that varies based on asset class. The Board considered that the group fee is designed to deliver the benefits of economies of scale to fund shareholders when total Fidelity fund assets increase, even if assets of any particular fund are unchanged or have declined, because some portion of Fidelity's costs are attributable to services provided to all Fidelity funds, and all funds benefit if those costs can be allocated among more assets. The Board concluded that, given the group fee structure, fund shareholders will benefit from lower management fees as group assets increase at the fund complex level, regardless of whether Fidelity achieves any such economies of scale.
Annual Report
Board Approval of Investment Advisory Contracts and
Management Fees - continued
The Board concluded, taking into account the analysis of the Economies of Scale Committee, that economies of scale, if any, are being appropriately shared between fund shareholders and Fidelity.
Additional Information Requested by the Board. In order to develop fully the factual basis for consideration of the Fidelity funds' Advisory Contracts, the Board requested and received additional information on certain topics, including: (i) fund performance trends and Fidelity's long-term strategies for certain funds; (ii) Fidelity's strategic marketing and product lineup goals; (iii) the methodology with respect to competitive fund data and peer group classifications; (iv) the arrangements with, and performance of, certain sub-advisers on behalf of the Fidelity funds, as well as certain proposed participating affiliate arrangements; (v) the realization of fall-out benefits in certain Fidelity business units; (vi) Fidelity's group fee structures, including the rationale for the individual fee rates of certain categories of funds and the definition of group assets; (vii) trends regarding industry use of performance fee structures and the performance adjustment methodologies applicable to the Fidelity funds; (viii) additional competitive analysis regarding the total expenses for certain classes; (ix) fund profitability methodology, including Fidelity's cost allocation methodology, and the impact of certain factors on fund profitability results; and (x) the process by which Fidelity determines sub-advisory fees for funds it advises.
Based on its evaluation of all of the conclusions noted above, and after considering all factors it believed relevant, the Board ultimately concluded that the advisory fee structures are fair and reasonable, and that the fund's Advisory Contracts should be renewed.
Annual Report
Investment Adviser
Fidelity Management & Research Company
Boston, MA
Investment Sub-Advisers
FMR Co., Inc.
Fidelity Management & Research
(U.K.) Inc.
Fidelity Investments Money Management, Inc.
Fidelity Management & Research
(Hong Kong) Limited
Fidelity Management & Research
(Japan) Inc.
General Distributor
Fidelity Distributors Corporation
Smithfield, RI
Transfer and Service Agents
Fidelity Investments Institutional
Operations Company, Inc.
Boston, MA
Fidelity Service Company, Inc.
Boston, MA
Custodian
JP Morgan Chase Bank
New York, NY
(Fidelity Investment logo)(registered trademark)
Corporate Headquarters
245 Summer St., Boston, MA 02210
www.fidelity.com
PUR-K-UANN-1014
1.863164.105
Item 2. Code of Ethics
As of the end of the period, August 31, 2014, Fidelity Puritan Trust (the trust) has adopted a code of ethics, as defined in Item 2 of Form N-CSR, that applies to its President and Treasurer and its Chief Financial Officer. A copy of the code of ethics is filed as an exhibit to this Form N-CSR.
Item 3. Audit Committee Financial Expert
The Board of Trustees of the trust has determined that Joseph Mauriello is an audit committee financial expert, as defined in Item 3 of Form N-CSR. Mr. Mauriello is independent for purposes of Item 3 of Form N-CSR.
Item 4. Principal Accountant Fees and Services
Fees and Services
The following table presents fees billed by PricewaterhouseCoopers LLP ("PwC") in each of the last two fiscal years for services rendered to Fidelity Balanced Fund and Fidelity Puritan Fund (the "Funds"):
Services Billed by PwC
August 31, 2014 FeesA
| Audit Fees | Audit-Related Fees | Tax Fees | All Other Fees |
Fidelity Balanced Fund | $119,000 | $- | $12,200 | $10,200 |
Fidelity Puritan Fund | $228,000 | $- | $27,800 | $9,500 |
August 31, 2013 FeesA
| Audit Fees | Audit-Related Fees | Tax Fees | All Other Fees |
Fidelity Balanced Fund | $121,000 | $- | $10,000 | $9,700 |
Fidelity Puritan Fund | $250,000 | $- | $10,000 | $9,300 |
A Amounts may reflect rounding.
The following table presents fees billed by PwC that were required to be approved by the Audit Committee for services that relate directly to the operations and financial reporting of the Funds and that are rendered on behalf of Fidelity Management & Research Company ("FMR") and entities controlling, controlled by, or under common control with FMR (not including any sub-adviser whose role is primarily portfolio management and is subcontracted with or overseen by another investment adviser) that provide ongoing services to the Funds ("Fund Service Providers"):
Services Billed by PwC
| August 31, 2014A | August 31, 2013A |
Audit-Related Fees | $4,935,000 | $5,335,000 |
Tax Fees | $- | $- |
All Other Fees | $20,000 | $30,000 |
A Amounts may reflect rounding.
"Audit-Related Fees" represent fees billed for assurance and related services that are reasonably related to the performance of the fund audit or the review of the fund's financial statements and that are not reported under Audit Fees.
"Tax Fees" represent fees billed for tax compliance, tax advice or tax planning that relate directly to the operations and financial reporting of the fund.
"All Other Fees" represent fees billed for services provided to the fund or Fund Service Provider, a significant portion of which are assurance related, that relate directly to the operations and financial reporting of the fund, excluding those services that are reported under Audit Fees, Audit-Related Fees or Tax Fees.
Assurance services must be performed by an independent public accountant.
* * *
The aggregate non-audit fees billed by PwC for services rendered to the Funds, FMR (not including any sub-adviser whose role is primarily portfolio management and is subcontracted with or overseen by another investment adviser), and any Fund Service Provider for each of the last two fiscal years of the Funds are as follows:
Billed By | August 31, 2014 A | August 31, 2013 A |
PwC | $6,125,000 | $6,220,000 |
A Amounts may reflect rounding.
The trust's Audit Committee has considered non-audit services that were not pre-approved that were provided by PwC to Fund Service Providers to be compatible with maintaining the independence of PwC in its audit of the Funds, taking into account representations from PwC, in accordance with Public Company Accounting Oversight Board rules, regarding its independence from the Funds and their related entities and FMR's review of the appropriateness and permissibility under applicable law of such non-audit services prior to their provision to the Fund Service Providers.
Audit Committee Pre-Approval Policies and Procedures
The trust's Audit Committee must pre-approve all audit and non-audit services provided by a fund's independent registered public accounting firm relating to the operations or financial reporting of the fund. Prior to the commencement of any audit or non-audit services to a fund, the Audit Committee reviews the services to determine whether they are appropriate and permissible under applicable law.
The Audit Committee has adopted policies and procedures to, among other purposes, provide a framework for the Committee's consideration of non-audit services by the audit firms that audit the Fidelity funds. The policies and procedures require that any non-audit service provided by a fund audit firm to a Fidelity fund and any non-audit service provided by a fund auditor to a Fund Service Provider that relates directly to the operations and financial reporting of a Fidelity fund ("Covered Service") are subject to approval by the Audit Committee before such service is provided.
All Covered Services must be approved in advance of provision of the service either: (i) by formal resolution of the Audit Committee, or (ii) by oral or written approval of the service by the Chair of the Audit Committee (or if the Chair is unavailable, such other member of the Audit Committee as may be designated by the Chair to act in the Chair's absence). The approval contemplated by (ii) above is permitted where the Treasurer determines that action on such an engagement is necessary before the next meeting of the Audit Committee.
Non-audit services provided by a fund audit firm to a Fund Service Provider that do not relate directly to the operations and financial reporting of a Fidelity fund are reported to the Audit Committee on a periodic basis.
Non-Audit Services Approved Pursuant to Rule 2-01(c)(7)(i)(C) and (ii) of Regulation S-X ("De Minimis Exception")
There were no non-audit services approved or required to be approved by the Audit Committee pursuant to the De Minimis Exception during the Funds' last two fiscal years relating to services provided to (i) the Funds or (ii) any Fund Service Provider that relate directly to the operations and financial reporting of the Funds.
Item 5. Audit Committee of Listed Registrants
Not applicable.
Item 6. Investments
(a) Not applicable.
(b) Not applicable
Item 7. Disclosure of Proxy Voting Policies and Procedures for Closed-End Management Investment Companies
Not applicable.
Item 8. Portfolio Managers of Closed-End Management Investment Companies
Not applicable.
Item 9. Purchase of Equity Securities by Closed-End Management Investment Company and Affiliated Purchasers
Not applicable.
Item 10. Submission of Matters to a Vote of Security Holders
There were no material changes to the procedures by which shareholders may recommend nominees to the trust's Board of Trustees.
Item 11. Controls and Procedures
(a)(i) The President and Treasurer and the Chief Financial Officer have concluded that the trust's disclosure controls and procedures (as defined in Rule 30a-3(c) under the Investment Company Act) provide reasonable assurances that material information relating to the trust is made known to them by the appropriate persons, based on their evaluation of these controls and procedures as of a date within 90 days of the filing date of this report.
(a)(ii) There was no change in the trust's internal control over financial reporting (as defined in Rule 30a-3(d) under the Investment Company Act) that occurred during the second fiscal quarter of the period covered by this report that has materially affected, or is reasonably likely to materially affect, the trust's internal control over financial reporting.
Item 12. Exhibits
(a) | (1) | Code of Ethics pursuant to Item 2 of Form N-CSR is filed and attached hereto as EX-99.CODE ETH. |
(a) | (2) | Certification pursuant to Rule 30a-2(a) under the Investment Company Act of 1940 (17 CFR 270.30a-2(a)) is filed and attached hereto as Exhibit 99.CERT. |
(a) | (3) | Not applicable. |
(b) | | Certification pursuant to Rule 30a-2(b) under the Investment Company Act of 1940 (17 CFR 270.30a-2(b)) is furnished and attached hereto as Exhibit 99.906CERT. |
SIGNATURES
Pursuant to the requirements of the Securities Exchange Act of 1934 and the Investment Company Act of 1940, the registrant has duly caused this report to be signed on its behalf by the undersigned, thereunto duly authorized.
Fidelity Puritan Trust
By: | /s/Kenneth B. Robins |
| Kenneth B. Robins |
| President and Treasurer |
| |
Date: | October 28, 2014 |
Pursuant to the requirements of the Securities Exchange Act of 1934 and the Investment Company Act of 1940, this report has been signed below by the following persons on behalf of the registrant and in the capacities and on the dates indicated.
By: | /s/Kenneth B. Robins |
| Kenneth B. Robins |
| President and Treasurer |
| |
Date: | October 28, 2014 |
By: | /s/Howard J. Galligan III |
| Howard J. Galligan III |
| Chief Financial Officer |
| |
Date: | October 28, 2014 |