UNITED STATES
SECURITIES AND EXCHANGE COMMISSION
Washington, D.C. 20549
FORM N-CSR
CERTIFIED SHAREHOLDER REPORT OF REGISTERED
MANAGEMENT INVESTMENT COMPANIES
Investment Company Act file number 811-649
Fidelity Puritan Trust
(Exact name of registrant as specified in charter)
245 Summer St., Boston, Massachusetts 02210
(Address of principal executive offices) (Zip code)
Marc Bryant, Secretary
245 Summer St.
Boston, Massachusetts 02210
(Name and address of agent for service)
Registrant's telephone number, including area code:
617-563-7000
| |
Date of fiscal year end: | July 31 |
|
|
Date of reporting period: | July 31, 2017 |
Item 1.
Reports to Stockholders
Fidelity Flex℠ Funds Fidelity Flex℠ Intrinsic Opportunities Fund
Annual Report July 31, 2017 |
 |
Contents
To view a fund's proxy voting guidelines and proxy voting record for the 12-month period ended June 30, visit http://www.fidelity.com/proxyvotingresults or visit the Securities and Exchange Commission's (SEC) web site at http://www.sec.gov.
You may also call 1-800-835-5092 to request a free copy of the proxy voting guidelines.
Standard & Poor's, S&P and S&P 500 are registered service marks of The McGraw-Hill Companies, Inc. and have been licensed for use by Fidelity Distributors Corporation.
Other third-party marks appearing herein are the property of their respective owners.
All other marks appearing herein are registered or unregistered trademarks or service marks of FMR LLC or an affiliated company. © 2017 FMR LLC. All rights reserved.
This report and the financial statements contained herein are submitted for the general information of the shareholders of the Fund. This report is not authorized for distribution to prospective investors in the Fund unless preceded or accompanied by an effective prospectus.
A fund files its complete schedule of portfolio holdings with the SEC for the first and third quarters of each fiscal year on Form N-Q. Forms N-Q are available on the SEC’s web site at http://www.sec.gov. A fund's Forms N-Q may be reviewed and copied at the SEC’s Public Reference Room in Washington, DC. Information regarding the operation of the SEC's Public Reference Room may be obtained by calling 1-800-SEC-0330.
For a complete list of a fund's portfolio holdings, view the most recent holdings listing, semiannual report, or annual report on Fidelity's web site at http://www.fidelity.com, http://www.institutional.fidelity.com, or http://www.401k.com, as applicable.
NOT FDIC INSURED •MAY LOSE VALUE •NO BANK GUARANTEE
Neither the Fund nor Fidelity Distributors Corporation is a bank.
Investment Summary (Unaudited)
Top Ten Stocks as of July 31, 2017
| | % of fund's net assets |
| Anthem, Inc. | 4.4 |
| Amgen, Inc. | 2.7 |
| The Western Union Co. | 2.4 |
| Best Buy Co., Inc. | 2.4 |
| UnitedHealth Group, Inc. | 2.2 |
| United Therapeutics Corp. | 2.1 |
| Itochu Corp. | 2.1 |
| Nitori Holdings Co. Ltd. | 1.8 |
| Hyundai Mobis | 1.7 |
| Aetna, Inc. | 1.7 |
| | 23.5 |
Top Five Market Sectors as of July 31, 2017
| | % of fund's net assets |
| Health Care | 22.7 |
| Consumer Discretionary | 21.3 |
| Financials | 15.3 |
| Information Technology | 11.6 |
| Industrials | 9.0 |
Asset Allocation (% of fund's net assets)
| As of July 31, 2017 * |
| | Stocks | 93.7% |
| | Short-Term Investments and Net Other Assets (Liabilities) | 6.3% |

* Foreign investments - 39.7%
Investments July 31, 2017
Showing Percentage of Net Assets
| Common Stocks - 93.6% | | | |
| | | Shares | Value |
| CONSUMER DISCRETIONARY - 21.3% | | | |
| Auto Components - 3.4% | | | |
| Adient PLC | | 93 | $6,089 |
| Cooper Tire & Rubber Co. | | 312 | 11,404 |
| Dongah Tire & Rubber Co. Ltd. | | 69 | 1,694 |
| Eagle Industry Co. Ltd. | | 195 | 3,400 |
| ElringKlinger AG | | 17 | 297 |
| Fukoku Co. Ltd. | | 100 | 948 |
| G-Tekt Corp. | | 1,800 | 34,924 |
| Gentex Corp. | | 136 | 2,315 |
| Hi-Lex Corp. | | 163 | 4,261 |
| Hyundai Mobis | | 623 | 136,845 |
| IJT Technology Holdings Co. Ltd. | | 800 | 4,535 |
| INFAC Corp. | | 71 | 380 |
| Piolax, Inc. | | 600 | 16,599 |
| Seoyon Co. Ltd. | | 214 | 1,882 |
| Seoyon E-Hwa Co., Ltd. | | 467 | 5,609 |
| TBK Co. Ltd. | | 400 | 1,803 |
| TPR Co. Ltd. | | 600 | 18,994 |
| Yorozu Corp. | | 1,300 | 21,968 |
| | | | 273,947 |
| Automobiles - 0.8% | | | |
| Audi AG | | 17 | 14,288 |
| Fiat Chrysler Automobiles NV | | 96 | 1,161 |
| Fiat Chrysler Automobiles NV | | 876 | 10,577 |
| General Motors Co. | | 969 | 34,865 |
| Harley-Davidson, Inc. | | 3 | 146 |
| | | | 61,037 |
| Distributors - 0.4% | | | |
| Chori Co. Ltd. | | 1,000 | 18,550 |
| Doshisha Co. Ltd. | | 300 | 6,047 |
| Harima-Kyowa Co. Ltd. | | 100 | 1,742 |
| Nakayamafuku Co. Ltd. | | 100 | 714 |
| Yagi & Co. Ltd. | | 300 | 4,817 |
| | | | 31,870 |
| Diversified Consumer Services - 0.6% | | | |
| Heian Ceremony Service Co. Ltd. | | 300 | 2,615 |
| Kukbo Design Co. Ltd. | | 14 | 250 |
| MegaStudy Co. Ltd. | | 247 | 6,661 |
| MegaStudyEdu Co. Ltd. | | 143 | 4,501 |
| Multicampus Co. Ltd. | | 35 | 1,175 |
| Tsukada Global Holdings, Inc. | | 700 | 3,810 |
| Weight Watchers International, Inc. (a) | | 784 | 28,083 |
| | | | 47,095 |
| Hotels, Restaurants & Leisure - 0.9% | | | |
| Brinker International, Inc. | | 52 | 1,844 |
| Dunkin' Brands Group, Inc. | | 208 | 11,030 |
| Flight Centre Travel Group Ltd. | | 85 | 2,958 |
| Hiday Hidaka Corp. | | 200 | 5,344 |
| Koshidaka Holdings Co. Ltd. | | 200 | 5,432 |
| Kura Corp. Ltd. | | 100 | 5,034 |
| Ohsho Food Service Corp. | | 100 | 3,891 |
| Retail Food Group Ltd. | | 1,315 | 5,102 |
| St. Marc Holdings Co. Ltd. | | 200 | 6,259 |
| The Restaurant Group PLC | | 4,803 | 21,191 |
| Whitbread PLC | | 1 | 51 |
| Wyndham Worldwide Corp. | | 3 | 313 |
| | | | 68,449 |
| Household Durables - 0.8% | | | |
| Ace Bed Co. Ltd. | | 28 | 4,343 |
| Emak SpA | | 409 | 765 |
| FJ Next Co. Ltd. | | 700 | 5,638 |
| Helen of Troy Ltd. (a) | | 418 | 42,114 |
| NACCO Industries, Inc. Class A | | 52 | 3,411 |
| Q.E.P. Co., Inc. (a) | | 24 | 634 |
| Sanyo Housing Nagoya Co. Ltd. | | 500 | 5,107 |
| Tupperware Brands Corp. | | 93 | 5,646 |
| | | | 67,658 |
| Internet & Direct Marketing Retail - 0.0% | | | |
| Hyundai Home Shopping Network Corp. | | 7 | 863 |
| NS Shopping Co. Ltd. | | 30 | 447 |
| Trade Maine Group Ltd. | | 34 | 140 |
| Webjet Ltd. | | 68 | 627 |
| | | | 2,077 |
| Leisure Products - 0.1% | | | |
| Mars Engineering Corp. | | 400 | 7,924 |
| Media - 2.4% | | | |
| AMC Networks, Inc. Class A (a) | | 87 | 5,564 |
| Comcast Corp. Class A | | 1,353 | 54,729 |
| Corus Entertainment, Inc. Class B (non-vtg.) | | 273 | 3,031 |
| Discovery Communications, Inc. Class A (a) | | 1,592 | 39,163 |
| DMS, Inc. | | 100 | 1,107 |
| Gendai Agency, Inc. | | 600 | 3,075 |
| Hyundai HCN | | 1,363 | 5,087 |
| Ipsos SA | | 7 | 242 |
| Liberty Global PLC LiLAC Class A (a) | | 5 | 129 |
| Multiplus SA | | 400 | 5,104 |
| Nippon BS Broadcasting Corp. | | 100 | 1,176 |
| Nippon Television Network Corp. | | 147 | 2,515 |
| Pico Far East Holdings Ltd. | | 6,000 | 2,474 |
| Proto Corp. | | 100 | 1,564 |
| Scripps Networks Interactive, Inc. Class A | | 69 | 6,031 |
| SMG PLC | | 7 | 36 |
| Television Broadcasts Ltd. | | 1,400 | 5,126 |
| The Walt Disney Co. | | 65 | 7,145 |
| Time Warner, Inc. | | 113 | 11,573 |
| Viacom, Inc.: | | | |
| Class A | | 554 | 22,437 |
| Class B (non-vtg.) | | 415 | 14,492 |
| WOWOW INC. | | 100 | 2,907 |
| | | | 194,707 |
| Multiline Retail - 0.4% | | | |
| Grazziotin SA (a) | | 200 | 1,534 |
| Hanwha Galleria Timeworld Co. Ltd.(a) | | 41 | 1,045 |
| Lifestyle China Group Ltd. (a) | | 8,500 | 3,482 |
| Lifestyle International Holdings Ltd. | | 8,500 | 11,622 |
| Macy's, Inc. | | 225 | 5,344 |
| Treasure Factory Co. Ltd. | | 600 | 4,512 |
| | | | 27,539 |
| Specialty Retail - 10.1% | | | |
| Arc Land Sakamoto Co. Ltd. | | 300 | 4,112 |
| AT-Group Co. Ltd. | | 237 | 6,019 |
| AutoNation, Inc. (a) | | 242 | 10,256 |
| Beacon Lighting Group Ltd. | | 17 | 19 |
| Best Buy Co., Inc. | | 3,277 | 191,180 |
| Dunelm Group PLC | | 136 | 1,080 |
| Ff Group (a) | | 589 | 14,119 |
| Fuji Corp. | | 99 | 1,829 |
| GameStop Corp. Class A | | 447 | 9,695 |
| GNC Holdings, Inc. Class A | | 4,112 | 39,105 |
| Goldlion Holdings Ltd. | | 5,000 | 2,183 |
| Guess?, Inc. | | 4,018 | 52,475 |
| Handsman Co. Ltd. | | 500 | 7,116 |
| Hibbett Sports, Inc. (a) | | 208 | 3,245 |
| JB Hi-Fi Ltd. | | 589 | 12,256 |
| John David Group PLC | | 23,333 | 110,182 |
| K's Holdings Corp. | | 1,700 | 34,171 |
| Ku Holdings Co. Ltd. | | 400 | 3,632 |
| Lookers PLC | | 750 | 1,089 |
| Mandarake, Inc. | | 100 | 550 |
| Nafco Co. Ltd. | | 200 | 3,173 |
| Nitori Holdings Co. Ltd. | | 1,000 | 141,140 |
| Oriental Watch Holdings Ltd. | | 4,000 | 845 |
| Padini Holdings Bhd | | 1,800 | 1,572 |
| Sacs Bar Holdings, Inc. | | 300 | 3,301 |
| Sally Beauty Holdings, Inc. (a) | | 3,220 | 65,141 |
| Samse SA | | 24 | 4,210 |
| Silvano Fashion Group A/S | | 7 | 21 |
| Sports Direct International PLC (a) | | 68 | 340 |
| Staples, Inc. | | 3,946 | 40,052 |
| The Buckle, Inc. | | 415 | 7,097 |
| Tokatsu Holdings Co. Ltd. | | 100 | 393 |
| Truworths International Ltd. | | 228 | 1,308 |
| Urban Outfitters, Inc. (a) | | 831 | 16,279 |
| Vita Group Ltd. | | 17 | 18 |
| Vitamin Shoppe, Inc. (a) | | 104 | 1,144 |
| Williams-Sonoma, Inc. | | 485 | 22,519 |
| | | | 812,866 |
| Textiles, Apparel & Luxury Goods - 1.4% | | | |
| Best Pacific International Holdings Ltd. | | 2,000 | 1,093 |
| Embry Holdings Ltd. | | 1,000 | 320 |
| Fossil Group, Inc. (a) | | 562 | 6,323 |
| Geox SpA | | 3,749 | 14,876 |
| Gerry Weber International AG (Bearer) | | 426 | 5,441 |
| Grendene SA | | 100 | 848 |
| Handsome Co. Ltd. | | 17 | 548 |
| Magni-Tech Industries Bhd | | 900 | 1,598 |
| Michael Kors Holdings Ltd. (a) | | 1,419 | 51,708 |
| Portico International Holdings (a) | | 8,000 | 2,694 |
| Sitoy Group Holdings Ltd. | | 6,000 | 1,314 |
| Texwinca Holdings Ltd. | | 2,000 | 1,214 |
| Van de Velde | | 65 | 3,501 |
| Vera Bradley, Inc. (a) | | 658 | 6,633 |
| Youngone Holdings Co. Ltd. | | 176 | 8,455 |
| Yue Yuen Industrial (Holdings) Ltd. | | 1,500 | 6,193 |
| | | | 112,759 |
|
| TOTAL CONSUMER DISCRETIONARY | | | 1,707,928 |
|
| CONSUMER STAPLES - 6.0% | | | |
| Beverages - 0.9% | | | |
| A.G. Barr PLC | | 273 | 2,161 |
| Britvic PLC | | 4,741 | 44,663 |
| C&C Group PLC | | 300 | 1,087 |
| Jinro Distillers Co. Ltd. | | 295 | 8,771 |
| Lucas Bols BV | | 82 | 1,922 |
| Olvi PLC (A Shares) | | 68 | 2,393 |
| Spritzer Bhd | | 200 | 111 |
| Willamette Valley Vineyards, Inc. (a) | | 3 | 24 |
| Yantai Changyu Pioneer Wine Co. Ltd. (B Shares) | | 4,200 | 10,679 |
| | | | 71,811 |
| Food & Staples Retailing - 3.1% | | | |
| Ain Holdings, Inc. | | 200 | 14,422 |
| Amsterdam Commodities NV | | 409 | 12,153 |
| CVS Health Corp. | | 692 | 55,312 |
| Dong Suh Companies, Inc. | | 468 | 12,348 |
| Genky Stores, Inc. | | 300 | 11,198 |
| J Sainsbury PLC | | 136 | 439 |
| Kroger Co. | | 1,246 | 30,552 |
| Majestic Wine PLC | | 334 | 1,409 |
| MARR SpA | | 545 | 13,949 |
| OM2 Network Co. Ltd. | | 100 | 1,167 |
| Retail Partners Co. Ltd. | | 400 | 4,223 |
| Satsudora Holdings Co. Ltd. | | 300 | 5,440 |
| Tesco PLC (a) | | 7,498 | 17,233 |
| United Natural Foods, Inc. (a) | | 285 | 10,981 |
| Valor Holdings Co. Ltd. | | 500 | 11,311 |
| Wal-Mart Stores, Inc. | | 354 | 28,316 |
| Walgreens Boots Alliance, Inc. | | 276 | 22,265 |
| | | | 252,718 |
| Food Products - 1.1% | | | |
| Ajinomoto Malaysia Bhd | | 1,200 | 7,259 |
| B&G Foods, Inc. Class A | | 227 | 8,229 |
| Bakkafrost | | 104 | 4,086 |
| Bell AG | | 9 | 4,142 |
| Binggrea Co. Ltd. | | 10 | 598 |
| Changshouhua Food Co. Ltd. | | 1,000 | 499 |
| Cranswick PLC | | 343 | 13,133 |
| Dean Foods Co. | | 34 | 510 |
| Kawan Food Bhd | | 100 | 114 |
| Lamb Weston Holdings, Inc. | | 17 | 748 |
| Lassonde Industries, Inc. Class A (sub. vtg.) | | 34 | 6,540 |
| London Biscuits Bhd (a) | | 2,700 | 470 |
| Pickles Corp. | | 100 | 1,472 |
| President Rice Products PCL | | 100 | 179 |
| Prima Meat Packers Ltd. | | 142 | 907 |
| S Foods, Inc. | | 200 | 7,456 |
| Select Harvests Ltd. | | 975 | 3,822 |
| Thai Wah PCL | | 300 | 87 |
| The Hain Celestial Group, Inc. (a) | | 467 | 20,880 |
| The J.M. Smucker Co. | | 23 | 2,804 |
| Toyo Sugar Refining Co. Ltd. | | 1,000 | 1,088 |
| Valsoia SpA | | 42 | 833 |
| Want Want China Holdings Ltd. | | 2,000 | 1,352 |
| | | | 87,208 |
| Personal Products - 0.6% | | | |
| Asaleo Care Ltd. | | 682 | 726 |
| Hengan International Group Co. Ltd. | | 1,633 | 12,461 |
| USANA Health Sciences, Inc. (a) | | 640 | 36,544 |
| | | | 49,731 |
| Tobacco - 0.3% | | | |
| KT&G Corp. | | 218 | 22,191 |
|
| TOTAL CONSUMER STAPLES | | | 483,659 |
|
| ENERGY - 3.0% | | | |
| Energy Equipment & Services - 0.5% | | | |
| AKITA Drilling Ltd. Class A (non-vtg.) | | 170 | 987 |
| Atwood Oceanics, Inc. (a) | | 1,070 | 8,410 |
| Baker Hughes, a GE Co. | | 110 | 4,058 |
| Carbo Ceramics, Inc. (a) | | 1,579 | 11,164 |
| Geospace Technologies Corp. (a) | | 401 | 6,171 |
| Gulfmark Offshore, Inc. Class A (a) | | 1,714 | 266 |
| National Oilwell Varco, Inc. | | 136 | 4,449 |
| Oceaneering International, Inc. | | 46 | 1,180 |
| Prosafe ASA (a) | | 68 | 264 |
| Tecnicas Reunidas SA | | 121 | 4,292 |
| | | | 41,241 |
| Oil, Gas & Consumable Fuels - 2.5% | | | |
| Alvopetro Energy Ltd. (a) | | 1,900 | 320 |
| Baytex Energy Corp. (a) | | 409 | 1,148 |
| Bonavista Energy Corp. | | 34 | 85 |
| Chevron Corp. | | 296 | 32,320 |
| China Petroleum & Chemical Corp. (H Shares) | | 28,667 | 21,732 |
| ConocoPhillips Co. | | 953 | 43,238 |
| Contango Oil & Gas Co. (a) | | 170 | 1,020 |
| Enagas SA | | 2,077 | 58,727 |
| Fuji Kosan Co. Ltd. | | 100 | 533 |
| Husky Energy, Inc. (a) | | 277 | 3,206 |
| Imperial Oil Ltd. | | 38 | 1,091 |
| International Seaways, Inc. (a) | | 7 | 160 |
| Motor Oil (HELLAS) Corinth Refineries SA | | 205 | 4,623 |
| Murphy Oil Corp. | | 682 | 18,128 |
| San-Ai Oil Co. Ltd. | | 100 | 1,017 |
| Ship Finance International Ltd. (NY Shares) | | 7 | 95 |
| Thai Oil PCL (For. Reg.) | | 400 | 1,031 |
| Total SA sponsored ADR | | 69 | 3,496 |
| Tsakos Energy Navigation Ltd. | | 307 | 1,514 |
| World Fuel Services Corp. | | 239 | 7,729 |
| | | | 201,213 |
|
| TOTAL ENERGY | | | 242,454 |
|
| FINANCIALS - 15.3% | | | |
| Banks - 5.1% | | | |
| Cambridge Bancorp | | 3 | 196 |
| Central Valley Community Bancorp | | 17 | 374 |
| Citizens Financial Services, Inc. | | 8 | 432 |
| Erste Group Bank AG | | 3 | 125 |
| F & M Bank Corp. | | 91 | 2,753 |
| Gunma Bank Ltd. | | 3,515 | 20,629 |
| Hiroshima Bank Ltd. | | 1,633 | 6,991 |
| JPMorgan Chase & Co. | | 944 | 86,659 |
| Mitsubishi UFJ Financial Group, Inc. | | 11,783 | 74,753 |
| Nordea Bank AB | | 69 | 871 |
| OFG Bancorp | | 1,220 | 12,261 |
| Skandiabanken ASA | | 346 | 3,894 |
| Sparebank 1 Oestlandet | | 692 | 7,371 |
| Sumitomo Mitsui Financial Group, Inc. | | 2,767 | 106,767 |
| The Keiyo Bank Ltd. | | 317 | 1,343 |
| The Mie Bank Ltd. | | 132 | 2,957 |
| The San-In Godo Bank Ltd. | | 1,075 | 8,747 |
| Unicaja Banco SA | | 4,154 | 6,044 |
| Van Lanschot NV (Bearer) | | 55 | 1,632 |
| Wells Fargo & Co. | | 823 | 44,393 |
| Yamaguchi Financial Group, Inc. | | 1,538 | 18,122 |
| | | | 407,314 |
| Capital Markets - 1.5% | | | |
| ABG Sundal Collier ASA | | 1,023 | 709 |
| Apollo Global Management LLC Class A | | 274 | 7,699 |
| Ares Capital Corp. | | 279 | 4,573 |
| Edify SA (a) | | 7 | 443 |
| Franklin Resources, Inc. | | 102 | 4,568 |
| Goldman Sachs Group, Inc. | | 67 | 15,097 |
| MLP AG | | 1,595 | 11,688 |
| Morgan Stanley | | 465 | 21,809 |
| T. Rowe Price Group, Inc. | | 17 | 1,406 |
| The Blackstone Group LP | | 1,493 | 49,941 |
| TPG Specialty Lending, Inc. | | 77 | 1,599 |
| | | | 119,532 |
| Consumer Finance - 0.9% | | | |
| Credit Corp. Group Ltd. | | 36 | 488 |
| Discover Financial Services | | 554 | 33,761 |
| Synchrony Financial | | 1,246 | 37,779 |
| | | | 72,028 |
| Diversified Financial Services - 1.4% | | | |
| Fuyo General Lease Co. Ltd. | | 400 | 23,475 |
| IBJ Leasing Co. Ltd. | | 163 | 3,881 |
| Kyushu Railway Co. | | 200 | 6,594 |
| NICE Holdings Co. Ltd. | | 156 | 2,305 |
| Ricoh Leasing Co. Ltd. | | 700 | 24,477 |
| Scandinavian Tobacco Group A/S | | 273 | 4,406 |
| Tokyo Century Corp. | | 1,000 | 42,632 |
| Varex Imaging Corp. (a) | | 69 | 2,129 |
| | | | 109,899 |
| Insurance - 6.2% | | | |
| AFLAC, Inc. | | 1,385 | 110,454 |
| ASR Nederland NV | | 692 | 26,173 |
| Assurant, Inc. | | 136 | 14,317 |
| Chubb Ltd. | | 345 | 50,529 |
| Dongbu Insurance Co. Ltd. | | 865 | 61,867 |
| Genworth Financial, Inc. Class A (a) | | 4,363 | 14,965 |
| Hannover Reuck SE | | 28 | 3,537 |
| Hyundai Fire & Marine Insurance Co. Ltd. | | 260 | 10,540 |
| Kansas City Life Insurance Co. | | 1 | 50 |
| MetLife, Inc. | | 2,311 | 127,105 |
| National Western Life Group, Inc. | | 7 | 2,356 |
| NN Group NV | | 1,108 | 44,976 |
| Prudential Financial, Inc. | | 154 | 17,437 |
| Sony Financial Holdings, Inc. | | 700 | 12,134 |
| | | | 496,440 |
| Mortgage Real Estate Investment Trusts - 0.0% | | | |
| Two Harbors Investment Corp. | | 103 | 1,019 |
| Thrifts & Mortgage Finance - 0.2% | | | |
| ASAX Co. Ltd. | | 200 | 3,062 |
| Genworth MI Canada, Inc. | | 312 | 9,102 |
| Genworth Mortgage Insurance Ltd. | | 2,216 | 5,336 |
| Hingham Institution for Savings | | 7 | 1,238 |
| | | | 18,738 |
|
| TOTAL FINANCIALS | | | 1,224,970 |
|
| HEALTH CARE - 22.7% | | | |
| Biotechnology - 8.2% | | | |
| AbbVie, Inc. | | 903 | 63,129 |
| Amgen, Inc. | | 1,229 | 214,473 |
| Biogen, Inc. (a) | | 346 | 100,198 |
| Bioverativ, Inc. | | 136 | 8,428 |
| Cell Biotech Co. Ltd. | | 104 | 3,301 |
| Essex Bio-Technology Ltd. | | 1,000 | 544 |
| Gilead Sciences, Inc. | | 1,258 | 95,721 |
| United Therapeutics Corp. (a) | | 1,316 | 168,974 |
| | | | 654,768 |
| Health Care Equipment & Supplies - 0.5% | | | |
| Ansell Ltd. | | 341 | 5,993 |
| Fukuda Denshi Co. Ltd. | | 300 | 22,314 |
| Nakanishi, Inc. | | 200 | 8,390 |
| Paramount Bed Holdings Co. Ltd. | | 100 | 4,563 |
| Value Added Technologies Co. Ltd. | | 52 | 1,439 |
| | | | 42,699 |
| Health Care Providers & Services - 11.1% | | | |
| Aetna, Inc. | | 865 | 133,478 |
| Almost Family, Inc. (a) | | 134 | 6,626 |
| Amedisys, Inc. (a) | | 1,003 | 47,502 |
| Anthem, Inc. | | 1,912 | 356,024 |
| Chemed Corp. | | 251 | 49,573 |
| Humana, Inc. | | 351 | 81,151 |
| Laboratory Corp. of America Holdings (a) | | 7 | 1,112 |
| Lifco AB | | 68 | 2,266 |
| MEDNAX, Inc. (a) | | 52 | 2,443 |
| Quest Diagnostics, Inc. | | 228 | 24,695 |
| Saint-Care Holding Corp. | | 100 | 1,582 |
| Sigma Healthcare Ltd. | | 4,500 | 3,456 |
| Tokai Corp. | | 100 | 4,422 |
| Uchiyama Holdings Co. Ltd. | | 500 | 2,109 |
| UnitedHealth Group, Inc. | | 900 | 172,629 |
| Universal Health Services, Inc. Class B | | 17 | 1,884 |
| | | | 890,952 |
| Health Care Technology - 0.1% | | | |
| Pharmagest Interactive | | 187 | 9,264 |
| Life Sciences Tools & Services - 0.2% | | | |
| ICON PLC (a) | | 104 | 10,915 |
| Pharmaceuticals - 2.6% | | | |
| Apex Healthcare Bhd | | 500 | 551 |
| AstraZeneca PLC sponsored ADR | | 682 | 20,583 |
| Biofermin Pharmaceutical Co. Ltd. | | 100 | 2,776 |
| Bristol-Myers Squibb Co. | | 148 | 8,421 |
| Dawnrays Pharmaceutical Holdings Ltd. | | 1,267 | 762 |
| DongKook Pharmaceutical Co. Ltd. | | 57 | 3,064 |
| Genomma Lab Internacional SA de CV (a) | | 3,300 | 4,243 |
| GlaxoSmithKline PLC | | 57 | 1,135 |
| Indivior PLC | | 1,772 | 8,978 |
| Johnson & Johnson | | 596 | 79,101 |
| Korea United Pharm, Inc. | | 90 | 1,619 |
| Lee's Pharmaceutical Holdings Ltd. | | 2,000 | 1,585 |
| Luye Pharma Group Ltd. | | 1,500 | 851 |
| Novo Nordisk A/S Series B sponsored ADR | | 173 | 7,335 |
| PT Tempo Scan Pacific Tbk | | 300 | 44 |
| Sanofi SA sponsored ADR | | 136 | 6,441 |
| SciClone Pharmaceuticals, Inc. (a) | | 3 | 33 |
| Stallergenes Greer PLC (a) | | 72 | 3,060 |
| Taro Pharmaceutical Industries Ltd. (a) | | 242 | 27,668 |
| Teva Pharmaceutical Industries Ltd. sponsored ADR | | 194 | 6,241 |
| Towa Pharmaceutical Co. Ltd. | | 100 | 4,835 |
| Tsumura & Co. | | 500 | 19,479 |
| Vetoquinol SA | | 7 | 435 |
| | | | 209,240 |
|
| TOTAL HEALTH CARE | | | 1,817,838 |
|
| INDUSTRIALS - 9.0% | | | |
| Aerospace & Defense - 0.0% | | | |
| Austal Ltd. | | 205 | 296 |
| Kongsberg Gruppen ASA | | 7 | 119 |
| Orbital ATK, Inc. | | 3 | 307 |
| SIFCO Industries, Inc. (a) | | 25 | 168 |
| The Lisi Group | | 3 | 145 |
| | | | 1,035 |
| Air Freight & Logistics - 0.5% | | | |
| C.H. Robinson Worldwide, Inc. | | 32 | 2,099 |
| CTI Logistics Ltd. | | 282 | 210 |
| Onelogix Group Ltd. | | 2,727 | 538 |
| SBS Co. Ltd. | | 100 | 764 |
| United Parcel Service, Inc. Class B | | 312 | 34,410 |
| | | | 38,021 |
| Building Products - 0.2% | | | |
| InnoTec TSS AG | | 33 | 692 |
| Nihon Dengi Co. Ltd. | | 200 | 5,227 |
| Noda Corp. | | 200 | 1,863 |
| Sekisui Jushi Corp. | | 400 | 7,278 |
| | | | 15,060 |
| Commercial Services & Supplies - 0.6% | | | |
| Aeon Delight Co. Ltd. | | 100 | 3,343 |
| Asia File Corp. Bhd | | 2,400 | 1,850 |
| Calian Technologies Ltd. | | 211 | 4,735 |
| Civeo Corp. (a) | | 2,007 | 3,874 |
| KAR Auction Services, Inc. | | 312 | 13,116 |
| Matsuda Sangyo Co. Ltd. | | 100 | 1,358 |
| Mitie Group PLC | | 1,636 | 5,746 |
| Riverstone Holdings Ltd. | | 100 | 78 |
| VSE Corp. | | 221 | 11,459 |
| | | | 45,559 |
| Construction & Engineering - 0.4% | | | |
| Arcadis NV | | 346 | 7,080 |
| Astaldi SpA | | 208 | 1,386 |
| Boustead Projs. Pte Ltd. | | 1,700 | 1,173 |
| Geumhwa PSC Co. Ltd. | | 1 | 34 |
| Meisei Industrial Co. Ltd. | | 400 | 2,594 |
| Monadelphous Group Ltd. | | 7 | 85 |
| Nippon Rietec Co. Ltd. | | 700 | 8,261 |
| Shinnihon Corp. | | 100 | 815 |
| Sumitomo Densetsu Co. Ltd. | | 155 | 2,470 |
| Toshiba Plant Systems & Services Corp. | | 390 | 6,353 |
| | | | 30,251 |
| Electrical Equipment - 0.5% | | | |
| Aichi Electric Co. Ltd. | | 100 | 2,767 |
| Aros Quality Group AB | | 582 | 16,688 |
| Canare Electric Co. Ltd. | | 30 | 676 |
| Eaton Corp. PLC | | 222 | 17,372 |
| Hammond Power Solutions, Inc. Class A | | 307 | 1,807 |
| Holding Co. ADMIE IPTO SA (a) | | 17 | 41 |
| Somfy SA | | 35 | 3,313 |
| | | | 42,664 |
| Industrial Conglomerates - 0.1% | | | |
| Carr's Group PLC | | 2,007 | 3,780 |
| Mytilineos Holdings SA (a) | | 205 | 2,039 |
| Nolato AB Series B | | 24 | 1,054 |
| Reunert Ltd. | | 205 | 1,119 |
| | | | 7,992 |
| Machinery - 0.8% | | | |
| Castings PLC | | 51 | 311 |
| Conrad Industries, Inc. | | 1 | 18 |
| Daihatsu Diesel Manufacturing Co. Ltd. | | 900 | 5,829 |
| Daiwa Industries Ltd. | | 700 | 7,994 |
| Fujimak Corp. | | 300 | 5,875 |
| Fukushima Industries Corp. | | 100 | 4,154 |
| Global Brass & Copper Holdings, Inc. | | 167 | 5,352 |
| Haitian International Holdings Ltd. | | 3,000 | 8,603 |
| Hy-Lok Corp. | | 68 | 1,400 |
| Ihara Science Corp. | | 63 | 1,237 |
| Luxfer Holdings PLC sponsored ADR | | 3 | 38 |
| Momentum Group AB Class B (a) | | 358 | 3,691 |
| Sansei Co. Ltd. | | 1,000 | 2,204 |
| Semperit AG Holding | | 234 | 7,152 |
| Teikoku Sen-I Co. Ltd. | | 500 | 9,107 |
| | | | 62,965 |
| Marine - 0.1% | | | |
| Japan Transcity Corp. | | 1,443 | 5,589 |
| Professional Services - 1.9% | | | |
| ABIST Co. Ltd. | | 32 | 1,287 |
| Akka Technologies SA | | 623 | 34,029 |
| Bertrandt AG | | 145 | 13,826 |
| Career Design Center Co. Ltd. | | 100 | 1,245 |
| CBIZ, Inc. (a) | | 1,471 | 21,844 |
| Dun & Bradstreet Corp. | | 606 | 67,121 |
| Harvey Nash Group PLC | | 205 | 263 |
| Robert Half International, Inc. | | 268 | 12,127 |
| WDB Holdings Co. Ltd. | | 100 | 2,094 |
| | | | 153,836 |
| Road & Rail - 0.6% | | | |
| Autohellas SA | | 450 | 10,947 |
| Daqin Railway Co. Ltd. (A Shares) | | 24,900 | 32,390 |
| Higashi Twenty One Co. Ltd. | | 100 | 346 |
| Nikkon Holdings Co. Ltd. | | 32 | 758 |
| SENKO Co. Ltd. | | 200 | 1,362 |
| STEF-TFE Group | | 7 | 778 |
| Tohbu Network Co. Ltd. | | 100 | 1,030 |
| Utoc Corp. | | 1,000 | 4,046 |
| | | | 51,657 |
| Trading Companies & Distributors - 3.3% | | | |
| AerCap Holdings NV (a) | | 467 | 22,930 |
| Bergman & Beving AB (B Shares) | | 358 | 4,434 |
| Canox Corp. | | 300 | 2,672 |
| Green Cross Co. Ltd. | | 200 | 3,498 |
| HERIGE | | 41 | 1,874 |
| Houston Wire & Cable Co. | | 934 | 5,371 |
| Howden Joinery Group PLC | | 102 | 572 |
| iMarketKorea, Inc. | | 7 | 80 |
| Itochu Corp. | | 10,754 | 168,804 |
| Kamei Corp. | | 1,207 | 17,266 |
| Meiwa Corp. | | 900 | 3,576 |
| Mitani Shoji Co. Ltd. | | 500 | 19,706 |
| Rasa Corp. | | 100 | 825 |
| Shinsho Corp. | | 32 | 847 |
| Yuasa Trading Co. Ltd. | | 400 | 12,826 |
| | | | 265,281 |
| Transportation Infrastructure - 0.0% | | | |
| Isewan Terminal Service Co. Ltd. | | 200 | 1,170 |
| Qingdao Port International Co. Ltd. | | 3,583 | 2,028 |
| | | | 3,198 |
|
| TOTAL INDUSTRIALS | | | 723,108 |
|
| INFORMATION TECHNOLOGY - 11.6% | | | |
| Communications Equipment - 1.5% | | | |
| Cisco Systems, Inc. | | 3,903 | 122,749 |
| EVS Broadcast Equipment SA | | 3 | 122 |
| HF Co. | | 153 | 1,686 |
| | | | 124,557 |
| Electronic Equipment & Components - 0.8% | | | |
| AAC Technology Holdings, Inc. | | 500 | 6,728 |
| Dell Technologies, Inc. (a) | | 128 | 8,227 |
| Elematec Corp. | | 300 | 5,440 |
| Intelligent Digital Integrated Security Co. Ltd. | | 88 | 636 |
| Lacroix SA | | 163 | 4,438 |
| Macnica Fuji Electronics Holdings, Inc. | | 1,300 | 20,718 |
| Makus, Inc. | | 205 | 678 |
| PAX Global Technology Ltd. | | 2,000 | 1,326 |
| Riken Kieki Co. Ltd. | | 400 | 7,572 |
| TE Connectivity Ltd. | | 134 | 10,772 |
| | | | 66,535 |
| Internet Software & Services - 1.0% | | | |
| Akamai Technologies, Inc. (a) | | 69 | 3,253 |
| Alphabet, Inc. Class A (a) | | 21 | 19,856 |
| AuFeminin.com SA (a) | | 85 | 2,627 |
| F@N Communications, Inc. | | 300 | 2,748 |
| Kakaku.com, Inc. | | 211 | 2,980 |
| Yahoo! Japan Corp. | | 3,500 | 15,874 |
| YY, Inc. ADR (a) | | 450 | 32,175 |
| Zappallas, Inc. | | 700 | 3,226 |
| | | | 82,739 |
| IT Services - 4.3% | | | |
| Amdocs Ltd. | | 870 | 58,438 |
| Cielo SA | | 400 | 3,348 |
| Computer Services, Inc. | | 3 | 147 |
| Data#3 Ltd. | | 341 | 486 |
| E-Credible Co. Ltd. | | 104 | 1,240 |
| Estore Corp. | | 300 | 2,155 |
| Future Corp. | | 300 | 2,427 |
| Korea Information & Communication Co. Ltd. (a) | | 225 | 2,300 |
| Leidos Holdings, Inc. | | 20 | 1,069 |
| Neurones | | 7 | 239 |
| Shinsegae Information & Communication Co. Ltd. | | 19 | 1,398 |
| Sopra Steria Group | | 381 | 65,873 |
| Tessi SA | | 50 | 9,151 |
| The Western Union Co. | | 9,811 | 193,767 |
| | | | 342,038 |
| Semiconductors & Semiconductor Equipment - 0.6% | | | |
| e-LITECOM Co. Ltd. | | 34 | 283 |
| KLA-Tencor Corp. | | 14 | 1,297 |
| Miraial Co. Ltd. | | 400 | 3,846 |
| Qualcomm, Inc. | | 562 | 29,893 |
| Taiwan Semiconductor Manufacturing Co. Ltd. sponsored ADR | | 260 | 9,350 |
| | | | 44,669 |
| Software - 0.5% | | | |
| Ebix, Inc. | | 217 | 12,532 |
| GAMEVIL, Inc. (a) | | 7 | 344 |
| InfoVine Co. Ltd. | | 43 | 1,044 |
| Jastec Co. Ltd. | | 100 | 1,188 |
| Justplanning, Inc. | | 100 | 677 |
| KSK Co., Ltd. | | 100 | 1,321 |
| Microsoft Corp. | | 277 | 20,138 |
| Uchida Esco Co. Ltd. | | 96 | 1,104 |
| | | | 38,348 |
| Technology Hardware, Storage & Peripherals - 2.9% | | | |
| Apple, Inc. | | 104 | 15,468 |
| Hewlett Packard Enterprise Co. | | 4,639 | 81,229 |
| HP, Inc. | | 4,916 | 93,896 |
| Seagate Technology LLC | | 1,170 | 38,563 |
| TPV Technology Ltd. | | 16,000 | 3,749 |
| | | | 232,905 |
|
| TOTAL INFORMATION TECHNOLOGY | | | 931,791 |
|
| MATERIALS - 1.9% | | | |
| Chemicals - 1.3% | | | |
| Bloomage BioTechnology Corp. Ltd. | | 2,500 | 4,679 |
| C. Uyemura & Co. Ltd. | | 100 | 5,742 |
| CF Industries Holdings, Inc. | | 184 | 5,400 |
| Chokwang Paint Ltd. | | 34 | 352 |
| Chugoku Marine Paints Ltd. | | 500 | 3,900 |
| Fuso Chemical Co. Ltd. | | 300 | 10,000 |
| K&S AG | | 569 | 14,815 |
| KPX Green Chemical Co. Ltd. | | 34 | 137 |
| Kuriyama Holdings Corp. | | 100 | 1,957 |
| LyondellBasell Industries NV Class A | | 103 | 9,279 |
| Nippon Soda Co. Ltd. | | 253 | 1,427 |
| Potash Corp. of Saskatchewan, Inc. | | 204 | 3,649 |
| Scientex Bhd | | 2,700 | 5,461 |
| Soda Aromatic Co. Ltd. | | 100 | 1,030 |
| T&K Toka Co. Ltd. | | 200 | 2,199 |
| Tae Kyung Industrial Co. Ltd. | | 614 | 2,741 |
| Toho Acetylene Co. Ltd. | | 200 | 3,204 |
| Yara International ASA | | 640 | 25,501 |
| Yip's Chemical Holdings Ltd. | | 2,000 | 832 |
| | | | 102,305 |
| Construction Materials - 0.1% | | | |
| Ibstock PLC | | 334 | 1,124 |
| Mitani Sekisan Co. Ltd. | | 200 | 4,708 |
| RHI AG | | 7 | 265 |
| | | | 6,097 |
| Containers & Packaging - 0.1% | | | |
| Mayr-Melnhof Karton AG | | 69 | 9,108 |
| Metals & Mining - 0.4% | | | |
| Ausdrill Ltd. | | 7,408 | 11,527 |
| Chubu Steel Plate Co. Ltd. | | 300 | 1,995 |
| CI Resources Ltd. | | 16 | 20 |
| Compania de Minas Buenaventura SA sponsored ADR | | 239 | 2,925 |
| Handy & Harman Ltd. (a) | | 68 | 2,251 |
| Mount Gibson Iron Ltd. (a) | | 6,817 | 2,427 |
| Orvana Minerals Corp. (a) | | 34 | 8 |
| Pacific Metals Co. Ltd. (a) | | 5,000 | 13,425 |
| Teck Resources Ltd. Class B (sub. vtg.) | | 7 | 152 |
| | | | 34,730 |
|
| TOTAL MATERIALS | | | 152,240 |
|
| REAL ESTATE - 0.6% | | | |
| Equity Real Estate Investment Trusts (REITs) - 0.5% | | | |
| Crown Castle International Corp. | | 121 | 12,170 |
| Duke Realty Corp. | | 138 | 3,945 |
| First Potomac Realty Trust | | 303 | 3,372 |
| Piedmont Office Realty Trust, Inc. Class A | | 286 | 6,009 |
| Public Storage | | 42 | 8,634 |
| Sabra Health Care REIT, Inc. | | 70 | 1,624 |
| Ventas, Inc. | | 46 | 3,098 |
| | | | 38,852 |
| Real Estate Management & Development - 0.1% | | | |
| HFF, Inc. | | 7 | 257 |
| Leopalace21 Corp. | | 300 | 2,142 |
| Nisshin Fudosan Co. Ltd. | | 1,800 | 10,041 |
| | | | 12,440 |
|
| TOTAL REAL ESTATE | | | 51,292 |
|
| TELECOMMUNICATION SERVICES - 1.1% | | | |
| Diversified Telecommunication Services - 1.0% | | | |
| AT&T, Inc. | | 843 | 32,877 |
| Verizon Communications, Inc. | | 1,054 | 51,014 |
| | | | 83,891 |
| Wireless Telecommunication Services - 0.1% | | | |
| Okinawa Cellular Telephone Co. | | 200 | 7,030 |
|
| TOTAL TELECOMMUNICATION SERVICES | | | 90,921 |
|
| UTILITIES - 1.1% | | | |
| Electric Utilities - 0.8% | | | |
| EVN AG | | 7 | 107 |
| Exelon Corp. | | 1,340 | 51,376 |
| Public Power Corp. of Greece (a) | | 17 | 45 |
| Southern Co. | | 244 | 11,695 |
| | | | 63,223 |
| Gas Utilities - 0.2% | | | |
| Busan City Gas Co. Ltd. | | 67 | 2,288 |
| K&O Energy Group, Inc. | | 100 | 1,529 |
| Rubis | | 14 | 891 |
| Seoul City Gas Co. Ltd. | | 67 | 5,217 |
| YESCO Co. Ltd. | | 160 | 5,472 |
| | | | 15,397 |
| Independent Power and Renewable Electricity Producers - 0.0% | | | |
| The AES Corp. | | 97 | 1,084 |
| Multi-Utilities - 0.1% | | | |
| Public Service Enterprise Group, Inc. | | 173 | 7,780 |
| Water Utilities - 0.0% | | | |
| Manila Water Co., Inc. | | 300 | 190 |
|
| TOTAL UTILITIES | | | 87,674 |
|
| TOTAL COMMON STOCKS | | | |
| (Cost $7,114,508) | | | 7,513,875 |
|
| Nonconvertible Preferred Stocks - 0.1% | | | |
| INDUSTRIALS - 0.0% | | | |
| Machinery - 0.0% | | | |
| Danieli & C. Officine Meccaniche SpA | | 7 | 131 |
| MATERIALS - 0.1% | | | |
| Construction Materials - 0.1% | | | |
| Buzzi Unicem SpA (Risparmio Shares) | | 375 | 5,358 |
| TOTAL NONCONVERTIBLE PREFERRED STOCKS | | | |
| (Cost $5,330) | | | 5,489 |
|
| Money Market Funds - 6.3% | | | |
| Fidelity Cash Central Fund, 1.11% (b) | | | |
| (Cost $502,634) | | 502,534 | 502,634 |
| TOTAL INVESTMENT PORTFOLIO - 100.0% | | | |
| (Cost $7,622,472) | | | 8,021,998 |
| NET OTHER ASSETS (LIABILITIES) - 0.0% | | | 3,116 |
| NET ASSETS - 100% | | | $8,025,114 |
Legend
(a) Non-income producing
(b) Affiliated fund that is generally available only to investment companies and other accounts managed by Fidelity Investments. The rate quoted is the annualized seven-day yield of the fund at period end. A complete unaudited listing of the fund's holdings as of its most recent quarter end is available upon request. In addition, each Fidelity Central Fund's financial statements, which are not covered by the Fund's Report of Independent Registered Public Accounting Firm, are available on the SEC's website or upon request.
Affiliated Central Funds
Information regarding fiscal year to date income earned by the Fund from investments in Fidelity Central Funds is as follows:
| Fund | Income earned |
| Fidelity Cash Central Fund | $2,601 |
| Total | $2,601 |
Investment Valuation
The following is a summary of the inputs used, as of July 31, 2017, involving the Fund's assets and liabilities carried at fair value. The inputs or methodology used for valuing securities may not be an indication of the risk associated with investing in those securities. For more information on valuation inputs, and their aggregation into the levels used below, please refer to the Investment Valuation section in the accompanying Notes to Financial Statements.
| | Valuation Inputs at Reporting Date: |
| Description | Total | Level 1 | Level 2 | Level 3 |
| Investments in Securities: | | | | |
| Equities: | | | | |
| Consumer Discretionary | $1,707,928 | $1,707,294 | $634 | $-- |
| Consumer Staples | 483,659 | 483,659 | -- | -- |
| Energy | 242,454 | 220,722 | 21,732 | -- |
| Financials | 1,224,970 | 1,043,450 | 181,520 | -- |
| Health Care | 1,817,838 | 1,816,703 | 1,135 | -- |
| Industrials | 723,239 | 723,239 | -- | -- |
| Information Technology | 931,791 | 931,791 | -- | -- |
| Materials | 157,598 | 157,598 | -- | -- |
| Real Estate | 51,292 | 51,292 | -- | -- |
| Telecommunication Services | 90,921 | 90,921 | -- | -- |
| Utilities | 87,674 | 87,674 | -- | -- |
| Money Market Funds | 502,634 | 502,634 | -- | -- |
| Total Investments in Securities: | $8,021,998 | $7,816,977 | $205,021 | $-- |
Other Information
Distribution of investments by country or territory of incorporation, as a percentage of Total Net Assets, is as follows (Unaudited):
| United States of America | 60.3% |
| Japan | 16.6% |
| Korea (South) | 4.0% |
| United Kingdom | 3.3% |
| France | 1.8% |
| Netherlands | 1.6% |
| Cayman Islands | 1.0% |
| Ireland | 1.0% |
| Others (Individually Less Than 1%) | 10.4% |
| | 100.0% |
See accompanying notes which are an integral part of the financial statements.
Financial Statements
Statement of Assets and Liabilities
| | | July 31, 2017 |
| Assets | | |
Investment in securities, at value — See accompanying schedule:
Unaffiliated issuers (cost $7,119,838) | $7,519,364 | |
| Fidelity Central Funds (cost $502,634) | 502,634 | |
| Total Investments (cost $7,622,472) | | $8,021,998 |
| Foreign currency held at value (cost $1,241) | | 1,245 |
| Receivable for fund shares sold | | 218 |
| Dividends receivable | | 3,130 |
| Distributions receivable from Fidelity Central Funds | | 653 |
| Other receivables | | 68 |
| Total assets | | 8,027,312 |
| Liabilities | | |
| Payable for investments purchased | $2,198 | |
| Total liabilities | | 2,198 |
| Net Assets | | $8,025,114 |
| Net Assets consist of: | | |
| Paid in capital | | $7,572,198 |
| Undistributed net investment income | | 43,586 |
| Accumulated undistributed net realized gain (loss) on investments and foreign currency transactions | | 9,783 |
| Net unrealized appreciation (depreciation) on investments and assets and liabilities in foreign currencies | | 399,547 |
| Net Assets, for 739,987 shares outstanding | | $8,025,114 |
| Net Asset Value, offering price and redemption price per share ($8,025,114 ÷ 739,987 shares) | | $10.84 |
See accompanying notes which are an integral part of the financial statements.
Statement of Operations
| | | For the period
March 8, 2017 (commencement of operations) to
July 31, 2017 |
| Investment Income | | |
| Dividends | | $41,006 |
| Income from Fidelity Central Funds | | 2,601 |
| Total income | | 43,607 |
| Expenses | | |
| Independent trustees' fees and expenses | $7 | |
| Miscellaneous | 5 | |
| Total expenses | | 12 |
| Net investment income (loss) | | 43,595 |
| Realized and Unrealized Gain (Loss) | | |
| Net realized gain (loss) on: | | |
| Investment securities: | | |
| Unaffiliated issuers | 8,066 | |
| Foreign currency transactions | 1,708 | |
| Total net realized gain (loss) | | 9,774 |
| Change in net unrealized appreciation (depreciation) on: | | |
| Investment securities | 399,526 | |
| Assets and liabilities in foreign currencies | 21 | |
| Total change in net unrealized appreciation (depreciation) | | 399,547 |
| Net gain (loss) | | 409,321 |
| Net increase (decrease) in net assets resulting from operations | | $452,916 |
See accompanying notes which are an integral part of the financial statements.
Statement of Changes in Net Assets
| | For the period
March 8, 2017 (commencement of operations) to
July 31, 2017 |
| Increase (Decrease) in Net Assets | |
| Operations | |
| Net investment income (loss) | $43,595 |
| Net realized gain (loss) | 9,774 |
| Change in net unrealized appreciation (depreciation) | 399,547 |
| Net increase (decrease) in net assets resulting from operations | 452,916 |
| Share transactions | |
| Proceeds from sales of shares | 7,638,459 |
| Cost of shares redeemed | (66,261) |
| Net increase (decrease) in net assets resulting from share transactions | 7,572,198 |
| Total increase (decrease) in net assets | 8,025,114 |
| Net Assets | |
| Beginning of period | – |
| End of period | $8,025,114 |
| Other Information | |
| Undistributed net investment income end of period | $43,586 |
| Shares | |
| Sold | 746,147 |
| Redeemed | (6,160) |
| Net increase (decrease) | 739,987 |
See accompanying notes which are an integral part of the financial statements.
Financial Highlights — Fidelity Flex Intrinsic Opportunities Fund
| Years ended July 31, | 2017 A |
| Selected Per–Share Data | |
| Net asset value, beginning of period | $10.00 |
| Income from Investment Operations | |
| Net investment income (loss)B | .08 |
| Net realized and unrealized gain (loss) | .76 |
| Total from investment operations | .84 |
| Net asset value, end of period | $10.84 |
| Total ReturnC,D | 8.40% |
| Ratios to Average Net AssetsE,F | |
| Expenses before reductions | - %G,H |
| Expenses net of fee waivers, if any | - %G,H |
| Expenses net of all reductions | - %G,H |
| Net investment income (loss) | 1.97%G |
| Supplemental Data | |
| Net assets, end of period (000 omitted) | $8,025 |
| Portfolio turnover rateI | 9%J |
A For the period March 8, 2017 (commencement of operations) to July 31, 2017.
B Calculated based on average shares outstanding during the period.
C Total returns for periods of less than one year are not annualized.
D Total returns would have been lower if certain expenses had not been reduced during the applicable periods shown.
E Fees and expenses of any underlying Fidelity Central Funds are not included in the Fund's expense ratio. The Fund indirectly bears its proportionate share of the expenses of any underlying Fidelity Central Funds.
F Expense ratios reflect operating expenses of the Fund. Expenses before reductions do not reflect amounts reimbursed by the investment adviser or reductions from brokerage service arrangements or reductions from other expense offset arrangements and do not represent the amount paid by the Fund during periods when reimbursements or reductions occur. Expense ratios before reductions for start-up periods may not be representative of longer term operating periods. Expenses net of fee waivers reflect expenses after reimbursement by the investment adviser but prior to reductions from brokerage service arrangements or other expense offset arrangements. Expenses net of all reductions represent the net expenses paid by the Fund.
G Annualized
H Amount represents less than .005%.
I Amount does not include the portfolio activity of any underlying Fidelity Central Funds.
J Amount not annualized.
See accompanying notes which are an integral part of the financial statements.
Notes to Financial Statements
For the period ended July 31, 2017
1. Organization.
Fidelity Flex Intrinsic Opportunities Fund (the Fund) is a fund of Fidelity Puritan Trust (the Trust) and is authorized to issue an unlimited number of shares. Share transactions on the Statement of Changes in Net Assets may contain exchanges between affiliated funds. The Trust is registered under the Investment Company Act of 1940, as amended (the 1940 Act), as an open-end management investment company organized as a Massachusetts business trust. The Fund is available only to certain fee-based accounts offered by Fidelity.
2. Investments in Fidelity Central Funds.
The Fund invests in Fidelity Central Funds, which are open-end investment companies generally available only to other investment companies and accounts managed by the investment adviser and its affiliates. The Fund's Schedule of Investments lists each of the Fidelity Central Funds held as of period end, if any, as an investment of the Fund, but does not include the underlying holdings of each Fidelity Central Fund. As an Investing Fund, the Fund indirectly bears its proportionate share of the expenses of the underlying Fidelity Central Funds.
The Money Market Central Funds seek preservation of capital and current income and are managed by Fidelity Investments Money Management, Inc. (FIMM), an affiliate of the investment adviser. Annualized expenses of the Money Market Central Funds as of their most recent shareholder report date are less than .005%.
A complete unaudited list of holdings for each Fidelity Central Fund is available upon request or at the Securities and Exchange Commission (the SEC) website at www.sec.gov. In addition, the financial statements of the Fidelity Central Funds, which are not covered by the Fund's Report of Independent Registered Public Accounting Firm, are available on the SEC website or upon request.
3. Significant Accounting Policies.
The Fund is an investment company and applies the accounting and reporting guidance of the Financial Accounting Standards Board (FASB) Accounting Standards Codification Topic 946 Financial Services – Investments Companies. The financial statements have been prepared in conformity with accounting principles generally accepted in the United States of America (GAAP), which require management to make certain estimates and assumptions at the date of the financial statements. Actual results could differ from those estimates. Subsequent events, if any, through the date that the financial statements were issued have been evaluated in the preparation of the financial statements. The following summarizes the significant accounting policies of the Fund:
Investment Valuation. Investments are valued as of 4:00 p.m. Eastern time on the last calendar day of the period. The Board of Trustees (the Board) has delegated the day to day responsibility for the valuation of the Fund's investments to the Fair Value Committee (the Committee) established by the Fund's investment adviser. In accordance with valuation policies and procedures approved by the Board, the Fund attempts to obtain prices from one or more third party pricing vendors or brokers to value its investments. When current market prices, quotations or currency exchange rates are not readily available or reliable, investments will be fair valued in good faith by the Committee, in accordance with procedures adopted by the Board. Factors used in determining fair value vary by investment type and may include market or investment specific events. The frequency with which these procedures are used cannot be predicted and they may be utilized to a significant extent. The Committee oversees the Fund's valuation policies and procedures and reports to the Board on the Committee's activities and fair value determinations. The Board monitors the appropriateness of the procedures used in valuing the Fund's investments and ratifies the fair value determinations of the Committee.
The Fund categorizes the inputs to valuation techniques used to value its investments into a disclosure hierarchy consisting of three levels as shown below:
- Level 1 – quoted prices in active markets for identical investments
- Level 2 – other significant observable inputs (including quoted prices for similar investments, interest rates, prepayment speeds, etc.)
- Level 3 – unobservable inputs (including the Fund's own assumptions based on the best information available)
Valuation techniques used to value the Fund's investments by major category are as follows:
Equity securities, including restricted securities, for which market quotations are readily available, are valued at the last reported sale price or official closing price as reported by a third party pricing vendor on the primary market or exchange on which they are traded and are categorized as Level 1 in the hierarchy. In the event there were no sales during the day or closing prices are not available, securities are valued at the last quoted bid price or may be valued using the last available price and are generally categorized as Level 2 in the hierarchy. For foreign equity securities, when market or security specific events arise, comparisons to the valuation of American Depositary Receipts (ADRs), futures contracts, Exchange-Traded Funds (ETFs) and certain indexes as well as quoted prices for similar securities may be used and would be categorized as Level 2 in the hierarchy. Utilizing these techniques may result in transfers between Level 1 and Level 2. For equity securities, including restricted securities, where observable inputs are limited, assumptions about market activity and risk are used and these securities may be categorized as Level 3 in the hierarchy.
Investments in the open-end mutual funds, including Fidelity Central Funds, are valued at their closing net asset value (NAV) each business day and are categorized as Level 1 in the hierarchy.
Changes in valuation techniques may result in transfers in or out of an assigned level within the disclosure hierarchy. The aggregate value of investments by input level as of July 31, 2017 is included at the end of the Fund's Schedule of Investments.
Foreign Currency. The Fund may use foreign currency contracts to facilitate transactions in foreign-denominated securities. Gains and losses from these transactions may arise from changes in the value of the foreign currency or if the counterparties do not perform under the contracts' terms.
Foreign-denominated assets, including investment securities, and liabilities are translated into U.S. dollars at the exchange rates at period end. Purchases and sales of investment securities, income and dividends received and expenses denominated in foreign currencies are translated into U.S. dollars at the exchange rate in effect on the transaction date.
The effects of exchange rate fluctuations on investments are included with the net realized and unrealized gain (loss) on investment securities. Other foreign currency transactions resulting in realized and unrealized gain (loss) are disclosed separately.
Investment Transactions and Income. For financial reporting purposes, the Fund's investment holdings and NAV include trades executed through the end of the last business day of the period. The NAV per share for processing shareholder transactions is calculated as of the close of business of the New York Stock Exchange (NYSE), normally 4:00 p.m. Eastern time and includes trades executed through the end of the prior business day. Gains and losses on securities sold are determined on the basis of identified cost. Dividend income is recorded on the ex-dividend date, except for certain dividends from foreign securities where the ex-dividend date may have passed, which are recorded as soon as the Fund is informed of the ex-dividend date. Non-cash dividends included in dividend income, if any, are recorded at the fair market value of the securities received. Income and capital gain distributions from Fidelity Central Funds, if any, are recorded on the ex-dividend date. Investment income is recorded net of foreign taxes withheld where recovery of such taxes is uncertain.
Expenses. Expenses directly attributable to a fund are charged to that fund. Expenses attributable to more than one fund are allocated among the respective funds on the basis of relative net assets or other appropriate methods. Expense estimates are accrued in the period to which they relate and adjustments are made when actual amounts are known.
Income Tax Information and Distributions to Shareholders. Each year, the Fund intends to qualify as a regulated investment company under Subchapter M of the Internal Revenue Code, including distributing substantially all of its taxable income and realized gains. As a result, no provision for U.S. Federal income taxes is required. As of July 31, 2017, the Fund did not have any unrecognized tax benefits in the financial statements; nor is the Fund aware of any tax positions for which it is reasonably possible that the total amounts of unrecognized tax benefits will significantly change in the next twelve months. The Fund files a U.S. federal tax return, in addition to state and local tax returns as required. The Fund's federal income tax returns are subject to examination by the Internal Revenue Service (IRS) for a period of three fiscal years after they are filed. State and local tax returns may be subject to examination for an additional fiscal year depending on the jurisdiction. Foreign taxes are provided for based on the Fund's understanding of the tax rules and rates that exist in the foreign markets in which it invests.
Distributions are declared and recorded on the ex-dividend date. Income and capital gain distributions are determined in accordance with income tax regulations, which may differ from GAAP.
Capital accounts within the financial statements are adjusted for permanent book-tax differences. These adjustments have no impact on net assets or the results of operations. Capital accounts are not adjusted for temporary book-tax differences which will reverse in a subsequent period.
Book-tax differences are primarily due to foreign currency transactions, passive foreign investment companies and partnerships.
The federal tax cost of investment securities and unrealized appreciation (depreciation) as of period end were as follows:
| Gross unrealized appreciation | $523,096 |
| Gross unrealized depreciation | (130,457) |
| Net unrealized appreciation (depreciation) on securities | $392,639 |
| Tax Cost | $7,629,359 |
The tax-based components of distributable earnings as of period end were as follows:
| Undistributed ordinary income | $60,256 |
| Net unrealized appreciation (depreciation) on securities and other investments | $392,660 |
4. Purchases and Sales of Investments.
Purchases and sales of securities, other than short-term securities, aggregated $7,601,908 and $490,039, respectively.
5. Fees and Other Transactions with Affiliates.
Management Fee. Fidelity Management & Research Company (the investment adviser) and its affiliates provide the Fund with investment management related services and the Fund does not pay any fees for these services. Under the management contract, the investment adviser or an affiliate pays all other expenses of the Fund, excluding fees and expenses of the independent Trustees, and certain miscellaneous expenses such as proxy and shareholder meeting expenses.
Brokerage Commissions. The Fund placed a portion of its portfolio transactions with brokerage firms which are affiliates of the investment adviser. Brokerage commissions are included in net realized gain (loss) and change in net unrealized appreciation (depreciation) in the Statement of Operations. The commissions paid to these affiliated firms were $360 for the period.
Interfund Trades. The Fund may purchase from or sell securities to other Fidelity Funds under procedures adopted by the Board. The procedures have been designed to ensure these interfund trades are executed in accordance with Rule 17a-7 of the 1940 Act. Interfund trades are included within the respective purchases and sales amounts shown in the Purchases and Sales of Investments note.
6. Committed Line of Credit.
The Fund participates with other funds managed by the investment adviser or an affiliate in a $4.25 billion credit facility (the "line of credit") to be utilized for temporary or emergency purposes to fund shareholder redemptions or for other short-term liquidity purposes. The Fund has agreed to pay commitment fees on its pro-rata portion of the line of credit, which amounted to $5 and is reflected in Miscellaneous expenses on the Statement of Operations. During the period, the Fund did not borrow on this line of credit.
7. Other.
The Fund's organizational documents provide former and current trustees and officers with a limited indemnification against liabilities arising in connection with the performance of their duties to the Fund. In the normal course of business, the Fund may also enter into contracts that provide general indemnifications. The Fund's maximum exposure under these arrangements is unknown as this would be dependent on future claims that may be made against the Fund. The risk of material loss from such claims is considered remote.
At the end of the period, the investment adviser or its affiliates were the owners of record of 68% of the total outstanding shares of the Fund.
Report of Independent Registered Public Accounting Firm
To the Trustees of Fidelity Puritan Trust and Shareholders of Fidelity Flex Intrinsic Opportunities Fund:
We have audited the accompanying statement of assets and liabilities of Fidelity Flex Intrinsic Opportunities Fund (the Fund), a fund of Fidelity Puritan Trust, including the schedule of investments, as of July 31, 2017, and the related statement of operations, the statement of changes in net assets and the financial highlights for the period from March 8, 2017 (commencement of operations) to July 31, 2017. These financial statements and financial highlights are the responsibility of the Fund's management. Our responsibility is to express an opinion on these financial statements and financial highlights based on our audit.
We conducted our audit in accordance with the standards of the Public Company Accounting Oversight Board (United States). Those standards require that we plan and perform the audit to obtain reasonable assurance about whether the financial statements and financial highlights are free of material misstatement. The Fund is not required to have, nor were we engaged to perform, an audit of its internal control over financial reporting. Our audit included consideration of internal control over financial reporting as a basis for designing audit procedures that are appropriate in the circumstances, but not for the purpose of expressing an opinion on the effectiveness of the Fund's internal control over financial reporting. Accordingly, we express no such opinion. An audit also includes examining, on a test basis, evidence supporting the amounts and disclosures in the financial statements, assessing the accounting principles used and significant estimates made by management, as well as evaluating the overall financial statement presentation. Our procedures included confirmation of securities owned as of July 31, 2017, by correspondence with the custodians and brokers; when replies were not received from brokers, we performed other auditing procedures. We believe that our audit provides a reasonable basis for our opinion.
In our opinion, such financial statements and financial highlights referred to above present fairly, in all material respects, the financial position of Fidelity Flex Intrinsic Opportunities Fund as of July 31, 2017, and the results of its operations, the changes in its net assets and the financial highlights for the period from March 8, 2017 (commencement of operations) to July 31, 2017, in conformity with accounting principles generally accepted in the United States of America.
DELOITTE & TOUCHE LLP
Boston, Massachusetts
September 19, 2017
Trustees and Officers
The Trustees, Members of the Advisory Board (if any), and officers of the trust and fund, as applicable, are listed below. The Board of Trustees governs the fund and is responsible for protecting the interests of shareholders. The Trustees are experienced executives who meet periodically throughout the year to oversee the fund's activities, review contractual arrangements with companies that provide services to the fund, oversee management of the risks associated with such activities and contractual arrangements, and review the fund's performance. Except for Jonathan Chiel, each of the Trustees oversees 190 funds. Mr. Chiel oversees 142 funds.
The Trustees hold office without limit in time except that (a) any Trustee may resign; (b) any Trustee may be removed by written instrument, signed by at least two-thirds of the number of Trustees prior to such removal; (c) any Trustee who requests to be retired or who has become incapacitated by illness or injury may be retired by written instrument signed by a majority of the other Trustees; and (d) any Trustee may be removed at any special meeting of shareholders by a two-thirds vote of the outstanding voting securities of the trust. Each Trustee who is not an interested person (as defined in the 1940 Act) of the trust and the fund is referred to herein as an Independent Trustee. Each Independent Trustee shall retire not later than the last day of the calendar year in which his or her 75th birthday occurs. The Independent Trustees may waive this mandatory retirement age policy with respect to individual Trustees. Officers and Advisory Board Members hold office without limit in time, except that any officer or Advisory Board Member may resign or may be removed by a vote of a majority of the Trustees at any regular meeting or any special meeting of the Trustees. Except as indicated, each individual has held the office shown or other offices in the same company for the past five years.
The fund’s Statement of Additional Information (SAI) includes more information about the Trustees. To request a free copy, call Fidelity at 1-800-835-5092.
Experience, Skills, Attributes, and Qualifications of the Trustees. The Governance and Nominating Committee has adopted a statement of policy that describes the experience, qualifications, attributes, and skills that are necessary and desirable for potential Independent Trustee candidates (Statement of Policy). The Board believes that each Trustee satisfied at the time he or she was initially elected or appointed a Trustee, and continues to satisfy, the standards contemplated by the Statement of Policy. The Governance and Nominating Committee also engages professional search firms to help identify potential Independent Trustee candidates who have the experience, qualifications, attributes, and skills consistent with the Statement of Policy. From time to time, additional criteria based on the composition and skills of the current Independent Trustees, as well as experience or skills that may be appropriate in light of future changes to board composition, business conditions, and regulatory or other developments, have also been considered by the professional search firms and the Governance and Nominating Committee. In addition, the Board takes into account the Trustees' commitment and participation in Board and committee meetings, as well as their leadership of standing and ad hoc committees throughout their tenure.
In determining that a particular Trustee was and continues to be qualified to serve as a Trustee, the Board has considered a variety of criteria, none of which, in isolation, was controlling. The Board believes that, collectively, the Trustees have balanced and diverse experience, qualifications, attributes, and skills, which allow the Board to operate effectively in governing the fund and protecting the interests of shareholders. Information about the specific experience, skills, attributes, and qualifications of each Trustee, which in each case led to the Board's conclusion that the Trustee should serve (or continue to serve) as a trustee of the fund, is provided below.
Board Structure and Oversight Function. James C. Curvey is an interested person and currently serves as Chairman. The Trustees have determined that an interested Chairman is appropriate and benefits shareholders because an interested Chairman has a personal and professional stake in the quality and continuity of services provided to the fund. Independent Trustees exercise their informed business judgment to appoint an individual of their choosing to serve as Chairman, regardless of whether the Trustee happens to be independent or a member of management. The Independent Trustees have determined that they can act independently and effectively without having an Independent Trustee serve as Chairman and that a key structural component for assuring that they are in a position to do so is for the Independent Trustees to constitute a substantial majority for the Board. The Independent Trustees also regularly meet in executive session. Ned C. Lautenbach serves as Chairman of the Independent Trustees and as such (i) acts as a liaison between the Independent Trustees and management with respect to matters important to the Independent Trustees and (ii) with management prepares agendas for Board meetings.
Fidelity® funds are overseen by different Boards of Trustees. The fund's Board oversees Fidelity's high income and certain equity funds, and other Boards oversee Fidelity's investment-grade bond, money market, asset allocation, and sector funds. The asset allocation funds may invest in Fidelity® funds overseen by the fund's Board. The use of separate Boards, each with its own committee structure, allows the Trustees of each group of Fidelity® funds to focus on the unique issues of the funds they oversee, including common research, investment, and operational issues. On occasion, the separate Boards establish joint committees to address issues of overlapping consequences for the Fidelity® funds overseen by each Board.
The Trustees operate using a system of committees to facilitate the timely and efficient consideration of all matters of importance to the Trustees, the fund, and fund shareholders and to facilitate compliance with legal and regulatory requirements and oversight of the fund's activities and associated risks. The Board, acting through its committees, has charged FMR and its affiliates with (i) identifying events or circumstances the occurrence of which could have demonstrably adverse effects on the fund's business and/or reputation; (ii) implementing processes and controls to lessen the possibility that such events or circumstances occur or to mitigate the effects of such events or circumstances if they do occur; and (iii) creating and maintaining a system designed to evaluate continuously business and market conditions in order to facilitate the identification and implementation processes described in (i) and (ii) above. Because the day-to-day operations and activities of the fund are carried out by or through FMR, its affiliates, and other service providers, the fund's exposure to risks is mitigated but not eliminated by the processes overseen by the Trustees. While each of the Board's committees has responsibility for overseeing different aspects of the fund's activities, oversight is exercised primarily through the Operations, Audit, and Compliance Committees. In addition, the Independent Trustees have worked with FMR to enhance the Board's oversight of investment and financial risks, legal and regulatory risks, technology risks, and operational risks, including the development of additional risk reporting to the Board. For example, a working group comprised of Independent Trustees and FMR has worked and continues to work to review the Fidelity® funds' valuation-related activities, reporting and risk management. Appropriate personnel, including but not limited to the fund's Chief Compliance Officer (CCO), FMR's internal auditor, the independent accountants, the fund's Treasurer and portfolio management personnel, make periodic reports to the Board's committees, as appropriate, including an annual review of Fidelity's risk management program for the Fidelity® funds. The responsibilities of each standing committee, including their oversight responsibilities, are described further under "Standing Committees of the Trustees."
Interested Trustees*:
Correspondence intended for a Trustee who is an interested person may be sent to Fidelity Investments, 245 Summer Street, Boston, Massachusetts 02210.
Name, Year of Birth; Principal Occupations and Other Relevant Experience+
Jonathan Chiel (1957)
Year of Election or Appointment: 2016
Trustee
Mr. Chiel also serves as Trustee of other Fidelity funds. Mr. Chiel is Executive Vice President and General Counsel for FMR LLC (diversified financial services company, 2012-present). Previously, Mr. Chiel served as general counsel (2004-2012) and senior vice president and deputy general counsel (2000-2004) for John Hancock Financial Services; a partner with Choate, Hall & Stewart (1996-2000) (law firm); and an Assistant United States Attorney for the United States Attorney’s Office of the District of Massachusetts (1986-95), including Chief of the Criminal Division (1993-1995). Mr. Chiel is a director on the boards of the Boston Bar Foundation and the Maimonides School.
James C. Curvey (1935)
Year of Election or Appointment: 2007
Trustee
Chairman of the Board of Trustees
Mr. Curvey also serves as Trustee of other Fidelity® funds. Mr. Curvey is a Director of Fidelity Research & Analysis Co. (investment adviser firm, 2009-present), and Vice Chairman (2007-present) and Director of FMR LLC (diversified financial services company). In addition, Mr. Curvey serves as an Overseer for the Boston Symphony Orchestra and a member of the board of Artis-Naples, Naples, Florida, and as a Trustee for Brewster Academy, Wolfeboro, New Hampshire. Previously, Mr. Curvey served as a Director of Fidelity Investments Money Management, Inc. (investment adviser firm, 2009-2014) and a Director of FMR and FMR Co., Inc. (investment adviser firms, 2007-2014).
Charles S. Morrison (1960)
Year of Election or Appointment: 2014
Trustee
Mr. Morrison also serves as Trustee of other funds. He serves as President of Fidelity Management & Research Company (FMR) (investment adviser firm, 2016-present), a Director of Fidelity Investments Money Management, Inc. (FIMM) (investment adviser firm, 2014-present), Director of Fidelity SelectCo, LLC (investment adviser firm, 2014-present), President, Asset Management (2014-present), and is an employee of Fidelity Investments. Previously, Mr. Morrison served as Vice President of Fidelity's Fixed Income and Asset Allocation Funds (2012-2014), President, Fixed Income (2011-2014), Vice President of Fidelity's Money Market Funds (2005-2009), President, Money Market Group Leader of FMR (investment adviser firm, 2009), and Senior Vice President, Money Market Group of FMR (2004-2009). Mr. Morrison also served as Vice President of Fidelity's Bond Funds (2002-2005), certain Balanced Funds (2002-2005), and certain Asset Allocation Funds (2002-2007), and as Senior Vice President (2002-2005) of Fidelity's Bond Division.
* Determined to be an “Interested Trustee” by virtue of, among other things, his or her affiliation with the trust or various entities under common control with FMR.
+ The information includes the Trustee's principal occupation during the last five years and other information relating to the experience, attributes, and skills relevant to the Trustee's qualifications to serve as a Trustee, which led to the conclusion that the Trustee should serve as a Trustee for the fund.
Independent Trustees:
Correspondence intended for an Independent Trustee may be sent to Fidelity Investments, P.O. Box 55235, Boston, Massachusetts 02205-5235.
Name, Year of Birth; Principal Occupations and Other Relevant Experience+
Dennis J. Dirks (1948)
Year of Election or Appointment: 2005
Trustee
Mr. Dirks also serves as Trustee of other Fidelity® funds. Prior to his retirement in May 2003, Mr. Dirks was Chief Operating Officer and a member of the Board of The Depository Trust & Clearing Corporation (DTCC). He also served as President, Chief Operating Officer, and Board member of The Depository Trust Company (DTC) and President and Board member of the National Securities Clearing Corporation (NSCC). In addition, Mr. Dirks served as Chief Executive Officer and Board member of the Government Securities Clearing Corporation, Chief Executive Officer and Board member of the Mortgage-Backed Securities Clearing Corporation, as a Trustee and a member of the Finance Committee of Manhattan College (2005-2008), as a Trustee and a member of the Finance Committee of AHRC of Nassau County (2006-2008), as a member of the Independent Directors Council (IDC) Governing Council (2010-2015), and as a member of the Board of Directors for The Brookville Center for Children’s Services, Inc. (2009-2017). Mr. Dirks is a member of the Finance Committee (2016-present) and Board of Directors (2017-present) of the Asolo Repertory Theatre.
Alan J. Lacy (1953)
Year of Election or Appointment: 2008
Trustee
Mr. Lacy also serves as Trustee of other Fidelity® funds. Mr. Lacy serves as a Director of Bristol-Myers Squibb Company (global pharmaceuticals, 2008-present). He is a Trustee of the California Chapter of The Nature Conservancy (2015-present) and a Director of the Center for Advanced Study in the Behavioral Sciences at Stanford University (2015-present). In addition, Mr. Lacy served as Senior Adviser (2007-2014) of Oak Hill Capital Partners, L.P. (private equity) and also served as Chief Executive Officer (2005) and Vice Chairman (2005-2006) of Sears Holdings Corporation (retail) and Chief Executive Officer and Chairman of the Board of Sears, Roebuck and Co. (retail, 2000-2005). Previously, Mr. Lacy served as Chairman (2014-2017) and a member (2010-2017) of the Board of Directors of Dave & Buster’s Entertainment, Inc. (restaurant and entertainment complexes), as Chairman (2008-2011) and a member (2006-2015) of the Board of Trustees of the National Parks Conservation Association, and as a member of the Board of Directors for The Hillman Companies, Inc. (hardware wholesalers, 2010-2014), Earth Fare, Inc. (retail grocery, 2010-2014), and The Western Union Company (global money transfer, 2006-2011).
Ned C. Lautenbach (1944)
Year of Election or Appointment: 2000
Trustee
Chairman of the Independent Trustees
Mr. Lautenbach also serves as Trustee of other Fidelity® funds. Mr. Lautenbach currently serves as the Lead Director of the Eaton Corporation Board of Directors (diversified industrial, 1997-present). Mr. Lautenbach is Chairman of the Board of Directors of Artis-Naples in Naples, Florida (2012-present), a member of the Council on Foreign Relations (1994-present), and currently Vice Chair of the Board of Governors, State University System of Florida (2013-present). Previously, Mr. Lautenbach was a Partner and Advisory Partner at Clayton, Dubilier & Rice, LLC (private equity investment, 1998-2010), as well as a Director of Sony Corporation (2006-2007). Mr. Lautenbach also had a 30-year career with IBM (technology company) during which time he served as Senior Vice President and a member of the Corporate Executive Committee (1968-1998).
Joseph Mauriello (1944)
Year of Election or Appointment: 2008
Trustee
Mr. Mauriello also serves as Trustee of other Fidelity® funds. Prior to his retirement in January 2006, Mr. Mauriello served in numerous senior management positions including Deputy Chairman and Chief Operating Officer (2004-2005), and Vice Chairman of Financial Services (2002-2004) of KPMG LLP US (professional services, 1965-2005). Mr. Mauriello currently serves as a member of the Board of Directors of XL Group plc. (global insurance and re-insurance, 2006-present) and the Independent Directors Council (IDC) Governing Council (2015-present). Previously, Mr. Mauriello served as a Director of the Hamilton Funds of the Bank of New York (2006-2007) and of Arcadia Resources Inc. (health care services and products, 2007-2012).
Cornelia M. Small (1944)
Year of Election or Appointment: 2005
Trustee
Ms. Small also serves as Trustee of other Fidelity® funds. Ms. Small is a member of the Board of Directors (2009-present) and Chair of the Investment Committee (2010-present) of the Teagle Foundation. Ms. Small also serves on the Investment Committee of the Berkshire Taconic Community Foundation (2008-present). Previously, Ms. Small served as Chairperson (2002-2008) and a member of the Investment Committee and Chairperson (2008-2012) and a member of the Board of Trustees of Smith College. In addition, Ms. Small served as Chief Investment Officer, Director of Global Equity Investments, and a member of the Board of Directors of Scudder, Stevens & Clark and Scudder Kemper Investments.
William S. Stavropoulos (1939)
Year of Election or Appointment: 2001
Trustee
Vice Chairman of the Independent Trustees
Mr. Stavropoulos also serves as Trustee of other Fidelity® funds. Mr. Stavropoulos serves as President and Founder of the Michigan Baseball Foundation, the Great Lakes Loons (2007-present). Mr. Stavropoulos is Chairman Emeritus of the Board of Directors of The Dow Chemical Company, where he previously served in numerous senior management positions, including President, CEO (1995-2000; 2002-2004), Chairman of the Executive Committee (2000-2006), and as a member of the Board of Directors (1990-2006). Currently, Mr. Stavropoulos is Chairman of the Board of Directors of Univar Inc. (global distributor of commodity and specialty chemicals), a Director of Teradata Corporation (data warehousing and technology solutions), and a member of the Advisory Board for Metalmark Capital LLC (private equity investment, 2005-present). Mr. Stavropoulos is an operating advisor to Clayton, Dubilier & Rice, LLC (private equity investment). In addition, Mr. Stavropoulos is a member of the University of Notre Dame Advisory Council for the College of Science, a Trustee of the Rollin L. Gerstacker Foundation, and a Director of Artis-Naples in Naples, Florida. Previously, Mr. Stavropoulos served as a Director of Chemical Financial Corporation (bank holding company, 1993-2012) and Tyco International, Ltd. (multinational manufacturing and services, 2007-2012).
David M. Thomas (1949)
Year of Election or Appointment: 2008
Trustee
Mr. Thomas also serves as Trustee of other Fidelity® funds. Mr. Thomas serves as Non-Executive Chairman of the Board of Directors of Fortune Brands Home and Security (home and security products, 2011-present), as a member of the Board of Directors (2004-present) and Presiding Director (2013-present) of Interpublic Group of Companies, Inc. (marketing communication), and as a member of the Board of Trustees of the University of Florida (2013-present). Previously, Mr. Thomas served as Executive Chairman (2005-2006) and Chairman and Chief Executive Officer (2000-2005) of IMS Health, Inc. (pharmaceutical and healthcare information solutions), and a Director of Fortune Brands, Inc. (consumer products, 2000-2011).
+ The information includes the Trustee's principal occupation during the last five years and other information relating to the experience, attributes, and skills relevant to the Trustee's qualifications to serve as a Trustee, which led to the conclusion that the Trustee should serve as a Trustee for the fund.
Advisory Board Members and Officers:
Correspondence intended for an officer or Peter S. Lynch may be sent to Fidelity Investments, 245 Summer Street, Boston, Massachusetts 02210. Officers appear below in alphabetical order.
Name, Year of Birth; Principal Occupation
Peter S. Lynch (1944)
Year of Election or Appointment: 2003
Member of the Advisory Board
Mr. Lynch also serves as Member of the Advisory Board of other Fidelity® funds. Mr. Lynch is Vice Chairman and a Director of FMR (investment adviser firm) and FMR Co., Inc. (investment adviser firm). In addition, Mr. Lynch serves as a Trustee of Boston College and as the Chairman of the Inner-City Scholarship Fund. Previously, Mr. Lynch served on the Special Olympics International Board of Directors (1997-2006).
Elizabeth Paige Baumann (1968)
Year of Election or Appointment: 2017
Anti-Money Laundering (AML) Officer
Ms. Baumann also serves as AML Officer of other funds. She is Chief AML Officer (2012-present) and Senior Vice President (2014-present) of FMR LLC (diversified financial services company) and is an employee of Fidelity Investments. Previously, Ms. Baumann served as AML Officer of the funds (2012-2016), and Vice President (2007-2014) and Deputy Anti-Money Laundering Officer (2007-2012) of FMR LLC.
Marc R. Bryant (1966)
Year of Election or Appointment: 2015
Secretary and Chief Legal Officer (CLO)
Mr. Bryant also serves as Secretary and CLO of other funds. Mr. Bryant serves as CLO, Secretary, and Senior Vice President of Fidelity Management & Research Company (investment adviser firm, 2015-present) and FMR Co., Inc. (investment adviser firm, 2015-present); Secretary of Fidelity SelectCo, LLC (investment adviser firm, 2015-present) and Fidelity Investments Money Management, Inc. (investment adviser firm, 2015-present); and CLO of Fidelity Management & Research (Hong Kong) Limited and FMR Investment Management (UK) Limited (investment adviser firms, 2015-present) and Fidelity Management & Research (Japan) Limited (investment adviser firm, 2016-present). He is Senior Vice President and Deputy General Counsel of FMR LLC (diversified financial services company). Previously, Mr. Bryant served as Secretary and CLO of Fidelity Rutland Square Trust II (2010-2014) and Assistant Secretary of Fidelity's Fixed Income and Asset Allocation Funds (2013-2015). Prior to joining Fidelity Investments, Mr. Bryant served as a Senior Vice President and the Head of Global Retail Legal for AllianceBernstein L.P. (2006-2010), and as the General Counsel for ProFund Advisors LLC (2001-2006).
William C. Coffey (1969)
Year of Election or Appointment: 2009
Assistant Secretary
Mr. Coffey also serves as Assistant Secretary of other funds. He is Senior Vice President and Deputy General Counsel of FMR LLC (diversified financial services company, 2010-present), and is an employee of Fidelity Investments. Previously, Mr. Coffey served as Vice President and Associate General Counsel of FMR LLC (2005-2009).
Jonathan Davis (1968)
Year of Election or Appointment: 2010
Assistant Treasurer
Mr. Davis also serves as Assistant Treasurer of other funds, and is an employee of Fidelity Investments. Previously, Mr. Davis served as Vice President and Associate General Counsel of FMR LLC (diversified financial services company, 2003-2010).
Adrien E. Deberghes (1967)
Year of Election or Appointment: 2016
Assistant Treasurer
Mr. Deberghes also serves as an officer of other funds. He serves as Executive Vice President of Fidelity Investments Money Management, Inc. (FIMM) (investment adviser firm, 2016-present) and is an employee of Fidelity Investments (2008-present). Prior to joining Fidelity Investments, Mr. Deberghes was Senior Vice President of Mutual Fund Administration at State Street Corporation (2007-2008), Senior Director of Mutual Fund Administration at Investors Bank & Trust (2005-2007), and Director of Finance for Dunkin' Brands (2000-2005). Previously, Mr. Deberghes served in other fund officer roles.
Stephanie J. Dorsey (1969)
Year of Election or Appointment: 2010
Assistant Treasurer
Ms. Dorsey also serves as an officer of other funds. She is an employee of Fidelity Investments (2008-present) and has served in other fund officer roles. Prior to joining Fidelity Investments, Ms. Dorsey served as Treasurer (2004-2008) of the JPMorgan Mutual Funds and Vice President (2004-2008) of JPMorgan Chase Bank.
Howard J. Galligan III (1966)
Year of Election or Appointment: 2014
Chief Financial Officer
Mr. Galligan also serves as Chief Financial Officer of other funds. Mr. Galligan serves as President of Fidelity Pricing and Cash Management Services (FPCMS) (2014-present) and as a Director of Strategic Advisers, Inc. (investment adviser firm, 2008-present). Previously, Mr. Galligan served as Chief Administrative Officer of Asset Management (2011-2014) and Chief Operating Officer and Senior Vice President of Investment Support for Strategic Advisers, Inc. (2003-2011).
Thomas C. Hense (1964)
Year of Election or Appointment: 2008, 2010, or 2015
Vice President
Mr. Hense serves as Vice President of Fidelity Advisor® Multi-Asset Income Fund (2015) and other funds (High Income (2008), Small Cap (2008), and Value (2010) funds), and is an employee of Fidelity Investments (1993-present). Previously, Mr. Hense served as a portfolio manager for Fidelity's Institutional Money Management Group (Pyramis) (2003-2008).
Brian B. Hogan (1964)
Year of Election or Appointment: 2009
Vice President
Mr. Hogan also serves as Trustee or Vice President of other funds. Mr. Hogan serves as a Director of FMR Investment Management (UK) Limited (investment adviser firm, 2015-present) and Fidelity SelectCo, LLC (investment adviser firm, 2014-present) and President of the Equity Division of FMR (investment adviser firm, 2009-present). Previously, Mr. Hogan served as Senior Vice President, Equity Research of FMR (2006-2009) and as a portfolio manager. Mr. Brian B. Hogan is not related to Mr. Colm A. Hogan.
Colm A. Hogan (1973)
Year of Election or Appointment: 2016
Deputy Treasurer
Mr. Hogan also serves as an officer of other funds. Mr. Hogan is an employee of Fidelity Investments (2005-present). Mr. Colm A. Hogan is not related to Mr. Brian B. Hogan.
Chris Maher (1972)
Year of Election or Appointment: 2013
Assistant Treasurer
Mr. Maher serves as Assistant Treasurer of other funds. Mr. Maher is Vice President of Valuation Oversight and is an employee of Fidelity Investments. Previously, Mr. Maher served as Vice President of Asset Management Compliance (2013), Vice President of the Program Management Group of FMR (investment adviser firm, 2010-2013), and Vice President of Valuation Oversight (2008-2010).
Rieco E. Mello (1969)
Year of Election or Appointment: 2017
Assistant Treasurer
Mr. Mello also serves as Assistant Treasurer of other funds. Mr. Mello is an employee of Fidelity Investments (1995-present).
Kenneth B. Robins (1969)
Year of Election or Appointment: 2016
Chief Compliance Officer
Mr. Robins also serves as an officer of other funds. Mr. Robins serves as Compliance Officer of Fidelity Management & Research Company and FMR Co., Inc. (investment adviser firms, 2016-present) and is an employee of Fidelity Investments (2004-present). Previously, Mr. Robins served as Executive Vice President of Fidelity Investments Money Management, Inc. (investment adviser firm, 2013-2016) and served in other fund officer roles.
Stacie M. Smith (1974)
Year of Election or Appointment: 2016
President and Treasurer
Ms. Smith also serves as an officer of other funds. She is an employee of Fidelity Investments (2009-present) and has served in other fund officer roles. Prior to joining Fidelity Investments, Ms. Smith served as Senior Audit Manager of Ernst & Young LLP (accounting firm, 1996-2009). Previously, Ms. Smith served as Deputy Treasurer of certain Fidelity® funds (2013-2016).
Marc L. Spector (1972)
Year of Election or Appointment: 2016
Assistant Treasurer
Mr. Spector also serves as an officer of other funds. Mr. Spector is an employee of Fidelity Investments (2016-present). Prior to joining Fidelity Investments, Mr. Spector served as Director at the Siegfried Group (accounting firm, 2013-2016), and prior to Siegfried Group as audit senior manager at Deloitte & Touche (accounting firm, 2005-2013).
Renee Stagnone (1975)
Year of Election or Appointment: 2016
Assistant Treasurer
Ms. Stagnone also serves as an officer of other funds. Ms. Stagnone is an employee of Fidelity Investments (1997-present). Previously, Ms. Stagnone served as Deputy Treasurer of certain Fidelity® funds (2013-2016).
Shareholder Expense Example
As a shareholder of a Fund, you incur two types of costs: (1) transaction costs and (2) ongoing costs and other Fund expenses. This Example is intended to help you understand your ongoing costs (in dollars) of investing in the Funds and to compare these costs with the ongoing costs of investing in other mutual funds.
The actual expense Example is based on an investment of $1,000 invested at the beginning of the period and held for the entire period (March 8, 2017 to July 31, 2017). The hypothetical expense Example is based on an investment of $1,000 invested for the one-half year period (January 1, 2017 to July 31, 2017).
Actual Expenses
The first line of the accompanying table provides information about actual account values and actual expenses. You may use the information in this line, together with the amount you invested, to estimate the expenses that you paid over the period. Simply divide your account value by $1,000.00 (for example, an $8,600 account value divided by $1,000.00 = 8.6), then multiply the result by the number in the first line under the heading entitled "Expenses Paid During Period" to estimate the expenses you paid on your account during this period. In addition, the Fund, as a shareholder in the underlying Fidelity Central Funds, will indirectly bear its pro-rata share of the fees and expenses incurred by the underlying Fidelity Central Funds. These fees and expenses are not included in the Fund's annualized expense ratio used to calculate the expense estimate in the table below.
Hypothetical Example for Comparison Purposes
The second line of the accompanying table provides information about hypothetical account values and hypothetical expenses based on the Fund's actual expense ratio and an assumed rate of return of 5% per year before expenses, which is not the Fund's actual return. The hypothetical account values and expenses may not be used to estimate the actual ending account balance or expenses you paid for the period. You may use this information to compare the ongoing costs of investing in the Fund and other funds. To do so, compare this 5% hypothetical example with the 5% hypothetical examples that appear in the shareholder reports of the other funds. In addition, the Fund, as a shareholder in the underlying Fidelity Central Funds, will indirectly bear its pro-rata share of the fees and expenses incurred by the underlying Fidelity Central Funds. These fees and expenses are not included in the Fund's annualized expense ratio used to calculate the expense estimate in the table below.
Please note that the expenses shown in the table are meant to highlight your ongoing costs only and do not reflect any transaction costs. Therefore, the second line of the table is useful in comparing ongoing costs only, and will not help you determine the relative total costs of owning different funds.
| | Annualized Expense Ratio-A | Beginning
Account Value | Ending
Account Value
July 31, 2017 | Expenses Paid
During Period |
| Actual | - %B | $1,000.00 | $1,084.00 | $-C |
| Hypothetical-D | | $1,000.00 | $1,024.79 | $-E |
A Annualized expense ratio reflects expenses net of applicable fee waivers.
B Amount represents less than .005%.
C Actual expenses are equal to the Fund's annualized expense ratio, multiplied by the average account value over the period, multiplied by 146/365 (to reflect the period March 8, 2017 to July 31, 2017).
D 5% return per year before expenses.
E Hypothetical expenses are equal to the Fund's annualized expense ratio, multiplied by the average account value over the period, multiplied by 181/365 (to reflect the one-half year period).
Distributions (Unaudited)
The Board of Trustees of Fidelity Flex Intrinsic Opportunities Fund voted to pay on September 18, 2017, to shareholders of record at the opening of business on September 15, 2017, a distribution of $0.019 per share derived from capital gains realized from sales of portfolio securities and a dividend of $0.049 per share from net investment income.
The fund will notify shareholders in January 2018 of amounts for use in preparing 2017 income tax returns.
Board Approval of Investment Advisory Contracts and Management Fees
Fidelity Flex Intrinsic Opportunities Fund
On January 18, 2017, the Board of Trustees, including the Independent Trustees (together, the Board), voted to approve the management contract with Fidelity Management & Research Company (FMR) and the sub-advisory agreements with affiliates of FMR (together, the Advisory Contracts) for the fund. The Board, assisted by the advice of fund counsel and Independent Trustees' counsel, considered a broad range of information.
Nature, Extent, and Quality of Services Provided. The Board considered Fidelity's staffing as it relates to the fund, including the backgrounds of investment personnel of Fidelity, and also considered the fund's investment objective, strategies, and related investment philosophy. The Board considered the structure of the investment personnel compensation program and whether this structure provides appropriate incentives to act in the best interests of the fund.
Resources Dedicated to Investment Management and Support Services. The Board and the Fund Oversight and Research Committees reviewed the general qualifications and capabilities of Fidelity's investment staff, including its size, education, experience, and resources, as well as Fidelity's approach to recruiting, training, managing, and compensating investment personnel. The Board noted that Fidelity has continued to increase the resources devoted to non-U.S. offices, including expansion of Fidelity's global investment organization. The Board also noted that Fidelity's analysts have extensive resources, tools and capabilities that allow them to conduct sophisticated quantitative and fundamental analysis, as well as credit analysis of issuers, counterparties and guarantors. Further, the Board considered that Fidelity's investment professionals have sufficient access to global information and data so as to provide competitive investment results over time, and that those professionals also have access to sophisticated tools that permit them to assess portfolio construction and risk and performance attribution characteristics continuously, as well as to transmit new information and research conclusions rapidly around the world. Additionally, in its deliberations, the Board considered Fidelity's trading, risk management, compliance, and technology and operations capabilities and resources, which are integral parts of the investment management process.
Shareholder and Administrative Services. The Board considered the nature, extent, quality, and cost of advisory, administrative, and shareholder services to be performed by FMR, the sub-advisers (together with FMR, the Investment Advisers), and their affiliates under the Advisory Contracts and under separate agreements covering transfer agency, pricing and bookkeeping, and securities lending services for the fund. The Board also considered the nature and extent of the supervision of third party service providers, principally custodians, subcustodians, and pricing vendors.
The Board noted that the growth of fund assets over time across the complex allows Fidelity to reinvest in the development of services designed to enhance the value or convenience of the Fidelity funds as investment vehicles. These services include 24-hour access to account information and market information through telephone representatives and over the Internet, investor education materials and asset allocation tools, and the expanded availability of Fidelity Investor Centers.
Investment Performance. The fund is a new fund and therefore had no historical performance for the Board to review at the time it approved the fund's Advisory Contracts. The Board considered the Investment Advisers' strength in fundamental, research-driven security selection, which the Board is familiar with through its supervision of other Fidelity funds.
Based on its review, the Board concluded that the nature, extent, and quality of services to be provided to the fund under the Advisory Contracts should benefit the shareholders of the fund.
Competitiveness of Management Fee and Total Expense Ratio. The Board noted that the fund is available exclusively to retirement plans offered through certain Fidelity fee-based programs. The Board considered that while the fund does not pay a management fee, FMR is indirectly compensated for its services out of the program fee. The Board noted that FMR pays all operating expenses, with certain limited exceptions, on behalf of the fund. Based on its review, the Board concluded that the fund's management fee and projected total expense ratio were reasonable in light of the services that the fund and its shareholders will receive and the other factors considered.
Costs of the Services and Profitability. The fund is a new fund and therefore no revenue, cost, or profitability data was available for the Board to review in respect of the fund at the time it approved the Advisory Contracts. In connection with its future renewal of the fund's Advisory Contracts, the Board will consider the revenues earned and the expenses incurred by Fidelity in conducting the business of developing, marketing, distributing, managing, administering and servicing the fund and servicing the fund's shareholders.
Economies of Scale. The Board will consider economies of scale when there is operating experience to permit assessment thereof. It noted, however, that because the fund pays no advisory fees and FMR bears most expenses of the fund, economies of scale cannot be realized by the fund.
Based on its evaluation of all of the conclusions noted above, and after considering all factors it believed relevant, the Board concluded that the advisory fee structures are fair and reasonable, and that the fund's Advisory Contracts should be approved.

Corporate Headquarters
245 Summer St.
Boston, MA 02210
www.fidelity.com
ZTO-ANN-0917
1.9881591.100
Fidelity® Value Discovery Fund
Annual Report July 31, 2017 |
|
Contents
To view a fund's proxy voting guidelines and proxy voting record for the 12-month period ended June 30, visit http://www.fidelity.com/proxyvotingresults or visit the Securities and Exchange Commission's (SEC) web site at http://www.sec.gov.
You may also call 1-800-544-8544 to request a free copy of the proxy voting guidelines.
Standard & Poor's, S&P and S&P 500 are registered service marks of The McGraw-Hill Companies, Inc. and have been licensed for use by Fidelity Distributors Corporation.
Other third-party marks appearing herein are the property of their respective owners.
All other marks appearing herein are registered or unregistered trademarks or service marks of FMR LLC or an affiliated company. © 2017 FMR LLC. All rights reserved.
This report and the financial statements contained herein are submitted for the general information of the shareholders of the Fund. This report is not authorized for distribution to prospective investors in the Fund unless preceded or accompanied by an effective prospectus.
A fund files its complete schedule of portfolio holdings with the SEC for the first and third quarters of each fiscal year on Form N-Q. Forms N-Q are available on the SEC’s web site at http://www.sec.gov. A fund's Forms N-Q may be reviewed and copied at the SEC’s Public Reference Room in Washington, DC. Information regarding the operation of the SEC's Public Reference Room may be obtained by calling 1-800-SEC-0330.
For a complete list of a fund's portfolio holdings, view the most recent holdings listing, semiannual report, or annual report on Fidelity's web site at http://www.fidelity.com, http://www.institutional.fidelity.com, or http://www.401k.com, as applicable.
NOT FDIC INSURED •MAY LOSE VALUE •NO BANK GUARANTEE
Neither the Fund nor Fidelity Distributors Corporation is a bank.
Performance: The Bottom Line
Average annual total return reflects the change in the value of an investment, assuming reinvestment of distributions from dividend income and capital gains (the profits earned upon the sale of securities that have grown in value, if any) and assuming a constant rate of performance each year. The hypothetical investment and the average annual total returns do not reflect the deduction of taxes that a shareholder would pay on fund distributions or the redemption of fund shares. During periods of reimbursement by Fidelity, a fund’s total return will be greater than it would be had the reimbursement not occurred. How a fund did yesterday is no guarantee of how it will do tomorrow.
Average Annual Total Returns
| For the periods ended July 31, 2017 | Past 1 year | Past 5 years | Past 10 years |
| Fidelity® Value Discovery Fund | 17.70% | 14.50% | 6.21% |
$10,000 Over 10 Years
Let's say hypothetically that $10,000 was invested in Fidelity® Value Discovery Fund, a class of the fund, on July 31, 2007.
The chart shows how the value of your investment would have changed, and also shows how the Russell 3000® Value Index performed over the same period.
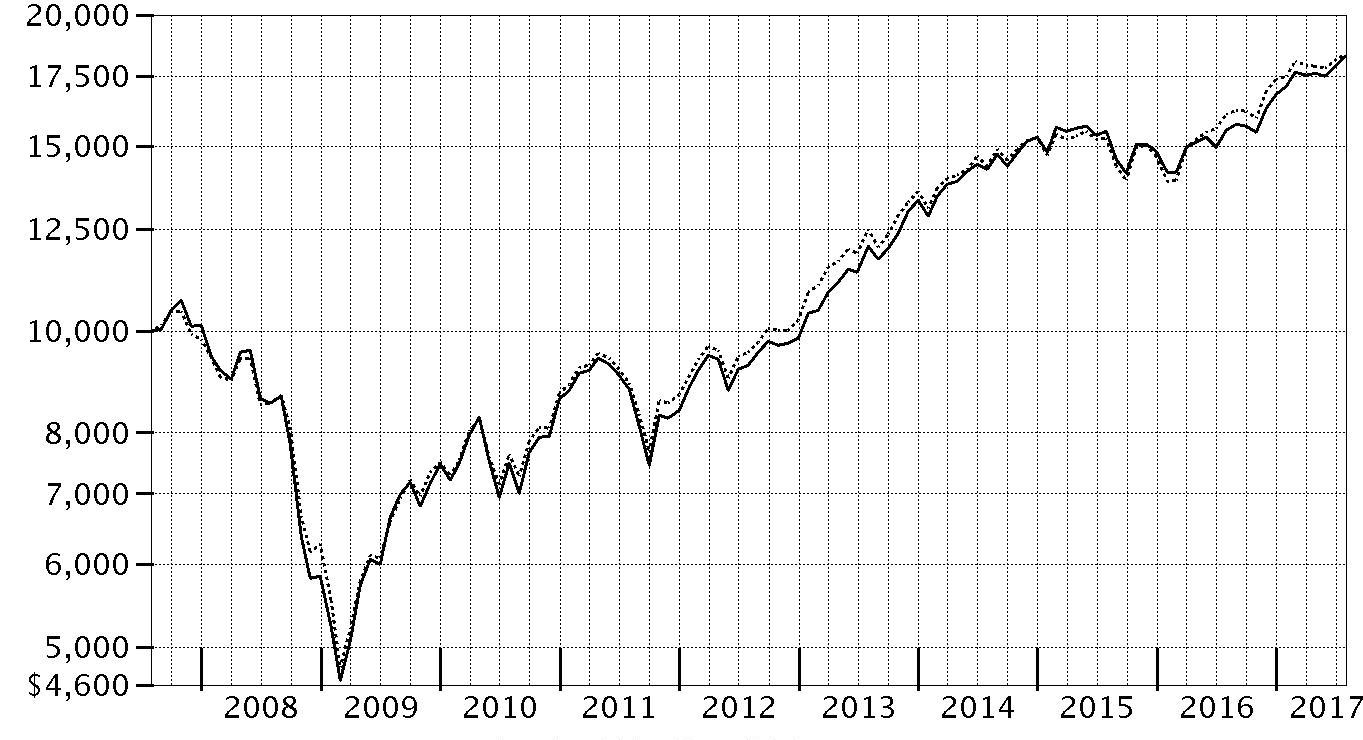
| Period Ending Values |
| $18,263 | Fidelity® Value Discovery Fund |
| $18,358 | Russell 3000® Value Index |
Management's Discussion of Fund Performance
Market Recap: The U.S. equity bellwether S&P 500
® index gained 16.04% for the year ending July 31, 2017, rising sharply following the November election and continuing to rally through the end of February on optimism for President Trump’s pro-business agenda. Equity markets leveled off, however, as the fledgling administration faced the first test of its domestic agenda. Stocks reacted with uncertainty to efforts by Congress in March to repeal and replace the Affordable Care Act, and then reverted upward through July 31. Growth stocks surged ahead of value, while small-caps’ advantage over large-caps narrowed. Sector-wise, financials (+36%) fared best, riding an uptick in bond yields and a surge in banks, particularly post-election. Information technology gained 29%, as a handful of major index constituents posted stellar returns. Industrials (+18%) was boosted by a call for increased infrastructure spending. Consumer discretionary (+14%) slightly lagged the broader market because brick-and-mortar retailers continued to suffer from increased online competition. Energy (0%) was hurt by low oil prices. Utilities (+6%), consumer staples (+4%), telecommunication services (-7%) and real estate (-2%) all struggled amid an improved backdrop for riskier assets that curbed demand for dividend-rich sectors, as well as the likelihood of further interest rate hikes later in 2017.
Comments from Portfolio Manager Sean Gavin: For the fiscal year, the fund’s Retail Class shares gained 17.70%, well ahead of the benchmark Russell 3000
® Value Index, which returned 14.17%. Versus the benchmark, the fund was helped most by strong stock picking in the energy sector. Most notably, we did not own lagging benchmark component Exxon Mobil, an integrated energy giant whose fundamentals I found unattractive at the firm’s current valuation. We also saw favorable results with a pair of affiliated energy-transportation companies: Teekay and Teekay LNG Partners. I should point out that a third Teekay entity we held, Teekay Offshore Partners, performed poorly this period, essentially offsetting the positive impact generated by its cousins. All three were out-of-benchmark holdings. The fund also benefited from good security selection in information technology – especially owning consumer electronics and computer designer Apple, one of the fund’s largest holdings at period end – and in consumer discretionary. Tempering the fund’s strength this period, however, was subpar stock picking in the financials and industrials sectors, as well as in health care, where a disappointing position in Teva Pharmaceutical Industries was a particularly big detractor, as the company faced various business challenges. Teva remained one of the fund’s largest holdings at period end, although it’s fair to say my confidence in the name has been shaken.
The views expressed above reflect those of the portfolio manager(s) only through the end of the period as stated on the cover of this report and do not necessarily represent the views of Fidelity or any other person in the Fidelity organization. Any such views are subject to change at any time based upon market or other conditions and Fidelity disclaims any responsibility to update such views. These views may not be relied on as investment advice and, because investment decisions for a Fidelity fund are based on numerous factors, may not be relied on as an indication of trading intent on behalf of any Fidelity fund.
Investment Summary (Unaudited)
Top Ten Stocks as of July 31, 2017
| | % of fund's net assets | % of fund's net assets 6 months ago |
| JPMorgan Chase & Co. | 3.8 | 3.4 |
| Berkshire Hathaway, Inc. Class B | 3.5 | 3.8 |
| Wells Fargo & Co. | 3.1 | 3.7 |
| Amgen, Inc. | 2.3 | 2.2 |
| Alphabet, Inc. Class A | 2.0 | 1.9 |
| U.S. Bancorp | 2.0 | 2.3 |
| Allergan PLC | 2.0 | 1.5 |
| Teva Pharmaceutical Industries Ltd. sponsored ADR | 1.9 | 1.4 |
| Johnson & Johnson | 1.7 | 1.8 |
| CVS Health Corp. | 1.7 | 1.2 |
| | 24.0 | |
Top Five Market Sectors as of July 31, 2017
| | % of fund's net assets | % of fund's net assets 6 months ago |
| Financials | 26.0 | 27.0 |
| Health Care | 16.4 | 14.6 |
| Information Technology | 11.7 | 14.1 |
| Consumer Discretionary | 10.8 | 10.1 |
| Consumer Staples | 7.4 | 4.3 |
Asset Allocation (% of fund's net assets)
| As of July 31, 2017* |
| | Stocks | 95.0% |
| | Convertible Securities | 0.6% |
| | Short-Term Investments and Net Other Assets (Liabilities) | 4.4% |

* Foreign investments - 23.2%
| As of January 31, 2017* |
| | Stocks | 93.7% |
| | Short-Term Investments and Net Other Assets (Liabilities) | 6.3% |

* Foreign investments - 23.4%
Investments July 31, 2017
Showing Percentage of Net Assets
| Common Stocks - 95.0% | | | |
| | | Shares | Value |
| CONSUMER DISCRETIONARY - 10.8% | | | |
| Auto Components - 0.5% | | | |
| Hyundai Mobis | | 67,953 | $14,926,257 |
| Leisure Products - 0.7% | | | |
| Vista Outdoor, Inc. (a) | | 789,600 | 18,231,864 |
| Media - 7.0% | | | |
| CBS Corp. Class B | | 547,400 | 36,035,342 |
| Charter Communications, Inc. Class A (a) | | 52,129 | 20,429,876 |
| Cinemark Holdings, Inc. | | 413,600 | 16,089,040 |
| John Wiley & Sons, Inc. Class A | | 277,085 | 15,308,946 |
| Lions Gate Entertainment Corp. Class B (a) | | 1,256,182 | 34,557,567 |
| Time Warner, Inc. | | 405,900 | 41,572,278 |
| Twenty-First Century Fox, Inc. Class A | | 1,175,400 | 34,204,140 |
| | | | 198,197,189 |
| Specialty Retail - 0.7% | | | |
| Cabela's, Inc. Class A (a) | | 337,600 | 19,236,448 |
| Textiles, Apparel & Luxury Goods - 1.9% | | | |
| Christian Dior SA | | 66,500 | 18,948,554 |
| PVH Corp. | | 290,300 | 34,629,887 |
| | | | 53,578,441 |
|
| TOTAL CONSUMER DISCRETIONARY | | | 304,170,199 |
|
| CONSUMER STAPLES - 7.4% | | | |
| Beverages - 1.4% | | | |
| C&C Group PLC | | 4,497,810 | 16,292,993 |
| PepsiCo, Inc. | | 207,300 | 24,173,253 |
| | | | 40,466,246 |
| Food & Staples Retailing - 2.2% | | | |
| CVS Health Corp. | | 600,000 | 47,958,000 |
| Sysco Corp. | | 281,800 | 14,828,316 |
| | | | 62,786,316 |
| Food Products - 2.2% | | | |
| Kellogg Co. | | 224,000 | 15,232,000 |
| Seaboard Corp. | | 3,324 | 14,210,100 |
| The J.M. Smucker Co. | | 276,921 | 33,756,670 |
| | | | 63,198,770 |
| Personal Products - 0.7% | | | |
| Unilever NV (Certificaten Van Aandelen) (Bearer) | | 323,200 | 18,835,325 |
| Tobacco - 0.9% | | | |
| British American Tobacco PLC: | | | |
| (United Kingdom) | | 241,700 | 15,035,127 |
| sponsored ADR | | 153,900 | 9,621,828 |
| | | | 24,656,955 |
|
| TOTAL CONSUMER STAPLES | | | 209,943,612 |
|
| ENERGY - 6.8% | | | |
| Oil, Gas & Consumable Fuels - 6.8% | | | |
| Chevron Corp. | | 397,181 | 43,368,193 |
| FLEX LNG Ltd. (a) | | 8,303,700 | 11,405,529 |
| GasLog Ltd. (b) | | 321,200 | 5,861,900 |
| GasLog Partners LP | | 923,000 | 22,844,250 |
| Golar LNG Partners LP | | 829,200 | 18,665,292 |
| Hoegh LNG Partners LP | | 548,900 | 10,785,885 |
| Phillips 66 Co. | | 294,000 | 24,622,500 |
| Suncor Energy, Inc. | | 474,700 | 15,485,100 |
| Teekay Corp. | | 1,405,300 | 13,771,940 |
| Teekay LNG Partners LP | | 919,415 | 17,330,973 |
| Teekay Offshore Partners LP | | 3,451,200 | 8,938,608 |
| | | | 193,080,170 |
| FINANCIALS - 26.0% | | | |
| Banks - 11.2% | | | |
| JPMorgan Chase & Co. | | 1,158,041 | 106,308,165 |
| PNC Financial Services Group, Inc. | | 257,100 | 33,114,480 |
| SunTrust Banks, Inc. | | 562,200 | 32,208,438 |
| U.S. Bancorp | | 1,059,700 | 55,930,966 |
| Wells Fargo & Co. | | 1,622,337 | 87,508,858 |
| | | | 315,070,907 |
| Capital Markets - 1.2% | | | |
| Goldman Sachs Group, Inc. | | 151,300 | 34,092,429 |
| Consumer Finance - 2.6% | | | |
| Capital One Financial Corp. | | 251,382 | 21,664,101 |
| Discover Financial Services | | 407,500 | 24,833,050 |
| Synchrony Financial | | 914,300 | 27,721,576 |
| | | | 74,218,727 |
| Diversified Financial Services - 3.5% | | | |
| Berkshire Hathaway, Inc. Class B (a) | | 566,031 | 99,038,444 |
| Insurance - 4.7% | | | |
| Allstate Corp. | | 283,400 | 25,789,400 |
| Chubb Ltd. | | 188,400 | 27,593,064 |
| FNF Group | | 411,220 | 20,092,209 |
| FNFV Group (a) | | 369,733 | 6,377,894 |
| Prudential PLC | | 932,373 | 22,750,364 |
| The Travelers Companies, Inc. | | 231,213 | 29,616,073 |
| | | | 132,219,004 |
| Mortgage Real Estate Investment Trusts - 2.8% | | | |
| Agnc Investment Corp. | | 1,220,899 | 25,858,641 |
| Annaly Capital Management, Inc. | | 2,428,695 | 29,217,201 |
| MFA Financial, Inc. | | 2,852,664 | 24,219,117 |
| | | | 79,294,959 |
|
| TOTAL FINANCIALS | | | 733,934,470 |
|
| HEALTH CARE - 15.8% | | | |
| Biotechnology - 3.6% | | | |
| Amgen, Inc. | | 379,400 | 66,209,094 |
| Dyax Corp. rights 12/31/19 (a) | | 635,500 | 2,084,440 |
| Shire PLC sponsored ADR | | 196,105 | 32,855,432 |
| | | | 101,148,966 |
| Health Care Providers & Services - 4.4% | | | |
| Aetna, Inc. | | 145,900 | 22,513,829 |
| Anthem, Inc. | | 121,500 | 22,624,515 |
| Cigna Corp. | | 264,400 | 45,889,264 |
| McKesson Corp. | | 204,800 | 33,150,976 |
| | | | 124,178,584 |
| Pharmaceuticals - 7.8% | | | |
| Allergan PLC | | 217,200 | 54,806,076 |
| Bayer AG | | 286,000 | 36,277,432 |
| Johnson & Johnson | | 363,108 | 48,191,694 |
| Sanofi SA sponsored ADR | | 549,200 | 26,010,112 |
| Teva Pharmaceutical Industries Ltd. sponsored ADR | | 1,685,868 | 54,234,374 |
| | | | 219,519,688 |
|
| TOTAL HEALTH CARE | | | 444,847,238 |
|
| INDUSTRIALS - 6.7% | | | |
| Aerospace & Defense - 1.6% | | | |
| United Technologies Corp. | | 390,600 | 46,313,442 |
| Industrial Conglomerates - 1.5% | | | |
| General Electric Co. | | 1,611,800 | 41,278,198 |
| Machinery - 0.7% | | | |
| Deere & Co. | | 148,490 | 19,048,297 |
| Professional Services - 2.4% | | | |
| Dun & Bradstreet Corp. | | 301,600 | 33,405,216 |
| Nielsen Holdings PLC | | 784,100 | 33,724,141 |
| | | | 67,129,357 |
| Trading Companies & Distributors - 0.5% | | | |
| AerCap Holdings NV (a) | | 294,000 | 14,435,400 |
|
| TOTAL INDUSTRIALS | | | 188,204,694 |
|
| INFORMATION TECHNOLOGY - 11.7% | | | |
| Communications Equipment - 2.8% | | | |
| Cisco Systems, Inc. | | 1,269,418 | 39,923,196 |
| Harris Corp. | | 194,400 | 22,252,968 |
| Juniper Networks, Inc. | | 572,000 | 15,987,400 |
| | | | 78,163,564 |
| Electronic Equipment & Components - 0.8% | | | |
| TE Connectivity Ltd. | | 286,202 | 23,007,779 |
| Internet Software & Services - 3.4% | | | |
| Alphabet, Inc. Class A (a) | | 61,600 | 58,242,800 |
| comScore, Inc. (a) | | 545,100 | 16,364,447 |
| VeriSign, Inc. (a)(b) | | 224,400 | 22,702,548 |
| | | | 97,309,795 |
| IT Services - 2.1% | | | |
| Amdocs Ltd. | | 276,747 | 18,589,096 |
| Cognizant Technology Solutions Corp. Class A | | 303,400 | 21,031,688 |
| The Western Union Co. | | 936,200 | 18,489,950 |
| | | | 58,110,734 |
| Semiconductors & Semiconductor Equipment - 0.8% | | | |
| Lattice Semiconductor Corp. (a) | | 413,800 | 2,880,048 |
| NXP Semiconductors NV (a) | | 171,200 | 18,888,496 |
| | | | 21,768,544 |
| Software - 0.3% | | | |
| Oracle Corp. | | 192,413 | 9,607,181 |
| Technology Hardware, Storage & Peripherals - 1.5% | | | |
| Apple, Inc. | | 283,500 | 42,164,955 |
|
| TOTAL INFORMATION TECHNOLOGY | | | 330,132,552 |
|
| MATERIALS - 3.1% | | | |
| Chemicals - 1.7% | | | |
| LyondellBasell Industries NV Class A | | 300,600 | 27,081,054 |
| Monsanto Co. | | 169,800 | 19,836,036 |
| | | | 46,917,090 |
| Containers & Packaging - 1.4% | | | |
| Ball Corp. | | 510,900 | 21,406,710 |
| Graphic Packaging Holding Co. | | 1,466,600 | 19,344,454 |
| | | | 40,751,164 |
|
| TOTAL MATERIALS | | | 87,668,254 |
|
| REAL ESTATE - 0.9% | | | |
| Real Estate Management & Development - 0.9% | | | |
| CBRE Group, Inc. (a) | | 711,600 | 27,033,684 |
| TELECOMMUNICATION SERVICES - 1.7% | | | |
| Diversified Telecommunication Services - 1.7% | | | |
| Verizon Communications, Inc. | | 970,100 | 46,952,840 |
| UTILITIES - 4.1% | | | |
| Electric Utilities - 3.8% | | | |
| Exelon Corp. | | 1,092,100 | 41,871,114 |
| PPL Corp. | | 696,500 | 26,696,845 |
| Xcel Energy, Inc. | | 810,800 | 38,358,948 |
| | | | 106,926,907 |
| Gas Utilities - 0.3% | | | |
| WGL Holdings, Inc. | | 107,000 | 9,172,040 |
|
| TOTAL UTILITIES | | | 116,098,947 |
|
| TOTAL COMMON STOCKS | | | |
| (Cost $2,369,112,330) | | | 2,682,066,660 |
|
| Convertible Preferred Stocks - 0.6% | | | |
| HEALTH CARE - 0.6% | | | |
| Pharmaceuticals - 0.6% | | | |
| Teva Pharmaceutical Industries Ltd. 7% | | | |
| (Cost $15,659,700) | | 27,005 | 15,630,494 |
|
| Money Market Funds - 10.3% | | | |
| Fidelity Cash Central Fund, 1.11% (c) | | 267,773,145 | 267,826,700 |
| Fidelity Securities Lending Cash Central Fund 1.11% (c)(d) | | 23,731,550 | 23,733,923 |
| TOTAL MONEY MARKET FUNDS | | | |
| (Cost $291,541,717) | | | 291,560,623 |
| TOTAL INVESTMENT PORTFOLIO - 105.9% | | | |
| (Cost $2,676,313,747) | | | 2,989,257,777 |
| NET OTHER ASSETS (LIABILITIES) - (5.9)% | | | (167,540,930) |
| NET ASSETS - 100% | | | $2,821,716,847 |
Legend
(a) Non-income producing
(b) Security or a portion of the security is on loan at period end.
(c) Affiliated fund that is generally available only to investment companies and other accounts managed by Fidelity Investments. The rate quoted is the annualized seven-day yield of the fund at period end. A complete unaudited listing of the fund's holdings as of its most recent quarter end is available upon request. In addition, each Fidelity Central Fund's financial statements , which are not covered by the Fund's Report of Independent Registered Public Accounting Firm, are available on the SEC's website or upon request.
(d) Investment made with cash collateral received from securities on loan.
Affiliated Central Funds
Information regarding fiscal year to date income earned by the Fund from investments in Fidelity Central Funds is as follows:
| Fund | Income earned |
| Fidelity Cash Central Fund | $976,171 |
| Fidelity Securities Lending Cash Central Fund | 160,605 |
| Total | $1,136,776 |
Investment Valuation
The following is a summary of the inputs used, as of July 31, 2017, involving the Fund's assets and liabilities carried at fair value. The inputs or methodology used for valuing securities may not be an indication of the risk associated with investing in those securities. For more information on valuation inputs, and their aggregation into the levels used below, please refer to the Investment Valuation section in the accompanying Notes to Financial Statements.
| | Valuation Inputs at Reporting Date: |
| Description | Total | Level 1 | Level 2 | Level 3 |
| Investments in Securities: | | | | |
| Equities: | | | | |
| Consumer Discretionary | $304,170,199 | $304,170,199 | $-- | $-- |
| Consumer Staples | 209,943,612 | 176,073,160 | 33,870,452 | -- |
| Energy | 193,080,170 | 193,080,170 | -- | -- |
| Financials | 733,934,470 | 711,184,106 | 22,750,364 | -- |
| Health Care | 460,477,732 | 442,762,798 | 15,630,494 | 2,084,440 |
| Industrials | 188,204,694 | 188,204,694 | -- | -- |
| Information Technology | 330,132,552 | 330,132,552 | -- | -- |
| Materials | 87,668,254 | 87,668,254 | -- | -- |
| Real Estate | 27,033,684 | 27,033,684 | -- | -- |
| Telecommunication Services | 46,952,840 | 46,952,840 | -- | -- |
| Utilities | 116,098,947 | 116,098,947 | -- | -- |
| Money Market Funds | 291,560,623 | 291,560,623 | -- | -- |
| Total Investments in Securities: | $2,989,257,777 | $2,914,922,027 | $72,251,310 | $2,084,440 |
Other Information
Distribution of investments by country or territory of incorporation, as a percentage of Total Net Assets, is as follows (Unaudited):
| United States of America | 76.8% |
| Marshall Islands | 3.3% |
| Netherlands | 2.9% |
| Ireland | 2.6% |
| United Kingdom | 2.5% |
| Israel | 2.5% |
| Switzerland | 1.8% |
| Canada | 1.7% |
| France | 1.6% |
| Germany | 1.3% |
| Bailiwick of Jersey | 1.2% |
| Others (Individually Less Than 1%) | 1.8% |
| | 100.0% |
See accompanying notes which are an integral part of the financial statements.
Financial Statements
Statement of Assets and Liabilities
| | | July 31, 2017 |
| Assets | | |
Investment in securities, at value (including securities loaned of $22,925,516) — See accompanying schedule:
Unaffiliated issuers (cost $2,384,772,030) | $2,697,697,154 | |
| Fidelity Central Funds (cost $291,541,717) | 291,560,623 | |
| Total Investments (cost $2,676,313,747) | | $2,989,257,777 |
| Receivable for fund shares sold | | 2,514,105 |
| Dividends receivable | | 2,211,949 |
| Distributions receivable from Fidelity Central Funds | | 146,228 |
| Other receivables | | 12,038 |
| Total assets | | 2,994,142,097 |
| Liabilities | | |
| Payable to custodian bank | $695 | |
| Payable for investments purchased | 134,328,289 | |
| Payable for fund shares redeemed | 12,532,315 | |
| Accrued management fee | 1,343,516 | |
| Other affiliated payables | 440,372 | |
| Other payables and accrued expenses | 47,263 | |
| Collateral on securities loaned | 23,732,800 | |
| Total liabilities | | 172,425,250 |
| Net Assets | | $2,821,716,847 |
| Net Assets consist of: | | |
| Paid in capital | | $2,465,188,686 |
| Undistributed net investment income | | 15,946,340 |
| Accumulated undistributed net realized gain (loss) on investments and foreign currency transactions | | 27,620,817 |
| Net unrealized appreciation (depreciation) on investments and assets and liabilities in foreign currencies | | 312,961,004 |
| Net Assets | | $2,821,716,847 |
| Value Discovery: | | |
| Net Asset Value, offering price and redemption price per share ($2,708,049,125 ÷ 96,369,101 shares) | | $28.10 |
| Class K: | | |
| Net Asset Value, offering price and redemption price per share ($113,667,722 ÷ 4,043,253 shares) | | $28.11 |
See accompanying notes which are an integral part of the financial statements.
Statement of Operations
| | | Year ended July 31, 2017 |
| Investment Income | | |
| Dividends | | $48,048,347 |
| Interest | | 602 |
| Income from Fidelity Central Funds | | 1,136,776 |
| Total income | | 49,185,725 |
| Expenses | | |
| Management fee | | |
| Basic fee | $12,297,144 | |
| Performance adjustment | (188,624) | |
| Transfer agent fees | 3,576,464 | |
| Accounting and security lending fees | 683,184 | |
| Custodian fees and expenses | 50,988 | |
| Independent trustees' fees and expenses | 8,744 | |
| Registration fees | 118,455 | |
| Audit | 51,219 | |
| Legal | 8,922 | |
| Miscellaneous | 17,866 | |
| Total expenses before reductions | 16,624,362 | |
| Expense reductions | (19,201) | 16,605,161 |
| Net investment income (loss) | | 32,580,564 |
| Realized and Unrealized Gain (Loss) | | |
| Net realized gain (loss) on: | | |
| Investment securities: | | |
| Unaffiliated issuers | 53,842,883 | |
| Redemption in-kind with affiliated entities | 79,326,353 | |
| Fidelity Central Funds | 7,391 | |
| Foreign currency transactions | 72,100 | |
| Futures contracts | (164,544) | |
| Total net realized gain (loss) | | 133,084,183 |
Change in net unrealized appreciation (depreciation) on:
Investment securities | 205,423,283 | |
| Assets and liabilities in foreign currencies | 15,701 | |
| Total change in net unrealized appreciation (depreciation) | | 205,438,984 |
| Net gain (loss) | | 338,523,167 |
| Net increase (decrease) in net assets resulting from operations | | $371,103,731 |
See accompanying notes which are an integral part of the financial statements.
Statement of Changes in Net Assets
| | Year ended July 31, 2017 | Year ended July 31, 2016 |
| Increase (Decrease) in Net Assets | | |
| Operations | | |
| Net investment income (loss) | $32,580,564 | $24,620,028 |
| Net realized gain (loss) | 133,084,183 | (25,059,512) |
| Change in net unrealized appreciation (depreciation) | 205,438,984 | 26,981,029 |
| Net increase (decrease) in net assets resulting from operations | 371,103,731 | 26,541,545 |
| Distributions to shareholders from net investment income | (23,479,663) | (29,737,484) |
| Distributions to shareholders from net realized gain | (411,905) | (18,889,095) |
| Total distributions | (23,891,568) | (48,626,579) |
| Share transactions - net increase (decrease) | 539,346,673 | 555,360,338 |
| Total increase (decrease) in net assets | 886,558,836 | 533,275,304 |
| Net Assets | | |
| Beginning of period | 1,935,158,011 | 1,401,882,707 |
| End of period | $2,821,716,847 | $1,935,158,011 |
| Other Information | | |
| Undistributed net investment income end of period | $15,946,340 | $10,520,477 |
See accompanying notes which are an integral part of the financial statements.
Financial Highlights — Fidelity Value Discovery Fund
| Years ended July 31, | 2017 | 2016 | 2015 | 2014 | 2013 |
| Selected Per–Share Data | | | | | |
| Net asset value, beginning of period | $24.16 | $24.99 | $23.32 | $19.93 | $15.62 |
| Income from Investment Operations | | | | | |
| Net investment income (loss)A | .38 | .34 | .66B | .31 | .29 |
| Net realized and unrealized gain (loss) | 3.86 | (.38)C | 1.35 | 3.34 | 4.29 |
| Total from investment operations | 4.24 | (.04) | 2.01 | 3.65 | 4.58 |
| Distributions from net investment income | (.29) | (.47) | (.32) | (.26) | (.27) |
| Distributions from net realized gain | (.01) | (.32) | (.02) | – | – |
| Total distributions | (.30) | (.79) | (.34) | (.26) | (.27) |
| Net asset value, end of period | $28.10 | $24.16 | $24.99 | $23.32 | $19.93 |
| Total ReturnD | 17.70% | .05% | 8.68% | 18.52% | 29.72% |
| Ratios to Average Net AssetsE,F | | | | | |
| Expenses before reductions | .75% | .86% | .84% | .80% | .74% |
| Expenses net of fee waivers, if any | .75% | .86% | .84% | .80% | .74% |
| Expenses net of all reductions | .75% | .86% | .84% | .80% | .73% |
| Net investment income (loss) | 1.44% | 1.46% | 2.69%B | 1.44% | 1.66% |
| Supplemental Data | | | | | |
| Net assets, end of period (000 omitted) | $2,708,049 | $1,712,212 | $1,205,423 | $686,767 | $454,974 |
| Portfolio turnover rateG | 32%H | 41% | 45% | 58% | 55% |
A Calculated based on average shares outstanding during the period.
B Net Investment income per share reflects a large, non-recurring dividend which amounted to $.26 per share. Excluding this non-recurring dividend, the ratio of net investment income (loss) to average net assets would have been 1.62%.
C The amount shown for a share outstanding does not correspond with the aggregate net gain (loss) on investments for the period due to the timing of sales and repurchases of shares in relation to fluctuating market values of the investments of the Fund.
D Total returns would have been lower if certain expenses had not been reduced during the applicable periods shown.
E Fees and expenses of any underlying Fidelity Central Funds are not included in the Fund's expense ratio. The Fund indirectly bears its proportionate share of the expenses of any underlying Fidelity Central Funds.
F Expense ratios reflect operating expenses of the class. Expenses before reductions do not reflect amounts reimbursed by the investment adviser or reductions from brokerage service arrangements or reductions from other expense offset arrangements and do not represent the amount paid by the class during periods when reimbursements or reductions occur. Expenses net of fee waivers reflect expenses after reimbursement by the investment adviser but prior to reductions from brokerage service arrangements or other expense offset arrangements. Expenses net of all reductions represent the net expenses paid by the class.
G Amount does not include the portfolio activity of any underlying Fidelity Central Funds.
H Portfolio turnover rate excludes securities received or delivered in-kind.
See accompanying notes which are an integral part of the financial statements.
Financial Highlights — Fidelity Value Discovery Fund Class K
| Years ended July 31, | 2017 | 2016 | 2015 | 2014 | 2013 |
| Selected Per–Share Data | | | | | |
| Net asset value, beginning of period | $24.17 | $24.99 | $23.32 | $19.93 | $15.62 |
| Income from Investment Operations | | | | | |
| Net investment income (loss)A | .41 | .38 | .69B | .34 | .32 |
| Net realized and unrealized gain (loss) | 3.86 | (.38)C | 1.34 | 3.34 | 4.29 |
| Total from investment operations | 4.27 | –D | 2.03 | 3.68 | 4.61 |
| Distributions from net investment income | (.32) | (.50) | (.34) | (.29) | (.30) |
| Distributions from net realized gain | (.01) | (.32) | (.02) | – | – |
| Total distributions | (.33) | (.82) | (.36) | (.29) | (.30) |
| Net asset value, end of period | $28.11 | $24.17 | $24.99 | $23.32 | $19.93 |
| Total ReturnE | 17.82% | .24% | 8.80% | 18.71% | 29.97% |
| Ratios to Average Net AssetsF,G | | | | | |
| Expenses before reductions | .63% | .70% | .71% | .66% | .57% |
| Expenses net of fee waivers, if any | .63% | .70% | .71% | .66% | .57% |
| Expenses net of all reductions | .63% | .70% | .71% | .66% | .56% |
| Net investment income (loss) | 1.56% | 1.62% | 2.82%B | 1.58% | 1.83% |
| Supplemental Data | | | | | |
| Net assets, end of period (000 omitted) | $113,668 | $222,946 | $196,460 | $114,246 | $71,212 |
| Portfolio turnover rateH | 32%I | 41% | 45% | 58% | 55% |
A Calculated based on average shares outstanding during the period.
B Net Investment income per share reflects a large, non-recurring dividend which amounted to $.26 per share. Excluding this non-recurring dividend, the ratio of net investment income (loss) to average net assets would have been 1.75%.
C The amount shown for a share outstanding does not correspond with the aggregate net gain (loss) on investments for the period due to the timing of sales and repurchases of shares in relation to fluctuating market values of the investments of the Fund.
D Amount represents less than $.005 per share.
E Total returns would have been lower if certain expenses had not been reduced during the applicable periods shown.
F Fees and expenses of any underlying Fidelity Central Funds are not included in the Fund's expense ratio. The Fund indirectly bears its proportionate share of the expenses of any underlying Fidelity Central Funds.
G Expense ratios reflect operating expenses of the class. Expenses before reductions do not reflect amounts reimbursed by the investment adviser or reductions from brokerage service arrangements or reductions from other expense offset arrangements and do not represent the amount paid by the class during periods when reimbursements or reductions occur. Expenses net of fee waivers reflect expenses after reimbursement by the investment adviser but prior to reductions from brokerage service arrangements or other expense offset arrangements. Expenses net of all reductions represent the net expenses paid by the class.
H Amount does not include the portfolio activity of any underlying Fidelity Central Funds.
I Portfolio turnover rate excludes securities received or delivered in-kind.
See accompanying notes which are an integral part of the financial statements.
Notes to Financial Statements
For the period ended July 31, 2017
1. Organization.
Fidelity Value Discovery Fund (the Fund) is a fund of Fidelity Puritan Trust (the Trust) and is authorized to issue an unlimited number of shares. The Trust is registered under the Investment Company Act of 1940, as amended (the 1940 Act), as an open-end management investment company organized as a Massachusetts business trust. The Fund offers Value Discovery and Class K shares, each of which has equal rights as to assets and voting privileges. Each class has exclusive voting rights with respect to matters that affect that class.
2. Investments in Fidelity Central Funds.
The Fund invests in Fidelity Central Funds, which are open-end investment companies generally available only to other investment companies and accounts managed by the investment adviser and its affiliates. The Fund's Schedule of Investments lists each of the Fidelity Central Funds held as of period end, if any, as an investment of the Fund, but does not include the underlying holdings of each Fidelity Central Fund. As an Investing Fund, the Fund indirectly bears its proportionate share of the expenses of the underlying Fidelity Central Funds.
The Money Market Central Funds seek preservation of capital and current income and are managed by Fidelity Investments Money Management, Inc. (FIMM), an affiliate of the investment adviser. Annualized expenses of the Money Market Central Funds as of their most recent shareholder report date are less than .005%.
A complete unaudited list of holdings for each Fidelity Central Fund is available upon request or at the Securities and Exchange Commission (the SEC) website at www.sec.gov. In addition, the financial statements of the Fidelity Central Funds, which are not covered by the Fund's Report of Independent Registered Public Accounting Firm, are available on the SEC website or upon request.
3. Significant Accounting Policies.
The Fund is an investment company and applies the accounting and reporting guidance of the Financial Accounting Standards Board (FASB) Accounting Standards Codification Topic 946 Financial Services – Investments Companies. The financial statements have been prepared in conformity with accounting principles generally accepted in the United States of America (GAAP), which require management to make certain estimates and assumptions at the date of the financial statements. Actual results could differ from those estimates. Subsequent events, if any, through the date that the financial statements were issued have been evaluated in the preparation of the financial statements. The following summarizes the significant accounting policies of the Fund:
Investment Valuation. Investments are valued as of 4:00 p.m. Eastern time on the last calendar day of the period. The Board of Trustees (the Board) has delegated the day to day responsibility for the valuation of the Fund's investments to the Fair Value Committee (the Committee) established by the Fund's investment adviser. In accordance with valuation policies and procedures approved by the Board, the Fund attempts to obtain prices from one or more third party pricing vendors or brokers to value its investments. When current market prices, quotations or currency exchange rates are not readily available or reliable, investments will be fair valued in good faith by the Committee, in accordance with procedures adopted by the Board. Factors used in determining fair value vary by investment type and may include market or investment specific events. The frequency with which these procedures are used cannot be predicted and they may be utilized to a significant extent. The Committee oversees the Fund's valuation policies and procedures and reports to the Board on the Committee's activities and fair value determinations. The Board monitors the appropriateness of the procedures used in valuing the Fund's investments and ratifies the fair value determinations of the Committee.
The Fund categorizes the inputs to valuation techniques used to value its investments into a disclosure hierarchy consisting of three levels as shown below:
- Level 1 – quoted prices in active markets for identical investments
- Level 2 – other significant observable inputs (including quoted prices for similar investments, interest rates, prepayment speeds, etc.)
- Level 3 – unobservable inputs (including the Fund's own assumptions based on the best information available)
Valuation techniques used to value the Fund's investments by major category are as follows:
Equity securities, including restricted securities, for which market quotations are readily available, are valued at the last reported sale price or official closing price as reported by a third party pricing vendor on the primary market or exchange on which they are traded and are categorized as Level 1 in the hierarchy. In the event there were no sales during the day or closing prices are not available, securities are valued at the last quoted bid price or may be valued using the last available price and are generally categorized as Level 2 in the hierarchy. For foreign equity securities, when market or security specific events arise, comparisons to the valuation of American Depositary Receipts (ADRs), futures contracts, Exchange-Traded Funds (ETFs) and certain indexes as well as quoted prices for similar securities may be used and would be categorized as Level 2 in the hierarchy. Utilizing these techniques may result in transfers between Level 1 and Level 2. For equity securities, including restricted securities, where observable inputs are limited, assumptions about market activity and risk are used and these securities may be categorized as Level 3 in the hierarchy.
Investments in open-end mutual funds, including the Fidelity Central Funds, are valued at their closing net asset value (NAV) each business day and are categorized as Level 1 in the hierarchy.
Changes in valuation techniques may result in transfers in or out of an assigned level within the disclosure hierarchy. The aggregate value of investments by input level as of July 31, 2017 is included at the end of the Fund's Schedule of Investments.
Foreign Currency. The Fund may use foreign currency contracts to facilitate transactions in foreign-denominated securities. Gains and losses from these transactions may arise from changes in the value of the foreign currency or if the counterparties do not perform under the contracts' terms.
Foreign-denominated assets, including investment securities, and liabilities are translated into U.S. dollars at the exchange rates at period end. Purchases and sales of investment securities, income and dividends received and expenses denominated in foreign currencies are translated into U.S. dollars at the exchange rate in effect on the transaction date.
The effects of exchange rate fluctuations on investments are included with the net realized and unrealized gain (loss) on investment securities. Other foreign currency transactions resulting in realized and unrealized gain (loss) are disclosed separately.
Investment Transactions and Income. For financial reporting purposes, the Fund's investment holdings and NAV include trades executed through the end of the last business day of the period. The NAV per share for processing shareholder transactions is calculated as of the close of business of the New York Stock Exchange (NYSE), normally 4:00 p.m. Eastern time and includes trades executed through the end of the prior business day. Gains and losses on securities sold are determined on the basis of identified cost and may include proceeds received from litigation. Dividend income is recorded on the ex-dividend date, except for certain dividends from foreign securities where the ex-dividend date may have passed, which are recorded as soon as the Fund is informed of the ex-dividend date. Non-cash dividends included in dividend income, if any, are recorded at the fair market value of the securities received. Income and capital gain distributions from Fidelity Central Funds, if any, are recorded on the ex-dividend date. Certain distributions received by the Fund represent a return of capital or capital gain. The Fund determines the components of these distributions subsequent to the ex-dividend date, based upon receipt of tax filings or other correspondence relating to the underlying investment. These distributions are recorded as a reduction of cost of investments and/or as a realized gain. Interest income is accrued as earned and includes coupon interest and amortization of premium and accretion of discount on debt securities as applicable. Investment income is recorded net of foreign taxes withheld where recovery of such taxes is uncertain.
Class Allocations and Expenses. Investment income, realized and unrealized capital gains and losses, common expenses of the Fund, and certain fund-level expense reductions, if any, are allocated daily on a pro-rata basis to each class based on the relative net assets of each class to the total net assets of the Fund. Each class differs with respect to transfer agent fees incurred. Certain expense reductions may also differ by class. For the reporting period, the allocated portion of income and expenses to each class as a percent of its average net assets may vary due to the timing of recording these transactions in relation to fluctuating net assets of the classes. Expenses directly attributable to a fund are charged to that fund. Expenses attributable to more than one fund are allocated among the respective funds on the basis of relative net assets or other appropriate methods. Expense estimates are accrued in the period to which they relate and adjustments are made when actual amounts are known.
Income Tax Information and Distributions to Shareholders. Each year, the Fund intends to qualify as a regulated investment company under Subchapter M of the Internal Revenue Code, including distributing substantially all of its taxable income and realized gains. As a result, no provision for U.S. Federal income taxes is required. As of July 31, 2017, the Fund did not have any unrecognized tax benefits in the financial statements; nor is the Fund aware of any tax positions for which it is reasonably possible that the total amounts of unrecognized tax benefits will significantly change in the next twelve months. The Fund files a U.S. federal tax return, in addition to state and local tax returns as required. The Fund's federal income tax returns are subject to examination by the Internal Revenue Service (IRS) for a period of three fiscal years after they are filed. State and local tax returns may be subject to examination for an additional fiscal year depending on the jurisdiction. Foreign taxes are provided for based on the Fund's understanding of the tax rules and rates that exist in the foreign markets in which it invests.
Distributions are declared and recorded on the ex-dividend date. Income dividends and capital gain distributions are declared separately for each class. Income and capital gain distributions are determined in accordance with income tax regulations, which may differ from GAAP. In addition, the Fund claimed a portion of the payment made to redeeming shareholders as a distribution for income tax purposes.
Capital accounts within the financial statements are adjusted for permanent book-tax differences. These adjustments have no impact on net assets or the results of operations. Capital accounts are not adjusted for temporary book-tax differences which will reverse in a subsequent period.
Book-tax differences are primarily due to foreign currency transactions, passive foreign investment companies (PFIC), redemptions in kind, partnerships, capital loss carryforwards and losses deferred due to wash sales.
The federal tax cost of investment securities and unrealized appreciation (depreciation) as of period end were as follows:
| Gross unrealized appreciation | $362,665,606 |
| Gross unrealized depreciation | (50,855,805) |
| Net unrealized appreciation (depreciation) on securities | $311,809,801 |
| Tax Cost | $2,677,447,976 |
The tax-based components of distributable earnings as of period end were as follows:
| Undistributed ordinary income | $31,333,175 |
| Undistributed long-term capital gain | $13,374,270 |
| Net unrealized appreciation (depreciation) on securities and other investments | $311,820,716 |
The tax character of distributions paid was as follows:
| | July 31, 2017 | July 31, 2016 |
| Ordinary Income | $23,891,568 | $ 30,651,336 |
| Long-term Capital Gains | – | 17,975,243 |
| Total | $23,891,568 | $ 48,626,579 |
4. Derivative Instruments.
Risk Exposures and the Use of Derivative Instruments. The Fund's investment objective allows the Fund to enter into various types of derivative contracts, including futures contracts. Derivatives are investments whose value is primarily derived from underlying assets, indices or reference rates and may be transacted on an exchange or over-the-counter (OTC). Derivatives may involve a future commitment to buy or sell a specified asset based on specified terms, to exchange future cash flows at periodic intervals based on a notional principal amount, or for one party to make one or more payments upon the occurrence of specified events in exchange for periodic payments from the other party.
The Fund used derivatives to increase returns and to manage exposure to certain risks as defined below. The success of any strategy involving derivatives depends on analysis of numerous economic factors, and if the strategies for investment do not work as intended, the Fund may not achieve its objectives.
The Fund's use of derivatives increased or decreased its exposure to the following risk:
| Equity Risk | Equity risk relates to the fluctuations in the value of financial instruments as a result of changes in market prices (other than those arising from interest rate risk or foreign exchange risk), whether caused by factors specific to an individual investment, its issuer, or all factors affecting all instruments traded in a market or market segment.
|
The Fund is also exposed to additional risks from investing in derivatives, such as liquidity risk and counterparty credit risk. Liquidity risk is the risk that the Fund will be unable to close out the derivative in the open market in a timely manner. Counterparty credit risk is the risk that the counterparty will not be able to fulfill its obligation to the Fund. Counterparty credit risk related to exchange-traded futures contracts may be mitigated by the protection provided by the exchange on which they trade.
Investing in derivatives may involve greater risks than investing in the underlying assets directly and, to varying degrees, may involve risk of loss in excess of any initial investment and collateral received and amounts recognized in the Statement of Assets and Liabilities. In addition, there may be the risk that the change in value of the derivative contract does not correspond to the change in value of the underlying instrument.
Futures Contracts. A futures contract is an agreement between two parties to buy or sell a specified underlying instrument for a fixed price at a specified future date. The Fund used futures contracts to manage its exposure to the stock market.
Upon entering into a futures contract, a fund is required to deposit either cash or securities (initial margin) with a clearing broker in an amount equal to a certain percentage of the face value of the contract. Futures contracts are marked-to-market daily and subsequent daily payments (variation margin) are made or received by a fund depending on the daily fluctuations in the value of the futures contracts and are recorded as unrealized appreciation or (depreciation). This receivable and/or payable, if any, is included in daily variation margin for derivative instruments in the Statement of Assets and Liabilities. Realized gain or (loss) is recorded upon the expiration or closing of a futures contract.
Any open futures contracts at period end are presented in the Schedule of Investments under the caption "Futures Contracts". The underlying face amount at value reflects each contract's exposure to the underlying instrument or index at period end.
During the period the Fund recognized net realized gain (loss) of $(164,544) related to its investment in futures contracts. This amount is included in the Statement of Operations.
5. Purchases and Sales of Investments.
Purchases and sales of securities, other than short-term securities and in-kind transactions, aggregated $1,537,016,202 and $688,498,322, respectively.
6. Fees and Other Transactions with Affiliates.
Management Fee. Fidelity Management & Research Company (the investment adviser) and its affiliates provide the Fund with investment management related services for which the Fund pays a monthly management fee. The management fee is the sum of an individual fund fee rate that is based on an annual rate of .30% of the Fund's average net assets and an annualized group fee rate that averaged .25% during the period. The group fee rate is based upon the average net assets of all the mutual funds advised by the investment adviser, including any mutual funds previously advised by the investment adviser that are currently advised by Fidelity SelectCo, LLC, an affiliate of the investment adviser. The group fee rate decreases as assets under management increase and increases as assets under management decrease. In addition, the management fee is subject to a performance adjustment (up to a maximum of +/- .20% of the Fund's average net assets over a 36 month performance period). The upward or downward adjustment to the management fee is based on the relative investment performance of Value Discovery as compared to its benchmark index, the Russell 3000 Value Index, over the same 36 month performance period. For the reporting period, the total annual management fee rate, including the performance adjustment, was .54% of the Fund's average net assets. The performance adjustment included in the management fee rate may be higher or lower than the maximum performance adjustment rate due to the difference between the average net assets for the reporting and performance periods.
Transfer Agent Fees. Fidelity Investments Institutional Operations Company, Inc., (FIIOC), an affiliate of the investment adviser, is the transfer, dividend disbursing and shareholder servicing agent for each class of the Fund. FIIOC receives account fees and asset-based fees that vary according to the account size and type of account of the shareholders of Value Discovery, except for Class K. FIIOC receives an asset-based fee of Class K's average net assets. FIIOC pays for typesetting, printing and mailing of shareholder reports, except proxy statements.
For the period, transfer agent fees for each class were as follows:
| | Amount | % of
Class-Level Average
Net Assets |
| Value Discovery | $3,492,907 | .17 |
| Class K | 83,557 | .05 |
| | $3,576,464 | |
Accounting and Security Lending Fees. Fidelity Service Company, Inc. (FSC), an affiliate of the investment adviser, maintains the Fund's accounting records. The accounting fee is based on the level of average net assets for each month. Under a separate contract, FSC administers the security lending program. The security lending fee is based on the number and duration of lending transactions.
Brokerage Commissions. The Fund placed a portion of its portfolio transactions with brokerage firms which are affiliates of the investment adviser. Brokerage commissions are included in net realized gain (loss) and change in net unrealized appreciation (depreciation) in the Statement of Operations. The commissions paid to these affiliated firms were $30,588 for the period.
Interfund Trades. The Fund may purchase from or sell securities to other Fidelity Funds under procedures adopted by the Board. The procedures have been designed to ensure these interfund trades are executed in accordance with Rule 17a-7 of the 1940 Act. Interfund trades are included within the respective purchases and sales amounts shown in the Purchases and Sales of Investments note.
Redemptions In-Kind. During the period, 10,568,389 shares of the Fund held by an affiliated entity were redeemed in kind for investments and cash with a value of $296,760,364. The net realized gain of $79,326,353 on investments delivered through in-kind redemptions is included in the accompanying Statement of Operations. The amount of in-kind redemptions is included in share transactions in the accompanying Statement of Changes in Net Assets as well as the Notes to Financial Statements. The Fund recognized no gain or loss for federal income tax purposes.
7. Committed Line of Credit.
The Fund participates with other funds managed by the investment adviser or an affiliate in a $4.25 billion credit facility (the "line of credit") to be utilized for temporary or emergency purposes to fund shareholder redemptions or for other short-term liquidity purposes. The Fund has agreed to pay commitment fees on its pro-rata portion of the line of credit, which amounted to $7,043 and is reflected in Miscellaneous expenses on the Statement of Operations. During the period, the Fund did not borrow on this line of credit.
8. Security Lending.
The Fund lends portfolio securities through a lending agent from time to time in order to earn additional income. For equity securities, a lending agent is used and may loan securities to certain qualified borrowers, including Fidelity Capital Markets (FCM), a broker-dealer affiliated with the Fund. On the settlement date of the loan, the Fund receives collateral (in the form of U.S. Treasury obligations, letters of credit and/or cash) against the loaned securities and maintains collateral in an amount not less than 100% of the market value of the loaned securities during the period of the loan. The market value of the loaned securities is determined at the close of business of the Fund and any additional required collateral is delivered to the Fund on the next business day. The Fund or borrower may terminate the loan at any time, and if the borrower defaults on its obligation to return the securities loaned because of insolvency or other reasons, the Fund may apply collateral received from the borrower against the obligation. The Fund may experience delays and costs in recovering the securities loaned. Any cash collateral received is invested in the Fidelity Securities Lending Cash Central Fund. The value of loaned securities and cash collateral at period end are disclosed on the Fund's Statement of Assets and Liabilities. At period end, there were no security loans outstanding with FCM. Security lending income represents the income earned on investing cash collateral, less rebates paid to borrowers and any lending agent fees associated with the loan, plus any premium payments received for lending certain types of securities. Security lending income is presented in the Statement of Operations as a component of income from Fidelity Central Funds. Total security lending income during the period amounted to $160,605, including $761 from securities loaned to FCM.
9. Expense Reductions.
Through arrangements with the Fund's custodian, credits realized as a result of certain uninvested cash balances were used to reduce the Fund's expenses. During the period, these credits reduced the Fund's custody expenses by $36.
In addition, during the period the investment adviser reimbursed and/or waived a portion of fund-level operating expenses in the amount of $19,165.
10. Distributions to Shareholders.
Distributions to shareholders of each class were as follows:
| | Year ended
July 31, 2017 | Year ended July 31, 2016 |
| From net investment income | | |
| Value Discovery | $21,711,684 | $24,729,091 |
| Class K | 1,767,979 | 5,008,393 |
| Total | $23,479,663 | $29,737,484 |
| From net realized gain | | |
| Value Discovery | $386,628 | $15,694,244 |
| Class K | 25,277 | 3,194,851 |
| Total | $411,905 | $18,889,095 |
11. Share Transactions.
Share transactions for each class were as follows and may contain automatic conversions between classes or exchanges between affiliated funds:
| | Shares | Shares | Dollars | Dollars |
| | Year ended July 31, 2017 | Year ended July 31, 2016 | Year ended July 31, 2017 | Year ended July 31, 2016 |
| Value Discovery | | | | |
| Shares sold | 42,512,937 | 39,797,389 | $1,119,827,793 | $921,588,433 |
| Reinvestment of distributions | 841,053 | 1,708,415 | 21,118,287 | 38,743,773 |
| Shares redeemed | (17,858,879) | (18,870,552) | (463,345,362) | (437,632,015) |
| Net increase (decrease) | 25,495,111 | 22,635,252 | $677,600,718 | $522,700,191 |
| Class K | | | | |
| Shares sold | 11,452,291 | 5,204,370 | $310,987,862 | $118,930,615 |
| Reinvestment of distributions | 71,873 | 361,938 | 1,793,256 | 8,203,244 |
| Shares redeemed | (16,704,580)(a) | (4,203,390) | (451,035,163)(a) | (94,473,712) |
| Net increase (decrease) | (5,180,416) | 1,362,918 | $(138,254,045) | $32,660,147 |
(a) Amount includes in-kind redemptions (see the Redemptions In-Kind note for additional details).
12. Other.
The Fund's organizational documents provide former and current trustees and officers with a limited indemnification against liabilities arising in connection with the performance of their duties to the Fund. In the normal course of business, the Fund may also enter into contracts that provide general indemnifications. The Fund's maximum exposure under these arrangements is unknown as this would be dependent on future claims that may be made against the Fund. The risk of material loss from such claims is considered remote.
Report of Independent Registered Public Accounting Firm
To the Trustees of Fidelity Puritan Trust and Shareholders of Fidelity Value Discovery Fund:
We have audited the accompanying statement of assets and liabilities of Fidelity Value Discovery Fund (the Fund), a fund of Fidelity Puritan Trust, including the schedule of investments, as of July 31, 2017, and the related statement of operations for the year then ended, the statement of changes in net assets for each of the two years in the period then ended, and the financial highlights for each of the five years in the period then ended. These financial statements and financial highlights are the responsibility of the Fund's management. Our responsibility is to express an opinion on these financial statements and financial highlights based on our audits.
We conducted our audits in accordance with the standards of the Public Company Accounting Oversight Board (United States). Those standards require that we plan and perform the audit to obtain reasonable assurance about whether the financial statements and financial highlights are free of material misstatement. The Fund is not required to have, nor were we engaged to perform, an audit of its internal control over financial reporting. Our audits included consideration of internal control over financial reporting as a basis for designing audit procedures that are appropriate in the circumstances, but not for the purpose of expressing an opinion on the effectiveness of the Fund's internal control over financial reporting. Accordingly, we express no such opinion. An audit also includes examining, on a test basis, evidence supporting the amounts and disclosures in the financial statements, assessing the accounting principles used and significant estimates made by management, as well as evaluating the overall financial statement presentation. Our procedures included confirmation of securities owned as of July 31, 2017, by correspondence with the custodians and brokers; when replies were not received from brokers, we performed other auditing procedures. We believe that our audits provide a reasonable basis for our opinion.
In our opinion, such financial statements and financial highlights referred to above present fairly, in all material respects, the financial position of Fidelity Value Discovery Fund as of July 31, 2017, the results of its operations for the year then ended, the changes in its net assets for each of the two years in the period then ended, and the financial highlights for each of the five years in the period then ended, in conformity with accounting principles generally accepted in the United States of America.
DELOITTE & TOUCHE LLP
Boston, Massachusetts
September 13, 2017
Trustees and Officers
The Trustees, Members of the Advisory Board (if any), and officers of the trust and fund, as applicable, are listed below. The Board of Trustees governs the fund and is responsible for protecting the interests of shareholders. The Trustees are experienced executives who meet periodically throughout the year to oversee the fund's activities, review contractual arrangements with companies that provide services to the fund, oversee management of the risks associated with such activities and contractual arrangements, and review the fund's performance. Except for Jonathan Chiel, each of the Trustees oversees 190 funds. Mr. Chiel oversees 142 funds.
The Trustees hold office without limit in time except that (a) any Trustee may resign; (b) any Trustee may be removed by written instrument, signed by at least two-thirds of the number of Trustees prior to such removal; (c) any Trustee who requests to be retired or who has become incapacitated by illness or injury may be retired by written instrument signed by a majority of the other Trustees; and (d) any Trustee may be removed at any special meeting of shareholders by a two-thirds vote of the outstanding voting securities of the trust. Each Trustee who is not an interested person (as defined in the 1940 Act) of the trust and the fund is referred to herein as an Independent Trustee. Each Independent Trustee shall retire not later than the last day of the calendar year in which his or her 75th birthday occurs. The Independent Trustees may waive this mandatory retirement age policy with respect to individual Trustees. Officers and Advisory Board Members hold office without limit in time, except that any officer or Advisory Board Member may resign or may be removed by a vote of a majority of the Trustees at any regular meeting or any special meeting of the Trustees. Except as indicated, each individual has held the office shown or other offices in the same company for the past five years.
The fund’s Statement of Additional Information (SAI) includes more information about the Trustees. To request a free copy, call Fidelity at 1-800-544-8544.
Experience, Skills, Attributes, and Qualifications of the Trustees. The Governance and Nominating Committee has adopted a statement of policy that describes the experience, qualifications, attributes, and skills that are necessary and desirable for potential Independent Trustee candidates (Statement of Policy). The Board believes that each Trustee satisfied at the time he or she was initially elected or appointed a Trustee, and continues to satisfy, the standards contemplated by the Statement of Policy. The Governance and Nominating Committee also engages professional search firms to help identify potential Independent Trustee candidates who have the experience, qualifications, attributes, and skills consistent with the Statement of Policy. From time to time, additional criteria based on the composition and skills of the current Independent Trustees, as well as experience or skills that may be appropriate in light of future changes to board composition, business conditions, and regulatory or other developments, have also been considered by the professional search firms and the Governance and Nominating Committee. In addition, the Board takes into account the Trustees' commitment and participation in Board and committee meetings, as well as their leadership of standing and ad hoc committees throughout their tenure.
In determining that a particular Trustee was and continues to be qualified to serve as a Trustee, the Board has considered a variety of criteria, none of which, in isolation, was controlling. The Board believes that, collectively, the Trustees have balanced and diverse experience, qualifications, attributes, and skills, which allow the Board to operate effectively in governing the fund and protecting the interests of shareholders. Information about the specific experience, skills, attributes, and qualifications of each Trustee, which in each case led to the Board's conclusion that the Trustee should serve (or continue to serve) as a trustee of the fund, is provided below.
Board Structure and Oversight Function. James C. Curvey is an interested person and currently serves as Chairman. The Trustees have determined that an interested Chairman is appropriate and benefits shareholders because an interested Chairman has a personal and professional stake in the quality and continuity of services provided to the fund. Independent Trustees exercise their informed business judgment to appoint an individual of their choosing to serve as Chairman, regardless of whether the Trustee happens to be independent or a member of management. The Independent Trustees have determined that they can act independently and effectively without having an Independent Trustee serve as Chairman and that a key structural component for assuring that they are in a position to do so is for the Independent Trustees to constitute a substantial majority for the Board. The Independent Trustees also regularly meet in executive session. Ned C. Lautenbach serves as Chairman of the Independent Trustees and as such (i) acts as a liaison between the Independent Trustees and management with respect to matters important to the Independent Trustees and (ii) with management prepares agendas for Board meetings.
Fidelity® funds are overseen by different Boards of Trustees. The fund's Board oversees Fidelity's high income and certain equity funds, and other Boards oversee Fidelity's investment-grade bond, money market, asset allocation, and sector funds. The asset allocation funds may invest in Fidelity® funds overseen by the fund's Board. The use of separate Boards, each with its own committee structure, allows the Trustees of each group of Fidelity® funds to focus on the unique issues of the funds they oversee, including common research, investment, and operational issues. On occasion, the separate Boards establish joint committees to address issues of overlapping consequences for the Fidelity® funds overseen by each Board.
The Trustees operate using a system of committees to facilitate the timely and efficient consideration of all matters of importance to the Trustees, the fund, and fund shareholders and to facilitate compliance with legal and regulatory requirements and oversight of the fund's activities and associated risks. The Board, acting through its committees, has charged FMR and its affiliates with (i) identifying events or circumstances the occurrence of which could have demonstrably adverse effects on the fund's business and/or reputation; (ii) implementing processes and controls to lessen the possibility that such events or circumstances occur or to mitigate the effects of such events or circumstances if they do occur; and (iii) creating and maintaining a system designed to evaluate continuously business and market conditions in order to facilitate the identification and implementation processes described in (i) and (ii) above. Because the day-to-day operations and activities of the fund are carried out by or through FMR, its affiliates, and other service providers, the fund's exposure to risks is mitigated but not eliminated by the processes overseen by the Trustees. While each of the Board's committees has responsibility for overseeing different aspects of the fund's activities, oversight is exercised primarily through the Operations, Audit, and Compliance Committees. In addition, the Independent Trustees have worked with FMR to enhance the Board's oversight of investment and financial risks, legal and regulatory risks, technology risks, and operational risks, including the development of additional risk reporting to the Board. For example, a working group comprised of Independent Trustees and FMR has worked and continues to work to review the Fidelity® funds' valuation-related activities, reporting and risk management. Appropriate personnel, including but not limited to the fund's Chief Compliance Officer (CCO), FMR's internal auditor, the independent accountants, the fund's Treasurer and portfolio management personnel, make periodic reports to the Board's committees, as appropriate, including an annual review of Fidelity's risk management program for the Fidelity® funds. The responsibilities of each standing committee, including their oversight responsibilities, are described further under "Standing Committees of the Trustees."
Interested Trustees*:
Correspondence intended for a Trustee who is an interested person may be sent to Fidelity Investments, 245 Summer Street, Boston, Massachusetts 02210.
Name, Year of Birth; Principal Occupations and Other Relevant Experience+
Jonathan Chiel (1957)
Year of Election or Appointment: 2016
Trustee
Mr. Chiel also serves as Trustee of other Fidelity funds. Mr. Chiel is Executive Vice President and General Counsel for FMR LLC (diversified financial services company, 2012-present). Previously, Mr. Chiel served as general counsel (2004-2012) and senior vice president and deputy general counsel (2000-2004) for John Hancock Financial Services; a partner with Choate, Hall & Stewart (1996-2000) (law firm); and an Assistant United States Attorney for the United States Attorney’s Office of the District of Massachusetts (1986-95), including Chief of the Criminal Division (1993-1995). Mr. Chiel is a director on the boards of the Boston Bar Foundation and the Maimonides School.
James C. Curvey (1935)
Year of Election or Appointment: 2007
Trustee
Chairman of the Board of Trustees
Mr. Curvey also serves as Trustee of other Fidelity® funds. Mr. Curvey is a Director of Fidelity Research & Analysis Co. (investment adviser firm, 2009-present), and Vice Chairman (2007-present) and Director of FMR LLC (diversified financial services company). In addition, Mr. Curvey serves as an Overseer for the Boston Symphony Orchestra and a member of the board of Artis-Naples, Naples, Florida, and as a Trustee for Brewster Academy, Wolfeboro, New Hampshire. Previously, Mr. Curvey served as a Director of Fidelity Investments Money Management, Inc. (investment adviser firm, 2009-2014) and a Director of FMR and FMR Co., Inc. (investment adviser firms, 2007-2014).
Charles S. Morrison (1960)
Year of Election or Appointment: 2014
Trustee
Mr. Morrison also serves as Trustee of other funds. He serves as President of Fidelity Management & Research Company (FMR) (investment adviser firm, 2016-present), a Director of Fidelity Investments Money Management, Inc. (FIMM) (investment adviser firm, 2014-present), Director of Fidelity SelectCo, LLC (investment adviser firm, 2014-present), President, Asset Management (2014-present), and is an employee of Fidelity Investments. Previously, Mr. Morrison served as Vice President of Fidelity's Fixed Income and Asset Allocation Funds (2012-2014), President, Fixed Income (2011-2014), Vice President of Fidelity's Money Market Funds (2005-2009), President, Money Market Group Leader of FMR (investment adviser firm, 2009), and Senior Vice President, Money Market Group of FMR (2004-2009). Mr. Morrison also served as Vice President of Fidelity's Bond Funds (2002-2005), certain Balanced Funds (2002-2005), and certain Asset Allocation Funds (2002-2007), and as Senior Vice President (2002-2005) of Fidelity's Bond Division.
* Determined to be an “Interested Trustee” by virtue of, among other things, his or her affiliation with the trust or various entities under common control with FMR.
+ The information includes the Trustee's principal occupation during the last five years and other information relating to the experience, attributes, and skills relevant to the Trustee's qualifications to serve as a Trustee, which led to the conclusion that the Trustee should serve as a Trustee for the fund.
Independent Trustees:
Correspondence intended for an Independent Trustee may be sent to Fidelity Investments, P.O. Box 55235, Boston, Massachusetts 02205-5235.
Name, Year of Birth; Principal Occupations and Other Relevant Experience+
Dennis J. Dirks (1948)
Year of Election or Appointment: 2005
Trustee
Mr. Dirks also serves as Trustee of other Fidelity® funds. Prior to his retirement in May 2003, Mr. Dirks was Chief Operating Officer and a member of the Board of The Depository Trust & Clearing Corporation (DTCC). He also served as President, Chief Operating Officer, and Board member of The Depository Trust Company (DTC) and President and Board member of the National Securities Clearing Corporation (NSCC). In addition, Mr. Dirks served as Chief Executive Officer and Board member of the Government Securities Clearing Corporation, Chief Executive Officer and Board member of the Mortgage-Backed Securities Clearing Corporation, as a Trustee and a member of the Finance Committee of Manhattan College (2005-2008), as a Trustee and a member of the Finance Committee of AHRC of Nassau County (2006-2008), as a member of the Independent Directors Council (IDC) Governing Council (2010-2015), and as a member of the Board of Directors for The Brookville Center for Children’s Services, Inc. (2009-2017). Mr. Dirks is a member of the Finance Committee (2016-present) and Board of Directors (2017-present) of the Asolo Repertory Theatre.
Alan J. Lacy (1953)
Year of Election or Appointment: 2008
Trustee
Mr. Lacy also serves as Trustee of other Fidelity® funds. Mr. Lacy serves as a Director of Bristol-Myers Squibb Company (global pharmaceuticals, 2008-present). He is a Trustee of the California Chapter of The Nature Conservancy (2015-present) and a Director of the Center for Advanced Study in the Behavioral Sciences at Stanford University (2015-present). In addition, Mr. Lacy served as Senior Adviser (2007-2014) of Oak Hill Capital Partners, L.P. (private equity) and also served as Chief Executive Officer (2005) and Vice Chairman (2005-2006) of Sears Holdings Corporation (retail) and Chief Executive Officer and Chairman of the Board of Sears, Roebuck and Co. (retail, 2000-2005). Previously, Mr. Lacy served as Chairman (2014-2017) and a member (2010-2017) of the Board of Directors of Dave & Buster’s Entertainment, Inc. (restaurant and entertainment complexes), as Chairman (2008-2011) and a member (2006-2015) of the Board of Trustees of the National Parks Conservation Association, and as a member of the Board of Directors for The Hillman Companies, Inc. (hardware wholesalers, 2010-2014), Earth Fare, Inc. (retail grocery, 2010-2014), and The Western Union Company (global money transfer, 2006-2011).
Ned C. Lautenbach (1944)
Year of Election or Appointment: 2000
Trustee
Chairman of the Independent Trustees
Mr. Lautenbach also serves as Trustee of other Fidelity® funds. Mr. Lautenbach currently serves as the Lead Director of the Eaton Corporation Board of Directors (diversified industrial, 1997-present). Mr. Lautenbach is Chairman of the Board of Directors of Artis-Naples in Naples, Florida (2012-present), a member of the Council on Foreign Relations (1994-present), and currently Vice Chair of the Board of Governors, State University System of Florida (2013-present). Previously, Mr. Lautenbach was a Partner and Advisory Partner at Clayton, Dubilier & Rice, LLC (private equity investment, 1998-2010), as well as a Director of Sony Corporation (2006-2007). Mr. Lautenbach also had a 30-year career with IBM (technology company) during which time he served as Senior Vice President and a member of the Corporate Executive Committee (1968-1998).
Joseph Mauriello (1944)
Year of Election or Appointment: 2008
Trustee
Mr. Mauriello also serves as Trustee of other Fidelity® funds. Prior to his retirement in January 2006, Mr. Mauriello served in numerous senior management positions including Deputy Chairman and Chief Operating Officer (2004-2005), and Vice Chairman of Financial Services (2002-2004) of KPMG LLP US (professional services, 1965-2005). Mr. Mauriello currently serves as a member of the Board of Directors of XL Group plc. (global insurance and re-insurance, 2006-present) and the Independent Directors Council (IDC) Governing Council (2015-present). Previously, Mr. Mauriello served as a Director of the Hamilton Funds of the Bank of New York (2006-2007) and of Arcadia Resources Inc. (health care services and products, 2007-2012).
Cornelia M. Small (1944)
Year of Election or Appointment: 2005
Trustee
Ms. Small also serves as Trustee of other Fidelity® funds. Ms. Small is a member of the Board of Directors (2009-present) and Chair of the Investment Committee (2010-present) of the Teagle Foundation. Ms. Small also serves on the Investment Committee of the Berkshire Taconic Community Foundation (2008-present). Previously, Ms. Small served as Chairperson (2002-2008) and a member of the Investment Committee and Chairperson (2008-2012) and a member of the Board of Trustees of Smith College. In addition, Ms. Small served as Chief Investment Officer, Director of Global Equity Investments, and a member of the Board of Directors of Scudder, Stevens & Clark and Scudder Kemper Investments.
William S. Stavropoulos (1939)
Year of Election or Appointment: 2001
Trustee
Vice Chairman of the Independent Trustees
Mr. Stavropoulos also serves as Trustee of other Fidelity® funds. Mr. Stavropoulos serves as President and Founder of the Michigan Baseball Foundation, the Great Lakes Loons (2007-present). Mr. Stavropoulos is Chairman Emeritus of the Board of Directors of The Dow Chemical Company, where he previously served in numerous senior management positions, including President, CEO (1995-2000; 2002-2004), Chairman of the Executive Committee (2000-2006), and as a member of the Board of Directors (1990-2006). Currently, Mr. Stavropoulos is Chairman of the Board of Directors of Univar Inc. (global distributor of commodity and specialty chemicals), a Director of Teradata Corporation (data warehousing and technology solutions), and a member of the Advisory Board for Metalmark Capital LLC (private equity investment, 2005-present). Mr. Stavropoulos is an operating advisor to Clayton, Dubilier & Rice, LLC (private equity investment). In addition, Mr. Stavropoulos is a member of the University of Notre Dame Advisory Council for the College of Science, a Trustee of the Rollin L. Gerstacker Foundation, and a Director of Artis-Naples in Naples, Florida. Previously, Mr. Stavropoulos served as a Director of Chemical Financial Corporation (bank holding company, 1993-2012) and Tyco International, Ltd. (multinational manufacturing and services, 2007-2012).
David M. Thomas (1949)
Year of Election or Appointment: 2008
Trustee
Mr. Thomas also serves as Trustee of other Fidelity® funds. Mr. Thomas serves as Non-Executive Chairman of the Board of Directors of Fortune Brands Home and Security (home and security products, 2011-present), as a member of the Board of Directors (2004-present) and Presiding Director (2013-present) of Interpublic Group of Companies, Inc. (marketing communication), and as a member of the Board of Trustees of the University of Florida (2013-present). Previously, Mr. Thomas served as Executive Chairman (2005-2006) and Chairman and Chief Executive Officer (2000-2005) of IMS Health, Inc. (pharmaceutical and healthcare information solutions), and a Director of Fortune Brands, Inc. (consumer products, 2000-2011).
+ The information includes the Trustee's principal occupation during the last five years and other information relating to the experience, attributes, and skills relevant to the Trustee's qualifications to serve as a Trustee, which led to the conclusion that the Trustee should serve as a Trustee for the fund.
Advisory Board Members and Officers:
Correspondence intended for an officer or Peter S. Lynch may be sent to Fidelity Investments, 245 Summer Street, Boston, Massachusetts 02210. Officers appear below in alphabetical order.
Name, Year of Birth; Principal Occupation
Peter S. Lynch (1944)
Year of Election or Appointment: 2003
Member of the Advisory Board
Mr. Lynch also serves as Member of the Advisory Board of other Fidelity® funds. Mr. Lynch is Vice Chairman and a Director of FMR (investment adviser firm) and FMR Co., Inc. (investment adviser firm). In addition, Mr. Lynch serves as a Trustee of Boston College and as the Chairman of the Inner-City Scholarship Fund. Previously, Mr. Lynch served on the Special Olympics International Board of Directors (1997-2006).
Elizabeth Paige Baumann (1968)
Year of Election or Appointment: 2017
Anti-Money Laundering (AML) Officer
Ms. Baumann also serves as AML Officer of other funds. She is Chief AML Officer (2012-present) and Senior Vice President (2014-present) of FMR LLC (diversified financial services company) and is an employee of Fidelity Investments. Previously, Ms. Baumann served as AML Officer of the funds (2012-2016), and Vice President (2007-2014) and Deputy Anti-Money Laundering Officer (2007-2012) of FMR LLC.
Marc R. Bryant (1966)
Year of Election or Appointment: 2015
Secretary and Chief Legal Officer (CLO)
Mr. Bryant also serves as Secretary and CLO of other funds. Mr. Bryant serves as CLO, Secretary, and Senior Vice President of Fidelity Management & Research Company (investment adviser firm, 2015-present) and FMR Co., Inc. (investment adviser firm, 2015-present); Secretary of Fidelity SelectCo, LLC (investment adviser firm, 2015-present) and Fidelity Investments Money Management, Inc. (investment adviser firm, 2015-present); and CLO of Fidelity Management & Research (Hong Kong) Limited and FMR Investment Management (UK) Limited (investment adviser firms, 2015-present) and Fidelity Management & Research (Japan) Limited (investment adviser firm, 2016-present). He is Senior Vice President and Deputy General Counsel of FMR LLC (diversified financial services company). Previously, Mr. Bryant served as Secretary and CLO of Fidelity Rutland Square Trust II (2010-2014) and Assistant Secretary of Fidelity's Fixed Income and Asset Allocation Funds (2013-2015). Prior to joining Fidelity Investments, Mr. Bryant served as a Senior Vice President and the Head of Global Retail Legal for AllianceBernstein L.P. (2006-2010), and as the General Counsel for ProFund Advisors LLC (2001-2006).
William C. Coffey (1969)
Year of Election or Appointment: 2009
Assistant Secretary
Mr. Coffey also serves as Assistant Secretary of other funds. He is Senior Vice President and Deputy General Counsel of FMR LLC (diversified financial services company, 2010-present), and is an employee of Fidelity Investments. Previously, Mr. Coffey served as Vice President and Associate General Counsel of FMR LLC (2005-2009).
Jonathan Davis (1968)
Year of Election or Appointment: 2010
Assistant Treasurer
Mr. Davis also serves as Assistant Treasurer of other funds, and is an employee of Fidelity Investments. Previously, Mr. Davis served as Vice President and Associate General Counsel of FMR LLC (diversified financial services company, 2003-2010).
Adrien E. Deberghes (1967)
Year of Election or Appointment: 2016
Assistant Treasurer
Mr. Deberghes also serves as an officer of other funds. He serves as Executive Vice President of Fidelity Investments Money Management, Inc. (FIMM) (investment adviser firm, 2016-present) and is an employee of Fidelity Investments (2008-present). Prior to joining Fidelity Investments, Mr. Deberghes was Senior Vice President of Mutual Fund Administration at State Street Corporation (2007-2008), Senior Director of Mutual Fund Administration at Investors Bank & Trust (2005-2007), and Director of Finance for Dunkin' Brands (2000-2005). Previously, Mr. Deberghes served in other fund officer roles.
Stephanie J. Dorsey (1969)
Year of Election or Appointment: 2010
Assistant Treasurer
Ms. Dorsey also serves as an officer of other funds. She is an employee of Fidelity Investments (2008-present) and has served in other fund officer roles. Prior to joining Fidelity Investments, Ms. Dorsey served as Treasurer (2004-2008) of the JPMorgan Mutual Funds and Vice President (2004-2008) of JPMorgan Chase Bank.
Howard J. Galligan III (1966)
Year of Election or Appointment: 2014
Chief Financial Officer
Mr. Galligan also serves as Chief Financial Officer of other funds. Mr. Galligan serves as President of Fidelity Pricing and Cash Management Services (FPCMS) (2014-present) and as a Director of Strategic Advisers, Inc. (investment adviser firm, 2008-present). Previously, Mr. Galligan served as Chief Administrative Officer of Asset Management (2011-2014) and Chief Operating Officer and Senior Vice President of Investment Support for Strategic Advisers, Inc. (2003-2011).
Thomas C. Hense (1964)
Year of Election or Appointment: 2008, 2010, or 2015
Vice President
Mr. Hense serves as Vice President of Fidelity Advisor® Multi-Asset Income Fund (2015) and other funds (High Income (2008), Small Cap (2008), and Value (2010) funds), and is an employee of Fidelity Investments (1993-present). Previously, Mr. Hense served as a portfolio manager for Fidelity's Institutional Money Management Group (Pyramis) (2003-2008).
Brian B. Hogan (1964)
Year of Election or Appointment: 2009
Vice President
Mr. Hogan also serves as Trustee or Vice President of other funds. Mr. Hogan serves as a Director of FMR Investment Management (UK) Limited (investment adviser firm, 2015-present) and Fidelity SelectCo, LLC (investment adviser firm, 2014-present) and President of the Equity Division of FMR (investment adviser firm, 2009-present). Previously, Mr. Hogan served as Senior Vice President, Equity Research of FMR (2006-2009) and as a portfolio manager. Mr. Brian B. Hogan is not related to Mr. Colm A. Hogan.
Colm A. Hogan (1973)
Year of Election or Appointment: 2016
Deputy Treasurer
Mr. Hogan also serves as an officer of other funds. Mr. Hogan is an employee of Fidelity Investments (2005-present). Mr. Colm A. Hogan is not related to Mr. Brian B. Hogan.
Chris Maher (1972)
Year of Election or Appointment: 2013
Assistant Treasurer
Mr. Maher serves as Assistant Treasurer of other funds. Mr. Maher is Vice President of Valuation Oversight and is an employee of Fidelity Investments. Previously, Mr. Maher served as Vice President of Asset Management Compliance (2013), Vice President of the Program Management Group of FMR (investment adviser firm, 2010-2013), and Vice President of Valuation Oversight (2008-2010).
Rieco E. Mello (1969)
Year of Election or Appointment: 2017
Assistant Treasurer
Mr. Mello also serves as Assistant Treasurer of other funds. Mr. Mello is an employee of Fidelity Investments (1995-present).
Kenneth B. Robins (1969)
Year of Election or Appointment: 2016
Chief Compliance Officer
Mr. Robins also serves as an officer of other funds. Mr. Robins serves as Compliance Officer of Fidelity Management & Research Company and FMR Co., Inc. (investment adviser firms, 2016-present) and is an employee of Fidelity Investments (2004-present). Previously, Mr. Robins served as Executive Vice President of Fidelity Investments Money Management, Inc. (investment adviser firm, 2013-2016) and served in other fund officer roles.
Stacie M. Smith (1974)
Year of Election or Appointment: 2016
President and Treasurer
Ms. Smith also serves as an officer of other funds. She is an employee of Fidelity Investments (2009-present) and has served in other fund officer roles. Prior to joining Fidelity Investments, Ms. Smith served as Senior Audit Manager of Ernst & Young LLP (accounting firm, 1996-2009). Previously, Ms. Smith served as Deputy Treasurer of certain Fidelity® funds (2013-2016).
Marc L. Spector (1972)
Year of Election or Appointment: 2016
Assistant Treasurer
Mr. Spector also serves as an officer of other funds. Mr. Spector is an employee of Fidelity Investments (2016-present). Prior to joining Fidelity Investments, Mr. Spector served as Director at the Siegfried Group (accounting firm, 2013-2016), and prior to Siegfried Group as audit senior manager at Deloitte & Touche (accounting firm, 2005-2013).
Renee Stagnone (1975)
Year of Election or Appointment: 2016
Assistant Treasurer
Ms. Stagnone also serves as an officer of other funds. Ms. Stagnone is an employee of Fidelity Investments (1997-present). Previously, Ms. Stagnone served as Deputy Treasurer of certain Fidelity® funds (2013-2016).
Shareholder Expense Example
As a shareholder of the Fund, you incur two types of costs: (1) transaction costs and (2) ongoing costs, including management fees and other Fund expenses. This Example is intended to help you understand your ongoing costs (in dollars) of investing in the Fund and to compare these costs with the ongoing costs of investing in other mutual funds.
The Example is based on an investment of $1,000 invested at the beginning of the period and held for the entire period (February 1, 2017 to July 31, 2017).
Actual Expenses
The first line of the accompanying table for each class of the Fund provides information about actual account values and actual expenses. You may use the information in this line, together with the amount you invested, to estimate the expenses that you paid over the period. Simply divide your account value by $1,000.00 (for example, an $8,600 account value divided by $1,000.00 = 8.6), then multiply the result by the number in the first line for a class of the Fund under the heading entitled "Expenses Paid During Period" to estimate the expenses you paid on your account during this period. A small balance maintenance fee of $12.00 that is charged once a year may apply for certain accounts with a value of less than $2,000. This fee is not included in the table below. If it was, the estimate of expenses you paid during the period would be higher, and your ending account value lower, by this amount. In addition, the Fund, as a shareholder in the underlying Fidelity Central Funds, will indirectly bear its pro-rata share of the fees and expenses incurred by the underlying Fidelity Central Funds. These fees and expenses are not included in the Fund's annualized expense ratio used to calculate the expense estimate in the table below.
Hypothetical Example for Comparison Purposes
The second line of the accompanying table for each class of the Fund provides information about hypothetical account values and hypothetical expenses based on a Class' actual expense ratio and an assumed rate of return of 5% per year before expenses, which is not the Class' actual return. The hypothetical account values and expenses may not be used to estimate the actual ending account balance or expenses you paid for the period. You may use this information to compare the ongoing costs of investing in the Fund and other funds. To do so, compare this 5% hypothetical example with the 5% hypothetical examples that appear in the shareholder reports of the other funds. A small balance maintenance fee of $12.00 that is charged once a year may apply for certain accounts with a value of less than $2,000. This fee is not included in the table below. If it was, the estimate of expenses you paid during the period would be higher, and your ending account value lower, by this amount. In addition, the Fund, as a shareholder in the underlying Fidelity Central Funds, will indirectly bear its pro-rata share of the fees and expenses incurred by the underlying Fidelity Central Funds. These fees and expenses are not included in the Fund's annualized expense ratio used to calculate the expense estimate in the table below.
Please note that the expenses shown in the table are meant to highlight your ongoing costs only and do not reflect any transaction costs. Therefore, the second line of the table is useful in comparing ongoing costs only, and will not help you determine the relative total costs of owning different funds.
| | Annualized Expense Ratio-A | Beginning
Account Value
February 1, 2017 | Ending
Account Value
July 31, 2017 | Expenses Paid
During Period-B
February 1, 2017
to July 31, 2017 |
| Value Discovery | .74% | | | |
| Actual | | $1,000.00 | $1,067.60 | $3.79 |
| Hypothetical-C | | $1,000.00 | $1,021.12 | $3.71 |
| Class K | .62% | | | |
| Actual | | $1,000.00 | $1,068.40 | $3.18 |
| Hypothetical-C | | $1,000.00 | $1,021.72 | $3.11 |
A Annualized expense ratio reflects expenses net of applicable fee waivers.
B Expenses are equal to each Class' annualized expense ratio, multiplied by the average account value over the period, multiplied by 181/365 (to reflect the one-half year period).
C 5% return per year before expenses
Distributions (Unaudited)
The Board of Trustees of Fidelity Value Discovery Fund voted to pay to shareholders of record at the opening of business on record date, the following distributions per share derived from capital gains realized from sales of portfolio securities, and dividends derived from net investment income:
| | Pay Date | Record Date | Dividends | Capital Gains |
| Fidelity Value Discovery Fund | | | | |
| Value Discovery | 09/11/17 | 09/08/17 | $0.133 | $0.242 |
| Class K | 09/11/17 | 09/08/17 | $0.139 | $0.242 |
|
The fund hereby designates as a capital gain dividend with respect to the taxable year ended July 31, 2017, $13,374,270, or, if subsequently determined to be different, the net capital gain of such year.
Value Discovery designates 100% and 91%; and Class K designates 99% and 85%; of the dividends distributed in September and December, respectively during the fiscal year as qualifying for the dividends–received deduction for corporate shareholders.
Value Discovery and Class K designate 100% of the dividends distributed in September and December during the fiscal year as amounts which may be taken into account as a dividend for the purposes of the maximum rate under section 1(h)(11) of the Internal Revenue Code.
The fund will notify shareholders in January 2018 of amounts for use in preparing 2017 income tax returns.
Board Approval of Investment Advisory Contracts and Management Fees
Fidelity Value Discovery Fund
Each year, the Board of Trustees, including the Independent Trustees (together, the Board), votes on the renewal of the management contract with Fidelity Management & Research Company (FMR) and the sub-advisory agreements (together, the Advisory Contracts) for the fund. FMR and the sub-advisers are referred to herein as the Investment Advisers. The Board, assisted by the advice of fund counsel and Independent Trustees' counsel, requests and considers a broad range of information relevant to the renewal of the Advisory Contracts throughout the year.
The Board meets regularly and, at each of its meetings, covers an extensive agenda of topics and materials and considers factors that are relevant to its annual consideration of the renewal of the fund's Advisory Contracts, including the services and support provided to the fund and its shareholders. The Board has established various standing committees (Committees), each composed of and chaired by Independent Trustees with varying backgrounds, to which the Board has assigned specific subject matter responsibilities in order to enhance effective decision-making by the Board. The Board, acting directly and through its Committees, requests and receives information concerning the annual consideration of the renewal of the fund's Advisory Contracts. The Board also meets as needed to review matters specifically related to the Board's annual consideration of the renewal of the Advisory Contracts. Members of the Board may also meet with trustees of other Fidelity funds through ad hoc joint committees to discuss certain matters relevant to all of the Fidelity funds.
At its July 2017 meeting, the Board unanimously determined to renew the fund's Advisory Contracts. In reaching its determination, the Board considered all factors it believed relevant, including (i) the nature, extent, and quality of the services to be provided to the fund and its shareholders (including the investment performance of the fund); (ii) the competitiveness of the fund's management fee and total expense ratio relative to peer funds; (iii) the total costs of the services to be provided by and the profits to be realized by Fidelity from its relationships with the fund; and (iv) the extent to which, if any, economies of scale exist and would be realized as the fund grows, and whether any economies of scale are appropriately shared with fund shareholders.
In considering whether to renew the Advisory Contracts for the fund, the Board reached a determination, with the assistance of fund counsel and Independent Trustees' counsel and through the exercise of its business judgment, that the renewal of the Advisory Contracts was in the best interests of the fund and its shareholders and that the compensation payable under the Advisory Contracts was fair and reasonable. The Board's decision to renew the Advisory Contracts was not based on any single factor, but rather was based on a comprehensive consideration of all the information provided to the Board at its meetings throughout the year. The Board, in reaching its determination to renew the Advisory Contracts, was aware that shareholders of the fund have a broad range of investment choices available to them, including a wide choice among funds offered by Fidelity's competitors, and that the fund's shareholders, who have the opportunity to review and weigh the disclosure provided by the fund in its prospectus and other public disclosures, have chosen to invest in this fund, which is part of the Fidelity family of funds.
Amendment to Group Fee Rate. The Board also approved an amendment to the management contract for the fund to add an additional breakpoint to the group fee schedule, effective October 1, 2017. The Board noted that the additional breakpoint would result in lower management fee rates as Fidelity's assets under management increase.
Nature, Extent, and Quality of Services Provided. The Board considered Fidelity's staffing as it relates to the fund, including the backgrounds of investment personnel of Fidelity, and also considered the fund's investment objective, strategies, and related investment philosophy. The Independent Trustees also had discussions with senior management of Fidelity's investment operations and investment groups. The Board considered the structure of the investment personnel compensation program and whether this structure provides appropriate incentives to act in the best interests of the fund. Additionally, the Board considered the portfolio managers' investments, if any, in the funds that they manage.
Resources Dedicated to Investment Management and Support Services. The Board and the Fund Oversight and Research Committees reviewed the general qualifications and capabilities of Fidelity's investment staff, including its size, education, experience, and resources, as well as Fidelity's approach to recruiting, training, managing, and compensating investment personnel. The Board noted that Fidelity has continued to increase the resources devoted to non-U.S. offices, including expansion of Fidelity's global investment organization. The Board also noted that Fidelity's analysts have extensive resources, tools and capabilities that allow them to conduct sophisticated quantitative and fundamental analysis, as well as credit analysis of issuers, counterparties and guarantors. Further, the Board considered that Fidelity's investment professionals have sufficient access to global information and data so as to provide competitive investment results over time, and that those professionals also have access to sophisticated tools that permit them to assess portfolio construction and risk and performance attribution characteristics continuously, as well as to transmit new information and research conclusions rapidly around the world. Additionally, in its deliberations, the Board considered Fidelity's trading, risk management, compliance, and technology and operations capabilities and resources, which are integral parts of the investment management process.
Shareholder and Administrative Services. The Board considered (i) the nature, extent, quality, and cost of advisory, administrative, and shareholder services performed by the Investment Advisers and their affiliates under the Advisory Contracts and under separate agreements covering transfer agency, pricing and bookkeeping, and securities lending services for the fund; (ii) the nature and extent of the supervision of third party service providers, principally custodians, subcustodians, and pricing vendors; and (iii) the resources devoted to, and the record of compliance with, the fund's compliance policies and procedures. The Board also reviewed the allocation of fund brokerage, including allocations to brokers affiliated with the Investment Advisers, the use of brokerage commissions to pay fund expenses, and the use of "soft" commission dollars to pay for research services.
The Board noted that the growth of fund assets over time across the complex allows Fidelity to reinvest in the development of services designed to enhance the value or convenience of the Fidelity funds as investment vehicles. These services include 24-hour access to account information and market information through telephone representatives and over the Internet, investor education materials and asset allocation tools, and the expanded availability of Fidelity Investor Centers.
In 2014, the Board formed an ad hoc Committee on Transfer Agency Fees to review the variety of transfer agency fee structures throughout the industry and Fidelity's competitive positioning with respect to industry participants.
Investment in a Large Fund Family. The Board considered the benefits to shareholders of investing in a Fidelity fund, including the benefits of investing in a fund that is part of a large family of funds offering a variety of investment disciplines and providing a large variety of mutual fund investor services. The Board noted that Fidelity had taken, or had made recommendations that resulted in the Fidelity funds taking, a number of actions over the previous year that benefited particular funds, including: (i) continuing to dedicate additional resources to Fidelity's investment research process, and to the support of the senior management team that oversees asset management; (ii) continuing efforts to enhance Fidelity's global research capabilities; (iii) launching new funds and making other enhancements to meet client needs; (iv) launching new share classes of existing funds; (v) eliminating purchase minimums and broadening eligibility requirements for certain lower-priced share classes; (vi) reducing management fees and total expenses for certain growth equity funds and index funds; (vii) lowering expense caps for certain existing funds and classes to reduce expenses borne by shareholders; (viii) eliminating short-term redemption fees for certain funds; (ix) introducing a new pricing structure for certain funds of funds that is expected to reduce overall expenses paid by shareholders; (x) rationalizing product lines and gaining increased efficiencies through proposals for fund mergers and share class consolidations; (xi) continuing to develop, acquire and implement systems and technology to improve services to the funds and shareholders, strengthen information security, and increase efficiency; and (xii) implementing enhancements to further strengthen Fidelity's product line to increase investors' probability of success in achieving their investment goals, including retirement income goals.
Investment Performance. The Board considered whether the fund has operated in accordance with its investment objective, as well as its record of compliance with its investment restrictions and its performance history.
The Board took into account discussions with representatives of the Investment Advisers about fund investment performance that occur at Board meetings throughout the year. In this regard the Board noted that as part of regularly scheduled fund reviews and other reports to the Board on fund performance, the Board considers annualized return information for the fund for different time periods, measured against a securities market index ("benchmark index") and a peer group of funds with similar objectives ("peer group"), if any. In its evaluation of fund investment performance, the Board gave particular attention to information indicating changes in performance of certain Fidelity funds for specific time periods and discussed with the Investment Advisers the reasons for any overperformance or underperformance.
In addition to reviewing absolute and relative fund performance, the Independent Trustees periodically consider the appropriateness of fund performance metrics in evaluating the results achieved. In general, the Independent Trustees believe that fund performance should be evaluated based on net performance (after fees and expenses) of both the highest performing and lowest performing fund share classes, where applicable, compared to appropriate benchmark indices, over appropriate time periods that may include full market cycles, and compared to peer groups, as applicable, over the same periods, taking into account relevant factors including the following: general market conditions; issuer-specific information; and fund cash flows and other factors.
The Independent Trustees recognize that shareholders evaluate performance on a net basis over their own holding periods, for which one-, three-, and five-year periods are often used as a proxy. For this reason, the performance information reviewed by the Board also included net cumulative calendar year total return information for the fund and an appropriate benchmark index and peer group for the most recent one-, three-, and five-year periods, as shown below. Returns are shown compared to the 25th percentile (top of box, 75% beaten) and 75th percentile (bottom of box, 25% beaten) of the peer universe.
Fidelity Value Discovery Fund
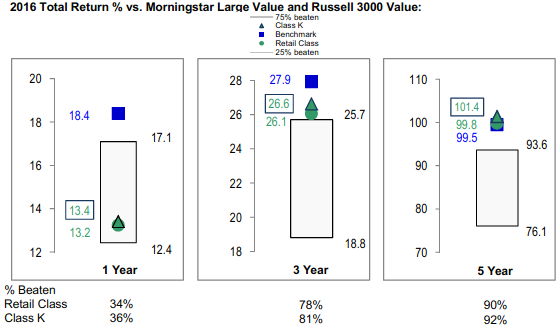
The Board also considered that the fund's management fee is subject to upward or downward adjustment depending upon whether, and to what extent, the fund's investment performance for the performance period (a rolling 36-month period) exceeds, or is exceeded by, a securities index, thus leading to a performance adjustment for the same period. The Board noted that the performance adjustment provides FMR with a strong economic incentive to seek to achieve superior long-term performance for the fund's shareholders and helps to more closely align the interests of FMR and the shareholders of the fund.
Based on its review, the Board concluded that the nature, extent, and quality of services provided to the fund under the Advisory Contracts should continue to benefit the shareholders of the fund.
Competitiveness of Management Fee and Total Expense Ratio. The Board considered the fund's management fee and total expense ratio compared to "mapped groups" of competitive funds and classes created for the purpose of facilitating the Trustees' competitive analysis of management fees and total expenses. Fidelity creates "mapped groups" by combining similar Lipper investment objective categories that have comparable investment mandates. Combining Lipper investment objective categories aids the Board's management fee and total expense ratio comparisons by broadening the competitive group used for comparison.
Management Fee. The Board considered two proprietary management fee comparisons for the 12-month periods shown in basis points (BP) in the chart below. The group of Lipper funds used by the Board for management fee comparisons is referred to below as the "Total Mapped Group." The Total Mapped Group comparison focuses on a fund's standing in terms of gross management fees before expense reimbursements or caps, and without giving effect to the fund's performance adjustment, relative to the total universe of funds with comparable investment mandates, regardless of whether their management fee structures also are comparable. Funds with comparable investment mandates offer exposure to similar types of securities. Funds with comparable management fee structures have similar management fee contractual arrangements (
e.g., flat rate charged for advisory services, all-inclusive fee rate,
etc.). "TMG %" represents the percentage of funds in the Total Mapped Group that had management fees that were lower than the fund's. For example, a hypothetical TMG % of 20% would mean that 80% of the funds in the Total Mapped Group had higher, and 20% had lower, management fees than the fund. The fund's actual TMG %s and the number of funds in the Total Mapped Group are in the chart below. The "Asset-Size Peer Group" (ASPG) comparison focuses on a fund's standing relative to a subset of non-Fidelity funds within the Total Mapped Group that are similar in size and management fee structure without taking into account performance adjustments, if any. For example, if a fund is in the first quartile of the ASPG, the fund's management fee ranks in the least expensive or lowest 25% of funds in the ASPG. The ASPG represents at least 15% of the funds in the Total Mapped Group with comparable asset size and management fee structures, subject to a minimum of 50 funds (or all funds in the Total Mapped Group if fewer than 50). Additional information, such as the ASPG quartile in which the fund's management fee rate ranked and the impact of the fund's performance adjustment, is also included in the chart and considered by the Board.
Fidelity Value Discovery Fund
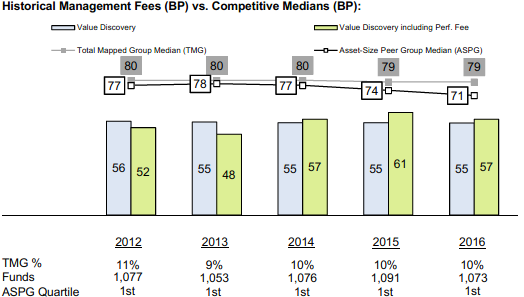
The Board noted that the fund's management fee rate ranked below the median of its Total Mapped Group and below the median of its ASPG for 2016. The Board also noted the effect of the fund's performance adjustment, if any, on the fund's management fee ranking.
The Board noted that, in 2014, the Board and the boards of other Fidelity funds formed the ad hoc Committee on Group Fee to conduct an in-depth review of the "group fee" component of the management fee of funds with such management fee structures. The Committee's focus included the mechanics of the group fee, the competitive landscape of group fee structures, Fidelity funds with no group fee component and investment products not included in group fee assets. The Board also considered that, for funds subject to the group fee, FMR agreed to voluntarily waive fees over a specified period of time in amounts designed to account for assets converted from certain funds to certain collective investment trusts.
The Board also noted that, in 2013, the ad hoc Committee on Management Fees was formed to conduct an in-depth review of the management fee rates of Fidelity's active equity mutual funds. The Committee focused on the following areas: (i) standard fee structures; (ii) research consumption and trading evolution; (iii) management fee competitiveness/profitability by category; and (iv) factors that drive institutional pricing.
Based on its review, the Board concluded that the fund's management fee is fair and reasonable in light of the services that the fund receives and the other factors considered.
Total Expense Ratio. In its review of each class's total expense ratio, the Board considered the fund's management fee rate as well as other fund or class expenses, as applicable, such as transfer agent fees, pricing and bookkeeping fees, and custodial, legal, and audit fees. The Board noted the impact of the fund's performance adjustment. The Board also noted that Fidelity may agree to waive fees and expenses from time to time, and the extent to which, if any, it has done so for the fund. As part of its review, the Board also considered the current and historical total expense ratios of each class of the fund compared to competitive fund median expenses. Each class of the fund is compared to those funds and classes in the Total Mapped Group (used by the Board for management fee comparisons) that have a similar sales load structure.
The Board noted that the total expense ratio of each class ranked below the competitive median for 2016.
Fees Charged to Other Fidelity Clients. The Board also considered Fidelity fee structures and other information with respect to clients of Fidelity, such as other funds advised or subadvised by Fidelity, pension plan clients, and other institutional clients with similar mandates. The Board noted that an ad hoc joint committee created by it and the boards of other Fidelity funds periodically (most recently in 2013) reviews and compares Fidelity's institutional investment advisory business with its business of providing services to the Fidelity funds, including the differences in services provided, fees charged, and costs incurred, as well as competition in their respective marketplaces.
Based on its review of total expense ratios and fees charged to other Fidelity clients, the Board concluded that the total expense ratio of each class of the fund was reasonable in light of the services that the fund and its shareholders receive and the other factors considered.
Costs of the Services and Profitability. The Board considered the revenues earned and the expenses incurred by Fidelity in conducting the business of developing, marketing, distributing, managing, administering and servicing the fund and servicing the fund's shareholders. The Board also considered the level of Fidelity's profits in respect of all the Fidelity funds.
On an annual basis, Fidelity presents to the Board information about the profitability of its relationships with the fund. Fidelity calculates profitability information for each fund, as well as aggregate profitability information for groups of Fidelity funds and all Fidelity funds, using a series of detailed revenue and cost allocation methodologies which originate with the books and records of Fidelity on which Fidelity's audited financial statements are based. The Audit Committee of the Board reviews any significant changes from the prior year's methodologies.
PricewaterhouseCoopers LLP (PwC), independent registered public accounting firm and auditor to Fidelity and certain Fidelity funds, has been engaged annually by the Board as part of the Board's assessment of Fidelity's profitability analysis. PwC's engagement includes the review and assessment of the methodologies used by Fidelity in determining the revenues and expenses attributable to Fidelity's mutual fund business, and completion of agreed-upon procedures in respect of the mathematical accuracy of the fund profitability information and its conformity to established allocation methodologies. After considering PwC's reports issued under the engagement and information provided by Fidelity, the Board concluded that while other allocation methods may also be reasonable, Fidelity's profitability methodologies are reasonable in all material respects.
The Board also reviewed Fidelity's non-fund businesses and potential fall-out benefits related to the mutual fund business as well as cases where Fidelity's affiliates may benefit from or be related to the fund's business.
The Board considered the costs of the services provided by and the profits realized by Fidelity in connection with the operation of the fund and was satisfied that the profitability was not excessive.
Economies of Scale. The Board considered whether there have been economies of scale in respect of the management of the Fidelity funds, whether the Fidelity funds (including the fund) have appropriately benefited from any such economies of scale, and whether there is potential for realization of any further economies of scale. The Board considered the extent to which the fund will benefit from economies of scale as assets grow through increased services to the fund, through waivers or reimbursements, or through fee or expense ratio reductions. The Board also noted that a committee (the Economies of Scale Committee) created by it and the boards of other Fidelity funds periodically (most recently in 2013) analyzes whether Fidelity attains economies of scale in respect of the management and servicing of the Fidelity funds, whether the Fidelity funds have appropriately benefited from such economies of scale, and whether there is potential for realization of any further economies of scale.
The Board recognized that the fund's management contract incorporates a "group fee" structure, which provides for lower group fee rates as total group assets increase, and for higher group fee rates as total group assets decrease (with "group assets" defined to include fund assets under FMR's management plus the assets of sector funds previously under FMR's management). FMR calculates the group fee rates based on a tiered asset "breakpoint" schedule that varies based on asset class. The Board considered that the group fee is designed to deliver the benefits of economies of scale to fund shareholders when total Fidelity fund assets increase, even if assets of any particular fund are unchanged or have declined, because some portion of Fidelity's costs are attributable to services provided to all Fidelity funds, and all funds benefit if those costs can be allocated among more assets. The Board concluded that, given the group fee structure, fund shareholders will benefit from lower management fees as group assets increase at the fund complex level, regardless of whether Fidelity achieves any such economies of scale.
The Board concluded, taking into account the analysis of the Economies of Scale Committee, that economies of scale, if any, are being appropriately shared between fund shareholders and Fidelity.
Additional Information Requested by the Board. In order to develop fully the factual basis for consideration of the Fidelity funds' advisory contracts, the Board requested and received additional information on certain topics, including: (i) fund performance trends, in particular the underperformance of certain funds, and Fidelity's long-term strategies for certain funds; (ii) Fidelity's fund profitability methodology, profitability trends for certain funds, and the impact of certain factors on fund profitability results, including the impact of market trends on actively managed funds; (iii) the use of performance fees and the calculation of performance adjustments, including the impact of underperformance and fund outflows on performance adjustments; (iv) metrics for evaluating index fund performance; (v) Fidelity's group fee structure, including the group fee breakpoint schedules; (vi) the terms of Fidelity's contractual and voluntary expense cap arrangements with the funds; (vii) the methodology with respect to evaluating competitive fund data and peer group classifications and fee comparisons; (viii) the expense structures for different funds and classes; (ix) Fidelity's arrangements with affiliated sub-advisers on behalf of the funds; (x) information regarding other accounts managed by Fidelity, including institutional accounts and collective investment trusts; (xi) recent changes to the fee structure for certain funds of funds; and (xii) the impact of the Department of Labor's new fiduciary rule on the funds' comparative expense information.
Based on its evaluation of all of the conclusions noted above, and after considering all factors it believed relevant, the Board concluded that the advisory fee structures are fair and reasonable, and that the fund's Advisory Contracts should be renewed.
Corporate Headquarters
245 Summer St.
Boston, MA 02210
www.fidelity.com
FVD-ANN-0917
1.788864.114
Fidelity® Low-Priced Stock K6 Fund
Annual Report July 31, 2017 |
|
Contents
To view a fund's proxy voting guidelines and proxy voting record for the 12-month period ended June 30, visit http://www.fidelity.com/proxyvotingresults or visit the Securities and Exchange Commission's (SEC) web site at http://www.sec.gov.
You may also call 1-800-835-5092 to request a free copy of the proxy voting guidelines.
Standard & Poor's, S&P and S&P 500 are registered service marks of The McGraw-Hill Companies, Inc. and have been licensed for use by Fidelity Distributors Corporation.
Other third-party marks appearing herein are the property of their respective owners.
All other marks appearing herein are registered or unregistered trademarks or service marks of FMR LLC or an affiliated company. © 2017 FMR LLC. All rights reserved.
This report and the financial statements contained herein are submitted for the general information of the shareholders of the Fund. This report is not authorized for distribution to prospective investors in the Fund unless preceded or accompanied by an effective prospectus.
A fund files its complete schedule of portfolio holdings with the SEC for the first and third quarters of each fiscal year on Form N-Q. Forms N-Q are available on the SEC’s web site at http://www.sec.gov. A fund's Forms N-Q may be reviewed and copied at the SEC’s Public Reference Room in Washington, DC. Information regarding the operation of the SEC's Public Reference Room may be obtained by calling 1-800-SEC-0330.
For a complete list of a fund's portfolio holdings, view the most recent holdings listing, semiannual report, or annual report on Fidelity's web site at http://www.fidelity.com, http://www.institutional.fidelity.com, or http://www.401k.com, as applicable.
NOT FDIC INSURED •MAY LOSE VALUE •NO BANK GUARANTEE
Neither the Fund nor Fidelity Distributors Corporation is a bank.
Note to Shareholders
On August 16, 2017, the Equity and High Income Board of Trustees approved a change to the investment policies of Fidelity’s Low-Priced Stock strategies. The change, effective on or about November 7, 2017, expands the definition of “low-priced stocks.” Previously, low-priced stocks were defined as those priced at or below $35 per share. This definition will be expanded to include stocks with an earnings yield at or above the median for the Russell 2000® Index, as well as those priced at or below $35 per share. Earnings yield represents a stock’s earnings per share for the most recent 12 months divided by current price per share. We believe the expanded definition will better reflect the portfolio managers’ investment process and provide greater flexibility while remaining faithful to the fund name. No changes to the investment process and portfolio characteristics are expected.
Investment Summary (Unaudited)
Top Ten Stocks as of July 31, 2017
| | % of fund's net assets |
| UnitedHealth Group, Inc. | 5.6 |
| Best Buy Co., Inc. | 3.1 |
| Ross Stores, Inc. | 2.6 |
| Metro, Inc. Class A (sub. vtg.) | 2.5 |
| Seagate Technology LLC | 2.4 |
| Unum Group | 2.3 |
| Next PLC | 2.0 |
| Aetna, Inc. | 2.0 |
| Barratt Developments PLC | 1.8 |
| ANSYS, Inc. | 1.5 |
| | 25.8 |
Top Five Market Sectors as of July 31, 2017
| | % of fund's net assets |
| Consumer Discretionary | 23.9 |
| Information Technology | 16.2 |
| Health Care | 12.5 |
| Financials | 11.9 |
| Consumer Staples | 9.3 |
Asset Allocation (% of fund's net assets)
| As of July 31, 2017 * |
| | Stocks | 88.5% |
| | Short-Term Investments and Net Other Assets (Liabilities) | 11.5% |

* Foreign investments - 41.3%
Investments July 31, 2017
Showing Percentage of Net Assets
| Common Stocks - 88.4% | | | |
| | | Shares | Value |
| CONSUMER DISCRETIONARY - 23.9% | | | |
| Auto Components - 1.0% | | | |
| Adient PLC | | 6,335 | $414,752 |
| ASTI Corp. | | 13,000 | 71,341 |
| Cooper Tire & Rubber Co. | | 302 | 11,038 |
| ElringKlinger AG | | 10,155 | 177,197 |
| G-Tekt Corp. | | 1,000 | 19,402 |
| Gentex Corp. | | 34,887 | 593,777 |
| Gentherm, Inc. (a) | | 1,707 | 57,099 |
| Hertz Global Holdings, Inc. (a) | | 500 | 6,835 |
| Hi-Lex Corp. | | 19,200 | 501,922 |
| Murakami Corp. | | 10,700 | 230,606 |
| Nippon Seiki Co. Ltd. | | 36,000 | 690,644 |
| Piolax, Inc. | | 34,000 | 940,632 |
| S&T Holdings Co. Ltd. | | 60 | 884 |
| Samsung Climate Control Co. Ltd. | | 35 | 397 |
| Shoei Co. Ltd. | | 2,400 | 68,792 |
| SJM Co. Ltd. | | 50 | 259 |
| Strattec Security Corp. | | 4,123 | 146,367 |
| Sungwoo Hitech Co. Ltd. | | 132 | 842 |
| TBK Co. Ltd. | | 12,600 | 56,803 |
| The Goodyear Tire & Rubber Co. | | 604 | 19,032 |
| Yachiyo Industry Co. Ltd. | | 12,300 | 142,474 |
| Yutaka Giken Co. Ltd. | | 16,700 | 382,338 |
| | | | 4,533,433 |
| Distributors - 0.2% | | | |
| Central Automotive Products Ltd. | | 1,000 | 14,114 |
| Chori Co. Ltd. | | 5,800 | 107,588 |
| Nakayamafuku Co. Ltd. | | 13,700 | 97,799 |
| PALTAC Corp. | | 1,600 | 58,053 |
| SPK Corp. | | 3,400 | 90,146 |
| Uni-Select, Inc. | | 22,533 | 525,936 |
| | | | 893,636 |
| Diversified Consumer Services - 0.7% | | | |
| American Public Education, Inc. (a) | | 7,942 | 169,165 |
| Clip Corp. | | 3,700 | 30,877 |
| Collectors Universe, Inc. | | 2,411 | 59,986 |
| Cross-Harbour Holdings Ltd. | | 32,000 | 48,589 |
| Houghton Mifflin Harcourt Co. (a) | | 16,672 | 199,230 |
| Meiko Network Japan Co. Ltd. | | 11,400 | 162,761 |
| Service Corp. International | | 2,008 | 69,738 |
| ServiceMaster Global Holdings, Inc. (a) | | 5,023 | 220,811 |
| Shingakukai Co. Ltd. | | 2,000 | 10,558 |
| Step Co. Ltd. | | 14,600 | 193,351 |
| Weight Watchers International, Inc. (a) | | 54,001 | 1,934,316 |
| | | | 3,099,382 |
| Hotels, Restaurants & Leisure - 0.6% | | | |
| Ark Restaurants Corp. | | 2,615 | 59,465 |
| Bojangles', Inc. (a) | | 1,408 | 18,726 |
| BRONCO BILLY Co. Ltd. | | 600 | 14,782 |
| Create Restaurants Holdings, Inc. | | 14,200 | 145,162 |
| El Pollo Loco Holdings, Inc. (a) | | 1,307 | 16,991 |
| Flanigans Enterprises, Inc. | | 1,006 | 26,961 |
| Greggs PLC | | 11,262 | 163,450 |
| Hiday Hidaka Corp. | | 29,400 | 785,636 |
| Ibersol SGPS SA | | 8,345 | 141,366 |
| ILG, Inc. | | 8,339 | 221,067 |
| Intralot SA (a) | | 17,198 | 24,024 |
| Koshidaka Holdings Co. Ltd. | | 2,500 | 67,894 |
| Kura Corp. Ltd. | | 1,300 | 65,445 |
| Monarch Casino & Resort, Inc. (a) | | 500 | 16,545 |
| Nagacorp Ltd. | | 6,000 | 3,649 |
| Ohsho Food Service Corp. | | 2,700 | 105,066 |
| Sportscene Group, Inc. Class A (a) | | 4,525 | 23,773 |
| St. Marc Holdings Co. Ltd. | | 12,700 | 397,433 |
| The Monogatari Corp. | | 2,800 | 146,292 |
| The Restaurant Group PLC | | 88,783 | 391,717 |
| TORIDOLL Holdings Corp. | | 1,200 | 33,634 |
| | | | 2,869,078 |
| Household Durables - 4.0% | | | |
| Abbey PLC | | 24,232 | 403,036 |
| Barratt Developments PLC | | 986,972 | 8,015,108 |
| Bellway PLC | | 53,491 | 2,251,375 |
| D.R. Horton, Inc. | | 41,324 | 1,474,854 |
| Dorel Industries, Inc. Class B (sub. vtg.) | | 36,197 | 956,350 |
| Emak SpA | | 59,926 | 112,086 |
| First Juken Co. Ltd. | | 19,100 | 274,256 |
| GUD Holdings Ltd. | | 3,383 | 32,341 |
| Helen of Troy Ltd. (a) | | 25,343 | 2,553,307 |
| Henry Boot PLC | | 44,442 | 177,669 |
| Iida Group Holdings Co. Ltd. | | 2,900 | 49,585 |
| M/I Homes, Inc. | | 2,512 | 65,161 |
| NACCO Industries, Inc. Class A | | 2,413 | 158,293 |
| P&F Industries, Inc. Class A | | 4,323 | 26,068 |
| PulteGroup, Inc. | | 6,430 | 157,021 |
| Q.E.P. Co., Inc. (a) | | 402 | 10,613 |
| Sanei Architecture Planning Co. Ltd. | | 16,400 | 292,610 |
| Stanley Furniture Co., Inc. | | 3,827 | 4,822 |
| Taylor Morrison Home Corp. (a) | | 5,322 | 120,384 |
| Token Corp. | | 8,700 | 1,107,179 |
| Toll Brothers, Inc. | | 1,507 | 58,155 |
| | | | 18,300,273 |
| Internet & Direct Marketing Retail - 0.3% | | | |
| Belluna Co. Ltd. | | 99,100 | 1,140,713 |
| Liberty Interactive Corp. QVC Group Series A (a) | | 14,663 | 351,032 |
| | | | 1,491,745 |
| Leisure Products - 0.3% | | | |
| Accell Group NV | | 24,300 | 741,021 |
| Amer Group PLC (A Shares) | | 2,109 | 56,674 |
| Kabe Husvagnar AB (B Shares) | | 3,821 | 99,858 |
| Mars Engineering Corp. | | 7,200 | 142,635 |
| Mattel, Inc. | | 5,324 | 106,586 |
| Miroku Corp. | | 10,000 | 43,993 |
| Vista Outdoor, Inc. (a) | | 604 | 13,946 |
| | | | 1,204,713 |
| Media - 0.9% | | | |
| Cinderella Media Group Ltd. (a) | | 216,000 | 91,811 |
| Corus Entertainment, Inc. Class B (non-vtg.) | | 8,044 | 89,295 |
| Discovery Communications, Inc. Class A (a) | | 23,125 | 568,875 |
| Gannett Co., Inc. | | 17,894 | 160,509 |
| Gray Television, Inc. (a) | | 4,620 | 68,838 |
| Harte-Hanks, Inc. (a) | | 10,155 | 9,800 |
| Hyundai HCN | | 191 | 713 |
| Informa PLC | | 5,563 | 51,048 |
| Intage Holdings, Inc. | | 22,700 | 464,110 |
| Interpublic Group of Companies, Inc. | | 6,027 | 130,243 |
| Ipsos SA | | 101 | 3,488 |
| ITE Group PLC | | 1,200 | 2,854 |
| Lions Gate Entertainment Corp. Class B (a) | | 1,908 | 52,489 |
| Live Nation Entertainment, Inc. (a) | | 7,032 | 262,083 |
| MSG Network, Inc. Class A (a) | | 3,316 | 70,962 |
| Pico Far East Holdings Ltd. | | 250,000 | 103,062 |
| Proto Corp. | | 3,200 | 50,041 |
| RKB Mainichi Broadcasting Corp. | | 600 | 27,484 |
| Saga Communications, Inc. Class A | | 5,027 | 195,299 |
| Salem Communications Corp. Class A | | 2,009 | 14,364 |
| Sky Network Television Ltd. | | 79,886 | 198,581 |
| STW Group Ltd. | | 56,026 | 51,544 |
| Tegna, Inc. | | 15,892 | 235,678 |
| Television Broadcasts Ltd. | | 47,100 | 172,461 |
| TOW Co. Ltd. | | 25,000 | 199,556 |
| TVA Group, Inc. Class B (non-vtg.) (a) | | 42,230 | 114,826 |
| Twenty-First Century Fox, Inc.: | | | |
| Class A | | 11,049 | 321,526 |
| Class B | | 603 | 17,300 |
| Viacom, Inc. Class B (non-vtg.) | | 7,235 | 252,646 |
| WOWOW INC. | | 2,500 | 72,679 |
| | | | 4,054,165 |
| Multiline Retail - 2.2% | | | |
| Lifestyle China Group Ltd. (a) | | 465,000 | 190,505 |
| Lifestyle International Holdings Ltd. | | 484,500 | 662,475 |
| Next PLC | | 179,000 | 9,328,818 |
| Watts Co. Ltd. | | 15,300 | 200,678 |
| | | | 10,382,476 |
| Specialty Retail - 12.5% | | | |
| Aarons, Inc. Class A | | 1,808 | 83,674 |
| Abercrombie & Fitch Co. Class A | | 67,970 | 668,825 |
| Adastria Co. Ltd. | | 3,700 | 92,496 |
| AT-Group Co. Ltd. | | 15,000 | 380,970 |
| AutoCanada, Inc. | | 2,612 | 42,069 |
| AutoZone, Inc. (a) | | 10,155 | 5,481,872 |
| Bed Bath & Beyond, Inc. | | 119,510 | 3,573,349 |
| Best Buy Co., Inc. | | 245,002 | 14,293,417 |
| BMTC Group, Inc. | | 53,800 | 507,038 |
| Bonia Corp. Bhd | | 200 | 27 |
| Bonjour Holdings Ltd. | | 52,000 | 2,497 |
| Buffalo Co. Ltd. | | 1,300 | 10,412 |
| Cars.com, Inc. (a) | | 5,830 | 141,669 |
| Cash Converters International Ltd. | | 301,616 | 79,627 |
| Chico's FAS, Inc. | | 18,386 | 168,232 |
| Delek Automotive Systems Ltd. | | 10,055 | 83,151 |
| DSW, Inc. Class A | | 58,413 | 1,053,771 |
| Dunelm Group PLC | | 8,848 | 70,278 |
| Ff Group (a) | | 59,624 | 1,429,304 |
| Fourlis Holdings SA | | 3,821 | 26,235 |
| GameStop Corp. Class A | | 129,216 | 2,802,695 |
| GNC Holdings, Inc. Class A | | 11,008 | 104,686 |
| Goldlion Holdings Ltd. | | 300,000 | 130,973 |
| Guess?, Inc. | | 68,110 | 889,517 |
| Halfords Group PLC | | 16,389 | 72,050 |
| Hibbett Sports, Inc. (a) | | 45 | 702 |
| Hour Glass Ltd. | | 112,000 | 55,374 |
| IA Group Corp. | | 8,000 | 48,764 |
| JB Hi-Fi Ltd. | | 1,449 | 30,151 |
| John David Group PLC | | 108,037 | 510,165 |
| Jumbo SA | | 136,200 | 2,281,455 |
| K's Holdings Corp. | | 45,000 | 904,531 |
| Ku Holdings Co. Ltd. | | 11,700 | 106,233 |
| Kyoto Kimono Yuzen Co. Ltd. | | 3,300 | 27,808 |
| Le Chateau, Inc. Class A (sub. vtg.) (a) | | 11,298 | 1,087 |
| Leon's Furniture Ltd. | | 2,514 | 36,377 |
| Lewis Group Ltd. | | 14,680 | 34,297 |
| Mr. Bricolage SA | | 11,700 | 220,222 |
| Nafco Co. Ltd. | | 26,300 | 417,241 |
| Office Depot, Inc. | | 17,936 | 105,284 |
| Pal Group Holdings Co. Ltd. | | 11,000 | 351,717 |
| Ross Stores, Inc. | | 212,155 | 11,736,415 |
| Sa Sa International Holdings Ltd. | | 44,000 | 16,167 |
| Sacs Bar Holdings, Inc. | | 5,000 | 55,014 |
| Sally Beauty Holdings, Inc. (a) | | 11,736 | 237,419 |
| Second Chance Properties Ltd. | | 24,600 | 4,629 |
| Second Chance Properties Ltd. warrants 1/23/20 (a) | | 100 | 1 |
| Sonic Automotive, Inc. Class A (sub. vtg.) | | 14,278 | 259,146 |
| Staples, Inc. | | 280,315 | 2,845,197 |
| The Buckle, Inc. | | 61,535 | 1,052,249 |
| Urban Outfitters, Inc. (a) | | 45,849 | 898,182 |
| USS Co. Ltd. | | 92,600 | 1,870,563 |
| Vitamin Shoppe, Inc. (a) | | 9,350 | 102,850 |
| Workman Co. Ltd. | | 30,200 | 917,683 |
| Zumiez, Inc. (a) | | 3,818 | 48,489 |
| | | | 57,364,246 |
| Textiles, Apparel & Luxury Goods - 1.2% | | | |
| Anta Sports Products Ltd. | | 9,000 | 30,880 |
| Best Pacific International Holdings Ltd. | | 64,000 | 34,987 |
| Coach, Inc. | | 12,926 | 609,332 |
| Daphne International Holdings Ltd. (a) | | 12,000 | 1,075 |
| Deckers Outdoor Corp. (a) | | 3 | 195 |
| Embry Holdings Ltd. | | 29,000 | 9,282 |
| Emerald Expositions Events, Inc. | | 2,109 | 48,275 |
| Fossil Group, Inc. (a) | | 26,517 | 298,316 |
| G-III Apparel Group Ltd. (a) | | 28 | 729 |
| Geox SpA | | 35 | 139 |
| Gerry Weber International AG (Bearer) | | 603 | 7,702 |
| Gildan Activewear, Inc. | | 100,953 | 3,042,153 |
| Handsome Co. Ltd. | | 149 | 4,803 |
| JLM Couture, Inc. (a) | | 2,212 | 6,716 |
| McRae Industries, Inc. | | 301 | 9,933 |
| Michael Kors Holdings Ltd. (a) | | 1,608 | 58,596 |
| Movado Group, Inc. | | 3,118 | 76,703 |
| Portico International Holdings (a) | | 139,500 | 46,972 |
| Steven Madden Ltd. (a) | | 10,145 | 415,945 |
| Sun Hing Vision Group Holdings Ltd. | | 270,000 | 108,542 |
| Texwinca Holdings Ltd. | | 680,000 | 412,659 |
| Vera Bradley, Inc. (a) | | 51 | 514 |
| Victory City International Holdings Ltd. | | 1,236,000 | 41,934 |
| Wolverine World Wide, Inc. | | 3,114 | 87,815 |
| Youngone Corp. | | 35 | 1,025 |
| Youngone Holdings Co. Ltd. | | 19 | 913 |
| Yue Yuen Industrial (Holdings) Ltd. | | 69,500 | 286,958 |
| | | | 5,643,093 |
|
| TOTAL CONSUMER DISCRETIONARY | | | 109,836,240 |
|
| CONSUMER STAPLES - 9.3% | | | |
| Beverages - 1.4% | | | |
| A.G. Barr PLC | | 42,029 | 332,718 |
| Baron de Ley SA (a) | | 1,810 | 233,552 |
| Beluga Group Pjsc (a) | | 1,160 | 11,680 |
| Britvic PLC | | 87,700 | 826,179 |
| C&C Group PLC | | 32,175 | 116,552 |
| Jinro Distillers Co. Ltd. | | 3 | 89 |
| Monster Beverage Corp. (a) | | 91,699 | 4,837,122 |
| Olvi PLC (A Shares) | | 1,304 | 45,893 |
| Spritzer Bhd | | 400 | 221 |
| Stock Spirits Group PLC | | 1,307 | 2,819 |
| Yantai Changyu Pioneer Wine Co. Ltd. (B Shares) | | 200 | 509 |
| | | | 6,407,334 |
| Food & Staples Retailing - 5.5% | | | |
| Amsterdam Commodities NV | | 1,910 | 56,753 |
| Aoki Super Co. Ltd. | | 3,000 | 36,954 |
| Belc Co. Ltd. | | 23,000 | 1,045,217 |
| Cosmos Pharmaceutical Corp. | | 16,100 | 3,428,981 |
| Create SD Holdings Co. Ltd. | | 75,200 | 1,903,789 |
| Daikokutenbussan Co. Ltd. | | 7,900 | 391,972 |
| Dong Suh Companies, Inc. | | 122 | 3,219 |
| Genky Stores, Inc. | | 10,100 | 376,992 |
| Halows Co. Ltd. | | 17,700 | 382,434 |
| Kroger Co. | | 32,647 | 800,504 |
| Kusuri No Aoki Holdings Co. Ltd. | | 11,300 | 622,169 |
| Majestic Wine PLC | | 40,848 | 172,329 |
| MARR SpA | | 3,217 | 82,335 |
| McColl's Retail Group PLC | | 20,282 | 62,485 |
| Medical System Network Co. Ltd. | | 900 | 3,935 |
| Metro, Inc. Class A (sub. vtg.) | | 335,100 | 11,350,530 |
| North West Co., Inc. | | 1,306 | 31,991 |
| Performance Food Group Co. (a) | | 1,907 | 54,922 |
| Qol Co. Ltd. | | 25,300 | 408,720 |
| Retail Partners Co. Ltd. | | 6,000 | 63,350 |
| Sligro Food Group NV | | 9,663 | 437,544 |
| Sundrug Co. Ltd. | | 44,100 | 1,644,075 |
| Tesco PLC (a) | | 141,470 | 325,154 |
| Total Produce PLC | | 121,964 | 314,029 |
| United Natural Foods, Inc. (a) | | 15,700 | 604,921 |
| Valor Holdings Co. Ltd. | | 6,600 | 149,307 |
| Yaoko Co. Ltd. | | 13,200 | 569,931 |
| | | | 25,324,542 |
| Food Products - 2.2% | | | |
| Aryzta AG | | 19,287 | 619,929 |
| Astral Foods Ltd. | | 1,324 | 14,536 |
| Bakkafrost | | 6 | 236 |
| Cranswick PLC | | 8,345 | 319,522 |
| Dean Foods Co. | | 4,812 | 72,180 |
| Devro PLC | | 33,683 | 95,993 |
| Food Empire Holdings Ltd. | | 553,000 | 269,328 |
| Fresh Del Monte Produce, Inc. | | 66,100 | 3,402,167 |
| Hilton Food Group PLC | | 8,000 | 71,300 |
| Japan Meat Co. Ltd. | | 4,000 | 65,817 |
| Lamb Weston Holdings, Inc. | | 603 | 26,520 |
| Lifeway Foods, Inc. (a) | | 3,013 | 27,629 |
| Mitsui Sugar Co. Ltd. | | 4,800 | 145,857 |
| Nam Yang Dairy Products | | 1 | 654 |
| Natori Co. Ltd. | | 2,200 | 40,909 |
| Omega Protein Corp. | | 8,734 | 139,744 |
| Origin Enterprises PLC | | 125,579 | 978,186 |
| Pacific Andes International Holdings Ltd. (a) | | 1,400,000 | 33,075 |
| Pacific Andes Resources Development Ltd. (a) | | 2,650,500 | 43,029 |
| Pickles Corp. | | 1,400 | 20,610 |
| President Rice Products PCL | | 16,500 | 29,503 |
| Rocky Mountain Chocolate Factory, Inc. | | 5,932 | 70,531 |
| S Foods, Inc. | | 5,400 | 201,315 |
| Seaboard Corp. | | 503 | 2,150,325 |
| Select Harvests Ltd. | | 60,605 | 237,572 |
| The Hain Celestial Group, Inc. (a) | | 16,569 | 740,800 |
| Want Want China Holdings Ltd. | | 215,000 | 145,337 |
| | | | 9,962,604 |
| Household Products - 0.0% | | | |
| Central Garden & Pet Co. Class A (non-vtg.) (a) | | 1,707 | 52,507 |
| Personal Products - 0.2% | | | |
| Asaleo Care Ltd. | | 1,088 | 1,158 |
| Coty, Inc. Class A | | 7,132 | 146,063 |
| Natural Alternatives International, Inc. (a) | | 903 | 9,030 |
| Nutraceutical International Corp. | | 12,970 | 542,146 |
| Sarantis SA | | 27,200 | 396,052 |
| | | | 1,094,449 |
| Tobacco - 0.0% | | | |
| Karelia Tobacco Co., Inc. | | 22 | 7,419 |
|
| TOTAL CONSUMER STAPLES | | | 42,848,855 |
|
| ENERGY - 2.8% | | | |
| Energy Equipment & Services - 0.9% | | | |
| AKITA Drilling Ltd. Class A (non-vtg.) | | 20,110 | 116,781 |
| Atwood Oceanics, Inc. (a) | | 95,419 | 749,993 |
| Bristow Group, Inc. | | 6,332 | 46,667 |
| Cathedral Energy Services Ltd. (a) | | 18,099 | 14,517 |
| Divestco, Inc. (a) | | 39,716 | 2,548 |
| Fugro NV (Certificaten Van Aandelen) (a) | | 21,618 | 347,275 |
| Geospace Technologies Corp. (a) | | 15,685 | 241,392 |
| Gulfmark Offshore, Inc. Class A (a) | | 34,689 | 5,377 |
| John Wood Group PLC | | 8,235 | 66,332 |
| Nabors Industries Ltd. | | 10,246 | 78,997 |
| National Oilwell Varco, Inc. | | 302 | 9,878 |
| Oceaneering International, Inc. | | 3,201 | 82,106 |
| Oil States International, Inc. (a) | | 32,172 | 799,474 |
| PHX Energy Services Corp. (a) | | 18,702 | 30,901 |
| Precision Drilling Corp. (a) | | 2,514 | 7,300 |
| Prosafe ASA (a) | | 2,514 | 9,752 |
| RigNet, Inc. (a) | | 808 | 15,312 |
| Shinko Plantech Co. Ltd. | | 16,000 | 136,859 |
| Solstad Offshore ASA (a) | | 28,153 | 33,728 |
| Total Energy Services, Inc. | | 28,053 | 272,261 |
| Unit Corp. (a) | | 59,021 | 1,061,198 |
| | | | 4,128,648 |
| Oil, Gas & Consumable Fuels - 1.9% | | | |
| Adams Resources & Energy, Inc. | | 1,810 | 68,762 |
| Beach Energy Ltd. | | 177,569 | 96,598 |
| Boardwalk Pipeline Partners, LP | | 9,041 | 151,346 |
| Bonavista Energy Corp. | | 3,821 | 9,593 |
| Contango Oil & Gas Co. (a) | | 26,946 | 161,676 |
| Denbury Resources, Inc. (a) | | 103,564 | 151,203 |
| Enagas SA | | 1,268 | 35,853 |
| Eni SpA | | 100,245 | 1,587,193 |
| Fuji Kosan Co. Ltd. | | 8,700 | 46,402 |
| Hankook Shell Oil Co. Ltd. | | 4 | 1,472 |
| HollyFrontier Corp. | | 1,307 | 37,694 |
| International Seaways, Inc. (a) | | 302 | 6,889 |
| James Fisher and Sons PLC | | 1,406 | 29,125 |
| Marathon Oil Corp. | | 39,614 | 484,479 |
| Murphy Oil Corp. | | 102,357 | 2,720,649 |
| Newfield Exploration Co. (a) | | 4,521 | 129,888 |
| Star Petroleum Refining PCL | | 83,500 | 38,643 |
| Tesoro Corp. | | 16,694 | 1,661,554 |
| Thai Oil PCL (For. Reg.) | | 5,000 | 12,884 |
| Uehara Sei Shoji Co. Ltd. | | 11,000 | 71,341 |
| Whitecap Resources, Inc. | | 5,624 | 41,546 |
| Whiting Petroleum Corp. (a) | | 2,610 | 13,703 |
| World Fuel Services Corp. | | 25,537 | 825,867 |
| WPX Energy, Inc. (a) | | 12,357 | 133,208 |
| | | | 8,517,568 |
|
| TOTAL ENERGY | | | 12,646,216 |
|
| FINANCIALS - 11.9% | | | |
| Banks - 1.2% | | | |
| ACNB Corp. | | 1,508 | 42,903 |
| Associated Banc-Corp. | | 5,222 | 125,067 |
| Bank Ireland Group PLC (a) | | 152,727 | 1,274,627 |
| Bank of America Corp. | | 1,908 | 46,021 |
| Bar Harbor Bankshares | | 703 | 19,607 |
| Boston Private Financial Holdings, Inc. | | 2,812 | 43,164 |
| Camden National Corp. | | 800 | 33,600 |
| Cathay General Bancorp | | 9,680 | 362,516 |
| Central Pacific Financial Corp. | | 1,908 | 59,014 |
| Central Valley Community Bancorp | | 1,808 | 39,740 |
| Codorus Valley Bancorp, Inc. | | 8,646 | 241,742 |
| CVB Financial Corp. | | 1,808 | 38,944 |
| Dah Sing Banking Group Ltd. | | 22,400 | 48,007 |
| Dimeco, Inc. | | 302 | 16,459 |
| East West Bancorp, Inc. | | 1,307 | 74,473 |
| First Bancorp, Puerto Rico (a) | | 96,417 | 565,004 |
| First West Virginia Bancorp, Inc. | | 505 | 10,555 |
| Hope Bancorp, Inc. | | 8,356 | 147,316 |
| Huntington Bancshares, Inc. | | 6,931 | 91,836 |
| Investors Bancorp, Inc. | | 2,615 | 34,727 |
| KeyCorp | | 4,921 | 88,775 |
| LCNB Corp. | | 5,820 | 116,691 |
| Northrim Bancorp, Inc. | | 1,508 | 43,958 |
| Norwood Financial Corp. | | 2,012 | 86,194 |
| OFG Bancorp | | 4,564 | 45,868 |
| Popular, Inc. | | 17,400 | 733,236 |
| Regions Financial Corp. | | 2,712 | 39,595 |
| SpareBank 1 SR-Bank ASA (primary capital certificate) | | 16,842 | 168,145 |
| Sparebanken More (primary capital certificate) | | 2,816 | 89,893 |
| Sparebanken Nord-Norge | | 31,672 | 236,648 |
| Trico Bancshares | | 6,634 | 244,795 |
| United Community Bank, Inc. | | 1,608 | 44,638 |
| Van Lanschot NV (Bearer) | | 14,376 | 426,564 |
| | | | 5,680,322 |
| Capital Markets - 0.6% | | | |
| AllianceBernstein Holding LP | | 8,141 | 201,490 |
| Ares Capital Corp. | | 45 | 738 |
| Banca Generali SpA | | 1,606 | 57,035 |
| Carlyle Group LP | | 905 | 18,553 |
| Close Brothers Group PLC | | 1,809 | 36,757 |
| Cowen Group, Inc. Class A (a) | | 7,941 | 127,056 |
| Federated Investors, Inc. Class B (non-vtg.) | | 5,727 | 165,109 |
| Franklin Resources, Inc. | | 13,473 | 603,321 |
| Greenhill & Co., Inc. | | 2,813 | 52,041 |
| Invesco Ltd. | | 1,707 | 59,352 |
| Lazard Ltd. Class A | | 3,822 | 178,526 |
| State Street Corp. | | 2,915 | 271,765 |
| Tullett Prebon PLC | | 7,632 | 49,029 |
| Waddell & Reed Financial, Inc. Class A | | 38,784 | 801,665 |
| | | | 2,622,437 |
| Consumer Finance - 0.7% | | | |
| Aeon Credit Service (Asia) Co. Ltd. | | 174,000 | 132,770 |
| Ally Financial, Inc. | | 4,019 | 90,990 |
| H&T Group PLC | | 7,340 | 27,939 |
| Nicholas Financial, Inc. (a) | | 4,826 | 41,504 |
| Santander Consumer U.S.A. Holdings, Inc. (a) | | 51,480 | 659,459 |
| Synchrony Financial | | 74,802 | 2,267,997 |
| | | | 3,220,659 |
| Diversified Financial Services - 0.4% | | | |
| Far East Horizon Ltd. | | 33,000 | 28,138 |
| Leucadia National Corp. | | 1,406 | 36,598 |
| Ricoh Leasing Co. Ltd. | | 10,500 | 367,160 |
| Scandinavian Tobacco Group A/S | | 26,719 | 431,264 |
| Varex Imaging Corp. (a) | | 1,300 | 40,105 |
| Voya Financial, Inc. | | 18,324 | 719,034 |
| | | | 1,622,299 |
| Insurance - 8.1% | | | |
| AEGON NV | | 650,943 | 3,648,831 |
| AFLAC, Inc. | | 3,819 | 304,565 |
| April | | 31,200 | 480,149 |
| ASR Nederland NV | | 7,641 | 289,001 |
| Assurant, Inc. | | 39,821 | 4,191,957 |
| Aub Group Ltd. | | 3,233 | 33,365 |
| Axis Capital Holdings Ltd. | | 51,200 | 3,306,496 |
| CNO Financial Group, Inc. | | 2,009 | 45,966 |
| FBD Holdings PLC (a) | | 2,000 | 20,006 |
| FNF Group | | 900 | 43,974 |
| Genworth Financial, Inc. Class A (a) | | 94,113 | 322,808 |
| Great-West Lifeco, Inc. | | 603 | 17,209 |
| Hartford Financial Services Group, Inc. | | 34,689 | 1,907,895 |
| Hiscox Ltd. | | 3,113 | 53,313 |
| Hyundai Fire & Marine Insurance Co. Ltd. | | 6 | 243 |
| James River Group Holdings Ltd. | | 4,212 | 169,154 |
| Lincoln National Corp. | | 71,427 | 5,218,457 |
| MetLife, Inc. | | 55 | 3,025 |
| National Western Life Group, Inc. | | 1,709 | 575,232 |
| NN Group NV | | 15,732 | 638,601 |
| Primerica, Inc. | | 2,311 | 187,307 |
| RenaissanceRe Holdings Ltd. | | 29,100 | 4,275,081 |
| Sony Financial Holdings, Inc. | | 35,400 | 613,628 |
| Torchmark Corp. | | 3,110 | 245,597 |
| Universal Insurance Holdings, Inc. | | 2,210 | 52,709 |
| Unum Group | | 207,010 | 10,377,411 |
| | | | 37,021,980 |
| Mortgage Real Estate Investment Trusts - 0.5% | | | |
| Annaly Capital Management, Inc. | | 197,274 | 2,373,206 |
| MFA Financial, Inc. | | 4,218 | 35,811 |
| | | | 2,409,017 |
| Thrifts & Mortgage Finance - 0.4% | | | |
| ASAX Co. Ltd. | | 1,500 | 22,967 |
| Genworth MI Canada, Inc. | | 54,698 | 1,595,642 |
| Genworth Mortgage Insurance Ltd. | | 84,428 | 203,303 |
| Meridian Bancorp, Inc. Maryland | | 3,316 | 58,527 |
| Nationstar Mortgage Holdings, Inc. (a) | | 7,237 | 129,036 |
| | | | 2,009,475 |
|
| TOTAL FINANCIALS | | | 54,586,189 |
|
| HEALTH CARE - 12.5% | | | |
| Biotechnology - 1.3% | | | |
| Amgen, Inc. | | 33,985 | 5,930,722 |
| Myriad Genetics, Inc. (a) | | 1,307 | 31,721 |
| | | | 5,962,443 |
| Health Care Equipment & Supplies - 0.7% | | | |
| Ansell Ltd. | | 3,780 | 66,437 |
| Arts Optical International Holdings Ltd. | | 314,000 | 112,160 |
| Atrion Corp. | | 101 | 63,852 |
| Boston Scientific Corp. (a) | | 4,824 | 128,415 |
| Exactech, Inc. (a) | | 2,014 | 58,708 |
| Hoshiiryou Sanki Co. Ltd. | | 4,100 | 156,755 |
| Huvitz Co. Ltd. | | 3 | 35 |
| Integer Holdings Corp. (a) | | 201 | 9,206 |
| Nakanishi, Inc. | | 8,500 | 356,592 |
| Prim SA | | 19,607 | 256,015 |
| ResMed, Inc. | | 1,306 | 100,719 |
| Shandong Weigao Medical Polymer Co. Ltd. (H Shares) | | 12,000 | 9,679 |
| Supermax Corp. Bhd | | 1,700 | 762 |
| Techno Medica Co. Ltd. | | 500 | 8,858 |
| Top Glove Corp. Bhd | | 100 | 134 |
| Utah Medical Products, Inc. | | 4,826 | 333,477 |
| Zimmer Biomet Holdings, Inc. | | 13,173 | 1,598,148 |
| | | | 3,259,952 |
| Health Care Providers & Services - 9.4% | | | |
| Aetna, Inc. | | 58,016 | 8,952,449 |
| Almost Family, Inc. (a) | | 6,442 | 318,557 |
| Anthem, Inc. | | 25,439 | 4,736,996 |
| DVx, Inc. | | 9,500 | 108,576 |
| Hanger, Inc. (a) | | 34,100 | 395,560 |
| LHC Group, Inc. (a) | | 8,656 | 501,182 |
| Lifco AB | | 8,144 | 271,440 |
| Medica Sur SA de CV | | 4,625 | 10,262 |
| MEDNAX, Inc. (a) | | 2,312 | 108,618 |
| Premier, Inc. (a) | | 1,900 | 66,310 |
| Ship Healthcare Holdings, Inc. | | 1,700 | 52,274 |
| Sigma Healthcare Ltd. | | 51,403 | 39,478 |
| The Ensign Group, Inc. | | 3,221 | 72,054 |
| Tokai Corp. | | 2,300 | 101,705 |
| Triple-S Management Corp. (a) | | 24,900 | 385,452 |
| Tsukui Corp. | | 12,400 | 75,359 |
| U.S. Physical Therapy, Inc. | | 603 | 38,049 |
| United Drug PLC (United Kingdom) | | 79,868 | 892,550 |
| UnitedHealth Group, Inc. | | 134,338 | 25,767,357 |
| WIN-Partners Co. Ltd. | | 34,100 | 432,726 |
| | | | 43,326,954 |
| Health Care Technology - 0.1% | | | |
| Addlife AB | | 5,200 | 107,236 |
| Computer Programs & Systems, Inc. | | 1,910 | 58,542 |
| HMS Holdings Corp. (a) | | 2,109 | 42,349 |
| ND Software Co. Ltd. | | 16,500 | 171,368 |
| Pharmagest Interactive | | 127 | 6,292 |
| | | | 385,787 |
| Life Sciences Tools & Services - 0.0% | | | |
| Bruker Corp. | | 1,707 | 48,957 |
| VWR Corp. (a) | | 2,000 | 66,000 |
| | | | 114,957 |
| Pharmaceuticals - 1.0% | | | |
| Akorn, Inc. (a) | | 1,205 | 40,512 |
| Daewoong Co. Ltd. | | 25 | 338 |
| Dawnrays Pharmaceutical Holdings Ltd. | | 152,000 | 91,463 |
| DepoMed, Inc. (a) | | 1,405 | 14,486 |
| DongKook Pharmaceutical Co. Ltd. | | 44 | 2,365 |
| Fuji Pharma Co. Ltd. | | 5,100 | 174,634 |
| Genomma Lab Internacional SA de CV (a) | | 52,454 | 67,444 |
| Indivior PLC | | 230,957 | 1,170,143 |
| Innoviva, Inc. (a) | | 3,716 | 50,984 |
| Korea United Pharm, Inc. | | 17 | 306 |
| Kyung Dong Pharmaceutical Co. Ltd. | | 34 | 583 |
| Lee's Pharmaceutical Holdings Ltd. | | 111,500 | 88,363 |
| Novo Nordisk A/S Series B sponsored ADR | | 15,183 | 643,759 |
| Phibro Animal Health Corp. Class A | | 1,834 | 70,059 |
| Recordati SpA | | 41,159 | 1,758,937 |
| Tsumura & Co. | | 10,200 | 397,379 |
| Whanin Pharmaceutical Co. Ltd. | | 122 | 2,151 |
| | | | 4,573,906 |
|
| TOTAL HEALTH CARE | | | 57,623,999 |
|
| INDUSTRIALS - 7.5% | | | |
| Aerospace & Defense - 0.1% | | | |
| Aerojet Rocketdyne Holdings, Inc. (a) | | 12,059 | 282,784 |
| Astronics Corp. (a) | | 1,004 | 29,367 |
| Austal Ltd. | | 19,279 | 27,839 |
| Engility Holdings, Inc. (a) | | 12,669 | 369,555 |
| | | | 709,545 |
| Air Freight & Logistics - 0.1% | | | |
| Air T, Inc. (a) | | 2,614 | 42,478 |
| Atlas Air Worldwide Holdings, Inc. (a) | | 42 | 2,495 |
| Yusen Logistics Co. Ltd. | | 28,300 | 256,701 |
| | | | 301,674 |
| Airlines - 0.0% | | | |
| Air New Zealand Ltd. | | 15,621 | 39,300 |
| JetBlue Airways Corp. (a) | | 1,306 | 28,641 |
| | | | 67,941 |
| Building Products - 0.1% | | | |
| Advanced Drain Systems, Inc. Del | | 100 | 2,055 |
| Builders FirstSource, Inc. (a) | | 1 | 16 |
| Continental Building Products, Inc. (a) | | 5,222 | 114,884 |
| Gibraltar Industries, Inc. (a) | | 1,406 | 41,969 |
| Kondotec, Inc. | | 21,400 | 194,890 |
| | | | 353,814 |
| Commercial Services & Supplies - 0.7% | | | |
| Acme United Corp. | | 301 | 8,329 |
| Aeon Delight Co. Ltd. | | 1,500 | 50,138 |
| Aggreko PLC | | 2,340 | 26,197 |
| AJIS Co. Ltd. | | 12,200 | 247,110 |
| Asia File Corp. Bhd | | 300 | 231 |
| Calian Technologies Ltd. | | 8,845 | 198,503 |
| Civeo Corp. (a) | | 162,987 | 314,565 |
| Essendant, Inc. | | 27,950 | 348,816 |
| Interface, Inc. | | 3,012 | 57,077 |
| IWG PLC | | 11,030 | 47,734 |
| Knoll, Inc. | | 2,410 | 46,658 |
| Lion Rock Group Ltd. | | 260,000 | 55,590 |
| Loomis AB (B Shares) | | 1,607 | 59,712 |
| Mears Group PLC | | 10,340 | 67,394 |
| Mitie Group PLC | | 186,520 | 655,104 |
| Nac Co. Ltd. | | 12,800 | 115,408 |
| NICE Total Cash Management Co., Ltd. | | 96 | 900 |
| Prestige International, Inc. | | 16,600 | 181,893 |
| Programmed Maintenance Services Ltd. | | 25,951 | 61,867 |
| VICOM Ltd. | | 38,500 | 161,085 |
| VSE Corp. | | 11,466 | 594,512 |
| West Corp. | | 3,114 | 72,774 |
| | | | 3,371,597 |
| Construction & Engineering - 1.1% | | | |
| AECOM (a) | | 93,113 | 2,970,305 |
| Arcadis NV | | 34,184 | 699,472 |
| Boustead Projs. Pte Ltd. | | 14,100 | 9,728 |
| Boustead Singapore Ltd. | | 57,300 | 40,169 |
| C-Cube Corp. | | 4,400 | 20,315 |
| Daiichi Kensetsu Corp. | | 23,500 | 285,637 |
| Geumhwa PSC Co. Ltd. | | 25 | 839 |
| Jacobs Engineering Group, Inc. | | 2,914 | 153,626 |
| KBR, Inc. | | 21,125 | 315,185 |
| Kyeryong Construction Industrial Co. Ltd. (a) | | 49 | 783 |
| Meisei Industrial Co. Ltd. | | 15,100 | 97,932 |
| Mirait Holdings Corp. | | 9,800 | 115,027 |
| Nippon Rietec Co. Ltd. | | 16,000 | 188,816 |
| Quanta Services, Inc. (a) | | 904 | 30,492 |
| Severfield PLC | | 37,705 | 36,938 |
| Shinnihon Corp. | | 21,500 | 175,323 |
| Sterling Construction Co., Inc. (a) | | 10,436 | 133,372 |
| Toshiba Plant Systems & Services Corp. | | 2,100 | 34,211 |
| | | | 5,308,170 |
| Electrical Equipment - 0.5% | | | |
| Aichi Electric Co. Ltd. | | 4,200 | 116,196 |
| Aros Quality Group AB | | 9,954 | 285,411 |
| AZZ, Inc. | | 15,787 | 800,401 |
| Chiyoda Integre Co. Ltd. | | 4,500 | 96,739 |
| Hammond Power Solutions, Inc. Class A | | 6,234 | 36,701 |
| Korea Electric Terminal Co. Ltd. | | 49 | 3,085 |
| Servotronics, Inc. | | 2,212 | 20,990 |
| TKH Group NV (depositary receipt) | | 12,912 | 790,093 |
| | | | 2,149,616 |
| Industrial Conglomerates - 1.4% | | | |
| Carr's Group PLC | | 30,466 | 57,381 |
| DCC PLC (United Kingdom) | | 68,600 | 6,032,547 |
| Mytilineos Holdings SA (a) | | 11,658 | 115,926 |
| Reunert Ltd. | | 23,226 | 126,751 |
| | | | 6,332,605 |
| Machinery - 1.6% | | | |
| Aalberts Industries NV | | 106,200 | 4,639,052 |
| Allison Transmission Holdings, Inc. | | 3,000 | 113,400 |
| ASL Marine Holdings Ltd. (a) | | 617,400 | 57,861 |
| Gencor Industries, Inc. (a) | | 2,614 | 41,955 |
| Global Brass & Copper Holdings, Inc. | | 604 | 19,358 |
| Haitian International Holdings Ltd. | | 95,000 | 272,443 |
| Hurco Companies, Inc. | | 6,739 | 222,050 |
| Hyster-Yale Materials Handling Class A | | 2,837 | 201,030 |
| Ihara Science Corp. | | 13,500 | 264,992 |
| Jaya Holdings Ltd. | | 42,000 | 2,665 |
| Kyowakogyosyo Co. Ltd. | | 3,000 | 25,416 |
| Luxfer Holdings PLC sponsored ADR | | 4,016 | 51,003 |
| Maruzen Co. Ltd. | | 22,000 | 361,196 |
| Miller Industries, Inc. | | 803 | 20,958 |
| Mincon Group PLC | | 28,345 | 33,555 |
| Nadex Co. Ltd. | | 10,900 | 88,588 |
| Nakano Refrigerators Co. Ltd. | | 300 | 9,483 |
| Nitchitsu Co. Ltd. | | 8,000 | 15,456 |
| Rexnord Corp. (a) | | 1,506 | 34,879 |
| Semperit AG Holding | | 6,334 | 193,603 |
| Takamatsu Machinery Co. Ltd. | | 5,000 | 45,036 |
| Techno Smart Corp. | | 9,800 | 119,294 |
| Tocalo Co. Ltd. | | 10,700 | 409,093 |
| Trinity Industrial Corp. | | 10,000 | 78,008 |
| | | | 7,320,374 |
| Marine - 0.0% | | | |
| SITC International Holdings Co. Ltd. | | 66,000 | 54,924 |
| Tokyo Kisen Co. Ltd. | | 11,000 | 73,337 |
| | | | 128,261 |
| Professional Services - 0.5% | | | |
| Akka Technologies SA | | 9,545 | 521,353 |
| Asiakastieto Group Oyj | | 1,006 | 26,093 |
| Boardroom Ltd. | | 35,200 | 17,143 |
| CBIZ, Inc. (a) | | 2,009 | 29,834 |
| Clarius Group Ltd. (a) | | 37,960 | 2,338 |
| ICF International, Inc. (a) | | 3,210 | 145,253 |
| McMillan Shakespeare Ltd. | | 28,734 | 329,866 |
| SHL-JAPAN Ltd. | | 700 | 25,811 |
| Stantec, Inc. | | 27,068 | 688,668 |
| Synergie SA | | 1,709 | 80,965 |
| TriNet Group, Inc. (a) | | 2,210 | 77,350 |
| TrueBlue, Inc. (a) | | 7,654 | 195,560 |
| | | | 2,140,234 |
| Road & Rail - 0.7% | | | |
| Alps Logistics Co. Ltd. | | 38,800 | 279,795 |
| Avis Budget Group, Inc. (a) | | 600 | 18,468 |
| Chilled & Frozen Logistics Holdings Co. Ltd. | | 17,300 | 206,040 |
| CSX Corp. | | 2,713 | 133,859 |
| Daqin Railway Co. Ltd. (A Shares) | | 1,800 | 2,341 |
| Hamakyorex Co. Ltd. | | 17,000 | 449,807 |
| Higashi Twenty One Co. Ltd. | | 3,400 | 11,750 |
| Roadrunner Transportation Systems, Inc. (a) | | 49,278 | 343,960 |
| Sakai Moving Service Co. Ltd. | | 16,100 | 776,924 |
| Trancom Co. Ltd. | | 11,600 | 573,450 |
| Universal Logistics Holdings, Inc. | | 19,796 | 288,032 |
| | | | 3,084,426 |
| Trading Companies & Distributors - 0.6% | | | |
| AddTech AB (B Shares) | | 16,889 | 329,463 |
| AerCap Holdings NV (a) | | 3,217 | 157,955 |
| Goodfellow, Inc. | | 9,854 | 61,570 |
| HD Supply Holdings, Inc. (a) | | 6,100 | 198,189 |
| HERIGE | | 805 | 36,794 |
| Houston Wire & Cable Co. | | 83 | 477 |
| KS Energy Services Ltd. (a) | | 180,000 | 3,852 |
| Meiwa Corp. | | 23,400 | 92,967 |
| Mitani Shoji Co. Ltd. | | 10,000 | 394,122 |
| MRC Global, Inc. (a) | | 4,059 | 66,324 |
| Nexeo Solutions, Inc. (a) | | 12,055 | 100,418 |
| Otec Corp. | | 1,700 | 24,225 |
| Parker Corp. | | 30,000 | 156,742 |
| Richelieu Hardware Ltd. | | 11,865 | 309,580 |
| Senshu Electric Co. Ltd. | | 12,200 | 245,450 |
| Strongco Corp. (a) | | 11,563 | 12,242 |
| Tanaka Co. Ltd. | | 500 | 3,424 |
| TECHNO ASSOCIE Co. Ltd. | | 3,500 | 39,843 |
| Titan Machinery, Inc. (a) | | 11,205 | 200,009 |
| Totech Corp. | | 12,700 | 230,396 |
| | | | 2,664,042 |
| Transportation Infrastructure - 0.1% | | | |
| Isewan Terminal Service Co. Ltd. | | 17,700 | 103,556 |
| Meiko Transportation Co. Ltd. | | 11,000 | 124,722 |
| Qingdao Port International Co. Ltd. | | 62,000 | 35,085 |
| Sinwa Ltd. | | 278,700 | 45,245 |
| | | | 308,608 |
|
| TOTAL INDUSTRIALS | | | 34,240,907 |
|
| INFORMATION TECHNOLOGY - 16.2% | | | |
| Communications Equipment - 0.1% | | | |
| ADTRAN, Inc. | | 2,510 | 58,860 |
| Black Box Corp. | | 20,311 | 160,457 |
| Cisco Systems, Inc. | | 1,105 | 34,752 |
| CommScope Holding Co., Inc. (a) | | 3,514 | 129,245 |
| Juniper Networks, Inc. | | 2,108 | 58,919 |
| Tessco Technologies, Inc. | | 1,507 | 20,118 |
| | | | 462,351 |
| Electronic Equipment & Components - 3.7% | | | |
| A&D Co. Ltd. | | 10,300 | 42,790 |
| AAC Technology Holdings, Inc. | | 4,500 | 60,551 |
| AVX Corp. | | 3,415 | 61,026 |
| Beijer Electronics AB (a) | | 1,508 | 8,274 |
| Bel Fuse, Inc. Class A | | 1,206 | 26,170 |
| Cardtronics PLC | | 4,017 | 125,732 |
| CDW Corp. | | 4,819 | 305,669 |
| Corning, Inc. | | 1,908 | 55,599 |
| CTS Corp. | | 4,624 | 101,728 |
| Daido Signal Co. Ltd. | | 1,000 | 4,844 |
| Elec & Eltek International Co. Ltd. | | 20,400 | 33,864 |
| Elematec Corp. | | 16,100 | 291,931 |
| Excel Co. Ltd. | | 10,200 | 133,045 |
| FLIR Systems, Inc. | | 1,909 | 71,244 |
| Hi-P International Ltd. | | 238,600 | 179,590 |
| IDIS Holdings Co. Ltd. | | 56 | 653 |
| Image Sensing Systems, Inc. (a) | | 905 | 3,258 |
| Intelligent Digital Integrated Security Co. Ltd. | | 63 | 456 |
| Isra Vision AG | | 4,626 | 848,272 |
| Jabil, Inc. | | 7,230 | 220,515 |
| Keysight Technologies, Inc. (a) | | 36,700 | 1,526,353 |
| Kingboard Chemical Holdings Ltd. | | 1,064,500 | 4,797,255 |
| Kingboard Laminates Holdings Ltd. | | 51,000 | 71,171 |
| Mesa Laboratories, Inc. | | 3,117 | 450,500 |
| Muramoto Electronic Thailand PCL (For. Reg.) | | 17,400 | 118,696 |
| Nippo Ltd. (a) | | 10,100 | 31,332 |
| PAX Global Technology Ltd. | | 55,000 | 36,475 |
| Philips Lighting NV | | 1,506 | 57,228 |
| Pinnacle Technology Holdings Ltd. | | 100,900 | 155,728 |
| ScanSource, Inc. (a) | | 28,656 | 1,134,778 |
| Shibaura Electronics Co. Ltd. | | 8,600 | 290,190 |
| Sigmatron International, Inc. (a) | | 3,318 | 27,738 |
| SYNNEX Corp. | | 36,901 | 4,388,267 |
| Tomen Devices Corp. | | 7,700 | 167,976 |
| TTM Technologies, Inc. (a) | | 15,949 | 277,194 |
| UKC Holdings Corp. | | 17,700 | 266,034 |
| VST Holdings Ltd. | | 1,638,000 | 436,196 |
| Wayside Technology Group, Inc. | | 803 | 13,812 |
| Wireless Telecom Group, Inc. (a) | | 5,329 | 7,887 |
| | | | 16,830,021 |
| Internet Software & Services - 0.1% | | | |
| Aucnet, Inc. | | 2,000 | 25,670 |
| eBay, Inc. (a) | | 1,333 | 47,628 |
| Gabia, Inc. | | 68 | 372 |
| Liquidity Services, Inc. (a) | | 3,821 | 25,983 |
| NetGem SA | | 11,563 | 33,673 |
| Pandora Media, Inc. (a) | | 603 | 5,397 |
| Softbank Technology Corp. | | 3,500 | 56,193 |
| Yahoo! Japan Corp. | | 37,500 | 170,076 |
| | | | 364,992 |
| IT Services - 4.7% | | | |
| ALTEN | | 8,947 | 772,647 |
| Amdocs Ltd. | | 88,177 | 5,922,849 |
| Argo Graphics, Inc. | | 5,300 | 129,610 |
| Blackhawk Network Holdings, Inc. (a) | | 1,506 | 65,737 |
| Computer Services, Inc. | | 3,519 | 172,431 |
| CSE Global Ltd. | | 552,700 | 169,258 |
| CSRA, Inc. | | 64,548 | 2,104,910 |
| Data#3 Ltd. | | 38,315 | 54,561 |
| DXC Technology Co. | | 1,241 | 97,270 |
| E-Credible Co. Ltd. | | 9 | 107 |
| EOH Holdings Ltd. | | 90,392 | 739,049 |
| Estore Corp. | | 3,900 | 28,018 |
| EVERTEC, Inc. | | 24,024 | 428,828 |
| ExlService Holdings, Inc. (a) | | 2,410 | 138,696 |
| First Data Corp. Class A (a) | | 8,229 | 153,553 |
| Genpact Ltd. | | 2,526 | 73,254 |
| GetBusy PLC (a) | | 2 | 0 |
| Hackett Group, Inc. | | 1,514 | 24,860 |
| HIQ International AB | | 6,938 | 46,403 |
| Indra Sistemas (a) | | 178,000 | 2,759,331 |
| Know IT AB | | 19,506 | 314,679 |
| Leidos Holdings, Inc. | | 8,748 | 467,493 |
| Luxoft Holding, Inc. (a) | | 1,207 | 75,981 |
| NCI, Inc. Class A (a) | | 8,857 | 176,697 |
| Net 1 UEPS Technologies, Inc. (a) | | 7,037 | 68,118 |
| Neustar, Inc. Class A (a) | | 15,585 | 520,539 |
| Paysafe Group PLC (a) | | 5,120 | 39,856 |
| Perficient, Inc. (a) | | 5,925 | 111,390 |
| Societe Pour L'Informatique Industrielle SA | | 22,500 | 597,967 |
| Softcreate Co. Ltd. | | 8,200 | 107,851 |
| Sword Group | | 4,366 | 179,346 |
| The Western Union Co. | | 249,959 | 4,936,690 |
| TravelSky Technology Ltd. (H Shares) | | 24,000 | 63,604 |
| Vantiv, Inc. (a) | | 904 | 57,449 |
| | | | 21,599,032 |
| Semiconductors & Semiconductor Equipment - 0.6% | | | |
| Axell Corp. | | 10,500 | 71,051 |
| Boe Varitronix Ltd. | | 99,000 | 52,854 |
| Diodes, Inc. (a) | | 300 | 7,959 |
| Entegris, Inc. (a) | | 6,125 | 159,863 |
| Integrated Device Technology, Inc. (a) | | 7,130 | 186,378 |
| Lasertec Corp. | | 1,000 | 14,949 |
| Leeno Industrial, Inc. | | 42 | 1,860 |
| Melexis NV | | 26,400 | 2,271,419 |
| Miraial Co. Ltd. | | 2,400 | 23,076 |
| ON Semiconductor Corp. (a) | | 13,044 | 195,008 |
| Trio-Tech International (a) | | 3,117 | 14,619 |
| | | | 2,999,036 |
| Software - 3.6% | | | |
| Activision Blizzard, Inc. | | 2,510 | 155,068 |
| AdaptIT Holdings Ltd. | | 34,387 | 26,093 |
| ANSYS, Inc. (a) | | 53,997 | 6,995,311 |
| Aspen Technology, Inc. (a) | | 1,811 | 102,992 |
| Ebix, Inc. | | 35,594 | 2,055,554 |
| ICT Automatisering NV | | 8,347 | 123,515 |
| IGE + XAO SA | | 402 | 46,923 |
| InfoVine Co. Ltd. | | 12 | 291 |
| init innovation in traffic systems AG | | 1,586 | 30,772 |
| Jorudan Co. Ltd. | | 5,900 | 57,906 |
| KSK Co., Ltd. | | 7,200 | 95,090 |
| Oracle Corp. | | 132,083 | 6,594,904 |
| Pegasystems, Inc. | | 2,510 | 151,730 |
| Pro-Ship, Inc. | | 3,400 | 56,623 |
| RealPage, Inc. (a) | | 4,816 | 186,620 |
| Reckon Ltd. | | 1,201 | 1,441 |
| Synopsys, Inc. (a) | | 302 | 23,124 |
| Vitec Software Group AB | | 10,859 | 114,658 |
| | | | 16,818,615 |
| Technology Hardware, Storage & Peripherals - 3.4% | | | |
| Hewlett Packard Enterprise Co. | | 69,780 | 1,221,848 |
| HP, Inc. | | 104,044 | 1,987,240 |
| Seagate Technology LLC | | 333,124 | 10,979,767 |
| Super Micro Computer, Inc. (a) | | 6,026 | 161,798 |
| TPV Technology Ltd. | | 952,000 | 223,045 |
| Xerox Corp. | | 29,961 | 918,904 |
| | | | 15,492,602 |
|
| TOTAL INFORMATION TECHNOLOGY | | | 74,566,649 |
|
| MATERIALS - 2.9% | | | |
| Chemicals - 2.0% | | | |
| Axalta Coating Systems (a) | | 5,826 | 183,519 |
| C. Uyemura & Co. Ltd. | | 5,200 | 298,571 |
| Chase Corp. | | 9,452 | 1,021,289 |
| Core Molding Technologies, Inc. | | 9,253 | 176,455 |
| EcoGreen International Group Ltd. | | 686,000 | 141,402 |
| FMC Corp. | | 19,305 | 1,474,516 |
| Fujikura Kasei Co., Ltd. | | 36,800 | 216,304 |
| Fuso Chemical Co. Ltd. | | 10,400 | 346,682 |
| Honshu Chemical Industry Co. Ltd. | | 10,700 | 97,057 |
| Innospec, Inc. | | 9,853 | 614,827 |
| JSR Corp. | | 3,000 | 53,009 |
| K&S AG | | 12,669 | 329,871 |
| KPC Holdings Corp. | | 3 | 179 |
| KPX Green Chemical Co. Ltd. | | 26 | 105 |
| Miwon Chemicals Co. Ltd. | | 4 | 236 |
| Miwon Commercial Co. Ltd. (a) | | 1 | 202 |
| Muto Seiko Co. Ltd. (a) | | 3,400 | 22,483 |
| Nihon Parkerizing Co. Ltd. | | 3,800 | 54,564 |
| Nippon Soda Co. Ltd. | | 21,000 | 118,482 |
| Olin Corp. | | 1,205 | 35,523 |
| PolyOne Corp. | | 1,205 | 44,079 |
| Potash Corp. of Saskatchewan, Inc. | | 22,221 | 397,456 |
| SK Kaken Co. Ltd. | | 4,000 | 362,828 |
| Soda Aromatic Co. Ltd. | | 3,400 | 35,035 |
| Soken Chemical & Engineer Co. Ltd. | | 9,100 | 127,860 |
| T&K Toka Co. Ltd. | | 18,600 | 204,483 |
| Thai Carbon Black PCL (For. Reg.) | | 156,800 | 170,811 |
| Thai Rayon PCL: | | | |
| (For. Reg.) | | 37,000 | 46,700 |
| NVDR | | 1,200 | 1,515 |
| Victrex PLC | | 101 | 2,627 |
| Yara International ASA | | 56,910 | 2,267,613 |
| Yip's Chemical Holdings Ltd. | | 352,000 | 146,464 |
| | | | 8,992,747 |
| Construction Materials - 0.1% | | | |
| Brampton Brick Ltd. Class A (sub. vtg.) (a) | | 9,150 | 62,529 |
| Mitani Sekisan Co. Ltd. | | 20,300 | 477,831 |
| RHI AG | | 1,204 | 45,495 |
| | | | 585,855 |
| Containers & Packaging - 0.4% | | | |
| AMVIG Holdings Ltd. | | 48,000 | 13,950 |
| Ball Corp. | | 4,320 | 181,008 |
| Berry Global Group, Inc. (a) | | 2,713 | 152,145 |
| Chuoh Pack Industry Co. Ltd. | | 5,700 | 65,870 |
| Graphic Packaging Holding Co. | | 1,607 | 21,196 |
| Kohsoku Corp. | | 23,600 | 234,405 |
| Owens-Illinois, Inc. (a) | | 1,105 | 26,410 |
| Pact Group Holdings Ltd. | | 6,703 | 30,727 |
| Samhwa Crown & Closure Co. Ltd. | | 4 | 185 |
| Sealed Air Corp. | | 1,508 | 65,613 |
| Silgan Holdings, Inc. | | 5,433 | 164,620 |
| The Pack Corp. | | 21,300 | 689,746 |
| UFP Technologies, Inc. (a) | | 1,104 | 31,850 |
| | | | 1,677,725 |
| Metals & Mining - 0.4% | | | |
| Alcoa Corp. | | 2,511 | 91,400 |
| Alconix Corp. | | 14,500 | 286,988 |
| Ausdrill Ltd. | | 28,629 | 44,547 |
| Chubu Steel Plate Co. Ltd. | | 5,600 | 37,233 |
| Compania de Minas Buenaventura SA sponsored ADR | | 30,868 | 377,824 |
| Freeport-McMoRan, Inc. (a) | | 6,630 | 96,931 |
| Granges AB | | 5,322 | 58,831 |
| Handy & Harman Ltd. (a) | | 1,508 | 49,915 |
| Hill & Smith Holdings PLC | | 12,898 | 228,036 |
| Newmont Mining Corp. | | 603 | 22,414 |
| Orosur Mining, Inc. (a) | | 40,621 | 7,331 |
| Orvana Minerals Corp. (a) | | 10,449 | 2,347 |
| Pacific Metals Co. Ltd. (a) | | 52,000 | 139,616 |
| Petra Diamonds Ltd. (a) | | 23,496 | 29,606 |
| Steel Dynamics, Inc. | | 1,808 | 64,021 |
| Tohoku Steel Co. Ltd. | | 8,500 | 122,359 |
| Tokyo Tekko Co. Ltd. | | 52,000 | 214,141 |
| Universal Stainless & Alloy Products, Inc. (a) | | 1,106 | 21,014 |
| Webco Industries, Inc. (a) | | 101 | 8,080 |
| | | | 1,902,634 |
| Paper & Forest Products - 0.0% | | | |
| Kapstone Paper & Packaging Corp. | | 1,708 | 39,045 |
| Western Forest Products, Inc. | | 25,606 | 50,935 |
| | | | 89,980 |
|
| TOTAL MATERIALS | | | 13,248,941 |
|
| REAL ESTATE - 0.9% | | | |
| Equity Real Estate Investment Trusts (REITs) - 0.3% | | | |
| CareTrust (REIT), Inc. | | 2,712 | 49,467 |
| Colony NorthStar, Inc. | | 12,162 | 178,052 |
| Corporate Office Properties Trust (SBI) | | 1,506 | 50,135 |
| Corrections Corp. of America | | 15,882 | 439,931 |
| Four Corners Property Trust, Inc. | | 4,219 | 107,078 |
| Healthcare Realty Trust, Inc. | | 1,406 | 46,820 |
| Nsi NV | | 113 | 4,417 |
| Outfront Media, Inc. | | 2,009 | 45,946 |
| Parkway, Inc. | | 3 | 69 |
| Senior Housing Properties Trust (SBI) | | 500 | 9,725 |
| Store Capital Corp. | | 2,610 | 61,048 |
| VEREIT, Inc. | | 46,651 | 387,670 |
| WP Glimcher, Inc. | | 1,910 | 17,228 |
| | | | 1,397,586 |
| Real Estate Management & Development - 0.6% | | | |
| Anabuki Kosan, Inc. | | 600 | 15,974 |
| BUWOG-Gemeinnuetzige Wohnung | | 2,286 | 67,208 |
| CBRE Group, Inc. (a) | | 1,910 | 72,561 |
| Century21 Real Estate Japan Ltd. | | 1,300 | 16,509 |
| Devine Ltd. (a) | | 24,056 | 7,024 |
| IMMOFINANZ Immobilien Anlagen AG | | 13,457 | 32,753 |
| Leopalace21 Corp. | | 58,000 | 414,041 |
| LSL Property Services PLC | | 17,866 | 59,992 |
| Realogy Holdings Corp. | | 2,009 | 66,699 |
| Relo Holdings Corp. | | 95,900 | 1,925,046 |
| Selvaag Bolig ASA | | 15,246 | 70,773 |
| Servcorp Ltd. | | 5,684 | 27,192 |
| Sino Land Ltd. | | 36,000 | 59,456 |
| Tejon Ranch Co. (a) | | 4,524 | 94,914 |
| Wing Tai Holdings Ltd. | | 22,643 | 34,086 |
| | | | 2,964,228 |
|
| TOTAL REAL ESTATE | | | 4,361,814 |
|
| TELECOMMUNICATION SERVICES - 0.0% | | | |
| Diversified Telecommunication Services - 0.0% | | | |
| Asia Satellite Telecommunications Holdings Ltd. | | 5,500 | 5,633 |
| UTILITIES - 0.5% | | | |
| Electric Utilities - 0.3% | | | |
| Exelon Corp. | | 38,307 | 1,468,690 |
| Hawaiian Electric Industries, Inc. | | 1,105 | 36,454 |
| | | | 1,505,144 |
| Gas Utilities - 0.1% | | | |
| Busan City Gas Co. Ltd. | | 1 | 34 |
| Hokuriku Gas Co. | | 2,100 | 54,383 |
| K&O Energy Group, Inc. | | 7,300 | 111,640 |
| Keiyo Gas Co. Ltd. | | 8,000 | 40,637 |
| South Jersey Industries, Inc. | | 3,114 | 105,783 |
| Star Gas Partners LP | | 4,723 | 51,859 |
| | | | 364,336 |
| Independent Power and Renewable Electricity Producers - 0.0% | | | |
| Mega First Corp. Bhd | | 2,300 | 2,063 |
| Mega First Corp. Bhd warrants 4/8/20 (a) | | 302 | 139 |
| The AES Corp. | | 4,017 | 44,910 |
| | | | 47,112 |
| Multi-Utilities - 0.1% | | | |
| CMS Energy Corp. | | 7,535 | 348,418 |
| Water Utilities - 0.0% | | | |
| Manila Water Co., Inc. | | 76,700 | 48,673 |
|
| TOTAL UTILITIES | | | 2,313,683 |
|
| TOTAL COMMON STOCKS | | | |
| (Cost $405,175,836) | | | 406,279,126 |
|
| Nonconvertible Preferred Stocks - 0.1% | | | |
| ENERGY - 0.0% | | | |
| Oil, Gas & Consumable Fuels - 0.0% | | | |
| Centrus Energy Corp. 7.50% (a)(b) | | 100 | 21,925 |
| MATERIALS - 0.1% | | | |
| Construction Materials - 0.1% | | | |
| Buzzi Unicem SpA (Risparmio Shares) | | 20,914 | 298,829 |
| TOTAL NONCONVERTIBLE PREFERRED STOCKS | | | |
| (Cost $315,681) | | | 320,754 |
| | | Principal Amount | Value |
|
| Nonconvertible Bonds - 0.0% | | | |
| ENERGY - 0.0% | | | |
| Oil, Gas & Consumable Fuels - 0.0% | | | |
| Centrus Energy Corp. 8.25% 2/28/27(b) | | | |
| (Cost $48,002) | | 60,000 | 48,000 |
| | | Shares | Value |
|
| Money Market Funds - 11.5% | | | |
| Fidelity Cash Central Fund, 1.11% (c) | | | |
| (Cost $52,999,644) | | 52,989,046 | 52,999,644 |
|
| Equity Funds - 0.0% | | | |
| International Equity Funds - 0.0% | | | |
| iShares MSCI Japan Small Capital Index ETF | | 38 | 2,724 |
| Small Blend Funds - 0.0% | | | |
| iShares Russell 2000 Index ETF | | 33 | 4,670 |
| TOTAL EQUITY FUNDS | | | |
| (Cost $7,158) | | | 7,394 |
| TOTAL INVESTMENT PORTFOLIO - 100.0% | | | |
| (Cost $458,546,321) | | | 459,654,918 |
| NET OTHER ASSETS (LIABILITIES) - 0.0% | | | (184,847) |
| NET ASSETS - 100% | | | $459,470,071 |
Security Type Abbreviations
ETF – Exchange-Traded Fund
Legend
(a) Non-income producing
(b) Security exempt from registration under Rule 144A of the Securities Act of 1933. These securities may be resold in transactions exempt from registration, normally to qualified institutional buyers. At the end of the period, the value of these securities amounted to $69,925 or 0.0% of net assets.
(c) Affiliated fund that is generally available only to investment companies and other accounts managed by Fidelity Investments. The rate quoted is the annualized seven-day yield of the fund at period end. A complete unaudited listing of the fund's holdings as of its most recent quarter end is available upon request. In addition, each Fidelity Central Fund's financial statements, which are not covered by the Fund's Report of Independent Registered Public Accounting Firm, are available on the SEC's website or upon request.
Affiliated Central Funds
Information regarding fiscal year to date income earned by the Fund from investments in Fidelity Central Funds is as follows:
| Fund | Income earned |
| Fidelity Cash Central Fund | $2,220 |
| Total | $2,220 |
Investment Valuation
The following is a summary of the inputs used, as of July 31, 2017, involving the Fund's assets and liabilities carried at fair value. The inputs or methodology used for valuing securities may not be an indication of the risk associated with investing in those securities. For more information on valuation inputs, and their aggregation into the levels used below, please refer to the Investment Valuation section in the accompanying Notes to Financial Statements.
| | Valuation Inputs at Reporting Date: |
| Description | Total | Level 1 | Level 2 | Level 3 |
| Investments in Securities: | | | | |
| Equities: | | | | |
| Consumer Discretionary | $109,836,240 | $109,818,911 | $10,613 | $6,716 |
| Consumer Staples | 42,848,855 | 42,772,751 | -- | 76,104 |
| Energy | 12,668,141 | 11,059,023 | 1,587,193 | 21,925 |
| Financials | 54,586,189 | 50,937,358 | 3,648,831 | -- |
| Health Care | 57,623,999 | 57,623,999 | -- | -- |
| Industrials | 34,240,907 | 34,240,907 | -- | -- |
| Information Technology | 74,566,649 | 74,566,649 | -- | -- |
| Materials | 13,547,770 | 13,547,770 | -- | -- |
| Real Estate | 4,361,814 | 4,361,814 | -- | -- |
| Telecommunication Services | 5,633 | 5,633 | -- | -- |
| Utilities | 2,313,683 | 2,313,683 | -- | -- |
| Corporate Bonds | 48,000 | -- | 48,000 | -- |
| Money Market Funds | 52,999,644 | 52,999,644 | -- | -- |
| Equity Funds | 7,394 | 7,394 | -- | -- |
| Total Investments in Securities: | $459,654,918 | $454,255,536 | $5,294,637 | $104,745 |
Other Information
Distribution of investments by country or territory of incorporation, as a percentage of Total Net Assets, is as follows (Unaudited):
| United States of America | 58.7% |
| Japan | 10.1% |
| United Kingdom | 5.7% |
| Ireland | 4.7% |
| Canada | 4.7% |
| Netherlands | 3.0% |
| Bermuda | 2.6% |
| Cayman Islands | 2.3% |
| Bailiwick of Guernsey | 1.3% |
| Others (Individually Less Than 1%) | 6.9% |
| | 100.0% |
See accompanying notes which are an integral part of the financial statements.
Financial Statements
Statement of Assets and Liabilities
| | | July 31, 2017 |
| Assets | | |
Investment in securities, at value — See accompanying schedule:
Unaffiliated issuers (cost $405,546,677) | $406,655,274 | |
| Fidelity Central Funds (cost $52,999,644) | 52,999,644 | |
| Total Investments (cost $458,546,321) | | $459,654,918 |
| Cash | | 40,384 |
| Foreign currency held at value (cost $59) | | 60 |
| Receivable for investments sold | | 53,032 |
| Receivable for fund shares sold | | 35,461 |
| Dividends receivable | | 724 |
| Interest receivable | | 2,309 |
| Distributions receivable from Fidelity Central Funds | | 1,788 |
| Total assets | | 459,788,676 |
| Liabilities | | |
| Payable for fund shares redeemed | $308,226 | |
| Accrued management fee | 10,379 | |
| Total liabilities | | 318,605 |
| Net Assets | | $459,470,071 |
| Net Assets consist of: | | |
| Paid in capital | | $458,364,807 |
| Undistributed net investment income | | 25,704 |
| Accumulated undistributed net realized gain (loss) on investments and foreign currency transactions | | (28,911) |
| Net unrealized appreciation (depreciation) on investments and assets and liabilities in foreign currencies | | 1,108,471 |
| Net Assets, for 44,897,878 shares outstanding | | $459,470,071 |
| Net Asset Value, offering price and redemption price per share ($459,470,071 ÷ 44,897,878 shares) | | $10.23 |
See accompanying notes which are an integral part of the financial statements.
Statement of Operations
| | | For the period
May 26, 2017 (commencement of operations) to
July 31, 2017 |
| Investment Income | | |
| Dividends | | $6,029 |
| Interest | | 37 |
| Income from Fidelity Central Funds | | 2,220 |
| Total income | | 8,286 |
| Expenses | | |
| Management fee | $11,330 | |
| Independent trustees' fees and expenses | 1 | |
| Total expenses | | 11,331 |
| Net investment income (loss) | | (3,045) |
| Realized and Unrealized Gain (Loss) | | |
| Net realized gain (loss) on: | | |
| Investment securities: | | |
| Unaffiliated issuers | 19 | |
| Foreign currency transactions | (180) | |
| Total net realized gain (loss) | | (161) |
Change in net unrealized appreciation (depreciation) on:
Investment securities | 1,108,597 | |
| Assets and liabilities in foreign currencies | (126) | |
| Total change in net unrealized appreciation (depreciation) | | 1,108,471 |
| Net gain (loss) | | 1,108,310 |
| Net increase (decrease) in net assets resulting from operations | | $1,105,265 |
See accompanying notes which are an integral part of the financial statements.
Statement of Changes in Net Assets
| | For the period
May 26, 2017 (commencement of operations) to
July 31, 2017 |
| Increase (Decrease) in Net Assets | |
| Operations | |
| Net investment income (loss) | $(3,045) |
| Net realized gain (loss) | (161) |
| Change in net unrealized appreciation (depreciation) | 1,108,471 |
| Net increase (decrease) in net assets resulting from operations | 1,105,265 |
| Share transactions | |
| Proceeds from sales of shares | 458,673,032 |
| Cost of shares redeemed | (308,226) |
| Net increase (decrease) in net assets resulting from share transactions | 458,364,806 |
| Total increase (decrease) in net assets | 459,470,071 |
| Net Assets | |
| Beginning of period | – |
| End of period | $459,470,071 |
| Other Information | |
| Undistributed net investment income end of period | $25,704 |
| Shares | |
| Sold | 44,928,008 |
| Redeemed | (30,130) |
| Net increase (decrease) | 44,897,878 |
See accompanying notes which are an integral part of the financial statements.
Financial Highlights — Fidelity Low-Priced Stock K6 Fund
| Years ended July 31, | 2017 A |
| Selected Per–Share Data | |
| Net asset value, beginning of period | $10.00 |
| Income from Investment Operations | |
| Net investment income (loss)B,C | – |
| Net realized and unrealized gain (loss) | .23 |
| Total from investment operations | .23 |
| Net asset value, end of period | $10.23 |
| Total ReturnD | 2.30% |
| Ratios to Average Net AssetsE,F | |
| Expenses before reductions | .50%G |
| Expenses net of fee waivers, if any | .50%G |
| Expenses net of all reductions | .50%G |
| Net investment income (loss) | (.14)%G |
| Supplemental Data | |
| Net assets, end of period (000 omitted) | $459,470 |
| Portfolio turnover rateH | 3%I,J |
A For the period May 26, 2017 (commencement of operations) to July 31, 2017.
B Calculated based on average shares outstanding during the period.
C Amount represents less than $.005 per share.
D Total returns for periods of less than one year are not annualized.
E Fees and expenses of any underlying Fidelity Central Funds are not included in the Fund's expense ratio. The Fund indirectly bears its proportionate share of the expenses of any underlying Fidelity Central Funds.
F Expense ratios reflect operating expenses of the Fund. Expenses before reductions do not reflect amounts reimbursed by the investment adviser or reductions from expense offset arrangements and do not represent the amount paid by the Fund during periods when reimbursements or reductions occur. Expense ratios before reductions for start-up periods may not be representative of longer term operating periods. Expenses net of fee waivers reflect expenses after reimbursement by the investment adviser but prior to reductions from expense offset arrangements. Expenses net of all reductions represent the net expenses paid by the Fund.
G Annualized
H Amount does not include the portfolio activity of any underlying Fidelity Central Funds.
I Portfolio turnover rate excludes securities received or delivered in-kind.
J Amount not annualized.
See accompanying notes which are an integral part of the financial statements.
Notes to Financial Statements
For the period ended July 31, 2017
1. Organization.
Fidelity Low-Priced Stock K6 Fund (the Fund) is a fund of Fidelity Puritan Trust (the Trust) and is authorized to issue an unlimited number of shares. Share transactions on the Statement of Changes in Net Assets may contain exchanges between affiliated funds. The Trust is registered under the Investment Company Act of 1940, as amended (the 1940 Act), as an open-end management investment company organized as a Massachusetts business trust. Shares generally are available only to employer-sponsored retirement plans that are recordkept by Fidelity.
2. Investments in Fidelity Central Funds.
The Fund invests in Fidelity Central Funds, which are open-end investment companies generally available only to other investment companies and accounts managed by the investment adviser and its affiliates. The Fund's Schedule of Investments lists each of the Fidelity Central Funds held as of period end, if any, as an investment of the Fund, but does not include the underlying holdings of each Fidelity Central Fund. As an Investing Fund, the Fund indirectly bears its proportionate share of the expenses of the underlying Fidelity Central Funds.
The Money Market Central Funds seek preservation of capital and current income and are managed by Fidelity Investments Money Management, Inc. (FIMM), an affiliate of the investment adviser. Annualized expenses of the Money Market Central Funds as of their most recent shareholder report date are less than .005%.
A complete unaudited list of holdings for each Fidelity Central Fund is available upon request or at the Securities and Exchange Commission (the SEC) website at www.sec.gov. In addition, the financial statements of the Fidelity Central Funds, which are not covered by the Fund's Report of Independent Registered Public Accounting Firm, are available on the SEC website or upon request.
3. Significant Accounting Policies.
The Fund is an investment company and applies the accounting and reporting guidance of the Financial Accounting Standards Board (FASB) Accounting Standards Codification Topic 946 Financial Services – Investments Companies. The financial statements have been prepared in conformity with accounting principles generally accepted in the United States of America (GAAP), which require management to make certain estimates and assumptions at the date of the financial statements. Actual results could differ from those estimates. Subsequent events, if any, through the date that the financial statements were issued have been evaluated in the preparation of the financial statements. The following summarizes the significant accounting policies of the Fund:
Investment Valuation. Investments are valued as of 4:00 p.m. Eastern time on the last calendar day of the period. The Board of Trustees (the Board) has delegated the day to day responsibility for the valuation of the Fund's investments to the Fair Value Committee (the Committee) established by the Fund's investment adviser. In accordance with valuation policies and procedures approved by the Board, the Fund attempts to obtain prices from one or more third party pricing vendors or brokers to value its investments. When current market prices, quotations or currency exchange rates are not readily available or reliable, investments will be fair valued in good faith by the Committee, in accordance with procedures adopted by the Board. Factors used in determining fair value vary by investment type and may include market or investment specific events, changes in interest rates and credit quality. The frequency with which these procedures are used cannot be predicted and they may be utilized to a significant extent. The Committee oversees the Fund's valuation policies and procedures and reports to the Board on the Committee's activities and fair value determinations. The Board monitors the appropriateness of the procedures used in valuing the Fund's investments and ratifies the fair value determinations of the Committee.
The Fund categorizes the inputs to valuation techniques used to value its investments into a disclosure hierarchy consisting of three levels as shown below:
- Level 1 – quoted prices in active markets for identical investments
- Level 2 – other significant observable inputs (including quoted prices for similar investments, interest rates, prepayment speeds, etc.)
- Level 3 – unobservable inputs (including the Fund's own assumptions based on the best information available)
Valuation techniques used to value the Fund's investments by major category are as follows:
Equity securities, including restricted securities, for which market quotations are readily available, are valued at the last reported sale price or official closing price as reported by a third party pricing vendor on the primary market or exchange on which they are traded and are categorized as Level 1 in the hierarchy. In the event there were no sales during the day or closing prices are not available, securities are valued at the last quoted bid price or may be valued using the last available price and are generally categorized as Level 2 in the hierarchy. For foreign equity securities, when market or security specific events arise, comparisons to the valuation of American Depositary Receipts (ADRs), futures contracts, Exchange-Traded Funds (ETFs) and certain indexes as well as quoted prices for similar securities may be used and would be categorized as Level 2 in the hierarchy. Utilizing these techniques may result in transfers between Level 1 and Level 2. For equity securities, including restricted securities, where observable inputs are limited, assumptions about market activity and risk are used and these securities may be categorized as Level 3 in the hierarchy.
Debt securities, including restricted securities, are valued based on evaluated prices received from third party pricing vendors or from brokers who make markets in such securities. Corporate bonds are valued by pricing vendors who utilize matrix pricing which considers yield or price of bonds of comparable quality, coupon, maturity and type or by broker-supplied prices. When independent prices are unavailable or unreliable, debt securities may be valued utilizing pricing methodologies which consider similar factors that would be used by third party pricing vendors. Debt securities are generally categorized as Level 2 in the hierarchy but may be Level 3 depending on the circumstances. ETFs are valued at their last sale price or official closing price as reported by a third party pricing vendor on the primary market or exchange on which they are traded and are categorized as Level 1 in the hierarchy. In the event there were no sales during the day but the exchange reports a closing bid level, ETFs are valued at the closing bid and would be categorized as Level 1 in the hierarchy. In the event there was no closing bid, ETFs may be valued by another method that the Board believes reflects fair value in accordance with the Board's fair value pricing policies and may be categorized as Level 2 in the hierarchy.
Investments in open-end mutual funds, including the Fidelity Central Funds, are valued at their closing net asset value (NAV) each business day and are categorized as Level 1 in the hierarchy.
Changes in valuation techniques may result in transfers in or out of an assigned level within the disclosure hierarchy. The aggregate value of investments by input level as of July 31, 2017 is included at the end of the Fund's Schedule of Investments.
Foreign Currency. The Fund may use foreign currency contracts to facilitate transactions in foreign-denominated securities. Gains and losses from these transactions may arise from changes in the value of the foreign currency or if the counterparties do not perform under the contracts' terms.
Foreign-denominated assets, including investment securities, and liabilities are translated into U.S. dollars at the exchange rates at period end. Purchases and sales of investment securities, income and dividends received and expenses denominated in foreign currencies are translated into U.S. dollars at the exchange rate in effect on the transaction date.
The effects of exchange rate fluctuations on investments are included with the net realized and unrealized gain (loss) on investment securities. Other foreign currency transactions resulting in realized and unrealized gain (loss) are disclosed separately.
Investment Transactions and Income. For financial reporting purposes, the Fund's investment holdings and NAV include trades executed through the end of the last business day of the period. The NAV per share for processing shareholder transactions is calculated as of the close of business of the New York Stock Exchange (NYSE), normally 4:00 p.m. Eastern time and includes trades executed through the end of the prior business day. Gains and losses on securities sold are determined on the basis of identified cost. Dividend income is recorded on the ex-dividend date, except for certain dividends from foreign securities where the ex-dividend date may have passed, which are recorded as soon as the Fund is informed of the ex-dividend date. Non-cash dividends included in dividend income, if any, are recorded at the fair market value of the securities received. Income and capital gain distributions from Fidelity Central Funds, if any, are recorded on the ex-dividend date. Certain distributions received by the Fund represent a return of capital or capital gain. The Fund determines the components of these distributions subsequent to the ex-dividend date, based upon receipt of tax filings or other correspondence relating to the underlying investment. These distributions are recorded as a reduction of cost of investments and/or as a realized gain. Interest income is accrued as earned and includes coupon interest and amortization of premium and accretion of discount on debt securities as applicable. Investment income is recorded net of foreign taxes withheld where recovery of such taxes is uncertain.
Expenses. Expenses directly attributable to a fund are charged to that fund. Expenses attributable to more than one fund are allocated among the respective funds on the basis of relative net assets or other appropriate methods. Expense estimates are accrued in the period to which they relate and adjustments are made when actual amounts are known.
Income Tax Information and Distributions to Shareholders. Each year, the Fund intends to qualify as a regulated investment company under Subchapter M of the Internal Revenue Code, including distributing substantially all of its taxable income and realized gains. As a result, no provision for U.S. Federal income taxes is required. As of July 31, 2017, the Fund did not have any unrecognized tax benefits in the financial statements; nor is the Fund aware of any tax positions for which it is reasonably possible that the total amounts of unrecognized tax benefits will significantly change in the next twelve months. The Fund files a U.S. federal tax return, in addition to state and local tax returns as required. The Fund's federal income tax returns are subject to examination by the Internal Revenue Service (IRS) for a period of three fiscal years after they are filed. State and local tax returns may be subject to examination for an additional fiscal year depending on the jurisdiction. Foreign taxes are provided for based on the Fund's understanding of the tax rules and rates that exist in the foreign markets in which it invests.
Distributions are declared and recorded on the ex-dividend date. Income and capital gain distributions are determined in accordance with income tax regulations, which may differ from GAAP.
Capital accounts within the financial statements are adjusted for permanent book-tax differences. These adjustments have no impact on net assets or the results of operations. Capital accounts are not adjusted for temporary book-tax differences which will reverse in a subsequent period.
Book-tax differences are primarily due to foreign currency transactions, passive foreign investment companies (PFIC), market discount, partnerships and losses deferred due to wash sales.
The federal tax cost of investment securities and unrealized appreciation (depreciation) as of period end were as follows:
| Gross unrealized appreciation | $2,606,273 |
| Gross unrealized depreciation | (1,526,607) |
| Net unrealized appreciation (depreciation) on securities | $1,079,666 |
| Tax Cost | $458,575,252 |
The tax-based components of distributable earnings as of period end were as follows:
| Undistributed ordinary income | $25,587 |
| Undistributed long-term capital gain | $21 |
| Net unrealized appreciation (depreciation) on securities and other investments | $1,079,657 |
Restricted Securities. The Fund may invest in securities that are subject to legal or contractual restrictions on resale. These securities generally may be resold in transactions exempt from registration or to the public if the securities are registered. Disposal of these securities may involve time-consuming negotiations and expense, and prompt sale at an acceptable price may be difficult. Information regarding restricted securities is included at the end of the Fund's Schedule of Investments.
4. Purchases and Sales of Investments.
Purchases and sales of securities, other than short-term securities and in-kind transactions, aggregated $1,791,108 and $67,741, respectively.
5. Fees and Other Transactions with Affiliates.
Management Fee. Fidelity Management & Research Company (the investment adviser) and its affiliates provide the Fund with investment management related services for which the Fund pays a monthly management fee that is based on an annual rate of .50% of average net assets. Under the management contract, the investment adviser or an affiliate pays all other expenses of the Fund, excluding fees and expenses of the independent Trustees, and certain miscellaneous expenses such as proxy and shareholder meeting expenses.
Brokerage Commissions. The Fund placed a portion of its portfolio transactions with brokerage firms which are affiliates of the investment adviser. Brokerage commissions are included in net realized gain (loss) and change in net unrealized appreciation (depreciation) in the Statement of Operations. The commissions paid to these affiliated firms were $6 for the period.
Interfund Trades. The Fund may purchase from or sell securities to other Fidelity Funds under procedures adopted by the Board. The procedures have been designed to ensure these interfund trades are executed in accordance with Rule 17a-7 of the 1940 Act. Interfund trades are included within the respective purchases and sales amounts shown in the Purchases and Sales of Investments note.
Exchanges In-Kind. During the period, an affiliated entity completed an exchange in-kind with the Fund. The affiliated entity delivered investments and cash valued at $456,637,585 in exchange for 44,724,543 shares of the Fund. The amount of in-kind exchanges is included in share transactions in the accompanying Statement of Changes in Net Assets. The Fund recognized no gain or loss for federal income tax purposes.
6. Other.
The Fund's organizational documents provide former and current trustees and officers with a limited indemnification against liabilities arising in connection with the performance of their duties to the Fund. In the normal course of business, the Fund may also enter into contracts that provide general indemnifications. The Fund's maximum exposure under these arrangements is unknown as this would be dependent on future claims that may be made against the Fund. The risk of material loss from such claims is considered remote.
At the end of the period, the investment adviser or its affiliates were the owners of record of 100% of the total outstanding shares of the fund.
Report of Independent Registered Public Accounting Firm
To the Trustees of Fidelity Puritan Trust and Shareholders of Fidelity Low-Priced Stock K6 Fund:
In our opinion, the accompanying statement of assets and liabilities, including the schedule of investments, and the related statements of operations and of changes in net assets and the financial highlights present fairly, in all material respects, the financial position of Fidelity Low-Priced Stock K6 Fund (a fund of Fidelity Puritan Trust) as of July 31, 2017, the results of its operations, the changes in its net assets and the financial highlights for the period May 26, 2017 (commencement of operations) through July 31, 2017, in conformity with accounting principles generally accepted in the United States of America. These financial statements and financial highlights (hereafter referred to as “financial statements”) are the responsibility of the Fidelity Low-Priced Stock K6 Fund’s management. Our responsibility is to express an opinion on these financial statements based on our audit. We conducted our audit of these financial statements in accordance with the standards of the Public Company Accounting Oversight Board (United States). Those standards require that we plan and perform the audit to obtain reasonable assurance about whether the financial statements are free of material misstatement. An audit includes examining, on a test basis, evidence supporting the amounts and disclosures in the financial statements, assessing the accounting principles used and significant estimates made by management, and evaluating the overall financial statement presentation. Our procedures included confirmation of securities owned as of July 31, 2017 by correspondence with the custodian and brokers; when replies were not received from brokers, we performed other auditing procedures. We believe that our audit provides a reasonable basis for our opinion.
PricewaterhouseCoopers LLP
Boston, Massachusetts
September 19, 2017
Trustees and Officers
The Trustees, Members of the Advisory Board (if any), and officers of the trust and fund, as applicable, are listed below. The Board of Trustees governs the fund and is responsible for protecting the interests of shareholders. The Trustees are experienced executives who meet periodically throughout the year to oversee the fund's activities, review contractual arrangements with companies that provide services to the fund, oversee management of the risks associated with such activities and contractual arrangements, and review the fund's performance. Except for Jonathan Chiel, each of the Trustees oversees 190 funds. Mr. Chiel oversees 142 funds.
The Trustees hold office without limit in time except that (a) any Trustee may resign; (b) any Trustee may be removed by written instrument, signed by at least two-thirds of the number of Trustees prior to such removal; (c) any Trustee who requests to be retired or who has become incapacitated by illness or injury may be retired by written instrument signed by a majority of the other Trustees; and (d) any Trustee may be removed at any special meeting of shareholders by a two-thirds vote of the outstanding voting securities of the trust. Each Trustee who is not an interested person (as defined in the 1940 Act) of the trust and the fund is referred to herein as an Independent Trustee. Each Independent Trustee shall retire not later than the last day of the calendar year in which his or her 75th birthday occurs. The Independent Trustees may waive this mandatory retirement age policy with respect to individual Trustees. Officers and Advisory Board Members hold office without limit in time, except that any officer or Advisory Board Member may resign or may be removed by a vote of a majority of the Trustees at any regular meeting or any special meeting of the Trustees. Except as indicated, each individual has held the office shown or other offices in the same company for the past five years.
The fund’s Statement of Additional Information (SAI) includes more information about the Trustees. To request a free copy, call Fidelity at 1-800-835-5092.
Experience, Skills, Attributes, and Qualifications of the Trustees. The Governance and Nominating Committee has adopted a statement of policy that describes the experience, qualifications, attributes, and skills that are necessary and desirable for potential Independent Trustee candidates (Statement of Policy). The Board believes that each Trustee satisfied at the time he or she was initially elected or appointed a Trustee, and continues to satisfy, the standards contemplated by the Statement of Policy. The Governance and Nominating Committee also engages professional search firms to help identify potential Independent Trustee candidates who have the experience, qualifications, attributes, and skills consistent with the Statement of Policy. From time to time, additional criteria based on the composition and skills of the current Independent Trustees, as well as experience or skills that may be appropriate in light of future changes to board composition, business conditions, and regulatory or other developments, have also been considered by the professional search firms and the Governance and Nominating Committee. In addition, the Board takes into account the Trustees' commitment and participation in Board and committee meetings, as well as their leadership of standing and ad hoc committees throughout their tenure.
In determining that a particular Trustee was and continues to be qualified to serve as a Trustee, the Board has considered a variety of criteria, none of which, in isolation, was controlling. The Board believes that, collectively, the Trustees have balanced and diverse experience, qualifications, attributes, and skills, which allow the Board to operate effectively in governing the fund and protecting the interests of shareholders. Information about the specific experience, skills, attributes, and qualifications of each Trustee, which in each case led to the Board's conclusion that the Trustee should serve (or continue to serve) as a trustee of the fund, is provided below.
Board Structure and Oversight Function. James C. Curvey is an interested person and currently serves as Chairman. The Trustees have determined that an interested Chairman is appropriate and benefits shareholders because an interested Chairman has a personal and professional stake in the quality and continuity of services provided to the fund. Independent Trustees exercise their informed business judgment to appoint an individual of their choosing to serve as Chairman, regardless of whether the Trustee happens to be independent or a member of management. The Independent Trustees have determined that they can act independently and effectively without having an Independent Trustee serve as Chairman and that a key structural component for assuring that they are in a position to do so is for the Independent Trustees to constitute a substantial majority for the Board. The Independent Trustees also regularly meet in executive session. Ned C. Lautenbach serves as Chairman of the Independent Trustees and as such (i) acts as a liaison between the Independent Trustees and management with respect to matters important to the Independent Trustees and (ii) with management prepares agendas for Board meetings.
Fidelity® funds are overseen by different Boards of Trustees. The fund's Board oversees Fidelity's high income and certain equity funds, and other Boards oversee Fidelity's investment-grade bond, money market, asset allocation, and sector funds. The asset allocation funds may invest in Fidelity® funds overseen by the fund's Board. The use of separate Boards, each with its own committee structure, allows the Trustees of each group of Fidelity® funds to focus on the unique issues of the funds they oversee, including common research, investment, and operational issues. On occasion, the separate Boards establish joint committees to address issues of overlapping consequences for the Fidelity® funds overseen by each Board.
The Trustees operate using a system of committees to facilitate the timely and efficient consideration of all matters of importance to the Trustees, the fund, and fund shareholders and to facilitate compliance with legal and regulatory requirements and oversight of the fund's activities and associated risks. The Board, acting through its committees, has charged FMR and its affiliates with (i) identifying events or circumstances the occurrence of which could have demonstrably adverse effects on the fund's business and/or reputation; (ii) implementing processes and controls to lessen the possibility that such events or circumstances occur or to mitigate the effects of such events or circumstances if they do occur; and (iii) creating and maintaining a system designed to evaluate continuously business and market conditions in order to facilitate the identification and implementation processes described in (i) and (ii) above. Because the day-to-day operations and activities of the fund are carried out by or through FMR, its affiliates, and other service providers, the fund's exposure to risks is mitigated but not eliminated by the processes overseen by the Trustees. While each of the Board's committees has responsibility for overseeing different aspects of the fund's activities, oversight is exercised primarily through the Operations, Audit, and Compliance Committees. In addition, the Independent Trustees have worked with FMR to enhance the Board's oversight of investment and financial risks, legal and regulatory risks, technology risks, and operational risks, including the development of additional risk reporting to the Board. For example, a working group comprised of Independent Trustees and FMR has worked and continues to work to review the Fidelity® funds' valuation-related activities, reporting and risk management. Appropriate personnel, including but not limited to the fund's Chief Compliance Officer (CCO), FMR's internal auditor, the independent accountants, the fund's Treasurer and portfolio management personnel, make periodic reports to the Board's committees, as appropriate, including an annual review of Fidelity's risk management program for the Fidelity® funds. The responsibilities of each standing committee, including their oversight responsibilities, are described further under "Standing Committees of the Trustees."
Interested Trustees*:
Correspondence intended for a Trustee who is an interested person may be sent to Fidelity Investments, 245 Summer Street, Boston, Massachusetts 02210.
Name, Year of Birth; Principal Occupations and Other Relevant Experience+
Jonathan Chiel (1957)
Year of Election or Appointment: 2016
Trustee
Mr. Chiel also serves as Trustee of other Fidelity funds. Mr. Chiel is Executive Vice President and General Counsel for FMR LLC (diversified financial services company, 2012-present). Previously, Mr. Chiel served as general counsel (2004-2012) and senior vice president and deputy general counsel (2000-2004) for John Hancock Financial Services; a partner with Choate, Hall & Stewart (1996-2000) (law firm); and an Assistant United States Attorney for the United States Attorney’s Office of the District of Massachusetts (1986-95), including Chief of the Criminal Division (1993-1995). Mr. Chiel is a director on the boards of the Boston Bar Foundation and the Maimonides School.
James C. Curvey (1935)
Year of Election or Appointment: 2007
Trustee
Chairman of the Board of Trustees
Mr. Curvey also serves as Trustee of other Fidelity® funds. Mr. Curvey is a Director of Fidelity Research & Analysis Co. (investment adviser firm, 2009-present), and Vice Chairman (2007-present) and Director of FMR LLC (diversified financial services company). In addition, Mr. Curvey serves as an Overseer for the Boston Symphony Orchestra and a member of the board of Artis-Naples, Naples, Florida, and as a Trustee for Brewster Academy, Wolfeboro, New Hampshire. Previously, Mr. Curvey served as a Director of Fidelity Investments Money Management, Inc. (investment adviser firm, 2009-2014) and a Director of FMR and FMR Co., Inc. (investment adviser firms, 2007-2014).
Charles S. Morrison (1960)
Year of Election or Appointment: 2014
Trustee
Mr. Morrison also serves as Trustee of other funds. He serves as President of Fidelity Management & Research Company (FMR) (investment adviser firm, 2016-present), a Director of Fidelity Investments Money Management, Inc. (FIMM) (investment adviser firm, 2014-present), Director of Fidelity SelectCo, LLC (investment adviser firm, 2014-present), President, Asset Management (2014-present), and is an employee of Fidelity Investments. Previously, Mr. Morrison served as Vice President of Fidelity's Fixed Income and Asset Allocation Funds (2012-2014), President, Fixed Income (2011-2014), Vice President of Fidelity's Money Market Funds (2005-2009), President, Money Market Group Leader of FMR (investment adviser firm, 2009), and Senior Vice President, Money Market Group of FMR (2004-2009). Mr. Morrison also served as Vice President of Fidelity's Bond Funds (2002-2005), certain Balanced Funds (2002-2005), and certain Asset Allocation Funds (2002-2007), and as Senior Vice President (2002-2005) of Fidelity's Bond Division.
* Determined to be an “Interested Trustee” by virtue of, among other things, his or her affiliation with the trust or various entities under common control with FMR.
+ The information includes the Trustee's principal occupation during the last five years and other information relating to the experience, attributes, and skills relevant to the Trustee's qualifications to serve as a Trustee, which led to the conclusion that the Trustee should serve as a Trustee for the fund.
Independent Trustees:
Correspondence intended for an Independent Trustee may be sent to Fidelity Investments, P.O. Box 55235, Boston, Massachusetts 02205-5235.
Name, Year of Birth; Principal Occupations and Other Relevant Experience+
Dennis J. Dirks (1948)
Year of Election or Appointment: 2005
Trustee
Mr. Dirks also serves as Trustee of other Fidelity® funds. Prior to his retirement in May 2003, Mr. Dirks was Chief Operating Officer and a member of the Board of The Depository Trust & Clearing Corporation (DTCC). He also served as President, Chief Operating Officer, and Board member of The Depository Trust Company (DTC) and President and Board member of the National Securities Clearing Corporation (NSCC). In addition, Mr. Dirks served as Chief Executive Officer and Board member of the Government Securities Clearing Corporation, Chief Executive Officer and Board member of the Mortgage-Backed Securities Clearing Corporation, as a Trustee and a member of the Finance Committee of Manhattan College (2005-2008), as a Trustee and a member of the Finance Committee of AHRC of Nassau County (2006-2008), as a member of the Independent Directors Council (IDC) Governing Council (2010-2015), and as a member of the Board of Directors for The Brookville Center for Children’s Services, Inc. (2009-2017). Mr. Dirks is a member of the Finance Committee (2016-present) and Board of Directors (2017-present) of the Asolo Repertory Theatre.
Alan J. Lacy (1953)
Year of Election or Appointment: 2008
Trustee
Mr. Lacy also serves as Trustee of other Fidelity® funds. Mr. Lacy serves as a Director of Bristol-Myers Squibb Company (global pharmaceuticals, 2008-present). He is a Trustee of the California Chapter of The Nature Conservancy (2015-present) and a Director of the Center for Advanced Study in the Behavioral Sciences at Stanford University (2015-present). In addition, Mr. Lacy served as Senior Adviser (2007-2014) of Oak Hill Capital Partners, L.P. (private equity) and also served as Chief Executive Officer (2005) and Vice Chairman (2005-2006) of Sears Holdings Corporation (retail) and Chief Executive Officer and Chairman of the Board of Sears, Roebuck and Co. (retail, 2000-2005). Previously, Mr. Lacy served as Chairman (2014-2017) and a member (2010-2017) of the Board of Directors of Dave & Buster’s Entertainment, Inc. (restaurant and entertainment complexes), as Chairman (2008-2011) and a member (2006-2015) of the Board of Trustees of the National Parks Conservation Association, and as a member of the Board of Directors for The Hillman Companies, Inc. (hardware wholesalers, 2010-2014), Earth Fare, Inc. (retail grocery, 2010-2014), and The Western Union Company (global money transfer, 2006-2011).
Ned C. Lautenbach (1944)
Year of Election or Appointment: 2000
Trustee
Chairman of the Independent Trustees
Mr. Lautenbach also serves as Trustee of other Fidelity® funds. Mr. Lautenbach currently serves as the Lead Director of the Eaton Corporation Board of Directors (diversified industrial, 1997-present). Mr. Lautenbach is Chairman of the Board of Directors of Artis-Naples in Naples, Florida (2012-present), a member of the Council on Foreign Relations (1994-present), and currently Vice Chair of the Board of Governors, State University System of Florida (2013-present). Previously, Mr. Lautenbach was a Partner and Advisory Partner at Clayton, Dubilier & Rice, LLC (private equity investment, 1998-2010), as well as a Director of Sony Corporation (2006-2007). Mr. Lautenbach also had a 30-year career with IBM (technology company) during which time he served as Senior Vice President and a member of the Corporate Executive Committee (1968-1998).
Joseph Mauriello (1944)
Year of Election or Appointment: 2008
Trustee
Mr. Mauriello also serves as Trustee of other Fidelity® funds. Prior to his retirement in January 2006, Mr. Mauriello served in numerous senior management positions including Deputy Chairman and Chief Operating Officer (2004-2005), and Vice Chairman of Financial Services (2002-2004) of KPMG LLP US (professional services, 1965-2005). Mr. Mauriello currently serves as a member of the Board of Directors of XL Group plc. (global insurance and re-insurance, 2006-present) and the Independent Directors Council (IDC) Governing Council (2015-present). Previously, Mr. Mauriello served as a Director of the Hamilton Funds of the Bank of New York (2006-2007) and of Arcadia Resources Inc. (health care services and products, 2007-2012).
Cornelia M. Small (1944)
Year of Election or Appointment: 2005
Trustee
Ms. Small also serves as Trustee of other Fidelity® funds. Ms. Small is a member of the Board of Directors (2009-present) and Chair of the Investment Committee (2010-present) of the Teagle Foundation. Ms. Small also serves on the Investment Committee of the Berkshire Taconic Community Foundation (2008-present). Previously, Ms. Small served as Chairperson (2002-2008) and a member of the Investment Committee and Chairperson (2008-2012) and a member of the Board of Trustees of Smith College. In addition, Ms. Small served as Chief Investment Officer, Director of Global Equity Investments, and a member of the Board of Directors of Scudder, Stevens & Clark and Scudder Kemper Investments.
William S. Stavropoulos (1939)
Year of Election or Appointment: 2001
Trustee
Vice Chairman of the Independent Trustees
Mr. Stavropoulos also serves as Trustee of other Fidelity® funds. Mr. Stavropoulos serves as President and Founder of the Michigan Baseball Foundation, the Great Lakes Loons (2007-present). Mr. Stavropoulos is Chairman Emeritus of the Board of Directors of The Dow Chemical Company, where he previously served in numerous senior management positions, including President, CEO (1995-2000; 2002-2004), Chairman of the Executive Committee (2000-2006), and as a member of the Board of Directors (1990-2006). Currently, Mr. Stavropoulos is Chairman of the Board of Directors of Univar Inc. (global distributor of commodity and specialty chemicals), a Director of Teradata Corporation (data warehousing and technology solutions), and a member of the Advisory Board for Metalmark Capital LLC (private equity investment, 2005-present). Mr. Stavropoulos is an operating advisor to Clayton, Dubilier & Rice, LLC (private equity investment). In addition, Mr. Stavropoulos is a member of the University of Notre Dame Advisory Council for the College of Science, a Trustee of the Rollin L. Gerstacker Foundation, and a Director of Artis-Naples in Naples, Florida. Previously, Mr. Stavropoulos served as a Director of Chemical Financial Corporation (bank holding company, 1993-2012) and Tyco International, Ltd. (multinational manufacturing and services, 2007-2012).
David M. Thomas (1949)
Year of Election or Appointment: 2008
Trustee
Mr. Thomas also serves as Trustee of other Fidelity® funds. Mr. Thomas serves as Non-Executive Chairman of the Board of Directors of Fortune Brands Home and Security (home and security products, 2011-present), as a member of the Board of Directors (2004-present) and Presiding Director (2013-present) of Interpublic Group of Companies, Inc. (marketing communication), and as a member of the Board of Trustees of the University of Florida (2013-present). Previously, Mr. Thomas served as Executive Chairman (2005-2006) and Chairman and Chief Executive Officer (2000-2005) of IMS Health, Inc. (pharmaceutical and healthcare information solutions), and a Director of Fortune Brands, Inc. (consumer products, 2000-2011).
+ The information includes the Trustee's principal occupation during the last five years and other information relating to the experience, attributes, and skills relevant to the Trustee's qualifications to serve as a Trustee, which led to the conclusion that the Trustee should serve as a Trustee for the fund.
Advisory Board Members and Officers:
Correspondence intended for an officer or Peter S. Lynch may be sent to Fidelity Investments, 245 Summer Street, Boston, Massachusetts 02210. Officers appear below in alphabetical order.
Name, Year of Birth; Principal Occupation
Peter S. Lynch (1944)
Year of Election or Appointment: 2003
Member of the Advisory Board
Mr. Lynch also serves as Member of the Advisory Board of other Fidelity® funds. Mr. Lynch is Vice Chairman and a Director of FMR (investment adviser firm) and FMR Co., Inc. (investment adviser firm). In addition, Mr. Lynch serves as a Trustee of Boston College and as the Chairman of the Inner-City Scholarship Fund. Previously, Mr. Lynch served on the Special Olympics International Board of Directors (1997-2006).
Elizabeth Paige Baumann (1968)
Year of Election or Appointment: 2017
Anti-Money Laundering (AML) Officer
Ms. Baumann also serves as AML Officer of other funds. She is Chief AML Officer (2012-present) and Senior Vice President (2014-present) of FMR LLC (diversified financial services company) and is an employee of Fidelity Investments. Previously, Ms. Baumann served as AML Officer of the funds (2012-2016), and Vice President (2007-2014) and Deputy Anti-Money Laundering Officer (2007-2012) of FMR LLC.
Marc R. Bryant (1966)
Year of Election or Appointment: 2015
Secretary and Chief Legal Officer (CLO)
Mr. Bryant also serves as Secretary and CLO of other funds. Mr. Bryant serves as CLO, Secretary, and Senior Vice President of Fidelity Management & Research Company (investment adviser firm, 2015-present) and FMR Co., Inc. (investment adviser firm, 2015-present); Secretary of Fidelity SelectCo, LLC (investment adviser firm, 2015-present) and Fidelity Investments Money Management, Inc. (investment adviser firm, 2015-present); and CLO of Fidelity Management & Research (Hong Kong) Limited and FMR Investment Management (UK) Limited (investment adviser firms, 2015-present) and Fidelity Management & Research (Japan) Limited (investment adviser firm, 2016-present). He is Senior Vice President and Deputy General Counsel of FMR LLC (diversified financial services company). Previously, Mr. Bryant served as Secretary and CLO of Fidelity Rutland Square Trust II (2010-2014) and Assistant Secretary of Fidelity's Fixed Income and Asset Allocation Funds (2013-2015). Prior to joining Fidelity Investments, Mr. Bryant served as a Senior Vice President and the Head of Global Retail Legal for AllianceBernstein L.P. (2006-2010), and as the General Counsel for ProFund Advisors LLC (2001-2006).
William C. Coffey (1969)
Year of Election or Appointment: 2009
Assistant Secretary
Mr. Coffey also serves as Assistant Secretary of other funds. He is Senior Vice President and Deputy General Counsel of FMR LLC (diversified financial services company, 2010-present), and is an employee of Fidelity Investments. Previously, Mr. Coffey served as Vice President and Associate General Counsel of FMR LLC (2005-2009).
Jonathan Davis (1968)
Year of Election or Appointment: 2010
Assistant Treasurer
Mr. Davis also serves as Assistant Treasurer of other funds, and is an employee of Fidelity Investments. Previously, Mr. Davis served as Vice President and Associate General Counsel of FMR LLC (diversified financial services company, 2003-2010).
Adrien E. Deberghes (1967)
Year of Election or Appointment: 2016
Assistant Treasurer
Mr. Deberghes also serves as an officer of other funds. He serves as Executive Vice President of Fidelity Investments Money Management, Inc. (FIMM) (investment adviser firm, 2016-present) and is an employee of Fidelity Investments (2008-present). Prior to joining Fidelity Investments, Mr. Deberghes was Senior Vice President of Mutual Fund Administration at State Street Corporation (2007-2008), Senior Director of Mutual Fund Administration at Investors Bank & Trust (2005-2007), and Director of Finance for Dunkin' Brands (2000-2005). Previously, Mr. Deberghes served in other fund officer roles.
Stephanie J. Dorsey (1969)
Year of Election or Appointment: 2010
Assistant Treasurer
Ms. Dorsey also serves as an officer of other funds. She is an employee of Fidelity Investments (2008-present) and has served in other fund officer roles. Prior to joining Fidelity Investments, Ms. Dorsey served as Treasurer (2004-2008) of the JPMorgan Mutual Funds and Vice President (2004-2008) of JPMorgan Chase Bank.
Howard J. Galligan III (1966)
Year of Election or Appointment: 2014
Chief Financial Officer
Mr. Galligan also serves as Chief Financial Officer of other funds. Mr. Galligan serves as President of Fidelity Pricing and Cash Management Services (FPCMS) (2014-present) and as a Director of Strategic Advisers, Inc. (investment adviser firm, 2008-present). Previously, Mr. Galligan served as Chief Administrative Officer of Asset Management (2011-2014) and Chief Operating Officer and Senior Vice President of Investment Support for Strategic Advisers, Inc. (2003-2011).
Thomas C. Hense (1964)
Year of Election or Appointment: 2008, 2010, or 2015
Vice President
Mr. Hense serves as Vice President of Fidelity Advisor® Multi-Asset Income Fund (2015) and other funds (High Income (2008), Small Cap (2008), and Value (2010) funds), and is an employee of Fidelity Investments (1993-present). Previously, Mr. Hense served as a portfolio manager for Fidelity's Institutional Money Management Group (Pyramis) (2003-2008).
Brian B. Hogan (1964)
Year of Election or Appointment: 2009
Vice President
Mr. Hogan also serves as Trustee or Vice President of other funds. Mr. Hogan serves as a Director of FMR Investment Management (UK) Limited (investment adviser firm, 2015-present) and Fidelity SelectCo, LLC (investment adviser firm, 2014-present) and President of the Equity Division of FMR (investment adviser firm, 2009-present). Previously, Mr. Hogan served as Senior Vice President, Equity Research of FMR (2006-2009) and as a portfolio manager. Mr. Brian B. Hogan is not related to Mr. Colm A. Hogan.
Colm A. Hogan (1973)
Year of Election or Appointment: 2016
Deputy Treasurer
Mr. Hogan also serves as an officer of other funds. Mr. Hogan is an employee of Fidelity Investments (2005-present). Mr. Colm A. Hogan is not related to Mr. Brian B. Hogan.
Chris Maher (1972)
Year of Election or Appointment: 2013
Assistant Treasurer
Mr. Maher serves as Assistant Treasurer of other funds. Mr. Maher is Vice President of Valuation Oversight and is an employee of Fidelity Investments. Previously, Mr. Maher served as Vice President of Asset Management Compliance (2013), Vice President of the Program Management Group of FMR (investment adviser firm, 2010-2013), and Vice President of Valuation Oversight (2008-2010).
Rieco E. Mello (1969)
Year of Election or Appointment: 2017
Assistant Treasurer
Mr. Mello also serves as Assistant Treasurer of other funds. Mr. Mello is an employee of Fidelity Investments (1995-present).
Kenneth B. Robins (1969)
Year of Election or Appointment: 2016
Chief Compliance Officer
Mr. Robins also serves as an officer of other funds. Mr. Robins serves as Compliance Officer of Fidelity Management & Research Company and FMR Co., Inc. (investment adviser firms, 2016-present) and is an employee of Fidelity Investments (2004-present). Previously, Mr. Robins served as Executive Vice President of Fidelity Investments Money Management, Inc. (investment adviser firm, 2013-2016) and served in other fund officer roles.
Stacie M. Smith (1974)
Year of Election or Appointment: 2016
President and Treasurer
Ms. Smith also serves as an officer of other funds. She is an employee of Fidelity Investments (2009-present) and has served in other fund officer roles. Prior to joining Fidelity Investments, Ms. Smith served as Senior Audit Manager of Ernst & Young LLP (accounting firm, 1996-2009). Previously, Ms. Smith served as Deputy Treasurer of certain Fidelity® funds (2013-2016).
Marc L. Spector (1972)
Year of Election or Appointment: 2016
Assistant Treasurer
Mr. Spector also serves as an officer of other funds. Mr. Spector is an employee of Fidelity Investments (2016-present). Prior to joining Fidelity Investments, Mr. Spector served as Director at the Siegfried Group (accounting firm, 2013-2016), and prior to Siegfried Group as audit senior manager at Deloitte & Touche (accounting firm, 2005-2013).
Renee Stagnone (1975)
Year of Election or Appointment: 2016
Assistant Treasurer
Ms. Stagnone also serves as an officer of other funds. Ms. Stagnone is an employee of Fidelity Investments (1997-present). Previously, Ms. Stagnone served as Deputy Treasurer of certain Fidelity® funds (2013-2016).
Shareholder Expense Example
As a shareholder of the Fund, you incur two types of costs: (1) transaction costs, and (2) ongoing costs, including management fees and other Fund expenses. This Example is intended to help you understand your ongoing costs (in dollars) of investing in the Fund and to compare these costs with the ongoing costs of investing in other mutual funds.
The actual expense Example is based on an investment of $1,000 invested at the beginning of the period and held for the entire period (May 26, 2017 to July 31, 2017). The hypothetical expense Example is based on an investment of $1,000 invested for the one-half year period (February 1, 2017 to July 31, 2017).
Actual Expenses
The first line of the accompanying table provides information about actual account values and actual expenses. You may use the information in this line, together with the amount you invested, to estimate the expenses that you paid over the period. Simply divide your account value by $1,000.00 (for example, an $8,600 account value divided by $1,000.00 = 8.6), then multiply the result by the number in the first line under the heading entitled "Expenses Paid During Period" to estimate the expenses you paid on your account during this period. In addition, the Fund, as a shareholder in the underlying Fidelity Central Funds, will indirectly bear its pro-rata share of the fees and expenses incurred by the underlying Fidelity Central Funds. These fees and expenses are not included in the Fund's annualized expense ratio used to calculate the expense estimate in the table below.
Hypothetical Example for Comparison Purposes
The second line of the accompanying table provides information about hypothetical account values and hypothetical expenses based on the Fund's actual expense ratio and an assumed rate of return of 5% per year before expenses, which is not the Fund's actual return. The hypothetical account values and expenses may not be used to estimate the actual ending account balance or expenses you paid for the period. You may use this information to compare the ongoing costs of investing in the Fund and other funds. To do so, compare this 5% hypothetical example with the 5% hypothetical examples that appear in the shareholder reports of the other funds. In addition, the Fund, as a shareholder in the underlying Fidelity Central Funds, will indirectly bear its pro-rata share of the fees and expenses incurred by the underlying Fidelity Central Funds. These fees and expenses are not included in the Fund's annualized expense ratio used to calculate the expense estimate in the table below.
Please note that the expenses shown in the table are meant to highlight your ongoing costs only and do not reflect any transaction costs. Therefore, the second line of the table is useful in comparing ongoing costs only, and will not help you determine the relative total costs of owning different funds.
| | Annualized Expense Ratio-A | Beginning
Account Value
| Ending
Account Value
July 31, 2017 | Expenses Paid
During Period
|
| Actual | .50% | $1,000.00 | $1,023.00 | $.93-B |
| Hypothetical-C | | $1,000.00 | $1,022.32 | $2.51-D |
A Annualized expense ratio reflects expenses net of applicable fee waivers.
B Actual expenses are equal to the Fund's annualized expense ratio, multiplied by the average account value over the period, multiplied by 67/365 (to reflect the period May 26, 2017 to July 31, 2017).
C 5% return per year before expenses
D Hypothetical expenses are equal to the Fund's annualized expense ratio, multiplied by the average account value over the period, multiplied by 181/365 (to reflect the one-half year period).
Distributions (Unaudited)
The fund hereby designates as a capital gain dividend with respect to the taxable year ended July 31, 2017, $21, or, if subsequently determined to be different, the net capital gain of such year.
The fund will notify shareholders in January 2018 of amounts for use in preparing 2017 income tax returns.
Board Approval of Investment Advisory Contracts and Management Fees
Fidelity Low Priced Stock K6 Fund
On January 18, 2017 the Board of Trustees, including the Independent Trustees (together, the Board), voted to approve the management contract with Fidelity Management & Research Company (FMR) and the sub-advisory agreements with affiliates of FMR (together, the Advisory Contracts) for the fund. The Board, assisted by the advice of fund counsel and Independent Trustees' counsel, considered a broad range of information.
Nature, Extent, and Quality of Services Provided. The Board considered Fidelity's staffing as it relates to the fund, including the backgrounds of investment personnel of Fidelity, and also considered the fund's investment objective, strategies, and related investment philosophy. The Board considered the structure of the investment personnel compensation program and whether this structure provides appropriate incentives to act in the best interests of the fund.
Resources Dedicated to Investment Management and Support Services. The Board and the Fund Oversight and Research Committees reviewed the general qualifications and capabilities of Fidelity's investment staff, including its size, education, experience, and resources, as well as Fidelity's approach to recruiting, training, managing, and compensating investment personnel. The Board noted that Fidelity has continued to increase the resources devoted to non-U.S. offices, including expansion of Fidelity's global investment organization. The Board also noted that Fidelity's analysts have extensive resources, tools and capabilities that allow them to conduct sophisticated quantitative and fundamental analysis, as well as credit analysis of issuers, counterparties and guarantors. Further, the Board considered that Fidelity's investment professionals have sufficient access to global information and data so as to provide competitive investment results over time, and that those professionals also have access to sophisticated tools that permit them to assess portfolio construction and risk and performance attribution characteristics continuously, as well as to transmit new information and research conclusions rapidly around the world. Additionally, in its deliberations, the Board considered Fidelity's trading, risk management, compliance, and technology and operations capabilities
and resources, which are integral parts of the investment management process.
Shareholder and Administrative Services. The Board considered the nature, extent, quality, and cost of advisory, administrative, and shareholder services to be performed by FMR, the sub-advisers (together with FMR, the Investment Advisers), and their affiliates under the Advisory Contracts and under separate agreements covering transfer agency, pricing and bookkeeping and securities lending services for the fund. The Board also considered the nature and extent of the supervision of third party service providers, principally custodians, subcustodians, and pricing vendors.
The Board noted that the growth of fund assets over time across the complex allows Fidelity to reinvest in the development of services designed to enhance the value or convenience of the Fidelity funds as investment vehicles. These services include 24-hour access to account information and market information through telephone representatives and over the Internet, investor education materials and asset allocation tools, and the expanded availability of Fidelity Investor Centers.
Investment Performance. The fund is a new fund and therefore had no historical performance for the Board to review at the time it approved the fund's Advisory Contracts. The Board considered the Investment Advisers' strength in fundamental, research-driven security selection, which the Board is familiar with through its supervision of other Fidelity funds, including funds with identical investment objectives as the fund.
Based on its review, the Board concluded that the nature, extent, and quality of services to be provided to the fund under the Advisory Contracts should benefit the shareholders of the fund.
Competitiveness of Management Fee and Total Expense Ratio ..The Board considered the fund's proposed management fee out of which FMR will pay all operating expenses, with certain limited exceptions, and the projected total expense ratio of the fund in reviewing the Advisory Contracts. The Board noted that the fund's proposed management fee rate is lower than the median fee rate of funds with similar Lipper investment objective categories and comparable investment mandates, regardless of whether their management fee structures are comparable. The Board also considered that the projected total expense ratio of the fund is below the median of those funds and classes used by the Board for management fee comparisons that have a similar sales load structure.
Based on its review, the Board concluded that the fund's management fee and projected total expense ratio were reasonable in light of the services that the fund and its shareholders will receive and the other factors considered.
Costs of the Services and Profitability. The fund is a new fund and therefore no revenue, cost, or profitability data was available for the Board to review in respect of the fund at the time it approved the Advisory Contracts. In connection with its future renewal of the fund's Advisory Contracts, the Board will consider the revenues earned and the expenses incurred by Fidelity in conducting the business of developing, marketing, distributing, managing, administering and servicing the fund and servicing the fund's shareholders.
Economies of Scale. The Board will consider economies of scale when there is operating experience to permit assessment thereof. It noted that, notwithstanding the entrepreneurial risk associated with a new fund, the management fee was at a level normally associated, by comparison with competitors, with very high fund net assets, and Fidelity asserted to the Board that the level of the fee anticipated economies of scale at lower asset levels even before, if ever, economies of scale are achieved. The Board also noted that the fund and its shareholders would have access to the very considerable number and variety of services available through Fidelity and its affiliates.
Based on its evaluation of all of the conclusions noted above, and after considering all factors it believed relevant, the Board concluded that the advisory fee structures are fair and reasonable, and that the fund's Advisory Contracts should be approved.
Corporate Headquarters
245 Summer St.
Boston, MA 02210
www.fidelity.com
LPSK6-ANN-0917
1.9883999.100
Fidelity® Series Intrinsic Opportunities Fund Fidelity® Series Intrinsic Opportunities Fund
Class F
Annual Report July 31, 2017 |
|
Contents
To view a fund's proxy voting guidelines and proxy voting record for the 12-month period ended June 30, visit http://www.fidelity.com/proxyvotingresults or visit the Securities and Exchange Commission's (SEC) web site at http://www.sec.gov.
You may also call 1-800-544-8544, or for Class F, call 1-800-835-5092, to request a free copy of the proxy voting guidelines.
Standard & Poor's, S&P and S&P 500 are registered service marks of The McGraw-Hill Companies, Inc. and have been licensed for use by Fidelity Distributors Corporation.
Other third-party marks appearing herein are the property of their respective owners.
All other marks appearing herein are registered or unregistered trademarks or service marks of FMR LLC or an affiliated company. © 2017 FMR LLC. All rights reserved.
This report and the financial statements contained herein are submitted for the general information of the shareholders of the Fund. This report is not authorized for distribution to prospective investors in the Fund unless preceded or accompanied by an effective prospectus.
A fund files its complete schedule of portfolio holdings with the SEC for the first and third quarters of each fiscal year on Form N-Q. Forms N-Q are available on the SEC’s web site at http://www.sec.gov. A fund's Forms N-Q may be reviewed and copied at the SEC’s Public Reference Room in Washington, DC. Information regarding the operation of the SEC's Public Reference Room may be obtained by calling 1-800-SEC-0330.
For a complete list of a fund's portfolio holdings, view the most recent holdings listing, semiannual report, or annual report on Fidelity's web site at http://www.fidelity.com, http://www.institutional.fidelity.com, or http://www.401k.com, as applicable.
NOT FDIC INSURED •MAY LOSE VALUE •NO BANK GUARANTEE
Neither the Fund nor Fidelity Distributors Corporation is a bank.
Performance: The Bottom Line
Average annual total return reflects the change in the value of an investment, assuming reinvestment of distributions from dividend income and capital gains (the profits earned upon the sale of securities that have grown in value, if any) and assuming a constant rate of performance each year. The hypothetical investment and the average annual total returns do not reflect the deduction of taxes that a shareholder would pay on fund distributions or the redemption of fund shares. During periods of reimbursement by Fidelity, a fund’s total return will be greater than it would be had the reimbursement not occurred. How a fund did yesterday is no guarantee of how it will do tomorrow.
Average Annual Total Returns
| For the periods ended July 31, 2017 | Past 1 year | Life of fundA |
| Fidelity® Series Intrinsic Opportunities Fund | 18.69% | 16.04% |
| Class F | 18.84% | 16.22% |
A From December 6, 2012
$10,000 Over Life of Fund
Let's say hypothetically that $10,000 was invested in Fidelity® Series Intrinsic Opportunities Fund, a class of the fund, on December 6, 2012, when the fund started.
The chart shows how the value of your investment would have changed, and also shows how the Russell 3000® Index performed over the same period.
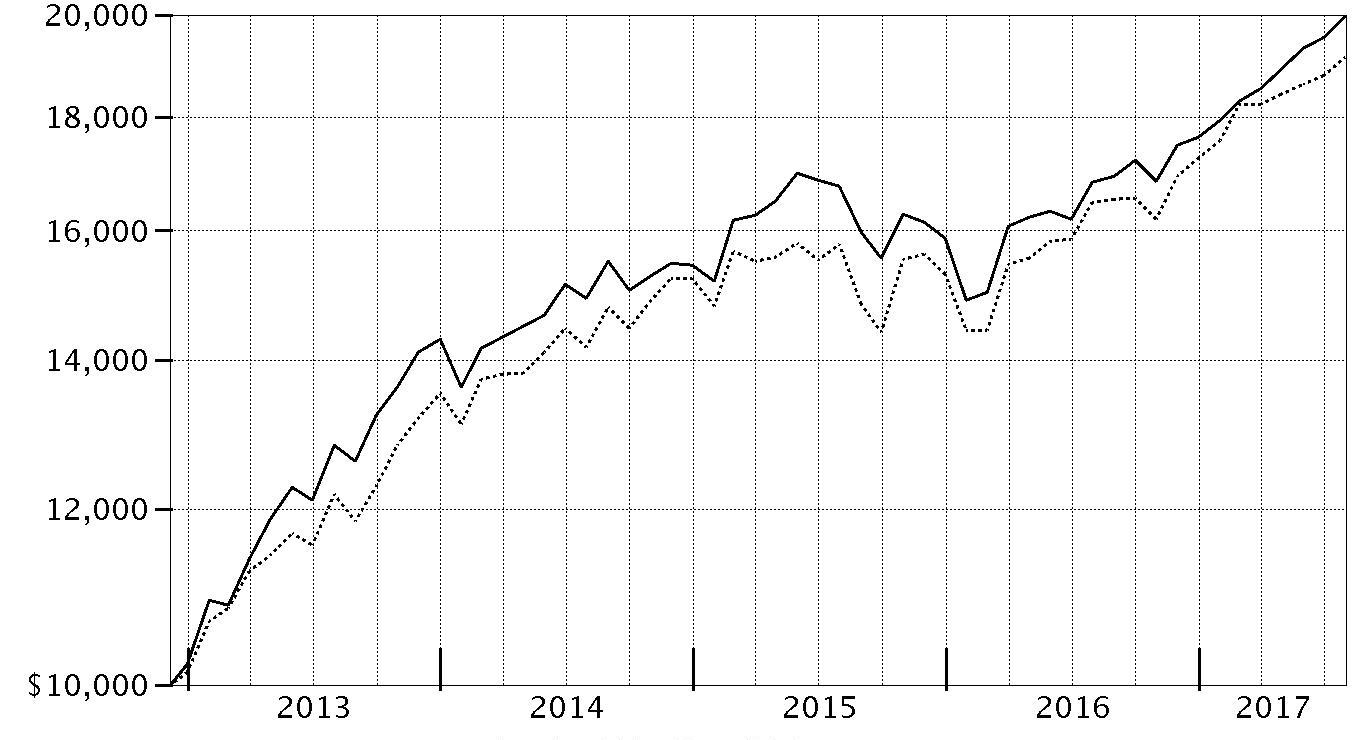
| Period Ending Values |
| $19,975 | Fidelity® Series Intrinsic Opportunities Fund |
| $19,144 | Russell 3000® Index |
Management's Discussion of Fund Performance
Market Recap: The U.S. equity bellwether S&P 500
® index gained 16.04% for the year ending July 31, 2017, rising sharply following the November election and continuing to rally through the end of February on optimism for President Trump’s pro-business agenda. Equity markets leveled off, however, as the fledgling administration faced the first test of its domestic agenda. Stocks reacted with uncertainty to efforts by Congress in March to repeal and replace the Affordable Care Act, and then reverted upward through July 31. Growth stocks surged ahead of value, while small-caps’ advantage over large-caps narrowed. Sector-wise, financials (+36%) fared best, riding an uptick in bond yields and a surge in banks, particularly post-election. Information technology gained 29%, as a handful of major index constituents posted stellar returns. Industrials (+18%) was boosted by a call for increased infrastructure spending. Consumer discretionary (+14%) slightly lagged the broader market because brick-and-mortar retailers continued to suffer from increased online competition. Energy (0%) was hurt by low oil prices. Utilities (+6%), consumer staples (+4%), telecommunication services (-7%) and real estate (-2%) all struggled amid an improved backdrop for riskier assets that curbed demand for dividend-rich sectors, as well as the likelihood of further interest rate hikes later in 2017.
Comments from Portfolio Manager Joel Tillinghast: For the fiscal year, the fund’s share classes gained about 19%, well ahead of the 16.14% return of the benchmark Russell 3000
® Index. Versus the benchmark, the fund was helped primarily by good stock picking in the health care sector. Most notably, our substantial overweighting in health benefits provider Anthem gained 44%, largely due to improving operational efficiency and better-than-expected earnings growth. Another large holding, UnitedHealth Group (+36%), also rallied sharply, as investors rewarded the company for prudent management and profit growth from its Optum data and systems unit. Picks in the industrials sector also helped, as did a significant underweighting in the poor-performing real estate sector. Lastly, our foreign holdings contributed, aided in part by a generally weaker U.S. dollar. Conversely, unfavorable stock selection and an underweighting in the strong-performing information technology sector hurt the fund's relative result, as did a similar situation in financials. A large underexposure to consumer tech giant Apple was our biggest individual detractor, as the stock performed well. Meanwhile, a large overweighting in poor-performing retailer Bed Bath & Beyond (since sold) proved disappointing, as the company had slower-than-expected earnings. In a rising equity market, the fund's cash position, averaging 10% of assets for the period, also dragged on performance.
The views expressed above reflect those of the portfolio manager(s) only through the end of the period as stated on the cover of this report and do not necessarily represent the views of Fidelity or any other person in the Fidelity organization. Any such views are subject to change at any time based upon market or other conditions and Fidelity disclaims any responsibility to update such views. These views may not be relied on as investment advice and, because investment decisions for a Fidelity fund are based on numerous factors, may not be relied on as an indication of trading intent on behalf of any Fidelity fund.
Investment Summary (Unaudited)
Top Ten Stocks as of July 31, 2017
| | % of fund's net assets | % of fund's net assets 6 months ago |
| Anthem, Inc. | 4.2 | 5.4 |
| Amgen, Inc. | 2.5 | 0.7 |
| The Western Union Co. | 2.3 | 3.5 |
| Itochu Corp. | 2.1 | 0.0 |
| Best Buy Co., Inc. | 2.0 | 2.9 |
| UnitedHealth Group, Inc. | 2.0 | 2.8 |
| United Therapeutics Corp. | 2.0 | 3.6 |
| Hyundai Mobis | 1.6 | 1.6 |
| Aetna, Inc. | 1.6 | 1.9 |
| MetLife, Inc. | 1.5 | 1.7 |
| | 21.8 | |
Top Five Market Sectors as of July 31, 2017
| | % of fund's net assets | % of fund's net assets 6 months ago |
| Consumer Discretionary | 21.1 | 23.2 |
| Health Care | 20.9 | 25.2 |
| Financials | 14.3 | 9.1 |
| Information Technology | 11.5 | 14.1 |
| Industrials | 9.2 | 7.2 |
Asset Allocation (% of fund's net assets)
| As of July 31, 2017* |
| | Stocks | 91.6% |
| | Short-Term Investments and Net Other Assets (Liabilities) | 8.4% |

* Foreign investments - 41.8%
| As of January 31, 2017* |
| | Stocks | 89.2% |
| | Short-Term Investments and Net Other Assets (Liabilities) | 10.8% |

* Foreign investments - 39.7%
Percentages shown as 0.0% may reflect amounts less than 0.05%.
Investments July 31, 2017
Showing Percentage of Net Assets
| Common Stocks - 91.5% | | | |
| | | Shares | Value |
| CONSUMER DISCRETIONARY - 21.1% | | | |
| Auto Components - 3.3% | | | |
| Adient PLC | | 135,000 | $8,838,450 |
| Cooper Tire & Rubber Co. (a) | | 450,000 | 16,447,500 |
| Dongah Tire & Rubber Co. Ltd. | | 100,000 | 2,455,500 |
| Eagle Industry Co. Ltd. | | 300,000 | 5,230,169 |
| ElringKlinger AG | | 50,000 | 872,461 |
| Exedy Corp. | | 15,000 | 470,089 |
| Fukoku Co. Ltd. | | 152,400 | 1,444,583 |
| G-Tekt Corp. (b) | | 2,600,000 | 50,445,825 |
| Gentex Corp. | | 200,000 | 3,404,000 |
| Hi-Lex Corp. | | 249,937 | 6,533,797 |
| Hu Lane Associate, Inc. | | 50,000 | 297,870 |
| Hyundai Mobis | | 900,000 | 197,690,045 |
| Ichikoh Industries Ltd. | | 25,000 | 196,154 |
| IJT Technology Holdings Co. Ltd. | | 1,225,000 | 6,944,759 |
| INFAC Corp. | | 362,529 | 1,938,995 |
| Nifco, Inc. | | 25,000 | 1,442,242 |
| Piolax, Inc. | | 924,000 | 25,563,064 |
| Seoyon Co. Ltd. | | 425,000 | 3,737,940 |
| Seoyon E-Hwa Co., Ltd. | | 685,725 | 8,235,300 |
| TBK Co. Ltd. (b) | | 1,800,000 | 8,114,654 |
| The Furukawa Battery Co. Ltd. | | 150,000 | 1,253,118 |
| TPR Co. Ltd. | | 825,000 | 26,116,831 |
| Yorozu Corp. (b) | | 1,850,000 | 31,262,642 |
| | | | 408,935,988 |
| Automobiles - 0.7% | | | |
| Audi AG | | 24,000 | 20,171,952 |
| Fiat Chrysler Automobiles NV | | 139,000 | 1,680,510 |
| Fiat Chrysler Automobiles NV | | 1,264,900 | 15,273,364 |
| General Motors Co. | | 1,400,000 | 50,372,000 |
| Harley-Davidson, Inc. (a) | | 5,000 | 243,350 |
| | | | 87,741,176 |
| Distributors - 0.4% | | | |
| Amcon Distributing Co. | | 500 | 48,475 |
| Chori Co. Ltd. (b) | | 1,566,400 | 29,056,084 |
| Doshisha Co. Ltd. | | 350,000 | 7,054,288 |
| Harima-Kyowa Co. Ltd. | | 72,100 | 1,256,330 |
| Nakayamafuku Co. Ltd. | | 200,000 | 1,427,729 |
| SPK Corp. | | 5,000 | 132,568 |
| Yagi & Co. Ltd. | | 400,000 | 6,422,060 |
| | | | 45,397,534 |
| Diversified Consumer Services - 0.6% | | | |
| Asante, Inc. | | 65,000 | 1,131,435 |
| Cross-Harbour Holdings Ltd. | | 300,000 | 455,523 |
| Heian Ceremony Service Co. Ltd. (a) | | 416,100 | 3,627,122 |
| Kukbo Design Co. Ltd. | | 20,000 | 357,164 |
| MegaStudy Co. Ltd. (b) | | 362,315 | 9,770,132 |
| MegaStudyEdu Co. Ltd. (b) | | 209,684 | 6,599,812 |
| Multicampus Co. Ltd. | | 46,501 | 1,561,196 |
| Step Co. Ltd. | | 217,000 | 2,873,781 |
| Tsukada Global Holdings, Inc. | | 1,050,000 | 5,714,545 |
| Weight Watchers International, Inc. (c) | | 1,150,000 | 41,193,000 |
| | | | 73,283,710 |
| Hotels, Restaurants & Leisure - 0.7% | | | |
| Brinker International, Inc. | | 75,000 | 2,660,250 |
| Dunkin' Brands Group, Inc. | | 100,000 | 5,303,000 |
| Flight Centre Travel Group Ltd. (a) | | 125,000 | 4,350,000 |
| Hiday Hidaka Corp. | | 240,000 | 6,413,352 |
| Hiramatsu, Inc. | | 25,000 | 139,689 |
| Hub Co. Ltd. | | 69,900 | 715,834 |
| Koshidaka Holdings Co. Ltd. | | 300,000 | 8,147,308 |
| Kura Corp. Ltd. | | 100,000 | 5,034,242 |
| Nagacorp Ltd. | | 500,000 | 304,066 |
| Ohsho Food Service Corp. | | 100,000 | 3,891,333 |
| Retail Food Group Ltd. (a) | | 1,900,000 | 7,372,000 |
| St. Marc Holdings Co. Ltd. | | 225,000 | 7,041,136 |
| The Monogatari Corp. | | 5,000 | 261,236 |
| The Restaurant Group PLC | | 6,937,000 | 30,606,554 |
| Whitbread PLC | | 1,000 | 50,771 |
| Wyndham Worldwide Corp. | | 10,000 | 1,043,700 |
| | | | 83,334,471 |
| Household Durables - 0.9% | | | |
| Ace Bed Co. Ltd. | | 42,029 | 6,518,626 |
| Emak SpA | | 600,000 | 1,122,242 |
| FJ Next Co. Ltd. (a) | | 1,100,000 | 8,860,266 |
| Fuji Corp. Ltd. | | 50,000 | 339,244 |
| Gree Electric Appliances, Inc. of Zhuhai Class A | | 149,927 | 874,614 |
| Helen of Troy Ltd. (c) | | 600,000 | 60,450,000 |
| NACCO Industries, Inc. Class A | | 75,000 | 4,920,000 |
| Nittoh Corp. | | 6,000 | 28,301 |
| Q.E.P. Co., Inc. (c) | | 34,998 | 923,947 |
| SABAF SpA | | 400,000 | 7,221,180 |
| Sanei Architecture Planning Co. Ltd. | | 660,000 | 11,775,772 |
| Sanyo Housing Nagoya Co. Ltd. | | 700,000 | 7,149,531 |
| Tupperware Brands Corp. | | 134,500 | 8,165,495 |
| | | | 118,349,218 |
| Internet & Direct Marketing Retail - 0.0% | | | |
| Hyundai Home Shopping Network Corp. | | 10,000 | 1,232,214 |
| N Brown Group PLC | | 25,000 | 103,045 |
| NS Shopping Co. Ltd. | | 50,000 | 745,579 |
| Trade Maine Group Ltd. | | 50,000 | 205,399 |
| Webjet Ltd. | | 100,000 | 921,600 |
| | | | 3,207,837 |
| Leisure Products - 0.3% | | | |
| Accell Group NV | | 650,000 | 19,821,547 |
| Mars Engineering Corp. | | 600,000 | 11,886,253 |
| | | | 31,707,800 |
| Media - 2.3% | | | |
| AMC Networks, Inc. Class A (c) | | 125,000 | 7,993,750 |
| Comcast Corp. Class A | | 1,954,400 | 79,055,480 |
| Corus Entertainment, Inc. Class B (non-vtg.) | | 400,000 | 4,440,345 |
| Discovery Communications, Inc.: | | | |
| Class A (a)(c) | | 2,300,000 | 56,580,000 |
| Class B (c) | | 4,365 | 106,724 |
| DMS, Inc. | | 116,900 | 1,293,646 |
| Gendai Agency, Inc. (b) | | 850,000 | 4,356,207 |
| Hyundai HCN | | 2,000,049 | 7,464,902 |
| Interspace Co. Ltd. | | 20,000 | 313,846 |
| Ipsos SA | | 10,000 | 345,314 |
| ITE Group PLC | | 202,135 | 480,721 |
| Liberty Global PLC LiLAC Class A (c) | | 6,871 | 176,722 |
| Multiplus SA | | 600,000 | 7,655,972 |
| Nippon BS Broadcasting Corp. | | 200,000 | 2,351,127 |
| Nippon Television Network Corp. | | 150,000 | 2,566,103 |
| Pico Far East Holdings Ltd. | | 8,000,000 | 3,297,998 |
| Proto Corp. | | 50,000 | 781,895 |
| Scripps Networks Interactive, Inc. Class A | | 100,000 | 8,741,000 |
| SMG PLC | | 10,000 | 51,424 |
| Television Broadcasts Ltd. | | 2,000,000 | 7,323,194 |
| The Walt Disney Co. | | 94,200 | 10,355,406 |
| Time Warner, Inc. | | 162,600 | 16,653,492 |
| Viacom, Inc.: | | | |
| Class A (a) | | 800,000 | 32,400,000 |
| Class B (non-vtg.) | | 600,000 | 20,952,000 |
| WOWOW INC. | | 200,000 | 5,814,323 |
| | | | 281,551,591 |
| Multiline Retail - 0.5% | | | |
| Grazziotin SA (c) | | 350,000 | 2,683,631 |
| Gwangju Shinsegae Co. Ltd. (b) | | 97,372 | 21,344,833 |
| Hanwha Galleria Timeworld Co. Ltd. (c) | | 45,000 | 1,147,165 |
| Lifestyle China Group Ltd. (c) | | 12,500,000 | 5,121,114 |
| Lifestyle International Holdings Ltd. | | 13,000,000 | 17,775,388 |
| Macy's, Inc. | | 324,900 | 7,716,375 |
| Treasure Factory Co. Ltd. (a)(b) | | 875,000 | 6,579,663 |
| Watts Co. Ltd. | | 350,000 | 4,590,684 |
| | | | 66,958,853 |
| Specialty Retail - 10.0% | | | |
| Arc Land Sakamoto Co. Ltd. | | 500,000 | 6,852,919 |
| AT-Group Co. Ltd. | | 561,000 | 14,248,265 |
| AutoNation, Inc. (a)(c) | | 350,000 | 14,833,000 |
| Beacon Lighting Group Ltd. | | 25,000 | 27,200 |
| Best Buy Co., Inc. | | 4,300,000 | 250,862,000 |
| DCM Japan Holdings Co. Ltd. | | 25,000 | 217,924 |
| Dunelm Group PLC | | 300,000 | 2,382,836 |
| E-Life Mall Corp. Ltd. | | 100,000 | 203,214 |
| Ff Group (c) | | 850,000 | 20,376,157 |
| Formosa Optical Technology Co. Ltd. | | 751,000 | 1,784,633 |
| Fuji Corp. (a)(b) | | 595,990 | 11,012,124 |
| GameStop Corp. Class A | | 1,996,591 | 43,306,059 |
| GNC Holdings, Inc. Class A (a)(b) | | 5,939,600 | 56,485,596 |
| Goldlion Holdings Ltd. | | 9,000,000 | 3,929,175 |
| Guess?, Inc. (b) | | 5,803,800 | 75,797,628 |
| Handsman Co. Ltd. | | 700,000 | 9,962,357 |
| Hibbett Sports, Inc. (a)(c) | | 1,025,300 | 15,994,680 |
| Hour Glass Ltd. | | 11,666,300 | 5,767,938 |
| IA Group Corp. | | 91,000 | 554,692 |
| International Housewares Retail Co. Ltd. | | 1,000,000 | 188,201 |
| JB Hi-Fi Ltd. (a) | | 863,636 | 17,970,538 |
| John David Group PLC | | 33,700,000 | 159,135,868 |
| Jumbo SA | | 1,750,000 | 29,313,847 |
| K's Holdings Corp. (a) | | 2,400,000 | 48,241,644 |
| Ku Holdings Co. Ltd. (a) | | 600,000 | 5,447,866 |
| L'Occitane Ltd. | | 100,000 | 231,730 |
| Lookers PLC | | 1,500,000 | 2,177,010 |
| Lovisa Holdings Ltd. | | 10,000 | 33,200 |
| Mandarake, Inc. (a) | | 180,000 | 989,433 |
| Mitsui & Associates Telepark Corp. | | 25,000 | 500,703 |
| Mr. Bricolage SA | | 311,600 | 5,865,066 |
| Nafco Co. Ltd. | | 640,400 | 10,159,732 |
| Nitori Holdings Co. Ltd. | | 1,300,000 | 183,482,244 |
| Nojima Co. Ltd. | | 50,000 | 810,014 |
| Oriental Watch Holdings Ltd. | | 7,600,000 | 1,605,469 |
| Padini Holdings Bhd | | 2,700,000 | 2,358,519 |
| Sa Sa International Holdings Ltd. | | 500,000 | 183,720 |
| Sacs Bar Holdings, Inc. | | 400,000 | 4,401,107 |
| Sally Beauty Holdings, Inc. (c) | | 4,650,000 | 94,069,500 |
| Samse SA | | 35,000 | 6,139,956 |
| Shimamura Co. Ltd. | | 5,000 | 622,250 |
| Silvano Fashion Group A/S | | 9,800 | 29,953 |
| Sports Direct International PLC (a)(c) | | 100,000 | 500,185 |
| Staples, Inc. | | 5,700,000 | 57,855,000 |
| The Buckle, Inc. | | 633,000 | 10,824,300 |
| Tokatsu Holdings Co. Ltd. | | 172,300 | 676,728 |
| Truworths International Ltd. | | 334,900 | 1,921,156 |
| Urban Outfitters, Inc. (a)(c) | | 1,200,000 | 23,508,000 |
| Vita Group Ltd. | | 25,681 | 26,914 |
| Vitamin Shoppe, Inc. (c) | | 150,000 | 1,650,000 |
| Williams-Sonoma, Inc. (a) | | 700,000 | 32,501,000 |
| | | | 1,238,019,250 |
| Textiles, Apparel & Luxury Goods - 1.4% | | | |
| Best Pacific International Holdings Ltd. | | 2,700,000 | 1,476,033 |
| Embry Holdings Ltd. | | 3,200,000 | 1,024,223 |
| Fossil Group, Inc. (a)(b)(c) | | 3,650,000 | 41,062,500 |
| Fujibo Holdings, Inc. | | 2,000 | 60,683 |
| Geox SpA (a) | | 500,000 | 1,984,049 |
| Gerry Weber International AG (Bearer) (a) | | 625,000 | 7,983,251 |
| Grendene SA | | 100,000 | 847,884 |
| Hagihara Industries, Inc. | | 50,000 | 1,435,439 |
| Handsome Co. Ltd. | | 25,000 | 805,850 |
| Magni-Tech Industries Bhd | | 1,250,000 | 2,218,849 |
| Michael Kors Holdings Ltd. (c) | | 2,050,000 | 74,702,000 |
| Portico International Holdings (c) | | 12,000,000 | 4,040,559 |
| Sitoy Group Holdings Ltd. | | 8,200,000 | 1,795,207 |
| Texwinca Holdings Ltd. | | 1,800,000 | 1,092,334 |
| Van de Velde | | 24,954 | 1,344,243 |
| Vera Bradley, Inc. (c) | | 950,000 | 9,576,000 |
| Youngone Holdings Co. Ltd. | | 258,000 | 12,393,934 |
| Yue Yuen Industrial (Holdings) Ltd. | | 2,500,000 | 10,322,246 |
| | | | 174,165,284 |
|
| TOTAL CONSUMER DISCRETIONARY | | | 2,612,652,712 |
|
| CONSUMER STAPLES - 6.5% | | | |
| Beverages - 0.9% | | | |
| A.G. Barr PLC | | 500,000 | 3,958,200 |
| Boston Beer Co., Inc. Class A (a)(c) | | 5,000 | 784,000 |
| Britvic PLC | | 6,900,000 | 65,001,560 |
| C&C Group PLC | | 400,000 | 1,448,971 |
| Jinro Distillers Co. Ltd. (b) | | 411,881 | 12,246,815 |
| Lucas Bols BV (a) | | 120,000 | 2,812,709 |
| Muhak Co. Ltd. | | 340,000 | 6,891,471 |
| Olvi PLC (A Shares) | | 100,000 | 3,519,437 |
| Spritzer Bhd | | 1,000,000 | 553,544 |
| Willamette Valley Vineyards, Inc. (c) | | 5,000 | 40,200 |
| Yantai Changyu Pioneer Wine Co. Ltd. (B Shares) | | 6,000,851 | 15,257,963 |
| | | | 112,514,870 |
| Food & Staples Retailing - 3.0% | | | |
| Ain Holdings, Inc. | | 100,000 | 7,211,211 |
| Amsterdam Commodities NV | | 625,000 | 18,570,862 |
| Belc Co. Ltd. | | 30,000 | 1,363,327 |
| Create SD Holdings Co. Ltd. | | 930,000 | 23,544,197 |
| CVS Health Corp. | | 1,000,000 | 79,930,000 |
| Daiichi Co. Ltd. | | 20,000 | 250,714 |
| Dong Suh Companies, Inc. | | 600,000 | 15,831,276 |
| Genky Stores, Inc. (a) | | 400,000 | 14,930,382 |
| Halows Co. Ltd. | | 65,000 | 1,404,417 |
| J Sainsbury PLC | | 200,000 | 645,978 |
| Kroger Co. | | 1,800,000 | 44,136,000 |
| Magnit OJSC | | 5,000 | 796,538 |
| Majestic Wine PLC | | 400,000 | 1,687,513 |
| MARR SpA | | 800,000 | 20,475,005 |
| Medical Ikkou Co. Ltd. | | 500 | 36,464 |
| Nihon Chouzai Co. Ltd. (a) | | 25,000 | 834,505 |
| OM2 Network Co. Ltd. (a) | | 140,800 | 1,643,699 |
| Retail Partners Co. Ltd. (a) | | 587,800 | 6,206,170 |
| Sapporo Clinical Laboratory | | 8,900 | 103,172 |
| Satoh & Co. Ltd. | | 17,000 | 203,855 |
| Satsudora Holdings Co. Ltd. (a)(b) | | 400,000 | 7,252,937 |
| Shoei Foods Corp. | | 60,000 | 2,568,824 |
| Tesco PLC (c) | | 11,000,000 | 25,282,343 |
| United Natural Foods, Inc. (c) | | 412,000 | 15,874,360 |
| Valor Holdings Co. Ltd. | | 650,000 | 14,704,522 |
| Wal-Mart Stores, Inc. | | 510,900 | 40,866,891 |
| Walgreens Boots Alliance, Inc. | | 398,100 | 32,114,727 |
| | | | 378,469,889 |
| Food Products - 1.6% | | | |
| Ajinomoto Malaysia Bhd | | 1,700,000 | 10,283,779 |
| Armanino Foods of Distinction | | 50,000 | 111,500 |
| B&G Foods, Inc. Class A | | 327,900 | 11,886,375 |
| Bakkafrost | | 150,000 | 5,892,901 |
| Bell AG | | 13,000 | 5,982,729 |
| Binggrea Co. Ltd. | | 15,000 | 897,374 |
| Changshouhua Food Co. Ltd. | | 2,332,000 | 1,164,388 |
| Cranswick PLC | | 502,941 | 19,257,102 |
| Dean Foods Co. | | 50,000 | 750,000 |
| Fresh Del Monte Produce, Inc. | | 1,150,000 | 59,190,500 |
| High Liner Foods, Inc. | | 20,000 | 271,907 |
| Hormel Foods Corp. | | 5,000 | 170,850 |
| Japan Meat Co. Ltd. | | 25,000 | 411,357 |
| JC Comsa Corp. | | 34,600 | 119,262 |
| Kaneko Seeds Co. Ltd. | | 79,700 | 1,042,473 |
| Kaveri Seed Co. Ltd. (c) | | 239,414 | 2,582,709 |
| Kawan Food Bhd | | 100,000 | 113,979 |
| Kwality Ltd. (c) | | 50,000 | 113,548 |
| Lamb Weston Holdings, Inc. | | 25,000 | 1,099,500 |
| Lassonde Industries, Inc. Class A (sub. vtg.) | | 50,000 | 9,617,004 |
| London Biscuits Bhd (c) | | 4,000,000 | 696,018 |
| London Biscuits Bhd warrants 1/26/20 (c) | | 400,000 | 16,817 |
| M. Dias Branco SA | | 10,000 | 162,778 |
| Natori Co. Ltd. | | 20,000 | 371,899 |
| Nitto Fuji Flour Milling Co. Ltd. | | 5,000 | 179,827 |
| Origin Enterprises PLC | | 50,000 | 389,470 |
| Pickles Corp. | | 100,000 | 1,472,176 |
| President Bakery PCL | | 16,500 | 30,990 |
| President Rice Products PCL | | 310,000 | 554,295 |
| Prima Meat Packers Ltd. | | 450,000 | 2,873,600 |
| S Foods, Inc. | | 300,000 | 11,184,181 |
| Select Harvests Ltd. (a) | | 1,430,000 | 5,605,600 |
| Synear Food Holdings Ltd. (c) | | 1,000,000 | 7 |
| Thai Wah PCL | | 426,000 | 123,538 |
| The Hain Celestial Group, Inc. (c) | | 675,000 | 30,179,250 |
| The J.M. Smucker Co. | | 33,000 | 4,022,700 |
| Toyo Sugar Refining Co. Ltd. | | 2,100,000 | 2,285,818 |
| Valsoia SpA | | 85,000 | 1,685,435 |
| Want Want China Holdings Ltd. | | 3,300,000 | 2,230,757 |
| | | | 195,024,393 |
| Personal Products - 0.7% | | | |
| Asaleo Care Ltd. | | 1,000,000 | 1,064,000 |
| Hengan International Group Co. Ltd. | | 2,000,000 | 15,260,921 |
| Sarantis SA | | 1,200,000 | 17,472,888 |
| USANA Health Sciences, Inc. (c) | | 925,000 | 52,817,500 |
| | | | 86,615,309 |
| Tobacco - 0.3% | | | |
| KT&G Corp. | | 315,000 | 32,064,361 |
|
| TOTAL CONSUMER STAPLES | | | 804,688,822 |
|
| ENERGY - 3.2% | | | |
| Energy Equipment & Services - 0.7% | | | |
| AKITA Drilling Ltd. Class A (non-vtg.) | | 250,000 | 1,451,775 |
| Atwood Oceanics, Inc. (c) | | 1,600,000 | 12,576,000 |
| Baker Hughes, a GE Co. | | 159,500 | 5,883,955 |
| Carbo Ceramics, Inc. (a)(b)(c) | | 2,360,200 | 16,686,614 |
| Geospace Technologies Corp. (c) | | 588,000 | 9,049,320 |
| Gulfmark Offshore, Inc. Class A (c) | | 162,530 | 25,192 |
| High Arctic Energy Services, Inc. | | 25,000 | 75,396 |
| National Oilwell Varco, Inc. | | 200,000 | 6,542,000 |
| Oceaneering International, Inc. | | 450,800 | 11,563,020 |
| Prosafe ASA (a)(c) | | 200,000 | 775,800 |
| Shinko Plantech Co. Ltd. | | 1,700,000 | 14,541,249 |
| Tecnicas Reunidas SA | | 200,000 | 7,094,513 |
| | | | 86,264,834 |
| Oil, Gas & Consumable Fuels - 2.5% | | | |
| Alvopetro Energy Ltd. (c) | | 2,800,000 | 471,626 |
| Baytex Energy Corp. (a)(c) | | 600,000 | 1,684,379 |
| Bonavista Energy Corp. | | 50,000 | 125,526 |
| Chevron Corp. | | 427,900 | 46,722,401 |
| China Petroleum & Chemical Corp. (H Shares) | | 41,500,000 | 31,459,818 |
| ConocoPhillips Co. | | 1,377,000 | 62,474,490 |
| Contango Oil & Gas Co. (c) | | 250,000 | 1,500,000 |
| Enagas SA | | 3,000,000 | 84,825,189 |
| EQT Midstream Partners LP | | 7,500 | 582,975 |
| Fuji Kosan Co. Ltd. | | 105,000 | 560,025 |
| Husky Energy, Inc. (c) | | 400,000 | 4,629,637 |
| Imperial Oil Ltd. | | 54,600 | 1,566,944 |
| International Seaways, Inc. (c) | | 5,000 | 114,050 |
| Motor Oil (HELLAS) Corinth Refineries SA | | 300,000 | 6,765,417 |
| Murphy Oil Corp. | | 1,000,000 | 26,580,000 |
| Oil & Natural Gas Corp. Ltd. | | 9,500,000 | 25,074,790 |
| San-Ai Oil Co. Ltd. | | 200,000 | 2,033,652 |
| Ship Finance International Ltd. (NY Shares) (a) | | 10,000 | 136,000 |
| Thai Oil PCL (For. Reg.) | | 500,000 | 1,288,447 |
| Total SA sponsored ADR (a) | | 100,000 | 5,067,000 |
| Tsakos Energy Navigation Ltd. | | 450,000 | 2,218,500 |
| World Fuel Services Corp. | | 350,000 | 11,319,000 |
| | | | 317,199,866 |
|
| TOTAL ENERGY | | | 403,464,700 |
|
| FINANCIALS - 14.3% | | | |
| Banks - 4.7% | | | |
| Bank of Kyoto Ltd. | | 10,000 | 95,968 |
| Cambridge Bancorp | | 5,000 | 327,250 |
| Central Valley Community Bancorp | | 25,000 | 549,500 |
| Citizens Financial Services, Inc. | | 12,726 | 687,204 |
| Credit Agricole Atlantique Vendee | | 7,000 | 965,472 |
| Erste Group Bank AG | | 5,000 | 207,846 |
| F & M Bank Corp. | | 131,632 | 3,981,868 |
| Gree Electric Appliances, Inc. of Zhuhai ELS (A Shares) (BNP Paribas Warrant Program) warrants 11/14/17 (c)(d) | | 325,000 | 1,895,920 |
| Gunma Bank Ltd. | | 5,100,000 | 29,930,609 |
| Hiroshima Bank Ltd. | | 2,000,000 | 8,562,747 |
| JPMorgan Chase & Co. | | 1,363,400 | 125,160,120 |
| Mitsubishi UFJ Financial Group, Inc. | | 17,000,000 | 107,849,912 |
| Nordea Bank AB | | 100,000 | 1,262,107 |
| OFG Bancorp | | 1,761,516 | 17,703,236 |
| Ogaki Kyoritsu Bank Ltd. | | 600,000 | 1,736,133 |
| Skandiabanken ASA | | 500,000 | 5,627,730 |
| Sparebank 1 Oestlandet (a) | | 1,000,000 | 10,651,354 |
| Sumitomo Mitsui Financial Group, Inc. | | 4,000,000 | 154,343,230 |
| The Keiyo Bank Ltd. | | 1,000,000 | 4,236,020 |
| The Mie Bank Ltd. | | 162,668 | 3,644,519 |
| The San-In Godo Bank Ltd. | | 1,500,000 | 12,204,635 |
| Unicaja Banco SA | | 6,000,000 | 8,729,341 |
| Van Lanschot NV (Bearer) | | 81,300 | 2,412,329 |
| Wells Fargo & Co. | | 1,189,200 | 64,145,448 |
| Yamaguchi Financial Group, Inc. | | 1,700,000 | 20,030,840 |
| | | | 586,941,338 |
| Capital Markets - 1.3% | | | |
| ABG Sundal Collier ASA | | 1,500,000 | 1,039,699 |
| Apollo Global Management LLC Class A | | 396,300 | 11,136,030 |
| Ares Capital Corp. | | 402,400 | 6,595,336 |
| BinckBank NV (a) | | 109,000 | 600,138 |
| Edify SA (c) | | 10,068 | 636,567 |
| FactSet Research Systems, Inc. | | 1,000 | 167,220 |
| Franklin Resources, Inc. | | 150,000 | 6,717,000 |
| Goldman Sachs Group, Inc. | | 100,000 | 22,533,000 |
| MLP AG | | 1,000,000 | 7,327,722 |
| Morgan Stanley | | 672,200 | 31,526,180 |
| T. Rowe Price Group, Inc. | | 25,000 | 2,068,000 |
| The Blackstone Group LP | | 2,155,700 | 72,108,165 |
| TPG Specialty Lending, Inc. | | 111,200 | 2,308,512 |
| | | | 164,763,569 |
| Consumer Finance - 0.9% | | | |
| Credit Corp. Group Ltd. | | 52,450 | 711,642 |
| Discover Financial Services | | 800,000 | 48,752,000 |
| Synchrony Financial | | 1,800,000 | 54,576,000 |
| | | | 104,039,642 |
| Diversified Financial Services - 1.3% | | | |
| Fuyo General Lease Co. Ltd. | | 550,000 | 32,278,108 |
| IBJ Leasing Co. Ltd. | | 200,000 | 4,762,121 |
| Kyushu Railway Co. | | 260,000 | 8,572,724 |
| NICE Holdings Co. Ltd. | | 225,000 | 3,324,970 |
| Ricoh Leasing Co. Ltd. | | 1,070,000 | 37,415,302 |
| Scandinavian Tobacco Group A/S | | 400,000 | 6,456,286 |
| Tokyo Century Corp. | | 1,500,000 | 63,948,478 |
| Varex Imaging Corp. (c) | | 100,000 | 3,085,000 |
| | | | 159,842,989 |
| Insurance - 5.9% | | | |
| AFLAC, Inc. | | 2,000,000 | 159,500,000 |
| April | | 1,129,000 | 17,374,633 |
| ASR Nederland NV | | 1,000,000 | 37,822,410 |
| Assurant, Inc. | | 200,000 | 21,054,000 |
| Chubb Ltd. | | 498,300 | 72,981,018 |
| Dongbu Insurance Co. Ltd. | | 1,250,000 | 89,402,510 |
| Genworth Financial, Inc. Class A (c) | | 6,400,000 | 21,952,000 |
| Hannover Reuck SE | | 40,000 | 5,052,458 |
| Hyundai Fire & Marine Insurance Co. Ltd. | | 375,000 | 15,201,775 |
| Kansas City Life Insurance Co. | | 2,000 | 100,000 |
| MetLife, Inc. | | 3,337,800 | 183,579,000 |
| National Western Life Group, Inc. | | 13,000 | 4,375,670 |
| NN Group NV | | 1,600,000 | 64,948,003 |
| Prudential Financial, Inc. | | 222,300 | 25,171,029 |
| Sony Financial Holdings, Inc. | | 1,000,000 | 17,334,119 |
| | | | 735,848,625 |
| Mortgage Real Estate Investment Trusts - 0.0% | | | |
| Two Harbors Investment Corp. | | 149,000 | 1,473,610 |
| Thrifts & Mortgage Finance - 0.2% | | | |
| ASAX Co. Ltd. | | 189,300 | 2,898,439 |
| Genworth MI Canada, Inc. (a) | | 450,000 | 13,127,331 |
| Genworth Mortgage Insurance Ltd. | | 3,250,899 | 7,828,165 |
| Hingham Institution for Savings | | 10,100 | 1,786,690 |
| | | | 25,640,625 |
|
| TOTAL FINANCIALS | | | 1,778,550,398 |
|
| HEALTH CARE - 20.9% | | | |
| Biotechnology - 7.6% | | | |
| AbbVie, Inc. | | 1,250,000 | 87,387,500 |
| Amgen, Inc. | | 1,775,000 | 309,755,250 |
| Biocon Ltd. | | 50,000 | 299,704 |
| Biogen, Inc. (c) | | 500,000 | 144,795,000 |
| Bioverativ, Inc. | | 210,000 | 13,013,700 |
| Cell Biotech Co. Ltd. | | 150,000 | 4,761,437 |
| Essex Bio-Technology Ltd. | | 1,494,000 | 812,913 |
| Gilead Sciences, Inc. | | 1,816,600 | 138,225,094 |
| United Therapeutics Corp. (c) | | 1,900,000 | 243,960,000 |
| | | | 943,010,598 |
| Health Care Equipment & Supplies - 0.7% | | | |
| A&T Corp. | | 42,600 | 347,771 |
| Ansell Ltd. | | 500,000 | 8,788,000 |
| Create Medic Co. Ltd. | | 27,600 | 247,097 |
| Daiken Medical Co. Ltd. | | 10,000 | 71,568 |
| Fukuda Denshi Co. Ltd. | | 480,800 | 35,761,803 |
| Kawasumi Laboratories, Inc. | | 100,000 | 634,949 |
| Medikit Co. Ltd. | | 35,000 | 1,682,616 |
| Microlife Corp. | | 800,000 | 1,864,006 |
| Nakanishi, Inc. | | 250,000 | 10,488,004 |
| Pacific Hospital Supply Co. Ltd. | | 200,000 | 509,689 |
| Paramount Bed Holdings Co. Ltd. | | 75,000 | 3,421,924 |
| St.Shine Optical Co. Ltd. | | 900,000 | 18,527,528 |
| TaiDoc Technology Corp. | | 149,999 | 516,305 |
| Value Added Technologies Co. Ltd. | | 75,000 | 2,076,013 |
| Vieworks Co. Ltd. | | 20,000 | 875,051 |
| | | | 85,812,324 |
| Health Care Providers & Services - 9.8% | | | |
| Aetna, Inc. | | 1,250,000 | 192,887,500 |
| Almost Family, Inc. (c) | | 100,000 | 4,945,000 |
| Amedisys, Inc. (c) | | 675,000 | 31,968,000 |
| Anthem, Inc. | | 2,761,300 | 514,181,676 |
| Chemed Corp. | | 250,000 | 49,375,000 |
| EBOS Group Ltd. | | 487,300 | 6,620,258 |
| Excelsior Medical Co. Ltd. | | 200,000 | 318,059 |
| Humana, Inc. | | 500,000 | 115,600,000 |
| Laboratory Corp. of America Holdings (c) | | 10,000 | 1,589,100 |
| Lifco AB | | 100,018 | 3,333,603 |
| Life Healthcare Group Ltd. | | 332,376 | 622,208 |
| MEDNAX, Inc. (c) | | 150,000 | 7,047,000 |
| Quest Diagnostics, Inc. | | 250,000 | 27,077,500 |
| Saint-Care Holding Corp. | | 90,200 | 1,426,902 |
| Ship Healthcare Holdings, Inc. | | 25,000 | 768,742 |
| Sigma Healthcare Ltd. | | 6,500,000 | 4,992,000 |
| Tokai Corp. | | 96,800 | 4,280,466 |
| Uchiyama Holdings Co. Ltd. | | 775,000 | 3,268,856 |
| UnitedHealth Group, Inc. | | 1,300,000 | 249,353,000 |
| Universal Health Services, Inc. Class B | | 25,000 | 2,770,750 |
| | | | 1,222,425,620 |
| Health Care Technology - 0.1% | | | |
| Cegedim SA (c) | | 14,867 | 568,466 |
| Pharmagest Interactive | | 275,000 | 13,624,058 |
| | | | 14,192,524 |
| Life Sciences Tools & Services - 0.2% | | | |
| Divi's Laboratories Ltd. (c) | | 350,000 | 3,669,601 |
| ICON PLC (c) | | 160,000 | 16,792,000 |
| | | | 20,461,601 |
| Pharmaceuticals - 2.5% | | | |
| Apex Healthcare Bhd | | 750,000 | 826,813 |
| AstraZeneca PLC sponsored ADR | | 800,000 | 24,144,000 |
| Biofermin Pharmaceutical Co. Ltd. | | 100,000 | 2,775,636 |
| Bliss Gvs Pharma Ltd. (c) | | 100,000 | 255,453 |
| Bristol-Myers Squibb Co. | | 213,800 | 12,165,220 |
| Dawnrays Pharmaceutical Holdings Ltd. | | 4,000,000 | 2,406,924 |
| DongKook Pharmaceutical Co. Ltd. | | 83,000 | 4,461,509 |
| Genomma Lab Internacional SA de CV (c) | | 5,000,000 | 6,428,872 |
| GlaxoSmithKline PLC | | 82,200 | 1,636,353 |
| Indivior PLC | | 2,700,000 | 13,679,539 |
| Johnson & Johnson | | 860,900 | 114,258,648 |
| Kaken Pharmaceutical Co. Ltd. | | 10,000 | 533,358 |
| Korea United Pharm, Inc. | | 130,000 | 2,338,975 |
| Kwang Dong Pharmaceutical Co. Ltd. | | 2,400,000 | 18,065,334 |
| Lee's Pharmaceutical Holdings Ltd. | | 6,760,000 | 5,357,249 |
| Luye Pharma Group Ltd. | | 2,500,000 | 1,417,909 |
| Nippon Chemiphar Co. Ltd. | | 26,810 | 1,259,702 |
| Novo Nordisk A/S Series B sponsored ADR | | 250,000 | 10,600,000 |
| Orient Europharma Co. Ltd. | | 200,000 | 456,734 |
| PT Tempo Scan Pacific Tbk | | 500,000 | 72,613 |
| Sanofi SA sponsored ADR | | 200,000 | 9,472,000 |
| SciClone Pharmaceuticals, Inc. (c) | | 5,000 | 54,750 |
| Stallergenes Greer PLC (c) | | 104,976 | 4,461,314 |
| Syngen Biotech Co. Ltd. | | 50,000 | 212,646 |
| Taro Pharmaceutical Industries Ltd. (a)(c) | | 350,000 | 40,015,500 |
| Teva Pharmaceutical Industries Ltd. sponsored ADR | | 280,200 | 9,014,034 |
| Towa Pharmaceutical Co. Ltd. | | 150,000 | 7,252,030 |
| Tsumura & Co. | | 407,300 | 15,867,872 |
| Vetoquinol SA | | 10,000 | 621,495 |
| | | | 310,112,482 |
|
| TOTAL HEALTH CARE | | | 2,596,015,149 |
|
| INDUSTRIALS - 9.2% | | | |
| Aerospace & Defense - 0.0% | | | |
| Austal Ltd. | | 300,000 | 433,200 |
| Kongsberg Gruppen ASA | | 10,000 | 169,786 |
| Orbital ATK, Inc. | | 5,000 | 510,900 |
| Senior Engineering Group PLC | | 100,000 | 327,739 |
| SIFCO Industries, Inc. (c) | | 36,000 | 241,200 |
| The Lisi Group | | 5,000 | 241,051 |
| | | | 1,923,876 |
| Air Freight & Logistics - 0.5% | | | |
| AIT Corp. (a) | | 900,000 | 8,792,235 |
| C.H. Robinson Worldwide, Inc. | | 46,800 | 3,070,080 |
| CTI Logistics Ltd. | | 421,930 | 313,916 |
| Onelogix Group Ltd. | | 4,000,000 | 789,149 |
| SBS Co. Ltd. | | 275,000 | 2,100,322 |
| United Parcel Service, Inc. Class B | | 450,000 | 49,630,500 |
| | | | 64,696,202 |
| Airlines - 0.0% | | | |
| Allegiant Travel Co. | | 6,900 | 891,825 |
| WestJet Airlines Ltd. | | 10,000 | 199,318 |
| | | | 1,091,143 |
| Building Products - 0.2% | | | |
| InnoTec TSS AG | | 50,000 | 1,048,314 |
| KVK Corp. | | 112,000 | 852,356 |
| Miyako, Inc. | | 6,100 | 48,581 |
| Nihon Dengi Co. Ltd. | | 250,000 | 6,533,176 |
| Noda Corp. (a) | | 250,000 | 2,328,904 |
| Sekisui Jushi Corp. | | 550,000 | 10,007,710 |
| Sunspring Metal Corp. | | 100,000 | 136,193 |
| | | | 20,955,234 |
| Commercial Services & Supplies - 0.8% | | | |
| Aeon Delight Co. Ltd. | | 170,000 | 5,682,344 |
| Asia File Corp. Bhd | | 3,525,600 | 2,717,384 |
| Calian Technologies Ltd. | | 309,000 | 6,934,686 |
| Civeo Corp. (c) | | 2,944,500 | 5,682,885 |
| CMC Corp. | | 5,000 | 190,485 |
| Fursys, Inc. | | 200,000 | 5,973,561 |
| KAR Auction Services, Inc. | | 450,000 | 18,918,000 |
| Matsuda Sangyo Co. Ltd. | | 150,000 | 2,036,827 |
| Mitie Group PLC | | 2,000,000 | 7,024,486 |
| Nippon Kanzai Co. Ltd. | | 20,000 | 359,926 |
| Prestige International, Inc. | | 1,811,400 | 19,848,258 |
| Riverstone Holdings Ltd. | | 100,000 | 77,851 |
| VSE Corp. | | 330,000 | 17,110,500 |
| | | | 92,557,193 |
| Construction & Engineering - 0.4% | | | |
| Arcadis NV | | 500,000 | 10,230,991 |
| Astaldi SpA | | 300,000 | 1,999,438 |
| Boustead Projs. Pte Ltd. | | 2,549,475 | 1,759,037 |
| Boustead Singapore Ltd. | | 6,570,060 | 4,605,805 |
| Daiichi Kensetsu Corp. | | 275,000 | 3,342,555 |
| Geumhwa PSC Co. Ltd. | | 1,000 | 33,573 |
| Hokuriku Electrical Construction Co. Ltd. | | 25,000 | 215,203 |
| Joban Kaihatsu Co. Ltd. | | 50,000 | 309,311 |
| Kawasaki Setsubi Kogyo Co. Ltd. | | 43,000 | 155,236 |
| Meisei Industrial Co. Ltd. | | 600,000 | 3,891,333 |
| Monadelphous Group Ltd. | | 10,000 | 121,840 |
| Nippon Rietec Co. Ltd. | | 925,100 | 10,917,095 |
| Shinnihon Corp. | | 75,000 | 611,592 |
| Sumitomo Densetsu Co. Ltd. | | 175,000 | 2,789,015 |
| Toshiba Plant Systems & Services Corp. | | 600,000 | 9,774,593 |
| Watanabe Sato Co. Ltd. | | 225,000 | 1,144,950 |
| | | | 51,901,567 |
| Electrical Equipment - 0.5% | | | |
| Aichi Electric Co. Ltd. | | 32,900 | 910,200 |
| Aros Quality Group AB | | 853,205 | 24,463,940 |
| Canare Electric Co. Ltd. | | 95,000 | 2,141,367 |
| Eaton Corp. PLC | | 320,800 | 25,102,600 |
| Hammond Power Solutions, Inc. Class A | | 450,000 | 2,649,288 |
| Holding Co. ADMIE IPTO SA (c) | | 25,000 | 60,374 |
| Iwabuchi Corp. | | 5,000 | 278,924 |
| Somfy SA | | 40,000 | 3,785,792 |
| Terasaki Electric Co. Ltd. | | 60,000 | 761,939 |
| | | | 60,154,424 |
| Industrial Conglomerates - 0.1% | | | |
| Carr's Group PLC | | 3,572,500 | 6,728,602 |
| Mytilineos Holdings SA (c) | | 300,000 | 2,983,176 |
| Nolato AB Series B | | 35,000 | 1,536,761 |
| Reunert Ltd. | | 300,000 | 1,637,181 |
| | | | 12,885,720 |
| Machinery - 1.0% | | | |
| Castings PLC | | 75,000 | 457,667 |
| Conrad Industries, Inc. | | 1,000 | 18,250 |
| Daihatsu Diesel Manufacturing Co. Ltd. (b) | | 3,184,000 | 20,621,126 |
| Daiwa Industries Ltd. | | 1,000,000 | 11,420,019 |
| Fuji Latex Co. Ltd. | | 168,000 | 496,784 |
| Fujimak Corp. (b) | | 395,000 | 7,735,544 |
| Fukushima Industries Corp. | | 75,000 | 3,115,788 |
| Global Brass & Copper Holdings, Inc. | | 250,000 | 8,012,500 |
| Haitian International Holdings Ltd. | | 3,750,000 | 10,754,340 |
| Hy-Lok Corp. | | 100,000 | 2,058,155 |
| Ihara Science Corp. | | 200,000 | 3,925,802 |
| Jaya Holdings Ltd. | | 1,157,500 | 73,457 |
| Koike Sanso Kogyo Co. Ltd. | | 310,000 | 866,071 |
| Luxfer Holdings PLC sponsored ADR | | 50,000 | 635,000 |
| Mitsuboshi Belting Ltd. | | 25,000 | 286,181 |
| Momentum Group AB Class B (c) | | 525,000 | 5,413,343 |
| Nakano Refrigerators Co. Ltd. | | 58,700 | 1,855,590 |
| Nansin Co. Ltd. | | 100,000 | 616,808 |
| Sakura Rubber Co. Ltd. | | 192,000 | 754,102 |
| Sansei Co. Ltd. (b) | | 711,000 | 1,567,173 |
| Semperit AG Holding (a) | | 350,000 | 10,698,001 |
| SIMPAC, Inc. (b) | | 2,325,000 | 9,611,942 |
| Suzumo Machinery Co. Ltd. | | 10,000 | 257,155 |
| Teikoku Sen-I Co. Ltd. | | 700,000 | 12,749,785 |
| Tocalo Co. Ltd. | | 100,000 | 3,823,303 |
| Yamada Corp. | | 223,000 | 817,198 |
| | | | 118,641,084 |
| Marine - 0.1% | | | |
| Japan Transcity Corp. | | 1,400,000 | 5,422,468 |
| Nippon Concept Corp. | | 25,000 | 282,553 |
| SITC International Holdings Co. Ltd. | | 200,000 | 166,436 |
| | | | 5,871,457 |
| Professional Services - 1.8% | | | |
| ABIST Co. Ltd. | | 133,300 | 5,362,470 |
| Akka Technologies SA | | 840,077 | 45,885,452 |
| Bertrandt AG (a) | | 210,000 | 20,024,569 |
| Career Design Center Co. Ltd. | | 110,000 | 1,369,949 |
| CBIZ, Inc. (c) | | 828,153 | 12,298,072 |
| Dun & Bradstreet Corp. | | 800,000 | 88,608,000 |
| Harvey Nash Group PLC | | 300,000 | 384,440 |
| McMillan Shakespeare Ltd. | | 2,592,772 | 29,765,023 |
| Robert Half International, Inc. | | 400,000 | 18,100,000 |
| SHL-JAPAN Ltd. | | 20,800 | 766,946 |
| WDB Holdings Co. Ltd. | | 210,000 | 4,398,295 |
| | | | 226,963,216 |
| Road & Rail - 0.6% | | | |
| Autohellas SA (b) | | 636,553 | 15,485,482 |
| Daqin Railway Co. Ltd. (A Shares) | | 36,000,867 | 46,830,483 |
| Hamakyorex Co. Ltd. | | 92,000 | 2,434,251 |
| Higashi Twenty One Co. Ltd. | | 200,000 | 691,188 |
| NANSO Transport Co. Ltd. | | 41,000 | 417,271 |
| Nikkon Holdings Co. Ltd. | | 100,000 | 2,367,454 |
| SENKO Co. Ltd. | | 200,000 | 1,362,420 |
| STEF-TFE Group | | 15,000 | 1,666,494 |
| Tohbu Network Co. Ltd. | | 135,000 | 1,389,859 |
| Utoc Corp. | | 1,500,000 | 6,068,302 |
| | | | 78,713,204 |
| Trading Companies & Distributors - 3.2% | | | |
| AerCap Holdings NV (c) | | 675,000 | 33,142,500 |
| Bergman & Beving AB (B Shares) | | 525,000 | 6,502,514 |
| Canox Corp. | | 304,300 | 2,710,532 |
| Green Cross Co. Ltd. | | 204,700 | 3,579,859 |
| HERIGE | | 60,000 | 2,742,391 |
| Houston Wire & Cable Co. (b) | | 1,348,500 | 7,753,875 |
| Howden Joinery Group PLC | | 225,000 | 1,261,379 |
| iMarketKorea, Inc. | | 35,000 | 398,461 |
| Itochu Corp. | | 16,500,000 | 258,998,141 |
| Kamei Corp. | | 1,749,993 | 25,032,781 |
| Lumax International Corp. Ltd. | | 150,000 | 264,608 |
| Meiwa Corp. | | 1,300,000 | 5,164,860 |
| Mitani Shoji Co. Ltd. | | 650,000 | 25,617,942 |
| Narasaki Sangyo Co. Ltd. | | 45,000 | 125,720 |
| Pla Matels Corp. | | 160,200 | 940,173 |
| Rasa Corp. | | 100,000 | 825,434 |
| Sakai Trading Co. Ltd. | | 96,000 | 285,618 |
| Shinsho Corp. | | 100,000 | 2,647,739 |
| Yamazen Co. Ltd. | | 50,000 | 513,856 |
| Yuasa Trading Co. Ltd. | | 550,000 | 17,635,720 |
| | | | 396,144,103 |
| Transportation Infrastructure - 0.0% | | | |
| Isewan Terminal Service Co. Ltd. | | 43,700 | 255,671 |
| Meiko Transportation Co. Ltd. | | 27,000 | 306,136 |
| Qingdao Port International Co. Ltd. | | 5,000,000 | 2,829,416 |
| | | | 3,391,223 |
|
| TOTAL INDUSTRIALS | | | 1,135,889,646 |
|
| INFORMATION TECHNOLOGY - 11.5% | | | |
| Communications Equipment - 1.5% | | | |
| Cisco Systems, Inc. | | 5,636,800 | 177,277,360 |
| EVS Broadcast Equipment SA | | 5,000 | 203,170 |
| HF Co. | | 225,000 | 2,479,765 |
| SerComm Corp. | | 125,000 | 316,487 |
| | | | 180,276,782 |
| Electronic Equipment & Components - 0.9% | | | |
| AAC Technology Holdings, Inc. | | 250,000 | 3,363,932 |
| Daido Signal Co. Ltd. | | 274,000 | 1,327,189 |
| Dell Technologies, Inc. (c) | | 184,400 | 11,851,388 |
| Elematec Corp. | | 400,000 | 7,252,937 |
| Hon Hai Precision Industry Co. Ltd. (Foxconn) | | 2,500,000 | 9,722,153 |
| Intelligent Digital Integrated Security Co. Ltd. | | 129,285 | 935,062 |
| ITC Networks Corp. | | 5,000 | 82,362 |
| Lacroix SA (b) | | 376,493 | 10,250,925 |
| Lagercrantz Group AB (B Shares) | | 10,000 | 113,020 |
| Macnica Fuji Electronics Holdings, Inc. | | 800,000 | 12,749,785 |
| Makus, Inc. | | 300,000 | 992,468 |
| New Cosmos Electric Co. Ltd. | | 15,000 | 203,819 |
| PAX Global Technology Ltd. | | 3,000,000 | 1,989,553 |
| Redington India Ltd. | | 2,261,800 | 5,252,747 |
| Riken Kieki Co. Ltd. | | 550,000 | 10,411,810 |
| Shibaura Electronics Co. Ltd. | | 233,200 | 7,868,874 |
| Simplo Technology Co. Ltd. | | 2,200,000 | 6,990,021 |
| TE Connectivity Ltd. | | 193,900 | 15,587,621 |
| VST Holdings Ltd. | | 20,443,500 | 5,444,062 |
| | | | 112,389,728 |
| Internet Software & Services - 1.0% | | | |
| Akamai Technologies, Inc. (c) | | 100,000 | 4,714,000 |
| Alphabet, Inc. Class A (c) | | 30,000 | 28,365,000 |
| Aucnet, Inc. | | 32,700 | 419,706 |
| AuFeminin.com SA (c) | | 125,018 | 3,864,184 |
| CROOZ, Inc. (a) | | 55,000 | 1,434,305 |
| F@N Communications, Inc. | | 500,000 | 4,580,707 |
| GMO Internet, Inc. | | 5,000 | 64,538 |
| GMO Pepabo, Inc. (a) | | 35,000 | 1,057,191 |
| Kakaku.com, Inc. | | 350,000 | 4,943,081 |
| mixi, Inc. | | 10,000 | 550,592 |
| XLMedia PLC | | 100,000 | 169,543 |
| Yahoo! Japan Corp. | | 5,000,000 | 22,676,765 |
| YY, Inc. ADR (c) | | 650,000 | 46,475,000 |
| Zappallas, Inc. (b) | | 1,100,000 | 5,068,711 |
| | | | 124,383,323 |
| IT Services - 4.4% | | | |
| All for One Steeb AG | | 10,000 | 769,470 |
| Amdocs Ltd. | | 1,250,000 | 83,962,500 |
| Avant Corp. | | 63,000 | 909,184 |
| Cielo SA | | 600,000 | 5,021,887 |
| Computer Services, Inc. | | 5,000 | 245,000 |
| Comture Corp. | | 5,000 | 229,035 |
| Data#3 Ltd. | | 500,001 | 712,001 |
| Dimerco Data System Corp. | | 425,000 | 519,039 |
| E-Credible Co. Ltd. | | 157,321 | 1,875,319 |
| eClerx Services Ltd. | | 129,101 | 2,611,087 |
| Enea Data AB | | 64,113 | 613,432 |
| Estore Corp. | | 500,000 | 3,592,000 |
| Future Corp. | | 450,000 | 3,640,981 |
| IFIS Japan Ltd. | | 10,000 | 63,404 |
| Korea Information & Communication Co. Ltd. (c) | | 325,000 | 3,322,737 |
| Leidos Holdings, Inc. | | 29,400 | 1,571,136 |
| Neurones | | 10,000 | 341,526 |
| Nice Information & Telecom, Inc. | | 125,000 | 2,734,534 |
| Paysafe Group PLC (c) | | 50,000 | 389,223 |
| Persistent Systems Ltd. | | 125,000 | 1,259,349 |
| Shinsegae Information & Communication Co. Ltd. | | 20,000 | 1,471,514 |
| Societe Pour L'Informatique Industrielle SA | | 174,000 | 4,624,278 |
| Softcreate Co. Ltd. | | 25,000 | 328,813 |
| Sopra Steria Group | | 550,000 | 95,091,694 |
| Tessi SA | | 199,798 | 36,568,492 |
| The Western Union Co. | | 14,170,000 | 279,857,500 |
| TravelSky Technology Ltd. (H Shares) | | 350,000 | 927,562 |
| Wipro Ltd. | | 1,942,184 | 8,728,934 |
| | | | 541,981,631 |
| Semiconductors & Semiconductor Equipment - 0.5% | | | |
| e-LITECOM Co. Ltd. | | 50,000 | 416,096 |
| KLA-Tencor Corp. | | 19,600 | 1,815,548 |
| Kyosha Co. Ltd. | | 50,000 | 223,139 |
| Miraial Co. Ltd. (b) | | 631,900 | 6,075,686 |
| Phison Electronics Corp. | | 100,000 | 1,390,061 |
| Qualcomm, Inc. | | 811,000 | 43,137,090 |
| Taiwan Semiconductor Manufacturing Co. Ltd. sponsored ADR | | 375,000 | 13,485,000 |
| | | | 66,542,620 |
| Software - 0.5% | | | |
| eBase Co. Ltd. | | 60,000 | 1,025,353 |
| Ebix, Inc. | | 318,700 | 18,404,925 |
| GAMEVIL, Inc. (c) | | 15,000 | 737,989 |
| InfoVine Co. Ltd. | | 63,600 | 1,544,661 |
| init innovation in traffic systems AG | | 30,000 | 582,074 |
| Jastec Co. Ltd. | | 100,000 | 1,188,263 |
| Justplanning, Inc. | | 111,200 | 752,462 |
| KPIT Cummins Infosystems Ltd. | | 1,800,000 | 3,588,501 |
| KSK Co., Ltd. | | 121,900 | 1,609,927 |
| Linedata Services | | 10,000 | 582,430 |
| Microsoft Corp. | | 400,000 | 29,080,000 |
| Sinosoft Tech Group Ltd. (a) | | 3,000,000 | 902,596 |
| Toho System Science Co. Ltd. | | 10,200 | 67,448 |
| Uchida Esco Co. Ltd. (b) | | 315,400 | 3,627,622 |
| Zensar Technologies Ltd. | | 100,000 | 1,246,884 |
| | | | 64,941,135 |
| Technology Hardware, Storage & Peripherals - 2.7% | | | |
| Apple, Inc. | | 150,000 | 22,309,500 |
| Bluecom Co. Ltd. | | 55,000 | 420,873 |
| Hewlett Packard Enterprise Co. | | 6,700,000 | 117,317,000 |
| HP, Inc. | | 7,100,000 | 135,610,000 |
| Seagate Technology LLC | | 1,500,000 | 49,440,000 |
| TPV Technology Ltd. | | 25,000,000 | 5,857,275 |
| | | | 330,954,648 |
|
| TOTAL INFORMATION TECHNOLOGY | | | 1,421,469,867 |
|
| MATERIALS - 1.9% | | | |
| Chemicals - 1.3% | | | |
| Bloomage BioTechnology Corp. Ltd. (a) | | 2,785,000 | 5,212,872 |
| C. Uyemura & Co. Ltd. | | 175,000 | 10,048,075 |
| CF Industries Holdings, Inc. | | 265,400 | 7,789,490 |
| Chokwang Paint Ltd. | | 50,000 | 517,887 |
| Chugoku Marine Paints Ltd. | | 850,000 | 6,630,686 |
| Dainichiseika Color & Chemicals Manufacturing Co. Ltd. | | 50,000 | 419,067 |
| Daishin-Chemical Co. Ltd. (b) | | 321,395 | 4,757,736 |
| Fuso Chemical Co. Ltd. | | 234,500 | 7,817,021 |
| Green Seal Holding Ltd. | | 55,000 | 161,098 |
| Hannong Chemicals, Inc. (b) | | 1,288,000 | 5,566,323 |
| Isamu Paint Co. Ltd. | | 56,000 | 304,776 |
| K&S AG (a) | | 850,000 | 22,132,029 |
| KH Neochem Co. Ltd. | | 50,000 | 1,022,722 |
| Koatsu Gas Kogyo Co. Ltd. | | 100,000 | 743,798 |
| KPC Holdings Corp. | | 12,000 | 717,899 |
| KPX Green Chemical Co. Ltd. | | 50,000 | 201,128 |
| Kuriyama Holdings Corp. | | 100,000 | 1,957,458 |
| LyondellBasell Industries NV Class A | | 148,300 | 13,360,347 |
| Nippon Soda Co. Ltd. | | 800,000 | 4,513,583 |
| NOF Corp. | | 150,000 | 2,040,909 |
| Potash Corp. of Saskatchewan, Inc. | | 300,000 | 5,365,951 |
| Scientex Bhd | | 4,000,000 | 8,090,622 |
| Soda Aromatic Co. Ltd. | | 150,000 | 1,545,648 |
| T&K Toka Co. Ltd. | | 300,000 | 3,298,109 |
| Tae Kyung Industrial Co. Ltd. | | 704,644 | 3,145,915 |
| Toho Acetylene Co. Ltd. | | 225,000 | 3,604,245 |
| Vivimed Labs Ltd. (c) | | 100,000 | 194,297 |
| Yara International ASA | | 925,000 | 36,857,183 |
| Yip's Chemical Holdings Ltd. | | 2,408,000 | 1,001,946 |
| Yung Chi Paint & Varnish Manufacturing Co. Ltd. | | 2,200,000 | 5,992,487 |
| | | | 165,011,307 |
| Construction Materials - 0.1% | | | |
| Ibstock PLC | | 500,000 | 1,682,235 |
| Mitani Sekisan Co. Ltd. | | 326,000 | 7,673,545 |
| RHI AG | | 10,000 | 377,869 |
| | | | 9,733,649 |
| Containers & Packaging - 0.1% | | | |
| Chuoh Pack Industry Co. Ltd. | | 12,000 | 138,673 |
| Mayr-Melnhof Karton AG | | 100,000 | 13,199,370 |
| | | | 13,338,043 |
| Metals & Mining - 0.4% | | | |
| Alconix Corp. | | 9,000 | 178,131 |
| Ausdrill Ltd. | | 10,700,000 | 16,649,200 |
| Chubu Steel Plate Co. Ltd. | | 379,600 | 2,523,895 |
| CI Resources Ltd. | | 85,263 | 105,726 |
| CK-SAN-ETSU Co. Ltd. | | 78,500 | 1,745,948 |
| Compania de Minas Buenaventura SA sponsored ADR | | 350,000 | 4,284,000 |
| Handy & Harman Ltd. (c) | | 100,000 | 3,310,000 |
| Labrador Iron Ore Royalty Corp. | | 50,000 | 690,596 |
| Mount Gibson Iron Ltd. (c) | | 11,000,000 | 3,916,000 |
| Orvana Minerals Corp. (c) | | 50,000 | 11,229 |
| Pacific Metals Co. Ltd. (a)(c) | | 7,000,000 | 18,794,503 |
| Teck Resources Ltd. Class B (sub. vtg.) | | 10,000 | 217,044 |
| | | | 52,426,272 |
|
| TOTAL MATERIALS | | | 240,509,271 |
|
| REAL ESTATE - 0.6% | | | |
| Equity Real Estate Investment Trusts (REITs) - 0.4% | | | |
| Crown Castle International Corp. | | 175,300 | 17,631,674 |
| Duke Realty Corp. | | 200,000 | 5,718,000 |
| First Potomac Realty Trust | | 438,100 | 4,876,053 |
| Piedmont Office Realty Trust, Inc. Class A | | 413,500 | 8,687,635 |
| Public Storage | | 60,000 | 12,334,200 |
| Sabra Health Care REIT, Inc. (a) | | 101,100 | 2,345,520 |
| Ventas, Inc. | | 66,700 | 4,492,245 |
| | | | 56,085,327 |
| Real Estate Management & Development - 0.2% | | | |
| CRE, Inc. | | 5,000 | 69,754 |
| HFF, Inc. | | 10,000 | 367,200 |
| Japan Corporate Housing Service, Inc. | | 25,000 | 161,912 |
| Lai Sun Garment (International) Ltd. | | 1,018,709 | 448,656 |
| Leopalace21 Corp. | | 500,000 | 3,569,323 |
| Nisshin Fudosan Co. Ltd. (b) | | 2,725,000 | 15,201,370 |
| | | | 19,818,215 |
|
| TOTAL REAL ESTATE | | | 75,903,542 |
|
| TELECOMMUNICATION SERVICES - 1.0% | | | |
| Diversified Telecommunication Services - 1.0% | | | |
| AT&T, Inc. | | 1,217,300 | 47,474,700 |
| Verizon Communications, Inc. | | 1,522,200 | 73,674,480 |
| | | | 121,149,180 |
| Wireless Telecommunication Services - 0.0% | | | |
| Okinawa Cellular Telephone Co. | | 235,700 | 8,284,616 |
|
| TOTAL TELECOMMUNICATION SERVICES | | | 129,433,796 |
|
| UTILITIES - 1.3% | | | |
| Electric Utilities - 0.8% | | | |
| EVN AG | | 10,000 | 153,125 |
| Exelon Corp. | | 1,935,800 | 74,218,572 |
| Public Power Corp. of Greece (c) | | 25,000 | 66,293 |
| Southern Co. | | 352,300 | 16,885,739 |
| | | | 91,323,729 |
| Gas Utilities - 0.4% | | | |
| Busan City Gas Co. Ltd. | | 101,515 | 3,467,120 |
| GAIL India Ltd. | | 5,500,000 | 32,286,148 |
| Hokuriku Gas Co. | | 39,000 | 1,009,978 |
| K&O Energy Group, Inc. | | 75,000 | 1,146,991 |
| Keiyo Gas Co. Ltd. | | 50,000 | 253,980 |
| Rubis (a) | | 20,592 | 1,310,497 |
| Seoul City Gas Co. Ltd. | | 82,820 | 6,448,503 |
| YESCO Co. Ltd. | | 235,000 | 8,036,627 |
| | | | 53,959,844 |
| Independent Power and Renewable Electricity Producers - 0.0% | | | |
| The AES Corp. | | 140,800 | 1,574,144 |
| Multi-Utilities - 0.1% | | | |
| Public Service Enterprise Group, Inc. | | 250,000 | 11,242,500 |
| Water Utilities - 0.0% | | | |
| Manila Water Co., Inc. | | 500,000 | 317,297 |
|
| TOTAL UTILITIES | | | 158,417,514 |
|
| TOTAL COMMON STOCKS | | | |
| (Cost $8,875,716,422) | | | 11,356,995,417 |
|
| Nonconvertible Preferred Stocks - 0.1% | | | |
| INDUSTRIALS - 0.0% | | | |
| Machinery - 0.0% | | | |
| Danieli & C. Officine Meccaniche SpA | | 10,000 | 187,159 |
| MATERIALS - 0.1% | | | |
| Construction Materials - 0.1% | | | |
| Buzzi Unicem SpA (Risparmio Shares) | | 550,000 | 7,858,656 |
| TOTAL NONCONVERTIBLE PREFERRED STOCKS | | | |
| (Cost $4,509,708) | | | 8,045,815 |
|
| Money Market Funds - 10.9% | | | |
| Fidelity Cash Central Fund, 1.11% (e) | | 1,024,059,916 | 1,024,264,728 |
| Fidelity Securities Lending Cash Central Fund 1.11% (e)(f) | | 334,825,451 | 334,858,934 |
| TOTAL MONEY MARKET FUNDS | | | |
| (Cost $1,359,103,780) | | | 1,359,123,662 |
| TOTAL INVESTMENT PORTFOLIO - 102.5% | | | |
| (Cost $10,239,329,910) | | | 12,724,164,894 |
| NET OTHER ASSETS (LIABILITIES) - (2.5)% | | | (313,839,197) |
| NET ASSETS - 100% | | | $12,410,325,697 |
Security Type Abbreviations
ELS – Equity-Linked Security
Legend
(a) Security or a portion of the security is on loan at period end.
(b) Affiliated company
(c) Non-income producing
(d) Security exempt from registration under Rule 144A of the Securities Act of 1933. These securities may be resold in transactions exempt from registration, normally to qualified institutional buyers. At the end of the period, the value of these securities amounted to $1,895,920 or 0.0% of net assets.
(e) Affiliated fund that is generally available only to investment companies and other accounts managed by Fidelity Investments. The rate quoted is the annualized seven-day yield of the fund at period end. A complete unaudited listing of the fund's holdings as of its most recent quarter end is available upon request. In addition, each Fidelity Central Fund's financial statements, which are not covered by the Fund's Report of Independent Registered Public Accounting Firm, are available on the SEC's website or upon request.
(f) Investment made with cash collateral received from securities on loan.
Affiliated Central Funds
Information regarding fiscal year to date income earned by the Fund from investments in Fidelity Central Funds is as follows:
| Fund | Income earned |
| Fidelity Cash Central Fund | $5,521,909 |
| Fidelity Securities Lending Cash Central Fund | 4,888,522 |
| Total | $10,410,431 |
Other Affiliated Issuers
An affiliated company is a company in which the Fund has ownership of at least 5% of the voting securities. Fiscal year to date transactions with companies which are or were affiliates are as follows:
| Affiliate | Value, beginning of period | Purchases* | Sales Proceeds | Dividend Income | Value, end of period |
| Amedisys, Inc. | $117,810,000 | $-- | $86,793,399 | $-- | $-- |
| Autohellas SA | 7,465,052 | 698,928 | -- | 503,312 | 15,485,482 |
| Carbo Ceramics, Inc. | -- | 15,421,993 | -- | -- | 16,686,614 |
| CBIZ, Inc. | 30,268,000 | -- | 29,432,975 | -- | -- |
| Chori Co. Ltd. | 21,454,810 | 2,374,586 | -- | 478,914 | 29,056,084 |
| Daihatsu Diesel Manufacturing Co. Ltd. | 17,807,163 | -- | -- | 387,313 | 20,621,126 |
| Daishin-Chemical Co. Ltd. | 2,748,995 | 1,046,930 | -- | 92,565 | 4,757,736 |
| Fossil Group, Inc. | 26,070,000 | 33,917,235 | -- | -- | 41,062,500 |
| Fuji Corp. | 9,845,160 | -- | -- | 150,119 | 11,012,124 |
| Fujimak Corp. | 1,194,480 | 3,249,280 | -- | 50,430 | 7,735,544 |
| G-Tekt Corp. | 38,160,465 | 1,806,038 | -- | 766,265 | 50,445,825 |
| Gendai Agency, Inc. | 4,353,168 | -- | -- | 180,782 | 4,356,207 |
| GNC Holdings, Inc. Class A | -- | 42,901,061 | -- | 15,000 | 56,485,596 |
| Guess?, Inc. | 51,520,000 | 26,727,915 | 565,983 | 3,668,355 | 75,797,628 |
| Gulfmark Offshore, Inc. Class A | 7,290,600 | 75,000 | 764,437 | -- | -- |
| Gwangju Shinsegae Co. Ltd. | 21,831,698 | -- | -- | 83,805 | 21,344,833 |
| Hannong Chemicals, Inc. | 4,774,443 | -- | -- | 97,993 | 5,566,323 |
| Houston Wire & Cable Co. | -- | 8,775,418 | -- | -- | 7,753,875 |
| Jinro Distillers Co. Ltd. | 10,899,806 | 1,368,745 | -- | 314,177 | 12,246,815 |
| Lacroix SA | 7,176,672 | -- | -- | 135,758 | 10,250,925 |
| MegaStudy Co. Ltd. | 10,972,336 | -- | -- | 176,346 | 9,770,132 |
| MegaStudyEdu Co. Ltd. | 8,884,436 | -- | -- | 143,079 | 6,599,812 |
| Miraial Co. Ltd. | 4,502,855 | -- | -- | 51,118 | 6,075,686 |
| Nisshin Fudosan Co. Ltd. | 8,878,686 | 668,654 | -- | 316,273 | 15,201,370 |
| Sansei Co. Ltd. | 1,041,822 | 345,210 | -- | 38,926 | 1,567,173 |
| Satsudora Holdings Co. Ltd. (formerly Sapporo Drug Store Co. Ltd.) | 8,289,984 | -- | -- | 110,677 | 7,252,937 |
| SIMPAC, Inc. | 10,801,806 | -- | -- | 157,819 | 9,611,942 |
| TBK Co. Ltd. | 6,623,944 | -- | -- | 245,490 | 8,114,654 |
| Treasure Factory Co. Ltd. | 7,938,429 | -- | -- | 118,525 | 6,579,663 |
| Uchida Esco Co. Ltd. | 2,414,074 | -- | -- | 63,353 | 3,627,622 |
| Yorozu Corp. | 26,169,214 | 2,628,565 | -- | 814,044 | 31,262,642 |
| Zappallas, Inc. | 3,937,668 | -- | -- | 44,581 | 5,068,711 |
| Total | $481,125,766 | $142,005,558 | $117,556,794 | $9,205,019 | $501,397,581 |
* Includes the value of securities received through in-kind transactions, if applicable.
Investment Valuation
The following is a summary of the inputs used, as of July 31, 2017, involving the Fund's assets and liabilities carried at fair value. The inputs or methodology used for valuing securities may not be an indication of the risk associated with investing in those securities. For more information on valuation inputs, and their aggregation into the levels used below, please refer to the Investment Valuation section in the accompanying Notes to Financial Statements.
| | Valuation Inputs at Reporting Date: |
| Description | Total | Level 1 | Level 2 | Level 3 |
| Investments in Securities: | | | | |
| Equities: | | | | |
| Consumer Discretionary | $2,612,652,712 | $2,611,728,765 | $923,947 | $-- |
| Consumer Staples | 804,688,822 | 804,688,815 | -- | 7 |
| Energy | 403,464,700 | 372,004,882 | 31,459,818 | -- |
| Financials | 1,778,550,398 | 1,514,461,336 | 264,089,062 | -- |
| Health Care | 2,596,015,149 | 2,594,378,796 | 1,636,353 | -- |
| Industrials | 1,136,076,805 | 1,136,076,805 | -- | -- |
| Information Technology | 1,421,469,867 | 1,421,469,867 | -- | -- |
| Materials | 248,367,927 | 248,367,927 | -- | -- |
| Real Estate | 75,903,542 | 75,903,542 | -- | -- |
| Telecommunication Services | 129,433,796 | 129,433,796 | -- | -- |
| Utilities | 158,417,514 | 158,417,514 | -- | -- |
| Money Market Funds | 1,359,123,662 | 1,359,123,662 | -- | -- |
| Total Investments in Securities: | $12,724,164,894 | $12,426,055,707 | $298,109,180 | $7 |
The following is a summary of transfers between Level 1 and Level 2 for the period ended July 31, 2017. Transfers are assumed to have occurred at the beginning of the period, and are primarily attributable to the valuation techniques used for foreign equity securities, as discussed in the accompanying Notes to Financial Statements:
| Transfers | Total |
| Level 1 to Level 2 | $629,961 |
| Level 2 to Level 1 | $1,072,821,854 |
Other Information
Distribution of investments by country or territory of incorporation, as a percentage of Total Net Assets, is as follows (Unaudited):
| United States of America | 58.2% |
| Japan | 16.4% |
| Korea (South) | 4.3% |
| United Kingdom | 3.1% |
| France | 2.3% |
| Netherlands | 1.7% |
| Cayman Islands | 1.3% |
| Others (Individually Less Than 1%) | 12.7% |
| | 100.0% |
See accompanying notes which are an integral part of the financial statements.
Financial Statements
Statement of Assets and Liabilities
| | | July 31, 2017 |
| Assets | | |
Investment in securities, at value (including securities loaned of $319,339,596) — See accompanying schedule:
Unaffiliated issuers (cost $8,312,193,038) | $10,863,643,651 | |
| Fidelity Central Funds (cost $1,359,103,780) | 1,359,123,662 | |
| Other affiliated issuers (cost $568,033,092) | 501,397,581 | |
| Total Investments (cost $10,239,329,910) | | $12,724,164,894 |
| Receivable for investments sold | | 25,355,322 |
| Receivable for fund shares sold | | 2,670,678 |
| Dividends receivable | | 7,801,872 |
| Distributions receivable from Fidelity Central Funds | | 1,417,305 |
| Other receivables | | 16,201 |
| Total assets | | 12,761,426,272 |
| Liabilities | | |
| Payable to custodian bank | $406,543 | |
| Payable for investments purchased | 10,138,929 | |
| Payable for fund shares redeemed | 2,938,591 | |
| Other payables and accrued expenses | 2,763,125 | |
| Collateral on securities loaned | 334,853,387 | |
| Total liabilities | | 351,100,575 |
| Net Assets | | $12,410,325,697 |
| Net Assets consist of: | | |
| Paid in capital | | $9,547,542,282 |
| Undistributed net investment income | | 89,540,306 |
| Accumulated undistributed net realized gain (loss) on investments and foreign currency transactions | | 290,943,814 |
| Net unrealized appreciation (depreciation) on investments and assets and liabilities in foreign currencies | | 2,482,299,295 |
| Net Assets | | $12,410,325,697 |
| Series Intrinsic Opportunities: | | |
| Net Asset Value, offering price and redemption price per share ($4,948,388,577 ÷ 286,030,626 shares) | | $17.30 |
| Class F: | | |
| Net Asset Value, offering price and redemption price per share ($7,461,937,120 ÷ 430,765,889 shares) | | $17.32 |
See accompanying notes which are an integral part of the financial statements.
Statement of Operations
| | | Year ended July 31, 2017 |
| Investment Income | | |
| Dividends (including $9,205,019 earned from other affiliated issuers) | | $158,910,491 |
| Income from Fidelity Central Funds | | 10,410,431 |
| Total income | | 169,320,922 |
| Expenses | | |
| Management fee | | |
| Basic fee | $35,609,853 | |
| Performance adjustment | (3,459,588) | |
| Transfer agent fees | 3,946,962 | |
| Accounting and security lending fees | 1,016,356 | |
| Custodian fees and expenses | 658,047 | |
| Independent trustees' fees and expenses | 32,393 | |
| Audit | 59,645 | |
| Legal | 19,133 | |
| Miscellaneous | 63,214 | |
| Total expenses before reductions | 37,946,015 | |
| Expense reductions | (115,303) | 37,830,712 |
| Net investment income (loss) | | 131,490,210 |
| Realized and Unrealized Gain (Loss) | | |
| Net realized gain (loss) on: | | |
| Investment securities: | | |
| Unaffiliated issuers | 322,784,864 | |
| Fidelity Central Funds | 100,967 | |
| Other affiliated issuers | 57,956,519 | |
| Foreign currency transactions | (951,273) | |
| Total net realized gain (loss) | | 379,891,077 |
| Change in net unrealized appreciation (depreciation) on: | | |
| Investment securities (net of increase in deferred foreign taxes of $2,472,916) | 963,288,204 | |
| Assets and liabilities in foreign currencies | 108,897 | |
| Total change in net unrealized appreciation (depreciation) | | 963,397,101 |
| Net gain (loss) | | 1,343,288,178 |
| Net increase (decrease) in net assets resulting from operations | | $1,474,778,388 |
See accompanying notes which are an integral part of the financial statements.
Statement of Changes in Net Assets
| | Year ended July 31, 2017 | Year ended July 31, 2016 |
| Increase (Decrease) in Net Assets | | |
| Operations | | |
| Net investment income (loss) | $131,490,210 | $87,925,156 |
| Net realized gain (loss) | 379,891,077 | (44,739,155) |
| Change in net unrealized appreciation (depreciation) | 963,397,101 | 29,082,263 |
| Net increase (decrease) in net assets resulting from operations | 1,474,778,388 | 72,268,264 |
| Distributions to shareholders from net investment income | (102,338,705) | (103,150,030) |
| Distributions to shareholders from net realized gain | (18,472,180) | (239,019,097) |
| Total distributions | (120,810,885) | (342,169,127) |
| Share transactions - net increase (decrease) | 3,954,188,911 | 974,036,633 |
| Total increase (decrease) in net assets | 5,308,156,414 | 704,135,770 |
| Net Assets | | |
| Beginning of period | 7,102,169,283 | 6,398,033,513 |
| End of period | $12,410,325,697 | $7,102,169,283 |
| Other Information | | |
| Undistributed net investment income end of period | $89,540,306 | $52,549,880 |
See accompanying notes which are an integral part of the financial statements.
Financial Highlights — Fidelity Series Intrinsic Opportunities Fund
| Years ended July 31, | 2017 | 2016 | 2015 | 2014 | 2013 A |
| Selected Per–Share Data | | | | | |
| Net asset value, beginning of period | $14.80 | $15.58 | $14.47 | $12.78 | $10.00 |
| Income from Investment Operations | | | | | |
| Net investment income (loss)B | .23 | .18 | .24C | .21 | .12 |
| Net realized and unrealized gain (loss) | 2.50 | (.16) | 1.49 | 1.84 | 2.69 |
| Total from investment operations | 2.73 | .02 | 1.73 | 2.05 | 2.81 |
| Distributions from net investment income | (.19) | (.23) | (.21) | (.15) | (.03) |
| Distributions from net realized gain | (.04) | (.58) | (.42) | (.21) | – |
| Total distributions | (.23) | (.80)D | (.62)E | (.36) | (.03) |
| Net asset value, end of period | $17.30 | $14.80 | $15.58 | $14.47 | $12.78 |
| Total ReturnF,G | 18.69% | .43% | 12.35% | 16.35% | 28.19% |
| Ratios to Average Net AssetsH,I | | | | | |
| Expenses before reductions | .52% | .79% | .82% | .81% | .81%J |
| Expenses net of fee waivers, if any | .52% | .79% | .82% | .81% | .81%J |
| Expenses net of all reductions | .52% | .79% | .82% | .81% | .79%J |
| Net investment income (loss) | 1.48% | 1.28% | 1.60%C | 1.55% | 1.58%J |
| Supplemental Data | | | | | |
| Net assets, end of period (000 omitted) | $4,948,389 | $2,776,843 | $2,619,363 | $2,479,629 | $1,995,564 |
| Portfolio turnover rateK | 35%L | 14% | 10% | 16% | 7%J |
A For the period December 6, 2012 (commencement of operations) to July 31, 2013.
B Calculated based on average shares outstanding during the period.
C Net Investment income per share reflects a large, non-recurring dividend which amounted to $.06 per share. Excluding this non-recurring dividend, the ratio of net investment income (loss) to average net assets would have been 1.18%.
D Total distributions of $.80 per share is comprised of distributions from net investment income of $.228 and distributions from net realized gain of $.576 per share.
E Total distributions of $.62 per share is comprised of distributions from net investment income of $.206 and distributions from net realized gain of $.416 per share.
F Total returns for periods of less than one year are not annualized.
G Total returns would have been lower if certain expenses had not been reduced during the applicable periods shown.
H Fees and expenses of any underlying Fidelity Central Funds are not included in the Fund's expense ratio. The Fund indirectly bears its proportionate share of the expenses of any underlying Fidelity Central Funds.
I Expense ratios reflect operating expenses of the class. Expenses before reductions do not reflect amounts reimbursed by the investment adviser or reductions from brokerage service arrangements or reductions from other expense offset arrangements and do not represent the amount paid by the class during periods when reimbursements or reductions occur. Expense ratios before reductions for start-up periods may not be representative of longer-term operating periods. Expenses net of fee waivers reflect expenses after reimbursement by the investment adviser but prior to reductions from brokerage service arrangements or other expense offset arrangements. Expenses net of all reductions represent the net expenses paid by the class.
J Annualized
K Amount does not include the portfolio activity of any underlying Fidelity Central Funds.
L Portfolio turnover rate excludes securities received or delivered in-kind.
See accompanying notes which are an integral part of the financial statements.
Financial Highlights — Fidelity Series Intrinsic Opportunities Fund Class F
| Years ended July 31, | 2017 | 2016 | 2015 | 2014 | 2013 A |
| Selected Per–Share Data | | | | | |
| Net asset value, beginning of period | $14.82 | $15.60 | $14.49 | $12.80 | $10.00 |
| Income from Investment Operations | | | | | |
| Net investment income (loss)B | .25 | .20 | .26C | .24 | .13 |
| Net realized and unrealized gain (loss) | 2.50 | (.15) | 1.50 | 1.83 | 2.70 |
| Total from investment operations | 2.75 | .05 | 1.76 | 2.07 | 2.83 |
| Distributions from net investment income | (.22) | (.25) | (.23) | (.17) | (.03) |
| Distributions from net realized gain | (.04) | (.58) | (.42) | (.21) | – |
| Total distributions | (.25)D | (.83) | (.65) | (.38) | (.03) |
| Net asset value, end of period | $17.32 | $14.82 | $15.60 | $14.49 | $12.80 |
| Total ReturnE,F | 18.84% | .61% | 12.52% | 16.48% | 28.40% |
| Ratios to Average Net AssetsG,H | | | | | |
| Expenses before reductions | .40% | .63% | .66% | .64% | .62%I |
| Expenses net of fee waivers, if any | .40% | .63% | .66% | .64% | .62%I |
| Expenses net of all reductions | .40% | .62% | .66% | .64% | .60%I |
| Net investment income (loss) | 1.60% | 1.44% | 1.76%C | 1.72% | 1.77%I |
| Supplemental Data | | | | | |
| Net assets, end of period (000 omitted) | $7,461,937 | $4,325,327 | $3,778,670 | $3,475,538 | $2,485,841 |
| Portfolio turnover rateJ | 35%K | 14% | 10% | 16% | 7%I |
A For the period December 6, 2012 (commencement of operations) to July 31, 2013.
B Calculated based on average shares outstanding during the period.
C Net Investment income per share reflects a large, non-recurring dividend which amounted to $.06 per share. Excluding this non-recurring dividend, the ratio of net investment income (loss) to average net assets would have been 1.34%.
D Total distributions of $.25 per share is comprised of distributions from net investment income of $.217 and distributions from net realized gain of $.037 per share.
E Total returns for periods of less than one year are not annualized.
F Total returns would have been lower if certain expenses had not been reduced during the applicable periods shown.
G Fees and expenses of any underlying Fidelity Central Funds are not included in the Fund's expense ratio. The Fund indirectly bears its proportionate share of the expenses of any underlying Fidelity Central Funds.
H Expense ratios reflect operating expenses of the class. Expenses before reductions do not reflect amounts reimbursed by the investment adviser or reductions from brokerage service arrangements or reductions from other expense offset arrangements and do not represent the amount paid by the class during periods when reimbursements or reductions occur. Expense ratios before reductions for start-up periods may not be representative of longer-term operating periods. Expenses net of fee waivers reflect expenses after reimbursement by the investment adviser but prior to reductions from brokerage service arrangements or other expense offset arrangements. Expenses net of all reductions represent the net expenses paid by the class.
I Annualized
J Amount does not include the portfolio activity of any underlying Fidelity Central Funds.
K Portfolio turnover rate excludes securities received or delivered in-kind.
See accompanying notes which are an integral part of the financial statements.
Notes to Financial Statements
For the period ended July 31, 2017
1. Organization.
Fidelity Series Intrinsic Opportunities Fund (the Fund) is a fund of Fidelity Puritan Trust (the Trust) and is authorized to issue an unlimited number of shares. Shares of the Fund are only available for purchase by mutual funds for which Fidelity Management & Research Company (FMR) or an affiliate serves as an investment manager. The Trust is registered under the Investment Company Act of 1940, as amended (the 1940 Act), as an open-end management investment company organized as a Massachusetts business trust. The Fund offers Series Intrinsic Opportunities and Class F shares, each of which has equal rights as to assets and voting privileges. Each class has exclusive voting rights with respect to matters that affect that class.
Effective August 28, 2017, the Fund no longer offered Class F, and all outstanding shares of class F were exchanged for shares of Series Intrinsic Opportunities Fund.
2. Investments in Fidelity Central Funds.
The Fund invests in Fidelity Central Funds, which are open-end investment companies generally available only to other investment companies and accounts managed by the investment adviser and its affiliates. The Fund's Schedule of Investments lists each of the Fidelity Central Funds held as of period end, if any, as an investment of the Fund, but does not include the underlying holdings of each Fidelity Central Fund. As an Investing Fund, the Fund indirectly bears its proportionate share of the expenses of the underlying Fidelity Central Funds.
The Money Market Central Funds seek preservation of capital and current income and are managed by Fidelity Investments Money Management, Inc. (FIMM), an affiliate of the investment adviser. Annualized expenses of the Money Market Central Funds as of their most recent shareholder report date are less than .005%.
A complete unaudited list of holdings for each Fidelity Central Fund is available upon request or at the Securities and Exchange Commission (the SEC) website at www.sec.gov. In addition, the financial statements of the Fidelity Central Funds, which are not covered by the Fund's Report of Independent Registered Public Accounting Firm, are available on the SEC website or upon request.
3. Significant Accounting Policies.
The Fund is an investment company and applies the accounting and reporting guidance of the Financial Accounting Standards Board (FASB) Accounting Standards Codification Topic 946 Financial Services – Investments Companies. The financial statements have been prepared in conformity with accounting principles generally accepted in the United States of America (GAAP), which require management to make certain estimates and assumptions at the date of the financial statements. Actual results could differ from those estimates. Subsequent events, if any, through the date that the financial statements were issued have been evaluated in the preparation of the financial statements. The following summarizes the significant accounting policies of the Fund:
Investment Valuation. Investments are valued as of 4:00 p.m. Eastern time on the last calendar day of the period. The Board of Trustees (the Board) has delegated the day to day responsibility for the valuation of the Fund's investments to the Fair Value Committee (the Committee) established by the Fund's investment adviser. In accordance with valuation policies and procedures approved by the Board, the Fund attempts to obtain prices from one or more third party pricing vendors or brokers to value its investments. When current market prices, quotations or currency exchange rates are not readily available or reliable, investments will be fair valued in good faith by the Committee, in accordance with procedures adopted by the Board. Factors used in determining fair value vary by investment type and may include market or investment specific events. The frequency with which these procedures are used cannot be predicted and they may be utilized to a significant extent. The Committee oversees the Fund's valuation policies and procedures and reports to the Board on the Committee's activities and fair value determinations. The Board monitors the appropriateness of the procedures used in valuing the Fund's investments and ratifies the fair value determinations of the Committee.
The Fund categorizes the inputs to valuation techniques used to value its investments into a disclosure hierarchy consisting of three levels as shown below:
- Level 1 – quoted prices in active markets for identical investments
- Level 2 – other significant observable inputs (including quoted prices for similar investments, interest rates, prepayment speeds, etc.)
- Level 3 – unobservable inputs (including the Fund's own assumptions based on the best information available)
Valuation techniques used to value the Fund's investments by major category are as follows:
Equity securities, including restricted securities, for which market quotations are readily available, are valued at the last reported sale price or official closing price as reported by a third party pricing vendor on the primary market or exchange on which they are traded and are categorized as Level 1 in the hierarchy. In the event there were no sales during the day or closing prices are not available, securities are valued at the last quoted bid price or may be valued using the last available price and are generally categorized as Level 2 in the hierarchy. For foreign equity securities, when market or security specific events arise, comparisons to the valuation of American Depositary Receipts (ADRs), futures contracts, Exchange-Traded Funds (ETFs) and certain indexes as well as quoted prices for similar securities may be used and would be categorized as Level 2 in the hierarchy. Utilizing these techniques may result in transfers between Level 1 and Level 2. For equity securities, including restricted securities, where observable inputs are limited, assumptions about market activity and risk are used and these securities may be categorized as Level 3 in the hierarchy.
Investments in open-end mutual funds, including the Fidelity Central Funds, are valued at their closing net asset value (NAV) each business day and are categorized as Level 1 in the hierarchy.
Changes in valuation techniques may result in transfers in or out of an assigned level within the disclosure hierarchy. The aggregate value of investments by input level as of July 31, 2017, including information on transfers between Levels 1 and 2 is included at the end of the Fund's Schedule of Investments.
Foreign Currency. The Fund may use foreign currency contracts to facilitate transactions in foreign-denominated securities. Gains and losses from these transactions may arise from changes in the value of the foreign currency or if the counterparties do not perform under the contracts' terms.
Foreign-denominated assets, including investment securities, and liabilities are translated into U.S. dollars at the exchange rates at period end. Purchases and sales of investment securities, income and dividends received and expenses denominated in foreign currencies are translated into U.S. dollars at the exchange rate in effect on the transaction date.
The effects of exchange rate fluctuations on investments are included with the net realized and unrealized gain (loss) on investment securities. Other foreign currency transactions resulting in realized and unrealized gain (loss) are disclosed separately.
Investment Transactions and Income. For financial reporting purposes, the Fund's investment holdings and NAV include trades executed through the end of the last business day of the period. The NAV per share for processing shareholder transactions is calculated as of the close of business of the New York Stock Exchange (NYSE), normally 4:00 p.m. Eastern time and includes trades executed through the end of the prior business day. Gains and losses on securities sold are determined on the basis of identified cost and may include proceeds received from litigation. Dividend income is recorded on the ex-dividend date, except for certain dividends from foreign securities where the ex-dividend date may have passed, which are recorded as soon as the Fund is informed of the ex-dividend date. Non-cash dividends included in dividend income, if any, are recorded at the fair market value of the securities received. Income and capital gain distributions from Fidelity Central Funds, if any, are recorded on the ex-dividend date. Certain distributions received by the Fund represent a return of capital or capital gain. The Fund determines the components of these distributions subsequent to the ex-dividend date, based upon receipt of tax filings or other correspondence relating to the underlying investment. These distributions are recorded as a reduction of cost of investments and/or as a realized gain. Investment income is recorded net of foreign taxes withheld where recovery of such taxes is uncertain.
Class Allocations and Expenses. Investment income, realized and unrealized capital gains and losses, common expenses of the Fund, and certain fund-level expense reductions, if any, are allocated daily on a pro-rata basis to each class based on the relative net assets of each class to the total net assets of the Fund. Each class differs with respect to transfer agent fees incurred. Certain expense reductions may also differ by class. For the reporting period, the allocated portion of income and expenses to each class as a percent of its average net assets may vary due to the timing of recording these transactions in relation to fluctuating net assets of the classes. Expenses directly attributable to a fund are charged to that fund. Expenses attributable to more than one fund are allocated among the respective funds on the basis of relative net assets or other appropriate methods. Expense estimates are accrued in the period to which they relate and adjustments are made when actual amounts are known.
Income Tax Information and Distributions to Shareholders. Each year, the Fund intends to qualify as a regulated investment company under Subchapter M of the Internal Revenue Code, including distributing substantially all of its taxable income and realized gains. As a result, no provision for U.S. Federal income taxes is required. As of July 31, 2017, the Fund did not have any unrecognized tax benefits in the financial statements; nor is the Fund aware of any tax positions for which it is reasonably possible that the total amounts of unrecognized tax benefits will significantly change in the next twelve months. The Fund files a U.S. federal tax return, in addition to state and local tax returns as required. The Fund's federal income tax returns are subject to examination by the Internal Revenue Service (IRS) for a period of three fiscal years after they are filed. State and local tax returns may be subject to examination for an additional fiscal year depending on the jurisdiction. Foreign taxes are provided for based on the Fund's understanding of the tax rules and rates that exist in the foreign markets in which it invests. An estimated deferred tax liability for net unrealized appreciation on the applicable securities is included in Other payables and accrued expenses on the Statement of Assets & Liabilities.
Distributions are declared and recorded on the ex-dividend date. Income dividends and capital gain distributions are declared separately for each class. Income and capital gain distributions are determined in accordance with income tax regulations, which may differ from GAAP.
Capital accounts within the financial statements are adjusted for permanent book-tax differences. These adjustments have no impact on net assets or the results of operations. Capital accounts are not adjusted for temporary book-tax differences which will reverse in a subsequent period.
Book-tax differences are primarily due to foreign currency transactions, certain foreign taxes, passive foreign investment companies (PFIC), partnerships, capital loss carryforwards, and losses deferred due to wash sales.
The federal tax cost of investment securities and unrealized appreciation (depreciation) as of period end were as follows:
| Gross unrealized appreciation | $2,930,494,566 |
| Gross unrealized depreciation | (477,797,319) |
| Net unrealized appreciation (depreciation) on securities | $2,452,697,247 |
| Tax Cost | $10,271,467,647 |
The tax-based components of distributable earnings as of period end were as follows:
| Undistributed ordinary income | $92,815,114 |
| Undistributed long-term capital gain | $319,810,018 |
| Net unrealized appreciation (depreciation) on securities and other investments | $2,452,722,083 |
The tax character of distributions paid was as follows:
| | July 31, 2017 | July 31, 2016 |
| Ordinary Income | $115,818,404 | $ 105,639,811 |
| Long-term Capital Gains | 4,992,481 | 236,529,316 |
| Total | $120,810,885 | $ 342,169,127 |
Restricted Securities. The Fund may invest in securities that are subject to legal or contractual restrictions on resale. These securities generally may be resold in transactions exempt from registration or to the public if the securities are registered. Disposal of these securities may involve time-consuming negotiations and expense, and prompt sale at an acceptable price may be difficult. Information regarding restricted securities is included at the end of the Fund's Schedule of Investments.
4. Purchases and Sales of Investments.
Purchases and sales of securities, other than short-term securities and in-kind transactions, aggregated $3,176,210,878 and $2,638,463,354, respectively.
5. Fees and Other Transactions with Affiliates.
Management Fee. Effective June 1, 2017, under the management contract approved by the Board and shareholders, Fidelity Management & Research Company (the investment adviser) and its affiliates provide the Fund with investment management related services for which the Fund does not pay a management fee. In addition, the investment adviser pays all ordinary operating expenses of the Fund, except custody fees, fees and expenses of the independent Trustees, and certain miscellaneous expenses such as proxy and shareholder meeting expenses.
Prior to June 1, 2017, the investment adviser and its affiliates provided the Fund with investment management related services for which the Fund paid a monthly management fee. The management fee was the sum of an individual fund fee rate that was based on an annual rate of .30% of the Fund's average net assets and an annualized group fee rate that averaged .25% during the period. The group fee rate was based upon the average net assets of all the mutual funds advised by the investment adviser, including any mutual funds previously advised by the investment adviser that are currently advised by Fidelity SelectCo, LLC, an affiliate of the investment adviser. The group fee rate decreased as assets under management increased and increased as assets under management decreased. In addition, the management fee was subject to a performance adjustment (up to a maximum of +/- .20% of the Fund's average net assets over a 36 month performance period). The upward or downward adjustment to the management fee was based on the relative investment performance of Series Intrinsic Opportunities as compared to its benchmark index, the Russell 3000 Index, over the same 36 month performance period. The performance adjustment included in the management fee rate may be higher or lower than the maximum performance adjustment rate due to the difference between the average net assets for the reporting and performance periods.
Transfer Agent Fees. Fidelity Investments Institutional Operations Company, Inc., (FIIOC), an affiliate of the investment adviser, is the transfer, dividend disbursing and shareholder servicing agent for each class of the Fund. Effective June 1, 2017, fees for these services are no longer charged to the classes. Prior to June 1, 2017, FIIOC received account fees and asset-based fees that varied according to the account size and type of account of the shareholders of Series Intrinsic Opportunities. FIIOC received no fees for providing transfer agency services to Class F. FIIOC pays for typesetting, printing and mailing of shareholder reports, except proxy statements.
For the period, transfer agent fees for each applicable class were as follows:
| | Amount | % of
Class-Level Average
Net Assets |
| Series Intrinsic Opportunities | $3,946,962 | .12 |
Accounting and Security Lending Fees. Fidelity Service Company, Inc. (FSC), an affiliate of the investment adviser, maintains the Fund's accounting records. The accounting fee is based on the level of average net assets for each month. Under a separate contract, FSC administers the security lending program. The security lending fee is based on the number and duration of lending transactions. Effective June 1, 2017, these fees are paid by the investment adviser or an affiliate.
Brokerage Commissions. The Fund placed a portion of its portfolio transactions with brokerage firms which are affiliates of the investment adviser. Brokerage commissions are included in net realized gain (loss) and change in net unrealized appreciation (depreciation) in the Statement of Operations. The commissions paid to these affiliated firms were $56,459 for the period.
Interfund Trades. The Fund may purchase from or sell securities to other Fidelity Funds under procedures adopted by the Board. The procedures have been designed to ensure these interfund trades are executed in accordance with Rule 17a-7 of the 1940 Act. Interfund trades are included within the respective purchases and sales amounts shown in the Purchases and Sales of Investments note.
Exchanges In-Kind. During the period, certain affiliated entities (Investing Funds) completed exchanges in-kind with the Fund. The Investing Funds delivered investments and cash valued at $3,024,754,769 in exchange for 178,428,561 shares of the Fund. The amount of in-kind exchanges is included in share transactions in the accompanying Statement of Changes in Net Assets as well as the Notes to Financial Statements. The Fund recognized no gain or loss for federal income tax purposes.
Other. During the period, the investment adviser reimbursed the Fund for certain losses in the amount of $713,658.
6. Committed Line of Credit.
The Fund participates with other funds managed by the investment adviser or an affiliate in a $4.25 billion credit facility (the "line of credit") to be utilized for temporary or emergency purposes to fund shareholder redemptions or for other short-term liquidity purposes. The Fund has agreed to pay commitment fees on its pro-rata portion of the line of credit, which amounted to $26,050 and is reflected in Miscellaneous expenses on the Statement of Operations. During the period, the Fund did not borrow on this line of credit.
7. Security Lending.
The Fund lends portfolio securities through a lending agent from time to time in order to earn additional income. For equity securities, a lending agent is used and may loan securities to certain qualified borrowers, including Fidelity Capital Markets (FCM), a broker-dealer affiliated with the Fund. On the settlement date of the loan, the Fund receives collateral (in the form of U.S. Treasury obligations, letters of credit and/or cash) against the loaned securities and maintains collateral in an amount not less than 100% of the market value of the loaned securities during the period of the loan. The market value of the loaned securities is determined at the close of business of the Fund and any additional required collateral is delivered to the Fund on the next business day. The Fund or borrower may terminate the loan at any time, and if the borrower defaults on its obligation to return the securities loaned because of insolvency or other reasons, the Fund may apply collateral received from the borrower against the obligation. The Fund may experience delays and costs in recovering the securities loaned. Any cash collateral received is invested in the Fidelity Securities Lending Cash Central Fund. The value of loaned securities and cash collateral at period end are disclosed on the Fund's Statement of Assets and Liabilities. The value of securities loaned to FCM at period end was $4,368,489. Security lending income represents the income earned on investing cash collateral, less rebates paid to borrowers and any lending agent fees associated with the loan, plus any premium payments received for lending certain types of securities. Security lending income is presented in the Statement of Operations as a component of income from Fidelity Central Funds. Total security lending income during the period amounted to $4,888,522, including $484,743 from securities loaned to FCM.
8. Expense Reductions.
Commissions paid to certain brokers with whom the investment adviser, or its affiliates, places trades on behalf of the Fund include an amount in addition to trade execution, which may be rebated back to the Fund to offset certain expenses. This amount totaled $44,533 for the period. In addition, through arrangements with the Fund's custodian, credits realized as a result of certain uninvested cash balances were used to reduce the Fund's expenses. During the period, these credits reduced the Fund's custody expenses by $1,374.
In addition, during the period the investment adviser reimbursed and/or waived a portion of fund-level operating expenses in the amount of $69,396.
9. Distributions to Shareholders.
Distributions to shareholders of each class were as follows:
| | Year ended July 31, 2017 | Year ended July 31, 2016 |
| From net investment income | | |
| Series Intrinsic Opportunities | $37,121,067 | $39,337,484 |
| Class F | 65,217,638 | 63,812,546 |
| Total | $102,338,705 | $103,150,030 |
| From net realized gain | | |
| Series Intrinsic Opportunities | $7,186,687 | $97,447,233 |
| Class F | 11,285,493 | 141,571,864 |
| Total | $18,472,180 | $239,019,097 |
10. Share Transactions.
Transactions for each class of shares were as follows:
| | Shares | Shares | Dollars | Dollars |
| | Year ended July 31, 2017 | Year ended July 31, 2016 | Year ended July 31, 2017 | Year ended July 31, 2016 |
| Series Intrinsic Opportunities | | | | |
| Shares sold | 98,373,368(a) | 10,630,599 | $1,647,612,534(a) | $149,097,059 |
| Reinvestment of distributions | 2,936,245 | 9,698,211 | 44,307,754 | 136,784,717 |
| Shares redeemed | (2,915,567) | (803,864) | (45,345,088) | (11,429,286) |
| Net increase (decrease) | 98,394,046 | 19,524,946 | $1,646,575,200 | $274,452,490 |
| Class F | | | | |
| Shares sold | 148,826,054(a) | 36,940,681 | $2,479,453,692(a) | $519,763,162 |
| Reinvestment of distributions | 5,068,588 | 14,556,463 | 76,503,131 | 205,384,410 |
| Shares redeemed | (14,981,144) | (1,797,099) | (248,343,112) | (25,563,429) |
| Net increase (decrease) | 138,913,498 | 49,700,045 | $2,307,613,711 | $699,584,143 |
(a) Amount includes in-kind exchanges (see the Exchanges In-Kind note for additional details).
11. Other.
The Fund's organizational documents provide former and current trustees and officers with a limited indemnification against liabilities arising in connection with the performance of their duties to the Fund. In the normal course of business, the Fund may also enter into contracts that provide general indemnifications. The Fund's maximum exposure under these arrangements is unknown as this would be dependent on future claims that may be made against the Fund. The risk of material loss from such claims is considered remote.
At the end of the period, mutual funds managed by the investment adviser or its affiliates were the owners of record of all of the outstanding shares of the Fund.
Report of Independent Registered Public Accounting Firm
To the Trustees of Fidelity Puritan Trust and Shareholders of Fidelity Series Intrinsic Opportunities Fund:
We have audited the accompanying statement of assets and liabilities of Fidelity Series Intrinsic Opportunities Fund (the Fund), a fund of Fidelity Puritan Trust, including the schedule of investments, as of July 31, 2017, and the related statement of operations for the year then ended, the statement of changes in net assets for each of the two years in the period then ended, and the financial highlights for each of the four years in the period then ended and for the period from December 6, 2012 (commencement of operations) to July 31, 2013. These financial statements and financial highlights are the responsibility of the Fund's management. Our responsibility is to express an opinion on these financial statements and financial highlights based on our audits.
We conducted our audits in accordance with the standards of the Public Company Accounting Oversight Board (United States). Those standards require that we plan and perform the audit to obtain reasonable assurance about whether the financial statements and financial highlights are free of material misstatement. The Fund is not required to have, nor were we engaged to perform, an audit of its internal control over financial reporting. Our audits included consideration of internal control over financial reporting as a basis for designing audit procedures that are appropriate in the circumstances, but not for the purpose of expressing an opinion on the effectiveness of the Fund's internal control over financial reporting. Accordingly, we express no such opinion. An audit also includes examining, on a test basis, evidence supporting the amounts and disclosures in the financial statements, assessing the accounting principles used and significant estimates made by management, as well as evaluating the overall financial statement presentation. Our procedures included confirmation of securities owned as of July 31, 2017, by correspondence with the custodians and brokers; when replies were not received from brokers, we performed other auditing procedures. We believe that our audits provide a reasonable basis for our opinion.
In our opinion, such financial statements and financial highlights referred to above present fairly, in all material respects, the financial position of Fidelity Series Intrinsic Opportunities Fund as of July 31, 2017, the results of its operations for the year then ended, the changes in its net assets for each of the two years in the period then ended, and the financial highlights for each of the four years in the period then ended and for the period from December 6, 2012 (commencement of operations) to July 31, 2013, in conformity with accounting principles generally accepted in the United States of America.
DELOITTE & TOUCHE LLP
Boston, Massachusetts
September 19, 2017
Trustees and Officers
The Trustees, Members of the Advisory Board (if any), and officers of the trust and fund, as applicable, are listed below. The Board of Trustees governs the fund and is responsible for protecting the interests of shareholders. The Trustees are experienced executives who meet periodically throughout the year to oversee the fund's activities, review contractual arrangements with companies that provide services to the fund, oversee management of the risks associated with such activities and contractual arrangements, and review the fund's performance. Except for Jonathan Chiel, each of the Trustees oversees 190 funds. Mr. Chiel oversees 142 funds.
The Trustees hold office without limit in time except that (a) any Trustee may resign; (b) any Trustee may be removed by written instrument, signed by at least two-thirds of the number of Trustees prior to such removal; (c) any Trustee who requests to be retired or who has become incapacitated by illness or injury may be retired by written instrument signed by a majority of the other Trustees; and (d) any Trustee may be removed at any special meeting of shareholders by a two-thirds vote of the outstanding voting securities of the trust. Each Trustee who is not an interested person (as defined in the 1940 Act) of the trust and the fund is referred to herein as an Independent Trustee. Each Independent Trustee shall retire not later than the last day of the calendar year in which his or her 75th birthday occurs. The Independent Trustees may waive this mandatory retirement age policy with respect to individual Trustees. Officers and Advisory Board Members hold office without limit in time, except that any officer or Advisory Board Member may resign or may be removed by a vote of a majority of the Trustees at any regular meeting or any special meeting of the Trustees. Except as indicated, each individual has held the office shown or other offices in the same company for the past five years.
The fund’s Statement of Additional Information (SAI) includes more information about the Trustees. To request a free copy, call Fidelity at 1-800-544-8544 for Fidelity® Series Intrinsic Opportunities Fund, or 1-800-835-5092 for Class F.
Experience, Skills, Attributes, and Qualifications of the Trustees. The Governance and Nominating Committee has adopted a statement of policy that describes the experience, qualifications, attributes, and skills that are necessary and desirable for potential Independent Trustee candidates (Statement of Policy). The Board believes that each Trustee satisfied at the time he or she was initially elected or appointed a Trustee, and continues to satisfy, the standards contemplated by the Statement of Policy. The Governance and Nominating Committee also engages professional search firms to help identify potential Independent Trustee candidates who have the experience, qualifications, attributes, and skills consistent with the Statement of Policy. From time to time, additional criteria based on the composition and skills of the current Independent Trustees, as well as experience or skills that may be appropriate in light of future changes to board composition, business conditions, and regulatory or other developments, have also been considered by the professional search firms and the Governance and Nominating Committee. In addition, the Board takes into account the Trustees' commitment and participation in Board and committee meetings, as well as their leadership of standing and ad hoc committees throughout their tenure.
In determining that a particular Trustee was and continues to be qualified to serve as a Trustee, the Board has considered a variety of criteria, none of which, in isolation, was controlling. The Board believes that, collectively, the Trustees have balanced and diverse experience, qualifications, attributes, and skills, which allow the Board to operate effectively in governing the fund and protecting the interests of shareholders. Information about the specific experience, skills, attributes, and qualifications of each Trustee, which in each case led to the Board's conclusion that the Trustee should serve (or continue to serve) as a trustee of the fund, is provided below.
Board Structure and Oversight Function. James C. Curvey is an interested person and currently serves as Chairman. The Trustees have determined that an interested Chairman is appropriate and benefits shareholders because an interested Chairman has a personal and professional stake in the quality and continuity of services provided to the fund. Independent Trustees exercise their informed business judgment to appoint an individual of their choosing to serve as Chairman, regardless of whether the Trustee happens to be independent or a member of management. The Independent Trustees have determined that they can act independently and effectively without having an Independent Trustee serve as Chairman and that a key structural component for assuring that they are in a position to do so is for the Independent Trustees to constitute a substantial majority for the Board. The Independent Trustees also regularly meet in executive session. Ned C. Lautenbach serves as Chairman of the Independent Trustees and as such (i) acts as a liaison between the Independent Trustees and management with respect to matters important to the Independent Trustees and (ii) with management prepares agendas for Board meetings.
Fidelity® funds are overseen by different Boards of Trustees. The fund's Board oversees Fidelity's high income and certain equity funds, and other Boards oversee Fidelity's investment-grade bond, money market, asset allocation, and sector funds. The asset allocation funds may invest in Fidelity® funds overseen by the fund's Board. The use of separate Boards, each with its own committee structure, allows the Trustees of each group of Fidelity® funds to focus on the unique issues of the funds they oversee, including common research, investment, and operational issues. On occasion, the separate Boards establish joint committees to address issues of overlapping consequences for the Fidelity® funds overseen by each Board.
The Trustees operate using a system of committees to facilitate the timely and efficient consideration of all matters of importance to the Trustees, the fund, and fund shareholders and to facilitate compliance with legal and regulatory requirements and oversight of the fund's activities and associated risks. The Board, acting through its committees, has charged FMR and its affiliates with (i) identifying events or circumstances the occurrence of which could have demonstrably adverse effects on the fund's business and/or reputation; (ii) implementing processes and controls to lessen the possibility that such events or circumstances occur or to mitigate the effects of such events or circumstances if they do occur; and (iii) creating and maintaining a system designed to evaluate continuously business and market conditions in order to facilitate the identification and implementation processes described in (i) and (ii) above. Because the day-to-day operations and activities of the fund are carried out by or through FMR, its affiliates, and other service providers, the fund's exposure to risks is mitigated but not eliminated by the processes overseen by the Trustees. While each of the Board's committees has responsibility for overseeing different aspects of the fund's activities, oversight is exercised primarily through the Operations, Audit, and Compliance Committees. In addition, the Independent Trustees have worked with FMR to enhance the Board's oversight of investment and financial risks, legal and regulatory risks, technology risks, and operational risks, including the development of additional risk reporting to the Board. For example, a working group comprised of Independent Trustees and FMR has worked and continues to work to review the Fidelity® funds' valuation-related activities, reporting and risk management. Appropriate personnel, including but not limited to the fund's Chief Compliance Officer (CCO), FMR's internal auditor, the independent accountants, the fund's Treasurer and portfolio management personnel, make periodic reports to the Board's committees, as appropriate, including an annual review of Fidelity's risk management program for the Fidelity® funds. The responsibilities of each standing committee, including their oversight responsibilities, are described further under "Standing Committees of the Trustees."
Interested Trustees*:
Correspondence intended for a Trustee who is an interested person may be sent to Fidelity Investments, 245 Summer Street, Boston, Massachusetts 02210.
Name, Year of Birth; Principal Occupations and Other Relevant Experience+
Jonathan Chiel (1957)
Year of Election or Appointment: 2016
Trustee
Mr. Chiel also serves as Trustee of other Fidelity funds. Mr. Chiel is Executive Vice President and General Counsel for FMR LLC (diversified financial services company, 2012-present). Previously, Mr. Chiel served as general counsel (2004-2012) and senior vice president and deputy general counsel (2000-2004) for John Hancock Financial Services; a partner with Choate, Hall & Stewart (1996-2000) (law firm); and an Assistant United States Attorney for the United States Attorney’s Office of the District of Massachusetts (1986-95), including Chief of the Criminal Division (1993-1995). Mr. Chiel is a director on the boards of the Boston Bar Foundation and the Maimonides School.
James C. Curvey (1935)
Year of Election or Appointment: 2007
Trustee
Chairman of the Board of Trustees
Mr. Curvey also serves as Trustee of other Fidelity® funds. Mr. Curvey is a Director of Fidelity Research & Analysis Co. (investment adviser firm, 2009-present), and Vice Chairman (2007-present) and Director of FMR LLC (diversified financial services company). In addition, Mr. Curvey serves as an Overseer for the Boston Symphony Orchestra and a member of the board of Artis-Naples, Naples, Florida, and as a Trustee for Brewster Academy, Wolfeboro, New Hampshire. Previously, Mr. Curvey served as a Director of Fidelity Investments Money Management, Inc. (investment adviser firm, 2009-2014) and a Director of FMR and FMR Co., Inc. (investment adviser firms, 2007-2014).
Charles S. Morrison (1960)
Year of Election or Appointment: 2014
Trustee
Mr. Morrison also serves as Trustee of other funds. He serves as President of Fidelity Management & Research Company (FMR) (investment adviser firm, 2016-present), a Director of Fidelity Investments Money Management, Inc. (FIMM) (investment adviser firm, 2014-present), Director of Fidelity SelectCo, LLC (investment adviser firm, 2014-present), President, Asset Management (2014-present), and is an employee of Fidelity Investments. Previously, Mr. Morrison served as Vice President of Fidelity's Fixed Income and Asset Allocation Funds (2012-2014), President, Fixed Income (2011-2014), Vice President of Fidelity's Money Market Funds (2005-2009), President, Money Market Group Leader of FMR (investment adviser firm, 2009), and Senior Vice President, Money Market Group of FMR (2004-2009). Mr. Morrison also served as Vice President of Fidelity's Bond Funds (2002-2005), certain Balanced Funds (2002-2005), and certain Asset Allocation Funds (2002-2007), and as Senior Vice President (2002-2005) of Fidelity's Bond Division.
* Determined to be an “Interested Trustee” by virtue of, among other things, his or her affiliation with the trust or various entities under common control with FMR.
+ The information includes the Trustee's principal occupation during the last five years and other information relating to the experience, attributes, and skills relevant to the Trustee's qualifications to serve as a Trustee, which led to the conclusion that the Trustee should serve as a Trustee for the fund.
Independent Trustees:
Correspondence intended for an Independent Trustee may be sent to Fidelity Investments, P.O. Box 55235, Boston, Massachusetts 02205-5235.
Name, Year of Birth; Principal Occupations and Other Relevant Experience+
Dennis J. Dirks (1948)
Year of Election or Appointment: 2005
Trustee
Mr. Dirks also serves as Trustee of other Fidelity® funds. Prior to his retirement in May 2003, Mr. Dirks was Chief Operating Officer and a member of the Board of The Depository Trust & Clearing Corporation (DTCC). He also served as President, Chief Operating Officer, and Board member of The Depository Trust Company (DTC) and President and Board member of the National Securities Clearing Corporation (NSCC). In addition, Mr. Dirks served as Chief Executive Officer and Board member of the Government Securities Clearing Corporation, Chief Executive Officer and Board member of the Mortgage-Backed Securities Clearing Corporation, as a Trustee and a member of the Finance Committee of Manhattan College (2005-2008), as a Trustee and a member of the Finance Committee of AHRC of Nassau County (2006-2008), as a member of the Independent Directors Council (IDC) Governing Council (2010-2015), and as a member of the Board of Directors for The Brookville Center for Children’s Services, Inc. (2009-2017). Mr. Dirks is a member of the Finance Committee (2016-present) and Board of Directors (2017-present) of the Asolo Repertory Theatre.
Alan J. Lacy (1953)
Year of Election or Appointment: 2008
Trustee
Mr. Lacy also serves as Trustee of other Fidelity® funds. Mr. Lacy serves as a Director of Bristol-Myers Squibb Company (global pharmaceuticals, 2008-present). He is a Trustee of the California Chapter of The Nature Conservancy (2015-present) and a Director of the Center for Advanced Study in the Behavioral Sciences at Stanford University (2015-present). In addition, Mr. Lacy served as Senior Adviser (2007-2014) of Oak Hill Capital Partners, L.P. (private equity) and also served as Chief Executive Officer (2005) and Vice Chairman (2005-2006) of Sears Holdings Corporation (retail) and Chief Executive Officer and Chairman of the Board of Sears, Roebuck and Co. (retail, 2000-2005). Previously, Mr. Lacy served as Chairman (2014-2017) and a member (2010-2017) of the Board of Directors of Dave & Buster’s Entertainment, Inc. (restaurant and entertainment complexes), as Chairman (2008-2011) and a member (2006-2015) of the Board of Trustees of the National Parks Conservation Association, and as a member of the Board of Directors for The Hillman Companies, Inc. (hardware wholesalers, 2010-2014), Earth Fare, Inc. (retail grocery, 2010-2014), and The Western Union Company (global money transfer, 2006-2011).
Ned C. Lautenbach (1944)
Year of Election or Appointment: 2000
Trustee
Chairman of the Independent Trustees
Mr. Lautenbach also serves as Trustee of other Fidelity® funds. Mr. Lautenbach currently serves as the Lead Director of the Eaton Corporation Board of Directors (diversified industrial, 1997-present). Mr. Lautenbach is Chairman of the Board of Directors of Artis-Naples in Naples, Florida (2012-present), a member of the Council on Foreign Relations (1994-present), and currently Vice Chair of the Board of Governors, State University System of Florida (2013-present). Previously, Mr. Lautenbach was a Partner and Advisory Partner at Clayton, Dubilier & Rice, LLC (private equity investment, 1998-2010), as well as a Director of Sony Corporation (2006-2007). Mr. Lautenbach also had a 30-year career with IBM (technology company) during which time he served as Senior Vice President and a member of the Corporate Executive Committee (1968-1998).
Joseph Mauriello (1944)
Year of Election or Appointment: 2008
Trustee
Mr. Mauriello also serves as Trustee of other Fidelity® funds. Prior to his retirement in January 2006, Mr. Mauriello served in numerous senior management positions including Deputy Chairman and Chief Operating Officer (2004-2005), and Vice Chairman of Financial Services (2002-2004) of KPMG LLP US (professional services, 1965-2005). Mr. Mauriello currently serves as a member of the Board of Directors of XL Group plc. (global insurance and re-insurance, 2006-present) and the Independent Directors Council (IDC) Governing Council (2015-present). Previously, Mr. Mauriello served as a Director of the Hamilton Funds of the Bank of New York (2006-2007) and of Arcadia Resources Inc. (health care services and products, 2007-2012).
Cornelia M. Small (1944)
Year of Election or Appointment: 2005
Trustee
Ms. Small also serves as Trustee of other Fidelity® funds. Ms. Small is a member of the Board of Directors (2009-present) and Chair of the Investment Committee (2010-present) of the Teagle Foundation. Ms. Small also serves on the Investment Committee of the Berkshire Taconic Community Foundation (2008-present). Previously, Ms. Small served as Chairperson (2002-2008) and a member of the Investment Committee and Chairperson (2008-2012) and a member of the Board of Trustees of Smith College. In addition, Ms. Small served as Chief Investment Officer, Director of Global Equity Investments, and a member of the Board of Directors of Scudder, Stevens & Clark and Scudder Kemper Investments.
William S. Stavropoulos (1939)
Year of Election or Appointment: 2001
Trustee
Vice Chairman of the Independent Trustees
Mr. Stavropoulos also serves as Trustee of other Fidelity® funds. Mr. Stavropoulos serves as President and Founder of the Michigan Baseball Foundation, the Great Lakes Loons (2007-present). Mr. Stavropoulos is Chairman Emeritus of the Board of Directors of The Dow Chemical Company, where he previously served in numerous senior management positions, including President, CEO (1995-2000; 2002-2004), Chairman of the Executive Committee (2000-2006), and as a member of the Board of Directors (1990-2006). Currently, Mr. Stavropoulos is Chairman of the Board of Directors of Univar Inc. (global distributor of commodity and specialty chemicals), a Director of Teradata Corporation (data warehousing and technology solutions), and a member of the Advisory Board for Metalmark Capital LLC (private equity investment, 2005-present). Mr. Stavropoulos is an operating advisor to Clayton, Dubilier & Rice, LLC (private equity investment). In addition, Mr. Stavropoulos is a member of the University of Notre Dame Advisory Council for the College of Science, a Trustee of the Rollin L. Gerstacker Foundation, and a Director of Artis-Naples in Naples, Florida. Previously, Mr. Stavropoulos served as a Director of Chemical Financial Corporation (bank holding company, 1993-2012) and Tyco International, Ltd. (multinational manufacturing and services, 2007-2012).
David M. Thomas (1949)
Year of Election or Appointment: 2008
Trustee
Mr. Thomas also serves as Trustee of other Fidelity® funds. Mr. Thomas serves as Non-Executive Chairman of the Board of Directors of Fortune Brands Home and Security (home and security products, 2011-present), as a member of the Board of Directors (2004-present) and Presiding Director (2013-present) of Interpublic Group of Companies, Inc. (marketing communication), and as a member of the Board of Trustees of the University of Florida (2013-present). Previously, Mr. Thomas served as Executive Chairman (2005-2006) and Chairman and Chief Executive Officer (2000-2005) of IMS Health, Inc. (pharmaceutical and healthcare information solutions), and a Director of Fortune Brands, Inc. (consumer products, 2000-2011).
+ The information includes the Trustee's principal occupation during the last five years and other information relating to the experience, attributes, and skills relevant to the Trustee's qualifications to serve as a Trustee, which led to the conclusion that the Trustee should serve as a Trustee for the fund.
Advisory Board Members and Officers:
Correspondence intended for an officer or Peter S. Lynch may be sent to Fidelity Investments, 245 Summer Street, Boston, Massachusetts 02210. Officers appear below in alphabetical order.
Name, Year of Birth; Principal Occupation
Peter S. Lynch (1944)
Year of Election or Appointment: 2003
Member of the Advisory Board
Mr. Lynch also serves as Member of the Advisory Board of other Fidelity® funds. Mr. Lynch is Vice Chairman and a Director of FMR (investment adviser firm) and FMR Co., Inc. (investment adviser firm). In addition, Mr. Lynch serves as a Trustee of Boston College and as the Chairman of the Inner-City Scholarship Fund. Previously, Mr. Lynch served on the Special Olympics International Board of Directors (1997-2006).
Elizabeth Paige Baumann (1968)
Year of Election or Appointment: 2017
Anti-Money Laundering (AML) Officer
Ms. Baumann also serves as AML Officer of other funds. She is Chief AML Officer (2012-present) and Senior Vice President (2014-present) of FMR LLC (diversified financial services company) and is an employee of Fidelity Investments. Previously, Ms. Baumann served as AML Officer of the funds (2012-2016), and Vice President (2007-2014) and Deputy Anti-Money Laundering Officer (2007-2012) of FMR LLC.
Marc R. Bryant (1966)
Year of Election or Appointment: 2015
Secretary and Chief Legal Officer (CLO)
Mr. Bryant also serves as Secretary and CLO of other funds. Mr. Bryant serves as CLO, Secretary, and Senior Vice President of Fidelity Management & Research Company (investment adviser firm, 2015-present) and FMR Co., Inc. (investment adviser firm, 2015-present); Secretary of Fidelity SelectCo, LLC (investment adviser firm, 2015-present) and Fidelity Investments Money Management, Inc. (investment adviser firm, 2015-present); and CLO of Fidelity Management & Research (Hong Kong) Limited and FMR Investment Management (UK) Limited (investment adviser firms, 2015-present) and Fidelity Management & Research (Japan) Limited (investment adviser firm, 2016-present). He is Senior Vice President and Deputy General Counsel of FMR LLC (diversified financial services company). Previously, Mr. Bryant served as Secretary and CLO of Fidelity Rutland Square Trust II (2010-2014) and Assistant Secretary of Fidelity's Fixed Income and Asset Allocation Funds (2013-2015). Prior to joining Fidelity Investments, Mr. Bryant served as a Senior Vice President and the Head of Global Retail Legal for AllianceBernstein L.P. (2006-2010), and as the General Counsel for ProFund Advisors LLC (2001-2006).
William C. Coffey (1969)
Year of Election or Appointment: 2009
Assistant Secretary
Mr. Coffey also serves as Assistant Secretary of other funds. He is Senior Vice President and Deputy General Counsel of FMR LLC (diversified financial services company, 2010-present), and is an employee of Fidelity Investments. Previously, Mr. Coffey served as Vice President and Associate General Counsel of FMR LLC (2005-2009).
Jonathan Davis (1968)
Year of Election or Appointment: 2010
Assistant Treasurer
Mr. Davis also serves as Assistant Treasurer of other funds, and is an employee of Fidelity Investments. Previously, Mr. Davis served as Vice President and Associate General Counsel of FMR LLC (diversified financial services company, 2003-2010).
Adrien E. Deberghes (1967)
Year of Election or Appointment: 2016
Assistant Treasurer
Mr. Deberghes also serves as an officer of other funds. He serves as Executive Vice President of Fidelity Investments Money Management, Inc. (FIMM) (investment adviser firm, 2016-present) and is an employee of Fidelity Investments (2008-present). Prior to joining Fidelity Investments, Mr. Deberghes was Senior Vice President of Mutual Fund Administration at State Street Corporation (2007-2008), Senior Director of Mutual Fund Administration at Investors Bank & Trust (2005-2007), and Director of Finance for Dunkin' Brands (2000-2005). Previously, Mr. Deberghes served in other fund officer roles.
Stephanie J. Dorsey (1969)
Year of Election or Appointment: 2010
Assistant Treasurer
Ms. Dorsey also serves as an officer of other funds. She is an employee of Fidelity Investments (2008-present) and has served in other fund officer roles. Prior to joining Fidelity Investments, Ms. Dorsey served as Treasurer (2004-2008) of the JPMorgan Mutual Funds and Vice President (2004-2008) of JPMorgan Chase Bank.
Howard J. Galligan III (1966)
Year of Election or Appointment: 2014
Chief Financial Officer
Mr. Galligan also serves as Chief Financial Officer of other funds. Mr. Galligan serves as President of Fidelity Pricing and Cash Management Services (FPCMS) (2014-present) and as a Director of Strategic Advisers, Inc. (investment adviser firm, 2008-present). Previously, Mr. Galligan served as Chief Administrative Officer of Asset Management (2011-2014) and Chief Operating Officer and Senior Vice President of Investment Support for Strategic Advisers, Inc. (2003-2011).
Thomas C. Hense (1964)
Year of Election or Appointment: 2008, 2010, or 2015
Vice President
Mr. Hense serves as Vice President of Fidelity Advisor® Multi-Asset Income Fund (2015) and other funds (High Income (2008), Small Cap (2008), and Value (2010) funds), and is an employee of Fidelity Investments (1993-present). Previously, Mr. Hense served as a portfolio manager for Fidelity's Institutional Money Management Group (Pyramis) (2003-2008).
Brian B. Hogan (1964)
Year of Election or Appointment: 2009
Vice President
Mr. Hogan also serves as Trustee or Vice President of other funds. Mr. Hogan serves as a Director of FMR Investment Management (UK) Limited (investment adviser firm, 2015-present) and Fidelity SelectCo, LLC (investment adviser firm, 2014-present) and President of the Equity Division of FMR (investment adviser firm, 2009-present). Previously, Mr. Hogan served as Senior Vice President, Equity Research of FMR (2006-2009) and as a portfolio manager. Mr. Brian B. Hogan is not related to Mr. Colm A. Hogan.
Colm A. Hogan (1973)
Year of Election or Appointment: 2016
Deputy Treasurer
Mr. Hogan also serves as an officer of other funds. Mr. Hogan is an employee of Fidelity Investments (2005-present). Mr. Colm A. Hogan is not related to Mr. Brian B. Hogan.
Chris Maher (1972)
Year of Election or Appointment: 2013
Assistant Treasurer
Mr. Maher serves as Assistant Treasurer of other funds. Mr. Maher is Vice President of Valuation Oversight and is an employee of Fidelity Investments. Previously, Mr. Maher served as Vice President of Asset Management Compliance (2013), Vice President of the Program Management Group of FMR (investment adviser firm, 2010-2013), and Vice President of Valuation Oversight (2008-2010).
Rieco E. Mello (1969)
Year of Election or Appointment: 2017
Assistant Treasurer
Mr. Mello also serves as Assistant Treasurer of other funds. Mr. Mello is an employee of Fidelity Investments (1995-present).
Kenneth B. Robins (1969)
Year of Election or Appointment: 2016
Chief Compliance Officer
Mr. Robins also serves as an officer of other funds. Mr. Robins serves as Compliance Officer of Fidelity Management & Research Company and FMR Co., Inc. (investment adviser firms, 2016-present) and is an employee of Fidelity Investments (2004-present). Previously, Mr. Robins served as Executive Vice President of Fidelity Investments Money Management, Inc. (investment adviser firm, 2013-2016) and served in other fund officer roles.
Stacie M. Smith (1974)
Year of Election or Appointment: 2016
President and Treasurer
Ms. Smith also serves as an officer of other funds. She is an employee of Fidelity Investments (2009-present) and has served in other fund officer roles. Prior to joining Fidelity Investments, Ms. Smith served as Senior Audit Manager of Ernst & Young LLP (accounting firm, 1996-2009). Previously, Ms. Smith served as Deputy Treasurer of certain Fidelity® funds (2013-2016).
Marc L. Spector (1972)
Year of Election or Appointment: 2016
Assistant Treasurer
Mr. Spector also serves as an officer of other funds. Mr. Spector is an employee of Fidelity Investments (2016-present). Prior to joining Fidelity Investments, Mr. Spector served as Director at the Siegfried Group (accounting firm, 2013-2016), and prior to Siegfried Group as audit senior manager at Deloitte & Touche (accounting firm, 2005-2013).
Renee Stagnone (1975)
Year of Election or Appointment: 2016
Assistant Treasurer
Ms. Stagnone also serves as an officer of other funds. Ms. Stagnone is an employee of Fidelity Investments (1997-present). Previously, Ms. Stagnone served as Deputy Treasurer of certain Fidelity® funds (2013-2016).
Shareholder Expense Example
As a shareholder of the Fund, you incur two types of costs: (1) transaction costs and (2) ongoing costs, including management fees and other Fund expenses. This Example is intended to help you understand your ongoing costs (in dollars) of investing in the Fund and to compare these costs with the ongoing costs of investing in other mutual funds.
The Example is based on an investment of $1,000 invested at the beginning of the period and held for the entire period (February 1, 2017 to July 31, 2017).
Actual Expenses
The first line of the accompanying table for each class of the Fund provides information about actual account values and actual expenses. You may use the information in this line, together with the amount you invested, to estimate the expenses that you paid over the period. Simply divide your account value by $1,000.00 (for example, an $8,600 account value divided by $1,000.00 = 8.6), then multiply the result by the number in the first line for a class of the Fund under the heading entitled "Expenses Paid During Period" to estimate the expenses you paid on your account during this period. In addition, the Fund, as a shareholder in the underlying Fidelity Central Funds, will indirectly bear its pro-rata share of the fees and expenses incurred by the underlying Fidelity Central Funds. These fees and expenses are not included in the Fund's annualized expense ratio used to calculate the expense estimate in the table below.
Hypothetical Example for Comparison Purposes
The second line of the accompanying table for each class of the Fund provides information about hypothetical account values and hypothetical expenses based on a Class' actual expense ratio and an assumed rate of return of 5% per year before expenses, which is not the Class' actual return. The hypothetical account values and expenses may not be used to estimate the actual ending account balance or expenses you paid for the period. You may use this information to compare the ongoing costs of investing in the Fund and other funds. To do so, compare this 5% hypothetical example with the 5% hypothetical examples that appear in the shareholder reports of the other funds. In addition, the Fund, as a shareholder in the underlying Fidelity Central Funds, will indirectly bear its pro-rata share of the fees and expenses incurred by the underlying Fidelity Central Funds. These fees and expenses are not included in the Fund's annualized expense ratio used to calculate the expense estimate in the table below.
Please note that the expenses shown in the table are meant to highlight your ongoing costs only and do not reflect any transaction costs. Therefore, the second line of the table is useful in comparing ongoing costs only, and will not help you determine the relative total costs of owning different funds.
| | Annualized Expense Ratio-A | Beginning
Account Value
February 1, 2017 | Ending
Account Value
July 31, 2017 | Expenses Paid
During Period-B
February 1, 2017
to July 31, 2017 |
| Series Intrinsic Opportunities | .41% | | | |
| Actual | | $1,000.00 | $1,113.30 | $2.15** |
| Hypothetical-C | | $1,000.00 | $1,022.76 | $2.06** |
| Class F | .32% | | | |
| Actual | | $1,000.00 | $1,113.80 | $1.68** |
| Hypothetical-C | | $1,000.00 | $1,023.21 | $1.61** |
A Annualized expense ratio reflects expenses net of applicable fee waivers.
B Expenses are equal to each Class' annualized expense ratio, multiplied by the average account value over the period, multiplied by 181/365 (to reflect the one-half year period).
C 5% return per year before expenses
** If fees and changes to the class level expense contract and/ or expense cap, effective June 1, 2017, had been in effect during the entire period, the annualized expense ratio and the expenses paid in the actual and hypothetical examples above would have been as shown in table below:
| | Annualized Expense Ratio-(a)
| Expenses Paid
|
| Series Intrinsic Opportunities | .01% | |
| Actual | | $.05 |
| Hypothetical-(b) | | $.05 |
| Class F | .01% | |
| Actual | | $.05 |
| Hypothetical-(b) | | $.05 |
(a) Annualized expense ratio reflects expenses net of applicable fee waivers.
(b) 5% return per year before expenses
Distributions (Unaudited)
The Board of Trustees of Fidelity Series Intrinsic Opportunities Fund voted to pay on September 18, 2017, to shareholders of record at the opening of business on September 15, 2017, a distribution of $0.448 per share derived from capital gains realized from sales of portfolio securities and a dividend of $0.124 per share from net investment income.
The fund hereby designates as a capital gain dividend with respect to the taxable year ended July 31, 2017, $324,802,499, or, if subsequently determined to be different, the net capital gain of such year.
Series Intrinsic Opportunities designates 65% and 69% and Class F designates 58% and 84%; of the dividends distributed in September and December, respectively during the fiscal year as qualifying for the dividends–received deduction for corporate shareholders.
Series Intrinsic Opportunities, and Class F designate 100% of the dividends distributed during the fiscal year as amounts which may be taken into account as a dividend for purposes of the maximum rate under section 1(h)(11) of the Internal Revenue Code.
The fund will notify shareholders in January 2018 of amounts for use in preparing 2017 income tax returns.
Board Approval of Investment Advisory Contracts and Management Fees
Fidelity Series Intrinsic Opportunities Fund
Each year, the Board of Trustees, including the Independent Trustees (together, the Board), votes on the renewal of the management contract with Fidelity Management & Research Company (FMR) and the sub-advisory agreements (together, the Advisory Contracts) for the fund. FMR and the sub-advisers are referred to herein as the Investment Advisers. The Board, assisted by the advice of fund counsel and Independent Trustees' counsel, requests and considers a broad range of information relevant to the renewal of the Advisory Contracts throughout the year.
The Board meets regularly and, at each of its meetings, covers an extensive agenda of topics and materials and considers factors that are relevant to its annual consideration of the renewal of the fund's Advisory Contracts, including the services and support provided to the fund and its shareholders. The Board has established various standing committees (Committees), each composed of and chaired by Independent Trustees with varying backgrounds, to which the Board has assigned specific subject matter responsibilities in order to enhance effective decision-making by the Board. The Board, acting directly and through its Committees, requests and receives information concerning the annual consideration of the renewal of the fund's Advisory Contracts. The Board also meets as needed to review matters specifically related to the Board's annual consideration of the renewal of the Advisory Contracts. Members of the Board may also meet with trustees of other Fidelity funds through ad hoc joint committees to discuss certain matters relevant to all of the Fidelity funds.
At its July 2017 meeting, the Board unanimously determined to renew the fund's Advisory Contracts. In reaching its determination, the Board considered that the Advisory Contracts currently in place had become effective on June 1, 2017 in connection with shareholders of certain other Fidelity funds that invest in the fund (referred to herein as Freedom Funds) voting to approve new management contracts for the Freedom Funds. The Board noted the Advisory Contracts implemented a new fee structure pursuant to which the fund does not pay a management fee to FMR. The Board also approved certain amendments to the sub-advisory agreements for the fund to ensure consistency in the sub-advisory fees paid under the new fee structure compared to the sub-advisory fees paid under the prior fee structure. The Board noted that the amendments will not result in any changes to the nature, extent, and quality of services provided to the fund.
In considering whether to renew the Advisory Contracts for the fund, the Board considered all factors it believed relevant and reached a determination, with the assistance of fund counsel and Independent Trustees' counsel and through the exercise of its business judgment, that the renewal of the Advisory Contracts was in the best interests of the fund and its shareholders and the fact that no fee is payable under the management contract was fair and reasonable.
Nature, Extent, and Quality of Services Provided. The Board considered Fidelity's staffing as it relates to the fund, including the backgrounds of investment personnel of Fidelity, and also considered the fund's investment objective, strategies, and related investment philosophy. The Independent Trustees also had discussions with senior management of Fidelity's investment operations and investment groups. The Board considered the structure of the investment personnel compensation program and whether this structure provides appropriate incentives to act in the best interests of the fund.
Resources Dedicated to Investment Management and Support Services. The Board and the Fund Oversight and Research Committees reviewed the general qualifications and capabilities of Fidelity's investment staff, including its size, education, experience, and resources, as well as Fidelity's approach to recruiting, training, managing, and compensating investment personnel. The Board noted that Fidelity has continued to increase the resources devoted to non-U.S. offices, including expansion of Fidelity's global investment organization. The Board also noted that Fidelity's analysts have extensive resources, tools and capabilities that allow them to conduct sophisticated quantitative and fundamental analysis, as well as credit analysis of issuers, counterparties and guarantors. Further, the Board considered that Fidelity's investment professionals have sufficient access to global information and data so as to provide competitive investment results over time, and that those professionals also have access to sophisticated tools that permit them to assess portfolio construction and risk and performance attribution characteristics continuously, as well as to transmit new information and research conclusions rapidly around the world. Additionally, in its deliberations, the Board considered Fidelity's trading, risk management, compliance, and technology and operations capabilities and resources, which are integral parts of the investment management process.
Administrative Services. The Board considered (i) the nature, extent, quality, and cost of advisory and administrative services performed by the Investment Advisers and their affiliates under the Advisory Contracts and under separate agreements covering transfer agency, pricing and bookkeeping, and securities lending services for the fund; (ii) the nature and extent of the supervision of third party service providers, principally custodians, subcustodians, and pricing vendors; and (iii) the resources devoted to, and the record of compliance with, the fund's compliance policies and procedures. The Board also reviewed the allocation of fund brokerage, including allocations to brokers affiliated with the Investment Advisers, the use of brokerage commissions to pay fund expenses, and the use of "soft" commission dollars to pay for research services.
Investment Performance. The Board considered whether the fund has operated in accordance with its investment objective, as well as its record of compliance with its investment restrictions. The Board reviewed the fund's absolute investment performance, as well as the fund's relative investment performance, but did not consider performance to be a material factor in its decision to renew the fund's Advisory Contracts, as the fund is not publicly offered as a stand-alone investment product. In this regard, the Board noted that the fund is designed to offer an investment option for other investment companies managed by Fidelity and ultimately to enhance the performance of those investment companies.
Based on its review, the Board concluded that the nature, extent, and quality of services provided to the fund under the Advisory Contracts should continue to benefit the shareholders of the fund.
Competitiveness of Management Fee and Total Expense Ratio. The Board considered that the fund does not pay FMR a management fee for investment advisory services. The Board also noted that FMR or an affiliate undertakes to pay all operating expenses of the fund, except transfer agent fees, 12b-1 fees, Independent Trustee fees and expenses, custodian fees and expenses, proxy and shareholder meeting expenses, interest, taxes, brokerage expenses, and extraordinary expenses (such as litigation expenses).
The Board further considered that, effective June 1, 2017, FMR has contractually agreed to reimburse the fund to the extent that total operating expenses (excluding interest, certain taxes, certain securities lending costs, brokerage commissions, fees and expenses of the Independent Trustees, proxy and shareholder meeting expenses, extraordinary expenses, and acquired fund fees and expenses, if any), as a percentage of its average net assets, exceed 0.014% through September 30, 2020.
Based on its review, the Board considered that the fund does not pay a management fee and concluded that the total expense ratio of each class of the fund was reasonable in light of the services that the fund and its shareholders receive and the other factors considered.
Costs of the Services and Profitability. The Board considered the level of Fidelity's profits in respect of all the Fidelity funds.
PricewaterhouseCoopers LLP (PwC), independent registered public accounting firm and auditor to Fidelity and certain Fidelity funds, has been engaged annually by the Board as part of the Board's assessment of Fidelity's profitability analysis. PwC's engagement includes the review and assessment of the methodologies used by Fidelity in determining the revenues and expenses attributable to Fidelity's mutual fund business, and completion of agreed-upon procedures in respect of the mathematical accuracy of the fund profitability information and its conformity to established allocation methodologies. After considering PwC's reports issued under the engagement and information provided by Fidelity, the Board concluded that while other allocation methods may also be reasonable, Fidelity's profitability methodologies are reasonable in all material respects.
The Board also reviewed Fidelity's non-fund businesses and potential fall-out benefits related to the mutual fund business as well as cases where Fidelity's affiliates may benefit from or be related to the fund's business.
The Board concluded that the costs of the services provided by and the profits realized by Fidelity in connection with the operation of the fund were not relevant to the renewal of the Advisory Contracts because the fund pays no advisory fees and FMR or an affiliate bears all expenses of the fund, with limited exceptions.
Economies of Scale. The Board concluded that because the fund pays no advisory fees and FMR or an affiliate bears all expenses of the fund, with limited exceptions, economies of scale cannot be realized by the fund.
Additional Information Requested by the Board. In order to develop fully the factual basis for consideration of the Fidelity funds' advisory contracts, the Board requested and received additional information on certain topics, including: (i) fund performance trends, in particular the underperformance of certain funds, and Fidelity's long-term strategies for certain funds; (ii) Fidelity's fund profitability methodology, profitability trends for certain funds, and the impact of certain factors on fund profitability results, including the impact of market trends on actively managed funds; (iii) the use of performance fees and the calculation of performance adjustments, including the impact of underperformance and fund outflows on performance adjustments; (iv) metrics for evaluating index fund performance; (v) Fidelity's group fee structure, including the group fee breakpoint schedules; (vi) the terms of Fidelity's contractual and voluntary expense cap arrangements with the funds; (vii) the methodology with respect to evaluating competitive fund data and peer group classifications and fee comparisons; (viii) the expense structures for different funds and classes; (ix) Fidelity's arrangements with affiliated sub-advisers on behalf of the funds; (x) information regarding other accounts managed by Fidelity, including institutional accounts and collective investment trusts; (xi) recent changes to the fee structure for certain funds of funds; and (xii) the impact of the Department of Labor's new fiduciary rule on the funds' comparative expense information.
Based on its evaluation of all of the conclusions noted above, and after considering all factors it believed relevant, the Board concluded that the advisory fee structures are fair and reasonable, and that the fund's Advisory Contracts should be renewed.
Corporate Headquarters
245 Summer St.
Boston, MA 02210
www.fidelity.com
O2T-ANN-0917
1.951012.104
Fidelity® Low-Priced Stock Fund Class K
Annual Report July 31, 2017 |
|
Contents
To view a fund's proxy voting guidelines and proxy voting record for the 12-month period ended June 30, visit http://www.fidelity.com/proxyvotingresults or visit the Securities and Exchange Commission's (SEC) web site at http://www.sec.gov.
You may also call 1-800-835-5092 to request a free copy of the proxy voting guidelines.
Standard & Poor's, S&P and S&P 500 are registered service marks of The McGraw-Hill Companies, Inc. and have been licensed for use by Fidelity Distributors Corporation.
Other third-party marks appearing herein are the property of their respective owners.
All other marks appearing herein are registered or unregistered trademarks or service marks of FMR LLC or an affiliated company. © 2017 FMR LLC. All rights reserved.
This report and the financial statements contained herein are submitted for the general information of the shareholders of the Fund. This report is not authorized for distribution to prospective investors in the Fund unless preceded or accompanied by an effective prospectus.
A fund files its complete schedule of portfolio holdings with the SEC for the first and third quarters of each fiscal year on Form N-Q. Forms N-Q are available on the SEC’s web site at http://www.sec.gov. A fund's Forms N-Q may be reviewed and copied at the SEC’s Public Reference Room in Washington, DC. Information regarding the operation of the SEC's Public Reference Room may be obtained by calling 1-800-SEC-0330.
For a complete list of a fund's portfolio holdings, view the most recent holdings listing, semiannual report, or annual report on Fidelity's web site at http://www.fidelity.com, http://www.institutional.fidelity.com, or http://www.401k.com, as applicable.
NOT FDIC INSURED •MAY LOSE VALUE •NO BANK GUARANTEE
Neither the Fund nor Fidelity Distributors Corporation is a bank.
Note to Shareholders
On August 16, 2017, the Equity and High Income Board of Trustees approved a change to the investment policies of Fidelity’s Low-Priced Stock strategies. The change, effective on or about November 7, 2017, expands the definition of “low-priced stocks.” Previously, low-priced stocks were defined as those priced at or below $35 per share. This definition will be expanded to include stocks with an earnings yield at or above the median for the Russell 2000 Index, as well as those priced at or below $35 per share. Earnings yield represents a stock’s earnings per share for the most recent 12 months divided by current price per share. We believe the expanded definition will better reflect the portfolio managers’ investment process and provide greater flexibility while remaining faithful to the fund name. No changes to the investment process and portfolio characteristics are expected.
Also, on April 21, 2017, Sam Chamovitz and Salim Hart became Co-Managers of the fund. Sam joined Morgen Peck, who manages the information technology and telecom sleeves, in co-managing the fund's all-sector subportfolio – previously run by Jamie Harmon and which was adjusted to include a global mandate. Salim assumed responsibility for a new U.S. all-sector subportfolio.
Performance: The Bottom Line
Average annual total return reflects the change in the value of an investment, assuming reinvestment of distributions from dividend income and capital gains (the profits earned upon the sale of securities that have grown in value, if any) and assuming a constant rate of performance each year. The hypothetical investment and the average annual total returns do not reflect the deduction of taxes that a shareholder would pay on fund distributions or the redemption of fund shares. During periods of reimbursement by Fidelity, a fund’s total return will be greater than it would be had the reimbursement not occurred. How a fund did yesterday is no guarantee of how it will do tomorrow.
Average Annual Total Returns
| For the periods ended July 31, 2017 | Past 1 year | Past 5 years | Past 10 years |
| Class K | 15.27% | 13.69% | 8.12% |
The initial offering of Class K shares took place on May 9, 2008. Returns prior to May 9, 2008 are those of Fidelity® Low-Priced Stock Fund, the original class of the fund.
$10,000 Over 10 Years
Let's say hypothetically that $10,000 was invested in Fidelity® Low-Priced Stock Fund - Class K on July 31, 2007.
The chart shows how the value of your investment would have changed, and also shows how the Russell 2000® Index performed over the same period.
See previous page for additional information regarding the performance of Class K.
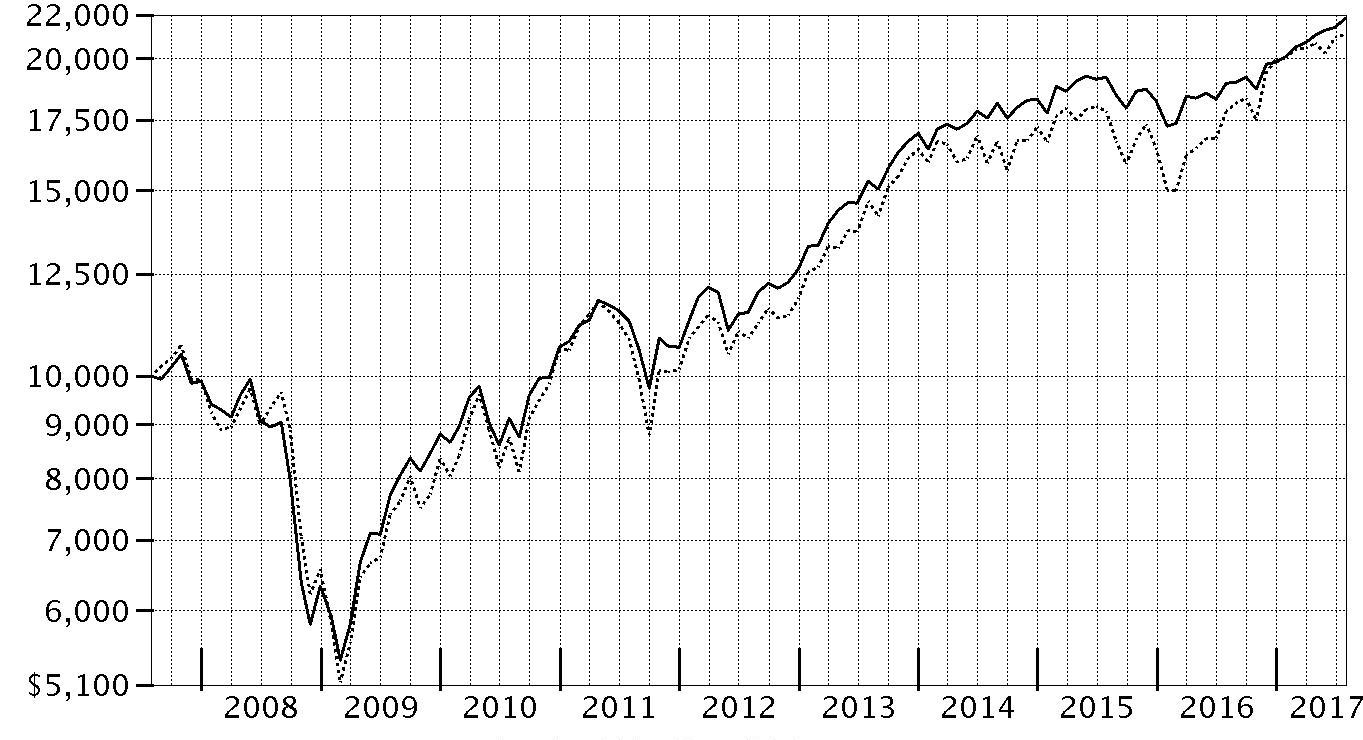
| Period Ending Values |
| $21,833 | Fidelity® Low-Priced Stock Fund - Class K |
| $21,111 | Russell 2000® Index |
Management's Discussion of Fund Performance
Market Recap: The U.S. equity bellwether S&P 500
® index gained 16.04% for the year ending July 31, 2017, rising sharply following the November election and continuing to rally through the end of February on optimism for President Trump’s pro-business agenda. Equity markets leveled off, however, as the fledgling administration faced the first test of its domestic agenda. Stocks reacted with uncertainty to efforts by Congress in March to repeal and replace the Affordable Care Act, and then reverted upward through July 31. Growth stocks surged ahead of value, while small-caps’ advantage over large-caps narrowed. Sector-wise, financials (+36%) fared best, riding an uptick in bond yields and a surge in banks, particularly post-election. Information technology gained 29%, as a handful of major index constituents posted stellar returns. Industrials (+18%) was boosted by a call for increased infrastructure spending. Consumer discretionary (+14%) slightly lagged the broader market because brick-and-mortar retailers continued to suffer from increased online competition. Energy (0%) was hurt by low oil prices. Utilities (+6%), consumer staples (+4%), telecommunication services (-7%) and real estate (-2%) all struggled amid an improved backdrop for riskier assets that curbed demand for dividend-rich sectors, as well as the likelihood of further interest rate hikes later in 2017.
Comments from Lead Portfolio Manager Joel Tillinghast: For the fiscal year, the fund’s share classes returned about 15%, trailing the 18.45% result of the benchmark Russell 2000
® Index. The fund’s return relative to the benchmark was hindered by the strengthening of the U.S. dollar, which held back many of the fund’s non-U.S. holdings. Also, less-profitable and more economically cyclical stocks, which generally are not a focus of the fund, rallied for weeks after the November 2016 U.S. elections. Specifically, the bulk of the fund’s relative weakness was due to outsized exposure to retailers within the consumer discretionary and consumer staples sectors – two categories that trailed the benchmark by a wide margin. Notable individual detractors included sizable positions in auto-parts retailer Autozone, Canada-based supermarket chain Metro and U.K. apparel retailer Next. Our stake in cash of about 10%, on average, detracted in a rising equity market. Conversely, good stock picking in the health care sector and in the insurance industry was helpful, led by UnitedHealth Group, the fund’s largest holding. Other contributors were insurance firm Unum Group, which benefited from an improving economy and rising expectations for higher interest rates, and retailer Best Buy, which bucked the trend of weakness in the retail industry. All of the stocks I've mentioned were non-benchmark holdings.
The views expressed above reflect those of the portfolio manager(s) only through the end of the period as stated on the cover of this report and do not necessarily represent the views of Fidelity or any other person in the Fidelity organization. Any such views are subject to change at any time based upon market or other conditions and Fidelity disclaims any responsibility to update such views. These views may not be relied on as investment advice and, because investment decisions for a Fidelity fund are based on numerous factors, may not be relied on as an indication of trading intent on behalf of any Fidelity fund.
Investment Summary (Unaudited)
Top Ten Stocks as of July 31, 2017
| | % of fund's net assets | % of fund's net assets 6 months ago |
| UnitedHealth Group, Inc. | 5.2 | 5.3 |
| Best Buy Co., Inc. | 2.9 | 2.6 |
| Ross Stores, Inc. | 2.4 | 3.0 |
| Metro, Inc. Class A (sub. vtg.) | 2.3 | 2.1 |
| Seagate Technology LLC | 2.2 | 3.2 |
| Unum Group | 2.1 | 2.0 |
| Next PLC | 1.9 | 1.8 |
| Hon Hai Precision Industry Co. Ltd. (Foxconn) | 1.9 | 1.3 |
| Aetna, Inc. | 1.8 | 1.4 |
| Barratt Developments PLC | 1.6 | 1.2 |
| | 24.3 | |
Top Five Market Sectors as of July 31, 2017
| | % of fund's net assets | % of fund's net assets 6 months ago |
| Consumer Discretionary | 22.7 | 23.5 |
| Information Technology | 17.8 | 18.1 |
| Health Care | 12.2 | 12.0 |
| Financials | 11.1 | 13.0 |
| Consumer Staples | 9.1 | 8.6 |
Asset Allocation (% of fund's net assets)
| As of July 31, 2017 * |
| | Stocks | 88.2% |
| | Short-Term Investments and Net Other Assets (Liabilities) | 11.8% |

* Foreign investments - 44.4%
| As of January 31, 2017* |
| | Stocks | 91.4% |
| | Short-Term Investments and Net Other Assets (Liabilities) | 8.6% |

* Foreign investments - 42.2%
Investments July 31, 2017
Showing Percentage of Net Assets
| Common Stocks - 88.1% | | | |
| | | Shares | Value (000s) |
| CONSUMER DISCRETIONARY - 22.7% | | | |
| Auto Components - 1.1% | | | |
| Adient PLC | | 486,837 | $31,873 |
| ASTI Corp. (a)(b) | | 1,019,000 | 5,592 |
| Cooper Tire & Rubber Co. | | 24,122 | 882 |
| ElringKlinger AG (a) | | 779,100 | 13,595 |
| G-Tekt Corp. | | 76,700 | 1,488 |
| Gentex Corp. | | 2,697,300 | 45,908 |
| Gentherm, Inc. (c) | | 138,897 | 4,646 |
| Hertz Global Holdings, Inc. (a)(c) | | 37,900 | 518 |
| Hi-Lex Corp. | | 1,473,400 | 38,517 |
| INFAC Corp. | | 325,139 | 1,739 |
| INZI Controls Co. Ltd. (b) | | 1,516,000 | 6,917 |
| Motonic Corp. (b) | | 3,250,000 | 28,729 |
| Murakami Corp. (b) | | 820,900 | 17,692 |
| Nippon Seiki Co. Ltd. | | 2,768,500 | 53,112 |
| Piolax, Inc. (b) | | 2,607,300 | 72,133 |
| S&T Holdings Co. Ltd. (b) | | 859,329 | 12,660 |
| Samsung Climate Control Co. Ltd. (b) | | 499,950 | 5,669 |
| Sewon Precision Industries Co. Ltd. (b) | | 500,000 | 7,366 |
| Shoei Co. Ltd. | | 166,200 | 4,764 |
| SJM Co. Ltd. (b) | | 1,282,000 | 6,651 |
| SJM Holdings Co. Ltd. (b) | | 1,332,974 | 6,082 |
| Strattec Security Corp. (b) | | 317,500 | 11,271 |
| Sungwoo Hitech Co. Ltd. | | 1,888,517 | 12,040 |
| TBK Co. Ltd. | | 970,900 | 4,377 |
| The Goodyear Tire & Rubber Co. | | 49,400 | 1,557 |
| Yachiyo Industry Co. Ltd. | | 940,200 | 10,891 |
| Yutaka Giken Co. Ltd. (b) | | 1,288,000 | 29,488 |
| | | | 436,157 |
| Distributors - 0.2% | | | |
| Central Automotive Products Ltd. | | 79,000 | 1,115 |
| Chori Co. Ltd. | | 451,400 | 8,373 |
| Nakayamafuku Co. Ltd. (b) | | 1,051,200 | 7,504 |
| PALTAC Corp. | | 126,800 | 4,601 |
| SPK Corp. (b) | | 265,900 | 7,050 |
| Uni-Select, Inc. | | 1,727,600 | 40,323 |
| | | | 68,966 |
| Diversified Consumer Services - 0.6% | | | |
| American Public Education, Inc. (c) | | 622,500 | 13,259 |
| Clip Corp. (b) | | 285,400 | 2,382 |
| Collectors Universe, Inc. | | 204,200 | 5,080 |
| Cross-Harbour Holdings Ltd. | | 2,434,000 | 3,696 |
| Houghton Mifflin Harcourt Co. (c) | | 1,383,400 | 16,532 |
| Meiko Network Japan Co. Ltd. | | 869,100 | 12,408 |
| Service Corp. International | | 156,200 | 5,425 |
| ServiceMaster Global Holdings, Inc. (c) | | 420,462 | 18,484 |
| Shingakukai Co. Ltd. | | 151,400 | 799 |
| Step Co. Ltd. (b) | | 1,129,800 | 14,962 |
| Weight Watchers International, Inc. (a)(b)(c) | | 4,146,300 | 148,520 |
| | | | 241,547 |
| Hotels, Restaurants & Leisure - 0.6% | | | |
| Ark Restaurants Corp. (b) | | 198,944 | 4,524 |
| Bojangles', Inc. (c) | | 114,100 | 1,518 |
| BRONCO BILLY Co. Ltd. (a) | | 47,100 | 1,160 |
| Create Restaurants Holdings, Inc. | | 1,085,900 | 11,101 |
| El Pollo Loco Holdings, Inc. (a)(c) | | 98,700 | 1,283 |
| Flanigans Enterprises, Inc. | | 76,939 | 2,062 |
| Greggs PLC | | 868,000 | 12,598 |
| Hiday Hidaka Corp. (b) | | 2,257,722 | 60,332 |
| Ibersol SGPS SA | | 637,780 | 10,804 |
| ILG, Inc. | | 691,700 | 18,337 |
| Intralot SA (c) | | 1,300,741 | 1,817 |
| Koshidaka Holdings Co. Ltd. | | 198,580 | 5,393 |
| Kura Corp. Ltd. | | 96,500 | 4,858 |
| Monarch Casino & Resort, Inc. (c) | | 37,600 | 1,244 |
| Nagacorp Ltd. | | 488,000 | 297 |
| Ohsho Food Service Corp. | | 208,800 | 8,125 |
| Sportscene Group, Inc. Class A (b)(c) | | 347,800 | 1,827 |
| St. Marc Holdings Co. Ltd. | | 971,400 | 30,399 |
| The Monogatari Corp. | | 216,200 | 11,296 |
| The Restaurant Group PLC | | 6,815,800 | 30,072 |
| TORIDOLL Holdings Corp. | | 96,200 | 2,696 |
| | | | 221,743 |
| Household Durables - 3.7% | | | |
| Abbey PLC (b) | | 1,862,400 | 30,976 |
| Barratt Developments PLC (b) | | 75,766,700 | 615,294 |
| Bellway PLC | | 4,106,100 | 172,821 |
| D.R. Horton, Inc. | | 3,190,243 | 113,860 |
| Dorel Industries, Inc. Class B (sub. vtg.) | | 2,774,900 | 73,315 |
| Emak SpA | | 4,602,200 | 8,608 |
| First Juken Co. Ltd. (b) | | 1,468,800 | 21,090 |
| GUD Holdings Ltd. | | 269,905 | 2,580 |
| Helen of Troy Ltd. (b)(c) | | 1,949,800 | 196,442 |
| Henry Boot PLC | | 3,414,100 | 13,649 |
| Iida Group Holdings Co. Ltd. | | 232,400 | 3,974 |
| M/I Homes, Inc. | | 207,500 | 5,383 |
| NACCO Industries, Inc. Class A | | 185,192 | 12,149 |
| P&F Industries, Inc. Class A (b) | | 329,348 | 1,986 |
| PulteGroup, Inc. | | 536,800 | 13,109 |
| Q.E.P. Co., Inc. (c) | | 31,400 | 829 |
| Sanei Architecture Planning Co. Ltd. (b) | | 1,269,700 | 22,654 |
| Stanley Furniture Co., Inc. | | 296,200 | 373 |
| Taylor Morrison Home Corp. (c) | | 432,700 | 9,788 |
| Token Corp. | | 672,100 | 85,533 |
| Toll Brothers, Inc. | | 125,500 | 4,843 |
| | | | 1,409,256 |
| Internet & Direct Marketing Retail - 0.3% | | | |
| Belluna Co. Ltd. (b) | | 7,601,500 | 87,499 |
| Liberty Interactive Corp. QVC Group Series A (c) | | 1,225,400 | 29,336 |
| | | | 116,835 |
| Leisure Products - 0.2% | | | |
| Accell Group NV (b) | | 1,875,700 | 57,199 |
| Amer Group PLC (A Shares) | | 168,100 | 4,517 |
| Fenix Outdoor AB Class B (c) | | 32,298 | 0 |
| Kabe Husvagnar AB (B Shares) | | 290,598 | 7,594 |
| Mars Engineering Corp. | | 555,500 | 11,005 |
| Mattel, Inc. | | 444,700 | 8,903 |
| Miroku Corp. | | 737,000 | 3,242 |
| Vista Outdoor, Inc. (c) | | 49,400 | 1,141 |
| | | | 93,601 |
| Media - 0.9% | | | |
| Cinderella Media Group Ltd. (c) | | 16,490,000 | 7,009 |
| Corus Entertainment, Inc. Class B (non-vtg.) | | 614,300 | 6,819 |
| Discovery Communications, Inc. Class A (c) | | 1,787,000 | 43,960 |
| Gannett Co., Inc. | | 1,409,198 | 12,641 |
| Gray Television, Inc. (c) | | 386,100 | 5,753 |
| Harte-Hanks, Inc. (c) | | 777,262 | 750 |
| Hyundai HCN | | 2,723,979 | 10,167 |
| Informa PLC | | 443,856 | 4,073 |
| Intage Holdings, Inc. (b) | | 1,747,500 | 35,728 |
| Interpublic Group of Companies, Inc. | | 497,700 | 10,755 |
| Ipsos SA | | 9,314 | 322 |
| ITE Group PLC | | 91,197 | 217 |
| Lions Gate Entertainment Corp. Class B (c) | | 153,100 | 4,212 |
| Live Nation Entertainment, Inc. (c) | | 580,500 | 21,635 |
| MSG Network, Inc. Class A (c) | | 259,384 | 5,551 |
| Multiplus SA | | 536,800 | 6,850 |
| Pico Far East Holdings Ltd. | | 19,440,000 | 8,014 |
| Proto Corp. | | 246,800 | 3,859 |
| RKB Mainichi Broadcasting Corp. | | 44,600 | 2,043 |
| Saga Communications, Inc. Class A | | 384,100 | 14,922 |
| Salem Communications Corp. Class A | | 164,200 | 1,174 |
| Sky Network Television Ltd. | | 6,132,711 | 15,245 |
| STW Group Ltd. | | 4,301,049 | 3,957 |
| Tegna, Inc. | | 1,225,500 | 18,174 |
| Television Broadcasts Ltd. | | 3,613,500 | 13,231 |
| TOW Co. Ltd. (b) | | 1,920,600 | 15,331 |
| TVA Group, Inc. Class B (non-vtg.) (c) | | 3,242,003 | 8,815 |
| Twenty-First Century Fox, Inc.: | | | |
| Class A | | 918,900 | 26,740 |
| Class B | | 47,207 | 1,354 |
| Viacom, Inc. Class B (non-vtg.) | | 554,800 | 19,374 |
| WOWOW INC. | | 193,400 | 5,622 |
| | | | 334,297 |
| Multiline Retail - 2.1% | | | |
| Lifestyle China Group Ltd. (c) | | 35,700,000 | 14,626 |
| Lifestyle International Holdings Ltd. | | 37,195,000 | 50,858 |
| Next PLC (b) | | 13,817,100 | 720,096 |
| Watts Co. Ltd. (b) | | 1,184,700 | 15,539 |
| | | | 801,119 |
| Specialty Retail - 11.5% | | | |
| Aarons, Inc. Class A | | 148,200 | 6,859 |
| Abercrombie & Fitch Co. Class A (a)(b) | | 5,217,080 | 51,336 |
| Adastria Co. Ltd. | | 289,300 | 7,232 |
| AT-Group Co. Ltd. | | 1,148,500 | 29,170 |
| AutoCanada, Inc. (a) | | 209,400 | 3,373 |
| AutoZone, Inc. (c) | | 782,218 | 422,257 |
| Bed Bath & Beyond, Inc. (b) | | 9,195,900 | 274,957 |
| Best Buy Co., Inc. (b) | | 18,649,400 | 1,088,006 |
| BMTC Group, Inc. (b) | | 4,154,400 | 39,153 |
| Bonia Corp. Bhd | | 2,503,000 | 336 |
| Bonjour Holdings Ltd. | | 4,073,000 | 196 |
| Buffalo Co. Ltd. | | 97,700 | 783 |
| Cars.com, Inc. (a)(c) | | 452,533 | 10,997 |
| Cash Converters International Ltd. | | 23,154,614 | 6,113 |
| Chico's FAS, Inc. | | 1,529,300 | 13,993 |
| Delek Automotive Systems Ltd. | | 773,200 | 6,394 |
| DSW, Inc. Class A | | 4,512,400 | 81,404 |
| Dunelm Group PLC | | 681,700 | 5,415 |
| Ff Group (b)(c) | | 4,576,300 | 109,703 |
| Formosa Optical Technology Co. Ltd. | | 1,362,000 | 3,237 |
| Fourlis Holdings SA | | 292,000 | 2,005 |
| GameStop Corp. Class A (a)(b) | | 9,997,181 | 216,839 |
| GNC Holdings, Inc. Class A (a) | | 815,722 | 7,758 |
| Goldlion Holdings Ltd. | | 23,023,000 | 10,051 |
| Guess?, Inc. (b) | | 5,216,963 | 68,134 |
| Halfords Group PLC | | 1,255,900 | 5,521 |
| Hour Glass Ltd. | | 8,743,600 | 4,323 |
| IA Group Corp. (b) | | 616,700 | 3,759 |
| JB Hi-Fi Ltd. | | 111,251 | 2,315 |
| John David Group PLC | | 8,292,600 | 39,159 |
| Jumbo SA (b) | | 10,516,868 | 176,166 |
| K's Holdings Corp. | | 3,455,200 | 69,452 |
| Ku Holdings Co. Ltd. | | 892,100 | 8,100 |
| Kyoto Kimono Yuzen Co. Ltd. | | 249,700 | 2,104 |
| Le Chateau, Inc. Class A (sub. vtg.) (c) | | 863,800 | 83 |
| Leon's Furniture Ltd. | | 195,400 | 2,827 |
| Lewis Group Ltd. | | 1,129,900 | 2,640 |
| Mr. Bricolage SA (b) | | 902,775 | 16,992 |
| Nafco Co. Ltd. (b) | | 2,033,200 | 32,256 |
| Office Depot, Inc. | | 1,274,200 | 7,480 |
| Pal Group Holdings Co. Ltd. | | 810,500 | 25,915 |
| Ross Stores, Inc. | | 16,289,000 | 901,107 |
| Sa Sa International Holdings Ltd. | | 3,384,000 | 1,243 |
| Sacs Bar Holdings, Inc. | | 388,500 | 4,275 |
| Sally Beauty Holdings, Inc. (c) | | 921,400 | 18,640 |
| Second Chance Properties Ltd. | | 1,892,900 | 356 |
| Second Chance Properties Ltd. warrants 1/23/20 (c) | | 1,941,600 | 11 |
| Sonic Automotive, Inc. Class A (sub. vtg.) | | 1,098,900 | 19,945 |
| Staples, Inc. | | 21,587,009 | 219,108 |
| The Buckle, Inc. (a)(b) | | 4,722,600 | 80,756 |
| Urban Outfitters, Inc. (a)(c) | | 3,516,300 | 68,884 |
| USS Co. Ltd. | | 7,107,900 | 143,583 |
| Vitamin Shoppe, Inc. (c) | | 732,008 | 8,052 |
| Workman Co. Ltd. (b) | | 2,315,500 | 70,361 |
| Zumiez, Inc. (c) | | 320,852 | 4,075 |
| | | | 4,405,189 |
| Textiles, Apparel & Luxury Goods - 1.5% | | | |
| Anta Sports Products Ltd. | | 680,000 | 2,333 |
| Best Pacific International Holdings Ltd. | | 5,052,000 | 2,762 |
| Coach, Inc. | | 987,200 | 46,537 |
| Daphne International Holdings Ltd. (c) | | 870,000 | 78 |
| Embry Holdings Ltd. | | 2,267,000 | 726 |
| Emerald Expositions Events, Inc. | | 171,800 | 3,933 |
| Fossil Group, Inc. (a)(c) | | 2,023,651 | 22,766 |
| Gerry Weber International AG (Bearer) | | 48,300 | 617 |
| Gildan Activewear, Inc. | | 7,749,600 | 233,529 |
| Handsome Co. Ltd. (b) | | 2,125,000 | 68,497 |
| JLM Couture, Inc. (b)(c) | | 168,167 | 511 |
| Makalot Industrial Co. Ltd. | | 906,000 | 4,048 |
| McRae Industries, Inc. | | 25,280 | 834 |
| Michael Kors Holdings Ltd. (c) | | 128,405 | 4,679 |
| Movado Group, Inc. | | 248,092 | 6,103 |
| Portico International Holdings (c) | | 10,696,500 | 3,602 |
| Steven Madden Ltd. (c) | | 830,800 | 34,063 |
| Sun Hing Vision Group Holdings Ltd. (b) | | 20,801,000 | 8,362 |
| Texwinca Holdings Ltd. | | 52,138,000 | 31,640 |
| Victory City International Holdings Ltd. | | 94,987,225 | 3,223 |
| Wolverine World Wide, Inc. | | 261,900 | 7,386 |
| Youngone Corp. | | 500,000 | 14,644 |
| Youngone Holdings Co. Ltd. (b) | | 889,600 | 42,735 |
| Yue Yuen Industrial (Holdings) Ltd. | | 5,343,000 | 22,061 |
| | | | 565,669 |
|
| TOTAL CONSUMER DISCRETIONARY | | | 8,694,379 |
|
| CONSUMER STAPLES - 9.1% | | | |
| Beverages - 1.5% | | | |
| A.G. Barr PLC | | 3,226,520 | 25,542 |
| Baron de Ley SA (c) | | 139,000 | 17,936 |
| Beluga Group Pjsc (c) | | 89,077 | 897 |
| Britvic PLC | | 6,767,200 | 63,751 |
| C&C Group PLC | | 2,468,000 | 8,940 |
| Jinro Distillers Co. Ltd. | | 47,081 | 1,400 |
| Kweichow Moutai Co. Ltd. (A Shares) | | 250,000 | 17,885 |
| Monster Beverage Corp. (c) | | 7,039,474 | 371,332 |
| Muhak Co. Ltd. (b) | | 2,799,256 | 56,738 |
| Olvi PLC (A Shares) | | 104,263 | 3,669 |
| Spritzer Bhd | | 5,120,400 | 2,834 |
| Stock Spirits Group PLC | | 97,300 | 210 |
| Yantai Changyu Pioneer Wine Co. Ltd. (B Shares) | | 2,799,936 | 7,119 |
| | | | 578,253 |
| Food & Staples Retailing - 5.2% | | | |
| Amsterdam Commodities NV | | 146,000 | 4,338 |
| Aoki Super Co. Ltd. | | 234,000 | 2,882 |
| Australasian Foods Holdco Pty Ltd. | | 3,481,102 | 2,506 |
| Belc Co. Ltd. (b) | | 1,776,700 | 80,741 |
| Cosmos Pharmaceutical Corp. (b) | | 1,234,000 | 262,818 |
| Create SD Holdings Co. Ltd. (b) | | 5,806,300 | 146,994 |
| Daikokutenbussan Co. Ltd. | | 608,100 | 30,172 |
| Dong Suh Companies, Inc. | | 1,663,000 | 43,879 |
| Genky Stores, Inc. (a)(b) | | 769,200 | 28,711 |
| Halows Co. Ltd. (b) | | 1,362,400 | 29,437 |
| Kroger Co. | | 2,552,400 | 62,585 |
| Kusuri No Aoki Holdings Co. Ltd. | | 864,300 | 47,588 |
| Majestic Wine PLC (a) | | 3,106,151 | 13,104 |
| MARR SpA | | 246,800 | 6,317 |
| McColl's Retail Group PLC | | 1,612,557 | 4,968 |
| Medical System Network Co. Ltd. | | 72,900 | 319 |
| Metro, Inc. Class A (sub. vtg.) (b) | | 25,865,599 | 876,121 |
| North West Co., Inc. | | 101,400 | 2,484 |
| Performance Food Group Co. (c) | | 154,600 | 4,452 |
| Qol Co. Ltd. (b) | | 1,942,700 | 31,384 |
| Retail Partners Co. Ltd. | | 461,700 | 4,875 |
| Safeway, Inc.: | | | |
| rights (c) | | 16,069,900 | 0 |
| rights (c) | | 16,069,900 | 2,893 |
| Sligro Food Group NV | | 729,500 | 33,032 |
| Sundrug Co. Ltd. | | 3,396,000 | 126,605 |
| Tesco PLC (c) | | 10,859,300 | 24,959 |
| Total Produce PLC | | 9,359,100 | 24,097 |
| United Natural Foods, Inc. (c) | | 1,214,198 | 46,783 |
| Valor Holdings Co. Ltd. | | 511,900 | 11,580 |
| Yaoko Co. Ltd. | | 1,008,300 | 43,535 |
| | | | 2,000,159 |
| Food Products - 2.1% | | | |
| Aryzta AG | | 1,480,820 | 47,597 |
| Astral Foods Ltd. | | 98,700 | 1,084 |
| Bakkafrost | | 432 | 17 |
| Cranswick PLC | | 638,449 | 24,446 |
| Dean Foods Co. | | 393,200 | 5,898 |
| Devro PLC | | 2,584,100 | 7,364 |
| Dutch Lady Milk Industries Bhd | | 100,000 | 1,377 |
| Food Empire Holdings Ltd. (b) | | 42,450,000 | 20,674 |
| Fresh Del Monte Produce, Inc. (b) | | 5,099,612 | 262,477 |
| Hilton Food Group PLC | | 624,200 | 5,563 |
| Japan Meat Co. Ltd. | | 316,100 | 5,201 |
| Kaveri Seed Co. Ltd. (c) | | 82,484 | 890 |
| Lamb Weston Holdings, Inc. | | 48,704 | 2,142 |
| Lifeway Foods, Inc. (c) | | 247,000 | 2,265 |
| Mitsui Sugar Co. Ltd. | | 368,300 | 11,191 |
| Nam Yang Dairy Products | | 10,500 | 6,863 |
| Natori Co. Ltd. | | 170,500 | 3,170 |
| Omega Protein Corp. | | 731,507 | 11,704 |
| Origin Enterprises PLC (b) | | 9,647,995 | 75,152 |
| Pacific Andes International Holdings Ltd. (c) | | 108,096,500 | 2,554 |
| Pacific Andes Resources Development Ltd. (c) | | 204,590,393 | 3,321 |
| Pickles Corp. | | 104,400 | 1,537 |
| President Rice Products PCL | | 1,268,200 | 2,268 |
| Rocky Mountain Chocolate Factory, Inc. (b) | | 457,493 | 5,440 |
| S Foods, Inc. | | 421,600 | 15,718 |
| Seaboard Corp. | | 41,528 | 177,532 |
| Select Harvests Ltd. (b) | | 4,652,584 | 18,238 |
| Sunjin Co. Ltd. (b) | | 1,627,260 | 27,026 |
| Synear Food Holdings Ltd. (c) | | 38,027,000 | 0 |
| The Hain Celestial Group, Inc. (c) | | 1,275,300 | 57,019 |
| Want Want China Holdings Ltd. | | 16,553,000 | 11,190 |
| | | | 816,918 |
| Household Products - 0.0% | | | |
| Central Garden & Pet Co. Class A (non-vtg.) (c) | | 133,300 | 4,100 |
| Personal Products - 0.3% | | | |
| Asaleo Care Ltd. | | 229,395 | 244 |
| Coty, Inc. Class A | | 592,900 | 12,143 |
| Grape King Bio Ltd. | | 1,748,000 | 11,079 |
| Natural Alternatives International, Inc. (c) | | 75,817 | 758 |
| Nutraceutical International Corp. (b) | | 993,838 | 41,542 |
| Sarantis SA (b) | | 2,100,300 | 30,582 |
| | | | 96,348 |
| Tobacco - 0.0% | | | |
| Karelia Tobacco Co., Inc. | | 1,689 | 570 |
|
| TOTAL CONSUMER STAPLES | | | 3,496,348 |
|
| ENERGY - 2.8% | | | |
| Energy Equipment & Services - 0.9% | | | |
| AKITA Drilling Ltd. Class A (non-vtg.) | | 1,544,500 | 8,969 |
| Atwood Oceanics, Inc. (a)(b)(c) | | 7,338,100 | 57,677 |
| Bristow Group, Inc. (a) | | 496,493 | 3,659 |
| Cathedral Energy Services Ltd. (c) | | 1,391,800 | 1,116 |
| Divestco, Inc. (c) | | 3,040,500 | 195 |
| Fugro NV (Certificaten Van Aandelen) (c) | | 1,661,600 | 26,692 |
| Geospace Technologies Corp. (b)(c) | | 1,205,016 | 18,545 |
| Gulfmark Offshore, Inc. Class A (b)(c) | | 2,665,500 | 413 |
| John Wood Group PLC | | 656,600 | 5,289 |
| Nabors Industries Ltd. | | 851,621 | 6,566 |
| National Oilwell Varco, Inc. | | 24,322 | 796 |
| Oceaneering International, Inc. | | 243,422 | 6,244 |
| Oil States International, Inc. (c) | | 2,486,975 | 61,801 |
| PHX Energy Services Corp. (c) | | 1,436,300 | 2,373 |
| Precision Drilling Corp. (c) | | 194,800 | 566 |
| Prosafe ASA (c) | | 194,802 | 756 |
| RigNet, Inc. (c) | | 69,200 | 1,311 |
| Shinko Plantech Co. Ltd. | | 1,232,300 | 10,541 |
| Solstad Offshore ASA (c) | | 2,168,662 | 2,598 |
| Total Energy Services, Inc. | | 2,154,200 | 20,907 |
| Unit Corp. (b)(c) | | 4,533,432 | 81,511 |
| | | | 318,525 |
| Oil, Gas & Consumable Fuels - 1.9% | | | |
| Adams Resources & Energy, Inc. | | 138,151 | 5,248 |
| Beach Energy Ltd. | | 13,631,705 | 7,416 |
| Boardwalk Pipeline Partners, LP | | 744,100 | 12,456 |
| Bonavista Energy Corp. | | 292,000 | 733 |
| Contango Oil & Gas Co. (b)(c) | | 2,075,000 | 12,450 |
| Denbury Resources, Inc. (a)(c) | | 7,951,071 | 11,609 |
| Enagas SA | | 97,370 | 2,753 |
| Eni SpA | | 7,692,100 | 121,790 |
| Fuji Kosan Co. Ltd. (b) | | 668,500 | 3,565 |
| Great Eastern Shipping Co. Ltd. | | 5,100,000 | 31,595 |
| Hankook Shell Oil Co. Ltd. | | 55,000 | 20,233 |
| HollyFrontier Corp. | | 102,497 | 2,956 |
| International Seaways, Inc. (c) | | 24,457 | 558 |
| James Fisher and Sons PLC | | 114,500 | 2,372 |
| KyungDong City Gas Co. Ltd. (c) | | 138,709 | 6,279 |
| Kyungdong Invest Co. Ltd. | | 84,315 | 4,005 |
| Marathon Oil Corp. | | 3,049,982 | 37,301 |
| Michang Oil Industrial Co. Ltd. (b) | | 173,900 | 13,913 |
| Murphy Oil Corp. (a) | | 7,863,500 | 209,012 |
| Newfield Exploration Co. (c) | | 374,257 | 10,752 |
| Star Petroleum Refining PCL | | 6,666,400 | 3,085 |
| Tesoro Corp. | | 1,283,400 | 127,737 |
| Thai Oil PCL (For. Reg.) | | 389,500 | 1,004 |
| Uehara Sei Shoji Co. Ltd. | | 848,000 | 5,500 |
| Whitecap Resources, Inc. | | 449,300 | 3,319 |
| Whiting Petroleum Corp. (c) | | 217,269 | 1,141 |
| World Fuel Services Corp. | | 1,970,510 | 63,726 |
| WPX Energy, Inc. (c) | | 1,026,024 | 11,061 |
| | | | 733,569 |
|
| TOTAL ENERGY | | | 1,052,094 |
|
| FINANCIALS - 11.1% | | | |
| Banks - 1.2% | | | |
| ACNB Corp. | | 114,873 | 3,268 |
| Associated Banc-Corp. | | 426,700 | 10,219 |
| Bank Ireland Group PLC (c) | | 12,007,377 | 100,211 |
| Bank of America Corp. | | 158,300 | 3,818 |
| Bar Harbor Bankshares | | 55,500 | 1,548 |
| Boston Private Financial Holdings, Inc. | | 231,200 | 3,549 |
| Camden National Corp. | | 58,184 | 2,444 |
| Cathay General Bancorp | | 740,400 | 27,728 |
| Central Pacific Financial Corp. | | 156,300 | 4,834 |
| Central Valley Community Bancorp | | 148,200 | 3,257 |
| Codorus Valley Bancorp, Inc. (b) | | 663,839 | 18,561 |
| CVB Financial Corp. | | 147,800 | 3,184 |
| Dah Sing Banking Group Ltd. | | 1,794,800 | 3,847 |
| Dimeco, Inc. | | 25,375 | 1,383 |
| East West Bancorp, Inc. | | 97,600 | 5,561 |
| First Bancorp, Puerto Rico (c) | | 7,447,217 | 43,641 |
| First West Virginia Bancorp, Inc. | | 56,056 | 1,172 |
| Hope Bancorp, Inc. | | 641,700 | 11,313 |
| Huntington Bancshares, Inc. | | 563,800 | 7,470 |
| Investors Bancorp, Inc. | | 205,800 | 2,733 |
| KeyCorp | | 401,300 | 7,239 |
| LCNB Corp. | | 470,900 | 9,442 |
| Northrim Bancorp, Inc. | | 112,300 | 3,274 |
| Norwood Financial Corp. | | 153,000 | 6,555 |
| OFG Bancorp (a) | | 342,658 | 3,444 |
| Popular, Inc. | | 1,343,600 | 56,619 |
| Regions Financial Corp. | | 227,300 | 3,319 |
| SpareBank 1 SR-Bank ASA (primary capital certificate) | | 1,293,750 | 12,916 |
| Sparebanken More (primary capital certificate) | | 218,734 | 6,982 |
| Sparebanken Nord-Norge | | 2,428,400 | 18,145 |
| Trico Bancshares | | 524,195 | 19,343 |
| United Community Bank, Inc. | | 73,400 | 2,038 |
| Van Lanschot NV (Bearer) | | 1,113,840 | 33,050 |
| | | | 442,107 |
| Capital Markets - 0.5% | | | |
| AllianceBernstein Holding LP | | 671,900 | 16,630 |
| Ares Capital Corp. | | 3,779 | 62 |
| Banca Generali SpA | | 129,500 | 4,599 |
| Carlyle Group LP | | 74,100 | 1,519 |
| Close Brothers Group PLC | | 144,800 | 2,942 |
| Cowen Group, Inc. Class A (a)(c) | | 662,369 | 10,598 |
| Federated Investors, Inc. Class B (non-vtg.) | | 477,300 | 13,761 |
| Franklin Resources, Inc. | | 1,084,744 | 48,575 |
| Greenhill & Co., Inc. | | 175,500 | 3,247 |
| Invesco Ltd. | | 148,300 | 5,156 |
| Lazard Ltd. Class A | | 296,200 | 13,836 |
| State Street Corp. | | 245,400 | 22,879 |
| Tullett Prebon PLC | | 607,600 | 3,903 |
| Waddell & Reed Financial, Inc. Class A (a) | | 3,036,400 | 62,762 |
| | | | 210,469 |
| Consumer Finance - 0.6% | | | |
| Aeon Credit Service (Asia) Co. Ltd. | | 13,370,000 | 10,202 |
| Ally Financial, Inc. | | 332,300 | 7,523 |
| H&T Group PLC | | 565,100 | 2,151 |
| Nicholas Financial, Inc. (c) | | 376,857 | 3,241 |
| Santander Consumer U.S.A. Holdings, Inc. (c) | | 3,948,800 | 50,584 |
| Synchrony Financial | | 5,793,400 | 175,656 |
| | | | 249,357 |
| Diversified Financial Services - 0.3% | | | |
| Far East Horizon Ltd. | | 2,631,000 | 2,243 |
| Leucadia National Corp. | | 112,900 | 2,939 |
| Newship Ltd. (c) | | 2,500 | 950 |
| Ricoh Leasing Co. Ltd. | | 803,000 | 28,079 |
| Scandinavian Tobacco Group A/S | | 2,062,958 | 33,298 |
| Varex Imaging Corp. (c) | | 98,700 | 3,045 |
| Voya Financial, Inc. | | 1,406,800 | 55,203 |
| | | | 125,757 |
| Insurance - 7.6% | | | |
| AEGON NV | | 49,971,300 | 280,112 |
| AFLAC, Inc. | | 312,014 | 24,883 |
| April | | 2,411,600 | 37,113 |
| ASR Nederland NV | | 584,200 | 22,096 |
| Assurant, Inc. (b) | | 3,060,400 | 322,168 |
| Aub Group Ltd. | | 257,965 | 2,662 |
| Axis Capital Holdings Ltd. | | 3,823,200 | 246,902 |
| CNO Financial Group, Inc. | | 170,500 | 3,901 |
| FBD Holdings PLC (c) | | 152,100 | 1,521 |
| FNF Group | | 73,100 | 3,572 |
| Genworth Financial, Inc. Class A (c) | | 7,228,100 | 24,792 |
| Great-West Lifeco, Inc. | | 48,700 | 1,390 |
| Hartford Financial Services Group, Inc. | | 2,665,500 | 146,603 |
| Hiscox Ltd. | | 251,594 | 4,309 |
| Hyundai Fire & Marine Insurance Co. Ltd. | | 114,734 | 4,651 |
| James River Group Holdings Ltd. | | 347,564 | 13,958 |
| Lincoln National Corp. | | 5,479,000 | 400,296 |
| MetLife, Inc. | | 792,253 | 43,574 |
| National Western Life Group, Inc. | | 129,314 | 43,526 |
| NN Group NV | | 1,207,656 | 49,022 |
| Primerica, Inc. | | 195,500 | 15,845 |
| RenaissanceRe Holdings Ltd. (b) | | 2,220,900 | 326,272 |
| Sony Financial Holdings, Inc. | | 2,719,800 | 47,145 |
| Torchmark Corp. | | 262,447 | 20,725 |
| Universal Insurance Holdings, Inc. (a) | | 182,500 | 4,353 |
| Unum Group (b) | | 15,989,533 | 801,555 |
| | | | 2,892,946 |
| Mortgage Real Estate Investment Trusts - 0.5% | | | |
| Annaly Capital Management, Inc. | | 15,142,246 | 182,161 |
| MFA Financial, Inc. | | 347,950 | 2,954 |
| | | | 185,115 |
| Thrifts & Mortgage Finance - 0.4% | | | |
| ASAX Co. Ltd. | | 116,600 | 1,785 |
| Genworth MI Canada, Inc. | | 4,195,900 | 122,402 |
| Genworth Mortgage Insurance Ltd. | | 6,481,407 | 15,607 |
| Meridian Bancorp, Inc. Maryland | | 263,200 | 4,645 |
| Nationstar Mortgage Holdings, Inc. (a)(c) | | 599,095 | 10,682 |
| | | | 155,121 |
|
| TOTAL FINANCIALS | | | 4,260,872 |
|
| HEALTH CARE - 12.2% | | | |
| Biotechnology - 1.2% | | | |
| Amgen, Inc. | | 2,607,043 | 454,955 |
| Myriad Genetics, Inc. (c) | | 97,307 | 2,362 |
| | | | 457,317 |
| Health Care Equipment & Supplies - 0.9% | | | |
| Ansell Ltd. | | 290,179 | 5,100 |
| Apex Biotechnology Corp. | | 1,400,000 | 1,608 |
| Arts Optical International Holdings Ltd. (b) | | 24,073,000 | 8,599 |
| Atrion Corp. | | 8,700 | 5,500 |
| Boston Scientific Corp. (c) | | 392,800 | 10,456 |
| Exactech, Inc. (c) | | 153,100 | 4,463 |
| Hoshiiryou Sanki Co. Ltd. (b) | | 312,964 | 11,966 |
| Huvitz Co. Ltd. | | 50,000 | 580 |
| Integer Holdings Corp. (c) | | 9,800 | 449 |
| Microlife Corp. | | 3,683,500 | 8,583 |
| Nakanishi, Inc. | | 652,200 | 27,361 |
| Pacific Hospital Supply Co. Ltd. | | 1,454,000 | 3,705 |
| Prim SA (b) | | 1,507,300 | 19,681 |
| ResMed, Inc. | | 102,400 | 7,897 |
| Shandong Weigao Medical Polymer Co. Ltd. (H Shares) | | 972,000 | 784 |
| St.Shine Optical Co. Ltd. | | 2,450,000 | 50,436 |
| Supermax Corp. Bhd | | 23,500,000 | 10,538 |
| Techno Medica Co. Ltd. | | 40,600 | 719 |
| Top Glove Corp. Bhd | | 1,000,034 | 1,341 |
| Utah Medical Products, Inc. (b) | | 369,269 | 25,516 |
| Zimmer Biomet Holdings, Inc. | | 1,011,900 | 122,764 |
| | | | 328,046 |
| Health Care Providers & Services - 8.7% | | | |
| Aetna, Inc. | | 4,456,484 | 687,680 |
| Almost Family, Inc. (c) | | 493,600 | 24,409 |
| Anthem, Inc. | | 1,955,532 | 364,140 |
| Civitas Solutions, Inc. (c) | | 700 | 12 |
| DVx, Inc. (b) | | 732,200 | 8,368 |
| Grupo Casa Saba SA de CV (c) | | 11,473,200 | 0 |
| Hanger, Inc. (b)(c) | | 2,631,432 | 30,525 |
| Hi-Clearance, Inc. | | 1,489,000 | 4,573 |
| LHC Group, Inc. (c) | | 591,400 | 34,242 |
| Lifco AB | | 624,200 | 20,805 |
| Medica Sur SA de CV | | 356,600 | 791 |
| MEDNAX, Inc. (c) | | 173,756 | 8,163 |
| Premier, Inc. (c) | | 150,600 | 5,256 |
| Ship Healthcare Holdings, Inc. | | 137,800 | 4,237 |
| Sigma Healthcare Ltd. | | 4,101,181 | 3,150 |
| The Ensign Group, Inc. | | 246,800 | 5,521 |
| Tokai Corp. | | 179,500 | 7,937 |
| Triple-S Management Corp. (b)(c) | | 1,923,595 | 29,777 |
| Tsukui Corp. | | 952,400 | 5,788 |
| U.S. Physical Therapy, Inc. | | 49,400 | 3,117 |
| United Drug PLC (United Kingdom) | | 6,140,600 | 68,623 |
| UnitedHealth Group, Inc. | | 10,316,400 | 1,978,792 |
| WIN-Partners Co. Ltd. (b) | | 2,651,200 | 33,644 |
| | | | 3,329,550 |
| Health Care Technology - 0.1% | | | |
| Addlife AB | | 403,800 | 8,327 |
| Computer Programs & Systems, Inc. (a) | | 146,011 | 4,475 |
| HMS Holdings Corp. (c) | | 172,000 | 3,454 |
| ND Software Co. Ltd. (b) | | 1,263,300 | 13,121 |
| Pharmagest Interactive | | 9,714 | 481 |
| | | | 29,858 |
| Life Sciences Tools & Services - 0.0% | | | |
| Bruker Corp. | | 140,000 | 4,015 |
| VWR Corp. (c) | | 160,676 | 5,302 |
| | | | 9,317 |
| Pharmaceuticals - 1.3% | | | |
| Akorn, Inc. (c) | | 97,100 | 3,265 |
| Apex Healthcare Bhd | | 47,600 | 52 |
| Bliss Gvs Pharma Ltd. (c) | | 4,600,000 | 11,751 |
| Daewon Pharmaceutical Co. Ltd. (b) | | 1,782,271 | 29,918 |
| Daewoong Co. Ltd. | | 350,000 | 4,735 |
| Dawnrays Pharmaceutical Holdings Ltd. | | 11,652,000 | 7,011 |
| DepoMed, Inc. (c) | | 119,800 | 1,235 |
| DongKook Pharmaceutical Co. Ltd. (b) | | 623,700 | 33,526 |
| FDC Ltd. (c) | | 3,250,000 | 9,163 |
| Fuji Pharma Co. Ltd. | | 394,900 | 13,522 |
| Genomma Lab Internacional SA de CV (c) | | 4,106,200 | 5,280 |
| Indivior PLC | | 17,727,400 | 89,816 |
| Innoviva, Inc. (c) | | 311,800 | 4,278 |
| Korea United Pharm, Inc. | | 239,629 | 4,311 |
| Kwang Dong Pharmaceutical Co. Ltd. (b) | | 3,100,000 | 23,334 |
| Kyung Dong Pharmaceutical Co. Ltd. | | 480,000 | 8,229 |
| Lee's Pharmaceutical Holdings Ltd. | | 8,570,598 | 6,792 |
| Novo Nordisk A/S Series B sponsored ADR | | 1,168,389 | 49,540 |
| Phibro Animal Health Corp. Class A | | 149,400 | 5,707 |
| Recordati SpA | | 3,059,100 | 130,731 |
| Torrent Pharmaceuticals Ltd. | | 150,000 | 3,081 |
| Tsumura & Co. | | 781,400 | 30,442 |
| Whanin Pharmaceutical Co. Ltd. (b) | | 1,750,000 | 30,861 |
| | | | 506,580 |
|
| TOTAL HEALTH CARE | | | 4,660,668 |
|
| INDUSTRIALS - 7.7% | | | |
| Aerospace & Defense - 0.1% | | | |
| Aerojet Rocketdyne Holdings, Inc. (c) | | 1,000,106 | 23,452 |
| Astronics Corp. (c) | | 79,100 | 2,314 |
| Austal Ltd. | | 1,479,993 | 2,137 |
| Engility Holdings, Inc. (c) | | 973,674 | 28,402 |
| | | | 56,305 |
| Air Freight & Logistics - 0.1% | | | |
| Air T, Inc. (b)(c) | | 201,601 | 3,276 |
| Yusen Logistics Co. Ltd. (b) | | 2,157,500 | 19,570 |
| | | | 22,846 |
| Airlines - 0.0% | | | |
| Air New Zealand Ltd. | | 1,246,270 | 3,135 |
| JetBlue Airways Corp. (c) | | 111,008 | 2,434 |
| | | | 5,569 |
| Building Products - 0.1% | | | |
| Advanced Drain Systems, Inc. Del | | 10,800 | 222 |
| Continental Building Products, Inc. (c) | | 432,300 | 9,511 |
| Gibraltar Industries, Inc. (c) | | 111,700 | 3,334 |
| Kondotec, Inc. (b) | | 1,642,500 | 14,958 |
| | | | 28,025 |
| Commercial Services & Supplies - 0.8% | | | |
| Acme United Corp. | | 25,100 | 695 |
| Aeon Delight Co. Ltd. | | 120,100 | 4,014 |
| Aggreko PLC | | 193,034 | 2,161 |
| AJIS Co. Ltd. (b) | | 936,400 | 18,967 |
| Asia File Corp. Bhd | | 4,480,000 | 3,453 |
| Calian Technologies Ltd. (b) | | 676,700 | 15,187 |
| Civeo Corp. (b)(c) | | 12,511,820 | 24,148 |
| Essendant, Inc. (b) | | 2,163,998 | 27,007 |
| Fursys, Inc. (b) | | 950,000 | 28,374 |
| Interface, Inc. | | 241,100 | 4,569 |
| IWG PLC | | 879,600 | 3,807 |
| Knoll, Inc. | | 216,000 | 4,182 |
| Lion Rock Group Ltd. | | 20,167,640 | 4,312 |
| Loomis AB (B Shares) | | 128,000 | 4,756 |
| Mears Group PLC | | 823,994 | 5,371 |
| Mitie Group PLC | | 14,314,600 | 50,276 |
| Nac Co. Ltd.(b) | | 969,300 | 8,739 |
| NICE Total Cash Management Co., Ltd. (b) | | 1,375,000 | 12,891 |
| Prestige International, Inc. | | 1,183,400 | 12,967 |
| Programmed Maintenance Services Ltd. | | 2,071,193 | 4,938 |
| VICOM Ltd. | | 2,955,300 | 12,365 |
| VSE Corp. (b) | | 876,117 | 45,427 |
| West Corp. | | 260,865 | 6,096 |
| | | | 304,702 |
| Construction & Engineering - 1.2% | | | |
| AECOM (c) | | 7,194,695 | 229,511 |
| Arcadis NV | | 2,702,409 | 55,297 |
| Astaldi SpA (c) | | 2,589,900 | 17,261 |
| Boustead Projs. Pte Ltd. | | 1,083,787 | 748 |
| Boustead Singapore Ltd. | | 4,396,700 | 3,082 |
| C-Cube Corp. | | 338,400 | 1,562 |
| Daiichi Kensetsu Corp. (b) | | 1,812,800 | 22,034 |
| Geumhwa PSC Co. Ltd. (b) | | 360,000 | 12,086 |
| Jacobs Engineering Group, Inc. | | 243,028 | 12,812 |
| KBR, Inc. | | 1,757,703 | 26,225 |
| Kyeryong Construction Industrial Co. Ltd. (b)(c) | | 692,971 | 11,076 |
| Meisei Industrial Co. Ltd. | | 1,158,300 | 7,512 |
| Mirait Holdings Corp. | | 647,400 | 7,599 |
| Nippon Rietec Co. Ltd. | | 1,225,900 | 14,467 |
| Quanta Services, Inc. (c) | | 74,100 | 2,499 |
| Severfield PLC | | 2,897,033 | 2,838 |
| Shinnihon Corp. | | 1,651,200 | 13,465 |
| ShoLodge, Inc. (b)(c) | | 443,162 | 0 |
| Sterling Construction Co., Inc. (c) | | 802,780 | 10,260 |
| Toshiba Plant Systems & Services Corp. | | 172,300 | 2,807 |
| United Integration Services Co. Ltd. | | 5,143,500 | 9,669 |
| | | | 462,810 |
| Electrical Equipment - 0.7% | | | |
| Aichi Electric Co. Ltd. | | 326,300 | 9,027 |
| Aros Quality Group AB | | 760,600 | 21,809 |
| AZZ, Inc. | | 1,214,300 | 61,565 |
| Bharat Heavy Electricals Ltd. | | 20,500,000 | 46,347 |
| Chiyoda Integre Co. Ltd. | | 345,500 | 7,427 |
| Hammond Power Solutions, Inc. Class A | | 474,800 | 2,795 |
| I-Sheng Electric Wire & Cable Co. Ltd. (b) | | 12,500,000 | 17,852 |
| Korea Electric Terminal Co. Ltd. (b) | | 700,000 | 44,065 |
| Servotronics, Inc. (b) | | 171,000 | 1,623 |
| TKH Group NV (depositary receipt) | | 962,200 | 58,878 |
| | | | 271,388 |
| Industrial Conglomerates - 1.3% | | | |
| Carr's Group PLC | | 2,339,700 | 4,407 |
| DCC PLC (United Kingdom) (b) | | 5,281,400 | 464,436 |
| Mytilineos Holdings SA (c) | | 907,900 | 9,028 |
| Reunert Ltd. | | 1,782,800 | 9,729 |
| | | | 487,600 |
| Machinery - 1.6% | | | |
| Aalberts Industries NV (b) | | 8,193,800 | 357,923 |
| Allison Transmission Holdings, Inc. | | 247,859 | 9,369 |
| ASL Marine Holdings Ltd. (b)(c) | | 47,393,013 | 4,442 |
| Foremost Income Fund (c) | | 2,141,103 | 8,887 |
| Gencor Industries, Inc. (c) | | 203,997 | 3,274 |
| Global Brass & Copper Holdings, Inc. | | 49,400 | 1,583 |
| Haitian International Holdings Ltd. | | 7,286,000 | 20,895 |
| Hurco Companies, Inc. (b) | | 507,892 | 16,735 |
| Hwacheon Machine Tool Co. Ltd. (b) | | 219,900 | 11,663 |
| Hyster-Yale Materials Handling: | | | |
| Class A (b) | | 217,570 | 15,417 |
| Class B (b) | | 310,000 | 21,967 |
| Ihara Science Corp. (b) | | 1,043,100 | 20,475 |
| Jaya Holdings Ltd. (b) | | 3,244,740 | 206 |
| Kyowakogyosyo Co. Ltd. | | 247,000 | 2,093 |
| Luxfer Holdings PLC sponsored ADR | | 321,400 | 4,082 |
| Maruzen Co. Ltd. (b) | | 1,667,000 | 27,369 |
| Miller Industries, Inc. | | 69,800 | 1,822 |
| Mincon Group PLC | | 2,261,598 | 2,677 |
| Mirle Automation Corp. | | 116,000 | 154 |
| Nadex Co. Ltd. (b) | | 834,500 | 6,782 |
| Nakano Refrigerators Co. Ltd. | | 26,900 | 850 |
| Nitchitsu Co. Ltd. | | 584,000 | 1,128 |
| Rexnord Corp. (c) | | 116,900 | 2,707 |
| Semperit AG Holding | | 485,600 | 14,843 |
| SIMPAC, Inc. | | 583,000 | 2,410 |
| Takamatsu Machinery Co. Ltd. | | 386,500 | 3,481 |
| Techno Smart Corp. (b) | | 743,800 | 9,054 |
| Tocalo Co. Ltd. (b) | | 825,800 | 31,573 |
| Trinity Industrial Corp. | | 757,000 | 5,905 |
| | | | 609,766 |
| Marine - 0.0% | | | |
| SITC International Holdings Co. Ltd. | | 5,285,000 | 4,398 |
| Tokyo Kisen Co. Ltd. (b) | | 870,000 | 5,800 |
| | | | 10,198 |
| Professional Services - 0.4% | | | |
| Akka Technologies SA | | 730,733 | 39,913 |
| Asiakastieto Group Oyj | | 81,166 | 2,105 |
| Boardroom Ltd. | | 2,699,642 | 1,315 |
| CBIZ, Inc. (c) | | 163,200 | 2,424 |
| Clarius Group Ltd. (c) | | 2,914,107 | 180 |
| ICF International, Inc. (c) | | 250,600 | 11,340 |
| McMillan Shakespeare Ltd. | | 2,217,901 | 25,462 |
| SHL-JAPAN Ltd. | | 53,400 | 1,969 |
| Sporton International, Inc. | | 302,999 | 1,509 |
| Stantec, Inc. (a) | | 2,073,100 | 52,744 |
| Synergie SA | | 133,800 | 6,339 |
| TriNet Group, Inc. (c) | | 184,800 | 6,468 |
| TrueBlue, Inc. (c) | | 623,200 | 15,923 |
| | | | 167,691 |
| Road & Rail - 0.7% | | | |
| Alps Logistics Co. Ltd. (b) | | 2,995,900 | 21,604 |
| Avis Budget Group, Inc. (c) | | 54,000 | 1,662 |
| Chilled & Frozen Logistics Holdings Co. Ltd. (b) | | 1,317,200 | 15,688 |
| CSX Corp. | | 226,513 | 11,176 |
| Daqin Railway Co. Ltd. (A Shares) | | 26,000,000 | 33,821 |
| Hamakyorex Co. Ltd. (b) | | 1,314,400 | 34,778 |
| Higashi Twenty One Co. Ltd. | | 262,500 | 907 |
| Roadrunner Transportation Systems, Inc. (b)(c) | | 3,785,032 | 26,420 |
| Sakai Moving Service Co. Ltd. (b) | | 1,234,000 | 59,548 |
| Trancom Co. Ltd. (b) | | 897,200 | 44,353 |
| Universal Logistics Holdings, Inc. (b) | | 1,530,200 | 22,264 |
| | | | 272,221 |
| Trading Companies & Distributors - 0.6% | | | |
| AddTech AB (B Shares) | | 1,292,600 | 25,215 |
| AerCap Holdings NV (c) | | 243,418 | 11,952 |
| Goodfellow, Inc. (b) | | 758,300 | 4,738 |
| Hanwa Co. Ltd. | | 40,000 | 286 |
| HD Supply Holdings, Inc. (c) | | 547,994 | 17,804 |
| HERIGE | | 63,953 | 2,923 |
| KS Energy Services Ltd. (c) | | 13,816,400 | 296 |
| Lumax International Corp. Ltd. | | 3,272,000 | 5,772 |
| Meiwa Corp. | | 1,801,400 | 7,157 |
| Mitani Shoji Co. Ltd. | | 771,100 | 30,391 |
| MRC Global, Inc. (c) | | 328,107 | 5,361 |
| Nexeo Solutions, Inc. (c) | | 817,625 | 6,811 |
| Otec Corp. | | 130,400 | 1,858 |
| Parker Corp. (b) | | 2,329,000 | 12,168 |
| Richelieu Hardware Ltd. | | 912,400 | 23,806 |
| Senshu Electric Co. Ltd. (b) | | 938,500 | 18,882 |
| Strongco Corp. (b)(c) | | 890,988 | 943 |
| Tanaka Co. Ltd. | | 38,400 | 263 |
| TECHNO ASSOCIE Co. Ltd. | | 267,500 | 3,045 |
| Titan Machinery, Inc. (c) | | 870,800 | 15,544 |
| Totech Corp. (b) | | 971,400 | 17,623 |
| | | | 212,838 |
| Transportation Infrastructure - 0.1% | | | |
| Isewan Terminal Service Co. Ltd. | | 1,355,700 | 7,932 |
| Meiko Transportation Co. Ltd. | | 870,000 | 9,864 |
| Qingdao Port International Co. Ltd. | | 4,936,000 | 2,793 |
| Sinwa Ltd. (b) | | 21,394,600 | 3,473 |
| | | | 24,062 |
|
| TOTAL INDUSTRIALS | | | 2,936,021 |
|
| INFORMATION TECHNOLOGY - 17.8% | | | |
| Communications Equipment - 0.1% | | | |
| ADTRAN, Inc. | | 212,500 | 4,983 |
| Black Box Corp. (b) | | 1,561,711 | 12,338 |
| Cisco Systems, Inc. | | 94,300 | 2,966 |
| CommScope Holding Co., Inc. (c) | | 273,201 | 10,048 |
| Juniper Networks, Inc. | | 171,900 | 4,805 |
| Tessco Technologies, Inc. | | 122,118 | 1,630 |
| | | | 36,770 |
| Electronic Equipment & Components - 5.6% | | | |
| A&D Co. Ltd. | | 789,800 | 3,281 |
| AAC Technology Holdings, Inc. | | 357,000 | 4,804 |
| AVX Corp. | | 287,100 | 5,130 |
| Beijer Electronics AB (c) | | 112,400 | 617 |
| Bel Fuse, Inc. Class A | | 88,800 | 1,927 |
| Cardtronics PLC | | 315,142 | 9,864 |
| CDW Corp. | | 381,786 | 24,217 |
| Corning, Inc. | | 159,400 | 4,645 |
| CTS Corp. | | 366,954 | 8,073 |
| Daido Signal Co. Ltd. | | 103,000 | 499 |
| DigiTech Systems Co., Ltd. (c) | | 725,000 | 0 |
| Dynapack International Technology Corp. | | 3,200,000 | 4,152 |
| Elec & Eltek International Co. Ltd. | | 1,564,100 | 2,596 |
| Elematec Corp. (b) | | 1,238,600 | 22,459 |
| Excel Co. Ltd. (b) | | 790,700 | 10,314 |
| FLIR Systems, Inc. | | 144,007 | 5,374 |
| Hi-P International Ltd. | | 18,315,700 | 13,786 |
| Hon Hai Precision Industry Co. Ltd. (Foxconn) | | 182,476,140 | 709,624 |
| IDIS Holdings Co. Ltd. (b) | | 800,000 | 9,322 |
| Image Sensing Systems, Inc. (c) | | 67,566 | 243 |
| Intelligent Digital Integrated Security Co. Ltd. (b) | | 900,010 | 6,509 |
| INTOPS Co. Ltd. (b) | | 1,719,800 | 18,044 |
| Isra Vision AG (b) | | 355,400 | 65,170 |
| Jabil, Inc. | | 577,912 | 17,626 |
| Keysight Technologies, Inc. (c) | | 2,813,500 | 117,013 |
| Kingboard Chemical Holdings Ltd. (b) | | 82,179,000 | 370,346 |
| Kingboard Laminates Holdings Ltd. | | 3,907,000 | 5,452 |
| Mesa Laboratories, Inc. (b) | | 236,900 | 34,239 |
| Muramoto Electronic Thailand PCL (For. Reg.) (b) | | 1,336,900 | 9,120 |
| Nippo Ltd. (b)(c) | | 772,800 | 2,397 |
| PAX Global Technology Ltd. | | 4,276,000 | 2,836 |
| Philips Lighting NV | | 116,200 | 4,416 |
| Pinnacle Technology Holdings Ltd. | | 7,785,800 | 12,017 |
| Redington India Ltd. | | 14,700,000 | 34,139 |
| ScanSource, Inc. (b)(c) | | 2,197,700 | 87,029 |
| Shibaura Electronics Co. Ltd. (b) | | 666,400 | 22,486 |
| Sigmatron International, Inc. (b)(c) | | 252,179 | 2,108 |
| Simplo Technology Co. Ltd. | | 10,500,000 | 33,361 |
| SYNNEX Corp. (b) | | 2,832,600 | 336,853 |
| Tomen Devices Corp. (b) | | 591,000 | 12,893 |
| Tripod Technology Corp. | | 1,497,000 | 4,885 |
| TTM Technologies, Inc. (c) | | 1,266,424 | 22,010 |
| UKC Holdings Corp. (b) | | 1,364,300 | 20,506 |
| VST Holdings Ltd. (b) | | 126,396,800 | 33,659 |
| Wayside Technology Group, Inc. | | 66,800 | 1,149 |
| Wireless Telecom Group, Inc. (c) | | 408,654 | 605 |
| Yageo Corp. | | 721,000 | 2,744 |
| | | | 2,120,539 |
| Internet Software & Services - 0.1% | | | |
| Aucnet, Inc. | | 161,500 | 2,073 |
| eBay, Inc. (c) | | 98,700 | 3,527 |
| Gabia, Inc. (b) | | 975,000 | 5,328 |
| Liquidity Services, Inc. (c) | | 292,022 | 1,986 |
| NetGem SA | | 891,300 | 2,596 |
| Pandora Media, Inc. (c) | | 49,400 | 442 |
| Softbank Technology Corp. | | 269,300 | 4,324 |
| Yahoo! Japan Corp. | | 2,881,500 | 13,069 |
| | | | 33,345 |
| IT Services - 4.5% | | | |
| ALTEN | | 692,900 | 59,838 |
| Amdocs Ltd. | | 6,778,200 | 455,292 |
| Argo Graphics, Inc. | | 412,900 | 10,097 |
| Blackhawk Network Holdings, Inc. (c) | | 123,800 | 5,404 |
| Computer Services, Inc. | | 270,964 | 13,277 |
| CSE Global Ltd. (b) | | 42,663,000 | 13,065 |
| CSRA, Inc. | | 4,958,113 | 161,684 |
| Data#3 Ltd. | | 2,941,333 | 4,188 |
| Dimerco Data System Corp. | | 510,000 | 623 |
| DXC Technology Co. | | 96,072 | 7,530 |
| E-Credible Co. Ltd. | | 129,349 | 1,542 |
| eClerx Services Ltd. | | 1,791,278 | 36,229 |
| EOH Holdings Ltd. | | 6,937,400 | 56,720 |
| Estore Corp. | | 297,700 | 2,139 |
| EVERTEC, Inc. | | 1,896,900 | 33,860 |
| ExlService Holdings, Inc. (c) | | 187,258 | 10,777 |
| First Data Corp. Class A (c) | | 645,909 | 12,053 |
| Genpact Ltd. | | 200,700 | 5,820 |
| GetBusy PLC (c) | | 39,893 | 4 |
| Hackett Group, Inc. | | 126,800 | 2,082 |
| HIQ International AB | | 535,500 | 3,582 |
| Indra Sistemas (b)(c) | | 13,738,800 | 212,977 |
| Know IT AB (b) | | 1,500,700 | 24,210 |
| Leidos Holdings, Inc. | | 672,070 | 35,915 |
| Luxoft Holding, Inc. (c) | | 96,210 | 6,056 |
| Mastek Ltd. | | 677,069 | 3,189 |
| NCI, Inc. Class A (c) | | 691,100 | 13,787 |
| Net 1 UEPS Technologies, Inc. (c) | | 543,344 | 5,260 |
| Neustar, Inc. Class A (c) | | 1,198,629 | 40,034 |
| Nice Information & Telecom, Inc. | | 53,000 | 1,159 |
| Paysafe Group PLC (c) | | 406,700 | 3,166 |
| Perficient, Inc. (c) | | 496,200 | 9,329 |
| Rolta India Ltd. (c) | | 2,699,942 | 2,444 |
| Societe Pour L'Informatique Industrielle SA (b) | | 1,738,100 | 46,192 |
| Softcreate Co. Ltd. | | 631,400 | 8,305 |
| Sword Group | | 319,286 | 13,116 |
| The Western Union Co. | | 19,196,400 | 379,129 |
| TravelSky Technology Ltd. (H Shares) | | 1,834,000 | 4,860 |
| Vantiv, Inc. (c) | | 74,200 | 4,715 |
| | | | 1,709,649 |
| Semiconductors & Semiconductor Equipment - 0.8% | | | |
| Axell Corp. (b) | | 802,100 | 5,428 |
| Boe Varitronix Ltd. | | 7,577,000 | 4,045 |
| Diodes, Inc. (c) | | 24,700 | 655 |
| Entegris, Inc. (c) | | 481,100 | 12,557 |
| Integrated Device Technology, Inc. (c) | | 560,380 | 14,648 |
| Lasertec Corp. | | 74,000 | 1,106 |
| Leeno Industrial, Inc. | | 600,000 | 26,573 |
| Melexis NV | | 2,003,501 | 172,378 |
| Miraial Co. Ltd. | | 188,500 | 1,812 |
| ON Semiconductor Corp. (c) | | 1,028,559 | 15,377 |
| Phison Electronics Corp. | | 1,900,000 | 26,411 |
| Powertech Technology, Inc. | | 9,000,000 | 29,161 |
| Trio-Tech International (b)(c) | | 240,700 | 1,129 |
| | | | 311,280 |
| Software - 3.5% | | | |
| Activision Blizzard, Inc. | | 194,298 | 12,004 |
| AdaptIT Holdings Ltd. | | 2,637,200 | 2,001 |
| ANSYS, Inc. (c) | | 4,146,300 | 537,153 |
| Aspen Technology, Inc. (c) | | 138,443 | 7,873 |
| AVG Technologies NV (c) | | 502,588 | 13,293 |
| Ebix, Inc. (a)(b) | | 2,736,087 | 158,009 |
| ICT Automatisering NV (b) | | 609,469 | 9,019 |
| IGE + XAO SA | | 34,729 | 4,054 |
| InfoVine Co. Ltd. (b) | | 175,000 | 4,250 |
| init innovation in traffic systems AG | | 121,711 | 2,361 |
| Jorudan Co. Ltd. (b) | | 456,300 | 4,478 |
| KPIT Cummins Infosystems Ltd. | | 9,000,000 | 17,943 |
| KSK Co., Ltd. (b) | | 557,300 | 7,360 |
| Majesco Ltd. (c) | | 200,000 | 1,160 |
| NIIT Technologies Ltd. | | 58,528 | 470 |
| Nucleus Software Exports Ltd. (b) | | 2,200,000 | 9,766 |
| Oracle Corp. | | 10,139,774 | 506,279 |
| Pegasystems, Inc. | | 200,171 | 12,100 |
| Pro-Ship, Inc. | | 264,800 | 4,410 |
| RealPage, Inc. (c) | | 380,425 | 14,741 |
| Reckon Ltd. | | 92,184 | 111 |
| RS Software (India) Ltd. (c) | | 362,238 | 420 |
| Synopsys, Inc. (c) | | 26,300 | 2,014 |
| Vitec Software Group AB | | 830,200 | 8,766 |
| Zensar Technologies Ltd. | | 800,000 | 9,975 |
| | | | 1,350,010 |
| Technology Hardware, Storage & Peripherals - 3.2% | | | |
| Compal Electronics, Inc. | | 72,000,000 | 47,778 |
| Hewlett Packard Enterprise Co. | | 5,355,306 | 93,771 |
| HP, Inc. | | 8,030,836 | 153,389 |
| Seagate Technology LLC (b) | | 25,568,700 | 842,744 |
| Super Micro Computer, Inc. (c) | | 464,207 | 12,464 |
| TPV Technology Ltd. | | 72,998,000 | 17,103 |
| Xerox Corp. | | 2,310,350 | 70,858 |
| | | | 1,238,107 |
|
| TOTAL INFORMATION TECHNOLOGY | | | 6,799,700 |
|
| MATERIALS - 3.2% | | | |
| Chemicals - 2.3% | | | |
| Axalta Coating Systems (c) | | 481,000 | 15,152 |
| C. Uyemura & Co. Ltd. | | 402,500 | 23,111 |
| Chase Corp. (b) | | 725,600 | 78,401 |
| Core Molding Technologies, Inc. (a)(b) | | 715,656 | 13,648 |
| Deepak Fertilisers and Petrochemicals Corp. Ltd. (b)(c) | | 6,000,000 | 33,595 |
| Deepak Nitrite Ltd. (c) | | 3,500,000 | 8,851 |
| EcoGreen International Group Ltd. (b) | | 52,572,080 | 10,836 |
| FMC Corp. | | 1,480,800 | 113,104 |
| Fujikura Kasei Co., Ltd. (b) | | 2,843,400 | 16,713 |
| Fuso Chemical Co. Ltd. | | 789,700 | 26,325 |
| Gujarat Narmada Valley Fertilizers Co. | | 7,597,439 | 35,519 |
| Gujarat State Fertilizers & Chemicals Ltd. (b) | | 30,400,000 | 65,224 |
| Honshu Chemical Industry Co. Ltd. (b) | | 826,900 | 7,501 |
| Innospec, Inc. | | 754,408 | 47,075 |
| JSR Corp. | | 243,700 | 4,306 |
| K&S AG (a) | | 973,700 | 25,353 |
| KPC Holdings Corp. | | 43,478 | 2,601 |
| KPX Chemical Co. Ltd. | | 163,083 | 10,353 |
| KPX Green Chemical Co. Ltd. | | 369,165 | 1,485 |
| Miwon Chemicals Co. Ltd. | | 55,095 | 3,247 |
| Miwon Commercial Co. Ltd. (c) | | 13,819 | 2,789 |
| Muto Seiko Co. Ltd. (c) | | 260,600 | 1,723 |
| Nihon Parkerizing Co. Ltd. | | 304,600 | 4,374 |
| Nippon Soda Co. Ltd. | | 1,652,000 | 9,321 |
| Olin Corp. | | 98,800 | 2,913 |
| PolyOne Corp. | | 98,800 | 3,614 |
| Potash Corp. of Saskatchewan, Inc. | | 1,709,400 | 30,575 |
| SK Kaken Co. Ltd. | | 340,000 | 30,840 |
| Soda Aromatic Co. Ltd. | | 261,700 | 2,697 |
| Soken Chemical & Engineer Co. Ltd. (b) | | 699,400 | 9,827 |
| T&K Toka Co. Ltd. (b) | | 1,425,900 | 15,676 |
| Thai Carbon Black PCL (For. Reg.) | | 12,032,900 | 13,108 |
| Thai Rayon PCL: | | | |
| (For. Reg.) | | 2,852,100 | 3,600 |
| NVDR | | 89,800 | 113 |
| UPL Ltd. | | 875,000 | 11,959 |
| Victrex PLC | | 9,664 | 251 |
| Vivimed Labs Ltd. (c) | | 600,000 | 1,166 |
| Yara International ASA | | 4,371,300 | 174,177 |
| Yip's Chemical Holdings Ltd. | | 26,942,000 | 11,210 |
| | | | 872,333 |
| Construction Materials - 0.1% | | | |
| Brampton Brick Ltd. Class A (sub. vtg.) (c) | | 705,400 | 4,821 |
| Mitani Sekisan Co. Ltd. (b) | | 1,562,900 | 36,788 |
| RHI AG | | 93,269 | 3,524 |
| | | | 45,133 |
| Containers & Packaging - 0.3% | | | |
| AMVIG Holdings Ltd. | | 3,640,000 | 1,058 |
| Ball Corp. | | 361,404 | 15,143 |
| Berry Global Group, Inc. (c) | | 229,034 | 12,844 |
| Chuoh Pack Industry Co. Ltd. (b) | | 442,300 | 5,111 |
| Graphic Packaging Holding Co. | | 132,800 | 1,752 |
| Kohsoku Corp. (b) | | 1,822,600 | 18,103 |
| Owens-Illinois, Inc. (c) | | 94,000 | 2,247 |
| Pact Group Holdings Ltd. | | 534,784 | 2,451 |
| Samhwa Crown & Closure Co. Ltd. | | 50,000 | 2,317 |
| Sealed Air Corp. | | 119,800 | 5,212 |
| Silgan Holdings, Inc. | | 421,000 | 12,756 |
| The Pack Corp. (b) | | 1,637,000 | 53,010 |
| UFP Technologies, Inc. (c) | | 92,000 | 2,654 |
| | | | 134,658 |
| Metals& Mining - 0.4% | | | |
| Alcoa Corp. | | 207,900 | 7,568 |
| Alconix Corp. (b) | | 1,111,900 | 22,007 |
| Ausdrill Ltd. | | 2,197,796 | 3,420 |
| Chubu Steel Plate Co. Ltd. | | 434,600 | 2,890 |
| Compania de Minas Buenaventura SA sponsored ADR | | 2,366,419 | 28,965 |
| Freeport-McMoRan, Inc. (c) | | 549,900 | 8,040 |
| Granges AB | | 423,200 | 4,678 |
| Handy & Harman Ltd. (c) | | 113,500 | 3,757 |
| Hill & Smith Holdings PLC | | 987,200 | 17,454 |
| Newmont Mining Corp. | | 50,600 | 1,881 |
| Orosur Mining, Inc. (c) | | 3,119,600 | 563 |
| Orvana Minerals Corp. (c) | | 802,183 | 180 |
| Pacific Metals Co. Ltd. (c) | | 3,997,000 | 10,732 |
| Petra Diamonds Ltd. (c) | | 1,870,900 | 2,357 |
| Steel Dynamics, Inc. | | 148,200 | 5,248 |
| Tohoku Steel Co. Ltd. (b) | | 656,400 | 9,449 |
| Tokyo Tekko Co. Ltd. (b) | | 3,997,000 | 16,460 |
| Universal Stainless & Alloy Products, Inc. (c) | | 87,527 | 1,663 |
| Webco Industries, Inc. (c) | | 7,998 | 640 |
| | | | 147,952 |
| Paper & Forest Products - 0.1% | | | |
| Kapstone Paper & Packaging Corp. | | 146,297 | 3,344 |
| Stella-Jones, Inc. | | 600,000 | 20,997 |
| Western Forest Products, Inc. | | 2,042,100 | 4,062 |
| | | | 28,403 |
|
| TOTAL MATERIALS | | | 1,228,479 |
|
| REAL ESTATE - 0.9% | | | |
| Equity Real Estate Investment Trusts (REITs) - 0.3% | | | |
| CareTrust (REIT), Inc. | | 221,800 | 4,046 |
| Colony NorthStar, Inc. | | 1,011,702 | 14,811 |
| Corporate Office Properties Trust (SBI) | | 117,400 | 3,908 |
| Corrections Corp. of America | | 1,244,436 | 34,471 |
| Four Corners Property Trust, Inc. | | 344,100 | 8,733 |
| Healthcare Realty Trust, Inc. | | 111,400 | 3,710 |
| Nsi NV | | 8,741 | 342 |
| Outfront Media, Inc. | | 168,900 | 3,863 |
| Senior Housing Properties Trust (SBI) | | 39,500 | 768 |
| Store Capital Corp. | | 210,400 | 4,921 |
| VEREIT, Inc. | | 3,611,700 | 30,013 |
| WP Glimcher, Inc. | | 147,000 | 1,326 |
| | | | 110,912 |
| Real Estate Management & Development - 0.6% | | | |
| Anabuki Kosan, Inc. | | 45,150 | 1,202 |
| BUWOG-Gemeinnuetzige Wohnung | | 182,585 | 5,368 |
| CBRE Group, Inc. (c) | | 162,300 | 6,166 |
| Century21 Real Estate Japan Ltd. | | 102,000 | 1,295 |
| Devine Ltd. (c) | | 1,846,772 | 539 |
| IMMOFINANZ Immobilien Anlagen AG | | 1,073,000 | 2,612 |
| Leopalace21 Corp. | | 4,456,500 | 31,813 |
| LSL Property Services PLC | | 1,427,938 | 4,795 |
| Realogy Holdings Corp. | | 163,700 | 5,435 |
| Relo Holdings Corp. | | 7,354,700 | 147,634 |
| Selvaag Bolig ASA | | 1,221,000 | 5,668 |
| Servcorp Ltd. | | 453,009 | 2,167 |
| Sino Land Ltd. | | 2,908,000 | 4,803 |
| Tejon Ranch Co. (c) | | 344,518 | 7,228 |
| Wing Tai Holdings Ltd. | | 1,805,900 | 2,719 |
| | | | 229,444 |
|
| TOTAL REAL ESTATE | | | 340,356 |
|
| TELECOMMUNICATION SERVICES - 0.0% | | | |
| Diversified Telecommunication Services - 0.0% | | | |
| Asia Satellite Telecommunications Holdings Ltd. | | 459,500 | 471 |
| UTILITIES - 0.6% | | | |
| Electric Utilities - 0.3% | | | |
| Exelon Corp. | | 2,950,500 | 113,122 |
| Hawaiian Electric Industries, Inc. | | 95,700 | 3,157 |
| | | | 116,279 |
| Gas Utilities - 0.1% | | | |
| Busan City Gas Co. Ltd. | | 13,931 | 476 |
| GAIL India Ltd. | | 2,000,000 | 11,740 |
| Hokuriku Gas Co. | | 160,400 | 4,154 |
| K&O Energy Group, Inc. | | 563,400 | 8,616 |
| Keiyo Gas Co. Ltd. | | 622,000 | 3,160 |
| South Jersey Industries, Inc. | | 258,359 | 8,776 |
| Star Gas Partners LP | | 395,300 | 4,340 |
| | | | 41,262 |
| Independent Power and Renewable Electricity Producers - 0.1% | | | |
| Mega First Corp. Bhd (b) | | 32,700,045 | 29,328 |
| Mega First Corp. Bhd warrants 4/8/20 (b)(c) | | 3,900,000 | 1,794 |
| The AES Corp. | | 336,000 | 3,756 |
| | | | 34,878 |
| Multi-Utilities - 0.1% | | | |
| CMS Energy Corp. | | 628,455 | 29,060 |
| Water Utilities - 0.0% | | | |
| Manila Water Co., Inc. | | 5,893,400 | 3,740 |
|
| TOTAL UTILITIES | | | 225,219 |
|
| TOTAL COMMON STOCKS | | | |
| (Cost $16,241,993) | | | 33,694,607 |
|
| Nonconvertible Preferred Stocks - 0.1% | | | |
| CONSUMER DISCRETIONARY - 0.0% | | | |
| Textiles, Apparel & Luxury Goods - 0.0% | | | |
| Alpargatas SA (PN) | | 811,100 | 3,873 |
| CONSUMER STAPLES - 0.0% | | | |
| Food Products - 0.0% | | | |
| Nam Yang Dairy Products | | 4,917 | 1,157 |
| ENERGY - 0.0% | | | |
| Oil, Gas & Consumable Fuels - 0.0% | | | |
| Centrus Energy Corp. 7.50% (c)(d) | | 6,752 | 1,480 |
| MATERIALS - 0.1% | | | |
| Construction Materials - 0.1% | | | |
| Buzzi Unicem SpA (Risparmio Shares) | | 1,606,600 | 22,956 |
| TOTAL NONCONVERTIBLE PREFERRED STOCKS | | | |
| (Cost $22,021) | | | 29,466 |
| | | Principal Amount (000s) | Value (000s) |
|
| Nonconvertible Bonds - 0.0% | | | |
| ENERGY - 0.0% | | | |
| Oil, Gas & Consumable Fuels - 0.0% | | | |
| Centrus Energy Corp. 8.25% 2/28/27 (d) | | | |
| (Cost $11,839) | | 4,832 | 3,865 |
| | | Shares | Value (000s) |
|
| Money Market Funds - 12.3% | | | |
| Fidelity Cash Central Fund, 1.11% (e) | | 4,351,859,851 | 4,352,730 |
| Fidelity Securities Lending Cash Central Fund 1.11% (e)(f) | | 339,400,686 | 339,435 |
| TOTAL MONEY MARKET FUNDS | | | |
| (Cost $4,691,556) | | | 4,692,165 |
| TOTAL INVESTMENT PORTFOLIO - 100.5% | | | |
| (Cost $20,967,409) | | | 38,420,103 |
| NET OTHER ASSETS (LIABILITIES) - (0.5)% | | | (199,967) |
| NET ASSETS - 100% | | | $38,220,136 |
Values shown as $0 may reflect amounts less than $500.
Legend
(a) Security or a portion of the security is on loan at period end.
(b) Affiliated company
(c) Non-income producing
(d) Security exempt from registration under Rule 144A of the Securities Act of 1933. These securities may be resold in transactions exempt from registration, normally to qualified institutional buyers. At the end of the period, the value of these securities amounted to $5,345,000 or 0.0% of net assets.
(e) Affiliated fund that is generally available only to investment companies and other accounts managed by Fidelity Investments. The rate quoted is the annualized seven-day yield of the fund at period end. A complete unaudited listing of the fund's holdings as of its most recent quarter end is available upon request. In addition, each Fidelity Central Fund's financial statements, which are not covered by the Fund's Report of Independent Registered Public Accounting Firm, are available on the SEC's website or upon request.
(f) Investment made with cash collateral received from securities on loan.
Affiliated Central Funds
Information regarding fiscal year to date income earned by the Fund from investments in Fidelity Central Funds is as follows:
| Fund | Income earned |
| | (Amounts in thousands) |
| Fidelity Cash Central Fund | $25,561 |
| Fidelity Securities Lending Cash Central Fund | 8,548 |
| Total | $34,109 |
Other Affiliated Issuers
An affiliated company is a company in which the Fund has ownership of at least 5% of the voting securities. Fiscal year to date transactions with companies which are or were affiliates are as follows:
| Affiliate (Amounts in thousands) | Value, beginning of period | Purchases | Sales Proceeds* | Dividend Income | Value, end of period |
| Aalberts Industries NV | $280,615 | $-- | $10,073 | $4,385 | $357,923 |
| Abbey PLC | 27,009 | -- | 855 | 313 | 30,976 |
| Abercrombie & Fitch Co. Class A | 111,229 | -- | 1,743 | 4,271 | 51,336 |
| Accell Group NV | 55,294 | -- | 7,082 | 1,494 | 57,199 |
| AECOM | 276,570 | 10,144 | 31,425 | -- | -- |
| Air T, Inc. | 4,609 | -- | 113 | -- | 3,276 |
| AJIS Co. Ltd. | 28,027 | -- | 613 | 311 | 18,967 |
| Alconix Corp. | 15,908 | 17 | 567 | 428 | 22,007 |
| Almost Family, Inc. | 32,103 | -- | 16,325 | -- | -- |
| Alps Logistics Co. Ltd. | 17,736 | -- | 605 | 472 | 21,604 |
| ANSYS, Inc. | 399,734 | -- | 36,192 | -- | -- |
| Arctic Cat, Inc. | 17,363 | -- | 246 | -- | -- |
| Ark Restaurants Corp. | 4,594 | 169 | 138 | 198 | 4,524 |
| Arts Optical International Holdings Ltd. | 12,370 | -- | 2,257 | 915 | 8,599 |
| ASL Marine Holdings Ltd. | 5,316 | 1,536 | 134 | -- | 4,442 |
| Assurant, Inc. | 352,793 | -- | 115,144 | 8,034 | 322,168 |
| ASTI Corp. | 2,051 | -- | 154 | 59 | 5,592 |
| Atlas Air Worldwide Holdings, Inc. | 72,657 | 487 | 91,289 | -- | -- |
| Atwood Oceanics, Inc. | 67,818 | 13,806 | 1,935 | -- | 57,677 |
| Axell Corp. | 5,716 | -- | 172 | 33 | 5,428 |
| Axis Capital Holdings Ltd. | 363,338 | -- | 173,977 | 8,648 | -- |
| AZZ, Inc. | 83,311 | -- | 7,528 | 867 | -- |
| Barratt Developments PLC | 451,627 | -- | 16,208 | 30,566 | 615,294 |
| Bed Bath & Beyond, Inc. | 265,416 | 106,308 | 7,309 | 3,163 | 274,957 |
| Bel Fuse, Inc. Class A | 3,309 | -- | 2,342 | 29 | -- |
| Belc Co. Ltd. | 74,524 | -- | 2,186 | 921 | 80,741 |
| Belluna Co. Ltd. | 59,870 | -- | 16,193 | 985 | 87,499 |
| Best Buy Co., Inc. | 1,013,053 | -- | 509,504 | 29,259 | 1,088,006 |
| Black Box Corp. | 21,944 | -- | 437 | 767 | 12,338 |
| BMTC Group, Inc. | 44,380 | -- | 2,506 | 672 | 39,153 |
| Calian Technologies Ltd. | 12,538 | -- | 401 | 499 | 15,187 |
| Carbo Ceramics, Inc. | 29,891 | -- | 14,074 | -- | -- |
| Chase Corp. | 49,296 | -- | 8,592 | 568 | 78,401 |
| Chilled & Frozen Logistics Holdings Co. Ltd. | 17,074 | -- | 4,456 | 283 | 15,688 |
| Chuoh Pack Industry Co. Ltd. | 4,728 | -- | 152 | 169 | 5,111 |
| Cinderella Media Group Ltd. | 4,868 | -- | 279 | -- | -- |
| Civeo Corp. | 14,344 | 7,191 | 841 | -- | 24,148 |
| Clip Corp. | 2,635 | -- | 70 | 95 | 2,382 |
| Codorus Valley Bancorp, Inc. | 13,291 | 664 | 507 | 348 | 18,561 |
| Contango Oil & Gas Co. | 18,778 | 743 | 430 | -- | 12,450 |
| Core Molding Technologies, Inc. | 11,084 | 2,643 | 2,338 | -- | 13,648 |
| Cosmos Pharmaceutical Corp. | 288,551 | -- | 28,400 | 833 | 262,818 |
| Create SD Holdings Co. Ltd. | 145,712 | -- | 4,166 | 1,479 | 146,994 |
| CSE Global Ltd. | 14,906 | -- | 421 | 871 | 13,065 |
| Daewon Pharmaceutical Co. Ltd. | 34,676 | -- | -- | 314 | 29,918 |
| Daiichi Kensetsu Corp. | 19,901 | -- | 608 | 391 | 22,034 |
| DCC PLC (United Kingdom) | 624,867 | -- | 150,929 | 8,699 | 464,436 |
| Deepak Fertilisers and Petrochemicals Corp. Ltd. | 18,663 | -- | 6,250 | -- | 33,595 |
| DongKook Pharmaceutical Co. Ltd. | 37,160 | -- | -- | 174 | 33,526 |
| DSW, Inc. Class A | 116,448 | 5,503 | 14,002 | 3,614 | -- |
| DVx, Inc. | 8,067 | -- | 252 | 140 | 8,368 |
| Ebix, Inc. | 153,226 | -- | 7,939 | 841 | 158,009 |
| EcoGreen International Group Ltd. | 10,325 | -- | 327 | 329 | 10,836 |
| Elematec Corp. | 28,328 | -- | 650 | 227 | 22,459 |
| EOH Holdings Ltd. | 72,904 | -- | 1,990 | 831 | -- |
| Essendant, Inc. | 41,363 | 2,783 | 1,068 | 1,166 | 27,007 |
| Excel Co. Ltd. | 10,832 | -- | 306 | 235 | 10,314 |
| Farstad Shipping ASA | 3,213 | 1,410 | 36 | -- | -- |
| Ff Group | 107,213 | 7,232 | 2,949 | -- | 109,703 |
| First Juken Co. Ltd. | 18,267 | -- | 599 | 522 | 21,090 |
| Food Empire Holdings Ltd. | 12,087 | -- | 1,928 | 187 | 20,674 |
| Fossil Group, Inc. | 144,576 | 718 | 31,850 | -- | -- |
| Fresh Del Monte Produce, Inc. | 299,600 | -- | 9,600 | 3,134 | 262,477 |
| Fuji Kosan Co. Ltd. | 2,866 | -- | 93 | 78 | 3,565 |
| Fujikura Kasei Co., Ltd. | 17,183 | -- | 488 | 396 | 16,713 |
| Fursys, Inc. | 28,855 | -- | -- | 458 | 28,374 |
| Fyffes PLC (Ireland) | 44,248 | -- | 301 | 825 | -- |
| Gabia, Inc. | 5,345 | -- | -- | 20 | 5,328 |
| GameStop Corp. Class A | 293,285 | 24,263 | 12,621 | 14,436 | 216,839 |
| Genky Stores, Inc. | 13,359 | -- | 741 | 139 | 28,711 |
| Geospace Technologies Corp. | 20,470 | -- | 592 | -- | 18,545 |
| Geumhwa PSC Co. Ltd. | 12,187 | 307 | -- | 223 | 12,086 |
| GNC Holdings, Inc. Class A | 98,942 | 26,341 | 53,283 | 1,875 | -- |
| Goodfellow, Inc. | 6,846 | -- | 140 | -- | 4,738 |
| Guess?, Inc. | 110,594 | -- | 26,195 | 6,247 | 68,134 |
| Gujarat Narmada Valley Fertilizers Co. | 31,358 | -- | 26,212 | 404 | -- |
| Gujarat State Fertilizers & Chemicals Ltd. | 33,010 | -- | 2,177 | 1,037 | 65,224 |
| Gulfmark Offshore, Inc. Class A | 1,906 | 675 | 88 | -- | 413 |
| Halows Co. Ltd. | 27,422 | -- | 842 | 236 | 29,437 |
| Hamakyorex Co. Ltd. | 24,611 | -- | 866 | 460 | 34,778 |
| Hampshire Group Ltd. | 12 | -- | 4 | -- | -- |
| Handsome Co. Ltd. | 74,379 | -- | -- | 439 | 68,497 |
| Hanger, Inc. | 29,120 | -- | 926 | -- | 30,525 |
| Helen of Troy Ltd. | 242,740 | -- | 45,261 | -- | 196,442 |
| Hiday Hidaka Corp. | 48,144 | -- | 1,576 | 586 | 60,332 |
| Honshu Chemical Industry Co. Ltd. | 5,713 | -- | 195 | 186 | 7,501 |
| Hoshiiryou Sanki Co. Ltd. | 10,919 | -- | 337 | 110 | 11,966 |
| Houston Wire & Cable Co. | 6,545 | 521 | 7,845 | 34 | -- |
| Hurco Companies, Inc. | 13,824 | 2,026 | 2,547 | 202 | 16,735 |
| Hwacheon Machine Tool Co. Ltd. | 9,871 | -- | -- | 187 | 11,663 |
| Hyster-Yale Materials Handling Class A | 14,289 | -- | 411 | 264 | 15,417 |
| Hyster-Yale Materials Handling Class B | 19,775 | -- | -- | 368 | 21,967 |
| I-Sheng Electric Wire & Cable Co. Ltd. | 15,341 | -- | -- | 1,312 | 17,852 |
| IA Group Corp. | 5,226 | -- | 943 | 142 | 3,759 |
| ICT Automatisering NV | 8,959 | -- | 1,821 | 204 | 9,019 |
| IDIS Holdings Co. Ltd. | 11,718 | -- | -- | 83 | 9,322 |
| Ihara Science Corp. | 8,622 | -- | 466 | 301 | 20,475 |
| Indra Sistemas | 171,608 | -- | 5,753 | -- | 212,977 |
| InfoVine Co. Ltd. | 4,207 | -- | -- | -- | 4,250 |
| Intage Holdings, Inc. | 28,744 | -- | 971 | 508 | 35,728 |
| Intelligent Digital Integrated Security Co. Ltd. | 10,555 | -- | -- | 120 | 6,509 |
| INTOPS Co. Ltd. | 15,416 | -- | -- | 117 | 18,044 |
| INZI Controls Co. Ltd. | 8,474 | -- | -- | 94 | 6,917 |
| Isewan Terminal Service Co. Ltd. | 9,100 | -- | 238 | 261 | -- |
| Isra Vision AG | 35,314 | -- | 5,257 | 167 | 65,170 |
| Jaya Holdings Ltd. | 1,121 | -- | 10 | 893 | 206 |
| JLM Couture, Inc. | 563 | -- | 15 | -- | 511 |
| Jorudan Co. Ltd. | 3,328 | -- | 123 | 55 | 4,478 |
| Jumbo SA | 127,943 | -- | 4,941 | 5,676 | 176,166 |
| Kingboard Chemical Holdings Ltd. | 182,540 | -- | 9,533 | 13,956 | 370,346 |
| Know IT AB | 13,677 | -- | 611 | 553 | 24,210 |
| Kohsoku Corp. | 16,596 | -- | 533 | 431 | 18,103 |
| Kondotec, Inc. | 12,597 | -- | 410 | 331 | 14,958 |
| Korea Electric Terminal Co. Ltd. | 55,230 | -- | -- | 346 | 44,065 |
| KSK Co., Ltd. | 5,892 | -- | 195 | 203 | 7,360 |
| Kwang Dong Pharmaceutical Co. Ltd. | 26,493 | -- | -- | 171 | 23,334 |
| Kyeryong Construction Industrial Co. Ltd. | 7,674 | -- | 114 | -- | 11,076 |
| Kyoto Kimono Yuzen Co. Ltd. | 7,517 | -- | 5,285 | 239 | -- |
| LCNB Corp. | 12,258 | 191 | 4,573 | 432 | -- |
| LHC Group, Inc. | 49,216 | -- | 27,705 | -- | -- |
| Maruzen Co. Ltd. | 16,271 | -- | 641 | 316 | 27,369 |
| Mastek Ltd. | 2,396 | -- | 1,972 | 48 | -- |
| Mega First Corp. Bhd | 14,781 | -- | -- | 387 | 29,328 |
| Mega First Corp. Bhd warrants 4/8/20 | 456 | -- | 189 | -- | 1,794 |
| Melexis NV | 177,059 | -- | 58,226 | 4,751 | -- |
| Mesa Laboratories, Inc. | 31,428 | -- | 4,621 | 167 | 34,239 |
| Metro, Inc. Class A (sub. vtg.) | 1,005,281 | -- | 56,298 | 10,469 | 876,121 |
| Michang Oil Industrial Co. Ltd. | 14,143 | -- | -- | 264 | 13,913 |
| Miroku Corp. | 2,212 | -- | 85 | 50 | -- |
| Mitani Sekisan Co. Ltd. | 34,093 | -- | 2,502 | 237 | 36,788 |
| Mitie Group PLC | 64,987 | -- | 16,213 | 979 | -- |
| Motonic Corp. | 27,044 | -- | -- | 556 | 28,729 |
| Mr. Bricolage SA | 13,237 | -- | 412 | 529 | 16,992 |
| Muhak Co. Ltd. | 59,618 | -- | -- | 686 | 56,738 |
| Murakami Corp. | 12,838 | -- | 496 | 228 | 17,692 |
| Muramoto Electronic Thailand PCL (For. Reg.) | 8,851 | -- | 268 | 492 | 9,120 |
| Nac Co. Ltd. | 9,478 | -- | 1,324 | 265 | 8,739 |
| Nadex Co. Ltd. | 4,108 | -- | 178 | 190 | 6,782 |
| Nafco Co. Ltd. | 33,322 | -- | 952 | 676 | 32,256 |
| Nakayamafuku Co. Ltd. | 8,398 | -- | 260 | 237 | 7,504 |
| NCI, Inc. Class A | 8,780 | 3,457 | 3,483 | -- | -- |
| ND Software Co. Ltd. | 10,531 | -- | 368 | 192 | 13,121 |
| Next PLC | 960,887 | -- | 36,381 | 44,537 | 720,096 |
| NICE Total Cash Management Co., Ltd. | 8,303 | -- | -- | 76 | 12,891 |
| Nippo Ltd. | 1,768 | -- | 62 | -- | 2,397 |
| Norwood Financial Corp. | 5,246 | 392 | 1,897 | 231 | -- |
| Nucleus Software Exports Ltd. | 6,405 | -- | -- | 170 | 9,766 |
| Nutraceutical International Corp. | 26,232 | -- | 1,063 | 255 | 41,542 |
| OFG Bancorp | 25,308 | -- | 19,229 | 421 | -- |
| Origin Enterprises PLC | 52,849 | 6,916 | 2,088 | 2,218 | 75,152 |
| P&F Industries, Inc. Class A | 3,150 | -- | 66 | 50 | 1,986 |
| Parker Corp. | 7,322 | -- | 336 | 172 | 12,168 |
| Piolax, Inc. | 45,328 | -- | 1,917 | 751 | 72,133 |
| Prim SA | 14,833 | -- | 503 | 651 | 19,681 |
| Qol Co. Ltd. | 27,774 | 964 | 864 | 408 | 31,384 |
| Relo Holdings Corp. | 157,507 | -- | 45,677 | 1,319 | -- |
| RenaissanceRe Holdings Ltd. | 325,965 | -- | 78,244 | 3,311 | 326,272 |
| Roadrunner Transportation Systems, Inc. | 21,448 | 8,216 | 810 | -- | 26,420 |
| Rocky Mountain Chocolate Factory, Inc. | 4,457 | 584 | 143 | 205 | 5,440 |
| S&T Holdings Co. Ltd. | 14,556 | -- | -- | 210 | 12,660 |
| Sakai Moving Service Co. Ltd. | 34,221 | -- | 6,742 | 473 | 59,548 |
| Samsung Climate Control Co. Ltd. | 4,560 | -- | -- | 31 | 5,669 |
| Sanei Architecture Planning Co. Ltd. | 14,043 | -- | 584 | 381 | 22,654 |
| Sarantis SA | 21,370 | -- | 813 | 344 | 30,582 |
| ScanSource, Inc. | 91,087 | 5,774 | 8,325 | -- | 87,029 |
| Seagate Technology LLC | 877,660 | -- | 76,446 | 67,778 | 842,744 |
| Select Harvests Ltd. | 27,700 | -- | 585 | 1,268 | 18,238 |
| Senshu Electric Co. Ltd. | 15,380 | -- | 518 | 319 | 18,882 |
| Servotronics, Inc. | 1,320 | 318 | 50 | 26 | 1,623 |
| Sewon Precision Industries Co. Ltd. | 8,290 | -- | -- | 38 | 7,366 |
| Shibaura Electronics Co. Ltd. | 11,774 | -- | 857 | 337 | 22,486 |
| ShoLodge, Inc. | 0 | -- | -- | -- | 0 |
| Sigmatron International, Inc. | 1,501 | 11 | 47 | -- | 2,108 |
| Sinwa Ltd. | 4,271 | -- | 104 | 186 | 3,473 |
| SJM Co. Ltd. | 8,445 | -- | -- | 177 | 6,651 |
| SJM Holdings Co. Ltd. | 6,768 | -- | -- | 184 | 6,082 |
| Societe Pour L'Informatique Industrielle SA | 25,005 | -- | 1,181 | 153 | 46,192 |
| Soken Chemical & Engineer Co. Ltd. | 6,538 | -- | 276 | 261 | 9,827 |
| Span-America Medical System, Inc. | 4,705 | 280 | 87 | 172 | -- |
| SPK Corp. | 5,479 | 140 | 187 | 146 | 7,050 |
| Sportscene Group, Inc. Class A | 1,316 | -- | 46 | -- | 1,827 |
| Step Co. Ltd. | 12,446 | -- | 434 | 306 | 14,962 |
| Sterling Construction Co., Inc. | 12,194 | 608 | 15,726 | -- | -- |
| Strattec Security Corp. | 7,047 | 5,383 | 288 | 145 | 11,271 |
| Strongco Corp. | 1,173 | -- | 27 | -- | 943 |
| Sun Hing Vision Group Holdings Ltd. | 7,647 | -- | 232 | 635 | 8,362 |
| Sunjin Co. Ltd. | 20,180 | -- | -- | 2 | 27,026 |
| Sword Group | 13,332 | -- | 5,676 | 385 | -- |
| SYNNEX Corp. | 307,461 | -- | 26,477 | 2,936 | 336,853 |
| T&K Toka Co. Ltd. | 13,161 | -- | 425 | 271 | 15,676 |
| Techno Smart Corp. | 3,363 | -- | 2,742 | 161 | 9,054 |
| Tessco Technologies, Inc. | 6,533 | -- | 4,960 | 362 | -- |
| The Buckle, Inc. | 132,461 | 4,280 | 7,231 | 8,449 | 80,756 |
| The Pack Corp. | 46,476 | -- | 1,419 | 655 | 53,010 |
| Tocalo Co. Ltd. | 16,802 | -- | 729 | 611 | 31,573 |
| Tohoku Steel Co. Ltd. | 6,546 | -- | 256 | 126 | 9,449 |
| Token Corp. | 57,849 | -- | 1,960 | 717 | -- |
| Tokyo Kisen Co. Ltd. | 5,555 | -- | 164 | 201 | 5,800 |
| Tokyo Tekko Co. Ltd. | 15,150 | -- | 491 | 238 | 16,460 |
| Tomen Devices Corp. | 10,840 | -- | 360 | 294 | 12,893 |
| Total Energy Services, Inc. | 21,762 | -- | 662 | 339 | -- |
| Totech Corp. | 11,171 | 395 | 463 | 350 | 17,623 |
| TOW Co. Ltd. | 11,751 | -- | 398 | 400 | 15,331 |
| Trancom Co. Ltd. | 59,491 | -- | 1,355 | 612 | 44,353 |
| Trio-Tech International | 875 | -- | 30 | -- | 1,129 |
| Triple-S Management Corp. | 49,208 | -- | 986 | -- | 29,777 |
| Tsukui Corp. | 28,721 | -- | 15,532 | 238 | -- |
| UKC Holdings Corp. | 22,097 | -- | 671 | 715 | 20,506 |
| Uni-Select, Inc. | 53,667 | -- | 11,726 | 471 | -- |
| Unit Corp. | 58,338 | -- | 2,870 | -- | 81,511 |
| Universal Logistics Holdings, Inc. | 24,741 | 2,671 | 4,302 | 471 | 22,264 |
| Unum Group | 576,028 | -- | 52,880 | 13,648 | 801,555 |
| Utah Medical Products, Inc. | 24,740 | -- | 721 | 399 | 25,516 |
| VSE Corp. | 27,966 | 646 | 1,118 | 223 | 45,427 |
| VST Holdings Ltd. | 31,048 | -- | 1,197 | 2,033 | 33,659 |
| Watts Co. Ltd. | 12,358 | -- | 728 | 165 | 15,539 |
| Weight Watchers International, Inc. | 52,032 | 59 | 6,431 | -- | 148,520 |
| Whanin Pharmaceutical Co. Ltd. | 25,398 | -- | -- | 301 | 30,861 |
| WIN-Partners Co. Ltd. | 20,281 | -- | 805 | 572 | 33,644 |
| Workman Co. Ltd. | 80,055 | -- | 2,033 | 1,018 | 70,361 |
| Youngone Holdings Co. Ltd. | 48,445 | -- | -- | 306 | 42,735 |
| Yusen Logistics Co. Ltd. | 34,365 | -- | 9,036 | 471 | 19,570 |
| Yutaka Giken Co. Ltd. | 26,673 | -- | 835 | 678 | 29,488 |
| Zumiez, Inc. | 32,011 | 406 | 32,561 | -- | -- |
| Total | $15,132,964 | $257,178 | $2,256,453 | $367,426 | $13,042,071 |
* Includes the value of securities delivered through in-kind transactions, if applicable.
Investment Valuation
The following is a summary of the inputs used, as of July 31, 2017, involving the Fund's assets and liabilities carried at fair value. The inputs or methodology used for valuing securities may not be an indication of the risk associated with investing in those securities. For more information on valuation inputs, and their aggregation into the levels used below, please refer to the Investment Valuation section in the accompanying Notes to Financial Statements.
| | Valuation Inputs at Reporting Date: |
| Description | Total | Level 1 | Level 2 | Level 3 |
| (Amounts in thousands) | | | | |
| Investments in Securities: | | | | |
| Equities: | | | | |
| Consumer Discretionary | $8,698,252 | $8,696,912 | $829 | $511 |
| Consumer Staples | 3,497,505 | 3,486,231 | -- | 11,274 |
| Energy | 1,053,574 | 930,304 | 121,790 | 1,480 |
| Financials | 4,260,872 | 3,979,810 | 280,112 | 950 |
| Health Care | 4,660,668 | 4,660,668 | -- | -- |
| Industrials | 2,936,021 | 2,927,134 | 8,887 | -- |
| Information Technology | 6,799,700 | 6,799,696 | -- | 4 |
| Materials | 1,251,435 | 1,251,435 | -- | -- |
| Real Estate | 340,356 | 340,356 | -- | -- |
| Telecommunication Services | 471 | 471 | -- | -- |
| Utilities | 225,219 | 225,219 | -- | -- |
| Corporate Bonds | 3,865 | -- | 3,865 | -- |
| Money Market Funds | 4,692,165 | 4,692,165 | -- | -- |
| Total Investments in Securities: | $38,420,103 | $37,990,401 | $415,483 | $14,219 |
The following is a summary of transfers between Level 1 and Level 2 for the period ended July 31, 2017. Transfers are assumed to have occurred at the beginning of the period, and are primarily attributable to the valuation techniques used for foreign equity securities, as discussed in the accompanying Notes to Financial Statements:
| Transfers | Total (000s) |
| Level 1 to Level 2 | $0 |
| Level 2 to Level 1 | $3,214,746 |
Other Information
Distribution of investments by country or territory of incorporation, as a percentage of Total Net Assets, is as follows (Unaudited):
| United States of America | 55.6% |
| Japan | 9.7% |
| United Kingdom | 5.3% |
| Ireland | 4.4% |
| Canada | 4.3% |
| Netherlands | 2.8% |
| Taiwan | 2.5% |
| Bermuda | 2.3% |
| Cayman Islands | 2.0% |
| Korea (South) | 1.9% |
| Bailiwick of Guernsey | 1.2% |
| India | 1.0% |
| Others (Individually Less Than 1%) | 7.0% |
| | 100.0% |
See accompanying notes which are an integral part of the financial statements.
Financial Statements
Statement of Assets and Liabilities
| Amounts in thousands (except per-share amounts) | | July 31, 2017 |
| Assets | | |
Investment in securities, at value (including securities loaned of $326,229) — See accompanying schedule:
Unaffiliated issuers (cost $10,045,447) | $20,685,867 | |
| Fidelity Central Funds (cost $4,691,556) | 4,692,165 | |
| Other affiliated issuers (cost $6,230,406) | 13,042,071 | |
| Total Investments (cost $20,967,409) | | $38,420,103 |
| Foreign currency held at value (cost $1,743) | | 1,742 |
| Receivable for investments sold | | 79,628 |
| Receivable for fund shares sold | | 28,550 |
| Dividends receivable | | 76,517 |
| Interest receivable | | 185 |
| Distributions receivable from Fidelity Central Funds | | 4,243 |
| Other receivables | | 2,005 |
| Total assets | | 38,612,973 |
| Liabilities | | |
| Payable for investments purchased | $2,563 | |
| Payable for fund shares redeemed | 31,241 | |
| Accrued management fee | 12,540 | |
| Other affiliated payables | 3,891 | |
| Other payables and accrued expenses | 3,166 | |
| Collateral on securities loaned | 339,436 | |
| Total liabilities | | 392,837 |
| Net Assets | | $38,220,136 |
| Net Assets consist of: | | |
| Paid in capital | | $18,213,039 |
| Undistributed net investment income | | 293,208 |
| Accumulated undistributed net realized gain (loss) on investments and foreign currency transactions | | 2,261,213 |
| Net unrealized appreciation (depreciation) on investments and assets and liabilities in foreign currencies | | 17,452,676 |
| Net Assets | | $38,220,136 |
| Low-Priced Stock: | | |
| Net Asset Value, offering price and redemption price per share ($28,334,033 ÷ 521,051 shares) | | $54.38 |
| Class K: | | |
| Net Asset Value, offering price and redemption price per share ($9,886,103 ÷ 181,871 shares) | | $54.36 |
See accompanying notes which are an integral part of the financial statements.
Statement of Operations
| Amounts in thousands | | Year ended July 31, 2017 |
| Investment Income | | |
| Dividends (including $367,426 earned from other affiliated issuers) | | $795,434 |
| Interest | | 603 |
| Income from Fidelity Central Funds | | 34,109 |
| Total income | | 830,146 |
| Expenses | | |
| Management fee | | |
| Basic fee | $231,997 | |
| Performance adjustment | (30,889) | |
| Transfer agent fees | 45,131 | |
| Accounting and security lending fees | 2,244 | |
| Custodian fees and expenses | 2,700 | |
| Independent trustees' fees and expenses | 159 | |
| Appreciation in deferred trustee compensation account | 1 | |
| Registration fees | 161 | |
| Audit | 215 | |
| Legal | 113 | |
| Miscellaneous | 342 | |
| Total expenses before reductions | 252,174 | |
| Expense reductions | (520) | 251,654 |
| Net investment income (loss) | | 578,492 |
| Realized and Unrealized Gain (Loss) | | |
| Net realized gain (loss) on: | | |
| Investment securities: | | |
| Unaffiliated issuers | 2,707,408 | |
| Redemptions in-kind with affiliated entities | 254,862 | |
| Fidelity Central Funds | 224 | |
| Other affiliated issuers | 811,078 | |
| Foreign currency transactions | (225) | |
| Total net realized gain (loss) | | 3,773,347 |
| Change in net unrealized appreciation (depreciation) on: | | |
| Investment securities (net of decrease in deferred foreign taxes of $395) | 1,136,407 | |
| Assets and liabilities in foreign currencies | 319 | |
| Total change in net unrealized appreciation (depreciation) | | 1,136,726 |
| Net gain (loss) | | 4,910,073 |
| Net increase (decrease) in net assets resulting from operations | | $5,488,565 |
See accompanying notes which are an integral part of the financial statements.
Statement of Changes in Net Assets
| Amounts in thousands | Year ended July 31, 2017 | Year ended July 31, 2016 |
| Increase (Decrease) in Net Assets | | |
| Operations | | |
| Net investment income (loss) | $578,492 | $508,914 |
| Net realized gain (loss) | 3,773,347 | 1,577,645 |
| Change in net unrealized appreciation (depreciation) | 1,136,726 | (2,865,712) |
| Net increase (decrease) in net assets resulting from operations | 5,488,565 | (779,153) |
| Distributions to shareholders from net investment income | (481,686) | (528,171) |
| Distributions to shareholders from net realized gain | (1,425,392) | (1,338,985) |
| Total distributions | (1,907,078) | (1,867,156) |
| Share transactions - net increase (decrease) | (5,374,274) | (1,482,043) |
| Redemption fees | 401 | 1,921 |
| Total increase (decrease) in net assets | (1,792,386) | (4,126,431) |
| Net Assets | | |
| Beginning of period | 40,012,522 | 44,138,953 |
| End of period | $38,220,136 | $40,012,522 |
| Other Information | | |
| Undistributed net investment income end of period | $293,208 | $225,648 |
See accompanying notes which are an integral part of the financial statements.
Financial Highlights — Fidelity Low-Priced Stock Fund
| Years ended July 31, | 2017 | 2016 | 2015 | 2014 | 2013 |
| Selected Per–Share Data | | | | | |
| Net asset value, beginning of period | $49.57 | $52.65 | $51.03 | $47.84 | $38.52 |
| Income from Investment Operations | | | | | |
| Net investment income (loss)A | .74 | .59 | .52 | .53 | .48 |
| Net realized and unrealized gain (loss) | 6.47 | (1.44) | 4.06 | 5.96 | 11.61 |
| Total from investment operations | 7.21 | (.85) | 4.58 | 6.49 | 12.09 |
| Distributions from net investment income | (.60) | (.62) | (.52) | (.39) | (.49) |
| Distributions from net realized gain | (1.80) | (1.61) | (2.44) | (2.91) | (2.28) |
| Total distributions | (2.40) | (2.23) | (2.96) | (3.30) | (2.77) |
| Redemption fees added to paid in capitalA,B | – | – | – | – | – |
| Net asset value, end of period | $54.38 | $49.57 | $52.65 | $51.03 | $47.84 |
| Total ReturnC | 15.17% | (1.48)% | 9.32% | 14.42% | 33.12% |
| Ratios to Average Net AssetsD,E | | | | | |
| Expenses before reductions | .67% | .88% | .79% | .82% | .79% |
| Expenses net of fee waivers, if any | .67% | .88% | .79% | .82% | .79% |
| Expenses net of all reductions | .67% | .88% | .79% | .82% | .79% |
| Net investment income (loss) | 1.46% | 1.24% | 1.02% | 1.07% | 1.14% |
| Supplemental Data | | | | | |
| Net assets, end of period (in millions) | $28,334 | $28,524 | $30,150 | $30,576 | $28,171 |
| Portfolio turnover rateF | 8%G | 9%G | 9%G | 12%G | 11% |
A Calculated based on average shares outstanding during the period.
B Amount represents less than $.005 per share.
C Total returns would have been lower if certain expenses had not been reduced during the applicable periods shown.
D Fees and expenses of any underlying Fidelity Central Funds are not included in the Fund's expense ratio. The Fund indirectly bears its proportionate share of the expenses of any underlying Fidelity Central Funds.
E Expense ratios reflect operating expenses of the class. Expenses before reductions do not reflect amounts reimbursed by the investment adviser or reductions from brokerage service arrangements or reductions from other expense offset arrangements and do not represent the amount paid by the class during periods when reimbursements or reductions occur. Expenses net of fee waivers reflect expenses after reimbursement by the investment adviser but prior to reductions from brokerage service arrangements or other expense offset arrangements. Expenses net of all reductions represent the net expenses paid by the class.
F Amount does not include the portfolio activity of any underlying Fidelity Central Funds.
G Portfolio turnover rate excludes securities received or delivered in-kind.
See accompanying notes which are an integral part of the financial statements.
Financial Highlights — Fidelity Low-Priced Stock Fund Class K
| Years ended July 31, | 2017 | 2016 | 2015 | 2014 | 2013 |
| Selected Per–Share Data | | | | | |
| Net asset value, beginning of period | $49.56 | $52.64 | $51.02 | $47.83 | $38.52 |
| Income from Investment Operations | | | | | |
| Net investment income (loss)A | .79 | .64 | .57 | .58 | .53 |
| Net realized and unrealized gain (loss) | 6.46 | (1.44) | 4.06 | 5.96 | 11.60 |
| Total from investment operations | 7.25 | (.80) | 4.63 | 6.54 | 12.13 |
| Distributions from net investment income | (.64) | (.67) | (.57) | (.44) | (.54) |
| Distributions from net realized gain | (1.80) | (1.61) | (2.44) | (2.91) | (2.28) |
| Total distributions | (2.45)B | (2.28) | (3.01) | (3.35) | (2.82) |
| Redemption fees added to paid in capitalA,C | – | – | – | – | – |
| Net asset value, end of period | $54.36 | $49.56 | $52.64 | $51.02 | $47.83 |
| Total ReturnD | 15.27% | (1.38)% | 9.44% | 14.55% | 33.27% |
| Ratios to Average Net AssetsE,F | | | | | |
| Expenses before reductions | .58% | .78% | .69% | .72% | .68% |
| Expenses net of fee waivers, if any | .58% | .78% | .69% | .72% | .68% |
| Expenses net of all reductions | .58% | .78% | .69% | .72% | .68% |
| Net investment income (loss) | 1.56% | 1.34% | 1.11% | 1.17% | 1.26% |
| Supplemental Data | | | | | |
| Net assets, end of period (in millions) | $9,886 | $11,489 | $13,989 | $16,198 | $14,691 |
| Portfolio turnover rateG | 8%H | 9%H | 9%H | 12%H | 11% |
A Calculated based on average shares outstanding during the period.
B Total distributions of $2.45 per share is comprised of distributions from net investment income of $.644 and distributions from net realized gain of $1.803 per share.
C Amount represents less than $.005 per share.
D Total returns would have been lower if certain expenses had not been reduced during the applicable periods shown.
E Fees and expenses of any underlying Fidelity Central Funds are not included in the Fund's expense ratio. The Fund indirectly bears its proportionate share of the expenses of any underlying Fidelity Central Funds.
F Expense ratios reflect operating expenses of the class. Expenses before reductions do not reflect amounts reimbursed by the investment adviser or reductions from brokerage service arrangements or reductions from other expense offset arrangements and do not represent the amount paid by the class during periods when reimbursements or reductions occur. Expenses net of fee waivers reflect expenses after reimbursement by the investment adviser but prior to reductions from brokerage service arrangements or other expense offset arrangements. Expenses net of all reductions represent the net expenses paid by the class.
G Amount does not include the portfolio activity of any underlying Fidelity Central Funds.
H Portfolio turnover rate excludes securities received or delivered in-kind.
See accompanying notes which are an integral part of the financial statements.
Notes to Financial Statements
For the period ended July 31, 2017
(Amounts in thousands except percentages)
1. Organization.
Fidelity Low-Priced Stock Fund (the Fund) is a fund of Fidelity Puritan Trust (the Trust) and is authorized to issue an unlimited number of shares. The Trust is registered under the Investment Company Act of 1940, as amended (the 1940 Act), as an open-end management investment company organized as a Massachusetts business trust. The Fund offers Low-Priced Stock and Class K shares, each of which has equal rights as to assets and voting privileges. Each class has exclusive voting rights with respect to matters that affect that class.
2. Investments in Fidelity Central Funds.
The Fund invests in Fidelity Central Funds, which are open-end investment companies generally available only to other investment companies and accounts managed by the investment adviser and its affiliates. The Fund's Schedule of Investments lists each of the Fidelity Central Funds held as of period end, if any, as an investment of the Fund, but does not include the underlying holdings of each Fidelity Central Fund. As an Investing Fund, the Fund indirectly bears its proportionate share of the expenses of the underlying Fidelity Central Funds.
The Money Market Central Funds seek preservation of capital and current income and are managed by Fidelity Investments Money Management, Inc. (FIMM), an affiliate of the investment adviser. Annualized expenses of the Money Market Central Funds as of their most recent shareholder report date are less than .005%.
A complete unaudited list of holdings for each Fidelity Central Fund is available upon request or at the Securities and Exchange Commission (the SEC) website at www.sec.gov. In addition, the financial statements of the Fidelity Central Funds, which are not covered by the Fund's Report of Independent Registered Public Accounting Firm, are available on the SEC website or upon request.
3. Significant Accounting Policies.
The Fund is an investment company and applies the accounting and reporting guidance of the Financial Accounting Standards Board (FASB) Accounting Standards Codification Topic 946 Financial Services – Investments Companies. The financial statements have been prepared in conformity with accounting principles generally accepted in the United States of America (GAAP), which require management to make certain estimates and assumptions at the date of the financial statements. Actual results could differ from those estimates. Subsequent events, if any, through the date that the financial statements were issued have been evaluated in the preparation of the financial statements. The following summarizes the significant accounting policies of the Fund:
Investment Valuation. Investments are valued as of 4:00 p.m. Eastern time on the last calendar day of the period. The Board of Trustees (the Board) has delegated the day to day responsibility for the valuation of the Fund's investments to the Fair Value Committee (the Committee) established by the Fund's investment adviser. In accordance with valuation policies and procedures approved by the Board, the Fund attempts to obtain prices from one or more third party pricing vendors or brokers to value its investments. When current market prices, quotations or currency exchange rates are not readily available or reliable, investments will be fair valued in good faith by the Committee, in accordance with procedures adopted by the Board. Factors used in determining fair value vary by investment type and may include market or investment specific events, changes in interest rates and credit quality. The frequency with which these procedures are used cannot be predicted and they may be utilized to a significant extent. The Committee oversees the Fund's valuation policies and procedures and reports to the Board on the Committee's activities and fair value determinations. The Board monitors the appropriateness of the procedures used in valuing the Fund's investments and ratifies the fair value determinations of the Committee.
The Fund categorizes the inputs to valuation techniques used to value its investments into a disclosure hierarchy consisting of three levels as shown below:
- Level 1 – quoted prices in active markets for identical investments
- Level 2 – other significant observable inputs (including quoted prices for similar investments, interest rates, prepayment speeds, etc.)
- Level 3 – unobservable inputs (including the Fund's own assumptions based on the best information available)
Valuation techniques used to value the Fund's investments by major category are as follows:
Equity securities, including restricted securities, for which market quotations are readily available, are valued at the last reported sale price or official closing price as reported by a third party pricing vendor on the primary market or exchange on which they are traded and are categorized as Level 1 in the hierarchy. In the event there were no sales during the day or closing prices are not available, securities are valued at the last quoted bid price or may be valued using the last available price and are generally categorized as Level 2 in the hierarchy. For foreign equity securities, when market or security specific events arise, comparisons to the valuation of American Depositary Receipts (ADRs), futures contracts, Exchange-Traded Funds (ETFs) and certain indexes as well as quoted prices for similar securities may be used and would be categorized as Level 2 in the hierarchy. Utilizing these techniques may result in transfers between Level 1 and Level 2. For equity securities, including restricted securities, where observable inputs are limited, assumptions about market activity and risk are used and these securities may be categorized as Level 3 in the hierarchy.
Debt securities, including restricted securities, are valued based on evaluated prices received from third party pricing vendors or from brokers who make markets in such securities. Corporate bonds are valued by pricing vendors who utilize matrix pricing which considers yield or price of bonds of comparable quality, coupon, maturity and type or by broker-supplied prices. When independent prices are unavailable or unreliable, debt securities may be valued utilizing pricing methodologies which consider similar factors that would be used by third party pricing vendors. Debt securities are generally categorized as Level 2 in the hierarchy but may be Level 3 depending on the circumstances.
Investments in open-end mutual funds, including the Fidelity Central Funds, are valued at their closing net asset value (NAV) each business day and are categorized as Level 1 in the hierarchy.
Changes in valuation techniques may result in transfers in or out of an assigned level within the disclosure hierarchy. The aggregate value of investments by input level as of July 31, 2017, including information on transfers between Levels 1 and 2, is included at the end of the Fund's Schedule of Investments.
Foreign Currency. The Fund may use foreign currency contracts to facilitate transactions in foreign-denominated securities. Gains and losses from these transactions may arise from changes in the value of the foreign currency or if the counterparties do not perform under the contracts' terms.
Foreign-denominated assets, including investment securities, and liabilities are translated into U.S. dollars at the exchange rates at period end. Purchases and sales of investment securities, income and dividends received and expenses denominated in foreign currencies are translated into U.S. dollars at the exchange rate in effect on the transaction date.
The effects of exchange rate fluctuations on investments are included with the net realized and unrealized gain (loss) on investment securities. Other foreign currency transactions resulting in realized and unrealized gain (loss) are disclosed separately.
Investment Transactions and Income. For financial reporting purposes, the Fund's investment holdings and NAV include trades executed through the end of the last business day of the period. The NAV per share for processing shareholder transactions is calculated as of the close of business of the New York Stock Exchange (NYSE), normally 4:00 p.m. Eastern time and includes trades executed through the end of the prior business day. Gains and losses on securities sold are determined on the basis of identified cost and may include proceeds received from litigation. Dividend income is recorded on the ex-dividend date, except for certain dividends from foreign securities where the ex-dividend date may have passed, which are recorded as soon as the Fund is informed of the ex-dividend date. Non-cash dividends included in dividend income, if any, are recorded at the fair market value of the securities received. Income and capital gain distributions from Fidelity Central Funds, if any, are recorded on the ex-dividend date. Certain distributions received by the Fund represent a return of capital or capital gain. The Fund determines the components of these distributions subsequent to the ex-dividend date, based upon receipt of tax filings or other correspondence relating to the underlying investment. These distributions are recorded as a reduction of cost of investments and/or as a realized gain. Interest income is accrued as earned and includes coupon interest and amortization of premium and accretion of discount on debt securities as applicable. Investment income is recorded net of foreign taxes withheld where recovery of such taxes is uncertain.
Class Allocations and Expenses. Investment income, realized and unrealized capital gains and losses, common expenses of the Fund, and certain fund-level expense reductions, if any, are allocated daily on a pro-rata basis to each class based on the relative net assets of each class to the total net assets of the Fund. Each class differs with respect to transfer agent fees incurred. Certain expense reductions may also differ by class. For the reporting period, the allocated portion of income and expenses to each class as a percent of its average net assets may vary due to the timing of recording these transactions in relation to fluctuating net assets of the classes. Expenses directly attributable to a fund are charged to that fund. Expenses attributable to more than one fund are allocated among the respective funds on the basis of relative net assets or other appropriate methods. Expense estimates are accrued in the period to which they relate and adjustments are made when actual amounts are known.
Deferred Trustee Compensation. Under a Deferred Compensation Plan (the Plan), independent Trustees may elect to defer receipt of a portion of their annual compensation. Deferred amounts are invested in a cross-section of Fidelity funds, are marked-to-market and remain in the Fund until distributed in accordance with the Plan. The investment of deferred amounts and the offsetting payable to the Trustees are included in the accompanying Statement of Assets and Liabilities.
Income Tax Information and Distributions to Shareholders. Each year, the Fund intends to qualify as a regulated investment company under Subchapter M of the Internal Revenue Code, including distributing substantially all of its taxable income and realized gains. As a result, no provision for U.S. Federal income taxes is required. As of July 31, 2017, the Fund did not have any unrecognized tax benefits in the financial statements; nor is the Fund aware of any tax positions for which it is reasonably possible that the total amounts of unrecognized tax benefits will significantly change in the next twelve months. The Fund files a U.S. federal tax return, in addition to state and local tax returns as required. The Fund's federal income tax returns are subject to examination by the Internal Revenue Service (IRS) for a period of three fiscal years after they are filed. State and local tax returns may be subject to examination for an additional fiscal year depending on the jurisdiction. Foreign taxes are provided for based on the Fund's understanding of the tax rules and rates that exist in the foreign markets in which it invests. The Fund is subject to a tax imposed on capital gains by certain countries in which it invests. An estimated deferred tax liability for net unrealized appreciation on the applicable securities is included in Other payables and accrued expenses on the Statement of Assets & Liabilities.
Distributions are declared and recorded on the ex-dividend date. Income dividends and capital gain distributions are declared separately for each class. Income and capital gain distributions are determined in accordance with income tax regulations, which may differ from GAAP. In addition, the Fund claimed a portion of the payment made to redeeming shareholders as a distribution for income tax purposes.
Capital accounts within the financial statements are adjusted for permanent book-tax differences. These adjustments have no impact on net assets or the results of operations. Capital accounts are not adjusted for temporary book-tax differences which will reverse in a subsequent period.
Book-tax differences are primarily due to foreign currency transactions, certain foreign taxes, passive foreign investment companies (PFIC), redemptions in kind, partnerships, deferred trustees compensation and losses deferred due to wash sales.
The federal tax cost of investment securities and unrealized appreciation (depreciation) as of period end were as follows:
| Gross unrealized appreciation | $19,037,580 |
| Gross unrealized depreciation | (1,869,333) |
| Net unrealized appreciation (depreciation) on securities | $17,168,247 |
| Tax Cost | $21,251,856 |
The tax-based components of distributable earnings as of period end were as follows:
| Undistributed ordinary income | $294,968 |
| Undistributed long-term capital gain | $2,545,661 |
| Net unrealized appreciation (depreciation) on securities and other investments | $17,169,065 |
The tax character of distributions paid was as follows:
| | July 31, 2017 | July 31, 2016 |
| Ordinary Income | $484,842 | $ 587,672 |
| Long-term Capital Gains | 1,422,236 | 1,279,484 |
| Total | $1,907,078 | $ 1,867,156 |
Short-Term Trading (Redemption) Fees. Shares held by investors in the Fund less than 90 days may have been subject to a redemption fee equal to 1.50% of the NAV of shares redeemed. All redemption fees, which reduce the proceeds of the shareholder redemption, are retained by the Fund and accounted for as an addition to paid in capital. In November 2016, the Board of Trustees approved the elimination of these redemption fees effective December 12, 2016.
Restricted Securities. The Fund may invest in securities that are subject to legal or contractual restrictions on resale. These securities generally may be resold in transactions exempt from registration or to the public if the securities are registered. Disposal of these securities may involve time-consuming negotiations and expense, and prompt sale at an acceptable price may be difficult. Information regarding restricted securities is included at the end of the Fund's Schedule of Investments.
4. Purchases and Sales of Investments.
Purchases and sales of securities, other than short-term securities and in-kind transactions, aggregated $2,902,162 and $7,887,582, respectively.
Redemptions In-Kind. During the period, 11,577 shares of the Fund held by unaffiliated entities were redeemed in-kind for investments and cash, including accrued interest, with a value of $587,646. The net realized gain of $324,974, on investments delivered through in-kind redemptions is included in the accompanying Statement of Operations. The amount of the in-kind redemptions is included in share transactions in the accompanying Statement of Changes in Net Assets as well as the Notes to Financial Statements. The Fund recognized no gain or loss for federal income tax purposes.
Prior Fiscal Year Redemptions In-Kind. During the prior period, 22,834 shares of the Fund held by unaffiliated entities were redeemed in-kind for investments and cash, including accrued interest, with a value of $1,089,429. The Fund had a net realized gain of $567,763 on investments delivered through the in-kind redemptions. The amount of the in-kind redemptions is included in share transactions in the accompanying Statement of Changes in Net Assets as well as the Notes to Financial Statements. The Fund recognized no gain or loss for federal income tax purposes.
5. Fees and Other Transactions with Affiliates.
Management Fee. Fidelity Management & Research Company (the investment adviser) and its affiliates provide the Fund with investment management related services for which the Fund pays a monthly management fee. The management fee is the sum of an individual fund fee rate that is based on an annual rate of .35% of the Fund's average net assets and an annualized group fee rate that averaged .25% during the period. The group fee rate is based upon the average net assets of all the mutual funds advised by the investment adviser, including any mutual funds previously advised by the investment adviser that are currently advised by Fidelity SelectCo, LLC, an affiliate of the investment adviser. The group fee rate decreases as assets under management increase and increases as assets under management decrease. In addition, the management fee is subject to a performance adjustment (up to a maximum of +/- .20% of the Fund's average net assets over a 36 month performance period). The upward or downward adjustment to the management fee is based on the relative investment performance of Low-Priced Stock as compared to its benchmark index, the Russell 2000 Index, over the same 36 month performance period. For the reporting period, the total annual management fee rate, including the performance adjustment, was .52% of the Fund's average net assets. The performance adjustment included in the management fee rate may be higher or lower than the maximum performance adjustment rate due to the difference between the average net assets for the reporting and performance periods.
Transfer Agent Fees. Fidelity Investments Institutional Operations Company, Inc., (FIIOC), an affiliate of the investment adviser, is the transfer, dividend disbursing and shareholder servicing agent for each class of the Fund. FIIOC receives account fees and asset-based fees that vary according to the account size and type of account of the shareholders of Low-Priced Stock, except for Class K. FIIOC receives an asset-based fee of Class K's average net assets. FIIOC pays for typesetting, printing and mailing of shareholder reports, except proxy statements.
For the period, transfer agent fees for each class were as follows:
| | Amount | % of
Class-Level Average
Net Assets |
| Low-Priced Stock | $40,048 | .14 |
| Class K | 5,083 | .05 |
| | $45,131 | |
Accounting and Security Lending Fees. Fidelity Service Company, Inc. (FSC), an affiliate of the investment adviser, maintains the Fund's accounting records. The accounting fee is based on the level of average net assets for each month. Under a separate contract, FSC administers the security lending program. The security lending fee is based on the number and duration of lending transactions.
Brokerage Commissions. The Fund placed a portion of its portfolio transactions with brokerage firms which are affiliates of the investment adviser. Brokerage commissions are included in net realized gain (loss) and change in net unrealized appreciation (depreciation) in the Statement of Operations. The commissions paid to these affiliated firms were $213 for the period.
Interfund Trades. The Fund may purchase from or sell securities to other Fidelity Funds under procedures adopted by the Board. The procedures have been designed to ensure these interfund trades are executed in accordance with Rule 17a-7 of the 1940 Act. Interfund trades are included within the respective purchases and sales amounts shown in the Purchases and Sales of Investments note.
Redemptions In-Kind. During the period, 8,419 shares of the Fund held by an affiliated entity were redeemed in-kind for investments and cash, including accrued interest, with a value of $456,638. The net realized gain of $254,862 on investments delivered through in-kind redemptions is included in the accompanying Statement of Operations. The amount of the in-kind redemptions is included in share transactions in the accompanying Statement of Changes in Net Assets as well as the Notes to Financial Statements. The Fund recognized no gain or loss for federal income tax purposes.
6. Committed Line of Credit.
The Fund participates with other funds managed by the investment adviser or an affiliate in a $4.25 billion credit facility (the "line of credit") to be utilized for temporary or emergency purposes to fund shareholder redemptions or for other short-term liquidity purposes. The Fund has agreed to pay commitment fees on its pro-rata portion of the line of credit, which amounted to $128 and is reflected in Miscellaneous expenses on the Statement of Operations. During the period, the Fund did not borrow on this line of credit.
7. Security Lending.
The Fund lends portfolio securities through a lending agent from time to time in order to earn additional income. For equity securities, a lending agent is used and may loan securities to certain qualified borrowers, including Fidelity Capital Markets (FCM), a broker-dealer affiliated with the Fund. On the settlement date of the loan, the Fund receives collateral (in the form of U.S. Treasury obligations, letters of credit and/or cash) against the loaned securities and maintains collateral in an amount not less than 100% of the market value of the loaned securities during the period of the loan. The market value of the loaned securities is determined at the close of business of the Fund and any additional required collateral is delivered to the Fund on the next business day. The Fund or borrower may terminate the loan at any time, and if the borrower defaults on its obligation to return the securities loaned because of insolvency or other reasons, the Fund may apply collateral received from the borrower against the obligation. The Fund may experience delays and costs in recovering the securities loaned. Any cash collateral received is invested in the Fidelity Securities Lending Cash Central Fund. The value of loaned securities and cash collateral at period end are disclosed on the Fund's Statement of Assets and Liabilities. The value of securities loaned to FCM at period end was $7,225. Security lending income represents the income earned on investing cash collateral, less rebates paid to borrowers and any lending agent fees associated with the loan, plus any premium payments received for lending certain types of securities. Security lending income is presented in the Statement of Operations as a component of income from Fidelity Central Funds. Total security lending income during the period amounted to $8,548, including $582 from securities loaned to FCM.
8. Expense Reductions.
Commissions paid to certain brokers with whom the investment adviser, or its affiliates, places trades on behalf of the Fund include an amount in addition to trade execution, which may be rebated back to the Fund to offset certain expenses. This amount totaled $161 for the period.
In addition, during the period the investment adviser reimbursed and/or waived a portion of fund-level operating expenses in the amount of $359.
9. Distributions to Shareholders.
Distributions to shareholders of each class were as follows:
| | Year ended
July 31, 2017 | Year ended
July 31, 2016 |
| From net investment income | | |
| Low-Priced Stock | $337,211 | $356,516 |
| Class K | 144,475 | 171,655 |
| Total | $481,686 | $528,171 |
| From net realized gain | | |
| Low-Priced Stock | $1,020,329 | $917,359 |
| Class K | 405,063 | 421,626 |
| Total | $1,425,392 | $1,338,985 |
10. Share Transactions.
Share transactions for each class were as follows and may contain automatic conversions between classes or exchanges between affiliated funds:
| | Shares | Shares | Dollars | Dollars |
| | Year ended July 31, 2017 | Year ended July 31, 2016 | Year ended July 31, 2017 | Year ended July 31, 2016 |
| Low-Priced Stock | | | | |
| Shares sold | 35,353 | 73,081 | $1,788,321 | $3,496,723 |
| Reinvestment of distributions | 25,783 | 24,403 | 1,255,306 | 1,179,176 |
| Shares redeemed | (115,449) | (94,728) | (5,836,933) | (4,533,400) |
| Net increase (decrease) | (54,313) | 2,756 | $(2,793,306) | $142,499 |
| Class K | | | | |
| Shares sold | 28,345 | 36,926 | $1,441,213 | $1,770,314 |
| Reinvestment of distributions | 11,296 | 12,287 | 549,537 | 593,281 |
| Shares redeemed | (89,600)(a) | (83,156)(b) | (4,571,718)(a) | (3,988,137)(b) |
| Net increase (decrease) | (49,959) | (33,943) | $(2,580,968) | $(1,624,542) |
(a) Amount includes in-kind redemptions (see the Redemptions In-Kind note for additional details).
(b) Amount includes in-kind redemptions (see the Prior Fiscal Year Redemptions In-Kind note for additional details).
11. Other.
The Fund's organizational documents provide former and current trustees and officers with a limited indemnification against liabilities arising in connection with the performance of their duties to the Fund. In the normal course of business, the Fund may also enter into contracts that provide general indemnifications. The Fund's maximum exposure under these arrangements is unknown as this would be dependent on future claims that may be made against the Fund. The risk of material loss from such claims is considered remote.
Report of Independent Registered Public Accounting Firm
To the Trustees of Fidelity Puritan Trust and Shareholders of Fidelity Low-Priced Stock Fund:
In our opinion, the accompanying statement of assets and liabilities, including the schedule of investments, and the related statements of operations and of changes in net assets and the financial highlights present fairly, in all material respects, the financial position of Fidelity Low-Priced Stock Fund (a fund of Fidelity Puritan Trust) as of July 31, 2017, the results of its operations for the year then ended, the changes in its net assets for each of the two years in the period then ended and the financial highlights for each of the five years in the period then ended, in conformity with accounting principles generally accepted in the United States of America. These financial statements and financial highlights (hereafter referred to as “financial statements”) are the responsibility of the Fidelity Low-Priced Stock Fund’s management. Our responsibility is to express an opinion on these financial statements based on our audits. We conducted our audits of these financial statements in accordance with the standards of the Public Company Accounting Oversight Board (United States). Those standards require that we plan and perform the audit to obtain reasonable assurance about whether the financial statements are free of material misstatement. An audit includes examining, on a test basis, evidence supporting the amounts and disclosures in the financial statements, assessing the accounting principles used and significant estimates made by management, and evaluating the overall financial statement presentation. Our procedures included confirmation of securities owned as of July 31, 2017 by correspondence with the custodian and brokers; when replies were not received from brokers, we performed other auditing procedures. We believe that our audits provide a reasonable basis for our opinion.
PricewaterhouseCoopers LLP
Boston, Massachusetts
September 19, 2017
Trustees and Officers
The Trustees, Members of the Advisory Board (if any), and officers of the trust and fund, as applicable, are listed below. The Board of Trustees governs the fund and is responsible for protecting the interests of shareholders. The Trustees are experienced executives who meet periodically throughout the year to oversee the fund's activities, review contractual arrangements with companies that provide services to the fund, oversee management of the risks associated with such activities and contractual arrangements, and review the fund's performance. Except for Jonathan Chiel, each of the Trustees oversees 190 funds. Mr. Chiel oversees 142 funds.
The Trustees hold office without limit in time except that (a) any Trustee may resign; (b) any Trustee may be removed by written instrument, signed by at least two-thirds of the number of Trustees prior to such removal; (c) any Trustee who requests to be retired or who has become incapacitated by illness or injury may be retired by written instrument signed by a majority of the other Trustees; and (d) any Trustee may be removed at any special meeting of shareholders by a two-thirds vote of the outstanding voting securities of the trust. Each Trustee who is not an interested person (as defined in the 1940 Act) of the trust and the fund is referred to herein as an Independent Trustee. Each Independent Trustee shall retire not later than the last day of the calendar year in which his or her 75th birthday occurs. The Independent Trustees may waive this mandatory retirement age policy with respect to individual Trustees. Officers and Advisory Board Members hold office without limit in time, except that any officer or Advisory Board Member may resign or may be removed by a vote of a majority of the Trustees at any regular meeting or any special meeting of the Trustees. Except as indicated, each individual has held the office shown or other offices in the same company for the past five years.
The fund’s Statement of Additional Information (SAI) includes more information about the Trustees. To request a free copy, call Fidelity at 1-800-835-5092.
Experience, Skills, Attributes, and Qualifications of the Trustees. The Governance and Nominating Committee has adopted a statement of policy that describes the experience, qualifications, attributes, and skills that are necessary and desirable for potential Independent Trustee candidates (Statement of Policy). The Board believes that each Trustee satisfied at the time he or she was initially elected or appointed a Trustee, and continues to satisfy, the standards contemplated by the Statement of Policy. The Governance and Nominating Committee also engages professional search firms to help identify potential Independent Trustee candidates who have the experience, qualifications, attributes, and skills consistent with the Statement of Policy. From time to time, additional criteria based on the composition and skills of the current Independent Trustees, as well as experience or skills that may be appropriate in light of future changes to board composition, business conditions, and regulatory or other developments, have also been considered by the professional search firms and the Governance and Nominating Committee. In addition, the Board takes into account the Trustees' commitment and participation in Board and committee meetings, as well as their leadership of standing and ad hoc committees throughout their tenure.
In determining that a particular Trustee was and continues to be qualified to serve as a Trustee, the Board has considered a variety of criteria, none of which, in isolation, was controlling. The Board believes that, collectively, the Trustees have balanced and diverse experience, qualifications, attributes, and skills, which allow the Board to operate effectively in governing the fund and protecting the interests of shareholders. Information about the specific experience, skills, attributes, and qualifications of each Trustee, which in each case led to the Board's conclusion that the Trustee should serve (or continue to serve) as a trustee of the fund, is provided below.
Board Structure and Oversight Function. James C. Curvey is an interested person and currently serves as Chairman. The Trustees have determined that an interested Chairman is appropriate and benefits shareholders because an interested Chairman has a personal and professional stake in the quality and continuity of services provided to the fund. Independent Trustees exercise their informed business judgment to appoint an individual of their choosing to serve as Chairman, regardless of whether the Trustee happens to be independent or a member of management. The Independent Trustees have determined that they can act independently and effectively without having an Independent Trustee serve as Chairman and that a key structural component for assuring that they are in a position to do so is for the Independent Trustees to constitute a substantial majority for the Board. The Independent Trustees also regularly meet in executive session. Ned C. Lautenbach serves as Chairman of the Independent Trustees and as such (i) acts as a liaison between the Independent Trustees and management with respect to matters important to the Independent Trustees and (ii) with management prepares agendas for Board meetings.
Fidelity® funds are overseen by different Boards of Trustees. The fund's Board oversees Fidelity's high income and certain equity funds, and other Boards oversee Fidelity's investment-grade bond, money market, asset allocation, and sector funds. The asset allocation funds may invest in Fidelity® funds overseen by the fund's Board. The use of separate Boards, each with its own committee structure, allows the Trustees of each group of Fidelity® funds to focus on the unique issues of the funds they oversee, including common research, investment, and operational issues. On occasion, the separate Boards establish joint committees to address issues of overlapping consequences for the Fidelity® funds overseen by each Board.
The Trustees operate using a system of committees to facilitate the timely and efficient consideration of all matters of importance to the Trustees, the fund, and fund shareholders and to facilitate compliance with legal and regulatory requirements and oversight of the fund's activities and associated risks. The Board, acting through its committees, has charged FMR and its affiliates with (i) identifying events or circumstances the occurrence of which could have demonstrably adverse effects on the fund's business and/or reputation; (ii) implementing processes and controls to lessen the possibility that such events or circumstances occur or to mitigate the effects of such events or circumstances if they do occur; and (iii) creating and maintaining a system designed to evaluate continuously business and market conditions in order to facilitate the identification and implementation processes described in (i) and (ii) above. Because the day-to-day operations and activities of the fund are carried out by or through FMR, its affiliates, and other service providers, the fund's exposure to risks is mitigated but not eliminated by the processes overseen by the Trustees. While each of the Board's committees has responsibility for overseeing different aspects of the fund's activities, oversight is exercised primarily through the Operations, Audit, and Compliance Committees. In addition, the Independent Trustees have worked with FMR to enhance the Board's oversight of investment and financial risks, legal and regulatory risks, technology risks, and operational risks, including the development of additional risk reporting to the Board. For example, a working group comprised of Independent Trustees and FMR has worked and continues to work to review the Fidelity® funds' valuation-related activities, reporting and risk management. Appropriate personnel, including but not limited to the fund's Chief Compliance Officer (CCO), FMR's internal auditor, the independent accountants, the fund's Treasurer and portfolio management personnel, make periodic reports to the Board's committees, as appropriate, including an annual review of Fidelity's risk management program for the Fidelity® funds. The responsibilities of each standing committee, including their oversight responsibilities, are described further under "Standing Committees of the Trustees."
Interested Trustees*:
Correspondence intended for a Trustee who is an interested person may be sent to Fidelity Investments, 245 Summer Street, Boston, Massachusetts 02210.
Name, Year of Birth; Principal Occupations and Other Relevant Experience+
Jonathan Chiel (1957)
Year of Election or Appointment: 2016
Trustee
Mr. Chiel also serves as Trustee of other Fidelity funds. Mr. Chiel is Executive Vice President and General Counsel for FMR LLC (diversified financial services company, 2012-present). Previously, Mr. Chiel served as general counsel (2004-2012) and senior vice president and deputy general counsel (2000-2004) for John Hancock Financial Services; a partner with Choate, Hall & Stewart (1996-2000) (law firm); and an Assistant United States Attorney for the United States Attorney’s Office of the District of Massachusetts (1986-95), including Chief of the Criminal Division (1993-1995). Mr. Chiel is a director on the boards of the Boston Bar Foundation and the Maimonides School.
James C. Curvey (1935)
Year of Election or Appointment: 2007
Trustee
Chairman of the Board of Trustees
Mr. Curvey also serves as Trustee of other Fidelity® funds. Mr. Curvey is a Director of Fidelity Research & Analysis Co. (investment adviser firm, 2009-present), and Vice Chairman (2007-present) and Director of FMR LLC (diversified financial services company). In addition, Mr. Curvey serves as an Overseer for the Boston Symphony Orchestra and a member of the board of Artis-Naples, Naples, Florida, and as a Trustee for Brewster Academy, Wolfeboro, New Hampshire. Previously, Mr. Curvey served as a Director of Fidelity Investments Money Management, Inc. (investment adviser firm, 2009-2014) and a Director of FMR and FMR Co., Inc. (investment adviser firms, 2007-2014).
Charles S. Morrison (1960)
Year of Election or Appointment: 2014
Trustee
Mr. Morrison also serves as Trustee of other funds. He serves as President of Fidelity Management & Research Company (FMR) (investment adviser firm, 2016-present), a Director of Fidelity Investments Money Management, Inc. (FIMM) (investment adviser firm, 2014-present), Director of Fidelity SelectCo, LLC (investment adviser firm, 2014-present), President, Asset Management (2014-present), and is an employee of Fidelity Investments. Previously, Mr. Morrison served as Vice President of Fidelity's Fixed Income and Asset Allocation Funds (2012-2014), President, Fixed Income (2011-2014), Vice President of Fidelity's Money Market Funds (2005-2009), President, Money Market Group Leader of FMR (investment adviser firm, 2009), and Senior Vice President, Money Market Group of FMR (2004-2009). Mr. Morrison also served as Vice President of Fidelity's Bond Funds (2002-2005), certain Balanced Funds (2002-2005), and certain Asset Allocation Funds (2002-2007), and as Senior Vice President (2002-2005) of Fidelity's Bond Division.
* Determined to be an “Interested Trustee” by virtue of, among other things, his or her affiliation with the trust or various entities under common control with FMR.
+ The information includes the Trustee's principal occupation during the last five years and other information relating to the experience, attributes, and skills relevant to the Trustee's qualifications to serve as a Trustee, which led to the conclusion that the Trustee should serve as a Trustee for the fund.
Independent Trustees:
Correspondence intended for an Independent Trustee may be sent to Fidelity Investments, P.O. Box 55235, Boston, Massachusetts 02205-5235.
Name, Year of Birth; Principal Occupations and Other Relevant Experience+
Dennis J. Dirks (1948)
Year of Election or Appointment: 2005
Trustee
Mr. Dirks also serves as Trustee of other Fidelity® funds. Prior to his retirement in May 2003, Mr. Dirks was Chief Operating Officer and a member of the Board of The Depository Trust & Clearing Corporation (DTCC). He also served as President, Chief Operating Officer, and Board member of The Depository Trust Company (DTC) and President and Board member of the National Securities Clearing Corporation (NSCC). In addition, Mr. Dirks served as Chief Executive Officer and Board member of the Government Securities Clearing Corporation, Chief Executive Officer and Board member of the Mortgage-Backed Securities Clearing Corporation, as a Trustee and a member of the Finance Committee of Manhattan College (2005-2008), as a Trustee and a member of the Finance Committee of AHRC of Nassau County (2006-2008), as a member of the Independent Directors Council (IDC) Governing Council (2010-2015), and as a member of the Board of Directors for The Brookville Center for Children’s Services, Inc. (2009-2017). Mr. Dirks is a member of the Finance Committee (2016-present) and Board of Directors (2017-present) of the Asolo Repertory Theatre.
Alan J. Lacy (1953)
Year of Election or Appointment: 2008
Trustee
Mr. Lacy also serves as Trustee of other Fidelity® funds. Mr. Lacy serves as a Director of Bristol-Myers Squibb Company (global pharmaceuticals, 2008-present). He is a Trustee of the California Chapter of The Nature Conservancy (2015-present) and a Director of the Center for Advanced Study in the Behavioral Sciences at Stanford University (2015-present). In addition, Mr. Lacy served as Senior Adviser (2007-2014) of Oak Hill Capital Partners, L.P. (private equity) and also served as Chief Executive Officer (2005) and Vice Chairman (2005-2006) of Sears Holdings Corporation (retail) and Chief Executive Officer and Chairman of the Board of Sears, Roebuck and Co. (retail, 2000-2005). Previously, Mr. Lacy served as Chairman (2014-2017) and a member (2010-2017) of the Board of Directors of Dave & Buster’s Entertainment, Inc. (restaurant and entertainment complexes), as Chairman (2008-2011) and a member (2006-2015) of the Board of Trustees of the National Parks Conservation Association, and as a member of the Board of Directors for The Hillman Companies, Inc. (hardware wholesalers, 2010-2014), Earth Fare, Inc. (retail grocery, 2010-2014), and The Western Union Company (global money transfer, 2006-2011).
Ned C. Lautenbach (1944)
Year of Election or Appointment: 2000
Trustee
Chairman of the Independent Trustees
Mr. Lautenbach also serves as Trustee of other Fidelity® funds. Mr. Lautenbach currently serves as the Lead Director of the Eaton Corporation Board of Directors (diversified industrial, 1997-present). Mr. Lautenbach is Chairman of the Board of Directors of Artis-Naples in Naples, Florida (2012-present), a member of the Council on Foreign Relations (1994-present), and currently Vice Chair of the Board of Governors, State University System of Florida (2013-present). Previously, Mr. Lautenbach was a Partner and Advisory Partner at Clayton, Dubilier & Rice, LLC (private equity investment, 1998-2010), as well as a Director of Sony Corporation (2006-2007). Mr. Lautenbach also had a 30-year career with IBM (technology company) during which time he served as Senior Vice President and a member of the Corporate Executive Committee (1968-1998).
Joseph Mauriello (1944)
Year of Election or Appointment: 2008
Trustee
Mr. Mauriello also serves as Trustee of other Fidelity® funds. Prior to his retirement in January 2006, Mr. Mauriello served in numerous senior management positions including Deputy Chairman and Chief Operating Officer (2004-2005), and Vice Chairman of Financial Services (2002-2004) of KPMG LLP US (professional services, 1965-2005). Mr. Mauriello currently serves as a member of the Board of Directors of XL Group plc. (global insurance and re-insurance, 2006-present) and the Independent Directors Council (IDC) Governing Council (2015-present). Previously, Mr. Mauriello served as a Director of the Hamilton Funds of the Bank of New York (2006-2007) and of Arcadia Resources Inc. (health care services and products, 2007-2012).
Cornelia M. Small (1944)
Year of Election or Appointment: 2005
Trustee
Ms. Small also serves as Trustee of other Fidelity® funds. Ms. Small is a member of the Board of Directors (2009-present) and Chair of the Investment Committee (2010-present) of the Teagle Foundation. Ms. Small also serves on the Investment Committee of the Berkshire Taconic Community Foundation (2008-present). Previously, Ms. Small served as Chairperson (2002-2008) and a member of the Investment Committee and Chairperson (2008-2012) and a member of the Board of Trustees of Smith College. In addition, Ms. Small served as Chief Investment Officer, Director of Global Equity Investments, and a member of the Board of Directors of Scudder, Stevens & Clark and Scudder Kemper Investments.
William S. Stavropoulos (1939)
Year of Election or Appointment: 2001
Trustee
Vice Chairman of the Independent Trustees
Mr. Stavropoulos also serves as Trustee of other Fidelity® funds. Mr. Stavropoulos serves as President and Founder of the Michigan Baseball Foundation, the Great Lakes Loons (2007-present). Mr. Stavropoulos is Chairman Emeritus of the Board of Directors of The Dow Chemical Company, where he previously served in numerous senior management positions, including President, CEO (1995-2000; 2002-2004), Chairman of the Executive Committee (2000-2006), and as a member of the Board of Directors (1990-2006). Currently, Mr. Stavropoulos is Chairman of the Board of Directors of Univar Inc. (global distributor of commodity and specialty chemicals), a Director of Teradata Corporation (data warehousing and technology solutions), and a member of the Advisory Board for Metalmark Capital LLC (private equity investment, 2005-present). Mr. Stavropoulos is an operating advisor to Clayton, Dubilier & Rice, LLC (private equity investment). In addition, Mr. Stavropoulos is a member of the University of Notre Dame Advisory Council for the College of Science, a Trustee of the Rollin L. Gerstacker Foundation, and a Director of Artis-Naples in Naples, Florida. Previously, Mr. Stavropoulos served as a Director of Chemical Financial Corporation (bank holding company, 1993-2012) and Tyco International, Ltd. (multinational manufacturing and services, 2007-2012).
David M. Thomas (1949)
Year of Election or Appointment: 2008
Trustee
Mr. Thomas also serves as Trustee of other Fidelity® funds. Mr. Thomas serves as Non-Executive Chairman of the Board of Directors of Fortune Brands Home and Security (home and security products, 2011-present), as a member of the Board of Directors (2004-present) and Presiding Director (2013-present) of Interpublic Group of Companies, Inc. (marketing communication), and as a member of the Board of Trustees of the University of Florida (2013-present). Previously, Mr. Thomas served as Executive Chairman (2005-2006) and Chairman and Chief Executive Officer (2000-2005) of IMS Health, Inc. (pharmaceutical and healthcare information solutions), and a Director of Fortune Brands, Inc. (consumer products, 2000-2011).
+ The information includes the Trustee's principal occupation during the last five years and other information relating to the experience, attributes, and skills relevant to the Trustee's qualifications to serve as a Trustee, which led to the conclusion that the Trustee should serve as a Trustee for the fund.
Advisory Board Members and Officers:
Correspondence intended for an officer or Peter S. Lynch may be sent to Fidelity Investments, 245 Summer Street, Boston, Massachusetts 02210. Officers appear below in alphabetical order.
Name, Year of Birth; Principal Occupation
Peter S. Lynch (1944)
Year of Election or Appointment: 2003
Member of the Advisory Board
Mr. Lynch also serves as Member of the Advisory Board of other Fidelity® funds. Mr. Lynch is Vice Chairman and a Director of FMR (investment adviser firm) and FMR Co., Inc. (investment adviser firm). In addition, Mr. Lynch serves as a Trustee of Boston College and as the Chairman of the Inner-City Scholarship Fund. Previously, Mr. Lynch served on the Special Olympics International Board of Directors (1997-2006).
Elizabeth Paige Baumann (1968)
Year of Election or Appointment: 2017
Anti-Money Laundering (AML) Officer
Ms. Baumann also serves as AML Officer of other funds. She is Chief AML Officer (2012-present) and Senior Vice President (2014-present) of FMR LLC (diversified financial services company) and is an employee of Fidelity Investments. Previously, Ms. Baumann served as AML Officer of the funds (2012-2016), and Vice President (2007-2014) and Deputy Anti-Money Laundering Officer (2007-2012) of FMR LLC.
Marc R. Bryant (1966)
Year of Election or Appointment: 2015
Secretary and Chief Legal Officer (CLO)
Mr. Bryant also serves as Secretary and CLO of other funds. Mr. Bryant serves as CLO, Secretary, and Senior Vice President of Fidelity Management & Research Company (investment adviser firm, 2015-present) and FMR Co., Inc. (investment adviser firm, 2015-present); Secretary of Fidelity SelectCo, LLC (investment adviser firm, 2015-present) and Fidelity Investments Money Management, Inc. (investment adviser firm, 2015-present); and CLO of Fidelity Management & Research (Hong Kong) Limited and FMR Investment Management (UK) Limited (investment adviser firms, 2015-present) and Fidelity Management & Research (Japan) Limited (investment adviser firm, 2016-present). He is Senior Vice President and Deputy General Counsel of FMR LLC (diversified financial services company). Previously, Mr. Bryant served as Secretary and CLO of Fidelity Rutland Square Trust II (2010-2014) and Assistant Secretary of Fidelity's Fixed Income and Asset Allocation Funds (2013-2015). Prior to joining Fidelity Investments, Mr. Bryant served as a Senior Vice President and the Head of Global Retail Legal for AllianceBernstein L.P. (2006-2010), and as the General Counsel for ProFund Advisors LLC (2001-2006).
William C. Coffey (1969)
Year of Election or Appointment: 2009
Assistant Secretary
Mr. Coffey also serves as Assistant Secretary of other funds. He is Senior Vice President and Deputy General Counsel of FMR LLC (diversified financial services company, 2010-present), and is an employee of Fidelity Investments. Previously, Mr. Coffey served as Vice President and Associate General Counsel of FMR LLC (2005-2009).
Jonathan Davis (1968)
Year of Election or Appointment: 2010
Assistant Treasurer
Mr. Davis also serves as Assistant Treasurer of other funds, and is an employee of Fidelity Investments. Previously, Mr. Davis served as Vice President and Associate General Counsel of FMR LLC (diversified financial services company, 2003-2010).
Adrien E. Deberghes (1967)
Year of Election or Appointment: 2016
Assistant Treasurer
Mr. Deberghes also serves as an officer of other funds. He serves as Executive Vice President of Fidelity Investments Money Management, Inc. (FIMM) (investment adviser firm, 2016-present) and is an employee of Fidelity Investments (2008-present). Prior to joining Fidelity Investments, Mr. Deberghes was Senior Vice President of Mutual Fund Administration at State Street Corporation (2007-2008), Senior Director of Mutual Fund Administration at Investors Bank & Trust (2005-2007), and Director of Finance for Dunkin' Brands (2000-2005). Previously, Mr. Deberghes served in other fund officer roles.
Stephanie J. Dorsey (1969)
Year of Election or Appointment: 2010
Assistant Treasurer
Ms. Dorsey also serves as an officer of other funds. She is an employee of Fidelity Investments (2008-present) and has served in other fund officer roles. Prior to joining Fidelity Investments, Ms. Dorsey served as Treasurer (2004-2008) of the JPMorgan Mutual Funds and Vice President (2004-2008) of JPMorgan Chase Bank.
Howard J. Galligan III (1966)
Year of Election or Appointment: 2014
Chief Financial Officer
Mr. Galligan also serves as Chief Financial Officer of other funds. Mr. Galligan serves as President of Fidelity Pricing and Cash Management Services (FPCMS) (2014-present) and as a Director of Strategic Advisers, Inc. (investment adviser firm, 2008-present). Previously, Mr. Galligan served as Chief Administrative Officer of Asset Management (2011-2014) and Chief Operating Officer and Senior Vice President of Investment Support for Strategic Advisers, Inc. (2003-2011).
Thomas C. Hense (1964)
Year of Election or Appointment: 2008, 2010, or 2015
Vice President
Mr. Hense serves as Vice President of Fidelity Advisor® Multi-Asset Income Fund (2015) and other funds (High Income (2008), Small Cap (2008), and Value (2010) funds), and is an employee of Fidelity Investments (1993-present). Previously, Mr. Hense served as a portfolio manager for Fidelity's Institutional Money Management Group (Pyramis) (2003-2008).
Brian B. Hogan (1964)
Year of Election or Appointment: 2009
Vice President
Mr. Hogan also serves as Trustee or Vice President of other funds. Mr. Hogan serves as a Director of FMR Investment Management (UK) Limited (investment adviser firm, 2015-present) and Fidelity SelectCo, LLC (investment adviser firm, 2014-present) and President of the Equity Division of FMR (investment adviser firm, 2009-present). Previously, Mr. Hogan served as Senior Vice President, Equity Research of FMR (2006-2009) and as a portfolio manager. Mr. Brian B. Hogan is not related to Mr. Colm A. Hogan.
Colm A. Hogan (1973)
Year of Election or Appointment: 2016
Deputy Treasurer
Mr. Hogan also serves as an officer of other funds. Mr. Hogan is an employee of Fidelity Investments (2005-present). Mr. Colm A. Hogan is not related to Mr. Brian B. Hogan.
Chris Maher (1972)
Year of Election or Appointment: 2013
Assistant Treasurer
Mr. Maher serves as Assistant Treasurer of other funds. Mr. Maher is Vice President of Valuation Oversight and is an employee of Fidelity Investments. Previously, Mr. Maher served as Vice President of Asset Management Compliance (2013), Vice President of the Program Management Group of FMR (investment adviser firm, 2010-2013), and Vice President of Valuation Oversight (2008-2010).
Rieco E. Mello (1969)
Year of Election or Appointment: 2017
Assistant Treasurer
Mr. Mello also serves as Assistant Treasurer of other funds. Mr. Mello is an employee of Fidelity Investments (1995-present).
Kenneth B. Robins (1969)
Year of Election or Appointment: 2016
Chief Compliance Officer
Mr. Robins also serves as an officer of other funds. Mr. Robins serves as Compliance Officer of Fidelity Management & Research Company and FMR Co., Inc. (investment adviser firms, 2016-present) and is an employee of Fidelity Investments (2004-present). Previously, Mr. Robins served as Executive Vice President of Fidelity Investments Money Management, Inc. (investment adviser firm, 2013-2016) and served in other fund officer roles.
Stacie M. Smith (1974)
Year of Election or Appointment: 2016
President and Treasurer
Ms. Smith also serves as an officer of other funds. She is an employee of Fidelity Investments (2009-present) and has served in other fund officer roles. Prior to joining Fidelity Investments, Ms. Smith served as Senior Audit Manager of Ernst & Young LLP (accounting firm, 1996-2009). Previously, Ms. Smith served as Deputy Treasurer of certain Fidelity® funds (2013-2016).
Marc L. Spector (1972)
Year of Election or Appointment: 2016
Assistant Treasurer
Mr. Spector also serves as an officer of other funds. Mr. Spector is an employee of Fidelity Investments (2016-present). Prior to joining Fidelity Investments, Mr. Spector served as Director at the Siegfried Group (accounting firm, 2013-2016), and prior to Siegfried Group as audit senior manager at Deloitte & Touche (accounting firm, 2005-2013).
Renee Stagnone (1975)
Year of Election or Appointment: 2016
Assistant Treasurer
Ms. Stagnone also serves as an officer of other funds. Ms. Stagnone is an employee of Fidelity Investments (1997-present). Previously, Ms. Stagnone served as Deputy Treasurer of certain Fidelity® funds (2013-2016).
Shareholder Expense Example
As a shareholder of the Fund, you incur two types of costs: (1) transaction costs, including redemption fees and (2) ongoing costs, including management fees and other Fund expenses. This Example is intended to help you understand your ongoing costs (in dollars) of investing in the Fund and to compare these costs with the ongoing costs of investing in other mutual funds.
The Example is based on an investment of $1,000 invested at the beginning of the period and held for the entire period (February 1, 2017 to July 31, 2017).
Actual Expenses
The first line of the accompanying table for each class of the Fund provides information about actual account values and actual expenses. You may use the information in this line, together with the amount you invested, to estimate the expenses that you paid over the period. Simply divide your account value by $1,000.00 (for example, an $8,600 account value divided by $1,000.00 = 8.6), then multiply the result by the number in the first line for a class of the Fund under the heading entitled "Expenses Paid During Period" to estimate the expenses you paid on your account during this period. A small balance maintenance fee of $12.00 that is charged once a year may apply for certain accounts with a value of less than $2,000. This fee is not included in the table below. If it was, the estimate of expenses you paid during the period would be higher, and your ending account value lower, by this amount. In addition, the Fund, as a shareholder in the underlying Fidelity Central Funds, will indirectly bear its pro-rata share of the fees and expenses incurred by the underlying Fidelity Central Funds. These fees and expenses are not included in the Fund's annualized expense ratio used to calculate the expense estimate in the table below.
Hypothetical Example for Comparison Purposes
The second line of the accompanying table for each class of the Fund provides information about hypothetical account values and hypothetical expenses based on a Class' actual expense ratio and an assumed rate of return of 5% per year before expenses, which is not the Class' actual return. The hypothetical account values and expenses may not be used to estimate the actual ending account balance or expenses you paid for the period. You may use this information to compare the ongoing costs of investing in the Fund and other funds. To do so, compare this 5% hypothetical example with the 5% hypothetical examples that appear in the shareholder reports of the other funds. A small balance maintenance fee of $12.00 that is charged once a year may apply for certain accounts with a value of less than $2,000. This fee is not included in the table below. If it was, the estimate of expenses you paid during the period would be higher, and your ending account value lower, by this amount. In addition, the Fund, as a shareholder in the underlying Fidelity Central Funds, will indirectly bear its pro-rata share of the fees and expenses incurred by the underlying Fidelity Central Funds. These fees and expenses are not included in the Fund's annualized expense ratio used to calculate the expense estimate in the table below.
Please note that the expenses shown in the table are meant to highlight your ongoing costs only and do not reflect any transaction costs. Therefore, the second line of the table is useful in comparing ongoing costs only, and will not help you determine the relative total costs of owning different funds. In addition, if these transactional costs were included, your costs would have been higher.
| | Annualized Expense Ratio-A | Beginning
Account Value
February 1, 2017 | Ending
Account Value
July 31, 2017 | Expenses Paid
During Period-B
February 1, 2017
to July 31, 2017 |
| Low-Priced Stock | .63% | | | |
| Actual | | $1,000.00 | $1,086.30 | $3.26 |
| Hypothetical-C | | $1,000.00 | $1,021.67 | $3.16 |
| Class K | .54% | | | |
| Actual | | $1,000.00 | $1,086.80 | $2.79 |
| Hypothetical-C | | $1,000.00 | $1,022.12 | $2.71 |
A Annualized expense ratio reflects expenses net of applicable fee waivers.
B Expenses are equal to each Class' annualized expense ratio, multiplied by the average account value over the period, multiplied by 181/365 (to reflect the one-half year period).
C 5% return per year before expenses
Distributions (Unaudited)
The Board of Trustees of Fidelity Low-Priced Stock Fund voted to pay to shareholders of record at the opening of business on record date, the following distributions per share derived from capital gains realized from sales of portfolio securities, and dividends derived from net investment income:
| | Pay Date | Record Date | Dividends | Capital Gains |
| Fidelity Low-Priced Stock Fund | | | | |
| Low-Priced Stock | 09/18/17 | 09/15/17 | $0.420 | $3.671 |
| Class K | 09/18/17 | 09/15/17 | $0.449 | $3.671 |
|
The fund hereby designates as a capital gain dividend with respect to the taxable year ended July 31, 2017, $3,131,359,738, or, if subsequently determined to be different, the net capital gain of such year.
Low-Priced Stock designates 80% and 52%; Class K designates 73% and 49%; of the dividends distributed in September and December, respectively during the fiscal year as qualifying for the dividends–received deduction for corporate shareholders.
Low-Priced Stock and Class K designate 100% of the dividends distributed during the fiscal year as amounts which may be taken into account as a dividend for purposes of the maximum rate under section 1(h)(11) of the Internal Revenue Code.
The fund will notify shareholders in January 2018 of amounts for use in preparing 2017 income tax returns.
Board Approval of Investment Advisory Contracts and Management Fees
Fidelity Low-Priced Stock Fund
Each year, the Board of Trustees, including the Independent Trustees (together, the Board), votes on the renewal of the management contract with Fidelity Management & Research Company (FMR) and the sub-advisory agreements (together, the Advisory Contracts) for the fund. FMR and the sub-advisers are referred to herein as the Investment Advisers. The Board, assisted by the advice of fund counsel and Independent Trustees' counsel, requests and considers a broad range of information relevant to the renewal of the Advisory Contracts throughout the year.
The Board meets regularly and, at each of its meetings, covers an extensive agenda of topics and materials and considers factors that are relevant to its annual consideration of the renewal of the fund's Advisory Contracts, including the services and support provided to the fund and its shareholders. The Board has established various standing committees (Committees), each composed of and chaired by Independent Trustees with varying backgrounds, to which the Board has assigned specific subject matter responsibilities in order to enhance effective decision-making by the Board. The Board, acting directly and through its Committees, requests and receives information concerning the annual consideration of the renewal of the fund's Advisory Contracts. The Board also meets as needed to review matters specifically related to the Board's annual consideration of the renewal of the Advisory Contracts. Members of the Board may also meet with trustees of other Fidelity funds through ad hoc joint committees to discuss certain matters relevant to all of the Fidelity funds.
At its July 2017 meeting, the Board unanimously determined to renew the fund's Advisory Contracts. In reaching its determination, the Board considered all factors it believed relevant, including (i) the nature, extent, and quality of the services to be provided to the fund and its shareholders (including the investment performance of the fund); (ii) the competitiveness of the fund's management fee and total expense ratio relative to peer funds; (iii) the total costs of the services to be provided by and the profits to be realized by Fidelity from its relationships with the fund; and (iv) the extent to which, if any, economies of scale exist and would be realized as the fund grows, and whether any economies of scale are appropriately shared with fund shareholders.
In considering whether to renew the Advisory Contracts for the fund, the Board reached a determination, with the assistance of fund counsel and Independent Trustees' counsel and through the exercise of its business judgment, that the renewal of the Advisory Contracts was in the best interests of the fund and its shareholders and that the compensation payable under the Advisory Contracts was fair and reasonable. The Board's decision to renew the Advisory Contracts was not based on any single factor, but rather was based on a comprehensive consideration of all the information provided to the Board at its meetings throughout the year. The Board, in reaching its determination to renew the Advisory Contracts, was aware that shareholders of the fund have a broad range of investment choices available to them, including a wide choice among funds offered by Fidelity's competitors, and that the fund's shareholders, who have the opportunity to review and weigh the disclosure provided by the fund in its prospectus and other public disclosures, have chosen to invest in this fund, which is part of the Fidelity family of funds.
Amendment to Group Fee Rate. The Board also approved an amendment to the management contract for the fund to add an additional breakpoint to the group fee schedule, effective October 1, 2017. The Board noted that the additional breakpoint would result in lower management fee rates as Fidelity's assets under management increase.
Nature, Extent, and Quality of Services Provided. The Board considered Fidelity's staffing as it relates to the fund, including the backgrounds of investment personnel of Fidelity, and also considered the fund's investment objective, strategies, and related investment philosophy. The Independent Trustees also had discussions with senior management of Fidelity's investment operations and investment groups. The Board considered the structure of the investment personnel compensation program and whether this structure provides appropriate incentives to act in the best interests of the fund. Additionally, the Board considered the portfolio managers' investments, if any, in the funds that they manage.
Resources Dedicated to Investment Management and Support Services. The Board and the Fund Oversight and Research Committees reviewed the general qualifications and capabilities of Fidelity's investment staff, including its size, education, experience, and resources, as well as Fidelity's approach to recruiting, training, managing, and compensating investment personnel. The Board noted that Fidelity has continued to increase the resources devoted to non-U.S. offices, including expansion of Fidelity's global investment organization. The Board also noted that Fidelity's analysts have extensive resources, tools and capabilities that allow them to conduct sophisticated quantitative and fundamental analysis, as well as credit analysis of issuers, counterparties and guarantors. Further, the Board considered that Fidelity's investment professionals have sufficient access to global information and data so as to provide competitive investment results over time, and that those professionals also have access to sophisticated tools that permit them to assess portfolio construction and risk and performance attribution characteristics continuously, as well as to transmit new information and research conclusions rapidly around the world. Additionally, in its deliberations, the Board considered Fidelity's trading, risk management, compliance, and technology and operations capabilities and resources, which are integral parts of the investment management process.
Shareholder and Administrative Services. The Board considered (i) the nature, extent, quality, and cost of advisory, administrative, and shareholder services performed by the Investment Advisers and their affiliates under the Advisory Contracts and under separate agreements covering transfer agency, pricing and bookkeeping, and securities lending services for the fund; (ii) the nature and extent of the supervision of third party service providers, principally custodians, subcustodians, and pricing vendors; and (iii) the resources devoted to, and the record of compliance with, the fund's compliance policies and procedures. The Board also reviewed the allocation of fund brokerage, including allocations to brokers affiliated with the Investment Advisers, the use of brokerage commissions to pay fund expenses, and the use of "soft" commission dollars to pay for research services.
The Board noted that the growth of fund assets over time across the complex allows Fidelity to reinvest in the development of services designed to enhance the value or convenience of the Fidelity funds as investment vehicles. These services include 24-hour access to account information and market information through telephone representatives and over the Internet, investor education materials and asset allocation tools, and the expanded availability of Fidelity Investor Centers.
In 2014, the Board formed an ad hoc Committee on Transfer Agency Fees to review the variety of transfer agency fee structures throughout the industry and Fidelity's competitive positioning with respect to industry participants.
Investment in a Large Fund Family. The Board considered the benefits to shareholders of investing in a Fidelity fund, including the benefits of investing in a fund that is part of a large family of funds offering a variety of investment disciplines and providing a large variety of mutual fund investor services. The Board noted that Fidelity had taken, or had made recommendations that resulted in the Fidelity funds taking, a number of actions over the previous year that benefited particular funds, including: (i) continuing to dedicate additional resources to Fidelity's investment research process, and to the support of the senior management team that oversees asset management; (ii) continuing efforts to enhance Fidelity's global research capabilities; (iii) launching new funds and making other enhancements to meet client needs; (iv) launching new share classes of existing funds; (v) eliminating purchase minimums and broadening eligibility requirements for certain lower-priced share classes; (vi) reducing management fees and total expenses for certain growth equity funds and index funds; (vii) lowering expense caps for certain existing funds and classes to reduce expenses borne by shareholders; (viii) eliminating short-term redemption fees for certain funds; (ix) introducing a new pricing structure for certain funds of funds that is expected to reduce overall expenses paid by shareholders; (x) rationalizing product lines and gaining increased efficiencies through proposals for fund mergers and share class consolidations; (xi) continuing to develop, acquire and implement systems and technology to improve services to the funds and shareholders, strengthen information security, and increase efficiency; and (xii) implementing enhancements to further strengthen Fidelity's product line to increase investors' probability of success in achieving their investment goals, including retirement income goals.
Investment Performance. The Board considered whether the fund has operated in accordance with its investment objective, as well as its record of compliance with its investment restrictions and its performance history.
The Board took into account discussions with representatives of the Investment Advisers about fund investment performance that occur at Board meetings throughout the year. In this regard the Board noted that as part of regularly scheduled fund reviews and other reports to the Board on fund performance, the Board considers annualized return information for the fund for different time periods, measured against a securities market index ("benchmark index") and a peer group of funds with similar objectives ("peer group"), if any. In its evaluation of fund investment performance, the Board gave particular attention to information indicating changes in performance of certain Fidelity funds for specific time periods and discussed with the Investment Advisers the reasons for any overperformance or underperformance.
In addition to reviewing absolute and relative fund performance, the Independent Trustees periodically consider the appropriateness of fund performance metrics in evaluating the results achieved. In general, the Independent Trustees believe that fund performance should be evaluated based on net performance (after fees and expenses) of both the highest performing and lowest performing fund share classes, where applicable, compared to appropriate benchmark indices, over appropriate time periods that may include full market cycles, and compared to peer groups, as applicable, over the same periods, taking into account relevant factors including the following: general market conditions; issuer-specific information; and fund cash flows and other factors.
The Independent Trustees recognize that shareholders evaluate performance on a net basis over their own holding periods, for which one-, three-, and five-year periods are often used as a proxy. For this reason, the performance information reviewed by the Board also included net cumulative calendar year total return information for the fund and an appropriate benchmark index and peer group for the most recent one-, three-, and five-year periods, as shown below. Returns are shown compared to the 25th percentile (top of box, 75% beaten) and 75th percentile (bottom of box, 25% beaten) of the peer universe.
Fidelity Low-Priced Stock Fund
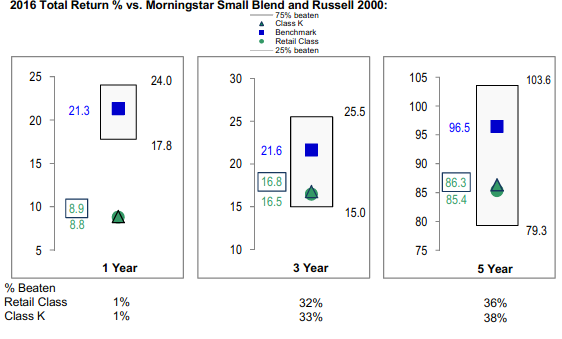
The Board has discussed the fund's underperformance with FMR, including the fund's investment strategy, the portfolio management team, and broader trends in the market that may have impacted the fund's performance, and has engaged with FMR to consider what steps might be taken to remediate the fund's underperformance while at the same time noting the superior long term performance of the fund. The Board also noted that there were portfolio management changes for the fund in May 2016 and April 2017.
The Board also considered that the fund's management fee is subject to upward or downward adjustment depending upon whether, and to what extent, the fund's investment performance for the performance period (a rolling 36-month period) exceeds, or is exceeded by, a securities index, thus leading to a performance adjustment for the same period. The Board noted that the performance adjustment provides FMR with a strong economic incentive to seek to achieve superior long-term performance for the fund's shareholders and helps to more closely align the interests of FMR and the shareholders of the fund.
Based on its review, the Board concluded that the nature, extent, and quality of services provided to the fund under the Advisory Contracts should continue to benefit the shareholders of the fund.
Competitiveness of Management Fee and Total Expense Ratio. The Board considered the fund's management fee and total expense ratio compared to "mapped groups" of competitive funds and classes created for the purpose of facilitating the Trustees' competitive analysis of management fees and total expenses. Fidelity creates "mapped groups" by combining similar Lipper investment objective categories that have comparable investment mandates. Combining Lipper investment objective categories aids the Board's management fee and total expense ratio comparisons by broadening the competitive group used for comparison.
Management Fee. The Board considered two proprietary management fee comparisons for the 12-month periods shown in basis points (BP) in the chart below. The group of Lipper funds used by the Board for management fee comparisons is referred to below as the "Total Mapped Group." The Total Mapped Group comparison focuses on a fund's standing in terms of gross management fees before expense reimbursements or caps, and without giving effect to the fund's performance adjustment, relative to the total universe of funds with comparable investment mandates, regardless of whether their management fee structures also are comparable. Funds with comparable investment mandates offer exposure to similar types of securities. Funds with comparable management fee structures have similar management fee contractual arrangements (
e.g., flat rate charged for advisory services, all-inclusive fee rate,
etc.). "TMG %" represents the percentage of funds in the Total Mapped Group that had management fees that were lower than the fund's. For example, a hypothetical TMG % of 20% would mean that 80% of the funds in the Total Mapped Group had higher, and 20% had lower, management fees than the fund. The fund's actual TMG %s and the number of funds in the Total Mapped Group are in the chart below. The "Asset-Size Peer Group" (ASPG) comparison focuses on a fund's standing relative to a subset of non-Fidelity funds within the Total Mapped Group that are similar in size and management fee structure without taking into account performance adjustments, if any. For example, if a fund is in the first quartile of the ASPG, the fund's management fee ranks in the least expensive or lowest 25% of funds in the ASPG. The ASPG represents at least 15% of the funds in the Total Mapped Group with comparable asset size and management fee structures, subject to a minimum of 50 funds (or all funds in the Total Mapped Group if fewer than 50). Additional information, such as the ASPG quartile in which the fund's management fee rate ranked and the impact of the fund's performance adjustment, is also included in the chart and considered by the Board.
Fidelity Low-Priced Stock Fund
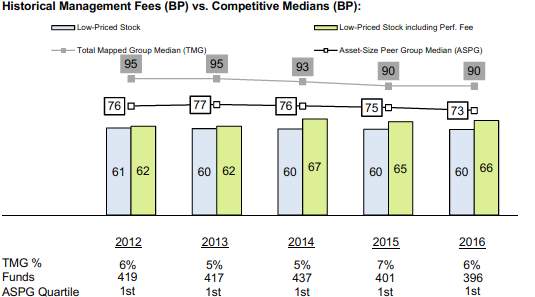
The Board noted that the fund's management fee rate ranked below the median of its Total Mapped Group and below the median of its ASPG for 2016. The Board also noted the effect of the fund's performance adjustment, if any, on the fund's management fee ranking. The Board noted that the comparisons for 2015 and 2016 reflect a revised Total Mapped Group that no longer includes funds with micro-cap objectives and that FMR believes this Total Mapped Group is a more appropriate comparison because the fund does not have a micro-cap objective.
The Board noted that, in 2014, the Board and the boards of other Fidelity funds formed the ad hoc Committee on Group Fee to conduct an in-depth review of the "group fee" component of the management fee of funds with such management fee structures. The Committee's focus included the mechanics of the group fee, the competitive landscape of group fee structures, Fidelity funds with no group fee component and investment products not included in group fee assets. The Board also considered that, for funds subject to the group fee, FMR agreed to voluntarily waive fees over a specified period of time in amounts designed to account for assets converted from certain funds to certain collective investment trusts.
The Board also noted that, in 2013, the ad hoc Committee on Management Fees was formed to conduct an in-depth review of the management fee rates of Fidelity's active equity mutual funds. The Committee focused on the following areas: (i) standard fee structures; (ii) research consumption and trading evolution; (iii) management fee competitiveness/profitability by category; and (iv) factors that drive institutional pricing.
Based on its review, the Board concluded that the fund's management fee is fair and reasonable in light of the services that the fund receives and the other factors considered.
Total Expense Ratio. In its review of each class's total expense ratio, the Board considered the fund's management fee rate as well as other fund or class expenses, as applicable, such as transfer agent fees, pricing and bookkeeping fees, and custodial, legal, and audit fees. The Board noted the impact of the fund's performance adjustment. The Board also noted that Fidelity may agree to waive fees and expenses from time to time, and the extent to which, if any, it has done so for the fund. As part of its review, the Board also considered the current and historical total expense ratios of each class of the fund compared to competitive fund median expenses. Each class of the fund is compared to those funds and classes in the Total Mapped Group (used by the Board for management fee comparisons) that have a similar sales load structure.
The Board noted that the total expense ratio of each class ranked below the competitive median for 2016.
Fees Charged to Other Fidelity Clients. The Board also considered Fidelity fee structures and other information with respect to clients of Fidelity, such as other funds advised or subadvised by Fidelity, pension plan clients, and other institutional clients with similar mandates. The Board noted that an ad hoc joint committee created by it and the boards of other Fidelity funds periodically (most recently in 2013) reviews and compares Fidelity's institutional investment advisory business with its business of providing services to the Fidelity funds, including the differences in services provided, fees charged, and costs incurred, as well as competition in their respective marketplaces.
Based on its review of total expense ratios and fees charged to other Fidelity clients, the Board concluded that the total expense ratio of each class of the fund was reasonable in light of the services that the fund and its shareholders receive and the other factors considered.
Costs of the Services and Profitability. The Board considered the revenues earned and the expenses incurred by Fidelity in conducting the business of developing, marketing, distributing, managing, administering and servicing the fund and servicing the fund's shareholders. The Board also considered the level of Fidelity's profits in respect of all the Fidelity funds.
On an annual basis, Fidelity presents to the Board information about the profitability of its relationships with the fund. Fidelity calculates profitability information for each fund, as well as aggregate profitability information for groups of Fidelity funds and all Fidelity funds, using a series of detailed revenue and cost allocation methodologies which originate with the books and records of Fidelity on which Fidelity's audited financial statements are based. The Audit Committee of the Board reviews any significant changes from the prior year's methodologies.
PricewaterhouseCoopers LLP (PwC), independent registered public accounting firm and auditor to Fidelity and certain Fidelity funds, has been engaged annually by the Board as part of the Board's assessment of Fidelity's profitability analysis. PwC's engagement includes the review and assessment of the methodologies used by Fidelity in determining the revenues and expenses attributable to Fidelity's mutual fund business, and completion of agreed-upon procedures in respect of the mathematical accuracy of the fund profitability information and its conformity to established allocation methodologies. After considering PwC's reports issued under the engagement and information provided by Fidelity, the Board concluded that while other allocation methods may also be reasonable, Fidelity's profitability methodologies are reasonable in all material respects.
The Board also reviewed Fidelity's non-fund businesses and potential fall-out benefits related to the mutual fund business as well as cases where Fidelity's affiliates may benefit from or be related to the fund's business.
The Board considered the costs of the services provided by and the profits realized by Fidelity in connection with the operation of the fund and was satisfied that the profitability was not excessive.
Economies of Scale. The Board considered whether there have been economies of scale in respect of the management of the Fidelity funds, whether the Fidelity funds (including the fund) have appropriately benefited from any such economies of scale, and whether there is potential for realization of any further economies of scale. The Board considered the extent to which the fund will benefit from economies of scale as assets grow through increased services to the fund, through waivers or reimbursements, or through fee or expense ratio reductions. The Board also noted that a committee (the Economies of Scale Committee) created by it and the boards of other Fidelity funds periodically (most recently in 2013) analyzes whether Fidelity attains economies of scale in respect of the management and servicing of the Fidelity funds, whether the Fidelity funds have appropriately benefited from such economies of scale, and whether there is potential for realization of any further economies of scale.
The Board recognized that the fund's management contract incorporates a "group fee" structure, which provides for lower group fee rates as total group assets increase, and for higher group fee rates as total group assets decrease (with "group assets" defined to include fund assets under FMR's management plus the assets of sector funds previously under FMR's management). FMR calculates the group fee rates based on a tiered asset "breakpoint" schedule that varies based on asset class. The Board considered that the group fee is designed to deliver the benefits of economies of scale to fund shareholders when total Fidelity fund assets increase, even if assets of any particular fund are unchanged or have declined, because some portion of Fidelity's costs are attributable to services provided to all Fidelity funds, and all funds benefit if those costs can be allocated among more assets. The Board concluded that, given the group fee structure, fund shareholders will benefit from lower management fees as group assets increase at the fund complex level, regardless of whether Fidelity achieves any such economies of scale.
The Board concluded, taking into account the analysis of the Economies of Scale Committee, that economies of scale, if any, are being appropriately shared between fund shareholders and Fidelity.
Additional Information Requested by the Board. In order to develop fully the factual basis for consideration of the Fidelity funds' advisory contracts, the Board requested and received additional information on certain topics, including: (i) fund performance trends, in particular the underperformance of certain funds, and Fidelity's long-term strategies for certain funds; (ii) Fidelity's fund profitability methodology, profitability trends for certain funds, and the impact of certain factors on fund profitability results, including the impact of market trends on actively managed funds; (iii) the use of performance fees and the calculation of performance adjustments, including the impact of underperformance and fund outflows on performance adjustments; (iv) metrics for evaluating index fund performance; (v) Fidelity's group fee structure, including the group fee breakpoint schedules; (vi) the terms of Fidelity's contractual and voluntary expense cap arrangements with the funds; (vii) the methodology with respect to evaluating competitive fund data and peer group classifications and fee comparisons; (viii) the expense structures for different funds and classes; (ix) Fidelity's arrangements with affiliated sub-advisers on behalf of the funds; (x) information regarding other accounts managed by Fidelity, including institutional accounts and collective investment trusts; (xi) recent changes to the fee structure for certain funds of funds; and (xii) the impact of the Department of Labor's new fiduciary rule on the funds' comparative expense information.
Based on its evaluation of all of the conclusions noted above, and after considering all factors it believed relevant, the Board concluded that the advisory fee structures are fair and reasonable, and that the fund's Advisory Contracts should be renewed.
Corporate Headquarters
245 Summer St.
Boston, MA 02210
www.fidelity.com
LPS-K-ANN-0917
1.863395.108
Fidelity® Value Discovery K6 Fund
Annual Report July 31, 2017 |
|
Contents
To view a fund's proxy voting guidelines and proxy voting record for the 12-month period ended June 30, visit http://www.fidelity.com/proxyvotingresults or visit the Securities and Exchange Commission's (SEC) web site at http://www.sec.gov.
You may also call 1-800-835-5092 to request a free copy of the proxy voting guidelines.
Standard & Poor's, S&P and S&P 500 are registered service marks of The McGraw-Hill Companies, Inc. and have been licensed for use by Fidelity Distributors Corporation.
Other third-party marks appearing herein are the property of their respective owners.
All other marks appearing herein are registered or unregistered trademarks or service marks of FMR LLC or an affiliated company. © 2017 FMR LLC. All rights reserved.
This report and the financial statements contained herein are submitted for the general information of the shareholders of the Fund. This report is not authorized for distribution to prospective investors in the Fund unless preceded or accompanied by an effective prospectus.
A fund files its complete schedule of portfolio holdings with the SEC for the first and third quarters of each fiscal year on Form N-Q. Forms N-Q are available on the SEC’s web site at http://www.sec.gov. A fund's Forms N-Q may be reviewed and copied at the SEC’s Public Reference Room in Washington, DC. Information regarding the operation of the SEC's Public Reference Room may be obtained by calling 1-800-SEC-0330.
For a complete list of a fund's portfolio holdings, view the most recent holdings listing, semiannual report, or annual report on Fidelity's web site at http://www.fidelity.com, http://www.institutional.fidelity.com, or http://www.401k.com, as applicable.
NOT FDIC INSURED •MAY LOSE VALUE •NO BANK GUARANTEE
Neither the Fund nor Fidelity Distributors Corporation is a bank.
Investment Summary (Unaudited)
Top Ten Stocks as of July 31, 2017
| | % of fund's net assets |
| JPMorgan Chase & Co. | 3.8 |
| Berkshire Hathaway, Inc. Class B | 3.6 |
| Wells Fargo & Co. | 3.1 |
| Amgen, Inc. | 2.3 |
| Alphabet, Inc. Class A | 2.1 |
| U.S. Bancorp | 2.0 |
| Allergan PLC | 2.0 |
| Teva Pharmaceutical Industries Ltd. sponsored ADR | 2.0 |
| Johnson & Johnson | 1.7 |
| CVS Health Corp. | 1.7 |
| | 24.3 |
Top Five Market Sectors as of July 31, 2017
| | % of fund's net assets |
| Financials | 26.3 |
| Health Care | 16.5 |
| Information Technology | 11.2 |
| Consumer Discretionary | 10.2 |
| Consumer Staples | 7.2 |
Asset Allocation (% of fund's net assets)
| As of July 31, 2017* |
| | Stocks | 94.4% |
| | Convertible Securities | 0.6% |
| | Short-Term Investments and Net Other Assets (Liabilities) | 5.0% |

* Foreign investments - 22.1%
Investments July 31, 2017
Showing Percentage of Net Assets
| Common Stocks - 94.4% | | | |
| | | Shares | Value |
| CONSUMER DISCRETIONARY - 10.2% | | | |
| Auto Components - 0.0% | | | |
| Hyundai Mobis | | 11 | $2,416 |
| Leisure Products - 0.6% | | | |
| Vista Outdoor, Inc. (a) | | 81,445 | 1,880,565 |
| Media - 7.0% | | | |
| CBS Corp. Class B | | 58,289 | 3,837,165 |
| Charter Communications, Inc. Class A (a) | | 5,510 | 2,159,424 |
| Cinemark Holdings, Inc. | | 44,054 | 1,713,701 |
| John Wiley & Sons, Inc. Class A | | 29,549 | 1,632,582 |
| Lions Gate Entertainment Corp.: | | | |
| Class A | | 42 | 1,235 |
| Class B (a) | | 127,684 | 3,512,587 |
| Time Warner, Inc. | | 43,175 | 4,421,984 |
| Twenty-First Century Fox, Inc. Class A | | 125,117 | 3,640,905 |
| | | | 20,919,583 |
| Specialty Retail - 0.7% | | | |
| Cabela's, Inc. Class A (a) | | 35,962 | 2,049,115 |
| Textiles, Apparel & Luxury Goods - 1.9% | | | |
| Christian Dior SA | | 6,715 | 1,913,377 |
| PVH Corp. | | 30,953 | 3,692,383 |
| | | | 5,605,760 |
|
| TOTAL CONSUMER DISCRETIONARY | | | 30,457,439 |
|
| CONSUMER STAPLES - 7.2% | | | |
| Beverages - 1.4% | | | |
| C&C Group PLC | | 455,000 | 1,648,205 |
| PepsiCo, Inc. | | 22,038 | 2,569,851 |
| | | | 4,218,056 |
| Food & Staples Retailing - 2.3% | | | |
| CVS Health Corp. | | 63,911 | 5,108,406 |
| Sysco Corp. | | 30,052 | 1,581,336 |
| | | | 6,689,742 |
| Food Products - 2.3% | | | |
| Kellogg Co. | | 23,841 | 1,621,188 |
| Seaboard Corp. | | 401 | 1,714,275 |
| The J.M. Smucker Co. | | 29,449 | 3,589,833 |
| | | | 6,925,296 |
| Personal Products - 0.7% | | | |
| Unilever NV (Certificaten Van Aandelen) (Bearer) | | 34,500 | 2,010,578 |
| Tobacco - 0.5% | | | |
| British American Tobacco PLC: | | | |
| (United Kingdom) | | 25,737 | 1,600,989 |
| sponsored ADR | | 6 | 375 |
| | | | 1,601,364 |
|
| TOTAL CONSUMER STAPLES | | | 21,445,036 |
|
| ENERGY - 6.9% | | | |
| Oil, Gas & Consumable Fuels - 6.9% | | | |
| Chevron Corp. | | 42,273 | 4,615,789 |
| FLEX LNG Ltd. (a) | | 840,022 | 1,153,810 |
| GasLog Ltd. | | 34,262 | 625,282 |
| GasLog Partners LP | | 98,278 | 2,432,381 |
| Golar LNG Partners LP | | 88,260 | 1,986,733 |
| Hoegh LNG Partners LP | | 58,506 | 1,149,643 |
| Phillips 66 Co. | | 31,254 | 2,617,523 |
| Suncor Energy, Inc. | | 50,587 | 1,650,189 |
| Teekay Corp. | | 149,400 | 1,464,120 |
| Teekay LNG Partners LP | | 97,700 | 1,841,645 |
| Teekay Offshore Partners LP | | 366,900 | 950,271 |
| | | | 20,487,386 |
| FINANCIALS - 26.3% | | | |
| Banks - 11.3% | | | |
| JPMorgan Chase & Co. | | 123,284 | 11,317,468 |
| PNC Financial Services Group, Inc. | | 27,320 | 3,518,816 |
| SunTrust Banks, Inc. | | 59,904 | 3,431,900 |
| U.S. Bancorp | | 112,895 | 5,958,598 |
| Wells Fargo & Co. | | 172,799 | 9,320,778 |
| | | | 33,547,560 |
| Capital Markets - 1.2% | | | |
| Goldman Sachs Group, Inc. | | 16,128 | 3,634,122 |
| Consumer Finance - 2.7% | | | |
| Capital One Financial Corp. | | 26,732 | 2,303,764 |
| Discover Financial Services | | 43,375 | 2,643,273 |
| Synchrony Financial | | 97,368 | 2,952,198 |
| | | | 7,899,235 |
| Diversified Financial Services - 3.6% | | | |
| Berkshire Hathaway, Inc. Class B (a) | | 60,304 | 10,551,391 |
| Insurance - 4.7% | | | |
| Allstate Corp. | | 30,152 | 2,743,832 |
| Chubb Ltd. | | 20,035 | 2,934,326 |
| FNF Group | | 43,765 | 2,138,358 |
| FNFV Group (a) | | 39,368 | 679,098 |
| Prudential PLC | | 99,288 | 2,422,676 |
| The Travelers Companies, Inc. | | 24,643 | 3,156,522 |
| | | | 14,074,812 |
| Mortgage Real Estate Investment Trusts - 2.8% | | | |
| Agnc Investment Corp. | | 130,025 | 2,753,930 |
| Annaly Capital Management, Inc. | | 258,624 | 3,111,247 |
| MFA Financial, Inc. | | 303,726 | 2,578,634 |
| | | | 8,443,811 |
|
| TOTAL FINANCIALS | | | 78,150,931 |
|
| HEALTH CARE - 15.9% | | | |
| Biotechnology - 3.5% | | | |
| Amgen, Inc. | | 40,368 | 7,044,620 |
| Shire PLC sponsored ADR | | 20,832 | 3,490,193 |
| | | | 10,534,813 |
| Health Care Providers & Services - 4.5% | | | |
| Aetna, Inc. | | 15,527 | 2,395,971 |
| Anthem, Inc. | | 12,922 | 2,406,206 |
| Cigna Corp. | | 28,149 | 4,885,540 |
| McKesson Corp. | | 21,838 | 3,534,917 |
| | | | 13,222,634 |
| Pharmaceuticals - 7.9% | | | |
| Allergan PLC | | 23,140 | 5,838,916 |
| Bayer AG | | 30,447 | 3,862,024 |
| Johnson & Johnson | | 38,667 | 5,131,884 |
| Sanofi SA sponsored ADR | | 58,501 | 2,770,607 |
| Teva Pharmaceutical Industries Ltd. sponsored ADR | | 179,511 | 5,774,869 |
| | | | 23,378,300 |
|
| TOTAL HEALTH CARE | | | 47,135,747 |
|
| INDUSTRIALS - 6.7% | | | |
| Aerospace & Defense - 1.6% | | | |
| United Technologies Corp. | | 41,572 | 4,929,192 |
| Industrial Conglomerates - 1.5% | | | |
| General Electric Co. | | 171,611 | 4,394,958 |
| Machinery - 0.7% | | | |
| Deere & Co. | | 15,827 | 2,030,288 |
| Professional Services - 2.4% | | | |
| Dun & Bradstreet Corp. | | 32,156 | 3,561,599 |
| Nielsen Holdings PLC | | 83,544 | 3,593,227 |
| | | | 7,154,826 |
| Trading Companies & Distributors - 0.5% | | | |
| AerCap Holdings NV (a) | | 31,254 | 1,534,571 |
|
| TOTAL INDUSTRIALS | | | 20,043,835 |
|
| INFORMATION TECHNOLOGY - 11.2% | | | |
| Communications Equipment - 2.8% | | | |
| Cisco Systems, Inc. | | 135,234 | 4,253,109 |
| Harris Corp. | | 20,736 | 2,373,650 |
| Juniper Networks, Inc. | | 60,905 | 1,702,295 |
| | | | 8,329,054 |
| Electronic Equipment & Components - 0.8% | | | |
| TE Connectivity Ltd. | | 30,449 | 2,447,795 |
| Internet Software & Services - 3.5% | | | |
| Alphabet, Inc. Class A (a) | | 6,611 | 6,250,701 |
| comScore, Inc. (a) | | 58,005 | 1,741,368 |
| VeriSign, Inc. (a) | | 23,841 | 2,411,994 |
| | | | 10,404,063 |
| IT Services - 2.1% | | | |
| Amdocs Ltd. | | 28,951 | 1,944,639 |
| Cognizant Technology Solutions Corp. Class A | | 32,256 | 2,235,986 |
| The Western Union Co. | | 99,681 | 1,968,700 |
| | | | 6,149,325 |
| Semiconductors & Semiconductor Equipment - 0.1% | | | |
| Lattice Semiconductor Corp. (a) | | 44,080 | 306,797 |
| NXP Semiconductors NV (a) | | 29 | 3,200 |
| | | | 309,997 |
| Software - 0.4% | | | |
| Oracle Corp. | | 20,565 | 1,026,810 |
| Technology Hardware, Storage & Peripherals - 1.5% | | | |
| Apple, Inc. | | 30,162 | 4,485,994 |
|
| TOTAL INFORMATION TECHNOLOGY | | | 33,153,038 |
|
| MATERIALS - 3.1% | | | |
| Chemicals - 1.7% | | | |
| LyondellBasell Industries NV Class A | | 31,955 | 2,878,826 |
| Monsanto Co. | | 18,131 | 2,118,063 |
| | | | 4,996,889 |
| Containers & Packaging - 1.4% | | | |
| Ball Corp. | | 54,394 | 2,279,109 |
| Graphic Packaging Holding Co. | | 156,170 | 2,059,882 |
| | | | 4,338,991 |
|
| TOTAL MATERIALS | | | 9,335,880 |
|
| REAL ESTATE - 1.0% | | | |
| Real Estate Management & Development - 1.0% | | | |
| CBRE Group, Inc. (a) | | 75,731 | 2,877,021 |
| TELECOMMUNICATION SERVICES - 1.7% | | | |
| Diversified Telecommunication Services - 1.7% | | | |
| Verizon Communications, Inc. | | 103,279 | 4,998,704 |
| UTILITIES - 4.2% | | | |
| Electric Utilities - 3.9% | | | |
| Exelon Corp. | | 116,301 | 4,458,980 |
| PPL Corp. | | 74,128 | 2,841,326 |
| Xcel Energy, Inc. | | 86,349 | 4,085,171 |
| | | | 11,385,477 |
| Gas Utilities - 0.3% | | | |
| WGL Holdings, Inc. | | 11,420 | 978,922 |
|
| TOTAL UTILITIES | | | 12,364,399 |
|
| TOTAL COMMON STOCKS | | | |
| (Cost $280,005,664) | | | 280,449,416 |
|
| Convertible Preferred Stocks - 0.6% | | | |
| HEALTH CARE - 0.6% | | | |
| Pharmaceuticals - 0.6% | | | |
| Teva Pharmaceutical Industries Ltd. 7% | | | |
| (Cost $1,686,060) | | 2,900 | 1,678,520 |
|
| Money Market Funds - 5.2% | | | |
| Fidelity Cash Central Fund, 1.11% (b) | | | |
| (Cost $15,568,096) | | 15,564,983 | 15,568,096 |
| TOTAL INVESTMENT PORTFOLIO - 100.2% | | | |
| (Cost $297,259,820) | | | 297,696,032 |
| NET OTHER ASSETS (LIABILITIES) - (0.2)% | | | (627,065) |
| NET ASSETS - 100% | | | $297,068,967 |
Legend
(a) Non-income producing
(b) Affiliated fund that is generally available only to investment companies and other accounts managed by Fidelity Investments. The rate quoted is the annualized seven-day yield of the fund at period end. A complete unaudited listing of the fund's holdings as of its most recent quarter end is available upon request. In addition, each Fidelity Central Fund's financial statements, which are not covered by the Fund's Report of Independent Registered Public Accounting Firm, are available on the SEC's website or upon request.
Affiliated Central Funds
Information regarding fiscal year to date income earned by the Fund from investments in Fidelity Central Funds is as follows:
| Fund | Income earned |
| Fidelity Cash Central Fund | $585 |
| Total | $585 |
Investment Valuation
The following is a summary of the inputs used, as of July 31, 2017, involving the Fund's assets and liabilities carried at fair value. The inputs or methodology used for valuing securities may not be an indication of the risk associated with investing in those securities. For more information on valuation inputs, and their aggregation into the levels used below, please refer to the Investment Valuation section in the accompanying Notes to Financial Statements.
| | Valuation Inputs at Reporting Date: |
| Description | Total | Level 1 | Level 2 | Level 3 |
| Investments in Securities: | | | | |
| Equities: | | | | |
| Consumer Discretionary | $30,457,439 | $30,457,439 | $-- | $-- |
| Consumer Staples | 21,445,036 | 17,833,469 | 3,611,567 | -- |
| Energy | 20,487,386 | 20,487,386 | -- | -- |
| Financials | 78,150,931 | 75,728,255 | 2,422,676 | -- |
| Health Care | 48,814,267 | 47,135,747 | 1,678,520 | -- |
| Industrials | 20,043,835 | 20,043,835 | -- | -- |
| Information Technology | 33,153,038 | 33,153,038 | -- | -- |
| Materials | 9,335,880 | 9,335,880 | -- | -- |
| Real Estate | 2,877,021 | 2,877,021 | -- | -- |
| Telecommunication Services | 4,998,704 | 4,998,704 | -- | -- |
| Utilities | 12,364,399 | 12,364,399 | -- | -- |
| Money Market Funds | 15,568,096 | 15,568,096 | -- | -- |
| Total Investments in Securities: | $297,696,032 | $289,983,269 | $7,712,763 | $-- |
Other Information
Distribution of investments by country or territory of incorporation, as a percentage of Total Net Assets, is as follows (Unaudited):
| United States of America | 77.9% |
| Marshall Islands | 3.3% |
| Israel | 2.6% |
| United Kingdom | 2.5% |
| Ireland | 2.5% |
| Netherlands | 2.2% |
| Switzerland | 1.8% |
| Canada | 1.8% |
| France | 1.6% |
| Germany | 1.3% |
| Bailiwick of Jersey | 1.2% |
| Others (Individually Less Than 1%) | 1.3% |
| | 100.0% |
See accompanying notes which are an integral part of the financial statements.
Financial Statements
Statement of Assets and Liabilities
| | | July 31, 2017 |
| Assets | | |
Investment in securities, at value — See accompanying schedule:
Unaffiliated issuers (cost $281,691,724) | $282,127,936 | |
| Fidelity Central Funds (cost $15,568,096) | 15,568,096 | |
| Total Investments (cost $297,259,820) | | $297,696,032 |
| Foreign currency held at value (cost $10) | | 10 |
| Receivable for fund shares sold | | 24,105 |
| Dividends receivable | | 285 |
| Distributions receivable from Fidelity Central Funds | | 494 |
| Other receivables | | 1,889 |
| Total assets | | 297,722,815 |
| Liabilities | | |
| Payable for fund shares redeemed | $648,084 | |
| Accrued management fee | 5,764 | |
| Total liabilities | | 653,848 |
| Net Assets | | $297,068,967 |
| Net Assets consist of: | | |
| Paid in capital | | $296,636,386 |
| Undistributed net investment income | | 2,764 |
| Accumulated undistributed net realized gain (loss) on investments and foreign currency transactions | | (6,395) |
| Net unrealized appreciation (depreciation) on investments | | 436,212 |
| Net Assets, for 28,607,086 shares outstanding | | $297,068,967 |
| Net Asset Value, offering price and redemption price per share ($297,068,967 ÷ 28,607,086 shares) | | $10.38 |
See accompanying notes which are an integral part of the financial statements.
Statement of Operations
| | | For the period
May 25, 2017 (commencement of operations) to
July 31, 2017 |
| Investment Income | | |
| Dividends | | $1,838 |
| Income from Fidelity Central Funds | | 585 |
| Total income | | 2,423 |
| Expenses | | |
| Management fee | $5,987 | |
| Independent trustees' fees and expenses | 1 | |
| Total expenses | | 5,988 |
| Net investment income (loss) | | (3,565) |
| Realized and Unrealized Gain (Loss) | | |
| Net realized gain (loss) on: | | |
| Investment securities: | | |
| Unaffiliated issuers | (76) | |
| Foreign currency transactions | 11 | |
| Total net realized gain (loss) | | (65) |
| Change in net unrealized appreciation (depreciation) on investment securities | | 436,212 |
| Net gain (loss) | | 436,147 |
| Net increase (decrease) in net assets resulting from operations | | $432,582 |
See accompanying notes which are an integral part of the financial statements.
Statement of Changes in Net Assets
| | For the period
May 25, 2017 (commencement of operations) to
July 31, 2017 |
| Increase (Decrease) in Net Assets | |
| Operations | |
| Net investment income (loss) | $(3,565) |
| Net realized gain (loss) | (65) |
| Change in net unrealized appreciation (depreciation) | 436,212 |
| Net increase (decrease) in net assets resulting from operations | 432,582 |
| Share transactions | |
| Proceeds from sales of shares | 297,284,469 |
| Cost of shares redeemed | (648,084) |
| Net increase (decrease) in net assets resulting from share transactions | 296,636,385 |
| Total increase (decrease) in net assets | 297,068,967 |
| Net Assets | |
| Beginning of period | – |
| End of period | $297,068,967 |
| Other Information | |
| Undistributed net investment income end of period | $2,764 |
| Shares | |
| Sold | 28,669,522 |
| Redeemed | (62,436) |
| Net increase (decrease) | 28,607,086 |
See accompanying notes which are an integral part of the financial statements.
Financial Highlights — Fidelity Value Discovery K6 Fund
| Years ended July 31, | 2017 A |
| Selected Per–Share Data | |
| Net asset value, beginning of period | $10.00 |
| Income from Investment Operations | |
| Net investment income (loss)B | –C |
| Net realized and unrealized gain (loss) | .38 |
| Total from investment operations | .38 |
| Net asset value, end of period | $10.38 |
| Total ReturnD | 3.80% |
| Ratios to Average Net AssetsE,F | |
| Expenses before reductions | .45%G |
| Expenses net of fee waivers, if any | .45%G |
| Expenses net of all reductions | .45%G |
| Net investment income (loss) | (.28)%G |
| Supplemental Data | |
| Net assets, end of period (000 omitted) | $297,069 |
| Portfolio turnover rateH | –%I,J |
A For the period May 25, 2017 (commencement of operations) to July 31, 2017.
B Calculated based on average shares outstanding during the period.
C Amount represents less than $.005 per share.
D Total returns for periods of less than one year are not annualized.
E Fees and expenses of any underlying Fidelity Central Funds are not included in the Fund's expense ratio. The Fund indirectly bears its proportionate share of the expenses of any underlying Fidelity Central Funds.
F Expense ratios reflect operating expenses of the Fund. Expenses before reductions do not reflect amounts reimbursed by the investment adviser or reductions from expense offset arrangements and do not represent the amount paid by the Fund during periods when reimbursements or reductions occur. Expense ratios before reductions for start-up periods may not be representative of longer term operating periods. Expenses net of fee waivers reflect expenses after reimbursement by the investment adviser but prior to reductions from expense offset arrangements. Expenses net of all reductions represent the net expenses paid by the Fund.
G Annualized
H Amount does not include the portfolio activity of any underlying Fidelity Central Funds.
I Portfolio turnover rate excludes securities received or delivered in-kind.
J Amount not annualized.
See accompanying notes which are an integral part of the financial statements.
Notes to Financial Statements
For the period ended July 31, 2017
1. Organization.
Fidelity Value Discovery K6 Fund (the Fund) is a fund of Fidelity Puritan Trust (the Trust) and is authorized to issue an unlimited number of shares. Share transactions on the Statement of Changes in Net Assets may contain exchanges between affiliated funds. The Trust is registered under the Investment Company Act of 1940, as amended (the 1940 Act), as an open-end management investment company organized as a Massachusetts business trust. Shares generally are available only to employer-sponsored retirement plans that are recordkept by Fidelity.
2. Investments in Fidelity Central Funds.
The Fund invests in Fidelity Central Funds, which are open-end investment companies generally available only to other investment companies and accounts managed by the investment adviser and its affiliates. The Fund's Schedule of Investments lists each of the Fidelity Central Funds held as of period end, if any, as an investment of the Fund, but does not include the underlying holdings of each Fidelity Central Fund. As an Investing Fund, the Fund indirectly bears its proportionate share of the expenses of the underlying Fidelity Central Funds.
The Money Market Central Funds seek preservation of capital and current income and are managed by Fidelity Investments Money Management, Inc. (FIMM), an affiliate of the investment adviser. Annualized expenses of the Money Market Central Funds as of their most recent shareholder report date are less than .005%.
A complete unaudited list of holdings for each Fidelity Central Fund is available upon request or at the Securities and Exchange Commission (the SEC) website at www.sec.gov. In addition, the financial statements of the Fidelity Central Funds, which are not covered by the Fund's Report of Independent Registered Public Accounting Firm, are available on the SEC website or upon request.
3. Significant Accounting Policies.
The Fund is an investment company and applies the accounting and reporting guidance of the Financial Accounting Standards Board (FASB) Accounting Standards Codification Topic 946 Financial Services – Investments Companies. The financial statements have been prepared in conformity with accounting principles generally accepted in the United States of America (GAAP), which require management to make certain estimates and assumptions at the date of the financial statements. Actual results could differ from those estimates. Subsequent events, if any, through the date that the financial statements were issued have been evaluated in the preparation of the financial statements. The following summarizes the significant accounting policies of the Fund:
Investment Valuation. Investments are valued as of 4:00 p.m. Eastern time on the last calendar day of the period. The Board of Trustees (the Board) has delegated the day to day responsibility for the valuation of the Fund's investments to the Fair Value Committee (the Committee) established by the Fund's investment adviser. In accordance with valuation policies and procedures approved by the Board, the Fund attempts to obtain prices from one or more third party pricing vendors or brokers to value its investments. When current market prices, quotations or currency exchange rates are not readily available or reliable, investments will be fair valued in good faith by the Committee, in accordance with procedures adopted by the Board. Factors used in determining fair value vary by investment type and may include market or investment specific events. The frequency with which these procedures are used cannot be predicted and they may be utilized to a significant extent. The Committee oversees the Fund's valuation policies and procedures and reports to the Board on the Committee's activities and fair value determinations. The Board monitors the appropriateness of the procedures used in valuing the Fund's investments and ratifies the fair value determinations of the Committee.
The Fund categorizes the inputs to valuation techniques used to value its investments into a disclosure hierarchy consisting of three levels as shown below:
- Level 1 – quoted prices in active markets for identical investments
- Level 2 – other significant observable inputs (including quoted prices for similar investments, interest rates, prepayment speeds, etc.)
- Level 3 – unobservable inputs (including the Fund's own assumptions based on the best information available)
Valuation techniques used to value the Fund's investments by major category are as follows:
Equity securities, including restricted securities, for which market quotations are readily available, are valued at the last reported sale price or official closing price as reported by a third party pricing vendor on the primary market or exchange on which they are traded and are categorized as Level 1 in the hierarchy. In the event there were no sales during the day or closing prices are not available, securities are valued at the last quoted bid price or may be valued using the last available price and are generally categorized as Level 2 in the hierarchy. For foreign equity securities, when market or security specific events arise, comparisons to the valuation of American Depositary Receipts (ADRs), futures contracts, Exchange-Traded Funds (ETFs) and certain indexes as well as quoted prices for similar securities may be used and would be categorized as Level 2 in the hierarchy. Utilizing these techniques may result in transfers between Level 1 and Level 2. For equity securities, including restricted securities, where observable inputs are limited, assumptions about market activity and risk are used and these securities may be categorized as Level 3 in the hierarchy.
Investments in open-end mutual funds, including the Fidelity Central Funds, are valued at their closing net asset value (NAV) each business day and are categorized as Level 1 in the hierarchy.
Changes in valuation techniques may result in transfers in or out of an assigned level within the disclosure hierarchy. The aggregate value of investments by input level as of July 31, 2017 is included at the end of the Fund's Schedule of Investments.
Foreign Currency. The Fund may use foreign currency contracts to facilitate transactions in foreign-denominated securities. Gains and losses from these transactions may arise from changes in the value of the foreign currency or if the counterparties do not perform under the contracts' terms.
Foreign-denominated assets, including investment securities, and liabilities are translated into U.S. dollars at the exchange rates at period end. Purchases and sales of investment securities, income and dividends received and expenses denominated in foreign currencies are translated into U.S. dollars at the exchange rate in effect on the transaction date.
The effects of exchange rate fluctuations on investments are included with the net realized and unrealized gain (loss) on investment securities. Other foreign currency transactions resulting in realized and unrealized gain (loss) are disclosed separately.
Investment Transactions and Income. For financial reporting purposes, the Fund's investment holdings and NAV include trades executed through the end of the last business day of the period. The NAV per share for processing shareholder transactions is calculated as of the close of business of the New York Stock Exchange (NYSE), normally 4:00 p.m. Eastern time and includes trades executed through the end of the prior business day. Gains and losses on securities sold are determined on the basis of identified cost. Dividend income is recorded on the ex-dividend date, except for certain dividends from foreign securities where the ex-dividend date may have passed, which are recorded as soon as the Fund is informed of the ex-dividend date. Non-cash dividends included in dividend income, if any, are recorded at the fair market value of the securities received. Income and capital gain distributions from Fidelity Central Funds, if any, are recorded on the ex-dividend date. Certain distributions received by the Fund represent a return of capital or capital gain. The Fund determines the components of these distributions subsequent to the ex-dividend date, based upon receipt of tax filings or other correspondence relating to the underlying investment. These distributions are recorded as a reduction of cost of investments and/or as a realized gain. Investment income is recorded net of foreign taxes withheld where recovery of such taxes is uncertain.
Expenses. Expenses directly attributable to a fund are charged to that fund. Expenses attributable to more than one fund are allocated among the respective funds on the basis of relative net assets or other appropriate methods. Expense estimates are accrued in the period to which they relate and adjustments are made when actual amounts are known.
Income Tax Information and Distributions to Shareholders. Each year, the Fund intends to qualify as a regulated investment company under Subchapter M of the Internal Revenue Code, including distributing substantially all of its taxable income and realized gains. As a result, no provision for U.S. Federal income taxes is required. As of July 31, 2017, the Fund did not have any unrecognized tax benefits in the financial statements; nor is the Fund aware of any tax positions for which it is reasonably possible that the total amounts of unrecognized tax benefits will significantly change in the next twelve months. The Fund files a U.S. federal tax return, in addition to state and local tax returns as required. The Fund's federal income tax returns are subject to examination by the Internal Revenue Service (IRS) for a period of three fiscal years after they are filed. State and local tax returns may be subject to examination for an additional fiscal year depending on the jurisdiction. Foreign taxes are provided for based on the Fund's understanding of the tax rules and rates that exist in the foreign markets in which it invests.
Distributions are declared and recorded on the ex-dividend date. Income and capital gain distributions are determined in accordance with income tax regulations, which may differ from GAAP.
Capital accounts within the financial statements are adjusted for permanent book-tax differences. These adjustments have no impact on net assets or the results of operations. Capital accounts are not adjusted for temporary book-tax differences which will reverse in a subsequent period.
Book-tax differences are primarily due to foreign currency transactions, passive foreign investment companies (PFIC) and capital loss carryforwards.
The federal tax cost of investment securities and unrealized appreciation (depreciation) as of period end were as follows:
| Gross unrealized appreciation | $1,237,075 |
| Gross unrealized depreciation | (807,182) |
| Net unrealized appreciation (depreciation) on securities | $429,893 |
| Tax Cost | $297,266,139 |
The tax-based components of distributable earnings as of period end were as follows:
| Undistributed ordinary income | $2,764 |
| Capital loss carryforward | $(76) |
| Net unrealized appreciation (depreciation) on securities and other investments | $429,893 |
Capital loss carryforwards are only available to offset future capital gains of the Fund to the extent provided by regulations and may be limited. Under the Regulated Investment Company Modernization Act of 2010 (the Act), the Fund is permitted to carry forward capital losses incurred in taxable years beginning after December 22, 2010 for an unlimited period and such capital losses are required to be used prior to any losses that expire. The capital loss carryforward information presented below, including any applicable limitation, is estimated as of fiscal period end and is subject to adjustment.
| No expiration | |
| Short-term | $(76) |
4. Purchases and Sales of Investments.
Purchases and sales of securities, other than short-term securities and in-kind transactions, aggregated $509,600 and $44,746, respectively.
5. Fees and Other Transactions with Affiliates.
Management Fee. Fidelity Management & Research Company (the investment adviser) and its affiliates provide the Fund with investment management related services for which the Fund pays a monthly management fee that is based on an annual rate of .45% of average net assets. Under the management contract, the investment adviser or an affiliate pays all other expenses of the Fund, excluding fees and expenses of the independent Trustees, and certain miscellaneous expenses such as proxy and shareholder meeting expenses.
Brokerage Commissions. The Fund placed a portion of its portfolio transactions with brokerage firms which are affiliates of the investment adviser. Brokerage commissions are included in net realized gain (loss) and change in net unrealized appreciation (depreciation) in the Statement of Operations. The commissions paid to these affiliated firms were $38 for the period.
Interfund Trades. The Fund may purchase from or sell securities to other Fidelity Funds under procedures adopted by the Board. The procedures have been designed to ensure these interfund trades are executed in accordance with Rule 17a-7 of the 1940 Act. Interfund trades are included within the respective purchases and sales amounts shown in the Purchases and Sales of Investments note.
Exchanges In-Kind. During the period, an affiliated entity completed an exchange in-kind with the Fund. The affiliated entity delivered investments and cash valued at $296,760,364 in exchange for 28,617,200 shares of the Fund. The amount of in-kind exchanges is included in share transactions in the accompanying Statement of Changes in Net Assets. The Fund recognized no gain or loss for federal income tax purposes.
6. Other.
The Fund's organizational documents provide former and current trustees and officers with a limited indemnification against liabilities arising in connection with the performance of their duties to the Fund. In the normal course of business, the Fund may also enter into contracts that provide general indemnifications. The Fund's maximum exposure under these arrangements is unknown as this would be dependent on future claims that may be made against the Fund. The risk of material loss from such claims is considered remote.
At the end of the period, the investment adviser or its affiliates were the owners of record of 100% of the total outstanding shares of the Fund.
Report of Independent Registered Public Accounting Firm
To the Trustees of Fidelity Puritan Trust and Shareholders of Fidelity Value Discovery K6 Fund:
We have audited the accompanying statement of assets and liabilities of Fidelity Value Discovery K6 Fund (the Fund), a fund of Fidelity Puritan Trust, including the schedule of investments, as of July 31, 2017, and the related statement of operations, the statement of changes in net assets and the financial highlights for the period from May 25, 2017 (commencement of operations) to July 31, 2017. These financial statements and financial highlights are the responsibility of the Fund's management. Our responsibility is to express an opinion on these financial statements and financial highlights based on our audit.
We conducted our audit in accordance with the standards of the Public Company Accounting Oversight Board (United States). Those standards require that we plan and perform the audit to obtain reasonable assurance about whether the financial statements and financial highlights are free of material misstatement. The Fund is not required to have, nor were we engaged to perform, an audit of its internal control over financial reporting. Our audit included consideration of internal control over financial reporting as a basis for designing audit procedures that are appropriate in the circumstances, but not for the purpose of expressing an opinion on the effectiveness of the Fund's internal control over financial reporting. Accordingly, we express no such opinion. An audit also includes examining, on a test basis, evidence supporting the amounts and disclosures in the financial statements, assessing the accounting principles used and significant estimates made by management, as well as evaluating the overall financial statement presentation. Our procedures included confirmation of securities owned as of July 31, 2017, by correspondence with the custodians and brokers; when replies were not received from brokers, we performed other auditing procedures. We believe that our audit provides a reasonable basis for our opinion.
In our opinion, such financial statements and financial highlights referred to above present fairly, in all material respects, the financial position of Fidelity Value Discovery K6 Fund as of July 31, 2017, and the results of its operations, the changes in its net assets and the financial highlights for the period from May 25, 2017 (commencement of operations) to July 31, 2017, in conformity with accounting principles generally accepted in the United States of America.
DELOITTE & TOUCHE LLP
Boston, Massachusetts
September 19, 2017
Trustees and Officers
The Trustees, Members of the Advisory Board (if any), and officers of the trust and fund, as applicable, are listed below. The Board of Trustees governs the fund and is responsible for protecting the interests of shareholders. The Trustees are experienced executives who meet periodically throughout the year to oversee the fund's activities, review contractual arrangements with companies that provide services to the fund, oversee management of the risks associated with such activities and contractual arrangements, and review the fund's performance. Except for Jonathan Chiel, each of the Trustees oversees 190 funds. Mr. Chiel oversees 142 funds.
The Trustees hold office without limit in time except that (a) any Trustee may resign; (b) any Trustee may be removed by written instrument, signed by at least two-thirds of the number of Trustees prior to such removal; (c) any Trustee who requests to be retired or who has become incapacitated by illness or injury may be retired by written instrument signed by a majority of the other Trustees; and (d) any Trustee may be removed at any special meeting of shareholders by a two-thirds vote of the outstanding voting securities of the trust. Each Trustee who is not an interested person (as defined in the 1940 Act) of the trust and the fund is referred to herein as an Independent Trustee. Each Independent Trustee shall retire not later than the last day of the calendar year in which his or her 75th birthday occurs. The Independent Trustees may waive this mandatory retirement age policy with respect to individual Trustees. Officers and Advisory Board Members hold office without limit in time, except that any officer or Advisory Board Member may resign or may be removed by a vote of a majority of the Trustees at any regular meeting or any special meeting of the Trustees. Except as indicated, each individual has held the office shown or other offices in the same company for the past five years.
The fund’s Statement of Additional Information (SAI) includes more information about the Trustees. To request a free copy, call Fidelity at 1-800-835-5092.
Experience, Skills, Attributes, and Qualifications of the Trustees. The Governance and Nominating Committee has adopted a statement of policy that describes the experience, qualifications, attributes, and skills that are necessary and desirable for potential Independent Trustee candidates (Statement of Policy). The Board believes that each Trustee satisfied at the time he or she was initially elected or appointed a Trustee, and continues to satisfy, the standards contemplated by the Statement of Policy. The Governance and Nominating Committee also engages professional search firms to help identify potential Independent Trustee candidates who have the experience, qualifications, attributes, and skills consistent with the Statement of Policy. From time to time, additional criteria based on the composition and skills of the current Independent Trustees, as well as experience or skills that may be appropriate in light of future changes to board composition, business conditions, and regulatory or other developments, have also been considered by the professional search firms and the Governance and Nominating Committee. In addition, the Board takes into account the Trustees' commitment and participation in Board and committee meetings, as well as their leadership of standing and ad hoc committees throughout their tenure.
In determining that a particular Trustee was and continues to be qualified to serve as a Trustee, the Board has considered a variety of criteria, none of which, in isolation, was controlling. The Board believes that, collectively, the Trustees have balanced and diverse experience, qualifications, attributes, and skills, which allow the Board to operate effectively in governing the fund and protecting the interests of shareholders. Information about the specific experience, skills, attributes, and qualifications of each Trustee, which in each case led to the Board's conclusion that the Trustee should serve (or continue to serve) as a trustee of the fund, is provided below.
Board Structure and Oversight Function. James C. Curvey is an interested person and currently serves as Chairman. The Trustees have determined that an interested Chairman is appropriate and benefits shareholders because an interested Chairman has a personal and professional stake in the quality and continuity of services provided to the fund. Independent Trustees exercise their informed business judgment to appoint an individual of their choosing to serve as Chairman, regardless of whether the Trustee happens to be independent or a member of management. The Independent Trustees have determined that they can act independently and effectively without having an Independent Trustee serve as Chairman and that a key structural component for assuring that they are in a position to do so is for the Independent Trustees to constitute a substantial majority for the Board. The Independent Trustees also regularly meet in executive session. Ned C. Lautenbach serves as Chairman of the Independent Trustees and as such (i) acts as a liaison between the Independent Trustees and management with respect to matters important to the Independent Trustees and (ii) with management prepares agendas for Board meetings.
Fidelity® funds are overseen by different Boards of Trustees. The fund's Board oversees Fidelity's high income and certain equity funds, and other Boards oversee Fidelity's investment-grade bond, money market, asset allocation, and sector funds. The asset allocation funds may invest in Fidelity® funds overseen by the fund's Board. The use of separate Boards, each with its own committee structure, allows the Trustees of each group of Fidelity® funds to focus on the unique issues of the funds they oversee, including common research, investment, and operational issues. On occasion, the separate Boards establish joint committees to address issues of overlapping consequences for the Fidelity® funds overseen by each Board.
The Trustees operate using a system of committees to facilitate the timely and efficient consideration of all matters of importance to the Trustees, the fund, and fund shareholders and to facilitate compliance with legal and regulatory requirements and oversight of the fund's activities and associated risks. The Board, acting through its committees, has charged FMR and its affiliates with (i) identifying events or circumstances the occurrence of which could have demonstrably adverse effects on the fund's business and/or reputation; (ii) implementing processes and controls to lessen the possibility that such events or circumstances occur or to mitigate the effects of such events or circumstances if they do occur; and (iii) creating and maintaining a system designed to evaluate continuously business and market conditions in order to facilitate the identification and implementation processes described in (i) and (ii) above. Because the day-to-day operations and activities of the fund are carried out by or through FMR, its affiliates, and other service providers, the fund's exposure to risks is mitigated but not eliminated by the processes overseen by the Trustees. While each of the Board's committees has responsibility for overseeing different aspects of the fund's activities, oversight is exercised primarily through the Operations, Audit, and Compliance Committees. In addition, the Independent Trustees have worked with FMR to enhance the Board's oversight of investment and financial risks, legal and regulatory risks, technology risks, and operational risks, including the development of additional risk reporting to the Board. For example, a working group comprised of Independent Trustees and FMR has worked and continues to work to review the Fidelity® funds' valuation-related activities, reporting and risk management. Appropriate personnel, including but not limited to the fund's Chief Compliance Officer (CCO), FMR's internal auditor, the independent accountants, the fund's Treasurer and portfolio management personnel, make periodic reports to the Board's committees, as appropriate, including an annual review of Fidelity's risk management program for the Fidelity® funds. The responsibilities of each standing committee, including their oversight responsibilities, are described further under "Standing Committees of the Trustees."
Interested Trustees*:
Correspondence intended for a Trustee who is an interested person may be sent to Fidelity Investments, 245 Summer Street, Boston, Massachusetts 02210.
Name, Year of Birth; Principal Occupations and Other Relevant Experience+
Jonathan Chiel (1957)
Year of Election or Appointment: 2016
Trustee
Mr. Chiel also serves as Trustee of other Fidelity funds. Mr. Chiel is Executive Vice President and General Counsel for FMR LLC (diversified financial services company, 2012-present). Previously, Mr. Chiel served as general counsel (2004-2012) and senior vice president and deputy general counsel (2000-2004) for John Hancock Financial Services; a partner with Choate, Hall & Stewart (1996-2000) (law firm); and an Assistant United States Attorney for the United States Attorney’s Office of the District of Massachusetts (1986-95), including Chief of the Criminal Division (1993-1995). Mr. Chiel is a director on the boards of the Boston Bar Foundation and the Maimonides School.
James C. Curvey (1935)
Year of Election or Appointment: 2007
Trustee
Chairman of the Board of Trustees
Mr. Curvey also serves as Trustee of other Fidelity® funds. Mr. Curvey is a Director of Fidelity Research & Analysis Co. (investment adviser firm, 2009-present), and Vice Chairman (2007-present) and Director of FMR LLC (diversified financial services company). In addition, Mr. Curvey serves as an Overseer for the Boston Symphony Orchestra and a member of the board of Artis-Naples, Naples, Florida, and as a Trustee for Brewster Academy, Wolfeboro, New Hampshire. Previously, Mr. Curvey served as a Director of Fidelity Investments Money Management, Inc. (investment adviser firm, 2009-2014) and a Director of FMR and FMR Co., Inc. (investment adviser firms, 2007-2014).
Charles S. Morrison (1960)
Year of Election or Appointment: 2014
Trustee
Mr. Morrison also serves as Trustee of other funds. He serves as President of Fidelity Management & Research Company (FMR) (investment adviser firm, 2016-present), a Director of Fidelity Investments Money Management, Inc. (FIMM) (investment adviser firm, 2014-present), Director of Fidelity SelectCo, LLC (investment adviser firm, 2014-present), President, Asset Management (2014-present), and is an employee of Fidelity Investments. Previously, Mr. Morrison served as Vice President of Fidelity's Fixed Income and Asset Allocation Funds (2012-2014), President, Fixed Income (2011-2014), Vice President of Fidelity's Money Market Funds (2005-2009), President, Money Market Group Leader of FMR (investment adviser firm, 2009), and Senior Vice President, Money Market Group of FMR (2004-2009). Mr. Morrison also served as Vice President of Fidelity's Bond Funds (2002-2005), certain Balanced Funds (2002-2005), and certain Asset Allocation Funds (2002-2007), and as Senior Vice President (2002-2005) of Fidelity's Bond Division.
* Determined to be an “Interested Trustee” by virtue of, among other things, his or her affiliation with the trust or various entities under common control with FMR.
+ The information includes the Trustee's principal occupation during the last five years and other information relating to the experience, attributes, and skills relevant to the Trustee's qualifications to serve as a Trustee, which led to the conclusion that the Trustee should serve as a Trustee for the fund.
Independent Trustees:
Correspondence intended for an Independent Trustee may be sent to Fidelity Investments, P.O. Box 55235, Boston, Massachusetts 02205-5235.
Name, Year of Birth; Principal Occupations and Other Relevant Experience+
Dennis J. Dirks (1948)
Year of Election or Appointment: 2005
Trustee
Mr. Dirks also serves as Trustee of other Fidelity® funds. Prior to his retirement in May 2003, Mr. Dirks was Chief Operating Officer and a member of the Board of The Depository Trust & Clearing Corporation (DTCC). He also served as President, Chief Operating Officer, and Board member of The Depository Trust Company (DTC) and President and Board member of the National Securities Clearing Corporation (NSCC). In addition, Mr. Dirks served as Chief Executive Officer and Board member of the Government Securities Clearing Corporation, Chief Executive Officer and Board member of the Mortgage-Backed Securities Clearing Corporation, as a Trustee and a member of the Finance Committee of Manhattan College (2005-2008), as a Trustee and a member of the Finance Committee of AHRC of Nassau County (2006-2008), as a member of the Independent Directors Council (IDC) Governing Council (2010-2015), and as a member of the Board of Directors for The Brookville Center for Children’s Services, Inc. (2009-2017). Mr. Dirks is a member of the Finance Committee (2016-present) and Board of Directors (2017-present) of the Asolo Repertory Theatre.
Alan J. Lacy (1953)
Year of Election or Appointment: 2008
Trustee
Mr. Lacy also serves as Trustee of other Fidelity® funds. Mr. Lacy serves as a Director of Bristol-Myers Squibb Company (global pharmaceuticals, 2008-present). He is a Trustee of the California Chapter of The Nature Conservancy (2015-present) and a Director of the Center for Advanced Study in the Behavioral Sciences at Stanford University (2015-present). In addition, Mr. Lacy served as Senior Adviser (2007-2014) of Oak Hill Capital Partners, L.P. (private equity) and also served as Chief Executive Officer (2005) and Vice Chairman (2005-2006) of Sears Holdings Corporation (retail) and Chief Executive Officer and Chairman of the Board of Sears, Roebuck and Co. (retail, 2000-2005). Previously, Mr. Lacy served as Chairman (2014-2017) and a member (2010-2017) of the Board of Directors of Dave & Buster’s Entertainment, Inc. (restaurant and entertainment complexes), as Chairman (2008-2011) and a member (2006-2015) of the Board of Trustees of the National Parks Conservation Association, and as a member of the Board of Directors for The Hillman Companies, Inc. (hardware wholesalers, 2010-2014), Earth Fare, Inc. (retail grocery, 2010-2014), and The Western Union Company (global money transfer, 2006-2011).
Ned C. Lautenbach (1944)
Year of Election or Appointment: 2000
Trustee
Chairman of the Independent Trustees
Mr. Lautenbach also serves as Trustee of other Fidelity® funds. Mr. Lautenbach currently serves as the Lead Director of the Eaton Corporation Board of Directors (diversified industrial, 1997-present). Mr. Lautenbach is Chairman of the Board of Directors of Artis-Naples in Naples, Florida (2012-present), a member of the Council on Foreign Relations (1994-present), and currently Vice Chair of the Board of Governors, State University System of Florida (2013-present). Previously, Mr. Lautenbach was a Partner and Advisory Partner at Clayton, Dubilier & Rice, LLC (private equity investment, 1998-2010), as well as a Director of Sony Corporation (2006-2007). Mr. Lautenbach also had a 30-year career with IBM (technology company) during which time he served as Senior Vice President and a member of the Corporate Executive Committee (1968-1998).
Joseph Mauriello (1944)
Year of Election or Appointment: 2008
Trustee
Mr. Mauriello also serves as Trustee of other Fidelity® funds. Prior to his retirement in January 2006, Mr. Mauriello served in numerous senior management positions including Deputy Chairman and Chief Operating Officer (2004-2005), and Vice Chairman of Financial Services (2002-2004) of KPMG LLP US (professional services, 1965-2005). Mr. Mauriello currently serves as a member of the Board of Directors of XL Group plc. (global insurance and re-insurance, 2006-present) and the Independent Directors Council (IDC) Governing Council (2015-present). Previously, Mr. Mauriello served as a Director of the Hamilton Funds of the Bank of New York (2006-2007) and of Arcadia Resources Inc. (health care services and products, 2007-2012).
Cornelia M. Small (1944)
Year of Election or Appointment: 2005
Trustee
Ms. Small also serves as Trustee of other Fidelity® funds. Ms. Small is a member of the Board of Directors (2009-present) and Chair of the Investment Committee (2010-present) of the Teagle Foundation. Ms. Small also serves on the Investment Committee of the Berkshire Taconic Community Foundation (2008-present). Previously, Ms. Small served as Chairperson (2002-2008) and a member of the Investment Committee and Chairperson (2008-2012) and a member of the Board of Trustees of Smith College. In addition, Ms. Small served as Chief Investment Officer, Director of Global Equity Investments, and a member of the Board of Directors of Scudder, Stevens & Clark and Scudder Kemper Investments.
William S. Stavropoulos (1939)
Year of Election or Appointment: 2001
Trustee
Vice Chairman of the Independent Trustees
Mr. Stavropoulos also serves as Trustee of other Fidelity® funds. Mr. Stavropoulos serves as President and Founder of the Michigan Baseball Foundation, the Great Lakes Loons (2007-present). Mr. Stavropoulos is Chairman Emeritus of the Board of Directors of The Dow Chemical Company, where he previously served in numerous senior management positions, including President, CEO (1995-2000; 2002-2004), Chairman of the Executive Committee (2000-2006), and as a member of the Board of Directors (1990-2006). Currently, Mr. Stavropoulos is Chairman of the Board of Directors of Univar Inc. (global distributor of commodity and specialty chemicals), a Director of Teradata Corporation (data warehousing and technology solutions), and a member of the Advisory Board for Metalmark Capital LLC (private equity investment, 2005-present). Mr. Stavropoulos is an operating advisor to Clayton, Dubilier & Rice, LLC (private equity investment). In addition, Mr. Stavropoulos is a member of the University of Notre Dame Advisory Council for the College of Science, a Trustee of the Rollin L. Gerstacker Foundation, and a Director of Artis-Naples in Naples, Florida. Previously, Mr. Stavropoulos served as a Director of Chemical Financial Corporation (bank holding company, 1993-2012) and Tyco International, Ltd. (multinational manufacturing and services, 2007-2012).
David M. Thomas (1949)
Year of Election or Appointment: 2008
Trustee
Mr. Thomas also serves as Trustee of other Fidelity® funds. Mr. Thomas serves as Non-Executive Chairman of the Board of Directors of Fortune Brands Home and Security (home and security products, 2011-present), as a member of the Board of Directors (2004-present) and Presiding Director (2013-present) of Interpublic Group of Companies, Inc. (marketing communication), and as a member of the Board of Trustees of the University of Florida (2013-present). Previously, Mr. Thomas served as Executive Chairman (2005-2006) and Chairman and Chief Executive Officer (2000-2005) of IMS Health, Inc. (pharmaceutical and healthcare information solutions), and a Director of Fortune Brands, Inc. (consumer products, 2000-2011).
+ The information includes the Trustee's principal occupation during the last five years and other information relating to the experience, attributes, and skills relevant to the Trustee's qualifications to serve as a Trustee, which led to the conclusion that the Trustee should serve as a Trustee for the fund.
Advisory Board Members and Officers:
Correspondence intended for an officer or Peter S. Lynch may be sent to Fidelity Investments, 245 Summer Street, Boston, Massachusetts 02210. Officers appear below in alphabetical order.
Name, Year of Birth; Principal Occupation
Peter S. Lynch (1944)
Year of Election or Appointment: 2003
Member of the Advisory Board
Mr. Lynch also serves as Member of the Advisory Board of other Fidelity® funds. Mr. Lynch is Vice Chairman and a Director of FMR (investment adviser firm) and FMR Co., Inc. (investment adviser firm). In addition, Mr. Lynch serves as a Trustee of Boston College and as the Chairman of the Inner-City Scholarship Fund. Previously, Mr. Lynch served on the Special Olympics International Board of Directors (1997-2006).
Elizabeth Paige Baumann (1968)
Year of Election or Appointment: 2017
Anti-Money Laundering (AML) Officer
Ms. Baumann also serves as AML Officer of other funds. She is Chief AML Officer (2012-present) and Senior Vice President (2014-present) of FMR LLC (diversified financial services company) and is an employee of Fidelity Investments. Previously, Ms. Baumann served as AML Officer of the funds (2012-2016), and Vice President (2007-2014) and Deputy Anti-Money Laundering Officer (2007-2012) of FMR LLC.
Marc R. Bryant (1966)
Year of Election or Appointment: 2015
Secretary and Chief Legal Officer (CLO)
Mr. Bryant also serves as Secretary and CLO of other funds. Mr. Bryant serves as CLO, Secretary, and Senior Vice President of Fidelity Management & Research Company (investment adviser firm, 2015-present) and FMR Co., Inc. (investment adviser firm, 2015-present); Secretary of Fidelity SelectCo, LLC (investment adviser firm, 2015-present) and Fidelity Investments Money Management, Inc. (investment adviser firm, 2015-present); and CLO of Fidelity Management & Research (Hong Kong) Limited and FMR Investment Management (UK) Limited (investment adviser firms, 2015-present) and Fidelity Management & Research (Japan) Limited (investment adviser firm, 2016-present). He is Senior Vice President and Deputy General Counsel of FMR LLC (diversified financial services company). Previously, Mr. Bryant served as Secretary and CLO of Fidelity Rutland Square Trust II (2010-2014) and Assistant Secretary of Fidelity's Fixed Income and Asset Allocation Funds (2013-2015). Prior to joining Fidelity Investments, Mr. Bryant served as a Senior Vice President and the Head of Global Retail Legal for AllianceBernstein L.P. (2006-2010), and as the General Counsel for ProFund Advisors LLC (2001-2006).
William C. Coffey (1969)
Year of Election or Appointment: 2009
Assistant Secretary
Mr. Coffey also serves as Assistant Secretary of other funds. He is Senior Vice President and Deputy General Counsel of FMR LLC (diversified financial services company, 2010-present), and is an employee of Fidelity Investments. Previously, Mr. Coffey served as Vice President and Associate General Counsel of FMR LLC (2005-2009).
Jonathan Davis (1968)
Year of Election or Appointment: 2010
Assistant Treasurer
Mr. Davis also serves as Assistant Treasurer of other funds, and is an employee of Fidelity Investments. Previously, Mr. Davis served as Vice President and Associate General Counsel of FMR LLC (diversified financial services company, 2003-2010).
Adrien E. Deberghes (1967)
Year of Election or Appointment: 2016
Assistant Treasurer
Mr. Deberghes also serves as an officer of other funds. He serves as Executive Vice President of Fidelity Investments Money Management, Inc. (FIMM) (investment adviser firm, 2016-present) and is an employee of Fidelity Investments (2008-present). Prior to joining Fidelity Investments, Mr. Deberghes was Senior Vice President of Mutual Fund Administration at State Street Corporation (2007-2008), Senior Director of Mutual Fund Administration at Investors Bank & Trust (2005-2007), and Director of Finance for Dunkin' Brands (2000-2005). Previously, Mr. Deberghes served in other fund officer roles.
Stephanie J. Dorsey (1969)
Year of Election or Appointment: 2010
Assistant Treasurer
Ms. Dorsey also serves as an officer of other funds. She is an employee of Fidelity Investments (2008-present) and has served in other fund officer roles. Prior to joining Fidelity Investments, Ms. Dorsey served as Treasurer (2004-2008) of the JPMorgan Mutual Funds and Vice President (2004-2008) of JPMorgan Chase Bank.
Howard J. Galligan III (1966)
Year of Election or Appointment: 2014
Chief Financial Officer
Mr. Galligan also serves as Chief Financial Officer of other funds. Mr. Galligan serves as President of Fidelity Pricing and Cash Management Services (FPCMS) (2014-present) and as a Director of Strategic Advisers, Inc. (investment adviser firm, 2008-present). Previously, Mr. Galligan served as Chief Administrative Officer of Asset Management (2011-2014) and Chief Operating Officer and Senior Vice President of Investment Support for Strategic Advisers, Inc. (2003-2011).
Thomas C. Hense (1964)
Year of Election or Appointment: 2008, 2010, or 2015
Vice President
Mr. Hense serves as Vice President of Fidelity Advisor® Multi-Asset Income Fund (2015) and other funds (High Income (2008), Small Cap (2008), and Value (2010) funds), and is an employee of Fidelity Investments (1993-present). Previously, Mr. Hense served as a portfolio manager for Fidelity's Institutional Money Management Group (Pyramis) (2003-2008).
Brian B. Hogan (1964)
Year of Election or Appointment: 2009
Vice President
Mr. Hogan also serves as Trustee or Vice President of other funds. Mr. Hogan serves as a Director of FMR Investment Management (UK) Limited (investment adviser firm, 2015-present) and Fidelity SelectCo, LLC (investment adviser firm, 2014-present) and President of the Equity Division of FMR (investment adviser firm, 2009-present). Previously, Mr. Hogan served as Senior Vice President, Equity Research of FMR (2006-2009) and as a portfolio manager. Mr. Brian B. Hogan is not related to Mr. Colm A. Hogan.
Colm A. Hogan (1973)
Year of Election or Appointment: 2016
Deputy Treasurer
Mr. Hogan also serves as an officer of other funds. Mr. Hogan is an employee of Fidelity Investments (2005-present). Mr. Colm A. Hogan is not related to Mr. Brian B. Hogan.
Chris Maher (1972)
Year of Election or Appointment: 2013
Assistant Treasurer
Mr. Maher serves as Assistant Treasurer of other funds. Mr. Maher is Vice President of Valuation Oversight and is an employee of Fidelity Investments. Previously, Mr. Maher served as Vice President of Asset Management Compliance (2013), Vice President of the Program Management Group of FMR (investment adviser firm, 2010-2013), and Vice President of Valuation Oversight (2008-2010).
Rieco E. Mello (1969)
Year of Election or Appointment: 2017
Assistant Treasurer
Mr. Mello also serves as Assistant Treasurer of other funds. Mr. Mello is an employee of Fidelity Investments (1995-present).
Kenneth B. Robins (1969)
Year of Election or Appointment: 2016
Chief Compliance Officer
Mr. Robins also serves as an officer of other funds. Mr. Robins serves as Compliance Officer of Fidelity Management & Research Company and FMR Co., Inc. (investment adviser firms, 2016-present) and is an employee of Fidelity Investments (2004-present). Previously, Mr. Robins served as Executive Vice President of Fidelity Investments Money Management, Inc. (investment adviser firm, 2013-2016) and served in other fund officer roles.
Stacie M. Smith (1974)
Year of Election or Appointment: 2016
President and Treasurer
Ms. Smith also serves as an officer of other funds. She is an employee of Fidelity Investments (2009-present) and has served in other fund officer roles. Prior to joining Fidelity Investments, Ms. Smith served as Senior Audit Manager of Ernst & Young LLP (accounting firm, 1996-2009). Previously, Ms. Smith served as Deputy Treasurer of certain Fidelity® funds (2013-2016).
Marc L. Spector (1972)
Year of Election or Appointment: 2016
Assistant Treasurer
Mr. Spector also serves as an officer of other funds. Mr. Spector is an employee of Fidelity Investments (2016-present). Prior to joining Fidelity Investments, Mr. Spector served as Director at the Siegfried Group (accounting firm, 2013-2016), and prior to Siegfried Group as audit senior manager at Deloitte & Touche (accounting firm, 2005-2013).
Renee Stagnone (1975)
Year of Election or Appointment: 2016
Assistant Treasurer
Ms. Stagnone also serves as an officer of other funds. Ms. Stagnone is an employee of Fidelity Investments (1997-present). Previously, Ms. Stagnone served as Deputy Treasurer of certain Fidelity® funds (2013-2016).
Shareholder Expense Example
As a shareholder of the Fund, you incur two types of costs: (1) transaction costs and (2) ongoing costs, including management fees and other Fund expenses. This Example is intended to help you understand your ongoing costs (in dollars) of investing in the Fund and to compare these costs with the ongoing costs of investing in other mutual funds.
The actual expense Example is based on an investment of $1,000 invested at the beginning of the period and held for the entire period (May 25, 2017 to July 31, 2017). The hypothetical expense Example is based on an investment of $1,000 invested for the one-half year period (February 1, 2017 to July 31, 2017).
Actual Expenses
The first line of the accompanying table provides information about actual account values and actual expenses. You may use the information in this line, together with the amount you invested, to estimate the expenses that you paid over the period. Simply divide your account value by $1,000.00 (for example, an $8,600 account value divided by $1,000.00 = 8.6), then multiply the result by the number in the first line under the heading entitled "Expenses Paid During Period" to estimate the expenses you paid on your account during this period. In addition, the Fund, as a shareholder in the underlying Fidelity Central Funds, will indirectly bear its pro-rata share of the fees and expenses incurred by the underlying Fidelity Central Funds. These fees and expenses are not included in the Fund's annualized expense ratio used to calculate the expense estimate in the table below.
Hypothetical Example for Comparison Purposes
The second line of the accompanying table provides information about hypothetical account values and hypothetical expenses based on the Fund's actual expense ratio and an assumed rate of return of 5% per year before expenses, which is not the Fund's actual return. The hypothetical account values and expenses may not be used to estimate the actual ending account balance or expenses you paid for the period. You may use this information to compare the ongoing costs of investing in the Fund and other funds. To do so, compare this 5% hypothetical example with the 5% hypothetical examples that appear in the shareholder reports of the other funds. In addition, the Fund, as a shareholder in the underlying Fidelity Central Funds, will indirectly bear its pro-rata share of the fees and expenses incurred by the underlying Fidelity Central Funds. These fees and expenses are not included in the Fund's annualized expense ratio used to calculate the expense estimate in the table below.
Please note that the expenses shown in the table are meant to highlight your ongoing costs only and do not reflect any transaction costs. Therefore, the second line of the table is useful in comparing ongoing costs only, and will not help you determine the relative total costs of owning different funds.
| | Annualized Expense Ratio-A | Beginning
Account Value
| Ending
Account Value
July 31, 2017 | Expenses Paid
During Period
|
| Actual | .45% | $1,000.00 | $1,038.00 | $.85-B |
| Hypothetical-C | | $1,000.00 | $1,022.56 | $2.26-D |
A Annualized expense ratio reflects expenses net of applicable fee waivers.
B Actual expenses are equal to the Fund's annualized expense ratio, multiplied by the average account value over the period, multiplied by 68/365 (to reflect the period May 25, 2017 to July 31, 2017).
C 5% return per year before expenses
D Hypothetical expenses are equal to the Fund's annualized expense ratio, multiplied by the average account value over the period, multiplied by 181/365 (to reflect the one-half year period).
Board Approval of Investment Advisory Contracts and Management Fees
Fidelity Value Discovery K6 Fund
On January 18, 2017 the Board of Trustees, including the Independent Trustees (together, the Board), voted to approve the management contract with Fidelity Management & Research Company (FMR) and the sub-advisory agreements with affiliates of FMR (together, the Advisory Contracts) for the fund. The Board, assisted by the advice of fund counsel and Independent Trustees' counsel, considered a broad range of information.
Nature, Extent, and Quality of Services Provided. The Board considered Fidelity's staffing as it relates to the fund, including the backgrounds of investment personnel of Fidelity, and also considered the fund's investment objective, strategies, and related investment philosophy. The Board considered the structure of the investment personnel compensation program and whether this structure provides appropriate incentives to act in the best interests of the fund.
Resources Dedicated to Investment Management and Support Services. The Board and the Fund Oversight and Research Committees reviewed the general qualifications and capabilities of Fidelity's investment staff, including its size, education, experience, and resources, as well as Fidelity's approach to recruiting, training, managing, and compensating investment personnel. The Board noted that Fidelity has continued to increase the resources devoted to non-U.S. offices, including expansion of Fidelity's global investment organization. The Board also noted that Fidelity's analysts have extensive resources, tools and capabilities that allow them to conduct sophisticated quantitative and fundamental analysis, as well as credit analysis of issuers, counterparties and guarantors. Further, the Board considered that Fidelity's investment professionals have sufficient access to global information and data so as to provide competitive investment results over time, and that those professionals also have access to sophisticated tools that permit them to assess portfolio construction and risk and performance attribution characteristics continuously, as well as to transmit new information and research conclusions rapidly around the world. Additionally, in its deliberations, the Board considered Fidelity's trading, risk management, compliance, and technology and operations capabilities and resources, which are integral parts of the investment management process.
Shareholder and Administrative Services. The Board considered the nature, extent, quality, and cost of advisory, administrative, and shareholder services to be performed by FMR, the sub-advisers (together with FMR, the Investment Advisers), and their affiliates under the Advisory Contracts and under separate agreements covering transfer agency, pricing and bookkeeping and securities lending services for the fund. The Board also considered the nature and extent of the supervision of third party service providers, principally custodians, subcustodians, and pricing vendors.
The Board noted that the growth of fund assets over time across the complex allows Fidelity to reinvest in the development of services designed to enhance the value or convenience of the Fidelity funds as investment vehicles. These services include 24-hour access to account information and market information through telephone representatives and over the Internet, investor education materials and asset allocation tools, and the expanded availability of Fidelity Investor Centers.
Investment Performance. The fund is a new fund and therefore had no historical performance for the Board to review at the time it approved the fund's Advisory Contracts. The Board considered the Investment Advisers' strength in fundamental, research-driven security selection, which the Board is familiar with through its supervision of other Fidelity funds, including funds with identical investment objectives as the fund.
Based on its review, the Board concluded that the nature, extent, and quality of services to be provided to the fund under the Advisory Contracts should benefit the shareholders of the fund.
Competitiveness of Management Fee and Total Expense Ratio. The Board considered the fund's proposed management fee out of which FMR will pay all operating expenses, with certain limited exceptions, and the projected total expense ratio of the fund in reviewing the Advisory Contracts. The Board noted that the fund's proposed management fee rate is lower than the median fee rate of funds with similar Lipper investment objective categories and comparable investment mandates, regardless of whether their management fee structures are comparable. The Board also considered that the projected total expense ratio of the fund is below the median of those funds and classes used by the Board for management fee comparisons that have a similar sales load structure.
Based on its review, the Board concluded that the fund's management fee and projected total expense ratio were reasonable in light of the services that the fund and its shareholders will receive and the other factors considered.
Costs of the Services and Profitability. The fund is a new fund and therefore no revenue, cost, or profitability data was available for the Board to review in respect of the fund at the time it approved the Advisory Contracts. In connection with its future renewal of the fund's Advisory Contracts, the Board will consider the revenues earned and the expenses incurred by Fidelity in conducting the business of developing, marketing, distributing, managing, administering and servicing the fund and servicing the fund's shareholders.
Economies of Scale. The Board will consider economies of scale when there is operating experience to permit assessment thereof. It noted that, notwithstanding the entrepreneurial risk associated with a new fund, the management fee was at a level normally associated, by comparison with competitors, with very high fund net assets, and Fidelity asserted to the Board that the level of the fee anticipated economies of scale at lower asset levels even before, if ever, economies of scale are achieved. The Board also noted that the fund and its shareholders would have access to the very considerable number and variety of services available through Fidelity and its affiliates.
Based on its evaluation of all of the conclusions noted above, and after considering all factors it believed relevant, the Board concluded that the advisory fee structures are fair and reasonable, and that the fund's Advisory Contracts should be approved.
Corporate Headquarters
245 Summer St.
Boston, MA 02210
www.fidelity.com
FVDK6-ANN-0917
1.9884003.100
Fidelity® Low-Priced Stock Fund
Annual Report July 31, 2017 |
|
Contents
To view a fund's proxy voting guidelines and proxy voting record for the 12-month period ended June 30, visit http://www.fidelity.com/proxyvotingresults or visit the Securities and Exchange Commission's (SEC) web site at http://www.sec.gov.
You may also call 1-800-544-8544 to request a free copy of the proxy voting guidelines.
Standard & Poor's, S&P and S&P 500 are registered service marks of The McGraw-Hill Companies, Inc. and have been licensed for use by Fidelity Distributors Corporation.
Other third-party marks appearing herein are the property of their respective owners.
All other marks appearing herein are registered or unregistered trademarks or service marks of FMR LLC or an affiliated company. © 2017 FMR LLC. All rights reserved.
This report and the financial statements contained herein are submitted for the general information of the shareholders of the Fund. This report is not authorized for distribution to prospective investors in the Fund unless preceded or accompanied by an effective prospectus.
A fund files its complete schedule of portfolio holdings with the SEC for the first and third quarters of each fiscal year on Form N-Q. Forms N-Q are available on the SEC’s web site at http://www.sec.gov. A fund's Forms N-Q may be reviewed and copied at the SEC’s Public Reference Room in Washington, DC. Information regarding the operation of the SEC's Public Reference Room may be obtained by calling 1-800-SEC-0330.
For a complete list of a fund's portfolio holdings, view the most recent holdings listing, semiannual report, or annual report on Fidelity's web site at http://www.fidelity.com, http://www.institutional.fidelity.com, or http://www.401k.com, as applicable.
NOT FDIC INSURED •MAY LOSE VALUE •NO BANK GUARANTEE
Neither the Fund nor Fidelity Distributors Corporation is a bank.
Note to Shareholders
On August 16, 2017, the Equity and High Income Board of Trustees approved a change to the investment policies of Fidelity’s Low-Priced Stock strategies. The change, effective on or about November 7, 2017, expands the definition of “low-priced stocks.” Previously, low-priced stocks were defined as those priced at or below $35 per share. This definition will be expanded to include stocks with an earnings yield at or above the median for the Russell 2000 Index, as well as those priced at or below $35 per share. Earnings yield represents a stock’s earnings per share for the most recent 12 months divided by current price per share. We believe the expanded definition will better reflect the portfolio managers’ investment process and provide greater flexibility while remaining faithful to the fund name. No changes to the investment process and portfolio characteristics are expected.
Also, on April 21, 2017, Sam Chamovitz and Salim Hart became Co-Managers of the fund. Sam joined Morgen Peck, who manages the information technology and telecom sleeves, in co-managing the fund's all-sector subportfolio – previously run by Jamie Harmon and which was adjusted to include a global mandate. Salim assumed responsibility for a new U.S. all-sector subportfolio.
Performance: The Bottom Line
Average annual total return reflects the change in the value of an investment, assuming reinvestment of distributions from dividend income and capital gains (the profits earned upon the sale of securities that have grown in value, if any) and assuming a constant rate of performance each year. The hypothetical investment and the average annual total returns do not reflect the deduction of taxes that a shareholder would pay on fund distributions or the redemption of fund shares. During periods of reimbursement by Fidelity, a fund’s total return will be greater than it would be had the reimbursement not occurred. How a fund did yesterday is no guarantee of how it will do tomorrow.
Average Annual Total Returns
| For the periods ended July 31, 2017 | Past 1 year | Past 5 years | Past 10 years |
| Fidelity® Low-Priced Stock Fund | 15.17% | 13.57% | 8.00% |
$10,000 Over 10 Years
Let's say hypothetically that $10,000 was invested in Fidelity® Low-Priced Stock Fund, a class of the fund, on July 31, 2007.
The chart shows how the value of your investment would have changed, and also shows how the Russell 2000® Index performed over the same period.
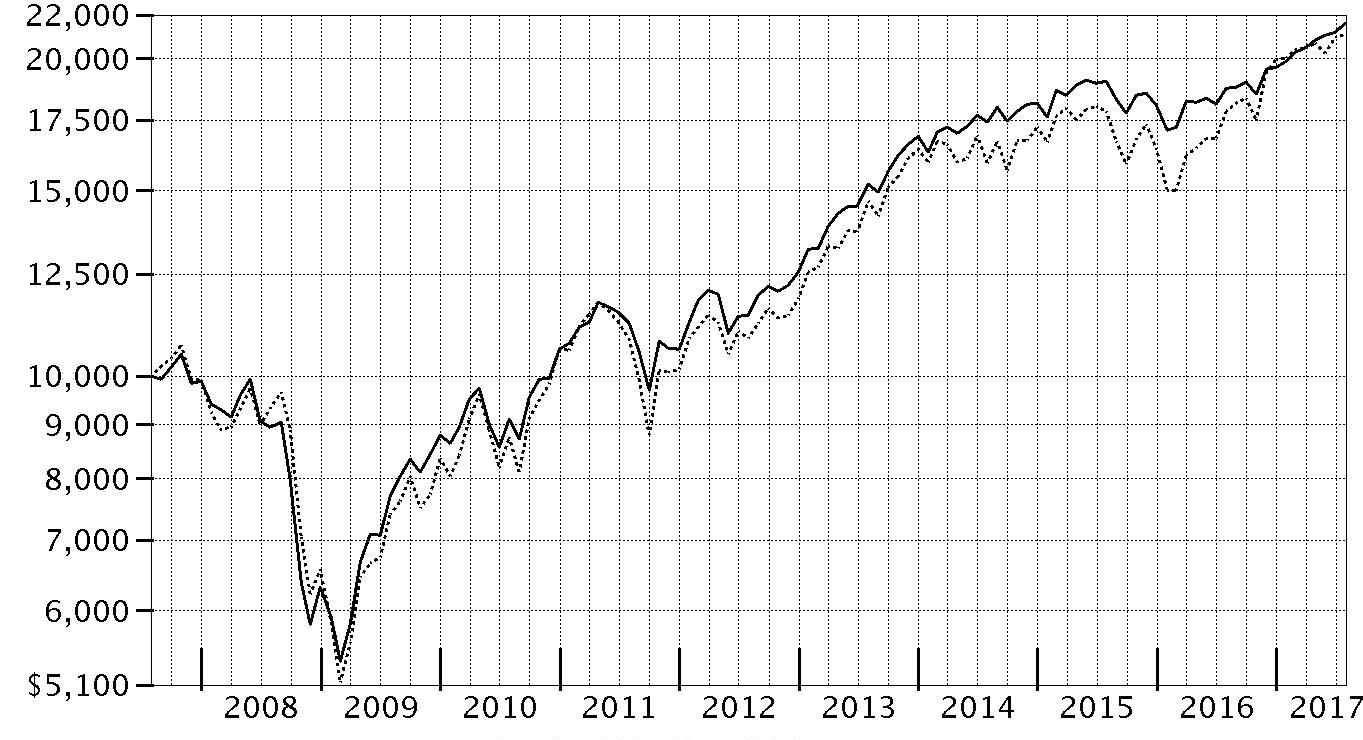
| Period Ending Values |
| $21,590 | Fidelity® Low-Priced Stock Fund |
| $21,111 | Russell 2000® Index |
Management's Discussion of Fund Performance
Market Recap: The U.S. equity bellwether S&P 500
® index gained 16.04% for the year ending July 31, 2017, rising sharply following the November election and continuing to rally through the end of February on optimism for President Trump’s pro-business agenda. Equity markets leveled off, however, as the fledgling administration faced the first test of its domestic agenda. Stocks reacted with uncertainty to efforts by Congress in March to repeal and replace the Affordable Care Act, and then reverted upward through July 31. Growth stocks surged ahead of value, while small-caps’ advantage over large-caps narrowed. Sector-wise, financials (+36%) fared best, riding an uptick in bond yields and a surge in banks, particularly post-election. Information technology gained 29%, as a handful of major index constituents posted stellar returns. Industrials (+18%) was boosted by a call for increased infrastructure spending. Consumer discretionary (+14%) slightly lagged the broader market because brick-and-mortar retailers continued to suffer from increased online competition. Energy (0%) was hurt by low oil prices. Utilities (+6%), consumer staples (+4%), telecommunication services (-7%) and real estate (-2%) all struggled amid an improved backdrop for riskier assets that curbed demand for dividend-rich sectors, as well as the likelihood of further interest rate hikes later in 2017.
Comments from Lead Portfolio Manager Joel Tillinghast: For the fiscal year, the fund’s share classes returned about 15%, trailing the 18.45% result of the benchmark Russell 2000
® Index. The fund’s return relative to the benchmark was hindered by the strengthening of the U.S. dollar, which held back many of the fund’s non-U.S. holdings. Also, less-profitable and more economically cyclical stocks, which generally are not a focus of the fund, rallied for weeks after the November 2016 U.S. elections. Specifically, the bulk of the fund’s relative weakness was due to outsized exposure to retailers within the consumer discretionary and consumer staples sectors – two categories that trailed the benchmark by a wide margin. Notable individual detractors included sizable positions in auto-parts retailer Autozone, Canada-based supermarket chain Metro and U.K. apparel retailer Next. Our stake in cash of about 10%, on average, detracted in a rising equity market. Conversely, good stock picking in the health care sector and in the insurance industry was helpful, led by UnitedHealth Group, the fund’s largest holding. Other contributors were insurance firm Unum Group, which benefited from an improving economy and rising expectations for higher interest rates, and retailer Best Buy, which bucked the trend of weakness in the retail industry. All of the stocks I've mentioned were non-benchmark holdings.
The views expressed above reflect those of the portfolio manager(s) only through the end of the period as stated on the cover of this report and do not necessarily represent the views of Fidelity or any other person in the Fidelity organization. Any such views are subject to change at any time based upon market or other conditions and Fidelity disclaims any responsibility to update such views. These views may not be relied on as investment advice and, because investment decisions for a Fidelity fund are based on numerous factors, may not be relied on as an indication of trading intent on behalf of any Fidelity fund.
Investment Summary (Unaudited)
Top Ten Stocks as of July 31, 2017
| | % of fund's net assets | % of fund's net assets 6 months ago |
| UnitedHealth Group, Inc. | 5.2 | 5.3 |
| Best Buy Co., Inc. | 2.9 | 2.6 |
| Ross Stores, Inc. | 2.4 | 3.0 |
| Metro, Inc. Class A (sub. vtg.) | 2.3 | 2.1 |
| Seagate Technology LLC | 2.2 | 3.2 |
| Unum Group | 2.1 | 2.0 |
| Next PLC | 1.9 | 1.8 |
| Hon Hai Precision Industry Co. Ltd. (Foxconn) | 1.9 | 1.3 |
| Aetna, Inc. | 1.8 | 1.4 |
| Barratt Developments PLC | 1.6 | 1.2 |
| | 24.3 | |
Top Five Market Sectors as of July 31, 2017
| | % of fund's net assets | % of fund's net assets 6 months ago |
| Consumer Discretionary | 22.7 | 23.5 |
| Information Technology | 17.8 | 18.1 |
| Health Care | 12.2 | 12.0 |
| Financials | 11.1 | 13.0 |
| Consumer Staples | 9.1 | 8.6 |
Asset Allocation (% of fund's net assets)
| As of July 31, 2017 * |
| | Stocks | 88.2% |
| | Short-Term Investments and Net Other Assets (Liabilities) | 11.8% |

* Foreign investments - 44.4%
| As of January 31, 2017 * |
| | Stocks | 91.4% |
| | Short-Term Investments and Net Other Assets (Liabilities) | 8.6% |

* Foreign investments - 42.2%
Investments July 31, 2017
Showing Percentage of Net Assets
| Common Stocks - 88.1% | | | |
| | | Shares | Value (000s) |
| CONSUMER DISCRETIONARY - 22.7% | | | |
| Auto Components - 1.1% | | | |
| Adient PLC | | 486,837 | $31,873 |
| ASTI Corp. (a)(b) | | 1,019,000 | 5,592 |
| Cooper Tire & Rubber Co. | | 24,122 | 882 |
| ElringKlinger AG (a) | | 779,100 | 13,595 |
| G-Tekt Corp. | | 76,700 | 1,488 |
| Gentex Corp. | | 2,697,300 | 45,908 |
| Gentherm, Inc. (c) | | 138,897 | 4,646 |
| Hertz Global Holdings, Inc. (a)(c) | | 37,900 | 518 |
| Hi-Lex Corp. | | 1,473,400 | 38,517 |
| INFAC Corp. | | 325,139 | 1,739 |
| INZI Controls Co. Ltd. (b) | | 1,516,000 | 6,917 |
| Motonic Corp. (b) | | 3,250,000 | 28,729 |
| Murakami Corp. (b) | | 820,900 | 17,692 |
| Nippon Seiki Co. Ltd. | | 2,768,500 | 53,112 |
| Piolax, Inc. (b) | | 2,607,300 | 72,133 |
| S&T Holdings Co. Ltd. (b) | | 859,329 | 12,660 |
| Samsung Climate Control Co. Ltd. (b) | | 499,950 | 5,669 |
| Sewon Precision Industries Co. Ltd. (b) | | 500,000 | 7,366 |
| Shoei Co. Ltd. | | 166,200 | 4,764 |
| SJM Co. Ltd. (b) | | 1,282,000 | 6,651 |
| SJM Holdings Co. Ltd. (b) | | 1,332,974 | 6,082 |
| Strattec Security Corp. (b) | | 317,500 | 11,271 |
| Sungwoo Hitech Co. Ltd. | | 1,888,517 | 12,040 |
| TBK Co. Ltd. | | 970,900 | 4,377 |
| The Goodyear Tire & Rubber Co. | | 49,400 | 1,557 |
| Yachiyo Industry Co. Ltd. | | 940,200 | 10,891 |
| Yutaka Giken Co. Ltd. (b) | | 1,288,000 | 29,488 |
| | | | 436,157 |
| Distributors - 0.2% | | | |
| Central Automotive Products Ltd. | | 79,000 | 1,115 |
| Chori Co. Ltd. | | 451,400 | 8,373 |
| Nakayamafuku Co. Ltd. (b) | | 1,051,200 | 7,504 |
| PALTAC Corp. | | 126,800 | 4,601 |
| SPK Corp. (b) | | 265,900 | 7,050 |
| Uni-Select, Inc. | | 1,727,600 | 40,323 |
| | | | 68,966 |
| Diversified Consumer Services - 0.6% | | | |
| American Public Education, Inc. (c) | | 622,500 | 13,259 |
| Clip Corp. (b) | | 285,400 | 2,382 |
| Collectors Universe, Inc. | | 204,200 | 5,080 |
| Cross-Harbour Holdings Ltd. | | 2,434,000 | 3,696 |
| Houghton Mifflin Harcourt Co. (c) | | 1,383,400 | 16,532 |
| Meiko Network Japan Co. Ltd. | | 869,100 | 12,408 |
| Service Corp. International | | 156,200 | 5,425 |
| ServiceMaster Global Holdings, Inc. (c) | | 420,462 | 18,484 |
| Shingakukai Co. Ltd. | | 151,400 | 799 |
| Step Co. Ltd. (b) | | 1,129,800 | 14,962 |
| Weight Watchers International, Inc. (a)(b)(c) | | 4,146,300 | 148,520 |
| | | | 241,547 |
| Hotels, Restaurants & Leisure - 0.6% | | | |
| Ark Restaurants Corp. (b) | | 198,944 | 4,524 |
| Bojangles', Inc. (c) | | 114,100 | 1,518 |
| BRONCO BILLY Co. Ltd. (a) | | 47,100 | 1,160 |
| Create Restaurants Holdings, Inc. | | 1,085,900 | 11,101 |
| El Pollo Loco Holdings, Inc. (a)(c) | | 98,700 | 1,283 |
| Flanigans Enterprises, Inc. | | 76,939 | 2,062 |
| Greggs PLC | | 868,000 | 12,598 |
| Hiday Hidaka Corp. (b) | | 2,257,722 | 60,332 |
| Ibersol SGPS SA | | 637,780 | 10,804 |
| ILG, Inc. | | 691,700 | 18,337 |
| Intralot SA (c) | | 1,300,741 | 1,817 |
| Koshidaka Holdings Co. Ltd. | | 198,580 | 5,393 |
| Kura Corp. Ltd. | | 96,500 | 4,858 |
| Monarch Casino & Resort, Inc. (c) | | 37,600 | 1,244 |
| Nagacorp Ltd. | | 488,000 | 297 |
| Ohsho Food Service Corp. | | 208,800 | 8,125 |
| Sportscene Group, Inc. Class A (b)(c) | | 347,800 | 1,827 |
| St. Marc Holdings Co. Ltd. | | 971,400 | 30,399 |
| The Monogatari Corp. | | 216,200 | 11,296 |
| The Restaurant Group PLC | | 6,815,800 | 30,072 |
| TORIDOLL Holdings Corp. | | 96,200 | 2,696 |
| | | | 221,743 |
| Household Durables - 3.7% | | | |
| Abbey PLC (b) | | 1,862,400 | 30,976 |
| Barratt Developments PLC (b) | | 75,766,700 | 615,294 |
| Bellway PLC | | 4,106,100 | 172,821 |
| D.R. Horton, Inc. | | 3,190,243 | 113,860 |
| Dorel Industries, Inc. Class B (sub. vtg.) | | 2,774,900 | 73,315 |
| Emak SpA | | 4,602,200 | 8,608 |
| First Juken Co. Ltd. (b) | | 1,468,800 | 21,090 |
| GUD Holdings Ltd. | | 269,905 | 2,580 |
| Helen of Troy Ltd. (b)(c) | | 1,949,800 | 196,442 |
| Henry Boot PLC | | 3,414,100 | 13,649 |
| Iida Group Holdings Co. Ltd. | | 232,400 | 3,974 |
| M/I Homes, Inc. | | 207,500 | 5,383 |
| NACCO Industries, Inc. Class A | | 185,192 | 12,149 |
| P&F Industries, Inc. Class A (b) | | 329,348 | 1,986 |
| PulteGroup, Inc. | | 536,800 | 13,109 |
| Q.E.P. Co., Inc. (c) | | 31,400 | 829 |
| Sanei Architecture Planning Co. Ltd. (b) | | 1,269,700 | 22,654 |
| Stanley Furniture Co., Inc. | | 296,200 | 373 |
| Taylor Morrison Home Corp. (c) | | 432,700 | 9,788 |
| Token Corp. | | 672,100 | 85,533 |
| Toll Brothers, Inc. | | 125,500 | 4,843 |
| | | | 1,409,256 |
| Internet & Direct Marketing Retail - 0.3% | | | |
| Belluna Co. Ltd. (b) | | 7,601,500 | 87,499 |
| Liberty Interactive Corp. QVC Group Series A (c) | | 1,225,400 | 29,336 |
| | | | 116,835 |
| Leisure Products - 0.2% | | | |
| Accell Group NV (b) | | 1,875,700 | 57,199 |
| Amer Group PLC (A Shares) | | 168,100 | 4,517 |
| Fenix Outdoor AB Class B (c) | | 32,298 | 0 |
| Kabe Husvagnar AB (B Shares) | | 290,598 | 7,594 |
| Mars Engineering Corp. | | 555,500 | 11,005 |
| Mattel, Inc. | | 444,700 | 8,903 |
| Miroku Corp. | | 737,000 | 3,242 |
| Vista Outdoor, Inc. (c) | | 49,400 | 1,141 |
| | | | 93,601 |
| Media - 0.9% | | | |
| Cinderella Media Group Ltd. (c) | | 16,490,000 | 7,009 |
| Corus Entertainment, Inc. Class B (non-vtg.) | | 614,300 | 6,819 |
| Discovery Communications, Inc. Class A (c) | | 1,787,000 | 43,960 |
| Gannett Co., Inc. | | 1,409,198 | 12,641 |
| Gray Television, Inc. (c) | | 386,100 | 5,753 |
| Harte-Hanks, Inc. (c) | | 777,262 | 750 |
| Hyundai HCN | | 2,723,979 | 10,167 |
| Informa PLC | | 443,856 | 4,073 |
| Intage Holdings, Inc. (b) | | 1,747,500 | 35,728 |
| Interpublic Group of Companies, Inc. | | 497,700 | 10,755 |
| Ipsos SA | | 9,314 | 322 |
| ITE Group PLC | | 91,197 | 217 |
| Lions Gate Entertainment Corp. Class B (c) | | 153,100 | 4,212 |
| Live Nation Entertainment, Inc. (c) | | 580,500 | 21,635 |
| MSG Network, Inc. Class A (c) | | 259,384 | 5,551 |
| Multiplus SA | | 536,800 | 6,850 |
| Pico Far East Holdings Ltd. | | 19,440,000 | 8,014 |
| Proto Corp. | | 246,800 | 3,859 |
| RKB Mainichi Broadcasting Corp. | | 44,600 | 2,043 |
| Saga Communications, Inc. Class A | | 384,100 | 14,922 |
| Salem Communications Corp. Class A | | 164,200 | 1,174 |
| Sky Network Television Ltd. | | 6,132,711 | 15,245 |
| STW Group Ltd. | | 4,301,049 | 3,957 |
| Tegna, Inc. | | 1,225,500 | 18,174 |
| Television Broadcasts Ltd. | | 3,613,500 | 13,231 |
| TOW Co. Ltd. (b) | | 1,920,600 | 15,331 |
| TVA Group, Inc. Class B (non-vtg.) (c) | | 3,242,003 | 8,815 |
| Twenty-First Century Fox, Inc.: | | | |
| Class A | | 918,900 | 26,740 |
| Class B | | 47,207 | 1,354 |
| Viacom, Inc. Class B (non-vtg.) | | 554,800 | 19,374 |
| WOWOW INC. | | 193,400 | 5,622 |
| | | | 334,297 |
| Multiline Retail - 2.1% | | | |
| Lifestyle China Group Ltd. (c) | | 35,700,000 | 14,626 |
| Lifestyle International Holdings Ltd. | | 37,195,000 | 50,858 |
| Next PLC (b) | | 13,817,100 | 720,096 |
| Watts Co. Ltd. (b) | | 1,184,700 | 15,539 |
| | | | 801,119 |
| Specialty Retail - 11.5% | | | |
| Aarons, Inc. Class A | | 148,200 | 6,859 |
| Abercrombie & Fitch Co. Class A (a)(b) | | 5,217,080 | 51,336 |
| Adastria Co. Ltd. | | 289,300 | 7,232 |
| AT-Group Co. Ltd. | | 1,148,500 | 29,170 |
| AutoCanada, Inc. (a) | | 209,400 | 3,373 |
| AutoZone, Inc. (c) | | 782,218 | 422,257 |
| Bed Bath & Beyond, Inc. (b) | | 9,195,900 | 274,957 |
| Best Buy Co., Inc. (b) | | 18,649,400 | 1,088,006 |
| BMTC Group, Inc. (b) | | 4,154,400 | 39,153 |
| Bonia Corp. Bhd | | 2,503,000 | 336 |
| Bonjour Holdings Ltd. | | 4,073,000 | 196 |
| Buffalo Co. Ltd. | | 97,700 | 783 |
| Cars.com, Inc. (a)(c) | | 452,533 | 10,997 |
| Cash Converters International Ltd. | | 23,154,614 | 6,113 |
| Chico's FAS, Inc. | | 1,529,300 | 13,993 |
| Delek Automotive Systems Ltd. | | 773,200 | 6,394 |
| DSW, Inc. Class A | | 4,512,400 | 81,404 |
| Dunelm Group PLC | | 681,700 | 5,415 |
| Ff Group (b)(c) | | 4,576,300 | 109,703 |
| Formosa Optical Technology Co. Ltd. | | 1,362,000 | 3,237 |
| Fourlis Holdings SA | | 292,000 | 2,005 |
| GameStop Corp. Class A (a)(b) | | 9,997,181 | 216,839 |
| GNC Holdings, Inc. Class A (a) | | 815,722 | 7,758 |
| Goldlion Holdings Ltd. | | 23,023,000 | 10,051 |
| Guess?, Inc. (b) | | 5,216,963 | 68,134 |
| Halfords Group PLC | | 1,255,900 | 5,521 |
| Hour Glass Ltd. | | 8,743,600 | 4,323 |
| IA Group Corp. (b) | | 616,700 | 3,759 |
| JB Hi-Fi Ltd. | | 111,251 | 2,315 |
| John David Group PLC | | 8,292,600 | 39,159 |
| Jumbo SA (b) | | 10,516,868 | 176,166 |
| K's Holdings Corp. | | 3,455,200 | 69,452 |
| Ku Holdings Co. Ltd. | | 892,100 | 8,100 |
| Kyoto Kimono Yuzen Co. Ltd. | | 249,700 | 2,104 |
| Le Chateau, Inc. Class A (sub. vtg.) (c) | | 863,800 | 83 |
| Leon's Furniture Ltd. | | 195,400 | 2,827 |
| Lewis Group Ltd. | | 1,129,900 | 2,640 |
| Mr. Bricolage SA (b) | | 902,775 | 16,992 |
| Nafco Co. Ltd. (b) | | 2,033,200 | 32,256 |
| Office Depot, Inc. | | 1,274,200 | 7,480 |
| Pal Group Holdings Co. Ltd. | | 810,500 | 25,915 |
| Ross Stores, Inc. | | 16,289,000 | 901,107 |
| Sa Sa International Holdings Ltd. | | 3,384,000 | 1,243 |
| Sacs Bar Holdings, Inc. | | 388,500 | 4,275 |
| Sally Beauty Holdings, Inc. (c) | | 921,400 | 18,640 |
| Second Chance Properties Ltd. | | 1,892,900 | 356 |
| Second Chance Properties Ltd. warrants 1/23/20 (c) | | 1,941,600 | 11 |
| Sonic Automotive, Inc. Class A (sub. vtg.) | | 1,098,900 | 19,945 |
| Staples, Inc. | | 21,587,009 | 219,108 |
| The Buckle, Inc. (a)(b) | | 4,722,600 | 80,756 |
| Urban Outfitters, Inc. (a)(c) | | 3,516,300 | 68,884 |
| USS Co. Ltd. | | 7,107,900 | 143,583 |
| Vitamin Shoppe, Inc. (c) | | 732,008 | 8,052 |
| Workman Co. Ltd. (b) | | 2,315,500 | 70,361 |
| Zumiez, Inc. (c) | | 320,852 | 4,075 |
| | | | 4,405,189 |
| Textiles, Apparel & Luxury Goods - 1.5% | | | |
| Anta Sports Products Ltd. | | 680,000 | 2,333 |
| Best Pacific International Holdings Ltd. | | 5,052,000 | 2,762 |
| Coach, Inc. | | 987,200 | 46,537 |
| Daphne International Holdings Ltd. (c) | | 870,000 | 78 |
| Embry Holdings Ltd. | | 2,267,000 | 726 |
| Emerald Expositions Events, Inc. | | 171,800 | 3,933 |
| Fossil Group, Inc. (a)(c) | | 2,023,651 | 22,766 |
| Gerry Weber International AG (Bearer) | | 48,300 | 617 |
| Gildan Activewear, Inc. | | 7,749,600 | 233,529 |
| Handsome Co. Ltd. (b) | | 2,125,000 | 68,497 |
| JLM Couture, Inc. (b)(c) | | 168,167 | 511 |
| Makalot Industrial Co. Ltd. | | 906,000 | 4,048 |
| McRae Industries, Inc. | | 25,280 | 834 |
| Michael Kors Holdings Ltd. (c) | | 128,405 | 4,679 |
| Movado Group, Inc. | | 248,092 | 6,103 |
| Portico International Holdings (c) | | 10,696,500 | 3,602 |
| Steven Madden Ltd. (c) | | 830,800 | 34,063 |
| Sun Hing Vision Group Holdings Ltd. (b) | | 20,801,000 | 8,362 |
| Texwinca Holdings Ltd. | | 52,138,000 | 31,640 |
| Victory City International Holdings Ltd. | | 94,987,225 | 3,223 |
| Wolverine World Wide, Inc. | | 261,900 | 7,386 |
| Youngone Corp. | | 500,000 | 14,644 |
| Youngone Holdings Co. Ltd. (b) | | 889,600 | 42,735 |
| Yue Yuen Industrial (Holdings) Ltd. | | 5,343,000 | 22,061 |
| | | | 565,669 |
|
| TOTAL CONSUMER DISCRETIONARY | | | 8,694,379 |
|
| CONSUMER STAPLES - 9.1% | | | |
| Beverages - 1.5% | | | |
| A.G. Barr PLC | | 3,226,520 | 25,542 |
| Baron de Ley SA (c) | | 139,000 | 17,936 |
| Beluga Group Pjsc (c) | | 89,077 | 897 |
| Britvic PLC | | 6,767,200 | 63,751 |
| C&C Group PLC | | 2,468,000 | 8,940 |
| Jinro Distillers Co. Ltd. | | 47,081 | 1,400 |
| Kweichow Moutai Co. Ltd. (A Shares) | | 250,000 | 17,885 |
| Monster Beverage Corp. (c) | | 7,039,474 | 371,332 |
| Muhak Co. Ltd. (b) | | 2,799,256 | 56,738 |
| Olvi PLC (A Shares) | | 104,263 | 3,669 |
| Spritzer Bhd | | 5,120,400 | 2,834 |
| Stock Spirits Group PLC | | 97,300 | 210 |
| Yantai Changyu Pioneer Wine Co. Ltd. (B Shares) | | 2,799,936 | 7,119 |
| | | | 578,253 |
| Food & Staples Retailing - 5.2% | | | |
| Amsterdam Commodities NV | | 146,000 | 4,338 |
| Aoki Super Co. Ltd. | | 234,000 | 2,882 |
| Australasian Foods Holdco Pty Ltd. | | 3,481,102 | 2,506 |
| Belc Co. Ltd. (b) | | 1,776,700 | 80,741 |
| Cosmos Pharmaceutical Corp. (b) | | 1,234,000 | 262,818 |
| Create SD Holdings Co. Ltd. (b) | | 5,806,300 | 146,994 |
| Daikokutenbussan Co. Ltd. | | 608,100 | 30,172 |
| Dong Suh Companies, Inc. | | 1,663,000 | 43,879 |
| Genky Stores, Inc. (a)(b) | | 769,200 | 28,711 |
| Halows Co. Ltd. (b) | | 1,362,400 | 29,437 |
| Kroger Co. | | 2,552,400 | 62,585 |
| Kusuri No Aoki Holdings Co. Ltd. | | 864,300 | 47,588 |
| Majestic Wine PLC (a) | | 3,106,151 | 13,104 |
| MARR SpA | | 246,800 | 6,317 |
| McColl's Retail Group PLC | | 1,612,557 | 4,968 |
| Medical System Network Co. Ltd. | | 72,900 | 319 |
| Metro, Inc. Class A (sub. vtg.) (b) | | 25,865,599 | 876,121 |
| North West Co., Inc. | | 101,400 | 2,484 |
| Performance Food Group Co. (c) | | 154,600 | 4,452 |
| Qol Co. Ltd. (b) | | 1,942,700 | 31,384 |
| Retail Partners Co. Ltd. | | 461,700 | 4,875 |
| Safeway, Inc.: | | | |
| rights (c) | | 16,069,900 | 0 |
| rights (c) | | 16,069,900 | 2,893 |
| Sligro Food Group NV | | 729,500 | 33,032 |
| Sundrug Co. Ltd. | | 3,396,000 | 126,605 |
| Tesco PLC (c) | | 10,859,300 | 24,959 |
| Total Produce PLC | | 9,359,100 | 24,097 |
| United Natural Foods, Inc. (c) | | 1,214,198 | 46,783 |
| Valor Holdings Co. Ltd. | | 511,900 | 11,580 |
| Yaoko Co. Ltd. | | 1,008,300 | 43,535 |
| | | | 2,000,159 |
| Food Products - 2.1% | | | |
| Aryzta AG | | 1,480,820 | 47,597 |
| Astral Foods Ltd. | | 98,700 | 1,084 |
| Bakkafrost | | 432 | 17 |
| Cranswick PLC | | 638,449 | 24,446 |
| Dean Foods Co. | | 393,200 | 5,898 |
| Devro PLC | | 2,584,100 | 7,364 |
| Dutch Lady Milk Industries Bhd | | 100,000 | 1,377 |
| Food Empire Holdings Ltd. (b) | | 42,450,000 | 20,674 |
| Fresh Del Monte Produce, Inc. (b) | | 5,099,612 | 262,477 |
| Hilton Food Group PLC | | 624,200 | 5,563 |
| Japan Meat Co. Ltd. | | 316,100 | 5,201 |
| Kaveri Seed Co. Ltd. (c) | | 82,484 | 890 |
| Lamb Weston Holdings, Inc. | | 48,704 | 2,142 |
| Lifeway Foods, Inc. (c) | | 247,000 | 2,265 |
| Mitsui Sugar Co. Ltd. | | 368,300 | 11,191 |
| Nam Yang Dairy Products | | 10,500 | 6,863 |
| Natori Co. Ltd. | | 170,500 | 3,170 |
| Omega Protein Corp. | | 731,507 | 11,704 |
| Origin Enterprises PLC (b) | | 9,647,995 | 75,152 |
| Pacific Andes International Holdings Ltd. (c) | | 108,096,500 | 2,554 |
| Pacific Andes Resources Development Ltd. (c) | | 204,590,393 | 3,321 |
| Pickles Corp. | | 104,400 | 1,537 |
| President Rice Products PCL | | 1,268,200 | 2,268 |
| Rocky Mountain Chocolate Factory, Inc. (b) | | 457,493 | 5,440 |
| S Foods, Inc. | | 421,600 | 15,718 |
| Seaboard Corp. | | 41,528 | 177,532 |
| Select Harvests Ltd. (b) | | 4,652,584 | 18,238 |
| Sunjin Co. Ltd. (b) | | 1,627,260 | 27,026 |
| Synear Food Holdings Ltd. (c) | | 38,027,000 | 0 |
| The Hain Celestial Group, Inc. (c) | | 1,275,300 | 57,019 |
| Want Want China Holdings Ltd. | | 16,553,000 | 11,190 |
| | | | 816,918 |
| Household Products - 0.0% | | | |
| Central Garden & Pet Co. Class A (non-vtg.) (c) | | 133,300 | 4,100 |
| Personal Products - 0.3% | | | |
| Asaleo Care Ltd. | | 229,395 | 244 |
| Coty, Inc. Class A | | 592,900 | 12,143 |
| Grape King Bio Ltd. | | 1,748,000 | 11,079 |
| Natural Alternatives International, Inc. (c) | | 75,817 | 758 |
| Nutraceutical International Corp. (b) | | 993,838 | 41,542 |
| Sarantis SA (b) | | 2,100,300 | 30,582 |
| | | | 96,348 |
| Tobacco - 0.0% | | | |
| Karelia Tobacco Co., Inc. | | 1,689 | 570 |
|
| TOTAL CONSUMER STAPLES | | | 3,496,348 |
|
| ENERGY - 2.8% | | | |
| Energy Equipment & Services - 0.9% | | | |
| AKITA Drilling Ltd. Class A (non-vtg.) | | 1,544,500 | 8,969 |
| Atwood Oceanics, Inc. (a)(b)(c) | | 7,338,100 | 57,677 |
| Bristow Group, Inc. (a) | | 496,493 | 3,659 |
| Cathedral Energy Services Ltd. (c) | | 1,391,800 | 1,116 |
| Divestco, Inc. (c) | | 3,040,500 | 195 |
| Fugro NV (Certificaten Van Aandelen) (c) | | 1,661,600 | 26,692 |
| Geospace Technologies Corp. (b)(c) | | 1,205,016 | 18,545 |
| Gulfmark Offshore, Inc. Class A (b)(c) | | 2,665,500 | 413 |
| John Wood Group PLC | | 656,600 | 5,289 |
| Nabors Industries Ltd. | | 851,621 | 6,566 |
| National Oilwell Varco, Inc. | | 24,322 | 796 |
| Oceaneering International, Inc. | | 243,422 | 6,244 |
| Oil States International, Inc. (c) | | 2,486,975 | 61,801 |
| PHX Energy Services Corp. (c) | | 1,436,300 | 2,373 |
| Precision Drilling Corp. (c) | | 194,800 | 566 |
| Prosafe ASA (c) | | 194,802 | 756 |
| RigNet, Inc. (c) | | 69,200 | 1,311 |
| Shinko Plantech Co. Ltd. | | 1,232,300 | 10,541 |
| Solstad Offshore ASA (c) | | 2,168,662 | 2,598 |
| Total Energy Services, Inc. | | 2,154,200 | 20,907 |
| Unit Corp. (b)(c) | | 4,533,432 | 81,511 |
| | | | 318,525 |
| Oil, Gas & Consumable Fuels - 1.9% | | | |
| Adams Resources & Energy, Inc. | | 138,151 | 5,248 |
| Beach Energy Ltd. | | 13,631,705 | 7,416 |
| Boardwalk Pipeline Partners, LP | | 744,100 | 12,456 |
| Bonavista Energy Corp. | | 292,000 | 733 |
| Contango Oil & Gas Co. (b)(c) | | 2,075,000 | 12,450 |
| Denbury Resources, Inc. (a)(c) | | 7,951,071 | 11,609 |
| Enagas SA | | 97,370 | 2,753 |
| Eni SpA | | 7,692,100 | 121,790 |
| Fuji Kosan Co. Ltd. (b) | | 668,500 | 3,565 |
| Great Eastern Shipping Co. Ltd. | | 5,100,000 | 31,595 |
| Hankook Shell Oil Co. Ltd. | | 55,000 | 20,233 |
| HollyFrontier Corp. | | 102,497 | 2,956 |
| International Seaways, Inc. (c) | | 24,457 | 558 |
| James Fisher and Sons PLC | | 114,500 | 2,372 |
| KyungDong City Gas Co. Ltd. (c) | | 138,709 | 6,279 |
| Kyungdong Invest Co. Ltd. | | 84,315 | 4,005 |
| Marathon Oil Corp. | | 3,049,982 | 37,301 |
| Michang Oil Industrial Co. Ltd. (b) | | 173,900 | 13,913 |
| Murphy Oil Corp. (a) | | 7,863,500 | 209,012 |
| Newfield Exploration Co. (c) | | 374,257 | 10,752 |
| Star Petroleum Refining PCL | | 6,666,400 | 3,085 |
| Tesoro Corp. | | 1,283,400 | 127,737 |
| Thai Oil PCL (For. Reg.) | | 389,500 | 1,004 |
| Uehara Sei Shoji Co. Ltd. | | 848,000 | 5,500 |
| Whitecap Resources, Inc. | | 449,300 | 3,319 |
| Whiting Petroleum Corp. (c) | | 217,269 | 1,141 |
| World Fuel Services Corp. | | 1,970,510 | 63,726 |
| WPX Energy, Inc. (c) | | 1,026,024 | 11,061 |
| | | | 733,569 |
|
| TOTAL ENERGY | | | 1,052,094 |
|
| FINANCIALS - 11.1% | | | |
| Banks - 1.2% | | | |
| ACNB Corp. | | 114,873 | 3,268 |
| Associated Banc-Corp. | | 426,700 | 10,219 |
| Bank Ireland Group PLC (c) | | 12,007,377 | 100,211 |
| Bank of America Corp. | | 158,300 | 3,818 |
| Bar Harbor Bankshares | | 55,500 | 1,548 |
| Boston Private Financial Holdings, Inc. | | 231,200 | 3,549 |
| Camden National Corp. | | 58,184 | 2,444 |
| Cathay General Bancorp | | 740,400 | 27,728 |
| Central Pacific Financial Corp. | | 156,300 | 4,834 |
| Central Valley Community Bancorp | | 148,200 | 3,257 |
| Codorus Valley Bancorp, Inc. (b) | | 663,839 | 18,561 |
| CVB Financial Corp. | | 147,800 | 3,184 |
| Dah Sing Banking Group Ltd. | | 1,794,800 | 3,847 |
| Dimeco, Inc. | | 25,375 | 1,383 |
| East West Bancorp, Inc. | | 97,600 | 5,561 |
| First Bancorp, Puerto Rico (c) | | 7,447,217 | 43,641 |
| First West Virginia Bancorp, Inc. | | 56,056 | 1,172 |
| Hope Bancorp, Inc. | | 641,700 | 11,313 |
| Huntington Bancshares, Inc. | | 563,800 | 7,470 |
| Investors Bancorp, Inc. | | 205,800 | 2,733 |
| KeyCorp | | 401,300 | 7,239 |
| LCNB Corp. | | 470,900 | 9,442 |
| Northrim Bancorp, Inc. | | 112,300 | 3,274 |
| Norwood Financial Corp. | | 153,000 | 6,555 |
| OFG Bancorp (a) | | 342,658 | 3,444 |
| Popular, Inc. | | 1,343,600 | 56,619 |
| Regions Financial Corp. | | 227,300 | 3,319 |
| SpareBank 1 SR-Bank ASA (primary capital certificate) | | 1,293,750 | 12,916 |
| Sparebanken More (primary capital certificate) | | 218,734 | 6,982 |
| Sparebanken Nord-Norge | | 2,428,400 | 18,145 |
| Trico Bancshares | | 524,195 | 19,343 |
| United Community Bank, Inc. | | 73,400 | 2,038 |
| Van Lanschot NV (Bearer) | | 1,113,840 | 33,050 |
| | | | 442,107 |
| Capital Markets - 0.5% | | | |
| AllianceBernstein Holding LP | | 671,900 | 16,630 |
| Ares Capital Corp. | | 3,779 | 62 |
| Banca Generali SpA | | 129,500 | 4,599 |
| Carlyle Group LP | | 74,100 | 1,519 |
| Close Brothers Group PLC | | 144,800 | 2,942 |
| Cowen Group, Inc. Class A (a)(c) | | 662,369 | 10,598 |
| Federated Investors, Inc. Class B (non-vtg.) | | 477,300 | 13,761 |
| Franklin Resources, Inc. | | 1,084,744 | 48,575 |
| Greenhill & Co., Inc. | | 175,500 | 3,247 |
| Invesco Ltd. | | 148,300 | 5,156 |
| Lazard Ltd. Class A | | 296,200 | 13,836 |
| State Street Corp. | | 245,400 | 22,879 |
| Tullett Prebon PLC | | 607,600 | 3,903 |
| Waddell & Reed Financial, Inc. Class A (a) | | 3,036,400 | 62,762 |
| | | | 210,469 |
| Consumer Finance - 0.6% | | | |
| Aeon Credit Service (Asia) Co. Ltd. | | 13,370,000 | 10,202 |
| Ally Financial, Inc. | | 332,300 | 7,523 |
| H&T Group PLC | | 565,100 | 2,151 |
| Nicholas Financial, Inc. (c) | | 376,857 | 3,241 |
| Santander Consumer U.S.A. Holdings, Inc. (c) | | 3,948,800 | 50,584 |
| Synchrony Financial | | 5,793,400 | 175,656 |
| | | | 249,357 |
| Diversified Financial Services - 0.3% | | | |
| Far East Horizon Ltd. | | 2,631,000 | 2,243 |
| Leucadia National Corp. | | 112,900 | 2,939 |
| Newship Ltd. (c) | | 2,500 | 950 |
| Ricoh Leasing Co. Ltd. | | 803,000 | 28,079 |
| Scandinavian Tobacco Group A/S | | 2,062,958 | 33,298 |
| Varex Imaging Corp. (c) | | 98,700 | 3,045 |
| Voya Financial, Inc. | | 1,406,800 | 55,203 |
| | | | 125,757 |
| Insurance - 7.6% | | | |
| AEGON NV | | 49,971,300 | 280,112 |
| AFLAC, Inc. | | 312,014 | 24,883 |
| April | | 2,411,600 | 37,113 |
| ASR Nederland NV | | 584,200 | 22,096 |
| Assurant, Inc. (b) | | 3,060,400 | 322,168 |
| Aub Group Ltd. | | 257,965 | 2,662 |
| Axis Capital Holdings Ltd. | | 3,823,200 | 246,902 |
| CNO Financial Group, Inc. | | 170,500 | 3,901 |
| FBD Holdings PLC (c) | | 152,100 | 1,521 |
| FNF Group | | 73,100 | 3,572 |
| Genworth Financial, Inc. Class A (c) | | 7,228,100 | 24,792 |
| Great-West Lifeco, Inc. | | 48,700 | 1,390 |
| Hartford Financial Services Group, Inc. | | 2,665,500 | 146,603 |
| Hiscox Ltd. | | 251,594 | 4,309 |
| Hyundai Fire & Marine Insurance Co. Ltd. | | 114,734 | 4,651 |
| James River Group Holdings Ltd. | | 347,564 | 13,958 |
| Lincoln National Corp. | | 5,479,000 | 400,296 |
| MetLife, Inc. | | 792,253 | 43,574 |
| National Western Life Group, Inc. | | 129,314 | 43,526 |
| NN Group NV | | 1,207,656 | 49,022 |
| Primerica, Inc. | | 195,500 | 15,845 |
| RenaissanceRe Holdings Ltd. (b) | | 2,220,900 | 326,272 |
| Sony Financial Holdings, Inc. | | 2,719,800 | 47,145 |
| Torchmark Corp. | | 262,447 | 20,725 |
| Universal Insurance Holdings, Inc. (a) | | 182,500 | 4,353 |
| Unum Group (b) | | 15,989,533 | 801,555 |
| | | | 2,892,946 |
| Mortgage Real Estate Investment Trusts - 0.5% | | | |
| Annaly Capital Management, Inc. | | 15,142,246 | 182,161 |
| MFA Financial, Inc. | | 347,950 | 2,954 |
| | | | 185,115 |
| Thrifts & Mortgage Finance - 0.4% | | | |
| ASAX Co. Ltd. | | 116,600 | 1,785 |
| Genworth MI Canada, Inc. | | 4,195,900 | 122,402 |
| Genworth Mortgage Insurance Ltd. | | 6,481,407 | 15,607 |
| Meridian Bancorp, Inc. Maryland | | 263,200 | 4,645 |
| Nationstar Mortgage Holdings, Inc. (a)(c) | | 599,095 | 10,682 |
| | | | 155,121 |
|
| TOTAL FINANCIALS | | | 4,260,872 |
|
| HEALTH CARE - 12.2% | | | |
| Biotechnology - 1.2% | | | |
| Amgen, Inc. | | 2,607,043 | 454,955 |
| Myriad Genetics, Inc. (c) | | 97,307 | 2,362 |
| | | | 457,317 |
| Health Care Equipment & Supplies - 0.9% | | | |
| Ansell Ltd. | | 290,179 | 5,100 |
| Apex Biotechnology Corp. | | 1,400,000 | 1,608 |
| Arts Optical International Holdings Ltd. (b) | | 24,073,000 | 8,599 |
| Atrion Corp. | | 8,700 | 5,500 |
| Boston Scientific Corp. (c) | | 392,800 | 10,456 |
| Exactech, Inc. (c) | | 153,100 | 4,463 |
| Hoshiiryou Sanki Co. Ltd. (b) | | 312,964 | 11,966 |
| Huvitz Co. Ltd. | | 50,000 | 580 |
| Integer Holdings Corp. (c) | | 9,800 | 449 |
| Microlife Corp. | | 3,683,500 | 8,583 |
| Nakanishi, Inc. | | 652,200 | 27,361 |
| Pacific Hospital Supply Co. Ltd. | | 1,454,000 | 3,705 |
| Prim SA (b) | | 1,507,300 | 19,681 |
| ResMed, Inc. | | 102,400 | 7,897 |
| Shandong Weigao Medical Polymer Co. Ltd. (H Shares) | | 972,000 | 784 |
| St.Shine Optical Co. Ltd. | | 2,450,000 | 50,436 |
| Supermax Corp. Bhd | | 23,500,000 | 10,538 |
| Techno Medica Co. Ltd. | | 40,600 | 719 |
| Top Glove Corp. Bhd | | 1,000,034 | 1,341 |
| Utah Medical Products, Inc. (b) | | 369,269 | 25,516 |
| Zimmer Biomet Holdings, Inc. | | 1,011,900 | 122,764 |
| | | | 328,046 |
| Health Care Providers & Services - 8.7% | | | |
| Aetna, Inc. | | 4,456,484 | 687,680 |
| Almost Family, Inc. (c) | | 493,600 | 24,409 |
| Anthem, Inc. | | 1,955,532 | 364,140 |
| Civitas Solutions, Inc. (c) | | 700 | 12 |
| DVx, Inc. (b) | | 732,200 | 8,368 |
| Grupo Casa Saba SA de CV (c) | | 11,473,200 | 0 |
| Hanger, Inc. (b)(c) | | 2,631,432 | 30,525 |
| Hi-Clearance, Inc. | | 1,489,000 | 4,573 |
| LHC Group, Inc. (c) | | 591,400 | 34,242 |
| Lifco AB | | 624,200 | 20,805 |
| Medica Sur SA de CV | | 356,600 | 791 |
| MEDNAX, Inc. (c) | | 173,756 | 8,163 |
| Premier, Inc. (c) | | 150,600 | 5,256 |
| Ship Healthcare Holdings, Inc. | | 137,800 | 4,237 |
| Sigma Healthcare Ltd. | | 4,101,181 | 3,150 |
| The Ensign Group, Inc. | | 246,800 | 5,521 |
| Tokai Corp. | | 179,500 | 7,937 |
| Triple-S Management Corp. (b)(c) | | 1,923,595 | 29,777 |
| Tsukui Corp. | | 952,400 | 5,788 |
| U.S. Physical Therapy, Inc. | | 49,400 | 3,117 |
| United Drug PLC (United Kingdom) | | 6,140,600 | 68,623 |
| UnitedHealth Group, Inc. | | 10,316,400 | 1,978,792 |
| WIN-Partners Co. Ltd. (b) | | 2,651,200 | 33,644 |
| | | | 3,329,550 |
| Health Care Technology - 0.1% | | | |
| Addlife AB | | 403,800 | 8,327 |
| Computer Programs & Systems, Inc. (a) | | 146,011 | 4,475 |
| HMS Holdings Corp. (c) | | 172,000 | 3,454 |
| ND Software Co. Ltd. (b) | | 1,263,300 | 13,121 |
| Pharmagest Interactive | | 9,714 | 481 |
| | | | 29,858 |
| Life Sciences Tools & Services - 0.0% | | | |
| Bruker Corp. | | 140,000 | 4,015 |
| VWR Corp. (c) | | 160,676 | 5,302 |
| | | | 9,317 |
| Pharmaceuticals - 1.3% | | | |
| Akorn, Inc. (c) | | 97,100 | 3,265 |
| Apex Healthcare Bhd | | 47,600 | 52 |
| Bliss Gvs Pharma Ltd. (c) | | 4,600,000 | 11,751 |
| Daewon Pharmaceutical Co. Ltd. (b) | | 1,782,271 | 29,918 |
| Daewoong Co. Ltd. | | 350,000 | 4,735 |
| Dawnrays Pharmaceutical Holdings Ltd. | | 11,652,000 | 7,011 |
| DepoMed, Inc. (c) | | 119,800 | 1,235 |
| DongKook Pharmaceutical Co. Ltd. (b) | | 623,700 | 33,526 |
| FDC Ltd. (c) | | 3,250,000 | 9,163 |
| Fuji Pharma Co. Ltd. | | 394,900 | 13,522 |
| Genomma Lab Internacional SA de CV (c) | | 4,106,200 | 5,280 |
| Indivior PLC | | 17,727,400 | 89,816 |
| Innoviva, Inc. (c) | | 311,800 | 4,278 |
| Korea United Pharm, Inc. | | 239,629 | 4,311 |
| Kwang Dong Pharmaceutical Co. Ltd. (b) | | 3,100,000 | 23,334 |
| Kyung Dong Pharmaceutical Co. Ltd. | | 480,000 | 8,229 |
| Lee's Pharmaceutical Holdings Ltd. | | 8,570,598 | 6,792 |
| Novo Nordisk A/S Series B sponsored ADR | | 1,168,389 | 49,540 |
| Phibro Animal Health Corp. Class A | | 149,400 | 5,707 |
| Recordati SpA | | 3,059,100 | 130,731 |
| Torrent Pharmaceuticals Ltd. | | 150,000 | 3,081 |
| Tsumura & Co. | | 781,400 | 30,442 |
| Whanin Pharmaceutical Co. Ltd. (b) | | 1,750,000 | 30,861 |
| | | | 506,580 |
|
| TOTAL HEALTH CARE | | | 4,660,668 |
|
| INDUSTRIALS - 7.7% | | | |
| Aerospace & Defense - 0.1% | | | |
| Aerojet Rocketdyne Holdings, Inc. (c) | | 1,000,106 | 23,452 |
| Astronics Corp. (c) | | 79,100 | 2,314 |
| Austal Ltd. | | 1,479,993 | 2,137 |
| Engility Holdings, Inc. (c) | | 973,674 | 28,402 |
| | | | 56,305 |
| Air Freight & Logistics - 0.1% | | | |
| Air T, Inc. (b)(c) | | 201,601 | 3,276 |
| Yusen Logistics Co. Ltd. (b) | | 2,157,500 | 19,570 |
| | | | 22,846 |
| Airlines - 0.0% | | | |
| Air New Zealand Ltd. | | 1,246,270 | 3,135 |
| JetBlue Airways Corp. (c) | | 111,008 | 2,434 |
| | | | 5,569 |
| Building Products - 0.1% | | | |
| Advanced Drain Systems, Inc. Del | | 10,800 | 222 |
| Continental Building Products, Inc. (c) | | 432,300 | 9,511 |
| Gibraltar Industries, Inc. (c) | | 111,700 | 3,334 |
| Kondotec, Inc. (b) | | 1,642,500 | 14,958 |
| | | | 28,025 |
| Commercial Services & Supplies - 0.8% | | | |
| Acme United Corp. | | 25,100 | 695 |
| Aeon Delight Co. Ltd. | | 120,100 | 4,014 |
| Aggreko PLC | | 193,034 | 2,161 |
| AJIS Co. Ltd. (b) | | 936,400 | 18,967 |
| Asia File Corp. Bhd | | 4,480,000 | 3,453 |
| Calian Technologies Ltd. (b) | | 676,700 | 15,187 |
| Civeo Corp. (b)(c) | | 12,511,820 | 24,148 |
| Essendant, Inc. (b) | | 2,163,998 | 27,007 |
| Fursys, Inc. (b) | | 950,000 | 28,374 |
| Interface, Inc. | | 241,100 | 4,569 |
| IWG PLC | | 879,600 | 3,807 |
| Knoll, Inc. | | 216,000 | 4,182 |
| Lion Rock Group Ltd. | | 20,167,640 | 4,312 |
| Loomis AB (B Shares) | | 128,000 | 4,756 |
| Mears Group PLC | | 823,994 | 5,371 |
| Mitie Group PLC | | 14,314,600 | 50,276 |
| Nac Co. Ltd.(b) | | 969,300 | 8,739 |
| NICE Total Cash Management Co., Ltd. (b) | | 1,375,000 | 12,891 |
| Prestige International, Inc. | | 1,183,400 | 12,967 |
| Programmed Maintenance Services Ltd. | | 2,071,193 | 4,938 |
| VICOM Ltd. | | 2,955,300 | 12,365 |
| VSE Corp. (b) | | 876,117 | 45,427 |
| West Corp. | | 260,865 | 6,096 |
| | | | 304,702 |
| Construction & Engineering - 1.2% | | | |
| AECOM (c) | | 7,194,695 | 229,511 |
| Arcadis NV | | 2,702,409 | 55,297 |
| Astaldi SpA (c) | | 2,589,900 | 17,261 |
| Boustead Projs. Pte Ltd. | | 1,083,787 | 748 |
| Boustead Singapore Ltd. | | 4,396,700 | 3,082 |
| C-Cube Corp. | | 338,400 | 1,562 |
| Daiichi Kensetsu Corp. (b) | | 1,812,800 | 22,034 |
| Geumhwa PSC Co. Ltd. (b) | | 360,000 | 12,086 |
| Jacobs Engineering Group, Inc. | | 243,028 | 12,812 |
| KBR, Inc. | | 1,757,703 | 26,225 |
| Kyeryong Construction Industrial Co. Ltd. (b)(c) | | 692,971 | 11,076 |
| Meisei Industrial Co. Ltd. | | 1,158,300 | 7,512 |
| Mirait Holdings Corp. | | 647,400 | 7,599 |
| Nippon Rietec Co. Ltd. | | 1,225,900 | 14,467 |
| Quanta Services, Inc. (c) | | 74,100 | 2,499 |
| Severfield PLC | | 2,897,033 | 2,838 |
| Shinnihon Corp. | | 1,651,200 | 13,465 |
| ShoLodge, Inc. (b)(c) | | 443,162 | 0 |
| Sterling Construction Co., Inc. (c) | | 802,780 | 10,260 |
| Toshiba Plant Systems & Services Corp. | | 172,300 | 2,807 |
| United Integration Services Co. Ltd. | | 5,143,500 | 9,669 |
| | | | 462,810 |
| Electrical Equipment - 0.7% | | | |
| Aichi Electric Co. Ltd. | | 326,300 | 9,027 |
| Aros Quality Group AB | | 760,600 | 21,809 |
| AZZ, Inc. | | 1,214,300 | 61,565 |
| Bharat Heavy Electricals Ltd. | | 20,500,000 | 46,347 |
| Chiyoda Integre Co. Ltd. | | 345,500 | 7,427 |
| Hammond Power Solutions, Inc. Class A | | 474,800 | 2,795 |
| I-Sheng Electric Wire & Cable Co. Ltd. (b) | | 12,500,000 | 17,852 |
| Korea Electric Terminal Co. Ltd. (b) | | 700,000 | 44,065 |
| Servotronics, Inc. (b) | | 171,000 | 1,623 |
| TKH Group NV (depositary receipt) | | 962,200 | 58,878 |
| | | | 271,388 |
| Industrial Conglomerates - 1.3% | | | |
| Carr's Group PLC | | 2,339,700 | 4,407 |
| DCC PLC (United Kingdom) (b) | | 5,281,400 | 464,436 |
| Mytilineos Holdings SA (c) | | 907,900 | 9,028 |
| Reunert Ltd. | | 1,782,800 | 9,729 |
| | | | 487,600 |
| Machinery - 1.6% | | | |
| Aalberts Industries NV (b) | | 8,193,800 | 357,923 |
| Allison Transmission Holdings, Inc. | | 247,859 | 9,369 |
| ASL Marine Holdings Ltd. (b)(c) | | 47,393,013 | 4,442 |
| Foremost Income Fund (c) | | 2,141,103 | 8,887 |
| Gencor Industries, Inc. (c) | | 203,997 | 3,274 |
| Global Brass & Copper Holdings, Inc. | | 49,400 | 1,583 |
| Haitian International Holdings Ltd. | | 7,286,000 | 20,895 |
| Hurco Companies, Inc. (b) | | 507,892 | 16,735 |
| Hwacheon Machine Tool Co. Ltd. (b) | | 219,900 | 11,663 |
| Hyster-Yale Materials Handling: | | | |
| Class A (b) | | 217,570 | 15,417 |
| Class B (b) | | 310,000 | 21,967 |
| Ihara Science Corp. (b) | | 1,043,100 | 20,475 |
| Jaya Holdings Ltd. (b) | | 3,244,740 | 206 |
| Kyowakogyosyo Co. Ltd. | | 247,000 | 2,093 |
| Luxfer Holdings PLC sponsored ADR | | 321,400 | 4,082 |
| Maruzen Co. Ltd. (b) | | 1,667,000 | 27,369 |
| Miller Industries, Inc. | | 69,800 | 1,822 |
| Mincon Group PLC | | 2,261,598 | 2,677 |
| Mirle Automation Corp. | | 116,000 | 154 |
| Nadex Co. Ltd. (b) | | 834,500 | 6,782 |
| Nakano Refrigerators Co. Ltd. | | 26,900 | 850 |
| Nitchitsu Co. Ltd. | | 584,000 | 1,128 |
| Rexnord Corp. (c) | | 116,900 | 2,707 |
| Semperit AG Holding | | 485,600 | 14,843 |
| SIMPAC, Inc. | | 583,000 | 2,410 |
| Takamatsu Machinery Co. Ltd. | | 386,500 | 3,481 |
| Techno Smart Corp. (b) | | 743,800 | 9,054 |
| Tocalo Co. Ltd. (b) | | 825,800 | 31,573 |
| Trinity Industrial Corp. | | 757,000 | 5,905 |
| | | | 609,766 |
| Marine - 0.0% | | | |
| SITC International Holdings Co. Ltd. | | 5,285,000 | 4,398 |
| Tokyo Kisen Co. Ltd. (b) | | 870,000 | 5,800 |
| | | | 10,198 |
| Professional Services - 0.4% | | | |
| Akka Technologies SA | | 730,733 | 39,913 |
| Asiakastieto Group Oyj | | 81,166 | 2,105 |
| Boardroom Ltd. | | 2,699,642 | 1,315 |
| CBIZ, Inc. (c) | | 163,200 | 2,424 |
| Clarius Group Ltd. (c) | | 2,914,107 | 180 |
| ICF International, Inc. (c) | | 250,600 | 11,340 |
| McMillan Shakespeare Ltd. | | 2,217,901 | 25,462 |
| SHL-JAPAN Ltd. | | 53,400 | 1,969 |
| Sporton International, Inc. | | 302,999 | 1,509 |
| Stantec, Inc. (a) | | 2,073,100 | 52,744 |
| Synergie SA | | 133,800 | 6,339 |
| TriNet Group, Inc. (c) | | 184,800 | 6,468 |
| TrueBlue, Inc. (c) | | 623,200 | 15,923 |
| | | | 167,691 |
| Road & Rail - 0.7% | | | |
| Alps Logistics Co. Ltd. (b) | | 2,995,900 | 21,604 |
| Avis Budget Group, Inc. (c) | | 54,000 | 1,662 |
| Chilled & Frozen Logistics Holdings Co. Ltd. (b) | | 1,317,200 | 15,688 |
| CSX Corp. | | 226,513 | 11,176 |
| Daqin Railway Co. Ltd. (A Shares) | | 26,000,000 | 33,821 |
| Hamakyorex Co. Ltd. (b) | | 1,314,400 | 34,778 |
| Higashi Twenty One Co. Ltd. | | 262,500 | 907 |
| Roadrunner Transportation Systems, Inc. (b)(c) | | 3,785,032 | 26,420 |
| Sakai Moving Service Co. Ltd. (b) | | 1,234,000 | 59,548 |
| Trancom Co. Ltd. (b) | | 897,200 | 44,353 |
| Universal Logistics Holdings, Inc. (b) | | 1,530,200 | 22,264 |
| | | | 272,221 |
| Trading Companies & Distributors - 0.6% | | | |
| AddTech AB (B Shares) | | 1,292,600 | 25,215 |
| AerCap Holdings NV (c) | | 243,418 | 11,952 |
| Goodfellow, Inc. (b) | | 758,300 | 4,738 |
| Hanwa Co. Ltd. | | 40,000 | 286 |
| HD Supply Holdings, Inc. (c) | | 547,994 | 17,804 |
| HERIGE | | 63,953 | 2,923 |
| KS Energy Services Ltd. (c) | | 13,816,400 | 296 |
| Lumax International Corp. Ltd. | | 3,272,000 | 5,772 |
| Meiwa Corp. | | 1,801,400 | 7,157 |
| Mitani Shoji Co. Ltd. | | 771,100 | 30,391 |
| MRC Global, Inc. (c) | | 328,107 | 5,361 |
| Nexeo Solutions, Inc. (c) | | 817,625 | 6,811 |
| Otec Corp. | | 130,400 | 1,858 |
| Parker Corp. (b) | | 2,329,000 | 12,168 |
| Richelieu Hardware Ltd. | | 912,400 | 23,806 |
| Senshu Electric Co. Ltd. (b) | | 938,500 | 18,882 |
| Strongco Corp. (b)(c) | | 890,988 | 943 |
| Tanaka Co. Ltd. | | 38,400 | 263 |
| TECHNO ASSOCIE Co. Ltd. | | 267,500 | 3,045 |
| Titan Machinery, Inc. (c) | | 870,800 | 15,544 |
| Totech Corp. (b) | | 971,400 | 17,623 |
| | | | 212,838 |
| Transportation Infrastructure - 0.1% | | | |
| Isewan Terminal Service Co. Ltd. | | 1,355,700 | 7,932 |
| Meiko Transportation Co. Ltd. | | 870,000 | 9,864 |
| Qingdao Port International Co. Ltd. | | 4,936,000 | 2,793 |
| Sinwa Ltd. (b) | | 21,394,600 | 3,473 |
| | | | 24,062 |
|
| TOTAL INDUSTRIALS | | | 2,936,021 |
|
| INFORMATION TECHNOLOGY - 17.8% | | | |
| Communications Equipment - 0.1% | | | |
| ADTRAN, Inc. | | 212,500 | 4,983 |
| Black Box Corp. (b) | | 1,561,711 | 12,338 |
| Cisco Systems, Inc. | | 94,300 | 2,966 |
| CommScope Holding Co., Inc. (c) | | 273,201 | 10,048 |
| Juniper Networks, Inc. | | 171,900 | 4,805 |
| Tessco Technologies, Inc. | | 122,118 | 1,630 |
| | | | 36,770 |
| Electronic Equipment & Components - 5.6% | | | |
| A&D Co. Ltd. | | 789,800 | 3,281 |
| AAC Technology Holdings, Inc. | | 357,000 | 4,804 |
| AVX Corp. | | 287,100 | 5,130 |
| Beijer Electronics AB (c) | | 112,400 | 617 |
| Bel Fuse, Inc. Class A | | 88,800 | 1,927 |
| Cardtronics PLC | | 315,142 | 9,864 |
| CDW Corp. | | 381,786 | 24,217 |
| Corning, Inc. | | 159,400 | 4,645 |
| CTS Corp. | | 366,954 | 8,073 |
| Daido Signal Co. Ltd. | | 103,000 | 499 |
| DigiTech Systems Co., Ltd. (c) | | 725,000 | 0 |
| Dynapack International Technology Corp. | | 3,200,000 | 4,152 |
| Elec & Eltek International Co. Ltd. | | 1,564,100 | 2,596 |
| Elematec Corp. (b) | | 1,238,600 | 22,459 |
| Excel Co. Ltd. (b) | | 790,700 | 10,314 |
| FLIR Systems, Inc. | | 144,007 | 5,374 |
| Hi-P International Ltd. | | 18,315,700 | 13,786 |
| Hon Hai Precision Industry Co. Ltd. (Foxconn) | | 182,476,140 | 709,624 |
| IDIS Holdings Co. Ltd. (b) | | 800,000 | 9,322 |
| Image Sensing Systems, Inc. (c) | | 67,566 | 243 |
| Intelligent Digital Integrated Security Co. Ltd. (b) | | 900,010 | 6,509 |
| INTOPS Co. Ltd. (b) | | 1,719,800 | 18,044 |
| Isra Vision AG (b) | | 355,400 | 65,170 |
| Jabil, Inc. | | 577,912 | 17,626 |
| Keysight Technologies, Inc. (c) | | 2,813,500 | 117,013 |
| Kingboard Chemical Holdings Ltd. (b) | | 82,179,000 | 370,346 |
| Kingboard Laminates Holdings Ltd. | | 3,907,000 | 5,452 |
| Mesa Laboratories, Inc. (b) | | 236,900 | 34,239 |
| Muramoto Electronic Thailand PCL (For. Reg.) (b) | | 1,336,900 | 9,120 |
| Nippo Ltd. (b)(c) | | 772,800 | 2,397 |
| PAX Global Technology Ltd. | | 4,276,000 | 2,836 |
| Philips Lighting NV | | 116,200 | 4,416 |
| Pinnacle Technology Holdings Ltd. | | 7,785,800 | 12,017 |
| Redington India Ltd. | | 14,700,000 | 34,139 |
| ScanSource, Inc. (b)(c) | | 2,197,700 | 87,029 |
| Shibaura Electronics Co. Ltd. (b) | | 666,400 | 22,486 |
| Sigmatron International, Inc. (b)(c) | | 252,179 | 2,108 |
| Simplo Technology Co. Ltd. | | 10,500,000 | 33,361 |
| SYNNEX Corp. (b) | | 2,832,600 | 336,853 |
| Tomen Devices Corp. (b) | | 591,000 | 12,893 |
| Tripod Technology Corp. | | 1,497,000 | 4,885 |
| TTM Technologies, Inc. (c) | | 1,266,424 | 22,010 |
| UKC Holdings Corp. (b) | | 1,364,300 | 20,506 |
| VST Holdings Ltd. (b) | | 126,396,800 | 33,659 |
| Wayside Technology Group, Inc. | | 66,800 | 1,149 |
| Wireless Telecom Group, Inc. (c) | | 408,654 | 605 |
| Yageo Corp. | | 721,000 | 2,744 |
| | | | 2,120,539 |
| Internet Software & Services - 0.1% | | | |
| Aucnet, Inc. | | 161,500 | 2,073 |
| eBay, Inc. (c) | | 98,700 | 3,527 |
| Gabia, Inc. (b) | | 975,000 | 5,328 |
| Liquidity Services, Inc. (c) | | 292,022 | 1,986 |
| NetGem SA | | 891,300 | 2,596 |
| Pandora Media, Inc. (c) | | 49,400 | 442 |
| Softbank Technology Corp. | | 269,300 | 4,324 |
| Yahoo! Japan Corp. | | 2,881,500 | 13,069 |
| | | | 33,345 |
| IT Services - 4.5% | | | |
| ALTEN | | 692,900 | 59,838 |
| Amdocs Ltd. | | 6,778,200 | 455,292 |
| Argo Graphics, Inc. | | 412,900 | 10,097 |
| Blackhawk Network Holdings, Inc. (c) | | 123,800 | 5,404 |
| Computer Services, Inc. | | 270,964 | 13,277 |
| CSE Global Ltd. (b) | | 42,663,000 | 13,065 |
| CSRA, Inc. | | 4,958,113 | 161,684 |
| Data#3 Ltd. | | 2,941,333 | 4,188 |
| Dimerco Data System Corp. | | 510,000 | 623 |
| DXC Technology Co. | | 96,072 | 7,530 |
| E-Credible Co. Ltd. | | 129,349 | 1,542 |
| eClerx Services Ltd. | | 1,791,278 | 36,229 |
| EOH Holdings Ltd. | | 6,937,400 | 56,720 |
| Estore Corp. | | 297,700 | 2,139 |
| EVERTEC, Inc. | | 1,896,900 | 33,860 |
| ExlService Holdings, Inc. (c) | | 187,258 | 10,777 |
| First Data Corp. Class A (c) | | 645,909 | 12,053 |
| Genpact Ltd. | | 200,700 | 5,820 |
| GetBusy PLC (c) | | 39,893 | 4 |
| Hackett Group, Inc. | | 126,800 | 2,082 |
| HIQ International AB | | 535,500 | 3,582 |
| Indra Sistemas (b)(c) | | 13,738,800 | 212,977 |
| Know IT AB (b) | | 1,500,700 | 24,210 |
| Leidos Holdings, Inc. | | 672,070 | 35,915 |
| Luxoft Holding, Inc. (c) | | 96,210 | 6,056 |
| Mastek Ltd. | | 677,069 | 3,189 |
| NCI, Inc. Class A (c) | | 691,100 | 13,787 |
| Net 1 UEPS Technologies, Inc. (c) | | 543,344 | 5,260 |
| Neustar, Inc. Class A (c) | | 1,198,629 | 40,034 |
| Nice Information & Telecom, Inc. | | 53,000 | 1,159 |
| Paysafe Group PLC (c) | | 406,700 | 3,166 |
| Perficient, Inc. (c) | | 496,200 | 9,329 |
| Rolta India Ltd. (c) | | 2,699,942 | 2,444 |
| Societe Pour L'Informatique Industrielle SA (b) | | 1,738,100 | 46,192 |
| Softcreate Co. Ltd. | | 631,400 | 8,305 |
| Sword Group | | 319,286 | 13,116 |
| The Western Union Co. | | 19,196,400 | 379,129 |
| TravelSky Technology Ltd. (H Shares) | | 1,834,000 | 4,860 |
| Vantiv, Inc. (c) | | 74,200 | 4,715 |
| | | | 1,709,649 |
| Semiconductors & Semiconductor Equipment - 0.8% | | | |
| Axell Corp. (b) | | 802,100 | 5,428 |
| Boe Varitronix Ltd. | | 7,577,000 | 4,045 |
| Diodes, Inc. (c) | | 24,700 | 655 |
| Entegris, Inc. (c) | | 481,100 | 12,557 |
| Integrated Device Technology, Inc. (c) | | 560,380 | 14,648 |
| Lasertec Corp. | | 74,000 | 1,106�� |
| Leeno Industrial, Inc. | | 600,000 | 26,573 |
| Melexis NV | | 2,003,501 | 172,378 |
| Miraial Co. Ltd. | | 188,500 | 1,812 |
| ON Semiconductor Corp. (c) | | 1,028,559 | 15,377 |
| Phison Electronics Corp. | | 1,900,000 | 26,411 |
| Powertech Technology, Inc. | | 9,000,000 | 29,161 |
| Trio-Tech International (b)(c) | | 240,700 | 1,129 |
| | | | 311,280 |
| Software - 3.5% | | | |
| Activision Blizzard, Inc. | | 194,298 | 12,004 |
| AdaptIT Holdings Ltd. | | 2,637,200 | 2,001 |
| ANSYS, Inc. (c) | | 4,146,300 | 537,153 |
| Aspen Technology, Inc. (c) | | 138,443 | 7,873 |
| AVG Technologies NV (c) | | 502,588 | 13,293 |
| Ebix, Inc. (a)(b) | | 2,736,087 | 158,009 |
| ICT Automatisering NV (b) | | 609,469 | 9,019 |
| IGE + XAO SA | | 34,729 | 4,054 |
| InfoVine Co. Ltd. (b) | | 175,000 | 4,250 |
| init innovation in traffic systems AG | | 121,711 | 2,361 |
| Jorudan Co. Ltd. (b) | | 456,300 | 4,478 |
| KPIT Cummins Infosystems Ltd. | | 9,000,000 | 17,943 |
| KSK Co., Ltd. (b) | | 557,300 | 7,360 |
| Majesco Ltd. (c) | | 200,000 | 1,160 |
| NIIT Technologies Ltd. | | 58,528 | 470 |
| Nucleus Software Exports Ltd. (b) | | 2,200,000 | 9,766 |
| Oracle Corp. | | 10,139,774 | 506,279 |
| Pegasystems, Inc. | | 200,171 | 12,100 |
| Pro-Ship, Inc. | | 264,800 | 4,410 |
| RealPage, Inc. (c) | | 380,425 | 14,741 |
| Reckon Ltd. | | 92,184 | 111 |
| RS Software (India) Ltd. (c) | | 362,238 | 420 |
| Synopsys, Inc. (c) | | 26,300 | 2,014 |
| Vitec Software Group AB | | 830,200 | 8,766 |
| Zensar Technologies Ltd. | | 800,000 | 9,975 |
| | | | 1,350,010 |
| Technology Hardware, Storage & Peripherals - 3.2% | | | |
| Compal Electronics, Inc. | | 72,000,000 | 47,778 |
| Hewlett Packard Enterprise Co. | | 5,355,306 | 93,771 |
| HP, Inc. | | 8,030,836 | 153,389 |
| Seagate Technology LLC (b) | | 25,568,700 | 842,744 |
| Super Micro Computer, Inc. (c) | | 464,207 | 12,464 |
| TPV Technology Ltd. | | 72,998,000 | 17,103 |
| Xerox Corp. | | 2,310,350 | 70,858 |
| | | | 1,238,107 |
|
| TOTAL INFORMATION TECHNOLOGY | | | 6,799,700 |
|
| MATERIALS - 3.2% | | | |
| Chemicals - 2.3% | | | |
| Axalta Coating Systems (c) | | 481,000 | 15,152 |
| C. Uyemura & Co. Ltd. | | 402,500 | 23,111 |
| Chase Corp. (b) | | 725,600 | 78,401 |
| Core Molding Technologies, Inc. (a)(b) | | 715,656 | 13,648 |
| Deepak Fertilisers and Petrochemicals Corp. Ltd. (b)(c) | | 6,000,000 | 33,595 |
| Deepak Nitrite Ltd. (c) | | 3,500,000 | 8,851 |
| EcoGreen International Group Ltd. (b) | | 52,572,080 | 10,836 |
| FMC Corp. | | 1,480,800 | 113,104 |
| Fujikura Kasei Co., Ltd. (b) | | 2,843,400 | 16,713 |
| Fuso Chemical Co. Ltd. | | 789,700 | 26,325 |
| Gujarat Narmada Valley Fertilizers Co. | | 7,597,439 | 35,519 |
| Gujarat State Fertilizers & Chemicals Ltd. (b) | | 30,400,000 | 65,224 |
| Honshu Chemical Industry Co. Ltd. (b) | | 826,900 | 7,501 |
| Innospec, Inc. | | 754,408 | 47,075 |
| JSR Corp. | | 243,700 | 4,306 |
| K&S AG (a) | | 973,700 | 25,353 |
| KPC Holdings Corp. | | 43,478 | 2,601 |
| KPX Chemical Co. Ltd. | | 163,083 | 10,353 |
| KPX Green Chemical Co. Ltd. | | 369,165 | 1,485 |
| Miwon Chemicals Co. Ltd. | | 55,095 | 3,247 |
| Miwon Commercial Co. Ltd. (c) | | 13,819 | 2,789 |
| Muto Seiko Co. Ltd. (c) | | 260,600 | 1,723 |
| Nihon Parkerizing Co. Ltd. | | 304,600 | 4,374 |
| Nippon Soda Co. Ltd. | | 1,652,000 | 9,321 |
| Olin Corp. | | 98,800 | 2,913 |
| PolyOne Corp. | | 98,800 | 3,614 |
| Potash Corp. of Saskatchewan, Inc. | | 1,709,400 | 30,575 |
| SK Kaken Co. Ltd. | | 340,000 | 30,840 |
| Soda Aromatic Co. Ltd. | | 261,700 | 2,697 |
| Soken Chemical & Engineer Co. Ltd. (b) | | 699,400 | 9,827 |
| T&K Toka Co. Ltd. (b) | | 1,425,900 | 15,676 |
| Thai Carbon Black PCL (For. Reg.) | | 12,032,900 | 13,108 |
| Thai Rayon PCL: | | | |
| (For. Reg.) | | 2,852,100 | 3,600 |
| NVDR | | 89,800 | 113 |
| UPL Ltd. | | 875,000 | 11,959 |
| Victrex PLC | | 9,664 | 251 |
| Vivimed Labs Ltd. (c) | | 600,000 | 1,166 |
| Yara International ASA | | 4,371,300 | 174,177 |
| Yip's Chemical Holdings Ltd. | | 26,942,000 | 11,210 |
| | | | 872,333 |
| Construction Materials - 0.1% | | | |
| Brampton Brick Ltd. Class A (sub. vtg.) (c) | | 705,400 | 4,821 |
| Mitani Sekisan Co. Ltd. (b) | | 1,562,900 | 36,788 |
| RHI AG | | 93,269 | 3,524 |
| | | | 45,133 |
| Containers & Packaging - 0.3% | | | |
| AMVIG Holdings Ltd. | | 3,640,000 | 1,058 |
| Ball Corp. | | 361,404 | 15,143 |
| Berry Global Group, Inc. (c) | | 229,034 | 12,844 |
| Chuoh Pack Industry Co. Ltd. (b) | | 442,300 | 5,111 |
| Graphic Packaging Holding Co. | | 132,800 | 1,752 |
| Kohsoku Corp. (b) | | 1,822,600 | 18,103 |
| Owens-Illinois, Inc. (c) | | 94,000 | 2,247 |
| Pact Group Holdings Ltd. | | 534,784 | 2,451 |
| Samhwa Crown & Closure Co. Ltd. | | 50,000 | 2,317 |
| Sealed Air Corp. | | 119,800 | 5,212 |
| Silgan Holdings, Inc. | | 421,000 | 12,756 |
| The Pack Corp. (b) | | 1,637,000 | 53,010 |
| UFP Technologies, Inc. (c) | | 92,000 | 2,654 |
| | | | 134,658 |
| Metals& Mining - 0.4% | | | |
| Alcoa Corp. | | 207,900 | 7,568 |
| Alconix Corp. (b) | | 1,111,900 | 22,007 |
| Ausdrill Ltd. | | 2,197,796 | 3,420 |
| Chubu Steel Plate Co. Ltd. | | 434,600 | 2,890 |
| Compania de Minas Buenaventura SA sponsored ADR | | 2,366,419 | 28,965 |
| Freeport-McMoRan, Inc. (c) | | 549,900 | 8,040 |
| Granges AB | | 423,200 | 4,678 |
| Handy & Harman Ltd. (c) | | 113,500 | 3,757 |
| Hill & Smith Holdings PLC | | 987,200 | 17,454 |
| Newmont Mining Corp. | | 50,600 | 1,881 |
| Orosur Mining, Inc. (c) | | 3,119,600 | 563 |
| Orvana Minerals Corp. (c) | | 802,183 | 180 |
| Pacific Metals Co. Ltd. (c) | | 3,997,000 | 10,732 |
| Petra Diamonds Ltd. (c) | | 1,870,900 | 2,357 |
| Steel Dynamics, Inc. | | 148,200 | 5,248 |
| Tohoku Steel Co. Ltd. (b) | | 656,400 | 9,449 |
| Tokyo Tekko Co. Ltd. (b) | | 3,997,000 | 16,460 |
| Universal Stainless & Alloy Products, Inc. (c) | | 87,527 | 1,663 |
| Webco Industries, Inc. (c) | | 7,998 | 640 |
| | | | 147,952 |
| Paper & Forest Products - 0.1% | | | |
| Kapstone Paper & Packaging Corp. | | 146,297 | 3,344 |
| Stella-Jones, Inc. | | 600,000 | 20,997 |
| Western Forest Products, Inc. | | 2,042,100 | 4,062 |
| | | | 28,403 |
|
| TOTAL MATERIALS | | | 1,228,479 |
|
| REAL ESTATE - 0.9% | | | |
| Equity Real Estate Investment Trusts (REITs) - 0.3% | | | |
| CareTrust (REIT), Inc. | | 221,800 | 4,046 |
| Colony NorthStar, Inc. | | 1,011,702 | 14,811 |
| Corporate Office Properties Trust (SBI) | | 117,400 | 3,908 |
| Corrections Corp. of America | | 1,244,436 | 34,471 |
| Four Corners Property Trust, Inc. | | 344,100 | 8,733 |
| Healthcare Realty Trust, Inc. | | 111,400 | 3,710 |
| Nsi NV | | 8,741 | 342 |
| Outfront Media, Inc. | | 168,900 | 3,863 |
| Senior Housing Properties Trust (SBI) | | 39,500 | 768 |
| Store Capital Corp. | | 210,400 | 4,921 |
| VEREIT, Inc. | | 3,611,700 | 30,013 |
| WP Glimcher, Inc. | | 147,000 | 1,326 |
| | | | 110,912 |
| Real Estate Management & Development - 0.6% | | | |
| Anabuki Kosan, Inc. | | 45,150 | 1,202 |
| BUWOG-Gemeinnuetzige Wohnung | | 182,585 | 5,368 |
| CBRE Group, Inc. (c) | | 162,300 | 6,166 |
| Century21 Real Estate Japan Ltd. | | 102,000 | 1,295 |
| Devine Ltd. (c) | | 1,846,772 | 539 |
| IMMOFINANZ Immobilien Anlagen AG | | 1,073,000 | 2,612 |
| Leopalace21 Corp. | | 4,456,500 | 31,813 |
| LSL Property Services PLC | | 1,427,938 | 4,795 |
| Realogy Holdings Corp. | | 163,700 | 5,435 |
| Relo Holdings Corp. | | 7,354,700 | 147,634 |
| Selvaag Bolig ASA | | 1,221,000 | 5,668 |
| Servcorp Ltd. | | 453,009 | 2,167 |
| Sino Land Ltd. | | 2,908,000 | 4,803 |
| Tejon Ranch Co. (c) | | 344,518 | 7,228 |
| Wing Tai Holdings Ltd. | | 1,805,900 | 2,719 |
| | | | 229,444 |
|
| TOTAL REAL ESTATE | | | 340,356 |
|
| TELECOMMUNICATION SERVICES - 0.0% | | | |
| Diversified Telecommunication Services - 0.0% | | | |
| Asia Satellite Telecommunications Holdings Ltd. | | 459,500 | 471 |
| UTILITIES - 0.6% | | | |
| Electric Utilities - 0.3% | | | |
| Exelon Corp. | | 2,950,500 | 113,122 |
| Hawaiian Electric Industries, Inc. | | 95,700 | 3,157 |
| | | | 116,279 |
| Gas Utilities - 0.1% | | | |
| Busan City Gas Co. Ltd. | | 13,931 | 476 |
| GAIL India Ltd. | | 2,000,000 | 11,740 |
| Hokuriku Gas Co. | | 160,400 | 4,154 |
| K&O Energy Group, Inc. | | 563,400 | 8,616 |
| Keiyo Gas Co. Ltd. | | 622,000 | 3,160 |
| South Jersey Industries, Inc. | | 258,359 | 8,776 |
| Star Gas Partners LP | | 395,300 | 4,340 |
| | | | 41,262 |
| Independent Power and Renewable Electricity Producers - 0.1% | | | |
| Mega First Corp. Bhd (b) | | 32,700,045 | 29,328 |
| Mega First Corp. Bhd warrants 4/8/20 (b)(c) | | 3,900,000 | 1,794 |
| The AES Corp. | | 336,000 | 3,756 |
| | | | 34,878 |
| Multi-Utilities - 0.1% | | | |
| CMS Energy Corp. | | 628,455 | 29,060 |
| Water Utilities - 0.0% | | | |
| Manila Water Co., Inc. | | 5,893,400 | 3,740 |
|
| TOTAL UTILITIES | | | 225,219 |
|
| TOTAL COMMON STOCKS | | | |
| (Cost $16,241,993) | | | 33,694,607 |
|
| Nonconvertible Preferred Stocks - 0.1% | | | |
| CONSUMER DISCRETIONARY - 0.0% | | | |
| Textiles, Apparel & Luxury Goods - 0.0% | | | |
| Alpargatas SA (PN) | | 811,100 | 3,873 |
| CONSUMER STAPLES - 0.0% | | | |
| Food Products - 0.0% | | | |
| Nam Yang Dairy Products | | 4,917 | 1,157 |
| ENERGY - 0.0% | | | |
| Oil, Gas & Consumable Fuels - 0.0% | | | |
| Centrus Energy Corp. 7.50% (c)(d) | | 6,752 | 1,480 |
| MATERIALS - 0.1% | | | |
| Construction Materials - 0.1% | | | |
| Buzzi Unicem SpA (Risparmio Shares) | | 1,606,600 | 22,956 |
| TOTAL NONCONVERTIBLE PREFERRED STOCKS | | | |
| (Cost $22,021) | | | 29,466 |
| | | Principal Amount (000s) | Value (000s) |
|
| Nonconvertible Bonds - 0.0% | | | |
| ENERGY - 0.0% | | | |
| Oil, Gas & Consumable Fuels - 0.0% | | | |
| Centrus Energy Corp. 8.25% 2/28/27 (d) | | | |
| (Cost $11,839) | | 4,832 | 3,865 |
| | | Shares | Value (000s) |
|
| Money Market Funds - 12.3% | | | |
| Fidelity Cash Central Fund, 1.11% (e) | | 4,351,859,851 | 4,352,730 |
| Fidelity Securities Lending Cash Central Fund 1.11% (e)(f) | | 339,400,686 | 339,435 |
| TOTAL MONEY MARKET FUNDS | | | |
| (Cost $4,691,556) | | | 4,692,165 |
| TOTAL INVESTMENT PORTFOLIO - 100.5% | | | |
| (Cost $20,967,409) | | | 38,420,103 |
| NET OTHER ASSETS (LIABILITIES) - (0.5)% | | | (199,967) |
| NET ASSETS - 100% | | | $38,220,136 |
Values shown as $0 may reflect amounts less than $500.
Legend
(a) Security or a portion of the security is on loan at period end.
(b) Affiliated company
(c) Non-income producing
(d) Security exempt from registration under Rule 144A of the Securities Act of 1933. These securities may be resold in transactions exempt from registration, normally to qualified institutional buyers. At the end of the period, the value of these securities amounted to $5,345,000 or 0.0% of net assets.
(e) Affiliated fund that is generally available only to investment companies and other accounts managed by Fidelity Investments. The rate quoted is the annualized seven-day yield of the fund at period end. A complete unaudited listing of the fund's holdings as of its most recent quarter end is available upon request. In addition, each Fidelity Central Fund's financial statements, which are not covered by the Fund's Report of Independent Registered Public Accounting Firm, are available on the SEC's website or upon request.
(f) Investment made with cash collateral received from securities on loan.
Affiliated Central Funds
Information regarding fiscal year to date income earned by the Fund from investments in Fidelity Central Funds is as follows:
| Fund | Income earned |
| | (Amounts in thousands) |
| Fidelity Cash Central Fund | $25,561 |
| Fidelity Securities Lending Cash Central Fund | 8,548 |
| Total | $34,109 |
Other Affiliated Issuers
An affiliated company is a company in which the Fund has ownership of at least 5% of the voting securities. Fiscal year to date transactions with companies which are or were affiliates are as follows:
| Affiliate (Amounts in thousands) | Value, beginning of period | Purchases | Sales Proceeds* | Dividend Income | Value, end of period |
| Aalberts Industries NV | $280,615 | $-- | $10,073 | $4,385 | $357,923 |
| Abbey PLC | 27,009 | -- | 855 | 313 | 30,976 |
| Abercrombie & Fitch Co. Class A | 111,229 | -- | 1,743 | 4,271 | 51,336 |
| Accell Group NV | 55,294 | -- | 7,082 | 1,494 | 57,199 |
| AECOM | 276,570 | 10,144 | 31,425 | -- | -- |
| Air T, Inc. | 4,609 | -- | 113 | -- | 3,276 |
| AJIS Co. Ltd. | 28,027 | -- | 613 | 311 | 18,967 |
| Alconix Corp. | 15,908 | 17 | 567 | 428 | 22,007 |
| Almost Family, Inc. | 32,103 | -- | 16,325 | -- | -- |
| Alps Logistics Co. Ltd. | 17,736 | -- | 605 | 472 | 21,604 |
| ANSYS, Inc. | 399,734 | -- | 36,192 | -- | -- |
| Arctic Cat, Inc. | 17,363 | -- | 246 | -- | -- |
| Ark Restaurants Corp. | 4,594 | 169 | 138 | 198 | 4,524 |
| Arts Optical International Holdings Ltd. | 12,370 | -- | 2,257 | 915 | 8,599 |
| ASL Marine Holdings Ltd. | 5,316 | 1,536 | 134 | -- | 4,442 |
| Assurant, Inc. | 352,793 | -- | 115,144 | 8,034 | 322,168 |
| ASTI Corp. | 2,051 | -- | 154 | 59 | 5,592 |
| Atlas Air Worldwide Holdings, Inc. | 72,657 | 487 | 91,289 | -- | -- |
| Atwood Oceanics, Inc. | 67,818 | 13,806 | 1,935 | -- | 57,677 |
| Axell Corp. | 5,716 | -- | 172 | 33 | 5,428 |
| Axis Capital Holdings Ltd. | 363,338 | -- | 173,977 | 8,648 | -- |
| AZZ, Inc. | 83,311 | -- | 7,528 | 867 | -- |
| Barratt Developments PLC | 451,627 | -- | 16,208 | 30,566 | 615,294 |
| Bed Bath & Beyond, Inc. | 265,416 | 106,308 | 7,309 | 3,163 | 274,957 |
| Bel Fuse, Inc. Class A | 3,309 | -- | 2,342 | 29 | -- |
| Belc Co. Ltd. | 74,524 | -- | 2,186 | 921 | 80,741 |
| Belluna Co. Ltd. | 59,870 | -- | 16,193 | 985 | 87,499 |
| Best Buy Co., Inc. | 1,013,053 | -- | 509,504 | 29,259 | 1,088,006 |
| Black Box Corp. | 21,944 | -- | 437 | 767 | 12,338 |
| BMTC Group, Inc. | 44,380 | -- | 2,506 | 672 | 39,153 |
| Calian Technologies Ltd. | 12,538 | -- | 401 | 499 | 15,187 |
| Carbo Ceramics, Inc. | 29,891 | -- | 14,074 | -- | -- |
| Chase Corp. | 49,296 | -- | 8,592 | 568 | 78,401 |
| Chilled & Frozen Logistics Holdings Co. Ltd. | 17,074 | -- | 4,456 | 283 | 15,688 |
| Chuoh Pack Industry Co. Ltd. | 4,728 | -- | 152 | 169 | 5,111 |
| Cinderella Media Group Ltd. | 4,868 | -- | 279 | -- | -- |
| Civeo Corp. | 14,344 | 7,191 | 841 | -- | 24,148 |
| Clip Corp. | 2,635 | -- | 70 | 95 | 2,382 |
| Codorus Valley Bancorp, Inc. | 13,291 | 664 | 507 | 348 | 18,561 |
| Contango Oil & Gas Co. | 18,778 | 743 | 430 | -- | 12,450 |
| Core Molding Technologies, Inc. | 11,084 | 2,643 | 2,338 | -- | 13,648 |
| Cosmos Pharmaceutical Corp. | 288,551 | -- | 28,400 | 833 | 262,818 |
| Create SD Holdings Co. Ltd. | 145,712 | -- | 4,166 | 1,479 | 146,994 |
| CSE Global Ltd. | 14,906 | -- | 421 | 871 | 13,065 |
| Daewon Pharmaceutical Co. Ltd. | 34,676 | -- | -- | 314 | 29,918 |
| Daiichi Kensetsu Corp. | 19,901 | -- | 608 | 391 | 22,034 |
| DCC PLC (United Kingdom) | 624,867 | -- | 150,929 | 8,699 | 464,436 |
| Deepak Fertilisers and Petrochemicals Corp. Ltd. | 18,663 | -- | 6,250 | -- | 33,595 |
| DongKook Pharmaceutical Co. Ltd. | 37,160 | -- | -- | 174 | 33,526 |
| DSW, Inc. Class A | 116,448 | 5,503 | 14,002 | 3,614 | -- |
| DVx, Inc. | 8,067 | -- | 252 | 140 | 8,368 |
| Ebix, Inc. | 153,226 | -- | 7,939 | 841 | 158,009 |
| EcoGreen International Group Ltd. | 10,325 | -- | 327 | 329 | 10,836 |
| Elematec Corp. | 28,328 | -- | 650 | 227 | 22,459 |
| EOH Holdings Ltd. | 72,904 | -- | 1,990 | 831 | -- |
| Essendant, Inc. | 41,363 | 2,783 | 1,068 | 1,166 | 27,007 |
| Excel Co. Ltd. | 10,832 | -- | 306 | 235 | 10,314 |
| Farstad Shipping ASA | 3,213 | 1,410 | 36 | -- | -- |
| Ff Group | 107,213 | 7,232 | 2,949 | -- | 109,703 |
| First Juken Co. Ltd. | 18,267 | -- | 599 | 522 | 21,090 |
| Food Empire Holdings Ltd. | 12,087 | -- | 1,928 | 187 | 20,674 |
| Fossil Group, Inc. | 144,576 | 718 | 31,850 | -- | -- |
| Fresh Del Monte Produce, Inc. | 299,600 | -- | 9,600 | 3,134 | 262,477 |
| Fuji Kosan Co. Ltd. | 2,866 | -- | 93 | 78 | 3,565 |
| Fujikura Kasei Co., Ltd. | 17,183 | -- | 488 | 396 | 16,713 |
| Fursys, Inc. | 28,855 | -- | -- | 458 | 28,374 |
| Fyffes PLC (Ireland) | 44,248 | -- | 301 | 825 | -- |
| Gabia, Inc. | 5,345 | -- | -- | 20 | 5,328 |
| GameStop Corp. Class A | 293,285 | 24,263 | 12,621 | 14,436 | 216,839 |
| Genky Stores, Inc. | 13,359 | -- | 741 | 139 | 28,711 |
| Geospace Technologies Corp. | 20,470 | -- | 592 | -- | 18,545 |
| Geumhwa PSC Co. Ltd. | 12,187 | 307 | -- | 223 | 12,086 |
| GNC Holdings, Inc. Class A | 98,942 | 26,341 | 53,283 | 1,875 | -- |
| Goodfellow, Inc. | 6,846 | -- | 140 | -- | 4,738 |
| Guess?, Inc. | 110,594 | -- | 26,195 | 6,247 | 68,134 |
| Gujarat Narmada Valley Fertilizers Co. | 31,358 | -- | 26,212 | 404 | -- |
| Gujarat State Fertilizers & Chemicals Ltd. | 33,010 | -- | 2,177 | 1,037 | 65,224 |
| Gulfmark Offshore, Inc. Class A | 1,906 | 675 | 88 | -- | 413 |
| Halows Co. Ltd. | 27,422 | -- | 842 | 236 | 29,437 |
| Hamakyorex Co. Ltd. | 24,611 | -- | 866 | 460 | 34,778 |
| Hampshire Group Ltd. | 12 | -- | 4 | -- | -- |
| Handsome Co. Ltd. | 74,379 | -- | -- | 439 | 68,497 |
| Hanger, Inc. | 29,120 | -- | 926 | -- | 30,525 |
| Helen of Troy Ltd. | 242,740 | -- | 45,261 | -- | 196,442 |
| Hiday Hidaka Corp. | 48,144 | -- | 1,576 | 586 | 60,332 |
| Honshu Chemical Industry Co. Ltd. | 5,713 | -- | 195 | 186 | 7,501 |
| Hoshiiryou Sanki Co. Ltd. | 10,919 | -- | 337 | 110 | 11,966 |
| Houston Wire & Cable Co. | 6,545 | 521 | 7,845 | 34 | -- |
| Hurco Companies, Inc. | 13,824 | 2,026 | 2,547 | 202 | 16,735 |
| Hwacheon Machine Tool Co. Ltd. | 9,871 | -- | -- | 187 | 11,663 |
| Hyster-Yale Materials Handling Class A | 14,289 | -- | 411 | 264 | 15,417 |
| Hyster-Yale Materials Handling Class B | 19,775 | -- | -- | 368 | 21,967 |
| I-Sheng Electric Wire & Cable Co. Ltd. | 15,341 | -- | -- | 1,312 | 17,852 |
| IA Group Corp. | 5,226 | -- | 943 | 142 | 3,759 |
| ICT Automatisering NV | 8,959 | -- | 1,821 | 204 | 9,019 |
| IDIS Holdings Co. Ltd. | 11,718 | -- | -- | 83 | 9,322 |
| Ihara Science Corp. | 8,622 | -- | 466 | 301 | 20,475 |
| Indra Sistemas | 171,608 | -- | 5,753 | -- | 212,977 |
| InfoVine Co. Ltd. | 4,207 | -- | -- | -- | 4,250 |
| Intage Holdings, Inc. | 28,744 | -- | 971 | 508 | 35,728 |
| Intelligent Digital Integrated Security Co. Ltd. | 10,555 | -- | -- | 120 | 6,509 |
| INTOPS Co. Ltd. | 15,416 | -- | -- | 117 | 18,044 |
| INZI Controls Co. Ltd. | 8,474 | -- | -- | 94 | 6,917 |
| Isewan Terminal Service Co. Ltd. | 9,100 | -- | 238 | 261 | -- |
| Isra Vision AG | 35,314 | -- | 5,257 | 167 | 65,170 |
| Jaya Holdings Ltd. | 1,121 | -- | 10 | 893 | 206 |
| JLM Couture, Inc. | 563 | -- | 15 | -- | 511 |
| Jorudan Co. Ltd. | 3,328 | -- | 123 | 55 | 4,478 |
| Jumbo SA | 127,943 | -- | 4,941 | 5,676 | 176,166 |
| Kingboard Chemical Holdings Ltd. | 182,540 | -- | 9,533 | 13,956 | 370,346 |
| Know IT AB | 13,677 | -- | 611 | 553 | 24,210 |
| Kohsoku Corp. | 16,596 | -- | 533 | 431 | 18,103 |
| Kondotec, Inc. | 12,597 | -- | 410 | 331 | 14,958 |
| Korea Electric Terminal Co. Ltd. | 55,230 | -- | -- | 346 | 44,065 |
| KSK Co., Ltd. | 5,892 | -- | 195 | 203 | 7,360 |
| Kwang Dong Pharmaceutical Co. Ltd. | 26,493 | -- | -- | 171 | 23,334 |
| Kyeryong Construction Industrial Co. Ltd. | 7,674 | -- | 114 | -- | 11,076 |
| Kyoto Kimono Yuzen Co. Ltd. | 7,517 | -- | 5,285 | 239 | -- |
| LCNB Corp. | 12,258 | 191 | 4,573 | 432 | -- |
| LHC Group, Inc. | 49,216 | -- | 27,705 | -- | -- |
| Maruzen Co. Ltd. | 16,271 | -- | 641 | 316 | 27,369 |
| Mastek Ltd. | 2,396 | -- | 1,972 | 48 | -- |
| Mega First Corp. Bhd | 14,781 | -- | -- | 387 | 29,328 |
| Mega First Corp. Bhd warrants 4/8/20 | 456 | -- | 189 | -- | 1,794 |
| Melexis NV | 177,059 | -- | 58,226 | 4,751 | -- |
| Mesa Laboratories, Inc. | 31,428 | -- | 4,621 | 167 | 34,239 |
| Metro, Inc. Class A (sub. vtg.) | 1,005,281 | -- | 56,298 | 10,469 | 876,121 |
| Michang Oil Industrial Co. Ltd. | 14,143 | -- | -- | 264 | 13,913 |
| Miroku Corp. | 2,212 | -- | 85 | 50 | -- |
| Mitani Sekisan Co. Ltd. | 34,093 | -- | 2,502 | 237 | 36,788 |
| Mitie Group PLC | 64,987 | -- | 16,213 | 979 | -- |
| Motonic Corp. | 27,044 | -- | -- | 556 | 28,729 |
| Mr. Bricolage SA | 13,237 | -- | 412 | 529 | 16,992 |
| Muhak Co. Ltd. | 59,618 | -- | -- | 686 | 56,738 |
| Murakami Corp. | 12,838 | -- | 496 | 228 | 17,692 |
| Muramoto Electronic Thailand PCL (For. Reg.) | 8,851 | -- | 268 | 492 | 9,120 |
| Nac Co. Ltd. | 9,478 | -- | 1,324 | 265 | 8,739 |
| Nadex Co. Ltd. | 4,108 | -- | 178 | 190 | 6,782 |
| Nafco Co. Ltd. | 33,322 | -- | 952 | 676 | 32,256 |
| Nakayamafuku Co. Ltd. | 8,398 | -- | 260 | 237 | 7,504 |
| NCI, Inc. Class A | 8,780 | 3,457 | 3,483 | -- | -- |
| ND Software Co. Ltd. | 10,531 | -- | 368 | 192 | 13,121 |
| Next PLC | 960,887 | -- | 36,381 | 44,537 | 720,096 |
| NICE Total Cash Management Co., Ltd. | 8,303 | -- | -- | 76 | 12,891 |
| Nippo Ltd. | 1,768 | -- | 62 | -- | 2,397 |
| Norwood Financial Corp. | 5,246 | 392 | 1,897 | 231 | -- |
| Nucleus Software Exports Ltd. | 6,405 | -- | -- | 170 | 9,766 |
| Nutraceutical International Corp. | 26,232 | -- | 1,063 | 255 | 41,542 |
| OFG Bancorp | 25,308 | -- | 19,229 | 421 | -- |
| Origin Enterprises PLC | 52,849 | 6,916 | 2,088 | 2,218 | 75,152 |
| P&F Industries, Inc. Class A | 3,150 | -- | 66 | 50 | 1,986 |
| Parker Corp. | 7,322 | -- | 336 | 172 | 12,168 |
| Piolax, Inc. | 45,328 | -- | 1,917 | 751 | 72,133 |
| Prim SA | 14,833 | -- | 503 | 651 | 19,681 |
| Qol Co. Ltd. | 27,774 | 964 | 864 | 408 | 31,384 |
| Relo Holdings Corp. | 157,507 | -- | 45,677 | 1,319 | -- |
| RenaissanceRe Holdings Ltd. | 325,965 | -- | 78,244 | 3,311 | 326,272 |
| Roadrunner Transportation Systems, Inc. | 21,448 | 8,216 | 810 | -- | 26,420 |
| Rocky Mountain Chocolate Factory, Inc. | 4,457 | 584 | 143 | 205 | 5,440 |
| S&T Holdings Co. Ltd. | 14,556 | -- | -- | 210 | 12,660 |
| Sakai Moving Service Co. Ltd. | 34,221 | -- | 6,742 | 473 | 59,548 |
| Samsung Climate Control Co. Ltd. | 4,560 | -- | -- | 31 | 5,669 |
| Sanei Architecture Planning Co. Ltd. | 14,043 | -- | 584 | 381 | 22,654 |
| Sarantis SA | 21,370 | -- | 813 | 344 | 30,582 |
| ScanSource, Inc. | 91,087 | 5,774 | 8,325 | -- | 87,029 |
| Seagate Technology LLC | 877,660 | -- | 76,446 | 67,778 | 842,744 |
| Select Harvests Ltd. | 27,700 | -- | 585 | 1,268 | 18,238 |
| Senshu Electric Co. Ltd. | 15,380 | -- | 518 | 319 | 18,882 |
| Servotronics, Inc. | 1,320 | 318 | 50 | 26 | 1,623 |
| Sewon Precision Industries Co. Ltd. | 8,290 | -- | -- | 38 | 7,366 |
| Shibaura Electronics Co. Ltd. | 11,774 | -- | 857 | 337 | 22,486 |
| ShoLodge, Inc. | 0 | -- | -- | -- | 0 |
| Sigmatron International, Inc. | 1,501 | 11 | 47 | -- | 2,108 |
| Sinwa Ltd. | 4,271 | -- | 104 | 186 | 3,473 |
| SJM Co. Ltd. | 8,445 | -- | -- | 177 | 6,651 |
| SJM Holdings Co. Ltd. | 6,768 | -- | -- | 184 | 6,082 |
| Societe Pour L'Informatique Industrielle SA | 25,005 | -- | 1,181 | 153 | 46,192 |
| Soken Chemical & Engineer Co. Ltd. | 6,538 | -- | 276 | 261 | 9,827 |
| Span-America Medical System, Inc. | 4,705 | 280 | 87 | 172 | -- |
| SPK Corp. | 5,479 | 140 | 187 | 146 | 7,050 |
| Sportscene Group, Inc. Class A | 1,316 | -- | 46 | -- | 1,827 |
| Step Co. Ltd. | 12,446 | -- | 434 | 306 | 14,962 |
| Sterling Construction Co., Inc. | 12,194 | 608 | 15,726 | -- | -- |
| Strattec Security Corp. | 7,047 | 5,383 | 288 | 145 | 11,271 |
| Strongco Corp. | 1,173 | -- | 27 | -- | 943 |
| Sun Hing Vision Group Holdings Ltd. | 7,647 | -- | 232 | 635 | 8,362 |
| Sunjin Co. Ltd. | 20,180 | -- | -- | 2 | 27,026 |
| Sword Group | 13,332 | -- | 5,676 | 385 | -- |
| SYNNEX Corp. | 307,461 | -- | 26,477 | 2,936 | 336,853 |
| T&K Toka Co. Ltd. | 13,161 | -- | 425 | 271 | 15,676 |
| Techno Smart Corp. | 3,363 | -- | 2,742 | 161 | 9,054 |
| Tessco Technologies, Inc. | 6,533 | -- | 4,960 | 362 | -- |
| The Buckle, Inc. | 132,461 | 4,280 | 7,231 | 8,449 | 80,756 |
| The Pack Corp. | 46,476 | -- | 1,419 | 655 | 53,010 |
| Tocalo Co. Ltd. | 16,802 | -- | 729 | 611 | 31,573 |
| Tohoku Steel Co. Ltd. | 6,546 | -- | 256 | 126 | 9,449 |
| Token Corp. | 57,849 | -- | 1,960 | 717 | -- |
| Tokyo Kisen Co. Ltd. | 5,555 | -- | 164 | 201 | 5,800 |
| Tokyo Tekko Co. Ltd. | 15,150 | -- | 491 | 238 | 16,460 |
| Tomen Devices Corp. | 10,840 | -- | 360 | 294 | 12,893 |
| Total Energy Services, Inc. | 21,762 | -- | 662 | 339 | -- |
| Totech Corp. | 11,171 | 395 | 463 | 350 | 17,623 |
| TOW Co. Ltd. | 11,751 | -- | 398 | 400 | 15,331 |
| Trancom Co. Ltd. | 59,491 | -- | 1,355 | 612 | 44,353 |
| Trio-Tech International | 875 | -- | 30 | -- | 1,129 |
| Triple-S Management Corp. | 49,208 | -- | 986 | -- | 29,777 |
| Tsukui Corp. | 28,721 | -- | 15,532 | 238 | -- |
| UKC Holdings Corp. | 22,097 | -- | 671 | 715 | 20,506 |
| Uni-Select, Inc. | 53,667 | -- | 11,726 | 471 | -- |
| Unit Corp. | 58,338 | -- | 2,870 | -- | 81,511 |
| Universal Logistics Holdings, Inc. | 24,741 | 2,671 | 4,302 | 471 | 22,264 |
| Unum Group | 576,028 | -- | 52,880 | 13,648 | 801,555 |
| Utah Medical Products, Inc. | 24,740 | -- | 721 | 399 | 25,516 |
| VSE Corp. | 27,966 | 646 | 1,118 | 223 | 45,427 |
| VST Holdings Ltd. | 31,048 | -- | 1,197 | 2,033 | 33,659 |
| Watts Co. Ltd. | 12,358 | -- | 728 | 165 | 15,539 |
| Weight Watchers International, Inc. | 52,032 | 59 | 6,431 | -- | 148,520 |
| Whanin Pharmaceutical Co. Ltd. | 25,398 | -- | -- | 301 | 30,861 |
| WIN-Partners Co. Ltd. | 20,281 | -- | 805 | 572 | 33,644 |
| Workman Co. Ltd. | 80,055 | -- | 2,033 | 1,018 | 70,361 |
| Youngone Holdings Co. Ltd. | 48,445 | -- | -- | 306 | 42,735 |
| Yusen Logistics Co. Ltd. | 34,365 | -- | 9,036 | 471 | 19,570 |
| Yutaka Giken Co. Ltd. | 26,673 | -- | 835 | 678 | 29,488 |
| Zumiez, Inc. | 32,011 | 406 | 32,561 | -- | -- |
| Total | $15,132,964 | $257,178 | $2,256,453 | $367,426 | $13,042,071 |
* Includes the value of securities delivered through in-kind transactions, if applicable.
Investment Valuation
The following is a summary of the inputs used, as of July 31, 2017, involving the Fund's assets and liabilities carried at fair value. The inputs or methodology used for valuing securities may not be an indication of the risk associated with investing in those securities. For more information on valuation inputs, and their aggregation into the levels used below, please refer to the Investment Valuation section in the accompanying Notes to Financial Statements.
| | Valuation Inputs at Reporting Date: |
| Description | Total | Level 1 | Level 2 | Level 3 |
| (Amounts in thousands) | | | | |
| Investments in Securities: | | | | |
| Equities: | | | | |
| Consumer Discretionary | $8,698,252 | $8,696,912 | $829 | $511 |
| Consumer Staples | 3,497,505 | 3,486,231 | -- | 11,274 |
| Energy | 1,053,574 | 930,304 | 121,790 | 1,480 |
| Financials | 4,260,872 | 3,979,810 | 280,112 | 950 |
| Health Care | 4,660,668 | 4,660,668 | -- | -- |
| Industrials | 2,936,021 | 2,927,134 | 8,887 | -- |
| Information Technology | 6,799,700 | 6,799,696 | -- | 4 |
| Materials | 1,251,435 | 1,251,435 | -- | -- |
| Real Estate | 340,356 | 340,356 | -- | -- |
| Telecommunication Services | 471 | 471 | -- | -- |
| Utilities | 225,219 | 225,219 | -- | -- |
| Corporate Bonds | 3,865 | -- | 3,865 | -- |
| Money Market Funds | 4,692,165 | 4,692,165 | -- | -- |
| Total Investments in Securities: | $38,420,103 | $37,990,401 | $415,483 | $14,219 |
The following is a summary of transfers between Level 1 and Level 2 for the period ended July 31, 2017. Transfers are assumed to have occurred at the beginning of the period, and are primarily attributable to the valuation techniques used for foreign equity securities, as discussed in the accompanying Notes to Financial Statements:
| Transfers | Total (000s) |
| Level 1 to Level 2 | $0 |
| Level 2 to Level 1 | $3,214,746 |
Other Information
Distribution of investments by country or territory of incorporation, as a percentage of Total Net Assets, is as follows (Unaudited):
| United States of America | 55.6% |
| Japan | 9.7% |
| United Kingdom | 5.3% |
| Ireland | 4.4% |
| Canada | 4.3% |
| Netherlands | 2.8% |
| Taiwan | 2.5% |
| Bermuda | 2.3% |
| Cayman Islands | 2.0% |
| Korea (South) | 1.9% |
| Bailiwick of Guernsey | 1.2% |
| India | 1.0% |
| Others (Individually Less Than 1%) | 7.0% |
| | 100.0% |
See accompanying notes which are an integral part of the financial statements.
Financial Statements
Statement of Assets and Liabilities
| Amounts in thousands (except per-share amounts) | | July 31, 2017 |
| Assets | | |
Investment in securities, at value (including securities loaned of $326,229) — See accompanying schedule:
Unaffiliated issuers (cost $10,045,447) | $20,685,867 | |
| Fidelity Central Funds (cost $4,691,556) | 4,692,165 | |
| Other affiliated issuers (cost $6,230,406) | 13,042,071 | |
| Total Investments (cost $20,967,409) | | $38,420,103 |
| Foreign currency held at value (cost $1,743) | | 1,742 |
| Receivable for investments sold | | 79,628 |
| Receivable for fund shares sold | | 28,550 |
| Dividends receivable | | 76,517 |
| Interest receivable | | 185 |
| Distributions receivable from Fidelity Central Funds | | 4,243 |
| Other receivables | | 2,005 |
| Total assets | | 38,612,973 |
| Liabilities | | |
| Payable for investments purchased | $2,563 | |
| Payable for fund shares redeemed | 31,241 | |
| Accrued management fee | 12,540 | |
| Other affiliated payables | 3,891 | |
| Other payables and accrued expenses | 3,166 | |
| Collateral on securities loaned | 339,436 | |
| Total liabilities | | 392,837 |
| Net Assets | | $38,220,136 |
| Net Assets consist of: | | |
| Paid in capital | | $18,213,039 |
| Undistributed net investment income | | 293,208 |
| Accumulated undistributed net realized gain (loss) on investments and foreign currency transactions | | 2,261,213 |
| Net unrealized appreciation (depreciation) on investments and assets and liabilities in foreign currencies | | 17,452,676 |
| Net Assets | | $38,220,136 |
| Low-Priced Stock: | | |
| Net Asset Value, offering price and redemption price per share ($28,334,033 ÷ 521,051 shares) | | $54.38 |
| Class K: | | |
| Net Asset Value, offering price and redemption price per share ($9,886,103 ÷ 181,871 shares) | | $54.36 |
See accompanying notes which are an integral part of the financial statements.
Statement of Operations
| Amounts in thousands | | Year ended July 31, 2017 |
| Investment Income | | |
| Dividends (including $367,426 earned from other affiliated issuers) | | $795,434 |
| Interest | | 603 |
| Income from Fidelity Central Funds | | 34,109 |
| Total income | | 830,146 |
| Expenses | | |
| Management fee | | |
| Basic fee | $231,997 | |
| Performance adjustment | (30,889) | |
| Transfer agent fees | 45,131 | |
| Accounting and security lending fees | 2,244 | |
| Custodian fees and expenses | 2,700 | |
| Independent trustees' fees and expenses | 159 | |
| Appreciation in deferred trustee compensation account | 1 | |
| Registration fees | 161 | |
| Audit | 215 | |
| Legal | 113 | |
| Miscellaneous | 342 | |
| Total expenses before reductions | 252,174 | |
| Expense reductions | (520) | 251,654 |
| Net investment income (loss) | | 578,492 |
| Realized and Unrealized Gain (Loss) | | |
| Net realized gain (loss) on: | | |
| Investment securities: | | |
| Unaffiliated issuers | 2,707,408 | |
| Redemptions in-kind with affiliated entities | 254,862 | |
| Fidelity Central Funds | 224 | |
| Other affiliated issuers | 811,078 | |
| Foreign currency transactions | (225) | |
| Total net realized gain (loss) | | 3,773,347 |
| Change in net unrealized appreciation (depreciation) on: | | |
| Investment securities (net of decrease in deferred foreign taxes of $395) | 1,136,407 | |
| Assets and liabilities in foreign currencies | 319 | |
| Total change in net unrealized appreciation (depreciation) | | 1,136,726 |
| Net gain (loss) | | 4,910,073 |
| Net increase (decrease) in net assets resulting from operations | | $5,488,565 |
See accompanying notes which are an integral part of the financial statements.
Statement of Changes in Net Assets
| Amounts in thousands | Year ended July 31, 2017 | Year ended July 31, 2016 |
| Increase (Decrease) in Net Assets | | |
| Operations | | |
| Net investment income (loss) | $578,492 | $508,914 |
| Net realized gain (loss) | 3,773,347 | 1,577,645 |
| Change in net unrealized appreciation (depreciation) | 1,136,726 | (2,865,712) |
| Net increase (decrease) in net assets resulting from operations | 5,488,565 | (779,153) |
| Distributions to shareholders from net investment income | (481,686) | (528,171) |
| Distributions to shareholders from net realized gain | (1,425,392) | (1,338,985) |
| Total distributions | (1,907,078) | (1,867,156) |
| Share transactions - net increase (decrease) | (5,374,274) | (1,482,043) |
| Redemption fees | 401 | 1,921 |
| Total increase (decrease) in net assets | (1,792,386) | (4,126,431) |
| Net Assets | | |
| Beginning of period | 40,012,522 | 44,138,953 |
| End of period | $38,220,136 | $40,012,522 |
| Other Information | | |
| Undistributed net investment income end of period | $293,208 | $225,648 |
See accompanying notes which are an integral part of the financial statements.
Financial Highlights — Fidelity Low-Priced Stock Fund
| Years ended July 31, | 2017 | 2016 | 2015 | 2014 | 2013 |
| Selected Per–Share Data | | | | | |
| Net asset value, beginning of period | $49.57 | $52.65 | $51.03 | $47.84 | $38.52 |
| Income from Investment Operations | | | | | |
| Net investment income (loss)A | .74 | .59 | .52 | .53 | .48 |
| Net realized and unrealized gain (loss) | 6.47 | (1.44) | 4.06 | 5.96 | 11.61 |
| Total from investment operations | 7.21 | (.85) | 4.58 | 6.49 | 12.09 |
| Distributions from net investment income | (.60) | (.62) | (.52) | (.39) | (.49) |
| Distributions from net realized gain | (1.80) | (1.61) | (2.44) | (2.91) | (2.28) |
| Total distributions | (2.40) | (2.23) | (2.96) | (3.30) | (2.77) |
| Redemption fees added to paid in capitalA,B | – | – | – | – | – |
| Net asset value, end of period | $54.38 | $49.57 | $52.65 | $51.03 | $47.84 |
| Total ReturnC | 15.17% | (1.48)% | 9.32% | 14.42% | 33.12% |
| Ratios to Average Net AssetsD,E | | | | | |
| Expenses before reductions | .67% | .88% | .79% | .82% | .79% |
| Expenses net of fee waivers, if any | .67% | .88% | .79% | .82% | .79% |
| Expenses net of all reductions | .67% | .88% | .79% | .82% | .79% |
| Net investment income (loss) | 1.46% | 1.24% | 1.02% | 1.07% | 1.14% |
| Supplemental Data | | | | | |
| Net assets, end of period (in millions) | $28,334 | $28,524 | $30,150 | $30,576 | $28,171 |
| Portfolio turnover rateF | 8%G | 9%G | 9%G | 12%G | 11% |
A Calculated based on average shares outstanding during the period.
B Amount represents less than $.005 per share.
C Total returns would have been lower if certain expenses had not been reduced during the applicable periods shown.
D Fees and expenses of any underlying Fidelity Central Funds are not included in the Fund's expense ratio. The Fund indirectly bears its proportionate share of the expenses of any underlying Fidelity Central Funds.
E Expense ratios reflect operating expenses of the class. Expenses before reductions do not reflect amounts reimbursed by the investment adviser or reductions from brokerage service arrangements or reductions from other expense offset arrangements and do not represent the amount paid by the class during periods when reimbursements or reductions occur. Expenses net of fee waivers reflect expenses after reimbursement by the investment adviser but prior to reductions from brokerage service arrangements or other expense offset arrangements. Expenses net of all reductions represent the net expenses paid by the class.
F Amount does not include the portfolio activity of any underlying Fidelity Central Funds.
G Portfolio turnover rate excludes securities received or delivered in-kind.
See accompanying notes which are an integral part of the financial statements.
Financial Highlights — Fidelity Low-Priced Stock Fund Class K
| Years ended July 31, | 2017 | 2016 | 2015 | 2014 | 2013 |
| Selected Per–Share Data | | | | | |
| Net asset value, beginning of period | $49.56 | $52.64 | $51.02 | $47.83 | $38.52 |
| Income from Investment Operations | | | | | |
| Net investment income (loss)A | .79 | .64 | .57 | .58 | .53 |
| Net realized and unrealized gain (loss) | 6.46 | (1.44) | 4.06 | 5.96 | 11.60 |
| Total from investment operations | 7.25 | (.80) | 4.63 | 6.54 | 12.13 |
| Distributions from net investment income | (.64) | (.67) | (.57) | (.44) | (.54) |
| Distributions from net realized gain | (1.80) | (1.61) | (2.44) | (2.91) | (2.28) |
| Total distributions | (2.45)B | (2.28) | (3.01) | (3.35) | (2.82) |
| Redemption fees added to paid in capitalA,C | – | – | – | – | – |
| Net asset value, end of period | $54.36 | $49.56 | $52.64 | $51.02 | $47.83 |
| Total ReturnD | 15.27% | (1.38)% | 9.44% | 14.55% | 33.27% |
| Ratios to Average Net AssetsE,F | | | | | |
| Expenses before reductions | .58% | .78% | .69% | .72% | .68% |
| Expenses net of fee waivers, if any | .58% | .78% | .69% | .72% | .68% |
| Expenses net of all reductions | .58% | .78% | .69% | .72% | .68% |
| Net investment income (loss) | 1.56% | 1.34% | 1.11% | 1.17% | 1.26% |
| Supplemental Data | | | | | |
| Net assets, end of period (in millions) | $9,886 | $11,489 | $13,989 | $16,198 | $14,691 |
| Portfolio turnover rateG | 8%H | 9%H | 9%H | 12%H | 11% |
A Calculated based on average shares outstanding during the period.
B Total distributions of $2.45 per share is comprised of distributions from net investment income of $.644 and distributions from net realized gain of $1.803 per share.
C Amount represents less than $.005 per share.
D Total returns would have been lower if certain expenses had not been reduced during the applicable periods shown.
E Fees and expenses of any underlying Fidelity Central Funds are not included in the Fund's expense ratio. The Fund indirectly bears its proportionate share of the expenses of any underlying Fidelity Central Funds.
F Expense ratios reflect operating expenses of the class. Expenses before reductions do not reflect amounts reimbursed by the investment adviser or reductions from brokerage service arrangements or reductions from other expense offset arrangements and do not represent the amount paid by the class during periods when reimbursements or reductions occur. Expenses net of fee waivers reflect expenses after reimbursement by the investment adviser but prior to reductions from brokerage service arrangements or other expense offset arrangements. Expenses net of all reductions represent the net expenses paid by the class.
G Amount does not include the portfolio activity of any underlying Fidelity Central Funds.
H Portfolio turnover rate excludes securities received or delivered in-kind.
See accompanying notes which are an integral part of the financial statements.
Notes to Financial Statements
For the period ended July 31, 2017
(Amounts in thousands except percentages)
1. Organization.
Fidelity Low-Priced Stock Fund (the Fund) is a fund of Fidelity Puritan Trust (the Trust) and is authorized to issue an unlimited number of shares. The Trust is registered under the Investment Company Act of 1940, as amended (the 1940 Act), as an open-end management investment company organized as a Massachusetts business trust. The Fund offers Low-Priced Stock and Class K shares, each of which has equal rights as to assets and voting privileges. Each class has exclusive voting rights with respect to matters that affect that class.
2. Investments in Fidelity Central Funds.
The Fund invests in Fidelity Central Funds, which are open-end investment companies generally available only to other investment companies and accounts managed by the investment adviser and its affiliates. The Fund's Schedule of Investments lists each of the Fidelity Central Funds held as of period end, if any, as an investment of the Fund, but does not include the underlying holdings of each Fidelity Central Fund. As an Investing Fund, the Fund indirectly bears its proportionate share of the expenses of the underlying Fidelity Central Funds.
The Money Market Central Funds seek preservation of capital and current income and are managed by Fidelity Investments Money Management, Inc. (FIMM), an affiliate of the investment adviser. Annualized expenses of the Money Market Central Funds as of their most recent shareholder report date are less than .005%.
A complete unaudited list of holdings for each Fidelity Central Fund is available upon request or at the Securities and Exchange Commission (the SEC) website at www.sec.gov. In addition, the financial statements of the Fidelity Central Funds, which are not covered by the Fund's Report of Independent Registered Public Accounting Firm, are available on the SEC website or upon request.
3. Significant Accounting Policies.
The Fund is an investment company and applies the accounting and reporting guidance of the Financial Accounting Standards Board (FASB) Accounting Standards Codification Topic 946 Financial Services – Investments Companies. The financial statements have been prepared in conformity with accounting principles generally accepted in the United States of America (GAAP), which require management to make certain estimates and assumptions at the date of the financial statements. Actual results could differ from those estimates. Subsequent events, if any, through the date that the financial statements were issued have been evaluated in the preparation of the financial statements. The following summarizes the significant accounting policies of the Fund:
Investment Valuation. Investments are valued as of 4:00 p.m. Eastern time on the last calendar day of the period. The Board of Trustees (the Board) has delegated the day to day responsibility for the valuation of the Fund's investments to the Fair Value Committee (the Committee) established by the Fund's investment adviser. In accordance with valuation policies and procedures approved by the Board, the Fund attempts to obtain prices from one or more third party pricing vendors or brokers to value its investments. When current market prices, quotations or currency exchange rates are not readily available or reliable, investments will be fair valued in good faith by the Committee, in accordance with procedures adopted by the Board. Factors used in determining fair value vary by investment type and may include market or investment specific events, changes in interest rates and credit quality. The frequency with which these procedures are used cannot be predicted and they may be utilized to a significant extent. The Committee oversees the Fund's valuation policies and procedures and reports to the Board on the Committee's activities and fair value determinations. The Board monitors the appropriateness of the procedures used in valuing the Fund's investments and ratifies the fair value determinations of the Committee.
The Fund categorizes the inputs to valuation techniques used to value its investments into a disclosure hierarchy consisting of three levels as shown below:
- Level 1 – quoted prices in active markets for identical investments
- Level 2 – other significant observable inputs (including quoted prices for similar investments, interest rates, prepayment speeds, etc.)
- Level 3 – unobservable inputs (including the Fund's own assumptions based on the best information available)
Valuation techniques used to value the Fund's investments by major category are as follows:
Equity securities, including restricted securities, for which market quotations are readily available, are valued at the last reported sale price or official closing price as reported by a third party pricing vendor on the primary market or exchange on which they are traded and are categorized as Level 1 in the hierarchy. In the event there were no sales during the day or closing prices are not available, securities are valued at the last quoted bid price or may be valued using the last available price and are generally categorized as Level 2 in the hierarchy. For foreign equity securities, when market or security specific events arise, comparisons to the valuation of American Depositary Receipts (ADRs), futures contracts, Exchange-Traded Funds (ETFs) and certain indexes as well as quoted prices for similar securities may be used and would be categorized as Level 2 in the hierarchy. Utilizing these techniques may result in transfers between Level 1 and Level 2. For equity securities, including restricted securities, where observable inputs are limited, assumptions about market activity and risk are used and these securities may be categorized as Level 3 in the hierarchy.
Debt securities, including restricted securities, are valued based on evaluated prices received from third party pricing vendors or from brokers who make markets in such securities. Corporate bonds are valued by pricing vendors who utilize matrix pricing which considers yield or price of bonds of comparable quality, coupon, maturity and type or by broker-supplied prices. When independent prices are unavailable or unreliable, debt securities may be valued utilizing pricing methodologies which consider similar factors that would be used by third party pricing vendors. Debt securities are generally categorized as Level 2 in the hierarchy but may be Level 3 depending on the circumstances.
Investments in open-end mutual funds, including the Fidelity Central Funds, are valued at their closing net asset value (NAV) each business day and are categorized as Level 1 in the hierarchy.
Changes in valuation techniques may result in transfers in or out of an assigned level within the disclosure hierarchy. The aggregate value of investments by input level as of July 31, 2017, including information on transfers between Levels 1 and 2, is included at the end of the Fund's Schedule of Investments.
Foreign Currency. The Fund may use foreign currency contracts to facilitate transactions in foreign-denominated securities. Gains and losses from these transactions may arise from changes in the value of the foreign currency or if the counterparties do not perform under the contracts' terms.
Foreign-denominated assets, including investment securities, and liabilities are translated into U.S. dollars at the exchange rates at period end. Purchases and sales of investment securities, income and dividends received and expenses denominated in foreign currencies are translated into U.S. dollars at the exchange rate in effect on the transaction date.
The effects of exchange rate fluctuations on investments are included with the net realized and unrealized gain (loss) on investment securities. Other foreign currency transactions resulting in realized and unrealized gain (loss) are disclosed separately.
Investment Transactions and Income. For financial reporting purposes, the Fund's investment holdings and NAV include trades executed through the end of the last business day of the period. The NAV per share for processing shareholder transactions is calculated as of the close of business of the New York Stock Exchange (NYSE), normally 4:00 p.m. Eastern time and includes trades executed through the end of the prior business day. Gains and losses on securities sold are determined on the basis of identified cost and may include proceeds received from litigation. Dividend income is recorded on the ex-dividend date, except for certain dividends from foreign securities where the ex-dividend date may have passed, which are recorded as soon as the Fund is informed of the ex-dividend date. Non-cash dividends included in dividend income, if any, are recorded at the fair market value of the securities received. Income and capital gain distributions from Fidelity Central Funds, if any, are recorded on the ex-dividend date. Certain distributions received by the Fund represent a return of capital or capital gain. The Fund determines the components of these distributions subsequent to the ex-dividend date, based upon receipt of tax filings or other correspondence relating to the underlying investment. These distributions are recorded as a reduction of cost of investments and/or as a realized gain. Interest income is accrued as earned and includes coupon interest and amortization of premium and accretion of discount on debt securities as applicable. Investment income is recorded net of foreign taxes withheld where recovery of such taxes is uncertain.
Class Allocations and Expenses. Investment income, realized and unrealized capital gains and losses, common expenses of the Fund, and certain fund-level expense reductions, if any, are allocated daily on a pro-rata basis to each class based on the relative net assets of each class to the total net assets of the Fund. Each class differs with respect to transfer agent fees incurred. Certain expense reductions may also differ by class. For the reporting period, the allocated portion of income and expenses to each class as a percent of its average net assets may vary due to the timing of recording these transactions in relation to fluctuating net assets of the classes. Expenses directly attributable to a fund are charged to that fund. Expenses attributable to more than one fund are allocated among the respective funds on the basis of relative net assets or other appropriate methods. Expense estimates are accrued in the period to which they relate and adjustments are made when actual amounts are known.
Deferred Trustee Compensation. Under a Deferred Compensation Plan (the Plan), independent Trustees may elect to defer receipt of a portion of their annual compensation. Deferred amounts are invested in a cross-section of Fidelity funds, are marked-to-market and remain in the Fund until distributed in accordance with the Plan. The investment of deferred amounts and the offsetting payable to the Trustees are included in the accompanying Statement of Assets and Liabilities.
Income Tax Information and Distributions to Shareholders. Each year, the Fund intends to qualify as a regulated investment company under Subchapter M of the Internal Revenue Code, including distributing substantially all of its taxable income and realized gains. As a result, no provision for U.S. Federal income taxes is required. As of July 31, 2017, the Fund did not have any unrecognized tax benefits in the financial statements; nor is the Fund aware of any tax positions for which it is reasonably possible that the total amounts of unrecognized tax benefits will significantly change in the next twelve months. The Fund files a U.S. federal tax return, in addition to state and local tax returns as required. The Fund's federal income tax returns are subject to examination by the Internal Revenue Service (IRS) for a period of three fiscal years after they are filed. State and local tax returns may be subject to examination for an additional fiscal year depending on the jurisdiction. Foreign taxes are provided for based on the Fund's understanding of the tax rules and rates that exist in the foreign markets in which it invests. The Fund is subject to a tax imposed on capital gains by certain countries in which it invests. An estimated deferred tax liability for net unrealized appreciation on the applicable securities is included in Other payables and accrued expenses on the Statement of Assets & Liabilities.
Distributions are declared and recorded on the ex-dividend date. Income dividends and capital gain distributions are declared separately for each class. Income and capital gain distributions are determined in accordance with income tax regulations, which may differ from GAAP. In addition, the Fund claimed a portion of the payment made to redeeming shareholders as a distribution for income tax purposes.
Capital accounts within the financial statements are adjusted for permanent book-tax differences. These adjustments have no impact on net assets or the results of operations. Capital accounts are not adjusted for temporary book-tax differences which will reverse in a subsequent period.
Book-tax differences are primarily due to foreign currency transactions, certain foreign taxes, passive foreign investment companies (PFIC), redemptions in kind, partnerships, deferred trustees compensation and losses deferred due to wash sales.
The federal tax cost of investment securities and unrealized appreciation (depreciation) as of period end were as follows:
| Gross unrealized appreciation | $19,037,580 |
| Gross unrealized depreciation | (1,869,333) |
| Net unrealized appreciation (depreciation) on securities | $17,168,247 |
| Tax Cost | $21,251,856 |
The tax-based components of distributable earnings as of period end were as follows:
| Undistributed ordinary income | $294,968 |
| Undistributed long-term capital gain | $2,545,661 |
| Net unrealized appreciation (depreciation) on securities and other investments | $17,169,065 |
The tax character of distributions paid was as follows:
| | July 31, 2017 | July 31, 2016 |
| Ordinary Income | $484,842 | $ 587,672 |
| Long-term Capital Gains | 1,422,236 | 1,279,484 |
| Total | $1,907,078 | $ 1,867,156 |
Short-Term Trading (Redemption) Fees. Shares held by investors in the Fund less than 90 days may have been subject to a redemption fee equal to 1.50% of the NAV of shares redeemed. All redemption fees, which reduce the proceeds of the shareholder redemption, are retained by the Fund and accounted for as an addition to paid in capital. In November 2016, the Board of Trustees approved the elimination of these redemption fees effective December 12, 2016.
Restricted Securities. The Fund may invest in securities that are subject to legal or contractual restrictions on resale. These securities generally may be resold in transactions exempt from registration or to the public if the securities are registered. Disposal of these securities may involve time-consuming negotiations and expense, and prompt sale at an acceptable price may be difficult. Information regarding restricted securities is included at the end of the Fund's Schedule of Investments.
4. Purchases and Sales of Investments.
Purchases and sales of securities, other than short-term securities and in-kind transactions, aggregated $2,902,162 and $7,887,582, respectively.
Redemptions In-Kind. During the period, 11,577 shares of the Fund held by unaffiliated entities were redeemed in-kind for investments and cash, including accrued interest, with a value of $587,646. The net realized gain of $324,974, on investments delivered through in-kind redemptions is included in the accompanying Statement of Operations. The amount of the in-kind redemptions is included in share transactions in the accompanying Statement of Changes in Net Assets as well as the Notes to Financial Statements. The Fund recognized no gain or loss for federal income tax purposes.
Prior Fiscal Year Redemptions In-Kind. During the prior period, 22,834 shares of the Fund held by unaffiliated entities were redeemed in-kind for investments and cash, including accrued interest, with a value of $1,089,429. The Fund had a net realized gain of $567,763 on investments delivered through the in-kind redemptions. The amount of the in-kind redemptions is included in share transactions in the accompanying Statement of Changes in Net Assets as well as the Notes to Financial Statements. The Fund recognized no gain or loss for federal income tax purposes.
5. Fees and Other Transactions with Affiliates.
Management Fee. Fidelity Management & Research Company (the investment adviser) and its affiliates provide the Fund with investment management related services for which the Fund pays a monthly management fee. The management fee is the sum of an individual fund fee rate that is based on an annual rate of .35% of the Fund's average net assets and an annualized group fee rate that averaged .25% during the period. The group fee rate is based upon the average net assets of all the mutual funds advised by the investment adviser, including any mutual funds previously advised by the investment adviser that are currently advised by Fidelity SelectCo, LLC, an affiliate of the investment adviser. The group fee rate decreases as assets under management increase and increases as assets under management decrease. In addition, the management fee is subject to a performance adjustment (up to a maximum of +/- .20% of the Fund's average net assets over a 36 month performance period). The upward or downward adjustment to the management fee is based on the relative investment performance of Low-Priced Stock as compared to its benchmark index, the Russell 2000 Index, over the same 36 month performance period. For the reporting period, the total annual management fee rate, including the performance adjustment, was .52% of the Fund's average net assets. The performance adjustment included in the management fee rate may be higher or lower than the maximum performance adjustment rate due to the difference between the average net assets for the reporting and performance periods.
Transfer Agent Fees. Fidelity Investments Institutional Operations Company, Inc., (FIIOC), an affiliate of the investment adviser, is the transfer, dividend disbursing and shareholder servicing agent for each class of the Fund. FIIOC receives account fees and asset-based fees that vary according to the account size and type of account of the shareholders of Low-Priced Stock, except for Class K. FIIOC receives an asset-based fee of Class K's average net assets. FIIOC pays for typesetting, printing and mailing of shareholder reports, except proxy statements.
For the period, transfer agent fees for each class were as follows:
| | Amount | % of
Class-Level Average
Net Assets |
| Low-Priced Stock | $40,048 | .14 |
| Class K | 5,083 | .05 |
| | $45,131 | |
Accounting and Security Lending Fees. Fidelity Service Company, Inc. (FSC), an affiliate of the investment adviser, maintains the Fund's accounting records. The accounting fee is based on the level of average net assets for each month. Under a separate contract, FSC administers the security lending program. The security lending fee is based on the number and duration of lending transactions.
Brokerage Commissions. The Fund placed a portion of its portfolio transactions with brokerage firms which are affiliates of the investment adviser. Brokerage commissions are included in net realized gain (loss) and change in net unrealized appreciation (depreciation) in the Statement of Operations. The commissions paid to these affiliated firms were $213 for the period.
Interfund Trades. The Fund may purchase from or sell securities to other Fidelity Funds under procedures adopted by the Board. The procedures have been designed to ensure these interfund trades are executed in accordance with Rule 17a-7 of the 1940 Act. Interfund trades are included within the respective purchases and sales amounts shown in the Purchases and Sales of Investments note.
Redemptions In-Kind. During the period, 8,419 shares of the Fund held by an affiliated entity were redeemed in-kind for investments and cash, including accrued interest, with a value of $456,638. The net realized gain of $254,862 on investments delivered through in-kind redemptions is included in the accompanying Statement of Operations. The amount of the in-kind redemptions is included in share transactions in the accompanying Statement of Changes in Net Assets as well as the Notes to Financial Statements. The Fund recognized no gain or loss for federal income tax purposes.
6. Committed Line of Credit.
The Fund participates with other funds managed by the investment adviser or an affiliate in a $4.25 billion credit facility (the "line of credit") to be utilized for temporary or emergency purposes to fund shareholder redemptions or for other short-term liquidity purposes. The Fund has agreed to pay commitment fees on its pro-rata portion of the line of credit, which amounted to $128 and is reflected in Miscellaneous expenses on the Statement of Operations. During the period, the Fund did not borrow on this line of credit.
7. Security Lending.
The Fund lends portfolio securities through a lending agent from time to time in order to earn additional income. For equity securities, a lending agent is used and may loan securities to certain qualified borrowers, including Fidelity Capital Markets (FCM), a broker-dealer affiliated with the Fund. On the settlement date of the loan, the Fund receives collateral (in the form of U.S. Treasury obligations, letters of credit and/or cash) against the loaned securities and maintains collateral in an amount not less than 100% of the market value of the loaned securities during the period of the loan. The market value of the loaned securities is determined at the close of business of the Fund and any additional required collateral is delivered to the Fund on the next business day. The Fund or borrower may terminate the loan at any time, and if the borrower defaults on its obligation to return the securities loaned because of insolvency or other reasons, the Fund may apply collateral received from the borrower against the obligation. The Fund may experience delays and costs in recovering the securities loaned. Any cash collateral received is invested in the Fidelity Securities Lending Cash Central Fund. The value of loaned securities and cash collateral at period end are disclosed on the Fund's Statement of Assets and Liabilities. The value of securities loaned to FCM at period end was $7,225. Security lending income represents the income earned on investing cash collateral, less rebates paid to borrowers and any lending agent fees associated with the loan, plus any premium payments received for lending certain types of securities. Security lending income is presented in the Statement of Operations as a component of income from Fidelity Central Funds. Total security lending income during the period amounted to $8,548, including $582 from securities loaned to FCM.
8. Expense Reductions.
Commissions paid to certain brokers with whom the investment adviser, or its affiliates, places trades on behalf of the Fund include an amount in addition to trade execution, which may be rebated back to the Fund to offset certain expenses. This amount totaled $161 for the period.
In addition, during the period the investment adviser reimbursed and/or waived a portion of fund-level operating expenses in the amount of $359.
9. Distributions to Shareholders.
Distributions to shareholders of each class were as follows:
| | Year ended
July 31, 2017 | Year ended
July 31, 2016 |
| From net investment income | | |
| Low-Priced Stock | $337,211 | $356,516 |
| Class K | 144,475 | 171,655 |
| Total | $481,686 | $528,171 |
| From net realized gain | | |
| Low-Priced Stock | $1,020,329 | $917,359 |
| Class K | 405,063 | 421,626 |
| Total | $1,425,392 | $1,338,985 |
10. Share Transactions.
Share transactions for each class were as follows and may contain automatic conversions between classes or exchanges between affiliated funds:
| | Shares | Shares | Dollars | Dollars |
| | Year ended July 31, 2017 | Year ended July 31, 2016 | Year ended July 31, 2017 | Year ended July 31, 2016 |
| Low-Priced Stock | | | | |
| Shares sold | 35,353 | 73,081 | $1,788,321 | $3,496,723 |
| Reinvestment of distributions | 25,783 | 24,403 | 1,255,306 | 1,179,176 |
| Shares redeemed | (115,449) | (94,728) | (5,836,933) | (4,533,400) |
| Net increase (decrease) | (54,313) | 2,756 | $(2,793,306) | $142,499 |
| Class K | | | | |
| Shares sold | 28,345 | 36,926 | $1,441,213 | $1,770,314 |
| Reinvestment of distributions | 11,296 | 12,287 | 549,537 | 593,281 |
| Shares redeemed | (89,600)(a) | (83,156)(b) | (4,571,718)(a) | (3,988,137)(b) |
| Net increase (decrease) | (49,959) | (33,943) | $(2,580,968) | $(1,624,542) |
(a) Amount includes in-kind redemptions (see the Redemptions In-Kind note for additional details).
(b) Amount includes in-kind redemptions (see the Prior Fiscal Year Redemptions In-Kind note for additional details).
11. Other.
The Fund's organizational documents provide former and current trustees and officers with a limited indemnification against liabilities arising in connection with the performance of their duties to the Fund. In the normal course of business, the Fund may also enter into contracts that provide general indemnifications. The Fund's maximum exposure under these arrangements is unknown as this would be dependent on future claims that may be made against the Fund. The risk of material loss from such claims is considered remote.
Report of Independent Registered Public Accounting Firm
To the Trustees of Fidelity Puritan Trust and Shareholders of Fidelity Low-Priced Stock Fund:
In our opinion, the accompanying statement of assets and liabilities, including the schedule of investments, and the related statements of operations and of changes in net assets and the financial highlights present fairly, in all material respects, the financial position of Fidelity Low-Priced Stock Fund (a fund of Fidelity Puritan Trust) as of July 31, 2017, the results of its operations for the year then ended, the changes in its net assets for each of the two years in the period then ended and the financial highlights for each of the five years in the period then ended, in conformity with accounting principles generally accepted in the United States of America. These financial statements and financial highlights (hereafter referred to as “financial statements”) are the responsibility of the Fidelity Low-Priced Stock Fund’s management. Our responsibility is to express an opinion on these financial statements based on our audits. We conducted our audits of these financial statements in accordance with the standards of the Public Company Accounting Oversight Board (United States). Those standards require that we plan and perform the audit to obtain reasonable assurance about whether the financial statements are free of material misstatement. An audit includes examining, on a test basis, evidence supporting the amounts and disclosures in the financial statements, assessing the accounting principles used and significant estimates made by management, and evaluating the overall financial statement presentation. Our procedures included confirmation of securities owned as of July 31, 2017 by correspondence with the custodian and brokers; when replies were not received from brokers, we performed other auditing procedures. We believe that our audits provide a reasonable basis for our opinion.
PricewaterhouseCoopers LLP
Boston, Massachusetts
September 19, 2017
Trustees and Officers
The Trustees, Members of the Advisory Board (if any), and officers of the trust and fund, as applicable, are listed below. The Board of Trustees governs the fund and is responsible for protecting the interests of shareholders. The Trustees are experienced executives who meet periodically throughout the year to oversee the fund's activities, review contractual arrangements with companies that provide services to the fund, oversee management of the risks associated with such activities and contractual arrangements, and review the fund's performance. Except for Jonathan Chiel, each of the Trustees oversees 190 funds. Mr. Chiel oversees 142 funds.
The Trustees hold office without limit in time except that (a) any Trustee may resign; (b) any Trustee may be removed by written instrument, signed by at least two-thirds of the number of Trustees prior to such removal; (c) any Trustee who requests to be retired or who has become incapacitated by illness or injury may be retired by written instrument signed by a majority of the other Trustees; and (d) any Trustee may be removed at any special meeting of shareholders by a two-thirds vote of the outstanding voting securities of the trust. Each Trustee who is not an interested person (as defined in the 1940 Act) of the trust and the fund is referred to herein as an Independent Trustee. Each Independent Trustee shall retire not later than the last day of the calendar year in which his or her 75th birthday occurs. The Independent Trustees may waive this mandatory retirement age policy with respect to individual Trustees. Officers and Advisory Board Members hold office without limit in time, except that any officer or Advisory Board Member may resign or may be removed by a vote of a majority of the Trustees at any regular meeting or any special meeting of the Trustees. Except as indicated, each individual has held the office shown or other offices in the same company for the past five years.
The fund’s Statement of Additional Information (SAI) includes more information about the Trustees. To request a free copy, call Fidelity at 1-800-844-8544.
Experience, Skills, Attributes, and Qualifications of the Trustees. The Governance and Nominating Committee has adopted a statement of policy that describes the experience, qualifications, attributes, and skills that are necessary and desirable for potential Independent Trustee candidates (Statement of Policy). The Board believes that each Trustee satisfied at the time he or she was initially elected or appointed a Trustee, and continues to satisfy, the standards contemplated by the Statement of Policy. The Governance and Nominating Committee also engages professional search firms to help identify potential Independent Trustee candidates who have the experience, qualifications, attributes, and skills consistent with the Statement of Policy. From time to time, additional criteria based on the composition and skills of the current Independent Trustees, as well as experience or skills that may be appropriate in light of future changes to board composition, business conditions, and regulatory or other developments, have also been considered by the professional search firms and the Governance and Nominating Committee. In addition, the Board takes into account the Trustees' commitment and participation in Board and committee meetings, as well as their leadership of standing and ad hoc committees throughout their tenure.
In determining that a particular Trustee was and continues to be qualified to serve as a Trustee, the Board has considered a variety of criteria, none of which, in isolation, was controlling. The Board believes that, collectively, the Trustees have balanced and diverse experience, qualifications, attributes, and skills, which allow the Board to operate effectively in governing the fund and protecting the interests of shareholders. Information about the specific experience, skills, attributes, and qualifications of each Trustee, which in each case led to the Board's conclusion that the Trustee should serve (or continue to serve) as a trustee of the fund, is provided below.
Board Structure and Oversight Function. James C. Curvey is an interested person and currently serves as Chairman. The Trustees have determined that an interested Chairman is appropriate and benefits shareholders because an interested Chairman has a personal and professional stake in the quality and continuity of services provided to the fund. Independent Trustees exercise their informed business judgment to appoint an individual of their choosing to serve as Chairman, regardless of whether the Trustee happens to be independent or a member of management. The Independent Trustees have determined that they can act independently and effectively without having an Independent Trustee serve as Chairman and that a key structural component for assuring that they are in a position to do so is for the Independent Trustees to constitute a substantial majority for the Board. The Independent Trustees also regularly meet in executive session. Ned C. Lautenbach serves as Chairman of the Independent Trustees and as such (i) acts as a liaison between the Independent Trustees and management with respect to matters important to the Independent Trustees and (ii) with management prepares agendas for Board meetings.
Fidelity® funds are overseen by different Boards of Trustees. The fund's Board oversees Fidelity's high income and certain equity funds, and other Boards oversee Fidelity's investment-grade bond, money market, asset allocation, and sector funds. The asset allocation funds may invest in Fidelity® funds overseen by the fund's Board. The use of separate Boards, each with its own committee structure, allows the Trustees of each group of Fidelity® funds to focus on the unique issues of the funds they oversee, including common research, investment, and operational issues. On occasion, the separate Boards establish joint committees to address issues of overlapping consequences for the Fidelity® funds overseen by each Board.
The Trustees operate using a system of committees to facilitate the timely and efficient consideration of all matters of importance to the Trustees, the fund, and fund shareholders and to facilitate compliance with legal and regulatory requirements and oversight of the fund's activities and associated risks. The Board, acting through its committees, has charged FMR and its affiliates with (i) identifying events or circumstances the occurrence of which could have demonstrably adverse effects on the fund's business and/or reputation; (ii) implementing processes and controls to lessen the possibility that such events or circumstances occur or to mitigate the effects of such events or circumstances if they do occur; and (iii) creating and maintaining a system designed to evaluate continuously business and market conditions in order to facilitate the identification and implementation processes described in (i) and (ii) above. Because the day-to-day operations and activities of the fund are carried out by or through FMR, its affiliates, and other service providers, the fund's exposure to risks is mitigated but not eliminated by the processes overseen by the Trustees. While each of the Board's committees has responsibility for overseeing different aspects of the fund's activities, oversight is exercised primarily through the Operations, Audit, and Compliance Committees. In addition, the Independent Trustees have worked with FMR to enhance the Board's oversight of investment and financial risks, legal and regulatory risks, technology risks, and operational risks, including the development of additional risk reporting to the Board. For example, a working group comprised of Independent Trustees and FMR has worked and continues to work to review the Fidelity® funds' valuation-related activities, reporting and risk management. Appropriate personnel, including but not limited to the fund's Chief Compliance Officer (CCO), FMR's internal auditor, the independent accountants, the fund's Treasurer and portfolio management personnel, make periodic reports to the Board's committees, as appropriate, including an annual review of Fidelity's risk management program for the Fidelity® funds. The responsibilities of each standing committee, including their oversight responsibilities, are described further under "Standing Committees of the Trustees."
Interested Trustees*:
Correspondence intended for a Trustee who is an interested person may be sent to Fidelity Investments, 245 Summer Street, Boston, Massachusetts 02210.
Name, Year of Birth; Principal Occupations and Other Relevant Experience+
Jonathan Chiel (1957)
Year of Election or Appointment: 2016
Trustee
Mr. Chiel also serves as Trustee of other Fidelity funds. Mr. Chiel is Executive Vice President and General Counsel for FMR LLC (diversified financial services company, 2012-present). Previously, Mr. Chiel served as general counsel (2004-2012) and senior vice president and deputy general counsel (2000-2004) for John Hancock Financial Services; a partner with Choate, Hall & Stewart (1996-2000) (law firm); and an Assistant United States Attorney for the United States Attorney’s Office of the District of Massachusetts (1986-95), including Chief of the Criminal Division (1993-1995). Mr. Chiel is a director on the boards of the Boston Bar Foundation and the Maimonides School.
James C. Curvey (1935)
Year of Election or Appointment: 2007
Trustee
Chairman of the Board of Trustees
Mr. Curvey also serves as Trustee of other Fidelity® funds. Mr. Curvey is a Director of Fidelity Research & Analysis Co. (investment adviser firm, 2009-present), and Vice Chairman (2007-present) and Director of FMR LLC (diversified financial services company). In addition, Mr. Curvey serves as an Overseer for the Boston Symphony Orchestra and a member of the board of Artis-Naples, Naples, Florida, and as a Trustee for Brewster Academy, Wolfeboro, New Hampshire. Previously, Mr. Curvey served as a Director of Fidelity Investments Money Management, Inc. (investment adviser firm, 2009-2014) and a Director of FMR and FMR Co., Inc. (investment adviser firms, 2007-2014).
Charles S. Morrison (1960)
Year of Election or Appointment: 2014
Trustee
Mr. Morrison also serves as Trustee of other funds. He serves as President of Fidelity Management & Research Company (FMR) (investment adviser firm, 2016-present), a Director of Fidelity Investments Money Management, Inc. (FIMM) (investment adviser firm, 2014-present), Director of Fidelity SelectCo, LLC (investment adviser firm, 2014-present), President, Asset Management (2014-present), and is an employee of Fidelity Investments. Previously, Mr. Morrison served as Vice President of Fidelity's Fixed Income and Asset Allocation Funds (2012-2014), President, Fixed Income (2011-2014), Vice President of Fidelity's Money Market Funds (2005-2009), President, Money Market Group Leader of FMR (investment adviser firm, 2009), and Senior Vice President, Money Market Group of FMR (2004-2009). Mr. Morrison also served as Vice President of Fidelity's Bond Funds (2002-2005), certain Balanced Funds (2002-2005), and certain Asset Allocation Funds (2002-2007), and as Senior Vice President (2002-2005) of Fidelity's Bond Division.
* Determined to be an “Interested Trustee” by virtue of, among other things, his or her affiliation with the trust or various entities under common control with FMR.
+ The information includes the Trustee's principal occupation during the last five years and other information relating to the experience, attributes, and skills relevant to the Trustee's qualifications to serve as a Trustee, which led to the conclusion that the Trustee should serve as a Trustee for the fund.
Independent Trustees:
Correspondence intended for an Independent Trustee may be sent to Fidelity Investments, P.O. Box 55235, Boston, Massachusetts 02205-5235.
Name, Year of Birth; Principal Occupations and Other Relevant Experience+
Dennis J. Dirks (1948)
Year of Election or Appointment: 2005
Trustee
Mr. Dirks also serves as Trustee of other Fidelity® funds. Prior to his retirement in May 2003, Mr. Dirks was Chief Operating Officer and a member of the Board of The Depository Trust & Clearing Corporation (DTCC). He also served as President, Chief Operating Officer, and Board member of The Depository Trust Company (DTC) and President and Board member of the National Securities Clearing Corporation (NSCC). In addition, Mr. Dirks served as Chief Executive Officer and Board member of the Government Securities Clearing Corporation, Chief Executive Officer and Board member of the Mortgage-Backed Securities Clearing Corporation, as a Trustee and a member of the Finance Committee of Manhattan College (2005-2008), as a Trustee and a member of the Finance Committee of AHRC of Nassau County (2006-2008), as a member of the Independent Directors Council (IDC) Governing Council (2010-2015), and as a member of the Board of Directors for The Brookville Center for Children’s Services, Inc. (2009-2017). Mr. Dirks is a member of the Finance Committee (2016-present) and Board of Directors (2017-present) of the Asolo Repertory Theatre.
Alan J. Lacy (1953)
Year of Election or Appointment: 2008
Trustee
Mr. Lacy also serves as Trustee of other Fidelity® funds. Mr. Lacy serves as a Director of Bristol-Myers Squibb Company (global pharmaceuticals, 2008-present). He is a Trustee of the California Chapter of The Nature Conservancy (2015-present) and a Director of the Center for Advanced Study in the Behavioral Sciences at Stanford University (2015-present). In addition, Mr. Lacy served as Senior Adviser (2007-2014) of Oak Hill Capital Partners, L.P. (private equity) and also served as Chief Executive Officer (2005) and Vice Chairman (2005-2006) of Sears Holdings Corporation (retail) and Chief Executive Officer and Chairman of the Board of Sears, Roebuck and Co. (retail, 2000-2005). Previously, Mr. Lacy served as Chairman (2014-2017) and a member (2010-2017) of the Board of Directors of Dave & Buster’s Entertainment, Inc. (restaurant and entertainment complexes), as Chairman (2008-2011) and a member (2006-2015) of the Board of Trustees of the National Parks Conservation Association, and as a member of the Board of Directors for The Hillman Companies, Inc. (hardware wholesalers, 2010-2014), Earth Fare, Inc. (retail grocery, 2010-2014), and The Western Union Company (global money transfer, 2006-2011).
Ned C. Lautenbach (1944)
Year of Election or Appointment: 2000
Trustee
Chairman of the Independent Trustees
Mr. Lautenbach also serves as Trustee of other Fidelity® funds. Mr. Lautenbach currently serves as the Lead Director of the Eaton Corporation Board of Directors (diversified industrial, 1997-present). Mr. Lautenbach is Chairman of the Board of Directors of Artis-Naples in Naples, Florida (2012-present), a member of the Council on Foreign Relations (1994-present), and currently Vice Chair of the Board of Governors, State University System of Florida (2013-present). Previously, Mr. Lautenbach was a Partner and Advisory Partner at Clayton, Dubilier & Rice, LLC (private equity investment, 1998-2010), as well as a Director of Sony Corporation (2006-2007). Mr. Lautenbach also had a 30-year career with IBM (technology company) during which time he served as Senior Vice President and a member of the Corporate Executive Committee (1968-1998).
Joseph Mauriello (1944)
Year of Election or Appointment: 2008
Trustee
Mr. Mauriello also serves as Trustee of other Fidelity® funds. Prior to his retirement in January 2006, Mr. Mauriello served in numerous senior management positions including Deputy Chairman and Chief Operating Officer (2004-2005), and Vice Chairman of Financial Services (2002-2004) of KPMG LLP US (professional services, 1965-2005). Mr. Mauriello currently serves as a member of the Board of Directors of XL Group plc. (global insurance and re-insurance, 2006-present) and the Independent Directors Council (IDC) Governing Council (2015-present). Previously, Mr. Mauriello served as a Director of the Hamilton Funds of the Bank of New York (2006-2007) and of Arcadia Resources Inc. (health care services and products, 2007-2012).
Cornelia M. Small (1944)
Year of Election or Appointment: 2005
Trustee
Ms. Small also serves as Trustee of other Fidelity® funds. Ms. Small is a member of the Board of Directors (2009-present) and Chair of the Investment Committee (2010-present) of the Teagle Foundation. Ms. Small also serves on the Investment Committee of the Berkshire Taconic Community Foundation (2008-present). Previously, Ms. Small served as Chairperson (2002-2008) and a member of the Investment Committee and Chairperson (2008-2012) and a member of the Board of Trustees of Smith College. In addition, Ms. Small served as Chief Investment Officer, Director of Global Equity Investments, and a member of the Board of Directors of Scudder, Stevens & Clark and Scudder Kemper Investments.
William S. Stavropoulos (1939)
Year of Election or Appointment: 2001
Trustee
Vice Chairman of the Independent Trustees
Mr. Stavropoulos also serves as Trustee of other Fidelity® funds. Mr. Stavropoulos serves as President and Founder of the Michigan Baseball Foundation, the Great Lakes Loons (2007-present). Mr. Stavropoulos is Chairman Emeritus of the Board of Directors of The Dow Chemical Company, where he previously served in numerous senior management positions, including President, CEO (1995-2000; 2002-2004), Chairman of the Executive Committee (2000-2006), and as a member of the Board of Directors (1990-2006). Currently, Mr. Stavropoulos is Chairman of the Board of Directors of Univar Inc. (global distributor of commodity and specialty chemicals), a Director of Teradata Corporation (data warehousing and technology solutions), and a member of the Advisory Board for Metalmark Capital LLC (private equity investment, 2005-present). Mr. Stavropoulos is an operating advisor to Clayton, Dubilier & Rice, LLC (private equity investment). In addition, Mr. Stavropoulos is a member of the University of Notre Dame Advisory Council for the College of Science, a Trustee of the Rollin L. Gerstacker Foundation, and a Director of Artis-Naples in Naples, Florida. Previously, Mr. Stavropoulos served as a Director of Chemical Financial Corporation (bank holding company, 1993-2012) and Tyco International, Ltd. (multinational manufacturing and services, 2007-2012).
David M. Thomas (1949)
Year of Election or Appointment: 2008
Trustee
Mr. Thomas also serves as Trustee of other Fidelity® funds. Mr. Thomas serves as Non-Executive Chairman of the Board of Directors of Fortune Brands Home and Security (home and security products, 2011-present), as a member of the Board of Directors (2004-present) and Presiding Director (2013-present) of Interpublic Group of Companies, Inc. (marketing communication), and as a member of the Board of Trustees of the University of Florida (2013-present). Previously, Mr. Thomas served as Executive Chairman (2005-2006) and Chairman and Chief Executive Officer (2000-2005) of IMS Health, Inc. (pharmaceutical and healthcare information solutions), and a Director of Fortune Brands, Inc. (consumer products, 2000-2011).
+ The information includes the Trustee's principal occupation during the last five years and other information relating to the experience, attributes, and skills relevant to the Trustee's qualifications to serve as a Trustee, which led to the conclusion that the Trustee should serve as a Trustee for the fund.
Advisory Board Members and Officers:
Correspondence intended for an officer or Peter S. Lynch may be sent to Fidelity Investments, 245 Summer Street, Boston, Massachusetts 02210. Officers appear below in alphabetical order.
Name, Year of Birth; Principal Occupation
Peter S. Lynch (1944)
Year of Election or Appointment: 2003
Member of the Advisory Board
Mr. Lynch also serves as Member of the Advisory Board of other Fidelity® funds. Mr. Lynch is Vice Chairman and a Director of FMR (investment adviser firm) and FMR Co., Inc. (investment adviser firm). In addition, Mr. Lynch serves as a Trustee of Boston College and as the Chairman of the Inner-City Scholarship Fund. Previously, Mr. Lynch served on the Special Olympics International Board of Directors (1997-2006).
Elizabeth Paige Baumann (1968)
Year of Election or Appointment: 2017
Anti-Money Laundering (AML) Officer
Ms. Baumann also serves as AML Officer of other funds. She is Chief AML Officer (2012-present) and Senior Vice President (2014-present) of FMR LLC (diversified financial services company) and is an employee of Fidelity Investments. Previously, Ms. Baumann served as AML Officer of the funds (2012-2016), and Vice President (2007-2014) and Deputy Anti-Money Laundering Officer (2007-2012) of FMR LLC.
Marc R. Bryant (1966)
Year of Election or Appointment: 2015
Secretary and Chief Legal Officer (CLO)
Mr. Bryant also serves as Secretary and CLO of other funds. Mr. Bryant serves as CLO, Secretary, and Senior Vice President of Fidelity Management & Research Company (investment adviser firm, 2015-present) and FMR Co., Inc. (investment adviser firm, 2015-present); Secretary of Fidelity SelectCo, LLC (investment adviser firm, 2015-present) and Fidelity Investments Money Management, Inc. (investment adviser firm, 2015-present); and CLO of Fidelity Management & Research (Hong Kong) Limited and FMR Investment Management (UK) Limited (investment adviser firms, 2015-present) and Fidelity Management & Research (Japan) Limited (investment adviser firm, 2016-present). He is Senior Vice President and Deputy General Counsel of FMR LLC (diversified financial services company). Previously, Mr. Bryant served as Secretary and CLO of Fidelity Rutland Square Trust II (2010-2014) and Assistant Secretary of Fidelity's Fixed Income and Asset Allocation Funds (2013-2015). Prior to joining Fidelity Investments, Mr. Bryant served as a Senior Vice President and the Head of Global Retail Legal for AllianceBernstein L.P. (2006-2010), and as the General Counsel for ProFund Advisors LLC (2001-2006).
William C. Coffey (1969)
Year of Election or Appointment: 2009
Assistant Secretary
Mr. Coffey also serves as Assistant Secretary of other funds. He is Senior Vice President and Deputy General Counsel of FMR LLC (diversified financial services company, 2010-present), and is an employee of Fidelity Investments. Previously, Mr. Coffey served as Vice President and Associate General Counsel of FMR LLC (2005-2009).
Jonathan Davis (1968)
Year of Election or Appointment: 2010
Assistant Treasurer
Mr. Davis also serves as Assistant Treasurer of other funds, and is an employee of Fidelity Investments. Previously, Mr. Davis served as Vice President and Associate General Counsel of FMR LLC (diversified financial services company, 2003-2010).
Adrien E. Deberghes (1967)
Year of Election or Appointment: 2016
Assistant Treasurer
Mr. Deberghes also serves as an officer of other funds. He serves as Executive Vice President of Fidelity Investments Money Management, Inc. (FIMM) (investment adviser firm, 2016-present) and is an employee of Fidelity Investments (2008-present). Prior to joining Fidelity Investments, Mr. Deberghes was Senior Vice President of Mutual Fund Administration at State Street Corporation (2007-2008), Senior Director of Mutual Fund Administration at Investors Bank & Trust (2005-2007), and Director of Finance for Dunkin' Brands (2000-2005). Previously, Mr. Deberghes served in other fund officer roles.
Stephanie J. Dorsey (1969)
Year of Election or Appointment: 2010
Assistant Treasurer
Ms. Dorsey also serves as an officer of other funds. She is an employee of Fidelity Investments (2008-present) and has served in other fund officer roles. Prior to joining Fidelity Investments, Ms. Dorsey served as Treasurer (2004-2008) of the JPMorgan Mutual Funds and Vice President (2004-2008) of JPMorgan Chase Bank.
Howard J. Galligan III (1966)
Year of Election or Appointment: 2014
Chief Financial Officer
Mr. Galligan also serves as Chief Financial Officer of other funds. Mr. Galligan serves as President of Fidelity Pricing and Cash Management Services (FPCMS) (2014-present) and as a Director of Strategic Advisers, Inc. (investment adviser firm, 2008-present). Previously, Mr. Galligan served as Chief Administrative Officer of Asset Management (2011-2014) and Chief Operating Officer and Senior Vice President of Investment Support for Strategic Advisers, Inc. (2003-2011).
Thomas C. Hense (1964)
Year of Election or Appointment: 2008, 2010, or 2015
Vice President
Mr. Hense serves as Vice President of Fidelity Advisor® Multi-Asset Income Fund (2015) and other funds (High Income (2008), Small Cap (2008), and Value (2010) funds), and is an employee of Fidelity Investments (1993-present). Previously, Mr. Hense served as a portfolio manager for Fidelity's Institutional Money Management Group (Pyramis) (2003-2008).
Brian B. Hogan (1964)
Year of Election or Appointment: 2009
Vice President
Mr. Hogan also serves as Trustee or Vice President of other funds. Mr. Hogan serves as a Director of FMR Investment Management (UK) Limited (investment adviser firm, 2015-present) and Fidelity SelectCo, LLC (investment adviser firm, 2014-present) and President of the Equity Division of FMR (investment adviser firm, 2009-present). Previously, Mr. Hogan served as Senior Vice President, Equity Research of FMR (2006-2009) and as a portfolio manager. Mr. Brian B. Hogan is not related to Mr. Colm A. Hogan.
Colm A. Hogan (1973)
Year of Election or Appointment: 2016
Deputy Treasurer
Mr. Hogan also serves as an officer of other funds. Mr. Hogan is an employee of Fidelity Investments (2005-present). Mr. Colm A. Hogan is not related to Mr. Brian B. Hogan.
Chris Maher (1972)
Year of Election or Appointment: 2013
Assistant Treasurer
Mr. Maher serves as Assistant Treasurer of other funds. Mr. Maher is Vice President of Valuation Oversight and is an employee of Fidelity Investments. Previously, Mr. Maher served as Vice President of Asset Management Compliance (2013), Vice President of the Program Management Group of FMR (investment adviser firm, 2010-2013), and Vice President of Valuation Oversight (2008-2010).
Rieco E. Mello (1969)
Year of Election or Appointment: 2017
Assistant Treasurer
Mr. Mello also serves as Assistant Treasurer of other funds. Mr. Mello is an employee of Fidelity Investments (1995-present).
Kenneth B. Robins (1969)
Year of Election or Appointment: 2016
Chief Compliance Officer
Mr. Robins also serves as an officer of other funds. Mr. Robins serves as Compliance Officer of Fidelity Management & Research Company and FMR Co., Inc. (investment adviser firms, 2016-present) and is an employee of Fidelity Investments (2004-present). Previously, Mr. Robins served as Executive Vice President of Fidelity Investments Money Management, Inc. (investment adviser firm, 2013-2016) and served in other fund officer roles.
Stacie M. Smith (1974)
Year of Election or Appointment: 2016
President and Treasurer
Ms. Smith also serves as an officer of other funds. She is an employee of Fidelity Investments (2009-present) and has served in other fund officer roles. Prior to joining Fidelity Investments, Ms. Smith served as Senior Audit Manager of Ernst & Young LLP (accounting firm, 1996-2009). Previously, Ms. Smith served as Deputy Treasurer of certain Fidelity® funds (2013-2016).
Marc L. Spector (1972)
Year of Election or Appointment: 2016
Assistant Treasurer
Mr. Spector also serves as an officer of other funds. Mr. Spector is an employee of Fidelity Investments (2016-present). Prior to joining Fidelity Investments, Mr. Spector served as Director at the Siegfried Group (accounting firm, 2013-2016), and prior to Siegfried Group as audit senior manager at Deloitte & Touche (accounting firm, 2005-2013).
Renee Stagnone (1975)
Year of Election or Appointment: 2016
Assistant Treasurer
Ms. Stagnone also serves as an officer of other funds. Ms. Stagnone is an employee of Fidelity Investments (1997-present). Previously, Ms. Stagnone served as Deputy Treasurer of certain Fidelity® funds (2013-2016).
Shareholder Expense Example
As a shareholder of the Fund, you incur two types of costs: (1) transaction costs, including redemption fees and (2) ongoing costs, including management fees and other Fund expenses. This Example is intended to help you understand your ongoing costs (in dollars) of investing in the Fund and to compare these costs with the ongoing costs of investing in other mutual funds.
The Example is based on an investment of $1,000 invested at the beginning of the period and held for the entire period (February 1, 2017 to July 31, 2017).
Actual Expenses
The first line of the accompanying table for each class of the Fund provides information about actual account values and actual expenses. You may use the information in this line, together with the amount you invested, to estimate the expenses that you paid over the period. Simply divide your account value by $1,000.00 (for example, an $8,600 account value divided by $1,000.00 = 8.6), then multiply the result by the number in the first line for a class of the Fund under the heading entitled "Expenses Paid During Period" to estimate the expenses you paid on your account during this period. A small balance maintenance fee of $12.00 that is charged once a year may apply for certain accounts with a value of less than $2,000. This fee is not included in the table below. If it was, the estimate of expenses you paid during the period would be higher, and your ending account value lower, by this amount. In addition, the Fund, as a shareholder in the underlying Fidelity Central Funds, will indirectly bear its pro-rata share of the fees and expenses incurred by the underlying Fidelity Central Funds. These fees and expenses are not included in the Fund's annualized expense ratio used to calculate the expense estimate in the table below.
Hypothetical Example for Comparison Purposes
The second line of the accompanying table for each class of the Fund provides information about hypothetical account values and hypothetical expenses based on a Class' actual expense ratio and an assumed rate of return of 5% per year before expenses, which is not the Class' actual return. The hypothetical account values and expenses may not be used to estimate the actual ending account balance or expenses you paid for the period. You may use this information to compare the ongoing costs of investing in the Fund and other funds. To do so, compare this 5% hypothetical example with the 5% hypothetical examples that appear in the shareholder reports of the other funds. A small balance maintenance fee of $12.00 that is charged once a year may apply for certain accounts with a value of less than $2,000. This fee is not included in the table below. If it was, the estimate of expenses you paid during the period would be higher, and your ending account value lower, by this amount. In addition, the Fund, as a shareholder in the underlying Fidelity Central Funds, will indirectly bear its pro-rata share of the fees and expenses incurred by the underlying Fidelity Central Funds. These fees and expenses are not included in the Fund's annualized expense ratio used to calculate the expense estimate in the table below.
Please note that the expenses shown in the table are meant to highlight your ongoing costs only and do not reflect any transaction costs. Therefore, the second line of the table is useful in comparing ongoing costs only, and will not help you determine the relative total costs of owning different funds. In addition, if these transactional costs were included, your costs would have been higher.
| | Annualized Expense Ratio-A | Beginning
Account Value
February 1, 2017 | Ending
Account Value
July 31, 2017 | Expenses Paid
During Period-B
February 1, 2017
to July 31, 2017 |
| Low-Priced Stock | .63% | | | |
| Actual | | $1,000.00 | $1,086.30 | $3.26 |
| Hypothetical-C | | $1,000.00 | $1,021.67 | $3.16 |
| Class K | .54% | | | |
| Actual | | $1,000.00 | $1,086.80 | $2.79 |
| Hypothetical-C | | $1,000.00 | $1,022.12 | $2.71 |
A Annualized expense ratio reflects expenses net of applicable fee waivers.
B Expenses are equal to each Class' annualized expense ratio, multiplied by the average account value over the period, multiplied by 181/365 (to reflect the one-half year period).
C 5% return per year before expenses
Distributions (Unaudited)
The Board of Trustees of Fidelity Low-Priced Stock Fund voted to pay to shareholders of record at the opening of business on record date, the following distributions per share derived from capital gains realized from sales of portfolio securities, and dividends derived from net investment income:
| | Pay Date | Record Date | Dividends | Capital Gains |
| Fidelity Low-Priced Stock Fund | | | | |
| Low-Priced Stock | 09/18/17 | 09/15/17 | $0.420 | $3.671 |
| Class K | 09/18/17 | 09/15/17 | $0.449 | $3.671 |
|
The fund hereby designates as a capital gain dividend with respect to the taxable year ended July 31, 2017, $3,131,359,738, or, if subsequently determined to be different, the net capital gain of such year.
Low-Priced Stock designates 80% and 52%; Class K designates 73% and 49%; of the dividends distributed in September and December, respectively during the fiscal year as qualifying for the dividends–received deduction for corporate shareholders.
Low-Priced Stock and Class K designate 100% of the dividends distributed during the fiscal year as amounts which may be taken into account as a dividend for purposes of the maximum rate under section 1(h)(11) of the Internal Revenue Code.
The fund will notify shareholders in January 2018 of amounts for use in preparing 2017 income tax returns.
Board Approval of Investment Advisory Contracts and Management Fees
Fidelity Low-Priced Stock Fund
Each year, the Board of Trustees, including the Independent Trustees (together, the Board), votes on the renewal of the management contract with Fidelity Management & Research Company (FMR) and the sub-advisory agreements (together, the Advisory Contracts) for the fund. FMR and the sub-advisers are referred to herein as the Investment Advisers. The Board, assisted by the advice of fund counsel and Independent Trustees' counsel, requests and considers a broad range of information relevant to the renewal of the Advisory Contracts throughout the year.
The Board meets regularly and, at each of its meetings, covers an extensive agenda of topics and materials and considers factors that are relevant to its annual consideration of the renewal of the fund's Advisory Contracts, including the services and support provided to the fund and its shareholders. The Board has established various standing committees (Committees), each composed of and chaired by Independent Trustees with varying backgrounds, to which the Board has assigned specific subject matter responsibilities in order to enhance effective decision-making by the Board. The Board, acting directly and through its Committees, requests and receives information concerning the annual consideration of the renewal of the fund's Advisory Contracts. The Board also meets as needed to review matters specifically related to the Board's annual consideration of the renewal of the Advisory Contracts. Members of the Board may also meet with trustees of other Fidelity funds through ad hoc joint committees to discuss certain matters relevant to all of the Fidelity funds.
At its July 2017 meeting, the Board unanimously determined to renew the fund's Advisory Contracts. In reaching its determination, the Board considered all factors it believed relevant, including (i) the nature, extent, and quality of the services to be provided to the fund and its shareholders (including the investment performance of the fund); (ii) the competitiveness of the fund's management fee and total expense ratio relative to peer funds; (iii) the total costs of the services to be provided by and the profits to be realized by Fidelity from its relationships with the fund; and (iv) the extent to which, if any, economies of scale exist and would be realized as the fund grows, and whether any economies of scale are appropriately shared with fund shareholders.
In considering whether to renew the Advisory Contracts for the fund, the Board reached a determination, with the assistance of fund counsel and Independent Trustees' counsel and through the exercise of its business judgment, that the renewal of the Advisory Contracts was in the best interests of the fund and its shareholders and that the compensation payable under the Advisory Contracts was fair and reasonable. The Board's decision to renew the Advisory Contracts was not based on any single factor, but rather was based on a comprehensive consideration of all the information provided to the Board at its meetings throughout the year. The Board, in reaching its determination to renew the Advisory Contracts, was aware that shareholders of the fund have a broad range of investment choices available to them, including a wide choice among funds offered by Fidelity's competitors, and that the fund's shareholders, who have the opportunity to review and weigh the disclosure provided by the fund in its prospectus and other public disclosures, have chosen to invest in this fund, which is part of the Fidelity family of funds.
Amendment to Group Fee Rate. The Board also approved an amendment to the management contract for the fund to add an additional breakpoint to the group fee schedule, effective October 1, 2017. The Board noted that the additional breakpoint would result in lower management fee rates as Fidelity's assets under management increase.
Nature, Extent, and Quality of Services Provided. The Board considered Fidelity's staffing as it relates to the fund, including the backgrounds of investment personnel of Fidelity, and also considered the fund's investment objective, strategies, and related investment philosophy. The Independent Trustees also had discussions with senior management of Fidelity's investment operations and investment groups. The Board considered the structure of the investment personnel compensation program and whether this structure provides appropriate incentives to act in the best interests of the fund. Additionally, the Board considered the portfolio managers' investments, if any, in the funds that they manage.
Resources Dedicated to Investment Management and Support Services. The Board and the Fund Oversight and Research Committees reviewed the general qualifications and capabilities of Fidelity's investment staff, including its size, education, experience, and resources, as well as Fidelity's approach to recruiting, training, managing, and compensating investment personnel. The Board noted that Fidelity has continued to increase the resources devoted to non-U.S. offices, including expansion of Fidelity's global investment organization. The Board also noted that Fidelity's analysts have extensive resources, tools and capabilities that allow them to conduct sophisticated quantitative and fundamental analysis, as well as credit analysis of issuers, counterparties and guarantors. Further, the Board considered that Fidelity's investment professionals have sufficient access to global information and data so as to provide competitive investment results over time, and that those professionals also have access to sophisticated tools that permit them to assess portfolio construction and risk and performance attribution characteristics continuously, as well as to transmit new information and research conclusions rapidly around the world. Additionally, in its deliberations, the Board considered Fidelity's trading, risk management, compliance, and technology and operations capabilities and resources, which are integral parts of the investment management process.
Shareholder and Administrative Services. The Board considered (i) the nature, extent, quality, and cost of advisory, administrative, and shareholder services performed by the Investment Advisers and their affiliates under the Advisory Contracts and under separate agreements covering transfer agency, pricing and bookkeeping, and securities lending services for the fund; (ii) the nature and extent of the supervision of third party service providers, principally custodians, subcustodians, and pricing vendors; and (iii) the resources devoted to, and the record of compliance with, the fund's compliance policies and procedures. The Board also reviewed the allocation of fund brokerage, including allocations to brokers affiliated with the Investment Advisers, the use of brokerage commissions to pay fund expenses, and the use of "soft" commission dollars to pay for research services.
The Board noted that the growth of fund assets over time across the complex allows Fidelity to reinvest in the development of services designed to enhance the value or convenience of the Fidelity funds as investment vehicles. These services include 24-hour access to account information and market information through telephone representatives and over the Internet, investor education materials and asset allocation tools, and the expanded availability of Fidelity Investor Centers.
In 2014, the Board formed an ad hoc Committee on Transfer Agency Fees to review the variety of transfer agency fee structures throughout the industry and Fidelity's competitive positioning with respect to industry participants.
Investment in a Large Fund Family. The Board considered the benefits to shareholders of investing in a Fidelity fund, including the benefits of investing in a fund that is part of a large family of funds offering a variety of investment disciplines and providing a large variety of mutual fund investor services. The Board noted that Fidelity had taken, or had made recommendations that resulted in the Fidelity funds taking, a number of actions over the previous year that benefited particular funds, including: (i) continuing to dedicate additional resources to Fidelity's investment research process, and to the support of the senior management team that oversees asset management; (ii) continuing efforts to enhance Fidelity's global research capabilities; (iii) launching new funds and making other enhancements to meet client needs; (iv) launching new share classes of existing funds; (v) eliminating purchase minimums and broadening eligibility requirements for certain lower-priced share classes; (vi) reducing management fees and total expenses for certain growth equity funds and index funds; (vii) lowering expense caps for certain existing funds and classes to reduce expenses borne by shareholders; (viii) eliminating short-term redemption fees for certain funds; (ix) introducing a new pricing structure for certain funds of funds that is expected to reduce overall expenses paid by shareholders; (x) rationalizing product lines and gaining increased efficiencies through proposals for fund mergers and share class consolidations; (xi) continuing to develop, acquire and implement systems and technology to improve services to the funds and shareholders, strengthen information security, and increase efficiency; and (xii) implementing enhancements to further strengthen Fidelity's product line to increase investors' probability of success in achieving their investment goals, including retirement income goals.
Investment Performance. The Board considered whether the fund has operated in accordance with its investment objective, as well as its record of compliance with its investment restrictions and its performance history.
The Board took into account discussions with representatives of the Investment Advisers about fund investment performance that occur at Board meetings throughout the year. In this regard the Board noted that as part of regularly scheduled fund reviews and other reports to the Board on fund performance, the Board considers annualized return information for the fund for different time periods, measured against a securities market index ("benchmark index") and a peer group of funds with similar objectives ("peer group"), if any. In its evaluation of fund investment performance, the Board gave particular attention to information indicating changes in performance of certain Fidelity funds for specific time periods and discussed with the Investment Advisers the reasons for any overperformance or underperformance.
In addition to reviewing absolute and relative fund performance, the Independent Trustees periodically consider the appropriateness of fund performance metrics in evaluating the results achieved. In general, the Independent Trustees believe that fund performance should be evaluated based on net performance (after fees and expenses) of both the highest performing and lowest performing fund share classes, where applicable, compared to appropriate benchmark indices, over appropriate time periods that may include full market cycles, and compared to peer groups, as applicable, over the same periods, taking into account relevant factors including the following: general market conditions; issuer-specific information; and fund cash flows and other factors.
The Independent Trustees recognize that shareholders evaluate performance on a net basis over their own holding periods, for which one-, three-, and five-year periods are often used as a proxy. For this reason, the performance information reviewed by the Board also included net cumulative calendar year total return information for the fund and an appropriate benchmark index and peer group for the most recent one-, three-, and five-year periods, as shown below. Returns are shown compared to the 25th percentile (top of box, 75% beaten) and 75th percentile (bottom of box, 25% beaten) of the peer universe.
Fidelity Low-Priced Stock Fund
The Board has discussed the fund's underperformance with FMR, including the fund's investment strategy, the portfolio management team, and broader trends in the market that may have impacted the fund's performance, and has engaged with FMR to consider what steps might be taken to remediate the fund's underperformance while at the same time noting the superior long term performance of the fund. The Board also noted that there were portfolio management changes for the fund in May 2016 and April 2017.
The Board also considered that the fund's management fee is subject to upward or downward adjustment depending upon whether, and to what extent, the fund's investment performance for the performance period (a rolling 36-month period) exceeds, or is exceeded by, a securities index, thus leading to a performance adjustment for the same period. The Board noted that the performance adjustment provides FMR with a strong economic incentive to seek to achieve superior long-term performance for the fund's shareholders and helps to more closely align the interests of FMR and the shareholders of the fund.
Based on its review, the Board concluded that the nature, extent, and quality of services provided to the fund under the Advisory Contracts should continue to benefit the shareholders of the fund.
Competitiveness of Management Fee and Total Expense Ratio. The Board considered the fund's management fee and total expense ratio compared to "mapped groups" of competitive funds and classes created for the purpose of facilitating the Trustees' competitive analysis of management fees and total expenses. Fidelity creates "mapped groups" by combining similar Lipper investment objective categories that have comparable investment mandates. Combining Lipper investment objective categories aids the Board's management fee and total expense ratio comparisons by broadening the competitive group used for comparison.
Management Fee. The Board considered two proprietary management fee comparisons for the 12-month periods shown in basis points (BP) in the chart below. The group of Lipper funds used by the Board for management fee comparisons is referred to below as the "Total Mapped Group." The Total Mapped Group comparison focuses on a fund's standing in terms of gross management fees before expense reimbursements or caps, and without giving effect to the fund's performance adjustment, relative to the total universe of funds with comparable investment mandates, regardless of whether their management fee structures also are comparable. Funds with comparable investment mandates offer exposure to similar types of securities. Funds with comparable management fee structures have similar management fee contractual arrangements (
e.g., flat rate charged for advisory services, all-inclusive fee rate,
etc.). "TMG %" represents the percentage of funds in the Total Mapped Group that had management fees that were lower than the fund's. For example, a hypothetical TMG % of 20% would mean that 80% of the funds in the Total Mapped Group had higher, and 20% had lower, management fees than the fund. The fund's actual TMG %s and the number of funds in the Total Mapped Group are in the chart below. The "Asset-Size Peer Group" (ASPG) comparison focuses on a fund's standing relative to a subset of non-Fidelity funds within the Total Mapped Group that are similar in size and management fee structure without taking into account performance adjustments, if any. For example, if a fund is in the first quartile of the ASPG, the fund's management fee ranks in the least expensive or lowest 25% of funds in the ASPG. The ASPG represents at least 15% of the funds in the Total Mapped Group with comparable asset size and management fee structures, subject to a minimum of 50 funds (or all funds in the Total Mapped Group if fewer than 50). Additional information, such as the ASPG quartile in which the fund's management fee rate ranked and the impact of the fund's performance adjustment, is also included in the chart and considered by the Board.
Fidelity Low-Priced Stock Fund
The Board noted that the fund's management fee rate ranked below the median of its Total Mapped Group and below the median of its ASPG for 2016. The Board also noted the effect of the fund's performance adjustment, if any, on the fund's management fee ranking. The Board noted that the comparisons for 2015 and 2016 reflect a revised Total Mapped Group that no longer includes funds with micro-cap objectives and that FMR believes this Total Mapped Group is a more appropriate comparison because the fund does not have a micro-cap objective.
The Board noted that, in 2014, the Board and the boards of other Fidelity funds formed the ad hoc Committee on Group Fee to conduct an in-depth review of the "group fee" component of the management fee of funds with such management fee structures. The Committee's focus included the mechanics of the group fee, the competitive landscape of group fee structures, Fidelity funds with no group fee component and investment products not included in group fee assets. The Board also considered that, for funds subject to the group fee, FMR agreed to voluntarily waive fees over a specified period of time in amounts designed to account for assets converted from certain funds to certain collective investment trusts.
The Board also noted that, in 2013, the ad hoc Committee on Management Fees was formed to conduct an in-depth review of the management fee rates of Fidelity's active equity mutual funds. The Committee focused on the following areas: (i) standard fee structures; (ii) research consumption and trading evolution; (iii) management fee competitiveness/profitability by category; and (iv) factors that drive institutional pricing.
Based on its review, the Board concluded that the fund's management fee is fair and reasonable in light of the services that the fund receives and the other factors considered.
Total Expense Ratio. In its review of each class's total expense ratio, the Board considered the fund's management fee rate as well as other fund or class expenses, as applicable, such as transfer agent fees, pricing and bookkeeping fees, and custodial, legal, and audit fees. The Board noted the impact of the fund's performance adjustment. The Board also noted that Fidelity may agree to waive fees and expenses from time to time, and the extent to which, if any, it has done so for the fund. As part of its review, the Board also considered the current and historical total expense ratios of each class of the fund compared to competitive fund median expenses. Each class of the fund is compared to those funds and classes in the Total Mapped Group (used by the Board for management fee comparisons) that have a similar sales load structure.
The Board noted that the total expense ratio of each class ranked below the competitive median for 2016.
Fees Charged to Other Fidelity Clients. The Board also considered Fidelity fee structures and other information with respect to clients of Fidelity, such as other funds advised or subadvised by Fidelity, pension plan clients, and other institutional clients with similar mandates. The Board noted that an ad hoc joint committee created by it and the boards of other Fidelity funds periodically (most recently in 2013) reviews and compares Fidelity's institutional investment advisory business with its business of providing services to the Fidelity funds, including the differences in services provided, fees charged, and costs incurred, as well as competition in their respective marketplaces.
Based on its review of total expense ratios and fees charged to other Fidelity clients, the Board concluded that the total expense ratio of each class of the fund was reasonable in light of the services that the fund and its shareholders receive and the other factors considered.
Costs of the Services and Profitability. The Board considered the revenues earned and the expenses incurred by Fidelity in conducting the business of developing, marketing, distributing, managing, administering and servicing the fund and servicing the fund's shareholders. The Board also considered the level of Fidelity's profits in respect of all the Fidelity funds.
On an annual basis, Fidelity presents to the Board information about the profitability of its relationships with the fund. Fidelity calculates profitability information for each fund, as well as aggregate profitability information for groups of Fidelity funds and all Fidelity funds, using a series of detailed revenue and cost allocation methodologies which originate with the books and records of Fidelity on which Fidelity's audited financial statements are based. The Audit Committee of the Board reviews any significant changes from the prior year's methodologies.
PricewaterhouseCoopers LLP (PwC), independent registered public accounting firm and auditor to Fidelity and certain Fidelity funds, has been engaged annually by the Board as part of the Board's assessment of Fidelity's profitability analysis. PwC's engagement includes the review and assessment of the methodologies used by Fidelity in determining the revenues and expenses attributable to Fidelity's mutual fund business, and completion of agreed-upon procedures in respect of the mathematical accuracy of the fund profitability information and its conformity to established allocation methodologies. After considering PwC's reports issued under the engagement and information provided by Fidelity, the Board concluded that while other allocation methods may also be reasonable, Fidelity's profitability methodologies are reasonable in all material respects.
The Board also reviewed Fidelity's non-fund businesses and potential fall-out benefits related to the mutual fund business as well as cases where Fidelity's affiliates may benefit from or be related to the fund's business.
The Board considered the costs of the services provided by and the profits realized by Fidelity in connection with the operation of the fund and was satisfied that the profitability was not excessive.
Economies of Scale. The Board considered whether there have been economies of scale in respect of the management of the Fidelity funds, whether the Fidelity funds (including the fund) have appropriately benefited from any such economies of scale, and whether there is potential for realization of any further economies of scale. The Board considered the extent to which the fund will benefit from economies of scale as assets grow through increased services to the fund, through waivers or reimbursements, or through fee or expense ratio reductions. The Board also noted that a committee (the Economies of Scale Committee) created by it and the boards of other Fidelity funds periodically (most recently in 2013) analyzes whether Fidelity attains economies of scale in respect of the management and servicing of the Fidelity funds, whether the Fidelity funds have appropriately benefited from such economies of scale, and whether there is potential for realization of any further economies of scale.
The Board recognized that the fund's management contract incorporates a "group fee" structure, which provides for lower group fee rates as total group assets increase, and for higher group fee rates as total group assets decrease (with "group assets" defined to include fund assets under FMR's management plus the assets of sector funds previously under FMR's management). FMR calculates the group fee rates based on a tiered asset "breakpoint" schedule that varies based on asset class. The Board considered that the group fee is designed to deliver the benefits of economies of scale to fund shareholders when total Fidelity fund assets increase, even if assets of any particular fund are unchanged or have declined, because some portion of Fidelity's costs are attributable to services provided to all Fidelity funds, and all funds benefit if those costs can be allocated among more assets. The Board concluded that, given the group fee structure, fund shareholders will benefit from lower management fees as group assets increase at the fund complex level, regardless of whether Fidelity achieves any such economies of scale.
The Board concluded, taking into account the analysis of the Economies of Scale Committee, that economies of scale, if any, are being appropriately shared between fund shareholders and Fidelity.
Additional Information Requested by the Board. In order to develop fully the factual basis for consideration of the Fidelity funds' advisory contracts, the Board requested and received additional information on certain topics, including: (i) fund performance trends, in particular the underperformance of certain funds, and Fidelity's long-term strategies for certain funds; (ii) Fidelity's fund profitability methodology, profitability trends for certain funds, and the impact of certain factors on fund profitability results, including the impact of market trends on actively managed funds; (iii) the use of performance fees and the calculation of performance adjustments, including the impact of underperformance and fund outflows on performance adjustments; (iv) metrics for evaluating index fund performance; (v) Fidelity's group fee structure, including the group fee breakpoint schedules; (vi) the terms of Fidelity's contractual and voluntary expense cap arrangements with the funds; (vii) the methodology with respect to evaluating competitive fund data and peer group classifications and fee comparisons; (viii) the expense structures for different funds and classes; (ix) Fidelity's arrangements with affiliated sub-advisers on behalf of the funds; (x) information regarding other accounts managed by Fidelity, including institutional accounts and collective investment trusts; (xi) recent changes to the fee structure for certain funds of funds; and (xii) the impact of the Department of Labor's new fiduciary rule on the funds' comparative expense information.
Based on its evaluation of all of the conclusions noted above, and after considering all factors it believed relevant, the Board concluded that the advisory fee structures are fair and reasonable, and that the fund's Advisory Contracts should be renewed.
Corporate Headquarters
245 Summer St.
Boston, MA 02210
www.fidelity.com
LPS-ANN-0917
1.536378.120
Fidelity® Value Discovery Fund Class K
Annual Report July 31, 2017 |
|
Contents
To view a fund's proxy voting guidelines and proxy voting record for the 12-month period ended June 30, visit http://www.fidelity.com/proxyvotingresults or visit the Securities and Exchange Commission's (SEC) web site at http://www.sec.gov.
You may also call 1-800-835-5092 to request a free copy of the proxy voting guidelines.
Standard & Poor's, S&P and S&P 500 are registered service marks of The McGraw-Hill Companies, Inc. and have been licensed for use by Fidelity Distributors Corporation.
Other third-party marks appearing herein are the property of their respective owners.
All other marks appearing herein are registered or unregistered trademarks or service marks of FMR LLC or an affiliated company. © 2017 FMR LLC. All rights reserved.
This report and the financial statements contained herein are submitted for the general information of the shareholders of the Fund. This report is not authorized for distribution to prospective investors in the Fund unless preceded or accompanied by an effective prospectus.
A fund files its complete schedule of portfolio holdings with the SEC for the first and third quarters of each fiscal year on Form N-Q. Forms N-Q are available on the SEC’s web site at http://www.sec.gov. A fund's Forms N-Q may be reviewed and copied at the SEC’s Public Reference Room in Washington, DC. Information regarding the operation of the SEC's Public Reference Room may be obtained by calling 1-800-SEC-0330.
For a complete list of a fund's portfolio holdings, view the most recent holdings listing, semiannual report, or annual report on Fidelity's web site at http://www.fidelity.com, http://www.institutional.fidelity.com, or http://www.401k.com, as applicable.
NOT FDIC INSURED •MAY LOSE VALUE •NO BANK GUARANTEE
Neither the Fund nor Fidelity Distributors Corporation is a bank.
Performance: The Bottom Line
Average annual total return reflects the change in the value of an investment, assuming reinvestment of distributions from dividend income and capital gains (the profits earned upon the sale of securities that have grown in value, if any) and assuming a constant rate of performance each year. The hypothetical investment and the average annual total returns do not reflect the deduction of taxes that a shareholder would pay on fund distributions or the redemption of fund shares. During periods of reimbursement by Fidelity, a fund’s total return will be greater than it would be had the reimbursement not occurred. How a fund did yesterday is no guarantee of how it will do tomorrow.
Average Annual Total Returns
| For the periods ended July 31, 2017 | Past 1 year | Past 5 years | Past 10 years |
| Class K | 17.82% | 14.67% | 6.38% |
The initial offering of Class K shares took place on May 9, 2008. Returns prior to May 9, 2008 are those of Fidelity® Value Discovery Fund, the original class of the fund.
$10,000 Over 10 Years
Let's say hypothetically that $10,000 was invested in Fidelity® Value Discovery Fund - Class K on July 31, 2007.
The chart shows how the value of your investment would have changed, and also shows how the Russell 3000® Value Index performed over the same period.
See previous page for additional information regarding the performance of Class K.
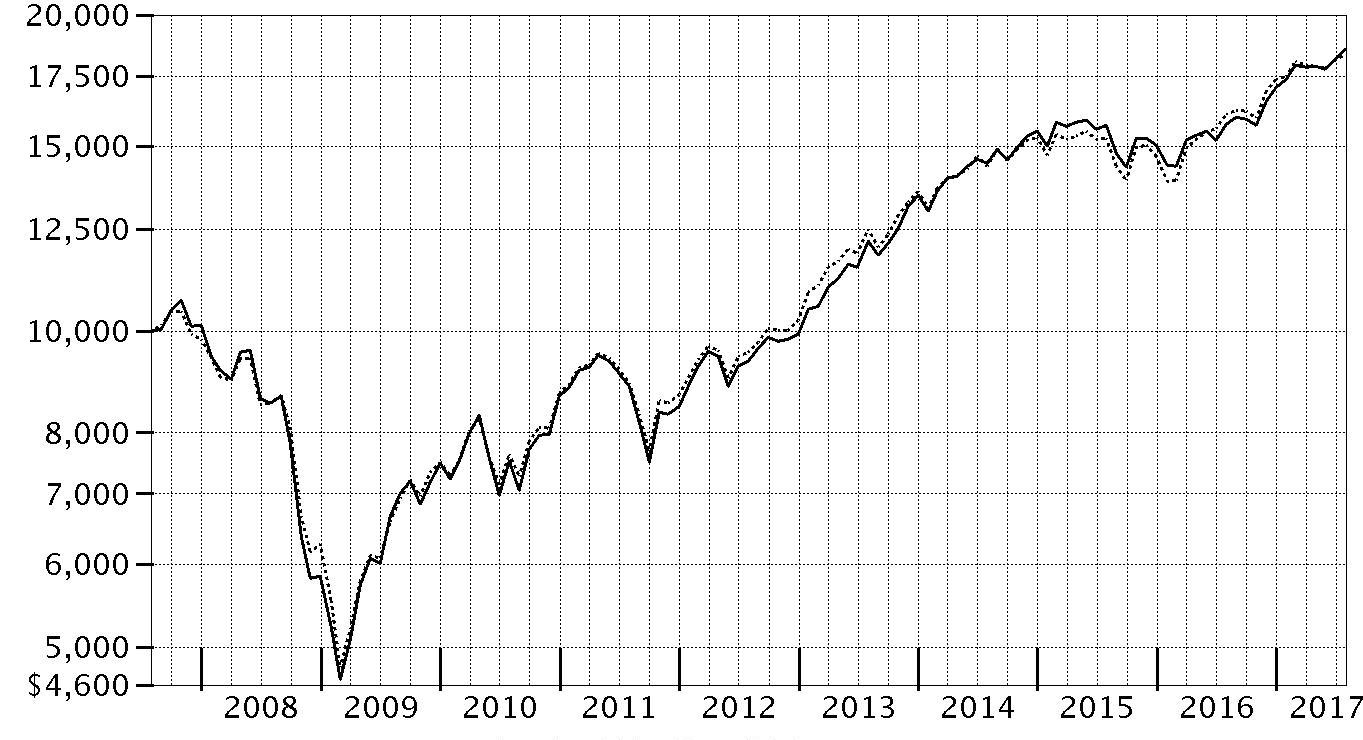
| Period Ending Values |
| $18,555 | Fidelity® Value Discovery Fund - Class K |
| $18,358 | Russell 3000® Value Index |
Management's Discussion of Fund Performance
Market Recap: The U.S. equity bellwether S&P 500
® index gained 16.04% for the year ending July 31, 2017, rising sharply following the November election and continuing to rally through the end of February on optimism for President Trump’s pro-business agenda. Equity markets leveled off, however, as the fledgling administration faced the first test of its domestic agenda. Stocks reacted with uncertainty to efforts by Congress in March to repeal and replace the Affordable Care Act, and then reverted upward through July 31. Growth stocks surged ahead of value, while small-caps’ advantage over large-caps narrowed. Sector-wise, financials (+36%) fared best, riding an uptick in bond yields and a surge in banks, particularly post-election. Information technology gained 29%, as a handful of major index constituents posted stellar returns. Industrials (+18%) was boosted by a call for increased infrastructure spending. Consumer discretionary (+14%) slightly lagged the broader market because brick-and-mortar retailers continued to suffer from increased online competition. Energy (0%) was hurt by low oil prices. Utilities (+6%), consumer staples (+4%), telecommunication services (-7%) and real estate (-2%) all struggled amid an improved backdrop for riskier assets that curbed demand for dividend-rich sectors, as well as the likelihood of further interest rate hikes later in 2017.
Comments from Portfolio Manager Sean Gavin: For the fiscal year, the fund’s Retail Class shares gained 17.70%, well ahead of the benchmark Russell 3000
® Value Index, which returned 14.17%. Versus the benchmark, the fund was helped most by strong stock picking in the energy sector. Most notably, we did not own lagging benchmark component Exxon Mobil, an integrated energy giant whose fundamentals I found unattractive at the firm’s current valuation. We also saw favorable results with a pair of affiliated energy-transportation companies: Teekay and Teekay LNG Partners. I should point out that a third Teekay entity we held, Teekay Offshore Partners, performed poorly this period, essentially offsetting the positive impact generated by its cousins. All three were out-of-benchmark holdings. The fund also benefited from good security selection in information technology – especially owning consumer electronics and computer designer Apple, one of the fund’s largest holdings at period end – and in consumer discretionary. Tempering the fund’s strength this period, however, was subpar stock picking in the financials and industrials sectors, as well as in health care, where a disappointing position in Teva Pharmaceutical Industries was a particularly big detractor, as the company faced various business challenges. Teva remained one of the fund’s largest holdings at period end, although it’s fair to say my confidence in the name has been shaken.
The views expressed above reflect those of the portfolio manager(s) only through the end of the period as stated on the cover of this report and do not necessarily represent the views of Fidelity or any other person in the Fidelity organization. Any such views are subject to change at any time based upon market or other conditions and Fidelity disclaims any responsibility to update such views. These views may not be relied on as investment advice and, because investment decisions for a Fidelity fund are based on numerous factors, may not be relied on as an indication of trading intent on behalf of any Fidelity fund.
Investment Summary (Unaudited)
Top Ten Stocks as of July 31, 2017
| | % of fund's net assets | % of fund's net assets 6 months ago |
| JPMorgan Chase & Co. | 3.8 | 3.4 |
| Berkshire Hathaway, Inc. Class B | 3.5 | 3.8 |
| Wells Fargo & Co. | 3.1 | 3.7 |
| Amgen, Inc. | 2.3 | 2.2 |
| Alphabet, Inc. Class A | 2.0 | 1.9 |
| U.S. Bancorp | 2.0 | 2.3 |
| Allergan PLC | 2.0 | 1.5 |
| Teva Pharmaceutical Industries Ltd. sponsored ADR | 1.9 | 1.4 |
| Johnson & Johnson | 1.7 | 1.8 |
| CVS Health Corp. | 1.7 | 1.2 |
| | 24.0 | |
Top Five Market Sectors as of July 31, 2017
| | % of fund's net assets | % of fund's net assets 6 months ago |
| Financials | 26.0 | 27.0 |
| Health Care | 16.4 | 14.6 |
| Information Technology | 11.7 | 14.1 |
| Consumer Discretionary | 10.8 | 10.1 |
| Consumer Staples | 7.4 | 4.3 |
Asset Allocation (% of fund's net assets)
| As of July 31, 2017* |
| | Stocks | 95.0% |
| | Convertible Securities | 0.6% |
| | Short-Term Investments and Net Other Assets (Liabilities) | 4.4% |

* Foreign investments - 23.2%
| As of January 31, 2017* |
| | Stocks | 93.7% |
| | Short-Term Investments and Net Other Assets (Liabilities) | 6.3% |

* Foreign investments - 23.4%
Investments July 31, 2017
Showing Percentage of Net Assets
| Common Stocks - 95.0% | | | |
| | | Shares | Value |
| CONSUMER DISCRETIONARY - 10.8% | | | |
| Auto Components - 0.5% | | | |
| Hyundai Mobis | | 67,953 | $14,926,257 |
| Leisure Products - 0.7% | | | |
| Vista Outdoor, Inc. (a) | | 789,600 | 18,231,864 |
| Media - 7.0% | | | |
| CBS Corp. Class B | | 547,400 | 36,035,342 |
| Charter Communications, Inc. Class A (a) | | 52,129 | 20,429,876 |
| Cinemark Holdings, Inc. | | 413,600 | 16,089,040 |
| John Wiley & Sons, Inc. Class A | | 277,085 | 15,308,946 |
| Lions Gate Entertainment Corp. Class B (a) | | 1,256,182 | 34,557,567 |
| Time Warner, Inc. | | 405,900 | 41,572,278 |
| Twenty-First Century Fox, Inc. Class A | | 1,175,400 | 34,204,140 |
| | | | 198,197,189 |
| Specialty Retail - 0.7% | | | |
| Cabela's, Inc. Class A (a) | | 337,600 | 19,236,448 |
| Textiles, Apparel & Luxury Goods - 1.9% | | | |
| Christian Dior SA | | 66,500 | 18,948,554 |
| PVH Corp. | | 290,300 | 34,629,887 |
| | | | 53,578,441 |
|
| TOTAL CONSUMER DISCRETIONARY | | | 304,170,199 |
|
| CONSUMER STAPLES - 7.4% | | | |
| Beverages - 1.4% | | | |
| C&C Group PLC | | 4,497,810 | 16,292,993 |
| PepsiCo, Inc. | | 207,300 | 24,173,253 |
| | | | 40,466,246 |
| Food & Staples Retailing - 2.2% | | | |
| CVS Health Corp. | | 600,000 | 47,958,000 |
| Sysco Corp. | | 281,800 | 14,828,316 |
| | | | 62,786,316 |
| Food Products - 2.2% | | | |
| Kellogg Co. | | 224,000 | 15,232,000 |
| Seaboard Corp. | | 3,324 | 14,210,100 |
| The J.M. Smucker Co. | | 276,921 | 33,756,670 |
| | | | 63,198,770 |
| Personal Products - 0.7% | | | |
| Unilever NV (Certificaten Van Aandelen) (Bearer) | | 323,200 | 18,835,325 |
| Tobacco - 0.9% | | | |
| British American Tobacco PLC: | | | |
| (United Kingdom) | | 241,700 | 15,035,127 |
| sponsored ADR | | 153,900 | 9,621,828 |
| | | | 24,656,955 |
|
| TOTAL CONSUMER STAPLES | | | 209,943,612 |
|
| ENERGY - 6.8% | | | |
| Oil, Gas & Consumable Fuels - 6.8% | | | |
| Chevron Corp. | | 397,181 | 43,368,193 |
| FLEX LNG Ltd. (a) | | 8,303,700 | 11,405,529 |
| GasLog Ltd. (b) | | 321,200 | 5,861,900 |
| GasLog Partners LP | | 923,000 | 22,844,250 |
| Golar LNG Partners LP | | 829,200 | 18,665,292 |
| Hoegh LNG Partners LP | | 548,900 | 10,785,885 |
| Phillips 66 Co. | | 294,000 | 24,622,500 |
| Suncor Energy, Inc. | | 474,700 | 15,485,100 |
| Teekay Corp. | | 1,405,300 | 13,771,940 |
| Teekay LNG Partners LP | | 919,415 | 17,330,973 |
| Teekay Offshore Partners LP | | 3,451,200 | 8,938,608 |
| | | | 193,080,170 |
| FINANCIALS - 26.0% | | | |
| Banks - 11.2% | | | |
| JPMorgan Chase & Co. | | 1,158,041 | 106,308,165 |
| PNC Financial Services Group, Inc. | | 257,100 | 33,114,480 |
| SunTrust Banks, Inc. | | 562,200 | 32,208,438 |
| U.S. Bancorp | | 1,059,700 | 55,930,966 |
| Wells Fargo & Co. | | 1,622,337 | 87,508,858 |
| | | | 315,070,907 |
| Capital Markets - 1.2% | | | |
| Goldman Sachs Group, Inc. | | 151,300 | 34,092,429 |
| Consumer Finance - 2.6% | | | |
| Capital One Financial Corp. | | 251,382 | 21,664,101 |
| Discover Financial Services | | 407,500 | 24,833,050 |
| Synchrony Financial | | 914,300 | 27,721,576 |
| | | | 74,218,727 |
| Diversified Financial Services - 3.5% | | | |
| Berkshire Hathaway, Inc. Class B (a) | | 566,031 | 99,038,444 |
| Insurance - 4.7% | | | |
| Allstate Corp. | | 283,400 | 25,789,400 |
| Chubb Ltd. | | 188,400 | 27,593,064 |
| FNF Group | | 411,220 | 20,092,209 |
| FNFV Group (a) | | 369,733 | 6,377,894 |
| Prudential PLC | | 932,373 | 22,750,364 |
| The Travelers Companies, Inc. | | 231,213 | 29,616,073 |
| | | | 132,219,004 |
| Mortgage Real Estate Investment Trusts - 2.8% | | | |
| Agnc Investment Corp. | | 1,220,899 | 25,858,641 |
| Annaly Capital Management, Inc. | | 2,428,695 | 29,217,201 |
| MFA Financial, Inc. | | 2,852,664 | 24,219,117 |
| | | | 79,294,959 |
|
| TOTAL FINANCIALS | | | 733,934,470 |
|
| HEALTH CARE - 15.8% | | | |
| Biotechnology - 3.6% | | | |
| Amgen, Inc. | | 379,400 | 66,209,094 |
| Dyax Corp. rights 12/31/19 (a) | | 635,500 | 2,084,440 |
| Shire PLC sponsored ADR | | 196,105 | 32,855,432 |
| | | | 101,148,966 |
| Health Care Providers & Services - 4.4% | | | |
| Aetna, Inc. | | 145,900 | 22,513,829 |
| Anthem, Inc. | | 121,500 | 22,624,515 |
| Cigna Corp. | | 264,400 | 45,889,264 |
| McKesson Corp. | | 204,800 | 33,150,976 |
| | | | 124,178,584 |
| Pharmaceuticals - 7.8% | | | |
| Allergan PLC | | 217,200 | 54,806,076 |
| Bayer AG | | 286,000 | 36,277,432 |
| Johnson & Johnson | | 363,108 | 48,191,694 |
| Sanofi SA sponsored ADR | | 549,200 | 26,010,112 |
| Teva Pharmaceutical Industries Ltd. sponsored ADR | | 1,685,868 | 54,234,374 |
| | | | 219,519,688 |
|
| TOTAL HEALTH CARE | | | 444,847,238 |
|
| INDUSTRIALS - 6.7% | | | |
| Aerospace & Defense - 1.6% | | | |
| United Technologies Corp. | | 390,600 | 46,313,442 |
| Industrial Conglomerates - 1.5% | | | |
| General Electric Co. | | 1,611,800 | 41,278,198 |
| Machinery - 0.7% | | | |
| Deere & Co. | | 148,490 | 19,048,297 |
| Professional Services - 2.4% | | | |
| Dun & Bradstreet Corp. | | 301,600 | 33,405,216 |
| Nielsen Holdings PLC | | 784,100 | 33,724,141 |
| | | | 67,129,357 |
| Trading Companies & Distributors - 0.5% | | | |
| AerCap Holdings NV (a) | | 294,000 | 14,435,400 |
|
| TOTAL INDUSTRIALS | | | 188,204,694 |
|
| INFORMATION TECHNOLOGY - 11.7% | | | |
| Communications Equipment - 2.8% | | | |
| Cisco Systems, Inc. | | 1,269,418 | 39,923,196 |
| Harris Corp. | | 194,400 | 22,252,968 |
| Juniper Networks, Inc. | | 572,000 | 15,987,400 |
| | | | 78,163,564 |
| Electronic Equipment & Components - 0.8% | | | |
| TE Connectivity Ltd. | | 286,202 | 23,007,779 |
| Internet Software & Services - 3.4% | | | |
| Alphabet, Inc. Class A (a) | | 61,600 | 58,242,800 |
| comScore, Inc. (a) | | 545,100 | 16,364,447 |
| VeriSign, Inc. (a)(b) | | 224,400 | 22,702,548 |
| | | | 97,309,795 |
| IT Services - 2.1% | | | |
| Amdocs Ltd. | | 276,747 | 18,589,096 |
| Cognizant Technology Solutions Corp. Class A | | 303,400 | 21,031,688 |
| The Western Union Co. | | 936,200 | 18,489,950 |
| | | | 58,110,734 |
| Semiconductors & Semiconductor Equipment - 0.8% | | | |
| Lattice Semiconductor Corp. (a) | | 413,800 | 2,880,048 |
| NXP Semiconductors NV (a) | | 171,200 | 18,888,496 |
| | | | 21,768,544 |
| Software - 0.3% | | | |
| Oracle Corp. | | 192,413 | 9,607,181 |
| Technology Hardware, Storage & Peripherals - 1.5% | | | |
| Apple, Inc. | | 283,500 | 42,164,955 |
|
| TOTAL INFORMATION TECHNOLOGY | | | 330,132,552 |
|
| MATERIALS - 3.1% | | | |
| Chemicals - 1.7% | | | |
| LyondellBasell Industries NV Class A | | 300,600 | 27,081,054 |
| Monsanto Co. | | 169,800 | 19,836,036 |
| | | | 46,917,090 |
| Containers & Packaging - 1.4% | | | |
| Ball Corp. | | 510,900 | 21,406,710 |
| Graphic Packaging Holding Co. | | 1,466,600 | 19,344,454 |
| | | | 40,751,164 |
|
| TOTAL MATERIALS | | | 87,668,254 |
|
| REAL ESTATE - 0.9% | | | |
| Real Estate Management & Development - 0.9% | | | |
| CBRE Group, Inc. (a) | | 711,600 | 27,033,684 |
| TELECOMMUNICATION SERVICES - 1.7% | | | |
| Diversified Telecommunication Services - 1.7% | | | |
| Verizon Communications, Inc. | | 970,100 | 46,952,840 |
| UTILITIES - 4.1% | | | |
| Electric Utilities - 3.8% | | | |
| Exelon Corp. | | 1,092,100 | 41,871,114 |
| PPL Corp. | | 696,500 | 26,696,845 |
| Xcel Energy, Inc. | | 810,800 | 38,358,948 |
| | | | 106,926,907 |
| Gas Utilities - 0.3% | | | |
| WGL Holdings, Inc. | | 107,000 | 9,172,040 |
|
| TOTAL UTILITIES | | | 116,098,947 |
|
| TOTAL COMMON STOCKS | | | |
| (Cost $2,369,112,330) | | | 2,682,066,660 |
|
| Convertible Preferred Stocks - 0.6% | | | |
| HEALTH CARE - 0.6% | | | |
| Pharmaceuticals - 0.6% | | | |
| Teva Pharmaceutical Industries Ltd. 7% | | | |
| (Cost $15,659,700) | | 27,005 | 15,630,494 |
|
| Money Market Funds - 10.3% | | | |
| Fidelity Cash Central Fund, 1.11% (c) | | 267,773,145 | 267,826,700 |
| Fidelity Securities Lending Cash Central Fund 1.11% (c)(d) | | 23,731,550 | 23,733,923 |
| TOTAL MONEY MARKET FUNDS | | | |
| (Cost $291,541,717) | | | 291,560,623 |
| TOTAL INVESTMENT PORTFOLIO - 105.9% | | | |
| (Cost $2,676,313,747) | | | 2,989,257,777 |
| NET OTHER ASSETS (LIABILITIES) - (5.9)% | | | (167,540,930) |
| NET ASSETS - 100% | | | $2,821,716,847 |
Legend
(a) Non-income producing
(b) Security or a portion of the security is on loan at period end.
(c) Affiliated fund that is generally available only to investment companies and other accounts managed by Fidelity Investments. The rate quoted is the annualized seven-day yield of the fund at period end. A complete unaudited listing of the fund's holdings as of its most recent quarter end is available upon request. In addition, each Fidelity Central Fund's financial statements , which are not covered by the Fund's Report of Independent Registered Public Accounting Firm, are available on the SEC's website or upon request.
(d) Investment made with cash collateral received from securities on loan.
Affiliated Central Funds
Information regarding fiscal year to date income earned by the Fund from investments in Fidelity Central Funds is as follows:
| Fund | Income earned |
| Fidelity Cash Central Fund | $976,171 |
| Fidelity Securities Lending Cash Central Fund | 160,605 |
| Total | $1,136,776 |
Investment Valuation
The following is a summary of the inputs used, as of July 31, 2017, involving the Fund's assets and liabilities carried at fair value. The inputs or methodology used for valuing securities may not be an indication of the risk associated with investing in those securities. For more information on valuation inputs, and their aggregation into the levels used below, please refer to the Investment Valuation section in the accompanying Notes to Financial Statements.
| | Valuation Inputs at Reporting Date: |
| Description | Total | Level 1 | Level 2 | Level 3 |
| Investments in Securities: | | | | |
| Equities: | | | | |
| Consumer Discretionary | $304,170,199 | $304,170,199 | $-- | $-- |
| Consumer Staples | 209,943,612 | 176,073,160 | 33,870,452 | -- |
| Energy | 193,080,170 | 193,080,170 | -- | -- |
| Financials | 733,934,470 | 711,184,106 | 22,750,364 | -- |
| Health Care | 460,477,732 | 442,762,798 | 15,630,494 | 2,084,440 |
| Industrials | 188,204,694 | 188,204,694 | -- | -- |
| Information Technology | 330,132,552 | 330,132,552 | -- | -- |
| Materials | 87,668,254 | 87,668,254 | -- | -- |
| Real Estate | 27,033,684 | 27,033,684 | -- | -- |
| Telecommunication Services | 46,952,840 | 46,952,840 | -- | -- |
| Utilities | 116,098,947 | 116,098,947 | -- | -- |
| Money Market Funds | 291,560,623 | 291,560,623 | -- | -- |
| Total Investments in Securities: | $2,989,257,777 | $2,914,922,027 | $72,251,310 | $2,084,440 |
Other Information
Distribution of investments by country or territory of incorporation, as a percentage of Total Net Assets, is as follows (Unaudited):
| United States of America | 76.8% |
| Marshall Islands | 3.3% |
| Netherlands | 2.9% |
| Ireland | 2.6% |
| United Kingdom | 2.5% |
| Israel | 2.5% |
| Switzerland | 1.8% |
| Canada | 1.7% |
| France | 1.6% |
| Germany | 1.3% |
| Bailiwick of Jersey | 1.2% |
| Others (Individually Less Than 1%) | 1.8% |
| | 100.0% |
See accompanying notes which are an integral part of the financial statements.
Financial Statements
Statement of Assets and Liabilities
| | | July 31, 2017 |
| Assets | | |
Investment in securities, at value (including securities loaned of $22,925,516) — See accompanying schedule:
Unaffiliated issuers (cost $2,384,772,030) | $2,697,697,154 | |
| Fidelity Central Funds (cost $291,541,717) | 291,560,623 | |
| Total Investments (cost $2,676,313,747) | | $2,989,257,777 |
| Receivable for fund shares sold | | 2,514,105 |
| Dividends receivable | | 2,211,949 |
| Distributions receivable from Fidelity Central Funds | | 146,228 |
| Other receivables | | 12,038 |
| Total assets | | 2,994,142,097 |
| Liabilities | | |
| Payable to custodian bank | $695 | |
| Payable for investments purchased | 134,328,289 | |
| Payable for fund shares redeemed | 12,532,315 | |
| Accrued management fee | 1,343,516 | |
| Other affiliated payables | 440,372 | |
| Other payables and accrued expenses | 47,263 | |
| Collateral on securities loaned | 23,732,800 | |
| Total liabilities | | 172,425,250 |
| Net Assets | | $2,821,716,847 |
| Net Assets consist of: | | |
| Paid in capital | | $2,465,188,686 |
| Undistributed net investment income | | 15,946,340 |
| Accumulated undistributed net realized gain (loss) on investments and foreign currency transactions | | 27,620,817 |
| Net unrealized appreciation (depreciation) on investments and assets and liabilities in foreign currencies | | 312,961,004 |
| Net Assets | | $2,821,716,847 |
| Value Discovery: | | |
| Net Asset Value, offering price and redemption price per share ($2,708,049,125 ÷ 96,369,101 shares) | | $28.10 |
| Class K: | | |
| Net Asset Value, offering price and redemption price per share ($113,667,722 ÷ 4,043,253 shares) | | $28.11 |
See accompanying notes which are an integral part of the financial statements.
Statement of Operations
| | | Year ended July 31, 2017 |
| Investment Income | | |
| Dividends | | $48,048,347 |
| Interest | | 602 |
| Income from Fidelity Central Funds | | 1,136,776 |
| Total income | | 49,185,725 |
| Expenses | | |
| Management fee | | |
| Basic fee | $12,297,144 | |
| Performance adjustment | (188,624) | |
| Transfer agent fees | 3,576,464 | |
| Accounting and security lending fees | 683,184 | |
| Custodian fees and expenses | 50,988 | |
| Independent trustees' fees and expenses | 8,744 | |
| Registration fees | 118,455 | |
| Audit | 51,219 | |
| Legal | 8,922 | |
| Miscellaneous | 17,866 | |
| Total expenses before reductions | 16,624,362 | |
| Expense reductions | (19,201) | 16,605,161 |
| Net investment income (loss) | | 32,580,564 |
| Realized and Unrealized Gain (Loss) | | |
| Net realized gain (loss) on: | | |
| Investment securities: | | |
| Unaffiliated issuers | 53,842,883 | |
| Redemption in-kind with affiliated entities | 79,326,353 | |
| Fidelity Central Funds | 7,391 | |
| Foreign currency transactions | 72,100 | |
| Futures contracts | (164,544) | |
| Total net realized gain (loss) | | 133,084,183 |
Change in net unrealized appreciation (depreciation) on:
Investment securities | 205,423,283 | |
| Assets and liabilities in foreign currencies | 15,701 | |
| Total change in net unrealized appreciation (depreciation) | | 205,438,984 |
| Net gain (loss) | | 338,523,167 |
| Net increase (decrease) in net assets resulting from operations | | $371,103,731 |
See accompanying notes which are an integral part of the financial statements.
Statement of Changes in Net Assets
| | Year ended July 31, 2017 | Year ended July 31, 2016 |
| Increase (Decrease) in Net Assets | | |
| Operations | | |
| Net investment income (loss) | $32,580,564 | $24,620,028 |
| Net realized gain (loss) | 133,084,183 | (25,059,512) |
| Change in net unrealized appreciation (depreciation) | 205,438,984 | 26,981,029 |
| Net increase (decrease) in net assets resulting from operations | 371,103,731 | 26,541,545 |
| Distributions to shareholders from net investment income | (23,479,663) | (29,737,484) |
| Distributions to shareholders from net realized gain | (411,905) | (18,889,095) |
| Total distributions | (23,891,568) | (48,626,579) |
| Share transactions - net increase (decrease) | 539,346,673 | 555,360,338 |
| Total increase (decrease) in net assets | 886,558,836 | 533,275,304 |
| Net Assets | | |
| Beginning of period | 1,935,158,011 | 1,401,882,707 |
| End of period | $2,821,716,847 | $1,935,158,011 |
| Other Information | | |
| Undistributed net investment income end of period | $15,946,340 | $10,520,477 |
See accompanying notes which are an integral part of the financial statements.
Financial Highlights — Fidelity Value Discovery Fund
| Years ended July 31, | 2017 | 2016 | 2015 | 2014 | 2013 |
| Selected Per–Share Data | | | | | |
| Net asset value, beginning of period | $24.16 | $24.99 | $23.32 | $19.93 | $15.62 |
| Income from Investment Operations | | | | | |
| Net investment income (loss)A | .38 | .34 | .66B | .31 | .29 |
| Net realized and unrealized gain (loss) | 3.86 | (.38)C | 1.35 | 3.34 | 4.29 |
| Total from investment operations | 4.24 | (.04) | 2.01 | 3.65 | 4.58 |
| Distributions from net investment income | (.29) | (.47) | (.32) | (.26) | (.27) |
| Distributions from net realized gain | (.01) | (.32) | (.02) | – | – |
| Total distributions | (.30) | (.79) | (.34) | (.26) | (.27) |
| Net asset value, end of period | $28.10 | $24.16 | $24.99 | $23.32 | $19.93 |
| Total ReturnD | 17.70% | .05% | 8.68% | 18.52% | 29.72% |
| Ratios to Average Net AssetsE,F | | | | | |
| Expenses before reductions | .75% | .86% | .84% | .80% | .74% |
| Expenses net of fee waivers, if any | .75% | .86% | .84% | .80% | .74% |
| Expenses net of all reductions | .75% | .86% | .84% | .80% | .73% |
| Net investment income (loss) | 1.44% | 1.46% | 2.69%B | 1.44% | 1.66% |
| Supplemental Data | | | | | |
| Net assets, end of period (000 omitted) | $2,708,049 | $1,712,212 | $1,205,423 | $686,767 | $454,974 |
| Portfolio turnover rateG | 32%H | 41% | 45% | 58% | 55% |
A Calculated based on average shares outstanding during the period.
B Net Investment income per share reflects a large, non-recurring dividend which amounted to $.26 per share. Excluding this non-recurring dividend, the ratio of net investment income (loss) to average net assets would have been 1.62%.
C The amount shown for a share outstanding does not correspond with the aggregate net gain (loss) on investments for the period due to the timing of sales and repurchases of shares in relation to fluctuating market values of the investments of the Fund.
D Total returns would have been lower if certain expenses had not been reduced during the applicable periods shown.
E Fees and expenses of any underlying Fidelity Central Funds are not included in the Fund's expense ratio. The Fund indirectly bears its proportionate share of the expenses of any underlying Fidelity Central Funds.
F Expense ratios reflect operating expenses of the class. Expenses before reductions do not reflect amounts reimbursed by the investment adviser or reductions from brokerage service arrangements or reductions from other expense offset arrangements and do not represent the amount paid by the class during periods when reimbursements or reductions occur. Expenses net of fee waivers reflect expenses after reimbursement by the investment adviser but prior to reductions from brokerage service arrangements or other expense offset arrangements. Expenses net of all reductions represent the net expenses paid by the class.
G Amount does not include the portfolio activity of any underlying Fidelity Central Funds.
H Portfolio turnover rate excludes securities received or delivered in-kind.
See accompanying notes which are an integral part of the financial statements.
Financial Highlights — Fidelity Value Discovery Fund Class K
| Years ended July 31, | 2017 | 2016 | 2015 | 2014 | 2013 |
| Selected Per–Share Data | | | | | |
| Net asset value, beginning of period | $24.17 | $24.99 | $23.32 | $19.93 | $15.62 |
| Income from Investment Operations | | | | | |
| Net investment income (loss)A | .41 | .38 | .69B | .34 | .32 |
| Net realized and unrealized gain (loss) | 3.86 | (.38)C | 1.34 | 3.34 | 4.29 |
| Total from investment operations | 4.27 | –D | 2.03 | 3.68 | 4.61 |
| Distributions from net investment income | (.32) | (.50) | (.34) | (.29) | (.30) |
| Distributions from net realized gain | (.01) | (.32) | (.02) | – | – |
| Total distributions | (.33) | (.82) | (.36) | (.29) | (.30) |
| Net asset value, end of period | $28.11 | $24.17 | $24.99 | $23.32 | $19.93 |
| Total ReturnE | 17.82% | .24% | 8.80% | 18.71% | 29.97% |
| Ratios to Average Net AssetsF,G | | | | | |
| Expenses before reductions | .63% | .70% | .71% | .66% | .57% |
| Expenses net of fee waivers, if any | .63% | .70% | .71% | .66% | .57% |
| Expenses net of all reductions | .63% | .70% | .71% | .66% | .56% |
| Net investment income (loss) | 1.56% | 1.62% | 2.82%B | 1.58% | 1.83% |
| Supplemental Data | | | | | |
| Net assets, end of period (000 omitted) | $113,668 | $222,946 | $196,460 | $114,246 | $71,212 |
| Portfolio turnover rateH | 32%I | 41% | 45% | 58% | 55% |
A Calculated based on average shares outstanding during the period.
B Net Investment income per share reflects a large, non-recurring dividend which amounted to $.26 per share. Excluding this non-recurring dividend, the ratio of net investment income (loss) to average net assets would have been 1.75%.
C The amount shown for a share outstanding does not correspond with the aggregate net gain (loss) on investments for the period due to the timing of sales and repurchases of shares in relation to fluctuating market values of the investments of the Fund.
D Amount represents less than $.005 per share.
E Total returns would have been lower if certain expenses had not been reduced during the applicable periods shown.
F Fees and expenses of any underlying Fidelity Central Funds are not included in the Fund's expense ratio. The Fund indirectly bears its proportionate share of the expenses of any underlying Fidelity Central Funds.
G Expense ratios reflect operating expenses of the class. Expenses before reductions do not reflect amounts reimbursed by the investment adviser or reductions from brokerage service arrangements or reductions from other expense offset arrangements and do not represent the amount paid by the class during periods when reimbursements or reductions occur. Expenses net of fee waivers reflect expenses after reimbursement by the investment adviser but prior to reductions from brokerage service arrangements or other expense offset arrangements. Expenses net of all reductions represent the net expenses paid by the class.
H Amount does not include the portfolio activity of any underlying Fidelity Central Funds.
I Portfolio turnover rate excludes securities received or delivered in-kind.
See accompanying notes which are an integral part of the financial statements.
Notes to Financial Statements
For the period ended July 31, 2017
1. Organization.
Fidelity Value Discovery Fund (the Fund) is a fund of Fidelity Puritan Trust (the Trust) and is authorized to issue an unlimited number of shares. The Trust is registered under the Investment Company Act of 1940, as amended (the 1940 Act), as an open-end management investment company organized as a Massachusetts business trust. The Fund offers Value Discovery and Class K shares, each of which has equal rights as to assets and voting privileges. Each class has exclusive voting rights with respect to matters that affect that class.
2. Investments in Fidelity Central Funds.
The Fund invests in Fidelity Central Funds, which are open-end investment companies generally available only to other investment companies and accounts managed by the investment adviser and its affiliates. The Fund's Schedule of Investments lists each of the Fidelity Central Funds held as of period end, if any, as an investment of the Fund, but does not include the underlying holdings of each Fidelity Central Fund. As an Investing Fund, the Fund indirectly bears its proportionate share of the expenses of the underlying Fidelity Central Funds.
The Money Market Central Funds seek preservation of capital and current income and are managed by Fidelity Investments Money Management, Inc. (FIMM), an affiliate of the investment adviser. Annualized expenses of the Money Market Central Funds as of their most recent shareholder report date are less than .005%.
A complete unaudited list of holdings for each Fidelity Central Fund is available upon request or at the Securities and Exchange Commission (the SEC) website at www.sec.gov. In addition, the financial statements of the Fidelity Central Funds, which are not covered by the Fund's Report of Independent Registered Public Accounting Firm, are available on the SEC website or upon request.
3. Significant Accounting Policies.
The Fund is an investment company and applies the accounting and reporting guidance of the Financial Accounting Standards Board (FASB) Accounting Standards Codification Topic 946 Financial Services – Investments Companies. The financial statements have been prepared in conformity with accounting principles generally accepted in the United States of America (GAAP), which require management to make certain estimates and assumptions at the date of the financial statements. Actual results could differ from those estimates. Subsequent events, if any, through the date that the financial statements were issued have been evaluated in the preparation of the financial statements. The following summarizes the significant accounting policies of the Fund:
Investment Valuation. Investments are valued as of 4:00 p.m. Eastern time on the last calendar day of the period. The Board of Trustees (the Board) has delegated the day to day responsibility for the valuation of the Fund's investments to the Fair Value Committee (the Committee) established by the Fund's investment adviser. In accordance with valuation policies and procedures approved by the Board, the Fund attempts to obtain prices from one or more third party pricing vendors or brokers to value its investments. When current market prices, quotations or currency exchange rates are not readily available or reliable, investments will be fair valued in good faith by the Committee, in accordance with procedures adopted by the Board. Factors used in determining fair value vary by investment type and may include market or investment specific events. The frequency with which these procedures are used cannot be predicted and they may be utilized to a significant extent. The Committee oversees the Fund's valuation policies and procedures and reports to the Board on the Committee's activities and fair value determinations. The Board monitors the appropriateness of the procedures used in valuing the Fund's investments and ratifies the fair value determinations of the Committee.
The Fund categorizes the inputs to valuation techniques used to value its investments into a disclosure hierarchy consisting of three levels as shown below:
- Level 1 – quoted prices in active markets for identical investments
- Level 2 – other significant observable inputs (including quoted prices for similar investments, interest rates, prepayment speeds, etc.)
- Level 3 – unobservable inputs (including the Fund's own assumptions based on the best information available)
Valuation techniques used to value the Fund's investments by major category are as follows:
Equity securities, including restricted securities, for which market quotations are readily available, are valued at the last reported sale price or official closing price as reported by a third party pricing vendor on the primary market or exchange on which they are traded and are categorized as Level 1 in the hierarchy. In the event there were no sales during the day or closing prices are not available, securities are valued at the last quoted bid price or may be valued using the last available price and are generally categorized as Level 2 in the hierarchy. For foreign equity securities, when market or security specific events arise, comparisons to the valuation of American Depositary Receipts (ADRs), futures contracts, Exchange-Traded Funds (ETFs) and certain indexes as well as quoted prices for similar securities may be used and would be categorized as Level 2 in the hierarchy. Utilizing these techniques may result in transfers between Level 1 and Level 2. For equity securities, including restricted securities, where observable inputs are limited, assumptions about market activity and risk are used and these securities may be categorized as Level 3 in the hierarchy.
Investments in open-end mutual funds, including the Fidelity Central Funds, are valued at their closing net asset value (NAV) each business day and are categorized as Level 1 in the hierarchy.
Changes in valuation techniques may result in transfers in or out of an assigned level within the disclosure hierarchy. The aggregate value of investments by input level as of July 31, 2017 is included at the end of the Fund's Schedule of Investments.
Foreign Currency. The Fund may use foreign currency contracts to facilitate transactions in foreign-denominated securities. Gains and losses from these transactions may arise from changes in the value of the foreign currency or if the counterparties do not perform under the contracts' terms.
Foreign-denominated assets, including investment securities, and liabilities are translated into U.S. dollars at the exchange rates at period end. Purchases and sales of investment securities, income and dividends received and expenses denominated in foreign currencies are translated into U.S. dollars at the exchange rate in effect on the transaction date.
The effects of exchange rate fluctuations on investments are included with the net realized and unrealized gain (loss) on investment securities. Other foreign currency transactions resulting in realized and unrealized gain (loss) are disclosed separately.
Investment Transactions and Income. For financial reporting purposes, the Fund's investment holdings and NAV include trades executed through the end of the last business day of the period. The NAV per share for processing shareholder transactions is calculated as of the close of business of the New York Stock Exchange (NYSE), normally 4:00 p.m. Eastern time and includes trades executed through the end of the prior business day. Gains and losses on securities sold are determined on the basis of identified cost and may include proceeds received from litigation. Dividend income is recorded on the ex-dividend date, except for certain dividends from foreign securities where the ex-dividend date may have passed, which are recorded as soon as the Fund is informed of the ex-dividend date. Non-cash dividends included in dividend income, if any, are recorded at the fair market value of the securities received. Income and capital gain distributions from Fidelity Central Funds, if any, are recorded on the ex-dividend date. Certain distributions received by the Fund represent a return of capital or capital gain. The Fund determines the components of these distributions subsequent to the ex-dividend date, based upon receipt of tax filings or other correspondence relating to the underlying investment. These distributions are recorded as a reduction of cost of investments and/or as a realized gain. Interest income is accrued as earned and includes coupon interest and amortization of premium and accretion of discount on debt securities as applicable. Investment income is recorded net of foreign taxes withheld where recovery of such taxes is uncertain.
Class Allocations and Expenses. Investment income, realized and unrealized capital gains and losses, common expenses of the Fund, and certain fund-level expense reductions, if any, are allocated daily on a pro-rata basis to each class based on the relative net assets of each class to the total net assets of the Fund. Each class differs with respect to transfer agent fees incurred. Certain expense reductions may also differ by class. For the reporting period, the allocated portion of income and expenses to each class as a percent of its average net assets may vary due to the timing of recording these transactions in relation to fluctuating net assets of the classes. Expenses directly attributable to a fund are charged to that fund. Expenses attributable to more than one fund are allocated among the respective funds on the basis of relative net assets or other appropriate methods. Expense estimates are accrued in the period to which they relate and adjustments are made when actual amounts are known.
Income Tax Information and Distributions to Shareholders. Each year, the Fund intends to qualify as a regulated investment company under Subchapter M of the Internal Revenue Code, including distributing substantially all of its taxable income and realized gains. As a result, no provision for U.S. Federal income taxes is required. As of July 31, 2017, the Fund did not have any unrecognized tax benefits in the financial statements; nor is the Fund aware of any tax positions for which it is reasonably possible that the total amounts of unrecognized tax benefits will significantly change in the next twelve months. The Fund files a U.S. federal tax return, in addition to state and local tax returns as required. The Fund's federal income tax returns are subject to examination by the Internal Revenue Service (IRS) for a period of three fiscal years after they are filed. State and local tax returns may be subject to examination for an additional fiscal year depending on the jurisdiction. Foreign taxes are provided for based on the Fund's understanding of the tax rules and rates that exist in the foreign markets in which it invests.
Distributions are declared and recorded on the ex-dividend date. Income dividends and capital gain distributions are declared separately for each class. Income and capital gain distributions are determined in accordance with income tax regulations, which may differ from GAAP. In addition, the Fund claimed a portion of the payment made to redeeming shareholders as a distribution for income tax purposes.
Capital accounts within the financial statements are adjusted for permanent book-tax differences. These adjustments have no impact on net assets or the results of operations. Capital accounts are not adjusted for temporary book-tax differences which will reverse in a subsequent period.
Book-tax differences are primarily due to foreign currency transactions, passive foreign investment companies (PFIC), redemptions in kind, partnerships, capital loss carryforwards and losses deferred due to wash sales.
The federal tax cost of investment securities and unrealized appreciation (depreciation) as of period end were as follows:
| Gross unrealized appreciation | $362,665,606 |
| Gross unrealized depreciation | (50,855,805) |
| Net unrealized appreciation (depreciation) on securities | $311,809,801 |
| Tax Cost | $2,677,447,976 |
The tax-based components of distributable earnings as of period end were as follows:
| Undistributed ordinary income | $31,333,175 |
| Undistributed long-term capital gain | $13,374,270 |
| Net unrealized appreciation (depreciation) on securities and other investments | $311,820,716 |
The tax character of distributions paid was as follows:
| | July 31, 2017 | July 31, 2016 |
| Ordinary Income | $23,891,568 | $ 30,651,336 |
| Long-term Capital Gains | – | 17,975,243 |
| Total | $23,891,568 | $ 48,626,579 |
4. Derivative Instruments.
Risk Exposures and the Use of Derivative Instruments. The Fund's investment objective allows the Fund to enter into various types of derivative contracts, including futures contracts. Derivatives are investments whose value is primarily derived from underlying assets, indices or reference rates and may be transacted on an exchange or over-the-counter (OTC). Derivatives may involve a future commitment to buy or sell a specified asset based on specified terms, to exchange future cash flows at periodic intervals based on a notional principal amount, or for one party to make one or more payments upon the occurrence of specified events in exchange for periodic payments from the other party.
The Fund used derivatives to increase returns and to manage exposure to certain risks as defined below. The success of any strategy involving derivatives depends on analysis of numerous economic factors, and if the strategies for investment do not work as intended, the Fund may not achieve its objectives.
The Fund's use of derivatives increased or decreased its exposure to the following risk:
| Equity Risk | Equity risk relates to the fluctuations in the value of financial instruments as a result of changes in market prices (other than those arising from interest rate risk or foreign exchange risk), whether caused by factors specific to an individual investment, its issuer, or all factors affecting all instruments traded in a market or market segment.
|
The Fund is also exposed to additional risks from investing in derivatives, such as liquidity risk and counterparty credit risk. Liquidity risk is the risk that the Fund will be unable to close out the derivative in the open market in a timely manner. Counterparty credit risk is the risk that the counterparty will not be able to fulfill its obligation to the Fund. Counterparty credit risk related to exchange-traded futures contracts may be mitigated by the protection provided by the exchange on which they trade.
Investing in derivatives may involve greater risks than investing in the underlying assets directly and, to varying degrees, may involve risk of loss in excess of any initial investment and collateral received and amounts recognized in the Statement of Assets and Liabilities. In addition, there may be the risk that the change in value of the derivative contract does not correspond to the change in value of the underlying instrument.
Futures Contracts. A futures contract is an agreement between two parties to buy or sell a specified underlying instrument for a fixed price at a specified future date. The Fund used futures contracts to manage its exposure to the stock market.
Upon entering into a futures contract, a fund is required to deposit either cash or securities (initial margin) with a clearing broker in an amount equal to a certain percentage of the face value of the contract. Futures contracts are marked-to-market daily and subsequent daily payments (variation margin) are made or received by a fund depending on the daily fluctuations in the value of the futures contracts and are recorded as unrealized appreciation or (depreciation). This receivable and/or payable, if any, is included in daily variation margin for derivative instruments in the Statement of Assets and Liabilities. Realized gain or (loss) is recorded upon the expiration or closing of a futures contract.
Any open futures contracts at period end are presented in the Schedule of Investments under the caption "Futures Contracts". The underlying face amount at value reflects each contract's exposure to the underlying instrument or index at period end.
During the period the Fund recognized net realized gain (loss) of $(164,544) related to its investment in futures contracts. This amount is included in the Statement of Operations.
5. Purchases and Sales of Investments.
Purchases and sales of securities, other than short-term securities and in-kind transactions, aggregated $1,537,016,202 and $688,498,322, respectively.
6. Fees and Other Transactions with Affiliates.
Management Fee. Fidelity Management & Research Company (the investment adviser) and its affiliates provide the Fund with investment management related services for which the Fund pays a monthly management fee. The management fee is the sum of an individual fund fee rate that is based on an annual rate of .30% of the Fund's average net assets and an annualized group fee rate that averaged .25% during the period. The group fee rate is based upon the average net assets of all the mutual funds advised by the investment adviser, including any mutual funds previously advised by the investment adviser that are currently advised by Fidelity SelectCo, LLC, an affiliate of the investment adviser. The group fee rate decreases as assets under management increase and increases as assets under management decrease. In addition, the management fee is subject to a performance adjustment (up to a maximum of +/- .20% of the Fund's average net assets over a 36 month performance period). The upward or downward adjustment to the management fee is based on the relative investment performance of Value Discovery as compared to its benchmark index, the Russell 3000 Value Index, over the same 36 month performance period. For the reporting period, the total annual management fee rate, including the performance adjustment, was .54% of the Fund's average net assets. The performance adjustment included in the management fee rate may be higher or lower than the maximum performance adjustment rate due to the difference between the average net assets for the reporting and performance periods.
Transfer Agent Fees. Fidelity Investments Institutional Operations Company, Inc., (FIIOC), an affiliate of the investment adviser, is the transfer, dividend disbursing and shareholder servicing agent for each class of the Fund. FIIOC receives account fees and asset-based fees that vary according to the account size and type of account of the shareholders of Value Discovery, except for Class K. FIIOC receives an asset-based fee of Class K's average net assets. FIIOC pays for typesetting, printing and mailing of shareholder reports, except proxy statements.
For the period, transfer agent fees for each class were as follows:
| | Amount | % of
Class-Level Average
Net Assets |
| Value Discovery | $3,492,907 | .17 |
| Class K | 83,557 | .05 |
| | $3,576,464 | |
Accounting and Security Lending Fees. Fidelity Service Company, Inc. (FSC), an affiliate of the investment adviser, maintains the Fund's accounting records. The accounting fee is based on the level of average net assets for each month. Under a separate contract, FSC administers the security lending program. The security lending fee is based on the number and duration of lending transactions.
Brokerage Commissions. The Fund placed a portion of its portfolio transactions with brokerage firms which are affiliates of the investment adviser. Brokerage commissions are included in net realized gain (loss) and change in net unrealized appreciation (depreciation) in the Statement of Operations. The commissions paid to these affiliated firms were $30,588 for the period.
Interfund Trades. The Fund may purchase from or sell securities to other Fidelity Funds under procedures adopted by the Board. The procedures have been designed to ensure these interfund trades are executed in accordance with Rule 17a-7 of the 1940 Act. Interfund trades are included within the respective purchases and sales amounts shown in the Purchases and Sales of Investments note.
Redemptions In-Kind. During the period, 10,568,389 shares of the Fund held by an affiliated entity were redeemed in kind for investments and cash with a value of $296,760,364. The net realized gain of $79,326,353 on investments delivered through in-kind redemptions is included in the accompanying Statement of Operations. The amount of in-kind redemptions is included in share transactions in the accompanying Statement of Changes in Net Assets as well as the Notes to Financial Statements. The Fund recognized no gain or loss for federal income tax purposes.
7. Committed Line of Credit.
The Fund participates with other funds managed by the investment adviser or an affiliate in a $4.25 billion credit facility (the "line of credit") to be utilized for temporary or emergency purposes to fund shareholder redemptions or for other short-term liquidity purposes. The Fund has agreed to pay commitment fees on its pro-rata portion of the line of credit, which amounted to $7,043 and is reflected in Miscellaneous expenses on the Statement of Operations. During the period, the Fund did not borrow on this line of credit.
8. Security Lending.
The Fund lends portfolio securities through a lending agent from time to time in order to earn additional income. For equity securities, a lending agent is used and may loan securities to certain qualified borrowers, including Fidelity Capital Markets (FCM), a broker-dealer affiliated with the Fund. On the settlement date of the loan, the Fund receives collateral (in the form of U.S. Treasury obligations, letters of credit and/or cash) against the loaned securities and maintains collateral in an amount not less than 100% of the market value of the loaned securities during the period of the loan. The market value of the loaned securities is determined at the close of business of the Fund and any additional required collateral is delivered to the Fund on the next business day. The Fund or borrower may terminate the loan at any time, and if the borrower defaults on its obligation to return the securities loaned because of insolvency or other reasons, the Fund may apply collateral received from the borrower against the obligation. The Fund may experience delays and costs in recovering the securities loaned. Any cash collateral received is invested in the Fidelity Securities Lending Cash Central Fund. The value of loaned securities and cash collateral at period end are disclosed on the Fund's Statement of Assets and Liabilities. At period end, there were no security loans outstanding with FCM. Security lending income represents the income earned on investing cash collateral, less rebates paid to borrowers and any lending agent fees associated with the loan, plus any premium payments received for lending certain types of securities. Security lending income is presented in the Statement of Operations as a component of income from Fidelity Central Funds. Total security lending income during the period amounted to $160,605, including $761 from securities loaned to FCM.
9. Expense Reductions.
Through arrangements with the Fund's custodian, credits realized as a result of certain uninvested cash balances were used to reduce the Fund's expenses. During the period, these credits reduced the Fund's custody expenses by $36.
In addition, during the period the investment adviser reimbursed and/or waived a portion of fund-level operating expenses in the amount of $19,165.
10. Distributions to Shareholders.
Distributions to shareholders of each class were as follows:
| | Year ended
July 31, 2017 | Year ended July 31, 2016 |
| From net investment income | | |
| Value Discovery | $21,711,684 | $24,729,091 |
| Class K | 1,767,979 | 5,008,393 |
| Total | $23,479,663 | $29,737,484 |
| From net realized gain | | |
| Value Discovery | $386,628 | $15,694,244 |
| Class K | 25,277 | 3,194,851 |
| Total | $411,905 | $18,889,095 |
11. Share Transactions.
Share transactions for each class were as follows and may contain automatic conversions between classes or exchanges between affiliated funds:
| | Shares | Shares | Dollars | Dollars |
| | Year ended July 31, 2017 | Year ended July 31, 2016 | Year ended July 31, 2017 | Year ended July 31, 2016 |
| Value Discovery | | | | |
| Shares sold | 42,512,937 | 39,797,389 | $1,119,827,793 | $921,588,433 |
| Reinvestment of distributions | 841,053 | 1,708,415 | 21,118,287 | 38,743,773 |
| Shares redeemed | (17,858,879) | (18,870,552) | (463,345,362) | (437,632,015) |
| Net increase (decrease) | 25,495,111 | 22,635,252 | $677,600,718 | $522,700,191 |
| Class K | | | | |
| Shares sold | 11,452,291 | 5,204,370 | $310,987,862 | $118,930,615 |
| Reinvestment of distributions | 71,873 | 361,938 | 1,793,256 | 8,203,244 |
| Shares redeemed | (16,704,580)(a) | (4,203,390) | (451,035,163)(a) | (94,473,712) |
| Net increase (decrease) | (5,180,416) | 1,362,918 | $(138,254,045) | $32,660,147 |
(a) Amount includes in-kind redemptions (see the Redemptions In-Kind note for additional details).
12. Other.
The Fund's organizational documents provide former and current trustees and officers with a limited indemnification against liabilities arising in connection with the performance of their duties to the Fund. In the normal course of business, the Fund may also enter into contracts that provide general indemnifications. The Fund's maximum exposure under these arrangements is unknown as this would be dependent on future claims that may be made against the Fund. The risk of material loss from such claims is considered remote.
Report of Independent Registered Public Accounting Firm
To the Trustees of Fidelity Puritan Trust and Shareholders of Fidelity Value Discovery Fund:
We have audited the accompanying statement of assets and liabilities of Fidelity Value Discovery Fund (the Fund), a fund of Fidelity Puritan Trust, including the schedule of investments, as of July 31, 2017, and the related statement of operations for the year then ended, the statement of changes in net assets for each of the two years in the period then ended, and the financial highlights for each of the five years in the period then ended. These financial statements and financial highlights are the responsibility of the Fund's management. Our responsibility is to express an opinion on these financial statements and financial highlights based on our audits.
We conducted our audits in accordance with the standards of the Public Company Accounting Oversight Board (United States). Those standards require that we plan and perform the audit to obtain reasonable assurance about whether the financial statements and financial highlights are free of material misstatement. The Fund is not required to have, nor were we engaged to perform, an audit of its internal control over financial reporting. Our audits included consideration of internal control over financial reporting as a basis for designing audit procedures that are appropriate in the circumstances, but not for the purpose of expressing an opinion on the effectiveness of the Fund's internal control over financial reporting. Accordingly, we express no such opinion. An audit also includes examining, on a test basis, evidence supporting the amounts and disclosures in the financial statements, assessing the accounting principles used and significant estimates made by management, as well as evaluating the overall financial statement presentation. Our procedures included confirmation of securities owned as of July 31, 2017, by correspondence with the custodians and brokers; when replies were not received from brokers, we performed other auditing procedures. We believe that our audits provide a reasonable basis for our opinion.
In our opinion, such financial statements and financial highlights referred to above present fairly, in all material respects, the financial position of Fidelity Value Discovery Fund as of July 31, 2017, the results of its operations for the year then ended, the changes in its net assets for each of the two years in the period then ended, and the financial highlights for each of the five years in the period then ended, in conformity with accounting principles generally accepted in the United States of America.
DELOITTE & TOUCHE LLP
Boston, Massachusetts
September 13, 2017
Trustees and Officers
The Trustees, Members of the Advisory Board (if any), and officers of the trust and fund, as applicable, are listed below. The Board of Trustees governs the fund and is responsible for protecting the interests of shareholders. The Trustees are experienced executives who meet periodically throughout the year to oversee the fund's activities, review contractual arrangements with companies that provide services to the fund, oversee management of the risks associated with such activities and contractual arrangements, and review the fund's performance. Except for Jonathan Chiel, each of the Trustees oversees 190 funds. Mr. Chiel oversees 142 funds.
The Trustees hold office without limit in time except that (a) any Trustee may resign; (b) any Trustee may be removed by written instrument, signed by at least two-thirds of the number of Trustees prior to such removal; (c) any Trustee who requests to be retired or who has become incapacitated by illness or injury may be retired by written instrument signed by a majority of the other Trustees; and (d) any Trustee may be removed at any special meeting of shareholders by a two-thirds vote of the outstanding voting securities of the trust. Each Trustee who is not an interested person (as defined in the 1940 Act) of the trust and the fund is referred to herein as an Independent Trustee. Each Independent Trustee shall retire not later than the last day of the calendar year in which his or her 75th birthday occurs. The Independent Trustees may waive this mandatory retirement age policy with respect to individual Trustees. Officers and Advisory Board Members hold office without limit in time, except that any officer or Advisory Board Member may resign or may be removed by a vote of a majority of the Trustees at any regular meeting or any special meeting of the Trustees. Except as indicated, each individual has held the office shown or other offices in the same company for the past five years.
The fund’s Statement of Additional Information (SAI) includes more information about the Trustees. To request a free copy, call Fidelity at 1-800-835-5092.
Experience, Skills, Attributes, and Qualifications of the Trustees. The Governance and Nominating Committee has adopted a statement of policy that describes the experience, qualifications, attributes, and skills that are necessary and desirable for potential Independent Trustee candidates (Statement of Policy). The Board believes that each Trustee satisfied at the time he or she was initially elected or appointed a Trustee, and continues to satisfy, the standards contemplated by the Statement of Policy. The Governance and Nominating Committee also engages professional search firms to help identify potential Independent Trustee candidates who have the experience, qualifications, attributes, and skills consistent with the Statement of Policy. From time to time, additional criteria based on the composition and skills of the current Independent Trustees, as well as experience or skills that may be appropriate in light of future changes to board composition, business conditions, and regulatory or other developments, have also been considered by the professional search firms and the Governance and Nominating Committee. In addition, the Board takes into account the Trustees' commitment and participation in Board and committee meetings, as well as their leadership of standing and ad hoc committees throughout their tenure.
In determining that a particular Trustee was and continues to be qualified to serve as a Trustee, the Board has considered a variety of criteria, none of which, in isolation, was controlling. The Board believes that, collectively, the Trustees have balanced and diverse experience, qualifications, attributes, and skills, which allow the Board to operate effectively in governing the fund and protecting the interests of shareholders. Information about the specific experience, skills, attributes, and qualifications of each Trustee, which in each case led to the Board's conclusion that the Trustee should serve (or continue to serve) as a trustee of the fund, is provided below.
Board Structure and Oversight Function. James C. Curvey is an interested person and currently serves as Chairman. The Trustees have determined that an interested Chairman is appropriate and benefits shareholders because an interested Chairman has a personal and professional stake in the quality and continuity of services provided to the fund. Independent Trustees exercise their informed business judgment to appoint an individual of their choosing to serve as Chairman, regardless of whether the Trustee happens to be independent or a member of management. The Independent Trustees have determined that they can act independently and effectively without having an Independent Trustee serve as Chairman and that a key structural component for assuring that they are in a position to do so is for the Independent Trustees to constitute a substantial majority for the Board. The Independent Trustees also regularly meet in executive session. Ned C. Lautenbach serves as Chairman of the Independent Trustees and as such (i) acts as a liaison between the Independent Trustees and management with respect to matters important to the Independent Trustees and (ii) with management prepares agendas for Board meetings.
Fidelity® funds are overseen by different Boards of Trustees. The fund's Board oversees Fidelity's high income and certain equity funds, and other Boards oversee Fidelity's investment-grade bond, money market, asset allocation, and sector funds. The asset allocation funds may invest in Fidelity® funds overseen by the fund's Board. The use of separate Boards, each with its own committee structure, allows the Trustees of each group of Fidelity® funds to focus on the unique issues of the funds they oversee, including common research, investment, and operational issues. On occasion, the separate Boards establish joint committees to address issues of overlapping consequences for the Fidelity® funds overseen by each Board.
The Trustees operate using a system of committees to facilitate the timely and efficient consideration of all matters of importance to the Trustees, the fund, and fund shareholders and to facilitate compliance with legal and regulatory requirements and oversight of the fund's activities and associated risks. The Board, acting through its committees, has charged FMR and its affiliates with (i) identifying events or circumstances the occurrence of which could have demonstrably adverse effects on the fund's business and/or reputation; (ii) implementing processes and controls to lessen the possibility that such events or circumstances occur or to mitigate the effects of such events or circumstances if they do occur; and (iii) creating and maintaining a system designed to evaluate continuously business and market conditions in order to facilitate the identification and implementation processes described in (i) and (ii) above. Because the day-to-day operations and activities of the fund are carried out by or through FMR, its affiliates, and other service providers, the fund's exposure to risks is mitigated but not eliminated by the processes overseen by the Trustees. While each of the Board's committees has responsibility for overseeing different aspects of the fund's activities, oversight is exercised primarily through the Operations, Audit, and Compliance Committees. In addition, the Independent Trustees have worked with FMR to enhance the Board's oversight of investment and financial risks, legal and regulatory risks, technology risks, and operational risks, including the development of additional risk reporting to the Board. For example, a working group comprised of Independent Trustees and FMR has worked and continues to work to review the Fidelity® funds' valuation-related activities, reporting and risk management. Appropriate personnel, including but not limited to the fund's Chief Compliance Officer (CCO), FMR's internal auditor, the independent accountants, the fund's Treasurer and portfolio management personnel, make periodic reports to the Board's committees, as appropriate, including an annual review of Fidelity's risk management program for the Fidelity® funds. The responsibilities of each standing committee, including their oversight responsibilities, are described further under "Standing Committees of the Trustees."
Interested Trustees*:
Correspondence intended for a Trustee who is an interested person may be sent to Fidelity Investments, 245 Summer Street, Boston, Massachusetts 02210.
Name, Year of Birth; Principal Occupations and Other Relevant Experience+
Jonathan Chiel (1957)
Year of Election or Appointment: 2016
Trustee
Mr. Chiel also serves as Trustee of other Fidelity funds. Mr. Chiel is Executive Vice President and General Counsel for FMR LLC (diversified financial services company, 2012-present). Previously, Mr. Chiel served as general counsel (2004-2012) and senior vice president and deputy general counsel (2000-2004) for John Hancock Financial Services; a partner with Choate, Hall & Stewart (1996-2000) (law firm); and an Assistant United States Attorney for the United States Attorney’s Office of the District of Massachusetts (1986-95), including Chief of the Criminal Division (1993-1995). Mr. Chiel is a director on the boards of the Boston Bar Foundation and the Maimonides School.
James C. Curvey (1935)
Year of Election or Appointment: 2007
Trustee
Chairman of the Board of Trustees
Mr. Curvey also serves as Trustee of other Fidelity® funds. Mr. Curvey is a Director of Fidelity Research & Analysis Co. (investment adviser firm, 2009-present), and Vice Chairman (2007-present) and Director of FMR LLC (diversified financial services company). In addition, Mr. Curvey serves as an Overseer for the Boston Symphony Orchestra and a member of the board of Artis-Naples, Naples, Florida, and as a Trustee for Brewster Academy, Wolfeboro, New Hampshire. Previously, Mr. Curvey served as a Director of Fidelity Investments Money Management, Inc. (investment adviser firm, 2009-2014) and a Director of FMR and FMR Co., Inc. (investment adviser firms, 2007-2014).
Charles S. Morrison (1960)
Year of Election or Appointment: 2014
Trustee
Mr. Morrison also serves as Trustee of other funds. He serves as President of Fidelity Management & Research Company (FMR) (investment adviser firm, 2016-present), a Director of Fidelity Investments Money Management, Inc. (FIMM) (investment adviser firm, 2014-present), Director of Fidelity SelectCo, LLC (investment adviser firm, 2014-present), President, Asset Management (2014-present), and is an employee of Fidelity Investments. Previously, Mr. Morrison served as Vice President of Fidelity's Fixed Income and Asset Allocation Funds (2012-2014), President, Fixed Income (2011-2014), Vice President of Fidelity's Money Market Funds (2005-2009), President, Money Market Group Leader of FMR (investment adviser firm, 2009), and Senior Vice President, Money Market Group of FMR (2004-2009). Mr. Morrison also served as Vice President of Fidelity's Bond Funds (2002-2005), certain Balanced Funds (2002-2005), and certain Asset Allocation Funds (2002-2007), and as Senior Vice President (2002-2005) of Fidelity's Bond Division.
* Determined to be an “Interested Trustee” by virtue of, among other things, his or her affiliation with the trust or various entities under common control with FMR.
+ The information includes the Trustee's principal occupation during the last five years and other information relating to the experience, attributes, and skills relevant to the Trustee's qualifications to serve as a Trustee, which led to the conclusion that the Trustee should serve as a Trustee for the fund.
Independent Trustees:
Correspondence intended for an Independent Trustee may be sent to Fidelity Investments, P.O. Box 55235, Boston, Massachusetts 02205-5235.
Name, Year of Birth; Principal Occupations and Other Relevant Experience+
Dennis J. Dirks (1948)
Year of Election or Appointment: 2005
Trustee
Mr. Dirks also serves as Trustee of other Fidelity® funds. Prior to his retirement in May 2003, Mr. Dirks was Chief Operating Officer and a member of the Board of The Depository Trust & Clearing Corporation (DTCC). He also served as President, Chief Operating Officer, and Board member of The Depository Trust Company (DTC) and President and Board member of the National Securities Clearing Corporation (NSCC). In addition, Mr. Dirks served as Chief Executive Officer and Board member of the Government Securities Clearing Corporation, Chief Executive Officer and Board member of the Mortgage-Backed Securities Clearing Corporation, as a Trustee and a member of the Finance Committee of Manhattan College (2005-2008), as a Trustee and a member of the Finance Committee of AHRC of Nassau County (2006-2008), as a member of the Independent Directors Council (IDC) Governing Council (2010-2015), and as a member of the Board of Directors for The Brookville Center for Children’s Services, Inc. (2009-2017). Mr. Dirks is a member of the Finance Committee (2016-present) and Board of Directors (2017-present) of the Asolo Repertory Theatre.
Alan J. Lacy (1953)
Year of Election or Appointment: 2008
Trustee
Mr. Lacy also serves as Trustee of other Fidelity® funds. Mr. Lacy serves as a Director of Bristol-Myers Squibb Company (global pharmaceuticals, 2008-present). He is a Trustee of the California Chapter of The Nature Conservancy (2015-present) and a Director of the Center for Advanced Study in the Behavioral Sciences at Stanford University (2015-present). In addition, Mr. Lacy served as Senior Adviser (2007-2014) of Oak Hill Capital Partners, L.P. (private equity) and also served as Chief Executive Officer (2005) and Vice Chairman (2005-2006) of Sears Holdings Corporation (retail) and Chief Executive Officer and Chairman of the Board of Sears, Roebuck and Co. (retail, 2000-2005). Previously, Mr. Lacy served as Chairman (2014-2017) and a member (2010-2017) of the Board of Directors of Dave & Buster’s Entertainment, Inc. (restaurant and entertainment complexes), as Chairman (2008-2011) and a member (2006-2015) of the Board of Trustees of the National Parks Conservation Association, and as a member of the Board of Directors for The Hillman Companies, Inc. (hardware wholesalers, 2010-2014), Earth Fare, Inc. (retail grocery, 2010-2014), and The Western Union Company (global money transfer, 2006-2011).
Ned C. Lautenbach (1944)
Year of Election or Appointment: 2000
Trustee
Chairman of the Independent Trustees
Mr. Lautenbach also serves as Trustee of other Fidelity® funds. Mr. Lautenbach currently serves as the Lead Director of the Eaton Corporation Board of Directors (diversified industrial, 1997-present). Mr. Lautenbach is Chairman of the Board of Directors of Artis-Naples in Naples, Florida (2012-present), a member of the Council on Foreign Relations (1994-present), and currently Vice Chair of the Board of Governors, State University System of Florida (2013-present). Previously, Mr. Lautenbach was a Partner and Advisory Partner at Clayton, Dubilier & Rice, LLC (private equity investment, 1998-2010), as well as a Director of Sony Corporation (2006-2007). Mr. Lautenbach also had a 30-year career with IBM (technology company) during which time he served as Senior Vice President and a member of the Corporate Executive Committee (1968-1998).
Joseph Mauriello (1944)
Year of Election or Appointment: 2008
Trustee
Mr. Mauriello also serves as Trustee of other Fidelity® funds. Prior to his retirement in January 2006, Mr. Mauriello served in numerous senior management positions including Deputy Chairman and Chief Operating Officer (2004-2005), and Vice Chairman of Financial Services (2002-2004) of KPMG LLP US (professional services, 1965-2005). Mr. Mauriello currently serves as a member of the Board of Directors of XL Group plc. (global insurance and re-insurance, 2006-present) and the Independent Directors Council (IDC) Governing Council (2015-present). Previously, Mr. Mauriello served as a Director of the Hamilton Funds of the Bank of New York (2006-2007) and of Arcadia Resources Inc. (health care services and products, 2007-2012).
Cornelia M. Small (1944)
Year of Election or Appointment: 2005
Trustee
Ms. Small also serves as Trustee of other Fidelity® funds. Ms. Small is a member of the Board of Directors (2009-present) and Chair of the Investment Committee (2010-present) of the Teagle Foundation. Ms. Small also serves on the Investment Committee of the Berkshire Taconic Community Foundation (2008-present). Previously, Ms. Small served as Chairperson (2002-2008) and a member of the Investment Committee and Chairperson (2008-2012) and a member of the Board of Trustees of Smith College. In addition, Ms. Small served as Chief Investment Officer, Director of Global Equity Investments, and a member of the Board of Directors of Scudder, Stevens & Clark and Scudder Kemper Investments.
William S. Stavropoulos (1939)
Year of Election or Appointment: 2001
Trustee
Vice Chairman of the Independent Trustees
Mr. Stavropoulos also serves as Trustee of other Fidelity® funds. Mr. Stavropoulos serves as President and Founder of the Michigan Baseball Foundation, the Great Lakes Loons (2007-present). Mr. Stavropoulos is Chairman Emeritus of the Board of Directors of The Dow Chemical Company, where he previously served in numerous senior management positions, including President, CEO (1995-2000; 2002-2004), Chairman of the Executive Committee (2000-2006), and as a member of the Board of Directors (1990-2006). Currently, Mr. Stavropoulos is Chairman of the Board of Directors of Univar Inc. (global distributor of commodity and specialty chemicals), a Director of Teradata Corporation (data warehousing and technology solutions), and a member of the Advisory Board for Metalmark Capital LLC (private equity investment, 2005-present). Mr. Stavropoulos is an operating advisor to Clayton, Dubilier & Rice, LLC (private equity investment). In addition, Mr. Stavropoulos is a member of the University of Notre Dame Advisory Council for the College of Science, a Trustee of the Rollin L. Gerstacker Foundation, and a Director of Artis-Naples in Naples, Florida. Previously, Mr. Stavropoulos served as a Director of Chemical Financial Corporation (bank holding company, 1993-2012) and Tyco International, Ltd. (multinational manufacturing and services, 2007-2012).
David M. Thomas (1949)
Year of Election or Appointment: 2008
Trustee
Mr. Thomas also serves as Trustee of other Fidelity® funds. Mr. Thomas serves as Non-Executive Chairman of the Board of Directors of Fortune Brands Home and Security (home and security products, 2011-present), as a member of the Board of Directors (2004-present) and Presiding Director (2013-present) of Interpublic Group of Companies, Inc. (marketing communication), and as a member of the Board of Trustees of the University of Florida (2013-present). Previously, Mr. Thomas served as Executive Chairman (2005-2006) and Chairman and Chief Executive Officer (2000-2005) of IMS Health, Inc. (pharmaceutical and healthcare information solutions), and a Director of Fortune Brands, Inc. (consumer products, 2000-2011).
+ The information includes the Trustee's principal occupation during the last five years and other information relating to the experience, attributes, and skills relevant to the Trustee's qualifications to serve as a Trustee, which led to the conclusion that the Trustee should serve as a Trustee for the fund.
Advisory Board Members and Officers:
Correspondence intended for an officer or Peter S. Lynch may be sent to Fidelity Investments, 245 Summer Street, Boston, Massachusetts 02210. Officers appear below in alphabetical order.
Name, Year of Birth; Principal Occupation
Peter S. Lynch (1944)
Year of Election or Appointment: 2003
Member of the Advisory Board
Mr. Lynch also serves as Member of the Advisory Board of other Fidelity® funds. Mr. Lynch is Vice Chairman and a Director of FMR (investment adviser firm) and FMR Co., Inc. (investment adviser firm). In addition, Mr. Lynch serves as a Trustee of Boston College and as the Chairman of the Inner-City Scholarship Fund. Previously, Mr. Lynch served on the Special Olympics International Board of Directors (1997-2006).
Elizabeth Paige Baumann (1968)
Year of Election or Appointment: 2017
Anti-Money Laundering (AML) Officer
Ms. Baumann also serves as AML Officer of other funds. She is Chief AML Officer (2012-present) and Senior Vice President (2014-present) of FMR LLC (diversified financial services company) and is an employee of Fidelity Investments. Previously, Ms. Baumann served as AML Officer of the funds (2012-2016), and Vice President (2007-2014) and Deputy Anti-Money Laundering Officer (2007-2012) of FMR LLC.
Marc R. Bryant (1966)
Year of Election or Appointment: 2015
Secretary and Chief Legal Officer (CLO)
Mr. Bryant also serves as Secretary and CLO of other funds. Mr. Bryant serves as CLO, Secretary, and Senior Vice President of Fidelity Management & Research Company (investment adviser firm, 2015-present) and FMR Co., Inc. (investment adviser firm, 2015-present); Secretary of Fidelity SelectCo, LLC (investment adviser firm, 2015-present) and Fidelity Investments Money Management, Inc. (investment adviser firm, 2015-present); and CLO of Fidelity Management & Research (Hong Kong) Limited and FMR Investment Management (UK) Limited (investment adviser firms, 2015-present) and Fidelity Management & Research (Japan) Limited (investment adviser firm, 2016-present). He is Senior Vice President and Deputy General Counsel of FMR LLC (diversified financial services company). Previously, Mr. Bryant served as Secretary and CLO of Fidelity Rutland Square Trust II (2010-2014) and Assistant Secretary of Fidelity's Fixed Income and Asset Allocation Funds (2013-2015). Prior to joining Fidelity Investments, Mr. Bryant served as a Senior Vice President and the Head of Global Retail Legal for AllianceBernstein L.P. (2006-2010), and as the General Counsel for ProFund Advisors LLC (2001-2006).
William C. Coffey (1969)
Year of Election or Appointment: 2009
Assistant Secretary
Mr. Coffey also serves as Assistant Secretary of other funds. He is Senior Vice President and Deputy General Counsel of FMR LLC (diversified financial services company, 2010-present), and is an employee of Fidelity Investments. Previously, Mr. Coffey served as Vice President and Associate General Counsel of FMR LLC (2005-2009).
Jonathan Davis (1968)
Year of Election or Appointment: 2010
Assistant Treasurer
Mr. Davis also serves as Assistant Treasurer of other funds, and is an employee of Fidelity Investments. Previously, Mr. Davis served as Vice President and Associate General Counsel of FMR LLC (diversified financial services company, 2003-2010).
Adrien E. Deberghes (1967)
Year of Election or Appointment: 2016
Assistant Treasurer
Mr. Deberghes also serves as an officer of other funds. He serves as Executive Vice President of Fidelity Investments Money Management, Inc. (FIMM) (investment adviser firm, 2016-present) and is an employee of Fidelity Investments (2008-present). Prior to joining Fidelity Investments, Mr. Deberghes was Senior Vice President of Mutual Fund Administration at State Street Corporation (2007-2008), Senior Director of Mutual Fund Administration at Investors Bank & Trust (2005-2007), and Director of Finance for Dunkin' Brands (2000-2005). Previously, Mr. Deberghes served in other fund officer roles.
Stephanie J. Dorsey (1969)
Year of Election or Appointment: 2010
Assistant Treasurer
Ms. Dorsey also serves as an officer of other funds. She is an employee of Fidelity Investments (2008-present) and has served in other fund officer roles. Prior to joining Fidelity Investments, Ms. Dorsey served as Treasurer (2004-2008) of the JPMorgan Mutual Funds and Vice President (2004-2008) of JPMorgan Chase Bank.
Howard J. Galligan III (1966)
Year of Election or Appointment: 2014
Chief Financial Officer
Mr. Galligan also serves as Chief Financial Officer of other funds. Mr. Galligan serves as President of Fidelity Pricing and Cash Management Services (FPCMS) (2014-present) and as a Director of Strategic Advisers, Inc. (investment adviser firm, 2008-present). Previously, Mr. Galligan served as Chief Administrative Officer of Asset Management (2011-2014) and Chief Operating Officer and Senior Vice President of Investment Support for Strategic Advisers, Inc. (2003-2011).
Thomas C. Hense (1964)
Year of Election or Appointment: 2008, 2010, or 2015
Vice President
Mr. Hense serves as Vice President of Fidelity Advisor® Multi-Asset Income Fund (2015) and other funds (High Income (2008), Small Cap (2008), and Value (2010) funds), and is an employee of Fidelity Investments (1993-present). Previously, Mr. Hense served as a portfolio manager for Fidelity's Institutional Money Management Group (Pyramis) (2003-2008).
Brian B. Hogan (1964)
Year of Election or Appointment: 2009
Vice President
Mr. Hogan also serves as Trustee or Vice President of other funds. Mr. Hogan serves as a Director of FMR Investment Management (UK) Limited (investment adviser firm, 2015-present) and Fidelity SelectCo, LLC (investment adviser firm, 2014-present) and President of the Equity Division of FMR (investment adviser firm, 2009-present). Previously, Mr. Hogan served as Senior Vice President, Equity Research of FMR (2006-2009) and as a portfolio manager. Mr. Brian B. Hogan is not related to Mr. Colm A. Hogan.
Colm A. Hogan (1973)
Year of Election or Appointment: 2016
Deputy Treasurer
Mr. Hogan also serves as an officer of other funds. Mr. Hogan is an employee of Fidelity Investments (2005-present). Mr. Colm A. Hogan is not related to Mr. Brian B. Hogan.
Chris Maher (1972)
Year of Election or Appointment: 2013
Assistant Treasurer
Mr. Maher serves as Assistant Treasurer of other funds. Mr. Maher is Vice President of Valuation Oversight and is an employee of Fidelity Investments. Previously, Mr. Maher served as Vice President of Asset Management Compliance (2013), Vice President of the Program Management Group of FMR (investment adviser firm, 2010-2013), and Vice President of Valuation Oversight (2008-2010).
Rieco E. Mello (1969)
Year of Election or Appointment: 2017
Assistant Treasurer
Mr. Mello also serves as Assistant Treasurer of other funds. Mr. Mello is an employee of Fidelity Investments (1995-present).
Kenneth B. Robins (1969)
Year of Election or Appointment: 2016
Chief Compliance Officer
Mr. Robins also serves as an officer of other funds. Mr. Robins serves as Compliance Officer of Fidelity Management & Research Company and FMR Co., Inc. (investment adviser firms, 2016-present) and is an employee of Fidelity Investments (2004-present). Previously, Mr. Robins served as Executive Vice President of Fidelity Investments Money Management, Inc. (investment adviser firm, 2013-2016) and served in other fund officer roles.
Stacie M. Smith (1974)
Year of Election or Appointment: 2016
President and Treasurer
Ms. Smith also serves as an officer of other funds. She is an employee of Fidelity Investments (2009-present) and has served in other fund officer roles. Prior to joining Fidelity Investments, Ms. Smith served as Senior Audit Manager of Ernst & Young LLP (accounting firm, 1996-2009). Previously, Ms. Smith served as Deputy Treasurer of certain Fidelity® funds (2013-2016).
Marc L. Spector (1972)
Year of Election or Appointment: 2016
Assistant Treasurer
Mr. Spector also serves as an officer of other funds. Mr. Spector is an employee of Fidelity Investments (2016-present). Prior to joining Fidelity Investments, Mr. Spector served as Director at the Siegfried Group (accounting firm, 2013-2016), and prior to Siegfried Group as audit senior manager at Deloitte & Touche (accounting firm, 2005-2013).
Renee Stagnone (1975)
Year of Election or Appointment: 2016
Assistant Treasurer
Ms. Stagnone also serves as an officer of other funds. Ms. Stagnone is an employee of Fidelity Investments (1997-present). Previously, Ms. Stagnone served as Deputy Treasurer of certain Fidelity® funds (2013-2016).
Shareholder Expense Example
As a shareholder of the Fund, you incur two types of costs: (1) transaction costs and (2) ongoing costs, including management fees and other Fund expenses. This Example is intended to help you understand your ongoing costs (in dollars) of investing in the Fund and to compare these costs with the ongoing costs of investing in other mutual funds.
The Example is based on an investment of $1,000 invested at the beginning of the period and held for the entire period (February 1, 2017 to July 31, 2017).
Actual Expenses
The first line of the accompanying table for each class of the Fund provides information about actual account values and actual expenses. You may use the information in this line, together with the amount you invested, to estimate the expenses that you paid over the period. Simply divide your account value by $1,000.00 (for example, an $8,600 account value divided by $1,000.00 = 8.6), then multiply the result by the number in the first line for a class of the Fund under the heading entitled "Expenses Paid During Period" to estimate the expenses you paid on your account during this period. A small balance maintenance fee of $12.00 that is charged once a year may apply for certain accounts with a value of less than $2,000. This fee is not included in the table below. If it was, the estimate of expenses you paid during the period would be higher, and your ending account value lower, by this amount. In addition, the Fund, as a shareholder in the underlying Fidelity Central Funds, will indirectly bear its pro-rata share of the fees and expenses incurred by the underlying Fidelity Central Funds. These fees and expenses are not included in the Fund's annualized expense ratio used to calculate the expense estimate in the table below.
Hypothetical Example for Comparison Purposes
The second line of the accompanying table for each class of the Fund provides information about hypothetical account values and hypothetical expenses based on a Class' actual expense ratio and an assumed rate of return of 5% per year before expenses, which is not the Class' actual return. The hypothetical account values and expenses may not be used to estimate the actual ending account balance or expenses you paid for the period. You may use this information to compare the ongoing costs of investing in the Fund and other funds. To do so, compare this 5% hypothetical example with the 5% hypothetical examples that appear in the shareholder reports of the other funds. A small balance maintenance fee of $12.00 that is charged once a year may apply for certain accounts with a value of less than $2,000. This fee is not included in the table below. If it was, the estimate of expenses you paid during the period would be higher, and your ending account value lower, by this amount. In addition, the Fund, as a shareholder in the underlying Fidelity Central Funds, will indirectly bear its pro-rata share of the fees and expenses incurred by the underlying Fidelity Central Funds. These fees and expenses are not included in the Fund's annualized expense ratio used to calculate the expense estimate in the table below.
Please note that the expenses shown in the table are meant to highlight your ongoing costs only and do not reflect any transaction costs. Therefore, the second line of the table is useful in comparing ongoing costs only, and will not help you determine the relative total costs of owning different funds.
| | Annualized Expense Ratio-A | Beginning
Account Value
February 1, 2017 | Ending
Account Value
July 31, 2017 | Expenses Paid
During Period-B
February 1, 2017
to July 31, 2017 |
| Value Discovery | .74% | | | |
| Actual | | $1,000.00 | $1,067.60 | $3.79 |
| Hypothetical-C | | $1,000.00 | $1,021.12 | $3.71 |
| Class K | .62% | | | |
| Actual | | $1,000.00 | $1,068.40 | $3.18 |
| Hypothetical-C | | $1,000.00 | $1,021.72 | $3.11 |
A Annualized expense ratio reflects expenses net of applicable fee waivers.
B Expenses are equal to each Class' annualized expense ratio, multiplied by the average account value over the period, multiplied by 181/365 (to reflect the one-half year period).
C 5% return per year before expenses
Distributions (Unaudited)
The Board of Trustees of Fidelity Value Discovery Fund voted to pay to shareholders of record at the opening of business on record date, the following distributions per share derived from capital gains realized from sales of portfolio securities, and dividends derived from net investment income:
| | Pay Date | Record Date | Dividends | Capital Gains |
| Fidelity Value Discovery Fund | | | | |
| Value Discovery | 09/11/17 | 09/08/17 | $0.133 | $0.242 |
| Class K | 09/11/17 | 09/08/17 | $0.139 | $0.242 |
|
The fund hereby designates as a capital gain dividend with respect to the taxable year ended July 31, 2017, $13,374,270, or, if subsequently determined to be different, the net capital gain of such year.
Value Discovery designates 100% and 91%; and Class K designates 99% and 85%; of the dividends distributed in September and December, respectively during the fiscal year as qualifying for the dividends–received deduction for corporate shareholders.
Value Discovery and Class K designate 100% of the dividends distributed in September and December during the fiscal year as amounts which may be taken into account as a dividend for the purposes of the maximum rate under section 1(h)(11) of the Internal Revenue Code.
The fund will notify shareholders in January 2018 of amounts for use in preparing 2017 income tax returns.
Board Approval of Investment Advisory Contracts and Management Fees
Fidelity Value Discovery Fund
Each year, the Board of Trustees, including the Independent Trustees (together, the Board), votes on the renewal of the management contract with Fidelity Management & Research Company (FMR) and the sub-advisory agreements (together, the Advisory Contracts) for the fund. FMR and the sub-advisers are referred to herein as the Investment Advisers. The Board, assisted by the advice of fund counsel and Independent Trustees' counsel, requests and considers a broad range of information relevant to the renewal of the Advisory Contracts throughout the year.
The Board meets regularly and, at each of its meetings, covers an extensive agenda of topics and materials and considers factors that are relevant to its annual consideration of the renewal of the fund's Advisory Contracts, including the services and support provided to the fund and its shareholders. The Board has established various standing committees (Committees), each composed of and chaired by Independent Trustees with varying backgrounds, to which the Board has assigned specific subject matter responsibilities in order to enhance effective decision-making by the Board. The Board, acting directly and through its Committees, requests and receives information concerning the annual consideration of the renewal of the fund's Advisory Contracts. The Board also meets as needed to review matters specifically related to the Board's annual consideration of the renewal of the Advisory Contracts. Members of the Board may also meet with trustees of other Fidelity funds through ad hoc joint committees to discuss certain matters relevant to all of the Fidelity funds.
At its July 2017 meeting, the Board unanimously determined to renew the fund's Advisory Contracts. In reaching its determination, the Board considered all factors it believed relevant, including (i) the nature, extent, and quality of the services to be provided to the fund and its shareholders (including the investment performance of the fund); (ii) the competitiveness of the fund's management fee and total expense ratio relative to peer funds; (iii) the total costs of the services to be provided by and the profits to be realized by Fidelity from its relationships with the fund; and (iv) the extent to which, if any, economies of scale exist and would be realized as the fund grows, and whether any economies of scale are appropriately shared with fund shareholders.
In considering whether to renew the Advisory Contracts for the fund, the Board reached a determination, with the assistance of fund counsel and Independent Trustees' counsel and through the exercise of its business judgment, that the renewal of the Advisory Contracts was in the best interests of the fund and its shareholders and that the compensation payable under the Advisory Contracts was fair and reasonable. The Board's decision to renew the Advisory Contracts was not based on any single factor, but rather was based on a comprehensive consideration of all the information provided to the Board at its meetings throughout the year. The Board, in reaching its determination to renew the Advisory Contracts, was aware that shareholders of the fund have a broad range of investment choices available to them, including a wide choice among funds offered by Fidelity's competitors, and that the fund's shareholders, who have the opportunity to review and weigh the disclosure provided by the fund in its prospectus and other public disclosures, have chosen to invest in this fund, which is part of the Fidelity family of funds.
Amendment to Group Fee Rate. The Board also approved an amendment to the management contract for the fund to add an additional breakpoint to the group fee schedule, effective October 1, 2017. The Board noted that the additional breakpoint would result in lower management fee rates as Fidelity's assets under management increase.
Nature, Extent, and Quality of Services Provided. The Board considered Fidelity's staffing as it relates to the fund, including the backgrounds of investment personnel of Fidelity, and also considered the fund's investment objective, strategies, and related investment philosophy. The Independent Trustees also had discussions with senior management of Fidelity's investment operations and investment groups. The Board considered the structure of the investment personnel compensation program and whether this structure provides appropriate incentives to act in the best interests of the fund. Additionally, the Board considered the portfolio managers' investments, if any, in the funds that they manage.
Resources Dedicated to Investment Management and Support Services. The Board and the Fund Oversight and Research Committees reviewed the general qualifications and capabilities of Fidelity's investment staff, including its size, education, experience, and resources, as well as Fidelity's approach to recruiting, training, managing, and compensating investment personnel. The Board noted that Fidelity has continued to increase the resources devoted to non-U.S. offices, including expansion of Fidelity's global investment organization. The Board also noted that Fidelity's analysts have extensive resources, tools and capabilities that allow them to conduct sophisticated quantitative and fundamental analysis, as well as credit analysis of issuers, counterparties and guarantors. Further, the Board considered that Fidelity's investment professionals have sufficient access to global information and data so as to provide competitive investment results over time, and that those professionals also have access to sophisticated tools that permit them to assess portfolio construction and risk and performance attribution characteristics continuously, as well as to transmit new information and research conclusions rapidly around the world. Additionally, in its deliberations, the Board considered Fidelity's trading, risk management, compliance, and technology and operations capabilities and resources, which are integral parts of the investment management process.
Shareholder and Administrative Services. The Board considered (i) the nature, extent, quality, and cost of advisory, administrative, and shareholder services performed by the Investment Advisers and their affiliates under the Advisory Contracts and under separate agreements covering transfer agency, pricing and bookkeeping, and securities lending services for the fund; (ii) the nature and extent of the supervision of third party service providers, principally custodians, subcustodians, and pricing vendors; and (iii) the resources devoted to, and the record of compliance with, the fund's compliance policies and procedures. The Board also reviewed the allocation of fund brokerage, including allocations to brokers affiliated with the Investment Advisers, the use of brokerage commissions to pay fund expenses, and the use of "soft" commission dollars to pay for research services.
The Board noted that the growth of fund assets over time across the complex allows Fidelity to reinvest in the development of services designed to enhance the value or convenience of the Fidelity funds as investment vehicles. These services include 24-hour access to account information and market information through telephone representatives and over the Internet, investor education materials and asset allocation tools, and the expanded availability of Fidelity Investor Centers.
In 2014, the Board formed an ad hoc Committee on Transfer Agency Fees to review the variety of transfer agency fee structures throughout the industry and Fidelity's competitive positioning with respect to industry participants.
Investment in a Large Fund Family. The Board considered the benefits to shareholders of investing in a Fidelity fund, including the benefits of investing in a fund that is part of a large family of funds offering a variety of investment disciplines and providing a large variety of mutual fund investor services. The Board noted that Fidelity had taken, or had made recommendations that resulted in the Fidelity funds taking, a number of actions over the previous year that benefited particular funds, including: (i) continuing to dedicate additional resources to Fidelity's investment research process, and to the support of the senior management team that oversees asset management; (ii) continuing efforts to enhance Fidelity's global research capabilities; (iii) launching new funds and making other enhancements to meet client needs; (iv) launching new share classes of existing funds; (v) eliminating purchase minimums and broadening eligibility requirements for certain lower-priced share classes; (vi) reducing management fees and total expenses for certain growth equity funds and index funds; (vii) lowering expense caps for certain existing funds and classes to reduce expenses borne by shareholders; (viii) eliminating short-term redemption fees for certain funds; (ix) introducing a new pricing structure for certain funds of funds that is expected to reduce overall expenses paid by shareholders; (x) rationalizing product lines and gaining increased efficiencies through proposals for fund mergers and share class consolidations; (xi) continuing to develop, acquire and implement systems and technology to improve services to the funds and shareholders, strengthen information security, and increase efficiency; and (xii) implementing enhancements to further strengthen Fidelity's product line to increase investors' probability of success in achieving their investment goals, including retirement income goals.
Investment Performance. The Board considered whether the fund has operated in accordance with its investment objective, as well as its record of compliance with its investment restrictions and its performance history.
The Board took into account discussions with representatives of the Investment Advisers about fund investment performance that occur at Board meetings throughout the year. In this regard the Board noted that as part of regularly scheduled fund reviews and other reports to the Board on fund performance, the Board considers annualized return information for the fund for different time periods, measured against a securities market index ("benchmark index") and a peer group of funds with similar objectives ("peer group"), if any. In its evaluation of fund investment performance, the Board gave particular attention to information indicating changes in performance of certain Fidelity funds for specific time periods and discussed with the Investment Advisers the reasons for any overperformance or underperformance.
In addition to reviewing absolute and relative fund performance, the Independent Trustees periodically consider the appropriateness of fund performance metrics in evaluating the results achieved. In general, the Independent Trustees believe that fund performance should be evaluated based on net performance (after fees and expenses) of both the highest performing and lowest performing fund share classes, where applicable, compared to appropriate benchmark indices, over appropriate time periods that may include full market cycles, and compared to peer groups, as applicable, over the same periods, taking into account relevant factors including the following: general market conditions; issuer-specific information; and fund cash flows and other factors.
The Independent Trustees recognize that shareholders evaluate performance on a net basis over their own holding periods, for which one-, three-, and five-year periods are often used as a proxy. For this reason, the performance information reviewed by the Board also included net cumulative calendar year total return information for the fund and an appropriate benchmark index and peer group for the most recent one-, three-, and five-year periods, as shown below. Returns are shown compared to the 25th percentile (top of box, 75% beaten) and 75th percentile (bottom of box, 25% beaten) of the peer universe.
Fidelity Value Discovery Fund
The Board also considered that the fund's management fee is subject to upward or downward adjustment depending upon whether, and to what extent, the fund's investment performance for the performance period (a rolling 36-month period) exceeds, or is exceeded by, a securities index, thus leading to a performance adjustment for the same period. The Board noted that the performance adjustment provides FMR with a strong economic incentive to seek to achieve superior long-term performance for the fund's shareholders and helps to more closely align the interests of FMR and the shareholders of the fund.
Based on its review, the Board concluded that the nature, extent, and quality of services provided to the fund under the Advisory Contracts should continue to benefit the shareholders of the fund.
Competitiveness of Management Fee and Total Expense Ratio. The Board considered the fund's management fee and total expense ratio compared to "mapped groups" of competitive funds and classes created for the purpose of facilitating the Trustees' competitive analysis of management fees and total expenses. Fidelity creates "mapped groups" by combining similar Lipper investment objective categories that have comparable investment mandates. Combining Lipper investment objective categories aids the Board's management fee and total expense ratio comparisons by broadening the competitive group used for comparison.
Management Fee. The Board considered two proprietary management fee comparisons for the 12-month periods shown in basis points (BP) in the chart below. The group of Lipper funds used by the Board for management fee comparisons is referred to below as the "Total Mapped Group." The Total Mapped Group comparison focuses on a fund's standing in terms of gross management fees before expense reimbursements or caps, and without giving effect to the fund's performance adjustment, relative to the total universe of funds with comparable investment mandates, regardless of whether their management fee structures also are comparable. Funds with comparable investment mandates offer exposure to similar types of securities. Funds with comparable management fee structures have similar management fee contractual arrangements (
e.g., flat rate charged for advisory services, all-inclusive fee rate,
etc.). "TMG %" represents the percentage of funds in the Total Mapped Group that had management fees that were lower than the fund's. For example, a hypothetical TMG % of 20% would mean that 80% of the funds in the Total Mapped Group had higher, and 20% had lower, management fees than the fund. The fund's actual TMG %s and the number of funds in the Total Mapped Group are in the chart below. The "Asset-Size Peer Group" (ASPG) comparison focuses on a fund's standing relative to a subset of non-Fidelity funds within the Total Mapped Group that are similar in size and management fee structure without taking into account performance adjustments, if any. For example, if a fund is in the first quartile of the ASPG, the fund's management fee ranks in the least expensive or lowest 25% of funds in the ASPG. The ASPG represents at least 15% of the funds in the Total Mapped Group with comparable asset size and management fee structures, subject to a minimum of 50 funds (or all funds in the Total Mapped Group if fewer than 50). Additional information, such as the ASPG quartile in which the fund's management fee rate ranked and the impact of the fund's performance adjustment, is also included in the chart and considered by the Board.
Fidelity Value Discovery Fund
The Board noted that the fund's management fee rate ranked below the median of its Total Mapped Group and below the median of its ASPG for 2016. The Board also noted the effect of the fund's performance adjustment, if any, on the fund's management fee ranking.
The Board noted that, in 2014, the Board and the boards of other Fidelity funds formed the ad hoc Committee on Group Fee to conduct an in-depth review of the "group fee" component of the management fee of funds with such management fee structures. The Committee's focus included the mechanics of the group fee, the competitive landscape of group fee structures, Fidelity funds with no group fee component and investment products not included in group fee assets. The Board also considered that, for funds subject to the group fee, FMR agreed to voluntarily waive fees over a specified period of time in amounts designed to account for assets converted from certain funds to certain collective investment trusts.
The Board also noted that, in 2013, the ad hoc Committee on Management Fees was formed to conduct an in-depth review of the management fee rates of Fidelity's active equity mutual funds. The Committee focused on the following areas: (i) standard fee structures; (ii) research consumption and trading evolution; (iii) management fee competitiveness/profitability by category; and (iv) factors that drive institutional pricing.
Based on its review, the Board concluded that the fund's management fee is fair and reasonable in light of the services that the fund receives and the other factors considered.
Total Expense Ratio. In its review of each class's total expense ratio, the Board considered the fund's management fee rate as well as other fund or class expenses, as applicable, such as transfer agent fees, pricing and bookkeeping fees, and custodial, legal, and audit fees. The Board noted the impact of the fund's performance adjustment. The Board also noted that Fidelity may agree to waive fees and expenses from time to time, and the extent to which, if any, it has done so for the fund. As part of its review, the Board also considered the current and historical total expense ratios of each class of the fund compared to competitive fund median expenses. Each class of the fund is compared to those funds and classes in the Total Mapped Group (used by the Board for management fee comparisons) that have a similar sales load structure.
The Board noted that the total expense ratio of each class ranked below the competitive median for 2016.
Fees Charged to Other Fidelity Clients. The Board also considered Fidelity fee structures and other information with respect to clients of Fidelity, such as other funds advised or subadvised by Fidelity, pension plan clients, and other institutional clients with similar mandates. The Board noted that an ad hoc joint committee created by it and the boards of other Fidelity funds periodically (most recently in 2013) reviews and compares Fidelity's institutional investment advisory business with its business of providing services to the Fidelity funds, including the differences in services provided, fees charged, and costs incurred, as well as competition in their respective marketplaces.
Based on its review of total expense ratios and fees charged to other Fidelity clients, the Board concluded that the total expense ratio of each class of the fund was reasonable in light of the services that the fund and its shareholders receive and the other factors considered.
Costs of the Services and Profitability. The Board considered the revenues earned and the expenses incurred by Fidelity in conducting the business of developing, marketing, distributing, managing, administering and servicing the fund and servicing the fund's shareholders. The Board also considered the level of Fidelity's profits in respect of all the Fidelity funds.
On an annual basis, Fidelity presents to the Board information about the profitability of its relationships with the fund. Fidelity calculates profitability information for each fund, as well as aggregate profitability information for groups of Fidelity funds and all Fidelity funds, using a series of detailed revenue and cost allocation methodologies which originate with the books and records of Fidelity on which Fidelity's audited financial statements are based. The Audit Committee of the Board reviews any significant changes from the prior year's methodologies.
PricewaterhouseCoopers LLP (PwC), independent registered public accounting firm and auditor to Fidelity and certain Fidelity funds, has been engaged annually by the Board as part of the Board's assessment of Fidelity's profitability analysis. PwC's engagement includes the review and assessment of the methodologies used by Fidelity in determining the revenues and expenses attributable to Fidelity's mutual fund business, and completion of agreed-upon procedures in respect of the mathematical accuracy of the fund profitability information and its conformity to established allocation methodologies. After considering PwC's reports issued under the engagement and information provided by Fidelity, the Board concluded that while other allocation methods may also be reasonable, Fidelity's profitability methodologies are reasonable in all material respects.
The Board also reviewed Fidelity's non-fund businesses and potential fall-out benefits related to the mutual fund business as well as cases where Fidelity's affiliates may benefit from or be related to the fund's business.
The Board considered the costs of the services provided by and the profits realized by Fidelity in connection with the operation of the fund and was satisfied that the profitability was not excessive.
Economies of Scale. The Board considered whether there have been economies of scale in respect of the management of the Fidelity funds, whether the Fidelity funds (including the fund) have appropriately benefited from any such economies of scale, and whether there is potential for realization of any further economies of scale. The Board considered the extent to which the fund will benefit from economies of scale as assets grow through increased services to the fund, through waivers or reimbursements, or through fee or expense ratio reductions. The Board also noted that a committee (the Economies of Scale Committee) created by it and the boards of other Fidelity funds periodically (most recently in 2013) analyzes whether Fidelity attains economies of scale in respect of the management and servicing of the Fidelity funds, whether the Fidelity funds have appropriately benefited from such economies of scale, and whether there is potential for realization of any further economies of scale.
The Board recognized that the fund's management contract incorporates a "group fee" structure, which provides for lower group fee rates as total group assets increase, and for higher group fee rates as total group assets decrease (with "group assets" defined to include fund assets under FMR's management plus the assets of sector funds previously under FMR's management). FMR calculates the group fee rates based on a tiered asset "breakpoint" schedule that varies based on asset class. The Board considered that the group fee is designed to deliver the benefits of economies of scale to fund shareholders when total Fidelity fund assets increase, even if assets of any particular fund are unchanged or have declined, because some portion of Fidelity's costs are attributable to services provided to all Fidelity funds, and all funds benefit if those costs can be allocated among more assets. The Board concluded that, given the group fee structure, fund shareholders will benefit from lower management fees as group assets increase at the fund complex level, regardless of whether Fidelity achieves any such economies of scale.
The Board concluded, taking into account the analysis of the Economies of Scale Committee, that economies of scale, if any, are being appropriately shared between fund shareholders and Fidelity.
Additional Information Requested by the Board. In order to develop fully the factual basis for consideration of the Fidelity funds' advisory contracts, the Board requested and received additional information on certain topics, including: (i) fund performance trends, in particular the underperformance of certain funds, and Fidelity's long-term strategies for certain funds; (ii) Fidelity's fund profitability methodology, profitability trends for certain funds, and the impact of certain factors on fund profitability results, including the impact of market trends on actively managed funds; (iii) the use of performance fees and the calculation of performance adjustments, including the impact of underperformance and fund outflows on performance adjustments; (iv) metrics for evaluating index fund performance; (v) Fidelity's group fee structure, including the group fee breakpoint schedules; (vi) the terms of Fidelity's contractual and voluntary expense cap arrangements with the funds; (vii) the methodology with respect to evaluating competitive fund data and peer group classifications and fee comparisons; (viii) the expense structures for different funds and classes; (ix) Fidelity's arrangements with affiliated sub-advisers on behalf of the funds; (x) information regarding other accounts managed by Fidelity, including institutional accounts and collective investment trusts; (xi) recent changes to the fee structure for certain funds of funds; and (xii) the impact of the Department of Labor's new fiduciary rule on the funds' comparative expense information.
Based on its evaluation of all of the conclusions noted above, and after considering all factors it believed relevant, the Board concluded that the advisory fee structures are fair and reasonable, and that the fund's Advisory Contracts should be renewed.
Corporate Headquarters
245 Summer St.
Boston, MA 02210
www.fidelity.com
FVD-K-ANN-0917
1.863359.108
Item 2.
Code of Ethics
As of the end of the period, July 31, 2017, Fidelity Puritan Trust (the trust) has adopted a code of ethics, as defined in Item 2 of Form N-CSR, that applies to its President and Treasurer and its Chief Financial Officer. A copy of the code of ethics is filed as an exhibit to this Form N-CSR.
Item 3.
Audit Committee Financial Expert
The Board of Trustees of the trust has determined that Joseph Mauriello is an audit committee financial expert, as defined in Item 3 of Form N-CSR. Mr. Mauriello is independent for purposes of Item 3 of Form N-CSR.
Item 4.
Principal Accountant Fees and Services
Fees and Services
The following table presents fees billed by Deloitte & Touche LLP, the member firms of Deloitte Touche Tohmatsu, and their respective affiliates (collectively, “Deloitte Entities”) in each of the last two fiscal years for services rendered to Fidelity Flex Intrinsic Opportunities Fund, Fidelity Series Intrinsic Opportunities Fund, Fidelity Value Discovery Fund and Fidelity Value Discovery K6 Fund (the “Funds”):
Services Billed by Deloitte Entities
July 31, 2017 FeesA,B
| | | | |
| Audit Fees | Audit-Related Fees | Tax Fees | All Other Fees |
Fidelity Flex Intrinsic Opportunities Fund | $47,000 | $- | $6,500 | $500 |
Fidelity Series Intrinsic Opportunities Fund | $60,000 | $100 | $6,500 | $1,700 |
Fidelity Value Discovery Fund | $38,000 | $100 | $5,500 | $1,100 |
Fidelity Value Discovery K6 Fund | $29,000 | $- | $5,400 | $200 |
| | | | |
| Audit Fees | Audit-Related Fees | Tax Fees | All Other Fees |
Fidelity Flex Intrinsic Opportunities Fund | $- | $- | $- | $- |
Fidelity Series Intrinsic Opportunities Fund | $60,000 | $100 | $6,500 | $1,800 |
Fidelity Value Discovery Fund | $39,000 | $100 | $6,000 | $1,100 |
Fidelity Value Discovery K6 Fund | $- | $- | $- | $- |
A Amounts may reflect rounding.
B Fidelity Flex Intrinsic Opportunities Fund commenced operations on March 8, 2017. Fidelity Value Discovery K6 Fund commenced operations on May 25, 2017.
C Certain amounts have been reclassified to align with current period presentation.
The following table presents fees billed by PricewaterhouseCoopers LLP (“PwC”) in each of the last two fiscal years for services rendered to Fidelity Low-Priced Stock Fund and Fidelity Low-Priced Stock K6 Fund (the “Funds”):
Services Billed by PwC
July 31, 2017 FeesA,B
| | | | |
| Audit Fees | Audit-Related Fees | Tax Fees | All Other Fees |
Fidelity Low-Priced Stock Fund | $139,000 | $11,400 | $20,100 | $5,400 |
Fidelity Low-Priced Stock K6 Fund | $50,000 | $900 | $4,200 | $400 |
| | | | |
| Audit Fees | Audit-Related Fees | Tax Fees | All Other Fees |
Fidelity Low-Priced Stock Fund | $142,000 | $22,800 | $27,500 | $10,400 |
Fidelity Low-Priced Stock K6 Fund | $- | $- | $- | $- |
A Amounts may reflect rounding.
B Fidelity Low-Priced Stock K6 Fund commenced operations on May 26, 2017.
C Certain amounts have been reclassified to align with current period presentation.
The following table presents fees billed by PwC and Deloitte Entities that were required to be approved by the Audit Committee for services that relate directly to the operations
and financial reporting of the Funds and that are rendered on behalf of Fidelity Management & Research Company (“FMR”) and entities controlling, controlled by, or under common control with FMR (not including any sub-adviser whose role is primarily portfolio management and is subcontracted with or overseen by another investment adviser) that provide ongoing services to the Funds (“Fund Service Providers”):
Services Billed by Deloitte Entities
| | |
| July 31, 2017A,B | July 31, 2016A,B |
Audit-Related Fees | $- | $35,000 |
Tax Fees | $25,000 | $10,000 |
All Other Fees | $- | $- |
A Amounts may reflect rounding.
B May include amounts billed prior to the Fidelity Flex Intrinsic Opportunities Fund and Fidelity Value Discovery K6 Fund’s commencement of operations.
Services Billed by PwC
| | |
| July 31, 2017A,B | July 31, 2016A,B,C |
Audit-Related Fees | $5,990,000 | $5,780,000 |
Tax Fees | $115,000 | $- |
All Other Fees | $- | $- |
A Amounts may reflect rounding.
B May include amounts billed prior to the Fidelity Low-Priced Stock K6 Fund’s commencement of operations.
C Certain amounts have been reclassified to align with current period presentation.
“Audit-Related Fees” represent fees billed for assurance and related services that are reasonably related to the performance of the fund audit or the review of the fund's financial statements and that are not reported under Audit Fees.
“Tax Fees” represent fees billed for tax compliance, tax advice or tax planning that relate directly to the operations and financial reporting of the fund.
“All Other Fees” represent fees billed for services provided to the fund or Fund Service Provider, a significant portion of which are assurance related, that relate directly to the operations and financial reporting of the fund, excluding those services that are reported under Audit Fees, Audit-Related Fees or Tax Fees.
Assurance services must be performed by an independent public accountant.
* * *
The aggregate non-audit fees billed by PwC and Deloitte Entities for services rendered to the Funds, FMR (not including any sub-adviser whose role is primarily portfolio management and is subcontracted with or overseen by another investment adviser), and any Fund Service Provider for each of the last two fiscal years of the Funds are as follows:
| | |
Billed By | July 31, 2017A,B | July 31, 2016A,B,C |
PwC | $7,985,000 | $6,830,000 |
Deloitte Entities | $395,000 | $90,000 |
A Amounts may reflect rounding.
B May include amounts billed prior to the Fidelity Flex Intrinsic Opportunities Fund, Fidelity Value Discovery K6 Fund and Fidelity Low-Priced Stock K6 Fund’s commencement of operations.
C Certain amounts have been reclassified to align with current period presentation.
The trust's Audit Committee has considered non-audit services that were not pre-approved that were provided by PwC and Deloitte Entities to Fund Service Providers to be compatible with maintaining the independence of PwC and Deloitte Entities in their audits of the Funds, taking into account representations from PwC and Deloitte Entities, in accordance with Public Company Accounting Oversight Board rules, regarding their independence from the Funds and their related entities and FMR’s review of the appropriateness and permissibility under applicable law of such non-audit services prior to their provision to the Fund Service Providers.
Audit Committee Pre-Approval Policies and Procedures
The trust’s Audit Committee must pre-approve all audit and non-audit services provided by a fund’s independent registered public accounting firm relating to the operations or financial reporting of the fund. Prior to the commencement of any audit or non-audit services to a fund, the Audit Committee reviews the services to determine whether they are appropriate and permissible under applicable law.
The Audit Committee has adopted policies and procedures to, among other purposes, provide a framework for the Committee’s consideration of non-audit services by the audit firms that audit the Fidelity funds. The policies and procedures require that any non-audit service provided by a fund audit firm to a Fidelity fund and any non-audit service provided by a fund auditor to a Fund Service Provider that relates directly to the operations and financial reporting of a Fidelity fund (“Covered Service”) are subject to approval by the Audit Committee before such service is provided.
All Covered Services must be approved in advance of provision of the service either: (i) by formal resolution of the Audit Committee, or (ii) by oral or written approval of the service by the Chair of the Audit Committee (or if the Chair is unavailable, such other member of the Audit Committee as may be designated by the Chair to act in the Chair’s absence). The approval contemplated by (ii) above is permitted where the Treasurer determines that action on such an engagement is necessary before the next meeting of the Audit Committee.
Non-audit services provided by a fund audit firm to a Fund Service Provider that do not relate directly to the operations and financial reporting of a Fidelity fund are reported to the Audit Committee on a periodic basis.
Non-Audit Services Approved Pursuant to Rule 2-01(c)(7)(i)(C) and (ii) of Regulation S-X (“De Minimis Exception”)
There were no non-audit services approved or required to be approved by the Audit Committee pursuant to the De Minimis Exception during the Funds’ last two fiscal years relating to services provided to (i) the Funds or (ii) any Fund Service Provider that relate directly to the operations and financial reporting of the Funds.
Item 5.
Audit Committee of Listed Registrants
Not applicable.
Item 6.
Investments
(a)
Not applicable.
(b)
Not applicable
Item 7.
Disclosure of Proxy Voting Policies and Procedures for Closed-End Management Investment Companies
Not applicable.
Item 8.
Portfolio Managers of Closed-End Management Investment Companies
Not applicable.
Item 9.
Purchase of Equity Securities by Closed-End Management Investment Company and Affiliated Purchasers
Not applicable.
Item 10.
Submission of Matters to a Vote of Security Holders
There were no material changes to the procedures by which shareholders may recommend nominees to the trust’s Board of Trustees.
Item 11.
Controls and Procedures
(a)(i) The President and Treasurer and the Chief Financial Officer have concluded that the trust’s disclosure controls and procedures (as defined in Rule 30a-3(c) under the Investment Company Act) provide reasonable assurances that material information relating to the trust is made known to them by the appropriate persons, based on their evaluation of these controls and procedures as of a date within 90 days of the filing date of this report.
(a)(ii) There was no change in the trust’s internal control over financial reporting (as defined in Rule 30a-3(d) under the Investment Company Act) that occurred during the second fiscal quarter of the period covered by this report that has materially affected, or is reasonably likely to materially affect, the trust’s internal control over financial reporting.
Item 12.
Exhibits
| | |
(a) | (1) | Code of Ethics pursuant to Item 2 of Form N-CSR is filed and attached hereto as EX-99.CODE ETH. |
(a) | (2) | Certification pursuant to Rule 30a-2(a) under the Investment Company Act of 1940 (17 CFR 270.30a-2(a)) is filed and attached hereto as Exhibit 99.CERT. |
(a) | (3) | Not applicable. |
(b) |
| Certification pursuant to Rule 30a-2(b) under the Investment Company Act of 1940 (17 CFR 270.30a-2(b)) is furnished and attached hereto as Exhibit 99.906CERT. |
SIGNATURES
Pursuant to the requirements of the Securities Exchange Act of 1934 and the Investment Company Act of 1940, the registrant has duly caused this report to be signed on its behalf by the undersigned, thereunto duly authorized.
Fidelity Puritan Trust
| |
By: | /s/Stacie M. Smith |
| Stacie M. Smith |
| President and Treasurer |
|
|
Date: | September 26, 2017 |
Pursuant to the requirements of the Securities Exchange Act of 1934 and the Investment Company Act of 1940, this report has been signed below by the following persons on behalf of the registrant and in the capacities and on the dates indicated.
| |
By: | /s/ Stacie M. Smith |
| Stacie M. Smith |
| President and Treasurer |
|
|
Date: | September 26, 2017 |
| |
By: | /s/Howard J. Galligan III |
| Howard J. Galligan III |
| Chief Financial Officer |
|
|
Date: | September 26, 2017 |