UNITED STATES
SECURITIES AND EXCHANGE COMMISSION
Washington, D.C. 20549
FORM N-CSR
CERTIFIED SHAREHOLDER REPORT OF REGISTERED
MANAGEMENT INVESTMENT COMPANIES
Investment Company Act file number 811-649
Fidelity Puritan Trust
(Exact name of registrant as specified in charter)
245 Summer St., Boston, Massachusetts 02210
(Address of principal executive offices) (Zip code)
Marc Bryant, Secretary
245 Summer St.
Boston, Massachusetts 02210
(Name and address of agent for service)
Registrant's telephone number, including area code:
617-563-7000
| |
Date of fiscal year end: | July 31 |
| |
Date of reporting period: | July 31, 2018 |
Item 1.
Reports to Stockholders
Fidelity® Low-Priced Stock Fund
Annual Report July 31, 2018 |
 |
Contents
To view a fund's proxy voting guidelines and proxy voting record for the 12-month period ended June 30, visit http://www.fidelity.com/proxyvotingresults or visit the Securities and Exchange Commission's (SEC) web site at http://www.sec.gov.
You may also call 1-800-544-8544 to request a free copy of the proxy voting guidelines.
Standard & Poor's, S&P and S&P 500 are registered service marks of The McGraw-Hill Companies, Inc. and have been licensed for use by Fidelity Distributors Corporation.
Other third-party marks appearing herein are the property of their respective owners.
All other marks appearing herein are registered or unregistered trademarks or service marks of FMR LLC or an affiliated company. © 2018 FMR LLC. All rights reserved.
This report and the financial statements contained herein are submitted for the general information of the shareholders of the Fund. This report is not authorized for distribution to prospective investors in the Fund unless preceded or accompanied by an effective prospectus.
A fund files its complete schedule of portfolio holdings with the SEC for the first and third quarters of each fiscal year on Form N-Q. Forms N-Q are available on the SEC’s web site at http://www.sec.gov. A fund's Forms N-Q may be reviewed and copied at the SEC’s Public Reference Room in Washington, DC. Information regarding the operation of the SEC's Public Reference Room may be obtained by calling 1-800-SEC-0330.
For a complete list of a fund's portfolio holdings, view the most recent holdings listing, semiannual report, or annual report on Fidelity's web site at http://www.fidelity.com, http://www.institutional.fidelity.com, or http://www.401k.com, as applicable.
NOT FDIC INSURED •MAY LOSE VALUE •NO BANK GUARANTEE
Neither the Fund nor Fidelity Distributors Corporation is a bank.
Notes to Shareholders
The Board of Trustees approved a change to the fund's investment policies (effective November 7, 2017) that has expanded the definition of “low-priced stocks.” Previously, low-priced stocks were defined as those priced at or below $35 per share. This definition was expanded to include stocks with an earnings yield at or above the median for the Russell 2000® Index, as well as those priced at or below $35 per share. Earnings yield represents a stock’s earnings per share for the most recent 12 months divided by current price per share. We believe the expanded definition better reflects the portfolio managers’ investment process and provides greater flexibility while remaining faithful to the fund name. No changes to the investment process and portfolio characteristics are expected.
During the period, Joel Tillinghast assumed responsibility of the fund's consumer and financials sleeves, succeeding Kathy Buck and Justin Bennett, respectively.
Performance: The Bottom Line
Average annual total return reflects the change in the value of an investment, assuming reinvestment of distributions from dividend income and capital gains (the profits earned upon the sale of securities that have grown in value, if any) and assuming a constant rate of performance each year. The hypothetical investment and the average annual total returns do not reflect the deduction of taxes that a shareholder would pay on fund distributions or the redemption of fund shares. During periods of reimbursement by Fidelity, a fund’s total return will be greater than it would be had the reimbursement not occurred. How a fund did yesterday is no guarantee of how it will do tomorrow.
Average Annual Total Returns
| For the periods ended July 31, 2018 | Past 1 year | Past 5 years | Past 10 years |
| Fidelity® Low-Priced Stock Fund | 12.07% | 9.73% | 10.46% |
$10,000 Over 10 Years
Let's say hypothetically that $10,000 was invested in Fidelity® Low-Priced Stock Fund, a class of the fund, on July 31, 2008.
The chart shows how the value of your investment would have changed, and also shows how the Russell 2000® Index performed over the same period.
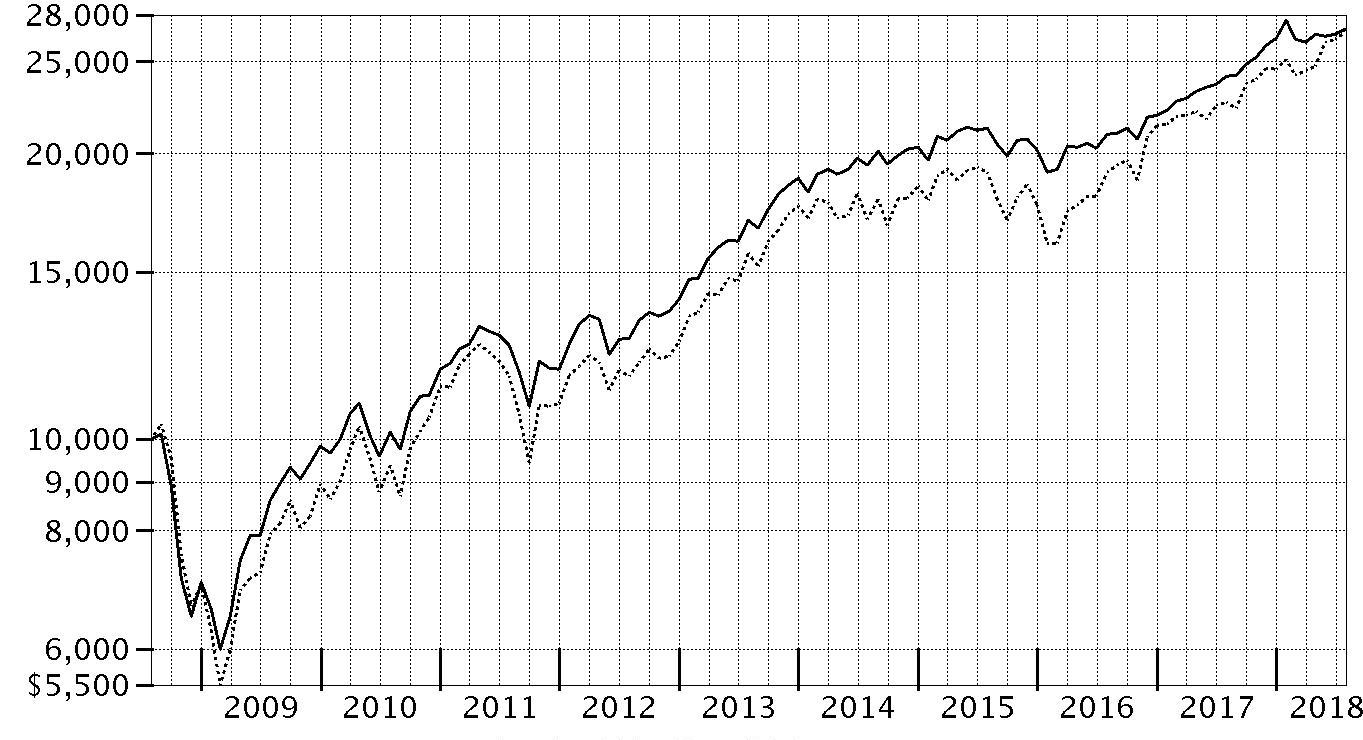
| Period Ending Values |
| $27,035 | Fidelity® Low-Priced Stock Fund |
| $26,870 | Russell 2000® Index |
Management's Discussion of Fund Performance
Market Recap: The U.S. equity bellwether S&P 500
® index gained 16.24% for the 12 months ending July 31, 2018, despite a resurgence in volatility that challenged the multiyear bull market. Stocks maintained their steady growth until a sharp reversal in February, as volatility spiked amid fear that rising inflation and the potential for the economy to overheat would prompt the U.S. Federal Reserve to pick up the pace of interest rate hikes. The index posted its first negative monthly result since October 2016, and then lost further ground in March on fear of a global trade war. The market stabilized in April and turned upward through mid-June, when escalating trade tension between the U.S. and China soured investor sentiment. The resulting uncertainty lingered into July, but strong corporate earnings helped the S&P 500 rise 3.72% that month to cap the period. For the full one-year period, growth handily topped value, while small-caps bested large-caps. By sector, information technology (+28%) led the way, boosted by strong earnings growth from several major index constituents. Consumer discretionary rose roughly 24%, driven by retailers (+49%). Energy (+20%) gained alongside higher oil prices. Laggards were telecommunication services (-2%), consumer staples (0%) and utilities (+3%), defensive groups that struggled amid rising interest rates and a general preference for risk. Real estate (+5%) fared a bit better but still lagged, as did financials, industrials, health care (each up 13%) and materials (+11%).
Comments from Lead Portfolio Manager Joel Tillinghast: For the fiscal year, the fund's share classes gained roughly 12%, trailing the 18.73% advance of the benchmark Russell 2000
® Index. The fund underperformed its benchmark in large part because the stocks that were largely in favor the past year – high-growth equities with elevated valuations – are not a focus of our investment approach, which seeks to own high-quality companies with stable earnings-growth prospects that we believe are mispriced. As a result, stock choices in several sectors, including financials, consumer staples, information technology and health care, detracted from our relative result. By industry, software & services and insurance hurt most, as did positioning in pharmaceuticals, biotechnology & life sciences. A non-benchmark position in electronics component manufacturer Hon Hai Precision Industry (-28%) was the fund’s biggest relative detractor. The stock was pressured by weaker-than-expected sales of Apple’s newly launched high-end smartphones, which impacted Hon Hai’s production. Shares in non-benchmark Unum Group (-19%) suffered from weakening financial trends in its long-term-care business. The fund's sizable allocation to cash – at 10% of assets, on average – amid a rising equity market also hindered our relative result. Our foreign holdings, which represented roughly a third of the fund’s assets this period, also detracted, in part due to the strength of the U.S. dollar. Conversely, a significant underweighting in the weak real estate sector boosted relative performance, as did stock selection in retailing and energy. The fund’s top relative contributors were non-benchmark positions in disk-drive maker Seagate Technology and discount retailer Ross Stores. All of the stocks mentioned were sizable fund holdings.
The views expressed above reflect those of the portfolio manager(s) only through the end of the period as stated on the cover of this report and do not necessarily represent the views of Fidelity or any other person in the Fidelity organization. Any such views are subject to change at any time based upon market or other conditions and Fidelity disclaims any responsibility to update such views. These views may not be relied on as investment advice and, because investment decisions for a Fidelity fund are based on numerous factors, may not be relied on as an indication of trading intent on behalf of any Fidelity fund.
Investment Summary (Unaudited)
Top Ten Stocks as of July 31, 2018
| | % of fund's net assets |
| UnitedHealth Group, Inc. | 6.2 |
| Ross Stores, Inc. | 3.2 |
| Best Buy Co., Inc. | 2.8 |
| Next PLC | 2.7 |
| Seagate Technology LLC | 2.7 |
| Metro, Inc. Class A (sub. vtg.) | 2.3 |
| Aetna, Inc. | 2.2 |
| Unum Group | 1.7 |
| ANSYS, Inc. | 1.7 |
| Amgen, Inc. | 1.6 |
| | 27.1 |
Top Five Market Sectors as of July 31, 2018
| | % of fund's net assets |
| Consumer Discretionary | 22.1 |
| Information Technology | 16.5 |
| Health Care | 14.2 |
| Financials | 11.3 |
| Consumer Staples | 8.4 |
Asset Allocation (% of fund's net assets)
| As of July 31, 2018* |
| | Stocks | 90.7% |
| | Short-Term Investments and Net Other Assets (Liabilities) | 9.3% |

* Foreign investments - 40.9%
Schedule of Investments July 31, 2018
Showing Percentage of Net Assets
| Common Stocks - 90.6% | | | |
| | | Shares | Value (000s) |
| CONSUMER DISCRETIONARY - 22.1% | | | |
| Auto Components - 1.2% | | | |
| Adient PLC | | 499,082 | $23,771 |
| ASTI Corp. (a)(b) | | 181,200 | 3,940 |
| Autoliv, Inc. (a) | | 17,500 | 1,793 |
| Cooper Tire & Rubber Co. | | 1,297,832 | 37,053 |
| ElringKlinger AG (a) | | 698,718 | 8,865 |
| G-Tekt Corp. | | 73,100 | 1,266 |
| Gentex Corp. | | 2,537,679 | 58,874 |
| GUD Holdings Ltd. | | 295,435 | 3,117 |
| Hi-Lex Corp. | | 1,367,200 | 33,968 |
| INFAC Corp. | | 325,139 | 1,314 |
| INZI Controls Co. Ltd. (b) | | 1,516,000 | 7,407 |
| Lear Corp. | | 19,173 | 3,454 |
| Motonic Corp. (b) | | 3,250,000 | 26,269 |
| Murakami Corp. (b) | | 782,700 | 21,350 |
| Nippon Seiki Co. Ltd. | | 2,639,800 | 55,197 |
| Piolax, Inc. (b) | | 2,486,100 | 60,277 |
| S&T Holdings Co. Ltd. (b) | | 885,108 | 10,056 |
| Samsung Climate Control Co. Ltd. (b) | | 499,950 | 4,804 |
| Sewon Precision Industries Co. Ltd. (b) | | 500,000 | 4,625 |
| SJM Co. Ltd. (b) | | 1,282,000 | 4,312 |
| SJM Holdings Co. Ltd. (b) | | 1,291,382 | 4,506 |
| Strattec Security Corp. (b) | | 343,035 | 11,320 |
| Sungwoo Hitech Co. Ltd. | | 2,518,110 | 10,312 |
| TBK Co. Ltd. | | 925,900 | 4,240 |
| Yachiyo Industry Co. Ltd. | | 896,600 | 10,280 |
| Yutaka Giken Co. Ltd. (b) | | 1,228,100 | 29,952 |
| | | | 442,322 |
| Distributors - 0.2% | | | |
| Central Automotive Products Ltd. | | 75,400 | 1,227 |
| Chori Co. Ltd. | | 430,500 | 7,989 |
| Nakayamafuku Co. Ltd. | | 748,500 | 4,793 |
| PALTAC Corp. | | 121,100 | 6,390 |
| SPK Corp. | | 253,600 | 6,128 |
| Uni-Select, Inc. | | 1,647,187 | 27,427 |
| | | | 53,954 |
| Diversified Consumer Services - 0.3% | | | |
| Clip Corp. (b) | | 272,000 | 2,255 |
| Cross-Harbour Holdings Ltd. | | 2,321,000 | 3,903 |
| Estacio Participacoes SA | | 407,600 | 2,818 |
| ServiceMaster Global Holdings, Inc. (c) | | 184,559 | 10,518 |
| Shingakukai Holdings Co. Ltd. | | 99,900 | 532 |
| Step Co. Ltd. (b) | | 1,077,300 | 15,560 |
| Weight Watchers International, Inc. (c) | | 1,000,774 | 89,599 |
| | | | 125,185 |
| Hotels, Restaurants & Leisure - 0.3% | | | |
| Ark Restaurants Corp. | | 157,407 | 3,542 |
| Bluegreen Vacations Corp. | | 218,433 | 5,616 |
| Brinker International, Inc. | | 22,714 | 1,071 |
| Flanigans Enterprises, Inc. | | 89,612 | 2,626 |
| Greggs PLC | | 499,482 | 6,910 |
| Hiday Hidaka Corp. (b) | | 1,845,300 | 39,244 |
| Ibersol SGPS SA | | 912,355 | 10,669 |
| Koshidaka Holdings Co. Ltd. | | 294,120 | 3,383 |
| Kura Corp. Ltd. | | 10,000 | 603 |
| Sportscene Group, Inc. Class A (b) | | 331,600 | 2,039 |
| St. Marc Holdings Co. Ltd. | | 400,300 | 9,734 |
| Texas Roadhouse, Inc. Class A | | 93,513 | 5,876 |
| The Monogatari Corp. | | 79,900 | 7,360 |
| The Restaurant Group PLC | | 6,498,637 | 22,604 |
| TORIDOLL Holdings Corp. | | 74,900 | 1,662 |
| Wyndham Destinations, Inc. | | 25,009 | 1,153 |
| Wyndham Hotels & Resorts, Inc. | | 25,009 | 1,451 |
| | | | 125,543 |
| Household Durables - 3.3% | | | |
| Abbey PLC (b) | | 1,775,890 | 31,773 |
| Barratt Developments PLC (b) | | 72,241,313 | 506,341 |
| Bellway PLC | | 3,914,975 | 149,893 |
| D.R. Horton, Inc. | | 2,866,806 | 125,279 |
| Dorel Industries, Inc. Class B (sub. vtg.) | | 2,585,365 | 47,401 |
| Emak SpA | | 4,388,097 | 6,199 |
| First Juken Co. Ltd. (b) | | 1,400,500 | 17,548 |
| Flexsteel Industries, Inc. | | 27,826 | 997 |
| Hamilton Beach Brands Holding Co.: | | | |
| Class A | | 176,552 | 4,484 |
| Class B | | 183,780 | 4,668 |
| Helen of Troy Ltd. (b)(c) | | 1,680,238 | 192,471 |
| Henry Boot PLC | | 2,949,666 | 10,144 |
| Iida Group Holdings Co. Ltd. | | 186,300 | 3,647 |
| M/I Homes, Inc. (c) | | 25,382 | 656 |
| Meritage Homes Corp. (c) | | 20,965 | 905 |
| P&F Industries, Inc. Class A (b) | | 322,495 | 2,683 |
| PulteGroup, Inc. | | 101,806 | 2,900 |
| Q.E.P. Co., Inc. | | 30,058 | 956 |
| Sanei Architecture Planning Co. Ltd. (b) | | 1,210,700 | 21,406 |
| Stanley Furniture Co., Inc. (c) | | 150,671 | 98 |
| Taylor Morrison Home Corp. (c) | | 210,457 | 4,110 |
| Token Corp. | | 623,700 | 47,970 |
| Toll Brothers, Inc. | | 94,819 | 3,343 |
| Tupperware Brands Corp. | | 29,354 | 1,078 |
| | | | 1,186,950 |
| Internet & Direct Marketing Retail - 0.3% | | | |
| Belluna Co. Ltd. (b) | | 6,985,900 | 81,345 |
| Liberty Interactive Corp. QVC Group Series A (c) | | 854,888 | 18,201 |
| | | | 99,546 |
| Leisure Products - 0.2% | | | |
| Accell Group NV (b) | | 1,757,314 | 36,577 |
| Amer Group PLC (A Shares) | | 118,243 | 3,795 |
| Brunswick Corp. | | 119,700 | 7,697 |
| Fenix Outdoor AB Class B (c)(d) | | 32,298 | 0 |
| Kabe Husvagnar AB (B Shares) | | 277,074 | 5,184 |
| Mars Engineering Corp. | | 500,000 | 10,835 |
| Miroku Corp. | | 140,500 | 2,586 |
| | | | 66,674 |
| Media - 1.1% | | | |
| Comcast Corp. Class A | | 2,644,653 | 94,626 |
| Corus Entertainment, Inc. Class B (non-vtg.) (a) | | 585,765 | 1,828 |
| Discovery Communications, Inc.: | | | |
| Class A (a)(c) | | 2,645,227 | 70,310 |
| Class C (non-vtg.) (c) | | 499,061 | 12,252 |
| DISH Network Corp. Class A (c) | | 109,980 | 3,471 |
| Entercom Communications Corp. Class A | | 50,107 | 378 |
| Gannett Co., Inc. | | 1,076,384 | 11,377 |
| Harte-Hanks, Inc. (c) | | 74,105 | 750 |
| Hyundai HCN | | 2,723,979 | 10,153 |
| Informa PLC | | 451,363 | 4,677 |
| Intage Holdings, Inc. (b) | | 3,306,600 | 34,244 |
| Ipsos SA | | 8,810 | 295 |
| KK Culture Holdings Ltd. (c) | | 8,087,000 | 1,690 |
| MSG Network, Inc. Class A (c) | | 288,809 | 6,801 |
| Multiplus SA | | 536,800 | 3,962 |
| Pico Far East Holdings Ltd. | | 18,538,000 | 7,676 |
| Proto Corp. | | 235,200 | 2,890 |
| RKB Mainichi Broadcasting Corp. | | 42,400 | 2,378 |
| Saga Communications, Inc. Class A | | 397,449 | 15,043 |
| Sky Network Television Ltd. | | 5,847,362 | 10,801 |
| STW Group Ltd. | | 4,100,892 | 2,803 |
| Tegna, Inc. | | 1,174,466 | 12,954 |
| Television Broadcasts Ltd. | | 1,962,100 | 6,087 |
| TOW Co. Ltd. (b) | | 1,831,300 | 13,217 |
| TVA Group, Inc. Class B (non-vtg.) (c) | | 3,091,099 | 7,105 |
| Twenty-First Century Fox, Inc. Class A | | 418,527 | 18,834 |
| Viacom, Inc. Class B (non-vtg.) | | 1,216,553 | 35,341 |
| WOWOW INC. | | 184,400 | 5,582 |
| | | | 397,525 |
| Multiline Retail - 2.9% | | | |
| Big Lots, Inc. (a) | | 140,068 | 6,083 |
| Lifestyle China Group Ltd. (c) | | 24,958,500 | 10,144 |
| Lifestyle International Holdings Ltd. | | 25,000,000 | 49,688 |
| Next PLC (b) | | 12,702,310 | 989,675 |
| Nordstrom, Inc. | | 79,448 | 4,164 |
| Watts Co. Ltd. | | 648,800 | 6,342 |
| | | | 1,066,096 |
| Specialty Retail - 10.9% | | | |
| Aaron's, Inc. Class A | | 65,395 | 2,832 |
| Abercrombie & Fitch Co. Class A | | 2,750,080 | 65,149 |
| AT-Group Co. Ltd. | | 1,095,100 | 27,795 |
| AutoCanada, Inc. | | 199,959 | 2,223 |
| AutoNation, Inc. (c) | | 78,859 | 3,827 |
| AutoZone, Inc. (c) | | 730,209 | 515,184 |
| Bed Bath & Beyond, Inc. | | 2,068,796 | 38,749 |
| Best Buy Co., Inc. | | 13,484,839 | 1,011,767 |
| BMTC Group, Inc. (b) | | 3,634,497 | 42,943 |
| Bonia Corp. Bhd | | 2,503,000 | 268 |
| Buffalo Co. Ltd. | | 93,200 | 791 |
| Burlington Stores, Inc. (c) | | 37,468 | 5,725 |
| Cars.com, Inc. (c) | | 434,702 | 12,332 |
| Cash Converters International Ltd. (c) | | 22,077,204 | 5,495 |
| Chico's FAS, Inc. | | 634,386 | 5,519 |
| Delek Automotive Systems Ltd. | | 737,100 | 3,894 |
| DSW, Inc. Class A | | 203,875 | 5,594 |
| Dunelm Group PLC | | 650,011 | 4,475 |
| Ff Group (b)(c)(d) | | 4,363,428 | 24,491 |
| Formosa Optical Technology Co. Ltd. | | 1,362,000 | 2,761 |
| Fourlis Holdings SA | | 200,431 | 1,352 |
| Francesca's Holdings Corp. (c) | | 299,858 | 2,441 |
| GameStop Corp. Class A (a) | | 3,030,465 | 43,669 |
| Genesco, Inc. (c) | | 599,091 | 24,383 |
| GNC Holdings, Inc. Class A (c) | | 949,973 | 3,021 |
| Goldlion Holdings Ltd. | | 21,953,000 | 9,090 |
| Guess?, Inc. (b) | | 4,938,084 | 111,897 |
| Hour Glass Ltd. | | 8,339,600 | 3,951 |
| IA Group Corp. (b) | | 117,640 | 3,987 |
| JB Hi-Fi Ltd. (a) | | 106,044 | 1,879 |
| John David Group PLC | | 7,906,780 | 48,559 |
| Jumbo SA (b) | | 10,027,525 | 160,642 |
| K's Holdings Corp. | | 4,790,300 | 53,852 |
| Ku Holdings Co. Ltd. | | 850,600 | 7,143 |
| Le Chateau, Inc. Class B (sub. vtg.) (c) | | 620,700 | 143 |
| Leon's Furniture Ltd. | | 186,348 | 2,620 |
| Lewis Group Ltd. | | 1,077,376 | 2,446 |
| Mr. Bricolage SA (b) | | 860,713 | 13,235 |
| Murphy U.S.A., Inc. (c) | | 46,567 | 3,690 |
| Nafco Co. Ltd. (b) | | 1,938,400 | 31,794 |
| Ross Stores, Inc. | | 13,400,498 | 1,171,606 |
| Sacs Bar Holdings, Inc. | | 199,900 | 1,734 |
| Sally Beauty Holdings, Inc. (c) | | 2,431,153 | 40,090 |
| Second Chance Properties Ltd. warrants 1/23/20 (c) | | 1,941,600 | 6 |
| Sonic Automotive, Inc. Class A (sub. vtg.) | | 1,098,619 | 22,357 |
| The Buckle, Inc. (a)(b) | | 4,502,441 | 108,284 |
| The Children's Place Retail Stores, Inc. | | 30,939 | 3,802 |
| Urban Outfitters, Inc. (c) | | 2,350,151 | 104,347 |
| USS Co. Ltd. | | 5,147,400 | 97,410 |
| Vitamin Shoppe, Inc. (c) | | 873,939 | 7,297 |
| Williams-Sonoma, Inc. (a) | | 354,771 | 20,751 |
| Workman Co. Ltd. | | 2,022,700 | 90,629 |
| | | | 3,979,921 |
| Textiles, Apparel & Luxury Goods - 1.4% | | | |
| Best Pacific International Holdings Ltd. | | 4,818,000 | 1,780 |
| Deckers Outdoor Corp. (c) | | 33,000 | 3,723 |
| Embry Holdings Ltd. | | 2,161,000 | 727 |
| Emerald Expositions Events, Inc. | | 128,392 | 2,478 |
| Fossil Group, Inc. (b)(c) | | 4,138,034 | 108,416 |
| Gildan Activewear, Inc. | | 6,895,942 | 177,640 |
| Handsome Co. Ltd. (b) | | 2,000,000 | 67,806 |
| JLM Couture, Inc. (b)(c) | | 160,355 | 1,267 |
| Makalot Industrial Co. Ltd. | | 906,000 | 4,029 |
| McRae Industries, Inc. | | 24,161 | 725 |
| Michael Kors Holdings Ltd. (c) | | 76,284 | 5,090 |
| Oxford Industries, Inc. | | 24,123 | 2,222 |
| Portico International Holdings (c) | | 10,198,500 | 5,314 |
| Steven Madden Ltd. | | 155,407 | 8,400 |
| Sun Hing Vision Group Holdings Ltd. (b) | | 19,833,000 | 6,974 |
| Texwinca Holdings Ltd. | | 48,936,000 | 21,572 |
| Victory City International Holdings Ltd. (c) | | 90,567,225 | 1,454 |
| Wolverine World Wide, Inc. | | 120,185 | 4,252 |
| Youngone Corp. | | 500,000 | 13,561 |
| Youngone Holdings Co. Ltd. (b) | | 889,600 | 42,903 |
| Yue Yuen Industrial (Holdings) Ltd. | | 5,095,500 | 13,698 |
| | | | 494,031 |
|
| TOTAL CONSUMER DISCRETIONARY | | | 8,037,747 |
|
| CONSUMER STAPLES - 8.4% | | | |
| Beverages - 1.6% | | | |
| A.G. Barr PLC | | 3,076,444 | 27,337 |
| Baron de Ley SA (c) | | 129,900 | 16,861 |
| Britvic PLC | | 6,452,327 | 68,091 |
| C&C Group PLC | | 1,890,226 | 7,604 |
| Jinro Distillers Co. Ltd. | | 47,081 | 1,294 |
| Monster Beverage Corp. (c) | | 6,712,002 | 402,854 |
| Muhak Co. Ltd. (b) | | 2,799,256 | 38,087 |
| Olvi PLC (A Shares) | | 99,277 | 3,738 |
| Spritzer Bhd | | 5,120,400 | 3,023 |
| Yantai Changyu Pioneer Wine Co. Ltd. (B Shares) | | 2,799,936 | 7,473 |
| | | | 576,362 |
| Food & Staples Retailing - 5.0% | | | |
| Amsterdam Commodities NV | | 139,172 | 3,263 |
| Aoki Super Co. Ltd. | | 225,000 | 2,652 |
| Australasian Foods Holdco Pty Ltd. (c)(d) | | 3,481,102 | 2,328 |
| Belc Co. Ltd. (b) | | 1,650,600 | 79,124 |
| Casey's General Stores, Inc. | | 18,000 | 1,969 |
| Cosmos Pharmaceutical Corp. | | 999,900 | 219,895 |
| Create SD Holdings Co. Ltd. (b) | | 5,347,100 | 132,942 |
| Daikokutenbussan Co. Ltd. | | 548,800 | 24,295 |
| Dong Suh Companies, Inc. | | 1,100,000 | 25,192 |
| Genky DrugStores Co. Ltd. | | 733,600 | 25,358 |
| Halows Co. Ltd. (b) | | 1,292,700 | 29,828 |
| Kirindo Holdings Co. Ltd. | | 151,200 | 3,067 |
| Kroger Co. | | 1,840,934 | 53,387 |
| Kusuri No Aoki Holdings Co. Ltd. | | 745,800 | 54,694 |
| Majestic Wine PLC | | 1,796,432 | 10,563 |
| McColl's Retail Group PLC | | 1,446,367 | 2,848 |
| Medical System Network Co. Ltd. | | 69,500 | 283 |
| Metro, Inc. Class A (sub. vtg.) (b) | | 24,662,015 | 831,515 |
| North West Co., Inc. | | 111,752 | 2,553 |
| Performance Food Group Co. (c) | | 196,165 | 7,033 |
| Qol Co. Ltd. | | 1,852,300 | 30,415 |
| Retail Partners Co. Ltd. | | 440,200 | 6,016 |
| Sligro Food Group NV (a) | | 350,919 | 14,526 |
| Sundrug Co. Ltd. | | 3,048,000 | 121,849 |
| Tesco PLC | | 3,001,515 | 10,250 |
| Thai President Foods PCL | | 512,288 | 2,387 |
| Total Produce PLC | | 8,923,590 | 23,165 |
| United Natural Foods, Inc. (c) | | 1,247,519 | 40,170 |
| Valor Holdings Co. Ltd. | | 488,000 | 10,466 |
| Walgreens Boots Alliance, Inc. | | 27,852 | 1,883 |
| Walmart, Inc. | | 33,935 | 3,028 |
| Yaoko Co. Ltd. | | 948,100 | 49,010 |
| | | | 1,825,954 |
| Food Products - 1.6% | | | |
| Aryzta AG (a) | | 850,479 | 12,029 |
| Carr's Group PLC | | 2,230,900 | 4,334 |
| Cranswick PLC | | 450,611 | 19,364 |
| Dean Foods Co. | | 196,383 | 1,928 |
| Devro PLC | | 1,450,246 | 3,746 |
| Food Empire Holdings Ltd. (b) | | 39,079,200 | 17,941 |
| Fresh Del Monte Produce, Inc. (b) | | 4,812,249 | 174,685 |
| Hilton Food Group PLC | | 666,255 | 8,360 |
| Inghams Group Ltd. (a) | | 1,677,688 | 4,574 |
| Ingredion, Inc. | | 22,634 | 2,293 |
| Japan Meat Co. Ltd. | | 167,800 | 3,165 |
| Kaveri Seed Co. Ltd. | | 82,484 | 736 |
| Mitsui Sugar Co. Ltd. | | 351,300 | 10,651 |
| Nam Yang Dairy Products | | 10,500 | 6,045 |
| Natori Co. Ltd. | | 49,900 | 826 |
| Origin Enterprises PLC (b) | | 9,199,309 | 64,974 |
| Pacific Andes International Holdings Ltd. (c)(d) | | 106,378,500 | 989 |
| Pacific Andes Resources Development Ltd. (c)(d) | | 207,240,893 | 1,675 |
| Pickles Corp. | | 99,600 | 1,980 |
| Rocky Mountain Chocolate Factory, Inc. (b) | | 436,321 | 4,481 |
| S Foods, Inc. | | 402,100 | 15,769 |
| Seaboard Corp. | | 39,475 | 143,610 |
| Select Harvests Ltd. (a) | | 3,909,740 | 17,428 |
| Sunjin Co. Ltd. (b)(c) | | 2,376,955 | 29,566 |
| The Hain Celestial Group, Inc. (c) | | 300,527 | 8,547 |
| Want Want China Holdings Ltd. | | 13,499,000 | 11,162 |
| | | | 570,858 |
| Household Products - 0.0% | | | |
| Central Garden & Pet Co. Class A (non-vtg.) (c) | | 87,630 | 3,516 |
| Personal Products - 0.1% | | | |
| Grape King Bio Ltd. | | 1,748,000 | 13,433 |
| Natural Alternatives International, Inc. (c) | | 131,621 | 1,336 |
| Sarantis SA (b) | | 4,005,208 | 32,784 |
| | | | 47,553 |
| Tobacco - 0.1% | | | |
| Karelia Tobacco Co., Inc. | | 1,610 | 520 |
| Scandinavian Tobacco Group A/S (e) | | 1,775,731 | 28,896 |
| | | | 29,416 |
|
| TOTAL CONSUMER STAPLES | | | 3,053,659 |
|
| ENERGY - 5.0% | | | |
| Energy Equipment & Services - 1.6% | | | |
| AKITA Drilling Ltd. Class A (non-vtg.) | | 1,472,682 | 5,513 |
| Bristow Group, Inc. (b)(c) | | 2,147,436 | 30,021 |
| Carbo Ceramics, Inc. (c) | | 970,992 | 9,059 |
| Cathedral Energy Services Ltd. (c) | | 1,326,950 | 1,193 |
| Diamond Offshore Drilling, Inc. (a)(c) | | 4,250,530 | 81,610 |
| Divestco, Inc. (c) | | 2,899,000 | 178 |
| Dril-Quip, Inc. (c) | | 195,745 | 10,091 |
| Ensco PLC Class A | | 11,026,797 | 81,929 |
| Fugro NV (Certificaten Van Aandelen) (a)(c) | | 1,321,088 | 19,055 |
| Geospace Technologies Corp. (b)(c) | | 1,148,900 | 16,165 |
| Gulf Island Fabrication, Inc. | | 59,879 | 542 |
| GulfMark Offshore, Inc. warrants 11/14/24 (c) | | 76,904 | 192 |
| John Wood Group PLC | | 683,959 | 5,833 |
| Liberty Oilfield Services, Inc. Class A (a) | | 1,500,783 | 29,415 |
| National Oilwell Varco, Inc. | | 249,728 | 12,142 |
| Oceaneering International, Inc. | | 399,941 | 10,942 |
| Oil States International, Inc. (c) | | 2,315,809 | 80,822 |
| PHX Energy Services Corp. (c) | | 1,369,526 | 2,148 |
| RigNet, Inc. (c) | | 65,049 | 800 |
| Shinko Plantech Co. Ltd. | | 1,174,900 | 11,085 |
| Smart Sand, Inc. (c) | | 125,008 | 725 |
| Solstad Offshore ASA (a)(c) | | 2,067,803 | 1,557 |
| Total Energy Services, Inc. | | 2,054,043 | 17,369 |
| Transocean Ltd. (United States) (a)(c) | | 2,885,654 | 37,138 |
| Unit Corp. (b)(c) | | 5,387,244 | 134,142 |
| | | | 599,666 |
| Oil, Gas & Consumable Fuels - 3.4% | | | |
| Adams Resources & Energy, Inc. | | 136,169 | 5,447 |
| Andeavor | | 1,123,672 | 168,618 |
| Beach Energy Ltd. | | 15,782,560 | 22,396 |
| Bonavista Energy Corp. | | 278,447 | 334 |
| Chevron Corp. | | 199,965 | 25,250 |
| CNX Resources Corp. (c) | | 293,265 | 4,774 |
| ConocoPhillips Co. | | 873,295 | 63,026 |
| CONSOL Energy, Inc. (c) | | 48,446 | 2,017 |
| Contango Oil & Gas Co. (b)(c) | | 2,599,689 | 14,584 |
| Denbury Resources, Inc. (c) | | 5,743,600 | 25,904 |
| Eni SpA | | 7,285,345 | 140,232 |
| Fuji Kosan Co. Ltd. (b) | | 637,500 | 3,729 |
| Great Eastern Shipping Co. Ltd. | | 5,100,000 | 22,494 |
| Hankook Shell Oil Co. Ltd. | | 49,000 | 15,468 |
| International Seaways, Inc. (c) | | 23,313 | 508 |
| KyungDong City Gas Co. Ltd. | | 208,063 | 8,241 |
| Kyungdong Invest Co. Ltd. | | 84,315 | 3,673 |
| Marathon Oil Corp. | | 3,736,234 | 78,909 |
| Marathon Petroleum Corp. | | 136,564 | 11,038 |
| Michang Oil Industrial Co. Ltd. (b) | | 173,900 | 12,557 |
| Murphy Oil Corp. (b) | | 10,909,025 | 362,834 |
| NACCO Industries, Inc. Class A | | 176,552 | 5,826 |
| Newfield Exploration Co. (c) | | 378,210 | 10,862 |
| QEP Resources, Inc. (c) | | 1,697,069 | 17,633 |
| Reliance Industries Ltd. | | 162,800 | 2,820 |
| Southwestern Energy Co. (c) | | 12,800,316 | 65,794 |
| Star Petroleum Refining PCL | | 7,445,700 | 3,267 |
| Thai Oil PCL (For. Reg.) | | 371,400 | 896 |
| Whitecap Resources, Inc. | | 456,136 | 3,012 |
| Whiting Petroleum Corp. (c) | | 1,398,961 | 69,458 |
| World Fuel Services Corp. | | 1,864,425 | 51,887 |
| WPX Energy, Inc. (c) | | 1,036,018 | 19,446 |
| | | | 1,242,934 |
|
| TOTAL ENERGY | | | 1,842,600 |
|
| FINANCIALS - 11.3% | | | |
| Banks - 1.1% | | | |
| ACNB Corp. | | 94,455 | 3,240 |
| Associated Banc-Corp. | | 175,888 | 4,749 |
| BancFirst Corp. | | 65,670 | 4,078 |
| Bank Ireland Group PLC | | 11,458,526 | 98,349 |
| Bank of America Corp. | | 125,951 | 3,889 |
| Boston Private Financial Holdings, Inc. | | 192,787 | 2,776 |
| Camden National Corp. | | 55,435 | 2,556 |
| Cathay General Bancorp | | 625,752 | 26,025 |
| Central Pacific Financial Corp. | | 147,641 | 4,069 |
| Codorus Valley Bancorp, Inc. (b) | | 624,297 | 19,497 |
| Cullen/Frost Bankers, Inc. | | 79,615 | 8,797 |
| Dah Sing Banking Group Ltd. | | 1,713,200 | 3,636 |
| Dimeco, Inc. | | 36,256 | 1,504 |
| East West Bancorp, Inc. | | 26,000 | 1,683 |
| First Bancorp, Puerto Rico (c) | | 4,650,140 | 38,224 |
| First Citizen Bancshares, Inc. | | 8,884 | 3,614 |
| First Hawaiian, Inc. | | 452,374 | 12,784 |
| Hanmi Financial Corp. | | 49,905 | 1,250 |
| Hope Bancorp, Inc. | | 798,410 | 13,397 |
| Huntington Bancshares, Inc. | | 263,871 | 4,074 |
| KeyCorp | | 148,277 | 3,095 |
| LCNB Corp. | | 141,217 | 2,627 |
| Meridian Bank/Malvern, PA (c) | | 148,930 | 2,593 |
| Northrim Bancorp, Inc. | | 114,636 | 4,620 |
| OFG Bancorp | | 435,546 | 7,252 |
| Peoples Bancorp, Inc. | | 52,121 | 1,888 |
| PNC Financial Services Group, Inc. | | 27,404 | 3,969 |
| Popular, Inc. | | 34,800 | 1,727 |
| Regions Financial Corp. | | 203,911 | 3,795 |
| SpareBank 1 SR-Bank ASA (primary capital certificate) | | 1,233,555 | 13,702 |
| Sparebanken More (primary capital certificate) | | 208,532 | 6,954 |
| Sparebanken Nord-Norge | | 2,315,482 | 17,600 |
| Umpqua Holdings Corp. | | 125,800 | 2,680 |
| Van Lanschot NV (Bearer) | | 1,062,198 | 29,313 |
| Wells Fargo & Co. | | 841,197 | 48,192 |
| | | | 408,198 |
| Capital Markets - 0.5% | | | |
| AllianceBernstein Holding LP | | 700,127 | 21,144 |
| Ameriprise Financial, Inc. | | 13,730 | 2,000 |
| Ares Capital Corp. | | 200,000 | 3,370 |
| Banca Generali SpA | | 129,514 | 3,495 |
| Close Brothers Group PLC | | 138,145 | 2,879 |
| Cowen Group, Inc. Class A (a)(c) | | 408,471 | 6,413 |
| Franklin Resources, Inc. | | 1,082,698 | 37,158 |
| GAMCO Investors, Inc. Class A | | 107,994 | 2,645 |
| Hamilton Lane, Inc. Class A | | 91,919 | 4,501 |
| Invesco Ltd. | | 108,593 | 2,931 |
| Lazard Ltd. Class A | | 352,724 | 19,153 |
| OM Asset Management Ltd. | | 204,456 | 2,913 |
| State Street Corp. | | 172,431 | 15,227 |
| Tullett Prebon PLC | | 709,958 | 2,609 |
| Waddell & Reed Financial, Inc. Class A | | 2,470,604 | 51,166 |
| | | | 177,604 |
| Consumer Finance - 1.3% | | | |
| Aeon Credit Service (Asia) Co. Ltd. | | 12,750,000 | 10,802 |
| American Express Co. | | 37,528 | 3,735 |
| Discover Financial Services | | 563,749 | 40,257 |
| H&T Group PLC | | 538,783 | 2,235 |
| Navient Corp. | | 1,126,615 | 14,883 |
| Nicholas Financial, Inc. (c) | | 359,572 | 3,308 |
| OneMain Holdings, Inc. (c) | | 685,356 | 22,788 |
| Santander Consumer U.S.A. Holdings, Inc. | | 9,040,082 | 173,931 |
| Synchrony Financial | | 6,694,447 | 193,737 |
| | | | 465,676 |
| Diversified Financial Services - 0.2% | | | |
| AXA Equitable Holdings, Inc. | | 2,195,561 | 48,280 |
| Far East Horizon Ltd. | | 2,513,000 | 2,420 |
| Newship Ltd. (c)(d) | | 2,500 | 906 |
| Ricoh Leasing Co. Ltd. | | 765,600 | 24,992 |
| | | | 76,598 |
| Insurance - 7.3% | | | |
| AEGON NV | | 45,707,932 | 301,557 |
| AFLAC, Inc. | | 654,832 | 30,476 |
| Allstate Corp. | | 40,170 | 3,821 |
| April | | 2,187,623 | 34,790 |
| ASR Nederland NV | | 556,991 | 24,945 |
| Assurant, Inc. | | 2,400,088 | 264,730 |
| Aub Group Ltd. | | 246,187 | 2,398 |
| Axis Capital Holdings Ltd. | | 1,600,497 | 90,524 |
| CNO Financial Group, Inc. | | 186,864 | 3,803 |
| Employers Holdings, Inc. | | 92,040 | 4,275 |
| FBD Holdings PLC | | 145,047 | 1,755 |
| First American Financial Corp. | | 109,261 | 6,119 |
| Great-West Lifeco, Inc. | | 46,294 | 1,144 |
| Hartford Financial Services Group, Inc. | | 1,896,469 | 99,944 |
| Hiscox Ltd. | | 240,081 | 5,036 |
| Hyundai Fire & Marine Insurance Co. Ltd. | | 114,734 | 3,776 |
| Investors Title Co. | | 7,423 | 1,421 |
| Lincoln National Corp. | | 4,474,622 | 304,722 |
| MetLife, Inc. | | 10,559,047 | 482,971 |
| National Western Life Group, Inc. | | 132,121 | 42,807 |
| NN Group NV | | 1,151,464 | 50,923 |
| Primerica, Inc. | | 123,713 | 14,202 |
| Principal Financial Group, Inc. | | 53,703 | 3,119 |
| RenaissanceRe Holdings Ltd. | | 1,686,076 | 222,309 |
| Sony Financial Holdings, Inc. | | 2,445,000 | 46,984 |
| The Travelers Companies, Inc. | | 28,419 | 3,698 |
| Torchmark Corp. | | 89,244 | 7,860 |
| Universal Insurance Holdings, Inc. | | 45,491 | 2,020 |
| Unum Group (b) | | 15,095,575 | 599,747 |
| WMI Holdings Corp. (c) | | 385,255 | 524 |
| | | | 2,662,400 |
| Mortgage Real Estate Investment Trusts - 0.5% | | | |
| Annaly Capital Management, Inc. | | 14,680,820 | 157,378 |
| MFA Financial, Inc. | | 277,769 | 2,236 |
| New Residential Investment Corp. | | 24,468 | 438 |
| Redwood Trust, Inc. | | 481,349 | 8,091 |
| | | | 168,143 |
| Thrifts & Mortgage Finance - 0.4% | | | |
| ASAX Co. Ltd. | | 333,800 | 1,914 |
| Genworth MI Canada, Inc. | | 4,000,817 | 140,829 |
| Genworth Mortgage Insurance Ltd. | | 6,179,851 | 12,351 |
| Meridian Bancorp, Inc. Maryland | | 211,193 | 3,865 |
| | | | 158,959 |
|
| TOTAL FINANCIALS | | | 4,117,578 |
|
| HEALTH CARE - 14.2% | | | |
| Biotechnology - 1.6% | | | |
| Amgen, Inc. | | 2,860,423 | 562,216 |
| Celgene Corp. (c) | | 9,789 | 882 |
| Gilead Sciences, Inc. | | 193,052 | 15,025 |
| United Therapeutics Corp. (c) | | 37,343 | 4,590 |
| | | | 582,713 |
| Health Care Equipment & Supplies - 0.8% | | | |
| Apex Biotechnology Corp. | | 1,200,000 | 1,099 |
| Arts Optical International Holdings Ltd. (b) | | 22,612,000 | 5,935 |
| Boston Scientific Corp. (c) | | 252,681 | 8,493 |
| Hoshiiryou Sanki Co. Ltd. (b) | | 298,464 | 10,891 |
| Huvitz Co. Ltd. | | 25,000 | 272 |
| LivaNova PLC (c) | | 64,834 | 7,140 |
| Microlife Corp. | | 3,683,500 | 10,323 |
| Nakanishi, Inc. | | 974,700 | 20,354 |
| Pacific Hospital Supply Co. Ltd. | | 1,454,000 | 3,148 |
| Prim SA (b) | | 1,437,100 | 22,014 |
| ResMed, Inc. | | 76,907 | 8,135 |
| Shandong Weigao Medical Polymer Co. Ltd. (H Shares) | | 928,000 | 709 |
| St.Shine Optical Co. Ltd. | | 2,000,000 | 44,014 |
| Supermax Corp. Bhd | | 10,000,000 | 10,750 |
| Techno Medica Co. Ltd. | | 38,800 | 734 |
| Utah Medical Products, Inc. (b) | | 283,123 | 27,463 |
| Zimmer Biomet Holdings, Inc. | | 800,062 | 100,424 |
| | | | 281,898 |
| Health Care Providers & Services - 10.6% | | | |
| Aetna, Inc. | | 4,166,607 | 784,947 |
| Anthem, Inc. | | 1,872,031 | 473,624 |
| CVS Health Corp. | | 555,122 | 36,005 |
| DVx, Inc. (b) | | 698,000 | 8,927 |
| Hanger, Inc. (b)(c) | | 2,494,350 | 43,651 |
| Hi-Clearance, Inc. | | 1,489,000 | 4,864 |
| Humana, Inc. | | 9,482 | 2,979 |
| Laboratory Corp. of America Holdings (c) | | 9,938 | 1,743 |
| Medica Sur SA de CV | | 333,308 | 679 |
| MEDNAX, Inc. (c) | | 490,950 | 21,008 |
| Patterson Companies, Inc. | | 249,574 | 6,120 |
| Premier, Inc. (c) | | 143,733 | 5,376 |
| Quest Diagnostics, Inc. | | 28,948 | 3,118 |
| Ship Healthcare Holdings, Inc. | | 131,400 | 5,094 |
| Tokai Corp. | | 342,500 | 7,495 |
| Triple-S Management Corp. (b)(c) | | 1,665,016 | 59,125 |
| Tsukui Corp. | | 375,300 | 3,393 |
| United Drug PLC (United Kingdom) | | 2,506,632 | 27,637 |
| UnitedHealth Group, Inc. | | 8,971,989 | 2,271,890 |
| Universal Health Services, Inc. Class B | | 612,771 | 74,819 |
| WIN-Partners Co. Ltd. (b) | | 2,528,500 | 37,651 |
| | | | 3,880,145 |
| Health Care Technology - 0.1% | | | |
| Addlife AB | | 299,732 | 7,193 |
| Computer Programs & Systems, Inc. (a) | | 139,215 | 4,344 |
| ND Software Co. Ltd. (b) | | 1,204,400 | 12,926 |
| | | | 24,463 |
| Pharmaceuticals - 1.1% | | | |
| Akorn, Inc. (c) | | 91,905 | 1,702 |
| Apex Healthcare Bhd | | 47,600 | 83 |
| Bliss Gvs Pharma Ltd. (c) | | 4,600,000 | 11,547 |
| Bristol-Myers Squibb Co. | | 45,818 | 2,692 |
| Daewon Pharmaceutical Co. Ltd. (b) | | 1,871,384 | 32,353 |
| Daewoong Co. Ltd. | | 350,000 | 4,621 |
| Dawnrays Pharmaceutical Holdings Ltd. | | 11,111,000 | 6,342 |
| DongKook Pharmaceutical Co. Ltd. (b) | | 623,700 | 35,177 |
| FDC Ltd. (c) | | 3,141,164 | 11,049 |
| Fuji Pharma Co. Ltd. | | 648,700 | 11,267 |
| Genomma Lab Internacional SA de CV (c) | | 5,507,300 | 4,394 |
| Indivior PLC (c) | | 16,590,396 | 66,590 |
| Jazz Pharmaceuticals PLC (c) | | 24,335 | 4,212 |
| Korea United Pharm, Inc. | | 239,629 | 5,144 |
| Kwang Dong Pharmaceutical Co. Ltd. (b) | | 3,100,000 | 20,881 |
| Kyung Dong Pharmaceutical Co. Ltd. | | 960,000 | 10,432 |
| Lee's Pharmaceutical Holdings Ltd. | | 5,959,000 | 6,385 |
| Novo Nordisk A/S Series B sponsored ADR | | 1,076,594 | 53,582 |
| Phibro Animal Health Corp. Class A | | 142,459 | 6,824 |
| Recordati SpA | | 1,541,484 | 57,645 |
| Taro Pharmaceutical Industries Ltd. (c) | | 45,405 | 5,097 |
| Tsumura & Co. | | 349,700 | 11,337 |
| Vivimed Labs Ltd. (c) | | 600,000 | 496 |
| Whanin Pharmaceutical Co. Ltd. (b) | | 1,750,000 | 33,084 |
| | | | 402,936 |
|
| TOTAL HEALTH CARE | | | 5,172,155 |
|
| INDUSTRIALS - 7.0% | | | |
| Aerospace & Defense - 0.2% | | | |
| Astronics Corp. (c) | | 75,489 | 3,096 |
| Austal Ltd. | | 1,411,147 | 1,793 |
| Engility Holdings, Inc. (c) | | 1,268,833 | 43,902 |
| United Technologies Corp. | | 72,961 | 9,904 |
| | | | 58,695 |
| Air Freight & Logistics - 0.0% | | | |
| Air T, Inc. (b)(c) | | 184,505 | 6,043 |
| Airlines - 0.1% | | | |
| Air New Zealand Ltd. | | 1,189,535 | 2,631 |
| American Airlines Group, Inc. | | 256,054 | 10,124 |
| JetBlue Airways Corp. (c) | | 359,150 | 6,465 |
| | | | 19,220 |
| Building Products - 0.1% | | | |
| Builders FirstSource, Inc. (c) | | 129,752 | 2,326 |
| Continental Building Products, Inc. (c) | | 336,645 | 10,739 |
| COVIA Corp. (a)(c) | | 402,013 | 7,248 |
| Gibraltar Industries, Inc. (c) | | 106,527 | 4,629 |
| Kondotec, Inc. (b) | | 1,566,200 | 14,329 |
| | | | 39,271 |
| Commercial Services & Supplies - 0.7% | | | |
| ABM Industries, Inc. | | 223,185 | 6,963 |
| Aeon Delight Co. Ltd. | | 114,700 | 4,190 |
| AJIS Co. Ltd. (b) | | 892,800 | 27,747 |
| Asia File Corp. Bhd | | 4,480,000 | 3,031 |
| Calian Technologies Ltd. (b) | | 625,174 | 15,163 |
| Civeo Corp. (b)(c) | | 11,929,673 | 45,452 |
| Essendant, Inc. | | 1,650,608 | 27,450 |
| Fursys, Inc. (b) | | 950,000 | 25,681 |
| Interface, Inc. | | 265,304 | 5,943 |
| KAR Auction Services, Inc. | | 37,054 | 2,203 |
| Lion Rock Group Ltd. | | 19,227,640 | 3,332 |
| Mears Group PLC | | 837,111 | 3,571 |
| Mitie Group PLC | | 13,439,459 | 27,130 |
| Nac Co. Ltd. | | 349,700 | 3,068 |
| NICE Total Cash Management Co., Ltd. | | 1,025,000 | 12,059 |
| VICOM Ltd. | | 2,653,500 | 11,948 |
| VSE Corp. (b) | | 839,329 | 36,175 |
| | | | 261,106 |
| Construction & Engineering - 1.1% | | | |
| AECOM (c) | | 6,933,069 | 232,674 |
| Arcadis NV | | 2,139,787 | 39,134 |
| Astaldi SpA (c) | | 2,589,900 | 5,857 |
| Boustead Projs. Pte Ltd. | | 1,033,287 | 687 |
| Boustead Singapore Ltd. | | 4,044,700 | 2,451 |
| C-Cube Corp. | | 322,700 | 2,658 |
| Daiichi Kensetsu Corp. (b) | | 1,728,700 | 27,504 |
| EMCOR Group, Inc. | | 151,109 | 11,628 |
| Geumhwa PSC Co. Ltd. (b) | | 360,000 | 10,669 |
| Kyeryong Construction Industrial Co. Ltd. (b)(c) | | 675,000 | 13,397 |
| Meisei Industrial Co. Ltd. | | 1,104,500 | 8,920 |
| Mirait Holdings Corp. | | 400,300 | 6,143 |
| Nippon Rietec Co. Ltd. | | 1,168,900 | 16,538 |
| Severfield PLC | | 2,762,161 | 3,009 |
| Shinnihon Corp. | | 1,574,500 | 19,897 |
| Toshiba Plant Systems & Services Corp. | | 164,500 | 3,635 |
| United Integrated Services Co. | | 5,143,500 | 9,822 |
| | | | 414,623 |
| Electrical Equipment - 0.5% | | | |
| Aichi Electric Co. Ltd. | | 311,100 | 9,251 |
| Aros Quality Group AB | | 725,232 | 13,444 |
| AZZ, Inc. | | 1,015,476 | 55,039 |
| Bharat Heavy Electricals Ltd. | | 30,750,000 | 33,261 |
| Chiyoda Integre Co. Ltd. | | 329,500 | 7,285 |
| Eaton Corp. PLC | | 48,307 | 4,018 |
| Generac Holdings, Inc. (c) | | 91,005 | 4,892 |
| Hammond Power Solutions, Inc. Class A | | 452,561 | 2,498 |
| I-Sheng Electric Wire & Cable Co. Ltd. (b) | | 12,500,000 | 17,495 |
| Korea Electric Terminal Co. Ltd. (b) | | 700,000 | 28,981 |
| Regal Beloit Corp. | | 46,710 | 4,015 |
| Servotronics, Inc. | | 114,683 | 1,104 |
| TKH Group NV (depositary receipt) | | 240,518 | 15,061 |
| | | | 196,344 |
| Industrial Conglomerates - 1.0% | | | |
| DCC PLC (United Kingdom) | | 3,221,853 | 298,133 |
| ITT, Inc. | | 84,533 | 4,790 |
| Lifco AB | | 500,191 | 22,441 |
| Mytilineos Holdings SA | | 890,419 | 8,954 |
| Reunert Ltd. | | 1,699,842 | 10,534 |
| | | | 344,852 |
| Machinery - 1.5% | | | |
| Aalberts Industries NV (b) | | 6,646,561 | 301,560 |
| Allison Transmission Holdings, Inc. | | 419,467 | 19,715 |
| ASL Marine Holdings Ltd. (b)(c) | | 45,187,913 | 3,319 |
| Cummins, Inc. | | 24,953 | 3,564 |
| Douglas Dynamics, Inc. | | 31,800 | 1,561 |
| Foremost Income Fund (c) | | 2,141,103 | 8,814 |
| Global Brass & Copper Holdings, Inc. | | 47,206 | 1,555 |
| Haitian International Holdings Ltd. | | 6,946,000 | 16,372 |
| Hurco Companies, Inc. | | 54,895 | 2,432 |
| Hwacheon Machine Tool Co. Ltd. (b) | | 219,900 | 10,270 |
| Hyster-Yale Materials Handling: | | | |
| Class A (b) | | 232,017 | 15,257 |
| Class B (b) | | 310,000 | 20,386 |
| Ihara Science Corp. (b) | | 983,500 | 19,975 |
| Jaya Holdings Ltd. (b)(c)(d) | | 3,239,440 | 69 |
| Kyowakogyosyo Co. Ltd. | | 45,000 | 2,612 |
| Luxfer Holdings PLC sponsored | | 306,766 | 5,675 |
| Maruzen Co. Ltd. (b) | | 1,589,000 | 31,406 |
| Miller Industries, Inc. | | 93,896 | 2,446 |
| Mincon Group PLC | | 2,158,692 | 3,786 |
| Nadex Co. Ltd. (b) | | 795,500 | 7,449 |
| Nakano Refrigerators Co. Ltd. | | 25,700 | 1,368 |
| Nitchitsu Co. Ltd. | | 55,800 | 915 |
| Rexnord Corp. (c) | | 227,335 | 6,875 |
| Semperit AG Holding (c) | | 439,700 | 8,741 |
| SIMPAC, Inc. | | 583,000 | 1,526 |
| Takamatsu Machinery Co. Ltd. | | 323,200 | 3,399 |
| Techno Smart Corp. (a) | | 529,900 | 5,649 |
| Tocalo Co. Ltd. | | 3,065,000 | 34,977 |
| Trinity Industrial Corp. | | 721,900 | 4,584 |
| WABCO Holdings, Inc. (c) | | 79,375 | 9,976 |
| | | | 556,233 |
| Marine - 0.0% | | | |
| SITC International Holdings Co. Ltd. | | 4,512,000 | 4,380 |
| Tokyo Kisen Co. Ltd. (b) | | 829,500 | 5,987 |
| | | | 10,367 |
| Professional Services - 0.3% | | | |
| Akka Technologies SA | | 225,557 | 16,617 |
| Asiakastieto Group Oyj (e) | | 82,580 | 2,965 |
| Boardroom Ltd. | | 2,574,042 | 1,475 |
| Clarius Group Ltd. (c) | | 1,956,883 | 77 |
| ICF International, Inc. | | 64,876 | 4,778 |
| Kelly Services, Inc. Class A (non-vtg.) | | 112,368 | 2,729 |
| McMillan Shakespeare Ltd. | | 1,800,353 | 21,736 |
| Nielsen Holdings PLC | | 511,628 | 12,054 |
| Robert Half International, Inc. | | 52,600 | 3,985 |
| SHL-JAPAN Ltd. | | 101,800 | 1,788 |
| Sporton International, Inc. | | 309,088 | 1,455 |
| Stantec, Inc. | | 750,247 | 19,592 |
| Synergie SA | | 127,600 | 5,961 |
| TrueBlue, Inc. (c) | | 283,809 | 7,677 |
| | | | 102,889 |
| Road & Rail - 0.7% | | | |
| Alps Logistics Co. Ltd. (b) | | 2,856,400 | 21,765 |
| Chilled & Frozen Logistics Holdings Co. Ltd. | | 1,098,500 | 13,194 |
| CSX Corp. | | 126,724 | 8,957 |
| Daqin Railway Co. Ltd. (A Shares) | | 26,000,000 | 34,157 |
| Hamakyorex Co. Ltd. (b) | | 1,253,500 | 43,329 |
| Higashi Twenty One Co. Ltd. | | 250,200 | 1,423 |
| Knight-Swift Transportation Holdings, Inc. Class A | | 147,000 | 4,785 |
| Norfolk Southern Corp. | | 39,845 | 6,734 |
| Roadrunner Transportation Systems, Inc. (b)(c) | | 3,155,561 | 6,911 |
| Sakai Moving Service Co. Ltd. (b) | | 1,081,600 | 57,168 |
| Trancom Co. Ltd. (b) | | 855,500 | 62,738 |
| | | | 261,161 |
| Trading Companies & Distributors - 0.7% | | | |
| AddTech AB (B Shares) | | 1,131,928 | 25,643 |
| AerCap Holdings NV (c) | | 232,124 | 13,029 |
| Alconix Corp. (b) | | 2,120,300 | 32,597 |
| Goodfellow, Inc. (b)(c) | | 723,079 | 4,058 |
| HD Supply Holdings, Inc. (c) | | 479,818 | 21,102 |
| HERIGE | | 60,993 | 2,511 |
| Houston Wire & Cable Co. (c) | | 76,246 | 610 |
| Kaman Corp. | | 42,219 | 2,796 |
| KS Energy Services Ltd. (c) | | 13,173,500 | 310 |
| Lumax International Corp. Ltd. | | 3,123,900 | 6,221 |
| Meiwa Corp. | | 1,717,700 | 7,451 |
| Mitani Shoji Co. Ltd. | | 735,300 | 34,195 |
| MRC Global, Inc. (c) | | 460,407 | 10,428 |
| Otec Corp. | | 124,300 | 2,289 |
| Parker Corp. (b) | | 2,220,000 | 10,960 |
| Richelieu Hardware Ltd. | | 700,992 | 15,169 |
| Senshu Electric Co. Ltd. (b) | | 894,900 | 26,771 |
| Strongco Corp. (b)(c) | | 849,615 | 1,437 |
| Tanaka Co. Ltd. | | 36,800 | 230 |
| TECHNO ASSOCIE Co. Ltd. | | 255,100 | 3,080 |
| Titan Machinery, Inc. (c) | | 729,535 | 11,045 |
| Totech Corp. (b) | | 926,400 | 21,516 |
| WESCO International, Inc. (c) | | 51,801 | 3,160 |
| | | | 256,608 |
| Transportation Infrastructure - 0.1% | | | |
| Isewan Terminal Service Co. Ltd. | | 1,292,700 | 8,509 |
| James Fisher and Sons PLC | | 127,253 | 3,010 |
| Meiko Transportation Co. Ltd. | | 829,400 | 9,064 |
| Qingdao Port International Co. Ltd. (e) | | 4,711,000 | 3,433 |
| Sinwa Ltd. (b) | | 20,399,000 | 3,446 |
| | | | 27,462 |
|
| TOTAL INDUSTRIALS | | | 2,554,874 |
|
| INFORMATION TECHNOLOGY - 16.5% | | | |
| Communications Equipment - 0.1% | | | |
| F5 Networks, Inc. (c) | | 22,931 | 3,930 |
| InterDigital, Inc. | | 150,998 | 12,450 |
| Juniper Networks, Inc. | | 176,774 | 4,656 |
| | | | 21,036 |
| Electronic Equipment & Components - 4.9% | | | |
| A&D Co. Ltd. | | 683,100 | 6,390 |
| AVX Corp. | | 150,000 | 3,117 |
| Bel Fuse, Inc. Class A | | 84,717 | 1,660 |
| Casa Systems, Inc. (c) | | 97,021 | 1,478 |
| CDW Corp. | | 174,276 | 14,655 |
| CTS Corp. | | 314,181 | 10,965 |
| Daido Signal Co. Ltd. | | 99,400 | 524 |
| Dynapack International Technology Corp. | | 3,200,000 | 4,076 |
| Elec & Eltek International Co. Ltd. | | 1,491,300 | 2,177 |
| Elematec Corp. (b) | | 1,180,800 | 27,752 |
| ePlus, Inc. (c) | | 99,513 | 9,817 |
| Excel Co. Ltd. (b) | | 745,800 | 16,942 |
| Fabrinet | | 112,812 | 4,413 |
| Hi-P International Ltd. | | 11,932,100 | 11,044 |
| Hon Hai Precision Industry Co. Ltd. (Foxconn) | | 182,476,140 | 500,033 |
| IDIS Holdings Co. Ltd. (b) | | 800,000 | 10,166 |
| Image Sensing Systems, Inc. (c) | | 64,468 | 271 |
| Insight Enterprises, Inc. (c) | | 299,412 | 15,051 |
| Intelligent Digital Integrated Security Co. Ltd. (b) | | 900,010 | 7,137 |
| INTOPS Co. Ltd. (b) | | 1,719,800 | 14,024 |
| Isra Vision AG (b) | | 1,250,390 | 76,909 |
| Keysight Technologies, Inc. (c) | | 2,635,824 | 152,878 |
| Kingboard Chemical Holdings Ltd. (b) | | 76,053,500 | 265,008 |
| Kingboard Laminates Holdings Ltd. | | 3,725,000 | 4,452 |
| Mesa Laboratories, Inc. | | 135,046 | 27,310 |
| Muramoto Electronic Thailand PCL (For. Reg.) (b) | | 1,228,600 | 7,016 |
| Nippo Ltd. (b) | | 736,700 | 2,971 |
| PAX Global Technology Ltd. | | 4,075,000 | 1,957 |
| Philips Lighting NV (e) | | 110,968 | 3,078 |
| Pinnacle Technology Holdings Ltd. | | 7,337,376 | 10,420 |
| Plexus Corp. (c) | | 148,139 | 8,802 |
| Redington India Ltd. | | 14,700,000 | 23,190 |
| Sanmina Corp. (c) | | 24,468 | 712 |
| ScanSource, Inc. (b)(c) | | 2,258,403 | 93,159 |
| Shibaura Electronics Co. Ltd. (b) | | 626,300 | 26,494 |
| Sigmatron International, Inc. (c) | | 170,707 | 1,193 |
| Simplo Technology Co. Ltd. | | 6,300,000 | 36,567 |
| SYNNEX Corp. (b) | | 2,700,847 | 260,551 |
| Tomen Devices Corp. (b) | | 538,200 | 13,785 |
| Tripod Technology Corp. | | 1,465,000 | 4,043 |
| TTM Technologies, Inc. (c) | | 934,794 | 16,228 |
| UKC Holdings Corp. (b) | | 1,272,500 | 25,947 |
| VST Holdings Ltd. (b) | | 118,976,800 | 64,422 |
| Wayside Technology Group, Inc. (b) | | 275,041 | 3,713 |
| Wireless Telecom Group, Inc. (c) | | 295,018 | 620 |
| | | | 1,793,117 |
| Internet Software & Services - 0.2% | | | |
| Alphabet, Inc.: | | | |
| Class A (c) | | 1,497 | 1,837 |
| Class C (c) | | 9,507 | 11,572 |
| Aucnet, Inc. | | 197,300 | 2,947 |
| Carbonite, Inc. (c) | | 218,985 | 7,511 |
| eBay, Inc. (c) | | 45,613 | 1,526 |
| Gabia, Inc. (b) | | 975,000 | 8,126 |
| j2 Global, Inc. | | 199,818 | 16,953 |
| Moneysupermarket.com Group PLC | | 744,253 | 3,068 |
| NetGem SA | | 849,884 | 2,345 |
| Softbank Technology Corp. (a) | | 256,800 | 4,568 |
| Yahoo! Japan Corp. (a) | | 1,957,300 | 7,447 |
| | | | 67,900 |
| IT Services - 3.7% | | | |
| ALTEN | | 610,716 | 60,666 |
| Amdocs Ltd. | | 6,376,612 | 430,931 |
| Argo Graphics, Inc. | | 393,600 | 15,365 |
| CACI International, Inc. Class A (c) | | 64,279 | 11,262 |
| Computer Services, Inc. | | 258,354 | 13,370 |
| CSE Global Ltd. (b) | | 40,677,900 | 13,446 |
| Data#3 Ltd. | | 2,804,497 | 3,177 |
| Dimerco Data System Corp. | | 510,000 | 615 |
| DXC Technology Co. | | 75,473 | 6,396 |
| E-Credible Co. Ltd. | | 129,349 | 1,748 |
| eClerx Services Ltd. | | 1,684,608 | 31,807 |
| EOH Holdings Ltd. | | 6,392,071 | 20,146 |
| Estore Corp. | | 283,800 | 2,452 |
| EVERTEC, Inc. | | 1,460,509 | 34,030 |
| ExlService Holdings, Inc. (c) | | 179,079 | 10,680 |
| Indra Sistemas SA (b)(c) | | 12,849,300 | 156,113 |
| Know IT AB (b) | | 1,392,111 | 27,548 |
| Leidos Holdings, Inc. | | 640,839 | 43,846 |
| Maximus, Inc. | | 312,392 | 20,246 |
| Net 1 UEPS Technologies, Inc. (c) | | 460,597 | 4,302 |
| Nice Information & Telecom, Inc. | | 53,000 | 1,159 |
| Rolta India Ltd. (c) | | 2,699,942 | 1,625 |
| Science Applications International Corp. | | 162,081 | 13,675 |
| Societe Pour L'Informatique Industrielle SA (b) | | 1,657,239 | 48,447 |
| Softcreate Co. Ltd. | | 602,100 | 9,391 |
| Sword Group | | 12,289 | 503 |
| Syntel, Inc. (c) | | 64,178 | 2,605 |
| The Western Union Co. | | 17,925,734 | 361,383 |
| TravelSky Technology Ltd. (H Shares) | | 1,005,000 | 2,849 |
| WNS Holdings Ltd. sponsored ADR (c) | | 73,352 | 3,569 |
| | | | 1,353,352 |
| Semiconductors & Semiconductor Equipment - 0.7% | | | |
| Amkor Technology, Inc. (c) | | 24,468 | 212 |
| Axell Corp. (b) | | 762,700 | 5,341 |
| Boe Varitronix Ltd. | | 5,034,000 | 1,988 |
| Cirrus Logic, Inc. (c) | | 73,110 | 3,163 |
| Diodes, Inc. (c) | | 268,979 | 9,995 |
| Entegris, Inc. | | 311,564 | 10,951 |
| Integrated Device Technology, Inc. (c) | | 463,127 | 15,945 |
| KLA-Tencor Corp. | | 23,456 | 2,754 |
| Leeno Industrial, Inc. | | 575,000 | 34,547 |
| Melexis NV | | 1,148,100 | 106,798 |
| Miraial Co. Ltd. | | 150,000 | 1,528 |
| Nanometrics, Inc. (c) | | 243,795 | 9,181 |
| ON Semiconductor Corp. (c) | | 205,718 | 4,536 |
| Phison Electronics Corp. | | 1,900,000 | 15,781 |
| Powertech Technology, Inc. | | 9,000,000 | 25,457 |
| Trio-Tech International (b)(c) | | 224,608 | 1,038 |
| United Microelectronics Corp. | | 4,331,000 | 2,483 |
| | | | 251,698 |
| Software - 3.4% | | | |
| Activision Blizzard, Inc. | | 148,513 | 10,904 |
| AdaptIT Holdings Ltd. | | 2,514,434 | 1,575 |
| ANSYS, Inc. (c) | | 3,525,193 | 595,335 |
| Aspen Technology, Inc. (c) | | 118,525 | 11,354 |
| Ebix, Inc. | | 1,500,202 | 119,041 |
| ICT Automatisering NV (b) | | 491,679 | 8,682 |
| InfoVine Co. Ltd. (b) | | 175,000 | 3,709 |
| Jorudan Co. Ltd. (b) | | 422,500 | 4,066 |
| KPIT Cummins Infosystems Ltd. | | 5,800,000 | 25,179 |
| KSK Co., Ltd. (b) | | 531,500 | 8,551 |
| Micro Focus International PLC | | 215,068 | 3,509 |
| Nucleus Software Exports Ltd. | | 601,191 | 3,034 |
| Oracle Corp. | | 8,039,806 | 383,338 |
| Pegasystems, Inc. | | 149,658 | 8,321 |
| Pro-Ship, Inc. | | 252,500 | 5,578 |
| RealPage, Inc. (c) | | 203,287 | 11,201 |
| Vitec Software Group AB | | 699,586 | 6,460 |
| Zensar Technologies Ltd. | | 800,000 | 14,441 |
| | | | 1,224,278 |
| Technology Hardware, Storage & Peripherals - 3.5% | | | |
| Compal Electronics, Inc. | | 67,500,000 | 41,938 |
| Hewlett Packard Enterprise Co. | | 2,064,640 | 31,878 |
| HP, Inc. | | 6,460,356 | 149,105 |
| Seagate Technology LLC (b) | | 18,610,388 | 979,279 |
| Super Micro Computer, Inc. (c) | | 632,618 | 13,981 |
| TPV Technology Ltd. | | 69,600,000 | 7,183 |
| Western Digital Corp. | | 41,758 | 2,929 |
| Xerox Corp. | | 2,446,803 | 63,543 |
| | | | 1,289,836 |
|
| TOTAL INFORMATION TECHNOLOGY | | | 6,001,217 |
|
| MATERIALS - 3.6% | | | |
| Chemicals - 2.4% | | | |
| Axalta Coating Systems Ltd. (c) | | 492,665 | 14,903 |
| C. Uyemura & Co. Ltd. | | 383,800 | 28,833 |
| Cabot Corp. | | 15,344 | 1,014 |
| Chase Corp. (b) | | 679,101 | 83,869 |
| Core Molding Technologies, Inc. | | 381,326 | 5,129 |
| Deepak Fertilisers and Petrochemicals Corp. Ltd. | | 1,800,000 | 7,267 |
| Deepak Nitrite Ltd. (c) | | 41,557 | 147 |
| DowDuPont, Inc. | | 49,070 | 3,375 |
| Eastman Chemical Co. | | 28,944 | 2,999 |
| EcoGreen International Group Ltd. (b) | | 50,122,080 | 10,664 |
| FMC Corp. | | 1,193,224 | 107,247 |
| Fujikura Kasei Co., Ltd. (b) | | 2,711,200 | 15,712 |
| Fuso Chemical Co. Ltd. | | 598,800 | 15,289 |
| Gujarat Narmada Valley Fertilizers Co. | | 5,000,000 | 30,485 |
| Gujarat State Fertilizers & Chemicals Ltd. (b) | | 28,500,000 | 48,562 |
| Honshu Chemical Industry Co. Ltd. (b) | | 762,700 | 7,715 |
| Huntsman Corp. | | 291,429 | 9,772 |
| Innospec, Inc. | | 799,627 | 64,730 |
| JSR Corp. | | 262,200 | 5,021 |
| KPC Holdings Corp. | | 43,478 | 2,452 |
| KPX Chemical Co. Ltd. | | 163,083 | 9,652 |
| KPX Green Chemical Co. Ltd. | | 225,000 | 875 |
| Miwon Chemicals Co. Ltd. | | 55,095 | 2,311 |
| Miwon Commercial Co. Ltd. | | 13,819 | 3,109 |
| Muto Seiko Co. Ltd. | | 238,200 | 1,638 |
| Nihon Parkerizing Co. Ltd. | | 307,700 | 4,554 |
| Nippon Soda Co. Ltd. | | 1,575,000 | 9,226 |
| SK Kaken Co. Ltd. | | 275,000 | 25,578 |
| Soken Chemical & Engineer Co. Ltd. (b) | | 667,000 | 12,151 |
| T&K Toka Co. Ltd. (b) | | 1,345,700 | 15,501 |
| Thai Carbon Black PCL (For. Reg.) (c) | | 11,472,900 | 18,104 |
| Thai Rayon PCL: | | | |
| (For. Reg.) | | 2,719,500 | 3,842 |
| NVDR | | 85,600 | 121 |
| The Chemours Co. LLC | | 259,548 | 11,890 |
| The Mosaic Co. | | 3,298,433 | 99,316 |
| UPL Ltd. | | 875,000 | 8,232 |
| Westlake Chemical Corp. | | 101,311 | 10,863 |
| Yara International ASA | | 3,498,135 | 154,350 |
| Yip's Chemical Holdings Ltd. | | 25,692,000 | 9,001 |
| | | | 865,499 |
| Construction Materials - 0.1% | | | |
| Brampton Brick Ltd. Class A (sub. vtg.) (c) | | 672,772 | 4,189 |
| Mitani Sekisan Co. Ltd. (b) | | 1,490,300 | 36,133 |
| RHI Magnesita NV | | 43,869 | 2,770 |
| | | | 43,092 |
| Containers & Packaging - 0.3% | | | |
| AMVIG Holdings Ltd. | | 3,472,000 | 854 |
| Berry Global Group, Inc. (c) | | 83,586 | 4,083 |
| Chuoh Pack Industry Co. Ltd. (b) | | 421,800 | 5,281 |
| Kohsoku Corp. (b) | | 1,737,600 | 21,243 |
| Pact Group Holdings Ltd. (e) | | 689,421 | 2,771 |
| Samhwa Crown & Closure Co. Ltd. | | 50,000 | 2,120 |
| Silgan Holdings, Inc. | | 190,711 | 5,246 |
| The Pack Corp. (b) | | 1,560,900 | 49,627 |
| | | | 91,225 |
| Metals & Mining - 0.7% | | | |
| Alcoa Corp. (c) | | 34,934 | 1,512 |
| Ausdrill Ltd. | | 2,095,496 | 2,841 |
| Chubu Steel Plate Co. Ltd. | | 414,300 | 2,542 |
| Cleveland-Cliffs, Inc. (a)(c) | | 12,750,121 | 137,574 |
| Compania de Minas Buenaventura SA sponsored ADR | | 2,256,390 | 31,003 |
| Freeport-McMoRan, Inc. | | 258,702 | 4,269 |
| Granges AB | | 262,218 | 3,283 |
| Hill & Smith Holdings PLC | | 799,599 | 15,816 |
| Newmont Mining Corp. | | 79,236 | 2,906 |
| Nucor Corp. | | 24,700 | 1,653 |
| Orosur Mining, Inc. (c) | | 2,974,432 | 137 |
| Orvana Minerals Corp. (c) | | 764,857 | 106 |
| Pacific Metals Co. Ltd. (c) | | 348,000 | 10,031 |
| Steel Dynamics, Inc. | | 73,859 | 3,478 |
| Tohoku Steel Co. Ltd. (b) | | 625,700 | 8,562 |
| Tokyo Tekko Co. Ltd. (b) | | 762,100 | 11,941 |
| Universal Stainless & Alloy Products, Inc. (c) | | 73,632 | 2,202 |
| Warrior Metropolitan Coal, Inc. (a) | | 1,036,929 | 26,825 |
| Webco Industries, Inc. (c) | | 7,595 | 851 |
| Worthington Industries, Inc. | | 78,970 | 3,697 |
| | | | 271,229 |
| Paper & Forest Products - 0.1% | | | |
| Louisiana-Pacific Corp. | | 105,226 | 2,833 |
| Stella-Jones, Inc. | | 596,610 | 19,928 |
| Western Forest Products, Inc. | | 1,949,247 | 3,626 |
| | | | 26,387 |
|
| TOTAL MATERIALS | | | 1,297,432 |
|
| REAL ESTATE - 0.7% | | | |
| Equity Real Estate Investment Trusts (REITs) - 0.3% | | | |
| Colony NorthStar, Inc. | | 1,910,980 | 11,772 |
| Corporate Office Properties Trust (SBI) | | 93,052 | 2,767 |
| Corrections Corp. of America | | 1,359,201 | 34,850 |
| Four Corners Property Trust, Inc. | | 220,706 | 5,496 |
| National Health Investors, Inc. | | 28,419 | 2,127 |
| NSI NV | | 8,335 | 325 |
| NSI NV rights 8/9/18 (c) | | 8,335 | 10 |
| Public Storage | | 12,800 | 2,788 |
| Spirit MTA REIT (c) | | 9,530 | 95 |
| Spirit Realty Capital, Inc. | | 531,805 | 4,451 |
| Store Capital Corp. | | 200,862 | 5,514 |
| Ventas, Inc. | | 55,322 | 3,119 |
| VEREIT, Inc. | | 3,614,188 | 27,576 |
| Washington Prime Group, Inc. | | 92,996 | 747 |
| | | | 101,637 |
| Real Estate Management & Development - 0.4% | | | |
| Anabuki Kosan, Inc. | | 42,950 | 1,198 |
| CBRE Group, Inc. (c) | | 65,075 | 3,241 |
| Century21 Real Estate Japan Ltd. | | 97,300 | 1,081 |
| Devine Ltd. (c) | | 1,760,889 | 412 |
| IMMOFINANZ Immobilien Anlagen AG | | 102,412 | 2,694 |
| Leopalace21 Corp. | | 1,496,900 | 8,220 |
| LSL Property Services PLC | | 1,400,272 | 4,779 |
| Relo Group, Inc. | | 3,800,400 | 102,815 |
| Selvaag Bolig ASA | | 944,200 | 5,145 |
| Servcorp Ltd. | | 759,770 | 2,461 |
| Sino Land Ltd. | | 2,776,000 | 4,768 |
| Tejon Ranch Co. (c) | | 432,058 | 10,110 |
| Wing Tai Holdings Ltd. | | 1,723,800 | 2,621 |
| | | | 149,545 |
|
| TOTAL REAL ESTATE | | | 251,182 |
|
| TELECOMMUNICATION SERVICES - 0.0% | | | |
| Diversified Telecommunication Services - 0.0% | | | |
| AT&T, Inc. | | 19,715 | 630 |
| UTILITIES - 1.8% | | | |
| Electric Utilities - 1.6% | | | |
| Exelon Corp. | | 3,264,039 | 138,722 |
| PG&E Corp. | | 3,243,471 | 139,729 |
| PPL Corp. | | 10,079,627 | 289,991 |
| | | | 568,442 |
| Gas Utilities - 0.1% | | | |
| Busan City Gas Co. Ltd. | | 13,931 | 456 |
| China Resource Gas Group Ltd. | | 758,000 | 3,592 |
| Hokuriku Gas Co. | | 152,700 | 4,199 |
| K&O Energy Group, Inc. | | 537,200 | 9,018 |
| Keiyo Gas Co. Ltd. | | 118,900 | 3,095 |
| Star Gas Partners LP | | 198,111 | 1,904 |
| | | | 22,264 |
| Independent Power and Renewable Electricity Producers - 0.1% | | | |
| Mega First Corp. Bhd (b) | | 32,700,045 | 28,477 |
| Mega First Corp. Bhd warrants 4/8/20 (c) | | 3,800,000 | 1,570 |
| The AES Corp. | | 225,550 | 3,013 |
| | | | 33,060 |
| Multi-Utilities - 0.0% | | | |
| CMS Energy Corp. | | 321,690 | 15,550 |
| Water Utilities - 0.0% | | | |
| Manila Water Co., Inc. | | 5,619,100 | 2,809 |
|
| TOTAL UTILITIES | | | 642,125 |
|
| TOTAL COMMON STOCKS | | | |
| (Cost $15,203,651) | | | 32,971,199 |
|
| Nonconvertible Preferred Stocks - 0.1% | | | |
| CONSUMER STAPLES - 0.0% | | | |
| Food Products - 0.0% | | | |
| Nam Yang Dairy Products | | 4,917 | 910 |
| ENERGY - 0.0% | | | |
| Oil, Gas & Consumable Fuels - 0.0% | | | |
| Centrus Energy Corp. 7.50% (c)(d)(e) | | 6,395 | 224 |
| INDUSTRIALS - 0.0% | | | |
| Industrial Conglomerates - 0.0% | | | |
| Steel Partners Holdings LP Series A, 6.00% | | 163,209 | 3,721 |
| MATERIALS - 0.1% | | | |
| Construction Materials - 0.1% | | | |
| Buzzi Unicem SpA (Risparmio Shares) | | 1,531,895 | 19,060 |
| TOTAL NONCONVERTIBLE PREFERRED STOCKS | | | |
| (Cost $20,295) | | | 23,915 |
| | | Principal Amount (000s) | Value (000s) |
|
| Nonconvertible Bonds - 0.0% | | | |
| ENERGY - 0.0% | | | |
| Oil, Gas & Consumable Fuels - 0.0% | | | |
| Centrus Energy Corp. 8.25% 2/28/27 (e) | | | |
| (Cost $10,585) | | 4,603 | 3,683 |
| | | Shares | Value (000s) |
|
| Money Market Funds - 10.0% | | | |
| Fidelity Cash Central Fund, 1.96% (f) | | 3,328,477,024 | 3,329,143 |
| Fidelity Securities Lending Cash Central Fund 1.97% (f)(g) | | 319,049,263 | 319,081 |
| TOTAL MONEY MARKET FUNDS | | | |
| (Cost $3,647,672) | | | 3,648,224 |
| TOTAL INVESTMENT IN SECURITIES - 100.7% | | | |
| (Cost $18,882,203) | | | 36,647,021 |
| NET OTHER ASSETS (LIABILITIES) - (0.7)% | | | (236,869) |
| NET ASSETS - 100% | | | $36,410,152 |
Values shown as $0 in the Schedule of Investments may reflect amounts less than $500.
Legend
(a) Security or a portion of the security is on loan at period end.
(b) Affiliated company
(c) Non-income producing
(d) Level 3 security
(e) Security exempt from registration under Rule 144A of the Securities Act of 1933. These securities may be resold in transactions exempt from registration, normally to qualified institutional buyers. At the end of the period, the value of these securities amounted to $45,050,000 or 0.1% of net assets.
(f) Affiliated fund that is generally available only to investment companies and other accounts managed by Fidelity Investments. The rate quoted is the annualized seven-day yield of the fund at period end. A complete unaudited listing of the fund's holdings as of its most recent quarter end is available upon request. In addition, each Fidelity Central Fund's financial statements, which are not covered by the Fund's Report of Independent Registered Public Accounting Firm, are available on the SEC's website or upon request.
(g) Investment made with cash collateral received from securities on loan.
Affiliated Central Funds
Information regarding fiscal year to date income earned by the Fund from investments in Fidelity Central Funds is as follows:
| Fund | Income earned |
| | (Amounts in thousands) |
| Fidelity Cash Central Fund | $52,293 |
| Fidelity Securities Lending Cash Central Fund | 7,783 |
| Total | $60,076 |
Amounts in the income column in the above table include any capital gain distributions from underlying funds, which are presented in the corresponding line-item in the Statement of Operations if applicable.
Other Affiliated Issuers
An affiliated company is a company in which the Fund has ownership of at least 5% of the voting securities. Fiscal year to date transactions with companies which are or were affiliates are as follows:
| Affiliate | Value, beginning of period | Purchases | Sales Proceeds(a) | Dividend Income | Realized Gain (loss) | Change in Unrealized appreciation (depreciation) | Value, end of period |
| Aalberts Industries NV | $357,923 | $-- | $77,681 | $4,784 | $52,119 | $(30,801) | $301,560 |
| Abbey PLC | 30,976 | -- | 1,526 | 372 | 1,261 | 1,062 | 31,773 |
| Abercrombie & Fitch Co. Class A | 51,336 | -- | 61,625 | 3,691 | (15,171) | 90,609 | -- |
| Accell Group NV | 57,199 | -- | 3,104 | 910 | 657 | (18,175) | 36,577 |
| Air T, Inc. | 3,276 | -- | 493 | -- | 334 | 2,926 | 6,043 |
| AJIS Co. Ltd. | 18,967 | -- | 1,161 | 414 | 820 | 9,121 | 27,747 |
| Alconix Corp. | 22,007 | -- | 2,016 | 572 | 1,396 | 11,210 | 32,597 |
| Alps Logistics Co. Ltd. | 21,604 | -- | 1,169 | 433 | 642 | 688 | 21,765 |
| Ark Restaurants Corp. | 4,524 | -- | 998 | 176 | 431 | (415) | -- |
| Arts Optical International Holdings Ltd. | 8,599 | -- | 414 | 62 | (119) | (2,131) | 5,935 |
| ASL Marine Holdings Ltd. | 4,442 | -- | 168 | -- | (15) | (940) | 3,319 |
| Assurant, Inc. | 322,168 | -- | 65,530 | 6,180 | 48,908 | (40,816) | -- |
| ASTI Corp. | 5,592 | -- | 895 | 91 | 640 | (1,397) | 3,940 |
| Atwood Oceanics, Inc. | 57,677 | -- | 67,863 | -- | (126,131) | 136,317 | -- |
| Axell Corp. | 5,428 | -- | 308 | 32 | (582) | 803 | 5,341 |
| Barratt Developments PLC | 615,294 | -- | 28,428 | 43,026 | 21,622 | (102,147) | 506,341 |
| Bed Bath & Beyond, Inc. | 274,957 | 30,030 | 160,399 | 5,908 | (93,805) | (12,034) | -- |
| Belc Co. Ltd. | 80,741 | -- | 7,138 | 977 | 5,989 | (468) | 79,124 |
| Belluna Co. Ltd. | 87,499 | -- | 6,957 | 743 | 4,100 | (3,297) | 81,345 |
| Best Buy Co., Inc. | 1,088,006 | 2,576 | 362,793 | 25,768 | 224,048 | 59,930 | -- |
| Black Box Corp. | 12,338 | -- | 2,847 | -- | (38,169) | 28,678 | -- |
| BMTC Group, Inc. | 39,153 | -- | 5,793 | 960 | 5,569 | 4,014 | 42,943 |
| Bristow Group, Inc. | 3,659 | 22,570 | 358 | -- | 92 | 4,058 | 30,021 |
| Calian Technologies Ltd. | 15,187 | -- | 1,273 | 497 | 702 | 547 | 15,163 |
| Chase Corp. | 78,401 | 2,051 | 7,606 | 575 | 5,538 | 5,485 | 83,869 |
| Chilled & Frozen Logistics Holdings Co. Ltd. | 15,688 | -- | 2,866 | 205 | 1,673 | (1,301) | -- |
| Chuoh Pack Industry Co. Ltd. | 5,111 | -- | 274 | 142 | 153 | 291 | 5,281 |
| Civeo Corp. | 24,148 | -- | 1,847 | -- | 720 | 22,431 | 45,452 |
| Clip Corp. | 2,382 | -- | 120 | 92 | 50 | (57) | 2,255 |
| Codorus Valley Bancorp, Inc. | 18,561 | 222 | 2,336 | 381 | 1,129 | 1,921 | 19,497 |
| Contango Oil & Gas Co. | 12,450 | 2,763 | 672 | -- | (408) | 451 | 14,584 |
| Core Molding Technologies, Inc. | 13,648 | -- | 6,519 | 102 | 2,301 | (4,301) | -- |
| Cosmos Pharmaceutical Corp. | 262,818 | -- | 47,647 | 834 | 43,190 | (38,466) | -- |
| Create SD Holdings Co. Ltd. | 146,994 | -- | 12,250 | 1,557 | 9,121 | (10,923) | 132,942 |
| CSE Global Ltd. | 13,065 | -- | 565 | 852 | 79 | 867 | 13,446 |
| Daewon Pharmaceutical Co. Ltd. | 29,918 | -- | -- | 360 | -- | 2,435 | 32,353 |
| Daiichi Kensetsu Corp. | 22,034 | -- | 1,285 | 439 | 765 | 5,990 | 27,504 |
| DCC PLC (United Kingdom) | 464,436 | -- | 196,034 | 6,362 | 176,252 | (146,521) | -- |
| Deepak Fertilisers and Petrochemicals Corp. Ltd. | 33,595 | -- | 23,589 | 454 | 13,841 | (16,580) | -- |
| DongKook Pharmaceutical Co. Ltd. | 33,526 | -- | -- | 251 | -- | 1,651 | 35,177 |
| DVx, Inc. | 8,368 | -- | 406 | 136 | 290 | 675 | 8,927 |
| Ebix, Inc. | 158,009 | -- | 96,463 | 741 | 75,105 | (17,610) | -- |
| EcoGreen International Group Ltd. | 10,836 | -- | 474 | 312 | 121 | 181 | 10,664 |
| Elematec Corp. | 22,459 | -- | 1,364 | 646 | 873 | 5,784 | 27,752 |
| Essendant, Inc. | 27,007 | 173 | 6,981 | 1,144 | (1,660) | 8,911 | -- |
| Excel Co. Ltd. | 10,314 | -- | 1,106 | 477 | 623 | 7,111 | 16,942 |
| Ff Group | 109,703 | -- | 4,363 | -- | 2,143 | (82,992) | 24,491 |
| First Juken Co. Ltd. | 21,090 | -- | 1,061 | 498 | 770 | (3,251) | 17,548 |
| Food Empire Holdings Ltd. | 20,674 | -- | 1,657 | 181 | 616 | (1,692) | 17,941 |
| Fossil Group, Inc. | 22,766 | 18,570 | 2,633 | -- | 1,727 | 67,986 | 108,416 |
| Fresh Del Monte Produce, Inc. | 262,477 | -- | 13,440 | 2,980 | 7,209 | (81,561) | 174,685 |
| Fuji Kosan Co. Ltd. | 3,565 | -- | 170 | 86 | (11) | 345 | 3,729 |
| Fujikura Kasei Co., Ltd. | 16,713 | -- | 832 | 365 | 238 | (407) | 15,712 |
| Fursys, Inc. | 28,374 | -- | -- | 590 | -- | (2,693) | 25,681 |
| Gabia, Inc. | 5,328 | -- | -- | 23 | -- | 2,798 | 8,126 |
| GameStop Corp. Class A | 216,839 | -- | 101,453 | 14,883 | (86,627) | 14,910 | -- |
| Genky Stores, Inc. | 28,711 | -- | 443 | 76 | 373 | (23,251) | -- |
| Geospace Technologies Corp. | 18,545 | -- | 704 | -- | (378) | (1,298) | 16,165 |
| Geumhwa PSC Co. Ltd. | 12,086 | -- | -- | 251 | -- | (1,417) | 10,669 |
| Goodfellow, Inc. | 4,738 | -- | 218 | -- | 130 | (592) | 4,058 |
| Guess?, Inc. | 68,134 | -- | 4,995 | 4,567 | (1,855) | 50,613 | 111,897 |
| Gujarat State Fertilizers & Chemicals Ltd. | 65,224 | -- | 3,971 | 1,037 | 737 | (13,428) | 48,562 |
| GulfMark Offshore, Inc. Class A | 413 | -- | 10,214 | -- | (4) | 9,805 | -- |
| Halows Co. Ltd. | 29,437 | -- | 1,627 | 268 | 1,109 | 909 | 29,828 |
| Hamakyorex Co. Ltd. | 34,778 | -- | 1,834 | 475 | 1,038 | 9,347 | 43,329 |
| Handsome Co. Ltd. | 68,497 | -- | 4,222 | 576 | 3,260 | 271 | 67,806 |
| Hanger, Inc. | 30,525 | -- | 2,098 | -- | (916) | 16,140 | 43,651 |
| Helen of Troy Ltd. | 196,442 | -- | 25,213 | -- | 23,984 | (2,742) | 192,471 |
| Hiday Hidaka Corp. | 60,332 | -- | 21,838 | 636 | 16,679 | (15,929) | 39,244 |
| Honshu Chemical Industry Co. Ltd. | 7,501 | -- | 769 | 181 | 360 | 623 | 7,715 |
| Hoshiiryou Sanki Co. Ltd. | 11,966 | -- | 552 | 101 | 276 | (799) | 10,891 |
| Hurco Companies, Inc. | 16,735 | 63 | 17,861 | 56 | 11,707 | (8,212) | -- |
| Hwacheon Machine Tool Co. Ltd. | 11,663 | -- | -- | 213 | -- | (1,393) | 10,270 |
| Hyster-Yale Materials Handling Class A | 15,417 | 1,786 | 831 | 267 | 709 | (1,824) | 15,257 |
| Hyster-Yale Materials Handling Class B | 21,967 | -- | -- | 377 | -- | (1,581) | 20,386 |
| I-Sheng Electric Wire & Cable Co. Ltd. | 17,852 | -- | -- | 1,044 | -- | (357) | 17,495 |
| IA Group Corp. | 3,759 | -- | 192 | 119 | 32 | 388 | 3,987 |
| ICT Automatisering NV | 9,019 | -- | 1,872 | 175 | 474 | 1,061 | 8,682 |
| IDIS Holdings Co. Ltd. | 9,322 | -- | -- | 93 | -- | 844 | 10,166 |
| Ihara Science Corp. | 20,475 | -- | 1,311 | 375 | 975 | (164) | 19,975 |
| Indra Sistemas SA | 212,977 | -- | 12,135 | -- | (4,348) | (40,381) | 156,113 |
| InfoVine Co. Ltd. | 4,250 | -- | -- | 147 | -- | (541) | 3,709 |
| Intage Holdings, Inc. | 35,728 | -- | 2,241 | 564 | 1,507 | (750) | 34,244 |
| Intelligent Digital Integrated Security Co. Ltd. | 6,509 | -- | -- | 140 | -- | 628 | 7,137 |
| INTOPS Co. Ltd. | 18,044 | -- | -- | 263 | -- | (4,020) | 14,024 |
| INZI Controls Co. Ltd. | 6,917 | -- | -- | 176 | -- | 490 | 7,407 |
| Isra Vision AG | 65,170 | -- | 27,568 | 195 | 24,859 | 14,448 | 76,909 |
| Jaya Holdings Ltd. | 206 | -- | -- | -- | (24) | (113) | 69 |
| JLM Couture, Inc. | 511 | -- | 31 | -- | (11) | 798 | 1,267 |
| Jorudan Co. Ltd. | 4,478 | -- | 331 | 47 | 82 | (163) | 4,066 |
| Jumbo SA | 176,166 | -- | 8,644 | 3,722 | 6,737 | (13,617) | 160,642 |
| Kingboard Chemical Holdings Ltd. | 370,346 | -- | 32,877 | 15,860 | 24,580 | (97,041) | 265,008 |
| Know IT AB | 24,210 | -- | 2,074 | 651 | 1,079 | 4,333 | 27,548 |
| Kohsoku Corp. | 18,103 | -- | 997 | 410 | 558 | 3,579 | 21,243 |
| Kondotec, Inc. | 14,958 | -- | 720 | 316 | 588 | (497) | 14,329 |
| Korea Electric Terminal Co. Ltd. | 44,065 | -- | -- | 375 | -- | (15,084) | 28,981 |
| KSK Co., Ltd. | 7,360 | -- | 420 | 211 | 286 | 1,325 | 8,551 |
| Kwang Dong Pharmaceutical Co. Ltd. | 23,334 | -- | -- | 192 | -- | (2,453) | 20,881 |
| Kyeryong Construction Industrial Co. Ltd. | 11,076 | -- | 280 | -- | (20) | 2,621 | 13,397 |
| Maruzen Co. Ltd. | 27,369 | -- | 1,699 | 355 | 1,386 | 4,350 | 31,406 |
| Mega First Corp. Bhd | 29,328 | -- | -- | 318 | -- | (851) | 28,477 |
| Mega First Corp. Bhd warrants 4/8/20 | 1,794 | -- | 43 | -- | 43 | (224) | -- |
| Mesa Laboratories, Inc. | 34,239 | -- | 19,351 | 145 | 17,943 | (5,521) | -- |
| Metro, Inc. Class A (sub. vtg.) | 876,121 | -- | 38,601 | 11,655 | 36,447 | (42,452) | 831,515 |
| Michang Oil Industrial Co. Ltd. | 13,913 | -- | -- | 230 | -- | (1,356) | 12,557 |
| Mitani Sekisan Co. Ltd. | 36,788 | -- | 1,729 | 294 | 1,391 | (317) | 36,133 |
| Motonic Corp. | 28,729 | -- | -- | 883 | -- | (2,460) | 26,269 |
| Mr. Bricolage SA | 16,992 | -- | 768 | 509 | 258 | (3,247) | 13,235 |
| Muhak Co. Ltd. | 56,738 | -- | -- | 760 | -- | (18,651) | 38,087 |
| Murakami Corp. | 17,692 | -- | 1,131 | 237 | 956 | 3,833 | 21,350 |
| Muramoto Electronic Thailand PCL (For. Reg.) | 9,120 | -- | 717 | 298 | 74 | (1,461) | 7,016 |
| Murphy Oil Corp. | 209,012 | 91,767 | 11,932 | 8,707 | 5,119 | 68,868 | 362,834 |
| Nac Co. Ltd. | 8,739 | -- | 5,396 | 96 | (5,141) | 4,866 | -- |
| Nadex Co. Ltd. | 6,782 | -- | 462 | 316 | 316 | 813 | 7,449 |
| Nafco Co. Ltd. | 32,256 | -- | 1,611 | 620 | 668 | 481 | 31,794 |
| Nakayamafuku Co. Ltd. | 7,504 | -- | 2,087 | 187 | (384) | (240) | -- |
| ND Software Co. Ltd. | 13,121 | -- | 648 | 202 | 321 | 132 | 12,926 |
| Next PLC | 720,096 | -- | 75,390 | 43,815 | 48,769 | 296,200 | 989,675 |
| NICE Total Cash Management Co., Ltd. | 12,891 | -- | 4,227 | 117 | 3,271 | 124 | -- |
| Nippo Ltd. | 2,397 | -- | 178 | 25 | 66 | 686 | 2,971 |
| Nucleus Software Exports Ltd. | 9,766 | -- | 9,099 | 90 | 5,213 | (2,846) | -- |
| Nutraceutical International Corp. | 41,542 | -- | 41,542 | -- | 27,850 | (27,850) | -- |
| Origin Enterprises PLC | 75,152 | -- | 3,245 | 2,387 | 665 | (7,598) | 64,974 |
| P&F Industries, Inc. Class A | 1,986 | 62 | 119 | 65 | 29 | 725 | 2,683 |
| Parker Corp. | 12,168 | -- | 678 | 187 | 505 | (1,035) | 10,960 |
| Piolax, Inc. | 72,133 | -- | 3,355 | 938 | 3,114 | (11,615) | 60,277 |
| Prim SA | 19,681 | -- | 914 | 829 | 297 | 2,950 | 22,014 |
| Qol Co. Ltd. | 31,384 | -- | 1,761 | 437 | 1,242 | (450) | -- |
| RenaissanceRe Holdings Ltd. | 326,272 | -- | 73,384 | 2,308 | 62,131 | (92,710) | -- |
| Roadrunner Transportation Systems, Inc. | 26,420 | -- | 2,118 | -- | (2,651) | (14,740) | 6,911 |
| Rocky Mountain Chocolate Factory, Inc. | 5,440 | -- | 251 | 215 | 67 | (775) | 4,481 |
| S&T Holdings Co. Ltd. | 12,660 | -- | -- | 131 | -- | (2,604) | 10,056 |
| Sakai Moving Service Co. Ltd. | 59,548 | -- | 7,910 | 461 | 6,186 | (656) | 57,168 |
| Samsung Climate Control Co. Ltd. | 5,669 | -- | -- | 39 | -- | (865) | 4,804 |
| Sanei Architecture Planning Co. Ltd. | 22,654 | -- | 1,251 | 458 | 866 | (863) | 21,406 |
| Sarantis SA | 30,582 | -- | 1,601 | 560 | 1,103 | 2,700 | 32,784 |
| ScanSource, Inc. | 87,029 | 7,946 | 6,637 | -- | 3,457 | 1,364 | 93,159 |
| Seagate Technology LLC | 842,744 | 2,218 | 391,238 | 59,484 | 296,575 | 230,426 | 979,279 |
| Select Harvests Ltd. | 18,238 | 175 | 3,941 | 178 | (474) | 3,430 | -- |
| Senshu Electric Co. Ltd. | 18,882 | -- | 1,231 | 370 | 805 | 8,315 | 26,771 |
| Servotronics, Inc. | 1,623 | -- | 627 | 18 | 61 | 47 | -- |
| Sewon Precision Industries Co. Ltd. | 7,366 | -- | -- | 37 | -- | (2,741) | 4,625 |
| Shibaura Electronics Co. Ltd. | 22,486 | -- | 1,841 | 398 | 1,445 | 4,404 | 26,494 |
| ShoLodge, Inc. | -- | -- | -- | -- | (4,783) | 4,783 | -- |
| Sigmatron International, Inc. | 2,108 | -- | 766 | -- | 196 | (345) | -- |
| Sinwa Ltd. | 3,473 | -- | 175 | 156 | 70 | 78 | 3,446 |
| SJM Co. Ltd. | 6,651 | -- | -- | 130 | -- | (2,339) | 4,312 |
| SJM Holdings Co. Ltd. | 6,082 | -- | 163 | 207 | (14) | (1,399) | 4,506 |
| Societe Pour L'Informatique Industrielle SA | 46,192 | -- | 2,334 | 210 | 1,919 | 2,670 | 48,447 |
| Soken Chemical & Engineer Co. Ltd. | 9,827 | -- | 744 | 395 | 388 | 2,680 | 12,151 |
| SPK Corp. | 7,050 | -- | 344 | 139 | 206 | (784) | -- |
| Sportscene Group, Inc. Class A | 1,827 | -- | 95 | 65 | 72 | 235 | 2,039 |
| Step Co. Ltd. | 14,962 | -- | 808 | 317 | 596 | 810 | 15,560 |
| Strattec Security Corp. | 11,271 | 1,437 | 599 | 182 | 246 | (1,035) | 11,320 |
| Strongco Corp. | 943 | -- | 64 | -- | (59) | 617 | 1,437 |
| Sun Hing Vision Group Holdings Ltd. | 8,362 | -- | 398 | 663 | 72 | (1,062) | 6,974 |
| Sunjin Co. Ltd. | 27,026 | 8,073 | -- | -- | -- | (5,533) | 29,566 |
| SYNNEX Corp. | 336,853 | -- | 16,399 | 3,713 | 14,300 | (74,203) | 260,551 |
| T&K Toka Co. Ltd. | 15,676 | -- | 998 | 387 | 590 | 233 | 15,501 |
| Techno Smart Corp. | 9,054 | -- | 2,623 | 136 | 1,469 | (2,251) | -- |
| The Buckle, Inc. | 80,756 | -- | 4,636 | 12,670 | (808) | 32,972 | 108,284 |
| The Pack Corp. | 53,010 | -- | 2,630 | 639 | 1,538 | (2,291) | 49,627 |
| Tocalo Co. Ltd. | 31,573 | -- | 2,810 | 685 | 1,853 | 4,361 | -- |
| Tohoku Steel Co. Ltd. | 9,449 | -- | 605 | 142 | 453 | (735) | 8,562 |
| Tokyo Kisen Co. Ltd. | 5,800 | -- | 307 | 141 | 202 | 292 | 5,987 |
| Tokyo Tekko Co. Ltd. | 16,460 | -- | 623 | 130 | 65 | (3,961) | 11,941 |
| Tomen Devices Corp. | 12,893 | -- | 1,471 | 364 | 52 | 2,311 | 13,785 |
| Totech Corp. | 17,623 | -- | 1,005 | 406 | 827 | 4,071 | 21,516 |
| TOW Co. Ltd. | 15,331 | -- | 736 | 405 | 491 | (1,869) | 13,217 |
| Trancom Co. Ltd. | 44,353 | -- | 2,807 | 590 | 2,753 | 18,439 | 62,738 |
| Trio-Tech International | 1,129 | 83 | 146 | -- | (23) | (5) | 1,038 |
| Triple-S Management Corp. | 29,777 | -- | 6,823 | -- | 2,373 | 33,798 | 59,125 |
| UKC Holdings Corp. | 20,506 | -- | 1,857 | 668 | 796 | 6,502 | 25,947 |
| Unit Corp. | 81,511 | 21,406 | 4,790 | -- | (125) | 36,140 | 134,142 |
| Universal Logistics Holdings, Inc. | 22,264 | 275 | 38,522 | 388 | 8,030 | 7,953 | -- |
| Unum Group | 801,555 | 104 | 45,621 | 14,586 | 30,475 | (186,766) | 599,747 |
| Utah Medical Products, Inc. | 25,516 | 1,232 | 10,082 | 382 | 8,150 | 2,647 | 27,463 |
| VSE Corp. | 45,427 | 195 | 2,038 | 247 | 1,528 | (8,937) | 36,175 |
| VST Holdings Ltd. | 33,659 | -- | 4,019 | 2,234 | 2,567 | 32,215 | 64,422 |
| Watts Co. Ltd. | 15,539 | -- | 5,625 | 144 | 2,227 | (5,799) | -- |
| Wayside Technology Group, Inc. | 1,149 | 3,102 | 92 | 88 | 8 | (454) | 3,713 |
| Weight Watchers International, Inc. | 148,520 | -- | 209,636 | -- | 117,895 | 32,820 | -- |
| Whanin Pharmaceutical Co. Ltd. | 30,861 | -- | -- | 407 | -- | 2,223 | 33,084 |
| WIN-Partners Co. Ltd. | 33,644 | -- | 1,680 | 621 | 1,329 | 4,358 | 37,651 |
| Workman Co. Ltd. | 70,361 | -- | 12,081 | 1,069 | 10,151 | 22,198 | -- |
| Youngone Holdings Co. Ltd. | 42,735 | -- | -- | 414 | -- | 168 | 42,903 |
| Yusen Logistics Co. Ltd. | 19,570 | -- | 22,774 | 62 | (5,564) | 8,768 | -- |
| Yutaka Giken Co. Ltd. | 29,488 | -- | 1,492 | 641 | 1,009 | 947 | 29,952 |
| Total | $13,278,657 | $218,879 | $2,716,164 | $349,602 | $1,189,231 | $105,893 | $9,391,906 |
(a) Includes the value of securities delivered through in-kind transactions, if applicable.
Investment Valuation
The following is a summary of the inputs used, as of July 31, 2018, involving the Fund's assets and liabilities carried at fair value. The inputs or methodology used for valuing securities may not be an indication of the risk associated with investing in those securities. For more information on valuation inputs, and their aggregation into the levels used below, please refer to the Investment Valuation section in the accompanying Notes to Financial Statements.
| | Valuation Inputs at Reporting Date: |
| Description | Total | Level 1 | Level 2 | Level 3 |
| (Amounts in thousands) | | | | |
| Investments in Securities: | | | | |
| Equities: | | | | |
| Consumer Discretionary | $8,037,747 | $8,013,256 | $-- | $24,491 |
| Consumer Staples | 3,054,569 | 3,039,327 | 10,250 | 4,992 |
| Energy | 1,842,824 | 1,702,368 | 140,232 | 224 |
| Financials | 4,117,578 | 4,069,688 | 46,984 | 906 |
| Health Care | 5,172,155 | 5,172,155 | -- | -- |
| Industrials | 2,558,595 | 2,549,712 | 8,814 | 69 |
| Information Technology | 6,001,217 | 5,987,778 | 13,439 | -- |
| Materials | 1,316,492 | 1,306,461 | 10,031 | -- |
| Real Estate | 251,182 | 251,182 | -- | -- |
| Telecommunication Services | 630 | 630 | -- | -- |
| Utilities | 642,125 | 642,125 | -- | -- |
| Corporate Bonds | 3,683 | -- | 3,683 | -- |
| Money Market Funds | 3,648,224 | 3,648,224 | -- | -- |
| Total Investments in Securities: | $36,647,021 | $36,382,906 | $233,433 | $30,682 |
The following is a summary of transfers between Level 1 and Level 2 for the period ended July 31, 2018. Transfers are assumed to have occurred at the beginning of the period, and are primarily attributable to the valuation techniques used for foreign equity securities, as discussed in the accompanying Notes to Financial Statements:
| Transfers | Total (000s) |
| Level 1 to Level 2 | $95,905 |
| Level 2 to Level 1 | $280,941 |
Other Information
Distribution of investments by country or territory of incorporation, as a percentage of Total Net Assets, is as follows (Unaudited):
| United States of America | 59.1% |
| Japan | 9.4% |
| United Kingdom | 5.7% |
| Ireland | 4.4% |
| Canada | 4.1% |
| Netherlands | 2.3% |
| Taiwan | 2.0% |
| Bermuda | 1.8% |
| Cayman Islands | 1.7% |
| Korea (South) | 1.5% |
| Bailiwick of Guernsey | 1.2% |
| India | 1.0% |
| Others (Individually Less Than 1%) | 5.8% |
| | 100.0% |
See accompanying notes which are an integral part of the financial statements.
Financial Statements
Statement of Assets and Liabilities
| Amounts in thousands (except per-share amounts) | | July 31, 2018 |
| Assets | | |
Investment in securities, at value (including securities loaned of $307,764) — See accompanying schedule:
Unaffiliated issuers (cost $10,923,152) | $23,606,891 | |
| Fidelity Central Funds (cost $3,647,672) | 3,648,224 | |
| Other affiliated issuers (cost $4,311,379) | 9,391,906 | |
| Total Investment in Securities (cost $18,882,203) | | $36,647,021 |
| Cash | | 101 |
| Foreign currency held at value (cost $1,845) | | 1,845 |
| Receivable for investments sold | | 80,395 |
| Receivable for fund shares sold | | 15,241 |
| Dividends receivable | | 54,867 |
| Interest receivable | | 159 |
| Distributions receivable from Fidelity Central Funds | | 5,553 |
| Prepaid expenses | | 93 |
| Other receivables | | 2,627 |
| Total assets | | 36,807,902 |
| Liabilities | | |
| Payable for investments purchased | $38,956 | |
| Payable for fund shares redeemed | 19,179 | |
| Accrued management fee | 11,388 | |
| Other affiliated payables | 3,701 | |
| Other payables and accrued expenses | 5,483 | |
| Collateral on securities loaned | 319,043 | |
| Total liabilities | | 397,750 |
| Net Assets | | $36,410,152 |
| Net Assets consist of: | | |
| Paid in capital | | $16,569,262 |
| Undistributed net investment income | | 275,404 |
| Accumulated undistributed net realized gain (loss) on investments and foreign currency transactions | | 1,802,947 |
| Net unrealized appreciation (depreciation) on investments and assets and liabilities in foreign currencies | | 17,762,539 |
| Net Assets | | $36,410,152 |
| Low-Priced Stock: | | |
| Net Asset Value, offering price and redemption price per share ($28,809,459 ÷ 517,656 shares) | | $55.65 |
| Class K: | | |
| Net Asset Value, offering price and redemption price per share ($7,600,693 ÷ 136,630 shares) | | $55.63 |
See accompanying notes which are an integral part of the financial statements.
Statement of Operations
| Amounts in thousands | | Year ended July 31, 2018 |
| Investment Income | | |
| Dividends (including $349,602 earned from other affiliated issuers) | | $740,172 |
| Income from Fidelity Central Funds | | 60,076 |
| Total income | | 800,248 |
| Expenses | | |
| Management fee | | |
| Basic fee | $225,892 | |
| Performance adjustment | (46,046) | |
| Transfer agent fees | 44,021 | |
| Accounting and security lending fees | 2,224 | |
| Custodian fees and expenses | 2,748 | |
| Independent trustees' fees and expenses | 165 | |
| Registration fees | 277 | |
| Audit | 241 | |
| Legal | 87 | |
| Miscellaneous | 283 | |
| Total expenses before reductions | 229,892 | |
| Expense reductions | (1,402) | |
| Total expenses after reductions | | 228,490 |
| Net investment income (loss) | | 571,758 |
| Realized and Unrealized Gain (Loss) | | |
| Net realized gain (loss) on: | | |
| Investment securities: | | |
| Unaffiliated issuers (net of foreign taxes of $782) | 2,336,158 | |
| Fidelity Central Funds | 98 | |
| Other affiliated issuers | 1,189,231 | |
| Foreign currency transactions | (582) | |
| Total net realized gain (loss) | | 3,524,905 |
| Change in net unrealized appreciation (depreciation) on: | | |
| Investment securities: | | |
| Unaffiliated issuers (net of increase in deferred foreign taxes of $1,352) | 204,936 | |
| Fidelity Central Funds | (57) | |
| Other affiliated issuers | 105,893 | |
| Assets and liabilities in foreign currencies | (909) | |
| Total change in net unrealized appreciation (depreciation) | | 309,863 |
| Net gain (loss) | | 3,834,768 |
| Net increase (decrease) in net assets resulting from operations | | $4,406,526 |
See accompanying notes which are an integral part of the financial statements.
Statement of Changes in Net Assets
| Amounts in thousands | Year ended July 31, 2018 | Year ended July 31, 2017 |
| Increase (Decrease) in Net Assets | | |
| Operations | | |
| Net investment income (loss) | $571,758 | $578,492 |
| Net realized gain (loss) | 3,524,905 | 3,773,347 |
| Change in net unrealized appreciation (depreciation) | 309,863 | 1,136,726 |
| Net increase (decrease) in net assets resulting from operations | 4,406,526 | 5,488,565 |
| Distributions to shareholders from net investment income | (570,162) | (481,686) |
| Distributions to shareholders from net realized gain | (2,830,480) | (1,425,392) |
| Total distributions | (3,400,642) | (1,907,078) |
| Share transactions - net increase (decrease) | (2,815,868) | (5,374,274) |
| Redemption fees | – | 401 |
| Total increase (decrease) in net assets | (1,809,984) | (1,792,386) |
| Net Assets | | |
| Beginning of period | 38,220,136 | 40,012,522 |
| End of period | $36,410,152 | $38,220,136 |
| Other Information | | |
| Undistributed net investment income end of period | $275,404 | $293,208 |
See accompanying notes which are an integral part of the financial statements.
Financial Highlights
Fidelity Low-Priced Stock Fund
| Years ended July 31, | 2018 | 2017 | 2016 | 2015 | 2014 |
| Selected Per–Share Data | | | | | |
| Net asset value, beginning of period | $54.38 | $49.57 | $52.65 | $51.03 | $47.84 |
| Income from Investment Operations | | | | | |
| Net investment income (loss)A | .80 | .74 | .59 | .52 | .53 |
| Net realized and unrealized gain (loss) | 5.33 | 6.47 | (1.44) | 4.06 | 5.96 |
| Total from investment operations | 6.13 | 7.21 | (.85) | 4.58 | 6.49 |
| Distributions from net investment income | (.79) | (.60) | (.62) | (.52) | (.39) |
| Distributions from net realized gain | (4.06) | (1.80) | (1.61) | (2.44) | (2.91) |
| Total distributions | (4.86)B | (2.40) | (2.23) | (2.96) | (3.30) |
| Redemption fees added to paid in capitalA | – | –C | –C | –C | –C |
| Net asset value, end of period | $55.65 | $54.38 | $49.57 | $52.65 | $51.03 |
| Total ReturnD | 12.07% | 15.17% | (1.48)% | 9.32% | 14.42% |
| Ratios to Average Net AssetsE,F | | | | | |
| Expenses before reductions | .62% | .67% | .88% | .79% | .82% |
| Expenses net of fee waivers, if any | .62% | .67% | .88% | .79% | .82% |
| Expenses net of all reductions | .62% | .67% | .88% | .79% | .82% |
| Net investment income (loss) | 1.48% | 1.46% | 1.24% | 1.02% | 1.07% |
| Supplemental Data | | | | | |
| Net assets, end of period (in millions) | $28,809 | $28,334 | $28,524 | $30,150 | $30,576 |
| Portfolio turnover rateG,H | 11% | 8% | 9% | 9% | 12% |
A Calculated based on average shares outstanding during the period.
B Total distributions of $4.86 per share is comprised of distributions from net investment income of $.793 and distributions from net realized gain of $4.064 per share.
C Amount represents less than $.005 per share.
D Total returns would have been lower if certain expenses had not been reduced during the applicable periods shown.
E Fees and expenses of any underlying Fidelity Central Funds are not included in the Fund's expense ratio. The Fund indirectly bears its proportionate share of the expenses of any underlying Fidelity Central Funds.
F Expense ratios reflect operating expenses of the class. Expenses before reductions do not reflect amounts reimbursed by the investment adviser or reductions from brokerage service arrangements or reductions from other expense offset arrangements and do not represent the amount paid by the class during periods when reimbursements or reductions occur. Expenses net of fee waivers reflect expenses after reimbursement by the investment adviser but prior to reductions from brokerage service arrangements or other expense offset arrangements. Expenses net of all reductions represent the net expenses paid by the class.
G Amount does not include the portfolio activity of any underlying Fidelity Central Funds.
H Portfolio turnover rate excludes securities received or delivered in-kind.
See accompanying notes which are an integral part of the financial statements.
Fidelity Low-Priced Stock Fund Class K
| Years ended July 31, | 2018 | 2017 | 2016 | 2015 | 2014 |
| Selected Per–Share Data | | | | | |
| Net asset value, beginning of period | $54.36 | $49.56 | $52.64 | $51.02 | $47.83 |
| Income from Investment Operations | | | | | |
| Net investment income (loss)A | .85 | .79 | .64 | .57 | .58 |
| Net realized and unrealized gain (loss) | 5.33 | 6.46 | (1.44) | 4.06 | 5.96 |
| Total from investment operations | 6.18 | 7.25 | (.80) | 4.63 | 6.54 |
| Distributions from net investment income | (.84) | (.64) | (.67) | (.57) | (.44) |
| Distributions from net realized gain | (4.06) | (1.80) | (1.61) | (2.44) | (2.91) |
| Total distributions | (4.91)B | (2.45)C | (2.28) | (3.01) | (3.35) |
| Redemption fees added to paid in capitalA | – | –D | –D | –D | –D |
| Net asset value, end of period | $55.63 | $54.36 | $49.56 | $52.64 | $51.02 |
| Total ReturnE | 12.18% | 15.27% | (1.38)% | 9.44% | 14.55% |
| Ratios to Average Net AssetsF,G | | | | | |
| Expenses before reductions | .53% | .58% | .78% | .69% | .72% |
| Expenses net of fee waivers, if any | .53% | .58% | .78% | .69% | .72% |
| Expenses net of all reductions | .53% | .58% | .78% | .69% | .72% |
| Net investment income (loss) | 1.57% | 1.56% | 1.34% | 1.11% | 1.17% |
| Supplemental Data | | | | | |
| Net assets, end of period (in millions) | $7,601 | $9,886 | $11,489 | $13,989 | $16,198 |
| Portfolio turnover rateH,I | 11% | 8% | 9% | 9% | 12% |
A Calculated based on average shares outstanding during the period.
B Total distributions of $4.91 per share is comprised of distributions from net investment income of $.842 and distributions from net realized gain of $4.064 per share.
C Total distributions of $2.45 per share is comprised of distributions from net investment income of $.644 and distributions from net realized gain of $1.803 per share.
D Amount represents less than $.005 per share.
E Total returns would have been lower if certain expenses had not been reduced during the applicable periods shown.
F Fees and expenses of any underlying Fidelity Central Funds are not included in the Fund's expense ratio. The Fund indirectly bears its proportionate share of the expenses of any underlying Fidelity Central Funds.
G Expense ratios reflect operating expenses of the class. Expenses before reductions do not reflect amounts reimbursed by the investment adviser or reductions from brokerage service arrangements or reductions from other expense offset arrangements and do not represent the amount paid by the class during periods when reimbursements or reductions occur. Expenses net of fee waivers reflect expenses after reimbursement by the investment adviser but prior to reductions from brokerage service arrangements or other expense offset arrangements. Expenses net of all reductions represent the net expenses paid by the class.
H Amount does not include the portfolio activity of any underlying Fidelity Central Funds.
I Portfolio turnover rate excludes securities received or delivered in-kind.
See accompanying notes which are an integral part of the financial statements.
Notes to Financial Statements
For the period ended July 31, 2018
(Amounts in thousands except percentages)
1. Organization.
Fidelity Low-Priced Stock Fund (the Fund) is a fund of Fidelity Puritan Trust (the Trust) and is authorized to issue an unlimited number of shares. The Trust is registered under the Investment Company Act of 1940, as amended (the 1940 Act), as an open-end management investment company organized as a Massachusetts business trust. The Fund offers Low-Priced Stock and Class K shares, each of which has equal rights as to assets and voting privileges. Each class has exclusive voting rights with respect to matters that affect that class.
2. Investments in Fidelity Central Funds.
The Fund invests in Fidelity Central Funds, which are open-end investment companies generally available only to other investment companies and accounts managed by the investment adviser and its affiliates. The Fund's Schedule of Investments lists each of the Fidelity Central Funds held as of period end, if any, as an investment of the Fund, but does not include the underlying holdings of each Fidelity Central Fund. As an Investing Fund, the Fund indirectly bears its proportionate share of the expenses of the underlying Fidelity Central Funds.
The Money Market Central Funds seek preservation of capital and current income and are managed by Fidelity Investments Money Management, Inc. (FIMM), an affiliate of the investment adviser. Annualized expenses of the Money Market Central Funds as of their most recent shareholder report date are less than .005%.
A complete unaudited list of holdings for each Fidelity Central Fund is available upon request or at the Securities and Exchange Commission (the SEC) website at www.sec.gov. In addition, the financial statements of the Fidelity Central Funds, which are not covered by the Fund's Report of Independent Registered Public Accounting Firm, are available on the SEC website or upon request.
3. Significant Accounting Policies.
The Fund is an investment company and applies the accounting and reporting guidance of the Financial Accounting Standards Board (FASB) Accounting Standards Codification Topic 946 Financial Services – Investments Companies. The financial statements have been prepared in conformity with accounting principles generally accepted in the United States of America (GAAP), which require management to make certain estimates and assumptions at the date of the financial statements. Actual results could differ from those estimates. Subsequent events, if any, through the date that the financial statements were issued have been evaluated in the preparation of the financial statements. The following summarizes the significant accounting policies of the Fund:
Investment Valuation. Investments are valued as of 4:00 p.m. Eastern time on the last calendar day of the period. The Board of Trustees (the Board) has delegated the day to day responsibility for the valuation of the Fund's investments to the Fair Value Committee (the Committee) established by the Fund's investment adviser. In accordance with valuation policies and procedures approved by the Board, the Fund attempts to obtain prices from one or more third party pricing vendors or brokers to value its investments. When current market prices, quotations or currency exchange rates are not readily available or reliable, investments will be fair valued in good faith by the Committee, in accordance with procedures adopted by the Board. Factors used in determining fair value vary by investment type and may include market or investment specific events, changes in interest rates and credit quality. The frequency with which these procedures are used cannot be predicted and they may be utilized to a significant extent. The Committee oversees the Fund's valuation policies and procedures and reports to the Board on the Committee's activities and fair value determinations. The Board monitors the appropriateness of the procedures used in valuing the Fund's investments and ratifies the fair value determinations of the Committee.
The Fund categorizes the inputs to valuation techniques used to value its investments into a disclosure hierarchy consisting of three levels as shown below:
- Level 1 – quoted prices in active markets for identical investments
- Level 2 – other significant observable inputs (including quoted prices for similar investments, interest rates, prepayment speeds, etc.)
- Level 3 – unobservable inputs (including the Fund's own assumptions based on the best information available)
Valuation techniques used to value the Fund's investments by major category are as follows:
Equity securities, including restricted securities, for which market quotations are readily available, are valued at the last reported sale price or official closing price as reported by a third party pricing vendor on the primary market or exchange on which they are traded and are categorized as Level 1 in the hierarchy. In the event there were no sales during the day or closing prices are not available, securities are valued at the last quoted bid price or may be valued using the last available price and are generally categorized as Level 2 in the hierarchy. For foreign equity securities, when market or security specific events arise, comparisons to the valuation of American Depositary Receipts (ADRs), futures contracts, Exchange-Traded Funds (ETFs) and certain indexes as well as quoted prices for similar securities may be used and would be categorized as Level 2 in the hierarchy. Utilizing these techniques may result in transfers between Level 1 and Level 2. For equity securities, including restricted securities, where observable inputs are limited, assumptions about market activity and risk are used and these securities may be categorized as Level 3 in the hierarchy.
Debt securities, including restricted securities, are valued based on evaluated prices received from third party pricing vendors or from brokers who make markets in such securities. Corporate bonds are valued by pricing vendors who utilize matrix pricing which considers yield or price of bonds of comparable quality, coupon, maturity and type or by broker-supplied prices. When independent prices are unavailable or unreliable, debt securities may be valued utilizing pricing methodologies which consider similar factors that would be used by third party pricing vendors. Debt securities are generally categorized as Level 2 in the hierarchy but may be Level 3 depending on the circumstances.
Investments in open-end mutual funds, including the Fidelity Central Funds, are valued at their closing net asset value (NAV) each business day and are categorized as Level 1 in the hierarchy.
Changes in valuation techniques may result in transfers in or out of an assigned level within the disclosure hierarchy. The aggregate value of investments by input level as of July 31, 2018, including information on transfers between Levels 1 and 2, is included at the end of the Fund's Schedule of Investments.
Foreign Currency. The Fund may use foreign currency contracts to facilitate transactions in foreign-denominated securities. Gains and losses from these transactions may arise from changes in the value of the foreign currency or if the counterparties do not perform under the contracts' terms.
Foreign-denominated assets, including investment securities, and liabilities are translated into U.S. dollars at the exchange rates at period end. Purchases and sales of investment securities, income and dividends received and expenses denominated in foreign currencies are translated into U.S. dollars at the exchange rate in effect on the transaction date.
The effects of exchange rate fluctuations on investments are included with the net realized and unrealized gain (loss) on investment securities. Other foreign currency transactions resulting in realized and unrealized gain (loss) are disclosed separately.
Investment Transactions and Income. For financial reporting purposes, the Fund's investment holdings and NAV include trades executed through the end of the last business day of the period. The NAV per share for processing shareholder transactions is calculated as of the close of business of the New York Stock Exchange (NYSE), normally 4:00 p.m. Eastern time and includes trades executed through the end of the prior business day. Gains and losses on securities sold are determined on the basis of identified cost and include proceeds received from litigation. Dividend income is recorded on the ex-dividend date, except for certain dividends from foreign securities where the ex-dividend date may have passed, which are recorded as soon as the Fund is informed of the ex-dividend date. Non-cash dividends included in dividend income, if any, are recorded at the fair market value of the securities received. Income and capital gain distributions from Fidelity Central Funds, if any, are recorded on the ex-dividend date. Certain distributions received by the Fund represent a return of capital or capital gain. The Fund determines the components of these distributions subsequent to the ex-dividend date, based upon receipt of tax filings or other correspondence relating to the underlying investment. These distributions are recorded as a reduction of cost of investments and/or as a realized gain. Investment income is recorded net of foreign taxes withheld where recovery of such taxes is uncertain.
Class Allocations and Expenses. Investment income, realized and unrealized capital gains and losses, common expenses of the Fund, and certain fund-level expense reductions, if any, are allocated daily on a pro-rata basis to each class based on the relative net assets of each class to the total net assets of the Fund. Each class differs with respect to transfer agent fees incurred. Certain expense reductions may also differ by class. For the reporting period, the allocated portion of income and expenses to each class as a percent of its average net assets may vary due to the timing of recording these transactions in relation to fluctuating net assets of the classes. Expenses directly attributable to a fund are charged to that fund. Expenses attributable to more than one fund are allocated among the respective funds on the basis of relative net assets or other appropriate methods. Expense estimates are accrued in the period to which they relate and adjustments are made when actual amounts are known.
Deferred Trustee Compensation. Under a Deferred Compensation Plan (the Plan), certain independent Trustees have elected to defer receipt of a portion of their annual compensation. Deferred amounts are invested in a cross-section of Fidelity funds, are marked-to-market and remain in the Fund until distributed in accordance with the Plan. The investment of deferred amounts and the offsetting payable to the Trustees of $2,221 are included in the accompanying Statement of Assets and Liabilities in other receivables and other payables and accrued expenses, respectively.
Income Tax Information and Distributions to Shareholders. Each year, the Fund intends to qualify as a regulated investment company under Subchapter M of the Internal Revenue Code, including distributing substantially all of its taxable income and realized gains. As a result, no provision for U.S. Federal income taxes is required. As of July 31, 2018, the Fund did not have any unrecognized tax benefits in the financial statements; nor is the Fund aware of any tax positions for which it is reasonably possible that the total amounts of unrecognized tax benefits will significantly change in the next twelve months. The Fund files a U.S. federal tax return, in addition to state and local tax returns as required. The Fund's federal income tax returns are subject to examination by the Internal Revenue Service (IRS) for a period of three fiscal years after they are filed. State and local tax returns may be subject to examination for an additional fiscal year depending on the jurisdiction. Foreign taxes are provided for based on the Fund's understanding of the tax rules and rates that exist in the foreign markets in which it invests. The Fund is subject to a tax imposed on capital gains by certain countries in which it invests. An estimated deferred tax liability for net unrealized appreciation on the applicable securities is included in Other payables and accrued expenses on the Statement of Assets & Liabilities.
Distributions are declared and recorded on the ex-dividend date. Income and capital gain distributions are declared separately for each class. Income and capital gain distributions are determined in accordance with income tax regulations, which may differ from GAAP. In addition, the Fund claimed a portion of the payment made to redeeming shareholders as a distribution for income tax purposes.
Capital accounts within the financial statements are adjusted for permanent book-tax differences. These adjustments have no impact on net assets or the results of operations. Capital accounts are not adjusted for temporary book-tax differences which will reverse in a subsequent period.
Book-tax differences are primarily due to foreign currency transactions, certain foreign taxes, deferred foreign income corporations, passive foreign investment companies (PFIC), redemptions in kind, partnerships, deferred trustees compensation and losses deferred due to wash sales.
As of period end, the cost and unrealized appreciation (depreciation) in securities, and derivatives if applicable, for federal income tax purposes were as follows:
| Gross unrealized appreciation | $18,671,830 |
| Gross unrealized depreciation | (1,233,048) |
| Net unrealized appreciation (depreciation) | $17,438,782 |
| Tax Cost | $19,208,240 |
The tax-based components of distributable earnings as of period end were as follows:
| Undistributed ordinary income | $277,633 |
| Undistributed long-term capital gain | $2,128,983 |
| Net unrealized appreciation (depreciation) on securities and other investments | $17,438,552 |
The tax character of distributions paid was as follows:
| | July 31, 2018 | July 31, 2017 |
| Ordinary Income | $649,155 | $ 484,842 |
| Long-term Capital Gains | 2,751,487 | 1,422,236 |
| Total | $3,400,642 | $ 1,907,078 |
Restricted Securities. The Fund may invest in securities that are subject to legal or contractual restrictions on resale. These securities generally may be resold in transactions exempt from registration or to the public if the securities are registered. Disposal of these securities may involve time-consuming negotiations and expense, and prompt sale at an acceptable price may be difficult. Information regarding restricted securities is included at the end of the Fund's Schedule of Investments.
4. Purchases and Sales of Investments.
Purchases and sales of securities, other than short-term securities and in-kind transactions, aggregated $3,796,044 and $6,449,979, respectively.
Redemptions In-Kind. During the period, 31,696 shares of the Fund held by unaffiliated entities were redeemed in-kind for investments and cash, including accrued interest, with a value of $1,710,031. The net realized gain of $1,005,957 on investments delivered through the in-kind redemptions is included in the accompanying Statement of Operations. The amount of the redemptions is included in share transactions activity shown in the accompanying Statement of Changes in Net Assets as well as the Notes to Financial Statements. The Fund recognized no gain or loss for federal income tax purposes.
Prior Fiscal Year Redemptions In-Kind. During the prior period, 11,577 shares of the Fund held by unaffiliated entities were redeemed in-kind for investments and cash, including accrued interest, with a value of $587,646. The Fund had a net realized gain of $324,974 on investments delivered through the in-kind redemptions. The amount of the in-kind redemptions is included in share transactions in the accompanying Statement of Changes in Net Assets as well as the Notes to Financial Statements. The Fund recognized no gain or loss for federal income tax purposes.
5. Fees and Other Transactions with Affiliates.
Management Fee. Fidelity Management & Research Company (the investment adviser) and its affiliates provide the Fund with investment management related services for which the Fund pays a monthly management fee. The management fee is the sum of an individual fund fee rate that is based on an annual rate of .35% of the Fund's average net assets and an annualized group fee rate that averaged .24% during the period. The group fee rate is based upon the average net assets of all the mutual funds advised by the investment adviser, including any mutual funds previously advised by the investment adviser that are currently advised by Fidelity SelectCo, LLC, an affiliate of the investment adviser. The group fee rate decreases as assets under management increase and increases as assets under management decrease. In addition, the management fee is subject to a performance adjustment (up to a maximum of +/- .20% of the Fund's average net assets over a 36 month performance period). The upward or downward adjustment to the management fee is based on the relative investment performance of Low-Priced Stock as compared to its benchmark index, the Russell 2000 Index, over the same 36 month performance period. For the reporting period, the total annual management fee rate, including the performance adjustment, was .47% of the Fund's average net assets. The performance adjustment included in the management fee rate may be higher or lower than the maximum performance adjustment rate due to the difference between the average net assets for the reporting and performance periods.
Transfer Agent Fees. Fidelity Investments Institutional Operations Company, Inc., (FIIOC), an affiliate of the investment adviser, is the transfer, dividend disbursing and shareholder servicing agent for each class of the Fund. FIIOC receives account fees and asset-based fees that vary according to the account size and type of account of the shareholders of Low-Priced Stock, except for Class K. FIIOC receives an asset-based fee of Class K's average net assets. FIIOC pays for typesetting, printing and mailing of shareholder reports, except proxy statements.
For the period, transfer agent fees for each class were as follows:
| | Amount | % of Class-Level Average Net Assets |
| Low-Priced Stock | $40,017 | .14 |
| Class K | 4,004 | .05 |
| | $44,021 | |
Accounting and Security Lending Fees. Fidelity Service Company, Inc. (FSC), an affiliate of the investment adviser, maintains the Fund's accounting records. The accounting fee is based on the level of average net assets for each month. Under a separate contract, FSC administers the security lending program. The security lending fee is based on the number and duration of lending transactions. For the period, the fees were equivalent to an annual rate of .01%.
Brokerage Commissions. The Fund placed a portion of its portfolio transactions with brokerage firms which are affiliates of the investment adviser. Brokerage commissions are included in net realized gain (loss) and change in net unrealized appreciation (depreciation) in the Statement of Operations. The commissions paid to these affiliated firms were $169 for the period.
Interfund Trades. The Fund may purchase from or sell securities to other Fidelity Funds under procedures adopted by the Board. The procedures have been designed to ensure these interfund trades are executed in accordance with Rule 17a-7 of the 1940 Act. Interfund trades are included within the respective purchases and sales amounts shown in the Purchases and Sales of Investments note.
Prior Fiscal Year Redemptions In-Kind. During the prior period, 8,419 shares of the Fund held by an affiliated entity were redeemed in-kind for investments and cash, included accrued interest, with a value of $456,638. The Fund had a net realized gain of $254,862 on investments delivered through in-kind redemptions. The amount of the in-kind redemptions is included in share transactions in the accompanying Statement of Changes in Net Assets as well as the Notes to Financial Statements. The Fund recognized no gain or loss for federal income tax purposes.
Other. During the period, the investment adviser reimbursed the Fund for certain losses in the amount of $6.
6. Committed Line of Credit.
The Fund participates with other funds managed by the investment adviser or an affiliate in a $4.25 billion credit facility (the "line of credit") to be utilized for temporary or emergency purposes to fund shareholder redemptions or for other short-term liquidity purposes. The Fund has agreed to pay commitment fees on its pro-rata portion of the line of credit, which amounted to $109 and is reflected in Miscellaneous expenses on the Statement of Operations. During the period, the Fund did not borrow on this line of credit.
7. Security Lending.
The Fund lends portfolio securities through a lending agent from time to time in order to earn additional income. For equity securities, a lending agent is used and may loan securities to certain qualified borrowers, including Fidelity Capital Markets (FCM), a broker-dealer affiliated with the Fund. On the settlement date of the loan, the Fund receives collateral (in the form of U.S. Treasury obligations, letters of credit and/or cash) against the loaned securities and maintains collateral in an amount not less than 100% of the market value of the loaned securities during the period of the loan. The market value of the loaned securities is determined at the close of business of the Fund and any additional required collateral is delivered to the Fund on the next business day. The Fund or borrower may terminate the loan at any time, and if the borrower defaults on its obligation to return the securities loaned because of insolvency or other reasons, the Fund may apply collateral received from the borrower against the obligation. The Fund may experience delays and costs in recovering the securities loaned. Any cash collateral received is invested in the Fidelity Securities Lending Cash Central Fund. The value of loaned securities and cash collateral at period end are disclosed on the Fund's Statement of Assets and Liabilities. The value of securities loaned to FCM at period end was $15,076. Security lending income represents the income earned on investing cash collateral, less rebates paid to borrowers and any lending agent fees associated with the loan, plus any premium payments received for lending certain types of securities. Security lending income is presented in the Statement of Operations as a component of income from Fidelity Central Funds. Total security lending income during the period amounted to $7,783, including $286 from securities loaned to FCM.
8. Expense Reductions.
Commissions paid to certain brokers with whom the investment adviser, or its affiliates, places trades on behalf of the Fund include an amount in addition to trade execution, which may be rebated back to the Fund to offset certain expenses. This amount totaled $1,007 for the period. In addition, through arrangements with the Fund's custodian, credits realized as a result of certain uninvested cash balances were used to reduce the Fund's expenses. During the period, these credits reduced the Fund's custody expenses by $2.
In addition, during the period the investment adviser reimbursed and/or waived a portion of fund-level operating expenses in the amount of $393.
9. Distributions to Shareholders.
Distributions to shareholders of each class were as follows:
| | Year ended
July 31, 2018 | Year ended
July 31, 2017 |
| From net investment income | | |
| Low-Priced Stock | $422,624 | $337,211 |
| Class K | 147,538 | 144,475 |
| Total | $570,162 | $481,686 |
| From net realized gain | | |
| Low-Priced Stock | $2,113,153 | $1,020,329 |
| Class K | 717,327 | 405,063 |
| Total | $2,830,480 | $1,425,392 |
10. Share Transactions.
Share transactions for each class were as follows and may contain automatic conversions between classes or exchanges between affiliated funds:
| | Shares | Shares | Dollars | Dollars |
| | Year ended July 31, 2018 | Year ended July 31, 2017 | Year ended July 31, 2018 | Year ended July 31, 2017 |
| Low-Priced Stock | | | | |
| Shares sold | 78,887 | 35,353 | $4,286,318 | $1,788,321 |
| Reinvestment of distributions | 45,637 | 25,783 | 2,359,539 | 1,255,306 |
| Shares redeemed | (127,919)(a) | (115,449) | (6,976,877)(a) | (5,836,933) |
| Net increase (decrease) | (3,395) | (54,313) | $(331,020) | $(2,793,306) |
| Class K | | | | |
| Shares sold | 23,375 | 28,345 | $1,267,880 | $1,441,213 |
| Reinvestment of distributions | 16,747 | 11,296 | 864,865 | 549,537 |
| Shares redeemed | (85,363)(a) | (89,600)(b) | (4,617,593)(a) | (4,571,718)(b) |
| Net increase (decrease) | (45,241) | (49,959) | $(2,484,848) | $(2,580,968) |
(a) Amount includes in-kind redemptions (see the Redemptions In-Kind note for additional details).
(b) Amount includes in-kind redemptions (see the Prior Fiscal Year Redemptions In-Kind note for additional details).
11. Other.
The Fund's organizational documents provide former and current trustees and officers with a limited indemnification against liabilities arising in connection with the performance of their duties to the Fund. In the normal course of business, the Fund may also enter into contracts that provide general indemnifications. The Fund's maximum exposure under these arrangements is unknown as this would be dependent on future claims that may be made against the Fund. The risk of material loss from such claims is considered remote.
Report of Independent Registered Public Accounting Firm
To the Board of Trustees of Fidelity Puritan Trust and Shareholders of Fidelity Low-Priced Stock Fund:
Opinion on the Financial Statements
We have audited the accompanying statement of assets and liabilities, including the schedule of investments, of Fidelity Low-Priced Stock Fund (one of the funds constituting Fidelity Puritan Trust, referred to hereafter as the "Fund") as of July 31, 2018, the related statement of operations for the year ended July 31, 2018, the statement of changes in net assets for each of the two years in the period ended July 31, 2018, including the related notes, and the financial highlights for each of the five years in the period ended July 31, 2018 (collectively referred to as the “financial statements”). In our opinion, the financial statements present fairly, in all material respects, the financial position of the Fund as of July 31, 2018, the results of its operations for the year then ended, the changes in its net assets for each of the two years in the period ended July 31, 2018 and the financial highlights for each of the five years in the period ended July 31, 2018 in conformity with accounting principles generally accepted in the United States of America.
Basis for Opinion
These financial statements are the responsibility of the Fund’s management. Our responsibility is to express an opinion on the Fund’s financial statements based on our audits. We are a public accounting firm registered with the Public Company Accounting Oversight Board (United States) (“PCAOB”) and are required to be independent with respect to the Fund in accordance with the U.S. federal securities laws and the applicable rules and regulations of the Securities and Exchange Commission and the PCAOB.
We conducted our audits of these financial statements in accordance with the standards of the PCAOB. Those standards require that we plan and perform the audit to obtain reasonable assurance about whether the financial statements are free of material misstatement, whether due to error or fraud.
Our audits included performing procedures to assess the risks of material misstatement of the financial statements, whether due to error or fraud, and performing procedures that respond to those risks. Such procedures included examining, on a test basis, evidence regarding the amounts and disclosures in the financial statements. Our audits also included evaluating the accounting principles used and significant estimates made by management, as well as evaluating the overall presentation of the financial statements. Our procedures included confirmation of securities owned as of July 31, 2018 by correspondence with the custodian and brokers; when replies were not received from brokers, we performed other auditing procedures. We believe that our audits provide a reasonable basis for our opinion.
PricewaterhouseCoopers LLP
Boston, Massachusetts
September 18, 2018
We have served as the auditor of one or more investment companies in the Fidelity group of funds since 1932.
Trustees and Officers
The Trustees, Members of the Advisory Board (if any), and officers of the trust and fund, as applicable, are listed below. The Board of Trustees governs the fund and is responsible for protecting the interests of shareholders. The Trustees are experienced executives who meet periodically throughout the year to oversee the fund's activities, review contractual arrangements with companies that provide services to the fund, oversee management of the risks associated with such activities and contractual arrangements, and review the fund's performance. Except for Jonathan Chiel, each of the Trustees oversees 286 funds. Mr. Chiel oversees 150 funds.
The Trustees hold office without limit in time except that (a) any Trustee may resign; (b) any Trustee may be removed by written instrument, signed by at least two-thirds of the number of Trustees prior to such removal; (c) any Trustee who requests to be retired or who has become incapacitated by illness or injury may be retired by written instrument signed by a majority of the other Trustees; and (d) any Trustee may be removed at any special meeting of shareholders by a two-thirds vote of the outstanding voting securities of the trust. Each Trustee who is not an interested person (as defined in the 1940 Act) of the trust and the fund is referred to herein as an Independent Trustee. Each Independent Trustee shall retire not later than the last day of the calendar year in which his or her 75th birthday occurs. The Independent Trustees may waive this mandatory retirement age policy with respect to individual Trustees. Officers and Advisory Board Members hold office without limit in time, except that any officer or Advisory Board Member may resign or may be removed by a vote of a majority of the Trustees at any regular meeting or any special meeting of the Trustees. Except as indicated, each individual has held the office shown or other offices in the same company for the past five years.
The fund’s Statement of Additional Information (SAI) includes more information about the Trustees. To request a free copy, call Fidelity at 1-800-544-8544.
Experience, Skills, Attributes, and Qualifications of the Trustees. The Governance and Nominating Committee has adopted a statement of policy that describes the experience, qualifications, attributes, and skills that are necessary and desirable for potential Independent Trustee candidates (Statement of Policy). The Board believes that each Trustee satisfied at the time he or she was initially elected or appointed a Trustee, and continues to satisfy, the standards contemplated by the Statement of Policy. The Governance and Nominating Committee also engages professional search firms to help identify potential Independent Trustee candidates who have the experience, qualifications, attributes, and skills consistent with the Statement of Policy. From time to time, additional criteria based on the composition and skills of the current Independent Trustees, as well as experience or skills that may be appropriate in light of future changes to board composition, business conditions, and regulatory or other developments, have also been considered by the professional search firms and the Governance and Nominating Committee. In addition, the Board takes into account the Trustees' commitment and participation in Board and committee meetings, as well as their leadership of standing and ad hoc committees throughout their tenure.
In determining that a particular Trustee was and continues to be qualified to serve as a Trustee, the Board has considered a variety of criteria, none of which, in isolation, was controlling. The Board believes that, collectively, the Trustees have balanced and diverse experience, qualifications, attributes, and skills, which allow the Board to operate effectively in governing the fund and protecting the interests of shareholders. Information about the specific experience, skills, attributes, and qualifications of each Trustee, which in each case led to the Board's conclusion that the Trustee should serve (or continue to serve) as a trustee of the fund, is provided below.
Board Structure and Oversight Function. James C. Curvey is an interested person and currently serves as Chairman. The Trustees have determined that an interested Chairman is appropriate and benefits shareholders because an interested Chairman has a personal and professional stake in the quality and continuity of services provided to the fund. Independent Trustees exercise their informed business judgment to appoint an individual of their choosing to serve as Chairman, regardless of whether the Trustee happens to be independent or a member of management. The Independent Trustees have determined that they can act independently and effectively without having an Independent Trustee serve as Chairman and that a key structural component for assuring that they are in a position to do so is for the Independent Trustees to constitute a substantial majority for the Board. The Independent Trustees also regularly meet in executive session. Ned C. Lautenbach serves as Chairman of the Independent Trustees and as such (i) acts as a liaison between the Independent Trustees and management with respect to matters important to the Independent Trustees and (ii) with management prepares agendas for Board meetings.
Fidelity® funds are overseen by different Boards of Trustees. The fund's Board oversees Fidelity's high income and certain equity funds, and other Boards oversee Fidelity's investment-grade bond, money market, asset allocation, and other equity funds. The asset allocation funds may invest in Fidelity® funds overseen by the fund's Board. The use of separate Boards, each with its own committee structure, allows the Trustees of each group of Fidelity® funds to focus on the unique issues of the funds they oversee, including common research, investment, and operational issues. On occasion, the separate Boards establish joint committees to address issues of overlapping consequences for the Fidelity® funds overseen by each Board.
The Trustees operate using a system of committees to facilitate the timely and efficient consideration of all matters of importance to the Trustees, the fund, and fund shareholders and to facilitate compliance with legal and regulatory requirements and oversight of the fund's activities and associated risks. The Board, acting through its committees, has charged FMR and its affiliates with (i) identifying events or circumstances the occurrence of which could have demonstrably adverse effects on the fund's business and/or reputation; (ii) implementing processes and controls to lessen the possibility that such events or circumstances occur or to mitigate the effects of such events or circumstances if they do occur; and (iii) creating and maintaining a system designed to evaluate continuously business and market conditions in order to facilitate the identification and implementation processes described in (i) and (ii) above. Because the day-to-day operations and activities of the fund are carried out by or through FMR, its affiliates, and other service providers, the fund's exposure to risks is mitigated but not eliminated by the processes overseen by the Trustees. While each of the Board's committees has responsibility for overseeing different aspects of the fund's activities, oversight is exercised primarily through the Operations, Audit, and Compliance Committees. In addition, the Independent Trustees have worked with Fidelity to enhance the Board's oversight of investment and financial risks, legal and regulatory risks, technology risks, and operational risks, including the development of additional risk reporting to the Board. Appropriate personnel, including but not limited to the fund's Chief Compliance Officer (CCO), FMR's internal auditor, the independent accountants, the fund's Treasurer and portfolio management personnel, make periodic reports to the Board's committees, as appropriate, including an annual review of Fidelity's risk management program for the Fidelity® funds. The responsibilities of each standing committee, including their oversight responsibilities, are described further under "Standing Committees of the Trustees."
Interested Trustees*:
Correspondence intended for a Trustee who is an interested person may be sent to Fidelity Investments, 245 Summer Street, Boston, Massachusetts 02210.
Name, Year of Birth; Principal Occupations and Other Relevant Experience+
Jonathan Chiel (1957)
Year of Election or Appointment: 2016
Trustee
Mr. Chiel also serves as Trustee of other Fidelity® funds. Mr. Chiel is Executive Vice President and General Counsel for FMR LLC (diversified financial services company, 2012-present). Previously, Mr. Chiel served as general counsel (2004-2012) and senior vice president and deputy general counsel (2000-2004) for John Hancock Financial Services; a partner with Choate, Hall & Stewart (1996-2000) (law firm); and an Assistant United States Attorney for the United States Attorney’s Office of the District of Massachusetts (1986-95), including Chief of the Criminal Division (1993-1995). Mr. Chiel is a director on the boards of the Boston Bar Foundation and the Maimonides School.
James C. Curvey (1935)
Year of Election or Appointment: 2007
Trustee
Chairman of the Board of Trustees
Mr. Curvey also serves as Trustee of other Fidelity® funds. Mr. Curvey is Vice Chairman (2007-present) and Director of FMR LLC (diversified financial services company). In addition, Mr. Curvey is an Overseer Emeritus for the Boston Symphony Orchestra, a Director of Artis-Naples, and a Trustee of Brewster Academy in Wolfeboro, New Hampshire. Previously, Mr. Curvey served as a Director of Fidelity Research & Analysis Co. (investment adviser firm, 2009-2018), Director of Fidelity Investments Money Management, Inc. (investment adviser firm, 2009-2014) and a Director of FMR and FMR Co., Inc. (investment adviser firms, 2007-2014).
Charles S. Morrison (1960)
Year of Election or Appointment: 2014
Trustee
Mr. Morrison also serves as Trustee of other funds. He serves as President of Fidelity SelectCo, LLC (investment adviser firm, 2017-present) and Fidelity Management & Research Company (FMR) (investment adviser firm, 2016-present), a Director of Fidelity Investments Money Management, Inc. (FIMM) (investment adviser firm, 2014-present), Director of Fidelity SelectCo, LLC (investment adviser firm, 2014-present), President, Asset Management (2014-present), and is an employee of Fidelity Investments. Previously, Mr. Morrison served as Vice President of Fidelity's Fixed Income and Asset Allocation Funds (2012-2014), President, Fixed Income (2011-2014), Vice President of Fidelity's Money Market Funds (2005-2009), President, Money Market Group Leader of FMR (investment adviser firm, 2009), and Senior Vice President, Money Market Group of FMR (2004-2009). Mr. Morrison also served as Vice President of Fidelity's Bond Funds (2002-2005), certain Balanced Funds (2002-2005), and certain Asset Allocation Funds (2002-2007), and as Senior Vice President (2002-2005) of Fidelity's Bond Division.
* Determined to be an “Interested Trustee” by virtue of, among other things, his or her affiliation with the trust or various entities under common control with FMR.
+ The information includes the Trustee's principal occupation during the last five years and other information relating to the experience, attributes, and skills relevant to the Trustee's qualifications to serve as a Trustee, which led to the conclusion that the Trustee should serve as a Trustee for the fund.
Independent Trustees:
Correspondence intended for an Independent Trustee may be sent to Fidelity Investments, P.O. Box 55235, Boston, Massachusetts 02205-5235.
Name, Year of Birth; Principal Occupations and Other Relevant Experience+
Dennis J. Dirks (1948)
Year of Election or Appointment: 2005
Trustee
Mr. Dirks also serves as Trustee of other Fidelity® funds. Prior to his retirement in May 2003, Mr. Dirks was Chief Operating Officer and a member of the Board of The Depository Trust & Clearing Corporation (DTCC). He also served as President, Chief Operating Officer, and Board member of The Depository Trust Company (DTC) and President and Board member of the National Securities Clearing Corporation (NSCC). In addition, Mr. Dirks served as Chief Executive Officer and Board member of the Government Securities Clearing Corporation, Chief Executive Officer and Board member of the Mortgage-Backed Securities Clearing Corporation, as a Trustee and a member of the Finance Committee of Manhattan College (2005-2008), as a Trustee and a member of the Finance Committee of AHRC of Nassau County (2006-2008), as a member of the Independent Directors Council (IDC) Governing Council (2010-2015), and as a member of the Board of Directors for The Brookville Center for Children’s Services, Inc. (2009-2017). Mr. Dirks is a member of the Finance Committee (2016-present), Board of Directors (2017-present) and Board of Trustees (2018-present) and is Treasurer (2018-present) of the Asolo Repertory Theatre.
Donald F. Donahue (1950)
Year of Election or Appointment: 2018
Trustee
Mr. Donahue also serves as a Trustee of other Fidelity® funds. Mr. Donahue is President and Chief Executive Officer of Miranda Partners, LLC (risk consulting for the financial services industry, 2012-present). Previously, Mr. Donahue served as a Member of the Advisory Board of certain Fidelity® funds (2015-2018) and Chief Executive Officer (2006-2012), Chief Operating Officer (2003-2006), and Managing Director, Customer Marketing and Development (1999-2003) of The Depository Trust & Clearing Corporation (financial markets infrastructure). Mr. Donahue serves as a Member (2007-present) and Co-Chairman (2016-present) of the Board of Directors of United Way of New York, Member of the Board of Directors of NYC Leadership Academy (2012-present) and Member of the Board of Advisors of Ripple Labs, Inc. (financial services, 2015-present). He also served as Chairman (2010-2012) and Member of the Board of Directors (2012-2013) of Omgeo, LLC (financial services), Treasurer of United Way of New York (2012-2016), and Member of the Board of Directors of XBRL US (financial services non-profit, 2009-2012) and the International Securities Services Association (2009-2012).
Alan J. Lacy (1953)
Year of Election or Appointment: 2008
Trustee
Mr. Lacy also serves as Trustee of other Fidelity® funds. Mr. Lacy serves as a Director of Bristol-Myers Squibb Company (global pharmaceuticals, 2008-present). He is a Trustee of the California Chapter of The Nature Conservancy (2015-present) and a Director of the Center for Advanced Study in the Behavioral Sciences at Stanford University (2015-present). In addition, Mr. Lacy served as Senior Adviser (2007-2014) of Oak Hill Capital Partners, L.P. (private equity) and also served as Chief Executive Officer (2005) and Vice Chairman (2005-2006) of Sears Holdings Corporation (retail) and Chief Executive Officer and Chairman of the Board of Sears, Roebuck and Co. (retail, 2000-2005). Previously, Mr. Lacy served as Chairman (2014-2017) and a member (2010-2017) of the Board of Directors of Dave & Buster’s Entertainment, Inc. (restaurant and entertainment complexes), as Chairman (2008-2011) and a member (2006-2015) of the Board of Trustees of the National Parks Conservation Association, and as a member of the Board of Directors for The Hillman Companies, Inc. (hardware wholesalers, 2010-2014), Earth Fare, Inc. (retail grocery, 2010-2014), and The Western Union Company (global money transfer, 2006-2011).
Ned C. Lautenbach (1944)
Year of Election or Appointment: 2000
Trustee
Chairman of the Independent Trustees
Mr. Lautenbach also serves as Trustee of other Fidelity® funds. Mr. Lautenbach currently serves as Vice Chair of the Board of Governors, State University System of Florida (2013-present) and is a member of the Council on Foreign Relations (1994-present). He is also a member and has most recently served as Chairman of the Board of Directors of Artis-Naples (2012-present). Previously, Mr. Lautenbach served as a member and then Lead Director of the Board of Directors of Eaton Corporation (diversified industrial, 1997-2016). He was also a Partner and Advisory Partner at Clayton, Dubilier & Rice, LLC (private equity investment, 1998-2010), as well as a Director of Sony Corporation (2006-2007). In addition, Mr. Lautenbach also had a 30-year career with IBM (technology company) during which time he served as Senior Vice President and a member of the Corporate Executive Committee (1968-1998).
Joseph Mauriello (1944)
Year of Election or Appointment: 2008
Trustee
Mr. Mauriello also serves as Trustee of other Fidelity® funds. Prior to his retirement in January 2006, Mr. Mauriello served in numerous senior management positions including Deputy Chairman and Chief Operating Officer (2004-2005), and Vice Chairman of Financial Services (2002-2004) of KPMG LLP US (professional services, 1965-2005). Mr. Mauriello currently serves as a member of the Board of Directors of XL Group plc. (global insurance and re-insurance, 2006-present) and the Independent Directors Council (IDC) Governing Council (2015-present). Previously, Mr. Mauriello served as a Director of the Hamilton Funds of the Bank of New York (2006-2007) and of Arcadia Resources Inc. (health care services and products, 2007-2012).
Cornelia M. Small (1944)
Year of Election or Appointment: 2005
Trustee
Ms. Small also serves as Trustee of other Fidelity® funds. Ms. Small is a member of the Board of Directors (2009-present) and Chair of the Investment Committee (2010-present) of the Teagle Foundation. Ms. Small also serves on the Investment Committee of the Berkshire Taconic Community Foundation (2008-present). Previously, Ms. Small served as Chairperson (2002-2008) and a member of the Investment Committee and Chairperson (2008-2012) and a member of the Board of Trustees of Smith College. In addition, Ms. Small served as Chief Investment Officer, Director of Global Equity Investments, and a member of the Board of Directors of Scudder, Stevens & Clark and Scudder Kemper Investments.
Garnett A. Smith (1947)
Year of Election or Appointment: 2018
Trustee
Mr. Smith also serves as Trustee of other Fidelity® funds. Prior to Mr. Smith's retirement, he served as Chairman and Chief Executive Officer of Inbrand Corp. (manufacturer of personal absorbent products, 1990-1997). He also served as President (1986-1990) of Inbrand Corp. Prior to his employment with Inbrand Corp., he was employed by a retail fabric chain and North Carolina National Bank. In addition, Mr. Smith served as a Member of the Advisory Board of certain Fidelity® funds (2012-2013) and as a board member of the Jackson Hole Land Trust (2009-2012).
David M. Thomas (1949)
Year of Election or Appointment: 2008
Trustee
Mr. Thomas also serves as Trustee of other Fidelity® funds. Mr. Thomas serves as Non-Executive Chairman of the Board of Directors of Fortune Brands Home and Security (home and security products, 2011-present), as a member of the Board of Directors (2004-present) and Presiding Director (2013-present) of Interpublic Group of Companies, Inc. (marketing communication), and as a member of the Board of Trustees of the University of Florida (2013-present). Previously, Mr. Thomas served as Executive Chairman (2005-2006) and Chairman and Chief Executive Officer (2000-2005) of IMS Health, Inc. (pharmaceutical and healthcare information solutions), and a Director of Fortune Brands, Inc. (consumer products, 2000-2011).
+ The information includes the Trustee's principal occupation during the last five years and other information relating to the experience, attributes, and skills relevant to the Trustee's qualifications to serve as a Trustee, which led to the conclusion that the Trustee should serve as a Trustee for the fund.
Advisory Board Members and Officers:
Correspondence intended for a Member of the Advisory Board (if any) may be sent to Fidelity Investments, P.O. Box 55235, Boston, Massachusetts 02205-5235. Correspondence intended for an officer or Peter S. Lynch may be sent to Fidelity Investments, 245 Summer Street, Boston, Massachusetts 02210. Officers appear below in alphabetical order.
Name, Year of Birth; Principal Occupation
Peter S. Lynch (1944)
Year of Election or Appointment: 2003
Member of the Advisory Board
Mr. Lynch also serves as Member of the Advisory Board of other Fidelity® funds. Mr. Lynch is Vice Chairman and a Director of FMR (investment adviser firm) and FMR Co., Inc. (investment adviser firm). In addition, Mr. Lynch serves as a Trustee of Boston College and as the Chairman of the Inner-City Scholarship Fund. Previously, Mr. Lynch served on the Special Olympics International Board of Directors (1997-2006).
William S. Stavropoulos (1939)
Year of Election or Appointment: 2018
Member of the Advisory Board
Mr. Stavropoulos also serves as Member of the Advisory Board of other Fidelity® funds. Mr. Stavropoulos serves as President and Founder of the Michigan Baseball Foundation, the Great Lakes Loons (2007-present). Mr. Stavropoulos is Chairman Emeritus of the Board of Directors of The Dow Chemical Company, where he previously served in numerous senior management positions, including President, CEO (1995-2000; 2002-2004), Chairman of the Executive Committee (2000-2006), and as a member of the Board of Directors (1990-2006). Currently, Mr. Stavropoulos is Chairman of the Board of Directors of Univar Inc. (global distributor of commodity and specialty chemicals), a Director of Teradata Corporation (data warehousing and technology solutions), and a member of the Advisory Board for Metalmark Capital LLC (private equity investment, 2005-present). Mr. Stavropoulos is an operating advisor to Clayton, Dubilier & Rice, LLC (private equity investment). In addition, Mr. Stavropoulos is a member of the University of Notre Dame Advisory Council for the College of Science, a Trustee of the Rollin L. Gerstacker Foundation, and a Director of Artis-Naples in Naples, Florida. Previously, Mr. Stavropoulos served as Trustee of certain Fidelity® funds (2001-2018) and as a Director of Chemical Financial Corporation (bank holding company, 1993-2012) and Tyco International, Ltd. (multinational manufacturing and services, 2007-2012).
Carol B. Tomé (1957)
Year of Election or Appointment: 2018
Member of the Advisory Board
Ms. Tomé also serves as Member of the Advisory Board of other Fidelity® funds. Ms. Tomé is Chief Financial Officer (2001-present) and Executive Vice President of Corporate Services (2007-present) of The Home Depot, Inc. (home improvement retailer) and a Director (2003-present) and Chair of the Audit Committee (2004-present) of United Parcel Service, Inc. (package delivery and supply chain management). Previously, Ms. Tomé served as Trustee of certain Fidelity® funds (2017), Senior Vice President of Finance and Accounting/Treasurer (2000-2007) and Vice President and Treasurer (1995-2000) of The Home Depot, Inc. and Chair of the Board (2010-2012), Vice Chair of the Board (2009 and 2013), and a Director (2008-2013) of the Federal Reserve Bank of Atlanta. Ms. Tomé is also a director or trustee of many community and professional organizations.
Michael E. Wiley (1950)
Year of Election or Appointment: 2018
Member of the Advisory Board
Mr. Wiley also serves as Trustee or Member of the Advisory Board of other Fidelity® funds. Mr. Wiley serves as a Director of Andeavor Corporation (independent oil refiner and marketer, 2005-present), a Director of Andeavor Logistics LP (natural resources logistics, 2015-present), and a Director of Bill Barrett Corporation (exploration and production, 2005-present). In addition, Mr. Wiley also serves as a Director of Post Oak Bank (privately-held bank, 2004-present). Previously, Mr. Wiley served as a Trustee of other Fidelity® funds (2008-2013), as a Director of Asia Pacific Exploration Consolidated (international oil and gas exploration and production, 2008-2013), as a member of the Board of Trustees of the University of Tulsa (2000-2006; 2007-2010), as a Senior Energy Advisor of Katzenbach Partners, LLC (consulting, 2006-2007), as an Advisory Director of Riverstone Holdings (private investment), Chairman, President, and CEO of Baker Hughes, Inc. (oilfield services, 2000-2004), and as Director of Spinnaker Exploration Company (exploration and production, 2001-2005).
Elizabeth Paige Baumann (1968)
Year of Election or Appointment: 2017
Anti-Money Laundering (AML) Officer
Ms. Baumann also serves as AML Officer of other funds. She is Chief AML Officer (2012-present) and Senior Vice President (2014-present) of FMR LLC (diversified financial services company) and is an employee of Fidelity Investments. Previously, Ms. Baumann served as AML Officer of the funds (2012-2016), and Vice President (2007-2014) and Deputy Anti-Money Laundering Officer (2007-2012) of FMR LLC.
Marc R. Bryant (1966)
Year of Election or Appointment: 2015
Secretary and Chief Legal Officer (CLO)
Mr. Bryant also serves as Secretary and CLO of other funds. Mr. Bryant serves as CLO, Secretary, and Senior Vice President of Fidelity Management & Research Company (investment adviser firm, 2015-present) and FMR Co., Inc. (investment adviser firm, 2015-present); Secretary of Fidelity SelectCo, LLC (investment adviser firm, 2015-present) and Fidelity Investments Money Management, Inc. (investment adviser firm, 2015-present); and CLO of Fidelity Management & Research (Hong Kong) Limited and FMR Investment Management (UK) Limited (investment adviser firms, 2015-present) and Fidelity Management & Research (Japan) Limited (investment adviser firm, 2016-present). He is Senior Vice President and Deputy General Counsel of FMR LLC (diversified financial services company). Previously, Mr. Bryant served as Secretary and CLO of Fidelity Rutland Square Trust II (2010-2014) and Assistant Secretary of Fidelity's Fixed Income and Asset Allocation Funds (2013-2015). Prior to joining Fidelity Investments, Mr. Bryant served as a Senior Vice President and the Head of Global Retail Legal for AllianceBernstein L.P. (2006-2010), and as the General Counsel for ProFund Advisors LLC (2001-2006).
John J. Burke III (1964)
Year of Election or Appointment: 2018
Chief Financial Officer
Mr. Burke also serves as Chief Financial Officer of other funds. Mr. Burke serves as Head of Investment Operations for Fidelity Fund and Investment Operations (2018-present) and is an employee of Fidelity Investments (1998-present). Previously Mr. Burke served as head of Asset Management Investment Operations (2012-2018).
William C. Coffey (1969)
Year of Election or Appointment: 2009
Assistant Secretary
Mr. Coffey also serves as Assistant Secretary of other funds. He is Senior Vice President and Deputy General Counsel of FMR LLC (diversified financial services company, 2010-present), and is an employee of Fidelity Investments. Previously, Mr. Coffey served as Vice President and Associate General Counsel of FMR LLC (2005-2009).
Timothy M. Cohen (1969)
Year of Election or Appointment: 2018
Vice President
Mr. Cohen also serves as Vice President of other funds. Mr. Cohen serves as Co-Head of Global Equity Research (2016-present), a Director of Fidelity Management & Research (Japan) Limited (investment adviser firm, 2016-present), and is an employee of Fidelity Investments. Previously, Mr. Cohen served as Chief Investment Officer - Equity and a Director of Fidelity Management & Research (U.K.) Inc. (investment adviser firm, 2013-2015) and as a Director of Fidelity Management & Research (Hong Kong) Limited (investment adviser firm, 2017).
Jonathan Davis (1968)
Year of Election or Appointment: 2010
Assistant Treasurer
Mr. Davis also serves as Assistant Treasurer of other funds. Mr. Davis serves as Assistant Treasurer of FMR Capital, Inc. (2017-present) and is an employee of Fidelity Investments. Previously, Mr. Davis served as Vice President and Associate General Counsel of FMR LLC (diversified financial services company, 2003-2010).
Adrien E. Deberghes (1967)
Year of Election or Appointment: 2016
Assistant Treasurer
Mr. Deberghes also serves as an officer of other funds. He serves as Assistant Treasurer of FMR Capital, Inc. (2017-present), Executive Vice President of Fidelity Investments Money Management, Inc. (FIMM) (investment adviser firm, 2016-present), and is an employee of Fidelity Investments (2008-present). Previously, Mr. Deberghes served as President and Treasurer of certain Fidelity® funds (2013-2018). Prior to joining Fidelity Investments, Mr. Deberghes was Senior Vice President of Mutual Fund Administration at State Street Corporation (2007-2008), Senior Director of Mutual Fund Administration at Investors Bank & Trust (2005-2007), and Director of Finance for Dunkin' Brands (2000-2005). Previously, Mr. Deberghes served in other fund officer roles.
Laura M. Del Prato (1964)
Year of Election or Appointment: 2018
Assistant Treasurer
Ms. Del Prato also serves as an officer of other funds. Ms. Del Prato is an employee of Fidelity Investments (2017-present). Prior to joining Fidelity Investments, Ms. Del Prato served as a Managing Director and Treasurer of the JPMorgan Mutual Funds (2014-2017). Prior to JPMorgan, Ms. Del Prato served as a partner at Cohen Fund Audit Services (accounting firm, 2012-2013) and KPMG LLP (accounting firm, 2004-2012).
Colm A. Hogan (1973)
Year of Election or Appointment: 2016
Deputy Treasurer
Mr. Hogan also serves as an officer of other funds. Mr. Hogan serves as Assistant Treasurer of FMR Capital, Inc. (2017-present) and is an employee of Fidelity Investments (2005-present). Previously, Mr. Hogan served as Assistant Treasurer of certain Fidelity® funds (2016-2018).
Pamela R. Holding (1964)
Year of Election or Appointment: 2018
Vice President
Ms. Holding also serves as a Vice President of other funds. Ms. Holding serves as Co-Head of Global Equity Research (2018-present) and is an employee of Fidelity Investments (2013-present).
Chris Maher (1972)
Year of Election or Appointment: 2013
Assistant Treasurer
Mr. Maher serves as Assistant Treasurer of other funds. Mr. Maher is Vice President of Valuation Oversight, serves as Assistant Treasurer of FMR Capital, Inc. (2017-present), and is an employee of Fidelity Investments. Previously, Mr. Maher served as Vice President of Asset Management Compliance (2013), Vice President of the Program Management Group of FMR (investment adviser firm, 2010-2013), and Vice President of Valuation Oversight (2008-2010).
Rieco E. Mello (1969)
Year of Election or Appointment: 2017
Assistant Treasurer
Mr. Mello also serves as Assistant Treasurer of other funds. Mr. Mello serves as Assistant Treasurer of FMR Capital, Inc. (2017-present) and is an employee of Fidelity Investments (1995-present).
Kenneth B. Robins (1969)
Year of Election or Appointment: 2016
Chief Compliance Officer
Mr. Robins also serves as an officer of other funds. Mr. Robins serves as Compliance Officer of Fidelity Management & Research Company and FMR Co., Inc. (investment adviser firms, 2016-present) and is an employee of Fidelity Investments (2004-present). Previously, Mr. Robins served as Executive Vice President of Fidelity Investments Money Management, Inc. (investment adviser firm, 2013-2016) and served in other fund officer roles.
Stacie M. Smith (1974)
Year of Election or Appointment: 2016
President and Treasurer
Ms. Smith also serves as an officer of other funds. Ms. Smith serves as Assistant Treasurer of FMR Capital, Inc. (2017-present), is an employee of Fidelity Investments (2009-present), and has served in other fund officer roles. Prior to joining Fidelity Investments, Ms. Smith served as Senior Audit Manager of Ernst & Young LLP (accounting firm, 1996-2009). Previously, Ms. Smith served as Assistant Treasurer (2013-2018) and Deputy Treasurer (2013-2016) of certain Fidelity® funds.
Marc L. Spector (1972)
Year of Election or Appointment: 2016
Assistant Treasurer
Mr. Spector also serves as an officer of other funds. Mr. Spector serves as Assistant Treasurer of FMR Capital, Inc. (2017-present) and is an employee of Fidelity Investments (2016-present). Prior to joining Fidelity Investments, Mr. Spector served as Director at the Siegfried Group (accounting firm, 2013-2016), and prior to Siegfried Group as audit senior manager at Deloitte & Touche (accounting firm, 2005-2013).
Renee Stagnone (1975)
Year of Election or Appointment: 2016
Assistant Treasurer
Ms. Stagnone also serves as an officer of other funds. Ms. Stagnone serves as Assistant Treasurer of FMR Capital, Inc. (2017-present) and is an employee of Fidelity Investments (1997-present). Previously, Ms. Stagnone served as Deputy Treasurer of certain Fidelity® funds (2013-2016).
Shareholder Expense Example
As a shareholder of a Fund, you incur two types of costs: (1) transaction costs and (2) ongoing costs, including management fees and other Fund expenses. This Example is intended to help you understand your ongoing costs (in dollars) of investing in the Funds and to compare these costs with the ongoing costs of investing in other mutual funds.
The Example is based on an investment of $1,000 invested at the beginning of the period and held for the entire period (February 1, 2018 to July 31, 2018).
Actual Expenses
The first line of the accompanying table for each class of the Fund provides information about actual account values and actual expenses. You may use the information in this line, together with the amount you invested, to estimate the expenses that you paid over the period. Simply divide your account value by $1,000.00 (for example, an $8,600 account value divided by $1,000.00 = 8.6), then multiply the result by the number in the first line for a class of the Fund under the heading entitled "Expenses Paid During Period" to estimate the expenses you paid on your account during this period. A small balance maintenance fee of $12.00 that is charged once a year may apply for certain accounts with a value of less than $2,000. This fee is not included in the table below. If it was, the estimate of expenses you paid during the period would be higher, and your ending account value lower, by this amount. In addition, the Fund, as a shareholder in the underlying Fidelity Central Funds, will indirectly bear its pro-rata share of the fees and expenses incurred by the underlying Fidelity Central Funds. These fees and expenses are not included in the Fund's annualized expense ratio used to calculate the expense estimate in the table below.
Hypothetical Example for Comparison Purposes
The second line of the accompanying table for each class of the Fund provides information about hypothetical account values and hypothetical expenses based on a Class' actual expense ratio and an assumed rate of return of 5% per year before expenses, which is not the Class' actual return. The hypothetical account values and expenses may not be used to estimate the actual ending account balance or expenses you paid for the period. You may use this information to compare the ongoing costs of investing in the Fund and other funds. To do so, compare this 5% hypothetical example with the 5% hypothetical examples that appear in the shareholder reports of the other funds. A small balance maintenance fee of $12.00 that is charged once a year may apply for certain accounts with a value of less than $2,000. This fee is not included in the table below. If it was, the estimate of expenses you paid during the period would be higher, and your ending account value lower, by this amount. In addition, the Fund, as a shareholder in the underlying Fidelity Central Funds, will indirectly bear its pro-rata share of the fees and expenses incurred by the underlying Fidelity Central Funds. These fees and expenses are not included in the Fund's annualized expense ratio used to calculate the expense estimate in the table below.
Please note that the expenses shown in the table are meant to highlight your ongoing costs only and do not reflect any transaction costs. Therefore, the second line of the table is useful in comparing ongoing costs only, and will not help you determine the relative total costs of owning different funds.
| | Annualized Expense Ratio-A | Beginning
Account Value
February 1, 2018 | Ending
Account Value
July 31, 2018 | Expenses Paid
During Period-B
February 1, 2018
to July 31, 2018 |
| Low-Priced Stock | .61% | | | |
| Actual | | $1,000.00 | $978.20 | $2.99 |
| Hypothetical-C | | $1,000.00 | $1,021.77 | $3.06 |
| Class K | .52% | | | |
| Actual | | $1,000.00 | $978.70 | $2.55 |
| Hypothetical-C | | $1,000.00 | $1,022.22 | $2.61 |
A Annualized expense ratio reflects expenses net of applicable fee waivers.
B Expenses are equal to each Class' annualized expense ratio, multiplied by the average account value over the period, multiplied by 181/365 (to reflect the one-half year period).
C 5% return per year before expenses
Distributions (Unaudited)
The Board of Trustees of Fidelity Low-Priced Stock Fund voted to pay to shareholders of record at the opening of business on record date, the following distributions per share derived from capital gains realized from sales of portfolio securities, and dividends derived from net investment income:
| | Pay Date | Record Date | Dividends | Capital Gains |
| Fidelity Low-Priced Stock Fund | | | | |
| Low-Priced Stock | 09/17/18 | 09/14/18 | $0.427 | $3.311 |
| Class K | 09/17/18 | 09/14/18 | $0.457 | $3.311 |
|
The fund hereby designates as a capital gain dividend with respect to the taxable year ended July 31, 2018, $2,434,865,294, or, if subsequently determined to be different, the net capital gain of such year.
Low-Priced Stock designates 50% and 35%; Class K designates 47% and 34%; of the dividends distributed in September and December, respectively during the fiscal year as qualifying for the dividends–received deduction for corporate shareholders.
Low-Priced Stock designates 100% and 84%; Class K designates 100% and 81%; of the dividends distributed in September and December, respectively during the fiscal year as amounts which may be taken into account as a dividend for purposes of the maximum rate under section 1(h)(11) of the Internal Revenue Code.
The fund will notify shareholders in January 2019 of amounts for use in preparing 2018 income tax returns.
Board Approval of Investment Advisory Contracts
Fidelity Low-Priced Stock Fund
At its July 2018 meeting, the Board of Trustees, including the Independent Trustees (together, the Board), voted to continue the management contract with Fidelity Management & Research Company (FMR) and the sub-advisory agreements (together, the Advisory Contracts) for the fund for six months through January 31, 2019, in connection with the reunification of the Fidelity Equity High Income Funds Board, which oversees the fund, and the Sector Portfolios Board.
The Board considered that the approval of the fund's Advisory Contracts will not result in any changes in (i) the investment process or strategies employed in the management of the fund's assets; (ii) the fees and expenses paid by shareholders; (iii) the nature, extent or quality of services provided under the fund's Advisory Contracts; or (iv) the day-to-day management of the fund or the persons primarily responsible for such management. The Board concluded that the fund's Advisory Contracts are fair and reasonable, and that the fund's Advisory Contracts should be renewed, without modification, through January 31, 2019, with the understanding that the Board will consider the annual renewal for a full one year period in January 2019.
In connection with its consideration of future renewals of the fund's Advisory Contracts, the Board will consider: (i) the nature, extent and quality of services provided to the fund, including shareholder and administrative services and investment performance; (ii) the competitiveness of the management fee and total expenses for the fund; (iii) the costs of the services and profitability, including the revenues earned and the expenses incurred in conducting the business of developing, marketing, distributing, managing, administering, and servicing the fund and its shareholders, to the extent applicable, as well as potential fall-out benefits from Fidelity's non-fund businesses; and (iv) whether there have been economies of scale in respect of the Fidelity funds, whether the Fidelity funds (including the fund) have appropriately benefited from any such economies of scale, and whether there is the potential for realization of any further economies.
Based on its evaluation of all of the conclusions noted above, and after considering all factors it believed relevant, the Board ultimately concluded that the fund's management fee structure is fair and reasonable, and that the continuation of the fund's Advisory Contracts should be approved.

Corporate Headquarters
245 Summer St.
Boston, MA 02210
www.fidelity.com
LPS-ANN-0918
1.536378.121
Fidelity® Low-Priced Stock Fund Class K
Annual Report July 31, 2018 |
|
Contents
To view a fund's proxy voting guidelines and proxy voting record for the 12-month period ended June 30, visit http://www.fidelity.com/proxyvotingresults or visit the Securities and Exchange Commission's (SEC) web site at http://www.sec.gov.
You may also call 1-800-835-5092 to request a free copy of the proxy voting guidelines.
Standard & Poor's, S&P and S&P 500 are registered service marks of The McGraw-Hill Companies, Inc. and have been licensed for use by Fidelity Distributors Corporation.
Other third-party marks appearing herein are the property of their respective owners.
All other marks appearing herein are registered or unregistered trademarks or service marks of FMR LLC or an affiliated company. © 2018 FMR LLC. All rights reserved.
This report and the financial statements contained herein are submitted for the general information of the shareholders of the Fund. This report is not authorized for distribution to prospective investors in the Fund unless preceded or accompanied by an effective prospectus.
A fund files its complete schedule of portfolio holdings with the SEC for the first and third quarters of each fiscal year on Form N-Q. Forms N-Q are available on the SEC’s web site at http://www.sec.gov. A fund's Forms N-Q may be reviewed and copied at the SEC’s Public Reference Room in Washington, DC. Information regarding the operation of the SEC's Public Reference Room may be obtained by calling 1-800-SEC-0330.
For a complete list of a fund's portfolio holdings, view the most recent holdings listing, semiannual report, or annual report on Fidelity's web site at http://www.fidelity.com, http://www.institutional.fidelity.com, or http://www.401k.com, as applicable.
NOT FDIC INSURED •MAY LOSE VALUE •NO BANK GUARANTEE
Neither the Fund nor Fidelity Distributors Corporation is a bank.
Notes to Shareholders
The Board of Trustees approved a change to the fund's investment policies (effective November 7, 2017) that has expanded the definition of “low-priced stocks.” Previously, low-priced stocks were defined as those priced at or below $35 per share. This definition was expanded to include stocks with an earnings yield at or above the median for the Russell 2000® Index, as well as those priced at or below $35 per share. Earnings yield represents a stock’s earnings per share for the most recent 12 months divided by current price per share. We believe the expanded definition better reflects the portfolio managers’ investment process and provides greater flexibility while remaining faithful to the fund name. No changes to the investment process and portfolio characteristics are expected.
During the period, Joel Tillinghast assumed responsibility of the fund's consumer and financials sleeves, succeeding Kathy Buck and Justin Bennett, respectively.
Performance: The Bottom Line
Average annual total return reflects the change in the value of an investment, assuming reinvestment of distributions from dividend income and capital gains (the profits earned upon the sale of securities that have grown in value, if any) and assuming a constant rate of performance each year. The hypothetical investment and the average annual total returns do not reflect the deduction of taxes that a shareholder would pay on fund distributions or the redemption of fund shares. During periods of reimbursement by Fidelity, a fund’s total return will be greater than it would be had the reimbursement not occurred. How a fund did yesterday is no guarantee of how it will do tomorrow.
Average Annual Total Returns
| For the periods ended July 31, 2018 | Past 1 year | Past 5 years | Past 10 years |
| Class K | 12.18% | 9.84% | 10.59% |
$10,000 Over 10 Years
Let's say hypothetically that $10,000 was invested in Fidelity® Low-Priced Stock Fund - Class K on July 31, 2008.
The chart shows how the value of your investment would have changed, and also shows how the Russell 2000® Index performed over the same period.
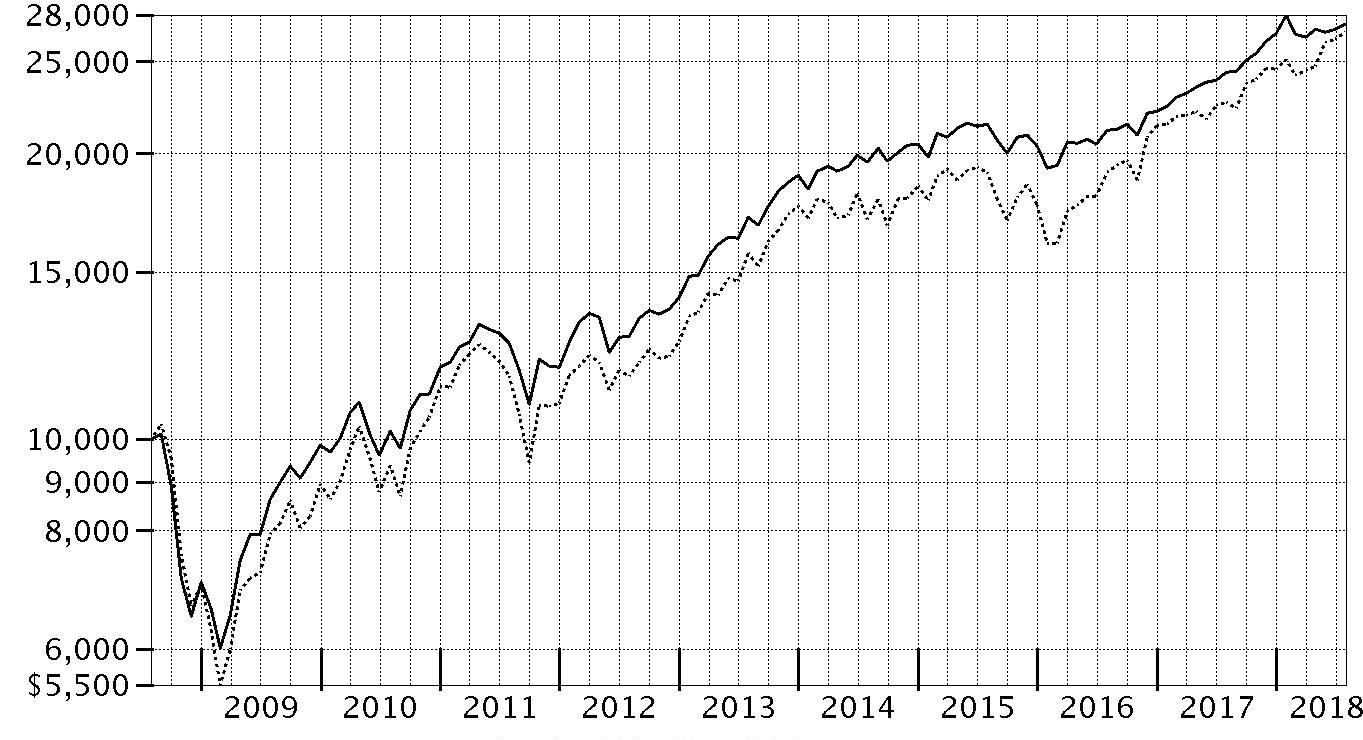
| Period Ending Values |
| $27,358 | Fidelity® Low-Priced Stock Fund - Class K |
| $26,870 | Russell 2000® Index |
Management's Discussion of Fund Performance
Market Recap: The U.S. equity bellwether S&P 500
® index gained 16.24% for the 12 months ending July 31, 2018, despite a resurgence in volatility that challenged the multiyear bull market. Stocks maintained their steady growth until a sharp reversal in February, as volatility spiked amid fear that rising inflation and the potential for the economy to overheat would prompt the U.S. Federal Reserve to pick up the pace of interest rate hikes. The index posted its first negative monthly result since October 2016, and then lost further ground in March on fear of a global trade war. The market stabilized in April and turned upward through mid-June, when escalating trade tension between the U.S. and China soured investor sentiment. The resulting uncertainty lingered into July, but strong corporate earnings helped the S&P 500 rise 3.72% that month to cap the period. For the full one-year period, growth handily topped value, while small-caps bested large-caps. By sector, information technology (+28%) led the way, boosted by strong earnings growth from several major index constituents. Consumer discretionary rose roughly 24%, driven by retailers (+49%). Energy (+20%) gained alongside higher oil prices. Laggards were telecommunication services (-2%), consumer staples (0%) and utilities (+3%), defensive groups that struggled amid rising interest rates and a general preference for risk. Real estate (+5%) fared a bit better but still lagged, as did financials, industrials, health care (each up 13%) and materials (+11%).
Comments from Lead Portfolio Manager Joel Tillinghast: For the fiscal year, the fund's share classes gained roughly 12%, trailing the 18.73% advance of the benchmark Russell 2000
® Index. The fund underperformed its benchmark in large part because the stocks that were largely in favor the past year – high-growth equities with elevated valuations – are not a focus of our investment approach, which seeks to own high-quality companies with stable earnings-growth prospects that we believe are mispriced. As a result, stock choices in several sectors, including financials, consumer staples, information technology and health care, detracted from our relative result. By industry, software & services and insurance hurt most, as did positioning in pharmaceuticals, biotechnology & life sciences. A non-benchmark position in electronics component manufacturer Hon Hai Precision Industry (-28%) was the fund’s biggest relative detractor. The stock was pressured by weaker-than-expected sales of Apple’s newly launched high-end smartphones, which impacted Hon Hai’s production. Shares in non-benchmark Unum Group (-19%) suffered from weakening financial trends in its long-term-care business. The fund's sizable allocation to cash – at 10% of assets, on average – amid a rising equity market also hindered our relative result. Our foreign holdings, which represented roughly a third of the fund’s assets this period, also detracted, in part due to the strength of the U.S. dollar. Conversely, a significant underweighting in the weak real estate sector boosted relative performance, as did stock selection in retailing and energy. The fund’s top relative contributors were non-benchmark positions in disk-drive maker Seagate Technology and discount retailer Ross Stores. All of the stocks mentioned were sizable fund holdings.
The views expressed above reflect those of the portfolio manager(s) only through the end of the period as stated on the cover of this report and do not necessarily represent the views of Fidelity or any other person in the Fidelity organization. Any such views are subject to change at any time based upon market or other conditions and Fidelity disclaims any responsibility to update such views. These views may not be relied on as investment advice and, because investment decisions for a Fidelity fund are based on numerous factors, may not be relied on as an indication of trading intent on behalf of any Fidelity fund.
Investment Summary (Unaudited)
Top Ten Stocks as of July 31, 2018
| | % of fund's net assets |
| UnitedHealth Group, Inc. | 6.2 |
| Ross Stores, Inc. | 3.2 |
| Best Buy Co., Inc. | 2.8 |
| Next PLC | 2.7 |
| Seagate Technology LLC | 2.7 |
| Metro, Inc. Class A (sub. vtg.) | 2.3 |
| Aetna, Inc. | 2.2 |
| Unum Group | 1.7 |
| ANSYS, Inc. | 1.7 |
| Amgen, Inc. | 1.6 |
| | 27.1 |
Top Five Market Sectors as of July 31, 2018
| | % of fund's net assets |
| Consumer Discretionary | 22.1 |
| Information Technology | 16.5 |
| Health Care | 14.2 |
| Financials | 11.3 |
| Consumer Staples | 8.4 |
Asset Allocation (% of fund's net assets)
| As of July 31, 2018* |
| | Stocks | 90.7% |
| | Short-Term Investments and Net Other Assets (Liabilities) | 9.3% |

* Foreign investments - 40.9%
Schedule of Investments July 31, 2018
Showing Percentage of Net Assets
| Common Stocks - 90.6% | | | |
| | | Shares | Value (000s) |
| CONSUMER DISCRETIONARY - 22.1% | | | |
| Auto Components - 1.2% | | | |
| Adient PLC | | 499,082 | $23,771 |
| ASTI Corp. (a)(b) | | 181,200 | 3,940 |
| Autoliv, Inc. (a) | | 17,500 | 1,793 |
| Cooper Tire & Rubber Co. | | 1,297,832 | 37,053 |
| ElringKlinger AG (a) | | 698,718 | 8,865 |
| G-Tekt Corp. | | 73,100 | 1,266 |
| Gentex Corp. | | 2,537,679 | 58,874 |
| GUD Holdings Ltd. | | 295,435 | 3,117 |
| Hi-Lex Corp. | | 1,367,200 | 33,968 |
| INFAC Corp. | | 325,139 | 1,314 |
| INZI Controls Co. Ltd. (b) | | 1,516,000 | 7,407 |
| Lear Corp. | | 19,173 | 3,454 |
| Motonic Corp. (b) | | 3,250,000 | 26,269 |
| Murakami Corp. (b) | | 782,700 | 21,350 |
| Nippon Seiki Co. Ltd. | | 2,639,800 | 55,197 |
| Piolax, Inc. (b) | | 2,486,100 | 60,277 |
| S&T Holdings Co. Ltd. (b) | | 885,108 | 10,056 |
| Samsung Climate Control Co. Ltd. (b) | | 499,950 | 4,804 |
| Sewon Precision Industries Co. Ltd. (b) | | 500,000 | 4,625 |
| SJM Co. Ltd. (b) | | 1,282,000 | 4,312 |
| SJM Holdings Co. Ltd. (b) | | 1,291,382 | 4,506 |
| Strattec Security Corp. (b) | | 343,035 | 11,320 |
| Sungwoo Hitech Co. Ltd. | | 2,518,110 | 10,312 |
| TBK Co. Ltd. | | 925,900 | 4,240 |
| Yachiyo Industry Co. Ltd. | | 896,600 | 10,280 |
| Yutaka Giken Co. Ltd. (b) | | 1,228,100 | 29,952 |
| | | | 442,322 |
| Distributors - 0.2% | | | |
| Central Automotive Products Ltd. | | 75,400 | 1,227 |
| Chori Co. Ltd. | | 430,500 | 7,989 |
| Nakayamafuku Co. Ltd. | | 748,500 | 4,793 |
| PALTAC Corp. | | 121,100 | 6,390 |
| SPK Corp. | | 253,600 | 6,128 |
| Uni-Select, Inc. | | 1,647,187 | 27,427 |
| | | | 53,954 |
| Diversified Consumer Services - 0.3% | | | |
| Clip Corp. (b) | | 272,000 | 2,255 |
| Cross-Harbour Holdings Ltd. | | 2,321,000 | 3,903 |
| Estacio Participacoes SA | | 407,600 | 2,818 |
| ServiceMaster Global Holdings, Inc. (c) | | 184,559 | 10,518 |
| Shingakukai Holdings Co. Ltd. | | 99,900 | 532 |
| Step Co. Ltd. (b) | | 1,077,300 | 15,560 |
| Weight Watchers International, Inc. (c) | | 1,000,774 | 89,599 |
| | | | 125,185 |
| Hotels, Restaurants & Leisure - 0.3% | | | |
| Ark Restaurants Corp. | | 157,407 | 3,542 |
| Bluegreen Vacations Corp. | | 218,433 | 5,616 |
| Brinker International, Inc. | | 22,714 | 1,071 |
| Flanigans Enterprises, Inc. | | 89,612 | 2,626 |
| Greggs PLC | | 499,482 | 6,910 |
| Hiday Hidaka Corp. (b) | | 1,845,300 | 39,244 |
| Ibersol SGPS SA | | 912,355 | 10,669 |
| Koshidaka Holdings Co. Ltd. | | 294,120 | 3,383 |
| Kura Corp. Ltd. | | 10,000 | 603 |
| Sportscene Group, Inc. Class A (b) | | 331,600 | 2,039 |
| St. Marc Holdings Co. Ltd. | | 400,300 | 9,734 |
| Texas Roadhouse, Inc. Class A | | 93,513 | 5,876 |
| The Monogatari Corp. | | 79,900 | 7,360 |
| The Restaurant Group PLC | | 6,498,637 | 22,604 |
| TORIDOLL Holdings Corp. | | 74,900 | 1,662 |
| Wyndham Destinations, Inc. | | 25,009 | 1,153 |
| Wyndham Hotels & Resorts, Inc. | | 25,009 | 1,451 |
| | | | 125,543 |
| Household Durables - 3.3% | | | |
| Abbey PLC (b) | | 1,775,890 | 31,773 |
| Barratt Developments PLC (b) | | 72,241,313 | 506,341 |
| Bellway PLC | | 3,914,975 | 149,893 |
| D.R. Horton, Inc. | | 2,866,806 | 125,279 |
| Dorel Industries, Inc. Class B (sub. vtg.) | | 2,585,365 | 47,401 |
| Emak SpA | | 4,388,097 | 6,199 |
| First Juken Co. Ltd. (b) | | 1,400,500 | 17,548 |
| Flexsteel Industries, Inc. | | 27,826 | 997 |
| Hamilton Beach Brands Holding Co.: | | | |
| Class A | | 176,552 | 4,484 |
| Class B | | 183,780 | 4,668 |
| Helen of Troy Ltd. (b)(c) | | 1,680,238 | 192,471 |
| Henry Boot PLC | | 2,949,666 | 10,144 |
| Iida Group Holdings Co. Ltd. | | 186,300 | 3,647 |
| M/I Homes, Inc. (c) | | 25,382 | 656 |
| Meritage Homes Corp. (c) | | 20,965 | 905 |
| P&F Industries, Inc. Class A (b) | | 322,495 | 2,683 |
| PulteGroup, Inc. | | 101,806 | 2,900 |
| Q.E.P. Co., Inc. | | 30,058 | 956 |
| Sanei Architecture Planning Co. Ltd. (b) | | 1,210,700 | 21,406 |
| Stanley Furniture Co., Inc. (c) | | 150,671 | 98 |
| Taylor Morrison Home Corp. (c) | | 210,457 | 4,110 |
| Token Corp. | | 623,700 | 47,970 |
| Toll Brothers, Inc. | | 94,819 | 3,343 |
| Tupperware Brands Corp. | | 29,354 | 1,078 |
| | | | 1,186,950 |
| Internet & Direct Marketing Retail - 0.3% | | | |
| Belluna Co. Ltd. (b) | | 6,985,900 | 81,345 |
| Liberty Interactive Corp. QVC Group Series A (c) | | 854,888 | 18,201 |
| | | | 99,546 |
| Leisure Products - 0.2% | | | |
| Accell Group NV (b) | | 1,757,314 | 36,577 |
| Amer Group PLC (A Shares) | | 118,243 | 3,795 |
| Brunswick Corp. | | 119,700 | 7,697 |
| Fenix Outdoor AB Class B (c)(d) | | 32,298 | 0 |
| Kabe Husvagnar AB (B Shares) | | 277,074 | 5,184 |
| Mars Engineering Corp. | | 500,000 | 10,835 |
| Miroku Corp. | | 140,500 | 2,586 |
| | | | 66,674 |
| Media - 1.1% | | | |
| Comcast Corp. Class A | | 2,644,653 | 94,626 |
| Corus Entertainment, Inc. Class B (non-vtg.) (a) | | 585,765 | 1,828 |
| Discovery Communications, Inc.: | | | |
| Class A (a)(c) | | 2,645,227 | 70,310 |
| Class C (non-vtg.) (c) | | 499,061 | 12,252 |
| DISH Network Corp. Class A (c) | | 109,980 | 3,471 |
| Entercom Communications Corp. Class A | | 50,107 | 378 |
| Gannett Co., Inc. | | 1,076,384 | 11,377 |
| Harte-Hanks, Inc. (c) | | 74,105 | 750 |
| Hyundai HCN | | 2,723,979 | 10,153 |
| Informa PLC | | 451,363 | 4,677 |
| Intage Holdings, Inc. (b) | | 3,306,600 | 34,244 |
| Ipsos SA | | 8,810 | 295 |
| KK Culture Holdings Ltd. (c) | | 8,087,000 | 1,690 |
| MSG Network, Inc. Class A (c) | | 288,809 | 6,801 |
| Multiplus SA | | 536,800 | 3,962 |
| Pico Far East Holdings Ltd. | | 18,538,000 | 7,676 |
| Proto Corp. | | 235,200 | 2,890 |
| RKB Mainichi Broadcasting Corp. | | 42,400 | 2,378 |
| Saga Communications, Inc. Class A | | 397,449 | 15,043 |
| Sky Network Television Ltd. | | 5,847,362 | 10,801 |
| STW Group Ltd. | | 4,100,892 | 2,803 |
| Tegna, Inc. | | 1,174,466 | 12,954 |
| Television Broadcasts Ltd. | | 1,962,100 | 6,087 |
| TOW Co. Ltd. (b) | | 1,831,300 | 13,217 |
| TVA Group, Inc. Class B (non-vtg.) (c) | | 3,091,099 | 7,105 |
| Twenty-First Century Fox, Inc. Class A | | 418,527 | 18,834 |
| Viacom, Inc. Class B (non-vtg.) | | 1,216,553 | 35,341 |
| WOWOW INC. | | 184,400 | 5,582 |
| | | | 397,525 |
| Multiline Retail - 2.9% | | | |
| Big Lots, Inc. (a) | | 140,068 | 6,083 |
| Lifestyle China Group Ltd. (c) | | 24,958,500 | 10,144 |
| Lifestyle International Holdings Ltd. | | 25,000,000 | 49,688 |
| Next PLC (b) | | 12,702,310 | 989,675 |
| Nordstrom, Inc. | | 79,448 | 4,164 |
| Watts Co. Ltd. | | 648,800 | 6,342 |
| | | | 1,066,096 |
| Specialty Retail - 10.9% | | | |
| Aaron's, Inc. Class A | | 65,395 | 2,832 |
| Abercrombie & Fitch Co. Class A | | 2,750,080 | 65,149 |
| AT-Group Co. Ltd. | | 1,095,100 | 27,795 |
| AutoCanada, Inc. | | 199,959 | 2,223 |
| AutoNation, Inc. (c) | | 78,859 | 3,827 |
| AutoZone, Inc. (c) | | 730,209 | 515,184 |
| Bed Bath & Beyond, Inc. | | 2,068,796 | 38,749 |
| Best Buy Co., Inc. | | 13,484,839 | 1,011,767 |
| BMTC Group, Inc. (b) | | 3,634,497 | 42,943 |
| Bonia Corp. Bhd | | 2,503,000 | 268 |
| Buffalo Co. Ltd. | | 93,200 | 791 |
| Burlington Stores, Inc. (c) | | 37,468 | 5,725 |
| Cars.com, Inc. (c) | | 434,702 | 12,332 |
| Cash Converters International Ltd. (c) | | 22,077,204 | 5,495 |
| Chico's FAS, Inc. | | 634,386 | 5,519 |
| Delek Automotive Systems Ltd. | | 737,100 | 3,894 |
| DSW, Inc. Class A | | 203,875 | 5,594 |
| Dunelm Group PLC | | 650,011 | 4,475 |
| Ff Group (b)(c)(d) | | 4,363,428 | 24,491 |
| Formosa Optical Technology Co. Ltd. | | 1,362,000 | 2,761 |
| Fourlis Holdings SA | | 200,431 | 1,352 |
| Francesca's Holdings Corp. (c) | | 299,858 | 2,441 |
| GameStop Corp. Class A (a) | | 3,030,465 | 43,669 |
| Genesco, Inc. (c) | | 599,091 | 24,383 |
| GNC Holdings, Inc. Class A (c) | | 949,973 | 3,021 |
| Goldlion Holdings Ltd. | | 21,953,000 | 9,090 |
| Guess?, Inc. (b) | | 4,938,084 | 111,897 |
| Hour Glass Ltd. | | 8,339,600 | 3,951 |
| IA Group Corp. (b) | | 117,640 | 3,987 |
| JB Hi-Fi Ltd. (a) | | 106,044 | 1,879 |
| John David Group PLC | | 7,906,780 | 48,559 |
| Jumbo SA (b) | | 10,027,525 | 160,642 |
| K's Holdings Corp. | | 4,790,300 | 53,852 |
| Ku Holdings Co. Ltd. | | 850,600 | 7,143 |
| Le Chateau, Inc. Class B (sub. vtg.) (c) | | 620,700 | 143 |
| Leon's Furniture Ltd. | | 186,348 | 2,620 |
| Lewis Group Ltd. | | 1,077,376 | 2,446 |
| Mr. Bricolage SA (b) | | 860,713 | 13,235 |
| Murphy U.S.A., Inc. (c) | | 46,567 | 3,690 |
| Nafco Co. Ltd. (b) | | 1,938,400 | 31,794 |
| Ross Stores, Inc. | | 13,400,498 | 1,171,606 |
| Sacs Bar Holdings, Inc. | | 199,900 | 1,734 |
| Sally Beauty Holdings, Inc. (c) | | 2,431,153 | 40,090 |
| Second Chance Properties Ltd. warrants 1/23/20 (c) | | 1,941,600 | 6 |
| Sonic Automotive, Inc. Class A (sub. vtg.) | | 1,098,619 | 22,357 |
| The Buckle, Inc. (a)(b) | | 4,502,441 | 108,284 |
| The Children's Place Retail Stores, Inc. | | 30,939 | 3,802 |
| Urban Outfitters, Inc. (c) | | 2,350,151 | 104,347 |
| USS Co. Ltd. | | 5,147,400 | 97,410 |
| Vitamin Shoppe, Inc. (c) | | 873,939 | 7,297 |
| Williams-Sonoma, Inc. (a) | | 354,771 | 20,751 |
| Workman Co. Ltd. | | 2,022,700 | 90,629 |
| | | | 3,979,921 |
| Textiles, Apparel & Luxury Goods - 1.4% | | | |
| Best Pacific International Holdings Ltd. | | 4,818,000 | 1,780 |
| Deckers Outdoor Corp. (c) | | 33,000 | 3,723 |
| Embry Holdings Ltd. | | 2,161,000 | 727 |
| Emerald Expositions Events, Inc. | | 128,392 | 2,478 |
| Fossil Group, Inc. (b)(c) | | 4,138,034 | 108,416 |
| Gildan Activewear, Inc. | | 6,895,942 | 177,640 |
| Handsome Co. Ltd. (b) | | 2,000,000 | 67,806 |
| JLM Couture, Inc. (b)(c) | | 160,355 | 1,267 |
| Makalot Industrial Co. Ltd. | | 906,000 | 4,029 |
| McRae Industries, Inc. | | 24,161 | 725 |
| Michael Kors Holdings Ltd. (c) | | 76,284 | 5,090 |
| Oxford Industries, Inc. | | 24,123 | 2,222 |
| Portico International Holdings (c) | | 10,198,500 | 5,314 |
| Steven Madden Ltd. | | 155,407 | 8,400 |
| Sun Hing Vision Group Holdings Ltd. (b) | | 19,833,000 | 6,974 |
| Texwinca Holdings Ltd. | | 48,936,000 | 21,572 |
| Victory City International Holdings Ltd. (c) | | 90,567,225 | 1,454 |
| Wolverine World Wide, Inc. | | 120,185 | 4,252 |
| Youngone Corp. | | 500,000 | 13,561 |
| Youngone Holdings Co. Ltd. (b) | | 889,600 | 42,903 |
| Yue Yuen Industrial (Holdings) Ltd. | | 5,095,500 | 13,698 |
| | | | 494,031 |
|
| TOTAL CONSUMER DISCRETIONARY | | | 8,037,747 |
|
| CONSUMER STAPLES - 8.4% | | | |
| Beverages - 1.6% | | | |
| A.G. Barr PLC | | 3,076,444 | 27,337 |
| Baron de Ley SA (c) | | 129,900 | 16,861 |
| Britvic PLC | | 6,452,327 | 68,091 |
| C&C Group PLC | | 1,890,226 | 7,604 |
| Jinro Distillers Co. Ltd. | | 47,081 | 1,294 |
| Monster Beverage Corp. (c) | | 6,712,002 | 402,854 |
| Muhak Co. Ltd. (b) | | 2,799,256 | 38,087 |
| Olvi PLC (A Shares) | | 99,277 | 3,738 |
| Spritzer Bhd | | 5,120,400 | 3,023 |
| Yantai Changyu Pioneer Wine Co. Ltd. (B Shares) | | 2,799,936 | 7,473 |
| | | | 576,362 |
| Food & Staples Retailing - 5.0% | | | |
| Amsterdam Commodities NV | | 139,172 | 3,263 |
| Aoki Super Co. Ltd. | | 225,000 | 2,652 |
| Australasian Foods Holdco Pty Ltd. (c)(d) | | 3,481,102 | 2,328 |
| Belc Co. Ltd. (b) | | 1,650,600 | 79,124 |
| Casey's General Stores, Inc. | | 18,000 | 1,969 |
| Cosmos Pharmaceutical Corp. | | 999,900 | 219,895 |
| Create SD Holdings Co. Ltd. (b) | | 5,347,100 | 132,942 |
| Daikokutenbussan Co. Ltd. | | 548,800 | 24,295 |
| Dong Suh Companies, Inc. | | 1,100,000 | 25,192 |
| Genky DrugStores Co. Ltd. | | 733,600 | 25,358 |
| Halows Co. Ltd. (b) | | 1,292,700 | 29,828 |
| Kirindo Holdings Co. Ltd. | | 151,200 | 3,067 |
| Kroger Co. | | 1,840,934 | 53,387 |
| Kusuri No Aoki Holdings Co. Ltd. | | 745,800 | 54,694 |
| Majestic Wine PLC | | 1,796,432 | 10,563 |
| McColl's Retail Group PLC | | 1,446,367 | 2,848 |
| Medical System Network Co. Ltd. | | 69,500 | 283 |
| Metro, Inc. Class A (sub. vtg.) (b) | | 24,662,015 | 831,515 |
| North West Co., Inc. | | 111,752 | 2,553 |
| Performance Food Group Co. (c) | | 196,165 | 7,033 |
| Qol Co. Ltd. | | 1,852,300 | 30,415 |
| Retail Partners Co. Ltd. | | 440,200 | 6,016 |
| Sligro Food Group NV (a) | | 350,919 | 14,526 |
| Sundrug Co. Ltd. | | 3,048,000 | 121,849 |
| Tesco PLC | | 3,001,515 | 10,250 |
| Thai President Foods PCL | | 512,288 | 2,387 |
| Total Produce PLC | | 8,923,590 | 23,165 |
| United Natural Foods, Inc. (c) | | 1,247,519 | 40,170 |
| Valor Holdings Co. Ltd. | | 488,000 | 10,466 |
| Walgreens Boots Alliance, Inc. | | 27,852 | 1,883 |
| Walmart, Inc. | | 33,935 | 3,028 |
| Yaoko Co. Ltd. | | 948,100 | 49,010 |
| | | | 1,825,954 |
| Food Products - 1.6% | | | |
| Aryzta AG (a) | | 850,479 | 12,029 |
| Carr's Group PLC | | 2,230,900 | 4,334 |
| Cranswick PLC | | 450,611 | 19,364 |
| Dean Foods Co. | | 196,383 | 1,928 |
| Devro PLC | | 1,450,246 | 3,746 |
| Food Empire Holdings Ltd. (b) | | 39,079,200 | 17,941 |
| Fresh Del Monte Produce, Inc. (b) | | 4,812,249 | 174,685 |
| Hilton Food Group PLC | | 666,255 | 8,360 |
| Inghams Group Ltd. (a) | | 1,677,688 | 4,574 |
| Ingredion, Inc. | | 22,634 | 2,293 |
| Japan Meat Co. Ltd. | | 167,800 | 3,165 |
| Kaveri Seed Co. Ltd. | | 82,484 | 736 |
| Mitsui Sugar Co. Ltd. | | 351,300 | 10,651 |
| Nam Yang Dairy Products | | 10,500 | 6,045 |
| Natori Co. Ltd. | | 49,900 | 826 |
| Origin Enterprises PLC (b) | | 9,199,309 | 64,974 |
| Pacific Andes International Holdings Ltd. (c)(d) | | 106,378,500 | 989 |
| Pacific Andes Resources Development Ltd. (c)(d) | | 207,240,893 | 1,675 |
| Pickles Corp. | | 99,600 | 1,980 |
| Rocky Mountain Chocolate Factory, Inc. (b) | | 436,321 | 4,481 |
| S Foods, Inc. | | 402,100 | 15,769 |
| Seaboard Corp. | | 39,475 | 143,610 |
| Select Harvests Ltd. (a) | | 3,909,740 | 17,428 |
| Sunjin Co. Ltd. (b)(c) | | 2,376,955 | 29,566 |
| The Hain Celestial Group, Inc. (c) | | 300,527 | 8,547 |
| Want Want China Holdings Ltd. | | 13,499,000 | 11,162 |
| | | | 570,858 |
| Household Products - 0.0% | | | |
| Central Garden & Pet Co. Class A (non-vtg.) (c) | | 87,630 | 3,516 |
| Personal Products - 0.1% | | | |
| Grape King Bio Ltd. | | 1,748,000 | 13,433 |
| Natural Alternatives International, Inc. (c) | | 131,621 | 1,336 |
| Sarantis SA (b) | | 4,005,208 | 32,784 |
| | | | 47,553 |
| Tobacco - 0.1% | | | |
| Karelia Tobacco Co., Inc. | | 1,610 | 520 |
| Scandinavian Tobacco Group A/S (e) | | 1,775,731 | 28,896 |
| | | | 29,416 |
|
| TOTAL CONSUMER STAPLES | | | 3,053,659 |
|
| ENERGY - 5.0% | | | |
| Energy Equipment & Services - 1.6% | | | |
| AKITA Drilling Ltd. Class A (non-vtg.) | | 1,472,682 | 5,513 |
| Bristow Group, Inc. (b)(c) | | 2,147,436 | 30,021 |
| Carbo Ceramics, Inc. (c) | | 970,992 | 9,059 |
| Cathedral Energy Services Ltd. (c) | | 1,326,950 | 1,193 |
| Diamond Offshore Drilling, Inc. (a)(c) | | 4,250,530 | 81,610 |
| Divestco, Inc. (c) | | 2,899,000 | 178 |
| Dril-Quip, Inc. (c) | | 195,745 | 10,091 |
| Ensco PLC Class A | | 11,026,797 | 81,929 |
| Fugro NV (Certificaten Van Aandelen) (a)(c) | | 1,321,088 | 19,055 |
| Geospace Technologies Corp. (b)(c) | | 1,148,900 | 16,165 |
| Gulf Island Fabrication, Inc. | | 59,879 | 542 |
| GulfMark Offshore, Inc. warrants 11/14/24 (c) | | 76,904 | 192 |
| John Wood Group PLC | | 683,959 | 5,833 |
| Liberty Oilfield Services, Inc. Class A (a) | | 1,500,783 | 29,415 |
| National Oilwell Varco, Inc. | | 249,728 | 12,142 |
| Oceaneering International, Inc. | | 399,941 | 10,942 |
| Oil States International, Inc. (c) | | 2,315,809 | 80,822 |
| PHX Energy Services Corp. (c) | | 1,369,526 | 2,148 |
| RigNet, Inc. (c) | | 65,049 | 800 |
| Shinko Plantech Co. Ltd. | | 1,174,900 | 11,085 |
| Smart Sand, Inc. (c) | | 125,008 | 725 |
| Solstad Offshore ASA (a)(c) | | 2,067,803 | 1,557 |
| Total Energy Services, Inc. | | 2,054,043 | 17,369 |
| Transocean Ltd. (United States) (a)(c) | | 2,885,654 | 37,138 |
| Unit Corp. (b)(c) | | 5,387,244 | 134,142 |
| | | | 599,666 |
| Oil, Gas & Consumable Fuels - 3.4% | | | |
| Adams Resources & Energy, Inc. | | 136,169 | 5,447 |
| Andeavor | | 1,123,672 | 168,618 |
| Beach Energy Ltd. | | 15,782,560 | 22,396 |
| Bonavista Energy Corp. | | 278,447 | 334 |
| Chevron Corp. | | 199,965 | 25,250 |
| CNX Resources Corp. (c) | | 293,265 | 4,774 |
| ConocoPhillips Co. | | 873,295 | 63,026 |
| CONSOL Energy, Inc. (c) | | 48,446 | 2,017 |
| Contango Oil & Gas Co. (b)(c) | | 2,599,689 | 14,584 |
| Denbury Resources, Inc. (c) | | 5,743,600 | 25,904 |
| Eni SpA | | 7,285,345 | 140,232 |
| Fuji Kosan Co. Ltd. (b) | | 637,500 | 3,729 |
| Great Eastern Shipping Co. Ltd. | | 5,100,000 | 22,494 |
| Hankook Shell Oil Co. Ltd. | | 49,000 | 15,468 |
| International Seaways, Inc. (c) | | 23,313 | 508 |
| KyungDong City Gas Co. Ltd. | | 208,063 | 8,241 |
| Kyungdong Invest Co. Ltd. | | 84,315 | 3,673 |
| Marathon Oil Corp. | | 3,736,234 | 78,909 |
| Marathon Petroleum Corp. | | 136,564 | 11,038 |
| Michang Oil Industrial Co. Ltd. (b) | | 173,900 | 12,557 |
| Murphy Oil Corp. (b) | | 10,909,025 | 362,834 |
| NACCO Industries, Inc. Class A | | 176,552 | 5,826 |
| Newfield Exploration Co. (c) | | 378,210 | 10,862 |
| QEP Resources, Inc. (c) | | 1,697,069 | 17,633 |
| Reliance Industries Ltd. | | 162,800 | 2,820 |
| Southwestern Energy Co. (c) | | 12,800,316 | 65,794 |
| Star Petroleum Refining PCL | | 7,445,700 | 3,267 |
| Thai Oil PCL (For. Reg.) | | 371,400 | 896 |
| Whitecap Resources, Inc. | | 456,136 | 3,012 |
| Whiting Petroleum Corp. (c) | | 1,398,961 | 69,458 |
| World Fuel Services Corp. | | 1,864,425 | 51,887 |
| WPX Energy, Inc. (c) | | 1,036,018 | 19,446 |
| | | | 1,242,934 |
|
| TOTAL ENERGY | | | 1,842,600 |
|
| FINANCIALS - 11.3% | | | |
| Banks - 1.1% | | | |
| ACNB Corp. | | 94,455 | 3,240 |
| Associated Banc-Corp. | | 175,888 | 4,749 |
| BancFirst Corp. | | 65,670 | 4,078 |
| Bank Ireland Group PLC | | 11,458,526 | 98,349 |
| Bank of America Corp. | | 125,951 | 3,889 |
| Boston Private Financial Holdings, Inc. | | 192,787 | 2,776 |
| Camden National Corp. | | 55,435 | 2,556 |
| Cathay General Bancorp | | 625,752 | 26,025 |
| Central Pacific Financial Corp. | | 147,641 | 4,069 |
| Codorus Valley Bancorp, Inc. (b) | | 624,297 | 19,497 |
| Cullen/Frost Bankers, Inc. | | 79,615 | 8,797 |
| Dah Sing Banking Group Ltd. | | 1,713,200 | 3,636 |
| Dimeco, Inc. | | 36,256 | 1,504 |
| East West Bancorp, Inc. | | 26,000 | 1,683 |
| First Bancorp, Puerto Rico (c) | | 4,650,140 | 38,224 |
| First Citizen Bancshares, Inc. | | 8,884 | 3,614 |
| First Hawaiian, Inc. | | 452,374 | 12,784 |
| Hanmi Financial Corp. | | 49,905 | 1,250 |
| Hope Bancorp, Inc. | | 798,410 | 13,397 |
| Huntington Bancshares, Inc. | | 263,871 | 4,074 |
| KeyCorp | | 148,277 | 3,095 |
| LCNB Corp. | | 141,217 | 2,627 |
| Meridian Bank/Malvern, PA (c) | | 148,930 | 2,593 |
| Northrim Bancorp, Inc. | | 114,636 | 4,620 |
| OFG Bancorp | | 435,546 | 7,252 |
| Peoples Bancorp, Inc. | | 52,121 | 1,888 |
| PNC Financial Services Group, Inc. | | 27,404 | 3,969 |
| Popular, Inc. | | 34,800 | 1,727 |
| Regions Financial Corp. | | 203,911 | 3,795 |
| SpareBank 1 SR-Bank ASA (primary capital certificate) | | 1,233,555 | 13,702 |
| Sparebanken More (primary capital certificate) | | 208,532 | 6,954 |
| Sparebanken Nord-Norge | | 2,315,482 | 17,600 |
| Umpqua Holdings Corp. | | 125,800 | 2,680 |
| Van Lanschot NV (Bearer) | | 1,062,198 | 29,313 |
| Wells Fargo & Co. | | 841,197 | 48,192 |
| | | | 408,198 |
| Capital Markets - 0.5% | | | |
| AllianceBernstein Holding LP | | 700,127 | 21,144 |
| Ameriprise Financial, Inc. | | 13,730 | 2,000 |
| Ares Capital Corp. | | 200,000 | 3,370 |
| Banca Generali SpA | | 129,514 | 3,495 |
| Close Brothers Group PLC | | 138,145 | 2,879 |
| Cowen Group, Inc. Class A (a)(c) | | 408,471 | 6,413 |
| Franklin Resources, Inc. | | 1,082,698 | 37,158 |
| GAMCO Investors, Inc. Class A | | 107,994 | 2,645 |
| Hamilton Lane, Inc. Class A | | 91,919 | 4,501 |
| Invesco Ltd. | | 108,593 | 2,931 |
| Lazard Ltd. Class A | | 352,724 | 19,153 |
| OM Asset Management Ltd. | | 204,456 | 2,913 |
| State Street Corp. | | 172,431 | 15,227 |
| Tullett Prebon PLC | | 709,958 | 2,609 |
| Waddell & Reed Financial, Inc. Class A | | 2,470,604 | 51,166 |
| | | | 177,604 |
| Consumer Finance - 1.3% | | | |
| Aeon Credit Service (Asia) Co. Ltd. | | 12,750,000 | 10,802 |
| American Express Co. | | 37,528 | 3,735 |
| Discover Financial Services | | 563,749 | 40,257 |
| H&T Group PLC | | 538,783 | 2,235 |
| Navient Corp. | | 1,126,615 | 14,883 |
| Nicholas Financial, Inc. (c) | | 359,572 | 3,308 |
| OneMain Holdings, Inc. (c) | | 685,356 | 22,788 |
| Santander Consumer U.S.A. Holdings, Inc. | | 9,040,082 | 173,931 |
| Synchrony Financial | | 6,694,447 | 193,737 |
| | | | 465,676 |
| Diversified Financial Services - 0.2% | | | |
| AXA Equitable Holdings, Inc. | | 2,195,561 | 48,280 |
| Far East Horizon Ltd. | | 2,513,000 | 2,420 |
| Newship Ltd. (c)(d) | | 2,500 | 906 |
| Ricoh Leasing Co. Ltd. | | 765,600 | 24,992 |
| | | | 76,598 |
| Insurance - 7.3% | | | |
| AEGON NV | | 45,707,932 | 301,557 |
| AFLAC, Inc. | | 654,832 | 30,476 |
| Allstate Corp. | | 40,170 | 3,821 |
| April | | 2,187,623 | 34,790 |
| ASR Nederland NV | | 556,991 | 24,945 |
| Assurant, Inc. | | 2,400,088 | 264,730 |
| Aub Group Ltd. | | 246,187 | 2,398 |
| Axis Capital Holdings Ltd. | | 1,600,497 | 90,524 |
| CNO Financial Group, Inc. | | 186,864 | 3,803 |
| Employers Holdings, Inc. | | 92,040 | 4,275 |
| FBD Holdings PLC | | 145,047 | 1,755 |
| First American Financial Corp. | | 109,261 | 6,119 |
| Great-West Lifeco, Inc. | | 46,294 | 1,144 |
| Hartford Financial Services Group, Inc. | | 1,896,469 | 99,944 |
| Hiscox Ltd. | | 240,081 | 5,036 |
| Hyundai Fire & Marine Insurance Co. Ltd. | | 114,734 | 3,776 |
| Investors Title Co. | | 7,423 | 1,421 |
| Lincoln National Corp. | | 4,474,622 | 304,722 |
| MetLife, Inc. | | 10,559,047 | 482,971 |
| National Western Life Group, Inc. | | 132,121 | 42,807 |
| NN Group NV | | 1,151,464 | 50,923 |
| Primerica, Inc. | | 123,713 | 14,202 |
| Principal Financial Group, Inc. | | 53,703 | 3,119 |
| RenaissanceRe Holdings Ltd. | | 1,686,076 | 222,309 |
| Sony Financial Holdings, Inc. | | 2,445,000 | 46,984 |
| The Travelers Companies, Inc. | | 28,419 | 3,698 |
| Torchmark Corp. | | 89,244 | 7,860 |
| Universal Insurance Holdings, Inc. | | 45,491 | 2,020 |
| Unum Group (b) | | 15,095,575 | 599,747 |
| WMI Holdings Corp. (c) | | 385,255 | 524 |
| | | | 2,662,400 |
| Mortgage Real Estate Investment Trusts - 0.5% | | | |
| Annaly Capital Management, Inc. | | 14,680,820 | 157,378 |
| MFA Financial, Inc. | | 277,769 | 2,236 |
| New Residential Investment Corp. | | 24,468 | 438 |
| Redwood Trust, Inc. | | 481,349 | 8,091 |
| | | | 168,143 |
| Thrifts & Mortgage Finance - 0.4% | | | |
| ASAX Co. Ltd. | | 333,800 | 1,914 |
| Genworth MI Canada, Inc. | | 4,000,817 | 140,829 |
| Genworth Mortgage Insurance Ltd. | | 6,179,851 | 12,351 |
| Meridian Bancorp, Inc. Maryland | | 211,193 | 3,865 |
| | | | 158,959 |
|
| TOTAL FINANCIALS | | | 4,117,578 |
|
| HEALTH CARE - 14.2% | | | |
| Biotechnology - 1.6% | | | |
| Amgen, Inc. | | 2,860,423 | 562,216 |
| Celgene Corp. (c) | | 9,789 | 882 |
| Gilead Sciences, Inc. | | 193,052 | 15,025 |
| United Therapeutics Corp. (c) | | 37,343 | 4,590 |
| | | | 582,713 |
| Health Care Equipment & Supplies - 0.8% | | | |
| Apex Biotechnology Corp. | | 1,200,000 | 1,099 |
| Arts Optical International Holdings Ltd. (b) | | 22,612,000 | 5,935 |
| Boston Scientific Corp. (c) | | 252,681 | 8,493 |
| Hoshiiryou Sanki Co. Ltd. (b) | | 298,464 | 10,891 |
| Huvitz Co. Ltd. | | 25,000 | 272 |
| LivaNova PLC (c) | | 64,834 | 7,140 |
| Microlife Corp. | | 3,683,500 | 10,323 |
| Nakanishi, Inc. | | 974,700 | 20,354 |
| Pacific Hospital Supply Co. Ltd. | | 1,454,000 | 3,148 |
| Prim SA (b) | | 1,437,100 | 22,014 |
| ResMed, Inc. | | 76,907 | 8,135 |
| Shandong Weigao Medical Polymer Co. Ltd. (H Shares) | | 928,000 | 709 |
| St.Shine Optical Co. Ltd. | | 2,000,000 | 44,014 |
| Supermax Corp. Bhd | | 10,000,000 | 10,750 |
| Techno Medica Co. Ltd. | | 38,800 | 734 |
| Utah Medical Products, Inc. (b) | | 283,123 | 27,463 |
| Zimmer Biomet Holdings, Inc. | | 800,062 | 100,424 |
| | | | 281,898 |
| Health Care Providers & Services - 10.6% | | | |
| Aetna, Inc. | | 4,166,607 | 784,947 |
| Anthem, Inc. | | 1,872,031 | 473,624 |
| CVS Health Corp. | | 555,122 | 36,005 |
| DVx, Inc. (b) | | 698,000 | 8,927 |
| Hanger, Inc. (b)(c) | | 2,494,350 | 43,651 |
| Hi-Clearance, Inc. | | 1,489,000 | 4,864 |
| Humana, Inc. | | 9,482 | 2,979 |
| Laboratory Corp. of America Holdings (c) | | 9,938 | 1,743 |
| Medica Sur SA de CV | | 333,308 | 679 |
| MEDNAX, Inc. (c) | | 490,950 | 21,008 |
| Patterson Companies, Inc. | | 249,574 | 6,120 |
| Premier, Inc. (c) | | 143,733 | 5,376 |
| Quest Diagnostics, Inc. | | 28,948 | 3,118 |
| Ship Healthcare Holdings, Inc. | | 131,400 | 5,094 |
| Tokai Corp. | | 342,500 | 7,495 |
| Triple-S Management Corp. (b)(c) | | 1,665,016 | 59,125 |
| Tsukui Corp. | | 375,300 | 3,393 |
| United Drug PLC (United Kingdom) | | 2,506,632 | 27,637 |
| UnitedHealth Group, Inc. | | 8,971,989 | 2,271,890 |
| Universal Health Services, Inc. Class B | | 612,771 | 74,819 |
| WIN-Partners Co. Ltd. (b) | | 2,528,500 | 37,651 |
| | | | 3,880,145 |
| Health Care Technology - 0.1% | | | |
| Addlife AB | | 299,732 | 7,193 |
| Computer Programs & Systems, Inc. (a) | | 139,215 | 4,344 |
| ND Software Co. Ltd. (b) | | 1,204,400 | 12,926 |
| | | | 24,463 |
| Pharmaceuticals - 1.1% | | | |
| Akorn, Inc. (c) | | 91,905 | 1,702 |
| Apex Healthcare Bhd | | 47,600 | 83 |
| Bliss Gvs Pharma Ltd. (c) | | 4,600,000 | 11,547 |
| Bristol-Myers Squibb Co. | | 45,818 | 2,692 |
| Daewon Pharmaceutical Co. Ltd. (b) | | 1,871,384 | 32,353 |
| Daewoong Co. Ltd. | | 350,000 | 4,621 |
| Dawnrays Pharmaceutical Holdings Ltd. | | 11,111,000 | 6,342 |
| DongKook Pharmaceutical Co. Ltd. (b) | | 623,700 | 35,177 |
| FDC Ltd. (c) | | 3,141,164 | 11,049 |
| Fuji Pharma Co. Ltd. | | 648,700 | 11,267 |
| Genomma Lab Internacional SA de CV (c) | | 5,507,300 | 4,394 |
| Indivior PLC (c) | | 16,590,396 | 66,590 |
| Jazz Pharmaceuticals PLC (c) | | 24,335 | 4,212 |
| Korea United Pharm, Inc. | | 239,629 | 5,144 |
| Kwang Dong Pharmaceutical Co. Ltd. (b) | | 3,100,000 | 20,881 |
| Kyung Dong Pharmaceutical Co. Ltd. | | 960,000 | 10,432 |
| Lee's Pharmaceutical Holdings Ltd. | | 5,959,000 | 6,385 |
| Novo Nordisk A/S Series B sponsored ADR | | 1,076,594 | 53,582 |
| Phibro Animal Health Corp. Class A | | 142,459 | 6,824 |
| Recordati SpA | | 1,541,484 | 57,645 |
| Taro Pharmaceutical Industries Ltd. (c) | | 45,405 | 5,097 |
| Tsumura & Co. | | 349,700 | 11,337 |
| Vivimed Labs Ltd. (c) | | 600,000 | 496 |
| Whanin Pharmaceutical Co. Ltd. (b) | | 1,750,000 | 33,084 |
| | | | 402,936 |
|
| TOTAL HEALTH CARE | | | 5,172,155 |
|
| INDUSTRIALS - 7.0% | | | |
| Aerospace & Defense - 0.2% | | | |
| Astronics Corp. (c) | | 75,489 | 3,096 |
| Austal Ltd. | | 1,411,147 | 1,793 |
| Engility Holdings, Inc. (c) | | 1,268,833 | 43,902 |
| United Technologies Corp. | | 72,961 | 9,904 |
| | | | 58,695 |
| Air Freight & Logistics - 0.0% | | | |
| Air T, Inc. (b)(c) | | 184,505 | 6,043 |
| Airlines - 0.1% | | | |
| Air New Zealand Ltd. | | 1,189,535 | 2,631 |
| American Airlines Group, Inc. | | 256,054 | 10,124 |
| JetBlue Airways Corp. (c) | | 359,150 | 6,465 |
| | | | 19,220 |
| Building Products - 0.1% | | | |
| Builders FirstSource, Inc. (c) | | 129,752 | 2,326 |
| Continental Building Products, Inc. (c) | | 336,645 | 10,739 |
| COVIA Corp. (a)(c) | | 402,013 | 7,248 |
| Gibraltar Industries, Inc. (c) | | 106,527 | 4,629 |
| Kondotec, Inc. (b) | | 1,566,200 | 14,329 |
| | | | 39,271 |
| Commercial Services & Supplies - 0.7% | | | |
| ABM Industries, Inc. | | 223,185 | 6,963 |
| Aeon Delight Co. Ltd. | | 114,700 | 4,190 |
| AJIS Co. Ltd. (b) | | 892,800 | 27,747 |
| Asia File Corp. Bhd | | 4,480,000 | 3,031 |
| Calian Technologies Ltd. (b) | | 625,174 | 15,163 |
| Civeo Corp. (b)(c) | | 11,929,673 | 45,452 |
| Essendant, Inc. | | 1,650,608 | 27,450 |
| Fursys, Inc. (b) | | 950,000 | 25,681 |
| Interface, Inc. | | 265,304 | 5,943 |
| KAR Auction Services, Inc. | | 37,054 | 2,203 |
| Lion Rock Group Ltd. | | 19,227,640 | 3,332 |
| Mears Group PLC | | 837,111 | 3,571 |
| Mitie Group PLC | | 13,439,459 | 27,130 |
| Nac Co. Ltd. | | 349,700 | 3,068 |
| NICE Total Cash Management Co., Ltd. | | 1,025,000 | 12,059 |
| VICOM Ltd. | | 2,653,500 | 11,948 |
| VSE Corp. (b) | | 839,329 | 36,175 |
| | | | 261,106 |
| Construction & Engineering - 1.1% | | | |
| AECOM (c) | | 6,933,069 | 232,674 |
| Arcadis NV | | 2,139,787 | 39,134 |
| Astaldi SpA (c) | | 2,589,900 | 5,857 |
| Boustead Projs. Pte Ltd. | | 1,033,287 | 687 |
| Boustead Singapore Ltd. | | 4,044,700 | 2,451 |
| C-Cube Corp. | | 322,700 | 2,658 |
| Daiichi Kensetsu Corp. (b) | | 1,728,700 | 27,504 |
| EMCOR Group, Inc. | | 151,109 | 11,628 |
| Geumhwa PSC Co. Ltd. (b) | | 360,000 | 10,669 |
| Kyeryong Construction Industrial Co. Ltd. (b)(c) | | 675,000 | 13,397 |
| Meisei Industrial Co. Ltd. | | 1,104,500 | 8,920 |
| Mirait Holdings Corp. | | 400,300 | 6,143 |
| Nippon Rietec Co. Ltd. | | 1,168,900 | 16,538 |
| Severfield PLC | | 2,762,161 | 3,009 |
| Shinnihon Corp. | | 1,574,500 | 19,897 |
| Toshiba Plant Systems & Services Corp. | | 164,500 | 3,635 |
| United Integrated Services Co. | | 5,143,500 | 9,822 |
| | | | 414,623 |
| Electrical Equipment - 0.5% | | | |
| Aichi Electric Co. Ltd. | | 311,100 | 9,251 |
| Aros Quality Group AB | | 725,232 | 13,444 |
| AZZ, Inc. | | 1,015,476 | 55,039 |
| Bharat Heavy Electricals Ltd. | | 30,750,000 | 33,261 |
| Chiyoda Integre Co. Ltd. | | 329,500 | 7,285 |
| Eaton Corp. PLC | | 48,307 | 4,018 |
| Generac Holdings, Inc. (c) | | 91,005 | 4,892 |
| Hammond Power Solutions, Inc. Class A | | 452,561 | 2,498 |
| I-Sheng Electric Wire & Cable Co. Ltd. (b) | | 12,500,000 | 17,495 |
| Korea Electric Terminal Co. Ltd. (b) | | 700,000 | 28,981 |
| Regal Beloit Corp. | | 46,710 | 4,015 |
| Servotronics, Inc. | | 114,683 | 1,104 |
| TKH Group NV (depositary receipt) | | 240,518 | 15,061 |
| | | | 196,344 |
| Industrial Conglomerates - 1.0% | | | |
| DCC PLC (United Kingdom) | | 3,221,853 | 298,133 |
| ITT, Inc. | | 84,533 | 4,790 |
| Lifco AB | | 500,191 | 22,441 |
| Mytilineos Holdings SA | | 890,419 | 8,954 |
| Reunert Ltd. | | 1,699,842 | 10,534 |
| | | | 344,852 |
| Machinery - 1.5% | | | |
| Aalberts Industries NV (b) | | 6,646,561 | 301,560 |
| Allison Transmission Holdings, Inc. | | 419,467 | 19,715 |
| ASL Marine Holdings Ltd. (b)(c) | | 45,187,913 | 3,319 |
| Cummins, Inc. | | 24,953 | 3,564 |
| Douglas Dynamics, Inc. | | 31,800 | 1,561 |
| Foremost Income Fund (c) | | 2,141,103 | 8,814 |
| Global Brass & Copper Holdings, Inc. | | 47,206 | 1,555 |
| Haitian International Holdings Ltd. | | 6,946,000 | 16,372 |
| Hurco Companies, Inc. | | 54,895 | 2,432 |
| Hwacheon Machine Tool Co. Ltd. (b) | | 219,900 | 10,270 |
| Hyster-Yale Materials Handling: | | | |
| Class A (b) | | 232,017 | 15,257 |
| Class B (b) | | 310,000 | 20,386 |
| Ihara Science Corp. (b) | | 983,500 | 19,975 |
| Jaya Holdings Ltd. (b)(c)(d) | | 3,239,440 | 69 |
| Kyowakogyosyo Co. Ltd. | | 45,000 | 2,612 |
| Luxfer Holdings PLC sponsored | | 306,766 | 5,675 |
| Maruzen Co. Ltd. (b) | | 1,589,000 | 31,406 |
| Miller Industries, Inc. | | 93,896 | 2,446 |
| Mincon Group PLC | | 2,158,692 | 3,786 |
| Nadex Co. Ltd. (b) | | 795,500 | 7,449 |
| Nakano Refrigerators Co. Ltd. | | 25,700 | 1,368 |
| Nitchitsu Co. Ltd. | | 55,800 | 915 |
| Rexnord Corp. (c) | | 227,335 | 6,875 |
| Semperit AG Holding (c) | | 439,700 | 8,741 |
| SIMPAC, Inc. | | 583,000 | 1,526 |
| Takamatsu Machinery Co. Ltd. | | 323,200 | 3,399 |
| Techno Smart Corp. (a) | | 529,900 | 5,649 |
| Tocalo Co. Ltd. | | 3,065,000 | 34,977 |
| Trinity Industrial Corp. | | 721,900 | 4,584 |
| WABCO Holdings, Inc. (c) | | 79,375 | 9,976 |
| | | | 556,233 |
| Marine - 0.0% | | | |
| SITC International Holdings Co. Ltd. | | 4,512,000 | 4,380 |
| Tokyo Kisen Co. Ltd. (b) | | 829,500 | 5,987 |
| | | | 10,367 |
| Professional Services - 0.3% | | | |
| Akka Technologies SA | | 225,557 | 16,617 |
| Asiakastieto Group Oyj (e) | | 82,580 | 2,965 |
| Boardroom Ltd. | | 2,574,042 | 1,475 |
| Clarius Group Ltd. (c) | | 1,956,883 | 77 |
| ICF International, Inc. | | 64,876 | 4,778 |
| Kelly Services, Inc. Class A (non-vtg.) | | 112,368 | 2,729 |
| McMillan Shakespeare Ltd. | | 1,800,353 | 21,736 |
| Nielsen Holdings PLC | | 511,628 | 12,054 |
| Robert Half International, Inc. | | 52,600 | 3,985 |
| SHL-JAPAN Ltd. | | 101,800 | 1,788 |
| Sporton International, Inc. | | 309,088 | 1,455 |
| Stantec, Inc. | | 750,247 | 19,592 |
| Synergie SA | | 127,600 | 5,961 |
| TrueBlue, Inc. (c) | | 283,809 | 7,677 |
| | | | 102,889 |
| Road & Rail - 0.7% | | | |
| Alps Logistics Co. Ltd. (b) | | 2,856,400 | 21,765 |
| Chilled & Frozen Logistics Holdings Co. Ltd. | | 1,098,500 | 13,194 |
| CSX Corp. | | 126,724 | 8,957 |
| Daqin Railway Co. Ltd. (A Shares) | | 26,000,000 | 34,157 |
| Hamakyorex Co. Ltd. (b) | | 1,253,500 | 43,329 |
| Higashi Twenty One Co. Ltd. | | 250,200 | 1,423 |
| Knight-Swift Transportation Holdings, Inc. Class A | | 147,000 | 4,785 |
| Norfolk Southern Corp. | | 39,845 | 6,734 |
| Roadrunner Transportation Systems, Inc. (b)(c) | | 3,155,561 | 6,911 |
| Sakai Moving Service Co. Ltd. (b) | | 1,081,600 | 57,168 |
| Trancom Co. Ltd. (b) | | 855,500 | 62,738 |
| | | | 261,161 |
| Trading Companies & Distributors - 0.7% | | | |
| AddTech AB (B Shares) | | 1,131,928 | 25,643 |
| AerCap Holdings NV (c) | | 232,124 | 13,029 |
| Alconix Corp. (b) | | 2,120,300 | 32,597 |
| Goodfellow, Inc. (b)(c) | | 723,079 | 4,058 |
| HD Supply Holdings, Inc. (c) | | 479,818 | 21,102 |
| HERIGE | | 60,993 | 2,511 |
| Houston Wire & Cable Co. (c) | | 76,246 | 610 |
| Kaman Corp. | | 42,219 | 2,796 |
| KS Energy Services Ltd. (c) | | 13,173,500 | 310 |
| Lumax International Corp. Ltd. | | 3,123,900 | 6,221 |
| Meiwa Corp. | | 1,717,700 | 7,451 |
| Mitani Shoji Co. Ltd. | | 735,300 | 34,195 |
| MRC Global, Inc. (c) | | 460,407 | 10,428 |
| Otec Corp. | | 124,300 | 2,289 |
| Parker Corp. (b) | | 2,220,000 | 10,960 |
| Richelieu Hardware Ltd. | | 700,992 | 15,169 |
| Senshu Electric Co. Ltd. (b) | | 894,900 | 26,771 |
| Strongco Corp. (b)(c) | | 849,615 | 1,437 |
| Tanaka Co. Ltd. | | 36,800 | 230 |
| TECHNO ASSOCIE Co. Ltd. | | 255,100 | 3,080 |
| Titan Machinery, Inc. (c) | | 729,535 | 11,045 |
| Totech Corp. (b) | | 926,400 | 21,516 |
| WESCO International, Inc. (c) | | 51,801 | 3,160 |
| | | | 256,608 |
| Transportation Infrastructure - 0.1% | | | |
| Isewan Terminal Service Co. Ltd. | | 1,292,700 | 8,509 |
| James Fisher and Sons PLC | | 127,253 | 3,010 |
| Meiko Transportation Co. Ltd. | | 829,400 | 9,064 |
| Qingdao Port International Co. Ltd. (e) | | 4,711,000 | 3,433 |
| Sinwa Ltd. (b) | | 20,399,000 | 3,446 |
| | | | 27,462 |
|
| TOTAL INDUSTRIALS | | | 2,554,874 |
|
| INFORMATION TECHNOLOGY - 16.5% | | | |
| Communications Equipment - 0.1% | | | |
| F5 Networks, Inc. (c) | | 22,931 | 3,930 |
| InterDigital, Inc. | | 150,998 | 12,450 |
| Juniper Networks, Inc. | | 176,774 | 4,656 |
| | | | 21,036 |
| Electronic Equipment & Components - 4.9% | | | |
| A&D Co. Ltd. | | 683,100 | 6,390 |
| AVX Corp. | | 150,000 | 3,117 |
| Bel Fuse, Inc. Class A | | 84,717 | 1,660 |
| Casa Systems, Inc. (c) | | 97,021 | 1,478 |
| CDW Corp. | | 174,276 | 14,655 |
| CTS Corp. | | 314,181 | 10,965 |
| Daido Signal Co. Ltd. | | 99,400 | 524 |
| Dynapack International Technology Corp. | | 3,200,000 | 4,076 |
| Elec & Eltek International Co. Ltd. | | 1,491,300 | 2,177 |
| Elematec Corp. (b) | | 1,180,800 | 27,752 |
| ePlus, Inc. (c) | | 99,513 | 9,817 |
| Excel Co. Ltd. (b) | | 745,800 | 16,942 |
| Fabrinet | | 112,812 | 4,413 |
| Hi-P International Ltd. | | 11,932,100 | 11,044 |
| Hon Hai Precision Industry Co. Ltd. (Foxconn) | | 182,476,140 | 500,033 |
| IDIS Holdings Co. Ltd. (b) | | 800,000 | 10,166 |
| Image Sensing Systems, Inc. (c) | | 64,468 | 271 |
| Insight Enterprises, Inc. (c) | | 299,412 | 15,051 |
| Intelligent Digital Integrated Security Co. Ltd. (b) | | 900,010 | 7,137 |
| INTOPS Co. Ltd. (b) | | 1,719,800 | 14,024 |
| Isra Vision AG (b) | | 1,250,390 | 76,909 |
| Keysight Technologies, Inc. (c) | | 2,635,824 | 152,878 |
| Kingboard Chemical Holdings Ltd. (b) | | 76,053,500 | 265,008 |
| Kingboard Laminates Holdings Ltd. | | 3,725,000 | 4,452 |
| Mesa Laboratories, Inc. | | 135,046 | 27,310 |
| Muramoto Electronic Thailand PCL (For. Reg.) (b) | | 1,228,600 | 7,016 |
| Nippo Ltd. (b) | | 736,700 | 2,971 |
| PAX Global Technology Ltd. | | 4,075,000 | 1,957 |
| Philips Lighting NV (e) | | 110,968 | 3,078 |
| Pinnacle Technology Holdings Ltd. | | 7,337,376 | 10,420 |
| Plexus Corp. (c) | | 148,139 | 8,802 |
| Redington India Ltd. | | 14,700,000 | 23,190 |
| Sanmina Corp. (c) | | 24,468 | 712 |
| ScanSource, Inc. (b)(c) | | 2,258,403 | 93,159 |
| Shibaura Electronics Co. Ltd. (b) | | 626,300 | 26,494 |
| Sigmatron International, Inc. (c) | | 170,707 | 1,193 |
| Simplo Technology Co. Ltd. | | 6,300,000 | 36,567 |
| SYNNEX Corp. (b) | | 2,700,847 | 260,551 |
| Tomen Devices Corp. (b) | | 538,200 | 13,785 |
| Tripod Technology Corp. | | 1,465,000 | 4,043 |
| TTM Technologies, Inc. (c) | | 934,794 | 16,228 |
| UKC Holdings Corp. (b) | | 1,272,500 | 25,947 |
| VST Holdings Ltd. (b) | | 118,976,800 | 64,422 |
| Wayside Technology Group, Inc. (b) | | 275,041 | 3,713 |
| Wireless Telecom Group, Inc. (c) | | 295,018 | 620 |
| | | | 1,793,117 |
| Internet Software & Services - 0.2% | | | |
| Alphabet, Inc.: | | | |
| Class A (c) | | 1,497 | 1,837 |
| Class C (c) | | 9,507 | 11,572 |
| Aucnet, Inc. | | 197,300 | 2,947 |
| Carbonite, Inc. (c) | | 218,985 | 7,511 |
| eBay, Inc. (c) | | 45,613 | 1,526 |
| Gabia, Inc. (b) | | 975,000 | 8,126 |
| j2 Global, Inc. | | 199,818 | 16,953 |
| Moneysupermarket.com Group PLC | | 744,253 | 3,068 |
| NetGem SA | | 849,884 | 2,345 |
| Softbank Technology Corp. (a) | | 256,800 | 4,568 |
| Yahoo! Japan Corp. (a) | | 1,957,300 | 7,447 |
| | | | 67,900 |
| IT Services - 3.7% | | | |
| ALTEN | | 610,716 | 60,666 |
| Amdocs Ltd. | | 6,376,612 | 430,931 |
| Argo Graphics, Inc. | | 393,600 | 15,365 |
| CACI International, Inc. Class A (c) | | 64,279 | 11,262 |
| Computer Services, Inc. | | 258,354 | 13,370 |
| CSE Global Ltd. (b) | | 40,677,900 | 13,446 |
| Data#3 Ltd. | | 2,804,497 | 3,177 |
| Dimerco Data System Corp. | | 510,000 | 615 |
| DXC Technology Co. | | 75,473 | 6,396 |
| E-Credible Co. Ltd. | | 129,349 | 1,748 |
| eClerx Services Ltd. | | 1,684,608 | 31,807 |
| EOH Holdings Ltd. | | 6,392,071 | 20,146 |
| Estore Corp. | | 283,800 | 2,452 |
| EVERTEC, Inc. | | 1,460,509 | 34,030 |
| ExlService Holdings, Inc. (c) | | 179,079 | 10,680 |
| Indra Sistemas SA (b)(c) | | 12,849,300 | 156,113 |
| Know IT AB (b) | | 1,392,111 | 27,548 |
| Leidos Holdings, Inc. | | 640,839 | 43,846 |
| Maximus, Inc. | | 312,392 | 20,246 |
| Net 1 UEPS Technologies, Inc. (c) | | 460,597 | 4,302 |
| Nice Information & Telecom, Inc. | | 53,000 | 1,159 |
| Rolta India Ltd. (c) | | 2,699,942 | 1,625 |
| Science Applications International Corp. | | 162,081 | 13,675 |
| Societe Pour L'Informatique Industrielle SA (b) | | 1,657,239 | 48,447 |
| Softcreate Co. Ltd. | | 602,100 | 9,391 |
| Sword Group | | 12,289 | 503 |
| Syntel, Inc. (c) | | 64,178 | 2,605 |
| The Western Union Co. | | 17,925,734 | 361,383 |
| TravelSky Technology Ltd. (H Shares) | | 1,005,000 | 2,849 |
| WNS Holdings Ltd. sponsored ADR (c) | | 73,352 | 3,569 |
| | | | 1,353,352 |
| Semiconductors & Semiconductor Equipment - 0.7% | | | |
| Amkor Technology, Inc. (c) | | 24,468 | 212 |
| Axell Corp. (b) | | 762,700 | 5,341 |
| Boe Varitronix Ltd. | | 5,034,000 | 1,988 |
| Cirrus Logic, Inc. (c) | | 73,110 | 3,163 |
| Diodes, Inc. (c) | | 268,979 | 9,995 |
| Entegris, Inc. | | 311,564 | 10,951 |
| Integrated Device Technology, Inc. (c) | | 463,127 | 15,945 |
| KLA-Tencor Corp. | | 23,456 | 2,754 |
| Leeno Industrial, Inc. | | 575,000 | 34,547 |
| Melexis NV | | 1,148,100 | 106,798 |
| Miraial Co. Ltd. | | 150,000 | 1,528 |
| Nanometrics, Inc. (c) | | 243,795 | 9,181 |
| ON Semiconductor Corp. (c) | | 205,718 | 4,536 |
| Phison Electronics Corp. | | 1,900,000 | 15,781 |
| Powertech Technology, Inc. | | 9,000,000 | 25,457 |
| Trio-Tech International (b)(c) | | 224,608 | 1,038 |
| United Microelectronics Corp. | | 4,331,000 | 2,483 |
| | | | 251,698 |
| Software - 3.4% | | | |
| Activision Blizzard, Inc. | | 148,513 | 10,904 |
| AdaptIT Holdings Ltd. | | 2,514,434 | 1,575 |
| ANSYS, Inc. (c) | | 3,525,193 | 595,335 |
| Aspen Technology, Inc. (c) | | 118,525 | 11,354 |
| Ebix, Inc. | | 1,500,202 | 119,041 |
| ICT Automatisering NV (b) | | 491,679 | 8,682 |
| InfoVine Co. Ltd. (b) | | 175,000 | 3,709 |
| Jorudan Co. Ltd. (b) | | 422,500 | 4,066 |
| KPIT Cummins Infosystems Ltd. | | 5,800,000 | 25,179 |
| KSK Co., Ltd. (b) | | 531,500 | 8,551 |
| Micro Focus International PLC | | 215,068 | 3,509 |
| Nucleus Software Exports Ltd. | | 601,191 | 3,034 |
| Oracle Corp. | | 8,039,806 | 383,338 |
| Pegasystems, Inc. | | 149,658 | 8,321 |
| Pro-Ship, Inc. | | 252,500 | 5,578 |
| RealPage, Inc. (c) | | 203,287 | 11,201 |
| Vitec Software Group AB | | 699,586 | 6,460 |
| Zensar Technologies Ltd. | | 800,000 | 14,441 |
| | | | 1,224,278 |
| Technology Hardware, Storage & Peripherals - 3.5% | | | |
| Compal Electronics, Inc. | | 67,500,000 | 41,938 |
| Hewlett Packard Enterprise Co. | | 2,064,640 | 31,878 |
| HP, Inc. | | 6,460,356 | 149,105 |
| Seagate Technology LLC (b) | | 18,610,388 | 979,279 |
| Super Micro Computer, Inc. (c) | | 632,618 | 13,981 |
| TPV Technology Ltd. | | 69,600,000 | 7,183 |
| Western Digital Corp. | | 41,758 | 2,929 |
| Xerox Corp. | | 2,446,803 | 63,543 |
| | | | 1,289,836 |
|
| TOTAL INFORMATION TECHNOLOGY | | | 6,001,217 |
|
| MATERIALS - 3.6% | | | |
| Chemicals - 2.4% | | | |
| Axalta Coating Systems Ltd. (c) | | 492,665 | 14,903 |
| C. Uyemura & Co. Ltd. | | 383,800 | 28,833 |
| Cabot Corp. | | 15,344 | 1,014 |
| Chase Corp. (b) | | 679,101 | 83,869 |
| Core Molding Technologies, Inc. | | 381,326 | 5,129 |
| Deepak Fertilisers and Petrochemicals Corp. Ltd. | | 1,800,000 | 7,267 |
| Deepak Nitrite Ltd. (c) | | 41,557 | 147 |
| DowDuPont, Inc. | | 49,070 | 3,375 |
| Eastman Chemical Co. | | 28,944 | 2,999 |
| EcoGreen International Group Ltd. (b) | | 50,122,080 | 10,664 |
| FMC Corp. | | 1,193,224 | 107,247 |
| Fujikura Kasei Co., Ltd. (b) | | 2,711,200 | 15,712 |
| Fuso Chemical Co. Ltd. | | 598,800 | 15,289 |
| Gujarat Narmada Valley Fertilizers Co. | | 5,000,000 | 30,485 |
| Gujarat State Fertilizers & Chemicals Ltd. (b) | | 28,500,000 | 48,562 |
| Honshu Chemical Industry Co. Ltd. (b) | | 762,700 | 7,715 |
| Huntsman Corp. | | 291,429 | 9,772 |
| Innospec, Inc. | | 799,627 | 64,730 |
| JSR Corp. | | 262,200 | 5,021 |
| KPC Holdings Corp. | | 43,478 | 2,452 |
| KPX Chemical Co. Ltd. | | 163,083 | 9,652 |
| KPX Green Chemical Co. Ltd. | | 225,000 | 875 |
| Miwon Chemicals Co. Ltd. | | 55,095 | 2,311 |
| Miwon Commercial Co. Ltd. | | 13,819 | 3,109 |
| Muto Seiko Co. Ltd. | | 238,200 | 1,638 |
| Nihon Parkerizing Co. Ltd. | | 307,700 | 4,554 |
| Nippon Soda Co. Ltd. | | 1,575,000 | 9,226 |
| SK Kaken Co. Ltd. | | 275,000 | 25,578 |
| Soken Chemical & Engineer Co. Ltd. (b) | | 667,000 | 12,151 |
| T&K Toka Co. Ltd. (b) | | 1,345,700 | 15,501 |
| Thai Carbon Black PCL (For. Reg.) (c) | | 11,472,900 | 18,104 |
| Thai Rayon PCL: | | | |
| (For. Reg.) | | 2,719,500 | 3,842 |
| NVDR | | 85,600 | 121 |
| The Chemours Co. LLC | | 259,548 | 11,890 |
| The Mosaic Co. | | 3,298,433 | 99,316 |
| UPL Ltd. | | 875,000 | 8,232 |
| Westlake Chemical Corp. | | 101,311 | 10,863 |
| Yara International ASA | | 3,498,135 | 154,350 |
| Yip's Chemical Holdings Ltd. | | 25,692,000 | 9,001 |
| | | | 865,499 |
| Construction Materials - 0.1% | | | |
| Brampton Brick Ltd. Class A (sub. vtg.) (c) | | 672,772 | 4,189 |
| Mitani Sekisan Co. Ltd. (b) | | 1,490,300 | 36,133 |
| RHI Magnesita NV | | 43,869 | 2,770 |
| | | | 43,092 |
| Containers & Packaging - 0.3% | | | |
| AMVIG Holdings Ltd. | | 3,472,000 | 854 |
| Berry Global Group, Inc. (c) | | 83,586 | 4,083 |
| Chuoh Pack Industry Co. Ltd. (b) | | 421,800 | 5,281 |
| Kohsoku Corp. (b) | | 1,737,600 | 21,243 |
| Pact Group Holdings Ltd. (e) | | 689,421 | 2,771 |
| Samhwa Crown & Closure Co. Ltd. | | 50,000 | 2,120 |
| Silgan Holdings, Inc. | | 190,711 | 5,246 |
| The Pack Corp. (b) | | 1,560,900 | 49,627 |
| | | | 91,225 |
| Metals & Mining - 0.7% | | | |
| Alcoa Corp. (c) | | 34,934 | 1,512 |
| Ausdrill Ltd. | | 2,095,496 | 2,841 |
| Chubu Steel Plate Co. Ltd. | | 414,300 | 2,542 |
| Cleveland-Cliffs, Inc. (a)(c) | | 12,750,121 | 137,574 |
| Compania de Minas Buenaventura SA sponsored ADR | | 2,256,390 | 31,003 |
| Freeport-McMoRan, Inc. | | 258,702 | 4,269 |
| Granges AB | | 262,218 | 3,283 |
| Hill & Smith Holdings PLC | | 799,599 | 15,816 |
| Newmont Mining Corp. | | 79,236 | 2,906 |
| Nucor Corp. | | 24,700 | 1,653 |
| Orosur Mining, Inc. (c) | | 2,974,432 | 137 |
| Orvana Minerals Corp. (c) | | 764,857 | 106 |
| Pacific Metals Co. Ltd. (c) | | 348,000 | 10,031 |
| Steel Dynamics, Inc. | | 73,859 | 3,478 |
| Tohoku Steel Co. Ltd. (b) | | 625,700 | 8,562 |
| Tokyo Tekko Co. Ltd. (b) | | 762,100 | 11,941 |
| Universal Stainless & Alloy Products, Inc. (c) | | 73,632 | 2,202 |
| Warrior Metropolitan Coal, Inc. (a) | | 1,036,929 | 26,825 |
| Webco Industries, Inc. (c) | | 7,595 | 851 |
| Worthington Industries, Inc. | | 78,970 | 3,697 |
| | | | 271,229 |
| Paper & Forest Products - 0.1% | | | |
| Louisiana-Pacific Corp. | | 105,226 | 2,833 |
| Stella-Jones, Inc. | | 596,610 | 19,928 |
| Western Forest Products, Inc. | | 1,949,247 | 3,626 |
| | | | 26,387 |
|
| TOTAL MATERIALS | | | 1,297,432 |
|
| REAL ESTATE - 0.7% | | | |
| Equity Real Estate Investment Trusts (REITs) - 0.3% | | | |
| Colony NorthStar, Inc. | | 1,910,980 | 11,772 |
| Corporate Office Properties Trust (SBI) | | 93,052 | 2,767 |
| Corrections Corp. of America | | 1,359,201 | 34,850 |
| Four Corners Property Trust, Inc. | | 220,706 | 5,496 |
| National Health Investors, Inc. | | 28,419 | 2,127 |
| NSI NV | | 8,335 | 325 |
| NSI NV rights 8/9/18 (c) | | 8,335 | 10 |
| Public Storage | | 12,800 | 2,788 |
| Spirit MTA REIT (c) | | 9,530 | 95 |
| Spirit Realty Capital, Inc. | | 531,805 | 4,451 |
| Store Capital Corp. | | 200,862 | 5,514 |
| Ventas, Inc. | | 55,322 | 3,119 |
| VEREIT, Inc. | | 3,614,188 | 27,576 |
| Washington Prime Group, Inc. | | 92,996 | 747 |
| | | | 101,637 |
| Real Estate Management & Development - 0.4% | | | |
| Anabuki Kosan, Inc. | | 42,950 | 1,198 |
| CBRE Group, Inc. (c) | | 65,075 | 3,241 |
| Century21 Real Estate Japan Ltd. | | 97,300 | 1,081 |
| Devine Ltd. (c) | | 1,760,889 | 412 |
| IMMOFINANZ Immobilien Anlagen AG | | 102,412 | 2,694 |
| Leopalace21 Corp. | | 1,496,900 | 8,220 |
| LSL Property Services PLC | | 1,400,272 | 4,779 |
| Relo Group, Inc. | | 3,800,400 | 102,815 |
| Selvaag Bolig ASA | | 944,200 | 5,145 |
| Servcorp Ltd. | | 759,770 | 2,461 |
| Sino Land Ltd. | | 2,776,000 | 4,768 |
| Tejon Ranch Co. (c) | | 432,058 | 10,110 |
| Wing Tai Holdings Ltd. | | 1,723,800 | 2,621 |
| | | | 149,545 |
|
| TOTAL REAL ESTATE | | | 251,182 |
|
| TELECOMMUNICATION SERVICES - 0.0% | | | |
| Diversified Telecommunication Services - 0.0% | | | |
| AT&T, Inc. | | 19,715 | 630 |
| UTILITIES - 1.8% | | | |
| Electric Utilities - 1.6% | | | |
| Exelon Corp. | | 3,264,039 | 138,722 |
| PG&E Corp. | | 3,243,471 | 139,729 |
| PPL Corp. | | 10,079,627 | 289,991 |
| | | | 568,442 |
| Gas Utilities - 0.1% | | | |
| Busan City Gas Co. Ltd. | | 13,931 | 456 |
| China Resource Gas Group Ltd. | | 758,000 | 3,592 |
| Hokuriku Gas Co. | | 152,700 | 4,199 |
| K&O Energy Group, Inc. | | 537,200 | 9,018 |
| Keiyo Gas Co. Ltd. | | 118,900 | 3,095 |
| Star Gas Partners LP | | 198,111 | 1,904 |
| | | | 22,264 |
| Independent Power and Renewable Electricity Producers - 0.1% | | | |
| Mega First Corp. Bhd (b) | | 32,700,045 | 28,477 |
| Mega First Corp. Bhd warrants 4/8/20 (c) | | 3,800,000 | 1,570 |
| The AES Corp. | | 225,550 | 3,013 |
| | | | 33,060 |
| Multi-Utilities - 0.0% | | | |
| CMS Energy Corp. | | 321,690 | 15,550 |
| Water Utilities - 0.0% | | | |
| Manila Water Co., Inc. | | 5,619,100 | 2,809 |
|
| TOTAL UTILITIES | | | 642,125 |
|
| TOTAL COMMON STOCKS | | | |
| (Cost $15,203,651) | | | 32,971,199 |
|
| Nonconvertible Preferred Stocks - 0.1% | | | |
| CONSUMER STAPLES - 0.0% | | | |
| Food Products - 0.0% | | | |
| Nam Yang Dairy Products | | 4,917 | 910 |
| ENERGY - 0.0% | | | |
| Oil, Gas & Consumable Fuels - 0.0% | | | |
| Centrus Energy Corp. 7.50% (c)(d)(e) | | 6,395 | 224 |
| INDUSTRIALS - 0.0% | | | |
| Industrial Conglomerates - 0.0% | | | |
| Steel Partners Holdings LP Series A, 6.00% | | 163,209 | 3,721 |
| MATERIALS - 0.1% | | | |
| Construction Materials - 0.1% | | | |
| Buzzi Unicem SpA (Risparmio Shares) | | 1,531,895 | 19,060 |
| TOTAL NONCONVERTIBLE PREFERRED STOCKS | | | |
| (Cost $20,295) | | | 23,915 |
| | | Principal Amount (000s) | Value (000s) |
|
| Nonconvertible Bonds - 0.0% | | | |
| ENERGY - 0.0% | | | |
| Oil, Gas & Consumable Fuels - 0.0% | | | |
| Centrus Energy Corp. 8.25% 2/28/27 (e) | | | |
| (Cost $10,585) | | 4,603 | 3,683 |
| | | Shares | Value (000s) |
|
| Money Market Funds - 10.0% | | | |
| Fidelity Cash Central Fund, 1.96% (f) | | 3,328,477,024 | 3,329,143 |
| Fidelity Securities Lending Cash Central Fund 1.97% (f)(g) | | 319,049,263 | 319,081 |
| TOTAL MONEY MARKET FUNDS | | | |
| (Cost $3,647,672) | | | 3,648,224 |
| TOTAL INVESTMENT IN SECURITIES - 100.7% | | | |
| (Cost $18,882,203) | | | 36,647,021 |
| NET OTHER ASSETS (LIABILITIES) - (0.7)% | | | (236,869) |
| NET ASSETS - 100% | | | $36,410,152 |
Values shown as $0 in the Schedule of Investments may reflect amounts less than $500.
Legend
(a) Security or a portion of the security is on loan at period end.
(b) Affiliated company
(c) Non-income producing
(d) Level 3 security
(e) Security exempt from registration under Rule 144A of the Securities Act of 1933. These securities may be resold in transactions exempt from registration, normally to qualified institutional buyers. At the end of the period, the value of these securities amounted to $45,050,000 or 0.1% of net assets.
(f) Affiliated fund that is generally available only to investment companies and other accounts managed by Fidelity Investments. The rate quoted is the annualized seven-day yield of the fund at period end. A complete unaudited listing of the fund's holdings as of its most recent quarter end is available upon request. In addition, each Fidelity Central Fund's financial statements, which are not covered by the Fund's Report of Independent Registered Public Accounting Firm, are available on the SEC's website or upon request.
(g) Investment made with cash collateral received from securities on loan.
Affiliated Central Funds
Information regarding fiscal year to date income earned by the Fund from investments in Fidelity Central Funds is as follows:
| Fund | Income earned |
| | (Amounts in thousands) |
| Fidelity Cash Central Fund | $52,293 |
| Fidelity Securities Lending Cash Central Fund | 7,783 |
| Total | $60,076 |
Amounts in the income column in the above table include any capital gain distributions from underlying funds, which are presented in the corresponding line-item in the Statement of Operations if applicable.
Other Affiliated Issuers
An affiliated company is a company in which the Fund has ownership of at least 5% of the voting securities. Fiscal year to date transactions with companies which are or were affiliates are as follows:
| Affiliate | Value, beginning of period | Purchases | Sales Proceeds(a) | Dividend Income | Realized Gain (loss) | Change in Unrealized appreciation (depreciation) | Value, end of period |
| Aalberts Industries NV | $357,923 | $-- | $77,681 | $4,784 | $52,119 | $(30,801) | $301,560 |
| Abbey PLC | 30,976 | -- | 1,526 | 372 | 1,261 | 1,062 | 31,773 |
| Abercrombie & Fitch Co. Class A | 51,336 | -- | 61,625 | 3,691 | (15,171) | 90,609 | -- |
| Accell Group NV | 57,199 | -- | 3,104 | 910 | 657 | (18,175) | 36,577 |
| Air T, Inc. | 3,276 | -- | 493 | -- | 334 | 2,926 | 6,043 |
| AJIS Co. Ltd. | 18,967 | -- | 1,161 | 414 | 820 | 9,121 | 27,747 |
| Alconix Corp. | 22,007 | -- | 2,016 | 572 | 1,396 | 11,210 | 32,597 |
| Alps Logistics Co. Ltd. | 21,604 | -- | 1,169 | 433 | 642 | 688 | 21,765 |
| Ark Restaurants Corp. | 4,524 | -- | 998 | 176 | 431 | (415) | -- |
| Arts Optical International Holdings Ltd. | 8,599 | -- | 414 | 62 | (119) | (2,131) | 5,935 |
| ASL Marine Holdings Ltd. | 4,442 | -- | 168 | -- | (15) | (940) | 3,319 |
| Assurant, Inc. | 322,168 | -- | 65,530 | 6,180 | 48,908 | (40,816) | -- |
| ASTI Corp. | 5,592 | -- | 895 | 91 | 640 | (1,397) | 3,940 |
| Atwood Oceanics, Inc. | 57,677 | -- | 67,863 | -- | (126,131) | 136,317 | -- |
| Axell Corp. | 5,428 | -- | 308 | 32 | (582) | 803 | 5,341 |
| Barratt Developments PLC | 615,294 | -- | 28,428 | 43,026 | 21,622 | (102,147) | 506,341 |
| Bed Bath & Beyond, Inc. | 274,957 | 30,030 | 160,399 | 5,908 | (93,805) | (12,034) | -- |
| Belc Co. Ltd. | 80,741 | -- | 7,138 | 977 | 5,989 | (468) | 79,124 |
| Belluna Co. Ltd. | 87,499 | -- | 6,957 | 743 | 4,100 | (3,297) | 81,345 |
| Best Buy Co., Inc. | 1,088,006 | 2,576 | 362,793 | 25,768 | 224,048 | 59,930 | -- |
| Black Box Corp. | 12,338 | -- | 2,847 | -- | (38,169) | 28,678 | -- |
| BMTC Group, Inc. | 39,153 | -- | 5,793 | 960 | 5,569 | 4,014 | 42,943 |
| Bristow Group, Inc. | 3,659 | 22,570 | 358 | -- | 92 | 4,058 | 30,021 |
| Calian Technologies Ltd. | 15,187 | -- | 1,273 | 497 | 702 | 547 | 15,163 |
| Chase Corp. | 78,401 | 2,051 | 7,606 | 575 | 5,538 | 5,485 | 83,869 |
| Chilled & Frozen Logistics Holdings Co. Ltd. | 15,688 | -- | 2,866 | 205 | 1,673 | (1,301) | -- |
| Chuoh Pack Industry Co. Ltd. | 5,111 | -- | 274 | 142 | 153 | 291 | 5,281 |
| Civeo Corp. | 24,148 | -- | 1,847 | -- | 720 | 22,431 | 45,452 |
| Clip Corp. | 2,382 | -- | 120 | 92 | 50 | (57) | 2,255 |
| Codorus Valley Bancorp, Inc. | 18,561 | 222 | 2,336 | 381 | 1,129 | 1,921 | 19,497 |
| Contango Oil & Gas Co. | 12,450 | 2,763 | 672 | -- | (408) | 451 | 14,584 |
| Core Molding Technologies, Inc. | 13,648 | -- | 6,519 | 102 | 2,301 | (4,301) | -- |
| Cosmos Pharmaceutical Corp. | 262,818 | -- | 47,647 | 834 | 43,190 | (38,466) | -- |
| Create SD Holdings Co. Ltd. | 146,994 | -- | 12,250 | 1,557 | 9,121 | (10,923) | 132,942 |
| CSE Global Ltd. | 13,065 | -- | 565 | 852 | 79 | 867 | 13,446 |
| Daewon Pharmaceutical Co. Ltd. | 29,918 | -- | -- | 360 | -- | 2,435 | 32,353 |
| Daiichi Kensetsu Corp. | 22,034 | -- | 1,285 | 439 | 765 | 5,990 | 27,504 |
| DCC PLC (United Kingdom) | 464,436 | -- | 196,034 | 6,362 | 176,252 | (146,521) | -- |
| Deepak Fertilisers and Petrochemicals Corp. Ltd. | 33,595 | -- | 23,589 | 454 | 13,841 | (16,580) | -- |
| DongKook Pharmaceutical Co. Ltd. | 33,526 | -- | -- | 251 | -- | 1,651 | 35,177 |
| DVx, Inc. | 8,368 | -- | 406 | 136 | 290 | 675 | 8,927 |
| Ebix, Inc. | 158,009 | -- | 96,463 | 741 | 75,105 | (17,610) | -- |
| EcoGreen International Group Ltd. | 10,836 | -- | 474 | 312 | 121 | 181 | 10,664 |
| Elematec Corp. | 22,459 | -- | 1,364 | 646 | 873 | 5,784 | 27,752 |
| Essendant, Inc. | 27,007 | 173 | 6,981 | 1,144 | (1,660) | 8,911 | -- |
| Excel Co. Ltd. | 10,314 | -- | 1,106 | 477 | 623 | 7,111 | 16,942 |
| Ff Group | 109,703 | -- | 4,363 | -- | 2,143 | (82,992) | 24,491 |
| First Juken Co. Ltd. | 21,090 | -- | 1,061 | 498 | 770 | (3,251) | 17,548 |
| Food Empire Holdings Ltd. | 20,674 | -- | 1,657 | 181 | 616 | (1,692) | 17,941 |
| Fossil Group, Inc. | 22,766 | 18,570 | 2,633 | -- | 1,727 | 67,986 | 108,416 |
| Fresh Del Monte Produce, Inc. | 262,477 | -- | 13,440 | 2,980 | 7,209 | (81,561) | 174,685 |
| Fuji Kosan Co. Ltd. | 3,565 | -- | 170 | 86 | (11) | 345 | 3,729 |
| Fujikura Kasei Co., Ltd. | 16,713 | -- | 832 | 365 | 238 | (407) | 15,712 |
| Fursys, Inc. | 28,374 | -- | -- | 590 | -- | (2,693) | 25,681 |
| Gabia, Inc. | 5,328 | -- | -- | 23 | -- | 2,798 | 8,126 |
| GameStop Corp. Class A | 216,839 | -- | 101,453 | 14,883 | (86,627) | 14,910 | -- |
| Genky Stores, Inc. | 28,711 | -- | 443 | 76 | 373 | (23,251) | -- |
| Geospace Technologies Corp. | 18,545 | -- | 704 | -- | (378) | (1,298) | 16,165 |
| Geumhwa PSC Co. Ltd. | 12,086 | -- | -- | 251 | -- | (1,417) | 10,669 |
| Goodfellow, Inc. | 4,738 | -- | 218 | -- | 130 | (592) | 4,058 |
| Guess?, Inc. | 68,134 | -- | 4,995 | 4,567 | (1,855) | 50,613 | 111,897 |
| Gujarat State Fertilizers & Chemicals Ltd. | 65,224 | -- | 3,971 | 1,037 | 737 | (13,428) | 48,562 |
| GulfMark Offshore, Inc. Class A | 413 | -- | 10,214 | -- | (4) | 9,805 | -- |
| Halows Co. Ltd. | 29,437 | -- | 1,627 | 268 | 1,109 | 909 | 29,828 |
| Hamakyorex Co. Ltd. | 34,778 | -- | 1,834 | 475 | 1,038 | 9,347 | 43,329 |
| Handsome Co. Ltd. | 68,497 | -- | 4,222 | 576 | 3,260 | 271 | 67,806 |
| Hanger, Inc. | 30,525 | -- | 2,098 | -- | (916) | 16,140 | 43,651 |
| Helen of Troy Ltd. | 196,442 | -- | 25,213 | -- | 23,984 | (2,742) | 192,471 |
| Hiday Hidaka Corp. | 60,332 | -- | 21,838 | 636 | 16,679 | (15,929) | 39,244 |
| Honshu Chemical Industry Co. Ltd. | 7,501 | -- | 769 | 181 | 360 | 623 | 7,715 |
| Hoshiiryou Sanki Co. Ltd. | 11,966 | -- | 552 | 101 | 276 | (799) | 10,891 |
| Hurco Companies, Inc. | 16,735 | 63 | 17,861 | 56 | 11,707 | (8,212) | -- |
| Hwacheon Machine Tool Co. Ltd. | 11,663 | -- | -- | 213 | -- | (1,393) | 10,270 |
| Hyster-Yale Materials Handling Class A | 15,417 | 1,786 | 831 | 267 | 709 | (1,824) | 15,257 |
| Hyster-Yale Materials Handling Class B | 21,967 | -- | -- | 377 | -- | (1,581) | 20,386 |
| I-Sheng Electric Wire & Cable Co. Ltd. | 17,852 | -- | -- | 1,044 | -- | (357) | 17,495 |
| IA Group Corp. | 3,759 | -- | 192 | 119 | 32 | 388 | 3,987 |
| ICT Automatisering NV | 9,019 | -- | 1,872 | 175 | 474 | 1,061 | 8,682 |
| IDIS Holdings Co. Ltd. | 9,322 | -- | -- | 93 | -- | 844 | 10,166 |
| Ihara Science Corp. | 20,475 | -- | 1,311 | 375 | 975 | (164) | 19,975 |
| Indra Sistemas SA | 212,977 | -- | 12,135 | -- | (4,348) | (40,381) | 156,113 |
| InfoVine Co. Ltd. | 4,250 | -- | -- | 147 | -- | (541) | 3,709 |
| Intage Holdings, Inc. | 35,728 | -- | 2,241 | 564 | 1,507 | (750) | 34,244 |
| Intelligent Digital Integrated Security Co. Ltd. | 6,509 | -- | -- | 140 | -- | 628 | 7,137 |
| INTOPS Co. Ltd. | 18,044 | -- | -- | 263 | -- | (4,020) | 14,024 |
| INZI Controls Co. Ltd. | 6,917 | -- | -- | 176 | -- | 490 | 7,407 |
| Isra Vision AG | 65,170 | -- | 27,568 | 195 | 24,859 | 14,448 | 76,909 |
| Jaya Holdings Ltd. | 206 | -- | -- | -- | (24) | (113) | 69 |
| JLM Couture, Inc. | 511 | -- | 31 | -- | (11) | 798 | 1,267 |
| Jorudan Co. Ltd. | 4,478 | -- | 331 | 47 | 82 | (163) | 4,066 |
| Jumbo SA | 176,166 | -- | 8,644 | 3,722 | 6,737 | (13,617) | 160,642 |
| Kingboard Chemical Holdings Ltd. | 370,346 | -- | 32,877 | 15,860 | 24,580 | (97,041) | 265,008 |
| Know IT AB | 24,210 | -- | 2,074 | 651 | 1,079 | 4,333 | 27,548 |
| Kohsoku Corp. | 18,103 | -- | 997 | 410 | 558 | 3,579 | 21,243 |
| Kondotec, Inc. | 14,958 | -- | 720 | 316 | 588 | (497) | 14,329 |
| Korea Electric Terminal Co. Ltd. | 44,065 | -- | -- | 375 | -- | (15,084) | 28,981 |
| KSK Co., Ltd. | 7,360 | -- | 420 | 211 | 286 | 1,325 | 8,551 |
| Kwang Dong Pharmaceutical Co. Ltd. | 23,334 | -- | -- | 192 | -- | (2,453) | 20,881 |
| Kyeryong Construction Industrial Co. Ltd. | 11,076 | -- | 280 | -- | (20) | 2,621 | 13,397 |
| Maruzen Co. Ltd. | 27,369 | -- | 1,699 | 355 | 1,386 | 4,350 | 31,406 |
| Mega First Corp. Bhd | 29,328 | -- | -- | 318 | -- | (851) | 28,477 |
| Mega First Corp. Bhd warrants 4/8/20 | 1,794 | -- | 43 | -- | 43 | (224) | -- |
| Mesa Laboratories, Inc. | 34,239 | -- | 19,351 | 145 | 17,943 | (5,521) | -- |
| Metro, Inc. Class A (sub. vtg.) | 876,121 | -- | 38,601 | 11,655 | 36,447 | (42,452) | 831,515 |
| Michang Oil Industrial Co. Ltd. | 13,913 | -- | -- | 230 | -- | (1,356) | 12,557 |
| Mitani Sekisan Co. Ltd. | 36,788 | -- | 1,729 | 294 | 1,391 | (317) | 36,133 |
| Motonic Corp. | 28,729 | -- | -- | 883 | -- | (2,460) | 26,269 |
| Mr. Bricolage SA | 16,992 | -- | 768 | 509 | 258 | (3,247) | 13,235 |
| Muhak Co. Ltd. | 56,738 | -- | -- | 760 | -- | (18,651) | 38,087 |
| Murakami Corp. | 17,692 | -- | 1,131 | 237 | 956 | 3,833 | 21,350 |
| Muramoto Electronic Thailand PCL (For. Reg.) | 9,120 | -- | 717 | 298 | 74 | (1,461) | 7,016 |
| Murphy Oil Corp. | 209,012 | 91,767 | 11,932 | 8,707 | 5,119 | 68,868 | 362,834 |
| Nac Co. Ltd. | 8,739 | -- | 5,396 | 96 | (5,141) | 4,866 | -- |
| Nadex Co. Ltd. | 6,782 | -- | 462 | 316 | 316 | 813 | 7,449 |
| Nafco Co. Ltd. | 32,256 | -- | 1,611 | 620 | 668 | 481 | 31,794 |
| Nakayamafuku Co. Ltd. | 7,504 | -- | 2,087 | 187 | (384) | (240) | -- |
| ND Software Co. Ltd. | 13,121 | -- | 648 | 202 | 321 | 132 | 12,926 |
| Next PLC | 720,096 | -- | 75,390 | 43,815 | 48,769 | 296,200 | 989,675 |
| NICE Total Cash Management Co., Ltd. | 12,891 | -- | 4,227 | 117 | 3,271 | 124 | -- |
| Nippo Ltd. | 2,397 | -- | 178 | 25 | 66 | 686 | 2,971 |
| Nucleus Software Exports Ltd. | 9,766 | -- | 9,099 | 90 | 5,213 | (2,846) | -- |
| Nutraceutical International Corp. | 41,542 | -- | 41,542 | -- | 27,850 | (27,850) | -- |
| Origin Enterprises PLC | 75,152 | -- | 3,245 | 2,387 | 665 | (7,598) | 64,974 |
| P&F Industries, Inc. Class A | 1,986 | 62 | 119 | 65 | 29 | 725 | 2,683 |
| Parker Corp. | 12,168 | -- | 678 | 187 | 505 | (1,035) | 10,960 |
| Piolax, Inc. | 72,133 | -- | 3,355 | 938 | 3,114 | (11,615) | 60,277 |
| Prim SA | 19,681 | -- | 914 | 829 | 297 | 2,950 | 22,014 |
| Qol Co. Ltd. | 31,384 | -- | 1,761 | 437 | 1,242 | (450) | -- |
| RenaissanceRe Holdings Ltd. | 326,272 | -- | 73,384 | 2,308 | 62,131 | (92,710) | -- |
| Roadrunner Transportation Systems, Inc. | 26,420 | -- | 2,118 | -- | (2,651) | (14,740) | 6,911 |
| Rocky Mountain Chocolate Factory, Inc. | 5,440 | -- | 251 | 215 | 67 | (775) | 4,481 |
| S&T Holdings Co. Ltd. | 12,660 | -- | -- | 131 | -- | (2,604) | 10,056 |
| Sakai Moving Service Co. Ltd. | 59,548 | -- | 7,910 | 461 | 6,186 | (656) | 57,168 |
| Samsung Climate Control Co. Ltd. | 5,669 | -- | -- | 39 | -- | (865) | 4,804 |
| Sanei Architecture Planning Co. Ltd. | 22,654 | -- | 1,251 | 458 | 866 | (863) | 21,406 |
| Sarantis SA | 30,582 | -- | 1,601 | 560 | 1,103 | 2,700 | 32,784 |
| ScanSource, Inc. | 87,029 | 7,946 | 6,637 | -- | 3,457 | 1,364 | 93,159 |
| Seagate Technology LLC | 842,744 | 2,218 | 391,238 | 59,484 | 296,575 | 230,426 | 979,279 |
| Select Harvests Ltd. | 18,238 | 175 | 3,941 | 178 | (474) | 3,430 | -- |
| Senshu Electric Co. Ltd. | 18,882 | -- | 1,231 | 370 | 805 | 8,315 | 26,771 |
| Servotronics, Inc. | 1,623 | -- | 627 | 18 | 61 | 47 | -- |
| Sewon Precision Industries Co. Ltd. | 7,366 | -- | -- | 37 | -- | (2,741) | 4,625 |
| Shibaura Electronics Co. Ltd. | 22,486 | -- | 1,841 | 398 | 1,445 | 4,404 | 26,494 |
| ShoLodge, Inc. | -- | -- | -- | -- | (4,783) | 4,783 | -- |
| Sigmatron International, Inc. | 2,108 | -- | 766 | -- | 196 | (345) | -- |
| Sinwa Ltd. | 3,473 | -- | 175 | 156 | 70 | 78 | 3,446 |
| SJM Co. Ltd. | 6,651 | -- | -- | 130 | -- | (2,339) | 4,312 |
| SJM Holdings Co. Ltd. | 6,082 | -- | 163 | 207 | (14) | (1,399) | 4,506 |
| Societe Pour L'Informatique Industrielle SA | 46,192 | -- | 2,334 | 210 | 1,919 | 2,670 | 48,447 |
| Soken Chemical & Engineer Co. Ltd. | 9,827 | -- | 744 | 395 | 388 | 2,680 | 12,151 |
| SPK Corp. | 7,050 | -- | 344 | 139 | 206 | (784) | -- |
| Sportscene Group, Inc. Class A | 1,827 | -- | 95 | 65 | 72 | 235 | 2,039 |
| Step Co. Ltd. | 14,962 | -- | 808 | 317 | 596 | 810 | 15,560 |
| Strattec Security Corp. | 11,271 | 1,437 | 599 | 182 | 246 | (1,035) | 11,320 |
| Strongco Corp. | 943 | -- | 64 | -- | (59) | 617 | 1,437 |
| Sun Hing Vision Group Holdings Ltd. | 8,362 | -- | 398 | 663 | 72 | (1,062) | 6,974 |
| Sunjin Co. Ltd. | 27,026 | 8,073 | -- | -- | -- | (5,533) | 29,566 |
| SYNNEX Corp. | 336,853 | -- | 16,399 | 3,713 | 14,300 | (74,203) | 260,551 |
| T&K Toka Co. Ltd. | 15,676 | -- | 998 | 387 | 590 | 233 | 15,501 |
| Techno Smart Corp. | 9,054 | -- | 2,623 | 136 | 1,469 | (2,251) | -- |
| The Buckle, Inc. | 80,756 | -- | 4,636 | 12,670 | (808) | 32,972 | 108,284 |
| The Pack Corp. | 53,010 | -- | 2,630 | 639 | 1,538 | (2,291) | 49,627 |
| Tocalo Co. Ltd. | 31,573 | -- | 2,810 | 685 | 1,853 | 4,361 | -- |
| Tohoku Steel Co. Ltd. | 9,449 | -- | 605 | 142 | 453 | (735) | 8,562 |
| Tokyo Kisen Co. Ltd. | 5,800 | -- | 307 | 141 | 202 | 292 | 5,987 |
| Tokyo Tekko Co. Ltd. | 16,460 | -- | 623 | 130 | 65 | (3,961) | 11,941 |
| Tomen Devices Corp. | 12,893 | -- | 1,471 | 364 | 52 | 2,311 | 13,785 |
| Totech Corp. | 17,623 | -- | 1,005 | 406 | 827 | 4,071 | 21,516 |
| TOW Co. Ltd. | 15,331 | -- | 736 | 405 | 491 | (1,869) | 13,217 |
| Trancom Co. Ltd. | 44,353 | -- | 2,807 | 590 | 2,753 | 18,439 | 62,738 |
| Trio-Tech International | 1,129 | 83 | 146 | -- | (23) | (5) | 1,038 |
| Triple-S Management Corp. | 29,777 | -- | 6,823 | -- | 2,373 | 33,798 | 59,125 |
| UKC Holdings Corp. | 20,506 | -- | 1,857 | 668 | 796 | 6,502 | 25,947 |
| Unit Corp. | 81,511 | 21,406 | 4,790 | -- | (125) | 36,140 | 134,142 |
| Universal Logistics Holdings, Inc. | 22,264 | 275 | 38,522 | 388 | 8,030 | 7,953 | -- |
| Unum Group | 801,555 | 104 | 45,621 | 14,586 | 30,475 | (186,766) | 599,747 |
| Utah Medical Products, Inc. | 25,516 | 1,232 | 10,082 | 382 | 8,150 | 2,647 | 27,463 |
| VSE Corp. | 45,427 | 195 | 2,038 | 247 | 1,528 | (8,937) | 36,175 |
| VST Holdings Ltd. | 33,659 | -- | 4,019 | 2,234 | 2,567 | 32,215 | 64,422 |
| Watts Co. Ltd. | 15,539 | -- | 5,625 | 144 | 2,227 | (5,799) | -- |
| Wayside Technology Group, Inc. | 1,149 | 3,102 | 92 | 88 | 8 | (454) | 3,713 |
| Weight Watchers International, Inc. | 148,520 | -- | 209,636 | -- | 117,895 | 32,820 | -- |
| Whanin Pharmaceutical Co. Ltd. | 30,861 | -- | -- | 407 | -- | 2,223 | 33,084 |
| WIN-Partners Co. Ltd. | 33,644 | -- | 1,680 | 621 | 1,329 | 4,358 | 37,651 |
| Workman Co. Ltd. | 70,361 | -- | 12,081 | 1,069 | 10,151 | 22,198 | -- |
| Youngone Holdings Co. Ltd. | 42,735 | -- | -- | 414 | -- | 168 | 42,903 |
| Yusen Logistics Co. Ltd. | 19,570 | -- | 22,774 | 62 | (5,564) | 8,768 | -- |
| Yutaka Giken Co. Ltd. | 29,488 | -- | 1,492 | 641 | 1,009 | 947 | 29,952 |
| Total | $13,278,657 | $218,879 | $2,716,164 | $349,602 | $1,189,231 | $105,893 | $9,391,906 |
(a) Includes the value of securities delivered through in-kind transactions, if applicable.
Investment Valuation
The following is a summary of the inputs used, as of July 31, 2018, involving the Fund's assets and liabilities carried at fair value. The inputs or methodology used for valuing securities may not be an indication of the risk associated with investing in those securities. For more information on valuation inputs, and their aggregation into the levels used below, please refer to the Investment Valuation section in the accompanying Notes to Financial Statements.
| | Valuation Inputs at Reporting Date: |
| Description | Total | Level 1 | Level 2 | Level 3 |
| (Amounts in thousands) | | | | |
| Investments in Securities: | | | | |
| Equities: | | | | |
| Consumer Discretionary | $8,037,747 | $8,013,256 | $-- | $24,491 |
| Consumer Staples | 3,054,569 | 3,039,327 | 10,250 | 4,992 |
| Energy | 1,842,824 | 1,702,368 | 140,232 | 224 |
| Financials | 4,117,578 | 4,069,688 | 46,984 | 906 |
| Health Care | 5,172,155 | 5,172,155 | -- | -- |
| Industrials | 2,558,595 | 2,549,712 | 8,814 | 69 |
| Information Technology | 6,001,217 | 5,987,778 | 13,439 | -- |
| Materials | 1,316,492 | 1,306,461 | 10,031 | -- |
| Real Estate | 251,182 | 251,182 | -- | -- |
| Telecommunication Services | 630 | 630 | -- | -- |
| Utilities | 642,125 | 642,125 | -- | -- |
| Corporate Bonds | 3,683 | -- | 3,683 | -- |
| Money Market Funds | 3,648,224 | 3,648,224 | -- | -- |
| Total Investments in Securities: | $36,647,021 | $36,382,906 | $233,433 | $30,682 |
The following is a summary of transfers between Level 1 and Level 2 for the period ended July 31, 2018. Transfers are assumed to have occurred at the beginning of the period, and are primarily attributable to the valuation techniques used for foreign equity securities, as discussed in the accompanying Notes to Financial Statements:
| Transfers | Total (000s) |
| Level 1 to Level 2 | $95,905 |
| Level 2 to Level 1 | $280,941 |
Other Information
Distribution of investments by country or territory of incorporation, as a percentage of Total Net Assets, is as follows (Unaudited):
| United States of America | 59.1% |
| Japan | 9.4% |
| United Kingdom | 5.7% |
| Ireland | 4.4% |
| Canada | 4.1% |
| Netherlands | 2.3% |
| Taiwan | 2.0% |
| Bermuda | 1.8% |
| Cayman Islands | 1.7% |
| Korea (South) | 1.5% |
| Bailiwick of Guernsey | 1.2% |
| India | 1.0% |
| Others (Individually Less Than 1%) | 5.8% |
| | 100.0% |
See accompanying notes which are an integral part of the financial statements.
Financial Statements
Statement of Assets and Liabilities
| Amounts in thousands (except per-share amounts) | | July 31, 2018 |
| Assets | | |
Investment in securities, at value (including securities loaned of $307,764) — See accompanying schedule:
Unaffiliated issuers (cost $10,923,152) | $23,606,891 | |
| Fidelity Central Funds (cost $3,647,672) | 3,648,224 | |
| Other affiliated issuers (cost $4,311,379) | 9,391,906 | |
| Total Investment in Securities (cost $18,882,203) | | $36,647,021 |
| Cash | | 101 |
| Foreign currency held at value (cost $1,845) | | 1,845 |
| Receivable for investments sold | | 80,395 |
| Receivable for fund shares sold | | 15,241 |
| Dividends receivable | | 54,867 |
| Interest receivable | | 159 |
| Distributions receivable from Fidelity Central Funds | | 5,553 |
| Prepaid expenses | | 93 |
| Other receivables | | 2,627 |
| Total assets | | 36,807,902 |
| Liabilities | | |
| Payable for investments purchased | $38,956 | |
| Payable for fund shares redeemed | 19,179 | |
| Accrued management fee | 11,388 | |
| Other affiliated payables | 3,701 | |
| Other payables and accrued expenses | 5,483 | |
| Collateral on securities loaned | 319,043 | |
| Total liabilities | | 397,750 |
| Net Assets | | $36,410,152 |
| Net Assets consist of: | | |
| Paid in capital | | $16,569,262 |
| Undistributed net investment income | | 275,404 |
| Accumulated undistributed net realized gain (loss) on investments and foreign currency transactions | | 1,802,947 |
| Net unrealized appreciation (depreciation) on investments and assets and liabilities in foreign currencies | | 17,762,539 |
| Net Assets | | $36,410,152 |
| Low-Priced Stock: | | |
| Net Asset Value, offering price and redemption price per share ($28,809,459 ÷ 517,656 shares) | | $55.65 |
| Class K: | | |
| Net Asset Value, offering price and redemption price per share ($7,600,693 ÷ 136,630 shares) | | $55.63 |
See accompanying notes which are an integral part of the financial statements.
Statement of Operations
| Amounts in thousands | | Year ended July 31, 2018 |
| Investment Income | | |
| Dividends (including $349,602 earned from other affiliated issuers) | | $740,172 |
| Income from Fidelity Central Funds | | 60,076 |
| Total income | | 800,248 |
| Expenses | | |
| Management fee | | |
| Basic fee | $225,892 | |
| Performance adjustment | (46,046) | |
| Transfer agent fees | 44,021 | |
| Accounting and security lending fees | 2,224 | |
| Custodian fees and expenses | 2,748 | |
| Independent trustees' fees and expenses | 165 | |
| Registration fees | 277 | |
| Audit | 241 | |
| Legal | 87 | |
| Miscellaneous | 283 | |
| Total expenses before reductions | 229,892 | |
| Expense reductions | (1,402) | |
| Total expenses after reductions | | 228,490 |
| Net investment income (loss) | | 571,758 |
| Realized and Unrealized Gain (Loss) | | |
| Net realized gain (loss) on: | | |
| Investment securities: | | |
| Unaffiliated issuers (net of foreign taxes of $782) | 2,336,158 | |
| Fidelity Central Funds | 98 | |
| Other affiliated issuers | 1,189,231 | |
| Foreign currency transactions | (582) | |
| Total net realized gain (loss) | | 3,524,905 |
| Change in net unrealized appreciation (depreciation) on: | | |
| Investment securities: | | |
| Unaffiliated issuers (net of increase in deferred foreign taxes of $1,352) | 204,936 | |
| Fidelity Central Funds | (57) | |
| Other affiliated issuers | 105,893 | |
| Assets and liabilities in foreign currencies | (909) | |
| Total change in net unrealized appreciation (depreciation) | | 309,863 |
| Net gain (loss) | | 3,834,768 |
| Net increase (decrease) in net assets resulting from operations | | $4,406,526 |
See accompanying notes which are an integral part of the financial statements.
Statement of Changes in Net Assets
| Amounts in thousands | Year ended July 31, 2018 | Year ended July 31, 2017 |
| Increase (Decrease) in Net Assets | | |
| Operations | | |
| Net investment income (loss) | $571,758 | $578,492 |
| Net realized gain (loss) | 3,524,905 | 3,773,347 |
| Change in net unrealized appreciation (depreciation) | 309,863 | 1,136,726 |
| Net increase (decrease) in net assets resulting from operations | 4,406,526 | 5,488,565 |
| Distributions to shareholders from net investment income | (570,162) | (481,686) |
| Distributions to shareholders from net realized gain | (2,830,480) | (1,425,392) |
| Total distributions | (3,400,642) | (1,907,078) |
| Share transactions - net increase (decrease) | (2,815,868) | (5,374,274) |
| Redemption fees | – | 401 |
| Total increase (decrease) in net assets | (1,809,984) | (1,792,386) |
| Net Assets | | |
| Beginning of period | 38,220,136 | 40,012,522 |
| End of period | $36,410,152 | $38,220,136 |
| Other Information | | |
| Undistributed net investment income end of period | $275,404 | $293,208 |
See accompanying notes which are an integral part of the financial statements.
Financial Highlights
Fidelity Low-Priced Stock Fund
| Years ended July 31, | 2018 | 2017 | 2016 | 2015 | 2014 |
| Selected Per–Share Data | | | | | |
| Net asset value, beginning of period | $54.38 | $49.57 | $52.65 | $51.03 | $47.84 |
| Income from Investment Operations | | | | | |
| Net investment income (loss)A | .80 | .74 | .59 | .52 | .53 |
| Net realized and unrealized gain (loss) | 5.33 | 6.47 | (1.44) | 4.06 | 5.96 |
| Total from investment operations | 6.13 | 7.21 | (.85) | 4.58 | 6.49 |
| Distributions from net investment income | (.79) | (.60) | (.62) | (.52) | (.39) |
| Distributions from net realized gain | (4.06) | (1.80) | (1.61) | (2.44) | (2.91) |
| Total distributions | (4.86)B | (2.40) | (2.23) | (2.96) | (3.30) |
| Redemption fees added to paid in capitalA | – | –C | –C | –C | –C |
| Net asset value, end of period | $55.65 | $54.38 | $49.57 | $52.65 | $51.03 |
| Total ReturnD | 12.07% | 15.17% | (1.48)% | 9.32% | 14.42% |
| Ratios to Average Net AssetsE,F | | | | | |
| Expenses before reductions | .62% | .67% | .88% | .79% | .82% |
| Expenses net of fee waivers, if any | .62% | .67% | .88% | .79% | .82% |
| Expenses net of all reductions | .62% | .67% | .88% | .79% | .82% |
| Net investment income (loss) | 1.48% | 1.46% | 1.24% | 1.02% | 1.07% |
| Supplemental Data | | | | | |
| Net assets, end of period (in millions) | $28,809 | $28,334 | $28,524 | $30,150 | $30,576 |
| Portfolio turnover rateG,H | 11% | 8% | 9% | 9% | 12% |
A Calculated based on average shares outstanding during the period.
B Total distributions of $4.86 per share is comprised of distributions from net investment income of $.793 and distributions from net realized gain of $4.064 per share.
C Amount represents less than $.005 per share.
D Total returns would have been lower if certain expenses had not been reduced during the applicable periods shown.
E Fees and expenses of any underlying Fidelity Central Funds are not included in the Fund's expense ratio. The Fund indirectly bears its proportionate share of the expenses of any underlying Fidelity Central Funds.
F Expense ratios reflect operating expenses of the class. Expenses before reductions do not reflect amounts reimbursed by the investment adviser or reductions from brokerage service arrangements or reductions from other expense offset arrangements and do not represent the amount paid by the class during periods when reimbursements or reductions occur. Expenses net of fee waivers reflect expenses after reimbursement by the investment adviser but prior to reductions from brokerage service arrangements or other expense offset arrangements. Expenses net of all reductions represent the net expenses paid by the class.
G Amount does not include the portfolio activity of any underlying Fidelity Central Funds.
H Portfolio turnover rate excludes securities received or delivered in-kind.
See accompanying notes which are an integral part of the financial statements.
Fidelity Low-Priced Stock Fund Class K
| Years ended July 31, | 2018 | 2017 | 2016 | 2015 | 2014 |
| Selected Per–Share Data | | | | | |
| Net asset value, beginning of period | $54.36 | $49.56 | $52.64 | $51.02 | $47.83 |
| Income from Investment Operations | | | | | |
| Net investment income (loss)A | .85 | .79 | .64 | .57 | .58 |
| Net realized and unrealized gain (loss) | 5.33 | 6.46 | (1.44) | 4.06 | 5.96 |
| Total from investment operations | 6.18 | 7.25 | (.80) | 4.63 | 6.54 |
| Distributions from net investment income | (.84) | (.64) | (.67) | (.57) | (.44) |
| Distributions from net realized gain | (4.06) | (1.80) | (1.61) | (2.44) | (2.91) |
| Total distributions | (4.91)B | (2.45)C | (2.28) | (3.01) | (3.35) |
| Redemption fees added to paid in capitalA | – | –D | –D | –D | –D |
| Net asset value, end of period | $55.63 | $54.36 | $49.56 | $52.64 | $51.02 |
| Total ReturnE | 12.18% | 15.27% | (1.38)% | 9.44% | 14.55% |
| Ratios to Average Net AssetsF,G | | | | | |
| Expenses before reductions | .53% | .58% | .78% | .69% | .72% |
| Expenses net of fee waivers, if any | .53% | .58% | .78% | .69% | .72% |
| Expenses net of all reductions | .53% | .58% | .78% | .69% | .72% |
| Net investment income (loss) | 1.57% | 1.56% | 1.34% | 1.11% | 1.17% |
| Supplemental Data | | | | | |
| Net assets, end of period (in millions) | $7,601 | $9,886 | $11,489 | $13,989 | $16,198 |
| Portfolio turnover rateH,I | 11% | 8% | 9% | 9% | 12% |
A Calculated based on average shares outstanding during the period.
B Total distributions of $4.91 per share is comprised of distributions from net investment income of $.842 and distributions from net realized gain of $4.064 per share.
C Total distributions of $2.45 per share is comprised of distributions from net investment income of $.644 and distributions from net realized gain of $1.803 per share.
D Amount represents less than $.005 per share.
E Total returns would have been lower if certain expenses had not been reduced during the applicable periods shown.
F Fees and expenses of any underlying Fidelity Central Funds are not included in the Fund's expense ratio. The Fund indirectly bears its proportionate share of the expenses of any underlying Fidelity Central Funds.
G Expense ratios reflect operating expenses of the class. Expenses before reductions do not reflect amounts reimbursed by the investment adviser or reductions from brokerage service arrangements or reductions from other expense offset arrangements and do not represent the amount paid by the class during periods when reimbursements or reductions occur. Expenses net of fee waivers reflect expenses after reimbursement by the investment adviser but prior to reductions from brokerage service arrangements or other expense offset arrangements. Expenses net of all reductions represent the net expenses paid by the class.
H Amount does not include the portfolio activity of any underlying Fidelity Central Funds.
I Portfolio turnover rate excludes securities received or delivered in-kind.
See accompanying notes which are an integral part of the financial statements.
Notes to Financial Statements
For the period ended July 31, 2018
(Amounts in thousands except percentages)
1. Organization.
Fidelity Low-Priced Stock Fund (the Fund) is a fund of Fidelity Puritan Trust (the Trust) and is authorized to issue an unlimited number of shares. The Trust is registered under the Investment Company Act of 1940, as amended (the 1940 Act), as an open-end management investment company organized as a Massachusetts business trust. The Fund offers Low-Priced Stock and Class K shares, each of which has equal rights as to assets and voting privileges. Each class has exclusive voting rights with respect to matters that affect that class.
2. Investments in Fidelity Central Funds.
The Fund invests in Fidelity Central Funds, which are open-end investment companies generally available only to other investment companies and accounts managed by the investment adviser and its affiliates. The Fund's Schedule of Investments lists each of the Fidelity Central Funds held as of period end, if any, as an investment of the Fund, but does not include the underlying holdings of each Fidelity Central Fund. As an Investing Fund, the Fund indirectly bears its proportionate share of the expenses of the underlying Fidelity Central Funds.
The Money Market Central Funds seek preservation of capital and current income and are managed by Fidelity Investments Money Management, Inc. (FIMM), an affiliate of the investment adviser. Annualized expenses of the Money Market Central Funds as of their most recent shareholder report date are less than .005%.
A complete unaudited list of holdings for each Fidelity Central Fund is available upon request or at the Securities and Exchange Commission (the SEC) website at www.sec.gov. In addition, the financial statements of the Fidelity Central Funds, which are not covered by the Fund's Report of Independent Registered Public Accounting Firm, are available on the SEC website or upon request.
3. Significant Accounting Policies.
The Fund is an investment company and applies the accounting and reporting guidance of the Financial Accounting Standards Board (FASB) Accounting Standards Codification Topic 946 Financial Services – Investments Companies. The financial statements have been prepared in conformity with accounting principles generally accepted in the United States of America (GAAP), which require management to make certain estimates and assumptions at the date of the financial statements. Actual results could differ from those estimates. Subsequent events, if any, through the date that the financial statements were issued have been evaluated in the preparation of the financial statements. The following summarizes the significant accounting policies of the Fund:
Investment Valuation. Investments are valued as of 4:00 p.m. Eastern time on the last calendar day of the period. The Board of Trustees (the Board) has delegated the day to day responsibility for the valuation of the Fund's investments to the Fair Value Committee (the Committee) established by the Fund's investment adviser. In accordance with valuation policies and procedures approved by the Board, the Fund attempts to obtain prices from one or more third party pricing vendors or brokers to value its investments. When current market prices, quotations or currency exchange rates are not readily available or reliable, investments will be fair valued in good faith by the Committee, in accordance with procedures adopted by the Board. Factors used in determining fair value vary by investment type and may include market or investment specific events, changes in interest rates and credit quality. The frequency with which these procedures are used cannot be predicted and they may be utilized to a significant extent. The Committee oversees the Fund's valuation policies and procedures and reports to the Board on the Committee's activities and fair value determinations. The Board monitors the appropriateness of the procedures used in valuing the Fund's investments and ratifies the fair value determinations of the Committee.
The Fund categorizes the inputs to valuation techniques used to value its investments into a disclosure hierarchy consisting of three levels as shown below:
- Level 1 – quoted prices in active markets for identical investments
- Level 2 – other significant observable inputs (including quoted prices for similar investments, interest rates, prepayment speeds, etc.)
- Level 3 – unobservable inputs (including the Fund's own assumptions based on the best information available)
Valuation techniques used to value the Fund's investments by major category are as follows:
Equity securities, including restricted securities, for which market quotations are readily available, are valued at the last reported sale price or official closing price as reported by a third party pricing vendor on the primary market or exchange on which they are traded and are categorized as Level 1 in the hierarchy. In the event there were no sales during the day or closing prices are not available, securities are valued at the last quoted bid price or may be valued using the last available price and are generally categorized as Level 2 in the hierarchy. For foreign equity securities, when market or security specific events arise, comparisons to the valuation of American Depositary Receipts (ADRs), futures contracts, Exchange-Traded Funds (ETFs) and certain indexes as well as quoted prices for similar securities may be used and would be categorized as Level 2 in the hierarchy. Utilizing these techniques may result in transfers between Level 1 and Level 2. For equity securities, including restricted securities, where observable inputs are limited, assumptions about market activity and risk are used and these securities may be categorized as Level 3 in the hierarchy.
Debt securities, including restricted securities, are valued based on evaluated prices received from third party pricing vendors or from brokers who make markets in such securities. Corporate bonds are valued by pricing vendors who utilize matrix pricing which considers yield or price of bonds of comparable quality, coupon, maturity and type or by broker-supplied prices. When independent prices are unavailable or unreliable, debt securities may be valued utilizing pricing methodologies which consider similar factors that would be used by third party pricing vendors. Debt securities are generally categorized as Level 2 in the hierarchy but may be Level 3 depending on the circumstances.
Investments in open-end mutual funds, including the Fidelity Central Funds, are valued at their closing net asset value (NAV) each business day and are categorized as Level 1 in the hierarchy.
Changes in valuation techniques may result in transfers in or out of an assigned level within the disclosure hierarchy. The aggregate value of investments by input level as of July 31, 2018, including information on transfers between Levels 1 and 2, is included at the end of the Fund's Schedule of Investments.
Foreign Currency. The Fund may use foreign currency contracts to facilitate transactions in foreign-denominated securities. Gains and losses from these transactions may arise from changes in the value of the foreign currency or if the counterparties do not perform under the contracts' terms.
Foreign-denominated assets, including investment securities, and liabilities are translated into U.S. dollars at the exchange rates at period end. Purchases and sales of investment securities, income and dividends received and expenses denominated in foreign currencies are translated into U.S. dollars at the exchange rate in effect on the transaction date.
The effects of exchange rate fluctuations on investments are included with the net realized and unrealized gain (loss) on investment securities. Other foreign currency transactions resulting in realized and unrealized gain (loss) are disclosed separately.
Investment Transactions and Income. For financial reporting purposes, the Fund's investment holdings and NAV include trades executed through the end of the last business day of the period. The NAV per share for processing shareholder transactions is calculated as of the close of business of the New York Stock Exchange (NYSE), normally 4:00 p.m. Eastern time and includes trades executed through the end of the prior business day. Gains and losses on securities sold are determined on the basis of identified cost and include proceeds received from litigation. Dividend income is recorded on the ex-dividend date, except for certain dividends from foreign securities where the ex-dividend date may have passed, which are recorded as soon as the Fund is informed of the ex-dividend date. Non-cash dividends included in dividend income, if any, are recorded at the fair market value of the securities received. Income and capital gain distributions from Fidelity Central Funds, if any, are recorded on the ex-dividend date. Certain distributions received by the Fund represent a return of capital or capital gain. The Fund determines the components of these distributions subsequent to the ex-dividend date, based upon receipt of tax filings or other correspondence relating to the underlying investment. These distributions are recorded as a reduction of cost of investments and/or as a realized gain. Investment income is recorded net of foreign taxes withheld where recovery of such taxes is uncertain.
Class Allocations and Expenses. Investment income, realized and unrealized capital gains and losses, common expenses of the Fund, and certain fund-level expense reductions, if any, are allocated daily on a pro-rata basis to each class based on the relative net assets of each class to the total net assets of the Fund. Each class differs with respect to transfer agent fees incurred. Certain expense reductions may also differ by class. For the reporting period, the allocated portion of income and expenses to each class as a percent of its average net assets may vary due to the timing of recording these transactions in relation to fluctuating net assets of the classes. Expenses directly attributable to a fund are charged to that fund. Expenses attributable to more than one fund are allocated among the respective funds on the basis of relative net assets or other appropriate methods. Expense estimates are accrued in the period to which they relate and adjustments are made when actual amounts are known.
Deferred Trustee Compensation. Under a Deferred Compensation Plan (the Plan), certain independent Trustees have elected to defer receipt of a portion of their annual compensation. Deferred amounts are invested in a cross-section of Fidelity funds, are marked-to-market and remain in the Fund until distributed in accordance with the Plan. The investment of deferred amounts and the offsetting payable to the Trustees of $2,221 are included in the accompanying Statement of Assets and Liabilities in other receivables and other payables and accrued expenses, respectively.
Income Tax Information and Distributions to Shareholders. Each year, the Fund intends to qualify as a regulated investment company under Subchapter M of the Internal Revenue Code, including distributing substantially all of its taxable income and realized gains. As a result, no provision for U.S. Federal income taxes is required. As of July 31, 2018, the Fund did not have any unrecognized tax benefits in the financial statements; nor is the Fund aware of any tax positions for which it is reasonably possible that the total amounts of unrecognized tax benefits will significantly change in the next twelve months. The Fund files a U.S. federal tax return, in addition to state and local tax returns as required. The Fund's federal income tax returns are subject to examination by the Internal Revenue Service (IRS) for a period of three fiscal years after they are filed. State and local tax returns may be subject to examination for an additional fiscal year depending on the jurisdiction. Foreign taxes are provided for based on the Fund's understanding of the tax rules and rates that exist in the foreign markets in which it invests. The Fund is subject to a tax imposed on capital gains by certain countries in which it invests. An estimated deferred tax liability for net unrealized appreciation on the applicable securities is included in Other payables and accrued expenses on the Statement of Assets & Liabilities.
Distributions are declared and recorded on the ex-dividend date. Income and capital gain distributions are declared separately for each class. Income and capital gain distributions are determined in accordance with income tax regulations, which may differ from GAAP. In addition, the Fund claimed a portion of the payment made to redeeming shareholders as a distribution for income tax purposes.
Capital accounts within the financial statements are adjusted for permanent book-tax differences. These adjustments have no impact on net assets or the results of operations. Capital accounts are not adjusted for temporary book-tax differences which will reverse in a subsequent period.
Book-tax differences are primarily due to foreign currency transactions, certain foreign taxes, deferred foreign income corporations, passive foreign investment companies (PFIC), redemptions in kind, partnerships, deferred trustees compensation and losses deferred due to wash sales.
As of period end, the cost and unrealized appreciation (depreciation) in securities, and derivatives if applicable, for federal income tax purposes were as follows:
| Gross unrealized appreciation | $18,671,830 |
| Gross unrealized depreciation | (1,233,048) |
| Net unrealized appreciation (depreciation) | $17,438,782 |
| Tax Cost | $19,208,240 |
The tax-based components of distributable earnings as of period end were as follows:
| Undistributed ordinary income | $277,633 |
| Undistributed long-term capital gain | $2,128,983 |
| Net unrealized appreciation (depreciation) on securities and other investments | $17,438,552 |
The tax character of distributions paid was as follows:
| | July 31, 2018 | July 31, 2017 |
| Ordinary Income | $649,155 | $ 484,842 |
| Long-term Capital Gains | 2,751,487 | 1,422,236 |
| Total | $3,400,642 | $ 1,907,078 |
Restricted Securities. The Fund may invest in securities that are subject to legal or contractual restrictions on resale. These securities generally may be resold in transactions exempt from registration or to the public if the securities are registered. Disposal of these securities may involve time-consuming negotiations and expense, and prompt sale at an acceptable price may be difficult. Information regarding restricted securities is included at the end of the Fund's Schedule of Investments.
4. Purchases and Sales of Investments.
Purchases and sales of securities, other than short-term securities and in-kind transactions, aggregated $3,796,044 and $6,449,979, respectively.
Redemptions In-Kind. During the period, 31,696 shares of the Fund held by unaffiliated entities were redeemed in-kind for investments and cash, including accrued interest, with a value of $1,710,031. The net realized gain of $1,005,957 on investments delivered through the in-kind redemptions is included in the accompanying Statement of Operations. The amount of the redemptions is included in share transactions activity shown in the accompanying Statement of Changes in Net Assets as well as the Notes to Financial Statements. The Fund recognized no gain or loss for federal income tax purposes.
Prior Fiscal Year Redemptions In-Kind. During the prior period, 11,577 shares of the Fund held by unaffiliated entities were redeemed in-kind for investments and cash, including accrued interest, with a value of $587,646. The Fund had a net realized gain of $324,974 on investments delivered through the in-kind redemptions. The amount of the in-kind redemptions is included in share transactions in the accompanying Statement of Changes in Net Assets as well as the Notes to Financial Statements. The Fund recognized no gain or loss for federal income tax purposes.
5. Fees and Other Transactions with Affiliates.
Management Fee. Fidelity Management & Research Company (the investment adviser) and its affiliates provide the Fund with investment management related services for which the Fund pays a monthly management fee. The management fee is the sum of an individual fund fee rate that is based on an annual rate of .35% of the Fund's average net assets and an annualized group fee rate that averaged .24% during the period. The group fee rate is based upon the average net assets of all the mutual funds advised by the investment adviser, including any mutual funds previously advised by the investment adviser that are currently advised by Fidelity SelectCo, LLC, an affiliate of the investment adviser. The group fee rate decreases as assets under management increase and increases as assets under management decrease. In addition, the management fee is subject to a performance adjustment (up to a maximum of +/- .20% of the Fund's average net assets over a 36 month performance period). The upward or downward adjustment to the management fee is based on the relative investment performance of Low-Priced Stock as compared to its benchmark index, the Russell 2000 Index, over the same 36 month performance period. For the reporting period, the total annual management fee rate, including the performance adjustment, was .47% of the Fund's average net assets. The performance adjustment included in the management fee rate may be higher or lower than the maximum performance adjustment rate due to the difference between the average net assets for the reporting and performance periods.
Transfer Agent Fees. Fidelity Investments Institutional Operations Company, Inc., (FIIOC), an affiliate of the investment adviser, is the transfer, dividend disbursing and shareholder servicing agent for each class of the Fund. FIIOC receives account fees and asset-based fees that vary according to the account size and type of account of the shareholders of Low-Priced Stock, except for Class K. FIIOC receives an asset-based fee of Class K's average net assets. FIIOC pays for typesetting, printing and mailing of shareholder reports, except proxy statements.
For the period, transfer agent fees for each class were as follows:
| | Amount | % of Class-Level Average Net Assets |
| Low-Priced Stock | $40,017 | .14 |
| Class K | 4,004 | .05 |
| | $44,021 | |
Accounting and Security Lending Fees. Fidelity Service Company, Inc. (FSC), an affiliate of the investment adviser, maintains the Fund's accounting records. The accounting fee is based on the level of average net assets for each month. Under a separate contract, FSC administers the security lending program. The security lending fee is based on the number and duration of lending transactions. For the period, the fees were equivalent to an annual rate of .01%.
Brokerage Commissions. The Fund placed a portion of its portfolio transactions with brokerage firms which are affiliates of the investment adviser. Brokerage commissions are included in net realized gain (loss) and change in net unrealized appreciation (depreciation) in the Statement of Operations. The commissions paid to these affiliated firms were $169 for the period.
Interfund Trades. The Fund may purchase from or sell securities to other Fidelity Funds under procedures adopted by the Board. The procedures have been designed to ensure these interfund trades are executed in accordance with Rule 17a-7 of the 1940 Act. Interfund trades are included within the respective purchases and sales amounts shown in the Purchases and Sales of Investments note.
Prior Fiscal Year Redemptions In-Kind. During the prior period, 8,419 shares of the Fund held by an affiliated entity were redeemed in-kind for investments and cash, included accrued interest, with a value of $456,638. The Fund had a net realized gain of $254,862 on investments delivered through in-kind redemptions. The amount of the in-kind redemptions is included in share transactions in the accompanying Statement of Changes in Net Assets as well as the Notes to Financial Statements. The Fund recognized no gain or loss for federal income tax purposes.
Other. During the period, the investment adviser reimbursed the Fund for certain losses in the amount of $6.
6. Committed Line of Credit.
The Fund participates with other funds managed by the investment adviser or an affiliate in a $4.25 billion credit facility (the "line of credit") to be utilized for temporary or emergency purposes to fund shareholder redemptions or for other short-term liquidity purposes. The Fund has agreed to pay commitment fees on its pro-rata portion of the line of credit, which amounted to $109 and is reflected in Miscellaneous expenses on the Statement of Operations. During the period, the Fund did not borrow on this line of credit.
7. Security Lending.
The Fund lends portfolio securities through a lending agent from time to time in order to earn additional income. For equity securities, a lending agent is used and may loan securities to certain qualified borrowers, including Fidelity Capital Markets (FCM), a broker-dealer affiliated with the Fund. On the settlement date of the loan, the Fund receives collateral (in the form of U.S. Treasury obligations, letters of credit and/or cash) against the loaned securities and maintains collateral in an amount not less than 100% of the market value of the loaned securities during the period of the loan. The market value of the loaned securities is determined at the close of business of the Fund and any additional required collateral is delivered to the Fund on the next business day. The Fund or borrower may terminate the loan at any time, and if the borrower defaults on its obligation to return the securities loaned because of insolvency or other reasons, the Fund may apply collateral received from the borrower against the obligation. The Fund may experience delays and costs in recovering the securities loaned. Any cash collateral received is invested in the Fidelity Securities Lending Cash Central Fund. The value of loaned securities and cash collateral at period end are disclosed on the Fund's Statement of Assets and Liabilities. The value of securities loaned to FCM at period end was $15,076. Security lending income represents the income earned on investing cash collateral, less rebates paid to borrowers and any lending agent fees associated with the loan, plus any premium payments received for lending certain types of securities. Security lending income is presented in the Statement of Operations as a component of income from Fidelity Central Funds. Total security lending income during the period amounted to $7,783, including $286 from securities loaned to FCM.
8. Expense Reductions.
Commissions paid to certain brokers with whom the investment adviser, or its affiliates, places trades on behalf of the Fund include an amount in addition to trade execution, which may be rebated back to the Fund to offset certain expenses. This amount totaled $1,007 for the period. In addition, through arrangements with the Fund's custodian, credits realized as a result of certain uninvested cash balances were used to reduce the Fund's expenses. During the period, these credits reduced the Fund's custody expenses by $2.
In addition, during the period the investment adviser reimbursed and/or waived a portion of fund-level operating expenses in the amount of $393.
9. Distributions to Shareholders.
Distributions to shareholders of each class were as follows:
| | Year ended
July 31, 2018 | Year ended
July 31, 2017 |
| From net investment income | | |
| Low-Priced Stock | $422,624 | $337,211 |
| Class K | 147,538 | 144,475 |
| Total | $570,162 | $481,686 |
| From net realized gain | | |
| Low-Priced Stock | $2,113,153 | $1,020,329 |
| Class K | 717,327 | 405,063 |
| Total | $2,830,480 | $1,425,392 |
10. Share Transactions.
Share transactions for each class were as follows and may contain automatic conversions between classes or exchanges between affiliated funds:
| | Shares | Shares | Dollars | Dollars |
| | Year ended July 31, 2018 | Year ended July 31, 2017 | Year ended July 31, 2018 | Year ended July 31, 2017 |
| Low-Priced Stock | | | | |
| Shares sold | 78,887 | 35,353 | $4,286,318 | $1,788,321 |
| Reinvestment of distributions | 45,637 | 25,783 | 2,359,539 | 1,255,306 |
| Shares redeemed | (127,919)(a) | (115,449) | (6,976,877)(a) | (5,836,933) |
| Net increase (decrease) | (3,395) | (54,313) | $(331,020) | $(2,793,306) |
| Class K | | | | |
| Shares sold | 23,375 | 28,345 | $1,267,880 | $1,441,213 |
| Reinvestment of distributions | 16,747 | 11,296 | 864,865 | 549,537 |
| Shares redeemed | (85,363)(a) | (89,600)(b) | (4,617,593)(a) | (4,571,718)(b) |
| Net increase (decrease) | (45,241) | (49,959) | $(2,484,848) | $(2,580,968) |
(a) Amount includes in-kind redemptions (see the Redemptions In-Kind note for additional details).
(b) Amount includes in-kind redemptions (see the Prior Fiscal Year Redemptions In-Kind note for additional details).
11. Other.
The Fund's organizational documents provide former and current trustees and officers with a limited indemnification against liabilities arising in connection with the performance of their duties to the Fund. In the normal course of business, the Fund may also enter into contracts that provide general indemnifications. The Fund's maximum exposure under these arrangements is unknown as this would be dependent on future claims that may be made against the Fund. The risk of material loss from such claims is considered remote.
Report of Independent Registered Public Accounting Firm
To the Board of Trustees of Fidelity Puritan Trust and Shareholders of Fidelity Low-Priced Stock Fund:
Opinion on the Financial Statements
We have audited the accompanying statement of assets and liabilities, including the schedule of investments, of Fidelity Low-Priced Stock Fund (one of the funds constituting Fidelity Puritan Trust, referred to hereafter as the "Fund") as of July 31, 2018, the related statement of operations for the year ended July 31, 2018, the statement of changes in net assets for each of the two years in the period ended July 31, 2018, including the related notes, and the financial highlights for each of the five years in the period ended July 31, 2018 (collectively referred to as the “financial statements”). In our opinion, the financial statements present fairly, in all material respects, the financial position of the Fund as of July 31, 2018, the results of its operations for the year then ended, the changes in its net assets for each of the two years in the period ended July 31, 2018 and the financial highlights for each of the five years in the period ended July 31, 2018 in conformity with accounting principles generally accepted in the United States of America.
Basis for Opinion
These financial statements are the responsibility of the Fund’s management. Our responsibility is to express an opinion on the Fund’s financial statements based on our audits. We are a public accounting firm registered with the Public Company Accounting Oversight Board (United States) (“PCAOB”) and are required to be independent with respect to the Fund in accordance with the U.S. federal securities laws and the applicable rules and regulations of the Securities and Exchange Commission and the PCAOB.
We conducted our audits of these financial statements in accordance with the standards of the PCAOB. Those standards require that we plan and perform the audit to obtain reasonable assurance about whether the financial statements are free of material misstatement, whether due to error or fraud.
Our audits included performing procedures to assess the risks of material misstatement of the financial statements, whether due to error or fraud, and performing procedures that respond to those risks. Such procedures included examining, on a test basis, evidence regarding the amounts and disclosures in the financial statements. Our audits also included evaluating the accounting principles used and significant estimates made by management, as well as evaluating the overall presentation of the financial statements. Our procedures included confirmation of securities owned as of July 31, 2018 by correspondence with the custodian and brokers; when replies were not received from brokers, we performed other auditing procedures. We believe that our audits provide a reasonable basis for our opinion.
PricewaterhouseCoopers LLP
Boston, Massachusetts
September 18, 2018
We have served as the auditor of one or more investment companies in the Fidelity group of funds since 1932.
Trustees and Officers
The Trustees, Members of the Advisory Board (if any), and officers of the trust and fund, as applicable, are listed below. The Board of Trustees governs the fund and is responsible for protecting the interests of shareholders. The Trustees are experienced executives who meet periodically throughout the year to oversee the fund's activities, review contractual arrangements with companies that provide services to the fund, oversee management of the risks associated with such activities and contractual arrangements, and review the fund's performance. Except for Jonathan Chiel, each of the Trustees oversees 286 funds. Mr. Chiel oversees 150 funds.
The Trustees hold office without limit in time except that (a) any Trustee may resign; (b) any Trustee may be removed by written instrument, signed by at least two-thirds of the number of Trustees prior to such removal; (c) any Trustee who requests to be retired or who has become incapacitated by illness or injury may be retired by written instrument signed by a majority of the other Trustees; and (d) any Trustee may be removed at any special meeting of shareholders by a two-thirds vote of the outstanding voting securities of the trust. Each Trustee who is not an interested person (as defined in the 1940 Act) of the trust and the fund is referred to herein as an Independent Trustee. Each Independent Trustee shall retire not later than the last day of the calendar year in which his or her 75th birthday occurs. The Independent Trustees may waive this mandatory retirement age policy with respect to individual Trustees. Officers and Advisory Board Members hold office without limit in time, except that any officer or Advisory Board Member may resign or may be removed by a vote of a majority of the Trustees at any regular meeting or any special meeting of the Trustees. Except as indicated, each individual has held the office shown or other offices in the same company for the past five years.
The fund’s Statement of Additional Information (SAI) includes more information about the Trustees. To request a free copy, call Fidelity at 1-800-835-5092.
Experience, Skills, Attributes, and Qualifications of the Trustees. The Governance and Nominating Committee has adopted a statement of policy that describes the experience, qualifications, attributes, and skills that are necessary and desirable for potential Independent Trustee candidates (Statement of Policy). The Board believes that each Trustee satisfied at the time he or she was initially elected or appointed a Trustee, and continues to satisfy, the standards contemplated by the Statement of Policy. The Governance and Nominating Committee also engages professional search firms to help identify potential Independent Trustee candidates who have the experience, qualifications, attributes, and skills consistent with the Statement of Policy. From time to time, additional criteria based on the composition and skills of the current Independent Trustees, as well as experience or skills that may be appropriate in light of future changes to board composition, business conditions, and regulatory or other developments, have also been considered by the professional search firms and the Governance and Nominating Committee. In addition, the Board takes into account the Trustees' commitment and participation in Board and committee meetings, as well as their leadership of standing and ad hoc committees throughout their tenure.
In determining that a particular Trustee was and continues to be qualified to serve as a Trustee, the Board has considered a variety of criteria, none of which, in isolation, was controlling. The Board believes that, collectively, the Trustees have balanced and diverse experience, qualifications, attributes, and skills, which allow the Board to operate effectively in governing the fund and protecting the interests of shareholders. Information about the specific experience, skills, attributes, and qualifications of each Trustee, which in each case led to the Board's conclusion that the Trustee should serve (or continue to serve) as a trustee of the fund, is provided below.
Board Structure and Oversight Function. James C. Curvey is an interested person and currently serves as Chairman. The Trustees have determined that an interested Chairman is appropriate and benefits shareholders because an interested Chairman has a personal and professional stake in the quality and continuity of services provided to the fund. Independent Trustees exercise their informed business judgment to appoint an individual of their choosing to serve as Chairman, regardless of whether the Trustee happens to be independent or a member of management. The Independent Trustees have determined that they can act independently and effectively without having an Independent Trustee serve as Chairman and that a key structural component for assuring that they are in a position to do so is for the Independent Trustees to constitute a substantial majority for the Board. The Independent Trustees also regularly meet in executive session. Ned C. Lautenbach serves as Chairman of the Independent Trustees and as such (i) acts as a liaison between the Independent Trustees and management with respect to matters important to the Independent Trustees and (ii) with management prepares agendas for Board meetings.
Fidelity® funds are overseen by different Boards of Trustees. The fund's Board oversees Fidelity's high income and certain equity funds, and other Boards oversee Fidelity's investment-grade bond, money market, asset allocation, and other equity funds. The asset allocation funds may invest in Fidelity® funds overseen by the fund's Board. The use of separate Boards, each with its own committee structure, allows the Trustees of each group of Fidelity® funds to focus on the unique issues of the funds they oversee, including common research, investment, and operational issues. On occasion, the separate Boards establish joint committees to address issues of overlapping consequences for the Fidelity® funds overseen by each Board.
The Trustees operate using a system of committees to facilitate the timely and efficient consideration of all matters of importance to the Trustees, the fund, and fund shareholders and to facilitate compliance with legal and regulatory requirements and oversight of the fund's activities and associated risks. The Board, acting through its committees, has charged FMR and its affiliates with (i) identifying events or circumstances the occurrence of which could have demonstrably adverse effects on the fund's business and/or reputation; (ii) implementing processes and controls to lessen the possibility that such events or circumstances occur or to mitigate the effects of such events or circumstances if they do occur; and (iii) creating and maintaining a system designed to evaluate continuously business and market conditions in order to facilitate the identification and implementation processes described in (i) and (ii) above. Because the day-to-day operations and activities of the fund are carried out by or through FMR, its affiliates, and other service providers, the fund's exposure to risks is mitigated but not eliminated by the processes overseen by the Trustees. While each of the Board's committees has responsibility for overseeing different aspects of the fund's activities, oversight is exercised primarily through the Operations, Audit, and Compliance Committees. In addition, the Independent Trustees have worked with Fidelity to enhance the Board's oversight of investment and financial risks, legal and regulatory risks, technology risks, and operational risks, including the development of additional risk reporting to the Board. Appropriate personnel, including but not limited to the fund's Chief Compliance Officer (CCO), FMR's internal auditor, the independent accountants, the fund's Treasurer and portfolio management personnel, make periodic reports to the Board's committees, as appropriate, including an annual review of Fidelity's risk management program for the Fidelity® funds. The responsibilities of each standing committee, including their oversight responsibilities, are described further under "Standing Committees of the Trustees."
Interested Trustees*:
Correspondence intended for a Trustee who is an interested person may be sent to Fidelity Investments, 245 Summer Street, Boston, Massachusetts 02210.
Name, Year of Birth; Principal Occupations and Other Relevant Experience+
Jonathan Chiel (1957)
Year of Election or Appointment: 2016
Trustee
Mr. Chiel also serves as Trustee of other Fidelity® funds. Mr. Chiel is Executive Vice President and General Counsel for FMR LLC (diversified financial services company, 2012-present). Previously, Mr. Chiel served as general counsel (2004-2012) and senior vice president and deputy general counsel (2000-2004) for John Hancock Financial Services; a partner with Choate, Hall & Stewart (1996-2000) (law firm); and an Assistant United States Attorney for the United States Attorney’s Office of the District of Massachusetts (1986-95), including Chief of the Criminal Division (1993-1995). Mr. Chiel is a director on the boards of the Boston Bar Foundation and the Maimonides School.
James C. Curvey (1935)
Year of Election or Appointment: 2007
Trustee
Chairman of the Board of Trustees
Mr. Curvey also serves as Trustee of other Fidelity® funds. Mr. Curvey is Vice Chairman (2007-present) and Director of FMR LLC (diversified financial services company). In addition, Mr. Curvey is an Overseer Emeritus for the Boston Symphony Orchestra, a Director of Artis-Naples, and a Trustee of Brewster Academy in Wolfeboro, New Hampshire. Previously, Mr. Curvey served as a Director of Fidelity Research & Analysis Co. (investment adviser firm, 2009-2018), Director of Fidelity Investments Money Management, Inc. (investment adviser firm, 2009-2014) and a Director of FMR and FMR Co., Inc. (investment adviser firms, 2007-2014).
Charles S. Morrison (1960)
Year of Election or Appointment: 2014
Trustee
Mr. Morrison also serves as Trustee of other funds. He serves as President of Fidelity SelectCo, LLC (investment adviser firm, 2017-present) and Fidelity Management & Research Company (FMR) (investment adviser firm, 2016-present), a Director of Fidelity Investments Money Management, Inc. (FIMM) (investment adviser firm, 2014-present), Director of Fidelity SelectCo, LLC (investment adviser firm, 2014-present), President, Asset Management (2014-present), and is an employee of Fidelity Investments. Previously, Mr. Morrison served as Vice President of Fidelity's Fixed Income and Asset Allocation Funds (2012-2014), President, Fixed Income (2011-2014), Vice President of Fidelity's Money Market Funds (2005-2009), President, Money Market Group Leader of FMR (investment adviser firm, 2009), and Senior Vice President, Money Market Group of FMR (2004-2009). Mr. Morrison also served as Vice President of Fidelity's Bond Funds (2002-2005), certain Balanced Funds (2002-2005), and certain Asset Allocation Funds (2002-2007), and as Senior Vice President (2002-2005) of Fidelity's Bond Division.
* Determined to be an “Interested Trustee” by virtue of, among other things, his or her affiliation with the trust or various entities under common control with FMR.
+ The information includes the Trustee's principal occupation during the last five years and other information relating to the experience, attributes, and skills relevant to the Trustee's qualifications to serve as a Trustee, which led to the conclusion that the Trustee should serve as a Trustee for the fund.
Independent Trustees:
Correspondence intended for an Independent Trustee may be sent to Fidelity Investments, P.O. Box 55235, Boston, Massachusetts 02205-5235.
Name, Year of Birth; Principal Occupations and Other Relevant Experience+
Dennis J. Dirks (1948)
Year of Election or Appointment: 2005
Trustee
Mr. Dirks also serves as Trustee of other Fidelity® funds. Prior to his retirement in May 2003, Mr. Dirks was Chief Operating Officer and a member of the Board of The Depository Trust & Clearing Corporation (DTCC). He also served as President, Chief Operating Officer, and Board member of The Depository Trust Company (DTC) and President and Board member of the National Securities Clearing Corporation (NSCC). In addition, Mr. Dirks served as Chief Executive Officer and Board member of the Government Securities Clearing Corporation, Chief Executive Officer and Board member of the Mortgage-Backed Securities Clearing Corporation, as a Trustee and a member of the Finance Committee of Manhattan College (2005-2008), as a Trustee and a member of the Finance Committee of AHRC of Nassau County (2006-2008), as a member of the Independent Directors Council (IDC) Governing Council (2010-2015), and as a member of the Board of Directors for The Brookville Center for Children’s Services, Inc. (2009-2017). Mr. Dirks is a member of the Finance Committee (2016-present), Board of Directors (2017-present) and Board of Trustees (2018-present) and is Treasurer (2018-present) of the Asolo Repertory Theatre.
Donald F. Donahue (1950)
Year of Election or Appointment: 2018
Trustee
Mr. Donahue also serves as a Trustee of other Fidelity® funds. Mr. Donahue is President and Chief Executive Officer of Miranda Partners, LLC (risk consulting for the financial services industry, 2012-present). Previously, Mr. Donahue served as a Member of the Advisory Board of certain Fidelity® funds (2015-2018) and Chief Executive Officer (2006-2012), Chief Operating Officer (2003-2006), and Managing Director, Customer Marketing and Development (1999-2003) of The Depository Trust & Clearing Corporation (financial markets infrastructure). Mr. Donahue serves as a Member (2007-present) and Co-Chairman (2016-present) of the Board of Directors of United Way of New York, Member of the Board of Directors of NYC Leadership Academy (2012-present) and Member of the Board of Advisors of Ripple Labs, Inc. (financial services, 2015-present). He also served as Chairman (2010-2012) and Member of the Board of Directors (2012-2013) of Omgeo, LLC (financial services), Treasurer of United Way of New York (2012-2016), and Member of the Board of Directors of XBRL US (financial services non-profit, 2009-2012) and the International Securities Services Association (2009-2012).
Alan J. Lacy (1953)
Year of Election or Appointment: 2008
Trustee
Mr. Lacy also serves as Trustee of other Fidelity® funds. Mr. Lacy serves as a Director of Bristol-Myers Squibb Company (global pharmaceuticals, 2008-present). He is a Trustee of the California Chapter of The Nature Conservancy (2015-present) and a Director of the Center for Advanced Study in the Behavioral Sciences at Stanford University (2015-present). In addition, Mr. Lacy served as Senior Adviser (2007-2014) of Oak Hill Capital Partners, L.P. (private equity) and also served as Chief Executive Officer (2005) and Vice Chairman (2005-2006) of Sears Holdings Corporation (retail) and Chief Executive Officer and Chairman of the Board of Sears, Roebuck and Co. (retail, 2000-2005). Previously, Mr. Lacy served as Chairman (2014-2017) and a member (2010-2017) of the Board of Directors of Dave & Buster’s Entertainment, Inc. (restaurant and entertainment complexes), as Chairman (2008-2011) and a member (2006-2015) of the Board of Trustees of the National Parks Conservation Association, and as a member of the Board of Directors for The Hillman Companies, Inc. (hardware wholesalers, 2010-2014), Earth Fare, Inc. (retail grocery, 2010-2014), and The Western Union Company (global money transfer, 2006-2011).
Ned C. Lautenbach (1944)
Year of Election or Appointment: 2000
Trustee
Chairman of the Independent Trustees
Mr. Lautenbach also serves as Trustee of other Fidelity® funds. Mr. Lautenbach currently serves as Vice Chair of the Board of Governors, State University System of Florida (2013-present) and is a member of the Council on Foreign Relations (1994-present). He is also a member and has most recently served as Chairman of the Board of Directors of Artis-Naples (2012-present). Previously, Mr. Lautenbach served as a member and then Lead Director of the Board of Directors of Eaton Corporation (diversified industrial, 1997-2016). He was also a Partner and Advisory Partner at Clayton, Dubilier & Rice, LLC (private equity investment, 1998-2010), as well as a Director of Sony Corporation (2006-2007). In addition, Mr. Lautenbach also had a 30-year career with IBM (technology company) during which time he served as Senior Vice President and a member of the Corporate Executive Committee (1968-1998).
Joseph Mauriello (1944)
Year of Election or Appointment: 2008
Trustee
Mr. Mauriello also serves as Trustee of other Fidelity® funds. Prior to his retirement in January 2006, Mr. Mauriello served in numerous senior management positions including Deputy Chairman and Chief Operating Officer (2004-2005), and Vice Chairman of Financial Services (2002-2004) of KPMG LLP US (professional services, 1965-2005). Mr. Mauriello currently serves as a member of the Board of Directors of XL Group plc. (global insurance and re-insurance, 2006-present) and the Independent Directors Council (IDC) Governing Council (2015-present). Previously, Mr. Mauriello served as a Director of the Hamilton Funds of the Bank of New York (2006-2007) and of Arcadia Resources Inc. (health care services and products, 2007-2012).
Cornelia M. Small (1944)
Year of Election or Appointment: 2005
Trustee
Ms. Small also serves as Trustee of other Fidelity® funds. Ms. Small is a member of the Board of Directors (2009-present) and Chair of the Investment Committee (2010-present) of the Teagle Foundation. Ms. Small also serves on the Investment Committee of the Berkshire Taconic Community Foundation (2008-present). Previously, Ms. Small served as Chairperson (2002-2008) and a member of the Investment Committee and Chairperson (2008-2012) and a member of the Board of Trustees of Smith College. In addition, Ms. Small served as Chief Investment Officer, Director of Global Equity Investments, and a member of the Board of Directors of Scudder, Stevens & Clark and Scudder Kemper Investments.
Garnett A. Smith (1947)
Year of Election or Appointment: 2018
Trustee
Mr. Smith also serves as Trustee of other Fidelity® funds. Prior to Mr. Smith's retirement, he served as Chairman and Chief Executive Officer of Inbrand Corp. (manufacturer of personal absorbent products, 1990-1997). He also served as President (1986-1990) of Inbrand Corp. Prior to his employment with Inbrand Corp., he was employed by a retail fabric chain and North Carolina National Bank. In addition, Mr. Smith served as a Member of the Advisory Board of certain Fidelity® funds (2012-2013) and as a board member of the Jackson Hole Land Trust (2009-2012).
David M. Thomas (1949)
Year of Election or Appointment: 2008
Trustee
Mr. Thomas also serves as Trustee of other Fidelity® funds. Mr. Thomas serves as Non-Executive Chairman of the Board of Directors of Fortune Brands Home and Security (home and security products, 2011-present), as a member of the Board of Directors (2004-present) and Presiding Director (2013-present) of Interpublic Group of Companies, Inc. (marketing communication), and as a member of the Board of Trustees of the University of Florida (2013-present). Previously, Mr. Thomas served as Executive Chairman (2005-2006) and Chairman and Chief Executive Officer (2000-2005) of IMS Health, Inc. (pharmaceutical and healthcare information solutions), and a Director of Fortune Brands, Inc. (consumer products, 2000-2011).
+ The information includes the Trustee's principal occupation during the last five years and other information relating to the experience, attributes, and skills relevant to the Trustee's qualifications to serve as a Trustee, which led to the conclusion that the Trustee should serve as a Trustee for the fund.
Advisory Board Members and Officers:
Correspondence intended for a Member of the Advisory Board (if any) may be sent to Fidelity Investments, P.O. Box 55235, Boston, Massachusetts 02205-5235. Correspondence intended for an officer or Peter S. Lynch may be sent to Fidelity Investments, 245 Summer Street, Boston, Massachusetts 02210. Officers appear below in alphabetical order.
Name, Year of Birth; Principal Occupation
Peter S. Lynch (1944)
Year of Election or Appointment: 2003
Member of the Advisory Board
Mr. Lynch also serves as Member of the Advisory Board of other Fidelity® funds. Mr. Lynch is Vice Chairman and a Director of FMR (investment adviser firm) and FMR Co., Inc. (investment adviser firm). In addition, Mr. Lynch serves as a Trustee of Boston College and as the Chairman of the Inner-City Scholarship Fund. Previously, Mr. Lynch served on the Special Olympics International Board of Directors (1997-2006).
William S. Stavropoulos (1939)
Year of Election or Appointment: 2018
Member of the Advisory Board
Mr. Stavropoulos also serves as Member of the Advisory Board of other Fidelity® funds. Mr. Stavropoulos serves as President and Founder of the Michigan Baseball Foundation, the Great Lakes Loons (2007-present). Mr. Stavropoulos is Chairman Emeritus of the Board of Directors of The Dow Chemical Company, where he previously served in numerous senior management positions, including President, CEO (1995-2000; 2002-2004), Chairman of the Executive Committee (2000-2006), and as a member of the Board of Directors (1990-2006). Currently, Mr. Stavropoulos is Chairman of the Board of Directors of Univar Inc. (global distributor of commodity and specialty chemicals), a Director of Teradata Corporation (data warehousing and technology solutions), and a member of the Advisory Board for Metalmark Capital LLC (private equity investment, 2005-present). Mr. Stavropoulos is an operating advisor to Clayton, Dubilier & Rice, LLC (private equity investment). In addition, Mr. Stavropoulos is a member of the University of Notre Dame Advisory Council for the College of Science, a Trustee of the Rollin L. Gerstacker Foundation, and a Director of Artis-Naples in Naples, Florida. Previously, Mr. Stavropoulos served as Trustee of certain Fidelity® funds (2001-2018) and as a Director of Chemical Financial Corporation (bank holding company, 1993-2012) and Tyco International, Ltd. (multinational manufacturing and services, 2007-2012).
Carol B. Tomé (1957)
Year of Election or Appointment: 2018
Member of the Advisory Board
Ms. Tomé also serves as Member of the Advisory Board of other Fidelity® funds. Ms. Tomé is Chief Financial Officer (2001-present) and Executive Vice President of Corporate Services (2007-present) of The Home Depot, Inc. (home improvement retailer) and a Director (2003-present) and Chair of the Audit Committee (2004-present) of United Parcel Service, Inc. (package delivery and supply chain management). Previously, Ms. Tomé served as Trustee of certain Fidelity® funds (2017), Senior Vice President of Finance and Accounting/Treasurer (2000-2007) and Vice President and Treasurer (1995-2000) of The Home Depot, Inc. and Chair of the Board (2010-2012), Vice Chair of the Board (2009 and 2013), and a Director (2008-2013) of the Federal Reserve Bank of Atlanta. Ms. Tomé is also a director or trustee of many community and professional organizations.
Michael E. Wiley (1950)
Year of Election or Appointment: 2018
Member of the Advisory Board
Mr. Wiley also serves as Trustee or Member of the Advisory Board of other Fidelity® funds. Mr. Wiley serves as a Director of Andeavor Corporation (independent oil refiner and marketer, 2005-present), a Director of Andeavor Logistics LP (natural resources logistics, 2015-present), and a Director of Bill Barrett Corporation (exploration and production, 2005-present). In addition, Mr. Wiley also serves as a Director of Post Oak Bank (privately-held bank, 2004-present). Previously, Mr. Wiley served as a Trustee of other Fidelity® funds (2008-2013), as a Director of Asia Pacific Exploration Consolidated (international oil and gas exploration and production, 2008-2013), as a member of the Board of Trustees of the University of Tulsa (2000-2006; 2007-2010), as a Senior Energy Advisor of Katzenbach Partners, LLC (consulting, 2006-2007), as an Advisory Director of Riverstone Holdings (private investment), Chairman, President, and CEO of Baker Hughes, Inc. (oilfield services, 2000-2004), and as Director of Spinnaker Exploration Company (exploration and production, 2001-2005).
Elizabeth Paige Baumann (1968)
Year of Election or Appointment: 2017
Anti-Money Laundering (AML) Officer
Ms. Baumann also serves as AML Officer of other funds. She is Chief AML Officer (2012-present) and Senior Vice President (2014-present) of FMR LLC (diversified financial services company) and is an employee of Fidelity Investments. Previously, Ms. Baumann served as AML Officer of the funds (2012-2016), and Vice President (2007-2014) and Deputy Anti-Money Laundering Officer (2007-2012) of FMR LLC.
Marc R. Bryant (1966)
Year of Election or Appointment: 2015
Secretary and Chief Legal Officer (CLO)
Mr. Bryant also serves as Secretary and CLO of other funds. Mr. Bryant serves as CLO, Secretary, and Senior Vice President of Fidelity Management & Research Company (investment adviser firm, 2015-present) and FMR Co., Inc. (investment adviser firm, 2015-present); Secretary of Fidelity SelectCo, LLC (investment adviser firm, 2015-present) and Fidelity Investments Money Management, Inc. (investment adviser firm, 2015-present); and CLO of Fidelity Management & Research (Hong Kong) Limited and FMR Investment Management (UK) Limited (investment adviser firms, 2015-present) and Fidelity Management & Research (Japan) Limited (investment adviser firm, 2016-present). He is Senior Vice President and Deputy General Counsel of FMR LLC (diversified financial services company). Previously, Mr. Bryant served as Secretary and CLO of Fidelity Rutland Square Trust II (2010-2014) and Assistant Secretary of Fidelity's Fixed Income and Asset Allocation Funds (2013-2015). Prior to joining Fidelity Investments, Mr. Bryant served as a Senior Vice President and the Head of Global Retail Legal for AllianceBernstein L.P. (2006-2010), and as the General Counsel for ProFund Advisors LLC (2001-2006).
John J. Burke III (1964)
Year of Election or Appointment: 2018
Chief Financial Officer
Mr. Burke also serves as Chief Financial Officer of other funds. Mr. Burke serves as Head of Investment Operations for Fidelity Fund and Investment Operations (2018-present) and is an employee of Fidelity Investments (1998-present). Previously Mr. Burke served as head of Asset Management Investment Operations (2012-2018).
William C. Coffey (1969)
Year of Election or Appointment: 2009
Assistant Secretary
Mr. Coffey also serves as Assistant Secretary of other funds. He is Senior Vice President and Deputy General Counsel of FMR LLC (diversified financial services company, 2010-present), and is an employee of Fidelity Investments. Previously, Mr. Coffey served as Vice President and Associate General Counsel of FMR LLC (2005-2009).
Timothy M. Cohen (1969)
Year of Election or Appointment: 2018
Vice President
Mr. Cohen also serves as Vice President of other funds. Mr. Cohen serves as Co-Head of Global Equity Research (2016-present), a Director of Fidelity Management & Research (Japan) Limited (investment adviser firm, 2016-present), and is an employee of Fidelity Investments. Previously, Mr. Cohen served as Chief Investment Officer - Equity and a Director of Fidelity Management & Research (U.K.) Inc. (investment adviser firm, 2013-2015) and as a Director of Fidelity Management & Research (Hong Kong) Limited (investment adviser firm, 2017).
Jonathan Davis (1968)
Year of Election or Appointment: 2010
Assistant Treasurer
Mr. Davis also serves as Assistant Treasurer of other funds. Mr. Davis serves as Assistant Treasurer of FMR Capital, Inc. (2017-present) and is an employee of Fidelity Investments. Previously, Mr. Davis served as Vice President and Associate General Counsel of FMR LLC (diversified financial services company, 2003-2010).
Adrien E. Deberghes (1967)
Year of Election or Appointment: 2016
Assistant Treasurer
Mr. Deberghes also serves as an officer of other funds. He serves as Assistant Treasurer of FMR Capital, Inc. (2017-present), Executive Vice President of Fidelity Investments Money Management, Inc. (FIMM) (investment adviser firm, 2016-present), and is an employee of Fidelity Investments (2008-present). Previously, Mr. Deberghes served as President and Treasurer of certain Fidelity® funds (2013-2018). Prior to joining Fidelity Investments, Mr. Deberghes was Senior Vice President of Mutual Fund Administration at State Street Corporation (2007-2008), Senior Director of Mutual Fund Administration at Investors Bank & Trust (2005-2007), and Director of Finance for Dunkin' Brands (2000-2005). Previously, Mr. Deberghes served in other fund officer roles.
Laura M. Del Prato (1964)
Year of Election or Appointment: 2018
Assistant Treasurer
Ms. Del Prato also serves as an officer of other funds. Ms. Del Prato is an employee of Fidelity Investments (2017-present). Prior to joining Fidelity Investments, Ms. Del Prato served as a Managing Director and Treasurer of the JPMorgan Mutual Funds (2014-2017). Prior to JPMorgan, Ms. Del Prato served as a partner at Cohen Fund Audit Services (accounting firm, 2012-2013) and KPMG LLP (accounting firm, 2004-2012).
Colm A. Hogan (1973)
Year of Election or Appointment: 2016
Deputy Treasurer
Mr. Hogan also serves as an officer of other funds. Mr. Hogan serves as Assistant Treasurer of FMR Capital, Inc. (2017-present) and is an employee of Fidelity Investments (2005-present). Previously, Mr. Hogan served as Assistant Treasurer of certain Fidelity® funds (2016-2018).
Pamela R. Holding (1964)
Year of Election or Appointment: 2018
Vice President
Ms. Holding also serves as a Vice President of other funds. Ms. Holding serves as Co-Head of Global Equity Research (2018-present) and is an employee of Fidelity Investments (2013-present).
Chris Maher (1972)
Year of Election or Appointment: 2013
Assistant Treasurer
Mr. Maher serves as Assistant Treasurer of other funds. Mr. Maher is Vice President of Valuation Oversight, serves as Assistant Treasurer of FMR Capital, Inc. (2017-present), and is an employee of Fidelity Investments. Previously, Mr. Maher served as Vice President of Asset Management Compliance (2013), Vice President of the Program Management Group of FMR (investment adviser firm, 2010-2013), and Vice President of Valuation Oversight (2008-2010).
Rieco E. Mello (1969)
Year of Election or Appointment: 2017
Assistant Treasurer
Mr. Mello also serves as Assistant Treasurer of other funds. Mr. Mello serves as Assistant Treasurer of FMR Capital, Inc. (2017-present) and is an employee of Fidelity Investments (1995-present).
Kenneth B. Robins (1969)
Year of Election or Appointment: 2016
Chief Compliance Officer
Mr. Robins also serves as an officer of other funds. Mr. Robins serves as Compliance Officer of Fidelity Management & Research Company and FMR Co., Inc. (investment adviser firms, 2016-present) and is an employee of Fidelity Investments (2004-present). Previously, Mr. Robins served as Executive Vice President of Fidelity Investments Money Management, Inc. (investment adviser firm, 2013-2016) and served in other fund officer roles.
Stacie M. Smith (1974)
Year of Election or Appointment: 2016
President and Treasurer
Ms. Smith also serves as an officer of other funds. Ms. Smith serves as Assistant Treasurer of FMR Capital, Inc. (2017-present), is an employee of Fidelity Investments (2009-present), and has served in other fund officer roles. Prior to joining Fidelity Investments, Ms. Smith served as Senior Audit Manager of Ernst & Young LLP (accounting firm, 1996-2009). Previously, Ms. Smith served as Assistant Treasurer (2013-2018) and Deputy Treasurer (2013-2016) of certain Fidelity® funds.
Marc L. Spector (1972)
Year of Election or Appointment: 2016
Assistant Treasurer
Mr. Spector also serves as an officer of other funds. Mr. Spector serves as Assistant Treasurer of FMR Capital, Inc. (2017-present) and is an employee of Fidelity Investments (2016-present). Prior to joining Fidelity Investments, Mr. Spector served as Director at the Siegfried Group (accounting firm, 2013-2016), and prior to Siegfried Group as audit senior manager at Deloitte & Touche (accounting firm, 2005-2013).
Renee Stagnone (1975)
Year of Election or Appointment: 2016
Assistant Treasurer
Ms. Stagnone also serves as an officer of other funds. Ms. Stagnone serves as Assistant Treasurer of FMR Capital, Inc. (2017-present) and is an employee of Fidelity Investments (1997-present). Previously, Ms. Stagnone served as Deputy Treasurer of certain Fidelity® funds (2013-2016).
Shareholder Expense Example
As a shareholder of a Fund, you incur two types of costs: (1) transaction costs and (2) ongoing costs, including management fees and other Fund expenses. This Example is intended to help you understand your ongoing costs (in dollars) of investing in the Funds and to compare these costs with the ongoing costs of investing in other mutual funds.
The Example is based on an investment of $1,000 invested at the beginning of the period and held for the entire period (February 1, 2018 to July 31, 2018).
Actual Expenses
The first line of the accompanying table for each class of the Fund provides information about actual account values and actual expenses. You may use the information in this line, together with the amount you invested, to estimate the expenses that you paid over the period. Simply divide your account value by $1,000.00 (for example, an $8,600 account value divided by $1,000.00 = 8.6), then multiply the result by the number in the first line for a class of the Fund under the heading entitled "Expenses Paid During Period" to estimate the expenses you paid on your account during this period. A small balance maintenance fee of $12.00 that is charged once a year may apply for certain accounts with a value of less than $2,000. This fee is not included in the table below. If it was, the estimate of expenses you paid during the period would be higher, and your ending account value lower, by this amount. In addition, the Fund, as a shareholder in the underlying Fidelity Central Funds, will indirectly bear its pro-rata share of the fees and expenses incurred by the underlying Fidelity Central Funds. These fees and expenses are not included in the Fund's annualized expense ratio used to calculate the expense estimate in the table below.
Hypothetical Example for Comparison Purposes
The second line of the accompanying table for each class of the Fund provides information about hypothetical account values and hypothetical expenses based on a Class' actual expense ratio and an assumed rate of return of 5% per year before expenses, which is not the Class' actual return. The hypothetical account values and expenses may not be used to estimate the actual ending account balance or expenses you paid for the period. You may use this information to compare the ongoing costs of investing in the Fund and other funds. To do so, compare this 5% hypothetical example with the 5% hypothetical examples that appear in the shareholder reports of the other funds. A small balance maintenance fee of $12.00 that is charged once a year may apply for certain accounts with a value of less than $2,000. This fee is not included in the table below. If it was, the estimate of expenses you paid during the period would be higher, and your ending account value lower, by this amount. In addition, the Fund, as a shareholder in the underlying Fidelity Central Funds, will indirectly bear its pro-rata share of the fees and expenses incurred by the underlying Fidelity Central Funds. These fees and expenses are not included in the Fund's annualized expense ratio used to calculate the expense estimate in the table below.
Please note that the expenses shown in the table are meant to highlight your ongoing costs only and do not reflect any transaction costs. Therefore, the second line of the table is useful in comparing ongoing costs only, and will not help you determine the relative total costs of owning different funds.
| | Annualized Expense Ratio-A | Beginning
Account Value
February 1, 2018 | Ending
Account Value
July 31, 2018 | Expenses Paid
During Period-B
February 1, 2018
to July 31, 2018 |
| Low-Priced Stock | .61% | | | |
| Actual | | $1,000.00 | $978.20 | $2.99 |
| Hypothetical-C | | $1,000.00 | $1,021.77 | $3.06 |
| Class K | .52% | | | |
| Actual | | $1,000.00 | $978.70 | $2.55 |
| Hypothetical-C | | $1,000.00 | $1,022.22 | $2.61 |
A Annualized expense ratio reflects expenses net of applicable fee waivers.
B Expenses are equal to each Class' annualized expense ratio, multiplied by the average account value over the period, multiplied by 181/365 (to reflect the one-half year period).
C 5% return per year before expenses
Distributions (Unaudited)
The Board of Trustees of Fidelity Low-Priced Stock Fund voted to pay to shareholders of record at the opening of business on record date, the following distributions per share derived from capital gains realized from sales of portfolio securities, and dividends derived from net investment income:
| | Pay Date | Record Date | Dividends | Capital Gains |
| Fidelity Low-Priced Stock Fund | | | | |
| Low-Priced Stock | 09/17/18 | 09/14/18 | $0.427 | $3.311 |
| Class K | 09/17/18 | 09/14/18 | $0.457 | $3.311 |
|
The fund hereby designates as a capital gain dividend with respect to the taxable year ended July 31, 2018, $2,434,865,294, or, if subsequently determined to be different, the net capital gain of such year.
Low-Priced Stock designates 50% and 35%; Class K designates 47% and 34%; of the dividends distributed in September and December, respectively during the fiscal year as qualifying for the dividends–received deduction for corporate shareholders.
Low-Priced Stock designates 100% and 84%; Class K designates 100% and 81%; of the dividends distributed in September and December, respectively during the fiscal year as amounts which may be taken into account as a dividend for purposes of the maximum rate under section 1(h)(11) of the Internal Revenue Code.
The fund will notify shareholders in January 2019 of amounts for use in preparing 2018 income tax returns.
Board Approval of Investment Advisory Contracts
Fidelity Low-Priced Stock Fund
At its July 2018 meeting, the Board of Trustees, including the Independent Trustees (together, the Board), voted to continue the management contract with Fidelity Management & Research Company (FMR) and the sub-advisory agreements (together, the Advisory Contracts) for the fund for six months through January 31, 2019, in connection with the reunification of the Fidelity Equity High Income Funds Board, which oversees the fund, and the Sector Portfolios Board.
The Board considered that the approval of the fund's Advisory Contracts will not result in any changes in (i) the investment process or strategies employed in the management of the fund's assets; (ii) the fees and expenses paid by shareholders; (iii) the nature, extent or quality of services provided under the fund's Advisory Contracts; or (iv) the day-to-day management of the fund or the persons primarily responsible for such management. The Board concluded that the fund's Advisory Contracts are fair and reasonable, and that the fund's Advisory Contracts should be renewed, without modification, through January 31, 2019, with the understanding that the Board will consider the annual renewal for a full one year period in January 2019.
In connection with its consideration of future renewals of the fund's Advisory Contracts, the Board will consider: (i) the nature, extent and quality of services provided to the fund, including shareholder and administrative services and investment performance; (ii) the competitiveness of the management fee and total expenses for the fund; (iii) the costs of the services and profitability, including the revenues earned and the expenses incurred in conducting the business of developing, marketing, distributing, managing, administering, and servicing the fund and its shareholders, to the extent applicable, as well as potential fall-out benefits from Fidelity's non-fund businesses; and (iv) whether there have been economies of scale in respect of the Fidelity funds, whether the Fidelity funds (including the fund) have appropriately benefited from any such economies of scale, and whether there is the potential for realization of any further economies.
Based on its evaluation of all of the conclusions noted above, and after considering all factors it believed relevant, the Board ultimately concluded that the fund's management fee structure is fair and reasonable, and that the continuation of the fund's Advisory Contracts should be approved.
Corporate Headquarters
245 Summer St.
Boston, MA 02210
www.fidelity.com
LPS-K-ANN-0918
1.863395.109
Fidelity® Value Discovery Fund
Annual Report July 31, 2018 |
|
Contents
To view a fund's proxy voting guidelines and proxy voting record for the 12-month period ended June 30, visit http://www.fidelity.com/proxyvotingresults or visit the Securities and Exchange Commission's (SEC) web site at http://www.sec.gov.
You may also call 1-800-544-8544 to request a free copy of the proxy voting guidelines.
Standard & Poor's, S&P and S&P 500 are registered service marks of The McGraw-Hill Companies, Inc. and have been licensed for use by Fidelity Distributors Corporation.
Other third-party marks appearing herein are the property of their respective owners.
All other marks appearing herein are registered or unregistered trademarks or service marks of FMR LLC or an affiliated company. © 2018 FMR LLC. All rights reserved.
This report and the financial statements contained herein are submitted for the general information of the shareholders of the Fund. This report is not authorized for distribution to prospective investors in the Fund unless preceded or accompanied by an effective prospectus.
A fund files its complete schedule of portfolio holdings with the SEC for the first and third quarters of each fiscal year on Form N-Q. Forms N-Q are available on the SEC’s web site at http://www.sec.gov. A fund's Forms N-Q may be reviewed and copied at the SEC’s Public Reference Room in Washington, DC. Information regarding the operation of the SEC's Public Reference Room may be obtained by calling 1-800-SEC-0330.
For a complete list of a fund's portfolio holdings, view the most recent holdings listing, semiannual report, or annual report on Fidelity's web site at http://www.fidelity.com, http://www.institutional.fidelity.com, or http://www.401k.com, as applicable.
NOT FDIC INSURED •MAY LOSE VALUE •NO BANK GUARANTEE
Neither the Fund nor Fidelity Distributors Corporation is a bank.
Performance: The Bottom Line
Average annual total return reflects the change in the value of an investment, assuming reinvestment of distributions from dividend income and capital gains (the profits earned upon the sale of securities that have grown in value, if any) and assuming a constant rate of performance each year. The hypothetical investment and the average annual total returns do not reflect the deduction of taxes that a shareholder would pay on fund distributions or the redemption of fund shares. During periods of reimbursement by Fidelity, a fund’s total return will be greater than it would be had the reimbursement not occurred. How a fund did yesterday is no guarantee of how it will do tomorrow.
Average Annual Total Returns
| For the periods ended July 31, 2018 | Past 1 year | Past 5 years | Past 10 years |
| Fidelity® Value Discovery Fund | 6.19% | 10.00% | 8.56% |
$10,000 Over 10 Years
Let's say hypothetically that $10,000 was invested in Fidelity® Value Discovery Fund, a class of the fund, on July 31, 2008.
The chart shows how the value of your investment would have changed, and also shows how the Russell 3000® Value Index performed over the same period.
See above for additional information regarding the performance of Fidelity® Value Discovery Fund.
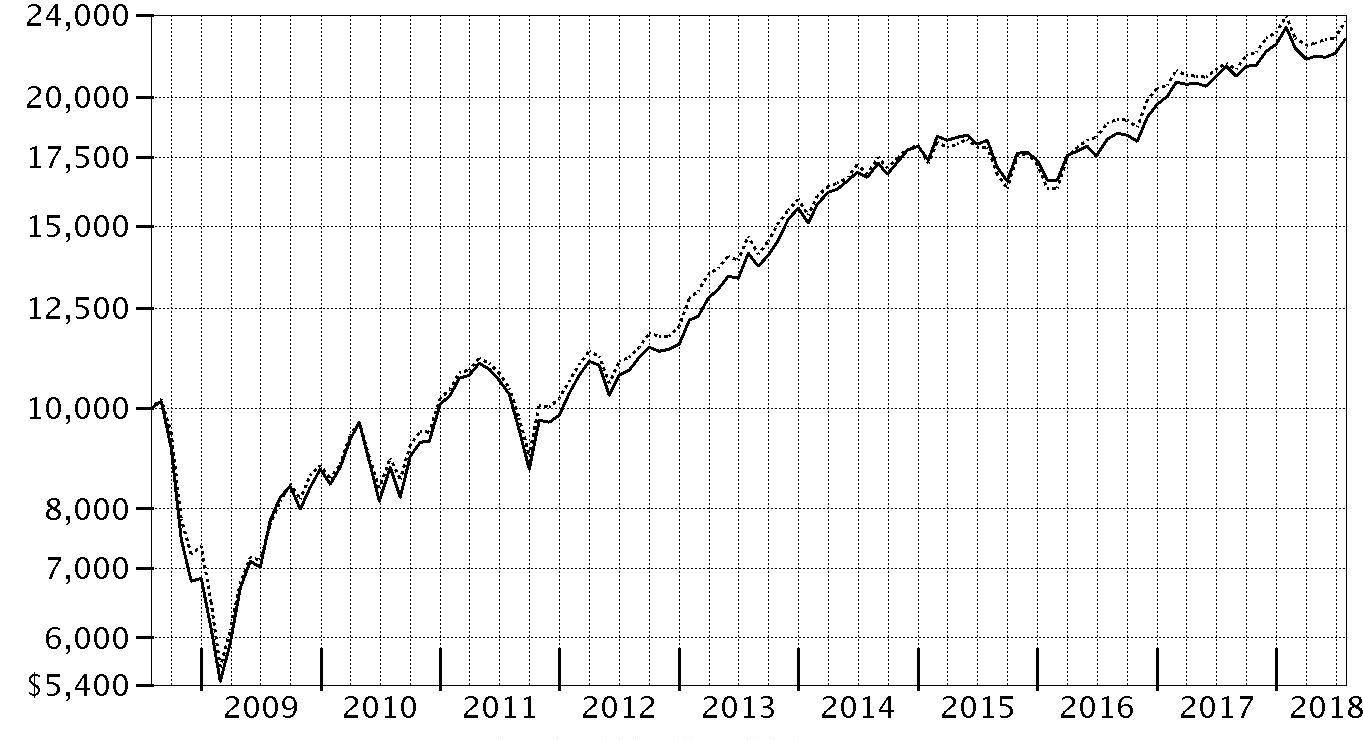
| Period Ending Values |
| $22,727 | Fidelity® Value Discovery Fund |
| $23,668 | Russell 3000® Value Index |
Management's Discussion of Fund Performance
Market Recap: The U.S. equity bellwether S&P 500
® index gained 16.24% for the 12 months ending July 31, 2018, despite a resurgence in volatility that challenged the multiyear bull market. Stocks maintained their steady growth until a sharp reversal in February, as volatility spiked amid fear that rising inflation and the potential for the economy to overheat would prompt the U.S. Federal Reserve to pick up the pace of interest rate hikes. The index posted its first negative monthly result since October 2016, and then lost further ground in March on fear of a global trade war. The market stabilized in April and turned upward through mid-June, when escalating trade tension between the U.S. and China soured investor sentiment. The resulting uncertainty lingered into July, but strong corporate earnings helped the S&P 500 rise 3.72% that month to cap the period. For the full one-year period, growth handily topped value, while small-caps bested large-caps. By sector, information technology (+28%) led the way, boosted by strong earnings growth from several major index constituents. Consumer discretionary rose roughly 24%, driven by retailers (+49%). Energy (+20%) gained alongside higher oil prices. Laggards were telecommunication services (-2%), consumer staples (0%) and utilities (+3%), defensive groups that struggled amid rising interest rates and a general preference for risk. Real estate (+5%) fared a bit better but still lagged, as did financials, industrials, health care (each up 13%) and materials (+11%).
Comments from Portfolio Manager Sean Gavin: For the fiscal year, the fund's share classes gained roughly 6%, trailing the 9.91% result of the benchmark Russell 3000
® Value Index. The fund's underperformance of the benchmark was due to ineffective stock picking, coupled with an unfavorable market backdrop for my style of investing. Security selection in the health care, financials and energy sectors were the largest relative detractors. Conversely, industry positioning – which derives from my bottom-up, stock-by-stock investment approach – helped the fund’s relative result, with an underweighting in the weak real estate group contributing most. My picks in consumer staples also provided a boost. On an individual basis, the biggest impact came from a non-benchmark equity position in Israeli drug maker Teva Pharmaceutical Industries, which returned -51% for the fund before I sold the position last fall. Over time, I concluded the company's challenges were too deep-rooted to justify further investment. Other detractors from the health care sector included drug store operator and pharmacy benefit management company CVS Health and drugmaker Allergan. Elsewhere, information-analytics company Nielsen Holdings also detracted. On the positive side, the biggest individual relative contributor stemmed from my decision to largely avoid benchmark component General Electric, which struggled amid numerous business challenges. Also, in consumer staples, we did not hold poor-performing benchmark stocks Procter & Gamble, a consumer-products company, and tobacco manufacturer Philip Morris International. It helped to overweight media company Twenty-First Century Fox, which was poised to be acquired by Disney. Both Fox and Disney were meaningful holdings in the fund at period end.
The views expressed above reflect those of the portfolio manager(s) only through the end of the period as stated on the cover of this report and do not necessarily represent the views of Fidelity or any other person in the Fidelity organization. Any such views are subject to change at any time based upon market or other conditions and Fidelity disclaims any responsibility to update such views. These views may not be relied on as investment advice and, because investment decisions for a Fidelity fund are based on numerous factors, may not be relied on as an indication of trading intent on behalf of any Fidelity fund.
Investment Summary (Unaudited)
Top Ten Stocks as of July 31, 2018
| | % of fund's net assets |
| JPMorgan Chase & Co. | 3.6 |
| Wells Fargo & Co. | 3.5 |
| Exxon Mobil Corp. | 2.9 |
| Berkshire Hathaway, Inc. Class B | 2.8 |
| Comcast Corp. Class A | 2.4 |
| Amgen, Inc. | 2.1 |
| U.S. Bancorp | 2.1 |
| CVS Health Corp. | 1.9 |
| Verizon Communications, Inc. | 1.9 |
| United Technologies Corp. | 1.8 |
| | 25.0 |
Top Five Market Sectors as of July 31, 2018
| | % of fund's net assets |
| Financials | 26.0 |
| Health Care | 15.1 |
| Energy | 11.6 |
| Consumer Discretionary | 11.2 |
| Information Technology | 8.2 |
Asset Allocation (% of fund's net assets)
| As of July 31, 2018* |
| | Stocks | 97.5% |
| | Short-Term Investments and Net Other Assets (Liabilities) | 2.5% |

* Foreign investments - 19.5%
Schedule of Investments July 31, 2018
Showing Percentage of Net Assets
| Common Stocks - 97.5% | | | |
| | | Shares | Value |
| CONSUMER DISCRETIONARY - 11.2% | | | |
| Media - 9.6% | | | |
| Cinemark Holdings, Inc. | | 417,979 | $15,013,806 |
| Comcast Corp. Class A | | 1,626,503 | 58,196,277 |
| Entercom Communications Corp. Class A (a) | | 1,367,736 | 10,326,407 |
| Interpublic Group of Companies, Inc. | | 1,251,945 | 28,231,360 |
| Lions Gate Entertainment Corp. Class B | | 948,377 | 21,689,382 |
| The Walt Disney Co. | | 320,808 | 36,430,956 |
| Twenty-First Century Fox, Inc. Class A | | 929,433 | 41,824,485 |
| WPP PLC | | 1,134,700 | 17,748,966 |
| | | | 229,461,639 |
| Multiline Retail - 0.6% | | | |
| Dollar General Corp. | | 154,900 | 15,203,435 |
| Textiles, Apparel & Luxury Goods - 1.0% | | | |
| PVH Corp. | | 147,928 | 22,709,907 |
|
| TOTAL CONSUMER DISCRETIONARY | | | 267,374,981 |
|
| CONSUMER STAPLES - 8.2% | | | |
| Beverages - 1.9% | | | |
| C&C Group PLC | | 3,432,610 | 13,807,893 |
| Coca-Cola European Partners PLC | | 270,600 | 11,159,544 |
| PepsiCo, Inc. | | 167,635 | 19,278,025 |
| | | | 44,245,462 |
| Food & Staples Retailing - 1.1% | | | |
| Sysco Corp. | | 202,346 | 13,599,675 |
| Walmart, Inc. | | 153,600 | 13,705,728 |
| | | | 27,305,403 |
| Food Products - 3.8% | | | |
| Kellogg Co. | | 319,186 | 22,671,782 |
| Mondelez International, Inc. | | 263,700 | 11,439,306 |
| Seaboard Corp. | | 2,189 | 7,963,582 |
| The Hershey Co. | | 119,508 | 11,736,881 |
| The J.M. Smucker Co. | | 330,261 | 36,698,602 |
| | | | 90,510,153 |
| Tobacco - 1.4% | | | |
| British American Tobacco PLC: | | | |
| (United Kingdom) | | 195,900 | 10,769,077 |
| sponsored ADR | | 412,452 | 22,594,121 |
| | | | 33,363,198 |
|
| TOTAL CONSUMER STAPLES | | | 195,424,216 |
|
| ENERGY - 11.6% | | | |
| Energy Equipment & Services - 1.4% | | | |
| Baker Hughes, a GE Co. Class A | | 793,234 | 27,430,032 |
| Dril-Quip, Inc. (b) | | 110,570 | 5,699,884 |
| | | | 33,129,916 |
| Oil, Gas & Consumable Fuels - 10.2% | | | |
| Chevron Corp. | | 326,337 | 41,206,573 |
| Exxon Mobil Corp. | | 843,740 | 68,773,247 |
| FLEX LNG Ltd. (a)(b) | | 5,399,800 | 8,109,647 |
| GasLog Ltd. | | 256,608 | 4,323,845 |
| GasLog Partners LP | | 780,682 | 19,634,152 |
| Golar LNG Partners LP | | 1,185,160 | 19,448,476 |
| Hoegh LNG Partners LP | | 389,395 | 7,164,868 |
| Phillips 66 Co. | | 241,705 | 29,811,895 |
| Suncor Energy, Inc. | | 478,600 | 20,154,290 |
| Teekay Corp. (a) | | 885,992 | 6,175,364 |
| Teekay LNG Partners LP | | 780,099 | 12,481,584 |
| Teekay Offshore Partners LP | | 2,310,169 | 5,867,829 |
| | | | 243,151,770 |
|
| TOTAL ENERGY | | | 276,281,686 |
|
| FINANCIALS - 26.0% | | | |
| Banks - 12.0% | | | |
| JPMorgan Chase & Co. | | 754,373 | 86,715,171 |
| PNC Financial Services Group, Inc. | | 211,231 | 30,592,586 |
| SunTrust Banks, Inc. | | 502,431 | 36,210,202 |
| U.S. Bancorp | | 939,233 | 49,788,741 |
| Wells Fargo & Co. | | 1,445,386 | 82,806,164 |
| | | | 286,112,864 |
| Capital Markets - 2.2% | | | |
| Goldman Sachs Group, Inc. | | 140,820 | 33,434,893 |
| State Street Corp. | | 214,119 | 18,908,849 |
| | | | 52,343,742 |
| Consumer Finance - 2.8% | | | |
| Capital One Financial Corp. | | 206,532 | 19,480,098 |
| Discover Financial Services | | 334,722 | 23,902,498 |
| Synchrony Financial | | 751,107 | 21,737,037 |
| | | | 65,119,633 |
| Diversified Financial Services - 3.3% | | | |
| Berkshire Hathaway, Inc. Class B (b) | | 342,360 | 67,742,773 |
| Cannae Holdings, Inc. (b) | | 158,930 | 2,900,473 |
| Standard Life PLC | | 2,046,576 | 8,389,107 |
| | | | 79,032,353 |
| Insurance - 4.2% | | | |
| Allstate Corp. | | 144,207 | 13,716,970 |
| Chubb Ltd. | | 182,847 | 25,547,383 |
| FNF Group | | 333,248 | 13,496,544 |
| Prudential PLC | | 766,007 | 18,072,816 |
| The Travelers Companies, Inc. | | 218,015 | 28,372,472 |
| | | | 99,206,185 |
| Mortgage Real Estate Investment Trusts - 1.5% | | | |
| AGNC Investment Corp. | | 670,611 | 13,056,796 |
| Annaly Capital Management, Inc. | | 1,259,111 | 13,497,670 |
| MFA Financial, Inc. | | 1,165,665 | 9,383,603 |
| | | | 35,938,069 |
|
| TOTAL FINANCIALS | | | 617,752,846 |
|
| HEALTH CARE - 15.1% | | | |
| Biotechnology - 3.5% | | | |
| Amgen, Inc. | | 255,393 | 50,197,494 |
| Dyax Corp. rights 12/31/19 (b)(c) | | 635,500 | 2,275,090 |
| Shire PLC sponsored ADR | | 187,119 | 31,924,373 |
| | | | 84,396,957 |
| Health Care Providers & Services - 6.5% | | | |
| Aetna, Inc. | | 115,126 | 21,688,587 |
| Anthem, Inc. | | 99,789 | 25,246,617 |
| Cigna Corp. | | 178,964 | 32,109,721 |
| CVS Health Corp. | | 701,265 | 45,484,048 |
| McKesson Corp. | | 67,952 | 8,534,771 |
| UnitedHealth Group, Inc. | | 84,700 | 21,447,734 |
| | | | 154,511,478 |
| Pharmaceuticals - 5.1% | | | |
| Allergan PLC | | 166,614 | 30,671,971 |
| Bayer AG | | 337,020 | 37,519,484 |
| Johnson & Johnson | | 83,380 | 11,049,518 |
| Pfizer, Inc. | | 231,057 | 9,226,106 |
| Roche Holding AG (participation certificate) | | 52,494 | 12,894,968 |
| Sanofi SA sponsored ADR | | 451,242 | 19,565,853 |
| | | | 120,927,900 |
|
| TOTAL HEALTH CARE | | | 359,836,335 |
|
| INDUSTRIALS - 5.9% | | | |
| Aerospace & Defense - 2.8% | | | |
| Harris Corp. | | 105,284 | 17,366,596 |
| Huntington Ingalls Industries, Inc. | | 20,581 | 4,796,402 |
| United Technologies Corp. | | 320,879 | 43,556,115 |
| | | | 65,719,113 |
| Machinery - 1.1% | | | |
| Allison Transmission Holdings, Inc. | | 205,004 | 9,635,188 |
| Deere & Co. | | 121,988 | 17,662,643 |
| | | | 27,297,831 |
| Professional Services - 0.7% | | | |
| Dun & Bradstreet Corp. | | 26,117 | 3,287,869 |
| Nielsen Holdings PLC | | 572,819 | 13,495,616 |
| | | | 16,783,485 |
| Road & Rail - 1.3% | | | |
| Union Pacific Corp. | | 200,972 | 30,123,693 |
|
| TOTAL INDUSTRIALS | | | 139,924,122 |
|
| INFORMATION TECHNOLOGY - 8.2% | | | |
| Communications Equipment - 1.8% | | | |
| Cisco Systems, Inc. | | 559,571 | 23,664,258 |
| F5 Networks, Inc. (b) | | 112,448 | 19,271,338 |
| | | | 42,935,596 |
| Electronic Equipment & Components - 0.9% | | | |
| TE Connectivity Ltd. | | 235,034 | 21,992,131 |
| Internet Software & Services - 2.4% | | | |
| Alphabet, Inc. Class A (b) | | 26,348 | 32,334,793 |
| comScore, Inc. (b) | | 616,916 | 12,338,320 |
| eBay, Inc. (b) | | 367,469 | 12,291,838 |
| | | | 56,964,951 |
| IT Services - 1.9% | | | |
| Amdocs Ltd. | | 227,282 | 15,359,718 |
| Cognizant Technology Solutions Corp. Class A | | 222,013 | 18,094,060 |
| The Western Union Co. | | 622,494 | 12,549,479 |
| | | | 46,003,257 |
| Technology Hardware, Storage & Peripherals - 1.2% | | | |
| Apple, Inc. | | 145,854 | 27,754,558 |
|
| TOTAL INFORMATION TECHNOLOGY | | | 195,650,493 |
|
| MATERIALS - 4.5% | | | |
| Chemicals - 3.1% | | | |
| DowDuPont, Inc. | | 520,773 | 35,813,559 |
| LyondellBasell Industries NV Class A | | 257,540 | 28,532,857 |
| The Scotts Miracle-Gro Co. Class A | | 105,374 | 8,369,857 |
| | | | 72,716,273 |
| Containers & Packaging - 1.4% | | | |
| Ball Corp. | | 414,095 | 16,137,282 |
| Graphic Packaging Holding Co. | | 1,204,939 | 17,507,764 |
| | | | 33,645,046 |
|
| TOTAL MATERIALS | | | 106,361,319 |
|
| REAL ESTATE - 1.2% | | | |
| Real Estate Management & Development - 1.2% | | | |
| CBRE Group, Inc. (b) | | 584,493 | 29,107,751 |
| TELECOMMUNICATION SERVICES - 2.7% | | | |
| Diversified Telecommunication Services - 2.7% | | | |
| AT&T, Inc. | | 617,651 | 19,746,302 |
| Verizon Communications, Inc. | | 876,918 | 45,284,046 |
| | | | 65,030,348 |
| UTILITIES - 2.9% | | | |
| Electric Utilities - 2.9% | | | |
| Exelon Corp. | | 822,912 | 34,973,760 |
| PPL Corp. | | 196,398 | 5,650,370 |
| Xcel Energy, Inc. | | 614,152 | 28,779,163 |
| | | | 69,403,293 |
| TOTAL COMMON STOCKS | | | |
| (Cost $2,125,657,521) | | | 2,322,147,390 |
|
| Money Market Funds - 3.1% | | | |
| Fidelity Cash Central Fund, 1.96% (d) | | 60,340,640 | 60,352,708 |
| Fidelity Securities Lending Cash Central Fund 1.97% (d)(e) | | 14,066,735 | 14,068,142 |
| TOTAL MONEY MARKET FUNDS | | | |
| (Cost $74,421,287) | | | 74,420,850 |
| TOTAL INVESTMENT IN SECURITIES - 100.6% | | | |
| (Cost $2,200,078,808) | | | 2,396,568,240 |
| NET OTHER ASSETS (LIABILITIES) - (0.6)% | | | (15,421,344) |
| NET ASSETS - 100% | | | $2,381,146,896 |
Legend
(a) Security or a portion of the security is on loan at period end.
(b) Non-income producing
(c) Level 3 security
(d) Affiliated fund that is generally available only to investment companies and other accounts managed by Fidelity Investments. The rate quoted is the annualized seven-day yield of the fund at period end. A complete unaudited listing of the fund's holdings as of its most recent quarter end is available upon request. In addition, each Fidelity Central Fund's financial statements, which are not covered by the Fund's Report of Independent Registered Public Accounting Firm, are available on the SEC's website or upon request.
(e) Investment made with cash collateral received from securities on loan.
Affiliated Central Funds
Information regarding fiscal year to date income earned by the Fund from investments in Fidelity Central Funds is as follows:
| Fund | Income earned |
| Fidelity Cash Central Fund | $1,539,223 |
| Fidelity Securities Lending Cash Central Fund | 322,883 |
| Total | $1,862,106 |
Amounts in the income column in the above table include any capital gain distributions from underlying funds, which are presented in the corresponding line-item in the Statement of Operations if applicable.
Investment Valuation
The following is a summary of the inputs used, as of July 31, 2018, involving the Fund's assets and liabilities carried at fair value. The inputs or methodology used for valuing securities may not be an indication of the risk associated with investing in those securities. For more information on valuation inputs, and their aggregation into the levels used below, please refer to the Investment Valuation section in the accompanying Notes to Financial Statements.
| | Valuation Inputs at Reporting Date: |
| Description | Total | Level 1 | Level 2 | Level 3 |
| Investments in Securities: | | | | |
| Equities: | | | | |
| Consumer Discretionary | $267,374,981 | $249,626,015 | $17,748,966 | $-- |
| Consumer Staples | 195,424,216 | 184,655,139 | 10,769,077 | -- |
| Energy | 276,281,686 | 276,281,686 | -- | -- |
| Financials | 617,752,846 | 599,680,030 | 18,072,816 | -- |
| Health Care | 359,836,335 | 307,146,793 | 50,414,452 | 2,275,090 |
| Industrials | 139,924,122 | 139,924,122 | -- | -- |
| Information Technology | 195,650,493 | 195,650,493 | -- | -- |
| Materials | 106,361,319 | 106,361,319 | -- | -- |
| Real Estate | 29,107,751 | 29,107,751 | -- | -- |
| Telecommunication Services | 65,030,348 | 65,030,348 | -- | -- |
| Utilities | 69,403,293 | 69,403,293 | -- | -- |
| Money Market Funds | 74,420,850 | 74,420,850 | -- | -- |
| Total Investments in Securities: | $2,396,568,240 | $2,297,287,839 | $97,005,311 | $2,275,090 |
The following is a summary of transfers between Level 1 and Level 2 for the period ended July 31, 2018. Transfers are assumed to have occurred at the beginning of the period, and are primarily attributable to the valuation techniques used for foreign equity securities, as discussed in the accompanying Notes to Financial Statements:
| Transfers | Total |
| Level 1 to Level 2 | $36,277,432 |
| Level 2 to Level 1 | $0 |
Other Information
Distribution of investments by country or territory of incorporation, as a percentage of Total Net Assets, is as follows (Unaudited):
| United States of America | 80.5% |
| United Kingdom | 3.6% |
| Marshall Islands | 3.0% |
| Switzerland | 2.5% |
| Bailiwick of Jersey | 2.1% |
| Ireland | 1.9% |
| Canada | 1.7% |
| Germany | 1.6% |
| Netherlands | 1.2% |
| Others (Individually Less Than 1%) | 1.9% |
| | 100.0% |
See accompanying notes which are an integral part of the financial statements.
Financial Statements
Statement of Assets and Liabilities
| | | July 31, 2018 |
| Assets | | |
Investment in securities, at value (including securities loaned of $13,601,659) — See accompanying schedule:
Unaffiliated issuers (cost $2,125,657,521) | $2,322,147,390 | |
| Fidelity Central Funds (cost $74,421,287) | 74,420,850 | |
| Total Investment in Securities (cost $2,200,078,808) | | $2,396,568,240 |
| Receivable for investments sold | | 7,836,089 |
| Receivable for fund shares sold | | 1,157,449 |
| Dividends receivable | | 2,283,747 |
| Distributions receivable from Fidelity Central Funds | | 117,038 |
| Prepaid expenses | | 5,799 |
| Other receivables | | 51,014 |
| Total assets | | 2,408,019,376 |
| Liabilities | | |
| Payable for fund shares redeemed | $11,601,089 | |
| Accrued management fee | 784,064 | |
| Other affiliated payables | 360,655 | |
| Other payables and accrued expenses | 60,580 | |
| Collateral on securities loaned | 14,066,092 | |
| Total liabilities | | 26,872,480 |
| Net Assets | | $2,381,146,896 |
| Net Assets consist of: | | |
| Paid in capital | | $2,148,155,963 |
| Undistributed net investment income | | 22,670,477 |
| Accumulated undistributed net realized gain (loss) on investments and foreign currency transactions | | 13,826,461 |
| Net unrealized appreciation (depreciation) on investments and assets and liabilities in foreign currencies | | 196,493,995 |
| Net Assets | | $2,381,146,896 |
| Value Discovery: | | |
| Net Asset Value, offering price and redemption price per share ($2,313,811,459 ÷ 79,097,168 shares) | | $29.25 |
| Class K: | | |
| Net Asset Value, offering price and redemption price per share ($67,335,437 ÷ 2,299,644 shares) | | $29.28 |
See accompanying notes which are an integral part of the financial statements.
Statement of Operations
| | | Year ended July 31, 2018 |
| Investment Income | | |
| Dividends | | $68,659,917 |
| Income from Fidelity Central Funds | | 1,862,106 |
| Total income | | 70,522,023 |
| Expenses | | |
| Management fee | | |
| Basic fee | $17,541,221 | |
| Performance adjustment | (1,772,182) | |
| Transfer agent fees | 5,299,510 | |
| Accounting and security lending fees | 933,282 | |
| Custodian fees and expenses | 53,895 | |
| Independent trustees' fees and expenses | 14,003 | |
| Registration fees | 129,153 | |
| Audit | 50,290 | |
| Legal | 10,076 | |
| Interest | 2,407 | |
| Miscellaneous | 22,533 | |
| Total expenses before reductions | 22,284,188 | |
| Expense reductions | (202,864) | |
| Total expenses after reductions | | 22,081,324 |
| Net investment income (loss) | | 48,440,699 |
| Realized and Unrealized Gain (Loss) | | |
| Net realized gain (loss) on: | | |
| Investment securities: | | |
| Unaffiliated issuers | 24,402,597 | |
| Redemptions in-kind with affiliated entities | 237,440,352 | |
| Fidelity Central Funds | 20,271 | |
| Foreign currency transactions | (147,043) | |
| Total net realized gain (loss) | | 261,716,177 |
| Change in net unrealized appreciation (depreciation) on: | | |
| Investment securities: | | |
| Unaffiliated issuers | (116,435,255) | |
| Fidelity Central Funds | (19,343) | |
| Assets and liabilities in foreign currencies | (12,411) | |
| Total change in net unrealized appreciation (depreciation) | | (116,467,009) |
| Net gain (loss) | | 145,249,168 |
| Net increase (decrease) in net assets resulting from operations | | $193,689,867 |
See accompanying notes which are an integral part of the financial statements.
Statement of Changes in Net Assets
| | Year ended July 31, 2018 | Year ended July 31, 2017 |
| Increase (Decrease) in Net Assets | | |
| Operations | | |
| Net investment income (loss) | $48,440,699 | $32,580,564 |
| Net realized gain (loss) | 261,716,177 | 133,084,183 |
| Change in net unrealized appreciation (depreciation) | (116,467,009) | 205,438,984 |
| Net increase (decrease) in net assets resulting from operations | 193,689,867 | 371,103,731 |
| Distributions to shareholders from net investment income | (38,872,556) | (23,479,663) |
| Distributions to shareholders from net realized gain | (29,026,203) | (411,905) |
| Total distributions | (67,898,759) | (23,891,568) |
| Share transactions - net increase (decrease) | (566,361,059) | 539,346,673 |
| Total increase (decrease) in net assets | (440,569,951) | 886,558,836 |
| Net Assets | | |
| Beginning of period | 2,821,716,847 | 1,935,158,011 |
| End of period | $2,381,146,896 | $2,821,716,847 |
| Other Information | | |
| Undistributed net investment income end of period | $22,670,477 | $15,946,340 |
See accompanying notes which are an integral part of the financial statements.
Financial Highlights
Fidelity Value Discovery Fund
| Years ended July 31, | 2018 | 2017 | 2016 | 2015 | 2014 |
| Selected Per–Share Data | | | | | |
| Net asset value, beginning of period | $28.10 | $24.16 | $24.99 | $23.32 | $19.93 |
| Income from Investment Operations | | | | | |
| Net investment income (loss)A | .42 | .38 | .34 | .66B | .31 |
| Net realized and unrealized gain (loss) | 1.28 | 3.86 | (.38)C | 1.35 | 3.34 |
| Total from investment operations | 1.70 | 4.24 | (.04) | 2.01 | 3.65 |
| Distributions from net investment income | (.31) | (.29) | (.47) | (.32) | (.26) |
| Distributions from net realized gain | (.24) | (.01) | (.32) | (.02) | – |
| Total distributions | (.55) | (.30) | (.79) | (.34) | (.26) |
| Net asset value, end of period | $29.25 | $28.10 | $24.16 | $24.99 | $23.32 |
| Total ReturnD | 6.19% | 17.70% | .05% | 8.68% | 18.52% |
| Ratios to Average Net AssetsE,F | | | | | |
| Expenses before reductions | .69% | .75% | .86% | .84% | .80% |
| Expenses net of fee waivers, if any | .69% | .75% | .86% | .84% | .80% |
| Expenses net of all reductions | .69% | .75% | .86% | .84% | .80% |
| Net investment income (loss) | 1.50% | 1.44% | 1.46% | 2.69%B | 1.44% |
| Supplemental Data | | | | | |
| Net assets, end of period (000 omitted) | $2,313,811 | $2,708,049 | $1,712,212 | $1,205,423 | $686,767 |
| Portfolio turnover rateG | 33%H | 32%H | 41% | 45% | 58% |
A Calculated based on average shares outstanding during the period.
B Net investment income per share reflects a large, non-recurring dividend which amounted to $.26 per share. Excluding this non-recurring dividend, the ratio of net investment income (loss) to average net assets would have been 1.62%.
C The amount shown for a share outstanding does not correspond with the aggregate net gain (loss) on investments for the period due to the timing of sales and repurchases of shares in relation to fluctuating market values of the investments of the Fund.
D Total returns would have been lower if certain expenses had not been reduced during the applicable periods shown.
E Fees and expenses of any underlying Fidelity Central Funds are not included in the Fund's expense ratio. The Fund indirectly bears its proportionate share of the expenses of any underlying Fidelity Central Funds.
F Expense ratios reflect operating expenses of the class. Expenses before reductions do not reflect amounts reimbursed by the investment adviser or reductions from brokerage service arrangements or reductions from other expense offset arrangements and do not represent the amount paid by the class during periods when reimbursements or reductions occur. Expenses net of fee waivers reflect expenses after reimbursement by the investment adviser but prior to reductions from brokerage service arrangements or other expense offset arrangements. Expenses net of all reductions represent the net expenses paid by the class.
G Amount does not include the portfolio activity of any underlying Fidelity Central Funds.
H Portfolio turnover rate excludes securities received or delivered in-kind.
See accompanying notes which are an integral part of the financial statements.
Fidelity Value Discovery Fund Class K
| Years ended July 31, | 2018 | 2017 | 2016 | 2015 | 2014 |
| Selected Per–Share Data | | | | | |
| Net asset value, beginning of period | $28.11 | $24.17 | $24.99 | $23.32 | $19.93 |
| Income from Investment Operations | | | | | |
| Net investment income (loss)A | .46 | .41 | .38 | .69B | .34 |
| Net realized and unrealized gain (loss) | 1.28 | 3.86 | (.38)C | 1.34 | 3.34 |
| Total from investment operations | 1.74 | 4.27 | –D | 2.03 | 3.68 |
| Distributions from net investment income | (.33) | (.32) | (.50) | (.34) | (.29) |
| Distributions from net realized gain | (.24) | (.01) | (.32) | (.02) | – |
| Total distributions | (.57) | (.33) | (.82) | (.36) | (.29) |
| Net asset value, end of period | $29.28 | $28.11 | $24.17 | $24.99 | $23.32 |
| Total ReturnE | 6.34% | 17.82% | .24% | 8.80% | 18.71% |
| Ratios to Average Net AssetsF,G | | | | | |
| Expenses before reductions | .57% | .63% | .70% | .71% | .66% |
| Expenses net of fee waivers, if any | .57% | .63% | .70% | .71% | .66% |
| Expenses net of all reductions | .56% | .63% | .70% | .71% | .66% |
| Net investment income (loss) | 1.62% | 1.56% | 1.62% | 2.82%B | 1.58% |
| Supplemental Data | | | | | |
| Net assets, end of period (000 omitted) | $67,335 | $113,668 | $222,946 | $196,460 | $114,246 |
| Portfolio turnover rateH | 33%I | 32%I | 41% | 45% | 58% |
A Calculated based on average shares outstanding during the period.
B Net investment income per share reflects a large, non-recurring dividend which amounted to $.26 per share. Excluding this non-recurring dividend, the ratio of net investment income (loss) to average net assets would have been 1.75%.
C The amount shown for a share outstanding does not correspond with the aggregate net gain (loss) on investments for the period due to the timing of sales and repurchases of shares in relation to fluctuating market values of the investments of the Fund.
D Amount represents less than $.005 per share.
E Total returns would have been lower if certain expenses had not been reduced during the applicable periods shown.
F Fees and expenses of any underlying Fidelity Central Funds are not included in the Fund's expense ratio. The Fund indirectly bears its proportionate share of the expenses of any underlying Fidelity Central Funds.
G Expense ratios reflect operating expenses of the class. Expenses before reductions do not reflect amounts reimbursed by the investment adviser or reductions from brokerage service arrangements or reductions from other expense offset arrangements and do not represent the amount paid by the class during periods when reimbursements or reductions occur. Expenses net of fee waivers reflect expenses after reimbursement by the investment adviser but prior to reductions from brokerage service arrangements or other expense offset arrangements. Expenses net of all reductions represent the net expenses paid by the class.
H Amount does not include the portfolio activity of any underlying Fidelity Central Funds.
I Portfolio turnover rate excludes securities received or delivered in-kind.
See accompanying notes which are an integral part of the financial statements.
Notes to Financial Statements
For the period ended July 31, 2018
1. Organization.
Fidelity Value Discovery Fund (the Fund) is a fund of Fidelity Puritan Trust (the Trust) and is authorized to issue an unlimited number of shares. The Trust is registered under the Investment Company Act of 1940, as amended (the 1940 Act), as an open-end management investment company organized as a Massachusetts business trust. The Fund offers Value Discovery and Class K shares, each of which has equal rights as to assets and voting privileges. Each class has exclusive voting rights with respect to matters that affect that class.
2. Investments in Fidelity Central Funds.
The Fund invests in Fidelity Central Funds, which are open-end investment companies generally available only to other investment companies and accounts managed by the investment adviser and its affiliates. The Fund's Schedule of Investments lists each of the Fidelity Central Funds held as of period end, if any, as an investment of the Fund, but does not include the underlying holdings of each Fidelity Central Fund. As an Investing Fund, the Fund indirectly bears its proportionate share of the expenses of the underlying Fidelity Central Funds.
The Money Market Central Funds seek preservation of capital and current income and are managed by Fidelity Investments Money Management, Inc. (FIMM), an affiliate of the investment adviser. Annualized expenses of the Money Market Central Funds as of their most recent shareholder report date are less than .005%.
A complete unaudited list of holdings for each Fidelity Central Fund is available upon request or at the Securities and Exchange Commission (the SEC) website at www.sec.gov. In addition, the financial statements of the Fidelity Central Funds, which are not covered by the Fund's Report of Independent Registered Public Accounting Firm, are available on the SEC website or upon request.
3. Significant Accounting Policies.
The Fund is an investment company and applies the accounting and reporting guidance of the Financial Accounting Standards Board (FASB) Accounting Standards Codification Topic 946 Financial Services – Investments Companies. The financial statements have been prepared in conformity with accounting principles generally accepted in the United States of America (GAAP), which require management to make certain estimates and assumptions at the date of the financial statements. Actual results could differ from those estimates. Subsequent events, if any, through the date that the financial statements were issued have been evaluated in the preparation of the financial statements. The following summarizes the significant accounting policies of the Fund:
Investment Valuation. Investments are valued as of 4:00 p.m. Eastern time on the last calendar day of the period. The Board of Trustees (the Board) has delegated the day to day responsibility for the valuation of the Fund's investments to the Fair Value Committee (the Committee) established by the Fund's investment adviser. In accordance with valuation policies and procedures approved by the Board, the Fund attempts to obtain prices from one or more third party pricing vendors or brokers to value its investments. When current market prices, quotations or currency exchange rates are not readily available or reliable, investments will be fair valued in good faith by the Committee, in accordance with procedures adopted by the Board. Factors used in determining fair value vary by investment type and may include market or investment specific events. The frequency with which these procedures are used cannot be predicted and they may be utilized to a significant extent. The Committee oversees the Fund's valuation policies and procedures and reports to the Board on the Committee's activities and fair value determinations. The Board monitors the appropriateness of the procedures used in valuing the Fund's investments and ratifies the fair value determinations of the Committee.
The Fund categorizes the inputs to valuation techniques used to value its investments into a disclosure hierarchy consisting of three levels as shown below:
- Level 1 – quoted prices in active markets for identical investments
- Level 2 – other significant observable inputs (including quoted prices for similar investments, interest rates, prepayment speeds, etc.)
- Level 3 – unobservable inputs (including the Fund's own assumptions based on the best information available)
Valuation techniques used to value the Fund's investments by major category are as follows:
Equity securities, including restricted securities, for which market quotations are readily available, are valued at the last reported sale price or official closing price as reported by a third party pricing vendor on the primary market or exchange on which they are traded and are categorized as Level 1 in the hierarchy. In the event there were no sales during the day or closing prices are not available, securities are valued at the last quoted bid price or may be valued using the last available price and are generally categorized as Level 2 in the hierarchy. For foreign equity securities, when market or security specific events arise, comparisons to the valuation of American Depositary Receipts (ADRs), futures contracts, Exchange-Traded Funds (ETFs) and certain indexes as well as quoted prices for similar securities may be used and would be categorized as Level 2 in the hierarchy. Utilizing these techniques may result in transfers between Level 1 and Level 2. For equity securities, including restricted securities, where observable inputs are limited, assumptions about market activity and risk are used and these securities may be categorized as Level 3 in the hierarchy.
Investments in open-end mutual funds, including the Fidelity Central Funds, are valued at their closing net asset value (NAV) each business day and are categorized as Level 1 in the hierarchy.
Changes in valuation techniques may result in transfers in or out of an assigned level within the disclosure hierarchy. The aggregate value of investments by input level as of July 31, 2018, including information on transfers between Levels 1 and 2, is included at the end of the Fund's Schedule of Investments.
Foreign Currency. The Fund may use foreign currency contracts to facilitate transactions in foreign-denominated securities. Gains and losses from these transactions may arise from changes in the value of the foreign currency or if the counterparties do not perform under the contracts' terms.
Foreign-denominated assets, including investment securities, and liabilities are translated into U.S. dollars at the exchange rates at period end. Purchases and sales of investment securities, income and dividends received and expenses denominated in foreign currencies are translated into U.S. dollars at the exchange rate in effect on the transaction date.
The effects of exchange rate fluctuations on investments are included with the net realized and unrealized gain (loss) on investment securities. Other foreign currency transactions resulting in realized and unrealized gain (loss) are disclosed separately.
Investment Transactions and Income. For financial reporting purposes, the Fund's investment holdings and NAV include trades executed through the end of the last business day of the period. The NAV per share for processing shareholder transactions is calculated as of the close of business of the New York Stock Exchange (NYSE), normally 4:00 p.m. Eastern time and includes trades executed through the end of the prior business day. Gains and losses on securities sold are determined on the basis of identified cost and include proceeds received from litigation. Dividend income is recorded on the ex-dividend date, except for certain dividends from foreign securities where the ex-dividend date may have passed, which are recorded as soon as the Fund is informed of the ex-dividend date. Non-cash dividends included in dividend income, if any, are recorded at the fair market value of the securities received. Income and capital gain distributions from Fidelity Central Funds, if any, are recorded on the ex-dividend date. Certain distributions received by the Fund represent a return of capital or capital gain. The Fund determines the components of these distributions subsequent to the ex-dividend date, based upon receipt of tax filings or other correspondence relating to the underlying investment. These distributions are recorded as a reduction of cost of investments and/or as a realized gain. Investment income is recorded net of foreign taxes withheld where recovery of such taxes is uncertain.
Class Allocations and Expenses. Investment income, realized and unrealized capital gains and losses, common expenses of the Fund, and certain fund-level expense reductions, if any, are allocated daily on a pro-rata basis to each class based on the relative net assets of each class to the total net assets of the Fund. Each class differs with respect to transfer agent fees incurred. Certain expense reductions may also differ by class. For the reporting period, the allocated portion of income and expenses to each class as a percent of its average net assets may vary due to the timing of recording these transactions in relation to fluctuating net assets of the classes. Expenses directly attributable to a fund are charged to that fund. Expenses attributable to more than one fund are allocated among the respective funds on the basis of relative net assets or other appropriate methods. Expense estimates are accrued in the period to which they relate and adjustments are made when actual amounts are known.
Income Tax Information and Distributions to Shareholders. Each year, the Fund intends to qualify as a regulated investment company under Subchapter M of the Internal Revenue Code, including distributing substantially all of its taxable income and realized gains. As a result, no provision for U.S. Federal income taxes is required. As of July 31, 2018, the Fund did not have any unrecognized tax benefits in the financial statements; nor is the Fund aware of any tax positions for which it is reasonably possible that the total amounts of unrecognized tax benefits will significantly change in the next twelve months. The Fund files a U.S. federal tax return, in addition to state and local tax returns as required. The Fund's federal income tax returns are subject to examination by the Internal Revenue Service (IRS) for a period of three fiscal years after they are filed. State and local tax returns may be subject to examination for an additional fiscal year depending on the jurisdiction. Foreign taxes are provided for based on the Fund's understanding of the tax rules and rates that exist in the foreign markets in which it invests.
Distributions are declared and recorded on the ex-dividend date. Income and capital gain distributions are declared separately for each class. Income and capital gain distributions are determined in accordance with income tax regulations, which may differ from GAAP. In addition, the Fund claimed a portion of the payment made to redeeming shareholders as a distribution for income tax purposes.
Capital accounts within the financial statements are adjusted for permanent book-tax differences. These adjustments have no impact on net assets or the results of operations. Capital accounts are not adjusted for temporary book-tax differences which will reverse in a subsequent period.
Book-tax differences are primarily due to foreign currency transactions, passive foreign investment companies (PFIC), redemptions in kind, partnerships and losses deferred due to wash sales.
As of period end, the cost and unrealized appreciation (depreciation) in securities, and derivatives if applicable, for federal income tax purposes were as follows:
| Gross unrealized appreciation | $296,172,300 |
| Gross unrealized depreciation | (98,400,026) |
| Net unrealized appreciation (depreciation) | $197,772,274 |
| Tax Cost | $2,198,795,966 |
The tax-based components of distributable earnings as of period end were as follows:
| Undistributed ordinary income | $23,668,919 |
| Undistributed long-term capital gain | $12,543,619 |
| Net unrealized appreciation (depreciation) on securities and other investments | $196,778,394 |
The tax character of distributions paid was as follows:
| | July 31, 2018 | July 31, 2017 |
| Ordinary Income | $54,465,144 | $ 23,891,568 |
| Long-term Capital Gains | 13,433,615 | – |
| Total | $67,898,759 | $ 23,891,568 |
4. Purchases and Sales of Investments.
Purchases and sales of securities, other than short-term securities and in-kind transactions, aggregated $1,709,514,122 and $1,018,846,085, respectively.
Redemptions In-Kind. During the period, 1,238,087 shares of the Fund held by unaffiliated entities were redeemed in-kind for investments and cash, with a value of $35,289,423. The net realized gain of $8,392,283 on investments delivered through the in-kind redemptions is included in the accompanying Statement of Operations. The amount of the redemptions is included in share transactions activity shown in the accompanying Statement of Changes in Net Assets as well as the Notes to Financial Statements. The Fund recognized no gain or loss for federal income tax purposes.
5. Fees and Other Transactions with Affiliates.
Management Fee. Fidelity Management & Research Company (the investment adviser) and its affiliates provide the Fund with investment management related services for which the Fund pays a monthly management fee. The management fee is the sum of an individual fund fee rate that is based on an annual rate of .30% of the Fund's average net assets and an annualized group fee rate that averaged .24% during the period. The group fee rate is based upon the average net assets of all the mutual funds advised by the investment adviser, including any mutual funds previously advised by the investment adviser that are currently advised by Fidelity SelectCo, LLC, an affiliate of the investment adviser. The group fee rate decreases as assets under management increase and increases as assets under management decrease. In addition, the management fee is subject to a performance adjustment (up to a maximum of +/- .20% of the Fund's average net assets over a 36 month performance period). The upward or downward adjustment to the management fee is based on the relative investment performance of Value Discovery as compared to its benchmark index, the Russell 3000 Value Index, over the same 36 month performance period. For the reporting period, the total annual management fee rate, including the performance adjustment, was .49% of the Fund's average net assets. The performance adjustment included in the management fee rate may be higher or lower than the maximum performance adjustment rate due to the difference between the average net assets for the reporting and performance periods.
Transfer Agent Fees. Fidelity Investments Institutional Operations Company, Inc., (FIIOC), an affiliate of the investment adviser, is the transfer, dividend disbursing and shareholder servicing agent for each class of the Fund. FIIOC receives account fees and asset-based fees that vary according to the account size and type of account of the shareholders of Value Discovery, except for Class K. FIIOC receives an asset-based fee of Class K's average net assets. FIIOC pays for typesetting, printing and mailing of shareholder reports, except proxy statements.
For the period, transfer agent fees for each class were as follows:
| | Amount | % of Class-Level Average Net Assets |
| Value Discovery | $5,259,000 | .17 |
| Class K | 40,510 | .05 |
| | $5,299,510 | |
Accounting and Security Lending Fees. Fidelity Service Company, Inc. (FSC), an affiliate of the investment adviser, maintains the Fund's accounting records. The accounting fee is based on the level of average net assets for each month. Under a separate contract, FSC administers the security lending program. The security lending fee is based on the number and duration of lending transactions. For the period, the fees were equivalent to an annual rate of .03%.
Brokerage Commissions. The Fund placed a portion of its portfolio transactions with brokerage firms which are affiliates of the investment adviser. Brokerage commissions are included in net realized gain (loss) and change in net unrealized appreciation (depreciation) in the Statement of Operations. The commissions paid to these affiliated firms were $37,564 for the period.
Interfund Lending Program. Pursuant to an Exemptive Order issued by the SEC, the Fund, along with other registered investment companies having management contracts with Fidelity Management & Research Company (FMR) or other affiliated entities of FMR, may participate in an interfund lending program. This program provides an alternative credit facility allowing the funds to borrow from, or lend money to, other participating affiliated funds. At period end, there were no interfund loans outstanding. The Fund's activity in this program during the period for which loans were outstanding was as follows:
| Borrower or Lender | Average Loan Balance | Weighted Average Interest Rate | Interest Expense |
| Borrower | $14,847,000 | 1.95% | $2,407 |
Interfund Trades. The Fund may purchase from or sell securities to other Fidelity Funds under procedures adopted by the Board. The procedures have been designed to ensure these interfund trades are executed in accordance with Rule 17a-7 of the 1940 Act. Interfund trades are included within the respective purchases and sales amounts shown in the Purchases and Sales of Investments note.
Redemptions In-Kind. During the period, 41,999,841 shares of the Fund held by an affiliated entity were redeemed in-kind for investments and cash with a value of $1,195,735,469. The net realized gain of $237,440,352 on investments delivered through in-kind redemptions is included in the accompanying Statement of Operations. The amount of the in-kind redemptions is included in share transactions in the accompanying Statement of Changes in Net Assets as well as the Notes to Financial Statements. The Fund recognized no gain or loss for federal income tax purposes.
Prior Fiscal Year Redemptions In-Kind. During the prior period, 10,568,389 shares of the Fund held by an affiliated entity were redeemed in kind for investments and cash with a value of $296,760,364. The Fund had a net realized gain of $79,326,353 on investments delivered through in-kind redemptions. The amount of in-kind redemptions is included in share transactions in the accompanying Statement of Changes in Net Assets as well as the Notes to Financial Statements. The Fund recognized no gain or loss for federal income tax purposes.
Other. During the period, the investment adviser reimbursed the Fund for certain losses in the amount of $39,027.
6. Committed Line of Credit.
The Fund participates with other funds managed by the investment adviser or an affiliate in a $4.25 billion credit facility (the "line of credit") to be utilized for temporary or emergency purposes to fund shareholder redemptions or for other short-term liquidity purposes. The Fund has agreed to pay commitment fees on its pro-rata portion of the line of credit, which amounted to $9,356 and is reflected in Miscellaneous expenses on the Statement of Operations. During the period, the Fund did not borrow on this line of credit.
7. Security Lending.
The Fund lends portfolio securities through a lending agent from time to time in order to earn additional income. For equity securities, a lending agent is used and may loan securities to certain qualified borrowers, including Fidelity Capital Markets (FCM), a broker-dealer affiliated with the Fund. On the settlement date of the loan, the Fund receives collateral (in the form of U.S. Treasury obligations, letters of credit and/or cash) against the loaned securities and maintains collateral in an amount not less than 100% of the market value of the loaned securities during the period of the loan. The market value of the loaned securities is determined at the close of business of the Fund and any additional required collateral is delivered to the Fund on the next business day. The Fund or borrower may terminate the loan at any time, and if the borrower defaults on its obligation to return the securities loaned because of insolvency or other reasons, the Fund may apply collateral received from the borrower against the obligation. The Fund may experience delays and costs in recovering the securities loaned. Any cash collateral received is invested in the Fidelity Securities Lending Cash Central Fund. The value of loaned securities and cash collateral at period end are disclosed on the Fund's Statement of Assets and Liabilities. Security lending income represents the income earned on investing cash collateral, less rebates paid to borrowers and any lending agent fees associated with the loan, plus any premium payments received for lending certain types of securities. Security lending income is presented in the Statement of Operations as a component of income from Fidelity Central Funds. Total security lending income during the period amounted to $322,883. During the period, there were no securities loaned to FCM.
8. Expense Reductions.
Commissions paid to certain brokers with whom the investment adviser, or its affiliates, places trades on behalf of the Fund include an amount in addition to trade execution, which may be rebated back to the Fund to offset certain expenses. This amount totaled $163,446 for the period. In addition, through arrangements with the Fund's custodian, credits realized as a result of certain uninvested cash balances were used to reduce the Fund's expenses. During the period, these credits reduced the Fund's custody expenses by $2,337.
In addition, during the period the investment adviser reimbursed and/or waived a portion of fund-level operating expenses in the amount of $37,081.
9. Distributions to Shareholders.
Distributions to shareholders of each class were as follows:
| | Year ended
July 31, 2018 | Year ended
July 31, 2017 |
| From net investment income | | |
| Value Discovery | $37,659,342 | $21,711,684 |
| Class K | 1,213,214 | 1,767,979 |
| Total | $38,872,556 | $23,479,663 |
| From net realized gain | | |
| Value Discovery | $28,024,993 | $386,628 |
| Class K | 1,001,210 | 25,277 |
| Total | $29,026,203 | $411,905 |
10. Share Transactions.
Share transactions for each class were as follows and may contain automatic conversions between classes or exchanges between affiliated funds:
| | Shares | Shares | Dollars | Dollars |
| | Year ended July 31, 2018 | Year ended July 31, 2017 | Year ended July 31, 2018 | Year ended July 31, 2017 |
| Value Discovery | | | | |
| Shares sold | 92,576,036 | 42,512,937 | $2,602,748,985 | $1,119,827,793 |
| Reinvestment of distributions | 2,218,173 | 841,053 | 60,950,359 | 21,118,287 |
| Shares redeemed | (112,066,142) | (17,858,879) | (3,180,236,752) | (463,345,362) |
| Net increase (decrease) | (17,271,933) | 25,495,111 | $(516,537,408) | $677,600,718 |
| Class K | | | | |
| Shares sold | 898,035 | 11,452,291 | $25,342,830 | $310,987,862 |
| Reinvestment of distributions | 80,757 | 71,873 | 2,214,424 | 1,793,256 |
| Shares redeemed | (2,722,401)(a) | (16,704,580)(b) | (77,380,905)(a) | (451,035,163)(b) |
| Net increase (decrease) | (1,743,609) | (5,180,416) | $(49,823,651) | $(138,254,045) |
(a) Amount includes in-kind redemptions (see the Redemptions In-Kind note for additional details).
(b) Amount includes in-kind redemptions (see the Prior Fiscal Year Redemptions In-Kind note for additional details).
11. Other.
The Fund's organizational documents provide former and current trustees and officers with a limited indemnification against liabilities arising in connection with the performance of their duties to the Fund. In the normal course of business, the Fund may also enter into contracts that provide general indemnifications. The Fund's maximum exposure under these arrangements is unknown as this would be dependent on future claims that may be made against the Fund. The risk of material loss from such claims is considered remote.
Report of Independent Registered Public Accounting Firm
To the Trustees of Fidelity Puritan Trust and Shareholders of Fidelity Value Discovery Fund:
Opinion on the Financial Statements and Financial Highlights
We have audited the accompanying statement of assets and liabilities of Fidelity Value Discovery Fund (the "Fund"), a fund of Fidelity Puritan Trust, including the schedule of investments, as of July 31, 2018, and the related statement of operations for the year then ended, the statement of changes in net assets for each of the two years in the period then ended, the financial highlights for each of the five years in the period then ended, and the related notes. In our opinion, the financial statements and financial highlights present fairly, in all material respects, the financial position of the Fund as of July 31, 2018, and the results of its operations for the year then ended, the changes in its net assets for each of the two years in the period then ended, and the financial highlights for each of the five years in the period then ended, in conformity with accounting principles generally accepted in the United States of America.
Basis for Opinion
These financial statements and financial highlights are the responsibility of the Fund's management. Our responsibility is to express an opinion on the Fund's financial statements and financial highlights based on our audits. We are a public accounting firm registered with the Public Company Accounting Oversight Board (United States) (PCAOB) and are required to be independent with respect to the Fund in accordance with the U.S. federal securities laws and the applicable rules and regulations of the Securities and Exchange Commission and the PCAOB.
We conducted our audits in accordance with the standards of the PCAOB. Those standards require that we plan and perform the audit to obtain reasonable assurance about whether the financial statements and financial highlights are free of material misstatement, whether due to error or fraud. The Fund is not required to have, nor were we engaged to perform, an audit of its internal control over financial reporting. As part of our audits we are required to obtain an understanding of internal control over financial reporting but not for the purpose of expressing an opinion on the effectiveness of the Fund’s internal control over financial reporting. Accordingly, we express no such opinion.
Our audits included performing procedures to assess the risks of material misstatement of the financial statements and financial highlights, whether due to error or fraud, and performing procedures that respond to those risks. Such procedures included examining, on a test basis, evidence regarding the amounts and disclosures in the financial statements and financial highlights. Our audits also included evaluating the accounting principles used and significant estimates made by management, as well as evaluating the overall presentation of the financial statements and financial highlights. Our procedures included confirmation of securities owned as of July 31, 2018, by correspondence with the custodians and brokers; when replies were not received from brokers, we performed other auditing procedures. We believe that our audits provide a reasonable basis for our opinion.
/s/ Deloitte & Touche LLP
Boston, Massachusetts
September 12, 2018
We have served as the auditor of one or more of the Fidelity investment companies since 1999.
Trustees and Officers
The Trustees, Members of the Advisory Board (if any), and officers of the trust and fund, as applicable, are listed below. The Board of Trustees governs the fund and is responsible for protecting the interests of shareholders. The Trustees are experienced executives who meet periodically throughout the year to oversee the fund's activities, review contractual arrangements with companies that provide services to the fund, oversee management of the risks associated with such activities and contractual arrangements, and review the fund's performance. Except for Jonathan Chiel, each of the Trustees oversees 286 funds. Mr. Chiel oversees 150 funds.
The Trustees hold office without limit in time except that (a) any Trustee may resign; (b) any Trustee may be removed by written instrument, signed by at least two-thirds of the number of Trustees prior to such removal; (c) any Trustee who requests to be retired or who has become incapacitated by illness or injury may be retired by written instrument signed by a majority of the other Trustees; and (d) any Trustee may be removed at any special meeting of shareholders by a two-thirds vote of the outstanding voting securities of the trust. Each Trustee who is not an interested person (as defined in the 1940 Act) of the trust and the fund is referred to herein as an Independent Trustee. Each Independent Trustee shall retire not later than the last day of the calendar year in which his or her 75th birthday occurs. The Independent Trustees may waive this mandatory retirement age policy with respect to individual Trustees. Officers and Advisory Board Members hold office without limit in time, except that any officer or Advisory Board Member may resign or may be removed by a vote of a majority of the Trustees at any regular meeting or any special meeting of the Trustees. Except as indicated, each individual has held the office shown or other offices in the same company for the past five years.
The fund’s Statement of Additional Information (SAI) includes more information about the Trustees. To request a free copy, call Fidelity at 1-800-544-8544.
Experience, Skills, Attributes, and Qualifications of the Trustees. The Governance and Nominating Committee has adopted a statement of policy that describes the experience, qualifications, attributes, and skills that are necessary and desirable for potential Independent Trustee candidates (Statement of Policy). The Board believes that each Trustee satisfied at the time he or she was initially elected or appointed a Trustee, and continues to satisfy, the standards contemplated by the Statement of Policy. The Governance and Nominating Committee also engages professional search firms to help identify potential Independent Trustee candidates who have the experience, qualifications, attributes, and skills consistent with the Statement of Policy. From time to time, additional criteria based on the composition and skills of the current Independent Trustees, as well as experience or skills that may be appropriate in light of future changes to board composition, business conditions, and regulatory or other developments, have also been considered by the professional search firms and the Governance and Nominating Committee. In addition, the Board takes into account the Trustees' commitment and participation in Board and committee meetings, as well as their leadership of standing and ad hoc committees throughout their tenure.
In determining that a particular Trustee was and continues to be qualified to serve as a Trustee, the Board has considered a variety of criteria, none of which, in isolation, was controlling. The Board believes that, collectively, the Trustees have balanced and diverse experience, qualifications, attributes, and skills, which allow the Board to operate effectively in governing the fund and protecting the interests of shareholders. Information about the specific experience, skills, attributes, and qualifications of each Trustee, which in each case led to the Board's conclusion that the Trustee should serve (or continue to serve) as a trustee of the fund, is provided below.
Board Structure and Oversight Function. James C. Curvey is an interested person and currently serves as Chairman. The Trustees have determined that an interested Chairman is appropriate and benefits shareholders because an interested Chairman has a personal and professional stake in the quality and continuity of services provided to the fund. Independent Trustees exercise their informed business judgment to appoint an individual of their choosing to serve as Chairman, regardless of whether the Trustee happens to be independent or a member of management. The Independent Trustees have determined that they can act independently and effectively without having an Independent Trustee serve as Chairman and that a key structural component for assuring that they are in a position to do so is for the Independent Trustees to constitute a substantial majority for the Board. The Independent Trustees also regularly meet in executive session. Ned C. Lautenbach serves as Chairman of the Independent Trustees and as such (i) acts as a liaison between the Independent Trustees and management with respect to matters important to the Independent Trustees and (ii) with management prepares agendas for Board meetings.
Fidelity® funds are overseen by different Boards of Trustees. The fund's Board oversees Fidelity's high income and certain equity funds, and other Boards oversee Fidelity's investment-grade bond, money market, asset allocation, and other equity funds. The asset allocation funds may invest in Fidelity® funds overseen by the fund's Board. The use of separate Boards, each with its own committee structure, allows the Trustees of each group of Fidelity® funds to focus on the unique issues of the funds they oversee, including common research, investment, and operational issues. On occasion, the separate Boards establish joint committees to address issues of overlapping consequences for the Fidelity® funds overseen by each Board.
The Trustees operate using a system of committees to facilitate the timely and efficient consideration of all matters of importance to the Trustees, the fund, and fund shareholders and to facilitate compliance with legal and regulatory requirements and oversight of the fund's activities and associated risks. The Board, acting through its committees, has charged FMR and its affiliates with (i) identifying events or circumstances the occurrence of which could have demonstrably adverse effects on the fund's business and/or reputation; (ii) implementing processes and controls to lessen the possibility that such events or circumstances occur or to mitigate the effects of such events or circumstances if they do occur; and (iii) creating and maintaining a system designed to evaluate continuously business and market conditions in order to facilitate the identification and implementation processes described in (i) and (ii) above. Because the day-to-day operations and activities of the fund are carried out by or through FMR, its affiliates, and other service providers, the fund's exposure to risks is mitigated but not eliminated by the processes overseen by the Trustees. While each of the Board's committees has responsibility for overseeing different aspects of the fund's activities, oversight is exercised primarily through the Operations, Audit, and Compliance Committees. In addition, the Independent Trustees have worked with Fidelity to enhance the Board's oversight of investment and financial risks, legal and regulatory risks, technology risks, and operational risks, including the development of additional risk reporting to the Board. Appropriate personnel, including but not limited to the fund's Chief Compliance Officer (CCO), FMR's internal auditor, the independent accountants, the fund's Treasurer and portfolio management personnel, make periodic reports to the Board's committees, as appropriate, including an annual review of Fidelity's risk management program for the Fidelity® funds. The responsibilities of each standing committee, including their oversight responsibilities, are described further under "Standing Committees of the Trustees."
Interested Trustees*:
Correspondence intended for a Trustee who is an interested person may be sent to Fidelity Investments, 245 Summer Street, Boston, Massachusetts 02210.
Name, Year of Birth; Principal Occupations and Other Relevant Experience+
Jonathan Chiel (1957)
Year of Election or Appointment: 2016
Trustee
Mr. Chiel also serves as Trustee of other Fidelity® funds. Mr. Chiel is Executive Vice President and General Counsel for FMR LLC (diversified financial services company, 2012-present). Previously, Mr. Chiel served as general counsel (2004-2012) and senior vice president and deputy general counsel (2000-2004) for John Hancock Financial Services; a partner with Choate, Hall & Stewart (1996-2000) (law firm); and an Assistant United States Attorney for the United States Attorney’s Office of the District of Massachusetts (1986-95), including Chief of the Criminal Division (1993-1995). Mr. Chiel is a director on the boards of the Boston Bar Foundation and the Maimonides School.
James C. Curvey (1935)
Year of Election or Appointment: 2007
Trustee
Chairman of the Board of Trustees
Mr. Curvey also serves as Trustee of other Fidelity® funds. Mr. Curvey is Vice Chairman (2007-present) and Director of FMR LLC (diversified financial services company). In addition, Mr. Curvey is an Overseer Emeritus for the Boston Symphony Orchestra, a Director of Artis-Naples, and a Trustee of Brewster Academy in Wolfeboro, New Hampshire. Previously, Mr. Curvey served as a Director of Fidelity Research & Analysis Co. (investment adviser firm, 2009-2018), Director of Fidelity Investments Money Management, Inc. (investment adviser firm, 2009-2014) and a Director of FMR and FMR Co., Inc. (investment adviser firms, 2007-2014).
Charles S. Morrison (1960)
Year of Election or Appointment: 2014
Trustee
Mr. Morrison also serves as Trustee of other funds. He serves as President of Fidelity SelectCo, LLC (investment adviser firm, 2017-present) and Fidelity Management & Research Company (FMR) (investment adviser firm, 2016-present), a Director of Fidelity Investments Money Management, Inc. (FIMM) (investment adviser firm, 2014-present), Director of Fidelity SelectCo, LLC (investment adviser firm, 2014-present), President, Asset Management (2014-present), and is an employee of Fidelity Investments. Previously, Mr. Morrison served as Vice President of Fidelity's Fixed Income and Asset Allocation Funds (2012-2014), President, Fixed Income (2011-2014), Vice President of Fidelity's Money Market Funds (2005-2009), President, Money Market Group Leader of FMR (investment adviser firm, 2009), and Senior Vice President, Money Market Group of FMR (2004-2009). Mr. Morrison also served as Vice President of Fidelity's Bond Funds (2002-2005), certain Balanced Funds (2002-2005), and certain Asset Allocation Funds (2002-2007), and as Senior Vice President (2002-2005) of Fidelity's Bond Division.
* Determined to be an “Interested Trustee” by virtue of, among other things, his or her affiliation with the trust or various entities under common control with FMR.
+ The information includes the Trustee's principal occupation during the last five years and other information relating to the experience, attributes, and skills relevant to the Trustee's qualifications to serve as a Trustee, which led to the conclusion that the Trustee should serve as a Trustee for the fund.
Independent Trustees:
Correspondence intended for an Independent Trustee may be sent to Fidelity Investments, P.O. Box 55235, Boston, Massachusetts 02205-5235.
Name, Year of Birth; Principal Occupations and Other Relevant Experience+
Dennis J. Dirks (1948)
Year of Election or Appointment: 2005
Trustee
Mr. Dirks also serves as Trustee of other Fidelity® funds. Prior to his retirement in May 2003, Mr. Dirks was Chief Operating Officer and a member of the Board of The Depository Trust & Clearing Corporation (DTCC). He also served as President, Chief Operating Officer, and Board member of The Depository Trust Company (DTC) and President and Board member of the National Securities Clearing Corporation (NSCC). In addition, Mr. Dirks served as Chief Executive Officer and Board member of the Government Securities Clearing Corporation, Chief Executive Officer and Board member of the Mortgage-Backed Securities Clearing Corporation, as a Trustee and a member of the Finance Committee of Manhattan College (2005-2008), as a Trustee and a member of the Finance Committee of AHRC of Nassau County (2006-2008), as a member of the Independent Directors Council (IDC) Governing Council (2010-2015), and as a member of the Board of Directors for The Brookville Center for Children’s Services, Inc. (2009-2017). Mr. Dirks is a member of the Finance Committee (2016-present), Board of Directors (2017-present) and Board of Trustees (2018-present) and is Treasurer (2018-present) of the Asolo Repertory Theatre.
Donald F. Donahue (1950)
Year of Election or Appointment: 2018
Trustee
Mr. Donahue also serves as a Trustee of other Fidelity® funds. Mr. Donahue is President and Chief Executive Officer of Miranda Partners, LLC (risk consulting for the financial services industry, 2012-present). Previously, Mr. Donahue served as a Member of the Advisory Board of certain Fidelity® funds (2015-2018) and Chief Executive Officer (2006-2012), Chief Operating Officer (2003-2006), and Managing Director, Customer Marketing and Development (1999-2003) of The Depository Trust & Clearing Corporation (financial markets infrastructure). Mr. Donahue serves as a Member (2007-present) and Co-Chairman (2016-present) of the Board of Directors of United Way of New York, Member of the Board of Directors of NYC Leadership Academy (2012-present) and Member of the Board of Advisors of Ripple Labs, Inc. (financial services, 2015-present). He also served as Chairman (2010-2012) and Member of the Board of Directors (2012-2013) of Omgeo, LLC (financial services), Treasurer of United Way of New York (2012-2016), and Member of the Board of Directors of XBRL US (financial services non-profit, 2009-2012) and the International Securities Services Association (2009-2012).
Alan J. Lacy (1953)
Year of Election or Appointment: 2008
Trustee
Mr. Lacy also serves as Trustee of other Fidelity® funds. Mr. Lacy serves as a Director of Bristol-Myers Squibb Company (global pharmaceuticals, 2008-present). He is a Trustee of the California Chapter of The Nature Conservancy (2015-present) and a Director of the Center for Advanced Study in the Behavioral Sciences at Stanford University (2015-present). In addition, Mr. Lacy served as Senior Adviser (2007-2014) of Oak Hill Capital Partners, L.P. (private equity) and also served as Chief Executive Officer (2005) and Vice Chairman (2005-2006) of Sears Holdings Corporation (retail) and Chief Executive Officer and Chairman of the Board of Sears, Roebuck and Co. (retail, 2000-2005). Previously, Mr. Lacy served as Chairman (2014-2017) and a member (2010-2017) of the Board of Directors of Dave & Buster’s Entertainment, Inc. (restaurant and entertainment complexes), as Chairman (2008-2011) and a member (2006-2015) of the Board of Trustees of the National Parks Conservation Association, and as a member of the Board of Directors for The Hillman Companies, Inc. (hardware wholesalers, 2010-2014), Earth Fare, Inc. (retail grocery, 2010-2014), and The Western Union Company (global money transfer, 2006-2011).
Ned C. Lautenbach (1944)
Year of Election or Appointment: 2000
Trustee
Chairman of the Independent Trustees
Mr. Lautenbach also serves as Trustee of other Fidelity® funds. Mr. Lautenbach currently serves as Vice Chair of the Board of Governors, State University System of Florida (2013-present) and is a member of the Council on Foreign Relations (1994-present). He is also a member and has most recently served as Chairman of the Board of Directors of Artis-Naples (2012-present). Previously, Mr. Lautenbach served as a member and then Lead Director of the Board of Directors of Eaton Corporation (diversified industrial, 1997-2016). He was also a Partner and Advisory Partner at Clayton, Dubilier & Rice, LLC (private equity investment, 1998-2010), as well as a Director of Sony Corporation (2006-2007). In addition, Mr. Lautenbach also had a 30-year career with IBM (technology company) during which time he served as Senior Vice President and a member of the Corporate Executive Committee (1968-1998).
Joseph Mauriello (1944)
Year of Election or Appointment: 2008
Trustee
Mr. Mauriello also serves as Trustee of other Fidelity® funds. Prior to his retirement in January 2006, Mr. Mauriello served in numerous senior management positions including Deputy Chairman and Chief Operating Officer (2004-2005), and Vice Chairman of Financial Services (2002-2004) of KPMG LLP US (professional services, 1965-2005). Mr. Mauriello currently serves as a member of the Board of Directors of XL Group plc. (global insurance and re-insurance, 2006-present) and the Independent Directors Council (IDC) Governing Council (2015-present). Previously, Mr. Mauriello served as a Director of the Hamilton Funds of the Bank of New York (2006-2007) and of Arcadia Resources Inc. (health care services and products, 2007-2012).
Cornelia M. Small (1944)
Year of Election or Appointment: 2005
Trustee
Ms. Small also serves as Trustee of other Fidelity® funds. Ms. Small is a member of the Board of Directors (2009-present) and Chair of the Investment Committee (2010-present) of the Teagle Foundation. Ms. Small also serves on the Investment Committee of the Berkshire Taconic Community Foundation (2008-present). Previously, Ms. Small served as Chairperson (2002-2008) and a member of the Investment Committee and Chairperson (2008-2012) and a member of the Board of Trustees of Smith College. In addition, Ms. Small served as Chief Investment Officer, Director of Global Equity Investments, and a member of the Board of Directors of Scudder, Stevens & Clark and Scudder Kemper Investments.
Garnett A. Smith (1947)
Year of Election or Appointment: 2018
Trustee
Mr. Smith also serves as Trustee of other Fidelity® funds. Prior to Mr. Smith's retirement, he served as Chairman and Chief Executive Officer of Inbrand Corp. (manufacturer of personal absorbent products, 1990-1997). He also served as President (1986-1990) of Inbrand Corp. Prior to his employment with Inbrand Corp., he was employed by a retail fabric chain and North Carolina National Bank. In addition, Mr. Smith served as a Member of the Advisory Board of certain Fidelity® funds (2012-2013) and as a board member of the Jackson Hole Land Trust (2009-2012).
David M. Thomas (1949)
Year of Election or Appointment: 2008
Trustee
Mr. Thomas also serves as Trustee of other Fidelity® funds. Mr. Thomas serves as Non-Executive Chairman of the Board of Directors of Fortune Brands Home and Security (home and security products, 2011-present), as a member of the Board of Directors (2004-present) and Presiding Director (2013-present) of Interpublic Group of Companies, Inc. (marketing communication), and as a member of the Board of Trustees of the University of Florida (2013-present). Previously, Mr. Thomas served as Executive Chairman (2005-2006) and Chairman and Chief Executive Officer (2000-2005) of IMS Health, Inc. (pharmaceutical and healthcare information solutions), and a Director of Fortune Brands, Inc. (consumer products, 2000-2011).
+ The information includes the Trustee's principal occupation during the last five years and other information relating to the experience, attributes, and skills relevant to the Trustee's qualifications to serve as a Trustee, which led to the conclusion that the Trustee should serve as a Trustee for the fund.
Advisory Board Members and Officers:
Correspondence intended for a Member of the Advisory Board (if any) may be sent to Fidelity Investments, P.O. Box 55235, Boston, Massachusetts 02205-5235. Correspondence intended for an officer or Peter S. Lynch may be sent to Fidelity Investments, 245 Summer Street, Boston, Massachusetts 02210. Officers appear below in alphabetical order.
Name, Year of Birth; Principal Occupation
Peter S. Lynch (1944)
Year of Election or Appointment: 2003
Member of the Advisory Board
Mr. Lynch also serves as Member of the Advisory Board of other Fidelity® funds. Mr. Lynch is Vice Chairman and a Director of FMR (investment adviser firm) and FMR Co., Inc. (investment adviser firm). In addition, Mr. Lynch serves as a Trustee of Boston College and as the Chairman of the Inner-City Scholarship Fund. Previously, Mr. Lynch served on the Special Olympics International Board of Directors (1997-2006).
William S. Stavropoulos (1939)
Year of Election or Appointment: 2018
Member of the Advisory Board
Mr. Stavropoulos also serves as Member of the Advisory Board of other Fidelity® funds. Mr. Stavropoulos serves as President and Founder of the Michigan Baseball Foundation, the Great Lakes Loons (2007-present). Mr. Stavropoulos is Chairman Emeritus of the Board of Directors of The Dow Chemical Company, where he previously served in numerous senior management positions, including President, CEO (1995-2000; 2002-2004), Chairman of the Executive Committee (2000-2006), and as a member of the Board of Directors (1990-2006). Currently, Mr. Stavropoulos is Chairman of the Board of Directors of Univar Inc. (global distributor of commodity and specialty chemicals), a Director of Teradata Corporation (data warehousing and technology solutions), and a member of the Advisory Board for Metalmark Capital LLC (private equity investment, 2005-present). Mr. Stavropoulos is an operating advisor to Clayton, Dubilier & Rice, LLC (private equity investment). In addition, Mr. Stavropoulos is a member of the University of Notre Dame Advisory Council for the College of Science, a Trustee of the Rollin L. Gerstacker Foundation, and a Director of Artis-Naples in Naples, Florida. Previously, Mr. Stavropoulos served as Trustee of certain Fidelity® funds (2001-2018) and as a Director of Chemical Financial Corporation (bank holding company, 1993-2012) and Tyco International, Ltd. (multinational manufacturing and services, 2007-2012).
Carol B. Tomé (1957)
Year of Election or Appointment: 2018
Member of the Advisory Board
Ms. Tomé also serves as Member of the Advisory Board of other Fidelity® funds. Ms. Tomé is Chief Financial Officer (2001-present) and Executive Vice President of Corporate Services (2007-present) of The Home Depot, Inc. (home improvement retailer) and a Director (2003-present) and Chair of the Audit Committee (2004-present) of United Parcel Service, Inc. (package delivery and supply chain management). Previously, Ms. Tomé served as Trustee of certain Fidelity® funds (2017), Senior Vice President of Finance and Accounting/Treasurer (2000-2007) and Vice President and Treasurer (1995-2000) of The Home Depot, Inc. and Chair of the Board (2010-2012), Vice Chair of the Board (2009 and 2013), and a Director (2008-2013) of the Federal Reserve Bank of Atlanta. Ms. Tomé is also a director or trustee of many community and professional organizations.
Michael E. Wiley (1950)
Year of Election or Appointment: 2018
Member of the Advisory Board
Mr. Wiley also serves as Trustee or Member of the Advisory Board of other Fidelity® funds. Mr. Wiley serves as a Director of Andeavor Corporation (independent oil refiner and marketer, 2005-present), a Director of Andeavor Logistics LP (natural resources logistics, 2015-present), and a Director of Bill Barrett Corporation (exploration and production, 2005-present). In addition, Mr. Wiley also serves as a Director of Post Oak Bank (privately-held bank, 2004-present). Previously, Mr. Wiley served as a Trustee of other Fidelity® funds (2008-2013), as a Director of Asia Pacific Exploration Consolidated (international oil and gas exploration and production, 2008-2013), as a member of the Board of Trustees of the University of Tulsa (2000-2006; 2007-2010), as a Senior Energy Advisor of Katzenbach Partners, LLC (consulting, 2006-2007), as an Advisory Director of Riverstone Holdings (private investment), Chairman, President, and CEO of Baker Hughes, Inc. (oilfield services, 2000-2004), and as Director of Spinnaker Exploration Company (exploration and production, 2001-2005).
Elizabeth Paige Baumann (1968)
Year of Election or Appointment: 2017
Anti-Money Laundering (AML) Officer
Ms. Baumann also serves as AML Officer of other funds. She is Chief AML Officer (2012-present) and Senior Vice President (2014-present) of FMR LLC (diversified financial services company) and is an employee of Fidelity Investments. Previously, Ms. Baumann served as AML Officer of the funds (2012-2016), and Vice President (2007-2014) and Deputy Anti-Money Laundering Officer (2007-2012) of FMR LLC.
Marc R. Bryant (1966)
Year of Election or Appointment: 2015
Secretary and Chief Legal Officer (CLO)
Mr. Bryant also serves as Secretary and CLO of other funds. Mr. Bryant serves as CLO, Secretary, and Senior Vice President of Fidelity Management & Research Company (investment adviser firm, 2015-present) and FMR Co., Inc. (investment adviser firm, 2015-present); Secretary of Fidelity SelectCo, LLC (investment adviser firm, 2015-present) and Fidelity Investments Money Management, Inc. (investment adviser firm, 2015-present); and CLO of Fidelity Management & Research (Hong Kong) Limited and FMR Investment Management (UK) Limited (investment adviser firms, 2015-present) and Fidelity Management & Research (Japan) Limited (investment adviser firm, 2016-present). He is Senior Vice President and Deputy General Counsel of FMR LLC (diversified financial services company). Previously, Mr. Bryant served as Secretary and CLO of Fidelity Rutland Square Trust II (2010-2014) and Assistant Secretary of Fidelity's Fixed Income and Asset Allocation Funds (2013-2015). Prior to joining Fidelity Investments, Mr. Bryant served as a Senior Vice President and the Head of Global Retail Legal for AllianceBernstein L.P. (2006-2010), and as the General Counsel for ProFund Advisors LLC (2001-2006).
John J. Burke III (1964)
Year of Election or Appointment: 2018
Chief Financial Officer
Mr. Burke also serves as Chief Financial Officer of other funds. Mr. Burke serves as Head of Investment Operations for Fidelity Fund and Investment Operations (2018-present) and is an employee of Fidelity Investments (1998-present). Previously Mr. Burke served as head of Asset Management Investment Operations (2012-2018).
William C. Coffey (1969)
Year of Election or Appointment: 2009
Assistant Secretary
Mr. Coffey also serves as Assistant Secretary of other funds. He is Senior Vice President and Deputy General Counsel of FMR LLC (diversified financial services company, 2010-present), and is an employee of Fidelity Investments. Previously, Mr. Coffey served as Vice President and Associate General Counsel of FMR LLC (2005-2009).
Timothy M. Cohen (1969)
Year of Election or Appointment: 2018
Vice President
Mr. Cohen also serves as Vice President of other funds. Mr. Cohen serves as Co-Head of Global Equity Research (2016-present), a Director of Fidelity Management & Research (Japan) Limited (investment adviser firm, 2016-present), and is an employee of Fidelity Investments. Previously, Mr. Cohen served as Chief Investment Officer - Equity and a Director of Fidelity Management & Research (U.K.) Inc. (investment adviser firm, 2013-2015) and as a Director of Fidelity Management & Research (Hong Kong) Limited (investment adviser firm, 2017).
Jonathan Davis (1968)
Year of Election or Appointment: 2010
Assistant Treasurer
Mr. Davis also serves as Assistant Treasurer of other funds. Mr. Davis serves as Assistant Treasurer of FMR Capital, Inc. (2017-present) and is an employee of Fidelity Investments. Previously, Mr. Davis served as Vice President and Associate General Counsel of FMR LLC (diversified financial services company, 2003-2010).
Adrien E. Deberghes (1967)
Year of Election or Appointment: 2016
Assistant Treasurer
Mr. Deberghes also serves as an officer of other funds. He serves as Assistant Treasurer of FMR Capital, Inc. (2017-present), Executive Vice President of Fidelity Investments Money Management, Inc. (FIMM) (investment adviser firm, 2016-present), and is an employee of Fidelity Investments (2008-present). Previously, Mr. Deberghes served as President and Treasurer of certain Fidelity® funds (2013-2018). Prior to joining Fidelity Investments, Mr. Deberghes was Senior Vice President of Mutual Fund Administration at State Street Corporation (2007-2008), Senior Director of Mutual Fund Administration at Investors Bank & Trust (2005-2007), and Director of Finance for Dunkin' Brands (2000-2005). Previously, Mr. Deberghes served in other fund officer roles.
Laura M. Del Prato (1964)
Year of Election or Appointment: 2018
Assistant Treasurer
Ms. Del Prato also serves as an officer of other funds. Ms. Del Prato is an employee of Fidelity Investments (2017-present). Prior to joining Fidelity Investments, Ms. Del Prato served as a Managing Director and Treasurer of the JPMorgan Mutual Funds (2014-2017). Prior to JPMorgan, Ms. Del Prato served as a partner at Cohen Fund Audit Services (accounting firm, 2012-2013) and KPMG LLP (accounting firm, 2004-2012).
Colm A. Hogan (1973)
Year of Election or Appointment: 2016
Deputy Treasurer
Mr. Hogan also serves as an officer of other funds. Mr. Hogan serves as Assistant Treasurer of FMR Capital, Inc. (2017-present) and is an employee of Fidelity Investments (2005-present). Previously, Mr. Hogan served as Assistant Treasurer of certain Fidelity® funds (2016-2018).
Pamela R. Holding (1964)
Year of Election or Appointment: 2018
Vice President
Ms. Holding also serves as a Vice President of other funds. Ms. Holding serves as Co-Head of Global Equity Research (2018-present) and is an employee of Fidelity Investments (2013-present).
Chris Maher (1972)
Year of Election or Appointment: 2013
Assistant Treasurer
Mr. Maher serves as Assistant Treasurer of other funds. Mr. Maher is Vice President of Valuation Oversight, serves as Assistant Treasurer of FMR Capital, Inc. (2017-present), and is an employee of Fidelity Investments. Previously, Mr. Maher served as Vice President of Asset Management Compliance (2013), Vice President of the Program Management Group of FMR (investment adviser firm, 2010-2013), and Vice President of Valuation Oversight (2008-2010).
Rieco E. Mello (1969)
Year of Election or Appointment: 2017
Assistant Treasurer
Mr. Mello also serves as Assistant Treasurer of other funds. Mr. Mello serves as Assistant Treasurer of FMR Capital, Inc. (2017-present) and is an employee of Fidelity Investments (1995-present).
Kenneth B. Robins (1969)
Year of Election or Appointment: 2016
Chief Compliance Officer
Mr. Robins also serves as an officer of other funds. Mr. Robins serves as Compliance Officer of Fidelity Management & Research Company and FMR Co., Inc. (investment adviser firms, 2016-present) and is an employee of Fidelity Investments (2004-present). Previously, Mr. Robins served as Executive Vice President of Fidelity Investments Money Management, Inc. (investment adviser firm, 2013-2016) and served in other fund officer roles.
Stacie M. Smith (1974)
Year of Election or Appointment: 2016
President and Treasurer
Ms. Smith also serves as an officer of other funds. Ms. Smith serves as Assistant Treasurer of FMR Capital, Inc. (2017-present), is an employee of Fidelity Investments (2009-present), and has served in other fund officer roles. Prior to joining Fidelity Investments, Ms. Smith served as Senior Audit Manager of Ernst & Young LLP (accounting firm, 1996-2009). Previously, Ms. Smith served as Assistant Treasurer (2013-2018) and Deputy Treasurer (2013-2016) of certain Fidelity® funds.
Marc L. Spector (1972)
Year of Election or Appointment: 2016
Assistant Treasurer
Mr. Spector also serves as an officer of other funds. Mr. Spector serves as Assistant Treasurer of FMR Capital, Inc. (2017-present) and is an employee of Fidelity Investments (2016-present). Prior to joining Fidelity Investments, Mr. Spector served as Director at the Siegfried Group (accounting firm, 2013-2016), and prior to Siegfried Group as audit senior manager at Deloitte & Touche (accounting firm, 2005-2013).
Renee Stagnone (1975)
Year of Election or Appointment: 2016
Assistant Treasurer
Ms. Stagnone also serves as an officer of other funds. Ms. Stagnone serves as Assistant Treasurer of FMR Capital, Inc. (2017-present) and is an employee of Fidelity Investments (1997-present). Previously, Ms. Stagnone served as Deputy Treasurer of certain Fidelity® funds (2013-2016).
Shareholder Expense Example
As a shareholder of the Fund, you incur two types of costs: (1) transaction costs and (2) ongoing costs, including management fees and other Fund expenses. This Example is intended to help you understand your ongoing costs (in dollars) of investing in the Fund and to compare these costs with the ongoing costs of investing in other mutual funds.
The Example is based on an investment of $1,000 invested at the beginning of the period and held for the entire period (February 1, 2018 to July 31, 2018).
Actual Expenses
The first line of the accompanying table for each class of the Fund provides information about actual account values and actual expenses. You may use the information in this line, together with the amount you invested, to estimate the expenses that you paid over the period. Simply divide your account value by $1,000.00 (for example, an $8,600 account value divided by $1,000.00 = 8.6), then multiply the result by the number in the first line for a class of the Fund under the heading entitled "Expenses Paid During Period" to estimate the expenses you paid on your account during this period. A small balance maintenance fee of $12.00 that is charged once a year may apply for certain accounts with a value of less than $2,000. This fee is not included in the table below. If it was, the estimate of expenses you paid during the period would be higher, and your ending account value lower, by this amount. In addition, the Fund, as a shareholder in the underlying Fidelity Central Funds, will indirectly bear its pro-rata share of the fees and expenses incurred by the underlying Fidelity Central Funds. These fees and expenses are not included in the Fund's annualized expense ratio used to calculate the expense estimate in the table below.
Hypothetical Example for Comparison Purposes
The second line of the accompanying table for each class of the Fund provides information about hypothetical account values and hypothetical expenses based on a Class' actual expense ratio and an assumed rate of return of 5% per year before expenses, which is not the Class' actual return. The hypothetical account values and expenses may not be used to estimate the actual ending account balance or expenses you paid for the period. You may use this information to compare the ongoing costs of investing in the Fund and other funds. To do so, compare this 5% hypothetical example with the 5% hypothetical examples that appear in the shareholder reports of the other funds. A small balance maintenance fee of $12.00 that is charged once a year may apply for certain accounts with a value of less than $2,000. This fee is not included in the table below. If it was, the estimate of expenses you paid during the period would be higher, and your ending account value lower, by this amount. In addition, the Fund, as a shareholder in the underlying Fidelity Central Funds, will indirectly bear its pro-rata share of the fees and expenses incurred by the underlying Fidelity Central Funds. These fees and expenses are not included in the Fund's annualized expense ratio used to calculate the expense estimate in the table below.
Please note that the expenses shown in the table are meant to highlight your ongoing costs only and do not reflect any transaction costs. Therefore, the second line of the table is useful in comparing ongoing costs only, and will not help you determine the relative total costs of owning different funds.
| | Annualized Expense Ratio-A | Beginning
Account Value
February 1, 2018 | Ending
Account Value
July 31, 2018 | Expenses Paid
During Period-B
February 1, 2018
to July 31, 2018 |
| Value Discovery | .65% | | | |
| Actual | | $1,000.00 | $974.00 | $3.18 |
| Hypothetical-C | | $1,000.00 | $1,021.57 | $3.26 |
| Class K | .53% | | | |
| Actual | | $1,000.00 | $974.70 | $2.59 |
| Hypothetical-C | | $1,000.00 | $1,022.17 | $2.66 |
A Annualized expense ratio reflects expenses net of applicable fee waivers.
B Expenses are equal to each Class' annualized expense ratio, multiplied by the average account value over the period, multiplied by 181/365 (to reflect the one-half year period).
C 5% return per year before expenses
Distributions (Unaudited)
The Board of Trustees of Fidelity Value Discovery Fund voted to pay to shareholders of record at the opening of business on record date, the following distributions per share derived from capital gains realized from sales of portfolio securities, and dividends derived from net investment income:
| | Pay Date | Record Date | Dividends | Capital Gains |
| Fidelity Value Discovery Fund | | | | |
| Value Discovery | 09/10/18 | 09/07/18 | $0.296 | $0.156 |
| Class K | 09/10/18 | 09/07/18 | $0.324 | $0.156 |
|
The fund hereby designates as a capital gain dividend with respect to the taxable year ended July 31, 2018, $13,085,210, or, if subsequently determined to be different, the net capital gain of such year.
Value Discovery designates 63% and 92%; and Class K designates 62% and 86% of the dividends distributed in September and December, respectively during the fiscal year as qualifying for the dividends–received deduction for corporate shareholders.
Value Discovery designates 90% and 100%; and Class K designates 88% and 100% of the dividends distributed in September and December, respectively during the fiscal year as amounts which may be taken into account as a dividend for purposes of the maximum rate under section 1(h)(11) of the Internal Revenue Code.
The fund will notify shareholders in January 2019 of amounts for use in preparing 2018 income tax returns.
Board Approval of Investment Advisory Contracts
Fidelity Value Discovery Fund
At its July 2018 meeting, the Board of Trustees, including the Independent Trustees (together, the Board), voted to continue the management contract with Fidelity Management & Research Company (FMR) and the sub-advisory agreements (together, the Advisory Contracts) for the fund for six months through January 31, 2019, in connection with the reunification of the Fidelity Equity High Income Funds Board, which oversees the fund, and the Sector Portfolios Board.
The Board considered that the approval of the fund's Advisory Contracts will not result in any changes in (i) the investment process or strategies employed in the management of the fund's assets; (ii) the fees and expenses paid by shareholders; (iii) the nature, extent or quality of services provided under the fund's Advisory Contracts; or (iv) the day-to-day management of the fund or the persons primarily responsible for such management. The Board concluded that the fund's Advisory Contracts are fair and reasonable, and that the fund's Advisory Contracts should be renewed, without modification, through January 31, 2019, with the understanding that the Board will consider the annual renewal for a full one year period in January 2019.
In connection with its consideration of future renewals of the fund's Advisory Contracts, the Board will consider: (i) the nature, extent and quality of services provided to the fund, including shareholder and administrative services and investment performance; (ii) the competitiveness of the management fee and total expenses for the fund; (iii) the costs of the services and profitability, including the revenues earned and the expenses incurred in conducting the business of developing, marketing, distributing, managing, administering, and servicing the fund and its shareholders, to the extent applicable, as well as potential fall-out benefits from Fidelity's non-fund businesses; and (iv) whether there have been economies of scale in respect of the Fidelity funds, whether the Fidelity funds (including the fund) have appropriately benefited from any such economies of scale, and whether there is the potential for realization of any further economies.
Based on its evaluation of all of the conclusions noted above, and after considering all factors it believed relevant, the Board ultimately concluded that the fund's management fee structure is fair and reasonable, and that the continuation of the fund's Advisory Contracts should be approved.
Corporate Headquarters
245 Summer St.
Boston, MA 02210
www.fidelity.com
FVD-ANN-0918
1.788864.115
Fidelity® Value Discovery Fund Class K
Annual Report July 31, 2018 |
|
Contents
To view a fund's proxy voting guidelines and proxy voting record for the 12-month period ended June 30, visit http://www.fidelity.com/proxyvotingresults or visit the Securities and Exchange Commission's (SEC) web site at http://www.sec.gov.
You may also call 1-800-835-5092 to request a free copy of the proxy voting guidelines.
Standard & Poor's, S&P and S&P 500 are registered service marks of The McGraw-Hill Companies, Inc. and have been licensed for use by Fidelity Distributors Corporation.
Other third-party marks appearing herein are the property of their respective owners.
All other marks appearing herein are registered or unregistered trademarks or service marks of FMR LLC or an affiliated company. © 2018 FMR LLC. All rights reserved.
This report and the financial statements contained herein are submitted for the general information of the shareholders of the Fund. This report is not authorized for distribution to prospective investors in the Fund unless preceded or accompanied by an effective prospectus.
A fund files its complete schedule of portfolio holdings with the SEC for the first and third quarters of each fiscal year on Form N-Q. Forms N-Q are available on the SEC’s web site at http://www.sec.gov. A fund's Forms N-Q may be reviewed and copied at the SEC’s Public Reference Room in Washington, DC. Information regarding the operation of the SEC's Public Reference Room may be obtained by calling 1-800-SEC-0330.
For a complete list of a fund's portfolio holdings, view the most recent holdings listing, semiannual report, or annual report on Fidelity's web site at http://www.fidelity.com, http://www.institutional.fidelity.com, or http://www.401k.com, as applicable.
NOT FDIC INSURED •MAY LOSE VALUE •NO BANK GUARANTEE
Neither the Fund nor Fidelity Distributors Corporation is a bank.
Performance: The Bottom Line
Average annual total return reflects the change in the value of an investment, assuming reinvestment of distributions from dividend income and capital gains (the profits earned upon the sale of securities that have grown in value, if any) and assuming a constant rate of performance each year. The hypothetical investment and the average annual total returns do not reflect the deduction of taxes that a shareholder would pay on fund distributions or the redemption of fund shares. During periods of reimbursement by Fidelity, a fund’s total return will be greater than it would be had the reimbursement not occurred. How a fund did yesterday is no guarantee of how it will do tomorrow.
Average Annual Total Returns
| For the periods ended July 31, 2018 | Past 1 year | Past 5 years | Past 10 years |
| Class K | 6.34% | 10.16% | 8.74% |
$10,000 Over 10 Years
Let's say hypothetically that $10,000 was invested in Fidelity® Value Discovery Fund - Class K on July 31, 2008.
The chart shows how the value of your investment would have changed, and also shows how the Russell 3000® Value Index performed over the same period.
See above for additional information regarding the performance of Class K.

| Period Ending Values |
| $23,121 | Fidelity® Value Discovery Fund - Class K |
| $23,668 | Russell 3000® Value Index |
Management's Discussion of Fund Performance
Market Recap: The U.S. equity bellwether S&P 500
® index gained 16.24% for the 12 months ending July 31, 2018, despite a resurgence in volatility that challenged the multiyear bull market. Stocks maintained their steady growth until a sharp reversal in February, as volatility spiked amid fear that rising inflation and the potential for the economy to overheat would prompt the U.S. Federal Reserve to pick up the pace of interest rate hikes. The index posted its first negative monthly result since October 2016, and then lost further ground in March on fear of a global trade war. The market stabilized in April and turned upward through mid-June, when escalating trade tension between the U.S. and China soured investor sentiment. The resulting uncertainty lingered into July, but strong corporate earnings helped the S&P 500 rise 3.72% that month to cap the period. For the full one-year period, growth handily topped value, while small-caps bested large-caps. By sector, information technology (+28%) led the way, boosted by strong earnings growth from several major index constituents. Consumer discretionary rose roughly 24%, driven by retailers (+49%). Energy (+20%) gained alongside higher oil prices. Laggards were telecommunication services (-2%), consumer staples (0%) and utilities (+3%), defensive groups that struggled amid rising interest rates and a general preference for risk. Real estate (+5%) fared a bit better but still lagged, as did financials, industrials, health care (each up 13%) and materials (+11%).
Comments from Portfolio Manager Sean Gavin: For the fiscal year, the fund's share classes gained roughly 6%, trailing the 9.91% result of the benchmark Russell 3000
® Value Index. The fund's underperformance of the benchmark was due to ineffective stock picking, coupled with an unfavorable market backdrop for my style of investing. Security selection in the health care, financials and energy sectors were the largest relative detractors. Conversely, industry positioning – which derives from my bottom-up, stock-by-stock investment approach – helped the fund’s relative result, with an underweighting in the weak real estate group contributing most. My picks in consumer staples also provided a boost. On an individual basis, the biggest impact came from a non-benchmark equity position in Israeli drug maker Teva Pharmaceutical Industries, which returned -51% for the fund before I sold the position last fall. Over time, I concluded the company's challenges were too deep-rooted to justify further investment. Other detractors from the health care sector included drug store operator and pharmacy benefit management company CVS Health and drugmaker Allergan. Elsewhere, information-analytics company Nielsen Holdings also detracted. On the positive side, the biggest individual relative contributor stemmed from my decision to largely avoid benchmark component General Electric, which struggled amid numerous business challenges. Also, in consumer staples, we did not hold poor-performing benchmark stocks Procter & Gamble, a consumer-products company, and tobacco manufacturer Philip Morris International. It helped to overweight media company Twenty-First Century Fox, which was poised to be acquired by Disney. Both Fox and Disney were meaningful holdings in the fund at period end.
The views expressed above reflect those of the portfolio manager(s) only through the end of the period as stated on the cover of this report and do not necessarily represent the views of Fidelity or any other person in the Fidelity organization. Any such views are subject to change at any time based upon market or other conditions and Fidelity disclaims any responsibility to update such views. These views may not be relied on as investment advice and, because investment decisions for a Fidelity fund are based on numerous factors, may not be relied on as an indication of trading intent on behalf of any Fidelity fund.
Investment Summary (Unaudited)
Top Ten Stocks as of July 31, 2018
| | % of fund's net assets |
| JPMorgan Chase & Co. | 3.6 |
| Wells Fargo & Co. | 3.5 |
| Exxon Mobil Corp. | 2.9 |
| Berkshire Hathaway, Inc. Class B | 2.8 |
| Comcast Corp. Class A | 2.4 |
| Amgen, Inc. | 2.1 |
| U.S. Bancorp | 2.1 |
| CVS Health Corp. | 1.9 |
| Verizon Communications, Inc. | 1.9 |
| United Technologies Corp. | 1.8 |
| | 25.0 |
Top Five Market Sectors as of July 31, 2018
| | % of fund's net assets |
| Financials | 26.0 |
| Health Care | 15.1 |
| Energy | 11.6 |
| Consumer Discretionary | 11.2 |
| Information Technology | 8.2 |
Asset Allocation (% of fund's net assets)
| As of July 31, 2018* |
| | Stocks | 97.5% |
| | Short-Term Investments and Net Other Assets (Liabilities) | 2.5% |

* Foreign investments - 19.5%
Schedule of Investments July 31, 2018
Showing Percentage of Net Assets
| Common Stocks - 97.5% | | | |
| | | Shares | Value |
| CONSUMER DISCRETIONARY - 11.2% | | | |
| Media - 9.6% | | | |
| Cinemark Holdings, Inc. | | 417,979 | $15,013,806 |
| Comcast Corp. Class A | | 1,626,503 | 58,196,277 |
| Entercom Communications Corp. Class A (a) | | 1,367,736 | 10,326,407 |
| Interpublic Group of Companies, Inc. | | 1,251,945 | 28,231,360 |
| Lions Gate Entertainment Corp. Class B | | 948,377 | 21,689,382 |
| The Walt Disney Co. | | 320,808 | 36,430,956 |
| Twenty-First Century Fox, Inc. Class A | | 929,433 | 41,824,485 |
| WPP PLC | | 1,134,700 | 17,748,966 |
| | | | 229,461,639 |
| Multiline Retail - 0.6% | | | |
| Dollar General Corp. | | 154,900 | 15,203,435 |
| Textiles, Apparel & Luxury Goods - 1.0% | | | |
| PVH Corp. | | 147,928 | 22,709,907 |
|
| TOTAL CONSUMER DISCRETIONARY | | | 267,374,981 |
|
| CONSUMER STAPLES - 8.2% | | | |
| Beverages - 1.9% | | | |
| C&C Group PLC | | 3,432,610 | 13,807,893 |
| Coca-Cola European Partners PLC | | 270,600 | 11,159,544 |
| PepsiCo, Inc. | | 167,635 | 19,278,025 |
| | | | 44,245,462 |
| Food & Staples Retailing - 1.1% | | | |
| Sysco Corp. | | 202,346 | 13,599,675 |
| Walmart, Inc. | | 153,600 | 13,705,728 |
| | | | 27,305,403 |
| Food Products - 3.8% | | | |
| Kellogg Co. | | 319,186 | 22,671,782 |
| Mondelez International, Inc. | | 263,700 | 11,439,306 |
| Seaboard Corp. | | 2,189 | 7,963,582 |
| The Hershey Co. | | 119,508 | 11,736,881 |
| The J.M. Smucker Co. | | 330,261 | 36,698,602 |
| | | | 90,510,153 |
| Tobacco - 1.4% | | | |
| British American Tobacco PLC: | | | |
| (United Kingdom) | | 195,900 | 10,769,077 |
| sponsored ADR | | 412,452 | 22,594,121 |
| | | | 33,363,198 |
|
| TOTAL CONSUMER STAPLES | | | 195,424,216 |
|
| ENERGY - 11.6% | | | |
| Energy Equipment & Services - 1.4% | | | |
| Baker Hughes, a GE Co. Class A | | 793,234 | 27,430,032 |
| Dril-Quip, Inc. (b) | | 110,570 | 5,699,884 |
| | | | 33,129,916 |
| Oil, Gas & Consumable Fuels - 10.2% | | | |
| Chevron Corp. | | 326,337 | 41,206,573 |
| Exxon Mobil Corp. | | 843,740 | 68,773,247 |
| FLEX LNG Ltd. (a)(b) | | 5,399,800 | 8,109,647 |
| GasLog Ltd. | | 256,608 | 4,323,845 |
| GasLog Partners LP | | 780,682 | 19,634,152 |
| Golar LNG Partners LP | | 1,185,160 | 19,448,476 |
| Hoegh LNG Partners LP | | 389,395 | 7,164,868 |
| Phillips 66 Co. | | 241,705 | 29,811,895 |
| Suncor Energy, Inc. | | 478,600 | 20,154,290 |
| Teekay Corp. (a) | | 885,992 | 6,175,364 |
| Teekay LNG Partners LP | | 780,099 | 12,481,584 |
| Teekay Offshore Partners LP | | 2,310,169 | 5,867,829 |
| | | | 243,151,770 |
|
| TOTAL ENERGY | | | 276,281,686 |
|
| FINANCIALS - 26.0% | | | |
| Banks - 12.0% | | | |
| JPMorgan Chase & Co. | | 754,373 | 86,715,171 |
| PNC Financial Services Group, Inc. | | 211,231 | 30,592,586 |
| SunTrust Banks, Inc. | | 502,431 | 36,210,202 |
| U.S. Bancorp | | 939,233 | 49,788,741 |
| Wells Fargo & Co. | | 1,445,386 | 82,806,164 |
| | | | 286,112,864 |
| Capital Markets - 2.2% | | | |
| Goldman Sachs Group, Inc. | | 140,820 | 33,434,893 |
| State Street Corp. | | 214,119 | 18,908,849 |
| | | | 52,343,742 |
| Consumer Finance - 2.8% | | | |
| Capital One Financial Corp. | | 206,532 | 19,480,098 |
| Discover Financial Services | | 334,722 | 23,902,498 |
| Synchrony Financial | | 751,107 | 21,737,037 |
| | | | 65,119,633 |
| Diversified Financial Services - 3.3% | | | |
| Berkshire Hathaway, Inc. Class B (b) | | 342,360 | 67,742,773 |
| Cannae Holdings, Inc. (b) | | 158,930 | 2,900,473 |
| Standard Life PLC | | 2,046,576 | 8,389,107 |
| | | | 79,032,353 |
| Insurance - 4.2% | | | |
| Allstate Corp. | | 144,207 | 13,716,970 |
| Chubb Ltd. | | 182,847 | 25,547,383 |
| FNF Group | | 333,248 | 13,496,544 |
| Prudential PLC | | 766,007 | 18,072,816 |
| The Travelers Companies, Inc. | | 218,015 | 28,372,472 |
| | | | 99,206,185 |
| Mortgage Real Estate Investment Trusts - 1.5% | | | |
| AGNC Investment Corp. | | 670,611 | 13,056,796 |
| Annaly Capital Management, Inc. | | 1,259,111 | 13,497,670 |
| MFA Financial, Inc. | | 1,165,665 | 9,383,603 |
| | | | 35,938,069 |
|
| TOTAL FINANCIALS | | | 617,752,846 |
|
| HEALTH CARE - 15.1% | | | |
| Biotechnology - 3.5% | | | |
| Amgen, Inc. | | 255,393 | 50,197,494 |
| Dyax Corp. rights 12/31/19 (b)(c) | | 635,500 | 2,275,090 |
| Shire PLC sponsored ADR | | 187,119 | 31,924,373 |
| | | | 84,396,957 |
| Health Care Providers & Services - 6.5% | | | |
| Aetna, Inc. | | 115,126 | 21,688,587 |
| Anthem, Inc. | | 99,789 | 25,246,617 |
| Cigna Corp. | | 178,964 | 32,109,721 |
| CVS Health Corp. | | 701,265 | 45,484,048 |
| McKesson Corp. | | 67,952 | 8,534,771 |
| UnitedHealth Group, Inc. | | 84,700 | 21,447,734 |
| | | | 154,511,478 |
| Pharmaceuticals - 5.1% | | | |
| Allergan PLC | | 166,614 | 30,671,971 |
| Bayer AG | | 337,020 | 37,519,484 |
| Johnson & Johnson | | 83,380 | 11,049,518 |
| Pfizer, Inc. | | 231,057 | 9,226,106 |
| Roche Holding AG (participation certificate) | | 52,494 | 12,894,968 |
| Sanofi SA sponsored ADR | | 451,242 | 19,565,853 |
| | | | 120,927,900 |
|
| TOTAL HEALTH CARE | | | 359,836,335 |
|
| INDUSTRIALS - 5.9% | | | |
| Aerospace & Defense - 2.8% | | | |
| Harris Corp. | | 105,284 | 17,366,596 |
| Huntington Ingalls Industries, Inc. | | 20,581 | 4,796,402 |
| United Technologies Corp. | | 320,879 | 43,556,115 |
| | | | 65,719,113 |
| Machinery - 1.1% | | | |
| Allison Transmission Holdings, Inc. | | 205,004 | 9,635,188 |
| Deere & Co. | | 121,988 | 17,662,643 |
| | | | 27,297,831 |
| Professional Services - 0.7% | | | |
| Dun & Bradstreet Corp. | | 26,117 | 3,287,869 |
| Nielsen Holdings PLC | | 572,819 | 13,495,616 |
| | | | 16,783,485 |
| Road & Rail - 1.3% | | | |
| Union Pacific Corp. | | 200,972 | 30,123,693 |
|
| TOTAL INDUSTRIALS | | | 139,924,122 |
|
| INFORMATION TECHNOLOGY - 8.2% | | | |
| Communications Equipment - 1.8% | | | |
| Cisco Systems, Inc. | | 559,571 | 23,664,258 |
| F5 Networks, Inc. (b) | | 112,448 | 19,271,338 |
| | | | 42,935,596 |
| Electronic Equipment & Components - 0.9% | | | |
| TE Connectivity Ltd. | | 235,034 | 21,992,131 |
| Internet Software & Services - 2.4% | | | |
| Alphabet, Inc. Class A (b) | | 26,348 | 32,334,793 |
| comScore, Inc. (b) | | 616,916 | 12,338,320 |
| eBay, Inc. (b) | | 367,469 | 12,291,838 |
| | | | 56,964,951 |
| IT Services - 1.9% | | | |
| Amdocs Ltd. | | 227,282 | 15,359,718 |
| Cognizant Technology Solutions Corp. Class A | | 222,013 | 18,094,060 |
| The Western Union Co. | | 622,494 | 12,549,479 |
| | | | 46,003,257 |
| Technology Hardware, Storage & Peripherals - 1.2% | | | |
| Apple, Inc. | | 145,854 | 27,754,558 |
|
| TOTAL INFORMATION TECHNOLOGY | | | 195,650,493 |
|
| MATERIALS - 4.5% | | | |
| Chemicals - 3.1% | | | |
| DowDuPont, Inc. | | 520,773 | 35,813,559 |
| LyondellBasell Industries NV Class A | | 257,540 | 28,532,857 |
| The Scotts Miracle-Gro Co. Class A | | 105,374 | 8,369,857 |
| | | | 72,716,273 |
| Containers & Packaging - 1.4% | | | |
| Ball Corp. | | 414,095 | 16,137,282 |
| Graphic Packaging Holding Co. | | 1,204,939 | 17,507,764 |
| | | | 33,645,046 |
|
| TOTAL MATERIALS | | | 106,361,319 |
|
| REAL ESTATE - 1.2% | | | |
| Real Estate Management & Development - 1.2% | | | |
| CBRE Group, Inc. (b) | | 584,493 | 29,107,751 |
| TELECOMMUNICATION SERVICES - 2.7% | | | |
| Diversified Telecommunication Services - 2.7% | | | |
| AT&T, Inc. | | 617,651 | 19,746,302 |
| Verizon Communications, Inc. | | 876,918 | 45,284,046 |
| | | | 65,030,348 |
| UTILITIES - 2.9% | | | |
| Electric Utilities - 2.9% | | | |
| Exelon Corp. | | 822,912 | 34,973,760 |
| PPL Corp. | | 196,398 | 5,650,370 |
| Xcel Energy, Inc. | | 614,152 | 28,779,163 |
| | | | 69,403,293 |
| TOTAL COMMON STOCKS | | | |
| (Cost $2,125,657,521) | | | 2,322,147,390 |
|
| Money Market Funds - 3.1% | | | |
| Fidelity Cash Central Fund, 1.96% (d) | | 60,340,640 | 60,352,708 |
| Fidelity Securities Lending Cash Central Fund 1.97% (d)(e) | | 14,066,735 | 14,068,142 |
| TOTAL MONEY MARKET FUNDS | | | |
| (Cost $74,421,287) | | | 74,420,850 |
| TOTAL INVESTMENT IN SECURITIES - 100.6% | | | |
| (Cost $2,200,078,808) | | | 2,396,568,240 |
| NET OTHER ASSETS (LIABILITIES) - (0.6)% | | | (15,421,344) |
| NET ASSETS - 100% | | | $2,381,146,896 |
Legend
(a) Security or a portion of the security is on loan at period end.
(b) Non-income producing
(c) Level 3 security
(d) Affiliated fund that is generally available only to investment companies and other accounts managed by Fidelity Investments. The rate quoted is the annualized seven-day yield of the fund at period end. A complete unaudited listing of the fund's holdings as of its most recent quarter end is available upon request. In addition, each Fidelity Central Fund's financial statements, which are not covered by the Fund's Report of Independent Registered Public Accounting Firm, are available on the SEC's website or upon request.
(e) Investment made with cash collateral received from securities on loan.
Affiliated Central Funds
Information regarding fiscal year to date income earned by the Fund from investments in Fidelity Central Funds is as follows:
| Fund | Income earned |
| Fidelity Cash Central Fund | $1,539,223 |
| Fidelity Securities Lending Cash Central Fund | 322,883 |
| Total | $1,862,106 |
Amounts in the income column in the above table include any capital gain distributions from underlying funds, which are presented in the corresponding line-item in the Statement of Operations if applicable.
Investment Valuation
The following is a summary of the inputs used, as of July 31, 2018, involving the Fund's assets and liabilities carried at fair value. The inputs or methodology used for valuing securities may not be an indication of the risk associated with investing in those securities. For more information on valuation inputs, and their aggregation into the levels used below, please refer to the Investment Valuation section in the accompanying Notes to Financial Statements.
| | Valuation Inputs at Reporting Date: |
| Description | Total | Level 1 | Level 2 | Level 3 |
| Investments in Securities: | | | | |
| Equities: | | | | |
| Consumer Discretionary | $267,374,981 | $249,626,015 | $17,748,966 | $-- |
| Consumer Staples | 195,424,216 | 184,655,139 | 10,769,077 | -- |
| Energy | 276,281,686 | 276,281,686 | -- | -- |
| Financials | 617,752,846 | 599,680,030 | 18,072,816 | -- |
| Health Care | 359,836,335 | 307,146,793 | 50,414,452 | 2,275,090 |
| Industrials | 139,924,122 | 139,924,122 | -- | -- |
| Information Technology | 195,650,493 | 195,650,493 | -- | -- |
| Materials | 106,361,319 | 106,361,319 | -- | -- |
| Real Estate | 29,107,751 | 29,107,751 | -- | -- |
| Telecommunication Services | 65,030,348 | 65,030,348 | -- | -- |
| Utilities | 69,403,293 | 69,403,293 | -- | -- |
| Money Market Funds | 74,420,850 | 74,420,850 | -- | -- |
| Total Investments in Securities: | $2,396,568,240 | $2,297,287,839 | $97,005,311 | $2,275,090 |
The following is a summary of transfers between Level 1 and Level 2 for the period ended July 31, 2018. Transfers are assumed to have occurred at the beginning of the period, and are primarily attributable to the valuation techniques used for foreign equity securities, as discussed in the accompanying Notes to Financial Statements:
| Transfers | Total |
| Level 1 to Level 2 | $36,277,432 |
| Level 2 to Level 1 | $0 |
Other Information
Distribution of investments by country or territory of incorporation, as a percentage of Total Net Assets, is as follows (Unaudited):
| United States of America | 80.5% |
| United Kingdom | 3.6% |
| Marshall Islands | 3.0% |
| Switzerland | 2.5% |
| Bailiwick of Jersey | 2.1% |
| Ireland | 1.9% |
| Canada | 1.7% |
| Germany | 1.6% |
| Netherlands | 1.2% |
| Others (Individually Less Than 1%) | 1.9% |
| | 100.0% |
See accompanying notes which are an integral part of the financial statements.
Financial Statements
Statement of Assets and Liabilities
| | | July 31, 2018 |
| Assets | | |
Investment in securities, at value (including securities loaned of $13,601,659) — See accompanying schedule:
Unaffiliated issuers (cost $2,125,657,521) | $2,322,147,390 | |
| Fidelity Central Funds (cost $74,421,287) | 74,420,850 | |
| Total Investment in Securities (cost $2,200,078,808) | | $2,396,568,240 |
| Receivable for investments sold | | 7,836,089 |
| Receivable for fund shares sold | | 1,157,449 |
| Dividends receivable | | 2,283,747 |
| Distributions receivable from Fidelity Central Funds | | 117,038 |
| Prepaid expenses | | 5,799 |
| Other receivables | | 51,014 |
| Total assets | | 2,408,019,376 |
| Liabilities | | |
| Payable for fund shares redeemed | $11,601,089 | |
| Accrued management fee | 784,064 | |
| Other affiliated payables | 360,655 | |
| Other payables and accrued expenses | 60,580 | |
| Collateral on securities loaned | 14,066,092 | |
| Total liabilities | | 26,872,480 |
| Net Assets | | $2,381,146,896 |
| Net Assets consist of: | | |
| Paid in capital | | $2,148,155,963 |
| Undistributed net investment income | | 22,670,477 |
| Accumulated undistributed net realized gain (loss) on investments and foreign currency transactions | | 13,826,461 |
| Net unrealized appreciation (depreciation) on investments and assets and liabilities in foreign currencies | | 196,493,995 |
| Net Assets | | $2,381,146,896 |
| Value Discovery: | | |
| Net Asset Value, offering price and redemption price per share ($2,313,811,459 ÷ 79,097,168 shares) | | $29.25 |
| Class K: | | |
| Net Asset Value, offering price and redemption price per share ($67,335,437 ÷ 2,299,644 shares) | | $29.28 |
See accompanying notes which are an integral part of the financial statements.
Statement of Operations
| | | Year ended July 31, 2018 |
| Investment Income | | |
| Dividends | | $68,659,917 |
| Income from Fidelity Central Funds | | 1,862,106 |
| Total income | | 70,522,023 |
| Expenses | | |
| Management fee | | |
| Basic fee | $17,541,221 | |
| Performance adjustment | (1,772,182) | |
| Transfer agent fees | 5,299,510 | |
| Accounting and security lending fees | 933,282 | |
| Custodian fees and expenses | 53,895 | |
| Independent trustees' fees and expenses | 14,003 | |
| Registration fees | 129,153 | |
| Audit | 50,290 | |
| Legal | 10,076 | |
| Interest | 2,407 | |
| Miscellaneous | 22,533 | |
| Total expenses before reductions | 22,284,188 | |
| Expense reductions | (202,864) | |
| Total expenses after reductions | | 22,081,324 |
| Net investment income (loss) | | 48,440,699 |
| Realized and Unrealized Gain (Loss) | | |
| Net realized gain (loss) on: | | |
| Investment securities: | | |
| Unaffiliated issuers | 24,402,597 | |
| Redemptions in-kind with affiliated entities | 237,440,352 | |
| Fidelity Central Funds | 20,271 | |
| Foreign currency transactions | (147,043) | |
| Total net realized gain (loss) | | 261,716,177 |
| Change in net unrealized appreciation (depreciation) on: | | |
| Investment securities: | | |
| Unaffiliated issuers | (116,435,255) | |
| Fidelity Central Funds | (19,343) | |
| Assets and liabilities in foreign currencies | (12,411) | |
| Total change in net unrealized appreciation (depreciation) | | (116,467,009) |
| Net gain (loss) | | 145,249,168 |
| Net increase (decrease) in net assets resulting from operations | | $193,689,867 |
See accompanying notes which are an integral part of the financial statements.
Statement of Changes in Net Assets
| | Year ended July 31, 2018 | Year ended July 31, 2017 |
| Increase (Decrease) in Net Assets | | |
| Operations | | |
| Net investment income (loss) | $48,440,699 | $32,580,564 |
| Net realized gain (loss) | 261,716,177 | 133,084,183 |
| Change in net unrealized appreciation (depreciation) | (116,467,009) | 205,438,984 |
| Net increase (decrease) in net assets resulting from operations | 193,689,867 | 371,103,731 |
| Distributions to shareholders from net investment income | (38,872,556) | (23,479,663) |
| Distributions to shareholders from net realized gain | (29,026,203) | (411,905) |
| Total distributions | (67,898,759) | (23,891,568) |
| Share transactions - net increase (decrease) | (566,361,059) | 539,346,673 |
| Total increase (decrease) in net assets | (440,569,951) | 886,558,836 |
| Net Assets | | |
| Beginning of period | 2,821,716,847 | 1,935,158,011 |
| End of period | $2,381,146,896 | $2,821,716,847 |
| Other Information | | |
| Undistributed net investment income end of period | $22,670,477 | $15,946,340 |
See accompanying notes which are an integral part of the financial statements.
Financial Highlights
Fidelity Value Discovery Fund
| Years ended July 31, | 2018 | 2017 | 2016 | 2015 | 2014 |
| Selected Per–Share Data | | | | | |
| Net asset value, beginning of period | $28.10 | $24.16 | $24.99 | $23.32 | $19.93 |
| Income from Investment Operations | | | | | |
| Net investment income (loss)A | .42 | .38 | .34 | .66B | .31 |
| Net realized and unrealized gain (loss) | 1.28 | 3.86 | (.38)C | 1.35 | 3.34 |
| Total from investment operations | 1.70 | 4.24 | (.04) | 2.01 | 3.65 |
| Distributions from net investment income | (.31) | (.29) | (.47) | (.32) | (.26) |
| Distributions from net realized gain | (.24) | (.01) | (.32) | (.02) | – |
| Total distributions | (.55) | (.30) | (.79) | (.34) | (.26) |
| Net asset value, end of period | $29.25 | $28.10 | $24.16 | $24.99 | $23.32 |
| Total ReturnD | 6.19% | 17.70% | .05% | 8.68% | 18.52% |
| Ratios to Average Net AssetsE,F | | | | | |
| Expenses before reductions | .69% | .75% | .86% | .84% | .80% |
| Expenses net of fee waivers, if any | .69% | .75% | .86% | .84% | .80% |
| Expenses net of all reductions | .69% | .75% | .86% | .84% | .80% |
| Net investment income (loss) | 1.50% | 1.44% | 1.46% | 2.69%B | 1.44% |
| Supplemental Data | | | | | |
| Net assets, end of period (000 omitted) | $2,313,811 | $2,708,049 | $1,712,212 | $1,205,423 | $686,767 |
| Portfolio turnover rateG | 33%H | 32%H | 41% | 45% | 58% |
A Calculated based on average shares outstanding during the period.
B Net investment income per share reflects a large, non-recurring dividend which amounted to $.26 per share. Excluding this non-recurring dividend, the ratio of net investment income (loss) to average net assets would have been 1.62%.
C The amount shown for a share outstanding does not correspond with the aggregate net gain (loss) on investments for the period due to the timing of sales and repurchases of shares in relation to fluctuating market values of the investments of the Fund.
D Total returns would have been lower if certain expenses had not been reduced during the applicable periods shown.
E Fees and expenses of any underlying Fidelity Central Funds are not included in the Fund's expense ratio. The Fund indirectly bears its proportionate share of the expenses of any underlying Fidelity Central Funds.
F Expense ratios reflect operating expenses of the class. Expenses before reductions do not reflect amounts reimbursed by the investment adviser or reductions from brokerage service arrangements or reductions from other expense offset arrangements and do not represent the amount paid by the class during periods when reimbursements or reductions occur. Expenses net of fee waivers reflect expenses after reimbursement by the investment adviser but prior to reductions from brokerage service arrangements or other expense offset arrangements. Expenses net of all reductions represent the net expenses paid by the class.
G Amount does not include the portfolio activity of any underlying Fidelity Central Funds.
H Portfolio turnover rate excludes securities received or delivered in-kind.
See accompanying notes which are an integral part of the financial statements.
Fidelity Value Discovery Fund Class K
| Years ended July 31, | 2018 | 2017 | 2016 | 2015 | 2014 |
| Selected Per–Share Data | | | | | |
| Net asset value, beginning of period | $28.11 | $24.17 | $24.99 | $23.32 | $19.93 |
| Income from Investment Operations | | | | | |
| Net investment income (loss)A | .46 | .41 | .38 | .69B | .34 |
| Net realized and unrealized gain (loss) | 1.28 | 3.86 | (.38)C | 1.34 | 3.34 |
| Total from investment operations | 1.74 | 4.27 | –D | 2.03 | 3.68 |
| Distributions from net investment income | (.33) | (.32) | (.50) | (.34) | (.29) |
| Distributions from net realized gain | (.24) | (.01) | (.32) | (.02) | – |
| Total distributions | (.57) | (.33) | (.82) | (.36) | (.29) |
| Net asset value, end of period | $29.28 | $28.11 | $24.17 | $24.99 | $23.32 |
| Total ReturnE | 6.34% | 17.82% | .24% | 8.80% | 18.71% |
| Ratios to Average Net AssetsF,G | | | | | |
| Expenses before reductions | .57% | .63% | .70% | .71% | .66% |
| Expenses net of fee waivers, if any | .57% | .63% | .70% | .71% | .66% |
| Expenses net of all reductions | .56% | .63% | .70% | .71% | .66% |
| Net investment income (loss) | 1.62% | 1.56% | 1.62% | 2.82%B | 1.58% |
| Supplemental Data | | | | | |
| Net assets, end of period (000 omitted) | $67,335 | $113,668 | $222,946 | $196,460 | $114,246 |
| Portfolio turnover rateH | 33%I | 32%I | 41% | 45% | 58% |
A Calculated based on average shares outstanding during the period.
B Net investment income per share reflects a large, non-recurring dividend which amounted to $.26 per share. Excluding this non-recurring dividend, the ratio of net investment income (loss) to average net assets would have been 1.75%.
C The amount shown for a share outstanding does not correspond with the aggregate net gain (loss) on investments for the period due to the timing of sales and repurchases of shares in relation to fluctuating market values of the investments of the Fund.
D Amount represents less than $.005 per share.
E Total returns would have been lower if certain expenses had not been reduced during the applicable periods shown.
F Fees and expenses of any underlying Fidelity Central Funds are not included in the Fund's expense ratio. The Fund indirectly bears its proportionate share of the expenses of any underlying Fidelity Central Funds.
G Expense ratios reflect operating expenses of the class. Expenses before reductions do not reflect amounts reimbursed by the investment adviser or reductions from brokerage service arrangements or reductions from other expense offset arrangements and do not represent the amount paid by the class during periods when reimbursements or reductions occur. Expenses net of fee waivers reflect expenses after reimbursement by the investment adviser but prior to reductions from brokerage service arrangements or other expense offset arrangements. Expenses net of all reductions represent the net expenses paid by the class.
H Amount does not include the portfolio activity of any underlying Fidelity Central Funds.
I Portfolio turnover rate excludes securities received or delivered in-kind.
See accompanying notes which are an integral part of the financial statements.
Notes to Financial Statements
For the period ended July 31, 2018
1. Organization.
Fidelity Value Discovery Fund (the Fund) is a fund of Fidelity Puritan Trust (the Trust) and is authorized to issue an unlimited number of shares. The Trust is registered under the Investment Company Act of 1940, as amended (the 1940 Act), as an open-end management investment company organized as a Massachusetts business trust. The Fund offers Value Discovery and Class K shares, each of which has equal rights as to assets and voting privileges. Each class has exclusive voting rights with respect to matters that affect that class.
2. Investments in Fidelity Central Funds.
The Fund invests in Fidelity Central Funds, which are open-end investment companies generally available only to other investment companies and accounts managed by the investment adviser and its affiliates. The Fund's Schedule of Investments lists each of the Fidelity Central Funds held as of period end, if any, as an investment of the Fund, but does not include the underlying holdings of each Fidelity Central Fund. As an Investing Fund, the Fund indirectly bears its proportionate share of the expenses of the underlying Fidelity Central Funds.
The Money Market Central Funds seek preservation of capital and current income and are managed by Fidelity Investments Money Management, Inc. (FIMM), an affiliate of the investment adviser. Annualized expenses of the Money Market Central Funds as of their most recent shareholder report date are less than .005%.
A complete unaudited list of holdings for each Fidelity Central Fund is available upon request or at the Securities and Exchange Commission (the SEC) website at www.sec.gov. In addition, the financial statements of the Fidelity Central Funds, which are not covered by the Fund's Report of Independent Registered Public Accounting Firm, are available on the SEC website or upon request.
3. Significant Accounting Policies.
The Fund is an investment company and applies the accounting and reporting guidance of the Financial Accounting Standards Board (FASB) Accounting Standards Codification Topic 946 Financial Services – Investments Companies. The financial statements have been prepared in conformity with accounting principles generally accepted in the United States of America (GAAP), which require management to make certain estimates and assumptions at the date of the financial statements. Actual results could differ from those estimates. Subsequent events, if any, through the date that the financial statements were issued have been evaluated in the preparation of the financial statements. The following summarizes the significant accounting policies of the Fund:
Investment Valuation. Investments are valued as of 4:00 p.m. Eastern time on the last calendar day of the period. The Board of Trustees (the Board) has delegated the day to day responsibility for the valuation of the Fund's investments to the Fair Value Committee (the Committee) established by the Fund's investment adviser. In accordance with valuation policies and procedures approved by the Board, the Fund attempts to obtain prices from one or more third party pricing vendors or brokers to value its investments. When current market prices, quotations or currency exchange rates are not readily available or reliable, investments will be fair valued in good faith by the Committee, in accordance with procedures adopted by the Board. Factors used in determining fair value vary by investment type and may include market or investment specific events. The frequency with which these procedures are used cannot be predicted and they may be utilized to a significant extent. The Committee oversees the Fund's valuation policies and procedures and reports to the Board on the Committee's activities and fair value determinations. The Board monitors the appropriateness of the procedures used in valuing the Fund's investments and ratifies the fair value determinations of the Committee.
The Fund categorizes the inputs to valuation techniques used to value its investments into a disclosure hierarchy consisting of three levels as shown below:
- Level 1 – quoted prices in active markets for identical investments
- Level 2 – other significant observable inputs (including quoted prices for similar investments, interest rates, prepayment speeds, etc.)
- Level 3 – unobservable inputs (including the Fund's own assumptions based on the best information available)
Valuation techniques used to value the Fund's investments by major category are as follows:
Equity securities, including restricted securities, for which market quotations are readily available, are valued at the last reported sale price or official closing price as reported by a third party pricing vendor on the primary market or exchange on which they are traded and are categorized as Level 1 in the hierarchy. In the event there were no sales during the day or closing prices are not available, securities are valued at the last quoted bid price or may be valued using the last available price and are generally categorized as Level 2 in the hierarchy. For foreign equity securities, when market or security specific events arise, comparisons to the valuation of American Depositary Receipts (ADRs), futures contracts, Exchange-Traded Funds (ETFs) and certain indexes as well as quoted prices for similar securities may be used and would be categorized as Level 2 in the hierarchy. Utilizing these techniques may result in transfers between Level 1 and Level 2. For equity securities, including restricted securities, where observable inputs are limited, assumptions about market activity and risk are used and these securities may be categorized as Level 3 in the hierarchy.
Investments in open-end mutual funds, including the Fidelity Central Funds, are valued at their closing net asset value (NAV) each business day and are categorized as Level 1 in the hierarchy.
Changes in valuation techniques may result in transfers in or out of an assigned level within the disclosure hierarchy. The aggregate value of investments by input level as of July 31, 2018, including information on transfers between Levels 1 and 2, is included at the end of the Fund's Schedule of Investments.
Foreign Currency. The Fund may use foreign currency contracts to facilitate transactions in foreign-denominated securities. Gains and losses from these transactions may arise from changes in the value of the foreign currency or if the counterparties do not perform under the contracts' terms.
Foreign-denominated assets, including investment securities, and liabilities are translated into U.S. dollars at the exchange rates at period end. Purchases and sales of investment securities, income and dividends received and expenses denominated in foreign currencies are translated into U.S. dollars at the exchange rate in effect on the transaction date.
The effects of exchange rate fluctuations on investments are included with the net realized and unrealized gain (loss) on investment securities. Other foreign currency transactions resulting in realized and unrealized gain (loss) are disclosed separately.
Investment Transactions and Income. For financial reporting purposes, the Fund's investment holdings and NAV include trades executed through the end of the last business day of the period. The NAV per share for processing shareholder transactions is calculated as of the close of business of the New York Stock Exchange (NYSE), normally 4:00 p.m. Eastern time and includes trades executed through the end of the prior business day. Gains and losses on securities sold are determined on the basis of identified cost and include proceeds received from litigation. Dividend income is recorded on the ex-dividend date, except for certain dividends from foreign securities where the ex-dividend date may have passed, which are recorded as soon as the Fund is informed of the ex-dividend date. Non-cash dividends included in dividend income, if any, are recorded at the fair market value of the securities received. Income and capital gain distributions from Fidelity Central Funds, if any, are recorded on the ex-dividend date. Certain distributions received by the Fund represent a return of capital or capital gain. The Fund determines the components of these distributions subsequent to the ex-dividend date, based upon receipt of tax filings or other correspondence relating to the underlying investment. These distributions are recorded as a reduction of cost of investments and/or as a realized gain. Investment income is recorded net of foreign taxes withheld where recovery of such taxes is uncertain.
Class Allocations and Expenses. Investment income, realized and unrealized capital gains and losses, common expenses of the Fund, and certain fund-level expense reductions, if any, are allocated daily on a pro-rata basis to each class based on the relative net assets of each class to the total net assets of the Fund. Each class differs with respect to transfer agent fees incurred. Certain expense reductions may also differ by class. For the reporting period, the allocated portion of income and expenses to each class as a percent of its average net assets may vary due to the timing of recording these transactions in relation to fluctuating net assets of the classes. Expenses directly attributable to a fund are charged to that fund. Expenses attributable to more than one fund are allocated among the respective funds on the basis of relative net assets or other appropriate methods. Expense estimates are accrued in the period to which they relate and adjustments are made when actual amounts are known.
Income Tax Information and Distributions to Shareholders. Each year, the Fund intends to qualify as a regulated investment company under Subchapter M of the Internal Revenue Code, including distributing substantially all of its taxable income and realized gains. As a result, no provision for U.S. Federal income taxes is required. As of July 31, 2018, the Fund did not have any unrecognized tax benefits in the financial statements; nor is the Fund aware of any tax positions for which it is reasonably possible that the total amounts of unrecognized tax benefits will significantly change in the next twelve months. The Fund files a U.S. federal tax return, in addition to state and local tax returns as required. The Fund's federal income tax returns are subject to examination by the Internal Revenue Service (IRS) for a period of three fiscal years after they are filed. State and local tax returns may be subject to examination for an additional fiscal year depending on the jurisdiction. Foreign taxes are provided for based on the Fund's understanding of the tax rules and rates that exist in the foreign markets in which it invests.
Distributions are declared and recorded on the ex-dividend date. Income and capital gain distributions are declared separately for each class. Income and capital gain distributions are determined in accordance with income tax regulations, which may differ from GAAP. In addition, the Fund claimed a portion of the payment made to redeeming shareholders as a distribution for income tax purposes.
Capital accounts within the financial statements are adjusted for permanent book-tax differences. These adjustments have no impact on net assets or the results of operations. Capital accounts are not adjusted for temporary book-tax differences which will reverse in a subsequent period.
Book-tax differences are primarily due to foreign currency transactions, passive foreign investment companies (PFIC), redemptions in kind, partnerships and losses deferred due to wash sales.
As of period end, the cost and unrealized appreciation (depreciation) in securities, and derivatives if applicable, for federal income tax purposes were as follows:
| Gross unrealized appreciation | $296,172,300 |
| Gross unrealized depreciation | (98,400,026) |
| Net unrealized appreciation (depreciation) | $197,772,274 |
| Tax Cost | $2,198,795,966 |
The tax-based components of distributable earnings as of period end were as follows:
| Undistributed ordinary income | $23,668,919 |
| Undistributed long-term capital gain | $12,543,619 |
| Net unrealized appreciation (depreciation) on securities and other investments | $196,778,394 |
The tax character of distributions paid was as follows:
| | July 31, 2018 | July 31, 2017 |
| Ordinary Income | $54,465,144 | $ 23,891,568 |
| Long-term Capital Gains | 13,433,615 | – |
| Total | $67,898,759 | $ 23,891,568 |
4. Purchases and Sales of Investments.
Purchases and sales of securities, other than short-term securities and in-kind transactions, aggregated $1,709,514,122 and $1,018,846,085, respectively.
Redemptions In-Kind. During the period, 1,238,087 shares of the Fund held by unaffiliated entities were redeemed in-kind for investments and cash, with a value of $35,289,423. The net realized gain of $8,392,283 on investments delivered through the in-kind redemptions is included in the accompanying Statement of Operations. The amount of the redemptions is included in share transactions activity shown in the accompanying Statement of Changes in Net Assets as well as the Notes to Financial Statements. The Fund recognized no gain or loss for federal income tax purposes.
5. Fees and Other Transactions with Affiliates.
Management Fee. Fidelity Management & Research Company (the investment adviser) and its affiliates provide the Fund with investment management related services for which the Fund pays a monthly management fee. The management fee is the sum of an individual fund fee rate that is based on an annual rate of .30% of the Fund's average net assets and an annualized group fee rate that averaged .24% during the period. The group fee rate is based upon the average net assets of all the mutual funds advised by the investment adviser, including any mutual funds previously advised by the investment adviser that are currently advised by Fidelity SelectCo, LLC, an affiliate of the investment adviser. The group fee rate decreases as assets under management increase and increases as assets under management decrease. In addition, the management fee is subject to a performance adjustment (up to a maximum of +/- .20% of the Fund's average net assets over a 36 month performance period). The upward or downward adjustment to the management fee is based on the relative investment performance of Value Discovery as compared to its benchmark index, the Russell 3000 Value Index, over the same 36 month performance period. For the reporting period, the total annual management fee rate, including the performance adjustment, was .49% of the Fund's average net assets. The performance adjustment included in the management fee rate may be higher or lower than the maximum performance adjustment rate due to the difference between the average net assets for the reporting and performance periods.
Transfer Agent Fees. Fidelity Investments Institutional Operations Company, Inc., (FIIOC), an affiliate of the investment adviser, is the transfer, dividend disbursing and shareholder servicing agent for each class of the Fund. FIIOC receives account fees and asset-based fees that vary according to the account size and type of account of the shareholders of Value Discovery, except for Class K. FIIOC receives an asset-based fee of Class K's average net assets. FIIOC pays for typesetting, printing and mailing of shareholder reports, except proxy statements.
For the period, transfer agent fees for each class were as follows:
| | Amount | % of Class-Level Average Net Assets |
| Value Discovery | $5,259,000 | .17 |
| Class K | 40,510 | .05 |
| | $5,299,510 | |
Accounting and Security Lending Fees. Fidelity Service Company, Inc. (FSC), an affiliate of the investment adviser, maintains the Fund's accounting records. The accounting fee is based on the level of average net assets for each month. Under a separate contract, FSC administers the security lending program. The security lending fee is based on the number and duration of lending transactions. For the period, the fees were equivalent to an annual rate of .03%.
Brokerage Commissions. The Fund placed a portion of its portfolio transactions with brokerage firms which are affiliates of the investment adviser. Brokerage commissions are included in net realized gain (loss) and change in net unrealized appreciation (depreciation) in the Statement of Operations. The commissions paid to these affiliated firms were $37,564 for the period.
Interfund Lending Program. Pursuant to an Exemptive Order issued by the SEC, the Fund, along with other registered investment companies having management contracts with Fidelity Management & Research Company (FMR) or other affiliated entities of FMR, may participate in an interfund lending program. This program provides an alternative credit facility allowing the funds to borrow from, or lend money to, other participating affiliated funds. At period end, there were no interfund loans outstanding. The Fund's activity in this program during the period for which loans were outstanding was as follows:
| Borrower or Lender | Average Loan Balance | Weighted Average Interest Rate | Interest Expense |
| Borrower | $14,847,000 | 1.95% | $2,407 |
Interfund Trades. The Fund may purchase from or sell securities to other Fidelity Funds under procedures adopted by the Board. The procedures have been designed to ensure these interfund trades are executed in accordance with Rule 17a-7 of the 1940 Act. Interfund trades are included within the respective purchases and sales amounts shown in the Purchases and Sales of Investments note.
Redemptions In-Kind. During the period, 41,999,841 shares of the Fund held by an affiliated entity were redeemed in-kind for investments and cash with a value of $1,195,735,469. The net realized gain of $237,440,352 on investments delivered through in-kind redemptions is included in the accompanying Statement of Operations. The amount of the in-kind redemptions is included in share transactions in the accompanying Statement of Changes in Net Assets as well as the Notes to Financial Statements. The Fund recognized no gain or loss for federal income tax purposes.
Prior Fiscal Year Redemptions In-Kind. During the prior period, 10,568,389 shares of the Fund held by an affiliated entity were redeemed in kind for investments and cash with a value of $296,760,364. The Fund had a net realized gain of $79,326,353 on investments delivered through in-kind redemptions. The amount of in-kind redemptions is included in share transactions in the accompanying Statement of Changes in Net Assets as well as the Notes to Financial Statements. The Fund recognized no gain or loss for federal income tax purposes.
Other. During the period, the investment adviser reimbursed the Fund for certain losses in the amount of $39,027.
6. Committed Line of Credit.
The Fund participates with other funds managed by the investment adviser or an affiliate in a $4.25 billion credit facility (the "line of credit") to be utilized for temporary or emergency purposes to fund shareholder redemptions or for other short-term liquidity purposes. The Fund has agreed to pay commitment fees on its pro-rata portion of the line of credit, which amounted to $9,356 and is reflected in Miscellaneous expenses on the Statement of Operations. During the period, the Fund did not borrow on this line of credit.
7. Security Lending.
The Fund lends portfolio securities through a lending agent from time to time in order to earn additional income. For equity securities, a lending agent is used and may loan securities to certain qualified borrowers, including Fidelity Capital Markets (FCM), a broker-dealer affiliated with the Fund. On the settlement date of the loan, the Fund receives collateral (in the form of U.S. Treasury obligations, letters of credit and/or cash) against the loaned securities and maintains collateral in an amount not less than 100% of the market value of the loaned securities during the period of the loan. The market value of the loaned securities is determined at the close of business of the Fund and any additional required collateral is delivered to the Fund on the next business day. The Fund or borrower may terminate the loan at any time, and if the borrower defaults on its obligation to return the securities loaned because of insolvency or other reasons, the Fund may apply collateral received from the borrower against the obligation. The Fund may experience delays and costs in recovering the securities loaned. Any cash collateral received is invested in the Fidelity Securities Lending Cash Central Fund. The value of loaned securities and cash collateral at period end are disclosed on the Fund's Statement of Assets and Liabilities. Security lending income represents the income earned on investing cash collateral, less rebates paid to borrowers and any lending agent fees associated with the loan, plus any premium payments received for lending certain types of securities. Security lending income is presented in the Statement of Operations as a component of income from Fidelity Central Funds. Total security lending income during the period amounted to $322,883. During the period, there were no securities loaned to FCM.
8. Expense Reductions.
Commissions paid to certain brokers with whom the investment adviser, or its affiliates, places trades on behalf of the Fund include an amount in addition to trade execution, which may be rebated back to the Fund to offset certain expenses. This amount totaled $163,446 for the period. In addition, through arrangements with the Fund's custodian, credits realized as a result of certain uninvested cash balances were used to reduce the Fund's expenses. During the period, these credits reduced the Fund's custody expenses by $2,337.
In addition, during the period the investment adviser reimbursed and/or waived a portion of fund-level operating expenses in the amount of $37,081.
9. Distributions to Shareholders.
Distributions to shareholders of each class were as follows:
| | Year ended
July 31, 2018 | Year ended
July 31, 2017 |
| From net investment income | | |
| Value Discovery | $37,659,342 | $21,711,684 |
| Class K | 1,213,214 | 1,767,979 |
| Total | $38,872,556 | $23,479,663 |
| From net realized gain | | |
| Value Discovery | $28,024,993 | $386,628 |
| Class K | 1,001,210 | 25,277 |
| Total | $29,026,203 | $411,905 |
10. Share Transactions.
Share transactions for each class were as follows and may contain automatic conversions between classes or exchanges between affiliated funds:
| | Shares | Shares | Dollars | Dollars |
| | Year ended July 31, 2018 | Year ended July 31, 2017 | Year ended July 31, 2018 | Year ended July 31, 2017 |
| Value Discovery | | | | |
| Shares sold | 92,576,036 | 42,512,937 | $2,602,748,985 | $1,119,827,793 |
| Reinvestment of distributions | 2,218,173 | 841,053 | 60,950,359 | 21,118,287 |
| Shares redeemed | (112,066,142) | (17,858,879) | (3,180,236,752) | (463,345,362) |
| Net increase (decrease) | (17,271,933) | 25,495,111 | $(516,537,408) | $677,600,718 |
| Class K | | | | |
| Shares sold | 898,035 | 11,452,291 | $25,342,830 | $310,987,862 |
| Reinvestment of distributions | 80,757 | 71,873 | 2,214,424 | 1,793,256 |
| Shares redeemed | (2,722,401)(a) | (16,704,580)(b) | (77,380,905)(a) | (451,035,163)(b) |
| Net increase (decrease) | (1,743,609) | (5,180,416) | $(49,823,651) | $(138,254,045) |
(a) Amount includes in-kind redemptions (see the Redemptions In-Kind note for additional details).
(b) Amount includes in-kind redemptions (see the Prior Fiscal Year Redemptions In-Kind note for additional details).
11. Other.
The Fund's organizational documents provide former and current trustees and officers with a limited indemnification against liabilities arising in connection with the performance of their duties to the Fund. In the normal course of business, the Fund may also enter into contracts that provide general indemnifications. The Fund's maximum exposure under these arrangements is unknown as this would be dependent on future claims that may be made against the Fund. The risk of material loss from such claims is considered remote.
Report of Independent Registered Public Accounting Firm
To the Trustees of Fidelity Puritan Trust and Shareholders of Fidelity Value Discovery Fund:
Opinion on the Financial Statements and Financial Highlights
We have audited the accompanying statement of assets and liabilities of Fidelity Value Discovery Fund (the "Fund"), a fund of Fidelity Puritan Trust, including the schedule of investments, as of July 31, 2018, and the related statement of operations for the year then ended, the statement of changes in net assets for each of the two years in the period then ended, the financial highlights for each of the five years in the period then ended, and the related notes. In our opinion, the financial statements and financial highlights present fairly, in all material respects, the financial position of the Fund as of July 31, 2018, and the results of its operations for the year then ended, the changes in its net assets for each of the two years in the period then ended, and the financial highlights for each of the five years in the period then ended, in conformity with accounting principles generally accepted in the United States of America.
Basis for Opinion
These financial statements and financial highlights are the responsibility of the Fund's management. Our responsibility is to express an opinion on the Fund's financial statements and financial highlights based on our audits. We are a public accounting firm registered with the Public Company Accounting Oversight Board (United States) (PCAOB) and are required to be independent with respect to the Fund in accordance with the U.S. federal securities laws and the applicable rules and regulations of the Securities and Exchange Commission and the PCAOB.
We conducted our audits in accordance with the standards of the PCAOB. Those standards require that we plan and perform the audit to obtain reasonable assurance about whether the financial statements and financial highlights are free of material misstatement, whether due to error or fraud. The Fund is not required to have, nor were we engaged to perform, an audit of its internal control over financial reporting. As part of our audits we are required to obtain an understanding of internal control over financial reporting but not for the purpose of expressing an opinion on the effectiveness of the Fund’s internal control over financial reporting. Accordingly, we express no such opinion.
Our audits included performing procedures to assess the risks of material misstatement of the financial statements and financial highlights, whether due to error or fraud, and performing procedures that respond to those risks. Such procedures included examining, on a test basis, evidence regarding the amounts and disclosures in the financial statements and financial highlights. Our audits also included evaluating the accounting principles used and significant estimates made by management, as well as evaluating the overall presentation of the financial statements and financial highlights. Our procedures included confirmation of securities owned as of July 31, 2018, by correspondence with the custodians and brokers; when replies were not received from brokers, we performed other auditing procedures. We believe that our audits provide a reasonable basis for our opinion.
/s/ Deloitte & Touche LLP
Boston, Massachusetts
September 12, 2018
We have served as the auditor of one or more of the Fidelity investment companies since 1999.
Trustees and Officers
The Trustees, Members of the Advisory Board (if any), and officers of the trust and fund, as applicable, are listed below. The Board of Trustees governs the fund and is responsible for protecting the interests of shareholders. The Trustees are experienced executives who meet periodically throughout the year to oversee the fund's activities, review contractual arrangements with companies that provide services to the fund, oversee management of the risks associated with such activities and contractual arrangements, and review the fund's performance. Except for Jonathan Chiel, each of the Trustees oversees 286 funds. Mr. Chiel oversees 150 funds.
The Trustees hold office without limit in time except that (a) any Trustee may resign; (b) any Trustee may be removed by written instrument, signed by at least two-thirds of the number of Trustees prior to such removal; (c) any Trustee who requests to be retired or who has become incapacitated by illness or injury may be retired by written instrument signed by a majority of the other Trustees; and (d) any Trustee may be removed at any special meeting of shareholders by a two-thirds vote of the outstanding voting securities of the trust. Each Trustee who is not an interested person (as defined in the 1940 Act) of the trust and the fund is referred to herein as an Independent Trustee. Each Independent Trustee shall retire not later than the last day of the calendar year in which his or her 75th birthday occurs. The Independent Trustees may waive this mandatory retirement age policy with respect to individual Trustees. Officers and Advisory Board Members hold office without limit in time, except that any officer or Advisory Board Member may resign or may be removed by a vote of a majority of the Trustees at any regular meeting or any special meeting of the Trustees. Except as indicated, each individual has held the office shown or other offices in the same company for the past five years.
The fund’s Statement of Additional Information (SAI) includes more information about the Trustees. To request a free copy, call Fidelity at 1-800-835-5092.
Experience, Skills, Attributes, and Qualifications of the Trustees. The Governance and Nominating Committee has adopted a statement of policy that describes the experience, qualifications, attributes, and skills that are necessary and desirable for potential Independent Trustee candidates (Statement of Policy). The Board believes that each Trustee satisfied at the time he or she was initially elected or appointed a Trustee, and continues to satisfy, the standards contemplated by the Statement of Policy. The Governance and Nominating Committee also engages professional search firms to help identify potential Independent Trustee candidates who have the experience, qualifications, attributes, and skills consistent with the Statement of Policy. From time to time, additional criteria based on the composition and skills of the current Independent Trustees, as well as experience or skills that may be appropriate in light of future changes to board composition, business conditions, and regulatory or other developments, have also been considered by the professional search firms and the Governance and Nominating Committee. In addition, the Board takes into account the Trustees' commitment and participation in Board and committee meetings, as well as their leadership of standing and ad hoc committees throughout their tenure.
In determining that a particular Trustee was and continues to be qualified to serve as a Trustee, the Board has considered a variety of criteria, none of which, in isolation, was controlling. The Board believes that, collectively, the Trustees have balanced and diverse experience, qualifications, attributes, and skills, which allow the Board to operate effectively in governing the fund and protecting the interests of shareholders. Information about the specific experience, skills, attributes, and qualifications of each Trustee, which in each case led to the Board's conclusion that the Trustee should serve (or continue to serve) as a trustee of the fund, is provided below.
Board Structure and Oversight Function. James C. Curvey is an interested person and currently serves as Chairman. The Trustees have determined that an interested Chairman is appropriate and benefits shareholders because an interested Chairman has a personal and professional stake in the quality and continuity of services provided to the fund. Independent Trustees exercise their informed business judgment to appoint an individual of their choosing to serve as Chairman, regardless of whether the Trustee happens to be independent or a member of management. The Independent Trustees have determined that they can act independently and effectively without having an Independent Trustee serve as Chairman and that a key structural component for assuring that they are in a position to do so is for the Independent Trustees to constitute a substantial majority for the Board. The Independent Trustees also regularly meet in executive session. Ned C. Lautenbach serves as Chairman of the Independent Trustees and as such (i) acts as a liaison between the Independent Trustees and management with respect to matters important to the Independent Trustees and (ii) with management prepares agendas for Board meetings.
Fidelity® funds are overseen by different Boards of Trustees. The fund's Board oversees Fidelity's high income and certain equity funds, and other Boards oversee Fidelity's investment-grade bond, money market, asset allocation, and other equity funds. The asset allocation funds may invest in Fidelity® funds overseen by the fund's Board. The use of separate Boards, each with its own committee structure, allows the Trustees of each group of Fidelity® funds to focus on the unique issues of the funds they oversee, including common research, investment, and operational issues. On occasion, the separate Boards establish joint committees to address issues of overlapping consequences for the Fidelity® funds overseen by each Board.
The Trustees operate using a system of committees to facilitate the timely and efficient consideration of all matters of importance to the Trustees, the fund, and fund shareholders and to facilitate compliance with legal and regulatory requirements and oversight of the fund's activities and associated risks. The Board, acting through its committees, has charged FMR and its affiliates with (i) identifying events or circumstances the occurrence of which could have demonstrably adverse effects on the fund's business and/or reputation; (ii) implementing processes and controls to lessen the possibility that such events or circumstances occur or to mitigate the effects of such events or circumstances if they do occur; and (iii) creating and maintaining a system designed to evaluate continuously business and market conditions in order to facilitate the identification and implementation processes described in (i) and (ii) above. Because the day-to-day operations and activities of the fund are carried out by or through FMR, its affiliates, and other service providers, the fund's exposure to risks is mitigated but not eliminated by the processes overseen by the Trustees. While each of the Board's committees has responsibility for overseeing different aspects of the fund's activities, oversight is exercised primarily through the Operations, Audit, and Compliance Committees. In addition, the Independent Trustees have worked with Fidelity to enhance the Board's oversight of investment and financial risks, legal and regulatory risks, technology risks, and operational risks, including the development of additional risk reporting to the Board. Appropriate personnel, including but not limited to the fund's Chief Compliance Officer (CCO), FMR's internal auditor, the independent accountants, the fund's Treasurer and portfolio management personnel, make periodic reports to the Board's committees, as appropriate, including an annual review of Fidelity's risk management program for the Fidelity® funds. The responsibilities of each standing committee, including their oversight responsibilities, are described further under "Standing Committees of the Trustees."
Interested Trustees*:
Correspondence intended for a Trustee who is an interested person may be sent to Fidelity Investments, 245 Summer Street, Boston, Massachusetts 02210.
Name, Year of Birth; Principal Occupations and Other Relevant Experience+
Jonathan Chiel (1957)
Year of Election or Appointment: 2016
Trustee
Mr. Chiel also serves as Trustee of other Fidelity® funds. Mr. Chiel is Executive Vice President and General Counsel for FMR LLC (diversified financial services company, 2012-present). Previously, Mr. Chiel served as general counsel (2004-2012) and senior vice president and deputy general counsel (2000-2004) for John Hancock Financial Services; a partner with Choate, Hall & Stewart (1996-2000) (law firm); and an Assistant United States Attorney for the United States Attorney’s Office of the District of Massachusetts (1986-95), including Chief of the Criminal Division (1993-1995). Mr. Chiel is a director on the boards of the Boston Bar Foundation and the Maimonides School.
James C. Curvey (1935)
Year of Election or Appointment: 2007
Trustee
Chairman of the Board of Trustees
Mr. Curvey also serves as Trustee of other Fidelity® funds. Mr. Curvey is Vice Chairman (2007-present) and Director of FMR LLC (diversified financial services company). In addition, Mr. Curvey is an Overseer Emeritus for the Boston Symphony Orchestra, a Director of Artis-Naples, and a Trustee of Brewster Academy in Wolfeboro, New Hampshire. Previously, Mr. Curvey served as a Director of Fidelity Research & Analysis Co. (investment adviser firm, 2009-2018), Director of Fidelity Investments Money Management, Inc. (investment adviser firm, 2009-2014) and a Director of FMR and FMR Co., Inc. (investment adviser firms, 2007-2014).
Charles S. Morrison (1960)
Year of Election or Appointment: 2014
Trustee
Mr. Morrison also serves as Trustee of other funds. He serves as President of Fidelity SelectCo, LLC (investment adviser firm, 2017-present) and Fidelity Management & Research Company (FMR) (investment adviser firm, 2016-present), a Director of Fidelity Investments Money Management, Inc. (FIMM) (investment adviser firm, 2014-present), Director of Fidelity SelectCo, LLC (investment adviser firm, 2014-present), President, Asset Management (2014-present), and is an employee of Fidelity Investments. Previously, Mr. Morrison served as Vice President of Fidelity's Fixed Income and Asset Allocation Funds (2012-2014), President, Fixed Income (2011-2014), Vice President of Fidelity's Money Market Funds (2005-2009), President, Money Market Group Leader of FMR (investment adviser firm, 2009), and Senior Vice President, Money Market Group of FMR (2004-2009). Mr. Morrison also served as Vice President of Fidelity's Bond Funds (2002-2005), certain Balanced Funds (2002-2005), and certain Asset Allocation Funds (2002-2007), and as Senior Vice President (2002-2005) of Fidelity's Bond Division.
* Determined to be an “Interested Trustee” by virtue of, among other things, his or her affiliation with the trust or various entities under common control with FMR.
+ The information includes the Trustee's principal occupation during the last five years and other information relating to the experience, attributes, and skills relevant to the Trustee's qualifications to serve as a Trustee, which led to the conclusion that the Trustee should serve as a Trustee for the fund.
Independent Trustees:
Correspondence intended for an Independent Trustee may be sent to Fidelity Investments, P.O. Box 55235, Boston, Massachusetts 02205-5235.
Name, Year of Birth; Principal Occupations and Other Relevant Experience+
Dennis J. Dirks (1948)
Year of Election or Appointment: 2005
Trustee
Mr. Dirks also serves as Trustee of other Fidelity® funds. Prior to his retirement in May 2003, Mr. Dirks was Chief Operating Officer and a member of the Board of The Depository Trust & Clearing Corporation (DTCC). He also served as President, Chief Operating Officer, and Board member of The Depository Trust Company (DTC) and President and Board member of the National Securities Clearing Corporation (NSCC). In addition, Mr. Dirks served as Chief Executive Officer and Board member of the Government Securities Clearing Corporation, Chief Executive Officer and Board member of the Mortgage-Backed Securities Clearing Corporation, as a Trustee and a member of the Finance Committee of Manhattan College (2005-2008), as a Trustee and a member of the Finance Committee of AHRC of Nassau County (2006-2008), as a member of the Independent Directors Council (IDC) Governing Council (2010-2015), and as a member of the Board of Directors for The Brookville Center for Children’s Services, Inc. (2009-2017). Mr. Dirks is a member of the Finance Committee (2016-present), Board of Directors (2017-present) and Board of Trustees (2018-present) and is Treasurer (2018-present) of the Asolo Repertory Theatre.
Donald F. Donahue (1950)
Year of Election or Appointment: 2018
Trustee
Mr. Donahue also serves as a Trustee of other Fidelity® funds. Mr. Donahue is President and Chief Executive Officer of Miranda Partners, LLC (risk consulting for the financial services industry, 2012-present). Previously, Mr. Donahue served as a Member of the Advisory Board of certain Fidelity® funds (2015-2018) and Chief Executive Officer (2006-2012), Chief Operating Officer (2003-2006), and Managing Director, Customer Marketing and Development (1999-2003) of The Depository Trust & Clearing Corporation (financial markets infrastructure). Mr. Donahue serves as a Member (2007-present) and Co-Chairman (2016-present) of the Board of Directors of United Way of New York, Member of the Board of Directors of NYC Leadership Academy (2012-present) and Member of the Board of Advisors of Ripple Labs, Inc. (financial services, 2015-present). He also served as Chairman (2010-2012) and Member of the Board of Directors (2012-2013) of Omgeo, LLC (financial services), Treasurer of United Way of New York (2012-2016), and Member of the Board of Directors of XBRL US (financial services non-profit, 2009-2012) and the International Securities Services Association (2009-2012).
Alan J. Lacy (1953)
Year of Election or Appointment: 2008
Trustee
Mr. Lacy also serves as Trustee of other Fidelity® funds. Mr. Lacy serves as a Director of Bristol-Myers Squibb Company (global pharmaceuticals, 2008-present). He is a Trustee of the California Chapter of The Nature Conservancy (2015-present) and a Director of the Center for Advanced Study in the Behavioral Sciences at Stanford University (2015-present). In addition, Mr. Lacy served as Senior Adviser (2007-2014) of Oak Hill Capital Partners, L.P. (private equity) and also served as Chief Executive Officer (2005) and Vice Chairman (2005-2006) of Sears Holdings Corporation (retail) and Chief Executive Officer and Chairman of the Board of Sears, Roebuck and Co. (retail, 2000-2005). Previously, Mr. Lacy served as Chairman (2014-2017) and a member (2010-2017) of the Board of Directors of Dave & Buster’s Entertainment, Inc. (restaurant and entertainment complexes), as Chairman (2008-2011) and a member (2006-2015) of the Board of Trustees of the National Parks Conservation Association, and as a member of the Board of Directors for The Hillman Companies, Inc. (hardware wholesalers, 2010-2014), Earth Fare, Inc. (retail grocery, 2010-2014), and The Western Union Company (global money transfer, 2006-2011).
Ned C. Lautenbach (1944)
Year of Election or Appointment: 2000
Trustee
Chairman of the Independent Trustees
Mr. Lautenbach also serves as Trustee of other Fidelity® funds. Mr. Lautenbach currently serves as Vice Chair of the Board of Governors, State University System of Florida (2013-present) and is a member of the Council on Foreign Relations (1994-present). He is also a member and has most recently served as Chairman of the Board of Directors of Artis-Naples (2012-present). Previously, Mr. Lautenbach served as a member and then Lead Director of the Board of Directors of Eaton Corporation (diversified industrial, 1997-2016). He was also a Partner and Advisory Partner at Clayton, Dubilier & Rice, LLC (private equity investment, 1998-2010), as well as a Director of Sony Corporation (2006-2007). In addition, Mr. Lautenbach also had a 30-year career with IBM (technology company) during which time he served as Senior Vice President and a member of the Corporate Executive Committee (1968-1998).
Joseph Mauriello (1944)
Year of Election or Appointment: 2008
Trustee
Mr. Mauriello also serves as Trustee of other Fidelity® funds. Prior to his retirement in January 2006, Mr. Mauriello served in numerous senior management positions including Deputy Chairman and Chief Operating Officer (2004-2005), and Vice Chairman of Financial Services (2002-2004) of KPMG LLP US (professional services, 1965-2005). Mr. Mauriello currently serves as a member of the Board of Directors of XL Group plc. (global insurance and re-insurance, 2006-present) and the Independent Directors Council (IDC) Governing Council (2015-present). Previously, Mr. Mauriello served as a Director of the Hamilton Funds of the Bank of New York (2006-2007) and of Arcadia Resources Inc. (health care services and products, 2007-2012).
Cornelia M. Small (1944)
Year of Election or Appointment: 2005
Trustee
Ms. Small also serves as Trustee of other Fidelity® funds. Ms. Small is a member of the Board of Directors (2009-present) and Chair of the Investment Committee (2010-present) of the Teagle Foundation. Ms. Small also serves on the Investment Committee of the Berkshire Taconic Community Foundation (2008-present). Previously, Ms. Small served as Chairperson (2002-2008) and a member of the Investment Committee and Chairperson (2008-2012) and a member of the Board of Trustees of Smith College. In addition, Ms. Small served as Chief Investment Officer, Director of Global Equity Investments, and a member of the Board of Directors of Scudder, Stevens & Clark and Scudder Kemper Investments.
Garnett A. Smith (1947)
Year of Election or Appointment: 2018
Trustee
Mr. Smith also serves as Trustee of other Fidelity® funds. Prior to Mr. Smith's retirement, he served as Chairman and Chief Executive Officer of Inbrand Corp. (manufacturer of personal absorbent products, 1990-1997). He also served as President (1986-1990) of Inbrand Corp. Prior to his employment with Inbrand Corp., he was employed by a retail fabric chain and North Carolina National Bank. In addition, Mr. Smith served as a Member of the Advisory Board of certain Fidelity® funds (2012-2013) and as a board member of the Jackson Hole Land Trust (2009-2012).
David M. Thomas (1949)
Year of Election or Appointment: 2008
Trustee
Mr. Thomas also serves as Trustee of other Fidelity® funds. Mr. Thomas serves as Non-Executive Chairman of the Board of Directors of Fortune Brands Home and Security (home and security products, 2011-present), as a member of the Board of Directors (2004-present) and Presiding Director (2013-present) of Interpublic Group of Companies, Inc. (marketing communication), and as a member of the Board of Trustees of the University of Florida (2013-present). Previously, Mr. Thomas served as Executive Chairman (2005-2006) and Chairman and Chief Executive Officer (2000-2005) of IMS Health, Inc. (pharmaceutical and healthcare information solutions), and a Director of Fortune Brands, Inc. (consumer products, 2000-2011).
+ The information includes the Trustee's principal occupation during the last five years and other information relating to the experience, attributes, and skills relevant to the Trustee's qualifications to serve as a Trustee, which led to the conclusion that the Trustee should serve as a Trustee for the fund.
Advisory Board Members and Officers:
Correspondence intended for a Member of the Advisory Board (if any) may be sent to Fidelity Investments, P.O. Box 55235, Boston, Massachusetts 02205-5235. Correspondence intended for an officer or Peter S. Lynch may be sent to Fidelity Investments, 245 Summer Street, Boston, Massachusetts 02210. Officers appear below in alphabetical order.
Name, Year of Birth; Principal Occupation
Peter S. Lynch (1944)
Year of Election or Appointment: 2003
Member of the Advisory Board
Mr. Lynch also serves as Member of the Advisory Board of other Fidelity® funds. Mr. Lynch is Vice Chairman and a Director of FMR (investment adviser firm) and FMR Co., Inc. (investment adviser firm). In addition, Mr. Lynch serves as a Trustee of Boston College and as the Chairman of the Inner-City Scholarship Fund. Previously, Mr. Lynch served on the Special Olympics International Board of Directors (1997-2006).
William S. Stavropoulos (1939)
Year of Election or Appointment: 2018
Member of the Advisory Board
Mr. Stavropoulos also serves as Member of the Advisory Board of other Fidelity® funds. Mr. Stavropoulos serves as President and Founder of the Michigan Baseball Foundation, the Great Lakes Loons (2007-present). Mr. Stavropoulos is Chairman Emeritus of the Board of Directors of The Dow Chemical Company, where he previously served in numerous senior management positions, including President, CEO (1995-2000; 2002-2004), Chairman of the Executive Committee (2000-2006), and as a member of the Board of Directors (1990-2006). Currently, Mr. Stavropoulos is Chairman of the Board of Directors of Univar Inc. (global distributor of commodity and specialty chemicals), a Director of Teradata Corporation (data warehousing and technology solutions), and a member of the Advisory Board for Metalmark Capital LLC (private equity investment, 2005-present). Mr. Stavropoulos is an operating advisor to Clayton, Dubilier & Rice, LLC (private equity investment). In addition, Mr. Stavropoulos is a member of the University of Notre Dame Advisory Council for the College of Science, a Trustee of the Rollin L. Gerstacker Foundation, and a Director of Artis-Naples in Naples, Florida. Previously, Mr. Stavropoulos served as Trustee of certain Fidelity® funds (2001-2018) and as a Director of Chemical Financial Corporation (bank holding company, 1993-2012) and Tyco International, Ltd. (multinational manufacturing and services, 2007-2012).
Carol B. Tomé (1957)
Year of Election or Appointment: 2018
Member of the Advisory Board
Ms. Tomé also serves as Member of the Advisory Board of other Fidelity® funds. Ms. Tomé is Chief Financial Officer (2001-present) and Executive Vice President of Corporate Services (2007-present) of The Home Depot, Inc. (home improvement retailer) and a Director (2003-present) and Chair of the Audit Committee (2004-present) of United Parcel Service, Inc. (package delivery and supply chain management). Previously, Ms. Tomé served as Trustee of certain Fidelity® funds (2017), Senior Vice President of Finance and Accounting/Treasurer (2000-2007) and Vice President and Treasurer (1995-2000) of The Home Depot, Inc. and Chair of the Board (2010-2012), Vice Chair of the Board (2009 and 2013), and a Director (2008-2013) of the Federal Reserve Bank of Atlanta. Ms. Tomé is also a director or trustee of many community and professional organizations.
Michael E. Wiley (1950)
Year of Election or Appointment: 2018
Member of the Advisory Board
Mr. Wiley also serves as Trustee or Member of the Advisory Board of other Fidelity® funds. Mr. Wiley serves as a Director of Andeavor Corporation (independent oil refiner and marketer, 2005-present), a Director of Andeavor Logistics LP (natural resources logistics, 2015-present), and a Director of Bill Barrett Corporation (exploration and production, 2005-present). In addition, Mr. Wiley also serves as a Director of Post Oak Bank (privately-held bank, 2004-present). Previously, Mr. Wiley served as a Trustee of other Fidelity® funds (2008-2013), as a Director of Asia Pacific Exploration Consolidated (international oil and gas exploration and production, 2008-2013), as a member of the Board of Trustees of the University of Tulsa (2000-2006; 2007-2010), as a Senior Energy Advisor of Katzenbach Partners, LLC (consulting, 2006-2007), as an Advisory Director of Riverstone Holdings (private investment), Chairman, President, and CEO of Baker Hughes, Inc. (oilfield services, 2000-2004), and as Director of Spinnaker Exploration Company (exploration and production, 2001-2005).
Elizabeth Paige Baumann (1968)
Year of Election or Appointment: 2017
Anti-Money Laundering (AML) Officer
Ms. Baumann also serves as AML Officer of other funds. She is Chief AML Officer (2012-present) and Senior Vice President (2014-present) of FMR LLC (diversified financial services company) and is an employee of Fidelity Investments. Previously, Ms. Baumann served as AML Officer of the funds (2012-2016), and Vice President (2007-2014) and Deputy Anti-Money Laundering Officer (2007-2012) of FMR LLC.
Marc R. Bryant (1966)
Year of Election or Appointment: 2015
Secretary and Chief Legal Officer (CLO)
Mr. Bryant also serves as Secretary and CLO of other funds. Mr. Bryant serves as CLO, Secretary, and Senior Vice President of Fidelity Management & Research Company (investment adviser firm, 2015-present) and FMR Co., Inc. (investment adviser firm, 2015-present); Secretary of Fidelity SelectCo, LLC (investment adviser firm, 2015-present) and Fidelity Investments Money Management, Inc. (investment adviser firm, 2015-present); and CLO of Fidelity Management & Research (Hong Kong) Limited and FMR Investment Management (UK) Limited (investment adviser firms, 2015-present) and Fidelity Management & Research (Japan) Limited (investment adviser firm, 2016-present). He is Senior Vice President and Deputy General Counsel of FMR LLC (diversified financial services company). Previously, Mr. Bryant served as Secretary and CLO of Fidelity Rutland Square Trust II (2010-2014) and Assistant Secretary of Fidelity's Fixed Income and Asset Allocation Funds (2013-2015). Prior to joining Fidelity Investments, Mr. Bryant served as a Senior Vice President and the Head of Global Retail Legal for AllianceBernstein L.P. (2006-2010), and as the General Counsel for ProFund Advisors LLC (2001-2006).
John J. Burke III (1964)
Year of Election or Appointment: 2018
Chief Financial Officer
Mr. Burke also serves as Chief Financial Officer of other funds. Mr. Burke serves as Head of Investment Operations for Fidelity Fund and Investment Operations (2018-present) and is an employee of Fidelity Investments (1998-present). Previously Mr. Burke served as head of Asset Management Investment Operations (2012-2018).
William C. Coffey (1969)
Year of Election or Appointment: 2009
Assistant Secretary
Mr. Coffey also serves as Assistant Secretary of other funds. He is Senior Vice President and Deputy General Counsel of FMR LLC (diversified financial services company, 2010-present), and is an employee of Fidelity Investments. Previously, Mr. Coffey served as Vice President and Associate General Counsel of FMR LLC (2005-2009).
Timothy M. Cohen (1969)
Year of Election or Appointment: 2018
Vice President
Mr. Cohen also serves as Vice President of other funds. Mr. Cohen serves as Co-Head of Global Equity Research (2016-present), a Director of Fidelity Management & Research (Japan) Limited (investment adviser firm, 2016-present), and is an employee of Fidelity Investments. Previously, Mr. Cohen served as Chief Investment Officer - Equity and a Director of Fidelity Management & Research (U.K.) Inc. (investment adviser firm, 2013-2015) and as a Director of Fidelity Management & Research (Hong Kong) Limited (investment adviser firm, 2017).
Jonathan Davis (1968)
Year of Election or Appointment: 2010
Assistant Treasurer
Mr. Davis also serves as Assistant Treasurer of other funds. Mr. Davis serves as Assistant Treasurer of FMR Capital, Inc. (2017-present) and is an employee of Fidelity Investments. Previously, Mr. Davis served as Vice President and Associate General Counsel of FMR LLC (diversified financial services company, 2003-2010).
Adrien E. Deberghes (1967)
Year of Election or Appointment: 2016
Assistant Treasurer
Mr. Deberghes also serves as an officer of other funds. He serves as Assistant Treasurer of FMR Capital, Inc. (2017-present), Executive Vice President of Fidelity Investments Money Management, Inc. (FIMM) (investment adviser firm, 2016-present), and is an employee of Fidelity Investments (2008-present). Previously, Mr. Deberghes served as President and Treasurer of certain Fidelity® funds (2013-2018). Prior to joining Fidelity Investments, Mr. Deberghes was Senior Vice President of Mutual Fund Administration at State Street Corporation (2007-2008), Senior Director of Mutual Fund Administration at Investors Bank & Trust (2005-2007), and Director of Finance for Dunkin' Brands (2000-2005). Previously, Mr. Deberghes served in other fund officer roles.
Laura M. Del Prato (1964)
Year of Election or Appointment: 2018
Assistant Treasurer
Ms. Del Prato also serves as an officer of other funds. Ms. Del Prato is an employee of Fidelity Investments (2017-present). Prior to joining Fidelity Investments, Ms. Del Prato served as a Managing Director and Treasurer of the JPMorgan Mutual Funds (2014-2017). Prior to JPMorgan, Ms. Del Prato served as a partner at Cohen Fund Audit Services (accounting firm, 2012-2013) and KPMG LLP (accounting firm, 2004-2012).
Colm A. Hogan (1973)
Year of Election or Appointment: 2016
Deputy Treasurer
Mr. Hogan also serves as an officer of other funds. Mr. Hogan serves as Assistant Treasurer of FMR Capital, Inc. (2017-present) and is an employee of Fidelity Investments (2005-present). Previously, Mr. Hogan served as Assistant Treasurer of certain Fidelity® funds (2016-2018).
Pamela R. Holding (1964)
Year of Election or Appointment: 2018
Vice President
Ms. Holding also serves as a Vice President of other funds. Ms. Holding serves as Co-Head of Global Equity Research (2018-present) and is an employee of Fidelity Investments (2013-present).
Chris Maher (1972)
Year of Election or Appointment: 2013
Assistant Treasurer
Mr. Maher serves as Assistant Treasurer of other funds. Mr. Maher is Vice President of Valuation Oversight, serves as Assistant Treasurer of FMR Capital, Inc. (2017-present), and is an employee of Fidelity Investments. Previously, Mr. Maher served as Vice President of Asset Management Compliance (2013), Vice President of the Program Management Group of FMR (investment adviser firm, 2010-2013), and Vice President of Valuation Oversight (2008-2010).
Rieco E. Mello (1969)
Year of Election or Appointment: 2017
Assistant Treasurer
Mr. Mello also serves as Assistant Treasurer of other funds. Mr. Mello serves as Assistant Treasurer of FMR Capital, Inc. (2017-present) and is an employee of Fidelity Investments (1995-present).
Kenneth B. Robins (1969)
Year of Election or Appointment: 2016
Chief Compliance Officer
Mr. Robins also serves as an officer of other funds. Mr. Robins serves as Compliance Officer of Fidelity Management & Research Company and FMR Co., Inc. (investment adviser firms, 2016-present) and is an employee of Fidelity Investments (2004-present). Previously, Mr. Robins served as Executive Vice President of Fidelity Investments Money Management, Inc. (investment adviser firm, 2013-2016) and served in other fund officer roles.
Stacie M. Smith (1974)
Year of Election or Appointment: 2016
President and Treasurer
Ms. Smith also serves as an officer of other funds. Ms. Smith serves as Assistant Treasurer of FMR Capital, Inc. (2017-present), is an employee of Fidelity Investments (2009-present), and has served in other fund officer roles. Prior to joining Fidelity Investments, Ms. Smith served as Senior Audit Manager of Ernst & Young LLP (accounting firm, 1996-2009). Previously, Ms. Smith served as Assistant Treasurer (2013-2018) and Deputy Treasurer (2013-2016) of certain Fidelity® funds.
Marc L. Spector (1972)
Year of Election or Appointment: 2016
Assistant Treasurer
Mr. Spector also serves as an officer of other funds. Mr. Spector serves as Assistant Treasurer of FMR Capital, Inc. (2017-present) and is an employee of Fidelity Investments (2016-present). Prior to joining Fidelity Investments, Mr. Spector served as Director at the Siegfried Group (accounting firm, 2013-2016), and prior to Siegfried Group as audit senior manager at Deloitte & Touche (accounting firm, 2005-2013).
Renee Stagnone (1975)
Year of Election or Appointment: 2016
Assistant Treasurer
Ms. Stagnone also serves as an officer of other funds. Ms. Stagnone serves as Assistant Treasurer of FMR Capital, Inc. (2017-present) and is an employee of Fidelity Investments (1997-present). Previously, Ms. Stagnone served as Deputy Treasurer of certain Fidelity® funds (2013-2016).
Shareholder Expense Example
As a shareholder of the Fund, you incur two types of costs: (1) transaction costs and (2) ongoing costs, including management fees and other Fund expenses. This Example is intended to help you understand your ongoing costs (in dollars) of investing in the Fund and to compare these costs with the ongoing costs of investing in other mutual funds.
The Example is based on an investment of $1,000 invested at the beginning of the period and held for the entire period (February 1, 2018 to July 31, 2018).
Actual Expenses
The first line of the accompanying table for each class of the Fund provides information about actual account values and actual expenses. You may use the information in this line, together with the amount you invested, to estimate the expenses that you paid over the period. Simply divide your account value by $1,000.00 (for example, an $8,600 account value divided by $1,000.00 = 8.6), then multiply the result by the number in the first line for a class of the Fund under the heading entitled "Expenses Paid During Period" to estimate the expenses you paid on your account during this period. A small balance maintenance fee of $12.00 that is charged once a year may apply for certain accounts with a value of less than $2,000. This fee is not included in the table below. If it was, the estimate of expenses you paid during the period would be higher, and your ending account value lower, by this amount. In addition, the Fund, as a shareholder in the underlying Fidelity Central Funds, will indirectly bear its pro-rata share of the fees and expenses incurred by the underlying Fidelity Central Funds. These fees and expenses are not included in the Fund's annualized expense ratio used to calculate the expense estimate in the table below.
Hypothetical Example for Comparison Purposes
The second line of the accompanying table for each class of the Fund provides information about hypothetical account values and hypothetical expenses based on a Class' actual expense ratio and an assumed rate of return of 5% per year before expenses, which is not the Class' actual return. The hypothetical account values and expenses may not be used to estimate the actual ending account balance or expenses you paid for the period. You may use this information to compare the ongoing costs of investing in the Fund and other funds. To do so, compare this 5% hypothetical example with the 5% hypothetical examples that appear in the shareholder reports of the other funds. A small balance maintenance fee of $12.00 that is charged once a year may apply for certain accounts with a value of less than $2,000. This fee is not included in the table below. If it was, the estimate of expenses you paid during the period would be higher, and your ending account value lower, by this amount. In addition, the Fund, as a shareholder in the underlying Fidelity Central Funds, will indirectly bear its pro-rata share of the fees and expenses incurred by the underlying Fidelity Central Funds. These fees and expenses are not included in the Fund's annualized expense ratio used to calculate the expense estimate in the table below.
Please note that the expenses shown in the table are meant to highlight your ongoing costs only and do not reflect any transaction costs. Therefore, the second line of the table is useful in comparing ongoing costs only, and will not help you determine the relative total costs of owning different funds.
| | Annualized Expense Ratio-A | Beginning
Account Value
February 1, 2018 | Ending
Account Value
July 31, 2018 | Expenses Paid
During Period-B
February 1, 2018
to July 31, 2018 |
| Value Discovery | .65% | | | |
| Actual | | $1,000.00 | $974.00 | $3.18 |
| Hypothetical-C | | $1,000.00 | $1,021.57 | $3.26 |
| Class K | .53% | | | |
| Actual | | $1,000.00 | $974.70 | $2.59 |
| Hypothetical-C | | $1,000.00 | $1,022.17 | $2.66 |
A Annualized expense ratio reflects expenses net of applicable fee waivers.
B Expenses are equal to each Class' annualized expense ratio, multiplied by the average account value over the period, multiplied by 181/365 (to reflect the one-half year period).
C 5% return per year before expenses
Distributions (Unaudited)
The Board of Trustees of Fidelity Value Discovery Fund voted to pay to shareholders of record at the opening of business on record date, the following distributions per share derived from capital gains realized from sales of portfolio securities, and dividends derived from net investment income:
| | Pay Date | Record Date | Dividends | Capital Gains |
| Fidelity Value Discovery Fund | | | | |
| Value Discovery | 09/10/18 | 09/07/18 | $0.296 | $0.156 |
| Class K | 09/10/18 | 09/07/18 | $0.324 | $0.156 |
|
The fund hereby designates as a capital gain dividend with respect to the taxable year ended July 31, 2018, $13,085,210, or, if subsequently determined to be different, the net capital gain of such year.
Value Discovery designates 63% and 92%; and Class K designates 62% and 86% of the dividends distributed in September and December, respectively during the fiscal year as qualifying for the dividends–received deduction for corporate shareholders.
Value Discovery designates 90% and 100%; and Class K designates 88% and 100% of the dividends distributed in September and December, respectively during the fiscal year as amounts which may be taken into account as a dividend for purposes of the maximum rate under section 1(h)(11) of the Internal Revenue Code.
The fund will notify shareholders in January 2019 of amounts for use in preparing 2018 income tax returns.
Board Approval of Investment Advisory Contracts
Fidelity Value Discovery Fund
At its July 2018 meeting, the Board of Trustees, including the Independent Trustees (together, the Board), voted to continue the management contract with Fidelity Management & Research Company (FMR) and the sub-advisory agreements (together, the Advisory Contracts) for the fund for six months through January 31, 2019, in connection with the reunification of the Fidelity Equity High Income Funds Board, which oversees the fund, and the Sector Portfolios Board.
The Board considered that the approval of the fund's Advisory Contracts will not result in any changes in (i) the investment process or strategies employed in the management of the fund's assets; (ii) the fees and expenses paid by shareholders; (iii) the nature, extent or quality of services provided under the fund's Advisory Contracts; or (iv) the day-to-day management of the fund or the persons primarily responsible for such management. The Board concluded that the fund's Advisory Contracts are fair and reasonable, and that the fund's Advisory Contracts should be renewed, without modification, through January 31, 2019, with the understanding that the Board will consider the annual renewal for a full one year period in January 2019.
In connection with its consideration of future renewals of the fund's Advisory Contracts, the Board will consider: (i) the nature, extent and quality of services provided to the fund, including shareholder and administrative services and investment performance; (ii) the competitiveness of the management fee and total expenses for the fund; (iii) the costs of the services and profitability, including the revenues earned and the expenses incurred in conducting the business of developing, marketing, distributing, managing, administering, and servicing the fund and its shareholders, to the extent applicable, as well as potential fall-out benefits from Fidelity's non-fund businesses; and (iv) whether there have been economies of scale in respect of the Fidelity funds, whether the Fidelity funds (including the fund) have appropriately benefited from any such economies of scale, and whether there is the potential for realization of any further economies.
Based on its evaluation of all of the conclusions noted above, and after considering all factors it believed relevant, the Board ultimately concluded that the fund's management fee structure is fair and reasonable, and that the continuation of the fund's Advisory Contracts should be approved.
Corporate Headquarters
245 Summer St.
Boston, MA 02210
www.fidelity.com
FVD-K-ANN-0918
1.863359.109
Fidelity® Series Intrinsic Opportunities Fund
Annual Report July 31, 2018 |
|
Contents
To view a fund's proxy voting guidelines and proxy voting record for the 12-month period ended June 30, visit http://www.fidelity.com/proxyvotingresults or visit the Securities and Exchange Commission's (SEC) web site at http://www.sec.gov.
You may also call 1-800-544-8544 to request a free copy of the proxy voting guidelines.
Standard & Poor's, S&P and S&P 500 are registered service marks of The McGraw-Hill Companies, Inc. and have been licensed for use by Fidelity Distributors Corporation.
Other third-party marks appearing herein are the property of their respective owners.
All other marks appearing herein are registered or unregistered trademarks or service marks of FMR LLC or an affiliated company. © 2018 FMR LLC. All rights reserved.
This report and the financial statements contained herein are submitted for the general information of the shareholders of the Fund. This report is not authorized for distribution to prospective investors in the Fund unless preceded or accompanied by an effective prospectus.
A fund files its complete schedule of portfolio holdings with the SEC for the first and third quarters of each fiscal year on Form N-Q. Forms N-Q are available on the SEC’s web site at http://www.sec.gov. A fund's Forms N-Q may be reviewed and copied at the SEC’s Public Reference Room in Washington, DC. Information regarding the operation of the SEC's Public Reference Room may be obtained by calling 1-800-SEC-0330.
For a complete list of a fund's portfolio holdings, view the most recent holdings listing, semiannual report, or annual report on Fidelity's web site at http://www.fidelity.com, http://www.institutional.fidelity.com, or http://www.401k.com, as applicable.
NOT FDIC INSURED •MAY LOSE VALUE •NO BANK GUARANTEE
Neither the Fund nor Fidelity Distributors Corporation is a bank.
Performance: The Bottom Line
Average annual total return reflects the change in the value of an investment, assuming reinvestment of distributions from dividend income and capital gains (the profits earned upon the sale of securities that have grown in value, if any) and assuming a constant rate of performance each year. The hypothetical investment and the average annual total returns do not reflect the deduction of taxes that a shareholder would pay on fund distributions or the redemption of fund shares. During periods of reimbursement by Fidelity, a fund’s total return will be greater than it would be had the reimbursement not occurred. How a fund did yesterday is no guarantee of how it will do tomorrow.
Average Annual Total Returns
| For the periods ended July 31, 2018 | Past 1 year | Past 5 years | Life of fundA |
| Fidelity® Series Intrinsic Opportunities Fund | 13.82% | 12.14% | 15.64% |
A From December 6, 2012
$10,000 Over Life of Fund
Let's say hypothetically that $10,000 was invested in Fidelity® Series Intrinsic Opportunities Fund on December 6, 2012, when the fund started.
The chart shows how the value of your investment would have changed, and also shows how the Russell 3000® Index performed over the same period.
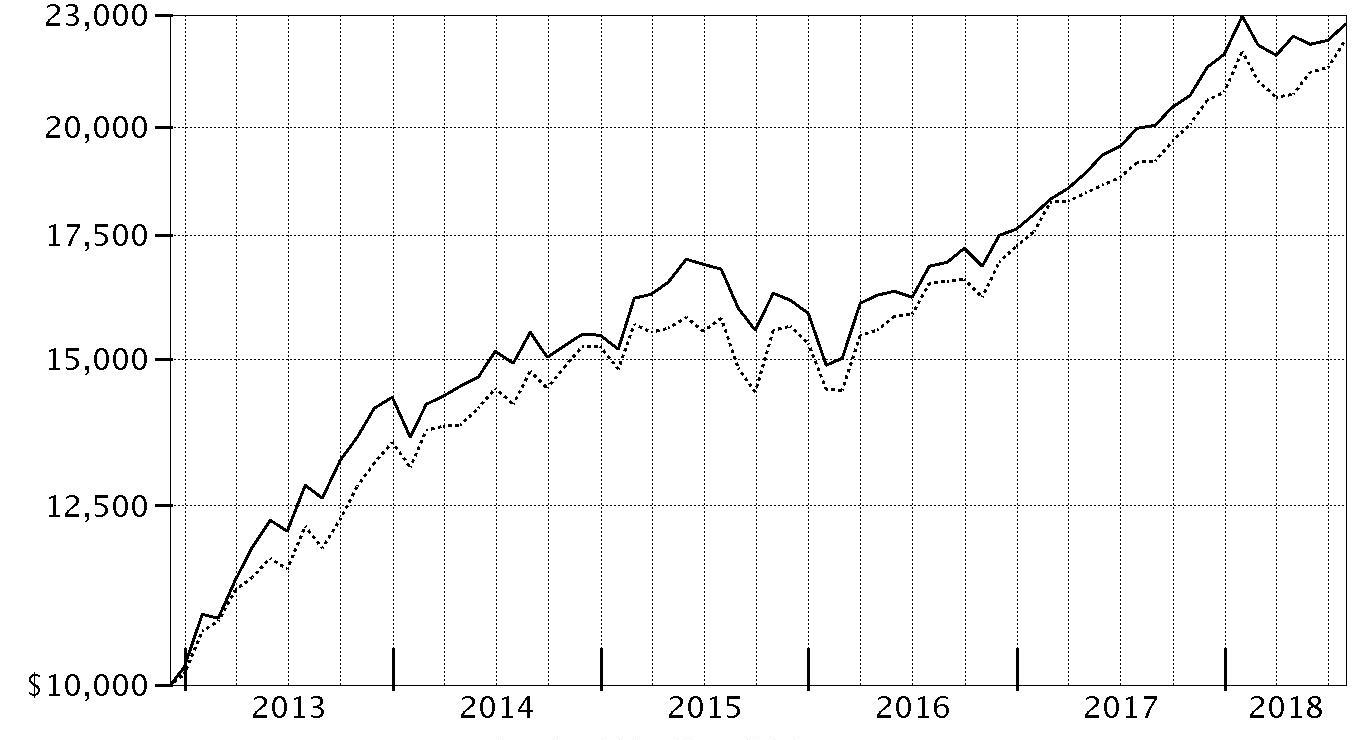
| Period Ending Values |
| $22,736 | Fidelity® Series Intrinsic Opportunities Fund |
| $22,282 | Russell 3000® Index |
Management's Discussion of Fund Performance
Market Recap: The U.S. equity bellwether S&P 500
® index gained 16.24% for the 12 months ending July 31, 2018, despite a resurgence in volatility that challenged the multiyear bull market. Stocks maintained their steady growth until a sharp reversal in February, as volatility spiked amid fear that rising inflation and the potential for the economy to overheat would prompt the U.S. Federal Reserve to pick up the pace of interest rate hikes. The index posted its first negative monthly result since October 2016, and then lost further ground in March on fear of a global trade war. The market stabilized in April and turned upward through mid-June, when escalating trade tension between the U.S. and China soured investor sentiment. The resulting uncertainty lingered into July, but strong corporate earnings helped the S&P 500 rise 3.72% that month to cap the period. For the full one-year period, growth handily topped value, while small-caps bested large-caps. By sector, information technology (+28%) led the way, boosted by strong earnings growth from several major index constituents. Consumer discretionary rose roughly 24%, driven by retailers (+49%). Energy (+20%) gained alongside higher oil prices. Laggards were telecommunication services (-2%), consumer staples (0%) and utilities (+3%), defensive groups that struggled amid rising interest rates and a general preference for risk. Real estate (+5%) fared a bit better but still lagged, as did financials, industrials, health care (each up 13%) and materials (+11%).
Comments from Portfolio Manager Joel Tillinghast: For the fiscal year, the fund gained 13.82%, trailing the 16.39% return of the benchmark Russell 3000
® Index. Versus the benchmark, stock selection was the primary detractor, with my choices in the retailing and software & services industries hurting most. In retailing, the fund's lack of ownership of e-commerce firm and benchmark component Amazon.com was the top relative detractor the past year. Although Amazon's share price rallied 80%, this stock's valuation and other characteristics did not meet the investment criteria we focus on. Similarly, relative performance was held back by largely avoiding software manufacturer Microsoft, a stock that gained 49% the past year. The fund's sizable allocation to cash – at about 11% of assets, on average – amid a rising equity market also hindered our relative result. Furthermore, our foreign holdings detracted overall, in part due to the strength of the U.S. dollar. Conversely, stock selection in the health care equipment & services and household & personal products groups added value. In the former category, a large position in health insurance company Anthem proved to be the fund's biggest individual contributor. Anthem's stock benefited from a series of better-than-expected quarterly earnings reports, fueled in part by membership growth, and investors responded positively to the company's share buybacks in the first half of 2018. Anthem was our largest holding. The fund's relative result also benefited from not owning a position in industrial conglomerate General Electric, a benchmark constituent that returned -45% the past year. GE reported a $15 billion shortfall in its insurance reserves and continued to suffer lackluster performance in its oil-and-gas and power-generation businesses.
The views expressed above reflect those of the portfolio manager(s) only through the end of the period as stated on the cover of this report and do not necessarily represent the views of Fidelity or any other person in the Fidelity organization. Any such views are subject to change at any time based upon market or other conditions and Fidelity disclaims any responsibility to update such views. These views may not be relied on as investment advice and, because investment decisions for a Fidelity fund are based on numerous factors, may not be relied on as an indication of trading intent on behalf of any Fidelity fund.
Investment Summary (Unaudited)
Top Ten Stocks as of July 31, 2018
| | % of fund's net assets |
| Anthem, Inc. | 4.8 |
| Amgen, Inc. | 2.6 |
| UnitedHealth Group, Inc. | 2.3 |
| Itochu Corp. | 2.2 |
| Best Buy Co., Inc. | 1.9 |
| The Western Union Co. | 1.9 |
| MetLife, Inc. | 1.8 |
| United Therapeutics Corp. | 1.7 |
| Aetna, Inc. | 1.6 |
| John David Group PLC | 1.4 |
| | 22.2 |
Top Five Market Sectors as of July 31, 2018
| | % of fund's net assets |
| Health Care | 21.1 |
| Consumer Discretionary | 20.7 |
| Financials | 14.4 |
| Energy | 9.3 |
| Information Technology | 8.5 |
Asset Allocation (% of fund's net assets)
| As of July 31, 2018* |
| | Stocks | 91.5% |
| | Short-Term Investments and Net Other Assets (Liabilities) | 8.5% |

* Foreign investments - 42.1%
Schedule of Investments July 31, 2018
Showing Percentage of Net Assets
| Common Stocks - 91.4% | | | |
| | | Shares | Value |
| CONSUMER DISCRETIONARY - 20.7% | | | |
| Auto Components - 2.7% | | | |
| Adient PLC | | 135,000 | $6,430,050 |
| ASTI Corp. | | 30,000 | 652,238 |
| Chita Kogyo Co. Ltd. | | 10,000 | 85,409 |
| Cooper Tire & Rubber Co. (a) | | 750,000 | 21,412,500 |
| DaikyoNishikawa Corp. | | 50,000 | 740,509 |
| Dongah Tire & Rubber Co. Ltd. | | 42,120 | 1,274,793 |
| Eagle Industry Co. Ltd. | | 300,000 | 4,850,870 |
| Exedy Corp. | | 15,000 | 480,928 |
| Fukoku Co. Ltd. | | 275,000 | 2,459,420 |
| G-Tekt Corp. (b) | | 2,700,000 | 46,772,794 |
| Gentex Corp. | | 200,000 | 4,640,000 |
| Hi-Lex Corp. | | 249,937 | 6,209,587 |
| Hu Lane Associate, Inc. | | 50,000 | 219,090 |
| Hyundai Mobis | | 925,000 | 189,407,887 |
| IJT Technology Holdings Co. Ltd. | | 1,225,000 | 9,213,656 |
| INFAC Corp. | | 362,529 | 1,465,132 |
| Linamar Corp. | | 5,000 | 228,504 |
| Murakami Corp. | | 35,000 | 954,702 |
| Piolax, Inc. | | 924,000 | 22,402,755 |
| Seoyon Co. Ltd. | | 425,000 | 1,839,744 |
| Seoyon E-Hwa Co., Ltd. | | 685,725 | 4,052,261 |
| SL Corp. | | 15,000 | 275,490 |
| Strattec Security Corp. | | 40,000 | 1,320,000 |
| TBK Co. Ltd. (b) | | 1,800,000 | 8,242,186 |
| The Furukawa Battery Co. Ltd. | | 150,000 | 1,231,498 |
| TPR Co. Ltd. | | 825,000 | 20,887,850 |
| Yorozu Corp. (b) | | 1,852,000 | 29,416,018 |
| | | | 387,165,871 |
| Automobiles - 0.7% | | | |
| Audi AG | | 26,000 | 22,194,263 |
| Fiat Chrysler Automobiles NV | | 139,000 | 2,360,220 |
| Fiat Chrysler Automobiles NV | | 1,264,900 | 21,592,060 |
| General Motors Co. | | 1,250,000 | 47,387,500 |
| Harley-Davidson, Inc. | | 50,000 | 2,144,500 |
| Renault SA | | 10,000 | 880,404 |
| | | | 96,558,947 |
| Distributors - 0.3% | | | |
| Amcon Distributing Co. | | 500 | 41,750 |
| Chori Co. Ltd. (b) | | 1,566,400 | 29,068,372 |
| Doshisha Co. Ltd. | | 350,000 | 7,881,769 |
| Harima-Kyowa Co. Ltd. | | 100,000 | 1,684,926 |
| Nakayamafuku Co. Ltd. | | 200,000 | 1,280,687 |
| SPK Corp. | | 15,000 | 362,474 |
| Yagi & Co. Ltd. | | 375,000 | 6,305,057 |
| Yamae Hisano Co. | | 50,000 | 635,872 |
| | | | 47,260,907 |
| Diversified Consumer Services - 0.4% | | | |
| Asante, Inc. | | 60,000 | 1,205,742 |
| Berry Petroleum Corp. | | 25,000 | 343,750 |
| Cross-Harbour Holdings Ltd. | | 300,000 | 504,520 |
| Estacio Participacoes SA | | 5,000 | 34,570 |
| Heian Ceremony Service Co. Ltd. (a) | | 500,000 | 4,194,428 |
| Kukbo Design Co. Ltd. | | 30,000 | 509,219 |
| MegaStudy Co. Ltd. (b) | | 1,086,945 | 14,593,862 |
| MegaStudyEdu Co. Ltd. (b) | | 209,684 | 31,166,266 |
| Multicampus Co. Ltd. | | 60,000 | 1,950,659 |
| Step Co. Ltd. | | 217,000 | 3,134,240 |
| Tsukada Global Holdings, Inc. | | 1,100,000 | 6,286,276 |
| | | | 63,923,532 |
| Hotels, Restaurants & Leisure - 0.4% | | | |
| Brinker International, Inc. (a) | | 75,000 | 3,537,750 |
| Fairwood Holdings Ltd. | | 50,000 | 190,469 |
| Hiday Hidaka Corp. | | 276,000 | 5,869,767 |
| Hiramatsu, Inc. | | 25,000 | 108,438 |
| Hub Co. Ltd. | | 74,000 | 690,927 |
| Koshidaka Holdings Co. Ltd. | | 500,000 | 5,750,570 |
| Kura Corp. Ltd. | | 100,000 | 6,027,814 |
| Nagacorp Ltd. | | 1,000,000 | 1,123,703 |
| Playtech Ltd. | | 100,000 | 705,889 |
| Retail Food Group Ltd. (a) | | 2,499,999 | 761,523 |
| St. Marc Holdings Co. Ltd. | | 100,000 | 2,431,695 |
| The Monogatari Corp. | | 5,000 | 460,582 |
| The Restaurant Group PLC | | 6,937,000 | 24,128,672 |
| Whitbread PLC | | 1,000 | 51,386 |
| Wyndham Destinations, Inc. | | 10,000 | 461,200 |
| Wyndham Hotels & Resorts, Inc. | | 10,000 | 580,000 |
| | | | 52,880,385 |
| Household Durables - 0.9% | | | |
| Ace Bed Co. Ltd. | | 50,029 | 6,083,618 |
| Cuckoo Holdings Co. Ltd. | | 40,000 | 5,765,759 |
| Emak SpA | | 600,000 | 847,545 |
| FJ Next Co. Ltd. | | 1,100,000 | 10,034,432 |
| Flexsteel Industries, Inc. | | 10,000 | 358,300 |
| Fuji Corp. Ltd. | | 50,000 | 413,182 |
| Gree Electric Appliances, Inc. of Zhuhai Class A | | 474,927 | 3,079,179 |
| Hamilton Beach Brands Holding Co.: | | | |
| Class A | | 125,000 | 3,175,000 |
| Class B | | 125,000 | 3,175,000 |
| Helen of Troy Ltd. (c) | | 550,000 | 63,002,500 |
| Iida Group Holdings Co. Ltd. | | 100,000 | 1,957,698 |
| Nittoh Corp. | | 25,000 | 118,499 |
| Q.E.P. Co., Inc. | | 34,998 | 1,112,936 |
| SABAF SpA (c) | | 400,000 | 7,577,388 |
| Sanei Architecture Planning Co. Ltd. (a) | | 660,000 | 11,669,454 |
| Sanyo Housing Nagoya Co. Ltd. | | 700,000 | 7,581,273 |
| Tupperware Brands Corp. | | 134,500 | 4,937,495 |
| Wellpool Co. Ltd. | | 200,000 | 357,738 |
| | | | 131,246,996 |
| Internet & Direct Marketing Retail - 0.0% | | | |
| Hyundai Home Shopping Network Corp. | | 10,000 | 987,903 |
| N Brown Group PLC | | 150,000 | 285,873 |
| NS Shopping Co. Ltd. | | 75,000 | 845,330 |
| Trade Maine Group Ltd. | | 100,000 | 330,576 |
| | | | 2,449,682 |
| Leisure Products - 0.2% | | | |
| Accell Group NV | | 625,000 | 13,009,019 |
| Mars Engineering Corp. | | 550,000 | 11,918,347 |
| | | | 24,927,366 |
| Media - 2.1% | | | |
| AMC Networks, Inc. Class A (c) | | 125,000 | 7,536,250 |
| Comcast Corp. Class A | | 3,700,000 | 132,386,000 |
| Corus Entertainment, Inc. Class B (non-vtg.) | | 400,000 | 1,248,415 |
| Discovery Communications, Inc.: | | | |
| Class A (a)(c) | | 2,400,000 | 63,792,000 |
| Class B (c) | | 19,308 | 588,894 |
| DISH Network Corp. Class A (c) | | 100,000 | 3,156,000 |
| DMS, Inc. | | 250,000 | 3,572,866 |
| Gendai Agency, Inc. (b) | | 850,000 | 4,074,587 |
| Hyundai HCN | | 2,250,049 | 8,386,129 |
| Interspace Co. Ltd. (a) | | 20,000 | 380,808 |
| Ipsos SA | | 10,000 | 334,668 |
| ITE Group PLC | | 2,338,871 | 2,548,005 |
| Liberty Latin America Ltd. Class A (c) | | 6,871 | 131,099 |
| Multiplus SA | | 600,000 | 4,428,103 |
| Nippon BS Broadcasting Corp. | | 200,000 | 2,488,038 |
| Nippon Television Network Corp. | | 150,000 | 2,413,361 |
| Pico Far East Holdings Ltd. | | 8,000,000 | 3,312,503 |
| Proto Corp. | | 50,000 | 614,408 |
| RKB Mainichi Broadcasting Corp. | | 3,000 | 168,224 |
| SMG PLC | | 10,000 | 56,571 |
| Television Broadcasts Ltd. | | 1,500,000 | 4,653,429 |
| The Walt Disney Co. | | 94,200 | 10,697,352 |
| Viacom, Inc.: | | | |
| Class A (a) | | 800,000 | 27,520,000 |
| Class B (non-vtg.) | | 600,000 | 17,430,000 |
| WOWOW INC. | | 250,000 | 7,568,305 |
| | | | 309,486,015 |
| Multiline Retail - 0.6% | | | |
| Grazziotin SA | | 350,000 | 1,874,351 |
| Gwangju Shinsegae Co. Ltd. (b) | | 97,372 | 18,101,973 |
| Lifestyle China Group Ltd. (c) | | 12,500,000 | 5,080,233 |
| Lifestyle International Holdings Ltd. | | 12,500,000 | 24,843,771 |
| Macy's, Inc. | | 500,000 | 19,865,000 |
| Treasure Factory Co. Ltd. (b) | | 875,000 | 6,322,944 |
| Watts Co. Ltd. | | 350,000 | 3,421,276 |
| | | | 79,509,548 |
| Specialty Retail - 10.7% | | | |
| ABC-MART, Inc. | | 25,000 | 1,352,681 |
| Arc Land Sakamoto Co. Ltd. | | 500,000 | 6,993,695 |
| AT-Group Co. Ltd. | | 755,000 | 19,162,814 |
| AutoNation, Inc. (c) | | 350,000 | 16,985,500 |
| Beacon Lighting Group Ltd. | | 25,441 | 27,218 |
| Bed Bath & Beyond, Inc. (b) | | 10,900,000 | 204,157,000 |
| Best Buy Co., Inc. | | 3,750,000 | 281,362,500 |
| Cars.com, Inc. (c) | | 25,000 | 709,250 |
| Cash Converters International Ltd. (c) | | 6,582,909 | 1,638,409 |
| DCM Japan Holdings Co. Ltd. | | 25,000 | 223,807 |
| DongAh Tire & Rubber Co. Ltd. (c) | | 57,879 | 678,349 |
| Dunelm Group PLC | | 300,000 | 2,065,297 |
| E-Life Mall Corp. Ltd. | | 100,000 | 211,242 |
| Ff Group (c)(d) | | 1,180,000 | 6,623,198 |
| Formosa Optical Technology Co. Ltd. | | 751,383 | 1,523,356 |
| Fuji Corp. (b) | | 705,790 | 16,821,807 |
| GameStop Corp. Class A (a)(b) | | 9,999,167 | 144,087,996 |
| Genesco, Inc. (c) | | 300,000 | 12,210,000 |
| GNC Holdings, Inc. Class A (a)(b)(c) | | 5,939,600 | 18,887,928 |
| Goldlion Holdings Ltd. | | 9,300,000 | 3,850,784 |
| Guess?, Inc. (b) | | 5,761,600 | 130,557,856 |
| Handsman Co. Ltd. | | 700,000 | 8,125,922 |
| Hibbett Sports, Inc. (a)(b)(c) | | 1,150,300 | 26,399,385 |
| Hour Glass Ltd. | | 11,748,400 | 5,566,326 |
| IA Group Corp. | | 18,200 | 616,894 |
| International Housewares Retail Co. Ltd. | | 999,600 | 248,338 |
| JB Hi-Fi Ltd. (a) | | 700,000 | 12,403,550 |
| John David Group PLC | | 33,700,000 | 206,965,902 |
| Jumbo SA | | 1,750,000 | 28,035,166 |
| K's Holdings Corp. | | 3,950,000 | 44,405,044 |
| Ku Holdings Co. Ltd. | | 600,000 | 5,038,680 |
| L'Occitane Ltd. | | 100,000 | 175,308 |
| Lookers PLC | | 1,534,541 | 2,114,870 |
| Lovisa Holdings Ltd. | | 10,000 | 83,359 |
| Mandarake, Inc. (a) | | 180,000 | 1,067,299 |
| Mitsui & Associates Telepark Corp. | | 25,000 | 605,017 |
| Mr. Bricolage SA | | 311,600 | 4,791,458 |
| Nafco Co. Ltd. | | 640,400 | 10,503,900 |
| Nitori Holdings Co. Ltd. | | 725,000 | 109,351,384 |
| Nojima Co. Ltd. | | 50,000 | 1,025,802 |
| Oriental Watch Holdings Ltd. | | 9,273,000 | 2,847,215 |
| Padini Holdings Bhd | | 2,700,000 | 3,985,240 |
| Sa Sa International Holdings Ltd. | | 521,053 | 277,486 |
| Sacs Bar Holdings, Inc. | | 400,000 | 3,470,017 |
| Sally Beauty Holdings, Inc. (c) | | 5,150,000 | 84,923,500 |
| Samse SA | | 37,000 | 6,836,020 |
| Shimamura Co. Ltd. | | 5,000 | 467,737 |
| Silvano Fashion Group A/S | | 9,800 | 33,250 |
| Sports Direct International PLC (c) | | 200,000 | 1,085,479 |
| The Buckle, Inc. | | 632,900 | 15,221,245 |
| Tokatsu Holdings Co. Ltd. (b) | | 250,000 | 1,202,880 |
| Truworths International Ltd. | | 334,900 | 2,082,014 |
| Urban Outfitters, Inc. (c) | | 950,000 | 42,180,000 |
| Vita Group Ltd. (a) | | 350,000 | 253,532 |
| Vitamin Shoppe, Inc. (a)(c) | | 400,000 | 3,340,000 |
| Williams-Sonoma, Inc. (a) | | 900,000 | 52,641,000 |
| | | | 1,558,500,906 |
| Textiles, Apparel & Luxury Goods - 1.7% | | | |
| Best Pacific International Holdings Ltd. | | 2,700,000 | 997,573 |
| Embry Holdings Ltd. | | 3,200,000 | 1,076,309 |
| Fossil Group, Inc. (a)(c) | | 2,338,700 | 61,273,940 |
| Fujibo Holdings, Inc. | | 2,000 | 55,896 |
| Gerry Weber International AG (Bearer) (a) | | 625,000 | 4,224,277 |
| Grendene SA | | 300,000 | 622,652 |
| Hagihara Industries, Inc. | | 125,000 | 2,170,997 |
| Handsome Co. Ltd. | | 25,000 | 847,576 |
| Magni-Tech Industries Bhd | | 2,750,000 | 3,247,232 |
| Michael Kors Holdings Ltd. (c) | | 1,900,000 | 126,787,000 |
| Only Corp. | | 15,000 | 134,016 |
| Pinduoduo, Inc. ADR | | 112,300 | 2,536,857 |
| Portico International Holdings (c) | | 12,000,000 | 6,252,986 |
| Sitoy Group Holdings Ltd. | | 11,200,000 | 3,224,849 |
| Texwinca Holdings Ltd. | | 1,800,000 | 793,472 |
| Vera Bradley, Inc. (c) | | 950,000 | 12,625,500 |
| Youngone Holdings Co. Ltd. | | 258,000 | 12,442,724 |
| Yue Yuen Industrial (Holdings) Ltd. | | 2,500,000 | 6,720,559 |
| | | | 246,034,415 |
|
| TOTAL CONSUMER DISCRETIONARY | | | 2,999,944,570 |
|
| CONSUMER STAPLES - 4.5% | | | |
| Beverages - 0.8% | | | |
| A.G. Barr PLC | | 500,000 | 4,442,982 |
| Britvic PLC | | 6,968,131 | 73,534,003 |
| C&C Group PLC | | 412,710 | 1,660,152 |
| Jinro Distillers Co. Ltd. (b) | | 523,000 | 14,372,906 |
| Lucas Bols BV (e) | | 120,000 | 2,371,442 |
| Muhak Co. Ltd. | | 340,000 | 4,626,079 |
| Olvi PLC (A Shares) | | 100,000 | 3,765,307 |
| Spritzer Bhd | | 1,000,000 | 590,406 |
| Thai Beverage PCL | | 100,000 | 55,827 |
| Willamette Valley Vineyards, Inc. | | 5,000 | 41,000 |
| Yantai Changyu Pioneer Wine Co. Ltd. (B Shares) | | 6,100,762 | 16,283,622 |
| | | | 121,743,726 |
| Food & Staples Retailing - 1.8% | | | |
| Amsterdam Commodities NV | | 625,000 | 14,653,417 |
| Belc Co. Ltd. | | 30,000 | 1,438,090 |
| Create SD Holdings Co. Ltd. | | 930,000 | 23,122,121 |
| Daiichi Co. Ltd. | | 150,000 | 1,026,249 |
| Dong Suh Companies, Inc. | | 500,000 | 11,450,690 |
| Genky DrugStores Co. Ltd. | | 400,000 | 13,826,410 |
| Halows Co. Ltd. | | 65,000 | 1,499,799 |
| J Sainsbury PLC | | 200,000 | 858,408 |
| Kroger Co. | | 2,000,000 | 58,000,000 |
| Magnit OJSC | | 5,388 | 356,016 |
| MARR SpA | | 800,000 | 21,609,588 |
| Medical Ikkou Co. Ltd. | | 4,000 | 336,270 |
| Metro Wholesale & Food Specialist AG | | 10,000 | 123,483 |
| Nihon Chouzai Co. Ltd. | | 50,000 | 1,326,298 |
| OM2 Network Co. Ltd. (a) | | 220,000 | 3,470,733 |
| Qol Co. Ltd. | | 100,000 | 1,641,998 |
| Retail Partners Co. Ltd. | | 587,800 | 8,032,539 |
| Sapporo Clinical Laboratory | | 20,000 | 468,631 |
| Satoh & Co. Ltd. | | 50,000 | 722,175 |
| Satsudora Holdings Co. Ltd. (b) | | 400,000 | 7,630,461 |
| Shoei Foods Corp. | | 50,000 | 1,730,537 |
| Tesco PLC | | 10,075,936 | 34,409,402 |
| Thai President Foods PCL | | 131,357 | 611,973 |
| United Natural Foods, Inc. (c) | | 412,000 | 13,266,400 |
| Valor Holdings Co. Ltd. | | 650,000 | 13,939,990 |
| Walgreens Boots Alliance, Inc. | | 398,100 | 26,919,522 |
| Yuasa Funashoku Co. Ltd. | | 10,000 | 313,017 |
| | | | 262,784,217 |
| Food Products - 1.3% | | | |
| Ajinomoto Malaysia Bhd | | 1,700,000 | 9,200,492 |
| Armanino Foods of Distinction | | 250,000 | 692,500 |
| B&G Foods, Inc. Class A (a) | | 275,000 | 8,635,000 |
| Bakkafrost | | 150,000 | 9,222,536 |
| Bakkavor Group PLC (a)(c)(e) | | 100,000 | 245,447 |
| Bell AG | | 40,500 | 11,841,388 |
| Binggrea Co. Ltd. | | 15,000 | 810,978 |
| Campbell Soup Co. (a) | | 50,000 | 2,045,000 |
| Carr's Group PLC | | 4,270,000 | 8,294,791 |
| Changshouhua Food Co. Ltd. | | 3,500,000 | 1,645,422 |
| Cranswick PLC | | 455,526 | 19,575,267 |
| Dean Foods Co. | | 50,000 | 491,000 |
| Fresh Del Monte Produce, Inc. | | 1,138,200 | 41,316,660 |
| High Liner Foods, Inc. | | 20,000 | 137,756 |
| Hormel Foods Corp. | | 5,000 | 179,850 |
| Japan Meat Co. Ltd. | | 25,000 | 471,538 |
| JC Comsa Corp. | | 150,000 | 496,356 |
| Kaneko Seeds Co. Ltd. | | 150,000 | 2,165,184 |
| Kaveri Seed Co. Ltd. | | 239,414 | 2,136,576 |
| Kawan Food Bhd | | 66,666 | 39,360 |
| Kwality Ltd. (c) | | 50,000 | 9,568 |
| Lassonde Industries, Inc. Class A (sub. vtg.) | | 50,000 | 10,193,335 |
| London Biscuits Bhd (c) | | 4,000,000 | 511,685 |
| London Biscuits Bhd warrants 1/26/20 (c) | | 400,000 | 16,236 |
| M. Dias Branco SA | | 10,000 | 102,230 |
| Nitto Fuji Flour Milling Co. Ltd. | | 10,000 | 464,160 |
| Origin Enterprises PLC | | 50,000 | 353,144 |
| Pickles Corp. (a) | | 100,000 | 1,988,105 |
| President Bakery PCL | | 16,500 | 30,500 |
| Prima Meat Packers Ltd. | | 450,000 | 2,257,747 |
| S Foods, Inc. | | 300,000 | 11,764,969 |
| Select Harvests Ltd. | | 1,443,687 | 6,435,524 |
| Shinobu Food Products Co. Ltd. | | 25,000 | 176,631 |
| Thai Wah PCL | | 426,000 | 118,440 |
| The Hain Celestial Group, Inc. (c) | | 650,000 | 18,486,000 |
| The J.M. Smucker Co. | | 33,000 | 3,666,960 |
| Toyo Sugar Refining Co. Ltd. | | 210,000 | 2,390,824 |
| Valsoia SpA | | 85,000 | 1,560,498 |
| | | | 180,169,657 |
| Personal Products - 0.3% | | | |
| Asaleo Care Ltd. | | 900,000 | 468,059 |
| Hengan International Group Co. Ltd. | | 1,800,000 | 16,018,499 |
| Sarantis SA | | 2,400,000 | 19,645,080 |
| | | | 36,131,638 |
| Tobacco - 0.3% | | | |
| KT&G Corp. | | 315,000 | 31,260,384 |
| Scandinavian Tobacco Group A/S (e) | | 400,000 | 6,509,168 |
| | | | 37,769,552 |
|
| TOTAL CONSUMER STAPLES | | | 638,598,790 |
|
| ENERGY - 9.3% | | | |
| Energy Equipment & Services - 1.1% | | | |
| AKITA Drilling Ltd. Class A (non-vtg.) | | 250,000 | 935,927 |
| Carbo Ceramics, Inc. (a)(b)(c) | | 2,360,200 | 22,020,666 |
| Cathedral Energy Services Ltd. (c) | | 360,000 | 323,788 |
| Diamond Offshore Drilling, Inc. (a)(c) | | 750,000 | 14,400,000 |
| Ensco PLC Class A | | 5,200,000 | 38,636,000 |
| Geospace Technologies Corp. (c) | | 588,000 | 8,273,160 |
| GulfMark Offshore, Inc. (a)(c) | | 75,441 | 2,843,371 |
| GulfMark Offshore, Inc. warrants 11/14/24 (c) | | 4,764 | 11,910 |
| High Arctic Energy Services, Inc. | | 225,000 | 671,100 |
| Liberty Oilfield Services, Inc. Class A (a) | | 225,000 | 4,410,000 |
| National Oilwell Varco, Inc. | | 200,000 | 9,724,000 |
| Oceaneering International, Inc. | | 530,800 | 14,522,688 |
| PHX Energy Services Corp. (c) | | 25,000 | 39,205 |
| Precision Drilling Corp. (c) | | 200,000 | 724,142 |
| Prosafe ASA (a)(c) | | 475,000 | 1,087,824 |
| Shelf Drilling Ltd. (c)(e) | | 100,000 | 735,106 |
| Shinko Plantech Co. Ltd. | | 1,925,000 | 18,162,814 |
| Subsea 7 SA | | 100,000 | 1,449,737 |
| Tecnicas Reunidas SA (a) | | 200,000 | 6,758,843 |
| Transocean Ltd. (United States) (c) | | 1,650,000 | 21,235,500 |
| | | | 166,965,781 |
| Oil, Gas & Consumable Fuels - 8.2% | | | |
| Advantage Oil & Gas Ltd. (c) | | 100,000 | 345,928 |
| Alvopetro Energy Ltd. (c) | | 2,800,000 | 968,597 |
| ARC Resources Ltd. | | 25,000 | 296,921 |
| Baytex Energy Corp. (a)(c) | | 2,500,000 | 7,764,154 |
| Beach Energy Ltd. | | 1,392,894 | 1,976,565 |
| Birchcliff Energy Ltd. | | 7,030,814 | 27,834,641 |
| Bonavista Energy Corp. (a) | | 2,000,000 | 2,398,432 |
| Bonterra Energy Corp. (a) | | 500,000 | 7,153,015 |
| Cenovus Energy, Inc. | | 150,000 | 1,504,785 |
| Chevron Corp. | | 525,000 | 66,291,750 |
| China Petroleum & Chemical Corp.: | | | |
| (H Shares) | | 200,500,000 | 192,729,215 |
| sponsored ADR (H Shares) | | 50,000 | 4,794,000 |
| CNOOC Ltd. | | 450,000 | 753,907 |
| CNOOC Ltd. sponsored ADR | | 100,000 | 16,800,000 |
| CNX Resources Corp. (c) | | 50,000 | 814,000 |
| ConocoPhillips Co. | | 2,550,000 | 184,033,500 |
| Contango Oil & Gas Co. (c) | | 250,000 | 1,402,500 |
| Denbury Resources, Inc. (c) | | 6,000,000 | 27,060,000 |
| Enagas SA | | 3,000,000 | 83,912,556 |
| Eni SpA | | 10,000 | 192,485 |
| EQT Midstream Partners LP | | 7,500 | 383,925 |
| Fuji Kosan Co. Ltd. | | 105,000 | 614,139 |
| Fuji Oil Co. Ltd. | | 200,000 | 756,607 |
| Husky Energy, Inc. | | 5,300,000 | 90,122,612 |
| Imperial Oil Ltd. | | 700,000 | 23,972,787 |
| International Seaways, Inc. (c) | | 55,000 | 1,197,350 |
| Motor Oil (HELLAS) Corinth Refineries SA | | 300,000 | 6,370,619 |
| Murphy Oil Corp. | | 1,575,000 | 52,384,500 |
| NACCO Industries, Inc. Class A | | 125,000 | 4,125,000 |
| Oil & Natural Gas Corp. Ltd. | | 35,000,000 | 84,713,701 |
| Oil India Ltd. | | 100,000 | 305,361 |
| Peyto Exploration & Development Corp. (a)(b) | | 12,474,700 | 102,801,079 |
| San-Ai Oil Co. Ltd. | | 200,000 | 2,561,374 |
| Sanrin Co. Ltd. | | 15,000 | 94,173 |
| Ship Finance International Ltd. (NY Shares) | | 10,000 | 145,500 |
| Sinopec Kantons Holdings Ltd. | | 6,000,000 | 2,652,550 |
| Star Petroleum Refining PCL | | 1,100,000 | 482,717 |
| Thai Oil PCL (For. Reg.) | | 1,000,000 | 2,412,083 |
| Total SA sponsored ADR | | 2,217,303 | 144,679,021 |
| TransGlobe Energy Corp. (c) | | 30,000 | 97,321 |
| Tsakos Energy Navigation Ltd. (a) | | 500,000 | 1,750,000 |
| Whiting Petroleum Corp. (c) | | 450,000 | 22,342,500 |
| World Fuel Services Corp. | | 350,000 | 9,740,500 |
| | | | 1,183,732,370 |
|
| TOTAL ENERGY | | | 1,350,698,151 |
|
| FINANCIALS - 14.4% | | | |
| Banks - 4.9% | | | |
| Banco de Sabadell SA | | 100,000 | 167,042 |
| Bar Harbor Bankshares | | 150,000 | 4,345,500 |
| Cambridge Bancorp (a) | | 5,000 | 449,750 |
| Central Valley Community Bancorp | | 25,000 | 537,250 |
| Citizens Financial Services, Inc. | | 12,853 | 816,166 |
| Credit Agricole Atlantique Vendee | | 7,000 | 1,040,862 |
| Erste Group Bank AG | | 5,000 | 216,096 |
| F & M Bank Corp. | | 131,632 | 5,002,016 |
| First Hawaiian, Inc. | | 100,000 | 2,826,000 |
| Gunma Bank Ltd. | | 5,100,000 | 27,092,966 |
| Hiroshima Bank Ltd. | | 1,000,000 | 6,877,431 |
| JPMorgan Chase & Co. | | 1,300,000 | 149,435,000 |
| Mitsubishi UFJ Financial Group, Inc. | | 17,000,000 | 104,326,722 |
| NIBC Holding NV (c) | | 1,050,000 | 9,847,096 |
| Nordea Bank AB | | 100,000 | 1,063,579 |
| OFG Bancorp (a) | | 1,861,516 | 30,994,241 |
| Ogaki Kyoritsu Bank Ltd. | | 60,000 | 1,568,484 |
| San ju San Financial Group, Inc. (c) | | 300,000 | 5,776,506 |
| Schweizerische Nationalbank | | 10 | 62,819 |
| Shinsei Bank Ltd. | | 100,000 | 1,575,008 |
| Skandiabanken ASA (e) | | 625,000 | 6,053,343 |
| Sparebank 1 Oestlandet | | 1,000,000 | 10,592,584 |
| Sumitomo Mitsui Financial Group, Inc. | | 4,000,000 | 158,750,968 |
| The Keiyo Bank Ltd. | | 1,000,000 | 4,400,125 |
| The San-In Godo Bank Ltd. | | 1,500,000 | 14,045,522 |
| Unicaja Banco SA (e) | | 6,000,000 | 10,131,248 |
| Van Lanschot NV (Bearer) | | 81,300 | 2,243,608 |
| Wells Fargo & Co. | | 2,250,000 | 128,902,500 |
| Yamaguchi Financial Group, Inc. | | 1,700,000 | 19,247,865 |
| | | | 708,388,297 |
| Capital Markets - 1.2% | | | |
| ABG Sundal Collier ASA | | 1,500,000 | 1,066,614 |
| Apollo Global Management LLC Class A | | 396,300 | 14,068,650 |
| Ares Capital Corp. | | 411,706 | 6,937,246 |
| BinckBank NV | | 109,000 | 660,238 |
| Blue Sky Alternative Investments Ltd. | | 10,000 | 14,339 |
| Brighthouse Financial, Inc. | | 303,436 | 13,178,225 |
| Edify SA (c) | | 10,068 | 718,154 |
| Franklin Resources, Inc. | | 225,000 | 7,722,000 |
| Goldman Sachs Group, Inc. | | 100,000 | 23,743,000 |
| Morgan Stanley | | 672,200 | 33,986,432 |
| The Blackstone Group LP | | 2,155,700 | 75,277,044 |
| TPG Specialty Lending, Inc. | | 116,714 | 2,277,090 |
| | | | 179,649,032 |
| Consumer Finance - 1.0% | | | |
| Aeon Credit Service (Asia) Co. Ltd. | | 10,300,000 | 8,726,534 |
| Credit Corp. Group Ltd. (a) | | 52,450 | 801,956 |
| Discover Financial Services | | 1,000,000 | 71,410,000 |
| Santander Consumer U.S.A. Holdings, Inc. | | 450,000 | 8,658,000 |
| Synchrony Financial | | 1,800,000 | 52,092,000 |
| | | | 141,688,490 |
| Diversified Financial Services - 1.0% | | | |
| Fuyo General Lease Co. Ltd. | | 550,000 | 34,284,309 |
| Granite Point Mortgage Trust, Inc. | | 14,119 | 268,261 |
| IBJ Leasing Co. Ltd. | | 200,000 | 5,144,211 |
| Kyushu Railway Co. | | 260,000 | 7,975,674 |
| NICE Holdings Co. Ltd. | | 225,000 | 3,223,033 |
| Ricoh Leasing Co. Ltd. | | 1,070,000 | 34,928,230 |
| Tokyo Century Corp. | | 1,350,000 | 73,648,437 |
| | | | 159,472,155 |
| Insurance - 6.1% | | | |
| AFLAC, Inc. | | 4,000,000 | 186,160,000 |
| April | | 1,100,000 | 17,493,476 |
| ASR Nederland NV | | 1,000,000 | 44,786,105 |
| Assurant, Inc. | | 200,000 | 22,060,000 |
| Chubb Ltd. | | 300,000 | 41,916,000 |
| Db Insurance Co. Ltd. | | 1,275,000 | 73,856,952 |
| Genworth Financial, Inc. Class A (c) | | 14,710,000 | 67,666,000 |
| Hannover Reuck SE | | 45,000 | 5,998,766 |
| Hyundai Fire & Marine Insurance Co. Ltd. | | 375,000 | 12,343,170 |
| Kansas City Life Insurance Co. | | 2,000 | 75,500 |
| MetLife, Inc. | | 5,850,000 | 267,579,000 |
| National Western Life Group, Inc. | | 24,000 | 7,776,000 |
| NN Group NV | | 2,022,101 | 89,427,047 |
| Power Corp. of Canada (sub. vtg.) | | 100,000 | 2,274,667 |
| Prudential Financial, Inc. | | 222,300 | 22,432,293 |
| Sony Financial Holdings, Inc. | | 1,000,000 | 19,216,477 |
| Sul America SA unit | | 150,000 | 882,024 |
| | | | 881,943,477 |
| Mortgage Real Estate Investment Trusts - 0.0% | | | |
| Two Harbors Investment Corp. | | 74,500 | 1,154,750 |
| Thrifts & Mortgage Finance - 0.2% | | | |
| ASAX Co. Ltd. | | 1,005,600 | 5,764,786 |
| Genworth MI Canada, Inc. (a) | | 450,000 | 15,840,028 |
| Genworth Mortgage Insurance Ltd. (a) | | 3,250,899 | 6,497,037 |
| Hingham Institution for Savings | | 10,100 | 2,232,807 |
| | | | 30,334,658 |
|
| TOTAL FINANCIALS | | | 2,102,630,859 |
|
| HEALTH CARE - 21.1% | | | |
| Biotechnology - 6.9% | | | |
| AbbVie, Inc. | | 1,000,000 | 92,230,000 |
| Amgen, Inc. | | 1,925,000 | 378,358,750 |
| Biogen, Inc. (c) | | 400,000 | 133,748,000 |
| Celgene Corp. (c) | | 35,000 | 3,153,150 |
| Cell Biotech Co. Ltd. | | 150,000 | 4,512,919 |
| Essex Bio-Technology Ltd. | | 1,000,000 | 812,837 |
| Gilead Sciences, Inc. | | 1,816,600 | 141,385,978 |
| United Therapeutics Corp. (c) | | 2,000,000 | 245,820,000 |
| | | | 1,000,021,634 |
| Health Care Equipment & Supplies - 0.7% | | | |
| A&T Corp. | | 90,000 | 768,680 |
| Ansell Ltd. | | 500,000 | 10,702,195 |
| Create Medic Co. Ltd. | | 35,000 | 436,033 |
| Daiken Medical Co. Ltd. | | 10,000 | 73,335 |
| Fukuda Denshi Co. Ltd. | | 550,000 | 36,596,163 |
| Kawasumi Laboratories, Inc. | | 100,000 | 636,766 |
| Medikit Co. Ltd. | | 35,000 | 1,887,493 |
| Microlife Corp. | | 800,000 | 2,241,915 |
| Nakanishi, Inc. | | 600,000 | 12,529,625 |
| Pacific Hospital Supply Co. Ltd. | | 200,000 | 432,949 |
| Paramount Bed Holdings Co. Ltd. | | 75,000 | 3,169,298 |
| Paul Hartmann AG | | 1,000 | 404,595 |
| St.Shine Optical Co. Ltd. | | 900,000 | 19,806,416 |
| Value Added Technology Co. Ltd. | | 75,000 | 2,118,378 |
| Varex Imaging Corp. (c) | | 100,000 | 3,824,000 |
| Vieworks Co. Ltd. | | 20,000 | 598,130 |
| | | | 96,225,971 |
| Health Care Providers & Services - 11.2% | | | |
| Aetna, Inc. | | 1,200,000 | 226,068,000 |
| Amedisys, Inc. (c) | | 200,000 | 18,726,000 |
| Anthem, Inc. | | 2,750,000 | 695,750,008 |
| Chemed Corp. | | 145,000 | 45,824,350 |
| CVS Health Corp. | | 1,200,000 | 77,832,000 |
| EBOS Group Ltd. | | 487,300 | 6,709,302 |
| Excelsior Medical Co. Ltd. | | 200,000 | 328,308 |
| Hokuyaku Takeyama Holdings, Inc. | | 15,000 | 115,369 |
| Humana, Inc. | | 500,000 | 157,090,000 |
| MEDNAX, Inc. (c) | | 450,000 | 19,255,500 |
| Patterson Companies, Inc. | | 100,000 | 2,452,000 |
| Quest Diagnostics, Inc. | | 250,000 | 26,930,000 |
| Saint-Care Holding Corp. | | 375,000 | 2,334,213 |
| Sigma Healthcare Ltd. | | 6,500,000 | 2,366,296 |
| Tokai Corp. | | 400,000 | 8,753,745 |
| Uchiyama Holdings Co. Ltd. | | 775,000 | 3,618,030 |
| UnitedHealth Group, Inc. | | 1,300,000 | 329,186,000 |
| Universal Health Services, Inc. Class B | | 75,000 | 9,157,500 |
| Yagami, Inc. | | 5,000 | 107,320 |
| | | | 1,632,603,941 |
| Health Care Technology - 0.1% | | | |
| Pharmagest Interactive | | 270,000 | 18,438,311 |
| Life Sciences Tools & Services - 0.2% | | | |
| Divi's Laboratories Ltd. | | 350,000 | 5,876,534 |
| ICON PLC (c) | | 160,000 | 22,265,600 |
| | | | 28,142,134 |
| Pharmaceuticals - 2.0% | | | |
| Apex Healthcare Bhd | | 750,000 | 1,309,963 |
| AstraZeneca PLC sponsored ADR | | 800,000 | 31,304,000 |
| Biofermin Pharmaceutical Co. Ltd. | | 100,000 | 2,557,796 |
| Bliss Gvs Pharma Ltd. (c) | | 100,000 | 251,022 |
| Daito Pharmaceutical Co. Ltd. | | 50,000 | 1,567,321 |
| Dawnrays Pharmaceutical Holdings Ltd. | | 9,000,000 | 5,136,927 |
| DongKook Pharmaceutical Co. Ltd. | | 83,000 | 4,681,222 |
| Genomma Lab Internacional SA de CV (c) | | 5,000,000 | 3,989,215 |
| GlaxoSmithKline PLC | | 83,500 | 1,734,316 |
| Huons Co. Ltd. | | 2,640 | 228,324 |
| Indivior PLC (c) | | 3,200,000 | 12,844,089 |
| Jazz Pharmaceuticals PLC (c) | | 10,000 | 1,730,800 |
| Johnson & Johnson | | 860,900 | 114,086,468 |
| Kaken Pharmaceutical Co. Ltd. | | 10,000 | 517,820 |
| Korea United Pharm, Inc. | | 130,000 | 2,790,376 |
| Kwang Dong Pharmaceutical Co. Ltd. | | 2,400,000 | 16,165,680 |
| Kyung Dong Pharmaceutical Co. Ltd. | | 50,000 | 543,346 |
| Lee's Pharmaceutical Holdings Ltd. | | 9,000,000 | 9,643,205 |
| Luye Pharma Group Ltd. | | 2,500,000 | 2,430,230 |
| Nippon Chemiphar Co. Ltd. | | 62,510 | 2,591,189 |
| Novo Nordisk A/S Series B sponsored ADR | | 250,000 | 12,442,500 |
| Orient Europharma Co. Ltd. | | 200,000 | 443,413 |
| PT Tempo Scan Pacific Tbk | | 500,000 | 52,011 |
| Samjin Pharmaceutical Co. Ltd. | | 2,000 | 82,535 |
| Sanofi SA sponsored ADR | | 200,000 | 8,672,000 |
| Stallergenes Greer PLC (c) | | 104,976 | 3,351,176 |
| Syngen Biotech Co. Ltd. | | 55,000 | 214,022 |
| Taro Pharmaceutical Industries Ltd. (c) | | 350,000 | 39,291,000 |
| Towa Pharmaceutical Co. Ltd. | | 150,000 | 8,330,725 |
| Vetoquinol SA | | 10,000 | 643,143 |
| Vivimed Labs Ltd. (c) | | 100,000 | 82,749 |
| | | | 289,708,583 |
|
| TOTAL HEALTH CARE | | | 3,065,140,574 |
|
| INDUSTRIALS - 8.0% | | | |
| Aerospace & Defense - 0.0% | | | |
| Austal Ltd. | | 300,000 | 381,133 |
| Avon Rubber PLC | | 10,000 | 190,976 |
| Magellan Aerospace Corp. | | 100,000 | 1,212,284 |
| SIFCO Industries, Inc. (c) | | 61,000 | 314,150 |
| The Lisi Group | | 5,000 | 173,356 |
| | | | 2,271,899 |
| Air Freight & Logistics - 0.1% | | | |
| AIT Corp. | | 900,000 | 8,813,665 |
| CTI Logistics Ltd. | | 436,771 | 340,724 |
| Onelogix Group Ltd. | | 4,600,100 | 1,519,684 |
| SBS Co. Ltd. | | 275,000 | 3,273,487 |
| | | | 13,947,560 |
| Airlines - 0.0% | | | |
| WestJet Airlines Ltd. | | 10,000 | 140,831 |
| Building Products - 0.2% | | | |
| Caesarstone Sdot-Yam Ltd. (a) | | 10,000 | 157,500 |
| InnoTec TSS AG | | 50,000 | 894,553 |
| Kondotec, Inc. | | 25,000 | 228,726 |
| KVK Corp. | | 75,000 | 1,051,737 |
| Miyako, Inc. | | 10,000 | 85,677 |
| Nihon Dengi Co. Ltd. | | 350,000 | 8,705,004 |
| Noda Corp. | | 275,000 | 2,884,899 |
| Sekisui Jushi Corp. | | 550,000 | 9,891,786 |
| | | | 23,899,882 |
| Commercial Services & Supplies - 0.4% | | | |
| Asia File Corp. Bhd | | 5,300,100 | 3,585,554 |
| Calian Technologies Ltd. | | 309,000 | 7,494,292 |
| Civeo Corp. (c) | | 2,944,500 | 11,218,545 |
| CMC Corp. (a) | | 15,000 | 346,107 |
| Fursys, Inc. | | 200,000 | 5,406,522 |
| Matsuda Sangyo Co. Ltd. | | 150,000 | 2,161,159 |
| Mitie Group PLC | | 2,000,000 | 4,037,404 |
| Nippon Kanzai Co. Ltd. | | 20,000 | 384,922 |
| Prestige International, Inc. | | 950,000 | 11,053,526 |
| Riverstone Holdings Ltd. | | 100,000 | 80,802 |
| Secom Joshinetsu Co. Ltd. | | 10,000 | 312,570 |
| VSE Corp. | | 330,000 | 14,223,000 |
| | | | 60,304,403 |
| Construction & Engineering - 0.5% | | | |
| Arcadis NV | | 900,000 | 16,459,771 |
| Astaldi SpA | | 300,000 | 678,457 |
| Boustead Projs. Pte Ltd. | | 2,549,475 | 1,694,843 |
| Boustead Singapore Ltd. | | 9,647,800 | 5,846,722 |
| Daiichi Kensetsu Corp. | | 275,000 | 4,375,307 |
| Geumhwa PSC Co. Ltd. | | 1,000 | 29,637 |
| Hokuriku Electrical Construction Co. Ltd. | | 25,000 | 239,458 |
| Joban Kaihatsu Co. Ltd. (a) | | 5,000 | 334,481 |
| Kawasaki Setsubi Kogyo Co. Ltd. | | 175,000 | 738,720 |
| Meisei Industrial Co. Ltd. | | 600,000 | 4,845,504 |
| Monadelphous Group Ltd. | | 10,000 | 109,511 |
| Nakano Corp. | | 10,000 | 63,408 |
| Nippon Rietec Co. Ltd. | | 986,546 | 13,958,018 |
| Seikitokyu Kogyo Co. Ltd. | | 550,000 | 3,610,428 |
| Shinnihon Corp. | | 75,000 | 947,771 |
| Sumiken Mitsui Road Co. Ltd. | | 50,000 | 160,086 |
| Sumitomo Densetsu Co. Ltd. | | 175,000 | 3,023,745 |
| Toshiba Plant Systems & Services Corp. | | 500,000 | 11,049,501 |
| TTK Co. Ltd. | | 100,000 | 716,362 |
| Watanabe Sato Co. Ltd. | | 60,000 | 1,211,108 |
| | | | 70,092,838 |
| Electrical Equipment - 0.4% | | | |
| Aichi Electric Co. Ltd. | | 110,800 | 3,294,817 |
| Aros Quality Group AB (a) | | 853,205 | 15,816,355 |
| Canare Electric Co. Ltd. | | 95,000 | 1,830,076 |
| Dewhurst PLC | | 25,000 | 375,717 |
| Eaton Corp. PLC | | 320,800 | 26,680,936 |
| Hammond Power Solutions, Inc. Class A | | 530,000 | 2,925,318 |
| Holding Co. ADMIE IPTO SA (c) | | 25,000 | 49,756 |
| Iwabuchi Corp. | | 10,000 | 487,412 |
| Somfy SA | | 25,000 | 2,233,459 |
| Terasaki Electric Co. Ltd. | | 110,000 | 1,328,087 |
| | | | 55,021,933 |
| Industrial Conglomerates - 0.1% | | | |
| Lifco AB | | 100,018 | 4,487,356 |
| Mytilineos Holdings SA | | 850,000 | 8,547,949 |
| Nolato AB Series B | | 10,000 | 896,173 |
| Reunert Ltd. | | 300,000 | 1,859,123 |
| | | | 15,790,601 |
| Machinery - 0.9% | | | |
| Conrad Industries, Inc. (c) | | 22,800 | 401,280 |
| Daihatsu Diesel Manufacturing Co. Ltd. (b) | | 3,184,000 | 21,071,949 |
| Daiwa Industries Ltd. | | 1,100,000 | 12,434,825 |
| Estic Corp. | | 10,000 | 477,575 |
| Fuji Latex Co. Ltd. | | 35,000 | 906,184 |
| Fujimak Corp. (b) | | 410,000 | 7,377,543 |
| Fukushima Industries Corp. | | 75,000 | 3,695,837 |
| Global Brass & Copper Holdings, Inc. | | 275,000 | 9,061,250 |
| Haitian International Holdings Ltd. | | 3,750,000 | 8,838,649 |
| Hy-Lok Corp. | | 150,000 | 3,307,229 |
| Ihara Science Corp. | | 200,000 | 4,062,067 |
| Jaya Holdings Ltd. (c)(d) | | 1,157,500 | 24,658 |
| Koike Sanso Kogyo Co. Ltd. | | 35,000 | 914,010 |
| Luxfer Holdings PLC sponsored | | 50,000 | 925,000 |
| Mitsuboshi Belting Ltd. | | 25,000 | 308,545 |
| Momentum Group AB Class B | | 525,000 | 7,021,534 |
| Nakanishi Manufacturing Co. Ltd. | | 65,900 | 739,655 |
| Nakano Refrigerators Co. Ltd. | | 100,000 | 5,321,290 |
| Nansin Co. Ltd. | | 250,000 | 1,182,757 |
| Sakura Rubber Co. Ltd. | | 350,000 | 1,734,114 |
| Sansei Co. Ltd. (b) | | 850,000 | 2,888,700 |
| Semperit AG Holding (a)(c) | | 350,000 | 6,957,633 |
| SIMPAC, Inc. | | 2,325,000 | 6,086,715 |
| Snap-On, Inc. | | 5,000 | 847,950 |
| Suzumo Machinery Co. Ltd. | | 10,000 | 167,688 |
| Teikoku Sen-I Co. Ltd. | | 575,000 | 12,341,815 |
| The Hanshin Diesel Works Ltd. | | 30,000 | 654,384 |
| Tocalo Co. Ltd. | | 400,000 | 4,564,683 |
| Yamada Corp. | | 80,000 | 1,761,481 |
| | | | 126,077,000 |
| Marine - 0.0% | | | |
| Freight Management Holdings Bhd | | 1,000,000 | 265,683 |
| Japan Transcity Corp. | | 1,400,000 | 7,174,350 |
| Nippon Concept Corp. | | 25,000 | 305,192 |
| | | | 7,745,225 |
| Professional Services - 1.3% | | | |
| ABIST Co. Ltd. | | 175,000 | 7,230,694 |
| Akka Technologies SA | | 625,000 | 46,043,156 |
| Bertrandt AG | | 200,000 | 20,229,755 |
| Career Design Center Co. Ltd. | | 110,000 | 1,999,016 |
| CBIZ, Inc. (c) | | 200,000 | 4,400,000 |
| Dun & Bradstreet Corp. | | 525,000 | 66,092,250 |
| Harvey Nash Group PLC | | 400,000 | 595,898 |
| McMillan Shakespeare Ltd. | | 2,600,000 | 31,389,637 |
| SHL-JAPAN Ltd. | | 100,000 | 1,756,473 |
| WDB Holdings Co. Ltd. | | 175,000 | 6,096,007 |
| | | | 185,832,886 |
| Road & Rail - 0.6% | | | |
| Autohellas SA (b) | | 650,000 | 17,937,829 |
| ComfortDelgro Corp. Ltd. | | 100,000 | 172,623 |
| Daqin Railway Co. Ltd. (A Shares) | | 41,200,767 | 54,126,391 |
| Hamakyorex Co. Ltd. | | 92,000 | 3,180,074 |
| Higashi Twenty One Co. Ltd. | | 200,000 | 1,137,593 |
| NANSO Transport Co. Ltd. | | 125,000 | 1,533,783 |
| Nikkon Holdings Co. Ltd. | | 100,000 | 2,705,362 |
| SENKO Co. Ltd. | | 200,000 | 1,570,451 |
| Shin-Keisei Electric Railway Co. Ltd. | | 25,000 | 486,741 |
| STEF-TFE Group | | 15,000 | 1,736,485 |
| The Hokkaido Chuo Bus Co. Ltd. | | 1,000 | 45,611 |
| Tohbu Network Co. Ltd. | | 175,000 | 1,799,848 |
| Utoc Corp. | | 1,600,000 | 7,498,100 |
| | | | 93,930,891 |
| Trading Companies & Distributors - 3.4% | | | |
| AerCap Holdings NV (c) | | 800,000 | 44,904,000 |
| Alconix Corp. | | 18,000 | 276,725 |
| Bergman & Beving AB (B Shares) | | 625,000 | 6,681,489 |
| Canox Corp. | | 348,700 | 3,118,544 |
| Daiichi Jitsugyo Co. Ltd. | | 25,000 | 795,958 |
| Green Cross Co. Ltd. (b) | | 260,000 | 5,010,956 |
| HERIGE | | 60,000 | 2,469,667 |
| Houston Wire & Cable Co. (b)(c) | | 1,348,500 | 10,788,000 |
| Howden Joinery Group PLC | | 225,000 | 1,408,990 |
| iMarketKorea, Inc. | | 35,000 | 221,290 |
| Itochu Corp. | | 18,050,000 | 320,502,967 |
| Kamei Corp. (b) | | 2,100,000 | 29,354,738 |
| Lumax International Corp. Ltd. | | 1,588,740 | 3,163,869 |
| Meiwa Corp. | | 1,300,000 | 5,638,778 |
| Mitani Shoji Co. Ltd. | | 665,000 | 30,926,083 |
| Mitsubishi Corp. | | 100,000 | 2,795,304 |
| Narasaki Sangyo Co. Ltd. | | 300,000 | 1,113,446 |
| Nishikawa Keisoku Co. Ltd. | | 20,000 | 651,075 |
| Pla Matels Corp. | | 300,000 | 2,036,399 |
| Rasa Corp. | | 100,000 | 894,334 |
| Sakai Trading Co. Ltd. | | 30,000 | 445,647 |
| Shinsho Corp. | | 100,000 | 2,920,002 |
| Yamazen Co. Ltd. | | 50,000 | 510,218 |
| Yuasa Trading Co. Ltd. | | 650,000 | 21,159,952 |
| | | | 497,788,431 |
| Transportation Infrastructure - 0.1% | | | |
| Isewan Terminal Service Co. Ltd. | | 300,000 | 1,974,690 |
| Meiko Transportation Co. Ltd. | | 75,000 | 819,657 |
| Qingdao Port International Co. Ltd. (e) | | 7,000,000 | 5,101,254 |
| | | | 7,895,601 |
|
| TOTAL INDUSTRIALS | | | 1,160,739,981 |
|
| INFORMATION TECHNOLOGY - 8.5% | | | |
| Communications Equipment - 0.0% | | | |
| HF Co. (b) | | 225,000 | 1,873,299 |
| Juniper Networks, Inc. | | 50,000 | 1,317,000 |
| SerComm Corp. | | 125,000 | 277,133 |
| | | | 3,467,432 |
| Electronic Equipment & Components - 0.9% | | | |
| Casa Systems, Inc. (c) | | 100,000 | 1,523,000 |
| Daido Signal Co. Ltd. | | 400,000 | 2,110,629 |
| Dell Technologies, Inc. (c) | | 184,400 | 17,060,688 |
| Elematec Corp. | | 400,000 | 9,401,243 |
| HAGIAWARA ELECTRIC Co. Ltd. | | 25,000 | 699,817 |
| Hon Hai Precision Industry Co. Ltd. (Foxconn) | | 2,500,000 | 6,850,659 |
| Intelligent Digital Integrated Security Co. Ltd. | | 129,285 | 1,025,251 |
| ITC Networks Corp. | | 5,000 | 99,584 |
| Kingboard Chemical Holdings Ltd. | | 5,675,000 | 19,774,527 |
| Kyosha Co. Ltd. | | 50,000 | 207,486 |
| Lacroix SA (b) | | 376,493 | 11,886,806 |
| Lagercrantz Group AB (B Shares) | | 10,000 | 104,743 |
| Makus, Inc. | | 300,000 | 1,395,637 |
| New Cosmos Electric Co. Ltd. | | 35,000 | 528,999 |
| Nihon Denkei Co. Ltd. | | 50,000 | 764,656 |
| PAX Global Technology Ltd. | | 5,500,000 | 2,641,721 |
| Redington India Ltd. | | 2,261,800 | 3,568,133 |
| Riken Kieki Co. Ltd. | | 550,000 | 11,878,997 |
| Shibaura Electronics Co. Ltd. | | 225,000 | 9,517,954 |
| Simplo Technology Co. Ltd. | | 1,320,000 | 7,661,620 |
| TE Connectivity Ltd. | | 50,000 | 4,678,500 |
| VST Holdings Ltd. | | 20,443,500 | 11,069,477 |
| | | | 124,450,127 |
| Internet Software & Services - 0.8% | | | |
| Alphabet, Inc. Class A (c) | | 5,000 | 6,136,100 |
| Aucnet, Inc. | | 125,000 | 1,866,923 |
| AuFeminin.com SA (c) | | 125,018 | 5,131,262 |
| CROOZ, Inc. (a) | | 55,000 | 1,012,789 |
| Danawa Co. Ltd. | | 10,000 | 145,940 |
| F@N Communications, Inc. | | 525,000 | 3,277,288 |
| GMO Internet, Inc. | | 5,000 | 106,023 |
| GMO Pepabo, Inc. (a) | | 35,000 | 1,511,872 |
| Kakaku.com, Inc. | | 500,000 | 10,517,372 |
| Mercari, Inc. (c) | | 31,900 | 1,343,728 |
| mixi, Inc. | | 10,000 | 262,666 |
| System Research Co. Ltd. | | 25,000 | 715,468 |
| XLMedia PLC | | 100,000 | 141,099 |
| Yahoo! Japan Corp. (a) | | 7,500,000 | 28,534,495 |
| YY, Inc. ADR (c) | | 625,000 | 58,268,750 |
| Zappallas, Inc. (b) | | 1,100,000 | 3,698,967 |
| | | | 122,670,742 |
| IT Services - 3.8% | | | |
| All for One Steeb AG | | 10,000 | 739,029 |
| Amdocs Ltd. | | 1,250,000 | 84,475,000 |
| Avant Corp. (a) | | 170,000 | 1,689,129 |
| Cielo SA | | 650,000 | 2,485,146 |
| Computer Services, Inc. | | 5,000 | 258,750 |
| Comture Corp. | | 10,000 | 323,302 |
| Data#3 Ltd. | | 800,001 | 906,400 |
| Dimerco Data System Corp. | | 425,000 | 512,818 |
| E-Credible Co. Ltd. | | 240,000 | 3,243,913 |
| eClerx Services Ltd. | | 123,576 | 2,333,251 |
| Enea Data AB (c) | | 210,000 | 2,163,779 |
| Estore Corp. | | 500,000 | 4,319,635 |
| Future Corp. | | 739,200 | 10,207,260 |
| IFIS Japan Ltd. | | 35,000 | 236,015 |
| Infocom Corp. | | 25,000 | 684,166 |
| Korea Information & Communication Co. Ltd. (c) | | 325,000 | 2,991,773 |
| Leidos Holdings, Inc. | | 29,400 | 2,011,548 |
| Netcompany Group A/S | | 53,900 | 1,960,600 |
| Neurones | | 10,000 | 270,120 |
| Nice Information & Telecom, Inc. | | 132,413 | 2,895,683 |
| Persistent Systems Ltd. | | 125,000 | 1,525,435 |
| Shinsegae Information & Communication Co. Ltd. | | 15,000 | 1,468,383 |
| Societe Pour L'Informatique Industrielle SA | | 174,000 | 5,086,673 |
| Softcreate Co. Ltd. | | 25,000 | 389,930 |
| Sopra Steria Group | | 500,000 | 88,519,795 |
| Tessi SA (b)(c) | | 199,798 | 42,638,167 |
| The Western Union Co. | | 13,877,600 | 279,772,416 |
| TravelSky Technology Ltd. (H Shares) | | 350,000 | 992,158 |
| Wipro Ltd. | | 1,504,974 | 6,076,173 |
| | | | 551,176,447 |
| Semiconductors & Semiconductor Equipment - 0.6% | | | |
| e-LITECOM Co. Ltd. | | 50,000 | 263,141 |
| KLA-Tencor Corp. | | 19,600 | 2,301,432 |
| Miraial Co. Ltd. (a)(b) | | 600,000 | 6,111,881 |
| Phison Electronics Corp. | | 600,000 | 4,983,486 |
| Qualcomm, Inc. | | 811,000 | 51,976,990 |
| Taiwan Semiconductor Manufacturing Co. Ltd. sponsored ADR | | 350,000 | 14,423,500 |
| | | | 80,060,430 |
| Software - 0.4% | | | |
| 8K Miles Software Services Ltd. (c) | | 5,000 | 20,998 |
| Cyient Ltd. | | 50,000 | 514,424 |
| eBase Co. Ltd. | | 120,000 | 1,940,348 |
| Ebix, Inc. | | 300,000 | 23,805,000 |
| GAMEVIL, Inc. (c) | | 15,000 | 700,513 |
| InfoVine Co. Ltd. | | 63,600 | 1,348,002 |
| init innovation in traffic systems AG | | 30,000 | 641,973 |
| Jastec Co. Ltd. | | 110,000 | 1,075,258 |
| Justplanning, Inc. (a) | | 505,000 | 4,724,143 |
| KPIT Cummins Infosystems Ltd. | | 1,800,000 | 7,814,198 |
| KSK Co., Ltd. | | 121,900 | 1,961,258 |
| Linedata Services | | 10,000 | 413,950 |
| Micro Focus International PLC sponsored ADR (a) | | 500,084 | 8,101,361 |
| Sinosoft Tech Group Ltd. | | 3,000,000 | 1,012,861 |
| Tenable Holdings, Inc. | | 25,300 | 756,470 |
| Toho System Science Co. Ltd. | | 100,000 | 784,331 |
| Uchida Esco Co. Ltd. (b) | | 315,400 | 4,831,912 |
| Zensar Technologies Ltd. | | 100,000 | 1,805,142 |
| | | | 62,252,142 |
| Technology Hardware, Storage & Peripherals - 2.0% | | | |
| Apple, Inc. | | 150,000 | 28,543,500 |
| Bluecom Co. Ltd. | | 55,000 | 244,012 |
| Elecom Co. Ltd. | | 40,000 | 949,068 |
| Hewlett Packard Enterprise Co. | | 6,500,000 | 100,360,000 |
| HP, Inc. | | 7,100,000 | 163,868,000 |
| TPV Technology Ltd. | | 25,000,000 | 2,579,930 |
| | | | 296,544,510 |
|
| TOTAL INFORMATION TECHNOLOGY | | | 1,240,621,830 |
|
| MATERIALS - 1.8% | | | |
| Chemicals - 1.2% | | | |
| C. Uyemura & Co. Ltd. | | 185,000 | 13,897,956 |
| CF Industries Holdings, Inc. | | 265,400 | 11,789,068 |
| Chokwang Paint Ltd. | | 50,000 | 357,890 |
| Chugoku Marine Paints Ltd. | | 700,000 | 6,698,565 |
| Dainichiseika Color & Chemicals Manufacturing Co. Ltd. | | 10,000 | 317,042 |
| Daishin-Chemical Co. Ltd. (b) | | 345,695 | 4,575,671 |
| Fuso Chemical Co. Ltd. | | 200,000 | 5,106,649 |
| Green Seal Holding Ltd. | | 55,000 | 48,739 |
| Hannong Chemicals, Inc. (b) | | 1,288,000 | 5,112,810 |
| Isamu Paint Co. Ltd. (a) | | 20,000 | 715,468 |
| K&S AG (a) | | 800,000 | 21,132,493 |
| KH Neochem Co. Ltd. | | 50,000 | 1,609,802 |
| Koatsu Gas Kogyo Co. Ltd. | | 200,000 | 1,674,194 |
| KPC Holdings Corp. | | 12,000 | 676,803 |
| KPX Green Chemical Co. Ltd. | | 50,000 | 194,437 |
| Kukdong Oil & Chemicals Co. Ltd. | | 100,000 | 308,046 |
| Kuriyama Holdings Corp. | | 100,000 | 1,794,035 |
| LyondellBasell Industries NV Class A | | 148,300 | 16,430,157 |
| Nippon Soda Co. Ltd. | | 800,000 | 4,686,312 |
| NOF Corp. | | 75,000 | 2,465,009 |
| Nutrien Ltd. | | 120,000 | 6,517,277 |
| Scientex Bhd | | 4,051,200 | 7,873,181 |
| T&K Toka Co. Ltd. | | 350,000 | 4,031,659 |
| Tae Kyung Industrial Co. Ltd. | | 675,000 | 4,528,411 |
| Thai Carbon Black PCL (For. Reg.) (c) | | 50,000 | 78,900 |
| Thai Rayon PCL NVDR | | 250,000 | 353,171 |
| The Mosaic Co. | | 100,000 | 3,011,000 |
| Toho Acetylene Co. Ltd. | | 225,000 | 3,114,967 |
| Yara International ASA (a) | | 850,000 | 37,504,981 |
| Yip's Chemical Holdings Ltd. | | 3,500,000 | 1,226,263 |
| Yung Chi Paint & Varnish Manufacturing Co. Ltd. | | 2,200,000 | 5,791,178 |
| | | | 173,622,134 |
| Construction Materials - 0.0% | | | |
| Brampton Brick Ltd. Class A (sub. vtg.) (c) | | 5,000 | 31,133 |
| Ibstock PLC (e) | | 500,000 | 1,611,811 |
| Mitani Sekisan Co. Ltd. | | 250,000 | 6,061,351 |
| Yotai Refractories Co. Ltd. | | 100,000 | 694,898 |
| | | | 8,399,193 |
| Containers & Packaging - 0.1% | | | |
| AMVIG Holdings Ltd. | | 2,500,000 | 614,724 |
| Chuoh Pack Industry Co. Ltd. | | 12,000 | 150,248 |
| Mayr-Melnhof Karton AG | | 100,000 | 13,611,234 |
| The Pack Corp. | | 75,000 | 2,384,519 |
| | | | 16,760,725 |
| Metals & Mining - 0.5% | | | |
| ArcelorMittal SA Class A unit (a) | | 25,000 | 796,250 |
| Ausdrill Ltd. | | 14,000,000 | 18,982,372 |
| Castings PLC | | 75,000 | 410,008 |
| Chubu Steel Plate Co. Ltd. | | 458,800 | 2,814,799 |
| CI Resources Ltd. | | 400,000 | 490,347 |
| CK-SAN-ETSU Co. Ltd. | | 110,000 | 3,615,347 |
| Compania de Minas Buenaventura SA sponsored ADR | | 350,000 | 4,809,000 |
| Labrador Iron Ore Royalty Corp. | | 100,000 | 1,907,983 |
| Mount Gibson Iron Ltd. | | 24,000,000 | 7,578,090 |
| Orvana Minerals Corp. (c) | | 50,000 | 6,919 |
| Pacific Metals Co. Ltd. (c) | | 679,999 | 19,601,480 |
| Rio Tinto PLC sponsored ADR | | 100,000 | 5,550,000 |
| Teck Resources Ltd. Class B (sub. vtg.) | | 50,000 | 1,304,147 |
| Warrior Metropolitan Coal, Inc. | | 50,000 | 1,293,500 |
| | | | 69,160,242 |
|
| TOTAL MATERIALS | | | 267,942,294 |
|
| REAL ESTATE - 0.3% | | | |
| Equity Real Estate Investment Trusts (REITs) - 0.2% | | | |
| Piedmont Office Realty Trust, Inc. Class A | | 413,500 | 8,179,030 |
| Public Storage | | 70,000 | 15,248,100 |
| Sabra Health Care REIT, Inc. | | 101,100 | 2,184,771 |
| Spirit MTA REIT (c) | | 5,000 | 49,950 |
| Spirit Realty Capital, Inc. | | 50,000 | 418,500 |
| Ventas, Inc. | | 66,700 | 3,760,546 |
| | | | 29,840,897 |
| Real Estate Management & Development - 0.1% | | | |
| CRE, Inc. | | 10,000 | 85,767 |
| Japan Corporate Housing Service, Inc. | | 25,000 | 167,911 |
| Lai Sun Garment (International) Ltd. | | 203,741 | 298,510 |
| Leopalace21 Corp. | | 500,000 | 2,745,607 |
| LSL Property Services PLC | | 50,000 | 170,632 |
| Nisshin Fudosan Co. Ltd. (b) | | 2,850,000 | 17,561,597 |
| | | | 21,030,024 |
|
| TOTAL REAL ESTATE | | | 50,870,921 |
|
| TELECOMMUNICATION SERVICES - 0.9% | | | |
| Diversified Telecommunication Services - 0.8% | | | |
| AT&T, Inc. | | 1,233,656 | 39,439,982 |
| Verizon Communications, Inc. | | 1,522,200 | 78,606,408 |
| | | | 118,046,390 |
| Wireless Telecommunication Services - 0.1% | | | |
| Okinawa Cellular Telephone Co. | | 250,000 | 9,591,736 |
|
| TOTAL TELECOMMUNICATION SERVICES | | | 127,638,126 |
|
| UTILITIES - 1.9% | | | |
| Electric Utilities - 1.5% | | | |
| EVN AG | | 10,000 | 199,023 |
| Exelon Corp. | | 1,900,000 | 80,750,000 |
| Fjordkraft Holding ASA (c) | | 650,000 | 2,669,601 |
| PG&E Corp. | | 150,000 | 6,462,000 |
| PPL Corp. | | 4,150,134 | 119,399,355 |
| Public Power Corp. of Greece (c) | | 25,000 | 51,890 |
| | | | 209,531,869 |
| Gas Utilities - 0.4% | | | |
| Busan City Gas Co. Ltd. | | 110,000 | 3,600,905 |
| China Resource Gas Group Ltd. | | 2,000,000 | 9,478,854 |
| ENN Energy Holdings Ltd. | | 100,000 | 1,017,321 |
| GAIL India Ltd. | | 5,416,666 | 29,682,475 |
| Hokuriku Gas Co. | | 75,000 | 2,062,559 |
| K&O Energy Group, Inc. | | 25,000 | 419,666 |
| Keiyo Gas Co. Ltd. | | 15,000 | 390,511 |
| Seoul City Gas Co. Ltd. | | 100,000 | 7,804,431 |
| YESCO Co. Ltd. | | 240,000 | 8,470,816 |
| | | | 62,927,538 |
| Water Utilities - 0.0% | | | |
| Manila Water Co., Inc. | | 500,000 | 249,929 |
| Thessaloniki Water & Sewage SA | | 50,000 | 269,535 |
| | | | 519,464 |
|
| TOTAL UTILITIES | | | 272,978,871 |
|
| TOTAL COMMON STOCKS | | | |
| (Cost $9,881,464,803) | | | 13,277,804,967 |
|
| Nonconvertible Preferred Stocks - 0.1% | | | |
| INDUSTRIALS - 0.0% | | | |
| Industrial Conglomerates - 0.0% | | | |
| Steel Partners Holdings LP Series A, 6.00% | | 148,400 | 3,383,520 |
| Machinery - 0.0% | | | |
| Danieli & C. Officine Meccaniche SpA | | 10,000 | 175,403 |
|
| TOTAL INDUSTRIALS | | | 3,558,923 |
|
| MATERIALS - 0.1% | | | |
| Construction Materials - 0.1% | | | |
| Buzzi Unicem SpA (Risparmio Shares) | | 550,000 | 6,843,036 |
| UTILITIES - 0.0% | | | |
| Electric Utilities - 0.0% | | | |
| Companhia Paranaense de Energia-Copel (PN-B) | | 500,000 | 2,730,930 |
| TOTAL NONCONVERTIBLE PREFERRED STOCKS | | | |
| (Cost $10,786,016) | | | 13,132,889 |
|
| Money Market Funds - 13.5% | | | |
| Fidelity Cash Central Fund, 1.96% (f) | | 1,568,704,161 | 1,569,017,902 |
| Fidelity Securities Lending Cash Central Fund 1.97% (f)(g) | | 391,394,176 | 391,433,315 |
| TOTAL MONEY MARKET FUNDS | | | |
| (Cost $1,960,437,452) | | | 1,960,451,217 |
| TOTAL INVESTMENT IN SECURITIES - 105.0% | | | |
| (Cost $11,852,688,271) | | | 15,251,389,073 |
| NET OTHER ASSETS (LIABILITIES) - (5.0)% | | | (731,343,884) |
| NET ASSETS - 100% | | | $14,520,045,189 |
Legend
(a) Security or a portion of the security is on loan at period end.
(b) Affiliated company
(c) Non-income producing
(d) Level 3 security
(e) Security exempt from registration under Rule 144A of the Securities Act of 1933. These securities may be resold in transactions exempt from registration, normally to qualified institutional buyers. At the end of the period, the value of these securities amounted to $32,758,819 or 0.2% of net assets.
(f) Affiliated fund that is generally available only to investment companies and other accounts managed by Fidelity Investments. The rate quoted is the annualized seven-day yield of the fund at period end. A complete unaudited listing of the fund's holdings as of its most recent quarter end is available upon request. In addition, each Fidelity Central Fund's financial statements, which are not covered by the Fund's Report of Independent Registered Public Accounting Firm, are available on the SEC's website or upon request.
(g) Investment made with cash collateral received from securities on loan.
Affiliated Central Funds
Information regarding fiscal year to date income earned by the Fund from investments in Fidelity Central Funds is as follows:
| Fund | Income earned |
| Fidelity Cash Central Fund | $23,341,301 |
| Fidelity Securities Lending Cash Central Fund | 7,462,799 |
| Total | $30,804,100 |
Amounts in the income column in the above table include any capital gain distributions from underlying funds, which are presented in the corresponding line-item in the Statement of Operations if applicable.
Other Affiliated Issuers
An affiliated company is a company in which the Fund has ownership of at least 5% of the voting securities. Fiscal year to date transactions with companies which are or were affiliates are as follows:
| Affiliate | Value, beginning of period | Purchases | Sales Proceeds | Dividend Income | Realized Gain (loss) | Change in Unrealized appreciation (depreciation) | Value, end of period |
| Autohellas SA | $15,485,482 | $368,661 | $-- | $716,872 | $-- | $2,083,686 | $17,937,829 |
| Bed Bath & Beyond, Inc. | -- | 207,951,286 | -- | 200,000 | -- | (3,794,286) | 204,157,000 |
| Carbo Ceramics, Inc. | 16,686,614 | -- | -- | -- | -- | 5,334,052 | 22,020,666 |
| Chori Co. Ltd. | 29,056,084 | -- | -- | 758,176 | -- | 12,288 | 29,068,372 |
| Daihatsu Diesel Manufacturing Co. Ltd. | 20,621,126 | -- | -- | 401,814 | -- | 450,823 | 21,071,949 |
| Daishin-Chemical Co. Ltd. | 4,757,736 | 329,770 | -- | 81,119 | -- | (511,835) | 4,575,671 |
| Fossil Group, Inc. | 41,062,500 | 9,959,164 | 20,659,556 | -- | (45,964,167) | 76,875,999 | -- |
| Fuji Corp. | 11,012,124 | 2,349,341 | -- | 165,377 | -- | 3,460,342 | 16,821,807 |
| Fujimak Corp. | 7,735,544 | 231,735 | -- | 136,394 | -- | (589,736) | 7,377,543 |
| G-Tekt Corp. | 50,445,825 | 1,778,623 | -- | 831,687 | -- | (5,451,654) | 46,772,794 |
| GameStop Corp. Class A | 43,306,059 | 116,016,639 | 1,844 | 3,190,810 | (467) | (15,232,391) | 144,087,996 |
| Gendai Agency, Inc. | 4,356,207 | -- | -- | 174,359 | -- | (281,620) | 4,074,587 |
| GNC Holdings, Inc. Class A | 56,485,596 | -- | -- | -- | -- | (37,597,668) | 18,887,928 |
| Green Cross Co. Ltd. | 3,579,859 | 1,064,921 | -- | 98,517 | -- | 366,176 | 5,010,956 |
| Guess?, Inc. | 75,797,628 | -- | 739,871 | 5,204,430 | (622,147) | 56,122,246 | 130,557,856 |
| Gwangju Shinsegae Co. Ltd. | 21,344,833 | -- | -- | 94,446 | -- | (3,242,860) | 18,101,973 |
| Hannong Chemicals, Inc. | 5,566,323 | -- | -- | 140,272 | -- | (453,513) | 5,112,810 |
| HF Co. | 2,479,765 | -- | -- | 111,609 | -- | (606,466) | 1,873,299 |
| Hibbett Sports, Inc. | 15,994,680 | 3,294,693 | -- | -- | -- | 7,110,012 | 26,399,385 |
| Houston Wire & Cable Co. | 7,753,875 | -- | -- | -- | -- | 3,034,125 | 10,788,000 |
| Jinro Distillers Co. Ltd. | 12,246,815 | 3,496,627 | -- | 385,453 | -- | (1,370,536) | 14,372,906 |
| Kamei Corp. | 25,032,781 | 5,245,701 | -- | 427,682 | -- | (923,744) | 29,354,738 |
| Lacroix SA | 10,250,925 | -- | -- | 237,365 | -- | 1,635,881 | 11,886,806 |
| MegaStudy Co. Ltd. | 9,770,132 | -- | -- | 195,953 | -- | 4,823,730 | 14,593,862 |
| MegaStudyEdu Co. Ltd. | 6,599,812 | -- | -- | 211,918 | -- | 24,566,454 | 31,166,266 |
| Miraial Co. Ltd. | 6,075,686 | -- | 589,214 | 153,035 | 47,109 | 578,300 | 6,111,881 |
| Nisshin Fudosan Co. Ltd. | 15,201,370 | 913,774 | -- | 383,129 | -- | 1,446,453 | 17,561,597 |
| Peyto Exploration & Development Corp. | -- | 115,758,279 | -- | 2,885,304 | -- | (12,957,200) | 102,801,079 |
| Sansei Co. Ltd. | 1,567,173 | 337,333 | -- | 71,164 | -- | 984,194 | 2,888,700 |
| Satsudora Holdings Co. Ltd. | 7,252,937 | -- | -- | 92,215 | -- | 377,524 | 7,630,461 |
| SIMPAC, Inc. | 9,611,942 | -- | -- | 144,369 | -- | (3,525,227) | -- |
| TBK Co. Ltd. | 8,114,654 | -- | -- | 236,059 | -- | 127,532 | 8,242,186 |
| Tessi SA | 36,568,492 | -- | -- | -- | -- | 6,069,675 | 42,638,167 |
| Tokatsu Holdings Co. Ltd. | 676,728 | 327,186 | -- | 21,033 | -- | 198,966 | 1,202,880 |
| Treasure Factory Co. Ltd. | 6,579,663 | -- | -- | 116,302 | -- | (256,719) | 6,322,944 |
| Uchida Esco Co. Ltd. | 3,627,622 | -- | -- | 113,839 | -- | 1,204,290 | 4,831,912 |
| Yorozu Corp. | 31,262,642 | 33,779 | -- | 890,306 | -- | (1,880,403) | 29,416,018 |
| Zappallas, Inc. | 5,068,711 | -- | -- | 45,267 | -- | (1,369,744) | 3,698,967 |
| Total | $629,035,945 | $469,457,512 | $21,990,485 | $18,916,275 | $(46,539,672) | $106,817,146 | $1,069,419,791 |
Investment Valuation
The following is a summary of the inputs used, as of July 31, 2018, involving the Fund's assets and liabilities carried at fair value. The inputs or methodology used for valuing securities may not be an indication of the risk associated with investing in those securities. For more information on valuation inputs, and their aggregation into the levels used below, please refer to the Investment Valuation section in the accompanying Notes to Financial Statements.
| | Valuation Inputs at Reporting Date: |
| Description | Total | Level 1 | Level 2 | Level 3 |
| Investments in Securities: | | | | |
| Equities: | | | | |
| Consumer Discretionary | $2,999,944,570 | $2,993,321,372 | $-- | $6,623,198 |
| Consumer Staples | 638,598,790 | 604,189,388 | 34,409,402 | -- |
| Energy | 1,350,698,151 | 1,157,022,544 | 193,675,607 | -- |
| Financials | 2,102,630,859 | 1,818,761,684 | 283,869,175 | -- |
| Health Care | 3,065,140,574 | 3,063,406,258 | 1,734,316 | -- |
| Industrials | 1,164,298,904 | 840,975,975 | 323,298,271 | 24,658 |
| Information Technology | 1,240,621,830 | 1,212,087,335 | 28,534,495 | -- |
| Materials | 274,785,330 | 255,183,850 | 19,601,480 | -- |
| Real Estate | 50,870,921 | 50,870,921 | -- | -- |
| Telecommunication Services | 127,638,126 | 127,638,126 | -- | -- |
| Utilities | 275,709,801 | 275,709,801 | -- | -- |
| Money Market Funds | 1,960,451,217 | 1,960,451,217 | -- | -- |
| Total Investments in Securities: | $15,251,389,073 | $14,359,618,471 | $885,122,746 | $6,647,856 |
The following is a summary of transfers between Level 1 and Level 2 for the period ended July 31, 2018. Transfers are assumed to have occurred at the beginning of the period, and are primarily attributable to the valuation techniques used for foreign equity securities, as discussed in the accompanying Notes to Financial Statements:
| Transfers | Total |
| Level 1 to Level 2 | $343,085,871 |
| Level 2 to Level 1 | $923,947 |
Other Information
Distribution of investments by country or territory of incorporation, as a percentage of Total Net Assets, is as follows (Unaudited):
| United States of America | 57.9% |
| Japan | 14.8% |
| Korea (South) | 3.3% |
| United Kingdom | 3.3% |
| France | 2.8% |
| Canada | 2.4% |
| Netherlands | 1.9% |
| China | 1.9% |
| Cayman Islands | 1.5% |
| India | 1.0% |
| Others (Individually Less Than 1%) | 9.2% |
| | 100.0% |
See accompanying notes which are an integral part of the financial statements.
Financial Statements
Statement of Assets and Liabilities
| | | July 31, 2018 |
| Assets | | |
Investment in securities, at value (including securities loaned of $376,456,284) — See accompanying schedule:
Unaffiliated issuers (cost $8,847,100,028) | $12,221,518,065 | |
| Fidelity Central Funds (cost $1,960,437,452) | 1,960,451,217 | |
| Other affiliated issuers (cost $1,045,150,791) | 1,069,419,791 | |
| Total Investment in Securities (cost $11,852,688,271) | | $15,251,389,073 |
| Foreign currency held at value (cost $2) | | 2 |
| Receivable for investments sold | | 14,467,880 |
| Receivable for fund shares sold | | 7,835 |
| Dividends receivable | | 11,019,222 |
| Distributions receivable from Fidelity Central Funds | | 3,449,596 |
| Other receivables | | 161,480 |
| Total assets | | 15,280,495,088 |
| Liabilities | | |
| Payable for investments purchased | $408,312 | |
| Payable for fund shares redeemed | 367,621,404 | |
| Other payables and accrued expenses | 992,995 | |
| Collateral on securities loaned | 391,427,188 | |
| Total liabilities | | 760,449,899 |
| Net Assets | | $14,520,045,189 |
| Net Assets consist of: | | |
| Paid in capital | | $10,501,883,567 |
| Undistributed net investment income | | 183,602,555 |
| Accumulated undistributed net realized gain (loss) on investments and foreign currency transactions | | 436,433,164 |
| Net unrealized appreciation (depreciation) on investments and assets and liabilities in foreign currencies | | 3,398,125,903 |
| Net Assets | | $14,520,045,189 |
| Series Intrinsic Opportunities: | | |
| Net Asset Value, offering price and redemption price per share ($14,520,045,189 ÷ 772,632,370 shares) | | $18.79 |
See accompanying notes which are an integral part of the financial statements.
Statement of Operations
| | | Year ended July 31, 2018 |
| Investment Income | | |
| Dividends (including $18,916,275 earned from other affiliated issuers) | | $274,802,019 |
| Income from Fidelity Central Funds | | 30,804,100 |
| Total income | | 305,606,119 |
| Expenses | | |
| Custodian fees and expenses | $1,007,921 | |
| Independent trustees' fees and expenses | 58,525 | |
| Legal | 864 | |
| Commitment fees | 38,478 | |
| Total expenses before reductions | 1,105,788 | |
| Expense reductions | (610,259) | |
| Total expenses after reductions | | 495,529 |
| Net investment income (loss) | | 305,110,590 |
| Realized and Unrealized Gain (Loss) | | |
| Net realized gain (loss) on: | | |
| Investment securities: | | |
| Unaffiliated issuers (net of foreign taxes of $86,883) | 583,304,523 | |
| Fidelity Central Funds | 6,698 | |
| Other affiliated issuers | (46,539,672) | |
| Foreign currency transactions | (831,696) | |
| Total net realized gain (loss) | | 535,939,853 |
| Change in net unrealized appreciation (depreciation) on: | | |
| Investment securities: | | |
| Unaffiliated issuers (net of decrease in deferred foreign taxes of $2,003,173) | 809,057,962 | |
| Fidelity Central Funds | (6,117) | |
| Other affiliated issuers | 106,817,146 | |
| Assets and liabilities in foreign currencies | (42,383) | |
| Total change in net unrealized appreciation (depreciation) | | 915,826,608 |
| Net gain (loss) | | 1,451,766,461 |
| Net increase (decrease) in net assets resulting from operations | | $1,756,877,051 |
See accompanying notes which are an integral part of the financial statements.
Statement of Changes in Net Assets
| | Year ended July 31, 2018 | Year ended July 31, 2017 |
| Increase (Decrease) in Net Assets | | |
| Operations | | |
| Net investment income (loss) | $305,110,590 | $131,490,210 |
| Net realized gain (loss) | 535,939,853 | 379,891,077 |
| Change in net unrealized appreciation (depreciation) | 915,826,608 | 963,397,101 |
| Net increase (decrease) in net assets resulting from operations | 1,756,877,051 | 1,474,778,388 |
| Distributions to shareholders from net investment income | (210,862,362) | (102,338,705) |
| Distributions to shareholders from net realized gain | (390,636,600) | (18,472,180) |
| Total distributions | (601,498,962) | (120,810,885) |
| Share transactions - net increase (decrease) | 954,341,403 | 3,954,188,911 |
| Total increase (decrease) in net assets | 2,109,719,492 | 5,308,156,414 |
| Net Assets | | |
| Beginning of period | 12,410,325,697 | 7,102,169,283 |
| End of period | $14,520,045,189 | $12,410,325,697 |
| Other Information | | |
| Undistributed net investment income end of period | $183,602,555 | $89,540,306 |
See accompanying notes which are an integral part of the financial statements.
Financial Highlights
Fidelity Series Intrinsic Opportunities Fund
| Years ended July 31, | 2018 | 2017 | 2016 | 2015 | 2014 |
| Selected Per–Share Data | | | | | |
| Net asset value, beginning of period | $17.30 | $14.80 | $15.58 | $14.47 | $12.78 |
| Income from Investment Operations | | | | | |
| Net investment income (loss)A | .40 | .23 | .18 | .24B | .21 |
| Net realized and unrealized gain (loss) | 1.91 | 2.50 | (.16) | 1.49 | 1.84 |
| Total from investment operations | 2.31 | 2.73 | .02 | 1.73 | 2.05 |
| Distributions from net investment income | (.28) | (.19) | (.23) | (.21) | (.15) |
| Distributions from net realized gain | (.54) | (.04) | (.58) | (.42) | (.21) |
| Total distributions | (.82) | (.23) | (.80)C | (.62)D | (.36) |
| Net asset value, end of period | $18.79 | $17.30 | $14.80 | $15.58 | $14.47 |
| Total ReturnE | 13.82% | 18.69% | .43% | 12.35% | 16.35% |
| Ratios to Average Net AssetsF,G | | | | | |
| Expenses before reductions | .01% | .52% | .79% | .82% | .81% |
| Expenses net of fee waivers, if any | .01% | .52% | .79% | .82% | .81% |
| Expenses net of all reductions | - %H | .52% | .79% | .82% | .81% |
| Net investment income (loss) | 2.19% | 1.48% | 1.28% | 1.60%B | 1.55% |
| Supplemental Data | | | | | |
| Net assets, end of period (000 omitted) | $14,520,045 | $4,948,389 | $2,776,843 | $2,619,363 | $2,479,629 |
| Portfolio turnover rateI | 13% | 35%J | 14% | 10% | 16% |
A Calculated based on average shares outstanding during the period.
B Net investment income per share reflects a large, non-recurring dividend which amounted to $.06 per share. Excluding this non-recurring dividend, the ratio of net investment income (loss) to average net assets would have been 1.18%.
C Total distributions of $.80 per share is comprised of distributions from net investment income of $.228 and distributions from net realized gain of $.576 per share.
D Total distributions of $.62 per share is comprised of distributions from net investment income of $.206 and distributions from net realized gain of $.416 per share.
E Total returns would have been lower if certain expenses had not been reduced during the applicable periods shown.
F Fees and expenses of any underlying Fidelity Central Funds are not included in the Fund's expense ratio. The Fund indirectly bears its proportionate share of the expenses of any underlying Fidelity Central Funds.
G Expense ratios reflect operating expenses of the class. Expenses before reductions do not reflect amounts reimbursed by the investment adviser or reductions from brokerage service arrangements or reductions from other expense offset arrangements and do not represent the amount paid by the class during periods when reimbursements or reductions occur. Expenses net of fee waivers reflect expenses after reimbursement by the investment adviser but prior to reductions from brokerage service arrangements or other expense offset arrangements. Expenses net of all reductions represent the net expenses paid by the class.
H Amount represents less than .005%.
I Amount does not include the portfolio activity of any underlying Fidelity Central Funds.
J Portfolio turnover rate excludes securities received or delivered in-kind.
See accompanying notes which are an integral part of the financial statements.
Notes to Financial Statements
For the period ended July 31, 2018
1. Organization.
Fidelity Series Intrinsic Opportunities Fund (the Fund) is a fund of Fidelity Puritan Trust (the Trust) and is authorized to issue an unlimited number of shares. Shares of the Fund are only available for purchase by mutual funds for which Fidelity Management & Research Company (FMR) or an affiliate serves as an investment manager. The Trust is registered under the Investment Company Act of 1940, as amended (the 1940 Act), as an open-end management investment company organized as a Massachusetts business trust. Effective August 28, 2017, the Fund no longer offered Class F, and all outstanding shares of Class F were exchanged for shares of Series Intrinsic Opportunities.
2. Investments in Fidelity Central Funds.
The Fund invests in Fidelity Central Funds, which are open-end investment companies generally available only to other investment companies and accounts managed by the investment adviser and its affiliates. The Fund's Schedule of Investments lists each of the Fidelity Central Funds held as of period end, if any, as an investment of the Fund, but does not include the underlying holdings of each Fidelity Central Fund. As an Investing Fund, the Fund indirectly bears its proportionate share of the expenses of the underlying Fidelity Central Funds.
The Money Market Central Funds seek preservation of capital and current income and are managed by Fidelity Investments Money Management, Inc. (FIMM), an affiliate of the investment adviser. Annualized expenses of the Money Market Central Funds as of their most recent shareholder report date are less than .005%.
A complete unaudited list of holdings for each Fidelity Central Fund is available upon request or at the Securities and Exchange Commission (the SEC) website at www.sec.gov. In addition, the financial statements of the Fidelity Central Funds, which are not covered by the Fund's Report of Independent Registered Public Accounting Firm, are available on the SEC website or upon request.
3. Significant Accounting Policies.
The Fund is an investment company and applies the accounting and reporting guidance of the Financial Accounting Standards Board (FASB) Accounting Standards Codification Topic 946 Financial Services – Investments Companies. The financial statements have been prepared in conformity with accounting principles generally accepted in the United States of America (GAAP), which require management to make certain estimates and assumptions at the date of the financial statements. Actual results could differ from those estimates. Subsequent events, if any, through the date that the financial statements were issued have been evaluated in the preparation of the financial statements. The following summarizes the significant accounting policies of the Fund:
Investment Valuation. Investments are valued as of 4:00 p.m. Eastern time on the last calendar day of the period. The Board of Trustees (the Board) has delegated the day to day responsibility for the valuation of the Fund's investments to the Fair Value Committee (the Committee) established by the Fund's investment adviser. In accordance with valuation policies and procedures approved by the Board, the Fund attempts to obtain prices from one or more third party pricing vendors or brokers to value its investments. When current market prices, quotations or currency exchange rates are not readily available or reliable, investments will be fair valued in good faith by the Committee, in accordance with procedures adopted by the Board. Factors used in determining fair value vary by investment type and may include market or investment specific events. The frequency with which these procedures are used cannot be predicted and they may be utilized to a significant extent. The Committee oversees the Fund's valuation policies and procedures and reports to the Board on the Committee's activities and fair value determinations. The Board monitors the appropriateness of the procedures used in valuing the Fund's investments and ratifies the fair value determinations of the Committee.
The Fund categorizes the inputs to valuation techniques used to value its investments into a disclosure hierarchy consisting of three levels as shown below:
- Level 1 – quoted prices in active markets for identical investments
- Level 2 – other significant observable inputs (including quoted prices for similar investments, interest rates, prepayment speeds, etc.)
- Level 3 – unobservable inputs (including the Fund's own assumptions based on the best information available)
Valuation techniques used to value the Fund's investments by major category are as follows:
Equity securities, including restricted securities, for which market quotations are readily available, are valued at the last reported sale price or official closing price as reported by a third party pricing vendor on the primary market or exchange on which they are traded and are categorized as Level 1 in the hierarchy. In the event there were no sales during the day or closing prices are not available, securities are valued at the last quoted bid price or may be valued using the last available price and are generally categorized as Level 2 in the hierarchy. For foreign equity securities, when market or security specific events arise, comparisons to the valuation of American Depositary Receipts (ADRs), futures contracts, Exchange-Traded Funds (ETFs) and certain indexes as well as quoted prices for similar securities may be used and would be categorized as Level 2 in the hierarchy. Utilizing these techniques may result in transfers between Level 1 and Level 2. For equity securities, including restricted securities, where observable inputs are limited, assumptions about market activity and risk are used and these securities may be categorized as Level 3 in the hierarchy.
Investments in open-end mutual funds, including the Fidelity Central Funds, are valued at their closing net asset value (NAV) each business day and are categorized as Level 1 in the hierarchy.
Changes in valuation techniques may result in transfers in or out of an assigned level within the disclosure hierarchy. The aggregate value of investments by input level as of July 31, 2018, including information on transfers between Levels 1 and 2, is included at the end of the Fund's Schedule of Investments.
Foreign Currency. The Fund may use foreign currency contracts to facilitate transactions in foreign-denominated securities. Gains and losses from these transactions may arise from changes in the value of the foreign currency or if the counterparties do not perform under the contracts' terms.
Foreign-denominated assets, including investment securities, and liabilities are translated into U.S. dollars at the exchange rates at period end. Purchases and sales of investment securities, income and dividends received and expenses denominated in foreign currencies are translated into U.S. dollars at the exchange rate in effect on the transaction date.
The effects of exchange rate fluctuations on investments are included with the net realized and unrealized gain (loss) on investment securities. Other foreign currency transactions resulting in realized and unrealized gain (loss) are disclosed separately.
Investment Transactions and Income. For financial reporting purposes, the Fund's investment holdings and NAV include trades executed through the end of the last business day of the period. The NAV per share for processing shareholder transactions is calculated as of the close of business of the New York Stock Exchange (NYSE), normally 4:00 p.m. Eastern time and includes trades executed through the end of the prior business day. Gains and losses on securities sold are determined on the basis of identified cost and include proceeds received from litigation. Dividend income is recorded on the ex-dividend date, except for certain dividends from foreign securities where the ex-dividend date may have passed, which are recorded as soon as the Fund is informed of the ex-dividend date. Non-cash dividends included in dividend income, if any, are recorded at the fair market value of the securities received. Income and capital gain distributions from Fidelity Central Funds, if any, are recorded on the ex-dividend date. Certain distributions received by the Fund represent a return of capital or capital gain. The Fund determines the components of these distributions subsequent to the ex-dividend date, based upon receipt of tax filings or other correspondence relating to the underlying investment. These distributions are recorded as a reduction of cost of investments and/or as a realized gain. Investment income is recorded net of foreign taxes withheld where recovery of such taxes is uncertain.
Class Allocations and Expenses. Investment income, realized and unrealized capital gains and losses, common expenses of the Fund, and certain fund-level expense reductions, if any, are allocated daily on a pro-rata basis to each class based on the relative net assets of each class to the total net assets of the Fund. Each class differs with respect to fees incurred. Certain expense reductions may also differ by class. For the reporting period, the allocated portion of income and expenses to each class as a percent of its average net assets may vary due to the timing of recording these transactions in relation to fluctuating net assets of the classes. Expenses directly attributable to a fund are charged to that fund. Expenses attributable to more than one fund are allocated among the respective funds on the basis of relative net assets or other appropriate methods. Expense estimates are accrued in the period to which they relate and adjustments are made when actual amounts are known.
Income Tax Information and Distributions to Shareholders. Each year, the Fund intends to qualify as a regulated investment company under Subchapter M of the Internal Revenue Code, including distributing substantially all of its taxable income and realized gains. As a result, no provision for U.S. Federal income taxes is required. As of July 31, 2018, the Fund did not have any unrecognized tax benefits in the financial statements; nor is the Fund aware of any tax positions for which it is reasonably possible that the total amounts of unrecognized tax benefits will significantly change in the next twelve months. The Fund files a U.S. federal tax return, in addition to state and local tax returns as required. The Fund's federal income tax returns are subject to examination by the Internal Revenue Service (IRS) for a period of three fiscal years after they are filed. State and local tax returns may be subject to examination for an additional fiscal year depending on the jurisdiction. Foreign taxes are provided for based on the Fund's understanding of the tax rules and rates that exist in the foreign markets in which it invests. The Fund is subject to a tax imposed on capital gains by certain countries in which it invests. An estimated deferred tax liability for net unrealized appreciation on the applicable securities is included in Other payables and accrued expenses on the Statement of Assets & Liabilities.
Distributions are declared and recorded on the ex-dividend date. Income and capital gain distributions are declared separately for each class. Income and capital gain distributions are determined in accordance with income tax regulations, which may differ from GAAP.
Capital accounts within the financial statements are adjusted for permanent book-tax differences. These adjustments have no impact on net assets or the results of operations. Capital accounts are not adjusted for temporary book-tax differences which will reverse in a subsequent period.
Book-tax differences are primarily due to foreign currency transactions, certain foreign taxes, passive foreign investment companies (PFIC), partnerships, and losses deferred due to wash sales.
As of period end, the cost and unrealized appreciation (depreciation) in securities, and derivatives if applicable, for federal income tax purposes were as follows:
| Gross unrealized appreciation | $3,914,970,289 |
| Gross unrealized depreciation | (553,477,386) |
| Net unrealized appreciation (depreciation) | $3,361,492,903 |
| Tax Cost | $11,889,896,170 |
The tax-based components of distributable earnings as of period end were as follows:
| Undistributed ordinary income | $242,252,857 |
| Undistributed long-term capital gain | $414,989,820 |
| Net unrealized appreciation (depreciation) on securities and other investments | $3,361,479,573 |
The tax character of distributions paid was as follows:
| | July 31, 2018 | July 31, 2017 |
| Ordinary Income | $231,899,093 | $ 115,818,404 |
| Long-term Capital Gains | 369,599,869 | 4,992,481 |
| Total | $601,498,962 | $ 120,810,885 |
Restricted Securities. The Fund may invest in securities that are subject to legal or contractual restrictions on resale. These securities generally may be resold in transactions exempt from registration or to the public if the securities are registered. Disposal of these securities may involve time-consuming negotiations and expense, and prompt sale at an acceptable price may be difficult. Information regarding restricted securities is included at the end of the Fund's Schedule of Investments.
4. Purchases and Sales of Investments.
Purchases and sales of securities, other than short-term securities, aggregated $2,151,823,972 and $1,600,944,143, respectively.
5. Fees and Other Transactions with Affiliates.
Management Fee. Fidelity Management & Research Company (the investment adviser) and its affiliates provide the Fund with investment management related services for which the Fund does not pay a management fee. Under the management contract, the investment adviser or an affiliate pays all ordinary operating expenses of the Fund, except custody fees, fees and expenses of the independent Trustees, and certain miscellaneous expenses such as proxy and shareholder meeting expenses.
Brokerage Commissions. The Fund placed a portion of its portfolio transactions with brokerage firms which are affiliates of the investment adviser. Brokerage commissions are included in net realized gain (loss) and change in net unrealized appreciation (depreciation) in the Statement of Operations. The commissions paid to these affiliated firms were $25,990 for the period.
Interfund Trades. The Fund may purchase from or sell securities to other Fidelity Funds under procedures adopted by the Board. The procedures have been designed to ensure these interfund trades are executed in accordance with Rule 17a-7 of the 1940 Act. Interfund trades are included within the respective purchases and sales amounts shown in the Purchases and Sales of Investments note.
Prior Fiscal Year Exchanges In-Kind. During the prior period, certain affiliated entities (Investing Funds) completed exchanges in-kind with the Fund. The Investing Funds delivered investments and cash valued at $3,024,754,769 in exchange for 178,428,561 shares of the Fund. The amount of the in-kind exchanges is included in share transactions in the accompanying Statement of Changes in Net Assets as well as the Notes to Financial Statements. The Fund recognized no gain or loss for federal income tax purposes.
6. Committed Line of Credit.
The Fund participates with other funds managed by the investment adviser or an affiliate in a $4.25 billion credit facility (the "line of credit") to be utilized for temporary or emergency purposes to fund shareholder redemptions or for other short-term liquidity purposes. The Fund has agreed to pay commitment fees on its pro-rata portion of the line of credit, which amounted to $38,478 and is reflected in Commitment fees on the Statement of Operations. During the period, the Fund did not borrow on this line of credit.
7. Security Lending.
The Fund lends portfolio securities through a lending agent from time to time in order to earn additional income. For equity securities, a lending agent is used and may loan securities to certain qualified borrowers, including Fidelity Capital Markets (FCM), a broker-dealer affiliated with the Fund. On the settlement date of the loan, the Fund receives collateral (in the form of U.S. Treasury obligations, letters of credit and/or cash) against the loaned securities and maintains collateral in an amount not less than 100% of the market value of the loaned securities during the period of the loan. The market value of the loaned securities is determined at the close of business of the Fund and any additional required collateral is delivered to the Fund on the next business day. The Fund or borrower may terminate the loan at any time, and if the borrower defaults on its obligation to return the securities loaned because of insolvency or other reasons, the Fund may apply collateral received from the borrower against the obligation. The Fund may experience delays and costs in recovering the securities loaned. Any cash collateral received is invested in the Fidelity Securities Lending Cash Central Fund. The value of loaned securities and cash collateral at period end are disclosed on the Fund's Statement of Assets and Liabilities. The value of securities loaned to FCM at period end was $4,473,237. Security lending income represents the income earned on investing cash collateral, less rebates paid to borrowers and any lending agent fees associated with the loan, plus any premium payments received for lending certain types of securities. Security lending income is presented in the Statement of Operations as a component of income from Fidelity Central Funds. Total security lending income during the period amounted to $7,462,799, including $586,157 from securities loaned to FCM.
8. Expense Reductions.
Commissions paid to certain brokers with whom the investment adviser, or its affiliates, places trades on behalf of the Fund include an amount in addition to trade execution, which may be rebated back to the Fund to offset certain expenses. This amount totaled $606,606 for the period. In addition, through arrangements with the Fund's custodian, credits realized as a result of certain uninvested cash balances were used to reduce the Fund's expenses. During the period, these credits reduced the Fund's custody expenses by $3,653.
9. Distributions to Shareholders.
Distributions to shareholders of each class were as follows:
| | Year ended
July 31, 2018 | Year ended
July 31, 2017 |
| From net investment income | | |
| Series Intrinsic Opportunities | $210,862,362 | $37,121,067 |
| Class F | – | 65,217,638 |
| Total | $210,862,362 | $102,338,705 |
| From net realized gain | | |
| Series Intrinsic Opportunities | $390,636,600 | $7,186,687 |
| Class F | – | 11,285,493 |
| Total | $390,636,600 | $18,472,180 |
10. Share Transactions.
Transactions for each class of shares were as follows:
| | Shares | Shares | Dollars | Dollars |
| | Year ended July 31, 2018 | Year ended July 31, 2017 | Year ended July 31, 2018 | Year ended July 31, 2017 |
| Series Intrinsic Opportunities | | | | |
| Shares sold | 511,169,556 | 98,373,368(a) | $8,888,451,603 | $1,647,612,534(a) |
| Reinvestment of distributions | 34,832,594 | 2,936,245 | 601,498,962 | 44,307,754 |
| Shares redeemed | (59,400,406) | (2,915,567) | (1,080,697,919) | (45,345,088) |
| Net increase (decrease) | 486,601,744 | 98,394,046 | $8,409,252,646 | $1,646,575,200 |
| Class F | | | | |
| Shares sold | 2,035,662 | 148,826,054(a) | $35,190,119 | $2,479,453,692(a) |
| Reinvestment of distributions | – | 5,068,588 | – | 76,503,131 |
| Shares redeemed | (432,801,551) | (14,981,144) | (7,490,101,362) | (248,343,112) |
| Net increase (decrease) | (430,765,889) | 138,913,498 | $(7,454,911,243) | $2,307,613,711 |
(a) Amount includes in-kind exchanges (see the Prior Fiscal Year Exchanges In-Kind note for additional details).
11. Other.
The Fund's organizational documents provide former and current trustees and officers with a limited indemnification against liabilities arising in connection with the performance of their duties to the Fund. In the normal course of business, the Fund may also enter into contracts that provide general indemnifications. The Fund's maximum exposure under these arrangements is unknown as this would be dependent on future claims that may be made against the Fund. The risk of material loss from such claims is considered remote.
At the end of the period, mutual funds managed by the investment adviser or its affiliates were the owners of record of all of the outstanding shares of the Fund.
Report of Independent Registered Public Accounting Firm
To the Trustees of Fidelity Puritan Trust and Shareholders of Fidelity Series Intrinsic Opportunities Fund:
Opinion on the Financial Statements and Financial Highlights
We have audited the accompanying statement of assets and liabilities of Fidelity Series Intrinsic Opportunities Fund (the "Fund"), a fund of Fidelity Puritan Trust, including the schedule of investments, as of July 31, 2018, and the related statement of operations for the year then ended, the statement of changes in net assets for each of the two years in the period then ended, the financial highlights for each of the five years in the period then ended, and the related notes. In our opinion, the financial statements and financial highlights present fairly, in all material respects, the financial position of the Fund as of July 31, 2018, and the results of its operations for the year then ended, the changes in its net assets for each of the two years in the period then ended, and the financial highlights for each of the five years in the period then ended, in conformity with accounting principles generally accepted in the United States of America.
Basis for Opinion
These financial statements and financial highlights are the responsibility of the Fund's management. Our responsibility is to express an opinion on the Fund's financial statements and financial highlights based on our audits. We are a public accounting firm registered with the Public Company Accounting Oversight Board (United States) (PCAOB) and are required to be independent with respect to the Fund in accordance with the U.S. federal securities laws and the applicable rules and regulations of the Securities and Exchange Commission and the PCAOB.
We conducted our audits in accordance with the standards of the PCAOB. Those standards require that we plan and perform the audit to obtain reasonable assurance about whether the financial statements and financial highlights are free of material misstatement, whether due to error or fraud. The Fund is not required to have, nor were we engaged to perform, an audit of its internal control over financial reporting. As part of our audits we are required to obtain an understanding of internal control over financial reporting but not for the purpose of expressing an opinion on the effectiveness of the Fund’s internal control over financial reporting. Accordingly, we express no such opinion.
Our audits included performing procedures to assess the risks of material misstatement of the financial statements and financial highlights, whether due to error or fraud, and performing procedures that respond to those risks. Such procedures included examining, on a test basis, evidence regarding the amounts and disclosures in the financial statements and financial highlights. Our audits also included evaluating the accounting principles used and significant estimates made by management, as well as evaluating the overall presentation of the financial statements and financial highlights. Our procedures included confirmation of securities owned as of July 31, 2018, by correspondence with the custodians and brokers; when replies were not received from brokers, we performed other auditing procedures. We believe that our audits provide a reasonable basis for our opinion.
/s/ Deloitte & Touche LLP
Boston, Massachusetts
September 17, 2018
We have served as the auditor of one or more of the Fidelity investment companies since 1999.
Trustees and Officers
The Trustees, Members of the Advisory Board (if any), and officers of the trust and fund, as applicable, are listed below. The Board of Trustees governs the fund and is responsible for protecting the interests of shareholders. The Trustees are experienced executives who meet periodically throughout the year to oversee the fund's activities, review contractual arrangements with companies that provide services to the fund, oversee management of the risks associated with such activities and contractual arrangements, and review the fund's performance. Except for Jonathan Chiel, each of the Trustees oversees 286 funds. Mr. Chiel oversees 150 funds.
The Trustees hold office without limit in time except that (a) any Trustee may resign; (b) any Trustee may be removed by written instrument, signed by at least two-thirds of the number of Trustees prior to such removal; (c) any Trustee who requests to be retired or who has become incapacitated by illness or injury may be retired by written instrument signed by a majority of the other Trustees; and (d) any Trustee may be removed at any special meeting of shareholders by a two-thirds vote of the outstanding voting securities of the trust. Each Trustee who is not an interested person (as defined in the 1940 Act) of the trust and the fund is referred to herein as an Independent Trustee. Each Independent Trustee shall retire not later than the last day of the calendar year in which his or her 75th birthday occurs. The Independent Trustees may waive this mandatory retirement age policy with respect to individual Trustees. Officers and Advisory Board Members hold office without limit in time, except that any officer or Advisory Board Member may resign or may be removed by a vote of a majority of the Trustees at any regular meeting or any special meeting of the Trustees. Except as indicated, each individual has held the office shown or other offices in the same company for the past five years.
The fund’s Statement of Additional Information (SAI) includes more information about the Trustees. To request a free copy, call Fidelity at 1-800-544-8544.
Experience, Skills, Attributes, and Qualifications of the Trustees. The Governance and Nominating Committee has adopted a statement of policy that describes the experience, qualifications, attributes, and skills that are necessary and desirable for potential Independent Trustee candidates (Statement of Policy). The Board believes that each Trustee satisfied at the time he or she was initially elected or appointed a Trustee, and continues to satisfy, the standards contemplated by the Statement of Policy. The Governance and Nominating Committee also engages professional search firms to help identify potential Independent Trustee candidates who have the experience, qualifications, attributes, and skills consistent with the Statement of Policy. From time to time, additional criteria based on the composition and skills of the current Independent Trustees, as well as experience or skills that may be appropriate in light of future changes to board composition, business conditions, and regulatory or other developments, have also been considered by the professional search firms and the Governance and Nominating Committee. In addition, the Board takes into account the Trustees' commitment and participation in Board and committee meetings, as well as their leadership of standing and ad hoc committees throughout their tenure.
In determining that a particular Trustee was and continues to be qualified to serve as a Trustee, the Board has considered a variety of criteria, none of which, in isolation, was controlling. The Board believes that, collectively, the Trustees have balanced and diverse experience, qualifications, attributes, and skills, which allow the Board to operate effectively in governing the fund and protecting the interests of shareholders. Information about the specific experience, skills, attributes, and qualifications of each Trustee, which in each case led to the Board's conclusion that the Trustee should serve (or continue to serve) as a trustee of the fund, is provided below.
Board Structure and Oversight Function. James C. Curvey is an interested person and currently serves as Chairman. The Trustees have determined that an interested Chairman is appropriate and benefits shareholders because an interested Chairman has a personal and professional stake in the quality and continuity of services provided to the fund. Independent Trustees exercise their informed business judgment to appoint an individual of their choosing to serve as Chairman, regardless of whether the Trustee happens to be independent or a member of management. The Independent Trustees have determined that they can act independently and effectively without having an Independent Trustee serve as Chairman and that a key structural component for assuring that they are in a position to do so is for the Independent Trustees to constitute a substantial majority for the Board. The Independent Trustees also regularly meet in executive session. Ned C. Lautenbach serves as Chairman of the Independent Trustees and as such (i) acts as a liaison between the Independent Trustees and management with respect to matters important to the Independent Trustees and (ii) with management prepares agendas for Board meetings.
Fidelity® funds are overseen by different Boards of Trustees. The fund's Board oversees Fidelity's high income and certain equity funds, and other Boards oversee Fidelity's investment-grade bond, money market, asset allocation, and other equity funds. The asset allocation funds may invest in Fidelity® funds overseen by the fund's Board. The use of separate Boards, each with its own committee structure, allows the Trustees of each group of Fidelity® funds to focus on the unique issues of the funds they oversee, including common research, investment, and operational issues. On occasion, the separate Boards establish joint committees to address issues of overlapping consequences for the Fidelity® funds overseen by each Board.
The Trustees operate using a system of committees to facilitate the timely and efficient consideration of all matters of importance to the Trustees, the fund, and fund shareholders and to facilitate compliance with legal and regulatory requirements and oversight of the fund's activities and associated risks. The Board, acting through its committees, has charged FMR and its affiliates with (i) identifying events or circumstances the occurrence of which could have demonstrably adverse effects on the fund's business and/or reputation; (ii) implementing processes and controls to lessen the possibility that such events or circumstances occur or to mitigate the effects of such events or circumstances if they do occur; and (iii) creating and maintaining a system designed to evaluate continuously business and market conditions in order to facilitate the identification and implementation processes described in (i) and (ii) above. Because the day-to-day operations and activities of the fund are carried out by or through FMR, its affiliates, and other service providers, the fund's exposure to risks is mitigated but not eliminated by the processes overseen by the Trustees. While each of the Board's committees has responsibility for overseeing different aspects of the fund's activities, oversight is exercised primarily through the Operations, Audit, and Compliance Committees. In addition, the Independent Trustees have worked with Fidelity to enhance the Board's oversight of investment and financial risks, legal and regulatory risks, technology risks, and operational risks, including the development of additional risk reporting to the Board. Appropriate personnel, including but not limited to the fund's Chief Compliance Officer (CCO), FMR's internal auditor, the independent accountants, the fund's Treasurer and portfolio management personnel, make periodic reports to the Board's committees, as appropriate, including an annual review of Fidelity's risk management program for the Fidelity® funds. The responsibilities of each standing committee, including their oversight responsibilities, are described further under "Standing Committees of the Trustees."
Interested Trustees*:
Correspondence intended for a Trustee who is an interested person may be sent to Fidelity Investments, 245 Summer Street, Boston, Massachusetts 02210.
Name, Year of Birth; Principal Occupations and Other Relevant Experience+
Jonathan Chiel (1957)
Year of Election or Appointment: 2016
Trustee
Mr. Chiel also serves as Trustee of other Fidelity® funds. Mr. Chiel is Executive Vice President and General Counsel for FMR LLC (diversified financial services company, 2012-present). Previously, Mr. Chiel served as general counsel (2004-2012) and senior vice president and deputy general counsel (2000-2004) for John Hancock Financial Services; a partner with Choate, Hall & Stewart (1996-2000) (law firm); and an Assistant United States Attorney for the United States Attorney’s Office of the District of Massachusetts (1986-95), including Chief of the Criminal Division (1993-1995). Mr. Chiel is a director on the boards of the Boston Bar Foundation and the Maimonides School.
James C. Curvey (1935)
Year of Election or Appointment: 2007
Trustee
Chairman of the Board of Trustees
Mr. Curvey also serves as Trustee of other Fidelity® funds. Mr. Curvey is Vice Chairman (2007-present) and Director of FMR LLC (diversified financial services company). In addition, Mr. Curvey is an Overseer Emeritus for the Boston Symphony Orchestra, a Director of Artis-Naples, and a Trustee of Brewster Academy in Wolfeboro, New Hampshire. Previously, Mr. Curvey served as a Director of Fidelity Research & Analysis Co. (investment adviser firm, 2009-2018), Director of Fidelity Investments Money Management, Inc. (investment adviser firm, 2009-2014) and a Director of FMR and FMR Co., Inc. (investment adviser firms, 2007-2014).
Charles S. Morrison (1960)
Year of Election or Appointment: 2014
Trustee
Mr. Morrison also serves as Trustee of other funds. He serves as President of Fidelity SelectCo, LLC (investment adviser firm, 2017-present) and Fidelity Management & Research Company (FMR) (investment adviser firm, 2016-present), a Director of Fidelity Investments Money Management, Inc. (FIMM) (investment adviser firm, 2014-present), Director of Fidelity SelectCo, LLC (investment adviser firm, 2014-present), President, Asset Management (2014-present), and is an employee of Fidelity Investments. Previously, Mr. Morrison served as Vice President of Fidelity's Fixed Income and Asset Allocation Funds (2012-2014), President, Fixed Income (2011-2014), Vice President of Fidelity's Money Market Funds (2005-2009), President, Money Market Group Leader of FMR (investment adviser firm, 2009), and Senior Vice President, Money Market Group of FMR (2004-2009). Mr. Morrison also served as Vice President of Fidelity's Bond Funds (2002-2005), certain Balanced Funds (2002-2005), and certain Asset Allocation Funds (2002-2007), and as Senior Vice President (2002-2005) of Fidelity's Bond Division.
* Determined to be an “Interested Trustee” by virtue of, among other things, his or her affiliation with the trust or various entities under common control with FMR.
+ The information includes the Trustee's principal occupation during the last five years and other information relating to the experience, attributes, and skills relevant to the Trustee's qualifications to serve as a Trustee, which led to the conclusion that the Trustee should serve as a Trustee for the fund.
Independent Trustees:
Correspondence intended for an Independent Trustee may be sent to Fidelity Investments, P.O. Box 55235, Boston, Massachusetts 02205-5235.
Name, Year of Birth; Principal Occupations and Other Relevant Experience+
Dennis J. Dirks (1948)
Year of Election or Appointment: 2005
Trustee
Mr. Dirks also serves as Trustee of other Fidelity® funds. Prior to his retirement in May 2003, Mr. Dirks was Chief Operating Officer and a member of the Board of The Depository Trust & Clearing Corporation (DTCC). He also served as President, Chief Operating Officer, and Board member of The Depository Trust Company (DTC) and President and Board member of the National Securities Clearing Corporation (NSCC). In addition, Mr. Dirks served as Chief Executive Officer and Board member of the Government Securities Clearing Corporation, Chief Executive Officer and Board member of the Mortgage-Backed Securities Clearing Corporation, as a Trustee and a member of the Finance Committee of Manhattan College (2005-2008), as a Trustee and a member of the Finance Committee of AHRC of Nassau County (2006-2008), as a member of the Independent Directors Council (IDC) Governing Council (2010-2015), and as a member of the Board of Directors for The Brookville Center for Children’s Services, Inc. (2009-2017). Mr. Dirks is a member of the Finance Committee (2016-present), Board of Directors (2017-present) and Board of Trustees (2018-present) and is Treasurer (2018-present) of the Asolo Repertory Theatre.
Donald F. Donahue (1950)
Year of Election or Appointment: 2018
Trustee
Mr. Donahue also serves as a Trustee of other Fidelity® funds. Mr. Donahue is President and Chief Executive Officer of Miranda Partners, LLC (risk consulting for the financial services industry, 2012-present). Previously, Mr. Donahue served as a Member of the Advisory Board of certain Fidelity® funds (2015-2018) and Chief Executive Officer (2006-2012), Chief Operating Officer (2003-2006), and Managing Director, Customer Marketing and Development (1999-2003) of The Depository Trust & Clearing Corporation (financial markets infrastructure). Mr. Donahue serves as a Member (2007-present) and Co-Chairman (2016-present) of the Board of Directors of United Way of New York, Member of the Board of Directors of NYC Leadership Academy (2012-present) and Member of the Board of Advisors of Ripple Labs, Inc. (financial services, 2015-present). He also served as Chairman (2010-2012) and Member of the Board of Directors (2012-2013) of Omgeo, LLC (financial services), Treasurer of United Way of New York (2012-2016), and Member of the Board of Directors of XBRL US (financial services non-profit, 2009-2012) and the International Securities Services Association (2009-2012).
Alan J. Lacy (1953)
Year of Election or Appointment: 2008
Trustee
Mr. Lacy also serves as Trustee of other Fidelity® funds. Mr. Lacy serves as a Director of Bristol-Myers Squibb Company (global pharmaceuticals, 2008-present). He is a Trustee of the California Chapter of The Nature Conservancy (2015-present) and a Director of the Center for Advanced Study in the Behavioral Sciences at Stanford University (2015-present). In addition, Mr. Lacy served as Senior Adviser (2007-2014) of Oak Hill Capital Partners, L.P. (private equity) and also served as Chief Executive Officer (2005) and Vice Chairman (2005-2006) of Sears Holdings Corporation (retail) and Chief Executive Officer and Chairman of the Board of Sears, Roebuck and Co. (retail, 2000-2005). Previously, Mr. Lacy served as Chairman (2014-2017) and a member (2010-2017) of the Board of Directors of Dave & Buster’s Entertainment, Inc. (restaurant and entertainment complexes), as Chairman (2008-2011) and a member (2006-2015) of the Board of Trustees of the National Parks Conservation Association, and as a member of the Board of Directors for The Hillman Companies, Inc. (hardware wholesalers, 2010-2014), Earth Fare, Inc. (retail grocery, 2010-2014), and The Western Union Company (global money transfer, 2006-2011).
Ned C. Lautenbach (1944)
Year of Election or Appointment: 2000
Trustee
Chairman of the Independent Trustees
Mr. Lautenbach also serves as Trustee of other Fidelity® funds. Mr. Lautenbach currently serves as Vice Chair of the Board of Governors, State University System of Florida (2013-present) and is a member of the Council on Foreign Relations (1994-present). He is also a member and has most recently served as Chairman of the Board of Directors of Artis-Naples (2012-present). Previously, Mr. Lautenbach served as a member and then Lead Director of the Board of Directors of Eaton Corporation (diversified industrial, 1997-2016). He was also a Partner and Advisory Partner at Clayton, Dubilier & Rice, LLC (private equity investment, 1998-2010), as well as a Director of Sony Corporation (2006-2007). In addition, Mr. Lautenbach also had a 30-year career with IBM (technology company) during which time he served as Senior Vice President and a member of the Corporate Executive Committee (1968-1998).
Joseph Mauriello (1944)
Year of Election or Appointment: 2008
Trustee
Mr. Mauriello also serves as Trustee of other Fidelity® funds. Prior to his retirement in January 2006, Mr. Mauriello served in numerous senior management positions including Deputy Chairman and Chief Operating Officer (2004-2005), and Vice Chairman of Financial Services (2002-2004) of KPMG LLP US (professional services, 1965-2005). Mr. Mauriello currently serves as a member of the Board of Directors of XL Group plc. (global insurance and re-insurance, 2006-present) and the Independent Directors Council (IDC) Governing Council (2015-present). Previously, Mr. Mauriello served as a Director of the Hamilton Funds of the Bank of New York (2006-2007) and of Arcadia Resources Inc. (health care services and products, 2007-2012).
Cornelia M. Small (1944)
Year of Election or Appointment: 2005
Trustee
Ms. Small also serves as Trustee of other Fidelity® funds. Ms. Small is a member of the Board of Directors (2009-present) and Chair of the Investment Committee (2010-present) of the Teagle Foundation. Ms. Small also serves on the Investment Committee of the Berkshire Taconic Community Foundation (2008-present). Previously, Ms. Small served as Chairperson (2002-2008) and a member of the Investment Committee and Chairperson (2008-2012) and a member of the Board of Trustees of Smith College. In addition, Ms. Small served as Chief Investment Officer, Director of Global Equity Investments, and a member of the Board of Directors of Scudder, Stevens & Clark and Scudder Kemper Investments.
Garnett A. Smith (1947)
Year of Election or Appointment: 2018
Trustee
Mr. Smith also serves as Trustee of other Fidelity® funds. Prior to Mr. Smith's retirement, he served as Chairman and Chief Executive Officer of Inbrand Corp. (manufacturer of personal absorbent products, 1990-1997). He also served as President (1986-1990) of Inbrand Corp. Prior to his employment with Inbrand Corp., he was employed by a retail fabric chain and North Carolina National Bank. In addition, Mr. Smith served as a Member of the Advisory Board of certain Fidelity® funds (2012-2013) and as a board member of the Jackson Hole Land Trust (2009-2012).
David M. Thomas (1949)
Year of Election or Appointment: 2008
Trustee
Mr. Thomas also serves as Trustee of other Fidelity® funds. Mr. Thomas serves as Non-Executive Chairman of the Board of Directors of Fortune Brands Home and Security (home and security products, 2011-present), as a member of the Board of Directors (2004-present) and Presiding Director (2013-present) of Interpublic Group of Companies, Inc. (marketing communication), and as a member of the Board of Trustees of the University of Florida (2013-present). Previously, Mr. Thomas served as Executive Chairman (2005-2006) and Chairman and Chief Executive Officer (2000-2005) of IMS Health, Inc. (pharmaceutical and healthcare information solutions), and a Director of Fortune Brands, Inc. (consumer products, 2000-2011).
+ The information includes the Trustee's principal occupation during the last five years and other information relating to the experience, attributes, and skills relevant to the Trustee's qualifications to serve as a Trustee, which led to the conclusion that the Trustee should serve as a Trustee for the fund.
Advisory Board Members and Officers:
Correspondence intended for a Member of the Advisory Board (if any) may be sent to Fidelity Investments, P.O. Box 55235, Boston, Massachusetts 02205-5235. Correspondence intended for an officer or Peter S. Lynch may be sent to Fidelity Investments, 245 Summer Street, Boston, Massachusetts 02210. Officers appear below in alphabetical order.
Name, Year of Birth; Principal Occupation
Peter S. Lynch (1944)
Year of Election or Appointment: 2003
Member of the Advisory Board
Mr. Lynch also serves as Member of the Advisory Board of other Fidelity® funds. Mr. Lynch is Vice Chairman and a Director of FMR (investment adviser firm) and FMR Co., Inc. (investment adviser firm). In addition, Mr. Lynch serves as a Trustee of Boston College and as the Chairman of the Inner-City Scholarship Fund. Previously, Mr. Lynch served on the Special Olympics International Board of Directors (1997-2006).
William S. Stavropoulos (1939)
Year of Election or Appointment: 2018
Member of the Advisory Board
Mr. Stavropoulos also serves as Member of the Advisory Board of other Fidelity® funds. Mr. Stavropoulos serves as President and Founder of the Michigan Baseball Foundation, the Great Lakes Loons (2007-present). Mr. Stavropoulos is Chairman Emeritus of the Board of Directors of The Dow Chemical Company, where he previously served in numerous senior management positions, including President, CEO (1995-2000; 2002-2004), Chairman of the Executive Committee (2000-2006), and as a member of the Board of Directors (1990-2006). Currently, Mr. Stavropoulos is Chairman of the Board of Directors of Univar Inc. (global distributor of commodity and specialty chemicals), a Director of Teradata Corporation (data warehousing and technology solutions), and a member of the Advisory Board for Metalmark Capital LLC (private equity investment, 2005-present). Mr. Stavropoulos is an operating advisor to Clayton, Dubilier & Rice, LLC (private equity investment). In addition, Mr. Stavropoulos is a member of the University of Notre Dame Advisory Council for the College of Science, a Trustee of the Rollin L. Gerstacker Foundation, and a Director of Artis-Naples in Naples, Florida. Previously, Mr. Stavropoulos served as Trustee of certain Fidelity® funds (2001-2018) and as a Director of Chemical Financial Corporation (bank holding company, 1993-2012) and Tyco International, Ltd. (multinational manufacturing and services, 2007-2012).
Carol B. Tomé (1957)
Year of Election or Appointment: 2018
Member of the Advisory Board
Ms. Tomé also serves as Member of the Advisory Board of other Fidelity® funds. Ms. Tomé is Chief Financial Officer (2001-present) and Executive Vice President of Corporate Services (2007-present) of The Home Depot, Inc. (home improvement retailer) and a Director (2003-present) and Chair of the Audit Committee (2004-present) of United Parcel Service, Inc. (package delivery and supply chain management). Previously, Ms. Tomé served as Trustee of certain Fidelity® funds (2017), Senior Vice President of Finance and Accounting/Treasurer (2000-2007) and Vice President and Treasurer (1995-2000) of The Home Depot, Inc. and Chair of the Board (2010-2012), Vice Chair of the Board (2009 and 2013), and a Director (2008-2013) of the Federal Reserve Bank of Atlanta. Ms. Tomé is also a director or trustee of many community and professional organizations.
Michael E. Wiley (1950)
Year of Election or Appointment: 2018
Member of the Advisory Board
Mr. Wiley also serves as Trustee or Member of the Advisory Board of other Fidelity® funds. Mr. Wiley serves as a Director of Andeavor Corporation (independent oil refiner and marketer, 2005-present), a Director of Andeavor Logistics LP (natural resources logistics, 2015-present), and a Director of Bill Barrett Corporation (exploration and production, 2005-present). In addition, Mr. Wiley also serves as a Director of Post Oak Bank (privately-held bank, 2004-present). Previously, Mr. Wiley served as a Trustee of other Fidelity® funds (2008-2013), as a Director of Asia Pacific Exploration Consolidated (international oil and gas exploration and production, 2008-2013), as a member of the Board of Trustees of the University of Tulsa (2000-2006; 2007-2010), as a Senior Energy Advisor of Katzenbach Partners, LLC (consulting, 2006-2007), as an Advisory Director of Riverstone Holdings (private investment), Chairman, President, and CEO of Baker Hughes, Inc. (oilfield services, 2000-2004), and as Director of Spinnaker Exploration Company (exploration and production, 2001-2005).
Elizabeth Paige Baumann (1968)
Year of Election or Appointment: 2017
Anti-Money Laundering (AML) Officer
Ms. Baumann also serves as AML Officer of other funds. She is Chief AML Officer (2012-present) and Senior Vice President (2014-present) of FMR LLC (diversified financial services company) and is an employee of Fidelity Investments. Previously, Ms. Baumann served as AML Officer of the funds (2012-2016), and Vice President (2007-2014) and Deputy Anti-Money Laundering Officer (2007-2012) of FMR LLC.
Marc R. Bryant (1966)
Year of Election or Appointment: 2015
Secretary and Chief Legal Officer (CLO)
Mr. Bryant also serves as Secretary and CLO of other funds. Mr. Bryant serves as CLO, Secretary, and Senior Vice President of Fidelity Management & Research Company (investment adviser firm, 2015-present) and FMR Co., Inc. (investment adviser firm, 2015-present); Secretary of Fidelity SelectCo, LLC (investment adviser firm, 2015-present) and Fidelity Investments Money Management, Inc. (investment adviser firm, 2015-present); and CLO of Fidelity Management & Research (Hong Kong) Limited and FMR Investment Management (UK) Limited (investment adviser firms, 2015-present) and Fidelity Management & Research (Japan) Limited (investment adviser firm, 2016-present). He is Senior Vice President and Deputy General Counsel of FMR LLC (diversified financial services company). Previously, Mr. Bryant served as Secretary and CLO of Fidelity Rutland Square Trust II (2010-2014) and Assistant Secretary of Fidelity's Fixed Income and Asset Allocation Funds (2013-2015). Prior to joining Fidelity Investments, Mr. Bryant served as a Senior Vice President and the Head of Global Retail Legal for AllianceBernstein L.P. (2006-2010), and as the General Counsel for ProFund Advisors LLC (2001-2006).
John J. Burke III (1964)
Year of Election or Appointment: 2018
Chief Financial Officer
Mr. Burke also serves as Chief Financial Officer of other funds. Mr. Burke serves as Head of Investment Operations for Fidelity Fund and Investment Operations (2018-present) and is an employee of Fidelity Investments (1998-present). Previously Mr. Burke served as head of Asset Management Investment Operations (2012-2018).
William C. Coffey (1969)
Year of Election or Appointment: 2009
Assistant Secretary
Mr. Coffey also serves as Assistant Secretary of other funds. He is Senior Vice President and Deputy General Counsel of FMR LLC (diversified financial services company, 2010-present), and is an employee of Fidelity Investments. Previously, Mr. Coffey served as Vice President and Associate General Counsel of FMR LLC (2005-2009).
Timothy M. Cohen (1969)
Year of Election or Appointment: 2018
Vice President
Mr. Cohen also serves as Vice President of other funds. Mr. Cohen serves as Co-Head of Global Equity Research (2016-present), a Director of Fidelity Management & Research (Japan) Limited (investment adviser firm, 2016-present), and is an employee of Fidelity Investments. Previously, Mr. Cohen served as Chief Investment Officer - Equity and a Director of Fidelity Management & Research (U.K.) Inc. (investment adviser firm, 2013-2015) and as a Director of Fidelity Management & Research (Hong Kong) Limited (investment adviser firm, 2017).
Jonathan Davis (1968)
Year of Election or Appointment: 2010
Assistant Treasurer
Mr. Davis also serves as Assistant Treasurer of other funds. Mr. Davis serves as Assistant Treasurer of FMR Capital, Inc. (2017-present) and is an employee of Fidelity Investments. Previously, Mr. Davis served as Vice President and Associate General Counsel of FMR LLC (diversified financial services company, 2003-2010).
Adrien E. Deberghes (1967)
Year of Election or Appointment: 2016
Assistant Treasurer
Mr. Deberghes also serves as an officer of other funds. He serves as Assistant Treasurer of FMR Capital, Inc. (2017-present), Executive Vice President of Fidelity Investments Money Management, Inc. (FIMM) (investment adviser firm, 2016-present), and is an employee of Fidelity Investments (2008-present). Previously, Mr. Deberghes served as President and Treasurer of certain Fidelity® funds (2013-2018). Prior to joining Fidelity Investments, Mr. Deberghes was Senior Vice President of Mutual Fund Administration at State Street Corporation (2007-2008), Senior Director of Mutual Fund Administration at Investors Bank & Trust (2005-2007), and Director of Finance for Dunkin' Brands (2000-2005). Previously, Mr. Deberghes served in other fund officer roles.
Laura M. Del Prato (1964)
Year of Election or Appointment: 2018
Assistant Treasurer
Ms. Del Prato also serves as an officer of other funds. Ms. Del Prato is an employee of Fidelity Investments (2017-present). Prior to joining Fidelity Investments, Ms. Del Prato served as a Managing Director and Treasurer of the JPMorgan Mutual Funds (2014-2017). Prior to JPMorgan, Ms. Del Prato served as a partner at Cohen Fund Audit Services (accounting firm, 2012-2013) and KPMG LLP (accounting firm, 2004-2012).
Colm A. Hogan (1973)
Year of Election or Appointment: 2016
Deputy Treasurer
Mr. Hogan also serves as an officer of other funds. Mr. Hogan serves as Assistant Treasurer of FMR Capital, Inc. (2017-present) and is an employee of Fidelity Investments (2005-present). Previously, Mr. Hogan served as Assistant Treasurer of certain Fidelity® funds (2016-2018).
Pamela R. Holding (1964)
Year of Election or Appointment: 2018
Vice President
Ms. Holding also serves as a Vice President of other funds. Ms. Holding serves as Co-Head of Global Equity Research (2018-present) and is an employee of Fidelity Investments (2013-present).
Chris Maher (1972)
Year of Election or Appointment: 2013
Assistant Treasurer
Mr. Maher serves as Assistant Treasurer of other funds. Mr. Maher is Vice President of Valuation Oversight, serves as Assistant Treasurer of FMR Capital, Inc. (2017-present), and is an employee of Fidelity Investments. Previously, Mr. Maher served as Vice President of Asset Management Compliance (2013), Vice President of the Program Management Group of FMR (investment adviser firm, 2010-2013), and Vice President of Valuation Oversight (2008-2010).
Rieco E. Mello (1969)
Year of Election or Appointment: 2017
Assistant Treasurer
Mr. Mello also serves as Assistant Treasurer of other funds. Mr. Mello serves as Assistant Treasurer of FMR Capital, Inc. (2017-present) and is an employee of Fidelity Investments (1995-present).
Kenneth B. Robins (1969)
Year of Election or Appointment: 2016
Chief Compliance Officer
Mr. Robins also serves as an officer of other funds. Mr. Robins serves as Compliance Officer of Fidelity Management & Research Company and FMR Co., Inc. (investment adviser firms, 2016-present) and is an employee of Fidelity Investments (2004-present). Previously, Mr. Robins served as Executive Vice President of Fidelity Investments Money Management, Inc. (investment adviser firm, 2013-2016) and served in other fund officer roles.
Stacie M. Smith (1974)
Year of Election or Appointment: 2016
President and Treasurer
Ms. Smith also serves as an officer of other funds. Ms. Smith serves as Assistant Treasurer of FMR Capital, Inc. (2017-present), is an employee of Fidelity Investments (2009-present), and has served in other fund officer roles. Prior to joining Fidelity Investments, Ms. Smith served as Senior Audit Manager of Ernst & Young LLP (accounting firm, 1996-2009). Previously, Ms. Smith served as Assistant Treasurer (2013-2018) and Deputy Treasurer (2013-2016) of certain Fidelity® funds.
Marc L. Spector (1972)
Year of Election or Appointment: 2016
Assistant Treasurer
Mr. Spector also serves as an officer of other funds. Mr. Spector serves as Assistant Treasurer of FMR Capital, Inc. (2017-present) and is an employee of Fidelity Investments (2016-present). Prior to joining Fidelity Investments, Mr. Spector served as Director at the Siegfried Group (accounting firm, 2013-2016), and prior to Siegfried Group as audit senior manager at Deloitte & Touche (accounting firm, 2005-2013).
Renee Stagnone (1975)
Year of Election or Appointment: 2016
Assistant Treasurer
Ms. Stagnone also serves as an officer of other funds. Ms. Stagnone serves as Assistant Treasurer of FMR Capital, Inc. (2017-present) and is an employee of Fidelity Investments (1997-present). Previously, Ms. Stagnone served as Deputy Treasurer of certain Fidelity® funds (2013-2016).
Shareholder Expense Example
As a shareholder of the Fund, you incur two types of costs: (1) transaction costs, and (2) ongoing costs, including other Fund expenses. This Example is intended to help you understand your ongoing costs (in dollars) of investing in the Fund and to compare these costs with the ongoing costs of investing in other mutual funds.
The Example is based on an investment of $1,000 invested at the beginning of the period and held for the entire period (February 1, 2018 to July 31, 2018).
Actual Expenses
The first line of the accompanying table provides information about actual account values and actual expenses. You may use the information in this line, together with the amount you invested, to estimate the expenses that you paid over the period. Simply divide your account value by $1,000.00 (for example, an $8,600 account value divided by $1,000.00 = 8.6), then multiply the result by the number in the first line under the heading entitled "Expenses Paid During Period" to estimate the expenses you paid on your account during this period. In addition, the Fund, as a shareholder in the underlying Fidelity Central Funds, will indirectly bear its pro-rata share of the fees and expenses incurred by the underlying Fidelity Central Funds. These fees and expenses are not included in the Fund's annualized expense ratio used to calculate the expense estimate in the table below.
Hypothetical Example for Comparison Purposes
The second line of the accompanying table provides information about hypothetical account values and hypothetical expenses based on the Fund's actual expense ratio and an assumed rate of return of 5% per year before expenses, which is not the Fund's actual return. The hypothetical account values and expenses may not be used to estimate the actual ending account balance or expenses you paid for the period. You may use this information to compare the ongoing costs of investing in the Fund and other funds. To do so, compare this 5% hypothetical example with the 5% hypothetical examples that appear in the shareholder reports of the other funds. In addition, the Fund, as a shareholder in the underlying Fidelity Central Funds, will indirectly bear its pro-rata share of the fees and expenses incurred by the underlying Fidelity Central Funds. These fees and expenses are not included in the Fund's annualized expense ratio used to calculate the expense estimate in the table below.
Please note that the expenses shown in the table are meant to highlight your ongoing costs only and do not reflect any transaction costs. Therefore, the second line of the table is useful in comparing ongoing costs only, and will not help you determine the relative total costs of owning different funds.
| | Annualized Expense Ratio-A | Beginning
Account Value
February 1, 2018 | Ending
Account Value
July 31, 2018 | Expenses Paid
During Period-B
February 1, 2018
to July 31, 2018 |
| Series Intrinsic Opportunities | .01% | | | |
| Actual | | $1,000.00 | $990.50 | $.05 |
| Hypothetical-C | | $1,000.00 | $1,024.74 | $.05 |
A Annualized expense ratio reflects expenses net of applicable fee waivers.
B Expenses are equal to the Fund's annualized expense ratio, multiplied by the average account value over the period, multiplied by 181/365 (to reflect the one-half year period).
C 5% return per year before expenses
Distributions (Unaudited)
The Board of Trustees of Fidelity Series Intrinsic Opportunities Fund voted to pay on September 17, 2018, to shareholders of record at the opening of business on September 14, 2018, a distribution of $0.612 per share derived from capital gains realized from sales of portfolio securities and a dividend of $0.237 per share from net investment income.
The fund hereby designates as a capital gain dividend with respect to the taxable year ended July 31, 2018, $464,804,258, or, if subsequently determined to be different, the net capital gain of such year.
The fund designates 48% and 39% of the dividends distributed in September and December, respectively during the fiscal year as qualifying for the dividends–received deduction for corporate shareholders.
The fund designates 90% and 68% of the dividends distributed in September and December, respectively during the fiscal year as amounts which may be taken into account as a dividend for the purposes of the maximum rate under section 1(h)(11) of the Internal Revenue Code.
The fund will notify shareholders in January 2019 of amounts for use in preparing 2018 income tax returns.
Board Approval of Investment Advisory Contracts
Fidelity Series Intrinsic Opportunities Fund
At its July 2018 meeting, the Board of Trustees, including the Independent Trustees (together, the Board), voted to continue the management contract with Fidelity Management & Research Company (FMR) and the sub-advisory agreements (together, the Advisory Contracts) for the fund for six months through January 31, 2019, in connection with the reunification of the Fidelity Equity High Income Funds Board, which oversees the fund, and the Sector Portfolios Board.
The Board considered that the approval of the fund's Advisory Contracts will not result in any changes in (i) the investment process or strategies employed in the management of the fund's assets; (ii) the fees and expenses paid by shareholders, including the expense cap arrangement currently in place for the fund; (iii) the nature, extent or quality of services provided under the fund's Advisory Contracts; or (iv) the day-to-day management of the fund or the persons primarily responsible for such management. The Board concluded that the fund's Advisory Contracts are fair and reasonable, and that the fund's Advisory Contracts should be renewed, without modification, through January 31, 2019, with the understanding that the Board will consider the annual renewal for a full one year period in January 2019.
In connection with its consideration of future renewals of the fund's Advisory Contracts, the Board will consider: (i) the nature, extent and quality of services provided to the fund, including shareholder and administrative services and investment performance; (ii) the competitiveness of the management fee and total expenses for the fund; (iii) the costs of the services and profitability, including the revenues earned and the expenses incurred in conducting the business of developing, marketing, distributing, managing, administering, and servicing the fund and its shareholders, to the extent applicable, as well as potential fall-out benefits from Fidelity's non-fund businesses; and (iv) whether there have been economies of scale in respect of the Fidelity funds, whether the Fidelity funds (including the fund) have appropriately benefited from any such economies of scale, and whether there is the potential for realization of any further economies.
Based on its evaluation of all of the conclusions noted above, and after considering all factors it believed relevant, the Board ultimately concluded that the fund's management fee structure is fair and reasonable, and that the continuation of the fund's Advisory Contracts should be approved.
Corporate Headquarters
245 Summer St.
Boston, MA 02210
www.fidelity.com
O2T-ANN-0918
1.951012.105
Fidelity Flex℠ Funds Fidelity Flex℠ Intrinsic Opportunities Fund
Annual Report July 31, 2018 |
|
Contents
To view a fund's proxy voting guidelines and proxy voting record for the 12-month period ended June 30, visit http://www.fidelity.com/proxyvotingresults or visit the Securities and Exchange Commission's (SEC) web site at http://www.sec.gov.
You may also call 1-800-835-5092 to request a free copy of the proxy voting guidelines.
Standard & Poor's, S&P and S&P 500 are registered service marks of The McGraw-Hill Companies, Inc. and have been licensed for use by Fidelity Distributors Corporation.
Other third-party marks appearing herein are the property of their respective owners.
All other marks appearing herein are registered or unregistered trademarks or service marks of FMR LLC or an affiliated company. © 2018 FMR LLC. All rights reserved.
This report and the financial statements contained herein are submitted for the general information of the shareholders of the Fund. This report is not authorized for distribution to prospective investors in the Fund unless preceded or accompanied by an effective prospectus.
A fund files its complete schedule of portfolio holdings with the SEC for the first and third quarters of each fiscal year on Form N-Q. Forms N-Q are available on the SEC’s web site at http://www.sec.gov. A fund's Forms N-Q may be reviewed and copied at the SEC’s Public Reference Room in Washington, DC. Information regarding the operation of the SEC's Public Reference Room may be obtained by calling 1-800-SEC-0330.
For a complete list of a fund's portfolio holdings, view the most recent holdings listing, semiannual report, or annual report on Fidelity's web site at http://www.fidelity.com, http://www.institutional.fidelity.com, or http://www.401k.com, as applicable.
NOT FDIC INSURED •MAY LOSE VALUE •NO BANK GUARANTEE
Neither the Fund nor Fidelity Distributors Corporation is a bank.
Performance: The Bottom Line
Average annual total return reflects the change in the value of an investment, assuming reinvestment of distributions from dividend income and capital gains (the profits earned upon the sale of securities that have grown in value, if any) and assuming a constant rate of performance each year. The hypothetical investment and the average annual total returns do not reflect the deduction of taxes that a shareholder would pay on fund distributions or the redemption of fund shares. During periods of reimbursement by Fidelity, a fund’s total return will be greater than it would be had the reimbursement not occurred. How a fund did yesterday is no guarantee of how it will do tomorrow.
Average Annual Total Returns
| For the periods ended July 31, 2018 | Past 1 year | Life of fundA |
| Fidelity Flex℠ Intrinsic Opportunities Fund | 14.86% | 16.98% |
A From March 8, 2017
$10,000 Over Life of Fund
Let's say hypothetically that $10,000 was invested in Fidelity Flex℠ Intrinsic Opportunities Fund on March 8, 2017, when the fund started.
The chart shows how the value of your investment would have changed, and also shows how the Russell 3000® Index performed over the same period.
| Period Ending Values |
| $12,451 | Fidelity Flex℠ Intrinsic Opportunities Fund |
| $12,247 | Russell 3000® Index |
Management's Discussion of Fund Performance
Market Recap: The U.S. equity bellwether S&P 500
® index gained 16.24% for the 12 months ending July 31, 2018, despite a resurgence in volatility that challenged the multiyear bull market. Stocks maintained their steady growth until a sharp reversal in February, as volatility spiked amid fear that rising inflation and the potential for the economy to overheat would prompt the U.S. Federal Reserve to pick up the pace of interest rate hikes. The index posted its first negative monthly result since October 2016, and then lost further ground in March on fear of a global trade war. The market stabilized in April and turned upward through mid-June, when escalating trade tension between the U.S. and China soured investor sentiment. The resulting uncertainty lingered into July, but strong corporate earnings helped the S&P 500 rise 3.72% that month to cap the period. For the full one-year period, growth handily topped value, while small-caps bested large-caps. By sector, information technology (+28%) led the way, boosted by strong earnings growth from several major index constituents. Consumer discretionary rose roughly 24%, driven by retailers (+49%). Energy (+20%) gained alongside higher oil prices. Laggards were telecommunication services (-2%), consumer staples (0%) and utilities (+3%), defensive groups that struggled amid rising interest rates and a general preference for risk. Real estate (+5%) fared a bit better but still lagged, as did financials, industrials, health care (each up 13%) and materials (+11%).
Comments from Portfolio Manager Joel Tillinghast: For the fiscal year, the fund gained 14.86%, trailing the 16.39% return of the benchmark Russell 3000
® Index. Versus the benchmark, stock selection held back the fund's performance, with my choices in the retailing and software & services industries hurting most. In retailing, the fund's lack of ownership of e-commerce firm and benchmark component Amazon.com was the top relative detractor the past year. Although Amazon's share price rallied 80%, this stock's valuation and other characteristics did not meet the investment criteria we focus on. Similarly, relative performance was held back by largely avoiding software manufacturer Microsoft, a stock that gained 49% the past year. The fund's sizable allocation to cash – at about 10% of assets, on average – amid a rising equity market also significantly hindered our relative result. Furthermore, our foreign holdings detracted overall, in part due to the strength of the U.S. dollar. Conversely, stock selection in the health care equipment & services and household & personal products groups added value. In the former category, a large position in health insurance company Anthem proved to be the fund's biggest individual contributor. Anthem's stock benefited from a series of better-than-expected quarterly earnings reports, fueled in part by membership growth, and investors responded positively to the company's share buybacks in the first half of 2018. Anthem was our largest holding. The fund's relative result also benefited from not owning a position in industrial conglomerate General Electric, a benchmark constituent that returned -45% the past year. GE reported a $15 billion shortfall in its insurance reserves and continued to suffer lackluster performance in its oil-and-gas and power-generation businesses.
The views expressed above reflect those of the portfolio manager(s) only through the end of the period as stated on the cover of this report and do not necessarily represent the views of Fidelity or any other person in the Fidelity organization. Any such views are subject to change at any time based upon market or other conditions and Fidelity disclaims any responsibility to update such views. These views may not be relied on as investment advice and, because investment decisions for a Fidelity fund are based on numerous factors, may not be relied on as an indication of trading intent on behalf of any Fidelity fund.
Investment Summary (Unaudited)
Top Ten Stocks as of July 31, 2018
| | % of fund's net assets |
| Anthem, Inc. | 5.5 |
| Amgen, Inc. | 3.0 |
| UnitedHealth Group, Inc. | 2.6 |
| Itochu Corp. | 2.5 |
| Best Buy Co., Inc. | 2.2 |
| United Therapeutics Corp. | 1.9 |
| Aetna, Inc. | 1.8 |
| MetLife, Inc. | 1.8 |
| John David Group PLC | 1.6 |
| China Petroleum & Chemical Corp. (H Shares) | 1.5 |
| | 24.4 |
Top Five Market Sectors as of July 31, 2018
| | % of fund's net assets |
| Health Care | 23.7 |
| Consumer Discretionary | 18.5 |
| Financials | 15.0 |
| Industrials | 8.0 |
| Energy | 7.7 |
Asset Allocation (% of fund's net assets)
| As of July 31, 2018* |
| | Stocks | 89.6% |
| | Short-Term Investments and Net Other Assets (Liabilities) | 10.4% |

* Foreign investments - 38.9%
Schedule of Investments July 31, 2018
Showing Percentage of Net Assets
| Common Stocks - 89.5% | | | |
| | | Shares | Value |
| CONSUMER DISCRETIONARY - 18.5% | | | |
| Auto Components - 2.6% | | | |
| Adient PLC | | 237 | $11,288 |
| Cooper Tire & Rubber Co. | | 1,441 | 41,141 |
| Dongah Tire & Rubber Co. Ltd. | | 29 | 878 |
| Eagle Industry Co. Ltd. | | 395 | 6,387 |
| Fukoku Co. Ltd. | | 200 | 1,789 |
| G-Tekt Corp. | | 6,200 | 107,404 |
| Gentex Corp. | | 325 | 7,540 |
| Hi-Lex Corp. | | 463 | 11,503 |
| Hyundai Mobis | | 2,221 | 454,784 |
| IJT Technology Holdings Co. Ltd. | | 2,900 | 21,812 |
| INFAC Corp. | | 71 | 287 |
| Piolax, Inc. | | 1,100 | 26,670 |
| Seoyon Co. Ltd. | | 345 | 1,493 |
| Seoyon E-Hwa Co., Ltd. | | 1,646 | 9,727 |
| TBK Co. Ltd. | | 400 | 1,832 |
| TPR Co. Ltd. | | 2,000 | 50,637 |
| Yorozu Corp. | | 3,500 | 55,592 |
| | | | 810,764 |
| Automobiles - 0.7% | | | |
| Audi AG | | 62 | 52,925 |
| Fiat Chrysler Automobiles NV | | 96 | 1,630 |
| Fiat Chrysler Automobiles NV | | 3,037 | 51,842 |
| General Motors Co. | | 3,001 | 113,768 |
| Harley-Davidson, Inc. | | 3 | 129 |
| | | | 220,294 |
| Distributors - 0.2% | | | |
| Chori Co. Ltd. | | 1,000 | 18,557 |
| Doshisha Co. Ltd. | | 800 | 18,015 |
| Harima-Kyowa Co. Ltd. | | 100 | 1,685 |
| Nakayamafuku Co. Ltd. | | 100 | 640 |
| Yagi & Co. Ltd. | | 700 | 11,769 |
| | | | 50,666 |
| Diversified Consumer Services - 1.0% | | | |
| Asante, Inc. | | 100 | 2,010 |
| Heian Ceremony Service Co. Ltd.�� | | 1,200 | 10,067 |
| Kukbo Design Co. Ltd. | | 14 | 238 |
| MegaStudy Co. Ltd. | | 2,610 | 35,043 |
| MegaStudyEdu Co. Ltd. | | 503 | 74,763 |
| Multicampus Co. Ltd. | | 35 | 1,138 |
| Tsukada Global Holdings, Inc. | | 2,700 | 15,430 |
| Weight Watchers International, Inc. (a) | | 1,861 | 166,615 |
| | | | 305,304 |
| Hotels, Restaurants & Leisure - 0.5% | | | |
| Brinker International, Inc. | | 52 | 2,453 |
| Dunkin' Brands Group, Inc. | | 240 | 16,711 |
| Flight Centre Travel Group Ltd. | | 85 | 4,295 |
| Hiday Hidaka Corp. | | 360 | 7,656 |
| Koshidaka Holdings Co. Ltd. | | 2,000 | 23,002 |
| Kura Corp. Ltd. | | 200 | 12,056 |
| Retail Food Group Ltd. | | 2,910 | 886 |
| St. Marc Holdings Co. Ltd. | | 500 | 12,158 |
| The Restaurant Group PLC | | 16,655 | 57,930 |
| Whitbread PLC | | 1 | 51 |
| Wyndham Destinations, Inc. | | 3 | 138 |
| Wyndham Hotels & Resorts, Inc. | | 3 | 174 |
| | | | 137,510 |
| Household Durables - 0.7% | | | |
| Ace Bed Co. Ltd. | | 120 | 14,592 |
| Emak SpA | | 409 | 578 |
| FJ Next Co. Ltd. | | 1,900 | 17,332 |
| Gree Electric Appliances, Inc. of Zhuhai Class A | | 600 | 3,890 |
| Hamilton Beach Brands Holding Co.: | | | |
| Class A | | 104 | 2,642 |
| Class B | | 104 | 2,642 |
| Helen of Troy Ltd. (a) | | 1,321 | 151,321 |
| Q.E.P. Co., Inc. | | 24 | 763 |
| Sanyo Housing Nagoya Co. Ltd. | | 1,700 | 18,412 |
| Tupperware Brands Corp. | | 323 | 11,857 |
| | | | 224,029 |
| Internet & Direct Marketing Retail - 0.0% | | | |
| Hyundai Home Shopping Network Corp. | | 7 | 692 |
| NS Shopping Co. Ltd. | | 30 | 338 |
| Trade Maine Group Ltd. | | 34 | 112 |
| Webjet Ltd. | | 79 | 784 |
| | | | 1,926 |
| Leisure Products - 0.1% | | | |
| Mars Engineering Corp. | | 1,100 | 23,837 |
| Media - 1.8% | | | |
| AMC Networks, Inc. Class A (a) | | 300 | 18,087 |
| Comcast Corp. Class A | | 5,282 | 188,990 |
| Corus Entertainment, Inc. Class B (non-vtg.) | | 273 | 852 |
| Discovery Communications, Inc. Class A (a)(b) | | 5,642 | 149,964 |
| DMS, Inc. | | 500 | 7,146 |
| Gendai Agency, Inc. | | 1,500 | 7,190 |
| Hyundai HCN | | 4,802 | 17,897 |
| Ipsos SA | | 7 | 234 |
| Liberty Latin America Ltd. Class A (a) | | 5 | 95 |
| Multiplus SA | | 900 | 6,642 |
| Nippon BS Broadcasting Corp. | | 200 | 2,488 |
| Nippon Television Network Corp. | | 147 | 2,365 |
| Pico Far East Holdings Ltd. | | 6,000 | 2,484 |
| Proto Corp. | | 100 | 1,229 |
| SMG PLC | | 7 | 40 |
| Television Broadcasts Ltd. | | 2,700 | 8,376 |
| The Walt Disney Co. | | 226 | 25,665 |
| Viacom, Inc.: | | | |
| Class A | | 1,921 | 66,082 |
| Class B (non-vtg.) | | 1,441 | 41,861 |
| WOWOW INC. | | 400 | 12,109 |
| | | | 559,796 |
| Multiline Retail - 0.5% | | | |
| Grazziotin SA | | 200 | 1,071 |
| Lifestyle China Group Ltd. (a) | | 30,000 | 12,193 |
| Lifestyle International Holdings Ltd. | | 31,000 | 61,613 |
| Macy's, Inc. | | 1,200 | 47,676 |
| Treasure Factory Co. Ltd. | | 1,300 | 9,394 |
| Watts Co. Ltd. | | 600 | 5,865 |
| | | | 137,812 |
| Specialty Retail - 8.8% | | | |
| ABC-MART, Inc. | | 100 | 5,411 |
| Arc Land Sakamoto Co. Ltd. | | 900 | 12,589 |
| AT-Group Co. Ltd. | | 1,837 | 46,625 |
| AutoNation, Inc. (a) | | 840 | 40,765 |
| Beacon Lighting Group Ltd. | | 17 | 18 |
| Best Buy Co., Inc. | | 9,124 | 684,574 |
| DongAh Tire & Rubber Co. Ltd. (a) | | 39 | 457 |
| Dunelm Group PLC | | 244 | 1,680 |
| Ff Group (a)(c) | | 2,761 | 15,497 |
| Fuji Corp. | | 1,699 | 40,494 |
| GameStop Corp. Class A | | 2,386 | 34,382 |
| Genesco, Inc. (a) | | 720 | 29,304 |
| GNC Holdings, Inc. Class A (a)(b) | | 14,261 | 45,350 |
| Goldlion Holdings Ltd. | | 22,000 | 9,109 |
| Guess?, Inc. | | 8,345 | 189,098 |
| Handsman Co. Ltd. | | 1,700 | 19,734 |
| Hibbett Sports, Inc. (a) | | 2,462 | 56,503 |
| JB Hi-Fi Ltd. | | 1,681 | 29,786 |
| John David Group PLC | | 80,912 | 496,915 |
| K's Holdings Corp. | | 10,000 | 112,418 |
| Ku Holdings Co. Ltd. | | 900 | 7,558 |
| Lookers PLC | | 764 | 1,053 |
| Mandarake, Inc. | | 100 | 593 |
| Nafco Co. Ltd. | | 200 | 3,280 |
| Nitori Holdings Co. Ltd. | | 2,200 | 331,825 |
| Oriental Watch Holdings Ltd. | | 4,000 | 1,228 |
| Padini Holdings Bhd | | 1,800 | 2,657 |
| Sacs Bar Holdings, Inc. | | 800 | 6,940 |
| Sally Beauty Holdings, Inc. (a) | | 11,404 | 188,052 |
| Samse SA | | 65 | 12,009 |
| Silvano Fashion Group A/S | | 7 | 24 |
| Sports Direct International PLC (a) | | 68 | 369 |
| The Buckle, Inc. | | 514 | 12,362 |
| Tokatsu Holdings Co. Ltd. | | 100 | 481 |
| Truworths International Ltd. | | 228 | 1,417 |
| Urban Outfitters, Inc. (a) | | 2,281 | 101,276 |
| Vita Group Ltd. | | 18 | 13 |
| Vitamin Shoppe, Inc. (a) | | 104 | 868 |
| Williams-Sonoma, Inc. (b) | | 2,641 | 154,472 |
| | | | 2,697,186 |
| Textiles, Apparel & Luxury Goods - 1.6% | | | |
| Best Pacific International Holdings Ltd. | | 2,000 | 739 |
| Embry Holdings Ltd. | | 1,000 | 336 |
| Fossil Group, Inc. (a) | | 4,470 | 117,114 |
| Gerry Weber International AG (Bearer) | | 1,501 | 10,145 |
| Grendene SA | | 300 | 623 |
| Handsome Co. Ltd. | | 17 | 576 |
| Magni-Tech Industries Bhd | | 4,500 | 5,314 |
| Michael Kors Holdings Ltd. (a) | | 4,562 | 304,422 |
| Portico International Holdings (a) | | 21,000 | 10,943 |
| Sitoy Group Holdings Ltd. | | 6,000 | 1,728 |
| Texwinca Holdings Ltd. | | 2,000 | 882 |
| Vera Bradley, Inc. (a) | | 2,281 | 30,314 |
| Youngone Holdings Co. Ltd. | | 176 | 8,488 |
| Yue Yuen Industrial (Holdings) Ltd. | | 5,000 | 13,441 |
| | | | 505,065 |
|
| TOTAL CONSUMER DISCRETIONARY | | | 5,674,189 |
|
| CONSUMER STAPLES - 4.9% | | | |
| Beverages - 0.9% | | | |
| A.G. Barr PLC | | 968 | 8,602 |
| Britvic PLC | | 16,730 | 176,550 |
| C&C Group PLC | | 307 | 1,235 |
| Jinro Distillers Co. Ltd. | | 1,256 | 34,517 |
| Lucas Bols BV (d) | | 82 | 1,620 |
| Olvi PLC (A Shares) | | 68 | 2,560 |
| Spritzer Bhd | | 200 | 118 |
| Willamette Valley Vineyards, Inc. | | 3 | 25 |
| Yantai Changyu Pioneer Wine Co. Ltd. (B Shares) | | 14,600 | 38,969 |
| | | | 264,196 |
| Food & Staples Retailing - 1.8% | | | |
| Amsterdam Commodities NV | | 1,501 | 35,192 |
| Belc Co. Ltd. | | 100 | 4,794 |
| Dong Suh Companies, Inc. | | 1,200 | 27,482 |
| Genky DrugStores Co. Ltd. | | 800 | 27,653 |
| Halows Co. Ltd. | | 100 | 2,307 |
| J Sainsbury PLC | | 136 | 584 |
| Kroger Co. | | 4,802 | 139,258 |
| MARR SpA | | 1,921 | 51,890 |
| OM2 Network Co. Ltd. | | 200 | 3,155 |
| Retail Partners Co. Ltd. | | 1,200 | 16,399 |
| Satsudora Holdings Co. Ltd. | | 800 | 15,261 |
| Shoei Foods Corp. | | 100 | 3,461 |
| Tesco PLC | | 24,191 | 82,612 |
| Thai President Foods PCL | | 43 | 200 |
| United Natural Foods, Inc. (a) | | 989 | 31,846 |
| Valor Holdings Co. Ltd. | | 1,600 | 34,314 |
| Walgreens Boots Alliance, Inc. | | 956 | 64,645 |
| | | | 541,053 |
| Food Products - 0.8% | | | |
| Ajinomoto Malaysia Bhd | | 3,000 | 16,236 |
| B&G Foods, Inc. Class A | | 720 | 22,608 |
| Bakkafrost | | 286 | 17,584 |
| Bell AG | | 50 | 14,619 |
| Binggrea Co. Ltd. | | 10 | 541 |
| Carr's Group PLC | | 4,948 | 9,612 |
| Changshouhua Food Co. Ltd. | | 1,000 | 470 |
| Cranswick PLC | | 970 | 41,684 |
| Dean Foods Co. | | 34 | 334 |
| Kaneko Seeds Co. Ltd. | | 100 | 1,443 |
| Kawan Food Bhd | | 133 | 79 |
| Lassonde Industries, Inc. Class A (sub. vtg.) | | 120 | 24,464 |
| London Biscuits Bhd (a) | | 2,700 | 345 |
| Pickles Corp. | | 100 | 1,988 |
| Prima Meat Packers Ltd. | | 1,142 | 5,730 |
| S Foods, Inc. | | 600 | 23,530 |
| Select Harvests Ltd. | | 3,451 | 15,384 |
| Thai Wah PCL | | 300 | 83 |
| The Hain Celestial Group, Inc. (a) | | 1,561 | 44,395 |
| The J.M. Smucker Co. | | 63 | 7,001 |
| Toyo Sugar Refining Co. Ltd. | | 200 | 2,277 |
| Valsoia SpA | | 42 | 771 |
| | | | 251,178 |
| Personal Products - 1.1% | | | |
| Asaleo Care Ltd. | | 682 | 355 |
| Hengan International Group Co. Ltd. | | 4,133 | 36,780 |
| USANA Health Sciences, Inc. (a) | | 2,221 | 293,727 |
| | | | 330,862 |
| Tobacco - 0.3% | | | |
| KT&G Corp. | | 756 | 75,025 |
| Scandinavian Tobacco Group A/S (d) | | 960 | 15,622 |
| | | | 90,647 |
|
| TOTAL CONSUMER STAPLES | | | 1,477,936 |
|
| ENERGY - 7.7% | | | |
| Energy Equipment & Services - 0.9% | | | |
| AKITA Drilling Ltd. Class A (non-vtg.) | | 170 | 636 |
| Carbo Ceramics, Inc. (a)(b) | | 5,667 | 52,873 |
| Diamond Offshore Drilling, Inc. (a) | | 581 | 11,155 |
| Ensco PLC Class A | | 9,604 | 71,358 |
| Geospace Technologies Corp. (a) | | 1,122 | 15,787 |
| GulfMark Offshore, Inc. (a) | | 4 | 151 |
| GulfMark Offshore, Inc. warrants 11/14/24 (a) | | 50 | 125 |
| National Oilwell Varco, Inc. | | 480 | 23,338 |
| Oceaneering International, Inc. | | 1,274 | 34,857 |
| Prosafe ASA (a) | | 68 | 156 |
| Shinko Plantech Co. Ltd. | | 4,300 | 40,571 |
| Tecnicas Reunidas SA | | 291 | 9,834 |
| | | | 260,841 |
| Oil, Gas & Consumable Fuels - 6.8% | | | |
| Alvopetro Energy Ltd. (a) | | 1,900 | 657 |
| Baytex Energy Corp. (a) | | 409 | 1,270 |
| Birchcliff Energy Ltd. | | 7,203 | 28,516 |
| Bonavista Energy Corp. | | 34 | 41 |
| Chevron Corp. | | 1,080 | 136,372 |
| China Petroleum & Chemical Corp. (H Shares) | | 480,667 | 462,038 |
| CNOOC Ltd. sponsored ADR | | 81 | 13,608 |
| ConocoPhillips Co. | | 6,002 | 433,164 |
| Contango Oil & Gas Co. (a) | | 170 | 954 |
| Enagas SA | | 7,203 | 201,474 |
| Fuji Kosan Co. Ltd. | | 100 | 585 |
| Husky Energy, Inc. | | 10,324 | 175,552 |
| Imperial Oil Ltd. | | 480 | 16,438 |
| International Seaways, Inc. (a) | | 7 | 152 |
| Motor Oil (HELLAS) Corinth Refineries SA | | 581 | 12,338 |
| Murphy Oil Corp. | | 3,121 | 103,804 |
| NACCO Industries, Inc. Class A | | 219 | 7,227 |
| Peyto Exploration & Development Corp. | | 21,608 | 178,066 |
| San-Ai Oil Co. Ltd. | | 200 | 2,561 |
| Ship Finance International Ltd. (NY Shares) | | 7 | 102 |
| Thai Oil PCL (For. Reg.) | | 400 | 965 |
| Total SA sponsored ADR | | 3,785 | 246,971 |
| Tsakos Energy Navigation Ltd. | | 307 | 1,075 |
| Whiting Petroleum Corp. (a) | | 960 | 47,664 |
| World Fuel Services Corp. | | 840 | 23,377 |
| | | | 2,094,971 |
|
| TOTAL ENERGY | | | 2,355,812 |
|
| FINANCIALS - 15.0% | | | |
| Banks - 5.3% | | | |
| Cambridge Bancorp | | 3 | 270 |
| Central Valley Community Bancorp | | 17 | 365 |
| Citizens Financial Services, Inc. | | 8 | 508 |
| Erste Group Bank AG | | 3 | 130 |
| F & M Bank Corp. | | 214 | 8,132 |
| Gunma Bank Ltd. | | 12,215 | 64,890 |
| Hiroshima Bank Ltd. | | 1,916 | 13,177 |
| JPMorgan Chase & Co. | | 3,121 | 358,759 |
| Mitsubishi UFJ Financial Group, Inc. | | 40,783 | 250,280 |
| Nordea Bank AB | | 69 | 734 |
| OFG Bancorp | | 4,229 | 70,413 |
| Ogaki Kyoritsu Bank Ltd. | | 100 | 2,614 |
| San ju San Financial Group, Inc. (a) | | 632 | 12,169 |
| Skandiabanken ASA (d) | | 1,441 | 13,957 |
| Sparebank 1 Oestlandet | | 2,401 | 25,433 |
| Sumitomo Mitsui Financial Group, Inc. | | 9,567 | 379,693 |
| The Keiyo Bank Ltd. | | 1,317 | 5,795 |
| The San-In Godo Bank Ltd. | | 3,575 | 33,475 |
| Unicaja Banco SA (d) | | 14,406 | 24,325 |
| Van Lanschot NV (Bearer) | | 55 | 1,518 |
| Wells Fargo & Co. | | 5,402 | 309,481 |
| Yamaguchi Financial Group, Inc. | | 4,538 | 51,380 |
| | | | 1,627,498 |
| Capital Markets - 1.3% | | | |
| ABG Sundal Collier ASA | | 1,023 | 727 |
| Apollo Global Management LLC Class A | | 951 | 33,761 |
| Brighthouse Financial, Inc. | | 729 | 31,660 |
| Edify SA (a) | | 7 | 499 |
| Franklin Resources, Inc. | | 206 | 7,070 |
| Goldman Sachs Group, Inc. | | 240 | 56,983 |
| Morgan Stanley | | 1,614 | 81,604 |
| T. Rowe Price Group, Inc. | | 17 | 2,024 |
| The Blackstone Group LP | | 5,176 | 180,746 |
| | | | 395,074 |
| Consumer Finance - 1.1% | | | |
| Aeon Credit Service (Asia) Co. Ltd. | | 24,000 | 20,334 |
| Credit Corp. Group Ltd. | | 36 | 550 |
| Discover Financial Services | | 2,401 | 171,455 |
| Santander Consumer U.S.A. Holdings, Inc. | | 614 | 11,813 |
| Synchrony Financial | | 4,322 | 125,079 |
| | | | 329,231 |
| Diversified Financial Services - 1.2% | | | |
| Fuyo General Lease Co. Ltd. | | 1,300 | 81,036 |
| Granite Point Mortgage Trust, Inc. | | 9 | 171 |
| IBJ Leasing Co. Ltd. | | 363 | 9,337 |
| Kyushu Railway Co. | | 500 | 15,338 |
| NICE Holdings Co. Ltd. | | 156 | 2,235 |
| Ricoh Leasing Co. Ltd. | | 2,600 | 84,872 |
| Tokyo Century Corp. | | 3,300 | 180,030 |
| | | | 373,019 |
| Insurance - 5.9% | | | |
| AFLAC, Inc. | | 9,604 | 446,970 |
| ASR Nederland NV | | 2,401 | 107,531 |
| Assurant, Inc. | | 480 | 52,944 |
| Chubb Ltd. | | 720 | 100,598 |
| Db Insurance Co. Ltd. | | 3,061 | 177,315 |
| Genworth Financial, Inc. Class A (a) | | 15,366 | 70,684 |
| Hannover Reuck SE | | 108 | 14,397 |
| Hyundai Fire & Marine Insurance Co. Ltd. | | 900 | 29,624 |
| Kansas City Life Insurance Co. | | 1 | 38 |
| MetLife, Inc. | | 11,765 | 538,131 |
| National Western Life Group, Inc. | | 31 | 10,044 |
| NN Group NV | | 4,075 | 180,216 |
| Prudential Financial, Inc. | | 534 | 53,886 |
| Sony Financial Holdings, Inc. | | 2,400 | 46,120 |
| | | | 1,828,498 |
| Mortgage Real Estate Investment Trusts - 0.0% | | | |
| Two Harbors Investment Corp. | | 51 | 791 |
| Thrifts & Mortgage Finance - 0.2% | | | |
| ASAX Co. Ltd. | | 1,500 | 8,599 |
| Genworth MI Canada, Inc. | | 1,080 | 38,016 |
| Genworth Mortgage Insurance Ltd. | | 7,805 | 15,599 |
| Hingham Institution for Savings | | 7 | 1,547 |
| | | | 63,761 |
|
| TOTAL FINANCIALS | | | 4,617,872 |
|
| HEALTH CARE - 23.7% | | | |
| Biotechnology - 7.9% | | | |
| AbbVie, Inc. | | 2,401 | 221,444 |
| Amgen, Inc. | | 4,622 | 908,454 |
| Biogen, Inc. (a) | | 1,020 | 341,057 |
| Celgene Corp. (a) | | 29 | 2,613 |
| Cell Biotech Co. Ltd. | | 360 | 10,831 |
| Essex Bio-Technology Ltd. | | 6,000 | 4,877 |
| Gilead Sciences, Inc. | | 4,362 | 339,494 |
| United Therapeutics Corp. (a) | | 4,802 | 590,214 |
| | | | 2,418,984 |
| Health Care Equipment & Supplies - 0.7% | | | |
| Ansell Ltd. | | 1,200 | 25,685 |
| Fukuda Denshi Co. Ltd. | | 1,300 | 86,500 |
| Medikit Co. Ltd. | | 100 | 5,393 |
| Nakanishi, Inc. | | 1,200 | 25,059 |
| Paramount Bed Holdings Co. Ltd. | | 100 | 4,226 |
| St.Shine Optical Co. Ltd. | | 2,000 | 44,014 |
| Value Added Technology Co. Ltd. | | 52 | 1,469 |
| Varex Imaging Corp. (a) | | 240 | 9,178 |
| | | | 201,524 |
| Health Care Providers & Services - 12.9% | | | |
| Aetna, Inc. | | 2,881 | 542,752 |
| Amedisys, Inc. (a) | | 1,145 | 107,206 |
| Anthem, Inc. | | 6,603 | 1,670,562 |
| Chemed Corp. | | 401 | 126,728 |
| CVS Health Corp. | | 2,881 | 186,862 |
| Humana, Inc. | | 1,200 | 377,016 |
| Laboratory Corp. of America Holdings (a) | | 7 | 1,227 |
| MEDNAX, Inc. (a) | | 960 | 41,078 |
| Quest Diagnostics, Inc. | | 600 | 64,632 |
| Saint-Care Holding Corp. | | 300 | 1,867 |
| Sigma Healthcare Ltd. | | 11,412 | 4,154 |
| Tokai Corp. | | 1,000 | 21,884 |
| Uchiyama Holdings Co. Ltd. | | 1,400 | 6,536 |
| UnitedHealth Group, Inc. | | 3,121 | 790,300 |
| Universal Health Services, Inc. Class B | | 132 | 16,117 |
| | | | 3,958,921 |
| Health Care Technology - 0.1% | | | |
| Pharmagest Interactive | | 648 | 44,252 |
| Life Sciences Tools & Services - 0.2% | | | |
| ICON PLC (a) | | 384 | 53,437 |
| Pharmaceuticals - 1.9% | | | |
| Apex Healthcare Bhd | | 500 | 873 |
| AstraZeneca PLC sponsored ADR | | 1,921 | 75,169 |
| Biofermin Pharmaceutical Co. Ltd. | | 100 | 2,558 |
| Dawnrays Pharmaceutical Holdings Ltd. | | 14,267 | 8,143 |
| DongKook Pharmaceutical Co. Ltd. | | 114 | 6,430 |
| Genomma Lab Internacional SA de CV (a) | | 6,900 | 5,505 |
| GlaxoSmithKline PLC | | 57 | 1,184 |
| Indivior PLC (a) | | 4,397 | 17,649 |
| Johnson & Johnson | | 2,067 | 273,919 |
| Korea United Pharm, Inc. | | 90 | 1,932 |
| Lee's Pharmaceutical Holdings Ltd. | | 21,500 | 23,037 |
| Luye Pharma Group Ltd. | | 1,500 | 1,458 |
| Nippon Chemiphar Co. Ltd. | | 100 | 4,145 |
| Novo Nordisk A/S Series B sponsored ADR | | 600 | 29,862 |
| PT Tempo Scan Pacific Tbk | | 300 | 31 |
| Sanofi SA sponsored ADR | | 351 | 15,219 |
| Stallergenes Greer PLC (a) | | 144 | 4,597 |
| Taro Pharmaceutical Industries Ltd. (a) | | 840 | 94,298 |
| Towa Pharmaceutical Co. Ltd. | | 400 | 22,215 |
| Vetoquinol SA | | 7 | 450 |
| | | | 588,674 |
|
| TOTAL HEALTH CARE | | | 7,265,792 |
|
| INDUSTRIALS - 8.0% | | | |
| Aerospace & Defense - 0.0% | | | |
| Austal Ltd. | | 205 | 260 |
| Kongsberg Gruppen ASA | | 7 | 142 |
| SIFCO Industries, Inc. (a) | | 25 | 129 |
| The Lisi Group | | 3 | 104 |
| | | | 635 |
| Air Freight & Logistics - 0.1% | | | |
| AIT Corp. | | 2,200 | 21,545 |
| CTI Logistics Ltd. | | 291 | 227 |
| Onelogix Group Ltd. | | 2,727 | 901 |
| SBS Co. Ltd. | | 300 | 3,571 |
| | | | 26,244 |
| Building Products - 0.1% | | | |
| InnoTec TSS AG | | 33 | 590 |
| Nihon Dengi Co. Ltd. | | 400 | 9,949 |
| Noda Corp. | | 700 | 7,343 |
| Sekisui Jushi Corp. | | 1,100 | 19,784 |
| | | | 37,666 |
| Commercial Services & Supplies - 0.4% | | | |
| Asia File Corp. Bhd | | 2,400 | 1,624 |
| Calian Technologies Ltd. | | 543 | 13,170 |
| Civeo Corp. (a) | | 7,070 | 26,937 |
| Matsuda Sangyo Co. Ltd. | | 100 | 1,441 |
| Mitie Group PLC | | 2,748 | 5,547 |
| Prestige International, Inc. | | 2,700 | 31,415 |
| Riverstone Holdings Ltd. | | 100 | 81 |
| VSE Corp. | | 579 | 24,955 |
| | | | 105,170 |
| Construction & Engineering - 0.3% | | | |
| Arcadis NV | | 1,200 | 21,946 |
| Boustead Projs. Pte Ltd. | | 1,700 | 1,130 |
| Boustead Singapore Ltd. | | 15,600 | 9,454 |
| Geumhwa PSC Co. Ltd. | | 1 | 30 |
| Meisei Industrial Co. Ltd. | | 1,100 | 8,883 |
| Monadelphous Group Ltd. | | 7 | 77 |
| Nippon Rietec Co. Ltd. | | 900 | 12,734 |
| Seikitokyu Kogyo Co. Ltd. | | 500 | 3,282 |
| Shinnihon Corp. | | 100 | 1,264 |
| Sumitomo Densetsu Co. Ltd. | | 155 | 2,678 |
| Toshiba Plant Systems & Services Corp. | | 1,490 | 32,928 |
| | | | 94,406 |
| Electrical Equipment - 0.4% | | | |
| Aichi Electric Co. Ltd. | | 100 | 2,974 |
| Aros Quality Group AB | | 2,048 | 37,965 |
| Canare Electric Co. Ltd. | | 130 | 2,504 |
| Eaton Corp. PLC | | 770 | 64,041 |
| Hammond Power Solutions, Inc. Class A | | 771 | 4,256 |
| Holding Co. ADMIE IPTO SA (a) | | 17 | 34 |
| Somfy SA | | 35 | 3,127 |
| | | | 114,901 |
| Industrial Conglomerates - 0.1% | | | |
| Lifco AB | | 191 | 8,569 |
| Mytilineos Holdings SA | | 2,041 | 20,525 |
| Nolato AB Series B | | 24 | 2,151 |
| Reunert Ltd. | | 205 | 1,270 |
| | | | 32,515 |
| Machinery - 0.5% | | | |
| Conrad Industries, Inc. (a) | | 1 | 18 |
| Daihatsu Diesel Manufacturing Co. Ltd. | | 900 | 5,956 |
| Daiwa Industries Ltd. | | 2,600 | 29,391 |
| Fujimak Corp. | | 800 | 14,395 |
| Fukushima Industries Corp. | | 100 | 4,928 |
| Global Brass & Copper Holdings, Inc. | | 477 | 15,717 |
| Haitian International Holdings Ltd. | | 7,000 | 16,499 |
| Hy-Lok Corp. | | 68 | 1,499 |
| Ihara Science Corp. | | 463 | 9,404 |
| Luxfer Holdings PLC sponsored | | 3 | 56 |
| Momentum Group AB Class B | | 922 | 12,331 |
| Nakano Refrigerators Co. Ltd. | | 200 | 10,643 |
| Nansin Co. Ltd. | | 200 | 946 |
| Sakura Rubber Co. Ltd. | | 1,000 | 4,955 |
| Sansei Co. Ltd. | | 1,000 | 3,398 |
| Semperit AG Holding (a) | | 614 | 12,206 |
| Teikoku Sen-I Co. Ltd. | | 1,100 | 23,610 |
| | | | 165,952 |
| Marine - 0.0% | | | |
| Japan Transcity Corp. | | 2,443 | 12,519 |
| Professional Services - 1.7% | | | |
| ABIST Co. Ltd. | | 332 | 13,718 |
| Akka Technologies SA | | 1,561 | 114,997 |
| Bertrandt AG | | 480 | 48,551 |
| Career Design Center Co. Ltd. | | 100 | 1,817 |
| CBIZ, Inc. (a) | | 325 | 7,150 |
| Dun & Bradstreet Corp. | | 1,441 | 181,407 |
| Harvey Nash Group PLC | | 205 | 305 |
| McMillan Shakespeare Ltd. | | 6,242 | 75,359 |
| Robert Half International, Inc. | | 763 | 57,805 |
| WDB Holdings Co. Ltd. | | 400 | 13,934 |
| | | | 515,043 |
| Road & Rail - 0.6% | | | |
| Autohellas SA | | 1,561 | 43,078 |
| Daqin Railway Co. Ltd. (A Shares) | | 98,900 | 129,927 |
| Higashi Twenty One Co. Ltd. | | 100 | 569 |
| Nikkon Holdings Co. Ltd. | | 132 | 3,571 |
| SENKO Co. Ltd. | | 200 | 1,570 |
| STEF-TFE Group | | 7 | 810 |
| Tohbu Network Co. Ltd. | | 100 | 1,028 |
| Utoc Corp. | | 3,100 | 14,528 |
| | | | 195,081 |
| Trading Companies & Distributors - 3.8% | | | |
| AerCap Holdings NV (a) | | 1,921 | 107,826 |
| Bergman & Beving AB (B Shares) | | 1,501 | 16,046 |
| Canox Corp. | | 800 | 7,155 |
| Green Cross Co. Ltd. | | 500 | 9,636 |
| HERIGE | | 41 | 1,688 |
| Houston Wire & Cable Co. (a) | | 3,238 | 25,904 |
| Howden Joinery Group PLC | | 102 | 639 |
| iMarketKorea, Inc. | | 7 | 44 |
| Itochu Corp. | | 43,354 | 769,811 |
| Kamei Corp. | | 5,007 | 69,990 |
| Meiwa Corp. | | 1,600 | 6,940 |
| Mitani Shoji Co. Ltd. | | 1,600 | 74,409 |
| Pla Matels Corp. | | 200 | 1,358 |
| Rasa Corp. | | 100 | 894 |
| Shinsho Corp. | | 132 | 3,854 |
| Yuasa Trading Co. Ltd. | | 1,600 | 52,086 |
| | | | 1,148,280 |
| Transportation Infrastructure - 0.0% | | | |
| Isewan Terminal Service Co. Ltd. | | 200 | 1,316 |
| Qingdao Port International Co. Ltd. (d) | | 10,583 | 7,712 |
| | | | 9,028 |
|
| TOTAL INDUSTRIALS | | | 2,457,440 |
|
| INFORMATION TECHNOLOGY - 7.6% | | | |
| Communications Equipment - 0.0% | | | |
| HF Co. | | 153 | 1,274 |
| Electronic Equipment & Components - 0.5% | | | |
| Casa Systems, Inc. (a) | | 194 | 2,955 |
| Daido Signal Co. Ltd. | | 1,000 | 5,277 |
| Dell Technologies, Inc. (a) | | 443 | 40,986 |
| Elematec Corp. | | 800 | 18,802 |
| Hon Hai Precision Industry Co. Ltd. (Foxconn) | | 5,000 | 13,701 |
| Intelligent Digital Integrated Security Co. Ltd. | | 88 | 698 |
| Lacroix SA | | 163 | 5,146 |
| Makus, Inc. | | 205 | 954 |
| PAX Global Technology Ltd. | | 2,000 | 961 |
| Riken Kieki Co. Ltd. | | 1,300 | 28,078 |
| Simplo Technology Co. Ltd. | | 3,000 | 17,413 |
| TE Connectivity Ltd. | | 81 | 7,579 |
| | | | 142,550 |
| Internet Software & Services - 1.0% | | | |
| Alphabet, Inc. Class A (a) | | 72 | 88,360 |
| Aucnet, Inc. | | 100 | 1,494 |
| AuFeminin.com SA (a) | | 203 | 8,332 |
| CROOZ, Inc. | | 100 | 1,841 |
| F@N Communications, Inc. | | 400 | 2,497 |
| Kakaku.com, Inc. | | 1,211 | 25,473 |
| Yahoo! Japan Corp. (b) | | 10,800 | 41,090 |
| YY, Inc. ADR (a) | | 1,561 | 145,532 |
| Zappallas, Inc. | | 2,600 | 8,743 |
| | | | 323,362 |
| IT Services - 2.4% | | | |
| Amdocs Ltd. | | 3,001 | 202,808 |
| Avant Corp. | | 200 | 1,987 |
| Cielo SA | | 1,400 | 5,353 |
| Computer Services, Inc. | | 3 | 155 |
| Data#3 Ltd. | | 341 | 386 |
| E-Credible Co. Ltd. | | 104 | 1,406 |
| Estore Corp. | | 300 | 2,592 |
| Future Corp. | | 800 | 11,047 |
| Korea Information & Communication Co. Ltd. (a) | | 780 | 7,180 |
| Leidos Holdings, Inc. | | 20 | 1,368 |
| Neurones | | 7 | 189 |
| Shinsegae Information & Communication Co. Ltd. | | 19 | 1,860 |
| Sopra Steria Group | | 1,200 | 212,448 |
| Tessi SA (a) | | 50 | 10,670 |
| The Western Union Co. | | 13,075 | 263,592 |
| | | | 723,041 |
| Semiconductors & Semiconductor Equipment - 0.6% | | | |
| e-LITECOM Co. Ltd. | | 34 | 179 |
| KLA-Tencor Corp. | | 14 | 1,644 |
| Miraial Co. Ltd. | | 1,500 | 15,280 |
| Phison Electronics Corp. | | 1,000 | 8,306 |
| Qualcomm, Inc. | | 1,947 | 124,783 |
| Taiwan Semiconductor Manufacturing Co. Ltd. sponsored ADR | | 840 | 34,616 |
| | | | 184,808 |
| Software - 0.3% | | | |
| eBase Co. Ltd. | | 200 | 3,234 |
| Ebix, Inc. | | 720 | 57,132 |
| GAMEVIL, Inc. (a) | | 7 | 327 |
| InfoVine Co. Ltd. | | 43 | 911 |
| Jastec Co. Ltd. | | 100 | 978 |
| Justplanning, Inc. | | 300 | 2,806 |
| KSK Co., Ltd. | | 100 | 1,609 |
| Micro Focus International PLC sponsored ADR | | 1,054 | 17,075 |
| Uchida Esco Co. Ltd. | | 96 | 1,471 |
| | | | 85,543 |
| Technology Hardware, Storage & Peripherals - 2.8% | | | |
| Apple, Inc. | | 360 | 68,504 |
| Hewlett Packard Enterprise Co. | | 15,966 | 246,515 |
| HP, Inc. | | 17,047 | 393,445 |
| Seagate Technology LLC | | 2,862 | 150,598 |
| TPV Technology Ltd. | | 22,000 | 2,270 |
| | | | 861,332 |
|
| TOTAL INFORMATION TECHNOLOGY | | | 2,321,910 |
|
| MATERIALS - 1.6% | | | |
| Chemicals - 1.1% | | | |
| C. Uyemura & Co. Ltd. | | 400 | 30,050 |
| CF Industries Holdings, Inc. | | 637 | 28,296 |
| Chokwang Paint Ltd. | | 34 | 243 |
| Chugoku Marine Paints Ltd. | | 1,700 | 16,268 |
| Daishin-Chemical Co. Ltd. | | 103 | 1,363 |
| Fuso Chemical Co. Ltd. | | 400 | 10,213 |
| K&S AG | | 2,041 | 53,914 |
| KPX Green Chemical Co. Ltd. | | 34 | 132 |
| Kuriyama Holdings Corp. | | 100 | 1,794 |
| LyondellBasell Industries NV Class A | | 356 | 39,441 |
| Nippon Soda Co. Ltd. | | 1,253 | 7,340 |
| NOF Corp. | | 100 | 3,287 |
| Nutrien Ltd. | | 288 | 15,641 |
| Scientex Bhd | | 7,100 | 13,798 |
| T&K Toka Co. Ltd. | | 600 | 6,911 |
| Tae Kyung Industrial Co. Ltd. | | 614 | 4,119 |
| Toho Acetylene Co. Ltd. | | 200 | 2,769 |
| Yara International ASA | | 2,041 | 90,056 |
| Yip's Chemical Holdings Ltd. | | 2,000 | 701 |
| Yung Chi Paint & Varnish Manufacturing Co. Ltd. | | 6,000 | 15,794 |
| | | | 342,130 |
| Construction Materials - 0.0% | | | |
| Ibstock PLC (d) | | 334 | 1,077 |
| Mitani Sekisan Co. Ltd. | | 400 | 9,698 |
| | | | 10,775 |
| Containers & Packaging - 0.1% | | | |
| Mayr-Melnhof Karton AG | | 240 | 32,667 |
| The Pack Corp. | | 200 | 6,359 |
| | | | 39,026 |
| Metals & Mining - 0.4% | | | |
| Ausdrill Ltd. | | 30,492 | 41,344 |
| Castings PLC | | 51 | 279 |
| Chubu Steel Plate Co. Ltd. | | 300 | 1,841 |
| CI Resources Ltd. | | 16 | 20 |
| CK-SAN-ETSU Co. Ltd. | | 200 | 6,573 |
| Compania de Minas Buenaventura SA sponsored ADR | | 481 | 6,609 |
| Mount Gibson Iron Ltd. | | 22,824 | 7,207 |
| Orvana Minerals Corp. (a) | | 34 | 5 |
| Pacific Metals Co. Ltd. (a) | | 1,600 | 46,121 |
| Teck Resources Ltd. Class B (sub. vtg.) | | 7 | 183 |
| | | | 110,182 |
|
| TOTAL MATERIALS | | | 502,113 |
|
| REAL ESTATE - 0.5% | | | |
| Equity Real Estate Investment Trusts (REITs) - 0.3% | | | |
| Crown Castle International Corp. | | 334 | 37,017 |
| Piedmont Office Realty Trust, Inc. Class A | | 726 | 14,360 |
| Public Storage | | 168 | 36,595 |
| Sabra Health Care REIT, Inc. | | 70 | 1,513 |
| Ventas, Inc. | | 46 | 2,593 |
| | | | 92,078 |
| Real Estate Management & Development - 0.2% | | | |
| HFF, Inc. | | 7 | 315 |
| Leopalace21 Corp. | | 900 | 4,942 |
| Nisshin Fudosan Co. Ltd. | | 6,800 | 41,901 |
| | | | 47,158 |
|
| TOTAL REAL ESTATE | | | 139,236 |
|
| TELECOMMUNICATION SERVICES - 1.0% | | | |
| Diversified Telecommunication Services - 0.9% | | | |
| AT&T, Inc. | | 2,883 | 92,170 |
| Verizon Communications, Inc. | | 3,655 | 188,744 |
| | | | 280,914 |
| Wireless Telecommunication Services - 0.1% | | | |
| Okinawa Cellular Telephone Co. | | 600 | 23,020 |
|
| TOTAL TELECOMMUNICATION SERVICES | | | 303,934 |
|
| UTILITIES - 1.0% | | | |
| Electric Utilities - 0.8% | | | |
| EVN AG | | 7 | 139 |
| Exelon Corp. | | 4,562 | 193,885 |
| Fjordkraft Holding ASA (a) | | 1,561 | 6,411 |
| PG&E Corp. | | 244 | 10,512 |
| PPL Corp. | | 840 | 24,167 |
| Public Power Corp. of Greece (a) | | 17 | 35 |
| | | | 235,149 |
| Gas Utilities - 0.2% | | | |
| Busan City Gas Co. Ltd. | | 210 | 6,874 |
| China Resource Gas Group Ltd. | | 4,000 | 18,958 |
| K&O Energy Group, Inc. | | 100 | 1,679 |
| Rubis | | 14 | 826 |
| Seoul City Gas Co. Ltd. | | 176 | 13,736 |
| YESCO Co. Ltd. | | 576 | 20,330 |
| | | | 62,403 |
| Independent Power and Renewable Electricity Producers - 0.0% | | | |
| The AES Corp. | | 97 | 1,296 |
| Water Utilities - 0.0% | | | |
| Manila Water Co., Inc. | | 300 | 150 |
|
| TOTAL UTILITIES | | | 298,998 |
|
| TOTAL COMMON STOCKS | | | |
| (Cost $24,990,148) | | | 27,415,232 |
|
| Nonconvertible Preferred Stocks - 0.1% | | | |
| INDUSTRIALS - 0.0% | | | |
| Industrial Conglomerates - 0.0% | | | |
| Steel Partners Holdings LP Series A, 6.00% | | 100 | 2,280 |
| Machinery - 0.0% | | | |
| Danieli & C. Officine Meccaniche SpA | | 7 | 123 |
|
| TOTAL INDUSTRIALS | | | 2,403 |
|
| MATERIALS - 0.1% | | | |
| Construction Materials - 0.1% | | | |
| Buzzi Unicem SpA (Risparmio Shares) | | 966 | 12,019 |
| UTILITIES - 0.0% | | | |
| Electric Utilities - 0.0% | | | |
| Companhia Paranaense de Energia-Copel (PN-B) | | 800 | 4,369 |
| TOTAL NONCONVERTIBLE PREFERRED STOCKS | | | |
| (Cost $22,152) | | | 18,791 |
|
| Money Market Funds - 11.7% | | | |
| Fidelity Cash Central Fund, 1.96% (e) | | 3,142,189 | 3,142,818 |
| Fidelity Securities Lending Cash Central Fund 1.97% (e)(f) | | 450,229 | 450,274 |
| TOTAL MONEY MARKET FUNDS | | | |
| (Cost $3,593,095) | | | 3,593,092 |
| TOTAL INVESTMENT IN SECURITIES - 101.3% | | | |
| (Cost $28,605,395) | | | 31,027,115 |
| NET OTHER ASSETS (LIABILITIES) - (1.3)% | | | (390,049) |
| NET ASSETS - 100% | | | $30,637,066 |
Legend
(a) Non-income producing
(b) Security or a portion of the security is on loan at period end.
(c) Level 3 security
(d) Security exempt from registration under Rule 144A of the Securities Act of 1933. These securities may be resold in transactions exempt from registration, normally to qualified institutional buyers. At the end of the period, the value of these securities amounted to $64,313 or 0.2% of net assets.
(e) Affiliated fund that is generally available only to investment companies and other accounts managed by Fidelity Investments. The rate quoted is the annualized seven-day yield of the fund at period end. A complete unaudited listing of the fund's holdings as of its most recent quarter end is available upon request. In addition, each Fidelity Central Fund's financial statements, which are not covered by the Fund's Report of Independent Registered Public Accounting Firm, are available on the SEC's website or upon request.
(f) Investment made with cash collateral received from securities on loan.
Affiliated Central Funds
Information regarding fiscal year to date income earned by the Fund from investments in Fidelity Central Funds is as follows:
| Fund | Income earned |
| Fidelity Cash Central Fund | $38,716 |
| Fidelity Securities Lending Cash Central Fund | 607 |
| Total | $39,323 |
Amounts in the income column in the above table include any capital gain distributions from underlying funds, which are presented in the corresponding line-item in the Statement of Operations if applicable.
Investment Valuation
The following is a summary of the inputs used, as of July 31, 2018, involving the Fund's assets and liabilities carried at fair value. The inputs or methodology used for valuing securities may not be an indication of the risk associated with investing in those securities. For more information on valuation inputs, and their aggregation into the levels used below, please refer to the Investment Valuation section in the accompanying Notes to Financial Statements.
| | Valuation Inputs at Reporting Date: |
| Description | Total | Level 1 | Level 2 | Level 3 |
| Investments in Securities: | | | | |
| Equities: | | | | |
| Consumer Discretionary | $5,674,189 | $5,658,692 | $-- | $15,497 |
| Consumer Staples | 1,477,936 | 1,395,324 | 82,612 | -- |
| Energy | 2,355,812 | 1,893,774 | 462,038 | -- |
| Financials | 4,617,872 | 3,941,779 | 676,093 | -- |
| Health Care | 7,265,792 | 7,264,608 | 1,184 | -- |
| Industrials | 2,459,843 | 1,690,032 | 769,811 | -- |
| Information Technology | 2,321,910 | 2,280,820 | 41,090 | -- |
| Materials | 514,132 | 468,011 | 46,121 | -- |
| Real Estate | 139,236 | 139,236 | -- | -- |
| Telecommunication Services | 303,934 | 303,934 | -- | -- |
| Utilities | 303,367 | 303,367 | -- | -- |
| Money Market Funds | 3,593,092 | 3,593,092 | -- | -- |
| Total Investments in Securities: | $31,027,115 | $28,932,669 | $2,078,949 | $15,497 |
Other Information
Distribution of investments by country or territory of incorporation, as a percentage of Total Net Assets, is as follows (Unaudited):
| United States of America | 61.1% |
| Japan | 14.3% |
| United Kingdom | 3.5% |
| Korea (South) | 3.3% |
| France | 2.1% |
| China | 2.0% |
| Canada | 1.9% |
| Netherlands | 1.7% |
| Cayman Islands | 1.1% |
| British Virgin Islands | 1.0% |
| Others (Individually Less Than 1%) | 8.0% |
| | 100.0% |
See accompanying notes which are an integral part of the financial statements.
Financial Statements
Statement of Assets and Liabilities
| | | July 31, 2018 |
| Assets | | |
Investment in securities, at value (including securities loaned of $439,687) — See accompanying schedule:
Unaffiliated issuers (cost $25,012,300) | $27,434,023 | |
| Fidelity Central Funds (cost $3,593,095) | 3,593,092 | |
| Total Investment in Securities (cost $28,605,395) | | $31,027,115 |
| Foreign currency held at value (cost $637) | | 622 |
| Receivable for fund shares sold | | 33,112 |
| Dividends receivable | | 22,715 |
| Distributions receivable from Fidelity Central Funds | | 5,111 |
| Other receivables | | 852 |
| Total assets | | 31,089,527 |
| Liabilities | | |
| Payable for fund shares redeemed | $2,171 | |
| Collateral on securities loaned | 450,290 | |
| Total liabilities | | 452,461 |
| Net Assets | | $30,637,066 |
| Net Assets consist of: | | |
| Paid in capital | | $27,867,406 |
| Undistributed net investment income | | 294,258 |
| Accumulated undistributed net realized gain (loss) on investments and foreign currency transactions | | 53,722 |
| Net unrealized appreciation (depreciation) on investments and assets and liabilities in foreign currencies | | 2,421,680 |
| Net Assets, for 2,498,887 shares outstanding | | $30,637,066 |
| Net Asset Value, offering price and redemption price per share ($30,637,066 ÷ 2,498,887 shares) | | $12.26 |
See accompanying notes which are an integral part of the financial statements.
Statement of Operations
| | | Year ended July 31, 2018 |
| Investment Income | | |
| Dividends | | $425,403 |
| Income from Fidelity Central Funds | | 39,323 |
| Total income | | 464,726 |
| Expenses | | |
| Independent trustees' fees and expenses | $83 | |
| Commitment fees | 51 | |
| Total expenses | | 134 |
| Net investment income (loss) | | 464,592 |
| Realized and Unrealized Gain (Loss) | | |
| Net realized gain (loss) on: | | |
| Investment securities: | | |
| Unaffiliated issuers | 126,403 | |
| Fidelity Central Funds | (13) | |
| Foreign currency transactions | (2,414) | |
| Total net realized gain (loss) | | 123,976 |
| Change in net unrealized appreciation (depreciation) on: | | |
| Investment securities: | | |
| Unaffiliated issuers | 2,022,197 | |
| Fidelity Central Funds | (3) | |
| Assets and liabilities in foreign currencies | (61) | |
| Total change in net unrealized appreciation (depreciation) | | 2,022,133 |
| Net gain (loss) | | 2,146,109 |
| Net increase (decrease) in net assets resulting from operations | | $2,610,701 |
See accompanying notes which are an integral part of the financial statements.
Statement of Changes in Net Assets
| | Year ended July 31, 2018 | For the period
March 8, 2017 (commencement of operations) to July 31, 2017 |
| Increase (Decrease) in Net Assets | | |
| Operations | | |
| Net investment income (loss) | $464,592 | $43,595 |
| Net realized gain (loss) | 123,976 | 9,774 |
| Change in net unrealized appreciation (depreciation) | 2,022,133 | 399,547 |
| Net increase (decrease) in net assets resulting from operations | 2,610,701 | 452,916 |
| Distributions to shareholders from net investment income | (160,531) | – |
| Distributions to shareholders from net realized gain | (66,106) | – |
| Total distributions | (226,637) | – |
| Share transactions | | |
| Proceeds from sales of shares | 29,809,685 | 7,638,459 |
| Reinvestment of distributions | 226,637 | – |
| Cost of shares redeemed | (9,808,434) | (66,261) |
| Net increase (decrease) in net assets resulting from share transactions | 20,227,888 | 7,572,198 |
| Total increase (decrease) in net assets | 22,611,952 | 8,025,114 |
| Net Assets | | |
| Beginning of period | 8,025,114 | – |
| End of period | $30,637,066 | $8,025,114 |
| Other Information | | |
| Undistributed net investment income end of period | $294,258 | $43,586 |
| Shares | | |
| Sold | 2,563,049 | 746,147 |
| Issued in reinvestment of distributions | 19,832 | – |
| Redeemed | (823,981) | (6,160) |
| Net increase (decrease) | 1,758,900 | 739,987 |
See accompanying notes which are an integral part of the financial statements.
Financial Highlights
Fidelity Flex Intrinsic Opportunities Fund
| | | |
| Years ended July 31, | 2018 | 2017 A |
| Selected Per–Share Data | | |
| Net asset value, beginning of period | $10.84 | $10.00 |
| Income from Investment Operations | | |
| Net investment income (loss)B | .26 | .08 |
| Net realized and unrealized gain (loss) | 1.34 | .76 |
| Total from investment operations | 1.60 | .84 |
| Distributions from net investment income | (.13) | – |
| Distributions from net realized gain | (.05) | – |
| Total distributions | (.18) | – |
| Net asset value, end of period | $12.26 | $10.84 |
| Total ReturnC,D | 14.86% | 8.40% |
| Ratios to Average Net AssetsE,F | | |
| Expenses before reductionsG | -% | - %H |
| Expenses net of fee waivers, if anyG | -% | - %H |
| Expenses net of all reductionsG | -% | - %H |
| Net investment income (loss) | 2.21% | 1.97%H |
| Supplemental Data | | |
| Net assets, end of period (000 omitted) | $30,637 | $8,025 |
| Portfolio turnover rateI | 6% | 9%J |
A For the period March 8, 2017 (commencement of operations) to July 31, 2017.
B Calculated based on average shares outstanding during the period.
C Total returns for periods of less than one year are not annualized.
D Total returns would have been lower if certain expenses had not been reduced during the applicable periods shown.
E Fees and expenses of any underlying Fidelity Central Funds are not included in the Fund's expense ratio. The Fund indirectly bears its proportionate share of the expenses of any underlying Fidelity Central Funds.
F Expense ratios reflect operating expenses of the Fund. Expenses before reductions do not reflect amounts reimbursed by the investment adviser or reductions from brokerage service arrangements or reductions from other expense offset arrangements and do not represent the amount paid by the Fund during periods when reimbursements or reductions occur. Expenses net of fee waivers reflect expenses after reimbursement by the investment adviser but prior to reductions from brokerage service arrangements or other expense offset arrangements. Expenses net of all reductions represent the net expenses paid by the Fund.
G Amount represents less than .005%.
H Annualized
I Amount does not include the portfolio activity of any underlying Fidelity Central Funds.
J Amount not annualized.
See accompanying notes which are an integral part of the financial statements.
Notes to Financial Statements
For the period ended July 31, 2018
1. Organization.
Fidelity Flex Intrinsic Opportunities Fund (the Fund) is a fund of Fidelity Puritan Trust (the Trust) and is authorized to issue an unlimited number of shares. Share transactions on the Statement of Changes in Net Assets may contain exchanges between affiliated funds. The Trust is registered under the Investment Company Act of 1940, as amended (the 1940 Act), as an open-end management investment company organized as a Massachusetts business trust. The Fund is available only to certain fee-based accounts offered by Fidelity.
2. Investments in Fidelity Central Funds.
The Fund invests in Fidelity Central Funds, which are open-end investment companies generally available only to other investment companies and accounts managed by the investment adviser and its affiliates. The Fund's Schedule of Investments lists each of the Fidelity Central Funds held as of period end, if any, as an investment of the Fund, but does not include the underlying holdings of each Fidelity Central Fund. As an Investing Fund, the Fund indirectly bears its proportionate share of the expenses of the underlying Fidelity Central Funds.
The Money Market Central Funds seek preservation of capital and current income and are managed by Fidelity Investments Money Management, Inc. (FIMM), an affiliate of the investment adviser. Annualized expenses of the Money Market Central Funds as of their most recent shareholder report date are less than .005%.
A complete unaudited list of holdings for each Fidelity Central Fund is available upon request or at the Securities and Exchange Commission (the SEC) website at www.sec.gov. In addition, the financial statements of the Fidelity Central Funds, which are not covered by the Fund's Report of Independent Registered Public Accounting Firm, are available on the SEC website or upon request.
3. Significant Accounting Policies.
The Fund is an investment company and applies the accounting and reporting guidance of the Financial Accounting Standards Board (FASB) Accounting Standards Codification Topic 946 Financial Services – Investments Companies. The financial statements have been prepared in conformity with accounting principles generally accepted in the United States of America (GAAP), which require management to make certain estimates and assumptions at the date of the financial statements. Actual results could differ from those estimates. Subsequent events, if any, through the date that the financial statements were issued have been evaluated in the preparation of the financial statements. The following summarizes the significant accounting policies of the Fund:
Investment Valuation. Investments are valued as of 4:00 p.m. Eastern time on the last calendar day of the period. The Board of Trustees (the Board) has delegated the day to day responsibility for the valuation of the Fund's investments to the Fair Value Committee (the Committee) established by the Fund's investment adviser. In accordance with valuation policies and procedures approved by the Board, the Fund attempts to obtain prices from one or more third party pricing vendors or brokers to value its investments. When current market prices, quotations or currency exchange rates are not readily available or reliable, investments will be fair valued in good faith by the Committee, in accordance with procedures adopted by the Board. Factors used in determining fair value vary by investment type and may include market or investment specific events. The frequency with which these procedures are used cannot be predicted and they may be utilized to a significant extent. The Committee oversees the Fund's valuation policies and procedures and reports to the Board on the Committee's activities and fair value determinations. The Board monitors the appropriateness of the procedures used in valuing the Fund's investments and ratifies the fair value determinations of the Committee.
The Fund categorizes the inputs to valuation techniques used to value its investments into a disclosure hierarchy consisting of three levels as shown below:
- Level 1 – quoted prices in active markets for identical investments
- Level 2 – other significant observable inputs (including quoted prices for similar investments, interest rates, prepayment speeds, etc.)
- Level 3 – unobservable inputs (including the Fund's own assumptions based on the best information available)
Valuation techniques used to value the Fund's investments by major category are as follows:
Equity securities, including restricted securities, for which market quotations are readily available, are valued at the last reported sale price or official closing price as reported by a third party pricing vendor on the primary market or exchange on which they are traded and are categorized as Level 1 in the hierarchy. In the event there were no sales during the day or closing prices are not available, securities are valued at the last quoted bid price or may be valued using the last available price and are generally categorized as Level 2 in the hierarchy. For foreign equity securities, when market or security specific events arise, comparisons to the valuation of American Depositary Receipts (ADRs), futures contracts, Exchange-Traded Funds (ETFs) and certain indexes as well as quoted prices for similar securities may be used and would be categorized as Level 2 in the hierarchy. Utilizing these techniques may result in transfers between Level 1 and Level 2. For equity securities, including restricted securities, where observable inputs are limited, assumptions about market activity and risk are used and these securities may be categorized as Level 3 in the hierarchy.
Investments in open-end mutual funds, including the Fidelity Central Funds, are valued at their closing net asset value (NAV) each business day and are categorized as Level 1 in the hierarchy.
Changes in valuation techniques may result in transfers in or out of an assigned level within the disclosure hierarchy. The aggregate value of investments by input level as of July 31, 2018 is included at the end of the Fund's Schedule of Investments.
Foreign Currency. The Fund may use foreign currency contracts to facilitate transactions in foreign-denominated securities. Gains and losses from these transactions may arise from changes in the value of the foreign currency or if the counterparties do not perform under the contracts' terms.
Foreign-denominated assets, including investment securities, and liabilities are translated into U.S. dollars at the exchange rates at period end. Purchases and sales of investment securities, income and dividends received and expenses denominated in foreign currencies are translated into U.S. dollars at the exchange rate in effect on the transaction date.
The effects of exchange rate fluctuations on investments are included with the net realized and unrealized gain (loss) on investment securities. Other foreign currency transactions resulting in realized and unrealized gain (loss) are disclosed separately.
Investment Transactions and Income. For financial reporting purposes, the Fund's investment holdings and NAV include trades executed through the end of the last business day of the period. The NAV per share for processing shareholder transactions is calculated as of the close of business of the New York Stock Exchange (NYSE), normally 4:00 p.m. Eastern time and includes trades executed through the end of the prior business day. Gains and losses on securities sold are determined on the basis of identified cost. Dividend income is recorded on the ex-dividend date, except for certain dividends from foreign securities where the ex-dividend date may have passed, which are recorded as soon as the Fund is informed of the ex-dividend date. Non-cash dividends included in dividend income, if any, are recorded at the fair market value of the securities received. Income and capital gain distributions from Fidelity Central Funds, if any, are recorded on the ex-dividend date. Certain distributions received by the Fund represent a return of capital or capital gain. The Fund determines the components of these distributions subsequent to the ex-dividend date, based upon receipt of tax filings or other correspondence relating to the underlying investment. These distributions are recorded as a reduction of cost of investments and/or as a realized gain. Investment income is recorded net of foreign taxes withheld where recovery of such taxes is uncertain.
Expenses. Expenses directly attributable to a fund are charged to that fund. Expenses attributable to more than one fund are allocated among the respective funds on the basis of relative net assets or other appropriate methods. Expense estimates are accrued in the period to which they relate and adjustments are made when actual amounts are known.
Income Tax Information and Distributions to Shareholders. Each year, the Fund intends to qualify as a regulated investment company under Subchapter M of the Internal Revenue Code, including distributing substantially all of its taxable income and realized gains. As a result, no provision for U.S. Federal income taxes is required. As of July 31, 2018, the Fund did not have any unrecognized tax benefits in the financial statements; nor is the Fund aware of any tax positions for which it is reasonably possible that the total amounts of unrecognized tax benefits will significantly change in the next twelve months. The Fund files a U.S. federal tax return, in addition to state and local tax returns as required. The Fund's federal income tax returns are subject to examination by the Internal Revenue Service (IRS) for a period of three fiscal years after they are filed. State and local tax returns may be subject to examination for an additional fiscal year depending on the jurisdiction. Foreign taxes are provided for based on the Fund's understanding of the tax rules and rates that exist in the foreign markets in which it invests.
Distributions are declared and recorded on the ex-dividend date. Income and capital gain distributions are determined in accordance with income tax regulations, which may differ from GAAP. In addition, the Fund claimed a portion of the payment made to redeeming shareholders as a distribution for income tax purposes.
Capital accounts within the financial statements are adjusted for permanent book-tax differences. These adjustments have no impact on net assets or the results of operations. Capital accounts are not adjusted for temporary book-tax differences which will reverse in a subsequent period.
Book-tax differences are primarily due to foreign currency transactions, passive foreign investment companies (PFIC), partnerships, and losses deferred due to wash sales.
As of period end, the cost and unrealized appreciation (depreciation) in securities, and derivatives if applicable, for federal income tax purposes were as follows:
| Gross unrealized appreciation | $3,395,461 |
| Gross unrealized depreciation | (996,798) |
| Net unrealized appreciation (depreciation) | $2,398,663 |
| Tax Cost | $28,628,452 |
The tax-based components of distributable earnings as of period end were as follows:
| Undistributed ordinary income | $365,028 |
| Undistributed long-term capital gain | $6,009 |
| Net unrealized appreciation (depreciation) on securities and other investments | $2,398,623 |
The tax character of distributions paid was as follows:
| | July 31, 2018 | July 31, 2017 |
| Ordinary Income | $226,637 | $ - |
Restricted Securities. The Fund may invest in securities that are subject to legal or contractual restrictions on resale. These securities generally may be resold in transactions exempt from registration or to the public if the securities are registered. Disposal of these securities may involve time-consuming negotiations and expense, and prompt sale at an acceptable price may be difficult. Information regarding restricted securities is included at the end of the Fund's Schedule of Investments.
4. Purchases and Sales of Investments.
Purchases and sales of securities, other than short-term securities, aggregated $18,878,954 and $1,047,894, respectively.
5. Fees and Other Transactions with Affiliates.
Management Fee. Fidelity Management & Research Company (the investment adviser) and its affiliates provide the Fund with investment management related services and the Fund does not pay any fees for these services. Under the management contract, the investment adviser or an affiliate pays all other expenses of the Fund, excluding fees and expenses of the independent Trustees, and certain miscellaneous expenses such as proxy and shareholder meeting expenses.
Brokerage Commissions. The Fund placed a portion of its portfolio transactions with brokerage firms which are affiliates of the investment adviser. Brokerage commissions are included in net realized gain (loss) and change in net unrealized appreciation (depreciation) in the Statement of Operations. The commissions paid to these affiliated firms were $104 for the period.
Interfund Trades. The Fund may purchase from or sell securities to other Fidelity Funds under procedures adopted by the Board. The procedures have been designed to ensure these interfund trades are executed in accordance with Rule 17a-7 of the 1940 Act. Interfund trades are included within the respective purchases and sales amounts shown in the Purchases and Sales of Investments note.
6. Committed Line of Credit.
The Fund participates with other funds managed by the investment adviser or an affiliate in a $4.25 billion credit facility (the "line of credit") to be utilized for temporary or emergency purposes to fund shareholder redemptions or for other short-term liquidity purposes. The Fund has agreed to pay commitment fees on its pro-rata portion of the line of credit, which amounted to $51 and is reflected in Commitment fees on the Statement of Operations. During the period, the Fund did not borrow on this line of credit.
7. Security Lending.
The Fund lends portfolio securities through a lending agent from time to time in order to earn additional income. For equity securities, a lending agent is used and may loan securities to certain qualified borrowers, including Fidelity Capital Markets (FCM), a broker-dealer affiliated with the Fund. On the settlement date of the loan, the Fund receives collateral (in the form of U.S. Treasury obligations, letters of credit and/or cash) against the loaned securities and maintains collateral in an amount not less than 100% of the market value of the loaned securities during the period of the loan. The market value of the loaned securities is determined at the close of business of the Fund and any additional required collateral is delivered to the Fund on the next business day. The Fund or borrower may terminate the loan at any time, and if the borrower defaults on its obligation to return the securities loaned because of insolvency or other reasons, the Fund may apply collateral received from the borrower against the obligation. The Fund may experience delays and costs in recovering the securities loaned. Any cash collateral received is invested in the Fidelity Securities Lending Cash Central Fund. The value of loaned securities and cash collateral at period end are disclosed on the Fund's Statement of Assets and Liabilities. Security lending income represents the income earned on investing cash collateral, less rebates paid to borrowers and any lending agent fees associated with the loan, plus any premium payments received for lending certain types of securities. Security lending income is presented in the Statement of Operations as a component of income from Fidelity Central Funds. Total security lending income during the period amounted to $607. During the period, there were no securities loaned to FCM.
8. Other.
The Fund's organizational documents provide former and current trustees and officers with a limited indemnification against liabilities arising in connection with the performance of their duties to the Fund. In the normal course of business, the Fund may also enter into contracts that provide general indemnifications. The Fund's maximum exposure under these arrangements is unknown as this would be dependent on future claims that may be made against the Fund. The risk of material loss from such claims is considered remote.
At the end of the period, the investment adviser or its affiliates were the owners of record of 20% of the total outstanding shares of the Fund.
Report of Independent Registered Public Accounting Firm
To the Trustees of Fidelity Puritan Trust and Shareholders of Fidelity Flex Intrinsic Opportunities Fund:
Opinion on the Financial Statements and Financial Highlights
We have audited the accompanying statement of assets and liabilities of Fidelity Flex Intrinsic Opportunities Fund (the "Fund"), a fund of Fidelity Puritan Trust, including the schedule of investments, as of July 31, 2018, the related statement of operations for the year then ended, the statement of changes in net assets and the financial highlights for the year then ended and for the period from March 8, 2017 (commencement of operations) to July 31, 2017, and the related notes. In our opinion, the financial statements and financial highlights present fairly, in all material respects, the financial position of the Fund as of July 31, 2018, the results of its operations for the year then ended, and the changes in its net assets and the financial highlights for the year then ended and for the period from March 8, 2017 (commencement of operations) to July 31, 2017, in conformity with accounting principles generally accepted in the United States of America.
Basis for Opinion
These financial statements and financial highlights are the responsibility of the Fund's management. Our responsibility is to express an opinion on the Fund's financial statements and financial highlights based on our audits. We are a public accounting firm registered with the Public Company Accounting Oversight Board (United States) (PCAOB) and are required to be independent with respect to the Fund in accordance with the U.S. federal securities laws and the applicable rules and regulations of the Securities and Exchange Commission and the PCAOB.
We conducted our audits in accordance with the standards of the PCAOB. Those standards require that we plan and perform the audit to obtain reasonable assurance about whether the financial statements and financial highlights are free of material misstatement, whether due to error or fraud. The Fund is not required to have, nor were we engaged to perform, an audit of its internal control over financial reporting. As part of our audits we are required to obtain an understanding of internal control over financial reporting but not for the purpose of expressing an opinion on the effectiveness of the Fund’s internal control over financial reporting. Accordingly, we express no such opinion.
Our audits included performing procedures to assess the risks of material misstatement of the financial statements and financial highlights, whether due to error or fraud, and performing procedures that respond to those risks. Such procedures included examining, on a test basis, evidence regarding the amounts and disclosures in the financial statements and financial highlights. Our audits also included evaluating the accounting principles used and significant estimates made by management, as well as evaluating the overall presentation of the financial statements and financial highlights. Our procedures included confirmation of securities owned as of July 31, 2018, by correspondence with the custodians and brokers; when replies were not received from brokers, we performed other auditing procedures. We believe that our audits provide a reasonable basis for our opinion.
/s/ Deloitte & Touche LLP
Boston, Massachusetts
September 17, 2018
We have served as the auditor of one or more of the Fidelity investment companies since 1999.
Trustees and Officers
The Trustees, Members of the Advisory Board (if any), and officers of the trust and fund, as applicable, are listed below. The Board of Trustees governs the fund and is responsible for protecting the interests of shareholders. The Trustees are experienced executives who meet periodically throughout the year to oversee the fund's activities, review contractual arrangements with companies that provide services to the fund, oversee management of the risks associated with such activities and contractual arrangements, and review the fund's performance. Except for Jonathan Chiel, each of the Trustees oversees 286 funds. Mr. Chiel oversees 150 funds.
The Trustees hold office without limit in time except that (a) any Trustee may resign; (b) any Trustee may be removed by written instrument, signed by at least two-thirds of the number of Trustees prior to such removal; (c) any Trustee who requests to be retired or who has become incapacitated by illness or injury may be retired by written instrument signed by a majority of the other Trustees; and (d) any Trustee may be removed at any special meeting of shareholders by a two-thirds vote of the outstanding voting securities of the trust. Each Trustee who is not an interested person (as defined in the 1940 Act) of the trust and the fund is referred to herein as an Independent Trustee. Each Independent Trustee shall retire not later than the last day of the calendar year in which his or her 75th birthday occurs. The Independent Trustees may waive this mandatory retirement age policy with respect to individual Trustees. Officers and Advisory Board Members hold office without limit in time, except that any officer or Advisory Board Member may resign or may be removed by a vote of a majority of the Trustees at any regular meeting or any special meeting of the Trustees. Except as indicated, each individual has held the office shown or other offices in the same company for the past five years.
The fund’s Statement of Additional Information (SAI) includes more information about the Trustees. To request a free copy, call Fidelity at 1-800-835-5092.
Experience, Skills, Attributes, and Qualifications of the Trustees. The Governance and Nominating Committee has adopted a statement of policy that describes the experience, qualifications, attributes, and skills that are necessary and desirable for potential Independent Trustee candidates (Statement of Policy). The Board believes that each Trustee satisfied at the time he or she was initially elected or appointed a Trustee, and continues to satisfy, the standards contemplated by the Statement of Policy. The Governance and Nominating Committee also engages professional search firms to help identify potential Independent Trustee candidates who have the experience, qualifications, attributes, and skills consistent with the Statement of Policy. From time to time, additional criteria based on the composition and skills of the current Independent Trustees, as well as experience or skills that may be appropriate in light of future changes to board composition, business conditions, and regulatory or other developments, have also been considered by the professional search firms and the Governance and Nominating Committee. In addition, the Board takes into account the Trustees' commitment and participation in Board and committee meetings, as well as their leadership of standing and ad hoc committees throughout their tenure.
In determining that a particular Trustee was and continues to be qualified to serve as a Trustee, the Board has considered a variety of criteria, none of which, in isolation, was controlling. The Board believes that, collectively, the Trustees have balanced and diverse experience, qualifications, attributes, and skills, which allow the Board to operate effectively in governing the fund and protecting the interests of shareholders. Information about the specific experience, skills, attributes, and qualifications of each Trustee, which in each case led to the Board's conclusion that the Trustee should serve (or continue to serve) as a trustee of the fund, is provided below.
Board Structure and Oversight Function. James C. Curvey is an interested person and currently serves as Chairman. The Trustees have determined that an interested Chairman is appropriate and benefits shareholders because an interested Chairman has a personal and professional stake in the quality and continuity of services provided to the fund. Independent Trustees exercise their informed business judgment to appoint an individual of their choosing to serve as Chairman, regardless of whether the Trustee happens to be independent or a member of management. The Independent Trustees have determined that they can act independently and effectively without having an Independent Trustee serve as Chairman and that a key structural component for assuring that they are in a position to do so is for the Independent Trustees to constitute a substantial majority for the Board. The Independent Trustees also regularly meet in executive session. Ned C. Lautenbach serves as Chairman of the Independent Trustees and as such (i) acts as a liaison between the Independent Trustees and management with respect to matters important to the Independent Trustees and (ii) with management prepares agendas for Board meetings.
Fidelity® funds are overseen by different Boards of Trustees. The fund's Board oversees Fidelity's high income and certain equity funds, and other Boards oversee Fidelity's investment-grade bond, money market, asset allocation, and other equity funds. The asset allocation funds may invest in Fidelity® funds overseen by the fund's Board. The use of separate Boards, each with its own committee structure, allows the Trustees of each group of Fidelity® funds to focus on the unique issues of the funds they oversee, including common research, investment, and operational issues. On occasion, the separate Boards establish joint committees to address issues of overlapping consequences for the Fidelity® funds overseen by each Board.
The Trustees operate using a system of committees to facilitate the timely and efficient consideration of all matters of importance to the Trustees, the fund, and fund shareholders and to facilitate compliance with legal and regulatory requirements and oversight of the fund's activities and associated risks. The Board, acting through its committees, has charged FMR and its affiliates with (i) identifying events or circumstances the occurrence of which could have demonstrably adverse effects on the fund's business and/or reputation; (ii) implementing processes and controls to lessen the possibility that such events or circumstances occur or to mitigate the effects of such events or circumstances if they do occur; and (iii) creating and maintaining a system designed to evaluate continuously business and market conditions in order to facilitate the identification and implementation processes described in (i) and (ii) above. Because the day-to-day operations and activities of the fund are carried out by or through FMR, its affiliates, and other service providers, the fund's exposure to risks is mitigated but not eliminated by the processes overseen by the Trustees. While each of the Board's committees has responsibility for overseeing different aspects of the fund's activities, oversight is exercised primarily through the Operations, Audit, and Compliance Committees. In addition, the Independent Trustees have worked with Fidelity to enhance the Board's oversight of investment and financial risks, legal and regulatory risks, technology risks, and operational risks, including the development of additional risk reporting to the Board. Appropriate personnel, including but not limited to the fund's Chief Compliance Officer (CCO), FMR's internal auditor, the independent accountants, the fund's Treasurer and portfolio management personnel, make periodic reports to the Board's committees, as appropriate, including an annual review of Fidelity's risk management program for the Fidelity® funds. The responsibilities of each standing committee, including their oversight responsibilities, are described further under "Standing Committees of the Trustees."
Interested Trustees*:
Correspondence intended for a Trustee who is an interested person may be sent to Fidelity Investments, 245 Summer Street, Boston, Massachusetts 02210.
Name, Year of Birth; Principal Occupations and Other Relevant Experience+
Jonathan Chiel (1957)
Year of Election or Appointment: 2016
Trustee
Mr. Chiel also serves as Trustee of other Fidelity® funds. Mr. Chiel is Executive Vice President and General Counsel for FMR LLC (diversified financial services company, 2012-present). Previously, Mr. Chiel served as general counsel (2004-2012) and senior vice president and deputy general counsel (2000-2004) for John Hancock Financial Services; a partner with Choate, Hall & Stewart (1996-2000) (law firm); and an Assistant United States Attorney for the United States Attorney’s Office of the District of Massachusetts (1986-95), including Chief of the Criminal Division (1993-1995). Mr. Chiel is a director on the boards of the Boston Bar Foundation and the Maimonides School.
James C. Curvey (1935)
Year of Election or Appointment: 2007
Trustee
Chairman of the Board of Trustees
Mr. Curvey also serves as Trustee of other Fidelity® funds. Mr. Curvey is Vice Chairman (2007-present) and Director of FMR LLC (diversified financial services company). In addition, Mr. Curvey is an Overseer Emeritus for the Boston Symphony Orchestra, a Director of Artis-Naples, and a Trustee of Brewster Academy in Wolfeboro, New Hampshire. Previously, Mr. Curvey served as a Director of Fidelity Research & Analysis Co. (investment adviser firm, 2009-2018), Director of Fidelity Investments Money Management, Inc. (investment adviser firm, 2009-2014) and a Director of FMR and FMR Co., Inc. (investment adviser firms, 2007-2014).
Charles S. Morrison (1960)
Year of Election or Appointment: 2014
Trustee
Mr. Morrison also serves as Trustee of other funds. He serves as President of Fidelity SelectCo, LLC (investment adviser firm, 2017-present) and Fidelity Management & Research Company (FMR) (investment adviser firm, 2016-present), a Director of Fidelity Investments Money Management, Inc. (FIMM) (investment adviser firm, 2014-present), Director of Fidelity SelectCo, LLC (investment adviser firm, 2014-present), President, Asset Management (2014-present), and is an employee of Fidelity Investments. Previously, Mr. Morrison served as Vice President of Fidelity's Fixed Income and Asset Allocation Funds (2012-2014), President, Fixed Income (2011-2014), Vice President of Fidelity's Money Market Funds (2005-2009), President, Money Market Group Leader of FMR (investment adviser firm, 2009), and Senior Vice President, Money Market Group of FMR (2004-2009). Mr. Morrison also served as Vice President of Fidelity's Bond Funds (2002-2005), certain Balanced Funds (2002-2005), and certain Asset Allocation Funds (2002-2007), and as Senior Vice President (2002-2005) of Fidelity's Bond Division.
* Determined to be an “Interested Trustee” by virtue of, among other things, his or her affiliation with the trust or various entities under common control with FMR.
+ The information includes the Trustee's principal occupation during the last five years and other information relating to the experience, attributes, and skills relevant to the Trustee's qualifications to serve as a Trustee, which led to the conclusion that the Trustee should serve as a Trustee for the fund.
Independent Trustees:
Correspondence intended for an Independent Trustee may be sent to Fidelity Investments, P.O. Box 55235, Boston, Massachusetts 02205-5235.
Name, Year of Birth; Principal Occupations and Other Relevant Experience+
Dennis J. Dirks (1948)
Year of Election or Appointment: 2005
Trustee
Mr. Dirks also serves as Trustee of other Fidelity® funds. Prior to his retirement in May 2003, Mr. Dirks was Chief Operating Officer and a member of the Board of The Depository Trust & Clearing Corporation (DTCC). He also served as President, Chief Operating Officer, and Board member of The Depository Trust Company (DTC) and President and Board member of the National Securities Clearing Corporation (NSCC). In addition, Mr. Dirks served as Chief Executive Officer and Board member of the Government Securities Clearing Corporation, Chief Executive Officer and Board member of the Mortgage-Backed Securities Clearing Corporation, as a Trustee and a member of the Finance Committee of Manhattan College (2005-2008), as a Trustee and a member of the Finance Committee of AHRC of Nassau County (2006-2008), as a member of the Independent Directors Council (IDC) Governing Council (2010-2015), and as a member of the Board of Directors for The Brookville Center for Children’s Services, Inc. (2009-2017). Mr. Dirks is a member of the Finance Committee (2016-present), Board of Directors (2017-present) and Board of Trustees (2018-present) and is Treasurer (2018-present) of the Asolo Repertory Theatre.
Donald F. Donahue (1950)
Year of Election or Appointment: 2018
Trustee
Mr. Donahue also serves as a Trustee of other Fidelity® funds. Mr. Donahue is President and Chief Executive Officer of Miranda Partners, LLC (risk consulting for the financial services industry, 2012-present). Previously, Mr. Donahue served as a Member of the Advisory Board of certain Fidelity® funds (2015-2018) and Chief Executive Officer (2006-2012), Chief Operating Officer (2003-2006), and Managing Director, Customer Marketing and Development (1999-2003) of The Depository Trust & Clearing Corporation (financial markets infrastructure). Mr. Donahue serves as a Member (2007-present) and Co-Chairman (2016-present) of the Board of Directors of United Way of New York, Member of the Board of Directors of NYC Leadership Academy (2012-present) and Member of the Board of Advisors of Ripple Labs, Inc. (financial services, 2015-present). He also served as Chairman (2010-2012) and Member of the Board of Directors (2012-2013) of Omgeo, LLC (financial services), Treasurer of United Way of New York (2012-2016), and Member of the Board of Directors of XBRL US (financial services non-profit, 2009-2012) and the International Securities Services Association (2009-2012).
Alan J. Lacy (1953)
Year of Election or Appointment: 2008
Trustee
Mr. Lacy also serves as Trustee of other Fidelity® funds. Mr. Lacy serves as a Director of Bristol-Myers Squibb Company (global pharmaceuticals, 2008-present). He is a Trustee of the California Chapter of The Nature Conservancy (2015-present) and a Director of the Center for Advanced Study in the Behavioral Sciences at Stanford University (2015-present). In addition, Mr. Lacy served as Senior Adviser (2007-2014) of Oak Hill Capital Partners, L.P. (private equity) and also served as Chief Executive Officer (2005) and Vice Chairman (2005-2006) of Sears Holdings Corporation (retail) and Chief Executive Officer and Chairman of the Board of Sears, Roebuck and Co. (retail, 2000-2005). Previously, Mr. Lacy served as Chairman (2014-2017) and a member (2010-2017) of the Board of Directors of Dave & Buster’s Entertainment, Inc. (restaurant and entertainment complexes), as Chairman (2008-2011) and a member (2006-2015) of the Board of Trustees of the National Parks Conservation Association, and as a member of the Board of Directors for The Hillman Companies, Inc. (hardware wholesalers, 2010-2014), Earth Fare, Inc. (retail grocery, 2010-2014), and The Western Union Company (global money transfer, 2006-2011).
Ned C. Lautenbach (1944)
Year of Election or Appointment: 2000
Trustee
Chairman of the Independent Trustees
Mr. Lautenbach also serves as Trustee of other Fidelity® funds. Mr. Lautenbach currently serves as Vice Chair of the Board of Governors, State University System of Florida (2013-present) and is a member of the Council on Foreign Relations (1994-present). He is also a member and has most recently served as Chairman of the Board of Directors of Artis-Naples (2012-present). Previously, Mr. Lautenbach served as a member and then Lead Director of the Board of Directors of Eaton Corporation (diversified industrial, 1997-2016). He was also a Partner and Advisory Partner at Clayton, Dubilier & Rice, LLC (private equity investment, 1998-2010), as well as a Director of Sony Corporation (2006-2007). In addition, Mr. Lautenbach also had a 30-year career with IBM (technology company) during which time he served as Senior Vice President and a member of the Corporate Executive Committee (1968-1998).
Joseph Mauriello (1944)
Year of Election or Appointment: 2008
Trustee
Mr. Mauriello also serves as Trustee of other Fidelity® funds. Prior to his retirement in January 2006, Mr. Mauriello served in numerous senior management positions including Deputy Chairman and Chief Operating Officer (2004-2005), and Vice Chairman of Financial Services (2002-2004) of KPMG LLP US (professional services, 1965-2005). Mr. Mauriello currently serves as a member of the Board of Directors of XL Group plc. (global insurance and re-insurance, 2006-present) and the Independent Directors Council (IDC) Governing Council (2015-present). Previously, Mr. Mauriello served as a Director of the Hamilton Funds of the Bank of New York (2006-2007) and of Arcadia Resources Inc. (health care services and products, 2007-2012).
Cornelia M. Small (1944)
Year of Election or Appointment: 2005
Trustee
Ms. Small also serves as Trustee of other Fidelity® funds. Ms. Small is a member of the Board of Directors (2009-present) and Chair of the Investment Committee (2010-present) of the Teagle Foundation. Ms. Small also serves on the Investment Committee of the Berkshire Taconic Community Foundation (2008-present). Previously, Ms. Small served as Chairperson (2002-2008) and a member of the Investment Committee and Chairperson (2008-2012) and a member of the Board of Trustees of Smith College. In addition, Ms. Small served as Chief Investment Officer, Director of Global Equity Investments, and a member of the Board of Directors of Scudder, Stevens & Clark and Scudder Kemper Investments.
Garnett A. Smith (1947)
Year of Election or Appointment: 2018
Trustee
Mr. Smith also serves as Trustee of other Fidelity® funds. Prior to Mr. Smith's retirement, he served as Chairman and Chief Executive Officer of Inbrand Corp. (manufacturer of personal absorbent products, 1990-1997). He also served as President (1986-1990) of Inbrand Corp. Prior to his employment with Inbrand Corp., he was employed by a retail fabric chain and North Carolina National Bank. In addition, Mr. Smith served as a Member of the Advisory Board of certain Fidelity® funds (2012-2013) and as a board member of the Jackson Hole Land Trust (2009-2012).
David M. Thomas (1949)
Year of Election or Appointment: 2008
Trustee
Mr. Thomas also serves as Trustee of other Fidelity® funds. Mr. Thomas serves as Non-Executive Chairman of the Board of Directors of Fortune Brands Home and Security (home and security products, 2011-present), as a member of the Board of Directors (2004-present) and Presiding Director (2013-present) of Interpublic Group of Companies, Inc. (marketing communication), and as a member of the Board of Trustees of the University of Florida (2013-present). Previously, Mr. Thomas served as Executive Chairman (2005-2006) and Chairman and Chief Executive Officer (2000-2005) of IMS Health, Inc. (pharmaceutical and healthcare information solutions), and a Director of Fortune Brands, Inc. (consumer products, 2000-2011).
+ The information includes the Trustee's principal occupation during the last five years and other information relating to the experience, attributes, and skills relevant to the Trustee's qualifications to serve as a Trustee, which led to the conclusion that the Trustee should serve as a Trustee for the fund.
Advisory Board Members and Officers:
Correspondence intended for a Member of the Advisory Board (if any) may be sent to Fidelity Investments, P.O. Box 55235, Boston, Massachusetts 02205-5235. Correspondence intended for an officer or Peter S. Lynch may be sent to Fidelity Investments, 245 Summer Street, Boston, Massachusetts 02210. Officers appear below in alphabetical order.
Name, Year of Birth; Principal Occupation
Peter S. Lynch (1944)
Year of Election or Appointment: 2003
Member of the Advisory Board
Mr. Lynch also serves as Member of the Advisory Board of other Fidelity® funds. Mr. Lynch is Vice Chairman and a Director of FMR (investment adviser firm) and FMR Co., Inc. (investment adviser firm). In addition, Mr. Lynch serves as a Trustee of Boston College and as the Chairman of the Inner-City Scholarship Fund. Previously, Mr. Lynch served on the Special Olympics International Board of Directors (1997-2006).
William S. Stavropoulos (1939)
Year of Election or Appointment: 2018
Member of the Advisory Board
Mr. Stavropoulos also serves as Member of the Advisory Board of other Fidelity® funds. Mr. Stavropoulos serves as President and Founder of the Michigan Baseball Foundation, the Great Lakes Loons (2007-present). Mr. Stavropoulos is Chairman Emeritus of the Board of Directors of The Dow Chemical Company, where he previously served in numerous senior management positions, including President, CEO (1995-2000; 2002-2004), Chairman of the Executive Committee (2000-2006), and as a member of the Board of Directors (1990-2006). Currently, Mr. Stavropoulos is Chairman of the Board of Directors of Univar Inc. (global distributor of commodity and specialty chemicals), a Director of Teradata Corporation (data warehousing and technology solutions), and a member of the Advisory Board for Metalmark Capital LLC (private equity investment, 2005-present). Mr. Stavropoulos is an operating advisor to Clayton, Dubilier & Rice, LLC (private equity investment). In addition, Mr. Stavropoulos is a member of the University of Notre Dame Advisory Council for the College of Science, a Trustee of the Rollin L. Gerstacker Foundation, and a Director of Artis-Naples in Naples, Florida. Previously, Mr. Stavropoulos served as Trustee of certain Fidelity® funds (2001-2018) and as a Director of Chemical Financial Corporation (bank holding company, 1993-2012) and Tyco International, Ltd. (multinational manufacturing and services, 2007-2012).
Carol B. Tomé (1957)
Year of Election or Appointment: 2018
Member of the Advisory Board
Ms. Tomé also serves as Member of the Advisory Board of other Fidelity® funds. Ms. Tomé is Chief Financial Officer (2001-present) and Executive Vice President of Corporate Services (2007-present) of The Home Depot, Inc. (home improvement retailer) and a Director (2003-present) and Chair of the Audit Committee (2004-present) of United Parcel Service, Inc. (package delivery and supply chain management). Previously, Ms. Tomé served as Trustee of certain Fidelity® funds (2017), Senior Vice President of Finance and Accounting/Treasurer (2000-2007) and Vice President and Treasurer (1995-2000) of The Home Depot, Inc. and Chair of the Board (2010-2012), Vice Chair of the Board (2009 and 2013), and a Director (2008-2013) of the Federal Reserve Bank of Atlanta. Ms. Tomé is also a director or trustee of many community and professional organizations.
Michael E. Wiley (1950)
Year of Election or Appointment: 2018
Member of the Advisory Board
Mr. Wiley also serves as Trustee or Member of the Advisory Board of other Fidelity® funds. Mr. Wiley serves as a Director of Andeavor Corporation (independent oil refiner and marketer, 2005-present), a Director of Andeavor Logistics LP (natural resources logistics, 2015-present), and a Director of Bill Barrett Corporation (exploration and production, 2005-present). In addition, Mr. Wiley also serves as a Director of Post Oak Bank (privately-held bank, 2004-present). Previously, Mr. Wiley served as a Trustee of other Fidelity® funds (2008-2013), as a Director of Asia Pacific Exploration Consolidated (international oil and gas exploration and production, 2008-2013), as a member of the Board of Trustees of the University of Tulsa (2000-2006; 2007-2010), as a Senior Energy Advisor of Katzenbach Partners, LLC (consulting, 2006-2007), as an Advisory Director of Riverstone Holdings (private investment), Chairman, President, and CEO of Baker Hughes, Inc. (oilfield services, 2000-2004), and as Director of Spinnaker Exploration Company (exploration and production, 2001-2005).
Elizabeth Paige Baumann (1968)
Year of Election or Appointment: 2017
Anti-Money Laundering (AML) Officer
Ms. Baumann also serves as AML Officer of other funds. She is Chief AML Officer (2012-present) and Senior Vice President (2014-present) of FMR LLC (diversified financial services company) and is an employee of Fidelity Investments. Previously, Ms. Baumann served as AML Officer of the funds (2012-2016), and Vice President (2007-2014) and Deputy Anti-Money Laundering Officer (2007-2012) of FMR LLC.
Marc R. Bryant (1966)
Year of Election or Appointment: 2015
Secretary and Chief Legal Officer (CLO)
Mr. Bryant also serves as Secretary and CLO of other funds. Mr. Bryant serves as CLO, Secretary, and Senior Vice President of Fidelity Management & Research Company (investment adviser firm, 2015-present) and FMR Co., Inc. (investment adviser firm, 2015-present); Secretary of Fidelity SelectCo, LLC (investment adviser firm, 2015-present) and Fidelity Investments Money Management, Inc. (investment adviser firm, 2015-present); and CLO of Fidelity Management & Research (Hong Kong) Limited and FMR Investment Management (UK) Limited (investment adviser firms, 2015-present) and Fidelity Management & Research (Japan) Limited (investment adviser firm, 2016-present). He is Senior Vice President and Deputy General Counsel of FMR LLC (diversified financial services company). Previously, Mr. Bryant served as Secretary and CLO of Fidelity Rutland Square Trust II (2010-2014) and Assistant Secretary of Fidelity's Fixed Income and Asset Allocation Funds (2013-2015). Prior to joining Fidelity Investments, Mr. Bryant served as a Senior Vice President and the Head of Global Retail Legal for AllianceBernstein L.P. (2006-2010), and as the General Counsel for ProFund Advisors LLC (2001-2006).
John J. Burke III (1964)
Year of Election or Appointment: 2018
Chief Financial Officer
Mr. Burke also serves as Chief Financial Officer of other funds. Mr. Burke serves as Head of Investment Operations for Fidelity Fund and Investment Operations (2018-present) and is an employee of Fidelity Investments (1998-present). Previously Mr. Burke served as head of Asset Management Investment Operations (2012-2018).
William C. Coffey (1969)
Year of Election or Appointment: 2009
Assistant Secretary
Mr. Coffey also serves as Assistant Secretary of other funds. He is Senior Vice President and Deputy General Counsel of FMR LLC (diversified financial services company, 2010-present), and is an employee of Fidelity Investments. Previously, Mr. Coffey served as Vice President and Associate General Counsel of FMR LLC (2005-2009).
Timothy M. Cohen (1969)
Year of Election or Appointment: 2018
Vice President
Mr. Cohen also serves as Vice President of other funds. Mr. Cohen serves as Co-Head of Global Equity Research (2016-present), a Director of Fidelity Management & Research (Japan) Limited (investment adviser firm, 2016-present), and is an employee of Fidelity Investments. Previously, Mr. Cohen served as Chief Investment Officer - Equity and a Director of Fidelity Management & Research (U.K.) Inc. (investment adviser firm, 2013-2015) and as a Director of Fidelity Management & Research (Hong Kong) Limited (investment adviser firm, 2017).
Jonathan Davis (1968)
Year of Election or Appointment: 2010
Assistant Treasurer
Mr. Davis also serves as Assistant Treasurer of other funds. Mr. Davis serves as Assistant Treasurer of FMR Capital, Inc. (2017-present) and is an employee of Fidelity Investments. Previously, Mr. Davis served as Vice President and Associate General Counsel of FMR LLC (diversified financial services company, 2003-2010).
Adrien E. Deberghes (1967)
Year of Election or Appointment: 2016
Assistant Treasurer
Mr. Deberghes also serves as an officer of other funds. He serves as Assistant Treasurer of FMR Capital, Inc. (2017-present), Executive Vice President of Fidelity Investments Money Management, Inc. (FIMM) (investment adviser firm, 2016-present), and is an employee of Fidelity Investments (2008-present). Previously, Mr. Deberghes served as President and Treasurer of certain Fidelity® funds (2013-2018). Prior to joining Fidelity Investments, Mr. Deberghes was Senior Vice President of Mutual Fund Administration at State Street Corporation (2007-2008), Senior Director of Mutual Fund Administration at Investors Bank & Trust (2005-2007), and Director of Finance for Dunkin' Brands (2000-2005). Previously, Mr. Deberghes served in other fund officer roles.
Laura M. Del Prato (1964)
Year of Election or Appointment: 2018
Assistant Treasurer
Ms. Del Prato also serves as an officer of other funds. Ms. Del Prato is an employee of Fidelity Investments (2017-present). Prior to joining Fidelity Investments, Ms. Del Prato served as a Managing Director and Treasurer of the JPMorgan Mutual Funds (2014-2017). Prior to JPMorgan, Ms. Del Prato served as a partner at Cohen Fund Audit Services (accounting firm, 2012-2013) and KPMG LLP (accounting firm, 2004-2012).
Colm A. Hogan (1973)
Year of Election or Appointment: 2016
Deputy Treasurer
Mr. Hogan also serves as an officer of other funds. Mr. Hogan serves as Assistant Treasurer of FMR Capital, Inc. (2017-present) and is an employee of Fidelity Investments (2005-present). Previously, Mr. Hogan served as Assistant Treasurer of certain Fidelity® funds (2016-2018).
Pamela R. Holding (1964)
Year of Election or Appointment: 2018
Vice President
Ms. Holding also serves as a Vice President of other funds. Ms. Holding serves as Co-Head of Global Equity Research (2018-present) and is an employee of Fidelity Investments (2013-present).
Chris Maher (1972)
Year of Election or Appointment: 2013
Assistant Treasurer
Mr. Maher serves as Assistant Treasurer of other funds. Mr. Maher is Vice President of Valuation Oversight, serves as Assistant Treasurer of FMR Capital, Inc. (2017-present), and is an employee of Fidelity Investments. Previously, Mr. Maher served as Vice President of Asset Management Compliance (2013), Vice President of the Program Management Group of FMR (investment adviser firm, 2010-2013), and Vice President of Valuation Oversight (2008-2010).
Rieco E. Mello (1969)
Year of Election or Appointment: 2017
Assistant Treasurer
Mr. Mello also serves as Assistant Treasurer of other funds. Mr. Mello serves as Assistant Treasurer of FMR Capital, Inc. (2017-present) and is an employee of Fidelity Investments (1995-present).
Kenneth B. Robins (1969)
Year of Election or Appointment: 2016
Chief Compliance Officer
Mr. Robins also serves as an officer of other funds. Mr. Robins serves as Compliance Officer of Fidelity Management & Research Company and FMR Co., Inc. (investment adviser firms, 2016-present) and is an employee of Fidelity Investments (2004-present). Previously, Mr. Robins served as Executive Vice President of Fidelity Investments Money Management, Inc. (investment adviser firm, 2013-2016) and served in other fund officer roles.
Stacie M. Smith (1974)
Year of Election or Appointment: 2016
President and Treasurer
Ms. Smith also serves as an officer of other funds. Ms. Smith serves as Assistant Treasurer of FMR Capital, Inc. (2017-present), is an employee of Fidelity Investments (2009-present), and has served in other fund officer roles. Prior to joining Fidelity Investments, Ms. Smith served as Senior Audit Manager of Ernst & Young LLP (accounting firm, 1996-2009). Previously, Ms. Smith served as Assistant Treasurer (2013-2018) and Deputy Treasurer (2013-2016) of certain Fidelity® funds.
Marc L. Spector (1972)
Year of Election or Appointment: 2016
Assistant Treasurer
Mr. Spector also serves as an officer of other funds. Mr. Spector serves as Assistant Treasurer of FMR Capital, Inc. (2017-present) and is an employee of Fidelity Investments (2016-present). Prior to joining Fidelity Investments, Mr. Spector served as Director at the Siegfried Group (accounting firm, 2013-2016), and prior to Siegfried Group as audit senior manager at Deloitte & Touche (accounting firm, 2005-2013).
Renee Stagnone (1975)
Year of Election or Appointment: 2016
Assistant Treasurer
Ms. Stagnone also serves as an officer of other funds. Ms. Stagnone serves as Assistant Treasurer of FMR Capital, Inc. (2017-present) and is an employee of Fidelity Investments (1997-present). Previously, Ms. Stagnone served as Deputy Treasurer of certain Fidelity® funds (2013-2016).
Shareholder Expense Example
As a shareholder of the Fund, you incur two types of costs: (1) transaction costs, and (2) ongoing costs, including other Fund expenses. This Example is intended to help you understand your ongoing costs (in dollars) of investing in the Fund and to compare these costs with the ongoing costs of investing in other mutual funds.
The Example is based on an investment of $1,000 invested at the beginning of the period and held for the entire period (February 1, 2018 to July 31, 2018).
Actual Expenses
The first line of the accompanying table provides information about actual account values and actual expenses. You may use the information in this line, together with the amount you invested, to estimate the expenses that you paid over the period. Simply divide your account value by $1,000.00 (for example, an $8,600 account value divided by $1,000.00 = 8.6), then multiply the result by the number in the first line under the heading entitled "Expenses Paid During Period" to estimate the expenses you paid on your account during this period. In addition, the Fund, as a shareholder in the underlying Fidelity Central Funds, will indirectly bear its pro-rata share of the fees and expenses incurred by the underlying Fidelity Central Funds. These fees and expenses are not included in the Fund's annualized expense ratio used to calculate the expense estimate in the table below.
Hypothetical Example for Comparison Purposes
The second line of the accompanying table provides information about hypothetical account values and hypothetical expenses based on the Fund's actual expense ratio and an assumed rate of return of 5% per year before expenses, which is not the Fund's actual return. The hypothetical account values and expenses may not be used to estimate the actual ending account balance or expenses you paid for the period. You may use this information to compare the ongoing costs of investing in the Fund and other funds. To do so, compare this 5% hypothetical example with the 5% hypothetical examples that appear in the shareholder reports of the other funds. In addition, the Fund, as a shareholder in the underlying Fidelity Central Funds, will indirectly bear its pro-rata share of the fees and expenses incurred by the underlying Fidelity Central Funds. These fees and expenses are not included in the Fund's annualized expense ratio used to calculate the expense estimate in the table below.
Please note that the expenses shown in the table are meant to highlight your ongoing costs only and do not reflect any transaction costs. Therefore, the second line of the table is useful in comparing ongoing costs only, and will not help you determine the relative total costs of owning different funds.
| | Annualized Expense Ratio-A | Beginning
Account Value
February 1, 2018 | Ending
Account Value
July 31, 2018 | Expenses Paid
During Period-B
February 1, 2018
to July 31, 2018 |
| Actual | - %-C | $1,000.00 | $997.60 | $--D |
| Hypothetical-E | | $1,000.00 | $1,024.79 | $--D |
A Annualized expense ratio reflects expenses net of applicable fee waivers.
B Expenses are equal to the Fund's annualized expense ratio, multiplied by the average account value over the period, multiplied by 181/365 (to reflect the one-half year period).
C Amount represents less than .005%.
D Amount represents less than $.005.
E 5% return per year before expenses
Distributions (Unaudited)
The Board of Trustees of Fidelity Flex Intrinsic Opportunities Fund voted to pay on September 17, 2018, to shareholders of record at the opening of business on September 14, 2018, a distribution of $0.032 per share derived from capital gains realized from sales of portfolio securities and a dividend of $0.118 per share from net investment income.
The fund hereby designates as a capital gain dividend with respect to the taxable year ended July 31, 2018, $6,009, or, if subsequently determined to be different, the net capital gain of such year.
The fund designates 34% and 35% of the dividends distributed in September and December, respectively during the fiscal year as qualifying for the dividends–received deduction for corporate shareholders.
The fund designates 62% and 60% of the dividends distributed in September and December, respectively during the fiscal year as amounts which may be taken into account as a dividend for the purposes of the maximum rate under section 1(h)(11) of the Internal Revenue Code.
The fund will notify shareholders in January 2019 of amounts for use in preparing 2018 income tax returns.
Board Approval of Investment Advisory Contracts
Fidelity Flex Intrinsic Opportunities Fund
At its July 2018 meeting, the Board of Trustees, including the Independent Trustees (together, the Board), voted to continue the management contract with Fidelity Management & Research Company (FMR) and the sub-advisory agreements (together, the Advisory Contracts) for the fund for six months through January 31, 2019, in connection with the reunification of the Fidelity Equity High Income Funds Board, which oversees the fund, and the Sector Portfolios Board.
The Board considered that the approval of the fund's Advisory Contracts will not result in any changes in (i) the investment process or strategies employed in the management of the fund's assets; (ii) the fees and expenses paid by shareholders; (iii) the nature, extent or quality of services provided under the fund's Advisory Contracts; or (iv) the day-to-day management of the fund or the persons primarily responsible for such management. The Board concluded that the fund's Advisory Contracts are fair and reasonable, and that the fund's Advisory Contracts should be renewed, without modification, through January 31, 2019, with the understanding that the Board will consider the annual renewal for a full one year period in January 2019.
In connection with its consideration of future renewals of the fund's Advisory Contracts, the Board will consider: (i) the nature, extent and quality of services provided to the fund, including shareholder and administrative services and investment performance; (ii) the competitiveness of the management fee and total expenses for the fund; (iii) the costs of the services and profitability, including the revenues earned and the expenses incurred in conducting the business of developing, marketing, distributing, managing, administering, and servicing the fund and its shareholders, to the extent applicable, as well as potential fall-out benefits from Fidelity's non-fund businesses; and (iv) whether there have been economies of scale in respect of the Fidelity funds, whether the Fidelity funds (including the fund) have appropriately benefited from any such economies of scale, and whether there is the potential for realization of any further economies.
Based on its evaluation of all of the conclusions noted above, and after considering all factors it believed relevant, the Board ultimately concluded that the fund's management fee structure is fair and reasonable, and that the continuation of the fund's Advisory Contracts should be approved.
Corporate Headquarters
245 Summer St.
Boston, MA 02210
www.fidelity.com
ZTO-ANN-0918
1.9881591.101
Fidelity® Low-Priced Stock K6 Fund
Annual Report July 31, 2018 |
|
Contents
To view a fund's proxy voting guidelines and proxy voting record for the 12-month period ended June 30, visit http://www.fidelity.com/proxyvotingresults or visit the Securities and Exchange Commission's (SEC) web site at http://www.sec.gov.
You may also call 1-800-835-5092 to request a free copy of the proxy voting guidelines.
Standard & Poor's, S&P and S&P 500 are registered service marks of The McGraw-Hill Companies, Inc. and have been licensed for use by Fidelity Distributors Corporation.
Other third-party marks appearing herein are the property of their respective owners.
All other marks appearing herein are registered or unregistered trademarks or service marks of FMR LLC or an affiliated company. © 2018 FMR LLC. All rights reserved.
This report and the financial statements contained herein are submitted for the general information of the shareholders of the Fund. This report is not authorized for distribution to prospective investors in the Fund unless preceded or accompanied by an effective prospectus.
A fund files its complete schedule of portfolio holdings with the SEC for the first and third quarters of each fiscal year on Form N-Q. Forms N-Q are available on the SEC’s web site at http://www.sec.gov. A fund's Forms N-Q may be reviewed and copied at the SEC’s Public Reference Room in Washington, DC. Information regarding the operation of the SEC's Public Reference Room may be obtained by calling 1-800-SEC-0330.
For a complete list of a fund's portfolio holdings, view the most recent holdings listing, semiannual report, or annual report on Fidelity's web site at http://www.fidelity.com, http://www.institutional.fidelity.com, or http://www.401k.com, as applicable.
NOT FDIC INSURED •MAY LOSE VALUE •NO BANK GUARANTEE
Neither the Fund nor Fidelity Distributors Corporation is a bank.
Performance: The Bottom Line
Average annual total return reflects the change in the value of an investment, assuming reinvestment of distributions from dividend income and capital gains (the profits earned upon the sale of securities that have grown in value, if any) and assuming a constant rate of performance each year. The hypothetical investment and the average annual total returns do not reflect the deduction of taxes that a shareholder would pay on fund distributions or the redemption of fund shares. During periods of reimbursement by Fidelity, a fund’s total return will be greater than it would be had the reimbursement not occurred. How a fund did yesterday is no guarantee of how it will do tomorrow.
Average Annual Total Returns
| For the periods ended July 31, 2018 | Past 1 year | Life of fundA |
| Fidelity® Low-Priced Stock K6 Fund | 13.33% | 13.34% |
A From May 26, 2017
$10,000 Over Life of Fund
Let's say hypothetically that $10,000 was invested in Fidelity® Low-Priced Stock K6 Fund on May 26, 2017, when the fund started.
The chart shows how the value of your investment would have changed, and also shows how the Russell 2000® Index performed over the same period.
| Period Ending Values |
| $11,594 | Fidelity® Low-Priced Stock K6 Fund |
| $12,270 | Russell 2000® Index |
Management's Discussion of Fund Performance
Market Recap: The U.S. equity bellwether S&P 500
® index gained 16.24% for the 12 months ending July 31, 2018, despite a resurgence in volatility that challenged the multiyear bull market. Stocks maintained their steady growth until a sharp reversal in February, as volatility spiked amid fear that rising inflation and the potential for the economy to overheat would prompt the U.S. Federal Reserve to pick up the pace of interest rate hikes. The index posted its first negative monthly result since October 2016, and then lost further ground in March on fear of a global trade war. The market stabilized in April and turned upward through mid-June, when escalating trade tension between the U.S. and China soured investor sentiment. The resulting uncertainty lingered into July, but strong corporate earnings helped the S&P 500 rise 3.72% that month to cap the period. For the full one-year period, growth handily topped value, while small-caps bested large-caps. By sector, information technology (+28%) led the way, boosted by strong earnings growth from several major index constituents. Consumer discretionary rose roughly 24%, driven by retailers (+49%). Energy (+20%) gained alongside higher oil prices. Laggards were telecommunication services (-2%), consumer staples (0%) and utilities (+3%), defensive groups that struggled amid rising interest rates and a general preference for risk. Real estate (+5%) fared a bit better but still lagged, as did financials, industrials, health care (each up 13%) and materials (+11%).
Comments from Lead Portfolio Manager Joel Tillinghast: For the fiscal year, the fund gained 13.33%, trailing the 18.73% return of the benchmark Russell 2000
® Index. Versus the benchmark, stock selection was the primary detractor, with choices in the software & services and insurance industries hurting most. In the latter group, a sizable out-of-benchmark position in Unum Group was the fund's biggest individual detractor, as it suffered from heightened concerns about weakening financial trends in its long-term care business. Positioning in the pharmaceuticals, biotechnology & life sciences industry also hurt relative performance. Elsewhere, U.K.-based homebuilder Barratt Developments, another sizable non-benchmark holding, performed poorly due to "Brexit" concerns and an uptick in interest rates. The fund's sizable allocation to cash – at about 11% of assets, on average – amid a rising equity market significantly hindered our relative result. Our foreign holdings detracted overall, in part due to the strength of the U.S. dollar. Conversely, a significant underweighting in the weak real estate sector lifted the fund's relative result. Stock selection in the energy sector, as well as in the retailing industry, also added value. A large non-benchmark position in disk-drive maker Seagate Technology was the fund's biggest relative contributor, as the stock gained in large part due to steady product demand. A sizable non-benchmark stake in discount retailer Ross Stores also contributed.
The views expressed above reflect those of the portfolio manager(s) only through the end of the period as stated on the cover of this report and do not necessarily represent the views of Fidelity or any other person in the Fidelity organization. Any such views are subject to change at any time based upon market or other conditions and Fidelity disclaims any responsibility to update such views. These views may not be relied on as investment advice and, because investment decisions for a Fidelity fund are based on numerous factors, may not be relied on as an indication of trading intent on behalf of any Fidelity fund.
Note to Shareholders: During the reporting period, Joel Tillinghast assumed responsibility for the fund's consumer and financials sleeves, succeeding Kathy Buck and Justin Bennett, respectively.
Investment Summary (Unaudited)
Top Ten Stocks as of July 31, 2018
| | % of fund's net assets |
| UnitedHealth Group, Inc. | 6.6 |
| Ross Stores, Inc. | 3.4 |
| Best Buy Co., Inc. | 3.0 |
| Seagate Technology LLC | 2.9 |
| Aetna, Inc. | 2.3 |
| Next PLC | 2.3 |
| Metro, Inc. Class A (sub. vtg.) | 1.9 |
| Unum Group | 1.7 |
| ANSYS, Inc. | 1.7 |
| Amgen, Inc. | 1.6 |
| | 27.4 |
Top Five Market Sectors as of July 31, 2018
| | % of fund's net assets |
| Consumer Discretionary | 21.9 |
| Information Technology | 15.1 |
| Health Care | 14.3 |
| Financials | 11.6 |
| Consumer Staples | 7.9 |
Asset Allocation (% of fund's net assets)
| As of July 31, 2018* |
| | Stocks | 89.2% |
| | Short-Term Investments and Net Other Assets (Liabilities) | 10.8% |

* Foreign investments - 37.6%
Schedule of Investments July 31, 2018
Showing Percentage of Net Assets
| Common Stocks - 89.1% | | | |
| | | Shares | Value |
| CONSUMER DISCRETIONARY - 21.9% | | | |
| Auto Components - 1.1% | | | |
| Adient PLC | | 30,346 | $1,445,380 |
| ASTI Corp. | | 11,000 | 239,154 |
| Autoliv, Inc. | | 990 | 101,435 |
| Cooper Tire & Rubber Co. | | 78,991 | 2,255,193 |
| ElringKlinger AG | | 42,492 | 539,115 |
| G-Tekt Corp. | | 3,500 | 60,631 |
| Gentex Corp. | | 153,425 | 3,559,460 |
| GUD Holdings Ltd. | | 16,809 | 177,333 |
| Hi-Lex Corp. | | 83,200 | 2,067,072 |
| Lear Corp. | | 1,075 | 193,640 |
| Murakami Corp. | | 47,600 | 1,298,395 |
| Nippon Seiki Co. Ltd. | | 160,700 | 3,360,163 |
| Piolax, Inc. | | 118,200 | 2,865,807 |
| S&T Holdings Co. Ltd. | | 53,202 | 604,422 |
| Samsung Climate Control Co. Ltd. | | 28,201 | 271,000 |
| SJM Co. Ltd. | | 50 | 168 |
| Strattec Security Corp. | | 20,933 | 690,789 |
| Sungwoo Hitech Co. Ltd. | | 149,030 | 610,323 |
| TBK Co. Ltd. | | 43,900 | 201,018 |
| Yachiyo Industry Co. Ltd. | | 54,600 | 626,009 |
| Yutaka Giken Co. Ltd. | | 58,400 | 1,424,288 |
| | | | 22,590,795 |
| Distributors - 0.1% | | | |
| Central Automotive Products Ltd. | | 3,500 | 56,938 |
| Chori Co. Ltd. | | 20,300 | 376,716 |
| Nakayamafuku Co. Ltd. | | 45,600 | 291,997 |
| PALTAC Corp. | | 6,900 | 364,084 |
| SPK Corp. | | 15,500 | 374,556 |
| Uni-Select, Inc. | | 100,317 | 1,670,343 |
| | | | 3,134,634 |
| Diversified Consumer Services - 0.3% | | | |
| Clip Corp. | | 13,000 | 107,776 |
| Cross-Harbour Holdings Ltd. | | 133,000 | 223,670 |
| Estacio Participacoes SA | | 22,600 | 156,255 |
| ServiceMaster Global Holdings, Inc. (a) | | 10,423 | 594,007 |
| Shingakukai Holdings Co. Ltd. | | 6,000 | 31,928 |
| Step Co. Ltd. | | 51,000 | 736,619 |
| Weight Watchers International, Inc. (a) | | 61,274 | 5,485,861 |
| | | | 7,336,116 |
| Hotels, Restaurants & Leisure - 0.3% | | | |
| Ark Restaurants Corp. | | 9,576 | 215,460 |
| Bluegreen Vacations Corp. | | 12,422 | 319,370 |
| Brinker International, Inc. | | 1,264 | 59,623 |
| Flanigans Enterprises, Inc. | | 5,419 | 158,777 |
| Greggs PLC | | 29,956 | 414,420 |
| Hiday Hidaka Corp. | | 105,920 | 2,252,629 |
| Ibersol SGPS SA | | 55,569 | 649,796 |
| Koshidaka Holdings Co. Ltd. | | 16,700 | 192,069 |
| Kura Corp. Ltd. | | 600 | 36,167 |
| Sportscene Group, Inc. Class A | | 15,725 | 96,706 |
| St. Marc Holdings Co. Ltd. | | 24,400 | 593,334 |
| Texas Roadhouse, Inc. Class A | | 5,292 | 332,549 |
| The Monogatari Corp. | | 4,900 | 451,371 |
| The Restaurant Group PLC | | 395,681 | 1,376,280 |
| TORIDOLL Holdings Corp. | | 3,800 | 84,316 |
| Wyndham Destinations, Inc. | | 1,371 | 63,231 |
| Wyndham Hotels & Resorts, Inc. | | 1,371 | 79,518 |
| | | | 7,375,616 |
| Household Durables - 3.4% | | | |
| Abbey PLC | | 90,691 | 1,622,558 |
| Barratt Developments PLC | | 4,398,101 | 30,826,365 |
| Bellway PLC | | 238,342 | 9,125,420 |
| D.R. Horton, Inc. | | 174,133 | 7,609,612 |
| Dorel Industries, Inc. Class B (sub. vtg.) | | 134,510 | 2,466,129 |
| Emak SpA | | 267,170 | 377,398 |
| First Juken Co. Ltd. | | 66,500 | 833,220 |
| Flexsteel Industries, Inc. | | 1,559 | 55,859 |
| Hamilton Beach Brands Holding Co.: | | | |
| Class A | | 10,129 | 257,277 |
| Class B | | 3,511 | 89,179 |
| Helen of Troy Ltd. (a) | | 102,076 | 11,692,806 |
| Henry Boot PLC | | 179,576 | 617,540 |
| Iida Group Holdings Co. Ltd. | | 10,400 | 203,601 |
| M/I Homes, Inc. (a) | | 1,357 | 35,092 |
| Meritage Homes Corp. (a) | | 1,084 | 46,775 |
| P&F Industries, Inc. Class A | | 18,414 | 153,204 |
| PulteGroup, Inc. | | 5,612 | 159,886 |
| Q.E.P. Co., Inc. | | 1,484 | 47,191 |
| Sanei Architecture Planning Co. Ltd. | | 57,400 | 1,014,889 |
| Stanley Furniture Co., Inc. (a) | | 7,340 | 4,771 |
| Taylor Morrison Home Corp. (a) | | 11,968 | 233,735 |
| Token Corp. | | 38,000 | 2,922,685 |
| Toll Brothers, Inc. | | 5,313 | 187,336 |
| Tupperware Brands Corp. | | 1,645 | 60,388 |
| | | | 70,642,916 |
| Internet & Direct Marketing Retail - 0.3% | | | |
| Belluna Co. Ltd. | | 425,300 | 4,952,293 |
| Liberty Interactive Corp. QVC Group Series A (a) | | 51,393 | 1,094,157 |
| | | | 6,046,450 |
| Leisure Products - 0.2% | | | |
| Accell Group NV | | 84,586 | 1,760,609 |
| Amer Group PLC (A Shares) | | 6,601 | 211,883 |
| Brunswick Corp. | | 6,700 | 430,810 |
| Kabe Husvagnar AB (B Shares) | | 16,828 | 314,821 |
| Mars Engineering Corp. | | 30,400 | 658,760 |
| Miroku Corp. | | 8,600 | 158,286 |
| | | | 3,535,169 |
| Media - 1.1% | | | |
| Comcast Corp. Class A | | 161,020 | 5,761,296 |
| Corus Entertainment, Inc. Class B (non-vtg.) | | 35,691 | 111,393 |
| Discovery Communications, Inc.: | | | |
| Class A (a)(b) | | 161,041 | 4,280,470 |
| Class C (non-vtg.) (a) | | 30,416 | 746,713 |
| DISH Network Corp. Class A (a) | | 6,506 | 205,329 |
| Entercom Communications Corp. Class A | | 3,024 | 22,831 |
| Gannett Co., Inc. | | 64,398 | 680,687 |
| Harte-Hanks, Inc. (a) | | 3,536 | 35,784 |
| Hyundai HCN | | 153,655 | 572,686 |
| Informa PLC | | 25,668 | 265,953 |
| Intage Holdings, Inc. | | 201,400 | 2,085,777 |
| Ipsos SA | | 474 | 15,863 |
| KK Culture Holdings Ltd. (a) | | 468,000 | 97,785 |
| MSG Network, Inc. Class A (a) | | 17,612 | 414,763 |
| Multiplus SA | | 30,300 | 223,619 |
| Pico Far East Holdings Ltd. | | 1,044,000 | 432,282 |
| Proto Corp. | | 14,400 | 176,949 |
| RKB Mainichi Broadcasting Corp. | | 2,100 | 117,757 |
| Saga Communications, Inc. Class A | | 24,025 | 909,346 |
| Sky Network Television Ltd. | | 355,985 | 657,553 |
| STW Group Ltd. | | 249,698 | 170,672 |
| Tegna, Inc. | | 71,487 | 788,502 |
| Television Broadcasts Ltd. | | 119,500 | 370,723 |
| TOW Co. Ltd. | | 111,500 | 804,727 |
| TVA Group, Inc. Class B (non-vtg.) (a) | | 169,465 | 389,515 |
| Twenty-First Century Fox, Inc. Class A | | 25,509 | 1,147,905 |
| Viacom, Inc. Class B (non-vtg.) | | 73,698 | 2,140,927 |
| WOWOW INC. | | 11,200 | 339,060 |
| | | | 23,966,867 |
| Multiline Retail - 2.5% | | | |
| Big Lots, Inc. | | 7,685 | 333,760 |
| Lifestyle China Group Ltd. (a) | | 1,444,500 | 587,072 |
| Lifestyle International Holdings Ltd. | | 1,527,000 | 3,034,915 |
| Next PLC | | 603,647 | 47,031,929 |
| Nordstrom, Inc. | | 4,452 | 233,329 |
| Watts Co. Ltd. | | 39,000 | 381,228 |
| | | | 51,602,233 |
| Specialty Retail - 11.4% | | | |
| Aaron's, Inc. Class A | | 3,664 | 158,688 |
| Abercrombie & Fitch Co. Class A | | 168,839 | 3,999,796 |
| AT-Group Co. Ltd. | | 66,700 | 1,692,927 |
| AutoCanada, Inc. | | 10,203 | 113,415 |
| AutoNation, Inc. (a) | | 4,419 | 214,454 |
| AutoZone, Inc. (a) | | 44,400 | 31,325,532 |
| Bed Bath & Beyond, Inc. | | 141,677 | 2,653,610 |
| Best Buy Co., Inc. | | 821,478 | 61,635,494 |
| BMTC Group, Inc. | | 199,177 | 2,353,346 |
| Bonia Corp. Bhd | | 200 | 21 |
| Buffalo Co. Ltd. | | 4,500 | 38,193 |
| Burlington Stores, Inc. (a) | | 2,130 | 325,485 |
| Cars.com, Inc. (a) | | 26,393 | 748,769 |
| Cash Converters International Ltd. (a) | | 1,210,490 | 301,277 |
| Chico's FAS, Inc. | | 36,779 | 319,977 |
| Delek Automotive Systems Ltd. | | 44,855 | 236,966 |
| DSW, Inc. Class A | | 11,488 | 315,231 |
| Dunelm Group PLC | | 39,579 | 272,475 |
| Ff Group (a)(c) | | 239,258 | 1,342,926 |
| Fourlis Holdings SA | | 12,453 | 84,022 |
| Francesca's Holdings Corp. (a) | | 16,432 | 133,756 |
| GameStop Corp. Class A (b) | | 203,816 | 2,936,989 |
| Genesco, Inc. (a) | | 36,446 | 1,483,352 |
| GNC Holdings, Inc. Class A (a)(b) | | 57,002 | 181,266 |
| Goldlion Holdings Ltd. | | 1,336,000 | 553,188 |
| Guess?, Inc. | | 300,612 | 6,811,868 |
| Hour Glass Ltd. | | 393,000 | 186,201 |
| IA Group Corp. | | 5,600 | 189,814 |
| JB Hi-Fi Ltd. (b) | | 6,489 | 114,981 |
| John David Group PLC | | 481,367 | 2,956,278 |
| Jumbo SA | | 476,540 | 7,634,216 |
| K's Holdings Corp. | | 291,600 | 3,278,104 |
| Ku Holdings Co. Ltd. | | 51,800 | 435,006 |
| Le Chateau, Inc. Class B (sub. vtg.) (a) | | 31,398 | 7,241 |
| Leon's Furniture Ltd. | | 11,369 | 159,849 |
| Lewis Group Ltd. | | 59,085 | 134,167 |
| Mr. Bricolage SA | | 40,973 | 630,040 |
| Murphy U.S.A., Inc. (a) | | 2,648 | 209,828 |
| Nafco Co. Ltd. | | 92,200 | 1,512,273 |
| Ross Stores, Inc. | | 816,832 | 71,415,622 |
| Sacs Bar Holdings, Inc. | | 11,500 | 99,763 |
| Sally Beauty Holdings, Inc. (a) | | 146,050 | 2,408,365 |
| Second Chance Properties Ltd. warrants 1/23/20 (a) | | 100 | 0 |
| Sonic Automotive, Inc. Class A (sub. vtg.) | | 66,888 | 1,361,171 |
| The Buckle, Inc. (b) | | 214,390 | 5,156,080 |
| The Children's Place Retail Stores, Inc. | | 1,759 | 216,181 |
| Urban Outfitters, Inc. (a) | | 143,403 | 6,367,093 |
| USS Co. Ltd. | | 313,800 | 5,938,388 |
| Vitamin Shoppe, Inc. (a) | | 53,164 | 443,919 |
| Williams-Sonoma, Inc. (b) | | 21,083 | 1,233,145 |
| Workman Co. Ltd. | | 118,500 | 5,309,529 |
| | | | 237,630,277 |
| Textiles, Apparel & Luxury Goods - 1.2% | | | |
| Best Pacific International Holdings Ltd. | | 242,000 | 89,412 |
| Deckers Outdoor Corp. (a) | | 1,865 | 210,428 |
| Embry Holdings Ltd. | | 102,000 | 34,307 |
| Emerald Expositions Events, Inc. | | 7,302 | 140,929 |
| Fossil Group, Inc. (a) | | 209,220 | 5,481,564 |
| Gildan Activewear, Inc. | | 420,194 | 10,824,231 |
| Handsome Co. Ltd. | | 87,081 | 2,952,309 |
| JLM Couture, Inc. (a) | | 7,641 | 60,364 |
| Makalot Industrial Co. Ltd. | | 51,000 | 226,807 |
| McRae Industries, Inc. | | 1,415 | 42,450 |
| Michael Kors Holdings Ltd. (a) | | 4,275 | 285,271 |
| Oxford Industries, Inc. | | 1,352 | 124,546 |
| Portico International Holdings (a) | | 583,000 | 303,791 |
| Steven Madden Ltd. | | 8,816 | 476,505 |
| Sun Hing Vision Group Holdings Ltd. | | 942,000 | 331,240 |
| Texwinca Holdings Ltd. | | 2,980,000 | 1,313,637 |
| Victory City International Holdings Ltd. (a) | | 5,512,000 | 88,484 |
| Wolverine World Wide, Inc. | | 6,797 | 240,478 |
| Youngone Corp. | | 30,054 | 815,137 |
| Youngone Holdings Co. Ltd. | | 19 | 916 |
| Yue Yuen Industrial (Holdings) Ltd. | | 310,500 | 834,693 |
| | | | 24,877,499 |
|
| TOTAL CONSUMER DISCRETIONARY | | | 458,738,572 |
|
| CONSUMER STAPLES - 7.9% | | | |
| Beverages - 1.6% | | | |
| A.G. Barr PLC | | 187,291 | 1,664,261 |
| Baron de Ley SA (a) | | 8,010 | 1,039,681 |
| Britvic PLC | | 396,396 | 4,183,128 |
| C&C Group PLC | | 117,781 | 473,782 |
| Jinro Distillers Co. Ltd. | | 2,262 | 62,164 |
| Monster Beverage Corp. (a) | | 408,636 | 24,526,333 |
| Olvi PLC (A Shares) | | 5,464 | 205,736 |
| Spritzer Bhd | | 288,800 | 170,509 |
| Yantai Changyu Pioneer Wine Co. Ltd. (B Shares) | | 168,255 | 449,092 |
| | | | 32,774,686 |
| Food & Staples Retailing - 4.7% | | | |
| Amsterdam Commodities NV | | 7,972 | 186,907 |
| Aoki Super Co. Ltd. | | 13,000 | 153,235 |
| Belc Co. Ltd. | | 100,500 | 4,817,601 |
| Casey's General Stores, Inc. | | 1,000 | 109,380 |
| Cosmos Pharmaceutical Corp. | | 61,100 | 13,436,918 |
| Create SD Holdings Co. Ltd. | | 255,200 | 6,344,909 |
| Daikokutenbussan Co. Ltd. | | 32,635 | 1,444,737 |
| Dong Suh Companies, Inc. | | 66,125 | 1,514,354 |
| Genky DrugStores Co. Ltd. | | 44,700 | 1,545,101 |
| Halows Co. Ltd. | | 78,700 | 1,815,910 |
| Kirindo Holdings Co. Ltd. | | 8,100 | 164,296 |
| Kroger Co. | | 114,043 | 3,307,247 |
| Kusuri No Aoki Holdings Co. Ltd. | | 45,400 | 3,329,428 |
| Majestic Wine PLC | | 109,367 | 643,102 |
| McColl's Retail Group PLC | | 82,251 | 161,938 |
| Medical System Network Co. Ltd. | | 3,200 | 13,022 |
| Metro, Inc. Class A (sub. vtg.) | | 1,172,179 | 39,521,675 |
| North West Co., Inc. | | 6,355 | 145,190 |
| Performance Food Group Co. (a) | | 10,978 | 393,561 |
| Qol Co. Ltd. | | 112,800 | 1,852,174 |
| Retail Partners Co. Ltd. | | 26,800 | 366,234 |
| Sligro Food Group NV | | 21,352 | 883,866 |
| Sundrug Co. Ltd. | | 185,700 | 7,423,682 |
| Tesco PLC | | 206,964 | 706,784 |
| Thai President Foods PCL | | 31,180 | 145,263 |
| Total Produce PLC | | 543,298 | 1,410,378 |
| United Natural Foods, Inc. (a) | | 75,977 | 2,446,459 |
| Valor Holdings Co. Ltd. | | 29,700 | 636,950 |
| Walgreens Boots Alliance, Inc. | | 1,561 | 105,555 |
| Walmart, Inc. | | 1,902 | 169,715 |
| Yaoko Co. Ltd. | | 57,700 | 2,982,659 |
| | | | 98,178,230 |
| Food Products - 1.4% | | | |
| Aryzta AG (b) | | 52,439 | 741,714 |
| Carr's Group PLC | | 106,117 | 206,140 |
| Cranswick PLC | | 27,540 | 1,183,473 |
| Dean Foods Co. | | 11,004 | 108,059 |
| Devro PLC | | 90,002 | 232,484 |
| Food Empire Holdings Ltd. | | 2,378,400 | 1,091,931 |
| Fresh Del Monte Produce, Inc. | | 250,156 | 9,080,663 |
| Hilton Food Group PLC | | 31,606 | 396,591 |
| Inghams Group Ltd. | | 95,414 | 260,158 |
| Ingredion, Inc. | | 1,287 | 130,373 |
| Japan Meat Co. Ltd. | | 9,400 | 177,298 |
| Kaveri Seed Co. Ltd. | | 4,958 | 44,246 |
| Mitsui Sugar Co. Ltd. | | 21,400 | 648,804 |
| Nam Yang Dairy Products | | 631 | 363,253 |
| Natori Co. Ltd. | | 3,100 | 51,318 |
| Origin Enterprises PLC | | 443,233 | 3,130,499 |
| Pacific Andes International Holdings Ltd. (a)(c) | | 3,118,000 | 28,999 |
| Pickles Corp. | | 6,100 | 121,274 |
| Rocky Mountain Chocolate Factory, Inc. | | 24,869 | 255,405 |
| S Foods, Inc. | | 23,900 | 937,276 |
| Seaboard Corp. | | 2,445 | 8,894,910 |
| Select Harvests Ltd. | | 237,850 | 1,060,264 |
| The Hain Celestial Group, Inc. (a) | | 18,849 | 536,066 |
| Want Want China Holdings Ltd. | | 826,000 | 682,979 |
| | | | 30,364,177 |
| Household Products - 0.0% | | | |
| Central Garden & Pet Co. Class A (non-vtg.) (a) | | 4,983 | 199,918 |
| Personal Products - 0.1% | | | |
| Natural Alternatives International, Inc. (a) | | 7,375 | 74,856 |
| Sarantis SA | | 190,277 | 1,557,503 |
| | | | 1,632,359 |
| Tobacco - 0.1% | | | |
| Karelia Tobacco Co., Inc. | | 77 | 24,851 |
| Scandinavian Tobacco Group A/S (d) | | 107,106 | 1,742,927 |
| | | | 1,767,778 |
|
| TOTAL CONSUMER STAPLES | | | 164,917,148 |
|
| ENERGY - 5.2% | | | |
| Energy Equipment & Services - 1.7% | | | |
| AKITA Drilling Ltd. Class A (non-vtg.) | | 80,762 | 302,349 |
| Bristow Group, Inc. (a) | | 122,072 | 1,706,567 |
| Carbo Ceramics, Inc. (a)(b) | | 59,086 | 551,272 |
| Cathedral Energy Services Ltd. (a) | | 63,222 | 56,863 |
| Diamond Offshore Drilling, Inc. (a)(b) | | 240,476 | 4,617,139 |
| Divestco, Inc. (a) | | 138,216 | 8,500 |
| Dril-Quip, Inc. (a) | | 11,919 | 614,424 |
| Ensco PLC Class A | | 671,292 | 4,987,700 |
| Fugro NV (Certificaten Van Aandelen) (a)(b) | | 80,385 | 1,159,468 |
| Geospace Technologies Corp. (a) | | 69,929 | 983,901 |
| Gulf Island Fabrication, Inc. | | 3,139 | 28,408 |
| GulfMark Offshore, Inc. warrants 11/14/24 (a) | | 2,256 | 5,640 |
| John Wood Group PLC | | 38,895 | 331,734 |
| Liberty Oilfield Services, Inc. Class A (b) | | 86,296 | 1,691,402 |
| National Oilwell Varco, Inc. | | 15,222 | 740,094 |
| Oceaneering International, Inc. | | 23,837 | 652,180 |
| Oil States International, Inc. (a) | | 140,043 | 4,887,501 |
| PHX Energy Services Corp. (a) | | 78,272 | 122,747 |
| RigNet, Inc. (a) | | 2,266 | 27,872 |
| Shinko Plantech Co. Ltd. | | 71,600 | 675,562 |
| Smart Sand, Inc. (a) | | 7,265 | 42,137 |
| Solstad Offshore ASA (a)(b) | | 125,885 | 94,761 |
| Total Energy Services, Inc. | | 99,606 | 842,269 |
| Transocean Ltd. (United States) (a) | | 173,164 | 2,228,621 |
| Unit Corp. (a) | | 328,010 | 8,167,449 |
| | | | 35,526,560 |
| Oil, Gas & Consumable Fuels - 3.5% | | | |
| Adams Resources & Energy, Inc. | | 7,289 | 291,560 |
| Andeavor | | 68,396 | 10,263,504 |
| Beach Energy Ltd. | | 960,883 | 1,363,526 |
| Bonavista Energy Corp. | | 13,241 | 15,879 |
| Chevron Corp. | | 12,030 | 1,519,028 |
| CNX Resources Corp. (a) | | 16,736 | 272,462 |
| ConocoPhillips Co. | | 53,133 | 3,834,609 |
| CONSOL Energy, Inc. (a) | | 2,936 | 122,226 |
| Contango Oil & Gas Co. (a) | | 158,268 | 887,883 |
| Denbury Resources, Inc. (a) | | 368,413 | 1,661,543 |
| Eni SpA | | 443,570 | 8,538,075 |
| Fuji Kosan Co. Ltd. | | 30,200 | 176,638 |
| Great Eastern Shipping Co. Ltd. | | 306,552 | 1,352,080 |
| Hankook Shell Oil Co. Ltd. | | 2,945 | 929,677 |
| International Seaways, Inc. (a) | | 1,100 | 23,947 |
| Kyungdong Invest Co. Ltd. | | 4,756 | 207,160 |
| Marathon Oil Corp. | | 226,338 | 4,780,259 |
| Marathon Petroleum Corp. | | 7,703 | 622,633 |
| Murphy Oil Corp. | | 663,807 | 22,078,221 |
| NACCO Industries, Inc. Class A | | 10,729 | 354,057 |
| Newfield Exploration Co. (a) | | 21,169 | 607,974 |
| QEP Resources, Inc. (a) | | 102,586 | 1,065,869 |
| Reliance Industries Ltd. | | 9,000 | 155,916 |
| Southwestern Energy Co. (a) | | 730,225 | 3,753,357 |
| Star Petroleum Refining PCL | | 423,400 | 185,802 |
| Thai Oil PCL (For. Reg.) | | 17,700 | 42,694 |
| Whitecap Resources, Inc. | | 25,939 | 171,285 |
| Whiting Petroleum Corp. (a) | | 85,198 | 4,230,081 |
| World Fuel Services Corp. | | 112,947 | 3,143,315 |
| WPX Energy, Inc. (a) | | 57,988 | 1,088,435 |
| | | | 73,739,695 |
|
| TOTAL ENERGY | | | 109,266,255 |
|
| FINANCIALS - 11.6% | | | |
| Banks - 1.2% | | | |
| ACNB Corp. | | 5,222 | 179,115 |
| Associated Banc-Corp. | | 9,826 | 265,302 |
| BancFirst Corp. | | 3,735 | 231,944 |
| Bank Ireland Group PLC | | 682,359 | 5,856,707 |
| Bank of America Corp. | | 7,077 | 218,538 |
| Boston Private Financial Holdings, Inc. | | 10,803 | 155,563 |
| Camden National Corp. | | 3,225 | 148,673 |
| Cathay General Bancorp | | 38,129 | 1,585,785 |
| Central Pacific Financial Corp. | | 8,273 | 228,004 |
| Codorus Valley Bancorp, Inc. | | 38,030 | 1,187,677 |
| Cullen/Frost Bankers, Inc. | | 4,497 | 496,874 |
| Dah Sing Banking Group Ltd. | | 97,600 | 207,161 |
| Dimeco, Inc. | | 1,820 | 75,512 |
| East West Bancorp, Inc. | | 1,468 | 95,038 |
| First Bancorp, Puerto Rico (a) | | 291,797 | 2,398,571 |
| First Citizen Bancshares, Inc. | | 501 | 203,817 |
| First Hawaiian, Inc. | | 26,621 | 752,309 |
| Hanmi Financial Corp. | | 2,796 | 70,040 |
| Hope Bancorp, Inc. | | 48,610 | 815,676 |
| Huntington Bancshares, Inc. | | 14,786 | 228,296 |
| KeyCorp | | 8,291 | 173,033 |
| LCNB Corp. | | 7,913 | 147,182 |
| Meridian Bank/Malvern, PA (a) | | 8,557 | 148,977 |
| Northrim Bancorp, Inc. | | 6,422 | 258,807 |
| OFG Bancorp | | 24,339 | 405,244 |
| Peoples Bancorp, Inc. | | 2,921 | 105,799 |
| PNC Financial Services Group, Inc. | | 1,536 | 222,459 |
| Popular, Inc. | | 1,964 | 97,473 |
| Regions Financial Corp. | | 11,427 | 212,656 |
| SpareBank 1 SR-Bank ASA (primary capital certificate) | | 75,107 | 834,251 |
| Sparebanken More (primary capital certificate) | | 12,719 | 424,141 |
| Sparebanken Nord-Norge | | 140,984 | 1,071,642 |
| Umpqua Holdings Corp. | | 7,116 | 151,571 |
| Van Lanschot NV (Bearer) | | 60,275 | 1,663,389 |
| Wells Fargo & Co. | | 50,602 | 2,898,989 |
| | | | 24,216,215 |
| Capital Markets - 0.5% | | | |
| AllianceBernstein Holding LP | | 39,602 | 1,195,980 |
| Ameriprise Financial, Inc. | | 769 | 112,020 |
| Ares Capital Corp. | | 11,300 | 190,405 |
| Banca Generali SpA | | 7,365 | 198,771 |
| Close Brothers Group PLC | | 7,856 | 163,745 |
| Cowen Group, Inc. Class A (a) | | 23,062 | 362,073 |
| Franklin Resources, Inc. | | 62,979 | 2,161,439 |
| GAMCO Investors, Inc. Class A | | 6,617 | 162,050 |
| Hamilton Lane, Inc. Class A | | 5,227 | 255,966 |
| Invesco Ltd. | | 6,085 | 164,234 |
| Lazard Ltd. Class A | | 21,056 | 1,143,341 |
| OM Asset Management Ltd. | | 11,479 | 163,576 |
| State Street Corp. | | 9,745 | 860,581 |
| Tullett Prebon PLC | | 40,280 | 148,035 |
| Waddell & Reed Financial, Inc. Class A | | 149,390 | 3,093,867 |
| | | | 10,376,083 |
| Consumer Finance - 1.3% | | | |
| Aeon Credit Service (Asia) Co. Ltd. | | 776,000 | 657,455 |
| American Express Co. | | 2,103 | 209,291 |
| Discover Financial Services | | 33,959 | 2,425,012 |
| H&T Group PLC | | 29,550 | 122,563 |
| Navient Corp. | | 65,461 | 864,740 |
| Nicholas Financial, Inc. (a) | | 20,540 | 188,968 |
| OneMain Holdings, Inc. (a) | | 33,884 | 1,126,643 |
| Santander Consumer U.S.A. Holdings, Inc. | | 546,083 | 10,506,637 |
| Synchrony Financial | | 401,037 | 11,606,011 |
| | | | 27,707,320 |
| Diversified Financial Services - 0.2% | | | |
| AXA Equitable Holdings, Inc. | | 130,328 | 2,865,913 |
| Far East Horizon Ltd. | | 143,000 | 137,734 |
| Ricoh Leasing Co. Ltd. | | 46,600 | 1,521,173 |
| | | | 4,524,820 |
| Insurance - 7.5% | | | |
| AEGON NV | | 2,618,532 | 17,275,693 |
| AFLAC, Inc. | | 37,491 | 1,744,831 |
| Allstate Corp. | | 2,251 | 214,115 |
| April | | 105,901 | 1,684,161 |
| ASR Nederland NV | | 33,885 | 1,517,577 |
| Assurant, Inc. | | 146,017 | 16,105,675 |
| Aub Group Ltd. | | 14,042 | 136,770 |
| Axis Capital Holdings Ltd. | | 99,811 | 5,645,310 |
| CNO Financial Group, Inc. | | 10,471 | 213,085 |
| Employers Holdings, Inc. | | 5,157 | 239,543 |
| FBD Holdings PLC | | 6,921 | 83,763 |
| First American Financial Corp. | | 6,201 | 347,256 |
| Great-West Lifeco, Inc. | | 2,289 | 56,572 |
| Hartford Financial Services Group, Inc. | | 115,479 | 6,085,743 |
| Hiscox Ltd. | | 13,653 | 286,366 |
| Hyundai Fire & Marine Insurance Co. Ltd. | | 6,437 | 211,875 |
| Investors Title Co. | | 431 | 82,493 |
| Lincoln National Corp. | | 272,422 | 18,551,938 |
| MetLife, Inc. | | 631,797 | 28,898,395 |
| National Western Life Group, Inc. | | 8,046 | 2,606,904 |
| NN Group NV | | 71,958 | 3,182,329 |
| Primerica, Inc. | | 7,013 | 805,092 |
| Principal Financial Group, Inc. | | 3,009 | 174,763 |
| RenaissanceRe Holdings Ltd. | | 87,476 | 11,533,711 |
| Sony Financial Holdings, Inc. | | 148,900 | 2,861,334 |
| The Travelers Companies, Inc. | | 1,592 | 207,183 |
| Torchmark Corp. | | 5,000 | 440,350 |
| Universal Insurance Holdings, Inc. | | 2,572 | 114,197 |
| Unum Group | | 918,408 | 36,488,350 |
| WMI Holdings Corp. (a) | | 21,556 | 29,316 |
| | | | 157,824,690 |
| Mortgage Real Estate Investment Trusts - 0.5% | | | |
| Annaly Capital Management, Inc. | | 893,726 | 9,580,743 |
| MFA Financial, Inc. | | 15,524 | 124,968 |
| New Residential Investment Corp. | | 1,357 | 24,277 |
| Redwood Trust, Inc. | | 29,299 | 492,516 |
| | | | 10,222,504 |
| Thrifts & Mortgage Finance - 0.4% | | | |
| ASAX Co. Ltd. | | 18,500 | 106,055 |
| Genworth MI Canada, Inc. | | 219,378 | 7,722,119 |
| Genworth Mortgage Insurance Ltd. | | 376,210 | 751,869 |
| Meridian Bancorp, Inc. Maryland | | 12,010 | 219,783 |
| | | | 8,799,826 |
|
| TOTAL FINANCIALS | | | 243,671,458 |
|
| HEALTH CARE - 14.3% | | | |
| Biotechnology - 1.7% | | | |
| Amgen, Inc. | | 173,979 | 34,195,572 |
| Celgene Corp. (a) | | 502 | 45,225 |
| Gilead Sciences, Inc. | | 11,650 | 906,720 |
| United Therapeutics Corp. (a) | | 2,094 | 257,374 |
| | | | 35,404,891 |
| Health Care Equipment & Supplies - 0.6% | | | |
| Arts Optical International Holdings Ltd. | | 1,234,000 | 323,866 |
| Boston Scientific Corp. (a) | | 14,308 | 480,892 |
| Hoshiiryou Sanki Co. Ltd. | | 14,200 | 518,142 |
| Huvitz Co. Ltd. | | 1,185 | 12,877 |
| LivaNova PLC (a) | | 2,801 | 308,474 |
| Nakanishi, Inc. | | 57,000 | 1,190,314 |
| Prim SA | | 68,407 | 1,047,892 |
| ResMed, Inc. | | 4,351 | 460,249 |
| Shandong Weigao Medical Polymer Co. Ltd. (H Shares) | | 44,000 | 33,635 |
| Supermax Corp. Bhd | | 608,900 | 654,586 |
| Techno Medica Co. Ltd. | | 1,700 | 32,171 |
| Utah Medical Products, Inc. | | 17,123 | 1,660,931 |
| Zimmer Biomet Holdings, Inc. | | 49,344 | 6,193,659 |
| | | | 12,917,688 |
| Health Care Providers & Services - 11.2% | | | |
| Aetna, Inc. | | 253,667 | 47,788,326 |
| Anthem, Inc. | | 113,869 | 28,808,857 |
| CVS Health Corp. | | 33,646 | 2,182,280 |
| DVx, Inc. | | 33,300 | 425,873 |
| Hanger, Inc. (a) | | 118,586 | 2,075,255 |
| Humana, Inc. | | 532 | 167,144 |
| Laboratory Corp. of America Holdings (a) | | 557 | 97,664 |
| Medica Sur SA de CV | | 15,925 | 32,461 |
| MEDNAX, Inc. (a) | | 29,750 | 1,273,003 |
| Patterson Companies, Inc. | | 15,189 | 372,434 |
| Premier, Inc. (a) | | 8,174 | 305,708 |
| Quest Diagnostics, Inc. | | 1,622 | 174,722 |
| Ship Healthcare Holdings, Inc. | | 7,500 | 290,770 |
| Tokai Corp. | | 18,400 | 402,672 |
| Triple-S Management Corp.(a) | | 87,961 | 3,123,495 |
| Tsukui Corp. | | 23,200 | 209,768 |
| United Drug PLC (United Kingdom) | | 151,794 | 1,673,593 |
| UnitedHealth Group, Inc. | | 546,080 | 138,278,354 |
| Universal Health Services, Inc. Class B | | 37,369 | 4,562,755 |
| WIN-Partners Co. Ltd. | | 119,400 | 1,777,946 |
| | | | 234,023,080 |
| Health Care Technology - 0.0% | | | |
| Addlife AB | | 13,886 | 333,215 |
| Computer Programs & Systems, Inc. | | 8,437 | 263,234 |
| ND Software Co. Ltd. | | 58,500 | 627,823 |
| | | | 1,224,272 |
| Pharmaceuticals - 0.8% | | | |
| Akorn, Inc. (a) | | 5,113 | 94,693 |
| Bliss Gvs Pharma Ltd. (a) | | 276,498 | 694,072 |
| Bristol-Myers Squibb Co. | | 2,567 | 150,811 |
| Daewoong Co. Ltd. | | 21,038 | 277,743 |
| Dawnrays Pharmaceutical Holdings Ltd. | | 676,000 | 385,840 |
| DongKook Pharmaceutical Co. Ltd. | | 796 | 44,895 |
| FDC Ltd. (a) | | 188,810 | 664,117 |
| Fuji Pharma Co. Ltd. | | 39,400 | 684,298 |
| Genomma Lab Internacional SA de CV (a) | | 321,321 | 256,364 |
| Indivior PLC (a) | | 794,038 | 3,187,092 |
| Jazz Pharmaceuticals PLC (a) | | 1,387 | 240,062 |
| Korea United Pharm, Inc. | | 14,404 | 309,174 |
| Kyung Dong Pharmaceutical Co. Ltd. | | 57,704 | 627,065 |
| Lee's Pharmaceutical Holdings Ltd. | | 365,500 | 391,621 |
| Novo Nordisk A/S Series B sponsored ADR | | 65,502 | 3,260,035 |
| Phibro Animal Health Corp. Class A | | 8,052 | 385,691 |
| Recordati SpA | | 93,836 | 3,509,074 |
| Taro Pharmaceutical Industries Ltd. (a) | | 2,545 | 285,702 |
| Tsumura & Co. | | 21,300 | 690,538 |
| Vivimed Labs Ltd. (a) | | 17,923 | 14,831 |
| Whanin Pharmaceutical Co. Ltd. | | 652 | 12,326 |
| | | | 16,166,044 |
|
| TOTAL HEALTH CARE | | | 299,735,975 |
|
| INDUSTRIALS - 6.9% | | | |
| Aerospace & Defense - 0.2% | | | |
| Astronics Corp. (a) | | 4,293 | 176,056 |
| Austal Ltd. | | 85,892 | 109,121 |
| Engility Holdings, Inc. (a) | | 76,961 | 2,662,851 |
| United Technologies Corp. | | 4,205 | 570,787 |
| | | | 3,518,815 |
| Air Freight & Logistics - 0.0% | | | |
| Air T, Inc. (a) | | 10,305 | 337,489 |
| Airlines - 0.1% | | | |
| Air New Zealand Ltd. | | 67,673 | 149,679 |
| American Airlines Group, Inc. | | 14,367 | 568,071 |
| JetBlue Airways Corp. (a) | | 20,124 | 362,232 |
| | | | 1,079,982 |
| Building Products - 0.1% | | | |
| Builders FirstSource, Inc. (a) | | 7,270 | 130,351 |
| Continental Building Products, Inc. (a) | | 18,948 | 604,441 |
| COVIA Corp. (a) | | 23,047 | 415,537 |
| Gibraltar Industries, Inc. (a) | | 6,058 | 263,220 |
| Kondotec, Inc. | | 95,300 | 871,904 |
| | | | 2,285,453 |
| Commercial Services & Supplies - 0.6% | | | |
| ABM Industries, Inc. | | 12,605 | 393,276 |
| Aeon Delight Co. Ltd. | | 6,600 | 241,122 |
| AJIS Co. Ltd. | | 42,600 | 1,323,928 |
| Asia File Corp. Bhd | | 252,700 | 170,953 |
| Calian Technologies Ltd. | | 33,413 | 810,378 |
| Civeo Corp. (a) | | 654,067 | 2,491,995 |
| Essendant, Inc. | | 100,447 | 1,670,434 |
| Interface, Inc. | | 15,064 | 337,434 |
| KAR Auction Services, Inc. | | 2,077 | 123,478 |
| Lion Rock Group Ltd. | | 1,100,000 | 190,596 |
| Mears Group PLC | | 47,605 | 203,073 |
| Mitie Group PLC | | 818,214 | 1,651,730 |
| Nac Co. Ltd. | | 22,500 | 197,402 |
| NICE Total Cash Management Co., Ltd. | | 61,611 | 724,855 |
| VICOM Ltd. | | 161,500 | 727,216 |
| VSE Corp. | | 41,936 | 1,807,442 |
| | | | 13,065,312 |
| Construction & Engineering - 1.1% | | | |
| AECOM (a) | | 418,599 | 14,048,182 |
| Arcadis NV | | 128,177 | 2,344,182 |
| Boustead Projs. Pte Ltd. | | 49,200 | 32,707 |
| Boustead Singapore Ltd. | | 231,200 | 140,111 |
| C-Cube Corp. | | 19,600 | 161,442 |
| Daiichi Kensetsu Corp. | | 81,900 | 1,303,046 |
| EMCOR Group, Inc. | | 8,512 | 654,998 |
| Geumhwa PSC Co. Ltd. | | 21,639 | 641,317 |
| Kyeryong Construction Industrial Co. Ltd. (a) | | 27,197 | 539,802 |
| Meisei Industrial Co. Ltd. | | 67,200 | 542,696 |
| Mirait Holdings Corp. | | 24,800 | 380,600 |
| Nippon Rietec Co. Ltd. | | 55,700 | 788,064 |
| Severfield PLC | | 168,134 | 183,168 |
| Shinnihon Corp. | | 95,800 | 1,210,619 |
| Toshiba Plant Systems & Services Corp. | | 9,300 | 205,521 |
| | | | 23,176,455 |
| Electrical Equipment - 0.5% | | | |
| Aichi Electric Co. Ltd. | | 17,800 | 529,312 |
| Aros Quality Group AB | | 44,164 | 818,694 |
| AZZ, Inc. | | 61,913 | 3,355,685 |
| Bharat Heavy Electricals Ltd. | | 1,848,330 | 1,999,253 |
| Chiyoda Integre Co. Ltd. | | 20,000 | 442,159 |
| Eaton Corp. PLC | | 2,716 | 225,890 |
| Generac Holdings, Inc. (a) | | 5,100 | 274,125 |
| Hammond Power Solutions, Inc. Class A | | 23,582 | 130,160 |
| Korea Electric Terminal Co. Ltd. | | 42,076 | 1,742,035 |
| Regal Beloit Corp. | | 2,618 | 225,017 |
| Servotronics, Inc. | | 6,928 | 66,703 |
| TKH Group NV (depositary receipt) | | 14,615 | 915,172 |
| | | | 10,724,205 |
| Industrial Conglomerates - 1.0% | | | |
| DCC PLC (United Kingdom) | | 196,421 | 18,175,773 |
| ITT, Inc. | | 4,807 | 272,413 |
| Lifco AB | | 31,159 | 1,397,964 |
| Mytilineos Holdings SA | | 52,865 | 531,632 |
| Reunert Ltd. | | 103,463 | 641,168 |
| | | | 21,018,950 |
| Machinery - 1.5% | | | |
| Aalberts Industries NV | | 404,895 | 18,370,402 |
| Allison Transmission Holdings, Inc. | | 23,678 | 1,112,866 |
| ASL Marine Holdings Ltd. (a) | | 2,751,100 | 202,086 |
| Cummins, Inc. | | 1,398 | 199,648 |
| Douglas Dynamics, Inc. | | 1,796 | 88,184 |
| Global Brass & Copper Holdings, Inc. | | 2,645 | 87,153 |
| Haitian International Holdings Ltd. | | 423,000 | 997,000 |
| Hurco Companies, Inc. | | 3,034 | 134,406 |
| Hyster-Yale Materials Handling Class A | | 32,780 | 2,155,613 |
| Ihara Science Corp. | | 59,800 | 1,214,558 |
| Jaya Holdings Ltd. (a)(c) | | 47,300 | 1,008 |
| Kyowakogyosyo Co. Ltd. | | 2,700 | 156,714 |
| Luxfer Holdings PLC sponsored | | 17,445 | 322,733 |
| Maruzen Co. Ltd. | | 76,000 | 1,502,124 |
| Miller Industries, Inc. | | 5,261 | 137,049 |
| Mincon Group PLC | | 122,754 | 215,314 |
| Nadex Co. Ltd. | | 38,000 | 355,820 |
| Nakano Refrigerators Co. Ltd. | | 1,200 | 63,855 |
| Nitchitsu Co. Ltd. | | 2,600 | 42,645 |
| Rexnord Corp. (a) | | 12,832 | 388,040 |
| Semperit AG Holding (a) | | 26,934 | 535,420 |
| Takamatsu Machinery Co. Ltd. | | 19,700 | 207,192 |
| Techno Smart Corp. | | 32,200 | 343,267 |
| Tocalo Co. Ltd. | | 147,400 | 1,682,086 |
| Trinity Industrial Corp. | | 41,300 | 262,246 |
| WABCO Holdings, Inc. (a) | | 4,325 | 543,566 |
| | | | 31,320,995 |
| Marine - 0.0% | | | |
| SITC International Holdings Co. Ltd. | | 257,000 | 249,500 |
| Tokyo Kisen Co. Ltd. | | 39,500 | 285,083 |
| | | | 534,583 |
| Professional Services - 0.3% | | | |
| Akka Technologies SA | | 13,751 | 1,013,023 |
| Asiakastieto Group Oyj (d) | | 4,701 | 168,761 |
| Boardroom Ltd. | | 122,600 | 70,245 |
| Clarius Group Ltd. (a) | | 129,610 | 5,104 |
| ICF International, Inc. | | 3,636 | 267,791 |
| Kelly Services, Inc. Class A (non-vtg.) | | 6,357 | 154,412 |
| McMillan Shakespeare Ltd. | | 109,805 | 1,325,669 |
| Nielsen Holdings PLC | | 29,488 | 694,737 |
| Robert Half International, Inc. | | 2,932 | 222,128 |
| SHL-JAPAN Ltd. | | 6,200 | 108,901 |
| Stantec, Inc. | | 46,170 | 1,205,669 |
| Synergie SA | | 7,813 | 364,988 |
| TrueBlue, Inc. (a) | | 15,951 | 431,475 |
| | | | 6,032,903 |
| Road& Rail - 0.7% | | | |
| Alps Logistics Co. Ltd. | | 135,900 | 1,035,521 |
| Chilled & Frozen Logistics Holdings Co. Ltd. | | 57,400 | 689,426 |
| CSX Corp. | | 7,132 | 504,090 |
| Daqin Railway Co. Ltd. (A Shares) | | 1,562,807 | 2,053,095 |
| Hamakyorex Co. Ltd. | | 76,300 | 2,637,388 |
| Higashi Twenty One Co. Ltd. | | 12,000 | 68,256 |
| Knight-Swift Transportation Holdings, Inc. Class A | | 8,300 | 270,165 |
| Norfolk Southern Corp. | | 2,211 | 373,659 |
| Roadrunner Transportation Systems, Inc. (a) | | 191,872 | 420,200 |
| Sakai Moving Service Co. Ltd. | | 65,800 | 3,477,870 |
| Trancom Co. Ltd. | | 40,600 | 2,977,418 |
| | | | 14,507,088 |
| Trading Companies & Distributors - 0.7% | | | |
| AddTech AB (B Shares) | | 68,825 | 1,559,197 |
| AerCap Holdings NV (a) | | 14,162 | 794,913 |
| Alconix Corp. | | 110,754 | 1,702,689 |
| Goodfellow, Inc. (a) | | 36,941 | 207,302 |
| HD Supply Holdings, Inc. (a) | | 26,898 | 1,182,974 |
| HERIGE | | 3,759 | 154,725 |
| Houston Wire & Cable Co. (a) | | 3,704 | 29,632 |
| Kaman Corp. | | 2,369 | 156,875 |
| KS Energy Services Ltd. (a) | | 627,100 | 14,741 |
| Lumax International Corp. Ltd. | | 29,000 | 57,752 |
| Meiwa Corp. | | 81,500 | 353,508 |
| Mitani Shoji Co. Ltd. | | 44,400 | 2,064,839 |
| MRC Global, Inc. (a) | | 25,964 | 588,085 |
| Otec Corp. | | 6,000 | 110,486 |
| Parker Corp. | | 106,000 | 523,293 |
| Richelieu Hardware Ltd. | | 42,835 | 926,936 |
| Senshu Electric Co. Ltd. | | 42,600 | 1,274,400 |
| Strongco Corp. (a) | | 40,279 | 68,120 |
| Tanaka Co. Ltd. | | 1,600 | 10,017 |
| TECHNO ASSOCIE Co. Ltd. | | 15,600 | 188,347 |
| Titan Machinery, Inc. (a) | | 44,426 | 672,610 |
| Totech Corp. | | 56,400 | 1,309,939 |
| WESCO International, Inc. (a) | | 2,903 | 177,083 |
| | | | 14,128,463 |
| Transportation Infrastructure - 0.1% | | | |
| Isewan Terminal Service Co. Ltd. | | 78,700 | 518,027 |
| James Fisher and Sons PLC | | 7,237 | 171,171 |
| Meiko Transportation Co. Ltd. | | 50,400 | 550,810 |
| Qingdao Port International Co. Ltd. (d) | | 268,000 | 195,305 |
| Sinwa Ltd. | | 1,166,300 | 197,046 |
| | | | 1,632,359 |
|
| TOTAL INDUSTRIALS | | | 143,363,052 |
|
| INFORMATION TECHNOLOGY - 15.1% | | | |
| Communications Equipment - 0.1% | | | |
| F5 Networks, Inc. (a) | | 1,285 | 220,223 |
| InterDigital, Inc. | | 8,465 | 697,939 |
| Juniper Networks, Inc. | | 9,569 | 252,047 |
| | | | 1,170,209 |
| Electronic Equipment & Components - 3.4% | | | |
| A&D Co. Ltd. | | 41,500 | 388,222 |
| AVX Corp. | | 8,500 | 176,630 |
| Bel Fuse, Inc. Class A | | 5,230 | 102,508 |
| Casa Systems, Inc. (a) | | 4,956 | 75,480 |
| CDW Corp. | | 9,662 | 812,478 |
| CTS Corp. | | 17,325 | 604,643 |
| Daido Signal Co. Ltd. | | 3,500 | 18,468 |
| Elec & Eltek International Co. Ltd. | | 81,800 | 119,428 |
| Elematec Corp. | | 71,900 | 1,689,873 |
| ePlus, Inc. (a) | | 5,421 | 534,782 |
| Excel Co. Ltd. | | 35,400 | 804,150 |
| Fabrinet | | 6,579 | 257,370 |
| Hi-P International Ltd. | | 726,500 | 672,413 |
| IDIS Holdings Co. Ltd. | | 48,087 | 611,091 |
| Image Sensing Systems, Inc. (a) | | 3,045 | 12,789 |
| Insight Enterprises, Inc. (a) | | 18,250 | 917,428 |
| Intelligent Digital Integrated Security Co. Ltd. | | 41,184 | 326,596 |
| Isra Vision AG | | 76,634 | 4,713,590 |
| Keysight Technologies, Inc. (a) | | 160,479 | 9,307,782 |
| Kingboard Chemical Holdings Ltd. | | 4,348,000 | 15,150,598 |
| Kingboard Laminates Holdings Ltd. | | 227,000 | 271,276 |
| Mesa Laboratories, Inc. | | 8,275 | 1,673,453 |
| Muramoto Electronic Thailand PCL (For. Reg.) | | 74,800 | 427,172 |
| Nippo Ltd. | | 42,100 | 169,808 |
| PAX Global Technology Ltd. | | 248,000 | 119,118 |
| Philips Lighting NV (d) | | 6,310 | 175,020 |
| Pinnacle Technology Holdings Ltd. | | 419,492 | 595,747 |
| Plexus Corp. (a) | | 8,070 | 479,519 |
| Redington India Ltd. | | 347,581 | 548,331 |
| Sanmina Corp. (a) | | 1,357 | 39,489 |
| ScanSource, Inc. (a) | | 137,429 | 5,668,946 |
| Shibaura Electronics Co. Ltd. | | 29,800 | 1,260,600 |
| Sigmatron International, Inc. (a) | | 9,932 | 69,425 |
| SYNNEX Corp. | | 164,421 | 15,861,694 |
| Tomen Devices Corp. | | 32,800 | 840,131 |
| Tripod Technology Corp. | | 49,000 | 135,234 |
| TTM Technologies, Inc. (a) | | 51,555 | 894,995 |
| UKC Holdings Corp. | | 77,400 | 1,578,250 |
| VST Holdings Ltd. | | 5,654,000 | 3,061,453 |
| Wayside Technology Group, Inc. | | 14,332 | 193,482 |
| Wireless Telecom Group, Inc. (a) | | 15,460 | 32,466 |
| | | | 71,391,928 |
| Internet Software & Services - 0.2% | | | |
| Alphabet, Inc.: | | | |
| Class A (a) | | 84 | 103,086 |
| Class C (a) | | 518 | 630,541 |
| Aucnet, Inc. | | 10,100 | 150,847 |
| Carbonite, Inc. (a) | | 11,928 | 409,130 |
| eBay, Inc. (a) | | 2,528 | 84,562 |
| Gabia, Inc. | | 58,606 | 488,440 |
| j2 Global, Inc. | | 11,031 | 935,870 |
| Moneysupermarket.com Group PLC | | 41,791 | 172,293 |
| NetGem SA | | 46,550 | 128,462 |
| Softbank Technology Corp. | | 15,700 | 279,276 |
| Yahoo! Japan Corp. (b) | | 119,200 | 453,508 |
| | | | 3,836,015 |
| IT Services - 3.6% | | | |
| ALTEN | | 37,051 | 3,680,509 |
| Amdocs Ltd. | | 386,422 | 26,114,399 |
| Argo Graphics, Inc. | | 24,000 | 936,905 |
| CACI International, Inc. Class A (a) | | 3,501 | 613,375 |
| Computer Services, Inc. | | 15,690 | 811,958 |
| CSE Global Ltd. | | 1,933,300 | 639,060 |
| Data#3 Ltd. | | 160,315 | 181,637 |
| DXC Technology Co. | | 4,220 | 357,603 |
| E-Credible Co. Ltd. | | 7,775 | 105,089 |
| eClerx Services Ltd. | | 101,259 | 1,911,881 |
| EOH Holdings Ltd. | | 389,169 | 1,226,544 |
| Estore Corp. | | 13,600 | 117,494 |
| EVERTEC, Inc. | | 88,807 | 2,069,203 |
| ExlService Holdings, Inc. (a) | | 9,754 | 581,729 |
| Indra Sistemas SA (a) | | 782,300 | 9,504,590 |
| Know IT AB | | 84,753 | 1,677,142 |
| Leidos Holdings, Inc. | | 39,057 | 2,672,280 |
| Maximus, Inc. | | 17,279 | 1,119,852 |
| Net 1 UEPS Technologies, Inc. (a) | | 26,337 | 245,988 |
| Rolta India Ltd. (a) | | 152,299 | 91,655 |
| Science Applications International Corp. | | 8,931 | 753,508 |
| Societe Pour L'Informatique Industrielle SA | | 78,736 | 2,301,749 |
| Softcreate Co. Ltd. | | 36,700 | 572,417 |
| Sword Group | | 379 | 15,511 |
| Syntel, Inc. (a) | | 3,539 | 143,648 |
| The Western Union Co. | | 853,909 | 17,214,805 |
| TravelSky Technology Ltd. (H Shares) | | 62,300 | 176,604 |
| WNS Holdings Ltd. sponsored ADR (a) | | 4,148 | 201,842 |
| | | | 76,038,977 |
| Semiconductors & Semiconductor Equipment - 0.6% | | | |
| Amkor Technology, Inc. (a) | | 257 | 2,231 |
| Axell Corp. | | 46,400 | 324,922 |
| Boe Varitronix Ltd. | | 306,000 | 120,855 |
| Cirrus Logic, Inc. (a) | | 3,899 | 168,671 |
| Diodes, Inc. (a) | | 14,719 | 546,958 |
| Entegris, Inc. | | 16,971 | 596,531 |
| Integrated Device Technology, Inc. (a) | | 26,228 | 903,030 |
| KLA-Tencor Corp. | | 1,314 | 154,290 |
| Leeno Industrial, Inc. | | 34,562 | 2,076,569 |
| Melexis NV | | 70,180 | 6,528,269 |
| Miraial Co. Ltd. | | 7,900 | 80,473 |
| Nanometrics, Inc. (a) | | 13,368 | 503,439 |
| ON Semiconductor Corp. (a) | | 11,206 | 247,092 |
| Trio-Tech International (a) | | 11,055 | 51,074 |
| United Microelectronics Corp. | | 240,000 | 137,592 |
| | | | 12,441,996 |
| Software - 3.5% | | | |
| Activision Blizzard, Inc. | | 8,344 | 612,616 |
| AdaptIT Holdings Ltd. | | 153,070 | 95,905 |
| ANSYS, Inc. (a) | | 214,828 | 36,280,153 |
| Aspen Technology, Inc. (a) | | 6,643 | 636,333 |
| Ebix, Inc. | | 91,370 | 7,250,210 |
| ICT Automatisering NV | | 29,956 | 528,939 |
| InfoVine Co. Ltd. | | 2,756 | 58,413 |
| Jorudan Co. Ltd. | | 19,800 | 190,536 |
| KPIT Cummins Infosystems Ltd. | | 350,682 | 1,522,388 |
| KSK Co., Ltd. | | 25,100 | 403,836 |
| Micro Focus International PLC | | 12,230 | 199,562 |
| Nucleus Software Exports Ltd. | | 35,047 | 176,899 |
| Oracle Corp. | | 491,689 | 23,443,732 |
| Pegasystems, Inc. | | 8,152 | 453,251 |
| Pro-Ship, Inc. | | 13,500 | 298,216 |
| RealPage, Inc. (a) | | 11,412 | 628,801 |
| Vitec Software Group AB | | 42,527 | 392,723 |
| Zensar Technologies Ltd. | | 45,127 | 814,606 |
| | | | 73,987,119 |
| Technology Hardware, Storage & Peripherals - 3.7% | | | |
| Hewlett Packard Enterprise Co. | | 129,163 | 1,994,277 |
| HP, Inc. | | 392,319 | 9,054,723 |
| Seagate Technology LLC | | 1,138,113 | 59,887,506 |
| Super Micro Computer, Inc. (a) | | 38,489 | 850,607 |
| TPV Technology Ltd. | | 4,238,000 | 437,350 |
| Western Digital Corp. | | 2,340 | 164,151 |
| Xerox Corp. | | 148,997 | 3,869,452 |
| | | | 76,258,066 |
|
| TOTAL INFORMATION TECHNOLOGY | | | 315,124,310 |
|
| MATERIALS - 3.7% | | | |
| Chemicals - 2.5% | | | |
| Axalta Coating Systems Ltd. (a) | | 27,673 | 837,108 |
| C. Uyemura & Co. Ltd. | | 23,300 | 1,750,391 |
| Cabot Corp. | | 859 | 56,780 |
| Chase Corp. | | 41,257 | 5,095,240 |
| Core Molding Technologies, Inc. | | 23,256 | 312,793 |
| Deepak Fertilisers and Petrochemicals Corp. Ltd. | | 108,617 | 438,530 |
| DowDuPont, Inc. | | 2,730 | 187,742 |
| Eastman Chemical Co. | | 1,622 | 168,072 |
| EcoGreen International Group Ltd. | | 3,050,000 | 648,932 |
| FMC Corp. | | 72,613 | 6,526,456 |
| Fujikura Kasei Co., Ltd. | | 128,800 | 746,433 |
| Fuso Chemical Co. Ltd. | | 36,500 | 931,964 |
| Gujarat Narmada Valley Fertilizers Co. | | 300,542 | 1,832,402 |
| Gujarat State Fertilizers & Chemicals Ltd. | | 1,713,087 | 2,918,954 |
| Honshu Chemical Industry Co. Ltd. | | 46,400 | 469,332 |
| Huntsman Corp. | | 16,315 | 547,042 |
| Innospec, Inc. | | 48,365 | 3,915,147 |
| JSR Corp. | | 15,000 | 287,215 |
| KPC Holdings Corp. | | 2,453 | 138,350 |
| KPX Green Chemical Co. Ltd. | | 14,002 | 54,450 |
| Miwon Chemicals Co. Ltd. | | 3,108 | 130,353 |
| Miwon Commercial Co. Ltd. | | 780 | 175,478 |
| Muto Seiko Co. Ltd. | | 12,600 | 86,656 |
| Nihon Parkerizing Co. Ltd. | | 17,400 | 257,541 |
| Nippon Soda Co. Ltd. | | 96,000 | 562,357 |
| SK Kaken Co. Ltd. | | 17,000 | 1,581,183 |
| Soken Chemical & Engineer Co. Ltd. | | 31,600 | 575,676 |
| T&K Toka Co. Ltd. | | 82,000 | 944,560 |
| Thai Carbon Black PCL (For. Reg.) (a) | | 698,500 | 1,102,232 |
| Thai Rayon PCL: | | | |
| (For. Reg.) | | 129,300 | 182,660 |
| NVDR | | 96,200 | 135,900 |
| The Chemours Co. LLC | | 14,528 | 665,528 |
| The Mosaic Co. | | 196,245 | 5,908,937 |
| UPL Ltd. | | 52,595 | 494,797 |
| Westlake Chemical Corp. | | 5,673 | 608,259 |
| Yara International ASA | | 212,696 | 9,384,893 |
| Yip's Chemical Holdings Ltd. | | 1,564,000 | 547,964 |
| | | | 51,208,307 |
| Construction Materials - 0.1% | | | |
| Brampton Brick Ltd. Class A (sub. vtg.) (a) | | 34,310 | 213,638 |
| Mitani Sekisan Co. Ltd. | | 90,800 | 2,201,483 |
| RHI Magnesita NV | | 2,495 | 157,547 |
| | | | 2,572,668 |
| Containers & Packaging - 0.2% | | | |
| AMVIG Holdings Ltd. | | 164,000 | 40,326 |
| Berry Global Group, Inc. (a) | | 4,678 | 228,520 |
| Chuoh Pack Industry Co. Ltd. | | 20,000 | 250,414 |
| Kohsoku Corp. | | 82,700 | 1,011,053 |
| Pact Group Holdings Ltd. (d) | | 39,154 | 157,374 |
| Samhwa Crown & Closure Co. Ltd. | | 2,820 | 119,540 |
| Silgan Holdings, Inc. | | 11,581 | 318,593 |
| The Pack Corp. | | 95,000 | 3,020,391 |
| | | | 5,146,211 |
| Metals & Mining - 0.8% | | | |
| Alcoa Corp. (a) | | 2,021 | 87,449 |
| Ausdrill Ltd. | | 119,844 | 162,495 |
| Chubu Steel Plate Co. Ltd. | | 25,300 | 155,219 |
| Cleveland-Cliffs, Inc. (a) | | 776,001 | 8,373,051 |
| Compania de Minas Buenaventura SA sponsored ADR | | 137,369 | 1,887,450 |
| Freeport-McMoRan, Inc. | | 14,430 | 238,095 |
| Granges AB | | 14,912 | 186,719 |
| Hill & Smith Holdings PLC | | 49,084 | 970,888 |
| Newmont Mining Corp. | | 4,440 | 162,859 |
| Nucor Corp. | | 1,394 | 93,300 |
| Orosur Mining, Inc. (a) | | 141,632 | 6,533 |
| Orvana Minerals Corp. (a) | | 36,409 | 5,038 |
| Pacific Metals Co. Ltd. (a) | | 21,200 | 611,106 |
| Steel Dynamics, Inc. | | 4,139 | 194,906 |
| Tohoku Steel Co. Ltd. | | 29,800 | 407,763 |
| Tokyo Tekko Co. Ltd. | | 36,300 | 568,775 |
| Universal Stainless & Alloy Products, Inc. (a) | | 4,444 | 132,920 |
| Warrior Metropolitan Coal, Inc. (b) | | 63,013 | 1,630,146 |
| Webco Industries, Inc. (a) | | 392 | 43,900 |
| Worthington Industries, Inc. | | 4,677 | 218,977 |
| | | | 16,137,589 |
| Paper & Forest Products - 0.1% | | | |
| Louisiana-Pacific Corp. | | 5,896 | 158,720 |
| Stella-Jones, Inc. | | 36,272 | 1,211,530 |
| Western Forest Products, Inc. | | 110,849 | 206,215 |
| | | | 1,576,465 |
|
| TOTAL MATERIALS | | | 76,641,240 |
|
| REAL ESTATE - 0.7% | | | |
| Equity Real Estate Investment Trusts (REITs) - 0.3% | | | |
| Colony NorthStar, Inc. | | 110,544 | 680,951 |
| Corporate Office Properties Trust (SBI) | | 5,292 | 157,384 |
| Corrections Corp. of America | | 81,380 | 2,086,583 |
| Four Corners Property Trust, Inc. | | 12,495 | 311,126 |
| National Health Investors, Inc. | | 1,592 | 119,145 |
| NSI NV | | 401 | 15,638 |
| NSI NV rights 8/9/18 (a) | | 401 | 488 |
| Public Storage | | 721 | 157,055 |
| Spirit MTA REIT (a) | | 467 | 4,665 |
| Spirit Realty Capital, Inc. | | 29,378 | 245,894 |
| Store Capital Corp. | | 11,423 | 313,561 |
| Ventas, Inc. | | 3,100 | 174,778 |
| VEREIT, Inc. | | 218,429 | 1,666,613 |
| Washington Prime Group, Inc. | | 4,528 | 36,360 |
| | | | 5,970,241 |
| Real Estate Management & Development - 0.4% | | | |
| Anabuki Kosan, Inc. | | 2,100 | 58,597 |
| CBRE Group, Inc. (a) | | 3,647 | 181,621 |
| Century21 Real Estate Japan Ltd. | | 4,600 | 51,095 |
| Devine Ltd. (a) | | 83,774 | 19,606 |
| IMMOFINANZ Immobilien Anlagen AG | | 5,824 | 153,232 |
| Leopalace21 Corp. | | 94,300 | 517,821 |
| LSL Property Services PLC | | 79,630 | 271,748 |
| Relo Group, Inc. | | 232,100 | 6,279,144 |
| Selvaag Bolig ASA | | 53,676 | 292,510 |
| Servcorp Ltd. | | 43,212 | 139,975 |
| Sino Land Ltd. | | 157,960 | 271,281 |
| Tejon Ranch Co. (a) | | 26,265 | 614,601 |
| Wing Tai Holdings Ltd. | | 98,030 | 149,059 |
| | | | 9,000,290 |
|
| TOTAL REAL ESTATE | | | 14,970,531 |
|
| TELECOMMUNICATION SERVICES - 0.0% | | | |
| Diversified Telecommunication Services - 0.0% | | | |
| AT&T, Inc. | | 1,007 | 32,194 |
| UTILITIES - 1.8% | | | |
| Electric Utilities - 1.6% | | | |
| Exelon Corp. | | 196,652 | 8,357,710 |
| PG&E Corp. | | 197,422 | 8,504,940 |
| PPL Corp. | | 611,556 | 17,594,466 |
| | | | 34,457,116 |
| Gas Utilities - 0.1% | | | |
| Busan City Gas Co. Ltd. | | 330 | 10,803 |
| China Resource Gas Group Ltd. | | 42,000 | 199,056 |
| Hokuriku Gas Co. | | 9,300 | 255,757 |
| K&O Energy Group, Inc. | | 32,700 | 548,924 |
| Keiyo Gas Co. Ltd. | | 6,900 | 179,635 |
| Star Gas Partners LP | | 10,889 | 104,643 |
| | | | 1,298,818 |
| Independent Power and Renewable Electricity Producers - 0.1% | | | |
| Mega First Corp. Bhd | | 1,252,000 | 1,090,303 |
| Mega First Corp. Bhd warrants 4/8/20 (a) | | 124,502 | 51,455 |
| The AES Corp. | | 12,490 | 166,866 |
| | | | 1,308,624 |
| Multi-Utilities - 0.0% | | | |
| CMS Energy Corp. | | 18,006 | 870,410 |
| Water Utilities - 0.0% | | | |
| Manila Water Co., Inc. | | 342,100 | 171,002 |
|
| TOTAL UTILITIES | | | 38,105,970 |
|
| TOTAL COMMON STOCKS | | | |
| (Cost $1,768,855,630) | | | 1,864,566,705 |
|
| Nonconvertible Preferred Stocks - 0.1% | | | |
| CONSUMER STAPLES - 0.0% | | | |
| Food Products - 0.0% | | | |
| Nam Yang Dairy Products | | 277 | 51,247 |
| ENERGY - 0.0% | | | |
| Oil, Gas & Consumable Fuels - 0.0% | | | |
| Centrus Energy Corp. 7.50% (a)(c)(d) | | 362 | 12,670 |
| INDUSTRIALS - 0.0% | | | |
| Industrial Conglomerates - 0.0% | | | |
| Steel Partners Holdings LP Series A, 6.00% | | 9,285 | 211,698 |
| MATERIALS - 0.1% | | | |
| Construction Materials - 0.1% | | | |
| Buzzi Unicem SpA (Risparmio Shares) | | 93,288 | 1,160,678 |
| TOTAL NONCONVERTIBLE PREFERRED STOCKS | | | |
| (Cost $1,696,986) | | | 1,436,293 |
| | | Principal Amount | Value |
|
| Nonconvertible Bonds - 0.0% | | | |
| ENERGY - 0.0% | | | |
| Oil, Gas & Consumable Fuels - 0.0% | | | |
| Centrus Energy Corp. 8.25% 2/28/27 (d) | | | |
| (Cost $195,542) | | 239,963 | 191,970 |
| | | Shares | Value |
|
| Money Market Funds - 11.2% | | | |
| Fidelity Cash Central Fund, 1.96% (e) | | 223,920,371 | 223,965,155 |
| Fidelity Securities Lending Cash Central Fund 1.97% (e)(f) | | 10,882,456 | 10,883,545 |
| TOTAL MONEY MARKET FUNDS | | | |
| (Cost $234,848,699) | | | 234,848,700 |
| TOTAL INVESTMENT IN SECURITIES - 100.4% | | | |
| (Cost $2,005,596,857) | | | 2,101,043,668 |
| NET OTHER ASSETS (LIABILITIES) - (0.4)% | | | (8,284,847) |
| NET ASSETS - 100% | | | $2,092,758,821 |
Legend
(a) Non-income producing
(b) Security or a portion of the security is on loan at period end.
(c) Level 3 security
(d) Security exempt from registration under Rule 144A of the Securities Act of 1933. These securities may be resold in transactions exempt from registration, normally to qualified institutional buyers. At the end of the period, the value of these securities amounted to $2,644,027 or 0.1% of net assets.
(e) Affiliated fund that is generally available only to investment companies and other accounts managed by Fidelity Investments. The rate quoted is the annualized seven-day yield of the fund at period end. A complete unaudited listing of the fund's holdings as of its most recent quarter end is available upon request. In addition, each Fidelity Central Fund's financial statements, which are not covered by the Fund's Report of Independent Registered Public Accounting Firm, are available on the SEC's website or upon request.
(f) Investment made with cash collateral received from securities on loan.
Affiliated Central Funds
Information regarding fiscal year to date income earned by the Fund from investments in Fidelity Central Funds is as follows:
| Fund | Income earned |
| Fidelity Cash Central Fund | $2,231,060 |
| Fidelity Securities Lending Cash Central Fund | 122,442 |
| Total | $2,353,502 |
Amounts in the income column in the above table include any capital gain distributions from underlying funds, which are presented in the corresponding line-item in the Statement of Operations if applicable.
Investment Valuation
The following is a summary of the inputs used, as of July 31, 2018, involving the Fund's assets and liabilities carried at fair value. The inputs or methodology used for valuing securities may not be an indication of the risk associated with investing in those securities. For more information on valuation inputs, and their aggregation into the levels used below, please refer to the Investment Valuation section in the accompanying Notes to Financial Statements.
| | Valuation Inputs at Reporting Date: |
| Description | Total | Level 1 | Level 2 | Level 3 |
| Investments in Securities: | | | | |
| Equities: | | | | |
| Consumer Discretionary | $458,738,572 | $457,395,646 | $-- | $1,342,926 |
| Consumer Staples | 164,968,395 | 164,232,612 | 706,784 | 28,999 |
| Energy | 109,278,925 | 100,728,180 | 8,538,075 | 12,670 |
| Financials | 243,671,458 | 240,810,124 | 2,861,334 | -- |
| Health Care | 299,735,975 | 299,735,975 | -- | -- |
| Industrials | 143,574,750 | 143,573,742 | -- | 1,008 |
| Information Technology | 315,124,310 | 314,333,648 | 790,662 | -- |
| Materials | 77,801,918 | 77,190,812 | 611,106 | -- |
| Real Estate | 14,970,531 | 14,970,531 | -- | -- |
| Telecommunication Services | 32,194 | 32,194 | -- | -- |
| Utilities | 38,105,970 | 38,105,970 | -- | -- |
| Corporate Bonds | 191,970 | -- | 191,970 | -- |
| Money Market Funds | 234,848,700 | 234,848,700 | -- | -- |
| Total Investments in Securities: | $2,101,043,668 | $2,085,958,134 | $13,699,931 | $1,385,603 |
Other Information
Distribution of investments by country or territory of incorporation, as a percentage of Total Net Assets, is as follows (Unaudited):
| United States of America | 62.4% |
| Japan | 9.1% |
| United Kingdom | 5.6% |
| Ireland | 4.7% |
| Canada | 3.7% |
| Netherlands | 2.5% |
| Bermuda | 1.9% |
| Cayman Islands | 1.6% |
| Bailiwick of Guernsey | 1.3% |
| Others (Individually Less Than 1%) | 7.2% |
| | 100.0% |
See accompanying notes which are an integral part of the financial statements.
Financial Statements
Statement of Assets and Liabilities
| | | July 31, 2018 |
| Assets | | |
Investment in securities, at value (including securities loaned of $10,526,382) — See accompanying schedule:
Unaffiliated issuers (cost $1,770,748,158) | $1,866,194,968 | |
| Fidelity Central Funds (cost $234,848,699) | 234,848,700 | |
| Total Investment in Securities (cost $2,005,596,857) | | $2,101,043,668 |
| Cash | | 30,112 |
| Foreign currency held at value (cost $295,211) | | 295,952 |
| Receivable for investments sold | | 4,216,871 |
| Receivable for fund shares sold | | 902,928 |
| Dividends receivable | | 1,731,348 |
| Interest receivable | | 8,285 |
| Distributions receivable from Fidelity Central Funds | | 342,557 |
| Other receivables | | 26,821 |
| Total assets | | 2,108,598,542 |
| Liabilities | | |
| Payable for investments purchased | $2,210,544 | |
| Payable for fund shares redeemed | 1,883,417 | |
| Accrued management fee | 862,430 | |
| Other payables and accrued expenses | 102 | |
| Collateral on securities loaned | 10,883,228 | |
| Total liabilities | | 15,839,721 |
| Net Assets | | $2,092,758,821 |
| Net Assets consist of: | | |
| Paid in capital | | $1,981,942,052 |
| Undistributed net investment income | | 15,458,700 |
| Accumulated undistributed net realized gain (loss) on investments and foreign currency transactions | | (79,595) |
| Net unrealized appreciation (depreciation) on investments and assets and liabilities in foreign currencies | | 95,437,664 |
| Net Assets, for 181,698,078 shares outstanding | | $2,092,758,821 |
| Net Asset Value, offering price and redemption price per share ($2,092,758,821 ÷ 181,698,078 shares) | | $11.52 |
See accompanying notes which are an integral part of the financial statements.
Statement of Operations
| | | Year ended July 31, 2018 |
| Investment Income | | |
| Dividends | | $24,614,060 |
| Interest | | 15,063 |
| Income from Fidelity Central Funds | | 2,353,502 |
| Total income | | 26,982,625 |
| Expenses | | |
| Management fee | $6,642,670 | |
| Independent trustees' fees and expenses | 4,999 | |
| Commitment fees | 1,583 | |
| Total expenses before reductions | 6,649,252 | |
| Expense reductions | (57,358) | |
| Total expenses after reductions | | 6,591,894 |
| Net investment income (loss) | | 20,390,731 |
| Realized and Unrealized Gain (Loss) | | |
| Net realized gain (loss) on: | | |
| Investment securities: | | |
| Unaffiliated issuers (net of foreign taxes of $2,695) | 957,959 | |
| Fidelity Central Funds | 294 | |
| Foreign currency transactions | (100,670) | |
| Total net realized gain (loss) | | 857,583 |
| Change in net unrealized appreciation (depreciation) on: | | |
| Investment securities: | | |
| Unaffiliated issuers | 94,338,213 | |
| Fidelity Central Funds | 1 | |
| Assets and liabilities in foreign currencies | (9,021) | |
| Total change in net unrealized appreciation (depreciation) | | 94,329,193 |
| Net gain (loss) | | 95,186,776 |
| Net increase (decrease) in net assets resulting from operations | | $115,577,507 |
See accompanying notes which are an integral part of the financial statements.
Statement of Changes in Net Assets
| | Year ended July 31, 2018 | For the period
May 26, 2017 (commencement of operations) to July 31, 2017 |
| Increase (Decrease) in Net Assets | | |
| Operations | | |
| Net investment income (loss) | $20,390,731 | $(3,045) |
| Net realized gain (loss) | 857,583 | (161) |
| Change in net unrealized appreciation (depreciation) | 94,329,193 | 1,108,471 |
| Net increase (decrease) in net assets resulting from operations | 115,577,507 | 1,105,265 |
| Distributions to shareholders from net investment income | (4,957,186) | – |
| Distributions to shareholders from net realized gain | (908,817) | – |
| Total distributions | (5,866,003) | – |
| Share transactions | | |
| Proceeds from sales of shares | 1,772,742,021 | 458,673,032 |
| Reinvestment of distributions | 5,866,003 | – |
| Cost of shares redeemed | (255,030,778) | (308,226) |
| Net increase (decrease) in net assets resulting from share transactions | 1,523,577,246 | 458,364,806 |
| Total increase (decrease) in net assets | 1,633,288,750 | 459,470,071 |
| Net Assets | | |
| Beginning of period | 459,470,071 | – |
| End of period | $2,092,758,821 | $459,470,071 |
| Other Information | | |
| Undistributed net investment income end of period | $15,458,700 | $25,704 |
| Shares | | |
| Sold | 158,977,052 | 44,928,008 |
| Issued in reinvestment of distributions | 531,341 | – |
| Redeemed | (22,708,193) | (30,130) |
| Net increase (decrease) | 136,800,200 | 44,897,878 |
See accompanying notes which are an integral part of the financial statements.
Financial Highlights
Fidelity Low-Priced Stock K6 Fund
| | | |
| Years ended July 31, | 2018 | 2017 A |
| Selected Per–Share Data | | |
| Net asset value, beginning of period | $10.23 | $10.00 |
| Income from Investment Operations | | |
| Net investment income (loss)B | .17 | –C |
| Net realized and unrealized gain (loss) | 1.19 | .23 |
| Total from investment operations | 1.36 | .23 |
| Distributions from net investment income | (.06) | – |
| Distributions from net realized gain | (.01) | – |
| Total distributions | (.07) | – |
| Net asset value, end of period | $11.52 | $10.23 |
| Total ReturnD,E | 13.33% | 2.30% |
| Ratios to Average Net AssetsF,G | | |
| Expenses before reductions | .50% | .50%H |
| Expenses net of fee waivers, if any | .50% | .50%H |
| Expenses net of all reductions | .50% | .50%H |
| Net investment income (loss) | 1.54% | (.14)%H |
| Supplemental Data | | |
| Net assets, end of period (000 omitted) | $2,092,759 | $459,470 |
| Portfolio turnover rateI | 23%J | 3%J,K |
A For the period May 26, 2017 (commencement of operations) to July 31, 2017.
B Calculated based on average shares outstanding during the period.
C Amount represents less than $.005 per share.
D Total returns for periods of less than one year are not annualized.
E Total returns would have been lower if certain expenses had not been reduced during the applicable periods shown.
F Fees and expenses of any underlying Fidelity Central Funds are not included in the Fund's expense ratio. The Fund indirectly bears its proportionate share of the expenses of any underlying Fidelity Central Funds.
G Expense ratios reflect operating expenses of the Fund. Expenses before reductions do not reflect amounts reimbursed by the investment adviser or reductions from brokerage service arrangements or reductions from other expense offset arrangements and do not represent the amount paid by the Fund during periods when reimbursements or reductions occur. Expenses net of fee waivers reflect expenses after reimbursement by the investment adviser but prior to reductions from brokerage service arrangements or other expense offset arrangements. Expenses net of all reductions represent the net expenses paid by the Fund.
H Annualized
I Amount does not include the portfolio activity of any underlying Fidelity Central Funds.
J Portfolio turnover rate excludes securities received or delivered in-kind.
K Amount not annualized.
See accompanying notes which are an integral part of the financial statements.
Notes to Financial Statements
For the period ended July 31, 2018
1. Organization.
Fidelity Low-Priced Stock K6 Fund (the Fund) is a fund of Fidelity Puritan Trust (the Trust) and is authorized to issue an unlimited number of shares. Share transactions on the Statement of Changes in Net Assets may contain exchanges between affiliated funds. The Trust is registered under the Investment Company Act of 1940, as amended (the 1940 Act), as an open-end management investment company organized as a Massachusetts business trust. Shares generally are available only to employer-sponsored retirement plans that are recordkept by Fidelity, or to certain employer-sponsored retirement plans that are not recordkept by Fidelity.
2. Investments in Fidelity Central Funds.
The Fund invests in Fidelity Central Funds, which are open-end investment companies generally available only to other investment companies and accounts managed by the investment adviser and its affiliates. The Fund's Schedule of Investments lists each of the Fidelity Central Funds held as of period end, if any, as an investment of the Fund, but does not include the underlying holdings of each Fidelity Central Fund. As an Investing Fund, the Fund indirectly bears its proportionate share of the expenses of the underlying Fidelity Central Funds.
The Money Market Central Funds seek preservation of capital and current income and are managed by Fidelity Investments Money Management, Inc. (FIMM), an affiliate of the investment adviser. Annualized expenses of the Money Market Central Funds as of their most recent shareholder report date are less than .005%.
A complete unaudited list of holdings for each Fidelity Central Fund is available upon request or at the Securities and Exchange Commission (the SEC) website at www.sec.gov. In addition, the financial statements of the Fidelity Central Funds, which are not covered by the Fund's Report of Independent Registered Public Accounting Firm, are available on the SEC website or upon request.
3. Significant Accounting Policies.
The Fund is an investment company and applies the accounting and reporting guidance of the Financial Accounting Standards Board (FASB) Accounting Standards Codification Topic 946 Financial Services – Investments Companies. The financial statements have been prepared in conformity with accounting principles generally accepted in the United States of America (GAAP), which require management to make certain estimates and assumptions at the date of the financial statements. Actual results could differ from those estimates. Subsequent events, if any, through the date that the financial statements were issued have been evaluated in the preparation of the financial statements. The following summarizes the significant accounting policies of the Fund:
Investment Valuation. Investments are valued as of 4:00 p.m. Eastern time on the last calendar day of the period. The Board of Trustees (the Board) has delegated the day to day responsibility for the valuation of the Fund's investments to the Fair Value Committee (the Committee) established by the Fund's investment adviser. In accordance with valuation policies and procedures approved by the Board, the Fund attempts to obtain prices from one or more third party pricing vendors or brokers to value its investments. When current market prices, quotations or currency exchange rates are not readily available or reliable, investments will be fair valued in good faith by the Committee, in accordance with procedures adopted by the Board. Factors used in determining fair value vary by investment type and may include market or investment specific events, changes in interest rates and credit quality. The frequency with which these procedures are used cannot be predicted and they may be utilized to a significant extent. The Committee oversees the Fund's valuation policies and procedures and reports to the Board on the Committee's activities and fair value determinations. The Board monitors the appropriateness of the procedures used in valuing the Fund's investments and ratifies the fair value determinations of the Committee.
The Fund categorizes the inputs to valuation techniques used to value its investments into a disclosure hierarchy consisting of three levels as shown below:
- Level 1 – quoted prices in active markets for identical investments
- Level 2 – other significant observable inputs (including quoted prices for similar investments, interest rates, prepayment speeds, etc.)
- Level 3 – unobservable inputs (including the Fund's own assumptions based on the best information available)
Valuation techniques used to value the Fund's investments by major category are as follows:
Equity securities, including restricted securities, for which market quotations are readily available, are valued at the last reported sale price or official closing price as reported by a third party pricing vendor on the primary market or exchange on which they are traded and are categorized as Level 1 in the hierarchy. In the event there were no sales during the day or closing prices are not available, securities are valued at the last quoted bid price or may be valued using the last available price and are generally categorized as Level 2 in the hierarchy. For foreign equity securities, when market or security specific events arise, comparisons to the valuation of American Depositary Receipts (ADRs), futures contracts, Exchange-Traded Funds (ETFs) and certain indexes as well as quoted prices for similar securities may be used and would be categorized as Level 2 in the hierarchy. Utilizing these techniques may result in transfers between Level 1 and Level 2. For equity securities, including restricted securities, where observable inputs are limited, assumptions about market activity and risk are used and these securities may be categorized as Level 3 in the hierarchy.
Debt securities, including restricted securities, are valued based on evaluated prices received from third party pricing vendors or from brokers who make markets in such securities. Corporate bonds are valued by pricing vendors who utilize matrix pricing which considers yield or price of bonds of comparable quality, coupon, maturity and type or by broker-supplied prices. When independent prices are unavailable or unreliable, debt securities may be valued utilizing pricing methodologies which consider similar factors that would be used by third party pricing vendors. Debt securities are generally categorized as Level 2 in the hierarchy but may be Level 3 depending on the circumstances.
Investments in open-end mutual funds, including the Fidelity Central Funds, are valued at their closing net asset value (NAV) each business day and are categorized as Level 1 in the hierarchy.
Changes in valuation techniques may result in transfers in or out of an assigned level within the disclosure hierarchy. The aggregate value of investments by input level as of July 31, 2018 is included at the end of the Fund's Schedule of Investments.
Foreign Currency. The Fund may use foreign currency contracts to facilitate transactions in foreign-denominated securities. Gains and losses from these transactions may arise from changes in the value of the foreign currency or if the counterparties do not perform under the contracts' terms.
Foreign-denominated assets, including investment securities, and liabilities are translated into U.S. dollars at the exchange rates at period end. Purchases and sales of investment securities, income and dividends received and expenses denominated in foreign currencies are translated into U.S. dollars at the exchange rate in effect on the transaction date.
The effects of exchange rate fluctuations on investments are included with the net realized and unrealized gain (loss) on investment securities. Other foreign currency transactions resulting in realized and unrealized gain (loss) are disclosed separately.
Investment Transactions and Income. For financial reporting purposes, the Fund's investment holdings and NAV include trades executed through the end of the last business day of the period. The NAV per share for processing shareholder transactions is calculated as of the close of business of the New York Stock Exchange (NYSE), normally 4:00 p.m. Eastern time and includes trades executed through the end of the prior business day. Gains and losses on securities sold are determined on the basis of identified cost. Dividend income is recorded on the ex-dividend date, except for certain dividends from foreign securities where the ex-dividend date may have passed, which are recorded as soon as the Fund is informed of the ex-dividend date. Non-cash dividends included in dividend income, if any, are recorded at the fair market value of the securities received. Income and capital gain distributions from Fidelity Central Funds, if any, are recorded on the ex-dividend date. Certain distributions received by the Fund represent a return of capital or capital gain. The Fund determines the components of these distributions subsequent to the ex-dividend date, based upon receipt of tax filings or other correspondence relating to the underlying investment. These distributions are recorded as a reduction of cost of investments and/or as a realized gain. Interest income is accrued as earned and includes coupon interest and amortization of premium and accretion of discount on debt securities as applicable. Investment income is recorded net of foreign taxes withheld where recovery of such taxes is uncertain.
Expenses. Expenses directly attributable to a fund are charged to that fund. Expenses attributable to more than one fund are allocated among the respective funds on the basis of relative net assets or other appropriate methods. Expense estimates are accrued in the period to which they relate and adjustments are made when actual amounts are known.
Income Tax Information and Distributions to Shareholders. Each year, the Fund intends to qualify as a regulated investment company under Subchapter M of the Internal Revenue Code, including distributing substantially all of its taxable income and realized gains. As a result, no provision for U.S. Federal income taxes is required. As of July 31, 2018, the Fund did not have any unrecognized tax benefits in the financial statements; nor is the Fund aware of any tax positions for which it is reasonably possible that the total amounts of unrecognized tax benefits will significantly change in the next twelve months. The Fund files a U.S. federal tax return, in addition to state and local tax returns as required. The Fund's federal income tax returns are subject to examination by the Internal Revenue Service (IRS) for a period of three fiscal years after they are filed. State and local tax returns may be subject to examination for an additional fiscal year depending on the jurisdiction. Foreign taxes are provided for based on the Fund's understanding of the tax rules and rates that exist in the foreign markets in which it invests. The Fund is subject to a tax imposed on capital gains by certain countries in which it invests.
Distributions are declared and recorded on the ex-dividend date. Income and capital gain distributions are determined in accordance with income tax regulations, which may differ from GAAP.
Capital accounts within the financial statements are adjusted for permanent book-tax differences. These adjustments have no impact on net assets or the results of operations. Capital accounts are not adjusted for temporary book-tax differences which will reverse in a subsequent period.
Book-tax differences are primarily due to foreign currency transactions, certain foreign taxes, passive foreign investment companies (PFIC), partnerships, market discount and losses deferred due to wash sales.
As of period end, the cost and unrealized appreciation (depreciation) in securities, and derivatives if applicable, for federal income tax purposes were as follows:
| Gross unrealized appreciation | $187,895,507 |
| Gross unrealized depreciation | (95,013,258) |
| Net unrealized appreciation (depreciation) | $92,882,249 |
| Tax Cost | $2,008,161,419 |
The tax-based components of distributable earnings as of period end were as follows:
| Undistributed ordinary income | $17,572,361 |
| Undistributed long-term capital gain | $371,736 |
| Net unrealized appreciation (depreciation) on securities and other investments | $92,872,672 |
The tax character of distributions paid was as follows:
| | July 31, 2018 |
| Ordinary Income | $5,783,383 |
| Long-term Capital Gains | 82,620 |
| Total | $5,866,003 |
Restricted Securities. The Fund may invest in securities that are subject to legal or contractual restrictions on resale. These securities generally may be resold in transactions exempt from registration or to the public if the securities are registered. Disposal of these securities may involve time-consuming negotiations and expense, and prompt sale at an acceptable price may be difficult. Information regarding restricted securities is included at the end of the Fund's Schedule of Investments.
4. Purchases and Sales of Investments.
Purchases and sales of securities, other than short-term securities and in-kind transactions, aggregated $540,678,693 and $248,114,248, respectively.
Exchanges In-Kind. Investments and cash, including accrued interest, received in-kind through subscriptions totaled $1,195,778,687 in exchange for 107,583,509 shares of the Fund. The amount of in-kind exchanges is included in share transactions in the accompanying Statement of Changes in Net Assets. The Fund recognized no gain or loss for federal income tax purposes.
5. Fees and Other Transactions with Affiliates.
Management Fee. Fidelity Management & Research Company (the investment adviser) and its affiliates provide the Fund with investment management related services for which the Fund pays a monthly management fee that is based on an annual rate of .50% of average net assets. Under the management contract, the investment adviser or an affiliate pays all other expenses of the Fund, excluding fees and expenses of the independent Trustees, and certain miscellaneous expenses such as proxy and shareholder meeting expenses.
Brokerage Commissions. The Fund placed a portion of its portfolio transactions with brokerage firms which are affiliates of the investment adviser. Brokerage commissions are included in net realized gain (loss) and change in net unrealized appreciation (depreciation) in the Statement of Operations. The commissions paid to these affiliated firms were $9,563 for the period.
Interfund Trades. The Fund may purchase from or sell securities to other Fidelity Funds under procedures adopted by the Board. The procedures have been designed to ensure these interfund trades are executed in accordance with Rule 17a-7 of the 1940 Act. Interfund trades are included within the respective purchases and sales amounts shown in the Purchases and Sales of Investments note.
Prior Fiscal Year Exchanges In-Kind. During the prior period, an affiliated entity completed an exchange in-kind with the Fund. The affiliated entity delivered investments and cash valued at $456,637,585 in exchange for 44,724,543 shares of the Fund. The amount of in-kind exchanges is included in share transactions in the accompanying Statement of Changes in Net Assets. The Fund recognized no gain or loss for federal income tax purposes.
6. Committed Line of Credit.
The Fund participates with other funds managed by the investment adviser or an affiliate in a $4.25 billion credit facility (the "line of credit") to be utilized for temporary or emergency purposes to fund shareholder redemptions or for other short-term liquidity purposes. The Fund has agreed to pay commitment fees on its pro-rata portion of the line of credit, which amounted to $1,583 and is reflected in Commitment fees on the Statement of Operations. During the period, the Fund did not borrow on this line of credit.
7. Security Lending.
The Fund lends portfolio securities through a lending agent from time to time in order to earn additional income. For equity securities, a lending agent is used and may loan securities to certain qualified borrowers, including Fidelity Capital Markets (FCM), a broker-dealer affiliated with the Fund. On the settlement date of the loan, the Fund receives collateral (in the form of U.S. Treasury obligations, letters of credit and/or cash) against the loaned securities and maintains collateral in an amount not less than 100% of the market value of the loaned securities during the period of the loan. The market value of the loaned securities is determined at the close of business of the Fund and any additional required collateral is delivered to the Fund on the next business day. The Fund or borrower may terminate the loan at any time, and if the borrower defaults on its obligation to return the securities loaned because of insolvency or other reasons, the Fund may apply collateral received from the borrower against the obligation. The Fund may experience delays and costs in recovering the securities loaned. Any cash collateral received is invested in the Fidelity Securities Lending Cash Central Fund. The value of loaned securities and cash collateral at period end are disclosed on the Fund's Statement of Assets and Liabilities. The value of securities loaned to FCM at period end was $173,803. Security lending income represents the income earned on investing cash collateral, less rebates paid to borrowers and any lending agent fees associated with the loan, plus any premium payments received for lending certain types of securities. Security lending income is presented in the Statement of Operations as a component of income from Fidelity Central Funds. Total security lending income during the period amounted to $122,442, including $18,743 from securities loaned to FCM.
8. Expense Reductions.
Commissions paid to certain brokers with whom the investment adviser, or its affiliates, places trades on behalf of the Fund include an amount in addition to trade execution, which may be rebated back to the Fund to offset certain expenses. This amount totaled $56,988 for the period. In addition, through arrangements with the Fund's custodian and transfer agent, credits realized as a result of certain uninvested cash balances were used to reduce the Fund's expenses. During the period, these credits reduced the Fund's expenses by $370.
9. Other.
The Fund's organizational documents provide former and current trustees and officers with a limited indemnification against liabilities arising in connection with the performance of their duties to the Fund. In the normal course of business, the Fund may also enter into contracts that provide general indemnifications. The Fund's maximum exposure under these arrangements is unknown as this would be dependent on future claims that may be made against the Fund. The risk of material loss from such claims is considered remote.
Report of Independent Registered Public Accounting Firm
To the Board of Trustees of Fidelity Puritan Trust and Shareholders of Fidelity Low-Priced Stock K6 Fund:
Opinion on the Financial Statements
We have audited the accompanying statement of assets and liabilities, including the schedule of investments, of Fidelity Low-Priced Stock K6 Fund (one of the funds constituting Fidelity Puritan Trust, referred to hereafter as the "Fund") as of July 31, 2018, the related statement of operations for the year ended July 31, 2018 and the statement of changes in net assets and the financial highlights for the year ended July 31, 2018 and for the period May 26, 2017 (commencement of operations) through July 31, 2017, including the related notes (collectively referred to as the “financial statements”). In our opinion, the financial statements present fairly, in all material respects, the financial position of the Fund as of July 31, 2018, the results of its operations for the year ended July 31, 2018, and the changes in its net assets and the financial highlights for the year ended July 31, 2018 and for the period May 26, 2017 (commencement of operations) through July 31, 2017 in conformity with accounting principles generally accepted in the United States of America.
Basis for Opinion
These financial statements are the responsibility of the Fund’s management. Our responsibility is to express an opinion on the Fund’s financial statements based on our audits. We are a public accounting firm registered with the Public Company Accounting Oversight Board (United States) (“PCAOB”) and are required to be independent with respect to the Fund in accordance with the U.S. federal securities laws and the applicable rules and regulations of the Securities and Exchange Commission and the PCAOB.
We conducted our audits of these financial statements in accordance with the standards of the PCAOB. Those standards require that we plan and perform the audit to obtain reasonable assurance about whether the financial statements are free of material misstatement, whether due to error or fraud.
Our audits included performing procedures to assess the risks of material misstatement of the financial statements, whether due to error or fraud, and performing procedures that respond to those risks. Such procedures included examining, on a test basis, evidence regarding the amounts and disclosures in the financial statements. Our audits also included evaluating the accounting principles used and significant estimates made by management, as well as evaluating the overall presentation of the financial statements. Our procedures included confirmation of securities owned as of July 31, 2018 by correspondence with the custodian and brokers; when replies were not received from brokers, we performed other auditing procedures. We believe that our audits provide a reasonable basis for our opinion.
PricewaterhouseCoopers LLP
Boston, Massachusetts
September 17, 2018
We have served as the auditor of one or more investment companies in the Fidelity group of funds since 1932.
Trustees and Officers
The Trustees, Members of the Advisory Board (if any), and officers of the trust and fund, as applicable, are listed below. The Board of Trustees governs the fund and is responsible for protecting the interests of shareholders. The Trustees are experienced executives who meet periodically throughout the year to oversee the fund's activities, review contractual arrangements with companies that provide services to the fund, oversee management of the risks associated with such activities and contractual arrangements, and review the fund's performance. Except for Jonathan Chiel each of the Trustees oversees 286 funds. Mr. Chiel oversees 150 funds.
The Trustees hold office without limit in time except that (a) any Trustee may resign; (b) any Trustee may be removed by written instrument, signed by at least two-thirds of the number of Trustees prior to such removal; (c) any Trustee who requests to be retired or who has become incapacitated by illness or injury may be retired by written instrument signed by a majority of the other Trustees; and (d) any Trustee may be removed at any special meeting of shareholders by a two-thirds vote of the outstanding voting securities of the trust. Each Trustee who is not an interested person (as defined in the 1940 Act) of the trust and the fund is referred to herein as an Independent Trustee. Each Independent Trustee shall retire not later than the last day of the calendar year in which his or her 75th birthday occurs. The Independent Trustees may waive this mandatory retirement age policy with respect to individual Trustees. Officers and Advisory Board Members hold office without limit in time, except that any officer or Advisory Board Member may resign or may be removed by a vote of a majority of the Trustees at any regular meeting or any special meeting of the Trustees. Except as indicated, each individual has held the office shown or other offices in the same company for the past five years.
The fund’s Statement of Additional Information (SAI) includes more information about the Trustees. To request a free copy, call Fidelity at 1-800-835-5092.
Experience, Skills, Attributes, and Qualifications of the Trustees. The Governance and Nominating Committee has adopted a statement of policy that describes the experience, qualifications, attributes, and skills that are necessary and desirable for potential Independent Trustee candidates (Statement of Policy). The Board believes that each Trustee satisfied at the time he or she was initially elected or appointed a Trustee, and continues to satisfy, the standards contemplated by the Statement of Policy. The Governance and Nominating Committee also engages professional search firms to help identify potential Independent Trustee candidates who have the experience, qualifications, attributes, and skills consistent with the Statement of Policy. From time to time, additional criteria based on the composition and skills of the current Independent Trustees, as well as experience or skills that may be appropriate in light of future changes to board composition, business conditions, and regulatory or other developments, have also been considered by the professional search firms and the Governance and Nominating Committee. In addition, the Board takes into account the Trustees' commitment and participation in Board and committee meetings, as well as their leadership of standing and ad hoc committees throughout their tenure.
In determining that a particular Trustee was and continues to be qualified to serve as a Trustee, the Board has considered a variety of criteria, none of which, in isolation, was controlling. The Board believes that, collectively, the Trustees have balanced and diverse experience, qualifications, attributes, and skills, which allow the Board to operate effectively in governing the fund and protecting the interests of shareholders. Information about the specific experience, skills, attributes, and qualifications of each Trustee, which in each case led to the Board's conclusion that the Trustee should serve (or continue to serve) as a trustee of the fund, is provided below.
Board Structure and Oversight Function. James C. Curvey is an interested person and currently serves as Chairman. The Trustees have determined that an interested Chairman is appropriate and benefits shareholders because an interested Chairman has a personal and professional stake in the quality and continuity of services provided to the fund. Independent Trustees exercise their informed business judgment to appoint an individual of their choosing to serve as Chairman, regardless of whether the Trustee happens to be independent or a member of management. The Independent Trustees have determined that they can act independently and effectively without having an Independent Trustee serve as Chairman and that a key structural component for assuring that they are in a position to do so is for the Independent Trustees to constitute a substantial majority for the Board. The Independent Trustees also regularly meet in executive session. Ned C. Lautenbach serves as Chairman of the Independent Trustees and as such (i) acts as a liaison between the Independent Trustees and management with respect to matters important to the Independent Trustees and (ii) with management prepares agendas for Board meetings.
Fidelity® funds are overseen by different Boards of Trustees. The fund's Board oversees Fidelity's high income and certain equity funds, and other Boards oversee Fidelity's investment-grade bond, money market, asset allocation, and other equity funds. The asset allocation funds may invest in Fidelity® funds overseen by the fund's Board. The use of separate Boards, each with its own committee structure, allows the Trustees of each group of Fidelity® funds to focus on the unique issues of the funds they oversee, including common research, investment, and operational issues. On occasion, the separate Boards establish joint committees to address issues of overlapping consequences for the Fidelity® funds overseen by each Board.
The Trustees operate using a system of committees to facilitate the timely and efficient consideration of all matters of importance to the Trustees, the fund, and fund shareholders and to facilitate compliance with legal and regulatory requirements and oversight of the fund's activities and associated risks. The Board, acting through its committees, has charged FMR and its affiliates with (i) identifying events or circumstances the occurrence of which could have demonstrably adverse effects on the fund's business and/or reputation; (ii) implementing processes and controls to lessen the possibility that such events or circumstances occur or to mitigate the effects of such events or circumstances if they do occur; and (iii) creating and maintaining a system designed to evaluate continuously business and market conditions in order to facilitate the identification and implementation processes described in (i) and (ii) above. Because the day-to-day operations and activities of the fund are carried out by or through FMR, its affiliates, and other service providers, the fund's exposure to risks is mitigated but not eliminated by the processes overseen by the Trustees. While each of the Board's committees has responsibility for overseeing different aspects of the fund's activities, oversight is exercised primarily through the Operations, Audit, and Compliance Committees. In addition, the Independent Trustees have worked with Fidelity to enhance the Board's oversight of investment and financial risks, legal and regulatory risks, technology risks, and operational risks, including the development of additional risk reporting to the Board. Appropriate personnel, including but not limited to the fund's Chief Compliance Officer (CCO), FMR's internal auditor, the independent accountants, the fund's Treasurer and portfolio management personnel, make periodic reports to the Board's committees, as appropriate, including an annual review of Fidelity's risk management program for the Fidelity® funds. The responsibilities of each standing committee, including their oversight responsibilities, are described further under "Standing Committees of the Trustees."
Interested Trustees*:
Correspondence intended for a Trustee who is an interested person may be sent to Fidelity Investments, 245 Summer Street, Boston, Massachusetts 02210.
Name, Year of Birth; Principal Occupations and Other Relevant Experience+
Jonathan Chiel (1957)
Year of Election or Appointment: 2016
Trustee
Mr. Chiel also serves as Trustee of other Fidelity® funds. Mr. Chiel is Executive Vice President and General Counsel for FMR LLC (diversified financial services company, 2012-present). Previously, Mr. Chiel served as general counsel (2004-2012) and senior vice president and deputy general counsel (2000-2004) for John Hancock Financial Services; a partner with Choate, Hall & Stewart (1996-2000) (law firm); and an Assistant United States Attorney for the United States Attorney’s Office of the District of Massachusetts (1986-95), including Chief of the Criminal Division (1993-1995). Mr. Chiel is a director on the boards of the Boston Bar Foundation and the Maimonides School.
James C. Curvey (1935)
Year of Election or Appointment: 2007
Trustee
Chairman of the Board of Trustees
Mr. Curvey also serves as Trustee of other Fidelity® funds. Mr. Curvey is Vice Chairman (2007-present) and Director of FMR LLC (diversified financial services company). In addition, Mr. Curvey is an Overseer Emeritus for the Boston Symphony Orchestra, a Director of Artis-Naples, and a Trustee of Brewster Academy in Wolfeboro, New Hampshire. Previously, Mr. Curvey served as a Director of Fidelity Research & Analysis Co. (investment adviser firm, 2009-2018), Director of Fidelity Investments Money Management, Inc. (investment adviser firm, 2009-2014) and a Director of FMR and FMR Co., Inc. (investment adviser firms, 2007-2014).
Charles S. Morrison (1960)
Year of Election or Appointment: 2014
Trustee
Mr. Morrison also serves as Trustee of other funds. He serves as President of Fidelity SelectCo, LLC (investment adviser firm, 2017-present) and Fidelity Management & Research Company (FMR) (investment adviser firm, 2016-present), a Director of Fidelity Investments Money Management, Inc. (FIMM) (investment adviser firm, 2014-present), Director of Fidelity SelectCo, LLC (investment adviser firm, 2014-present), President, Asset Management (2014-present), and is an employee of Fidelity Investments. Previously, Mr. Morrison served as Vice President of Fidelity's Fixed Income and Asset Allocation Funds (2012-2014), President, Fixed Income (2011-2014), Vice President of Fidelity's Money Market Funds (2005-2009), President, Money Market Group Leader of FMR (investment adviser firm, 2009), and Senior Vice President, Money Market Group of FMR (2004-2009). Mr. Morrison also served as Vice President of Fidelity's Bond Funds (2002-2005), certain Balanced Funds (2002-2005), and certain Asset Allocation Funds (2002-2007), and as Senior Vice President (2002-2005) of Fidelity's Bond Division.
* Determined to be an “Interested Trustee” by virtue of, among other things, his or her affiliation with the trust or various entities under common control with FMR.
+ The information includes the Trustee's principal occupation during the last five years and other information relating to the experience, attributes, and skills relevant to the Trustee's qualifications to serve as a Trustee, which led to the conclusion that the Trustee should serve as a Trustee for the fund.
Independent Trustees:
Correspondence intended for an Independent Trustee may be sent to Fidelity Investments, P.O. Box 55235, Boston, Massachusetts 02205-5235.
Name, Year of Birth; Principal Occupations and Other Relevant Experience+
Dennis J. Dirks (1948)
Year of Election or Appointment: 2005
Trustee
Mr. Dirks also serves as Trustee of other Fidelity® funds. Prior to his retirement in May 2003, Mr. Dirks was Chief Operating Officer and a member of the Board of The Depository Trust & Clearing Corporation (DTCC). He also served as President, Chief Operating Officer, and Board member of The Depository Trust Company (DTC) and President and Board member of the National Securities Clearing Corporation (NSCC). In addition, Mr. Dirks served as Chief Executive Officer and Board member of the Government Securities Clearing Corporation, Chief Executive Officer and Board member of the Mortgage-Backed Securities Clearing Corporation, as a Trustee and a member of the Finance Committee of Manhattan College (2005-2008), as a Trustee and a member of the Finance Committee of AHRC of Nassau County (2006-2008), as a member of the Independent Directors Council (IDC) Governing Council (2010-2015), and as a member of the Board of Directors for The Brookville Center for Children’s Services, Inc. (2009-2017). Mr. Dirks is a member of the Finance Committee (2016-present), Board of Directors (2017-present) and Board of Trustees (2018-present) and is Treasurer (2018-present) of the Asolo Repertory Theatre.
Donald F. Donahue (1950)
Year of Election or Appointment: 2018
Trustee
Mr. Donahue also serves as a Trustee of other Fidelity® funds. Mr. Donahue is President and Chief Executive Officer of Miranda Partners, LLC (risk consulting for the financial services industry, 2012-present). Previously, Mr. Donahue served as a Member of the Advisory Board of certain Fidelity® funds (2015-2018) and Chief Executive Officer (2006-2012), Chief Operating Officer (2003-2006), and Managing Director, Customer Marketing and Development (1999-2003) of The Depository Trust & Clearing Corporation (financial markets infrastructure). Mr. Donahue serves as a Member (2007-present) and Co-Chairman (2016-present) of the Board of Directors of United Way of New York, Member of the Board of Directors of NYC Leadership Academy (2012-present) and Member of the Board of Advisors of Ripple Labs, Inc. (financial services, 2015-present). He also served as Chairman (2010-2012) and Member of the Board of Directors (2012-2013) of Omgeo, LLC (financial services), Treasurer of United Way of New York (2012-2016), and Member of the Board of Directors of XBRL US (financial services non-profit, 2009-2012) and the International Securities Services Association (2009-2012).
Alan J. Lacy (1953)
Year of Election or Appointment: 2008
Trustee
Mr. Lacy also serves as Trustee of other Fidelity® funds. Mr. Lacy serves as a Director of Bristol-Myers Squibb Company (global pharmaceuticals, 2008-present). He is a Trustee of the California Chapter of The Nature Conservancy (2015-present) and a Director of the Center for Advanced Study in the Behavioral Sciences at Stanford University (2015-present). In addition, Mr. Lacy served as Senior Adviser (2007-2014) of Oak Hill Capital Partners, L.P. (private equity) and also served as Chief Executive Officer (2005) and Vice Chairman (2005-2006) of Sears Holdings Corporation (retail) and Chief Executive Officer and Chairman of the Board of Sears, Roebuck and Co. (retail, 2000-2005). Previously, Mr. Lacy served as Chairman (2014-2017) and a member (2010-2017) of the Board of Directors of Dave & Buster’s Entertainment, Inc. (restaurant and entertainment complexes), as Chairman (2008-2011) and a member (2006-2015) of the Board of Trustees of the National Parks Conservation Association, and as a member of the Board of Directors for The Hillman Companies, Inc. (hardware wholesalers, 2010-2014), Earth Fare, Inc. (retail grocery, 2010-2014), and The Western Union Company (global money transfer, 2006-2011).
Ned C. Lautenbach (1944)
Year of Election or Appointment: 2000
Trustee
Chairman of the Independent Trustees
Mr. Lautenbach also serves as Trustee of other Fidelity® funds. Mr. Lautenbach currently serves as Vice Chair of the Board of Governors, State University System of Florida (2013-present) and is a member of the Council on Foreign Relations (1994-present). He is also a member and has most recently served as Chairman of the Board of Directors of Artis-Naples (2012-present). Previously, Mr. Lautenbach served as a member and then Lead Director of the Board of Directors of Eaton Corporation (diversified industrial, 1997-2016). He was also a Partner and Advisory Partner at Clayton, Dubilier & Rice, LLC (private equity investment, 1998-2010), as well as a Director of Sony Corporation (2006-2007). In addition, Mr. Lautenbach also had a 30-year career with IBM (technology company) during which time he served as Senior Vice President and a member of the Corporate Executive Committee (1968-1998).
Joseph Mauriello (1944)
Year of Election or Appointment: 2008
Trustee
Mr. Mauriello also serves as Trustee of other Fidelity® funds. Prior to his retirement in January 2006, Mr. Mauriello served in numerous senior management positions including Deputy Chairman and Chief Operating Officer (2004-2005), and Vice Chairman of Financial Services (2002-2004) of KPMG LLP US (professional services, 1965-2005). Mr. Mauriello currently serves as a member of the Board of Directors of XL Group plc. (global insurance and re-insurance, 2006-present) and the Independent Directors Council (IDC) Governing Council (2015-present). Previously, Mr. Mauriello served as a Director of the Hamilton Funds of the Bank of New York (2006-2007) and of Arcadia Resources Inc. (health care services and products, 2007-2012).
Cornelia M. Small (1944)
Year of Election or Appointment: 2005
Trustee
Ms. Small also serves as Trustee of other Fidelity® funds. Ms. Small is a member of the Board of Directors (2009-present) and Chair of the Investment Committee (2010-present) of the Teagle Foundation. Ms. Small also serves on the Investment Committee of the Berkshire Taconic Community Foundation (2008-present). Previously, Ms. Small served as Chairperson (2002-2008) and a member of the Investment Committee and Chairperson (2008-2012) and a member of the Board of Trustees of Smith College. In addition, Ms. Small served as Chief Investment Officer, Director of Global Equity Investments, and a member of the Board of Directors of Scudder, Stevens & Clark and Scudder Kemper Investments.
Garnett A. Smith (1947)
Year of Election or Appointment: 2018
Trustee
Mr. Smith also serves as Trustee of other Fidelity® funds. Prior to Mr. Smith's retirement, he served as Chairman and Chief Executive Officer of Inbrand Corp. (manufacturer of personal absorbent products, 1990-1997). He also served as President (1986-1990) of Inbrand Corp. Prior to his employment with Inbrand Corp., he was employed by a retail fabric chain and North Carolina National Bank. In addition, Mr. Smith served as a Member of the Advisory Board of certain Fidelity® funds (2012-2013) and as a board member of the Jackson Hole Land Trust (2009-2012).
David M. Thomas (1949)
Year of Election or Appointment: 2008
Trustee
Mr. Thomas also serves as Trustee of other Fidelity® funds. Mr. Thomas serves as Non-Executive Chairman of the Board of Directors of Fortune Brands Home and Security (home and security products, 2011-present), as a member of the Board of Directors (2004-present) and Presiding Director (2013-present) of Interpublic Group of Companies, Inc. (marketing communication), and as a member of the Board of Trustees of the University of Florida (2013-present). Previously, Mr. Thomas served as Executive Chairman (2005-2006) and Chairman and Chief Executive Officer (2000-2005) of IMS Health, Inc. (pharmaceutical and healthcare information solutions), and a Director of Fortune Brands, Inc. (consumer products, 2000-2011).
+ The information includes the Trustee's principal occupation during the last five years and other information relating to the experience, attributes, and skills relevant to the Trustee's qualifications to serve as a Trustee, which led to the conclusion that the Trustee should serve as a Trustee for the fund.
Advisory Board Members and Officers:
Correspondence intended for a Member of the Advisory Board (if any) may be sent to Fidelity Investments, P.O. Box 55235, Boston, Massachusetts 02205-5235. Correspondence intended for an officer or Peter S. Lynch may be sent to Fidelity Investments, 245 Summer Street, Boston, Massachusetts 02210. Officers appear below in alphabetical order.
Name, Year of Birth; Principal Occupation
Peter S. Lynch (1944)
Year of Election or Appointment: 2003
Member of the Advisory Board
Mr. Lynch also serves as Member of the Advisory Board of other Fidelity® funds. Mr. Lynch is Vice Chairman and a Director of FMR (investment adviser firm) and FMR Co., Inc. (investment adviser firm). In addition, Mr. Lynch serves as a Trustee of Boston College and as the Chairman of the Inner-City Scholarship Fund. Previously, Mr. Lynch served on the Special Olympics International Board of Directors (1997-2006).
William S. Stavropoulos (1939)
Year of Election or Appointment: 2018
Member of the Advisory Board
Mr. Stavropoulos also serves as Member of the Advisory Board of other Fidelity® funds. Mr. Stavropoulos serves as President and Founder of the Michigan Baseball Foundation, the Great Lakes Loons (2007-present). Mr. Stavropoulos is Chairman Emeritus of the Board of Directors of The Dow Chemical Company, where he previously served in numerous senior management positions, including President, CEO (1995-2000; 2002-2004), Chairman of the Executive Committee (2000-2006), and as a member of the Board of Directors (1990-2006). Currently, Mr. Stavropoulos is Chairman of the Board of Directors of Univar Inc. (global distributor of commodity and specialty chemicals), a Director of Teradata Corporation (data warehousing and technology solutions), and a member of the Advisory Board for Metalmark Capital LLC (private equity investment, 2005-present). Mr. Stavropoulos is an operating advisor to Clayton, Dubilier & Rice, LLC (private equity investment). In addition, Mr. Stavropoulos is a member of the University of Notre Dame Advisory Council for the College of Science, a Trustee of the Rollin L. Gerstacker Foundation, and a Director of Artis-Naples in Naples, Florida. Previously, Mr. Stavropoulos served as Trustee of certain Fidelity® funds (2001-2018) and as a Director of Chemical Financial Corporation (bank holding company, 1993-2012) and Tyco International, Ltd. (multinational manufacturing and services, 2007-2012).
Carol B. Tomé (1957)
Year of Election or Appointment: 2018
Member of the Advisory Board
Ms. Tomé also serves as Member of the Advisory Board of other Fidelity® funds. Ms. Tomé is Chief Financial Officer (2001-present) and Executive Vice President of Corporate Services (2007-present) of The Home Depot, Inc. (home improvement retailer) and a Director (2003-present) and Chair of the Audit Committee (2004-present) of United Parcel Service, Inc. (package delivery and supply chain management). Previously, Ms. Tomé served as Trustee of certain Fidelity® funds (2017), Senior Vice President of Finance and Accounting/Treasurer (2000-2007) and Vice President and Treasurer (1995-2000) of The Home Depot, Inc. and Chair of the Board (2010-2012), Vice Chair of the Board (2009 and 2013), and a Director (2008-2013) of the Federal Reserve Bank of Atlanta. Ms. Tomé is also a director or trustee of many community and professional organizations.
Michael E. Wiley (1950)
Year of Election or Appointment: 2018
Member of the Advisory Board
Mr. Wiley also serves as Trustee or Member of the Advisory Board of other Fidelity® funds. Mr. Wiley serves as a Director of Andeavor Corporation (independent oil refiner and marketer, 2005-present), a Director of Andeavor Logistics LP (natural resources logistics, 2015-present), and a Director of Bill Barrett Corporation (exploration and production, 2005-present). In addition, Mr. Wiley also serves as a Director of Post Oak Bank (privately-held bank, 2004-present). Previously, Mr. Wiley served as a Trustee of other Fidelity® funds (2008-2013), as a Director of Asia Pacific Exploration Consolidated (international oil and gas exploration and production, 2008-2013), as a member of the Board of Trustees of the University of Tulsa (2000-2006; 2007-2010), as a Senior Energy Advisor of Katzenbach Partners, LLC (consulting, 2006-2007), as an Advisory Director of Riverstone Holdings (private investment), Chairman, President, and CEO of Baker Hughes, Inc. (oilfield services, 2000-2004), and as Director of Spinnaker Exploration Company (exploration and production, 2001-2005).
Elizabeth Paige Baumann (1968)
Year of Election or Appointment: 2017
Anti-Money Laundering (AML) Officer
Ms. Baumann also serves as AML Officer of other funds. She is Chief AML Officer (2012-present) and Senior Vice President (2014-present) of FMR LLC (diversified financial services company) and is an employee of Fidelity Investments. Previously, Ms. Baumann served as AML Officer of the funds (2012-2016), and Vice President (2007-2014) and Deputy Anti-Money Laundering Officer (2007-2012) of FMR LLC.
Marc R. Bryant (1966)
Year of Election or Appointment: 2015
Secretary and Chief Legal Officer (CLO)
Mr. Bryant also serves as Secretary and CLO of other funds. Mr. Bryant serves as CLO, Secretary, and Senior Vice President of Fidelity Management & Research Company (investment adviser firm, 2015-present) and FMR Co., Inc. (investment adviser firm, 2015-present); Secretary of Fidelity SelectCo, LLC (investment adviser firm, 2015-present) and Fidelity Investments Money Management, Inc. (investment adviser firm, 2015-present); and CLO of Fidelity Management & Research (Hong Kong) Limited and FMR Investment Management (UK) Limited (investment adviser firms, 2015-present) and Fidelity Management & Research (Japan) Limited (investment adviser firm, 2016-present). He is Senior Vice President and Deputy General Counsel of FMR LLC (diversified financial services company). Previously, Mr. Bryant served as Secretary and CLO of Fidelity Rutland Square Trust II (2010-2014) and Assistant Secretary of Fidelity's Fixed Income and Asset Allocation Funds (2013-2015). Prior to joining Fidelity Investments, Mr. Bryant served as a Senior Vice President and the Head of Global Retail Legal for AllianceBernstein L.P. (2006-2010), and as the General Counsel for ProFund Advisors LLC (2001-2006).
John J. Burke III (1964)
Year of Election or Appointment: 2018
Chief Financial Officer
Mr. Burke also serves as Chief Financial Officer of other funds. Mr. Burke serves as Head of Investment Operations for Fidelity Fund and Investment Operations (2018-present) and is an employee of Fidelity Investments (1998-present). Previously Mr. Burke served as head of Asset Management Investment Operations (2012-2018).
William C. Coffey (1969)
Year of Election or Appointment: 2009
Assistant Secretary
Mr. Coffey also serves as Assistant Secretary of other funds. He is Senior Vice President and Deputy General Counsel of FMR LLC (diversified financial services company, 2010-present), and is an employee of Fidelity Investments. Previously, Mr. Coffey served as Vice President and Associate General Counsel of FMR LLC (2005-2009).
Timothy M. Cohen (1969)
Year of Election or Appointment: 2018
Vice President
Mr. Cohen also serves as Vice President of other funds. Mr. Cohen serves as Co-Head of Global Equity Research (2016-present), a Director of Fidelity Management & Research (Japan) Limited (investment adviser firm, 2016-present), and is an employee of Fidelity Investments. Previously, Mr. Cohen served as Chief Investment Officer - Equity and a Director of Fidelity Management & Research (U.K.) Inc. (investment adviser firm, 2013-2015) and as a Director of Fidelity Management & Research (Hong Kong) Limited (investment adviser firm, 2017).
Jonathan Davis (1968)
Year of Election or Appointment: 2010
Assistant Treasurer
Mr. Davis also serves as Assistant Treasurer of other funds. Mr. Davis serves as Assistant Treasurer of FMR Capital, Inc. (2017-present) and is an employee of Fidelity Investments. Previously, Mr. Davis served as Vice President and Associate General Counsel of FMR LLC (diversified financial services company, 2003-2010).
Adrien E. Deberghes (1967)
Year of Election or Appointment: 2016
Assistant Treasurer
Mr. Deberghes also serves as an officer of other funds. He serves as Assistant Treasurer of FMR Capital, Inc. (2017-present), Executive Vice President of Fidelity Investments Money Management, Inc. (FIMM) (investment adviser firm, 2016-present), and is an employee of Fidelity Investments (2008-present). Previously, Mr. Deberghes served as President and Treasurer of certain Fidelity® funds (2013-2018). Prior to joining Fidelity Investments, Mr. Deberghes was Senior Vice President of Mutual Fund Administration at State Street Corporation (2007-2008), Senior Director of Mutual Fund Administration at Investors Bank & Trust (2005-2007), and Director of Finance for Dunkin' Brands (2000-2005). Previously, Mr. Deberghes served in other fund officer roles.
Laura M. Del Prato (1964)
Year of Election or Appointment: 2018
Assistant Treasurer
Ms. Del Prato also serves as an officer of other funds. Ms. Del Prato is an employee of Fidelity Investments (2017-present). Prior to joining Fidelity Investments, Ms. Del Prato served as a Managing Director and Treasurer of the JPMorgan Mutual Funds (2014-2017). Prior to JPMorgan, Ms. Del Prato served as a partner at Cohen Fund Audit Services (accounting firm, 2012-2013) and KPMG LLP (accounting firm, 2004-2012).
Colm A. Hogan (1973)
Year of Election or Appointment: 2016
Deputy Treasurer
Mr. Hogan also serves as an officer of other funds. Mr. Hogan serves as Assistant Treasurer of FMR Capital, Inc. (2017-present) and is an employee of Fidelity Investments (2005-present). Previously, Mr. Hogan served as Assistant Treasurer of certain Fidelity® funds (2016-2018).
Pamela R. Holding (1964)
Year of Election or Appointment: 2018
Vice President
Ms. Holding also serves as a Vice President of other funds. Ms. Holding serves as Co-Head of Global Equity Research (2018-present) and is an employee of Fidelity Investments (2013-present).
Chris Maher (1972)
Year of Election or Appointment: 2013
Assistant Treasurer
Mr. Maher serves as Assistant Treasurer of other funds. Mr. Maher is Vice President of Valuation Oversight, serves as Assistant Treasurer of FMR Capital, Inc. (2017-present), and is an employee of Fidelity Investments. Previously, Mr. Maher served as Vice President of Asset Management Compliance (2013), Vice President of the Program Management Group of FMR (investment adviser firm, 2010-2013), and Vice President of Valuation Oversight (2008-2010).
Rieco E. Mello (1969)
Year of Election or Appointment: 2017
Assistant Treasurer
Mr. Mello also serves as Assistant Treasurer of other funds. Mr. Mello serves as Assistant Treasurer of FMR Capital, Inc. (2017-present) and is an employee of Fidelity Investments (1995-present).
Kenneth B. Robins (1969)
Year of Election or Appointment: 2016
Chief Compliance Officer
Mr. Robins also serves as an officer of other funds. Mr. Robins serves as Compliance Officer of Fidelity Management & Research Company and FMR Co., Inc. (investment adviser firms, 2016-present) and is an employee of Fidelity Investments (2004-present). Previously, Mr. Robins served as Executive Vice President of Fidelity Investments Money Management, Inc. (investment adviser firm, 2013-2016) and served in other fund officer roles.
Stacie M. Smith (1974)
Year of Election or Appointment: 2016
President and Treasurer
Ms. Smith also serves as an officer of other funds. Ms. Smith serves as Assistant Treasurer of FMR Capital, Inc. (2017-present), is an employee of Fidelity Investments (2009-present), and has served in other fund officer roles. Prior to joining Fidelity Investments, Ms. Smith served as Senior Audit Manager of Ernst & Young LLP (accounting firm, 1996-2009). Previously, Ms. Smith served as Assistant Treasurer (2013-2018) and Deputy Treasurer (2013-2016) of certain Fidelity® funds.
Marc L. Spector (1972)
Year of Election or Appointment: 2016
Assistant Treasurer
Mr. Spector also serves as an officer of other funds. Mr. Spector serves as Assistant Treasurer of FMR Capital, Inc. (2017-present) and is an employee of Fidelity Investments (2016-present). Prior to joining Fidelity Investments, Mr. Spector served as Director at the Siegfried Group (accounting firm, 2013-2016), and prior to Siegfried Group as audit senior manager at Deloitte & Touche (accounting firm, 2005-2013).
Renee Stagnone (1975)
Year of Election or Appointment: 2016
Assistant Treasurer
Ms. Stagnone also serves as an officer of other funds. Ms. Stagnone serves as Assistant Treasurer of FMR Capital, Inc. (2017-present) and is an employee of Fidelity Investments (1997-present). Previously, Ms. Stagnone served as Deputy Treasurer of certain Fidelity® funds (2013-2016).
Shareholder Expense Example
As a shareholder of the Fund, you incur two types of costs: (1) transaction costs and (2) ongoing costs, including management fees and other Fund expenses. This Example is intended to help you understand your ongoing costs (in dollars) of investing in the Fund and to compare these costs with the ongoing costs of investing in other mutual funds.
The Example is based on an investment of $1,000 invested at the beginning of the period and held for the entire period (February 1, 2018 to July 31, 2018).
Actual Expenses
The first line of the accompanying table provides information about actual account values and actual expenses. You may use the information in this line, together with the amount you invested, to estimate the expenses that you paid over the period. Simply divide your account value by $1,000.00 (for example, an $8,600 account value divided by $1,000.00 = 8.6), then multiply the result by the number in the first line under the heading entitled "Expenses Paid During Period" to estimate the expenses you paid on your account during this period. In addition, the Fund, as a shareholder in the underlying Fidelity Central Funds, will indirectly bear its pro-rata share of the fees and expenses incurred by the underlying Fidelity Central Funds. These fees and expenses are not included in the Fund's annualized expense ratio used to calculate the expense estimate in the table below.
Hypothetical Example for Comparison Purposes
The second line of the accompanying table provides information about hypothetical account values and hypothetical expenses based on the Fund's actual expense ratio and an assumed rate of return of 5% per year before expenses, which is not the Fund's actual return. The hypothetical account values and expenses may not be used to estimate the actual ending account balance or expenses you paid for the period. You may use this information to compare the ongoing costs of investing in the Fund and other funds. To do so, compare this 5% hypothetical example with the 5% hypothetical examples that appear in the shareholder reports of the other funds. In addition, the Fund, as a shareholder in the underlying Fidelity Central Funds, will indirectly bear its pro-rata share of the fees and expenses incurred by the underlying Fidelity Central Funds. These fees and expenses are not included in the Fund's annualized expense ratio used to calculate the expense estimate in the table below.
Please note that the expenses shown in the table are meant to highlight your ongoing costs only and do not reflect any transaction costs. Therefore, the second line of the table is useful in comparing ongoing costs only, and will not help you determine the relative total costs of owning different funds.
| | Annualized Expense Ratio-A | Beginning
Account Value
February 1, 2018 | Ending
Account Value
July 31, 2018 | Expenses Paid
During Period-B
February 1, 2018
to July 31, 2018 |
| Actual | .50% | $1,000.00 | $984.60 | $2.46 |
| Hypothetical-C | | $1,000.00 | $1,022.32 | $2.51 |
A Annualized expense ratio reflects expenses net of applicable fee waivers.
B Expenses are equal to the Fund's annualized expense ratio, multiplied by the average account value over the period, multiplied by 181/365 (to reflect the one-half year period).
C 5% return per year before expenses
Distributions (Unaudited)
The Board of Trustees of Fidelity Low-Priced Stock K6 Fund voted to pay on September 17, 2018, to shareholders of record at the opening of business on September 14, 2018, a distribution of $0.015 per share derived from capital gains realized from sales of portfolio securities and a dividend of $0.086 per share from net investment income.
The fund hereby designates as a capital gain dividend with respect to the taxable year ended July 31, 2018, $454,340, or, if subsequently determined to be different, the net capital gain of such year.
The fund designates 42% of the dividend distributed during the fiscal year as qualifying for the dividends–received deduction for corporate shareholders.
The fund designates 91% of the dividend distributed during the fiscal year as amounts which may be taken into account as a dividend for the purposes of the maximum rate under section 1(h)(11) of the Internal Revenue Code.
The fund will notify shareholders in January 2019 of amounts for use in preparing 2018 income tax returns.
Board Approval of Investment Advisory Contracts
Fidelity Low-Priced Stock K6 Fund
At its July 2018 meeting, the Board of Trustees, including the Independent Trustees (together, the Board), voted to continue the management contract with Fidelity Management & Research Company (FMR) and the sub-advisory agreements (together, the Advisory Contracts) for the fund for six months through January 31, 2019, in connection with the reunification of the Fidelity Equity High Income Funds Board, which oversees the fund, and the Sector Portfolios Board.
The Board considered that the approval of the fund's Advisory Contracts will not result in any changes in (i) the investment process or strategies employed in the management of the fund's assets; (ii) the fees and expenses paid by shareholders; (iii) the nature, extent or quality of services provided under the fund's Advisory Contracts; or (iv) the day-to-day management of the fund or the persons primarily responsible for such management. The Board concluded that the fund's Advisory Contracts are fair and reasonable, and that the fund's Advisory Contracts should be renewed, without modification, through January 31, 2019, with the understanding that the Board will consider the annual renewal for a full one year period in January 2019.
In connection with its consideration of future renewals of the fund's Advisory Contracts, the Board will consider: (i) the nature, extent and quality of services provided to the fund, including shareholder and administrative services and investment performance; (ii) the competitiveness of the management fee and total expenses for the fund; (iii) the costs of the services and profitability, including the revenues earned and the expenses incurred in conducting the business of developing, marketing, distributing, managing, administering, and servicing the fund and its shareholders, to the extent applicable, as well as potential fall-out benefits from Fidelity's non-fund businesses; and (iv) whether there have been economies of scale in respect of the Fidelity funds, whether the Fidelity funds (including the fund) have appropriately benefited from any such economies of scale, and whether there is the potential for realization of any further economies.
Based on its evaluation of all of the conclusions noted above, and after considering all factors it believed relevant, the Board ultimately concluded that the fund's management fee structure is fair and reasonable, and that the continuation of the fund's Advisory Contracts should be approved.
Corporate Headquarters
245 Summer St.
Boston, MA 02210
www.fidelity.com
LPSK6-ANN-0918
1.9883999.101
Fidelity® Value Discovery K6 Fund
Annual Report July 31, 2018 |
|
Contents
To view a fund's proxy voting guidelines and proxy voting record for the 12-month period ended June 30, visit http://www.fidelity.com/proxyvotingresults or visit the Securities and Exchange Commission's (SEC) web site at http://www.sec.gov.
You may also call 1-800-835-5092 to request a free copy of the proxy voting guidelines.
Standard & Poor's, S&P and S&P 500 are registered service marks of The McGraw-Hill Companies, Inc. and have been licensed for use by Fidelity Distributors Corporation.
Other third-party marks appearing herein are the property of their respective owners.
All other marks appearing herein are registered or unregistered trademarks or service marks of FMR LLC or an affiliated company. © 2018 FMR LLC. All rights reserved.
This report and the financial statements contained herein are submitted for the general information of the shareholders of the Fund. This report is not authorized for distribution to prospective investors in the Fund unless preceded or accompanied by an effective prospectus.
A fund files its complete schedule of portfolio holdings with the SEC for the first and third quarters of each fiscal year on Form N-Q. Forms N-Q are available on the SEC’s web site at http://www.sec.gov. A fund's Forms N-Q may be reviewed and copied at the SEC’s Public Reference Room in Washington, DC. Information regarding the operation of the SEC's Public Reference Room may be obtained by calling 1-800-SEC-0330.
For a complete list of a fund's portfolio holdings, view the most recent holdings listing, semiannual report, or annual report on Fidelity's web site at http://www.fidelity.com, http://www.institutional.fidelity.com, or http://www.401k.com, as applicable.
NOT FDIC INSURED •MAY LOSE VALUE •NO BANK GUARANTEE
Neither the Fund nor Fidelity Distributors Corporation is a bank.
Performance: The Bottom Line
Average annual total return reflects the change in the value of an investment, assuming reinvestment of distributions from dividend income and capital gains (the profits earned upon the sale of securities that have grown in value, if any) and assuming a constant rate of performance each year. The hypothetical investment and the average annual total returns do not reflect the deduction of taxes that a shareholder would pay on fund distributions or the redemption of fund shares. During periods of reimbursement by Fidelity, a fund’s total return will be greater than it would be had the reimbursement not occurred. How a fund did yesterday is no guarantee of how it will do tomorrow.
Average Annual Total Returns
| For the periods ended July 31, 2018 | Past 1 year | Life of fundA |
| Fidelity® Value Discovery K6 Fund | 6.58% | 8.91% |
A From May 25, 2017
$10,000 Over Life of Fund
Let's say hypothetically that $10,000 was invested in Fidelity® Value Discovery K6 Fund on May 25, 2017, when the fund started.
The chart shows how the value of your investment would have changed, and also shows how the Russell 3000® Value Index performed over the same period.
| Period Ending Values |
| $11,063 | Fidelity® Value Discovery K6 Fund |
| $11,278 | Russell 3000® Value Index |
Management's Discussion of Fund Performance
Market Recap: The U.S. equity bellwether S&P 500
® index gained 16.24% for the 12 months ending July 31, 2018, despite a resurgence in volatility that challenged the multiyear bull market. Stocks maintained their steady growth until a sharp reversal in February, as volatility spiked amid fear that rising inflation and the potential for the economy to overheat would prompt the U.S. Federal Reserve to pick up the pace of interest rate hikes. The index posted its first negative monthly result since October 2016, and then lost further ground in March on fear of a global trade war. The market stabilized in April and turned upward through mid-June, when escalating trade tension between the U.S. and China soured investor sentiment. The resulting uncertainty lingered into July, but strong corporate earnings helped the S&P 500 rise 3.72% that month to cap the period. For the full one-year period, growth handily topped value, while small-caps bested large-caps. By sector, information technology (+28%) led the way, boosted by strong earnings growth from several major index constituents. Consumer discretionary rose roughly 24%, driven by retailers (+49%). Energy (+20%) gained alongside higher oil prices. Laggards were telecommunication services (-2%), consumer staples (0%) and utilities (+3%), defensive groups that struggled amid rising interest rates and a general preference for risk. Real estate (+5%) fared a bit better but still lagged, as did financials, industrials, health care (each up 13%) and materials (+11%).
Comments from Portfolio Manager Sean Gavin: For the fiscal year, the fund gained 6.58%, trailing the 9.91% result of the benchmark Russell 3000
® Value Index. The fund's underperformance of the benchmark was due to ineffective stock picking, coupled with an unfavorable market backdrop for my style of investing. Security selection in the health care, financials and energy sectors were the largest relative detractors. Conversely, industry positioning – which derives from my bottom-up, stock-by-stock investment approach – helped the fund’s relative result, with an underweighting in the weak real estate group contributing most. My picks in consumer staples also provided a boost. On an individual basis, the biggest impact came from a non-benchmark equity position in Israeli drug maker Teva Pharmaceutical Industries, which returned -51% for the fund before I sold the position last fall. Over time, I concluded the company's challenges were too deep-rooted to justify further investment. Other detractors from the health care sector included drug store operator and pharmacy benefit management company CVS Health and drugmaker Allergan. Elsewhere, information-analytics company Nielsen Holdings also detracted. On the positive side, the biggest individual relative contributor stemmed from my decision to largely avoid benchmark component General Electric, which struggled amid numerous business challenges. Also, in consumer staples, we did not hold poor-performing benchmark stocks Procter & Gamble, a consumer-products company, and tobacco manufacturer Philip Morris International. It helped to overweight media company Twenty-First Century Fox, which was poised to be acquired by Disney. Both Fox and Disney were meaningful holdings in the fund at period end.
The views expressed above reflect those of the portfolio manager(s) only through the end of the period as stated on the cover of this report and do not necessarily represent the views of Fidelity or any other person in the Fidelity organization. Any such views are subject to change at any time based upon market or other conditions and Fidelity disclaims any responsibility to update such views. These views may not be relied on as investment advice and, because investment decisions for a Fidelity fund are based on numerous factors, may not be relied on as an indication of trading intent on behalf of any Fidelity fund.
Investment Summary (Unaudited)
Top Ten Stocks as of July 31, 2018
| | % of fund's net assets |
| JPMorgan Chase & Co. | 3.6 |
| Wells Fargo & Co. | 3.4 |
| Exxon Mobil Corp. | 2.9 |
| Berkshire Hathaway, Inc. Class B | 2.8 |
| Comcast Corp. Class A | 2.4 |
| Amgen, Inc. | 2.1 |
| U.S. Bancorp | 2.1 |
| CVS Health Corp. | 1.9 |
| Verizon Communications, Inc. | 1.9 |
| United Technologies Corp. | 1.8 |
| | 24.9 |
Top Five Market Sectors as of July 31, 2018
| | % of fund's net assets |
| Financials | 25.8 |
| Health Care | 14.9 |
| Energy | 11.8 |
| Consumer Discretionary | 11.2 |
| Information Technology | 8.3 |
Asset Allocation (% of fund's net assets)
| As of July 31, 2018* |
| | Stocks | 97.4% |
| | Short-Term Investments and Net Other Assets (Liabilities) | 2.6% |

* Foreign investments - 19.7%
Schedule of Investments July 31, 2018
Showing Percentage of Net Assets
| Common Stocks - 97.4% | | | |
| | | Shares | Value |
| CONSUMER DISCRETIONARY - 11.2% | | | |
| Media - 9.6% | | | |
| Cinemark Holdings, Inc. | | 46,375 | $1,665,790 |
| Comcast Corp. Class A | | 180,597 | 6,461,761 |
| Entercom Communications Corp. Class A (a) | | 151,864 | 1,146,573 |
| Interpublic Group of Companies, Inc. | | 139,055 | 3,135,690 |
| Lions Gate Entertainment Corp. Class B | | 105,289 | 2,407,959 |
| The Walt Disney Co. | | 35,592 | 4,041,828 |
| Twenty-First Century Fox, Inc. Class A | | 103,184 | 4,643,280 |
| WPP PLC | | 126,000 | 1,970,891 |
| | | | 25,473,772 |
| Multiline Retail - 0.6% | | | |
| Dollar General Corp. | | 17,200 | 1,688,180 |
| Textiles, Apparel & Luxury Goods - 1.0% | | | |
| PVH Corp. | | 16,425 | 2,521,566 |
|
| TOTAL CONSUMER DISCRETIONARY | | | 29,683,518 |
|
| CONSUMER STAPLES - 8.2% | | | |
| Beverages - 1.9% | | | |
| C&C Group PLC | | 381,200 | 1,533,401 |
| Coca-Cola European Partners PLC | | 30,100 | 1,241,324 |
| PepsiCo, Inc. | | 18,603 | 2,139,345 |
| | | | 4,914,070 |
| Food & Staples Retailing - 1.1% | | | |
| Sysco Corp. | | 22,506 | 1,512,628 |
| Walmart, Inc. | | 17,100 | 1,525,833 |
| | | | 3,038,461 |
| Food Products - 3.8% | | | |
| Kellogg Co. | | 35,455 | 2,518,369 |
| Mondelez International, Inc. | | 29,300 | 1,271,034 |
| Seaboard Corp. | | 281 | 1,022,278 |
| The Hershey Co. | | 13,292 | 1,305,407 |
| The J.M. Smucker Co. | | 36,709 | 4,079,104 |
| | | | 10,196,192 |
| Tobacco - 1.4% | | | |
| British American Tobacco PLC: | | | |
| (United Kingdom) | | 21,737 | 1,194,933 |
| sponsored ADR | | 45,854 | 2,511,882 |
| | | | 3,706,815 |
|
| TOTAL CONSUMER STAPLES | | | 21,855,538 |
|
| ENERGY - 11.8% | | | |
| Energy Equipment & Services - 1.4% | | | |
| Baker Hughes, a GE Co. Class A | | 88,066 | 3,045,322 |
| Dril-Quip, Inc. (b) | | 12,330 | 635,612 |
| | | | 3,680,934 |
| Oil, Gas & Consumable Fuels - 10.4% | | | |
| Chevron Corp. | | 36,217 | 4,573,121 |
| Exxon Mobil Corp. | | 93,660 | 7,634,227 |
| FLEX LNG Ltd. (b) | | 599,722 | 900,688 |
| GasLog Ltd. | | 28,454 | 479,450 |
| GasLog Partners LP | | 86,696 | 2,180,404 |
| Golar LNG Partners LP | | 148,000 | 2,428,680 |
| Hoegh LNG Partners LP | | 64,011 | 1,177,802 |
| Phillips 66 Co. | | 26,849 | 3,311,556 |
| Suncor Energy, Inc. | | 53,187 | 2,239,754 |
| Teekay Corp. (a) | | 97,836 | 681,917 |
| Teekay LNG Partners LP | | 89,875 | 1,438,000 |
| Teekay Offshore Partners LP | | 256,531 | 651,589 |
| | | | 27,697,188 |
|
| TOTAL ENERGY | | | 31,378,122 |
|
| FINANCIALS - 25.8% | | | |
| Banks - 11.9% | | | |
| JPMorgan Chase & Co. | | 83,752 | 9,627,293 |
| PNC Financial Services Group, Inc. | | 23,489 | 3,401,912 |
| SunTrust Banks, Inc. | | 55,773 | 4,019,560 |
| U.S. Bancorp | | 104,362 | 5,532,230 |
| Wells Fargo & Co. | | 160,550 | 9,197,910 |
| | | | 31,778,905 |
| Capital Markets - 2.2% | | | |
| Goldman Sachs Group, Inc. | | 16,208 | 3,848,265 |
| State Street Corp. | | 23,781 | 2,100,100 |
| | | | 5,948,365 |
| Consumer Finance - 2.7% | | | |
| Capital One Financial Corp. | | 22,982 | 2,167,662 |
| Discover Financial Services | | 37,153 | 2,653,096 |
| Synchrony Financial | | 83,461 | 2,415,361 |
| | | | 7,236,119 |
| Diversified Financial Services - 3.3% | | | |
| Berkshire Hathaway, Inc. Class B (b) | | 37,975 | 7,514,113 |
| Cannae Holdings, Inc. (b) | | 17,510 | 319,558 |
| Standard Life PLC | | 227,260 | 931,560 |
| | | | 8,765,231 |
| Insurance - 4.2% | | | |
| Allstate Corp. | | 16,045 | 1,526,200 |
| Chubb Ltd. | | 20,288 | 2,834,639 |
| FNF Group | | 37,037 | 1,499,999 |
| Prudential PLC | | 85,082 | 2,007,386 |
| The Travelers Companies, Inc. | | 24,241 | 3,154,724 |
| | | | 11,022,948 |
| Mortgage Real Estate Investment Trusts - 1.5% | | | |
| AGNC Investment Corp. | | 74,513 | 1,450,768 |
| Annaly Capital Management, Inc. | | 139,808 | 1,498,742 |
| MFA Financial, Inc. | | 129,425 | 1,041,871 |
| | | | 3,991,381 |
|
| TOTAL FINANCIALS | | | 68,742,949 |
|
| HEALTH CARE - 14.9% | | | |
| Biotechnology - 3.4% | | | |
| Amgen, Inc. | | 28,375 | 5,577,106 |
| Shire PLC sponsored ADR | | 20,818 | 3,551,759 |
| | | | 9,128,865 |
| Health Care Providers & Services - 6.5% | | | |
| Aetna, Inc. | | 12,801 | 2,411,580 |
| Anthem, Inc. | | 11,133 | 2,816,649 |
| Cigna Corp. | | 19,885 | 3,567,767 |
| CVS Health Corp. | | 77,846 | 5,049,092 |
| McKesson Corp. | | 7,586 | 952,802 |
| UnitedHealth Group, Inc. | | 9,400 | 2,380,268 |
| | | | 17,178,158 |
| Pharmaceuticals - 5.0% | | | |
| Allergan PLC | | 18,526 | 3,410,451 |
| Bayer AG | | 37,437 | 4,167,755 |
| Johnson & Johnson | | 9,295 | 1,231,773 |
| Pfizer, Inc. | | 25,643 | 1,023,925 |
| Roche Holding AG (participation certificate) | | 5,836 | 1,433,593 |
| Sanofi SA sponsored ADR | | 50,159 | 2,174,894 |
| | | | 13,442,391 |
|
| TOTAL HEALTH CARE | | | 39,749,414 |
|
| INDUSTRIALS - 5.9% | | | |
| Aerospace & Defense - 2.7% | | | |
| Harris Corp. | | 11,652 | 1,921,997 |
| Huntington Ingalls Industries, Inc. | | 2,119 | 493,833 |
| United Technologies Corp. | | 35,593 | 4,831,394 |
| | | | 7,247,224 |
| Machinery - 1.2% | | | |
| Allison Transmission Holdings, Inc. | | 28,796 | 1,353,412 |
| Deere & Co. | | 13,529 | 1,958,864 |
| | | | 3,312,276 |
| Professional Services - 0.7% | | | |
| Dun & Bradstreet Corp. | | 2,939 | 369,991 |
| Nielsen Holdings PLC | | 63,825 | 1,503,717 |
| | | | 1,873,708 |
| Road & Rail - 1.3% | | | |
| Union Pacific Corp. | | 22,328 | 3,346,744 |
|
| TOTAL INDUSTRIALS | | | 15,779,952 |
|
| INFORMATION TECHNOLOGY - 8.3% | | | |
| Communications Equipment - 1.8% | | | |
| Cisco Systems, Inc. | | 62,181 | 2,629,634 |
| F5 Networks, Inc. (b) | | 12,452 | 2,134,024 |
| | | | 4,763,658 |
| Electronic Equipment & Components - 0.9% | | | |
| TE Connectivity Ltd. | | 26,117 | 2,443,768 |
| Internet Software & Services - 2.5% | | | |
| Alphabet, Inc. Class A (b) | | 2,963 | 3,636,253 |
| comScore, Inc. (b) | | 84,389 | 1,687,780 |
| eBay, Inc. (b) | | 40,831 | 1,365,797 |
| | | | 6,689,830 |
| IT Services - 1.9% | | | |
| Amdocs Ltd. | | 25,269 | 1,707,679 |
| Cognizant Technology Solutions Corp. Class A | | 24,643 | 2,008,405 |
| The Western Union Co. | | 69,087 | 1,392,794 |
| | | | 5,108,878 |
| Technology Hardware, Storage & Peripherals - 1.2% | | | |
| Apple, Inc. | | 16,208 | 3,084,220 |
|
| TOTAL INFORMATION TECHNOLOGY | | | 22,090,354 |
|
| MATERIALS - 4.5% | | | |
| Chemicals - 3.1% | | | |
| DowDuPont, Inc. | | 57,827 | 3,976,763 |
| LyondellBasell Industries NV Class A | | 28,615 | 3,170,256 |
| The Scotts Miracle-Gro Co. Class A | | 11,703 | 929,569 |
| | | | 8,076,588 |
| Containers & Packaging - 1.4% | | | |
| Ball Corp. | | 45,999 | 1,792,581 |
| Graphic Packaging Holding Co. | | 133,831 | 1,944,564 |
| | | | 3,737,145 |
|
| TOTAL MATERIALS | | | 11,813,733 |
|
| REAL ESTATE - 1.2% | | | |
| Real Estate Management & Development - 1.2% | | | |
| CBRE Group, Inc. (b) | | 64,938 | 3,233,912 |
| TELECOMMUNICATION SERVICES - 2.7% | | | |
| Diversified Telecommunication Services - 2.7% | | | |
| AT&T, Inc. | | 68,562 | 2,191,927 |
| Verizon Communications, Inc. | | 97,361 | 5,027,722 |
| | | | 7,219,649 |
| UTILITIES - 2.9% | | | |
| Electric Utilities - 2.9% | | | |
| Exelon Corp. | | 91,389 | 3,884,033 |
| PPL Corp. | | 21,830 | 628,049 |
| Xcel Energy, Inc. | | 68,197 | 3,195,711 |
| | | | 7,707,793 |
| TOTAL COMMON STOCKS | | | |
| (Cost $243,840,235) | | | 259,254,934 |
|
| Money Market Funds - 2.8% | | | |
| Fidelity Cash Central Fund, 1.96% (c) | | 5,624,337 | 5,625,462 |
| Fidelity Securities Lending Cash Central Fund 1.97% (c)(d) | | 1,891,885 | 1,892,074 |
| TOTAL MONEY MARKET FUNDS | | | |
| (Cost $7,517,536) | | | 7,517,536 |
| TOTAL INVESTMENT IN SECURITIES - 100.2% | | | |
| (Cost $251,357,771) | | | 266,772,470 |
| NET OTHER ASSETS (LIABILITIES) - (0.2)% | | | (557,011) |
| NET ASSETS - 100% | | | $266,215,459 |
Legend
(a) Security or a portion of the security is on loan at period end.
(b) Non-income producing
(c) Affiliated fund that is generally available only to investment companies and other accounts managed by Fidelity Investments. The rate quoted is the annualized seven-day yield of the fund at period end. A complete unaudited listing of the fund's holdings as of its most recent quarter end is available upon request. In addition, each Fidelity Central Fund's financial statements, which are not covered by the Fund's Report of Independent Registered Public Accounting Firm, are available on the SEC's website or upon request.
(d) Investment made with cash collateral received from securities on loan.
Affiliated Central Funds
Information regarding fiscal year to date income earned by the Fund from investments in Fidelity Central Funds is as follows:
| Fund | Income earned |
| Fidelity Cash Central Fund | $133,809 |
| Fidelity Securities Lending Cash Central Fund | 39,225 |
| Total | $173,034 |
Amounts in the income column in the above table include any capital gain distributions from underlying funds, which are presented in the corresponding line-item in the Statement of Operations if applicable.
Investment Valuation
The following is a summary of the inputs used, as of July 31, 2018, involving the Fund's assets and liabilities carried at fair value. The inputs or methodology used for valuing securities may not be an indication of the risk associated with investing in those securities. For more information on valuation inputs, and their aggregation into the levels used below, please refer to the Investment Valuation section in the accompanying Notes to Financial Statements.
| | Valuation Inputs at Reporting Date: |
| Description | Total | Level 1 | Level 2 | Level 3 |
| Investments in Securities: | | | | |
| Equities: | | | | |
| Consumer Discretionary | $29,683,518 | $27,712,627 | $1,970,891 | $-- |
| Consumer Staples | 21,855,538 | 20,660,605 | 1,194,933 | -- |
| Energy | 31,378,122 | 31,378,122 | -- | -- |
| Financials | 68,742,949 | 66,735,563 | 2,007,386 | -- |
| Health Care | 39,749,414 | 34,148,066 | 5,601,348 | -- |
| Industrials | 15,779,952 | 15,779,952 | -- | -- |
| Information Technology | 22,090,354 | 22,090,354 | -- | -- |
| Materials | 11,813,733 | 11,813,733 | -- | -- |
| Real Estate | 3,233,912 | 3,233,912 | -- | -- |
| Telecommunication Services | 7,219,649 | 7,219,649 | -- | -- |
| Utilities | 7,707,793 | 7,707,793 | -- | -- |
| Money Market Funds | 7,517,536 | 7,517,536 | -- | -- |
| Total Investments in Securities: | $266,772,470 | $255,997,912 | $10,774,558 | $-- |
The following is a summary of transfers between Level 1 and Level 2 for the period ended July 31, 2018. Transfers are assumed to have occurred at the beginning of the period, and are primarily attributable to the valuation techniques used for foreign equity securities, as discussed in the accompanying Notes to Financial Statements:
| Transfers | Total |
| Level 1 to Level 2 | $3,862,024 |
| Level 2 to Level 1 | $0 |
Other Information
Distribution of investments by country or territory of incorporation, as a percentage of Total Net Assets, is as follows (Unaudited):
| United States of America | 80.3% |
| United Kingdom | 3.6% |
| Marshall Islands | 3.2% |
| Switzerland | 2.5% |
| Bailiwick of Jersey | 2.1% |
| Ireland | 1.9% |
| Canada | 1.7% |
| Germany | 1.6% |
| Netherlands | 1.2% |
| Others (Individually Less Than 1%) | 1.9% |
| | 100.0% |
See accompanying notes which are an integral part of the financial statements.
Financial Statements
Statement of Assets and Liabilities
| | | July 31, 2018 |
| Assets | | |
Investment in securities, at value (including securities loaned of $1,834,280) — See accompanying schedule:
Unaffiliated issuers (cost $243,840,235) | $259,254,934 | |
| Fidelity Central Funds (cost $7,517,536) | 7,517,536 | |
| Total Investment in Securities (cost $251,357,771) | | $266,772,470 |
| Cash | | 32,345 |
| Receivable for investments sold | | 1,130,767 |
| Receivable for fund shares sold | | 24,231 |
| Dividends receivable | | 288,654 |
| Distributions receivable from Fidelity Central Funds | | 15,686 |
| Other receivables | | 7,752 |
| Total assets | | 268,271,905 |
| Liabilities | | |
| Payable for fund shares redeemed | $49,110 | |
| Accrued management fee | 115,050 | |
| Collateral on securities loaned | 1,892,286 | |
| Total liabilities | | 2,056,446 |
| Net Assets | | $266,215,459 |
| Net Assets consist of: | | |
| Paid in capital | | $249,553,074 |
| Undistributed net investment income | | 3,192,986 |
| Accumulated undistributed net realized gain (loss) on investments and foreign currency transactions | | (1,945,406) |
| Net unrealized appreciation (depreciation) on investments and assets and liabilities in foreign currencies | | 15,414,805 |
| Net Assets, for 24,249,917 shares outstanding | | $266,215,459 |
| Net Asset Value, offering price and redemption price per share ($266,215,459 ÷ 24,249,917 shares) | | $10.98 |
See accompanying notes which are an integral part of the financial statements.
Statement of Operations
| | | Year ended July 31, 2018 |
| Investment Income | | |
| Dividends | | $6,938,036 |
| Income from Fidelity Central Funds | | 173,034 |
| Total income | | 7,111,070 |
| Expenses | | |
| Management fee | $1,420,227 | |
| Independent trustees' fees and expenses | 1,233 | |
| Commitment fees | 277 | |
| Total expenses before reductions | 1,421,737 | |
| Expense reductions | (18,438) | |
| Total expenses after reductions | | 1,403,299 |
| Net investment income (loss) | | 5,707,771 |
| Realized and Unrealized Gain (Loss) | | |
| Net realized gain (loss) on: | | |
| Investment securities: | | |
| Unaffiliated issuers | (1,979,104) | |
| Fidelity Central Funds | (212) | |
| Foreign currency transactions | (19,830) | |
| Total net realized gain (loss) | | (1,999,146) |
| Change in net unrealized appreciation (depreciation) on: | | |
| Investment securities: | | |
| Unaffiliated issuers | 14,978,487 | |
| Assets and liabilities in foreign currencies | 106 | |
| Total change in net unrealized appreciation (depreciation) | | 14,978,593 |
| Net gain (loss) | | 12,979,447 |
| Net increase (decrease) in net assets resulting from operations | | $18,687,218 |
See accompanying notes which are an integral part of the financial statements.
Statement of Changes in Net Assets
| | Year ended July 31, 2018 | For the period
May 25, 2017 (commencement of operations) to July 31, 2017 |
| Increase (Decrease) in Net Assets | | |
| Operations | | |
| Net investment income (loss) | $5,707,771 | $(3,565) |
| Net realized gain (loss) | (1,999,146) | (65) |
| Change in net unrealized appreciation (depreciation) | 14,978,593 | 436,212 |
| Net increase (decrease) in net assets resulting from operations | 18,687,218 | 432,582 |
| Distributions to shareholders from net investment income | (2,457,414) | – |
| Share transactions | | |
| Proceeds from sales of shares | 96,394,707 | 297,284,469 |
| Reinvestment of distributions | 2,457,414 | – |
| Cost of shares redeemed | (145,935,433) | (648,084) |
| Net increase (decrease) in net assets resulting from share transactions | (47,083,312) | 296,636,385 |
| Total increase (decrease) in net assets | (30,853,508) | 297,068,967 |
| Net Assets | | |
| Beginning of period | 297,068,967 | – |
| End of period | $266,215,459 | $297,068,967 |
| Other Information | | |
| Undistributed net investment income end of period | $3,192,986 | $2,764 |
| Shares | | |
| Sold | 9,017,571 | 28,669,522 |
| Issued in reinvestment of distributions | 229,023 | – |
| Redeemed | (13,603,763) | (62,436) |
| Net increase (decrease) | (4,357,169) | 28,607,086 |
See accompanying notes which are an integral part of the financial statements.
Financial Highlights
Fidelity Value Discovery K6 Fund
| | | |
| Years ended July 31, | 2018 | 2017 A |
| Selected Per–Share Data | | |
| Net asset value, beginning of period | $10.38 | $10.00 |
| Income from Investment Operations | | |
| Net investment income (loss)B | .19 | –C |
| Net realized and unrealized gain (loss) | .49 | .38 |
| Total from investment operations | .68 | .38 |
| Distributions from net investment income | (.08) | – |
| Total distributions | (.08) | – |
| Net asset value, end of period | $10.98 | $10.38 |
| Total ReturnD,E | 6.58% | 3.80% |
| Ratios to Average Net AssetsF,G | | |
| Expenses before reductions | .45% | .45%H |
| Expenses net of fee waivers, if any | .45% | .45%H |
| Expenses net of all reductions | .45% | .45%H |
| Net investment income (loss) | 1.81% | (.28)%H |
| Supplemental Data | | |
| Net assets, end of period (000 omitted) | $266,215 | $297,069 |
| Portfolio turnover rateI | 38%J | - %J,K |
A For the period May 25, 2017 (commencement of operations) to July 31, 2017.
B Calculated based on average shares outstanding during the period.
C Amount represents less than $.005 per share.
D Total returns for periods of less than one year are not annualized.
E Total returns would have been lower if certain expenses had not been reduced during the applicable periods shown.
F Fees and expenses of any underlying Fidelity Central Funds are not included in the Fund's expense ratio. The Fund indirectly bears its proportionate share of the expenses of any underlying Fidelity Central Funds.
G Expense ratios reflect operating expenses of the Fund. Expenses before reductions do not reflect amounts reimbursed by the investment adviser or reductions from brokerage service arrangements or reductions from other expense offset arrangements and do not represent the amount paid by the Fund during periods when reimbursements or reductions occur. Expense ratios before reductions for start-up periods may not be representative of longer term operating periods. Expenses net of fee waivers reflect expenses after reimbursement by the investment adviser but prior to reductions from brokerage service arrangements or other expense offset arrangements. Expenses net of all reductions represent the net expenses paid by the Fund.
H Annualized
I Amount does not include the portfolio activity of any underlying Fidelity Central Funds.
J Portfolio turnover rate excludes securities received or delivered in-kind.
K Amount not annualized.
See accompanying notes which are an integral part of the financial statements.
Notes to Financial Statements
For the period ended July 31, 2018
1. Organization.
Fidelity Value Discovery K6 Fund (the Fund) is a fund of Fidelity Puritan Trust (the Trust) and is authorized to issue an unlimited number of shares. Share transactions on the Statement of Changes in Net Assets may contain exchanges between affiliated funds. The Trust is registered under the Investment Company Act of 1940, as amended (the 1940 Act), as an open-end management investment company organized as a Massachusetts business trust. Shares generally are available only to employer-sponsored retirement plans that are recordkept by Fidelity, or to certain employer-sponsored retirement plans that are not recordkept by Fidelity.
2. Investments in Fidelity Central Funds.
The Fund invests in Fidelity Central Funds, which are open-end investment companies generally available only to other investment companies and accounts managed by the investment adviser and its affiliates. The Fund's Schedule of Investments lists each of the Fidelity Central Funds held as of period end, if any, as an investment of the Fund, but does not include the underlying holdings of each Fidelity Central Fund. As an Investing Fund, the Fund indirectly bears its proportionate share of the expenses of the underlying Fidelity Central Funds.
The Money Market Central Funds seek preservation of capital and current income and are managed by Fidelity Investments Money Management, Inc. (FIMM), an affiliate of the investment adviser. Annualized expenses of the Money Market Central Funds as of their most recent shareholder report date are less than .005%.
A complete unaudited list of holdings for each Fidelity Central Fund is available upon request or at the Securities and Exchange Commission (the SEC) website at www.sec.gov. In addition, the financial statements of the Fidelity Central Funds, which are not covered by the Fund's Report of Independent Registered Public Accounting Firm, are available on the SEC website or upon request.
3. Significant Accounting Policies.
The Fund is an investment company and applies the accounting and reporting guidance of the Financial Accounting Standards Board (FASB) Accounting Standards Codification Topic 946 Financial Services – Investments Companies. The financial statements have been prepared in conformity with accounting principles generally accepted in the United States of America (GAAP), which require management to make certain estimates and assumptions at the date of the financial statements. Actual results could differ from those estimates. Subsequent events, if any, through the date that the financial statements were issued have been evaluated in the preparation of the financial statements. The following summarizes the significant accounting policies of the Fund:
Investment Valuation. Investments are valued as of 4:00 p.m. Eastern time on the last calendar day of the period. The Board of Trustees (the Board) has delegated the day to day responsibility for the valuation of the Fund's investments to the Fair Value Committee (the Committee) established by the Fund's investment adviser. In accordance with valuation policies and procedures approved by the Board, the Fund attempts to obtain prices from one or more third party pricing vendors or brokers to value its investments. When current market prices, quotations or currency exchange rates are not readily available or reliable, investments will be fair valued in good faith by the Committee, in accordance with procedures adopted by the Board. Factors used in determining fair value vary by investment type and may include market or investment specific events. The frequency with which these procedures are used cannot be predicted and they may be utilized to a significant extent. The Committee oversees the Fund's valuation policies and procedures and reports to the Board on the Committee's activities and fair value determinations. The Board monitors the appropriateness of the procedures used in valuing the Fund's investments and ratifies the fair value determinations of the Committee.
The Fund categorizes the inputs to valuation techniques used to value its investments into a disclosure hierarchy consisting of three levels as shown below:
- Level 1 – quoted prices in active markets for identical investments
- Level 2 – other significant observable inputs (including quoted prices for similar investments, interest rates, prepayment speeds, etc.)
- Level 3 – unobservable inputs (including the Fund's own assumptions based on the best information available)
Valuation techniques used to value the Fund's investments by major category are as follows:
Equity securities, including restricted securities, for which market quotations are readily available, are valued at the last reported sale price or official closing price as reported by a third party pricing vendor on the primary market or exchange on which they are traded and are categorized as Level 1 in the hierarchy. In the event there were no sales during the day or closing prices are not available, securities are valued at the last quoted bid price or may be valued using the last available price and are generally categorized as Level 2 in the hierarchy. For foreign equity securities, when market or security specific events arise, comparisons to the valuation of American Depositary Receipts (ADRs), futures contracts, Exchange-Traded Funds (ETFs) and certain indexes as well as quoted prices for similar securities may be used and would be categorized as Level 2 in the hierarchy. Utilizing these techniques may result in transfers between Level 1 and Level 2. For equity securities, including restricted securities, where observable inputs are limited, assumptions about market activity and risk are used and these securities may be categorized as Level 3 in the hierarchy.
Investments in open-end mutual funds, including the Fidelity Central Funds, are valued at their closing net asset value (NAV) each business day and are categorized as Level 1 in the hierarchy.
Changes in valuation techniques may result in transfers in or out of an assigned level within the disclosure hierarchy. The aggregate value of investments by input level as of July 31, 2018, including information on transfers between Levels 1 and 2, is included at the end of the Fund's Schedule of Investments.
Foreign Currency. The Fund may use foreign currency contracts to facilitate transactions in foreign-denominated securities. Gains and losses from these transactions may arise from changes in the value of the foreign currency or if the counterparties do not perform under the contracts' terms.
Foreign-denominated assets, including investment securities, and liabilities are translated into U.S. dollars at the exchange rates at period end. Purchases and sales of investment securities, income and dividends received and expenses denominated in foreign currencies are translated into U.S. dollars at the exchange rate in effect on the transaction date.
The effects of exchange rate fluctuations on investments are included with the net realized and unrealized gain (loss) on investment securities. Other foreign currency transactions resulting in realized and unrealized gain (loss) are disclosed separately.
Investment Transactions and Income. For financial reporting purposes, the Fund's investment holdings and NAV include trades executed through the end of the last business day of the period. The NAV per share for processing shareholder transactions is calculated as of the close of business of the New York Stock Exchange (NYSE), normally 4:00 p.m. Eastern time and includes trades executed through the end of the prior business day. Gains and losses on securities sold are determined on the basis of identified cost. Dividend income is recorded on the ex-dividend date, except for certain dividends from foreign securities where the ex-dividend date may have passed, which are recorded as soon as the Fund is informed of the ex-dividend date. Non-cash dividends included in dividend income, if any, are recorded at the fair market value of the securities received. Income and capital gain distributions from Fidelity Central Funds, if any, are recorded on the ex-dividend date. Certain distributions received by the Fund represent a return of capital or capital gain. The Fund determines the components of these distributions subsequent to the ex-dividend date, based upon receipt of tax filings or other correspondence relating to the underlying investment. These distributions are recorded as a reduction of cost of investments and/or as a realized gain. Investment income is recorded net of foreign taxes withheld where recovery of such taxes is uncertain.
Expenses. Expenses directly attributable to a fund are charged to that fund. Expenses attributable to more than one fund are allocated among the respective funds on the basis of relative net assets or other appropriate methods. Expense estimates are accrued in the period to which they relate and adjustments are made when actual amounts are known.
Income Tax Information and Distributions to Shareholders. Each year, the Fund intends to qualify as a regulated investment company under Subchapter M of the Internal Revenue Code, including distributing substantially all of its taxable income and realized gains. As a result, no provision for U.S. Federal income taxes is required. As of July 31, 2018, the Fund did not have any unrecognized tax benefits in the financial statements; nor is the Fund aware of any tax positions for which it is reasonably possible that the total amounts of unrecognized tax benefits will significantly change in the next twelve months. The Fund files a U.S. federal tax return, in addition to state and local tax returns as required. The Fund's federal income tax returns are subject to examination by the Internal Revenue Service (IRS) for a period of three fiscal years after they are filed. State and local tax returns may be subject to examination for an additional fiscal year depending on the jurisdiction. Foreign taxes are provided for based on the Fund's understanding of the tax rules and rates that exist in the foreign markets in which it invests.
Distributions are declared and recorded on the ex-dividend date. Income and capital gain distributions are determined in accordance with income tax regulations, which may differ from GAAP.
Capital accounts within the financial statements are adjusted for permanent book-tax differences. These adjustments have no impact on net assets or the results of operations. Capital accounts are not adjusted for temporary book-tax differences which will reverse in a subsequent period.
Book-tax differences are primarily due to foreign currency transactions, partnerships, passive foreign investment companies (PFIC), capital loss carryforwards and losses deferred due to wash sales.
As of period end, the cost and unrealized appreciation (depreciation) in securities, and derivatives if applicable, for federal income tax purposes were as follows:
| Gross unrealized appreciation | $24,921,316 |
| Gross unrealized depreciation | (9,768,409) |
| Net unrealized appreciation (depreciation) | $15,152,907 |
| Tax Cost | $251,619,563 |
The tax-based components of distributable earnings as of period end were as follows:
| Undistributed ordinary income | $3,192,986 |
| Capital loss carryforward | $(1,683,615) |
| Net unrealized appreciation (depreciation) on securities and other investments | $15,153,013 |
Capital loss carryforwards are only available to offset future capital gains of the Fund to the extent provided by regulations and may be limited. Under the Regulated Investment Company Modernization Act of 2010 (the Act), the Fund is permitted to carry forward capital losses incurred in taxable years beginning after December 22, 2010 for an unlimited period and such capital losses are required to be used prior to any losses that expire. The capital loss carryforward information presented below, including any applicable limitation, is estimated as of fiscal period end and is subject to adjustment.
| No expiration | |
| Short-term | $(1,683,615) |
The tax character of distributions paid was as follows:
| | July 31, 2018 |
| Ordinary Income | $2,457,414 |
4. Purchases and Sales of Investments.
Purchases and sales of securities, other than short-term securities and in-kind transactions, aggregated $112,487,255 and $179,330,041, respectively.
Exchanges In-Kind. Investments and cash, received in-kind through subscriptions totaled $35,289,423 in exchange for 3,301,335 shares of the Fund. The amount of in-kind exchanges is included in share transactions in the accompanying Statement of Changes in Net Assets. The Fund recognized no gain or loss for federal income tax purposes.
5. Fees and Other Transactions with Affiliates.
Management Fee. Fidelity Management & Research Company (the investment adviser) and its affiliates provide the Fund with investment management related services for which the Fund pays a monthly management fee that is based on an annual rate of .45% of average net assets. Under the management contract, the investment adviser or an affiliate pays all other expenses of the Fund, excluding fees and expenses of the independent Trustees, and certain miscellaneous expenses such as proxy and shareholder meeting expenses.
Brokerage Commissions. The Fund placed a portion of its portfolio transactions with brokerage firms which are affiliates of the investment adviser. Brokerage commissions are included in net realized gain (loss) and change in net unrealized appreciation (depreciation) in the Statement of Operations. The commissions paid to these affiliated firms were $2,527 for the period.
Interfund Trades. The Fund may purchase from or sell securities to other Fidelity Funds under procedures adopted by the Board. The procedures have been designed to ensure these interfund trades are executed in accordance with Rule 17a-7 of the 1940 Act. Interfund trades are included within the respective purchases and sales amounts shown in the Purchases and Sales of Investments note.
Prior Fiscal Year Exchanges In-Kind. During the prior period, an affiliated entity completed an exchange in-kind with the Fund. The affiliated entity delivered investments and cash valued at $296,760,364 in exchange for 28,617,200 shares of the Fund. The amount of in-kind exchanges is included in share transactions in the accompanying Statement of Changes in Net Assets. The Fund recognized no gain or loss for federal income tax purposes.
Other. During the period, the investment adviser reimbursed the Fund for certain losses in the amount of $3,993.
6. Committed Line of Credit.
The Fund participates with other funds managed by the investment adviser or an affiliate in a $4.25 billion credit facility (the "line of credit") to be utilized for temporary or emergency purposes to fund shareholder redemptions or for other short-term liquidity purposes. The Fund has agreed to pay commitment fees on its pro-rata portion of the line of credit, which amounted to $277 and is reflected in Commitment fees on the Statement of Operations. During the period, the Fund did not borrow on this line of credit.
7. Security Lending.
The Fund lends portfolio securities through a lending agent from time to time in order to earn additional income. For equity securities, a lending agent is used and may loan securities to certain qualified borrowers, including Fidelity Capital Markets (FCM), a broker-dealer affiliated with the Fund. On the settlement date of the loan, the Fund receives collateral (in the form of U.S. Treasury obligations, letters of credit and/or cash) against the loaned securities and maintains collateral in an amount not less than 100% of the market value of the loaned securities during the period of the loan. The market value of the loaned securities is determined at the close of business of the Fund and any additional required collateral is delivered to the Fund on the next business day. The Fund or borrower may terminate the loan at any time, and if the borrower defaults on its obligation to return the securities loaned because of insolvency or other reasons, the Fund may apply collateral received from the borrower against the obligation. The Fund may experience delays and costs in recovering the securities loaned. Any cash collateral received is invested in the Fidelity Securities Lending Cash Central Fund. The value of loaned securities and cash collateral at period end are disclosed on the Fund's Statement of Assets and Liabilities. Security lending income represents the income earned on investing cash collateral, less rebates paid to borrowers and any lending agent fees associated with the loan, plus any premium payments received for lending certain types of securities. Security lending income is presented in the Statement of Operations as a component of income from Fidelity Central Funds. Total security lending income during the period amounted to $39,225. During the period, there were no securities loaned to FCM.
8. Expense Reductions.
Commissions paid to certain brokers with whom the investment adviser, or its affiliates, places trades on behalf of the Fund include an amount in addition to trade execution, which may be rebated back to the Fund to offset certain expenses. This amount totaled $18,329 for the period. In addition, through arrangements with the Fund's custodian, credits realized as a result of certain uninvested cash balances were used to reduce the Fund's expenses. During the period, these credits reduced the Fund's custody expenses by $109.
9. Other.
The Fund's organizational documents provide former and current trustees and officers with a limited indemnification against liabilities arising in connection with the performance of their duties to the Fund. In the normal course of business, the Fund may also enter into contracts that provide general indemnifications. The Fund's maximum exposure under these arrangements is unknown as this would be dependent on future claims that may be made against the Fund. The risk of material loss from such claims is considered remote.
Report of Independent Registered Public Accounting Firm
To the Trustees of Fidelity Puritan Trust and Shareholders of Fidelity Value Discovery K6 Fund:
Opinion on the Financial Statements and Financial Highlights
We have audited the accompanying statement of assets and liabilities of Fidelity Value Discovery K6 Fund (the "Fund"), a fund of Fidelity Puritan Trust, including the schedule of investments, as of July 31, 2018, the related statement of operations for the year then ended, the statement of changes in net assets and the financial highlights for the year then ended and for the period from May 25, 2017 (commencement of operations) to July 31, 2017, and the related notes. In our opinion, the financial statements and financial highlights present fairly, in all material respects, the financial position of the Fund as of July 31, 2018, the results of its operations for the year then ended, and the changes in its net assets, and the financial highlights for the year then ended and for the period from May 25, 2017 (commencement of operations) to July 31, 2017, in conformity with accounting principles generally accepted in the United States of America.
Basis for Opinion
These financial statements and financial highlights are the responsibility of the Fund's management. Our responsibility is to express an opinion on the Fund's financial statements and financial highlights based on our audits. We are a public accounting firm registered with the Public Company Accounting Oversight Board (United States) (PCAOB) and are required to be independent with respect to the Fund in accordance with the U.S. federal securities laws and the applicable rules and regulations of the Securities and Exchange Commission and the PCAOB.
We conducted our audits in accordance with the standards of the PCAOB. Those standards require that we plan and perform the audit to obtain reasonable assurance about whether the financial statements and financial highlights are free of material misstatement, whether due to error or fraud. The Fund is not required to have, nor were we engaged to perform, an audit of its internal control over financial reporting. As part of our audits we are required to obtain an understanding of internal control over financial reporting but not for the purpose of expressing an opinion on the effectiveness of the Fund’s internal control over financial reporting. Accordingly, we express no such opinion.
Our audits included performing procedures to assess the risks of material misstatement of the financial statements and financial highlights, whether due to error or fraud, and performing procedures that respond to those risks. Such procedures included examining, on a test basis, evidence regarding the amounts and disclosures in the financial statements and financial highlights. Our audits also included evaluating the accounting principles used and significant estimates made by management, as well as evaluating the overall presentation of the financial statements and financial highlights. Our procedures included confirmation of securities owned as of July 31, 2018, by correspondence with the custodians and brokers; when replies were not received from brokers, we performed other auditing procedures. We believe that our audits provide a reasonable basis for our opinion.
/s/ Deloitte & Touche LLP
Boston, Massachusetts
September 14, 2018
We have served as the auditor of one or more of the Fidelity investment companies since 1999.
Trustees and Officers
The Trustees, Members of the Advisory Board (if any), and officers of the trust and fund, as applicable, are listed below. The Board of Trustees governs the fund and is responsible for protecting the interests of shareholders. The Trustees are experienced executives who meet periodically throughout the year to oversee the fund's activities, review contractual arrangements with companies that provide services to the fund, oversee management of the risks associated with such activities and contractual arrangements, and review the fund's performance. Except for Jonathan Chiel, each of the Trustees oversees 286 funds. Mr. Chiel oversees 150 funds.
The Trustees hold office without limit in time except that (a) any Trustee may resign; (b) any Trustee may be removed by written instrument, signed by at least two-thirds of the number of Trustees prior to such removal; (c) any Trustee who requests to be retired or who has become incapacitated by illness or injury may be retired by written instrument signed by a majority of the other Trustees; and (d) any Trustee may be removed at any special meeting of shareholders by a two-thirds vote of the outstanding voting securities of the trust. Each Trustee who is not an interested person (as defined in the 1940 Act) of the trust and the fund is referred to herein as an Independent Trustee. Each Independent Trustee shall retire not later than the last day of the calendar year in which his or her 75th birthday occurs. The Independent Trustees may waive this mandatory retirement age policy with respect to individual Trustees. Officers and Advisory Board Members hold office without limit in time, except that any officer or Advisory Board Member may resign or may be removed by a vote of a majority of the Trustees at any regular meeting or any special meeting of the Trustees. Except as indicated, each individual has held the office shown or other offices in the same company for the past five years.
The fund’s Statement of Additional Information (SAI) includes more information about the Trustees. To request a free copy, call Fidelity at 1-800-835-5092.
Experience, Skills, Attributes, and Qualifications of the Trustees. The Governance and Nominating Committee has adopted a statement of policy that describes the experience, qualifications, attributes, and skills that are necessary and desirable for potential Independent Trustee candidates (Statement of Policy). The Board believes that each Trustee satisfied at the time he or she was initially elected or appointed a Trustee, and continues to satisfy, the standards contemplated by the Statement of Policy. The Governance and Nominating Committee also engages professional search firms to help identify potential Independent Trustee candidates who have the experience, qualifications, attributes, and skills consistent with the Statement of Policy. From time to time, additional criteria based on the composition and skills of the current Independent Trustees, as well as experience or skills that may be appropriate in light of future changes to board composition, business conditions, and regulatory or other developments, have also been considered by the professional search firms and the Governance and Nominating Committee. In addition, the Board takes into account the Trustees' commitment and participation in Board and committee meetings, as well as their leadership of standing and ad hoc committees throughout their tenure.
In determining that a particular Trustee was and continues to be qualified to serve as a Trustee, the Board has considered a variety of criteria, none of which, in isolation, was controlling. The Board believes that, collectively, the Trustees have balanced and diverse experience, qualifications, attributes, and skills, which allow the Board to operate effectively in governing the fund and protecting the interests of shareholders. Information about the specific experience, skills, attributes, and qualifications of each Trustee, which in each case led to the Board's conclusion that the Trustee should serve (or continue to serve) as a trustee of the fund, is provided below.
Board Structure and Oversight Function. James C. Curvey is an interested person and currently serves as Chairman. The Trustees have determined that an interested Chairman is appropriate and benefits shareholders because an interested Chairman has a personal and professional stake in the quality and continuity of services provided to the fund. Independent Trustees exercise their informed business judgment to appoint an individual of their choosing to serve as Chairman, regardless of whether the Trustee happens to be independent or a member of management. The Independent Trustees have determined that they can act independently and effectively without having an Independent Trustee serve as Chairman and that a key structural component for assuring that they are in a position to do so is for the Independent Trustees to constitute a substantial majority for the Board. The Independent Trustees also regularly meet in executive session. Ned C. Lautenbach serves as Chairman of the Independent Trustees and as such (i) acts as a liaison between the Independent Trustees and management with respect to matters important to the Independent Trustees and (ii) with management prepares agendas for Board meetings.
Fidelity® funds are overseen by different Boards of Trustees. The fund's Board oversees Fidelity's high income and certain equity funds, and other Boards oversee Fidelity's investment-grade bond, money market, asset allocation, and other equity funds. The asset allocation funds may invest in Fidelity® funds overseen by the fund's Board. The use of separate Boards, each with its own committee structure, allows the Trustees of each group of Fidelity® funds to focus on the unique issues of the funds they oversee, including common research, investment, and operational issues. On occasion, the separate Boards establish joint committees to address issues of overlapping consequences for the Fidelity® funds overseen by each Board.
The Trustees operate using a system of committees to facilitate the timely and efficient consideration of all matters of importance to the Trustees, the fund, and fund shareholders and to facilitate compliance with legal and regulatory requirements and oversight of the fund's activities and associated risks. The Board, acting through its committees, has charged FMR and its affiliates with (i) identifying events or circumstances the occurrence of which could have demonstrably adverse effects on the fund's business and/or reputation; (ii) implementing processes and controls to lessen the possibility that such events or circumstances occur or to mitigate the effects of such events or circumstances if they do occur; and (iii) creating and maintaining a system designed to evaluate continuously business and market conditions in order to facilitate the identification and implementation processes described in (i) and (ii) above. Because the day-to-day operations and activities of the fund are carried out by or through FMR, its affiliates, and other service providers, the fund's exposure to risks is mitigated but not eliminated by the processes overseen by the Trustees. While each of the Board's committees has responsibility for overseeing different aspects of the fund's activities, oversight is exercised primarily through the Operations, Audit, and Compliance Committees. In addition, the Independent Trustees have worked with Fidelity to enhance the Board's oversight of investment and financial risks, legal and regulatory risks, technology risks, and operational risks, including the development of additional risk reporting to the Board. Appropriate personnel, including but not limited to the fund's Chief Compliance Officer (CCO), FMR's internal auditor, the independent accountants, the fund's Treasurer and portfolio management personnel, make periodic reports to the Board's committees, as appropriate, including an annual review of Fidelity's risk management program for the Fidelity® funds. The responsibilities of each standing committee, including their oversight responsibilities, are described further under "Standing Committees of the Trustees."
Interested Trustees*:
Correspondence intended for a Trustee who is an interested person may be sent to Fidelity Investments, 245 Summer Street, Boston, Massachusetts 02210.
Name, Year of Birth; Principal Occupations and Other Relevant Experience+
Jonathan Chiel (1957)
Year of Election or Appointment: 2016
Trustee
Mr. Chiel also serves as Trustee of other Fidelity® funds. Mr. Chiel is Executive Vice President and General Counsel for FMR LLC (diversified financial services company, 2012-present). Previously, Mr. Chiel served as general counsel (2004-2012) and senior vice president and deputy general counsel (2000-2004) for John Hancock Financial Services; a partner with Choate, Hall & Stewart (1996-2000) (law firm); and an Assistant United States Attorney for the United States Attorney’s Office of the District of Massachusetts (1986-95), including Chief of the Criminal Division (1993-1995). Mr. Chiel is a director on the boards of the Boston Bar Foundation and the Maimonides School.
James C. Curvey (1935)
Year of Election or Appointment: 2007
Trustee
Chairman of the Board of Trustees
Mr. Curvey also serves as Trustee of other Fidelity® funds. Mr. Curvey is Vice Chairman (2007-present) and Director of FMR LLC (diversified financial services company). In addition, Mr. Curvey is an Overseer Emeritus for the Boston Symphony Orchestra, a Director of Artis-Naples, and a Trustee of Brewster Academy in Wolfeboro, New Hampshire. Previously, Mr. Curvey served as a Director of Fidelity Research & Analysis Co. (investment adviser firm, 2009-2018), Director of Fidelity Investments Money Management, Inc. (investment adviser firm, 2009-2014) and a Director of FMR and FMR Co., Inc. (investment adviser firms, 2007-2014).
Charles S. Morrison (1960)
Year of Election or Appointment: 2014
Trustee
Mr. Morrison also serves as Trustee of other funds. He serves as President of Fidelity SelectCo, LLC (investment adviser firm, 2017-present) and Fidelity Management & Research Company (FMR) (investment adviser firm, 2016-present), a Director of Fidelity Investments Money Management, Inc. (FIMM) (investment adviser firm, 2014-present), Director of Fidelity SelectCo, LLC (investment adviser firm, 2014-present), President, Asset Management (2014-present), and is an employee of Fidelity Investments. Previously, Mr. Morrison served as Vice President of Fidelity's Fixed Income and Asset Allocation Funds (2012-2014), President, Fixed Income (2011-2014), Vice President of Fidelity's Money Market Funds (2005-2009), President, Money Market Group Leader of FMR (investment adviser firm, 2009), and Senior Vice President, Money Market Group of FMR (2004-2009). Mr. Morrison also served as Vice President of Fidelity's Bond Funds (2002-2005), certain Balanced Funds (2002-2005), and certain Asset Allocation Funds (2002-2007), and as Senior Vice President (2002-2005) of Fidelity's Bond Division.
* Determined to be an “Interested Trustee” by virtue of, among other things, his or her affiliation with the trust or various entities under common control with FMR.
+ The information includes the Trustee's principal occupation during the last five years and other information relating to the experience, attributes, and skills relevant to the Trustee's qualifications to serve as a Trustee, which led to the conclusion that the Trustee should serve as a Trustee for the fund.
Independent Trustees:
Correspondence intended for an Independent Trustee may be sent to Fidelity Investments, P.O. Box 55235, Boston, Massachusetts 02205-5235.
Name, Year of Birth; Principal Occupations and Other Relevant Experience+
Dennis J. Dirks (1948)
Year of Election or Appointment: 2005
Trustee
Mr. Dirks also serves as Trustee of other Fidelity® funds. Prior to his retirement in May 2003, Mr. Dirks was Chief Operating Officer and a member of the Board of The Depository Trust & Clearing Corporation (DTCC). He also served as President, Chief Operating Officer, and Board member of The Depository Trust Company (DTC) and President and Board member of the National Securities Clearing Corporation (NSCC). In addition, Mr. Dirks served as Chief Executive Officer and Board member of the Government Securities Clearing Corporation, Chief Executive Officer and Board member of the Mortgage-Backed Securities Clearing Corporation, as a Trustee and a member of the Finance Committee of Manhattan College (2005-2008), as a Trustee and a member of the Finance Committee of AHRC of Nassau County (2006-2008), as a member of the Independent Directors Council (IDC) Governing Council (2010-2015), and as a member of the Board of Directors for The Brookville Center for Children’s Services, Inc. (2009-2017). Mr. Dirks is a member of the Finance Committee (2016-present), Board of Directors (2017-present) and Board of Trustees (2018-present) and is Treasurer (2018-present) of the Asolo Repertory Theatre.
Donald F. Donahue (1950)
Year of Election or Appointment: 2018
Trustee
Mr. Donahue also serves as a Trustee of other Fidelity® funds. Mr. Donahue is President and Chief Executive Officer of Miranda Partners, LLC (risk consulting for the financial services industry, 2012-present). Previously, Mr. Donahue served as a Member of the Advisory Board of certain Fidelity® funds (2015-2018) and Chief Executive Officer (2006-2012), Chief Operating Officer (2003-2006), and Managing Director, Customer Marketing and Development (1999-2003) of The Depository Trust & Clearing Corporation (financial markets infrastructure). Mr. Donahue serves as a Member (2007-present) and Co-Chairman (2016-present) of the Board of Directors of United Way of New York, Member of the Board of Directors of NYC Leadership Academy (2012-present) and Member of the Board of Advisors of Ripple Labs, Inc. (financial services, 2015-present). He also served as Chairman (2010-2012) and Member of the Board of Directors (2012-2013) of Omgeo, LLC (financial services), Treasurer of United Way of New York (2012-2016), and Member of the Board of Directors of XBRL US (financial services non-profit, 2009-2012) and the International Securities Services Association (2009-2012).
Alan J. Lacy (1953)
Year of Election or Appointment: 2008
Trustee
Mr. Lacy also serves as Trustee of other Fidelity® funds. Mr. Lacy serves as a Director of Bristol-Myers Squibb Company (global pharmaceuticals, 2008-present). He is a Trustee of the California Chapter of The Nature Conservancy (2015-present) and a Director of the Center for Advanced Study in the Behavioral Sciences at Stanford University (2015-present). In addition, Mr. Lacy served as Senior Adviser (2007-2014) of Oak Hill Capital Partners, L.P. (private equity) and also served as Chief Executive Officer (2005) and Vice Chairman (2005-2006) of Sears Holdings Corporation (retail) and Chief Executive Officer and Chairman of the Board of Sears, Roebuck and Co. (retail, 2000-2005). Previously, Mr. Lacy served as Chairman (2014-2017) and a member (2010-2017) of the Board of Directors of Dave & Buster’s Entertainment, Inc. (restaurant and entertainment complexes), as Chairman (2008-2011) and a member (2006-2015) of the Board of Trustees of the National Parks Conservation Association, and as a member of the Board of Directors for The Hillman Companies, Inc. (hardware wholesalers, 2010-2014), Earth Fare, Inc. (retail grocery, 2010-2014), and The Western Union Company (global money transfer, 2006-2011).
Ned C. Lautenbach (1944)
Year of Election or Appointment: 2000
Trustee
Chairman of the Independent Trustees
Mr. Lautenbach also serves as Trustee of other Fidelity® funds. Mr. Lautenbach currently serves as Vice Chair of the Board of Governors, State University System of Florida (2013-present) and is a member of the Council on Foreign Relations (1994-present). He is also a member and has most recently served as Chairman of the Board of Directors of Artis-Naples (2012-present). Previously, Mr. Lautenbach served as a member and then Lead Director of the Board of Directors of Eaton Corporation (diversified industrial, 1997-2016). He was also a Partner and Advisory Partner at Clayton, Dubilier & Rice, LLC (private equity investment, 1998-2010), as well as a Director of Sony Corporation (2006-2007). In addition, Mr. Lautenbach also had a 30-year career with IBM (technology company) during which time he served as Senior Vice President and a member of the Corporate Executive Committee (1968-1998).
Joseph Mauriello (1944)
Year of Election or Appointment: 2008
Trustee
Mr. Mauriello also serves as Trustee of other Fidelity® funds. Prior to his retirement in January 2006, Mr. Mauriello served in numerous senior management positions including Deputy Chairman and Chief Operating Officer (2004-2005), and Vice Chairman of Financial Services (2002-2004) of KPMG LLP US (professional services, 1965-2005). Mr. Mauriello currently serves as a member of the Board of Directors of XL Group plc. (global insurance and re-insurance, 2006-present) and the Independent Directors Council (IDC) Governing Council (2015-present). Previously, Mr. Mauriello served as a Director of the Hamilton Funds of the Bank of New York (2006-2007) and of Arcadia Resources Inc. (health care services and products, 2007-2012).
Cornelia M. Small (1944)
Year of Election or Appointment: 2005
Trustee
Ms. Small also serves as Trustee of other Fidelity® funds. Ms. Small is a member of the Board of Directors (2009-present) and Chair of the Investment Committee (2010-present) of the Teagle Foundation. Ms. Small also serves on the Investment Committee of the Berkshire Taconic Community Foundation (2008-present). Previously, Ms. Small served as Chairperson (2002-2008) and a member of the Investment Committee and Chairperson (2008-2012) and a member of the Board of Trustees of Smith College. In addition, Ms. Small served as Chief Investment Officer, Director of Global Equity Investments, and a member of the Board of Directors of Scudder, Stevens & Clark and Scudder Kemper Investments.
Garnett A. Smith (1947)
Year of Election or Appointment: 2018
Trustee
Mr. Smith also serves as Trustee of other Fidelity® funds. Prior to Mr. Smith's retirement, he served as Chairman and Chief Executive Officer of Inbrand Corp. (manufacturer of personal absorbent products, 1990-1997). He also served as President (1986-1990) of Inbrand Corp. Prior to his employment with Inbrand Corp., he was employed by a retail fabric chain and North Carolina National Bank. In addition, Mr. Smith served as a Member of the Advisory Board of certain Fidelity® funds (2012-2013) and as a board member of the Jackson Hole Land Trust (2009-2012).
David M. Thomas (1949)
Year of Election or Appointment: 2008
Trustee
Mr. Thomas also serves as Trustee of other Fidelity® funds. Mr. Thomas serves as Non-Executive Chairman of the Board of Directors of Fortune Brands Home and Security (home and security products, 2011-present), as a member of the Board of Directors (2004-present) and Presiding Director (2013-present) of Interpublic Group of Companies, Inc. (marketing communication), and as a member of the Board of Trustees of the University of Florida (2013-present). Previously, Mr. Thomas served as Executive Chairman (2005-2006) and Chairman and Chief Executive Officer (2000-2005) of IMS Health, Inc. (pharmaceutical and healthcare information solutions), and a Director of Fortune Brands, Inc. (consumer products, 2000-2011).
+ The information includes the Trustee's principal occupation during the last five years and other information relating to the experience, attributes, and skills relevant to the Trustee's qualifications to serve as a Trustee, which led to the conclusion that the Trustee should serve as a Trustee for the fund.
Advisory Board Members and Officers:
Correspondence intended for a Member of the Advisory Board (if any) may be sent to Fidelity Investments, P.O. Box 55235, Boston, Massachusetts 02205-5235. Correspondence intended for an officer or Peter S. Lynch may be sent to Fidelity Investments, 245 Summer Street, Boston, Massachusetts 02210. Officers appear below in alphabetical order.
Name, Year of Birth; Principal Occupation
Peter S. Lynch (1944)
Year of Election or Appointment: 2003
Member of the Advisory Board
Mr. Lynch also serves as Member of the Advisory Board of other Fidelity® funds. Mr. Lynch is Vice Chairman and a Director of FMR (investment adviser firm) and FMR Co., Inc. (investment adviser firm). In addition, Mr. Lynch serves as a Trustee of Boston College and as the Chairman of the Inner-City Scholarship Fund. Previously, Mr. Lynch served on the Special Olympics International Board of Directors (1997-2006).
William S. Stavropoulos (1939)
Year of Election or Appointment: 2018
Member of the Advisory Board
Mr. Stavropoulos also serves as Member of the Advisory Board of other Fidelity® funds. Mr. Stavropoulos serves as President and Founder of the Michigan Baseball Foundation, the Great Lakes Loons (2007-present). Mr. Stavropoulos is Chairman Emeritus of the Board of Directors of The Dow Chemical Company, where he previously served in numerous senior management positions, including President, CEO (1995-2000; 2002-2004), Chairman of the Executive Committee (2000-2006), and as a member of the Board of Directors (1990-2006). Currently, Mr. Stavropoulos is Chairman of the Board of Directors of Univar Inc. (global distributor of commodity and specialty chemicals), a Director of Teradata Corporation (data warehousing and technology solutions), and a member of the Advisory Board for Metalmark Capital LLC (private equity investment, 2005-present). Mr. Stavropoulos is an operating advisor to Clayton, Dubilier & Rice, LLC (private equity investment). In addition, Mr. Stavropoulos is a member of the University of Notre Dame Advisory Council for the College of Science, a Trustee of the Rollin L. Gerstacker Foundation, and a Director of Artis-Naples in Naples, Florida. Previously, Mr. Stavropoulos served as Trustee of certain Fidelity® funds (2001-2018) and as a Director of Chemical Financial Corporation (bank holding company, 1993-2012) and Tyco International, Ltd. (multinational manufacturing and services, 2007-2012).
Carol B. Tomé (1957)
Year of Election or Appointment: 2018
Member of the Advisory Board
Ms. Tomé also serves as Member of the Advisory Board of other Fidelity® funds. Ms. Tomé is Chief Financial Officer (2001-present) and Executive Vice President of Corporate Services (2007-present) of The Home Depot, Inc. (home improvement retailer) and a Director (2003-present) and Chair of the Audit Committee (2004-present) of United Parcel Service, Inc. (package delivery and supply chain management). Previously, Ms. Tomé served as Trustee of certain Fidelity® funds (2017), Senior Vice President of Finance and Accounting/Treasurer (2000-2007) and Vice President and Treasurer (1995-2000) of The Home Depot, Inc. and Chair of the Board (2010-2012), Vice Chair of the Board (2009 and 2013), and a Director (2008-2013) of the Federal Reserve Bank of Atlanta. Ms. Tomé is also a director or trustee of many community and professional organizations.
Michael E. Wiley (1950)
Year of Election or Appointment: 2018
Member of the Advisory Board
Mr. Wiley also serves as Trustee or Member of the Advisory Board of other Fidelity® funds. Mr. Wiley serves as a Director of Andeavor Corporation (independent oil refiner and marketer, 2005-present), a Director of Andeavor Logistics LP (natural resources logistics, 2015-present), and a Director of Bill Barrett Corporation (exploration and production, 2005-present). In addition, Mr. Wiley also serves as a Director of Post Oak Bank (privately-held bank, 2004-present). Previously, Mr. Wiley served as a Trustee of other Fidelity® funds (2008-2013), as a Director of Asia Pacific Exploration Consolidated (international oil and gas exploration and production, 2008-2013), as a member of the Board of Trustees of the University of Tulsa (2000-2006; 2007-2010), as a Senior Energy Advisor of Katzenbach Partners, LLC (consulting, 2006-2007), as an Advisory Director of Riverstone Holdings (private investment), Chairman, President, and CEO of Baker Hughes, Inc. (oilfield services, 2000-2004), and as Director of Spinnaker Exploration Company (exploration and production, 2001-2005).
Elizabeth Paige Baumann (1968)
Year of Election or Appointment: 2017
Anti-Money Laundering (AML) Officer
Ms. Baumann also serves as AML Officer of other funds. She is Chief AML Officer (2012-present) and Senior Vice President (2014-present) of FMR LLC (diversified financial services company) and is an employee of Fidelity Investments. Previously, Ms. Baumann served as AML Officer of the funds (2012-2016), and Vice President (2007-2014) and Deputy Anti-Money Laundering Officer (2007-2012) of FMR LLC.
Marc R. Bryant (1966)
Year of Election or Appointment: 2015
Secretary and Chief Legal Officer (CLO)
Mr. Bryant also serves as Secretary and CLO of other funds. Mr. Bryant serves as CLO, Secretary, and Senior Vice President of Fidelity Management & Research Company (investment adviser firm, 2015-present) and FMR Co., Inc. (investment adviser firm, 2015-present); Secretary of Fidelity SelectCo, LLC (investment adviser firm, 2015-present) and Fidelity Investments Money Management, Inc. (investment adviser firm, 2015-present); and CLO of Fidelity Management & Research (Hong Kong) Limited and FMR Investment Management (UK) Limited (investment adviser firms, 2015-present) and Fidelity Management & Research (Japan) Limited (investment adviser firm, 2016-present). He is Senior Vice President and Deputy General Counsel of FMR LLC (diversified financial services company). Previously, Mr. Bryant served as Secretary and CLO of Fidelity Rutland Square Trust II (2010-2014) and Assistant Secretary of Fidelity's Fixed Income and Asset Allocation Funds (2013-2015). Prior to joining Fidelity Investments, Mr. Bryant served as a Senior Vice President and the Head of Global Retail Legal for AllianceBernstein L.P. (2006-2010), and as the General Counsel for ProFund Advisors LLC (2001-2006).
John J. Burke III (1964)
Year of Election or Appointment: 2018
Chief Financial Officer
Mr. Burke also serves as Chief Financial Officer of other funds. Mr. Burke serves as Head of Investment Operations for Fidelity Fund and Investment Operations (2018-present) and is an employee of Fidelity Investments (1998-present). Previously Mr. Burke served as head of Asset Management Investment Operations (2012-2018).
William C. Coffey (1969)
Year of Election or Appointment: 2009
Assistant Secretary
Mr. Coffey also serves as Assistant Secretary of other funds. He is Senior Vice President and Deputy General Counsel of FMR LLC (diversified financial services company, 2010-present), and is an employee of Fidelity Investments. Previously, Mr. Coffey served as Vice President and Associate General Counsel of FMR LLC (2005-2009).
Timothy M. Cohen (1969)
Year of Election or Appointment: 2018
Vice President
Mr. Cohen also serves as Vice President of other funds. Mr. Cohen serves as Co-Head of Global Equity Research (2016-present), a Director of Fidelity Management & Research (Japan) Limited (investment adviser firm, 2016-present), and is an employee of Fidelity Investments. Previously, Mr. Cohen served as Chief Investment Officer - Equity and a Director of Fidelity Management & Research (U.K.) Inc. (investment adviser firm, 2013-2015) and as a Director of Fidelity Management & Research (Hong Kong) Limited (investment adviser firm, 2017).
Jonathan Davis (1968)
Year of Election or Appointment: 2010
Assistant Treasurer
Mr. Davis also serves as Assistant Treasurer of other funds. Mr. Davis serves as Assistant Treasurer of FMR Capital, Inc. (2017-present) and is an employee of Fidelity Investments. Previously, Mr. Davis served as Vice President and Associate General Counsel of FMR LLC (diversified financial services company, 2003-2010).
Adrien E. Deberghes (1967)
Year of Election or Appointment: 2016
Assistant Treasurer
Mr. Deberghes also serves as an officer of other funds. He serves as Assistant Treasurer of FMR Capital, Inc. (2017-present), Executive Vice President of Fidelity Investments Money Management, Inc. (FIMM) (investment adviser firm, 2016-present), and is an employee of Fidelity Investments (2008-present). Previously, Mr. Deberghes served as President and Treasurer of certain Fidelity® funds (2013-2018). Prior to joining Fidelity Investments, Mr. Deberghes was Senior Vice President of Mutual Fund Administration at State Street Corporation (2007-2008), Senior Director of Mutual Fund Administration at Investors Bank & Trust (2005-2007), and Director of Finance for Dunkin' Brands (2000-2005). Previously, Mr. Deberghes served in other fund officer roles.
Laura M. Del Prato (1964)
Year of Election or Appointment: 2018
Assistant Treasurer
Ms. Del Prato also serves as an officer of other funds. Ms. Del Prato is an employee of Fidelity Investments (2017-present). Prior to joining Fidelity Investments, Ms. Del Prato served as a Managing Director and Treasurer of the JPMorgan Mutual Funds (2014-2017). Prior to JPMorgan, Ms. Del Prato served as a partner at Cohen Fund Audit Services (accounting firm, 2012-2013) and KPMG LLP (accounting firm, 2004-2012).
Colm A. Hogan (1973)
Year of Election or Appointment: 2016
Deputy Treasurer
Mr. Hogan also serves as an officer of other funds. Mr. Hogan serves as Assistant Treasurer of FMR Capital, Inc. (2017-present) and is an employee of Fidelity Investments (2005-present). Previously, Mr. Hogan served as Assistant Treasurer of certain Fidelity® funds (2016-2018).
Pamela R. Holding (1964)
Year of Election or Appointment: 2018
Vice President
Ms. Holding also serves as a Vice President of other funds. Ms. Holding serves as Co-Head of Global Equity Research (2018-present) and is an employee of Fidelity Investments (2013-present).
Chris Maher (1972)
Year of Election or Appointment: 2013
Assistant Treasurer
Mr. Maher serves as Assistant Treasurer of other funds. Mr. Maher is Vice President of Valuation Oversight, serves as Assistant Treasurer of FMR Capital, Inc. (2017-present), and is an employee of Fidelity Investments. Previously, Mr. Maher served as Vice President of Asset Management Compliance (2013), Vice President of the Program Management Group of FMR (investment adviser firm, 2010-2013), and Vice President of Valuation Oversight (2008-2010).
Rieco E. Mello (1969)
Year of Election or Appointment: 2017
Assistant Treasurer
Mr. Mello also serves as Assistant Treasurer of other funds. Mr. Mello serves as Assistant Treasurer of FMR Capital, Inc. (2017-present) and is an employee of Fidelity Investments (1995-present).
Kenneth B. Robins (1969)
Year of Election or Appointment: 2016
Chief Compliance Officer
Mr. Robins also serves as an officer of other funds. Mr. Robins serves as Compliance Officer of Fidelity Management & Research Company and FMR Co., Inc. (investment adviser firms, 2016-present) and is an employee of Fidelity Investments (2004-present). Previously, Mr. Robins served as Executive Vice President of Fidelity Investments Money Management, Inc. (investment adviser firm, 2013-2016) and served in other fund officer roles.
Stacie M. Smith (1974)
Year of Election or Appointment: 2016
President and Treasurer
Ms. Smith also serves as an officer of other funds. Ms. Smith serves as Assistant Treasurer of FMR Capital, Inc. (2017-present), is an employee of Fidelity Investments (2009-present), and has served in other fund officer roles. Prior to joining Fidelity Investments, Ms. Smith served as Senior Audit Manager of Ernst & Young LLP (accounting firm, 1996-2009). Previously, Ms. Smith served as Assistant Treasurer (2013-2018) and Deputy Treasurer (2013-2016) of certain Fidelity® funds.
Marc L. Spector (1972)
Year of Election or Appointment: 2016
Assistant Treasurer
Mr. Spector also serves as an officer of other funds. Mr. Spector serves as Assistant Treasurer of FMR Capital, Inc. (2017-present) and is an employee of Fidelity Investments (2016-present). Prior to joining Fidelity Investments, Mr. Spector served as Director at the Siegfried Group (accounting firm, 2013-2016), and prior to Siegfried Group as audit senior manager at Deloitte & Touche (accounting firm, 2005-2013).
Renee Stagnone (1975)
Year of Election or Appointment: 2016
Assistant Treasurer
Ms. Stagnone also serves as an officer of other funds. Ms. Stagnone serves as Assistant Treasurer of FMR Capital, Inc. (2017-present) and is an employee of Fidelity Investments (1997-present). Previously, Ms. Stagnone served as Deputy Treasurer of certain Fidelity® funds (2013-2016).
Shareholder Expense Example
As a shareholder of the Fund, you incur two types of costs: (1) transaction costs and (2) ongoing costs, including management fees and other Fund expenses. This Example is intended to help you understand your ongoing costs (in dollars) of investing in the Fund and to compare these costs with the ongoing costs of investing in other mutual funds.
The Example is based on an investment of $1,000 invested at the beginning of the period and held for the entire period (February 1, 2018 to July 31, 2018).
Actual Expenses
The first line of the accompanying table provides information about actual account values and actual expenses. You may use the information in this line, together with the amount you invested, to estimate the expenses that you paid over the period. Simply divide your account value by $1,000.00 (for example, an $8,600 account value divided by $1,000.00 = 8.6), then multiply the result by the number in the first line under the heading entitled "Expenses Paid During Period" to estimate the expenses you paid on your account during this period. In addition, the Fund, as a shareholder in the underlying Fidelity Central Funds, will indirectly bear its pro-rata share of the fees and expenses incurred by the underlying Fidelity Central Funds. These fees and expenses are not included in the Fund's annualized expense ratio used to calculate the expense estimate in the table below.
Hypothetical Example for Comparison Purposes
The second line of the accompanying table provides information about hypothetical account values and hypothetical expenses based on the Fund's actual expense ratio and an assumed rate of return of 5% per year before expenses, which is not the Fund's actual return. The hypothetical account values and expenses may not be used to estimate the actual ending account balance or expenses you paid for the period. You may use this information to compare the ongoing costs of investing in the Fund and other funds. To do so, compare this 5% hypothetical example with the 5% hypothetical examples that appear in the shareholder reports of the other funds. In addition, the Fund, as a shareholder in the underlying Fidelity Central Funds, will indirectly bear its pro-rata share of the fees and expenses incurred by the underlying Fidelity Central Funds. These fees and expenses are not included in the Fund's annualized expense ratio used to calculate the expense estimate in the table below.
Please note that the expenses shown in the table are meant to highlight your ongoing costs only and do not reflect any transaction costs. Therefore, the second line of the table is useful in comparing ongoing costs only, and will not help you determine the relative total costs of owning different funds.
| | Annualized Expense Ratio-A | Beginning
Account Value
February 1, 2018 | Ending
Account Value
July 31, 2018 | Expenses Paid
During Period-B
February 1, 2018
to July 31, 2018 |
| Actual | .45% | $1,000.00 | $975.10 | $2.20 |
| Hypothetical-C | | $1,000.00 | $1,022.56 | $2.26 |
A Annualized expense ratio reflects expenses net of applicable fee waivers.
B Expenses are equal to the Fund's annualized expense ratio, multiplied by the average account value over the period, multiplied by 181/365 (to reflect the one-half year period).
C 5% return per year before expenses
Distributions (Unaudited)
The fund designates 76% of the dividend distributed during the fiscal year as qualifying for the dividends–received deduction for corporate shareholders.
The fund designates 100% of the dividend distributed during the fiscal year as an amount which may be taken into account as a dividend for the purposes of the maximum rate under section 1(h)(11) of the Internal Revenue Code.
The fund will notify shareholders in January 2019 of amounts for use in preparing 2018 income tax returns.
Board Approval of Investment Advisory Contracts
Fidelity Value Discovery K6 Fund
At its July 2018 meeting, the Board of Trustees, including the Independent Trustees (together, the Board), voted to continue the management contract with Fidelity Management & Research Company (FMR) and the sub-advisory agreements (together, the Advisory Contracts) for the fund for six months through January 31, 2019, in connection with the reunification of the Fidelity Equity High Income Funds Board, which oversees the fund, and the Sector Portfolios Board.
The Board considered that the approval of the fund's Advisory Contracts will not result in any changes in (i) the investment process or strategies employed in the management of the fund's assets; (ii) the fees and expenses paid by shareholders; (iii) the nature, extent or quality of services provided under the fund's Advisory Contracts; or (iv) the day-to-day management of the fund or the persons primarily responsible for such management. The Board concluded that the fund's Advisory Contracts are fair and reasonable, and that the fund's Advisory Contracts should be renewed, without modification, through January 31, 2019, with the understanding that the Board will consider the annual renewal for a full one year period in January 2019.
In connection with its consideration of future renewals of the fund's Advisory Contracts, the Board will consider: (i) the nature, extent and quality of services provided to the fund, including shareholder and administrative services and investment performance; (ii) the competitiveness of the management fee and total expenses for the fund; (iii) the costs of the services and profitability, including the revenues earned and the expenses incurred in conducting the business of developing, marketing, distributing, managing, administering, and servicing the fund and its shareholders, to the extent applicable, as well as potential fall-out benefits from Fidelity's non-fund businesses; and (iv) whether there have been economies of scale in respect of the Fidelity funds, whether the Fidelity funds (including the fund) have appropriately benefited from any such economies of scale, and whether there is the potential for realization of any further economies.
Based on its evaluation of all of the conclusions noted above, and after considering all factors it believed relevant, the Board ultimately concluded that the fund's management fee structure is fair and reasonable, and that the continuation of the fund's Advisory Contracts should be approved.
Corporate Headquarters
245 Summer St.
Boston, MA 02210
www.fidelity.com
FVDK6-ANN-0918
1.9884003.101
Item 2.
Code of Ethics
As of the end of the period, July 31, 2018, Fidelity Puritan Trust (the trust) has adopted a code of ethics, as defined in Item 2 of Form N-CSR, that applies to its President and Treasurer and its Chief Financial Officer. A copy of the code of ethics is filed as an exhibit to this Form N-CSR.
Item 3.
Audit Committee Financial Expert
The Board of Trustees of the trust has determined that Joseph Mauriello is an audit committee financial expert, as defined in Item 3 of Form N-CSR. Mr. Mauriello is independent for purposes of Item 3 of Form N-CSR.
Item 4.
Principal Accountant Fees and Services
Fees and Services
The following table presents fees billed by Deloitte & Touche LLP, the member firms of Deloitte Touche Tohmatsu, and their respective affiliates (collectively, “Deloitte Entities”) in each of the last two fiscal years for services rendered to Fidelity Flex Intrinsic Opportunities Fund, Fidelity Series Intrinsic Opportunities Fund, Fidelity Value Discovery Fund and Fidelity Value Discovery K6 Fund (the “Funds”):
Services Billed by Deloitte Entities
July 31, 2018 FeesA
| | | | |
| Audit Fees | Audit-Related Fees | Tax Fees | All Other Fees |
Fidelity Flex Intrinsic Opportunities Fund | $58,000 | $100 | $6,600 | $1,600 |
Fidelity Series Intrinsic Opportunities Fund | $58,000 | $100 | $6,600 | $1,700 |
Fidelity Value Discovery Fund | $38,000 | $100 | $5,400 | $1,100 |
Fidelity Value Discovery K6 Fund | $37,000 | $100 | $5,500 | $1,000 |
| | | | |
| Audit Fees | Audit-Related Fees | Tax Fees | All Other Fees |
Fidelity Flex Intrinsic Opportunities Fund | $47,000 | $- | $6,500 | $500 |
Fidelity Series Intrinsic Opportunities Fund | $60,000 | $100 | $6,500 | $1,700 |
Fidelity Value Discovery Fund | $38,000 | $100 | $5,500 | $1,100 |
Fidelity Value Discovery K6 Fund | $29,000 | $- | $5,400 | $200 |
A Amounts may reflect rounding.
B Fidelity Flex Intrinsic Opportunities Fund commenced operations on March 8, 2017. Fidelity Value Discovery K6 Fund commenced operations on May 25, 2017.
The following table presents fees billed by PricewaterhouseCoopers LLP (“PwC”) in each of the last two fiscal years for services rendered to Fidelity Low-Priced Stock Fund and Fidelity Low-Priced Stock K6 Fund (the “Funds”):
Services Billed by PwC
July 31, 2018 FeesA
| | | | |
| Audit Fees | Audit-Related Fees | Tax Fees | All Other Fees |
Fidelity Low-Priced Stock Fund | $135,000 | $10,100 | $6,100 | $4,900 |
Fidelity Low-Priced Stock K6 Fund | $58,000 | $5,100 | $4,600 | $2,500 |
| | | | |
| Audit Fees | Audit-Related Fees | Tax Fees | All Other Fees |
Fidelity Low-Priced Stock Fund | $139,000 | $11,400 | $20,100 | $5,400 |
Fidelity Low-Priced Stock K6 Fund | $50,000 | $900 | $4,200 | $400 |
A Amounts may reflect rounding.
B Fidelity Low-Priced Stock K6 Fund commenced operations on May 26, 2017.
The following table presents fees billed by PwC and Deloitte Entities that were required to be approved by the Audit Committee for services that relate directly to the operations and financial reporting of the Funds and that are rendered on behalf of Fidelity Management & Research Company (“FMR”) and entities controlling, controlled by, or under common control with FMR (not including any sub-adviser whose role is primarily portfolio management and is subcontracted with or overseen by another investment adviser) that provide ongoing services to the Funds (“Fund Service Providers”):
Services Billed by Deloitte Entities
| | |
| July 31, 2018A | July 31, 2017A,B |
Audit-Related Fees | $5,000 | $- |
Tax Fees | $5,000 | $25,000 |
All Other Fees | $- | $- |
A Amounts may reflect rounding.
B May include amounts billed prior to the Fidelity Flex Intrinsic Opportunities Fund and Fidelity Value Discovery K6 Fund’s commencement of operations.
Services Billed by PwC
| | |
| July 31, 2018A | July 31, 2017A,B |
Audit-Related Fees | $7,605,000 | $6,070,000 |
Tax Fees | $20,000 | $160,000 |
All Other Fees | $- | $- |
A Amounts may reflect rounding.
B May include amounts billed prior to the Fidelity Low-Priced Stock K6 Fund’s commencement of operations.
“Audit-Related Fees” represent fees billed for assurance and related services that are reasonably related to the performance of the fund audit or the review of the fund's financial statements and that are not reported under Audit Fees.
“Tax Fees” represent fees billed for tax compliance, tax advice or tax planning that relate directly to the operations and financial reporting of the fund.
“All Other Fees” represent fees billed for services provided to the fund or Fund Service Provider, a significant portion of which are assurance related, that relate directly to the operations and financial reporting of the fund, excluding those services that are reported under Audit Fees, Audit-Related Fees or Tax Fees.
Assurance services must be performed by an independent public accountant.
* * *
The aggregate non-audit fees billed by PwC and Deloitte Entities for services rendered to the Funds, FMR (not including any sub-adviser whose role is primarily portfolio management and is subcontracted with or overseen by another investment adviser), and any Fund Service Provider for each of the last two fiscal years of the Funds are as follows:
| | |
Billed By | July 31, 2018A | July 31, 2017A,B |
Deloitte Entities | $375,000 | $530,000 |
PwC | $10,395,000 | $7,535,000 |
A Amounts may reflect rounding.
B May include amounts billed prior to the Fidelity Flex Intrinsic Opportunities Fund, Fidelity Low-Priced Stock K6 Fund and Fidelity Value Discovery K6 Fund’s commencement of operations.
The trust's Audit Committee has considered non-audit services that were not pre-approved that were provided by PwC and Deloitte Entities to Fund Service Providers to be compatible with maintaining the independence of PwC and Deloitte Entities in their audits of the Funds, taking into account representations from PwC and Deloitte Entities, in accordance with Public Company Accounting Oversight Board rules, regarding their independence from the Funds and their related entities and FMR’s review of the appropriateness and permissibility under applicable law of such non-audit services prior to their provision to the Fund Service Providers.
Audit Committee Pre-Approval Policies and Procedures
The trust’s Audit Committee must pre-approve all audit and non-audit services provided by a fund’s independent registered public accounting firm relating to the operations or financial reporting of the fund. Prior to the commencement of any audit or non-audit services to a fund, the Audit Committee reviews the services to determine whether they are appropriate and permissible under applicable law.
The Audit Committee has adopted policies and procedures to, among other purposes, provide a framework for the Committee’s consideration of non-audit services by the audit firms that audit the Fidelity funds. The policies and procedures require that any non-audit service provided by a fund audit firm to a Fidelity fund and any non-audit service provided by a fund auditor to a Fund Service Provider that relates directly to the operations and financial reporting of a Fidelity fund (“Covered Service”) are subject to approval by the Audit Committee before such service is provided.
All Covered Services must be approved in advance of provision of the service either: (i) by formal resolution of the Audit Committee, or (ii) by oral or written approval of the service by the Chair of the Audit Committee (or if the Chair is unavailable, such other member of the Audit Committee as may be designated by the Chair to act in the Chair’s absence). The approval contemplated by (ii) above is permitted where the Treasurer determines that action on such an engagement is necessary before the next meeting of the Audit Committee.
Non-audit services provided by a fund audit firm to a Fund Service Provider that do not relate directly to the operations and financial reporting of a Fidelity fund are reported to the Audit Committee periodically.
Non-Audit Services Approved Pursuant to Rule 2-01(c)(7)(i)(C) and (ii) of Regulation S-X (“De Minimis Exception”)
There were no non-audit services approved or required to be approved by the Audit Committee pursuant to the De Minimis Exception during the Funds’ last two fiscal years relating to services provided to (i) the Funds or (ii) any Fund Service Provider that relate directly to the operations and financial reporting of the Funds.
Item 5.
Audit Committee of Listed Registrants
Not applicable.
Item 6.
Investments
(a)
Not applicable.
(b)
Not applicable
Item 7.
Disclosure of Proxy Voting Policies and Procedures for Closed-End Management Investment Companies
Not applicable.
Item 8.
Portfolio Managers of Closed-End Management Investment Companies
Not applicable.
Item 9.
Purchase of Equity Securities by Closed-End Management Investment Company and Affiliated Purchasers
Not applicable.
Item 10.
Submission of Matters to a Vote of Security Holders
There were no material changes to the procedures by which shareholders may recommend nominees to the trust’s Board of Trustees.
Item 11.
Controls and Procedures
(a)(i) The President and Treasurer and the Chief Financial Officer have concluded that the trust’s disclosure controls and procedures (as defined in Rule 30a-3(c) under the Investment Company Act) provide reasonable assurances that material information relating to the trust is made known to them by the appropriate persons, based on their evaluation of these controls and procedures as of a date within 90 days of the filing date of this report.
(a)(ii) There was no change in the trust’s internal control over financial reporting (as defined in Rule 30a-3(d) under the Investment Company Act) that occurred during the period covered by this report that has materially affected, or is reasonably likely to materially affect, the trust’s internal control over financial reporting.
Item 12.
Disclosure of Securities Lending Activities for Closed-End Management
Investment Companies
Not applicable.
Item 13.
Exhibits
| | |
(a) | (1) | Code of Ethics pursuant to Item 2 of Form N-CSR is filed and attached hereto as EX-99.CODE ETH. |
(a) | (2) | Certification pursuant to Rule 30a-2(a) under the Investment Company Act of 1940 (17 CFR 270.30a-2(a)) is filed and attached hereto as Exhibit 99.CERT. |
(a) | (3) | Not applicable. |
(b) | | Certification pursuant to Rule 30a-2(b) under the Investment Company Act of 1940 (17 CFR 270.30a-2(b)) is furnished and attached hereto as Exhibit 99.906CERT. |
SIGNATURES
Pursuant to the requirements of the Securities Exchange Act of 1934 and the Investment Company Act of 1940, the registrant has duly caused this report to be signed on its behalf by the undersigned, thereunto duly authorized.
Fidelity Puritan Trust
| |
By: | /s/Stacie M. Smith |
| Stacie M. Smith |
| President and Treasurer |
| |
Date: | September 26, 2018 |
Pursuant to the requirements of the Securities Exchange Act of 1934 and the Investment Company Act of 1940, this report has been signed below by the following persons on behalf of the registrant and in the capacities and on the dates indicated.
| |
By: | /s/Stacie M. Smith |
| Stacie M. Smith |
| President and Treasurer |
| |
Date: | September 26, 2018 |
| |
By: | /s/John J. Burke III |
| John J. Burke III |
| Chief Financial Officer |
| |
Date: | September 26, 2018 |