UNITED STATES
SECURITIES AND EXCHANGE COMMISSION
Washington, D.C. 20549
FORM N-CSR
CERTIFIED SHAREHOLDER REPORT OF REGISTERED
MANAGEMENT INVESTMENT COMPANIES
Investment Company Act file number 811-00649
Fidelity Puritan Trust
(Exact name of registrant as specified in charter)
245 Summer St., Boston, Massachusetts 02210
(Address of principal executive offices) (Zip code)
Cynthia Lo Bessette, Secretary
245 Summer St.
Boston, Massachusetts 02210
(Name and address of agent for service)
Registrant's telephone number, including area code:
617-563-7000
| |
Date of fiscal year end: | July 31 |
|
|
Date of reporting period: | July 31, 2021 |
Item 1.
Reports to Stockholders
Fidelity® Low-Priced Stock Fund
Annual Report
July 31, 2021


Contents
To view a fund's proxy voting guidelines and proxy voting record for the 12-month period ended June 30, visit http://www.fidelity.com/proxyvotingresults or visit the Securities and Exchange Commission's (SEC) web site at http://www.sec.gov.
You may also call 1-800-544-8544 if you’re an individual investing directly with Fidelity, call 1-800-835-5092 if you’re a plan sponsor or participant with Fidelity as your recordkeeper or call 1-877-208-0098 on institutional accounts or if you’re an advisor or invest through one to request a free copy of the proxy voting guidelines.
Standard & Poor's, S&P and S&P 500 are registered service marks of The McGraw-Hill Companies, Inc. and have been licensed for use by Fidelity Distributors Corporation.
Other third-party marks appearing herein are the property of their respective owners.
All other marks appearing herein are registered or unregistered trademarks or service marks of FMR LLC or an affiliated company. © 2021 FMR LLC. All rights reserved.
This report and the financial statements contained herein are submitted for the general information of the shareholders of the Fund. This report is not authorized for distribution to prospective investors in the Fund unless preceded or accompanied by an effective prospectus.
A fund files its complete schedule of portfolio holdings with the SEC for the first and third quarters of each fiscal year on Form N-PORT. Forms N-PORT are available on the SEC’s web site at http://www.sec.gov. A fund's Forms N-PORT may be reviewed and copied at the SEC’s Public Reference Room in Washington, DC. Information regarding the operation of the SEC's Public Reference Room may be obtained by calling 1-800-SEC-0330.
For a complete list of a fund's portfolio holdings, view the most recent holdings listing, semiannual report, or annual report on Fidelity's web site at http://www.fidelity.com, http://www.institutional.fidelity.com, or http://www.401k.com, as applicable.
NOT FDIC INSURED •MAY LOSE VALUE •NO BANK GUARANTEE
Neither the Fund nor Fidelity Distributors Corporation is a bank.
Note to Shareholders:
Early in 2020, the outbreak and spread of a new coronavirus emerged as a public health emergency that had a major influence on financial markets, primarily based on its impact on the global economy and the outlook for corporate earnings. The virus causes a respiratory disease known as COVID-19. On March 11, 2020 the World Health Organization declared the COVID-19 outbreak a pandemic, citing sustained risk of further global spread.
In the weeks following, as the crisis worsened, we witnessed an escalating human tragedy with wide-scale social and economic consequences from coronavirus-containment measures. The outbreak of COVID-19 prompted a number of measures to limit the spread, including travel and border restrictions, quarantines, and restrictions on large gatherings. In turn, these resulted in lower consumer activity, diminished demand for a wide range of products and services, disruption in manufacturing and supply chains, and – given the wide variability in outcomes regarding the outbreak – significant market uncertainty and volatility. Amid the turmoil, global governments and central banks took unprecedented action to help support consumers, businesses, and the broader economies, and to limit disruption to financial systems.
The situation continues to unfold, and the extent and duration of its impact on financial markets and the economy remain highly uncertain. Extreme events such as the coronavirus crisis are “exogenous shocks” that can have significant adverse effects on mutual funds and their investments. Although multiple asset classes may be affected by market disruption, the duration and impact may not be the same for all types of assets.
Fidelity is committed to helping you stay informed amid news about COVID-19 and during increased market volatility, and we’re taking extra steps to be responsive to customer needs. We encourage you to visit our websites, where we offer ongoing updates, commentary, and analysis on the markets and our funds.
Performance: The Bottom Line
Average annual total return reflects the change in the value of an investment, assuming reinvestment of distributions from dividend income and capital gains (the profits earned upon the sale of securities that have grown in value, if any) and assuming a constant rate of performance each year. The hypothetical investment and the average annual total returns do not reflect the deduction of taxes that a shareholder would pay on fund distributions or the redemption of fund shares. During periods of reimbursement by Fidelity, a fund’s total return will be greater than it would be had the reimbursement not occurred. How a fund did yesterday is no guarantee of how it will do tomorrow.
Average Annual Total Returns
| For the periods ended July 31, 2021 | Past 1 year | Past 5 years | Past 10 years |
| Fidelity® Low-Priced Stock Fund | 45.83% | 13.10% | 11.93% |
| Class K | 45.94% | 13.20% | 12.04% |
$10,000 Over 10 Years
Let's say hypothetically that $10,000 was invested in Fidelity® Low-Priced Stock Fund, a class of the fund, on July 31, 2011.
The chart shows how the value of your investment would have changed, and also shows how the Russell 2000® Index performed over the same period.
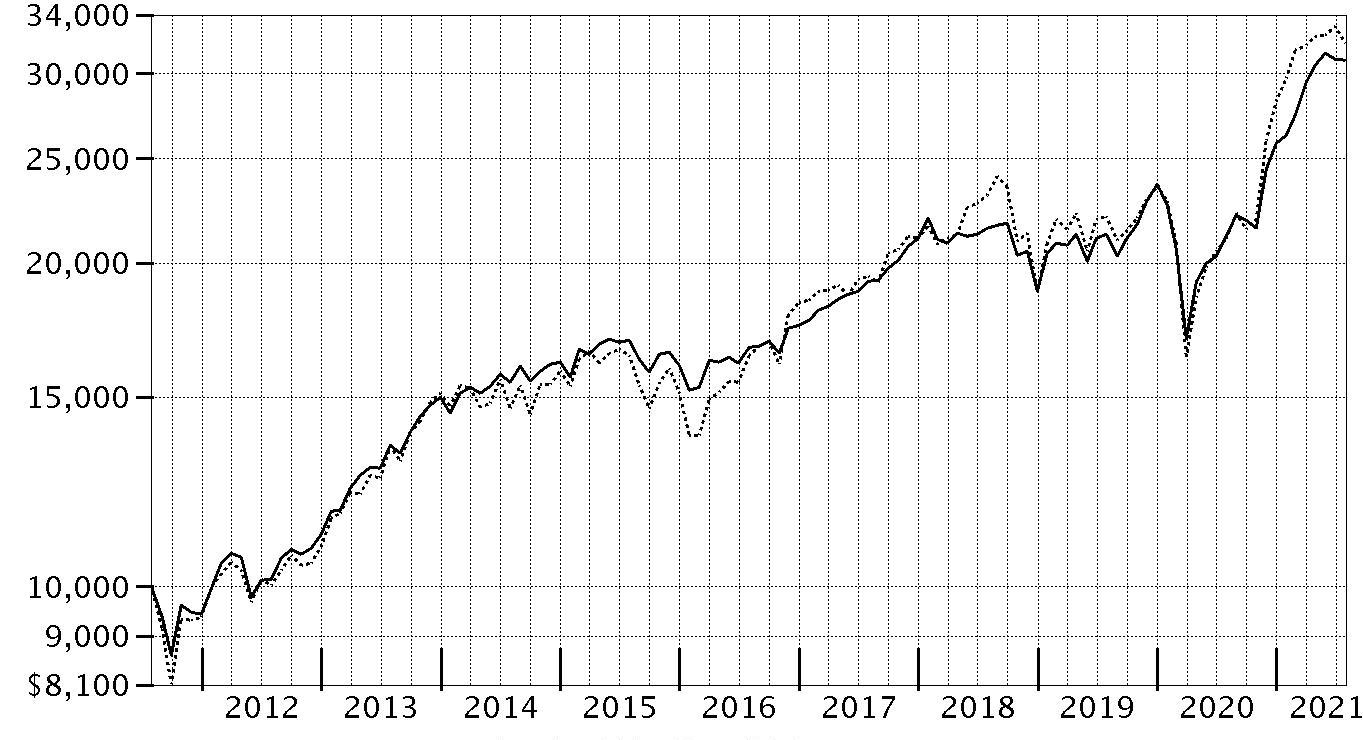
| Period Ending Values |
| $30,872 | Fidelity® Low-Priced Stock Fund |
| $32,006 | Russell 2000® Index |
Management's Discussion of Fund Performance
Market Recap: The S&P 500
® index gained 36.45% for the 12 months ending July 31, 2021, as U.S. equities continued a historic rebound following a steep but brief decline due to the early-2020 outbreak and spread of COVID-19. A confluence of powerful forces propelled risk assets, returning the stock market to pre-pandemic highs by late August 2020. The rally slowed in September, when stocks began a two-month retreat amid Congress’s inability to reach a deal on additional fiscal stimulus, as well as uncertainty about the election. But as the calendar turned, investors grew hopeful. The rollout of three COVID-19 vaccines was underway, the U.S. Federal Reserve pledged to hold interest rates near zero until the economy recovered, and the federal government planned to deploy trillions of dollars to boost consumers and the economy. This backdrop fueled a sharp rotation, with small-cap value usurping leadership from large growth. As part of the “reopening” theme, investors moved out of tech-driven mega-caps that had thrived due to the work-from-home trend in favor of cheap smaller companies that stood to benefit from a broad cyclical recovery. A flattish May reflected concerns about inflation and jobs, but the uptrend resumed through July, driven by corporate earnings. Notably, this leg saw momentum shift back to large growth, as easing rates and a hawkish Fed stymied the reflation trade. By sector, financials (+55%) led, driven by banks (+63%), whereas utilities (+12%) and consumer staples (+18%) notably lagged.
Comments from Lead Manager Joel Tillinghast and Co-Managers Sam Chamovitz and Salim Hart: For the fiscal year ending July 31, 2021, the fund's share classes gained roughly 46%, trailing the 51.97% result of the benchmark Russell 2000
® Index. Versus the benchmark, security selection was the primary detractor, especially in the retailing area of the consumer discretionary sector. Weak picks in the consumer staples sector, primarily within the food & staples retailing industry, also hurt. Also hindering performance was security selection and an underweighting in the industrials sector, especially within the capital goods industry. Metro, the fund's top individual detractor, rose 20% this period. This was among the fund's biggest holdings. Our second-largest detractor was Amgen, which gained roughly 2% the past 12 months. Another detractor this period was Cosmos Pharmaceutical. The fund's shares in Cosmos Pharmaceutical returned -7% the past 12 months. All these detractors were non-benchmark positions. Also, the fund's foreign holdings detracted overall, despite benefiting from a broadly weaker U.S. dollar. In contrast, the largest contributor to performance versus the benchmark was an overweighting in the consumer discretionary sector, primarily driven by the retailing industry. Strong picks in financials also helped the fund's relative performance. Also helping the fund's relative performance were stock picks in the information technology sector, especially within the technology hardware & equipment industry. Seagate Technology, the fund's biggest individual contributor, gained about 133% this period. Our second-largest contributor was Synchrony Financial, which gained roughly 118% the past year. This was among the largest holdings at period end. Another contributor this period was Synnex. The stock gained roughly 129% the past 12 months. All these contributors were non-benchmark positions. Notable changes in positioning include a higher allocation to the energy and financials sectors.
The views expressed above reflect those of the portfolio manager(s) only through the end of the period as stated on the cover of this report and do not necessarily represent the views of Fidelity or any other person in the Fidelity organization. Any such views are subject to change at any time based upon market or other conditions and Fidelity disclaims any responsibility to update such views. These views may not be relied on as investment advice and, because investment decisions for a Fidelity fund are based on numerous factors, may not be relied on as an indication of trading intent on behalf of any Fidelity fund.
Investment Summary (Unaudited)
Top Ten Stocks as of July 31, 2021
| | % of fund's net assets |
| UnitedHealth Group, Inc. | 4.7 |
| Metro, Inc. | 3.6 |
| Next PLC | 3.6 |
| AutoZone, Inc. | 3.0 |
| Ross Stores, Inc. | 2.5 |
| Anthem, Inc. | 2.1 |
| Synchrony Financial | 1.9 |
| Monster Beverage Corp. | 1.8 |
| Seagate Technology Holdings PLC | 1.8 |
| Hon Hai Precision Industry Co. Ltd. (Foxconn) | 1.7 |
| | 26.7 |
Top Five Market Sectors as of July 31, 2021
| | % of fund's net assets |
| Consumer Discretionary | 22.1 |
| Financials | 14.2 |
| Information Technology | 13.7 |
| Consumer Staples | 12.2 |
| Health Care | 11.7 |
Asset Allocation (% of fund's net assets)
| As of July 31, 2021* |
| | Stocks | 94.1% |
| | Short-Term Investments and Net Other Assets (Liabilities) | 5.9% |

* Foreign investments - 40.4%
Schedule of Investments July 31, 2021
Showing Percentage of Net Assets
| Common Stocks - 94.1% | | | |
| | | Shares | Value (000s) |
| COMMUNICATION SERVICES - 1.5% | | | |
| Diversified Telecommunication Services - 0.0% | | | |
| Frontier Communications Parent, Inc. (a) | | 99,912 | $2,988 |
| Verizon Communications, Inc. | | 29,891 | 1,667 |
| | | | 4,655 |
| Entertainment - 0.0% | | | |
| GungHo Online Entertainment, Inc. | | 50,000 | 922 |
| Madison Square Garden Entertainment Corp. (a)(b) | | 94,527 | 6,613 |
| | | | 7,535 |
| Interactive Media & Services - 0.1% | | | |
| Cars.com, Inc. (a) | | 199,835 | 2,414 |
| Dip Corp. | | 274,961 | 8,008 |
| QuinStreet, Inc. (a) | | 318,578 | 5,843 |
| XLMedia PLC (a) | | 8,464,118 | 6,000 |
| ZIGExN Co. Ltd. | | 399,728 | 1,549 |
| | | | 23,814 |
| Media - 1.4% | | | |
| AMC Networks, Inc. Class A (a)(b) | | 386,235 | 19,327 |
| Comcast Corp. Class A | | 1,000,508 | 58,860 |
| Corus Entertainment, Inc. Class B (non-vtg.) (b) | | 598,801 | 2,779 |
| Discovery Communications, Inc. Class C (non-vtg.) (a) | | 5,350,089 | 145,041 |
| Gray Television, Inc. | | 100,092 | 2,219 |
| Hyundai HCN | | 2,500,079 | 9,987 |
| Intage Holdings, Inc. (c) | | 3,233,786 | 45,159 |
| Legs Co. Ltd. | | 19,982 | 390 |
| Meredith Corp. (a) | | 291,832 | 12,736 |
| Nexstar Broadcasting Group, Inc. Class A | | 21,000 | 3,088 |
| Nordic Entertainment Group AB (B Shares) (a) | | 26,276 | 1,405 |
| Pico Far East Holdings Ltd. | | 22,835,660 | 3,820 |
| Proto Corp. | | 250,060 | 3,157 |
| RKB Mainichi Broadcasting Corp. | | 40,002 | 2,181 |
| Saga Communications, Inc. Class A | | 453,145 | 9,892 |
| Sky Network Television Ltd. (a) | | 23,948,499 | 2,753 |
| TechTarget, Inc. (a) | | 101,855 | 7,444 |
| Tegna, Inc. | | 1,197,845 | 21,226 |
| TOW Co. Ltd. (c) | | 3,582,037 | 10,253 |
| Trenders, Inc. | | 99,912 | 603 |
| TVA Group, Inc. Class B (non-vtg.) (a) | | 3,022,986 | 7,269 |
| ViacomCBS, Inc. Class B | | 2,300,047 | 94,141 |
| WOWOW INC. | | 199,604 | 4,328 |
| | | | 468,058 |
| Wireless Telecommunication Services - 0.0% | | | |
| Okinawa Cellular Telephone Co. | | 50,000 | 2,375 |
|
| TOTAL COMMUNICATION SERVICES | | | 506,437 |
|
| CONSUMER DISCRETIONARY - 22.1% | | | |
| Auto Components - 1.3% | | | |
| Adient PLC (a) | | 857,061 | 36,108 |
| ASTI Corp. (c) | | 177,660 | 4,426 |
| Cie Automotive SA | | 225,056 | 6,706 |
| Cooper-Standard Holding, Inc. (a) | | 748,409 | 19,496 |
| DaikyoNishikawa Corp. | | 249,246 | 1,597 |
| G-Tekt Corp. | | 199,864 | 2,820 |
| Gentex Corp. | | 1,550,522 | 52,764 |
| GUD Holdings Ltd. | | 262,181 | 2,259 |
| Hi-Lex Corp. | | 1,397,039 | 21,127 |
| Lear Corp. | | 550,039 | 96,246 |
| Linamar Corp. | | 250,680 | 14,833 |
| Motonic Corp. (c) | | 2,066,285 | 19,986 |
| Murakami Corp. (c) | | 807,476 | 23,333 |
| Nippon Seiki Co. Ltd. | | 2,594,547 | 29,988 |
| Patrick Industries, Inc. | | 30,096 | 2,487 |
| Piolax, Inc. (c) | | 2,431,386 | 33,643 |
| Plastic Omnium SA | | 250,112 | 7,940 |
| Sewon Precision Industries Co. Ltd. (c)(d) | | 500,000 | 1,744 |
| SJM Co. Ltd. (c) | | 1,282,000 | 5,950 |
| SJM Holdings Co. Ltd. | | 500,470 | 2,010 |
| SNT Holdings Co. Ltd. (c) | | 885,108 | 15,894 |
| Strattec Security Corp. (a)(c) | | 265,085 | 10,916 |
| Sungwoo Hitech Co. Ltd. | | 1,500,110 | 8,550 |
| TBK Co. Ltd. | | 898,112 | 3,365 |
| Yachiyo Industry Co. Ltd. | | 876,947 | 4,732 |
| Yutaka Giken Co. Ltd. (c) | | 1,200,913 | 22,101 |
| | | | 451,021 |
| Automobiles - 0.0% | | | |
| Isuzu Motors Ltd. | | 277,116 | 3,697 |
| Kabe Husvagnar AB (B Shares) | | 249,994 | 6,331 |
| | | | 10,028 |
| Distributors - 0.1% | | | |
| Arata Corp. | | 91,973 | 3,571 |
| Central Automotive Products Ltd. | | 73,651 | 2,242 |
| LKQ Corp. (a) | | 109,609 | 5,563 |
| Nakayamafuku Co. Ltd. | | 519,639 | 2,070 |
| PALTAC Corp. | | 34,838 | 1,610 |
| SPK Corp. | | 498,946 | 6,217 |
| Uni-Select, Inc. (a) | | 600,110 | 7,432 |
| | | | 28,705 |
| Diversified Consumer Services - 0.1% | | | |
| Adtalem Global Education, Inc. (a) | | 86,324 | 3,137 |
| Clip Corp. (c) | | 239,800 | 1,893 |
| Cross-Harbour Holdings Ltd. | | 2,413,732 | 3,870 |
| JP-Holdings, Inc. | | 99,912 | 248 |
| Kukbo Design Co. Ltd. | | 100,000 | 1,947 |
| Step Co. Ltd. (c) | | 999,146 | 16,339 |
| YDUQS Participacoes SA | | 533,800 | 2,896 |
| | | | 30,330 |
| Hotels, Restaurants & Leisure - 0.3% | | | |
| Ark Restaurants Corp. (a) | | 28,319 | 447 |
| Betsson AB (B Shares) | | 1,106,312 | 8,906 |
| Curves Holdings Co. Ltd. | | 257,726 | 1,912 |
| Everi Holdings, Inc. (a) | | 150,678 | 3,419 |
| Fairwood Holdings Ltd. | | 100,000 | 225 |
| Flanigans Enterprises, Inc. (a) | | 78,804 | 2,474 |
| Hiday Hidaka Corp. | | 950,063 | 15,190 |
| Ibersol SGPS SA (a) | | 923,220 | 6,483 |
| J.D. Weatherspoon PLC (a) | | 179,317 | 2,829 |
| Kindred Group PLC (depositary receipt) | | 400,012 | 6,554 |
| Koshidaka Holdings Co. Ltd. | | 257,726 | 1,301 |
| Ruth's Hospitality Group, Inc. (a) | | 125,223 | 2,501 |
| Sportscene Group, Inc. Class A (a)(c) | | 590,055 | 1,750 |
| The Monogatari Corp. | | 50,038 | 3,102 |
| The Restaurant Group PLC (a) | | 16,500,199 | 26,330 |
| | | | 83,423 |
| Household Durables - 5.0% | | | |
| Barratt Developments PLC (c) | | 53,500,083 | 523,233 |
| Bellway PLC | | 3,447,000 | 157,251 |
| Coway Co. Ltd. | | 35,000 | 2,605 |
| Cuckoo Holdings Co. Ltd. | | 55,000 | 6,107 |
| D.R. Horton, Inc. | | 998,737 | 95,309 |
| Dorel Industries, Inc. Class B (sub. vtg.) (a) | | 1,864,972 | 21,182 |
| Emak SpA | | 4,200,004 | 8,719 |
| First Juken Co. Ltd. (c) | | 1,369,515 | 14,431 |
| FJ Next Co. Ltd. | | 200,067 | 1,875 |
| Gree Electric Appliances, Inc. of Zhuhai (A Shares) | | 13,100,869 | 96,308 |
| Hamilton Beach Brands Holding Co.: | | | |
| Class A | | 207,012 | 3,869 |
| Class B (a) | | 182,462 | 3,410 |
| Helen of Troy Ltd. (a) | | 835,022 | 186,536 |
| Henry Boot PLC | | 1,946,621 | 7,387 |
| Lennar Corp. Class A | | 58,813 | 6,184 |
| M/I Homes, Inc. (a) | | 776,700 | 50,260 |
| Mohawk Industries, Inc. (a) | | 1,350,075 | 263,130 |
| Newell Brands, Inc. | | 99,917 | 2,473 |
| Open House Co. Ltd. | | 160,043 | 8,053 |
| Pressance Corp. | | 738,635 | 10,732 |
| Q.E.P. Co., Inc. | | 19,218 | 464 |
| Sanei Architecture Planning Co. Ltd. (c) | | 1,184,094 | 21,295 |
| Taylor Morrison Home Corp. (a) | | 3,514,508 | 94,259 |
| Tempur Sealy International, Inc. | | 225,774 | 9,769 |
| Token Corp. | | 597,172 | 53,836 |
| Toll Brothers, Inc. | | 42,000 | 2,489 |
| TopBuild Corp. (a) | | 14,333 | 2,905 |
| TRI Pointe Homes, Inc. (a) | | 916,515 | 22,106 |
| Whirlpool Corp. | | 10,978 | 2,432 |
| ZAGG, Inc. rights (a)(d) | | 448,847 | 40 |
| | | | 1,678,649 |
| Internet & Direct Marketing Retail - 0.2% | | | |
| Aucfan Co. Ltd. (a) | | 50,000 | 556 |
| Aucnet, Inc. | | 120,043 | 1,741 |
| Belluna Co. Ltd. (c) | | 6,200,043 | 52,446 |
| Ci Medical Co. Ltd. | | 70,093 | 4,632 |
| Dustin Group AB (e) | | 257,346 | 2,988 |
| Papyless Co. Ltd. | | 40,500 | 577 |
| Qurate Retail, Inc. Series A | | 265,537 | 3,149 |
| Vipshop Holdings Ltd. ADR (a) | | 300,000 | 4,989 |
| | | | 71,078 |
| Leisure Products - 0.0% | | | |
| Fenix Outdoor AB (B Shares) (a)(d) | | 32,298 | 0 |
| Mars Group Holdings Corp. | | 420,095 | 6,257 |
| Miroku Corp. | | 137,449 | 2,030 |
| Nautilus, Inc. (a)(b) | | 59,316 | 857 |
| | | | 9,144 |
| Multiline Retail - 3.8% | | | |
| Big Lots, Inc. (b) | | 1,082,277 | 62,350 |
| Kohl's Corp. | | 61,100 | 3,104 |
| Lifestyle China Group Ltd. (a) | | 17,962,162 | 2,658 |
| Lifestyle International Holdings Ltd. (a) | | 19,535,491 | 13,927 |
| Max Stock Ltd. | | 24,978 | 102 |
| Next PLC (c) | | 10,975,061 | 1,202,425 |
| Ryohin Keikaku Co. Ltd. | | 9,977 | 202 |
| | | | 1,284,768 |
| Specialty Retail - 9.6% | | | |
| AT-Group Co. Ltd. | | 1,097,701 | 14,298 |
| AutoNation, Inc. (a) | | 47,261 | 5,734 |
| AutoZone, Inc. (a) | | 623,871 | 1,012,898 |
| Bed Bath & Beyond, Inc. (a)(b)(c) | | 10,477,557 | 299,029 |
| Best Buy Co., Inc. | | 1,721,631 | 193,425 |
| BMTC Group, Inc. (c) | | 3,434,525 | 43,689 |
| Bonia Corp. Bhd | | 675,810 | 141 |
| Buffalo Co. Ltd. | | 91,069 | 1,003 |
| Burlington Stores, Inc. (a) | | 17,840 | 5,973 |
| Delek Automotive Systems Ltd. | | 350,116 | 4,413 |
| Dick's Sporting Goods, Inc. | | 69,136 | 7,200 |
| Foot Locker, Inc. | | 3,033,242 | 173,077 |
| Formosa Optical Technology Co. Ltd. | | 1,362,000 | 3,077 |
| Genesco, Inc. (a) | | 609,708 | 35,028 |
| Goldlion Holdings Ltd. | | 21,953,780 | 4,972 |
| Hour Glass Ltd. | | 4,040,137 | 4,592 |
| IA Group Corp. (c) | | 115,194 | 3,833 |
| JD Sports Fashion PLC | | 6,768,553 | 84,392 |
| Jumbo SA (c) | | 9,729,000 | 154,650 |
| K's Holdings Corp. | | 998,425 | 11,749 |
| Kid ASA (e) | | 24,978 | 327 |
| Ku Holdings Co. Ltd. | | 880,829 | 8,029 |
| Leon's Furniture Ltd. | | 207,692 | 3,861 |
| Maisons du Monde SA (e) | | 150,984 | 3,455 |
| Mr. Bricolage SA (a) | | 841,748 | 11,433 |
| Nafco Co. Ltd. (c) | | 1,895,622 | 32,381 |
| Nextage Co. Ltd. | | 320,047 | 6,549 |
| Ross Stores, Inc. | | 6,950,087 | 852,706 |
| Sally Beauty Holdings, Inc. (a)(c) | | 6,234,550 | 117,958 |
| T-Gaia Corp. | | 19,152 | 344 |
| The Buckle, Inc. (b) | | 2,399,343 | 100,964 |
| Urban Outfitters, Inc. (a) | | 700,151 | 26,032 |
| WH Smith PLC (a) | | 87,313 | 1,972 |
| Williams-Sonoma, Inc. | | 26,971 | 4,092 |
| | | | 3,233,276 |
| Textiles, Apparel & Luxury Goods - 1.7% | | | |
| Best Pacific International Holdings Ltd. | | 24,249,894 | 7,177 |
| Capri Holdings Ltd. (a) | | 2,540,654 | 143,064 |
| Carter's, Inc. | | 10,096 | 987 |
| Deckers Outdoor Corp. (a) | | 26,040 | 10,699 |
| Embry Holdings Ltd. | | 2,295,794 | 328 |
| Fossil Group, Inc. (a)(c) | | 4,046,854 | 51,071 |
| G-III Apparel Group Ltd. (a) | | 776,735 | 23,193 |
| Gildan Activewear, Inc. | | 6,150,095 | 212,020 |
| Handsome Co. Ltd. (c) | | 1,450,000 | 49,371 |
| JLM Couture, Inc. (a)(c) | | 156,822 | 274 |
| McRae Industries, Inc. | | 23,661 | 755 |
| Movado Group, Inc. | | 59,936 | 1,802 |
| Samsonite International SA (a)(e) | | 1,995,690 | 3,708 |
| Sun Hing Vision Group Holdings Ltd. (c) | | 19,397,146 | 3,544 |
| Ted Baker PLC (a) | | 475,857 | 868 |
| Texwinca Holdings Ltd. | | 47,859,365 | 10,778 |
| Victory City International Holdings Ltd. (a)(d) | | 8,499,357 | 317 |
| Youngone Corp. | | 250,000 | 8,642 |
| Youngone Holdings Co. Ltd. (c) | | 889,600 | 35,692 |
| | | | 564,290 |
|
| TOTAL CONSUMER DISCRETIONARY | | | 7,444,712 |
|
| CONSUMER STAPLES - 12.2% | | | |
| Beverages - 2.2% | | | |
| A.G. Barr PLC (a) | | 2,395,731 | 19,148 |
| Britvic PLC | | 6,146,749 | 83,261 |
| Jinro Distillers Co. Ltd. | | 23,907 | 671 |
| Monster Beverage Corp. (a) | | 6,512,346 | 614,244 |
| Muhak Co. Ltd. (c) | | 2,799,256 | 19,839 |
| Olvi PLC (A Shares) | | 14,788 | 928 |
| Spritzer Bhd | | 5,125,400 | 2,478 |
| Yantai Changyu Pioneer Wine Co. Ltd. (B Shares) | | 3,009,936 | 5,663 |
| | | | 746,232 |
| Food & Staples Retailing - 7.7% | | | |
| Alimentation Couche-Tard, Inc. Class A (multi-vtg.) | | 300,034 | 12,258 |
| Aoki Super Co. Ltd. | | 98,630 | 2,823 |
| Australasian Foods Holdco Pty Ltd. (a)(d) | | 3,481,102 | 0 |
| Belc Co. Ltd. (c) | | 1,634,253 | 79,847 |
| BJ's Wholesale Club Holdings, Inc. (a) | | 136,087 | 6,891 |
| Corporativo Fragua S.A.B. de CV | | 165,056 | 2,740 |
| Cosmos Pharmaceutical Corp. | | 1,671,479 | 283,240 |
| Create SD Holdings Co. Ltd. (c) | | 5,075,318 | 169,786 |
| Daikokutenbussan Co. Ltd. | | 300,033 | 17,257 |
| G-7 Holdings, Inc. | | 300,038 | 9,983 |
| Genky DrugStores Co. Ltd. | | 710,043 | 26,148 |
| Halows Co. Ltd. (c) | | 1,369,956 | 35,340 |
| Kroger Co. | | 105,000 | 4,274 |
| Kusuri No Aoki Holdings Co. Ltd. | | 600,086 | 40,095 |
| MARR SpA | | 113,412 | 2,634 |
| Metro, Inc. (c) | | 23,529,229 | 1,220,216 |
| Naked Wines PLC (a)(b) | | 250,180 | 3,057 |
| North West Co., Inc. | | 84,920 | 2,475 |
| Olam International Ltd. | | 49,892 | 49 |
| Qol Holdings Co. Ltd. | | 1,811,522 | 24,967 |
| Rami Levi Chain Stores Hashikma Marketing 2006 Ltd. | | 10,000 | 651 |
| Sprouts Farmers Market LLC (a)(b) | | 1,325,018 | 32,569 |
| Sugi Holdings Co. Ltd. | | 42,010 | 3,090 |
| Sundrug Co. Ltd. | | 2,958,985 | 95,751 |
| United Natural Foods, Inc. (a)(b) | | 546,980 | 18,116 |
| Valor Holdings Co. Ltd. | | 244,244 | 5,163 |
| Walgreens Boots Alliance, Inc. | | 9,379,541 | 442,245 |
| YAKUODO Holdings Co. Ltd. | | 1,900 | 40 |
| Yaoko Co. Ltd. | | 698,507 | 42,023 |
| | | | 2,583,728 |
| Food Products - 1.7% | | | |
| Ausnutria Dairy Corp. Ltd. (H Shares) | | 700,000 | 663 |
| Carr's Group PLC | | 2,195,712 | 4,822 |
| Cranswick PLC | | 373,898 | 21,049 |
| Darling Ingredients, Inc. (a) | | 56,688 | 3,915 |
| Dole PLC | | 1,114,293 | 16,157 |
| Food Empire Holdings Ltd. (c) | | 37,700,102 | 23,372 |
| Fresh Del Monte Produce, Inc. (c) | | 4,600,000 | 141,956 |
| Inghams Group Ltd. | | 1,065,338 | 2,971 |
| Ingredion, Inc. | | 749,409 | 65,806 |
| Kaveri Seed Co. Ltd. | | 400,714 | 3,880 |
| Kri Kri Milk Industry SA | | 100,074 | 1,045 |
| Lassonde Industries, Inc. Class A (sub. vtg.) | | 16,120 | 2,230 |
| Mitsui Sugar Co. Ltd. | | 343,573 | 5,838 |
| Namyang Dairy Products Co. Ltd. | | 3,121 | 1,633 |
| Origin Enterprises PLC (c) | | 8,996,797 | 36,713 |
| Pacific Andes International Holdings Ltd. (a)(d) | | 106,294,500 | 999 |
| Pacific Andes Resources Development Ltd. (a)(d) | | 207,064,007 | 1,681 |
| Pickles Corp. | | 99,834 | 3,358 |
| Rocky Mountain Chocolate Factory, Inc. (a)(c) | | 460,381 | 3,853 |
| S Foods, Inc. | | 398,742 | 12,394 |
| Seaboard Corp. | | 39,900 | 163,989 |
| Sunjin Co. Ltd. (c) | | 2,300,055 | 31,326 |
| Sunjuice Holdings Co. Ltd. | | 161,000 | 2,910 |
| Thai President Foods PCL | | 501,015 | 2,943 |
| Tyson Foods, Inc. Class A | | 342,027 | 24,441 |
| Ulker Biskuvi Sanayi A/S | | 4,977 | 12 |
| | | | 579,956 |
| Household Products - 0.0% | | | |
| Oil-Dri Corp. of America | | 25,072 | 892 |
| Spectrum Brands Holdings, Inc. | | 40,000 | 3,494 |
| Transaction Co. Ltd. | | 350,076 | 4,046 |
| | | | 8,432 |
| Personal Products - 0.5% | | | |
| Hengan International Group Co. Ltd. | | 3,600,574 | 21,382 |
| Herbalife Nutrition Ltd. (a) | | 1,855,337 | 94,511 |
| Nu Skin Enterprises, Inc. Class A | | 59,280 | 3,183 |
| Sarantis SA (c) | | 3,916,953 | 40,889 |
| TCI Co. Ltd. | | 900,000 | 10,540 |
| | | | 170,505 |
| Tobacco - 0.1% | | | |
| KT&G Corp. | | 25,000 | 1,785 |
| Scandinavian Tobacco Group A/S (e) | | 1,100,053 | 22,541 |
| | | | 24,326 |
|
| TOTAL CONSUMER STAPLES | | | 4,113,179 |
|
| ENERGY - 5.4% | | | |
| Energy Equipment & Services - 0.3% | | | |
| AKITA Drilling Ltd. Class A (non-vtg.) (a) | | 1,440,233 | 935 |
| Bristow Group, Inc. (a) | | 224,757 | 5,839 |
| Cathedral Energy Services Ltd. (a) | | 1,297,710 | 520 |
| Championx Corp. (a) | | 399,734 | 9,290 |
| Geospace Technologies Corp. (a)(c) | | 696,035 | 6,076 |
| Helix Energy Solutions Group, Inc. (a)(b) | | 649,508 | 2,695 |
| John Wood Group PLC (a) | | 779,663 | 2,363 |
| KS Energy Services Ltd. (a)(d) | | 12,911,018 | 124 |
| Liberty Oilfield Services, Inc. Class A (a) | | 4,716,938 | 48,066 |
| Oil States International, Inc. (a) | | 2,644,719 | 14,969 |
| PHX Energy Services Corp. | | 1,339,349 | 4,423 |
| Tidewater, Inc. warrants 11/14/24 (a) | | 61,369 | 14 |
| Total Energy Services, Inc. (a) | | 1,967,156 | 6,339 |
| | | | 101,653 |
| Oil, Gas & Consumable Fuels - 5.1% | | | |
| Adams Resources & Energy, Inc. | | 136,803 | 3,655 |
| Beach Energy Ltd. | | 13,919,345 | 12,258 |
| Berry Corp. | | 2,680,414 | 14,876 |
| Bonanza Creek Energy, Inc. | | 1,332,197 | 51,250 |
| China Petroleum & Chemical Corp.: | | | |
| (H Shares) | | 24,978,229 | 11,422 |
| sponsored ADR (H Shares) | | 97,952 | 4,478 |
| CNX Resources Corp. (a)(b) | | 1,400,002 | 16,940 |
| Delek U.S. Holdings, Inc. (b) | | 1,696,384 | 29,483 |
| Denbury, Inc. (a) | | 135,237 | 8,886 |
| DHT Holdings, Inc. | | 1,536,343 | 8,911 |
| Diamondback Energy, Inc. | | 649,439 | 50,091 |
| Energy Transfer LP | | 300,000 | 2,958 |
| Enterprise Products Partners LP | | 1,500,867 | 33,875 |
| EQT Corp. (a) | | 7,700,018 | 141,603 |
| Extraction Oil & Gas, Inc. (a) | | 600,046 | 26,696 |
| Fuji Kosan Co. Ltd. | | 247,981 | 2,355 |
| Great Eastern Shipping Co. Ltd. | | 2,048,255 | 9,367 |
| Hankook Shell Oil Co. Ltd. | | 44,000 | 10,458 |
| HollyFrontier Corp. | | 1,650,077 | 48,512 |
| Iwatani Corp. | | 100,034 | 5,717 |
| Kyungdong Invest Co. Ltd. | | 100,015 | 3,505 |
| Marathon Oil Corp. | | 12,189,565 | 141,277 |
| Marathon Petroleum Corp. | | 1,498,758 | 82,761 |
| Mi Chang Oil Industrial Co. Ltd. (c) | | 173,900 | 12,551 |
| Murphy Oil Corp. (b)(c) | | 12,656,027 | 274,762 |
| NACCO Industries, Inc. Class A | | 488,357 | 12,243 |
| Northern Oil & Gas, Inc. | | 133,334 | 2,303 |
| Oasis Petroleum, Inc. | | 400,057 | 36,689 |
| Oil & Natural Gas Corp. Ltd. | | 67,000,893 | 103,912 |
| Oil India Ltd. | | 10,746,554 | 24,119 |
| Ovintiv, Inc. | | 1,876,158 | 48,142 |
| PDC Energy, Inc. | | 200,067 | 7,913 |
| Petronet LNG Ltd. | | 4,169,900 | 12,242 |
| Pioneer Natural Resources Co. | | 17,692 | 2,572 |
| Range Resources Corp. (a) | | 300,023 | 4,569 |
| Reliance Industries Ltd. | | 92,600 | 2,535 |
| SilverBow Resources, Inc. (a) | | 245,089 | 4,858 |
| Southwestern Energy Co. (a)(c) | | 35,768,884 | 168,471 |
| Star Petroleum Refining PCL (a) | | 8,977,428 | 2,295 |
| Thai Oil PCL (For. Reg.) | | 489,382 | 655 |
| Thungela Resources Ltd. (a) | | 19,982 | 62 |
| Total SA sponsored ADR | | 1,596,654 | 69,662 |
| Whiting Petroleum Corp. (a)(c) | | 3,896,617 | 182,751 |
| World Fuel Services Corp. | | 876,993 | 30,221 |
| | | | 1,724,861 |
|
| TOTAL ENERGY | | | 1,826,514 |
|
| FINANCIALS - 14.2% | | | |
| Banks - 2.7% | | | |
| ACNB Corp. | | 360,116 | 10,058 |
| Arrow Financial Corp. | | 220,026 | 7,932 |
| Associated Banc-Corp. | | 134,389 | 2,661 |
| Bank Norwegian ASA | | 300,000 | 3,511 |
| Bank of America Corp. | | 80,444 | 3,086 |
| Bank7 Corp. | | 20,186 | 387 |
| Bar Harbor Bankshares | | 414,274 | 11,865 |
| C & F Financial Corp. | | 29,974 | 1,566 |
| Camden National Corp. | | 405,208 | 18,141 |
| Cathay General Bancorp | | 763,194 | 28,902 |
| Central Pacific Financial Corp. | | 67,203 | 1,720 |
| Central Valley Community Bancorp | | 100,000 | 2,239 |
| Codorus Valley Bancorp, Inc. (c) | | 712,779 | 15,560 |
| Comerica, Inc. | | 39,920 | 2,741 |
| Community Trust Bancorp, Inc. | | 66,639 | 2,650 |
| Dimeco, Inc. | | 35,458 | 1,303 |
| Eagle Bancorp, Inc. | | 775,059 | 42,651 |
| East West Bancorp, Inc. | | 467,686 | 33,276 |
| Financial Institutions, Inc. | | 378,582 | 11,145 |
| First Foundation, Inc. | | 113,090 | 2,666 |
| First of Long Island Corp. | | 1,047,840 | 22,581 |
| Five Star Bancorp (b) | | 142,274 | 3,467 |
| FNB Corp., Pennsylvania | | 399,656 | 4,580 |
| Glacier Bancorp, Inc. | | 65,361 | 3,370 |
| Hanmi Financial Corp. | | 676,770 | 12,338 |
| Hilltop Holdings, Inc. | | 133,484 | 4,229 |
| Hope Bancorp, Inc. | | 1,514,532 | 20,068 |
| Independent Bank Corp. | | 127,984 | 2,692 |
| IndusInd Bank Ltd. (a) | | 218,200 | 2,879 |
| LCNB Corp. | | 120,825 | 2,035 |
| Meridian Bank/Malvern, PA | | 156,994 | 4,239 |
| NIBC Holding NV (e) | | 244,490 | 2,030 |
| Oak Valley Bancorp Oakdale California | | 17,300 | 302 |
| OFG Bancorp | | 425,950 | 9,839 |
| Plumas Bancorp | | 24,978 | 780 |
| Popular, Inc. | | 54,890 | 3,994 |
| Preferred Bank, Los Angeles | | 159,858 | 9,428 |
| Regions Financial Corp. | | 155,882 | 3,001 |
| Seven Bank Ltd. | | 100,000 | 218 |
| Sparebank 1 Sr Bank ASA (primary capital certificate) | | 1,100,610 | 14,414 |
| Sparebanken More (primary capital certificate) | | 200,037 | 8,672 |
| Sparebanken Nord-Norge | | 2,000,199 | 18,950 |
| Synovus Financial Corp. | | 72,736 | 2,975 |
| Texas Capital Bancshares, Inc. (a) | | 1,099,026 | 69,217 |
| The First Bancorp, Inc. | | 59,947 | 1,742 |
| Unity Bancorp, Inc. | | 97,957 | 2,176 |
| Van Lanschot NV (Bearer) | | 1,038,843 | 26,680 |
| Washington Trust Bancorp, Inc. | | 486,857 | 23,734 |
| Wells Fargo & Co. | | 8,797,424 | 404,154 |
| West Bancorp., Inc. | | 550,014 | 16,214 |
| Zions Bancorp NA | | 52,257 | 2,725 |
| | | | 907,783 |
| Capital Markets - 1.5% | | | |
| AllianceBernstein Holding LP | | 300,002 | 14,481 |
| Banca Generali SpA | | 44,641 | 1,854 |
| CI Financial Corp. | | 3,500,065 | 63,824 |
| Cowen Group, Inc. Class A | | 43,342 | 1,733 |
| Daou Data Corp. | | 30,000 | 368 |
| Diamond Hill Investment Group, Inc. | | 14,987 | 2,582 |
| Donnelley Financial Solutions, Inc. (a) | | 49,900 | 1,607 |
| Federated Hermes, Inc. | | 2,470,015 | 80,127 |
| Goldman Sachs Group, Inc. | | 8,400 | 3,149 |
| Hamilton Lane, Inc. Class A | | 48,766 | 4,535 |
| Lazard Ltd. Class A | | 1,598,302 | 75,440 |
| LPL Financial | | 32,377 | 4,566 |
| State Street Corp. | | 2,900,016 | 252,707 |
| Virtu Financial, Inc. Class A | | 116,800 | 3,006 |
| | | | 509,979 |
| Consumer Finance - 4.2% | | | |
| Aeon Credit Service (Asia) Co. Ltd. | | 12,891,036 | 8,178 |
| Cash Converters International Ltd. | | 19,000,789 | 3,695 |
| Credit Acceptance Corp. (a)(b) | | 24,978 | 12,109 |
| Discover Financial Services | | 2,438,337 | 303,134 |
| Encore Capital Group, Inc. (a) | | 52,693 | 2,494 |
| H&T Group PLC | | 499,936 | 1,821 |
| Navient Corp. | | 1,265,799 | 25,860 |
| Nicholas Financial, Inc. (a) | | 185,119 | 2,018 |
| OneMain Holdings, Inc. | | 64,510 | 3,935 |
| Regional Management Corp. | | 278,078 | 14,385 |
| Santander Consumer U.S.A. Holdings, Inc. | | 9,750,848 | 400,077 |
| Synchrony Financial | | 13,187,898 | 620,095 |
| | | | 1,397,801 |
| Diversified Financial Services - 0.1% | | | |
| Far East Horizon Ltd. | | 1,398,524 | 1,492 |
| Ricoh Leasing Co. Ltd. | | 696,004 | 21,856 |
| Zenkoku Hosho Co. Ltd. | | 250,000 | 11,303 |
| | | | 34,651 |
| Insurance - 5.5% | | | |
| AEGON NV | | 42,708,742 | 181,837 |
| AFLAC, Inc. | | 4,939,801 | 271,689 |
| Allstate Corp. | | 38,041 | 4,947 |
| American Financial Group, Inc. | | 24,552 | 3,106 |
| ASR Nederland NV | | 1,250,009 | 51,380 |
| Chubb Ltd. | | 15,487 | 2,613 |
| Db Insurance Co. Ltd. | | 850,000 | 42,103 |
| Employers Holdings, Inc. | | 1,200,187 | 49,832 |
| FBD Holdings PLC (a) | | 139,649 | 1,292 |
| First American Financial Corp. | | 38,123 | 2,566 |
| Globe Life, Inc. | | 23,453 | 2,184 |
| GoHealth, Inc. (a) | | 9,961 | 88 |
| Hartford Financial Services Group, Inc. | | 86,326 | 5,492 |
| Hiscox Ltd. (a) | | 211,097 | 2,572 |
| Hyundai Fire & Marine Insurance Co. Ltd. | | 420,804 | 9,473 |
| Legal & General Group PLC | | 4,300,000 | 15,624 |
| Lincoln National Corp. | | 3,900,908 | 240,374 |
| MetLife, Inc. | | 130,910 | 7,554 |
| National Western Life Group, Inc. | | 111,587 | 23,198 |
| NN Group NV | | 1,126,091 | 56,011 |
| Old Republic International Corp. | | 102,929 | 2,538 |
| Primerica, Inc. | | 209,182 | 30,587 |
| Principal Financial Group, Inc. | | 269,998 | 16,775 |
| Prudential Financial, Inc. | | 1,398,948 | 140,287 |
| Qualitas Controladora S.A.B. de CV | | 613,231 | 2,985 |
| Reinsurance Group of America, Inc. | | 2,150,079 | 236,896 |
| RenaissanceRe Holdings Ltd. | | 433,512 | 66,193 |
| Selectquote, Inc. (a) | | 106,096 | 1,889 |
| Talanx AG | | 99,840 | 4,247 |
| The Travelers Companies, Inc. | | 19,983 | 2,976 |
| Unum Group (c) | | 14,069,102 | 385,493 |
| | | | 1,864,801 |
| Mortgage Real Estate Investment Trusts - 0.0% | | | |
| Annaly Capital Management, Inc. | | 81,932 | 696 |
| Thrifts & Mortgage Finance - 0.2% | | | |
| ASAX Co. Ltd. | | 399,228 | 2,515 |
| Axos Financial, Inc. (a) | | 160,000 | 7,656 |
| Equitable Group, Inc. | | 110,000 | 13,225 |
| Essent Group Ltd. | | 100,000 | 4,517 |
| Federal Agricultural Mortgage Corp.: | | | |
| Class A (multi-vtg.) | | 4,999 | 453 |
| Class C (non-vtg.) | | 124,962 | 12,184 |
| Genworth Mortgage Insurance Ltd. | | 3,977,018 | 5,954 |
| Hingham Institution for Savings | | 11,500 | 3,439 |
| Meta Financial Group, Inc. | | 71,855 | 3,571 |
| Southern Missouri Bancorp, Inc. | | 102,367 | 4,594 |
| Walker & Dunlop, Inc. | | 18,084 | 1,871 |
| | | | 59,979 |
|
| TOTAL FINANCIALS | | | 4,775,690 |
|
| HEALTH CARE - 11.7% | | | |
| Biotechnology - 1.6% | | | |
| Amgen, Inc. | | 1,858,947 | 449,010 |
| Cell Biotech Co. Ltd. | | 50,000 | 848 |
| Essex Bio-Technology Ltd. | | 5,000,249 | 4,298 |
| Gilead Sciences, Inc. | | 146,589 | 10,011 |
| Regeneron Pharmaceuticals, Inc. (a) | | 144,041 | 82,767 |
| | | | 546,934 |
| Health Care Equipment & Supplies - 0.5% | | | |
| Arts Optical International Holdings Ltd. (a) | | 18,807,377 | 1,694 |
| Boston Scientific Corp. (a) | | 119,640 | 5,456 |
| Hologic, Inc. (a) | | 34,929 | 2,621 |
| Hoshiiryou Sanki Co. Ltd. (c) | | 277,151 | 9,208 |
| I-Sens, Inc. | | 150,000 | 4,222 |
| InBody Co. Ltd. | | 310,022 | 7,826 |
| Integra LifeSciences Holdings Corp. (a) | | 52,948 | 3,833 |
| Meridian Bioscience, Inc. (a) | | 124,912 | 2,561 |
| Nakanishi, Inc. | | 488,985 | 10,127 |
| Prim SA (c) | | 1,405,544 | 22,342 |
| ResMed, Inc. | | 42,230 | 11,478 |
| St.Shine Optical Co. Ltd. | | 2,275,000 | 31,336 |
| Techno Medica Co. Ltd. | | 38,118 | 555 |
| Utah Medical Products, Inc. (c) | | 257,715 | 23,040 |
| Value Added Technology Co. Ltd. | | 280,000 | 8,744 |
| Vieworks Co. Ltd. | | 310,330 | 9,893 |
| | | | 154,936 |
| Health Care Providers & Services - 8.4% | | | |
| Anthem, Inc. | | 1,807,969 | 694,278 |
| Centene Corp. (a) | | 680,073 | 46,660 |
| Cigna Corp. | | 153,315 | 35,184 |
| CVS Health Corp. | | 71,502 | 5,889 |
| DVx, Inc. (c) | | 629,421 | 5,669 |
| HCA Holdings, Inc. | | 13,971 | 3,468 |
| Hi-Clearance, Inc. | | 1,540,000 | 7,721 |
| Humana, Inc. | | 7,772 | 3,310 |
| Laboratory Corp. of America Holdings (a) | | 18,035 | 5,341 |
| Medica Sur SA de CV | | 325,388 | 519 |
| MEDNAX, Inc. (a) | | 1,773,614 | 51,648 |
| Quest Diagnostics, Inc. | | 28,346 | 4,019 |
| Ship Healthcare Holdings, Inc. | | 70,329 | 1,767 |
| Sinopharm Group Co. Ltd. (H Shares) | | 23,996,316 | 62,993 |
| Tokai Corp. | | 211,013 | 4,639 |
| Triple-S Management Corp. (a)(c) | | 1,699,215 | 41,342 |
| UDG Healthcare PLC (United Kingdom) | | 550,041 | 8,242 |
| UnitedHealth Group, Inc. | | 3,811,909 | 1,571,350 |
| Universal Health Services, Inc. Class B | | 1,586,123 | 254,430 |
| WIN-Partners Co. Ltd. (c) | | 2,473,045 | 22,407 |
| | | | 2,830,876 |
| Health Care Technology - 0.1% | | | |
| Schrodinger, Inc. (a) | | 198,846 | 13,456 |
| Pharmaceuticals - 1.1% | | | |
| Bliss Gvs Pharma Ltd. | | 3,000,000 | 4,350 |
| Bristol-Myers Squibb Co. | | 33,932 | 2,303 |
| China Medical System Holdings Ltd. | | 4,500,044 | 9,126 |
| Consun Pharmaceutical Group Ltd. | | 4,000,075 | 2,368 |
| Daewon Pharmaceutical Co. Ltd. (c) | | 2,080,507 | 28,516 |
| Dai Han Pharmaceutical Co. Ltd. | | 230,937 | 6,481 |
| Daito Pharmaceutical Co. Ltd. | | 355,893 | 10,754 |
| Dawnrays Pharmaceutical Holdings Ltd. | | 36,500,533 | 8,361 |
| DongKook Pharmaceutical Co. Ltd.(c) | | 3,000,500 | 65,593 |
| Faes Farma SA | | 450,012 | 1,756 |
| FDC Ltd. (a) | | 2,507,108 | 12,552 |
| Fuji Pharma Co. Ltd. | | 634,496 | 6,507 |
| Genomma Lab Internacional SA de CV (a) | | 2,832,384 | 2,752 |
| Granules India Ltd. | | 100,000 | 510 |
| Huons Co. Ltd. (c) | | 736,314 | 38,644 |
| Hypermarcas SA | | 10,000 | 68 |
| Jazz Pharmaceuticals PLC (a) | | 15,432 | 2,616 |
| Kaken Pharmaceutical Co. Ltd. | | 35,056 | 1,545 |
| Kissei Pharmaceutical Co. Ltd. | | 100,000 | 2,046 |
| Kwang Dong Pharmaceutical Co. Ltd. (c) | | 3,100,000 | 23,773 |
| Kyung Dong Pharmaceutical Co. Ltd. | | 800,000 | 7,217 |
| Lee's Pharmaceutical Holdings Ltd. | | 11,976,221 | 6,134 |
| Luye Pharma Group Ltd. (e) | | 2,500,015 | 1,345 |
| Organon & Co. (a) | | 9,991 | 290 |
| Recordati SpA | | 1,425,407 | 88,231 |
| Syngen Biotech Co. Ltd. | | 300,000 | 1,072 |
| Taro Pharmaceutical Industries Ltd. (a) | | 42,415 | 3,020 |
| Towa Pharmaceutical Co. Ltd. | | 50,000 | 1,272 |
| Whanin Pharmaceutical Co. Ltd. (c) | | 1,750,000 | 32,487 |
| Zhaoke Ophthalmology Ltd. (a)(e) | | 1,300,550 | 1,339 |
| | | | 373,028 |
|
| TOTAL HEALTH CARE | | | 3,919,230 |
|
| INDUSTRIALS - 7.3% | | | |
| Aerospace & Defense - 0.1% | | | |
| Curtiss-Wright Corp. | | 135,341 | 16,011 |
| The Boeing Co. (a) | | 39,700 | 8,991 |
| Ultra Electronics Holdings PLC | | 91,770 | 4,044 |
| Vectrus, Inc. (a) | | 98,186 | 4,447 |
| | | | 33,493 |
| Air Freight & Logistics - 0.1% | | | |
| Sinotrans Ltd. (H Shares) | | 28,000,160 | 10,341 |
| Airlines - 0.0% | | | |
| Jet2 PLC (a) | | 112,260 | 1,937 |
| Spirit Airlines, Inc. (a) | | 185,925 | 5,016 |
| | | | 6,953 |
| Building Products - 0.2% | | | |
| American Woodmark Corp. (a) | | 23,010 | 1,708 |
| Builders FirstSource, Inc. (a) | | 89,156 | 3,967 |
| Gibraltar Industries, Inc. (a) | | 47,192 | 3,524 |
| Jeld-Wen Holding, Inc. (a) | | 589,281 | 15,604 |
| Kondotec, Inc. (c) | | 1,612,264 | 14,652 |
| Nihon Flush Co. Ltd. | | 500,020 | 5,570 |
| Owens Corning | | 42,114 | 4,050 |
| | | | 49,075 |
| Commercial Services & Supplies - 0.7% | | | |
| Aeon Delight Co. Ltd. | | 83,215 | 2,727 |
| AJIS Co. Ltd. (c) | | 873,165 | 27,897 |
| Asia File Corp. Bhd (a) | | 4,500,000 | 2,485 |
| Calian Group Ltd. | | 75,299 | 3,686 |
| Civeo Corp. (a)(c) | | 963,049 | 20,908 |
| CoreCivic, Inc. (a) | | 4,704,155 | 48,359 |
| CTS Co. Ltd. | | 4,990 | 37 |
| Fursys, Inc. (c) | | 890,000 | 27,717 |
| Left Field Printing Group Ltd. | | 1,175,162 | 82 |
| Lion Rock Group Ltd. | | 18,802,601 | 1,984 |
| Matthews International Corp. Class A | | 200,481 | 6,937 |
| Mears Group PLC (a) | | 1,026,566 | 2,711 |
| Mitie Group PLC (a) | | 37,300,134 | 32,871 |
| NICE Total Cash Management Co., Ltd. | | 1,025,000 | 6,553 |
| Prosegur Compania de Seguridad SA (Reg.) | | 717,364 | 2,451 |
| Sunny Friend Environmental Technology Co. Ltd. | | 150,000 | 1,093 |
| The Brink's Co. | | 3,000 | 231 |
| VICOM Ltd. | | 374,254 | 563 |
| VSE Corp. (c) | | 1,020,073 | 51,055 |
| | | | 240,347 |
| Construction & Engineering - 0.6% | | | |
| AECOM (a) | | 209,108 | 13,165 |
| API Group Corp. (a)(e) | | 570,360 | 13,073 |
| Argan, Inc. | | 66,423 | 2,986 |
| Boustead Projs. Pte Ltd. | | 1,956,222 | 1,891 |
| Boustead Singapore Ltd. | | 4,923,080 | 4,324 |
| Comfort Systems U.S.A., Inc. | | 27,944 | 2,089 |
| Construction Partners, Inc. Class A (a) | | 80,747 | 2,711 |
| Daiichi Kensetsu Corp. (c) | | 1,675,595 | 32,029 |
| EMCOR Group, Inc. | | 109,979 | 13,397 |
| Fluor Corp. (a) | | 711,764 | 11,858 |
| Geumhwa PSC Co. Ltd. (c) | | 360,000 | 10,337 |
| Granite Construction, Inc. | | 365,521 | 14,043 |
| Kyeryong Construction Industrial Co. Ltd. (c) | | 675,000 | 19,148 |
| Meisei Industrial Co. Ltd. | | 1,098,046 | 7,427 |
| Mirait Holdings Corp. | | 391,545 | 7,677 |
| Nippon Rietec Co. Ltd. | | 997,895 | 15,664 |
| Per Aarsleff Holding A/S | | 9,991 | 431 |
| Primoris Services Corp. | | 32,800 | 981 |
| Raiznext Corp. | | 1,400,038 | 14,549 |
| Seikitokyu Kogyo Co. Ltd. | | 249,981 | 1,992 |
| Shinnihon Corp. | | 1,700,012 | 13,280 |
| Totetsu Kogyo Co. Ltd. | | 150,048 | 3,173 |
| United Integrated Services Co. | | 300,800 | 2,111 |
| Valmont Industries, Inc. | | 13,273 | 3,145 |
| | | | 211,481 |
| Electrical Equipment - 0.9% | | | |
| Acuity Brands, Inc. | | 564,947 | 99,080 |
| Aichi Electric Co. Ltd. | | 318,193 | 8,295 |
| AQ Group AB (a) | | 709,252 | 26,118 |
| Atkore, Inc. (a) | | 102,854 | 7,725 |
| AZZ, Inc. | | 52,500 | 2,782 |
| Chiyoda Integre Co. Ltd. | | 322,176 | 5,227 |
| Generac Holdings, Inc. (a) | | 10,001 | 4,194 |
| GrafTech International Ltd. | | 5,792,793 | 65,864 |
| Hammond Power Solutions, Inc. Class A | | 442,293 | 3,652 |
| I-Sheng Electric Wire & Cable Co. Ltd. | | 5,500,000 | 8,910 |
| Korea Electric Terminal Co. Ltd. (c) | | 559,623 | 45,876 |
| Sensata Technologies, Inc. PLC (a) | | 286,272 | 16,781 |
| Servotronics, Inc. (a) | | 112,155 | 960 |
| TKH Group NV (depositary receipt) | | 150,099 | 7,966 |
| Vitzrocell Co. Ltd. | | 125,000 | 1,805 |
| | | | 305,235 |
| Industrial Conglomerates - 0.4% | | | |
| DCC PLC (United Kingdom) | | 1,549,617 | 129,798 |
| Mytilineos SA | | 198,659 | 3,686 |
| Reunert Ltd. | | 1,662,387 | 5,390 |
| Rheinmetall AG | | 27,841 | 2,674 |
| | | | 141,548 |
| Machinery - 1.9% | | | |
| Aalberts Industries NV (c) | | 6,375,304 | 388,118 |
| Allison Transmission Holdings, Inc. | | 333,077 | 13,293 |
| ASL Marine Holdings Ltd. (a)(c) | | 44,012,442 | 2,274 |
| Clean & Science Co. Ltd. | | 45,000 | 890 |
| Daiwa Industries Ltd. | | 190,617 | 1,979 |
| Estic Corp. | | 11,480 | 479 |
| Foremost Income Fund (a) | | 2,141,103 | 9,576 |
| Haitian International Holdings Ltd. | | 5,847,732 | 21,408 |
| Hurco Companies, Inc. | | 133,921 | 4,545 |
| Hyster-Yale Materials Handling: | | | |
| Class A (c) | | 209,623 | 15,017 |
| Class B (a)(c) | | 310,000 | 22,208 |
| Ihara Science Corp. (c) | | 961,846 | 17,132 |
| ITT, Inc. | | 58,537 | 5,731 |
| JOST Werke AG (e) | | 76,545 | 4,676 |
| Kyowakogyosyo Co. Ltd. | | 42,300 | 1,716 |
| Luxfer Holdings PLC sponsored | | 174,183 | 3,632 |
| Maruzen Co. Ltd. (c) | | 1,554,041 | 33,728 |
| Miller Industries, Inc. | | 75,158 | 2,819 |
| Mincon Group PLC | | 2,111,912 | 3,182 |
| Mitsui Engineering & Shipbuilding Co. (a) | | 1,000,069 | 4,678 |
| Nadex Co. Ltd. (c) | | 778,484 | 5,173 |
| Nippon Dry-Chemical Co. Ltd. | | 62,222 | 1,059 |
| Nitchitsu Co. Ltd. | | 50,046 | 648 |
| Park-Ohio Holdings Corp. | | 401,981 | 11,694 |
| Semperit AG Holding | | 372,948 | 13,737 |
| Shinwa Co. Ltd. | | 700 | 14 |
| SIMPAC, Inc. | | 1,300,000 | 7,905 |
| Stabilus SA | | 37,925 | 3,007 |
| Takamatsu Machinery Co. Ltd. | | 326,704 | 2,162 |
| TK Group Holdings Ltd. | | 18,000 | 7 |
| Tocalo Co. Ltd. | | 2,997,742 | 37,409 |
| Trinity Industrial Corp. | | 828,279 | 6,599 |
| | | | 646,495 |
| Marine - 0.1% | | | |
| Eagle Bulk Shipping, Inc. (a) | | 92,787 | 3,869 |
| Genco Shipping & Trading Ltd. | | 733,818 | 12,879 |
| Kirby Corp. (a) | | 180,823 | 10,471 |
| SITC International Holdings Co. Ltd. | | 459,955 | 1,894 |
| Tokyo Kisen Co. Ltd. (c) | | 811,258 | 4,400 |
| | | | 33,513 |
| Professional Services - 0.3% | | | |
| ABIST Co. Ltd. | | 74,647 | 1,990 |
| Altech Corp. | | 100,082 | 1,847 |
| Barrett Business Services, Inc. | | 25,091 | 1,837 |
| Benext-Yumeshin Group Co. | | 100,000 | 1,239 |
| Career Design Center Co. Ltd. | | 23,300 | 228 |
| Careerlink Co. Ltd. (b) | | 49,956 | 873 |
| Hito Communications Holdings, Inc. | | 78,678 | 1,502 |
| Kelly Services, Inc. Class A (non-vtg.) (a) | | 200,018 | 4,384 |
| Kforce, Inc. | | 45,136 | 2,818 |
| McMillan Shakespeare Ltd. | | 1,582,758 | 14,693 |
| Nielsen Holdings PLC | | 974,947 | 23,096 |
| Outsourcing, Inc. | | 24,978 | 474 |
| Persol Holdings Co. Ltd. | | 200,870 | 4,019 |
| Quick Co. Ltd. | | 257,867 | 2,811 |
| Robert Half International, Inc. | | 28,496 | 2,799 |
| SaraminHR Co. Ltd. | | 75,000 | 3,217 |
| Science Applications Internati | | 99,733 | 8,707 |
| SHL-JAPAN Ltd. | | 109,525 | 2,899 |
| Synergie SA | | 135,088 | 5,929 |
| TrueBlue, Inc. (a) | | 409,461 | 11,133 |
| WDB Holdings Co. Ltd. | | 130,241 | 3,591 |
| Will Group, Inc. | | 597,357 | 5,222 |
| World Holdings Co. Ltd. | | 175,000 | 5,065 |
| | | | 110,373 |
| Road & Rail - 0.7% | | | |
| Alps Logistics Co. Ltd. (c) | | 2,725,677 | 24,224 |
| Chilled & Frozen Logistics Holdings Co. Ltd. | | 825,320 | 12,383 |
| Daqin Railway Co. Ltd. (A Shares) | | 32,500,000 | 29,575 |
| Hamakyorex Co. Ltd. (c) | | 1,225,995 | 35,258 |
| Higashi Twenty One Co. Ltd. | | 195,842 | 1,239 |
| Knight-Swift Transportation Holdings, Inc. Class A | | 203,778 | 10,126 |
| Ryder System, Inc. | | 20,958 | 1,596 |
| Sakai Moving Service Co. Ltd. (c) | | 1,124,027 | 53,996 |
| Stef SA | | 25,000 | 2,906 |
| Trancom Co. Ltd. (c) | | 836,447 | 65,037 |
| Universal Logistics Holdings, Inc. | | 191,235 | 4,408 |
| | | | 240,748 |
| Trading Companies & Distributors - 1.2% | | | |
| AddTech AB (B Shares) | | 2,425,043 | 50,425 |
| Alconix Corp. (c) | | 2,073,581 | 27,426 |
| Applied Industrial Technologies, Inc. | | 49,620 | 4,451 |
| Chori Co. Ltd. | | 483,213 | 8,285 |
| GMS, Inc. (a) | | 71,800 | 3,528 |
| Goodfellow, Inc. (c) | | 707,146 | 5,770 |
| Itochu Corp. | | 3,991,406 | 118,143 |
| Jalux, Inc. (a) | | 9,978 | 152 |
| Lumax International Corp. Ltd. | | 1,988,900 | 4,887 |
| Meiwa Corp. | | 1,679,944 | 7,167 |
| Mitani Shoji Co. Ltd. | | 710,723 | 53,318 |
| MRC Global, Inc. (a) | | 1,914,700 | 17,558 |
| Nishikawa Keisoku Co. Ltd. | | 9,971 | 427 |
| NOW, Inc. (a) | | 650,032 | 6,416 |
| Otec Corp. | | 121,823 | 2,854 |
| Parker Corp. (c) | | 2,171,119 | 10,944 |
| Richelieu Hardware Ltd. | | 728,425 | 25,404 |
| Rush Enterprises, Inc. Class A | | 79,939 | 3,756 |
| Senshu Electric Co. Ltd. (c) | | 870,254 | 30,184 |
| Tanaka Co. Ltd. | | 36,129 | 215 |
| TECHNO ASSOCIE Co. Ltd. | | 240,919 | 2,398 |
| Totech Corp. (c) | | 881,825 | 21,012 |
| Yamazen Co. Ltd. | | 49,966 | 469 |
| | | | 405,189 |
| Transportation Infrastructure - 0.1% | | | |
| Anhui Expressway Co. Ltd. (H Shares) | | 8,836,157 | 5,276 |
| Daito Koun Co. Ltd. | | 7,094 | 40 |
| Isewan Terminal Service Co. Ltd. | | 1,264,114 | 7,997 |
| Meiko Transportation Co. Ltd. | | 822,647 | 8,871 |
| Qingdao Port International Co. Ltd. (H Shares) (e) | | 16,588,315 | 8,538 |
| | | | 30,722 |
|
| TOTAL INDUSTRIALS | | | 2,465,513 |
|
| INFORMATION TECHNOLOGY - 13.7% | | | |
| Communications Equipment - 0.0% | | | |
| Calix, Inc. (a) | | 166,261 | 7,778 |
| Casa Systems, Inc. (a) | | 636,475 | 4,780 |
| | | | 12,558 |
| Electronic Equipment & Components - 5.4% | | | |
| A&D Co. Ltd. | | 587,816 | 5,272 |
| Advanced Energy Industries, Inc. | | 178,003 | 18,468 |
| Alviva Holdings Ltd. (c) | | 7,393,459 | 6,636 |
| Amphenol Corp. Class A | | 106,363 | 7,710 |
| Arrow Electronics, Inc. (a) | | 28,477 | 3,377 |
| Avnet, Inc. | | 67,754 | 2,800 |
| CDW Corp. | | 79,335 | 14,546 |
| CONEXIO Corp. | | 22,752 | 331 |
| Daido Signal Co. Ltd. | | 97,140 | 536 |
| Daiwabo Holdings Co. Ltd. | | 650,034 | 13,059 |
| Dynapack International Technology Corp. | | 1,809,000 | 6,590 |
| Elematec Corp. (c) | | 2,179,162 | 22,625 |
| FLEXium Interconnect, Inc. | | 500,000 | 2,337 |
| Hon Hai Precision Industry Co. Ltd. (Foxconn) | | 142,480,912 | 563,589 |
| IDIS Holdings Co. Ltd. (c) | | 800,000 | 9,716 |
| Insight Enterprises, Inc. (a) | | 377,612 | 37,905 |
| Keysight Technologies, Inc. (a) | | 100,313 | 16,507 |
| Kingboard Chemical Holdings Ltd. (c) | | 68,861,979 | 360,652 |
| Kitron ASA | | 1,000,002 | 2,200 |
| Methode Electronics, Inc. Class A | | 898,012 | 42,952 |
| Muramoto Electronic Thailand PCL (For. Reg.) | | 957,485 | 6,818 |
| Nippo Ltd. (c) | | 699,406 | 3,908 |
| PAX Global Technology Ltd. | | 16,989,470 | 18,364 |
| Redington India Ltd. | | 13,947,410 | 61,395 |
| Restar Holdings Corp. | | 700,305 | 12,384 |
| SAMT Co. Ltd. | | 100,000 | 366 |
| ScanSource, Inc. (a)(c) | | 1,500,480 | 41,398 |
| Shibaura Electronics Co. Ltd. (c) | | 501,400 | 22,601 |
| Simplo Technology Co. Ltd. | | 5,400,000 | 71,503 |
| SYNNEX Corp. | | 2,483,178 | 296,839 |
| Test Research, Inc. | | 100,000 | 206 |
| Thinking Electronic Industries Co. Ltd. | | 400,000 | 3,170 |
| Tomen Devices Corp. (c) | | 526,409 | 24,280 |
| Tripod Technology Corp. | | 1,266,000 | 5,449 |
| VSTECS Holdings Ltd. (c) | | 114,253,692 | 91,154 |
| Wayside Technology Group, Inc. (c) | | 314,754 | 8,923 |
| | | | 1,806,566 |
| IT Services - 4.3% | | | |
| ALTEN | | 475,036 | 75,511 |
| Amdocs Ltd. | | 4,176,876 | 322,079 |
| Argo Graphics, Inc. | | 745,967 | 23,357 |
| CDS Co. Ltd. | | 277,088 | 4,021 |
| Concentrix Corp. (a) | | 2,526,050 | 413,590 |
| CSE Global Ltd. (c) | | 39,895,270 | 15,164 |
| Data Applications Co. Ltd. | | 29,923 | 437 |
| Densan System Holdings Co. Ltd. | | 40,078 | 1,054 |
| Dimerco Data System Corp. | | 850,000 | 2,196 |
| DTS Corp. | | 300,015 | 7,203 |
| DXC Technology Co. (a) | | 1,600,025 | 63,969 |
| E-Credible Co. Ltd. | | 130,349 | 2,358 |
| eClerx Services Ltd. | | 1,000,270 | 30,209 |
| EOH Holdings Ltd. (a)(b) | | 6,251,222 | 2,773 |
| EPAM Systems, Inc. (a) | | 25,483 | 14,265 |
| Estore Corp. | | 99,932 | 1,694 |
| ExlService Holdings, Inc. (a) | | 149,392 | 16,914 |
| Gabia, Inc. (c) | | 900,000 | 12,492 |
| Global Payments, Inc. | | 57,484 | 11,118 |
| Indra Sistemas SA (a)(c) | | 11,930,802 | 124,829 |
| Information Planning Co. Ltd. | | 34,782 | 937 |
| Know IT AB (c) | | 1,100,080 | 38,593 |
| Nice Information & Telecom, Inc. | | 306,987 | 9,014 |
| Paya Holdings, Inc. (a)(b) | | 551,007 | 6,331 |
| Poletowin Pitcrew Holdings, Inc. | | 50,000 | 471 |
| Proact IT Group AB | | 5,000 | 47 |
| Societe Pour L'Informatique Industrielle SA (c) | | 1,620,722 | 66,906 |
| Softcreate Co. Ltd. | | 600,070 | 15,682 |
| Sysage Technology Co. Ltd. | | 1,900,000 | 2,720 |
| TDC Soft, Inc. | | 256,535 | 2,561 |
| The Western Union Co. | | 7,036,388 | 163,315 |
| TravelSky Technology Ltd. (H Shares) | | 200,049 | 340 |
| Verra Mobility Corp. (a) | | 800,614 | 12,257 |
| WNS Holdings Ltd. sponsored ADR (a) | | 57,428 | 4,729 |
| | | | 1,469,136 |
| Semiconductors & Semiconductor Equipment - 0.4% | | | |
| ASM Pacific Technology Ltd. | | 133,183 | 1,714 |
| Axell Corp. | | 99,935 | 778 |
| CMC Materials, Inc. | | 68,445 | 9,900 |
| FormFactor, Inc. (a) | | 149,304 | 5,563 |
| Japan Material Co. Ltd. | | 100,056 | 1,191 |
| Machvision, Inc. | | 1,000 | 9 |
| Melexis NV | | 124,746 | 13,903 |
| Miraial Co. Ltd. | | 175,457 | 1,985 |
| MKS Instruments, Inc. | | 88,867 | 13,902 |
| Powertech Technology, Inc. | | 9,000,000 | 35,699 |
| Renesas Electronics Corp. (a) | | 419,805 | 4,519 |
| Semtech Corp. (a) | | 136,113 | 8,427 |
| Synaptics, Inc. (a) | | 59,537 | 9,045 |
| Systems Technology, Inc. | | 125,000 | 1,854 |
| Topco Scientific Co. Ltd. | | 3,400,000 | 15,799 |
| Trio-Tech International (a) | | 49,069 | 238 |
| | | | 124,526 |
| Software - 1.4% | | | |
| AdaptIT Holdings Ltd. (a) | | 2,800,794 | 1,298 |
| ANSYS, Inc. (a) | | 974,136 | 358,930 |
| Aspen Technology, Inc. (a) | | 48,079 | 7,032 |
| Cerence, Inc. (a)(b) | | 101,602 | 10,923 |
| Check Point Software Technologies Ltd. (a) | | 15,000 | 1,907 |
| Cresco Ltd. | | 350,085 | 6,245 |
| Focus Systems Corp. | | 31,372 | 284 |
| InfoVine Co. Ltd. (c) | | 175,000 | 4,205 |
| KSK Co., Ltd. (c) | | 519,838 | 11,102 |
| Manhattan Associates, Inc. (a) | | 109,413 | 17,466 |
| Minwise Co. Ltd. | | 214,374 | 3,831 |
| NetGem SA (a) | | 831,155 | 1,114 |
| Nippon Systemware Co. Ltd. | | 150,047 | 3,292 |
| Nucleus Software Exports Ltd. | | 600,000 | 5,475 |
| Open Text Corp. | | 58,523 | 3,040 |
| Pegasystems, Inc. | | 56,247 | 7,179 |
| Pro-Ship, Inc. | | 523,928 | 6,982 |
| Sinosoft Tech Group Ltd. | | 999,115 | 152 |
| SPS Commerce, Inc. (a) | | 138,220 | 15,059 |
| System Research Co. Ltd. | | 38,562 | 757 |
| Telos Corp. | | 183,722 | 5,148 |
| | | | 471,421 |
| Technology Hardware, Storage & Peripherals - 2.2% | | | |
| Chenbro Micom Co. Ltd. | | 609,000 | 1,629 |
| Dell Technologies, Inc. (a) | | 950,046 | 91,793 |
| Elecom Co. Ltd. | | 150,000 | 2,632 |
| HP, Inc. | | 153,292 | 4,426 |
| MCJ Co. Ltd. | | 650,035 | 7,324 |
| Samsung Electronics Co. Ltd. | | 35,500 | 2,417 |
| Seagate Technology Holdings PLC | | 6,750,385 | 593,359 |
| Super Micro Computer, Inc. (a) | | 650,087 | 24,729 |
| TSC Auto ID Technology Corp. | | 582,000 | 4,815 |
| | | | 733,124 |
|
| TOTAL INFORMATION TECHNOLOGY | | | 4,617,331 |
|
| MATERIALS - 4.2% | | | |
| Chemicals - 2.0% | | | |
| AdvanSix, Inc. (a) | | 150,000 | 5,018 |
| Axalta Coating Systems Ltd. (a) | | 286,360 | 8,619 |
| Birla Carbon Thailand PCL (For. Reg.) | | 11,275,884 | 15,442 |
| C. Uyemura & Co. Ltd. | | 750,844 | 31,415 |
| Chase Corp. (c) | | 498,958 | 58,144 |
| Core Molding Technologies, Inc. (a) | | 281,899 | 4,011 |
| Deepak Fertilisers and Petrochemicals Corp. Ltd. (a) | | 756,706 | 4,386 |
| EcoGreen International Group Ltd. (c) | | 51,754,838 | 13,453 |
| Element Solutions, Inc. | | 169,156 | 3,957 |
| FMC Corp. | | 1,011,619 | 108,193 |
| Fujikura Kasei Co., Ltd. (c) | | 2,651,544 | 12,012 |
| Fuso Chemical Co. Ltd. | | 50,088 | 1,797 |
| Gujarat Narmada Valley Fertilizers Co. | | 5,000,000 | 25,873 |
| Gujarat State Fertilizers & Chemicals Ltd. (c) | | 26,500,000 | 43,576 |
| Honshu Chemical Industry Co. Ltd. (c) | | 745,967 | 12,403 |
| Huntsman Corp. | | 162,529 | 4,292 |
| Innospec, Inc. | | 167,906 | 14,851 |
| KPX Chemical Co. Ltd. | | 163,083 | 9,054 |
| KPX Holdings Corp. | | 60,171 | 3,555 |
| Miwon Chemicals Co. Ltd. | | 53,095 | 3,749 |
| Miwon Commercial Co. Ltd. | | 52,000 | 9,473 |
| Muto Seiko Co. Ltd. | | 233,096 | 1,241 |
| Nihon Parkerizing Co. Ltd. | | 301,106 | 3,080 |
| Nippon Soda Co. Ltd. | | 308,042 | 9,842 |
| Scientex Bhd | | 100,000 | 99 |
| SK Kaken Co. Ltd. | | 49,665 | 18,878 |
| Soken Chemical & Engineer Co. Ltd. (c) | | 652,212 | 11,682 |
| T&K Toka Co. Ltd. (c) | | 1,315,869 | 9,788 |
| Thai Rayon PCL: | | | |
| (For. Reg.) | | 2,659,605 | 2,509 |
| NVDR | | 83,604 | 79 |
| The Chemours Co. LLC | | 419,757 | 13,957 |
| The Mosaic Co. | | 2,795,054 | 87,290 |
| Trinseo SA (b) | | 88,498 | 4,811 |
| Yara International ASA | | 1,697,142 | 89,383 |
| Yip's Chemical Holdings Ltd. | | 26,975,354 | 17,703 |
| | | | 663,615 |
| Construction Materials - 0.2% | | | |
| Buzzi Unicem SpA | | 1,000,504 | 26,467 |
| Eagle Materials, Inc. | | 23,180 | 3,276 |
| Mitani Sekisan Co. Ltd. (c) | | 1,369,688 | 55,497 |
| RHI Magnesita NV | | 94,541 | 4,973 |
| West China Cement Ltd. | | 3,000,759 | 448 |
| | | | 90,661 |
| Containers & Packaging - 0.3% | | | |
| Berry Global Group, Inc. (a) | | 47,405 | 3,048 |
| Chuoh Pack Industry Co. Ltd. (c) | | 412,645 | 4,123 |
| International Paper Co. | | 26,105 | 1,508 |
| Kohsoku Corp. (c) | | 1,699,254 | 23,187 |
| Mayr-Melnhof Karton AG | | 12,462 | 2,652 |
| O-I Glass, Inc. (a) | | 181,450 | 2,684 |
| Packaging Corp. of America | | 28,595 | 4,046 |
| Samhwa Crown & Closure Co. Ltd. | | 47,893 | 1,822 |
| Silgan Holdings, Inc. | | 186,509 | 7,557 |
| The Pack Corp. (c) | | 1,491,537 | 38,517 |
| WestRock Co. | | 35,770 | 1,760 |
| | | | 90,904 |
| Metals & Mining - 1.4% | | | |
| Anglo American PLC (United Kingdom) | | 199,823 | 8,855 |
| Arconic Corp. (a) | | 50,759 | 1,824 |
| Boliden AB | | 150,000 | 5,846 |
| Chubu Steel Plate Co. Ltd. | | 405,181 | 2,899 |
| Cleveland-Cliffs, Inc. (a) | | 11,800,489 | 295,012 |
| Commercial Metals Co. | | 112,074 | 3,676 |
| Compania de Minas Buenaventura SA sponsored ADR (a) | | 2,098,765 | 17,336 |
| Gatos Silver, Inc. | | 779,345 | 10,630 |
| Granges AB | | 325,793 | 4,307 |
| Hill & Smith Holdings PLC | | 781,981 | 17,652 |
| Kirkland Lake Gold Ltd. | | 400,009 | 17,105 |
| Newmont Corp. | | 100,000 | 6,282 |
| Perenti Global Ltd. | | 12,000,755 | 8,014 |
| Reliance Steel & Aluminum Co. | | 19,229 | 3,022 |
| Sandfire Resources NL | | 2,300,096 | 11,680 |
| Teck Resources Ltd. Class B (sub. vtg.) | | 500,736 | 11,431 |
| Tohoku Steel Co. Ltd. (c) | | 611,903 | 9,538 |
| Tokyo Tekko Co. Ltd. (c) | | 745,371 | 10,518 |
| Warrior Metropolitan Coal, Inc. | | 1,424,412 | 26,594 |
| Webco Industries, Inc. (a) | | 7,428 | 943 |
| | | | 473,164 |
| Paper & Forest Products - 0.3% | | | |
| Louisiana-Pacific Corp. | | 228,816 | 12,686 |
| Schweitzer-Mauduit International, Inc. | | 69,942 | 2,751 |
| Stella-Jones, Inc. | | 2,150,092 | 78,018 |
| Western Forest Products, Inc. | | 1,905,790 | 2,948 |
| | | | 96,403 |
|
| TOTAL MATERIALS | | | 1,414,747 |
|
| REAL ESTATE - 0.2% | | | |
| Equity Real Estate Investment Trusts (REITs) - 0.0% | | | |
| CubeSmart | | 54,100 | 2,687 |
| Real Estate Management & Development - 0.2% | | | |
| Anabuki Kosan, Inc. | | 98,701 | 1,815 |
| Century21 Real Estate Japan Ltd. | | 99,929 | 966 |
| Daito Trust Construction Co. Ltd. | | 100,000 | 11,704 |
| Jones Lang LaSalle, Inc. (a) | | 23,057 | 5,132 |
| LSL Property Services PLC | | 1,225,463 | 7,171 |
| Realogy Holdings Corp. (a) | | 202,166 | 3,582 |
| Relo Group, Inc. | | 199,584 | 4,379 |
| Selvaag Bolig ASA | | 520,667 | 3,448 |
| Servcorp Ltd. | | 824,638 | 2,003 |
| Sino Land Ltd. | | 1,755,426 | 2,688 |
| Tejon Ranch Co. (a) | | 422,538 | 7,703 |
| Wing Tai Holdings Ltd. | | 1,686,490 | 2,278 |
| | | | 52,869 |
|
| TOTAL REAL ESTATE | | | 55,556 |
|
| UTILITIES - 1.6% | | | |
| Electric Utilities - 1.4% | | | |
| Exelon Corp. | | 300,799 | 14,077 |
| PG&E Corp. (a) | | 27,200,184 | 239,090 |
| PPL Corp. | | 7,579,990 | 215,044 |
| | | | 468,211 |
| Gas Utilities - 0.1% | | | |
| Busan City Gas Co. Ltd. | | 55,026 | 2,917 |
| China Resource Gas Group Ltd. | | 197,066 | 1,215 |
| GAIL India Ltd. | | 3,400,310 | 6,383 |
| Hokuriku Gas Co. | | 149,692 | 4,305 |
| K&O Energy Group, Inc. | | 200,097 | 2,375 |
| Keiyo Gas Co. Ltd. | | 122,742 | 3,703 |
| KyungDong City Gas Co. Ltd. | | 260,078 | 5,347 |
| Star Gas Partners LP | | 195,008 | 2,299 |
| | | | 28,544 |
| Independent Power and Renewable Electricity Producers - 0.1% | | | |
| Mega First Corp. Bhd | | 35,000,090 | 29,360 |
| Multi-Utilities - 0.0% | | | |
| CMS Energy Corp. | | 157,621 | 9,739 |
| Water Utilities - 0.0% | | | |
| Manila Water Co., Inc. (a) | | 5,495,276 | 1,782 |
|
| TOTAL UTILITIES | | | 537,636 |
|
| TOTAL COMMON STOCKS | | | |
| (Cost $14,558,538) | | | 31,676,545 |
|
| Nonconvertible Preferred Stocks - 0.0% | | | |
| CONSUMER DISCRETIONARY - 0.0% | | | |
| Internet & Direct Marketing Retail - 0.0% | | | |
| Qurate Retail, Inc. 8.00% | | 17,337 | 1,880 |
| CONSUMER STAPLES - 0.0% | | | |
| Food Products - 0.0% | | | |
| Namyang Dairy Products Co. Ltd. | | 4,917 | 1,514 |
| INDUSTRIALS - 0.0% | | | |
| Industrial Conglomerates - 0.0% | | | |
| Steel Partners Holdings LP Series A, 6.00% | | 76,944 | 1,795 |
| TOTAL NONCONVERTIBLE PREFERRED STOCKS | | | |
| (Cost $3,596) | | | 5,189 |
| | | Principal Amount (000s) | Value (000s) |
|
| Nonconvertible Bonds - 0.0% | | | |
| ENERGY - 0.0% | | | |
| Energy Equipment & Services - 0.0% | | | |
Bristow Group, Inc. 6.25% 10/15/22
(Cost $0)(d)(f) | | 9,933 | 0 |
| | | Shares | Value (000s) |
|
| Money Market Funds - 6.5% | | | |
| Fidelity Cash Central Fund 0.06% (g) | | 2,015,451,622 | 2,015,855 |
| Fidelity Securities Lending Cash Central Fund 0.06% (g)(h) | | 173,788,057 | 173,805 |
| TOTAL MONEY MARKET FUNDS | | | |
| (Cost $2,189,628) | | | 2,189,660 |
| TOTAL INVESTMENT IN SECURITIES - 100.6% | | | |
| (Cost $16,751,762) | | | 33,871,394 |
| NET OTHER ASSETS (LIABILITIES) - (0.6)% | | | (193,835) |
| NET ASSETS - 100% | | | $33,677,559 |
Values shown as $0 in the Schedule of Investments may reflect amounts less than $500.
Legend
(a) Non-income producing
(b) Security or a portion of the security is on loan at period end.
(c) Affiliated company
(d) Level 3 security
(e) Security exempt from registration under Rule 144A of the Securities Act of 1933. These securities may be resold in transactions exempt from registration, normally to qualified institutional buyers. At the end of the period, the value of these securities amounted to $64,020,000 or 0.2% of net assets.
(f) Non-income producing - Security is in default.
(g) Affiliated fund that is generally available only to investment companies and other accounts managed by Fidelity Investments. The rate quoted is the annualized seven-day yield of the fund at period end. A complete unaudited listing of the fund's holdings as of its most recent quarter end is available upon request. In addition, each Fidelity Central Fund's financial statements, which are not covered by the Fund's Report of Independent Registered Public Accounting Firm, are available on the SEC's website or upon request.
(h) Investment made with cash collateral received from securities on loan.
Affiliated Central Funds
Information regarding fiscal year to date income earned by the Fund from investments in Fidelity Central Funds is as follows:
| Fund | Income earned |
| | (Amounts in thousands) |
| Fidelity Cash Central Fund | $754 |
| Fidelity Securities Lending Cash Central Fund | 2,243 |
| Total | $2,997 |
Amounts in the income column in the above table include any capital gain distributions from underlying funds, which are presented in the corresponding line-item in the Statement of Operations, if applicable. Amount for Fidelity Securities Lending Cash Central Fund represents the income earned on investing cash collateral, less rebates paid to borrowers and any lending agent fees associated with the loan, plus any premium payments received for lending certain types of securities.
Fiscal year to date information regarding the Fund's investments in Fidelity Central Funds, including the ownership percentage, is presented below.
| Fund (Amounts in thousands) | Value, beginning of period | Purchases | Sales Proceeds | Realized Gain/Loss | Change in Unrealized appreciation (depreciation) | Value, end of period | % ownership, end of period |
| Fidelity Cash Central Fund 0.06% | $497,380 | $6,460,357 | $4,941,838 | $65 | $(109) | $2,015,855 | 3.0% |
| Fidelity Securities Lending Cash Central Fund 0.06% | 474,026 | 2,357,838 | 2,658,059 | -- | -- | 173,805 | 0.5% |
| Total | $971,406 | $8,818,195 | $7,599,897 | $65 | $(109) | $2,189,660 | |
Other Affiliated Issuers
An affiliated company is a company in which the Fund has ownership of at least 5% of the voting securities. Fiscal year to date transactions with companies which are or were affiliates are as follows:
| Affiliate | Value, beginning of period | Purchases | Sales Proceeds(a) | Dividend Income | Realized Gain (loss) | Change in Unrealized appreciation (depreciation) | Value, end of period |
| Aalberts Industries NV | $232,253 | $-- | $8,032 | $4,046 | $5,191 | $158,706 | $388,118 |
| AJIS Co. Ltd. | 19,443 | -- | 139 | 543 | 103 | 8,490 | 27,897 |
| Alconix Corp. | 23,815 | -- | 139 | 729 | 78 | 3,672 | 27,426 |
| Alps Logistics Co. Ltd. | 18,932 | -- | 782 | 576 | 311 | 5,763 | 24,224 |
| Alviva Holdings Ltd. | 2,320 | 187 | 24 | 55 | (4) | 4,157 | 6,636 |
| ASL Marine Holdings Ltd. | 925 | -- | 16 | -- | (107) | 1,472 | 2,274 |
| ASTI Corp. | 2,002 | 7 | 14 | 103 | 7 | 2,424 | 4,426 |
| Barratt Developments PLC | 390,589 | -- | 48,147 | 6,026 | 22,953 | 157,838 | 523,233 |
| Bed Bath & Beyond, Inc. | 121,725 | -- | 35,315 | -- | 14,644 | 197,975 | 299,029 |
| Belc Co. Ltd. | 116,293 | 1,343 | 788 | 1,180 | 672 | (37,673) | 79,847 |
| Belluna Co. Ltd. | 45,969 | -- | 2,687 | 875 | 1,379 | 7,785 | 52,446 |
| BMTC Group, Inc. | 23,435 | -- | 280 | 683 | 268 | 20,266 | 43,689 |
| Bonanza Creek Energy, Inc. | 22,527 | 1,980 | 183 | 467 | 120 | 26,806 | -- |
| Calian Group Ltd. | 26,532 | -- | 25,142 | 269 | 19,870 | (17,574) | -- |
| Chase Corp. | 51,781 | -- | 1,672 | 402 | 1,560 | 6,475 | 58,144 |
| Chuoh Pack Industry Co. Ltd. | 4,308 | -- | 19 | 138 | 8 | (174) | 4,123 |
| Civeo Corp. | 9,637 | -- | 70 | -- | (83) | 11,424 | 20,908 |
| Clip Corp. | 1,712 | -- | 139 | 84 | (31) | 351 | 1,893 |
| Codorus Valley Bancorp, Inc. | 8,334 | 704 | 544 | 345 | (245) | 7,311 | 15,560 |
| Concentrix Corp. | -- | 2,441 | 22,342 | -- | 18,758 | 388,058 | -- |
| Core Molding Technologies, Inc. | 3,182 | -- | 6,115 | -- | 2,273 | 4,671 | -- |
| Create SD Holdings Co. Ltd. | 182,840 | -- | 851 | 1,883 | 703 | (12,906) | 169,786 |
| CSE Global Ltd. | 13,975 | 50 | 72 | 815 | 22 | 1,189 | 15,164 |
| Daewon Pharmaceutical Co. Ltd. | 35,127 | -- | -- | 228 | -- | (6,611) | 28,516 |
| Daiichi Kensetsu Corp. | 27,488 | -- | 434 | 512 | 185 | 4,790 | 32,029 |
| DongKook Pharmaceutical Co. Ltd. | 76,511 | -- | 3,218 | 400 | 2,447 | (10,147) | 65,593 |
| DVx, Inc. | 5,570 | -- | 299 | 129 | 149 | 249 | 5,669 |
| EcoGreen International Group Ltd. | 7,498 | 661 | 49 | 495 | 10 | 5,333 | 13,453 |
| Elematec Corp. | 18,567 | -- | 1,587 | 693 | 189 | 5,456 | 22,625 |
| Ff Group | 6,061 | -- | 56 | -- | (69,427) | 63,422 | -- |
| First Juken Co. Ltd. | 11,647 | -- | 71 | 499 | 25 | 2,830 | 14,431 |
| Flanigans Enterprises, Inc. | 1,419 | 80 | 548 | -- | 161 | 1,362 | -- |
| Food Empire Holdings Ltd. | 14,599 | -- | 370 | 628 | 131 | 9,012 | 23,372 |
| Fossil Group, Inc. | 13,459 | 217 | 643 | -- | 216 | 37,822 | 51,071 |
| Fresh Del Monte Produce, Inc. | 105,284 | -- | 1,579 | 1,617 | 28 | 38,223 | 141,956 |
| Fujikura Kasei Co., Ltd. | 12,911 | -- | 64 | 355 | 5 | (840) | 12,012 |
| Fursys, Inc. | 22,839 | -- | 2,293 | 679 | 514 | 6,657 | 27,717 |
| Gabia, Inc. | 13,534 | -- | 1,027 | 36 | 620 | (635) | 12,492 |
| Geospace Technologies Corp. | 5,280 | -- | 27 | -- | (37) | 860 | 6,076 |
| Geumhwa PSC Co. Ltd. | 7,451 | -- | -- | 335 | -- | 2,886 | 10,337 |
| Goodfellow, Inc. | 3,177 | -- | 24 | 242 | 15 | 2,602 | 5,770 |
| Guess?, Inc. | 40,290 | -- | 102,703 | 1,422 | (312) | 62,725 | -- |
| Gujarat State Fertilizers & Chemicals Ltd. | 22,634 | -- | 3,048 | 355 | (255) | 24,245 | 43,576 |
| Halows Co. Ltd. | 44,122 | 3,970 | 3,048 | 364 | 1,780 | (11,484) | 35,340 |
| Hamakyorex Co. Ltd. | 36,481 | -- | 169 | 768 | 90 | (1,144) | 35,258 |
| Handsome Co. Ltd. | 49,408 | -- | 18,929 | 588 | 15,253 | 3,639 | 49,371 |
| Honshu Chemical Industry Co. Ltd. | 8,235 | -- | 57 | 77 | 42 | 4,183 | 12,403 |
| Hoshiiryou Sanki Co. Ltd. | 9,378 | -- | 46 | 116 | 20 | (144) | 9,208 |
| Huons Co. Ltd. | -- | 41,499 | -- | -- | -- | (2,855) | 38,644 |
| Hyster-Yale Materials Handling Class A | 7,972 | 4,015 | 9,393 | 320 | 6,395 | 6,028 | 15,017 |
| Hyster-Yale Materials Handling Class B | 11,566 | -- | -- | 395 | -- | 10,642 | 22,208 |
| I-Sheng Electric Wire & Cable Co. Ltd. | 17,035 | -- | 9,408 | -- | (1,176) | 2,459 | -- |
| IA Group Corp. | 3,466 | -- | 17 | 116 | 2 | 382 | 3,833 |
| ICT Group NV | 4,211 | -- | 8,232 | 198 | 4,235 | (214) | -- |
| IDIS Holdings Co. Ltd. | 9,366 | -- | -- | 114 | -- | 350 | 9,716 |
| Ihara Science Corp. | 12,854 | -- | 75 | 370 | 53 | 4,300 | 17,132 |
| Indra Sistemas SA | 89,947 | -- | 488 | -- | (445) | 35,815 | 124,829 |
| InfoVine Co. Ltd. | 2,612 | -- | -- | 112 | -- | 1,593 | 4,205 |
| Intage Holdings, Inc. | 26,489 | -- | 177 | 921 | 125 | 18,722 | 45,159 |
| INTOPS Co. Ltd. | 20,257 | -- | 46,500 | 247 | 36,589 | (10,346) | -- |
| JLM Couture, Inc. | 347 | -- | 3 | -- | (2) | (68) | 274 |
| Jumbo SA | 191,257 | -- | 812 | 9,400 | 626 | (36,421) | 154,650 |
| Kingboard Chemical Holdings Ltd. | 218,217 | -- | 29,666 | 21,246 | 14,823 | 157,278 | 360,652 |
| Know IT AB | 28,167 | -- | 9,335 | 962 | 6,574 | 13,187 | 38,593 |
| Kohsoku Corp. | 22,145 | -- | 117 | 597 | 74 | 1,085 | 23,187 |
| Kondotec, Inc. | 17,155 | -- | 80 | 418 | 66 | (2,489) | 14,652 |
| Korea Electric Terminal Co. Ltd. | 22,783 | -- | 12,015 | 353 | 9,285 | 25,823 | 45,876 |
| KSK Co., Ltd. | 9,617 | -- | 51 | 328 | 37 | 1,499 | 11,102 |
| Kwang Dong Pharmaceutical Co. Ltd. | 23,719 | -- | -- | 221 | -- | 54 | 23,773 |
| Kyeryong Construction Industrial Co. Ltd. | 14,393 | -- | -- | 290 | -- | 4,755 | 19,148 |
| Maruzen Co. Ltd. | 26,344 | -- | 136 | 398 | 106 | 7,414 | 33,728 |
| Mega First Corp. Bhd | 48,295 | -- | 22,766 | 1,018 | 16,361 | (12,530) | -- |
| Metro, Inc. Class A (sub. vtg.) | 1,043,110 | -- | 11,357 | 14,535 | 9,952 | 178,511 | 1,220,216 |
| Mi Chang Oil Industrial Co. Ltd. | 8,420 | -- | -- | 261 | -- | 4,131 | 12,551 |
| Mitani Sekisan Co. Ltd. | 75,529 | -- | 4,705 | 498 | 3,387 | (18,714) | 55,497 |
| Motonic Corp. | 17,755 | -- | 9,995 | 652 | 4,080 | 8,146 | 19,986 |
| Muhak Co. Ltd. | 12,640 | -- | -- | 296 | -- | 7,199 | 19,839 |
| Murakami Corp. | 17,475 | -- | 100 | 337 | 81 | 5,877 | 23,333 |
| Muramoto Electronic Thailand PCL (For. Reg.) | 5,037 | -- | 1,994 | 357 | 107 | 3,668 | -- |
| Murphy Oil Corp. | 158,530 | 13,271 | 918 | 6,058 | 640 | 103,239 | 274,762 |
| Nadex Co. Ltd. | 4,926 | 3 | 23 | 123 | 9 | 258 | 5,173 |
| Nafco Co. Ltd. | 33,196 | -- | 179 | 792 | 90 | (726) | 32,381 |
| Next PLC | 840,932 | -- | 89,479 | -- | 64,102 | 386,870 | 1,202,425 |
| Nippo Ltd. | 2,954 | -- | 131 | 59 | (41) | 1,126 | 3,908 |
| Origin Enterprises PLC | 33,754 | -- | 179 | 338 | (68) | 3,206 | 36,713 |
| Parker Corp. | 9,129 | -- | 46 | 234 | 30 | 1,831 | 10,944 |
| Piolax, Inc. | 33,555 | -- | 169 | 705 | 146 | 111 | 33,643 |
| Prim SA | 15,437 | -- | 80 | 769 | 21 | 6,964 | 22,342 |
| Rocky Mountain Chocolate Factory, Inc. | 1,578 | 422 | 253 | -- | (574) | 2,680 | 3,853 |
| Sakai Moving Service Co. Ltd. | 45,181 | 3,168 | 247 | 698 | 201 | 5,693 | 53,996 |
| Sally Beauty Holdings, Inc. | 46,546 | 28,967 | 2,011 | -- | (1,668) | 46,124 | 117,958 |
| Samsung Climate Control Co. Ltd. | 2,634 | -- | 7,083 | 28 | 4,107 | 342 | -- |
| Sanei Architecture Planning Co. Ltd. | 13,397 | -- | 97 | 596 | 58 | 7,937 | 21,295 |
| Sarantis SA | 39,173 | -- | 201 | 1,021 | 153 | 1,764 | 40,889 |
| ScanSource, Inc. | 32,105 | 3,532 | 1,002 | -- | 64 | 6,699 | 41,398 |
| Senshu Electric Co. Ltd. | 24,640 | -- | 304 | 540 | 159 | 5,689 | 30,184 |
| Sewon Precision Industries Co. Ltd. | 1,686 | -- | -- | 9 | -- | 58 | 1,744 |
| Shibaura Electronics Co. Ltd. | 11,755 | -- | 5,207 | 376 | 3,508 | 12,545 | 22,601 |
| SJM Co. Ltd. | 2,707 | -- | -- | 47 | -- | 3,243 | 5,950 |
| SNT Holdings Co. Ltd. | 11,509 | -- | -- | 418 | -- | 4,385 | 15,894 |
| Societe Pour L'Informatique Industrielle SA | 36,445 | -- | 233 | 161 | 194 | 30,500 | 66,906 |
| Soken Chemical & Engineer Co. Ltd. | 7,150 | -- | 56 | 400 | 22 | 4,566 | 11,682 |
| Southwestern Energy Co. | 48,253 | 62,209 | 498 | -- | 165 | 58,342 | 168,471 |
| Sportscene Group, Inc. Class A | 1,370 | -- | 218 | -- | 167 | 431 | 1,750 |
| Step Co. Ltd. | 14,501 | -- | 864 | 352 | 453 | 2,249 | 16,339 |
| Strattec Security Corp. | 8,206 | 905 | 6,574 | -- | 1,579 | 6,800 | 10,916 |
| Sun Hing Vision Group Holdings Ltd. | 3,068 | -- | 17 | -- | (16) | 509 | 3,544 |
| Sunjin Co. Ltd. | 19,638 | -- | 1,110 | 169 | 282 | 12,516 | 31,326 |
| SYNNEX Corp. | 333,006 | 3,276 | 25,803 | 1,556 | 17,643 | (4,608) | -- |
| T&K Toka Co. Ltd. | 9,717 | -- | 49 | 164 | 12 | 108 | 9,788 |
| The Buckle, Inc. | 73,426 | 1,758 | 91,659 | 14,147 | 19,715 | 97,724 | -- |
| The Pack Corp. | 37,290 | -- | 187 | 694 | 84 | 1,330 | 38,517 |
| Tohoku Steel Co. Ltd. | 8,143 | -- | 42 | 82 | 26 | 1,411 | 9,538 |
| Tokyo Kisen Co. Ltd. | 4,789 | -- | 21 | 66 | 12 | (380) | 4,400 |
| Tokyo Tekko Co. Ltd. | 10,839 | -- | 63 | 433 | 8 | (266) | 10,518 |
| Tomen Devices Corp. | 18,162 | -- | 89 | 732 | 30 | 6,177 | 24,280 |
| Totech Corp. | 18,933 | -- | 108 | 612 | 86 | 2,101 | 21,012 |
| TOW Co. Ltd. | 8,840 | -- | 49 | 389 | 26 | 1,436 | 10,253 |
| Trancom Co. Ltd. | 60,496 | -- | 326 | 807 | 321 | 4,546 | 65,037 |
| Trio-Tech International | 834 | -- | 880 | -- | (99) | 383 | -- |
| Triple-S Management Corp. | 33,340 | -- | 296 | -- | 76 | 8,222 | 41,342 |
| Unum Group | 245,540 | -- | 4,582 | 16,343 | (136) | 144,671 | 385,493 |
| Utah Medical Products, Inc. | 20,646 | 702 | 330 | 287 | 66 | 1,956 | 23,040 |
| VSE Corp. | 23,991 | 6,764 | 764 | 338 | 200 | 20,864 | 51,055 |
| VSTECS Holdings Ltd. | 68,486 | -- | 1,611 | 3,242 | 1,197 | 23,082 | 91,154 |
| Wayside Technology Group, Inc. | 8,084 | 356 | 1,225 | 231 | 263 | 1,445 | 8,923 |
| Whanin Pharmaceutical Co. Ltd. | 22,390 | -- | -- | 375 | -- | 10,097 | 32,487 |
| Whiting Petroleum Corp. | -- | 112,474 | 418 | -- | 245 | 70,450 | 182,751 |
| WIN-Partners Co. Ltd. | 21,431 | -- | 118 | 687 | 84 | 1,010 | 22,407 |
| Winas Ltd. | -- | -- | 131 | -- | (4,507) | -- | -- |
| Winas Ltd. | 117 | -- | -- | -- | -- | 4,521 | -- |
| Youngone Holdings Co. Ltd. | 25,851 | -- | -- | 760 | -- | 9,841 | 35,692 |
| Yutaka Giken Co. Ltd. | 15,764 | -- | 90 | 353 | 43 | 6,384 | 22,101 |
| | $6,503,749 | $294,961 | $717,243 | $140,908 | $260,812 | $2,735,534 | $8,159,673 |
(a) Includes the value of securities delivered through in-kind transactions, if applicable.
Investment Valuation
The following is a summary of the inputs used, as of July 31, 2021, involving the Fund's assets and liabilities carried at fair value. The inputs or methodology used for valuing securities may not be an indication of the risk associated with investing in those securities. For more information on valuation inputs, and their aggregation into the levels used below, please refer to the Investment Valuation section in the accompanying Notes to Financial Statements.
| | Valuation Inputs at Reporting Date: |
| Description | Total | Level 1 | Level 2 | Level 3 |
| (Amounts in thousands) | | | | |
| Investments in Securities: | | | | |
| Equities: | | | | |
| Communication Services | $506,437 | $506,437 | $-- | $-- |
| Consumer Discretionary | 7,446,592 | 7,437,717 | 6,774 | 2,101 |
| Consumer Staples | 4,114,693 | 4,098,563 | 13,450 | 2,680 |
| Energy | 1,826,514 | 1,814,968 | 11,422 | 124 |
| Financials | 4,775,690 | 4,593,853 | 181,837 | -- |
| Health Care | 3,919,230 | 3,879,101 | 40,129 | -- |
| Industrials | 2,467,308 | 2,317,910 | 149,398 | -- |
| Information Technology | 4,617,331 | 3,901,629 | 715,702 | -- |
| Materials | 1,414,747 | 1,405,892 | 8,855 | -- |
| Real Estate | 55,556 | 55,556 | -- | -- |
| Utilities | 537,636 | 537,636 | -- | -- |
| Corporate Bonds | -- | -- | -- | -- |
| Money Market Funds | 2,189,660 | 2,189,660 | -- | -- |
| Total Investments in Securities: | $33,871,394 | $32,738,922 | $1,127,567 | $4,905 |
Other Information
Distribution of investments by country or territory of incorporation, as a percentage of Total Net Assets, is as follows (Unaudited):
| United States of America | 59.6% |
| Japan | 8.4% |
| United Kingdom | 7.0% |
| Canada | 5.3% |
| Cayman Islands | 2.5% |
| Ireland | 2.5% |
| Taiwan | 2.2% |
| Netherlands | 2.2% |
| Korea (South) | 1.7% |
| Bermuda | 1.2% |
| India | 1.1% |
| Bailiwick of Guernsey | 1.0% |
| Others (Individually Less Than 1%) | 5.3% |
| | 100.0% |
See accompanying notes which are an integral part of the financial statements.
Financial Statements
Statement of Assets and Liabilities
| Amounts in thousands (except per-share amounts) | | July 31, 2021 |
| Assets | | |
Investment in securities, at value (including securities loaned of $167,643) — See accompanying schedule:
Unaffiliated issuers (cost $11,230,366) | $23,522,061 | |
| Fidelity Central Funds (cost $2,189,628) | 2,189,660 | |
| Other affiliated issuers (cost $3,331,768) | 8,159,673 | |
| Total Investment in Securities (cost $16,751,762) | | $33,871,394 |
| Cash | | 1,424 |
| Foreign currency held at value (cost $11,969) | | 11,969 |
| Receivable for investments sold | | 43,730 |
| Receivable for fund shares sold | | 9,429 |
| Dividends receivable | | 43,120 |
| Distributions receivable from Fidelity Central Funds | | 239 |
| Prepaid expenses | | 24 |
| Other receivables | | 4,084 |
| Total assets | | 33,985,413 |
| Liabilities | | |
| Payable for investments purchased | $88,010 | |
| Payable for fund shares redeemed | 18,653 | |
| Accrued management fee | 18,328 | |
| Other affiliated payables | 3,285 | |
| Other payables and accrued expenses | 5,830 | |
| Collateral on securities loaned | 173,748 | |
| Total liabilities | | 307,854 |
| Net Assets | | $33,677,559 |
| Net Assets consist of: | | |
| Paid in capital | | $14,726,264 |
| Total accumulated earnings (loss) | | 18,951,295 |
| Net Assets | | $33,677,559 |
| Net Asset Value and Maximum Offering Price | | |
| Low-Priced Stock: | | |
| Net Asset Value, offering price and redemption price per share ($28,251,224 ÷ 486,702 shares) | | $58.05 |
| Class K: | | |
| Net Asset Value, offering price and redemption price per share ($5,426,335 ÷ 93,556 shares) | | $58.00 |
See accompanying notes which are an integral part of the financial statements.
Statement of Operations
| Amounts in thousands | | Year ended July 31, 2021 |
| Investment Income | | |
| Dividends (including $140,908 earned from other affiliated issuers) | | $513,865 |
| Income from Fidelity Central Funds (including $2,243 from security lending) | | 2,997 |
| Total income | | 516,862 |
| Expenses | | |
| Management fee | | |
| Basic fee | $169,038 | |
| Performance adjustment | (21,057) | |
| Transfer agent fees | 32,913 | |
| Accounting fees | 1,978 | |
| Custodian fees and expenses | 1,351 | |
| Independent trustees' fees and expenses | 121 | |
| Registration fees | 376 | |
| Audit | 136 | |
| Legal | 66 | |
| Miscellaneous | 130 | |
| Total expenses before reductions | 185,052 | |
| Expense reductions | (816) | |
| Total expenses after reductions | | 184,236 |
| Net investment income (loss) | | 332,626 |
| Realized and Unrealized Gain (Loss) | | |
| Net realized gain (loss) on: | | |
| Investment securities: | | |
| Unaffiliated issuers (net of foreign taxes of $7) | 3,395,151 | |
| Fidelity Central Funds | 65 | |
| Other affiliated issuers | 260,812 | |
| Foreign currency transactions | (320) | |
| Total net realized gain (loss) | | 3,655,708 |
| Change in net unrealized appreciation (depreciation) on: | | |
| Investment securities: | | |
| Unaffiliated issuers (net of increase in deferred foreign taxes of $2,234) | 3,827,994 | |
| Fidelity Central Funds | (109) | |
| Other affiliated issuers | 2,735,534 | |
| Assets and liabilities in foreign currencies | (214) | |
| Total change in net unrealized appreciation (depreciation) | | 6,563,205 |
| Net gain (loss) | | 10,218,913 |
| Net increase (decrease) in net assets resulting from operations | | $10,551,539 |
See accompanying notes which are an integral part of the financial statements.
Statement of Changes in Net Assets
| Amounts in thousands | Year ended July 31, 2021 | Year ended July 31, 2020 |
| Increase (Decrease) in Net Assets | | |
| Operations | | |
| Net investment income (loss) | $332,626 | $435,458 |
| Net realized gain (loss) | 3,655,708 | 1,793,954 |
| Change in net unrealized appreciation (depreciation) | 6,563,205 | (2,670,784) |
| Net increase (decrease) in net assets resulting from operations | 10,551,539 | (441,372) |
| Distributions to shareholders | (2,896,021) | (2,435,932) |
| Share transactions - net increase (decrease) | 2,211,116 | (3,134,072) |
| Total increase (decrease) in net assets | 9,866,634 | (6,011,376) |
| Net Assets | | |
| Beginning of period | 23,810,925 | 29,822,301 |
| End of period | $33,677,559 | $23,810,925 |
See accompanying notes which are an integral part of the financial statements.
Financial Highlights
Fidelity Low-Priced Stock Fund
| Years ended July 31, | 2021 | 2020 | 2019 | 2018 | 2017 |
| Selected Per–Share Data | | | | | |
| Net asset value, beginning of period | $44.78 | $49.03 | $55.65 | $54.38 | $49.57 |
| Income from Investment Operations | | | | | |
| Net investment income (loss)A | .58 | .73 | .91 | .80 | .74 |
| Net realized and unrealized gain (loss) | 18.11 | (.91) | (1.69) | 5.33 | 6.47 |
| Total from investment operations | 18.69 | (.18) | (.78) | 6.13 | 7.21 |
| Distributions from net investment income | (.86) | (.89) | (.84) | (.79) | (.60) |
| Distributions from net realized gain | (4.56) | (3.19) | (5.00) | (4.06) | (1.80) |
| Total distributions | (5.42) | (4.07)B | (5.84) | (4.86)B | (2.40) |
| Redemption fees added to paid in capitalA | – | – | – | – | –C |
| Net asset value, end of period | $58.05 | $44.78 | $49.03 | $55.65 | $54.38 |
| Total ReturnD | 45.83% | (.48)% | (1.20)% | 12.07% | 15.17% |
| Ratios to Average Net AssetsE,F | | | | | |
| Expenses before reductions | .65% | .78% | .52% | .62% | .67% |
| Expenses net of fee waivers, if any | .64% | .78% | .52% | .62% | .67% |
| Expenses net of all reductions | .64% | .78% | .51% | .62% | .67% |
| Net investment income (loss) | 1.12% | 1.64% | 1.86% | 1.48% | 1.46% |
| Supplemental Data | | | | | |
| Net assets, end of period (in millions) | $28,251 | $19,517 | $24,047 | $28,809 | $28,334 |
| Portfolio turnover rateG,H | 21% | 9%I | 17% | 11% | 8% |
A Calculated based on average shares outstanding during the period.
B Total distributions per share do not sum due to rounding.
C Amount represents less than $.005 per share.
D Total returns would have been lower if certain expenses had not been reduced during the applicable periods shown.
E Fees and expenses of any underlying mutual funds or exchange-traded funds (ETFs) are not included in the Fund's expense ratio. The Fund indirectly bears its proportionate share of these expenses. For additional expense information related to investments in Fidelity Central Funds, please refer to the "Investments in Fidelity Central Funds" note found in the Notes to Financial Statements section of the most recent Annual or Semi-Annual report.
F Expense ratios reflect operating expenses of the class. Expenses before reductions do not reflect amounts reimbursed, waived, or reduced through arrangements with the investment adviser, brokerage services, or other offset arrangements, if applicable, and do not represent the amount paid by the class during periods when reimbursements, waivers or reductions occur.
G Portfolio turnover rate excludes securities received or delivered in-kind.
H Amount does not include the portfolio activity of any underlying mutual funds or exchange-traded funds (ETFs).
I The portfolio turnover rate does not include the assets acquired in the merger.
See accompanying notes which are an integral part of the financial statements.
Fidelity Low-Priced Stock Fund Class K
| Years ended July 31, | 2021 | 2020 | 2019 | 2018 | 2017 |
| Selected Per–Share Data | | | | | |
| Net asset value, beginning of period | $44.75 | $49.01 | $55.63 | $54.36 | $49.56 |
| Income from Investment Operations | | | | | |
| Net investment income (loss)A | .62 | .77 | .96 | .85 | .79 |
| Net realized and unrealized gain (loss) | 18.09 | (.91) | (1.69) | 5.33 | 6.46 |
| Total from investment operations | 18.71 | (.14) | (.73) | 6.18 | 7.25 |
| Distributions from net investment income | (.90) | (.93) | (.89) | (.84) | (.64) |
| Distributions from net realized gain | (4.56) | (3.19) | (5.00) | (4.06) | (1.80) |
| Total distributions | (5.46) | (4.12) | (5.89) | (4.91)B | (2.45)B |
| Redemption fees added to paid in capitalA | – | – | – | – | –C |
| Net asset value, end of period | $58.00 | $44.75 | $49.01 | $55.63 | $54.36 |
| Total ReturnD | 45.94% | (.41)% | (1.10)% | 12.18% | 15.27% |
| Ratios to Average Net AssetsE,F | | | | | |
| Expenses before reductions | .56% | .69% | .43% | .53% | .58% |
| Expenses net of fee waivers, if any | .56% | .69% | .43% | .53% | .58% |
| Expenses net of all reductions | .56% | .69% | .43% | .53% | .58% |
| Net investment income (loss) | 1.20% | 1.72% | 1.95% | 1.57% | 1.56% |
| Supplemental Data | | | | | |
| Net assets, end of period (in millions) | $5,426 | $4,294 | $5,776 | $7,601 | $9,886 |
| Portfolio turnover rateG,H | 21% | 9%I | 17% | 11% | 8% |
A Calculated based on average shares outstanding during the period.
B Total distributions per share do not sum due to rounding.
C Amount represents less than $.005 per share.
D Total returns would have been lower if certain expenses had not been reduced during the applicable periods shown.
E Fees and expenses of any underlying mutual funds or exchange-traded funds (ETFs) are not included in the Fund's expense ratio. The Fund indirectly bears its proportionate share of these expenses. For additional expense information related to investments in Fidelity Central Funds, please refer to the "Investments in Fidelity Central Funds" note found in the Notes to Financial Statements section of the most recent Annual or Semi-Annual report.
F Expense ratios reflect operating expenses of the class. Expenses before reductions do not reflect amounts reimbursed, waived, or reduced through arrangements with the investment adviser, brokerage services, or other offset arrangements, if applicable, and do not represent the amount paid by the class during periods when reimbursements, waivers or reductions occur.
G Portfolio turnover rate excludes securities received or delivered in-kind.
H Amount does not include the portfolio activity of any underlying mutual funds or exchange-traded funds (ETFs).
I The portfolio turnover rate does not include the assets acquired in the merger.
See accompanying notes which are an integral part of the financial statements.
Notes to Financial Statements
For the period ended July 31, 2021
(Amounts in thousands except percentages)
1. Organization.
Fidelity Low-Priced Stock Fund (the Fund) is a fund of Fidelity Puritan Trust (the Trust) and is authorized to issue an unlimited number of shares. The Trust is registered under the Investment Company Act of 1940, as amended (the 1940 Act), as an open-end management investment company organized as a Massachusetts business trust. The Fund offers Low-Priced Stock and Class K shares, each of which has equal rights as to assets and voting privileges. Each class has exclusive voting rights with respect to matters that affect that class. The Fund's investments in emerging markets can be subject to social, economic, regulatory, and political uncertainties and can be extremely volatile.
2. Investments in Fidelity Central Funds.
Funds may invest in Fidelity Central Funds, which are open-end investment companies generally available only to other investment companies and accounts managed by the investment adviser and its affiliates. The Schedule of Investments lists any Fidelity Central Funds held as an investment as of period end, but does not include the underlying holdings of each Fidelity Central Fund. An investing fund indirectly bears its proportionate share of the expenses of the underlying Fidelity Central Funds.
Based on its investment objective, each Fidelity Central Fund may invest or participate in various investment vehicles or strategies that are similar to those of the investing fund. These strategies are consistent with the investment objectives of the investing fund and may involve certain economic risks which may cause a decline in value of each of the Fidelity Central Funds and thus a decline in the value of the investing fund.
| Fidelity Central Fund | Investment Manager | Investment Objective | Investment Practices | Expense Ratio(a) |
| Fidelity Money Market Central Funds | Fidelity Management & Research Company LLC (FMR) | Each fund seeks to obtain a high level of current income consistent with the preservation of capital and liquidity. | Short-term Investments | Less than .005% to .01% |
(a) Expenses expressed as a percentage of average net assets and are as of each underlying Central Fund's most recent annual or semi-annual shareholder report.
A complete unaudited list of holdings for each Fidelity Central Fund is available upon request or at the Securities and Exchange Commission website at www.sec.gov. In addition, the financial statements of the Fidelity Central Funds which contain the significant accounting policies (including investment valuation policies) of those funds, and are not covered by the Report of Independent Registered Public Accounting Firm, are available on the Securities and Exchange Commission website or upon request.
3. Significant Accounting Policies.
The Fund is an investment company and applies the accounting and reporting guidance of the Financial Accounting Standards Board (FASB) Accounting Standards Codification Topic 946 Financial Services - Investment Companies. The financial statements have been prepared in conformity with accounting principles generally accepted in the United States of America (GAAP), which require management to make certain estimates and assumptions at the date of the financial statements. Actual results could differ from those estimates. Subsequent events, if any, through the date that the financial statements were issued have been evaluated in the preparation of the financial statements. The Fund's Schedule of Investments lists any underlying mutual funds or exchange-traded funds (ETFs) but does not include the underlying holdings of these funds. The following summarizes the significant accounting policies of the Fund:
Investment Valuation. Investments are valued as of 4:00 p.m. Eastern time on the last calendar day of the period. The Board of Trustees (the Board) has delegated the day to day responsibility for the valuation of the Fund's investments to the Fair Value Committee (the Committee) established by the Fund's investment adviser. In accordance with valuation policies and procedures approved by the Board, the Fund attempts to obtain prices from one or more third party pricing vendors or brokers to value its investments. When current market prices, quotations or currency exchange rates are not readily available or reliable, investments will be fair valued in good faith by the Committee, in accordance with procedures adopted by the Board. Factors used in determining fair value vary by investment type and may include market or investment specific events, changes in interest rates and credit quality. The frequency with which these procedures are used cannot be predicted and they may be utilized to a significant extent. The Committee oversees the Fund's valuation policies and procedures and reports to the Board on the Committee's activities and fair value determinations. The Board monitors the appropriateness of the procedures used in valuing the Fund's investments and ratifies the fair value determinations of the Committee.
The Fund categorizes the inputs to valuation techniques used to value its investments into a disclosure hierarchy consisting of three levels as shown below:
- Level 1 – quoted prices in active markets for identical investments
- Level 2 – other significant observable inputs (including quoted prices for similar investments, interest rates, prepayment speeds, etc.)
- Level 3 – unobservable inputs (including the Fund's own assumptions based on the best information available)
Valuation techniques used to value the Fund's investments by major category are as follows:
Equity securities, including restricted securities, for which market quotations are readily available, are valued at the last reported sale price or official closing price as reported by a third party pricing vendor on the primary market or exchange on which they are traded and are categorized as Level 1 in the hierarchy. In the event there were no sales during the day or closing prices are not available, securities are valued at the last quoted bid price or may be valued using the last available price and are generally categorized as Level 2 in the hierarchy. For foreign equity securities, when market or security specific events arise, comparisons to the valuation of American Depositary Receipts (ADRs), futures contracts, ETFs and certain indexes as well as quoted prices for similar securities may be used and would be categorized as Level 2 in the hierarchy. For equity securities, including restricted securities, where observable inputs are limited, assumptions about market activity and risk are used and these securities may be categorized as Level 3 in the hierarchy.
Debt securities, including restricted securities, are valued based on evaluated prices received from third party pricing vendors or from brokers who make markets in such securities. Corporate bonds are valued by pricing vendors who utilize matrix pricing which considers yield or price of bonds of comparable quality, coupon, maturity and type or by broker-supplied prices. When independent prices are unavailable or unreliable, debt securities may be valued utilizing pricing methodologies which consider similar factors that would be used by third party pricing vendors. Debt securities are generally categorized as Level 2 in the hierarchy but may be Level 3 depending on the circumstances.
Investments in open-end mutual funds, including the Fidelity Central Funds, are valued at their closing net asset value (NAV) each business day and are categorized as Level 1 in the hierarchy.
Changes in valuation techniques may result in transfers in or out of an assigned level within the disclosure hierarchy. The aggregate value of investments by input level as of July 31, 2021 is included at the end of the Fund's Schedule of Investments.
Foreign Currency. Certain Funds may use foreign currency contracts to facilitate transactions in foreign-denominated securities. Gains and losses from these transactions may arise from changes in the value of the foreign currency or if the counterparties do not perform under the contracts' terms.
Foreign-denominated assets, including investment securities, and liabilities are translated into U.S. dollars at the exchange rates at period end. Purchases and sales of investment securities, income and dividends received, and expenses denominated in foreign currencies are translated into U.S. dollars at the exchange rate in effect on the transaction date.
The effects of exchange rate fluctuations on investments are included with the net realized and unrealized gain (loss) on investment securities. Other foreign currency transactions resulting in realized and unrealized gain (loss) are disclosed separately.
Investment Transactions and Income. For financial reporting purposes, the Fund's investment holdings and NAV include trades executed through the end of the last business day of the period. The NAV per share for processing shareholder transactions is calculated as of the close of business of the New York Stock Exchange (NYSE), normally 4:00 p.m. Eastern time and includes trades executed through the end of the prior business day. Gains and losses on securities sold are determined on the basis of identified cost and include proceeds received from litigation. Dividend income is recorded on the ex-dividend date, except for certain dividends from foreign securities where the ex-dividend date may have passed, which are recorded as soon as the Fund is informed of the ex-dividend date. Non-cash dividends included in dividend income, if any, are recorded at the fair market value of the securities received. Income and capital gain distributions from Fidelity Central Funds, if any, are recorded on the ex-dividend date. Certain distributions received by the Fund represent a return of capital or capital gain. The Fund determines the components of these distributions subsequent to the ex-dividend date, based upon receipt of tax filings or other correspondence relating to the underlying investment. These distributions are recorded as a reduction of cost of investments and/or as a realized gain. Investment income is recorded net of foreign taxes withheld where recovery of such taxes is uncertain.
Class Allocations and Expenses. Investment income, realized and unrealized capital gains and losses, common expenses of a fund, and certain fund-level expense reductions, if any, are allocated daily on a pro-rata basis to each class based on the relative net assets of each class to the total net assets of a fund. Each class differs with respect to transfer agent and distribution and service plan fees incurred, as applicable. Certain expense reductions may also differ by class, if applicable. For the reporting period, the allocated portion of income and expenses to each class as a percent of its average net assets may vary due to the timing of recording these transactions in relation to fluctuating net assets of the classes. Expenses directly attributable to a fund are charged to that fund. Expenses attributable to more than one fund are allocated among the respective funds on the basis of relative net assets or other appropriate methods. Expenses included in the accompanying financial statements reflect the expenses of that fund and do not include any expenses associated with any underlying mutual funds or exchange-traded funds. Although not included in a fund's expenses, a fund indirectly bears its proportionate share of these expenses through the net asset value of each underlying mutual fund or exchange-traded fund. Expense estimates are accrued in the period to which they relate and adjustments are made when actual amounts are known.
Deferred Trustee Compensation. Under a Deferred Compensation Plan (the Plan) for certain Funds, certain independent Trustees have elected to defer receipt of a portion of their annual compensation. Deferred amounts are invested in affiliated mutual funds, are marked-to-market and remain in a fund until distributed in accordance with the Plan. The investment of deferred amounts and the offsetting payable to the Trustees presented below are included in the accompanying Statement of Assets and Liabilities in other receivables and other payables and accrued expenses, as applicable.
| Fidelity Low-Priced Stock Fund | $2,662 |
Income Tax Information and Distributions to Shareholders. Each year, the Fund intends to qualify as a regulated investment company under Subchapter M of the Internal Revenue Code, including distributing substantially all of its taxable income and realized gains. As a result, no provision for U.S. Federal income taxes is required. As of July 31, 2021, the Fund did not have any unrecognized tax benefits in the financial statements; nor is the Fund aware of any tax positions for which it is reasonably possible that the total amounts of unrecognized tax benefits will significantly change in the next twelve months. The Fund files a U.S. federal tax return, in addition to state and local tax returns as required. The Fund's federal income tax returns are subject to examination by the Internal Revenue Service (IRS) for a period of three fiscal years after they are filed. State and local tax returns may be subject to examination for an additional fiscal year depending on the jurisdiction. Foreign taxes are provided for based on the Fund's understanding of the tax rules and rates that exist in the foreign markets in which it invests. The Fund is subject to a tax imposed on capital gains by certain countries in which it invests. An estimated deferred tax liability for net unrealized appreciation on the applicable securities is included in Other payables and accrued expenses on the Statement of Assets & Liabilities.
Distributions are declared and recorded on the ex-dividend date. Income and capital gain distributions are declared separately for each class. Income and capital gain distributions are determined in accordance with income tax regulations, which may differ from GAAP. In addition, the Fund claimed a portion of the payment made to redeeming shareholders as a distribution for income tax purposes.
Capital accounts within the financial statements are adjusted for permanent book-tax differences. These adjustments have no impact on net assets or the results of operations. Capital accounts are not adjusted for temporary book-tax differences which will reverse in a subsequent period.
Book-tax differences are primarily due to foreign currency transactions, certain foreign taxes, passive foreign investment companies (PFIC), equity-debt classifications, redemptions in kind, partnerships, deferred trustees compensation, capital loss carryforwards and losses deferred due to wash sales.
As of period end, the cost and unrealized appreciation (depreciation) in securities, and derivatives if applicable, for federal income tax purposes were as follows:
| Gross unrealized appreciation | $17,615,854 |
| Gross unrealized depreciation | (1,203,997) |
| Net unrealized appreciation (depreciation) | $16,411,857 |
| Tax Cost | $17,459,537 |
The tax-based components of distributable earnings as of period end were as follows:
| Undistributed ordinary income | $423,255 |
| Undistributed long-term capital gain | $2,190,015 |
| Net unrealized appreciation (depreciation) on securities and other investments | $16,411,936 |
| Capital loss carryforward | $(69,772) |
Capital loss carryforwards are only available to offset future capital gains of the Fund to the extent provided by regulations and may be limited. The capital loss carryforward information presented below, including any applicable limitation, is estimated as of fiscal period end and is subject to adjustment.
| No expiration | |
| Short-term | $(43,541) |
| Long-term | (26,231) |
| Total capital loss carryforward | $(69,772) |
Due to a merger in a prior period, approximately $69,772 of the Fund's realized capital losses are subject to limitation. Due to this limitation, the Fund will only be permitted to use approximately $680 of those capital losses per year to offset capital gains. These realized capital losses were acquired from Fidelity Event Driven Opportunities Fund when it merged into the Fund on June 19, 2020.
The tax character of distributions paid was as follows:
| | July 31, 2021 | July 31, 2020 |
| Ordinary Income | $464,968 | $ 538,464 |
| Long-term Capital Gains | 2,431,053 | 1,897,468 |
| Total | $2,896,021 | $ 2,435,932 |
Restricted Securities (including Private Placements). Funds may invest in securities that are subject to legal or contractual restrictions on resale. These securities generally may be resold in transactions exempt from registration or to the public if the securities are registered. Disposal of these securities may involve time-consuming negotiations and expense, and prompt sale at an acceptable price may be difficult. Information regarding restricted securities held at period end is included at the end of the Schedule of Investments, if applicable.
4. Purchases and Sales of Investments.
Purchases and sales of securities, other than short-term securities and in-kind transactions, as applicable, are noted in the table below.
| | Purchases ($) | Sales ($) |
| Fidelity Low-Priced Stock Fund | 5,789,924 | 7,303,796 |
Unaffiliated Redemptions In-Kind. Shares that were redeemed in-kind for investments, including accrued interest and cash, if any, are shown in the table below. The net realized gain or loss on investments delivered through in-kind redemptions is included in the accompanying Statement of Operations. The amount of the in-kind redemptions is included in share transactions in the accompanying Statement of Changes in Net Assets. There was no gain or loss for federal income tax purposes.
| | Shares | Total net realized gain or loss
($) | Total Proceeds
($) | Participating classes |
| Fidelity Low-Priced Stock Fund | 2,540 | 85,490 | 132,618 | Class K |
Prior Fiscal Year Unaffiliated Redemptions In-Kind. Shares that were redeemed in-kind for investments, including accrued interest and cash, if any, are shown in the table below; along with realized gain or loss on investments delivered through in-kind redemptions. The amount of the in-kind redemptions is included in share transactions in the accompanying Statement of Changes in Net Assets. There was no gain or loss for federal income tax purposes.
| | Shares | Total net realized gain or loss
($) | Total Proceeds
($) | Participating classes |
| Fidelity Low-Priced Stock Fund | 4,797 | 131,827 | 224,491 | Class K |
5. Fees and Other Transactions with Affiliates.
Management Fee. Fidelity Management & Research Company LLC (the investment adviser) and its affiliates provide the Fund with investment management related services for which the Fund pays a monthly management fee. The management fee is the sum of an individual fund fee rate that is based on an annual rate of .35% of the Fund's average net assets and an annualized group fee rate that averaged .23% during the period. The group fee rate is based upon the monthly average net assets of a group of registered investment companies with which the investment adviser has management contracts. The group fee rate decreases as assets under management increase and increases as assets under management decrease. In addition, the management fee is subject to a performance adjustment (up to a maximum of +/-.20% of the Fund's average net assets over a 36 month performance period). The upward or downward adjustment to the management fee is based on the relative investment performance of Low-Priced Stock as compared to its benchmark index, the Russell 2000 Index, over the same 36 month performance period. For the reporting period, the total annual management fee rate, including the performance adjustment, was .51% of the Fund's average net assets. The performance adjustment included in the management fee rate may be higher or lower than the maximum performance adjustment rate due to the difference between the average net assets for the reporting and performance periods.
Transfer Agent Fees. Fidelity Investments Institutional Operations Company LLC (FIIOC), an affiliate of the investment adviser, is the transfer, dividend disbursing and shareholder servicing agent for each class of the Fund. FIIOC receives account fees and asset-based fees that vary according to the account size and type of account of the shareholders of the respective classes of the Fund, except for Class K. FIIOC receives an asset-based fee of Class K's average net assets. FIIOC pays for typesetting, printing and mailing of shareholder reports, except proxy statements.
For the period, transfer agent fees for each class were as follows:
| | Amount | % of Class-Level Average Net Assets |
| Low-Priced Stock | $30,811 | .13 |
| Class K | 2,102 | .04 |
| | $32,913 | |
Accounting Fees. Fidelity Service Company, Inc. (FSC), an affiliate of the investment adviser, maintains the Fund's accounting records. The accounting fee is based on the level of average net assets for each month. For the period, the fees were equivalent to the following annual rates:
| | % of Average Net Assets |
| Fidelity Low-Priced Stock Fund | .01 |
Brokerage Commissions. A portion of portfolio transactions were placed with brokerage firms which are affiliates of the investment adviser. Brokerage commissions are included in net realized gain (loss) and change in net unrealized appreciation (depreciation) in the Statement of Operations. The commissions paid to these affiliated firms were as follows:
| | Amount |
| Fidelity Low-Priced Stock Fund | $152 |
Interfund Trades. Funds may purchase from or sell securities to other Fidelity Funds under procedures adopted by the Board. The procedures have been designed to ensure these interfund trades are executed in accordance with Rule 17a-7 of the 1940 Act. Any interfund trades are included within the respective purchases and sales amounts shown in the Purchases and Sales of Investments note and are noted in the table below.
| | Purchases ($) | Sales ($) |
| Fidelity Low-Priced Stock Fund | 401,744 | 276,428 |
Other. During the period, the investment adviser reimbursed the Fund for certain losses as follows:
| | Amount ($) |
| Fidelity Low-Priced Stock Fund | 6 |
6. Committed Line of Credit.
Certain Funds participate with other funds managed by the investment adviser or an affiliate in a $4.25 billion credit facility (the "line of credit") to be utilized for temporary or emergency purposes to fund shareholder redemptions or for other short-term liquidity purposes. The participating funds have agreed to pay commitment fees on their pro-rata portion of the line of credit, which are reflected in Miscellaneous expenses on the Statement of Operations, and are listed below. During the period, there were no borrowings on this line of credit.
| | Amount |
| Fidelity Low-Priced Stock Fund | $54 |
7. Security Lending.
Funds lend portfolio securities from time to time in order to earn additional income. Lending agents are used, including National Financial Services (NFS), an affiliate of the investment adviser. Pursuant to a securities lending agreement, NFS will receive a fee, which is capped at 9.9% of a fund's daily lending revenue, for its services as lending agent. A fund may lend securities to certain qualified borrowers, including NFS. On the settlement date of the loan, a fund receives collateral (in the form of U.S. Treasury obligations, letters of credit and/or cash) against the loaned securities and maintains collateral in an amount not less than 100% of the market value of the loaned securities during the period of the loan. The market value of the loaned securities is determined at the close of business of a fund and any additional required collateral is delivered to a fund on the next business day. A fund or borrower may terminate the loan at any time, and if the borrower defaults on its obligation to return the securities loaned because of insolvency or other reasons, a fund may apply collateral received from the borrower against the obligation. A fund may experience delays and costs in recovering the securities loaned. Any cash collateral received is invested in the Fidelity Securities Lending Cash Central Fund. Any loaned securities are identified as such in the Schedule of Investments, and the value of loaned securities and cash collateral at period end, as applicable, are presented in the Statement of Assets and Liabilities. Security lending income represents the income earned on investing cash collateral, less rebates paid to borrowers and any lending agent fees associated with the loan, plus any premium payments received for lending certain types of securities. Security lending income is presented in the Statement of Operations as a component of income from Fidelity Central Funds. Affiliated security lending activity, if any, was as follows:
| | Total Security Lending Fees Paid to NFS | Security Lending Income From Securities Loaned to NFS | Value of Securities Loaned to NFS at Period End |
| Fidelity Low-Priced Stock Fund | $213 | $–(a) | $– |
(a) In the amount of less than five hundred dollars.
8. Expense Reductions.
Commissions paid to certain brokers with whom the investment adviser, or its affiliates, places trades on behalf of the Fund include an amount in addition to trade execution, which may be rebated back to the Fund to offset expenses. This amount totaled $528 for the period.
In addition, during the period the investment adviser or an affiliate reimbursed and/or waived a portion of fund-level operating expenses in the amount of $288.
9. Distributions to Shareholders.
Distributions to shareholders of each class were as follows:
| | Year ended
July 31, 2021 | Year ended
July 31, 2020 |
| Fidelity Low-Priced Stock Fund | | |
| Distributions to shareholders | | |
| Low-Priced Stock | $2,398,869 | $1,964,134 |
| Class K | 497,152 | 471,798 |
| Total | $2,896,021 | $2,435,932 |
10. Share Transactions.
Share transactions for each class were as follows and may contain in-kind transactions, automatic conversions between classes or exchanges between affiliated funds:
| | Shares | Shares | Dollars | Dollars |
| | Year ended July 31, 2021 | Year ended July 31, 2020 | Year ended July 31, 2021 | Year ended July 31, 2020 |
| Fidelity Low-Priced Stock Fund | | | | |
| Low-Priced Stock | | | | |
| Shares sold | 68,345 | 31,910 | $3,509,228 | $1,400,927 |
Issued in exchange for the shares of Fidelity Event Driven
Opportunities Fund | – | 1,443 | – | 62,388
|
| Reinvestment of distributions | 49,768 | 39,403 | 2,225,821 | 1,803,602 |
| Shares redeemed | (67,217) | (127,351) | (3,387,827) | (5,416,848) |
| Net increase (decrease) | 50,896 | (54,595) | $2,347,222 | $(2,149,931) |
| Class K | | | | |
| Shares sold | 21,379 | 19,495 | $1,125,901 | $873,715 |
| Reinvestment of distributions | 11,150 | 10,318 | 497,152 | 471,798 |
| Shares redeemed | (34,914) | (51,729) | (1,759,159) | (2,329,654) |
| Net increase (decrease) | (2,385) | (21,916) | $(136,106) | $(984,141) |
11. Other.
Fund's organizational documents provide former and current trustees and officers with a limited indemnification against liabilities arising in connection with the performance of their duties to the fund. In the normal course of business, the fund may also enter into contracts that provide general indemnifications. The fund's maximum exposure under these arrangements is unknown as this would be dependent on future claims that may be made against the fund. The risk of material loss from such claims is considered remote.
12. Prior Fiscal Year Merger Information.
On June 19, 2020, the Fund acquired all of the assets and assumed all of the liabilities of Fidelity Event Driven Opportunities Fund ("Target Fund") pursuant to an Agreement and Plan of Reorganization approved by the Board of Trustees ("The Board"). The acquisition was accomplished by an exchange of each class of the Fund for corresponding shares then outstanding of the Target Fund at its respective net asset value on the acquisition date. The reorganization provides shareholders of the Target Fund access to a larger portfolio with a similar investment objective and lower expenses. The reorganization qualified as a tax-free reorganization for federal income tax purposes with no gain or loss recognized to the funds or their shareholders. The Target Fund's net assets of $62,388, including securities of $55,831 and unrealized depreciation of $1,114, was combined with the Fund's net assets of $23,506,074 for total net assets after the acquisition of $23,568,462.
Pro forma results of operations of the combined entity for the entire period ended July 31, 2020 as though the acquisition had occurred as of the beginning of the year (rather than on the actual acquisition date), are as follows:
| Net investment income (loss) | $436,155 |
| Total net realized gain (loss) | 1,766,938 |
| Total change in net unrealized appreciation (depreciation) | (2,662,227) |
| Net increase (decrease) in net assets resulting from operations | $(459,134) |
Because the combined investment portfolios have been managed as a single portfolio since the acquisition was completed, it is not practicable to separate the amounts of revenue and earnings of the acquired fund that has been included in the Fund's Statement of Operations since June 19, 2020.
13. Coronavirus (COVID-19) Pandemic.
An outbreak of COVID-19 first detected in China during December 2019 has since spread globally and was declared a pandemic by the World Health Organization during March 2020. Developments that disrupt global economies and financial markets, such as the COVID-19 pandemic, may magnify factors that affect the Fund's performance.
Report of Independent Registered Public Accounting Firm
To the Board of Trustees of Fidelity Puritan Trust and Shareholders of Fidelity Low-Priced Stock Fund
Opinion on the Financial Statements
We have audited the accompanying statement of assets and liabilities, including the schedule of investments, of Fidelity Low-Priced Stock Fund (one of the funds constituting Fidelity Puritan Trust, referred to hereafter as the “Fund”) as of July 31, 2021, the related statement of operations for the year ended July 31, 2021, the statement of changes in net assets for each of the two years in the period ended July 31, 2021, including the related notes, and the financial highlights for each of the five years in the period ended July 31, 2021 (collectively referred to as the “financial statements”). In our opinion, the financial statements present fairly, in all material respects, the financial position of the Fund as of July 31, 2021, the results of its operations for the year then ended, the changes in its net assets for each of the two years in the period ended July 31, 2021 and the financial highlights for each of the five years in the period ended July 31, 2021 in conformity with accounting principles generally accepted in the United States of America.
Basis for Opinion
These financial statements are the responsibility of the Fund’s management. Our responsibility is to express an opinion on the Fund’s financial statements based on our audits. We are a public accounting firm registered with the Public Company Accounting Oversight Board (United States) (PCAOB) and are required to be independent with respect to the Fund in accordance with the U.S. federal securities laws and the applicable rules and regulations of the Securities and Exchange Commission and the PCAOB.
We conducted our audits of these financial statements in accordance with the standards of the PCAOB. Those standards require that we plan and perform the audit to obtain reasonable assurance about whether the financial statements are free of material misstatement, whether due to error or fraud.
Our audits included performing procedures to assess the risks of material misstatement of the financial statements, whether due to error or fraud, and performing procedures that respond to those risks. Such procedures included examining, on a test basis, evidence regarding the amounts and disclosures in the financial statements. Our audits also included evaluating the accounting principles used and significant estimates made by management, as well as evaluating the overall presentation of the financial statements. Our procedures included confirmation of securities owned as of July 31, 2021 by correspondence with the custodian and brokers; when replies were not received from brokers, we performed other auditing procedures. We believe that our audits provide a reasonable basis for our opinion.
/s/ PricewaterhouseCoopers LLP
Boston, Massachusetts
September 10, 2021
We have served as the auditor of one or more investment companies in the Fidelity group of funds since 1932.
Trustees and Officers
The Trustees, Members of the Advisory Board (if any), and officers of the trust and fund, as applicable, are listed below. The Board of Trustees governs the fund and is responsible for protecting the interests of shareholders. The Trustees are experienced executives who meet periodically throughout the year to oversee the fund's activities, review contractual arrangements with companies that provide services to the fund, oversee management of the risks associated with such activities and contractual arrangements, and review the fund's performance. Except for Jonathan Chiel, each of the Trustees oversees 314 funds. Mr. Chiel oversees 176 funds.
The Trustees hold office without limit in time except that (a) any Trustee may resign; (b) any Trustee may be removed by written instrument, signed by at least two-thirds of the number of Trustees prior to such removal; (c) any Trustee who requests to be retired or who has become incapacitated by illness or injury may be retired by written instrument signed by a majority of the other Trustees; and (d) any Trustee may be removed at any special meeting of shareholders by a two-thirds vote of the outstanding voting securities of the trust. Each Trustee who is not an interested person (as defined in the 1940 Act) of the trust and the fund is referred to herein as an Independent Trustee. Each Independent Trustee shall retire not later than the last day of the calendar year in which his or her 75th birthday occurs. The Independent Trustees may waive this mandatory retirement age policy with respect to individual Trustees. Officers and Advisory Board Members hold office without limit in time, except that any officer or Advisory Board Member may resign or may be removed by a vote of a majority of the Trustees at any regular meeting or any special meeting of the Trustees. Except as indicated, each individual has held the office shown or other offices in the same company for the past five years.
The fund's Statement of Additional Information (SAI) includes more information about the Trustees. To request a free copy, call Fidelity at 1-800-544-8544 if you’re an individual investing directly with Fidelity, call 1-800-835-5092 if you’re a plan sponsor or participant with Fidelity as your recordkeeper or call 1-877-208-0098 on institutional accounts or if you’re an advisor or invest through one.
Experience, Skills, Attributes, and Qualifications of the Trustees. The Governance and Nominating Committee has adopted a statement of policy that describes the experience, qualifications, attributes, and skills that are necessary and desirable for potential Independent Trustee candidates (Statement of Policy). The Board believes that each Trustee satisfied at the time he or she was initially elected or appointed a Trustee, and continues to satisfy, the standards contemplated by the Statement of Policy. The Governance and Nominating Committee also engages professional search firms to help identify potential Independent Trustee candidates who have the experience, qualifications, attributes, and skills consistent with the Statement of Policy. From time to time, additional criteria based on the composition and skills of the current Independent Trustees, as well as experience or skills that may be appropriate in light of future changes to board composition, business conditions, and regulatory or other developments, have also been considered by the professional search firms and the Governance and Nominating Committee. In addition, the Board takes into account the Trustees' commitment and participation in Board and committee meetings, as well as their leadership of standing and ad hoc committees throughout their tenure.
In determining that a particular Trustee was and continues to be qualified to serve as a Trustee, the Board has considered a variety of criteria, none of which, in isolation, was controlling. The Board believes that, collectively, the Trustees have balanced and diverse experience, qualifications, attributes, and skills, which allow the Board to operate effectively in governing the fund and protecting the interests of shareholders. Information about the specific experience, skills, attributes, and qualifications of each Trustee, which in each case led to the Board's conclusion that the Trustee should serve (or continue to serve) as a trustee of the fund, is provided below.
Board Structure and Oversight Function. Robert A. Lawrence is an interested person and currently serves as Acting Chairman. The Trustees have determined that an interested Chairman is appropriate and benefits shareholders because an interested Chairman has a personal and professional stake in the quality and continuity of services provided to the fund. Independent Trustees exercise their informed business judgment to appoint an individual of their choosing to serve as Chairman, regardless of whether the Trustee happens to be independent or a member of management. The Independent Trustees have determined that they can act independently and effectively without having an Independent Trustee serve as Chairman and that a key structural component for assuring that they are in a position to do so is for the Independent Trustees to constitute a substantial majority for the Board. The Independent Trustees also regularly meet in executive session. David M. Thomas serves as Lead Independent Trustee and as such (i) acts as a liaison between the Independent Trustees and management with respect to matters important to the Independent Trustees and (ii) with management prepares agendas for Board meetings.
Fidelity® funds are overseen by different Boards of Trustees. The fund's Board oversees Fidelity's high income and certain equity funds, and other Boards oversee Fidelity's investment-grade bond, money market, asset allocation, and other equity funds. The asset allocation funds may invest in Fidelity® funds overseen by the fund's Board. The use of separate Boards, each with its own committee structure, allows the Trustees of each group of Fidelity® funds to focus on the unique issues of the funds they oversee, including common research, investment, and operational issues. On occasion, the separate Boards establish joint committees to address issues of overlapping consequences for the Fidelity® funds overseen by each Board.
The Trustees operate using a system of committees to facilitate the timely and efficient consideration of all matters of importance to the Trustees, the fund, and fund shareholders and to facilitate compliance with legal and regulatory requirements and oversight of the fund's activities and associated risks. The Board, acting through its committees, has charged FMR and its affiliates with (i) identifying events or circumstances the occurrence of which could have demonstrably adverse effects on the fund's business and/or reputation; (ii) implementing processes and controls to lessen the possibility that such events or circumstances occur or to mitigate the effects of such events or circumstances if they do occur; and (iii) creating and maintaining a system designed to evaluate continuously business and market conditions in order to facilitate the identification and implementation processes described in (i) and (ii) above. Because the day-to-day operations and activities of the fund are carried out by or through FMR, its affiliates, and other service providers, the fund's exposure to risks is mitigated but not eliminated by the processes overseen by the Trustees. While each of the Board's committees has responsibility for overseeing different aspects of the fund's activities, oversight is exercised primarily through the Operations, Audit, and Compliance Committees. Appropriate personnel, including but not limited to the fund's Chief Compliance Officer (CCO), FMR's internal auditor, the independent accountants, the fund's Treasurer and portfolio management personnel, make periodic reports to the Board's committees, as appropriate, including an annual review of Fidelity's risk management program for the Fidelity® funds. The responsibilities of each standing committee, including their oversight responsibilities, are described further under "Standing Committees of the Trustees."
Interested Trustees*:
Correspondence intended for a Trustee who is an interested person may be sent to Fidelity Investments, 245 Summer Street, Boston, Massachusetts 02210.
Name, Year of Birth; Principal Occupations and Other Relevant Experience+
Jonathan Chiel (1957)
Year of Election or Appointment: 2016
Trustee
Mr. Chiel also serves as Trustee of other Fidelity® funds. Mr. Chiel is Executive Vice President and General Counsel for FMR LLC (diversified financial services company, 2012-present). Previously, Mr. Chiel served as general counsel (2004-2012) and senior vice president and deputy general counsel (2000-2004) for John Hancock Financial Services; a partner with Choate, Hall & Stewart (1996-2000) (law firm); and an Assistant United States Attorney for the United States Attorney’s Office of the District of Massachusetts (1986-95), including Chief of the Criminal Division (1993-1995). Mr. Chiel is a director on the boards of the Boston Bar Foundation and the Maimonides School.
Bettina Doulton (1964)
Year of Election or Appointment: 2021
Trustee
Ms. Doulton also serves as Trustee of other Fidelity® funds. Prior to her retirement, Ms. Doulton served in a variety of positions at Fidelity Investments, including as a managing director of research (2006-2007), portfolio manager to certain Fidelity® funds (1993-2005), equity analyst and portfolio assistant (1990-1993), and research assistant (1987-1990). Ms. Doulton currently owns and operates Phi Builders + Architects and Cellardoor Winery. Previously, Ms. Doulton served as a member of the Board of Brown Capital Management, LLC (2014-2018).
Robert A. Lawrence (1952)
Year of Election or Appointment: 2020
Trustee
Acting Chairman of the Board of Trustees
Mr. Lawrence also serves as Trustee of other funds. Previously, Mr. Lawrence served as a Member of the Advisory Board of certain funds. Prior to his retirement in 2008, Mr. Lawrence served as Vice President of certain Fidelity® funds (2006-2008), Senior Vice President, Head of High Income Division of Fidelity Management & Research Company (investment adviser firm, 2006-2008), and President of Fidelity Strategic Investments (investment adviser firm, 2002-2005).
* Determined to be an “Interested Trustee” by virtue of, among other things, his or her affiliation with the trust or various entities under common control with FMR.
+ The information includes the Trustee's principal occupation during the last five years and other information relating to the experience, attributes, and skills relevant to the Trustee's qualifications to serve as a Trustee, which led to the conclusion that the Trustee should serve as a Trustee for the fund.
Independent Trustees:
Correspondence intended for an Independent Trustee may be sent to Fidelity Investments, P.O. Box 55235, Boston, Massachusetts 02205-5235.
Name, Year of Birth; Principal Occupations and Other Relevant Experience+
Thomas P. Bostick (1956)
Year of Election or Appointment: 2021
Trustee
Lieutenant General Bostick also serves as Trustee of other Fidelity® funds. Prior to his retirement, General Bostick (United States Army, Retired) held a variety of positions within the U.S. Army, including Commanding General and Chief of Engineers, U.S. Army Corps of Engineers (2012-2016) and Deputy Chief of Staff and Director of Human Resources, U.S. Army (2009-2012). General Bostick currently serves as a member of the Board and Finance and Governance Committees of CSX Corporation (transportation, 2020-present) and a member of the Board and Corporate Governance and Nominating Committee of Perma-Fix Environmental Services, Inc. (nuclear waste management, 2020-present). General Bostick serves as Chief Executive Officer of Bostick Global Strategies, LLC (consulting, 2016-present) and Managing Partner, Sustainability, of Ridge-Lane Limited Partners (strategic advisory and venture development, 2016-present). Previously, General Bostick served as a Member of the Advisory Board of certain Fidelity® funds (2021), President, Intrexon Bioengineering (2018-2020) and Chief Operating Officer (2017-2020) and Senior Vice President of the Environment Sector (2016-2017) of Intrexon Corporation (biopharmaceutical company).
Dennis J. Dirks (1948)
Year of Election or Appointment: 2005
Trustee
Mr. Dirks also serves as Trustee of other Fidelity® funds. Prior to his retirement in May 2003, Mr. Dirks served as Chief Operating Officer and as a member of the Board of The Depository Trust & Clearing Corporation (financial markets infrastructure), President, Chief Operating Officer and a member of the Board of The Depository Trust Company (DTC), President and a member of the Board of the National Securities Clearing Corporation (NSCC), Chief Executive Officer and a member of the Board of the Government Securities Clearing Corporation and Chief Executive Officer and a member of the Board of the Mortgage-Backed Securities Clearing Corporation. Mr. Dirks currently serves as a member of the Finance Committee (2016-present) and Board (2017-present) and is Treasurer (2018-present) of the Asolo Repertory Theatre.
Donald F. Donahue (1950)
Year of Election or Appointment: 2018
Trustee
Mr. Donahue also serves as Trustee of other Fidelity® funds. Mr. Donahue serves as President and Chief Executive Officer of Miranda Partners, LLC (risk consulting for the financial services industry, 2012-present). Previously, Mr. Donahue served as Chief Executive Officer (2006-2012), Chief Operating Officer (2003-2006) and Managing Director, Customer Marketing and Development (1999-2003) of The Depository Trust & Clearing Corporation (financial markets infrastructure). Mr. Donahue currently serves as a member (2007-present) and Co-Chairman (2016-present) of the Board of United Way of New York and a member of the Board of NYC Leadership Academy (2012-present). Mr. Donahue previously served as a member of the Advisory Board of certain Fidelity® funds (2015-2018).
Vicki L. Fuller (1957)
Year of Election or Appointment: 2020
Trustee
Ms. Fuller also serves as Trustee of other Fidelity® funds. Previously, Ms. Fuller served as a member of the Advisory Board of certain Fidelity® funds (2018-2020), Chief Investment Officer of the New York State Common Retirement Fund (2012-2018) and held a variety of positions at AllianceBernstein L.P. (global asset management, 1985-2012), including Managing Director (2006-2012) and Senior Vice President and Senior Portfolio Manager (2001-2006). Ms. Fuller currently serves as a member of the Board, Audit Committee and Nominating and Governance Committee of The Williams Companies, Inc. (natural gas infrastructure, 2018-present), as a member of the Board, Audit Committee and Nominating and Governance Committee of two Blackstone business development companies (2020-present) and as a member of the Board of Treliant, LLC (consulting, 2019-present).
Patricia L. Kampling (1959)
Year of Election or Appointment: 2020
Trustee
Ms. Kampling also serves as Trustee of other Fidelity® funds. Prior to her retirement, Ms. Kampling served as Chairman of the Board and Chief Executive Officer (2012-2019), President and Chief Operating Officer (2011-2012) and Executive Vice President and Chief Financial Officer (2010-2011) of Alliant Energy Corporation. Ms. Kampling currently serves as a member of the Board, Finance Committee and Governance, Compensation and Nominating Committee of Xcel Energy Inc. (utilities company, 2020-present) and as a member of the Board, Audit, Finance and Risk Committee and Safety, Environmental, Technology and Operations Committee of American Water Works Company, Inc. (utilities company, 2019-present). In addition, Ms. Kampling currently serves as a member of the Board of the Nature Conservancy, Wisconsin Chapter (2019-present). Previously, Ms. Kampling served as a Member of the Advisory Board of certain Fidelity® funds (2020), a member of the Board, Compensation Committee and Executive Committee and Chair of the Audit Committee of Briggs & Stratton Corporation (manufacturing, 2011-2021), a member of the Board of Interstate Power and Light Company (2012-2019) and Wisconsin Power and Light Company (2012-2019) (each a subsidiary of Alliant Energy Corporation) and as a member of the Board and Workforce Development Committee of the Business Roundtable (2018-2019).
Thomas A. Kennedy (1955)
Year of Election or Appointment: 2021
Trustee
Mr. Kennedy also serves as Trustee of other Fidelity® funds. Previously, Mr. Kennedy served as a Member of the Advisory Board of certain Fidelity® funds (2020) and held a variety of positions at Raytheon Company (aerospace and defense, 1983-2020), including Chairman and Chief Executive Officer (2014-2020) and Executive Vice President and Chief Operating Officer (2013-2014). Mr. Kennedy currently serves as Executive Chairman of the Board of Directors of Raytheon Technologies Corporation (aerospace and defense, 2020-present). He is also a member of the Rutgers School of Engineering Industry Advisory Board (2011-present) and a member of the UCLA Engineering Dean’s Executive Board (2016-present).
Oscar Munoz (1959)
Year of Election or Appointment: 2021
Trustee
Mr. Munoz also serves as Trustee of other Fidelity® funds. Prior to his retirement, Mr. Munoz served as Executive Chairman (2020-2021), Chief Executive Officer (2015-2020), President (2015-2016) and a member of the Board (2010-2021) of United Airlines Holdings, Inc. Mr. Munoz currently serves as a member of the Board of CBRE Group, Inc. (commercial real estate, 2020-present), a member of the Board of Univision Communications, Inc. (Hispanic media, 2020-present) and a member of the Advisory Board of Salesforce.com, Inc. (cloud-based software, 2020-present). Previously, Mr. Munoz served as a Member of the Advisory Board of certain Fidelity® funds (2021).
Garnett A. Smith (1947)
Year of Election or Appointment: 2018
Trustee
Mr. Smith also serves as Trustee of other Fidelity® funds. Prior to his retirement, Mr. Smith served as Chairman and Chief Executive Officer (1990-1997) and President (1986-1990) of Inbrand Corp. (manufacturer of personal absorbent products). Prior to his employment with Inbrand Corp., he was employed by a retail fabric chain and North Carolina National Bank (now Bank of America). Mr. Smith previously served as a member of the Advisory Board of certain Fidelity® funds (2012-2013).
David M. Thomas (1949)
Year of Election or Appointment: 2008
Trustee
Lead Independent Trustee
Mr. Thomas also serves as Trustee of other Fidelity® funds. Previously, Mr. Thomas served as Executive Chairman (2005-2006) and Chairman and Chief Executive Officer (2000-2005) of IMS Health, Inc. (pharmaceutical and healthcare information solutions). Mr. Thomas currently serves as a member of the Board of Fortune Brands Home and Security (home and security products, 2004-present) and Presiding Director (2013-present) of Interpublic Group of Companies, Inc. (marketing communication).
Susan Tomasky (1953)
Year of Election or Appointment: 2020
Trustee
Ms. Tomasky also serves as Trustee of other Fidelity® funds. Prior to her retirement, Ms. Tomasky served in various executive officer positions at American Electric Power Company, Inc. (1998-2011), including most recently as President of AEP Transmission (2007-2011). Ms. Tomasky currently serves as a member of the Board and Sustainability Committee and as Chair of the Audit Committee of Marathon Petroleum Corporation (2018-present) and as a member of the Board, Corporate Governance Committee and Organization and Compensation Committee and as Chair of the Audit Committee of Public Service Enterprise Group, Inc. (utilities company, 2012-present). In addition, Ms. Tomasky currently serves as a member (2009-present) and President (2020-present) of the Board of the Royal Shakespeare Company – America (2009-present), as a member of the Board of the Columbus Association for the Performing Arts (2011-present) and as a member of the Board and Investment Committee of Kenyon College (2016-present). Previously, Ms. Tomasky served as a Member of the Advisory Board of certain Fidelity® funds (2020), as a member of the Board of the Columbus Regional Airport Authority (2007-2020), as a member of the Board (2011-2018) and Lead Independent Director (2015-2018) of Andeavor Corporation (previously Tesoro Corporation) (independent oil refiner and marketer) and as a member of the Board of Summit Midstream Partners LP (energy, 2012-2018).
Michael E. Wiley (1950)
Year of Election or Appointment: 2020
Trustee
Mr. Wiley also serves as Trustee of other Fidelity® funds. Previously, Mr. Wiley served as a member of the Advisory Board of certain Fidelity® funds (2018-2020), Chairman, President and CEO of Baker Hughes, Inc. (oilfield services, 2000-2004). Mr. Wiley also previously served as a member of the Board of Andeavor Corporation (independent oil refiner and marketer, 2005-2018), a member of the Board of Andeavor Logistics LP (natural resources logistics, 2015-2018) and a member of the Board of High Point Resources (exploration and production, 2005-2020).
+ The information includes the Trustee's principal occupation during the last five years and other information relating to the experience, attributes, and skills relevant to the Trustee's qualifications to serve as a Trustee, which led to the conclusion that the Trustee should serve as a Trustee for the fund.
Advisory Board Members and Officers:
Correspondence intended for a Member of the Advisory Board (if any) may be sent to Fidelity Investments, P.O. Box 55235, Boston, Massachusetts 02205-5235. Correspondence intended for an officer or Peter S. Lynch may be sent to Fidelity Investments, 245 Summer Street, Boston, Massachusetts 02210. Officers appear below in alphabetical order.
Name, Year of Birth; Principal Occupation
Peter S. Lynch (1944)
Year of Election or Appointment: 2003
Member of the Advisory Board
Mr. Lynch also serves as a Member of the Advisory Board of other Fidelity® funds. Mr. Lynch is Vice Chairman and a Director of Fidelity Management & Research Company LLC (investment adviser firm). In addition, Mr. Lynch serves as a Trustee of Boston College and as the Chairman of the Inner-City Scholarship Fund. Previously, Mr. Lynch served as Vice Chairman and a Director of FMR Co., Inc. (investment adviser firm) and on the Special Olympics International Board of Directors (1997-2006).
Craig S. Brown (1977)
Year of Election or Appointment: 2019
Assistant Treasurer
Mr. Brown also serves as an officer of other funds. Mr. Brown serves as Assistant Treasurer of FIMM, LLC (2021-present) and is an employee of Fidelity Investments (2013-present).
John J. Burke III (1964)
Year of Election or Appointment: 2018
Chief Financial Officer
Mr. Burke also serves as Chief Financial Officer of other funds. Mr. Burke serves as Head of Investment Operations for Fidelity Fund and Investment Operations (2018-present) and is an employee of Fidelity Investments (1998-present). Previously Mr. Burke served as head of Asset Management Investment Operations (2012-2018).
William C. Coffey (1969)
Year of Election or Appointment: 2019
Assistant Secretary
Mr. Coffey also serves as Assistant Secretary of other funds. He is Senior Vice President and Deputy General Counsel of FMR LLC (diversified financial services company, 2010-present), and is an employee of Fidelity Investments. Previously, Mr. Coffey served as Secretary and CLO of certain funds (2018-2019); CLO, Secretary, and Senior Vice President of Fidelity Management & Research Company and FMR Co., Inc. (investment adviser firms, 2018-2019); Secretary of Fidelity SelectCo, LLC and Fidelity Investments Money Management, Inc. (investment adviser firms, 2018-2019); CLO of Fidelity Management & Research (Hong Kong) Limited, FMR Investment Management (UK) Limited, and Fidelity Management & Research (Japan) Limited (investment adviser firms, 2018-2019); and Assistant Secretary of certain funds (2009-2018).
Timothy M. Cohen (1969)
Year of Election or Appointment: 2018
Vice President
Mr. Cohen also serves as Vice President of other funds. Mr. Cohen serves as Co-Head of Equity (2018-present), a Director of Fidelity Management & Research (Japan) Limited (investment adviser firm, 2016-present), and is an employee of Fidelity Investments. Previously, Mr. Cohen served as Executive Vice President of Fidelity SelectCo, LLC (2019), Head of Global Equity Research (2016-2018), Chief Investment Officer - Equity and a Director of Fidelity Management & Research (U.K.) Inc. (investment adviser firm, 2013-2015) and as a Director of Fidelity Management & Research (Hong Kong) Limited (investment adviser firm, 2017).
Jonathan Davis (1968)
Year of Election or Appointment: 2010
Assistant Treasurer
Mr. Davis also serves as an officer of other funds. Mr. Davis serves as Assistant Treasurer of FIMM, LLC (2021-present) and FMR Capital, Inc. (2017-present) and is an employee of Fidelity Investments. Previously, Mr. Davis served as Vice President and Associate General Counsel of FMR LLC (diversified financial services company, 2003-2010).
Laura M. Del Prato (1964)
Year of Election or Appointment: 2018
Assistant Treasurer
Ms. Del Prato also serves as an officer of other funds. Ms. Del Prato serves as Assistant Treasurer of FIMM, LLC (2021-present) and is an employee of Fidelity Investments (2017-present). Previously, Ms. Del Prato served as President and Treasurer of The North Carolina Capital Management Trust: Cash Portfolio and Term Portfolio (2018-2020). Prior to joining Fidelity Investments, Ms. Del Prato served as a Managing Director and Treasurer of the JPMorgan Mutual Funds (2014-2017). Prior to JPMorgan, Ms. Del Prato served as a partner at Cohen Fund Audit Services (accounting firm, 2012-2013) and KPMG LLP (accounting firm, 2004-2012).
Colm A. Hogan (1973)
Year of Election or Appointment: 2020
Assistant Treasurer
Mr. Hogan also serves as an officer of other funds. Mr. Hogan serves as Assistant Treasurer of FIMM, LLC (2021-present) and FMR Capital, Inc. (2017-present) and is an employee of Fidelity Investments (2005-present). Previously, Mr. Hogan served as Deputy Treasurer of certain Fidelity® funds (2016-2020) and Assistant Treasurer of certain Fidelity® funds (2016-2018).
Pamela R. Holding (1964)
Year of Election or Appointment: 2018
Vice President
Ms. Holding also serves as Vice President of other funds. Ms. Holding serves as Co-Head of Equity (2018-present) and is an employee of Fidelity Investments (2013-present). Previously, Ms. Holding served as Executive Vice President of Fidelity SelectCo, LLC (2019) and as Chief Investment Officer of Fidelity Institutional Asset Management (2013-2018).
Cynthia Lo Bessette (1969)
Year of Election or Appointment: 2019
Secretary and Chief Legal Officer (CLO)
Ms. Lo Bessette also serves as an officer of other funds. Ms. Lo Bessette serves as CLO, Secretary, and Senior Vice President of Fidelity Management & Research Company LLC (investment adviser firm, 2019-present); and CLO of Fidelity Management & Research (Hong Kong) Limited, FMR Investment Management (UK) Limited, and Fidelity Management & Research (Japan) Limited (investment adviser firms, 2019-present). She is a Senior Vice President and Deputy General Counsel of FMR LLC (diversified financial services company, 2019-present), and is an employee of Fidelity Investments. Previously, Ms. Lo Bessette served as CLO, Secretary, and Senior Vice President of FMR Co., Inc. (investment adviser firm, 2019); Secretary of Fidelity SelectCo, LLC and Fidelity Investments Money Management, Inc. (investment adviser firms, 2019). Prior to joining Fidelity Investments, Ms. Lo Bessette was Executive Vice President, General Counsel (2016-2019) and Senior Vice President, Deputy General Counsel (2015-2016) of OppenheimerFunds (investment management company) and Deputy Chief Legal Officer (2013-2015) of Jennison Associates LLC (investment adviser firm).
Chris Maher (1972)
Year of Election or Appointment: 2020
Deputy Treasurer
Mr. Maher also serves as an officer of other funds. Mr. Maher serves as Assistant Treasurer of FIMM, LLC (2021-present) and FMR Capital, Inc. (2017-present), and is an employee of Fidelity Investments (2008-present). Previously, Mr. Maher served as Assistant Treasurer of certain funds (2013-2020); Vice President of Asset Management Compliance (2013), Vice President of the Program Management Group of FMR (investment adviser firm, 2010-2013), and Vice President of Valuation Oversight (2008-2010).
Jason P. Pogorelec (1975)
Year of Election or Appointment: 2020
Chief Compliance Officer
Mr. Pogorelec also serves as Chief Compliance Officer of other funds. Mr. Pogorelec is a senior Vice President of Asset Management Compliance for Fidelity Investments and is an employee of Fidelity Investments (2006-present). Previously, Mr. Pogorelec served as Vice President, Associate General Counsel for Fidelity Investments (2010-2020) and Assistant Secretary of certain Fidelity funds (2015-2020).
Brett Segaloff (1972)
Year of Election or Appointment: 2021
Anti-Money Laundering (AML) Officer
Mr. Segaloff also serves as an AML Officer of other funds and other related entities. He is Director, Anti-Money Laundering (2007-present) of FMR LLC (diversified financial services company) and is an employee of Fidelity Investments (1996-present).
Stacie M. Smith (1974)
Year of Election or Appointment: 2016
President and Treasurer
Ms. Smith also serves as an officer of other funds. Ms. Smith serves as Assistant Treasurer of FIMM, LLC (2021-present) and FMR Capital, Inc. (2017-present), is an employee of Fidelity Investments (2009-present), and has served in other fund officer roles. Prior to joining Fidelity Investments, Ms. Smith served as Senior Audit Manager of Ernst & Young LLP (accounting firm, 1996-2009). Previously, Ms. Smith served as Assistant Treasurer (2013-2019) and Deputy Treasurer (2013-2016) of certain Fidelity® funds.
Marc L. Spector (1972)
Year of Election or Appointment: 2016
Assistant Treasurer
Mr. Spector also serves as an officer of other funds. Mr. Spector serves as Assistant Treasurer of FIMM, LLC (2021-present) and FMR Capital, Inc. (2017-present) and is an employee of Fidelity Investments (2016-present). Prior to joining Fidelity Investments, Mr. Spector served as Director at the Siegfried Group (accounting firm, 2013-2016), and prior to Siegfried Group as audit senior manager at Deloitte & Touche LLP (accounting firm, 2005-2013).
Jim Wegmann (1979)
Year of Election or Appointment: 2019
Assistant Treasurer
Mr. Wegmann also serves as an officer of other funds. Mr. Wegmann serves as Assistant Treasurer of FIMM, LLC (2021-present) and is an employee of Fidelity Investments (2011-present).
Shareholder Expense Example
As a shareholder, you incur two types of costs: (1) transaction costs, which may include sales charges (loads) on purchase payments or redemption proceeds, as applicable and (2) ongoing costs, which generally include management fees, distribution and/or service (12b-1) fees and other Fund expenses. This Example is intended to help you understand your ongoing costs (in dollars) of investing in a fund and to compare these costs with the ongoing costs of investing in other mutual funds.
The Example is based on an investment of $1,000 invested at the beginning of the period and held for the entire period (February 1, 2021 to July 31, 2021).
Actual Expenses
The first line of the accompanying table provides information about actual account values and actual expenses. You may use the information in this line, together with the amount you invested, to estimate the expenses that you paid over the period. Simply divide your account value by $1,000.00 (for example, an $8,600 account value divided by $1,000.00 = 8.6), then multiply the result by the number in the first line for a class/Fund under the heading entitled "Expenses Paid During Period" to estimate the expenses you paid on your account during this period. If any fund is a shareholder of any underlying mutual funds or exchange-traded funds (ETFs) (the Underlying Funds), such fund indirectly bears its proportional share of the expenses of the Underlying Funds in addition to the direct expenses incurred presented in the table. These fees and expenses are not included in the annualized expense ratio used to calculate the expense estimate in the table below.
Hypothetical Example for Comparison Purposes
The second line of the accompanying table provides information about hypothetical account values and hypothetical expenses based on the actual expense ratio and an assumed rate of return of 5% per year before expenses, which is not the actual return. The hypothetical account values and expenses may not be used to estimate the actual ending account balance or expenses you paid for the period. You may use this information to compare the ongoing costs of investing in the Fund and other funds. To do so, compare this 5% hypothetical example with the 5% hypothetical examples that appear in the shareholder reports of the other funds. If any fund is a shareholder of any Underlying Funds, such fund indirectly bears its proportional share of the expenses of the Underlying Funds in addition to the direct expenses as presented in the table. These fees and expenses are not included in the annualized expense ratio used to calculate the expense estimate in the table below.
Please note that the expenses shown in the table are meant to highlight your ongoing costs only and do not reflect any transaction costs. Therefore, the second line of the table is useful in comparing ongoing costs only, and will not help you determine the relative total costs of owning different funds.
| | Annualized Expense Ratio-A | Beginning
Account Value
February 1, 2021 | Ending
Account Value
July 31, 2021 | Expenses Paid
During Period-B
February 1, 2021
to July 31, 2021 |
| Fidelity Low-Priced Stock Fund | | | | |
| Low-Priced Stock | .64% | | | |
| Actual | | $1,000.00 | $1,175.10 | $3.45 |
| Hypothetical-C | | $1,000.00 | $1,021.62 | $3.21 |
| Class K | .56% | | | |
| Actual | | $1,000.00 | $1,175.50 | $3.02 |
| Hypothetical-C | | $1,000.00 | $1,022.02 | $2.81 |
A Annualized expense ratio reflects expenses net of applicable fee waivers.
B Expenses are equal to the annualized expense ratio, multiplied by the average account value over the period, multiplied by 181/ 365 (to reflect the one-half year period). The fees and expenses of any Underlying Funds are not included in each annualized expense ratio.
C 5% return per year before expenses
Distributions (Unaudited)
The Board of Trustees of Fidelity Low-Priced Stock Fund voted to pay to shareholders of record at the opening of business on record date, the following distributions per share derived from capital gains realized from sales of portfolio securities and dividends derived from net investment income:
| | Pay Date | Record Date | Dividends | Capital Gains |
| Fidelity Low-Priced Stock Fund | | | | |
| Low-Priced Stock | 09/13/21 | 09/10/21 | $0.479 | $4.071 |
| Class K | 09/13/21 | 09/10/21 | $0.505 | $4.071 |
|
The fund hereby designates as a capital gain dividend with respect to the taxable year ended July 31, 2021 $3,206,847,582, or, if subsequently determined to be different, the net capital gain of such year.
Low-Priced Stock designates 59% and 44%; Class K designates 56% and 43% of the dividends distributed in September and December, respectively during the fiscal year as qualifying for the dividends–received deduction for corporate shareholders.
Low-Priced Stock designates 100% and 75%; Class K designates 100% and 72% of the dividends distributed in September and December, respectively during the fiscal year as amounts which may be taken into account as a dividend for purposes of the maximum rate under section 1(h)(11) of the Internal Revenue Code.
Low-Priced Stock designates 0%, and 2%; Class K designates 1%, and 1% of the dividends distributed in September and December, respectively during the fiscal year as a section 199A dividend.
The fund will notify shareholders in January 2022 of amounts for use in preparing 2021 income tax returns.
Board Approval of Investment Advisory Contracts and Management Fees
Fidelity Low-Priced Stock Fund
Each year, the Board of Trustees, including the Independent Trustees (together, the Board), votes on the renewal of the management contract with Fidelity Management & Research Company LLC (FMR) and the sub-advisory agreements (together, the Advisory Contracts) for the fund. FMR and the sub-advisers are referred to herein as the Investment Advisers. The Board, assisted by the advice of fund counsel and Independent Trustees' counsel, requests and considers a broad range of information relevant to the renewal of the Advisory Contracts throughout the year.
The Board meets regularly and, at each of its meetings, covers an extensive agenda of topics and materials and considers factors that are relevant to its annual consideration of the renewal of the fund's Advisory Contracts, including the services and support provided to the fund and its shareholders. The Board has established various standing committees (Committees), each composed of and chaired by Independent Trustees with varying backgrounds, to which the Board has assigned specific subject matter responsibilities in order to enhance effective decision-making by the Board. The Board, acting directly and through its Committees, requests and receives information concerning the annual consideration of the renewal of the fund's Advisory Contracts. The Board also meets as needed to review matters specifically related to the Board's annual consideration of the renewal of the Advisory Contracts. Members of the Board may also meet with trustees of other Fidelity funds through joint ad hoc committees to discuss certain matters relevant to all of the Fidelity funds.
At its May 2021 meeting, the Board unanimously determined to renew the fund's Advisory Contracts. In reaching its determination, the Board considered all factors it believed relevant, including (i) the nature, extent, and quality of the services provided to the fund and its shareholders (including the investment performance of the fund); (ii) the competitiveness of the fund's management fee and total expense ratio relative to peer funds; (iii) the total costs of the services provided by and the profits realized by Fidelity from its relationships with the fund; and (iv) the extent to which, if any, economies of scale exist and are realized as the fund grows, and whether any economies of scale are appropriately shared with fund shareholders.
In considering whether to renew the Advisory Contracts for the fund, the Board reached a determination, with the assistance of fund counsel and Independent Trustees' counsel and through the exercise of its business judgment, that the renewal of the Advisory Contracts was in the best interests of the fund and its shareholders and that the compensation payable under the Advisory Contracts was fair and reasonable. The Board's decision to renew the Advisory Contracts was not based on any single factor, but rather was based on a comprehensive consideration of all the information provided to the Board at its meetings throughout the year. The Board, in reaching its determination to renew the Advisory Contracts, was aware that shareholders of the fund have a broad range of investment choices available to them, including a wide choice among funds offered by Fidelity's competitors, and that the fund's shareholders, who have the opportunity to review and weigh the disclosure provided by the fund in its prospectus and other public disclosures, have chosen to invest in this fund, which is part of the Fidelity family of funds.
Nature, Extent, and Quality of Services Provided. The Board considered Fidelity's staffing as it relates to the fund, including the backgrounds of investment personnel of Fidelity, and also considered the fund's investment objective, strategies, and related investment philosophy. The Independent Trustees also had discussions with senior management of Fidelity's investment operations and investment groups. The Board considered the structure of the investment personnel compensation program and whether this structure provides appropriate incentives to act in the best interests of the fund. Additionally, the Board considered the portfolio managers' investments, if any, in the funds that they manage.
Resources Dedicated to Investment Management and Support Services. The Board and the Fund Oversight and Research Committees reviewed the general qualifications and capabilities of Fidelity's investment staff, including its size, education, experience, and resources, as well as Fidelity's approach to recruiting, training, managing, and compensating investment personnel. The Board noted that Fidelity has continued to increase the resources devoted to non-U.S. offices, including expansion of Fidelity's global investment organization. The Board also noted that Fidelity's analysts have extensive resources, tools and capabilities that allow them to conduct sophisticated quantitative and fundamental analysis, as well as credit analysis of issuers, counterparties and guarantors. Further, the Board considered that Fidelity's investment professionals have sufficient access to global information and data so as to provide competitive investment results over time, and that those professionals also have access to sophisticated tools that permit them to assess portfolio construction and risk and performance attribution characteristics continuously, as well as to transmit new information and research conclusions rapidly around the world. Additionally, in its deliberations, the Board considered Fidelity's trading, risk management, compliance, and technology and operations capabilities and resources, which are integral parts of the investment management process. The Board also considered Fidelity's investments in business continuity planning, and its success in continuously providing services to the fund notwithstanding the severe disruptions caused by the COVID-19 pandemic.
Shareholder and Administrative Services. The Board considered (i) the nature, extent, quality, and cost of advisory, administrative, and shareholder services performed by the Investment Advisers and their affiliates under the Advisory Contracts and under separate agreements covering transfer agency, pricing and bookkeeping, and securities lending services for the fund; (ii) the nature and extent of the supervision of third party service providers, principally custodians, subcustodians, and pricing vendors; and (iii) the resources devoted to, and the record of compliance with, the fund's compliance policies and procedures. The Board also reviewed the allocation of fund brokerage, including allocations to brokers affiliated with the Investment Advisers, the use of brokerage commissions to pay fund expenses, and the use of "soft" commission dollars to pay for research services.
The Board noted that the growth of fund assets over time across the complex allows Fidelity to reinvest in the development of services designed to enhance the value and convenience of the Fidelity funds as investment vehicles. These services include 24-hour access to account information and market information over the Internet and through telephone representatives, investor education materials and asset allocation tools, and the expanded availability of Fidelity Investor Centers.
The Board noted that, in the past, it and the boards of certain other Fidelity funds had formed an ad hoc Committee on Transfer Agency Fees to review the variety of transfer agency fee structures throughout the industry and Fidelity's competitive positioning with respect to industry participants.
Investment in a Large Fund Family. The Board considered the benefits to shareholders of investing in a Fidelity fund, including the benefits of investing in a fund that is part of a large family of funds offering a variety of investment disciplines and providing a large variety of mutual fund investor services. The Board noted that Fidelity had taken, or had made recommendations that resulted in the Fidelity funds taking, a number of actions over the previous year that benefited particular funds, including: (i) continuing to dedicate additional resources to Fidelity's investment research process, which includes meetings with management of issuers of securities in which the funds invest, and to the support of the senior management team that oversees asset management; (ii) continuing efforts to enhance Fidelity's global research capabilities; (iii) launching new funds and ETFs with innovative structures, strategies and pricing and making other enhancements to meet client needs; (iv) launching new share classes of existing funds; (v) eliminating purchase minimums and broadening eligibility requirements for certain funds and share classes; (vi) approving the reduction in the holding period for the Class C to Class A conversion policy; (vii) reducing management fees and total expenses for certain target date funds and classes and index funds; (viii) lowering expenses for certain existing funds and classes by implementing or lowering expense caps; (ix) rationalizing product lines and gaining increased efficiencies from fund mergers, liquidations, and share class consolidations; (x) continuing to develop, acquire and implement systems and technology to improve services to the funds and shareholders, strengthen information security, and increase efficiency; and (xi) continuing to implement enhancements to further strengthen Fidelity's product line to increase investors' probability of success in achieving their investment goals, including retirement income goals.
Investment Performance. The Board considered whether the fund has operated in accordance with its investment objective, as well as its record of compliance with its investment restrictions and its performance history. The Board noted that there was a portfolio management change for the fund in April 2018. The Board will continue to monitor closely the fund's performance, taking into account the portfolio management change.
The Board took into account discussions that occur at Board meetings throughout the year with representatives of the Investment Advisers about fund investment performance. In this regard the Board noted that as part of regularly scheduled fund reviews and other reports to the Board on fund performance, the Board considers annualized return information for the fund for different time periods, measured against an appropriate securities market index (benchmark index) and an appropriate peer group of funds with similar objectives (peer group). In its evaluation of fund investment performance, the Board gave particular attention to information indicating changes in performance of certain Fidelity funds for specific time periods and discussed with the Investment Advisers the reasons for any overperformance or underperformance.
In addition to reviewing absolute and relative fund performance, the Independent Trustees periodically consider the appropriateness of fund performance metrics in evaluating the results achieved. In general, the Independent Trustees believe that fund performance should be evaluated based on net performance (after fees and expenses) of both the highest performing and lowest performing fund share classes, where applicable, compared to appropriate benchmark indices, over appropriate time periods that may include full market cycles, and compared to peer groups, as applicable, over the same periods, taking into account relevant factors including the following: general market conditions; issuer-specific information; and fund cash flows and other factors.
The Independent Trustees recognize that shareholders evaluate performance on a net basis over their own holding periods, for which one-, three-, and five-year periods are often used as a proxy. For this reason, the performance information reviewed by the Board also included net cumulative total return information for the fund and an appropriate benchmark index and peer group for the most recent one-, three-, and five-year periods ended September 30, 2020, as shown below. Returns are shown compared to the 25th percentile (top of box, 75% beaten) and 75th percentile (bottom of box, 25% beaten) of the peer universe.
Fidelity Low-Priced Stock Fund
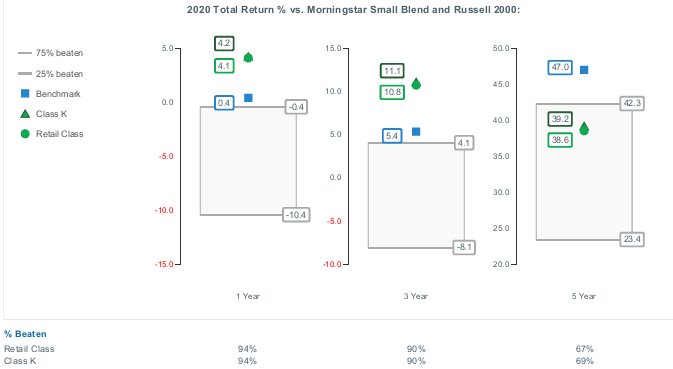
The Board also considered that the fund's management fee is subject to upward or downward adjustment depending upon whether, and to what extent, the fund's investment performance for the performance period (a rolling 36-month period) exceeds, or is exceeded by, a securities index, thus leading to a performance adjustment for the same period. The Board noted that the performance adjustment provides FMR with a strong economic incentive to seek to achieve superior long-term performance for the fund's shareholders and helps to more closely align the interests of FMR and the shareholders of the fund.
Based on its review, the Board concluded that the nature, extent, and quality of services provided to the fund under the Advisory Contracts should continue to benefit the shareholders of the fund.
Competitiveness of Management Fee and Total Expense Ratio. The Board considered the fund's management fee and total expense ratio compared to "mapped groups" of competitive funds and classes created for the purpose of facilitating the Trustees' competitive analysis of management fees and total expenses. Fidelity creates "mapped groups" by combining similar Lipper investment objective categories that have comparable investment mandates. Combining Lipper investment objective categories aids the Board's management fee and total expense ratio comparisons by broadening the competitive group used for comparison.
Management Fee. The Board considered two proprietary management fee comparisons for the 12-month periods ended September 30 (June 30 for periods ended 2019 and 2018 and December 31 for periods prior to 2018) shown in basis points (BP) in the chart below. The group of Lipper funds used by the Board for management fee comparisons is referred to below as the "Total Mapped Group." The Total Mapped Group comparison focuses on a fund's standing in terms of gross management fees before expense reimbursements or caps, and without giving effect to the fund's performance adjustment, relative to the total universe of funds with comparable investment mandates, regardless of whether their management fee structures also are comparable. Funds with comparable investment mandates offer exposure to similar types of securities. Funds with comparable management fee structures have similar management fee contractual arrangements (
e.g., flat rate charged for advisory services, all-inclusive fee rate,
etc.). "TMG %" represents the percentage of funds in the Total Mapped Group that had management fees that were lower than the fund's. For example, a hypothetical TMG % of 20% would mean that 80% of the funds in the Total Mapped Group had higher, and 20% had lower, management fees than the fund. The fund's actual TMG %s and the number of funds in the Total Mapped Group are in the chart below. The "Asset-Sized Peer Group" (ASPG) comparison focuses on a fund's standing relative to a subset of non-Fidelity funds within the Total Mapped Group that are similar in size and management fee structure without taking into account performance adjustments, if any. For example, if a fund is in the first quartile of the ASPG, the fund's management fee ranks in the least expensive or lowest 25% of funds in the ASPG. The ASPG represents at least 15% of the funds in the Total Mapped Group with comparable asset size and management fee structures, subject to a minimum of 50 funds (or all funds in the Total Mapped Group if fewer than 50). Additional information, such as the ASPG quartile in which the fund's management fee rate ranked and the impact of the fund's performance adjustment, is also included in the chart and was considered by the Board.
Fidelity Low-Priced Stock Fund
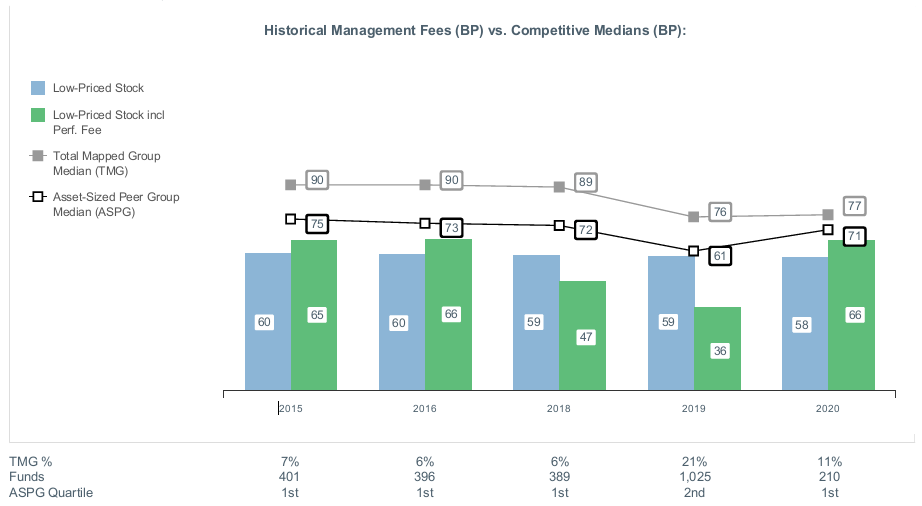
The Board noted that the fund's management fee rate ranked below the median of its Total Mapped Group and below the median of its ASPG for the 12-month period ended September 30, 2020. The Board also noted the effect of the fund's performance adjustment, if any, on the fund's management fee ranking.
The Board noted that, in the past, it and the boards of other Fidelity funds had formed an ad hoc Committee on Group Fee to conduct an in-depth review of the "group fee" component of the management fee of funds with such management fee structures. The Committee's focus included the mechanics of the group fee, the competitive landscape of group fee structures, Fidelity funds with no group fee component and investment products not included in group fee assets. The Board also considered that, for funds subject to the group fee, FMR agreed to voluntarily waive fees over a specified period of time in amounts designed to account for assets converted from certain funds to certain collective investment trusts.
The Board also noted that, in 2013, the ad hoc Committee on Management Fees was formed to conduct an in-depth review of the management fee rates of Fidelity's active equity mutual funds. The Committee focused on the following areas: (i) standard fee structures; (ii) research consumption and trading evolution; (iii) management fee competitiveness/profitability by category; and (iv) factors that drive institutional pricing.
Based on its review, the Board concluded that the fund's management fee is fair and reasonable in light of the services that the fund receives and the other factors considered.
Total Expense Ratio. In its review of each class's total expense ratio, the Board considered the fund's management fee rate as well as other fund or class expenses, as applicable, such as transfer agent fees, pricing and bookkeeping fees, and custodial, legal, and audit fees. The Board noted the impact of the fund's performance adjustment. The Board also noted that Fidelity may agree to waive fees or reimburse expenses from time to time, and the extent to which, if any, it has done so for the fund. As part of its review, the Board also considered the current and historical total expense ratios of a representative class of the fund compared to competitive fund median expenses. The fund's representative class is compared to those funds and classes in the Total Mapped Group (used by the Board for management fee comparisons) that have a similar sales load structure (SLTG). The Board also considered a total expense ASPG comparison for the representative class, which focuses on the total expenses of the representative class relative to a subset of non-Fidelity funds within the total expense SLTG. The total expense ASPG is limited to 15 larger and 15 smaller classes in fund average assets for a total of 30 classes, where possible. The total expense ASPG comparison excludes performance adjustments and fund-paid 12b-1 fees to eliminate variability in fee structures.
The Board noted that the total expense ratio of the retail class ranked below the SLTG competitive median and below the ASPG competitive median for the 12-month period ended September 30, 2020.
Fees Charged to Other Fidelity Clients. The Board also considered Fidelity fee structures and other information with respect to clients of Fidelity, such as other funds advised or subadvised by Fidelity, pension plan clients, and other institutional clients with similar mandates. The Board noted that a joint ad hoc committee created by it and the boards of other Fidelity funds periodically reviews and compares Fidelity's institutional investment advisory business with its business of providing services to the Fidelity funds and also noted the most recent findings of the committee. The Board noted that the committee's review included a consideration of the differences in services provided, fees charged, and costs incurred, as well as competition in the markets serving the different categories of clients.
Based on its review of total expense ratios and fees charged to other Fidelity clients, the Board concluded that the total expense ratio of each class of the fund was reasonable in light of the services that the fund and its shareholders receive and the other factors considered.
Costs of the Services and Profitability. The Board considered the revenues earned and the expenses incurred by Fidelity in conducting the business of developing, marketing, distributing, managing, administering and servicing the fund and servicing the fund's shareholders. The Board also considered the level of Fidelity's profits in respect of all the Fidelity funds.
On an annual basis, Fidelity presents to the Board information about the profitability of its relationships with the fund. Fidelity calculates profitability information for each fund, as well as aggregate profitability information for groups of Fidelity funds and all Fidelity funds, using a series of detailed revenue and cost allocation methodologies which originate with the books and records of Fidelity on which Fidelity's audited financial statements are based. The Audit Committee of the Board reviews any significant changes from the prior year's methodologies and the full Board approves such changes.
A public accounting firm has been engaged annually by the Board as part of the Board's assessment of Fidelity's profitability analysis. The engagement includes the review and assessment of the methodologies used by Fidelity in determining the revenues and expenses attributable to Fidelity's mutual fund business, and completion of agreed-upon procedures in respect of the mathematical accuracy of certain fund profitability information and its conformity to established allocation methodologies. After considering the reports issued under the engagement and information provided by Fidelity, the Board concluded that while other allocation methods may also be reasonable, Fidelity's profitability methodologies are reasonable in all material respects.
The Board also reviewed Fidelity's non-fund businesses and potential indirect benefits such businesses may have received as a result of their association with Fidelity's mutual fund business (i.e., fall-out benefits) as well as cases where Fidelity's affiliates may benefit from the funds' business. The Board considered areas where potential indirect benefits to the Fidelity funds from their relationships with Fidelity may exist. The Board also considered that in 2019 a joint ad hoc committee created by it and the boards of other Fidelity funds evaluated potential fall-out benefits (PFOB Committee). The Board noted that it considered the PFOB Committee's findings in connection with its consideration of the renewal of the Advisory Contracts.
The Board considered the costs of the services provided by and the profits realized by Fidelity in connection with the operation of the fund, including the conclusions of the PFOB Committee, and was satisfied that the profitability was not excessive.
Economies of Scale. The Board considered whether there have been economies of scale in respect of the management of the Fidelity funds, whether the Fidelity funds (including the fund) have appropriately benefited from any such economies of scale, and whether there is potential for realization of any further economies of scale. The Board considered the extent to which the fund will benefit from economies of scale as assets grow through increased services to the fund, through waivers or reimbursements, or through fee or expense ratio reductions. The Board also noted that a committee (the Economies of Scale Committee) created by it and the boards of other Fidelity funds periodically analyzes whether Fidelity attains economies of scale in respect of the management and servicing of the Fidelity funds, whether the Fidelity funds have appropriately benefited from such economies of scale, and whether there is potential for realization of any further economies of scale.
The Board recognized that the fund's management contract incorporates a "group fee" structure, which provides for lower group fee rates as total "group assets" increase, and for higher group fee rates as total "group assets" decrease ("group assets" as defined in the management contract). FMR calculates the group fee rates based on a tiered asset "breakpoint" schedule that varies based on asset class. The Board considered that the group fee is designed to deliver the benefits of economies of scale to fund shareholders when total Fidelity fund assets increase, even if assets of any particular fund are unchanged or have declined, because some portion of Fidelity's costs are attributable to services provided to all Fidelity funds, and all funds benefit if those costs can be allocated among more assets. The Board further considered that Fidelity agreed to impose a temporary fee waiver in the form of additional breakpoints to the current breakpoint schedule. The Board concluded that, given the group fee structure, fund shareholders will benefit from lower management fees as "group assets" increase at the fund complex level, regardless of whether Fidelity achieves any such economies of scale.
The Board concluded, taking into account the analysis of the Economies of Scale Committee, that economies of scale, if any, are being appropriately shared between fund shareholders and Fidelity.
Additional Information Requested by the Board. In order to develop fully the factual basis for consideration of the Fidelity funds' advisory contracts, the Board requested and received additional information on certain topics, including: (i) fund flow and performance trends, in particular the underperformance of certain funds and strategies, and Fidelity's long-term strategies for certain funds; (ii) consideration of expanding the use of performance fees for additional funds; (iii) Fidelity's pricing philosophy compared to competitors; (iv) metrics for evaluating index fund and ETF performance and information about ETF trading characteristics; (v) the methodology with respect to evaluating competitive fund data and peer group classifications and fee and expense comparisons; (vi) the expense structures for different funds and classes and information about the differences between various expense structures; (vii) group fee breakpoints; (viii) information regarding other accounts managed by Fidelity and sub-advisory arrangements; and (ix) Fidelity's philosophies and strategies for evaluating funds and classes with lower or declining asset levels.
Based on its evaluation of all of the conclusions noted above, and after considering all factors it believed relevant, the Board concluded that the advisory fee arrangements are fair and reasonable, and that the fund's Advisory Contracts should be renewed.
Liquidity Risk Management Program
The Securities and Exchange Commission adopted Rule 22e-4 under the Investment Company Act of 1940 (the Liquidity Rule) to promote effective liquidity risk management throughout the open-end investment company industry, thereby reducing the risk that funds will be unable to meet their redemption obligations and mitigating dilution of the interests of fund shareholders.
The Fund has adopted and implemented a liquidity risk management program pursuant to the Liquidity Rule (the Program) effective December 1, 2018. The Program is reasonably designed to assess and manage the Fund’s liquidity risk and to comply with the requirements of the Liquidity Rule. The Fund’s Board of Trustees (the Board) has designated the Fund’s investment adviser as administrator of the Program. The Fidelity advisers have established a Liquidity Risk Management Committee (the LRM Committee) to manage the Program for each of the Fidelity Funds. The LRM Committee monitors the adequacy and effectiveness of implementation of the Program and on a periodic basis assesses each Fund’s liquidity risk based on a variety of factors including (1) the Fund’s investment strategy, (2) portfolio liquidity and cash flow projections during normal and reasonably foreseeable stressed conditions, (3) shareholder redemptions, (4) borrowings and other funding sources and (5) in the case of exchange-traded funds, certain additional factors including the effect of the Fund’s prices and spreads, market participants, and basket compositions on the overall liquidity of the Fund’s portfolio, as applicable.
In accordance with the Program, each of the Fund’s portfolio investments is classified into one of four liquidity categories described below based on a determination of a reasonable expectation for how long it would take to convert the investment to cash (or sell or dispose of the investment) without significantly changing its market value.
- Highly liquid investments – cash or convertible to cash within three business days or less
- Moderately liquid investments – convertible to cash in three to seven calendar days
- Less liquid investments – can be sold or disposed of, but not settled, within seven calendar days
- Illiquid investments – cannot be sold or disposed of within seven calendar days
Liquidity classification determinations take into account a variety of factors including various market, trading and investment-specific considerations, as well as market depth, and generally utilize analysis from a third-party liquidity metrics service.
The Liquidity Rule places a 15% limit on a fund’s illiquid investments and requires funds that do not primarily hold assets that are highly liquid investments to determine and maintain a minimum percentage of the fund’s net assets to be invested in highly liquid investments (highly liquid investment minimum or HLIM). The Program includes provisions reasonably designed to comply with the 15% limit on illiquid investments and for determining, periodically reviewing and complying with the HLIM requirement as applicable.
At a recent meeting of the Fund’s Board of Trustees, the LRM Committee provided a written report to the Board pertaining to the operation, adequacy, and effectiveness of implementation of the Program for the annual period from December 1, 2019 through November 30, 2020. The report concluded that the Program has been implemented and is operating effectively and is reasonably designed to assess and manage the Fund’s liquidity risk.

LPS-ANN-0921
1.536378.124
Fidelity® Low-Priced Stock K6 Fund
Annual Report
July 31, 2021
Contents
To view a fund's proxy voting guidelines and proxy voting record for the 12-month period ended June 30, visit http://www.fidelity.com/proxyvotingresults or visit the Securities and Exchange Commission's (SEC) web site at http://www.sec.gov.
You may also call 1-800-835-5092 to request a free copy of the proxy voting guidelines.
Standard & Poor's, S&P and S&P 500 are registered service marks of The McGraw-Hill Companies, Inc. and have been licensed for use by Fidelity Distributors Corporation.
Other third-party marks appearing herein are the property of their respective owners.
All other marks appearing herein are registered or unregistered trademarks or service marks of FMR LLC or an affiliated company. © 2021 FMR LLC. All rights reserved.
This report and the financial statements contained herein are submitted for the general information of the shareholders of the Fund. This report is not authorized for distribution to prospective investors in the Fund unless preceded or accompanied by an effective prospectus.
A fund files its complete schedule of portfolio holdings with the SEC for the first and third quarters of each fiscal year on Form N-PORT. Forms N-PORT are available on the SEC’s web site at http://www.sec.gov. A fund's Forms N-PORT may be reviewed and copied at the SEC’s Public Reference Room in Washington, DC. Information regarding the operation of the SEC's Public Reference Room may be obtained by calling 1-800-SEC-0330.
For a complete list of a fund's portfolio holdings, view the most recent holdings listing, semiannual report, or annual report on Fidelity's web site at http://www.fidelity.com, http://www.institutional.fidelity.com, or http://www.401k.com, as applicable.
NOT FDIC INSURED •MAY LOSE VALUE •NO BANK GUARANTEE
Neither the Fund nor Fidelity Distributors Corporation is a bank.
Note to Shareholders:
Early in 2020, the outbreak and spread of a new coronavirus emerged as a public health emergency that had a major influence on financial markets, primarily based on its impact on the global economy and the outlook for corporate earnings. The virus causes a respiratory disease known as COVID-19. On March 11, 2020 the World Health Organization declared the COVID-19 outbreak a pandemic, citing sustained risk of further global spread.
In the weeks following, as the crisis worsened, we witnessed an escalating human tragedy with wide-scale social and economic consequences from coronavirus-containment measures. The outbreak of COVID-19 prompted a number of measures to limit the spread, including travel and border restrictions, quarantines, and restrictions on large gatherings. In turn, these resulted in lower consumer activity, diminished demand for a wide range of products and services, disruption in manufacturing and supply chains, and – given the wide variability in outcomes regarding the outbreak – significant market uncertainty and volatility. Amid the turmoil, global governments and central banks took unprecedented action to help support consumers, businesses, and the broader economies, and to limit disruption to financial systems.
The situation continues to unfold, and the extent and duration of its impact on financial markets and the economy remain highly uncertain. Extreme events such as the coronavirus crisis are “exogenous shocks” that can have significant adverse effects on mutual funds and their investments. Although multiple asset classes may be affected by market disruption, the duration and impact may not be the same for all types of assets.
Fidelity is committed to helping you stay informed amid news about COVID-19 and during increased market volatility, and we’re taking extra steps to be responsive to customer needs. We encourage you to visit our websites, where we offer ongoing updates, commentary, and analysis on the markets and our funds.
Performance: The Bottom Line
Average annual total return reflects the change in the value of an investment, assuming reinvestment of distributions from dividend income and capital gains (the profits earned upon the sale of securities that have grown in value, if any) and assuming a constant rate of performance each year. The hypothetical investment and the average annual total returns do not reflect the deduction of taxes that a shareholder would pay on fund distributions or the redemption of fund shares. During periods of reimbursement by Fidelity, a fund’s total return will be greater than it would be had the reimbursement not occurred. How a fund did yesterday is no guarantee of how it will do tomorrow.
Average Annual Total Returns
| For the periods ended July 31, 2021 | Past 1 year | Life of fundA |
| Fidelity® Low-Priced Stock K6 Fund | 45.81% | 12.97% |
A From May 26, 2017
$10,000 Over Life of Fund
Let's say hypothetically that $10,000 was invested in Fidelity® Low-Priced Stock K6 Fund on May 26, 2017, when the fund started.
The chart shows how the value of your investment would have changed, and also shows how the Russell 2000® Index performed over the same period.

| Period Ending Values |
| $16,659 | Fidelity® Low-Priced Stock K6 Fund |
| $17,005 | Russell 2000® Index |
Management's Discussion of Fund Performance
Market Recap: The S&P 500
® index gained 36.45% for the 12 months ending July 31, 2021, as U.S. equities continued a historic rebound following a steep but brief decline due to the early-2020 outbreak and spread of COVID-19. A confluence of powerful forces propelled risk assets, returning the stock market to pre-pandemic highs by late August 2020. The rally slowed in September, when stocks began a two-month retreat amid Congress’s inability to reach a deal on additional fiscal stimulus, as well as uncertainty about the election. But as the calendar turned, investors grew hopeful. The rollout of three COVID-19 vaccines was underway, the U.S. Federal Reserve pledged to hold interest rates near zero until the economy recovered, and the federal government planned to deploy trillions of dollars to boost consumers and the economy. This backdrop fueled a sharp rotation, with small-cap value usurping leadership from large growth. As part of the “reopening” theme, investors moved out of tech-driven mega-caps that had thrived due to the work-from-home trend in favor of cheap smaller companies that stood to benefit from a broad cyclical recovery. A flattish May reflected concerns about inflation and jobs, but the uptrend resumed through July, driven by corporate earnings. Notably, this leg saw momentum shift back to large growth, as easing rates and a hawkish Fed stymied the reflation trade. By sector, financials (+55%) led, driven by banks (+63%), whereas utilities (+12%) and consumer staples (+18%) notably lagged.
Comments from Lead Manager Joel Tillinghast: For the fiscal year ending July 31, 2021, the fund gained 45.81%, underperforming the 51.97% result of the benchmark Russell 2000
® Index. Versus the benchmark, security selection was the primary detractor, especially in the food & staples retailing area of the consumer staples sector. Weak picks in the consumer discretionary sector, especially within the retailing industry, also hindered the fund's relative result. Also hampering performance were stock picks and an underweighting in the industrials sector, primarily within the capital goods industry. Metro, the fund's top individual detractor, advanced 20% this period. This was among the fund's largest holdings. Our second-largest detractor was Amgen, which gained about 2% the past year. Another detractor this period was UnitedHealth Group. The shares gained roughly 38% the past 12 months. This was among our biggest holdings. All these detractors were non-benchmark positions. Also, the fund's foreign holdings detracted overall, despite benefiting from a broadly weaker U.S. dollar. In contrast, the top contributor to performance versus the benchmark was our stock selection in financials. Strong picks in the information technology sector, especially within the technology hardware & equipment industry, also lifted the fund's relative result. Also helping was an overweighting in the consumer discretionary sector, primarily driven by the retailing industry. Our top individual relative contributor was an out-of-benchmark stake in Seagate Technology (+133%), which was among our largest holdings this period. The fund's non-benchmark stake in Synchrony Financial, one of our biggest holdings as of July 31, gained approximately 117%. Another notable relative contributor was an outsized stake in Bed Bath & Beyond (+179%). Notable changes in positioning include increased exposure to the energy sector and a lower allocation to health care.
The views expressed above reflect those of the portfolio manager(s) only through the end of the period as stated on the cover of this report and do not necessarily represent the views of Fidelity or any other person in the Fidelity organization. Any such views are subject to change at any time based upon market or other conditions and Fidelity disclaims any responsibility to update such views. These views may not be relied on as investment advice and, because investment decisions for a Fidelity fund are based on numerous factors, may not be relied on as an indication of trading intent on behalf of any Fidelity fund.
Investment Summary (Unaudited)
Top Ten Stocks as of July 31, 2021
| | % of fund's net assets |
| UnitedHealth Group, Inc. | 4.4 |
| AutoZone, Inc. | 2.7 |
| Metro, Inc. | 2.7 |
| Next PLC | 2.7 |
| Ross Stores, Inc. | 2.4 |
| Anthem, Inc. | 2.0 |
| Synchrony Financial | 1.8 |
| Seagate Technology Holdings PLC | 1.7 |
| Monster Beverage Corp. | 1.7 |
| Hon Hai Precision Industry Co. Ltd. (Foxconn) | 1.6 |
| | 23.7 |
Top Five Market Sectors as of July 31, 2021
| | % of fund's net assets |
| Consumer Discretionary | 19.8 |
| Financials | 13.6 |
| Information Technology | 13.3 |
| Health Care | 10.7 |
| Consumer Staples | 10.5 |
Asset Allocation (% of fund's net assets)
| As of July 31, 2021* |
| | Stocks | 87.0% |
| | Short-Term Investments and Net Other Assets (Liabilities) | 13.0% |

* Foreign investments - 35.2%
Schedule of Investments July 31, 2021
Showing Percentage of Net Assets
| Common Stocks - 87.0% | | | |
| | | Shares | Value |
| COMMUNICATION SERVICES - 1.5% | | | |
| Diversified Telecommunication Services - 0.0% | | | |
| Frontier Communications Parent, Inc. (a) | | 9,888 | $295,750 |
| Verizon Communications, Inc. | | 2,661 | 148,431 |
| | | | 444,181 |
| Entertainment - 0.0% | | | |
| GungHo Online Entertainment, Inc. | | 4,300 | 79,333 |
| Madison Square Garden Entertainment Corp. (a)(b) | | 7,833 | 547,997 |
| | | | 627,330 |
| Interactive Media & Services - 0.1% | | | |
| Cars.com, Inc. (a) | | 16,165 | 195,273 |
| Dip Corp. | | 28,539 | 831,157 |
| QuinStreet, Inc. (a) | | 27,159 | 498,096 |
| XLMedia PLC (a) | | 275,541 | 195,331 |
| ZIGExN Co. Ltd. | | 64,972 | 251,703 |
| | | | 1,971,560 |
| Media - 1.4% | | | |
| AMC Networks, Inc. Class A (a)(b) | | 32,550 | 1,628,802 |
| Comcast Corp. Class A | | 85,202 | 5,012,434 |
| Corus Entertainment, Inc. Class B (non-vtg.) | | 49,977 | 231,939 |
| Discovery Communications, Inc. Class C (non-vtg.) (a) | | 467,970 | 12,686,667 |
| Gray Television, Inc. | | 17,208 | 381,501 |
| Hyundai HCN | | 211,755 | 845,910 |
| Intage Holdings, Inc. | | 247,858 | 3,461,268 |
| Legs Co. Ltd. | | 1,418 | 27,661 |
| Meredith Corp. (a) | | 24,430 | 1,066,125 |
| Nexstar Broadcasting Group, Inc. Class A | | 1,800 | 264,726 |
| Nordic Entertainment Group AB (B Shares) (a) | | 79 | 4,223 |
| Pico Far East Holdings Ltd. | | 1,840,348 | 307,863 |
| Proto Corp. | | 21,199 | 267,632 |
| RKB Mainichi Broadcasting Corp. | | 2,926 | 159,496 |
| Saga Communications, Inc. Class A | | 35,309 | 770,795 |
| Sky Network Television Ltd. (a) | | 2,006,102 | 230,612 |
| TechTarget, Inc. (a) | | 8,411 | 614,676 |
| Tegna, Inc. | | 103,998 | 1,842,845 |
| TOW Co. Ltd. | | 274,209 | 784,847 |
| Trenders, Inc. | | 9,388 | 56,651 |
| TVA Group, Inc. Class B (non-vtg.) (a) | | 213,897 | 514,340 |
| ViacomCBS, Inc. Class B | | 199,953 | 8,184,076 |
| WOWOW INC. | | 16,686 | 361,843 |
| | | | 39,706,932 |
| Wireless Telecommunication Services - 0.0% | | | |
| Okinawa Cellular Telephone Co. | | 4,190 | 198,987 |
|
| TOTAL COMMUNICATION SERVICES | | | 42,948,990 |
|
| CONSUMER DISCRETIONARY - 19.8% | | | |
| Auto Components - 1.2% | | | |
| Adient PLC (a) | | 73,991 | 3,117,241 |
| ASTI Corp. | | 14,935 | 372,065 |
| Cie Automotive SA | | 19,744 | 588,344 |
| Cooper-Standard Holding, Inc. (a) | | 61,516 | 1,602,492 |
| DaikyoNishikawa Corp. | | 19,937 | 127,758 |
| ElringKlinger AG (a) | | 127 | 2,075 |
| G-Tekt Corp. | | 16,742 | 236,239 |
| Gentex Corp. | | 134,243 | 4,568,289 |
| GUD Holdings Ltd. | | 18,231 | 157,067 |
| Hi-Lex Corp. | | 116,164 | 1,756,675 |
| Lear Corp. | | 46,624 | 8,158,268 |
| Linamar Corp. | | 20,655 | 1,222,148 |
| Motonic Corp. | | 152,681 | 1,476,798 |
| Murakami Corp. | | 68,937 | 1,991,981 |
| Nippon Seiki Co. Ltd. | | 224,518 | 2,595,040 |
| Patrick Industries, Inc. | | 2,504 | 206,906 |
| Piolax, Inc. | | 154,837 | 2,142,496 |
| Plastic Omnium SA | | 21,288 | 675,767 |
| SJM Co. Ltd. | | 50 | 232 |
| SNT Holdings Co. Ltd. | | 68,802 | 1,235,471 |
| Strattec Security Corp. (a) | | 21,407 | 881,540 |
| Sungwoo Hitech Co. Ltd. | | 126,930 | 723,420 |
| TBK Co. Ltd. | | 57,532 | 215,539 |
| Yachiyo Industry Co. Ltd. | | 67,146 | 362,339 |
| Yutaka Giken Co. Ltd. | | 76,624 | 1,410,181 |
| | | | 35,826,371 |
| Automobiles - 0.0% | | | |
| Isuzu Motors Ltd. | | 25,021 | 333,772 |
| Kabe Husvagnar AB (B Shares) | | 20,698 | 524,158 |
| | | | 857,930 |
| Distributors - 0.1% | | | |
| Arata Corp. | | 6,873 | 266,888 |
| Central Automotive Products Ltd. | | 4,722 | 143,763 |
| LKQ Corp. (a) | | 8,922 | 452,792 |
| Nakayamafuku Co. Ltd. | | 41,068 | 163,591 |
| PALTAC Corp. | | 2,704 | 124,965 |
| SPK Corp. | | 41,302 | 514,651 |
| Uni-Select, Inc. (a) | | 52,069 | 644,811 |
| | | | 2,311,461 |
| Diversified Consumer Services - 0.1% | | | |
| Adtalem Global Education, Inc. (a) | | 7,176 | 260,776 |
| Clip Corp. | | 16,359 | 129,136 |
| Cross-Harbour Holdings Ltd. | | 208,199 | 333,819 |
| JP-Holdings, Inc. | | 8,088 | 20,053 |
| Kukbo Design Co. Ltd. | | 8,700 | 169,432 |
| Step Co. Ltd. | | 66,644 | 1,089,826 |
| YDUQS Participacoes SA | | 52,100 | 282,695 |
| | | | 2,285,737 |
| Hotels, Restaurants & Leisure - 0.2% | | | |
| Ark Restaurants Corp. (a) | | 1,225 | 19,355 |
| Betsson AB (B Shares) | | 94,090 | 757,451 |
| Curves Holdings Co. Ltd. | | 20,463 | 151,833 |
| Everi Holdings, Inc. (a) | | 12,622 | 286,393 |
| Fairwood Holdings Ltd. | | 9,000 | 20,244 |
| Flanigans Enterprises, Inc. (a) | | 6,206 | 194,868 |
| Hiday Hidaka Corp. | | 82,245 | 1,314,960 |
| Ibersol SGPS SA (a) | | 72,219 | 507,165 |
| J.D. Weatherspoon PLC (a) | | 14,483 | 228,491 |
| Kindred Group PLC (depositary receipt) | | 34,788 | 570,007 |
| Koshidaka Holdings Co. Ltd. | | 20,463 | 103,336 |
| Ruth's Hospitality Group, Inc. (a) | | 10,468 | 209,046 |
| Sportscene Group, Inc. Class A (a) | | 40,090 | 118,895 |
| The Monogatari Corp. | | 4,294 | 266,161 |
| The Restaurant Group PLC (a) | | 1,419,278 | 2,264,770 |
| | | | 7,012,975 |
| Household Durables - 4.8% | | | |
| Barratt Developments PLC | | 4,640,735 | 45,386,574 |
| Bellway PLC | | 291,061 | 13,278,145 |
| Coway Co. Ltd. | | 3,100 | 230,733 |
| Cuckoo Holdings Co. Ltd. | | 4,600 | 510,774 |
| D.R. Horton, Inc. | | 77,351 | 7,381,606 |
| Dorel Industries, Inc. Class B (sub. vtg.) (a) | | 126,973 | 1,442,135 |
| Emak SpA | | 325,531 | 675,782 |
| First Juken Co. Ltd. | | 87,332 | 920,248 |
| FJ Next Co. Ltd. | | 16,933 | 158,672 |
| Gree Electric Appliances, Inc. of Zhuhai (A Shares) | | 1,136,498 | 8,354,728 |
| Hamilton Beach Brands Holding Co.: | | | |
| Class A | | 19,603 | 366,380 |
| Class B (a) | | 2,326 | 43,473 |
| Helen of Troy Ltd. (a) | | 61,895 | 13,826,724 |
| Henry Boot PLC | | 159,483 | 605,190 |
| Lennar Corp. Class A | | 4,869 | 511,975 |
| M/I Homes, Inc. (a) | | 65,539 | 4,241,029 |
| Mohawk Industries, Inc. (a) | | 116,974 | 22,798,233 |
| Newell Brands, Inc. | | 8,083 | 200,054 |
| Open House Co. Ltd. | | 13,755 | 692,107 |
| Pressance Corp. | | 63,065 | 916,327 |
| Q.E.P. Co., Inc. | | 1,539 | 37,198 |
| Sanei Architecture Planning Co. Ltd. | | 75,272 | 1,353,736 |
| Taylor Morrison Home Corp. (a) | | 304,162 | 8,157,625 |
| Tempur Sealy International, Inc. | | 18,652 | 807,072 |
| Token Corp. | | 51,202 | 4,615,904 |
| Toll Brothers, Inc. | | 4,700 | 278,569 |
| TopBuild Corp. (a) | | 1,443 | 292,482 |
| TRI Pointe Homes, Inc. (a) | | 76,981 | 1,856,782 |
| Whirlpool Corp. | | 972 | 215,337 |
| ZAGG, Inc. rights (a)(c) | | 384 | 35 |
| | | | 140,155,629 |
| Internet & Direct Marketing Retail - 0.2% | | | |
| Aucfan Co. Ltd. (a) | | 4,300 | 47,780 |
| Aucnet, Inc. | | 11,556 | 167,591 |
| Belluna Co. Ltd. | | 494,714 | 4,184,810 |
| Ci Medical Co. Ltd. | | 5,907 | 390,372 |
| Dustin Group AB (d) | | 24,024 | 278,937 |
| Papyless Co. Ltd. | | 3,500 | 49,897 |
| Qurate Retail, Inc. Series A | | 21,919 | 259,959 |
| Vipshop Holdings Ltd. ADR (a) | | 25,200 | 419,076 |
| | | | 5,798,422 |
| Leisure Products - 0.0% | | | |
| Mars Group Holdings Corp. | | 34,241 | 510,002 |
| Miroku Corp. | | 10,515 | 155,274 |
| Nautilus, Inc. (a)(b) | | 5,100 | 73,695 |
| | | | 738,971 |
| Multiline Retail - 2.9% | | | |
| Big Lots, Inc. (b) | | 91,382 | 5,264,517 |
| Kohl's Corp. | | 5,500 | 279,400 |
| Lifestyle China Group Ltd. (a) | | 1,503,627 | 222,512 |
| Lifestyle International Holdings Ltd. (a) | | 1,607,448 | 1,145,939 |
| Max Stock Ltd. | | 2,022 | 8,288 |
| Next PLC | | 710,385 | 77,829,639 |
| Ryohin Keikaku Co. Ltd. | | 914 | 18,487 |
| | | | 84,768,782 |
| Specialty Retail - 8.8% | | | |
| AT-Group Co. Ltd. | | 84,859 | 1,105,360 |
| AutoNation, Inc. (a) | | 3,839 | 465,786 |
| AutoZone, Inc. (a) | | 48,949 | 79,472,128 |
| Bed Bath & Beyond, Inc. (a) | | 866,375 | 24,726,343 |
| Best Buy Co., Inc. | | 145,928 | 16,395,011 |
| BMTC Group, Inc. | | 242,642 | 3,086,509 |
| Bonia Corp. Bhd | | 54 | 11 |
| Buffalo Co. Ltd. | | 5,975 | 65,793 |
| Burlington Stores, Inc. (a) | | 1,520 | 508,896 |
| Delek Automotive Systems Ltd. | | 29,601 | 373,069 |
| Dick's Sporting Goods, Inc. | | 5,848 | 609,011 |
| Foot Locker, Inc. | | 260,185 | 14,846,156 |
| Genesco, Inc. (a) | | 51,394 | 2,952,585 |
| Goldlion Holdings Ltd. | | 1,876,337 | 424,950 |
| Hour Glass Ltd. | | 406,395 | 461,898 |
| IA Group Corp. | | 7,248 | 241,149 |
| JD Sports Fashion PLC | | 511,919 | 6,382,760 |
| Jumbo SA | | 612,370 | 9,734,080 |
| K's Holdings Corp. | | 83,157 | 978,585 |
| Kid ASA (d) | | 2,822 | 36,925 |
| Ku Holdings Co. Ltd. | | 67,358 | 613,992 |
| Leon's Furniture Ltd. | | 24,611 | 457,462 |
| Maisons du Monde SA (d) | | 11,616 | 265,806 |
| Mr. Bricolage SA (a) | | 53,675 | 729,044 |
| Nafco Co. Ltd. | | 120,821 | 2,063,885 |
| Nextage Co. Ltd. | | 28,253 | 578,169 |
| Ross Stores, Inc. | | 575,864 | 70,652,754 |
| Sally Beauty Holdings, Inc. (a) | | 530,332 | 10,033,881 |
| T-Gaia Corp. | | 831 | 14,930 |
| The Buckle, Inc. | | 207,580 | 8,734,966 |
| Urban Outfitters, Inc. (a) | | 60,705 | 2,257,012 |
| WH Smith PLC (a) | | 6,287 | 142,008 |
| Williams-Sonoma, Inc. | | 2,455 | 372,424 |
| | | | 259,783,338 |
| Textiles, Apparel & Luxury Goods - 1.5% | | | |
| Best Pacific International Holdings Ltd. | | 523,641 | 154,980 |
| Capri Holdings Ltd. (a) | | 215,981 | 12,161,890 |
| Carter's, Inc. | | 904 | 88,357 |
| Deckers Outdoor Corp. (a) | | 2,138 | 878,397 |
| Embry Holdings Ltd. | | 151,574 | 21,650 |
| Fossil Group, Inc. (a) | | 299,837 | 3,783,943 |
| G-III Apparel Group Ltd. (a) | | 66,109 | 1,974,015 |
| Gildan Activewear, Inc. | | 532,784 | 18,367,297 |
| Handsome Co. Ltd. | | 89,900 | 3,060,980 |
| JLM Couture, Inc. (a) | | 10,007 | 17,512 |
| McRae Industries, Inc. | | 1,735 | 55,347 |
| Movado Group, Inc. | | 5,064 | 152,274 |
| Samsonite International SA (a)(d) | | 158,910 | 295,279 |
| Sun Hing Vision Group Holdings Ltd. | | 1,234,530 | 225,582 |
| Ted Baker PLC (a) | | 337,794 | 616,498 |
| Texwinca Holdings Ltd. | | 3,666,415 | 825,647 |
| Victory City International Holdings Ltd. (a)(c) | | 4,501,799 | 167,996 |
| Youngone Corp. | | 21,264 | 735,080 |
| Youngone Holdings Co. Ltd. | | 19 | 762 |
| | | | 43,583,486 |
|
| TOTAL CONSUMER DISCRETIONARY | | | 583,123,102 |
|
| CONSUMER STAPLES - 10.5% | | | |
| Beverages - 2.0% | | | |
| A.G. Barr PLC (a) | | 221,170 | 1,767,701 |
| Britvic PLC | | 511,936 | 6,934,455 |
| Jinro Distillers Co. Ltd. | | 1,190 | 33,395 |
| Monster Beverage Corp. (a) | | 521,340 | 49,172,789 |
| Olvi PLC (A Shares) | | 1,632 | 102,412 |
| Spritzer Bhd | | 415,500 | 200,858 |
| Yantai Changyu Pioneer Wine Co. Ltd. (B Shares) | | 248,255 | 467,046 |
| | | | 58,678,656 |
| Food & Staples Retailing - 6.5% | | | |
| Alimentation Couche-Tard, Inc. Class A (multi-vtg.) | | 25,466 | 1,040,399 |
| Aoki Super Co. Ltd. | | 8,600 | 246,151 |
| Belc Co. Ltd. | | 135,682 | 6,629,192 |
| BJ's Wholesale Club Holdings, Inc. (a) | | 11,688 | 591,880 |
| Corporativo Fragua S.A.B. de CV | | 14,344 | 238,151 |
| Cosmos Pharmaceutical Corp. | | 133,910 | 22,691,645 |
| Create SD Holdings Co. Ltd. | | 328,116 | 10,976,580 |
| Daikokutenbussan Co. Ltd. | | 25,461 | 1,464,463 |
| G-7 Holdings, Inc. | | 25,462 | 847,147 |
| Genky DrugStores Co. Ltd. | | 54,824 | 2,018,950 |
| Halows Co. Ltd. | | 117,646 | 3,034,850 |
| Kroger Co. | | 8,800 | 358,160 |
| Kusuri No Aoki Holdings Co. Ltd. | | 52,372 | 3,499,264 |
| MARR SpA | | 9,100 | 211,364 |
| MARR SpA | | 1,900 | 44,131 |
| Metro, Inc. | | 1,505,847 | 78,092,578 |
| Naked Wines PLC (a) | | 21,212 | 259,170 |
| North West Co., Inc. | | 6,967 | 203,046 |
| Olam International Ltd. | | 4,008 | 3,905 |
| Qol Holdings Co. Ltd. | | 188,566 | 2,598,895 |
| Rami Levi Chain Stores Hashikma Marketing 2006 Ltd. | | 800 | 52,046 |
| Sprouts Farmers Market LLC (a) | | 114,939 | 2,825,201 |
| Sugi Holdings Co. Ltd. | | 3,190 | 234,659 |
| Sundrug Co. Ltd. | | 233,232 | 7,547,273 |
| United Natural Foods, Inc. (a)(b) | | 43,163 | 1,429,559 |
| Valor Holdings Co. Ltd. | | 24,536 | 518,654 |
| Walgreens Boots Alliance, Inc. | | 836,327 | 39,432,818 |
| YAKUODO Holdings Co. Ltd. | | 300 | 6,306 |
| Yaoko Co. Ltd. | | 58,294 | 3,507,045 |
| | | | 190,603,482 |
| Food Products - 1.5% | | | |
| Ausnutria Dairy Corp. Ltd. (H Shares) | | 59,500 | 56,352 |
| Carr's Group PLC | | 176,969 | 388,659 |
| Cranswick PLC | | 31,195 | 1,756,123 |
| Darling Ingredients, Inc. (a) | | 4,722 | 326,149 |
| Dole PLC | | 96,484 | 1,399,018 |
| Food Empire Holdings Ltd. | | 3,021,916 | 1,873,434 |
| Fresh Del Monte Produce, Inc. | | 317,953 | 9,812,030 |
| Inghams Group Ltd. | | 75,850 | 211,518 |
| Ingredion, Inc. | | 60,730 | 5,332,701 |
| Kaveri Seed Co. Ltd. | | 38,300 | 370,875 |
| Kri Kri Milk Industry SA | | 12,149 | 126,823 |
| Lassonde Industries, Inc. Class A (sub. vtg.) | | 1,153 | 159,485 |
| Mitsui Sugar Co. Ltd. | | 28,637 | 486,572 |
| Namyang Dairy Products Co. Ltd. | | 189 | 98,864 |
| Origin Enterprises PLC | | 578,913 | 2,362,370 |
| Pacific Andes International Holdings Ltd. (a)(c) | | 3,104,000 | 29,158 |
| Pacific Andes Resources Development Ltd. (a)(c) | | 176,886 | 1,436 |
| Pickles Corp. | | 8,499 | 285,869 |
| Rocky Mountain Chocolate Factory, Inc. (a) | | 56,981 | 476,931 |
| S Foods, Inc. | | 29,090 | 904,215 |
| Seaboard Corp. | | 3,500 | 14,385,000 |
| Sunjuice Holdings Co. Ltd. | | 13,900 | 251,256 |
| Thai President Foods PCL | | 38,292 | 224,904 |
| Tyson Foods, Inc. Class A | | 30,487 | 2,178,601 |
| Ulker Biskuvi Sanayi A/S | | 14 | 33 |
| | | | 43,498,376 |
| Household Products - 0.0% | | | |
| Oil-Dri Corp. of America | | 2,428 | 86,364 |
| Spectrum Brands Holdings, Inc. | | 3,500 | 305,725 |
| Transaction Co. Ltd. | | 53,024 | 612,866 |
| | | | 1,004,955 |
| Personal Products - 0.4% | | | |
| Hengan International Group Co. Ltd. | | 307,285 | 1,824,853 |
| Herbalife Nutrition Ltd. (a) | | 157,263 | 8,010,977 |
| Nu Skin Enterprises, Inc. Class A | | 4,920 | 264,155 |
| Sarantis SA | | 249,406 | 2,603,549 |
| TCI Co. Ltd. | | 79,000 | 925,176 |
| | | | 13,628,710 |
| Tobacco - 0.1% | | | |
| KT&G Corp. | | 2,000 | 142,788 |
| Scandinavian Tobacco Group A/S (d) | | 93,388 | 1,913,627 |
| | | | 2,056,415 |
|
| TOTAL CONSUMER STAPLES | | | 309,470,594 |
|
| ENERGY - 5.3% | | | |
| Energy Equipment & Services - 0.3% | | | |
| AKITA Drilling Ltd. Class A (non-vtg.) (a) | | 101,927 | 66,176 |
| Bristow Group, Inc. (a) | | 17,669 | 459,041 |
| Cathedral Energy Services Ltd. (a) | | 82,803 | 33,185 |
| Championx Corp. (a) | | 32,409 | 753,185 |
| Geospace Technologies Corp. (a) | | 55,495 | 484,471 |
| Helix Energy Solutions Group, Inc. (a)(b) | | 56,337 | 233,799 |
| John Wood Group PLC (a) | | 60,242 | 182,545 |
| KS Energy Services Ltd. (a)(c) | | 810,548 | 7,777 |
| Liberty Oilfield Services, Inc. Class A (a) | | 405,465 | 4,131,688 |
| Oil States International, Inc. (a) | | 264,405 | 1,496,532 |
| PHX Energy Services Corp. | | 97,787 | 322,926 |
| Tidewater, Inc. warrants 11/14/24 (a) | | 3,018 | 679 |
| Total Energy Services, Inc. (a) | | 127,006 | 409,237 |
| | | | 8,581,241 |
| Oil, Gas & Consumable Fuels - 5.0% | | | |
| Adams Resources & Energy, Inc. | | 10,141 | 270,968 |
| Beach Energy Ltd. | | 1,148,085 | 1,011,027 |
| Berry Corp. | | 228,361 | 1,267,404 |
| Bonanza Creek Energy, Inc. | | 114,056 | 4,387,734 |
| China Petroleum & Chemical Corp.: | | | |
| (H Shares) | | 2,102,135 | 961,245 |
| sponsored ADR (H Shares) | | 7,263 | 332,064 |
| CNX Resources Corp. (a) | | 121,572 | 1,471,021 |
| Delek U.S. Holdings, Inc. | | 136,648 | 2,374,942 |
| Denbury, Inc. (a) | | 11,363 | 746,663 |
| DHT Holdings, Inc. | | 130,564 | 757,271 |
| Diamondback Energy, Inc. | | 55,070 | 4,247,549 |
| Energy Transfer LP | | 42,600 | 420,036 |
| Enterprise Products Partners LP | | 126,433 | 2,853,593 |
| EQT Corp. (a) | | 667,942 | 12,283,453 |
| Extraction Oil & Gas, Inc. (a) | | 51,954 | 2,311,433 |
| Fuji Kosan Co. Ltd. | | 19,405 | 184,313 |
| Great Eastern Shipping Co. Ltd. | | 169,627 | 775,766 |
| Hankook Shell Oil Co. Ltd. | | 3,400 | 808,147 |
| HollyFrontier Corp. | | 140,725 | 4,137,315 |
| Iwatani Corp. | | 9,266 | 529,582 |
| Kyungdong Invest Co. Ltd. | | 7,756 | 271,819 |
| Marathon Oil Corp. | | 1,039,825 | 12,051,572 |
| Marathon Petroleum Corp. | | 126,424 | 6,981,133 |
| Murphy Oil Corp. (b) | | 1,077,841 | 23,399,928 |
| NACCO Industries, Inc. Class A | | 42,652 | 1,069,286 |
| Northern Oil & Gas, Inc. | | 11,437 | 197,517 |
| Oasis Petroleum, Inc. | | 34,643 | 3,177,110 |
| Oil & Natural Gas Corp. Ltd. | | 5,735,669 | 8,895,500 |
| Oil India Ltd. | | 1,091,487 | 2,449,637 |
| Ovintiv, Inc. | | 159,000 | 4,079,940 |
| PDC Energy, Inc. | | 16,133 | 638,060 |
| Petronet LNG Ltd. | | 361,000 | 1,059,787 |
| Pioneer Natural Resources Co. | | 1,206 | 175,316 |
| Range Resources Corp. (a) | | 26,777 | 407,814 |
| Reliance Industries Ltd. | | 6,900 | 188,901 |
| SilverBow Resources, Inc. (a) | | 21,011 | 416,438 |
| Southwestern Energy Co. (a) | | 3,060,231 | 14,413,688 |
| Star Petroleum Refining PCL (a) | | 751,066 | 191,995 |
| Thai Oil PCL (For. Reg.) | | 36,777 | 49,245 |
| Thungela Resources Ltd. (a) | | 1,898 | 5,881 |
| Total SA sponsored ADR | | 140,368 | 6,124,256 |
| Whiting Petroleum Corp. (a) | | 332,958 | 15,615,730 |
| World Fuel Services Corp. | | 77,169 | 2,659,244 |
| | | | 146,651,323 |
|
| TOTAL ENERGY | | | 155,232,564 |
|
| FINANCIALS - 13.6% | | | |
| Banks - 2.6% | | | |
| ACNB Corp. | | 30,623 | 855,300 |
| Arrow Financial Corp. | | 18,874 | 680,408 |
| Associated Banc-Corp. | | 10,911 | 216,038 |
| Bank Norwegian ASA | | 26,100 | 305,469 |
| Bank of America Corp. | | 6,368 | 244,276 |
| Bank7 Corp. | | 2,100 | 40,278 |
| Bar Harbor Bankshares | | 37,609 | 1,077,122 |
| C & F Financial Corp. | | 2,526 | 132,009 |
| Camden National Corp. | | 35,548 | 1,591,484 |
| Cathay General Bancorp | | 64,833 | 2,455,226 |
| Central Pacific Financial Corp. | | 5,836 | 149,402 |
| Central Valley Community Bancorp | | 8,635 | 193,338 |
| Codorus Valley Bancorp, Inc. | | 57,687 | 1,259,307 |
| Comerica, Inc. | | 3,280 | 225,205 |
| Community Trust Bancorp, Inc. | | 5,534 | 220,032 |
| Dimeco, Inc. | | 2,349 | 86,326 |
| Eagle Bancorp, Inc. | | 67,241 | 3,700,272 |
| East West Bancorp, Inc. | | 38,025 | 2,705,479 |
| Financial Institutions, Inc. | | 30,204 | 889,206 |
| First Foundation, Inc. | | 9,228 | 217,504 |
| First of Long Island Corp. | | 90,360 | 1,947,258 |
| Five Star Bancorp | | 11,926 | 290,637 |
| FNB Corp., Pennsylvania | | 32,445 | 371,820 |
| Glacier Bancorp, Inc. | | 5,739 | 295,903 |
| Hanmi Financial Corp. | | 59,790 | 1,089,972 |
| Hilltop Holdings, Inc. | | 10,816 | 342,651 |
| Hope Bancorp, Inc. | | 131,950 | 1,748,338 |
| Independent Bank Corp. | | 10,358 | 217,829 |
| IndusInd Bank Ltd. (a) | | 19,300 | 254,673 |
| LCNB Corp. | | 9,728 | 163,820 |
| Meridian Bank/Malvern, PA | | 11,875 | 320,625 |
| NIBC Holding NV (d) | | 18,526 | 153,835 |
| Oak Valley Bancorp Oakdale California | | 1,700 | 29,716 |
| OFG Bancorp | | 30,574 | 706,259 |
| Plumas Bancorp (b) | | 2,022 | 63,147 |
| Popular, Inc. | | 4,510 | 328,148 |
| Preferred Bank, Los Angeles | | 13,142 | 775,115 |
| Regions Financial Corp. | | 13,318 | 256,372 |
| Seven Bank Ltd. | | 8,500 | 18,518 |
| Sparebank 1 Sr Bank ASA (primary capital certificate) | | 87,366 | 1,144,146 |
| Sparebanken More (primary capital certificate) | | 15,648 | 678,365 |
| Sparebanken Nord-Norge | | 169,736 | 1,608,071 |
| Synovus Financial Corp. | | 5,947 | 243,232 |
| Texas Capital Bancshares, Inc. (a) | | 95,874 | 6,038,145 |
| The First Bancorp, Inc. | | 4,653 | 135,216 |
| Unity Bancorp, Inc. (b) | | 8,243 | 183,077 |
| Van Lanschot NV (Bearer) | | 75,394 | 1,936,292 |
| Washington Trust Bancorp, Inc. | | 42,303 | 2,062,271 |
| Wells Fargo & Co. | | 744,697 | 34,211,380 |
| West Bancorp., Inc. | | 47,091 | 1,388,243 |
| Zions Bancorp NA | | 4,043 | 210,842 |
| | | | 76,457,597 |
| Capital Markets - 1.5% | | | |
| AllianceBernstein Holding LP | | 25,427 | 1,227,361 |
| Banca Generali SpA | | 3,528 | 146,520 |
| CI Financial Corp. | | 303,735 | 5,538,611 |
| Cowen Group, Inc. Class A | | 3,388 | 135,452 |
| Daou Data Corp. | | 2,500 | 30,687 |
| Diamond Hill Investment Group, Inc. | | 1,213 | 208,939 |
| Donnelley Financial Solutions, Inc. (a) | | 4,500 | 144,945 |
| Federated Hermes, Inc. | | 210,285 | 6,821,645 |
| Goldman Sachs Group, Inc. | | 700 | 262,416 |
| Hamilton Lane, Inc. Class A | | 4,110 | 382,230 |
| Lazard Ltd. Class A | | 135,121 | 6,377,711 |
| LPL Financial | | 2,669 | 376,436 |
| State Street Corp. | | 246,261 | 21,459,184 |
| Virtu Financial, Inc. Class A | | 9,800 | 252,252 |
| | | | 43,364,389 |
| Consumer Finance - 4.0% | | | |
| Aeon Credit Service (Asia) Co. Ltd. | | 1,015,107 | 643,982 |
| Cash Converters International Ltd. | | 1,407,220 | 273,662 |
| Credit Acceptance Corp. (a)(b) | | 2,122 | 1,028,682 |
| Discover Financial Services | | 195,428 | 24,295,609 |
| Encore Capital Group, Inc. (a) | | 4,407 | 208,627 |
| H&T Group PLC | | 37,269 | 135,726 |
| Navient Corp. | | 106,531 | 2,176,428 |
| Nicholas Financial, Inc. (a) | | 15,532 | 169,299 |
| OneMain Holdings, Inc. | | 5,230 | 319,030 |
| Regional Management Corp. | | 24,022 | 1,242,658 |
| Santander Consumer U.S.A. Holdings, Inc. | | 825,753 | 33,880,646 |
| Synchrony Financial | | 1,117,331 | 52,536,904 |
| | | | 116,911,253 |
| Diversified Financial Services - 0.1% | | | |
| Far East Horizon Ltd. | | 118,138 | 126,026 |
| Ricoh Leasing Co. Ltd. | | 59,500 | 1,868,443 |
| Zenkoku Hosho Co. Ltd. | | 21,700 | 981,104 |
| | | | 2,975,573 |
| Insurance - 5.2% | | | |
| AEGON NV | | 3,669,461 | 15,623,102 |
| AFLAC, Inc. | | 427,822 | 23,530,210 |
| Allstate Corp. | | 3,176 | 413,039 |
| American Financial Group, Inc. | | 2,048 | 259,052 |
| ASR Nederland NV | | 107,921 | 4,435,938 |
| Chubb Ltd. | | 1,283 | 216,493 |
| Db Insurance Co. Ltd. | | 72,700 | 3,601,070 |
| Employers Holdings, Inc. | | 104,127 | 4,323,353 |
| FBD Holdings PLC (a) | | 8,462 | 78,297 |
| First American Financial Corp. | | 3,177 | 213,844 |
| Globe Life, Inc. | | 1,997 | 185,941 |
| GoHealth, Inc. (a) | | 722 | 6,354 |
| Hartford Financial Services Group, Inc. | | 7,071 | 449,857 |
| Hiscox Ltd. (a) | | 21,392 | 260,596 |
| Hyundai Fire & Marine Insurance Co. Ltd. | | 41,397 | 931,896 |
| Legal & General Group PLC | | 350,000 | 1,271,711 |
| Lincoln National Corp. | | 331,288 | 20,413,967 |
| MetLife, Inc. | | 10,708 | 617,852 |
| National Western Life Group, Inc. | | 9,713 | 2,019,236 |
| NN Group NV | | 95,640 | 4,757,082 |
| Old Republic International Corp. | | 8,113 | 200,067 |
| Primerica, Inc. | | 17,549 | 2,566,015 |
| Principal Financial Group, Inc. | | 22,758 | 1,413,955 |
| Prudential Financial, Inc. | | 116,615 | 11,694,152 |
| Qualitas Controladora S.A.B. de CV | | 52,177 | 253,962 |
| Reinsurance Group of America, Inc. | | 182,494 | 20,107,189 |
| RenaissanceRe Holdings Ltd. | | 31,971 | 4,881,652 |
| Selectquote, Inc. (a) | | 8,904 | 158,491 |
| Talanx AG | | 8,160 | 347,118 |
| The Travelers Companies, Inc. | | 1,817 | 270,588 |
| Unum Group | | 1,054,928 | 28,905,027 |
| | | | 154,407,106 |
| Mortgage Real Estate Investment Trusts - 0.0% | | | |
| Annaly Capital Management, Inc. | | 6,068 | 51,517 |
| Thrifts & Mortgage Finance - 0.2% | | | |
| ASAX Co. Ltd. | | 33,298 | 209,734 |
| Axos Financial, Inc. (a) | | 13,800 | 660,330 |
| Equitable Group, Inc. | | 9,600 | 1,154,216 |
| Essent Group Ltd. | | 8,700 | 392,979 |
| Federal Agricultural Mortgage Corp.: | | | |
| Class A (multi-vtg.) (b) | | 501 | 45,431 |
| Class C (non-vtg.) | | 11,538 | 1,124,955 |
| Genworth Mortgage Insurance Ltd. | | 318,211 | 476,379 |
| Hingham Institution for Savings | | 925 | 276,575 |
| Meta Financial Group, Inc. | | 6,145 | 305,407 |
| Southern Missouri Bancorp, Inc. | | 8,833 | 396,425 |
| Walker & Dunlop, Inc. | | 1,416 | 146,528 |
| | | | 5,188,959 |
|
| TOTAL FINANCIALS | | | 399,356,394 |
|
| HEALTH CARE - 10.7% | | | |
| Biotechnology - 1.6% | | | |
| Amgen, Inc. | | 156,171 | 37,721,543 |
| Cell Biotech Co. Ltd. | | 10,500 | 178,073 |
| Essex Bio-Technology Ltd. | | 648,606 | 557,535 |
| Gilead Sciences, Inc. | | 11,498 | 785,198 |
| Regeneron Pharmaceuticals, Inc. (a) | | 12,909 | 7,417,640 |
| | | | 46,659,989 |
| Health Care Equipment & Supplies - 0.5% | | | |
| Arts Optical International Holdings Ltd. (a) | | 1,445,053 | 130,166 |
| Boston Scientific Corp. (a) | | 10,096 | 460,378 |
| Hologic, Inc. (a) | | 2,871 | 215,440 |
| Hoshiiryou Sanki Co. Ltd. | | 17,537 | 582,675 |
| I-Sens, Inc. | | 13,000 | 365,948 |
| InBody Co. Ltd. | | 40,100 | 1,012,275 |
| Integra LifeSciences Holdings Corp. (a) | | 4,485 | 324,669 |
| Meridian Bioscience, Inc. (a) | | 10,988 | 225,254 |
| Nakanishi, Inc. | | 37,775 | 782,324 |
| Prim SA | | 89,548 | 1,423,433 |
| ResMed, Inc. | | 3,565 | 968,967 |
| St.Shine Optical Co. Ltd. | | 228,000 | 3,140,512 |
| Techno Medica Co. Ltd. | | 2,116 | 30,822 |
| Utah Medical Products, Inc. | | 21,391 | 1,912,355 |
| Value Added Technology Co. Ltd. | | 31,600 | 986,849 |
| Vieworks Co. Ltd. | | 28,800 | 918,144 |
| | | | 13,480,211 |
| Health Care Providers & Services - 8.0% | | | |
| Anthem, Inc. | | 153,300 | 58,868,733 |
| Centene Corp. (a) | | 57,770 | 3,963,600 |
| Cigna Corp. | | 13,123 | 3,011,597 |
| CVS Health Corp. | | 5,809 | 478,429 |
| DVx, Inc. | | 40,048 | 360,671 |
| HCA Holdings, Inc. | | 1,129 | 280,218 |
| Hi-Clearance, Inc. | | 120,000 | 601,611 |
| Humana, Inc. | | 635 | 270,421 |
| Laboratory Corp. of America Holdings (a) | | 1,536 | 454,886 |
| Medica Sur SA de CV (b) | | 20,806 | 33,185 |
| MEDNAX, Inc. (a)(b) | | 150,742 | 4,389,607 |
| Quest Diagnostics, Inc. | | 2,323 | 329,401 |
| Ship Healthcare Holdings, Inc. | | 8,223 | 206,578 |
| Sinopharm Group Co. Ltd. (H Shares) | | 2,081,884 | 5,465,141 |
| Tokai Corp. | | 17,211 | 378,405 |
| Triple-S Management Corp. (a) | | 129,502 | 3,150,784 |
| UDG Healthcare PLC (United Kingdom) | | 48,364 | 724,696 |
| UnitedHealth Group, Inc. | | 310,696 | 128,075,110 |
| Universal Health Services, Inc. Class B | | 136,976 | 21,972,320 |
| WIN-Partners Co. Ltd. | | 156,331 | 1,416,462 |
| | | | 234,431,855 |
| Health Care Technology - 0.0% | | | |
| Schrodinger, Inc. (a) | | 15,912 | 1,076,765 |
| Pharmaceuticals - 0.6% | | | |
| Bliss Gvs Pharma Ltd. | | 247,098 | 358,299 |
| Bristol-Myers Squibb Co. | | 2,868 | 194,651 |
| China Medical System Holdings Ltd. | | 389,656 | 790,228 |
| Consun Pharmaceutical Group Ltd. | | 337,025 | 199,496 |
| Dai Han Pharmaceutical Co. Ltd. | | 18,400 | 516,361 |
| Daito Pharmaceutical Co. Ltd. | | 38,023 | 1,148,956 |
| Dawnrays Pharmaceutical Holdings Ltd. | | 4,056,273 | 929,099 |
| DongKook Pharmaceutical Co. Ltd. | | 4,580 | 100,121 |
| Faes Farma SA | | 38,488 | 150,210 |
| FDC Ltd. (a) | | 200,021 | 1,001,403 |
| Fuji Pharma Co. Ltd. | | 52,614 | 539,545 |
| Genomma Lab Internacional SA de CV (a) | | 211,352 | 205,340 |
| Granules India Ltd. | | 9,800 | 50,013 |
| Huons Co. Ltd. | | 63,800 | 3,348,399 |
| Hypermarcas SA | | 800 | 5,476 |
| Jazz Pharmaceuticals PLC (a) | | 1,281 | 217,155 |
| Kaken Pharmaceutical Co. Ltd. | | 3,745 | 165,052 |
| Kissei Pharmaceutical Co. Ltd. | | 8,500 | 173,944 |
| Kyung Dong Pharmaceutical Co. Ltd. | | 67,904 | 612,618 |
| Lee's Pharmaceutical Holdings Ltd. | | 1,210,316 | 619,864 |
| Luye Pharma Group Ltd. (d) | | 209,885 | 112,894 |
| Organon & Co. (a) | | 809 | 23,469 |
| Recordati SpA | | 111,114 | 6,877,793 |
| Syngen Biotech Co. Ltd. | | 26,000 | 92,934 |
| Taro Pharmaceutical Industries Ltd. (a) | | 3,485 | 248,132 |
| Towa Pharmaceutical Co. Ltd. | | 4,300 | 109,357 |
| Whanin Pharmaceutical Co. Ltd. | | 652 | 12,104 |
| Zhaoke Ophthalmology Ltd. (a)(d) | | 110,198 | 113,443 |
| | | | 18,916,356 |
|
| TOTAL HEALTH CARE | | | 314,565,176 |
|
| INDUSTRIALS - 6.7% | | | |
| Aerospace & Defense - 0.1% | | | |
| Curtiss-Wright Corp. | | 11,539 | 1,365,064 |
| The Boeing Co. (a) | | 3,482 | 788,603 |
| Ultra Electronics Holdings PLC | | 9,473 | 417,409 |
| Vectrus, Inc. (a) | | 8,748 | 396,197 |
| | | | 2,967,273 |
| Air Freight & Logistics - 0.0% | | | |
| Air T Funding warrants 8/30/21 (a) | | 137 | 10 |
| Air T, Inc. (a) | | 54 | 1,654 |
| Sinotrans Ltd. (H Shares) | | 2,428,530 | 896,892 |
| | | | 898,556 |
| Airlines - 0.0% | | | |
| Jet2 PLC (a) | | 8,640 | 149,099 |
| Spirit Airlines, Inc. (a) | | 15,864 | 428,011 |
| | | | 577,110 |
| Building Products - 0.1% | | | |
| American Woodmark Corp. (a) | | 1,848 | 137,214 |
| Builders FirstSource, Inc. (a) | | 8,539 | 379,986 |
| Gibraltar Industries, Inc. (a) | | 3,916 | 292,447 |
| Jeld-Wen Holding, Inc. (a) | | 50,079 | 1,326,092 |
| Kondotec, Inc. | | 127,266 | 1,156,595 |
| Nihon Flush Co. Ltd. | | 43,380 | 483,208 |
| Owens Corning | | 3,465 | 333,194 |
| | | | 4,108,736 |
| Commercial Services & Supplies - 0.6% | | | |
| Aeon Delight Co. Ltd. | | 6,346 | 207,957 |
| AJIS Co. Ltd. | | 55,735 | 1,780,695 |
| Asia File Corp. Bhd (a) | | 361,200 | 199,430 |
| Calian Group Ltd. | | 7,126 | 348,875 |
| Civeo Corp. (a) | | 68,151 | 1,479,558 |
| CoreCivic, Inc. (a) | | 400,267 | 4,114,745 |
| CTS Co. Ltd. | | 310 | 2,292 |
| Left Field Printing Group Ltd. | | 86,046 | 5,979 |
| Lion Rock Group Ltd. | | 1,376,737 | 145,271 |
| Matthews International Corp. Class A | | 15,733 | 544,362 |
| Mears Group PLC (a) | | 76,059 | 200,872 |
| Mitie Group PLC (a) | | 3,052,597 | 2,690,132 |
| NICE Total Cash Management Co., Ltd. | | 121,311 | 775,584 |
| Prosegur Compania de Seguridad SA (Reg.) | | 63,787 | 217,922 |
| Sunny Friend Environmental Technology Co. Ltd. | | 13,000 | 94,721 |
| The Brink's Co. | | 264 | 20,317 |
| VICOM Ltd. | | 17,839 | 26,858 |
| VSE Corp. | | 86,703 | 4,339,485 |
| | | | 17,195,055 |
| Construction & Engineering - 0.5% | | | |
| AECOM (a) | | 17,057 | 1,073,909 |
| API Group Corp. (a)(d) | | 48,860 | 1,119,871 |
| Argan, Inc. | | 5,776 | 259,631 |
| Boustead Projs. Pte Ltd. | | 137,004 | 132,459 |
| Boustead Singapore Ltd. | | 290,062 | 254,750 |
| Comfort Systems U.S.A., Inc. | | 2,456 | 183,586 |
| Construction Partners, Inc. Class A (a) | | 6,753 | 226,766 |
| Daiichi Kensetsu Corp. | | 107,501 | 2,054,871 |
| EMCOR Group, Inc. | | 9,239 | 1,125,403 |
| Fluor Corp. (a) | | 61,834 | 1,030,154 |
| Geumhwa PSC Co. Ltd. | | 28,039 | 805,103 |
| Granite Construction, Inc. | | 31,114 | 1,195,400 |
| Kyeryong Construction Industrial Co. Ltd. | | 27,197 | 771,489 |
| Meisei Industrial Co. Ltd. | | 91,598 | 619,532 |
| Mirait Holdings Corp. | | 32,482 | 636,879 |
| Nippon Rietec Co. Ltd. | | 72,507 | 1,138,116 |
| Per Aarsleff Holding A/S | | 909 | 39,210 |
| Primoris Services Corp. | | 2,706 | 80,909 |
| Raiznext Corp. | | 119,288 | 1,239,582 |
| Seikitokyu Kogyo Co. Ltd. | | 16,877 | 134,456 |
| Shinnihon Corp. | | 144,042 | 1,125,236 |
| Totetsu Kogyo Co. Ltd. | | 13,352 | 282,363 |
| United Integrated Services Co. | | 20,200 | 141,765 |
| Valmont Industries, Inc. | | 1,098 | 260,171 |
| | | | 15,931,611 |
| Electrical Equipment - 0.9% | | | |
| Acuity Brands, Inc. | | 48,053 | 8,427,535 |
| Aichi Electric Co. Ltd. | | 25,360 | 661,133 |
| AQ Group AB (a) | | 54,353 | 2,001,522 |
| Atkore, Inc. (a) | | 9,029 | 678,168 |
| AZZ, Inc. | | 4,500 | 238,455 |
| Chiyoda Integre Co. Ltd. | | 24,671 | 400,295 |
| Generac Holdings, Inc. (a) | | 798 | 334,649 |
| GrafTech International Ltd. | | 491,458 | 5,587,877 |
| Hammond Power Solutions, Inc. Class A | | 30,148 | 248,897 |
| I-Sheng Electric Wire & Cable Co. Ltd. | | 477,000 | 772,767 |
| Korea Electric Terminal Co. Ltd. | | 47,736 | 3,913,262 |
| Sensata Technologies, Inc. PLC (a) | | 24,349 | 1,427,338 |
| Servotronics, Inc. (a) | | 10,543 | 90,210 |
| TKH Group NV (depositary receipt) | | 12,733 | 675,776 |
| Vitzrocell Co. Ltd. | | 10,000 | 144,436 |
| | | | 25,602,320 |
| Industrial Conglomerates - 0.4% | | | |
| DCC PLC (United Kingdom) | | 122,676 | 10,275,514 |
| Mytilineos SA | | 16,476 | 305,678 |
| Reunert Ltd. | | 138,349 | 448,534 |
| Rheinmetall AG | | 2,259 | 216,952 |
| | | | 11,246,678 |
| Machinery - 1.7% | | | |
| Aalberts Industries NV | | 541,449 | 32,962,522 |
| Allison Transmission Holdings, Inc. | | 27,515 | 1,098,124 |
| ASL Marine Holdings Ltd. (a) | | 3,386,050 | 174,932 |
| Clean & Science Co. Ltd. | | 5,100 | 100,871 |
| Daiwa Industries Ltd. | | 16,464 | 170,936 |
| Estic Corp. | | 1,020 | 42,537 |
| Haitian International Holdings Ltd. | | 504,685 | 1,847,640 |
| Hurco Companies, Inc. | | 10,837 | 367,808 |
| Hyster-Yale Materials Handling Class A | | 16,770 | 1,201,403 |
| Ihara Science Corp. | | 73,602 | 1,310,955 |
| ITT, Inc. | | 4,874 | 477,213 |
| JOST Werke AG (d) | | 7,127 | 435,402 |
| Kyowakogyosyo Co. Ltd. | | 2,927 | 118,729 |
| Luxfer Holdings PLC sponsored | | 13,474 | 280,933 |
| Maruzen Co. Ltd. | | 99,489 | 2,159,275 |
| Miller Industries, Inc. | | 5,999 | 225,022 |
| Mincon Group PLC | | 152,904 | 230,356 |
| Mitsui Engineering & Shipbuilding Co. (a) | | 85,031 | 397,747 |
| Nadex Co. Ltd. | | 49,749 | 330,587 |
| Nippon Dry-Chemical Co. Ltd. | | 6,678 | 113,649 |
| Nitchitsu Co. Ltd. | | 3,360 | 43,522 |
| Park-Ohio Holdings Corp. | | 34,100 | 991,969 |
| Semperit AG Holding | | 28,459 | 1,048,232 |
| Shinwa Co. Ltd. | | 300 | 6,161 |
| SIMPAC, Inc. | | 110,420 | 671,470 |
| Stabilus SA | | 3,512 | 278,504 |
| Takamatsu Machinery Co. Ltd. | | 25,053 | 165,794 |
| Tocalo Co. Ltd. | | 194,925 | 2,432,454 |
| Trinity Industrial Corp. | | 69,599 | 554,483 |
| | | | 50,239,230 |
| Marine - 0.1% | | | |
| Eagle Bulk Shipping, Inc. (a) | | 7,833 | 326,636 |
| Genco Shipping & Trading Ltd. | | 62,451 | 1,096,015 |
| Kirby Corp. (a) | | 14,931 | 864,654 |
| SITC International Holdings Co. Ltd. | | 70,784 | 291,474 |
| Tokyo Kisen Co. Ltd. | | 51,648 | 280,120 |
| | | | 2,858,899 |
| Professional Services - 0.4% | | | |
| ABIST Co. Ltd. | | 225 | 5,999 |
| Altech Corp. | | 8,718 | 160,922 |
| Barrett Business Services, Inc. | | 2,009 | 147,079 |
| Benext-Yumeshin Group Co. | | 8,500 | 105,296 |
| Career Design Center Co. Ltd. | | 2,000 | 19,598 |
| Careerlink Co. Ltd. | | 4,044 | 70,665 |
| Hito Communications Holdings, Inc. | | 7,522 | 143,645 |
| Kelly Services, Inc. Class A (non-vtg.) (a) | | 17,282 | 378,821 |
| Kforce, Inc. | | 3,691 | 230,429 |
| McMillan Shakespeare Ltd. | | 121,081 | 1,124,019 |
| Nielsen Holdings PLC | | 82,962 | 1,965,370 |
| Outsourcing, Inc. | | 2,022 | 38,355 |
| Persol Holdings Co. Ltd. | | 18,194 | 364,029 |
| Quick Co. Ltd. | | 24,533 | 267,458 |
| Robert Half International, Inc. | | 2,308 | 226,669 |
| SaraminHR Co. Ltd. | | 9,700 | 416,101 |
| Science Applications Internati | | 7,869 | 686,964 |
| SHL-JAPAN Ltd. | | 19,004 | 503,055 |
| Synergie SA | | 11,404 | 500,536 |
| TrueBlue, Inc. (a) | | 52,439 | 1,425,816 |
| WDB Holdings Co. Ltd. | | 13,459 | 371,118 |
| Will Group, Inc. | | 71,443 | 624,528 |
| World Holdings Co. Ltd. | | 24,200 | 700,378 |
| | | | 10,476,850 |
| Road & Rail - 0.7% | | | |
| Alps Logistics Co. Ltd. | | 177,924 | 1,581,294 |
| Chilled & Frozen Logistics Holdings Co. Ltd. | | 70,034 | 1,050,781 |
| Daqin Railway Co. Ltd. (A Shares) | | 3,066,746 | 2,790,777 |
| Hamakyorex Co. Ltd. | | 119,899 | 3,448,169 |
| Higashi Twenty One Co. Ltd. | | 10,238 | 64,766 |
| Knight-Swift Transportation Holdings, Inc. Class A | | 17,159 | 852,631 |
| Ryder System, Inc. | | 3,042 | 231,648 |
| Sakai Moving Service Co. Ltd. | | 97,156 | 4,667,172 |
| Stef SA | | 2,400 | 279,006 |
| Trancom Co. Ltd. | | 53,420 | 4,153,617 |
| Universal Logistics Holdings, Inc. | | 17,294 | 398,627 |
| | | | 19,518,488 |
| Trading Companies & Distributors - 1.1% | | | |
| AddTech AB (B Shares) | | 205,920 | 4,281,827 |
| Alconix Corp. | | 145,611 | 1,925,906 |
| Applied Industrial Technologies, Inc. | | 4,041 | 362,478 |
| Chori Co. Ltd. | | 26,857 | 460,490 |
| GMS, Inc. (a) | | 6,000 | 294,780 |
| Goodfellow, Inc. | | 47,478 | 387,405 |
| Itochu Corp. | | 330,808 | 9,791,665 |
| Jalux, Inc. (a) | | 1,322 | 20,088 |
| Lumax International Corp. Ltd. | | 158,000 | 388,242 |
| Meiwa Corp. | | 132,470 | 565,115 |
| Mitani Shoji Co. Ltd. | | 59,903 | 4,493,885 |
| MRC Global, Inc. (a) | | 153,764 | 1,410,016 |
| Nishikawa Keisoku Co. Ltd. | | 620 | 26,534 |
| NOW, Inc. (a) | | 52,380 | 516,991 |
| Otec Corp. | | 7,568 | 177,291 |
| Parker Corp. | | 138,751 | 699,415 |
| Richelieu Hardware Ltd. | | 56,154 | 1,958,369 |
| Rush Enterprises, Inc. Class A | | 6,761 | 317,699 |
| Senshu Electric Co. Ltd. | | 55,742 | 1,933,351 |
| Tanaka Co. Ltd. | | 2,009 | 11,958 |
| TECHNO ASSOCIE Co. Ltd. | | 19,153 | 190,648 |
| Totech Corp. | | 72,560 | 1,728,926 |
| Yamazen Co. Ltd. | | 3,517 | 32,988 |
| | | | 31,976,067 |
| Transportation Infrastructure - 0.1% | | | |
| Anhui Expressway Co. Ltd. (H Shares) | | 736,663 | 439,847 |
| Daito Koun Co. Ltd. | | 1,006 | 5,649 |
| Isewan Terminal Service Co. Ltd. | | 96,914 | 613,083 |
| Meiko Transportation Co. Ltd. | | 71,059 | 766,262 |
| Qingdao Port International Co. Ltd. (H Shares) (d) | | 1,360,829 | 700,452 |
| | | | 2,525,293 |
|
| TOTAL INDUSTRIALS | | | 196,122,166 |
|
| INFORMATION TECHNOLOGY - 13.3% | | | |
| Communications Equipment - 0.0% | | | |
| Calix, Inc. (a) | | 14,139 | 661,422 |
| Casa Systems, Inc. (a) | | 54,125 | 406,479 |
| | | | 1,067,901 |
| Electronic Equipment & Components - 5.2% | | | |
| A&D Co. Ltd. | | 44,974 | 403,395 |
| Advanced Energy Industries, Inc. | | 14,834 | 1,539,028 |
| Alviva Holdings Ltd. | | 619,280 | 555,825 |
| Amphenol Corp. Class A | | 9,100 | 659,659 |
| Arrow Electronics, Inc. (a) | | 2,378 | 281,959 |
| Avnet, Inc. | | 5,537 | 228,789 |
| CDW Corp. | | 6,785 | 1,244,030 |
| CONEXIO Corp. | | 1,931 | 28,110 |
| Daido Signal Co. Ltd. | | 6,393 | 35,256 |
| Daiwabo Holdings Co. Ltd. | | 56,266 | 1,130,398 |
| Dynapack International Technology Corp. | | 154,000 | 561,030 |
| Elematec Corp. | | 188,170 | 1,953,654 |
| FLEXium Interconnect, Inc. | | 42,000 | 196,286 |
| Hon Hai Precision Industry Co. Ltd. (Foxconn) | | 11,737,000 | 46,426,180 |
| IDIS Holdings Co. Ltd. | | 48,087 | 584,005 |
| Insight Enterprises, Inc. (a) | | 31,770 | 3,189,073 |
| Keysight Technologies, Inc. (a) | | 9,019 | 1,484,076 |
| Kingboard Chemical Holdings Ltd. | | 5,925,048 | 31,031,373 |
| Kitron ASA | | 175,598 | 386,386 |
| Methode Electronics, Inc. Class A | | 78,688 | 3,763,647 |
| Muramoto Electronic Thailand PCL (For. Reg.) | | 76,980 | 548,184 |
| Nippo Ltd. | | 51,656 | 288,639 |
| PAX Global Technology Ltd. | | 1,473,279 | 1,592,498 |
| Redington India Ltd. | | 2,089,461 | 9,197,524 |
| Restar Holdings Corp. | | 59,466 | 1,051,584 |
| SAMT Co. Ltd. | | 8,500 | 31,117 |
| ScanSource, Inc. (a) | | 125,924 | 3,474,243 |
| Shibaura Electronics Co. Ltd. | | 39,048 | 1,760,105 |
| Simplo Technology Co. Ltd. | | 432,000 | 5,720,277 |
| SYNNEX Corp. | | 205,114 | 24,519,328 |
| Test Research, Inc. | | 8,000 | 16,517 |
| Thinking Electronic Industries Co. Ltd. | | 34,000 | 269,487 |
| Tomen Devices Corp. | | 40,387 | 1,862,798 |
| Tripod Technology Corp. | | 103,000 | 443,328 |
| VSTECS Holdings Ltd. | | 7,360,914 | 5,872,704 |
| Wayside Technology Group, Inc. | | 26,581 | 753,571 |
| | | | 153,084,063 |
| IT Services - 4.1% | | | |
| ALTEN | | 40,223 | 6,393,748 |
| Amdocs Ltd. | | 342,840 | 26,436,392 |
| Argo Graphics, Inc. | | 61,351 | 1,920,976 |
| CDS Co. Ltd. | | 24,612 | 357,161 |
| Concentrix Corp. (a) | | 203,142 | 33,260,440 |
| CSE Global Ltd. | | 2,543,887 | 966,900 |
| Data Applications Co. Ltd. | | 2,060 | 30,082 |
| Densan System Holdings Co. Ltd. | | 3,622 | 95,218 |
| Dimerco Data System Corp. | | 73,000 | 188,620 |
| DTS Corp. | | 30,785 | 739,143 |
| DXC Technology Co. (a) | | 136,020 | 5,438,080 |
| E-Credible Co. Ltd. | | 20,175 | 364,906 |
| eClerx Services Ltd. | | 84,931 | 2,565,003 |
| EOH Holdings Ltd. (a) | | 478,988 | 212,502 |
| EPAM Systems, Inc. (a) | | 2,265 | 1,267,947 |
| Estore Corp. | | 7,868 | 133,398 |
| ExlService Holdings, Inc. (a) | | 12,672 | 1,434,724 |
| Gabia, Inc. | | 71,800 | 996,565 |
| Global Payments, Inc. | | 4,844 | 936,878 |
| Indra Sistemas SA (a) | | 1,020,401 | 10,676,175 |
| Information Planning Co. Ltd. | | 3,418 | 92,036 |
| Know IT AB | | 93,218 | 3,270,275 |
| Nice Information & Telecom, Inc. | | 29,780 | 874,469 |
| Paya Holdings, Inc. (a) | | 45,593 | 523,864 |
| Poletowin Pitcrew Holdings, Inc. | | 4,100 | 38,644 |
| Proact IT Group AB | | 400 | 3,745 |
| Societe Pour L'Informatique Industrielle SA | | 103,202 | 4,260,333 |
| Softcreate Co. Ltd. | | 48,089 | 1,256,745 |
| Sysage Technology Co. Ltd. | | 162,000 | 231,920 |
| TDC Soft, Inc. | | 22,665 | 226,226 |
| The Western Union Co. | | 595,754 | 13,827,450 |
| TravelSky Technology Ltd. (H Shares) | | 17,263 | 29,323 |
| Verra Mobility Corp. (a) | | 68,128 | 1,043,040 |
| WNS Holdings Ltd. sponsored ADR (a) | | 5,133 | 422,651 |
| | | | 120,515,579 |
| Semiconductors & Semiconductor Equipment - 0.4% | | | |
| ASM Pacific Technology Ltd. | | 14,594 | 187,797 |
| Axell Corp. | | 9,008 | 70,123 |
| CMC Materials, Inc. | | 5,807 | 839,924 |
| FormFactor, Inc. (a) | | 14,872 | 554,131 |
| Japan Material Co. Ltd. | | 8,544 | 101,713 |
| Machvision, Inc. | | 1,000 | 9,306 |
| Melexis NV | | 10,340 | 1,152,374 |
| Miraial Co. Ltd. | | 12,282 | 138,936 |
| MKS Instruments, Inc. | | 7,544 | 1,180,183 |
| Powertech Technology, Inc. | | 738,000 | 2,927,319 |
| Renesas Electronics Corp. (a) | | 37,793 | 406,850 |
| Semtech Corp. (a) | | 11,662 | 721,994 |
| Synaptics, Inc. (a) | | 5,125 | 778,590 |
| Systems Technology, Inc. | | 21,500 | 318,930 |
| Topco Scientific Co. Ltd. | | 295,500 | 1,373,141 |
| Trio-Tech International (a) | | 4,041 | 19,639 |
| | | | 10,780,950 |
| Software - 1.5% | | | |
| AdaptIT Holdings Ltd. (a) | | 238,137 | 110,363 |
| ANSYS, Inc. (a) | | 79,681 | 29,359,261 |
| Aspen Technology, Inc. (a) | | 4,055 | 593,084 |
| Cerence, Inc. (a)(b) | | 8,440 | 907,384 |
| Check Point Software Technologies Ltd. (a) | | 1,300 | 165,230 |
| Cresco Ltd. | | 29,715 | 530,078 |
| Cyient Ltd. | | 300,000 | 3,981,653 |
| Focus Systems Corp. | | 3,528 | 31,902 |
| InfoVine Co. Ltd. | | 2,756 | 66,225 |
| KSK Co., Ltd. | | 32,869 | 701,992 |
| Manhattan Associates, Inc. (a) | | 9,231 | 1,473,545 |
| Minwise Co. Ltd. | | 22,100 | 394,930 |
| NetGem SA (a) | | 58,771 | 78,780 |
| Nippon Systemware Co. Ltd. | | 13,053 | 286,391 |
| Nucleus Software Exports Ltd. | | 35,047 | 319,811 |
| Open Text Corp. | | 5,603 | 291,018 |
| Pegasystems, Inc. | | 4,783 | 610,502 |
| Pro-Ship, Inc. | | 41,823 | 557,360 |
| Sinosoft Tech Group Ltd. | | 84,885 | 12,889 |
| SPS Commerce, Inc. (a) | | 11,756 | 1,280,816 |
| System Research Co. Ltd. | | 4,433 | 87,080 |
| Telos Corp. | | 15,234 | 426,857 |
| | | | 42,267,151 |
| Technology Hardware, Storage & Peripherals - 2.1% | | | |
| Chenbro Micom Co. Ltd. | | 53,000 | 141,795 |
| Dell Technologies, Inc. (a) | | 82,954 | 8,015,015 |
| Elecom Co. Ltd. | | 13,000 | 228,112 |
| HP, Inc. | | 12,310 | 355,390 |
| MCJ Co. Ltd. | | 56,090 | 631,942 |
| Samsung Electronics Co. Ltd. | | 3,300 | 224,722 |
| Seagate Technology Holdings PLC | | 573,365 | 50,398,784 |
| Super Micro Computer, Inc. (a) | | 55,245 | 2,101,520 |
| TSC Auto ID Technology Corp. | | 54,000 | 446,779 |
| | | | 62,544,059 |
|
| TOTAL INFORMATION TECHNOLOGY | | | 390,259,703 |
|
| MATERIALS - 3.9% | | | |
| Chemicals - 1.8% | | | |
| AdvanSix, Inc. (a) | | 13,000 | 434,850 |
| Axalta Coating Systems Ltd. (a) | | 24,692 | 743,229 |
| Birla Carbon Thailand PCL (For. Reg.) | | 867,741 | 1,188,325 |
| C. Uyemura & Co. Ltd. | | 61,866 | 2,588,441 |
| Chase Corp. | | 38,341 | 4,467,877 |
| Core Molding Technologies, Inc. (a) | | 22,450 | 319,464 |
| Deepak Fertilisers and Petrochemicals Corp. Ltd. (a) | | 54,216 | 314,276 |
| EcoGreen International Group Ltd. | | 4,343,031 | 1,128,909 |
| Element Solutions, Inc. | | 14,161 | 331,226 |
| FMC Corp. | | 79,960 | 8,551,722 |
| Fujikura Kasei Co., Ltd. | | 168,701 | 764,271 |
| Fuso Chemical Co. Ltd. | | 4,255 | 152,622 |
| Gujarat Narmada Valley Fertilizers Co. | | 423,142 | 2,189,603 |
| Gujarat State Fertilizers & Chemicals Ltd. | | 2,288,187 | 3,762,681 |
| Honshu Chemical Industry Co. Ltd. | | 57,051 | 948,553 |
| Huntsman Corp. | | 12,701 | 335,433 |
| Innospec, Inc. | | 14,164 | 1,252,806 |
| KPX Holdings Corp. | | 4,873 | 287,875 |
| Miwon Chemicals Co. Ltd. | | 3,008 | 212,404 |
| Miwon Commercial Co. Ltd. | | 3,600 | 655,817 |
| Muto Seiko Co. Ltd. | | 16,004 | 85,195 |
| Nihon Parkerizing Co. Ltd. | | 21,591 | 220,820 |
| Nippon Soda Co. Ltd. | | 23,729 | 758,125 |
| Scientex Bhd | | 9,800 | 9,707 |
| SK Kaken Co. Ltd. | | 4,050 | 1,539,447 |
| Soken Chemical & Engineer Co. Ltd. | | 41,568 | 744,552 |
| T&K Toka Co. Ltd. | | 101,070 | 751,772 |
| Thai Rayon PCL: | | | |
| (For. Reg.) | | 261,798 | 246,979 |
| NVDR | | 180 | 170 |
| The Chemours Co. LLC | | 33,957 | 1,129,070 |
| The Mosaic Co. | | 236,735 | 7,393,234 |
| Trinseo SA | | 8,345 | 453,634 |
| Yara International ASA | | 133,908 | 7,052,536 |
| Yip's Chemical Holdings Ltd. | | 2,079,782 | 1,364,906 |
| | | | 52,380,531 |
| Construction Materials - 0.3% | | | |
| Buzzi Unicem SpA | | 84,912 | 2,246,209 |
| Eagle Materials, Inc. | | 1,920 | 271,334 |
| Mitani Sekisan Co. Ltd. | | 110,859 | 4,491,757 |
| RHI Magnesita NV | | 8,177 | 430,091 |
| West China Cement Ltd. | | 268,454 | 40,072 |
| | | | 7,479,463 |
| Containers & Packaging - 0.2% | | | |
| Berry Global Group, Inc. (a) | | 4,095 | 263,268 |
| Chuoh Pack Industry Co. Ltd. | | 26,146 | 261,210 |
| International Paper Co. | | 2,053 | 118,581 |
| Kohsoku Corp. | | 108,427 | 1,479,561 |
| Mayr-Melnhof Karton AG | | 1,214 | 258,355 |
| O-I Glass, Inc. (a) | | 14,950 | 221,111 |
| Packaging Corp. of America | | 2,528 | 357,712 |
| Samhwa Crown & Closure Co. Ltd. | | 2,820 | 107,270 |
| Silgan Holdings, Inc. | | 14,263 | 577,937 |
| The Pack Corp. | | 120,901 | 3,122,123 |
| WestRock Co. | | 2,830 | 139,264 |
| | | | 6,906,392 |
| Metals & Mining - 1.3% | | | |
| Anglo American PLC (United Kingdom) | | 18,977 | 840,946 |
| Arconic Corp. (a) | | 154 | 5,535 |
| Boliden AB | | 13,000 | 506,656 |
| Chubu Steel Plate Co. Ltd. | | 31,023 | 221,987 |
| Cleveland-Cliffs, Inc. (a) | | 999,822 | 24,995,550 |
| Commercial Metals Co. | | 9,176 | 300,973 |
| Compania de Minas Buenaventura SA sponsored ADR (a) | | 174,881 | 1,444,517 |
| Gatos Silver, Inc. | | 63,146 | 861,311 |
| Granges AB | | 23,216 | 306,907 |
| Hill & Smith Holdings PLC | | 63,298 | 1,428,864 |
| Kirkland Lake Gold Ltd. | | 33,991 | 1,453,527 |
| Newmont Corp. | | 8,510 | 534,598 |
| Perenti Global Ltd. | | 1,016,550 | 678,856 |
| Reliance Steel & Aluminum Co. | | 1,589 | 249,711 |
| Sandfire Resources NL | | 194,804 | 989,262 |
| Teck Resources Ltd. Class B (sub. vtg.) | | 44,064 | 1,005,885 |
| Tohoku Steel Co. Ltd. | | 39,046 | 608,620 |
| Tokyo Tekko Co. Ltd. | | 47,448 | 669,518 |
| Warrior Metropolitan Coal, Inc. | | 114,343 | 2,134,784 |
| Webco Industries, Inc. (a) | | 503 | 63,881 |
| | | | 39,301,888 |
| Paper & Forest Products - 0.3% | | | |
| Louisiana-Pacific Corp. | | 19,092 | 1,058,460 |
| Schweitzer-Mauduit International, Inc. | | 5,658 | 222,529 |
| Stella-Jones, Inc. | | 186,589 | 6,770,507 |
| Western Forest Products, Inc. | | 138,002 | 213,485 |
| | | | 8,264,981 |
|
| TOTAL MATERIALS | | | 114,333,255 |
|
| REAL ESTATE - 0.2% | | | |
| Equity Real Estate Investment Trusts (REITs) - 0.0% | | | |
| CubeSmart | | 4,309 | 213,985 |
| Real Estate Management & Development - 0.2% | | | |
| Anabuki Kosan, Inc. | | 8,554 | 157,271 |
| Century21 Real Estate Japan Ltd. | | 9,800 | 94,690 |
| Daito Trust Construction Co. Ltd. | | 8,700 | 1,018,258 |
| Jones Lang LaSalle, Inc. (a) | | 1,943 | 432,454 |
| LSL Property Services PLC | | 95,609 | 559,494 |
| Realogy Holdings Corp. (a) | | 16,408 | 290,750 |
| Relo Group, Inc. | | 16,773 | 368,011 |
| Selvaag Bolig ASA | | 48,039 | 318,094 |
| Servcorp Ltd. | | 70,745 | 171,843 |
| Sino Land Ltd. | | 151,154 | 231,463 |
| Tejon Ranch Co. (a) | | 32,338 | 589,522 |
| Wing Tai Holdings Ltd. | | 122,121 | 164,937 |
| | | | 4,396,787 |
|
| TOTAL REAL ESTATE | | | 4,610,772 |
|
| UTILITIES - 1.5% | | | |
| Electric Utilities - 1.3% | | | |
| Exelon Corp. | | 24,702 | 1,156,054 |
| PG&E Corp. (a) | | 2,349,000 | 20,647,710 |
| PPL Corp. | | 638,203 | 18,105,819 |
| | | | 39,909,583 |
| Gas Utilities - 0.1% | | | |
| Busan City Gas Co. Ltd. | | 4,700 | 249,115 |
| China Resource Gas Group Ltd. | | 14,595 | 89,961 |
| GAIL India Ltd. | | 289,500 | 543,420 |
| Hokuriku Gas Co. | | 12,552 | 360,982 |
| K&O Energy Group, Inc. | | 17,058 | 202,448 |
| Keiyo Gas Co. Ltd. | | 9,258 | 279,331 |
| Star Gas Partners LP | | 15,393 | 181,483 |
| | | | 1,906,740 |
| Independent Power and Renewable Electricity Producers - 0.1% | | | |
| Mega First Corp. Bhd | | 2,882,200 | 2,417,770 |
| Multi-Utilities - 0.0% | | | |
| CMS Energy Corp. | | 13,370 | 826,132 |
| Water Utilities - 0.0% | | | |
| Manila Water Co., Inc. (a) | | 421,083 | 136,581 |
|
| TOTAL UTILITIES | | | 45,196,806 |
|
| TOTAL COMMON STOCKS | | | |
| (Cost $1,938,220,476) | | | 2,555,219,522 |
|
| Nonconvertible Preferred Stocks - 0.0% | | | |
| CONSUMER DISCRETIONARY - 0.0% | | | |
| Internet & Direct Marketing Retail - 0.0% | | | |
| Qurate Retail, Inc. 8.00% | | 1,335 | 144,794 |
| CONSUMER STAPLES - 0.0% | | | |
| Food Products - 0.0% | | | |
| Namyang Dairy Products Co. Ltd. | | 400 | 123,183 |
| INDUSTRIALS - 0.0% | | | |
| Industrial Conglomerates - 0.0% | | | |
| Steel Partners Holdings LP Series A, 6.00% | | 2,193 | 51,163 |
| TOTAL NONCONVERTIBLE PREFERRED STOCKS | | | |
| (Cost $252,532) | | | 319,140 |
| | | Principal Amount | Value |
|
| Nonconvertible Bonds - 0.0% | | | |
| ENERGY - 0.0% | | | |
| Energy Equipment & Services - 0.0% | | | |
Bristow Group, Inc. 6.25% 10/15/22
(Cost $0)(c)(e) | | 388,666 | 0 |
| | | Shares | Value |
|
| Money Market Funds - 13.6% | | | |
| Fidelity Cash Central Fund 0.06% (f) | | 379,846,011 | 379,921,980 |
| Fidelity Securities Lending Cash Central Fund 0.06% (f)(g) | | 19,766,332 | 19,768,309 |
| TOTAL MONEY MARKET FUNDS | | | |
| (Cost $399,690,288) | | | 399,690,289 |
| TOTAL INVESTMENT IN SECURITIES - 100.6% | | | |
| (Cost $2,338,163,296) | | | 2,955,228,951 |
| NET OTHER ASSETS (LIABILITIES) - (0.6)% | | | (18,183,800) |
| NET ASSETS - 100% | | | $2,937,045,151 |
Legend
(a) Non-income producing
(b) Security or a portion of the security is on loan at period end.
(c) Level 3 security
(d) Security exempt from registration under Rule 144A of the Securities Act of 1933. These securities may be resold in transactions exempt from registration, normally to qualified institutional buyers. At the end of the period, the value of these securities amounted to $5,426,471 or 0.2% of net assets.
(e) Non-income producing - Security is in default.
(f) Affiliated fund that is generally available only to investment companies and other accounts managed by Fidelity Investments. The rate quoted is the annualized seven-day yield of the fund at period end. A complete unaudited listing of the fund's holdings as of its most recent quarter end is available upon request. In addition, each Fidelity Central Fund's financial statements, which are not covered by the Fund's Report of Independent Registered Public Accounting Firm, are available on the SEC's website or upon request.
(g) Investment made with cash collateral received from securities on loan.
Affiliated Central Funds
Information regarding fiscal year to date income earned by the Fund from investments in Fidelity Central Funds is as follows:
| Fund | Income earned |
| Fidelity Cash Central Fund | $120,134 |
| Fidelity Securities Lending Cash Central Fund | 210,605 |
| Total | $330,739 |
Amounts in the income column in the above table include any capital gain distributions from underlying funds, which are presented in the corresponding line-item in the Statement of Operations, if applicable. Amount for Fidelity Securities Lending Cash Central Fund represents the income earned on investing cash collateral, less rebates paid to borrowers and any lending agent fees associated with the loan, plus any premium payments received for lending certain types of securities.
Fiscal year to date information regarding the Fund's investments in Fidelity Central Funds, including the ownership percentage, is presented below.
| Fund | Value, beginning of period | Purchases | Sales Proceeds | Realized Gain/Loss | Change in Unrealized appreciation (depreciation) | Value, end of period | % ownership, end of period |
| Fidelity Cash Central Fund 0.06% | $85,346,582 | $1,156,848,289 | $862,264,201 | $44 | $(8,734) | $379,921,980 | 0.6% |
| Fidelity Securities Lending Cash Central Fund 0.06% | 42,686,629 | 281,128,342 | 304,046,662 | -- | -- | 19,768,309 | 0.1% |
| Total | $128,033,211 | $1,437,976,631 | $1,166,310,863 | $44 | $(8,734) | $399,690,289 | |
Investment Valuation
The following is a summary of the inputs used, as of July 31, 2021, involving the Fund's assets and liabilities carried at fair value. The inputs or methodology used for valuing securities may not be an indication of the risk associated with investing in those securities. For more information on valuation inputs, and their aggregation into the levels used below, please refer to the Investment Valuation section in the accompanying Notes to Financial Statements.
| | Valuation Inputs at Reporting Date: |
| Description | Total | Level 1 | Level 2 | Level 3 |
| Investments in Securities: | | | | |
| Equities: | | | | |
| Communication Services | $42,948,990 | $42,948,990 | $-- | $-- |
| Consumer Discretionary | 583,267,896 | 582,766,093 | 333,772 | 168,031 |
| Consumer Staples | 309,593,777 | 308,386,751 | 1,176,432 | 30,594 |
| Energy | 155,232,564 | 154,263,542 | 961,245 | 7,777 |
| Financials | 399,356,394 | 383,733,292 | 15,623,102 | -- |
| Health Care | 314,565,176 | 310,730,119 | 3,835,057 | -- |
| Industrials | 196,173,329 | 184,586,422 | 11,586,907 | -- |
| Information Technology | 390,259,703 | 331,317,024 | 58,942,679 | -- |
| Materials | 114,333,255 | 113,492,309 | 840,946 | -- |
| Real Estate | 4,610,772 | 4,610,772 | -- | -- |
| Utilities | 45,196,806 | 45,196,806 | -- | -- |
| Corporate Bonds | -- | -- | -- | -- |
| Money Market Funds | 399,690,289 | 399,690,289 | -- | -- |
| Total Investments in Securities: | $2,955,228,951 | $2,861,722,409 | $93,300,140 | $206,402 |
Other Information
Distribution of investments by country or territory of incorporation, as a percentage of Total Net Assets, is as follows (Unaudited):
| United States of America | 64.8% |
| Japan | 7.6% |
| United Kingdom | 5.8% |
| Canada | 4.4% |
| Ireland | 2.4% |
| Cayman Islands | 2.1% |
| Taiwan | 2.1% |
| Netherlands | 2.1% |
| India | 1.4% |
| Bermuda | 1.0% |
| Others (Individually Less Than 1%) | 6.3% |
| | 100.0% |
See accompanying notes which are an integral part of the financial statements.
Financial Statements
Statement of Assets and Liabilities
| | | July 31, 2021 |
| Assets | | |
Investment in securities, at value (including securities loaned of $18,904,802) — See accompanying schedule:
Unaffiliated issuers (cost $1,938,473,008) | $2,555,538,662 | |
| Fidelity Central Funds (cost $399,690,288) | 399,690,289 | |
| Total Investment in Securities (cost $2,338,163,296) | | $2,955,228,951 |
| Cash | | 142,762 |
| Foreign currency held at value (cost $2,005,219) | | 2,008,991 |
| Receivable for investments sold | | 2,832,038 |
| Receivable for fund shares sold | | 5,304,513 |
| Dividends receivable | | 3,263,852 |
| Distributions receivable from Fidelity Central Funds | | 20,661 |
| Other receivables | | 98,256 |
| Total assets | | 2,968,900,024 |
| Liabilities | | |
| Payable for investments purchased | $7,526,264 | |
| Payable for fund shares redeemed | 2,005,330 | |
| Accrued management fee | 1,204,314 | |
| Other payables and accrued expenses | 1,352,065 | |
| Collateral on securities loaned | 19,766,900 | |
| Total liabilities | | 31,854,873 |
| Net Assets | | $2,937,045,151 |
| Net Assets consist of: | | |
| Paid in capital | | $2,219,301,627 |
| Total accumulated earnings (loss) | | 717,743,524 |
| Net Assets | | $2,937,045,151 |
| Net Asset Value, offering price and redemption price per share ($2,937,045,151 ÷ 189,301,669 shares) | | $15.52 |
See accompanying notes which are an integral part of the financial statements.
Statement of Operations
| | | Year ended July 31, 2021 |
| Investment Income | | |
| Dividends | | $40,056,583 |
| Income from Fidelity Central Funds (including $210,605 from security lending) | | 330,739 |
| Total income | | 40,387,322 |
| Expenses | | |
| Management fee | $11,647,746 | |
| Independent trustees' fees and expenses | 9,504 | |
| Interest | 244 | |
| Miscellaneous | 4,481 | |
| Total expenses before reductions | 11,661,975 | |
| Expense reductions | (43,956) | |
| Total expenses after reductions | | 11,618,019 |
| Net investment income (loss) | | 28,769,303 |
| Realized and Unrealized Gain (Loss) | | |
| Net realized gain (loss) on: | | |
| Investment securities: | | |
| Unaffiliated issuers (net of foreign taxes of $3,605) | 150,670,450 | |
| Fidelity Central Funds | 44 | |
| Foreign currency transactions | (23,264) | |
| Total net realized gain (loss) | | 150,647,230 |
| Change in net unrealized appreciation (depreciation) on: | | |
| Investment securities: | | |
| Unaffiliated issuers (net of increase in deferred foreign taxes of $1,352,286) | 636,763,137 | |
| Fidelity Central Funds | (8,734) | |
| Assets and liabilities in foreign currencies | (9,426) | |
| Total change in net unrealized appreciation (depreciation) | | 636,744,977 |
| Net gain (loss) | | 787,392,207 |
| Net increase (decrease) in net assets resulting from operations | | $816,161,510 |
See accompanying notes which are an integral part of the financial statements.
Statement of Changes in Net Assets
| | Year ended July 31, 2021 | Year ended July 31, 2020 |
| Increase (Decrease) in Net Assets | | |
| Operations | | |
| Net investment income (loss) | $28,769,303 | $36,216,173 |
| Net realized gain (loss) | 150,647,230 | (53,525,566) |
| Change in net unrealized appreciation (depreciation) | 636,744,977 | (30,941,753) |
| Net increase (decrease) in net assets resulting from operations | 816,161,510 | (48,251,146) |
| Distributions to shareholders | (31,826,765) | (51,263,392) |
| Share transactions | | |
| Proceeds from sales of shares | 925,276,719 | 718,795,421 |
| Reinvestment of distributions | 31,826,765 | 51,263,392 |
| Cost of shares redeemed | (665,885,100) | (732,369,550) |
| Net increase (decrease) in net assets resulting from share transactions | 291,218,384 | 37,689,263 |
| Total increase (decrease) in net assets | 1,075,553,129 | (61,825,275) |
| Net Assets | | |
| Beginning of period | 1,861,492,022 | 1,923,317,297 |
| End of period | $2,937,045,151 | $1,861,492,022 |
| Other Information | | |
| Shares | | |
| Sold | 65,541,821 | 65,370,553 |
| Issued in reinvestment of distributions | 2,747,573 | 4,541,122 |
| Redeemed | (50,964,020) | (69,800,041) |
| Net increase (decrease) | 17,325,374 | 111,634 |
See accompanying notes which are an integral part of the financial statements.
Financial Highlights
Fidelity Low-Priced Stock K6 Fund
| | | | | | |
| Years ended July 31, | 2021 | 2020 | 2019 | 2018 | 2017 A |
| Selected Per–Share Data | | | | | |
| Net asset value, beginning of period | $10.82 | $11.19 | $11.52 | $10.23 | $10.00 |
| Income from Investment Operations | | | | | |
| Net investment income (loss)B | .17 | .20 | .20 | .17 | –C |
| Net realized and unrealized gain (loss) | 4.72 | (.27) | (.29) | 1.19 | .23 |
| Total from investment operations | 4.89 | (.07) | (.09) | 1.36 | .23 |
| Distributions from net investment income | (.19) | (.22) | (.17) | (.06) | – |
| Distributions from net realized gain | – | (.08) | (.06) | (.01) | – |
| Total distributions | (.19) | (.30) | (.24)D | (.07) | – |
| Net asset value, end of period | $15.52 | $10.82 | $11.19 | $11.52 | $10.23 |
| Total ReturnE,F | 45.81% | (.74)% | (.73)% | 13.33% | 2.30% |
| Ratios to Average Net AssetsG,H | | | | | |
| Expenses before reductions | .50% | .50% | .50% | .50% | .50%I |
| Expenses net of fee waivers, if any | .50% | .50% | .50% | .50% | .50%I |
| Expenses net of all reductions | .50% | .50% | .50% | .50% | .50%I |
| Net investment income (loss) | 1.23% | 1.86% | 1.85% | 1.54% | (.14)%I |
| Supplemental Data | | | | | |
| Net assets, end of period (000 omitted) | $2,937,045 | $1,861,492 | $1,923,317 | $2,092,759 | $459,470 |
| Portfolio turnover rateJ,K | 27% | 21% | 20% | 23% | 3%L |
A For the period May 26, 2017 (commencement of operations) to July 31, 2017.
B Calculated based on average shares outstanding during the period.
C Amount represents less than $.005 per share.
D Total distributions per share do not sum due to rounding.
E Total returns for periods of less than one year are not annualized.
F Total returns would have been lower if certain expenses had not been reduced during the applicable periods shown.
G Fees and expenses of any underlying mutual funds or exchange-traded funds (ETFs) are not included in the Fund's expense ratio. The Fund indirectly bears its proportionate share of these expenses. For additional expense information related to investments in Fidelity Central Funds, please refer to the "Investments in Fidelity Central Funds" note found in the Notes to Financial Statements section of the most recent Annual or Semi-Annual report.
H Expense ratios reflect operating expenses of the class. Expenses before reductions do not reflect amounts reimbursed, waived, or reduced through arrangements with the investment advisor, brokerage services, or other offset arrangements, if applicable, and do not represent the amount paid by the class during periods when reimbursements, waivers or reductions occur.
I Annualized
J Portfolio turnover rate excludes securities received or delivered in-kind.
K Amount does not include the portfolio activity of any underlying mutual funds or exchange-traded funds (ETFs).
L Amount not annualized.
See accompanying notes which are an integral part of the financial statements.
Notes to Financial Statements
For the period ended July 31, 2021
1. Organization.
Fidelity Low-Priced Stock K6 Fund (the Fund) is a fund of Fidelity Puritan Trust (the Trust) and is authorized to issue an unlimited number of shares. Share transactions on the Statement of Changes in Net Assets may contain exchanges between affiliated funds. The Trust is registered under the Investment Company Act of 1940, as amended (the 1940 Act), as an open-end management investment company organized as a Massachusetts business trust. Shares generally are available only to employer-sponsored retirement plans that are recordkept by Fidelity, or to certain employer-sponsored retirement plans that are not recordkept by Fidelity.
2. Investments in Fidelity Central Funds.
Funds may invest in Fidelity Central Funds, which are open-end investment companies generally available only to other investment companies and accounts managed by the investment adviser and its affiliates. The Schedule of Investments lists any Fidelity Central Funds held as an investment as of period end, but does not include the underlying holdings of each Fidelity Central Fund. An investing fund indirectly bears its proportionate share of the expenses of the underlying Fidelity Central Funds.
Based on its investment objective, each Fidelity Central Fund may invest or participate in various investment vehicles or strategies that are similar to those of the investing fund. These strategies are consistent with the investment objectives of the investing fund and may involve certain economic risks which may cause a decline in value of each of the Fidelity Central Funds and thus a decline in the value of the investing fund.
| Fidelity Central Fund | Investment Manager | Investment Objective | Investment Practices | Expense Ratio(a) |
| Fidelity Money Market Central Funds | Fidelity Management & Research Company LLC (FMR) | Each fund seeks to obtain a high level of current income consistent with the preservation of capital and liquidity. | Short-term Investments | Less than .005% to .01% |
(a) Expenses expressed as a percentage of average net assets and are as of each underlying Central Fund's most recent annual or semi-annual shareholder report.
A complete unaudited list of holdings for each Fidelity Central Fund is available upon request or at the Securities and Exchange Commission website at www.sec.gov. In addition, the financial statements of the Fidelity Central Funds which contain the significant accounting policies (including investment valuation policies) of those funds, and are not covered by the Report of Independent Registered Public Accounting Firm, are available on the Securities and Exchange Commission website or upon request.
3. Significant Accounting Policies.
The Fund is an investment company and applies the accounting and reporting guidance of the Financial Accounting Standards Board (FASB) Accounting Standards Codification Topic 946 Financial Services - Investment Companies. The financial statements have been prepared in conformity with accounting principles generally accepted in the United States of America (GAAP), which require management to make certain estimates and assumptions at the date of the financial statements. Actual results could differ from those estimates. Subsequent events, if any, through the date that the financial statements were issued have been evaluated in the preparation of the financial statements. The Fund's Schedule of Investments lists any underlying mutual funds or exchange-traded funds (ETFs) but does not include the underlying holdings of these funds. The following summarizes the significant accounting policies of the Fund:
Investment Valuation. Investments are valued as of 4:00 p.m. Eastern time on the last calendar day of the period. The Board of Trustees (the Board) has delegated the day to day responsibility for the valuation of the Fund's investments to the Fair Value Committee (the Committee) established by the Fund's investment adviser. In accordance with valuation policies and procedures approved by the Board, the Fund attempts to obtain prices from one or more third party pricing vendors or brokers to value its investments. When current market prices, quotations or currency exchange rates are not readily available or reliable, investments will be fair valued in good faith by the Committee, in accordance with procedures adopted by the Board. Factors used in determining fair value vary by investment type and may include market or investment specific events, changes in interest rates and credit quality. The frequency with which these procedures are used cannot be predicted and they may be utilized to a significant extent. The Committee oversees the Fund's valuation policies and procedures and reports to the Board on the Committee's activities and fair value determinations. The Board monitors the appropriateness of the procedures used in valuing the Fund's investments and ratifies the fair value determinations of the Committee.
The Fund categorizes the inputs to valuation techniques used to value its investments into a disclosure hierarchy consisting of three levels as shown below:
- Level 1 – quoted prices in active markets for identical investments
- Level 2 – other significant observable inputs (including quoted prices for similar investments, interest rates, prepayment speeds, etc.)
- Level 3 – unobservable inputs (including the Fund's own assumptions based on the best information available)
Valuation techniques used to value the Fund's investments by major category are as follows:
Equity securities, including restricted securities, for which market quotations are readily available, are valued at the last reported sale price or official closing price as reported by a third party pricing vendor on the primary market or exchange on which they are traded and are categorized as Level 1 in the hierarchy. In the event there were no sales during the day or closing prices are not available, securities are valued at the last quoted bid price or may be valued using the last available price and are generally categorized as Level 2 in the hierarchy. For foreign equity securities, when market or security specific events arise, comparisons to the valuation of American Depositary Receipts (ADRs), futures contracts, ETFs and certain indexes as well as quoted prices for similar securities may be used and would be categorized as Level 2 in the hierarchy. For equity securities, including restricted securities, where observable inputs are limited, assumptions about market activity and risk are used and these securities may be categorized as Level 3 in the hierarchy.
Debt securities, including restricted securities, are valued based on evaluated prices received from third party pricing vendors or from brokers who make markets in such securities. Corporate bonds are valued by pricing vendors who utilize matrix pricing which considers yield or price of bonds of comparable quality, coupon, maturity and type or by broker-supplied prices. When independent prices are unavailable or unreliable, debt securities may be valued utilizing pricing methodologies which consider similar factors that would be used by third party pricing vendors. Debt securities are generally categorized as Level 2 in the hierarchy but may be Level 3 depending on the circumstances.
Investments in open-end mutual funds, including the Fidelity Central Funds, are valued at their closing net asset value (NAV) each business day and are categorized as Level 1 in the hierarchy.
Changes in valuation techniques may result in transfers in or out of an assigned level within the disclosure hierarchy. The aggregate value of investments by input level as of July 31, 2021 is included at the end of the Fund's Schedule of Investments.
Foreign Currency. Certain Funds may use foreign currency contracts to facilitate transactions in foreign-denominated securities. Gains and losses from these transactions may arise from changes in the value of the foreign currency or if the counterparties do not perform under the contracts' terms.
Foreign-denominated assets, including investment securities, and liabilities are translated into U.S. dollars at the exchange rates at period end. Purchases and sales of investment securities, income and dividends received, and expenses denominated in foreign currencies are translated into U.S. dollars at the exchange rate in effect on the transaction date.
The effects of exchange rate fluctuations on investments are included with the net realized and unrealized gain (loss) on investment securities. Other foreign currency transactions resulting in realized and unrealized gain (loss) are disclosed separately.
Investment Transactions and Income. For financial reporting purposes, the Fund's investment holdings and NAV include trades executed through the end of the last business day of the period. The NAV per share for processing shareholder transactions is calculated as of the close of business of the New York Stock Exchange (NYSE), normally 4:00 p.m. Eastern time and includes trades executed through the end of the prior business day. Gains and losses on securities sold are determined on the basis of identified cost and include proceeds received from litigation. Dividend income is recorded on the ex-dividend date, except for certain dividends from foreign securities where the ex-dividend date may have passed, which are recorded as soon as the Fund is informed of the ex-dividend date. Non-cash dividends included in dividend income, if any, are recorded at the fair market value of the securities received. Income and capital gain distributions from Fidelity Central Funds, if any, are recorded on the ex-dividend date. Certain distributions received by the Fund represent a return of capital or capital gain. The Fund determines the components of these distributions subsequent to the ex-dividend date, based upon receipt of tax filings or other correspondence relating to the underlying investment. These distributions are recorded as a reduction of cost of investments and/or as a realized gain. Investment income is recorded net of foreign taxes withheld where recovery of such taxes is uncertain.
Expenses. Expenses directly attributable to a fund are charged to that fund. Expenses attributable to more than one fund are allocated among the respective funds on the basis of relative net assets or other appropriate methods. Expenses included in the accompanying financial statements reflect the expenses of that fund and do not include any expenses associated with any underlying mutual funds or exchange-traded funds. Although not included in a fund's expenses, a fund indirectly bears its proportionate share of these expenses through the net asset value of each underlying mutual fund or exchange-traded fund. Expense estimates are accrued in the period to which they relate and adjustments are made when actual amounts are known.
Income Tax Information and Distributions to Shareholders. Each year, the Fund intends to qualify as a regulated investment company under Subchapter M of the Internal Revenue Code, including distributing substantially all of its taxable income and realized gains. As a result, no provision for U.S. Federal income taxes is required. As of July 31, 2021, the Fund did not have any unrecognized tax benefits in the financial statements; nor is the Fund aware of any tax positions for which it is reasonably possible that the total amounts of unrecognized tax benefits will significantly change in the next twelve months. The Fund files a U.S. federal tax return, in addition to state and local tax returns as required. The Fund's federal income tax returns are subject to examination by the Internal Revenue Service (IRS) for a period of three fiscal years after they are filed. State and local tax returns may be subject to examination for an additional fiscal year depending on the jurisdiction. Foreign taxes are provided for based on the Fund's understanding of the tax rules and rates that exist in the foreign markets in which it invests. The Fund is subject to a tax imposed on capital gains by certain countries in which it invests. An estimated deferred tax liability for net unrealized appreciation on the applicable securities is included in Other payables and accrued expenses on the Statement of Assets & Liabilities.
Distributions are declared and recorded on the ex-dividend date. Income and capital gain distributions are determined in accordance with income tax regulations, which may differ from GAAP.
Capital accounts within the financial statements are adjusted for permanent book-tax differences. These adjustments have no impact on net assets or the results of operations. Capital accounts are not adjusted for temporary book-tax differences which will reverse in a subsequent period.
Book-tax differences are primarily due to foreign currency transactions, certain foreign taxes, passive foreign investment companies (PFIC), capital loss carryforwards, partnerships and losses deferred due to wash sales.
As of period end, the cost and unrealized appreciation (depreciation) in securities, and derivatives if applicable, for federal income tax purposes were as follows:
| Gross unrealized appreciation | $736,755,290 |
| Gross unrealized depreciation | (124,764,641) |
| Net unrealized appreciation (depreciation) | $611,990,649 |
| Tax Cost | $2,343,238,302 |
The tax-based components of distributable earnings as of period end were as follows:
| Undistributed ordinary income | $18,866,359 |
| Undistributed long-term capital gain | $88,241,577 |
| Net unrealized appreciation (depreciation) on securities and other investments | $611,997,455 |
The tax character of distributions paid was as follows:
| | July 31, 2021 | July 31, 2020 |
| Ordinary Income | $31,826,765 | $ 40,773,456 |
| Long-term Capital Gains | – | 10,489,936 |
| Total | $31,826,765 | $ 51,263,392 |
Restricted Securities (including Private Placements). Funds may invest in securities that are subject to legal or contractual restrictions on resale. These securities generally may be resold in transactions exempt from registration or to the public if the securities are registered. Disposal of these securities may involve time-consuming negotiations and expense, and prompt sale at an acceptable price may be difficult. Information regarding restricted securities held at period end is included at the end of the Schedule of Investments, if applicable.
4. Purchases and Sales of Investments.
Purchases and sales of securities, other than short-term securities and in-kind transactions, as applicable, are noted in the table below.
| | Purchases ($) | Sales ($) |
| Fidelity Low-Priced Stock K6 Fund | 573,005,380 | 646,463,959 |
Unaffiliated Exchanges In-Kind. Shares that were exchanged for investments, including accrued interest and cash, if any, are shown in the table below. The amount of in-kind exchanges is included in share transactions in the accompanying Statement of Changes in Net Assets.
| | Shares | Total Proceeds
($) |
| Fidelity Low-Priced Stock K6 Fund | 6,118,083 | 85,955,302 |
Prior Fiscal Year Unaffiliated Redemptions In-Kind. Shares that were redeemed in-kind for investments, including accrued interest and cash, if any, are shown in the table below; along with realized gain or loss on investments delivered through in-kind redemptions. The amount of the in-kind redemptions is included in share transactions in the accompanying Statement of Changes in Net Assets. There was no gain or loss for federal income tax purposes.
| | Shares | Total net realized gain or loss
($) | Total Proceeds
($) |
| Fidelity Low-Priced Stock K6 Fund | 3,929,798 | 8,990,208 | 43,502,867 |
Prior Year Unaffiliated Exchanges In-Kind. Shares that were exchanged for investments, including accrued interest and cash, if any, are shown in the table below. The amount of in-kind exchanges is included in share transactions in the accompanying Statement of Changes in Net Assets.
| | Shares | Total Proceeds
($) |
| Fidelity Low-Priced Stock K6 Fund | 19,957,245 | 224,490,934 |
5. Fees and Other Transactions with Affiliates.
Management Fee. Fidelity Management & Research Company LLC (the investment adviser) and its affiliates provide the Fund with investment management related services for which the Fund pays a monthly management fee that is based on an annual rate of .50% of average net assets. Under the management contract, the investment adviser or an affiliate pays all other expenses of the Fund, excluding fees and expenses of the independent Trustees, and certain miscellaneous expenses such as proxy and shareholder meeting expenses.
Brokerage Commissions. A portion of portfolio transactions were placed with brokerage firms which are affiliates of the investment adviser. Brokerage commissions are included in net realized gain (loss) and change in net unrealized appreciation (depreciation) in the Statement of Operations. The commissions paid to these affiliated firms were as follows:
| | Amount |
| Fidelity Low-Priced Stock K6 Fund | $13,128 |
Interfund Lending Program. Pursuant to an Exemptive Order issued by the Securities and Exchange Commission (the SEC), the Fund, along with other registered investment companies having management contracts with Fidelity Management & Research Company LLC (FMR), or other affiliated entities of FMR, may participate in an interfund lending program. This program provides an alternative credit facility allowing the Fund to borrow from, or lend money to, other participating affiliated funds. At period end, there were no interfund loans outstanding. Activity in this program during the period for which loans were outstanding was as follows:
| | Borrower or Lender | Average Loan Balance | Weighted Average Interest Rate | Interest Expense |
| Fidelity Low-Priced Stock K6 Fund | Borrower | $13,128,000 | .34% | $244 |
Interfund Trades. Funds may purchase from or sell securities to other Fidelity Funds under procedures adopted by the Board. The procedures have been designed to ensure these interfund trades are executed in accordance with Rule 17a-7 of the 1940 Act. Any interfund trades are included within the respective purchases and sales amounts shown in the Purchases and Sales of Investments note and are noted in the table below.
| | Purchases ($) | Sales ($) |
| Fidelity Low-Priced Stock K6 Fund | 32,593,140 | 23,153,194 |
6. Committed Line of Credit.
Certain Funds participate with other funds managed by the investment adviser or an affiliate in a $4.25 billion credit facility (the "line of credit") to be utilized for temporary or emergency purposes to fund shareholder redemptions or for other short-term liquidity purposes. The participating funds have agreed to pay commitment fees on their pro-rata portion of the line of credit, which are reflected in Miscellaneous expenses on the Statement of Operations, and are listed below. Effective during January 2021, commitment fees are borne by the investment adviser. During the period, there were no borrowings on this line of credit.
| | Amount |
| Fidelity Low-Priced Stock K6 Fund | $983 |
7. Security Lending.
Funds lend portfolio securities from time to time in order to earn additional income. Lending agents are used, including National Financial Services (NFS), an affiliate of the investment adviser. Pursuant to a securities lending agreement, NFS will receive a fee, which is capped at 9.9% of a fund's daily lending revenue, for its services as lending agent. A fund may lend securities to certain qualified borrowers, including NFS. On the settlement date of the loan, a fund receives collateral (in the form of U.S. Treasury obligations, letters of credit and/or cash) against the loaned securities and maintains collateral in an amount not less than 100% of the market value of the loaned securities during the period of the loan. The market value of the loaned securities is determined at the close of business of a fund and any additional required collateral is delivered to a fund on the next business day. A fund or borrower may terminate the loan at any time, and if the borrower defaults on its obligation to return the securities loaned because of insolvency or other reasons, a fund may apply collateral received from the borrower against the obligation. A fund may experience delays and costs in recovering the securities loaned. Any cash collateral received is invested in the Fidelity Securities Lending Cash Central Fund. Any loaned securities are identified as such in the Schedule of Investments, and the value of loaned securities and cash collateral at period end, as applicable, are presented in the Statement of Assets and Liabilities. Security lending income represents the income earned on investing cash collateral, less rebates paid to borrowers and any lending agent fees associated with the loan, plus any premium payments received for lending certain types of securities. Security lending income is presented in the Statement of Operations as a component of income from Fidelity Central Funds. Affiliated security lending activity, if any, was as follows:
| | Total Security Lending Fees Paid to NFS | Security Lending Income From Securities Loaned to NFS | Value of Securities Loaned to NFS at Period End |
| Fidelity Low-Priced Stock K6 Fund | $24,683 | $119 | $– |
8. Expense Reductions.
Commissions paid to certain brokers with whom the investment adviser, or its affiliates, places trades on behalf of the Fund include an amount in addition to trade execution, which may be rebated back to the Fund to offset expenses. This amount totaled $43,924 for the period. In addition, through arrangements with the Fund's custodian, credits realized as a result of certain uninvested cash balances were used to reduce the Fund's expenses by $32.
9. Other.
Fund's organizational documents provide former and current trustees and officers with a limited indemnification against liabilities arising in connection with the performance of their duties to the fund. In the normal course of business, the fund may also enter into contracts that provide general indemnifications. The fund's maximum exposure under these arrangements is unknown as this would be dependent on future claims that may be made against the fund. The risk of material loss from such claims is considered remote.
10. Coronavirus (COVID-19) Pandemic.
An outbreak of COVID-19 first detected in China during December 2019 has since spread globally and was declared a pandemic by the World Health Organization during March 2020. Developments that disrupt global economies and financial markets, such as the COVID-19 pandemic, may magnify factors that affect the Fund's performance.
Report of Independent Registered Public Accounting Firm
To the Board of Trustees of Fidelity Puritan Trust and Shareholders of Fidelity Low-Priced Stock K6 Fund
Opinion on the Financial Statements
We have audited the accompanying statement of assets and liabilities, including the schedule of investments, of Fidelity Low-Priced Stock K6 Fund (one of the funds constituting Fidelity Puritan Trust, referred to hereafter as the “Fund”) as of July 31, 2021, the related statement of operations for the year ended July 31, 2021, the statement of changes in net assets for each of the two years in the period ended July 31, 2021, including the related notes, and the financial highlights for each of the four years in the period ended July 31, 2021 and for the period May 26, 2017 (commencement of operations) to July 31, 2017 (collectively referred to as the “financial statements”). In our opinion, the financial statements present fairly, in all material respects, the financial position of the Fund as of July 31, 2021, the results of its operations for the year then ended, the changes in its net assets for each of the two years in the period ended July 31, 2021 and the financial highlights for each of the four years in the period ended July 31, 2021 and for the period May 26, 2017 (commencement of operations) to July 31, 2017 in conformity with accounting principles generally accepted in the United States of America.
Basis for Opinion
These financial statements are the responsibility of the Fund’s management. Our responsibility is to express an opinion on the Fund’s financial statements based on our audits. We are a public accounting firm registered with the Public Company Accounting Oversight Board (United States) (PCAOB) and are required to be independent with respect to the Fund in accordance with the U.S. federal securities laws and the applicable rules and regulations of the Securities and Exchange Commission and the PCAOB.
We conducted our audits of these financial statements in accordance with the standards of the PCAOB. Those standards require that we plan and perform the audit to obtain reasonable assurance about whether the financial statements are free of material misstatement, whether due to error or fraud.
Our audits included performing procedures to assess the risks of material misstatement of the financial statements, whether due to error or fraud, and performing procedures that respond to those risks. Such procedures included examining, on a test basis, evidence regarding the amounts and disclosures in the financial statements. Our audits also included evaluating the accounting principles used and significant estimates made by management, as well as evaluating the overall presentation of the financial statements. Our procedures included confirmation of securities owned as of July 31, 2021 by correspondence with the custodian and brokers; when replies were not received from brokers, we performed other auditing procedures. We believe that our audits provide a reasonable basis for our opinion.
/s/ PricewaterhouseCoopers LLP
Boston, Massachusetts
September 10, 2021
We have served as the auditor of one or more investment companies in the Fidelity group of funds since 1932.
Trustees and Officers
The Trustees, Members of the Advisory Board (if any), and officers of the trust and fund, as applicable, are listed below. The Board of Trustees governs the fund and is responsible for protecting the interests of shareholders. The Trustees are experienced executives who meet periodically throughout the year to oversee the fund's activities, review contractual arrangements with companies that provide services to the fund, oversee management of the risks associated with such activities and contractual arrangements, and review the fund's performance. Except for Jonathan Chiel, each of the Trustees oversees 314 funds. Mr. Chiel oversees 176 funds.
The Trustees hold office without limit in time except that (a) any Trustee may resign; (b) any Trustee may be removed by written instrument, signed by at least two-thirds of the number of Trustees prior to such removal; (c) any Trustee who requests to be retired or who has become incapacitated by illness or injury may be retired by written instrument signed by a majority of the other Trustees; and (d) any Trustee may be removed at any special meeting of shareholders by a two-thirds vote of the outstanding voting securities of the trust. Each Trustee who is not an interested person (as defined in the 1940 Act) of the trust and the fund is referred to herein as an Independent Trustee. Each Independent Trustee shall retire not later than the last day of the calendar year in which his or her 75th birthday occurs. The Independent Trustees may waive this mandatory retirement age policy with respect to individual Trustees. Officers and Advisory Board Members hold office without limit in time, except that any officer or Advisory Board Member may resign or may be removed by a vote of a majority of the Trustees at any regular meeting or any special meeting of the Trustees. Except as indicated, each individual has held the office shown or other offices in the same company for the past five years.
The fund’s Statement of Additional Information (SAI) includes more information about the Trustees. To request a free copy, call Fidelity at 1-800-835-5092.
Experience, Skills, Attributes, and Qualifications of the Trustees. The Governance and Nominating Committee has adopted a statement of policy that describes the experience, qualifications, attributes, and skills that are necessary and desirable for potential Independent Trustee candidates (Statement of Policy). The Board believes that each Trustee satisfied at the time he or she was initially elected or appointed a Trustee, and continues to satisfy, the standards contemplated by the Statement of Policy. The Governance and Nominating Committee also engages professional search firms to help identify potential Independent Trustee candidates who have the experience, qualifications, attributes, and skills consistent with the Statement of Policy. From time to time, additional criteria based on the composition and skills of the current Independent Trustees, as well as experience or skills that may be appropriate in light of future changes to board composition, business conditions, and regulatory or other developments, have also been considered by the professional search firms and the Governance and Nominating Committee. In addition, the Board takes into account the Trustees' commitment and participation in Board and committee meetings, as well as their leadership of standing and ad hoc committees throughout their tenure.
In determining that a particular Trustee was and continues to be qualified to serve as a Trustee, the Board has considered a variety of criteria, none of which, in isolation, was controlling. The Board believes that, collectively, the Trustees have balanced and diverse experience, qualifications, attributes, and skills, which allow the Board to operate effectively in governing the fund and protecting the interests of shareholders. Information about the specific experience, skills, attributes, and qualifications of each Trustee, which in each case led to the Board's conclusion that the Trustee should serve (or continue to serve) as a trustee of the fund, is provided below.
Board Structure and Oversight Function. Robert A. Lawrence is an interested person and currently serves as Acting Chairman. The Trustees have determined that an interested Chairman is appropriate and benefits shareholders because an interested Chairman has a personal and professional stake in the quality and continuity of services provided to the fund. Independent Trustees exercise their informed business judgment to appoint an individual of their choosing to serve as Chairman, regardless of whether the Trustee happens to be independent or a member of management. The Independent Trustees have determined that they can act independently and effectively without having an Independent Trustee serve as Chairman and that a key structural component for assuring that they are in a position to do so is for the Independent Trustees to constitute a substantial majority for the Board. The Independent Trustees also regularly meet in executive session. David M. Thomas serves as Lead Independent Trustee and as such (i) acts as a liaison between the Independent Trustees and management with respect to matters important to the Independent Trustees and (ii) with management prepares agendas for Board meetings.
Fidelity® funds are overseen by different Boards of Trustees. The fund's Board oversees Fidelity's high income and certain equity funds, and other Boards oversee Fidelity's investment-grade bond, money market, asset allocation, and other equity funds. The asset allocation funds may invest in Fidelity® funds overseen by the fund's Board. The use of separate Boards, each with its own committee structure, allows the Trustees of each group of Fidelity® funds to focus on the unique issues of the funds they oversee, including common research, investment, and operational issues. On occasion, the separate Boards establish joint committees to address issues of overlapping consequences for the Fidelity® funds overseen by each Board.
The Trustees operate using a system of committees to facilitate the timely and efficient consideration of all matters of importance to the Trustees, the fund, and fund shareholders and to facilitate compliance with legal and regulatory requirements and oversight of the fund's activities and associated risks. The Board, acting through its committees, has charged FMR and its affiliates with (i) identifying events or circumstances the occurrence of which could have demonstrably adverse effects on the fund's business and/or reputation; (ii) implementing processes and controls to lessen the possibility that such events or circumstances occur or to mitigate the effects of such events or circumstances if they do occur; and (iii) creating and maintaining a system designed to evaluate continuously business and market conditions in order to facilitate the identification and implementation processes described in (i) and (ii) above. Because the day-to-day operations and activities of the fund are carried out by or through FMR, its affiliates, and other service providers, the fund's exposure to risks is mitigated but not eliminated by the processes overseen by the Trustees. While each of the Board's committees has responsibility for overseeing different aspects of the fund's activities, oversight is exercised primarily through the Operations, Audit, and Compliance Committees. Appropriate personnel, including but not limited to the fund's Chief Compliance Officer (CCO), FMR's internal auditor, the independent accountants, the fund's Treasurer and portfolio management personnel, make periodic reports to the Board's committees, as appropriate, including an annual review of Fidelity's risk management program for the Fidelity® funds. The responsibilities of each standing committee, including their oversight responsibilities, are described further under "Standing Committees of the Trustees."
Interested Trustees*:
Correspondence intended for a Trustee who is an interested person may be sent to Fidelity Investments, 245 Summer Street, Boston, Massachusetts 02210.
Name, Year of Birth; Principal Occupations and Other Relevant Experience+
Jonathan Chiel (1957)
Year of Election or Appointment: 2016
Trustee
Mr. Chiel also serves as Trustee of other Fidelity® funds. Mr. Chiel is Executive Vice President and General Counsel for FMR LLC (diversified financial services company, 2012-present). Previously, Mr. Chiel served as general counsel (2004-2012) and senior vice president and deputy general counsel (2000-2004) for John Hancock Financial Services; a partner with Choate, Hall & Stewart (1996-2000) (law firm); and an Assistant United States Attorney for the United States Attorney’s Office of the District of Massachusetts (1986-95), including Chief of the Criminal Division (1993-1995). Mr. Chiel is a director on the boards of the Boston Bar Foundation and the Maimonides School.
Bettina Doulton (1964)
Year of Election or Appointment: 2021
Trustee
Ms. Doulton also serves as Trustee of other Fidelity® funds. Prior to her retirement, Ms. Doulton served in a variety of positions at Fidelity Investments, including as a managing director of research (2006-2007), portfolio manager to certain Fidelity® funds (1993-2005), equity analyst and portfolio assistant (1990-1993), and research assistant (1987-1990). Ms. Doulton currently owns and operates Phi Builders + Architects and Cellardoor Winery. Previously, Ms. Doulton served as a member of the Board of Brown Capital Management, LLC (2014-2018).
Robert A. Lawrence (1952)
Year of Election or Appointment: 2020
Trustee
Acting Chairman of the Board of Trustees
Mr. Lawrence also serves as Trustee of other funds. Previously, Mr. Lawrence served as a Member of the Advisory Board of certain funds. Prior to his retirement in 2008, Mr. Lawrence served as Vice President of certain Fidelity® funds (2006-2008), Senior Vice President, Head of High Income Division of Fidelity Management & Research Company (investment adviser firm, 2006-2008), and President of Fidelity Strategic Investments (investment adviser firm, 2002-2005).
* Determined to be an “Interested Trustee” by virtue of, among other things, his or her affiliation with the trust or various entities under common control with FMR.
+ The information includes the Trustee's principal occupation during the last five years and other information relating to the experience, attributes, and skills relevant to the Trustee's qualifications to serve as a Trustee, which led to the conclusion that the Trustee should serve as a Trustee for the fund.
Independent Trustees:
Correspondence intended for an Independent Trustee may be sent to Fidelity Investments, P.O. Box 55235, Boston, Massachusetts 02205-5235.
Name, Year of Birth; Principal Occupations and Other Relevant Experience+
Thomas P. Bostick (1956)
Year of Election or Appointment: 2021
Trustee
Lieutenant General Bostick also serves as Trustee of other Fidelity® funds. Prior to his retirement, General Bostick (United States Army, Retired) held a variety of positions within the U.S. Army, including Commanding General and Chief of Engineers, U.S. Army Corps of Engineers (2012-2016) and Deputy Chief of Staff and Director of Human Resources, U.S. Army (2009-2012). General Bostick currently serves as a member of the Board and Finance and Governance Committees of CSX Corporation (transportation, 2020-present) and a member of the Board and Corporate Governance and Nominating Committee of Perma-Fix Environmental Services, Inc. (nuclear waste management, 2020-present). General Bostick serves as Chief Executive Officer of Bostick Global Strategies, LLC (consulting, 2016-present) and Managing Partner, Sustainability, of Ridge-Lane Limited Partners (strategic advisory and venture development, 2016-present). Previously, General Bostick served as a Member of the Advisory Board of certain Fidelity® funds (2021), President, Intrexon Bioengineering (2018-2020) and Chief Operating Officer (2017-2020) and Senior Vice President of the Environment Sector (2016-2017) of Intrexon Corporation (biopharmaceutical company).
Dennis J. Dirks (1948)
Year of Election or Appointment: 2005
Trustee
Mr. Dirks also serves as Trustee of other Fidelity® funds. Prior to his retirement in May 2003, Mr. Dirks served as Chief Operating Officer and as a member of the Board of The Depository Trust & Clearing Corporation (financial markets infrastructure), President, Chief Operating Officer and a member of the Board of The Depository Trust Company (DTC), President and a member of the Board of the National Securities Clearing Corporation (NSCC), Chief Executive Officer and a member of the Board of the Government Securities Clearing Corporation and Chief Executive Officer and a member of the Board of the Mortgage-Backed Securities Clearing Corporation. Mr. Dirks currently serves as a member of the Finance Committee (2016-present) and Board (2017-present) and is Treasurer (2018-present) of the Asolo Repertory Theatre.
Donald F. Donahue (1950)
Year of Election or Appointment: 2018
Trustee
Mr. Donahue also serves as Trustee of other Fidelity® funds. Mr. Donahue serves as President and Chief Executive Officer of Miranda Partners, LLC (risk consulting for the financial services industry, 2012-present). Previously, Mr. Donahue served as Chief Executive Officer (2006-2012), Chief Operating Officer (2003-2006) and Managing Director, Customer Marketing and Development (1999-2003) of The Depository Trust & Clearing Corporation (financial markets infrastructure). Mr. Donahue currently serves as a member (2007-present) and Co-Chairman (2016-present) of the Board of United Way of New York and a member of the Board of NYC Leadership Academy (2012-present). Mr. Donahue previously served as a member of the Advisory Board of certain Fidelity® funds (2015-2018).
Vicki L. Fuller (1957)
Year of Election or Appointment: 2020
Trustee
Ms. Fuller also serves as Trustee of other Fidelity® funds. Previously, Ms. Fuller served as a member of the Advisory Board of certain Fidelity® funds (2018-2020), Chief Investment Officer of the New York State Common Retirement Fund (2012-2018) and held a variety of positions at AllianceBernstein L.P. (global asset management, 1985-2012), including Managing Director (2006-2012) and Senior Vice President and Senior Portfolio Manager (2001-2006). Ms. Fuller currently serves as a member of the Board, Audit Committee and Nominating and Governance Committee of The Williams Companies, Inc. (natural gas infrastructure, 2018-present), as a member of the Board, Audit Committee and Nominating and Governance Committee of two Blackstone business development companies (2020-present) and as a member of the Board of Treliant, LLC (consulting, 2019-present).
Patricia L. Kampling (1959)
Year of Election or Appointment: 2020
Trustee
Ms. Kampling also serves as Trustee of other Fidelity® funds. Prior to her retirement, Ms. Kampling served as Chairman of the Board and Chief Executive Officer (2012-2019), President and Chief Operating Officer (2011-2012) and Executive Vice President and Chief Financial Officer (2010-2011) of Alliant Energy Corporation. Ms. Kampling currently serves as a member of the Board, Finance Committee and Governance, Compensation and Nominating Committee of Xcel Energy Inc. (utilities company, 2020-present) and as a member of the Board, Audit, Finance and Risk Committee and Safety, Environmental, Technology and Operations Committee of American Water Works Company, Inc. (utilities company, 2019-present). In addition, Ms. Kampling currently serves as a member of the Board of the Nature Conservancy, Wisconsin Chapter (2019-present). Previously, Ms. Kampling served as a Member of the Advisory Board of certain Fidelity® funds (2020), a member of the Board, Compensation Committee and Executive Committee and Chair of the Audit Committee of Briggs & Stratton Corporation (manufacturing, 2011-2021), a member of the Board of Interstate Power and Light Company (2012-2019) and Wisconsin Power and Light Company (2012-2019) (each a subsidiary of Alliant Energy Corporation) and as a member of the Board and Workforce Development Committee of the Business Roundtable (2018-2019).
Thomas A. Kennedy (1955)
Year of Election or Appointment: 2021
Trustee
Mr. Kennedy also serves as Trustee of other Fidelity® funds. Previously, Mr. Kennedy served as a Member of the Advisory Board of certain Fidelity® funds (2020) and held a variety of positions at Raytheon Company (aerospace and defense, 1983-2020), including Chairman and Chief Executive Officer (2014-2020) and Executive Vice President and Chief Operating Officer (2013-2014). Mr. Kennedy currently serves as Executive Chairman of the Board of Directors of Raytheon Technologies Corporation (aerospace and defense, 2020-present). He is also a member of the Rutgers School of Engineering Industry Advisory Board (2011-present) and a member of the UCLA Engineering Dean’s Executive Board (2016-present).
Oscar Munoz (1959)
Year of Election or Appointment: 2021
Trustee
Mr. Munoz also serves as Trustee of other Fidelity® funds. Prior to his retirement, Mr. Munoz served as Executive Chairman (2020-2021), Chief Executive Officer (2015-2020), President (2015-2016) and a member of the Board (2010-2021) of United Airlines Holdings, Inc. Mr. Munoz currently serves as a member of the Board of CBRE Group, Inc. (commercial real estate, 2020-present), a member of the Board of Univision Communications, Inc. (Hispanic media, 2020-present) and a member of the Advisory Board of Salesforce.com, Inc. (cloud-based software, 2020-present). Previously, Mr. Munoz served as a Member of the Advisory Board of certain Fidelity® funds (2021).
Garnett A. Smith (1947)
Year of Election or Appointment: 2018
Trustee
Mr. Smith also serves as Trustee of other Fidelity® funds. Prior to his retirement, Mr. Smith served as Chairman and Chief Executive Officer (1990-1997) and President (1986-1990) of Inbrand Corp. (manufacturer of personal absorbent products). Prior to his employment with Inbrand Corp., he was employed by a retail fabric chain and North Carolina National Bank (now Bank of America). Mr. Smith previously served as a member of the Advisory Board of certain Fidelity® funds (2012-2013).
David M. Thomas (1949)
Year of Election or Appointment: 2008
Trustee
Lead Independent Trustee
Mr. Thomas also serves as Trustee of other Fidelity® funds. Previously, Mr. Thomas served as Executive Chairman (2005-2006) and Chairman and Chief Executive Officer (2000-2005) of IMS Health, Inc. (pharmaceutical and healthcare information solutions). Mr. Thomas currently serves as a member of the Board of Fortune Brands Home and Security (home and security products, 2004-present) and Presiding Director (2013-present) of Interpublic Group of Companies, Inc. (marketing communication).
Susan Tomasky (1953)
Year of Election or Appointment: 2020
Trustee
Ms. Tomasky also serves as Trustee of other Fidelity® funds. Prior to her retirement, Ms. Tomasky served in various executive officer positions at American Electric Power Company, Inc. (1998-2011), including most recently as President of AEP Transmission (2007-2011). Ms. Tomasky currently serves as a member of the Board and Sustainability Committee and as Chair of the Audit Committee of Marathon Petroleum Corporation (2018-present) and as a member of the Board, Corporate Governance Committee and Organization and Compensation Committee and as Chair of the Audit Committee of Public Service Enterprise Group, Inc. (utilities company, 2012-present). In addition, Ms. Tomasky currently serves as a member (2009-present) and President (2020-present) of the Board of the Royal Shakespeare Company – America (2009-present), as a member of the Board of the Columbus Association for the Performing Arts (2011-present) and as a member of the Board and Investment Committee of Kenyon College (2016-present). Previously, Ms. Tomasky served as a Member of the Advisory Board of certain Fidelity® funds (2020), as a member of the Board of the Columbus Regional Airport Authority (2007-2020), as a member of the Board (2011-2018) and Lead Independent Director (2015-2018) of Andeavor Corporation (previously Tesoro Corporation) (independent oil refiner and marketer) and as a member of the Board of Summit Midstream Partners LP (energy, 2012-2018).
Michael E. Wiley (1950)
Year of Election or Appointment: 2020
Trustee
Mr. Wiley also serves as Trustee of other Fidelity® funds. Previously, Mr. Wiley served as a member of the Advisory Board of certain Fidelity® funds (2018-2020), Chairman, President and CEO of Baker Hughes, Inc. (oilfield services, 2000-2004). Mr. Wiley also previously served as a member of the Board of Andeavor Corporation (independent oil refiner and marketer, 2005-2018), a member of the Board of Andeavor Logistics LP (natural resources logistics, 2015-2018) and a member of the Board of High Point Resources (exploration and production, 2005-2020).
+ The information includes the Trustee's principal occupation during the last five years and other information relating to the experience, attributes, and skills relevant to the Trustee's qualifications to serve as a Trustee, which led to the conclusion that the Trustee should serve as a Trustee for the fund.
Advisory Board Members and Officers:
Correspondence intended for a Member of the Advisory Board (if any) may be sent to Fidelity Investments, P.O. Box 55235, Boston, Massachusetts 02205-5235. Correspondence intended for an officer or Peter S. Lynch may be sent to Fidelity Investments, 245 Summer Street, Boston, Massachusetts 02210. Officers appear below in alphabetical order.
Name, Year of Birth; Principal Occupation
Peter S. Lynch (1944)
Year of Election or Appointment: 2003
Member of the Advisory Board
Mr. Lynch also serves as a Member of the Advisory Board of other Fidelity® funds. Mr. Lynch is Vice Chairman and a Director of Fidelity Management & Research Company LLC (investment adviser firm). In addition, Mr. Lynch serves as a Trustee of Boston College and as the Chairman of the Inner-City Scholarship Fund. Previously, Mr. Lynch served as Vice Chairman and a Director of FMR Co., Inc. (investment adviser firm) and on the Special Olympics International Board of Directors (1997-2006).
Craig S. Brown (1977)
Year of Election or Appointment: 2019
Assistant Treasurer
Mr. Brown also serves as an officer of other funds. Mr. Brown serves as Assistant Treasurer of FIMM, LLC (2021-present) and is an employee of Fidelity Investments (2013-present).
John J. Burke III (1964)
Year of Election or Appointment: 2018
Chief Financial Officer
Mr. Burke also serves as Chief Financial Officer of other funds. Mr. Burke serves as Head of Investment Operations for Fidelity Fund and Investment Operations (2018-present) and is an employee of Fidelity Investments (1998-present). Previously Mr. Burke served as head of Asset Management Investment Operations (2012-2018).
William C. Coffey (1969)
Year of Election or Appointment: 2019
Assistant Secretary
Mr. Coffey also serves as Assistant Secretary of other funds. He is Senior Vice President and Deputy General Counsel of FMR LLC (diversified financial services company, 2010-present), and is an employee of Fidelity Investments. Previously, Mr. Coffey served as Secretary and CLO of certain funds (2018-2019); CLO, Secretary, and Senior Vice President of Fidelity Management & Research Company and FMR Co., Inc. (investment adviser firms, 2018-2019); Secretary of Fidelity SelectCo, LLC and Fidelity Investments Money Management, Inc. (investment adviser firms, 2018-2019); CLO of Fidelity Management & Research (Hong Kong) Limited, FMR Investment Management (UK) Limited, and Fidelity Management & Research (Japan) Limited (investment adviser firms, 2018-2019); and Assistant Secretary of certain funds (2009-2018).
Timothy M. Cohen (1969)
Year of Election or Appointment: 2018
Vice President
Mr. Cohen also serves as Vice President of other funds. Mr. Cohen serves as Co-Head of Equity (2018-present), a Director of Fidelity Management & Research (Japan) Limited (investment adviser firm, 2016-present), and is an employee of Fidelity Investments. Previously, Mr. Cohen served as Executive Vice President of Fidelity SelectCo, LLC (2019), Head of Global Equity Research (2016-2018), Chief Investment Officer - Equity and a Director of Fidelity Management & Research (U.K.) Inc. (investment adviser firm, 2013-2015) and as a Director of Fidelity Management & Research (Hong Kong) Limited (investment adviser firm, 2017).
Jonathan Davis (1968)
Year of Election or Appointment: 2010
Assistant Treasurer
Mr. Davis also serves as an officer of other funds. Mr. Davis serves as Assistant Treasurer of FIMM, LLC (2021-present) and FMR Capital, Inc. (2017-present) and is an employee of Fidelity Investments. Previously, Mr. Davis served as Vice President and Associate General Counsel of FMR LLC (diversified financial services company, 2003-2010).
Laura M. Del Prato (1964)
Year of Election or Appointment: 2018
Assistant Treasurer
Ms. Del Prato also serves as an officer of other funds. Ms. Del Prato serves as Assistant Treasurer of FIMM, LLC (2021-present) and is an employee of Fidelity Investments (2017-present). Previously, Ms. Del Prato served as President and Treasurer of The North Carolina Capital Management Trust: Cash Portfolio and Term Portfolio (2018-2020). Prior to joining Fidelity Investments, Ms. Del Prato served as a Managing Director and Treasurer of the JPMorgan Mutual Funds (2014-2017). Prior to JPMorgan, Ms. Del Prato served as a partner at Cohen Fund Audit Services (accounting firm, 2012-2013) and KPMG LLP (accounting firm, 2004-2012).
Colm A. Hogan (1973)
Year of Election or Appointment: 2020
Assistant Treasurer
Mr. Hogan also serves as an officer of other funds. Mr. Hogan serves as Assistant Treasurer of FIMM, LLC (2021-present) and FMR Capital, Inc. (2017-present) and is an employee of Fidelity Investments (2005-present). Previously, Mr. Hogan served as Deputy Treasurer of certain Fidelity® funds (2016-2020) and Assistant Treasurer of certain Fidelity® funds (2016-2018).
Pamela R. Holding (1964)
Year of Election or Appointment: 2018
Vice President
Ms. Holding also serves as Vice President of other funds. Ms. Holding serves as Co-Head of Equity (2018-present) and is an employee of Fidelity Investments (2013-present). Previously, Ms. Holding served as Executive Vice President of Fidelity SelectCo, LLC (2019) and as Chief Investment Officer of Fidelity Institutional Asset Management (2013-2018).
Cynthia Lo Bessette (1969)
Year of Election or Appointment: 2019
Secretary and Chief Legal Officer (CLO)
Ms. Lo Bessette also serves as an officer of other funds. Ms. Lo Bessette serves as CLO, Secretary, and Senior Vice President of Fidelity Management & Research Company LLC (investment adviser firm, 2019-present); and CLO of Fidelity Management & Research (Hong Kong) Limited, FMR Investment Management (UK) Limited, and Fidelity Management & Research (Japan) Limited (investment adviser firms, 2019-present). She is a Senior Vice President and Deputy General Counsel of FMR LLC (diversified financial services company, 2019-present), and is an employee of Fidelity Investments. Previously, Ms. Lo Bessette served as CLO, Secretary, and Senior Vice President of FMR Co., Inc. (investment adviser firm, 2019); Secretary of Fidelity SelectCo, LLC and Fidelity Investments Money Management, Inc. (investment adviser firms, 2019). Prior to joining Fidelity Investments, Ms. Lo Bessette was Executive Vice President, General Counsel (2016-2019) and Senior Vice President, Deputy General Counsel (2015-2016) of OppenheimerFunds (investment management company) and Deputy Chief Legal Officer (2013-2015) of Jennison Associates LLC (investment adviser firm).
Chris Maher (1972)
Year of Election or Appointment: 2020
Deputy Treasurer
Mr. Maher also serves as an officer of other funds. Mr. Maher serves as Assistant Treasurer of FIMM, LLC (2021-present) and FMR Capital, Inc. (2017-present), and is an employee of Fidelity Investments (2008-present). Previously, Mr. Maher served as Assistant Treasurer of certain funds (2013-2020); Vice President of Asset Management Compliance (2013), Vice President of the Program Management Group of FMR (investment adviser firm, 2010-2013), and Vice President of Valuation Oversight (2008-2010).
Jason P. Pogorelec (1975)
Year of Election or Appointment: 2020
Chief Compliance Officer
Mr. Pogorelec also serves as Chief Compliance Officer of other funds. Mr. Pogorelec is a senior Vice President of Asset Management Compliance for Fidelity Investments and is an employee of Fidelity Investments (2006-present). Previously, Mr. Pogorelec served as Vice President, Associate General Counsel for Fidelity Investments (2010-2020) and Assistant Secretary of certain Fidelity funds (2015-2020).
Brett Segaloff (1972)
Year of Election or Appointment: 2021
Anti-Money Laundering (AML) Officer
Mr. Segaloff also serves as an AML Officer of other funds and other related entities. He is Director, Anti-Money Laundering (2007-present) of FMR LLC (diversified financial services company) and is an employee of Fidelity Investments (1996-present).
Stacie M. Smith (1974)
Year of Election or Appointment: 2016
President and Treasurer
Ms. Smith also serves as an officer of other funds. Ms. Smith serves as Assistant Treasurer of FIMM, LLC (2021-present) and FMR Capital, Inc. (2017-present), is an employee of Fidelity Investments (2009-present), and has served in other fund officer roles. Prior to joining Fidelity Investments, Ms. Smith served as Senior Audit Manager of Ernst & Young LLP (accounting firm, 1996-2009). Previously, Ms. Smith served as Assistant Treasurer (2013-2019) and Deputy Treasurer (2013-2016) of certain Fidelity® funds.
Marc L. Spector (1972)
Year of Election or Appointment: 2016
Assistant Treasurer
Mr. Spector also serves as an officer of other funds. Mr. Spector serves as Assistant Treasurer of FIMM, LLC (2021-present) and FMR Capital, Inc. (2017-present) and is an employee of Fidelity Investments (2016-present). Prior to joining Fidelity Investments, Mr. Spector served as Director at the Siegfried Group (accounting firm, 2013-2016), and prior to Siegfried Group as audit senior manager at Deloitte & Touche LLP (accounting firm, 2005-2013).
Jim Wegmann (1979)
Year of Election or Appointment: 2019
Assistant Treasurer
Mr. Wegmann also serves as an officer of other funds. Mr. Wegmann serves as Assistant Treasurer of FIMM, LLC (2021-present) and is an employee of Fidelity Investments (2011-present).
Shareholder Expense Example
As a shareholder, you incur two types of costs: (1) transaction costs, which may include sales charges (loads) on purchase payments or redemption proceeds, as applicable and (2) ongoing costs, which generally include management fees, distribution and/or service (12b-1) fees and other Fund expenses. This Example is intended to help you understand your ongoing costs (in dollars) of investing in a fund and to compare these costs with the ongoing costs of investing in other mutual funds.
The Example is based on an investment of $1,000 invested at the beginning of the period and held for the entire period (February 1, 2021 to July 31, 2021).
Actual Expenses
The first line of the accompanying table provides information about actual account values and actual expenses. You may use the information in this line, together with the amount you invested, to estimate the expenses that you paid over the period. Simply divide your account value by $1,000.00 (for example, an $8,600 account value divided by $1,000.00 = 8.6), then multiply the result by the number in the first line for a class/Fund under the heading entitled "Expenses Paid During Period" to estimate the expenses you paid on your account during this period. If any fund is a shareholder of any underlying mutual funds or exchange-traded funds (ETFs) (the Underlying Funds), such fund indirectly bears its proportional share of the expenses of the Underlying Funds in addition to the direct expenses incurred presented in the table. These fees and expenses are not included in the annualized expense ratio used to calculate the expense estimate in the table below.
Hypothetical Example for Comparison Purposes
The second line of the accompanying table provides information about hypothetical account values and hypothetical expenses based on the actual expense ratio and an assumed rate of return of 5% per year before expenses, which is not the actual return. The hypothetical account values and expenses may not be used to estimate the actual ending account balance or expenses you paid for the period. You may use this information to compare the ongoing costs of investing in the Fund and other funds. To do so, compare this 5% hypothetical example with the 5% hypothetical examples that appear in the shareholder reports of the other funds. If any fund is a shareholder of any Underlying Funds, such fund indirectly bears its proportional share of the expenses of the Underlying Funds in addition to the direct expenses as presented in the table. These fees and expenses are not included in the annualized expense ratio used to calculate the expense estimate in the table below.
Please note that the expenses shown in the table are meant to highlight your ongoing costs only and do not reflect any transaction costs. Therefore, the second line of the table is useful in comparing ongoing costs only, and will not help you determine the relative total costs of owning different funds.
| | Annualized Expense Ratio-A | Beginning
Account Value
February 1, 2021 | Ending
Account Value
July 31, 2021 | Expenses Paid
During Period-B
February 1, 2021
to July 31, 2021 |
| Fidelity Low-Priced Stock K6 Fund | .50% | | | |
| Actual | | $1,000.00 | $1,174.00 | $2.70 |
| Hypothetical-C | | $1,000.00 | $1,022.32 | $2.51 |
A Annualized expense ratio reflects expenses net of applicable fee waivers.
B Expenses are equal to the annualized expense ratio, multiplied by the average account value over the period, multiplied by 181/ 365 (to reflect the one-half year period). The fees and expenses of any Underlying Funds are not included in each annualized expense ratio.
C 5% return per year before expenses
Distributions (Unaudited)
The Board of Trustees of Fidelity Low-Priced Stock K6 Fund voted to pay on September 13, 2021, to shareholders of record at the opening of business on September 10, 2021, a distribution of $0.474 per share derived from capital gains realized from sales of portfolio securities and a dividend of $0.101 per share from net investment income.
The fund hereby designates as a capital gain dividend with respect to the taxable year ended July 31, 2021, $ 88,241,577, or, if subsequently determined to be different, the net capital gain of such year.
The fund designates 54% and 61% of the dividends distributed in September and December, respectively, during the fiscal year as qualifying for the dividends–received deduction for corporate shareholders.
The fund designates 86% and 100% of the dividends distributed in September and December, respectively, during the fiscal year as amounts which may be taken into account as a dividend for the purposes of the maximum rate under section 1(h)(11) of the Internal Revenue Code.
The fund designates 2% and 0% of the dividends distributed in September and December, respectively, during the fiscal year as a section 199A dividend.
The fund will notify shareholders in January 2022 of amounts for use in preparing 2021 income tax returns.
Board Approval of Investment Advisory Contracts and Management Fees
Fidelity Low-Priced Stock K6 Fund
Each year, the Board of Trustees, including the Independent Trustees (together, the Board), votes on the renewal of the management contract with Fidelity Management & Research Company LLC (FMR) and the sub-advisory agreements (together, the Advisory Contracts) for the fund. FMR and the sub-advisers are referred to herein as the Investment Advisers. The Board, assisted by the advice of fund counsel and Independent Trustees' counsel, requests and considers a broad range of information relevant to the renewal of the Advisory Contracts throughout the year.
The Board meets regularly and, at each of its meetings, covers an extensive agenda of topics and materials and considers factors that are relevant to its annual consideration of the renewal of the fund's Advisory Contracts, including the services and support provided to the fund and its shareholders. The Board has established various standing committees (Committees), each composed of and chaired by Independent Trustees with varying backgrounds, to which the Board has assigned specific subject matter responsibilities in order to enhance effective decision-making by the Board. The Board, acting directly and through its Committees, requests and receives information concerning the annual consideration of the renewal of the fund's Advisory Contracts. The Board also meets as needed to review matters specifically related to the Board's annual consideration of the renewal of the Advisory Contracts. Members of the Board may also meet with trustees of other Fidelity funds through joint ad hoc committees to discuss certain matters relevant to all of the Fidelity funds.
At its May 2021 meeting, the Board unanimously determined to renew the fund's Advisory Contracts. In reaching its determination, the Board considered all factors it believed relevant, including (i) the nature, extent, and quality of the services provided to the fund and its shareholders (including the investment performance of the fund); (ii) the competitiveness of the fund's management fee and total expense ratio relative to peer funds; (iii) the total costs of the services provided by and the profits realized by Fidelity from its relationships with the fund; and (iv) the extent to which, if any, economies of scale exist and are realized as the fund grows, and whether any economies of scale are appropriately shared with fund shareholders.
In considering whether to renew the Advisory Contracts for the fund, the Board reached a determination, with the assistance of fund counsel and Independent Trustees' counsel and through the exercise of its business judgment, that the renewal of the Advisory Contracts was in the best interests of the fund and its shareholders and that the compensation payable under the Advisory Contracts was fair and reasonable. The Board's decision to renew the Advisory Contracts was not based on any single factor, but rather was based on a comprehensive consideration of all the information provided to the Board at its meetings throughout the year. The Board, in reaching its determination to renew the Advisory Contracts, was aware that shareholders of the fund have a broad range of investment choices available to them, including a wide choice among funds offered by Fidelity's competitors, and that the fund's shareholders, who have the opportunity to review and weigh the disclosure provided by the fund in its prospectus and other public disclosures, have chosen to invest in this fund, which is part of the Fidelity family of funds.
Nature, Extent, and Quality of Services Provided. The Board considered Fidelity's staffing as it relates to the fund, including the backgrounds of investment personnel of Fidelity, and also considered the fund's investment objective, strategies, and related investment philosophy. The Independent Trustees also had discussions with senior management of Fidelity's investment operations and investment groups. The Board considered the structure of the investment personnel compensation program and whether this structure provides appropriate incentives to act in the best interests of the fund. Additionally, the Board considered the portfolio managers' investments, if any, in the funds that they manage.
Resources Dedicated to Investment Management and Support Services. The Board and the Fund Oversight and Research Committees reviewed the general qualifications and capabilities of Fidelity's investment staff, including its size, education, experience, and resources, as well as Fidelity's approach to recruiting, training, managing, and compensating investment personnel. The Board noted that Fidelity has continued to increase the resources devoted to non-U.S. offices, including expansion of Fidelity's global investment organization. The Board also noted that Fidelity's analysts have extensive resources, tools and capabilities that allow them to conduct sophisticated quantitative and fundamental analysis, as well as credit analysis of issuers, counterparties and guarantors. Further, the Board considered that Fidelity's investment professionals have sufficient access to global information and data so as to provide competitive investment results over time, and that those professionals also have access to sophisticated tools that permit them to assess portfolio construction and risk and performance attribution characteristics continuously, as well as to transmit new information and research conclusions rapidly around the world. Additionally, in its deliberations, the Board considered Fidelity's trading, risk management, compliance, and technology and operations capabilities and resources, which are integral parts of the investment management process. The Board also considered Fidelity's investments in business continuity planning, and its success in continuously providing services to the fund notwithstanding the severe disruptions caused by the COVID-19 pandemic.
Shareholder and Administrative Services. The Board considered (i) the nature, extent, quality, and cost of advisory, administrative, and shareholder services performed by the Investment Advisers and their affiliates under the Advisory Contracts and under separate agreements covering transfer agency, pricing and bookkeeping, and securities lending services for the fund; (ii) the nature and extent of the supervision of third party service providers, principally custodians, subcustodians, and pricing vendors; and (iii) the resources devoted to, and the record of compliance with, the fund's compliance policies and procedures. The Board also reviewed the allocation of fund brokerage, including allocations to brokers affiliated with the Investment Advisers, the use of brokerage commissions to pay fund expenses, and the use of "soft" commission dollars to pay for research services.
The Board noted that the growth of fund assets over time across the complex allows Fidelity to reinvest in the development of services designed to enhance the value and convenience of the Fidelity funds as investment vehicles. These services include 24-hour access to account information and market information over the Internet and through telephone representatives, investor education materials and asset allocation tools, and the expanded availability of Fidelity Investor Centers.
The Board noted that, in the past, it and the boards of certain other Fidelity funds had formed an ad hoc Committee on Transfer Agency Fees to review the variety of transfer agency fee structures throughout the industry and Fidelity's competitive positioning with respect to industry participants.
Investment in a Large Fund Family. The Board considered the benefits to shareholders of investing in a Fidelity fund, including the benefits of investing in a fund that is part of a large family of funds offering a variety of investment disciplines and providing a large variety of mutual fund investor services. The Board noted that Fidelity had taken, or had made recommendations that resulted in the Fidelity funds taking, a number of actions over the previous year that benefited particular funds, including: (i) continuing to dedicate additional resources to Fidelity's investment research process, which includes meetings with management of issuers of securities in which the funds invest, and to the support of the senior management team that oversees asset management; (ii) continuing efforts to enhance Fidelity's global research capabilities; (iii) launching new funds and ETFs with innovative structures, strategies and pricing and making other enhancements to meet client needs; (iv) launching new share classes of existing funds; (v) eliminating purchase minimums and broadening eligibility requirements for certain funds and share classes; (vi) approving the reduction in the holding period for the Class C to Class A conversion policy; (vii) reducing management fees and total expenses for certain target date funds and classes and index funds; (viii) lowering expenses for certain existing funds and classes by implementing or lowering expense caps; (ix) rationalizing product lines and gaining increased efficiencies from fund mergers, liquidations, and share class consolidations; (x) continuing to develop, acquire and implement systems and technology to improve services to the funds and shareholders, strengthen information security, and increase efficiency; and (xi) continuing to implement enhancements to further strengthen Fidelity's product line to increase investors' probability of success in achieving their investment goals, including retirement income goals.
Investment Performance. The Board considered whether the fund has operated in accordance with its investment objective, as well as its record of compliance with its investment restrictions and its performance history. The Board noted that there were portfolio management changes for the fund in April 2018 and June 2018. The Board will continue to monitor closely the fund's performance, taking into account the portfolio management changes.
The Board took into account discussions that occur at Board meetings throughout the year with representatives of the Investment Advisers about fund investment performance. In this regard the Board noted that as part of regularly scheduled fund reviews and other reports to the Board on fund performance, the Board considers annualized return information for the fund for different time periods, measured against an appropriate securities market index (benchmark index) and an appropriate peer group of funds with similar objectives (peer group). In its evaluation of fund investment performance, the Board gave particular attention to information indicating changes in performance of certain Fidelity funds for specific time periods and discussed with the Investment Advisers the reasons for any overperformance or underperformance.
In addition to reviewing absolute and relative fund performance, the Independent Trustees periodically consider the appropriateness of fund performance metrics in evaluating the results achieved. In general, the Independent Trustees believe that fund performance should be evaluated based on net performance (after fees and expenses) of both the highest performing and lowest performing fund share classes, where applicable, compared to appropriate benchmark indices, over appropriate time periods that may include full market cycles, and compared to peer groups, as applicable, over the same periods, taking into account relevant factors including the following: general market conditions; issuer-specific information; and fund cash flows and other factors.
The Independent Trustees recognize that shareholders evaluate performance on a net basis over their own holding periods, for which one-, three-, and five-year periods are often used as a proxy. For this reason, the performance information reviewed by the Board also included net cumulative total return information for the fund and an appropriate benchmark index and peer group for the most recent one- and three-year periods ended September 30, 2020, as shown below. Returns are shown compared to the 25th percentile (top of box, 75% beaten) and 75th percentile (bottom of box, 25% beaten) of the peer universe.
Fidelity Low-Priced Stock K6 Fund

Based on its review, the Board concluded that the nature, extent, and quality of services provided to the fund under the Advisory Contracts should continue to benefit the shareholders of the fund.
Competitiveness of Management Fee and Total Expense Ratio. The Board considered the fund's management fee and total expense ratio compared to "mapped groups" of competitive funds and classes created for the purpose of facilitating the Trustees' competitive analysis of management fees and total expenses. Fidelity creates "mapped groups" by combining similar Lipper investment objective categories that have comparable investment mandates. Combining Lipper investment objective categories aids the Board's management fee and total expense ratio comparisons by broadening the competitive group used for comparison.
Management Fee. The Board considered two proprietary management fee comparisons for the 12-month (or shorter) periods ended September 30 (June 30 for periods ended 2019 and 2018) shown in basis points (BP) in the chart below. The group of Lipper funds used by the Board for management fee comparisons is referred to below as the "Total Mapped Group." The Total Mapped Group comparison focuses on a fund's standing in terms of gross management fees before expense reimbursements or caps relative to the total universe of funds with comparable investment mandates, regardless of whether their management fee structures also are comparable. Funds with comparable investment mandates offer exposure to similar types of securities. Funds with comparable management fee structures have similar management fee contractual arrangements (
e.g., flat rate charged for advisory services, all-inclusive fee rate,
etc.). "TMG %" represents the percentage of funds in the Total Mapped Group that had management fees that were lower than the fund's. For example, a hypothetical TMG % of 20% would mean that 80% of the funds in the Total Mapped Group had higher, and 20% had lower, management fees than the fund. The fund's actual TMG %s and the number of funds in the Total Mapped Group are in the chart below. The "Asset-Sized Peer Group" (ASPG) comparison focuses on a fund's standing relative to a subset of non-Fidelity funds within the Total Mapped Group that are similar in size and management fee structure. For example, if a fund is in the first quartile of the ASPG, the fund's management fee ranks in the least expensive or lowest 25% of funds in the ASPG. The ASPG represents at least 15% of the funds in the Total Mapped Group with comparable asset size and management fee structures, subject to a minimum of 50 funds (or all funds in the Total Mapped Group if fewer than 50). Additional information, such as the ASPG quartile in which the fund's management fee rate ranked, is also included in the chart and was considered by the Board.
Fidelity Low-Priced Stock K6 Fund

The Board noted that the fund's management fee rate ranked below the median of its Total Mapped Group and below the median of its ASPG for the 12-month period ended September 30, 2020.
The Board noted that, in the past, it and the boards of other Fidelity funds had formed an ad hoc Committee on Group Fee to conduct an in-depth review of the "group fee" component of the management fee of funds with such management fee structures. The Committee's focus included the mechanics of the group fee, the competitive landscape of group fee structures, Fidelity funds with no group fee component (such as the fund) and investment products not included in group fee assets. The Board also considered that, for funds subject to the group fee, FMR agreed to voluntarily waive fees over a specified period of time in amounts designed to account for assets converted from certain funds to certain collective investment trusts.
The Board also noted that, in 2013, the ad hoc Committee on Management Fees was formed to conduct an in-depth review of the management fee rates of Fidelity's active equity mutual funds. The Committee focused on the following areas: (i) standard fee structures; (ii) research consumption and trading evolution; (iii) management fee competitiveness/profitability by category; and (iv) factors that drive institutional pricing.
Based on its review, the Board concluded that the fund's management fee is fair and reasonable in light of the services that the fund receives and the other factors considered.
Total Expense Ratio. In its review of the fund's total expense ratio, the Board considered the fund's unitary fee rate as well as other fund expenses paid by FMR under the fund's management contract, such as transfer agent fees, pricing and bookkeeping fees, and custodial, legal, and audit fees. The Board also noted that Fidelity may agree to waive fees or reimburse expenses from time to time, and the extent to which, if any, it has done so for the fund. As part of its review, the Board also considered the current and historical total expense ratios of the fund compared to competitive fund median expenses. The fund is compared to those funds and classes in the Total Mapped Group (used by the Board for management fee comparisons) that have a similar sales load structure (SLTG). The Board also considered a total expense ASPG comparison for the fund, which focuses on the total expenses of the fund relative to a subset of non-Fidelity funds within the total expense SLTG. The total expense ASPG is limited to 15 larger and 15 smaller classes in fund average assets for a total of 30 classes, where possible. The total expense ASPG comparison excludes performance adjustments and fund-paid 12b-1 fees to eliminate variability in fee structures.
The Board noted that the fund's total expense ratio ranked below the SLTG competitive median and below the ASPG competitive median for the 12-month period ended September 30, 2020.
Fees Charged to Other Fidelity Clients. The Board also considered Fidelity fee structures and other information with respect to clients of Fidelity, such as other funds advised or subadvised by Fidelity, pension plan clients, and other institutional clients with similar mandates. The Board noted that a joint ad hoc committee created by it and the boards of other Fidelity funds periodically reviews and compares Fidelity's institutional investment advisory business with its business of providing services to the Fidelity funds and also noted the most recent findings of the committee. The Board noted that the committee's review included a consideration of the differences in services provided, fees charged, and costs incurred, as well as competition in the markets serving the different categories of clients.
Based on its review of total expense ratios and fees charged to other Fidelity clients, the Board concluded that the fund's total expense ratio was reasonable in light of the services that the fund and its shareholders receive and the other factors considered.
Costs of the Services and Profitability. The Board considered the revenues earned and the expenses incurred by Fidelity in conducting the business of developing, marketing, distributing, managing, administering and servicing the fund and servicing the fund's shareholders. The Board also considered the level of Fidelity's profits in respect of all the Fidelity funds.
On an annual basis, Fidelity presents to the Board information about the profitability of its relationships with the fund. Fidelity calculates profitability information for each fund, as well as aggregate profitability information for groups of Fidelity funds and all Fidelity funds, using a series of detailed revenue and cost allocation methodologies which originate with the books and records of Fidelity on which Fidelity's audited financial statements are based. The Audit Committee of the Board reviews any significant changes from the prior year's methodologies and the full Board approves such changes.
A public accounting firm has been engaged annually by the Board as part of the Board's assessment of Fidelity's profitability analysis. The engagement includes the review and assessment of the methodologies used by Fidelity in determining the revenues and expenses attributable to Fidelity's mutual fund business, and completion of agreed-upon procedures in respect of the mathematical accuracy of certain fund profitability information and its conformity to established allocation methodologies. After considering the reports issued under the engagement and information provided by Fidelity, the Board concluded that while other allocation methods may also be reasonable, Fidelity's profitability methodologies are reasonable in all material respects.
The Board also reviewed Fidelity's non-fund businesses and potential indirect benefits such businesses may have received as a result of their association with Fidelity's mutual fund business (i.e., fall-out benefits) as well as cases where Fidelity's affiliates may benefit from the funds' business. The Board considered areas where potential indirect benefits to the Fidelity funds from their relationships with Fidelity may exist. The Board also considered that in 2019 a joint ad hoc committee created by it and the boards of other Fidelity funds evaluated potential fall-out benefits (PFOB Committee). The Board noted that it considered the PFOB Committee's findings in connection with its consideration of the renewal of the Advisory Contracts.
The Board considered the costs of the services provided by and the profits realized by Fidelity in connection with the operation of the fund, including the conclusions of the PFOB Committee, and was satisfied that the profitability was not excessive.
Economies of Scale. The Board considered whether there have been economies of scale in respect of the management of the Fidelity funds, whether the Fidelity funds (including the fund) have appropriately benefited from any such economies of scale, and whether there is potential for realization of any further economies of scale. The Board considered the extent to which the fund will benefit from economies of scale as assets grow through increased services to the fund, through waivers or reimbursements, or through fee or expense ratio reductions. The Board recognized that, due to the fund's current contractual arrangements, its expense ratio will not decline if the fund's operating costs decrease as assets grow, or rise as assets decrease. The Board also noted that a committee (the Economies of Scale Committee) created by it and the boards of other Fidelity funds periodically analyzes whether Fidelity attains economies of scale in respect of the management and servicing of the Fidelity funds, whether the Fidelity funds have appropriately benefited from such economies of scale, and whether there is potential for realization of any further economies of scale.
The Board concluded, taking into account the analysis of the Economies of Scale Committee, that economies of scale, if any, are being appropriately shared between fund shareholders and Fidelity.
Additional Information Requested by the Board. In order to develop fully the factual basis for consideration of the Fidelity funds' advisory contracts, the Board requested and received additional information on certain topics, including: (i) fund flow and performance trends, in particular the underperformance of certain funds and strategies, and Fidelity's long-term strategies for certain funds; (ii) consideration of expanding the use of performance fees for additional funds; (iii) Fidelity's pricing philosophy compared to competitors; (iv) metrics for evaluating index fund and ETF performance and information about ETF trading characteristics; (v) the methodology with respect to evaluating competitive fund data and peer group classifications and fee and expense comparisons; (vi) the expense structures for different funds and classes and information about the differences between various expense structures; (vii) group fee breakpoints; (viii) information regarding other accounts managed by Fidelity and sub-advisory arrangements; and (ix) Fidelity's philosophies and strategies for evaluating funds and classes with lower or declining asset levels.
Based on its evaluation of all of the conclusions noted above, and after considering all factors it believed relevant, the Board concluded that the advisory fee arrangements are fair and reasonable, and that the fund's Advisory Contracts should be renewed.
Liquidity Risk Management Program
The Securities and Exchange Commission adopted Rule 22e-4 under the Investment Company Act of 1940 (the Liquidity Rule) to promote effective liquidity risk management throughout the open-end investment company industry, thereby reducing the risk that funds will be unable to meet their redemption obligations and mitigating dilution of the interests of fund shareholders.
The Fund has adopted and implemented a liquidity risk management program pursuant to the Liquidity Rule (the Program) effective December 1, 2018. The Program is reasonably designed to assess and manage the Fund’s liquidity risk and to comply with the requirements of the Liquidity Rule. The Fund’s Board of Trustees (the Board) has designated the Fund’s investment adviser as administrator of the Program. The Fidelity advisers have established a Liquidity Risk Management Committee (the LRM Committee) to manage the Program for each of the Fidelity Funds. The LRM Committee monitors the adequacy and effectiveness of implementation of the Program and on a periodic basis assesses each Fund’s liquidity risk based on a variety of factors including (1) the Fund’s investment strategy, (2) portfolio liquidity and cash flow projections during normal and reasonably foreseeable stressed conditions, (3) shareholder redemptions, (4) borrowings and other funding sources and (5) in the case of exchange-traded funds, certain additional factors including the effect of the Fund’s prices and spreads, market participants, and basket compositions on the overall liquidity of the Fund’s portfolio, as applicable.
In accordance with the Program, each of the Fund’s portfolio investments is classified into one of four liquidity categories described below based on a determination of a reasonable expectation for how long it would take to convert the investment to cash (or sell or dispose of the investment) without significantly changing its market value.
- Highly liquid investments – cash or convertible to cash within three business days or less
- Moderately liquid investments – convertible to cash in three to seven calendar days
- Less liquid investments – can be sold or disposed of, but not settled, within seven calendar days
- Illiquid investments – cannot be sold or disposed of within seven calendar days
Liquidity classification determinations take into account a variety of factors including various market, trading and investment-specific considerations, as well as market depth, and generally utilize analysis from a third-party liquidity metrics service.
The Liquidity Rule places a 15% limit on a fund’s illiquid investments and requires funds that do not primarily hold assets that are highly liquid investments to determine and maintain a minimum percentage of the fund’s net assets to be invested in highly liquid investments (highly liquid investment minimum or HLIM). The Program includes provisions reasonably designed to comply with the 15% limit on illiquid investments and for determining, periodically reviewing and complying with the HLIM requirement as applicable.
At a recent meeting of the Fund’s Board of Trustees, the LRM Committee provided a written report to the Board pertaining to the operation, adequacy, and effectiveness of implementation of the Program for the annual period from December 1, 2019 through November 30, 2020. The report concluded that the Program has been implemented and is operating effectively and is reasonably designed to assess and manage the Fund’s liquidity risk.
LPSK6-ANN-0921
1.9883999.104
Fidelity® Value Discovery Fund
Annual Report
July 31, 2021
Contents
To view a fund's proxy voting guidelines and proxy voting record for the 12-month period ended June 30, visit http://www.fidelity.com/proxyvotingresults or visit the Securities and Exchange Commission's (SEC) web site at http://www.sec.gov.
You may also call 1-800-544-8544 if you’re an individual investing directly with Fidelity, call 1-800-835-5092 if you’re a plan sponsor or participant with Fidelity as your recordkeeper or call 1-877-208-0098 on institutional accounts or if you’re an advisor or invest through one to request a free copy of the proxy voting guidelines.
Standard & Poor's, S&P and S&P 500 are registered service marks of The McGraw-Hill Companies, Inc. and have been licensed for use by Fidelity Distributors Corporation.
Other third-party marks appearing herein are the property of their respective owners.
All other marks appearing herein are registered or unregistered trademarks or service marks of FMR LLC or an affiliated company. © 2021 FMR LLC. All rights reserved.
This report and the financial statements contained herein are submitted for the general information of the shareholders of the Fund. This report is not authorized for distribution to prospective investors in the Fund unless preceded or accompanied by an effective prospectus.
A fund files its complete schedule of portfolio holdings with the SEC for the first and third quarters of each fiscal year on Form N-PORT. Forms N-PORT are available on the SEC’s web site at http://www.sec.gov. A fund's Forms N-PORT may be reviewed and copied at the SEC’s Public Reference Room in Washington, DC. Information regarding the operation of the SEC's Public Reference Room may be obtained by calling 1-800-SEC-0330.
For a complete list of a fund's portfolio holdings, view the most recent holdings listing, semiannual report, or annual report on Fidelity's web site at http://www.fidelity.com, http://www.institutional.fidelity.com, or http://www.401k.com, as applicable.
NOT FDIC INSURED •MAY LOSE VALUE •NO BANK GUARANTEE
Neither the Fund nor Fidelity Distributors Corporation is a bank.
Note to Shareholders:
Early in 2020, the outbreak and spread of a new coronavirus emerged as a public health emergency that had a major influence on financial markets, primarily based on its impact on the global economy and the outlook for corporate earnings. The virus causes a respiratory disease known as COVID-19. On March 11, 2020 the World Health Organization declared the COVID-19 outbreak a pandemic, citing sustained risk of further global spread.
In the weeks following, as the crisis worsened, we witnessed an escalating human tragedy with wide-scale social and economic consequences from coronavirus-containment measures. The outbreak of COVID-19 prompted a number of measures to limit the spread, including travel and border restrictions, quarantines, and restrictions on large gatherings. In turn, these resulted in lower consumer activity, diminished demand for a wide range of products and services, disruption in manufacturing and supply chains, and – given the wide variability in outcomes regarding the outbreak – significant market uncertainty and volatility. Amid the turmoil, global governments and central banks took unprecedented action to help support consumers, businesses, and the broader economies, and to limit disruption to financial systems.
The situation continues to unfold, and the extent and duration of its impact on financial markets and the economy remain highly uncertain. Extreme events such as the coronavirus crisis are “exogenous shocks” that can have significant adverse effects on mutual funds and their investments. Although multiple asset classes may be affected by market disruption, the duration and impact may not be the same for all types of assets.
Fidelity is committed to helping you stay informed amid news about COVID-19 and during increased market volatility, and we’re taking extra steps to be responsive to customer needs. We encourage you to visit our websites, where we offer ongoing updates, commentary, and analysis on the markets and our funds.
Performance: The Bottom Line
Average annual total return reflects the change in the value of an investment, assuming reinvestment of distributions from dividend income and capital gains (the profits earned upon the sale of securities that have grown in value, if any) and assuming a constant rate of performance each year. The hypothetical investment and the average annual total returns do not reflect the deduction of taxes that a shareholder would pay on fund distributions or the redemption of fund shares. During periods of reimbursement by Fidelity, a fund’s total return will be greater than it would be had the reimbursement not occurred. How a fund did yesterday is no guarantee of how it will do tomorrow.
Average Annual Total Returns
| For the periods ended July 31, 2021 | Past 1 year | Past 5 years | Past 10 years |
| Fidelity® Value Discovery Fund | 42.65% | 12.08% | 12.04% |
| Class K | 42.76% | 12.20% | 12.19% |
$10,000 Over 10 Years
Let's say hypothetically that $10,000 was invested in Fidelity® Value Discovery Fund, a class of the fund, on July 31, 2011.
The chart shows how the value of your investment would have changed, and also shows how the Russell 3000® Value Index performed over the same period.

| Period Ending Values |
| $31,177 | Fidelity® Value Discovery Fund |
| $30,991 | Russell 3000® Value Index |
Management's Discussion of Fund Performance
Market Recap: The S&P 500
® index gained 36.45% for the 12 months ending July 31, 2021, as U.S. equities continued a historic rebound following a steep but brief decline due to the early-2020 outbreak and spread of COVID-19. A confluence of powerful forces propelled risk assets, returning the stock market to pre-pandemic highs by late August 2020. The rally slowed in September, when stocks began a two-month retreat amid Congress’s inability to reach a deal on additional fiscal stimulus, as well as uncertainty about the election. But as the calendar turned, investors grew hopeful. The rollout of three COVID-19 vaccines was underway, the U.S. Federal Reserve pledged to hold interest rates near zero until the economy recovered, and the federal government planned to deploy trillions of dollars to boost consumers and the economy. This backdrop fueled a sharp rotation, with small-cap value usurping leadership from large growth. As part of the “reopening” theme, investors moved out of tech-driven mega-caps that had thrived due to the work-from-home trend in favor of cheap smaller companies that stood to benefit from a broad cyclical recovery. A flattish May reflected concerns about inflation and jobs, but the uptrend resumed through July, driven by corporate earnings. Notably, this leg saw momentum shift back to large growth, as easing rates and a hawkish Fed stymied the reflation trade. By sector, financials (+55%) led, driven by banks (+63%), whereas utilities (+12%) and consumer staples (+18%) notably lagged.
Comments from Portfolio Manager Sean Gavin: For the fiscal year ending July 31, 2021, the fund's share classes gained roughly 43%, outperforming the 40.72% result of the benchmark Russell 3000
® Value Index. Versus the benchmark, security selection was the primary contributor, especially in the real estate sector. Strong picks among industrials stocks, primarily driven by the capital goods industry, also helped. Also bolstering performance were favorable investment choices in the communication services sector, notably within the media & entertainment industry. The fund's top individual relative contributor was an outsized stake in Discover Financial Services, which gained about 155% the past year. Also boosting value was our overweighting in CBRE Group, which gained 120%. CBRE Group was among the fund's biggest holdings. Another notable relative contributor was a larger-than-benchmark holding in Capital One Financial (+153%). In contrast, the largest detractor from performance versus the benchmark was an overweighting in utilities. Also weighing on the fund's relative result was security selection and an overweighting in health care, as well as an underweighting and stock picks in energy. The fund's largest individual relative detractor was an overweighting in Centene, which gained 5% the past 12 months. The company was among the fund's biggest holdings this period. Also hampering performance was our outsized stake in Newmont, which returned roughly -7%. Further pressuring the portfolio’s relative return was our overweighting in Amgen, which gained about 2%. Notable changes in positioning include increased exposure to the utilities sector and a lower allocation to consumer discretionary stocks.
The views expressed above reflect those of the portfolio manager(s) only through the end of the period as stated on the cover of this report and do not necessarily represent the views of Fidelity or any other person in the Fidelity organization. Any such views are subject to change at any time based upon market or other conditions and Fidelity disclaims any responsibility to update such views. These views may not be relied on as investment advice and, because investment decisions for a Fidelity fund are based on numerous factors, may not be relied on as an indication of trading intent on behalf of any Fidelity fund.
Investment Summary (Unaudited)
Top Ten Stocks as of July 31, 2021
| | % of fund's net assets |
| Berkshire Hathaway, Inc. Class B | 4.0 |
| Comcast Corp. Class A | 3.3 |
| UnitedHealth Group, Inc. | 2.5 |
| Bristol-Myers Squibb Co. | 2.4 |
| Alphabet, Inc. Class A | 2.4 |
| CBRE Group, Inc. | 2.4 |
| Bank of America Corp. | 2.4 |
| Procter & Gamble Co. | 2.4 |
| JPMorgan Chase & Co. | 2.2 |
| Cigna Corp. | 2.2 |
| | 26.2 |
Top Five Market Sectors as of July 31, 2021
| | % of fund's net assets |
| Health Care | 19.0 |
| Financials | 18.7 |
| Industrials | 11.9 |
| Communication Services | 10.7 |
| Information Technology | 8.8 |
Asset Allocation (% of fund's net assets)
| As of July 31, 2021* |
| | Stocks | 97.3% |
| | Short-Term Investments and Net Other Assets (Liabilities) | 2.7% |

* Foreign investments - 18.1%
Schedule of Investments July 31, 2021
Showing Percentage of Net Assets
| Common Stocks - 95.6% | | | |
| | | Shares | Value |
| COMMUNICATION SERVICES - 10.7% | | | |
| Diversified Telecommunication Services - 1.7% | | | |
| Verizon Communications, Inc. | | 1,000,300 | $55,796,734 |
| Entertainment - 0.3% | | | |
| Lions Gate Entertainment Corp. Class B (a) | | 682,677 | 9,120,565 |
| Interactive Media & Services - 2.9% | | | |
| Alphabet, Inc. Class A (a) | | 29,248 | 78,809,613 |
| Facebook, Inc. Class A (a) | | 50,600 | 18,028,780 |
| | | | 96,838,393 |
| Media - 5.8% | | | |
| Comcast Corp. Class A | | 1,830,203 | 107,670,842 |
| Fox Corp. Class A | | 255,311 | 9,104,390 |
| Interpublic Group of Companies, Inc. | | 1,515,645 | 53,593,207 |
| WPP PLC | | 1,430,500 | 18,500,702 |
| | | | 188,869,141 |
|
| TOTAL COMMUNICATION SERVICES | | | 350,624,833 |
|
| CONSUMER DISCRETIONARY - 4.3% | | | |
| Auto Components - 0.3% | | | |
| Lear Corp. | | 52,500 | 9,186,450 |
| Household Durables - 0.5% | | | |
| Whirlpool Corp. | | 69,995 | 15,506,692 |
| Multiline Retail - 1.2% | | | |
| Dollar General Corp. | | 165,400 | 38,478,656 |
| Specialty Retail - 1.2% | | | |
| Best Buy Co., Inc. | | 263,800 | 29,637,930 |
| Lowe's Companies, Inc. | | 48,300 | 9,306,927 |
| | | | 38,944,857 |
| Textiles, Apparel & Luxury Goods - 1.1% | | | |
| PVH Corp. (a) | | 152,528 | 15,957,479 |
| Tapestry, Inc. (a) | | 526,400 | 22,266,720 |
| | | | 38,224,199 |
|
| TOTAL CONSUMER DISCRETIONARY | | | 140,340,854 |
|
| CONSUMER STAPLES - 6.8% | | | |
| Food & Staples Retailing - 1.5% | | | |
| Kroger Co. | | 840,400 | 34,204,280 |
| U.S. Foods Holding Corp. (a) | | 447,600 | 15,370,584 |
| | | | 49,574,864 |
| Food Products - 2.0% | | | |
| Mondelez International, Inc. | | 766,100 | 48,463,486 |
| Tyson Foods, Inc. Class A | | 253,000 | 18,079,380 |
| | | | 66,542,866 |
| Household Products - 3.3% | | | |
| Procter & Gamble Co. | | 535,100 | 76,107,273 |
| Reckitt Benckiser Group PLC | | 308,600 | 23,607,794 |
| Spectrum Brands Holdings, Inc. | | 80,049 | 6,992,280 |
| | | | 106,707,347 |
|
| TOTAL CONSUMER STAPLES | | | 222,825,077 |
|
| ENERGY - 1.0% | | | |
| Energy Equipment & Services - 0.0% | | | |
| Hoegh LNG Partners LP (b) | | 379,295 | 2,078,537 |
| Oil, Gas & Consumable Fuels - 1.0% | | | |
| Parex Resources, Inc. | | 1,204,900 | 19,798,373 |
| Teekay LNG Partners LP | | 825,199 | 11,957,134 |
| | | | 31,755,507 |
|
| TOTAL ENERGY | | | 33,834,044 |
|
| FINANCIALS - 18.7% | | | |
| Banks - 7.1% | | | |
| Bank of America Corp. | | 2,020,200 | 77,494,872 |
| Cullen/Frost Bankers, Inc. | | 72,400 | 7,769,968 |
| JPMorgan Chase & Co. | | 485,300 | 73,658,834 |
| M&T Bank Corp. | | 232,500 | 31,120,125 |
| PNC Financial Services Group, Inc. | | 236,900 | 43,212,929 |
| | | | 233,256,728 |
| Capital Markets - 1.7% | | | |
| Affiliated Managers Group, Inc. | | 157,600 | 24,970,144 |
| BlackRock, Inc. Class A | | 13,000 | 11,273,210 |
| Invesco Ltd. | | 419,900 | 10,237,162 |
| State Street Corp. | | 91,719 | 7,992,394 |
| | | | 54,472,910 |
| Consumer Finance - 2.4% | | | |
| Capital One Financial Corp. | | 196,132 | 31,714,544 |
| Discover Financial Services | | 377,722 | 46,958,399 |
| | | | 78,672,943 |
| Diversified Financial Services - 4.0% | | | |
| Berkshire Hathaway, Inc. Class B (a) | | 473,360 | 131,731,351 |
| Insurance - 3.5% | | | |
| Allstate Corp. | | 66,007 | 8,584,210 |
| American International Group, Inc. | | 335,300 | 15,876,455 |
| Chubb Ltd. | | 266,947 | 45,044,637 |
| The Travelers Companies, Inc. | | 310,115 | 46,182,326 |
| | | | 115,687,628 |
|
| TOTAL FINANCIALS | | | 613,821,560 |
|
| HEALTH CARE - 19.0% | | | |
| Biotechnology - 2.4% | | | |
| Amgen, Inc. | | 180,693 | 43,644,587 |
| Regeneron Pharmaceuticals, Inc. (a) | | 59,000 | 33,901,990 |
| | | | 77,546,577 |
| Health Care Providers & Services - 10.1% | | | |
| Anthem, Inc. | | 106,289 | 40,816,039 |
| Centene Corp. (a) | | 951,100 | 65,254,971 |
| Cigna Corp. | | 313,364 | 71,913,904 |
| CVS Health Corp. | | 430,460 | 35,452,686 |
| Humana, Inc. | | 86,100 | 36,666,546 |
| UnitedHealth Group, Inc. | | 199,500 | 82,237,890 |
| | | | 332,342,036 |
| Pharmaceuticals - 6.5% | | | |
| AstraZeneca PLC sponsored ADR (b) | | 732,033 | 41,901,569 |
| Bristol-Myers Squibb Co. | | 1,163,200 | 78,946,384 |
| Roche Holding AG (participation certificate) | | 141,904 | 54,819,245 |
| Sanofi SA sponsored ADR | | 714,742 | 36,852,098 |
| | | | 212,519,296 |
|
| TOTAL HEALTH CARE | | | 622,407,909 |
|
| INDUSTRIALS - 11.9% | | | |
| Aerospace & Defense - 2.4% | | | |
| L3Harris Technologies, Inc. | | 134,100 | 30,405,834 |
| Northrop Grumman Corp. | | 134,000 | 48,644,680 |
| | | | 79,050,514 |
| Air Freight & Logistics - 0.6% | | | |
| Deutsche Post AG | | 286,100 | 19,389,354 |
| Building Products - 1.5% | | | |
| Johnson Controls International PLC | | 317,000 | 22,640,140 |
| Owens Corning | | 56,800 | 5,461,888 |
| Trane Technologies PLC | | 105,500 | 21,480,855 |
| | | | 49,582,883 |
| Electrical Equipment - 0.6% | | | |
| Regal Beloit Corp. | | 146,900 | 21,628,087 |
| Industrial Conglomerates - 2.5% | | | |
| 3M Co. | | 211,700 | 41,903,898 |
| Siemens AG | | 250,500 | 39,086,307 |
| | | | 80,990,205 |
| Machinery - 4.3% | | | |
| ITT, Inc. | | 275,400 | 26,964,414 |
| Oshkosh Corp. | | 363,400 | 43,444,470 |
| Otis Worldwide Corp. | | 274,950 | 24,621,773 |
| Pentair PLC | | 351,000 | 25,858,170 |
| Stanley Black & Decker, Inc. | | 102,300 | 20,158,215 |
| | | | 141,047,042 |
|
| TOTAL INDUSTRIALS | | | 391,688,085 |
|
| INFORMATION TECHNOLOGY - 7.1% | | | |
| Communications Equipment - 2.2% | | | |
| Cisco Systems, Inc. | | 1,274,800 | 70,585,676 |
| Electronic Equipment & Components - 1.4% | | | |
| TE Connectivity Ltd. | | 318,334 | 46,944,715 |
| IT Services - 2.3% | | | |
| Amdocs Ltd. | | 286,182 | 22,067,494 |
| Capgemini SA | | 89,000 | 19,241,272 |
| Cognizant Technology Solutions Corp. Class A | | 461,813 | 33,957,110 |
| | | | 75,265,876 |
| Semiconductors & Semiconductor Equipment - 0.6% | | | |
| NXP Semiconductors NV | | 99,700 | 20,577,083 |
| Software - 0.6% | | | |
| NortonLifeLock, Inc. | | 721,500 | 17,907,630 |
|
| TOTAL INFORMATION TECHNOLOGY | | | 231,280,980 |
|
| MATERIALS - 3.3% | | | |
| Chemicals - 1.4% | | | |
| DuPont de Nemours, Inc. | | 329,890 | 24,758,245 |
| International Flavors & Fragrances, Inc. | | 140,576 | 21,176,369 |
| | | | 45,934,614 |
| Metals & Mining - 1.9% | | | |
| BHP Group Ltd. sponsored ADR | | 39,700 | 3,118,832 |
| Lundin Mining Corp. | | 2,471,100 | 22,520,365 |
| Newmont Corp. | | 571,700 | 35,914,194 |
| | | | 61,553,391 |
|
| TOTAL MATERIALS | | | 107,488,005 |
|
| REAL ESTATE - 4.3% | | | |
| Equity Real Estate Investment Trusts (REITs) - 1.9% | | | |
| American Tower Corp. | | 146,200 | 41,345,360 |
| Simon Property Group, Inc. | | 172,800 | 21,862,656 |
| | | | 63,208,016 |
| Real Estate Management & Development - 2.4% | | | |
| CBRE Group, Inc. (a) | | 806,893 | 77,832,899 |
|
| TOTAL REAL ESTATE | | | 141,040,915 |
|
| UTILITIES - 8.5% | | | |
| Electric Utilities - 7.1% | | | |
| Duke Energy Corp. | | 345,800 | 36,347,038 |
| Entergy Corp. | | 15,900 | 1,636,428 |
| Evergy, Inc. | | 535,800 | 34,944,876 |
| Exelon Corp. | | 885,612 | 41,446,642 |
| PG&E Corp. (a) | | 2,871,300 | 25,238,727 |
| Portland General Electric Co. | | 421,300 | 20,601,570 |
| PPL Corp. | | 861,900 | 24,452,103 |
| Southern Co. | | 773,900 | 49,428,993 |
| | | | 234,096,377 |
| Multi-Utilities - 1.4% | | | |
| Dominion Energy, Inc. | | 619,100 | 46,352,017 |
|
| TOTAL UTILITIES | | | 280,448,394 |
|
| TOTAL COMMON STOCKS | | | |
| (Cost $2,317,758,091) | | | 3,135,800,656 |
|
| Nonconvertible Preferred Stocks - 1.7% | | | |
| INFORMATION TECHNOLOGY - 1.7% | | | |
| Technology Hardware, Storage & Peripherals - 1.7% | | | |
| Samsung Electronics Co. Ltd. | | | |
| (Cost $39,413,829) | | 923,290 | 57,747,674 |
|
| Money Market Funds - 2.9% | | | |
| Fidelity Cash Central Fund 0.06% (c) | | 82,983,832 | 83,000,429 |
| Fidelity Securities Lending Cash Central Fund 0.06% (c)(d) | | 11,320,868 | 11,322,000 |
| TOTAL MONEY MARKET FUNDS | | | |
| (Cost $94,322,429) | | | 94,322,429 |
| TOTAL INVESTMENT IN SECURITIES - 100.2% | | | |
| (Cost $2,451,494,349) | | | 3,287,870,759 |
| NET OTHER ASSETS (LIABILITIES) - (0.2)% | | | (7,942,106) |
| NET ASSETS - 100% | | | $3,279,928,653 |
Legend
(a) Non-income producing
(b) Security or a portion of the security is on loan at period end.
(c) Affiliated fund that is generally available only to investment companies and other accounts managed by Fidelity Investments. The rate quoted is the annualized seven-day yield of the fund at period end. A complete unaudited listing of the fund's holdings as of its most recent quarter end is available upon request. In addition, each Fidelity Central Fund's financial statements, which are not covered by the Fund's Report of Independent Registered Public Accounting Firm, are available on the SEC's website or upon request.
(d) Investment made with cash collateral received from securities on loan.
Affiliated Central Funds
Information regarding fiscal year to date income earned by the Fund from investments in Fidelity Central Funds is as follows:
| Fund | Income earned |
| Fidelity Cash Central Fund | $38,184 |
| Fidelity Securities Lending Cash Central Fund | 35,565 |
| Total | $73,749 |
Amounts in the income column in the above table include any capital gain distributions from underlying funds, which are presented in the corresponding line-item in the Statement of Operations, if applicable. Amount for Fidelity Securities Lending Cash Central Fund represents the income earned on investing cash collateral, less rebates paid to borrowers and any lending agent fees associated with the loan, plus any premium payments received for lending certain types of securities.
Fiscal year to date information regarding the Fund's investments in Fidelity Central Funds, including the ownership percentage, is presented below.
| Fund | Value, beginning of period | Purchases | Sales Proceeds | Realized Gain/Loss | Change in Unrealized appreciation (depreciation) | Value, end of period | % ownership, end of period |
| Fidelity Cash Central Fund 0.06% | $43,132,118 | $725,808,552 | $685,937,124 | $(1,380) | $(1,737) | $83,000,429 | 0.1% |
| Fidelity Securities Lending Cash Central Fund 0.06% | 7,115,250 | 170,867,831 | 166,661,081 | -- | -- | 11,322,000 | 0.0% |
| Total | $50,247,368 | $896,676,383 | $852,598,205 | $(1,380) | $(1,737) | $94,322,429 | |
Investment Valuation
The following is a summary of the inputs used, as of July 31, 2021, involving the Fund's assets and liabilities carried at fair value. The inputs or methodology used for valuing securities may not be an indication of the risk associated with investing in those securities. For more information on valuation inputs, and their aggregation into the levels used below, please refer to the Investment Valuation section in the accompanying Notes to Financial Statements.
| | Valuation Inputs at Reporting Date: |
| Description | Total | Level 1 | Level 2 | Level 3 |
| Investments in Securities: | | | | |
| Equities: | | | | |
| Communication Services | $350,624,833 | $332,124,131 | $18,500,702 | $-- |
| Consumer Discretionary | 140,340,854 | 140,340,854 | -- | -- |
| Consumer Staples | 222,825,077 | 199,217,283 | 23,607,794 | -- |
| Energy | 33,834,044 | 33,834,044 | -- | -- |
| Financials | 613,821,560 | 613,821,560 | -- | -- |
| Health Care | 622,407,909 | 567,588,664 | 54,819,245 | -- |
| Industrials | 391,688,085 | 333,212,424 | 58,475,661 | -- |
| Information Technology | 289,028,654 | 289,028,654 | -- | -- |
| Materials | 107,488,005 | 107,488,005 | -- | -- |
| Real Estate | 141,040,915 | 141,040,915 | -- | -- |
| Utilities | 280,448,394 | 280,448,394 | -- | -- |
| Money Market Funds | 94,322,429 | 94,322,429 | -- | -- |
| Total Investments in Securities: | $3,287,870,759 | $3,132,467,357 | $155,403,402 | $-- |
Other Information
Distribution of investments by country or territory of incorporation, as a percentage of Total Net Assets, is as follows (Unaudited):
| United States of America | 81.9% |
| Switzerland | 4.5% |
| Ireland | 2.1% |
| United Kingdom | 2.0% |
| Germany | 1.8% |
| Korea (South) | 1.7% |
| France | 1.7% |
| Canada | 1.6% |
| Others (Individually Less Than 1%) | 2.7% |
| | 100.0% |
See accompanying notes which are an integral part of the financial statements.
Financial Statements
Statement of Assets and Liabilities
| | | July 31, 2021 |
| Assets | | |
Investment in securities, at value (including securities loaned of $10,982,588) — See accompanying schedule:
Unaffiliated issuers (cost $2,357,171,920) | $3,193,548,330 | |
| Fidelity Central Funds (cost $94,322,429) | 94,322,429 | |
| Total Investment in Securities (cost $2,451,494,349) | | $3,287,870,759 |
| Foreign currency held at value (cost $1,607) | | 1,600 |
| Receivable for fund shares sold | | 2,673,449 |
| Dividends receivable | | 3,933,184 |
| Distributions receivable from Fidelity Central Funds | | 5,364 |
| Prepaid expenses | | 2,435 |
| Other receivables | | 49,209 |
| Total assets | | 3,294,536,000 |
| Liabilities | | |
| Payable for fund shares redeemed | $1,180,368 | |
| Accrued management fee | 1,603,065 | |
| Other affiliated payables | 447,531 | |
| Other payables and accrued expenses | 54,383 | |
| Collateral on securities loaned | 11,322,000 | |
| Total liabilities | | 14,607,347 |
| Net Assets | | $3,279,928,653 |
| Net Assets consist of: | | |
| Paid in capital | | $2,389,106,245 |
| Total accumulated earnings (loss) | | 890,822,408 |
| Net Assets | | $3,279,928,653 |
| Net Asset Value and Maximum Offering Price | | |
| Value Discovery: | | |
| Net Asset Value, offering price and redemption price per share ($3,192,072,525 ÷ 84,105,004 shares) | | $37.95 |
| Class K: | | |
| Net Asset Value, offering price and redemption price per share ($87,856,128 ÷ 2,312,941 shares) | | $37.98 |
See accompanying notes which are an integral part of the financial statements.
Statement of Operations
| | | Year ended July 31, 2021 |
| Investment Income | | |
| Dividends | | $52,073,543 |
| Income from Fidelity Central Funds (including $35,565 from security lending) | | 73,749 |
| Total income | | 52,147,292 |
| Expenses | | |
| Management fee | | |
| Basic fee | $14,086,350 | |
| Performance adjustment | 1,115,697 | |
| Transfer agent fees | 3,665,408 | |
| Accounting fees | 792,159 | |
| Custodian fees and expenses | 51,377 | |
| Independent trustees' fees and expenses | 10,638 | |
| Registration fees | 133,089 | |
| Audit | 53,514 | |
| Legal | 6,664 | |
| Miscellaneous | 12,062 | |
| Total expenses before reductions | 19,926,958 | |
| Expense reductions | (84,574) | |
| Total expenses after reductions | | 19,842,384 |
| Net investment income (loss) | | 32,304,908 |
| Realized and Unrealized Gain (Loss) | | |
| Net realized gain (loss) on: | | |
| Investment securities: | | |
| Unaffiliated issuers | 132,814,296 | |
| Fidelity Central Funds | (1,380) | |
| Foreign currency transactions | 58,277 | |
| Total net realized gain (loss) | | 132,871,193 |
| Change in net unrealized appreciation (depreciation) on: | | |
| Investment securities: | | |
| Unaffiliated issuers | 740,831,047 | |
| Fidelity Central Funds | (1,737) | |
| Assets and liabilities in foreign currencies | 1,597 | |
| Total change in net unrealized appreciation (depreciation) | | 740,830,907 |
| Net gain (loss) | | 873,702,100 |
| Net increase (decrease) in net assets resulting from operations | | $906,007,008 |
See accompanying notes which are an integral part of the financial statements.
Statement of Changes in Net Assets
| | Year ended July 31, 2021 | Year ended July 31, 2020 |
| Increase (Decrease) in Net Assets | | |
| Operations | | |
| Net investment income (loss) | $32,304,908 | $41,983,196 |
| Net realized gain (loss) | 132,871,193 | (30,233,128) |
| Change in net unrealized appreciation (depreciation) | 740,830,907 | (81,597,401) |
| Net increase (decrease) in net assets resulting from operations | 906,007,008 | (69,847,333) |
| Distributions to shareholders | (31,222,091) | (70,564,497) |
| Share transactions - net increase (decrease) | 579,722,575 | (490,630,701) |
| Total increase (decrease) in net assets | 1,454,507,492 | (631,042,531) |
| Net Assets | | |
| Beginning of period | 1,825,421,161 | 2,456,463,692 |
| End of period | $3,279,928,653 | $1,825,421,161 |
See accompanying notes which are an integral part of the financial statements.
Financial Highlights
Fidelity Value Discovery Fund
| Years ended July 31, | 2021 | 2020 | 2019 | 2018 | 2017 |
| Selected Per–Share Data | | | | | |
| Net asset value, beginning of period | $26.99 | $28.85 | $29.25 | $28.10 | $24.16 |
| Income from Investment Operations | | | | | |
| Net investment income (loss)A | .40 | .57B | .54 | .42 | .38 |
| Net realized and unrealized gain (loss) | 10.98 | (1.53) | .22 | 1.28 | 3.86 |
| Total from investment operations | 11.38 | (.96) | .76 | 1.70 | 4.24 |
| Distributions from net investment income | (.42) | (.52) | (.57) | (.31) | (.29) |
| Distributions from net realized gain | – | (.38) | (.59) | (.24) | (.01) |
| Total distributions | (.42) | (.90) | (1.16) | (.55) | (.30) |
| Net asset value, end of period | $37.95 | $26.99 | $28.85 | $29.25 | $28.10 |
| Total ReturnC | 42.65% | (3.54)% | 2.86% | 6.19% | 17.70% |
| Ratios to Average Net AssetsD,E | | | | | |
| Expenses before reductions | .75% | .66% | .60% | .69% | .75% |
| Expenses net of fee waivers, if any | .75% | .66% | .60% | .69% | .75% |
| Expenses net of all reductions | .74% | .64% | .60% | .69% | .75% |
| Net investment income (loss) | 1.21% | 2.07%B | 1.95% | 1.50% | 1.44% |
| Supplemental Data | | | | | |
| Net assets, end of period (000 omitted) | $3,192,073 | $1,788,146 | $2,400,695 | $2,313,811 | $2,708,049 |
| Portfolio turnover rateF | 36% | 70%G | 48% | 33%G | 32%G |
A Calculated based on average shares outstanding during the period.
B Net investment income per share reflects one or more large, non-recurring dividend(s) which amounted to $.09 per share. Excluding such non-recurring dividend(s), the ratio of net investment income (loss) to average net assets would have been 1.74%.
C Total returns would have been lower if certain expenses had not been reduced during the applicable periods shown.
D Fees and expenses of any underlying mutual funds or exchange-traded funds (ETFs) are not included in the Fund's expense ratio. The Fund indirectly bears its proportionate share of these expenses. For additional expense information related to investments in Fidelity Central Funds, please refer to the "Investments in Fidelity Central Funds" note found in the Notes to Financial Statements section of the most recent Annual or Semi-Annual report.
E Expense ratios reflect operating expenses of the class. Expenses before reductions do not reflect amounts reimbursed, waived, or reduced through arrangements with the investment adviser, brokerage services, or other offset arrangements, if applicable, and do not represent the amount paid by the class during periods when reimbursements, waivers or reductions occur.
F Amount does not include the portfolio activity of any underlying mutual funds or exchange-traded funds (ETFs).
G Portfolio turnover rate excludes securities received or delivered in-kind.
See accompanying notes which are an integral part of the financial statements.
Fidelity Value Discovery Fund Class K
| Years ended July 31, | 2021 | 2020 | 2019 | 2018 | 2017 |
| Selected Per–Share Data | | | | | |
| Net asset value, beginning of period | $27.01 | $28.86 | $29.28 | $28.11 | $24.17 |
| Income from Investment Operations | | | | | |
| Net investment income (loss)A | .44 | .60B | .58 | .46 | .41 |
| Net realized and unrealized gain (loss) | 10.97 | (1.52) | .20 | 1.28 | 3.86 |
| Total from investment operations | 11.41 | (.92) | .78 | 1.74 | 4.27 |
| Distributions from net investment income | (.44) | (.55) | (.61) | (.33) | (.32) |
| Distributions from net realized gain | – | (.38) | (.59) | (.24) | (.01) |
| Total distributions | (.44) | (.93) | (1.20) | (.57) | (.33) |
| Net asset value, end of period | $37.98 | $27.01 | $28.86 | $29.28 | $28.11 |
| Total ReturnC | 42.76% | (3.40)% | 2.93% | 6.34% | 17.82% |
| Ratios to Average Net AssetsD,E | | | | | |
| Expenses before reductions | .65% | .56% | .49% | .57% | .63% |
| Expenses net of fee waivers, if any | .65% | .56% | .49% | .57% | .63% |
| Expenses net of all reductions | .65% | .54% | .48% | .56% | .63% |
| Net investment income (loss) | 1.30% | 2.17%B | 2.06% | 1.62% | 1.56% |
| Supplemental Data | | | | | |
| Net assets, end of period (000 omitted) | $87,856 | $37,275 | $55,768 | $67,335 | $113,668 |
| Portfolio turnover rateF | 36% | 70%G | 48% | 33%G | 32%G |
A Calculated based on average shares outstanding during the period.
B Net investment income per share reflects one or more large, non-recurring dividend(s) which amounted to $.09 per share. Excluding such non-recurring dividend(s), the ratio of net investment income (loss) to average net assets would have been 1.84%.
C Total returns would have been lower if certain expenses had not been reduced during the applicable periods shown.
D Fees and expenses of any underlying mutual funds or exchange-traded funds (ETFs) are not included in the Fund's expense ratio. The Fund indirectly bears its proportionate share of these expenses. For additional expense information related to investments in Fidelity Central Funds, please refer to the "Investments in Fidelity Central Funds" note found in the Notes to Financial Statements section of the most recent Annual or Semi-Annual report.
E Expense ratios reflect operating expenses of the class. Expenses before reductions do not reflect amounts reimbursed, waived, or reduced through arrangements with the investment adviser, brokerage services, or other offset arrangements, if applicable, and do not represent the amount paid by the class during periods when reimbursements, waivers or reductions occur.
F Amount does not include the portfolio activity of any underlying mutual funds or exchange-traded funds (ETFs).
G Portfolio turnover rate excludes securities received or delivered in-kind.
See accompanying notes which are an integral part of the financial statements.
Notes to Financial Statements
For the period ended July 31, 2021
1. Organization.
Fidelity Value Discovery Fund (the Fund) is a fund of Fidelity Puritan Trust (the Trust) and is authorized to issue an unlimited number of shares. The Trust is registered under the Investment Company Act of 1940, as amended (the 1940 Act), as an open-end management investment company organized as a Massachusetts business trust. The Fund offers Value Discovery and Class K shares, each of which has equal rights as to assets and voting privileges. Each class has exclusive voting rights with respect to matters that affect that class.
2. Investments in Fidelity Central Funds.
Funds may invest in Fidelity Central Funds, which are open-end investment companies generally available only to other investment companies and accounts managed by the investment adviser and its affiliates. The Schedule of Investments lists any Fidelity Central Funds held as an investment as of period end, but does not include the underlying holdings of each Fidelity Central Fund. An investing fund indirectly bears its proportionate share of the expenses of the underlying Fidelity Central Funds.
Based on its investment objective, each Fidelity Central Fund may invest or participate in various investment vehicles or strategies that are similar to those of the investing fund. These strategies are consistent with the investment objectives of the investing fund and may involve certain economic risks which may cause a decline in value of each of the Fidelity Central Funds and thus a decline in the value of the investing fund.
| Fidelity Central Fund | Investment Manager | Investment Objective | Investment Practices | Expense Ratio(a) |
| Fidelity Money Market Central Funds | Fidelity Management & Research Company LLC (FMR) | Each fund seeks to obtain a high level of current income consistent with the preservation of capital and liquidity. | Short-term Investments | Less than .005% to .01% |
(a) Expenses expressed as a percentage of average net assets and are as of each underlying Central Fund's most recent annual or semi-annual shareholder report.
A complete unaudited list of holdings for each Fidelity Central Fund is available upon request or at the Securities and Exchange Commission website at www.sec.gov. In addition, the financial statements of the Fidelity Central Funds which contain the significant accounting policies (including investment valuation policies) of those funds, and are not covered by the Report of Independent Registered Public Accounting Firm, are available on the Securities and Exchange Commission website or upon request.
3. Significant Accounting Policies.
The Fund is an investment company and applies the accounting and reporting guidance of the Financial Accounting Standards Board (FASB) Accounting Standards Codification Topic 946 Financial Services - Investment Companies. The financial statements have been prepared in conformity with accounting principles generally accepted in the United States of America (GAAP), which require management to make certain estimates and assumptions at the date of the financial statements. Actual results could differ from those estimates. Subsequent events, if any, through the date that the financial statements were issued have been evaluated in the preparation of the financial statements. The Fund's Schedule of Investments lists any underlying mutual funds or exchange-traded funds (ETFs) but does not include the underlying holdings of these funds. The following summarizes the significant accounting policies of the Fund:
Investment Valuation. Investments are valued as of 4:00 p.m. Eastern time on the last calendar day of the period. The Board of Trustees (the Board) has delegated the day to day responsibility for the valuation of the Fund's investments to the Fair Value Committee (the Committee) established by the Fund's investment adviser. In accordance with valuation policies and procedures approved by the Board, the Fund attempts to obtain prices from one or more third party pricing vendors or brokers to value its investments. When current market prices, quotations or currency exchange rates are not readily available or reliable, investments will be fair valued in good faith by the Committee, in accordance with procedures adopted by the Board. Factors used in determining fair value vary by investment type and may include market or investment specific events. The frequency with which these procedures are used cannot be predicted and they may be utilized to a significant extent. The Committee oversees the Fund's valuation policies and procedures and reports to the Board on the Committee's activities and fair value determinations. The Board monitors the appropriateness of the procedures used in valuing the Fund's investments and ratifies the fair value determinations of the Committee.
The Fund categorizes the inputs to valuation techniques used to value its investments into a disclosure hierarchy consisting of three levels as shown below:
- Level 1 – quoted prices in active markets for identical investments
- Level 2 – other significant observable inputs (including quoted prices for similar investments, interest rates, prepayment speeds, etc.)
- Level 3 – unobservable inputs (including the Fund's own assumptions based on the best information available)
Valuation techniques used to value the Fund's investments by major category are as follows:
Equity securities, including restricted securities, for which market quotations are readily available, are valued at the last reported sale price or official closing price as reported by a third party pricing vendor on the primary market or exchange on which they are traded and are categorized as Level 1 in the hierarchy. In the event there were no sales during the day or closing prices are not available, securities are valued at the last quoted bid price or may be valued using the last available price and are generally categorized as Level 2 in the hierarchy. For foreign equity securities, when market or security specific events arise, comparisons to the valuation of American Depositary Receipts (ADRs), futures contracts, Exchange-Traded Funds (ETFs) and certain indexes as well as quoted prices for similar securities may be used and would be categorized as Level 2 in the hierarchy. For equity securities, including restricted securities, where observable inputs are limited, assumptions about market activity and risk are used and these securities may be categorized as Level 3 in the hierarchy.
Investments in open-end mutual funds, including the Fidelity Central Funds, are valued at their closing net asset value (NAV) each business day and are categorized as Level 1 in the hierarchy.
Changes in valuation techniques may result in transfers in or out of an assigned level within the disclosure hierarchy. The aggregate value of investments by input level as of July 31, 2021 is included at the end of the Fund's Schedule of Investments.
Foreign Currency. Certain Funds may use foreign currency contracts to facilitate transactions in foreign-denominated securities. Gains and losses from these transactions may arise from changes in the value of the foreign currency or if the counterparties do not perform under the contracts' terms.
Foreign-denominated assets, including investment securities, and liabilities are translated into U.S. dollars at the exchange rates at period end. Purchases and sales of investment securities, income and dividends received, and expenses denominated in foreign currencies are translated into U.S. dollars at the exchange rate in effect on the transaction date.
The effects of exchange rate fluctuations on investments are included with the net realized and unrealized gain (loss) on investment securities. Other foreign currency transactions resulting in realized and unrealized gain (loss) are disclosed separately.
Investment Transactions and Income. For financial reporting purposes, the Fund's investment holdings and NAV include trades executed through the end of the last business day of the period. The NAV per share for processing shareholder transactions is calculated as of the close of business of the New York Stock Exchange (NYSE), normally 4:00 p.m. Eastern time and includes trades executed through the end of the prior business day. Gains and losses on securities sold are determined on the basis of identified cost and include proceeds received from litigation. Dividend income is recorded on the ex-dividend date, except for certain dividends from foreign securities where the ex-dividend date may have passed, which are recorded as soon as the Fund is informed of the ex-dividend date. Non-cash dividends included in dividend income, if any, are recorded at the fair market value of the securities received. Income and capital gain distributions from Fidelity Central Funds, if any, are recorded on the ex-dividend date. Certain distributions received by the Fund represent a return of capital or capital gain. The Fund determines the components of these distributions subsequent to the ex-dividend date, based upon receipt of tax filings or other correspondence relating to the underlying investment. These distributions are recorded as a reduction of cost of investments and/or as a realized gain. Investment income is recorded net of foreign taxes withheld where recovery of such taxes is uncertain.
Class Allocations and Expenses. Investment income, realized and unrealized capital gains and losses, common expenses of a fund, and certain fund-level expense reductions, if any, are allocated daily on a pro-rata basis to each class based on the relative net assets of each class to the total net assets of a fund. Each class differs with respect to transfer agent and distribution and service plan fees incurred, as applicable. Certain expense reductions may also differ by class, if applicable. For the reporting period, the allocated portion of income and expenses to each class as a percent of its average net assets may vary due to the timing of recording these transactions in relation to fluctuating net assets of the classes. Expenses directly attributable to a fund are charged to that fund. Expenses attributable to more than one fund are allocated among the respective funds on the basis of relative net assets or other appropriate methods. Expenses included in the accompanying financial statements reflect the expenses of that fund and do not include any expenses associated with any underlying mutual funds or exchange-traded funds. Although not included in a fund's expenses, a fund indirectly bears its proportionate share of these expenses through the net asset value of each underlying mutual fund or exchange-traded fund. Expense estimates are accrued in the period to which they relate and adjustments are made when actual amounts are known.
Income Tax Information and Distributions to Shareholders. Each year, the Fund intends to qualify as a regulated investment company under Subchapter M of the Internal Revenue Code, including distributing substantially all of its taxable income and realized gains. As a result, no provision for U.S. Federal income taxes is required. As of July 31, 2021, the Fund did not have any unrecognized tax benefits in the financial statements; nor is the Fund aware of any tax positions for which it is reasonably possible that the total amounts of unrecognized tax benefits will significantly change in the next twelve months. The Fund files a U.S. federal tax return, in addition to state and local tax returns as required. The Fund's federal income tax returns are subject to examination by the Internal Revenue Service (IRS) for a period of three fiscal years after they are filed. State and local tax returns may be subject to examination for an additional fiscal year depending on the jurisdiction. Foreign taxes are provided for based on the Fund's understanding of the tax rules and rates that exist in the foreign markets in which it invests.
Distributions are declared and recorded on the ex-dividend date. Income and capital gain distributions are declared separately for each class. Income and capital gain distributions are determined in accordance with income tax regulations, which may differ from GAAP. In addition, the Fund claimed a portion of the payment made to redeeming shareholders as a distribution for income tax purposes.
Capital accounts within the financial statements are adjusted for permanent book-tax differences. These adjustments have no impact on net assets or the results of operations. Capital accounts are not adjusted for temporary book-tax differences which will reverse in a subsequent period.
Book-tax differences are primarily due to foreign currency transactions, losses deferred due to wash sales and excise tax regulations.
As of period end, the cost and unrealized appreciation (depreciation) in securities, and derivatives if applicable, for federal income tax purposes were as follows:
| Gross unrealized appreciation | $866,449,155 |
| Gross unrealized depreciation | (33,706,736) |
| Net unrealized appreciation (depreciation) | $832,742,419 |
| Tax Cost | $2,455,128,340 |
The tax-based components of distributable earnings as of period end were as follows:
| Undistributed ordinary income | $58,047,669 |
| Net unrealized appreciation (depreciation) on securities and other investments | $832,774,738 |
The tax character of distributions paid was as follows:
| | July 31, 2021 | July 31, 2020 |
| Ordinary Income | $31,222,091 | $ 46,510,387 |
| Long-term Capital Gains | – | 24,054,110 |
| Total | $31,222,091 | $ 70,564,497 |
4. Purchases and Sales of Investments.
Purchases and sales of securities, other than short-term securities and in-kind transactions, as applicable, are noted in the table below.
| | Purchases ($) | Sales ($) |
| Fidelity Value Discovery Fund | 1,465,023,793 | 920,672,836 |
5. Fees and Other Transactions with Affiliates.
Management Fee. Fidelity Management & Research Company LLC (the investment adviser) and its affiliates provide the Fund with investment management related services for which the Fund pays a monthly management fee. The management fee is the sum of an individual fund fee rate that is based on an annual rate of .30% of the Fund's average net assets and an annualized group fee rate that averaged .23% during the period. The group fee rate is based upon the monthly average net assets of a group of registered investment companies with which the investment adviser has management contracts. The group fee rate decreases as assets under management increase and increases as assets under management decrease. In addition, the management fee is subject to a performance adjustment (up to a maximum of +/- .20% of the Fund's average net assets over a 36 month performance period). The upward or downward adjustment to the management fee is based on the relative investment performance of Value Discovery as compared to its benchmark index, the Russell 3000 Value Index, over the same 36 month performance period. For the reporting period, the total annual management fee rate, including the performance adjustment, was .57% of the Fund's average net assets. The performance adjustment included in the management fee rate may be higher or lower than the maximum performance adjustment rate due to the difference between the average net assets for the reporting and performance periods.
Transfer Agent Fees. Fidelity Investments Institutional Operations Company LLC (FIIOC), an affiliate of the investment adviser, is the transfer, dividend disbursing and shareholder servicing agent for each class of the Fund. FIIOC receives account fees and asset-based fees that vary according to the account size and type of account of the shareholders of Value Discovery, except for Class K. FIIOC receives an asset-based fee of Class K's average net assets. FIIOC pays for typesetting, printing and mailing of shareholder reports, except proxy statements.
For the period, transfer agent fees for each class were as follows:
| | Amount | % of Class-Level Average Net Assets |
| Value Discovery | $3,641,120 | .14 |
| Class K | 24,288 | .04 |
| | $3,665,408 | |
Accounting Fees. Fidelity Service Company, Inc. (FSC), an affiliate of the investment adviser, maintains the Fund's accounting records. The accounting fee is based on the level of average net assets for each month. For the period, the fees were equivalent to the following annual rates:
| | % of Average Net Assets |
| Fidelity Value Discovery Fund | .03 |
Brokerage Commissions. A portion of portfolio transactions were placed with brokerage firms which are affiliates of the investment adviser. Brokerage commissions are included in net realized gain (loss) and change in net unrealized appreciation (depreciation) in the Statement of Operations. The commissions paid to these affiliated firms were as follows:
| | Amount |
| Fidelity Value Discovery Fund | $16,490 |
Interfund Trades. Funds may purchase from or sell securities to other Fidelity Funds under procedures adopted by the Board. The procedures have been designed to ensure these interfund trades are executed in accordance with Rule 17a-7 of the 1940 Act. Any interfund trades are included within the respective purchases and sales amounts shown in the Purchases and Sales of Investments note and are noted in the table below.
| | Purchases ($) | Sales ($) |
| Fidelity Value Discovery Fund | 136,725,686 | 52,687,332 |
Prior Fiscal Year Affiliated Redemptions In-Kind. Shares that were redeemed in-kind for investments, including accrued interest and cash, if any, are shown in the table below; along with realized gain or loss on investments delivered through in-kind redemptions. The amount of the in-kind redemptions is included in share transactions in the accompanying Statement of Changes in Net Assets. There was no gain or loss for federal income tax purposes.
| | Shares | Total net realized gain or loss
($) | Total Proceeds
($) | Participating classes |
| Fidelity Value Discovery Fund | 7,715,624 | 45,570,810 | 230,194,879 | Value Discovery |
6. Committed Line of Credit.
Certain Funds participate with other funds managed by the investment adviser or an affiliate in a $4.25 billion credit facility (the "line of credit") to be utilized for temporary or emergency purposes to fund shareholder redemptions or for other short-term liquidity purposes. The participating funds have agreed to pay commitment fees on their pro-rata portion of the line of credit, which are reflected in Miscellaneous expenses on the Statement of Operations, and are listed below. During the period, there were no borrowings on this line of credit.
| | Amount |
| Fidelity Value Discovery Fund | $4,854 |
7. Security Lending.
Funds lend portfolio securities from time to time in order to earn additional income. Lending agents are used, including National Financial Services (NFS), an affiliate of the investment adviser. Pursuant to a securities lending agreement, NFS will receive a fee, which is capped at 9.9% of a fund's daily lending revenue, for its services as lending agent. A fund may lend securities to certain qualified borrowers, including NFS. On the settlement date of the loan, a fund receives collateral (in the form of U.S. Treasury obligations, letters of credit and/or cash) against the loaned securities and maintains collateral in an amount not less than 100% of the market value of the loaned securities during the period of the loan. The market value of the loaned securities is determined at the close of business of a fund and any additional required collateral is delivered to a fund on the next business day. A fund or borrower may terminate the loan at any time, and if the borrower defaults on its obligation to return the securities loaned because of insolvency or other reasons, a fund may apply collateral received from the borrower against the obligation. A fund may experience delays and costs in recovering the securities loaned. Any cash collateral received is invested in the Fidelity Securities Lending Cash Central Fund. Any loaned securities are identified as such in the Schedule of Investments, and the value of loaned securities and cash collateral at period end, as applicable, are presented in the Statement of Assets and Liabilities. Security lending income represents the income earned on investing cash collateral, less rebates paid to borrowers and any lending agent fees associated with the loan, plus any premium payments received for lending certain types of securities. Security lending income is presented in the Statement of Operations as a component of income from Fidelity Central Funds. Affiliated security lending activity, if any, was as follows:
| | Total Security Lending Fees Paid to NFS | Security Lending Income From Securities Loaned to NFS | Value of Securities Loaned to NFS at Period End |
| Fidelity Value Discovery Fund | $4,140 | $– | $– |
8. Expense Reductions.
Commissions paid to certain brokers with whom the investment adviser, or its affiliates, places trades on behalf of the Fund include an amount in addition to trade execution, which may be rebated back to the Fund to offset expenses. This amount totaled $57,360 for the period. In addition, through arrangements with the Fund's custodian, credits realized as a result of certain uninvested cash balances were used to reduce the Fund's expenses. During the period, custodian credits reduced the Fund's expenses by $28.
In addition, during the period the investment adviser or an affiliate reimbursed and/or waived a portion of fund-level operating expenses in the amount of $27,186.
9. Distributions to Shareholders.
Distributions to shareholders of each class were as follows:
| | Year ended
July 31, 2021 | Year ended
July 31, 2020 |
| Fidelity Value Discovery Fund | | |
| Distributions to shareholders | | |
| Value Discovery | $30,572,278 | $68,839,664 |
| Class K | 649,813 | 1,724,833 |
| Total | $31,222,091 | $70,564,497 |
10. Share Transactions.
Share transactions for each class were as follows and may contain in-kind transactions, automatic conversions between classes or exchanges between affiliated funds:
| | Shares | Shares | Dollars | Dollars |
| | Year ended July 31, 2021 | Year ended July 31, 2020 | Year ended July 31, 2021 | Year ended July 31, 2020 |
| Fidelity Value Discovery Fund | | | | |
| Value Discovery | | | | |
| Shares sold | 33,282,966 | 33,438,247 | $1,060,677,148 | $858,881,720 |
| Reinvestment of distributions | 697,213 | 1,722,368 | 20,391,490 | 49,825,323 |
| Shares redeemed | (16,126,218) | (52,136,661) | (534,871,305) | (1,384,972,163) |
| Net increase (decrease) | 17,853,961 | (16,976,046) | $546,197,333 | $(476,265,120) |
| Class K | | | | |
| Shares sold | 1,438,921 | 313,065 | $50,378,390 | $8,551,240 |
| Reinvestment of distributions | 22,129 | 59,409 | 649,813 | 1,724,833 |
| Shares redeemed | (528,282) | (924,367) | (17,502,961) | (24,641,654) |
| Net increase (decrease) | 932,768 | (551,893) | $33,525,242 | $(14,365,581) |
11. Other.
Fund's organizational documents provide former and current trustees and officers with a limited indemnification against liabilities arising in connection with the performance of their duties to the fund. In the normal course of business, the fund may also enter into contracts that provide general indemnifications. The fund's maximum exposure under these arrangements is unknown as this would be dependent on future claims that may be made against the fund. The risk of material loss from such claims is considered remote.
12. Coronavirus (COVID-19) Pandemic.
An outbreak of COVID-19 first detected in China during December 2019 has since spread globally and was declared a pandemic by the World Health Organization during March 2020. Developments that disrupt global economies and financial markets, such as the COVID-19 pandemic, may magnify factors that affect the Fund's performance.
Report of Independent Registered Public Accounting Firm
To the Board of Trustees of Fidelity Puritan Trust and Shareholders of Fidelity Value Discovery Fund
Opinion on the Financial Statements and Financial Highlights
We have audited the accompanying statement of assets and liabilities of Fidelity Value Discovery Fund (the "Fund"), a fund of Fidelity Puritan Trust, including the schedule of investments, as of July 31, 2021, the related statement of operations for the year then ended, the statement of changes in net assets for each of the two years in the period then ended, the financial highlights for each of the five years in the period then ended, and the related notes. In our opinion, the financial statements and financial highlights present fairly, in all material respects, the financial position of the Fund as of July 31, 2021, and the results of its operations for the year then ended, the changes in its net assets for each of the two years in the period then ended, and the financial highlights for each of the five years in the period then ended in conformity with accounting principles generally accepted in the United States of America.
Basis for Opinion
These financial statements and financial highlights are the responsibility of the Fund's management. Our responsibility is to express an opinion on the Fund's financial statements and financial highlights based on our audits. We are a public accounting firm registered with the Public Company Accounting Oversight Board (United States) (PCAOB) and are required to be independent with respect to the Fund in accordance with the U.S. federal securities laws and the applicable rules and regulations of the Securities and Exchange Commission and the PCAOB.
We conducted our audits in accordance with the standards of the PCAOB. Those standards require that we plan and perform the audit to obtain reasonable assurance about whether the financial statements and financial highlights are free of material misstatement, whether due to error or fraud. The Fund is not required to have, nor were we engaged to perform, an audit of its internal control over financial reporting. As part of our audits we are required to obtain an understanding of internal control over financial reporting but not for the purpose of expressing an opinion on the effectiveness of the Fund’s internal control over financial reporting. Accordingly, we express no such opinion.
Our audits included performing procedures to assess the risks of material misstatement of the financial statements and financial highlights, whether due to error or fraud, and performing procedures that respond to those risks. Such procedures included examining, on a test basis, evidence regarding the amounts and disclosures in the financial statements and financial highlights. Our audits also included evaluating the accounting principles used and significant estimates made by management, as well as evaluating the overall presentation of the financial statements and financial highlights. Our procedures included confirmation of securities owned as of July 31, 2021, by correspondence with the custodian and brokers; when replies were not received from brokers, we performed other auditing procedures. We believe that our audits provide a reasonable basis for our opinion.
/s/ Deloitte & Touche LLP
Boston, Massachusetts
September 14, 2021
We have served as the auditor of one or more of the Fidelity investment companies since 1999.
Trustees and Officers
The Trustees, Members of the Advisory Board (if any), and officers of the trust and fund, as applicable, are listed below. The Board of Trustees governs the fund and is responsible for protecting the interests of shareholders. The Trustees are experienced executives who meet periodically throughout the year to oversee the fund's activities, review contractual arrangements with companies that provide services to the fund, oversee management of the risks associated with such activities and contractual arrangements, and review the fund's performance. Except for Jonathan Chiel, each of the Trustees oversees 314 funds. Mr. Chiel oversees 176 funds.
The Trustees hold office without limit in time except that (a) any Trustee may resign; (b) any Trustee may be removed by written instrument, signed by at least two-thirds of the number of Trustees prior to such removal; (c) any Trustee who requests to be retired or who has become incapacitated by illness or injury may be retired by written instrument signed by a majority of the other Trustees; and (d) any Trustee may be removed at any special meeting of shareholders by a two-thirds vote of the outstanding voting securities of the trust. Each Trustee who is not an interested person (as defined in the 1940 Act) of the trust and the fund is referred to herein as an Independent Trustee. Each Independent Trustee shall retire not later than the last day of the calendar year in which his or her 75th birthday occurs. The Independent Trustees may waive this mandatory retirement age policy with respect to individual Trustees. Officers and Advisory Board Members hold office without limit in time, except that any officer or Advisory Board Member may resign or may be removed by a vote of a majority of the Trustees at any regular meeting or any special meeting of the Trustees. Except as indicated, each individual has held the office shown or other offices in the same company for the past five years.
The fund's Statement of Additional Information (SAI) includes more information about the Trustees. To request a free copy, call Fidelity at 1-800-544-8544 if you’re an individual investing directly with Fidelity, call 1-800-835-5092 if you’re a plan sponsor or participant with Fidelity as your recordkeeper or call 1-877-208-0098 on institutional accounts or if you’re an advisor or invest through one.
Experience, Skills, Attributes, and Qualifications of the Trustees. The Governance and Nominating Committee has adopted a statement of policy that describes the experience, qualifications, attributes, and skills that are necessary and desirable for potential Independent Trustee candidates (Statement of Policy). The Board believes that each Trustee satisfied at the time he or she was initially elected or appointed a Trustee, and continues to satisfy, the standards contemplated by the Statement of Policy. The Governance and Nominating Committee also engages professional search firms to help identify potential Independent Trustee candidates who have the experience, qualifications, attributes, and skills consistent with the Statement of Policy. From time to time, additional criteria based on the composition and skills of the current Independent Trustees, as well as experience or skills that may be appropriate in light of future changes to board composition, business conditions, and regulatory or other developments, have also been considered by the professional search firms and the Governance and Nominating Committee. In addition, the Board takes into account the Trustees' commitment and participation in Board and committee meetings, as well as their leadership of standing and ad hoc committees throughout their tenure.
In determining that a particular Trustee was and continues to be qualified to serve as a Trustee, the Board has considered a variety of criteria, none of which, in isolation, was controlling. The Board believes that, collectively, the Trustees have balanced and diverse experience, qualifications, attributes, and skills, which allow the Board to operate effectively in governing the fund and protecting the interests of shareholders. Information about the specific experience, skills, attributes, and qualifications of each Trustee, which in each case led to the Board's conclusion that the Trustee should serve (or continue to serve) as a trustee of the fund, is provided below.
Board Structure and Oversight Function. Robert A. Lawrence is an interested person and currently serves as Acting Chairman. The Trustees have determined that an interested Chairman is appropriate and benefits shareholders because an interested Chairman has a personal and professional stake in the quality and continuity of services provided to the fund. Independent Trustees exercise their informed business judgment to appoint an individual of their choosing to serve as Chairman, regardless of whether the Trustee happens to be independent or a member of management. The Independent Trustees have determined that they can act independently and effectively without having an Independent Trustee serve as Chairman and that a key structural component for assuring that they are in a position to do so is for the Independent Trustees to constitute a substantial majority for the Board. The Independent Trustees also regularly meet in executive session. David M. Thomas serves as Lead Independent Trustee and as such (i) acts as a liaison between the Independent Trustees and management with respect to matters important to the Independent Trustees and (ii) with management prepares agendas for Board meetings.
Fidelity® funds are overseen by different Boards of Trustees. The fund's Board oversees Fidelity's high income and certain equity funds, and other Boards oversee Fidelity's investment-grade bond, money market, asset allocation, and other equity funds. The asset allocation funds may invest in Fidelity® funds overseen by the fund's Board. The use of separate Boards, each with its own committee structure, allows the Trustees of each group of Fidelity® funds to focus on the unique issues of the funds they oversee, including common research, investment, and operational issues. On occasion, the separate Boards establish joint committees to address issues of overlapping consequences for the Fidelity® funds overseen by each Board.
The Trustees operate using a system of committees to facilitate the timely and efficient consideration of all matters of importance to the Trustees, the fund, and fund shareholders and to facilitate compliance with legal and regulatory requirements and oversight of the fund's activities and associated risks. The Board, acting through its committees, has charged FMR and its affiliates with (i) identifying events or circumstances the occurrence of which could have demonstrably adverse effects on the fund's business and/or reputation; (ii) implementing processes and controls to lessen the possibility that such events or circumstances occur or to mitigate the effects of such events or circumstances if they do occur; and (iii) creating and maintaining a system designed to evaluate continuously business and market conditions in order to facilitate the identification and implementation processes described in (i) and (ii) above. Because the day-to-day operations and activities of the fund are carried out by or through FMR, its affiliates, and other service providers, the fund's exposure to risks is mitigated but not eliminated by the processes overseen by the Trustees. While each of the Board's committees has responsibility for overseeing different aspects of the fund's activities, oversight is exercised primarily through the Operations, Audit, and Compliance Committees. Appropriate personnel, including but not limited to the fund's Chief Compliance Officer (CCO), FMR's internal auditor, the independent accountants, the fund's Treasurer and portfolio management personnel, make periodic reports to the Board's committees, as appropriate, including an annual review of Fidelity's risk management program for the Fidelity® funds. The responsibilities of each standing committee, including their oversight responsibilities, are described further under "Standing Committees of the Trustees."
Interested Trustees*:
Correspondence intended for a Trustee who is an interested person may be sent to Fidelity Investments, 245 Summer Street, Boston, Massachusetts 02210.
Name, Year of Birth; Principal Occupations and Other Relevant Experience+
Jonathan Chiel (1957)
Year of Election or Appointment: 2016
Trustee
Mr. Chiel also serves as Trustee of other Fidelity® funds. Mr. Chiel is Executive Vice President and General Counsel for FMR LLC (diversified financial services company, 2012-present). Previously, Mr. Chiel served as general counsel (2004-2012) and senior vice president and deputy general counsel (2000-2004) for John Hancock Financial Services; a partner with Choate, Hall & Stewart (1996-2000) (law firm); and an Assistant United States Attorney for the United States Attorney’s Office of the District of Massachusetts (1986-95), including Chief of the Criminal Division (1993-1995). Mr. Chiel is a director on the boards of the Boston Bar Foundation and the Maimonides School.
Bettina Doulton (1964)
Year of Election or Appointment: 2021
Trustee
Ms. Doulton also serves as Trustee of other Fidelity® funds. Prior to her retirement, Ms. Doulton served in a variety of positions at Fidelity Investments, including as a managing director of research (2006-2007), portfolio manager to certain Fidelity® funds (1993-2005), equity analyst and portfolio assistant (1990-1993), and research assistant (1987-1990). Ms. Doulton currently owns and operates Phi Builders + Architects and Cellardoor Winery. Previously, Ms. Doulton served as a member of the Board of Brown Capital Management, LLC (2014-2018).
Robert A. Lawrence (1952)
Year of Election or Appointment: 2020
Trustee
Acting Chairman of the Board of Trustees
Mr. Lawrence also serves as Trustee of other funds. Previously, Mr. Lawrence served as a Member of the Advisory Board of certain funds. Prior to his retirement in 2008, Mr. Lawrence served as Vice President of certain Fidelity® funds (2006-2008), Senior Vice President, Head of High Income Division of Fidelity Management & Research Company (investment adviser firm, 2006-2008), and President of Fidelity Strategic Investments (investment adviser firm, 2002-2005).
* Determined to be an “Interested Trustee” by virtue of, among other things, his or her affiliation with the trust or various entities under common control with FMR.
+ The information includes the Trustee's principal occupation during the last five years and other information relating to the experience, attributes, and skills relevant to the Trustee's qualifications to serve as a Trustee, which led to the conclusion that the Trustee should serve as a Trustee for the fund.
Independent Trustees:
Correspondence intended for an Independent Trustee may be sent to Fidelity Investments, P.O. Box 55235, Boston, Massachusetts 02205-5235.
Name, Year of Birth; Principal Occupations and Other Relevant Experience+
Thomas P. Bostick (1956)
Year of Election or Appointment: 2021
Trustee
Lieutenant General Bostick also serves as Trustee of other Fidelity® funds. Prior to his retirement, General Bostick (United States Army, Retired) held a variety of positions within the U.S. Army, including Commanding General and Chief of Engineers, U.S. Army Corps of Engineers (2012-2016) and Deputy Chief of Staff and Director of Human Resources, U.S. Army (2009-2012). General Bostick currently serves as a member of the Board and Finance and Governance Committees of CSX Corporation (transportation, 2020-present) and a member of the Board and Corporate Governance and Nominating Committee of Perma-Fix Environmental Services, Inc. (nuclear waste management, 2020-present). General Bostick serves as Chief Executive Officer of Bostick Global Strategies, LLC (consulting, 2016-present) and Managing Partner, Sustainability, of Ridge-Lane Limited Partners (strategic advisory and venture development, 2016-present). Previously, General Bostick served as a Member of the Advisory Board of certain Fidelity® funds (2021), President, Intrexon Bioengineering (2018-2020) and Chief Operating Officer (2017-2020) and Senior Vice President of the Environment Sector (2016-2017) of Intrexon Corporation (biopharmaceutical company).
Dennis J. Dirks (1948)
Year of Election or Appointment: 2005
Trustee
Mr. Dirks also serves as Trustee of other Fidelity® funds. Prior to his retirement in May 2003, Mr. Dirks served as Chief Operating Officer and as a member of the Board of The Depository Trust & Clearing Corporation (financial markets infrastructure), President, Chief Operating Officer and a member of the Board of The Depository Trust Company (DTC), President and a member of the Board of the National Securities Clearing Corporation (NSCC), Chief Executive Officer and a member of the Board of the Government Securities Clearing Corporation and Chief Executive Officer and a member of the Board of the Mortgage-Backed Securities Clearing Corporation. Mr. Dirks currently serves as a member of the Finance Committee (2016-present) and Board (2017-present) and is Treasurer (2018-present) of the Asolo Repertory Theatre.
Donald F. Donahue (1950)
Year of Election or Appointment: 2018
Trustee
Mr. Donahue also serves as Trustee of other Fidelity® funds. Mr. Donahue serves as President and Chief Executive Officer of Miranda Partners, LLC (risk consulting for the financial services industry, 2012-present). Previously, Mr. Donahue served as Chief Executive Officer (2006-2012), Chief Operating Officer (2003-2006) and Managing Director, Customer Marketing and Development (1999-2003) of The Depository Trust & Clearing Corporation (financial markets infrastructure). Mr. Donahue currently serves as a member (2007-present) and Co-Chairman (2016-present) of the Board of United Way of New York and a member of the Board of NYC Leadership Academy (2012-present). Mr. Donahue previously served as a member of the Advisory Board of certain Fidelity® funds (2015-2018).
Vicki L. Fuller (1957)
Year of Election or Appointment: 2020
Trustee
Ms. Fuller also serves as Trustee of other Fidelity® funds. Previously, Ms. Fuller served as a member of the Advisory Board of certain Fidelity® funds (2018-2020), Chief Investment Officer of the New York State Common Retirement Fund (2012-2018) and held a variety of positions at AllianceBernstein L.P. (global asset management, 1985-2012), including Managing Director (2006-2012) and Senior Vice President and Senior Portfolio Manager (2001-2006). Ms. Fuller currently serves as a member of the Board, Audit Committee and Nominating and Governance Committee of The Williams Companies, Inc. (natural gas infrastructure, 2018-present), as a member of the Board, Audit Committee and Nominating and Governance Committee of two Blackstone business development companies (2020-present) and as a member of the Board of Treliant, LLC (consulting, 2019-present).
Patricia L. Kampling (1959)
Year of Election or Appointment: 2020
Trustee
Ms. Kampling also serves as Trustee of other Fidelity® funds. Prior to her retirement, Ms. Kampling served as Chairman of the Board and Chief Executive Officer (2012-2019), President and Chief Operating Officer (2011-2012) and Executive Vice President and Chief Financial Officer (2010-2011) of Alliant Energy Corporation. Ms. Kampling currently serves as a member of the Board, Finance Committee and Governance, Compensation and Nominating Committee of Xcel Energy Inc. (utilities company, 2020-present) and as a member of the Board, Audit, Finance and Risk Committee and Safety, Environmental, Technology and Operations Committee of American Water Works Company, Inc. (utilities company, 2019-present). In addition, Ms. Kampling currently serves as a member of the Board of the Nature Conservancy, Wisconsin Chapter (2019-present). Previously, Ms. Kampling served as a Member of the Advisory Board of certain Fidelity® funds (2020), a member of the Board, Compensation Committee and Executive Committee and Chair of the Audit Committee of Briggs & Stratton Corporation (manufacturing, 2011-2021), a member of the Board of Interstate Power and Light Company (2012-2019) and Wisconsin Power and Light Company (2012-2019) (each a subsidiary of Alliant Energy Corporation) and as a member of the Board and Workforce Development Committee of the Business Roundtable (2018-2019).
Thomas A. Kennedy (1955)
Year of Election or Appointment: 2021
Trustee
Mr. Kennedy also serves as Trustee of other Fidelity® funds. Previously, Mr. Kennedy served as a Member of the Advisory Board of certain Fidelity® funds (2020) and held a variety of positions at Raytheon Company (aerospace and defense, 1983-2020), including Chairman and Chief Executive Officer (2014-2020) and Executive Vice President and Chief Operating Officer (2013-2014). Mr. Kennedy currently serves as Executive Chairman of the Board of Directors of Raytheon Technologies Corporation (aerospace and defense, 2020-present). He is also a member of the Rutgers School of Engineering Industry Advisory Board (2011-present) and a member of the UCLA Engineering Dean’s Executive Board (2016-present).
Oscar Munoz (1959)
Year of Election or Appointment: 2021
Trustee
Mr. Munoz also serves as Trustee of other Fidelity® funds. Prior to his retirement, Mr. Munoz served as Executive Chairman (2020-2021), Chief Executive Officer (2015-2020), President (2015-2016) and a member of the Board (2010-2021) of United Airlines Holdings, Inc. Mr. Munoz currently serves as a member of the Board of CBRE Group, Inc. (commercial real estate, 2020-present), a member of the Board of Univision Communications, Inc. (Hispanic media, 2020-present) and a member of the Advisory Board of Salesforce.com, Inc. (cloud-based software, 2020-present). Previously, Mr. Munoz served as a Member of the Advisory Board of certain Fidelity® funds (2021).
Garnett A. Smith (1947)
Year of Election or Appointment: 2018
Trustee
Mr. Smith also serves as Trustee of other Fidelity® funds. Prior to his retirement, Mr. Smith served as Chairman and Chief Executive Officer (1990-1997) and President (1986-1990) of Inbrand Corp. (manufacturer of personal absorbent products). Prior to his employment with Inbrand Corp., he was employed by a retail fabric chain and North Carolina National Bank (now Bank of America). Mr. Smith previously served as a member of the Advisory Board of certain Fidelity® funds (2012-2013).
David M. Thomas (1949)
Year of Election or Appointment: 2008
Trustee
Lead Independent Trustee
Mr. Thomas also serves as Trustee of other Fidelity® funds. Previously, Mr. Thomas served as Executive Chairman (2005-2006) and Chairman and Chief Executive Officer (2000-2005) of IMS Health, Inc. (pharmaceutical and healthcare information solutions). Mr. Thomas currently serves as a member of the Board of Fortune Brands Home and Security (home and security products, 2004-present) and Presiding Director (2013-present) of Interpublic Group of Companies, Inc. (marketing communication).
Susan Tomasky (1953)
Year of Election or Appointment: 2020
Trustee
Ms. Tomasky also serves as Trustee of other Fidelity® funds. Prior to her retirement, Ms. Tomasky served in various executive officer positions at American Electric Power Company, Inc. (1998-2011), including most recently as President of AEP Transmission (2007-2011). Ms. Tomasky currently serves as a member of the Board and Sustainability Committee and as Chair of the Audit Committee of Marathon Petroleum Corporation (2018-present) and as a member of the Board, Corporate Governance Committee and Organization and Compensation Committee and as Chair of the Audit Committee of Public Service Enterprise Group, Inc. (utilities company, 2012-present). In addition, Ms. Tomasky currently serves as a member (2009-present) and President (2020-present) of the Board of the Royal Shakespeare Company – America (2009-present), as a member of the Board of the Columbus Association for the Performing Arts (2011-present) and as a member of the Board and Investment Committee of Kenyon College (2016-present). Previously, Ms. Tomasky served as a Member of the Advisory Board of certain Fidelity® funds (2020), as a member of the Board of the Columbus Regional Airport Authority (2007-2020), as a member of the Board (2011-2018) and Lead Independent Director (2015-2018) of Andeavor Corporation (previously Tesoro Corporation) (independent oil refiner and marketer) and as a member of the Board of Summit Midstream Partners LP (energy, 2012-2018).
Michael E. Wiley (1950)
Year of Election or Appointment: 2020
Trustee
Mr. Wiley also serves as Trustee of other Fidelity® funds. Previously, Mr. Wiley served as a member of the Advisory Board of certain Fidelity® funds (2018-2020), Chairman, President and CEO of Baker Hughes, Inc. (oilfield services, 2000-2004). Mr. Wiley also previously served as a member of the Board of Andeavor Corporation (independent oil refiner and marketer, 2005-2018), a member of the Board of Andeavor Logistics LP (natural resources logistics, 2015-2018) and a member of the Board of High Point Resources (exploration and production, 2005-2020).
+ The information includes the Trustee's principal occupation during the last five years and other information relating to the experience, attributes, and skills relevant to the Trustee's qualifications to serve as a Trustee, which led to the conclusion that the Trustee should serve as a Trustee for the fund.
Advisory Board Members and Officers:
Correspondence intended for a Member of the Advisory Board (if any) may be sent to Fidelity Investments, P.O. Box 55235, Boston, Massachusetts 02205-5235. Correspondence intended for an officer or Peter S. Lynch may be sent to Fidelity Investments, 245 Summer Street, Boston, Massachusetts 02210. Officers appear below in alphabetical order.
Name, Year of Birth; Principal Occupation
Peter S. Lynch (1944)
Year of Election or Appointment: 2003
Member of the Advisory Board
Mr. Lynch also serves as a Member of the Advisory Board of other Fidelity® funds. Mr. Lynch is Vice Chairman and a Director of Fidelity Management & Research Company LLC (investment adviser firm). In addition, Mr. Lynch serves as a Trustee of Boston College and as the Chairman of the Inner-City Scholarship Fund. Previously, Mr. Lynch served as Vice Chairman and a Director of FMR Co., Inc. (investment adviser firm) and on the Special Olympics International Board of Directors (1997-2006).
Craig S. Brown (1977)
Year of Election or Appointment: 2019
Assistant Treasurer
Mr. Brown also serves as an officer of other funds. Mr. Brown serves as Assistant Treasurer of FIMM, LLC (2021-present) and is an employee of Fidelity Investments (2013-present).
John J. Burke III (1964)
Year of Election or Appointment: 2018
Chief Financial Officer
Mr. Burke also serves as Chief Financial Officer of other funds. Mr. Burke serves as Head of Investment Operations for Fidelity Fund and Investment Operations (2018-present) and is an employee of Fidelity Investments (1998-present). Previously Mr. Burke served as head of Asset Management Investment Operations (2012-2018).
William C. Coffey (1969)
Year of Election or Appointment: 2019
Assistant Secretary
Mr. Coffey also serves as Assistant Secretary of other funds. He is Senior Vice President and Deputy General Counsel of FMR LLC (diversified financial services company, 2010-present), and is an employee of Fidelity Investments. Previously, Mr. Coffey served as Secretary and CLO of certain funds (2018-2019); CLO, Secretary, and Senior Vice President of Fidelity Management & Research Company and FMR Co., Inc. (investment adviser firms, 2018-2019); Secretary of Fidelity SelectCo, LLC and Fidelity Investments Money Management, Inc. (investment adviser firms, 2018-2019); CLO of Fidelity Management & Research (Hong Kong) Limited, FMR Investment Management (UK) Limited, and Fidelity Management & Research (Japan) Limited (investment adviser firms, 2018-2019); and Assistant Secretary of certain funds (2009-2018).
Timothy M. Cohen (1969)
Year of Election or Appointment: 2018
Vice President
Mr. Cohen also serves as Vice President of other funds. Mr. Cohen serves as Co-Head of Equity (2018-present), a Director of Fidelity Management & Research (Japan) Limited (investment adviser firm, 2016-present), and is an employee of Fidelity Investments. Previously, Mr. Cohen served as Executive Vice President of Fidelity SelectCo, LLC (2019), Head of Global Equity Research (2016-2018), Chief Investment Officer - Equity and a Director of Fidelity Management & Research (U.K.) Inc. (investment adviser firm, 2013-2015) and as a Director of Fidelity Management & Research (Hong Kong) Limited (investment adviser firm, 2017).
Jonathan Davis (1968)
Year of Election or Appointment: 2010
Assistant Treasurer
Mr. Davis also serves as an officer of other funds. Mr. Davis serves as Assistant Treasurer of FIMM, LLC (2021-present) and FMR Capital, Inc. (2017-present) and is an employee of Fidelity Investments. Previously, Mr. Davis served as Vice President and Associate General Counsel of FMR LLC (diversified financial services company, 2003-2010).
Laura M. Del Prato (1964)
Year of Election or Appointment: 2018
Assistant Treasurer
Ms. Del Prato also serves as an officer of other funds. Ms. Del Prato serves as Assistant Treasurer of FIMM, LLC (2021-present) and is an employee of Fidelity Investments (2017-present). Previously, Ms. Del Prato served as President and Treasurer of The North Carolina Capital Management Trust: Cash Portfolio and Term Portfolio (2018-2020). Prior to joining Fidelity Investments, Ms. Del Prato served as a Managing Director and Treasurer of the JPMorgan Mutual Funds (2014-2017). Prior to JPMorgan, Ms. Del Prato served as a partner at Cohen Fund Audit Services (accounting firm, 2012-2013) and KPMG LLP (accounting firm, 2004-2012).
Colm A. Hogan (1973)
Year of Election or Appointment: 2020
Assistant Treasurer
Mr. Hogan also serves as an officer of other funds. Mr. Hogan serves as Assistant Treasurer of FIMM, LLC (2021-present) and FMR Capital, Inc. (2017-present) and is an employee of Fidelity Investments (2005-present). Previously, Mr. Hogan served as Deputy Treasurer of certain Fidelity® funds (2016-2020) and Assistant Treasurer of certain Fidelity® funds (2016-2018).
Pamela R. Holding (1964)
Year of Election or Appointment: 2018
Vice President
Ms. Holding also serves as Vice President of other funds. Ms. Holding serves as Co-Head of Equity (2018-present) and is an employee of Fidelity Investments (2013-present). Previously, Ms. Holding served as Executive Vice President of Fidelity SelectCo, LLC (2019) and as Chief Investment Officer of Fidelity Institutional Asset Management (2013-2018).
Cynthia Lo Bessette (1969)
Year of Election or Appointment: 2019
Secretary and Chief Legal Officer (CLO)
Ms. Lo Bessette also serves as an officer of other funds. Ms. Lo Bessette serves as CLO, Secretary, and Senior Vice President of Fidelity Management & Research Company LLC (investment adviser firm, 2019-present); and CLO of Fidelity Management & Research (Hong Kong) Limited, FMR Investment Management (UK) Limited, and Fidelity Management & Research (Japan) Limited (investment adviser firms, 2019-present). She is a Senior Vice President and Deputy General Counsel of FMR LLC (diversified financial services company, 2019-present), and is an employee of Fidelity Investments. Previously, Ms. Lo Bessette served as CLO, Secretary, and Senior Vice President of FMR Co., Inc. (investment adviser firm, 2019); Secretary of Fidelity SelectCo, LLC and Fidelity Investments Money Management, Inc. (investment adviser firms, 2019). Prior to joining Fidelity Investments, Ms. Lo Bessette was Executive Vice President, General Counsel (2016-2019) and Senior Vice President, Deputy General Counsel (2015-2016) of OppenheimerFunds (investment management company) and Deputy Chief Legal Officer (2013-2015) of Jennison Associates LLC (investment adviser firm).
Chris Maher (1972)
Year of Election or Appointment: 2020
Deputy Treasurer
Mr. Maher also serves as an officer of other funds. Mr. Maher serves as Assistant Treasurer of FIMM, LLC (2021-present) and FMR Capital, Inc. (2017-present), and is an employee of Fidelity Investments (2008-present). Previously, Mr. Maher served as Assistant Treasurer of certain funds (2013-2020); Vice President of Asset Management Compliance (2013), Vice President of the Program Management Group of FMR (investment adviser firm, 2010-2013), and Vice President of Valuation Oversight (2008-2010).
Jason P. Pogorelec (1975)
Year of Election or Appointment: 2020
Chief Compliance Officer
Mr. Pogorelec also serves as Chief Compliance Officer of other funds. Mr. Pogorelec is a senior Vice President of Asset Management Compliance for Fidelity Investments and is an employee of Fidelity Investments (2006-present). Previously, Mr. Pogorelec served as Vice President, Associate General Counsel for Fidelity Investments (2010-2020) and Assistant Secretary of certain Fidelity funds (2015-2020).
Brett Segaloff (1972)
Year of Election or Appointment: 2021
Anti-Money Laundering (AML) Officer
Mr. Segaloff also serves as an AML Officer of other funds and other related entities. He is Director, Anti-Money Laundering (2007-present) of FMR LLC (diversified financial services company) and is an employee of Fidelity Investments (1996-present).
Stacie M. Smith (1974)
Year of Election or Appointment: 2016
President and Treasurer
Ms. Smith also serves as an officer of other funds. Ms. Smith serves as Assistant Treasurer of FIMM, LLC (2021-present) and FMR Capital, Inc. (2017-present), is an employee of Fidelity Investments (2009-present), and has served in other fund officer roles. Prior to joining Fidelity Investments, Ms. Smith served as Senior Audit Manager of Ernst & Young LLP (accounting firm, 1996-2009). Previously, Ms. Smith served as Assistant Treasurer (2013-2019) and Deputy Treasurer (2013-2016) of certain Fidelity® funds.
Marc L. Spector (1972)
Year of Election or Appointment: 2016
Assistant Treasurer
Mr. Spector also serves as an officer of other funds. Mr. Spector serves as Assistant Treasurer of FIMM, LLC (2021-present) and FMR Capital, Inc. (2017-present) and is an employee of Fidelity Investments (2016-present). Prior to joining Fidelity Investments, Mr. Spector served as Director at the Siegfried Group (accounting firm, 2013-2016), and prior to Siegfried Group as audit senior manager at Deloitte & Touche LLP (accounting firm, 2005-2013).
Jim Wegmann (1979)
Year of Election or Appointment: 2019
Assistant Treasurer
Mr. Wegmann also serves as an officer of other funds. Mr. Wegmann serves as Assistant Treasurer of FIMM, LLC (2021-present) and is an employee of Fidelity Investments (2011-present).
Shareholder Expense Example
As a shareholder, you incur two types of costs: (1) transaction costs, which may include sales charges (loads) on purchase payments or redemption proceeds, as applicable and (2) ongoing costs, which generally include management fees, distribution and/or service (12b-1) fees and other Fund expenses. This Example is intended to help you understand your ongoing costs (in dollars) of investing in a fund and to compare these costs with the ongoing costs of investing in other mutual funds.
The Example is based on an investment of $1,000 invested at the beginning of the period and held for the entire period (February 1, 2021 to July 31, 2021).
Actual Expenses
The first line of the accompanying table provides information about actual account values and actual expenses. You may use the information in this line, together with the amount you invested, to estimate the expenses that you paid over the period. Simply divide your account value by $1,000.00 (for example, an $8,600 account value divided by $1,000.00 = 8.6), then multiply the result by the number in the first line for a class/Fund under the heading entitled "Expenses Paid During Period" to estimate the expenses you paid on your account during this period. If any fund is a shareholder of any underlying mutual funds or exchange-traded funds (ETFs) (the Underlying Funds), such fund indirectly bears its proportional share of the expenses of the Underlying Funds in addition to the direct expenses incurred presented in the table. These fees and expenses are not included in the annualized expense ratio used to calculate the expense estimate in the table below.
Hypothetical Example for Comparison Purposes
The second line of the accompanying table provides information about hypothetical account values and hypothetical expenses based on the actual expense ratio and an assumed rate of return of 5% per year before expenses, which is not the actual return. The hypothetical account values and expenses may not be used to estimate the actual ending account balance or expenses you paid for the period. You may use this information to compare the ongoing costs of investing in the Fund and other funds. To do so, compare this 5% hypothetical example with the 5% hypothetical examples that appear in the shareholder reports of the other funds. If any fund is a shareholder of any Underlying Funds, such fund indirectly bears its proportional share of the expenses of the Underlying Funds in addition to the direct expenses as presented in the table. These fees and expenses are not included in the annualized expense ratio used to calculate the expense estimate in the table below.
Please note that the expenses shown in the table are meant to highlight your ongoing costs only and do not reflect any transaction costs. Therefore, the second line of the table is useful in comparing ongoing costs only, and will not help you determine the relative total costs of owning different funds.
| | Annualized Expense Ratio-A | Beginning
Account Value
February 1, 2021 | Ending
Account Value
July 31, 2021 | Expenses Paid
During Period-B
February 1, 2021
to July 31, 2021 |
| Fidelity Value Discovery Fund | | | | |
| Value Discovery | .74% | | | |
| Actual | | $1,000.00 | $1,183.30 | $4.01 |
| Hypothetical-C | | $1,000.00 | $1,021.12 | $3.71 |
| Class K | .64% | | | |
| Actual | | $1,000.00 | $1,183.90 | $3.47 |
| Hypothetical-C | | $1,000.00 | $1,021.62 | $3.21 |
A Annualized expense ratio reflects expenses net of applicable fee waivers.
B Expenses are equal to the annualized expense ratio, multiplied by the average account value over the period, multiplied by 181/ 365 (to reflect the one-half year period). The fees and expenses of any Underlying Funds are not included in each annualized expense ratio.
C 5% return per year before expenses
Distributions (Unaudited)
The Board of Trustees of Fidelity Value Discovery Fund voted to pay to shareholders of record at the opening of business on record date, the following distributions per share derived from capital gains realized from sales of portfolio securities, and dividends derived from net investment income:
| | Pay Date | Record Date | Dividends | Capital Gains |
| Fidelity Value Discovery Fund | | | | |
| Value Discovery | 09/07/21 | 09/03/21 | $0.243 | $0.459 |
| Class K | 09/07/21 | 09/03/21 | $0.221 | $0.459 |
|
Value Discovery and Class K designate 100% of the dividends distributed in September and December, respectively during the fiscal year as qualifying for the dividends–received deduction for corporate shareholders.
Value Discovery and Class K designate 100% of the dividends distributed in September and December, respectively during the fiscal year as amounts which may be taken into account as a dividend for purposes of the maximum rate under section 1(h)(11) of the Internal Revenue Code.
The fund will notify shareholders in January 2022 of amounts for use in preparing 2021 income tax returns.
Board Approval of Investment Advisory Contracts and Management Fees
Fidelity Value Discovery Fund
Each year, the Board of Trustees, including the Independent Trustees (together, the Board), votes on the renewal of the management contract with Fidelity Management & Research Company LLC (FMR) and the sub-advisory agreements (together, the Advisory Contracts) for the fund. FMR and the sub-advisers are referred to herein as the Investment Advisers. The Board, assisted by the advice of fund counsel and Independent Trustees' counsel, requests and considers a broad range of information relevant to the renewal of the Advisory Contracts throughout the year.
The Board meets regularly and, at each of its meetings, covers an extensive agenda of topics and materials and considers factors that are relevant to its annual consideration of the renewal of the fund's Advisory Contracts, including the services and support provided to the fund and its shareholders. The Board has established various standing committees (Committees), each composed of and chaired by Independent Trustees with varying backgrounds, to which the Board has assigned specific subject matter responsibilities in order to enhance effective decision-making by the Board. The Board, acting directly and through its Committees, requests and receives information concerning the annual consideration of the renewal of the fund's Advisory Contracts. The Board also meets as needed to review matters specifically related to the Board's annual consideration of the renewal of the Advisory Contracts. Members of the Board may also meet with trustees of other Fidelity funds through joint ad hoc committees to discuss certain matters relevant to all of the Fidelity funds.
At its May 2021 meeting, the Board unanimously determined to renew the fund's Advisory Contracts. In reaching its determination, the Board considered all factors it believed relevant, including (i) the nature, extent, and quality of the services provided to the fund and its shareholders (including the investment performance of the fund); (ii) the competitiveness of the fund's management fee and total expense ratio relative to peer funds; (iii) the total costs of the services provided by and the profits realized by Fidelity from its relationships with the fund; and (iv) the extent to which, if any, economies of scale exist and are realized as the fund grows, and whether any economies of scale are appropriately shared with fund shareholders.
In considering whether to renew the Advisory Contracts for the fund, the Board reached a determination, with the assistance of fund counsel and Independent Trustees' counsel and through the exercise of its business judgment, that the renewal of the Advisory Contracts was in the best interests of the fund and its shareholders and that the compensation payable under the Advisory Contracts was fair and reasonable. The Board's decision to renew the Advisory Contracts was not based on any single factor, but rather was based on a comprehensive consideration of all the information provided to the Board at its meetings throughout the year. The Board, in reaching its determination to renew the Advisory Contracts, was aware that shareholders of the fund have a broad range of investment choices available to them, including a wide choice among funds offered by Fidelity's competitors, and that the fund's shareholders, who have the opportunity to review and weigh the disclosure provided by the fund in its prospectus and other public disclosures, have chosen to invest in this fund, which is part of the Fidelity family of funds.
Nature, Extent, and Quality of Services Provided. The Board considered Fidelity's staffing as it relates to the fund, including the backgrounds of investment personnel of Fidelity, and also considered the fund's investment objective, strategies, and related investment philosophy. The Independent Trustees also had discussions with senior management of Fidelity's investment operations and investment groups. The Board considered the structure of the investment personnel compensation program and whether this structure provides appropriate incentives to act in the best interests of the fund. Additionally, the Board considered the portfolio managers' investments, if any, in the funds that they manage.
Resources Dedicated to Investment Management and Support Services. The Board and the Fund Oversight and Research Committees reviewed the general qualifications and capabilities of Fidelity's investment staff, including its size, education, experience, and resources, as well as Fidelity's approach to recruiting, training, managing, and compensating investment personnel. The Board noted that Fidelity has continued to increase the resources devoted to non-U.S. offices, including expansion of Fidelity's global investment organization. The Board also noted that Fidelity's analysts have extensive resources, tools and capabilities that allow them to conduct sophisticated quantitative and fundamental analysis, as well as credit analysis of issuers, counterparties and guarantors. Further, the Board considered that Fidelity's investment professionals have sufficient access to global information and data so as to provide competitive investment results over time, and that those professionals also have access to sophisticated tools that permit them to assess portfolio construction and risk and performance attribution characteristics continuously, as well as to transmit new information and research conclusions rapidly around the world. Additionally, in its deliberations, the Board considered Fidelity's trading, risk management, compliance, and technology and operations capabilities and resources, which are integral parts of the investment management process. The Board also considered Fidelity's investments in business continuity planning, and its success in continuously providing services to the fund notwithstanding the severe disruptions caused by the COVID-19 pandemic.
Shareholder and Administrative Services. The Board considered (i) the nature, extent, quality, and cost of advisory, administrative, and shareholder services performed by the Investment Advisers and their affiliates under the Advisory Contracts and under separate agreements covering transfer agency, pricing and bookkeeping, and securities lending services for the fund; (ii) the nature and extent of the supervision of third party service providers, principally custodians, subcustodians, and pricing vendors; and (iii) the resources devoted to, and the record of compliance with, the fund's compliance policies and procedures. The Board also reviewed the allocation of fund brokerage, including allocations to brokers affiliated with the Investment Advisers, the use of brokerage commissions to pay fund expenses, and the use of "soft" commission dollars to pay for research services.
The Board noted that the growth of fund assets over time across the complex allows Fidelity to reinvest in the development of services designed to enhance the value and convenience of the Fidelity funds as investment vehicles. These services include 24-hour access to account information and market information over the Internet and through telephone representatives, investor education materials and asset allocation tools, and the expanded availability of Fidelity Investor Centers.
The Board noted that, in the past, it and the boards of certain other Fidelity funds had formed an ad hoc Committee on Transfer Agency Fees to review the variety of transfer agency fee structures throughout the industry and Fidelity's competitive positioning with respect to industry participants.
Investment in a Large Fund Family. The Board considered the benefits to shareholders of investing in a Fidelity fund, including the benefits of investing in a fund that is part of a large family of funds offering a variety of investment disciplines and providing a large variety of mutual fund investor services. The Board noted that Fidelity had taken, or had made recommendations that resulted in the Fidelity funds taking, a number of actions over the previous year that benefited particular funds, including: (i) continuing to dedicate additional resources to Fidelity's investment research process, which includes meetings with management of issuers of securities in which the funds invest, and to the support of the senior management team that oversees asset management; (ii) continuing efforts to enhance Fidelity's global research capabilities; (iii) launching new funds and ETFs with innovative structures, strategies and pricing and making other enhancements to meet client needs; (iv) launching new share classes of existing funds; (v) eliminating purchase minimums and broadening eligibility requirements for certain funds and share classes; (vi) approving the reduction in the holding period for the Class C to Class A conversion policy; (vii) reducing management fees and total expenses for certain target date funds and classes and index funds; (viii) lowering expenses for certain existing funds and classes by implementing or lowering expense caps; (ix) rationalizing product lines and gaining increased efficiencies from fund mergers, liquidations, and share class consolidations; (x) continuing to develop, acquire and implement systems and technology to improve services to the funds and shareholders, strengthen information security, and increase efficiency; and (xi) continuing to implement enhancements to further strengthen Fidelity's product line to increase investors' probability of success in achieving their investment goals, including retirement income goals.
Investment Performance. The Board considered whether the fund has operated in accordance with its investment objective, as well as its record of compliance with its investment restrictions and its performance history.
The Board took into account discussions that occur at Board meetings throughout the year with representatives of the Investment Advisers about fund investment performance. In this regard the Board noted that as part of regularly scheduled fund reviews and other reports to the Board on fund performance, the Board considers annualized return information for the fund for different time periods, measured against an appropriate securities market index (benchmark index) and a an appropriate peer group of funds with similar objectives (peer group). In its evaluation of fund investment performance, the Board gave particular attention to information indicating changes in performance of certain Fidelity funds for specific time periods and discussed with the Investment Advisers the reasons for any overperformance or underperformance.
In addition to reviewing absolute and relative fund performance, the Independent Trustees periodically consider the appropriateness of fund performance metrics in evaluating the results achieved. In general, the Independent Trustees believe that fund performance should be evaluated based on net performance (after fees and expenses) of both the highest performing and lowest performing fund share classes, where applicable, compared to appropriate benchmark indices, over appropriate time periods that may include full market cycles, and compared to peer groups, as applicable, over the same periods, taking into account relevant factors including the following: general market conditions; issuer-specific information; and fund cash flows and other factors.
The Independent Trustees recognize that shareholders evaluate performance on a net basis over their own holding periods, for which one-, three-, and five-year periods are often used as a proxy. For this reason, the performance information reviewed by the Board also included net cumulative total return information for the fund and an appropriate benchmark index and peer group for the most recent one-, three-, and five-year periods ended September 30, 2020, as shown below. Returns are shown compared to the 25th percentile (top of box, 75% beaten) and 75th percentile (bottom of box, 25% beaten) of the peer universe.
Fidelity Value Discovery Fund
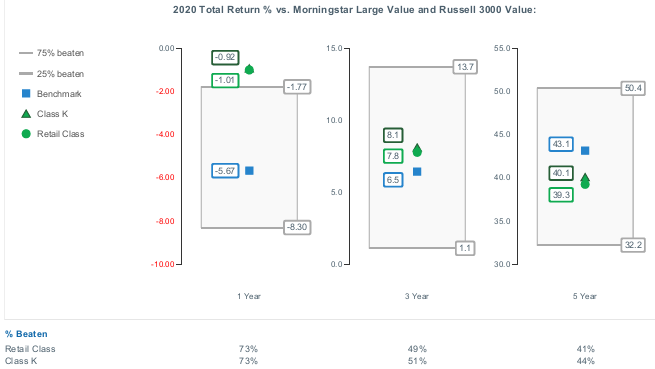
The Board also considered that the fund's management fee is subject to upward or downward adjustment depending upon whether, and to what extent, the fund's investment performance for the performance period (a rolling 36-month period) exceeds, or is exceeded by, a securities index, thus leading to a performance adjustment for the same period. The Board noted that the performance adjustment provides FMR with a strong economic incentive to seek to achieve superior long-term performance for the fund's shareholders and helps to more closely align the interests of FMR and the shareholders of the fund.
Based on its review, the Board concluded that the nature, extent, and quality of services provided to the fund under the Advisory Contracts should continue to benefit the shareholders of the fund.
Competitiveness of Management Fee and Total Expense Ratio. The Board considered the fund's management fee and total expense ratio compared to "mapped groups" of competitive funds and classes created for the purpose of facilitating the Trustees' competitive analysis of management fees and total expenses. Fidelity creates "mapped groups" by combining similar Lipper investment objective categories that have comparable investment mandates. Combining Lipper investment objective categories aids the Board's management fee and total expense ratio comparisons by broadening the competitive group used for comparison.
Management Fee. The Board considered two proprietary management fee comparisons for the 12-month periods ended September 30 (June 30 for periods ended 2019 and 2018 and December 31 for periods prior to 2018) shown in basis points (BP) in the chart below. The group of Lipper funds used by the Board for management fee comparisons is referred to below as the "Total Mapped Group." The Total Mapped Group comparison focuses on a fund's standing in terms of gross management fees before expense reimbursements or caps, and without giving effect to the fund's performance adjustment, relative to the total universe of funds with comparable investment mandates, regardless of whether their management fee structures also are comparable. Funds with comparable investment mandates offer exposure to similar types of securities. Funds with comparable management fee structures have similar management fee contractual arrangements (e.g., flat rate charged for advisory services, all-inclusive fee rate, etc.). "TMG %" represents the percentage of funds in the Total Mapped Group that had management fees that were lower than the fund's. For example, a hypothetical TMG % of 20% would mean that 80% of the funds in the Total Mapped Group had higher, and 20% had lower, management fees than the fund. The fund's actual TMG %s and the number of funds in the Total Mapped Group are in the chart below. The "Asset-Sized Peer Group" (ASPG) comparison focuses on a fund's standing relative to a subset of non-Fidelity funds within the Total Mapped Group that are similar in size and management fee structure without taking into account performance adjustments, if any. For example, if a fund is in the first quartile of the ASPG, the fund's management fee ranks in the least expensive or lowest 25% of funds in the ASPG. The ASPG represents at least 15% of the funds in the Total Mapped Group with comparable asset size and management fee structures, subject to a minimum of 50 funds (or all funds in the Total Mapped Group if fewer than 50). Additional information, such as the ASPG quartile in which the fund's management fee rate ranked and the impact of the fund's performance adjustment, is also included in the chart and was considered by the Board.
Fidelity Value Discovery Fund

The Board noted that the fund's management fee rate ranked below the median of its Total Mapped Group and below the median of its ASPG for the 12-month period ended September 30, 2020. The Board also noted the effect of the fund's performance adjustment, if any, on the fund's management fee ranking.
The Board noted that, in the past, it and the boards of other Fidelity funds had formed an ad hoc Committee on Group Fee to conduct an in-depth review of the "group fee" component of the management fee of funds with such management fee structures. The Committee's focus included the mechanics of the group fee, the competitive landscape of group fee structures, Fidelity funds with no group fee component and investment products not included in group fee assets. The Board also considered that, for funds subject to the group fee, FMR agreed to voluntarily waive fees over a specified period of time in amounts designed to account for assets converted from certain funds to certain collective investment trusts.
The Board also noted that, in 2013, the ad hoc Committee on Management Fees was formed to conduct an in-depth review of the management fee rates of Fidelity's active equity mutual funds. The Committee focused on the following areas: (i) standard fee structures; (ii) research consumption and trading evolution; (iii) management fee competitiveness/profitability by category; and (iv) factors that drive institutional pricing.
Based on its review, the Board concluded that the fund's management fee is fair and reasonable in light of the services that the fund receives and the other factors considered.
Total Expense Ratio. In its review of each class's total expense ratio, the Board considered the fund's management fee rate as well as other fund or class expenses, as applicable, such as transfer agent fees, pricing and bookkeeping fees, and custodial, legal, and audit fees. The Board noted the impact of the fund's performance adjustment. The Board also noted that Fidelity may agree to waive fees or reimburse expenses from time to time, and the extent to which, if any, it has done so for the fund. As part of its review, the Board also considered the current and historical total expense ratios of a representative class of the fund compared to competitive fund median expenses. The fund's representative class is compared to those funds and classes in the Total Mapped Group (used by the Board for management fee comparisons) that have a similar sales load structure (SLTG). The Board also considered a total expense ASPG comparison for the representative class, which focuses on the total expenses of the representative class relative to a subset of non-Fidelity funds within the total expense SLTG. The total expense ASPG is limited to 15 larger and 15 smaller classes in fund average assets for a total of 30 classes, where possible. The total expense ASPG comparison excludes performance adjustments and fund-paid 12b-1 fees to eliminate variability in fee structures.
The Board noted that the total expense ratio of the retail class ranked below the SLTG competitive median and below the ASPG competitive median for the 12-month period ended September 30, 2020.
Fees Charged to Other Fidelity Clients. The Board also considered Fidelity fee structures and other information with respect to clients of Fidelity, such as other funds advised or subadvised by Fidelity, pension plan clients, and other institutional clients with similar mandates. The Board noted that a joint ad hoc committee created by it and the boards of other Fidelity funds periodically reviews and compares Fidelity's institutional investment advisory business with its business of providing services to the Fidelity funds and also noted the most recent findings of the committee. The Board noted that the committee's review included a consideration of the differences in services provided, fees charged, and costs incurred, as well as competition in the markets serving the different categories of clients.
Based on its review of total expense ratios and fees charged to other Fidelity clients, the Board concluded that the total expense ratio of each class of the fund was reasonable in light of the services that the fund and its shareholders receive and the other factors considered.
Costs of the Services and Profitability. The Board considered the revenues earned and the expenses incurred by Fidelity in conducting the business of developing, marketing, distributing, managing, administering and servicing the fund and servicing the fund's shareholders. The Board also considered the level of Fidelity's profits in respect of all the Fidelity funds.
On an annual basis, Fidelity presents to the Board information about the profitability of its relationships with the fund. Fidelity calculates profitability information for each fund, as well as aggregate profitability information for groups of Fidelity funds and all Fidelity funds, using a series of detailed revenue and cost allocation methodologies which originate with the books and records of Fidelity on which Fidelity's audited financial statements are based. The Audit Committee of the Board reviews any significant changes from the prior year's methodologies and the full Board approves such changes.
A public accounting firm has been engaged annually by the Board as part of the Board's assessment of Fidelity's profitability analysis. The engagement includes the review and assessment of the methodologies used by Fidelity in determining the revenues and expenses attributable to Fidelity's mutual fund business, and completion of agreed-upon procedures in respect of the mathematical accuracy of certain fund profitability information and its conformity to established allocation methodologies. After considering the reports issued under the engagement and information provided by Fidelity, the Board concluded that while other allocation methods may also be reasonable, Fidelity's profitability methodologies are reasonable in all material respects.
The Board also reviewed Fidelity's non-fund businesses and potential indirect benefits such businesses may have received as a result of their association with Fidelity's mutual fund business (i.e., fall-out benefits) as well as cases where Fidelity's affiliates may benefit from the funds' business. The Board considered areas where potential indirect benefits to the Fidelity funds from their relationships with Fidelity may exist. The Board also considered that in 2019 a joint ad hoc committee created by it and the boards of other Fidelity funds evaluated potential fall-out benefits (PFOB Committee). The Board noted that it considered the PFOB Committee's findings in connection with its consideration of the renewal of the Advisory Contracts.
The Board considered the costs of the services provided by and the profits realized by Fidelity in connection with the operation of the fund, including the conclusions of the PFOB Committee, and was satisfied that the profitability was not excessive.
Economies of Scale. The Board considered whether there have been economies of scale in respect of the management of the Fidelity funds, whether the Fidelity funds (including the fund) have appropriately benefited from any such economies of scale, and whether there is potential for realization of any further economies of scale. The Board considered the extent to which the fund will benefit from economies of scale as assets grow through increased services to the fund, through waivers or reimbursements, or through fee or expense ratio reductions. The Board also noted that a committee (the Economies of Scale Committee) created by it and the boards of other Fidelity funds periodically analyzes whether Fidelity attains economies of scale in respect of the management and servicing of the Fidelity funds, whether the Fidelity funds have appropriately benefited from such economies of scale, and whether there is potential for realization of any further economies of scale.
The Board recognized that the fund's management contract incorporates a "group fee" structure, which provides for lower group fee rates as total "group assets" increase, and for higher group fee rates as total "group assets" decrease ("group assets" as defined in the management contract). FMR calculates the group fee rates based on a tiered asset "breakpoint" schedule that varies based on asset class. The Board considered that the group fee is designed to deliver the benefits of economies of scale to fund shareholders when total Fidelity fund assets increase, even if assets of any particular fund are unchanged or have declined, because some portion of Fidelity's costs are attributable to services provided to all Fidelity funds, and all funds benefit if those costs can be allocated among more assets. The Board further considered that Fidelity agreed to impose a temporary fee waiver in the form of additional breakpoints to the current breakpoint schedule. The Board concluded that, given the group fee structure, fund shareholders will benefit from lower management fees as "group assets" increase at the fund complex level, regardless of whether Fidelity achieves any such economies of scale.
The Board concluded, taking into account the analysis of the Economies of Scale Committee, that economies of scale, if any, are being appropriately shared between fund shareholders and Fidelity.
Additional Information Requested by the Board. In order to develop fully the factual basis for consideration of the Fidelity funds' advisory contracts, the Board requested and received additional information on certain topics, including: (i) fund flow and performance trends, in particular the underperformance of certain funds and strategies, and Fidelity's long-term strategies for certain funds; (ii) consideration of expanding the use of performance fees for additional funds; (iii) Fidelity's pricing philosophy compared to competitors; (iv) metrics for evaluating index fund and ETF performance and information about ETF trading characteristics; (v) the methodology with respect to evaluating competitive fund data and peer group classifications and fee and expense comparisons; (vi) the expense structures for different funds and classes and information about the differences between various expense structures; (vii) group fee breakpoints; (viii) information regarding other accounts managed by Fidelity and sub-advisory arrangements; and (ix) Fidelity's philosophies and strategies for evaluating funds and classes with lower or declining asset levels.
Based on its evaluation of all of the conclusions noted above, and after considering all factors it believed relevant, the Board concluded that the advisory fee arrangements are fair and reasonable, and that the fund's Advisory Contracts should be renewed.
Liquidity Risk Management Program
The Securities and Exchange Commission adopted Rule 22e-4 under the Investment Company Act of 1940 (the Liquidity Rule) to promote effective liquidity risk management throughout the open-end investment company industry, thereby reducing the risk that funds will be unable to meet their redemption obligations and mitigating dilution of the interests of fund shareholders.
The Fund has adopted and implemented a liquidity risk management program pursuant to the Liquidity Rule (the Program) effective December 1, 2018. The Program is reasonably designed to assess and manage the Fund’s liquidity risk and to comply with the requirements of the Liquidity Rule. The Fund’s Board of Trustees (the Board) has designated the Fund’s investment adviser as administrator of the Program. The Fidelity advisers have established a Liquidity Risk Management Committee (the LRM Committee) to manage the Program for each of the Fidelity Funds. The LRM Committee monitors the adequacy and effectiveness of implementation of the Program and on a periodic basis assesses each Fund’s liquidity risk based on a variety of factors including (1) the Fund’s investment strategy, (2) portfolio liquidity and cash flow projections during normal and reasonably foreseeable stressed conditions, (3) shareholder redemptions, (4) borrowings and other funding sources and (5) in the case of exchange-traded funds, certain additional factors including the effect of the Fund’s prices and spreads, market participants, and basket compositions on the overall liquidity of the Fund’s portfolio, as applicable.
In accordance with the Program, each of the Fund’s portfolio investments is classified into one of four liquidity categories described below based on a determination of a reasonable expectation for how long it would take to convert the investment to cash (or sell or dispose of the investment) without significantly changing its market value.
- Highly liquid investments – cash or convertible to cash within three business days or less
- Moderately liquid investments – convertible to cash in three to seven calendar days
- Less liquid investments – can be sold or disposed of, but not settled, within seven calendar days
- Illiquid investments – cannot be sold or disposed of within seven calendar days
Liquidity classification determinations take into account a variety of factors including various market, trading and investment-specific considerations, as well as market depth, and generally utilize analysis from a third-party liquidity metrics service.
The Liquidity Rule places a 15% limit on a fund’s illiquid investments and requires funds that do not primarily hold assets that are highly liquid investments to determine and maintain a minimum percentage of the fund’s net assets to be invested in highly liquid investments (highly liquid investment minimum or HLIM). The Program includes provisions reasonably designed to comply with the 15% limit on illiquid investments and for determining, periodically reviewing and complying with the HLIM requirement as applicable.
At a recent meeting of the Fund’s Board of Trustees, the LRM Committee provided a written report to the Board pertaining to the operation, adequacy, and effectiveness of implementation of the Program for the annual period from December 1, 2019 through November 30, 2020. The report concluded that the Program has been implemented and is operating effectively and is reasonably designed to assess and manage the Fund’s liquidity risk.
FVD-ANN-0921
1.788864.118
Fidelity® Value Discovery K6 Fund
Annual Report
July 31, 2021
Contents
To view a fund's proxy voting guidelines and proxy voting record for the 12-month period ended June 30, visit http://www.fidelity.com/proxyvotingresults or visit the Securities and Exchange Commission's (SEC) web site at http://www.sec.gov.
You may also call 1-800-835-5092 to request a free copy of the proxy voting guidelines.
Standard & Poor's, S&P and S&P 500 are registered service marks of The McGraw-Hill Companies, Inc. and have been licensed for use by Fidelity Distributors Corporation.
Other third-party marks appearing herein are the property of their respective owners.
All other marks appearing herein are registered or unregistered trademarks or service marks of FMR LLC or an affiliated company. © 2021 FMR LLC. All rights reserved.
This report and the financial statements contained herein are submitted for the general information of the shareholders of the Fund. This report is not authorized for distribution to prospective investors in the Fund unless preceded or accompanied by an effective prospectus.
A fund files its complete schedule of portfolio holdings with the SEC for the first and third quarters of each fiscal year on Form N-PORT. Forms N-PORT are available on the SEC’s web site at http://www.sec.gov. A fund's Forms N-PORT may be reviewed and copied at the SEC’s Public Reference Room in Washington, DC. Information regarding the operation of the SEC's Public Reference Room may be obtained by calling 1-800-SEC-0330.
For a complete list of a fund's portfolio holdings, view the most recent holdings listing, semiannual report, or annual report on Fidelity's web site at http://www.fidelity.com, http://www.institutional.fidelity.com, or http://www.401k.com, as applicable.
NOT FDIC INSURED •MAY LOSE VALUE •NO BANK GUARANTEE
Neither the Fund nor Fidelity Distributors Corporation is a bank.
Note to Shareholders:
Early in 2020, the outbreak and spread of a new coronavirus emerged as a public health emergency that had a major influence on financial markets, primarily based on its impact on the global economy and the outlook for corporate earnings. The virus causes a respiratory disease known as COVID-19. On March 11, 2020 the World Health Organization declared the COVID-19 outbreak a pandemic, citing sustained risk of further global spread.
In the weeks following, as the crisis worsened, we witnessed an escalating human tragedy with wide-scale social and economic consequences from coronavirus-containment measures. The outbreak of COVID-19 prompted a number of measures to limit the spread, including travel and border restrictions, quarantines, and restrictions on large gatherings. In turn, these resulted in lower consumer activity, diminished demand for a wide range of products and services, disruption in manufacturing and supply chains, and – given the wide variability in outcomes regarding the outbreak – significant market uncertainty and volatility. Amid the turmoil, global governments and central banks took unprecedented action to help support consumers, businesses, and the broader economies, and to limit disruption to financial systems.
The situation continues to unfold, and the extent and duration of its impact on financial markets and the economy remain highly uncertain. Extreme events such as the coronavirus crisis are “exogenous shocks” that can have significant adverse effects on mutual funds and their investments. Although multiple asset classes may be affected by market disruption, the duration and impact may not be the same for all types of assets.
Fidelity is committed to helping you stay informed amid news about COVID-19 and during increased market volatility, and we’re taking extra steps to be responsive to customer needs. We encourage you to visit our websites, where we offer ongoing updates, commentary, and analysis on the markets and our funds.
Performance: The Bottom Line
Average annual total return reflects the change in the value of an investment, assuming reinvestment of distributions from dividend income and capital gains (the profits earned upon the sale of securities that have grown in value, if any) and assuming a constant rate of performance each year. The hypothetical investment and the average annual total returns do not reflect the deduction of taxes that a shareholder would pay on fund distributions or the redemption of fund shares. During periods of reimbursement by Fidelity, a fund’s total return will be greater than it would be had the reimbursement not occurred. How a fund did yesterday is no guarantee of how it will do tomorrow.
Average Annual Total Returns
| For the periods ended July 31, 2021 | Past 1 year | Life of fundA |
| Fidelity® Value Discovery K6 Fund | 42.84% | 11.30% |
A From May 25, 2017
$10,000 Over Life of Fund
Let's say hypothetically that $10,000 was invested in Fidelity® Value Discovery K6 Fund on May 25, 2017, when the fund started.
The chart shows how the value of your investment would have changed, and also shows how the Russell 3000® Value Index performed over the same period.

| Period Ending Values |
| $15,655 | Fidelity® Value Discovery K6 Fund |
| $15,438 | Russell 3000® Value Index |
Management's Discussion of Fund Performance
Market Recap: The S&P 500
® index gained 36.45% for the 12 months ending July 31, 2021, as U.S. equities continued a historic rebound following a steep but brief decline due to the early-2020 outbreak and spread of COVID-19. A confluence of powerful forces propelled risk assets, returning the stock market to pre-pandemic highs by late August 2020. The rally slowed in September, when stocks began a two-month retreat amid Congress’s inability to reach a deal on additional fiscal stimulus, as well as uncertainty about the election. But as the calendar turned, investors grew hopeful. The rollout of three COVID-19 vaccines was underway, the U.S. Federal Reserve pledged to hold interest rates near zero until the economy recovered, and the federal government planned to deploy trillions of dollars to boost consumers and the economy. This backdrop fueled a sharp rotation, with small-cap value usurping leadership from large growth. As part of the “reopening” theme, investors moved out of tech-driven mega-caps that had thrived due to the work-from-home trend in favor of cheap smaller companies that stood to benefit from a broad cyclical recovery. A flattish May reflected concerns about inflation and jobs, but the uptrend resumed through July, driven by corporate earnings. Notably, this leg saw momentum shift back to large growth, as easing rates and a hawkish Fed stymied the reflation trade. By sector, financials (+55%) led, driven by banks (+63%), whereas utilities (+12%) and consumer staples (+18%) notably lagged.
Comments from Portfolio Manager Sean Gavin: For the fiscal year ending July 31, 2021, the fund gained 42.84%, outperforming the 40.72% increase in the benchmark Russell 3000
® Value Index. Versus the benchmark, security selection was the primary contributor, especially in the industrials sector. Strong picks in real estate also lifted the fund's relative result. Also aiding performance were favorable investment choices among communication services stocks, especially within the media & entertainment industry. The biggest individual relative contributor was an overweight position in Discover Financial Services (+154%) and we decreased our position in this company this period. Also bolstering performance was our overweighting in CBRE Group, which gained 120%. CBRE Group was among the biggest holdings as of July 31. Another notable relative contributor was an outsized stake in Capital One Financial (+150%), which we reduced our stake in this period. In contrast, the biggest detractor from performance versus the benchmark was an overweighting in utilities. Also hindering the portfolio's relative result was stock selection and an overweighting in health care, along with subpar picks and an underweighting in energy. The biggest individual relative detractor was an overweight position in Centene (+6%), one of our largest holdings this period. Further pressuring the fund’s relative return was a larger-than-benchmark position in Amgen (+1%). Another key relative detractor was an outsized stake in Newmont (-7%). Notable changes in positioning include increased exposure to the utilities sector and a lower allocation to consumer discretionary stocks.
The views expressed above reflect those of the portfolio manager(s) only through the end of the period as stated on the cover of this report and do not necessarily represent the views of Fidelity or any other person in the Fidelity organization. Any such views are subject to change at any time based upon market or other conditions and Fidelity disclaims any responsibility to update such views. These views may not be relied on as investment advice and, because investment decisions for a Fidelity fund are based on numerous factors, may not be relied on as an indication of trading intent on behalf of any Fidelity fund.
Investment Summary (Unaudited)
Top Ten Stocks as of July 31, 2021
| | % of fund's net assets |
| Berkshire Hathaway, Inc. Class B | 4.0 |
| Comcast Corp. Class A | 3.3 |
| UnitedHealth Group, Inc. | 2.5 |
| Bristol-Myers Squibb Co. | 2.4 |
| Alphabet, Inc. Class A | 2.4 |
| CBRE Group, Inc. | 2.4 |
| Bank of America Corp. | 2.4 |
| Procter & Gamble Co. | 2.3 |
| JPMorgan Chase & Co. | 2.2 |
| Cigna Corp. | 2.2 |
| | 26.1 |
Top Five Market Sectors as of July 31, 2021
| | % of fund's net assets |
| Health Care | 18.9 |
| Financials | 18.6 |
| Industrials | 11.9 |
| Communication Services | 10.6 |
| Information Technology | 8.9 |
Asset Allocation (% of fund's net assets)
| As of July 31, 2021* |
| | Stocks | 97.8% |
| | Short-Term Investments and Net Other Assets (Liabilities) | 2.2% |

* Foreign investments - 18.7%
Schedule of Investments July 31, 2021
Showing Percentage of Net Assets
| Common Stocks - 96.0% | | | |
| | | Shares | Value |
| COMMUNICATION SERVICES - 10.6% | | | |
| Diversified Telecommunication Services - 1.7% | | | |
| Verizon Communications, Inc. | | 54,783 | $3,055,796 |
| Entertainment - 0.3% | | | |
| Lions Gate Entertainment Corp. Class B (a) | | 37,388 | 499,504 |
| Interactive Media & Services - 2.9% | | | |
| Alphabet, Inc. Class A (a) | | 1,601 | 4,313,943 |
| Facebook, Inc. Class A (a) | | 2,771 | 987,307 |
| | | | 5,301,250 |
| Media - 5.7% | | | |
| Comcast Corp. Class A | | 100,234 | 5,896,766 |
| Fox Corp. Class A | | 14,049 | 500,987 |
| Interpublic Group of Companies, Inc. | | 83,007 | 2,935,128 |
| WPP PLC | | 78,344 | 1,013,225 |
| | | | 10,346,106 |
|
| TOTAL COMMUNICATION SERVICES | | | 19,202,656 |
|
| CONSUMER DISCRETIONARY - 4.4% | | | |
| Auto Components - 0.3% | | | |
| Lear Corp. | | 2,795 | 489,069 |
| Household Durables - 0.5% | | | |
| Whirlpool Corp. | | 3,833 | 849,163 |
| Multiline Retail - 1.1% | | | |
| Dollar General Corp. | | 9,058 | 2,107,253 |
| Specialty Retail - 1.2% | | | |
| Best Buy Co., Inc. | | 14,447 | 1,623,120 |
| Lowe's Companies, Inc. | | 2,645 | 509,665 |
| | | | 2,132,785 |
| Textiles, Apparel & Luxury Goods - 1.3% | | | |
| PVH Corp. (a) | | 11,706 | 1,224,682 |
| Tapestry, Inc. (a) | | 28,829 | 1,219,467 |
| | | | 2,444,149 |
|
| TOTAL CONSUMER DISCRETIONARY | | | 8,022,419 |
|
| CONSUMER STAPLES - 6.8% | | | |
| Food & Staples Retailing - 1.5% | | | |
| Kroger Co. | | 46,026 | 1,873,258 |
| U.S. Foods Holding Corp. (a) | | 24,513 | 841,776 |
| | | | 2,715,034 |
| Food Products - 2.0% | | | |
| Mondelez International, Inc. | | 41,956 | 2,654,137 |
| Tyson Foods, Inc. Class A | | 13,856 | 990,150 |
| | | | 3,644,287 |
| Household Products - 3.3% | | | |
| Procter & Gamble Co. | | 29,305 | 4,168,050 |
| Reckitt Benckiser Group PLC | | 16,901 | 1,292,921 |
| Spectrum Brands Holdings, Inc. | | 5,140 | 448,979 |
| | | | 5,909,950 |
|
| TOTAL CONSUMER STAPLES | | | 12,269,271 |
|
| ENERGY - 1.5% | | | |
| Energy Equipment & Services - 0.1% | | | |
| Hoegh LNG Partners LP | | 21,167 | 115,995 |
| Oil, Gas & Consumable Fuels - 1.4% | | | |
| Parex Resources, Inc. | | 114,800 | 1,886,342 |
| Teekay LNG Partners LP | | 45,841 | 664,236 |
| | | | 2,550,578 |
|
| TOTAL ENERGY | | | 2,666,573 |
|
| FINANCIALS - 18.6% | | | |
| Banks - 7.1% | | | |
| Bank of America Corp. | | 110,640 | 4,244,150 |
| Cullen/Frost Bankers, Inc. | | 4,024 | 431,856 |
| JPMorgan Chase & Co. | | 26,578 | 4,034,009 |
| M&T Bank Corp. | | 12,733 | 1,704,312 |
| PNC Financial Services Group, Inc. | | 12,974 | 2,366,587 |
| | | | 12,780,914 |
| Capital Markets - 1.6% | | | |
| Affiliated Managers Group, Inc. | | 8,631 | 1,367,496 |
| BlackRock, Inc. Class A | | 711 | 616,558 |
| Invesco Ltd. | | 22,996 | 560,642 |
| State Street Corp. | | 5,023 | 437,704 |
| | | | 2,982,400 |
| Consumer Finance - 2.4% | | | |
| Capital One Financial Corp. | | 10,741 | 1,736,820 |
| Discover Financial Services | | 20,686 | 2,571,684 |
| | | | 4,308,504 |
| Diversified Financial Services - 4.0% | | | |
| Berkshire Hathaway, Inc. Class B (a) | | 25,924 | 7,214,389 |
| Insurance - 3.5% | | | |
| Allstate Corp. | | 3,615 | 470,131 |
| American International Group, Inc. | | 18,363 | 869,488 |
| Chubb Ltd. | | 14,618 | 2,466,641 |
| The Travelers Companies, Inc. | | 16,984 | 2,529,257 |
| | | | 6,335,517 |
|
| TOTAL FINANCIALS | | | 33,621,724 |
|
| HEALTH CARE - 18.9% | | | |
| Biotechnology - 2.4% | | | |
| Amgen, Inc. | | 9,892 | 2,389,314 |
| Regeneron Pharmaceuticals, Inc. (a) | | 3,231 | 1,856,565 |
| | | | 4,245,879 |
| Health Care Providers & Services - 10.1% | | | |
| Anthem, Inc. | | 5,821 | 2,235,322 |
| Centene Corp. (a) | | 52,088 | 3,573,758 |
| Cigna Corp. | | 17,161 | 3,938,278 |
| CVS Health Corp. | | 23,573 | 1,941,472 |
| Humana, Inc. | | 4,715 | 2,007,930 |
| UnitedHealth Group, Inc. | | 10,925 | 4,503,504 |
| | | | 18,200,264 |
| Pharmaceuticals - 6.4% | | | |
| AstraZeneca PLC sponsored ADR | | 40,089 | 2,294,694 |
| Bristol-Myers Squibb Co. | | 63,704 | 4,323,590 |
| Roche Holding AG (participation certificate) | | 7,770 | 3,001,646 |
| Sanofi SA sponsored ADR | | 39,144 | 2,018,265 |
| | | | 11,638,195 |
|
| TOTAL HEALTH CARE | | | 34,084,338 |
|
| INDUSTRIALS - 11.9% | | | |
| Aerospace & Defense - 2.4% | | | |
| L3Harris Technologies, Inc. | | 7,487 | 1,697,602 |
| Northrop Grumman Corp. | | 7,338 | 2,663,841 |
| | | | 4,361,443 |
| Air Freight & Logistics - 0.6% | | | |
| Deutsche Post AG | | 15,668 | 1,061,840 |
| Building Products - 1.5% | | | |
| Johnson Controls International PLC | | 17,361 | 1,239,923 |
| Owens Corning | | 2,765 | 265,882 |
| Trane Technologies PLC | | 5,788 | 1,178,495 |
| | | | 2,684,300 |
| Electrical Equipment - 0.6% | | | |
| Regal Beloit Corp. | | 8,045 | 1,184,465 |
| Industrial Conglomerates - 2.5% | | | |
| 3M Co. | | 11,594 | 2,294,916 |
| Siemens AG | | 13,719 | 2,140,619 |
| | | | 4,435,535 |
| Machinery - 4.3% | | | |
| ITT, Inc. | | 15,082 | 1,476,679 |
| Oshkosh Corp. | | 19,902 | 2,379,284 |
| Otis Worldwide Corp. | | 15,058 | 1,348,444 |
| Pentair PLC | | 19,223 | 1,416,158 |
| Stanley Black & Decker, Inc. | | 5,602 | 1,103,874 |
| | | | 7,724,439 |
|
| TOTAL INDUSTRIALS | | | 21,452,022 |
|
| INFORMATION TECHNOLOGY - 7.1% | | | |
| Communications Equipment - 2.1% | | | |
| Cisco Systems, Inc. | | 69,816 | 3,865,712 |
| Electronic Equipment & Components - 1.4% | | | |
| TE Connectivity Ltd. | | 17,434 | 2,570,992 |
| IT Services - 2.3% | | | |
| Amdocs Ltd. | | 15,717 | 1,211,938 |
| Capgemini SA | | 4,874 | 1,053,730 |
| Cognizant Technology Solutions Corp. Class A | | 25,292 | 1,859,721 |
| | | | 4,125,389 |
| Semiconductors & Semiconductor Equipment - 0.7% | | | |
| NXP Semiconductors NV | | 6,082 | 1,255,264 |
| Software - 0.6% | | | |
| NortonLifeLock, Inc. | | 39,514 | 980,737 |
|
| TOTAL INFORMATION TECHNOLOGY | | | 12,798,094 |
|
| MATERIALS - 3.3% | | | |
| Chemicals - 1.4% | | | |
| DuPont de Nemours, Inc. | | 18,067 | 1,355,928 |
| International Flavors & Fragrances, Inc. | | 8,129 | 1,224,553 |
| | | | 2,580,481 |
| Metals & Mining - 1.9% | | | |
| BHP Group Ltd. sponsored ADR | | 2,398 | 188,387 |
| Lundin Mining Corp. | | 135,290 | 1,232,965 |
| Newmont Corp. | | 31,310 | 1,966,894 |
| | | | 3,388,246 |
|
| TOTAL MATERIALS | | | 5,968,727 |
|
| REAL ESTATE - 4.3% | | | |
| Equity Real Estate Investment Trusts (REITs) - 1.9% | | | |
| American Tower Corp. | | 8,006 | 2,264,097 |
| Simon Property Group, Inc. | | 9,463 | 1,197,259 |
| | | | 3,461,356 |
| Real Estate Management & Development - 2.4% | | | |
| CBRE Group, Inc. (a) | | 44,191 | 4,262,664 |
|
| TOTAL REAL ESTATE | | | 7,724,020 |
|
| UTILITIES - 8.6% | | | |
| Electric Utilities - 7.2% | | | |
| Duke Energy Corp. | | 18,938 | 1,990,573 |
| Entergy Corp. | | 900 | 92,628 |
| Evergy, Inc. | | 29,344 | 1,913,816 |
| Exelon Corp. | | 48,502 | 2,269,894 |
| PG&E Corp. (a) | | 157,252 | 1,382,245 |
| Portland General Electric Co. | | 26,040 | 1,273,356 |
| PPL Corp. | | 47,203 | 1,339,149 |
| Southern Co. | | 42,384 | 2,707,066 |
| | | | 12,968,727 |
| Multi-Utilities - 1.4% | | | |
| Dominion Energy, Inc. | | 33,906 | 2,538,542 |
|
| TOTAL UTILITIES | | | 15,507,269 |
|
| TOTAL COMMON STOCKS | | | |
| (Cost $124,764,772) | | | 173,317,113 |
|
| Nonconvertible Preferred Stocks - 1.8% | | | |
| INFORMATION TECHNOLOGY - 1.8% | | | |
| Technology Hardware, Storage & Peripherals - 1.8% | | | |
| Samsung Electronics Co. Ltd. | | | |
| (Cost $2,148,432) | | 50,565 | 3,162,615 |
|
| Money Market Funds - 2.2% | | | |
| Fidelity Cash Central Fund 0.06% (b) | | | |
| (Cost $4,029,546) | | 4,028,740 | 4,029,546 |
| TOTAL INVESTMENT IN SECURITIES - 100.0% | | | |
| (Cost $130,942,750) | | | 180,509,274 |
| NET OTHER ASSETS (LIABILITIES) - 0.0% | | | 65,249 |
| NET ASSETS - 100% | | | $180,574,523 |
Legend
(a) Non-income producing
(b) Affiliated fund that is generally available only to investment companies and other accounts managed by Fidelity Investments. The rate quoted is the annualized seven-day yield of the fund at period end. A complete unaudited listing of the fund's holdings as of its most recent quarter end is available upon request. In addition, each Fidelity Central Fund's financial statements, which are not covered by the Fund's Report of Independent Registered Public Accounting Firm, are available on the SEC's website or upon request.
Affiliated Central Funds
Information regarding fiscal year to date income earned by the Fund from investments in Fidelity Central Funds is as follows:
| Fund | Income earned |
| Fidelity Cash Central Fund | $2,242 |
| Fidelity Securities Lending Cash Central Fund | 109 |
| Total | $2,351 |
Amounts in the income column in the above table include any capital gain distributions from underlying funds, which are presented in the corresponding line-item in the Statement of Operations, if applicable. Amount for Fidelity Securities Lending Cash Central Fund represents the income earned on investing cash collateral, less rebates paid to borrowers and any lending agent fees associated with the loan, plus any premium payments received for lending certain types of securities.
Fiscal year to date information regarding the Fund's investments in Fidelity Central Funds, including the ownership percentage, is presented below.
| Fund | Value, beginning of period | Purchases | Sales Proceeds | Realized Gain/Loss | Change in Unrealized appreciation (depreciation) | Value, end of period | % ownership, end of period |
| Fidelity Cash Central Fund 0.06% | $704,677 | $67,957,043 | $64,632,568 | $462 | $(68) | $4,029,546 | 0.0% |
| Fidelity Securities Lending Cash Central Fund 0.06% | 4,752 | 3,750,505 | 3,755,257 | -- | -- | -- | 0.0% |
| Total | $709,429 | $71,707,548 | $68,387,825 | $462 | $(68) | $4,029,546 | |
Investment Valuation
The following is a summary of the inputs used, as of July 31, 2021, involving the Fund's assets and liabilities carried at fair value. The inputs or methodology used for valuing securities may not be an indication of the risk associated with investing in those securities. For more information on valuation inputs, and their aggregation into the levels used below, please refer to the Investment Valuation section in the accompanying Notes to Financial Statements.
| | Valuation Inputs at Reporting Date: |
| Description | Total | Level 1 | Level 2 | Level 3 |
| Investments in Securities: | | | | |
| Equities: | | | | |
| Communication Services | $19,202,656 | $18,189,431 | $1,013,225 | $-- |
| Consumer Discretionary | 8,022,419 | 8,022,419 | -- | -- |
| Consumer Staples | 12,269,271 | 10,976,350 | 1,292,921 | -- |
| Energy | 2,666,573 | 2,666,573 | -- | -- |
| Financials | 33,621,724 | 33,621,724 | -- | -- |
| Health Care | 34,084,338 | 31,082,692 | 3,001,646 | -- |
| Industrials | 21,452,022 | 18,249,563 | 3,202,459 | -- |
| Information Technology | 15,960,709 | 15,960,709 | -- | -- |
| Materials | 5,968,727 | 5,968,727 | -- | -- |
| Real Estate | 7,724,020 | 7,724,020 | -- | -- |
| Utilities | 15,507,269 | 15,507,269 | -- | -- |
| Money Market Funds | 4,029,546 | 4,029,546 | -- | -- |
| Total Investments in Securities: | $180,509,274 | $171,999,023 | $8,510,251 | $-- |
Other Information
Distribution of investments by country or territory of incorporation, as a percentage of Total Net Assets, is as follows (Unaudited):
| United States of America | 81.3% |
| Switzerland | 4.4% |
| Ireland | 2.2% |
| Canada | 2.0% |
| United Kingdom | 2.0% |
| Germany | 1.8% |
| Korea (South) | 1.8% |
| France | 1.7% |
| Others (Individually Less Than 1%) | 2.8% |
| | 100.0% |
See accompanying notes which are an integral part of the financial statements.
Financial Statements
Statement of Assets and Liabilities
| | | July 31, 2021 |
| Assets | | |
Investment in securities, at value — See accompanying schedule:
Unaffiliated issuers (cost $126,913,204) | $176,479,728 | |
| Fidelity Central Funds (cost $4,029,546) | 4,029,546 | |
| Total Investment in Securities (cost $130,942,750) | | $180,509,274 |
| Receivable for fund shares sold | | 49,033 |
| Dividends receivable | | 225,069 |
| Distributions receivable from Fidelity Central Funds | | 225 |
| Other receivables | | 5,857 |
| Total assets | | 180,789,458 |
| Liabilities | | |
| Payable for fund shares redeemed | 149,496 | |
| Accrued management fee | 65,439 | |
| Total liabilities | | 214,935 |
| Net Assets | | $180,574,523 |
| Net Assets consist of: | | |
| Paid in capital | | $120,906,291 |
| Total accumulated earnings (loss) | | 59,668,232 |
| Net Assets | | $180,574,523 |
| Net Asset Value, offering price and redemption price per share ($180,574,523 ÷ 12,696,596 shares) | | $14.22 |
See accompanying notes which are an integral part of the financial statements.
Statement of Operations
| | | Year ended July 31, 2021 |
| Investment Income | | |
| Dividends | | $3,287,094 |
| Non-Cash dividends | | 210,622 |
| Income from Fidelity Central Funds (including $109 from security lending) | | 2,351 |
| Total income | | 3,500,067 |
| Expenses | | |
| Management fee | $804,841 | |
| Independent trustees' fees and expenses | 771 | |
| Interest | 1,540 | |
| Miscellaneous | 87 | |
| Total expenses before reductions | 807,239 | |
| Expense reductions | (7,511) | |
| Total expenses after reductions | | 799,728 |
| Net investment income (loss) | | 2,700,339 |
| Realized and Unrealized Gain (Loss) | | |
| Net realized gain (loss) on: | | |
| Investment securities: | | |
| Unaffiliated issuers | 19,592,414 | |
| Fidelity Central Funds | 462 | |
| Foreign currency transactions | 4,236 | |
| Total net realized gain (loss) | | 19,597,112 |
| Change in net unrealized appreciation (depreciation) on: | | |
| Investment securities: | | |
| Unaffiliated issuers | 41,320,521 | |
| Fidelity Central Funds | (68) | |
| Assets and liabilities in foreign currencies | 177 | |
| Total change in net unrealized appreciation (depreciation) | | 41,320,630 |
| Net gain (loss) | | 60,917,742 |
| Net increase (decrease) in net assets resulting from operations | | $63,618,081 |
See accompanying notes which are an integral part of the financial statements.
Statement of Changes in Net Assets
| | Year ended July 31, 2021 | Year ended July 31, 2020 |
| Increase (Decrease) in Net Assets | | |
| Operations | | |
| Net investment income (loss) | $2,700,339 | $3,978,139 |
| Net realized gain (loss) | 19,597,112 | (8,634,620) |
| Change in net unrealized appreciation (depreciation) | 41,320,630 | (2,850,046) |
| Net increase (decrease) in net assets resulting from operations | 63,618,081 | (7,506,527) |
| Distributions to shareholders | (3,362,410) | (6,868,130) |
| Share transactions | | |
| Proceeds from sales of shares | 70,189,811 | 62,134,131 |
| Reinvestment of distributions | 3,362,410 | 6,868,130 |
| Cost of shares redeemed | (117,625,866) | (81,936,188) |
| Net increase (decrease) in net assets resulting from share transactions | (44,073,645) | (12,933,927) |
| Total increase (decrease) in net assets | 16,182,026 | (27,308,584) |
| Net Assets | | |
| Beginning of period | 164,392,497 | 191,701,081 |
| End of period | $180,574,523 | $164,392,497 |
| Other Information | | |
| Shares | | |
| Sold | 5,533,329 | 6,095,665 |
| Issued in reinvestment of distributions | 310,770 | 624,873 |
| Redeemed | (9,346,543) | (8,047,567) |
| Net increase (decrease) | (3,502,444) | (1,327,029) |
See accompanying notes which are an integral part of the financial statements.
Financial Highlights
Fidelity Value Discovery K6 Fund
| | | | | | |
| Years ended July 31, | 2021 | 2020 | 2019 | 2018 | 2017 A |
| Selected Per–Share Data | | | | | |
| Net asset value, beginning of period | $10.15 | $10.94 | $10.98 | $10.38 | $10.00 |
| Income from Investment Operations | | | | | |
| Net investment income (loss)B | .19 | .23C | .22 | .19 | –D |
| Net realized and unrealized gain (loss) | 4.09 | (.62) | .09 | .49 | .38 |
| Total from investment operations | 4.28 | (.39) | .31 | .68 | .38 |
| Distributions from net investment income | (.21) | (.23) | (.27) | (.08) | – |
| Distributions from net realized gain | – | (.17) | (.08) | – | – |
| Total distributions | (.21) | (.40) | (.35) | (.08) | – |
| Net asset value, end of period | $14.22 | $10.15 | $10.94 | $10.98 | $10.38 |
| Total ReturnE,F | 42.84% | (3.80)% | 2.98% | 6.58% | 3.80% |
| Ratios to Average Net AssetsG,H | | | | | |
| Expenses before reductions | .45% | .45% | .45% | .45% | .45%I |
| Expenses net of fee waivers, if any | .45% | .45% | .45% | .45% | .45%I |
| Expenses net of all reductions | .45% | .44% | .45% | .45% | .45%I |
| Net investment income (loss) | 1.51% | 2.27%C | 2.13% | 1.81% | (.28)%I |
| Supplemental Data | | | | | |
| Net assets, end of period (000 omitted) | $180,575 | $164,392 | $191,701 | $266,215 | $297,069 |
| Portfolio turnover rateJ | 55% | 82% | 45% | 38%K | - %K,L |
A For the period May 25, 2017 (commencement of operations) to July 31, 2017.
B Calculated based on average shares outstanding during the period.
C Net investment income per share reflects one or more large, non-recurring dividend(s) which amounted to $.03 per share. Excluding such non-recurring dividend(s), the ratio of net investment income (loss) to average net assets would have been 1.93%.
D Amount represents less than $.005 per share.
E Total returns for periods of less than one year are not annualized.
F Total returns would have been lower if certain expenses had not been reduced during the applicable periods shown.
G Fees and expenses of any underlying mutual funds or exchange-traded funds (ETFs) are not included in the Fund's expense ratio. The Fund indirectly bears its proportionate share of these expenses. For additional expense information related to investments in Fidelity Central Funds, please refer to the "Investments in Fidelity Central Funds" note found in the Notes to Financial Statements section of the most recent Annual or Semi-Annual report.
H Expense ratios reflect operating expenses of the class. Expenses before reductions do not reflect amounts reimbursed, waived, or reduced through arrangements with the investment advisor, brokerage services, or other offset arrangements, if applicable, and do not represent the amount paid by the class during periods when reimbursements, waivers or reductions occur.
I Annualized
J Amount does not include the portfolio activity of any underlying mutual funds or exchange-traded funds (ETFs).
K Portfolio turnover rate excludes securities received or delivered in-kind.
L Amount not annualized.
See accompanying notes which are an integral part of the financial statements.
Notes to Financial Statements
For the period ended July 31, 2021
1. Organization.
Fidelity Value Discovery K6 Fund (the Fund) is a fund of Fidelity Puritan Trust (the Trust) and is authorized to issue an unlimited number of shares. Share transactions on the Statement of Changes in Net Assets may contain exchanges between affiliated funds. The Trust is registered under the Investment Company Act of 1940, as amended (the 1940 Act), as an open-end management investment company organized as a Massachusetts business trust. Shares generally are available only to employer-sponsored retirement plans that are recordkept by Fidelity, or to certain employer-sponsored retirement plans that are not recordkept by Fidelity.
2. Investments in Fidelity Central Funds.
Funds may invest in Fidelity Central Funds, which are open-end investment companies generally available only to other investment companies and accounts managed by the investment adviser and its affiliates. The Schedule of Investments lists any Fidelity Central Funds held as an investment as of period end, but does not include the underlying holdings of each Fidelity Central Fund. An investing fund indirectly bears its proportionate share of the expenses of the underlying Fidelity Central Funds.
Based on its investment objective, each Fidelity Central Fund may invest or participate in various investment vehicles or strategies that are similar to those of the investing fund. These strategies are consistent with the investment objectives of the investing fund and may involve certain economic risks which may cause a decline in value of each of the Fidelity Central Funds and thus a decline in the value of the investing fund.
| Fidelity Central Fund | Investment Manager | Investment Objective | Investment Practices | Expense Ratio(a) |
| Fidelity Money Market Central Funds | Fidelity Management & Research Company LLC (FMR) | Each fund seeks to obtain a high level of current income consistent with the preservation of capital and liquidity. | Short-term Investments | Less than .005% to .01% |
(a) Expenses expressed as a percentage of average net assets and are as of each underlying Central Fund's most recent annual or semi-annual shareholder report.
A complete unaudited list of holdings for each Fidelity Central Fund is available upon request or at the Securities and Exchange Commission website at www.sec.gov. In addition, the financial statements of the Fidelity Central Funds which contain the significant accounting policies (including investment valuation policies) of those funds, and are not covered by the Report of Independent Registered Public Accounting Firm, are available on the Securities and Exchange Commission website or upon request.
3. Significant Accounting Policies.
The Fund is an investment company and applies the accounting and reporting guidance of the Financial Accounting Standards Board (FASB) Accounting Standards Codification Topic 946 Financial Services - Investment Companies. The financial statements have been prepared in conformity with accounting principles generally accepted in the United States of America (GAAP), which require management to make certain estimates and assumptions at the date of the financial statements. Actual results could differ from those estimates. Subsequent events, if any, through the date that the financial statements were issued have been evaluated in the preparation of the financial statements. The Fund's Schedule of Investments lists any underlying mutual funds or exchange-traded funds (ETFs) but does not include the underlying holdings of these funds. The following summarizes the significant accounting policies of the Fund:
Investment Valuation. Investments are valued as of 4:00 p.m. Eastern time on the last calendar day of the period. The Board of Trustees (the Board) has delegated the day to day responsibility for the valuation of the Fund's investments to the Fair Value Committee (the Committee) established by the Fund's investment adviser. In accordance with valuation policies and procedures approved by the Board, the Fund attempts to obtain prices from one or more third party pricing vendors or brokers to value its investments. When current market prices, quotations or currency exchange rates are not readily available or reliable, investments will be fair valued in good faith by the Committee, in accordance with procedures adopted by the Board. Factors used in determining fair value vary by investment type and may include market or investment specific events. The frequency with which these procedures are used cannot be predicted and they may be utilized to a significant extent. The Committee oversees the Fund's valuation policies and procedures and reports to the Board on the Committee's activities and fair value determinations. The Board monitors the appropriateness of the procedures used in valuing the Fund's investments and ratifies the fair value determinations of the Committee.
The Fund categorizes the inputs to valuation techniques used to value its investments into a disclosure hierarchy consisting of three levels as shown below:
- Level 1 – quoted prices in active markets for identical investments
- Level 2 – other significant observable inputs (including quoted prices for similar investments, interest rates, prepayment speeds, etc.)
- Level 3 – unobservable inputs (including the Fund's own assumptions based on the best information available)
Valuation techniques used to value the Fund's investments by major category are as follows:
Equity securities, including restricted securities, for which market quotations are readily available, are valued at the last reported sale price or official closing price as reported by a third party pricing vendor on the primary market or exchange on which they are traded and are categorized as Level 1 in the hierarchy. In the event there were no sales during the day or closing prices are not available, securities are valued at the last quoted bid price or may be valued using the last available price and are generally categorized as Level 2 in the hierarchy. For foreign equity securities, when market or security specific events arise, comparisons to the valuation of American Depositary Receipts (ADRs), futures contracts, Exchange-Traded Funds (ETFs) and certain indexes as well as quoted prices for similar securities may be used and would be categorized as Level 2 in the hierarchy. For equity securities, including restricted securities, where observable inputs are limited, assumptions about market activity and risk are used and these securities may be categorized as Level 3 in the hierarchy.
Investments in open-end mutual funds, including the Fidelity Central Funds, are valued at their closing net asset value (NAV) each business day and are categorized as Level 1 in the hierarchy.
Changes in valuation techniques may result in transfers in or out of an assigned level within the disclosure hierarchy. The aggregate value of investments by input level as of July 31, 2021 is included at the end of the Fund's Schedule of Investments.
Foreign Currency. Certain Funds may use foreign currency contracts to facilitate transactions in foreign-denominated securities. Gains and losses from these transactions may arise from changes in the value of the foreign currency or if the counterparties do not perform under the contracts' terms.
Foreign-denominated assets, including investment securities, and liabilities are translated into U.S. dollars at the exchange rates at period end. Purchases and sales of investment securities, income and dividends received, and expenses denominated in foreign currencies are translated into U.S. dollars at the exchange rate in effect on the transaction date.
The effects of exchange rate fluctuations on investments are included with the net realized and unrealized gain (loss) on investment securities. Other foreign currency transactions resulting in realized and unrealized gain (loss) are disclosed separately.
Investment Transactions and Income. For financial reporting purposes, the Fund's investment holdings and NAV include trades executed through the end of the last business day of the period. The NAV per share for processing shareholder transactions is calculated as of the close of business of the New York Stock Exchange (NYSE), normally 4:00 p.m. Eastern time and includes trades executed through the end of the prior business day. Gains and losses on securities sold are determined on the basis of identified cost. Dividend income is recorded on the ex-dividend date, except for certain dividends from foreign securities where the ex-dividend date may have passed, which are recorded as soon as the Fund is informed of the ex-dividend date. Non-cash dividends included in dividend income, if any, are recorded at the fair market value of the securities received. Income and capital gain distributions from Fidelity Central Funds, if any, are recorded on the ex-dividend date. Certain distributions received by the Fund represent a return of capital or capital gain. The Fund determines the components of these distributions subsequent to the ex-dividend date, based upon receipt of tax filings or other correspondence relating to the underlying investment. These distributions are recorded as a reduction of cost of investments and/or as a realized gain. Investment income is recorded net of foreign taxes withheld where recovery of such taxes is uncertain.
Expenses. Expenses directly attributable to a fund are charged to that fund. Expenses attributable to more than one fund are allocated among the respective funds on the basis of relative net assets or other appropriate methods. Expenses included in the accompanying financial statements reflect the expenses of that fund and do not include any expenses associated with any underlying mutual funds or exchange-traded funds. Although not included in a fund's expenses, a fund indirectly bears its proportionate share of these expenses through the net asset value of each underlying mutual fund or exchange-traded fund. Expense estimates are accrued in the period to which they relate and adjustments are made when actual amounts are known.
Income Tax Information and Distributions to Shareholders. Each year, the Fund intends to qualify as a regulated investment company under Subchapter M of the Internal Revenue Code, including distributing substantially all of its taxable income and realized gains. As a result, no provision for U.S. Federal income taxes is required. As of July 31, 2021, the Fund did not have any unrecognized tax benefits in the financial statements; nor is the Fund aware of any tax positions for which it is reasonably possible that the total amounts of unrecognized tax benefits will significantly change in the next twelve months. The Fund files a U.S. federal tax return, in addition to state and local tax returns as required. The Fund's federal income tax returns are subject to examination by the Internal Revenue Service (IRS) for a period of three fiscal years after they are filed. State and local tax returns may be subject to examination for an additional fiscal year depending on the jurisdiction. Foreign taxes are provided for based on the Fund's understanding of the tax rules and rates that exist in the foreign markets in which it invests.
Distributions are declared and recorded on the ex-dividend date. Income and capital gain distributions are determined in accordance with income tax regulations, which may differ from GAAP.
Capital accounts within the financial statements are adjusted for permanent book-tax differences. These adjustments have no impact on net assets or the results of operations. Capital accounts are not adjusted for temporary book-tax differences which will reverse in a subsequent period.
Book-tax differences are primarily due to foreign currency transactions, and losses deferred due to wash sales and excise tax regulations.
As of period end, the cost and unrealized appreciation (depreciation) in securities, and derivatives if applicable, for federal income tax purposes were as follows:
| Gross unrealized appreciation | $50,862,771 |
| Gross unrealized depreciation | (1,849,061) |
| Net unrealized appreciation (depreciation) | $49,013,710 |
| Tax Cost | $131,495,564 |
The tax-based components of distributable earnings as of period end were as follows:
| Undistributed ordinary income | $7,530,654 |
| Undistributed long-term capital gain | $3,121,302 |
| Net unrealized appreciation (depreciation) on securities and other investments | $49,016,278 |
The tax character of distributions paid was as follows:
| | July 31, 2021 | July 31, 2020 |
| Ordinary Income | $3,362,410 | $ 4,466,081 |
| Long-term Capital Gains | – | 2,402,049 |
| Total | $3,362,410 | $ 6,868,130 |
4. Purchases and Sales of Investments.
Purchases and sales of securities, other than short-term securities and in-kind transactions, as applicable, are noted in the table below.
| | Purchases ($) | Sales ($) |
| Fidelity Value Discovery K6 Fund | 95,764,713 | 142,605,556 |
5. Fees and Other Transactions with Affiliates.
Management Fee. Fidelity Management & Research Company LLC (the investment adviser) and its affiliates provide the Fund with investment management related services for which the Fund pays a monthly management fee that is based on an annual rate of .45% of average net assets. Under the management contract, the investment adviser or an affiliate pays all other expenses of the Fund, excluding fees and expenses of the independent Trustees, and certain miscellaneous expenses such as proxy and shareholder meeting expenses.
Brokerage Commissions. A portion of portfolio transactions were placed with brokerage firms which are affiliates of the investment adviser. Brokerage commissions are included in net realized gain (loss) and change in net unrealized appreciation (depreciation) in the Statement of Operations. The commissions paid to these affiliated firms were as follows:
| | Amount |
| Fidelity Value Discovery K6 Fund | $1,906 |
Interfund Lending Program. Pursuant to an Exemptive Order issued by the Securities and Exchange Commission (the SEC), the Fund, along with other registered investment companies having management contracts with Fidelity Management & Research Company LLC (FMR), or other affiliated entities of FMR, may participate in an interfund lending program. This program provides an alternative credit facility allowing the Fund to borrow from, or lend money to, other participating affiliated funds. At period end, there were no interfund loans outstanding. Activity in this program during the period for which loans were outstanding was as follows:
| | Borrower or Lender | Average Loan Balance | Weighted Average Interest Rate | Interest Expense |
| Fidelity Value Discovery K6 Fund | Borrower | $3,371,500 | .33% | $62 |
Interfund Trades. Funds may purchase from or sell securities to other Fidelity Funds under procedures adopted by the Board. The procedures have been designed to ensure these interfund trades are executed in accordance with Rule 17a-7 of the 1940 Act. Any interfund trades are included within the respective purchases and sales amounts shown in the Purchases and Sales of Investments note and are noted in the table below.
| | Purchases ($) | Sales ($) |
| Fidelity Value Discovery K6 Fund | 5,227,432 | 9,543,692 |
6. Committed Line of Credit.
Certain Funds participate with other funds managed by the investment adviser or an affiliate in a $4.25 billion credit facility (the "line of credit") to be utilized for temporary or emergency purposes to fund shareholder redemptions or for other short-term liquidity purposes. The participating funds have agreed to pay commitment fees on their pro-rata portion of the line of credit, which are reflected in Miscellaneous expenses on the Statement of Operations, and are listed below. Effective during January 2021, commitment fees are borne by the investment adviser. During the period, there were no borrowings on this line of credit.
| | Amount |
| Fidelity Value Discovery K6 Fund | $87 |
7. Security Lending.
Funds lend portfolio securities from time to time in order to earn additional income. Lending agents are used, including National Financial Services (NFS), an affiliate of the investment adviser. Pursuant to a securities lending agreement, NFS will receive a fee, which is capped at 9.9% of a fund's daily lending revenue, for its services as lending agent. A fund may lend securities to certain qualified borrowers, including NFS. On the settlement date of the loan, a fund receives collateral (in the form of U.S. Treasury obligations, letters of credit and/or cash) against the loaned securities and maintains collateral in an amount not less than 100% of the market value of the loaned securities during the period of the loan. The market value of the loaned securities is determined at the close of business of a fund and any additional required collateral is delivered to a fund on the next business day. A fund or borrower may terminate the loan at any time, and if the borrower defaults on its obligation to return the securities loaned because of insolvency or other reasons, a fund may apply collateral received from the borrower against the obligation. A fund may experience delays and costs in recovering the securities loaned. Any cash collateral received is invested in the Fidelity Securities Lending Cash Central Fund. Any loaned securities are identified as such in the Schedule of Investments, and the value of loaned securities and cash collateral at period end, as applicable, are presented in the Statement of Assets and Liabilities. Security lending income represents the income earned on investing cash collateral, less rebates paid to borrowers and any lending agent fees associated with the loan, plus any premium payments received for lending certain types of securities. Security lending income is presented in the Statement of Operations as a component of income from Fidelity Central Funds. Affiliated security lending activity, if any, was as follows:
| | Total Security Lending Fees Paid to NFS | Security Lending Income From Securities Loaned to NFS | Value of Securities Loaned to NFS at Period End |
| Fidelity Value Discovery K6 Fund | $55 | $– | $– |
8. Bank Borrowings.
The Fund is permitted to have bank borrowings for temporary or emergency purposes to fund shareholder redemptions or for other short-term liquidity requirements. The Fund has established borrowing arrangements with certain banks. The interest rate on the borrowings is the bank's base rate, as revised from time to time. Any open loans, including accrued interest, at period end are presented under the caption "Notes payable" in the Statement of Assets and Liabilities, if applicable. Activity in this program during the period for which loans were outstanding was as follows:
| | Average Loan Balance | Weighted Average Interest Rate | Interest Expense |
| Fidelity Value Discovery K6 Fund | $30,574,000 | .58% | $1,478 |
9. Expense Reductions.
Commissions paid to certain brokers with whom the investment adviser, or its affiliates, places trades on behalf of the Fund include an amount in addition to trade execution, which may be rebated back to the Fund to offset expenses. This amount totaled $7,508 for the period. In addition, through arrangements with the Fund's custodian, credits realized as a result of certain uninvested cash balances were used to reduce the Fund's expenses by $3.
10. Other.
Fund's organizational documents provide former and current trustees and officers with a limited indemnification against liabilities arising in connection with the performance of their duties to the fund. In the normal course of business, the fund may also enter into contracts that provide general indemnifications. The fund's maximum exposure under these arrangements is unknown as this would be dependent on future claims that may be made against the fund. The risk of material loss from such claims is considered remote.
11. Coronavirus (COVID-19) Pandemic.
An outbreak of COVID-19 first detected in China during December 2019 has since spread globally and was declared a pandemic by the World Health Organization during March 2020. Developments that disrupt global economies and financial markets, such as the COVID-19 pandemic, may magnify factors that affect the Fund's performance.
Report of Independent Registered Public Accounting Firm
To the Board of Trustees of Fidelity Puritan Trust and Shareholders of Fidelity Value Discovery K6 Fund
Opinion on the Financial Statements and Financial Highlights
We have audited the accompanying statement of assets and liabilities of Fidelity Value Discovery K6 Fund (the "Fund"), a fund of Fidelity Puritan Trust, including the schedule of investments, as of July 31, 2021, the related statement of operations for the year then ended, the statement of changes in net assets for each of the two years in the period then ended, the financial highlights for each of the four years in the period then ended and for the period from May 25, 2017 (commencement of operations) through July 31, 2017, and the related notes. In our opinion, the financial statements and financial highlights present fairly, in all material respects, the financial position of the Fund as of July 31, 2021, and the results of its operations for the year then ended, the changes in its net assets for each of the two years in the period then ended, and the financial highlights for each of the four years in the period then ended and for the period from May 25, 2017 (commencement of operations) through July 31, 2017 in conformity with accounting principles generally accepted in the United States of America.
Basis for Opinion
These financial statements and financial highlights are the responsibility of the Fund's management. Our responsibility is to express an opinion on the Fund's financial statements and financial highlights based on our audits. We are a public accounting firm registered with the Public Company Accounting Oversight Board (United States) (PCAOB) and are required to be independent with respect to the Fund in accordance with the U.S. federal securities laws and the applicable rules and regulations of the Securities and Exchange Commission and the PCAOB.
We conducted our audits in accordance with the standards of the PCAOB. Those standards require that we plan and perform the audit to obtain reasonable assurance about whether the financial statements and financial highlights are free of material misstatement, whether due to error or fraud. The Fund is not required to have, nor were we engaged to perform, an audit of its internal control over financial reporting. As part of our audits we are required to obtain an understanding of internal control over financial reporting but not for the purpose of expressing an opinion on the effectiveness of the Fund’s internal control over financial reporting. Accordingly, we express no such opinion.
Our audits included performing procedures to assess the risks of material misstatement of the financial statements and financial highlights, whether due to error or fraud, and performing procedures that respond to those risks. Such procedures included examining, on a test basis, evidence regarding the amounts and disclosures in the financial statements and financial highlights. Our audits also included evaluating the accounting principles used and significant estimates made by management, as well as evaluating the overall presentation of the financial statements and financial highlights. Our procedures included confirmation of securities owned as of July 31, 2021, by correspondence with the custodian and brokers; when replies were not received from brokers, we performed other auditing procedures. We believe that our audits provide a reasonable basis for our opinion.
/s/ Deloitte & Touche LLP
Boston, Massachusetts
September 14, 2021
We have served as the auditor of one or more of the Fidelity investment companies since 1999.
Trustees and Officers
The Trustees, Members of the Advisory Board (if any), and officers of the trust and fund, as applicable, are listed below. The Board of Trustees governs the fund and is responsible for protecting the interests of shareholders. The Trustees are experienced executives who meet periodically throughout the year to oversee the fund's activities, review contractual arrangements with companies that provide services to the fund, oversee management of the risks associated with such activities and contractual arrangements, and review the fund's performance. Except for Jonathan Chiel, each of the Trustees oversees 314 funds. Mr. Chiel oversees 176 funds.
The Trustees hold office without limit in time except that (a) any Trustee may resign; (b) any Trustee may be removed by written instrument, signed by at least two-thirds of the number of Trustees prior to such removal; (c) any Trustee who requests to be retired or who has become incapacitated by illness or injury may be retired by written instrument signed by a majority of the other Trustees; and (d) any Trustee may be removed at any special meeting of shareholders by a two-thirds vote of the outstanding voting securities of the trust. Each Trustee who is not an interested person (as defined in the 1940 Act) of the trust and the fund is referred to herein as an Independent Trustee. Each Independent Trustee shall retire not later than the last day of the calendar year in which his or her 75th birthday occurs. The Independent Trustees may waive this mandatory retirement age policy with respect to individual Trustees. Officers and Advisory Board Members hold office without limit in time, except that any officer or Advisory Board Member may resign or may be removed by a vote of a majority of the Trustees at any regular meeting or any special meeting of the Trustees. Except as indicated, each individual has held the office shown or other offices in the same company for the past five years.
The fund’s Statement of Additional Information (SAI) includes more information about the Trustees. To request a free copy, call Fidelity at 1-800-835-5092.
Experience, Skills, Attributes, and Qualifications of the Trustees. The Governance and Nominating Committee has adopted a statement of policy that describes the experience, qualifications, attributes, and skills that are necessary and desirable for potential Independent Trustee candidates (Statement of Policy). The Board believes that each Trustee satisfied at the time he or she was initially elected or appointed a Trustee, and continues to satisfy, the standards contemplated by the Statement of Policy. The Governance and Nominating Committee also engages professional search firms to help identify potential Independent Trustee candidates who have the experience, qualifications, attributes, and skills consistent with the Statement of Policy. From time to time, additional criteria based on the composition and skills of the current Independent Trustees, as well as experience or skills that may be appropriate in light of future changes to board composition, business conditions, and regulatory or other developments, have also been considered by the professional search firms and the Governance and Nominating Committee. In addition, the Board takes into account the Trustees' commitment and participation in Board and committee meetings, as well as their leadership of standing and ad hoc committees throughout their tenure.
In determining that a particular Trustee was and continues to be qualified to serve as a Trustee, the Board has considered a variety of criteria, none of which, in isolation, was controlling. The Board believes that, collectively, the Trustees have balanced and diverse experience, qualifications, attributes, and skills, which allow the Board to operate effectively in governing the fund and protecting the interests of shareholders. Information about the specific experience, skills, attributes, and qualifications of each Trustee, which in each case led to the Board's conclusion that the Trustee should serve (or continue to serve) as a trustee of the fund, is provided below.
Board Structure and Oversight Function. Robert A. Lawrence is an interested person and currently serves as Acting Chairman. The Trustees have determined that an interested Chairman is appropriate and benefits shareholders because an interested Chairman has a personal and professional stake in the quality and continuity of services provided to the fund. Independent Trustees exercise their informed business judgment to appoint an individual of their choosing to serve as Chairman, regardless of whether the Trustee happens to be independent or a member of management. The Independent Trustees have determined that they can act independently and effectively without having an Independent Trustee serve as Chairman and that a key structural component for assuring that they are in a position to do so is for the Independent Trustees to constitute a substantial majority for the Board. The Independent Trustees also regularly meet in executive session. David M. Thomas serves as Lead Independent Trustee and as such (i) acts as a liaison between the Independent Trustees and management with respect to matters important to the Independent Trustees and (ii) with management prepares agendas for Board meetings.
Fidelity® funds are overseen by different Boards of Trustees. The fund's Board oversees Fidelity's high income and certain equity funds, and other Boards oversee Fidelity's investment-grade bond, money market, asset allocation, and other equity funds. The asset allocation funds may invest in Fidelity® funds overseen by the fund's Board. The use of separate Boards, each with its own committee structure, allows the Trustees of each group of Fidelity® funds to focus on the unique issues of the funds they oversee, including common research, investment, and operational issues. On occasion, the separate Boards establish joint committees to address issues of overlapping consequences for the Fidelity® funds overseen by each Board.
The Trustees operate using a system of committees to facilitate the timely and efficient consideration of all matters of importance to the Trustees, the fund, and fund shareholders and to facilitate compliance with legal and regulatory requirements and oversight of the fund's activities and associated risks. The Board, acting through its committees, has charged FMR and its affiliates with (i) identifying events or circumstances the occurrence of which could have demonstrably adverse effects on the fund's business and/or reputation; (ii) implementing processes and controls to lessen the possibility that such events or circumstances occur or to mitigate the effects of such events or circumstances if they do occur; and (iii) creating and maintaining a system designed to evaluate continuously business and market conditions in order to facilitate the identification and implementation processes described in (i) and (ii) above. Because the day-to-day operations and activities of the fund are carried out by or through FMR, its affiliates, and other service providers, the fund's exposure to risks is mitigated but not eliminated by the processes overseen by the Trustees. While each of the Board's committees has responsibility for overseeing different aspects of the fund's activities, oversight is exercised primarily through the Operations, Audit, and Compliance Committees. Appropriate personnel, including but not limited to the fund's Chief Compliance Officer (CCO), FMR's internal auditor, the independent accountants, the fund's Treasurer and portfolio management personnel, make periodic reports to the Board's committees, as appropriate, including an annual review of Fidelity's risk management program for the Fidelity® funds. The responsibilities of each standing committee, including their oversight responsibilities, are described further under "Standing Committees of the Trustees."
Interested Trustees*:
Correspondence intended for a Trustee who is an interested person may be sent to Fidelity Investments, 245 Summer Street, Boston, Massachusetts 02210.
Name, Year of Birth; Principal Occupations and Other Relevant Experience+
Jonathan Chiel (1957)
Year of Election or Appointment: 2016
Trustee
Mr. Chiel also serves as Trustee of other Fidelity® funds. Mr. Chiel is Executive Vice President and General Counsel for FMR LLC (diversified financial services company, 2012-present). Previously, Mr. Chiel served as general counsel (2004-2012) and senior vice president and deputy general counsel (2000-2004) for John Hancock Financial Services; a partner with Choate, Hall & Stewart (1996-2000) (law firm); and an Assistant United States Attorney for the United States Attorney’s Office of the District of Massachusetts (1986-95), including Chief of the Criminal Division (1993-1995). Mr. Chiel is a director on the boards of the Boston Bar Foundation and the Maimonides School.
Bettina Doulton (1964)
Year of Election or Appointment: 2021
Trustee
Ms. Doulton also serves as Trustee of other Fidelity® funds. Prior to her retirement, Ms. Doulton served in a variety of positions at Fidelity Investments, including as a managing director of research (2006-2007), portfolio manager to certain Fidelity® funds (1993-2005), equity analyst and portfolio assistant (1990-1993), and research assistant (1987-1990). Ms. Doulton currently owns and operates Phi Builders + Architects and Cellardoor Winery. Previously, Ms. Doulton served as a member of the Board of Brown Capital Management, LLC (2014-2018).
Robert A. Lawrence (1952)
Year of Election or Appointment: 2020
Trustee
Acting Chairman of the Board of Trustees
Mr. Lawrence also serves as Trustee of other funds. Previously, Mr. Lawrence served as a Member of the Advisory Board of certain funds. Prior to his retirement in 2008, Mr. Lawrence served as Vice President of certain Fidelity® funds (2006-2008), Senior Vice President, Head of High Income Division of Fidelity Management & Research Company (investment adviser firm, 2006-2008), and President of Fidelity Strategic Investments (investment adviser firm, 2002-2005).
* Determined to be an “Interested Trustee” by virtue of, among other things, his or her affiliation with the trust or various entities under common control with FMR.
+ The information includes the Trustee's principal occupation during the last five years and other information relating to the experience, attributes, and skills relevant to the Trustee's qualifications to serve as a Trustee, which led to the conclusion that the Trustee should serve as a Trustee for the fund.
Independent Trustees:
Correspondence intended for an Independent Trustee may be sent to Fidelity Investments, P.O. Box 55235, Boston, Massachusetts 02205-5235.
Name, Year of Birth; Principal Occupations and Other Relevant Experience+
Thomas P. Bostick (1956)
Year of Election or Appointment: 2021
Trustee
Lieutenant General Bostick also serves as Trustee of other Fidelity® funds. Prior to his retirement, General Bostick (United States Army, Retired) held a variety of positions within the U.S. Army, including Commanding General and Chief of Engineers, U.S. Army Corps of Engineers (2012-2016) and Deputy Chief of Staff and Director of Human Resources, U.S. Army (2009-2012). General Bostick currently serves as a member of the Board and Finance and Governance Committees of CSX Corporation (transportation, 2020-present) and a member of the Board and Corporate Governance and Nominating Committee of Perma-Fix Environmental Services, Inc. (nuclear waste management, 2020-present). General Bostick serves as Chief Executive Officer of Bostick Global Strategies, LLC (consulting, 2016-present) and Managing Partner, Sustainability, of Ridge-Lane Limited Partners (strategic advisory and venture development, 2016-present). Previously, General Bostick served as a Member of the Advisory Board of certain Fidelity® funds (2021), President, Intrexon Bioengineering (2018-2020) and Chief Operating Officer (2017-2020) and Senior Vice President of the Environment Sector (2016-2017) of Intrexon Corporation (biopharmaceutical company).
Dennis J. Dirks (1948)
Year of Election or Appointment: 2005
Trustee
Mr. Dirks also serves as Trustee of other Fidelity® funds. Prior to his retirement in May 2003, Mr. Dirks served as Chief Operating Officer and as a member of the Board of The Depository Trust & Clearing Corporation (financial markets infrastructure), President, Chief Operating Officer and a member of the Board of The Depository Trust Company (DTC), President and a member of the Board of the National Securities Clearing Corporation (NSCC), Chief Executive Officer and a member of the Board of the Government Securities Clearing Corporation and Chief Executive Officer and a member of the Board of the Mortgage-Backed Securities Clearing Corporation. Mr. Dirks currently serves as a member of the Finance Committee (2016-present) and Board (2017-present) and is Treasurer (2018-present) of the Asolo Repertory Theatre.
Donald F. Donahue (1950)
Year of Election or Appointment: 2018
Trustee
Mr. Donahue also serves as Trustee of other Fidelity® funds. Mr. Donahue serves as President and Chief Executive Officer of Miranda Partners, LLC (risk consulting for the financial services industry, 2012-present). Previously, Mr. Donahue served as Chief Executive Officer (2006-2012), Chief Operating Officer (2003-2006) and Managing Director, Customer Marketing and Development (1999-2003) of The Depository Trust & Clearing Corporation (financial markets infrastructure). Mr. Donahue currently serves as a member (2007-present) and Co-Chairman (2016-present) of the Board of United Way of New York and a member of the Board of NYC Leadership Academy (2012-present). Mr. Donahue previously served as a member of the Advisory Board of certain Fidelity® funds (2015-2018).
Vicki L. Fuller (1957)
Year of Election or Appointment: 2020
Trustee
Ms. Fuller also serves as Trustee of other Fidelity® funds. Previously, Ms. Fuller served as a member of the Advisory Board of certain Fidelity® funds (2018-2020), Chief Investment Officer of the New York State Common Retirement Fund (2012-2018) and held a variety of positions at AllianceBernstein L.P. (global asset management, 1985-2012), including Managing Director (2006-2012) and Senior Vice President and Senior Portfolio Manager (2001-2006). Ms. Fuller currently serves as a member of the Board, Audit Committee and Nominating and Governance Committee of The Williams Companies, Inc. (natural gas infrastructure, 2018-present), as a member of the Board, Audit Committee and Nominating and Governance Committee of two Blackstone business development companies (2020-present) and as a member of the Board of Treliant, LLC (consulting, 2019-present).
Patricia L. Kampling (1959)
Year of Election or Appointment: 2020
Trustee
Ms. Kampling also serves as Trustee of other Fidelity® funds. Prior to her retirement, Ms. Kampling served as Chairman of the Board and Chief Executive Officer (2012-2019), President and Chief Operating Officer (2011-2012) and Executive Vice President and Chief Financial Officer (2010-2011) of Alliant Energy Corporation. Ms. Kampling currently serves as a member of the Board, Finance Committee and Governance, Compensation and Nominating Committee of Xcel Energy Inc. (utilities company, 2020-present) and as a member of the Board, Audit, Finance and Risk Committee and Safety, Environmental, Technology and Operations Committee of American Water Works Company, Inc. (utilities company, 2019-present). In addition, Ms. Kampling currently serves as a member of the Board of the Nature Conservancy, Wisconsin Chapter (2019-present). Previously, Ms. Kampling served as a Member of the Advisory Board of certain Fidelity® funds (2020), a member of the Board, Compensation Committee and Executive Committee and Chair of the Audit Committee of Briggs & Stratton Corporation (manufacturing, 2011-2021), a member of the Board of Interstate Power and Light Company (2012-2019) and Wisconsin Power and Light Company (2012-2019) (each a subsidiary of Alliant Energy Corporation) and as a member of the Board and Workforce Development Committee of the Business Roundtable (2018-2019).
Thomas A. Kennedy (1955)
Year of Election or Appointment: 2021
Trustee
Mr. Kennedy also serves as Trustee of other Fidelity® funds. Previously, Mr. Kennedy served as a Member of the Advisory Board of certain Fidelity® funds (2020) and held a variety of positions at Raytheon Company (aerospace and defense, 1983-2020), including Chairman and Chief Executive Officer (2014-2020) and Executive Vice President and Chief Operating Officer (2013-2014). Mr. Kennedy currently serves as Executive Chairman of the Board of Directors of Raytheon Technologies Corporation (aerospace and defense, 2020-present). He is also a member of the Rutgers School of Engineering Industry Advisory Board (2011-present) and a member of the UCLA Engineering Dean’s Executive Board (2016-present).
Oscar Munoz (1959)
Year of Election or Appointment: 2021
Trustee
Mr. Munoz also serves as Trustee of other Fidelity® funds. Prior to his retirement, Mr. Munoz served as Executive Chairman (2020-2021), Chief Executive Officer (2015-2020), President (2015-2016) and a member of the Board (2010-2021) of United Airlines Holdings, Inc. Mr. Munoz currently serves as a member of the Board of CBRE Group, Inc. (commercial real estate, 2020-present), a member of the Board of Univision Communications, Inc. (Hispanic media, 2020-present) and a member of the Advisory Board of Salesforce.com, Inc. (cloud-based software, 2020-present). Previously, Mr. Munoz served as a Member of the Advisory Board of certain Fidelity® funds (2021).
Garnett A. Smith (1947)
Year of Election or Appointment: 2018
Trustee
Mr. Smith also serves as Trustee of other Fidelity® funds. Prior to his retirement, Mr. Smith served as Chairman and Chief Executive Officer (1990-1997) and President (1986-1990) of Inbrand Corp. (manufacturer of personal absorbent products). Prior to his employment with Inbrand Corp., he was employed by a retail fabric chain and North Carolina National Bank (now Bank of America). Mr. Smith previously served as a member of the Advisory Board of certain Fidelity® funds (2012-2013).
David M. Thomas (1949)
Year of Election or Appointment: 2008
Trustee
Lead Independent Trustee
Mr. Thomas also serves as Trustee of other Fidelity® funds. Previously, Mr. Thomas served as Executive Chairman (2005-2006) and Chairman and Chief Executive Officer (2000-2005) of IMS Health, Inc. (pharmaceutical and healthcare information solutions). Mr. Thomas currently serves as a member of the Board of Fortune Brands Home and Security (home and security products, 2004-present) and Presiding Director (2013-present) of Interpublic Group of Companies, Inc. (marketing communication).
Susan Tomasky (1953)
Year of Election or Appointment: 2020
Trustee
Ms. Tomasky also serves as Trustee of other Fidelity® funds. Prior to her retirement, Ms. Tomasky served in various executive officer positions at American Electric Power Company, Inc. (1998-2011), including most recently as President of AEP Transmission (2007-2011). Ms. Tomasky currently serves as a member of the Board and Sustainability Committee and as Chair of the Audit Committee of Marathon Petroleum Corporation (2018-present) and as a member of the Board, Corporate Governance Committee and Organization and Compensation Committee and as Chair of the Audit Committee of Public Service Enterprise Group, Inc. (utilities company, 2012-present). In addition, Ms. Tomasky currently serves as a member (2009-present) and President (2020-present) of the Board of the Royal Shakespeare Company – America (2009-present), as a member of the Board of the Columbus Association for the Performing Arts (2011-present) and as a member of the Board and Investment Committee of Kenyon College (2016-present). Previously, Ms. Tomasky served as a Member of the Advisory Board of certain Fidelity® funds (2020), as a member of the Board of the Columbus Regional Airport Authority (2007-2020), as a member of the Board (2011-2018) and Lead Independent Director (2015-2018) of Andeavor Corporation (previously Tesoro Corporation) (independent oil refiner and marketer) and as a member of the Board of Summit Midstream Partners LP (energy, 2012-2018).
Michael E. Wiley (1950)
Year of Election or Appointment: 2020
Trustee
Mr. Wiley also serves as Trustee of other Fidelity® funds. Previously, Mr. Wiley served as a member of the Advisory Board of certain Fidelity® funds (2018-2020), Chairman, President and CEO of Baker Hughes, Inc. (oilfield services, 2000-2004). Mr. Wiley also previously served as a member of the Board of Andeavor Corporation (independent oil refiner and marketer, 2005-2018), a member of the Board of Andeavor Logistics LP (natural resources logistics, 2015-2018) and a member of the Board of High Point Resources (exploration and production, 2005-2020).
+ The information includes the Trustee's principal occupation during the last five years and other information relating to the experience, attributes, and skills relevant to the Trustee's qualifications to serve as a Trustee, which led to the conclusion that the Trustee should serve as a Trustee for the fund.
Advisory Board Members and Officers:
Correspondence intended for a Member of the Advisory Board (if any) may be sent to Fidelity Investments, P.O. Box 55235, Boston, Massachusetts 02205-5235. Correspondence intended for an officer or Peter S. Lynch may be sent to Fidelity Investments, 245 Summer Street, Boston, Massachusetts 02210. Officers appear below in alphabetical order.
Name, Year of Birth; Principal Occupation
Peter S. Lynch (1944)
Year of Election or Appointment: 2003
Member of the Advisory Board
Mr. Lynch also serves as a Member of the Advisory Board of other Fidelity® funds. Mr. Lynch is Vice Chairman and a Director of Fidelity Management & Research Company LLC (investment adviser firm). In addition, Mr. Lynch serves as a Trustee of Boston College and as the Chairman of the Inner-City Scholarship Fund. Previously, Mr. Lynch served as Vice Chairman and a Director of FMR Co., Inc. (investment adviser firm) and on the Special Olympics International Board of Directors (1997-2006).
Craig S. Brown (1977)
Year of Election or Appointment: 2019
Assistant Treasurer
Mr. Brown also serves as an officer of other funds. Mr. Brown serves as Assistant Treasurer of FIMM, LLC (2021-present) and is an employee of Fidelity Investments (2013-present).
John J. Burke III (1964)
Year of Election or Appointment: 2018
Chief Financial Officer
Mr. Burke also serves as Chief Financial Officer of other funds. Mr. Burke serves as Head of Investment Operations for Fidelity Fund and Investment Operations (2018-present) and is an employee of Fidelity Investments (1998-present). Previously Mr. Burke served as head of Asset Management Investment Operations (2012-2018).
William C. Coffey (1969)
Year of Election or Appointment: 2019
Assistant Secretary
Mr. Coffey also serves as Assistant Secretary of other funds. He is Senior Vice President and Deputy General Counsel of FMR LLC (diversified financial services company, 2010-present), and is an employee of Fidelity Investments. Previously, Mr. Coffey served as Secretary and CLO of certain funds (2018-2019); CLO, Secretary, and Senior Vice President of Fidelity Management & Research Company and FMR Co., Inc. (investment adviser firms, 2018-2019); Secretary of Fidelity SelectCo, LLC and Fidelity Investments Money Management, Inc. (investment adviser firms, 2018-2019); CLO of Fidelity Management & Research (Hong Kong) Limited, FMR Investment Management (UK) Limited, and Fidelity Management & Research (Japan) Limited (investment adviser firms, 2018-2019); and Assistant Secretary of certain funds (2009-2018).
Timothy M. Cohen (1969)
Year of Election or Appointment: 2018
Vice President
Mr. Cohen also serves as Vice President of other funds. Mr. Cohen serves as Co-Head of Equity (2018-present), a Director of Fidelity Management & Research (Japan) Limited (investment adviser firm, 2016-present), and is an employee of Fidelity Investments. Previously, Mr. Cohen served as Executive Vice President of Fidelity SelectCo, LLC (2019), Head of Global Equity Research (2016-2018), Chief Investment Officer - Equity and a Director of Fidelity Management & Research (U.K.) Inc. (investment adviser firm, 2013-2015) and as a Director of Fidelity Management & Research (Hong Kong) Limited (investment adviser firm, 2017).
Jonathan Davis (1968)
Year of Election or Appointment: 2010
Assistant Treasurer
Mr. Davis also serves as an officer of other funds. Mr. Davis serves as Assistant Treasurer of FIMM, LLC (2021-present) and FMR Capital, Inc. (2017-present) and is an employee of Fidelity Investments. Previously, Mr. Davis served as Vice President and Associate General Counsel of FMR LLC (diversified financial services company, 2003-2010).
Laura M. Del Prato (1964)
Year of Election or Appointment: 2018
Assistant Treasurer
Ms. Del Prato also serves as an officer of other funds. Ms. Del Prato serves as Assistant Treasurer of FIMM, LLC (2021-present) and is an employee of Fidelity Investments (2017-present). Previously, Ms. Del Prato served as President and Treasurer of The North Carolina Capital Management Trust: Cash Portfolio and Term Portfolio (2018-2020). Prior to joining Fidelity Investments, Ms. Del Prato served as a Managing Director and Treasurer of the JPMorgan Mutual Funds (2014-2017). Prior to JPMorgan, Ms. Del Prato served as a partner at Cohen Fund Audit Services (accounting firm, 2012-2013) and KPMG LLP (accounting firm, 2004-2012).
Colm A. Hogan (1973)
Year of Election or Appointment: 2020
Assistant Treasurer
Mr. Hogan also serves as an officer of other funds. Mr. Hogan serves as Assistant Treasurer of FIMM, LLC (2021-present) and FMR Capital, Inc. (2017-present) and is an employee of Fidelity Investments (2005-present). Previously, Mr. Hogan served as Deputy Treasurer of certain Fidelity® funds (2016-2020) and Assistant Treasurer of certain Fidelity® funds (2016-2018).
Pamela R. Holding (1964)
Year of Election or Appointment: 2018
Vice President
Ms. Holding also serves as Vice President of other funds. Ms. Holding serves as Co-Head of Equity (2018-present) and is an employee of Fidelity Investments (2013-present). Previously, Ms. Holding served as Executive Vice President of Fidelity SelectCo, LLC (2019) and as Chief Investment Officer of Fidelity Institutional Asset Management (2013-2018).
Cynthia Lo Bessette (1969)
Year of Election or Appointment: 2019
Secretary and Chief Legal Officer (CLO)
Ms. Lo Bessette also serves as an officer of other funds. Ms. Lo Bessette serves as CLO, Secretary, and Senior Vice President of Fidelity Management & Research Company LLC (investment adviser firm, 2019-present); and CLO of Fidelity Management & Research (Hong Kong) Limited, FMR Investment Management (UK) Limited, and Fidelity Management & Research (Japan) Limited (investment adviser firms, 2019-present). She is a Senior Vice President and Deputy General Counsel of FMR LLC (diversified financial services company, 2019-present), and is an employee of Fidelity Investments. Previously, Ms. Lo Bessette served as CLO, Secretary, and Senior Vice President of FMR Co., Inc. (investment adviser firm, 2019); Secretary of Fidelity SelectCo, LLC and Fidelity Investments Money Management, Inc. (investment adviser firms, 2019). Prior to joining Fidelity Investments, Ms. Lo Bessette was Executive Vice President, General Counsel (2016-2019) and Senior Vice President, Deputy General Counsel (2015-2016) of OppenheimerFunds (investment management company) and Deputy Chief Legal Officer (2013-2015) of Jennison Associates LLC (investment adviser firm).
Chris Maher (1972)
Year of Election or Appointment: 2020
Deputy Treasurer
Mr. Maher also serves as an officer of other funds. Mr. Maher serves as Assistant Treasurer of FIMM, LLC (2021-present) and FMR Capital, Inc. (2017-present), and is an employee of Fidelity Investments (2008-present). Previously, Mr. Maher served as Assistant Treasurer of certain funds (2013-2020); Vice President of Asset Management Compliance (2013), Vice President of the Program Management Group of FMR (investment adviser firm, 2010-2013), and Vice President of Valuation Oversight (2008-2010).
Jason P. Pogorelec (1975)
Year of Election or Appointment: 2020
Chief Compliance Officer
Mr. Pogorelec also serves as Chief Compliance Officer of other funds. Mr. Pogorelec is a senior Vice President of Asset Management Compliance for Fidelity Investments and is an employee of Fidelity Investments (2006-present). Previously, Mr. Pogorelec served as Vice President, Associate General Counsel for Fidelity Investments (2010-2020) and Assistant Secretary of certain Fidelity funds (2015-2020).
Brett Segaloff (1972)
Year of Election or Appointment: 2021
Anti-Money Laundering (AML) Officer
Mr. Segaloff also serves as an AML Officer of other funds and other related entities. He is Director, Anti-Money Laundering (2007-present) of FMR LLC (diversified financial services company) and is an employee of Fidelity Investments (1996-present).
Stacie M. Smith (1974)
Year of Election or Appointment: 2016
President and Treasurer
Ms. Smith also serves as an officer of other funds. Ms. Smith serves as Assistant Treasurer of FIMM, LLC (2021-present) and FMR Capital, Inc. (2017-present), is an employee of Fidelity Investments (2009-present), and has served in other fund officer roles. Prior to joining Fidelity Investments, Ms. Smith served as Senior Audit Manager of Ernst & Young LLP (accounting firm, 1996-2009). Previously, Ms. Smith served as Assistant Treasurer (2013-2019) and Deputy Treasurer (2013-2016) of certain Fidelity® funds.
Marc L. Spector (1972)
Year of Election or Appointment: 2016
Assistant Treasurer
Mr. Spector also serves as an officer of other funds. Mr. Spector serves as Assistant Treasurer of FIMM, LLC (2021-present) and FMR Capital, Inc. (2017-present) and is an employee of Fidelity Investments (2016-present). Prior to joining Fidelity Investments, Mr. Spector served as Director at the Siegfried Group (accounting firm, 2013-2016), and prior to Siegfried Group as audit senior manager at Deloitte & Touche LLP (accounting firm, 2005-2013).
Jim Wegmann (1979)
Year of Election or Appointment: 2019
Assistant Treasurer
Mr. Wegmann also serves as an officer of other funds. Mr. Wegmann serves as Assistant Treasurer of FIMM, LLC (2021-present) and is an employee of Fidelity Investments (2011-present).
Shareholder Expense Example
As a shareholder, you incur two types of costs: (1) transaction costs, which may include sales charges (loads) on purchase payments or redemption proceeds, as applicable and (2) ongoing costs, which generally include management fees, distribution and/or service (12b-1) fees and other Fund expenses. This Example is intended to help you understand your ongoing costs (in dollars) of investing in a fund and to compare these costs with the ongoing costs of investing in other mutual funds.
The Example is based on an investment of $1,000 invested at the beginning of the period and held for the entire period (February 1, 2021 to July 31, 2021).
Actual Expenses
The first line of the accompanying table provides information about actual account values and actual expenses. You may use the information in this line, together with the amount you invested, to estimate the expenses that you paid over the period. Simply divide your account value by $1,000.00 (for example, an $8,600 account value divided by $1,000.00 = 8.6), then multiply the result by the number in the first line for a class/Fund under the heading entitled "Expenses Paid During Period" to estimate the expenses you paid on your account during this period. If any fund is a shareholder of any underlying mutual funds or exchange-traded funds (ETFs) (the Underlying Funds), such fund indirectly bears its proportional share of the expenses of the Underlying Funds in addition to the direct expenses incurred presented in the table. These fees and expenses are not included in the annualized expense ratio used to calculate the expense estimate in the table below.
Hypothetical Example for Comparison Purposes
The second line of the accompanying table provides information about hypothetical account values and hypothetical expenses based on the actual expense ratio and an assumed rate of return of 5% per year before expenses, which is not the actual return. The hypothetical account values and expenses may not be used to estimate the actual ending account balance or expenses you paid for the period. You may use this information to compare the ongoing costs of investing in the Fund and other funds. To do so, compare this 5% hypothetical example with the 5% hypothetical examples that appear in the shareholder reports of the other funds. If any fund is a shareholder of any Underlying Funds, such fund indirectly bears its proportional share of the expenses of the Underlying Funds in addition to the direct expenses as presented in the table. These fees and expenses are not included in the annualized expense ratio used to calculate the expense estimate in the table below.
Please note that the expenses shown in the table are meant to highlight your ongoing costs only and do not reflect any transaction costs. Therefore, the second line of the table is useful in comparing ongoing costs only, and will not help you determine the relative total costs of owning different funds.
| | Annualized Expense Ratio-A | Beginning
Account Value
February 1, 2021 | Ending
Account Value
July 31, 2021 | Expenses Paid
During Period-B
February 1, 2021
to July 31, 2021 |
| Fidelity Value Discovery K6 Fund | .45% | | | |
| Actual | | $1,000.00 | $1,181.10 | $2.43 |
| Hypothetical-C | | $1,000.00 | $1,022.56 | $2.26 |
A Annualized expense ratio reflects expenses net of applicable fee waivers.
B Expenses are equal to the annualized expense ratio, multiplied by the average account value over the period, multiplied by 181/ 365 (to reflect the one-half year period). The fees and expenses of any Underlying Funds are not included in each annualized expense ratio.
C 5% return per year before expenses
Distributions (Unaudited)
The Board of Trustees of Fidelity Value Discovery K6 Fund voted to pay on September 13, 2021 to shareholders of record at the opening of business on September 10, 2021, a distribution of $0.744 per share derived from capital gains realized from sales of portfolio securities and a dividend of $0.114 per share from net investment income.
The fund hereby designates as a capital gain dividend with respect to the taxable year ended July 31, 2021, $3,121,301, or, if subsequently determined to be different, the net capital gain of such year.
The fund designates 100%, and 88% of the dividends distributed in September and December, respectively during the fiscal year as qualifying for the dividends–received deduction for corporate shareholders.
The fund designates 100% of the dividends distributed during the fiscal year as amounts which may be taken into account as a dividend for the purposes of the maximum rate under section 1(h)(11) of the Internal Revenue Code.
The fund will notify shareholders in January 2022 of amounts for use in preparing 2021 income tax returns.
Board Approval of Investment Advisory Contracts and Management Fees
Fidelity Value Discovery K6 Fund
Each year, the Board of Trustees, including the Independent Trustees (together, the Board), votes on the renewal of the management contract with Fidelity Management & Research Company LLC (FMR) and the sub-advisory agreements (together, the Advisory Contracts) for the fund. FMR and the sub-advisers are referred to herein as the Investment Advisers. The Board, assisted by the advice of fund counsel and Independent Trustees' counsel, requests and considers a broad range of information relevant to the renewal of the Advisory Contracts throughout the year.
The Board meets regularly and, at each of its meetings, covers an extensive agenda of topics and materials and considers factors that are relevant to its annual consideration of the renewal of the fund's Advisory Contracts, including the services and support provided to the fund and its shareholders. The Board has established various standing committees (Committees), each composed of and chaired by Independent Trustees with varying backgrounds, to which the Board has assigned specific subject matter responsibilities in order to enhance effective decision-making by the Board. The Board, acting directly and through its Committees, requests and receives information concerning the annual consideration of the renewal of the fund's Advisory Contracts. The Board also meets as needed to review matters specifically related to the Board's annual consideration of the renewal of the Advisory Contracts. Members of the Board may also meet with trustees of other Fidelity funds through joint ad hoc committees to discuss certain matters relevant to all of the Fidelity funds.
At its May 2021 meeting, the Board unanimously determined to renew the fund's Advisory Contracts. In reaching its determination, the Board considered all factors it believed relevant, including (i) the nature, extent, and quality of the services provided to the fund and its shareholders (including the investment performance of the fund); (ii) the competitiveness of the fund's management fee and total expense ratio relative to peer funds; (iii) the total costs of the services provided by and the profits realized by Fidelity from its relationships with the fund; and (iv) the extent to which, if any, economies of scale exist and are realized as the fund grows, and whether any economies of scale are appropriately shared with fund shareholders.
In considering whether to renew the Advisory Contracts for the fund, the Board reached a determination, with the assistance of fund counsel and Independent Trustees' counsel and through the exercise of its business judgment, that the renewal of the Advisory Contracts was in the best interests of the fund and its shareholders and that the compensation payable under the Advisory Contracts was fair and reasonable. The Board's decision to renew the Advisory Contracts was not based on any single factor, but rather was based on a comprehensive consideration of all the information provided to the Board at its meetings throughout the year. The Board, in reaching its determination to renew the Advisory Contracts, was aware that shareholders of the fund have a broad range of investment choices available to them, including a wide choice among funds offered by Fidelity's competitors, and that the fund's shareholders, who have the opportunity to review and weigh the disclosure provided by the fund in its prospectus and other public disclosures, have chosen to invest in this fund, which is part of the Fidelity family of funds.
Nature, Extent, and Quality of Services Provided. The Board considered Fidelity's staffing as it relates to the fund, including the backgrounds of investment personnel of Fidelity, and also considered the fund's investment objective, strategies, and related investment philosophy. The Independent Trustees also had discussions with senior management of Fidelity's investment operations and investment groups. The Board considered the structure of the investment personnel compensation program and whether this structure provides appropriate incentives to act in the best interests of the fund. Additionally, the Board considered the portfolio managers' investments, if any, in the funds that they manage.
Resources Dedicated to Investment Management and Support Services. The Board and the Fund Oversight and Research Committees reviewed the general qualifications and capabilities of Fidelity's investment staff, including its size, education, experience, and resources, as well as Fidelity's approach to recruiting, training, managing, and compensating investment personnel. The Board noted that Fidelity has continued to increase the resources devoted to non-U.S. offices, including expansion of Fidelity's global investment organization. The Board also noted that Fidelity's analysts have extensive resources, tools and capabilities that allow them to conduct sophisticated quantitative and fundamental analysis, as well as credit analysis of issuers, counterparties and guarantors. Further, the Board considered that Fidelity's investment professionals have sufficient access to global information and data so as to provide competitive investment results over time, and that those professionals also have access to sophisticated tools that permit them to assess portfolio construction and risk and performance attribution characteristics continuously, as well as to transmit new information and research conclusions rapidly around the world. Additionally, in its deliberations, the Board considered Fidelity's trading, risk management, compliance, and technology and operations capabilities and resources, which are integral parts of the investment management process. The Board also considered Fidelity's investments in business continuity planning, and its success in continuously providing services to the fund notwithstanding the severe disruptions caused by the COVID-19 pandemic.
Shareholder and Administrative Services. The Board considered (i) the nature, extent, quality, and cost of advisory, administrative, and shareholder services performed by the Investment Advisers and their affiliates under the Advisory Contracts and under separate agreements covering transfer agency, pricing and bookkeeping, and securities lending services for the fund; (ii) the nature and extent of the supervision of third party service providers, principally custodians, subcustodians, and pricing vendors; and (iii) the resources devoted to, and the record of compliance with, the fund's compliance policies and procedures. The Board also reviewed the allocation of fund brokerage, including allocations to brokers affiliated with the Investment Advisers, the use of brokerage commissions to pay fund expenses, and the use of "soft" commission dollars to pay for research services.
The Board noted that the growth of fund assets over time across the complex allows Fidelity to reinvest in the development of services designed to enhance the value and convenience of the Fidelity funds as investment vehicles. These services include 24-hour access to account information and market information over the Internet and through telephone representatives, investor education materials and asset allocation tools, and the expanded availability of Fidelity Investor Centers.
The Board noted that, in the past, it and the boards of certain other Fidelity funds had formed an ad hoc Committee on Transfer Agency Fees to review the variety of transfer agency fee structures throughout the industry and Fidelity's competitive positioning with respect to industry participants.
Investment in a Large Fund Family. The Board considered the benefits to shareholders of investing in a Fidelity fund, including the benefits of investing in a fund that is part of a large family of funds offering a variety of investment disciplines and providing a large variety of mutual fund investor services. The Board noted that Fidelity had taken, or had made recommendations that resulted in the Fidelity funds taking, a number of actions over the previous year that benefited particular funds, including: (i) continuing to dedicate additional resources to Fidelity's investment research process, which includes meetings with management of issuers of securities in which the funds invest, and to the support of the senior management team that oversees asset management; (ii) continuing efforts to enhance Fidelity's global research capabilities; (iii) launching new funds and ETFs with innovative structures, strategies and pricing and making other enhancements to meet client needs; (iv) launching new share classes of existing funds; (v) eliminating purchase minimums and broadening eligibility requirements for certain funds and share classes; (vi) approving the reduction in the holding period for the Class C to Class A conversion policy; (vii) reducing management fees and total expenses for certain target date funds and classes and index funds; (viii) lowering expenses for certain existing funds and classes by implementing or lowering expense caps; (ix) rationalizing product lines and gaining increased efficiencies from fund mergers, liquidations, and share class consolidations; (x) continuing to develop, acquire and implement systems and technology to improve services to the funds and shareholders, strengthen information security, and increase efficiency; and (xi) continuing to implement enhancements to further strengthen Fidelity's product line to increase investors' probability of success in achieving their investment goals, including retirement income goals.
Investment Performance. The Board considered whether the fund has operated in accordance with its investment objective, as well as its record of compliance with its investment restrictions and its performance history.
The Board took into account discussions that occur at Board meetings throughout the year with representatives of the Investment Advisers about fund investment performance. In this regard the Board noted that as part of regularly scheduled fund reviews and other reports to the Board on fund performance, the Board considers annualized return information for the fund for different time periods, measured against an appropriate securities market index (benchmark index) and an appropriate peer group of funds with similar objectives (peer group). In its evaluation of fund investment performance, the Board gave particular attention to information indicating changes in performance of certain Fidelity funds for specific time periods and discussed with the Investment Advisers the reasons for any overperformance or underperformance.
In addition to reviewing absolute and relative fund performance, the Independent Trustees periodically consider the appropriateness of fund performance metrics in evaluating the results achieved. In general, the Independent Trustees believe that fund performance should be evaluated based on net performance (after fees and expenses) of both the highest performing and lowest performing fund share classes, where applicable, compared to appropriate benchmark indices, over appropriate time periods that may include full market cycles, and compared to peer groups, as applicable, over the same periods, taking into account relevant factors including the following: general market conditions; issuer-specific information; and fund cash flows and other factors.
The Independent Trustees recognize that shareholders evaluate performance on a net basis over their own holding periods, for which one-, three-, and five-year periods are often used as a proxy. For this reason, the performance information reviewed by the Board also included net total return information for the fund and an appropriate benchmark index and peer group for the most recent one- and three-year period ended September 30, 2020, as shown below. Returns are shown compared to the 25th percentile (top of box, 75% beaten) and 75th percentile (bottom of box, 25% beaten) of the peer universe.
Fidelity Value Discovery K6 Fund
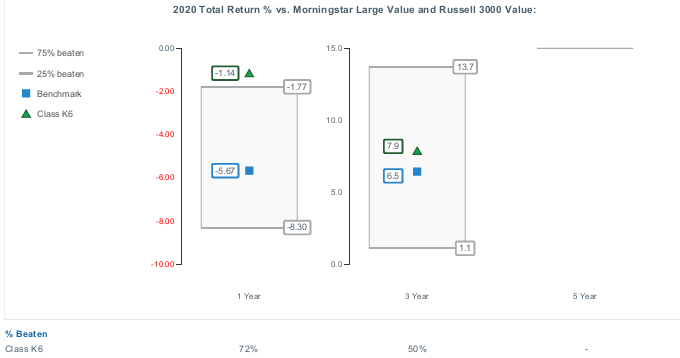
Based on its review, the Board concluded that the nature, extent, and quality of services provided to the fund under the Advisory Contracts should continue to benefit the shareholders of the fund.
Competitiveness of Management Fee and Total Expense Ratio. The Board considered the fund's management fee and total expense ratio compared to "mapped groups" of competitive funds and classes created for the purpose of facilitating the Trustees' competitive analysis of management fees and total expenses. Fidelity creates "mapped groups" by combining similar Lipper investment objective categories that have comparable investment mandates. Combining Lipper investment objective categories aids the Board's management fee and total expense ratio comparisons by broadening the competitive group used for comparison.
Management Fee. The Board considered two proprietary management fee comparisons for the 12-month periods ended September 30 (June 30 for the periods ended 2019 and 2018) shown in basis points (BP) in the chart below. The group of Lipper funds used by the Board for management fee comparisons is referred to below as the "Total Mapped Group." The Total Mapped Group comparison focuses on a fund's standing in terms of gross management fees before expense reimbursements or caps relative to the total universe of funds with comparable investment mandates, regardless of whether their management fee structures also are comparable. Funds with comparable investment mandates offer exposure to similar types of securities. Funds with comparable management fee structures have similar management fee contractual arrangements (
e.g., flat rate charged for advisory services, all-inclusive fee rate,
etc.). "TMG %" represents the percentage of funds in the Total Mapped Group that had management fees that were lower than the fund's. For example, a hypothetical TMG % of 20% would mean that 80% of the funds in the Total Mapped Group had higher, and 20% had lower, management fees than the fund. The fund's actual TMG %s and the number of funds in the Total Mapped Group are in the chart below. The "Asset-Sized Peer Group" (ASPG) comparison focuses on a fund's standing relative to a subset of non-Fidelity funds within the Total Mapped Group that are similar in size and management fee structure. For example, if a fund is in the first quartile of the ASPG, the fund's management fee ranks in the least expensive or lowest 25% of funds in the ASPG. The ASPG represents at least 15% of the funds in the Total Mapped Group with comparable asset size and management fee structures, subject to a minimum of 50 funds (or all funds in the Total Mapped Group if fewer than 50). Additional information, such as the ASPG quartile in which the fund's management fee rate ranked is also included in the chart and was considered by the Board.
Fidelity Value Discovery K6 Fund
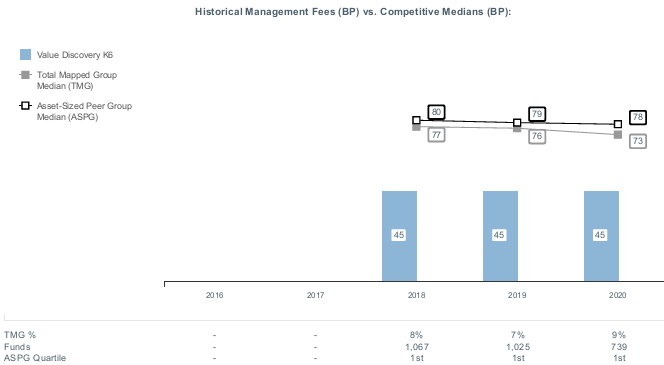
The Board noted that the fund's management fee rate ranked below the median of its Total Mapped Group and below the median of its ASPG for the 12-month period ended September 30, 2020.
The Board noted that, in the past, it and the boards of other Fidelity funds had formed an ad hoc Committee on Group Fee to conduct an in-depth review of the "group fee" component of the management fee of funds with such management fee structures. The Committee's focus included the mechanics of the group fee, the competitive landscape of group fee structures, Fidelity funds with no group fee component (such as the fund) and investment products not included in group fee assets. The Board also considered that, for funds subject to the group fee, FMR agreed to voluntarily waive fees over a specified period of time in amounts designed to account for assets converted from certain funds to certain collective investment trusts.
The Board also noted that, in 2013, the ad hoc Committee on Management Fees was formed to conduct an in-depth review of the management fee rates of Fidelity's active equity mutual funds. The Committee focused on the following areas: (i) standard fee structures; (ii) research consumption and trading evolution; (iii) management fee competitiveness/profitability by category; and (iv) factors that drive institutional pricing.
Based on its review, the Board concluded that the fund's management fee is fair and reasonable in light of the services that the fund receives and the other factors considered.
Total Expense Ratio. In its review of the fund's total expense ratio, the Board considered the fund's unitary fee rate as well as other fund expenses paid by FMR under the fund's management contract, such as transfer agent fees, pricing and bookkeeping fees, and custodial, legal, and audit fees. The Board also noted that Fidelity may agree to waive fees or reimburse expenses from time to time, and the extent to which, if any, it has done so for the fund. As part of its review, the Board also considered the current and historical total expense ratios of the fund compared to competitive fund median expenses. The fund is compared to those funds and classes in the Total Mapped Group (used by the Board for management fee comparisons) that have a similar sales load structure (SLTG). The Board also considered a total expense ASPG comparison for the fund, which focuses on the total expenses of the fund relative to a subset of non-Fidelity funds within the total expense SLTG. The total expense ASPG is limited to 15 larger and 15 smaller classes in fund average assets for a total of 30 classes, where possible. The total expense ASPG comparison excludes performance adjustments and fund-paid 12b-1 fees to eliminate variability in fee structures.
The Board noted that the fund's total expense ratio ranked below the SLTG competitive median and below the ASPG competitive median for the 12-month period ended September 30, 2020.
Fees Charged to Other Fidelity Clients. The Board also considered Fidelity fee structures and other information with respect to clients of Fidelity, such as other funds advised or subadvised by Fidelity, pension plan clients, and other institutional clients with similar mandates. The Board noted that a joint ad hoc committee created by it and the boards of other Fidelity funds periodically reviews and compares Fidelity's institutional investment advisory business with its business of providing services to the Fidelity funds and also noted the most recent findings of the committee. The Board noted that the committee's review included a consideration of the differences in services provided, fees charged, and costs incurred, as well as competition in the markets serving the different categories of clients.
Based on its review of total expense ratios and fees charged to other Fidelity clients, the Board concluded that the fund's total expense ratio was reasonable in light of the services that the fund and its shareholders receive and the other factors considered.
Costs of the Services and Profitability. The Board considered the revenues earned and the expenses incurred by Fidelity in conducting the business of developing, marketing, distributing, managing, administering and servicing the fund and servicing the fund's shareholders. The Board also considered the level of Fidelity's profits in respect of all the Fidelity funds.
On an annual basis, Fidelity presents to the Board information about the profitability of its relationships with the fund. Fidelity calculates profitability information for each fund, as well as aggregate profitability information for groups of Fidelity funds and all Fidelity funds, using a series of detailed revenue and cost allocation methodologies which originate with the books and records of Fidelity on which Fidelity's audited financial statements are based. The Audit Committee of the Board reviews any significant changes from the prior year's methodologies and the full Board approves such changes.
A public accounting firm has been engaged annually by the Board as part of the Board's assessment of Fidelity's profitability analysis. The engagement includes the review and assessment of the methodologies used by Fidelity in determining the revenues and expenses attributable to Fidelity's mutual fund business, and completion of agreed-upon procedures in respect of the mathematical accuracy of certain fund profitability information and its conformity to established allocation methodologies. After considering the reports issued under the engagement and information provided by Fidelity, the Board concluded that while other allocation methods may also be reasonable, Fidelity's profitability methodologies are reasonable in all material respects.
The Board also reviewed Fidelity's non-fund businesses and potential indirect benefits such businesses may have received as a result of their association with Fidelity's mutual fund business (i.e., fall-out benefits) as well as cases where Fidelity's affiliates may benefit from the funds' business. The Board considered areas where potential indirect benefits to the Fidelity funds from their relationships with Fidelity may exist. The Board also considered that in 2019 a joint ad hoc committee created by it and the boards of other Fidelity funds evaluated potential fall-out benefits (PFOB Committee). The Board noted that it considered the PFOB Committee's findings in connection with its consideration of the renewal of the Advisory Contracts.
The Board considered the costs of the services provided by and the profits realized by Fidelity in connection with the operation of the fund, including the conclusions of the PFOB Committee, and was satisfied that the profitability was not excessive.
Economies of Scale. The Board considered whether there have been economies of scale in respect of the management of the Fidelity funds, whether the Fidelity funds (including the fund) have appropriately benefited from any such economies of scale, and whether there is potential for realization of any further economies of scale. The Board considered the extent to which the fund will benefit from economies of scale as assets grow through increased services to the fund, through waivers or reimbursements, or through fee or expense ratio reductions. The Board recognized that, due to the fund's current contractual arrangements, its expense ratio will not decline if the fund's operating costs decrease as assets grow, or rise as assets decrease. The Board also noted that a committee (the Economies of Scale Committee) created by it and the boards of other Fidelity funds periodically analyzes whether Fidelity attains economies of scale in respect of the management and servicing of the Fidelity funds, whether the Fidelity funds have appropriately benefited from such economies of scale, and whether there is potential for realization of any further economies of scale.
The Board concluded, taking into account the analysis of the Economies of Scale Committee, that economies of scale, if any, are being appropriately shared between fund shareholders and Fidelity.
Additional Information Requested by the Board. In order to develop fully the factual basis for consideration of the Fidelity funds' advisory contracts, the Board requested and received additional information on certain topics, including: (i) fund flow and performance trends, in particular the underperformance of certain funds and strategies, and Fidelity's long-term strategies for certain funds; (ii) consideration of expanding the use of performance fees for additional funds; (iii) Fidelity's pricing philosophy compared to competitors; (iv) metrics for evaluating index fund and ETF performance and information about ETF trading characteristics; (v) the methodology with respect to evaluating competitive fund data and peer group classifications and fee and expense comparisons; (vi) the expense structures for different funds and classes and information about the differences between various expense structures; (vii) group fee breakpoints; (viii) information regarding other accounts managed by Fidelity and sub-advisory arrangements; and (ix) Fidelity's philosophies and strategies for evaluating funds and classes with lower or declining asset levels.
Based on its evaluation of all of the conclusions noted above, and after considering all factors it believed relevant, the Board concluded that the advisory fee arrangements are fair and reasonable, and that the fund's Advisory Contracts should be renewed.
Liquidity Risk Management Program
The Securities and Exchange Commission adopted Rule 22e-4 under the Investment Company Act of 1940 (the Liquidity Rule) to promote effective liquidity risk management throughout the open-end investment company industry, thereby reducing the risk that funds will be unable to meet their redemption obligations and mitigating dilution of the interests of fund shareholders.
The Fund has adopted and implemented a liquidity risk management program pursuant to the Liquidity Rule (the Program) effective December 1, 2018. The Program is reasonably designed to assess and manage the Fund’s liquidity risk and to comply with the requirements of the Liquidity Rule. The Fund’s Board of Trustees (the Board) has designated the Fund’s investment adviser as administrator of the Program. The Fidelity advisers have established a Liquidity Risk Management Committee (the LRM Committee) to manage the Program for each of the Fidelity Funds. The LRM Committee monitors the adequacy and effectiveness of implementation of the Program and on a periodic basis assesses each Fund’s liquidity risk based on a variety of factors including (1) the Fund’s investment strategy, (2) portfolio liquidity and cash flow projections during normal and reasonably foreseeable stressed conditions, (3) shareholder redemptions, (4) borrowings and other funding sources and (5) in the case of exchange-traded funds, certain additional factors including the effect of the Fund’s prices and spreads, market participants, and basket compositions on the overall liquidity of the Fund’s portfolio, as applicable.
In accordance with the Program, each of the Fund’s portfolio investments is classified into one of four liquidity categories described below based on a determination of a reasonable expectation for how long it would take to convert the investment to cash (or sell or dispose of the investment) without significantly changing its market value.
- Highly liquid investments – cash or convertible to cash within three business days or less
- Moderately liquid investments – convertible to cash in three to seven calendar days
- Less liquid investments – can be sold or disposed of, but not settled, within seven calendar days
- Illiquid investments – cannot be sold or disposed of within seven calendar days
Liquidity classification determinations take into account a variety of factors including various market, trading and investment-specific considerations, as well as market depth, and generally utilize analysis from a third-party liquidity metrics service.
The Liquidity Rule places a 15% limit on a fund’s illiquid investments and requires funds that do not primarily hold assets that are highly liquid investments to determine and maintain a minimum percentage of the fund’s net assets to be invested in highly liquid investments (highly liquid investment minimum or HLIM). The Program includes provisions reasonably designed to comply with the 15% limit on illiquid investments and for determining, periodically reviewing and complying with the HLIM requirement as applicable.
At a recent meeting of the Fund’s Board of Trustees, the LRM Committee provided a written report to the Board pertaining to the operation, adequacy, and effectiveness of implementation of the Program for the annual period from December 1, 2019 through November 30, 2020. The report concluded that the Program has been implemented and is operating effectively and is reasonably designed to assess and manage the Fund’s liquidity risk.
FVDK6-ANN-0921
1.9884003.104
Fidelity Flex® Funds
Fidelity Flex® Intrinsic Opportunities Fund
Annual Report
July 31, 2021
Contents
To view a fund's proxy voting guidelines and proxy voting record for the 12-month period ended June 30, visit http://www.fidelity.com/proxyvotingresults or visit the Securities and Exchange Commission's (SEC) web site at http://www.sec.gov.
You may also call 1-800-544-3455 (for managed account clients) or 1-800-835-5092 (for retirement plan participants) to request a free copy of the proxy voting guidelines.
Standard & Poor's, S&P and S&P 500 are registered service marks of The McGraw-Hill Companies, Inc. and have been licensed for use by Fidelity Distributors Corporation.
Other third-party marks appearing herein are the property of their respective owners.
All other marks appearing herein are registered or unregistered trademarks or service marks of FMR LLC or an affiliated company. © 2021 FMR LLC. All rights reserved.
This report and the financial statements contained herein are submitted for the general information of the shareholders of the Fund. This report is not authorized for distribution to prospective investors in the Fund unless preceded or accompanied by an effective prospectus.
A fund files its complete schedule of portfolio holdings with the SEC for the first and third quarters of each fiscal year on Form N-PORT. Forms N-PORT are available on the SEC’s web site at http://www.sec.gov. A fund's Forms N-PORT may be reviewed and copied at the SEC’s Public Reference Room in Washington, DC. Information regarding the operation of the SEC's Public Reference Room may be obtained by calling 1-800-SEC-0330.
For a complete list of a fund's portfolio holdings, view the most recent holdings listing, semiannual report, or annual report on Fidelity's web site at http://www.fidelity.com, http://www.institutional.fidelity.com, or http://www.401k.com, as applicable.
NOT FDIC INSURED •MAY LOSE VALUE •NO BANK GUARANTEE
Neither the Fund nor Fidelity Distributors Corporation is a bank.
Note to Shareholders:
Early in 2020, the outbreak and spread of a new coronavirus emerged as a public health emergency that had a major influence on financial markets, primarily based on its impact on the global economy and the outlook for corporate earnings. The virus causes a respiratory disease known as COVID-19. On March 11, 2020 the World Health Organization declared the COVID-19 outbreak a pandemic, citing sustained risk of further global spread.
In the weeks following, as the crisis worsened, we witnessed an escalating human tragedy with wide-scale social and economic consequences from coronavirus-containment measures. The outbreak of COVID-19 prompted a number of measures to limit the spread, including travel and border restrictions, quarantines, and restrictions on large gatherings. In turn, these resulted in lower consumer activity, diminished demand for a wide range of products and services, disruption in manufacturing and supply chains, and – given the wide variability in outcomes regarding the outbreak – significant market uncertainty and volatility. Amid the turmoil, global governments and central banks took unprecedented action to help support consumers, businesses, and the broader economies, and to limit disruption to financial systems.
The situation continues to unfold, and the extent and duration of its impact on financial markets and the economy remain highly uncertain. Extreme events such as the coronavirus crisis are “exogenous shocks” that can have significant adverse effects on mutual funds and their investments. Although multiple asset classes may be affected by market disruption, the duration and impact may not be the same for all types of assets.
Fidelity is committed to helping you stay informed amid news about COVID-19 and during increased market volatility, and we’re taking extra steps to be responsive to customer needs. We encourage you to visit our websites, where we offer ongoing updates, commentary, and analysis on the markets and our funds.
Performance: The Bottom Line
Average annual total return reflects the change in the value of an investment, assuming reinvestment of distributions from dividend income and capital gains (the profits earned upon the sale of securities that have grown in value, if any) and assuming a constant rate of performance each year. The hypothetical investment and the average annual total returns do not reflect the deduction of taxes that a shareholder would pay on fund distributions or the redemption of fund shares. During periods of reimbursement by Fidelity, a fund’s total return will be greater than it would be had the reimbursement not occurred. How a fund did yesterday is no guarantee of how it will do tomorrow.
Average Annual Total Returns
| For the periods ended July 31, 2021 | Past 1 year | Life of fundA |
| Fidelity Flex® Intrinsic Opportunities Fund | 72.26% | 17.30% |
A From March 8, 2017
$10,000 Over Life of Fund
Let's say hypothetically that $10,000 was invested in Fidelity Flex® Intrinsic Opportunities Fund on March 8, 2017, when the fund started.
The chart shows how the value of your investment would have changed, and also shows how the Russell 3000® Index performed over the same period.
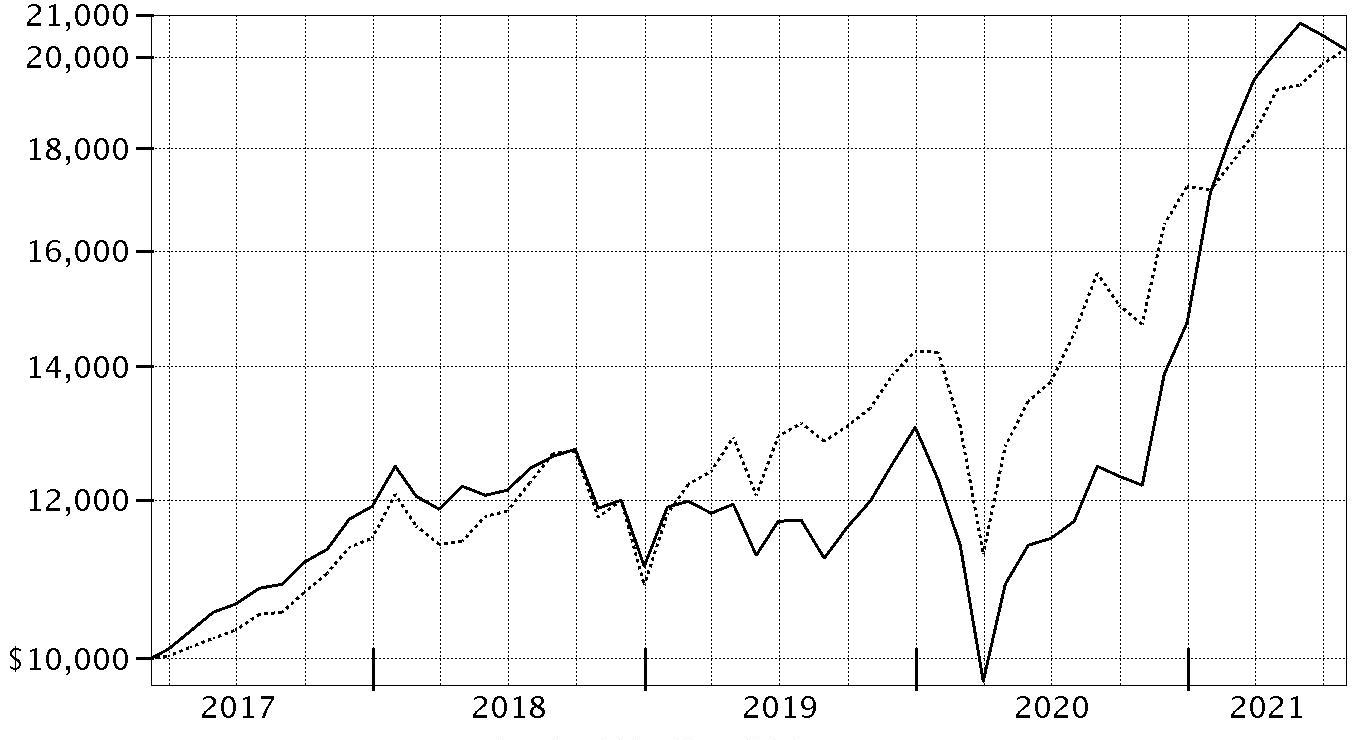
| Period Ending Values |
| $20,180 | Fidelity Flex® Intrinsic Opportunities Fund |
| $20,176 | Russell 3000® Index |
Management's Discussion of Fund Performance
Market Recap: The S&P 500
® index gained 36.45% for the 12 months ending July 31, 2021, as U.S. equities continued a historic rebound following a steep but brief decline due to the early-2020 outbreak and spread of COVID-19. A confluence of powerful forces propelled risk assets, returning the stock market to pre-pandemic highs by late August 2020. The rally slowed in September, when stocks began a two-month retreat amid Congress’s inability to reach a deal on additional fiscal stimulus, as well as uncertainty about the election. But as the calendar turned, investors grew hopeful. The rollout of three COVID-19 vaccines was underway, the U.S. Federal Reserve pledged to hold interest rates near zero until the economy recovered, and the federal government planned to deploy trillions of dollars to boost consumers and the economy. This backdrop fueled a sharp rotation, with small-cap value usurping leadership from large growth. As part of the “reopening” theme, investors moved out of tech-driven mega-caps that had thrived due to the work-from-home trend in favor of cheap smaller companies that stood to benefit from a broad cyclical recovery. A flattish May reflected concerns about inflation and jobs, but the uptrend resumed through July, driven by corporate earnings. Notably, this leg saw momentum shift back to large growth, as easing rates and a hawkish Fed stymied the reflation trade. By sector, financials (+55%) led, driven by banks (+63%), whereas utilities (+12%) and consumer staples (+18%) notably lagged.
Comments from Portfolio Manager Joel Tillinghast: For the fiscal year ending July 31, 2021, the fund gained 72.26%, outperforming the 38.73% result of the benchmark Russell 3000
® Index. Versus the benchmark, security selection was the primary contributor, especially in the consumer discretionary sector. Stock picking and an overweighting in financials also boosted the fund's relative result. Also bolstering the fund's relative result were stock picks in the communication services sector, especially within the media & entertainment industry. One of the biggest individual relative contributors was an overweight position in ViacomCBS (+241%). Also helping performance was our outsized stake in Discover Financial Services, which gained 155%. Discover Financial Services was among our largest holdings. Another notable relative contributor was an overweighting in Synchrony Financial (+116%), which was one of the fund's biggest holdings. Conversely, the largest detractor from performance versus the benchmark was an overweighting in health care. Weak picks in the industrials sector, especially within the capital goods industry, also hampered relative performance. Also detracting from the fund's relative result was an underweighting in the information technology sector, primarily within the semiconductors & semiconductor equipment industry. Lastly, the fund's position in cash was a notable detractor. Not owning Alphabet, a benchmark component that gained 82%, was the largest individual relative detractor. Another notable relative detractor was an outsized stake in Amgen (+2%), which was among our biggest holdings this period. Another notable relative detractor was an overweighting in Western Union (-1%). Notable changes in positioning include a higher allocation to the energy and financials sectors.
The views expressed above reflect those of the portfolio manager(s) only through the end of the period as stated on the cover of this report and do not necessarily represent the views of Fidelity or any other person in the Fidelity organization. Any such views are subject to change at any time based upon market or other conditions and Fidelity disclaims any responsibility to update such views. These views may not be relied on as investment advice and, because investment decisions for a Fidelity fund are based on numerous factors, may not be relied on as an indication of trading intent on behalf of any Fidelity fund.
Investment Summary (Unaudited)
Top Ten Stocks as of July 31, 2021
| | % of fund's net assets |
| Anthem, Inc. | 6.4 |
| Itochu Corp. | 3.5 |
| Synchrony Financial | 3.0 |
| JD Sports Fashion PLC | 2.8 |
| Discover Financial Services | 2.6 |
| AFLAC, Inc. | 2.4 |
| UnitedHealth Group, Inc. | 2.3 |
| Lear Corp. | 2.1 |
| United Therapeutics Corp. | 2.0 |
| Southwestern Energy Co. | 1.9 |
| | 29.0 |
Top Five Market Sectors as of July 31, 2021
| | % of fund's net assets |
| Consumer Discretionary | 19.2 |
| Health Care | 18.1 |
| Financials | 16.7 |
| Industrials | 10.3 |
| Energy | 8.4 |
Asset Allocation (% of fund's net assets)
| As of July 31, 2021 * |
| | Stocks | 91.2% |
| | Short-Term Investments and Net Other Assets (Liabilities) | 8.8% |

* Foreign investments - 40.9%
Schedule of Investments July 31, 2021
Showing Percentage of Net Assets
| Common Stocks - 91.2% | | | |
| | | Shares | Value |
| COMMUNICATION SERVICES - 2.9% | | | |
| Entertainment - 0.0% | | | |
| GAMEVIL, Inc. (a) | | 7 | $215 |
| Interactive Media & Services - 0.5% | | | |
| Cars.com, Inc. (a) | | 1,758 | 21,237 |
| Dip Corp. | | 1,649 | 48,025 |
| JOYY, Inc. ADR | | 1,797 | 96,050 |
| Zappallas, Inc. | | 2,400 | 12,054 |
| ZIGExN Co. Ltd. | | 5,051 | 19,568 |
| | | | 196,934 |
| Media - 1.9% | | | |
| AMC Networks, Inc. Class A (a) | | 371 | 18,565 |
| Cogeco Communications, Inc. | | 65 | 6,155 |
| Comcast Corp. Class A | | 7,327 | 431,047 |
| Corus Entertainment, Inc. Class B (non-vtg.) | | 710 | 3,295 |
| Discovery Communications, Inc.: | | | |
| Class A (a)(b) | | 2,859 | 82,940 |
| Class C (non-vtg.) (a) | | 4,741 | 128,529 |
| DMS, Inc. | | 664 | 9,666 |
| F@N Communications, Inc. | | 1,290 | 4,704 |
| Gendai Agency, Inc. (a) | | 1,954 | 6,109 |
| Gray Television, Inc. | | 100 | 2,217 |
| Hyundai HCN | | 5,719 | 22,846 |
| Hyve Group PLC (a) | | 676 | 1,236 |
| Pico Far East Holdings Ltd. | | 17,939 | 3,001 |
| Proto Corp. | | 200 | 2,525 |
| Trenders, Inc. | | 409 | 2,468 |
| ViacomCBS, Inc. Class B | | 650 | 26,605 |
| WOWOW INC. | | 568 | 12,317 |
| | | | 764,225 |
| Wireless Telecommunication Services - 0.5% | | | |
| KDDI Corp. | | 3,712 | 113,526 |
| Okinawa Cellular Telephone Co. | | 1,602 | 76,081 |
| | | | 189,607 |
|
| TOTAL COMMUNICATION SERVICES | | | 1,150,981 |
|
| CONSUMER DISCRETIONARY - 19.2% | | | |
| Auto Components - 6.5% | | | |
| Adient PLC (a) | | 5,231 | 220,382 |
| ASTI Corp. | | 507 | 12,631 |
| Burelle SA | | 6 | 5,139 |
| Cooper-Standard Holding, Inc. (a) | | 2,115 | 55,096 |
| DaikyoNishikawa Corp. | | 6,299 | 40,365 |
| DTR Automotive Corp. | | 97 | 3,357 |
| Eagle Industry Co. Ltd. | | 700 | 8,244 |
| G-Tekt Corp. | | 8,687 | 122,579 |
| Gentex Corp. | | 663 | 22,562 |
| Hi-Lex Corp. | | 737 | 11,145 |
| Hyundai Mobis | | 2,082 | 481,326 |
| IJTT Co. Ltd. | | 4,833 | 30,926 |
| Lear Corp. | | 4,674 | 817,857 |
| Linamar Corp. | | 7,983 | 472,351 |
| Murakami Corp. | | 65 | 1,878 |
| Patrick Industries, Inc. | | 27 | 2,231 |
| Piolax, Inc. | | 1,100 | 15,221 |
| Plastic Omnium SA | | 2,296 | 72,884 |
| Seoyon Co. Ltd. | | 1,136 | 16,211 |
| Stanley Electric Co. Ltd. | | 300 | 7,769 |
| Strattec Security Corp. (a) | | 226 | 9,307 |
| TBK Co. Ltd. | | 400 | 1,499 |
| Topre Corp. | | 891 | 12,792 |
| TPR Co. Ltd. | | 2,341 | 32,606 |
| Yorozu Corp. | | 6,077 | 67,470 |
| | | | 2,543,828 |
| Distributors - 0.1% | | | |
| Doshisha Co. Ltd. | | 872 | 13,680 |
| Harima-Kyowa Co. Ltd. | | 349 | 5,736 |
| Nakayamafuku Co. Ltd. | | 537 | 2,139 |
| Yagi & Co. Ltd. | | 1,095 | 14,882 |
| | | | 36,437 |
| Diversified Consumer Services - 0.7% | | | |
| Cross-Harbour Holdings Ltd. | | 4,335 | 6,951 |
| Heian Ceremony Service Co. Ltd. | | 1,340 | 10,944 |
| Kukbo Design Co. Ltd. | | 930 | 18,112 |
| MegaStudy Co. Ltd. | | 2,610 | 31,358 |
| MegaStudyEdu Co. Ltd. | | 2,971 | 205,153 |
| Multicampus Co. Ltd. | | 135 | 4,725 |
| Tsukada Global Holdings, Inc. (a) | | 3,245 | 8,933 |
| | | | 286,176 |
| Hotels, Restaurants & Leisure - 0.2% | | | |
| Betsson AB (B Shares) | | 533 | 4,291 |
| The Restaurant Group PLC (a) | | 59,010 | 94,163 |
| | | | 98,454 |
| Household Durables - 2.6% | | | |
| Ace Bed Co. Ltd. | | 685 | 28,790 |
| Avantia Co. Ltd. | | 1,811 | 15,138 |
| Bellway PLC | | 240 | 10,949 |
| Cuckoo Holdings Co. Ltd. | | 102 | 11,326 |
| Emak SpA | | 3,041 | 6,313 |
| FJ Next Co. Ltd. | | 2,804 | 26,275 |
| Gree Electric Appliances, Inc. of Zhuhai (A Shares) | | 19,810 | 145,629 |
| Hamilton Beach Brands Holding Co.: | | | |
| Class A | | 398 | 7,439 |
| Class B (a) | | 104 | 1,944 |
| Helen of Troy Ltd. (a) | | 1,103 | 246,399 |
| Mohawk Industries, Inc. (a) | | 1,474 | 287,283 |
| Open House Co. Ltd. | | 347 | 17,460 |
| Pressance Corp. | | 1,710 | 24,846 |
| Sanei Architecture Planning Co. Ltd. | | 738 | 13,273 |
| Taylor Morrison Home Corp. (a) | | 7,276 | 195,142 |
| | | | 1,038,206 |
| Internet & Direct Marketing Retail - 0.1% | | | |
| Aucnet, Inc. | | 252 | 3,655 |
| CROOZ, Inc. (a) | | 100 | 1,664 |
| Danawa Co. Ltd. | | 107 | 2,794 |
| Hamee Corp. | | 200 | 2,837 |
| Hyundai Home Shopping Network Corp. | | 7 | 494 |
| Moneysupermarket.com Group PLC | | 2,660 | 9,391 |
| Vipshop Holdings Ltd. ADR (a) | | 300 | 4,989 |
| | | | 25,824 |
| Leisure Products - 0.1% | | | |
| Mars Group Holdings Corp. | | 1,460 | 21,746 |
| Multiline Retail - 0.3% | | | |
| Big Lots, Inc. | | 273 | 15,728 |
| Grazziotin SA | | 880 | 5,505 |
| Lifestyle China Group Ltd. (a) | | 26,833 | 3,971 |
| Lifestyle International Holdings Ltd. (a) | | 30,541 | 21,772 |
| Macy's, Inc. (a) | | 2,206 | 37,502 |
| Ryohin Keikaku Co. Ltd. | | 206 | 4,167 |
| Treasure Factory Co. Ltd. | | 2,331 | 20,993 |
| | | | 109,638 |
| Specialty Retail - 6.5% | | | |
| Arcland Sakamoto Co. Ltd. | | 1,295 | 17,789 |
| AT-Group Co. Ltd. | | 2,741 | 35,704 |
| Bed Bath & Beyond, Inc. (a) | | 1,577 | 45,008 |
| Foot Locker, Inc. | | 5,143 | 293,460 |
| Fuji Corp. | | 4,198 | 46,608 |
| Genesco, Inc. (a) | | 931 | 53,486 |
| Goldlion Holdings Ltd. | | 20,919 | 4,738 |
| Guess?, Inc. | | 10,712 | 239,092 |
| Handsman Co. Ltd. | | 2,267 | 31,989 |
| Hour Glass Ltd. | | 48,700 | 55,351 |
| JB Hi-Fi Ltd. | | 680 | 23,973 |
| JD Sports Fashion PLC | | 89,102 | 1,110,950 |
| K's Holdings Corp. | | 5,228 | 61,523 |
| Ku Holdings Co. Ltd. | | 1,373 | 12,515 |
| Leon's Furniture Ltd. | | 740 | 13,755 |
| Lookers PLC (a) | | 3,142 | 2,922 |
| Mandarake, Inc. | | 100 | 576 |
| Nafco Co. Ltd. | | 200 | 3,416 |
| Nitori Holdings Co. Ltd. | | 111 | 21,098 |
| Nojima Co. Ltd. | | 83 | 2,148 |
| Padini Holdings Bhd | | 5,800 | 3,862 |
| Sally Beauty Holdings, Inc. (a) | | 9,576 | 181,178 |
| Samse SA | | 74 | 16,240 |
| Silvano Fashion Group A/S (a) | | 7 | 14 |
| SuperGroup PLC (a) | | 326 | 1,695 |
| T-Gaia Corp. | | 67 | 1,204 |
| The Buckle, Inc. | | 3,282 | 138,107 |
| Tokatsu Holdings Co. Ltd. | | 494 | 1,914 |
| Truworths International Ltd. | | 228 | 962 |
| Urban Outfitters, Inc. (a) | | 4,009 | 149,055 |
| Vita Group Ltd. | | 18 | 13 |
| | | | 2,570,345 |
| Textiles, Apparel & Luxury Goods - 2.1% | | | |
| Best Pacific International Holdings Ltd. | | 99,275 | 29,382 |
| Capri Holdings Ltd. (a) | | 9,718 | 547,221 |
| Carter's, Inc. | | 40 | 3,910 |
| Embry Holdings Ltd. | | 1,000 | 143 |
| Fossil Group, Inc. (a) | | 8,604 | 108,582 |
| Gildan Activewear, Inc. | | 618 | 21,305 |
| Hagihara Industries, Inc. | | 604 | 7,851 |
| Magni-Tech Industries Bhd | | 23,484 | 12,132 |
| PVH Corp. (a) | | 304 | 31,804 |
| Sakai Ovex Co. Ltd. | | 477 | 16,544 |
| Sitoy Group Holdings Ltd. | | 19,000 | 1,369 |
| Ted Baker PLC (a) | | 11,453 | 20,903 |
| Texwinca Holdings Ltd. | | 2,000 | 450 |
| Youngone Holdings Co. Ltd. | | 176 | 7,061 |
| | | | 808,657 |
|
| TOTAL CONSUMER DISCRETIONARY | | | 7,539,311 |
|
| CONSUMER STAPLES - 4.3% | | | |
| Beverages - 1.0% | | | |
| A.G. Barr PLC (a) | | 1,395 | 11,150 |
| Britvic PLC | | 20,425 | 276,668 |
| C&C Group PLC (United Kingdom) (a) | | 835 | 2,748 |
| Jinro Distillers Co. Ltd. | | 1,855 | 52,057 |
| Lucas Bols BV (a)(c) | | 192 | 2,364 |
| Olvi PLC (A Shares) | | 272 | 17,069 |
| Spritzer Bhd | | 200 | 97 |
| Yantai Changyu Pioneer Wine Co. Ltd. (B Shares) | | 16,898 | 31,791 |
| | | | 393,944 |
| Food & Staples Retailing - 0.8% | | | |
| Alimentation Couche-Tard, Inc. Class A (multi-vtg.) | | 300 | 12,256 |
| Amsterdam Commodities NV | | 1,902 | 54,263 |
| Belc Co. Ltd. | | 100 | 4,886 |
| Daiichi Co. Ltd. | | 631 | 4,998 |
| G-7 Holdings, Inc. | | 200 | 6,654 |
| Genky DrugStores Co. Ltd. | | 1,215 | 44,744 |
| Halows Co. Ltd. | | 380 | 9,803 |
| MARR SpA | | 1,742 | 40,461 |
| Natural Grocers by Vitamin Cottage, Inc. | | 100 | 1,118 |
| Nihon Chouzai Co. Ltd. | | 239 | 3,728 |
| OM2 Network Co. Ltd. | | 657 | 6,887 |
| Qol Holdings Co. Ltd. | | 331 | 4,562 |
| Retail Partners Co. Ltd. | | 1,270 | 13,903 |
| Satoh & Co. Ltd. | | 108 | 1,532 |
| Satudora Holdings Co. Ltd. | | 759 | 14,349 |
| Sprouts Farmers Market LLC (a) | | 100 | 2,458 |
| Valor Holdings Co. Ltd. | | 1,969 | 41,622 |
| Walgreens Boots Alliance, Inc. | | 314 | 14,805 |
| YAKUODO Holdings Co. Ltd. | | 629 | 13,222 |
| | | | 296,251 |
| Food Products - 2.1% | | | |
| Ajinomoto Malaysia Bhd | | 4,545 | 17,081 |
| Armanino Foods of Distinction | | 3,237 | 11,491 |
| Bell AG | | 173 | 53,284 |
| Cal-Maine Foods, Inc. (a) | | 359 | 12,526 |
| Carr's Group PLC | | 15,269 | 33,534 |
| Cranswick PLC | | 1,342 | 75,548 |
| Delfi Ltd. | | 37,937 | 23,659 |
| Delsole Corp. | | 614 | 2,899 |
| Fresh Del Monte Produce, Inc. | | 5,262 | 162,385 |
| Ingredion, Inc. | | 2,344 | 205,827 |
| Kaneko Seeds Co. Ltd. | | 432 | 5,615 |
| Kaveri Seed Co. Ltd. | | 527 | 5,103 |
| Lassonde Industries, Inc. Class A (sub. vtg.) | | 120 | 16,599 |
| LDC SA | | 52 | 6,354 |
| London Biscuits Bhd (a)(d) | | 3,375 | 16 |
| Origin Enterprises PLC | | 1,809 | 7,382 |
| Pickles Corp. | | 318 | 10,696 |
| Prima Meat Packers Ltd. | | 3,660 | 98,785 |
| S Foods, Inc. | | 1,434 | 44,574 |
| Thai President Foods PCL | | 364 | 2,138 |
| Thai Wah PCL | | 300 | 53 |
| Toyo Sugar Refining Co. Ltd. | | 631 | 6,891 |
| Tyson Foods, Inc. Class A | | 48 | 3,430 |
| | | | 805,870 |
| Household Products - 0.0% | | | |
| Transaction Co. Ltd. | | 819 | 9,466 |
| Personal Products - 0.2% | | | |
| Hengan International Group Co. Ltd. | | 12,350 | 73,342 |
| Herbalife Nutrition Ltd. (a) | | 200 | 10,188 |
| | | | 83,530 |
| Tobacco - 0.2% | | | |
| KT&G Corp. | | 900 | 64,254 |
| Scandinavian Tobacco Group A/S (c) | | 1,057 | 21,659 |
| | | | 85,913 |
|
| TOTAL CONSUMER STAPLES | | | 1,674,974 |
|
| ENERGY - 8.4% | | | |
| Energy Equipment & Services - 0.4% | | | |
| AKITA Drilling Ltd. Class A (non-vtg.) (a) | | 170 | 110 |
| Bristow Group, Inc. (a) | | 691 | 17,952 |
| Championx Corp. (a) | | 2,821 | 65,560 |
| Geospace Technologies Corp. (a) | | 1,181 | 10,310 |
| Liberty Oilfield Services, Inc. Class A (a) | | 1,638 | 16,691 |
| Oil States International, Inc. (a) | | 6,510 | 36,847 |
| Smart Sand, Inc. (a) | | 1,617 | 4,576 |
| Solaris Oilfield Infrastructure, Inc. Class A | | 628 | 5,464 |
| Tidewater, Inc. warrants 11/14/24 (a) | | 50 | 11 |
| | | | 157,521 |
| Oil, Gas & Consumable Fuels - 8.0% | | | |
| Alvopetro Energy Ltd. (a) | | 4,657 | 3,726 |
| Antero Resources Corp. (a) | | 100 | 1,360 |
| ARC Resources Ltd. | | 371 | 2,807 |
| Baytex Energy Corp. (a) | | 13,387 | 22,855 |
| Beach Energy Ltd. | | 4,064 | 3,579 |
| Berry Corp. | | 165 | 916 |
| Birchcliff Energy Ltd. | | 21,231 | 80,152 |
| Bonanza Creek Energy, Inc. | | 2,885 | 110,986 |
| Bonterra Energy Corp. (a) | | 617 | 2,804 |
| Cenovus Energy, Inc.: | | | |
| warrants 1/1/26 (a) | | 1,182 | 5,685 |
| (Canada) | | 18,865 | 157,410 |
| China Petroleum & Chemical Corp.: | | | |
| (H Shares) | | 668,266 | 305,578 |
| sponsored ADR (H Shares) | | 152 | 6,949 |
| CNOOC Ltd. | | 1,090 | 1,080 |
| CONSOL Energy, Inc. (a) | | 539 | 11,324 |
| Delek U.S. Holdings, Inc. | | 1,188 | 20,647 |
| Denbury, Inc. warrants 9/18/23 (a) | | 92 | 2,969 |
| Diamondback Energy, Inc. | | 224 | 17,277 |
| EQT Corp. (a) | | 5,789 | 106,460 |
| Equitrans Midstream Corp. | | 337 | 2,770 |
| HollyFrontier Corp. | | 1,583 | 46,540 |
| International Seaways, Inc. | | 137 | 2,254 |
| Marathon Oil Corp. | | 1,469 | 17,026 |
| Motor Oil (HELLAS) Corinth Refineries SA | | 774 | 12,450 |
| Murphy Oil Corp. | | 12,805 | 277,997 |
| NACCO Industries, Inc. Class A | | 482 | 12,084 |
| Oil & Natural Gas Corp. Ltd. | | 222,757 | 345,476 |
| Oil India Ltd. | | 1,012 | 2,271 |
| Ovintiv, Inc. | | 5,807 | 149,008 |
| PDC Energy, Inc. | | 1,215 | 48,053 |
| Peyto Exploration & Development Corp. | | 21,608 | 125,221 |
| S-Oil Corp. | | 27 | 2,302 |
| San-Ai Oil Co. Ltd. | | 390 | 4,828 |
| Sinopec Kantons Holdings Ltd. | | 14,943 | 5,326 |
| Southwestern Energy Co. (a) | | 157,878 | 743,605 |
| Star Petroleum Refining PCL (a) | | 6,058 | 1,549 |
| Thai Oil PCL (For. Reg.) | | 3,206 | 4,293 |
| Total SA sponsored ADR | | 10,989 | 479,450 |
| Tsakos Energy Navigation Ltd. | | 172 | 1,367 |
| Unit Corp. warrants 9/3/27 (a)(d) | | 320 | 375 |
| Whiting Petroleum Corp. warrants 9/1/24 (a) | | 880 | 5,280 |
| | | | 3,154,089 |
|
| TOTAL ENERGY | | | 3,311,610 |
|
| FINANCIALS - 16.7% | | | |
| Banks - 3.0% | | | |
| Bank Norwegian ASA | | 300 | 3,511 |
| Bar Harbor Bankshares | | 946 | 27,093 |
| Camden National Corp. | | 101 | 4,522 |
| Central Valley Community Bancorp | | 17 | 381 |
| Citizens Financial Services, Inc. | | 34 | 2,127 |
| Community Trust Bancorp, Inc. | | 90 | 3,578 |
| Eagle Bancorp, Inc. | | 100 | 5,503 |
| East West Bancorp, Inc. | | 2,398 | 170,618 |
| F & M Bank Corp. | | 335 | 9,698 |
| First Foundation, Inc. | | 100 | 2,357 |
| Gunma Bank Ltd. | | 16,717 | 53,333 |
| Hirogin Holdings, Inc. | | 2,467 | 13,245 |
| NIBC Holding NV (c) | | 2,281 | 18,941 |
| OFG Bancorp | | 5,587 | 129,060 |
| Ogaki Kyoritsu Bank Ltd. | | 100 | 1,681 |
| Parke Bancorp, Inc. | | 100 | 1,996 |
| San ju San Financial Group, Inc. | | 804 | 10,443 |
| Seven Bank Ltd. | | 300 | 654 |
| Shinsei Bank Ltd. | | 1,875 | 24,799 |
| Sparebank 1 Oestlandet | | 2,555 | 35,514 |
| Texas Capital Bancshares, Inc. (a) | | 390 | 24,562 |
| The Keiyo Bank Ltd. | | 1,772 | 6,752 |
| The San-In Godo Bank Ltd. | | 4,866 | 24,174 |
| Van Lanschot NV (Bearer) | | 55 | 1,413 |
| Wells Fargo & Co. | | 12,606 | 579,120 |
| West Bancorp., Inc. | | 100 | 2,948 |
| Yamaguchi Financial Group, Inc. | | 4,540 | 26,072 |
| | | | 1,184,095 |
| Capital Markets - 0.3% | | | |
| ABG Sundal Collier ASA | | 1,023 | 1,137 |
| CI Financial Corp. | | 3,309 | 60,340 |
| Diamond Hill Investment Group, Inc. | | 51 | 8,785 |
| Federated Hermes, Inc. | | 268 | 8,694 |
| GAMCO Investors, Inc. Class A | | 516 | 13,901 |
| Lazard Ltd. Class A | | 695 | 32,804 |
| | | | 125,661 |
| Consumer Finance - 6.1% | | | |
| Aeon Credit Service (Asia) Co. Ltd. | | 32,992 | 20,930 |
| Cash Converters International Ltd. | | 36,676 | 7,132 |
| Discover Financial Services | | 8,079 | 1,004,381 |
| Navient Corp. | | 3,132 | 63,987 |
| Santander Consumer U.S.A. Holdings, Inc. | | 3,043 | 124,854 |
| Synchrony Financial | | 25,053 | 1,177,992 |
| | | | 2,399,276 |
| Diversified Financial Services - 1.1% | | | |
| Fuyo General Lease Co. Ltd. | | 1,781 | 115,914 |
| Mizuho Leasing Co. Ltd. | | 516 | 17,074 |
| NICE Holdings Co. Ltd. | | 697 | 11,276 |
| Ricoh Leasing Co. Ltd. | | 3,046 | 95,652 |
| Tokyo Century Corp. | | 3,340 | 182,672 |
| | | | 422,588 |
| Insurance - 6.1% | | | |
| AFLAC, Inc. | | 16,930 | 931,150 |
| ASR Nederland NV | | 2,985 | 122,694 |
| Db Insurance Co. Ltd. | | 4,783 | 236,918 |
| Genworth Financial, Inc. Class A (a) | | 36,302 | 121,249 |
| Hyundai Fire & Marine Insurance Co. Ltd. | | 1,732 | 38,989 |
| Lincoln National Corp. | | 1,168 | 71,972 |
| MetLife, Inc. | | 3,500 | 201,950 |
| NN Group NV | | 5,990 | 297,939 |
| Power Corp. of Canada (sub. vtg.) | | 1,458 | 46,535 |
| Principal Financial Group, Inc. | | 571 | 35,476 |
| Prudential Financial, Inc. | | 941 | 94,363 |
| Reinsurance Group of America, Inc. | | 1,529 | 168,465 |
| Talanx AG | | 448 | 19,057 |
| | | | 2,386,757 |
| Thrifts & Mortgage Finance - 0.1% | | | |
| ASAX Co. Ltd. | | 2,490 | 15,684 |
| Axos Financial, Inc. (a) | | 100 | 4,785 |
| Genworth Mortgage Insurance Ltd. | | 11,224 | 16,803 |
| Greene County Bancorp, Inc. | | 74 | 2,289 |
| Hingham Institution for Savings | | 28 | 8,372 |
| | | | 47,933 |
|
| TOTAL FINANCIALS | | | 6,566,310 |
|
| HEALTH CARE - 18.1% | | | |
| Biotechnology - 4.6% | | | |
| Amgen, Inc. | | 2,673 | 645,636 |
| Cell Biotech Co. Ltd. | | 946 | 16,044 |
| Essex Bio-Technology Ltd. | | 9,280 | 7,977 |
| Gilead Sciences, Inc. | | 2,469 | 168,608 |
| Regeneron Pharmaceuticals, Inc. (a) | | 366 | 210,307 |
| United Therapeutics Corp. (a) | | 4,232 | 769,928 |
| | | | 1,818,500 |
| Health Care Equipment & Supplies - 0.7% | | | |
| Fukuda Denshi Co. Ltd. | | 1,985 | 180,759 |
| Medikit Co. Ltd. | | 210 | 6,145 |
| Meridian Bioscience, Inc. (a) | | 107 | 2,194 |
| Nakanishi, Inc. | | 106 | 2,195 |
| St.Shine Optical Co. Ltd. | | 4,192 | 57,741 |
| Value Added Technology Co. Ltd. | | 419 | 13,085 |
| Vieworks Co. Ltd. | | 56 | 1,785 |
| | | | 263,904 |
| Health Care Providers & Services - 11.9% | | | |
| Anthem, Inc. | | 6,504 | 2,497,584 |
| Centene Corp. (a) | | 521 | 35,746 |
| Cigna Corp. | | 100 | 22,949 |
| CVS Health Corp. | | 4,004 | 329,769 |
| Humana, Inc. | | 1,113 | 473,982 |
| Laboratory Corp. of America Holdings (a) | | 445 | 131,787 |
| MEDNAX, Inc. (a) | | 144 | 4,193 |
| Tokai Corp. | | 997 | 21,920 |
| UnitedHealth Group, Inc. | | 2,227 | 918,014 |
| Universal Health Services, Inc. Class B | | 1,469 | 235,642 |
| | | | 4,671,586 |
| Health Care Technology - 0.0% | | | |
| Schrodinger, Inc. (a) | | 126 | 8,526 |
| Life Sciences Tools & Services - 0.1% | | | |
| ICON PLC (a) | | 112 | 27,246 |
| Pharmaceuticals - 0.8% | | | |
| Apex Healthcare Bhd | | 8,041 | 5,564 |
| Daito Pharmaceutical Co. Ltd. | | 651 | 19,672 |
| Dawnrays Pharmaceutical Holdings Ltd. | | 76,256 | 17,467 |
| DongKook Pharmaceutical Co. Ltd. | | 1,073 | 23,456 |
| Genomma Lab Internacional SA de CV (a) | | 6,914 | 6,717 |
| Jazz Pharmaceuticals PLC (a) | | 718 | 121,715 |
| Korea United Pharm, Inc. | | 115 | 5,307 |
| Lee's Pharmaceutical Holdings Ltd. | | 37,908 | 19,415 |
| Luye Pharma Group Ltd. (c) | | 10,874 | 5,849 |
| Nippon Chemiphar Co. Ltd. | | 183 | 3,712 |
| PT Tempo Scan Pacific Tbk | | 300 | 30 |
| Sawai Group Holdings Co. Ltd. | | 200 | 8,532 |
| Supernus Pharmaceuticals, Inc. (a) | | 100 | 2,633 |
| Taro Pharmaceutical Industries Ltd. (a) | | 670 | 47,704 |
| Towa Pharmaceutical Co. Ltd. | | 1,732 | 44,048 |
| | | | 331,821 |
|
| TOTAL HEALTH CARE | | | 7,121,583 |
|
| INDUSTRIALS - 10.3% | | | |
| Aerospace & Defense - 0.2% | | | |
| Huntington Ingalls Industries, Inc. | | 284 | 58,257 |
| Magellan Aerospace Corp. | | 634 | 5,199 |
| Vectrus, Inc. (a) | | 132 | 5,978 |
| | | | 69,434 |
| Air Freight & Logistics - 0.1% | | | |
| AIT Corp. | | 3,116 | 31,641 |
| Onelogix Group Ltd. (a) | | 2,727 | 426 |
| SBS Co. Ltd. | | 387 | 11,853 |
| | | | 43,920 |
| Building Products - 0.3% | | | |
| Caesarstone Sdot-Yam Ltd. | | 100 | 1,327 |
| InnoTec TSS AG | | 33 | 480 |
| KVK Corp. | | 109 | 2,205 |
| Nihon Dengi Co. Ltd. | | 1,126 | 39,927 |
| Nihon Flush Co. Ltd. | | 915 | 10,192 |
| Noda Corp. | | 1,158 | 8,371 |
| Sekisui Jushi Corp. | | 1,930 | 38,246 |
| | | | 100,748 |
| Commercial Services & Supplies - 0.4% | | | |
| Asia File Corp. Bhd (a) | | 17,831 | 9,845 |
| Civeo Corp. (a) | | 580 | 12,592 |
| Fursys, Inc. | | 664 | 20,679 |
| Matsuda Sangyo Co. Ltd. | | 374 | 7,374 |
| Mitie Group PLC (a) | | 15,690 | 13,827 |
| VSE Corp. | | 2,162 | 108,208 |
| | | | 172,525 |
| Construction & Engineering - 0.5% | | | |
| Boustead Projs. Pte Ltd. | | 8,376 | 8,098 |
| Boustead Singapore Ltd. | | 28,038 | 24,625 |
| Br Holding Corp. | | 100 | 424 |
| Dai-Dan Co. Ltd. | | 107 | 2,567 |
| Geumhwa PSC Co. Ltd. | | 1 | 29 |
| Hokuriku Electrical Construction Co. Ltd. | | 422 | 4,966 |
| Kawasaki Setsubi Kogyo Co. Ltd. | | 383 | 1,540 |
| Meisei Industrial Co. Ltd. | | 1,517 | 10,260 |
| Mirait Holdings Corp. | | 109 | 2,137 |
| Nippon Rietec Co. Ltd. | | 2,796 | 43,888 |
| Primoris Services Corp. | | 100 | 2,990 |
| Raiznext Corp. | | 5,512 | 57,278 |
| Seikitokyu Kogyo Co. Ltd. | | 1,344 | 10,707 |
| Shinnihon Corp. | | 100 | 781 |
| Sumitomo Densetsu Co. Ltd. | | 456 | 8,937 |
| Totetsu Kogyo Co. Ltd. | | 585 | 12,371 |
| Watanabe Sato Co. Ltd. | | 78 | 2,304 |
| | | | 193,902 |
| Electrical Equipment - 0.9% | | | |
| Acuity Brands, Inc. | | 1,321 | 231,677 |
| Aichi Electric Co. Ltd. | | 574 | 14,964 |
| AQ Group AB (a) | | 2,796 | 102,961 |
| Canare Electric Co. Ltd. | | 258 | 4,043 |
| Hammond Power Solutions, Inc. Class A | | 771 | 6,365 |
| Iwabuchi Corp. | | 20 | 1,052 |
| Terasaki Electric Co. Ltd. | | 170 | 1,970 |
| | | | 363,032 |
| Industrial Conglomerates - 0.1% | | | |
| Mytilineos SA | | 2,385 | 44,249 |
| Reunert Ltd. | | 205 | 665 |
| | | | 44,914 |
| Machinery - 0.8% | | | |
| Daihatsu Diesel Manufacturing Co. Ltd. | | 900 | 3,979 |
| Daiwa Industries Ltd. | | 2,980 | 30,940 |
| Estic Corp. | | 221 | 9,216 |
| Fujimak Corp. | | 2,056 | 15,143 |
| Fukushima Industries Corp. | | 262 | 10,759 |
| Haitian International Holdings Ltd. | | 2,154 | 7,886 |
| Hokuetsu Industries Co. Ltd. | | 320 | 3,188 |
| Hosokawa Micron Corp. | | 212 | 12,001 |
| Hy-Lok Corp. | | 413 | 6,180 |
| Ihara Science Corp. | | 463 | 8,247 |
| Koike Sanso Kogyo Co. Ltd. | | 72 | 1,487 |
| Krones AG | | 22 | 2,170 |
| Nakanishi Manufacturing Co. Ltd. | | 536 | 5,726 |
| Nansin Co. Ltd. | | 628 | 3,360 |
| Park-Ohio Holdings Corp. | | 102 | 2,967 |
| Sakura Rubber Co. Ltd. | | 100 | 3,537 |
| Sansei Co. Ltd. | | 2,505 | 10,549 |
| Semperit AG Holding | | 1,337 | 49,246 |
| SIMPAC, Inc. | | 6,572 | 39,965 |
| Teikoku Sen-I Co. Ltd. | | 1,260 | 22,477 |
| TK Group Holdings Ltd. | | 112,151 | 40,553 |
| Tocalo Co. Ltd. | | 936 | 11,680 |
| Yamada Corp. | | 171 | 3,587 |
| | | | 304,843 |
| Marine - 0.1% | | | |
| Japan Transcity Corp. | | 3,405 | 17,692 |
| Professional Services - 0.9% | | | |
| ABIST Co. Ltd. | | 611 | 16,291 |
| Akka Technologies SA (a) | | 1,985 | 110,907 |
| Altech Corp. | | 537 | 9,912 |
| Barrett Business Services, Inc. | | 8 | 586 |
| Benext-Yumeshin Group Co. | | 255 | 3,159 |
| Bertrandt AG | | 648 | 38,319 |
| Career Design Center Co. Ltd. | | 403 | 3,949 |
| en-japan, Inc. | | 147 | 5,105 |
| Gakujo Co. Ltd. | | 278 | 2,912 |
| Hays PLC (a) | | 1,620 | 3,333 |
| Hito Communications Holdings, Inc. | | 100 | 1,910 |
| JAC Recruitment Co. Ltd. | | 672 | 10,707 |
| Kelly Services, Inc. Class A (non-vtg.) (a) | | 130 | 2,850 |
| McMillan Shakespeare Ltd. | | 9,084 | 84,329 |
| Quick Co. Ltd. | | 1,674 | 18,250 |
| SHL-JAPAN Ltd. | | 449 | 11,885 |
| TrueBlue, Inc. (a) | | 521 | 14,166 |
| WDB Holdings Co. Ltd. | | 338 | 9,320 |
| Will Group, Inc. | | 100 | 874 |
| World Holdings Co. Ltd. | | 100 | 2,894 |
| | | | 351,658 |
| Road & Rail - 0.8% | | | |
| Autohellas SA | | 8,080 | 69,970 |
| Daqin Railway Co. Ltd. (A Shares) | | 126,402 | 115,027 |
| Hamakyorex Co. Ltd. | | 479 | 13,776 |
| NANSO Transport Co. Ltd. | | 356 | 3,816 |
| Nikkon Holdings Co. Ltd. | | 1,088 | 23,812 |
| SENKO Co. Ltd. | | 1,687 | 17,008 |
| Shin-Keisei Electric Railway Co. Ltd. | | 75 | 1,465 |
| Stef SA | | 494 | 57,429 |
| Tohbu Network Co. Ltd. | | 278 | 2,379 |
| Utoc Corp. | | 4,021 | 18,876 |
| | | | 323,558 |
| Trading Companies & Distributors - 5.1% | | | |
| Bergman & Beving AB (B Shares) | | 1,682 | 32,943 |
| Canox Corp. | | 1,394 | 12,516 |
| Chori Co. Ltd. | | 3,108 | 53,290 |
| Daiichi Jitsugyo Co. Ltd. | | 52 | 2,204 |
| Green Cross Co. Ltd. | | 1,200 | 10,698 |
| Hanwa Co. Ltd. | | 469 | 13,766 |
| HERIGE | | 169 | 8,641 |
| Itochu Corp. | | 46,778 | 1,384,593 |
| Kamei Corp. | | 6,366 | 66,036 |
| Lumax International Corp. Ltd. | | 8,164 | 20,061 |
| Meiwa Corp. | | 1,600 | 6,826 |
| Mitani Shoji Co. Ltd. | | 1,989 | 149,214 |
| Mitsubishi Corp. | | 4,129 | 115,813 |
| Momentum Group AB (B Shares) | | 1,442 | 32,095 |
| Narasaki Sangyo Co. Ltd. | | 89 | 1,707 |
| Nishikawa Keisoku Co. Ltd. | | 37 | 1,583 |
| Rasa Corp. (a) | | 541 | 4,389 |
| Sanyo Trading Co. Ltd. | | 520 | 5,702 |
| Shinsho Corp. | | 250 | 6,741 |
| Totech Corp. | | 249 | 5,933 |
| Yamazen Co. Ltd. | | 176 | 1,651 |
| Yuasa Trading Co. Ltd. | | 2,427 | 69,024 |
| | | | 2,005,426 |
| Transportation Infrastructure - 0.1% | | | |
| Anhui Expressway Co. Ltd. (H Shares) | | 7,299 | 4,358 |
| Isewan Terminal Service Co. Ltd. | | 677 | 4,283 |
| Meiko Transportation Co. Ltd. | | 148 | 1,596 |
| Qingdao Port International Co. Ltd. (H Shares) (c) | | 44,993 | 23,159 |
| | | | 33,396 |
|
| TOTAL INDUSTRIALS | | | 4,025,048 |
|
| INFORMATION TECHNOLOGY - 5.3% | | | |
| Communications Equipment - 0.0% | | | |
| HF Co. | | 651 | 4,958 |
| Electronic Equipment & Components - 1.3% | | | |
| Daido Signal Co. Ltd. | | 848 | 4,677 |
| Elematec Corp. | | 1,942 | 20,163 |
| Hagiwara Electric Holdings Co. Ltd. | | 891 | 18,526 |
| Kingboard Chemical Holdings Ltd. | | 20,929 | 109,612 |
| Lacroix SA | | 163 | 8,140 |
| Makus, Inc. | | 890 | 4,926 |
| PAX Global Technology Ltd. | | 24,660 | 26,656 |
| Redington India Ltd. | | 29,297 | 128,961 |
| Riken Kieki Co. Ltd. | | 1,633 | 38,315 |
| Simplo Technology Co. Ltd. | | 4,074 | 53,945 |
| SYNNEX Corp. | | 151 | 18,051 |
| Thinking Electronic Industries Co. Ltd. | | 4,827 | 38,259 |
| Vontier Corp. | | 300 | 9,705 |
| | | | 479,936 |
| IT Services - 2.9% | | | |
| Amdocs Ltd. | | 1,894 | 146,046 |
| Avant Corp. | | 640 | 9,532 |
| Cielo SA | | 8,843 | 5,739 |
| Concentrix Corp. (a) | | 148 | 24,232 |
| Dimerco Data System Corp. | | 1,115 | 2,881 |
| DTS Corp. | | 1,518 | 36,447 |
| DXC Technology Co. (a) | | 300 | 11,994 |
| E-Credible Co. Ltd. | | 622 | 11,250 |
| Enea Data AB (a) | | 468 | 12,912 |
| Estore Corp. | | 600 | 10,173 |
| Future Corp. | | 2,081 | 34,789 |
| IFIS Japan Ltd. | | 254 | 1,533 |
| Korea Information & Communication Co. Ltd. (a) | | 936 | 8,022 |
| Neurones | | 7 | 250 |
| Nice Information & Telecom, Inc. | | 408 | 11,981 |
| Sopra Steria Group | | 980 | 194,839 |
| TDC Soft, Inc. | | 296 | 2,954 |
| The Western Union Co. | | 26,730 | 620,403 |
| | | | 1,145,977 |
| Semiconductors & Semiconductor Equipment - 0.1% | | | |
| Miraial Co. Ltd. | | 1,456 | 16,471 |
| Phison Electronics Corp. | | 1,567 | 26,806 |
| | | | 43,277 |
| Software - 0.2% | | | |
| Cresco Ltd. | | 420 | 7,492 |
| InfoVine Co. Ltd. | | 43 | 1,033 |
| KSK Co., Ltd. | | 373 | 7,966 |
| Miroku Jyoho Service Co., Ltd. | | 100 | 1,432 |
| Sinosoft Tech Group Ltd. | | 9,956 | 1,512 |
| System Research Co. Ltd. | | 796 | 15,636 |
| Uchida Esco Co. Ltd. | | 596 | 15,918 |
| Zensar Technologies Ltd. | | 5,200 | 29,090 |
| | | | 80,079 |
| Technology Hardware, Storage & Peripherals - 0.8% | | | |
| Dell Technologies, Inc. (a) | | 1,764 | 170,438 |
| Elecom Co. Ltd. | | 202 | 3,545 |
| HP, Inc. | | 4,567 | 131,849 |
| MCJ Co. Ltd. | | 1,182 | 13,317 |
| | | | 319,149 |
|
| TOTAL INFORMATION TECHNOLOGY | | | 2,073,376 |
|
| MATERIALS - 3.6% | | | |
| Chemicals - 2.5% | | | |
| AdvanSix, Inc. (a) | | 100 | 3,345 |
| Air Water, Inc. | | 260 | 3,875 |
| C. Uyemura & Co. Ltd. | | 1,440 | 60,249 |
| Daishin-Chemical Co. Ltd. | | 603 | 7,778 |
| Fuso Chemical Co. Ltd. | | 495 | 17,755 |
| HEXPOL AB (B Shares) | | 14 | 191 |
| Isamu Paint Co. Ltd. | | 52 | 1,604 |
| K+S AG | | 916 | 13,142 |
| Koatsu Gas Kogyo Co. Ltd. | | 537 | 3,260 |
| Kuriyama Holdings Corp. | | 650 | 4,781 |
| Nippon Soda Co. Ltd. | | 407 | 13,003 |
| Nutrien Ltd. | | 43 | 2,557 |
| Scientex Bhd | | 48,900 | 48,436 |
| Scientex Bhd warrants 1/14/26 (a) | | 1,880 | 535 |
| The Mosaic Co. | | 22,424 | 700,302 |
| Toho Acetylene Co. Ltd. | | 509 | 5,401 |
| Tokuyama Corp. | | 71 | 1,504 |
| Yara International ASA | | 1,978 | 104,175 |
| Yip's Chemical Holdings Ltd. | | 8,343 | 5,475 |
| | | | 997,368 |
| Construction Materials - 0.2% | | | |
| Buzzi Unicem SpA | | 992 | 26,242 |
| Mitani Sekisan Co. Ltd. | | 778 | 31,523 |
| | | | 57,765 |
| Containers & Packaging - 0.2% | | | |
| Mayr-Melnhof Karton AG | | 204 | 43,414 |
| Packaging Corp. of America | | 33 | 4,670 |
| The Pack Corp. | | 200 | 5,165 |
| WestRock Co. | | 594 | 29,231 |
| | | | 82,480 |
| Metals & Mining - 0.7% | | | |
| ArcelorMittal SA Class A unit | | 618 | 21,778 |
| Chubu Steel Plate Co. Ltd. | | 1,262 | 9,030 |
| CI Resources Ltd. | | 16 | 12 |
| CK-SAN-ETSU Co. Ltd. | | 325 | 8,621 |
| Gatos Silver, Inc. | | 1,097 | 14,963 |
| Mount Gibson Iron Ltd. | | 88,890 | 56,099 |
| Newmont Corp. | | 100 | 6,282 |
| Pacific Metals Co. Ltd. | | 1,214 | 18,847 |
| Perenti Global Ltd. | | 70,369 | 46,993 |
| Rio Tinto PLC sponsored ADR | | 258 | 22,268 |
| St Barbara Ltd. | | 29,546 | 38,378 |
| Teck Resources Ltd. Class B (sub. vtg.) | | 1,757 | 40,109 |
| Warrior Metropolitan Coal, Inc. | | 405 | 7,561 |
| | | | 290,941 |
|
| TOTAL MATERIALS | | | 1,428,554 |
|
| REAL ESTATE - 0.1% | | | |
| Real Estate Management & Development - 0.1% | | | |
| Nisshin Group Holdings Co. | | 7,964 | 34,265 |
| Realogy Holdings Corp. (a) | | 100 | 1,772 |
| | | | 36,037 |
| UTILITIES - 2.3% | | | |
| Electric Utilities - 1.9% | | | |
| EVN AG | | 92 | 2,226 |
| Fjordkraft Holding ASA (c) | | 1,137 | 6,473 |
| Holding Co. ADMIE IPTO SA | | 17 | 52 |
| PG&E Corp. (a) | | 41,033 | 360,680 |
| PPL Corp. | | 13,365 | 379,165 |
| | | | 748,596 |
| Gas Utilities - 0.4% | | | |
| Busan City Gas Co. Ltd. | | 258 | 13,675 |
| China Resource Gas Group Ltd. | | 5,005 | 30,850 |
| GAIL India Ltd. | | 20,794 | 39,032 |
| Hokuriku Gas Co. | | 164 | 4,716 |
| Seoul City Gas Co. Ltd. | | 291 | 34,584 |
| Towngas China Co. Ltd. | | 12,220 | 8,035 |
| YESCO Co. Ltd. | | 618 | 20,024 |
| | | | 150,916 |
| Water Utilities - 0.0% | | | |
| Manila Water Co., Inc. (a) | | 300 | 97 |
|
| TOTAL UTILITIES | | | 899,609 |
|
| TOTAL COMMON STOCKS | | | |
| (Cost $26,189,274) | | | 35,827,393 |
|
| Nonconvertible Preferred Stocks - 0.0% | | | |
| CONSUMER DISCRETIONARY - 0.0% | | | |
| Automobiles - 0.0% | | | |
| Porsche Automobil Holding SE (Germany) | | 25 | 2,706 |
| INDUSTRIALS - 0.0% | | | |
| Machinery - 0.0% | | | |
| Danieli & C. Officine Meccaniche SpA | | 7 | 129 |
| TOTAL NONCONVERTIBLE PREFERRED STOCKS | | | |
| (Cost $1,812) | | �� | 2,835 |
| | | Principal Amount | Value |
|
| Nonconvertible Bonds - 0.0% | | | |
| FINANCIALS - 0.0% | | | |
| Capital Markets - 0.0% | | | |
GAMCO Investors, Inc. 4% 6/15/23
(Cost $1,000)(d)(e) | | 1,000 | 1,000 |
| | | Shares | Value |
|
| Money Market Funds - 8.8% | | | |
| Fidelity Cash Central Fund 0.06% (f) | | 3,357,375 | 3,358,047 |
| Fidelity Securities Lending Cash Central Fund 0.06% (f)(g) | | 70,846 | 70,853 |
| TOTAL MONEY MARKET FUNDS | | | |
| (Cost $3,428,900) | | | 3,428,900 |
| TOTAL INVESTMENT IN SECURITIES - 100.0% | | | |
| (Cost $29,620,986) | | | 39,260,128 |
| NET OTHER ASSETS (LIABILITIES) - 0.0% | | | 18,939 |
| NET ASSETS - 100% | | | $39,279,067 |
Legend
(a) Non-income producing
(b) Security or a portion of the security is on loan at period end.
(c) Security exempt from registration under Rule 144A of the Securities Act of 1933. These securities may be resold in transactions exempt from registration, normally to qualified institutional buyers. At the end of the period, the value of these securities amounted to $78,445 or 0.2% of net assets.
(d) Level 3 security
(e) Security initially issued at one coupon which converts to a higher coupon at a specified date. The rate shown is the rate at period end.
(f) Affiliated fund that is generally available only to investment companies and other accounts managed by Fidelity Investments. The rate quoted is the annualized seven-day yield of the fund at period end. A complete unaudited listing of the fund's holdings as of its most recent quarter end is available upon request. In addition, each Fidelity Central Fund's financial statements, which are not covered by the Fund's Report of Independent Registered Public Accounting Firm, are available on the SEC's website or upon request.
(g) Investment made with cash collateral received from securities on loan.
Affiliated Central Funds
Information regarding fiscal year to date income earned by the Fund from investments in Fidelity Central Funds is as follows:
| Fund | Income earned |
| Fidelity Cash Central Fund | $948 |
| Fidelity Securities Lending Cash Central Fund | 1,181 |
| Total | $2,129 |
Amounts in the income column in the above table include any capital gain distributions from underlying funds, which are presented in the corresponding line-item in the Statement of Operations, if applicable. Amount for Fidelity Securities Lending Cash Central Fund represents the income earned on investing cash collateral, less rebates paid to borrowers and any lending agent fees associated with the loan, plus any premium payments received for lending certain types of securities.
Fiscal year to date information regarding the Fund's investments in Fidelity Central Funds, including the ownership percentage, is presented below.
| Fund | Value, beginning of period | Purchases | Sales Proceeds | Realized Gain/Loss | Change in Unrealized appreciation (depreciation) | Value, end of period | % ownership, end of period |
| Fidelity Cash Central Fund 0.06% | $2,485,739 | $29,489,581 | $28,617,151 | $127 | $(249) | $3,358,047 | 0.0% |
| Fidelity Securities Lending Cash Central Fund 0.06% | 54,474 | 3,381,365 | 3,364,986 | -- | -- | 70,853 | 0.0% |
| Total | $2,540,213 | $32,870,946 | $31,982,137 | $127 | $(249) | $3,428,900 | |
Investment Valuation
The following is a summary of the inputs used, as of July 31, 2021, involving the Fund's assets and liabilities carried at fair value. The inputs or methodology used for valuing securities may not be an indication of the risk associated with investing in those securities. For more information on valuation inputs, and their aggregation into the levels used below, please refer to the Investment Valuation section in the accompanying Notes to Financial Statements.
| | Valuation Inputs at Reporting Date: |
| Description | Total | Level 1 | Level 2 | Level 3 |
| Investments in Securities: | | | | |
| Equities: | | | | |
| Communication Services | $1,150,981 | $1,037,455 | $113,526 | $-- |
| Consumer Discretionary | 7,542,017 | 7,518,213 | 23,804 | -- |
| Consumer Staples | 1,674,974 | 1,674,958 | -- | 16 |
| Energy | 3,311,610 | 3,005,657 | 305,578 | 375 |
| Financials | 6,566,310 | 6,541,511 | 24,799 | -- |
| Health Care | 7,121,583 | 7,063,842 | 57,741 | -- |
| Industrials | 4,025,177 | 2,504,710 | 1,520,467 | -- |
| Information Technology | 2,073,376 | 1,951,485 | 121,891 | -- |
| Materials | 1,428,554 | 1,408,203 | 20,351 | -- |
| Real Estate | 36,037 | 36,037 | -- | -- |
| Utilities | 899,609 | 899,609 | -- | -- |
| Corporate Bonds | 1,000 | -- | -- | 1,000 |
| Money Market Funds | 3,428,900 | 3,428,900 | -- | -- |
| Total Investments in Securities: | $39,260,128 | $37,070,580 | $2,188,157 | $1,391 |
Other Information
Distribution of investments by country or territory of incorporation, as a percentage of Total Net Assets, is as follows (Unaudited):
| United States of America | 59.1% |
| Japan | 13.6% |
| United Kingdom | 4.3% |
| Korea (South) | 3.7% |
| Canada | 2.8% |
| France | 2.0% |
| China | 1.7% |
| Cayman Islands | 1.5% |
| India | 1.4% |
| British Virgin Islands | 1.4% |
| Netherlands | 1.4% |
| Ireland | 1.0% |
| Others (Individually Less Than 1%) | 6.1% |
| | 100.0% |
See accompanying notes which are an integral part of the financial statements.
Financial Statements
Statement of Assets and Liabilities
| | | July 31, 2021 |
| Assets | | |
Investment in securities, at value (including securities loaned of $66,723) — See accompanying schedule:
Unaffiliated issuers (cost $26,192,086) | $35,831,228 | |
| Fidelity Central Funds (cost $3,428,900) | 3,428,900 | |
| Total Investment in Securities (cost $29,620,986) | | $39,260,128 |
| Cash | | 16,565 |
| Foreign currency held at value (cost $39,639) | | 40,145 |
| Receivable for investments sold | | 22,350 |
| Receivable for fund shares sold | | 32,943 |
| Dividends receivable | | 25,803 |
| Interest receivable | | 5 |
| Distributions receivable from Fidelity Central Funds | | 209 |
| Other receivables | | 2,646 |
| Total assets | | 39,400,794 |
| Liabilities | | |
| Payable for investments purchased | $18,791 | |
| Payable for fund shares redeemed | 7,775 | |
| Other payables and accrued expenses | 24,321 | |
| Collateral on securities loaned | 70,840 | |
| Total liabilities | | 121,727 |
| Net Assets | | $39,279,067 |
| Net Assets consist of: | | |
| Paid in capital | | $23,224,518 |
| Total accumulated earnings (loss) | | 16,054,549 |
| Net Assets | | $39,279,067 |
| Net Asset Value, offering price and redemption price per share ($39,279,067 ÷ 2,145,862 shares) | | $18.30 |
See accompanying notes which are an integral part of the financial statements.
Statement of Operations
| | | Year ended July 31, 2021 |
| Investment Income | | |
| Dividends | | $734,661 |
| Interest | | 55 |
| Income from Fidelity Central Funds (including $1,181 from security lending) | | 2,129 |
| Total income | | 736,845 |
| Expenses | | |
| Independent trustees' fees and expenses | $146 | |
| Miscellaneous | 14 | |
| Total expenses before reductions | 160 | |
| Expense reductions | (3) | |
| Total expenses after reductions | | 157 |
| Net investment income (loss) | | 736,688 |
| Realized and Unrealized Gain (Loss) | | |
| Net realized gain (loss) on: | | |
| Investment securities: | | |
| Unaffiliated issuers (net of foreign taxes of $6,324) | 8,532,627 | |
| Fidelity Central Funds | 127 | |
| Foreign currency transactions | (4,948) | |
| Total net realized gain (loss) | | 8,527,806 |
| Change in net unrealized appreciation (depreciation) on: | | |
| Investment securities: | | |
| Unaffiliated issuers (net of increase in deferred foreign taxes of $21,271) | 9,404,149 | |
| Fidelity Central Funds | (249) | |
| Assets and liabilities in foreign currencies | 2,622 | |
| Total change in net unrealized appreciation (depreciation) | | 9,406,522 |
| Net gain (loss) | | 17,934,328 |
| Net increase (decrease) in net assets resulting from operations | | $18,671,016 |
See accompanying notes which are an integral part of the financial statements.
Statement of Changes in Net Assets
| | Year ended July 31, 2021 | Year ended July 31, 2020 |
| Increase (Decrease) in Net Assets | | |
| Operations | | |
| Net investment income (loss) | $736,688 | $423,997 |
| Net realized gain (loss) | 8,527,806 | (343,193) |
| Change in net unrealized appreciation (depreciation) | 9,406,522 | 284,356 |
| Net increase (decrease) in net assets resulting from operations | 18,671,016 | 365,160 |
| Distributions to shareholders | (597,794) | (475,154) |
| Share transactions | | |
| Proceeds from sales of shares | 20,223,662 | 17,387,666 |
| Reinvestment of distributions | 597,794 | 475,154 |
| Cost of shares redeemed | (24,091,460) | (9,731,174) |
| Net increase (decrease) in net assets resulting from share transactions | (3,270,004) | 8,131,646 |
| Total increase (decrease) in net assets | 14,803,218 | 8,021,652 |
| Net Assets | | |
| Beginning of period | 24,475,849 | 16,454,197 |
| End of period | $39,279,067 | $24,475,849 |
| Other Information | | |
| Shares | | |
| Sold | 1,411,118 | 1,657,408 |
| Issued in reinvestment of distributions | 48,525 | 41,842 |
| Redeemed | (1,572,590) | (907,259) |
| Net increase (decrease) | (112,947) | 791,991 |
See accompanying notes which are an integral part of the financial statements.
Financial Highlights
Fidelity Flex Intrinsic Opportunities Fund
| | | | | | |
| Years ended July 31, | 2021 | 2020 | 2019 | 2018 | 2017 A |
| Selected Per–Share Data | | | | | |
| Net asset value, beginning of period | $10.84 | $11.22 | $12.26 | $10.84 | $10.00 |
| Income from Investment Operations | | | | | |
| Net investment income (loss)B | .31 | .26 | .30 | .26 | .08 |
| Net realized and unrealized gain (loss) | 7.40 | (.25) | (1.01) | 1.34 | .76 |
| Total from investment operations | 7.71 | .01 | (.71) | 1.60 | .84 |
| Distributions from net investment income | (.25) | (.28) | (.28) | (.13) | – |
| Distributions from net realized gain | – | (.11) | (.05) | (.05) | – |
| Total distributions | (.25) | (.39) | (.33) | (.18) | – |
| Net asset value, end of period | $18.30 | $10.84 | $11.22 | $12.26 | $10.84 |
| Total ReturnC,D | 72.26% | (.07)% | (5.84)% | 14.86% | 8.40% |
| Ratios to Average Net AssetsE,F | | | | | |
| Expenses before reductions | - %G | .01% | - %G | - %G | - %G,H |
| Expenses net of fee waivers, if anyG | -% | -% | -% | -% | - %H |
| Expenses net of all reductionsG | -% | -% | -% | -% | - %H |
| Net investment income (loss) | 2.02% | 2.45% | 2.56% | 2.21% | 1.97%H |
| Supplemental Data | | | | | |
| Net assets, end of period (000 omitted) | $39,279 | $24,476 | $16,454 | $30,637 | $8,025 |
| Portfolio turnover rateI | 78% | 33% | 27% | 6% | 9%J |
A For the period March 8, 2017 (commencement of operations) to July 31, 2017.
B Calculated based on average shares outstanding during the period.
C Total returns for periods of less than one year are not annualized.
D Total returns would have been lower if certain expenses had not been reduced during the applicable periods shown.
E Fees and expenses of any underlying mutual funds or exchange-traded funds (ETFs) are not included in the Fund's expense ratio. The Fund indirectly bears its proportionate share of these expenses. For additional expense information related to investments in Fidelity Central Funds, please refer to the "Investments in Fidelity Central Funds" note found in the Notes to Financial Statements section of the most recent Annual or Semi-Annual report.
F Expense ratios reflect operating expenses of the class. Expenses before reductions do not reflect amounts reimbursed, waived, or reduced through arrangements with the investment advisor, brokerage services, or other offset arrangements, if applicable, and do not represent the amount paid by the class during periods when reimbursements, waivers or reductions occur.
G Amount represents less than .005%.
H Annualized
I Amount does not include the portfolio activity of any underlying mutual funds or exchange-traded funds (ETFs).
J Amount not annualized.
See accompanying notes which are an integral part of the financial statements.
Notes to Financial Statements
For the period ended July 31, 2021
1. Organization.
Fidelity Flex Intrinsic Opportunities Fund (the Fund) is a fund of Fidelity Puritan Trust (the Trust) and is authorized to issue an unlimited number of shares. Share transactions on the Statement of Changes in Net Assets may contain exchanges between affiliated funds. The Trust is registered under the Investment Company Act of 1940, as amended (the 1940 Act), as an open-end management investment company organized as a Massachusetts business trust. The Fund is available only to certain fee-based accounts and advisory programs offered by Fidelity.
2. Investments in Fidelity Central Funds.
Funds may invest in Fidelity Central Funds, which are open-end investment companies generally available only to other investment companies and accounts managed by the investment adviser and its affiliates. The Schedule of Investments lists any Fidelity Central Funds held as an investment as of period end, but does not include the underlying holdings of each Fidelity Central Fund. An investing fund indirectly bears its proportionate share of the expenses of the underlying Fidelity Central Funds.
Based on its investment objective, each Fidelity Central Fund may invest or participate in various investment vehicles or strategies that are similar to those of the investing fund. These strategies are consistent with the investment objectives of the investing fund and may involve certain economic risks which may cause a decline in value of each of the Fidelity Central Funds and thus a decline in the value of the investing fund.
| Fidelity Central Fund | Investment Manager | Investment Objective | Investment Practices | Expense Ratio(a) |
| Fidelity Money Market Central Funds | Fidelity Management & Research Company LLC (FMR) | Each fund seeks to obtain a high level of current income consistent with the preservation of capital and liquidity. | Short-term Investments | Less than .005% to .01% |
(a) Expenses expressed as a percentage of average net assets and are as of each underlying Central Fund's most recent annual or semi-annual shareholder report.
A complete unaudited list of holdings for each Fidelity Central Fund is available upon request or at the Securities and Exchange Commission website at www.sec.gov. In addition, the financial statements of the Fidelity Central Funds which contain the significant accounting policies (including investment valuation policies) of those funds, and are not covered by the Report of Independent Registered Public Accounting Firm, are available on the Securities and Exchange Commission website or upon request.
3. Significant Accounting Policies.
The Fund is an investment company and applies the accounting and reporting guidance of the Financial Accounting Standards Board (FASB) Accounting Standards Codification Topic 946 Financial Services - Investment Companies. The financial statements have been prepared in conformity with accounting principles generally accepted in the United States of America (GAAP), which require management to make certain estimates and assumptions at the date of the financial statements. Actual results could differ from those estimates. Subsequent events, if any, through the date that the financial statements were issued have been evaluated in the preparation of the financial statements. The Fund's Schedule of Investments lists any underlying mutual funds or exchange-traded funds (ETFs) but does not include the underlying holdings of these funds. The following summarizes the significant accounting policies of the Fund:
Investment Valuation. Investments are valued as of 4:00 p.m. Eastern time on the last calendar day of the period. The Board of Trustees (the Board) has delegated the day to day responsibility for the valuation of the Fund's investments to the Fair Value Committee (the Committee) established by the Fund's investment adviser. In accordance with valuation policies and procedures approved by the Board, the Fund attempts to obtain prices from one or more third party pricing vendors or brokers to value its investments. When current market prices, quotations or currency exchange rates are not readily available or reliable, investments will be fair valued in good faith by the Committee, in accordance with procedures adopted by the Board. Factors used in determining fair value vary by investment type and may include market or investment specific events, changes in interest rates and credit quality. The frequency with which these procedures are used cannot be predicted and they may be utilized to a significant extent. The Committee oversees the Fund's valuation policies and procedures and reports to the Board on the Committee's activities and fair value determinations. The Board monitors the appropriateness of the procedures used in valuing the Fund's investments and ratifies the fair value determinations of the Committee.
The Fund categorizes the inputs to valuation techniques used to value its investments into a disclosure hierarchy consisting of three levels as shown below:
- Level 1 – quoted prices in active markets for identical investments
- Level 2 – other significant observable inputs (including quoted prices for similar investments, interest rates, prepayment speeds, etc.)
- Level 3 – unobservable inputs (including the Fund's own assumptions based on the best information available)
Valuation techniques used to value the Fund's investments by major category are as follows:
Equity securities, including restricted securities, for which market quotations are readily available, are valued at the last reported sale price or official closing price as reported by a third party pricing vendor on the primary market or exchange on which they are traded and are categorized as Level 1 in the hierarchy. In the event there were no sales during the day or closing prices are not available, securities are valued at the last quoted bid price or may be valued using the last available price and are generally categorized as Level 2 in the hierarchy. For foreign equity securities, when market or security specific events arise, comparisons to the valuation of American Depositary Receipts (ADRs), futures contracts, ETFs and certain indexes as well as quoted prices for similar securities may be used and would be categorized as Level 2 in the hierarchy. For equity securities, including restricted securities, where observable inputs are limited, assumptions about market activity and risk are used and these securities may be categorized as Level 3 in the hierarchy.
Debt securities, including restricted securities, are valued based on evaluated prices received from third party pricing vendors or from brokers who make markets in such securities. Corporate bonds are valued by pricing vendors who utilize matrix pricing which considers yield or price of bonds of comparable quality, coupon, maturity and type or by broker-supplied prices. When independent prices are unavailable or unreliable, debt securities may be valued utilizing pricing methodologies which consider similar factors that would be used by third party pricing vendors. Debt securities are generally categorized as Level 2 in the hierarchy but may be Level 3 depending on the circumstances.
Investments in open-end mutual funds, including the Fidelity Central Funds, are valued at their closing net asset value (NAV) each business day and are categorized as Level 1 in the hierarchy.
Changes in valuation techniques may result in transfers in or out of an assigned level within the disclosure hierarchy. The aggregate value of investments by input level as of July 31, 2021 is included at the end of the Fund's Schedule of Investments.
Foreign Currency. Certain Funds may use foreign currency contracts to facilitate transactions in foreign-denominated securities. Gains and losses from these transactions may arise from changes in the value of the foreign currency or if the counterparties do not perform under the contracts' terms.
Foreign-denominated assets, including investment securities, and liabilities are translated into U.S. dollars at the exchange rates at period end. Purchases and sales of investment securities, income and dividends received, and expenses denominated in foreign currencies are translated into U.S. dollars at the exchange rate in effect on the transaction date.
The effects of exchange rate fluctuations on investments are included with the net realized and unrealized gain (loss) on investment securities. Other foreign currency transactions resulting in realized and unrealized gain (loss) are disclosed separately.
Investment Transactions and Income. For financial reporting purposes, the Fund's investment holdings and NAV include trades executed through the end of the last business day of the period. The NAV per share for processing shareholder transactions is calculated as of the close of business of the New York Stock Exchange (NYSE), normally 4:00 p.m. Eastern time and includes trades executed through the end of the prior business day. Gains and losses on securities sold are determined on the basis of identified cost. Dividend income is recorded on the ex-dividend date, except for certain dividends from foreign securities where the ex-dividend date may have passed, which are recorded as soon as the Fund is informed of the ex-dividend date. Non-cash dividends included in dividend income, if any, are recorded at the fair market value of the securities received. Income and capital gain distributions from Fidelity Central Funds, if any, are recorded on the ex-dividend date. Interest income is accrued as earned and includes coupon interest and amortization of premium and accretion of discount on debt securities as applicable. Investment income is recorded net of foreign taxes withheld where recovery of such taxes is uncertain.
Expenses. Expenses directly attributable to a fund are charged to that fund. Expenses attributable to more than one fund are allocated among the respective funds on the basis of relative net assets or other appropriate methods. Expenses included in the accompanying financial statements reflect the expenses of that fund and do not include any expenses associated with any underlying mutual funds or exchange-traded funds. Although not included in a fund's expenses, a fund indirectly bears its proportionate share of these expenses through the net asset value of each underlying mutual fund or exchange-traded fund. Expense estimates are accrued in the period to which they relate and adjustments are made when actual amounts are known.
Income Tax Information and Distributions to Shareholders. Each year, the Fund intends to qualify as a regulated investment company under Subchapter M of the Internal Revenue Code, including distributing substantially all of its taxable income and realized gains. As a result, no provision for U.S. Federal income taxes is required. As of July 31, 2021, the Fund did not have any unrecognized tax benefits in the financial statements; nor is the Fund aware of any tax positions for which it is reasonably possible that the total amounts of unrecognized tax benefits will significantly change in the next twelve months. The Fund files a U.S. federal tax return, in addition to state and local tax returns as required. The Fund's federal income tax returns are subject to examination by the Internal Revenue Service (IRS) for a period of three fiscal years after they are filed. State and local tax returns may be subject to examination for an additional fiscal year depending on the jurisdiction. Foreign taxes are provided for based on the Fund's understanding of the tax rules and rates that exist in the foreign markets in which it invests. The Fund is subject to a tax imposed on capital gains by certain countries in which it invests. An estimated deferred tax liability for net unrealized appreciation on the applicable securities is included in Other payables and accrued expenses on the Statement of Assets & Liabilities.
Distributions are declared and recorded on the ex-dividend date. Income and capital gain distributions are determined in accordance with income tax regulations, which may differ from GAAP. In addition, the Fund claimed a portion of the payment made to redeeming shareholders as a distribution for income tax purposes.
Capital accounts within the financial statements are adjusted for permanent book-tax differences. These adjustments have no impact on net assets or the results of operations. Capital accounts are not adjusted for temporary book-tax differences which will reverse in a subsequent period.
Book-tax differences are primarily due to foreign currency transactions, certain foreign taxes, passive foreign investment companies (PFIC), partnerships, capital loss carryforwards and losses deferred due to wash sales.
As of period end, the cost and unrealized appreciation (depreciation) in securities, and derivatives if applicable, for federal income tax purposes were as follows:
| Gross unrealized appreciation | $10,370,866 |
| Gross unrealized depreciation | (980,580) |
| Net unrealized appreciation (depreciation) | $9,390,286 |
| Tax Cost | $29,869,842 |
The tax-based components of distributable earnings as of period end were as follows:
| Undistributed ordinary income | $2,623,648 |
| Undistributed long-term capital gain | $4,059,301 |
| Net unrealized appreciation (depreciation) on securities and other investments | $9,392,872 |
The tax character of distributions paid was as follows:
| | July 31, 2021 | July 31, 2020 |
| Ordinary Income | $597,794 | $ 331,484 |
| Long-term Capital Gains | – | 143,670 |
| Total | $597,794 | $ 475,154 |
Restricted Securities (including Private Placements). Funds may invest in securities that are subject to legal or contractual restrictions on resale. These securities generally may be resold in transactions exempt from registration or to the public if the securities are registered. Disposal of these securities may involve time-consuming negotiations and expense, and prompt sale at an acceptable price may be difficult. Information regarding restricted securities held at period end is included at the end of the Schedule of Investments, if applicable.
4. Purchases and Sales of Investments.
Purchases and sales of securities, other than short-term securities and in-kind transactions, as applicable, are noted in the table below.
| | Purchases ($) | Sales ($) |
| Fidelity Flex Intrinsic Opportunities Fund | 26,606,081 | 30,597,686 |
5. Fees and Other Transactions with Affiliates.
Management Fee. Fidelity Management & Research Company LLC (the investment adviser) and its affiliates provide the Fund with investment management related services and the Fund does not pay any fees for these services. Under the management contract, the investment adviser or an affiliate pays all other expenses of the Fund, excluding fees and expenses of the independent Trustees, and certain miscellaneous expenses such as proxy and shareholder meeting expenses.
Brokerage Commissions. A portion of portfolio transactions were placed with brokerage firms which are affiliates of the investment adviser. Brokerage commissions are included in net realized gain (loss) and change in net unrealized appreciation (depreciation) in the Statement of Operations. The commissions paid to these affiliated firms were as follows:
| | Amount |
| Fidelity Flex Intrinsic Opportunities Fund | $389 |
Interfund Trades. Funds may purchase from or sell securities to other Fidelity Funds under procedures adopted by the Board. The procedures have been designed to ensure these interfund trades are executed in accordance with Rule 17a-7 of the 1940 Act. Any interfund trades are included within the respective purchases and sales amounts shown in the Purchases and Sales of Investments note and are noted in the table below.
| | Purchases ($) | Sales ($) |
| Fidelity Flex Intrinsic Opportunities Fund | 416,276 | 938,787 |
6. Committed Line of Credit.
Certain Funds participate with other funds managed by the investment adviser or an affiliate in a $4.25 billion credit facility (the "line of credit") to be utilized for temporary or emergency purposes to fund shareholder redemptions or for other short-term liquidity purposes. The participating funds have agreed to pay commitment fees on their pro-rata portion of the line of credit, which are reflected in Miscellaneous expenses on the Statement of Operations, and are listed below. Effective during January 2021, commitment fees are borne by the investment adviser. During the period, there were no borrowings on this line of credit.
| | Amount |
| Fidelity Flex Intrinsic Opportunities Fund | $14 |
7. Security Lending.
Funds lend portfolio securities through a lending agent from time to time in order to earn additional income. A fund may lend securities to certain qualified borrowers, including NFS. On the settlement date of the loan, a fund receives collateral (in the form of U.S. Treasury obligations, letters of credit and/or cash) against the loaned securities and maintains collateral in an amount not less than 100% of the market value of the loaned securities during the period of the loan. The market value of the loaned securities is determined at the close of business of a fund and any additional required collateral is delivered to a fund on the next business day. The Fund or borrower may terminate the loan at any time, and if the borrower defaults on its obligation to return the securities loaned because of insolvency or other reasons, a fund may apply collateral received from the borrower against the obligation. A fund may experience delays and costs in recovering the securities loaned. Any cash collateral received is invested in the Fidelity Securities Lending Cash Central Fund. Any loaned securities are identified as such in the Schedule of Investments, and the value of loaned securities and cash collateral at period end, as applicable, are presented in the Statement of Assets and Liabilities. Security lending income represents the income earned on investing cash collateral, less rebates paid to borrowers and any lending agent fees associated with the loan, plus any premium payments received for lending certain types of securities. Security lending income is presented in the Statement of Operations as a component of income from Fidelity Central Funds.
| | Security Lending Income From Securities Loaned to NFS | Value of Securities Loaned to NFS at Period End |
| Fidelity Flex Intrinsic Opportunities Fund | $– | $– |
8. Expense Reductions.
Through arrangements with the Fund's custodian, credits realized as a result of certain uninvested cash balances were used to reduce the Fund's expenses by $3.
9. Other.
Fund's organizational documents provide former and current trustees and officers with a limited indemnification against liabilities arising in connection with the performance of their duties to the fund. In the normal course of business, the fund may also enter into contracts that provide general indemnifications. The fund's maximum exposure under these arrangements is unknown as this would be dependent on future claims that may be made against the fund. The risk of material loss from such claims is considered remote.
At the end of the period, the investment adviser or its affiliates were owners of record of more than 10% of the outstanding shares as follows:
| Fund | Affiliated % |
| Fidelity Flex Intrinsic Opportunities Fund | 26% |
10. Coronavirus (COVID-19) Pandemic.
An outbreak of COVID-19 first detected in China during December 2019 has since spread globally and was declared a pandemic by the World Health Organization during March 2020. Developments that disrupt global economies and financial markets, such as the COVID-19 pandemic, may magnify factors that affect the Fund's performance.
Report of Independent Registered Public Accounting Firm
To the Board of Trustees of Fidelity Puritan Trust and Shareholders of Fidelity Flex Intrinsic Opportunities Fund
Opinion on the Financial Statements and Financial Highlights
We have audited the accompanying statement of assets and liabilities of Fidelity Flex Intrinsic Opportunities Fund (the "Fund"), a fund of Fidelity Puritan Trust, including the schedule of investments, as of July 31, 2021, the related statement of operations for the year then ended, the statement of changes in net assets for each of the two years in the period then ended, the financial highlights for each of the four years in the period then ended and for the period from March 8, 2017 (commencement of operations) through July 31, 2017, and the related notes. In our opinion, the financial statements and financial highlights present fairly, in all material respects, the financial position of the Fund as of July 31, 2021, and the results of its operations for the year then ended, the changes in its net assets for each of the two years in the period then ended, and the financial highlights for each of the four years in the period then ended and for the period from March 8, 2017 (commencement of operations) through July 31, 2017 in conformity with accounting principles generally accepted in the United States of America.
Basis for Opinion
These financial statements and financial highlights are the responsibility of the Fund's management. Our responsibility is to express an opinion on the Fund's financial statements and financial highlights based on our audits. We are a public accounting firm registered with the Public Company Accounting Oversight Board (United States) (PCAOB) and are required to be independent with respect to the Fund in accordance with the U.S. federal securities laws and the applicable rules and regulations of the Securities and Exchange Commission and the PCAOB.
We conducted our audits in accordance with the standards of the PCAOB. Those standards require that we plan and perform the audit to obtain reasonable assurance about whether the financial statements and financial highlights are free of material misstatement, whether due to error or fraud. The Fund is not required to have, nor were we engaged to perform, an audit of its internal control over financial reporting. As part of our audits we are required to obtain an understanding of internal control over financial reporting but not for the purpose of expressing an opinion on the effectiveness of the Fund’s internal control over financial reporting. Accordingly, we express no such opinion.
Our audits included performing procedures to assess the risks of material misstatement of the financial statements and financial highlights, whether due to error or fraud, and performing procedures that respond to those risks. Such procedures included examining, on a test basis, evidence regarding the amounts and disclosures in the financial statements and financial highlights. Our audits also included evaluating the accounting principles used and significant estimates made by management, as well as evaluating the overall presentation of the financial statements and financial highlights. Our procedures included confirmation of securities owned as of July 31, 2021, by correspondence with the custodian and brokers; when replies were not received from brokers, we performed other auditing procedures. We believe that our audits provide a reasonable basis for our opinion.
/s/ Deloitte & Touche LLP
Boston, Massachusetts
September 10, 2021
We have served as the auditor of one or more of the Fidelity investment companies since 1999.
Trustees and Officers
The Trustees, Members of the Advisory Board (if any), and officers of the trust and fund, as applicable, are listed below. The Board of Trustees governs the fund and is responsible for protecting the interests of shareholders. The Trustees are experienced executives who meet periodically throughout the year to oversee the fund's activities, review contractual arrangements with companies that provide services to the fund, oversee management of the risks associated with such activities and contractual arrangements, and review the fund's performance. Except for Jonathan Chiel, each of the Trustees oversees 314 funds. Mr. Chiel oversees 176 funds.
The Trustees hold office without limit in time except that (a) any Trustee may resign; (b) any Trustee may be removed by written instrument, signed by at least two-thirds of the number of Trustees prior to such removal; (c) any Trustee who requests to be retired or who has become incapacitated by illness or injury may be retired by written instrument signed by a majority of the other Trustees; and (d) any Trustee may be removed at any special meeting of shareholders by a two-thirds vote of the outstanding voting securities of the trust. Each Trustee who is not an interested person (as defined in the 1940 Act) of the trust and the fund is referred to herein as an Independent Trustee. Each Independent Trustee shall retire not later than the last day of the calendar year in which his or her 75th birthday occurs. The Independent Trustees may waive this mandatory retirement age policy with respect to individual Trustees. Officers and Advisory Board Members hold office without limit in time, except that any officer or Advisory Board Member may resign or may be removed by a vote of a majority of the Trustees at any regular meeting or any special meeting of the Trustees. Except as indicated, each individual has held the office shown or other offices in the same company for the past five years.
The fund’s Statement of Additional Information (SAI) includes more information about the Trustees. To request a free copy, call Fidelity at 1-800-544-3455 (for managed account clients) or 1-800-835-5092 (for retirement plan participants).
Experience, Skills, Attributes, and Qualifications of the Trustees. The Governance and Nominating Committee has adopted a statement of policy that describes the experience, qualifications, attributes, and skills that are necessary and desirable for potential Independent Trustee candidates (Statement of Policy). The Board believes that each Trustee satisfied at the time he or she was initially elected or appointed a Trustee, and continues to satisfy, the standards contemplated by the Statement of Policy. The Governance and Nominating Committee also engages professional search firms to help identify potential Independent Trustee candidates who have the experience, qualifications, attributes, and skills consistent with the Statement of Policy. From time to time, additional criteria based on the composition and skills of the current Independent Trustees, as well as experience or skills that may be appropriate in light of future changes to board composition, business conditions, and regulatory or other developments, have also been considered by the professional search firms and the Governance and Nominating Committee. In addition, the Board takes into account the Trustees' commitment and participation in Board and committee meetings, as well as their leadership of standing and ad hoc committees throughout their tenure.
In determining that a particular Trustee was and continues to be qualified to serve as a Trustee, the Board has considered a variety of criteria, none of which, in isolation, was controlling. The Board believes that, collectively, the Trustees have balanced and diverse experience, qualifications, attributes, and skills, which allow the Board to operate effectively in governing the fund and protecting the interests of shareholders. Information about the specific experience, skills, attributes, and qualifications of each Trustee, which in each case led to the Board's conclusion that the Trustee should serve (or continue to serve) as a trustee of the fund, is provided below.
Board Structure and Oversight Function. Robert A. Lawrence is an interested person and currently serves as Acting Chairman. The Trustees have determined that an interested Chairman is appropriate and benefits shareholders because an interested Chairman has a personal and professional stake in the quality and continuity of services provided to the fund. Independent Trustees exercise their informed business judgment to appoint an individual of their choosing to serve as Chairman, regardless of whether the Trustee happens to be independent or a member of management. The Independent Trustees have determined that they can act independently and effectively without having an Independent Trustee serve as Chairman and that a key structural component for assuring that they are in a position to do so is for the Independent Trustees to constitute a substantial majority for the Board. The Independent Trustees also regularly meet in executive session. David M. Thomas serves as Lead Independent Trustee and as such (i) acts as a liaison between the Independent Trustees and management with respect to matters important to the Independent Trustees and (ii) with management prepares agendas for Board meetings.
Fidelity® funds are overseen by different Boards of Trustees. The fund's Board oversees Fidelity's high income and certain equity funds, and other Boards oversee Fidelity's investment-grade bond, money market, asset allocation, and other equity funds. The asset allocation funds may invest in Fidelity® funds overseen by the fund's Board. The use of separate Boards, each with its own committee structure, allows the Trustees of each group of Fidelity® funds to focus on the unique issues of the funds they oversee, including common research, investment, and operational issues. On occasion, the separate Boards establish joint committees to address issues of overlapping consequences for the Fidelity® funds overseen by each Board.
The Trustees operate using a system of committees to facilitate the timely and efficient consideration of all matters of importance to the Trustees, the fund, and fund shareholders and to facilitate compliance with legal and regulatory requirements and oversight of the fund's activities and associated risks. The Board, acting through its committees, has charged FMR and its affiliates with (i) identifying events or circumstances the occurrence of which could have demonstrably adverse effects on the fund's business and/or reputation; (ii) implementing processes and controls to lessen the possibility that such events or circumstances occur or to mitigate the effects of such events or circumstances if they do occur; and (iii) creating and maintaining a system designed to evaluate continuously business and market conditions in order to facilitate the identification and implementation processes described in (i) and (ii) above. Because the day-to-day operations and activities of the fund are carried out by or through FMR, its affiliates, and other service providers, the fund's exposure to risks is mitigated but not eliminated by the processes overseen by the Trustees. While each of the Board's committees has responsibility for overseeing different aspects of the fund's activities, oversight is exercised primarily through the Operations, Audit, and Compliance Committees. Appropriate personnel, including but not limited to the fund's Chief Compliance Officer (CCO), FMR's internal auditor, the independent accountants, the fund's Treasurer and portfolio management personnel, make periodic reports to the Board's committees, as appropriate, including an annual review of Fidelity's risk management program for the Fidelity® funds. The responsibilities of each standing committee, including their oversight responsibilities, are described further under "Standing Committees of the Trustees."
Interested Trustees*:
Correspondence intended for a Trustee who is an interested person may be sent to Fidelity Investments, 245 Summer Street, Boston, Massachusetts 02210.
Name, Year of Birth; Principal Occupations and Other Relevant Experience+
Jonathan Chiel (1957)
Year of Election or Appointment: 2016
Trustee
Mr. Chiel also serves as Trustee of other Fidelity® funds. Mr. Chiel is Executive Vice President and General Counsel for FMR LLC (diversified financial services company, 2012-present). Previously, Mr. Chiel served as general counsel (2004-2012) and senior vice president and deputy general counsel (2000-2004) for John Hancock Financial Services; a partner with Choate, Hall & Stewart (1996-2000) (law firm); and an Assistant United States Attorney for the United States Attorney’s Office of the District of Massachusetts (1986-95), including Chief of the Criminal Division (1993-1995). Mr. Chiel is a director on the boards of the Boston Bar Foundation and the Maimonides School.
Bettina Doulton (1964)
Year of Election or Appointment: 2021
Trustee
Ms. Doulton also serves as Trustee of other Fidelity® funds. Prior to her retirement, Ms. Doulton served in a variety of positions at Fidelity Investments, including as a managing director of research (2006-2007), portfolio manager to certain Fidelity® funds (1993-2005), equity analyst and portfolio assistant (1990-1993), and research assistant (1987-1990). Ms. Doulton currently owns and operates Phi Builders + Architects and Cellardoor Winery. Previously, Ms. Doulton served as a member of the Board of Brown Capital Management, LLC (2014-2018).
Robert A. Lawrence (1952)
Year of Election or Appointment: 2020
Trustee
Acting Chairman of the Board of Trustees
Mr. Lawrence also serves as Trustee of other funds. Previously, Mr. Lawrence served as a Member of the Advisory Board of certain funds. Prior to his retirement in 2008, Mr. Lawrence served as Vice President of certain Fidelity® funds (2006-2008), Senior Vice President, Head of High Income Division of Fidelity Management & Research Company (investment adviser firm, 2006-2008), and President of Fidelity Strategic Investments (investment adviser firm, 2002-2005).
* Determined to be an “Interested Trustee” by virtue of, among other things, his or her affiliation with the trust or various entities under common control with FMR.
+ The information includes the Trustee's principal occupation during the last five years and other information relating to the experience, attributes, and skills relevant to the Trustee's qualifications to serve as a Trustee, which led to the conclusion that the Trustee should serve as a Trustee for the fund.
Independent Trustees:
Correspondence intended for an Independent Trustee may be sent to Fidelity Investments, P.O. Box 55235, Boston, Massachusetts 02205-5235.
Name, Year of Birth; Principal Occupations and Other Relevant Experience+
Thomas P. Bostick (1956)
Year of Election or Appointment: 2021
Trustee
Lieutenant General Bostick also serves as Trustee of other Fidelity® funds. Prior to his retirement, General Bostick (United States Army, Retired) held a variety of positions within the U.S. Army, including Commanding General and Chief of Engineers, U.S. Army Corps of Engineers (2012-2016) and Deputy Chief of Staff and Director of Human Resources, U.S. Army (2009-2012). General Bostick currently serves as a member of the Board and Finance and Governance Committees of CSX Corporation (transportation, 2020-present) and a member of the Board and Corporate Governance and Nominating Committee of Perma-Fix Environmental Services, Inc. (nuclear waste management, 2020-present). General Bostick serves as Chief Executive Officer of Bostick Global Strategies, LLC (consulting, 2016-present) and Managing Partner, Sustainability, of Ridge-Lane Limited Partners (strategic advisory and venture development, 2016-present). Previously, General Bostick served as a Member of the Advisory Board of certain Fidelity® funds (2021), President, Intrexon Bioengineering (2018-2020) and Chief Operating Officer (2017-2020) and Senior Vice President of the Environment Sector (2016-2017) of Intrexon Corporation (biopharmaceutical company).
Dennis J. Dirks (1948)
Year of Election or Appointment: 2005
Trustee
Mr. Dirks also serves as Trustee of other Fidelity® funds. Prior to his retirement in May 2003, Mr. Dirks served as Chief Operating Officer and as a member of the Board of The Depository Trust & Clearing Corporation (financial markets infrastructure), President, Chief Operating Officer and a member of the Board of The Depository Trust Company (DTC), President and a member of the Board of the National Securities Clearing Corporation (NSCC), Chief Executive Officer and a member of the Board of the Government Securities Clearing Corporation and Chief Executive Officer and a member of the Board of the Mortgage-Backed Securities Clearing Corporation. Mr. Dirks currently serves as a member of the Finance Committee (2016-present) and Board (2017-present) and is Treasurer (2018-present) of the Asolo Repertory Theatre.
Donald F. Donahue (1950)
Year of Election or Appointment: 2018
Trustee
Mr. Donahue also serves as Trustee of other Fidelity® funds. Mr. Donahue serves as President and Chief Executive Officer of Miranda Partners, LLC (risk consulting for the financial services industry, 2012-present). Previously, Mr. Donahue served as Chief Executive Officer (2006-2012), Chief Operating Officer (2003-2006) and Managing Director, Customer Marketing and Development (1999-2003) of The Depository Trust & Clearing Corporation (financial markets infrastructure). Mr. Donahue currently serves as a member (2007-present) and Co-Chairman (2016-present) of the Board of United Way of New York and a member of the Board of NYC Leadership Academy (2012-present). Mr. Donahue previously served as a member of the Advisory Board of certain Fidelity® funds (2015-2018).
Vicki L. Fuller (1957)
Year of Election or Appointment: 2020
Trustee
Ms. Fuller also serves as Trustee of other Fidelity® funds. Previously, Ms. Fuller served as a member of the Advisory Board of certain Fidelity® funds (2018-2020), Chief Investment Officer of the New York State Common Retirement Fund (2012-2018) and held a variety of positions at AllianceBernstein L.P. (global asset management, 1985-2012), including Managing Director (2006-2012) and Senior Vice President and Senior Portfolio Manager (2001-2006). Ms. Fuller currently serves as a member of the Board, Audit Committee and Nominating and Governance Committee of The Williams Companies, Inc. (natural gas infrastructure, 2018-present), as a member of the Board, Audit Committee and Nominating and Governance Committee of two Blackstone business development companies (2020-present) and as a member of the Board of Treliant, LLC (consulting, 2019-present).
Patricia L. Kampling (1959)
Year of Election or Appointment: 2020
Trustee
Ms. Kampling also serves as Trustee of other Fidelity® funds. Prior to her retirement, Ms. Kampling served as Chairman of the Board and Chief Executive Officer (2012-2019), President and Chief Operating Officer (2011-2012) and Executive Vice President and Chief Financial Officer (2010-2011) of Alliant Energy Corporation. Ms. Kampling currently serves as a member of the Board, Finance Committee and Governance, Compensation and Nominating Committee of Xcel Energy Inc. (utilities company, 2020-present) and as a member of the Board, Audit, Finance and Risk Committee and Safety, Environmental, Technology and Operations Committee of American Water Works Company, Inc. (utilities company, 2019-present). In addition, Ms. Kampling currently serves as a member of the Board of the Nature Conservancy, Wisconsin Chapter (2019-present). Previously, Ms. Kampling served as a Member of the Advisory Board of certain Fidelity® funds (2020), a member of the Board, Compensation Committee and Executive Committee and Chair of the Audit Committee of Briggs & Stratton Corporation (manufacturing, 2011-2021), a member of the Board of Interstate Power and Light Company (2012-2019) and Wisconsin Power and Light Company (2012-2019) (each a subsidiary of Alliant Energy Corporation) and as a member of the Board and Workforce Development Committee of the Business Roundtable (2018-2019).
Thomas A. Kennedy (1955)
Year of Election or Appointment: 2021
Trustee
Mr. Kennedy also serves as Trustee of other Fidelity® funds. Previously, Mr. Kennedy served as a Member of the Advisory Board of certain Fidelity® funds (2020) and held a variety of positions at Raytheon Company (aerospace and defense, 1983-2020), including Chairman and Chief Executive Officer (2014-2020) and Executive Vice President and Chief Operating Officer (2013-2014). Mr. Kennedy currently serves as Executive Chairman of the Board of Directors of Raytheon Technologies Corporation (aerospace and defense, 2020-present). He is also a member of the Rutgers School of Engineering Industry Advisory Board (2011-present) and a member of the UCLA Engineering Dean’s Executive Board (2016-present).
Oscar Munoz (1959)
Year of Election or Appointment: 2021
Trustee
Mr. Munoz also serves as Trustee of other Fidelity® funds. Prior to his retirement, Mr. Munoz served as Executive Chairman (2020-2021), Chief Executive Officer (2015-2020), President (2015-2016) and a member of the Board (2010-2021) of United Airlines Holdings, Inc. Mr. Munoz currently serves as a member of the Board of CBRE Group, Inc. (commercial real estate, 2020-present), a member of the Board of Univision Communications, Inc. (Hispanic media, 2020-present) and a member of the Advisory Board of Salesforce.com, Inc. (cloud-based software, 2020-present). Previously, Mr. Munoz served as a Member of the Advisory Board of certain Fidelity® funds (2021).
Garnett A. Smith (1947)
Year of Election or Appointment: 2018
Trustee
Mr. Smith also serves as Trustee of other Fidelity® funds. Prior to his retirement, Mr. Smith served as Chairman and Chief Executive Officer (1990-1997) and President (1986-1990) of Inbrand Corp. (manufacturer of personal absorbent products). Prior to his employment with Inbrand Corp., he was employed by a retail fabric chain and North Carolina National Bank (now Bank of America). Mr. Smith previously served as a member of the Advisory Board of certain Fidelity® funds (2012-2013).
David M. Thomas (1949)
Year of Election or Appointment: 2008
Trustee
Lead Independent Trustee
Mr. Thomas also serves as Trustee of other Fidelity® funds. Previously, Mr. Thomas served as Executive Chairman (2005-2006) and Chairman and Chief Executive Officer (2000-2005) of IMS Health, Inc. (pharmaceutical and healthcare information solutions). Mr. Thomas currently serves as a member of the Board of Fortune Brands Home and Security (home and security products, 2004-present) and Presiding Director (2013-present) of Interpublic Group of Companies, Inc. (marketing communication).
Susan Tomasky (1953)
Year of Election or Appointment: 2020
Trustee
Ms. Tomasky also serves as Trustee of other Fidelity® funds. Prior to her retirement, Ms. Tomasky served in various executive officer positions at American Electric Power Company, Inc. (1998-2011), including most recently as President of AEP Transmission (2007-2011). Ms. Tomasky currently serves as a member of the Board and Sustainability Committee and as Chair of the Audit Committee of Marathon Petroleum Corporation (2018-present) and as a member of the Board, Corporate Governance Committee and Organization and Compensation Committee and as Chair of the Audit Committee of Public Service Enterprise Group, Inc. (utilities company, 2012-present). In addition, Ms. Tomasky currently serves as a member (2009-present) and President (2020-present) of the Board of the Royal Shakespeare Company – America (2009-present), as a member of the Board of the Columbus Association for the Performing Arts (2011-present) and as a member of the Board and Investment Committee of Kenyon College (2016-present). Previously, Ms. Tomasky served as a Member of the Advisory Board of certain Fidelity® funds (2020), as a member of the Board of the Columbus Regional Airport Authority (2007-2020), as a member of the Board (2011-2018) and Lead Independent Director (2015-2018) of Andeavor Corporation (previously Tesoro Corporation) (independent oil refiner and marketer) and as a member of the Board of Summit Midstream Partners LP (energy, 2012-2018).
Michael E. Wiley (1950)
Year of Election or Appointment: 2020
Trustee
Mr. Wiley also serves as Trustee of other Fidelity® funds. Previously, Mr. Wiley served as a member of the Advisory Board of certain Fidelity® funds (2018-2020), Chairman, President and CEO of Baker Hughes, Inc. (oilfield services, 2000-2004). Mr. Wiley also previously served as a member of the Board of Andeavor Corporation (independent oil refiner and marketer, 2005-2018), a member of the Board of Andeavor Logistics LP (natural resources logistics, 2015-2018) and a member of the Board of High Point Resources (exploration and production, 2005-2020).
+ The information includes the Trustee's principal occupation during the last five years and other information relating to the experience, attributes, and skills relevant to the Trustee's qualifications to serve as a Trustee, which led to the conclusion that the Trustee should serve as a Trustee for the fund.
Advisory Board Members and Officers:
Correspondence intended for a Member of the Advisory Board (if any) may be sent to Fidelity Investments, P.O. Box 55235, Boston, Massachusetts 02205-5235. Correspondence intended for an officer or Peter S. Lynch may be sent to Fidelity Investments, 245 Summer Street, Boston, Massachusetts 02210. Officers appear below in alphabetical order.
Name, Year of Birth; Principal Occupation
Peter S. Lynch (1944)
Year of Election or Appointment: 2003
Member of the Advisory Board
Mr. Lynch also serves as a Member of the Advisory Board of other Fidelity® funds. Mr. Lynch is Vice Chairman and a Director of Fidelity Management & Research Company LLC (investment adviser firm). In addition, Mr. Lynch serves as a Trustee of Boston College and as the Chairman of the Inner-City Scholarship Fund. Previously, Mr. Lynch served as Vice Chairman and a Director of FMR Co., Inc. (investment adviser firm) and on the Special Olympics International Board of Directors (1997-2006).
Craig S. Brown (1977)
Year of Election or Appointment: 2019
Assistant Treasurer
Mr. Brown also serves as an officer of other funds. Mr. Brown serves as Assistant Treasurer of FIMM, LLC (2021-present) and is an employee of Fidelity Investments (2013-present).
John J. Burke III (1964)
Year of Election or Appointment: 2018
Chief Financial Officer
Mr. Burke also serves as Chief Financial Officer of other funds. Mr. Burke serves as Head of Investment Operations for Fidelity Fund and Investment Operations (2018-present) and is an employee of Fidelity Investments (1998-present). Previously Mr. Burke served as head of Asset Management Investment Operations (2012-2018).
William C. Coffey (1969)
Year of Election or Appointment: 2019
Assistant Secretary
Mr. Coffey also serves as Assistant Secretary of other funds. He is Senior Vice President and Deputy General Counsel of FMR LLC (diversified financial services company, 2010-present), and is an employee of Fidelity Investments. Previously, Mr. Coffey served as Secretary and CLO of certain funds (2018-2019); CLO, Secretary, and Senior Vice President of Fidelity Management & Research Company and FMR Co., Inc. (investment adviser firms, 2018-2019); Secretary of Fidelity SelectCo, LLC and Fidelity Investments Money Management, Inc. (investment adviser firms, 2018-2019); CLO of Fidelity Management & Research (Hong Kong) Limited, FMR Investment Management (UK) Limited, and Fidelity Management & Research (Japan) Limited (investment adviser firms, 2018-2019); and Assistant Secretary of certain funds (2009-2018).
Timothy M. Cohen (1969)
Year of Election or Appointment: 2018
Vice President
Mr. Cohen also serves as Vice President of other funds. Mr. Cohen serves as Co-Head of Equity (2018-present), a Director of Fidelity Management & Research (Japan) Limited (investment adviser firm, 2016-present), and is an employee of Fidelity Investments. Previously, Mr. Cohen served as Executive Vice President of Fidelity SelectCo, LLC (2019), Head of Global Equity Research (2016-2018), Chief Investment Officer - Equity and a Director of Fidelity Management & Research (U.K.) Inc. (investment adviser firm, 2013-2015) and as a Director of Fidelity Management & Research (Hong Kong) Limited (investment adviser firm, 2017).
Jonathan Davis (1968)
Year of Election or Appointment: 2010
Assistant Treasurer
Mr. Davis also serves as an officer of other funds. Mr. Davis serves as Assistant Treasurer of FIMM, LLC (2021-present) and FMR Capital, Inc. (2017-present) and is an employee of Fidelity Investments. Previously, Mr. Davis served as Vice President and Associate General Counsel of FMR LLC (diversified financial services company, 2003-2010).
Laura M. Del Prato (1964)
Year of Election or Appointment: 2018
Assistant Treasurer
Ms. Del Prato also serves as an officer of other funds. Ms. Del Prato serves as Assistant Treasurer of FIMM, LLC (2021-present) and is an employee of Fidelity Investments (2017-present). Previously, Ms. Del Prato served as President and Treasurer of The North Carolina Capital Management Trust: Cash Portfolio and Term Portfolio (2018-2020). Prior to joining Fidelity Investments, Ms. Del Prato served as a Managing Director and Treasurer of the JPMorgan Mutual Funds (2014-2017). Prior to JPMorgan, Ms. Del Prato served as a partner at Cohen Fund Audit Services (accounting firm, 2012-2013) and KPMG LLP (accounting firm, 2004-2012).
Colm A. Hogan (1973)
Year of Election or Appointment: 2020
Assistant Treasurer
Mr. Hogan also serves as an officer of other funds. Mr. Hogan serves as Assistant Treasurer of FIMM, LLC (2021-present) and FMR Capital, Inc. (2017-present) and is an employee of Fidelity Investments (2005-present). Previously, Mr. Hogan served as Deputy Treasurer of certain Fidelity® funds (2016-2020) and Assistant Treasurer of certain Fidelity® funds (2016-2018).
Pamela R. Holding (1964)
Year of Election or Appointment: 2018
Vice President
Ms. Holding also serves as Vice President of other funds. Ms. Holding serves as Co-Head of Equity (2018-present) and is an employee of Fidelity Investments (2013-present). Previously, Ms. Holding served as Executive Vice President of Fidelity SelectCo, LLC (2019) and as Chief Investment Officer of Fidelity Institutional Asset Management (2013-2018).
Cynthia Lo Bessette (1969)
Year of Election or Appointment: 2019
Secretary and Chief Legal Officer (CLO)
Ms. Lo Bessette also serves as an officer of other funds. Ms. Lo Bessette serves as CLO, Secretary, and Senior Vice President of Fidelity Management & Research Company LLC (investment adviser firm, 2019-present); and CLO of Fidelity Management & Research (Hong Kong) Limited, FMR Investment Management (UK) Limited, and Fidelity Management & Research (Japan) Limited (investment adviser firms, 2019-present). She is a Senior Vice President and Deputy General Counsel of FMR LLC (diversified financial services company, 2019-present), and is an employee of Fidelity Investments. Previously, Ms. Lo Bessette served as CLO, Secretary, and Senior Vice President of FMR Co., Inc. (investment adviser firm, 2019); Secretary of Fidelity SelectCo, LLC and Fidelity Investments Money Management, Inc. (investment adviser firms, 2019). Prior to joining Fidelity Investments, Ms. Lo Bessette was Executive Vice President, General Counsel (2016-2019) and Senior Vice President, Deputy General Counsel (2015-2016) of OppenheimerFunds (investment management company) and Deputy Chief Legal Officer (2013-2015) of Jennison Associates LLC (investment adviser firm).
Chris Maher (1972)
Year of Election or Appointment: 2020
Deputy Treasurer
Mr. Maher also serves as an officer of other funds. Mr. Maher serves as Assistant Treasurer of FIMM, LLC (2021-present) and FMR Capital, Inc. (2017-present), and is an employee of Fidelity Investments (2008-present). Previously, Mr. Maher served as Assistant Treasurer of certain funds (2013-2020); Vice President of Asset Management Compliance (2013), Vice President of the Program Management Group of FMR (investment adviser firm, 2010-2013), and Vice President of Valuation Oversight (2008-2010).
Jason P. Pogorelec (1975)
Year of Election or Appointment: 2020
Chief Compliance Officer
Mr. Pogorelec also serves as Chief Compliance Officer of other funds. Mr. Pogorelec is a senior Vice President of Asset Management Compliance for Fidelity Investments and is an employee of Fidelity Investments (2006-present). Previously, Mr. Pogorelec served as Vice President, Associate General Counsel for Fidelity Investments (2010-2020) and Assistant Secretary of certain Fidelity funds (2015-2020).
Brett Segaloff (1972)
Year of Election or Appointment: 2021
Anti-Money Laundering (AML) Officer
Mr. Segaloff also serves as an AML Officer of other funds and other related entities. He is Director, Anti-Money Laundering (2007-present) of FMR LLC (diversified financial services company) and is an employee of Fidelity Investments (1996-present).
Stacie M. Smith (1974)
Year of Election or Appointment: 2016
President and Treasurer
Ms. Smith also serves as an officer of other funds. Ms. Smith serves as Assistant Treasurer of FIMM, LLC (2021-present) and FMR Capital, Inc. (2017-present), is an employee of Fidelity Investments (2009-present), and has served in other fund officer roles. Prior to joining Fidelity Investments, Ms. Smith served as Senior Audit Manager of Ernst & Young LLP (accounting firm, 1996-2009). Previously, Ms. Smith served as Assistant Treasurer (2013-2019) and Deputy Treasurer (2013-2016) of certain Fidelity® funds.
Marc L. Spector (1972)
Year of Election or Appointment: 2016
Assistant Treasurer
Mr. Spector also serves as an officer of other funds. Mr. Spector serves as Assistant Treasurer of FIMM, LLC (2021-present) and FMR Capital, Inc. (2017-present) and is an employee of Fidelity Investments (2016-present). Prior to joining Fidelity Investments, Mr. Spector served as Director at the Siegfried Group (accounting firm, 2013-2016), and prior to Siegfried Group as audit senior manager at Deloitte & Touche LLP (accounting firm, 2005-2013).
Jim Wegmann (1979)
Year of Election or Appointment: 2019
Assistant Treasurer
Mr. Wegmann also serves as an officer of other funds. Mr. Wegmann serves as Assistant Treasurer of FIMM, LLC (2021-present) and is an employee of Fidelity Investments (2011-present).
Shareholder Expense Example
As a shareholder, you incur two types of costs: (1) transaction costs, which may include sales charges (loads) on purchase payments or redemption proceeds, as applicable and (2) ongoing costs, which generally include management fees, distribution and/or service (12b-1) fees and other Fund expenses. This Example is intended to help you understand your ongoing costs (in dollars) of investing in a fund and to compare these costs with the ongoing costs of investing in other mutual funds.
The Example is based on an investment of $1,000 invested at the beginning of the period and held for the entire period (February 1, 2021 to July 31, 2021).
Actual Expenses
The first line of the accompanying table provides information about actual account values and actual expenses. You may use the information in this line, together with the amount you invested, to estimate the expenses that you paid over the period. Simply divide your account value by $1,000.00 (for example, an $8,600 account value divided by $1,000.00 = 8.6), then multiply the result by the number in the first line for a class/Fund under the heading entitled "Expenses Paid During Period" to estimate the expenses you paid on your account during this period. If any fund is a shareholder of any underlying mutual funds or exchange-traded funds (ETFs) (the Underlying Funds), such fund indirectly bears its proportional share of the expenses of the Underlying Funds in addition to the direct expenses incurred presented in the table. These fees and expenses are not included in the annualized expense ratio used to calculate the expense estimate in the table below.
Hypothetical Example for Comparison Purposes
The second line of the accompanying table provides information about hypothetical account values and hypothetical expenses based on the actual expense ratio and an assumed rate of return of 5% per year before expenses, which is not the actual return. The hypothetical account values and expenses may not be used to estimate the actual ending account balance or expenses you paid for the period. You may use this information to compare the ongoing costs of investing in the Fund and other funds. To do so, compare this 5% hypothetical example with the 5% hypothetical examples that appear in the shareholder reports of the other funds. If any fund is a shareholder of any Underlying Funds, such fund indirectly bears its proportional share of the expenses of the Underlying Funds in addition to the direct expenses as presented in the table. These fees and expenses are not included in the annualized expense ratio used to calculate the expense estimate in the table below.
Please note that the expenses shown in the table are meant to highlight your ongoing costs only and do not reflect any transaction costs. Therefore, the second line of the table is useful in comparing ongoing costs only, and will not help you determine the relative total costs of owning different funds.
| | Annualized Expense Ratio-A | Beginning
Account Value
February 1, 2021 | Ending
Account Value
July 31, 2021 | Expenses Paid
During Period-B
February 1, 2021
to July 31, 2021 |
| Fidelity Flex Intrinsic Opportunities Fund | - %-C | | | |
| Actual | | $1,000.00 | $1,179.90 | $--D |
| Hypothetical-E | | $1,000.00 | $1,024.79 | $--D |
A Annualized expense ratio reflects expenses net of applicable fee waivers.
B Expenses are equal to the annualized expense ratio, multiplied by the average account value over the period, multiplied by 181/ 365 (to reflect the one-half year period). The fees and expenses of any Underlying Funds are not included in each annualized expense ratio.
C Amount represents less than .005%.
D Amount represents less than $.005.
E 5% return per year before expenses
Distributions (Unaudited)
The Board of Trustees of Fidelity Flex Intrinsic Opportunities Fund voted to pay on September 13, 2021, to shareholders of record at the opening of business on September 10, 2021, a distribution of $3.19 per share derived from capital gains realized from sales of portfolio securities and a dividend of $0.263 per share from net investment income.
The fund hereby designates as a capital gain dividend with respect to the taxable year ended July 31, 2021, $4,059,301, or, if subsequently determined to be different, the net capital gain of such year.
The fund designates 53% and 41% of the dividends distributed in September and December, respectively during the fiscal year as qualifying for the dividends–received deduction for corporate shareholders.
The fund designates 99% and 73% of the dividends distributed in September and December, respectively during the fiscal year as amounts which may be taken into account as a dividend for the purposes of the maximum rate under section 1(h)(11) of the Internal Revenue Code.
The fund will notify shareholders in January 2022 of amounts for use in preparing 2021 income tax returns.
Board Approval of Investment Advisory Contracts and Management Fees
Fidelity Flex Intrinsic Opportunities Fund
Each year, the Board of Trustees, including the Independent Trustees (together, the Board), votes on the renewal of the management contract with Fidelity Management & Research Company LLC (FMR) and the sub-advisory agreements (together, the Advisory Contracts) for the fund. FMR and the sub-advisers are referred to herein as the Investment Advisers. The Board, assisted by the advice of fund counsel and Independent Trustees' counsel, requests and considers a broad range of information relevant to the renewal of the Advisory Contracts throughout the year.
The Board meets regularly and, at each of its meetings, covers an extensive agenda of topics and materials and considers factors that are relevant to its annual consideration of the renewal of the fund's Advisory Contracts, including the services and support provided to the fund and its shareholders. The Board has established various standing committees (Committees), each composed of and chaired by Independent Trustees with varying backgrounds, to which the Board has assigned specific subject matter responsibilities in order to enhance effective decision-making by the Board. The Board, acting directly and through its Committees, requests and receives information concerning the annual consideration of the renewal of the fund's Advisory Contracts. The Board also meets as needed to review matters specifically related to the Board's annual consideration of the renewal of the Advisory Contracts. Members of the Board may also meet with trustees of other Fidelity funds through joint ad hoc committees to discuss certain matters relevant to all of the Fidelity funds.
At its May 2021 meeting, the Board unanimously determined to renew the fund's Advisory Contracts. In considering whether to renew the Advisory Contracts for the fund, the Board considered all factors it believed relevant and reached a determination, with the assistance of fund counsel and Independent Trustees' counsel and through the exercise of its business judgment, that the renewal of the Advisory Contracts was in the best interests of the fund and its shareholders and the fact that no fee is payable under the management contract was fair and reasonable.
Nature, Extent, and Quality of Services Provided. The Board considered Fidelity's staffing as it relates to the fund, including the backgrounds of investment personnel of Fidelity, and also considered the fund's investment objective, strategies, and related investment philosophy. The Independent Trustees also had discussions with senior management of Fidelity's investment operations and investment groups. The Board considered the structure of the investment personnel compensation program and whether this structure provides appropriate incentives to act in the best interests of the fund. Additionally, the Board considered the portfolio managers' investments, if any, in the funds that they manage.
Resources Dedicated to Investment Management and Support Services. The Board and the Fund Oversight and Research Committees reviewed the general qualifications and capabilities of Fidelity's investment staff, including its size, education, experience, and resources, as well as Fidelity's approach to recruiting, training, managing, and compensating investment personnel. The Board noted that Fidelity has continued to increase the resources devoted to non-U.S. offices, including expansion of Fidelity's global investment organization. The Board also noted that Fidelity's analysts have extensive resources, tools and capabilities that allow them to conduct sophisticated quantitative and fundamental analysis, as well as credit analysis of issuers, counterparties and guarantors. Further, the Board considered that Fidelity's investment professionals have sufficient access to global information and data so as to provide competitive investment results over time, and that those professionals also have access to sophisticated tools that permit them to assess portfolio construction and risk and performance attribution characteristics continuously, as well as to transmit new information and research conclusions rapidly around the world. Additionally, in its deliberations, the Board considered Fidelity's trading, risk management, compliance, and technology and operations capabilities and resources, which are integral parts of the investment management process. The Board also considered Fidelity's investments in business continuity planning, and its success in continuously providing services to the fund notwithstanding the severe disruptions caused by the COVID-19 pandemic.
Shareholder and Administrative Services. The Board considered (i) the nature, extent, quality, and cost of advisory, administrative, and shareholder services performed by the Investment Advisers and their affiliates under the Advisory Contracts and under separate agreements covering transfer agency, pricing and bookkeeping, and securities lending services for the fund; (ii) the nature and extent of the supervision of third party service providers, principally custodians, subcustodians, and pricing vendors; and (iii) the resources devoted to, and the record of compliance with, the fund's compliance policies and procedures. The Board also reviewed the allocation of fund brokerage, including allocations to brokers affiliated with the Investment Advisers, the use of brokerage commissions to pay fund expenses, and the use of "soft" commission dollars to pay for research services.
The Board noted that the growth of fund assets over time across the complex allows Fidelity to reinvest in the development of services designed to enhance the value and convenience of the Fidelity funds as investment vehicles. These services include 24-hour access to account information and market information over the Internet and through telephone representatives, investor education materials and asset allocation tools, and the expanded availability of Fidelity Investor Centers.
Investment in a Large Fund Family. The Board considered the benefits to shareholders of investing in a Fidelity fund, including the benefits of investing in a fund that is part of a large family of funds offering a variety of investment disciplines and providing a large variety of mutual fund investor services. The Board noted that Fidelity had taken, or had made recommendations that resulted in the Fidelity funds taking, a number of actions over the previous year that benefited particular funds, including: (i) continuing to dedicate additional resources to Fidelity's investment research process, which includes meetings with management of issuers of securities in which the funds invest, and to the support of the senior management team that oversees asset management; (ii) continuing efforts to enhance Fidelity's global research capabilities; (iii) launching new funds and ETFs with innovative structures, strategies and pricing and making other enhancements to meet client needs; (iv) launching new share classes of existing funds; (v) eliminating purchase minimums and broadening eligibility requirements for certain funds and share classes; (vi) approving the reduction in the holding period for the Class C to Class A conversion policy; (vii) reducing management fees and total expenses for certain target date funds and classes and index funds; (viii) lowering expenses for certain existing funds and classes by implementing or lowering expense caps; (ix) rationalizing product lines and gaining increased efficiencies from fund mergers, liquidations, and share class consolidations; (x) continuing to develop, acquire and implement systems and technology to improve services to the funds and shareholders, strengthen information security, and increase efficiency; and (xi) continuing to implement enhancements to further strengthen Fidelity's product line to increase investors' probability of success in achieving their investment goals, including retirement income goals.
Investment Performance. The Board considered whether the fund has operated in accordance with its investment objective, as well as its record of compliance with its investment restrictions. The Board reviewed the fund's absolute investment performance, as well as the fund's relative investment performance, and considered the fund's underperformance for different time periods ended December 31, 2020. The Board did not consider performance to be a material factor in its decision to renew the fund's Advisory Contracts, as the fund is not publicly offered as a stand-alone investment product. In this regard, the Board noted that the fund is available exclusively to certain fee-based accounts and advisor programs offered by Fidelity, including certain employer-sponsored plans and discretionary investment programs.
Based on its review, the Board concluded that the nature, extent, and quality of services provided to the fund under the Advisory Contracts should continue to benefit the shareholders of the fund.
Competitiveness of Management Fee and Total Expense Ratio. The Board noted that the fund is available exclusively through certain Fidelity fee-based accounts and advisory programs. The Board considered that the fund does not pay FMR a management fee for investment advisory services, but that FMR is indirectly compensated for its services out of Fidelity fee-based account and advisory program fees. The Board also noted that FMR or an affiliate undertakes to pay all operating expenses of the fund, except Independent Trustee fees and expenses, proxy and shareholder meeting expenses, interest, taxes, and extraordinary expenses (such as litigation expenses). The Board further noted that the fund pays its non-operating expenses, including brokerage commissions and fees and expenses associated with the fund's securities lending program, if applicable.
Based on its review, the Board considered that the fund does not pay a management fee and concluded that the total expense ratio of the fund was reasonable in light of the services that the fund and its shareholders receive and the other factors considered.
Costs of the Services and Profitability. The Board considered the level of Fidelity's profits in respect of all the Fidelity funds.
A public accounting firm has been engaged annually by the Board as part of the Board's assessment of Fidelity's profitability analysis. The engagement includes the review and assessment of the methodologies used by Fidelity in determining the revenues and expenses attributable to Fidelity's mutual fund business, and completion of agreed-upon procedures in respect of the mathematical accuracy of certain fund profitability information and its conformity to established allocation methodologies. After considering the reports issued under the engagement and information provided by Fidelity, the Board concluded that while other allocation methods may also be reasonable, Fidelity's profitability methodologies are reasonable in all material respects.
The Board also reviewed Fidelity's non-fund businesses and potential indirect benefits such businesses may have received as a result of their association with Fidelity's mutual fund business (i.e., fall-out benefits) as well as cases where Fidelity's affiliates may benefit from the funds' business. The Board considered areas where potential indirect benefits to the Fidelity funds from their relationships with Fidelity may exist. The Board also considered that in 2019 a joint ad hoc committee created by it and the boards of other Fidelity funds evaluated potential fall-out benefits (PFOB Committee). The Board noted that it considered the PFOB Committee's findings in connection with its consideration of the renewal of the Advisory Contracts.
The Board concluded that the costs of the services provided by and the profits realized by Fidelity in connection with the operation of the fund were not relevant to the renewal of the Advisory Contracts because the fund pays no advisory fees and FMR or an affiliate bears all expenses of the fund with limited exceptions.
Economies of Scale. The Board concluded that because the fund pays no advisory fees and FMR or an affiliate bears all expenses of the fund with limited exceptions, the realization of economies of scale was not a material factor in the Board's decision to renew the fund's Advisory Contracts.
Additional Information Requested by the Board. In order to develop fully the factual basis for consideration of the Fidelity funds' advisory contracts, the Board requested and received additional information on certain topics, including: (i) fund flow and performance trends, in particular the underperformance of certain funds and strategies, and Fidelity's long-term strategies for certain funds; (ii) consideration of expanding the use of performance fees for additional funds; (iii) Fidelity's pricing philosophy compared to competitors; (iv) metrics for evaluating index fund and ETF performance and information about ETF trading characteristics; (v) the methodology with respect to evaluating competitive fund data and peer group classifications and fee and expense comparisons; (vi) the expense structures for different funds and classes and information about the differences between various expense structures; (vii) group fee breakpoints; (viii) information regarding other accounts managed by Fidelity and sub-advisory arrangements; and (ix) Fidelity's philosophies and strategies for evaluating funds and classes with lower or declining asset levels.
Based on its evaluation of all of the conclusions noted above, and after considering all factors it believed relevant, the Board concluded that the advisory fee arrangements are fair and reasonable, and that the fund's Advisory Contracts should be renewed.
Liquidity Risk Management Program
The Securities and Exchange Commission adopted Rule 22e-4 under the Investment Company Act of 1940 (the Liquidity Rule) to promote effective liquidity risk management throughout the open-end investment company industry, thereby reducing the risk that funds will be unable to meet their redemption obligations and mitigating dilution of the interests of fund shareholders.
The Fund has adopted and implemented a liquidity risk management program pursuant to the Liquidity Rule (the Program) effective December 1, 2018. The Program is reasonably designed to assess and manage the Fund’s liquidity risk and to comply with the requirements of the Liquidity Rule. The Fund’s Board of Trustees (the Board) has designated the Fund’s investment adviser as administrator of the Program. The Fidelity advisers have established a Liquidity Risk Management Committee (the LRM Committee) to manage the Program for each of the Fidelity Funds. The LRM Committee monitors the adequacy and effectiveness of implementation of the Program and on a periodic basis assesses each Fund’s liquidity risk based on a variety of factors including (1) the Fund’s investment strategy, (2) portfolio liquidity and cash flow projections during normal and reasonably foreseeable stressed conditions, (3) shareholder redemptions, (4) borrowings and other funding sources and (5) in the case of exchange-traded funds, certain additional factors including the effect of the Fund’s prices and spreads, market participants, and basket compositions on the overall liquidity of the Fund’s portfolio, as applicable.
In accordance with the Program, each of the Fund’s portfolio investments is classified into one of four liquidity categories described below based on a determination of a reasonable expectation for how long it would take to convert the investment to cash (or sell or dispose of the investment) without significantly changing its market value.
- Highly liquid investments – cash or convertible to cash within three business days or less
- Moderately liquid investments – convertible to cash in three to seven calendar days
- Less liquid investments – can be sold or disposed of, but not settled, within seven calendar days
- Illiquid investments – cannot be sold or disposed of within seven calendar days
Liquidity classification determinations take into account a variety of factors including various market, trading and investment-specific considerations, as well as market depth, and generally utilize analysis from a third-party liquidity metrics service.
The Liquidity Rule places a 15% limit on a fund’s illiquid investments and requires funds that do not primarily hold assets that are highly liquid investments to determine and maintain a minimum percentage of the fund’s net assets to be invested in highly liquid investments (highly liquid investment minimum or HLIM). The Program includes provisions reasonably designed to comply with the 15% limit on illiquid investments and for determining, periodically reviewing and complying with the HLIM requirement as applicable.
At a recent meeting of the Fund’s Board of Trustees, the LRM Committee provided a written report to the Board pertaining to the operation, adequacy, and effectiveness of implementation of the Program for the annual period from December 1, 2019 through November 30, 2020. The report concluded that the Program has been implemented and is operating effectively and is reasonably designed to assess and manage the Fund’s liquidity risk.
ZTO-ANN-0921
1.9881591.104
Fidelity® Series Intrinsic Opportunities Fund
Annual Report
July 31, 2021
Contents
To view a fund's proxy voting guidelines and proxy voting record for the 12-month period ended June 30, visit http://www.fidelity.com/proxyvotingresults or visit the Securities and Exchange Commission's (SEC) web site at http://www.sec.gov.
You may also call 1-800-544-8544 to request a free copy of the proxy voting guidelines.
Standard & Poor's, S&P and S&P 500 are registered service marks of The McGraw-Hill Companies, Inc. and have been licensed for use by Fidelity Distributors Corporation.
Other third-party marks appearing herein are the property of their respective owners.
All other marks appearing herein are registered or unregistered trademarks or service marks of FMR LLC or an affiliated company. © 2021 FMR LLC. All rights reserved.
This report and the financial statements contained herein are submitted for the general information of the shareholders of the Fund. This report is not authorized for distribution to prospective investors in the Fund unless preceded or accompanied by an effective prospectus.
A fund files its complete schedule of portfolio holdings with the SEC for the first and third quarters of each fiscal year on Form N-PORT. Forms N-PORT are available on the SEC’s web site at http://www.sec.gov. A fund's Forms N-PORT may be reviewed and copied at the SEC’s Public Reference Room in Washington, DC. Information regarding the operation of the SEC's Public Reference Room may be obtained by calling 1-800-SEC-0330.
For a complete list of a fund's portfolio holdings, view the most recent holdings listing, semiannual report, or annual report on Fidelity's web site at http://www.fidelity.com, http://www.institutional.fidelity.com, or http://www.401k.com, as applicable.
NOT FDIC INSURED •MAY LOSE VALUE •NO BANK GUARANTEE
Neither the Fund nor Fidelity Distributors Corporation is a bank.
Note to Shareholders:
Early in 2020, the outbreak and spread of a new coronavirus emerged as a public health emergency that had a major influence on financial markets, primarily based on its impact on the global economy and the outlook for corporate earnings. The virus causes a respiratory disease known as COVID-19. On March 11, 2020 the World Health Organization declared the COVID-19 outbreak a pandemic, citing sustained risk of further global spread.
In the weeks following, as the crisis worsened, we witnessed an escalating human tragedy with wide-scale social and economic consequences from coronavirus-containment measures. The outbreak of COVID-19 prompted a number of measures to limit the spread, including travel and border restrictions, quarantines, and restrictions on large gatherings. In turn, these resulted in lower consumer activity, diminished demand for a wide range of products and services, disruption in manufacturing and supply chains, and – given the wide variability in outcomes regarding the outbreak – significant market uncertainty and volatility. Amid the turmoil, global governments and central banks took unprecedented action to help support consumers, businesses, and the broader economies, and to limit disruption to financial systems.
The situation continues to unfold, and the extent and duration of its impact on financial markets and the economy remain highly uncertain. Extreme events such as the coronavirus crisis are “exogenous shocks” that can have significant adverse effects on mutual funds and their investments. Although multiple asset classes may be affected by market disruption, the duration and impact may not be the same for all types of assets.
Fidelity is committed to helping you stay informed amid news about COVID-19 and during increased market volatility, and we’re taking extra steps to be responsive to customer needs. We encourage you to visit our websites, where we offer ongoing updates, commentary, and analysis on the markets and our funds.
Performance: The Bottom Line
Average annual total return reflects the change in the value of an investment, assuming reinvestment of distributions from dividend income and capital gains (the profits earned upon the sale of securities that have grown in value, if any) and assuming a constant rate of performance each year. The hypothetical investment and the average annual total returns do not reflect the deduction of taxes that a shareholder would pay on fund distributions or the redemption of fund shares. During periods of reimbursement by Fidelity, a fund’s total return will be greater than it would be had the reimbursement not occurred. How a fund did yesterday is no guarantee of how it will do tomorrow.
Average Annual Total Returns
| For the periods ended July 31, 2021 | Past 1 year | Past 5 years | Life of fundA |
| Fidelity® Series Intrinsic Opportunities Fund | 53.18% | 14.01% | 14.56% |
A From December 6, 2012
$10,000 Over Life of Fund
Let's say hypothetically that $10,000 was invested in Fidelity® Series Intrinsic Opportunities Fund on December 6, 2012, when the fund started.
The chart shows how the value of your investment would have changed, and also shows how the Russell 3000® Index performed over the same period.

| Period Ending Values |
| $32,419 | Fidelity® Series Intrinsic Opportunities Fund |
| $36,707 | Russell 3000® Index |
Management's Discussion of Fund Performance
Market Recap: The S&P 500
® index gained 36.45% for the 12 months ending July 31, 2021, as U.S. equities continued a historic rebound following a steep but brief decline due to the early-2020 outbreak and spread of COVID-19. A confluence of powerful forces propelled risk assets, returning the stock market to pre-pandemic highs by late August 2020. The rally slowed in September, when stocks began a two-month retreat amid Congress’s inability to reach a deal on additional fiscal stimulus, as well as uncertainty about the election. But as the calendar turned, investors grew hopeful. The rollout of three COVID-19 vaccines was underway, the U.S. Federal Reserve pledged to hold interest rates near zero until the economy recovered, and the federal government planned to deploy trillions of dollars to boost consumers and the economy. This backdrop fueled a sharp rotation, with small-cap value usurping leadership from large growth. As part of the “reopening” theme, investors moved out of tech-driven mega-caps that had thrived due to the work-from-home trend in favor of cheap smaller companies that stood to benefit from a broad cyclical recovery. A flattish May reflected concerns about inflation and jobs, but the uptrend resumed through July, driven by corporate earnings. Notably, this leg saw momentum shift back to large growth, as easing rates and a hawkish Fed stymied the reflation trade. By sector, financials (+55%) led, driven by banks (+63%), whereas utilities (+12%) and consumer staples (+18%) notably lagged.
Comments from Portfolio Manager Joel Tillinghast: For the fiscal year ending July 31, 2021, the fund gained 53.18%, outperforming the 38.73% result of the benchmark Russell 3000
® Index. Versus the benchmark, security selection was the primary contributor, especially in the consumer discretionary sector. Stock picking and an overweighting in financials also bolstered the fund's relative result. Also boosting performance was security selection in the communication services sector, primarily driven by the media & entertainment industry. One of the fund's largest individual relative contributors was an outsized stake in ViacomCBS, which gained 245% the past year. Also adding value was our overweighting in Discover Financial Services, which gained 157%. Discover Financial Services was among the fund's biggest holdings. Another notable relative contributor was an outsized stake in Synchrony Financial (+118%), which was one of our largest holdings. In contrast, the biggest detractor from performance versus the benchmark was an overweighting in health care. Weak picks in the industrials sector, primarily within the capital goods industry, also hurt the fund's relative result. Also hindering the fund's relative result was an underweighting in the information technology sector, especially within the semiconductors & semiconductor equipment industry. Lastly, the fund's position in cash was a notable detractor. Not owning Alphabet, a benchmark component that gained 82%, was the biggest individual relative detractor. Also hampering performance was our overweighting in Amgen, which gained about 2%. Amgen was one of our largest holdings the past 12 months. Also hindering performance was our outsized stake in Western Union, which returned roughly -1%. Notable changes in positioning include increased exposure to the energy sector and a lower allocation to consumer staples.
The views expressed above reflect those of the portfolio manager(s) only through the end of the period as stated on the cover of this report and do not necessarily represent the views of Fidelity or any other person in the Fidelity organization. Any such views are subject to change at any time based upon market or other conditions and Fidelity disclaims any responsibility to update such views. These views may not be relied on as investment advice and, because investment decisions for a Fidelity fund are based on numerous factors, may not be relied on as an indication of trading intent on behalf of any Fidelity fund.
Investment Summary (Unaudited)
Top Ten Stocks as of July 31, 2021
| | % of fund's net assets |
| Anthem, Inc. | 6.1 |
| Itochu Corp. | 3.4 |
| Synchrony Financial | 2.9 |
| JD Sports Fashion PLC | 2.7 |
| Discover Financial Services | 2.5 |
| AFLAC, Inc. | 2.3 |
| UnitedHealth Group, Inc. | 2.2 |
| Lear Corp. | 2.1 |
| United Therapeutics Corp. | 1.9 |
| Southwestern Energy Co. | 1.7 |
| | 27.8 |
Top Five Market Sectors as of July 31, 2021
| | % of fund's net assets |
| Consumer Discretionary | 19.5 |
| Health Care | 17.5 |
| Financials | 16.3 |
| Industrials | 10.1 |
| Energy | 8.3 |
Asset Allocation (% of fund's net assets)
| As of July 31, 2021* |
| | Stocks | 90.3% |
| | Short-Term Investments and Net Other Assets (Liabilities) | 9.7% |

* Foreign investments - 42.4%
Schedule of Investments July 31, 2021
Showing Percentage of Net Assets
| Common Stocks - 90.2% | | | |
| | | Shares | Value |
| COMMUNICATION SERVICES - 2.9% | | | |
| Entertainment - 0.0% | | | |
| Ateam, Inc. | | 5,000 | $66,816 |
| GAMEVIL, Inc. (a) | | 15,000 | 459,983 |
| Nihon Falcom Corp. | | 35,000 | 480,151 |
| | | | 1,006,950 |
| Interactive Media & Services - 0.5% | | | |
| Cars.com, Inc. (a) | | 656,000 | 7,924,480 |
| Dip Corp. | | 535,000 | 15,581,104 |
| JOYY, Inc. ADR | | 600,000 | 32,070,000 |
| Momo, Inc. ADR | | 5,000 | 61,950 |
| XLMedia PLC (a) | | 125,000 | 88,613 |
| Zappallas, Inc. (b) | | 800,000 | 4,018,048 |
| ZIGExN Co. Ltd. | | 1,950,000 | 7,554,350 |
| | | | 67,298,545 |
| Media - 1.9% | | | |
| AMC Networks, Inc. Class A (a)(c) | | 125,000 | 6,255,000 |
| Cogeco Communications, Inc. | | 25,000 | 2,367,145 |
| Comcast Corp. Class A | | 2,500,000 | 147,075,000 |
| Corus Entertainment, Inc. Class B (non-vtg.) (c) | | 400,000 | 1,856,364 |
| Discovery Communications, Inc.: | | | |
| Class A (a) | | 1,000,300 | 29,018,703 |
| Class C (non-vtg.) (a) | | 1,600,000 | 43,376,000 |
| DMS, Inc. | | 250,000 | 3,639,305 |
| eBook Initiative Japan Co. Ltd. (a) | | 50,000 | 1,485,803 |
| F@N Communications, Inc. | | 525,000 | 1,914,225 |
| Gendai Agency, Inc. (a)(b) | | 850,000 | 2,657,582 |
| Gray Television, Inc. | | 50,000 | 1,108,500 |
| Hyundai HCN | | 2,250,049 | 8,988,407 |
| Hyve Group PLC (a) | | 500,027 | 913,974 |
| Interspace Co. Ltd. | | 20,000 | 193,063 |
| Nippon BS Broadcasting Corp. | | 2,615 | 26,220 |
| Pico Far East Holdings Ltd. | | 10,600,000 | 1,773,225 |
| Proto Corp. | | 100,000 | 1,262,477 |
| RKB Mainichi Broadcasting Corp. | | 3,000 | 163,529 |
| Sky Network Television Ltd. (a) | | 3,500,000 | 402,344 |
| Trenders, Inc. (c) | | 148,291 | 894,842 |
| ViacomCBS, Inc. Class B | | 200,000 | 8,186,000 |
| WOWOW INC. | | 250,000 | 5,421,357 |
| | | | 268,979,065 |
| Wireless Telecommunication Services - 0.5% | | | |
| KDDI Corp. | | 1,250,000 | 38,229,503 |
| Okinawa Cellular Telephone Co. | | 525,000 | 24,932,774 |
| | | | 63,162,277 |
|
| TOTAL COMMUNICATION SERVICES | | | 400,446,837 |
|
| CONSUMER DISCRETIONARY - 19.4% | | | |
| Auto Components - 6.4% | | | |
| Adient PLC (a) | | 1,800,000 | 75,834,000 |
| ASTI Corp. | | 120,000 | 2,989,472 |
| Brembo SpA | | 1 | 14 |
| Brembo SpA | | 25,000 | 349,647 |
| Burelle SA | | 1,700 | 1,456,003 |
| Chita Kogyo Co. Ltd. | | 10,000 | 63,443 |
| Cie Automotive SA | | 50,000 | 1,489,930 |
| Cooper-Standard Holding, Inc. (a) | | 700,084 | 18,237,188 |
| DaikyoNishikawa Corp. | | 1,455,653 | 9,327,962 |
| DTR Automotive Corp. | | 50,120 | 1,734,783 |
| Eagle Industry Co. Ltd. | | 300,000 | 3,533,112 |
| Exedy Corp. | | 15,000 | 226,015 |
| Fukoku Co. Ltd. | | 78,648 | 729,809 |
| G-Tekt Corp. (b) | | 2,918,382 | 41,180,031 |
| Gentex Corp. | | 250,000 | 8,507,500 |
| Hankook & Co. | | 20,352 | 316,908 |
| Hi-Lex Corp. | | 249,937 | 3,779,641 |
| Hu Lane Associate, Inc. | | 10,000 | 48,657 |
| Hyundai Mobis | | 700,000 | 161,829,002 |
| IJTT Co. Ltd. | | 1,711,631 | 10,952,691 |
| Johnson Electric Holdings Ltd. | | 10,000 | 23,446 |
| Lear Corp. | | 1,650,000 | 288,717,000 |
| Linamar Corp. | | 2,688,000 | 159,047,900 |
| Murakami Corp. | | 35,000 | 1,011,349 |
| Nokian Tyres PLC | | 5,000 | 210,915 |
| Patrick Industries, Inc. | | 10,000 | 826,300 |
| Piolax, Inc. | | 924,000 | 12,785,488 |
| Plastic Omnium SA | | 760,000 | 24,125,478 |
| Seoyon Co. Ltd. | | 425,000 | 6,064,792 |
| Seoyon E-Hwa Co., Ltd. | | 48,729 | 336,905 |
| Stanley Electric Co. Ltd. | | 100,000 | 2,589,672 |
| Strattec Security Corp. (a) | | 35,000 | 1,441,300 |
| TBK Co. Ltd. (b) | | 1,800,000 | 6,743,539 |
| Topre Corp. | | 317,509 | 4,558,376 |
| TPR Co. Ltd. | | 883,400 | 12,304,227 |
| Yorozu Corp. (b) | | 1,852,000 | 20,561,834 |
| | | | 883,934,329 |
| Automobiles - 0.0% | | | |
| Kabe Husvagnar AB (B Shares) | | 25,000 | 633,103 |
| Renault SA (a) | | 10,000 | 379,897 |
| | | | 1,013,000 |
| Distributors - 0.1% | | | |
| Doshisha Co. Ltd. | | 350,000 | 5,490,634 |
| Harima-Kyowa Co. Ltd. | | 150,000 | 2,465,248 |
| Headlam Group PLC | | 125,000 | 920,875 |
| Nakayamafuku Co. Ltd. | | 200,000 | 796,682 |
| SPK Corp. | | 30,000 | 373,821 |
| Yagi & Co. Ltd. | | 450,000 | 6,115,947 |
| | | | 16,163,207 |
| Diversified Consumer Services - 0.7% | | | |
| Cross-Harbour Holdings Ltd. | | 1,300,000 | 2,084,376 |
| Heian Ceremony Service Co. Ltd. | | 500,000 | 4,083,679 |
| Kukbo Design Co. Ltd. | | 200,000 | 3,895,000 |
| MegaStudy Co. Ltd. (b) | | 1,086,945 | 13,059,256 |
| MegaStudyEdu Co. Ltd. (b) | | 1,000,420 | 69,080,669 |
| Multicampus Co. Ltd. | | 60,000 | 2,100,177 |
| Step Co. Ltd. | | 217,000 | 3,548,589 |
| Tear Corp. | | 25,000 | 108,017 |
| Tsukada Global Holdings, Inc. (a) | | 1,000,000 | 2,752,837 |
| YDUQS Participacoes SA | | 5,000 | 27,130 |
| | | | 100,739,730 |
| Hotels, Restaurants & Leisure - 0.2% | | | |
| Betsson AB (B Shares) | | 200,000 | 1,610,055 |
| Fairwood Holdings Ltd. | | 50,000 | 112,467 |
| Playtech Ltd. (a) | | 100,000 | 514,300 |
| Renaissance, Inc. | | 1,000 | 10,227 |
| Ride On Express Holdings Co. Lt | | 10,000 | 134,269 |
| The Restaurant Group PLC (a) | | 19,248,612 | 30,715,395 |
| Tosho Co. Ltd. | | 5,000 | 76,204 |
| | | | 33,172,917 |
| Household Durables - 2.7% | | | |
| Ace Bed Co. Ltd. | | 250,145 | 10,513,485 |
| Avantia Co. Ltd. | | 650,000 | 5,433,207 |
| Bellway PLC | | 100,000 | 4,561,980 |
| Cuckoo Holdings Co. Ltd. | | 40,000 | 4,441,514 |
| Emak SpA | | 1,200,000 | 2,491,125 |
| FJ Next Co. Ltd. | | 1,100,000 | 10,307,643 |
| Fuji Corp. Ltd. | | 50,000 | 292,147 |
| Gree Electric Appliances, Inc. of Zhuhai (A Shares) | | 6,850,581 | 50,360,615 |
| Haier Smart Home Co. Ltd. | | 1,600 | 5,477 |
| Hamilton Beach Brands Holding Co.: | | | |
| Class A | | 125,000 | 2,336,250 |
| Class B (a) | | 125,000 | 2,336,250 |
| Helen of Troy Ltd. (a)(c) | | 375,000 | 83,771,250 |
| Hinokiya Holdings Co. Ltd. | | 25,000 | 559,227 |
| Mohawk Industries, Inc. (a) | | 500,010 | 97,451,949 |
| Nittoh Corp. | | 25,000 | 106,422 |
| Open House Co. Ltd. | | 100,000 | 5,031,676 |
| Portmeirion Group PLC (a) | | 50,000 | 427,425 |
| Pressance Corp. | | 536,800 | 7,799,637 |
| Q.E.P. Co., Inc. | | 25,824 | 624,166 |
| SABAF SpA | | 337,241 | 10,201,330 |
| Sanei Architecture Planning Co. Ltd. | | 660,000 | 11,869,833 |
| Taylor Morrison Home Corp. (a) | | 2,500,000 | 67,050,000 |
| Wellpool Co. Ltd. | | 158,000 | 347,577 |
| | | | 378,320,185 |
| Internet & Direct Marketing Retail - 0.1% | | | |
| Aucnet, Inc. | | 75,000 | 1,087,690 |
| CROOZ, Inc. (a)(c) | | 40,000 | 665,786 |
| Danawa Co. Ltd. | | 50,000 | 1,305,562 |
| Hamee Corp. | | 30,000 | 426,513 |
| Hyundai Home Shopping Network Corp. | | 10,000 | 705,264 |
| Moneysupermarket.com Group PLC | | 1,000,000 | 3,530,600 |
| Papyless Co. Ltd. | | 35,000 | 498,975 |
| Vipshop Holdings Ltd. ADR (a) | | 100,000 | 1,663,000 |
| | | | 9,883,390 |
| Leisure Products - 0.1% | | | |
| Dream International Ltd. | | 448,000 | 175,253 |
| Mars Group Holdings Corp. | | 550,000 | 8,191,969 |
| | | | 8,367,222 |
| Multiline Retail - 0.4% | | | |
| Big Lots, Inc. | | 105,000 | 6,049,050 |
| Grazziotin SA | | 400,000 | 2,502,184 |
| Gwangju Shinsegae Co. Ltd. (b) | | 97,372 | 15,668,922 |
| Lifestyle China Group Ltd. (a) | | 12,500,000 | 1,849,791 |
| Lifestyle International Holdings Ltd. (a) | | 11,700,000 | 8,340,850 |
| Macy's, Inc. (a)(c) | | 700,000 | 11,900,000 |
| Max Stock Ltd. | | 200,000 | 819,799 |
| Ryohin Keikaku Co. Ltd. | | 100,000 | 2,022,697 |
| Treasure Factory Co. Ltd. (b) | | 800,000 | 7,204,776 |
| | | | 56,358,069 |
| Specialty Retail - 6.8% | | | |
| Arcland Sakamoto Co. Ltd. | | 525,000 | 7,211,841 |
| AT-Group Co. Ltd. | | 1,000,000 | 13,025,842 |
| Bed Bath & Beyond, Inc. (a) | | 500,000 | 14,270,000 |
| DCM Holdings Co. Ltd. | | 25,000 | 245,659 |
| Foot Locker, Inc. | | 1,800,000 | 102,708,000 |
| Formosa Optical Technology Co. Ltd. | | 751,383 | 1,697,441 |
| Fuji Corp. (b) | | 1,357,780 | 15,074,755 |
| Genesco, Inc. (a)(c) | | 325,000 | 18,671,250 |
| Goldlion Holdings Ltd. | | 9,300,000 | 2,106,252 |
| Guess?, Inc. (b)(c) | | 3,700,000 | 82,584,000 |
| Handsman Co. Ltd. (b) | | 743,100 | 10,485,564 |
| Hour Glass Ltd. | | 28,000,000 | 31,824,053 |
| IA Group Corp. | | 18,200 | 605,533 |
| International Housewares Retail Co. Ltd. | | 999,600 | 371,740 |
| JB Hi-Fi Ltd. | | 250,000 | 8,813,538 |
| JD Sports Fashion PLC | | 30,000,000 | 374,049,000 |
| Jumbo SA | | 1,725,000 | 27,420,169 |
| K's Holdings Corp. | | 1,700,000 | 20,005,469 |
| Ku Holdings Co. Ltd. | | 600,000 | 5,469,213 |
| Leon's Furniture Ltd. | | 225,000 | 4,182,230 |
| Lookers PLC (a) | | 1,534,541 | 1,426,985 |
| Mandarake, Inc. | | 180,000 | 1,036,963 |
| Mr. Bricolage SA (a) | | 311,600 | 4,232,326 |
| Nafco Co. Ltd. | | 640,400 | 10,939,425 |
| Nitori Holdings Co. Ltd. | | 40,000 | 7,603,048 |
| Nojima Co. Ltd. | | 51,000 | 1,319,803 |
| Oriental Watch Holdings Ltd. | | 3,783,272 | 2,020,367 |
| Padini Holdings Bhd | | 2,000,000 | 1,331,754 |
| Sacs Bar Holdings, Inc. | | 316,889 | 1,701,359 |
| Sally Beauty Holdings, Inc. (a) | | 3,000,200 | 56,763,784 |
| Samse SA | | 31,834 | 6,986,170 |
| Silvano Fashion Group A/S (a) | | 9,800 | 19,079 |
| SuperGroup PLC (a) | | 125,000 | 649,825 |
| T-Gaia Corp. | | 25,000 | 449,159 |
| The Buckle, Inc. (c) | | 1,100,000 | 46,288,000 |
| Tokatsu Holdings Co. Ltd. (b) | | 250,000 | 968,506 |
| Truworths International Ltd. | | 334,900 | 1,412,632 |
| Urban Outfitters, Inc. (a)(c) | | 1,350,000 | 50,193,000 |
| Vita Group Ltd. | | 350,000 | 259,416 |
| | | | 936,423,150 |
| Textiles, Apparel & Luxury Goods - 1.9% | | | |
| Best Pacific International Holdings Ltd. | | 31,821,941 | 9,418,228 |
| Bjorn Borg AB | | 5,000 | 20,213 |
| Capri Holdings Ltd. (a) | | 3,100,000 | 174,561,000 |
| Carter's, Inc. | | 15,000 | 1,466,100 |
| Embry Holdings Ltd. | | 3,200,000 | 457,075 |
| Fossil Group, Inc. (a)(c) | | 2,338,700 | 29,514,394 |
| Gildan Activewear, Inc. | | 200,000 | 6,894,838 |
| Hagihara Industries, Inc. | | 241,202 | 3,135,263 |
| Magni-Tech Industries Bhd | | 8,533,333 | 4,408,215 |
| Only Corp. | | 15,000 | 63,443 |
| PVH Corp. (a) | | 100,000 | 10,462,000 |
| Sakai Ovex Co. Ltd. | | 190,000 | 6,589,946 |
| Sitoy Group Holdings Ltd. | | 10,500,000 | 756,645 |
| Ted Baker PLC (a)(c) | | 4,411,145 | 8,050,648 |
| Texwinca Holdings Ltd. | | 1,500,000 | 337,788 |
| Youngone Holdings Co. Ltd. | | 258,000 | 10,351,244 |
| | | | 266,487,040 |
|
| TOTAL CONSUMER DISCRETIONARY | | | 2,690,862,239 |
|
| CONSUMER STAPLES - 4.3% | | | |
| Beverages - 1.0% | | | |
| A.G. Barr PLC (a) | | 500,000 | 3,996,250 |
| Britvic PLC | | 6,968,131 | 94,387,167 |
| C&C Group PLC (United Kingdom) (a) | | 520,373 | 1,712,818 |
| Jinro Distillers Co. Ltd. (b) | | 460,240 | 12,915,754 |
| Lucas Bols BV (a)(d) | | 120,000 | 1,477,593 |
| Muhak Co. Ltd. | | 340,000 | 2,409,695 |
| Olvi PLC (A Shares) | | 100,000 | 6,275,263 |
| Spritzer Bhd | | 1,000,000 | 483,412 |
| Yantai Changyu Pioneer Wine Co. Ltd. (B Shares) | | 6,350,762 | 11,947,799 |
| | | | 135,605,751 |
| Food & Staples Retailing - 0.9% | | | |
| Alimentation Couche-Tard, Inc. Class A (multi-vtg.) | | 100,000 | 4,085,444 |
| Amsterdam Commodities NV | | 625,000 | 17,830,820 |
| Belc Co. Ltd. | | 25,000 | 1,221,458 |
| Create SD Holdings Co. Ltd. | | 930,000 | 31,111,618 |
| Daiichi Co. Ltd. | | 200,000 | 1,584,249 |
| G-7 Holdings, Inc. | | 25,000 | 831,776 |
| Genky DrugStores Co. Ltd. | | 400,000 | 14,730,413 |
| Halows Co. Ltd. | | 110,000 | 2,837,610 |
| MARR SpA | | 750,000 | 17,420,081 |
| Medical Ikkou Co. Ltd. | | 6,000 | 151,169 |
| Natural Grocers by Vitamin Cottage, Inc. (c) | | 15,000 | 167,700 |
| Nihon Chouzai Co. Ltd. | | 100,000 | 1,559,637 |
| OM2 Network Co. Ltd. | | 220,000 | 2,306,185 |
| Qol Holdings Co. Ltd. | | 150,000 | 2,067,362 |
| Retail Partners Co. Ltd. | | 550,000 | 6,021,148 |
| Sapporo Clinical Laboratory | | 20,000 | 276,195 |
| Satoh & Co. Ltd. | | 50,000 | 709,175 |
| Satudora Holdings Co. Ltd. (b)(c) | | 325,000 | 6,144,205 |
| Sprouts Farmers Market LLC (a) | | 50,000 | 1,229,000 |
| Sugi Holdings Co. Ltd. | | 10,000 | 735,609 |
| Valor Holdings Co. Ltd. | | 650,000 | 13,740,030 |
| Walgreens Boots Alliance, Inc. | | 100,000 | 4,715,000 |
| YAKUODO Holdings Co. Ltd. | | 150,000 | 3,153,001 |
| Yuasa Funashoku Co. Ltd. | | 10,000 | 277,107 |
| | | | 134,905,992 |
| Food Products - 1.8% | | | |
| Ajinomoto Malaysia Bhd | | 1,650,000�� | 6,201,185 |
| Armanino Foods of Distinction | | 1,000,344 | 3,551,221 |
| Astral Foods Ltd. | | 10,000 | 104,769 |
| Axyz Co. Ltd. | | 1,000 | 29,443 |
| Bakkavor Group PLC (d) | | 100,000 | 175,974 |
| Bell AG | | 37,500 | 11,549,925 |
| Carr's Group PLC | | 4,270,000 | 9,377,774 |
| Cranswick PLC | | 450,773 | 25,376,266 |
| Delfi Ltd. | | 13,999,920 | 8,730,900 |
| Delsole Corp. | | 200,000 | 944,351 |
| Fleury Michon SA | | 2,000 | 56,228 |
| Fresh Del Monte Produce, Inc. | | 1,426,600 | 44,024,876 |
| Glanbia PLC | | 5,000 | 85,944 |
| High Liner Foods, Inc. | | 50,000 | 525,810 |
| Ingredion, Inc. | | 800,000 | 70,248,000 |
| Kaneko Seeds Co. Ltd. | | 150,000 | 1,949,774 |
| Kaveri Seed Co. Ltd. | | 207,575 | 2,010,038 |
| Lassonde Industries, Inc. Class A (sub. vtg.) | | 50,000 | 6,916,079 |
| LDC SA | | 18,150 | 2,217,635 |
| London Biscuits Bhd (a)(e) | | 5,000,000 | 23,697 |
| M. Dias Branco SA | | 10,000 | 59,828 |
| Nissin Foods Co. Ltd. | | 100,000 | 71,933 |
| Nitto Fuji Flour Milling Co. Ltd. | | 10,000 | 601,613 |
| Origin Enterprises PLC | | 700,000 | 2,856,490 |
| Pickles Corp. | | 100,000 | 3,363,566 |
| President Bakery PCL | | 16,500 | 34,647 |
| Prima Meat Packers Ltd. | | 1,250,000 | 33,738,207 |
| S Foods, Inc. | | 325,000 | 10,102,092 |
| Shinobu Food Products Co. Ltd. | | 35,000 | 198,122 |
| Thai President Foods PCL | | 131,357 | 771,513 |
| Thai Wah PCL | | 426,000 | 75,840 |
| Toyo Sugar Refining Co. Ltd. | | 200,000 | 2,184,039 |
| Tyson Foods, Inc. Class A | | 20,000 | 1,429,200 |
| | | | 249,586,979 |
| Household Products - 0.0% | | | |
| Transaction Co. Ltd. | | 200,000 | 2,311,654 |
| Personal Products - 0.4% | | | |
| Hengan International Group Co. Ltd. | | 4,000,000 | 23,754,528 |
| Herbalife Nutrition Ltd. (a) | | 60,000 | 3,056,400 |
| Jacques Bogart SA | | 15,000 | 217,084 |
| Sarantis SA | | 2,400,000 | 25,053,600 |
| | | | 52,081,612 |
| Tobacco - 0.2% | | | |
| KT&G Corp. | | 315,000 | 22,489,070 |
| Scandinavian Tobacco Group A/S (d) | | 400,000 | 8,196,460 |
| | | | 30,685,530 |
|
| TOTAL CONSUMER STAPLES | | | 605,177,518 |
|
| ENERGY - 8.3% | | | |
| Energy Equipment & Services - 0.4% | | | |
| AKITA Drilling Ltd. Class A (non-vtg.) (a) | | 250,000 | 162,312 |
| Bristow Group, Inc. (a)(c) | | 250,000 | 6,495,000 |
| Cathedral Energy Services Ltd. (a) | | 800,000 | 320,616 |
| Championx Corp. (a) | | 900,000 | 20,916,000 |
| Geospace Technologies Corp. (a) | | 440,000 | 3,841,200 |
| High Arctic Energy Services, Inc. (a) | | 400,000 | 436,037 |
| Liberty Oilfield Services, Inc. Class A (a) | | 658,100 | 6,706,039 |
| Oil States International, Inc. (a)(c) | | 2,199,391 | 12,448,553 |
| PHX Energy Services Corp. | | 25,000 | 82,559 |
| Smart Sand, Inc. (a)(c) | | 550,000 | 1,556,500 |
| Solaris Oilfield Infrastructure, Inc. Class A | | 250,000 | 2,175,000 |
| Tidewater, Inc. warrants 11/14/24 (a) | | 4,764 | 1,072 |
| | | | 55,140,888 |
| Oil, Gas & Consumable Fuels - 7.9% | | | |
| Advantage Energy Ltd. (a) | | 200,000 | 751,844 |
| Alvopetro Energy Ltd. (a) | | 1,100,000 | 880,000 |
| Antero Resources Corp. (a) | | 50,000 | 680,000 |
| ARC Resources Ltd. | | 221,600 | 1,676,743 |
| Baytex Energy Corp. (a)(c) | | 4,000,000 | 6,829,112 |
| Beach Energy Ltd. | | 1,392,894 | 1,226,610 |
| Berry Corp. | | 200,000 | 1,110,000 |
| Birchcliff Energy Ltd. (c) | | 7,030,814 | 26,543,070 |
| Bonanza Creek Energy, Inc. | | 1,200,000 | 46,164,000 |
| Bonterra Energy Corp. (a)(c) | | 500,000 | 2,272,363 |
| Cenovus Energy, Inc.: | | | |
| warrants 1/1/26 (a) | | 520,800 | 2,504,649 |
| (Canada) | | 6,426,000 | 53,618,676 |
| China Petroleum & Chemical Corp.: | | | |
| (H Shares) | | 225,000,000 | 102,885,902 |
| sponsored ADR (H Shares) | | 50,000 | 2,286,000 |
| CONSOL Energy, Inc. (a) | | 250,000 | 5,252,500 |
| Delek U.S. Holdings, Inc. | | 450,000 | 7,821,000 |
| Denbury, Inc. warrants 9/18/23 (a) | | 38,922 | 1,256,013 |
| Diamondback Energy, Inc. | | 75,000 | 5,784,750 |
| Enterprise Products Partners LP | | 15,000 | 338,550 |
| EQT Corp. (a) | | 2,000,000 | 36,780,000 |
| Equitrans Midstream Corp. | | 122,000 | 1,002,840 |
| Extraction Oil & Gas, Inc. (a) | | 25,000 | 1,112,250 |
| Frontline Ltd. (NY Shares) (c) | | 25,000 | 199,000 |
| HollyFrontier Corp. | | 500,000 | 14,700,000 |
| International Seaways, Inc. (c) | | 55,000 | 904,750 |
| Marathon Oil Corp. | | 500,000 | 5,795,000 |
| Motor Oil (HELLAS) Corinth Refineries SA | | 300,000 | 4,825,665 |
| Murphy Oil Corp. | | 4,000,000 | 86,840,000 |
| NACCO Industries, Inc. Class A | | 173,109 | 4,339,843 |
| NuVista Energy Ltd. (a)(c) | | 250,000 | 701,347 |
| Oil & Natural Gas Corp. Ltd. | | 75,000,616 | 116,319,127 |
| Oil India Ltd. | | 75,656 | 169,796 |
| Ovintiv, Inc. | | 2,000,000 | 51,320,000 |
| Ovintiv, Inc. | | 10,000 | 257,054 |
| PDC Energy, Inc. | | 400,000 | 15,820,000 |
| Peyto Exploration & Development Corp. (b)(c) | | 12,474,700 | 72,292,466 |
| S-Oil Corp. | | 10,000 | 852,736 |
| San-Ai Oil Co. Ltd. | | 200,000 | 2,475,730 |
| Sanrin Co. Ltd. | | 15,000 | 103,915 |
| Sinopec Kantons Holdings Ltd. | | 6,000,000 | 2,138,680 |
| Southwestern Energy Co. (a)(b)(c) | | 50,360,100 | 237,196,071 |
| Star Petroleum Refining PCL (a) | | 3,700,000 | 945,831 |
| Thai Oil PCL (For. Reg.) | | 1,000,000 | 1,339,014 |
| Total SA sponsored ADR (c) | | 3,700,083 | 161,434,621 |
| TransGlobe Energy Corp. (a) | | 30,000 | 50,256 |
| Tsakos Energy Navigation Ltd. (c) | | 140,000 | 1,113,000 |
| Unit Corp. warrants 9/3/27 (a)(c)(e) | | 186,865 | 218,701 |
| Whiting Petroleum Corp.: | | | |
| warrants 9/1/24 (a) | | 412,696 | 2,476,176 |
| warrants 9/1/25 (a) | | 206,344 | 1,042,037 |
| | | | 1,094,647,688 |
|
| TOTAL ENERGY | | | 1,149,788,576 |
|
| FINANCIALS - 16.3% | | | |
| Banks - 3.0% | | | |
| Banco de Sabadell SA (a) | | 101,510 | 70,612 |
| Bank Norwegian ASA | | 100,000 | 1,170,378 |
| Bar Harbor Bankshares | | 350,000 | 10,024,000 |
| Camden National Corp. | | 46,843 | 2,097,161 |
| Central Valley Community Bancorp | | 25,000 | 559,750 |
| Citizens Financial Services, Inc. | | 15,508 | 970,025 |
| Community Trust Bancorp, Inc. | | 45,000 | 1,789,200 |
| Credit Agricole Atlantique Vendee | | 4,821 | 588,705 |
| Eagle Bancorp, Inc. | | 25,000 | 1,375,750 |
| East West Bancorp, Inc. | | 825,000 | 58,698,750 |
| F & M Bank Corp. | | 131,632 | 3,810,746 |
| First Foundation, Inc. | | 25,000 | 589,250 |
| First of Long Island Corp. | | 5,000 | 107,750 |
| FNB Corp., Pennsylvania | | 50,000 | 573,000 |
| Gunma Bank Ltd. | | 5,600,000 | 17,866,095 |
| Hirogin Holdings, Inc. | | 1,000,000 | 5,368,944 |
| NIBC Holding NV (c)(d) | | 1,000,000 | 8,303,750 |
| Oak Valley Bancorp Oakdale California (c) | | 50,000 | 874,000 |
| OFG Bancorp (c) | | 1,861,516 | 43,001,020 |
| Ogaki Kyoritsu Bank Ltd. | | 60,000 | 1,008,523 |
| Parke Bancorp, Inc. | | 75,000 | 1,497,000 |
| Preferred Bank, Los Angeles | | 10,000 | 589,800 |
| San ju San Financial Group, Inc. | | 300,000 | 3,896,814 |
| Schweizerische Nationalbank | | 10 | 58,288 |
| Seven Bank Ltd. | | 100,000 | 217,857 |
| Shinsei Bank Ltd. | | 711,200 | 9,406,578 |
| Sparebank 1 Oestlandet | | 875,000 | 12,162,200 |
| Texas Capital Bancshares, Inc. (a) | | 150,000 | 9,447,000 |
| The Keiyo Bank Ltd. | | 600,000 | 2,286,131 |
| The San-In Godo Bank Ltd. | | 1,800,000 | 8,942,163 |
| Van Lanschot NV (Bearer) | | 94,300 | 2,421,842 |
| Washington Trust Bancorp, Inc. | | 25,000 | 1,218,750 |
| Wells Fargo & Co. | | 4,250,000 | 195,245,000 |
| West Bancorp., Inc. | | 20,795 | 613,037 |
| Yamaguchi Financial Group, Inc. | | 1,700,000 | 9,762,545 |
| | | | 416,612,414 |
| Capital Markets - 0.3% | | | |
| ABG Sundal Collier ASA | | 800,000 | 889,216 |
| Blue Sky Alternative Investments Ltd. (a)(e) | | 10,000 | 0 |
| CI Financial Corp. | | 1,150,000 | 20,970,263 |
| Daou Data Corp. | | 10,000 | 122,749 |
| Diamond Hill Investment Group, Inc. | | 25,000 | 4,306,250 |
| Federated Hermes, Inc. | | 150,000 | 4,866,000 |
| GAMCO Investors, Inc. Class A | | 150,000 | 4,041,000 |
| Lazard Ltd. Class A | | 250,000 | 11,800,000 |
| | | | 46,995,478 |
| Consumer Finance - 5.9% | | | |
| Aeon Credit Service (Asia) Co. Ltd. | | 10,300,000 | 6,534,297 |
| Cash Converters International Ltd. | | 14,000,000 | 2,722,583 |
| Discover Financial Services | | 2,750,032 | 341,883,978 |
| Navient Corp. | | 1,050,000 | 21,451,500 |
| Santander Consumer U.S.A. Holdings, Inc. | | 1,000,000 | 41,030,000 |
| Synchrony Financial | | 8,650,759 | 406,758,688 |
| | | | 820,381,046 |
| Diversified Financial Services - 1.1% | | | |
| Fuyo General Lease Co. Ltd. | | 600,000 | 39,050,180 |
| Mizuho Leasing Co. Ltd. | | 200,000 | 6,617,748 |
| NICE Holdings Co. Ltd. | | 250,000 | 4,044,641 |
| Ricoh Leasing Co. Ltd. | | 1,050,000 | 32,972,517 |
| Tokyo Century Corp. | | 1,150,000 | 62,895,948 |
| Zenkoku Hosho Co. Ltd. | | 30,000 | 1,356,365 |
| | | | 146,937,399 |
| Insurance - 5.9% | | | |
| AFLAC, Inc. | | 5,725,347 | 314,894,085 |
| ASR Nederland NV | | 1,050,000 | 43,158,741 |
| Db Insurance Co. Ltd. | | 1,625,000 | 80,491,603 |
| FBD Holdings PLC (a) | | 9,811 | 90,779 |
| Genworth Financial, Inc. Class A (a) | | 12,000,000 | 40,080,000 |
| Hyundai Fire & Marine Insurance Co. Ltd. | | 600,000 | 13,506,714 |
| Legal & General Group PLC | | 500,000 | 1,816,730 |
| Lincoln National Corp. | | 400,000 | 24,648,000 |
| MetLife, Inc. | | 1,200,000 | 69,240,000 |
| NN Group NV | | 2,022,101 | 100,578,217 |
| Power Corp. of Canada (sub. vtg.) | | 500,000 | 15,958,641 |
| Primerica, Inc. | | 10,000 | 1,462,200 |
| Principal Financial Group, Inc. | | 200,000 | 12,426,000 |
| Prudential Financial, Inc. | | 325,000 | 32,591,000 |
| Qualitas Controladora S.A.B. de CV | | 10,000 | 48,673 |
| Reinsurance Group of America, Inc. | | 525,700 | 57,921,626 |
| Shinkong Insurance Co. Ltd. | | 100,000 | 149,036 |
| Talanx AG | | 180,000 | 7,657,007 |
| | | | 816,719,052 |
| Thrifts & Mortgage Finance - 0.1% | | | |
| ASAX Co. Ltd. | | 1,035,600 | 6,522,944 |
| Axos Financial, Inc. (a) | | 30,000 | 1,435,500 |
| Genworth Mortgage Insurance Ltd. | | 4,500,899 | 6,738,089 |
| Greene County Bancorp, Inc. (c) | | 25,000 | 773,250 |
| Hingham Institution for Savings | | 10,100 | 3,019,900 |
| Walker & Dunlop, Inc. | | 1,000 | 103,480 |
| | | | 18,593,163 |
|
| TOTAL FINANCIALS | | | 2,266,238,552 |
|
| HEALTH CARE - 17.5% | | | |
| Biotechnology - 4.4% | | | |
| Amgen, Inc. | | 900,000 | 217,386,000 |
| Cell Biotech Co. Ltd. | | 375,000 | 6,359,737 |
| Essex Bio-Technology Ltd. | | 4,000,000 | 3,438,359 |
| Gilead Sciences, Inc. | | 850,000 | 58,046,500 |
| Regeneron Pharmaceuticals, Inc. (a) | | 125,000 | 71,826,250 |
| United Therapeutics Corp. (a) | | 1,425,000 | 259,250,250 |
| | | | 616,307,096 |
| Health Care Equipment & Supplies - 0.6% | | | |
| Create Medic Co. Ltd. | | 35,000 | 306,276 |
| Fukuda Denshi Co. Ltd. | | 681,532 | 62,061,936 |
| InBody Co. Ltd. | | 5,000 | 126,219 |
| Interojo Co. Ltd. | | 5,463 | 141,935 |
| Medikit Co. Ltd. | | 70,000 | 2,048,220 |
| Meridian Bioscience, Inc. (a)(c) | | 50,000 | 1,025,000 |
| Nakanishi, Inc. | | 50,000 | 1,035,504 |
| Paul Hartmann AG | | 1,000 | 434,168 |
| St.Shine Optical Co. Ltd. | | 1,200,000 | 16,529,012 |
| Value Added Technology Co. Ltd. | | 135,000 | 4,215,969 |
| Vieworks Co. Ltd. | | 25,000 | 797,000 |
| | | | 88,721,239 |
| Health Care Providers & Services - 11.4% | | | |
| Anthem, Inc. | | 2,190,000 | 840,981,889 |
| Centene Corp. (a) | | 180,000 | 12,349,800 |
| Cigna Corp. | | 15,000 | 3,442,350 |
| CVS Health Corp. | | 1,400,030 | 115,306,471 |
| Hokuyaku Takeyama Holdings, Inc. | | 15,000 | 99,540 |
| Humana, Inc. | | 375,000 | 159,697,500 |
| Laboratory Corp. of America Holdings (a) | | 150,000 | 44,422,500 |
| MEDNAX, Inc. (a) | | 50,000 | 1,456,000 |
| Saint-Care Holding Corp. | | 199,593 | 1,712,019 |
| Tokai Corp. | | 375,000 | 8,244,838 |
| Uchiyama Holdings Co. Ltd. | | 687,006 | 2,198,069 |
| UnitedHealth Group, Inc. | | 750,000 | 309,165,000 |
| Universal Health Services, Inc. Class B | | 500,000 | 80,205,000 |
| Viemed Healthcare, Inc. (a) | | 25,000 | 173,934 |
| Yagami, Inc. | | 5,000 | 113,896 |
| | | | 1,579,568,806 |
| Health Care Technology - 0.0% | | | |
| Schrodinger, Inc. (a) | | 50,000 | 3,383,500 |
| Life Sciences Tools & Services - 0.1% | | | |
| ICON PLC (a) | | 40,000 | 9,730,800 |
| Pharmaceuticals - 1.0% | | | |
| Apex Healthcare Bhd | | 100,000 | 69,194 |
| Daito Pharmaceutical Co. Ltd. | | 255,000 | 7,705,437 |
| Dawnrays Pharmaceutical Holdings Ltd. | | 26,581,000 | 6,088,440 |
| DongKook Pharmaceutical Co. Ltd. | | 415,000 | 9,072,140 |
| Genomma Lab Internacional SA de CV (a) | | 2,700,000 | 2,623,196 |
| Huons Co. Ltd. | | 3,513 | 184,372 |
| Jazz Pharmaceuticals PLC (a) | | 240,000 | 40,684,800 |
| Kaken Pharmaceutical Co. Ltd. | | 10,000 | 440,727 |
| Korea United Pharm, Inc. | | 50,000 | 2,307,505 |
| Kwang Dong Pharmaceutical Co. Ltd. | | 2,400,000 | 18,404,525 |
| Kyung Dong Pharmaceutical Co. Ltd. | | 50,000 | 451,091 |
| Lee's Pharmaceutical Holdings Ltd. | | 11,200,000 | 5,736,088 |
| Luye Pharma Group Ltd. (d) | | 4,700,000 | 2,528,069 |
| Nippon Chemiphar Co. Ltd. | | 75,010 | 1,521,328 |
| Orient Europharma Co. Ltd. | | 57,000 | 84,715 |
| PT Tempo Scan Pacific Tbk | | 500,000 | 50,475 |
| Samjin Pharmaceutical Co. Ltd. | | 2,000 | 46,584 |
| Sawai Group Holdings Co. Ltd. | | 50,000 | 2,132,993 |
| Supernus Pharmaceuticals, Inc. (a)(c) | | 50,000 | 1,316,500 |
| Syngen Biotech Co. Ltd. | | 62,618 | 223,820 |
| Taro Pharmaceutical Industries Ltd. (a) | | 206,193 | 14,680,942 |
| Towa Pharmaceutical Co. Ltd. | | 546,700 | 13,903,587 |
| Zhaoke Ophthalmology Ltd. (a)(d) | | 972,530 | 1,001,170 |
| | | | 131,257,698 |
|
| TOTAL HEALTH CARE | | | 2,428,969,139 |
|
| INDUSTRIALS - 10.1% | | | |
| Aerospace & Defense - 0.2% | | | |
| Hexcel Corp. (a)(c) | | 1,000 | 54,420 |
| Huntington Ingalls Industries, Inc. | | 100,000 | 20,513,000 |
| Magellan Aerospace Corp. | | 200,000 | 1,639,949 |
| SIFCO Industries, Inc. (a) | | 44,296 | 491,686 |
| The Lisi Group | | 10,000 | 341,047 |
| Vectrus, Inc. (a) | | 60,000 | 2,717,400 |
| | | | 25,757,502 |
| Air Freight & Logistics - 0.1% | | | |
| AIT Corp. | | 900,000 | 9,139,055 |
| Onelogix Group Ltd. (a) | | 4,600,100 | 718,999 |
| SBS Co. Ltd. | | 150,000 | 4,594,139 |
| | | | 14,452,193 |
| Building Products - 0.3% | | | |
| Caesarstone Sdot-Yam Ltd. | | 11,126 | 147,642 |
| Euro Ceramics Ltd. (a)(e) | | 5,000 | 71 |
| InnoTec TSS AG | | 50,000 | 726,578 |
| Kondotec, Inc. | | 87,000 | 790,657 |
| KVK Corp. | | 75,000 | 1,517,023 |
| Nichias Corp. | | 5,000 | 126,293 |
| Nihon Dengi Co. Ltd. | | 350,000 | 12,410,556 |
| Nihon Flush Co. Ltd. | | 359,680 | 4,006,462 |
| Noda Corp. | | 400,000 | 2,891,391 |
| Sekisui Jushi Corp. | | 650,000 | 12,880,908 |
| Xinyi Glass Holdings Ltd. | | 300,000 | 1,119,525 |
| | | | 36,617,106 |
| Commercial Services & Supplies - 0.3% | | | |
| Asia File Corp. Bhd (a) | | 5,300,100 | 2,926,359 |
| BIC SA | | 1,000 | 67,794 |
| Civeo Corp. (a) | | 243,058 | 5,276,789 |
| CMC Corp. | | 15,000 | 389,135 |
| Delta Plus Group | | 1,000 | 104,983 |
| Fursys, Inc. | | 200,000 | 6,228,530 |
| Matsuda Sangyo Co. Ltd. | | 150,000 | 2,957,477 |
| Mitie Group PLC (a) | | 6,500,317 | 5,728,469 |
| VSE Corp. (c) | | 503,200 | 25,185,160 |
| | | | 48,864,696 |
| Construction & Engineering - 0.6% | | | |
| Argan, Inc. | | 10,000 | 449,500 |
| Boustead Projs. Pte Ltd. | | 2,549,475 | 2,464,897 |
| Boustead Singapore Ltd. | | 10,300,300 | 9,046,354 |
| Br Holding Corp. | | 25,000 | 105,966 |
| Dai-Dan Co. Ltd. | | 50,000 | 1,199,581 |
| Daiichi Kensetsu Corp. | | 275,000 | 5,256,597 |
| Geumhwa PSC Co. Ltd. | | 1,000 | 28,714 |
| Hokuriku Electrical Construction Co. Ltd. | | 125,000 | 1,470,990 |
| Kawada Technologies, Inc. | | 1,000 | 33,271 |
| Kawasaki Setsubi Kogyo Co. Ltd. | | 175,000 | 703,478 |
| Meisei Industrial Co. Ltd. | | 600,000 | 4,058,156 |
| Mirait Holdings Corp. | | 47,000 | 921,535 |
| Nakano Corp. | | 10,000 | 37,373 |
| Nippon Rietec Co. Ltd. | | 925,046 | 14,520,115 |
| Primoris Services Corp. | | 5,000 | 149,500 |
| Raiznext Corp. | | 1,925,000 | 20,003,646 |
| Seikitokyu Kogyo Co. Ltd. | | 600,000 | 4,780,092 |
| Shinnihon Corp. | | 75,000 | 585,889 |
| Sinopec Engineering Group Co. Ltd. (H Shares) | | 100,000 | 57,006 |
| Sumiken Mitsui Road Co. Ltd. | | 60,000 | 547,468 |
| Sumitomo Densetsu Co. Ltd. | | 175,000 | 3,429,652 |
| Totetsu Kogyo Co. Ltd. | | 250,000 | 5,286,906 |
| Watanabe Sato Co. Ltd. | | 60,000 | 1,772,025 |
| | | | 76,908,711 |
| Electrical Equipment - 0.9% | | | |
| Acuity Brands, Inc. | | 450,000 | 78,921,000 |
| Aichi Electric Co. Ltd. | | 150,000 | 3,910,487 |
| AQ Group AB (a) | | 853,205 | 31,418,845 |
| Atkore, Inc. (a) | | 10,000 | 751,100 |
| BizLink Holding, Inc. | | 25,000 | 231,036 |
| Canare Electric Co. Ltd. | | 95,000 | 1,488,583 |
| Dewhurst PLC | | 25,000 | 834,000 |
| Gerard Perrier Industrie SA | | 100 | 9,205 |
| Hammond Power Solutions, Inc. Class A | | 529,700 | 4,373,124 |
| Iwabuchi Corp. | | 10,000 | 525,956 |
| Terasaki Electric Co. Ltd. | | 110,000 | 1,274,418 |
| | | | 123,737,754 |
| Industrial Conglomerates - 0.1% | | | |
| Mytilineos SA | | 800,000 | 14,842,360 |
| Reunert Ltd. | | 300,000 | 972,613 |
| | | | 15,814,973 |
| Machinery - 0.9% | | | |
| Beijer Alma AB (B Shares) | | 1,000 | 24,395 |
| Daihatsu Diesel Manufacturing Co. Ltd. (b) | | 3,184,000 | 14,076,296 |
| Daiwa Industries Ltd. | | 1,100,000 | 11,420,628 |
| Estic Corp. | | 75,135 | 3,133,336 |
| Fujimak Corp. (b) | | 820,000 | 6,039,469 |
| Fukushima Industries Corp. | | 100,000 | 4,106,467 |
| Haitian International Holdings Ltd. | | 350,000 | 1,281,342 |
| Hokuetsu Industries Co. Ltd. | | 150,000 | 1,494,462 |
| Hosokawa Micron Corp. | | 75,000 | 4,245,477 |
| Hy-Lok Corp. | | 150,000 | 2,244,613 |
| Ihara Science Corp. | | 200,000 | 3,562,281 |
| Impro Precision Industries Ltd. (d) | | 250,000 | 63,697 |
| Koike Sanso Kogyo Co. Ltd. | | 35,000 | 722,939 |
| Krones AG | | 15,000 | 1,479,550 |
| Mitsuboshi Belting Ltd. | | 12,500 | 207,488 |
| Nakanishi Manufacturing Co. Ltd. | | 250,000 | 2,670,799 |
| Nansin Co. Ltd. | | 250,000 | 1,337,678 |
| Park-Ohio Holdings Corp. | | 30,000 | 872,700 |
| Sakura Rubber Co. Ltd. | | 41,100 | 1,453,607 |
| Sansei Co. Ltd. (b) | | 850,000 | 3,579,600 |
| Semperit AG Holding | | 300,000 | 11,049,919 |
| Shinwa Co. Ltd. | | 75,000 | 1,540,267 |
| SIMPAC, Inc. | | 2,300,000 | 13,986,433 |
| Suzumo Machinery Co. Ltd. | | 10,000 | 155,964 |
| Teikoku Sen-I Co. Ltd. | | 503,864 | 8,988,304 |
| The Hanshin Diesel Works Ltd. | | 27,778 | 450,707 |
| TK Group Holdings Ltd. | | 36,536,000 | 13,211,193 |
| Tocalo Co. Ltd. | | 400,000 | 4,991,568 |
| Tsubakimoto Chain Co. | | 1,000 | 30,217 |
| Yamada Corp. | | 80,000 | 1,677,955 |
| | | | 120,099,351 |
| Marine - 0.0% | | | |
| Japan Transcity Corp. | | 1,400,000 | 7,274,053 |
| Professional Services - 0.8% | | | |
| ABIST Co. Ltd. (b) | | 260,000 | 6,932,227 |
| Akka Technologies SA (a) | | 660,000 | 36,875,768 |
| Altech Corp. | | 194,053 | 3,581,945 |
| Applus Services SA | | 50,000 | 481,321 |
| Artner Co. Ltd. | | 5,000 | 36,917 |
| Barrett Business Services, Inc. | | 5,000 | 366,050 |
| Benext-Yumeshin Group Co. | | 75,000 | 929,083 |
| Bertrandt AG | | 200,000 | 11,826,913 |
| Career Design Center Co. Ltd. | | 150,000 | 1,469,851 |
| en-japan, Inc. | | 50,000 | 1,736,475 |
| Etteplan OYJ | | 15,000 | 313,170 |
| Gakujo Co. Ltd. | | 73,422 | 768,988 |
| Hays PLC (a) | | 500,000 | 1,028,600 |
| Hito Communications Holdings, Inc. | | 10,000 | 190,967 |
| HRnetgroup Ltd. | | 25,000 | 14,668 |
| JAC Recruitment Co. Ltd. | | 300,000 | 4,780,092 |
| Kelly Services, Inc. Class A (non-vtg.) (a) | | 50,000 | 1,096,000 |
| Kforce, Inc. | | 11,000 | 686,730 |
| McMillan Shakespeare Ltd. | | 2,500,000 | 23,208,006 |
| Quick Co. Ltd. | | 475,227 | 5,180,908 |
| Robert Walters PLC | | 5,000 | 46,426 |
| SaraminHR Co. Ltd. | | 25,000 | 1,072,426 |
| SHL-JAPAN Ltd. | | 159,600 | 4,224,770 |
| TriNet Group, Inc. (a) | | 5,000 | 414,900 |
| TrueBlue, Inc. (a) | | 174,017 | 4,731,522 |
| WDB Holdings Co. Ltd. | | 125,000 | 3,446,744 |
| Will Group, Inc. | | 14,400 | 125,879 |
| World Holdings Co. Ltd. | | 36,600 | 1,059,250 |
| | | | 116,626,596 |
| Road & Rail - 0.8% | | | |
| Autohellas SA (b) | | 2,600,000 | 22,515,025 |
| Daqin Railway Co. Ltd. (A Shares) | | 42,000,622 | 38,221,089 |
| Hamakyorex Co. Ltd. | | 250,000 | 7,189,736 |
| Higashi Twenty One Co. Ltd. | | 182,586 | 1,155,049 |
| NANSO Transport Co. Ltd. | | 125,000 | 1,339,957 |
| Nikkon Holdings Co. Ltd. | | 400,000 | 8,754,387 |
| SENKO Co. Ltd. | | 600,000 | 6,048,949 |
| Shin-Keisei Electric Railway Co. Ltd. | | 35,000 | 683,697 |
| Stef SA | | 177,660 | 20,653,419 |
| The Hokkaido Chuo Bus Co. Ltd. | | 1,000 | 29,306 |
| Tohbu Network Co. Ltd. | | 175,000 | 1,497,881 |
| Universal Logistics Holdings, Inc. | | 10,000 | 230,500 |
| Utoc Corp. | | 1,600,000 | 7,511,052 |
| | | | 115,830,047 |
| Trading Companies & Distributors - 5.0% | | | |
| Alconix Corp. | | 18,000 | 238,075 |
| Bergman & Beving AB (B Shares) | | 625,000 | 12,240,951 |
| Canox Corp. | | 422,100 | 3,789,877 |
| Chori Co. Ltd. (b) | | 1,566,400 | 26,857,467 |
| Daiichi Jitsugyo Co. Ltd. | | 25,000 | 1,059,660 |
| Green Cross Co. Ltd. (b) | | 612,000 | 5,455,868 |
| Hanwa Co. Ltd. | | 200,000 | 5,870,289 |
| HERIGE | | 60,000 | 3,067,643 |
| Itochu Corp. | | 15,750,000 | 466,188,024 |
| James Latham PLC | | 10,000 | 177,225 |
| Kamei Corp. (b) | | 2,150,000 | 22,302,539 |
| Lumax International Corp. Ltd. | | 1,588,740 | 3,903,892 |
| Maruka Machinery Co. Ltd. | | 5,000 | 116,266 |
| Meiwa Corp. | | 1,425,000 | 6,079,030 |
| Mitani Shoji Co. Ltd. | | 665,000 | 49,887,881 |
| Mitsubishi Corp. | | 1,400,000 | 39,268,295 |
| Momentum Group AB (B Shares) | | 500,000 | 11,128,665 |
| Narasaki Sangyo Co. Ltd. | | 70,000 | 1,342,509 |
| Nishikawa Keisoku Co. Ltd. | | 20,000 | 855,932 |
| Parker Corp. | | 100 | 504 |
| Rasa Corp. (a) | | 250,000 | 2,028,166 |
| Sakai Trading Co. Ltd. | | 30,000 | 607,083 |
| Sam Yung Trading Co. Ltd. | | 10,000 | 141,400 |
| Sanyo Trading Co. Ltd. | | 200,000 | 2,193,154 |
| Shinsho Corp. | | 100,000 | 2,696,322 |
| Totech Corp. | | 53,181 | 1,267,172 |
| Yamazen Co. Ltd. | | 100,000 | 937,970 |
| Yuasa Trading Co. Ltd. | | 675,000 | 19,196,937 |
| | | | 688,898,796 |
| Transportation Infrastructure - 0.1% | | | |
| Anhui Expressway Co. Ltd. (H Shares) | | 3,000,000 | 1,791,241 |
| Isewan Terminal Service Co. Ltd. | | 300,000 | 1,897,817 |
| Meiko Transportation Co. Ltd. | | 100,000 | 1,078,346 |
| Qingdao Port International Co. Ltd. (H Shares) (d) | | 17,000,000 | 8,750,314 |
| | | | 13,517,718 |
|
| TOTAL INDUSTRIALS | | | 1,404,399,496 |
|
| INFORMATION TECHNOLOGY - 5.6% | | | |
| Communications Equipment - 0.0% | | | |
| HF Co. (b) | | 218,596 | 1,664,767 |
| Electronic Equipment & Components - 1.5% | | | |
| AAC Technology Holdings, Inc. | | 5,000 | 29,951 |
| Ai Holdings Corp. | | 25,000 | 463,744 |
| CONEXIO Corp. | | 10,000 | 145,572 |
| Daido Signal Co. Ltd. | | 425,000 | 2,343,786 |
| Elematec Corp. | | 800,000 | 8,305,911 |
| FLEXium Interconnect, Inc. | | 25,000 | 116,837 |
| Forval Corp. | | 1,000 | 8,751 |
| Hagiwara Electric Holdings Co. Ltd. | | 350,000 | 7,277,244 |
| Insight Enterprises, Inc. (a) | | 1,000 | 100,380 |
| Kimball Electronics, Inc. (a) | | 100 | 2,039 |
| Kingboard Chemical Holdings Ltd. | | 6,950,000 | 36,399,375 |
| Kyosha Co. Ltd. (a)(c) | | 50,000 | 161,342 |
| Lacroix SA (b) | | 374,515 | 18,703,701 |
| Makus, Inc. | | 300,000 | 1,660,363 |
| New Cosmos Electric Co. Ltd. | | 35,000 | 678,593 |
| Nihon Denkei Co. Ltd. | | 50,000 | 814,001 |
| PAX Global Technology Ltd. | | 9,000,000 | 9,728,290 |
| Redington India Ltd. | | 8,976,871 | 39,514,968 |
| Riken Kieki Co. Ltd. | | 550,000 | 12,904,608 |
| Shibaura Electronics Co. Ltd. | | 215,000 | 9,691,217 |
| Simplo Technology Co. Ltd. | | 1,400,000 | 18,537,933 |
| Solid State PLC | | 4,486 | 55,746 |
| SYNNEX Corp. | | 50,000 | 5,977,000 |
| Test Research, Inc. | | 50,000 | 103,233 |
| Thinking Electronic Industries Co. Ltd. | | 1,600,000 | 12,681,741 |
| Vontier Corp. | | 100,000 | 3,235,000 |
| VSTECS Holdings Ltd. | | 20,310,900 | 16,204,497 |
| Zepp Health Corp. ADR (a) | | 1,000 | 11,140 |
| Zhejiang Dahua Technology Co. Ltd. (A Shares) | | 99,950 | 326,853 |
| | | | 206,183,816 |
| IT Services - 2.9% | | | |
| Amdocs Ltd. | | 625,000 | 48,193,750 |
| Asahi Intelligence Service Co. | | 13,100 | 156,429 |
| Avant Corp. | | 300,000 | 4,468,347 |
| CDS Co. Ltd. | | 46,700 | 677,694 |
| Cielo SA | | 3,400,000 | 2,206,499 |
| Concentrix Corp. (a) | | 50,000 | 8,186,500 |
| Data Applications Co. Ltd. | | 30,200 | 441,005 |
| Dimerco Data System Corp. | | 500,000 | 1,291,915 |
| DTS Corp. | | 550,003 | 13,205,487 |
| DXC Technology Co. (a) | | 100,000 | 3,998,000 |
| E-Credible Co. Ltd. | | 240,000 | 4,340,886 |
| Enea Data AB (a) | | 200,000 | 5,517,866 |
| Estore Corp. (c) | | 175,000 | 2,967,048 |
| Future Corp. | | 739,200 | 12,357,621 |
| IFIS Japan Ltd. | | 189,800 | 1,145,322 |
| Jfe Systems, Inc. | | 12,400 | 195,882 |
| Korea Information & Communication Co. Ltd. (a) | | 325,000 | 2,785,489 |
| KPS AG | | 15,000 | 94,663 |
| Maximus, Inc. | | 1,000 | 89,000 |
| Neurones | | 12,000 | 428,474 |
| Nice Information & Telecom, Inc. | | 150,749 | 4,426,640 |
| NS Solutions Corp. | | 1,000 | 31,676 |
| Relia, Inc. | | 1,000 | 12,205 |
| Societe Pour L'Informatique Industrielle SA | | 174,000 | 7,182,981 |
| Sopra Steria Group | | 330,000 | 65,609,115 |
| TDC Soft, Inc. | | 201,107 | 2,007,312 |
| The Western Union Co. | | 9,000,000 | 208,890,000 |
| Wavestone | | 1,000 | 49,823 |
| | | | 400,957,629 |
| Semiconductors & Semiconductor Equipment - 0.1% | | | |
| Miraial Co. Ltd. (b) | | 600,000 | 6,787,293 |
| Phison Electronics Corp. | | 600,000 | 10,263,801 |
| Protec Co. Ltd. | | 5,352 | 127,212 |
| Systems Technology, Inc. | | 5,000 | 74,170 |
| | | | 17,252,476 |
| Software - 0.2% | | | |
| Cresco Ltd. | | 200,000 | 3,567,750 |
| Fukui Computer Holdings, Inc. | | 10,000 | 366,893 |
| InfoVine Co. Ltd. | | 63,600 | 1,528,263 |
| KSK Co., Ltd. | | 121,900 | 2,603,452 |
| Linedata Services | | 10,000 | 482,804 |
| Miroku Jyoho Service Co., Ltd. | | 10,000 | 143,202 |
| Sinosoft Tech Group Ltd. | | 5,000,000 | 759,218 |
| System Information Co. Ltd. | | 50,000 | 418,851 |
| System Research Co. Ltd. | | 200,000 | 3,928,718 |
| Toho System Science Co. Ltd. | | 80,100 | 695,093 |
| Uchida Esco Co. Ltd. (c) | | 167,600 | 4,476,259 |
| Zensar Technologies Ltd. | | 1,850,000 | 10,349,459 |
| | | | 29,319,962 |
| Technology Hardware, Storage & Peripherals - 0.9% | | | |
| Dell Technologies, Inc. (a)(c) | | 700,000 | 67,634,000 |
| Elecom Co. Ltd. | | 80,000 | 1,403,765 |
| HP, Inc. | | 1,500,540 | 43,320,590 |
| MCJ Co. Ltd. | | 366,800 | 4,132,581 |
| TSC Auto ID Technology Corp. | | 23,000 | 190,295 |
| | | | 116,681,231 |
|
| TOTAL INFORMATION TECHNOLOGY | | | 772,059,881 |
|
| MATERIALS - 3.5% | | | |
| Chemicals - 2.5% | | | |
| AdvanSix, Inc. (a) | | 10,100 | 337,845 |
| Air Water, Inc. | | 100,000 | 1,490,361 |
| Birla Carbon Thailand PCL (For. Reg.) | | 50,000 | 68,472 |
| C. Uyemura & Co. Ltd. | | 370,000 | 15,480,607 |
| Ciner Resources LP (a) | | 10,000 | 140,600 |
| Dainichiseika Color & Chemicals Manufacturing Co. Ltd. | | 10,000 | 209,927 |
| Daishin-Chemical Co. Ltd. (b) | | 411,495 | 5,307,556 |
| EcoGreen International Group Ltd. | | 1,000,000 | 259,936 |
| Fuso Chemical Co. Ltd. | | 200,000 | 7,173,784 |
| HEXPOL AB (B Shares) | | 5,000 | 68,073 |
| Ingevity Corp. (a) | | 1,000 | 84,940 |
| Insecticides (India) Ltd. (a) | | 53,200 | 560,742 |
| Isamu Paint Co. Ltd. (c) | | 20,000 | 617,110 |
| Johnson Matthey PLC | | 5,000 | 206,554 |
| K+S AG | | 300,000 | 4,304,308 |
| Kangnam Jevisco Co. Ltd. | | 5,000 | 137,279 |
| Koatsu Gas Kogyo Co. Ltd. | | 200,000 | 1,214,165 |
| KPX Holdings Corp. | | 12,000 | 708,907 |
| Kuriyama Holdings Corp. | | 225,000 | 1,655,121 |
| Nippon Soda Co. Ltd. | | 160,000 | 5,111,891 |
| Nutrien Ltd. | | 20,000 | 1,189,163 |
| Okamoto Industries, Inc. | | 2,000 | 75,293 |
| Scientex Bhd | | 12,153,600 | 12,038,400 |
| Scientex Bhd warrants 1/14/26 (a) | | 810,240 | 230,400 |
| T&K Toka Co. Ltd. | | 157,063 | 1,168,255 |
| Thai Rayon PCL NVDR | | 250,000 | 235,849 |
| The Mosaic Co. | | 7,550,000 | 235,786,500 |
| Toho Acetylene Co. Ltd. | | 225,000 | 2,387,311 |
| Tokuyama Corp. | | 61,200 | 1,296,010 |
| Westlake Chemical Partners LP | | 100 | 2,672 |
| Yara International ASA | | 675,000 | 35,550,242 |
| Yip's Chemical Holdings Ltd. | | 3,500,000 | 2,296,957 |
| Yung Chi Paint & Varnish Manufacturing Co. Ltd. | | 1,656,640 | 4,538,611 |
| | | | 341,933,841 |
| Construction Materials - 0.1% | | | |
| Buzzi Unicem SpA | | 368,500 | 9,748,069 |
| Imerys SA | | 10,000 | 463,112 |
| Mitani Sekisan Co. Ltd. | | 240,000 | 9,724,261 |
| Yamau Holdings Co. Ltd. | | 5,000 | 29,807 |
| Yotai Refractories Co. Ltd. | | 79,388 | 901,668 |
| | | | 20,866,917 |
| Containers & Packaging - 0.2% | | | |
| Chuoh Pack Industry Co. Ltd. | | 12,000 | 119,885 |
| Groupe Guillin SA | | 10,000 | 282,328 |
| Mayr-Melnhof Karton AG | | 65,000 | 13,832,861 |
| Packaging Corp. of America | | 10,000 | 1,415,000 |
| Showa Paxxs Corp. | | 5,000 | 79,349 |
| The Pack Corp. | | 75,000 | 1,936,785 |
| WestRock Co. | | 200,000 | 9,842,000 |
| | | | 27,508,208 |
| Metals & Mining - 0.7% | | | |
| ArcelorMittal SA Class A unit (c) | | 200,000 | 7,048,000 |
| Castings PLC | | 60,301 | 331,083 |
| Chubu Steel Plate Co. Ltd. | | 458,800 | 3,282,968 |
| CI Resources Ltd. | | 400,000 | 293,540 |
| CK-SAN-ETSU Co. Ltd. | | 110,000 | 2,917,825 |
| Gatos Silver, Inc. | | 275,200 | 3,753,728 |
| Mount Gibson Iron Ltd. | | 30,009,314 | 18,939,208 |
| Newmont Corp. | | 5,000 | 314,100 |
| Okaya & Co. Ltd. | | 100 | 8,660 |
| Pacific Metals Co. Ltd. | | 500,999 | 7,777,870 |
| Perenti Global Ltd. (c) | | 24,000,434 | 16,027,574 |
| Rio Tinto PLC sponsored ADR (c) | | 100,000 | 8,631,000 |
| St Barbara Ltd. | | 10,000,732 | 12,990,096 |
| Teck Resources Ltd. Class B (sub. vtg.) | | 600,000 | 13,696,698 |
| Warrior Metropolitan Coal, Inc. | | 180,000 | 3,360,600 |
| Young Poong Corp. | | 1,000 | 594,226 |
| | | | 99,967,176 |
| Paper & Forest Products - 0.0% | | | |
| Miquel y Costas & Miquel SA | | 5,000 | 97,154 |
|
| TOTAL MATERIALS | | | 490,373,296 |
|
| REAL ESTATE - 0.1% | | | |
| Real Estate Management & Development - 0.1% | | | |
| Arealink Co. Ltd. | | 50,000 | 720,569 |
| Business One Holdings, Inc. | | 17,400 | 73,752 |
| Century21 Real Estate Japan Ltd. | | 10,000 | 96,623 |
| Daito Trust Construction Co. Ltd. | | 5,000 | 585,206 |
| Dongwon Development Co. Ltd. | | 10,000 | 55,866 |
| Lai Sun Garment (International) Ltd. (a) | | 303,370 | 133,900 |
| Nisshin Group Holdings Co. (b) | | 2,850,000 | 12,261,975 |
| Realogy Holdings Corp. (a) | | 25,000 | 443,000 |
| Sunnexta Group, Inc. | | 25,000 | 222,870 |
| | | | 14,593,761 |
| UTILITIES - 2.2% | | | |
| Electric Utilities - 1.8% | | | |
| EVN AG | | 50,000 | 1,209,975 |
| Fjordkraft Holding ASA (d) | | 400,000 | 2,277,371 |
| Holding Co. ADMIE IPTO SA | | 25,000 | 77,106 |
| PG&E Corp. (a) | | 13,815,789 | 121,440,785 |
| Power Grid Corp. of India Ltd. | | 100,000 | 230,215 |
| Power Grid Corporation of India Ltd. (a) | | 33,333 | 76,738 |
| PPL Corp. | | 4,500,134 | 127,668,802 |
| | | | 252,980,992 |
| Gas Utilities - 0.4% | | | |
| Busan City Gas Co. Ltd. | | 110,000 | 5,830,355 |
| China Resource Gas Group Ltd. | | 1,800,000 | 11,094,883 |
| GAIL India Ltd. | | 7,684,648 | 14,424,834 |
| Hokuriku Gas Co. | | 75,000 | 2,156,921 |
| Keiyo Gas Co. Ltd. | | 15,000 | 452,577 |
| Seoul City Gas Co. Ltd. | | 100,000 | 11,884,521 |
| Towngas China Co. Ltd. | | 4,500,000 | 2,959,022 |
| YESCO Co. Ltd. | | 240,000 | 7,776,120 |
| | | | 56,579,233 |
| Water Utilities - 0.0% | | | |
| Manila Water Co., Inc. (a) | | 500,000 | 162,178 |
| Thessaloniki Water & Sewage SA | | 82,633 | 452,868 |
| | | | 615,046 |
|
| TOTAL UTILITIES | | | 310,175,271 |
|
| TOTAL COMMON STOCKS | | | |
| (Cost $8,020,450,036) | | | 12,533,084,566 |
|
| Nonconvertible Preferred Stocks - 0.1% | | | |
| CONSUMER DISCRETIONARY - 0.1% | | | |
| Automobiles - 0.1% | | | |
| Porsche Automobil Holding SE (Germany) | | 15,000 | 1,623,468 |
| Internet & Direct Marketing Retail - 0.0% | | | |
| Qurate Retail, Inc. 8.00% | | 1,500 | 162,690 |
|
| TOTAL CONSUMER DISCRETIONARY | | | 1,786,158 |
|
| INDUSTRIALS - 0.0% | | | |
| Industrial Conglomerates - 0.0% | | | |
| Steel Partners Holdings LP Series A, 6.00% | | 61,043 | 1,424,133 |
| Machinery - 0.0% | | | |
| Danieli & C. Officine Meccaniche SpA | | 10,000 | 183,632 |
|
| TOTAL INDUSTRIALS | | | 1,607,765 |
|
| TOTAL NONCONVERTIBLE PREFERRED STOCKS | | | |
| (Cost $2,147,815) | | | 3,393,923 |
| | | Principal Amount | Value |
|
| Nonconvertible Bonds - 0.0% | | | |
| FINANCIALS - 0.0% | | | |
| Capital Markets - 0.0% | | | |
GAMCO Investors, Inc. 4% 6/15/23
(Cost $300,000)(e)(f) | | 300,000 | 299,992 |
| | | Shares | Value |
|
| Money Market Funds - 9.6% | | | |
| Fidelity Cash Central Fund 0.06% (g) | | 1,271,137,560 | 1,271,391,788 |
| Fidelity Securities Lending Cash Central Fund 0.06% (g)(h) | | 64,601,857 | 64,608,317 |
| TOTAL MONEY MARKET FUNDS | | | |
| (Cost $1,336,000,105) | | | 1,336,000,105 |
| TOTAL INVESTMENT IN SECURITIES - 99.9% | | | |
| (Cost $9,358,897,956) | | | 13,872,778,586 |
| NET OTHER ASSETS (LIABILITIES) - 0.1% | | | 18,573,749 |
| NET ASSETS - 100% | | | $13,891,352,335 |
Legend
(a) Non-income producing
(b) Affiliated company
(c) Security or a portion of the security is on loan at period end.
(d) Security exempt from registration under Rule 144A of the Securities Act of 1933. These securities may be resold in transactions exempt from registration, normally to qualified institutional buyers. At the end of the period, the value of these securities amounted to $32,774,398 or 0.2% of net assets.
(e) Level 3 security
(f) Security initially issued at one coupon which converts to a higher coupon at a specified date. The rate shown is the rate at period end.
(g) Affiliated fund that is generally available only to investment companies and other accounts managed by Fidelity Investments. The rate quoted is the annualized seven-day yield of the fund at period end. A complete unaudited listing of the fund's holdings as of its most recent quarter end is available upon request. In addition, each Fidelity Central Fund's financial statements, which are not covered by the Fund's Report of Independent Registered Public Accounting Firm, are available on the SEC's website or upon request.
(h) Investment made with cash collateral received from securities on loan.
Affiliated Central Funds
Information regarding fiscal year to date income earned by the Fund from investments in Fidelity Central Funds is as follows:
| Fund | Income earned |
| Fidelity Cash Central Fund | $386,772 |
| Fidelity Securities Lending Cash Central Fund | 8,403,776 |
| Total | $8,790,548 |
Amounts in the income column in the above table include any capital gain distributions from underlying funds, which are presented in the corresponding line-item in the Statement of Operations, if applicable. Amount for Fidelity Securities Lending Cash Central Fund represents the income earned on investing cash collateral, less rebates paid to borrowers and any lending agent fees associated with the loan, plus any premium payments received for lending certain types of securities.
Fiscal year to date information regarding the Fund's investments in Fidelity Central Funds, including the ownership percentage, is presented below.
| Fund | Value, beginning of period | Purchases | Sales Proceeds | Realized Gain/Loss | Change in Unrealized appreciation (depreciation) | Value, end of period | % ownership, end of period |
| Fidelity Cash Central Fund 0.06% | $713,717,856 | $5,002,052,666 | $4,444,321,140 | $28,866 | $(86,460) | $1,271,391,788 | 1.9% |
| Fidelity Securities Lending Cash Central Fund 0.06% | 316,970,467 | 2,196,066,986 | 2,448,429,136 | -- | -- | 64,608,317 | 0.2% |
| Total | $1,030,688,323 | $7,198,119,652 | $6,892,750,276 | $28,866 | $(86,460) | $1,336,000,105 | |
Other Affiliated Issuers
An affiliated company is a company in which the Fund has ownership of at least 5% of the voting securities. Fiscal year to date transactions with companies which are or were affiliates are as follows:
| Affiliate | Value, beginning of period | Purchases | Sales Proceeds | Dividend Income | Realized Gain (loss) | Change in Unrealized appreciation (depreciation) | Value, end of period |
| ABIST Co. Ltd. | $6,263,285 | $-- | $-- | $225,750 | $-- | $668,942 | $6,932,227 |
| Autohellas SA | 9,938,364 | -- | -- | 674,477 | -- | 12,576,661 | 22,515,025 |
| Bonanza Creek Energy, Inc. | 21,828,000 | -- | -- | 420,000 | -- | 24,336,000 | -- |
| Chori Co. Ltd. | 20,879,414 | -- | -- | 461,926 | -- | 5,978,053 | 26,857,467 |
| Daihatsu Diesel Manufacturing Co. Ltd. | 12,061,631 | -- | -- | 342,902 | -- | 2,014,665 | 14,076,296 |
| Daishin-Chemical Co. Ltd. | 4,894,168 | -- | -- | 115,813 | -- | 413,388 | 5,307,556 |
| Estore Corp. | 3,035,862 | -- | 2,778,137 | 45,328 | 2,162,066 | 547,257 | -- |
| Fuji Corp. | 12,928,315 | -- | 602,009 | 243,098 | 26,442 | 2,722,007 | 15,074,755 |
| Fujimak Corp. | 4,911,247 | -- | -- | 134,466 | -- | 1,128,222 | 6,039,469 |
| G-Tekt Corp. | 23,504,322 | 918,194 | -- | 1,167,315 | -- | 16,757,515 | 41,180,031 |
| GameStop Corp. Class A | 27,982,851 | -- | 333,797,625 | -- | 233,086,896 | 72,727,878 | -- |
| Gendai Agency, Inc. | 2,119,881 | -- | -- | -- | -- | 537,701 | 2,657,582 |
| Green Cross Co. Ltd. | 5,579,141 | -- | -- | 119,847 | -- | (123,273) | 5,455,868 |
| Guess?, Inc. | 47,564,000 | -- | 22,553,701 | 1,935,000 | (748,741) | 58,322,442 | 82,584,000 |
| Gwangju Shinsegae Co. Ltd. | 11,236,546 | -- | -- | 260,442 | -- | 4,432,376 | 15,668,922 |
| Handsman Co. Ltd. | 10,635,270 | -- | -- | 200,529 | -- | (149,706) | 10,485,564 |
| Hannong Chemicals, Inc. | 5,492,951 | -- | 21,466,728 | 176,182 | 16,406,441 | (432,664) | -- |
| HF Co. | 962,091 | -- | 49,472 | 98,127 | (15,784) | 767,932 | 1,664,767 |
| Hibbett, Inc. | 31,313,457 | -- | 101,261,274 | 12,500 | 75,821,330 | (5,873,513) | -- |
| Houston Wire & Cable Co. | 3,384,735 | -- | -- | -- | (1,628,368) | 5,390,683 | -- |
| Jinro Distillers Co. Ltd. | 11,545,833 | -- | -- | 474,818 | -- | 1,369,921 | 12,915,754 |
| Kamei Corp. | 18,846,535 | 535,833 | -- | 550,782 | -- | 2,920,171 | 22,302,539 |
| Lacroix SA | 9,668,080 | -- | 98,445 | 171,615 | 42,962 | 9,091,104 | 18,703,701 |
| MegaStudy Co. Ltd. | 9,225,571 | -- | -- | 493,581 | -- | 3,833,685 | 13,059,256 |
| MegaStudyEdu Co. Ltd. | 29,764,236 | -- | 3,019,110 | 610,292 | 1,821,405 | 40,514,138 | 69,080,669 |
| Miraial Co. Ltd. | 5,713,476 | -- | -- | 150,056 | -- | 1,073,817 | 6,787,293 |
| Nisshin Group Holdings Co. | 9,504,039 | -- | -- | 393,788 | -- | 2,757,936 | 12,261,975 |
| Peyto Exploration & Development Corp. | 18,533,467 | -- | -- | 331,718 | -- | 53,758,999 | 72,292,466 |
| Sally Beauty Holdings, Inc. | 69,569,442 | -- | 35,920,133 | -- | (16,679,227) | 39,793,702 | -- |
| Sansei Co. Ltd. | 2,609,702 | -- | -- | 91,358 | -- | 969,898 | 3,579,600 |
| Satudora Holdings Co. Ltd. | 6,315,243 | -- | 487,014 | 79,754 | 139,842 | 176,134 | 6,144,205 |
| Southwestern Energy Co. | 122,132,043 | 250,000 | -- | -- | -- | 114,814,028 | 237,196,071 |
| TBK Co. Ltd. | 7,192,858 | -- | -- | 41,433 | -- | (449,319) | 6,743,539 |
| Tessi SA | 22,593,797 | -- | 41,504,338 | -- | 19,764,991 | (854,450) | -- |
| Tokatsu Holdings Co. Ltd. | 944,688 | -- | -- | 19,191 | -- | 23,818 | 968,506 |
| Treasure Factory Co. Ltd. | 5,420,150 | -- | 470,756 | 69,515 | (23,372) | 2,278,754 | 7,204,776 |
| Uchida Esco Co. Ltd. | 13,083,936 | -- | 3,802,727 | 78,343 | 3,120,282 | (7,925,232) | -- |
| Unit Corp. | 263,520 | -- | 218,701 | -- | (17,106,550) | 17,061,731 | -- |
| Whiting Petroleum Corp. | 6,146,091 | -- | -- | -- | -- | 1,838,339 | -- |
| Yorozu Corp. | 17,653,091 | -- | -- | 184,821 | -- | 2,908,743 | 20,561,834 |
| Zappallas, Inc. | 3,580,369 | -- | 1,004,834 | 53,853 | (1,139,646) | 2,582,159 | 4,018,048 |
| Total | $656,821,698 | $1,704,027 | $569,035,004 | $10,428,620 | $315,050,969 | $491,280,642 | $770,319,761 |
Investment Valuation
The following is a summary of the inputs used, as of July 31, 2021, involving the Fund's assets and liabilities carried at fair value. The inputs or methodology used for valuing securities may not be an indication of the risk associated with investing in those securities. For more information on valuation inputs, and their aggregation into the levels used below, please refer to the Investment Valuation section in the accompanying Notes to Financial Statements.
| | Valuation Inputs at Reporting Date: |
| Description | Total | Level 1 | Level 2 | Level 3 |
| Investments in Securities: | | | | |
| Equities: | | | | |
| Communication Services | $400,446,837 | $362,217,334 | $38,229,503 | $-- |
| Consumer Discretionary | 2,692,648,397 | 2,681,328,206 | 11,320,191 | -- |
| Consumer Staples | 605,177,518 | 605,153,821 | -- | 23,697 |
| Energy | 1,149,788,576 | 1,046,683,973 | 102,885,902 | 218,701 |
| Financials | 2,266,238,552 | 2,256,682,938 | 9,555,614 | -- |
| Health Care | 2,428,969,139 | 2,412,131,592 | 16,837,547 | -- |
| Industrials | 1,406,007,261 | 896,415,943 | 509,591,247 | 71 |
| Information Technology | 772,059,881 | 728,874,126 | 43,185,755 | -- |
| Materials | 490,373,296 | 476,760,805 | 13,612,491 | -- |
| Real Estate | 14,593,761 | 14,593,761 | -- | -- |
| Utilities | 310,175,271 | 310,175,271 | -- | -- |
| Corporate Bonds | 299,992 | -- | -- | 299,992 |
| Money Market Funds | 1,336,000,105 | 1,336,000,105 | -- | -- |
| Total Investments in Securities: | $13,872,778,586 | $13,127,017,875 | $745,218,250 | $542,461 |
Other Information
Distribution of investments by country or territory of incorporation, as a percentage of Total Net Assets, is as follows (Unaudited):
| United States of America | 57.6% |
| Japan | 14.7% |
| United Kingdom | 4.2% |
| Korea (South) | 3.8% |
| Canada | 2.9% |
| France | 2.3% |
| China | 1.7% |
| Cayman Islands | 1.6% |
| India | 1.3% |
| British Virgin Islands | 1.3% |
| Netherlands | 1.2% |
| Ireland | 1.0% |
| Others (Individually Less Than 1%) | 6.4% |
| | 100.0% |
See accompanying notes which are an integral part of the financial statements.
Financial Statements
Statement of Assets and Liabilities
| | | July 31, 2021 |
| Assets | | |
Investment in securities, at value (including securities loaned of $61,275,059) — See accompanying schedule:
Unaffiliated issuers (cost $7,383,713,881) | $11,766,458,720 | |
| Fidelity Central Funds (cost $1,336,000,105) | 1,336,000,105 | |
| Other affiliated issuers (cost $639,183,970) | 770,319,761 | |
| Total Investment in Securities (cost $9,358,897,956) | | $13,872,778,586 |
| Foreign currency held at value (cost $585,238) | | 585,530 |
| Receivable for investments sold | | 13,104,440 |
| Receivable for fund shares sold | | 74,144,047 |
| Dividends receivable | | 10,453,061 |
| Interest receivable | | 1,763 |
| Distributions receivable from Fidelity Central Funds | | 75,420 |
| Receivable from investment adviser for expense reductions | | 26,199 |
| Other receivables | | 2,188,984 |
| Total assets | | 13,973,358,030 |
| Liabilities | | |
| Payable for investments purchased | $5,053,169 | |
| Payable for fund shares redeemed | 8,300,407 | |
| Other payables and accrued expenses | 4,071,378 | |
| Collateral on securities loaned | 64,580,741 | |
| Total liabilities | | 82,005,695 |
| Net Assets | | $13,891,352,335 |
| Net Assets consist of: | | |
| Paid in capital | | $7,604,170,198 |
| Total accumulated earnings (loss) | | 6,287,182,137 |
| Net Assets | | $13,891,352,335 |
| Net Asset Value, offering price and redemption price per share ($13,891,352,335 ÷ 619,779,788 shares) | | $22.41 |
See accompanying notes which are an integral part of the financial statements.
Statement of Operations
| | | Year ended July 31, 2021 |
| Investment Income | | |
| Dividends (including $10,428,620 earned from other affiliated issuers) | | $272,723,658 |
| Interest | | 104 |
| Income from Fidelity Central Funds (including $8,403,776 from security lending) | | 8,790,548 |
| Total income | | 281,514,310 |
| Expenses | | |
| Custodian fees and expenses | $652,314 | |
| Independent trustees' fees and expenses | 57,671 | |
| Interest | 328 | |
| Miscellaneous | 6,354 | |
| Total expenses before reductions | 716,667 | |
| Expense reductions | (246,170) | |
| Total expenses after reductions | | 470,497 |
| Net investment income (loss) | | 281,043,813 |
| Realized and Unrealized Gain (Loss) | | |
| Net realized gain (loss) on: | | |
| Investment securities: | | |
| Unaffiliated issuers (net of foreign taxes of $2,185,334) | 1,651,172,521 | |
| Fidelity Central Funds | 28,866 | |
| Other affiliated issuers | 315,050,969 | |
| Foreign currency transactions | (2,831,247) | |
| Total net realized gain (loss) | | 1,963,421,109 |
| Change in net unrealized appreciation (depreciation) on: | | |
| Investment securities: | | |
| Unaffiliated issuers (net of increase in deferred foreign taxes of $1,358,593) | 2,905,870,783 | |
| Fidelity Central Funds | (86,460) | |
| Other affiliated issuers | 491,280,642 | |
| Assets and liabilities in foreign currencies | 1,841,744 | |
| Total change in net unrealized appreciation (depreciation) | | 3,398,906,709 |
| Net gain (loss) | | 5,362,327,818 |
| Net increase (decrease) in net assets resulting from operations | | $5,643,371,631 |
See accompanying notes which are an integral part of the financial statements.
Statement of Changes in Net Assets
| | Year ended July 31, 2021 | Year ended July 31, 2020 |
| Increase (Decrease) in Net Assets | | |
| Operations | | |
| Net investment income (loss) | $281,043,813 | $303,445,514 |
| Net realized gain (loss) | 1,963,421,109 | (25,027,693) |
| Change in net unrealized appreciation (depreciation) | 3,398,906,709 | (512,910,971) |
| Net increase (decrease) in net assets resulting from operations | 5,643,371,631 | (234,493,150) |
| Distributions to shareholders | (560,407,401) | (689,965,124) |
| Share transactions | | |
| Proceeds from sales of shares | 1,070,269,829 | 1,814,757,837 |
| Reinvestment of distributions | 560,407,401 | 689,965,123 |
| Cost of shares redeemed | (4,609,996,978) | (3,381,648,521) |
| Net increase (decrease) in net assets resulting from share transactions | (2,979,319,748) | (876,925,561) |
| Total increase (decrease) in net assets | 2,103,644,482 | (1,801,383,835) |
| Net Assets | | |
| Beginning of period | 11,787,707,853 | 13,589,091,688 |
| End of period | $13,891,352,335 | $11,787,707,853 |
| Other Information | | |
| Shares | | |
| Sold | 51,249,739 | 115,478,799 |
| Issued in reinvestment of distributions | 32,527,746 | 42,928,837 |
| Redeemed | (234,889,944) | (214,994,521) |
| Net increase (decrease) | (151,112,459) | (56,586,885) |
See accompanying notes which are an integral part of the financial statements.
Financial Highlights
Fidelity Series Intrinsic Opportunities Fund
| | | | | | |
| Years ended July 31, | 2021 | 2020 | 2019 | 2018 | 2017 |
| Selected Per–Share Data | | | | | |
| Net asset value, beginning of period | $15.29 | $16.42 | $18.79 | $17.30 | $14.80 |
| Income from Investment Operations | | | | | |
| Net investment income (loss)A | .40 | .38 | .44 | .40 | .23 |
| Net realized and unrealized gain (loss) | 7.49 | (.65) | (1.37) | 1.91 | 2.50 |
| Total from investment operations | 7.89 | (.27) | (.93) | 2.31 | 2.73 |
| Distributions from net investment income | (.44) | (.45) | (.42) | (.28) | (.19) |
| Distributions from net realized gain | (.33) | (.40) | (1.02) | (.54) | (.04) |
| Total distributions | (.77) | (.86)B | (1.44) | (.82) | (.23) |
| Net asset value, end of period | $22.41 | $15.29 | $16.42 | $18.79 | $17.30 |
| Total ReturnC | 53.18% | (1.89)% | (5.13)% | 13.82% | 18.69% |
| Ratios to Average Net AssetsD,E | | | | | |
| Expenses before reductions | .01% | .01% | .01% | .01% | .52% |
| Expenses net of fee waivers, if any | - %F | .01% | .01% | .01% | .52% |
| Expenses net of all reductions | - %F | .01% | .01% | - %F | .52% |
| Net investment income (loss) | 2.08% | 2.46% | 2.61% | 2.19% | 1.48% |
| Supplemental Data | | | | | |
| Net assets, end of period (000 omitted) | $13,891,352 | $11,787,708 | $13,589,092 | $14,520,045 | $4,948,389 |
| Portfolio turnover rateG | 10% | 19% | 27% | 13% | 35%H |
A Calculated based on average shares outstanding during the period.
B Total distributions per share do not sum due to rounding.
C Total returns would have been lower if certain expenses had not been reduced during the applicable periods shown.
D Fees and expenses of any underlying mutual funds or exchange-traded funds (ETFs) are not included in the Fund's expense ratio. The Fund indirectly bears its proportionate share of these expenses. For additional expense information related to investments in Fidelity Central Funds, please refer to the "Investments in Fidelity Central Funds" note found in the Notes to Financial Statements section of the most recent Annual or Semi-Annual report.
E Expense ratios reflect operating expenses of the class. Expenses before reductions do not reflect amounts reimbursed, waived, or reduced through arrangements with the investment advisor, brokerage services, or other offset arrangements, if applicable, and do not represent the amount paid by the class during periods when reimbursements, waivers or reductions occur.
F Amount represents less than .005%.
G Amount does not include the portfolio activity of any underlying mutual funds or exchange-traded funds (ETFs).
H Portfolio turnover rate excludes securities received or delivered in-kind.
See accompanying notes which are an integral part of the financial statements.
Notes to Financial Statements
For the period ended July 31, 2021
1. Organization.
Fidelity Series Intrinsic Opportunities Fund (the Fund) is a fund of Fidelity Puritan Trust (the Trust) and is authorized to issue an unlimited number of shares. Shares are offered only to certain other Fidelity funds and Fidelity managed 529 plans. The Trust is registered under the Investment Company Act of 1940, as amended (the 1940 Act), as an open-end management investment company organized as a Massachusetts business trust.
2. Investments in Fidelity Central Funds.
Funds may invest in Fidelity Central Funds, which are open-end investment companies generally available only to other investment companies and accounts managed by the investment adviser and its affiliates. The Schedule of Investments lists any Fidelity Central Funds held as an investment as of period end, but does not include the underlying holdings of each Fidelity Central Fund. An investing fund indirectly bears its proportionate share of the expenses of the underlying Fidelity Central Funds.
Based on its investment objective, each Fidelity Central Fund may invest or participate in various investment vehicles or strategies that are similar to those of the investing fund. These strategies are consistent with the investment objectives of the investing fund and may involve certain economic risks which may cause a decline in value of each of the Fidelity Central Funds and thus a decline in the value of the investing fund.
| Fidelity Central Fund | Investment Manager | Investment Objective | Investment Practices | Expense Ratio(a) |
| Fidelity Money Market Central Funds | Fidelity Management & Research Company LLC (FMR) | Each fund seeks to obtain a high level of current income consistent with the preservation of capital and liquidity. | Short-term Investments | Less than .005% to .01% |
(a) Expenses expressed as a percentage of average net assets and are as of each underlying Central Fund's most recent annual or semi-annual shareholder report.
A complete unaudited list of holdings for each Fidelity Central Fund is available upon request or at the Securities and Exchange Commission website at www.sec.gov. In addition, the financial statements of the Fidelity Central Funds which contain the significant accounting policies (including investment valuation policies) of those funds, and are not covered by the Report of Independent Registered Public Accounting Firm, are available on the Securities and Exchange Commission website or upon request.
3. Significant Accounting Policies.
The Fund is an investment company and applies the accounting and reporting guidance of the Financial Accounting Standards Board (FASB) Accounting Standards Codification Topic 946 Financial Services - Investment Companies. The financial statements have been prepared in conformity with accounting principles generally accepted in the United States of America (GAAP), which require management to make certain estimates and assumptions at the date of the financial statements. Actual results could differ from those estimates. Subsequent events, if any, through the date that the financial statements were issued have been evaluated in the preparation of the financial statements. The Fund's Schedule of Investments lists any underlying mutual funds or exchange-traded funds (ETFs) but does not include the underlying holdings of these funds. The following summarizes the significant accounting policies of the Fund:
Investment Valuation. Investments are valued as of 4:00 p.m. Eastern time on the last calendar day of the period. The Board of Trustees (the Board) has delegated the day to day responsibility for the valuation of the Fund's investments to the Fair Value Committee (the Committee) established by the Fund's investment adviser. In accordance with valuation policies and procedures approved by the Board, the Fund attempts to obtain prices from one or more third party pricing vendors or brokers to value its investments. When current market prices, quotations or currency exchange rates are not readily available or reliable, investments will be fair valued in good faith by the Committee, in accordance with procedures adopted by the Board. Factors used in determining fair value vary by investment type and may include market or investment specific events, changes in interest rates and credit quality. The frequency with which these procedures are used cannot be predicted and they may be utilized to a significant extent. The Committee oversees the Fund's valuation policies and procedures and reports to the Board on the Committee's activities and fair value determinations. The Board monitors the appropriateness of the procedures used in valuing the Fund's investments and ratifies the fair value determinations of the Committee.
The Fund categorizes the inputs to valuation techniques used to value its investments into a disclosure hierarchy consisting of three levels as shown below:
- Level 1 – quoted prices in active markets for identical investments
- Level 2 – other significant observable inputs (including quoted prices for similar investments, interest rates, prepayment speeds, etc.)
- Level 3 – unobservable inputs (including the Fund's own assumptions based on the best information available)
Valuation techniques used to value the Fund's investments by major category are as follows:
Equity securities, including restricted securities, for which market quotations are readily available, are valued at the last reported sale price or official closing price as reported by a third party pricing vendor on the primary market or exchange on which they are traded and are categorized as Level 1 in the hierarchy. In the event there were no sales during the day or closing prices are not available, securities are valued at the last quoted bid price or may be valued using the last available price and are generally categorized as Level 2 in the hierarchy. For foreign equity securities, when market or security specific events arise, comparisons to the valuation of American Depositary Receipts (ADRs), futures contracts, Exchange-Traded Funds (ETFs) and certain indexes as well as quoted prices for similar securities may be used and would be categorized as Level 2 in the hierarchy. For equity securities, including restricted securities, where observable inputs are limited, assumptions about market activity and risk are used and these securities may be categorized as Level 3 in the hierarchy.
Debt securities, including restricted securities, are valued based on evaluated prices received from third party pricing vendors or from brokers who make markets in such securities. Corporate bonds are valued by pricing vendors who utilize matrix pricing which considers yield or price of bonds of comparable quality, coupon, maturity and type or by broker-supplied prices. When independent prices are unavailable or unreliable, debt securities may be valued utilizing pricing methodologies which consider similar factors that would be used by third party pricing vendors. Debt securities are generally categorized as Level 2 in the hierarchy but may be Level 3 depending on the circumstances.
Investments in open-end mutual funds, including the Fidelity Central Funds, are valued at their closing net asset value (NAV) each business day and are categorized as Level 1 in the hierarchy.
Changes in valuation techniques may result in transfers in or out of an assigned level within the disclosure hierarchy. The aggregate value of investments by input level as of July 31, 2021 is included at the end of the Fund's Schedule of Investments.
Foreign Currency. Certain Funds may use foreign currency contracts to facilitate transactions in foreign-denominated securities. Gains and losses from these transactions may arise from changes in the value of the foreign currency or if the counterparties do not perform under the contracts' terms.
Foreign-denominated assets, including investment securities, and liabilities are translated into U.S. dollars at the exchange rates at period end. Purchases and sales of investment securities, income and dividends received, and expenses denominated in foreign currencies are translated into U.S. dollars at the exchange rate in effect on the transaction date.
The effects of exchange rate fluctuations on investments are included with the net realized and unrealized gain (loss) on investment securities. Other foreign currency transactions resulting in realized and unrealized gain (loss) are disclosed separately.
Investment Transactions and Income. For financial reporting purposes, the Fund's investment holdings and NAV include trades executed through the end of the last business day of the period. The NAV per share for processing shareholder transactions is calculated as of the close of business of the New York Stock Exchange (NYSE), normally 4:00 p.m. Eastern time and includes trades executed through the end of the prior business day. Gains and losses on securities sold are determined on the basis of identified cost and include proceeds received from litigation. Dividend income is recorded on the ex-dividend date, except for certain dividends from foreign securities where the ex-dividend date may have passed, which are recorded as soon as the Fund is informed of the ex-dividend date. Non-cash dividends included in dividend income, if any, are recorded at the fair market value of the securities received. Income and capital gain distributions from Fidelity Central Funds, if any, are recorded on the ex-dividend date. Certain distributions received by the Fund represent a return of capital or capital gain. The Fund determines the components of these distributions subsequent to the ex-dividend date, based upon receipt of tax filings or other correspondence relating to the underlying investment. These distributions are recorded as a reduction of cost of investments and/or as a realized gain. Interest income is accrued as earned and includes coupon interest and amortization of premium and accretion of discount on debt securities as applicable. Investment income is recorded net of foreign taxes withheld where recovery of such taxes is uncertain.
Expenses. Expenses directly attributable to a fund are charged to that fund. Expenses attributable to more than one fund are allocated among the respective funds on the basis of relative net assets or other appropriate methods. Expenses included in the accompanying financial statements reflect the expenses of that fund and do not include any expenses associated with any underlying mutual funds or exchange-traded funds. Although not included in a fund's expenses, a fund indirectly bears its proportionate share of these expenses through the net asset value of each underlying mutual fund or exchange-traded fund. Expense estimates are accrued in the period to which they relate and adjustments are made when actual amounts are known.
Income Tax Information and Distributions to Shareholders. Each year, the Fund intends to qualify as a regulated investment company under Subchapter M of the Internal Revenue Code, including distributing substantially all of its taxable income and realized gains. As a result, no provision for U.S. Federal income taxes is required. As of July 31, 2021, the Fund did not have any unrecognized tax benefits in the financial statements; nor is the Fund aware of any tax positions for which it is reasonably possible that the total amounts of unrecognized tax benefits will significantly change in the next twelve months. The Fund files a U.S. federal tax return, in addition to state and local tax returns as required. The Fund's federal income tax returns are subject to examination by the Internal Revenue Service (IRS) for a period of three fiscal years after they are filed. State and local tax returns may be subject to examination for an additional fiscal year depending on the jurisdiction. Foreign taxes are provided for based on the Fund's understanding of the tax rules and rates that exist in the foreign markets in which it invests. The Fund is subject to a tax imposed on capital gains by certain countries in which it invests. An estimated deferred tax liability for net unrealized appreciation on the applicable securities is included in Other payables and accrued expenses on the Statement of Assets & Liabilities.
Distributions are declared and recorded on the ex-dividend date. Income and capital gain distributions are determined in accordance with income tax regulations, which may differ from GAAP.
Capital accounts within the financial statements are adjusted for permanent book-tax differences. These adjustments have no impact on net assets or the results of operations. Capital accounts are not adjusted for temporary book-tax differences which will reverse in a subsequent period.
Book-tax differences are primarily due to foreign currency transactions, certain foreign taxes, passive foreign investment companies (PFIC), partnerships, capital loss carryforwards and losses deferred due to wash sales.
As of period end, the cost and unrealized appreciation (depreciation) in securities, and derivatives if applicable, for federal income tax purposes were as follows:
| Gross unrealized appreciation | $5,200,044,958 |
| Gross unrealized depreciation | (753,332,748) |
| Net unrealized appreciation (depreciation) | $4,446,712,210 |
| Tax Cost | $9,426,066,376 |
The tax-based components of distributable earnings as of period end were as follows:
| Undistributed ordinary income | $327,087,596 |
| Undistributed long-term capital gain | $1,513,132,869 |
| Net unrealized appreciation (depreciation) on securities and other investments | $4,448,546,658 |
The tax character of distributions paid was as follows:
| | July 31, 2021 | July 31, 2020 |
| Ordinary Income | $326,527,382 | $ 378,276,400 |
| Long-term Capital Gains | 233,880,019 | 311,688,724 |
| Total | $560,407,401 | $ 689,965,124 |
Restricted Securities (including Private Placements). Funds may invest in securities that are subject to legal or contractual restrictions on resale. These securities generally may be resold in transactions exempt from registration or to the public if the securities are registered. Disposal of these securities may involve time-consuming negotiations and expense, and prompt sale at an acceptable price may be difficult. Information regarding restricted securities held at period end is included at the end of the Schedule of Investments, if applicable.
4. Purchases and Sales of Investments.
Purchases and sales of securities, other than short-term securities and in-kind transactions, as applicable, are noted in the table below.
| | Purchases ($) | Sales ($) |
| Fidelity Series Intrinsic Opportunities Fund | 1,280,195,809 | 5,235,877,693 |
5. Fees and Other Transactions with Affiliates.
Management Fee. Fidelity Management & Research Company LLC (the investment adviser) and its affiliates provide the Fund with investment management related services for which the Fund does not pay a management fee. Under the management contract, the investment adviser or an affiliate pays all ordinary operating expenses of the Fund, except custody fees, fees and expenses of the independent Trustees, and certain miscellaneous expenses such as proxy and shareholder meeting expenses.
Brokerage Commissions. A portion of portfolio transactions were placed with brokerage firms which are affiliates of the investment adviser. Brokerage commissions are included in net realized gain (loss) and change in net unrealized appreciation (depreciation) in the Statement of Operations. The commissions paid to these affiliated firms were as follows:
| | Amount |
| Fidelity Series Intrinsic Opportunities Fund | $48,682 |
Interfund Lending Program. Pursuant to an Exemptive Order issued by the Securities and Exchange Commission (the SEC), the Fund, along with other registered investment companies having management contracts with Fidelity Management & Research Company LLC (FMR), or other affiliated entities of FMR, may participate in an interfund lending program. This program provides an alternative credit facility allowing the Fund to borrow from, or lend money to, other participating affiliated funds. At period end, there were no interfund loans outstanding. Activity in this program during the period for which loans were outstanding was as follows:
| | Borrower or Lender | Average Loan Balance | Weighted Average Interest Rate | Interest Expense |
| Fidelity Series Intrinsic Opportunities Fund | Borrower | $20,954,000 | .28% | $328 |
Interfund Trades. Funds may purchase from or sell securities to other Fidelity Funds under procedures adopted by the Board. The procedures have been designed to ensure these interfund trades are executed in accordance with Rule 17a-7 of the 1940 Act. Any interfund trades are included within the respective purchases and sales amounts shown in the Purchases and Sales of Investments note and are noted in the table below.
| | Purchases ($) | Sales ($) |
| Fidelity Series Intrinsic Opportunities Fund | 59,394,867 | 375,218,977 |
Other. During the period, the investment adviser reimbursed the Fund for certain losses as follows:
| | Amount ($) |
| Fidelity Series Intrinsic Opportunities Fund | 2,887 |
6. Committed Line of Credit.
Certain Funds participate with other funds managed by the investment adviser or an affiliate in a $4.25 billion credit facility (the "line of credit") to be utilized for temporary or emergency purposes to fund shareholder redemptions or for other short-term liquidity purposes. The participating funds have agreed to pay commitment fees on their pro-rata portion of the line of credit, which are reflected in Miscellaneous expenses on the Statement of Operations, and are listed below. Effective during January 2021, commitment fees are borne by the investment adviser. During the period, there were no borrowings on this line of credit.
| | Amount |
| Fidelity Series Intrinsic Opportunities Fund | $6,354 |
7. Security Lending.
Funds lend portfolio securities from time to time in order to earn additional income. Lending agents are used, including National Financial Services (NFS), an affiliate of the investment adviser. Pursuant to a securities lending agreement, NFS will receive a fee, which is capped at 9.9% of a fund's daily lending revenue, for its services as lending agent. A fund may lend securities to certain qualified borrowers, including NFS. On the settlement date of the loan, a fund receives collateral (in the form of U.S. Treasury obligations, letters of credit and/or cash) against the loaned securities and maintains collateral in an amount not less than 100% of the market value of the loaned securities during the period of the loan. The market value of the loaned securities is determined at the close of business of a fund and any additional required collateral is delivered to a fund on the next business day. A fund or borrower may terminate the loan at any time, and if the borrower defaults on its obligation to return the securities loaned because of insolvency or other reasons, a fund may apply collateral received from the borrower against the obligation. A fund may experience delays and costs in recovering the securities loaned. Any cash collateral received is invested in the Fidelity Securities Lending Cash Central Fund. Any loaned securities are identified as such in the Schedule of Investments, and the value of loaned securities and cash collateral at period end, as applicable, are presented in the Statement of Assets and Liabilities. Security lending income represents the income earned on investing cash collateral, less rebates paid to borrowers and any lending agent fees associated with the loan, plus any premium payments received for lending certain types of securities. Security lending income is presented in the Statement of Operations as a component of income from Fidelity Central Funds. Affiliated security lending activity, if any, was as follows:
| | Total Security Lending Fees Paid to NFS | Security Lending Income From Securities Loaned to NFS | Value of Securities Loaned to NFS at Period End |
| Fidelity Series Intrinsic Opportunities Fund | $863,031 | $147 | $– |
8. Expense Reductions.
The investment adviser contractually agreed to reimburse the Fund to the extent annual operating expenses exceeded .003% of average net assets. This reimbursement will remain in place through November 30, 2024. Some expenses, for example the compensation of the independent Trustees, and certain other expenses such as interest expense, are excluded from this reimbursement. During the period this reimbursement reduced the Fund's expenses by $241,584.
In addition, during the period the investment adviser or an affiliate reimbursed and/or waived a portion of operating expenses in the amount of $4,586.
9. Other.
Fund's organizational documents provide former and current trustees and officers with a limited indemnification against liabilities arising in connection with the performance of their duties to the fund. In the normal course of business, the fund may also enter into contracts that provide general indemnifications. The fund's maximum exposure under these arrangements is unknown as this would be dependent on future claims that may be made against the fund. The risk of material loss from such claims is considered remote.
At the end of the period, mutual funds and accounts managed by the investment adviser or its affiliates were the owners of record of all of the outstanding shares of the Fund.
10. Coronavirus (COVID-19) Pandemic.
An outbreak of COVID-19 first detected in China during December 2019 has since spread globally and was declared a pandemic by the World Health Organization during March 2020. Developments that disrupt global economies and financial markets, such as the COVID-19 pandemic, may magnify factors that affect the Fund's performance.
Report of Independent Registered Public Accounting Firm
To the Board of Trustees of Fidelity Puritan Trust and Shareholders of Fidelity Series Intrinsic Opportunities Fund
Opinion on the Financial Statements and Financial Highlights
We have audited the accompanying statement of assets and liabilities of Fidelity Series Intrinsic Opportunities Fund (the "Fund"), a fund of Fidelity Puritan Trust, including the schedule of investments, as of July 31, 2021, the related statement of operations for the year then ended, the statement of changes in net assets for each of the two years in the period then ended, the financial highlights for each of the five years in the period then ended, and the related notes. In our opinion, the financial statements and financial highlights present fairly, in all material respects, the financial position of the Fund as of July 31, 2021, and the results of its operations for the year then ended, the changes in its net assets for each of the two years in the period then ended, and the financial highlights for each of the five years in the period then ended in conformity with accounting principles generally accepted in the United States of America.
Basis for Opinion
These financial statements and financial highlights are the responsibility of the Fund's management. Our responsibility is to express an opinion on the Fund's financial statements and financial highlights based on our audits. We are a public accounting firm registered with the Public Company Accounting Oversight Board (United States) (PCAOB) and are required to be independent with respect to the Fund in accordance with the U.S. federal securities laws and the applicable rules and regulations of the Securities and Exchange Commission and the PCAOB
We conducted our audits in accordance with the standards of the PCAOB. Those standards require that we plan and perform the audit to obtain reasonable assurance about whether the financial statements and financial highlights are free of material misstatement, whether due to error or fraud. The Fund is not required to have, nor were we engaged to perform, an audit of its internal control over financial reporting. As part of our audits we are required to obtain an understanding of internal control over financial reporting but not for the purpose of expressing an opinion on the effectiveness of the Fund’s internal control over financial reporting. Accordingly, we express no such opinion.
Our audits included performing procedures to assess the risks of material misstatement of the financial statements and financial highlights, whether due to error or fraud, and performing procedures that respond to those risks. Such procedures included examining, on a test basis, evidence regarding the amounts and disclosures in the financial statements and financial highlights. Our audits also included evaluating the accounting principles used and significant estimates made by management, as well as evaluating the overall presentation of the financial statements and financial highlights. Our procedures included confirmation of securities owned as of July 31, 2021, by correspondence with the custodian and brokers; when replies were not received from brokers, we performed other auditing procedures. We believe that our audits provide a reasonable basis for our opinion.
/s/ Deloitte & Touche LLP
Boston, Massachusetts
September 10, 2021
We have served as the auditor of one or more of the Fidelity investment companies since 1999.
Trustees and Officers
The Trustees, Members of the Advisory Board (if any), and officers of the trust and fund, as applicable, are listed below. The Board of Trustees governs the fund and is responsible for protecting the interests of shareholders. The Trustees are experienced executives who meet periodically throughout the year to oversee the fund's activities, review contractual arrangements with companies that provide services to the fund, oversee management of the risks associated with such activities and contractual arrangements, and review the fund's performance. Except for Jonathan Chiel, each of the Trustees oversees 314 funds. Mr. Chiel oversees 176 funds.
The Trustees hold office without limit in time except that (a) any Trustee may resign; (b) any Trustee may be removed by written instrument, signed by at least two-thirds of the number of Trustees prior to such removal; (c) any Trustee who requests to be retired or who has become incapacitated by illness or injury may be retired by written instrument signed by a majority of the other Trustees; and (d) any Trustee may be removed at any special meeting of shareholders by a two-thirds vote of the outstanding voting securities of the trust. Each Trustee who is not an interested person (as defined in the 1940 Act) of the trust and the fund is referred to herein as an Independent Trustee. Each Independent Trustee shall retire not later than the last day of the calendar year in which his or her 75th birthday occurs. The Independent Trustees may waive this mandatory retirement age policy with respect to individual Trustees. Officers and Advisory Board Members hold office without limit in time, except that any officer or Advisory Board Member may resign or may be removed by a vote of a majority of the Trustees at any regular meeting or any special meeting of the Trustees. Except as indicated, each individual has held the office shown or other offices in the same company for the past five years.
The fund’s Statement of Additional Information (SAI) includes more information about the Trustees. To request a free copy, call Fidelity at 1-800-544-3455.
Experience, Skills, Attributes, and Qualifications of the Trustees. The Governance and Nominating Committee has adopted a statement of policy that describes the experience, qualifications, attributes, and skills that are necessary and desirable for potential Independent Trustee candidates (Statement of Policy). The Board believes that each Trustee satisfied at the time he or she was initially elected or appointed a Trustee, and continues to satisfy, the standards contemplated by the Statement of Policy. The Governance and Nominating Committee also engages professional search firms to help identify potential Independent Trustee candidates who have the experience, qualifications, attributes, and skills consistent with the Statement of Policy. From time to time, additional criteria based on the composition and skills of the current Independent Trustees, as well as experience or skills that may be appropriate in light of future changes to board composition, business conditions, and regulatory or other developments, have also been considered by the professional search firms and the Governance and Nominating Committee. In addition, the Board takes into account the Trustees' commitment and participation in Board and committee meetings, as well as their leadership of standing and ad hoc committees throughout their tenure.
In determining that a particular Trustee was and continues to be qualified to serve as a Trustee, the Board has considered a variety of criteria, none of which, in isolation, was controlling. The Board believes that, collectively, the Trustees have balanced and diverse experience, qualifications, attributes, and skills, which allow the Board to operate effectively in governing the fund and protecting the interests of shareholders. Information about the specific experience, skills, attributes, and qualifications of each Trustee, which in each case led to the Board's conclusion that the Trustee should serve (or continue to serve) as a trustee of the fund, is provided below.
Board Structure and Oversight Function. Robert A. Lawrence is an interested person and currently serves as Acting Chairman. The Trustees have determined that an interested Chairman is appropriate and benefits shareholders because an interested Chairman has a personal and professional stake in the quality and continuity of services provided to the fund. Independent Trustees exercise their informed business judgment to appoint an individual of their choosing to serve as Chairman, regardless of whether the Trustee happens to be independent or a member of management. The Independent Trustees have determined that they can act independently and effectively without having an Independent Trustee serve as Chairman and that a key structural component for assuring that they are in a position to do so is for the Independent Trustees to constitute a substantial majority for the Board. The Independent Trustees also regularly meet in executive session. David M. Thomas serves as Lead Independent Trustee and as such (i) acts as a liaison between the Independent Trustees and management with respect to matters important to the Independent Trustees and (ii) with management prepares agendas for Board meetings.
Fidelity® funds are overseen by different Boards of Trustees. The fund's Board oversees Fidelity's high income and certain equity funds, and other Boards oversee Fidelity's investment-grade bond, money market, asset allocation, and other equity funds. The asset allocation funds may invest in Fidelity® funds overseen by the fund's Board. The use of separate Boards, each with its own committee structure, allows the Trustees of each group of Fidelity® funds to focus on the unique issues of the funds they oversee, including common research, investment, and operational issues. On occasion, the separate Boards establish joint committees to address issues of overlapping consequences for the Fidelity® funds overseen by each Board.
The Trustees operate using a system of committees to facilitate the timely and efficient consideration of all matters of importance to the Trustees, the fund, and fund shareholders and to facilitate compliance with legal and regulatory requirements and oversight of the fund's activities and associated risks. The Board, acting through its committees, has charged FMR and its affiliates with (i) identifying events or circumstances the occurrence of which could have demonstrably adverse effects on the fund's business and/or reputation; (ii) implementing processes and controls to lessen the possibility that such events or circumstances occur or to mitigate the effects of such events or circumstances if they do occur; and (iii) creating and maintaining a system designed to evaluate continuously business and market conditions in order to facilitate the identification and implementation processes described in (i) and (ii) above. Because the day-to-day operations and activities of the fund are carried out by or through FMR, its affiliates, and other service providers, the fund's exposure to risks is mitigated but not eliminated by the processes overseen by the Trustees. While each of the Board's committees has responsibility for overseeing different aspects of the fund's activities, oversight is exercised primarily through the Operations, Audit, and Compliance Committees. Appropriate personnel, including but not limited to the fund's Chief Compliance Officer (CCO), FMR's internal auditor, the independent accountants, the fund's Treasurer and portfolio management personnel, make periodic reports to the Board's committees, as appropriate, including an annual review of Fidelity's risk management program for the Fidelity® funds. The responsibilities of each standing committee, including their oversight responsibilities, are described further under "Standing Committees of the Trustees."
Interested Trustees*:
Correspondence intended for a Trustee who is an interested person may be sent to Fidelity Investments, 245 Summer Street, Boston, Massachusetts 02210.
Name, Year of Birth; Principal Occupations and Other Relevant Experience+
Jonathan Chiel (1957)
Year of Election or Appointment: 2016
Trustee
Mr. Chiel also serves as Trustee of other Fidelity® funds. Mr. Chiel is Executive Vice President and General Counsel for FMR LLC (diversified financial services company, 2012-present). Previously, Mr. Chiel served as general counsel (2004-2012) and senior vice president and deputy general counsel (2000-2004) for John Hancock Financial Services; a partner with Choate, Hall & Stewart (1996-2000) (law firm); and an Assistant United States Attorney for the United States Attorney’s Office of the District of Massachusetts (1986-95), including Chief of the Criminal Division (1993-1995). Mr. Chiel is a director on the boards of the Boston Bar Foundation and the Maimonides School.
Bettina Doulton (1964)
Year of Election or Appointment: 2021
Trustee
Ms. Doulton also serves as Trustee of other Fidelity® funds. Prior to her retirement, Ms. Doulton served in a variety of positions at Fidelity Investments, including as a managing director of research (2006-2007), portfolio manager to certain Fidelity® funds (1993-2005), equity analyst and portfolio assistant (1990-1993), and research assistant (1987-1990). Ms. Doulton currently owns and operates Phi Builders + Architects and Cellardoor Winery. Previously, Ms. Doulton served as a member of the Board of Brown Capital Management, LLC (2014-2018).
Robert A. Lawrence (1952)
Year of Election or Appointment: 2020
Trustee
Acting Chairman of the Board of Trustees
Mr. Lawrence also serves as Trustee of other funds. Previously, Mr. Lawrence served as a Member of the Advisory Board of certain funds. Prior to his retirement in 2008, Mr. Lawrence served as Vice President of certain Fidelity® funds (2006-2008), Senior Vice President, Head of High Income Division of Fidelity Management & Research Company (investment adviser firm, 2006-2008), and President of Fidelity Strategic Investments (investment adviser firm, 2002-2005).
* Determined to be an “Interested Trustee” by virtue of, among other things, his or her affiliation with the trust or various entities under common control with FMR.
+ The information includes the Trustee's principal occupation during the last five years and other information relating to the experience, attributes, and skills relevant to the Trustee's qualifications to serve as a Trustee, which led to the conclusion that the Trustee should serve as a Trustee for the fund.
Independent Trustees:
Correspondence intended for an Independent Trustee may be sent to Fidelity Investments, P.O. Box 55235, Boston, Massachusetts 02205-5235.
Name, Year of Birth; Principal Occupations and Other Relevant Experience+
Thomas P. Bostick (1956)
Year of Election or Appointment: 2021
Trustee
Lieutenant General Bostick also serves as Trustee of other Fidelity® funds. Prior to his retirement, General Bostick (United States Army, Retired) held a variety of positions within the U.S. Army, including Commanding General and Chief of Engineers, U.S. Army Corps of Engineers (2012-2016) and Deputy Chief of Staff and Director of Human Resources, U.S. Army (2009-2012). General Bostick currently serves as a member of the Board and Finance and Governance Committees of CSX Corporation (transportation, 2020-present) and a member of the Board and Corporate Governance and Nominating Committee of Perma-Fix Environmental Services, Inc. (nuclear waste management, 2020-present). General Bostick serves as Chief Executive Officer of Bostick Global Strategies, LLC (consulting, 2016-present) and Managing Partner, Sustainability, of Ridge-Lane Limited Partners (strategic advisory and venture development, 2016-present). Previously, General Bostick served as a Member of the Advisory Board of certain Fidelity® funds (2021), President, Intrexon Bioengineering (2018-2020) and Chief Operating Officer (2017-2020) and Senior Vice President of the Environment Sector (2016-2017) of Intrexon Corporation (biopharmaceutical company).
Dennis J. Dirks (1948)
Year of Election or Appointment: 2005
Trustee
Mr. Dirks also serves as Trustee of other Fidelity® funds. Prior to his retirement in May 2003, Mr. Dirks served as Chief Operating Officer and as a member of the Board of The Depository Trust & Clearing Corporation (financial markets infrastructure), President, Chief Operating Officer and a member of the Board of The Depository Trust Company (DTC), President and a member of the Board of the National Securities Clearing Corporation (NSCC), Chief Executive Officer and a member of the Board of the Government Securities Clearing Corporation and Chief Executive Officer and a member of the Board of the Mortgage-Backed Securities Clearing Corporation. Mr. Dirks currently serves as a member of the Finance Committee (2016-present) and Board (2017-present) and is Treasurer (2018-present) of the Asolo Repertory Theatre.
Donald F. Donahue (1950)
Year of Election or Appointment: 2018
Trustee
Mr. Donahue also serves as Trustee of other Fidelity® funds. Mr. Donahue serves as President and Chief Executive Officer of Miranda Partners, LLC (risk consulting for the financial services industry, 2012-present). Previously, Mr. Donahue served as Chief Executive Officer (2006-2012), Chief Operating Officer (2003-2006) and Managing Director, Customer Marketing and Development (1999-2003) of The Depository Trust & Clearing Corporation (financial markets infrastructure). Mr. Donahue currently serves as a member (2007-present) and Co-Chairman (2016-present) of the Board of United Way of New York and a member of the Board of NYC Leadership Academy (2012-present). Mr. Donahue previously served as a member of the Advisory Board of certain Fidelity® funds (2015-2018).
Vicki L. Fuller (1957)
Year of Election or Appointment: 2020
Trustee
Ms. Fuller also serves as Trustee of other Fidelity® funds. Previously, Ms. Fuller served as a member of the Advisory Board of certain Fidelity® funds (2018-2020), Chief Investment Officer of the New York State Common Retirement Fund (2012-2018) and held a variety of positions at AllianceBernstein L.P. (global asset management, 1985-2012), including Managing Director (2006-2012) and Senior Vice President and Senior Portfolio Manager (2001-2006). Ms. Fuller currently serves as a member of the Board, Audit Committee and Nominating and Governance Committee of The Williams Companies, Inc. (natural gas infrastructure, 2018-present), as a member of the Board, Audit Committee and Nominating and Governance Committee of two Blackstone business development companies (2020-present) and as a member of the Board of Treliant, LLC (consulting, 2019-present).
Patricia L. Kampling (1959)
Year of Election or Appointment: 2020
Trustee
Ms. Kampling also serves as Trustee of other Fidelity® funds. Prior to her retirement, Ms. Kampling served as Chairman of the Board and Chief Executive Officer (2012-2019), President and Chief Operating Officer (2011-2012) and Executive Vice President and Chief Financial Officer (2010-2011) of Alliant Energy Corporation. Ms. Kampling currently serves as a member of the Board, Finance Committee and Governance, Compensation and Nominating Committee of Xcel Energy Inc. (utilities company, 2020-present) and as a member of the Board, Audit, Finance and Risk Committee and Safety, Environmental, Technology and Operations Committee of American Water Works Company, Inc. (utilities company, 2019-present). In addition, Ms. Kampling currently serves as a member of the Board of the Nature Conservancy, Wisconsin Chapter (2019-present). Previously, Ms. Kampling served as a Member of the Advisory Board of certain Fidelity® funds (2020), a member of the Board, Compensation Committee and Executive Committee and Chair of the Audit Committee of Briggs & Stratton Corporation (manufacturing, 2011-2021), a member of the Board of Interstate Power and Light Company (2012-2019) and Wisconsin Power and Light Company (2012-2019) (each a subsidiary of Alliant Energy Corporation) and as a member of the Board and Workforce Development Committee of the Business Roundtable (2018-2019).
Thomas A. Kennedy (1955)
Year of Election or Appointment: 2021
Trustee
Mr. Kennedy also serves as Trustee of other Fidelity® funds. Previously, Mr. Kennedy served as a Member of the Advisory Board of certain Fidelity® funds (2020) and held a variety of positions at Raytheon Company (aerospace and defense, 1983-2020), including Chairman and Chief Executive Officer (2014-2020) and Executive Vice President and Chief Operating Officer (2013-2014). Mr. Kennedy currently serves as Executive Chairman of the Board of Directors of Raytheon Technologies Corporation (aerospace and defense, 2020-present). He is also a member of the Rutgers School of Engineering Industry Advisory Board (2011-present) and a member of the UCLA Engineering Dean’s Executive Board (2016-present).
Oscar Munoz (1959)
Year of Election or Appointment: 2021
Trustee
Mr. Munoz also serves as Trustee of other Fidelity® funds. Prior to his retirement, Mr. Munoz served as Executive Chairman (2020-2021), Chief Executive Officer (2015-2020), President (2015-2016) and a member of the Board (2010-2021) of United Airlines Holdings, Inc. Mr. Munoz currently serves as a member of the Board of CBRE Group, Inc. (commercial real estate, 2020-present), a member of the Board of Univision Communications, Inc. (Hispanic media, 2020-present) and a member of the Advisory Board of Salesforce.com, Inc. (cloud-based software, 2020-present). Previously, Mr. Munoz served as a Member of the Advisory Board of certain Fidelity® funds (2021).
Garnett A. Smith (1947)
Year of Election or Appointment: 2018
Trustee
Mr. Smith also serves as Trustee of other Fidelity® funds. Prior to his retirement, Mr. Smith served as Chairman and Chief Executive Officer (1990-1997) and President (1986-1990) of Inbrand Corp. (manufacturer of personal absorbent products). Prior to his employment with Inbrand Corp., he was employed by a retail fabric chain and North Carolina National Bank (now Bank of America). Mr. Smith previously served as a member of the Advisory Board of certain Fidelity® funds (2012-2013).
David M. Thomas (1949)
Year of Election or Appointment: 2008
Trustee
Lead Independent Trustee
Mr. Thomas also serves as Trustee of other Fidelity® funds. Previously, Mr. Thomas served as Executive Chairman (2005-2006) and Chairman and Chief Executive Officer (2000-2005) of IMS Health, Inc. (pharmaceutical and healthcare information solutions). Mr. Thomas currently serves as a member of the Board of Fortune Brands Home and Security (home and security products, 2004-present) and Presiding Director (2013-present) of Interpublic Group of Companies, Inc. (marketing communication).
Susan Tomasky (1953)
Year of Election or Appointment: 2020
Trustee
Ms. Tomasky also serves as Trustee of other Fidelity® funds. Prior to her retirement, Ms. Tomasky served in various executive officer positions at American Electric Power Company, Inc. (1998-2011), including most recently as President of AEP Transmission (2007-2011). Ms. Tomasky currently serves as a member of the Board and Sustainability Committee and as Chair of the Audit Committee of Marathon Petroleum Corporation (2018-present) and as a member of the Board, Corporate Governance Committee and Organization and Compensation Committee and as Chair of the Audit Committee of Public Service Enterprise Group, Inc. (utilities company, 2012-present). In addition, Ms. Tomasky currently serves as a member (2009-present) and President (2020-present) of the Board of the Royal Shakespeare Company – America (2009-present), as a member of the Board of the Columbus Association for the Performing Arts (2011-present) and as a member of the Board and Investment Committee of Kenyon College (2016-present). Previously, Ms. Tomasky served as a Member of the Advisory Board of certain Fidelity® funds (2020), as a member of the Board of the Columbus Regional Airport Authority (2007-2020), as a member of the Board (2011-2018) and Lead Independent Director (2015-2018) of Andeavor Corporation (previously Tesoro Corporation) (independent oil refiner and marketer) and as a member of the Board of Summit Midstream Partners LP (energy, 2012-2018).
Michael E. Wiley (1950)
Year of Election or Appointment: 2020
Trustee
Mr. Wiley also serves as Trustee of other Fidelity® funds. Previously, Mr. Wiley served as a member of the Advisory Board of certain Fidelity® funds (2018-2020), Chairman, President and CEO of Baker Hughes, Inc. (oilfield services, 2000-2004). Mr. Wiley also previously served as a member of the Board of Andeavor Corporation (independent oil refiner and marketer, 2005-2018), a member of the Board of Andeavor Logistics LP (natural resources logistics, 2015-2018) and a member of the Board of High Point Resources (exploration and production, 2005-2020).
+ The information includes the Trustee's principal occupation during the last five years and other information relating to the experience, attributes, and skills relevant to the Trustee's qualifications to serve as a Trustee, which led to the conclusion that the Trustee should serve as a Trustee for the fund.
Advisory Board Members and Officers:
Correspondence intended for a Member of the Advisory Board (if any) may be sent to Fidelity Investments, P.O. Box 55235, Boston, Massachusetts 02205-5235. Correspondence intended for an officer or Peter S. Lynch may be sent to Fidelity Investments, 245 Summer Street, Boston, Massachusetts 02210. Officers appear below in alphabetical order.
Name, Year of Birth; Principal Occupation
Peter S. Lynch (1944)
Year of Election or Appointment: 2003
Member of the Advisory Board
Mr. Lynch also serves as a Member of the Advisory Board of other Fidelity® funds. Mr. Lynch is Vice Chairman and a Director of Fidelity Management & Research Company LLC (investment adviser firm). In addition, Mr. Lynch serves as a Trustee of Boston College and as the Chairman of the Inner-City Scholarship Fund. Previously, Mr. Lynch served as Vice Chairman and a Director of FMR Co., Inc. (investment adviser firm) and on the Special Olympics International Board of Directors (1997-2006).
Craig S. Brown (1977)
Year of Election or Appointment: 2019
Assistant Treasurer
Mr. Brown also serves as an officer of other funds. Mr. Brown serves as Assistant Treasurer of FIMM, LLC (2021-present) and is an employee of Fidelity Investments (2013-present).
John J. Burke III (1964)
Year of Election or Appointment: 2018
Chief Financial Officer
Mr. Burke also serves as Chief Financial Officer of other funds. Mr. Burke serves as Head of Investment Operations for Fidelity Fund and Investment Operations (2018-present) and is an employee of Fidelity Investments (1998-present). Previously Mr. Burke served as head of Asset Management Investment Operations (2012-2018).
William C. Coffey (1969)
Year of Election or Appointment: 2019
Assistant Secretary
Mr. Coffey also serves as Assistant Secretary of other funds. He is Senior Vice President and Deputy General Counsel of FMR LLC (diversified financial services company, 2010-present), and is an employee of Fidelity Investments. Previously, Mr. Coffey served as Secretary and CLO of certain funds (2018-2019); CLO, Secretary, and Senior Vice President of Fidelity Management & Research Company and FMR Co., Inc. (investment adviser firms, 2018-2019); Secretary of Fidelity SelectCo, LLC and Fidelity Investments Money Management, Inc. (investment adviser firms, 2018-2019); CLO of Fidelity Management & Research (Hong Kong) Limited, FMR Investment Management (UK) Limited, and Fidelity Management & Research (Japan) Limited (investment adviser firms, 2018-2019); and Assistant Secretary of certain funds (2009-2018).
Timothy M. Cohen (1969)
Year of Election or Appointment: 2018
Vice President
Mr. Cohen also serves as Vice President of other funds. Mr. Cohen serves as Co-Head of Equity (2018-present), a Director of Fidelity Management & Research (Japan) Limited (investment adviser firm, 2016-present), and is an employee of Fidelity Investments. Previously, Mr. Cohen served as Executive Vice President of Fidelity SelectCo, LLC (2019), Head of Global Equity Research (2016-2018), Chief Investment Officer - Equity and a Director of Fidelity Management & Research (U.K.) Inc. (investment adviser firm, 2013-2015) and as a Director of Fidelity Management & Research (Hong Kong) Limited (investment adviser firm, 2017).
Jonathan Davis (1968)
Year of Election or Appointment: 2010
Assistant Treasurer
Mr. Davis also serves as an officer of other funds. Mr. Davis serves as Assistant Treasurer of FIMM, LLC (2021-present) and FMR Capital, Inc. (2017-present) and is an employee of Fidelity Investments. Previously, Mr. Davis served as Vice President and Associate General Counsel of FMR LLC (diversified financial services company, 2003-2010).
Laura M. Del Prato (1964)
Year of Election or Appointment: 2018
Assistant Treasurer
Ms. Del Prato also serves as an officer of other funds. Ms. Del Prato serves as Assistant Treasurer of FIMM, LLC (2021-present) and is an employee of Fidelity Investments (2017-present). Previously, Ms. Del Prato served as President and Treasurer of The North Carolina Capital Management Trust: Cash Portfolio and Term Portfolio (2018-2020). Prior to joining Fidelity Investments, Ms. Del Prato served as a Managing Director and Treasurer of the JPMorgan Mutual Funds (2014-2017). Prior to JPMorgan, Ms. Del Prato served as a partner at Cohen Fund Audit Services (accounting firm, 2012-2013) and KPMG LLP (accounting firm, 2004-2012).
Colm A. Hogan (1973)
Year of Election or Appointment: 2020
Assistant Treasurer
Mr. Hogan also serves as an officer of other funds. Mr. Hogan serves as Assistant Treasurer of FIMM, LLC (2021-present) and FMR Capital, Inc. (2017-present) and is an employee of Fidelity Investments (2005-present). Previously, Mr. Hogan served as Deputy Treasurer of certain Fidelity® funds (2016-2020) and Assistant Treasurer of certain Fidelity® funds (2016-2018).
Pamela R. Holding (1964)
Year of Election or Appointment: 2018
Vice President
Ms. Holding also serves as Vice President of other funds. Ms. Holding serves as Co-Head of Equity (2018-present) and is an employee of Fidelity Investments (2013-present). Previously, Ms. Holding served as Executive Vice President of Fidelity SelectCo, LLC (2019) and as Chief Investment Officer of Fidelity Institutional Asset Management (2013-2018).
Cynthia Lo Bessette (1969)
Year of Election or Appointment: 2019
Secretary and Chief Legal Officer (CLO)
Ms. Lo Bessette also serves as an officer of other funds. Ms. Lo Bessette serves as CLO, Secretary, and Senior Vice President of Fidelity Management & Research Company LLC (investment adviser firm, 2019-present); and CLO of Fidelity Management & Research (Hong Kong) Limited, FMR Investment Management (UK) Limited, and Fidelity Management & Research (Japan) Limited (investment adviser firms, 2019-present). She is a Senior Vice President and Deputy General Counsel of FMR LLC (diversified financial services company, 2019-present), and is an employee of Fidelity Investments. Previously, Ms. Lo Bessette served as CLO, Secretary, and Senior Vice President of FMR Co., Inc. (investment adviser firm, 2019); Secretary of Fidelity SelectCo, LLC and Fidelity Investments Money Management, Inc. (investment adviser firms, 2019). Prior to joining Fidelity Investments, Ms. Lo Bessette was Executive Vice President, General Counsel (2016-2019) and Senior Vice President, Deputy General Counsel (2015-2016) of OppenheimerFunds (investment management company) and Deputy Chief Legal Officer (2013-2015) of Jennison Associates LLC (investment adviser firm).
Chris Maher (1972)
Year of Election or Appointment: 2020
Deputy Treasurer
Mr. Maher also serves as an officer of other funds. Mr. Maher serves as Assistant Treasurer of FIMM, LLC (2021-present) and FMR Capital, Inc. (2017-present), and is an employee of Fidelity Investments (2008-present). Previously, Mr. Maher served as Assistant Treasurer of certain funds (2013-2020); Vice President of Asset Management Compliance (2013), Vice President of the Program Management Group of FMR (investment adviser firm, 2010-2013), and Vice President of Valuation Oversight (2008-2010).
Jason P. Pogorelec (1975)
Year of Election or Appointment: 2020
Chief Compliance Officer
Mr. Pogorelec also serves as Chief Compliance Officer of other funds. Mr. Pogorelec is a senior Vice President of Asset Management Compliance for Fidelity Investments and is an employee of Fidelity Investments (2006-present). Previously, Mr. Pogorelec served as Vice President, Associate General Counsel for Fidelity Investments (2010-2020) and Assistant Secretary of certain Fidelity funds (2015-2020).
Brett Segaloff (1972)
Year of Election or Appointment: 2021
Anti-Money Laundering (AML) Officer
Mr. Segaloff also serves as an AML Officer of other funds and other related entities. He is Director, Anti-Money Laundering (2007-present) of FMR LLC (diversified financial services company) and is an employee of Fidelity Investments (1996-present).
Stacie M. Smith (1974)
Year of Election or Appointment: 2016
President and Treasurer
Ms. Smith also serves as an officer of other funds. Ms. Smith serves as Assistant Treasurer of FIMM, LLC (2021-present) and FMR Capital, Inc. (2017-present), is an employee of Fidelity Investments (2009-present), and has served in other fund officer roles. Prior to joining Fidelity Investments, Ms. Smith served as Senior Audit Manager of Ernst & Young LLP (accounting firm, 1996-2009). Previously, Ms. Smith served as Assistant Treasurer (2013-2019) and Deputy Treasurer (2013-2016) of certain Fidelity® funds.
Marc L. Spector (1972)
Year of Election or Appointment: 2016
Assistant Treasurer
Mr. Spector also serves as an officer of other funds. Mr. Spector serves as Assistant Treasurer of FIMM, LLC (2021-present) and FMR Capital, Inc. (2017-present) and is an employee of Fidelity Investments (2016-present). Prior to joining Fidelity Investments, Mr. Spector served as Director at the Siegfried Group (accounting firm, 2013-2016), and prior to Siegfried Group as audit senior manager at Deloitte & Touche LLP (accounting firm, 2005-2013).
Jim Wegmann (1979)
Year of Election or Appointment: 2019
Assistant Treasurer
Mr. Wegmann also serves as an officer of other funds. Mr. Wegmann serves as Assistant Treasurer of FIMM, LLC (2021-present) and is an employee of Fidelity Investments (2011-present).
Shareholder Expense Example
As a shareholder, you incur two types of costs: (1) transaction costs, which may include sales charges (loads) on purchase payments or redemption proceeds, as applicable and (2) ongoing costs, which generally include management fees, distribution and/or service (12b-1) fees and other Fund expenses. This Example is intended to help you understand your ongoing costs (in dollars) of investing in a fund and to compare these costs with the ongoing costs of investing in other mutual funds.
The Example is based on an investment of $1,000 invested at the beginning of the period and held for the entire period (February 1, 2021 to July 31, 2021).
Actual Expenses
The first line of the accompanying table provides information about actual account values and actual expenses. You may use the information in this line, together with the amount you invested, to estimate the expenses that you paid over the period. Simply divide your account value by $1,000.00 (for example, an $8,600 account value divided by $1,000.00 = 8.6), then multiply the result by the number in the first line for a class/Fund under the heading entitled "Expenses Paid During Period" to estimate the expenses you paid on your account during this period. If any fund is a shareholder of any underlying mutual funds or exchange-traded funds (ETFs) (the Underlying Funds), such fund indirectly bears its proportional share of the expenses of the Underlying Funds in addition to the direct expenses incurred presented in the table. These fees and expenses are not included in the annualized expense ratio used to calculate the expense estimate in the table below.
Hypothetical Example for Comparison Purposes
The second line of the accompanying table provides information about hypothetical account values and hypothetical expenses based on the actual expense ratio and an assumed rate of return of 5% per year before expenses, which is not the actual return. The hypothetical account values and expenses may not be used to estimate the actual ending account balance or expenses you paid for the period. You may use this information to compare the ongoing costs of investing in the Fund and other funds. To do so, compare this 5% hypothetical example with the 5% hypothetical examples that appear in the shareholder reports of the other funds. If any fund is a shareholder of any Underlying Funds, such fund indirectly bears its proportional share of the expenses of the Underlying Funds in addition to the direct expenses as presented in the table. These fees and expenses are not included in the annualized expense ratio used to calculate the expense estimate in the table below.
Please note that the expenses shown in the table are meant to highlight your ongoing costs only and do not reflect any transaction costs. Therefore, the second line of the table is useful in comparing ongoing costs only, and will not help you determine the relative total costs of owning different funds.
| | Annualized Expense Ratio-A | Beginning
Account Value
February 1, 2021 | Ending
Account Value
July 31, 2021 | Expenses Paid
During Period-B
February 1, 2021
to July 31, 2021 |
| Fidelity Series Intrinsic Opportunities Fund | - %-C | | | |
| Actual | | $1,000.00 | $1,184.50 | $--D |
| Hypothetical-E | | $1,000.00 | $1,024.79 | $--D |
A Annualized expense ratio reflects expenses net of applicable fee waivers.
B Expenses are equal to the annualized expense ratio, multiplied by the average account value over the period, multiplied by 181/ 365 (to reflect the one-half year period). The fees and expenses of any Underlying Funds are not included in each annualized expense ratio.
C Amount represents less than .005%.
D Amount represents less than $.005.
E 5% return per year before expenses
Distributions (Unaudited)
The Board of Trustees of Fidelity Series Intrinsic Opportunities Fund voted to pay on September 13, 2021, to shareholders of record at the opening of business on September 10, 2021, a distribution of $2.732 per share derived from capital gains realized from sales of portfolio securities and a dividend of $0.23 per share from net investment income.
The fund hereby designates as a capital gain dividend with respect to the taxable year ended July 31, 2021, $1,747,012,888, or, if subsequently determined to be different, the net capital gain of such year.
The fund designates 43% and 40% of the dividends distributed in September and December, respectively during the fiscal year as qualifying for the dividends–received deduction for corporate shareholders.
The fund designates 78% and 66% of the dividends distributed in September and December, respectively during the fiscal year as amounts which may be taken into account as a dividend for purposes of the maximum rate under section 1(h)(11) of the Internal Revenue Code.
The fund will notify shareholders in January 2022 of amounts for use in preparing 2021 income tax returns.
Board Approval of Investment Advisory Contracts and Management Fees
Fidelity Series Intrinsic Opportunities Fund
Each year, the Board of Trustees, including the Independent Trustees (together, the Board), votes on the renewal of the management contract with Fidelity Management & Research Company LLC (FMR) and the sub-advisory agreements (together, the Advisory Contracts) for the fund. FMR and the sub-advisers are referred to herein as the Investment Advisers. The Board, assisted by the advice of fund counsel and Independent Trustees' counsel, requests and considers a broad range of information relevant to the renewal of the Advisory Contracts throughout the year.
The Board meets regularly and, at each of its meetings, covers an extensive agenda of topics and materials and considers factors that are relevant to its annual consideration of the renewal of the fund's Advisory Contracts, including the services and support provided to the fund and its shareholders. The Board has established various standing committees (Committees), each composed of and chaired by Independent Trustees with varying backgrounds, to which the Board has assigned specific subject matter responsibilities in order to enhance effective decision-making by the Board. The Board, acting directly and through its Committees, requests and receives information concerning the annual consideration of the renewal of the fund's Advisory Contracts. The Board also meets as needed to review matters specifically related to the Board's annual consideration of the renewal of the Advisory Contracts. Members of the Board may also meet with trustees of other Fidelity funds through joint ad hoc committees to discuss certain matters relevant to all of the Fidelity funds.
At its May 2021 meeting, the Board unanimously determined to renew the fund's Advisory Contracts. In considering whether to renew the Advisory Contracts for the fund, the Board considered all factors it believed relevant and reached a determination, with the assistance of fund counsel and Independent Trustees' counsel and through the exercise of its business judgment, that the renewal of the Advisory Contracts was in the best interests of the fund and its shareholders and the fact that no fee is payable under the management contract was fair and reasonable.
Nature, Extent, and Quality of Services Provided. The Board considered Fidelity's staffing as it relates to the fund, including the backgrounds of investment personnel of Fidelity, and also considered the fund's investment objective, strategies, and related investment philosophy. The Independent Trustees also had discussions with senior management of Fidelity's investment operations and investment groups. The Board considered the structure of the investment personnel compensation program and whether this structure provides appropriate incentives to act in the best interests of the fund.
Resources Dedicated to Investment Management and Support Services. The Board and the Fund Oversight and Research Committees reviewed the general qualifications and capabilities of Fidelity's investment staff, including its size, education, experience, and resources, as well as Fidelity's approach to recruiting, training, managing, and compensating investment personnel. The Board noted that Fidelity has continued to increase the resources devoted to non-U.S. offices, including expansion of Fidelity's global investment organization. The Board also noted that Fidelity's analysts have extensive resources, tools and capabilities that allow them to conduct sophisticated quantitative and fundamental analysis, as well as credit analysis of issuers, counterparties and guarantors. Further, the Board considered that Fidelity's investment professionals have sufficient access to global information and data so as to provide competitive investment results over time, and that those professionals also have access to sophisticated tools that permit them to assess portfolio construction and risk and performance attribution characteristics continuously, as well as to transmit new information and research conclusions rapidly around the world. Additionally, in its deliberations, the Board considered Fidelity's trading, risk management, compliance, and technology and operations capabilities and resources, which are integral parts of the investment management process. The Board also considered Fidelity's investments in business continuity planning, and its success in continuously providing services to the fund notwithstanding the severe disruptions caused by the COVID-19 pandemic.
Administrative Services. The Board considered (i) the nature, extent, quality, and cost of advisory and administrative services performed by the Investment Advisers and their affiliates under the Advisory Contracts and under separate agreements covering transfer agency, pricing and bookkeeping, and securities lending services for the fund; (ii) the nature and extent of the supervision of third party service providers, principally custodians, subcustodians, and pricing vendors; and (iii) the resources devoted to, and the record of compliance with, the fund's compliance policies and procedures. The Board also reviewed the allocation of fund brokerage, including allocations to brokers affiliated with the Investment Advisers, the use of brokerage commissions to pay fund expenses, and the use of "soft" commission dollars to pay for research services.
Investment Performance. The Board considered whether the fund has operated in accordance with its investment objective, as well as its record of compliance with its investment restrictions. The Board reviewed the fund's absolute investment performance, as well as the fund's relative investment performance, and considered the fund's underperformance for different time periods ended December 31, 2020. The Board did not consider performance to be a material factor in its decision to renew the fund's Advisory Contracts, as the fund is not publicly offered as a stand-alone investment product. In this regard, the Board noted that the fund is designed to offer an investment option for other investment companies and 529 plans managed by Fidelity and ultimately to enhance the performance of those investment companies and 529 plans.
Based on its review, the Board concluded that the nature, extent, and quality of services provided to the fund under the Advisory Contracts should continue to benefit the shareholders of the fund.
Competitiveness of Management Fee and Total Expense Ratio. The Board considered that the fund does not pay FMR a management fee for investment advisory services, but that FMR receives fees for providing services to funds that invest in the fund. The Board noted that FMR or an affiliate undertakes to pay all operating expenses of the fund, except transfer agent fees, 12b-1 fees, Independent Trustee fees and expenses, custodian fees and expenses, proxy and shareholder meeting expenses, interest, taxes, and extraordinary expenses (such as litigation expenses). The Board further noted that the fund pays its non-operating expenses, including brokerage commissions and fees and expenses associated with the fund's securities lending program, if applicable.
The Board further considered that FMR has contractually agreed to reimburse the fund to the extent that total operating expenses, with certain exceptions, as a percentage of its average net assets, exceed 0.003% through November 30, 2023.
Based on its review, the Board considered that the fund does not pay a management fee and concluded that the total expense ratio of the fund was reasonable in light of the services that the fund and its shareholders receive and the other factors considered.
Costs of the Services and Profitability. The Board considered the level of Fidelity's profits in respect of all the Fidelity funds.
A public accounting firm has been engaged annually by the Board as part of the Board's assessment of Fidelity's profitability analysis. The engagement includes the review and assessment of the methodologies used by Fidelity in determining the revenues and expenses attributable to Fidelity's mutual fund business, and completion of agreed-upon procedures in respect of the mathematical accuracy of certain fund profitability information and its conformity to established allocation methodologies. After considering the reports issued under the engagement and information provided by Fidelity, the Board concluded that while other allocation methods may also be reasonable, Fidelity's profitability methodologies are reasonable in all material respects.
The Board also reviewed Fidelity's non-fund businesses and potential indirect benefits such businesses may have received as a result of their association with Fidelity's mutual fund business (i.e., fall-out benefits) as well as cases where Fidelity's affiliates may benefit from the funds' business. The Board considered areas where potential indirect benefits to the Fidelity funds from their relationships with Fidelity may exist. The Board also considered that in 2019 a joint ad hoc committee created by it and the boards of other Fidelity funds evaluated potential fall-out benefits (PFOB Committee). The Board noted that it considered the PFOB Committee's findings in connection with its consideration of the renewal of the Advisory Contracts.
The Board concluded that the costs of the services provided by and the profits realized by Fidelity in connection with the operation of the fund were not relevant to the renewal of the Advisory Contracts because the fund pays no advisory fees and FMR bears all expenses of the fund with certain exceptions.
Economies of Scale. The Board concluded that because the fund pays no advisory fees and FMR bears all expenses of the fund with certain exceptions, the realization of economies of scale was not a material factor in the Board's decision to renew the fund's Advisory Contracts.
Additional Information Requested by the Board. In order to develop fully the factual basis for consideration of the Fidelity funds' advisory contracts, the Board requested and received additional information on certain topics, including: (i) fund flow and performance trends, in particular the underperformance of certain funds and strategies, and Fidelity's long-term strategies for certain funds; (ii) consideration of expanding the use of performance fees for additional funds; (iii) Fidelity's pricing philosophy compared to competitors; (iv) metrics for evaluating index fund and ETF performance and information about ETF trading characteristics; (v) the methodology with respect to evaluating competitive fund data and peer group classifications and fee and expense comparisons; (vi) the expense structures for different funds and classes and information about the differences between various expense structures; (vii) group fee breakpoints; (viii) information regarding other accounts managed by Fidelity and sub-advisory arrangements; and (ix) Fidelity's philosophies and strategies for evaluating funds and classes with lower or declining asset levels.
Based on its evaluation of all of the conclusions noted above, and after considering all factors it believed relevant, the Board concluded that the advisory fee arrangements are fair and reasonable, and that the fund's Advisory Contracts should be renewed.
Liquidity Risk Management Program
The Securities and Exchange Commission adopted Rule 22e-4 under the Investment Company Act of 1940 (the Liquidity Rule) to promote effective liquidity risk management throughout the open-end investment company industry, thereby reducing the risk that funds will be unable to meet their redemption obligations and mitigating dilution of the interests of fund shareholders.
The Fund has adopted and implemented a liquidity risk management program pursuant to the Liquidity Rule (the Program) effective December 1, 2018. The Program is reasonably designed to assess and manage the Fund’s liquidity risk and to comply with the requirements of the Liquidity Rule. The Fund’s Board of Trustees (the Board) has designated the Fund’s investment adviser as administrator of the Program. The Fidelity advisers have established a Liquidity Risk Management Committee (the LRM Committee) to manage the Program for each of the Fidelity Funds. The LRM Committee monitors the adequacy and effectiveness of implementation of the Program and on a periodic basis assesses each Fund’s liquidity risk based on a variety of factors including (1) the Fund’s investment strategy, (2) portfolio liquidity and cash flow projections during normal and reasonably foreseeable stressed conditions, (3) shareholder redemptions, (4) borrowings and other funding sources and (5) in the case of exchange-traded funds, certain additional factors including the effect of the Fund’s prices and spreads, market participants, and basket compositions on the overall liquidity of the Fund’s portfolio, as applicable.
In accordance with the Program, each of the Fund’s portfolio investments is classified into one of four liquidity categories described below based on a determination of a reasonable expectation for how long it would take to convert the investment to cash (or sell or dispose of the investment) without significantly changing its market value.
- Highly liquid investments – cash or convertible to cash within three business days or less
- Moderately liquid investments – convertible to cash in three to seven calendar days
- Less liquid investments – can be sold or disposed of, but not settled, within seven calendar days
- Illiquid investments – cannot be sold or disposed of within seven calendar days
Liquidity classification determinations take into account a variety of factors including various market, trading and investment-specific considerations, as well as market depth, and generally utilize analysis from a third-party liquidity metrics service.
The Liquidity Rule places a 15% limit on a fund’s illiquid investments and requires funds that do not primarily hold assets that are highly liquid investments to determine and maintain a minimum percentage of the fund’s net assets to be invested in highly liquid investments (highly liquid investment minimum or HLIM). The Program includes provisions reasonably designed to comply with the 15% limit on illiquid investments and for determining, periodically reviewing and complying with the HLIM requirement as applicable.
At a recent meeting of the Fund’s Board of Trustees, the LRM Committee provided a written report to the Board pertaining to the operation, adequacy, and effectiveness of implementation of the Program for the annual period from December 1, 2019 through November 30, 2020. The report concluded that the Program has been implemented and is operating effectively and is reasonably designed to assess and manage the Fund’s liquidity risk.
O2T-ANN-0921
1.951012.108
Item 2.
Code of Ethics
As of the end of the period, July 31, 2021, Fidelity Puritan Trust (the trust) has adopted a code of ethics, as defined in Item 2 of Form N-CSR, that applies to its President and Treasurer and its Chief Financial Officer. A copy of the code of ethics is filed as an exhibit to this Form N-CSR.
Item 3.
Audit Committee Financial Expert
The Board of Trustees of the trust has determined that Donald F. Donahue is an audit committee financial expert, as defined in Item 3 of Form N-CSR. Mr. Donahue is independent for purposes of Item 3 of Form N-CSR.
Item 4.
Principal Accountant Fees and Services
Fees and Services
The following table presents fees billed by Deloitte & Touche LLP, the member firms of Deloitte Touche Tohmatsu, and their respective affiliates (collectively, “Deloitte Entities”) in each of the last two fiscal years for services rendered to Fidelity Flex Intrinsic Opportunities Fund, Fidelity Series Intrinsic Opportunities Fund, Fidelity Value Discovery Fund and Fidelity Value Discovery K6 Fund (the “Funds”):
Services Billed by Deloitte Entities
July 31, 2021 FeesA
| | | | |
| Audit Fees | Audit-Related Fees | Tax Fees | All Other Fees |
Fidelity Flex Intrinsic Opportunities Fund | $53,100 | $- | $9,400 | $1,300 |
Fidelity Series Intrinsic Opportunities Fund | $52,800 | $- | $9,500 | $1,300 |
Fidelity Value Discovery Fund | $34,400 | $- | $9,900 | $900 |
Fidelity Value Discovery K6 Fund | $33,200 | $- | $7,600 | $900 |
| | | | |
| Audit Fees | Audit-Related Fees | Tax Fees | All Other Fees |
Fidelity Flex Intrinsic Opportunities Fund | $53,900 | $- | $9,600 | $1,200 |
Fidelity Series Intrinsic Opportunities Fund | $53,900 | $- | $9,900 | $1,200 |
Fidelity Value Discovery Fund | $35,300 | $- | $8,000 | $800 |
Fidelity Value Discovery K6 Fund | $34,000 | $- | $8,500 | $800 |
A Amounts may reflect rounding.
The following table presents fees billed by PricewaterhouseCoopers LLP (“PwC”) in each of the last two fiscal years for services rendered to Fidelity Low-Priced Stock Fund and Fidelity Low-Priced Stock K6 Fund (the “Funds”):
Services Billed by PwC
July 31, 2021 FeesA
| | | | |
| Audit Fees | Audit-Related Fees | Tax Fees | All Other Fees |
Fidelity Low-Priced Stock Fund | $78,600 | $6,300 | $18,200 | $2,200 |
Fidelity Low-Priced Stock K6 Fund | $64,700 | $5,400 | $11,700 | $1,900 |
| | | | |
| Audit Fees | Audit-Related Fees | Tax Fees | All Other Fees |
Fidelity Low-Priced Stock Fund | $96,600 | $6,100 | $15,400 | $2,500 |
Fidelity Low-Priced Stock K6 Fund | $70,300 | $5,200 | $10,800 | $2,100 |
A Amounts may reflect rounding.
The following table(s) present(s) fees billed by Deloitte Entities and PwC that were required to be approved by the Audit Committee for services that relate directly to the operations and financial reporting of the Fund(s) and that are rendered on behalf of Fidelity Management & Research Company LLC ("FMR") and entities controlling, controlled by, or under common control with FMR (not including any sub-adviser whose role is primarily portfolio management and is subcontracted with or overseen by another investment adviser) that provide ongoing services to the Fund(s) (“Fund Service Providers”):
Services Billed by Deloitte Entities
| | |
| July 31, 2021A | July 31, 2020A |
Audit-Related Fees | $- | $- |
Tax Fees | $- | $3,000 |
All Other Fees | $- | $- |
A Amounts may reflect rounding.
Services Billed by PwC
| | |
| July 31, 2021A | July 31, 2020A |
Audit-Related Fees | $8,959,700 | $8,940,200 |
Tax Fees | $11,200 | $20,800 |
All Other Fees | $- | $- |
A Amounts may reflect rounding.
“Audit-Related Fees” represent fees billed for assurance and related services that are reasonably related to the performance of the fund audit or the review of the fund's financial statements and that are not reported under Audit Fees.
“Tax Fees” represent fees billed for tax compliance, tax advice or tax planning that relate directly to the operations and financial reporting of the fund.
“All Other Fees” represent fees billed for services provided to the fund or Fund Service Provider, a significant portion of which are assurance related, that relate directly to the operations and financial reporting of the fund, excluding those services that are reported under Audit Fees, Audit-Related Fees or Tax Fees.
Assurance services must be performed by an independent public accountant.
* * *
The aggregate non-audit fees billed by Deloitte Entities and PwC for services rendered to the Fund(s), FMR (not including any sub-adviser whose role is primarily portfolio management and is subcontracted with or overseen by another investment adviser), and any Fund Service Provider for each of the last two fiscal years of the Fund(s) are as follows:
| | |
Billed By | July 31, 2021A | July 31, 2020A |
Deloitte Entities | $562,400 | $544,600 |
PwC | $14,319,300 | $14,284,300 |
A Amounts may reflect rounding.
The trust's Audit Committee has considered non-audit services that were not pre-approved that were provided by Deloitte Entities and PwC to Fund Service Providers to be compatible with maintaining the independence of Deloitte Entities and PwC in its(their) audit of the Fund(s), taking into account representations from Deloitte Entities and PwC, in accordance with Public Company Accounting Oversight Board rules, regarding its independence from the Fund(s) and its(their) related entities and FMR’s review of the appropriateness and permissibility under applicable law of such non-audit services prior to their provision to the Fund(s) Service Providers.
Audit Committee Pre-Approval Policies and Procedures
The trust’s Audit Committee must pre-approve all audit and non-audit services provided by a fund’s independent registered public accounting firm relating to the operations or financial reporting of the fund. Prior to the commencement of any audit or non-audit services to a fund, the Audit Committee reviews the services to determine whether they are appropriate and permissible under applicable law.
The Audit Committee has adopted policies and procedures to, among other purposes, provide a framework for the Committee’s consideration of non-audit services by the audit firms that audit the Fidelity funds. The policies and procedures require that any non-audit service provided by a fund audit firm to a Fidelity fund and any non-audit service provided by a fund auditor to a Fund Service Provider that relates directly to the operations and financial reporting of a Fidelity fund (“Covered Service”) are subject to approval by the Audit Committee before such service is provided.
All Covered Services must be approved in advance of provision of the service either: (i) by formal resolution of the Audit Committee, or (ii) by oral or written approval of the service by the Chair of the Audit Committee (or if the Chair is unavailable, such other member of the Audit Committee as may be designated by the Chair to act in the Chair’s absence). The approval contemplated by (ii) above is permitted where the Treasurer determines that action on such an engagement is necessary before the next meeting of the Audit Committee.
Non-audit services provided by a fund audit firm to a Fund Service Provider that do not relate directly to the operations and financial reporting of a Fidelity fund are reported to the Audit Committee periodically.
Non-Audit Services Approved Pursuant to Rule 2-01(c)(7)(i)(C) and (ii) of Regulation S-X (“De Minimis Exception”)
There were no non-audit services approved or required to be approved by the Audit Committee pursuant to the De Minimis Exception during the Fund’s(s’) last two fiscal years relating to services provided to (i) the Fund(s) or (ii) any Fund Service Provider that relate directly to the operations and financial reporting of the Fund(s).
Item 5.
Audit Committee of Listed Registrants
Not applicable.
Item 6.
Investments
(a)
Not applicable.
(b)
Not applicable.
Item 7.
Disclosure of Proxy Voting Policies and Procedures for Closed-End Management Investment Companies
Not applicable.
Item 8.
Portfolio Managers of Closed-End Management Investment Companies
Not applicable.
Item 9.
Purchase of Equity Securities by Closed-End Management Investment Company and Affiliated Purchasers
Not applicable.
Item 10.
Submission of Matters to a Vote of Security Holders
There were no material changes to the procedures by which shareholders may recommend nominees to the trust’s Board of Trustees.
Item 11.
Controls and Procedures
(a)(i) The President and Treasurer and the Chief Financial Officer have concluded that the trust’s disclosure controls and procedures (as defined in Rule 30a-3(c) under the Investment Company Act) provide reasonable assurances that material information relating to the trust is made known to them by the appropriate persons, based on their evaluation of these controls and procedures as of a date within 90 days of the filing date of this report.
(a)(ii) There was no change in the trust’s internal control over financial reporting (as defined in Rule 30a-3(d) under the Investment Company Act) that occurred during the period covered by this report that has materially affected, or is reasonably likely to materially affect, the trust’s internal control over financial reporting.
Item 12.
Disclosure of Securities Lending Activities for Closed-End Management
Investment Companies
Not applicable.
Item 13.
Exhibits
SIGNATURES
Pursuant to the requirements of the Securities Exchange Act of 1934 and the Investment Company Act of 1940, the registrant has duly caused this report to be signed on its behalf by the undersigned, thereunto duly authorized.
Fidelity Puritan Trust
| |
By: | /s/Stacie M. Smith |
| Stacie M. Smith |
| President and Treasurer |
|
|
Date: | September 21, 2021 |
Pursuant to the requirements of the Securities Exchange Act of 1934 and the Investment Company Act of 1940, this report has been signed below by the following persons on behalf of the registrant and in the capacities and on the dates indicated.
| |
By: | /s/Stacie M. Smith |
| Stacie M. Smith |
| President and Treasurer |
|
|
Date: | September 21, 2021 |
| |
By: | /s/John J. Burke III |
| John J. Burke III |
| Chief Financial Officer |
|
|
Date: | September 21, 2021 |