UNITED STATES
SECURITIES AND EXCHANGE COMMISSION
Washington, D.C. 20549
FORM N-CSR
CERTIFIED SHAREHOLDER REPORT OF REGISTERED
MANAGEMENT INVESTMENT COMPANIES
Investment Company Act file number 811-00649
Fidelity Puritan Trust
(Exact name of registrant as specified in charter)
245 Summer St., Boston, Massachusetts 02210
(Address of principal executive offices) (Zip code)
Cynthia Lo Bessette, Secretary
245 Summer St.
Boston, Massachusetts 02210
(Name and address of agent for service)
Registrant's telephone number, including area code:
617-563-7000
| |
Date of fiscal year end: | July 31 |
|
|
Date of reporting period: | July 31, 2020 |
Item 1.
Reports to Stockholders
Fidelity® Low-Priced Stock Fund
Annual Report
July 31, 2020

See the inside front cover for important information about access to your fund’s shareholder reports.

Beginning on January 1, 2021, as permitted by regulations adopted by the Securities and Exchange Commission, paper copies of a fund’s shareholder reports will no longer be sent by mail, unless you specifically request paper copies of the reports from the fund or from your financial intermediary, such as a financial advisor, broker-dealer or bank. Instead, the reports will be made available on a website, and you will be notified by mail each time a report is posted and provided with a website link to access the report.
If you already elected to receive shareholder reports electronically, you will not be affected by this change and you need not take any action. You may elect to receive shareholder reports and other communications from a fund electronically, by contacting your financial intermediary. For Fidelity customers, visit Fidelity's web site or call Fidelity using the contact information listed below.
You may elect to receive all future reports in paper free of charge. If you wish to continue receiving paper copies of your shareholder reports, you may contact your financial intermediary or, if you are a Fidelity customer, visit Fidelity’s website, or call Fidelity at the applicable toll-free number listed below. Your election to receive reports in paper will apply to all funds held with the fund complex/your financial intermediary.
| Account Type | Website | Phone Number |
| Brokerage, Mutual Fund, or Annuity Contracts: | fidelity.com/mailpreferences | 1-800-343-3548 |
| Employer Provided Retirement Accounts: | netbenefits.fidelity.com/preferences (choose 'no' under Required Disclosures to continue to print) | 1-800-343-0860 |
| Advisor Sold Accounts Serviced Through Your Financial Intermediary: | Contact Your Financial Intermediary | Your Financial Intermediary's phone number |
| Advisor Sold Accounts Serviced by Fidelity: | institutional.fidelity.com | 1-877-208-0098 |
Contents
To view a fund's proxy voting guidelines and proxy voting record for the 12-month period ended June 30, visit http://www.fidelity.com/proxyvotingresults or visit the Securities and Exchange Commission's (SEC) web site at http://www.sec.gov.
You may also call 1-800-544-8544 if you’re an individual investing directly with Fidelity, call 1-800-835-5092 if you’re a plan sponsor or participant with Fidelity as your recordkeeper or call 1-877-208-0098 on institutional accounts or if you’re an advisor or invest through one to request a free copy of the proxy voting guidelines.
Standard & Poor's, S&P and S&P 500 are registered service marks of The McGraw-Hill Companies, Inc. and have been licensed for use by Fidelity Distributors Corporation.
Other third-party marks appearing herein are the property of their respective owners.
All other marks appearing herein are registered or unregistered trademarks or service marks of FMR LLC or an affiliated company. © 2020 FMR LLC. All rights reserved.
This report and the financial statements contained herein are submitted for the general information of the shareholders of the Fund. This report is not authorized for distribution to prospective investors in the Fund unless preceded or accompanied by an effective prospectus.
A fund files its complete schedule of portfolio holdings with the SEC for the first and third quarters of each fiscal year on Form N-PORT. Forms N-PORT are available on the SEC’s web site at http://www.sec.gov. A fund's Forms N-PORT may be reviewed and copied at the SEC’s Public Reference Room in Washington, DC. Information regarding the operation of the SEC's Public Reference Room may be obtained by calling 1-800-SEC-0330.
For a complete list of a fund's portfolio holdings, view the most recent holdings listing, semiannual report, or annual report on Fidelity's web site at http://www.fidelity.com, http://www.institutional.fidelity.com, or http://www.401k.com, as applicable.
NOT FDIC INSURED •MAY LOSE VALUE •NO BANK GUARANTEE
Neither the Fund nor Fidelity Distributors Corporation is a bank.
Note to Shareholders:
Early in 2020, the outbreak and spread of a new coronavirus emerged as a public health emergency that had a major influence on financial markets, primarily based on its impact on the global economy and the outlook for corporate earnings. The virus causes a respiratory disease known as COVID-19. On March 11, the World Health Organization declared the COVID-19 outbreak a pandemic, citing sustained risk of further global spread.
In the weeks following, as the crisis worsened, we witnessed an escalating human tragedy with wide-scale social and economic consequences from coronavirus-containment measures. The outbreak of COVID-19 prompted a number of measures to limit the spread, including travel and border restrictions, quarantines, and restrictions on large gatherings. In turn, these resulted in lower consumer activity, diminished demand for a wide range of products and services, disruption in manufacturing and supply chains, and – given the wide variability in outcomes regarding the outbreak – significant market uncertainty and volatility. Amid the turmoil, the U.S. government took unprecedented action – in concert with the U.S. Federal Reserve and central banks around the world – to help support consumers, businesses, and the broader economy, and to limit disruption to the financial system.
The situation continues to unfold, and the extent and duration of its impact on financial markets and the economy remain highly uncertain. Extreme events such as the coronavirus crisis are “exogenous shocks” that can have significant adverse effects on mutual funds and their investments. Although multiple asset classes may be affected by market disruption, the duration and impact may not be the same for all types of assets.
Fidelity is committed to helping you stay informed amid news about COVID-19 and during increased market volatility, and we’re taking extra steps to be responsive to customer needs. We encourage you to visit our websites, where we offer ongoing updates, commentary, and analysis on the markets and our funds.
Performance: The Bottom Line
Average annual total return reflects the change in the value of an investment, assuming reinvestment of distributions from dividend income and capital gains (the profits earned upon the sale of securities that have grown in value, if any) and assuming a constant rate of performance each year. The hypothetical investment and the average annual total returns do not reflect the deduction of taxes that a shareholder would pay on fund distributions or the redemption of fund shares. During periods of reimbursement by Fidelity, a fund’s total return will be greater than it would be had the reimbursement not occurred. How a fund did yesterday is no guarantee of how it will do tomorrow.
Average Annual Total Returns
| For the periods ended July 31, 2020 | Past 1 year | Past 5 years | Past 10 years |
| Fidelity® Low-Priced Stock Fund | (0.48)% | 4.57% | 10.09% |
| Class K | (0.41)% | 4.66% | 10.20% |
$10,000 Over 10 Years
Let's say hypothetically that $10,000 was invested in Fidelity® Low-Priced Stock Fund, a class of the fund, on July 31, 2010.
The chart shows how the value of your investment would have changed, and also shows how the Russell 2000® Index performed over the same period.

| Period Ending Values |
| $26,151 | Fidelity® Low-Priced Stock Fund |
| $26,100 | Russell 2000® Index |
Management's Discussion of Fund Performance
Market Recap: The S&P 500
® index gained 11.96% for the 12 months ending July 31, 2020, in what was a bumpy ride for U.S. equity investors, marked by a steep but brief decline due to the early-2020 outbreak and spread of the coronavirus, followed by a historic rebound. Declared a pandemic on March 11, the COVID-19 crisis and containment efforts caused broad contraction in economic activity, along with extreme uncertainty, volatility and dislocation in financial markets. By mid-March, U.S. stocks entered bear-market territory less than a month after hitting an all-time high and extending the longest-running bull market in American history. Stocks slid in late February, after a surge in COVID-19 cases outside China. The sudden downtrend continued in March (-12%), capping the index’s worst quarter since 2008. A historically rapid and expansive U.S. monetary/fiscal-policy response provided a partial offset to the economic disruption and fueled a sharp uptrend. Aggressive support for financial markets by the U.S. Federal Reserve, plans for reopening the economy and improving infection data boosted stocks in April (+13%) and May (+5%). In June and July, the index gained amid progress on potential treatments and signs of an early recovery in economic activity. For the full 12 months, growth stocks widely topped value, while large-caps handily bested smaller-caps. The information technology sector (+39%) led the way, followed by consumer discretionary (+22%). In contrast, energy (-38%) fell hard along with the price of crude oil.
Comments from Lead Portfolio Manager Joel Tillinghast: For the fiscal year, the fund's share classes returned roughly 0%, ahead of the -4.59% result of the benchmark Russell 2000
® Index. Stock selection and industry positioning drove the fund’s outperformance of the benchmark the past 12 months. Active management added value in eight of 11 sectors. Our picks in the energy, consumer staples and information technology sectors contributed most. An underweighting in financials – especially in the weak banking segment – was particularly helpful to the fund’s relative result, as was an overweighting in the outperforming retailing group within the consumer discretionary sector. In consumer staples, a sizable overweighting in the strong-performing food & staples retailing category also contributed. A cash position of 5%, on average, provided a boost in a down market. Managed care provider UnitedHealth Group (+23%) – the fund’s largest holding – was the top individual contributor by far the past 12 months. We reduced our stake this period. A sizable stake in Ansys (+53%), a developer of engineering simulation software, notably boosted relative performance. In addition, the fund's foreign holdings contributed, aided in part by favorable foreign exchange. Conversely, stock choices in the consumer durables & apparel group within the consumer discretionary sector held back the fund’s performance. A sizable underweighting in the strong-performing pharmaceuticals, biotechnology & life sciences industry within the health care sector also detracted. Insurance provider Unum Group (-43%) hurt more than any other stock this period. Private-label credit card provider Synchrony Financial (-36%) also detracted. All of the stocks mentioned were non-benchmark holdings.
The views expressed above reflect those of the portfolio manager(s) only through the end of the period as stated on the cover of this report and do not necessarily represent the views of Fidelity or any other person in the Fidelity organization. Any such views are subject to change at any time based upon market or other conditions and Fidelity disclaims any responsibility to update such views. These views may not be relied on as investment advice and, because investment decisions for a Fidelity fund are based on numerous factors, may not be relied on as an indication of trading intent on behalf of any Fidelity fund.
Investment Summary (Unaudited)
Top Ten Stocks as of July 31, 2020
| | % of fund's net assets |
| UnitedHealth Group, Inc. | 5.5 |
| Metro, Inc. Class A (sub. vtg.) | 4.4 |
| Next PLC | 3.5 |
| AutoZone, Inc. | 3.2 |
| Ross Stores, Inc. | 3.2 |
| Best Buy Co., Inc. | 2.5 |
| Amgen, Inc. | 2.5 |
| MetLife, Inc. | 2.3 |
| Seagate Technology LLC | 2.2 |
| Monster Beverage Corp. | 2.2 |
| | 31.5 |
Top Five Market Sectors as of July 31, 2020
| | % of fund's net assets |
| Consumer Discretionary | 23.8 |
| Information Technology | 15.3 |
| Health Care | 14.0 |
| Consumer Staples | 13.8 |
| Financials | 11.3 |
Asset Allocation (% of fund's net assets)
| As of July 31, 2020* |
| | Stocks | 97.4% |
| | Short-Term Investments and Net Other Assets (Liabilities) | 2.6% |

* Foreign investments - 46.9%
Schedule of Investments July 31, 2020
Showing Percentage of Net Assets
| Common Stocks - 97.3% | | | |
| | | Shares | Value (000s) |
| COMMUNICATION SERVICES - 1.9% | | | |
| Diversified Telecommunication Services - 0.0% | | | |
| Iridium Communications, Inc. (a) | | 301,666 | $8,263 |
| Interactive Media & Services - 0.8% | | | |
| XLMedia PLC | | 8,504,200 | 2,505 |
| Yahoo! Japan Corp. | | 37,500,241 | 199,416 |
| | | | 201,921 |
| Media - 1.1% | | | |
| AMC Networks, Inc. Class A (a) | | 50,938 | 1,177 |
| Comcast Corp. Class A | | 1,800,087 | 77,044 |
| Corus Entertainment, Inc. Class B (non-vtg.) | | 575,570 | 1,031 |
| Discovery Communications, Inc.: | | | |
| Class A (a)(b) | | 2,500,978 | 52,771 |
| Class C (non-vtg.) (a) | | 700,152 | 13,268 |
| Gray Television, Inc. (a) | | 131,800 | 1,890 |
| Hyundai HCN | | 2,723,979 | 9,032 |
| Intage Holdings, Inc. (c) | | 3,249,100 | 26,489 |
| MSG Network, Inc. Class A (a)(b) | | 283,783 | 2,704 |
| Nexstar Broadcasting Group, Inc. Class A | | 56,628 | 4,963 |
| Nordic Entertainment Group AB Class B | | 26,400 | 1,100 |
| Pico Far East Holdings Ltd. | | 22,936,000 | 3,019 |
| Proto Corp. | | 199,300 | 1,958 |
| Reach PLC | | 227,802 | 181 |
| RKB Mainichi Broadcasting Corp. | | 41,900 | 2,209 |
| Saga Communications, Inc. Class A | | 409,638 | 9,577 |
| Sky Network Television Ltd. (a) | | 23,693,962 | 2,027 |
| Tegna, Inc. | | 1,696,768 | 19,988 |
| TOW Co. Ltd. (c) | | 3,599,000 | 8,840 |
| TVA Group, Inc. Class B (non-vtg.) (a) | | 3,037,301 | 3,061 |
| ViacomCBS, Inc. Class B | | 250,000 | 6,518 |
| WOWOW INC. | | 181,300 | 4,206 |
| | | | 253,053 |
| Wireless Telecommunication Services - 0.0% | | | |
| Okinawa Cellular Telephone Co. | | 30,000 | 1,197 |
|
| TOTAL COMMUNICATION SERVICES | | | 464,434 |
|
| CONSUMER DISCRETIONARY - 23.8% | | | |
| Auto Components - 1.2% | | | |
| Adient PLC (a) | | 500,902 | 8,335 |
| ASTI Corp. (b)(c) | | 178,100 | 2,002 |
| DaikyoNishikawa Corp. | | 250,400 | 1,046 |
| ElringKlinger AG (a)(b) | | 686,557 | 4,165 |
| G-Tekt Corp. | | 171,900 | 1,418 |
| Gentex Corp. | | 1,998,812 | 53,948 |
| GUD Holdings Ltd. | | 313,318 | 2,516 |
| Hi-Lex Corp. | | 1,343,500 | 13,923 |
| INFAC Corp. | | 325,139 | 1,264 |
| INZI Controls Co. Ltd. | | 300,000 | 1,287 |
| Lear Corp. | | 186,839 | 20,623 |
| Linamar Corp. | | 251,867 | 7,522 |
| Motonic Corp. (c) | | 2,850,000 | 17,755 |
| Murakami Corp. (c) | | 811,300 | 17,475 |
| Nippon Seiki Co. Ltd. | | 2,593,800 | 29,061 |
| Piolax, Inc. (c) | | 2,442,900 | 33,555 |
| S&T Holdings Co. Ltd. (c) | | 885,108 | 11,509 |
| Samsung Climate Control Co. Ltd. (c) | | 499,950 | 2,634 |
| Sewon Precision Industries Co. Ltd. (c)(d) | | 500,000 | 1,686 |
| SJM Co. Ltd. (c) | | 1,282,000 | 2,707 |
| SJM Holdings Co. Ltd. | | 569,470 | 1,210 |
| Strattec Security Corp. (c) | | 379,730 | 8,206 |
| Sungwoo Hitech Co. Ltd. | | 2,518,110 | 6,170 |
| TBK Co. Ltd. | | 909,800 | 3,636 |
| Yachiyo Industry Co. Ltd. | | 881,100 | 3,121 |
| Yutaka Giken Co. Ltd. (c) | | 1,206,600 | 15,764 |
| | | | 272,538 |
| Automobiles - 0.0% | | | |
| Fiat Chrysler Automobiles NV | | 1,500 | 15 |
| Isuzu Motors Ltd. | | 278,400 | 2,271 |
| Kabe Husvagnar AB (B Shares) | | 272,253 | 4,868 |
| | | | 7,154 |
| Distributors - 0.1% | | | |
| Arata Corp. | | 92,400 | 4,382 |
| Central Automotive Products Ltd. | | 74,000 | 1,482 |
| LKQ Corp. (a) | | 112,500 | 3,171 |
| Nakayamafuku Co. Ltd. | | 522,100 | 2,234 |
| PALTAC Corp. | | 35,000 | 1,891 |
| SPK Corp. | | 498,200 | 6,297 |
| Uni-Select, Inc. | | 1,279,717 | 7,318 |
| | | | 26,775 |
| Diversified Consumer Services - 0.1% | | | |
| Clip Corp. (c) | | 257,800 | 1,712 |
| Cross-Harbour Holdings Ltd. | | 2,380,000 | 3,317 |
| Estacio Participacoes SA | | 258,300 | 1,678 |
| Step Co. Ltd. (c) | | 1,058,600 | 14,501 |
| | | | 21,208 |
| Hotels, Restaurants & Leisure - 0.2% | | | |
| Ark Restaurants Corp. | | 89,449 | 882 |
| Brinker International, Inc. | | 200,000 | 5,378 |
| Curves Holdings Co. Ltd. (a) | | 258,920 | 1,255 |
| Flanigans Enterprises, Inc. (a) | | 90,008 | 1,419 |
| Hiday Hidaka Corp. | | 1,300,740 | 18,051 |
| Ibersol SGPS SA (a) | | 896,477 | 5,702 |
| Koshidaka Holdings Co. Ltd. | | 258,920 | 812 |
| Melco International Development Ltd. | | 8,000 | 15 |
| Sportscene Group, Inc. Class A (c) | | 646,000 | 1,370 |
| The Monogatari Corp. | | 49,000 | 3,324 |
| The Restaurant Group PLC | | 15,284,765 | 8,843 |
| Wyndham Hotels & Resorts, Inc. | | 206 | 9 |
| | | | 47,060 |
| Household Durables - 4.4% | | | |
| Barratt Developments PLC (c) | | 58,438,523 | 390,589 |
| Bellway PLC | | 3,497,209 | 116,552 |
| D.R. Horton, Inc. | | 1,656,793 | 109,613 |
| Dorel Industries, Inc. Class B (sub. vtg.) | | 1,873,803 | 13,556 |
| Emak SpA (a) | | 4,311,725 | 3,972 |
| First Juken Co. Ltd. (c) | | 1,376,000 | 11,647 |
| Gree Electric Appliances, Inc. of Zhuhai (A Shares) | | 1,265,000 | 10,321 |
| Hamilton Beach Brands Holding Co.: | | | |
| Class A | | 171,883 | 2,613 |
| Class B | | 182,462 | 2,773 |
| Helen of Troy Ltd. (a) | | 940,385 | 177,027 |
| Henry Boot PLC | | 2,074,206 | 6,788 |
| Iida Group Holdings Co. Ltd. | | 52,900 | 814 |
| iRobot Corp. (a)(b) | | 18,000 | 1,308 |
| Lennar Corp. Class A | | 59,324 | 4,292 |
| M/I Homes, Inc. (a) | | 853,202 | 35,519 |
| Mohawk Industries, Inc. (a) | | 925,675 | 73,915 |
| Q.E.P. Co., Inc. (a) | | 18,384 | 207 |
| Sanei Architecture Planning Co. Ltd. (c) | | 1,189,700 | 13,397 |
| Taylor Morrison Home Corp. (a) | | 503,660 | 11,811 |
| Tempur Sealy International, Inc. (a) | | 32,500 | 2,631 |
| Token Corp. | | 600,000 | 38,090 |
| TopBuild Corp. (a) | | 14,400 | 1,900 |
| TRI Pointe Homes, Inc. (a) | | 218,720 | 3,657 |
| Whirlpool Corp. | | 18,000 | 2,936 |
| Zagg, Inc. (a)(b) | | 571,952 | 1,630 |
| | | | 1,037,558 |
| Internet & Direct Marketing Retail - 0.2% | | | |
| Aucnet, Inc. | | 120,600 | 1,285 |
| Belluna Co. Ltd. (c) | | 6,496,700 | 45,969 |
| Dustin Group AB (e) | | 258,538 | 1,564 |
| Moneysupermarket.com Group PLC | | 380,970 | 1,466 |
| Secoo Holding Ltd. ADR (a)(b) | | 201,000 | 529 |
| | | | 50,813 |
| Leisure Products - 0.0% | | | |
| Fenix Outdoor AB Class B (a)(d) | | 32,298 | 0 |
| Mars Group Holdings Corp. | | 446,800 | 6,264 |
| Miroku Corp. | | 138,100 | 2,070 |
| | | | 8,334 |
| Multiline Retail - 3.9% | | | |
| Big Lots, Inc. (b) | | 1,582,230 | 62,245 |
| Lifestyle China Group Ltd. (a) | | 17,961,000 | 3,708 |
| Lifestyle International Holdings Ltd. | | 19,628,000 | 15,904 |
| Next PLC (c) | | 11,787,588 | 840,932 |
| Ryohin Keikaku Co. Ltd. | | 5,000 | 60 |
| | | | 922,849 |
| Specialty Retail - 12.6% | | | |
| AT-Group Co. Ltd. | | 1,076,100 | 13,155 |
| AutoNation, Inc. (a) | | 205,362 | 10,543 |
| AutoZone, Inc. (a) | | 631,478 | 762,459 |
| Bed Bath & Beyond, Inc. (b)(c) | | 11,250,026 | 121,725 |
| Best Buy Co., Inc. | | 5,977,863 | 595,335 |
| BMTC Group, Inc. (c) | | 3,464,623 | 23,435 |
| Bonia Corp. Bhd | | 625,750 | 89 |
| Buffalo Co. Ltd. | | 91,500 | 866 |
| Burlington Stores, Inc. (a) | | 21,426 | 4,028 |
| Delek Automotive Systems Ltd. | | 724,200 | 3,382 |
| Five Below, Inc. (a) | | 100 | 11 |
| Foot Locker, Inc. | | 1,100,171 | 32,334 |
| Formosa Optical Technology Co. Ltd. | | 1,362,000 | 3,099 |
| GameStop Corp. Class A (a)(b) | | 2,041,421 | 8,186 |
| Genesco, Inc. (a) | | 500,328 | 7,780 |
| Goldlion Holdings Ltd. | | 21,571,000 | 4,091 |
| Guess?, Inc. (c) | | 3,896,528 | 40,290 |
| Hibbett Sports, Inc. (a) | | 100,000 | 2,319 |
| Hour Glass Ltd. | | 8,702,900 | 4,285 |
| IA Group Corp. (c) | | 115,740 | 3,466 |
| JB Hi-Fi Ltd. | | 99,944 | 3,261 |
| John David Group PLC | | 6,942,645 | 55,036 |
| Jumbo SA (c) | | 9,775,071 | 191,257 |
| K's Holdings Corp. | | 3,297,300 | 42,363 |
| Ku Holdings Co. Ltd. | | 885,000 | 6,948 |
| Leon's Furniture Ltd. | | 208,675 | 2,086 |
| Mitsui & Associates Telepark Corp. | | 10,000 | 179 |
| Mr. Bricolage SA (a) | | 845,734 | 5,180 |
| Murphy U.S.A., Inc. (a) | | 68,806 | 9,111 |
| Nafco Co. Ltd. (c) | | 1,904,600 | 33,196 |
| Ross Stores, Inc. | | 8,375,130 | 750,998 |
| Sally Beauty Holdings, Inc. (a) | | 4,009,160 | 46,546 |
| The Buckle, Inc. (b)(c) | | 4,580,514 | 73,426 |
| Urban Outfitters, Inc. (a)(b) | | 2,000,739 | 33,092 |
| USS Co. Ltd. | | 4,250,400 | 63,080 |
| Williams-Sonoma, Inc. | | 584,888 | 50,955 |
| | | | 3,007,592 |
| Textiles, Apparel & Luxury Goods - 1.1% | | | |
| Best Pacific International Holdings Ltd. | | 23,740,000 | 3,216 |
| Capri Holdings Ltd. (a) | | 1,750,000 | 26,215 |
| CRG, Inc. BHD (a)(d) | | 2,503,000 | 53 |
| Deckers Outdoor Corp. (a) | | 18,500 | 3,871 |
| Embry Holdings Ltd. | | 2,124,000 | 288 |
| Ff Group (a)(c)(d) | | 4,287,486 | 6,061 |
| Fossil Group, Inc. (a)(c) | | 4,066,017 | 13,459 |
| Gildan Activewear, Inc. | | 6,454,215 | 114,537 |
| Handsome Co. Ltd. (c) | | 1,950,000 | 49,408 |
| JLM Couture, Inc. (a)(c)(d) | | 157,564 | 347 |
| Kontoor Brands, Inc. | | 20,800 | 399 |
| Mavi Jeans Class B (a)(e) | | 2,000 | 12 |
| McRae Industries, Inc. | | 23,766 | 431 |
| Steven Madden Ltd. | | 119,068 | 2,522 |
| Sun Hing Vision Group Holdings Ltd. (c) | | 19,489,000 | 3,068 |
| Tapestry, Inc. | | 100,000 | 1,336 |
| Ted Baker PLC | | 478,111 | 460 |
| Texwinca Holdings Ltd. | | 48,086,000 | 6,825 |
| Victory City International Holdings Ltd. (a) | | 14,479,108 | 267 |
| Victory City International Holdings Ltd. rights 8/6/20 (a) | | 28,958,216 | 37 |
| Youngone Corp. | | 300,000 | 6,058 |
| Youngone Holdings Co. Ltd. (c) | | 889,600 | 25,851 |
| Yue Yuen Industrial (Holdings) Ltd. | | 1,499,000 | 2,379 |
| | | | 267,100 |
|
| TOTAL CONSUMER DISCRETIONARY | | | 5,668,981 |
|
| CONSUMER STAPLES - 13.8% | | | |
| Beverages - 2.6% | | | |
| A.G. Barr PLC | | 2,398,050 | 13,498 |
| Anhui Gujing Distillery Co. Ltd. (A Shares) | | 5,000 | 153 |
| Britvic PLC | | 6,175,856 | 64,552 |
| Jinro Distillers Co. Ltd. | | 41,431 | 1,039 |
| Monster Beverage Corp. (a) | | 6,543,242 | 513,514 |
| Muhak Co. Ltd. (a)(c) | | 2,799,256 | 12,640 |
| Olvi PLC (A Shares) | | 76,164 | 3,813 |
| Spritzer Bhd | | 5,120,400 | 2,443 |
| Yantai Changyu Pioneer Wine Co. Ltd. (B Shares) | | 2,799,936 | 5,650 |
| | | | 617,302 |
| Food & Staples Retailing - 9.4% | | | |
| Amsterdam Commodities NV | | 147,675 | 3,281 |
| Aoki Super Co. Ltd. | | 99,700 | 2,728 |
| Australasian Foods Holdco Pty Ltd. (a)(d) | | 3,481,102 | 0 |
| Belc Co. Ltd. (c) | | 1,621,900 | 116,293 |
| BJ's Wholesale Club Holdings, Inc. (a) | | 57,200 | 2,291 |
| Casey's General Stores, Inc. | | 20,387 | 3,245 |
| Cosmos Pharmaceutical Corp. | | 1,851,400 | 338,081 |
| Create SD Holdings Co. Ltd. (c) | | 5,100,000 | 182,840 |
| Daikokutenbussan Co. Ltd. | | 375,000 | 21,114 |
| Dong Suh Companies, Inc. | | 1,025,000 | 18,514 |
| Genky DrugStores Co. Ltd. | | 720,900 | 24,994 |
| Halows Co. Ltd. (c) | | 1,302,800 | 44,122 |
| Jm Holdings Co. Ltd. | | 70,100 | 2,427 |
| Kirindo Holdings Co. Ltd. | | 148,500 | 3,774 |
| Kroger Co. | | 112,600 | 3,917 |
| Kusuri No Aoki Holdings Co. Ltd. | | 492,200 | 45,800 |
| McColl's Retail Group PLC | | 1,537,925 | 744 |
| Metro, Inc. Class A (sub. vtg.) (c) | | 23,777,963 | 1,043,110 |
| Naked Wines PLC (b) | | 904,412 | 5,002 |
| North West Co., Inc. | | 113,736 | 2,530 |
| Qol Holdings Co. Ltd. | | 1,820,100 | 17,744 |
| Sundrug Co. Ltd. | | 2,977,000 | 101,525 |
| Total Produce PLC | | 8,768,283 | 11,031 |
| United Natural Foods, Inc. (a)(b) | | 166,300 | 3,301 |
| Valor Holdings Co. Ltd. | | 245,400 | 5,311 |
| Walgreens Boots Alliance, Inc. | | 4,103,237 | 167,043 |
| Yaoko Co. Ltd. | | 802,100 | 63,650 |
| | | | 2,234,412 |
| Food Products - 1.6% | | | |
| Carr's Group PLC | | 2,192,074 | 3,694 |
| Cranswick PLC | | 442,768 | 20,749 |
| Food Empire Holdings Ltd. (c) | | 38,296,700 | 14,599 |
| Fresh Del Monte Produce, Inc. (c) | | 4,662,694 | 105,284 |
| Hilton Food Group PLC | | 617,691 | 8,910 |
| Inghams Group Ltd. | | 1,070,272 | 2,539 |
| Ingredion, Inc. | | 399,715 | 34,575 |
| Kaveri Seed Co. Ltd. | | 330,714 | 2,668 |
| Lassonde Industries, Inc. Class A (sub. vtg.) | | 16,194 | 1,980 |
| Mitsui Sugar Co. Ltd. | | 345,200 | 6,261 |
| Nam Yang Dairy Products | | 10,500 | 2,669 |
| Origin Enterprises PLC (c) | | 9,039,401 | 33,754 |
| Pacific Andes International Holdings Ltd. (d) | | 106,294,500 | 1,001 |
| Pacific Andes Resources Development Ltd. (a)(d) | | 207,240,893 | 1,659 |
| Pickles Corp. | | 97,800 | 2,434 |
| Rocky Mountain Chocolate Factory, Inc. (c) | | 475,342 | 1,578 |
| S Foods, Inc. | | 394,800 | 9,414 |
| Seaboard Corp. | | 36,461 | 98,563 |
| Sunjin Co. Ltd. (c) | | 2,376,955 | 19,638 |
| Thai President Foods PCL | | 503,388 | 3,147 |
| The Simply Good Foods Co. (a) | | 89,800 | 2,159 |
| Ulker Biskuvi Sanayi A/S (a) | | 5,000 | 19 |
| | | | 377,294 |
| Personal Products - 0.1% | | | |
| Hengan International Group Co. Ltd. | | 492,000 | 4,129 |
| Sarantis SA (c) | | 3,935,501 | 39,173 |
| | | | 43,302 |
| Tobacco - 0.1% | | | |
| Karelia Tobacco Co., Inc. (a) | | 1,581 | 469 |
| Scandinavian Tobacco Group A/S (e) | | 1,498,949 | 22,028 |
| | | | 22,497 |
|
| TOTAL CONSUMER STAPLES | | | 3,294,807 |
|
| ENERGY - 3.4% | | | |
| Energy Equipment & Services - 0.2% | | | |
| AKITA Drilling Ltd. Class A (non-vtg.) | | 1,447,052 | 362 |
| Bristow Group, Inc. (a) | | 128,574 | 2,058 |
| Cactus, Inc. | | 70,000 | 1,583 |
| Cathedral Energy Services Ltd. (a) | | 1,303,855 | 146 |
| Championx Corp. (a) | | 375,000 | 3,566 |
| Geospace Technologies Corp. (a)(c) | | 699,332 | 5,280 |
| Helix Energy Solutions Group, Inc. (a) | | 500,000 | 2,095 |
| John Wood Group PLC | | 783,273 | 1,959 |
| KS Energy Services Ltd. (a) | | 12,944,200 | 149 |
| Liberty Oilfield Services, Inc. Class A | | 3,101,912 | 17,526 |
| Oil States International, Inc. (a) | | 2,400,628 | 10,755 |
| PHX Energy Services Corp. (a) | | 1,345,692 | 1,045 |
| Smart Sand, Inc. (a)(b) | | 144,100 | 169 |
| Solaris Oilfield Infrastructure, Inc. Class A | | 121,200 | 880 |
| Tidewater, Inc. warrants 11/14/24 (a) | | 76,371 | 28 |
| Total Energy Services, Inc. | | 1,976,471 | 3,099 |
| | | | 50,700 |
| Oil, Gas & Consumable Fuels - 3.2% | | | |
| Adams Resources & Energy, Inc. | | 124,675 | 2,639 |
| Beach Energy Ltd. | | 13,985,260 | 14,138 |
| Berry Petroleum Corp. | | 1,400,615 | 6,590 |
| Bonanza Creek Energy, Inc. (a)(c) | | 1,238,407 | 22,527 |
| China Petroleum & Chemical Corp.: | | | |
| (H Shares) | | 4,466,000 | 1,903 |
| sponsored ADR (H Shares) | | 98,416 | 4,184 |
| Cimarex Energy Co. | | 24,822 | 607 |
| CNX Resources Corp. (a) | | 992,834 | 9,581 |
| ConocoPhillips Co. | | 26,200 | 980 |
| CONSOL Energy, Inc. (a)(b) | | 70,000 | 412 |
| Contango Oil & Gas Co. (a)(b) | | 1,288,991 | 2,294 |
| Delek U.S. Holdings, Inc. | | 1,000,470 | 17,488 |
| Eni SpA | | 4,795,060 | 42,713 |
| Enterprise Products Partners LP | | 99,432 | 1,750 |
| EQT Corp. | | 5,100,695 | 74,062 |
| Fuji Kosan Co. Ltd. | | 300,500 | 1,178 |
| Great Eastern Shipping Co. Ltd. | | 4,700,000 | 14,200 |
| Hankook Shell Oil Co. Ltd. | | 46,500 | 9,138 |
| HollyFrontier Corp. | | 49,947 | 1,374 |
| Kyungdong Invest Co. Ltd. | | 84,315 | 1,935 |
| Marathon Oil Corp. (b) | | 10,500,409 | 57,647 |
| Marathon Petroleum Corp. | | 2,000,727 | 76,428 |
| Michang Oil Industrial Co. Ltd. (c) | | 173,900 | 8,420 |
| Murphy Oil Corp. (b)(c) | | 12,000,766 | 158,530 |
| NACCO Industries, Inc. Class A | | 220,046 | 4,806 |
| Oil & Natural Gas Corp. Ltd. | | 39,210,893 | 40,980 |
| Oil India Ltd. | | 1,249,977 | 1,613 |
| Ovintiv, Inc. (b) | | 1,749,092 | 16,949 |
| QEP Resources, Inc. | | 8,000,761 | 11,761 |
| Reliance Industries Ltd. | | 112,200 | 3,096 |
| Southwestern Energy Co. (a)(b) | | 19,857,357 | 48,253 |
| Star Petroleum Refining PCL | | 9,019,000 | 2,010 |
| Thai Oil PCL (For. Reg.) | | 491,700 | 662 |
| Total SA sponsored ADR | | 1,599,202 | 60,226 |
| Tsakos Energy Navigation Ltd. | | 10,000 | 87 |
| Whitecap Resources, Inc. | | 448,312 | 740 |
| World Fuel Services Corp. | | 1,104,855 | 25,997 |
| WPX Energy, Inc. (a) | | 667,328 | 3,984 |
| | | | 751,882 |
|
| TOTAL ENERGY | | | 802,582 |
|
| FINANCIALS - 11.3% | | | |
| Banks - 0.7% | | | |
| ACNB Corp. | | 116,205 | 2,394 |
| Bank Ireland Group PLC | | 10,260,163 | 21,150 |
| Bank of America Corp. | | 84,915 | 2,113 |
| Camden National Corp. | | 116,209 | 3,683 |
| Cathay General Bancorp (b) | | 679,577 | 16,432 |
| Central Pacific Financial Corp. | | 67,500 | 1,050 |
| Central Valley Community Bancorp | | 102,000 | 1,340 |
| Codorus Valley Bancorp, Inc. (c) | | 709,242 | 8,334 |
| Community Trust Bancorp, Inc. | | 66,933 | 2,049 |
| Dah Sing Banking Group Ltd. | | 1,566,000 | 1,414 |
| Dimeco, Inc. | | 35,625 | 1,249 |
| East West Bancorp, Inc. | | 400,278 | 13,874 |
| First Bancorp, Puerto Rico | | 1,433,606 | 7,799 |
| First Citizens Bancshares, Inc. | | 8,391 | 3,573 |
| First Hawaiian, Inc. | | 100,236 | 1,742 |
| FNB Corp., Pennsylvania | | 150,228 | 1,113 |
| Hanmi Financial Corp. | | 362,960 | 3,350 |
| Hope Bancorp, Inc. | | 1,347,181 | 11,357 |
| Independent Bank Corp. | | 134,865 | 1,883 |
| LCNB Corp. | | 96,200 | 1,204 |
| Meridian Bank/Malvern, PA | | 146,339 | 2,198 |
| NIBC Holding NV (e) | | 245,648 | 2,115 |
| OFG Bancorp | | 427,967 | 5,598 |
| Sparebank 1 Sr Bank ASA (primary capital certificate) (a) | | 1,192,230 | 9,411 |
| Sparebanken More (primary capital certificate) | | 204,903 | 6,709 |
| Sparebanken Nord-Norge | | 2,198,362 | 15,120 |
| Trico Bancshares | | 26,000 | 728 |
| Van Lanschot NV (Bearer) | | 1,043,747 | 18,073 |
| Western Alliance Bancorp. | | 69,231 | 2,489 |
| | | | 169,544 |
| Capital Markets - 1.4% | | | |
| AllianceBernstein Holding LP | | 375,129 | 10,657 |
| Banca Generali SpA | | 54,355 | 1,613 |
| Daou Data Corp. | | 5,000 | 61 |
| GAMCO Investors, Inc. Class A | | 122,924 | 1,449 |
| Hamilton Lane, Inc. Class A | | 48,992 | 3,539 |
| Lazard Ltd. Class A | | 2,269,485 | 66,541 |
| State Street Corp. | | 3,190,503 | 203,522 |
| Tullett Prebon PLC | | 472,783 | 2,052 |
| Waddell & Reed Financial, Inc. Class A (b) | | 2,427,822 | 35,422 |
| | | | 324,856 |
| Consumer Finance - 2.6% | | | |
| Aeon Credit Service (Asia) Co. Ltd. | | 12,530,000 | 8,633 |
| Cash Converters International Ltd. (a) | | 19,950,304 | 2,566 |
| Discover Financial Services | | 2,500,663 | 123,608 |
| H&T Group PLC | | 529,407 | 2,183 |
| Navient Corp. | | 989,390 | 7,876 |
| Nicholas Financial, Inc. (a) | | 244,569 | 1,996 |
| OneMain Holdings, Inc. | | 66,600 | 1,911 |
| Santander Consumer U.S.A. Holdings, Inc. | | 9,390,723 | 172,414 |
| Synchrony Financial | | 13,540,996 | 299,662 |
| | | | 620,849 |
| Diversified Financial Services - 0.1% | | | |
| Far East Horizon Ltd. | | 1,405,000 | 1,157 |
| Ricoh Leasing Co. Ltd. | | 699,300 | 17,559 |
| Voya Financial, Inc. | | 52,144 | 2,576 |
| | | | 21,292 |
| Insurance - 5.9% | | | |
| AEGON NV | | 41,953,642 | 122,940 |
| AFLAC, Inc. | | 139,960 | 4,978 |
| Allstate Corp. | | 39,511 | 3,729 |
| Amerisafe, Inc. | | 44,600 | 2,830 |
| ASR Nederland NV | | 547,297 | 17,619 |
| Brighthouse Financial, Inc. (a) | | 25,048 | 710 |
| Chubb Ltd. | | 16,602 | 2,112 |
| Db Insurance Co. Ltd. | | 20,000 | 788 |
| FBD Holdings PLC (a) | | 142,522 | 1,115 |
| First American Financial Corp. | | 118,157 | 6,027 |
| Globe Life, Inc. | | 26,645 | 2,121 |
| Hartford Financial Services Group, Inc. | | 100,000 | 4,232 |
| Hiscox Ltd. | | 141,499 | 1,448 |
| Hyundai Fire & Marine Insurance Co. Ltd. | | 120,804 | 2,354 |
| Lincoln National Corp. | | 4,496,292 | 167,577 |
| MetLife, Inc. | | 14,571,679 | 551,538 |
| National Western Life Group, Inc. | | 126,317 | 24,605 |
| NN Group NV | | 1,131,424 | 41,316 |
| Old Republic International Corp. | | 107,800 | 1,732 |
| Primerica, Inc. | | 59,994 | 7,179 |
| Principal Financial Group, Inc. | | 168,532 | 7,151 |
| Prudential Financial, Inc. | | 400,013 | 25,349 |
| Reinsurance Group of America, Inc. | | 1,010,100 | 86,111 |
| RenaissanceRe Holdings Ltd. | | 449,577 | 81,095 |
| The Travelers Companies, Inc. | | 27,953 | 3,198 |
| Unum Group (c) | | 14,250,749 | 245,540 |
| | | | 1,415,394 |
| Mortgage Real Estate Investment Trusts - 0.3% | | | |
| Annaly Capital Management, Inc. | | 11,000,338 | 81,513 |
| Thrifts & Mortgage Finance - 0.3% | | | |
| ASAX Co. Ltd. | | 393,900 | 2,434 |
| Genworth MI Canada, Inc. | | 2,497,849 | 61,894 |
| Genworth Mortgage Insurance Ltd. | | 3,995,851 | 4,839 |
| | | | 69,167 |
|
| TOTAL FINANCIALS | | | 2,702,615 |
|
| HEALTH CARE - 14.0% | | | |
| Biotechnology - 2.7% | | | |
| Alexion Pharmaceuticals, Inc. (a) | | 84,465 | 8,657 |
| Amgen, Inc. | | 2,408,528 | 589,295 |
| Biogen, Inc. (a) | | 99,421 | 27,310 |
| Cell Biotech Co. Ltd. | | 50,000 | 746 |
| Essex Bio-Technology Ltd. | | 2,190,000 | 1,390 |
| Gilead Sciences, Inc. | | 241,679 | 16,804 |
| United Therapeutics Corp. (a) | | 10,000 | 1,115 |
| | | | 645,317 |
| Health Care Equipment & Supplies - 0.4% | | | |
| Apex Biotechnology Corp. | | 500,000 | 454 |
| Arts Optical International Holdings Ltd. (a) | | 19,282,000 | 2,040 |
| Boston Scientific Corp. (a) | | 120,194 | 4,636 |
| Hoshiiryou Sanki Co. Ltd. (c) | | 278,464 | 9,378 |
| InBody Co. Ltd. | | 10,000 | 139 |
| Integra LifeSciences Holdings Corp. (a) | | 53,192 | 2,540 |
| Nakanishi, Inc. | | 491,300 | 7,709 |
| Prim SA (c) | | 1,412,200 | 15,437 |
| ResMed, Inc. | | 40,179 | 8,137 |
| Shandong Weigao Medical Polymer Co. Ltd. (H Shares) | | 920,000 | 2,338 |
| St.Shine Optical Co. Ltd. | | 2,100,000 | 22,172 |
| Techno Medica Co. Ltd. | | 38,300 | 626 |
| Utah Medical Products, Inc. (c) | | 253,322 | 20,646 |
| Vieworks Co. Ltd. | | 5,000 | 151 |
| | | | 96,403 |
| Health Care Providers & Services - 9.4% | | | |
| AmerisourceBergen Corp. | | 15,884 | 1,591 |
| Anthem, Inc. | | 1,816,527 | 497,365 |
| Cigna Corp. | | 19,300 | 3,333 |
| Covetrus, Inc. (a) | | 5,000 | 111 |
| CVS Health Corp. | | 1,975,157 | 124,316 |
| DVx, Inc. (c) | | 661,700 | 5,570 |
| Hi-Clearance, Inc. | | 1,442,000 | 5,279 |
| Humana, Inc. | | 13,187 | 5,175 |
| Laboratory Corp. of America Holdings (a) | | 259,260 | 50,016 |
| Medica Sur SA de CV (a) | | 326,928 | 230 |
| MEDNAX, Inc. (a) | | 1,225,990 | 24,495 |
| Patterson Companies, Inc. (b) | | 78,200 | 2,077 |
| Quest Diagnostics, Inc. | | 77,926 | 9,902 |
| Ship Healthcare Holdings, Inc. | | 44,300 | 1,900 |
| Tokai Corp. | | 336,600 | 6,703 |
| Triple-S Management Corp. (b)(c) | | 1,713,238 | 33,340 |
| United Drug PLC (United Kingdom) | | 999,660 | 9,317 |
| UnitedHealth Group, Inc. | | 4,319,604 | 1,307,889 |
| Universal Health Services, Inc. Class B | | 1,261,004 | 138,584 |
| WIN-Partners Co. Ltd. (c) | | 2,484,700 | 21,431 |
| | | | 2,248,624 |
| Health Care Technology - 0.1% | | | |
| Schrodinger, Inc. (b) | | 199,788 | 14,461 |
| Life Sciences Tools & Services - 0.0% | | | |
| Berkeley Lights, Inc. (a) | | 30,300 | 1,817 |
| Pharmaceuticals - 1.4% | | | |
| Apex Healthcare Bhd | | 190,400 | 152 |
| Bliss Gvs Pharma Ltd. (a) | | 3,700,000 | 5,299 |
| Bristol-Myers Squibb Co. | | 47,477 | 2,785 |
| Bristol-Myers Squibb Co. rights (a) | | 999,264 | 3,597 |
| Daewon Pharmaceutical Co. Ltd. (c) | | 1,981,436 | 35,127 |
| Daewoong Co. Ltd. | | 350,000 | 7,493 |
| Dai Han Pharmaceutical Co. Ltd. | | 29,837 | 744 |
| Daito Pharmaceutical Co. Ltd. | | 107,800 | 3,208 |
| Dawnrays Pharmaceutical Holdings Ltd. | | 35,373,000 | 4,062 |
| DongKook Pharmaceutical Co. Ltd. (c) | | 623,700 | 76,511 |
| Elanco Animal Health, Inc. (a) | | 490 | 12 |
| FDC Ltd. | | 2,816,443 | 11,246 |
| Fuji Pharma Co. Ltd. | | 637,500 | 6,330 |
| Genomma Lab Internacional SA de CV (a) | | 2,845,500 | 3,005 |
| Jazz Pharmaceuticals PLC (a) | | 30,000 | 3,248 |
| Kaken Pharmaceutical Co. Ltd. | | 1,000 | 45 |
| Korea United Pharm, Inc. | | 239,629 | 4,959 |
| Kwang Dong Pharmaceutical Co. Ltd. (c) | | 3,100,000 | 23,719 |
| Kyung Dong Pharmaceutical Co. Ltd. | | 960,000 | 10,075 |
| Lee's Pharmaceutical Holdings Ltd. | | 7,874,000 | 6,218 |
| Recordati SpA | | 1,547,738 | 82,480 |
| Royalty Pharma PLC | | 200,000 | 8,610 |
| Taro Pharmaceutical Industries Ltd. (a) | | 41,800 | 2,717 |
| Vivimed Labs Ltd. (a) | | 600,000 | 86 |
| Whanin Pharmaceutical Co. Ltd. (c) | | 1,750,000 | 22,390 |
| | | | 324,118 |
|
| TOTAL HEALTH CARE | | | 3,330,740 |
|
| INDUSTRIALS - 7.7% | | | |
| Aerospace & Defense - 0.0% | | | |
| Curtiss-Wright Corp. | | 30,600 | 2,727 |
| Spirit AeroSystems Holdings, Inc. Class A | | 120,500 | 2,358 |
| Ultra Electronics Holdings PLC | | 71,644 | 2,234 |
| Vectrus, Inc. (a) | | 94,125 | 4,141 |
| | | | 11,460 |
| Air Freight & Logistics - 0.0% | | | |
| Air T Funding warrants 9/8/20 (a) | | 180,589 | 7 |
| Air T, Inc. (a) | | 64,757 | 786 |
| FedEx Corp. | | 47,928 | 8,071 |
| Sinotrans Ltd. (H Shares) | | 1,000,000 | 209 |
| | | | 9,073 |
| Airlines - 0.0% | | | |
| Ryanair Holdings PLC sponsored ADR (a) | | 500 | 38 |
| Building Products - 0.2% | | | |
| American Woodmark Corp. (a) | | 37,941 | 3,059 |
| Builders FirstSource, Inc. (a) | | 143,200 | 3,392 |
| Carrier Global Corp. | | 100,000 | 2,724 |
| Gibraltar Industries, Inc. (a) | | 74,411 | 3,849 |
| Jeld-Wen Holding, Inc. (a) | | 537,671 | 10,538 |
| Kondotec, Inc. (c) | | 1,619,900 | 17,155 |
| Owens Corning | | 42,300 | 2,558 |
| | | | 43,275 |
| Commercial Services & Supplies - 0.6% | | | |
| Acme United Corp. | | 22,187 | 481 |
| Aeon Delight Co. Ltd. | | 83,600 | 2,507 |
| AJIS Co. Ltd. (c) | | 877,300 | 19,443 |
| Asia File Corp. Bhd | | 4,480,000 | 1,962 |
| Calian Technologies Ltd. (c) | | 599,808 | 26,532 |
| Civeo Corp. (a)(c) | | 11,611,315 | 9,637 |
| Fursys, Inc. (c) | | 950,000 | 22,839 |
| Left Field Printing Group Ltd. | | 1,180,727 | 63 |
| Lion Rock Group Ltd. | | 18,891,640 | 1,682 |
| Mears Group PLC | | 822,749 | 1,475 |
| Mitie Group PLC | | 29,250,508 | 12,520 |
| NICE Total Cash Management Co., Ltd. | | 1,025,000 | 5,383 |
| Prosegur Compania de Seguridad SA (Reg.) | | 720,686 | 1,893 |
| VICOM Ltd. | | 5,962,800 | 9,317 |
| VSE Corp. (c) | | 852,874 | 23,991 |
| | | | 139,725 |
| Construction & Engineering - 1.0% | | | |
| AECOM (a) | | 1,813,326 | 65,624 |
| Arcadis NV | | 1,018,469 | 20,815 |
| Argan, Inc. | | 300 | 13 |
| Boustead Projs. Pte Ltd. | | 1,965,487 | 1,099 |
| Boustead Singapore Ltd. | | 4,953,800 | 2,568 |
| Comfort Systems U.S.A., Inc. | | 26,100 | 1,297 |
| Daiichi Kensetsu Corp. (c) | | 1,698,600 | 27,488 |
| EMCOR Group, Inc. | | 87,923 | 6,023 |
| Geumhwa PSC Co. Ltd. (c) | | 360,000 | 7,451 |
| Granite Construction, Inc. | | 495,840 | 8,409 |
| Kyeryong Construction Industrial Co. Ltd. (c) | | 675,000 | 14,393 |
| Meisei Industrial Co. Ltd. | | 1,085,200 | 8,171 |
| Mirait Holdings Corp. | | 393,400 | 5,396 |
| Nippon Rietec Co. Ltd. | | 1,123,800 | 31,414 |
| Raiznext Corp. | | 1,154,500 | 12,946 |
| Seikitokyu Kogyo Co. Ltd. | | 200,000 | 1,349 |
| Severfield PLC | | 2,650,088 | 2,061 |
| Shinnihon Corp. | | 1,547,200 | 11,401 |
| United Integrated Services Co. | | 300,800 | 2,105 |
| Valmont Industries, Inc. | | 36,862 | 4,468 |
| | | | 234,491 |
| Electrical Equipment - 0.6% | | | |
| Acuity Brands, Inc. | | 120,737 | 11,965 |
| Aichi Electric Co. Ltd. | | 319,700 | 6,916 |
| Aros Quality Group AB | | 712,609 | 14,755 |
| Atkore International Group, Inc. (a) | | 47,300 | 1,261 |
| AZZ, Inc. | | 591,062 | 18,666 |
| Chiyoda Integre Co. Ltd. | | 323,700 | 5,186 |
| Eaton Corp. PLC | | 37,500 | 3,492 |
| Generac Holdings, Inc. (a) | | 39,389 | 6,207 |
| GrafTech International Ltd. | | 117,800 | 715 |
| Hammond Power Solutions, Inc. Class A | | 444,387 | 2,239 |
| I-Sheng Electric Wire & Cable Co. Ltd. (c) | | 11,700,000 | 17,035 |
| Korea Electric Terminal Co. Ltd. (c) | | 700,401 | 22,783 |
| Regal Beloit Corp. | | 26,843 | 2,469 |
| Sensata Technologies, Inc. PLC (a) | | 420,540 | 15,972 |
| Servotronics, Inc. | | 112,686 | 936 |
| TKH Group NV (depositary receipt) | | 197,028 | 7,710 |
| | | | 138,307 |
| Industrial Conglomerates - 0.9% | | | |
| DCC PLC (United Kingdom) | | 1,775,442 | 158,779 |
| General Electric Co. | | 581,857 | 3,532 |
| Lifco AB | | 425,200 | 32,446 |
| Mytilineos SA | | 824,791 | 7,617 |
| Reunert Ltd. | | 1,670,259 | 3,095 |
| | | | 205,469 |
| Machinery - 1.8% | | | |
| Aalberts Industries NV (c) | | 6,530,884 | 232,253 |
| Allison Transmission Holdings, Inc. | | 335,009 | 12,516 |
| ASL Marine Holdings Ltd. (a)(c) | | 44,401,413 | 925 |
| Colfax Corp. (a) | | 218,848 | 6,364 |
| Cummins, Inc. | | 15,000 | 2,899 |
| Daiwa Industries Ltd. | | 191,500 | 1,492 |
| Ebara Jitsugyo Co. Ltd. | | 5,000 | 135 |
| Foremost Income Fund (a) | | 2,141,103 | 8,560 |
| Haitian International Holdings Ltd. | | 9,324,000 | 21,462 |
| Hurco Companies, Inc. | | 24,973 | 693 |
| Hyster-Yale Materials Handling: | | | |
| Class A (c) | | 213,657 | 7,972 |
| Class B (c) | | 310,000 | 11,566 |
| Ihara Science Corp. (c) | | 966,400 | 12,854 |
| ITT, Inc. | | 66,728 | 3,852 |
| JOST Werke AG (e) | | 76,900 | 2,813 |
| Kyowakogyosyo Co. Ltd. | | 42,500 | 1,586 |
| Luxfer Holdings PLC sponsored | | 174,990 | 2,222 |
| Maruzen Co. Ltd. (c) | | 1,561,400 | 26,344 |
| Mincon Group PLC | | 2,121,692 | 2,074 |
| Nadex Co. Ltd. (c) | | 781,700 | 4,926 |
| Nitchitsu Co. Ltd. | | 54,700 | 656 |
| Oshkosh Corp. | | 19,269 | 1,517 |
| Otis Worldwide Corp. | | 500 | 31 |
| Semperit AG Holding (a) | | 374,714 | 7,415 |
| SIMPAC, Inc. | | 1,483,000 | 3,001 |
| Stabilus SA | | 38,100 | 1,906 |
| Takamatsu Machinery Co. Ltd. | | 317,500 | 1,950 |
| Tocalo Co. Ltd. | | 3,011,900 | 33,489 |
| Trinity Industrial Corp. | | 831,900 | 4,707 |
| | | | 418,180 |
| Marine - 0.0% | | | |
| SITC International Holdings Co. Ltd. | | 4,514,000 | 4,525 |
| Tokyo Kisen Co. Ltd. (c) | | 815,100 | 4,789 |
| | | | 9,314 |
| Professional Services - 0.2% | | | |
| ABIST Co. Ltd. | | 75,000 | 1,807 |
| Enento Group Oyj (e) | | 31,394 | 1,331 |
| McMillan Shakespeare Ltd. | | 1,590,253 | 10,021 |
| Nielsen Holdings PLC | | 636,686 | 9,187 |
| Persol Holdings Co., Ltd. | | 201,800 | 2,551 |
| Robert Half International, Inc. | | 79,700 | 4,054 |
| SHL-JAPAN Ltd. | | 100,000 | 1,976 |
| Sporton International, Inc. | | 100,088 | 847 |
| Synergie SA (a) | | 125,379 | 2,954 |
| TrueBlue, Inc. (a) | | 122,300 | 1,887 |
| | | | 36,615 |
| Road & Rail - 0.9% | | | |
| Alps Logistics Co. Ltd. (c) | | 2,806,800 | 18,932 |
| Chilled & Frozen Logistics Holdings Co. Ltd. | | 1,079,500 | 15,848 |
| Daqin Railway Co. Ltd. (A Shares) | | 32,500,000 | 30,239 |
| Hamakyorex Co. Ltd. (c) | | 1,231,800 | 36,481 |
| Higashi Twenty One Co. Ltd. | | 245,700 | 977 |
| Knight-Swift Transportation Holdings, Inc. Class A | | 62,643 | 2,724 |
| Ryder System, Inc. | | 180,835 | 6,624 |
| Sakai Moving Service Co. Ltd. (c) | | 1,062,800 | 45,181 |
| Trancom Co. Ltd. (c) | | 840,400 | 60,496 |
| | | | 217,502 |
| Trading Companies & Distributors - 1.4% | | | |
| AddTech AB (B Shares) | | 935,601 | 43,539 |
| AerCap Holdings NV (a) | | 100,085 | 2,695 |
| Alconix Corp. (c) | | 2,083,400 | 23,815 |
| Applied Industrial Technologies, Inc. | | 37,962 | 2,396 |
| Chori Co. Ltd. | | 485,500 | 6,471 |
| GMS, Inc. (a) | | 111,846 | 2,621 |
| Goodfellow, Inc. (c) | | 710,495 | 3,177 |
| HD Supply Holdings, Inc. (a) | | 449,894 | 15,791 |
| HERIGE (a) | | 59,930 | 1,624 |
| Houston Wire & Cable Co. (a) | | 99,216 | 249 |
| Itochu Corp. | | 4,085,500 | 89,580 |
| Lumax International Corp. Ltd. | | 1,988,900 | 4,545 |
| Meiwa Corp. | | 1,687,900 | 6,697 |
| Mitani Shoji Co. Ltd. | | 722,400 | 44,700 |
| MRC Global, Inc. (a) | | 1,564,595 | 9,309 |
| MSC Industrial Direct Co., Inc. Class A | | 25,500 | 1,683 |
| Nishikawa Keisoku Co. Ltd. | | 5,000 | 181 |
| Otec Corp. | | 122,400 | 2,866 |
| Parker Corp. (c) | | 2,181,400 | 9,129 |
| Richelieu Hardware Ltd. | | 765,723 | 18,979 |
| Senshu Electric Co. Ltd. (c) | | 879,400 | 24,640 |
| Tanaka Co. Ltd. | | 36,300 | 233 |
| TECHNO ASSOCIE Co. Ltd. | | 250,500 | 2,111 |
| Totech Corp. (c) | | 886,000 | 18,933 |
| Yamazen Co. Ltd. | | 10,000 | 90 |
| | | | 336,054 |
| Transportation Infrastructure - 0.1% | | | |
| Anhui Expressway Co. Ltd. (H Shares) | | 8,878,000 | 4,261 |
| Isewan Terminal Service Co. Ltd. | | 1,270,100 | 9,191 |
| Meiko Transportation Co. Ltd. | | 815,000 | 8,785 |
| Qingdao Port International Co. Ltd. (H Shares) (e) | | 11,509,000 | 6,519 |
| Winas Ltd. (c)(d) | | 20,043,900 | 117 |
| | | | 28,873 |
|
| TOTAL INDUSTRIALS | | | 1,828,376 |
|
| INFORMATION TECHNOLOGY - 15.3% | | | |
| Communications Equipment - 0.0% | | | |
| F5 Networks, Inc. (a) | | 49,947 | 6,788 |
| Electronic Equipment & Components - 5.7% | | | |
| A&D Co. Ltd. | | 590,600 | 3,504 |
| Amphenol Corp. Class A | | 72,009 | 7,616 |
| Arrow Electronics, Inc. (a) | | 39,800 | 2,850 |
| Avnet, Inc. | | 85,800 | 2,293 |
| CDW Corp. | | 110,981 | 12,902 |
| Coda Octopus Group, Inc. (a)(b) | | 10,220 | 59 |
| Daido Signal Co. Ltd. | | 97,600 | 565 |
| Dynapack International Technology Corp. | | 3,200,000 | 9,089 |
| Elec & Eltek International Co. Ltd. | | 1,093,000 | 2,495 |
| Elematec Corp. (c) | | 2,320,400 | 18,567 |
| ePlus, Inc. (a) | | 94,691 | 7,058 |
| Fabrinet (a) | | 36,463 | 2,648 |
| Hi-P International Ltd. | | 11,724,400 | 10,992 |
| Hon Hai Precision Industry Co. Ltd. (Foxconn) | | 142,480,912 | 380,441 |
| IDIS Holdings Co. Ltd. (c) | | 800,000 | 9,366 |
| Image Sensing Systems, Inc. (a) | | 63,348 | 231 |
| Insight Enterprises, Inc. (a) | | 405,184 | 20,194 |
| INTOPS Co. Ltd. (c) | | 1,700,000 | 20,257 |
| ITC Networks Corp. | | 10,000 | 120 |
| Jabil, Inc. | | 82,800 | 2,886 |
| Keysight Technologies, Inc. (a) | | 215,082 | 21,485 |
| Kingboard Chemical Holdings Ltd. (c) | | 74,668,900 | 218,217 |
| Kingboard Laminates Holdings Ltd. | | 3,659,500 | 4,113 |
| Muramoto Electronic Thailand PCL (For. Reg.) (c) | | 1,190,100 | 5,037 |
| Nippo Ltd. (c) | | 723,800 | 2,954 |
| PAX Global Technology Ltd. | | 9,504,000 | 4,451 |
| Pinnacle Technology Holdings Ltd. (c) | | 7,209,676 | 2,320 |
| Redington India Ltd. | | 13,947,410 | 16,848 |
| ScanSource, Inc. (a)(c) | | 1,398,915 | 32,105 |
| Shibaura Electronics Co. Ltd. (c) | | 615,400 | 11,755 |
| Sigmatron International, Inc. (a) | | 167,735 | 520 |
| Simplo Technology Co. Ltd. | | 5,400,000 | 59,955 |
| SYNNEX Corp. (c) | | 2,669,602 | 333,006 |
| Tomen Devices Corp. (c) | | 528,900 | 18,162 |
| Tripod Technology Corp. | | 1,066,000 | 4,611 |
| TTM Technologies, Inc. (a) | | 589,522 | 7,257 |
| UKC Holdings Corp. | | 894,500 | 15,658 |
| VST Holdings Ltd. (c) | | 116,146,200 | 68,486 |
| Wayside Technology Group, Inc. (c) | | 349,510 | 8,084 |
| Wireless Telecom Group, Inc. (a) | | 245,607 | 270 |
| | | | 1,349,427 |
| IT Services - 3.8% | | | |
| ALTEN (a) | | 546,548 | 42,620 |
| Amdocs Ltd. | | 4,642,738 | 288,314 |
| Argo Graphics, Inc. | | 749,500 | 22,905 |
| CACI International, Inc. Class A (a) | | 49,575 | 10,303 |
| Computer Services, Inc. | | 500,019 | 28,626 |
| CSE Global Ltd. (c) | | 39,969,900 | 13,975 |
| Data Applications Co. Ltd. | | 10,000 | 127 |
| Data#3 Ltd. | | 2,755,897 | 11,125 |
| Dimerco Data System Corp. | | 510,000 | 929 |
| DXC Technology Co. | | 500,000 | 8,955 |
| E-Credible Co. Ltd. | | 130,349 | 2,578 |
| eClerx Services Ltd. | | 1,609,270 | 10,311 |
| EOH Holdings Ltd. (a) | | 6,280,824 | 1,786 |
| Estore Corp. | | 168,300 | 1,688 |
| ExlService Holdings, Inc. (a) | | 133,912 | 8,578 |
| Fiserv, Inc. (a) | | 67,893 | 6,775 |
| Gabia, Inc. (c) | | 975,000 | 13,534 |
| Global Dominion Access SA (e) | | 182,167 | 599 |
| Global Payments, Inc. | | 67,738 | 12,059 |
| Indra Sistemas SA (a)(b)(c) | | 11,987,300 | 89,947 |
| Know IT AB (c) | | 1,367,884 | 28,167 |
| Leidos Holdings, Inc. | | 24,500 | 2,331 |
| Maximus, Inc. | | 32,467 | 2,409 |
| Net 1 UEPS Technologies, Inc. (a)(b) | | 300,022 | 942 |
| NIC, Inc. | | 98,000 | 2,148 |
| Nice Information & Telecom, Inc. | | 189,987 | 3,765 |
| Perspecta, Inc. | | 470,236 | 10,063 |
| Science Applications International Corp. | | 213,490 | 17,075 |
| Societe Pour L'Informatique Industrielle SA (c) | | 1,628,396 | 36,445 |
| Softcreate Co. Ltd. | | 591,600 | 12,826 |
| The Western Union Co. | | 8,192,464 | 198,913 |
| TravelSky Technology Ltd. (H Shares) | | 987,000 | 1,898 |
| WNS Holdings Ltd. sponsored ADR (a) | | 57,693 | 3,690 |
| | | | 896,406 |
| Semiconductors & Semiconductor Equipment - 0.7% | | | |
| Advanced Energy Industries, Inc. (a) | | 105,295 | 7,747 |
| ASM Pacific Technology Ltd. | | 133,800 | 1,504 |
| Axell Corp. | | 150,500 | 1,068 |
| Boe Varitronix Ltd. | | 4,771,000 | 1,299 |
| Cabot Microelectronics Corp. | | 62,632 | 9,440 |
| Diodes, Inc. (a) | | 124,176 | 6,389 |
| Entegris, Inc. | | 220,378 | 15,847 |
| Leeno Industrial, Inc. | | 550,000 | 62,963 |
| Melexis NV | | 285,400 | 24,323 |
| Miraial Co. Ltd. | | 147,200 | 1,402 |
| MKS Instruments, Inc. | | 83,560 | 10,649 |
| Powertech Technology, Inc. | | 9,000,000 | 30,100 |
| Renesas Electronics Corp. (a) | | 482,500 | 2,635 |
| Systems Technology, Inc. | | 25,000 | 401 |
| Trio-Tech International (a)(c) | | 220,699 | 834 |
| | | | 176,601 |
| Software - 2.4% | | | |
| AdaptIT Holdings Ltd. (a) | | 2,470,673 | 192 |
| Altair Engineering, Inc. Class A (a) | | 128,803 | 5,191 |
| ANSYS, Inc. (a) | | 1,525,366 | 473,779 |
| Aspen Technology, Inc. (a) | | 36,581 | 3,558 |
| Ebix, Inc. (b) | | 970,885 | 21,413 |
| ICT Automatisering NV (c) | | 481,755 | 4,211 |
| InfoVine Co. Ltd. (c) | | 175,000 | 2,612 |
| KSK Co., Ltd. (c) | | 522,300 | 9,617 |
| Micro Focus International PLC sponsored ADR | | 1,939 | 7 |
| NetGem SA (a) | | 835,091 | 1,033 |
| Nucleus Software Exports Ltd. (a) | | 600,000 | 2,396 |
| Open Text Corp. | | 44,759 | 2,015 |
| Pegasystems, Inc. | | 79,887 | 9,338 |
| Pro-Ship, Inc. | | 496,300 | 6,414 |
| RealPage, Inc. (a) | | 114,444 | 7,211 |
| Vitec Software Group AB | | 463,818 | 14,183 |
| Zensar Technologies Ltd. | | 3,500,000 | 7,472 |
| | | | 570,642 |
| Technology Hardware, Storage & Peripherals - 2.7% | | | |
| Compal Electronics, Inc. | | 58,500,000 | 37,158 |
| HP, Inc. | | 2,058,185 | 36,183 |
| Seagate Technology LLC | | 11,741,409 | 530,947 |
| Super Micro Computer, Inc. (a) | | 975,469 | 29,562 |
| Xerox Holdings Corp. | | 115,000 | 1,915 |
| | | | 635,765 |
|
| TOTAL INFORMATION TECHNOLOGY | | | 3,635,629 |
|
| MATERIALS - 3.7% | | | |
| Chemicals - 2.2% | | | |
| Axalta Coating Systems Ltd. (a) | | 342,028 | 7,593 |
| C. Uyemura & Co. Ltd. | | 377,200 | 22,200 |
| Chase Corp. (c) | | 514,928 | 51,781 |
| Core Molding Technologies, Inc. (a)(c) | | 691,704 | 3,182 |
| Deepak Fertilisers and Petrochemicals Corp. Ltd. | | 1,150,000 | 2,450 |
| DuPont de Nemours, Inc. | | 57,590 | 3,080 |
| EcoGreen International Group Ltd. (c) | | 49,250,080 | 7,498 |
| FMC Corp. | | 1,100,481 | 116,706 |
| Fujikura Kasei Co., Ltd. (c) | | 2,664,100 | 12,911 |
| Fuso Chemical Co. Ltd. | | 450,700 | 17,222 |
| Gujarat Narmada Valley Fertilizers Co. | | 4,900,000 | 10,742 |
| Gujarat State Fertilizers & Chemicals Ltd. (c) | | 28,500,000 | 22,634 |
| Honshu Chemical Industry Co. Ltd. (c) | | 749,500 | 8,235 |
| Huntsman Corp. | | 174,654 | 3,231 |
| Innospec, Inc. | | 595,169 | 44,739 |
| KPC Holdings Corp. | | 55,171 | 1,933 |
| KPX Chemical Co. Ltd. | | 163,083 | 6,123 |
| Livent Corp. (a) | | 1,096,599 | 6,876 |
| Miwon Chemicals Co. Ltd. | | 55,095 | 2,387 |
| Miwon Commercial Co. Ltd. | | 89,782 | 6,141 |
| Muto Seiko Co. Ltd. | | 234,200 | 1,004 |
| Nihon Parkerizing Co. Ltd. | | 302,500 | 2,921 |
| Nippon Soda Co. Ltd. | | 309,500 | 7,891 |
| SK Kaken Co. Ltd. | | 49,900 | 17,677 |
| Soken Chemical & Engineer Co. Ltd. (c) | | 655,300 | 7,150 |
| T&K Toka Co. Ltd. (c) | | 1,322,100 | 9,717 |
| Thai Carbon Black PCL (For. Reg.) | | 11,273,100 | 14,277 |
| Thai Rayon PCL: | | | |
| (For. Reg.) | | 2,672,200 | 2,228 |
| NVDR | | 84,000 | 70 |
| The Chemours Co. LLC | | 255,999 | 4,744 |
| The Mosaic Co. | | 202,000 | 2,721 |
| Westlake Chemical Corp. | | 54,911 | 2,993 |
| Yara International ASA | | 2,025,380 | 84,626 |
| Yip's Chemical Holdings Ltd. | | 25,244,000 | 7,035 |
| | | | 522,718 |
| Construction Materials - 0.3% | | | |
| Brampton Brick Ltd. Class A (sub. vtg.) (a) | | 660,277 | 2,588 |
| Mitani Sekisan Co. Ltd. (c) | | 1,464,300 | 75,529 |
| RHI Magnesita NV | | 94,979 | 3,014 |
| West China Cement Ltd. | | 168,000 | 36 |
| | | | 81,167 |
| Containers & Packaging - 0.4% | | | |
| AMVIG Holdings Ltd. | | 5,405,000 | 935 |
| Chuoh Pack Industry Co. Ltd. (c) | | 414,600 | 4,308 |
| Kohsoku Corp. (c) | | 1,707,300 | 22,145 |
| Mayr-Melnhof Karton AG | | 14,917 | 2,309 |
| Packaging Corp. of America | | 25,019 | 2,405 |
| Samhwa Crown & Closure Co. Ltd. | | 50,000 | 1,723 |
| Silgan Holdings, Inc. | | 235,192 | 8,996 |
| The Pack Corp. (c) | | 1,498,600 | 37,290 |
| WestRock Co. | | 287,300 | 7,717 |
| | | | 87,828 |
| Metals & Mining - 0.7% | | | |
| Arconic Rolled Products Corp. (a) | | 51,000 | 831 |
| Chubu Steel Plate Co. Ltd. | | 407,100 | 2,781 |
| Cleveland-Cliffs, Inc. (b) | | 11,987,692 | 62,096 |
| Compania de Minas Buenaventura SA sponsored ADR | | 2,217,119 | 26,295 |
| Granges AB | | 240,021 | 1,926 |
| Hill & Smith Holdings PLC | | 785,684 | 12,444 |
| Orvana Minerals Corp. (a) | | 695,019 | 130 |
| Perenti Global Ltd. | | 10,714,497 | 9,148 |
| Steel Dynamics, Inc. | | 53,391 | 1,463 |
| Tohoku Steel Co. Ltd. (c) | | 614,800 | 8,143 |
| Tokyo Tekko Co. Ltd. (c) | | 748,900 | 10,839 |
| Warrior Metropolitan Coal, Inc. | | 1,308,395 | 20,830 |
| Webco Industries, Inc. (a) | | 7,463 | 597 |
| | | | 157,523 |
| Paper & Forest Products - 0.1% | | | |
| Louisiana-Pacific Corp. | | 182,860 | 5,791 |
| Schweitzer-Mauduit International, Inc. | | 55,500 | 1,805 |
| Stella-Jones, Inc. | | 506,891 | 15,395 |
| Western Forest Products, Inc. | | 1,914,615 | 1,501 |
| | | | 24,492 |
|
| TOTAL MATERIALS | | | 873,728 |
|
| REAL ESTATE - 0.2% | | | |
| Equity Real Estate Investment Trusts (REITs) - 0.1% | | | |
| CoreCivic, Inc. | | 1,569,058 | 13,980 |
| CorePoint Lodging, Inc. | | 1,311 | 7 |
| CubeSmart | | 115,753 | 3,434 |
| NSI NV | | 8,315 | 297 |
| NSI NV rights (a)(f) | | 8,315 | 10 |
| Reysas Gayrimenkul Yatirim Ortakligi A/S (a) | | 2,655,290 | 1,899 |
| | | | 19,627 |
| Real Estate Management & Development - 0.1% | | | |
| Anabuki Kosan, Inc. | | 84,800 | 1,122 |
| CBRE Group, Inc. (a) | | 42,500 | 1,862 |
| Century21 Real Estate Japan Ltd. | | 112,204 | 1,194 |
| IMMOFINANZ Immobilien Anlagen AG (a) | | 79,070 | 1,307 |
| Jones Lang LaSalle, Inc. | | 24,973 | 2,470 |
| LSL Property Services PLC | | 1,336,131 | 3,341 |
| Midland Holdings Ltd. (a) | | 16,000 | 2 |
| Open House Co. Ltd. | | 1,000 | 28 |
| Relo Group, Inc. | | 500,700 | 8,647 |
| Selvaag Bolig ASA | | 549,800 | 3,057 |
| Servcorp Ltd. | | 828,456 | 1,231 |
| Sino Land Ltd. | | 1,741,954 | 2,110 |
| Tejon Ranch Co. (a) | | 424,538 | 6,092 |
| Wing Tai Holdings Ltd. | | 1,694,300 | 2,110 |
| | | | 34,573 |
|
| TOTAL REAL ESTATE | | | 54,200 |
|
| UTILITIES - 2.2% | | | |
| Electric Utilities - 1.8% | | | |
| Exelon Corp. | | 744,333 | 28,739 |
| NRG Energy, Inc. | | 66,433 | 2,246 |
| PG&E Corp. (a) | | 112,000 | 1,047 |
| PG&E Corp. (g) | | 22,105,263 | 196,350 |
| PPL Corp. | | 7,810,125 | 207,906 |
| | | | 436,288 |
| Gas Utilities - 0.1% | | | |
| Busan City Gas Co. Ltd. | | 50,971 | 1,554 |
| China Resource Gas Group Ltd. | | 198,000 | 976 |
| GAIL India Ltd. | | 1,000,000 | 1,290 |
| Hokuriku Gas Co. | | 149,900 | 4,418 |
| K&O Energy Group, Inc. | | 260,100 | 3,676 |
| Keiyo Gas Co. Ltd. | | 117,000 | 3,570 |
| KyungDong City Gas Co. Ltd. | | 260,078 | 3,621 |
| Star Gas Partners LP | | 195,556 | 1,842 |
| | | | 20,947 |
| Independent Power and Renewable Electricity Producers - 0.2% | | | |
| Mega First Corp. Bhd (c) | | 30,500,045 | 48,295 |
| Vistra Corp. | | 119,380 | 2,228 |
| | | | 50,523 |
| Multi-Utilities - 0.1% | | | |
| CenterPoint Energy, Inc. | | 149,841 | 2,848 |
| CMS Energy Corp. | | 229,225 | 14,712 |
| | | | 17,560 |
| Water Utilities - 0.0% | | | |
| Manila Water Co., Inc. | | 5,521,300 | 1,442 |
|
| TOTAL UTILITIES | | | 526,760 |
|
| TOTAL COMMON STOCKS | | | |
| (Cost $12,635,946) | | | 23,182,852 |
|
| Nonconvertible Preferred Stocks - 0.1% | | | |
| CONSUMER STAPLES - 0.0% | | | |
| Food Products - 0.0% | | | |
| Nam Yang Dairy Products | | 4,917 | 773 |
| INDUSTRIALS - 0.0% | | | |
| Air Freight & Logistics - 0.0% | | | |
| Air T Funding 8.00% | | 3,419 | 72 |
| Industrial Conglomerates - 0.0% | | | |
| Steel Partners Holdings LP Series A, 6.00% | | 130,312 | 2,127 |
|
| TOTAL INDUSTRIALS | | | 2,199 |
|
| MATERIALS - 0.1% | | | |
| Construction Materials - 0.1% | | | |
| Buzzi Unicem SpA (Risparmio Shares) | | 1,414,885 | 18,133 |
| TOTAL NONCONVERTIBLE PREFERRED STOCKS | | | |
| (Cost $14,173) | | | 21,105 |
| | | Principal Amount (000s) | Value (000s) |
|
| Nonconvertible Bonds - 0.0% | | | |
| ENERGY - 0.0% | | | |
| Energy Equipment & Services - 0.0% | | | |
Bristow Group, Inc. 6.25% 10/15/22
(Cost $0)(d)(h) | | 9,933 | 0 |
| | | Shares | Value (000s) |
|
| Money Market Funds - 4.1% | | | |
| Fidelity Cash Central Fund 0.14% (i) | | 497,230,989 | 497,380 |
| Fidelity Securities Lending Cash Central Fund 0.13% (i)(j) | | 473,978,806 | 474,026 |
| TOTAL MONEY MARKET FUNDS | | | |
| (Cost $971,265) | | | 971,406 |
| TOTAL INVESTMENT IN SECURITIES - 101.5% | | | |
| (Cost $13,621,384) | | | 24,175,363 |
| NET OTHER ASSETS (LIABILITIES) - (1.5)% | | | (364,438) |
| NET ASSETS - 100% | | | $23,810,925 |
Values shown as $0 in the Schedule of Investments may reflect amounts less than $500.
Legend
(a) Non-income producing
(b) Security or a portion of the security is on loan at period end.
(c) Affiliated company
(d) Level 3 security
(e) Security exempt from registration under Rule 144A of the Securities Act of 1933. These securities may be resold in transactions exempt from registration, normally to qualified institutional buyers. At the end of the period, the value of these securities amounted to $36,981,000 or 0.2% of net assets.
(f) Security or a portion of the security purchased on a delayed delivery or when-issued basis.
(g) Restricted securities (including private placements) - Investment in securities not registered under the Securities Act of 1933 (excluding 144A issues). At the end of the period, the value of restricted securities (excluding 144A issues) amounted to $196,350,000 or 0.8% of net assets.
(h) Non-income producing - Security is in default.
(i) Affiliated fund that is generally available only to investment companies and other accounts managed by Fidelity Investments. The rate quoted is the annualized seven-day yield of the fund at period end. A complete unaudited listing of the fund's holdings as of its most recent quarter end is available upon request. In addition, each Fidelity Central Fund's financial statements, which are not covered by the Fund's Report of Independent Registered Public Accounting Firm, are available on the SEC's website or upon request.
(j) Investment made with cash collateral received from securities on loan.
Additional information on each restricted holding is as follows:
| Security | Acquisition Date | Acquisition Cost (000s) |
| PG&E Corp. | 6/30/20 | $210,000 |
Affiliated Central Funds
Information regarding fiscal year to date income earned by the Fund from investments in Fidelity Central Funds is as follows:
| Fund | Income earned |
| | (Amounts in thousands) |
| Fidelity Cash Central Fund | $16,235 |
| Fidelity Securities Lending Cash Central Fund | 9,656 |
| Total | $25,891 |
Amounts in the income column in the above table include any capital gain distributions from underlying funds, which are presented in the corresponding line-item in the Statement of Operations, if applicable. Amount for Fidelity Securities Lending Cash Central Fund represents the income earned on investing cash collateral, less rebates paid to borrowers and any lending agent fees associated with the loan, plus any premium payments received for lending certain types of securities.
Other Affiliated Issuers
An affiliated company is a company in which the Fund has ownership of at least 5% of the voting securities. Fiscal year to date transactions with companies which are or were affiliates are as follows:
| Affiliate (Amounts in thousands) | Value, beginning of period | Purchases | Sales Proceeds(a) | Dividend Income | Realized Gain (loss) | Change in Unrealized appreciation (depreciation) | Value, end of period |
| Aalberts Industries NV | $265,799 | $-- | $2,198 | $4,990 | $1,656 | $(33,004) | $232,253 |
| Abbey PLC | 27,245 | -- | 35,820 | 208 | 30,188 | (21,613) | -- |
| AJIS Co. Ltd. | 28,053 | -- | 203 | 528 | 146 | (8,553) | 19,443 |
| Alconix Corp. | 25,239 | -- | 213 | 711 | 106 | (1,317) | 23,815 |
| Alps Logistics Co. Ltd. | 19,486 | -- | 170 | 456 | 81 | (465) | 18,932 |
| Arts Optical International Holdings Ltd. | 4,468 | -- | 142 | -- | (185) | (2,101) | -- |
| ASL Marine Holdings Ltd. | 1,522 | -- | 9 | -- | (22) | (566) | 925 |
| ASTI Corp. | 2,944 | -- | 25 | 74 | 11 | (928) | 2,002 |
| Barratt Developments PLC | 557,092 | -- | 123,449 | 32,470 | 56,432 | (99,486) | 390,589 |
| Bed Bath & Beyond, Inc. | 111,107 | 1,259 | 3,254 | 5,765 | (4,265) | 16,878 | 121,725 |
| Belc Co. Ltd. | 76,070 | -- | 676 | 1,002 | 562 | 40,337 | 116,293 |
| Belluna Co. Ltd. | 42,634 | -- | 335 | 845 | 196 | 3,474 | 45,969 |
| BMTC Group, Inc. | 28,923 | -- | 452 | 621 | 427 | (5,463) | 23,435 |
| Bonanza Creek Energy, Inc. | 1,090 | 20,466 | 44 | -- | 8 | 1,007 | 22,527 |
| Calian Technologies Ltd. | 15,779 | -- | 626 | 434 | 350 | 11,029 | 26,532 |
| Carbo Ceramics, Inc. | 1,231 | 300 | 48 | -- | (7,053) | 5,570 | -- |
| Chase Corp. | 61,160 | -- | 7,698 | 432 | 7,148 | (8,829) | 51,781 |
| Chuoh Pack Industry Co. Ltd. | 4,611 | -- | 39 | 135 | 18 | (282) | 4,308 |
| Civeo Corp. | 19,319 | -- | 121 | -- | (152) | (9,409) | 9,637 |
| Clip Corp. | 1,903 | -- | 66 | 86 | (15) | (110) | 1,712 |
| Codorus Valley Bancorp, Inc. | 15,373 | 364 | 125 | 399 | 92 | (7,370) | 8,334 |
| Contango Oil & Gas Co. | 3,426 | 1,647 | 7,120 | -- | (10,560) | 14,901 | -- |
| Core Molding Technologies, Inc. | 4,638 | -- | 22 | -- | 8 | (1,442) | 3,182 |
| Create SD Holdings Co. Ltd. | 119,508 | -- | 6,013 | 1,652 | 4,534 | 64,811 | 182,840 |
| CSE Global Ltd. | 13,482 | -- | 122 | 794 | 33 | 582 | 13,975 |
| Daewon Pharmaceutical Co. Ltd. | 23,694 | -- | -- | 337 | -- | 11,433 | 35,127 |
| Daiichi Kensetsu Corp. | 27,897 | -- | 225 | 482 | 138 | (322) | 27,488 |
| DongKook Pharmaceutical Co. Ltd. | 34,908 | -- | -- | 334 | -- | 41,603 | 76,511 |
| DVx, Inc. | 5,048 | 6 | 229 | 132 | 90 | 655 | 5,570 |
| EcoGreen International Group Ltd. | 9,478 | -- | 74 | 413 | 6 | (1,912) | 7,498 |
| Elematec Corp. | 22,045 | -- | 191 | 603 | 105 | (3,392) | 18,567 |
| Excel Co. Ltd. | 10,324 | -- | 487 | 99 | 2,100 | (1,489) | -- |
| Ff Group | 5,743 | -- | 47 | -- | (327) | 692 | 6,061 |
| First Juken Co. Ltd. | 16,033 | -- | 129 | 480 | 55 | (4,312) | 11,647 |
| Food Empire Holdings Ltd. | 14,526 | -- | 137 | 543 | 77 | 133 | 14,599 |
| Fossil Group, Inc. | 45,264 | -- | 272 | -- | 194 | (31,727) | 13,459 |
| Fresh Del Monte Produce, Inc. | 144,615 | -- | 3,135 | 1,371 | 536 | (36,732) | 105,284 |
| Fuji Kosan Co. Ltd. | 5,162 | -- | 2,170 | 40 | (50) | (1,764) | -- |
| Fujikura Kasei Co., Ltd. | 14,692 | -- | 114 | 347 | 12 | (1,679) | 12,911 |
| Fursys, Inc. | 24,260 | -- | -- | 640 | -- | (1,421) | 22,839 |
| Gabia, Inc. | 6,838 | -- | -- | 26 | -- | 6,696 | 13,534 |
| Geospace Technologies Corp. | 13,221 | -- | 1,942 | -- | (1,993) | (4,006) | 5,280 |
| Geumhwa PSC Co. Ltd. | 9,558 | -- | -- | 315 | -- | (2,107) | 7,451 |
| Goodfellow, Inc. | 2,877 | -- | 23 | 91 | 7 | 316 | 3,177 |
| Guess?, Inc. | 72,686 | -- | 7,427 | 931 | (4,203) | (20,766) | 40,290 |
| Gujarat State Fertilizers & Chemicals Ltd. | 33,181 | -- | -- | 874 | -- | (10,547) | 22,634 |
| Halows Co. Ltd. | 27,291 | -- | 255 | 296 | 187 | 16,899 | 44,122 |
| Hamakyorex Co. Ltd. | 44,528 | -- | 328 | 701 | 188 | (7,907) | 36,481 |
| Handsome Co. Ltd. | 60,853 | -- | -- | 591 | -- | (11,445) | 49,408 |
| Honshu Chemical Industry Co. Ltd. | 8,219 | -- | 68 | 196 | 41 | 43 | 8,235 |
| Hoshiiryou Sanki Co. Ltd. | 9,794 | -- | 87 | 113 | 42 | (371) | 9,378 |
| Hwacheon Machine Tool Co. Ltd. | 7,900 | -- | 7,521 | -- | 1,607 | (1,986) | -- |
| Hyster-Yale Materials Handling Class A | 13,942 | -- | 657 | 272 | 93 | (5,406) | 7,972 |
| Hyster-Yale Materials Handling Class B | 19,170 | -- | -- | 394 | -- | (7,604) | 11,566 |
| I-Sheng Electric Wire & Cable Co. Ltd. | 16,575 | -- | 1,091 | 961 | (332) | 1,883 | 17,035 |
| IA Group Corp. | 3,881 | -- | 30 | 113 | 5 | (390) | 3,466 |
| ICT Automatisering NV | 7,529 | -- | 50 | -- | 26 | (3,294) | 4,211 |
| IDIS Holdings Co. Ltd. | 7,730 | -- | -- | 108 | -- | 1,636 | 9,366 |
| Ihara Science Corp. | 11,403 | -- | 104 | 371 | 64 | 1,491 | 12,854 |
| Indra Sistemas SA | 106,266 | -- | 3,833 | -- | (3,835) | (8,651) | 89,947 |
| InfoVine Co. Ltd. | 3,003 | -- | -- | 106 | -- | (391) | 2,612 |
| Intage Holdings, Inc. | 27,857 | -- | 225 | 815 | 134 | (1,277) | 26,489 |
| INTOPS Co. Ltd. | 21,209 | -- | -- | 283 | -- | (952) | 20,257 |
| JLM Couture, Inc. | 1,144 | -- | 5 | -- | (2) | (790) | 347 |
| Jumbo SA | 194,124 | -- | 3,106 | 8,124 | 1,739 | (1,500) | 191,257 |
| Kingboard Chemical Holdings Ltd. | 185,508 | -- | 1,943 | 13,289 | 1,445 | 33,207 | 218,217 |
| Know IT AB | 27,240 | -- | 228 | -- | 138 | 1,017 | 28,167 |
| Kohsoku Corp. | 19,797 | -- | 166 | 416 | 92 | 2,422 | 22,145 |
| Kondotec, Inc. | 13,903 | -- | 129 | 382 | 106 | 3,275 | 17,155 |
| Korea Electric Terminal Co. Ltd. | 39,666 | -- | 377 | 326 | 70 | (16,576) | 22,783 |
| KSK Co., Ltd. | 9,160 | -- | 75 | 240 | 52 | 480 | 9,617 |
| Kwang Dong Pharmaceutical Co. Ltd. | 17,632 | -- | -- | 167 | -- | 6,087 | 23,719 |
| Kyeryong Construction Industrial Co. Ltd. | 14,437 | -- | -- | 272 | -- | (44) | 14,393 |
| Maruzen Co. Ltd. | 30,393 | -- | 249 | 381 | 196 | (3,996) | 26,344 |
| Mega First Corp. Bhd | 29,374 | 1,940 | 5,283 | -- | 2,312 | 19,952 | 48,295 |
| Metro, Inc. Class A (sub. vtg.) | 955,721 | -- | 26,731 | 13,059 | 22,367 | 91,753 | 1,043,110 |
| Michang Oil Industrial Co. Ltd. | 11,337 | -- | -- | 233 | -- | (2,917) | 8,420 |
| Mitani Sekisan Co. Ltd. | 40,529 | -- | 401 | 481 | 340 | 35,061 | 75,529 |
| Motonic Corp. | 22,792 | -- | -- | 576 | -- | (5,037) | 17,755 |
| Mr. Bricolage SA | 3,257 | -- | 22 | -- | (63) | 2,008 | -- |
| Muhak Co. Ltd. | 24,675 | -- | -- | -- | -- | (12,035) | 12,640 |
| Murakami Corp. | 17,807 | -- | 163 | 317 | 132 | (301) | 17,475 |
| Muramoto Electronic Thailand PCL (For. Reg.) | 7,007 | -- | 152 | 344 | (33) | (1,785) | 5,037 |
| Murphy Oil Corp. | 256,063 | 51,813 | 43,617 | 10,692 | (45,151) | (60,578) | 158,530 |
| Nadex Co. Ltd. | 6,340 | -- | 52 | 120 | 27 | (1,389) | 4,926 |
| Nafco Co. Ltd. | 24,981 | -- | 203 | 604 | 43 | 8,375 | 33,196 |
| Next PLC | 887,471 | -- | 20,193 | 9,064 | 13,698 | (40,044) | 840,932 |
| Nippo Ltd. | 3,334 | -- | 30 | 60 | 11 | (361) | 2,954 |
| Origin Enterprises PLC | 49,896 | -- | 325 | 2,133 | (112) | (15,705) | 33,754 |
| Parker Corp. | 10,008 | -- | 86 | 231 | 57 | (850) | 9,129 |
| Pinnacle Technology Holdings Ltd. | 8,195 | -- | 55 | 124 | 7 | (5,827) | 2,320 |
| Piolax, Inc. | 44,402 | -- | 367 | 893 | 327 | (10,807) | 33,555 |
| Prim SA | 17,498 | -- | 145 | 170 | 40 | (1,956) | 15,437 |
| Rocky Mountain Chocolate Factory, Inc. | 3,980 | 316 | 68 | 164 | (57) | (2,593) | 1,578 |
| S&T Holdings Co. Ltd. | 11,296 | -- | -- | 299 | -- | 213 | 11,509 |
| Sakai Moving Service Co. Ltd. | 64,032 | -- | 544 | 525 | 464 | (18,771) | 45,181 |
| Samsung Climate Control Co. Ltd. | 4,098 | -- | -- | 20 | -- | (1,464) | 2,634 |
| Sanei Architecture Planning Co. Ltd. | 16,795 | -- | 140 | 464 | 73 | (3,331) | 13,397 |
| Sarantis SA | 38,088 | -- | 301 | 675 | 217 | 1,169 | 39,173 |
| ScanSource, Inc. | 47,275 | 277 | 376 | -- | 279 | (15,350) | 32,105 |
| Seagate Technology LLC | 830,868 | -- | 319,480 | 39,280 | 236,684 | (217,125) | -- |
| Senshu Electric Co. Ltd. | 22,080 | -- | 208 | 500 | 134 | 2,634 | 24,640 |
| Sewon Precision Industries Co. Ltd. | 3,405 | -- | -- | (18) | -- | (1,719) | 1,686 |
| Shibaura Electronics Co. Ltd. | 16,857 | -- | 142 | 385 | 107 | (5,067) | 11,755 |
| SJM Co. Ltd. | 3,338 | -- | -- | 107 | -- | (631) | 2,707 |
| SJM Holdings Co. Ltd. | 2,363 | -- | 789 | 86 | (273) | (91) | -- |
| Societe Pour L'Informatique Industrielle SA | 50,896 | -- | 403 | 305 | 333 | (14,381) | 36,445 |
| Soken Chemical & Engineer Co. Ltd. | 9,895 | -- | 68 | 301 | 7 | (2,684) | 7,150 |
| Southwestern Energy Co. | 110,107 | 364 | 51,313 | -- | (98,587) | 87,682 | -- |
| Sportscene Group, Inc. Class A | 2,738 | -- | 48 | 126 | 40 | (1,360) | 1,370 |
| Step Co. Ltd. | 15,022 | -- | 123 | 336 | 86 | (484) | 14,501 |
| Strattec Security Corp. | 7,581 | 368 | 64 | 158 | 3 | 318 | 8,206 |
| Strongco Corp. | 989 | -- | 8 | -- | (2,992) | 3,839 | -- |
| Sun Hing Vision Group Holdings Ltd. | 7,237 | -- | 43 | 288 | (13) | (4,113) | 3,068 |
| Sunjin Co. Ltd. | 20,333 | -- | -- | 80 | -- | (695) | 19,638 |
| SYNNEX Corp. | 267,538 | 7,288 | 14,656 | 2,094 | 8,195 | 64,641 | 333,006 |
| T&K Toka Co. Ltd. | 11,924 | -- | 98 | 365 | 44 | (2,153) | 9,717 |
| The Buckle, Inc. | 91,206 | 2,397 | 1,617 | 7,970 | (377) | (18,183) | 73,426 |
| The Pack Corp. | 46,911 | -- | 1,448 | 715 | 638 | (8,811) | 37,290 |
| Tohoku Steel Co. Ltd. | 8,241 | -- | 68 | 130 | 39 | (69) | 8,143 |
| Tokyo Kisen Co. Ltd. | 5,462 | -- | 47 | 136 | 29 | (655) | 4,789 |
| Tokyo Tekko Co. Ltd. | 9,670 | -- | 82 | 375 | (15) | 1,266 | 10,839 |
| Tomen Devices Corp. | 11,363 | -- | 122 | 663 | 18 | 6,903 | 18,162 |
| Totech Corp. | 19,551 | -- | 161 | 585 | 130 | (587) | 18,933 |
| TOW Co. Ltd. | 13,043 | -- | 112 | 472 | 71 | (4,162) | 8,840 |
| Trancom Co. Ltd. | 49,084 | -- | 498 | 710 | 489 | 11,421 | 60,496 |
| Trio-Tech International | 743 | -- | 7 | -- | (2) | 100 | 834 |
| Triple-S Management Corp. | 40,938 | 1,533 | 932 | -- | (422) | (7,777) | 33,340 |
| Unit Corp. | 34,695 | -- | 13,201 | -- | (127,418) | 105,924 | -- |
| Unum Group | 475,667 | -- | 16,214 | 16,481 | (2,644) | (211,269) | 245,540 |
| Utah Medical Products, Inc. | 23,814 | 931 | 1,768 | 278 | 1,618 | (3,949) | 20,646 |
| VSE Corp. | 25,766 | -- | 244 | 308 | 154 | (1,685) | 23,991 |
| VST Holdings Ltd. | 64,133 | -- | 548 | 2,502 | 332 | 4,569 | 68,486 |
| Wayside Technology Group, Inc. | 3,785 | 264 | 111 | 237 | 23 | 4,123 | 8,084 |
| Whanin Pharmaceutical Co. Ltd. | 24,055 | -- | -- | 354 | -- | (1,665) | 22,390 |
| Whiting Petroleum Corp. | 81,030 | 18,816 | 7,352 | -- | (136,043) | 43,549 | -- |
| WIN-Partners Co. Ltd. | 27,729 | -- | 251 | 685 | 191 | (6,238) | 21,431 |
| Winas Ltd. | 602 | -- | 3 | -- | (14) | (468) | 117 |
| Youngone Holdings Co. Ltd. | 39,347 | -- | -- | 595 | -- | (13,496) | 25,851 |
| Yutaka Giken Co. Ltd. | 19,348 | -- | 182 | 706 | 99 | (3,501) | 15,764 |
| | $8,049,911 | $110,349 | $757,784 | $208,120 | $(45,811) | $(345,756) | $6,407,531 |
(a) Includes the value of securities delivered through in-kind transactions, if applicable.
Investment Valuation
The following is a summary of the inputs used, as of July 31, 2020, involving the Fund's assets and liabilities carried at fair value. The inputs or methodology used for valuing securities may not be an indication of the risk associated with investing in those securities. For more information on valuation inputs, and their aggregation into the levels used below, please refer to the Investment Valuation section in the accompanying Notes to Financial Statements.
| | Valuation Inputs at Reporting Date: |
| Description | Total | Level 1 | Level 2 | Level 3 |
| (Amounts in thousands) | | | | |
| Investments in Securities: | | | | |
| Equities: | | | | |
| Communication Services | $464,434 | $265,018 | $199,416 | $-- |
| Consumer Discretionary | 5,668,981 | 5,654,189 | 6,645 | 8,147 |
| Consumer Staples | 3,295,580 | 3,275,878 | 17,042 | 2,660 |
| Energy | 802,582 | 757,817 | 44,765 | -- |
| Financials | 2,702,615 | 2,579,675 | 122,940 | -- |
| Health Care | 3,330,740 | 3,330,588 | 152 | -- |
| Industrials | 1,830,575 | 1,716,447 | 114,011 | 117 |
| Information Technology | 3,635,629 | 3,608,167 | 27,462 | -- |
| Materials | 891,861 | 891,861 | -- | -- |
| Real Estate | 54,200 | 52,090 | 2,110 | -- |
| Utilities | 526,760 | 280,673 | 246,087 | -- |
| Corporate Bonds | -- | -- | -- | 0 |
| Money Market Funds | 971,406 | 971,406 | -- | -- |
| Total Investments in Securities: | $24,175,363 | $23,383,809 | $780,630 | $10,924 |
Other Information
Distribution of investments by country or territory of incorporation, as a percentage of Total Net Assets, is as follows (Unaudited):
| United States of America | 53.1% |
| Japan | 12.6% |
| United Kingdom | 6.8% |
| Canada | 6.0% |
| Ireland | 3.4% |
| Korea (South) | 2.5% |
| Taiwan | 2.4% |
| Netherlands | 2.0% |
| Cayman Islands | 1.9% |
| Bermuda | 1.5% |
| Bailiwick of Guernsey | 1.2% |
| Others (Individually Less Than 1%) | 6.6% |
| | 100.0% |
See accompanying notes which are an integral part of the financial statements.
Financial Statements
Statement of Assets and Liabilities
| Amounts in thousands (except per-share amounts) | | July 31, 2020 |
| Assets | | |
Investment in securities, at value (including securities loaned of $449,793) — See accompanying schedule:
Unaffiliated issuers (cost $9,165,089) | $16,796,426 | |
| Fidelity Central Funds (cost $971,265) | 971,406 | |
| Other affiliated issuers (cost $3,485,030) | 6,407,531 | |
| Total Investment in Securities (cost $13,621,384) | | $24,175,363 |
| Foreign currency held at value (cost $2,526) | | 2,526 |
| Receivable for investments sold | | 102,355 |
| Receivable for fund shares sold | | 7,334 |
| Dividends receivable | | 42,968 |
| Interest receivable | | 45 |
| Distributions receivable from Fidelity Central Funds | | 1,627 |
| Prepaid expenses | | 4 |
| Other receivables | | 3,353 |
| Total assets | | 24,335,575 |
| Liabilities | | |
| Payable to custodian bank | $4,496 | |
| Payable for investments purchased | | |
| Regular delivery | 9,773 | |
| Delayed delivery | 10 | |
| Payable for fund shares redeemed | 18,943 | |
| Accrued management fee | 12,317 | |
| Other affiliated payables | 2,512 | |
| Other payables and accrued expenses | 2,630 | |
| Collateral on securities loaned | 473,969 | |
| Total liabilities | | 524,650 |
| Net Assets | | $23,810,925 |
| Net Assets consist of: | | |
| Paid in capital | | $12,308,080 |
| Total accumulated earnings (loss) | | 11,502,845 |
| Net Assets | | $23,810,925 |
| Net Asset Value and Maximum Offering Price | | |
| Low-Priced Stock: | | |
| Net Asset Value, offering price and redemption price per share ($19,517,113 ÷ 435,806 shares) | | $44.78 |
| Class K: | | |
| Net Asset Value, offering price and redemption price per share ($4,293,812 ÷ 95,941 shares) | | $44.75 |
See accompanying notes which are an integral part of the financial statements.
Statement of Operations
| Amounts in thousands | | Year ended July 31, 2020 |
| Investment Income | | |
| Dividends (including $208,120 earned from other affiliated issuers) | | $610,808 |
| Interest | | (648) |
| Income from Fidelity Central Funds (including $9,656 from security lending) | | 25,891 |
| Total income | | 636,051 |
| Expenses | | |
| Management fee | | |
| Basic fee | $153,919 | |
| Performance adjustment | 12,813 | |
| Transfer agent fees | 30,683 | |
| Accounting fees | 1,905 | |
| Custodian fees and expenses | 1,176 | |
| Independent trustees' fees and expenses | 172 | |
| Registration fees | 195 | |
| Audit | 161 | |
| Legal | 73 | |
| Miscellaneous | 387 | |
| Total expenses before reductions | 201,484 | |
| Expense reductions | (891) | |
| Total expenses after reductions | | 200,593 |
| Net investment income (loss) | | 435,458 |
| Realized and Unrealized Gain (Loss) | | |
| Net realized gain (loss) on: | | |
| Investment securities: | | |
| Unaffiliated issuers | 1,839,933 | |
| Fidelity Central Funds | 283 | |
| Other affiliated issuers | (45,811) | |
| Foreign currency transactions | (451) | |
| Total net realized gain (loss) | | 1,793,954 |
| Change in net unrealized appreciation (depreciation) on: | | |
| Investment securities: | | |
| Unaffiliated issuers (net of decrease in deferred foreign taxes of $3) | (2,325,998) | |
| Fidelity Central Funds | (190) | |
| Other affiliated issuers | (345,756) | |
| Assets and liabilities in foreign currencies | 1,160 | |
| Total change in net unrealized appreciation (depreciation) | | (2,670,784) |
| Net gain (loss) | | (876,830) |
| Net increase (decrease) in net assets resulting from operations | | $(441,372) |
See accompanying notes which are an integral part of the financial statements.
Statement of Changes in Net Assets
| Amounts in thousands | Year ended July 31, 2020 | Year ended July 31, 2019 |
| Increase (Decrease) in Net Assets | | |
| Operations | | |
| Net investment income (loss) | $435,458 | $600,458 |
| Net realized gain (loss) | 1,793,954 | 3,283,051 |
| Change in net unrealized appreciation (depreciation) | (2,670,784) | (4,536,367) |
| Net increase (decrease) in net assets resulting from operations | (441,372) | (652,858) |
| Distributions to shareholders | (2,435,932) | (3,794,431) |
| Share transactions - net increase (decrease) | (3,134,072) | (2,140,562) |
| Total increase (decrease) in net assets | (6,011,376) | (6,587,851) |
| Net Assets | | |
| Beginning of period | 29,822,301 | 36,410,152 |
| End of period | $23,810,925 | $29,822,301 |
See accompanying notes which are an integral part of the financial statements.
Financial Highlights
Fidelity Low-Priced Stock Fund
| Years ended July 31, | 2020 | 2019 | 2018 | 2017 | 2016 |
| Selected Per–Share Data | | | | | |
| Net asset value, beginning of period | $49.03 | $55.65 | $54.38 | $49.57 | $52.65 |
| Income from Investment Operations | | | | | |
| Net investment income (loss)A | .73 | .91 | .80 | .74 | .59 |
| Net realized and unrealized gain (loss) | (.91) | (1.69) | 5.33 | 6.47 | (1.44) |
| Total from investment operations | (.18) | (.78) | 6.13 | 7.21 | (.85) |
| Distributions from net investment income | (.89) | (.84) | (.79) | (.60) | (.62) |
| Distributions from net realized gain | (3.19) | (5.00) | (4.06) | (1.80) | (1.61) |
| Total distributions | (4.07)B | (5.84) | (4.86)C | (2.40) | (2.23) |
| Redemption fees added to paid in capitalA | – | – | – | –D | –D |
| Net asset value, end of period | $44.78 | $49.03 | $55.65 | $54.38 | $49.57 |
| Total ReturnE | (.48)% | (1.20)% | 12.07% | 15.17% | (1.48)% |
| Ratios to Average Net AssetsF,G | | | | | |
| Expenses before reductions | .78% | .52% | .62% | .67% | .88% |
| Expenses net of fee waivers, if any | .78% | .52% | .62% | .67% | .88% |
| Expenses net of all reductions | .78% | .51% | .62% | .67% | .88% |
| Net investment income (loss) | 1.64% | 1.86% | 1.48% | 1.46% | 1.24% |
| Supplemental Data | | | | | |
| Net assets, end of period (in millions) | $19,517 | $24,047 | $28,809 | $28,334 | $28,524 |
| Portfolio turnover rateH,I | 9%J | 17% | 11% | 8% | 9% |
A Calculated based on average shares outstanding during the period.
B Total distributions of $4.07 per share is comprised of distributions from net investment income of $.885 and distributions from net realized gain of $3.186 per share.
C Total distributions of $4.86 per share is comprised of distributions from net investment income of $.793 and distributions from net realized gain of $4.064 per share.
D Amount represents less than $.005 per share.
E Total returns would have been lower if certain expenses had not been reduced during the applicable periods shown.
F Fees and expenses of any underlying mutual funds or exchange-traded funds (ETFs) are not included in the Fund's expense ratio. The Fund indirectly bears its proportionate share of these expenses. For additional expense information related to investments in Fidelity Central Funds, please refer to the "Investments in Fidelity Central Funds" note found in the Notes to Financial Statements section of the most recent Annual or Semi-Annual report.
G Expense ratios reflect operating expenses of the class. Expenses before reductions do not reflect amounts reimbursed by the investment adviser or reductions from brokerage service arrangements or reductions from other expense offset arrangements and do not represent the amount paid by the class during periods when reimbursements or reductions occur. Expenses net of fee waivers reflect expenses after reimbursement by the investment adviser but prior to reductions from brokerage service arrangements or other expense offset arrangements. Expenses net of all reductions represent the net expenses paid by the class.
H Amount does not include the portfolio activity of any underlying Fidelity Central Funds.
I Portfolio turnover rate excludes securities received or delivered in-kind.
J The portfolio turnover rate does not include the assets acquired in the merger.
See accompanying notes which are an integral part of the financial statements.
Fidelity Low-Priced Stock Fund Class K
| Years ended July 31, | 2020 | 2019 | 2018 | 2017 | 2016 |
| Selected Per–Share Data | | | | | |
| Net asset value, beginning of period | $49.01 | $55.63 | $54.36 | $49.56 | $52.64 |
| Income from Investment Operations | | | | | |
| Net investment income (loss)A | .77 | .96 | .85 | .79 | .64 |
| Net realized and unrealized gain (loss) | (.91) | (1.69) | 5.33 | 6.46 | (1.44) |
| Total from investment operations | (.14) | (.73) | 6.18 | 7.25 | (.80) |
| Distributions from net investment income | (.93) | (.89) | (.84) | (.64) | (.67) |
| Distributions from net realized gain | (3.19) | (5.00) | (4.06) | (1.80) | (1.61) |
| Total distributions | (4.12) | (5.89) | (4.91)B | (2.45)C | (2.28) |
| Redemption fees added to paid in capitalA | – | – | – | –D | –D |
| Net asset value, end of period | $44.75 | $49.01 | $55.63 | $54.36 | $49.56 |
| Total ReturnE | (.41)% | (1.10)% | 12.18% | 15.27% | (1.38)% |
| Ratios to Average Net AssetsF,G | | | | | |
| Expenses before reductions | .69% | .43% | .53% | .58% | .78% |
| Expenses net of fee waivers, if any | .69% | .43% | .53% | .58% | .78% |
| Expenses net of all reductions | .69% | .43% | .53% | .58% | .78% |
| Net investment income (loss) | 1.72% | 1.95% | 1.57% | 1.56% | 1.34% |
| Supplemental Data | | | | | |
| Net assets, end of period (in millions) | $4,294 | $5,776 | $7,601 | $9,886 | $11,489 |
| Portfolio turnover rateH,I | 9%J | 17% | 11% | 8% | 9% |
A Calculated based on average shares outstanding during the period.
B Total distributions of $4.91 per share is comprised of distributions from net investment income of $.842 and distributions from net realized gain of $4.064 per share.
C Total distributions of $2.45 per share is comprised of distributions from net investment income of $.644 and distributions from net realized gain of $1.803 per share.
D Amount represents less than $.005 per share.
E Total returns would have been lower if certain expenses had not been reduced during the applicable periods shown.
F Fees and expenses of any underlying mutual funds or exchange-traded funds (ETFs) are not included in the Fund's expense ratio. The Fund indirectly bears its proportionate share of these expenses. For additional expense information related to investments in Fidelity Central Funds, please refer to the "Investments in Fidelity Central Funds" note found in the Notes to Financial Statements section of the most recent Annual or Semi-Annual report.
G Expense ratios reflect operating expenses of the class. Expenses before reductions do not reflect amounts reimbursed by the investment adviser or reductions from brokerage service arrangements or reductions from other expense offset arrangements and do not represent the amount paid by the class during periods when reimbursements or reductions occur. Expenses net of fee waivers reflect expenses after reimbursement by the investment adviser but prior to reductions from brokerage service arrangements or other expense offset arrangements. Expenses net of all reductions represent the net expenses paid by the class.
H Amount does not include the portfolio activity of any underlying Fidelity Central Funds.
I Portfolio turnover rate excludes securities received or delivered in-kind.
J The portfolio turnover rate does not include the assets acquired in the merger.
See accompanying notes which are an integral part of the financial statements.
Notes to Financial Statements
For the period ended July 31, 2020
(Amounts in thousands except percentages)
1. Organization.
Fidelity Low-Priced Stock Fund (the Fund) is a fund of Fidelity Puritan Trust (the Trust) and is authorized to issue an unlimited number of shares. The Trust is registered under the Investment Company Act of 1940, as amended (the 1940 Act), as an open-end management investment company organized as a Massachusetts business trust. The Fund offers Low-Priced Stock and Class K shares, each of which has equal rights as to assets and voting privileges. Each class has exclusive voting rights with respect to matters that affect that class. The Fund's investments in emerging markets can be subject to social, economic, regulatory, and political uncertainties and can be extremely volatile.
Effective January 1, 2020:
Investment advisers Fidelity Investments Money Management, Inc., FMR Co., Inc., and Fidelity SelectCo, LLC, merged with and into Fidelity Management & Research Company. In connection with the merger transactions, the resulting, merged investment adviser was then redomiciled from Massachusetts to Delaware, changed its corporate structure from a corporation to a limited liability company, and changed its name to "Fidelity Management & Research Company LLC".
Fidelity Investments Institutional Operations Company, Inc. converted from a Massachusetts corporation to a Massachusetts LLC, and changed its name to "Fidelity Investments Institutional Operations Company LLC".
2. Investments in Fidelity Central Funds.
The Fund invests in Fidelity Central Funds, which are open-end investment companies generally available only to other investment companies and accounts managed by the investment adviser and its affiliates. The Fund's Schedule of Investments lists each of the Fidelity Central Funds held as of period end, if any, as an investment of the Fund, but does not include the underlying holdings of each Fidelity Central Fund. As an Investing Fund, the Fund indirectly bears its proportionate share of the expenses of the underlying Fidelity Central Funds.
The Money Market Central Funds seek preservation of capital and current income and are managed by the investment adviser. Annualized expenses of the Money Market Central Funds as of their most recent shareholder report date ranged from less than .005% to .01%.
A complete unaudited list of holdings for each Fidelity Central Fund is available upon request or at the Securities and Exchange Commission (the SEC) website at www.sec.gov. In addition, the financial statements of the Fidelity Central Funds, which are not covered by the Fund's Report of Independent Registered Public Accounting Firm, are available on the SEC website or upon request.
3. Significant Accounting Policies.
The Fund is an investment company and applies the accounting and reporting guidance of the Financial Accounting Standards Board (FASB) Accounting Standards Codification Topic 946 Financial Services – Investment Companies. The financial statements have been prepared in conformity with accounting principles generally accepted in the United States of America (GAAP), which require management to make certain estimates and assumptions at the date of the financial statements. Actual results could differ from those estimates. Subsequent events, if any, through the date that the financial statements were issued have been evaluated in the preparation of the financial statements. The following summarizes the significant accounting policies of the Fund:
Investment Valuation. Investments are valued as of 4:00 p.m. Eastern time on the last calendar day of the period. The Board of Trustees (the Board) has delegated the day to day responsibility for the valuation of the Fund's investments to the Fair Value Committee (the Committee) established by the Fund's investment adviser. In accordance with valuation policies and procedures approved by the Board, the Fund attempts to obtain prices from one or more third party pricing vendors or brokers to value its investments. When current market prices, quotations or currency exchange rates are not readily available or reliable, investments will be fair valued in good faith by the Committee, in accordance with procedures adopted by the Board. Factors used in determining fair value vary by investment type and may include market or investment specific events, changes in interest rates and credit quality. The frequency with which these procedures are used cannot be predicted and they may be utilized to a significant extent. The Committee oversees the Fund's valuation policies and procedures and reports to the Board on the Committee's activities and fair value determinations. The Board monitors the appropriateness of the procedures used in valuing the Fund's investments and ratifies the fair value determinations of the Committee.
The Fund categorizes the inputs to valuation techniques used to value its investments into a disclosure hierarchy consisting of three levels as shown below:
- Level 1 – quoted prices in active markets for identical investments
- Level 2 – other significant observable inputs (including quoted prices for similar investments, interest rates, prepayment speeds, etc.)
- Level 3 – unobservable inputs (including the Fund's own assumptions based on the best information available)
Valuation techniques used to value the Fund's investments by major category are as follows:
Equity securities, including restricted securities, for which market quotations are readily available, are valued at the last reported sale price or official closing price as reported by a third party pricing vendor on the primary market or exchange on which they are traded and are categorized as Level 1 in the hierarchy. In the event there were no sales during the day or closing prices are not available, securities are valued at the last quoted bid price or may be valued using the last available price and are generally categorized as Level 2 in the hierarchy. For foreign equity securities, when market or security specific events arise, comparisons to the valuation of American Depositary Receipts (ADRs), futures contracts, Exchange-Traded Funds (ETFs) and certain indexes as well as quoted prices for similar securities may be used and would be categorized as Level 2 in the hierarchy. For equity securities, including restricted securities, where observable inputs are limited, assumptions about market activity and risk are used and these securities may be categorized as Level 3 in the hierarchy.
Debt securities, including restricted securities, are valued based on evaluated prices received from third party pricing vendors or from brokers who make markets in such securities. Corporate bonds are valued by pricing vendors who utilize matrix pricing which considers yield or price of bonds of comparable quality, coupon, maturity and type or by broker-supplied prices. When independent prices are unavailable or unreliable, debt securities may be valued utilizing pricing methodologies which consider similar factors that would be used by third party pricing vendors. Debt securities are generally categorized as Level 2 in the hierarchy but may be Level 3 depending on the circumstances.
Investments in open-end mutual funds, including the Fidelity Central Funds, are valued at their closing net asset value (NAV) each business day and are categorized as Level 1 in the hierarchy.
Changes in valuation techniques may result in transfers in or out of an assigned level within the disclosure hierarchy. The aggregate value of investments by input level as of July 31, 2020 is included at the end of the Fund's Schedule of Investments.
Foreign Currency. The Fund may use foreign currency contracts to facilitate transactions in foreign-denominated securities. Gains and losses from these transactions may arise from changes in the value of the foreign currency or if the counterparties do not perform under the contracts' terms.
Foreign-denominated assets, including investment securities, and liabilities are translated into U.S. dollars at the exchange rates at period end. Purchases and sales of investment securities, income and dividends received and expenses denominated in foreign currencies are translated into U.S. dollars at the exchange rate in effect on the transaction date.
The effects of exchange rate fluctuations on investments are included with the net realized and unrealized gain (loss) on investment securities. Other foreign currency transactions resulting in realized and unrealized gain (loss) are disclosed separately.
Investment Transactions and Income. For financial reporting purposes, the Fund's investment holdings and NAV include trades executed through the end of the last business day of the period. The NAV per share for processing shareholder transactions is calculated as of the close of business of the New York Stock Exchange (NYSE), normally 4:00 p.m. Eastern time and includes trades executed through the end of the prior business day. Gains and losses on securities sold are determined on the basis of identified cost and include proceeds received from litigation. Dividend income is recorded on the ex-dividend date, except for certain dividends from foreign securities where the ex-dividend date may have passed, which are recorded as soon as the Fund is informed of the ex-dividend date. Non-cash dividends included in dividend income, if any, are recorded at the fair market value of the securities received. Income and capital gain distributions from Fidelity Central Funds, if any, are recorded on the ex-dividend date. Certain distributions received by the Fund represent a return of capital or capital gain. The Fund determines the components of these distributions subsequent to the ex-dividend date, based upon receipt of tax filings or other correspondence relating to the underlying investment. These distributions are recorded as a reduction of cost of investments and/or as a realized gain. Interest income is accrued as earned and includes coupon interest and amortization of premium and accretion of discount on debt securities as applicable. Investment income is recorded net of foreign taxes withheld where recovery of such taxes is uncertain.
Class Allocations and Expenses. Investment income, realized and unrealized capital gains and losses, common expenses of the Fund, and certain fund-level expense reductions, if any, are allocated daily on a pro-rata basis to each class based on the relative net assets of each class to the total net assets of the Fund. Each class differs with respect to transfer agent fees incurred. Certain expense reductions may also differ by class. For the reporting period, the allocated portion of income and expenses to each class as a percent of its average net assets may vary due to the timing of recording these transactions in relation to fluctuating net assets of the classes. Expenses directly attributable to a fund are charged to that fund. Expenses attributable to more than one fund are allocated among the respective funds on the basis of relative net assets or other appropriate methods. Expense estimates are accrued in the period to which they relate and adjustments are made when actual amounts are known.
Deferred Trustee Compensation. Under a Deferred Compensation Plan (the Plan) for the Fund, certain independent Trustees have elected to defer receipt of a portion of their annual compensation. Deferred amounts are invested in a cross-section of Fidelity funds, are marked-to-market and remain in the Fund until distributed in accordance with the Plan. The investment of deferred amounts and the offsetting payable to the Trustees of $2,102 are included in the accompanying Statement of Assets and Liabilities in other receivables and other payables and accrued expenses, respectively.
Income Tax Information and Distributions to Shareholders. Each year, the Fund intends to qualify as a regulated investment company under Subchapter M of the Internal Revenue Code, including distributing substantially all of its taxable income and realized gains. As a result, no provision for U.S. Federal income taxes is required. As of July 31, 2020, the Fund did not have any unrecognized tax benefits in the financial statements; nor is the Fund aware of any tax positions for which it is reasonably possible that the total amounts of unrecognized tax benefits will significantly change in the next twelve months. The Fund files a U.S. federal tax return, in addition to state and local tax returns as required. The Fund's federal income tax returns are subject to examination by the Internal Revenue Service (IRS) for a period of three fiscal years after they are filed. State and local tax returns may be subject to examination for an additional fiscal year depending on the jurisdiction. Foreign taxes are provided for based on the Fund's understanding of the tax rules and rates that exist in the foreign markets in which it invests. The Fund is subject to a tax imposed on capital gains by certain countries in which it invests. An estimated deferred tax liability for net unrealized appreciation on the applicable securities is included in Other payables and accrued expenses on the Statement of Assets & Liabilities.
Distributions are declared and recorded on the ex-dividend date. Income and capital gain distributions are declared separately for each class. Income and capital gain distributions are determined in accordance with income tax regulations, which may differ from GAAP. In addition, the Fund claimed a portion of the payment made to redeeming shareholders as a distribution for income tax purposes.
Capital accounts within the financial statements are adjusted for permanent book-tax differences. These adjustments have no impact on net assets or the results of operations. Capital accounts are not adjusted for temporary book-tax differences which will reverse in a subsequent period.
Book-tax differences are primarily due to foreign currency transactions, certain foreign taxes, passive foreign investment companies (PFIC), market discount, equity-debt classifications, redemptions in kind, partnerships, deferred trustees compensation and losses deferred due to wash sales.
As of period end, the cost and unrealized appreciation (depreciation) in securities, and derivatives if applicable, for federal income tax purposes were as follows:
| Gross unrealized appreciation | $12,476,359 |
| Gross unrealized depreciation | (2,543,154) |
| Net unrealized appreciation (depreciation) | $9,933,205 |
| Tax Cost | $14,242,158 |
The tax-based components of distributable earnings as of period end were as follows:
| Undistributed ordinary income | $227,479 |
| Undistributed long-term capital gain | $1,414,420 |
| Net unrealized appreciation (depreciation) on securities and other investments | $9,933,497 |
Due to a merger in the period, approximately $70,453 of the Fund's realized capital losses are subject to limitation. Due to this limitation, the Fund will only be permitted to use approximately $680 of those capital losses per year to offset capital gains. These realized capital losses were acquired from Fidelity Event Driven Opportunities Fund when it merged into the Fund on June 19, 2020.
The tax character of distributions paid was as follows:
| | July 31, 2020 | July 31, 2019 |
| Ordinary Income | $538,464 | $ 605,328 |
| Long-term Capital Gains | 1,897,468 | 3,189,103 |
| Total | $2,435,932 | $ 3,794,431 |
Delayed Delivery Transactions and When-Issued Securities. During the period, the Fund transacted in securities on a delayed delivery or when-issued basis. Payment and delivery may take place after the customary settlement period for that security. The price of the underlying securities and the date when the securities will be delivered and paid for are fixed at the time the transaction is negotiated. The securities purchased on a delayed delivery or when-issued basis are identified as such in the Fund's Schedule of Investments. Losses may arise due to changes in the value of the underlying securities or if the counterparty does not perform under the contract's terms, or if the issuer does not issue the securities due to political, economic, or other factors.
Restricted Securities (including Private Placements). The Fund may invest in securities that are subject to legal or contractual restrictions on resale. These securities generally may be resold in transactions exempt from registration or to the public if the securities are registered. Disposal of these securities may involve time-consuming negotiations and expense, and prompt sale at an acceptable price may be difficult. Information regarding restricted securities is included at the end of the Fund's Schedule of Investments.
4. Purchases and Sales of Investments.
Purchases and sales of securities, other than short-term securities, securities acquired in the merger and in-kind transactions, are noted in the table below.
| | Purchases ($) | Sales ($) |
| Fidelity Low-Priced Stock Fund | 2,222,811 | 5,892,979 |
Unaffiliated Redemptions In-Kind. During the period, 4,797 shares of the Fund were redeemed in-kind for investments, including accrued interest, and cash with a value of $224,491. The net realized gain of $131,827 on investments delivered through in-kind redemptions is included in the accompanying Statement of Operations. The amount of the in-kind redemptions is included in share transactions in the accompanying Statement of Changes in Net Assets as well as the Notes to Financial Statements. The Fund recognized no gain or loss for federal income tax purposes.
Prior Fiscal Year Unaffiliated Redemptions In-Kind. During the prior period, shares of the Fidelity Low-Priced Stock Fund were redeemed in-kind for investments. The amount of the in-kind redemptions is included in share transactions in the accompanying Statement of Changes in Net Assets. For additional information of the Fidelity Low-Priced Stock Fund in-kind transactions, please refer to the Fidelity Low-Priced Stock Fund prior annual shareholder report
5. Fees and Other Transactions with Affiliates.
Management Fee. Fidelity Management & Research Company LLC (the investment adviser) and its affiliates provide the Fund with investment management related services for which the Fund pays a monthly management fee. The management fee is the sum of an individual fund fee rate that is based on an annual rate of .35% of the Fund's average net assets and an annualized group fee rate that averaged .23% during the period. The group fee rate is based upon the monthly average net assets of a group of registered investment companies with which the investment adviser has management contracts. The group fee rate decreases as assets under management increase and increases as assets under management decrease. In addition, the management fee is subject to a performance adjustment (up to a maximum of +/- .20% of the Fund's average net assets over a 36 month performance period). The upward or downward adjustment to the management fee is based on the relative investment performance of Low-Priced Stock as compared to its benchmark index, the Russell 2000 Index, over the same 36 month performance period. For the reporting period, the total annual management fee rate, including the performance adjustment, was .63% of the Fund's average net assets. The performance adjustment included in the management fee rate may be higher or lower than the maximum performance adjustment rate due to the difference between the average net assets for the reporting and performance periods.
Transfer Agent Fees. Fidelity Investments Institutional Operations Company LLC (FIIOC), an affiliate of the investment adviser, is the transfer, dividend disbursing and shareholder servicing agent for each class of the Fund. FIIOC receives account fees and asset-based fees that vary according to the account size and type of account of the shareholders of the respective classes of the Fund, except for Class K. FIIOC receives an asset-based fee of Class K's average net assets. FIIOC pays for typesetting, printing and mailing of shareholder reports, except proxy statements. Effective February 1, 2020, the Board approved to change the fee for Class K from .046% to .044%.
For the period, transfer agent fees for each class were as follows:
| | Amount | % of Class-Level Average Net Assets |
| Low-Priced Stock | $28,551 | .13 |
| Class K | 2,132 | .04 |
| | $30,683 | |
Accounting Fees. Fidelity Service Company, Inc. (FSC), an affiliate of the investment adviser, maintains the Fund's accounting records. The accounting fee is based on the level of average net assets for each month. For the period, the fees were equivalent to the following annual rates:
| | % of Average Net Assets |
| Fidelity Low-Priced Stock Fund | .01 |
Brokerage Commissions. A portion of portfolio transactions were placed with brokerage firms which are affiliates of the investment adviser. Brokerage commissions are included in net realized gain (loss) and change in net unrealized appreciation (depreciation) in the Statement of Operations. The commissions paid to these affiliated firms were as follows:
| | Amount |
| Fidelity Low-Priced Stock Fund | $120 |
Interfund Trades. Funds may purchase from or sell securities to other Fidelity Funds under procedures adopted by the Board. The procedures have been designed to ensure these interfund trades are executed in accordance with Rule 17a-7 of the 1940 Act. Interfund trades are included within the respective purchases and sales amounts shown in the Purchases and Sales of Investments note.
Other. During the period, the investment adviser reimbursed the Fund for certain losses in the amount of $109.
6. Committed Line of Credit.
Certain Funds participate with other funds managed by the investment adviser or an affiliate in a $4.25 billion credit facility (the "line of credit") to be utilized for temporary or emergency purposes to fund shareholder redemptions or for other short-term liquidity purposes. The participating funds have agreed to pay commitment fees on their pro-rata portion of the line of credit, which are reflected in Miscellaneous expenses on the Statement of Operations, and are as follows:
| | Amount |
| Fidelity Low-Priced Stock Fund | $66 |
During the period, there were no borrowings on this line of credit.
7. Security Lending.
The Fund lends portfolio securities from time to time in order to earn additional income. Lending agents are used, including National Financial Services (NFS), an affiliate of the Fund. Pursuant to a securities lending agreement, NFS will receive a fee, which is capped at 9.9% of daily lending revenue, for its services as lending agent. The Fund may lend securities to certain qualified borrowers, including NFS. On the settlement date of the loan, the Fund receives collateral (in the form of U.S. Treasury obligations, letters of credit and/or cash) against the loaned securities and maintains collateral in an amount not less than 100% of the market value of the loaned securities during the period of the loan. The market value of the loaned securities is determined at the close of business of the Fund and any additional required collateral is delivered to the Fund on the next business day. The Fund or borrower may terminate the loan at any time, and if the borrower defaults on its obligation to return the securities loaned because of insolvency or other reasons, the Fund may apply collateral received from the borrower against the obligation. The Fund may experience delays and costs in recovering the securities loaned. Any cash collateral received is invested in the Fidelity Securities Lending Cash Central Fund. The value of loaned securities and cash collateral at period end are disclosed on the Fund's Statement of Assets and Liabilities. The value of securities loaned to NFS, as affiliated borrower, at period end was $124. Total fees paid by the Fund to NFS, as lending agent, amounted to $616. Security lending income represents the income earned on investing cash collateral, less rebates paid to borrowers and any lending agent fees associated with the loan, plus any premium payments received for lending certain types of securities. Net income from the Fidelity Securities Lending Cash Central Fund during the period is presented in the Statement of Operations as a component of income from Fidelity Central Funds (and includes $32 from securities loaned to NFS, as affiliated borrower).
8. Expense Reductions.
Commissions paid to certain brokers with whom the investment adviser, or its affiliates, places trades on behalf of the Fund include an amount in addition to trade execution, which may be rebated back to the Fund to offset certain expenses. This amount totaled $768 for the period. In addition, through arrangements with the Fund's custodian and each class' transfer agent, credits realized as a result of certain uninvested cash balances were used to reduce the Fund's expenses. During the period, transfer agent credits reduced each class' expenses as noted in the table below.
| | Expense reduction |
| Low-Priced Stock | $2 |
In addition, during the period the investment adviser or an affiliate reimbursed and/or waived a portion of fund-level operating expenses in the amount of $121.
9. Distributions to Shareholders.
Distributions to shareholders of each class were as follows:
| | Year ended
July 31, 2020 | Year ended
July 31, 2019 |
| Distributions to shareholders | | |
| Low-Priced Stock | $1,964,134 | $3,002,760 |
| Class K | 471,798 | 791,671 |
| Total | $2,435,932 | $3,794,431 |
10. Share Transactions.
Share transactions for each class were as follows and may contain automatic conversions between classes or exchanges between affiliated funds:
| | Shares | Shares | Dollars | Dollars |
| | Year ended July 31, 2020 | Year ended July 31, 2019 | Year ended July 31, 2020 | Year ended July 31, 2019 |
| Low-Priced Stock | | | | |
| Shares sold | 31,910 | 27,483 | $1,400,927 | $1,342,106 |
| Issued in exchange for the shares of Fidelity Event Driven Opportunities Fund | 1,443 | – | 62,388 | – |
| Reinvestment of distributions | 39,403 | 55,804(a) | 1,803,602 | 2,757,121(a) |
| Shares redeemed | (127,351) | (110,542) | (5,416,848) | (5,355,052) |
| Net increase (decrease) | (54,595) | (27,255) | $(2,149,931) | $(1,255,825) |
| Class K | | | | |
| Shares sold | 19,495 | 13,313 | $873,715 | $656,387 |
| Reinvestment of distributions | 10,318 | 16,031 | 471,798 | 791,671 |
| Shares redeemed | (51,729)(b) | (48,117)(a) | (2,329,654)(b) | (2,332,795)(a) |
| Net increase (decrease) | (21,916) | (18,773) | $(984,141) | $(884,737) |
(a) Amount includes in-kind redemptions (see the Prior Fiscal Year Unaffiliated Redemptions In-Kind note for additional details).
(b) Amount includes in-kind redemptions (see the Unaffiliated Redemptions In-Kind note for additional details).
11. Other.
The Fund's organizational documents provide former and current trustees and officers with a limited indemnification against liabilities arising in connection with the performance of their duties to the Fund. In the normal course of business, the Fund may also enter into contracts that provide general indemnifications. The Fund's maximum exposure under these arrangements is unknown as this would be dependent on future claims that may be made against the Fund. The risk of material loss from such claims is considered remote.
12. Merger Information.
On June 19, 2020, the Fund acquired all of the assets and assumed all of the liabilities of Fidelity Event Driven Opportunities Fund ("Target Fund") pursuant to an Agreement and Plan of Reorganization approved by the Board of Trustees ("The Board"). The acquisition was accomplished by an exchange of each class of the Fund for corresponding shares then outstanding of the Target Fund at its respective net asset value on the acquisition date. The reorganization provides shareholders of the Target Fund access to a larger portfolio with a similar investment objective and lower expenses. The reorganization qualified as a tax-free reorganization for federal income tax purposes with no gain or loss recognized to the funds or their shareholders. The Target Fund's net assets of $62,388, including securities of $55,831 and unrealized depreciation of $1,114, was combined with the Fund's net assets of $23,506,074 for total net assets after the acquisition of $23,568,462.
Pro forma results of operations of the combined entity for the entire period ended July 31, 2020 as though the acquisition had occurred as of the beginning of the year (rather than on the actual acquisition date), are as follows:
| Net investment income (loss) | $436,155 |
| Total net realized gain (loss) | 1,766,938 |
| Total change in net unrealized appreciation (depreciation) | (2,662,227) |
| Net increase (decrease) in net assets resulting from operations | $(459,134) |
Because the combined investment portfolios have been managed as a single portfolio since the acquisition was completed, it is not practicable to separate the amounts of revenue and earnings of the acquired fund that has been included in the Fund's accompanying Statement of Operations since June 19, 2020.
13. Coronavirus (COVID-19) Pandemic.
An outbreak of COVID-19 first detected in China during December 2019 has since spread globally and was declared a pandemic by the World Health Organization during March 2020. Developments that disrupt global economies and financial markets, such as the COVID-19 pandemic, may magnify factors that affect the Fund's performance.
Report of Independent Registered Public Accounting Firm
To the Board of Trustees of Fidelity Puritan Trust and Shareholders of Fidelity Low-Priced Stock Fund
Opinion on the Financial Statements
We have audited the accompanying statement of assets and liabilities, including the schedule of investments, of Fidelity Low-Priced Stock Fund (one of the funds constituting Fidelity Puritan Trust, referred to hereafter as the “Fund”) as of July 31, 2020, the related statement of operations for the year ended July 31, 2020, the statement of changes in net assets for each of the two years in the period ended July 31, 2020, including the related notes, and the financial highlights for each of the five years in the period ended July 31, 2020 (collectively referred to as the “financial statements”). In our opinion, the financial statements present fairly, in all material respects, the financial position of the Fund as of July 31, 2020, the results of its operations for the year then ended, the changes in its net assets for each of the two years in the period ended July 31, 2020 and the financial highlights for each of the five years in the period ended July 31, 2020 in conformity with accounting principles generally accepted in the United States of America.
Basis for Opinion
These financial statements are the responsibility of the Fund’s management. Our responsibility is to express an opinion on the Fund’s financial statements based on our audits. We are a public accounting firm registered with the Public Company Accounting Oversight Board (United States) (PCAOB) and are required to be independent with respect to the Fund in accordance with the U.S. federal securities laws and the applicable rules and regulations of the Securities and Exchange Commission and the PCAOB.
We conducted our audits of these financial statements in accordance with the standards of the PCAOB. Those standards require that we plan and perform the audit to obtain reasonable assurance about whether the financial statements are free of material misstatement, whether due to error or fraud.
Our audits included performing procedures to assess the risks of material misstatement of the financial statements, whether due to error or fraud, and performing procedures that respond to those risks. Such procedures included examining, on a test basis, evidence regarding the amounts and disclosures in the financial statements. Our audits also included evaluating the accounting principles used and significant estimates made by management, as well as evaluating the overall presentation of the financial statements. Our procedures included confirmation of securities owned as of July 31, 2020 by correspondence with the custodian, issuers of privately offered securities and brokers; when replies were not received from brokers, we performed other auditing procedures. We believe that our audits provide a reasonable basis for our opinion.
/s/ PricewaterhouseCoopers LLP
Boston, Massachusetts
September 14, 2020
We have served as the auditor of one or more investment companies in the Fidelity group of funds since 1932.
Trustees and Officers
The Trustees, Members of the Advisory Board (if any), and officers of the trust and fund, as applicable, are listed below. The Board of Trustees governs the fund and is responsible for protecting the interests of shareholders. The Trustees are experienced executives who meet periodically throughout the year to oversee the fund's activities, review contractual arrangements with companies that provide services to the fund, oversee management of the risks associated with such activities and contractual arrangements, and review the fund's performance. Except for Jonathan Chiel, each of the Trustees oversees 311 funds. Mr. Chiel oversees 174 funds.
The Trustees hold office without limit in time except that (a) any Trustee may resign; (b) any Trustee may be removed by written instrument, signed by at least two-thirds of the number of Trustees prior to such removal; (c) any Trustee who requests to be retired or who has become incapacitated by illness or injury may be retired by written instrument signed by a majority of the other Trustees; and (d) any Trustee may be removed at any special meeting of shareholders by a two-thirds vote of the outstanding voting securities of the trust. Each Trustee who is not an interested person (as defined in the 1940 Act) of the trust and the fund is referred to herein as an Independent Trustee. Each Independent Trustee shall retire not later than the last day of the calendar year in which his or her 75th birthday occurs. The Independent Trustees may waive this mandatory retirement age policy with respect to individual Trustees. Officers and Advisory Board Members hold office without limit in time, except that any officer or Advisory Board Member may resign or may be removed by a vote of a majority of the Trustees at any regular meeting or any special meeting of the Trustees. Except as indicated, each individual has held the office shown or other offices in the same company for the past five years.
The fund's Statement of Additional Information (SAI) includes more information about the Trustees. To request a free copy, call Fidelity at 1-800-544-8544 if you’re an individual investing directly with Fidelity, call 1-800-835-5092 if you’re a plan sponsor or participant with Fidelity as your recordkeeper or call 1-877-208-0098 on institutional accounts or if you’re an advisor or invest through one.
Experience, Skills, Attributes, and Qualifications of the Trustees. The Governance and Nominating Committee has adopted a statement of policy that describes the experience, qualifications, attributes, and skills that are necessary and desirable for potential Independent Trustee candidates (Statement of Policy). The Board believes that each Trustee satisfied at the time he or she was initially elected or appointed a Trustee, and continues to satisfy, the standards contemplated by the Statement of Policy. The Governance and Nominating Committee also engages professional search firms to help identify potential Independent Trustee candidates who have the experience, qualifications, attributes, and skills consistent with the Statement of Policy. From time to time, additional criteria based on the composition and skills of the current Independent Trustees, as well as experience or skills that may be appropriate in light of future changes to board composition, business conditions, and regulatory or other developments, have also been considered by the professional search firms and the Governance and Nominating Committee. In addition, the Board takes into account the Trustees' commitment and participation in Board and committee meetings, as well as their leadership of standing and ad hoc committees throughout their tenure.
In determining that a particular Trustee was and continues to be qualified to serve as a Trustee, the Board has considered a variety of criteria, none of which, in isolation, was controlling. The Board believes that, collectively, the Trustees have balanced and diverse experience, qualifications, attributes, and skills, which allow the Board to operate effectively in governing the fund and protecting the interests of shareholders. Information about the specific experience, skills, attributes, and qualifications of each Trustee, which in each case led to the Board's conclusion that the Trustee should serve (or continue to serve) as a trustee of the fund, is provided below.
Board Structure and Oversight Function. Robert A. Lawrence is an interested person and currently serves as Acting Chairman. The Trustees have determined that an interested Chairman is appropriate and benefits shareholders because an interested Chairman has a personal and professional stake in the quality and continuity of services provided to the fund. Independent Trustees exercise their informed business judgment to appoint an individual of their choosing to serve as Chairman, regardless of whether the Trustee happens to be independent or a member of management. The Independent Trustees have determined that they can act independently and effectively without having an Independent Trustee serve as Chairman and that a key structural component for assuring that they are in a position to do so is for the Independent Trustees to constitute a substantial majority for the Board. The Independent Trustees also regularly meet in executive session. Ned C. Lautenbach and David M. Thomas serve as Co-Lead Independent Trustees and as such each (i) acts as a liaison between the Independent Trustees and management with respect to matters important to the Independent Trustees and (ii) with management prepares agendas for Board meetings.
Fidelity® funds are overseen by different Boards of Trustees. The fund's Board oversees Fidelity's high income and certain equity funds, and other Boards oversee Fidelity's investment-grade bond, money market, asset allocation, and other equity funds. The asset allocation funds may invest in Fidelity® funds overseen by the fund's Board. The use of separate Boards, each with its own committee structure, allows the Trustees of each group of Fidelity® funds to focus on the unique issues of the funds they oversee, including common research, investment, and operational issues. On occasion, the separate Boards establish joint committees to address issues of overlapping consequences for the Fidelity® funds overseen by each Board.
The Trustees operate using a system of committees to facilitate the timely and efficient consideration of all matters of importance to the Trustees, the fund, and fund shareholders and to facilitate compliance with legal and regulatory requirements and oversight of the fund's activities and associated risks. The Board, acting through its committees, has charged FMR and its affiliates with (i) identifying events or circumstances the occurrence of which could have demonstrably adverse effects on the fund's business and/or reputation; (ii) implementing processes and controls to lessen the possibility that such events or circumstances occur or to mitigate the effects of such events or circumstances if they do occur; and (iii) creating and maintaining a system designed to evaluate continuously business and market conditions in order to facilitate the identification and implementation processes described in (i) and (ii) above. Because the day-to-day operations and activities of the fund are carried out by or through FMR, its affiliates, and other service providers, the fund's exposure to risks is mitigated but not eliminated by the processes overseen by the Trustees. While each of the Board's committees has responsibility for overseeing different aspects of the fund's activities, oversight is exercised primarily through the Operations, Audit, and Compliance Committees. Appropriate personnel, including but not limited to the fund's Chief Compliance Officer (CCO), FMR's internal auditor, the independent accountants, the fund's Treasurer and portfolio management personnel, make periodic reports to the Board's committees, as appropriate, including an annual review of Fidelity's risk management program for the Fidelity® funds. The responsibilities of each standing committee, including their oversight responsibilities, are described further under "Standing Committees of the Trustees."
Interested Trustees*:
Correspondence intended for a Trustee who is an interested person may be sent to Fidelity Investments, 245 Summer Street, Boston, Massachusetts 02210.
Name, Year of Birth; Principal Occupations and Other Relevant Experience+
Jonathan Chiel (1957)
Year of Election or Appointment: 2016
Trustee
Mr. Chiel also serves as Trustee of other Fidelity® funds. Mr. Chiel is Executive Vice President and General Counsel for FMR LLC (diversified financial services company, 2012-present). Previously, Mr. Chiel served as general counsel (2004-2012) and senior vice president and deputy general counsel (2000-2004) for John Hancock Financial Services; a partner with Choate, Hall & Stewart (1996-2000) (law firm); and an Assistant United States Attorney for the United States Attorney’s Office of the District of Massachusetts (1986-95), including Chief of the Criminal Division (1993-1995). Mr. Chiel is a director on the boards of the Boston Bar Foundation and the Maimonides School.
Robert A. Lawrence (1952)
Year of Election or Appointment: 2020
Trustee
Acting Chairman of the Board of Trustees
Mr. Lawrence also serves as Trustee of other funds. Previously, Mr. Lawrence served as a Member of the Advisory Board of certain funds. Prior to his retirement in 2008, Mr. Lawrence served as Vice President of certain Fidelity® funds (2006-2008), Senior Vice President, Head of High Income Division of Fidelity Management & Research Company (investment adviser firm, 2006-2008), and President of Fidelity Strategic Investments (investment adviser firm, 2002-2005).
* Determined to be an “Interested Trustee” by virtue of, among other things, his or her affiliation with the trust or various entities under common control with FMR.
+ The information includes the Trustee's principal occupation during the last five years and other information relating to the experience, attributes, and skills relevant to the Trustee's qualifications to serve as a Trustee, which led to the conclusion that the Trustee should serve as a Trustee for the fund.
Independent Trustees:
Correspondence intended for an Independent Trustee may be sent to Fidelity Investments, P.O. Box 55235, Boston, Massachusetts 02205-5235.
Name, Year of Birth; Principal Occupations and Other Relevant Experience+
Dennis J. Dirks (1948)
Year of Election or Appointment: 2005
Trustee
Mr. Dirks also serves as Trustee of other Fidelity® funds. Prior to his retirement in May 2003, Mr. Dirks served as Chief Operating Officer and as a member of the Board of The Depository Trust & Clearing Corporation (financial markets infrastructure), President, Chief Operating Officer and a member of the Board of The Depository Trust Company (DTC), President and a member of the Board of the National Securities Clearing Corporation (NSCC), Chief Executive Officer and a member of the Board of the Government Securities Clearing Corporation and Chief Executive Officer and a member of the Board of the Mortgage-Backed Securities Clearing Corporation. Mr. Dirks currently serves as a member of the Finance Committee (2016-present) and Board (2017-present) and is Treasurer (2018-present) of the Asolo Repertory Theatre.
Donald F. Donahue (1950)
Year of Election or Appointment: 2018
Trustee
Mr. Donahue also serves as Trustee of other Fidelity® funds. Mr. Donahue serves as President and Chief Executive Officer of Miranda Partners, LLC (risk consulting for the financial services industry, 2012-present). Previously, Mr. Donahue served as Chief Executive Officer (2006-2012), Chief Operating Officer (2003-2006) and Managing Director, Customer Marketing and Development (1999-2003) of The Depository Trust & Clearing Corporation (financial markets infrastructure). Mr. Donahue currently serves as a member (2007-present) and Co-Chairman (2016-present) of the Board of United Way of New York, a member of the Board of NYC Leadership Academy (2012-present) and a member of the Board of Advisors of Ripple Labs, Inc. (financial services, 2015-present). Mr. Donahue previously served as a member of the Advisory Board of certain Fidelity® funds (2015-2018).
Vicki L. Fuller (1957)
Year of Election or Appointment: 2020
Trustee
Ms. Fuller also serves as Trustee of other Fidelity® funds. Previously, Ms. Fuller served as a member of the Advisory Board of certain Fidelity® funds (2018-2020), Chief Investment Officer of the New York State Common Retirement Fund (2012-2018) and held a variety of positions at AllianceBernstein L.P. (global asset management, 1985-2012), including Managing Director (2006-2012) and Senior Vice President and Senior Portfolio Manager (2001-2006). Ms. Fuller currently serves as a member of the Board, Audit Committee and Nominating and Governance Committee of The Williams Companies, Inc. (natural gas infrastructure, 2018-present) and as a member of the Board of Treliant, LLC (consulting, 2019-present).
Patricia L. Kampling (1959)
Year of Election or Appointment: 2020
Trustee
Ms. Kampling also serves as Trustee of other Fidelity® funds. Prior to her retirement, Ms. Kampling served as Chairman of the Board and Chief Executive Officer (2012-2019), President and Chief Operating Officer (2011-2012) and Executive Vice President and Chief Financial Officer (2010-2011) of Alliant Energy Corporation. Ms. Kampling currently serves as a member of the Board, Compensation Committee and Executive Committee and as Chair of the Audit Committee of Briggs & Stratton Corporation (manufacturing, 2011-present) and as a member of the Board, Audit, Finance and Risk Committee and Safety, Environmental, Technology and Operations Committee of American Water Works Company, Inc. (utilities company, 2019-present). In addition, Ms. Kampling currently serves as a member of the Board of the Nature Conservancy, Wisconsin Chapter (2019-present). Previously, Ms. Kampling served as a Member of the Advisory Board of certain Fidelity® funds (2020), a member of the Board of Interstate Power and Light Company (2012-2019) and Wisconsin Power and Light Company (2012-2019) (each a subsidiary of Alliant Energy Corporation) and as a member of the Board and Workforce Development Committee of the Business Roundtable (2018-2019).
Alan J. Lacy (1953)
Year of Election or Appointment: 2008
Trustee
Mr. Lacy also serves as Trustee of other Fidelity® funds. Previously, Mr. Lacy served as Senior Adviser (2007-2014) of Oak Hill Capital Partners, L.P. (private equity), Chief Executive Officer (2005) and Vice Chairman (2005-2006) of Sears Holdings Corporation (retail), Chief Executive Officer and Chairman of the Board of Sears, Roebuck and Co. (retail, 2000-2005), Chairman (2014-2017) and a member of the Board (2010-2017) of Dave & Buster’s Entertainment, Inc. (restaurant and entertainment complexes) and a member of the Board of Bristol-Myers Squibb Company (global pharmaceuticals, 2008-2020). Mr. Lacy currently serves as a Trustee of the California Chapter of The Nature Conservancy (2015-present) and a member of the Board of the Center for Advanced Study in the Behavioral Sciences at Stanford University (2015-present).
Ned C. Lautenbach (1944)
Year of Election or Appointment: 2000
Trustee
Co-Lead Independent Trustee
Mr. Lautenbach also serves as Trustee of other Fidelity® funds. Mr. Lautenbach currently serves as Chair of the Board of Governors, State University System of Florida (2013-present) and is a member of the Council on Foreign Relations (1994-present). He is also a member and has in the past served as Chairman of the Board of Directors of Artis-Naples (2012-present). Previously, Mr. Lautenbach served as a member and then Lead Director of the Board of Directors of Eaton Corporation (diversified industrial, 1997-2016). He was also a Partner at Clayton, Dubilier & Rice, LLC (private equity investment, 1998-2010); as well as Director of Sony Corporation (2006-2007). In addition, Mr. Lautenbach had a 30-year career with IBM (technology company), during which time he served as Senior Vice President and as a member of the Corporate Executive Committee (1968-1998).
Joseph Mauriello (1944)
Year of Election or Appointment: 2008
Trustee
Mr. Mauriello also serves as Trustee of other Fidelity® funds. Prior to his retirement in January 2006, Mr. Mauriello served in numerous senior management positions including Deputy Chairman and Chief Operating Officer (2004-2005), and Vice Chairman of Financial Services (2002-2004) of KPMG LLP US (professional services, 1965-2005). Mr. Mauriello currently serves as a member of the Independent Directors Council Governing Council (2015-present). Previously, Mr. Mauriello served as a member of the Board of XL Group plc. (global insurance and re-insurance, 2006-2018).
Cornelia M. Small (1944)
Year of Election or Appointment: 2005
Trustee
Ms. Small also serves as Trustee of other Fidelity® funds. Previously, Ms. Small served as Chief Investment Officer, Director of Global Equity Investments and a member of Scudder, Stevens & Clark and Scudder Kemper Investments. Ms. Small previously served as a member of the Board (2009-2019) and Chair of the Investment Committee (2010-2019) of the Teagle Foundation and a member of the Investment Committee of the Berkshire Taconic Community Foundation (2008-2019).
Garnett A. Smith (1947)
Year of Election or Appointment: 2018
Trustee
Mr. Smith also serves as Trustee of other Fidelity® funds. Prior to his retirement, Mr. Smith served as Chairman and Chief Executive Officer (1990-1997) and President (1986-1990) of Inbrand Corp. (manufacturer of personal absorbent products). Prior to his employment with Inbrand Corp., he was employed by a retail fabric chain and North Carolina National Bank (now Bank of America). Mr. Smith previously served as a member of the Advisory Board of certain Fidelity® funds (2012-2013).
David M. Thomas (1949)
Year of Election or Appointment: 2008
Trustee
Co-Lead Independent Trustee
Mr. Thomas also serves as Trustee of other Fidelity® funds. Previously, Mr. Thomas served as Executive Chairman (2005-2006) and Chairman and Chief Executive Officer (2000-2005) of IMS Health, Inc. (pharmaceutical and healthcare information solutions). Mr. Thomas currently serves as Non-Executive Chairman of the Board of Fortune Brands Home and Security (home and security products, 2011-present), and a member of the Board (2004-present) and Presiding Director (2013-present) of Interpublic Group of Companies, Inc. (marketing communication).
Susan Tomasky (1953)
Year of Election or Appointment: 2020
Trustee
Ms. Tomasky also serves as Trustee of other Fidelity® funds. Prior to her retirement, Ms. Tomasky served in various executive officer positions at American Electric Power Company, Inc. (1998-2011), including most recently as President of AEP Transmission (2007-2011). Ms. Tomasky currently serves as a member of the Board and Sustainability Committee and as Chair of the Audit Committee of Marathon Petroleum Corporation (2018-present) and as a member of the Board, Corporate Governance Committee and Organization and Compensation Committee and as Chair of the Audit Committee of Public Service Enterprise Group, Inc. (utilities company, 2012-present). In addition, Ms. Tomasky currently serves as a member of the Board of the Columbus Regional Airport Authority (2007-present), as a member of the Board of the Royal Shakespeare Company – America (2009-present), as a member of the Board of the Columbus Association for the Performing Arts (2011-present) and as a member of the Board of Kenyon College (2016-present). Previously, Ms. Tomasky served as a Member of the Advisory Board of certain Fidelity® funds (2020), a member of the Board (2011-2019) and as Lead Independent Director (2015-2018) of Andeavor Corporation (previously Tesoro Corporation) (independent oil refiner and marketer) and as a member of the Board of Summit Midstream Partners LP (energy, 2012-2018).
Michael E. Wiley (1950)
Year of Election or Appointment: 2020
Trustee
Mr. Wiley also serves as Trustee of other Fidelity® funds. Previously, Mr. Wiley served as a member of the Advisory Board of certain Fidelity® funds (2018-2020), Chairman, President and CEO of Baker Hughes, Inc. (oilfield services, 2000-2004). Mr. Wiley also previously served as a member of the Board of Andeavor Corporation (independent oil refiner and marketer, 2005-2018), a member of the Board of Andeavor Logistics LP (natural resources logistics, 2015-2018) and a member of the Board of High Point Resources (exploration and production, 2005-2020).
+ The information includes the Trustee's principal occupation during the last five years and other information relating to the experience, attributes, and skills relevant to the Trustee's qualifications to serve as a Trustee, which led to the conclusion that the Trustee should serve as a Trustee for the fund.
Advisory Board Members and Officers:
Correspondence intended for a Member of the Advisory Board (if any) may be sent to Fidelity Investments, P.O. Box 55235, Boston, Massachusetts 02205-5235. Correspondence intended for an officer or Peter S. Lynch may be sent to Fidelity Investments, 245 Summer Street, Boston, Massachusetts 02210. Officers appear below in alphabetical order.
Name, Year of Birth; Principal Occupation
Peter S. Lynch (1944)
Year of Election or Appointment: 2003
Member of the Advisory Board
Mr. Lynch also serves as a Member of the Advisory Board of other Fidelity® funds. Mr. Lynch is Vice Chairman and a Director of Fidelity Management & Research Company LLC (investment adviser firm). In addition, Mr. Lynch serves as a Trustee of Boston College and as the Chairman of the Inner-City Scholarship Fund. Previously, Mr. Lynch served as Vice Chairman and a Director of FMR Co., Inc. (investment adviser firm) and on the Special Olympics International Board of Directors (1997-2006).
Elizabeth Paige Baumann (1968)
Year of Election or Appointment: 2017
Anti-Money Laundering (AML) Officer
Ms. Baumann also serves as AML Officer of other funds. She is Chief AML Officer (2012-present) and Senior Vice President (2014-present) of FMR LLC (diversified financial services company) and is an employee of Fidelity Investments. Previously, Ms. Baumann served as AML Officer of certain funds (2017-2019), as AML Officer of the funds (2012-2016), and Vice President (2007-2014) and Deputy Anti-Money Laundering Officer (2007-2012) of FMR LLC.
Craig S. Brown (1977)
Year of Election or Appointment: 2019
Assistant Treasurer
Mr. Brown also serves as Assistant Treasurer of other funds. Mr. Brown is an employee of Fidelity Investments (2013-present).
John J. Burke III (1964)
Year of Election or Appointment: 2018
Chief Financial Officer
Mr. Burke also serves as Chief Financial Officer of other funds. Mr. Burke serves as Head of Investment Operations for Fidelity Fund and Investment Operations (2018-present) and is an employee of Fidelity Investments (1998-present). Previously Mr. Burke served as head of Asset Management Investment Operations (2012-2018).
William C. Coffey (1969)
Year of Election or Appointment: 2019
Assistant Secretary
Mr. Coffey also serves as Assistant Secretary of other funds. He is Senior Vice President and Deputy General Counsel of FMR LLC (diversified financial services company, 2010-present), and is an employee of Fidelity Investments. Previously, Mr. Coffey served as Secretary and CLO of certain funds (2018-2019); CLO, Secretary, and Senior Vice President of Fidelity Management & Research Company and FMR Co., Inc. (investment adviser firms, 2018-2019); Secretary of Fidelity SelectCo, LLC and Fidelity Investments Money Management, Inc. (investment adviser firms, 2018-2019); CLO of Fidelity Management & Research (Hong Kong) Limited, FMR Investment Management (UK) Limited, and Fidelity Management & Research (Japan) Limited (investment adviser firms, 2018-2019); and Assistant Secretary of certain funds (2009-2018).
Timothy M. Cohen (1969)
Year of Election or Appointment: 2018
Vice President
Mr. Cohen also serves as Vice President of other funds. Mr. Cohen serves as Co-Head of Equity (2018-present), a Director of Fidelity Management & Research (Japan) Limited (investment adviser firm, 2016-present), and is an employee of Fidelity Investments. Previously, Mr. Cohen served as Executive Vice President of Fidelity SelectCo, LLC (2019), Head of Global Equity Research (2016-2018), Chief Investment Officer - Equity and a Director of Fidelity Management & Research (U.K.) Inc. (investment adviser firm, 2013-2015) and as a Director of Fidelity Management & Research (Hong Kong) Limited (investment adviser firm, 2017).
Jonathan Davis (1968)
Year of Election or Appointment: 2010
Assistant Treasurer
Mr. Davis also serves as Assistant Treasurer of other funds. Mr. Davis serves as Assistant Treasurer of FMR Capital, Inc. (2017-present) and is an employee of Fidelity Investments. Previously, Mr. Davis served as Vice President and Associate General Counsel of FMR LLC (diversified financial services company, 2003-2010).
Laura M. Del Prato (1964)
Year of Election or Appointment: 2018
Assistant Treasurer
Ms. Del Prato also serves as an officer of other funds. Ms. Del Prato is an employee of Fidelity Investments (2017-present). Previously, Ms. Del Prato served as President and Treasurer of The North Carolina Capital Management Trust: Cash Portfolio and Term Portfolio (2018-2020). Prior to joining Fidelity Investments, Ms. Del Prato served as a Managing Director and Treasurer of the JPMorgan Mutual Funds (2014-2017). Prior to JPMorgan, Ms. Del Prato served as a partner at Cohen Fund Audit Services (accounting firm, 2012-2013) and KPMG LLP (accounting firm, 2004-2012).
Colm A. Hogan (1973)
Year of Election or Appointment: 2020
Assistant Treasurer
Mr. Hogan also serves as an officer of other funds. Mr. Hogan serves as Assistant Treasurer of FMR Capital, Inc. (2017-present) and is an employee of Fidelity Investments (2005-present). Previously, Mr. Hogan served as Deputy Treasurer of certain Fidelity® funds (2016-2020) and Assistant Treasurer of certain Fidelity® funds (2016-2018).
Pamela R. Holding (1964)
Year of Election or Appointment: 2018
Vice President
Ms. Holding also serves as Vice President of other funds. Ms. Holding serves as Co-Head of Equity (2018-present) and is an employee of Fidelity Investments (2013-present). Previously, Ms. Holding served as Executive Vice President of Fidelity SelectCo, LLC (2019) and as Chief Investment Officer of Fidelity Institutional Asset Management (2013-2018).
Cynthia Lo Bessette (1969)
Year of Election or Appointment: 2019
Secretary and Chief Legal Officer (CLO)
Ms. Lo Bessette also serves as an officer of other funds. Ms. Lo Bessette serves as CLO, Secretary, and Senior Vice President of Fidelity Management & Research Company LLC (investment adviser firm, 2019-present); and CLO of Fidelity Management & Research (Hong Kong) Limited, FMR Investment Management (UK) Limited, and Fidelity Management & Research (Japan) Limited (investment adviser firms, 2019-present). She is a Senior Vice President and Deputy General Counsel of FMR LLC (diversified financial services company, 2019-present), and is an employee of Fidelity Investments. Previously, Ms. Lo Bessette served as CLO, Secretary, and Senior Vice President of FMR Co., Inc. (investment adviser firm, 2019); Secretary of Fidelity SelectCo, LLC and Fidelity Investments Money Management, Inc. (investment adviser firms, 2019). Prior to joining Fidelity Investments, Ms. Lo Bessette was Executive Vice President, General Counsel (2016-2019) and Senior Vice President, Deputy General Counsel (2015-2016) of OppenheimerFunds (investment management company) and Deputy Chief Legal Officer (2013-2015) of Jennison Associates LLC (investment adviser firm).
Chris Maher (1972)
Year of Election or Appointment: 2020
Deputy Treasurer
Mr. Maher also serves as an officer of other funds. Mr. Maher serves as Assistant Treasurer of FMR Capital, Inc. (2017-present), and is an employee of Fidelity Investments (2008-present). Previously, Mr. Maher served as Assistant Treasurer of certain funds (2013-2020); Vice President of Asset Management Compliance (2013), Vice President of the Program Management Group of FMR (investment adviser firm, 2010-2013), and Vice President of Valuation Oversight (2008-2010).
Jason P. Pogorelec (1975)
Year of Election or Appointment: 2020
Chief Compliance Officer
Mr. Pogorelec also serves as Chief Compliance Officer of other funds. Mr. Pogorelec is a senior Vice President of Asset Management Compliance for Fidelity Investments and is an employee of Fidelity Investments (2006-present). Previously, Mr. Pogorelec served as Vice President, Associate General Counsel for Fidelity Investments (2010-2020) and Assistant Secretary of certain Fidelity funds (2015-2020).
Stacie M. Smith (1974)
Year of Election or Appointment: 2016
President and Treasurer
Ms. Smith also serves as an officer of other funds. Ms. Smith serves as Assistant Treasurer of FMR Capital, Inc. (2017-present), is an employee of Fidelity Investments (2009-present), and has served in other fund officer roles. Prior to joining Fidelity Investments, Ms. Smith served as Senior Audit Manager of Ernst & Young LLP (accounting firm, 1996-2009). Previously, Ms. Smith served as Assistant Treasurer (2013-2019) and Deputy Treasurer (2013-2016) of certain Fidelity® funds.
Marc L. Spector (1972)
Year of Election or Appointment: 2016
Assistant Treasurer
Mr. Spector also serves as an officer of other funds. Mr. Spector serves as Assistant Treasurer of FMR Capital, Inc. (2017-present) and is an employee of Fidelity Investments (2016-present). Prior to joining Fidelity Investments, Mr. Spector served as Director at the Siegfried Group (accounting firm, 2013-2016), and prior to Siegfried Group as audit senior manager at Deloitte & Touche LLP (accounting firm, 2005-2013).
Jim Wegmann (1979)
Year of Election or Appointment: 2019
Assistant Treasurer
Mr. Wegmann also serves as Assistant Treasurer of other funds. Mr. Wegmann is an employee of Fidelity Investments (2011-present).
Shareholder Expense Example
As a shareholder, you incur two types of costs: (1) transaction costs, which may include sales charges (loads) on purchase payments or redemption proceeds, as applicable and (2) ongoing costs, which generally include management fees, distribution and/or service (12b-1) fees and other Fund expenses. This Example is intended to help you understand your ongoing costs (in dollars) of investing in a fund and to compare these costs with the ongoing costs of investing in other mutual funds.
The Example is based on an investment of $1,000 invested at the beginning of the period and held for the entire period (February 1, 2020 to July 31, 2020).
Actual Expenses
The first line of the accompanying table provides information about actual account values and actual expenses. You may use the information in this line, together with the amount you invested, to estimate the expenses that you paid over the period. Simply divide your account value by $1,000.00 (for example, an $8,600 account value divided by $1,000.00 = 8.6), then multiply the result by the number in the first line for a class/Fund under the heading entitled "Expenses Paid During Period" to estimate the expenses you paid on your account during this period. If any fund is a shareholder of any underlying mutual funds or exchange-traded funds (ETFs) (the Underlying Funds), such fund indirectly bears its proportional share of the expenses of the Underlying Funds in addition to the direct expenses incurred presented in the table. These fees and expenses are not included in the annualized expense ratio used to calculate the expense estimate in the table below.
Hypothetical Example for Comparison Purposes
The second line of the accompanying table provides information about hypothetical account values and hypothetical expenses based on the actual expense ratio and an assumed rate of return of 5% per year before expenses, which is not the actual return. The hypothetical account values and expenses may not be used to estimate the actual ending account balance or expenses you paid for the period. You may use this information to compare the ongoing costs of investing in the Fund and other funds. To do so, compare this 5% hypothetical example with the 5% hypothetical examples that appear in the shareholder reports of the other funds. If any fund is a shareholder of any Underlying Funds, such fund indirectly bears its proportional share of the expenses of the Underlying Funds in addition to the direct expenses as presented in the table. These fees and expenses are not included in the annualized expense ratio used to calculate the expense estimate in the table below.
Please note that the expenses shown in the table are meant to highlight your ongoing costs only and do not reflect any transaction costs. Therefore, the second line of the table is useful in comparing ongoing costs only, and will not help you determine the relative total costs of owning different funds.
| | Annualized Expense Ratio-A | Beginning
Account Value
February 1, 2020 | Ending
Account Value
July 31, 2020 | Expenses Paid
During Period-B
February 1, 2020
to July 31, 2020 |
| Fidelity Low-Priced Stock Fund | | | | |
| Low-Priced Stock | .83% | | | |
| Actual | | $1,000.00 | $935.60 | $3.99 |
| Hypothetical-C | | $1,000.00 | $1,020.74 | $4.17 |
| Class K | .74% | | | |
| Actual | | $1,000.00 | $936.00 | $3.56 |
| Hypothetical-C | | $1,000.00 | $1,021.18 | $3.72 |
A Annualized expense ratio reflects expenses net of applicable fee waivers.
B Expenses are equal to the annualized expense ratio, multiplied by the average account value over the period, multiplied by 182/ 366 (to reflect the one-half year period). The fees and expenses of any Underlying Funds are not included in each annualized expense ratio.
C 5% return per year before expenses
Distributions (Unaudited)
The Board of Trustees of Fidelity Low-Priced Stock Fund voted to pay to shareholders of record at the opening of business on record date, the following distributions per share derived from capital gains realized from sales of portfolio securities and dividends derived from net investment income:
| | Pay Date | Record Date | Dividends | Capital Gains |
| Fidelity Low-Priced Stock Fund | | | | |
| Low-Priced Stock | 09/14/20 | 09/11/20 | $0.435 | $2.727 |
| Class K | 09/14/20 | 09/11/20 | $0.459 | $2.727 |
|
The fund hereby designates as a capital gain dividend with respect to the taxable year ended July 31, 2020, $1,618,140,424, or, if subsequently determined to be different, the net capital gain of such year.
Low-Priced Stock designates 54% and 50%; and Class K designates 51% and 48% of the dividends distributed in September and December, respectively during the fiscal year as qualifying for the dividends–received deduction for corporate shareholders.
Low-Priced Stock and Class K designate 100% of the dividends distributed during the fiscal year as amounts which may be taken into account as a dividend for purposes of the maximum rate under section 1(h)(11) of the Internal Revenue Code.
Fidelity Event Driven Opportunities Fund designates 59% of the dividends distributed in June during the fiscal year as qualifying for the dividends–received deduction for corporate shareholders.
Fidelity Event Driven Opportunities Fund designates 84% of the dividends distributed during the fiscal year as amounts which may be taken into account as a dividend for purposes of the maximum rate under section 1(h)(11) of the Internal Revenue Code.
The fund will notify shareholders in January 2021 of amounts for use in preparing 2020 income tax returns.
Liquidity Risk Management Program
The Securities and Exchange Commission adopted Rule 22e-4 under the Investment Company Act of 1940 (the Liquidity Rule) to promote effective liquidity risk management throughout the open-end investment company industry, thereby reducing the risk that funds will be unable to meet their redemption obligations and mitigating dilution of the interests of fund shareholders.
The Fund has adopted and implemented a liquidity risk management program pursuant to the Liquidity Rule (the Program) effective December 1, 2018. The Program is reasonably designed to assess and manage the Fund’s liquidity risk and to comply with the requirements of the Liquidity Rule. The Fund’s Board of Trustees (the Board) has designated the Fund’s investment adviser as administrator of the Program. The Fidelity advisers have established a Liquidity Risk Management Committee (the LRM Committee) to manage the Program for each of the Fidelity Funds. The LRM Committee monitors the adequacy and effectiveness of implementation of the Program and on a periodic basis assesses each Fund’s liquidity risk based on a variety of factors including (1) the Fund’s investment strategy, (2) portfolio liquidity and cash flow projections during normal and reasonably foreseeable stressed conditions, (3) shareholder redemptions, (4) borrowings and other funding sources and (5) in the case of exchange-traded funds, certain additional factors including the effect of the Fund’s prices and spreads, market participants, and basket compositions on the overall liquidity of the Fund’s portfolio, as applicable.
In accordance with the Program, each of the Fund’s portfolio investments is classified into one of four liquidity categories described below based on a determination of a reasonable expectation for how long it would take to convert the investment to cash (or sell or dispose of the investment) without significantly changing its market value.
- Highly liquid investments – cash or convertible to cash within three business days or less
- Moderately liquid investments – convertible to cash in three to seven calendar days
- Less liquid investments – can be sold or disposed of, but not settled, within seven calendar days
- Illiquid investments – cannot be sold or disposed of within seven calendar days
Liquidity classification determinations take into account a variety of factors including various market, trading and investment-specific considerations, as well as market depth, and generally utilize analysis from a third-party liquidity metrics service.
The Liquidity Rule places a 15% limit on a fund’s illiquid investments and requires funds that do not primarily hold assets that are highly liquid investments to determine and maintain a minimum percentage of the fund’s net assets to be invested in highly liquid investments (highly liquid investment minimum or HLIM). The Program includes provisions reasonably designed to comply with the 15% limit on illiquid investments and for determining, periodically reviewing and complying with the HLIM requirement as applicable.
At a recent meeting of the Fund’s Board of Trustees, the LRM Committee provided a written report to the Board pertaining to the operation, adequacy, and effectiveness of implementation of the Program for the annual period from December 1, 2018 through November 30, 2019. The report concluded that the Program has been implemented and is operating effectively and is reasonably designed to assess and manage the Fund’s liquidity risk.
Proxy Voting Results
A special meeting of shareholders was held on June 9, 2020. The results of votes taken among shareholders on the proposals before them are reported below. Each vote reported represents one dollar of net asset value held on the record date for the meeting.
PROPOSAL 1
To elect a Board of Trustees.
| | # of
Votes | % of
Votes |
| Dennis J. Dirks |
| Affirmative | 51,196,847,491.427 | 94.398 |
| Withheld | 3,038,239,286.369 | 5.602 |
| TOTAL | 54,235,086,777.797 | 100.000 |
| Donald F. Donahue |
| Affirmative | 51,237,854,534.400 | 94.474 |
| Withheld | 2,997,232,243.397 | 5.526 |
| TOTAL | 54,235,086,777.797 | 100.000 |
| Bettina Doulton |
| Affirmative | 51,360,110,652.541 | 94.699 |
| Withheld | 2,874,976,125.255 | 5.301 |
| TOTAL | 54,235,086,777.797 | 100.000 |
| Vicki L. Fuller |
| Affirmative | 51,563,431,518.122 | 95.074 |
| Withheld | 2,671,655,259.675 | 4.926 |
| TOTAL | 54,235,086,777.797 | 100.000 |
| Patricia L. Kampling |
| Affirmative | 51,164,274,033.278 | 94.338 |
| Withheld | 3,070,812,744.518 | 5.662 |
| TOTAL | 54,235,086,777.797 | 100.000 |
| Alan J. Lacy |
| Affirmative | 50,656,049,520.376 | 93.401 |
| Withheld | 3,579,037,257.420 | 6.599 |
| TOTAL | 54,235,086,777.797 | 100.000 |
| Ned C. Lautenbach |
| Affirmative | 50,648,184,728.350 | 93.386 |
| Withheld | 3,586,902,049.447 | 6.614 |
| TOTAL | 54,235,086,777.797 | 100.000 |
| Robert A. Lawrence |
| Affirmative | 50,828,079,099.188 | 93.718 |
| Withheld | 3,407,007,678.608 | 6.282 |
| TOTAL | 54,235,086,777.797 | 100.000 |
| Joseph Mauriello |
| Affirmative | 50,733,010,817.685 | 93.543 |
| Withheld | 3,502,075,960.112 | 6.457 |
| TOTAL | 54,235,086,777.797 | 100.000 |
| Cornelia M. Small |
| Affirmative | 50,936,822,997.692 | 93.919 |
| Withheld | 3,298,263,780.105 | 6.081 |
| TOTAL | 54,235,086,777.797 | 100.000 |
| Garnett A. Smith |
| Affirmative | 50,777,344,834.274 | 93.625 |
| Withheld | 3,457,741,943.523 | 6.375 |
| TOTAL | 54,235,086,777.797 | 100.000 |
| David M. Thomas |
| Affirmative | 50,835,673,463.433 | 93.732 |
| Withheld | 3,399,413,314.364 | 6.268 |
| TOTAL | 54,235,086,777.797 | 100.000 |
| Susan Tomasky |
| Affirmative | 51,193,289,850.509 | 94.391 |
| Withheld | 3,041,796,927.288 | 5.609 |
| TOTAL | 54,235,086,777.797 | 100.000 |
| Michael E. Wiley |
| Affirmative | 50,830,132,792.508 | 93.722 |
| Withheld | 3,404,953,985.289 | 6.278 |
| TOTAL | 54,235,086,777.797 | 100.000 |
PROPOSAL 2
To convert a fundamental investment policy to a non-fundamental investment policy.
| | # of
Votes | % of
Votes |
| Affirmative | 8,024,290,802.810 | 68.978 |
| Against | 1,746,850,201.565 | 15.016 |
| Abstain | 1,333,748,463.547 | 11.465 |
| Broker Non-Vote | 528,253,646.120 | 4.541 |
| TOTAL | 11,633,143,114.042 | 100.000 |
PROPOSAL 5
A shareholder proposal to institute procedures to avoid holding investments in companies that contribute to genocide or crimes against humanity.
| | # of
Votes | % of
Votes |
| Affirmative | 3,500,236,283.715 | 30.088 |
| Against | 6,658,173,616.229 | 57.235 |
| Abstain | 918,253,016.169 | 7.893 |
| Broker Non-Vote | 556,480,197.930 | 4.784 |
| TOTAL | 11,633,143,114.042 | 100.000 |
| Proposal 1 reflects trust wide proposal and voting results. |
| Proposal 5 was not approved by shareholders. |

LPS-ANN-0920
1.536378.123
Fidelity® Value Discovery Fund
Annual Report
July 31, 2020
See the inside front cover for important information about access to your fund’s shareholder reports.
Beginning on January 1, 2021, as permitted by regulations adopted by the Securities and Exchange Commission, paper copies of a fund’s shareholder reports will no longer be sent by mail, unless you specifically request paper copies of the reports from the fund or from your financial intermediary, such as a financial advisor, broker-dealer or bank. Instead, the reports will be made available on a website, and you will be notified by mail each time a report is posted and provided with a website link to access the report.
If you already elected to receive shareholder reports electronically, you will not be affected by this change and you need not take any action. You may elect to receive shareholder reports and other communications from a fund electronically, by contacting your financial intermediary. For Fidelity customers, visit Fidelity's web site or call Fidelity using the contact information listed below.
You may elect to receive all future reports in paper free of charge. If you wish to continue receiving paper copies of your shareholder reports, you may contact your financial intermediary or, if you are a Fidelity customer, visit Fidelity’s website, or call Fidelity at the applicable toll-free number listed below. Your election to receive reports in paper will apply to all funds held with the fund complex/your financial intermediary.
| Account Type | Website | Phone Number |
| Brokerage, Mutual Fund, or Annuity Contracts: | fidelity.com/mailpreferences | 1-800-343-3548 |
| Employer Provided Retirement Accounts: | netbenefits.fidelity.com/preferences (choose 'no' under Required Disclosures to continue to print) | 1-800-343-0860 |
| Advisor Sold Accounts Serviced Through Your Financial Intermediary: | Contact Your Financial Intermediary | Your Financial Intermediary's phone number |
| Advisor Sold Accounts Serviced by Fidelity: | institutional.fidelity.com | 1-877-208-0098 |
Contents
To view a fund's proxy voting guidelines and proxy voting record for the 12-month period ended June 30, visit http://www.fidelity.com/proxyvotingresults or visit the Securities and Exchange Commission's (SEC) web site at http://www.sec.gov.
You may also call 1-800-544-8544 if you’re an individual investing directly with Fidelity, call 1-800-835-5092 if you’re a plan sponsor or participant with Fidelity as your recordkeeper or call 1-877-208-0098 on institutional accounts or if you’re an advisor or invest through one to request a free copy of the proxy voting guidelines.
Standard & Poor's, S&P and S&P 500 are registered service marks of The McGraw-Hill Companies, Inc. and have been licensed for use by Fidelity Distributors Corporation.
Other third-party marks appearing herein are the property of their respective owners.
All other marks appearing herein are registered or unregistered trademarks or service marks of FMR LLC or an affiliated company. © 2020 FMR LLC. All rights reserved.
This report and the financial statements contained herein are submitted for the general information of the shareholders of the Fund. This report is not authorized for distribution to prospective investors in the Fund unless preceded or accompanied by an effective prospectus.
A fund files its complete schedule of portfolio holdings with the SEC for the first and third quarters of each fiscal year on Form N-PORT. Forms N-PORT are available on the SEC’s web site at http://www.sec.gov. A fund's Forms N-PORT may be reviewed and copied at the SEC’s Public Reference Room in Washington, DC. Information regarding the operation of the SEC's Public Reference Room may be obtained by calling 1-800-SEC-0330.
For a complete list of a fund's portfolio holdings, view the most recent holdings listing, semiannual report, or annual report on Fidelity's web site at http://www.fidelity.com, http://www.institutional.fidelity.com, or http://www.401k.com, as applicable.
NOT FDIC INSURED •MAY LOSE VALUE •NO BANK GUARANTEE
Neither the Fund nor Fidelity Distributors Corporation is a bank.
Note to Shareholders:
Early in 2020, the outbreak and spread of a new coronavirus emerged as a public health emergency that had a major influence on financial markets, primarily based on its impact on the global economy and the outlook for corporate earnings. The virus causes a respiratory disease known as COVID-19. On March 11, the World Health Organization declared the COVID-19 outbreak a pandemic, citing sustained risk of further global spread.
In the weeks following, as the crisis worsened, we witnessed an escalating human tragedy with wide-scale social and economic consequences from coronavirus-containment measures. The outbreak of COVID-19 prompted a number of measures to limit the spread, including travel and border restrictions, quarantines, and restrictions on large gatherings. In turn, these resulted in lower consumer activity, diminished demand for a wide range of products and services, disruption in manufacturing and supply chains, and – given the wide variability in outcomes regarding the outbreak – significant market uncertainty and volatility. Amid the turmoil, the U.S. government took unprecedented action – in concert with the U.S. Federal Reserve and central banks around the world – to help support consumers, businesses, and the broader economy, and to limit disruption to the financial system.
The situation continues to unfold, and the extent and duration of its impact on financial markets and the economy remain highly uncertain. Extreme events such as the coronavirus crisis are “exogenous shocks” that can have significant adverse effects on mutual funds and their investments. Although multiple asset classes may be affected by market disruption, the duration and impact may not be the same for all types of assets.
Fidelity is committed to helping you stay informed amid news about COVID-19 and during increased market volatility, and we’re taking extra steps to be responsive to customer needs. We encourage you to visit our websites, where we offer ongoing updates, commentary, and analysis on the markets and our funds.
Performance: The Bottom Line
Average annual total return reflects the change in the value of an investment, assuming reinvestment of distributions from dividend income and capital gains (the profits earned upon the sale of securities that have grown in value, if any) and assuming a constant rate of performance each year. The hypothetical investment and the average annual total returns do not reflect the deduction of taxes that a shareholder would pay on fund distributions or the redemption of fund shares. During periods of reimbursement by Fidelity, a fund’s total return will be greater than it would be had the reimbursement not occurred. How a fund did yesterday is no guarantee of how it will do tomorrow.
Average Annual Total Returns
| For the periods ended July 31, 2020 | Past 1 year | Past 5 years | Past 10 years |
| Fidelity® Value Discovery Fund | (3.54)% | 4.41% | 9.91% |
| Class K | (3.40)% | 4.54% | 10.07% |
$10,000 Over 10 Years
Let's say hypothetically that $10,000 was invested in Fidelity® Value Discovery Fund, a class of the fund, on July 31, 2010.
The chart shows how the value of your investment would have changed, and also shows how the Russell 3000® Value Index performed over the same period.
See (above) (previous page) for additional information regarding the performance of Fidelity® Value Discovery Fund.

| Period Ending Values |
| $25,722 | Fidelity® Value Discovery Fund |
| $25,745 | Russell 3000® Value Index |
Management's Discussion of Fund Performance
Market Recap: The S&P 500
® index gained 11.96% for the 12 months ending July 31, 2020, in what was a bumpy ride for U.S. equity investors, marked by a steep but brief decline due to the early-2020 outbreak and spread of the coronavirus, followed by a historic rebound. Declared a pandemic on March 11, the COVID-19 crisis and containment efforts caused broad contraction in economic activity, along with extreme uncertainty, volatility and dislocation in financial markets. By mid-March, U.S. stocks entered bear-market territory less than a month after hitting an all-time high and extending the longest-running bull market in American history. Stocks slid in late February, after a surge in COVID-19 cases outside China. The sudden downtrend continued in March (-12%), capping the index’s worst quarter since 2008. A historically rapid and expansive U.S. monetary/fiscal-policy response provided a partial offset to the economic disruption and fueled a sharp uptrend. Aggressive support for financial markets by the U.S. Federal Reserve, plans for reopening the economy and improving infection data boosted stocks in April (+13%) and May (+5%). In June and July, the index gained amid progress on potential treatments and signs of an early recovery in economic activity. For the full 12 months, growth stocks widely topped value, while large-caps handily bested smaller-caps. The information technology sector (+39%) led the way, followed by consumer discretionary (+22%). In contrast, energy (-38%) fell hard along with the price of crude oil.
Comments from Portfolio Manager: For the fiscal year ending July 31, 2020, the fund's share classes returned about -4% to -3%, outperforming the -6.67% result of the benchmark Russell 3000
® Value Index. The top contributor to performance versus the benchmark was an overweighting and security selection in health care. The fund's largest individual relative contributor was an outsized stake in Newmont, which gained 75% the past 12 months. The company was among the largest holdings as of July 31. Also boosting value was our overweighting in Amgen, which gained 34%. We reduced our stake the past 12 months. Another notable relative contributor was a larger-than-benchmark position in Centene (+25%), which also was one of our biggest holdings in the fund. Conversely, the primary detractor from performance versus the benchmark was security selection in the financials sector, primarily within the banks industry. Weak stock picks in consumer staples and real estate also hindered relative performance. The fund's largest individual relative detractor was an overweighting in Wells Fargo, which returned -47% the past year. The company was among our biggest holdings. Also hurting performance was an underweighting in Intel, which returned about -5%. This was a position we established the past 12 months. The fund's stake in GasLog Partners returned -76%. We decreased our non-benchmark stake in the company the past year. Notable changes in positioning include a higher allocation to the information technology and industrials sectors.
The views expressed above reflect those of the portfolio manager(s) only through the end of the period as stated on the cover of this report and do not necessarily represent the views of Fidelity or any other person in the Fidelity organization. Any such views are subject to change at any time based upon market or other conditions and Fidelity disclaims any responsibility to update such views. These views may not be relied on as investment advice and, because investment decisions for a Fidelity fund are based on numerous factors, may not be relied on as an indication of trading intent on behalf of any Fidelity fund.
Investment Summary (Unaudited)
Top Ten Stocks as of July 31, 2020
| | % of fund's net assets |
| Berkshire Hathaway, Inc. Class B | 3.4 |
| Comcast Corp. Class A | 2.8 |
| Cisco Systems, Inc. | 2.6 |
| Centene Corp. | 2.3 |
| Wells Fargo & Co. | 2.2 |
| Cigna Corp. | 2.2 |
| Bristol-Myers Squibb Co. | 2.2 |
| UnitedHealth Group, Inc. | 2.1 |
| Newmont Corp. | 2.1 |
| DuPont de Nemours, Inc. | 2.0 |
| | 23.9 |
Top Five Market Sectors as of July 31, 2020
| | % of fund's net assets |
| Health Care | 17.9 |
| Financials | 17.6 |
| Industrials | 14.5 |
| Information Technology | 10.8 |
| Communication Services | 9.5 |
Asset Allocation (% of fund's net assets)
| As of July 31, 2020* |
| | Stocks | 98.5% |
| | Short-Term Investments and Net Other Assets (Liabilities) | 1.5% |

* Foreign investments - 17.3%
Schedule of Investments July 31, 2020
Showing Percentage of Net Assets
| Common Stocks - 97.1% | | | |
| | | Shares | Value |
| COMMUNICATION SERVICES - 9.5% | | | |
| Entertainment - 0.2% | | | |
| Lions Gate Entertainment Corp. Class B (a) | | 569,477 | $4,048,981 |
| Interactive Media & Services - 2.9% | | | |
| Alphabet, Inc. Class A (a) | | 21,248 | 31,615,962 |
| Facebook, Inc. Class A (a) | | 86,400 | 21,917,088 |
| | | | 53,533,050 |
| Media - 4.7% | | | |
| Comcast Corp. Class A | | 1,190,803 | 50,966,368 |
| Fox Corp. Class A | | 218,511 | 5,631,028 |
| Interpublic Group of Companies, Inc. | | 1,194,645 | 21,563,342 |
| WPP PLC | | 1,106,700 | 8,207,615 |
| | | | 86,368,353 |
| Wireless Telecommunication Services - 1.7% | | | |
| T-Mobile U.S., Inc. | | 281,900 | 30,270,422 |
|
| TOTAL COMMUNICATION SERVICES | | | 174,220,806 |
|
| CONSUMER DISCRETIONARY - 8.1% | | | |
| Auto Components - 0.7% | | | |
| Lear Corp. | | 120,500 | 13,300,790 |
| Household Durables - 1.2% | | | |
| Newell Brands, Inc. | | 284,000 | 4,657,600 |
| Whirlpool Corp. (b) | | 103,495 | 16,882,104 |
| | | | 21,539,704 |
| Multiline Retail - 1.0% | | | |
| Dollar General Corp. | | 92,400 | 17,592,960 |
| Specialty Retail - 3.9% | | | |
| Best Buy Co., Inc. | | 230,700 | 22,975,413 |
| Dick's Sporting Goods, Inc. | | 191,000 | 8,713,420 |
| Lowe's Companies, Inc. | | 195,500 | 29,111,905 |
| Tiffany & Co., Inc. | | 37,300 | 4,675,928 |
| Urban Outfitters, Inc. (a) | | 110,800 | 1,832,632 |
| Williams-Sonoma, Inc. | | 57,700 | 5,026,824 |
| | | | 72,336,122 |
| Textiles, Apparel & Luxury Goods - 1.3% | | | |
| PVH Corp. | | 336,928 | 16,394,916 |
| Tapestry, Inc. | | 546,700 | 7,303,912 |
| | | | 23,698,828 |
|
| TOTAL CONSUMER DISCRETIONARY | | | 148,468,404 |
|
| CONSUMER STAPLES - 4.7% | | | |
| Beverages - 0.5% | | | |
| C&C Group PLC (United Kingdom) | | 3,229,410 | 9,786,194 |
| Food & Staples Retailing - 2.9% | | | |
| Performance Food Group Co. (a) | | 401,700 | 11,255,634 |
| Sysco Corp. | | 321,946 | 17,014,846 |
| U.S. Foods Holding Corp. (a) | | 1,163,600 | 23,621,080 |
| | | | 51,891,560 |
| Food Products - 0.3% | | | |
| Tyson Foods, Inc. Class A | | 84,600 | 5,198,670 |
| Household Products - 0.2% | | | |
| Spectrum Brands Holdings, Inc. | | 68,039 | 3,684,992 |
| Tobacco - 0.8% | | | |
| Altria Group, Inc. | | 364,200 | 14,986,830 |
|
| TOTAL CONSUMER STAPLES | | | 85,548,246 |
|
| ENERGY - 3.4% | | | |
| Energy Equipment & Services - 0.2% | | | |
| Hoegh LNG Partners LP (b) | | 342,695 | 3,529,759 |
| Oil, Gas & Consumable Fuels - 3.2% | | | |
| BP PLC sponsored ADR | | 247,400 | 5,452,696 |
| Cabot Oil & Gas Corp. | | 778,500 | 14,557,950 |
| GasLog Partners LP (b) | | 119,652 | 457,071 |
| Golar LNG Partners LP (b) | | 644,422 | 1,681,941 |
| Parex Resources, Inc. (a) | | 1,310,700 | 15,852,283 |
| Teekay LNG Partners LP | | 710,599 | 7,731,317 |
| Total SA sponsored ADR | | 199,000 | 7,494,340 |
| Valero Energy Corp. | | 93,900 | 5,279,997 |
| | | | 58,507,595 |
|
| TOTAL ENERGY | | | 62,037,354 |
|
| FINANCIALS - 17.6% | | | |
| Banks - 6.4% | | | |
| Bank of America Corp. | | 1,267,900 | 31,545,352 |
| CIT Group, Inc. | | 219,100 | 4,156,327 |
| Cullen/Frost Bankers, Inc. | | 63,400 | 4,568,604 |
| JPMorgan Chase & Co. | | 234,200 | 22,633,088 |
| M&T Bank Corp. | | 81,500 | 8,634,925 |
| Truist Financial Corp. | | 141,950 | 5,317,447 |
| Wells Fargo & Co. | | 1,653,786 | 40,120,848 |
| | | | 116,976,591 |
| Capital Markets - 1.2% | | | |
| Affiliated Managers Group, Inc. | | 115,000 | 7,910,850 |
| BlackRock, Inc. Class A | | 11,000 | 6,325,110 |
| Invesco Ltd. | | 220,300 | 2,211,812 |
| State Street Corp. | | 78,319 | 4,995,969 |
| | | | 21,443,741 |
| Consumer Finance - 2.5% | | | |
| Capital One Financial Corp. | | 323,032 | 20,609,442 |
| Discover Financial Services | | 504,722 | 24,948,408 |
| | | | 45,557,850 |
| Diversified Financial Services - 3.4% | | | |
| Berkshire Hathaway, Inc. Class B (a) | | 317,760 | 62,211,057 |
| Insurance - 3.4% | | | |
| Allstate Corp. | | 57,307 | 5,409,208 |
| American International Group, Inc. | | 242,500 | 7,793,950 |
| Chubb Ltd. | | 171,047 | 21,764,020 |
| MetLife, Inc. | | 102,700 | 3,887,195 |
| The Travelers Companies, Inc. | | 204,515 | 23,400,606 |
| | | | 62,254,979 |
| Mortgage Real Estate Investment Trusts - 0.2% | | | |
| AGNC Investment Corp. | | 273,500 | 3,719,600 |
| Thrifts & Mortgage Finance - 0.5% | | | |
| Essent Group Ltd. | | 157,400 | 5,639,642 |
| MGIC Investment Corp. | | 408,400 | 3,377,468 |
| | | | 9,017,110 |
|
| TOTAL FINANCIALS | | | 321,180,928 |
|
| HEALTH CARE - 17.9% | | | |
| Biotechnology - 3.5% | | | |
| Alexion Pharmaceuticals, Inc. (a) | | 146,400 | 15,004,536 |
| Amgen, Inc. | | 121,093 | 29,627,824 |
| Regeneron Pharmaceuticals, Inc. (a) | | 32,300 | 20,415,861 |
| | | | 65,048,221 |
| Health Care Providers & Services - 9.4% | | | |
| Anthem, Inc. | | 77,389 | 21,189,108 |
| Centene Corp. (a) | | 650,600 | 42,451,650 |
| Cigna Corp. | | 230,664 | 39,833,366 |
| CVS Health Corp. | | 338,160 | 21,283,790 |
| Humana, Inc. | | 19,800 | 7,770,510 |
| UnitedHealth Group, Inc. | | 128,700 | 38,967,786 |
| | | | 171,496,210 |
| Pharmaceuticals - 5.0% | | | |
| Bristol-Myers Squibb Co. | | 674,500 | 39,566,170 |
| Bristol-Myers Squibb Co. rights (a) | | 414,000 | 1,490,400 |
| Roche Holding AG (participation certificate) | | 85,044 | 29,455,548 |
| Sanofi SA sponsored ADR | | 394,142 | 20,672,748 |
| | | | 91,184,866 |
|
| TOTAL HEALTH CARE | | | 327,729,297 |
|
| INDUSTRIALS - 14.5% | | | |
| Aerospace & Defense - 2.4% | | | |
| Airbus Group NV | | 168,300 | 12,318,880 |
| General Dynamics Corp. | | 151,200 | 22,187,088 |
| Raytheon Technologies Corp. | | 169,300 | 9,595,924 |
| | | | 44,101,892 |
| Air Freight & Logistics - 0.5% | | | |
| Deutsche Post AG | | 145,300 | 5,897,754 |
| XPO Logistics, Inc. (a) | | 52,800 | 3,961,056 |
| | | | 9,858,810 |
| Airlines - 0.8% | | | |
| Alaska Air Group, Inc. | | 229,800 | 7,914,312 |
| Copa Holdings SA Class A (b) | | 151,600 | 6,282,304 |
| | | | 14,196,616 |
| Building Products - 2.3% | | | |
| Carrier Global Corp. | | 173,300 | 4,720,692 |
| Jeld-Wen Holding, Inc. (a) | | 173,600 | 3,402,560 |
| Owens Corning | | 316,200 | 19,120,614 |
| Trane Technologies PLC | | 126,200 | 14,117,994 |
| | | | 41,361,860 |
| Commercial Services & Supplies - 0.0% | | | |
| Steelcase, Inc. Class A | | 87,000 | 933,510 |
| Electrical Equipment - 2.8% | | | |
| Acuity Brands, Inc. | | 160,900 | 15,945,190 |
| Regal Beloit Corp. | | 161,400 | 14,843,958 |
| Vestas Wind Systems A/S | | 158,000 | 20,253,224 |
| | | | 51,042,372 |
| Industrial Conglomerates - 1.2% | | | |
| Siemens AG | | 171,600 | 21,868,024 |
| Machinery - 3.2% | | | |
| Gardner Denver Holdings, Inc. (a) | | 191,983 | 6,064,743 |
| ITT, Inc. | | 60,400 | 3,486,892 |
| Oshkosh Corp. | | 251,800 | 19,821,696 |
| Otis Worldwide Corp. | | 119,150 | 7,475,471 |
| Stanley Black & Decker, Inc. | | 139,800 | 21,434,136 |
| | | | 58,282,938 |
| Trading Companies & Distributors - 1.3% | | | |
| Beacon Roofing Supply, Inc. (a) | | 67,300 | 2,097,068 |
| HD Supply Holdings, Inc. (a) | | 432,600 | 15,184,260 |
| United Rentals, Inc. (a) | | 39,200 | 6,090,504 |
| | | | 23,371,832 |
|
| TOTAL INDUSTRIALS | | | 265,017,854 |
|
| INFORMATION TECHNOLOGY - 9.4% | | | |
| Communications Equipment - 2.7% | | | |
| Cisco Systems, Inc. | | 994,100 | 46,822,110 |
| CommScope Holding Co., Inc. (a) | | 231,400 | 2,147,392 |
| | | | 48,969,502 |
| Electronic Equipment & Components - 1.3% | | | |
| Avnet, Inc. | | 26,600 | 710,752 |
| TE Connectivity Ltd. | | 267,334 | 23,811,439 |
| | | | 24,522,191 |
| IT Services - 2.1% | | | |
| Amdocs Ltd. | | 175,982 | 10,928,482 |
| Capgemini SA | | 64,300 | 8,293,769 |
| Cognizant Technology Solutions Corp. Class A | | 268,713 | 18,358,472 |
| | | | 37,580,723 |
| Semiconductors & Semiconductor Equipment - 2.8% | | | |
| Broadcom, Inc. | | 6,800 | 2,153,900 |
| Intel Corp. | | 746,100 | 35,611,353 |
| NXP Semiconductors NV | | 94,100 | 11,059,573 |
| ON Semiconductor Corp. (a) | | 120,800 | 2,488,480 |
| | | | 51,313,306 |
| Software - 0.5% | | | |
| Nortonlifelock, Inc. | | 413,900 | 8,878,155 |
|
| TOTAL INFORMATION TECHNOLOGY | | | 171,263,877 |
|
| MATERIALS - 5.3% | | | |
| Chemicals - 2.5% | | | |
| Albemarle Corp. U.S. (b) | | 111,700 | 9,210,782 |
| DuPont de Nemours, Inc. | | 684,900 | 36,628,452 |
| | | | 45,839,234 |
| Metals & Mining - 2.8% | | | |
| BHP Billiton Ltd. sponsored ADR | | 39,700 | 2,097,748 |
| Lundin Mining Corp. | | 1,843,400 | 10,321,774 |
| Newmont Corp. | | 550,300 | 38,080,760 |
| | | | 50,500,282 |
|
| TOTAL MATERIALS | | | 96,339,516 |
|
| REAL ESTATE - 1.9% | | | |
| Equity Real Estate Investment Trusts (REITs) - 0.5% | | | |
| Simon Property Group, Inc. | | 137,500 | 8,573,125 |
| Real Estate Management & Development - 1.4% | | | |
| CBRE Group, Inc. (a) | | 580,493 | 25,431,398 |
|
| TOTAL REAL ESTATE | | | 34,004,523 |
|
| UTILITIES - 4.8% | | | |
| Electric Utilities - 3.7% | | | |
| Exelon Corp. | | 576,412 | 22,255,267 |
| PG&E Corp. (a) | | 1,594,700 | 14,910,445 |
| Southern Co. | | 543,700 | 29,691,457 |
| | | | 66,857,169 |
| Multi-Utilities - 1.1% | | | |
| Dominion Energy, Inc. | | 249,000 | 20,176,470 |
|
| TOTAL UTILITIES | | | 87,033,639 |
|
| TOTAL COMMON STOCKS | | | |
| (Cost $1,678,023,123) | | | 1,772,844,444 |
|
| Nonconvertible Preferred Stocks - 1.4% | | | |
| INFORMATION TECHNOLOGY - 1.4% | | | |
| Technology Hardware, Storage & Peripherals - 1.4% | | | |
| Samsung Electronics Co. Ltd. | | | |
| (Cost $24,209,328) | | 602,360 | 24,933,370 |
|
| Money Market Funds - 2.7% | | | |
| Fidelity Cash Central Fund 0.14% (c) | | 43,119,182 | 43,132,118 |
| Fidelity Securities Lending Cash Central Fund 0.13% (c)(d) | | 7,114,538 | 7,115,250 |
| TOTAL MONEY MARKET FUNDS | | | |
| (Cost $50,245,631) | | | 50,247,368 |
| TOTAL INVESTMENT IN SECURITIES - 101.2% | | | |
| (Cost $1,752,478,082) | | | 1,848,025,182 |
| NET OTHER ASSETS (LIABILITIES) - (1.2)% | | | (22,604,021) |
| NET ASSETS - 100% | | | $1,825,421,161 |
Legend
(a) Non-income producing
(b) Security or a portion of the security is on loan at period end.
(c) Affiliated fund that is generally available only to investment companies and other accounts managed by Fidelity Investments. The rate quoted is the annualized seven-day yield of the fund at period end. A complete unaudited listing of the fund's holdings as of its most recent quarter end is available upon request. In addition, each Fidelity Central Fund's financial statements, which are not covered by the Fund's Report of Independent Registered Public Accounting Firm, are available on the SEC's website or upon request.
(d) Investment made with cash collateral received from securities on loan.
Affiliated Central Funds
Information regarding fiscal year to date income earned by the Fund from investments in Fidelity Central Funds is as follows:
| Fund | Income earned |
| Fidelity Cash Central Fund | $725,463 |
| Fidelity Securities Lending Cash Central Fund | 79,610 |
| Total | $805,073 |
Amounts in the income column in the above table include any capital gain distributions from underlying funds, which are presented in the corresponding line-item in the Statement of Operations, if applicable. Amount for Fidelity Securities Lending Cash Central Fund represents the income earned on investing cash collateral, less rebates paid to borrowers and any lending agent fees associated with the loan, plus any premium payments received for lending certain types of securities.
Investment Valuation
The following is a summary of the inputs used, as of July 31, 2020, involving the Fund's assets and liabilities carried at fair value. The inputs or methodology used for valuing securities may not be an indication of the risk associated with investing in those securities. For more information on valuation inputs, and their aggregation into the levels used below, please refer to the Investment Valuation section in the accompanying Notes to Financial Statements.
| | Valuation Inputs at Reporting Date: |
| Description | Total | Level 1 | Level 2 | Level 3 |
| Investments in Securities: | | | | |
| Equities: | | | | |
| Communication Services | $174,220,806 | $166,013,191 | $8,207,615 | $-- |
| Consumer Discretionary | 148,468,404 | 148,468,404 | -- | -- |
| Consumer Staples | 85,548,246 | 85,548,246 | -- | -- |
| Energy | 62,037,354 | 62,037,354 | -- | -- |
| Financials | 321,180,928 | 321,180,928 | -- | -- |
| Health Care | 327,729,297 | 298,273,749 | 29,455,548 | -- |
| Industrials | 265,017,854 | 204,679,972 | 60,337,882 | -- |
| Information Technology | 196,197,247 | 196,197,247 | -- | -- |
| Materials | 96,339,516 | 96,339,516 | -- | -- |
| Real Estate | 34,004,523 | 34,004,523 | -- | -- |
| Utilities | 87,033,639 | 87,033,639 | -- | -- |
| Money Market Funds | 50,247,368 | 50,247,368 | -- | -- |
| Total Investments in Securities: | $1,848,025,182 | $1,750,024,137 | $98,001,045 | $-- |
Other Information
Distribution of investments by country or territory of incorporation, as a percentage of Total Net Assets, is as follows (Unaudited):
| United States of America | 82.7% |
| Switzerland | 4.1% |
| France | 2.0% |
| Canada | 1.7% |
| Germany | 1.5% |
| Korea (South) | 1.4% |
| Ireland | 1.3% |
| Netherlands | 1.3% |
| Denmark | 1.1% |
| Others (Individually Less Than 1%) | 2.9% |
| | 100.0% |
See accompanying notes which are an integral part of the financial statements.
Financial Statements
Statement of Assets and Liabilities
| | | July 31, 2020 |
| Assets | | |
Investment in securities, at value (including securities loaned of $6,863,716) — See accompanying schedule:
Unaffiliated issuers (cost $1,702,232,451) | $1,797,777,814 | |
| Fidelity Central Funds (cost $50,245,631) | 50,247,368 | |
| Total Investment in Securities (cost $1,752,478,082) | | $1,848,025,182 |
| Foreign currency held at value (cost $1,328) | | 1,384 |
| Receivable for fund shares sold | | 34,770,020 |
| Dividends receivable | | 2,040,949 |
| Distributions receivable from Fidelity Central Funds | | 9,760 |
| Prepaid expenses | | 275 |
| Other receivables | | 149,506 |
| Total assets | | 1,884,997,076 |
| Liabilities | | |
| Payable for investments purchased | $50,130,794 | |
| Payable for fund shares redeemed | 1,329,756 | |
| Accrued management fee | 719,499 | |
| Other affiliated payables | 247,081 | |
| Other payables and accrued expenses | 33,048 | |
| Collateral on securities loaned | 7,115,737 | |
| Total liabilities | | 59,575,915 |
| Net Assets | | $1,825,421,161 |
| Net Assets consist of: | | |
| Paid in capital | | $1,808,575,171 |
| Total accumulated earnings (loss) | | 16,845,990 |
| Net Assets | | $1,825,421,161 |
| Net Asset Value and Maximum Offering Price | | |
| Value Discovery: | | |
| Net Asset Value, offering price and redemption price per share ($1,788,146,055 ÷ 66,251,043 shares) | | $26.99 |
| Class K: | | |
| Net Asset Value, offering price and redemption price per share ($37,275,106 ÷ 1,380,173 shares) | | $27.01 |
See accompanying notes which are an integral part of the financial statements.
Statement of Operations
| | | Year ended July 31, 2020 |
| Investment Income | | |
| Dividends | | $47,538,316 |
| Special dividends | | 6,644,400 |
| Income from Fidelity Central Funds (including $79,610 from security lending) | | 805,073 |
| Total income | | 54,987,789 |
| Expenses | | |
| Management fee | | |
| Basic fee | $10,799,238 | |
| Performance adjustment | (1,229,274) | |
| Transfer agent fees | 2,864,978 | |
| Accounting fees | 613,997 | |
| Custodian fees and expenses | 40,732 | |
| Independent trustees' fees and expenses | 13,223 | |
| Registration fees | 117,078 | |
| Audit | 50,024 | |
| Legal | 6,372 | |
| Interest | 12,481 | |
| Miscellaneous | 36,764 | |
| Total expenses before reductions | 13,325,613 | |
| Expense reductions | (321,020) | |
| Total expenses after reductions | | 13,004,593 |
| Net investment income (loss) | | 41,983,196 |
| Realized and Unrealized Gain (Loss) | | |
| Net realized gain (loss) on: | | |
| Investment securities: | | |
| Unaffiliated issuers | (75,763,684) | |
| Redemptions in-kind with affiliated entities | 45,570,810 | |
| Fidelity Central Funds | (1,599) | |
| Foreign currency transactions | (38,655) | |
| Total net realized gain (loss) | | (30,233,128) |
| Change in net unrealized appreciation (depreciation) on: | | |
| Investment securities: | | |
| Unaffiliated issuers (net of decrease in deferred foreign taxes of $79,995) | (81,638,697) | |
| Fidelity Central Funds | 1,557 | |
| Assets and liabilities in foreign currencies | 39,739 | |
| Total change in net unrealized appreciation (depreciation) | | (81,597,401) |
| Net gain (loss) | | (111,830,529) |
| Net increase (decrease) in net assets resulting from operations | | $(69,847,333) |
See accompanying notes which are an integral part of the financial statements.
Statement of Changes in Net Assets
| | Year ended July 31, 2020 | Year ended July 31, 2019 |
| Increase (Decrease) in Net Assets | | |
| Operations | | |
| Net investment income (loss) | $41,983,196 | $45,287,729 |
| Net realized gain (loss) | (30,233,128) | 45,693,992 |
| Change in net unrealized appreciation (depreciation) | (81,597,401) | (19,318,772) |
| Net increase (decrease) in net assets resulting from operations | (69,847,333) | 71,662,949 |
| Distributions to shareholders | (70,564,497) | (94,739,011) |
| Share transactions - net increase (decrease) | (490,630,701) | 98,392,858 |
| Total increase (decrease) in net assets | (631,042,531) | 75,316,796 |
| Net Assets | | |
| Beginning of period | 2,456,463,692 | 2,381,146,896 |
| End of period | $1,825,421,161 | $2,456,463,692 |
See accompanying notes which are an integral part of the financial statements.
Financial Highlights
Fidelity Value Discovery Fund
| Years ended July 31, | 2020 | 2019 | 2018 | 2017 | 2016 |
| Selected Per–Share Data | | | | | |
| Net asset value, beginning of period | $28.85 | $29.25 | $28.10 | $24.16 | $24.99 |
| Income from Investment Operations | | | | | |
| Net investment income (loss)A | .57B | .54 | .42 | .38 | .34 |
| Net realized and unrealized gain (loss) | (1.53) | .22 | 1.28 | 3.86 | (.38) |
| Total from investment operations | (.96) | .76 | 1.70 | 4.24 | (.04) |
| Distributions from net investment income | (.52) | (.57) | (.31) | (.29) | (.47) |
| Distributions from net realized gain | (.38) | (.59) | (.24) | (.01) | (.32) |
| Total distributions | (.90) | (1.16) | (.55) | (.30) | (.79) |
| Net asset value, end of period | $26.99 | $28.85 | $29.25 | $28.10 | $24.16 |
| Total ReturnC | (3.54)% | 2.86% | 6.19% | 17.70% | .05% |
| Ratios to Average Net AssetsD,E | | | | | |
| Expenses before reductions | .66% | .60% | .69% | .75% | .86% |
| Expenses net of fee waivers, if any | .66% | .60% | .69% | .75% | .86% |
| Expenses net of all reductions | .64% | .60% | .69% | .75% | .86% |
| Net investment income (loss) | 2.07%B | 1.95% | 1.50% | 1.44% | 1.46% |
| Supplemental Data | | | | | |
| Net assets, end of period (000 omitted) | $1,788,146 | $2,400,695 | $2,313,811 | $2,708,049 | $1,712,212 |
| Portfolio turnover rateF | 70%G | 48% | 33%G | 32%G | 41% |
A Calculated based on average shares outstanding during the period.
B Net investment income per share reflects a large, non-recurring dividend which amounted to $.09 per share. Excluding this non-recurring dividend, the ratio of net investment income (loss) to average net assets would have been 1.74%.
C Total returns would have been lower if certain expenses had not been reduced during the applicable periods shown.
D Fees and expenses of any underlying mutual funds or exchange-traded funds (ETFs) are not included in the Fund's expense ratio. The Fund indirectly bears its proportionate share of these expenses. For additional expense information related to investments in Fidelity Central Funds, please refer to the "Investments in Fidelity Central Funds" note found in the Notes to Financial Statements section of the most recent Annual or Semi-Annual report.
E Expense ratios reflect operating expenses of the class. Expenses before reductions do not reflect amounts reimbursed by the investment adviser or reductions from brokerage service arrangements or reductions from other expense offset arrangements and do not represent the amount paid by the class during periods when reimbursements or reductions occur. Expenses net of fee waivers reflect expenses after reimbursement by the investment adviser but prior to reductions from brokerage service arrangements or other expense offset arrangements. Expenses net of all reductions represent the net expenses paid by the class.
F Amount does not include the portfolio activity of any underlying Fidelity Central Funds.
G Portfolio turnover rate excludes securities received or delivered in-kind.
See accompanying notes which are an integral part of the financial statements.
Fidelity Value Discovery Fund Class K
| Years ended July 31, | 2020 | 2019 | 2018 | 2017 | 2016 |
| Selected Per–Share Data | | | | | |
| Net asset value, beginning of period | $28.86 | $29.28 | $28.11 | $24.17 | $24.99 |
| Income from Investment Operations | | | | | |
| Net investment income (loss)A | .60B | .58 | .46 | .41 | .38 |
| Net realized and unrealized gain (loss) | (1.52) | .20 | 1.28 | 3.86 | (.38) |
| Total from investment operations | (.92) | .78 | 1.74 | 4.27 | –C |
| Distributions from net investment income | (.55) | (.61) | (.33) | (.32) | (.50) |
| Distributions from net realized gain | (.38) | (.59) | (.24) | (.01) | (.32) |
| Total distributions | (.93) | (1.20) | (.57) | (.33) | (.82) |
| Net asset value, end of period | $27.01 | $28.86 | $29.28 | $28.11 | $24.17 |
| Total ReturnD | (3.40)% | 2.93% | 6.34% | 17.82% | .24% |
| Ratios to Average Net AssetsE,F | | | | | |
| Expenses before reductions | .56% | .49% | .57% | .63% | .70% |
| Expenses net of fee waivers, if any | .56% | .49% | .57% | .63% | .70% |
| Expenses net of all reductions | .54% | .48% | .56% | .63% | .70% |
| Net investment income (loss) | 2.17%B | 2.06% | 1.62% | 1.56% | 1.62% |
| Supplemental Data | | | | | |
| Net assets, end of period (000 omitted) | $37,275 | $55,768 | $67,335 | $113,668 | $222,946 |
| Portfolio turnover rateG | 70%H | 48% | 33%H | 32%H | 41% |
A Calculated based on average shares outstanding during the period.
B Net investment income per share reflects a large, non-recurring dividend which amounted to $.09 per share. Excluding this non-recurring dividend, the ratio of net investment income (loss) to average net assets would have been 1.84%.
C Amount represents less than $.005 per share.
D Total returns would have been lower if certain expenses had not been reduced during the applicable periods shown.
E Fees and expenses of any underlying mutual funds or exchange-traded funds (ETFs) are not included in the Fund's expense ratio. The Fund indirectly bears its proportionate share of these expenses. For additional expense information related to investments in Fidelity Central Funds, please refer to the "Investments in Fidelity Central Funds" note found in the Notes to Financial Statements section of the most recent Annual or Semi-Annual report.
F Expense ratios reflect operating expenses of the class. Expenses before reductions do not reflect amounts reimbursed by the investment adviser or reductions from brokerage service arrangements or reductions from other expense offset arrangements and do not represent the amount paid by the class during periods when reimbursements or reductions occur. Expenses net of fee waivers reflect expenses after reimbursement by the investment adviser but prior to reductions from brokerage service arrangements or other expense offset arrangements. Expenses net of all reductions represent the net expenses paid by the class.
G Amount does not include the portfolio activity of any underlying Fidelity Central Funds.
H Portfolio turnover rate excludes securities received or delivered in-kind.
See accompanying notes which are an integral part of the financial statements.
Notes to Financial Statements
For the period ended July 31, 2020
1. Organization.
Fidelity Value Discovery Fund (the Fund) is a fund of Fidelity Puritan Trust (the Trust) and is authorized to issue an unlimited number of shares. The Trust is registered under the Investment Company Act of 1940, as amended (the 1940 Act), as an open-end management investment company organized as a Massachusetts business trust. The Fund offers Value Discovery and Class K shares, each of which has equal rights as to assets and voting privileges. Each class has exclusive voting rights with respect to matters that affect that class.
Effective January 1, 2020:
Investment advisers Fidelity Investments Money Management, Inc., FMR Co., Inc., and Fidelity SelectCo, LLC, merged with and into Fidelity Management & Research Company. In connection with the merger transactions, the resulting, merged investment adviser was then redomiciled from Massachusetts to Delaware, changed its corporate structure from a corporation to a limited liability company, and changed its name to "Fidelity Management & Research Company LLC".
Fidelity Investments Institutional Operations Company, Inc. converted from a Massachusetts corporation to a Massachusetts LLC, and changed its name to "Fidelity Investments Institutional Operations Company LLC".
2. Investments in Fidelity Central Funds.
The Fund invests in Fidelity Central Funds, which are open-end investment companies generally available only to other investment companies and accounts managed by the investment adviser and its affiliates. The Fund's Schedule of Investments lists each of the Fidelity Central Funds held as of period end, if any, as an investment of the Fund, but does not include the underlying holdings of each Fidelity Central Fund. As an Investing Fund, the Fund indirectly bears its proportionate share of the expenses of the underlying Fidelity Central Funds.
The Money Market Central Funds seek preservation of capital and current income and are managed by the investment adviser. Annualized expenses of the Money Market Central Funds as of their most recent shareholder report date ranged from less than .005% to .01%.
A complete unaudited list of holdings for each Fidelity Central Fund is available upon request or at the Securities and Exchange Commission (the SEC) website at www.sec.gov. In addition, the financial statements of the Fidelity Central Funds, which are not covered by the Fund's Report of Independent Registered Public Accounting Firm, are available on the SEC website or upon request.
3. Significant Accounting Policies.
The Fund is an investment company and applies the accounting and reporting guidance of the Financial Accounting Standards Board (FASB) Accounting Standards Codification Topic 946 Financial Services – Investment Companies. The financial statements have been prepared in conformity with accounting principles generally accepted in the United States of America (GAAP), which require management to make certain estimates and assumptions at the date of the financial statements. Actual results could differ from those estimates. Subsequent events, if any, through the date that the financial statements were issued have been evaluated in the preparation of the financial statements. The following summarizes the significant accounting policies of the Fund:
Investment Valuation. Investments are valued as of 4:00 p.m. Eastern time on the last calendar day of the period. The Board of Trustees (the Board) has delegated the day to day responsibility for the valuation of the Fund's investments to the Fair Value Committee (the Committee) established by the Fund's investment adviser. In accordance with valuation policies and procedures approved by the Board, the Fund attempts to obtain prices from one or more third party pricing vendors or brokers to value its investments. When current market prices, quotations or currency exchange rates are not readily available or reliable, investments will be fair valued in good faith by the Committee, in accordance with procedures adopted by the Board. Factors used in determining fair value vary by investment type and may include market or investment specific events. The frequency with which these procedures are used cannot be predicted and they may be utilized to a significant extent. The Committee oversees the Fund's valuation policies and procedures and reports to the Board on the Committee's activities and fair value determinations. The Board monitors the appropriateness of the procedures used in valuing the Fund's investments and ratifies the fair value determinations of the Committee.
The Fund categorizes the inputs to valuation techniques used to value its investments into a disclosure hierarchy consisting of three levels as shown below:
- Level 1 – quoted prices in active markets for identical investments
- Level 2 – other significant observable inputs (including quoted prices for similar investments, interest rates, prepayment speeds, etc.)
- Level 3 – unobservable inputs (including the Fund's own assumptions based on the best information available)
Valuation techniques used to value the Fund's investments by major category are as follows:
Equity securities, including restricted securities, for which market quotations are readily available, are valued at the last reported sale price or official closing price as reported by a third party pricing vendor on the primary market or exchange on which they are traded and are categorized as Level 1 in the hierarchy. In the event there were no sales during the day or closing prices are not available, securities are valued at the last quoted bid price or may be valued using the last available price and are generally categorized as Level 2 in the hierarchy. For foreign equity securities, when market or security specific events arise, comparisons to the valuation of American Depositary Receipts (ADRs), futures contracts, Exchange-Traded Funds (ETFs and certain indexes as well as quoted prices for similar securities may be used and would be categorized as Level 2 in the hierarchy. For equity securities, including restricted securities, where observable inputs are limited, assumptions about market activity and risk are used and these securities may be categorized as Level 3 in the hierarchy.
Investments in open-end mutual funds ,including the Fidelity Central Funds, are valued at their closing net asset value (NAV) each business day and are categorized as Level 1 in the hierarchy.
Changes in valuation techniques may result in transfers in or out of an assigned level within the disclosure hierarchy. The aggregate value of investments by input level as of July 31, 2020 is included at the end of the Fund's Schedule of Investments.
Foreign Currency. The Fund may use foreign currency contracts to facilitate transactions in foreign-denominated securities. Gains and losses from these transactions may arise from changes in the value of the foreign currency or if the counterparties do not perform under the contracts' terms.
Foreign-denominated assets, including investment securities, and liabilities are translated into U.S. dollars at the exchange rates at period end. Purchases and sales of investment securities, income and dividends received and expenses denominated in foreign currencies are translated into U.S. dollars at the exchange rate in effect on the transaction date.
The effects of exchange rate fluctuations on investments are included with the net realized and unrealized gain (loss) on investment securities. Other foreign currency transactions resulting in realized and unrealized gain (loss) are disclosed separately.
Investment Transactions and Income. For financial reporting purposes, the Fund's investment holdings and NAV include trades executed through the end of the last business day of the period. The NAV per share for processing shareholder transactions is calculated as of the close of business of the New York Stock Exchange (NYSE), normally 4:00 p.m. Eastern time and includes trades executed through the end of the prior business day. Gains and losses on securities sold are determined on the basis of identified cost and include proceeds received from litigation. Dividend income is recorded on the ex-dividend date, except for certain dividends from foreign securities where the ex-dividend date may have passed, which are recorded as soon as the Fund is informed of the ex-dividend date. Non-cash dividends included in dividend income, if any, are recorded at the fair market value of the securities received. Income and capital gain distributions from Fidelity Central Funds, if any, are recorded on the ex-dividend date. Certain distributions received by the Fund represent a return of capital or capital gain. The Fund determines the components of these distributions subsequent to the ex-dividend date, based upon receipt of tax filings or other correspondence relating to the underlying investment. These distributions are recorded as a reduction of cost of investments and/or as a realized gain. Large, non-recurring dividends recognized by the Fund are presented separately on the Statement of Operations as "Special Dividends" and the impact of these dividends is presented in the Financial Highlights. Investment income is recorded net of foreign taxes withheld where recovery of such taxes is uncertain.
Class Allocations and Expenses. Investment income, realized and unrealized capital gains and losses, common expenses of the Fund, and certain fund-level expense reductions, if any, are allocated daily on a pro-rata basis to each class based on the relative net assets of each class to the total net assets of the Fund. Each class differs with respect to transfer agent fees incurred. Certain expense reductions may also differ by class. For the reporting period, the allocated portion of income and expenses to each class as a percent of its average net assets may vary due to the timing of recording these transactions in relation to fluctuating net assets of the classes. Expenses directly attributable to a fund are charged to that fund. Expenses attributable to more than one fund are allocated among the respective funds on the basis of relative net assets or other appropriate methods. Expense estimates are accrued in the period to which they relate and adjustments are made when actual amounts are known.
Income Tax Information and Distributions to Shareholders. Each year, the Fund intends to qualify as a regulated investment company under Subchapter M of the Internal Revenue Code, including distributing substantially all of its taxable income and realized gains. As a result, no provision for U.S. Federal income taxes is required. As of July 31, 2020, the Fund did not have any unrecognized tax benefits in the financial statements; nor is the Fund aware of any tax positions for which it is reasonably possible that the total amounts of unrecognized tax benefits will significantly change in the next twelve months. The Fund files a U.S. federal tax return, in addition to state and local tax returns as required. The Fund's federal income tax returns are subject to examination by the Internal Revenue Service (IRS) for a period of three fiscal years after they are filed. State and local tax returns may be subject to examination for an additional fiscal year depending on the jurisdiction. Foreign taxes are provided for based on the Fund's understanding of the tax rules and rates that exist in the foreign markets in which it invests.
Distributions are declared and recorded on the ex-dividend date. Income and capital gain distributions are declared separately for each class. Income and capital gain distributions are determined in accordance with income tax regulations, which may differ from GAAP. In addition, the Fund claimed a portion of the payment made to redeeming shareholders as a distribution for income tax purposes.
Capital accounts within the financial statements are adjusted for permanent book-tax differences. These adjustments have no impact on net assets or the results of operations. Capital accounts are not adjusted for temporary book-tax differences which will reverse in a subsequent period.
Book-tax differences are primarily due to foreign currency transactions, partnerships, redemptions in kind, losses deferred due to wash sales and excise tax regulations.
As of period end, the cost and unrealized appreciation (depreciation) in securities, and derivatives if applicable, for federal income tax purposes were as follows:
| Gross unrealized appreciation | $264,422,117 |
| Gross unrealized depreciation | (180,603,065) |
| Net unrealized appreciation (depreciation) | $83,819,052 |
| Tax Cost | $1,764,206,130 |
The tax-based components of distributable earnings as of period end were as follows:
| Undistributed ordinary income | $18,108,010 |
| Net unrealized appreciation (depreciation) on securities and other investments | $83,849,774 |
The Fund intends to elect to defer to its next fiscal year $85,111,794 of capital losses recognized during the period November 1, 2019 to July 31, 2020.
The tax character of distributions paid was as follows:
| | July 31, 2020 | July 31, 2019 |
| Ordinary Income | $46,510,387 | $ 46,250,060 |
| Long-term Capital Gains | 24,054,110 | 48,488,952 |
| Total | $70,564,497 | $ 94,739,012 |
4. Purchases and Sales of Investments.
Purchases and sales of securities, other than short-term securities and in-kind transactions are noted in the table below.
| | Purchases ($) | Sales ($) |
| Fidelity Value Discovery Fund | 1,396,933,452 | 1,618,241,951 |
5. Fees and Other Transactions with Affiliates.
Management Fee. Fidelity Management & Research Company LLC (the investment adviser) and its affiliates provide the Fund with investment management related services for which the Fund pays a monthly management fee. The management fee is the sum of an individual fund fee rate that is based on an annual rate of .30% of the Fund's average net assets and an annualized group fee rate that averaged .23% during the period. The group fee rate is based upon the monthly average net assets of a group of registered investment companies with which the investment adviser has management contracts. The group fee rate decreases as assets under management increase and increases as assets under management decrease. In addition, the management fee is subject to a performance adjustment (up to a maximum of +/- .20% of the Fund's average net assets over a 36 month performance period). The upward or downward adjustment to the management fee is based on the relative investment performance of Value Discovery as compared to its benchmark index, the Russell 3000 Value Index, over the same 36 month performance period. For the reporting period, the total annual management fee rate, including the performance adjustment, was .47% of the Fund's average net assets. The performance adjustment included in the management fee rate may be higher or lower than the maximum performance adjustment rate due to the difference between the average net assets for the reporting and performance periods.
Transfer Agent Fees. Fidelity Investments Institutional Operations Company LLC (FIIOC), an affiliate of the investment adviser, is the transfer, dividend disbursing and shareholder servicing agent for each class of the Fund. FIIOC receives account fees and asset-based fees that vary according to the account size and type of account of the shareholders of Value Discovery, except for Class K. FIIOC receives an asset-based fee of Class K's average net assets. FIIOC pays for typesetting, printing and mailing of shareholder reports, except proxy statements. Effective February 1, 2020, the Board approved to change the fee for Class K from .046% to .044%.
For the period, transfer agent fees for each class were as follows:
| | Amount | % of Class-Level Average Net Assets |
| Value Discovery | $2,844,184 | .14 |
| Class K | 20,794 | .04 |
| | $2,864,978 | |
Accounting Fees. Fidelity Service Company, Inc. (FSC), an affiliate of the investment adviser, maintains the Fund's accounting records. The accounting fee is based on the level of average net assets for each month. For the period, the fees were equivalent to the following annual rates:
| | % of Average Net Assets |
| Fidelity Value Discovery Fund | .03 |
Brokerage Commissions. A portion of portfolio transactions were placed with brokerage firms which are affiliates of the investment adviser. Brokerage commissions are included in net realized gain (loss) and change in net unrealized appreciation (depreciation) in the Statement of Operations. The commissions paid to these affiliated firms were as follows:
| | Amount |
| Fidelity Value Discovery Fund | $35,830 |
Interfund Lending Program. Pursuant to an Exemptive Order issued by the SEC, the fund, along with other registered investment companies having management contracts with Fidelity Management & Research Company LLC (FMR), or other affiliated entities of FMR, may participate in an interfund lending program. This program provides an alternative credit facility allowing the fund to borrow from, or lend money to, other participating affiliated funds. At period end, there were no interfund loans outstanding. Activity in this program during the period for which loans were outstanding was as follows:
| | Borrower or Lender | Average Loan Balance | Weighted Average Interest Rate | Interest Expense |
| Fidelity Value Discovery Fund | Borrower | $22,125,000 | 1.69% | $12,481 |
Interfund Trades. Funds may purchase from or sell securities to other Fidelity Funds under procedures adopted by the Board. The procedures have been designed to ensure these interfund trades are executed in accordance with Rule 17a-7 of the 1940 Act. Interfund trades are included within the respective purchases and sales amounts shown in the Purchases and Sales of Investments note.
Affiliated Redemptions In-Kind. During the period, 7,715,624 shares of the Fund were redeemed in-kind for investments and cash with a value of $230,194,879. The net realized gain of $45,570,810 on investments delivered through in-kind redemptions is included in the accompanying Statement of Operations. The amount of the in-kind redemptions is included in share transactions in the accompanying Statement of Changes in Net Assets as well as the Notes to Financial Statements. The Fund recognized no gain or loss for federal income tax purposes.
Other. During the period, the investment adviser reimbursed the Fund for certain losses in the amount of $22,985.
6. Committed Line of Credit.
Certain Funds participate with other funds managed by the investment adviser or an affiliate in a $4.25 billion credit facility (the "line of credit") to be utilized for temporary or emergency purposes to fund shareholder redemptions or for other short-term liquidity purposes. The participating funds have agreed to pay commitment fees on their pro-rata portion of the line of credit, which are reflected in Miscellaneous expenses on the Statement of Operations, and are as follows:
| | Amount |
| Fidelity Value Discovery Fund | $5,098 |
During the period, there were no borrowings on this line of credit.
7. Security Lending.
The Fund lends portfolio securities from time to time in order to earn additional income. Lending agents are used, including National Financial Services (NFS), an affiliate of the Fund. Pursuant to a securities lending agreement, NFS will receive a fee, which is capped at 9.9% of daily lending revenue, for its services as lending agent. The Fund may lend securities to certain qualified borrowers, including NFS. On the settlement date of the loan, the Fund receives collateral (in the form of U.S. Treasury obligations, letters of credit and/or cash) against the loaned securities and maintains collateral in an amount not less than 100% of the market value of the loaned securities during the period of the loan. The market value of the loaned securities is determined at the close of business of the Fund and any additional required collateral is delivered to the Fund on the next business day. The Fund or borrower may terminate the loan at any time, and if the borrower defaults on its obligation to return the securities loaned because of insolvency or other reasons, the Fund may apply collateral received from the borrower against the obligation. The Fund may experience delays and costs in recovering the securities loaned. Any cash collateral received is invested in the Fidelity Securities Lending Cash Central Fund. The value of loaned securities and cash collateral at period end are disclosed on the Fund's Statement of Assets and Liabilities. Total fees paid by the Fund to NFS, as lending agent, amounted to $7,526. Security lending income represents the income earned on investing cash collateral, less rebates paid to borrowers and any lending agent fees associated with the loan, plus any premium payments received for lending certain types of securities. Net income from the Fidelity Securities Lending Cash Central Fund during the period is presented in the Statement of Operations as a component of income from Fidelity Central Funds. During the period, there were no securities loaned to NFS.
8. Expense Reductions.
Commissions paid to certain brokers with whom the investment adviser, or its affiliates, places trades on behalf of the Fund include an amount in addition to trade execution, which may be rebated back to the Fund to offset certain expenses. This amount totaled $311,598 for the period. In addition, through arrangements with the Fund's custodian, credits realized as a result of certain uninvested cash balances were used to reduce the Fund's expenses. During the period, custodian credits reduced the Fund's expenses by $622.
In addition, during the period the investment adviser or an affiliate reimbursed and/or waived a portion of fund-level operating expenses in the amount of $8,800.
9. Distributions to Shareholders.
Distributions to shareholders of each class were as follows:
| | Year ended
July 31, 2020 | Year ended
July 31, 2019 |
| Distributions to shareholders | | |
| Value Discovery | $68,839,664 | $91,991,501 |
| Class K | 1,724,833 | 2,747,510 |
| Total | $70,564,497 | $94,739,011 |
10. Share Transactions.
Share transactions for each class were as follows and may contain automatic conversions between classes or exchanges between affiliated funds:
| | Shares | Shares | Dollars | Dollars |
| | Year ended July 31, 2020 | Year ended July 31, 2019 | Year ended July 31, 2020 | Year ended July 31, 2019 |
| Value Discovery | | | | |
| Shares sold | 33,438,247 | 26,907,992 | $858,881,720 | $728,614,220 |
| Reinvestment of distributions | 1,722,368 | 2,791,422 | 49,825,323 | 76,426,545 |
| Shares redeemed | (52,136,661)(a) | (25,569,493) | (1,384,972,163)(a) | (696,228,144) |
| Net increase (decrease) | (16,976,046) | 4,129,921 | $(476,265,120) | $108,812,621 |
| Class K | | | | |
| Shares sold | 313,065 | 327,970 | $8,551,240 | $9,123,505 |
| Reinvestment of distributions | 59,409 | 100,296 | 1,724,833 | 2,747,510 |
| Shares redeemed | (924,367) | (795,844) | (24,641,654) | (22,290,778) |
| Net increase (decrease) | (551,893) | (367,578) | $(14,365,581) | $(10,419,763) |
(a) Amount includes in-kind redemptions (see the Affiliated Redemptions In-Kind note for additional details).
11. Other.
The Fund's organizational documents provide former and current trustees and officers with a limited indemnification against liabilities arising in connection with the performance of their duties to the Fund. In the normal course of business, the Fund may also enter into contracts that provide general indemnifications. The Fund's maximum exposure under these arrangements is unknown as this would be dependent on future claims that may be made against the Fund. The risk of material loss from such claims is considered remote.
12. Coronavirus (COVID-19) Pandemic.
An outbreak of COVID-19 first detected in China during December 2019 has since spread globally and was declared a pandemic by the World Health Organization during March 2020. Developments that disrupt global economies and financial markets, such as the COVID-19 pandemic, may magnify factors that affect the Fund's performance.
Report of Independent Registered Public Accounting Firm
To the Board of Trustees of Fidelity Puritan Trust and Shareholders of Fidelity Value Discovery Fund
Opinion on the Financial Statements and Financial Highlights
We have audited the accompanying statement of assets and liabilities of Fidelity Value Discovery Fund (the "Fund"), a fund of Fidelity Puritan Trust, including the schedule of investments, as of July 31, 2020, the related statement of operations for the year then ended, the statement of changes in net assets for each of the two years in the period then ended, the financial highlights for each of the five years in the period then ended, and the related notes. In our opinion, the financial statements and financial highlights present fairly, in all material respects, the financial position of the Fund as of July 31, 2020, and the results of its operations for the year then ended, the changes in its net assets for each of the two years in the period then ended, and the financial highlights for each of the five years in the period then ended in conformity with accounting principles generally accepted in the United States of America.
Basis for Opinion
These financial statements and financial highlights are the responsibility of the Fund's management. Our responsibility is to express an opinion on the Fund's financial statements and financial highlights based on our audits. We are a public accounting firm registered with the Public Company Accounting Oversight Board (United States) (PCAOB) and are required to be independent with respect to the Fund in accordance with the U.S. federal securities laws and the applicable rules and regulations of the Securities and Exchange Commission and the PCAOB.
We conducted our audits in accordance with the standards of the PCAOB. Those standards require that we plan and perform the audit to obtain reasonable assurance about whether the financial statements and financial highlights are free of material misstatement, whether due to error or fraud. The Fund is not required to have, nor were we engaged to perform, an audit of its internal control over financial reporting. As part of our audits we are required to obtain an understanding of internal control over financial reporting but not for the purpose of expressing an opinion on the effectiveness of the Fund’s internal control over financial reporting. Accordingly, we express no such opinion.
Our audits included performing procedures to assess the risks of material misstatement of the financial statements and financial highlights, whether due to error or fraud, and performing procedures that respond to those risks. Such procedures included examining, on a test basis, evidence regarding the amounts and disclosures in the financial statements and financial highlights. Our audits also included evaluating the accounting principles used and significant estimates made by management, as well as evaluating the overall presentation of the financial statements and financial highlights. Our procedures included confirmation of securities owned as of July 31, 2020, by correspondence with the custodian and brokers; when replies were not received from brokers, we performed other auditing procedures. We believe that our audits provide a reasonable basis for our opinion.
/s/ Deloitte & Touche LLP
Boston, Massachusetts
September 9, 2020
We have served as the auditor of one or more of the Fidelity investment companies since 1999.
Trustees and Officers
The Trustees, Members of the Advisory Board (if any), and officers of the trust and fund, as applicable, are listed below. The Board of Trustees governs the fund and is responsible for protecting the interests of shareholders. The Trustees are experienced executives who meet periodically throughout the year to oversee the fund's activities, review contractual arrangements with companies that provide services to the fund, oversee management of the risks associated with such activities and contractual arrangements, and review the fund's performance. Except for Jonathan Chiel, each of the Trustees oversees 311 funds. Mr. Chiel oversees 174 funds.
The Trustees hold office without limit in time except that (a) any Trustee may resign; (b) any Trustee may be removed by written instrument, signed by at least two-thirds of the number of Trustees prior to such removal; (c) any Trustee who requests to be retired or who has become incapacitated by illness or injury may be retired by written instrument signed by a majority of the other Trustees; and (d) any Trustee may be removed at any special meeting of shareholders by a two-thirds vote of the outstanding voting securities of the trust. Each Trustee who is not an interested person (as defined in the 1940 Act) of the trust and the fund is referred to herein as an Independent Trustee. Each Independent Trustee shall retire not later than the last day of the calendar year in which his or her 75th birthday occurs. The Independent Trustees may waive this mandatory retirement age policy with respect to individual Trustees. Officers and Advisory Board Members hold office without limit in time, except that any officer or Advisory Board Member may resign or may be removed by a vote of a majority of the Trustees at any regular meeting or any special meeting of the Trustees. Except as indicated, each individual has held the office shown or other offices in the same company for the past five years.
The fund's Statement of Additional Information (SAI) includes more information about the Trustees. To request a free copy, call Fidelity at 1-800-544-8544 if you’re an individual investing directly with Fidelity, call 1-800-835-5092 if you’re a plan sponsor or participant with Fidelity as your recordkeeper or call 1-877-208-0098 on institutional accounts or if you’re an advisor or invest through one.
Experience, Skills, Attributes, and Qualifications of the Trustees. The Governance and Nominating Committee has adopted a statement of policy that describes the experience, qualifications, attributes, and skills that are necessary and desirable for potential Independent Trustee candidates (Statement of Policy). The Board believes that each Trustee satisfied at the time he or she was initially elected or appointed a Trustee, and continues to satisfy, the standards contemplated by the Statement of Policy. The Governance and Nominating Committee also engages professional search firms to help identify potential Independent Trustee candidates who have the experience, qualifications, attributes, and skills consistent with the Statement of Policy. From time to time, additional criteria based on the composition and skills of the current Independent Trustees, as well as experience or skills that may be appropriate in light of future changes to board composition, business conditions, and regulatory or other developments, have also been considered by the professional search firms and the Governance and Nominating Committee. In addition, the Board takes into account the Trustees' commitment and participation in Board and committee meetings, as well as their leadership of standing and ad hoc committees throughout their tenure.
In determining that a particular Trustee was and continues to be qualified to serve as a Trustee, the Board has considered a variety of criteria, none of which, in isolation, was controlling. The Board believes that, collectively, the Trustees have balanced and diverse experience, qualifications, attributes, and skills, which allow the Board to operate effectively in governing the fund and protecting the interests of shareholders. Information about the specific experience, skills, attributes, and qualifications of each Trustee, which in each case led to the Board's conclusion that the Trustee should serve (or continue to serve) as a trustee of the fund, is provided below.
Board Structure and Oversight Function. Robert A. Lawrence is an interested person and currently serves as Acting Chairman. The Trustees have determined that an interested Chairman is appropriate and benefits shareholders because an interested Chairman has a personal and professional stake in the quality and continuity of services provided to the fund. Independent Trustees exercise their informed business judgment to appoint an individual of their choosing to serve as Chairman, regardless of whether the Trustee happens to be independent or a member of management. The Independent Trustees have determined that they can act independently and effectively without having an Independent Trustee serve as Chairman and that a key structural component for assuring that they are in a position to do so is for the Independent Trustees to constitute a substantial majority for the Board. The Independent Trustees also regularly meet in executive session. Ned C. Lautenbach and David M. Thomas serve as Co-Lead Independent Trustees and as such each (i) acts as a liaison between the Independent Trustees and management with respect to matters important to the Independent Trustees and (ii) with management prepares agendas for Board meetings.
Fidelity® funds are overseen by different Boards of Trustees. The fund's Board oversees Fidelity's high income and certain equity funds, and other Boards oversee Fidelity's investment-grade bond, money market, asset allocation, and other equity funds. The asset allocation funds may invest in Fidelity® funds overseen by the fund's Board. The use of separate Boards, each with its own committee structure, allows the Trustees of each group of Fidelity® funds to focus on the unique issues of the funds they oversee, including common research, investment, and operational issues. On occasion, the separate Boards establish joint committees to address issues of overlapping consequences for the Fidelity® funds overseen by each Board.
The Trustees operate using a system of committees to facilitate the timely and efficient consideration of all matters of importance to the Trustees, the fund, and fund shareholders and to facilitate compliance with legal and regulatory requirements and oversight of the fund's activities and associated risks. The Board, acting through its committees, has charged FMR and its affiliates with (i) identifying events or circumstances the occurrence of which could have demonstrably adverse effects on the fund's business and/or reputation; (ii) implementing processes and controls to lessen the possibility that such events or circumstances occur or to mitigate the effects of such events or circumstances if they do occur; and (iii) creating and maintaining a system designed to evaluate continuously business and market conditions in order to facilitate the identification and implementation processes described in (i) and (ii) above. Because the day-to-day operations and activities of the fund are carried out by or through FMR, its affiliates, and other service providers, the fund's exposure to risks is mitigated but not eliminated by the processes overseen by the Trustees. While each of the Board's committees has responsibility for overseeing different aspects of the fund's activities, oversight is exercised primarily through the Operations, Audit, and Compliance Committees. Appropriate personnel, including but not limited to the fund's Chief Compliance Officer (CCO), FMR's internal auditor, the independent accountants, the fund's Treasurer and portfolio management personnel, make periodic reports to the Board's committees, as appropriate, including an annual review of Fidelity's risk management program for the Fidelity® funds. The responsibilities of each standing committee, including their oversight responsibilities, are described further under "Standing Committees of the Trustees."
Interested Trustees*:
Correspondence intended for a Trustee who is an interested person may be sent to Fidelity Investments, 245 Summer Street, Boston, Massachusetts 02210.
Name, Year of Birth; Principal Occupations and Other Relevant Experience+
Jonathan Chiel (1957)
Year of Election or Appointment: 2016
Trustee
Mr. Chiel also serves as Trustee of other Fidelity® funds. Mr. Chiel is Executive Vice President and General Counsel for FMR LLC (diversified financial services company, 2012-present). Previously, Mr. Chiel served as general counsel (2004-2012) and senior vice president and deputy general counsel (2000-2004) for John Hancock Financial Services; a partner with Choate, Hall & Stewart (1996-2000) (law firm); and an Assistant United States Attorney for the United States Attorney’s Office of the District of Massachusetts (1986-95), including Chief of the Criminal Division (1993-1995). Mr. Chiel is a director on the boards of the Boston Bar Foundation and the Maimonides School.
Robert A. Lawrence (1952)
Year of Election or Appointment: 2020
Trustee
Acting Chairman of the Board of Trustees
Mr. Lawrence also serves as Trustee of other funds. Previously, Mr. Lawrence served as a Member of the Advisory Board of certain funds. Prior to his retirement in 2008, Mr. Lawrence served as Vice President of certain Fidelity® funds (2006-2008), Senior Vice President, Head of High Income Division of Fidelity Management & Research Company (investment adviser firm, 2006-2008), and President of Fidelity Strategic Investments (investment adviser firm, 2002-2005).
* Determined to be an “Interested Trustee” by virtue of, among other things, his or her affiliation with the trust or various entities under common control with FMR.
+ The information includes the Trustee's principal occupation during the last five years and other information relating to the experience, attributes, and skills relevant to the Trustee's qualifications to serve as a Trustee, which led to the conclusion that the Trustee should serve as a Trustee for the fund.
Independent Trustees:
Correspondence intended for an Independent Trustee may be sent to Fidelity Investments, P.O. Box 55235, Boston, Massachusetts 02205-5235.
Name, Year of Birth; Principal Occupations and Other Relevant Experience+
Dennis J. Dirks (1948)
Year of Election or Appointment: 2005
Trustee
Mr. Dirks also serves as Trustee of other Fidelity® funds. Prior to his retirement in May 2003, Mr. Dirks served as Chief Operating Officer and as a member of the Board of The Depository Trust & Clearing Corporation (financial markets infrastructure), President, Chief Operating Officer and a member of the Board of The Depository Trust Company (DTC), President and a member of the Board of the National Securities Clearing Corporation (NSCC), Chief Executive Officer and a member of the Board of the Government Securities Clearing Corporation and Chief Executive Officer and a member of the Board of the Mortgage-Backed Securities Clearing Corporation. Mr. Dirks currently serves as a member of the Finance Committee (2016-present) and Board (2017-present) and is Treasurer (2018-present) of the Asolo Repertory Theatre.
Donald F. Donahue (1950)
Year of Election or Appointment: 2018
Trustee
Mr. Donahue also serves as Trustee of other Fidelity® funds. Mr. Donahue serves as President and Chief Executive Officer of Miranda Partners, LLC (risk consulting for the financial services industry, 2012-present). Previously, Mr. Donahue served as Chief Executive Officer (2006-2012), Chief Operating Officer (2003-2006) and Managing Director, Customer Marketing and Development (1999-2003) of The Depository Trust & Clearing Corporation (financial markets infrastructure). Mr. Donahue currently serves as a member (2007-present) and Co-Chairman (2016-present) of the Board of United Way of New York, a member of the Board of NYC Leadership Academy (2012-present) and a member of the Board of Advisors of Ripple Labs, Inc. (financial services, 2015-present). Mr. Donahue previously served as a member of the Advisory Board of certain Fidelity® funds (2015-2018).
Vicki L. Fuller (1957)
Year of Election or Appointment: 2020
Trustee
Ms. Fuller also serves as Trustee of other Fidelity® funds. Previously, Ms. Fuller served as a member of the Advisory Board of certain Fidelity® funds (2018-2020), Chief Investment Officer of the New York State Common Retirement Fund (2012-2018) and held a variety of positions at AllianceBernstein L.P. (global asset management, 1985-2012), including Managing Director (2006-2012) and Senior Vice President and Senior Portfolio Manager (2001-2006). Ms. Fuller currently serves as a member of the Board, Audit Committee and Nominating and Governance Committee of The Williams Companies, Inc. (natural gas infrastructure, 2018-present) and as a member of the Board of Treliant, LLC (consulting, 2019-present).
Patricia L. Kampling (1959)
Year of Election or Appointment: 2020
Trustee
Ms. Kampling also serves as Trustee of other Fidelity® funds. Prior to her retirement, Ms. Kampling served as Chairman of the Board and Chief Executive Officer (2012-2019), President and Chief Operating Officer (2011-2012) and Executive Vice President and Chief Financial Officer (2010-2011) of Alliant Energy Corporation. Ms. Kampling currently serves as a member of the Board, Compensation Committee and Executive Committee and as Chair of the Audit Committee of Briggs & Stratton Corporation (manufacturing, 2011-present) and as a member of the Board, Audit, Finance and Risk Committee and Safety, Environmental, Technology and Operations Committee of American Water Works Company, Inc. (utilities company, 2019-present). In addition, Ms. Kampling currently serves as a member of the Board of the Nature Conservancy, Wisconsin Chapter (2019-present). Previously, Ms. Kampling served as a Member of the Advisory Board of certain Fidelity® funds (2020), a member of the Board of Interstate Power and Light Company (2012-2019) and Wisconsin Power and Light Company (2012-2019) (each a subsidiary of Alliant Energy Corporation) and as a member of the Board and Workforce Development Committee of the Business Roundtable (2018-2019).
Alan J. Lacy (1953)
Year of Election or Appointment: 2008
Trustee
Mr. Lacy also serves as Trustee of other Fidelity® funds. Previously, Mr. Lacy served as Senior Adviser (2007-2014) of Oak Hill Capital Partners, L.P. (private equity), Chief Executive Officer (2005) and Vice Chairman (2005-2006) of Sears Holdings Corporation (retail), Chief Executive Officer and Chairman of the Board of Sears, Roebuck and Co. (retail, 2000-2005), Chairman (2014-2017) and a member of the Board (2010-2017) of Dave & Buster’s Entertainment, Inc. (restaurant and entertainment complexes) and a member of the Board of Bristol-Myers Squibb Company (global pharmaceuticals, 2008-2020). Mr. Lacy currently serves as a Trustee of the California Chapter of The Nature Conservancy (2015-present) and a member of the Board of the Center for Advanced Study in the Behavioral Sciences at Stanford University (2015-present).
Ned C. Lautenbach (1944)
Year of Election or Appointment: 2000
Trustee
Co-Lead Independent Trustee
Mr. Lautenbach also serves as Trustee of other Fidelity® funds. Mr. Lautenbach currently serves as Chair of the Board of Governors, State University System of Florida (2013-present) and is a member of the Council on Foreign Relations (1994-present). He is also a member and has in the past served as Chairman of the Board of Directors of Artis-Naples (2012-present). Previously, Mr. Lautenbach served as a member and then Lead Director of the Board of Directors of Eaton Corporation (diversified industrial, 1997-2016). He was also a Partner at Clayton, Dubilier & Rice, LLC (private equity investment, 1998-2010); as well as Director of Sony Corporation (2006-2007). In addition, Mr. Lautenbach had a 30-year career with IBM (technology company), during which time he served as Senior Vice President and as a member of the Corporate Executive Committee (1968-1998).
Joseph Mauriello (1944)
Year of Election or Appointment: 2008
Trustee
Mr. Mauriello also serves as Trustee of other Fidelity® funds. Prior to his retirement in January 2006, Mr. Mauriello served in numerous senior management positions including Deputy Chairman and Chief Operating Officer (2004-2005), and Vice Chairman of Financial Services (2002-2004) of KPMG LLP US (professional services, 1965-2005). Mr. Mauriello currently serves as a member of the Independent Directors Council Governing Council (2015-present). Previously, Mr. Mauriello served as a member of the Board of XL Group plc. (global insurance and re-insurance, 2006-2018).
Cornelia M. Small (1944)
Year of Election or Appointment: 2005
Trustee
Ms. Small also serves as Trustee of other Fidelity® funds. Previously, Ms. Small served as Chief Investment Officer, Director of Global Equity Investments and a member of Scudder, Stevens & Clark and Scudder Kemper Investments. Ms. Small previously served as a member of the Board (2009-2019) and Chair of the Investment Committee (2010-2019) of the Teagle Foundation and a member of the Investment Committee of the Berkshire Taconic Community Foundation (2008-2019).
Garnett A. Smith (1947)
Year of Election or Appointment: 2018
Trustee
Mr. Smith also serves as Trustee of other Fidelity® funds. Prior to his retirement, Mr. Smith served as Chairman and Chief Executive Officer (1990-1997) and President (1986-1990) of Inbrand Corp. (manufacturer of personal absorbent products). Prior to his employment with Inbrand Corp., he was employed by a retail fabric chain and North Carolina National Bank (now Bank of America). Mr. Smith previously served as a member of the Advisory Board of certain Fidelity® funds (2012-2013).
David M. Thomas (1949)
Year of Election or Appointment: 2008
Trustee
Co-Lead Independent Trustee
Mr. Thomas also serves as Trustee of other Fidelity® funds. Previously, Mr. Thomas served as Executive Chairman (2005-2006) and Chairman and Chief Executive Officer (2000-2005) of IMS Health, Inc. (pharmaceutical and healthcare information solutions). Mr. Thomas currently serves as Non-Executive Chairman of the Board of Fortune Brands Home and Security (home and security products, 2011-present), and a member of the Board (2004-present) and Presiding Director (2013-present) of Interpublic Group of Companies, Inc. (marketing communication).
Susan Tomasky (1953)
Year of Election or Appointment: 2020
Trustee
Ms. Tomasky also serves as Trustee of other Fidelity® funds. Prior to her retirement, Ms. Tomasky served in various executive officer positions at American Electric Power Company, Inc. (1998-2011), including most recently as President of AEP Transmission (2007-2011). Ms. Tomasky currently serves as a member of the Board and Sustainability Committee and as Chair of the Audit Committee of Marathon Petroleum Corporation (2018-present) and as a member of the Board, Corporate Governance Committee and Organization and Compensation Committee and as Chair of the Audit Committee of Public Service Enterprise Group, Inc. (utilities company, 2012-present). In addition, Ms. Tomasky currently serves as a member of the Board of the Columbus Regional Airport Authority (2007-present), as a member of the Board of the Royal Shakespeare Company – America (2009-present), as a member of the Board of the Columbus Association for the Performing Arts (2011-present) and as a member of the Board of Kenyon College (2016-present). Previously, Ms. Tomasky served as a Member of the Advisory Board of certain Fidelity® funds (2020), a member of the Board (2011-2019) and as Lead Independent Director (2015-2018) of Andeavor Corporation (previously Tesoro Corporation) (independent oil refiner and marketer) and as a member of the Board of Summit Midstream Partners LP (energy, 2012-2018).
Michael E. Wiley (1950)
Year of Election or Appointment: 2020
Trustee
Mr. Wiley also serves as Trustee of other Fidelity® funds. Previously, Mr. Wiley served as a member of the Advisory Board of certain Fidelity® funds (2018-2020), Chairman, President and CEO of Baker Hughes, Inc. (oilfield services, 2000-2004). Mr. Wiley also previously served as a member of the Board of Andeavor Corporation (independent oil refiner and marketer, 2005-2018), a member of the Board of Andeavor Logistics LP (natural resources logistics, 2015-2018) and a member of the Board of High Point Resources (exploration and production, 2005-2020).
+ The information includes the Trustee's principal occupation during the last five years and other information relating to the experience, attributes, and skills relevant to the Trustee's qualifications to serve as a Trustee, which led to the conclusion that the Trustee should serve as a Trustee for the fund.
Advisory Board Members and Officers:
Correspondence intended for a Member of the Advisory Board (if any) may be sent to Fidelity Investments, P.O. Box 55235, Boston, Massachusetts 02205-5235. Correspondence intended for an officer or Peter S. Lynch may be sent to Fidelity Investments, 245 Summer Street, Boston, Massachusetts 02210. Officers appear below in alphabetical order.
Name, Year of Birth; Principal Occupation
Peter S. Lynch (1944)
Year of Election or Appointment: 2003
Member of the Advisory Board
Mr. Lynch also serves as a Member of the Advisory Board of other Fidelity® funds. Mr. Lynch is Vice Chairman and a Director of Fidelity Management & Research Company LLC (investment adviser firm). In addition, Mr. Lynch serves as a Trustee of Boston College and as the Chairman of the Inner-City Scholarship Fund. Previously, Mr. Lynch served as Vice Chairman and a Director of FMR Co., Inc. (investment adviser firm) and on the Special Olympics International Board of Directors (1997-2006).
Elizabeth Paige Baumann (1968)
Year of Election or Appointment: 2017
Anti-Money Laundering (AML) Officer
Ms. Baumann also serves as AML Officer of other funds. She is Chief AML Officer (2012-present) and Senior Vice President (2014-present) of FMR LLC (diversified financial services company) and is an employee of Fidelity Investments. Previously, Ms. Baumann served as AML Officer of certain funds (2017-2019), as AML Officer of the funds (2012-2016), and Vice President (2007-2014) and Deputy Anti-Money Laundering Officer (2007-2012) of FMR LLC.
Craig S. Brown (1977)
Year of Election or Appointment: 2019
Assistant Treasurer
Mr. Brown also serves as Assistant Treasurer of other funds. Mr. Brown is an employee of Fidelity Investments (2013-present).
John J. Burke III (1964)
Year of Election or Appointment: 2018
Chief Financial Officer
Mr. Burke also serves as Chief Financial Officer of other funds. Mr. Burke serves as Head of Investment Operations for Fidelity Fund and Investment Operations (2018-present) and is an employee of Fidelity Investments (1998-present). Previously Mr. Burke served as head of Asset Management Investment Operations (2012-2018).
William C. Coffey (1969)
Year of Election or Appointment: 2019
Assistant Secretary
Mr. Coffey also serves as Assistant Secretary of other funds. He is Senior Vice President and Deputy General Counsel of FMR LLC (diversified financial services company, 2010-present), and is an employee of Fidelity Investments. Previously, Mr. Coffey served as Secretary and CLO of certain funds (2018-2019); CLO, Secretary, and Senior Vice President of Fidelity Management & Research Company and FMR Co., Inc. (investment adviser firms, 2018-2019); Secretary of Fidelity SelectCo, LLC and Fidelity Investments Money Management, Inc. (investment adviser firms, 2018-2019); CLO of Fidelity Management & Research (Hong Kong) Limited, FMR Investment Management (UK) Limited, and Fidelity Management & Research (Japan) Limited (investment adviser firms, 2018-2019); and Assistant Secretary of certain funds (2009-2018).
Timothy M. Cohen (1969)
Year of Election or Appointment: 2018
Vice President
Mr. Cohen also serves as Vice President of other funds. Mr. Cohen serves as Co-Head of Equity (2018-present), a Director of Fidelity Management & Research (Japan) Limited (investment adviser firm, 2016-present), and is an employee of Fidelity Investments. Previously, Mr. Cohen served as Executive Vice President of Fidelity SelectCo, LLC (2019), Head of Global Equity Research (2016-2018), Chief Investment Officer - Equity and a Director of Fidelity Management & Research (U.K.) Inc. (investment adviser firm, 2013-2015) and as a Director of Fidelity Management & Research (Hong Kong) Limited (investment adviser firm, 2017).
Jonathan Davis (1968)
Year of Election or Appointment: 2010
Assistant Treasurer
Mr. Davis also serves as Assistant Treasurer of other funds. Mr. Davis serves as Assistant Treasurer of FMR Capital, Inc. (2017-present) and is an employee of Fidelity Investments. Previously, Mr. Davis served as Vice President and Associate General Counsel of FMR LLC (diversified financial services company, 2003-2010).
Laura M. Del Prato (1964)
Year of Election or Appointment: 2018
Assistant Treasurer
Ms. Del Prato also serves as an officer of other funds. Ms. Del Prato is an employee of Fidelity Investments (2017-present). Previously, Ms. Del Prato served as President and Treasurer of The North Carolina Capital Management Trust: Cash Portfolio and Term Portfolio (2018-2020). Prior to joining Fidelity Investments, Ms. Del Prato served as a Managing Director and Treasurer of the JPMorgan Mutual Funds (2014-2017). Prior to JPMorgan, Ms. Del Prato served as a partner at Cohen Fund Audit Services (accounting firm, 2012-2013) and KPMG LLP (accounting firm, 2004-2012).
Colm A. Hogan (1973)
Year of Election or Appointment: 2020
Assistant Treasurer
Mr. Hogan also serves as an officer of other funds. Mr. Hogan serves as Assistant Treasurer of FMR Capital, Inc. (2017-present) and is an employee of Fidelity Investments (2005-present). Previously, Mr. Hogan served as Deputy Treasurer of certain Fidelity® funds (2016-2020) and Assistant Treasurer of certain Fidelity® funds (2016-2018).
Pamela R. Holding (1964)
Year of Election or Appointment: 2018
Vice President
Ms. Holding also serves as Vice President of other funds. Ms. Holding serves as Co-Head of Equity (2018-present) and is an employee of Fidelity Investments (2013-present). Previously, Ms. Holding served as Executive Vice President of Fidelity SelectCo, LLC (2019) and as Chief Investment Officer of Fidelity Institutional Asset Management (2013-2018).
Cynthia Lo Bessette (1969)
Year of Election or Appointment: 2019
Secretary and Chief Legal Officer (CLO)
Ms. Lo Bessette also serves as an officer of other funds. Ms. Lo Bessette serves as CLO, Secretary, and Senior Vice President of Fidelity Management & Research Company LLC (investment adviser firm, 2019-present); and CLO of Fidelity Management & Research (Hong Kong) Limited, FMR Investment Management (UK) Limited, and Fidelity Management & Research (Japan) Limited (investment adviser firms, 2019-present). She is a Senior Vice President and Deputy General Counsel of FMR LLC (diversified financial services company, 2019-present), and is an employee of Fidelity Investments. Previously, Ms. Lo Bessette served as CLO, Secretary, and Senior Vice President of FMR Co., Inc. (investment adviser firm, 2019); Secretary of Fidelity SelectCo, LLC and Fidelity Investments Money Management, Inc. (investment adviser firms, 2019). Prior to joining Fidelity Investments, Ms. Lo Bessette was Executive Vice President, General Counsel (2016-2019) and Senior Vice President, Deputy General Counsel (2015-2016) of OppenheimerFunds (investment management company) and Deputy Chief Legal Officer (2013-2015) of Jennison Associates LLC (investment adviser firm).
Chris Maher (1972)
Year of Election or Appointment: 2020
Deputy Treasurer
Mr. Maher also serves as an officer of other funds. Mr. Maher serves as Assistant Treasurer of FMR Capital, Inc. (2017-present), and is an employee of Fidelity Investments (2008-present). Previously, Mr. Maher served as Assistant Treasurer of certain funds (2013-2020); Vice President of Asset Management Compliance (2013), Vice President of the Program Management Group of FMR (investment adviser firm, 2010-2013), and Vice President of Valuation Oversight (2008-2010).
Jason P. Pogorelec (1975)
Year of Election or Appointment: 2020
Chief Compliance Officer
Mr. Pogorelec also serves as Chief Compliance Officer of other funds. Mr. Pogorelec is a senior Vice President of Asset Management Compliance for Fidelity Investments and is an employee of Fidelity Investments (2006-present). Previously, Mr. Pogorelec served as Vice President, Associate General Counsel for Fidelity Investments (2010-2020) and Assistant Secretary of certain Fidelity funds (2015-2020).
Stacie M. Smith (1974)
Year of Election or Appointment: 2016
President and Treasurer
Ms. Smith also serves as an officer of other funds. Ms. Smith serves as Assistant Treasurer of FMR Capital, Inc. (2017-present), is an employee of Fidelity Investments (2009-present), and has served in other fund officer roles. Prior to joining Fidelity Investments, Ms. Smith served as Senior Audit Manager of Ernst & Young LLP (accounting firm, 1996-2009). Previously, Ms. Smith served as Assistant Treasurer (2013-2019) and Deputy Treasurer (2013-2016) of certain Fidelity® funds.
Marc L. Spector (1972)
Year of Election or Appointment: 2016
Assistant Treasurer
Mr. Spector also serves as an officer of other funds. Mr. Spector serves as Assistant Treasurer of FMR Capital, Inc. (2017-present) and is an employee of Fidelity Investments (2016-present). Prior to joining Fidelity Investments, Mr. Spector served as Director at the Siegfried Group (accounting firm, 2013-2016), and prior to Siegfried Group as audit senior manager at Deloitte & Touche LLP (accounting firm, 2005-2013).
Jim Wegmann (1979)
Year of Election or Appointment: 2019
Assistant Treasurer
Mr. Wegmann also serves as Assistant Treasurer of other funds. Mr. Wegmann is an employee of Fidelity Investments (2011-present).
Shareholder Expense Example
As a shareholder, you incur two types of costs: (1) transaction costs, which may include sales charges (loads) on purchase payments or redemption proceeds, as applicable and (2) ongoing costs, which generally include management fees, distribution and/or service (12b-1) fees and other Fund expenses. This Example is intended to help you understand your ongoing costs (in dollars) of investing in a fund and to compare these costs with the ongoing costs of investing in other mutual funds.
The Example is based on an investment of $1,000 invested at the beginning of the period and held for the entire period (February 1, 2020 to July 31, 2020).
Actual Expenses
The first line of the accompanying table provides information about actual account values and actual expenses. You may use the information in this line, together with the amount you invested, to estimate the expenses that you paid over the period. Simply divide your account value by $1,000.00 (for example, an $8,600 account value divided by $1,000.00 = 8.6), then multiply the result by the number in the first line for a class/Fund under the heading entitled "Expenses Paid During Period" to estimate the expenses you paid on your account during this period. If any fund is a shareholder of any underlying mutual funds or exchange-traded funds (ETFs) (the Underlying Funds), such fund indirectly bears its proportional share of the expenses of the Underlying Funds in addition to the direct expenses incurred presented in the table. These fees and expenses are not included in the annualized expense ratio used to calculate the expense estimate in the table below.
Hypothetical Example for Comparison Purposes
The second line of the accompanying table provides information about hypothetical account values and hypothetical expenses based on the actual expense ratio and an assumed rate of return of 5% per year before expenses, which is not the actual return. The hypothetical account values and expenses may not be used to estimate the actual ending account balance or expenses you paid for the period. You may use this information to compare the ongoing costs of investing in the Fund and other funds. To do so, compare this 5% hypothetical example with the 5% hypothetical examples that appear in the shareholder reports of the other funds. If any fund is a shareholder of any Underlying Funds, such fund indirectly bears its proportional share of the expenses of the Underlying Funds in addition to the direct expenses as presented in the table. These fees and expenses are not included in the annualized expense ratio used to calculate the expense estimate in the table below.
Please note that the expenses shown in the table are meant to highlight your ongoing costs only and do not reflect any transaction costs. Therefore, the second line of the table is useful in comparing ongoing costs only, and will not help you determine the relative total costs of owning different funds.
| | Annualized Expense Ratio-A | Beginning
Account Value
February 1, 2020 | Ending
Account Value
July 31, 2020 | Expenses Paid
During Period-B
February 1, 2020
to July 31, 2020 |
| Fidelity Value Discovery Fund | | | | |
| Value Discovery | .68% | | | |
| Actual | | $1,000.00 | $932.00 | $3.27 |
| Hypothetical-C | | $1,000.00 | $1,021.48 | $3.42 |
| Class K | .58% | | | |
| Actual | | $1,000.00 | $932.70 | $2.79 |
| Hypothetical-C | | $1,000.00 | $1,021.98 | $2.92 |
A Annualized expense ratio reflects expenses net of applicable fee waivers.
B Expenses are equal to the annualized expense ratio, multiplied by the average account value over the period, multiplied by 182/ 366 (to reflect the one-half year period). The fees and expenses of any Underlying Funds are not included in each annualized expense ratio.
C 5% return per year before expenses
Distributions (Unaudited)
The fund hereby designates as a capital gain dividend with respect to the taxable year ended July 31, 2020, $13,769,503, or, if subsequently determined to be different, the net capital gain of such year.
Value Discovery designates 93% and 80%; and Class K designates 88% and 76% of the dividends distributed in September and December, respectively, during the fiscal year as qualifying for the dividends–received deduction for corporate shareholders.
Value Discovery designates 100% and 98%; and Class K designates 100% and 93% of the dividends distributed in September and December, respectively, during the fiscal year as amounts which may be taken into account as a dividend for the purposes of the maximum rate under section 1(h)(11) of the Internal Revenue Code.
Value Discovery designates 0% and 3%; and Class K designates 1% and 7% of the dividends distributed in September and December, respectively, during the fiscal year as a section 199A dividend.
The fund will notify shareholders in January 2021 of amounts for use in preparing 2020 income tax returns.
Liquidity Risk Management Program
The Securities and Exchange Commission adopted Rule 22e-4 under the Investment Company Act of 1940 (the Liquidity Rule) to promote effective liquidity risk management throughout the open-end investment company industry, thereby reducing the risk that funds will be unable to meet their redemption obligations and mitigating dilution of the interests of fund shareholders.
The Fund has adopted and implemented a liquidity risk management program pursuant to the Liquidity Rule (the Program) effective December 1, 2018. The Program is reasonably designed to assess and manage the Fund’s liquidity risk and to comply with the requirements of the Liquidity Rule. The Fund’s Board of Trustees (the Board) has designated the Fund’s investment adviser as administrator of the Program. The Fidelity advisers have established a Liquidity Risk Management Committee (the LRM Committee) to manage the Program for each of the Fidelity Funds. The LRM Committee monitors the adequacy and effectiveness of implementation of the Program and on a periodic basis assesses each Fund’s liquidity risk based on a variety of factors including (1) the Fund’s investment strategy, (2) portfolio liquidity and cash flow projections during normal and reasonably foreseeable stressed conditions, (3) shareholder redemptions, (4) borrowings and other funding sources and (5) in the case of exchange-traded funds, certain additional factors including the effect of the Fund’s prices and spreads, market participants, and basket compositions on the overall liquidity of the Fund’s portfolio, as applicable.
In accordance with the Program, each of the Fund’s portfolio investments is classified into one of four liquidity categories described below based on a determination of a reasonable expectation for how long it would take to convert the investment to cash (or sell or dispose of the investment) without significantly changing its market value.
- Highly liquid investments – cash or convertible to cash within three business days or less
- Moderately liquid investments – convertible to cash in three to seven calendar days
- Less liquid investments – can be sold or disposed of, but not settled, within seven calendar days
- Illiquid investments – cannot be sold or disposed of within seven calendar days
Liquidity classification determinations take into account a variety of factors including various market, trading and investment-specific considerations, as well as market depth, and generally utilize analysis from a third-party liquidity metrics service.
The Liquidity Rule places a 15% limit on a fund’s illiquid investments and requires funds that do not primarily hold assets that are highly liquid investments to determine and maintain a minimum percentage of the fund’s net assets to be invested in highly liquid investments (highly liquid investment minimum or HLIM). The Program includes provisions reasonably designed to comply with the 15% limit on illiquid investments and for determining, periodically reviewing and complying with the HLIM requirement as applicable.
At a recent meeting of the Fund’s Board of Trustees, the LRM Committee provided a written report to the Board pertaining to the operation, adequacy, and effectiveness of implementation of the Program for the annual period from December 1, 2018 through November 30, 2019. The report concluded that the Program has been implemented and is operating effectively and is reasonably designed to assess and manage the Fund’s liquidity risk.
Proxy Voting Results
A special meeting of shareholders was held on June 9, 2020. The results of votes taken among shareholders on the proposals before them are reported below. Each vote reported represents one dollar of net asset value held on the record date for the meeting.
PROPOSAL 1
To elect a Board of Trustees.
| | # of
Votes | % of
Votes |
| Dennis J. Dirks |
| Affirmative | 51,196,847,491.427 | 94.398 |
| Withheld | 3,038,239,286.369 | 5.602 |
| TOTAL | 54,235,086,777.797 | 100.000 |
| Donald F. Donahue |
| Affirmative | 51,237,854,534.400 | 94.474 |
| Withheld | 2,997,232,243.397 | 5.526 |
| TOTAL | 54,235,086,777.797 | 100.000 |
| Bettina Doulton |
| Affirmative | 51,360,110,652.541 | 94.699 |
| Withheld | 2,874,976,125.255 | 5.301 |
| TOTAL | 54,235,086,777.797 | 100.000 |
| Vicki L. Fuller |
| Affirmative | 51,563,431,518.122 | 95.074 |
| Withheld | 2,671,655,259.675 | 4.926 |
| TOTAL | 54,235,086,777.797 | 100.000 |
| Patricia L. Kampling |
| Affirmative | 51,164,274,033.278 | 94.338 |
| Withheld | 3,070,812,744.518 | 5.662 |
| TOTAL | 54,235,086,777.797 | 100.000 |
| Alan J. Lacy |
| Affirmative | 50,656,049,520.376 | 93.401 |
| Withheld | 3,579,037,257.420 | 6.599 |
| TOTAL | 54,235,086,777.797 | 100.000 |
| Ned C. Lautenbach |
| Affirmative | 50,648,184,728.350 | 93.386 |
| Withheld | 3,586,902,049.447 | 6.614 |
| TOTAL | 54,235,086,777.797 | 100.000 |
| Robert A. Lawrence |
| Affirmative | 50,828,079,099.188 | 93.718 |
| Withheld | 3,407,007,678.608 | 6.282 |
| TOTAL | 54,235,086,777.797 | 100.000 |
| Joseph Mauriello |
| Affirmative | 50,733,010,817.685 | 93.543 |
| Withheld | 3,502,075,960.112 | 6.457 |
| TOTAL | 54,235,086,777.797 | 100.000 |
| Cornelia M. Small |
| Affirmative | 50,936,822,997.692 | 93.919 |
| Withheld | 3,298,263,780.105 | 6.081 |
| TOTAL | 54,235,086,777.797 | 100.000 |
| Garnett A. Smith |
| Affirmative | 50,777,344,834.274 | 93.625 |
| Withheld | 3,457,741,943.523 | 6.375 |
| TOTAL | 54,235,086,777.797 | 100.000 |
| David M. Thomas |
| Affirmative | 50,835,673,463.433 | 93.732 |
| Withheld | 3,399,413,314.364 | 6.268 |
| TOTAL | 54,235,086,777.797 | 100.000 |
| Susan Tomasky |
| Affirmative | 51,193,289,850.509 | 94.391 |
| Withheld | 3,041,796,927.288 | 5.609 |
| TOTAL | 54,235,086,777.797 | 100.000 |
| Michael E. Wiley |
| Affirmative | 50,830,132,792.508 | 93.722 |
| Withheld | 3,404,953,985.289 | 6.278 |
| TOTAL | 54,235,086,777.797 | 100.000 |
PROPOSAL 2
To convert a fundamental investment policy to a non-fundamental investment policy.
| | # of
Votes | % of
Votes |
| Affirmative | 876,082,766.425 | 70.641 |
| Against | 221,850,579.733 | 17.888 |
| Abstain | 128,446,643.406 | 10.357 |
| Broker Non-Vote | 13,817,491.880 | 1.114 |
| TOTAL | 1,240,197,481.444 | 100.000 |
|
| Proposal 1 reflects trust wide proposal and voting results. |
FVD-ANN-0920
1.788864.117
Fidelity® Series Intrinsic Opportunities Fund
Annual Report
July 31, 2020
See the inside front cover for important information about access to your fund’s shareholder reports.
Beginning on January 1, 2021, as permitted by regulations adopted by the Securities and Exchange Commission, paper copies of a fund’s shareholder reports will no longer be sent by mail, unless you specifically request paper copies of the reports from the fund or from your financial intermediary, such as a financial advisor, broker-dealer or bank. Instead, the reports will be made available on a website, and you will be notified by mail each time a report is posted and provided with a website link to access the report.
If you already elected to receive shareholder reports electronically, you will not be affected by this change and you need not take any action. You may elect to receive shareholder reports and other communications from a fund electronically, by contacting your financial intermediary. For Fidelity customers, visit Fidelity's web site or call Fidelity using the contact information listed below.
You may elect to receive all future reports in paper free of charge. If you wish to continue receiving paper copies of your shareholder reports, you may contact your financial intermediary or, if you are a Fidelity customer, visit Fidelity’s website, or call Fidelity at the applicable toll-free number listed below. Your election to receive reports in paper will apply to all funds held with the fund complex/your financial intermediary.
| Account Type | Website | Phone Number |
| Brokerage, Mutual Fund, or Annuity Contracts: | fidelity.com/mailpreferences | 1-800-343-3548 |
| Employer Provided Retirement Accounts: | netbenefits.fidelity.com/preferences (choose 'no' under Required Disclosures to continue to print) | 1-800-343-0860 |
| Advisor Sold Accounts Serviced Through Your Financial Intermediary: | Contact Your Financial Intermediary | Your Financial Intermediary's phone number |
| Advisor Sold Accounts Serviced by Fidelity: | institutional.fidelity.com | 1-877-208-0098 |
Contents
To view a fund's proxy voting guidelines and proxy voting record for the 12-month period ended June 30, visit http://www.fidelity.com/proxyvotingresults or visit the Securities and Exchange Commission's (SEC) web site at http://www.sec.gov.
You may also call 1-800-544-8544 to request a free copy of the proxy voting guidelines.
Standard & Poor's, S&P and S&P 500 are registered service marks of The McGraw-Hill Companies, Inc. and have been licensed for use by Fidelity Distributors Corporation.
Other third-party marks appearing herein are the property of their respective owners.
All other marks appearing herein are registered or unregistered trademarks or service marks of FMR LLC or an affiliated company. © 2020 FMR LLC. All rights reserved.
This report and the financial statements contained herein are submitted for the general information of the shareholders of the Fund. This report is not authorized for distribution to prospective investors in the Fund unless preceded or accompanied by an effective prospectus.
A fund files its complete schedule of portfolio holdings with the SEC for the first and third quarters of each fiscal year on Form N-PORT. Forms N-PORT are available on the SEC’s web site at http://www.sec.gov. A fund's Forms N-PORT may be reviewed and copied at the SEC’s Public Reference Room in Washington, DC. Information regarding the operation of the SEC's Public Reference Room may be obtained by calling 1-800-SEC-0330.
For a complete list of a fund's portfolio holdings, view the most recent holdings listing, semiannual report, or annual report on Fidelity's web site at http://www.fidelity.com, http://www.institutional.fidelity.com, or http://www.401k.com, as applicable.
NOT FDIC INSURED •MAY LOSE VALUE •NO BANK GUARANTEE
Neither the Fund nor Fidelity Distributors Corporation is a bank.
Note to Shareholders:
Early in 2020, the outbreak and spread of a new coronavirus emerged as a public health emergency that had a major influence on financial markets, primarily based on its impact on the global economy and the outlook for corporate earnings. The virus causes a respiratory disease known as COVID-19. On March 11, the World Health Organization declared the COVID-19 outbreak a pandemic, citing sustained risk of further global spread.
In the weeks following, as the crisis worsened, we witnessed an escalating human tragedy with wide-scale social and economic consequences from coronavirus-containment measures. The outbreak of COVID-19 prompted a number of measures to limit the spread, including travel and border restrictions, quarantines, and restrictions on large gatherings. In turn, these resulted in lower consumer activity, diminished demand for a wide range of products and services, disruption in manufacturing and supply chains, and – given the wide variability in outcomes regarding the outbreak – significant market uncertainty and volatility. Amid the turmoil, the U.S. government took unprecedented action – in concert with the U.S. Federal Reserve and central banks around the world – to help support consumers, businesses, and the broader economy, and to limit disruption to the financial system.
The situation continues to unfold, and the extent and duration of its impact on financial markets and the economy remain highly uncertain. Extreme events such as the coronavirus crisis are “exogenous shocks” that can have significant adverse effects on mutual funds and their investments. Although multiple asset classes may be affected by market disruption, the duration and impact may not be the same for all types of assets.
Fidelity is committed to helping you stay informed amid news about COVID-19 and during increased market volatility, and we’re taking extra steps to be responsive to customer needs. We encourage you to visit our websites, where we offer ongoing updates, commentary, and analysis on the markets and our funds.
Performance: The Bottom Line
Average annual total return reflects the change in the value of an investment, assuming reinvestment of distributions from dividend income and capital gains (the profits earned upon the sale of securities that have grown in value, if any) and assuming a constant rate of performance each year. The hypothetical investment and the average annual total returns do not reflect the deduction of taxes that a shareholder would pay on fund distributions or the redemption of fund shares. During periods of reimbursement by Fidelity, a fund’s total return will be greater than it would be had the reimbursement not occurred. How a fund did yesterday is no guarantee of how it will do tomorrow.
Average Annual Total Returns
| For the periods ended July 31, 2020 | Past 1 year | Past 5 years | Life of fundA |
| Fidelity® Series Intrinsic Opportunities Fund | (1.89)% | 4.78% | 10.29% |
A From December 6, 2012
$10,000 Over Life of Fund
Let's say hypothetically that $10,000 was invested in Fidelity® Series Intrinsic Opportunities Fund on December 6, 2012, when the fund started.
The chart shows how the value of your investment would have changed, and also shows how the Russell 3000® Index performed over the same period.

| Period Ending Values |
| $21,163 | Fidelity® Series Intrinsic Opportunities Fund |
| $26,460 | Russell 3000® Index |
Management's Discussion of Fund Performance
Market Recap: The S&P 500
® index gained 11.96% for the 12 months ending July 31, 2020, in what was a bumpy ride for U.S. equity investors, marked by a steep but brief decline due to the early-2020 outbreak and spread of the coronavirus, followed by a historic rebound. Declared a pandemic on March 11, the COVID-19 crisis and containment efforts caused broad contraction in economic activity, along with extreme uncertainty, volatility and dislocation in financial markets. By mid-March, U.S. stocks entered bear-market territory less than a month after hitting an all-time high and extending the longest-running bull market in American history. Stocks slid in late February, after a surge in COVID-19 cases outside China. The sudden downtrend continued in March (-12%), capping the index’s worst quarter since 2008. A historically rapid and expansive U.S. monetary/fiscal-policy response provided a partial offset to the economic disruption and fueled a sharp uptrend. Aggressive support for financial markets by the U.S. Federal Reserve, plans for reopening the economy and improving infection data boosted stocks in April (+13%) and May (+5%). In June and July, the index gained amid progress on potential treatments and signs of an early recovery in economic activity. For the full 12 months, growth stocks widely topped value, while large-caps handily bested smaller-caps. The information technology sector (+39%) led the way, followed by consumer discretionary (+22%). In contrast, energy (-38%) fell hard along with the price of crude oil.
Comments from Portfolio Manager Joel Tillinghast: For the fiscal year ending July 31, 2020, the fund returned -1.89%, underperforming the 10.93% result of the benchmark Russell 3000
® Index. The primary detractor from performance versus the benchmark was our stock picks in consumer discretionary. An underweighting and stock selection in information technology and an overweighting in energy also hurt. Not owning Apple, a benchmark component that gained 102%, was the largest individual relative detractor versus the Russell 3000 Index. Our second-largest relative detractor this period was avoiding Amazon.com, a benchmark component that gained roughly 70%. Avoiding Microsoft, a benchmark component that gained about 52%, hurt performance. Foreign holdings detracted, despite favorable foreign exchange. Conversely, the top contributor to performance versus the benchmark was an overweighting in the outperforming consumer discretionary sector. Also lifting the fund's relative result was an underweighting in the lagging real estate sector and an overweighting in the strong-performing health care sector. Our top individual relative contributor was an out-of-benchmark stake in Z Holdings (+83%). We reduced our position the past year. Our second-largest relative contributor this period was avoiding Exxon Mobil, a benchmark component that returned -40%. Another notable relative contributor was an outsized stake in Amgen (+35%), which also was one of our biggest holdings in the fund even though we reduced our stake during the period. Notable changes in positioning include increased exposure to consumer staples and communication services. The fund's stake in cash declined to 6% of assets at period end, from about 13% of assets a year ago.
The views expressed above reflect those of the portfolio manager(s) only through the end of the period as stated on the cover of this report and do not necessarily represent the views of Fidelity or any other person in the Fidelity organization. Any such views are subject to change at any time based upon market or other conditions and Fidelity disclaims any responsibility to update such views. These views may not be relied on as investment advice and, because investment decisions for a Fidelity fund are based on numerous factors, may not be relied on as an indication of trading intent on behalf of any Fidelity fund.
Investment Summary (Unaudited)
Top Ten Stocks as of July 31, 2020
| | % of fund's net assets |
| Anthem, Inc. | 5.7 |
| Itochu Corp. | 3.5 |
| Amgen, Inc. | 3.1 |
| MetLife, Inc. | 2.7 |
| UnitedHealth Group, Inc. | 2.3 |
| John David Group PLC | 2.2 |
| The Western Union Co. | 2.0 |
| United Therapeutics Corp. | 1.8 |
| Synchrony Financial | 1.8 |
| Walgreens Boots Alliance, Inc. | 1.8 |
| | 26.9 |
Top Five Market Sectors as of July 31, 2020
| | % of fund's net assets |
| Health Care | 21.9 |
| Consumer Discretionary | 18.7 |
| Financials | 13.9 |
| Industrials | 9.9 |
| Energy | 6.5 |
Asset Allocation (% of fund's net assets)
| As of July 31, 2020* |
| | Stocks | 94.6% |
| | Short-Term Investments and Net Other Assets (Liabilities) | 5.4% |

* Foreign investments - 41.8%
Schedule of Investments July 31, 2020
Showing Percentage of Net Assets
| Common Stocks - 94.5% | | | |
| | | Shares | Value |
| COMMUNICATION SERVICES - 5.1% | | | |
| Diversified Telecommunication Services - 0.6% | | | |
| Verizon Communications, Inc. | | 1,150,200 | $66,113,496 |
| Entertainment - 0.0% | | | |
| Ateam, Inc. | | 5,000 | 39,299 |
| GAMEVIL, Inc. (a) | | 15,000 | 420,200 |
| Nihon Falcom Corp. | | 35,000 | 432,478 |
| | | | 891,977 |
| Interactive Media & Services - 1.4% | | | |
| Cars.com, Inc. (a)(b) | | 656,000 | 5,326,720 |
| Kakaku.com, Inc. | | 500,000 | 12,011,714 |
| mixi, Inc. | | 10,000 | 194,228 |
| Momo, Inc. ADR | | 5,000 | 92,350 |
| XLMedia PLC | | 125,000 | 36,816 |
| Yahoo! Japan Corp. | | 18,000,000 | 95,719,265 |
| YY, Inc. ADR (a) | | 600,000 | 47,892,000 |
| Zappallas, Inc. (a)(c) | | 1,000,000 | 3,580,369 |
| ZIGExN Co. Ltd. | | 300,000 | 802,041 |
| | | | 165,655,503 |
| Media - 2.9% | | | |
| AMC Networks, Inc. Class A (a)(b) | | 125,000 | 2,887,500 |
| Comcast Corp. Class A | | 3,550,000 | 151,940,000 |
| Corus Entertainment, Inc. Class B (non-vtg.) | | 400,000 | 716,712 |
| Criteo SA sponsored ADR (a) | | 25,000 | 342,250 |
| Discovery Communications, Inc.: | | | |
| Class A (a)(b) | | 2,600,000 | 54,860,000 |
| Class B (a)(b) | | 19,308 | 681,186 |
| DISH Network Corp. Class A (a) | | 100,000 | 3,211,000 |
| DMS, Inc. | | 250,000 | 3,792,924 |
| F@N Communications, Inc. | | 525,000 | 2,107,836 |
| Gendai Agency, Inc. (c) | | 850,000 | 2,119,881 |
| Hyundai HCN | | 2,250,049 | 7,460,275 |
| Interspace Co. Ltd. | | 20,000 | 223,891 |
| Ipsos SA | | 10,000 | 263,272 |
| ITE Group PLC | | 548,427 | 572,877 |
| Nippon BS Broadcasting Corp. | | 200,000 | 1,991,403 |
| Nippon Television Network Corp. | | 200,000 | 2,153,890 |
| Omnicom Group, Inc. | | 100,000 | 5,373,000 |
| Pico Far East Holdings Ltd. | | 10,600,000 | 1,395,043 |
| Proto Corp. | | 100,000 | 982,476 |
| RKB Mainichi Broadcasting Corp. | | 3,000 | 158,141 |
| Sky Network Television Ltd. (a) | | 3,500,000 | 299,435 |
| Television Broadcasts Ltd. | | 1,500,000 | 1,747,674 |
| ViacomCBS, Inc.: | | | |
| Class A (b) | | 650,906 | 18,056,132 |
| Class B (b) | | 3,050,000 | 79,513,500 |
| WOWOW INC. | | 250,000 | 5,800,387 |
| | | | 348,650,685 |
| Wireless Telecommunication Services - 0.2% | | | |
| Okinawa Cellular Telephone Co. | | 525,000 | 20,954,372 |
|
| TOTAL COMMUNICATION SERVICES | | | 602,266,033 |
|
| CONSUMER DISCRETIONARY - 18.7% | | | |
| Auto Components - 4.9% | | | |
| Adient PLC (a) | | 1,200,000 | 19,968,000 |
| ASTI Corp. | | 30,000 | 337,254 |
| ATLASBX Co. Ltd. | | 6,000 | 229,291 |
| Brembo SpA | | 1,000 | 9,000 |
| Burelle SA | | 1,700 | 993,247 |
| Chita Kogyo Co. Ltd. | | 10,000 | 56,115 |
| Compagnie Plastic Omnium | | 10,000 | 201,076 |
| Cooper Tire & Rubber Co. | | 350,000 | 10,871,000 |
| Cooper-Standard Holding, Inc. (a) | | 300,000 | 3,213,000 |
| DaikyoNishikawa Corp. | | 1,000,000 | 4,175,523 |
| DongAh Tire & Rubber Co. Ltd. | | 57,879 | 513,034 |
| DTR Automotive Corp. | | 50,120 | 1,012,157 |
| Eagle Industry Co. Ltd. | | 300,000 | 1,762,789 |
| Exedy Corp. | | 15,000 | 183,506 |
| Fukoku Co. Ltd. | | 250,000 | 1,473,714 |
| G-Tekt Corp. (c) | | 2,850,000 | 23,504,322 |
| Gentex Corp. | | 250,000 | 6,747,500 |
| Hi-Lex Corp. | | 249,937 | 2,590,155 |
| Hu Lane Associate, Inc. | | 50,000 | 128,568 |
| Hyundai Mobis | | 950,000 | 163,250,715 |
| IJT Technology Holdings Co. Ltd. | | 1,600,000 | 6,544,802 |
| INFAC Corp. | | 362,529 | 1,409,663 |
| Johnson Electric Holdings Ltd. | | 10,000 | 18,399 |
| Lear Corp. | | 1,725,200 | 190,427,576 |
| Linamar Corp. | | 2,650,000 | 79,136,959 |
| Murakami Corp. | | 35,000 | 753,861 |
| Nokian Tyres PLC | | 5,000 | 119,915 |
| Piolax, Inc. | | 924,000 | 12,691,852 |
| Seoyon Co. Ltd. | | 425,000 | 2,370,470 |
| Seoyon E-Hwa Co., Ltd. | | 685,725 | 2,058,563 |
| SL Corp. | | 15,000 | 142,993 |
| Stanley Electric Co. Ltd. | | 100,000 | 2,376,836 |
| Strattec Security Corp. | | 40,000 | 864,400 |
| TBK Co. Ltd. (c) | | 1,800,000 | 7,192,858 |
| The Furukawa Battery Co. Ltd. (b) | | 150,000 | 1,476,548 |
| TPR Co. Ltd. | | 825,000 | 9,944,736 |
| Xinyi Glass Holdings Ltd. | | 300,000 | 439,725 |
| Yorozu Corp. (c) | | 1,852,000 | 17,653,091 |
| | | | 576,843,213 |
| Automobiles - 0.2% | | | |
| Audi AG (a) | | 11,352 | 20,994,179 |
| Kabe Husvagnar AB (B Shares) | | 25,000 | 447,023 |
| Renault SA | | 10,000 | 236,238 |
| | | | 21,677,440 |
| Distributors - 0.1% | | | |
| Doshisha Co. Ltd. | | 350,000 | 5,511,785 |
| Harima-Kyowa Co. Ltd. | | 150,000 | 2,553,493 |
| Headlam Group PLC | | 50,000 | 179,988 |
| LKQ Corp. (a) | | 5,000 | 140,950 |
| Nakayamafuku Co. Ltd. | | 200,000 | 855,888 |
| SPK Corp. | | 30,000 | 379,198 |
| Uni-Select, Inc. | | 25,000 | 142,969 |
| Yagi & Co. Ltd. | | 450,000 | 6,533,938 |
| Yamae Hisano Co. | | 50,000 | 566,813 |
| | | | 16,865,022 |
| Diversified Consumer Services - 0.5% | | | |
| Cross-Harbour Holdings Ltd. | | 1,300,000 | 1,811,543 |
| Estacio Participacoes SA | | 5,000 | 32,483 |
| Heian Ceremony Service Co. Ltd. | | 500,000 | 3,944,074 |
| Kukbo Design Co. Ltd. | | 200,000 | 2,600,639 |
| MegaStudy Co. Ltd. (c) | | 1,086,945 | 9,225,571 |
| MegaStudyEdu Co. Ltd. (c) | | 1,048,420 | 29,764,236 |
| Multicampus Co. Ltd. | | 60,000 | 1,472,580 |
| Step Co. Ltd. | | 217,000 | 2,972,462 |
| Tsukada Global Holdings, Inc. | | 1,100,000 | 2,275,755 |
| | | | 54,099,343 |
| Hotels, Restaurants & Leisure - 0.2% | | | |
| Betsson AB (B Shares) | | 125,000 | 936,756 |
| Biglari Holdings, Inc. (a) | | 2,000 | 129,860 |
| Brinker International, Inc. | | 50,000 | 1,344,500 |
| Fairwood Holdings Ltd. | | 50,000 | 107,093 |
| Hiday Hidaka Corp. | | 250,000 | 3,469,368 |
| Kura Sushi, Inc. | | 100,000 | 4,137,736 |
| NetEnt AB | | 175,000 | 1,524,720 |
| Playtech Ltd. | | 100,000 | 390,344 |
| The Cheesecake Factory, Inc. (b) | | 50,000 | 1,200,000 |
| The Restaurant Group PLC (b) | | 16,957,111 | 9,811,011 |
| ZEAL Network SE | | 1,000 | 40,639 |
| | | | 23,092,027 |
| Household Durables - 2.3% | | | |
| Ace Bed Co. Ltd. | | 250,145 | 8,806,302 |
| Avantia Co. Ltd. | | 700,000 | 5,720,089 |
| Cuckoo Holdings Co. Ltd. | | 35,000 | 2,350,191 |
| Emak SpA (a) | | 1,200,000 | 1,105,388 |
| FJ Next Co. Ltd. (b) | | 1,100,000 | 8,261,301 |
| Flexsteel Industries, Inc. | | 10,000 | 157,700 |
| Fuji Corp. Ltd. | | 50,000 | 225,781 |
| Gree Electric Appliances, Inc. of Zhuhai (A Shares) | | 6,850,581 | 55,893,646 |
| Haier Electronics Group Co. Ltd. | | 1,000 | 4,381 |
| Hamilton Beach Brands Holding Co.: | | | |
| Class A | | 125,000 | 1,900,000 |
| Class B | | 125,000 | 1,900,000 |
| Helen of Troy Ltd. (a) | | 425,000 | 80,006,250 |
| Iida Group Holdings Co. Ltd. | | 100,000 | 1,537,953 |
| iRobot Corp. (a)(b) | | 10,000 | 726,900 |
| Mohawk Industries, Inc. (a) | | 550,000 | 43,917,500 |
| Nittoh Corp. | | 25,000 | 101,790 |
| Q.E.P. Co., Inc. (a) | | 30,998 | 348,728 |
| SABAF SpA (a) | | 400,000 | 5,206,539 |
| Sanei Architecture Planning Co. Ltd. | | 660,000 | 7,432,053 |
| Taylor Morrison Home Corp. (a) | | 2,100,000 | 49,245,000 |
| Urbi, Desarrollos Urbanos, S.A.B. de CV (a) | | 16 | 12 |
| Wellpool Co. Ltd. | | 200,000 | 340,236 |
| | | | 275,187,740 |
| Internet & Direct Marketing Retail - 0.0% | | | |
| Aucnet, Inc. | | 100,000 | 1,065,609 |
| CROOZ, Inc. (a) | | 50,000 | 683,482 |
| Danawa Co. Ltd. | | 10,000 | 229,124 |
| Hyundai Home Shopping Network Corp. | | 10,000 | 506,748 |
| Liberty Interactive Corp. QVC Group Series A (a) | | 50,000 | 545,500 |
| NS Shopping Co. Ltd. | | 75,000 | 790,226 |
| | | | 3,820,689 |
| Leisure Products - 0.1% | | | |
| Dream International Ltd. | | 448,000 | 168,788 |
| Mars Group Holdings Corp. | | 550,000 | 7,710,547 |
| | | | 7,879,335 |
| Multiline Retail - 0.4% | | | |
| Big Lots, Inc. | | 100,000 | 3,934,000 |
| Grazziotin SA | | 400,000 | 1,959,916 |
| Gwangju Shinsegae Co. Ltd. (c) | | 97,372 | 11,236,546 |
| Lifestyle China Group Ltd. (a) | | 12,500,000 | 2,580,545 |
| Lifestyle International Holdings Ltd. | | 11,700,000 | 9,480,407 |
| Macy's, Inc. (b) | | 700,000 | 4,242,000 |
| Ryohin Keikaku Co. Ltd. | | 100,000 | 1,196,920 |
| Treasure Factory Co. Ltd. (c) | | 850,000 | 5,420,150 |
| Watts Co. Ltd. | | 68,300 | 644,577 |
| | | | 40,695,061 |
| Specialty Retail - 9.2% | | | |
| ABC-MART, Inc. | | 25,000 | 1,317,840 |
| Arc Land Sakamoto Co. Ltd. | | 525,000 | 9,686,127 |
| AT-Group Co. Ltd. | | 971,907 | 11,880,853 |
| AutoNation, Inc. (a) | | 600,000 | 30,804,000 |
| Bed Bath & Beyond, Inc. (b) | | 500,000 | 5,410,000 |
| Best Buy Co., Inc. | | 1,950,000 | 194,200,500 |
| DCM Japan Holdings Co. Ltd. (b) | | 25,000 | 313,873 |
| Dick's Sporting Goods, Inc. | | 25,000 | 1,140,500 |
| Dunelm Group PLC | | 300,000 | 4,830,210 |
| E-Life Mall Corp. Ltd. | | 100,000 | 236,701 |
| Fenix Outdoor International AG | | 3,000 | 333,132 |
| Foot Locker, Inc. (b) | | 750,000 | 22,042,500 |
| Formosa Optical Technology Co. Ltd. | | 751,383 | 1,709,433 |
| Fuji Corp. (c) | | 705,790 | 12,928,315 |
| GameStop Corp. Class A (a)(b)(c) | | 6,978,267 | 27,982,851 |
| Genesco, Inc. (a)(b) | | 450,000 | 6,997,500 |
| Goldlion Holdings Ltd. | | 9,300,000 | 1,763,932 |
| Guess?, Inc. (b)(c) | | 4,600,000 | 47,564,000 |
| Handsman Co. Ltd. (c) | | 743,100 | 10,635,270 |
| Hibbett Sports, Inc. (a)(b)(c) | | 1,350,300 | 31,313,457 |
| Hour Glass Ltd. | | 28,600,000 | 14,081,479 |
| IA Group Corp. | | 18,200 | 545,029 |
| International Housewares Retail Co. Ltd. | | 999,600 | 285,036 |
| JB Hi-Fi Ltd. | | 750,000 | 24,471,699 |
| John David Group PLC | | 33,000,000 | 261,601,032 |
| Jumbo SA | | 1,725,000 | 33,750,918 |
| K's Holdings Corp. | | 1,900,000 | 24,410,751 |
| Ku Holdings Co. Ltd. | | 600,000 | 4,710,217 |
| Leon's Furniture Ltd. | | 225,000 | 2,249,244 |
| Lookers PLC (d) | | 1,534,541 | 421,830 |
| Mandarake, Inc. | | 180,000 | 799,206 |
| Mitsui & Associates Telepark Corp. | | 25,000 | 446,601 |
| Mr. Bricolage SA (a) | | 311,600 | 1,908,656 |
| Nafco Co. Ltd. | | 640,400 | 11,161,853 |
| Nitori Holdings Co. Ltd. | | 350,000 | 76,609,513 |
| Nojima Co. Ltd. | | 50,000 | 1,246,044 |
| Oriental Watch Holdings Ltd. | | 9,273,000 | 2,345,081 |
| Padini Holdings Bhd | | 2,000,000 | 1,007,621 |
| Sacs Bar Holdings, Inc. | | 400,000 | 1,787,351 |
| Sally Beauty Holdings, Inc. (a)(b)(c) | | 5,992,200 | 69,569,442 |
| Samse SA | | 37,000 | 5,448,019 |
| Silvano Fashion Group A/S | | 9,800 | 18,839 |
| SuperGroup PLC | | 125,000 | 188,332 |
| The Buckle, Inc. | | 1,000,000 | 16,030,000 |
| Tokatsu Holdings Co. Ltd. (c) | | 250,000 | 944,688 |
| Truworths International Ltd. | | 334,900 | 639,286 |
| Urban Outfitters, Inc. (a) | | 1,850,000 | 30,599,000 |
| Vita Group Ltd. | | 350,000 | 256,309 |
| Williams-Sonoma, Inc. (b) | | 900,000 | 78,408,000 |
| | | | 1,089,032,070 |
| Textiles, Apparel & Luxury Goods - 0.8% | | | |
| Best Pacific International Holdings Ltd. | | 31,200,000 | 4,226,933 |
| Bjorn Borg AB (a) | | 5,000 | 8,086 |
| Capri Holdings Ltd. (a) | | 2,825,000 | 42,318,500 |
| Embry Holdings Ltd. | | 3,200,000 | 433,532 |
| Ff Group (a)(d) | | 1,180,000 | 1,667,977 |
| Fossil Group, Inc. (a)(b) | | 2,338,700 | 7,741,097 |
| Fujibo Holdings, Inc. | | 2,000 | 57,815 |
| Gildan Activewear, Inc. | | 50,000 | 887,304 |
| Grendene SA | | 300,000 | 438,221 |
| Hagihara Industries, Inc. | | 135,000 | 1,702,565 |
| Magni-Tech Industries Bhd | | 8,533,333 | 4,258,035 |
| Movado Group, Inc. (b) | | 25,000 | 241,000 |
| Only Corp. | | 15,000 | 74,961 |
| PVH Corp. | | 100,000 | 4,866,000 |
| Sakai Ovex Co. Ltd. | | 190,000 | 3,885,976 |
| Sitoy Group Holdings Ltd. | | 11,200,000 | 534,689 |
| Tapestry, Inc. | | 900,000 | 12,024,000 |
| Ted Baker PLC (b) | | 4,411,145 | 4,244,029 |
| Texwinca Holdings Ltd. | | 1,800,000 | 255,474 |
| Youngone Holdings Co. Ltd. | | 258,000 | 7,497,115 |
| Yue Yuen Industrial (Holdings) Ltd. | | 1,138,000 | 1,806,046 |
| | | | 99,169,355 |
|
| TOTAL CONSUMER DISCRETIONARY | | | 2,208,361,295 |
|
| CONSUMER STAPLES - 6.3% | | | |
| Beverages - 0.9% | | | |
| A.G. Barr PLC | | 500,000 | 2,814,350 |
| Britvic PLC | | 6,968,131 | 72,833,449 |
| C&C Group PLC (United Kingdom) | | 412,710 | 1,250,650 |
| Jinro Distillers Co. Ltd. (c) | | 460,240 | 11,545,833 |
| Lucas Bols BV (e) | | 120,000 | 1,094,080 |
| Muhak Co. Ltd. (a) | | 340,000 | 1,535,297 |
| National Beverage Corp. (a)(b) | | 1,000 | 64,150 |
| Olvi PLC (A Shares) | | 100,000 | 5,006,287 |
| Spritzer Bhd | | 1,000,000 | 477,176 |
| Willamette Valley Vineyards, Inc. (a) | | 5,000 | 31,750 |
| Yantai Changyu Pioneer Wine Co. Ltd. (B Shares) | | 6,350,762 | 12,815,751 |
| | | | 109,468,773 |
| Food & Staples Retailing - 2.9% | | | |
| Amsterdam Commodities NV | | 625,000 | 13,885,086 |
| Belc Co. Ltd. | | 25,000 | 1,792,546 |
| Create SD Holdings Co. Ltd. | | 930,000 | 33,341,363 |
| Daiichi Co. Ltd. | | 200,000 | 1,745,784 |
| Dong Suh Companies, Inc. | | 500,000 | 9,031,157 |
| Genky DrugStores Co. Ltd. | | 400,000 | 13,868,027 |
| Halows Co. Ltd. | | 100,000 | 3,386,708 |
| Magnit OJSC | | 5,388 | 330,888 |
| MARR SpA | | 750,000 | 11,149,297 |
| Medical Ikkou Co. Ltd. | | 3,000 | 221,057 |
| Nihon Chouzai Co. Ltd. | | 100,000 | 1,485,050 |
| OM2 Network Co. Ltd. | | 220,000 | 2,493,978 |
| Qol Holdings Co. Ltd. | | 150,000 | 1,462,378 |
| Retail Partners Co. Ltd. (b) | | 550,000 | 11,020,264 |
| Sapporo Clinical Laboratory | | 20,000 | 291,153 |
| Satoh & Co. Ltd. | | 50,000 | 694,346 |
| Satsudora Holdings Co. Ltd. (c) | | 350,000 | 6,315,243 |
| Shoei Foods Corp. (b) | | 40,000 | 1,373,577 |
| Total Produce PLC | | 100,000 | 125,805 |
| Valor Holdings Co. Ltd. | | 650,000 | 14,067,829 |
| Walgreens Boots Alliance, Inc. | | 5,050,100 | 205,589,571 |
| Yuasa Funashoku Co. Ltd. | | 10,000 | 278,305 |
| | | | 333,949,412 |
| Food Products - 1.8% | | | |
| Ajinomoto Malaysia Bhd | | 1,650,000 | 5,921,009 |
| Armanino Foods of Distinction | | 425,000 | 930,750 |
| Astral Foods Ltd. | | 10,000 | 80,140 |
| Axyz Co. Ltd. | | 1,000 | 27,235 |
| Bakkavor Group PLC (e) | | 100,000 | 83,776 |
| Bell AG | | 40,500 | 10,362,473 |
| Binggrea Co. Ltd. | | 15,000 | 763,885 |
| Cal-Maine Foods, Inc. (a)(b) | | 100,000 | 4,394,500 |
| Carr's Group PLC | | 4,270,000 | 7,196,391 |
| Changshouhua Food Co. Ltd. (a) | | 11,300,000 | 3,936,622 |
| Cranswick PLC | | 462,773 | 21,686,561 |
| Delfi Ltd. | | 13,979,520 | 7,659,208 |
| Fleury Michon SA (a) | | 2,000 | 56,777 |
| Fresh Del Monte Produce, Inc. | | 1,438,000 | 32,470,040 |
| Glanbia PLC | | 5,000 | 60,488 |
| High Liner Foods, Inc. | | 50,000 | 206,801 |
| Ingredion, Inc. | | 675,000 | 58,387,500 |
| JC Comsa Corp. | | 150,000 | 683,010 |
| Kaneko Seeds Co. Ltd. | | 150,000 | 1,983,846 |
| Kaveri Seed Co. Ltd. | | 207,575 | 1,674,287 |
| Lassonde Industries, Inc. Class A (sub. vtg.) | | 50,000 | 6,114,450 |
| LDC SA | | 500 | 60,664 |
| London Biscuits Bhd (a)(d) | | 5,000,000 | 23,588 |
| M. Dias Branco SA | | 10,000 | 74,915 |
| Nissin Foods Co. Ltd. | | 500,000 | 483,852 |
| Nitto Fuji Flour Milling Co. Ltd. | | 10,000 | 565,868 |
| Origin Enterprises PLC | | 100,000 | 373,410 |
| Pickles Corp. | | 100,000 | 2,488,309 |
| President Bakery PCL | | 16,500 | 36,105 |
| Prima Meat Packers Ltd. | | 1,250,000 | 33,087,714 |
| S Foods, Inc. | | 300,000 | 7,153,181 |
| Shinobu Food Products Co. Ltd. | | 25,000 | 135,090 |
| Thai President Foods PCL | | 131,357 | 821,244 |
| Thai Wah PCL | | 426,000 | 52,994 |
| Toyo Sugar Refining Co. Ltd. | | 210,000 | 2,360,777 |
| Tyson Foods, Inc. Class A | | 20,000 | 1,229,000 |
| Valsoia SpA | | 50,000 | 674,376 |
| | | | 214,300,836 |
| Personal Products - 0.5% | | | |
| Asaleo Care Ltd. | | 700,000 | 475,109 |
| Hengan International Group Co. Ltd. | | 4,000,000 | 33,572,894 |
| Jacques Bogart SA | | 15,000 | 159,023 |
| Sarantis SA | | 2,400,000 | 23,888,826 |
| | | | 58,095,852 |
| Tobacco - 0.2% | | | |
| KT&G Corp. | | 315,000 | 21,309,769 |
| Scandinavian Tobacco Group A/S (e) | | 400,000 | 5,878,166 |
| | | | 27,187,935 |
|
| TOTAL CONSUMER STAPLES | | | 743,002,808 |
|
| ENERGY - 6.5% | | | |
| Energy Equipment & Services - 0.2% | | | |
| AKITA Drilling Ltd. Class A (non-vtg.) | | 250,000 | 62,526 |
| Cactus, Inc. | | 5,000 | 113,100 |
| Cathedral Energy Services Ltd. (a) | | 800,000 | 89,589 |
| Championx Corp. (a) | | 1,000,000 | 9,510,000 |
| Core Laboratories NV | | 20,000 | 426,600 |
| Geospace Technologies Corp. (a) | | 440,000 | 3,322,000 |
| High Arctic Energy Services, Inc. (b) | | 400,000 | 176,192 |
| Liberty Oilfield Services, Inc. Class A | | 650,000 | 3,672,500 |
| Oil States International, Inc. (a) | | 2,199,391 | 9,853,272 |
| PHX Energy Services Corp. (a) | | 25,000 | 19,411 |
| Prosafe ASA (a)(b) | | 600,000 | 96,903 |
| Shelf Drilling Ltd. (a)(e) | | 100,000 | 35,268 |
| Smart Sand, Inc. (a)(b) | | 455,000 | 532,350 |
| Solaris Oilfield Infrastructure, Inc. Class A | | 200,000 | 1,452,000 |
| Subsea 7 SA (a) | | 100,000 | 749,738 |
| Tidewater, Inc. (a)(b) | | 82,985 | 516,167 |
| Tidewater, Inc. warrants 11/14/24 (a) | | 4,764 | 1,763 |
| | | | 30,629,379 |
| Oil, Gas & Consumable Fuels - 6.3% | | | |
| Advantage Oil & Gas Ltd. (a) | | 300,000 | 358,356 |
| Alvopetro Energy Ltd. (a) | | 2,800,000 | 1,672,328 |
| ARC Resources Ltd. | | 100,000 | 424,801 |
| Baytex Energy Corp. (a)(b) | | 5,300,000 | 2,453,246 |
| Beach Energy Ltd. | | 1,392,894 | 1,408,142 |
| Berry Petroleum Corp. | | 200,000 | 941,000 |
| Birchcliff Energy Ltd. (b) | | 7,030,814 | 6,298,837 |
| Bonanza Creek Energy, Inc. (a)(c) | | 1,200,000 | 21,828,000 |
| Bonavista Energy Corp. (a)(b) | | 2,335,000 | 87,163 |
| Bonterra Energy Corp. (b) | | 500,000 | 578,596 |
| Cenovus Energy, Inc. (Canada) | | 150,000 | 667,438 |
| China Petroleum & Chemical Corp.: | | | |
| (H Shares) | | 225,000,000 | 95,854,713 |
| sponsored ADR (H Shares) | | 50,000 | 2,125,500 |
| CNOOC Ltd. | | 450,000 | 474,975 |
| ConocoPhillips Co. | | 1,500,000 | 56,085,000 |
| CONSOL Energy, Inc. (a)(b) | | 250,000 | 1,470,000 |
| Delek U.S. Holdings, Inc. | | 450,000 | 7,866,000 |
| Denbury Resources, Inc. (a)(b) | | 15,000,000 | 382,500 |
| Enterprise Products Partners LP | | 15,000 | 264,000 |
| EQT Corp. | | 1,400,000 | 20,328,000 |
| Equitrans Midstream Corp. (b) | | 122,000 | 1,177,300 |
| Frontline Ltd. (NY Shares) | | 25,000 | 200,000 |
| Fuji Oil Co. Ltd. (a) | | 150,000 | 216,806 |
| HollyFrontier Corp. (b) | | 216,022 | 5,940,605 |
| Husky Energy, Inc. | | 8,000,000 | 25,741,909 |
| Imperial Oil Ltd. | | 800,000 | 12,512,598 |
| International Seaways, Inc. | | 55,000 | 949,850 |
| Marathon Oil Corp. | | 500,000 | 2,745,000 |
| Motor Oil (HELLAS) Corinth Refineries SA | | 300,000 | 4,042,724 |
| Murphy Oil Corp. | | 4,000,000 | 52,840,000 |
| NACCO Industries, Inc. Class A | | 150,000 | 3,276,000 |
| NuVista Energy Ltd. (a)(b) | | 250,000 | 121,318 |
| Oil & Natural Gas Corp. Ltd. | | 75,000,616 | 78,384,253 |
| Oil India Ltd. | | 75,656 | 97,599 |
| Ovintiv, Inc. (b) | | 2,000,000 | 19,380,000 |
| Ovintiv, Inc. | | 10,000 | 96,756 |
| PDC Energy, Inc. (a) | | 400,000 | 5,704,000 |
| Peyto Exploration & Development Corp. (b)(c) | | 12,474,700 | 18,533,467 |
| QEP Resources, Inc. | | 1,500,000 | 2,205,000 |
| S-Oil Corp. | | 10,000 | 510,093 |
| San-Ai Oil Co. Ltd. | | 200,000 | 1,607,860 |
| Sanrin Co. Ltd. | | 15,000 | 103,160 |
| Seven Generations Energy Ltd. (a) | | 200,000 | 547,986 |
| Sinopec Kantons Holdings Ltd. | | 6,000,000 | 2,616,673 |
| Southwestern Energy Co. (a)(b)(c) | | 50,260,100 | 122,132,043 |
| Star Petroleum Refining PCL | | 3,700,000 | 824,463 |
| Thai Oil PCL (For. Reg.) | | 1,000,000 | 1,346,585 |
| Total SA sponsored ADR | | 3,750,083 | 141,228,126 |
| TransGlobe Energy Corp. (b) | | 30,000 | 17,470 |
| Tsakos Energy Navigation Ltd. (b) | | 140,000 | 1,218,000 |
| Unit Corp. (a)(b)(c) | | 5,400,000 | 263,520 |
| Whiting Petroleum Corp. (a)(b)(c) | | 7,879,604 | 6,146,091 |
| World Fuel Services Corp. | | 250,000 | 5,882,500 |
| | | | 740,178,350 |
|
| TOTAL ENERGY | | | 770,807,729 |
|
| FINANCIALS - 13.9% | | | |
| Banks - 2.1% | | | |
| Banco de Sabadell SA | | 101,510 | 34,557 |
| Bar Harbor Bankshares | | 350,000 | 6,958,000 |
| Camden National Corp. | | 46,843 | 1,484,455 |
| Central Valley Community Bancorp | | 25,000 | 328,500 |
| Citizens Financial Services, Inc. | | 15,355 | 752,395 |
| Community Trust Bancorp, Inc. | | 35,000 | 1,071,350 |
| Credit Agricole Atlantique Vendee | | 7,000 | 940,004 |
| East West Bancorp, Inc. | | 1,025,000 | 35,526,500 |
| F & M Bank Corp. | | 131,632 | 2,599,732 |
| First Hawaiian, Inc. | | 100,000 | 1,738,000 |
| First of Long Island Corp. | | 5,000 | 74,550 |
| FNB Corp., Pennsylvania | | 50,000 | 370,500 |
| Gunma Bank Ltd. | | 5,600,000 | 17,510,746 |
| Hiroshima Bank Ltd. | | 1,000,000 | 4,553,399 |
| NIBC Holding NV (b)(e) | | 1,000,000 | 8,610,814 |
| Nordea Bank ABP (Stockholm Stock Exchange) | | 100,000 | 772,408 |
| OFG Bancorp (b) | | 1,861,516 | 24,348,629�� |
| Ogaki Kyoritsu Bank Ltd. | | 60,000 | 1,167,068 |
| Regions Financial Corp. | | 25,000 | 271,500 |
| San ju San Financial Group, Inc. | | 300,000 | 3,545,416 |
| Schweizerische Nationalbank | | 10 | 52,813 |
| Shinsei Bank Ltd. | | 711,200 | 8,034,610 |
| Skandiabanken ASA (e) | | 625,000 | 4,490,845 |
| Sparebank 1 Oestlandet | | 1,000,000 | 9,657,377 |
| Sumitomo Mitsui Financial Group, Inc. | | 3,000,000 | 79,939,329 |
| Texas Capital Bancshares, Inc. (a) | | 200,000 | 6,644,000 |
| The Keiyo Bank Ltd. | | 600,000 | 2,692,362 |
| The San-In Godo Bank Ltd. | | 1,800,000 | 8,349,157 |
| Unicaja Banco SA (e) | | 6,000,000 | 3,324,646 |
| Van Lanschot NV (Bearer) | | 94,300 | 1,632,886 |
| Yamaguchi Financial Group, Inc. | | 1,700,000 | 9,973,076 |
| | | | 247,449,624 |
| Capital Markets - 0.4% | | | |
| ABG Sundal Collier ASA | | 1,500,000 | 689,695 |
| Blue Sky Alternative Investments Ltd. (a)(d) | | 10,000 | 0 |
| CI Financial Corp. | | 10,000 | 137,444 |
| Daou Data Corp. | | 10,000 | 121,670 |
| Diamond Hill Investment Group, Inc. | | 16,000 | 1,824,480 |
| Edify SA (a) | | 10,068 | 545,542 |
| Franklin Resources, Inc. (b) | | 50,000 | 1,052,500 |
| Goldman Sachs Group, Inc. | | 150,000 | 29,694,000 |
| Lazard Ltd. Class A | | 225,000 | 6,597,000 |
| | | | 40,662,331 |
| Consumer Finance - 3.4% | | | |
| Aeon Credit Service (Asia) Co. Ltd. | | 10,300,000 | 7,096,758 |
| Cash Converters International Ltd. (a) | | 14,200,000 | 1,826,134 |
| Discover Financial Services | | 3,375,932 | 166,872,319 |
| Santander Consumer U.S.A. Holdings, Inc. | | 1,000,000 | 18,360,000 |
| Synchrony Financial | | 9,400,759 | 208,038,797 |
| | | | 402,194,008 |
| Diversified Financial Services - 1.2% | | | |
| Fuyo General Lease Co. Ltd. | | 600,000 | 33,668,698 |
| IBJ Leasing Co. Ltd. | | 200,000 | 4,389,023 |
| NICE Holdings Co. Ltd. | | 250,000 | 4,264,713 |
| Ricoh Leasing Co. Ltd. | | 1,050,000 | 26,365,311 |
| Tokyo Century Corp. | | 1,350,000 | 74,861,839 |
| | | | 143,549,584 |
| Insurance - 6.6% | | | |
| AFLAC, Inc. | | 4,150,000 | 147,615,500 |
| ASR Nederland NV | | 1,000,000 | 32,193,373 |
| Db Insurance Co. Ltd. | | 1,600,000 | 63,017,410 |
| FBD Holdings PLC (a) | | 9,811 | 76,738 |
| Genworth Financial, Inc. Class A (a) | | 12,500,000 | 25,500,000 |
| Hartford Financial Services Group, Inc. | | 150,000 | 6,348,000 |
| Hyundai Fire & Marine Insurance Co. Ltd. | | 550,000 | 10,716,137 |
| Lincoln National Corp. | | 350,000 | 13,044,500 |
| MetLife, Inc. | | 8,500,956 | 321,761,185 |
| National Western Life Group, Inc. | | 24,000 | 4,674,960 |
| NN Group NV | | 2,022,101 | 73,839,950 |
| Power Corp. of Canada (sub. vtg.) | | 600,000 | 10,647,654 |
| Principal Financial Group, Inc. | | 200,000 | 8,486,000 |
| Prudential Financial, Inc. | | 250,000 | 15,842,500 |
| Qualitas Controladora S.A.B. de CV | | 10,000 | 40,400 |
| Reinsurance Group of America, Inc. | | 500,700 | 42,684,675 |
| Shinkong Insurance Co. Ltd. | | 100,000 | 116,647 |
| Talanx AG | | 180,000 | 6,560,239 |
| | | | 783,165,868 |
| Thrifts & Mortgage Finance - 0.2% | | | |
| ASAX Co. Ltd. | | 1,035,600 | 6,398,209 |
| Genworth MI Canada, Inc. | | 443,200 | 10,981,976 |
| Genworth Mortgage Insurance Ltd. | | 3,200,899 | 3,876,266 |
| Hingham Institution for Savings | | 10,100 | 1,777,600 |
| | | | 23,034,051 |
|
| TOTAL FINANCIALS | | | 1,640,055,466 |
|
| HEALTH CARE - 21.9% | | | |
| Biotechnology - 6.6% | | | |
| Alexion Pharmaceuticals, Inc. (a) | | 475,000 | 48,682,750 |
| Amgen, Inc. | | 1,500,000 | 367,005,000 |
| Biogen, Inc. (a) | | 75,000 | 20,601,750 |
| Cell Biotech Co. Ltd. | | 375,000 | 5,597,436 |
| Essex Bio-Technology Ltd. | | 3,500,000 | 2,221,849 |
| Gilead Sciences, Inc. | | 1,816,600 | 126,308,198 |
| United Therapeutics Corp. (a) | | 1,900,000 | 211,793,000 |
| | | | 782,209,983 |
| Health Care Equipment & Supplies - 0.6% | | | |
| A&T Corp. (b) | | 90,000 | 1,357,801 |
| Create Medic Co. Ltd. | | 35,000 | 316,423 |
| Fukuda Denshi Co. Ltd. | | 650,000 | 43,965,802 |
| InBody Co. Ltd. | | 5,000 | 69,615 |
| Interojo Co. Ltd. | | 5,304 | 99,573 |
| Kawasumi Laboratories, Inc. | | 100,000 | 740,636 |
| Medikit Co. Ltd. | | 70,000 | 2,324,406 |
| Meridian Bioscience, Inc.(a) | | 50,000 | 1,224,500 |
| Nakanishi, Inc. | | 250,000 | 3,922,819 |
| Paramount Bed Holdings Co. Ltd. | | 75,000 | 3,191,866 |
| Paul Hartmann AG | | 1,000 | 369,876 |
| Riverstone Holdings Ltd. | | 100,000 | 275,065 |
| St.Shine Optical Co. Ltd. | | 900,000 | 9,502,078 |
| Value Added Technology Co. Ltd. | | 135,000 | 2,681,125 |
| Vieworks Co. Ltd. | | 25,000 | 752,596 |
| | | | 70,794,181 |
| Health Care Providers & Services - 12.9% | | | |
| Anthem, Inc. | | 2,450,000 | 670,809,998 |
| CVS Health Corp. | | 3,150,030 | 198,262,888 |
| EBOS Group Ltd. | | 487,300 | 7,045,266 |
| Excelsior Medical Co. Ltd. | | 200,000 | 393,025 |
| Hokuyaku Takeyama Holdings, Inc. | | 15,000 | 104,152 |
| Humana, Inc. | | 448,600 | 176,053,070 |
| Laboratory Corp. of America Holdings (a) | | 430,000 | 82,955,600 |
| Quest Diagnostics, Inc. | | 375,000 | 47,651,250 |
| Saint-Care Holding Corp. | | 375,000 | 1,452,459 |
| Sigma Healthcare Ltd. | | 6,500,000 | 3,088,210 |
| Tokai Corp. | | 375,000 | 7,467,763 |
| Uchiyama Holdings Co. Ltd. (b) | | 775,000 | 2,020,689 |
| UnitedHealth Group, Inc. | | 900,000 | 272,502,000 |
| Universal Health Services, Inc. Class B | | 460,000 | 50,554,000 |
| Viemed Healthcare, Inc. (a) | | 25,000 | 271,380 |
| Yagami, Inc. | | 5,000 | 77,701 |
| | | | 1,520,709,451 |
| Health Care Technology - 0.2% | | | |
| Pharmagest Interactive | | 150,000 | 14,276,754 |
| Schrodinger, Inc. (b) | | 50,000 | 3,619,000 |
| | | | 17,895,754 |
| Life Sciences Tools & Services - 0.1% | | | |
| Berkeley Lights, Inc. (a) | | 15,400 | 923,538 |
| ICON PLC (a) | | 50,000 | 9,273,000 |
| | | | 10,196,538 |
| Pharmaceuticals - 1.5% | | | |
| Apex Healthcare Bhd | | 3,000,000 | 2,392,011 |
| Biofermin Pharmaceutical Co. Ltd. | | 100,000 | 2,190,733 |
| Boiron SA | | 15,000 | 590,153 |
| Bristol-Myers Squibb Co. | | 550,000 | 32,263,000 |
| Daito Pharmaceutical Co. Ltd. | | 210,000 | 6,249,114 |
| Dawnrays Pharmaceutical Holdings Ltd. | | 22,505,000 | 2,584,345 |
| Dong E-E-Jiao Co. Ltd. (A Shares) | | 10,000 | 58,379 |
| DongKook Pharmaceutical Co. Ltd. | | 83,000 | 10,181,877 |
| Genomma Lab Internacional SA de CV (a) | | 3,200,000 | 3,379,016 |
| Huons Co. Ltd. | | 3,194 | 161,054 |
| Jazz Pharmaceuticals PLC (a) | | 325,000 | 35,181,250 |
| Kaken Pharmaceutical Co. Ltd. | | 10,000 | 451,089 |
| Korea United Pharm, Inc. | | 130,000 | 2,690,532 |
| Kwang Dong Pharmaceutical Co. Ltd. | | 2,400,000 | 18,363,354 |
| Kyung Dong Pharmaceutical Co. Ltd. | | 50,000 | 524,727 |
| Lee's Pharmaceutical Holdings Ltd. | | 10,200,000 | 8,054,398 |
| Luye Pharma Group Ltd. (e) | | 4,700,000 | 2,965,434 |
| Nippon Chemiphar Co. Ltd. | | 75,010 | 1,731,136 |
| Orient Europharma Co. Ltd. | | 200,000 | 349,431 |
| PT Tempo Scan Pacific Tbk | | 500,000 | 47,402 |
| Royalty Pharma PLC | | 200,000 | 8,610,000 |
| Samjin Pharmaceutical Co. Ltd. | | 2,000 | 47,832 |
| Sanofi SA sponsored ADR | | 200,000 | 10,490,000 |
| Supernus Pharmaceuticals, Inc. (a)(b) | | 15,000 | 333,975 |
| Syngen Biotech Co. Ltd. | | 62,618 | 247,384 |
| Taro Pharmaceutical Industries Ltd. (a) | | 350,000 | 22,753,500 |
| Towa Pharmaceutical Co. Ltd. | | 450,000 | 8,030,325 |
| Vetoquinol SA | | 10,000 | 810,430 |
| Vivimed Labs Ltd. (a) | | 100,000 | 14,282 |
| | | | 181,746,163 |
|
| TOTAL HEALTH CARE | | | 2,583,552,070 |
|
| INDUSTRIALS - 9.9% | | | |
| Aerospace & Defense - 0.1% | | | |
| Magellan Aerospace Corp. | | 200,000 | 995,931 |
| Moog, Inc. Class A | | 20,000 | 1,074,400 |
| SIFCO Industries, Inc. (a) | | 61,000 | 232,410 |
| The Lisi Group | | 10,000 | 224,517 |
| Vectrus, Inc. (a) | | 60,000 | 2,639,400 |
| | | | 5,166,658 |
| Air Freight & Logistics - 0.1% | | | |
| AIT Corp. | | 900,000 | 7,702,990 |
| CTI Logistics Ltd. (a) | | 456,843 | 156,668 |
| Hub Group, Inc. Class A (a) | | 15,000 | 793,500 |
| Onelogix Group Ltd. | | 4,600,100 | 538,220 |
| SBS Co. Ltd. | | 250,000 | 5,271,362 |
| | | | 14,462,740 |
| Building Products - 0.3% | | | |
| InnoTec TSS AG | | 50,000 | 533,022 |
| Installux SA (a) | | 500 | 176,693 |
| Kondotec, Inc. | | 60,000 | 635,397 |
| KVK Corp. | | 75,000 | 1,176,137 |
| Nichias Corp. | | 5,000 | 107,553 |
| Nihon Dengi Co. Ltd. | | 350,000 | 11,588,966 |
| Nihon Flush Co. Ltd. | | 100,000 | 1,350,905 |
| Noda Corp. | | 400,000 | 2,195,456 |
| Resideo Technologies, Inc. (a) | | 50,000 | 664,000 |
| Sekisui Jushi Corp. | | 750,000 | 14,021,539 |
| | | | 32,449,668 |
| Commercial Services & Supplies - 0.3% | | | |
| Asia File Corp. Bhd | | 5,300,100 | 2,321,316 |
| BIC SA | | 1,000 | 59,074 |
| Calian Technologies Ltd. | | 309,000 | 13,668,483 |
| Civeo Corp. (a) | | 2,916,700 | 2,420,861 |
| CMC Corp. | | 15,000 | 283,690 |
| Fursys, Inc. | | 200,000 | 4,808,255 |
| Loomis AB (B Shares) (a) | | 75,000 | 1,792,080 |
| Matsuda Sangyo Co. Ltd. | | 150,000 | 2,302,678 |
| Matthews International Corp. Class A | | 10,000 | 216,000 |
| Mitie Group PLC | | 3,487,817 | 1,492,936 |
| Nippon Kanzai Co. Ltd. | | 20,000 | 366,539 |
| Relia, Inc. | | 1,000 | 10,524 |
| Secom Joshinetsu Co. Ltd. | | 26,250 | 818,336 |
| VSE Corp. | | 335,000 | 9,423,550 |
| | | | 39,984,322 |
| Construction & Engineering - 0.9% | | | |
| Arcadis NV | | 1,000,562 | 20,448,918 |
| Argan, Inc. | | 5,000 | 214,500 |
| Boustead Projs. Pte Ltd. | | 2,549,475 | 1,425,807 |
| Boustead Singapore Ltd. | | 9,598,200 | 4,974,726 |
| Daiichi Kensetsu Corp. | | 275,000 | 4,450,191 |
| EMCOR Group, Inc. | | 1,000 | 68,500 |
| Geumhwa PSC Co. Ltd. | | 1,000 | 20,696 |
| Hokuriku Electrical Construction Co. Ltd. | | 125,000 | 1,063,955 |
| Joban Kaihatsu Co. Ltd. (b) | | 5,000 | 248,925 |
| Kawada Technologies, Inc. | | 1,000 | 39,394 |
| Kawasaki Setsubi Kogyo Co. Ltd. | | 175,000 | 843,134 |
| Meisei Industrial Co. Ltd. | | 600,000 | 4,517,500 |
| Mirait Holdings Corp. | | 47,000 | 644,693 |
| Nakano Corp. | | 10,000 | 35,237 |
| Nippon Rietec Co. Ltd. (b) | | 1,041,046 | 29,100,705 |
| Raiznext Corp. | | 1,925,000 | 21,585,896 |
| Seikitokyu Kogyo Co. Ltd. | | 600,000 | 4,047,045 |
| Shinnihon Corp. | | 75,000 | 552,643 |
| Sinopec Engineering Group Co. Ltd. (H Shares) | | 100,000 | 44,256 |
| Sumiken Mitsui Road Co. Ltd. | | 60,000 | 411,506 |
| Sumitomo Densetsu Co. Ltd. | | 175,000 | 3,551,084 |
| Watanabe Sato Co. Ltd. | | 60,000 | 1,178,971 |
| | | | 99,468,282 |
| Electrical Equipment - 0.5% | | | |
| Acuity Brands, Inc. | | 250,000 | 24,775,000 |
| Aichi Electric Co. Ltd. | | 150,000 | 3,245,005 |
| Aros Quality Group AB | | 853,205 | 17,665,987 |
| BizLink Holding, Inc. | | 25,000 | 166,457 |
| Canare Electric Co. Ltd. | | 95,000 | 1,361,438 |
| Dewhurst PLC | | 25,000 | 292,071 |
| Gerard Perrier Industrie SA | | 100 | 7,091 |
| Hammond Power Solutions, Inc. Class A | | 529,700 | 2,669,361 |
| Iwabuchi Corp. | | 10,000 | 542,251 |
| Sensata Technologies, Inc. PLC (a) | | 100,000 | 3,798,000 |
| Terasaki Electric Co. Ltd. | | 110,000 | 1,004,865 |
| | | | 55,527,526 |
| Industrial Conglomerates - 0.2% | | | |
| Lifco AB | | 100,018 | 7,632,092 |
| Mytilineos SA | | 875,000 | 8,080,737 |
| Nolato AB (B Shares) | | 65,000 | 5,393,039 |
| Reunert Ltd. | | 300,000 | 555,817 |
| | | | 21,661,685 |
| Machinery - 0.9% | | | |
| Aalberts Industries NV | | 5,000 | 177,812 |
| Beijer Alma AB (B Shares) | | 1,000 | 11,936 |
| Conrad Industries, Inc. (a) | | 22,800 | 228,000 |
| Crane Co. | | 20,000 | 1,131,400 |
| Daihatsu Diesel Manufacturing Co. Ltd. (c) | | 3,184,000 | 12,061,631 |
| Daiwa Industries Ltd. | | 1,100,000 | 8,573,048 |
| Estic Corp. | | 70,000 | 2,681,498 |
| Fuji Latex Co. Ltd. | | 35,000 | 1,072,930 |
| Fujimak Corp. (c) | | 820,000 | 4,911,247 |
| Fukushima Industries Corp. | | 100,000 | 3,216,664 |
| Haitian International Holdings Ltd. | | 4,501,000 | 10,360,611 |
| Hillenbrand, Inc. | | 25,000 | 730,750 |
| Hokuetsu Industries Co. Ltd. | | 1,000 | 10,118 |
| Hosokawa Micron Corp. | | 10,000 | 517,689 |
| Hy-Lok Corp. | | 150,000 | 1,649,441 |
| Ihara Science Corp. | | 200,000 | 2,660,243 |
| Impro Precision Industries Ltd. (e) | | 250,000 | 86,126 |
| ITT, Inc. | | 10,000 | 577,300 |
| Koike Sanso Kogyo Co. Ltd. | | 35,000 | 766,095 |
| Krones AG | | 15,000 | 909,966 |
| Mitsuboshi Belting Ltd. | | 12,500 | 206,060 |
| Nakanishi Manufacturing Co. Ltd. | | 250,000 | 2,267,252 |
| Nansin Co. Ltd. | | 250,000 | 1,133,626 |
| Oshkosh Corp. | | 5,000 | 393,600 |
| Sakura Rubber Co. Ltd. | | 41,100 | 1,888,919 |
| Sansei Co. Ltd. (c) | | 850,000 | 2,609,702 |
| Semperit AG Holding (a)(b) | | 300,000 | 5,936,868 |
| SIMPAC, Inc. | | 2,325,000 | 4,704,982 |
| Snap-On, Inc. | | 25,000 | 3,646,750 |
| Stanley Black & Decker, Inc. | | 25,000 | 3,833,000 |
| Suzumo Machinery Co. Ltd. | | 10,000 | 143,498 |
| Teikoku Sen-I Co. Ltd. | | 550,000 | 12,194,511 |
| The Hanshin Diesel Works Ltd. | | 30,000 | 563,412 |
| TK Group Holdings Ltd. | | 36,536,000 | 9,852,553 |
| Tocalo Co. Ltd. | | 400,000 | 4,447,593 |
| Tsubakimoto Chain Co. | | 1,000 | 23,220 |
| Yamada Corp. | | 80,000 | 1,513,769 |
| | | | 107,693,820 |
| Marine - 0.1% | | | |
| Freight Management Holdings Bhd | | 1,500,000 | 187,263 |
| Japan Transcity Corp. | | 1,400,000 | 6,044,117 |
| SITC International Holdings Co. Ltd. | | 8,000,000 | 8,020,335 |
| | | | 14,251,715 |
| Professional Services - 0.5% | | | |
| ABIST Co. Ltd. (c) | | 260,000 | 6,263,285 |
| Akka Technologies SA (b) | | 660,000 | 13,698,616 |
| Benext Group, Inc. | | 75,000 | 698,597 |
| Bertrandt AG | | 200,000 | 7,397,526 |
| Career Design Center Co. Ltd. | | 110,000 | 779,368 |
| Cpl Resources PLC | | 50,000 | 412,283 |
| Kelly Services, Inc. Class A (non-vtg.) | | 25,000 | 370,250 |
| McMillan Shakespeare Ltd. | | 2,500,000 | 15,753,623 |
| Quick Co. Ltd. | | 5,000 | 47,943 |
| Robert Half International, Inc. | | 100,000 | 5,087,000 |
| SaraminHR Co. Ltd. | | 25,000 | 524,727 |
| SHL-JAPAN Ltd. | | 152,300 | 3,009,887 |
| TrueBlue, Inc. (a) | | 100,000 | 1,543,000 |
| WDB Holdings Co. Ltd. | | 100,000 | 2,369,279 |
| | | | 57,955,384 |
| Road & Rail - 0.7% | | | |
| Autohellas SA (c) | | 2,600,000 | 9,938,364 |
| Daqin Railway Co. Ltd. (A Shares) | | 42,000,622 | 39,079,308 |
| Hamakyorex Co. Ltd. | | 250,000 | 7,403,996 |
| Higashi Twenty One Co. Ltd. | | 200,000 | 795,428 |
| Kyushu Railway Co. | | 150,000 | 2,944,594 |
| NANSO Transport Co. Ltd. | | 125,000 | 1,218,648 |
| Nikkon Holdings Co. Ltd. | | 100,000 | 1,803,410 |
| Ryder System, Inc. | | 20,000 | 732,600 |
| SENKO Co. Ltd. | | 250,000 | 1,849,228 |
| Shin-Keisei Electric Railway Co. Ltd. | | 35,000 | 694,677 |
| STEF-TFE Group (a) | | 105,000 | 8,064,246 |
| The Hokkaido Chuo Bus Co. Ltd. | | 1,000 | 36,276 |
| Tohbu Network Co. Ltd. | | 175,000 | 1,368,854 |
| Universal Logistics Holdings, Inc. | | 10,000 | 183,700 |
| Utoc Corp. | | 1,600,000 | 7,270,323 |
| | | | 83,383,652 |
| Trading Companies & Distributors - 5.2% | | | |
| AerCap Holdings NV (a) | | 750,000 | 20,197,500 |
| Alconix Corp. | | 18,000 | 205,753 |
| Applied Industrial Technologies, Inc. | | 1,000 | 63,120 |
| Bergman & Beving AB (B Shares) | | 625,000 | 5,694,566 |
| Canox Corp. | | 422,100 | 2,799,246 |
| Chori Co. Ltd. (c) | | 1,566,400 | 20,879,414 |
| Daiichi Jitsugyo Co. Ltd. | | 25,000 | 828,964 |
| Green Cross Co. Ltd. (c) | | 612,000 | 5,579,141 |
| HERIGE (a) | | 60,000 | 1,625,571 |
| Houston Wire & Cable Co. (a)(c) | | 1,348,500 | 3,384,735 |
| Howden Joinery Group PLC | | 225,000 | 1,444,056 |
| iMarketKorea, Inc. | | 35,000 | 248,775 |
| Itochu Corp. | | 19,000,000 | 416,600,144 |
| Kamei Corp. (c) | | 2,100,000 | 18,846,535 |
| Latham James PLC | | 10,000 | 107,338 |
| Lumax International Corp. Ltd. | | 1,588,740 | 3,630,695 |
| Maruka Machinery Co. Ltd. | | 5,000 | 90,218 |
| Meiwa Corp. | | 1,425,000 | 5,653,961 |
| Mitani Shoji Co. Ltd. | | 665,000 | 41,148,269 |
| Mitsubishi Corp. | | 1,400,000 | 28,209,712 |
| Momentum Group AB Class B | | 525,000 | 8,394,930 |
| MSC Industrial Direct Co., Inc. Class A | | 25,000 | 1,650,250 |
| Narasaki Sangyo Co. Ltd. | | 70,000 | 1,218,743 |
| Nishikawa Keisoku Co. Ltd. | | 20,000 | 723,631 |
| Parker Corp. | | 100 | 419 |
| Pla Matels Corp. | | 300,000 | 1,502,055 |
| Rasa Corp. | | 235,000 | 2,071,277 |
| Sakai Trading Co. Ltd. | | 30,000 | 452,033 |
| Sam Yung Trading Co. Ltd. | | 10,000 | 108,290 |
| Sanyo Trading Co. Ltd. | | 75,000 | 633,414 |
| Shinsho Corp. | | 100,000 | 1,643,758 |
| Totech Corp. | | 10,000 | 213,689 |
| Yamazen Co. Ltd. | | 100,000 | 901,233 |
| Yuasa Trading Co. Ltd. | | 675,000 | 17,924,756 |
| | | | 614,676,191 |
| Transportation Infrastructure - 0.1% | | | |
| Anhui Expressway Co. Ltd. (H Shares) | | 3,000,000 | 1,439,944 |
| Isewan Terminal Service Co. Ltd. | | 300,000 | 2,170,894 |
| Meiko Transportation Co. Ltd. | | 100,000 | 1,077,890 |
| Qingdao Port International Co. Ltd. (H Shares) (e) | | 17,000,000 | 9,629,305 |
| | | | 14,318,033 |
|
| TOTAL INDUSTRIALS | | | 1,160,999,676 |
|
| INFORMATION TECHNOLOGY - 6.4% | | | |
| Communications Equipment - 0.1% | | | |
| Casa Systems, Inc. (a) | | 105,000 | 589,050 |
| F5 Networks, Inc. (a) | | 100,000 | 13,590,000 |
| HF Co. (a)(c) | | 225,000 | 962,091 |
| | | | 15,141,141 |
| Electronic Equipment & Components - 1.1% | | | |
| AAC Technology Holdings, Inc. | | 5,000 | 39,420 |
| Ai Holdings Corp. | | 25,000 | 330,405 |
| Arrow Electronics, Inc. (a) | | 1,000 | 71,620 |
| Avnet, Inc. | | 100,000 | 2,672,000 |
| Daido Signal Co. Ltd. | | 400,000 | 2,316,376 |
| Elematec Corp. | | 800,000 | 6,401,209 |
| FLEXium Interconnect, Inc. | | 25,000 | 120,479 |
| Forval Corp. | | 1,000 | 9,371 |
| HAGIAWARA ELECTRIC Co. Ltd. | | 350,000 | 6,149,922 |
| Insight Enterprises, Inc. (a) | | 1,000 | 49,840 |
| ITC Networks Corp. | | 5,000 | 59,988 |
| Kingboard Chemical Holdings Ltd. | | 8,038,500 | 23,492,255 |
| Kyosha Co. Ltd. (b) | | 50,000 | 118,086 |
| Lacroix SA (c) | | 376,493 | 9,668,080 |
| Lagercrantz Group AB (B Shares) | | 10,000 | 202,499 |
| Makus, Inc. | | 300,000 | 1,078,722 |
| MTS Systems Corp. | | 5,000 | 92,750 |
| New Cosmos Electric Co. Ltd. | | 35,000 | 578,622 |
| Nihon Denkei Co. Ltd. | | 50,000 | 559,728 |
| PAX Global Technology Ltd. | | 9,000,000 | 4,215,321 |
| Redington India Ltd. | | 8,976,871 | 10,843,658 |
| Riken Kieki Co. Ltd. | | 550,000 | 12,724,482 |
| Shibaura Electronics Co. Ltd. | | 225,000 | 4,297,860 |
| Simplo Technology Co. Ltd. | | 1,400,000 | 15,543,900 |
| SYNNEX Corp. | | 50,000 | 6,237,000 |
| TE Connectivity Ltd. | | 1,000 | 89,070 |
| Thinking Electronic Industries Co. Ltd. | | 1,600,000 | 5,296,642 |
| VST Holdings Ltd. | | 20,310,900 | 11,976,415 |
| | | | 125,235,720 |
| IT Services - 3.8% | | | |
| All for One Steeb AG | | 10,000 | 512,408 |
| Amdocs Ltd. | | 950,000 | 58,995,000 |
| Avant Corp. | | 300,000 | 2,797,223 |
| Bouvet ASA | | 5,000 | 286,755 |
| Cielo SA | | 3,400,000 | 3,500,014 |
| Computer Services, Inc. | | 10,000 | 572,500 |
| Data Applications Co. Ltd. | | 16,400 | 208,379 |
| Data#3 Ltd. | | 800,001 | 3,229,318 |
| Dimerco Data System Corp. | | 500,000 | 911,041 |
| E-Credible Co. Ltd. | | 240,000 | 4,746,375 |
| eClerx Services Ltd. | | 118,050 | 756,406 |
| Enea Data AB (a) | | 210,000 | 4,329,009 |
| Estore Corp. (b)(c) | | 302,600 | 3,035,862 |
| Future Corp. | | 739,200 | 12,283,339 |
| IFIS Japan Ltd. | | 175,000 | 1,196,920 |
| Korea Information & Communication Co. Ltd. (a) | | 325,000 | 2,497,575 |
| Neurones | | 12,000 | 337,836 |
| Nice Information & Telecom, Inc. | | 132,413 | 2,624,210 |
| Persistent Systems Ltd. | | 450,739 | 5,523,538 |
| Societe Pour L'Informatique Industrielle SA | | 174,000 | 3,894,303 |
| Softcreate Co. Ltd. | | 50,000 | 1,084,030 |
| Sonata Software Ltd. | | 100,000 | 352,242 |
| Sopra Steria Group | | 480,000 | 71,468,582 |
| Tessi SA (a)(b) | | 199,798 | 22,593,797 |
| The Western Union Co. | | 9,800,000 | 237,944,000 |
| | | | 445,680,662 |
| Semiconductors & Semiconductor Equipment - 0.1% | | | |
| e-LITECOM Co. Ltd. | | 50,000 | 276,370 |
| Miraial Co. Ltd. (c) | | 600,000 | 5,713,476 |
| Phison Electronics Corp. | | 600,000 | 6,017,982 |
| Protec Co. Ltd. | | 5,352 | 129,340 |
| | | | 12,137,168 |
| Software - 0.3% | | | |
| 8K Miles Software Services Ltd. (a)(d) | | 5,000 | 1,605 |
| Cyient Ltd. | | 100,000 | 440,470 |
| eBase Co. Ltd. | | 400,000 | 5,649,237 |
| Ebix, Inc. (b) | | 225,000 | 4,962,375 |
| Fukui Computer Holdings, Inc. | | 10,000 | 229,370 |
| InfoVine Co. Ltd. | | 63,600 | 949,325 |
| Integrated Research Ltd. | | 15,000 | 43,617 |
| Jastec Co. Ltd. | | 110,000 | 1,127,486 |
| KPIT Cummins Infosystems Ltd. | | 1,800,000 | 2,890,283 |
| KPIT Engineering Ltd. | | 1,000,000 | 858,249 |
| KSK Co., Ltd. | | 121,900 | 2,244,420 |
| Linedata Services | | 10,000 | 279,174 |
| Sinosoft Tech Group Ltd. | | 5,000,000 | 1,290,273 |
| Software AG (Bearer) | | 10,000 | 466,468 |
| System Research Co. Ltd. | | 50,000 | 864,390 |
| Toho System Science Co. Ltd. | | 100,000 | 892,731 |
| Uchida Esco Co. Ltd. (c) | | 250,000 | 13,083,936 |
| Zensar Technologies Ltd. | | 1,912,686 | 4,083,477 |
| | | | 40,356,886 |
| Technology Hardware, Storage & Peripherals - 1.0% | | | |
| Bluecom Co. Ltd. (a) | | 55,000 | 385,413 |
| Elecom Co. Ltd. | | 40,000 | 1,972,510 |
| HP, Inc. | | 6,500,000 | 114,270,000 |
| NetApp, Inc. | | 10,000 | 443,000 |
| | | | 117,070,923 |
|
| TOTAL INFORMATION TECHNOLOGY | | | 755,622,500 |
|
| MATERIALS - 2.9% | | | |
| Chemicals - 1.8% | | | |
| Air Water, Inc. | | 100,000 | 1,289,500 |
| C. Uyemura & Co. Ltd. | | 185,000 | 10,888,007 |
| Celanese Corp. Class A | | 25,000 | 2,430,000 |
| Chokwang Paint Ltd. | | 50,000 | 229,960 |
| Ciner Resources LP | | 10,000 | 111,000 |
| Dainichiseika Color & Chemicals Manufacturing Co. Ltd. | | 10,000 | 211,421 |
| Daishin-Chemical Co. Ltd. (c) | | 411,495 | 4,894,168 |
| Dow, Inc. | | 16,666 | 684,306 |
| EcoGreen International Group Ltd. | | 1,000,000 | 152,252 |
| Fuso Chemical Co. Ltd. | | 200,000 | 7,642,530 |
| Hannong Chemicals, Inc. (c) | | 1,288,000 | 5,492,951 |
| Insecticides (India) Ltd. | | 53,200 | 295,682 |
| Isamu Paint Co. Ltd. (b) | | 20,000 | 550,376 |
| Jcu Corp. | | 5,000 | 147,371 |
| Johnson Matthey PLC | | 5,000 | 146,543 |
| Koatsu Gas Kogyo Co. Ltd. | | 200,000 | 1,405,696 |
| KPC Holdings Corp. | | 12,000 | 420,451 |
| KPX Green Chemical Co. Ltd. | | 60,204 | 167,393 |
| Kraton Performance Polymers, Inc. (a) | | 13,000 | 170,950 |
| Kukdong Oil & Chemicals Co. Ltd. | | 100,000 | 257,973 |
| Kunsul Chemical Industrial Co. Ltd. | | 5,000 | 62,716 |
| Kuriyama Holdings Corp. | | 225,000 | 1,109,537 |
| Nippon Soda Co. Ltd. | | 160,000 | 4,079,543 |
| NOF Corp. | | 275,000 | 10,209,721 |
| Nutrien Ltd. | | 120,000 | 3,907,873 |
| Okamoto Industries, Inc. | | 2,000 | 75,197 |
| Scientex Bhd | | 4,051,200 | 8,714,916 |
| T&K Toka Co. Ltd. | | 350,000 | 2,572,387 |
| Tae Kyung Industrial Co. Ltd. | | 675,000 | 2,768,614 |
| Thai Carbon Black PCL (For. Reg.) | | 50,000 | 63,322 |
| Thai Rayon PCL NVDR | | 250,000 | 208,400 |
| The Mosaic Co. | | 7,000,000 | 94,290,000 |
| Toho Acetylene Co. Ltd. | | 225,000 | 2,574,040 |
| Westlake Chemical Corp. | | 25,000 | 1,362,500 |
| Yara International ASA | | 700,000 | 29,247,900 |
| Yip's Chemical Holdings Ltd. | | 3,500,000 | 975,446 |
| Yung Chi Paint & Varnish Manufacturing Co. Ltd. | | 2,000,000 | 4,822,560 |
| | | | 204,633,202 |
| Construction Materials - 0.1% | | | |
| Brampton Brick Ltd. Class A (sub. vtg.) (a) | | 5,000 | 19,598 |
| Ibstock PLC (e) | | 500,000 | 1,040,001 |
| Imerys SA | | 10,000 | 366,578 |
| Mitani Sekisan Co. Ltd. | | 250,000 | 12,894,998 |
| Yamau Co. Ltd. | | 5,000 | 20,500 |
| Yotai Refractories Co. Ltd. | | 225,000 | 1,483,633 |
| | | | 15,825,308 |
| Containers & Packaging - 0.4% | | | |
| AMVIG Holdings Ltd. | | 21,542,000 | 3,724,537 |
| Chuoh Pack Industry Co. Ltd. | | 12,000 | 124,699 |
| Groupe Guillin SA | | 10,000 | 246,781 |
| Mayr-Melnhof Karton AG | | 156,000 | 24,146,090 |
| Packaging Corp. of America | | 150,000 | 14,418,000 |
| Showa Paxxs Corp. | | 1,000 | 16,419 |
| The Pack Corp. | | 75,000 | 1,866,232 |
| WestRock Co. | | 250,000 | 6,715,000 |
| | | | 51,257,758 |
| Metals & Mining - 0.6% | | | |
| ArcelorMittal SA Class A unit (a) | | 200,000 | 2,194,000 |
| Castings PLC | | 75,000 | 338,704 |
| Chubu Steel Plate Co. Ltd. | | 458,800 | 3,133,649 |
| CI Resources Ltd. (d) | | 400,000 | 244,342 |
| CK-SAN-ETSU Co. Ltd. | | 110,000 | 3,096,689 |
| Compania de Minas Buenaventura SA sponsored ADR | | 350,000 | 4,151,000 |
| Mount Gibson Iron Ltd. | | 24,000,603 | 12,174,534 |
| Okaya & Co. Ltd. | | 100 | 8,030 |
| Pacific Metals Co. Ltd. (b) | | 650,999 | 9,175,436 |
| Perenti Global Ltd. | | 22,122,434 | 18,887,421 |
| Rio Tinto PLC sponsored ADR | | 100,000 | 6,104,000 |
| St Barbara Ltd. | | 500,000 | 1,196,704 |
| Teck Resources Ltd. Class B (sub. vtg.) | | 150,000 | 1,519,654 |
| Warrior Metropolitan Coal, Inc. | | 180,000 | 2,865,600 |
| Young Poong Corp. | | 1,000 | 436,506 |
| | | | 65,526,269 |
| Paper & Forest Products - 0.0% | | | |
| Miquel y Costas & Miquel SA | | 5,000 | 69,499 |
|
| TOTAL MATERIALS | | | 337,312,036 |
|
| REAL ESTATE - 0.1% | | | |
| Real Estate Management & Development - 0.1% | | | |
| Arealink Co. Ltd. | | 50,000 | 424,165 |
| Century21 Real Estate Japan Ltd. | | 10,000 | 106,372 |
| Dongwon Development Co. Ltd. | | 10,000 | 30,187 |
| Housecom Corp. | | 25,000 | 303,481 |
| Japan Corporate Housing Service, Inc. | | 25,000 | 238,062 |
| Jones Lang LaSalle, Inc. | | 15,002 | 1,483,848 |
| Lai Sun Garment (International) Ltd. | | 206,647 | 215,438 |
| LSL Property Services PLC | | 50,000 | 125,010 |
| Nisshin Group Holdings Co. (c) | | 2,850,000 | 9,504,039 |
| | | | 12,430,602 |
| UTILITIES - 2.8% | | | |
| Electric Utilities - 2.3% | | | |
| EVN AG | | 50,000 | 828,099 |
| Exelon Corp. | | 500,000 | 19,305,000 |
| Fjordkraft Holding ASA (e) | | 400,000 | 3,564,111 |
| Holding Co. ADMIE IPTO SA | | 25,000 | 65,082 |
| PG&E Corp. (f) | | 13,815,789 | 122,718,746 |
| PPL Corp. | | 4,600,134 | 122,455,567 |
| Public Power Corp. of Greece (a) | | 25,000 | 112,789 |
| | | | 269,049,394 |
| Gas Utilities - 0.4% | | | |
| Busan City Gas Co. Ltd. | | 110,000 | 3,352,817 |
| China Resource Gas Group Ltd. | | 1,800,000 | 8,871,915 |
| GAIL India Ltd. | | 15,000,000 | 19,350,641 |
| Hokuriku Gas Co. | | 75,000 | 2,210,571 |
| Keiyo Gas Co. Ltd. | | 15,000 | 457,702 |
| Seoul City Gas Co. Ltd. | | 100,000 | 5,585,938 |
| Towngas China Co. Ltd. | | 3,000,000 | 1,443,815 |
| YESCO Co. Ltd. | | 240,000 | 6,843,610 |
| | | | 48,117,009 |
| Multi-Utilities - 0.1% | | | |
| CenterPoint Energy, Inc. | | 500,000 | 9,505,000 |
| Water Utilities - 0.0% | | | |
| Manila Water Co., Inc. | | 500,000 | 130,606 |
| Thessaloniki Water & Sewage SA | | 100,000 | 459,401 |
| | | | 590,007 |
|
| TOTAL UTILITIES | | | 327,261,410 |
|
| TOTAL COMMON STOCKS | | | |
| (Cost $10,031,485,824) | | | 11,141,671,625 |
|
| Nonconvertible Preferred Stocks - 0.1% | | | |
| CONSUMER DISCRETIONARY - 0.0% | | | |
| Automobiles - 0.0% | | | |
| Porsche Automobil Holding SE (Germany) | | 15,000 | 849,044 |
| INDUSTRIALS - 0.0% | | | |
| Industrial Conglomerates - 0.0% | | | |
| Steel Partners Holdings LP Series A, 6.00% | | 120,197 | 1,961,615 |
| Machinery - 0.0% | | | |
| Danieli & C. Officine Meccaniche SpA | | 10,000 | 79,394 |
| Jungheinrich AG | | 1,000 | 30,273 |
| | | | 109,667 |
|
| TOTAL INDUSTRIALS | | | 2,071,282 |
|
| MATERIALS - 0.1% | | | |
| Construction Materials - 0.1% | | | |
| Buzzi Unicem SpA (Risparmio Shares) | | 550,000 | 7,048,853 |
| UTILITIES - 0.0% | | | |
| Electric Utilities - 0.0% | | | |
| Companhia Paranaense de Energia-Copel (PN-B) | | 500,000 | 6,362,443 |
| TOTAL NONCONVERTIBLE PREFERRED STOCKS | | | |
| (Cost $11,146,811) | | | 16,331,622 |
|
| Money Market Funds - 8.8% | | | |
| Fidelity Cash Central Fund 0.14% (g) | | 713,503,805 | 713,717,856 |
| Fidelity Securities Lending Cash Central Fund 0.13% (g)(h) | | 316,938,773 | 316,970,467 |
| TOTAL MONEY MARKET FUNDS | | | |
| (Cost $1,030,601,863) | | | 1,030,688,323 |
| TOTAL INVESTMENT IN SECURITIES - 103.4% | | | |
| (Cost $11,073,234,498) | | | 12,188,691,570 |
| NET OTHER ASSETS (LIABILITIES) - (3.4)% | | | (400,983,717) |
| NET ASSETS - 100% | | | $11,787,707,853 |
Legend
(a) Non-income producing
(b) Security or a portion of the security is on loan at period end.
(c) Affiliated company
(d) Level 3 security
(e) Security exempt from registration under Rule 144A of the Securities Act of 1933. These securities may be resold in transactions exempt from registration, normally to qualified institutional buyers. At the end of the period, the value of these securities amounted to $40,802,572 or 0.3% of net assets.
(f) Restricted securities (including private placements) - Investment in securities not registered under the Securities Act of 1933 (excluding 144A issues). At the end of the period, the value of restricted securities (excluding 144A issues) amounted to $122,718,746 or 1.0% of net assets.
(g) Affiliated fund that is generally available only to investment companies and other accounts managed by Fidelity Investments. The rate quoted is the annualized seven-day yield of the fund at period end. A complete unaudited listing of the fund's holdings as of its most recent quarter end is available upon request. In addition, each Fidelity Central Fund's financial statements, which are not covered by the Fund's Report of Independent Registered Public Accounting Firm, are available on the SEC's website or upon request.
(h) Investment made with cash collateral received from securities on loan.
Additional information on each restricted holding is as follows:
| Security | Acquisition Date | Acquisition Cost |
| PG&E Corp. | 6/30/20 | $131,249,996 |
Affiliated Central Funds
Information regarding fiscal year to date income earned by the Fund from investments in Fidelity Central Funds is as follows:
| Fund | Income earned |
| Fidelity Cash Central Fund | $14,932,047 |
| Fidelity Securities Lending Cash Central Fund | 11,091,775 |
| Total | $26,023,822 |
Amounts in the income column in the above table include any capital gain distributions from underlying funds, which are presented in the corresponding line-item in the Statement of Operations, if applicable. Amount for Fidelity Securities Lending Cash Central Fund represents the income earned on investing cash collateral, less rebates paid to borrowers and any lending agent fees associated with the loan, plus any premium payments received for lending certain types of securities.
Other Affiliated Issuers
An affiliated company is a company in which the Fund has ownership of at least 5% of the voting securities. Fiscal year to date transactions with companies which are or were affiliates are as follows:
| Affiliate | Value, beginning of period | Purchases | Sales Proceeds | Dividend Income | Realized Gain (loss) | Change in Unrealized appreciation (depreciation) | Value, end of period |
| ABIST Co. Ltd. | $6,220,700 | $251,051 | $-- | $208,140 | $-- | $(208,466) | $6,263,285 |
| Autohellas SA | 16,981,380 | -- | -- | 650,276 | -- | (7,043,016) | 9,938,364 |
| Bonanza Creek Energy, Inc. | 1,308,000 | 15,398,300 | -- | -- | -- | 5,121,700 | 21,828,000 |
| Carbo Ceramics, Inc. | 3,021,056 | -- | 335,782 | -- | (15,086,211) | 12,400,937 | -- |
| Chori Co. Ltd. | 24,549,242 | -- | -- | 824,711 | -- | (3,669,828) | 20,879,414 |
| Daihatsu Diesel Manufacturing Co. Ltd. | 18,936,005 | -- | -- | 422,340 | -- | (6,874,374) | 12,061,631 |
| Daishin-Chemical Co. Ltd. | 4,520,053 | -- | -- | 134,739 | -- | 374,115 | 4,894,168 |
| Estore Corp. | 2,419,910 | -- | -- | 77,601 | -- | 615,952 | 3,035,862 |
| Fuji Corp. | 13,234,779 | -- | -- | 219,641 | -- | (306,464) | 12,928,315 |
| Fujimak Corp. | 6,082,728 | -- | -- | 145,025 | -- | (1,171,481) | 4,911,247 |
| G-Tekt Corp. | 41,784,631 | -- | -- | 1,141,969 | -- | (18,280,309) | 23,504,322 |
| GameStop Corp. Class A | 40,196,651 | -- | 14,835,552 | -- | (45,538,033) | 48,159,785 | 27,982,851 |
| Gendai Agency, Inc. | 3,383,123 | -- | -- | 177,814 | -- | (1,263,242) | 2,119,881 |
| GNC Holdings, Inc. Class A | 12,354,368 | -- | 2,860,091 | -- | (40,040,971) | 30,546,694 | -- |
| Green Cross Co. Ltd. | 5,887,490 | 16,836 | -- | 163,546 | -- | (325,185) | 5,579,141 |
| Guess?, Inc. | 88,474,295 | -- | 11,292,184 | 1,135,373 | (6,301,210) | (23,316,901) | 47,564,000 |
| Gwangju Shinsegae Co. Ltd. | 14,164,458 | -- | -- | 244,082 | -- | (2,927,912) | 11,236,546 |
| Handsman Co. Ltd. | 7,904,428 | 172,420 | -- | 146,402 | -- | 2,558,422 | 10,635,270 |
| Hannong Chemicals, Inc. | 4,247,540 | -- | -- | 137,687 | -- | 1,245,411 | 5,492,951 |
| HF Co. | 1,320,098 | -- | -- | -- | -- | (358,007) | 962,091 |
| Hibbett Sports, Inc. | 21,165,520 | 2,070,075 | -- | -- | -- | 8,077,862 | 31,313,457 |
| Houston Wire & Cable Co. | 6,270,525 | -- | -- | -- | -- | (2,885,790) | 3,384,735 |
| Jinro Distillers Co. Ltd. | 12,952,463 | -- | -- | 1,930,158 | -- | (1,406,630) | 11,545,833 |
| Kamei Corp. | 21,523,118 | -- | -- | 525,882 | -- | (2,676,583) | 18,846,535 |
| Lacroix SA | 7,856,261 | -- | -- | 316,401 | -- | 1,811,819 | 9,668,080 |
| MegaStudy Co. Ltd. | 9,393,601 | -- | -- | 350,268 | -- | (168,030) | 9,225,571 |
| MegaStudyEdu Co. Ltd. | 27,372,320 | -- | -- | 824,674 | -- | 2,391,916 | 29,764,236 |
| Miraial Co. Ltd. | 7,770,935 | -- | -- | 156,691 | -- | (2,057,459) | 5,713,476 |
| Nisshin Group Holdings Co. | 12,260,318 | -- | -- | 453,645 | -- | (2,756,279) | 9,504,039 |
| Peyto Exploration & Development Corp. | 37,807,850 | -- | -- | 1,340,475 | -- | (19,274,383) | 18,533,467 |
| Sally Beauty Holdings, Inc. | 82,440,000 | 2,702,000 | 2,812,198 | -- | (863,271) | (11,897,089) | 69,569,442 |
| Sansei Co. Ltd. | 3,148,727 | -- | -- | 97,726 | -- | (539,025) | 2,609,702 |
| Satsudora Holdings Co. Ltd. | 6,930,435 | -- | 793,594 | 82,184 | 111,193 | 67,209 | 6,315,243 |
| Southwestern Energy Co. | 31,317,220 | 60,614,118 | -- | -- | -- | 30,200,705 | 122,132,043 |
| TBK Co. Ltd. | 6,601,710 | -- | -- | 180,605 | -- | 591,148 | 7,192,858 |
| Tessi SA | 26,983,519 | -- | -- | -- | -- | (4,389,722) | -- |
| Tokatsu Holdings Co. Ltd. | 1,043,294 | -- | -- | 22,107 | -- | (98,606) | 944,688 |
| Treasure Factory Co. Ltd. | 9,782,149 | -- | -- | 119,912 | -- | (4,361,999) | 5,420,150 |
| Uchida Esco Co. Ltd. | 5,247,486 | -- | 3,149,814 | 91,302 | 2,532,797 | 8,453,467 | 13,083,936 |
| Unit Corp. | -- | 17,325,251 | -- | -- | -- | (17,061,731) | 263,520 |
| Whiting Petroleum Corp. | 14,144,000 | 7,984,430 | 5,450,627 | -- | (14,288,919) | 3,757,207 | 6,146,091 |
| Yorozu Corp. | 24,428,900 | -- | -- | 387,400 | -- | (6,775,809) | 17,653,091 |
| Zappallas, Inc. | 3,116,095 | -- | -- | -- | -- | 464,274 | 3,580,369 |
| Total | $696,547,381 | $106,534,481 | $41,529,842 | $12,708,776 | $(119,474,625) | $14,744,303 | $634,227,901 |
Investment Valuation
The following is a summary of the inputs used, as of July 31, 2020, involving the Fund's assets and liabilities carried at fair value. The inputs or methodology used for valuing securities may not be an indication of the risk associated with investing in those securities. For more information on valuation inputs, and their aggregation into the levels used below, please refer to the Investment Valuation section in the accompanying Notes to Financial Statements.
| | Valuation Inputs at Reporting Date: |
| Description | Total | Level 1 | Level 2 | Level 3 |
| Investments in Securities: | | | | |
| Equities: | | | | |
| Communication Services | $602,266,033 | $506,546,768 | $95,719,265 | $-- |
| Consumer Discretionary | 2,209,210,339 | 2,186,924,353 | 20,196,179 | 2,089,807 |
| Consumer Staples | 743,002,808 | 728,921,827 | 14,057,393 | 23,588 |
| Energy | 770,807,729 | 674,478,041 | 96,329,688 | -- |
| Financials | 1,640,055,466 | 1,551,309,119 | 88,746,347 | -- |
| Health Care | 2,583,552,070 | 2,580,837,592 | 2,714,478 | -- |
| Industrials | 1,163,070,958 | 709,351,990 | 453,718,968 | -- |
| Information Technology | 755,622,500 | 755,581,475 | 39,420 | 1,605 |
| Materials | 344,360,889 | 326,226,195 | 17,890,352 | 244,342 |
| Real Estate | 12,430,602 | 12,430,602 | -- | -- |
| Utilities | 333,623,853 | 210,774,501 | 122,849,352 | -- |
| Money Market Funds | 1,030,688,323 | 1,030,688,323 | -- | -- |
| Total Investments in Securities: | $12,188,691,570 | $11,274,070,786 | $912,261,442 | $2,359,342 |
Other Information
Distribution of investments by country or territory of incorporation, as a percentage of Total Net Assets, is as follows (Unaudited):
| United States of America | 58.2% |
| Japan | 16.4% |
| Korea (South) | 4.0% |
| United Kingdom | 3.4% |
| France | 2.7% |
| Cayman Islands | 1.8% |
| China | 1.8% |
| Canada | 1.7% |
| Netherlands | 1.5% |
| India | 1.1% |
| Others (Individually Less Than 1%) | 7.4% |
| | 100.0% |
See accompanying notes which are an integral part of the financial statements.
Financial Statements
Statement of Assets and Liabilities
| | | July 31, 2020 |
| Assets | | |
Investment in securities, at value (including securities loaned of $289,582,066) — See accompanying schedule:
Unaffiliated issuers (cost $9,090,500,152) | $10,523,775,346 | |
| Fidelity Central Funds (cost $1,030,601,863) | 1,030,688,323 | |
| Other affiliated issuers (cost $952,132,483) | 634,227,901 | |
| Total Investment in Securities (cost $11,073,234,498) | | $12,188,691,570 |
| Foreign currency held at value (cost $1,372) | | 1,372 |
| Receivable for investments sold | | 5,660,906 |
| Receivable for fund shares sold | | 7,510,783 |
| Dividends receivable | | 12,141,322 |
| Distributions receivable from Fidelity Central Funds | | 1,709,661 |
| Other receivables | | 1,087 |
| Total assets | | 12,215,716,701 |
| Liabilities | | |
| Payable for investments purchased | $94,287,876 | |
| Payable for fund shares redeemed | 16,363,920 | |
| Other payables and accrued expenses | 414,161 | |
| Collateral on securities loaned | 316,942,891 | |
| Total liabilities | | 428,008,848 |
| Net Assets | | $11,787,707,853 |
| Net Assets consist of: | | |
| Paid in capital | | $10,583,489,947 |
| Total accumulated earnings (loss) | | 1,204,217,906 |
| Net Assets | | $11,787,707,853 |
| Net Asset Value, offering price and redemption price per share ($11,787,707,853 ÷ 770,892,247 shares) | | $15.29 |
See accompanying notes which are an integral part of the financial statements.
Statement of Operations
| | | Year ended July 31, 2020 |
| Investment Income | | |
| Dividends (including $12,708,776 earned from other affiliated issuers) | | $278,145,304 |
| Income from Fidelity Central Funds (including $11,091,775 from security lending) | | 26,023,822 |
| Total income | | 304,169,126 |
| Expenses | | |
| Custodian fees and expenses | $581,228 | |
| Independent trustees' fees and expenses | 79,790 | |
| Legal | 36,524 | |
| Miscellaneous | 30,565 | |
| Total expenses before reductions | 728,107 | |
| Expense reductions | (4,495) | |
| Total expenses after reductions | | 723,612 |
| Net investment income (loss) | | 303,445,514 |
| Realized and Unrealized Gain (Loss) | | |
| Net realized gain (loss) on: | | |
| Investment securities: | | |
| Unaffiliated issuers | 95,161,550 | |
| Fidelity Central Funds | 102,905 | |
| Other affiliated issuers | (119,474,625) | |
| Foreign currency transactions | (817,523) | |
| Total net realized gain (loss) | | (25,027,693) |
| Change in net unrealized appreciation (depreciation) on: | | |
| Investment securities: | | |
| Unaffiliated issuers (net of decrease in deferred foreign taxes of $807,243) | (527,803,665) | |
| Fidelity Central Funds | 70,851 | |
| Other affiliated issuers | 14,744,303 | |
| Assets and liabilities in foreign currencies | 77,540 | |
| Total change in net unrealized appreciation (depreciation) | | (512,910,971) |
| Net gain (loss) | | (537,938,664) |
| Net increase (decrease) in net assets resulting from operations | | $(234,493,150) |
See accompanying notes which are an integral part of the financial statements.
Statement of Changes in Net Assets
| | Year ended July 31, 2020 | Year ended July 31, 2019 |
| Increase (Decrease) in Net Assets | | |
| Operations | | |
| Net investment income (loss) | $303,445,514 | $368,875,776 |
| Net realized gain (loss) | (25,027,693) | 653,606,646 |
| Change in net unrealized appreciation (depreciation) | (512,910,971) | (1,769,991,548) |
| Net increase (decrease) in net assets resulting from operations | (234,493,150) | (747,509,126) |
| Distributions to shareholders | (689,965,124) | (1,141,976,315) |
| Share transactions | | |
| Proceeds from sales of shares | 1,814,757,837 | 1,028,461,371 |
| Reinvestment of distributions | 689,965,123 | 1,141,976,315 |
| Cost of shares redeemed | (3,381,648,521) | (1,211,905,746) |
| Net increase (decrease) in net assets resulting from share transactions | (876,925,561) | 958,531,940 |
| Total increase (decrease) in net assets | (1,801,383,835) | (930,953,501) |
| Net Assets | | |
| Beginning of period | 13,589,091,688 | 14,520,045,189 |
| End of period | $11,787,707,853 | $13,589,091,688 |
| Other Information | | |
| Shares | | |
| Sold | 115,478,799 | 60,662,086 |
| Issued in reinvestment of distributions | 42,928,837 | 66,767,287 |
| Redeemed | (214,994,521) | (72,582,611) |
| Net increase (decrease) | (56,586,885) | 54,846,762 |
See accompanying notes which are an integral part of the financial statements.
Financial Highlights
Fidelity Series Intrinsic Opportunities Fund
| | | | | | |
| Years ended July 31, | 2020 | 2019 | 2018 | 2017 | 2016 |
| Selected Per–Share Data | | | | | |
| Net asset value, beginning of period | $16.42 | $18.79 | $17.30 | $14.80 | $15.58 |
| Income from Investment Operations | | | | | |
| Net investment income (loss)A | .38 | .44 | .40 | .23 | .18 |
| Net realized and unrealized gain (loss) | (.65) | (1.37) | 1.91 | 2.50 | (.16) |
| Total from investment operations | (.27) | (.93) | 2.31 | 2.73 | .02 |
| Distributions from net investment income | (.45) | (.42) | (.28) | (.19) | (.23) |
| Distributions from net realized gain | (.40) | (1.02) | (.54) | (.04) | (.58) |
| Total distributions | (.86)B | (1.44) | (.82) | (.23) | (.80)C |
| Net asset value, end of period | $15.29 | $16.42 | $18.79 | $17.30 | $14.80 |
| Total ReturnD | (1.89)% | (5.13)% | 13.82% | 18.69% | .43% |
| Ratios to Average Net AssetsE,F | | | | | |
| Expenses before reductions | .01% | .01% | .01% | .52% | .79% |
| Expenses net of fee waivers, if any | .01% | .01% | .01% | .52% | .79% |
| Expenses net of all reductions | .01% | .01% | - %G | .52% | .79% |
| Net investment income (loss) | 2.46% | 2.61% | 2.19% | 1.48% | 1.28% |
| Supplemental Data | | | | | |
| Net assets, end of period (000 omitted) | $11,787,708 | $13,589,092 | $14,520,045 | $4,948,389 | $2,776,843 |
| Portfolio turnover rateH | 19% | 27% | 13% | 35%I | 14% |
A Calculated based on average shares outstanding during the period.
B Total distributions of $.86 per share is comprised of distributions from net investment income of $.453 and distributions from net realized gain of $.402 per share.
C Total distributions of $.80 per share is comprised of distributions from net investment income of $.228 and distributions from net realized gain of $.576 per share.
D Total returns would have been lower if certain expenses had not been reduced during the applicable periods shown.
E Fees and expenses of any underlying mutual funds or exchange-traded funds (ETFs) are not included in the Fund's expense ratio. The Fund indirectly bears its proportionate share of these expenses. For additional expense information related to investments in Fidelity Central Funds, please refer to the "Investments in Fidelity Central Funds" note found in the Notes to Financial Statements section of the most recent Annual or Semi-Annual report.
F Expense ratios reflect operating expenses of the Fund. Expenses before reductions do not reflect amounts reimbursed by the investment adviser or reductions from brokerage service arrangements or reductions from other expense offset arrangements and do not represent the amount paid by the Fund during periods when reimbursements or reductions occur. Expenses net of fee waivers reflect expenses after reimbursement by the investment adviser but prior to reductions from brokerage service arrangements or other expense offset arrangements. Expenses net of all reductions represent the net expenses paid by the Fund.
G Amount represents less than .005%.
H Amount does not include the portfolio activity of any underlying Fidelity Central Funds.
I Portfolio turnover rate excludes securities received or delivered in-kind.
See accompanying notes which are an integral part of the financial statements.
Notes to Financial Statements
For the period ended July 31, 2020
1. Organization.
Fidelity Series Intrinsic Opportunities Fund (the Fund) is a fund of Fidelity Puritan Trust (the Trust) and is authorized to issue an unlimited number of shares. Shares are offered only to certain other Fidelity funds and Fidelity managed 529 plans. The Trust is registered under the Investment Company Act of 1940, as amended (the 1940 Act), as an open-end management investment company organized as a Massachusetts business trust.
Effective January 1, 2020:
Investment advisers Fidelity Investments Money Management, Inc., FMR Co., Inc., and Fidelity SelectCo, LLC, merged with and into Fidelity Management & Research Company. In connection with the merger transactions, the resulting, merged investment adviser was then redomiciled from Massachusetts to Delaware, changed its corporate structure from a corporation to a limited liability company, and changed its name to "Fidelity Management & Research Company LLC".
2. Investments in Fidelity Central Funds.
The Fund invests in Fidelity Central Funds, which are open-end investment companies generally available only to other investment companies and accounts managed by the investment adviser and its affiliates. The Fund's Schedule of Investments lists each of the Fidelity Central Funds held as of period end, if any, as an investment of the Fund, but does not include the underlying holdings of each Fidelity Central Fund. As an Investing Fund, the Fund indirectly bears its proportionate share of the expenses of the underlying Fidelity Central Funds.
The Money Market Central Funds seek preservation of capital and current income and are managed by the investment adviser. Annualized expenses of the Money Market Central Funds as of their most recent shareholder report date ranged from less than .005% to .01%.
A complete unaudited list of holdings for each Fidelity Central Fund is available upon request or at the Securities and Exchange Commission (the SEC) website at www.sec.gov. In addition, the financial statements of the Fidelity Central Funds, which are not covered by the Fund's Report of Independent Registered Public Accounting Firm, are available on the SEC website or upon request.
3. Significant Accounting Policies.
The Fund is an investment company and applies the accounting and reporting guidance of the Financial Accounting Standards Board (FASB) Accounting Standards Codification Topic 946 Financial Services – Investment Companies. The financial statements have been prepared in conformity with accounting principles generally accepted in the United States of America (GAAP), which require management to make certain estimates and assumptions at the date of the financial statements. Actual results could differ from those estimates. Subsequent events, if any, through the date that the financial statements were issued have been evaluated in the preparation of the financial statements. The following summarizes the significant accounting policies of the Fund:
Investment Valuation. Investments are valued as of 4:00 p.m. Eastern time on the last calendar day of the period. The Board of Trustees (the Board) has delegated the day to day responsibility for the valuation of the Fund's investments to the Fair Value Committee (the Committee) established by the Fund's investment adviser. In accordance with valuation policies and procedures approved by the Board, the Fund attempts to obtain prices from one or more third party pricing vendors or brokers to value its investments. When current market prices, quotations or currency exchange rates are not readily available or reliable, investments will be fair valued in good faith by the Committee, in accordance with procedures adopted by the Board. Factors used in determining fair value vary by investment type and may include market or investment specific events. The frequency with which these procedures are used cannot be predicted and they may be utilized to a significant extent. The Committee oversees the Fund's valuation policies and procedures and reports to the Board on the Committee's activities and fair value determinations. The Board monitors the appropriateness of the procedures used in valuing the Fund's investments and ratifies the fair value determinations of the Committee.
The Fund categorizes the inputs to valuation techniques used to value its investments into a disclosure hierarchy consisting of three levels as shown below:
- Level 1 – quoted prices in active markets for identical investments
- Level 2 – other significant observable inputs (including quoted prices for similar investments, interest rates, prepayment speeds, etc.)
- Level 3 – unobservable inputs (including the Fund's own assumptions based on the best information available)
Valuation techniques used to value the Fund's investments by major category are as follows:
Equity securities, including restricted securities, for which market quotations are readily available, are valued at the last reported sale price or official closing price as reported by a third party pricing vendor on the primary market or exchange on which they are traded and are categorized as Level 1 in the hierarchy. In the event there were no sales during the day or closing prices are not available, securities are valued at the last quoted bid price or may be valued using the last available price and are generally categorized as Level 2 in the hierarchy. For foreign equity securities, when market or security specific events arise, comparisons to the valuation of American Depositary Receipts (ADRs), Exchange-Traded Funds (ETFs) and certain indexes as well as quoted prices for similar securities may be used and would be categorized as Level 2 in the hierarchy. For equity securities, including restricted securities, where observable inputs are limited, assumptions about market activity and risk are used and these securities may be categorized as Level 3 in the hierarchy.
Investments in open-end mutual funds are valued at their closing net asset value (NAV) each business day and are categorized as Level 1 in the hierarchy.
Changes in valuation techniques may result in transfers in or out of an assigned level within the disclosure hierarchy. The aggregate value of investments by input level as of July 31, 2020 is included at the end of the Fund's Schedule of Investments.
Foreign Currency. The Fund may use foreign currency contracts to facilitate transactions in foreign-denominated securities. Gains and losses from these transactions may arise from changes in the value of the foreign currency or if the counterparties do not perform under the contracts' terms.
Foreign-denominated assets, including investment securities, and liabilities are translated into U.S. dollars at the exchange rates at period end. Purchases and sales of investment securities, income and dividends received and expenses denominated in foreign currencies are translated into U.S. dollars at the exchange rate in effect on the transaction date.
The effects of exchange rate fluctuations on investments are included with the net realized and unrealized gain (loss) on investment securities. Other foreign currency transactions resulting in realized and unrealized gain (loss) are disclosed separately.
Investment Transactions and Income. For financial reporting purposes, the Fund's investment holdings and NAV include trades executed through the end of the last business day of the period. The NAV per share for processing shareholder transactions is calculated as of the close of business of the New York Stock Exchange (NYSE), normally 4:00 p.m. Eastern time and includes trades executed through the end of the prior business day. Gains and losses on securities sold are determined on the basis of identified cost and include proceeds received from litigation. Dividend income is recorded on the ex-dividend date, except for certain dividends from foreign securities where the ex-dividend date may have passed, which are recorded as soon as the Fund is informed of the ex-dividend date. Non-cash dividends included in dividend income, if any, are recorded at the fair market value of the securities received. Income and capital gain distributions from Fidelity Central Funds, if any, are recorded on the ex-dividend date. Certain distributions received by the Fund represent a return of capital or capital gain. The Fund determines the components of these distributions subsequent to the ex-dividend date, based upon receipt of tax filings or other correspondence relating to the underlying investment. These distributions are recorded as a reduction of cost of investments and/or as a realized gain. Investment income is recorded net of foreign taxes withheld where recovery of such taxes is uncertain.
Expenses. Expenses directly attributable to a fund are charged to that fund. Expenses attributable to more than one fund are allocated among the respective funds on the basis of relative net assets or other appropriate methods. Expense estimates are accrued in the period to which they relate and adjustments are made when actual amounts are known.
Income Tax Information and Distributions to Shareholders. Each year, the Fund intends to qualify as a regulated investment company under Subchapter M of the Internal Revenue Code, including distributing substantially all of its taxable income and realized gains. As a result, no provision for U.S. Federal income taxes is required. As of July 31, 2020, the Fund did not have any unrecognized tax benefits in the financial statements; nor is the Fund aware of any tax positions for which it is reasonably possible that the total amounts of unrecognized tax benefits will significantly change in the next twelve months. The Fund files a U.S. federal tax return, in addition to state and local tax returns as required. The Fund's federal income tax returns are subject to examination by the Internal Revenue Service (IRS) for a period of three fiscal years after they are filed. State and local tax returns may be subject to examination for an additional fiscal year depending on the jurisdiction. Foreign taxes are provided for based on the Fund's understanding of the tax rules and rates that exist in the foreign markets in which it invests. The Fund is subject to a tax imposed on capital gains by certain countries in which it invests. An estimated deferred tax liability for net unrealized appreciation on the applicable securities is included in Other payables and accrued expenses on the Statement of Assets & Liabilities.
Distributions are declared and recorded on the ex-dividend date. Income and capital gain distributions are determined in accordance with income tax regulations, which may differ from GAAP.
Capital accounts within the financial statements are adjusted for permanent book-tax differences. These adjustments have no impact on net assets or the results of operations. Capital accounts are not adjusted for temporary book-tax differences which will reverse in a subsequent period.
Book-tax differences are primarily due to foreign currency transactions, passive foreign investment companies (PFIC), partnerships, capital loss carryforwards and losses deferred due to wash sales.
As of period end, the cost and unrealized appreciation (depreciation) in securities, and derivatives if applicable, for federal income tax purposes were as follows:
| Gross unrealized appreciation | $3,073,949,288 |
| Gross unrealized depreciation | (2,010,910,305) |
| Net unrealized appreciation (depreciation) | $1,063,038,983 |
| Tax Cost | $11,125,652,587 |
The tax-based components of distributable earnings as of period end were as follows:
| Undistributed ordinary income | $166,501,555 |
| Capital loss carryforward | $(25,088,942) |
| Net unrealized appreciation (depreciation) on securities and other investments | $1,063,031,687 |
Capital loss carryforwards are only available to offset future capital gains of the Fund to the extent provided by regulations and may be limited. The capital loss carryforward information presented below, including any applicable limitation, is estimated as of fiscal period end and is subject to adjustment.
| No expiration | |
| Short-term | $(25,088,942) |
The tax character of distributions paid was as follows:
| | July 31, 2020 | July 31, 2019 |
| Ordinary Income | $378,276,400 | $ 397,898,729 |
| Long-term Capital Gains | 311,688,724 | 744,077,586 |
| Total | $689,965,124 | $ 1,141,976,315 |
Restricted Securities (including Private Placements). The Fund may invest in securities that are subject to legal or contractual restrictions on resale. These securities generally may be resold in transactions exempt from registration or to the public if the securities are registered. Disposal of these securities may involve time-consuming negotiations and expense, and prompt sale at an acceptable price may be difficult. Information regarding restricted securities is included at the end of the Fund's Schedule of Investments.
4. Purchases and Sales of Investments.
Purchases and sales of securities, other than short-term securities, are noted in the table below.
| | Purchases ($) | Sales ($) |
| Fidelity Series Intrinsic Opportunities Fund | 2,135,120,611 | 2,370,830,870 |
5. Fees and Other Transactions with Affiliates.
Management Fee. Fidelity Management & Research Company LLC (the investment adviser) and its affiliates provide the Fund with investment management related services for which the Fund does not pay a management fee. Under the management contract, the investment adviser or an affiliate pays all ordinary operating expenses of the Fund, except custody fees, fees and expenses of the independent Trustees, and certain miscellaneous expenses such as proxy and shareholder meeting expenses.
Brokerage Commissions. A portion of portfolio transactions were placed with brokerage firms which are affiliates of the investment adviser. Brokerage commissions are included in net realized gain (loss) and change in net unrealized appreciation (depreciation) in the Statement of Operations. The commissions paid to these affiliated firms were as follows:
| | Amount |
| Fidelity Series Intrinsic Opportunities Fund | $62,416 |
Interfund Trades. Funds may purchase from or sell securities to other Fidelity Funds under procedures adopted by the Board. The procedures have been designed to ensure these interfund trades are executed in accordance with Rule 17a-7 of the 1940 Act. Interfund trades are included within the respective purchases and sales amounts shown in the Purchases and Sales of Investments note.
Other. During the period, the investment adviser reimbursed the Fund for certain losses in the amount of $49,521.
6. Committed Line of Credit.
Certain Funds participate with other funds managed by the investment adviser or an affiliate in a $4.25 billion credit facility (the "line of credit") to be utilized for temporary or emergency purposes to fund shareholder redemptions or for other short-term liquidity purposes. The participating funds have agreed to pay commitment fees on their pro-rata portion of the line of credit, which are reflected in Miscellaneous expenses on the Statement of Operations, and are as follows:
| | Amount |
| Fidelity Series Intrinsic Opportunities Fund | $30,545 |
During the period, there were no borrowings on this line of credit.
7. Security Lending.
The Fund lends portfolio securities from time to time in order to earn additional income. Lending agents are used, including National Financial Services (NFS), an affiliate of the Fund. Pursuant to a securities lending agreement, NFS will receive a fee, which is capped at 9.9% of daily lending revenue, for its services as lending agent. The Fund may lend securities to certain qualified borrowers, including NFS. On the settlement date of the loan, the Fund receives collateral (in the form of U.S. Treasury obligations, letters of credit and/or cash) against the loaned securities and maintains collateral in an amount not less than 100% of the market value of the loaned securities during the period of the loan. The market value of the loaned securities is determined at the close of business of the Fund and any additional required collateral is delivered to the Fund on the next business day. The Fund or borrower may terminate the loan at any time, and if the borrower defaults on its obligation to return the securities loaned because of insolvency or other reasons, the Fund may apply collateral received from the borrower against the obligation. The Fund may experience delays and costs in recovering the securities loaned. Any cash collateral received is invested in the Fidelity Securities Lending Cash Central Fund. The value of loaned securities and cash collateral at period end are disclosed on the Fund's Statement of Assets and Liabilities. The value of securities loaned to NFS, as affiliated borrower, at period end was $112,716. Total fees paid by the Fund to NFS, as lending agent, amounted to $950,350. Security lending income represents the income earned on investing cash collateral, less rebates paid to borrowers and any lending agent fees associated with the loan, plus any premium payments received for lending certain types of securities. Net income from the Fidelity Securities Lending Cash Central Fund during the period is presented in the Statement of Operations as a component of income from Fidelity Central Funds (and includes $7,813 from securities loaned to NFS, as affiliated borrower).
8. Expense Reductions.
Through arrangements with the Fund's custodian, credits realized as a result of certain uninvested cash balances were used to reduce the Fund's expenses by $4,495.
9. Other.
The Fund's organizational documents provide former and current trustees and officers with a limited indemnification against liabilities arising in connection with the performance of their duties to the Fund. In the normal course of business, the Fund may also enter into contracts that provide general indemnifications. The Fund's maximum exposure under these arrangements is unknown as this would be dependent on future claims that may be made against the Fund. The risk of material loss from such claims is considered remote.
At the end of the period, mutual funds and accounts managed by the investment adviser or its affiliates were the owners of record of all of the outstanding shares of the Fund.
10. Coronavirus (COVID-19) Pandemic.
An outbreak of COVID-19 first detected in China during December 2019 has since spread globally and was declared a pandemic by the World Health Organization during March 2020. Developments that disrupt global economies and financial markets, such as the COVID-19 pandemic, may magnify factors that affect the Fund's performance.
Report of Independent Registered Public Accounting Firm
To the Board of Trustees of Fidelity Puritan Trust and Shareholders of Fidelity Series Intrinsic Opportunities Fund:
Opinion on the Financial Statements and Financial Highlights
We have audited the accompanying statement of assets and liabilities of Fidelity Series Intrinsic Opportunities Fund (the "Fund"), a fund of Fidelity Puritan Trust, including the schedule of investments, as of July 31, 2020, the related statement of operations for the year then ended, the statement of changes in net assets for each of the two years in the period then ended, the financial highlights for each of the five years in the period then ended, and the related notes. In our opinion, the financial statements and financial highlights present fairly, in all material respects, the financial position of the Fund as of July 31, 2020, and the results of its operations for the year then ended, the changes in its net assets for each of the two years in the period then ended, and the financial highlights for each of the five years in the period then ended in conformity with accounting principles generally accepted in the United States of America.
Basis for Opinion
These financial statements and financial highlights are the responsibility of the Fund's management. Our responsibility is to express an opinion on the Fund's financial statements and financial highlights based on our audits. We are a public accounting firm registered with the Public Company Accounting Oversight Board (United States) (PCAOB) and are required to be independent with respect to the Fund in accordance with the U.S. federal securities laws and the applicable rules and regulations of the Securities and Exchange Commission and the PCAOB.
We conducted our audits in accordance with the standards of the PCAOB. Those standards require that we plan and perform the audit to obtain reasonable assurance about whether the financial statements and financial highlights are free of material misstatement, whether due to error or fraud. The Fund is not required to have, nor were we engaged to perform, an audit of its internal control over financial reporting. As part of our audits we are required to obtain an understanding of internal control over financial reporting but not for the purpose of expressing an opinion on the effectiveness of the Fund’s internal control over financial reporting. Accordingly, we express no such opinion.
Our audits included performing procedures to assess the risks of material misstatement of the financial statements and financial highlights, whether due to error or fraud, and performing procedures that respond to those risks. Such procedures included examining, on a test basis, evidence regarding the amounts and disclosures in the financial statements and financial highlights. Our audits also included evaluating the accounting principles used and significant estimates made by management, as well as evaluating the overall presentation of the financial statements and financial highlights. Our procedures included confirmation of securities owned as of July 31, 2020, by correspondence with the custodian and brokers; when replies were not received from brokers, we performed other auditing procedures. We believe that our audits provide a reasonable basis for our opinion.
/s/ Deloitte & Touche LLP
Boston, Massachusetts
September 14, 2020
We have served as the auditor of one or more of the Fidelity investment companies since 1999.
Trustees and Officers
The Trustees, Members of the Advisory Board (if any), and officers of the trust and fund, as applicable, are listed below. The Board of Trustees governs the fund and is responsible for protecting the interests of shareholders. The Trustees are experienced executives who meet periodically throughout the year to oversee the fund's activities, review contractual arrangements with companies that provide services to the fund, oversee management of the risks associated with such activities and contractual arrangements, and review the fund's performance. Except for Jonathan Chiel, each of the Trustees oversees 311 funds. Mr. Chiel oversees 174 funds.
The Trustees hold office without limit in time except that (a) any Trustee may resign; (b) any Trustee may be removed by written instrument, signed by at least two-thirds of the number of Trustees prior to such removal; (c) any Trustee who requests to be retired or who has become incapacitated by illness or injury may be retired by written instrument signed by a majority of the other Trustees; and (d) any Trustee may be removed at any special meeting of shareholders by a two-thirds vote of the outstanding voting securities of the trust. Each Trustee who is not an interested person (as defined in the 1940 Act) of the trust and the fund is referred to herein as an Independent Trustee. Each Independent Trustee shall retire not later than the last day of the calendar year in which his or her 75th birthday occurs. The Independent Trustees may waive this mandatory retirement age policy with respect to individual Trustees. Officers and Advisory Board Members hold office without limit in time, except that any officer or Advisory Board Member may resign or may be removed by a vote of a majority of the Trustees at any regular meeting or any special meeting of the Trustees. Except as indicated, each individual has held the office shown or other offices in the same company for the past five years.
The fund’s Statement of Additional Information (SAI) includes more information about the Trustees. To request a free copy, call Fidelity at 1-800-544-3455.
Experience, Skills, Attributes, and Qualifications of the Trustees. The Governance and Nominating Committee has adopted a statement of policy that describes the experience, qualifications, attributes, and skills that are necessary and desirable for potential Independent Trustee candidates (Statement of Policy). The Board believes that each Trustee satisfied at the time he or she was initially elected or appointed a Trustee, and continues to satisfy, the standards contemplated by the Statement of Policy. The Governance and Nominating Committee also engages professional search firms to help identify potential Independent Trustee candidates who have the experience, qualifications, attributes, and skills consistent with the Statement of Policy. From time to time, additional criteria based on the composition and skills of the current Independent Trustees, as well as experience or skills that may be appropriate in light of future changes to board composition, business conditions, and regulatory or other developments, have also been considered by the professional search firms and the Governance and Nominating Committee. In addition, the Board takes into account the Trustees' commitment and participation in Board and committee meetings, as well as their leadership of standing and ad hoc committees throughout their tenure.
In determining that a particular Trustee was and continues to be qualified to serve as a Trustee, the Board has considered a variety of criteria, none of which, in isolation, was controlling. The Board believes that, collectively, the Trustees have balanced and diverse experience, qualifications, attributes, and skills, which allow the Board to operate effectively in governing the fund and protecting the interests of shareholders. Information about the specific experience, skills, attributes, and qualifications of each Trustee, which in each case led to the Board's conclusion that the Trustee should serve (or continue to serve) as a trustee of the fund, is provided below.
Board Structure and Oversight Function. Robert A. Lawrence is an interested person and currently serves as Acting Chairman. The Trustees have determined that an interested Chairman is appropriate and benefits shareholders because an interested Chairman has a personal and professional stake in the quality and continuity of services provided to the fund. Independent Trustees exercise their informed business judgment to appoint an individual of their choosing to serve as Chairman, regardless of whether the Trustee happens to be independent or a member of management. The Independent Trustees have determined that they can act independently and effectively without having an Independent Trustee serve as Chairman and that a key structural component for assuring that they are in a position to do so is for the Independent Trustees to constitute a substantial majority for the Board. The Independent Trustees also regularly meet in executive session. Ned C. Lautenbach and David M. Thomas serve as Co-Lead Independent Trustees and as such each (i) acts as a liaison between the Independent Trustees and management with respect to matters important to the Independent Trustees and (ii) with management prepares agendas for Board meetings.
Fidelity® funds are overseen by different Boards of Trustees. The fund's Board oversees Fidelity's high income and certain equity funds, and other Boards oversee Fidelity's investment-grade bond, money market, asset allocation, and other equity funds. The asset allocation funds may invest in Fidelity® funds overseen by the fund's Board. The use of separate Boards, each with its own committee structure, allows the Trustees of each group of Fidelity® funds to focus on the unique issues of the funds they oversee, including common research, investment, and operational issues. On occasion, the separate Boards establish joint committees to address issues of overlapping consequences for the Fidelity® funds overseen by each Board.
The Trustees operate using a system of committees to facilitate the timely and efficient consideration of all matters of importance to the Trustees, the fund, and fund shareholders and to facilitate compliance with legal and regulatory requirements and oversight of the fund's activities and associated risks. The Board, acting through its committees, has charged FMR and its affiliates with (i) identifying events or circumstances the occurrence of which could have demonstrably adverse effects on the fund's business and/or reputation; (ii) implementing processes and controls to lessen the possibility that such events or circumstances occur or to mitigate the effects of such events or circumstances if they do occur; and (iii) creating and maintaining a system designed to evaluate continuously business and market conditions in order to facilitate the identification and implementation processes described in (i) and (ii) above. Because the day-to-day operations and activities of the fund are carried out by or through FMR, its affiliates, and other service providers, the fund's exposure to risks is mitigated but not eliminated by the processes overseen by the Trustees. While each of the Board's committees has responsibility for overseeing different aspects of the fund's activities, oversight is exercised primarily through the Operations, Audit, and Compliance Committees. Appropriate personnel, including but not limited to the fund's Chief Compliance Officer (CCO), FMR's internal auditor, the independent accountants, the fund's Treasurer and portfolio management personnel, make periodic reports to the Board's committees, as appropriate, including an annual review of Fidelity's risk management program for the Fidelity® funds. The responsibilities of each standing committee, including their oversight responsibilities, are described further under "Standing Committees of the Trustees."
Interested Trustees*:
Correspondence intended for a Trustee who is an interested person may be sent to Fidelity Investments, 245 Summer Street, Boston, Massachusetts 02210.
Name, Year of Birth; Principal Occupations and Other Relevant Experience+
Jonathan Chiel (1957)
Year of Election or Appointment: 2016
Trustee
Mr. Chiel also serves as Trustee of other Fidelity® funds. Mr. Chiel is Executive Vice President and General Counsel for FMR LLC (diversified financial services company, 2012-present). Previously, Mr. Chiel served as general counsel (2004-2012) and senior vice president and deputy general counsel (2000-2004) for John Hancock Financial Services; a partner with Choate, Hall & Stewart (1996-2000) (law firm); and an Assistant United States Attorney for the United States Attorney’s Office of the District of Massachusetts (1986-95), including Chief of the Criminal Division (1993-1995). Mr. Chiel is a director on the boards of the Boston Bar Foundation and the Maimonides School.
Robert A. Lawrence (1952)
Year of Election or Appointment: 2020
Trustee
Acting Chairman of the Board of Trustees
Mr. Lawrence also serves as Trustee of other funds. Previously, Mr. Lawrence served as a Member of the Advisory Board of certain funds. Prior to his retirement in 2008, Mr. Lawrence served as Vice President of certain Fidelity® funds (2006-2008), Senior Vice President, Head of High Income Division of Fidelity Management & Research Company (investment adviser firm, 2006-2008), and President of Fidelity Strategic Investments (investment adviser firm, 2002-2005).
* Determined to be an “Interested Trustee” by virtue of, among other things, his or her affiliation with the trusts or various entities under common control with FMR.
+ The information includes the Trustee's principal occupation during the last five years and other information relating to the experience, attributes, and skills relevant to the Trustee's qualifications to serve as a Trustee, which led to the conclusion that the Trustee should serve as a Trustee for the fund.
Independent Trustees:
Correspondence intended for an Independent Trustee may be sent to Fidelity Investments, P.O. Box 55235, Boston, Massachusetts 02205-5235.
Name, Year of Birth; Principal Occupations and Other Relevant Experience+
Dennis J. Dirks (1948)
Year of Election or Appointment: 2005
Trustee
Mr. Dirks also serves as Trustee of other Fidelity® funds. Prior to his retirement in May 2003, Mr. Dirks served as Chief Operating Officer and as a member of the Board of The Depository Trust & Clearing Corporation (financial markets infrastructure), President, Chief Operating Officer and a member of the Board of The Depository Trust Company (DTC), President and a member of the Board of the National Securities Clearing Corporation (NSCC), Chief Executive Officer and a member of the Board of the Government Securities Clearing Corporation and Chief Executive Officer and a member of the Board of the Mortgage-Backed Securities Clearing Corporation. Mr. Dirks currently serves as a member of the Finance Committee (2016-present) and Board (2017-present) and is Treasurer (2018-present) of the Asolo Repertory Theatre.
Donald F. Donahue (1950)
Year of Election or Appointment: 2018
Trustee
Mr. Donahue also serves as Trustee of other Fidelity® funds. Mr. Donahue serves as President and Chief Executive Officer of Miranda Partners, LLC (risk consulting for the financial services industry, 2012-present). Previously, Mr. Donahue served as Chief Executive Officer (2006-2012), Chief Operating Officer (2003-2006) and Managing Director, Customer Marketing and Development (1999-2003) of The Depository Trust & Clearing Corporation (financial markets infrastructure). Mr. Donahue currently serves as a member (2007-present) and Co-Chairman (2016-present) of the Board of United Way of New York, a member of the Board of NYC Leadership Academy (2012-present) and a member of the Board of Advisors of Ripple Labs, Inc. (financial services, 2015-present). Mr. Donahue previously served as a member of the Advisory Board of certain Fidelity® funds (2015-2018).
Vicki L. Fuller (1957)
Year of Election or Appointment: 2020
Trustee
Ms. Fuller also serves as Trustee of other Fidelity® funds. Previously, Ms. Fuller served as a member of the Advisory Board of certain Fidelity® funds (2018-2020), Chief Investment Officer of the New York State Common Retirement Fund (2012-2018) and held a variety of positions at AllianceBernstein L.P. (global asset management, 1985-2012), including Managing Director (2006-2012) and Senior Vice President and Senior Portfolio Manager (2001-2006). Ms. Fuller currently serves as a member of the Board, Audit Committee and Nominating and Governance Committee of The Williams Companies, Inc. (natural gas infrastructure, 2018-present) and as a member of the Board of Treliant, LLC (consulting, 2019-present).
Patricia L. Kampling (1959)
Year of Election or Appointment: 2020
Trustee
Ms. Kampling also serves as Trustee of other Fidelity® funds. Prior to her retirement, Ms. Kampling served as Chairman of the Board and Chief Executive Officer (2012-2019), President and Chief Operating Officer (2011-2012) and Executive Vice President and Chief Financial Officer (2010-2011) of Alliant Energy Corporation. Ms. Kampling currently serves as a member of the Board, Compensation Committee and Executive Committee and as Chair of the Audit Committee of Briggs & Stratton Corporation (manufacturing, 2011-present) and as a member of the Board, Audit, Finance and Risk Committee and Safety, Environmental, Technology and Operations Committee of American Water Works Company, Inc. (utilities company, 2019-present). In addition, Ms. Kampling currently serves as a member of the Board of the Nature Conservancy, Wisconsin Chapter (2019-present). Previously, Ms. Kampling served as a Member of the Advisory Board of certain Fidelity® funds (2020), a member of the Board of Interstate Power and Light Company (2012-2019) and Wisconsin Power and Light Company (2012-2019) (each a subsidiary of Alliant Energy Corporation) and as a member of the Board and Workforce Development Committee of the Business Roundtable (2018-2019).
Alan J. Lacy (1953)
Year of Election or Appointment: 2008
Trustee
Mr. Lacy also serves as Trustee of other Fidelity® funds. Previously, Mr. Lacy served as Senior Adviser (2007-2014) of Oak Hill Capital Partners, L.P. (private equity), Chief Executive Officer (2005) and Vice Chairman (2005-2006) of Sears Holdings Corporation (retail), Chief Executive Officer and Chairman of the Board of Sears, Roebuck and Co. (retail, 2000-2005), Chairman (2014-2017) and a member of the Board (2010-2017) of Dave & Buster’s Entertainment, Inc. (restaurant and entertainment complexes) and a member of the Board of Bristol-Myers Squibb Company (global pharmaceuticals, 2008-2020). Mr. Lacy currently serves as a Trustee of the California Chapter of The Nature Conservancy (2015-present) and a member of the Board of the Center for Advanced Study in the Behavioral Sciences at Stanford University (2015-present).
Ned C. Lautenbach (1944)
Year of Election or Appointment: 2000
Trustee
Co-Lead Independent Trustee
Mr. Lautenbach also serves as Trustee of other Fidelity® funds. Mr. Lautenbach currently serves as Chair of the Board of Governors, State University System of Florida (2013-present) and is a member of the Council on Foreign Relations (1994-present). He is also a member and has in the past served as Chairman of the Board of Directors of Artis-Naples (2012-present). Previously, Mr. Lautenbach served as a member and then Lead Director of the Board of Directors of Eaton Corporation (diversified industrial, 1997-2016). He was also a Partner at Clayton, Dubilier & Rice, LLC (private equity investment, 1998-2010); as well as Director of Sony Corporation (2006-2007). In addition, Mr. Lautenbach had a 30-year career with IBM (technology company), during which time he served as Senior Vice President and as a member of the Corporate Executive Committee (1968-1998).
Joseph Mauriello (1944)
Year of Election or Appointment: 2008
Trustee
Mr. Mauriello also serves as Trustee of other Fidelity® funds. Prior to his retirement in January 2006, Mr. Mauriello served in numerous senior management positions including Deputy Chairman and Chief Operating Officer (2004-2005), and Vice Chairman of Financial Services (2002-2004) of KPMG LLP US (professional services, 1965-2005). Mr. Mauriello currently serves as a member of the Independent Directors Council Governing Council (2015-present). Previously, Mr. Mauriello served as a member of the Board of XL Group plc. (global insurance and re-insurance, 2006-2018).
Cornelia M. Small (1944)
Year of Election or Appointment: 2005
Trustee
Ms. Small also serves as Trustee of other Fidelity® funds. Previously, Ms. Small served as Chief Investment Officer, Director of Global Equity Investments and a member of Scudder, Stevens & Clark and Scudder Kemper Investments. Ms. Small previously served as a member of the Board (2009-2019) and Chair of the Investment Committee (2010-2019) of the Teagle Foundation and a member of the Investment Committee of the Berkshire Taconic Community Foundation (2008-2019).
Garnett A. Smith (1947)
Year of Election or Appointment: 2018
Trustee
Mr. Smith also serves as Trustee of other Fidelity® funds. Prior to his retirement, Mr. Smith served as Chairman and Chief Executive Officer (1990-1997) and President (1986-1990) of Inbrand Corp. (manufacturer of personal absorbent products). Prior to his employment with Inbrand Corp., he was employed by a retail fabric chain and North Carolina National Bank (now Bank of America). Mr. Smith previously served as a member of the Advisory Board of certain Fidelity® funds (2012-2013).
David M. Thomas (1949)
Year of Election or Appointment: 2008
Trustee
Co-Lead Independent Trustee
Mr. Thomas also serves as Trustee of other Fidelity® funds. Previously, Mr. Thomas served as Executive Chairman (2005-2006) and Chairman and Chief Executive Officer (2000-2005) of IMS Health, Inc. (pharmaceutical and healthcare information solutions). Mr. Thomas currently serves as Non-Executive Chairman of the Board of Fortune Brands Home and Security (home and security products, 2011-present), and a member of the Board (2004-present) and Presiding Director (2013-present) of Interpublic Group of Companies, Inc. (marketing communication).
Susan Tomasky (1953)
Year of Election or Appointment: 2020
Trustee
Ms. Tomasky also serves as Trustee of other Fidelity® funds. Prior to her retirement, Ms. Tomasky served in various executive officer positions at American Electric Power Company, Inc. (1998-2011), including most recently as President of AEP Transmission (2007-2011). Ms. Tomasky currently serves as a member of the Board and Sustainability Committee and as Chair of the Audit Committee of Marathon Petroleum Corporation (2018-present) and as a member of the Board, Corporate Governance Committee and Organization and Compensation Committee and as Chair of the Audit Committee of Public Service Enterprise Group, Inc. (utilities company, 2012-present). In addition, Ms. Tomasky currently serves as a member of the Board of the Columbus Regional Airport Authority (2007-present), as a member of the Board of the Royal Shakespeare Company – America (2009-present), as a member of the Board of the Columbus Association for the Performing Arts (2011-present) and as a member of the Board of Kenyon College (2016-present). Previously, Ms. Tomasky served as a Member of the Advisory Board of certain Fidelity® funds (2020), a member of the Board (2011-2019) and as Lead Independent Director (2015-2018) of Andeavor Corporation (previously Tesoro Corporation) (independent oil refiner and marketer) and as a member of the Board of Summit Midstream Partners LP (energy, 2012-2018).
Michael E. Wiley (1950)
Year of Election or Appointment: 2020
Trustee
Mr. Wiley also serves as Trustee of other Fidelity® funds. Previously, Mr. Wiley served as a member of the Advisory Board of certain Fidelity® funds (2018-2020), Chairman, President and CEO of Baker Hughes, Inc. (oilfield services, 2000-2004). Mr. Wiley also previously served as a member of the Board of Andeavor Corporation (independent oil refiner and marketer, 2005-2018), a member of the Board of Andeavor Logistics LP (natural resources logistics, 2015-2018) and a member of the Board of High Point Resources (exploration and production, 2005-2020).
+ The information includes the Trustee's principal occupation during the last five years and other information relating to the experience, attributes, and skills relevant to the Trustee's qualifications to serve as a Trustee, which led to the conclusion that the Trustee should serve as a Trustee for the fund.
Advisory Board Members and Officers:
Correspondence intended for a Member of the Advisory Board (if any) may be sent to Fidelity Investments, P.O. Box 55235, Boston, Massachusetts 02205-5235. Correspondence intended for an officer or Peter S. Lynch may be sent to Fidelity Investments, 245 Summer Street, Boston, Massachusetts 02210. Officers appear below in alphabetical order.
Name, Year of Birth; Principal Occupation
Peter S. Lynch (1944)
Year of Election or Appointment: 2003
Member of the Advisory Board
Mr. Lynch also serves as a Member of the Advisory Board of other Fidelity® funds. Mr. Lynch is Vice Chairman and a Director of Fidelity Management & Research Company LLC (investment adviser firm). In addition, Mr. Lynch serves as a Trustee of Boston College and as the Chairman of the Inner-City Scholarship Fund. Previously, Mr. Lynch served as Vice Chairman and a Director of FMR Co., Inc. (investment adviser firm) and on the Special Olympics International Board of Directors (1997-2006).
Elizabeth Paige Baumann (1968)
Year of Election or Appointment: 2017
Anti-Money Laundering (AML) Officer
Ms. Baumann also serves as AML Officer of other funds. She is Chief AML Officer (2012-present) and Senior Vice President (2014-present) of FMR LLC (diversified financial services company) and is an employee of Fidelity Investments. Previously, Ms. Baumann served as AML Officer of certain funds (2017-2019), as AML Officer of the funds (2012-2016), and Vice President (2007-2014) and Deputy Anti-Money Laundering Officer (2007-2012) of FMR LLC.
Craig S. Brown (1977)
Year of Election or Appointment: 2019
Assistant Treasurer
Mr. Brown also serves as Assistant Treasurer of other funds. Mr. Brown is an employee of Fidelity Investments (2013-present).
John J. Burke III (1964)
Year of Election or Appointment: 2018
Chief Financial Officer
Mr. Burke also serves as Chief Financial Officer of other funds. Mr. Burke serves as Head of Investment Operations for Fidelity Fund and Investment Operations (2018-present) and is an employee of Fidelity Investments (1998-present). Previously Mr. Burke served as head of Asset Management Investment Operations (2012-2018).
William C. Coffey (1969)
Year of Election or Appointment: 2019
Assistant Secretary
Mr. Coffey also serves as Assistant Secretary of other funds. He is Senior Vice President and Deputy General Counsel of FMR LLC (diversified financial services company, 2010-present), and is an employee of Fidelity Investments. Previously, Mr. Coffey served as Secretary and CLO of certain funds (2018-2019); CLO, Secretary, and Senior Vice President of Fidelity Management & Research Company and FMR Co., Inc. (investment adviser firms, 2018-2019); Secretary of Fidelity SelectCo, LLC and Fidelity Investments Money Management, Inc. (investment adviser firms, 2018-2019); CLO of Fidelity Management & Research (Hong Kong) Limited, FMR Investment Management (UK) Limited, and Fidelity Management & Research (Japan) Limited (investment adviser firms, 2018-2019); and Assistant Secretary of certain funds (2009-2018).
Timothy M. Cohen (1969)
Year of Election or Appointment: 2018
Vice President
Mr. Cohen also serves as Vice President of other funds. Mr. Cohen serves as Co-Head of Equity (2018-present), a Director of Fidelity Management & Research (Japan) Limited (investment adviser firm, 2016-present), and is an employee of Fidelity Investments. Previously, Mr. Cohen served as Executive Vice President of Fidelity SelectCo, LLC (2019), Head of Global Equity Research (2016-2018), Chief Investment Officer - Equity and a Director of Fidelity Management & Research (U.K.) Inc. (investment adviser firm, 2013-2015) and as a Director of Fidelity Management & Research (Hong Kong) Limited (investment adviser firm, 2017).
Jonathan Davis (1968)
Year of Election or Appointment: 2010
Assistant Treasurer
Mr. Davis also serves as Assistant Treasurer of other funds. Mr. Davis serves as Assistant Treasurer of FMR Capital, Inc. (2017-present) and is an employee of Fidelity Investments. Previously, Mr. Davis served as Vice President and Associate General Counsel of FMR LLC (diversified financial services company, 2003-2010).
Laura M. Del Prato (1964)
Year of Election or Appointment: 2018
Assistant Treasurer
Ms. Del Prato also serves as an officer of other funds. Ms. Del Prato is an employee of Fidelity Investments (2017-present). Previously, Ms. Del Prato served as President and Treasurer of The North Carolina Capital Management Trust: Cash Portfolio and Term Portfolio (2018-2020). Prior to joining Fidelity Investments, Ms. Del Prato served as a Managing Director and Treasurer of the JPMorgan Mutual Funds (2014-2017). Prior to JPMorgan, Ms. Del Prato served as a partner at Cohen Fund Audit Services (accounting firm, 2012-2013) and KPMG LLP (accounting firm, 2004-2012).
Colm A. Hogan (1973)
Year of Election or Appointment: 2020
Assistant Treasurer
Mr. Hogan also serves as an officer of other funds. Mr. Hogan serves as Assistant Treasurer of FMR Capital, Inc. (2017-present) and is an employee of Fidelity Investments (2005-present). Previously, Mr. Hogan served as Deputy Treasurer of certain Fidelity® funds (2016-2020) and Assistant Treasurer of certain Fidelity® funds (2016-2018).
Pamela R. Holding (1964)
Year of Election or Appointment: 2018
Vice President
Ms. Holding also serves as Vice President of other funds. Ms. Holding serves as Co-Head of Equity (2018-present) and is an employee of Fidelity Investments (2013-present). Previously, Ms. Holding served as Executive Vice President of Fidelity SelectCo, LLC (2019) and as Chief Investment Officer of Fidelity Institutional Asset Management (2013-2018).
Cynthia Lo Bessette (1969)
Year of Election or Appointment: 2019
Secretary and Chief Legal Officer (CLO)
Ms. Lo Bessette also serves as an officer of other funds. Ms. Lo Bessette serves as CLO, Secretary, and Senior Vice President of Fidelity Management & Research Company LLC (investment adviser firm, 2019-present); and CLO of Fidelity Management & Research (Hong Kong) Limited, FMR Investment Management (UK) Limited, and Fidelity Management & Research (Japan) Limited (investment adviser firms, 2019-present). She is a Senior Vice President and Deputy General Counsel of FMR LLC (diversified financial services company, 2019-present), and is an employee of Fidelity Investments. Previously, Ms. Lo Bessette served as CLO, Secretary, and Senior Vice President of FMR Co., Inc. (investment adviser firm, 2019); Secretary of Fidelity SelectCo, LLC and Fidelity Investments Money Management, Inc. (investment adviser firms, 2019). Prior to joining Fidelity Investments, Ms. Lo Bessette was Executive Vice President, General Counsel (2016-2019) and Senior Vice President, Deputy General Counsel (2015-2016) of OppenheimerFunds (investment management company) and Deputy Chief Legal Officer (2013-2015) of Jennison Associates LLC (investment adviser firm).
Chris Maher (1972)
Year of Election or Appointment: 2020
Deputy Treasurer
Mr. Maher also serves as an officer of other funds. Mr. Maher serves as Assistant Treasurer of FMR Capital, Inc. (2017-present), and is an employee of Fidelity Investments (2008-present). Previously, Mr. Maher served as Assistant Treasurer of certain funds (2013-2020); Vice President of Asset Management Compliance (2013), Vice President of the Program Management Group of FMR (investment adviser firm, 2010-2013), and Vice President of Valuation Oversight (2008-2010).
Jason P. Pogorelec (1975)
Year of Election or Appointment: 2020
Chief Compliance Officer
Mr. Pogorelec also serves as Chief Compliance Officer of other funds. Mr. Pogorelec is a senior Vice President of Asset Management Compliance for Fidelity Investments and is an employee of Fidelity Investments (2006-present). Previously, Mr. Pogorelec served as Vice President, Associate General Counsel for Fidelity Investments (2010-2020) and Assistant Secretary of certain Fidelity funds (2015-2020).
Stacie M. Smith (1974)
Year of Election or Appointment: 2016
President and Treasurer
Ms. Smith also serves as an officer of other funds. Ms. Smith serves as Assistant Treasurer of FMR Capital, Inc. (2017-present), is an employee of Fidelity Investments (2009-present), and has served in other fund officer roles. Prior to joining Fidelity Investments, Ms. Smith served as Senior Audit Manager of Ernst & Young LLP (accounting firm, 1996-2009). Previously, Ms. Smith served as Assistant Treasurer (2013-2019) and Deputy Treasurer (2013-2016) of certain Fidelity® funds.
Marc L. Spector (1972)
Year of Election or Appointment: 2016
Assistant Treasurer
Mr. Spector also serves as an officer of other funds. Mr. Spector serves as Assistant Treasurer of FMR Capital, Inc. (2017-present) and is an employee of Fidelity Investments (2016-present). Prior to joining Fidelity Investments, Mr. Spector served as Director at the Siegfried Group (accounting firm, 2013-2016), and prior to Siegfried Group as audit senior manager at Deloitte & Touche LLP (accounting firm, 2005-2013).
Jim Wegmann (1979)
Year of Election or Appointment: 2019
Assistant Treasurer
Mr. Wegmann also serves as Assistant Treasurer of other funds. Mr. Wegmann is an employee of Fidelity Investments (2011-present).
Shareholder Expense Example
As a shareholder, you incur two types of costs: (1) transaction costs, which may include sales charges (loads) on purchase payments or redemption proceeds, as applicable and (2) ongoing costs, which generally include management fees, distribution and/or service (12b-1) fees and other Fund expenses. This Example is intended to help you understand your ongoing costs (in dollars) of investing in a fund and to compare these costs with the ongoing costs of investing in other mutual funds.
The Example is based on an investment of $1,000 invested at the beginning of the period and held for the entire period (February 1, 2020 to July 31, 2020).
Actual Expenses
The first line of the accompanying table provides information about actual account values and actual expenses. You may use the information in this line, together with the amount you invested, to estimate the expenses that you paid over the period. Simply divide your account value by $1,000.00 (for example, an $8,600 account value divided by $1,000.00 = 8.6), then multiply the result by the number in the first line for a class/Fund under the heading entitled "Expenses Paid During Period" to estimate the expenses you paid on your account during this period. If any fund is a shareholder of any underlying mutual funds or exchange-traded funds (ETFs) (the Underlying Funds), such fund indirectly bears its proportional share of the expenses of the Underlying Funds in addition to the direct expenses incurred presented in the table. These fees and expenses are not included in the annualized expense ratio used to calculate the expense estimate in the table below.
Hypothetical Example for Comparison Purposes
The second line of the accompanying table provides information about hypothetical account values and hypothetical expenses based on the actual expense ratio and an assumed rate of return of 5% per year before expenses, which is not the actual return. The hypothetical account values and expenses may not be used to estimate the actual ending account balance or expenses you paid for the period. You may use this information to compare the ongoing costs of investing in the Fund and other funds. To do so, compare this 5% hypothetical example with the 5% hypothetical examples that appear in the shareholder reports of the other funds. If any fund is a shareholder of any Underlying Funds, such fund indirectly bears its proportional share of the expenses of the Underlying Funds in addition to the direct expenses as presented in the table. These fees and expenses are not included in the annualized expense ratio used to calculate the expense estimate in the table below.
Please note that the expenses shown in the table are meant to highlight your ongoing costs only and do not reflect any transaction costs. Therefore, the second line of the table is useful in comparing ongoing costs only, and will not help you determine the relative total costs of owning different funds.
| | Annualized Expense Ratio-A | Beginning
Account Value
February 1, 2020 | Ending
Account Value
July 31, 2020 | Expenses Paid
During Period-B
February 1, 2020
to July 31, 2020 |
| Fidelity Series Intrinsic Opportunities Fund | - % | | | |
| Actual | | $1,000.00 | $940.90 | $- |
| Hypothetical-C | | $1,000.00 | $1,024.86 | $- |
A Annualized expense ratio reflects expenses net of applicable fee waivers.
B Expenses are equal to the annualized expense ratio, multiplied by the average account value over the period, multiplied by 182/ 366 (to reflect the one-half year period). The fees and expenses of any Underlying Funds are not included in each annualized expense ratio.
C 5% return per year before expenses
Distributions (Unaudited)
The fund designates 33% and 37% of the dividends distributed in September and December, respectively during the fiscal year as qualifying for the dividends–received deduction for corporate shareholders.
The fund designates 69 % and 78 % of the dividends distributed in September and December, respectively during the fiscal year as amounts which may be taken into account as a dividend for the purposes of the maximum rate under section 1(h)(11) of the Internal Revenue Code.
The fund designates 1% and 0% of the dividends distributed in September and December, respectively during the fiscal year as a section 199A dividend.
The fund will notify shareholders in January 2021 of amounts for use in preparing 2020 income tax returns.
Liquidity Risk Management Program
The Securities and Exchange Commission adopted Rule 22e-4 under the Investment Company Act of 1940 (the Liquidity Rule) to promote effective liquidity risk management throughout the open-end investment company industry, thereby reducing the risk that funds will be unable to meet their redemption obligations and mitigating dilution of the interests of fund shareholders.
The Fund has adopted and implemented a liquidity risk management program pursuant to the Liquidity Rule (the Program) effective December 1, 2018. The Program is reasonably designed to assess and manage the Fund’s liquidity risk and to comply with the requirements of the Liquidity Rule. The Fund’s Board of Trustees (the Board) has designated the Fund’s investment adviser as administrator of the Program. The Fidelity advisers have established a Liquidity Risk Management Committee (the LRM Committee) to manage the Program for each of the Fidelity Funds. The LRM Committee monitors the adequacy and effectiveness of implementation of the Program and on a periodic basis assesses each Fund’s liquidity risk based on a variety of factors including (1) the Fund’s investment strategy, (2) portfolio liquidity and cash flow projections during normal and reasonably foreseeable stressed conditions, (3) shareholder redemptions, (4) borrowings and other funding sources and (5) in the case of exchange-traded funds, certain additional factors including the effect of the Fund’s prices and spreads, market participants, and basket compositions on the overall liquidity of the Fund’s portfolio, as applicable.
In accordance with the Program, each of the Fund’s portfolio investments is classified into one of four liquidity categories described below based on a determination of a reasonable expectation for how long it would take to convert the investment to cash (or sell or dispose of the investment) without significantly changing its market value.
- Highly liquid investments – cash or convertible to cash within three business days or less
- Moderately liquid investments – convertible to cash in three to seven calendar days
- Less liquid investments – can be sold or disposed of, but not settled, within seven calendar days
- Illiquid investments – cannot be sold or disposed of within seven calendar days
Liquidity classification determinations take into account a variety of factors including various market, trading and investment-specific considerations, as well as market depth, and generally utilize analysis from a third-party liquidity metrics service.
The Liquidity Rule places a 15% limit on a fund’s illiquid investments and requires funds that do not primarily hold assets that are highly liquid investments to determine and maintain a minimum percentage of the fund’s net assets to be invested in highly liquid investments (highly liquid investment minimum or HLIM). The Program includes provisions reasonably designed to comply with the 15% limit on illiquid investments and for determining, periodically reviewing and complying with the HLIM requirement as applicable.
At a recent meeting of the Fund’s Board of Trustees, the LRM Committee provided a written report to the Board pertaining to the operation, adequacy, and effectiveness of implementation of the Program for the annual period from December 1, 2018 through November 30, 2019. The report concluded that the Program has been implemented and is operating effectively and is reasonably designed to assess and manage the Fund’s liquidity risk.
Proxy Voting Results
A special meeting of shareholders was held on June 9, 2020. The results of votes taken among shareholders on the proposals before them are reported below. Each vote reported represents one dollar of net asset value held on the record date for the meeting.
PROPOSAL 1
To elect a Board of Trustees.
| | # of
Votes | % of
Votes |
| Dennis J. Dirks |
| Affirmative | 51,196,847,491.427 | 94.398 |
| Withheld | 3,038,239,286.369 | 5.602 |
| TOTAL | 54,235,086,777.797 | 100.000 |
| Donald F. Donahue |
| Affirmative | 51,237,854,534.400 | 94.474 |
| Withheld | 2,997,232,243.397 | 5.526 |
| TOTAL | 54,235,086,777.797 | 100.000 |
| Bettina Doulton |
| Affirmative | 51,360,110,652.541 | 94.699 |
| Withheld | 2,874,976,125.255 | 5.301 |
| TOTAL | 54,235,086,777.797 | 100.000 |
| Vicki L. Fuller |
| Affirmative | 51,563,431,518.122 | 95.074 |
| Withheld | 2,671,655,259.675 | 4.926 |
| TOTAL | 54,235,086,777.797 | 100.000 |
| Patricia L. Kampling |
| Affirmative | 51,164,274,033.278 | 94.338 |
| Withheld | 3,070,812,744.518 | 5.662 |
| TOTAL | 54,235,086,777.797 | 100.000 |
| Alan J. Lacy |
| Affirmative | 50,656,049,520.376 | 93.401 |
| Withheld | 3,579,037,257.420 | 6.599 |
| TOTAL | 54,235,086,777.797 | 100.000 |
| Ned C. Lautenbach |
| Affirmative | 50,648,184,728.350 | 93.386 |
| Withheld | 3,586,902,049.447 | 6.614 |
| TOTAL | 54,235,086,777.797 | 100.000 |
| Robert A. Lawrence |
| Affirmative | 50,828,079,099.188 | 93.718 |
| Withheld | 3,407,007,678.608 | 6.282 |
| TOTAL | 54,235,086,777.797 | 100.000 |
| Joseph Mauriello |
| Affirmative | 50,733,010,817.685 | 93.543 |
| Withheld | 3,502,075,960.112 | 6.457 |
| TOTAL | 54,235,086,777.797 | 100.000 |
| Cornelia M. Small |
| Affirmative | 50,936,822,997.692 | 93.919 |
| Withheld | 3,298,263,780.105 | 6.081 |
| TOTAL | 54,235,086,777.797 | 100.000 |
| Garnett A. Smith |
| Affirmative | 50,777,344,834.274 | 93.625 |
| Withheld | 3,457,741,943.523 | 6.375 |
| TOTAL | 54,235,086,777.797 | 100.000 |
| David M. Thomas |
| Affirmative | 50,835,673,463.433 | 93.732 |
| Withheld | 3,399,413,314.364 | 6.268 |
| TOTAL | 54,235,086,777.797 | 100.000 |
| Susan Tomasky |
| Affirmative | 51,193,289,850.509 | 94.391 |
| Withheld | 3,041,796,927.288 | 5.609 |
| TOTAL | 54,235,086,777.797 | 100.000 |
| Michael E. Wiley |
| Affirmative | 50,830,132,792.508 | 93.722 |
| Withheld | 3,404,953,985.289 | 6.278 |
| TOTAL | 54,235,086,777.797 | 100.000 |
PROPOSAL 2
To convert a fundamental investment policy to a non-fundamental investment policy.
| | # of
Votes | % of
Votes |
| Affirmative | 10,635,195,924.693 | 100.000 |
| Against | 0.000 | 0.000 |
| Abstain | 0.000 | 0.000 |
| Broker Non-Vote | 0.000 | 0.000 |
| TOTAL | 10,635,195,924.693 | 100.000 |
|
| Proposal 1 reflects trust wide proposal and voting results. |
O2T-ANN-0920
1.951012.107
Fidelity Flex® Funds
Fidelity Flex® Intrinsic Opportunities Fund
Annual Report
July 31, 2020
See the inside front cover for important information about access to your fund’s shareholder reports.
Beginning on January 1, 2021, as permitted by regulations adopted by the Securities and Exchange Commission, paper copies of a fund’s shareholder reports will no longer be sent by mail, unless you specifically request paper copies of the reports from the fund or from your financial intermediary, such as a financial advisor, broker-dealer or bank. Instead, the reports will be made available on a website, and you will be notified by mail each time a report is posted and provided with a website link to access the report.
If you already elected to receive shareholder reports electronically, you will not be affected by this change and you need not take any action. You may elect to receive shareholder reports and other communications from a fund electronically, by contacting your financial intermediary. For Fidelity customers, visit Fidelity's web site or call Fidelity using the contact information listed below.
You may elect to receive all future reports in paper free of charge. If you wish to continue receiving paper copies of your shareholder reports, you may contact your financial intermediary or, if you are a Fidelity customer, visit Fidelity’s website, or call Fidelity at the applicable toll-free number listed below. Your election to receive reports in paper will apply to all funds held with the fund complex/your financial intermediary.
| Account Type | Website | Phone Number |
| Brokerage, Mutual Fund, or Annuity Contracts: | fidelity.com/mailpreferences | 1-800-343-3548 |
| Employer Provided Retirement Accounts: | netbenefits.fidelity.com/preferences (choose 'no' under Required Disclosures to continue to print) | 1-800-343-0860 |
| Advisor Sold Accounts Serviced Through Your Financial Intermediary: | Contact Your Financial Intermediary | Your Financial Intermediary's phone number |
| Advisor Sold Accounts Serviced by Fidelity: | institutional.fidelity.com | 1-877-208-0098 |
Contents
To view a fund's proxy voting guidelines and proxy voting record for the 12-month period ended June 30, visit http://www.fidelity.com/proxyvotingresults or visit the Securities and Exchange Commission's (SEC) web site at http://www.sec.gov.
You may also call 1-800-544-3455 (for managed account clients) or 1-800-835-5092 (for retirement plan participants) to request a free copy of the proxy voting guidelines.
Standard & Poor's, S&P and S&P 500 are registered service marks of The McGraw-Hill Companies, Inc. and have been licensed for use by Fidelity Distributors Corporation.
Other third-party marks appearing herein are the property of their respective owners.
All other marks appearing herein are registered or unregistered trademarks or service marks of FMR LLC or an affiliated company. © 2020 FMR LLC. All rights reserved.
This report and the financial statements contained herein are submitted for the general information of the shareholders of the Fund. This report is not authorized for distribution to prospective investors in the Fund unless preceded or accompanied by an effective prospectus.
A fund files its complete schedule of portfolio holdings with the SEC for the first and third quarters of each fiscal year on Form N-PORT. Forms N-PORT are available on the SEC’s web site at http://www.sec.gov. A fund's Forms N-PORT may be reviewed and copied at the SEC’s Public Reference Room in Washington, DC. Information regarding the operation of the SEC's Public Reference Room may be obtained by calling 1-800-SEC-0330.
For a complete list of a fund's portfolio holdings, view the most recent holdings listing, semiannual report, or annual report on Fidelity's web site at http://www.fidelity.com, http://www.institutional.fidelity.com, or http://www.401k.com, as applicable.
NOT FDIC INSURED •MAY LOSE VALUE •NO BANK GUARANTEE
Neither the Fund nor Fidelity Distributors Corporation is a bank.
Note to Shareholders:
Early in 2020, the outbreak and spread of a new coronavirus emerged as a public health emergency that had a major influence on financial markets, primarily based on its impact on the global economy and the outlook for corporate earnings. The virus causes a respiratory disease known as COVID-19. On March 11, the World Health Organization declared the COVID-19 outbreak a pandemic, citing sustained risk of further global spread.
In the weeks following, as the crisis worsened, we witnessed an escalating human tragedy with wide-scale social and economic consequences from coronavirus-containment measures. The outbreak of COVID-19 prompted a number of measures to limit the spread, including travel and border restrictions, quarantines, and restrictions on large gatherings. In turn, these resulted in lower consumer activity, diminished demand for a wide range of products and services, disruption in manufacturing and supply chains, and – given the wide variability in outcomes regarding the outbreak – significant market uncertainty and volatility. Amid the turmoil, the U.S. government took unprecedented action – in concert with the U.S. Federal Reserve and central banks around the world – to help support consumers, businesses, and the broader economy, and to limit disruption to the financial system.
The situation continues to unfold, and the extent and duration of its impact on financial markets and the economy remain highly uncertain. Extreme events such as the coronavirus crisis are “exogenous shocks” that can have significant adverse effects on mutual funds and their investments. Although multiple asset classes may be affected by market disruption, the duration and impact may not be the same for all types of assets.
Fidelity is committed to helping you stay informed amid news about COVID-19 and during increased market volatility, and we’re taking extra steps to be responsive to customer needs. We encourage you to visit our websites, where we offer ongoing updates, commentary, and analysis on the markets and our funds.
Performance: The Bottom Line
Average annual total return reflects the change in the value of an investment, assuming reinvestment of distributions from dividend income and capital gains (the profits earned upon the sale of securities that have grown in value, if any) and assuming a constant rate of performance each year. The hypothetical investment and the average annual total returns do not reflect the deduction of taxes that a shareholder would pay on fund distributions or the redemption of fund shares. During periods of reimbursement by Fidelity, a fund’s total return will be greater than it would be had the reimbursement not occurred. How a fund did yesterday is no guarantee of how it will do tomorrow.
Average Annual Total Returns
| For the periods ended July 31, 2020 | Past 1 year | Life of fundA |
| Fidelity Flex® Intrinsic Opportunities Fund | (0.07)% | 4.77% |
A From March 8, 2017
$10,000 Over Life of Fund
Let's say hypothetically that $10,000 was invested in Fidelity Flex® Intrinsic Opportunities Fund on March 8, 2017, when the fund started.
The chart shows how the value of your investment would have changed, and also shows how the Russell 3000® Index performed over the same period.

| Period Ending Values |
| $11,715 | Fidelity Flex® Intrinsic Opportunities Fund |
| $14,544 | Russell 3000® Index |
Management's Discussion of Fund Performance
Market Recap: The S&P 500
® index gained 11.96% for the 12 months ending July 31, 2020, in what was a bumpy ride for U.S. equity investors, marked by a steep but brief decline due to the early-2020 outbreak and spread of the coronavirus, followed by a historic rebound. Declared a pandemic on March 11, the COVID-19 crisis and containment efforts caused broad contraction in economic activity, along with extreme uncertainty, volatility and dislocation in financial markets. By mid-March, U.S. stocks entered bear-market territory less than a month after hitting an all-time high and extending the longest-running bull market in American history. Stocks slid in late February, after a surge in COVID-19 cases outside China. The sudden downtrend continued in March (-12%), capping the index’s worst quarter since 2008. A historically rapid and expansive U.S. monetary/fiscal-policy response provided a partial offset to the economic disruption and fueled a sharp uptrend. Aggressive support for financial markets by the U.S. Federal Reserve, plans for reopening the economy and improving infection data boosted stocks in April (+13%) and May (+5%). In June and July, the index gained amid progress on potential treatments and signs of an early recovery in economic activity. For the full 12 months, growth stocks widely topped value, while large-caps handily bested smaller-caps. The information technology sector (+39%) led the way, followed by consumer discretionary (+22%). In contrast, energy (-38%) fell hard along with the price of crude oil.
Comments from Lead Portfolio Manager Joel Tillinghast: For the fiscal year ending July 31, 2020, the fund returned -0.07%, trailing the 10.93% result of the benchmark Russell 3000 Index. The largest detractor from performance versus the benchmark was security selection in consumer discretionary. An underweighting and stock selection in information technology and an overweighting in energy also hampered performance. Not owning Apple, a benchmark component that gained 102%, was the largest individual relative detractor versus the Russell 3000 Index. Our second-largest relative detractor this period was avoiding Amazon.com, a benchmark component that gained roughly 70%. Avoiding Microsoft, a benchmark component that gained about 52%, hurt performance. Foreign holdings detracted from the fund’s performance, despite favorable foreign exchange. Conversely, the biggest contributor to performance versus the benchmark was an overweighting in the outperforming consumer discretionary sector. Also helping was an underweighting in the lagging real estate sector and an overweighting in strong-performing health care stocks. Lastly, the fund's position in cash was a notable contributor. Our non-benchmark stake in Z Holdings was the fund's largest individual relative contributor, driven by an 83% rise. This was among the biggest holdings at period end. Our second-largest relative contributor this period was avoiding Exxon Mobil, a benchmark component that returned -40%. Another notable relative contributor was an overweighting in Amgen (+34%), which also was one of our largest holdings in the fund. Notable changes in positioning include reduced exposure to the energy sector and a higher allocation to communication services. The fund’s stake in cash rose from about 6%, on average, to roughly 10% this period.
The views expressed above reflect those of the portfolio manager(s) only through the end of the period as stated on the cover of this report and do not necessarily represent the views of Fidelity or any other person in the Fidelity organization. Any such views are subject to change at any time based upon market or other conditions and Fidelity disclaims any responsibility to update such views. These views may not be relied on as investment advice and, because investment decisions for a Fidelity fund are based on numerous factors, may not be relied on as an indication of trading intent on behalf of any Fidelity fund.
Investment Summary (Unaudited)
Top Ten Stocks as of July 31, 2020
| | % of fund's net assets |
| Anthem, Inc. | 5.4 |
| Itochu Corp. | 3.4 |
| Amgen, Inc. | 3.0 |
| MetLife, Inc. | 2.6 |
| UnitedHealth Group, Inc. | 2.2 |
| John David Group PLC | 2.2 |
| The Western Union Co. | 2.0 |
| Yahoo! Japan Corp. | 1.8 |
| Best Buy Co., Inc. | 1.8 |
| United Therapeutics Corp. | 1.7 |
| | 26.1 |
Top Five Market Sectors as of July 31, 2020
| | % of fund's net assets |
| Health Care | 21.3 |
| Consumer Discretionary | 18.6 |
| Financials | 13.2 |
| Industrials | 9.3 |
| Communication Services | 5.8 |
Asset Allocation (% of fund's net assets)
| As of July 31, 2020 * |
| | Stocks | 89.6% |
| | Short-Term Investments and Net Other Assets (Liabilities) | 10.4% |

* Foreign investments - 41.1%
Schedule of Investments July 31, 2020
Showing Percentage of Net Assets
| Common Stocks - 89.5% | | | |
| | | Shares | Value |
| COMMUNICATION SERVICES - 5.8% | | | |
| Diversified Telecommunication Services - 0.5% | | | |
| Verizon Communications, Inc. | | 2,282 | $131,169 |
| Entertainment - 0.0% | | | |
| GAMEVIL, Inc. (a) | | 7 | 196 |
| Interactive Media & Services - 2.4% | | | |
| Cars.com, Inc. (a) | | 1,305 | 10,597 |
| Kakaku.com, Inc. | | 982 | 23,591 |
| Yahoo! Japan Corp. | | 83,324 | 443,095 |
| YY, Inc. ADR (a) | | 1,240 | 98,977 |
| Zappallas, Inc. (a) | | 2,143 | 7,673 |
| | | | 583,933 |
| Media - 2.7% | | | |
| AMC Networks, Inc. Class A (a) | | 261 | 6,029 |
| Comcast Corp. Class A | | 7,043 | 301,440 |
| Corus Entertainment, Inc. Class B (non-vtg.) | | 710 | 1,272 |
| Discovery Communications, Inc.: | | | |
| Class A (a) | | 5,158 | 108,834 |
| Class B (a) | | 38 | 1,341 |
| DISH Network Corp. Class A (a) | | 233 | 7,482 |
| DMS, Inc. | | 466 | 7,070 |
| F@N Communications, Inc. | | 1,290 | 5,179 |
| Gendai Agency, Inc. | | 1,954 | 4,873 |
| Hyundai HCN | | 4,802 | 15,922 |
| Ipsos SA | | 7 | 184 |
| ITE Group PLC | | 676 | 706 |
| Nippon BS Broadcasting Corp. | | 402 | 4,003 |
| Nippon Television Network Corp. | | 312 | 3,360 |
| Omnicom Group, Inc. | | 226 | 12,143 |
| Pico Far East Holdings Ltd. | | 17,939 | 2,361 |
| Proto Corp. | | 200 | 1,965 |
| Television Broadcasts Ltd. | | 2,700 | 3,146 |
| ViacomCBS, Inc.: | | | |
| Class A | | 1,326 | 36,783 |
| Class B | | 4,960 | 129,307 |
| WOWOW INC. | | 562 | 13,039 |
| | | | 666,439 |
| Wireless Telecommunication Services - 0.2% | | | |
| Okinawa Cellular Telephone Co. | | 1,042 | 41,589 |
|
| TOTAL COMMUNICATION SERVICES | | | 1,423,326 |
|
| CONSUMER DISCRETIONARY - 18.6% | | | |
| Auto Components - 4.5% | | | |
| Adient PLC (a) | | 2,268 | 37,740 |
| Burelle SA | | 2 | 1,169 |
| Cooper Tire & Rubber Co. | | 753 | 23,388 |
| Cooper-Standard Holding, Inc. (a) | | 187 | 2,003 |
| DaikyoNishikawa Corp. | | 1,660 | 6,931 |
| DongAh Tire & Rubber Co. Ltd. | | 39 | 346 |
| DTR Automotive Corp. | | 97 | 1,959 |
| Eagle Industry Co. Ltd. | | 700 | 4,113 |
| Fukoku Co. Ltd. | | 548 | 3,230 |
| G-Tekt Corp. | | 5,654 | 46,629 |
| Gentex Corp. | | 557 | 15,033 |
| Hi-Lex Corp. | | 466 | 4,829 |
| Hyundai Mobis | | 1,885 | 323,924 |
| IJT Technology Holdings Co. Ltd. | | 3,211 | 13,135 |
| INFAC Corp. | | 71 | 276 |
| Lear Corp. | | 3,373 | 372,312 |
| Linamar Corp. | | 4,861 | 145,164 |
| Murakami Corp. | | 65 | 1,400 |
| Piolax, Inc. | | 1,100 | 15,109 |
| Seoyon Co. Ltd. | | 1,083 | 6,041 |
| Seoyon E-Hwa Co., Ltd. | | 1,808 | 5,428 |
| Stanley Electric Co. Ltd. | | 196 | 4,659 |
| Strattec Security Corp. | | 63 | 1,361 |
| TBK Co. Ltd. | | 400 | 1,598 |
| The Furukawa Battery Co. Ltd. | | 244 | 2,402 |
| TPR Co. Ltd. | | 1,783 | 21,493 |
| Yorozu Corp. | | 3,725 | 35,506 |
| | | | 1,097,178 |
| Automobiles - 0.4% | | | |
| Audi AG (a) | | 53 | 98,017 |
| Distributors - 0.1% | | | |
| Doshisha Co. Ltd. | | 840 | 13,228 |
| Harima-Kyowa Co. Ltd. | | 349 | 5,941 |
| Nakayamafuku Co. Ltd. | | 537 | 2,298 |
| Yagi & Co. Ltd. | | 994 | 14,433 |
| Yamae Hisano Co. | | 137 | 1,553 |
| | | | 37,453 |
| Diversified Consumer Services - 0.5% | | | |
| Heian Ceremony Service Co. Ltd. | | 953 | 7,517 |
| Kukbo Design Co. Ltd. | | 494 | 6,424 |
| MegaStudy Co. Ltd. | | 2,610 | 22,153 |
| MegaStudyEdu Co. Ltd. | | 2,515 | 71,400 |
| Multicampus Co. Ltd. | | 135 | 3,313 |
| Tsukada Global Holdings, Inc. | | 2,050 | 4,241 |
| | | | 115,048 |
| Hotels, Restaurants & Leisure - 0.2% | | | |
| Hiday Hidaka Corp. | | 466 | 6,467 |
| Kura Sushi, Inc. | | 187 | 7,738 |
| The Restaurant Group PLC | | 35,927 | 20,787 |
| Wyndham Destinations, Inc. | | 426 | 11,332 |
| | | | 46,324 |
| Household Durables - 1.9% | | | |
| Ace Bed Co. Ltd. | | 489 | 17,215 |
| Avantia Co. Ltd. | | 1,675 | 13,687 |
| Cuckoo Holdings Co. Ltd. | | 100 | 6,715 |
| Emak SpA (a) | | 409 | 377 |
| FJ Next Co. Ltd. | | 2,125 | 15,959 |
| Gree Electric Appliances, Inc. of Zhuhai (A Shares) | | 13,500 | 110,146 |
| Hamilton Beach Brands Holding Co.: | | | |
| Class A | | 207 | 3,146 |
| Class B | | 104 | 1,581 |
| Helen of Troy Ltd. (a) | | 843 | 158,695 |
| Iida Group Holdings Co. Ltd. | | 257 | 3,953 |
| iRobot Corp. (a) | | 35 | 2,544 |
| Mohawk Industries, Inc. (a) | | 496 | 39,606 |
| Q.E.P. Co., Inc. (a) | | 24 | 270 |
| Sanei Architecture Planning Co. Ltd. | | 738 | 8,310 |
| Taylor Morrison Home Corp. (a) | | 3,769 | 88,383 |
| | | | 470,587 |
| Internet & Direct Marketing Retail - 0.0% | | | |
| Aucnet, Inc. | | 252 | 2,685 |
| CROOZ, Inc. (a) | | 100 | 1,367 |
| Hyundai Home Shopping Network Corp. | | 7 | 355 |
| NS Shopping Co. Ltd. | | 30 | 316 |
| | | | 4,723 |
| Leisure Products - 0.1% | | | |
| Mars Group Holdings Corp. | | 1,167 | 16,360 |
| Multiline Retail - 0.3% | | | |
| Big Lots, Inc. | | 211 | 8,301 |
| Grazziotin SA | | 880 | 4,312 |
| Lifestyle China Group Ltd. (a) | | 26,833 | 5,540 |
| Lifestyle International Holdings Ltd. | | 22,812 | 18,484 |
| Macy's, Inc. (b) | | 1,647 | 9,981 |
| Ryohin Keikaku Co. Ltd. | | 206 | 2,466 |
| Treasure Factory Co. Ltd. | | 1,972 | 12,575 |
| Watts Co. Ltd. | | 600 | 5,662 |
| | | | 67,321 |
| Specialty Retail - 8.8% | | | |
| ABC-MART, Inc. | | 100 | 5,271 |
| Arc Land Sakamoto Co. Ltd. | | 1,225 | 22,601 |
| AT-Group Co. Ltd. | | 2,039 | 24,925 |
| AutoNation, Inc. (a) | | 1,190 | 61,095 |
| Best Buy Co., Inc. | | 4,365 | 434,710 |
| Dunelm Group PLC | | 565 | 9,097 |
| Foot Locker, Inc. | | 650 | 19,104 |
| Fuji Corp. | | 1,699 | 31,121 |
| GameStop Corp. Class A (a) | | 13,844 | 55,514 |
| Genesco, Inc. (a) | | 915 | 14,228 |
| GNC Holdings, Inc. Class A (a) | | 7,697 | 1,539 |
| Goldlion Holdings Ltd. | | 20,919 | 3,968 |
| Guess?, Inc. | | 9,126 | 94,363 |
| Handsman Co. Ltd. | | 1,502 | 21,497 |
| Hibbett Sports, Inc. (a) | | 2,689 | 62,358 |
| Hour Glass Ltd. | | 48,700 | 23,978 |
| JB Hi-Fi Ltd. | | 1,786 | 58,275 |
| John David Group PLC | | 66,461 | 526,857 |
| K's Holdings Corp. | | 7,737 | 99,403 |
| Ku Holdings Co. Ltd. | | 1,413 | 11,093 |
| Leon's Furniture Ltd. | | 453 | 4,528 |
| Lookers PLC (c) | | 3,142 | 864 |
| Mandarake, Inc. | | 100 | 444 |
| Mitsui & Associates Telepark Corp. | | 67 | 1,197 |
| Nafco Co. Ltd. | | 200 | 3,486 |
| Nitori Holdings Co. Ltd. | | 1,240 | 271,417 |
| Nojima Co. Ltd. | | 83 | 2,068 |
| Oriental Watch Holdings Ltd. | | 4,000 | 1,012 |
| Padini Holdings Bhd | | 5,800 | 2,922 |
| Sacs Bar Holdings, Inc. | | 746 | 3,333 |
| Sally Beauty Holdings, Inc. (a) | | 7,476 | 86,796 |
| Samse SA | | 87 | 12,810 |
| Silvano Fashion Group A/S | | 7 | 13 |
| SuperGroup PLC | | 326 | 491 |
| The Buckle, Inc. | | 1,340 | 21,480 |
| Tokatsu Holdings Co. Ltd. | | 494 | 1,867 |
| Truworths International Ltd. | | 228 | 435 |
| Urban Outfitters, Inc. (a) | | 210 | 3,473 |
| Vita Group Ltd. | | 18 | 13 |
| Williams-Sonoma, Inc. | | 1,786 | 155,596 |
| | | | 2,155,242 |
| Textiles, Apparel & Luxury Goods - 1.8% | | | |
| Best Pacific International Holdings Ltd. | | 2,000 | 271 |
| Capri Holdings Ltd. (a) | | 3,968 | 59,441 |
| Embry Holdings Ltd. | | 1,000 | 135 |
| Ff Group (a)(c) | | 2,761 | 3,903 |
| Fossil Group, Inc. (a) | | 4,922 | 16,292 |
| Grendene SA | | 300 | 438 |
| Hagihara Industries, Inc. | | 306 | 3,859 |
| Magni-Tech Industries Bhd | | 17,076 | 8,521 |
| Sakai Ovex Co. Ltd. | | 336 | 6,872 |
| Sitoy Group Holdings Ltd. | | 19,000 | 907 |
| Tapestry, Inc. | | 1,815 | 24,248 |
| Ted Baker PLC | | 332,663 | 320,060 |
| Texwinca Holdings Ltd. | | 2,000 | 284 |
| Youngone Holdings Co. Ltd. | | 176 | 5,114 |
| Yue Yuen Industrial (Holdings) Ltd. | | 3,097 | 4,915 |
| | | | 455,260 |
|
| TOTAL CONSUMER DISCRETIONARY | | | 4,563,513 |
|
| CONSUMER STAPLES - 5.2% | | | |
| Beverages - 0.9% | | | |
| A.G. Barr PLC | | 932 | 5,246 |
| Britvic PLC | | 13,824 | 144,493 |
| C&C Group PLC (United Kingdom) | | 663 | 2,009 |
| Jinro Distillers Co. Ltd. | | 1,105 | 27,721 |
| Lucas Bols BV (d) | | 192 | 1,751 |
| Olvi PLC (A Shares) | | 187 | 9,362 |
| Spritzer Bhd | | 200 | 95 |
| Willamette Valley Vineyards, Inc. (a) | | 3 | 19 |
| Yantai Changyu Pioneer Wine Co. Ltd. (B Shares) | | 12,600 | 25,427 |
| | | | 216,123 |
| Food & Staples Retailing - 2.3% | | | |
| Amsterdam Commodities NV | | 1,282 | 28,481 |
| Belc Co. Ltd. | | 100 | 7,170 |
| Daiichi Co. Ltd. | | 253 | 2,208 |
| Dong Suh Companies, Inc. | | 1,090 | 19,688 |
| Genky DrugStores Co. Ltd. | | 800 | 27,736 |
| Halows Co. Ltd. | | 187 | 6,333 |
| Kroger Co. | | 1,490 | 51,837 |
| MARR SpA | | 1,576 | 23,428 |
| Nihon Chouzai Co. Ltd. | | 239 | 3,549 |
| OM2 Network Co. Ltd. | | 420 | 4,761 |
| Qol Holdings Co. Ltd. | | 331 | 3,227 |
| Retail Partners Co. Ltd. | | 1,113 | 22,301 |
| Satoh & Co. Ltd. | | 108 | 1,500 |
| Satsudora Holdings Co. Ltd. | | 768 | 13,857 |
| Shoei Foods Corp. | | 100 | 3,434 |
| Valor Holdings Co. Ltd. | | 1,373 | 29,716 |
| Walgreens Boots Alliance, Inc. | | 7,440 | 302,882 |
| | | | 552,108 |
| Food Products - 1.5% | | | |
| Ajinomoto Malaysia Bhd | | 3,600 | 12,919 |
| Armanino Foods of Distinction | | 402 | 880 |
| Bell AG | | 85 | 21,748 |
| Binggrea Co. Ltd. | | 10 | 509 |
| Cal-Maine Foods, Inc. (a) | | 187 | 8,218 |
| Carr's Group PLC | | 8,719 | 14,694 |
| Changshouhua Food Co. Ltd. (a) | | 5,785 | 2,015 |
| Cranswick PLC | | 918 | 43,020 |
| Fresh Del Monte Produce, Inc. | | 1,405 | 31,725 |
| Ingredion, Inc. | | 1,339 | 115,824 |
| JC Comsa Corp. | | 414 | 1,885 |
| Kaneko Seeds Co. Ltd. | | 398 | 5,264 |
| Kaveri Seed Co. Ltd. | | 213 | 1,718 |
| Lassonde Industries, Inc. Class A (sub. vtg.) | | 120 | 14,675 |
| London Biscuits Bhd (a)(c) | | 3,375 | 16 |
| Pickles Corp. | | 197 | 4,902 |
| Prima Meat Packers Ltd. | | 2,480 | 65,646 |
| S Foods, Inc. | | 600 | 14,306 |
| Thai President Foods PCL | | 364 | 2,276 |
| Thai Wah PCL | | 300 | 37 |
| Toyo Sugar Refining Co. Ltd. | | 392 | 4,407 |
| Tyson Foods, Inc. Class A | | 48 | 2,950 |
| Valsoia SpA | | 42 | 566 |
| | | | 370,200 |
| Personal Products - 0.3% | | | |
| Asaleo Care Ltd. | | 682 | 463 |
| Hengan International Group Co. Ltd. | | 7,936 | 66,609 |
| | | | 67,072 |
| Tobacco - 0.2% | | | |
| KT&G Corp. | | 631 | 42,687 |
| Scandinavian Tobacco Group A/S (d) | | 952 | 13,990 |
| | | | 56,677 |
|
| TOTAL CONSUMER STAPLES | | | 1,262,180 |
|
| ENERGY - 5.7% | | | |
| Energy Equipment & Services - 0.2% | | | |
| AKITA Drilling Ltd. Class A (non-vtg.) | | 170 | 43 |
| COVIA Corp. (a)(b) | | 1,142 | 19 |
| Geospace Technologies Corp. (a) | | 851 | 6,425 |
| Liberty Oilfield Services, Inc. Class A | | 1,530 | 8,645 |
| Oil States International, Inc. (a) | | 4,363 | 19,546 |
| Prosafe ASA (a) | | 68 | 11 |
| Smart Sand, Inc. (a)(b) | | 617 | 722 |
| Subsea 7 SA (a) | | 155 | 1,162 |
| Tidewater, Inc. (a) | | 89 | 554 |
| Tidewater, Inc. warrants 11/14/24 (a) | | 50 | 19 |
| Transocean Ltd. (United States) (a) | | 2,598 | 5,300 |
| Valaris PLC Class A (a) | | 7,147 | 2,802 |
| | | | 45,248 |
| Oil, Gas & Consumable Fuels - 5.5% | | | |
| Alvopetro Energy Ltd. (a) | | 4,657 | 2,781 |
| Baytex Energy Corp. (a) | | 14,914 | 6,903 |
| Beach Energy Ltd. | | 4,064 | 4,108 |
| Berry Petroleum Corp. | | 165 | 776 |
| Birchcliff Energy Ltd. | | 15,705 | 14,070 |
| Bonanza Creek Energy, Inc.(a) | | 2,182 | 39,691 |
| Bonavista Energy Corp. (a) | | 4,304 | 161 |
| Bonterra Energy Corp. | | 617 | 714 |
| Cenovus Energy, Inc. (Canada) | | 190 | 845 |
| China Petroleum & Chemical Corp.: | | | |
| (H Shares) | | 446,381 | 190,168 |
| sponsored ADR (H Shares) | | 93 | 3,953 |
| Cimarex Energy Co. | | 27 | 660 |
| CNOOC Ltd. | | 1,090 | 1,150 |
| CNOOC Ltd. sponsored ADR | | 170 | 17,961 |
| ConocoPhillips Co. | | 3,407 | 127,388 |
| Delek U.S. Holdings, Inc. | | 969 | 16,938 |
| Denbury Resources, Inc. (a) | | 35,566 | 907 |
| EQT Corp. | | 2,681 | 38,928 |
| Equitrans Midstream Corp. | | 337 | 3,252 |
| HollyFrontier Corp. | | 1,017 | 27,968 |
| Husky Energy, Inc. | | 12,399 | 39,897 |
| Imperial Oil Ltd. | | 1,696 | 26,527 |
| International Seaways, Inc. | | 137 | 2,366 |
| Motor Oil (HELLAS) Corinth Refineries SA | | 698 | 9,406 |
| NACCO Industries, Inc. Class A | | 233 | 5,089 |
| Oil & Natural Gas Corp. Ltd. | | 119,036 | 124,406 |
| Oil India Ltd. | | 12 | 15 |
| Ovintiv, Inc. (b) | | 4,209 | 40,785 |
| PDC Energy, Inc. (a) | | 746 | 10,638 |
| Peyto Exploration & Development Corp. | | 21,608 | 32,103 |
| S-Oil Corp. | | 27 | 1,377 |
| San-Ai Oil Co. Ltd. | | 390 | 3,135 |
| Seven Generations Energy Ltd. (a) | | 335 | 918 |
| Sinopec Kantons Holdings Ltd. | | 14,943 | 6,517 |
| Southwestern Energy Co. (a) | | 99,712 | 242,300 |
| Star Petroleum Refining PCL | | 6,058 | 1,350 |
| Thai Oil PCL (For. Reg.) | | 1,393 | 1,876 |
| Total SA sponsored ADR | | 7,440 | 280,190 |
| Tsakos Energy Navigation Ltd. | | 172 | 1,496 |
| Unit Corp. (a) | | 9,276 | 453 |
| World Fuel Services Corp. | | 547 | 12,871 |
| | | | 1,343,037 |
|
| TOTAL ENERGY | | | 1,388,285 |
|
| FINANCIALS - 13.2% | | | |
| Banks - 2.1% | | | |
| Bar Harbor Bankshares | | 795 | 15,805 |
| Central Valley Community Bancorp | | 17 | 223 |
| Citizens Financial Services, Inc. | | 34 | 1,666 |
| Community Trust Bancorp, Inc. | | 90 | 2,755 |
| Credit Agricole Atlantique Vendee | | 9 | 1,209 |
| East West Bancorp, Inc. | | 2,033 | 70,464 |
| Erste Group Bank AG | | 3 | 67 |
| F & M Bank Corp. | | 308 | 6,083 |
| First Hawaiian, Inc. | | 270 | 4,693 |
| Gunma Bank Ltd. | | 11,146 | 34,853 |
| Hiroshima Bank Ltd. | | 1,863 | 8,483 |
| JPMorgan Chase & Co. | | 28 | 2,706 |
| NIBC Holding NV (d) | | 1,951 | 16,800 |
| Nordea Bank ABP (Stockholm Stock Exchange) | | 69 | 533 |
| OFG Bancorp | | 3,693 | 48,304 |
| Ogaki Kyoritsu Bank Ltd. | | 100 | 1,945 |
| San ju San Financial Group, Inc. | | 559 | 6,606 |
| Shinsei Bank Ltd. | | 1,529 | 17,274 |
| Skandiabanken ASA (d) | | 1,373 | 9,865 |
| Sparebank 1 Oestlandet | | 1,948 | 18,813 |
| Sumitomo Mitsui Financial Group, Inc. | | 6,937 | 184,846 |
| Texas Capital Bancshares, Inc. (a) | | 456 | 15,148 |
| The Keiyo Bank Ltd. | | 1,118 | 5,017 |
| The San-In Godo Bank Ltd. | | 3,880 | 17,997 |
| Unicaja Banco SA (d) | | 11,179 | 6,194 |
| Van Lanschot NV (Bearer) | | 55 | 952 |
| Yamaguchi Financial Group, Inc. | | 3,660 | 21,471 |
| | | | 520,772 |
| Capital Markets - 0.6% | | | |
| ABG Sundal Collier ASA | | 1,023 | 470 |
| Diamond Hill Investment Group, Inc. | | 38 | 4,333 |
| Edify SA (a) | | 7 | 379 |
| Franklin Resources, Inc. | | 111 | 2,337 |
| Goldman Sachs Group, Inc. | | 694 | 137,384 |
| Lazard Ltd. Class A | | 53 | 1,554 |
| | | | 146,457 |
| Consumer Finance - 3.2% | | | |
| Aeon Credit Service (Asia) Co. Ltd. | | 20,896 | 14,397 |
| Cash Converters International Ltd. (a) | | 36,676 | 4,717 |
| Discover Financial Services | | 6,450 | 318,824 |
| Santander Consumer U.S.A. Holdings, Inc. | | 1,778 | 32,644 |
| Synchrony Financial | | 17,857 | 395,175 |
| | | | 765,757 |
| Diversified Financial Services - 1.2% | | | |
| AXA Equitable Holdings, Inc. | | 852 | 17,432 |
| Fuyo General Lease Co. Ltd. | | 1,141 | 64,027 |
| IBJ Leasing Co. Ltd. | | 373 | 8,186 |
| NICE Holdings Co. Ltd. | | 466 | 7,949 |
| Ricoh Leasing Co. Ltd. | | 2,083 | 52,304 |
| Tokyo Century Corp. | | 2,678 | 148,504 |
| | | | 298,402 |
| Insurance - 5.9% | | | |
| AFLAC, Inc. | | 7,092 | 252,262 |
| ASR Nederland NV | | 1,984 | 63,872 |
| Db Insurance Co. Ltd. | | 3,174 | 125,011 |
| Genworth Financial, Inc. Class A (a) | | 25,056 | 51,114 |
| Hartford Financial Services Group, Inc. | | 332 | 14,050 |
| Hyundai Fire & Marine Insurance Co. Ltd. | | 1,153 | 22,465 |
| Kansas City Life Insurance Co. | | 1 | 29 |
| Lincoln National Corp. | | 718 | 26,760 |
| MetLife, Inc. | | 16,865 | 638,340 |
| National Western Life Group, Inc. | | 56 | 10,908 |
| NN Group NV | | 4,012 | 146,504 |
| Power Corp. of Canada (sub. vtg.) | | 1,276 | 22,644 |
| Principal Financial Group, Inc. | | 441 | 18,712 |
| Prudential Financial, Inc. | | 298 | 18,884 |
| Reinsurance Group of America, Inc. | | 207 | 17,647 |
| Talanx AG | | 365 | 13,303 |
| | | | 1,442,505 |
| Thrifts & Mortgage Finance - 0.2% | | | |
| ASAX Co. Ltd. | | 2,303 | 14,229 |
| Genworth MI Canada, Inc. | | 1,080 | 26,761 |
| Genworth Mortgage Insurance Ltd. | | 7,604 | 9,208 |
| Hingham Institution for Savings | | 27 | 4,752 |
| | | | 54,950 |
|
| TOTAL FINANCIALS | | | 3,228,843 |
|
| HEALTH CARE - 21.3% | | | |
| Biotechnology - 7.0% | | | |
| AbbVie, Inc. | | 942 | 89,405 |
| Alexion Pharmaceuticals, Inc. (a) | | 843 | 86,399 |
| Amgen, Inc. | | 2,976 | 728,138 |
| Biogen, Inc. (a) | | 404 | 110,975 |
| Cell Biotech Co. Ltd. | | 882 | 13,165 |
| Essex Bio-Technology Ltd. | | 5,405 | 3,431 |
| Gilead Sciences, Inc. | | 3,604 | 250,586 |
| United Therapeutics Corp. (a) | | 3,769 | 420,130 |
| | | | 1,702,229 |
| Health Care Equipment & Supplies - 0.6% | | | |
| A&T Corp. | | 105 | 1,584 |
| Fukuda Denshi Co. Ltd. | | 1,290 | 87,255 |
| Kawasumi Laboratories, Inc. | | 167 | 1,237 |
| Medikit Co. Ltd. | | 200 | 6,641 |
| Nakanishi, Inc. | | 559 | 8,771 |
| Paramount Bed Holdings Co. Ltd. | | 147 | 6,256 |
| Riverstone Holdings Ltd. | | 100 | 275 |
| St.Shine Optical Co. Ltd. | | 2,000 | 21,116 |
| Value Added Technology Co. Ltd. | | 116 | 2,304 |
| Vieworks Co. Ltd. | | 56 | 1,686 |
| | | | 137,125 |
| Health Care Providers & Services - 12.3% | | | |
| Anthem, Inc. | | 4,861 | 1,330,949 |
| CVS Health Corp. | | 6,249 | 393,312 |
| EBOS Group Ltd. | | 1,064 | 15,383 |
| Humana, Inc. | | 890 | 349,281 |
| Laboratory Corp. of America Holdings (a) | | 853 | 164,561 |
| Quest Diagnostics, Inc. | | 744 | 94,540 |
| Saint-Care Holding Corp. | | 849 | 3,288 |
| Sigma Healthcare Ltd. | | 16,748 | 7,957 |
| Tokai Corp. | | 790 | 15,732 |
| Uchiyama Holdings Co. Ltd. | | 1,706 | 4,448 |
| UnitedHealth Group, Inc. | | 1,786 | 540,765 |
| Universal Health Services, Inc. Class B | | 913 | 100,339 |
| | | | 3,020,555 |
| Health Care Technology - 0.1% | | | |
| Pharmagest Interactive | | 321 | 30,552 |
| Schrodinger, Inc. | | 93 | 6,731 |
| | | | 37,283 |
| Life Sciences Tools & Services - 0.1% | | | |
| ICON PLC (a) | | 99 | 18,361 |
| Pharmaceuticals - 1.2% | | | |
| Apex Healthcare Bhd | | 5,000 | 3,987 |
| Biofermin Pharmaceutical Co. Ltd. | | 187 | 4,097 |
| Bristol-Myers Squibb Co. | | 1,091 | 63,998 |
| Daito Pharmaceutical Co. Ltd. | | 462 | 13,748 |
| Dawnrays Pharmaceutical Holdings Ltd. | | 41,929 | 4,815 |
| DongKook Pharmaceutical Co. Ltd. | | 114 | 13,985 |
| Genomma Lab Internacional SA de CV (a) | | 6,900 | 7,286 |
| Jazz Pharmaceuticals PLC (a) | | 546 | 59,105 |
| Korea United Pharm, Inc. | | 356 | 7,368 |
| Lee's Pharmaceutical Holdings Ltd. | | 21,527 | 16,999 |
| Luye Pharma Group Ltd. (d) | | 10,874 | 6,861 |
| Nippon Chemiphar Co. Ltd. | | 183 | 4,223 |
| PT Tempo Scan Pacific Tbk | | 300 | 28 |
| Sanofi SA sponsored ADR | | 431 | 22,606 |
| Taro Pharmaceutical Industries Ltd. (a) | | 694 | 45,117 |
| Towa Pharmaceutical Co. Ltd. | | 892 | 15,918 |
| Vetoquinol SA | | 7 | 567 |
| Vivimed Labs Ltd. (a) | | 200 | 29 |
| | | | 290,737 |
|
| TOTAL HEALTH CARE | | | 5,206,290 |
|
| INDUSTRIALS - 9.3% | | | |
| Aerospace & Defense - 0.0% | | | |
| Magellan Aerospace Corp. | | 231 | 1,150 |
| Moog, Inc. Class A | | 38 | 2,041 |
| SIFCO Industries, Inc. (a) | | 25 | 95 |
| The Lisi Group | | 3 | 67 |
| Vectrus, Inc. (a) | | 132 | 5,807 |
| | | | 9,160 |
| Air Freight & Logistics - 0.1% | | | |
| AIT Corp. | | 2,010 | 17,203 |
| CTI Logistics Ltd. (a) | | 304 | 104 |
| Hub Group, Inc. Class A (a) | | 26 | 1,375 |
| Onelogix Group Ltd. | | 2,727 | 319 |
| SBS Co. Ltd. | | 596 | 12,567 |
| | | | 31,568 |
| Building Products - 0.3% | | | |
| InnoTec TSS AG | | 33 | 352 |
| KVK Corp. | | 109 | 1,709 |
| Nihon Dengi Co. Ltd. | | 753 | 24,933 |
| Nihon Flush Co. Ltd. | | 136 | 1,837 |
| Noda Corp. | | 1,075 | 5,900 |
| Resideo Technologies, Inc. (a) | | 116 | 1,540 |
| Sekisui Jushi Corp. | | 1,515 | 28,324 |
| | | | 64,595 |
| Commercial Services & Supplies - 0.3% | | | |
| Asia File Corp. Bhd | | 11,144 | 4,881 |
| Calian Technologies Ltd. | | 543 | 24,019 |
| Civeo Corp. (a) | | 6,970 | 5,785 |
| Loomis AB (B Shares) (a) | | 218 | 5,209 |
| Matsuda Sangyo Co. Ltd. | | 374 | 5,741 |
| Mitie Group PLC | | 8,937 | 3,825 |
| Secom Joshinetsu Co. Ltd. | | 45 | 1,403 |
| VSE Corp. | | 665 | 18,706 |
| | | | 69,569 |
| Construction & Engineering - 0.8% | | | |
| Arcadis NV | | 1,997 | 40,814 |
| Boustead Projs. Pte Ltd. | | 4,000 | 2,237 |
| Boustead Singapore Ltd. | | 22,716 | 11,774 |
| Geumhwa PSC Co. Ltd. | | 1 | 21 |
| Hokuriku Electrical Construction Co. Ltd. | | 159 | 1,353 |
| Kawasaki Setsubi Kogyo Co. Ltd. | | 383 | 1,845 |
| Meisei Industrial Co. Ltd. | | 1,118 | 8,418 |
| Mirait Holdings Corp. | | 109 | 1,495 |
| Nippon Rietec Co. Ltd. | | 2,065 | 57,724 |
| Raiznext Corp. | | 3,819 | 42,824 |
| Seikitokyu Kogyo Co. Ltd. | | 1,316 | 8,877 |
| Shinnihon Corp. | | 100 | 737 |
| Sumitomo Densetsu Co. Ltd. | | 326 | 6,615 |
| Watanabe Sato Co. Ltd. | | 78 | 1,533 |
| | | | 186,267 |
| Electrical Equipment - 0.5% | | | |
| Acuity Brands, Inc. | | 496 | 49,154 |
| Aichi Electric Co. Ltd. | | 100 | 2,163 |
| Aros Quality Group AB | | 2,048 | 42,405 |
| Canare Electric Co. Ltd. | | 258 | 3,697 |
| Hammond Power Solutions, Inc. Class A | | 771 | 3,885 |
| Iwabuchi Corp. | | 20 | 1,085 |
| Regal Beloit Corp. | | 218 | 20,049 |
| Sensata Technologies, Inc. PLC (a) | | 187 | 7,102 |
| Terasaki Electric Co. Ltd. | | 170 | 1,553 |
| | | | 131,093 |
| Industrial Conglomerates - 0.2% | | | |
| Lifco AB | | 187 | 14,269 |
| Mytilineos SA | | 1,778 | 16,420 |
| Nolato AB (B Shares) | | 121 | 10,039 |
| Reunert Ltd. | | 205 | 380 |
| | | | 41,108 |
| Machinery - 0.7% | | | |
| Conrad Industries, Inc. (a) | | 1 | 10 |
| Cummins, Inc. | | 51 | 9,856 |
| Daihatsu Diesel Manufacturing Co. Ltd. | | 900 | 3,409 |
| Daiwa Industries Ltd. | | 2,336 | 18,206 |
| Estic Corp. | | 153 | 5,861 |
| Fuji Latex Co. Ltd. | | 88 | 2,698 |
| Fujimak Corp. | | 1,914 | 11,464 |
| Fukushima Industries Corp. | | 187 | 6,015 |
| Haitian International Holdings Ltd. | | 8,999 | 20,714 |
| Hy-Lok Corp. | | 413 | 4,541 |
| Ihara Science Corp. | | 463 | 6,158 |
| Koike Sanso Kogyo Co. Ltd. | | 72 | 1,576 |
| Krones AG | | 22 | 1,335 |
| Nakanishi Manufacturing Co. Ltd. | | 522 | 4,734 |
| Nansin Co. Ltd. | | 628 | 2,848 |
| Sakura Rubber Co. Ltd. | | 100 | 4,596 |
| Sansei Co. Ltd. | | 1,705 | 5,235 |
| Semperit AG Holding (a) | | 559 | 11,062 |
| SIMPAC, Inc. | | 5,408 | 10,944 |
| Snap-On, Inc. | | 47 | 6,856 |
| Stanley Black & Decker, Inc. | | 47 | 7,206 |
| Teikoku Sen-I Co. Ltd. | | 1,074 | 23,813 |
| The Hanshin Diesel Works Ltd. | | 78 | 1,465 |
| Tocalo Co. Ltd. | | 936 | 10,407 |
| | | | 181,009 |
| Marine - 0.1% | | | |
| Japan Transcity Corp. | | 3,121 | 13,474 |
| SITC International Holdings Co. Ltd. | | 17,526 | 17,571 |
| | | | 31,045 |
| Professional Services - 0.5% | | | |
| ABIST Co. Ltd. | | 611 | 14,719 |
| Akka Technologies SA | | 1,311 | 27,210 |
| Bertrandt AG | | 397 | 14,684 |
| Career Design Center Co. Ltd. | | 100 | 709 |
| McMillan Shakespeare Ltd. | | 5,203 | 32,786 |
| Robert Half International, Inc. | | 238 | 12,107 |
| SHL-JAPAN Ltd. | | 308 | 6,087 |
| WDB Holdings Co. Ltd. | | 200 | 4,739 |
| | | | 113,041 |
| Road & Rail - 0.7% | | | |
| Autohellas SA | | 5,307 | 20,286 |
| Daqin Railway Co. Ltd. (A Shares) | | 83,300 | 77,506 |
| Hamakyorex Co. Ltd. | | 479 | 14,186 |
| Higashi Twenty One Co. Ltd. | | 186 | 740 |
| Kyushu Railway Co. | | 449 | 8,814 |
| NANSO Transport Co. Ltd. | | 356 | 3,471 |
| Nikkon Holdings Co. Ltd. | | 231 | 4,166 |
| SENKO Co. Ltd. | | 645 | 4,771 |
| Shin-Keisei Electric Railway Co. Ltd. | | 75 | 1,489 |
| STEF-TFE Group (a) | | 206 | 15,821 |
| Tohbu Network Co. Ltd. | | 278 | 2,175 |
| Utoc Corp. | | 3,496 | 15,886 |
| | | | 169,311 |
| Trading Companies & Distributors - 5.0% | | | |
| AerCap Holdings NV (a) | | 1,703 | 45,862 |
| Bergman & Beving AB (B Shares) | | 1,165 | 10,615 |
| Canox Corp. | | 861 | 5,710 |
| Chori Co. Ltd. | | 3,108 | 41,428 |
| Daiichi Jitsugyo Co. Ltd. | | 52 | 1,724 |
| Green Cross Co. Ltd. | | 1,200 | 10,939 |
| HERIGE (a) | | 167 | 4,525 |
| Houston Wire & Cable Co. (a) | | 2,641 | 6,629 |
| Howden Joinery Group PLC | | 589 | 3,780 |
| iMarketKorea, Inc. | | 7 | 50 |
| Itochu Corp. | | 37,694 | 826,491 |
| Kamei Corp. | | 4,166 | 37,388 |
| Lumax International Corp. Ltd. | | 2,994 | 6,842 |
| Meiwa Corp. | | 1,600 | 6,348 |
| Mitani Shoji Co. Ltd. | | 1,319 | 81,616 |
| Mitsubishi Corp. | | 2,777 | 55,956 |
| Momentum Group AB Class B | | 978 | 15,639 |
| MSC Industrial Direct Co., Inc. Class A | | 53 | 3,499 |
| Narasaki Sangyo Co. Ltd. | | 89 | 1,550 |
| Nishikawa Keisoku Co. Ltd. | | 37 | 1,339 |
| Pla Matels Corp. | | 500 | 2,503 |
| Rasa Corp. | | 541 | 4,768 |
| Sanyo Trading Co. Ltd. | | 137 | 1,157 |
| Shinsho Corp. | | 250 | 4,109 |
| Yamazen Co. Ltd. | | 176 | 1,586 |
| Yuasa Trading Co. Ltd. | | 1,600 | 42,488 |
| | | | 1,224,541 |
| Transportation Infrastructure - 0.1% | | | |
| Anhui Expressway Co. Ltd. (H Shares) | | 7,299 | 3,503 |
| Isewan Terminal Service Co. Ltd. | | 677 | 4,899 |
| Meiko Transportation Co. Ltd. | | 148 | 1,595 |
| Qingdao Port International Co. Ltd. (H Shares) (d) | | 35,650 | 20,193 |
| | | | 30,190 |
|
| TOTAL INDUSTRIALS | | | 2,282,497 |
|
| INFORMATION TECHNOLOGY - 5.8% | | | |
| Communications Equipment - 0.1% | | | |
| F5 Networks, Inc. (a) | | 205 | 27,860 |
| HF Co. (a) | | 153 | 654 |
| | | | 28,514 |
| Electronic Equipment & Components - 0.7% | | | |
| Daido Signal Co. Ltd. | | 848 | 4,911 |
| Elematec Corp. | | 1,600 | 12,802 |
| HAGIAWARA ELECTRIC Co. Ltd. | | 700 | 12,300 |
| Kingboard Chemical Holdings Ltd. | | 11,421 | 33,378 |
| Lacroix SA | | 163 | 4,186 |
| Makus, Inc. | | 205 | 737 |
| PAX Global Technology Ltd. | | 18,119 | 8,486 |
| Redington India Ltd. | | 10,834 | 13,087 |
| Riken Kieki Co. Ltd. | | 1,088 | 25,171 |
| Simplo Technology Co. Ltd. | | 2,829 | 31,410 |
| Thinking Electronic Industries Co. Ltd. | | 3,609 | 11,947 |
| | | | 158,415 |
| IT Services - 3.7% | | | |
| Amdocs Ltd. | | 1,984 | 123,206 |
| Avant Corp. | | 676 | 6,303 |
| Cielo SA | | 6,335 | 6,521 |
| Computer Services, Inc. | | 6 | 344 |
| Data#3 Ltd. | | 1,821 | 7,351 |
| Dimerco Data System Corp. | | 1,115 | 2,032 |
| E-Credible Co. Ltd. | | 447 | 8,840 |
| eClerx Services Ltd. | | 287 | 1,839 |
| Enea Data AB (a) | | 485 | 9,998 |
| Estore Corp. | | 200 | 2,007 |
| Future Corp. | | 1,442 | 23,962 |
| IFIS Japan Ltd. | | 254 | 1,737 |
| Korea Information & Communication Co. Ltd. (a) | | 606 | 4,657 |
| Neurones | | 7 | 197 |
| NIC, Inc. | | 273 | 5,984 |
| Nice Information & Telecom, Inc. | | 268 | 5,311 |
| Persistent Systems Ltd. | | 788 | 9,656 |
| Softcreate Co. Ltd. | | 102 | 2,211 |
| Sopra Steria Group | | 952 | 141,746 |
| Tessi SA (a)(b) | | 403 | 45,573 |
| The Western Union Co. | | 20,038 | 486,523 |
| TravelSky Technology Ltd. (H Shares) | | 747 | 1,436 |
| | | | 897,434 |
| Semiconductors & Semiconductor Equipment - 0.1% | | | |
| e-LITECOM Co. Ltd. | | 34 | 188 |
| Miraial Co. Ltd. | | 1,346 | 12,817 |
| Phison Electronics Corp. | | 1,225 | 12,287 |
| | | | 25,292 |
| Software - 0.3% | | | |
| eBase Co. Ltd. | | 800 | 11,298 |
| Ebix, Inc. | | 511 | 11,270 |
| InfoVine Co. Ltd. | | 43 | 642 |
| Jastec Co. Ltd. | | 303 | 3,106 |
| KPIT Cummins Infosystems Ltd. | | 3,700 | 5,941 |
| KPIT Engineering Ltd. | | 1,100 | 944 |
| KSK Co., Ltd. | | 227 | 4,180 |
| System Research Co. Ltd. | | 101 | 1,746 |
| Toho System Science Co. Ltd. | | 202 | 1,803 |
| Uchida Esco Co. Ltd. | | 596 | 31,192 |
| Zensar Technologies Ltd. | | 1,000 | 2,135 |
| | | | 74,257 |
| Technology Hardware, Storage & Peripherals - 0.9% | | | |
| Elecom Co. Ltd. | | 101 | 4,981 |
| HP, Inc. | | 12,895 | 226,694 |
| | | | 231,675 |
|
| TOTAL INFORMATION TECHNOLOGY | | | 1,415,587 |
|
| MATERIALS - 2.5% | | | |
| Chemicals - 1.5% | | | |
| Air Water, Inc. | | 260 | 3,353 |
| C. Uyemura & Co. Ltd. | | 360 | 21,187 |
| Celanese Corp. Class A | | 47 | 4,568 |
| CF Industries Holdings, Inc. | | 191 | 5,984 |
| Chokwang Paint Ltd. | | 34 | 156 |
| Daishin-Chemical Co. Ltd. | | 603 | 7,172 |
| Dow, Inc. | | 27 | 1,109 |
| Fuso Chemical Co. Ltd. | | 448 | 17,119 |
| Isamu Paint Co. Ltd. | | 52 | 1,431 |
| Koatsu Gas Kogyo Co. Ltd. | | 537 | 3,774 |
| KPX Green Chemical Co. Ltd. | | 40 | 111 |
| Kuriyama Holdings Corp. | | 200 | 986 |
| Nippon Soda Co. Ltd. | | 298 | 7,598 |
| NOF Corp. | | 565 | 20,976 |
| Nutrien Ltd. | | 285 | 9,281 |
| Scientex Bhd | | 7,984 | 17,175 |
| T&K Toka Co. Ltd. | | 925 | 6,798 |
| Tae Kyung Industrial Co. Ltd. | | 1,551 | 6,362 |
| The Mosaic Co. | | 10,911 | 146,971 |
| Toho Acetylene Co. Ltd. | | 509 | 5,823 |
| Westlake Chemical Corp. | | 27 | 1,472 |
| Yara International ASA | | 1,587 | 66,309 |
| Yip's Chemical Holdings Ltd. | | 8,343 | 2,325 |
| Yung Chi Paint & Varnish Manufacturing Co. Ltd. | | 4,000 | 9,645 |
| | | | 367,685 |
| Construction Materials - 0.1% | | | |
| Ibstock PLC (d) | | 766 | 1,593 |
| Mitani Sekisan Co. Ltd. | | 489 | 25,223 |
| Yotai Refractories Co. Ltd. | | 588 | 3,877 |
| | | | 30,693 |
| Containers & Packaging - 0.4% | | | |
| AMVIG Holdings Ltd. | | 27,556 | 4,764 |
| Mayr-Melnhof Karton AG | | 308 | 47,673 |
| Packaging Corp. of America | | 332 | 31,912 |
| The Pack Corp. | | 200 | 4,977 |
| WestRock Co. | | 94 | 2,525 |
| | | | 91,851 |
| Metals & Mining - 0.5% | | | |
| ArcelorMittal SA Class A unit (a) | | 389 | 4,267 |
| Castings PLC | | 51 | 230 |
| Chubu Steel Plate Co. Ltd. | | 864 | 5,901 |
| CI Resources Ltd. (c) | | 16 | 10 |
| CK-SAN-ETSU Co. Ltd. | | 229 | 6,447 |
| Compania de Minas Buenaventura SA sponsored ADR | | 735 | 8,717 |
| Mount Gibson Iron Ltd. | | 47,398 | 24,043 |
| Pacific Metals Co. Ltd. | | 1,284 | 18,097 |
| Perenti Global Ltd. | | 46,360 | 39,581 |
| Rio Tinto PLC sponsored ADR | | 232 | 14,161 |
| Teck Resources Ltd. Class B (sub. vtg.) | | 298 | 3,019 |
| Warrior Metropolitan Coal, Inc. | | 227 | 3,614 |
| | | | 128,087 |
|
| TOTAL MATERIALS | | | 618,316 |
|
| REAL ESTATE - 0.1% | | | |
| Real Estate Management & Development - 0.1% | | | |
| Jones Lang LaSalle, Inc. | | 28 | 2,769 |
| Nisshin Group Holdings Co. | | 6,038 | 20,135 |
| | | | 22,904 |
| UTILITIES - 2.0% | | | |
| Electric Utilities - 1.4% | | | |
| EVN AG | | 92 | 1,524 |
| Exelon Corp. | | 992 | 38,301 |
| Fjordkraft Holding ASA (d) | | 1,515 | 13,499 |
| Holding Co. ADMIE IPTO SA | | 17 | 44 |
| PPL Corp. | | 10,713 | 285,180 |
| Public Power Corp. of Greece (a) | | 17 | 77 |
| | | | 338,625 |
| Gas Utilities - 0.5% | | | |
| Busan City Gas Co. Ltd. | | 205 | 6,248 |
| China Resource Gas Group Ltd. | | 4,311 | 21,248 |
| Enagas SA | | 1,616 | 40,679 |
| GAIL India Ltd. | | 23,299 | 30,057 |
| Hokuriku Gas Co. | | 164 | 4,834 |
| Seoul City Gas Co. Ltd. | | 216 | 12,066 |
| YESCO Co. Ltd. | | 526 | 14,999 |
| | | | 130,131 |
| Multi-Utilities - 0.1% | | | |
| CenterPoint Energy, Inc. | | 1,057 | 20,094 |
| Water Utilities - 0.0% | | | |
| Manila Water Co., Inc. | | 300 | 78 |
|
| TOTAL UTILITIES | | | 488,928 |
|
| TOTAL COMMON STOCKS | | | |
| (Cost $21,688,948) | | | 21,900,669 |
|
| Nonconvertible Preferred Stocks - 0.1% | | | |
| CONSUMER DISCRETIONARY - 0.0% | | | |
| Automobiles - 0.0% | | | |
| Porsche Automobil Holding SE (Germany) | | 25 | 1,415 |
| INDUSTRIALS - 0.0% | | | |
| Industrial Conglomerates - 0.0% | | | |
| Steel Partners Holdings LP Series A, 6.00% | | 253 | 4,129 |
| Machinery - 0.0% | | | |
| Danieli & C. Officine Meccaniche SpA | | 7 | 56 |
|
| TOTAL INDUSTRIALS | | | 4,185 |
|
| MATERIALS - 0.1% | | | |
| Construction Materials - 0.1% | | | |
| Buzzi Unicem SpA (Risparmio Shares) | | 1,249 | 16,007 |
| UTILITIES - 0.0% | | | |
| Electric Utilities - 0.0% | | | |
| Companhia Paranaense de Energia-Copel (PN-B) | | 1,083 | 13,780 |
| TOTAL NONCONVERTIBLE PREFERRED STOCKS | | | |
| (Cost $33,386) | | | 35,387 |
|
| Money Market Funds - 10.4% | | | |
| Fidelity Cash Central Fund 0.14% (e) | | 2,484,994 | 2,485,739 |
| Fidelity Securities Lending Cash Central Fund 0.13% (e)(f) | | 54,468 | 54,474 |
| TOTAL MONEY MARKET FUNDS | | | |
| (Cost $2,539,964) | | | 2,540,213 |
| TOTAL INVESTMENT IN SECURITIES - 100.0% | | | |
| (Cost $24,262,298) | | | 24,476,269 |
| NET OTHER ASSETS (LIABILITIES) - 0.0% | | | (420) |
| NET ASSETS - 100% | | | $24,475,849 |
Legend
(a) Non-income producing
(b) Security or a portion of the security is on loan at period end.
(c) Level 3 security
(d) Security exempt from registration under Rule 144A of the Securities Act of 1933. These securities may be resold in transactions exempt from registration, normally to qualified institutional buyers. At the end of the period, the value of these securities amounted to $90,746 or 0.4% of net assets.
(e) Affiliated fund that is generally available only to investment companies and other accounts managed by Fidelity Investments. The rate quoted is the annualized seven-day yield of the fund at period end. A complete unaudited listing of the fund's holdings as of its most recent quarter end is available upon request. In addition, each Fidelity Central Fund's financial statements, which are not covered by the Fund's Report of Independent Registered Public Accounting Firm, are available on the SEC's website or upon request.
(f) Investment made with cash collateral received from securities on loan.
Affiliated Central Funds
Information regarding fiscal year to date income earned by the Fund from investments in Fidelity Central Funds is as follows:
| Fund | Income earned |
| Fidelity Cash Central Fund | $15,326 |
| Fidelity Securities Lending Cash Central Fund | 6,256 |
| Total | $21,582 |
Amounts in the income column in the above table include any capital gain distributions from underlying funds, which are presented in the corresponding line-item in the Statement of Operations, if applicable. Amount for Fidelity Securities Lending Cash Central Fund represents the income earned on investing cash collateral, less rebates paid to borrowers and any lending agent fees associated with the loan, plus any premium payments received for lending certain types of securities.
Investment Valuation
The following is a summary of the inputs used, as of July 31, 2020, involving the Fund's assets and liabilities carried at fair value. The inputs or methodology used for valuing securities may not be an indication of the risk associated with investing in those securities. For more information on valuation inputs, and their aggregation into the levels used below, please refer to the Investment Valuation section in the accompanying Notes to Financial Statements.
| | Valuation Inputs at Reporting Date: |
| Description | Total | Level 1 | Level 2 | Level 3 |
| Investments in Securities: | | | | |
| Equities: | | | | |
| Communication Services | $1,423,326 | $980,231 | $443,095 | $-- |
| Consumer Discretionary | 4,564,928 | 4,523,325 | 36,836 | 4,767 |
| Consumer Staples | 1,262,180 | 1,249,150 | 13,014 | 16 |
| Energy | 1,388,285 | 1,196,967 | 191,318 | -- |
| Financials | 3,228,843 | 3,026,190 | 202,653 | -- |
| Health Care | 5,206,290 | 5,202,000 | 4,290 | -- |
| Industrials | 2,286,682 | 1,385,343 | 901,339 | -- |
| Information Technology | 1,415,587 | 1,415,587 | -- | -- |
| Materials | 634,323 | 599,041 | 35,272 | 10 |
| Real Estate | 22,904 | 22,904 | -- | -- |
| Utilities | 502,708 | 502,630 | 78 | -- |
| Money Market Funds | 2,540,213 | 2,540,213 | -- | -- |
| Total Investments in Securities: | $24,476,269 | $22,643,581 | $1,827,895 | $4,793 |
Other Information
Distribution of investments by country or territory of incorporation, as a percentage of Total Net Assets, is as follows (Unaudited):
| United States of America | 58.9% |
| Japan | 17.0% |
| United Kingdom | 4.6% |
| Korea (South) | 3.4% |
| France | 2.5% |
| China | 1.7% |
| Canada | 1.7% |
| Netherlands | 1.5% |
| Cayman Islands | 1.3% |
| Others (Individually Less Than 1%) | 7.4% |
| | 100.0% |
See accompanying notes which are an integral part of the financial statements.
Financial Statements
Statement of Assets and Liabilities
| | | July 31, 2020 |
| Assets | | |
Investment in securities, at value (including securities loaned of $51,472) — See accompanying schedule:
Unaffiliated issuers (cost $21,722,334) | $21,936,056 | |
| Fidelity Central Funds (cost $2,539,964) | 2,540,213 | |
| Total Investment in Securities (cost $24,262,298) | | $24,476,269 |
| Cash | | 28,481 |
| Foreign currency held at value (cost $812) | | 825 |
| Receivable for fund shares sold | | 16,616 |
| Dividends receivable | | 19,376 |
| Distributions receivable from Fidelity Central Funds | | 1,080 |
| Receivable from investment adviser for expense reductions | | 933 |
| Other receivables | | 62 |
| Total assets | | 24,543,642 |
| Liabilities | | |
| Payable for fund shares redeemed | $12,395 | |
| Other payables and accrued expenses | 937 | |
| Collateral on securities loaned | 54,461 | |
| Total liabilities | | 67,793 |
| Net Assets | | $24,475,849 |
| Net Assets consist of: | | |
| Paid in capital | | $24,486,445 |
| Total accumulated earnings (loss) | | (10,596) |
| Net Assets | | $24,475,849 |
| Net Asset Value, offering price and redemption price per share ($24,475,849 ÷ 2,258,809 shares) | | $10.84 |
See accompanying notes which are an integral part of the financial statements.
Statement of Operations
| | | Year ended July 31, 2020 |
| Investment Income | | |
| Dividends | | $402,563 |
| Income from Fidelity Central Funds (including $6,256 from security lending) | | 21,582 |
| Total income | | 424,145 |
| Expenses | | |
| Independent trustees' fees and expenses | $108 | |
| Proxy | 933 | |
| Miscellaneous | 40 | |
| Total expenses before reductions | 1,081 | |
| Expense reductions | (933) | |
| Total expenses after reductions | | 148 |
| Net investment income (loss) | | 423,997 |
| Realized and Unrealized Gain (Loss) | | |
| Net realized gain (loss) on: | | |
| Investment securities: | | |
| Unaffiliated issuers | (318,982) | |
| Fidelity Central Funds | 232 | |
| Foreign currency transactions | (24,443) | |
| Total net realized gain (loss) | | (343,193) |
| Change in net unrealized appreciation (depreciation) on: | | |
| Investment securities: | | |
| Unaffiliated issuers | 284,039 | |
| Fidelity Central Funds | 249 | |
| Assets and liabilities in foreign currencies | 68 | |
| Total change in net unrealized appreciation (depreciation) | | 284,356 |
| Net gain (loss) | | (58,837) |
| Net increase (decrease) in net assets resulting from operations | | $365,160 |
See accompanying notes which are an integral part of the financial statements.
Statement of Changes in Net Assets
| | Year ended July 31, 2020 | Year ended July 31, 2019 |
| Increase (Decrease) in Net Assets | | |
| Operations | | |
| Net investment income (loss) | $423,997 | $608,093 |
| Net realized gain (loss) | (343,193) | 211,432 |
| Change in net unrealized appreciation (depreciation) | 284,356 | (2,492,101) |
| Net increase (decrease) in net assets resulting from operations | 365,160 | (1,672,576) |
| Distributions to shareholders | (475,154) | (762,655) |
| Share transactions | | |
| Proceeds from sales of shares | 17,387,666 | 5,505,397 |
| Reinvestment of distributions | 475,154 | 762,655 |
| Cost of shares redeemed | (9,731,174) | (18,015,690) |
| Net increase (decrease) in net assets resulting from share transactions | 8,131,646 | (11,747,638) |
| Total increase (decrease) in net assets | 8,021,652 | (14,182,869) |
| Net Assets | | |
| Beginning of period | 16,454,197 | 30,637,066 |
| End of period | $24,475,849 | $16,454,197 |
| Other Information | | |
| Shares | | |
| Sold | 1,657,408 | 474,926 |
| Issued in reinvestment of distributions | 41,842 | 66,096 |
| Redeemed | (907,259) | (1,573,091) |
| Net increase (decrease) | 791,991 | (1,032,069) |
See accompanying notes which are an integral part of the financial statements.
Financial Highlights
Fidelity Flex Intrinsic Opportunities Fund
| | | | | |
| Years ended July 31, | 2020 | 2019 | 2018 | 2017 A |
| Selected Per–Share Data | | | | |
| Net asset value, beginning of period | $11.22 | $12.26 | $10.84 | $10.00 |
| Income from Investment Operations | | | | |
| Net investment income (loss)B | .26 | .30 | .26 | .08 |
| Net realized and unrealized gain (loss) | (.25) | (1.01) | 1.34 | .76 |
| Total from investment operations | .01 | (.71) | 1.60 | .84 |
| Distributions from net investment income | (.28) | (.28) | (.13) | – |
| Distributions from net realized gain | (.11) | (.05) | (.05) | – |
| Total distributions | (.39) | (.33) | (.18) | – |
| Net asset value, end of period | $10.84 | $11.22 | $12.26 | $10.84 |
| Total ReturnC,D | (.07)% | (5.84)% | 14.86% | 8.40% |
| Ratios to Average Net AssetsE,F | | | | |
| Expenses before reductions | .01% | - %G | - %G | - %G,H |
| Expenses net of fee waivers, if anyG | -% | -% | -% | - %H |
| Expenses net of all reductionsG | -% | -% | -% | - %H |
| Net investment income (loss) | 2.45% | 2.56% | 2.21% | 1.97%H |
| Supplemental Data | | | | |
| Net assets, end of period (000 omitted) | $24,476 | $16,454 | $30,637 | $8,025 |
| Portfolio turnover rateI | 33% | 27% | 6% | 9%J |
A For the period March 8, 2017 (commencement of operations) to July 31, 2017.
B Calculated based on average shares outstanding during the period.
C Total returns for periods of less than one year are not annualized.
D Total returns would have been lower if certain expenses had not been reduced during the applicable periods shown.
E Fees and expenses of any underlying mutual funds or exchange-traded funds (ETFs) are not included in the Fund's expense ratio. The Fund indirectly bears its proportionate share of these expenses. For additional expense information related to investments in Fidelity Central Funds, please refer to the "Investments in Fidelity Central Funds" note found in the Notes to Financial Statements section of the most recent Annual or Semi-Annual report.
F Expense ratios reflect operating expenses of the Fund. Expenses before reductions do not reflect amounts reimbursed by the investment adviser or reductions from expense offset arrangements and do not represent the amount paid by the Fund during periods when reimbursements or reductions occur. Expenses net of fee waivers reflect expenses after reimbursement by the investment adviser but prior to reductions from expense offset arrangements. Expenses net of all reductions represent the net expenses paid by the Fund.
G Amount represents less than .005%.
H Annualized
I Amount does not include the portfolio activity of any underlying Fidelity Central Funds.
J Amount not annualized.
See accompanying notes which are an integral part of the financial statements.
Notes to Financial Statements
For the period ended July 31, 2020
1. Organization.
Fidelity Flex Intrinsic Opportunities Fund (the Fund) is a fund of Fidelity Puritan Trust (the Trust) and is authorized to issue an unlimited number of shares. Share transactions on the Statement of Changes in Net Assets may contain exchanges between affiliated funds. The Trust is registered under the Investment Company Act of 1940, as amended (the 1940 Act), as an open-end management investment company organized as a Massachusetts business trust. The Fund is available only to certain fee-based accounts offered by Fidelity.
Effective January 1, 2020:
Investment advisers Fidelity Investments Money Management, Inc., FMR Co., Inc., and Fidelity SelectCo, LLC, merged with and into Fidelity Management & Research Company. In connection with the merger transactions, the resulting, merged investment adviser was then redomiciled from Massachusetts to Delaware, changed its corporate structure from a corporation to a limited liability company, and changed its name to "Fidelity Management & Research Company LLC".
2. Investments in Fidelity Central Funds.
The Fund invest in Fidelity Central Funds, which are open-end investment companies generally available only to other investment companies and accounts managed by the investment adviser and its affiliates. The Fund's Schedule of Investments lists each of the Fidelity Central Funds held as of period end, if any, as an investment of the Fund, but does not include the underlying holdings of each Fidelity Central Fund. As an Investing Fund, the Fund indirectly bears its proportionate share of the expenses of the underlying Fidelity Central Funds.
The Money Market Central Funds seek preservation of capital and current income and are managed by the investment adviser. Annualized expenses of the Money Market Central Funds as of their most recent shareholder report date ranged from less than .005% to .01%.
A complete unaudited list of holdings for each Fidelity Central Fund is available upon request or at the Securities and Exchange Commission (the SEC) website at www.sec.gov. In addition, the financial statements of the Fidelity Central Funds, which are not covered by the Fund's Report of Independent Registered Public Accounting Firm, are available on the SEC website or upon request.
3. Significant Accounting Policies.
The Fund is an investment company and applies the accounting and reporting guidance of the Financial Accounting Standards Board (FASB) Accounting Standards Codification Topic 946 Financial Services – Investment Companies. The financial statements have been prepared in conformity with accounting principles generally accepted in the United States of America (GAAP), which require management to make certain estimates and assumptions at the date of the financial statements. Actual results could differ from those estimates. Subsequent events, if any, through the date that the financial statements were issued have been evaluated in the preparation of the financial statements. The following summarizes the significant accounting policies of the Fund:
Investment Valuation. Investments are valued as of 4:00 p.m. Eastern time on the last calendar day of the period. The Board of Trustees (the Board) has delegated the day to day responsibility for the valuation of the Fund's investments to the Fair Value Committee (the Committee) established by the Fund's investment adviser. In accordance with valuation policies and procedures approved by the Board, the Fund attempts to obtain prices from one or more third party pricing vendors or brokers to value its investments. When current market prices, quotations or currency exchange rates are not readily available or reliable, investments will be fair valued in good faith by the Committee, in accordance with procedures adopted by the Board. Factors used in determining fair value vary by investment type and may include market or investment specific events. The frequency with which these procedures are used cannot be predicted and they may be utilized to a significant extent. The Committee oversees the Fund's valuation policies and procedures and reports to the Board on the Committee's activities and fair value determinations. The Board monitors the appropriateness of the procedures used in valuing the Fund's investments and ratifies the fair value determinations of the Committee.
The Fund categorizes the inputs to valuation techniques used to value its investments into a disclosure hierarchy consisting of three levels as shown below:
- Level 1 – quoted prices in active markets for identical investments
- Level 2 – other significant observable inputs (including quoted prices for similar investments, interest rates, prepayment speeds, etc.)
- Level 3 – unobservable inputs (including the Fund's own assumptions based on the best information available)
Valuation techniques used to value the Fund's investments by major category are as follows:
Equity securities, including restricted securities, for which market quotations are readily available, are valued at the last reported sale price or official closing price as reported by a third party pricing vendor on the primary market or exchange on which they are traded and are categorized as Level 1 in the hierarchy. In the event there were no sales during the day or closing prices are not available, securities are valued at the last quoted bid price or may be valued using the last available price and are generally categorized as Level 2 in the hierarchy. For foreign equity securities, when market or security specific events arise, comparisons to the valuation of American Depositary Receipts (ADRs), futures contracts, Exchange-Traded Funds (ETFs) and certain indexes as well as quoted prices for similar securities may be used and would be categorized as Level 2 in the hierarchy. For equity securities, including restricted securities, where observable inputs are limited, assumptions about market activity and risk are used and these securities may be categorized as Level 3 in the hierarchy.
Investments in open-end mutual funds, including the Fidelity Central Funds, are valued at their closing net asset value (NAV) each business day and are categorized as Level 1 in the hierarchy
Changes in valuation techniques may result in transfers in or out of an assigned level within the disclosure hierarchy. The aggregate value of investments by input level as of July 31, 2020 is included at the end of the Fund's Schedule of Investments.
Foreign Currency. The Fund may use foreign currency contracts to facilitate transactions in foreign-denominated securities. Gains and losses from these transactions may arise from changes in the value of the foreign currency or if the counterparties do not perform under the contracts' terms.
Foreign-denominated assets, including investment securities, and liabilities are translated into U.S. dollars at the exchange rates at period end. Purchases and sales of investment securities, income and dividends received and expenses denominated in foreign currencies are translated into U.S. dollars at the exchange rate in effect on the transaction date.
The effects of exchange rate fluctuations on investments are included with the net realized and unrealized gain (loss) on investment securities. Other foreign currency transactions resulting in realized and unrealized gain (loss) are disclosed separately.
Investment Transactions and Income. For financial reporting purposes, the Fund's investment holdings and NAV include trades executed through the end of the last business day of the period. The NAV per share for processing shareholder transactions is calculated as of the close of business of the New York Stock Exchange (NYSE), normally 4:00 p.m. Eastern time and includes trades executed through the end of the prior business day. Gains and losses on securities sold are determined on the basis of identified cost and include proceeds received from litigation. Dividend income is recorded on the ex-dividend date, except for certain dividends from foreign securities where the ex-dividend date may have passed, which are recorded as soon as the Fund is informed of the ex-dividend date. Non-cash dividends included in dividend income, if any, are recorded at the fair market value of the securities received. Income and capital gain distributions from Fidelity Central Funds, if any, are recorded on the ex-dividend date. Certain distributions received by the Fund represent a return of capital or capital gain. The Fund determines the components of these distributions subsequent to the ex-dividend date, based upon receipt of tax filings or other correspondence relating to the underlying investment. These distributions are recorded as a reduction of cost of investments and/or as a realized gain. Investment income is recorded net of foreign taxes withheld where recovery of such taxes is uncertain.
Expenses. Expenses directly attributable to a fund are charged to that fund. Expenses attributable to more than one fund are allocated among the respective funds on the basis of relative net assets or other appropriate methods. Expense estimates are accrued in the period to which they relate and adjustments are made when actual amounts are known.
Income Tax Information and Distributions to Shareholders. Each year, the Fund intends to qualify as a regulated investment company under Subchapter M of the Internal Revenue Code, including distributing substantially all of its taxable income and realized gains. As a result, no provision for U.S. Federal income taxes is required. As of July 31, 2020, the Fund did not have any unrecognized tax benefits in the financial statements; nor is the Fund aware of any tax positions for which it is reasonably possible that the total amounts of unrecognized tax benefits will significantly change in the next twelve months. The Fund files a U.S. federal tax return, in addition to state and local tax returns as required. The Fund's federal income tax returns are subject to examination by the Internal Revenue Service (IRS) for a period of three fiscal years after they are filed. State and local tax returns may be subject to examination for an additional fiscal year depending on the jurisdiction. Foreign taxes are provided for based on the Fund's understanding of the tax rules and rates that exist in the foreign markets in which it invests. The Fund is subject to a tax imposed on capital gains by certain countries in which it invests.
Distributions are declared and recorded on the ex-dividend date. Income and capital gain distributions are determined in accordance with income tax regulations, which may differ from GAAP. In addition, the Funds claimed a portion of the payment made to redeeming shareholders as a distribution for income tax purposes.
Capital accounts within the financial statements are adjusted for permanent book-tax differences. These adjustments have no impact on net assets or the results of operations. Capital accounts are not adjusted for temporary book-tax differences which will reverse in a subsequent period.
Book-tax differences are primarily due to foreign currency transactions, certain foreign taxes, passive foreign investment companies (PFIC), capital loss carryforwards, partnerships, losses deferred due to wash sales and excise tax regulations.
As of period end, the cost and unrealized appreciation (depreciation) in securities, and derivatives if applicable, for federal income tax purposes were as follows:
| Gross unrealized appreciation | $3,236,864 |
| Gross unrealized depreciation | (3,080,472) |
| Net unrealized appreciation (depreciation) | $156,392 |
| Tax Cost | $24,319,877 |
The tax-based components of distributable earnings as of period end were as follows:
| Undistributed ordinary income | $238,857 |
| Capital loss carryforward | $(405,809) |
| Net unrealized appreciation (depreciation) on securities and other investments | $156,356 |
Capital loss carryforwards are only available to offset future capital gains of the Fund to the extent provided by regulations and may be limited. The capital loss carryforward information presented below, including any applicable limitation, is estimated as of fiscal period end and is subject to adjustment.
| No expiration | |
| Short-term | $(176,387) |
| Long-term | (229,422) |
| Total capital loss carryforward | $(405,809) |
The tax character of distributions paid was as follows:
| | July 31, 2020 | July 31, 2019 |
| Ordinary Income | $331,484 | $ 742,159 |
| Long-term Capital Gains | 143,670 | 20,496 |
| Total | $475,154 | $ 762,655 |
Restricted Securities (including Private Placements). The Fund may invest in securities that are subject to legal or contractual restrictions on resale. These securities generally may be resold in transactions exempt from registration or to the public if the securities are registered. Disposal of these securities may involve time-consuming negotiations and expense, and prompt sale at an acceptable price may be difficult. Information regarding restricted securities is included at the end of the Fund's Schedule of Investments.
4. Purchases and Sales of Investments.
Purchases and sales of securities, other than short-term securities, are noted in the table below.
| | Purchases ($) | Sales ($) |
| Fidelity Flex Intrinsic Opportunities Fund | 11,590,901 | 5,066,978 |
5. Fees and Other Transactions with Affiliates.
Management Fee. Fidelity Management & Research Company LLC (the investment adviser) and its affiliates provide the Fund with investment management related services and the Fund does not pay any fees for these services. Under the management contract, the investment adviser or an affiliate pays all other expenses of the Fund, excluding fees and expenses of the independent Trustees, and certain miscellaneous expenses such as proxy and shareholder meeting expenses.
Brokerage Commissions. A portion of portfolio transactions were placed with brokerage firms which are affiliates of the investment adviser. Brokerage commissions are included in net realized gain (loss) and change in net unrealized appreciation (depreciation) in the Statement of Operations. The commissions paid to these affiliated firms were as follows:
| | Amount |
| Fidelity Flex Intrinsic Opportunities Fund | $275 |
Interfund Trades. Funds may purchase from or sell securities to other Fidelity Funds under procedures adopted by the Board. The procedures have been designed to ensure these interfund trades are executed in accordance with Rule 17a-7 of the 1940 Act. Interfund trades are included within the respective purchases and sales amounts shown in the Purchases and Sales of Investments note.
6. Committed Line of Credit.
Certain Funds participate with other funds managed by the investment adviser or an affiliate in a $4.25 billion credit facility (the "line of credit") to be utilized for temporary or emergency purposes to fund shareholder redemptions or for other short-term liquidity purposes. The participating funds have agreed to pay commitment fees on their pro-rata portion of the line of credit, which are reflected in Miscellaneous expenses on the Statement of Operations, and are as follows:
| | Amount |
| Fidelity Flex Intrinsic Opportunities Fund | $40 |
During the period, there were no borrowings on this line of credit.
7. Security Lending.
The Fund lends portfolio securities through a lending agent from time to time in order to earn additional income. On the settlement date of the loan, the Fund receives collateral (in the form of U.S. Treasury obligations, letters of credit and/or cash) against the loaned securities and maintains collateral in an amount not less than 100% of the market value of the loaned securities during the period of the loan. The market value of the loaned securities is determined at the close of business of the Fund and any additional required collateral is delivered to the Fund on the next business day. The Fund or borrower may terminate the loan at any time, and if the borrower defaults on its obligation to return the securities loaned because of insolvency or other reasons, the Fund may apply collateral received from the borrower against the obligation. The Fund may experience delays and costs in recovering the securities loaned. Any cash collateral received is invested in the Fidelity Securities Lending Cash Central Fund. The value of loaned securities and cash collateral at period end are disclosed on the Fund's Statement of Assets and Liabilities. Security lending income represents the income earned on investing cash collateral, less rebates paid to borrowers and any lending agent fees associated with the loan, plus any premium payments received for lending certain types of securities. Net income from the Fidelity Securities Lending Cash Central Fund during the period is presented in the Statement of Operations as a component of income from Fidelity Central Funds.
8. Expense Reductions.
During the period the investment adviser or an affiliate reimbursed and/or waived a portion of operating expenses in the amount of $933.
9. Other.
The Fund's organizational documents provide former and current trustees and officers with a limited indemnification against liabilities arising in connection with the performance of their duties to the Fund. In the normal course of business, the Fund may also enter into contracts that provide general indemnifications. The Fund's maximum exposure under these arrangements is unknown as this would be dependent on future claims that may be made against the Fund. The risk of material loss from such claims is considered remote.
At the end of the period, the investment adviser or its affiliates were the owners of record of 24% of the total outstanding shares of the fund.
10. Coronavirus (COVID-19) Pandemic.
An outbreak of COVID-19 first detected in China during December 2019 has since spread globally and was declared a pandemic by the World Health Organization during March 2020. Developments that disrupt global economies and financial markets, such as the COVID-19 pandemic, may magnify factors that affect the Fund's performance.
Report of Independent Registered Public Accounting Firm
To the Board of Trustees of Fidelity Puritan Trust and Shareholders of Fidelity Flex Intrinsic Opportunities Fund
Opinion on the Financial Statements and Financial Highlights
We have audited the accompanying statement of assets and liabilities of Fidelity Flex Intrinsic Opportunities Fund (the "Fund"), a fund of Fidelity Puritan Trust, including the schedule of investments, as of July 31, 2020, the related statement of operations for the year then ended, the statement of changes in net assets for each of the two years in the period then ended, the financial highlights for each of the three years in the period then ended and for the period from March 8, 2017 (commencement of operations) to July 31, 2017, and the related notes. In our opinion, the financial statements and financial highlights present fairly, in all material respects, the financial position of the Fund as of July 31, 2020, and the results of its operations for the year then ended, the changes in its net assets for each of the two years in the period then ended, and the financial highlights for each of the three years in the period then ended and for the period from March 8, 2017 (commencement of operations) to July 31, 2017 in conformity with accounting principles generally accepted in the United States of America.
Basis for Opinion
These financial statements and financial highlights are the responsibility of the Fund's management. Our responsibility is to express an opinion on the Fund's financial statements and financial highlights based on our audits. We are a public accounting firm registered with the Public Company Accounting Oversight Board (United States) (PCAOB) and are required to be independent with respect to the Fund in accordance with the U.S. federal securities laws and the applicable rules and regulations of the Securities and Exchange Commission and the PCAOB.
We conducted our audits in accordance with the standards of the PCAOB. Those standards require that we plan and perform the audit to obtain reasonable assurance about whether the financial statements and financial highlights are free of material misstatement, whether due to error or fraud. The Fund is not required to have, nor were we engaged to perform, an audit of its internal control over financial reporting. As part of our audits we are required to obtain an understanding of internal control over financial reporting but not for the purpose of expressing an opinion on the effectiveness of the Fund’s internal control over financial reporting. Accordingly, we express no such opinion.
Our audits included performing procedures to assess the risks of material misstatement of the financial statements and financial highlights, whether due to error or fraud, and performing procedures that respond to those risks. Such procedures included examining, on a test basis, evidence regarding the amounts and disclosures in the financial statements and financial highlights. Our audits also included evaluating the accounting principles used and significant estimates made by management, as well as evaluating the overall presentation of the financial statements and financial highlights. Our procedures included confirmation of securities owned as of July 31, 2020, by correspondence with the custodian and brokers; when replies were not received from brokers, we performed other auditing procedures. We believe that our audits provide a reasonable basis for our opinion.
/s/ Deloitte & Touche LLP
Boston, Massachusetts
September 14, 2020
We have served as the auditor of one or more of the Fidelity investment companies since 1999.
Trustees and Officers
The Trustees, Members of the Advisory Board (if any), and officers of the trust and fund, as applicable, are listed below. The Board of Trustees governs the fund and is responsible for protecting the interests of shareholders. The Trustees are experienced executives who meet periodically throughout the year to oversee the fund's activities, review contractual arrangements with companies that provide services to the fund, oversee management of the risks associated with such activities and contractual arrangements, and review the fund's performance. Except for Jonathan Chiel, each of the Trustees oversees 311 funds. Mr. Chiel oversees 174 funds.
The Trustees hold office without limit in time except that (a) any Trustee may resign; (b) any Trustee may be removed by written instrument, signed by at least two-thirds of the number of Trustees prior to such removal; (c) any Trustee who requests to be retired or who has become incapacitated by illness or injury may be retired by written instrument signed by a majority of the other Trustees; and (d) any Trustee may be removed at any special meeting of shareholders by a two-thirds vote of the outstanding voting securities of the trust. Each Trustee who is not an interested person (as defined in the 1940 Act) of the trust and the fund is referred to herein as an Independent Trustee. Each Independent Trustee shall retire not later than the last day of the calendar year in which his or her 75th birthday occurs. The Independent Trustees may waive this mandatory retirement age policy with respect to individual Trustees. Officers and Advisory Board Members hold office without limit in time, except that any officer or Advisory Board Member may resign or may be removed by a vote of a majority of the Trustees at any regular meeting or any special meeting of the Trustees. Except as indicated, each individual has held the office shown or other offices in the same company for the past five years.
The fund’s Statement of Additional Information (SAI) includes more information about the Trustees. To request a free copy, call Fidelity at 1-800-544-3455 (for managed account clients) or 1-800-835-5092 (for retirement plan participants).
Experience, Skills, Attributes, and Qualifications of the Trustees. The Governance and Nominating Committee has adopted a statement of policy that describes the experience, qualifications, attributes, and skills that are necessary and desirable for potential Independent Trustee candidates (Statement of Policy). The Board believes that each Trustee satisfied at the time he or she was initially elected or appointed a Trustee, and continues to satisfy, the standards contemplated by the Statement of Policy. The Governance and Nominating Committee also engages professional search firms to help identify potential Independent Trustee candidates who have the experience, qualifications, attributes, and skills consistent with the Statement of Policy. From time to time, additional criteria based on the composition and skills of the current Independent Trustees, as well as experience or skills that may be appropriate in light of future changes to board composition, business conditions, and regulatory or other developments, have also been considered by the professional search firms and the Governance and Nominating Committee. In addition, the Board takes into account the Trustees' commitment and participation in Board and committee meetings, as well as their leadership of standing and ad hoc committees throughout their tenure.
In determining that a particular Trustee was and continues to be qualified to serve as a Trustee, the Board has considered a variety of criteria, none of which, in isolation, was controlling. The Board believes that, collectively, the Trustees have balanced and diverse experience, qualifications, attributes, and skills, which allow the Board to operate effectively in governing the fund and protecting the interests of shareholders. Information about the specific experience, skills, attributes, and qualifications of each Trustee, which in each case led to the Board's conclusion that the Trustee should serve (or continue to serve) as a trustee of the fund, is provided below.
Board Structure and Oversight Function. Robert A. Lawrence is an interested person and currently serves as Acting Chairman. The Trustees have determined that an interested Chairman is appropriate and benefits shareholders because an interested Chairman has a personal and professional stake in the quality and continuity of services provided to the fund. Independent Trustees exercise their informed business judgment to appoint an individual of their choosing to serve as Chairman, regardless of whether the Trustee happens to be independent or a member of management. The Independent Trustees have determined that they can act independently and effectively without having an Independent Trustee serve as Chairman and that a key structural component for assuring that they are in a position to do so is for the Independent Trustees to constitute a substantial majority for the Board. The Independent Trustees also regularly meet in executive session. Ned C. Lautenbach and David M. Thomas serve as Co-Lead Independent Trustees and as such each (i) acts as a liaison between the Independent Trustees and management with respect to matters important to the Independent Trustees and (ii) with management prepares agendas for Board meetings.
Fidelity® funds are overseen by different Boards of Trustees. The fund's Board oversees Fidelity's high income and certain equity funds, and other Boards oversee Fidelity's investment-grade bond, money market, asset allocation, and other equity funds. The asset allocation funds may invest in Fidelity® funds overseen by the fund's Board. The use of separate Boards, each with its own committee structure, allows the Trustees of each group of Fidelity® funds to focus on the unique issues of the funds they oversee, including common research, investment, and operational issues. On occasion, the separate Boards establish joint committees to address issues of overlapping consequences for the Fidelity® funds overseen by each Board.
The Trustees operate using a system of committees to facilitate the timely and efficient consideration of all matters of importance to the Trustees, the fund, and fund shareholders and to facilitate compliance with legal and regulatory requirements and oversight of the fund's activities and associated risks. The Board, acting through its committees, has charged FMR and its affiliates with (i) identifying events or circumstances the occurrence of which could have demonstrably adverse effects on the fund's business and/or reputation; (ii) implementing processes and controls to lessen the possibility that such events or circumstances occur or to mitigate the effects of such events or circumstances if they do occur; and (iii) creating and maintaining a system designed to evaluate continuously business and market conditions in order to facilitate the identification and implementation processes described in (i) and (ii) above. Because the day-to-day operations and activities of the fund are carried out by or through FMR, its affiliates, and other service providers, the fund's exposure to risks is mitigated but not eliminated by the processes overseen by the Trustees. While each of the Board's committees has responsibility for overseeing different aspects of the fund's activities, oversight is exercised primarily through the Operations, Audit, and Compliance Committees. Appropriate personnel, including but not limited to the fund's Chief Compliance Officer (CCO), FMR's internal auditor, the independent accountants, the fund's Treasurer and portfolio management personnel, make periodic reports to the Board's committees, as appropriate, including an annual review of Fidelity's risk management program for the Fidelity® funds. The responsibilities of each standing committee, including their oversight responsibilities, are described further under "Standing Committees of the Trustees."
Interested Trustees*:
Correspondence intended for a Trustee who is an interested person may be sent to Fidelity Investments, 245 Summer Street, Boston, Massachusetts 02210.
Name, Year of Birth; Principal Occupations and Other Relevant Experience+
Jonathan Chiel (1957)
Year of Election or Appointment: 2016
Trustee
Mr. Chiel also serves as Trustee of other Fidelity® funds. Mr. Chiel is Executive Vice President and General Counsel for FMR LLC (diversified financial services company, 2012-present). Previously, Mr. Chiel served as general counsel (2004-2012) and senior vice president and deputy general counsel (2000-2004) for John Hancock Financial Services; a partner with Choate, Hall & Stewart (1996-2000) (law firm); and an Assistant United States Attorney for the United States Attorney’s Office of the District of Massachusetts (1986-95), including Chief of the Criminal Division (1993-1995). Mr. Chiel is a director on the boards of the Boston Bar Foundation and the Maimonides School.
Robert A. Lawrence (1952)
Year of Election or Appointment: 2020
Trustee
Acting Chairman of the Board of Trustees
Mr. Lawrence also serves as Trustee of other funds. Previously, Mr. Lawrence served as a Member of the Advisory Board of certain funds. Prior to his retirement in 2008, Mr. Lawrence served as Vice President of certain Fidelity® funds (2006-2008), Senior Vice President, Head of High Income Division of Fidelity Management & Research Company (investment adviser firm, 2006-2008), and President of Fidelity Strategic Investments (investment adviser firm, 2002-2005).
* Determined to be an “Interested Trustee” by virtue of, among other things, his or her affiliation with the trust[s] or various entities under common control with FMR.
+ The information includes the Trustee's principal occupation during the last five years and other information relating to the experience, attributes, and skills relevant to the Trustee's qualifications to serve as a Trustee, which led to the conclusion that the Trustee should serve as a Trustee for the fund.
Independent Trustees:
Correspondence intended for an Independent Trustee may be sent to Fidelity Investments, P.O. Box 55235, Boston, Massachusetts 02205-5235.
Name, Year of Birth; Principal Occupations and Other Relevant Experience+
Dennis J. Dirks (1948)
Year of Election or Appointment: 2005
Trustee
Mr. Dirks also serves as Trustee of other Fidelity® funds. Prior to his retirement in May 2003, Mr. Dirks served as Chief Operating Officer and as a member of the Board of The Depository Trust & Clearing Corporation (financial markets infrastructure), President, Chief Operating Officer and a member of the Board of The Depository Trust Company (DTC), President and a member of the Board of the National Securities Clearing Corporation (NSCC), Chief Executive Officer and a member of the Board of the Government Securities Clearing Corporation and Chief Executive Officer and a member of the Board of the Mortgage-Backed Securities Clearing Corporation. Mr. Dirks currently serves as a member of the Finance Committee (2016-present) and Board (2017-present) and is Treasurer (2018-present) of the Asolo Repertory Theatre.
Donald F. Donahue (1950)
Year of Election or Appointment: 2018
Trustee
Mr. Donahue also serves as Trustee of other Fidelity® funds. Mr. Donahue serves as President and Chief Executive Officer of Miranda Partners, LLC (risk consulting for the financial services industry, 2012-present). Previously, Mr. Donahue served as Chief Executive Officer (2006-2012), Chief Operating Officer (2003-2006) and Managing Director, Customer Marketing and Development (1999-2003) of The Depository Trust & Clearing Corporation (financial markets infrastructure). Mr. Donahue currently serves as a member (2007-present) and Co-Chairman (2016-present) of the Board of United Way of New York, a member of the Board of NYC Leadership Academy (2012-present) and a member of the Board of Advisors of Ripple Labs, Inc. (financial services, 2015-present). Mr. Donahue previously served as a member of the Advisory Board of certain Fidelity® funds (2015-2018).
Vicki L. Fuller (1957)
Year of Election or Appointment: 2020
Trustee
Ms. Fuller also serves as Trustee of other Fidelity® funds. Previously, Ms. Fuller served as a member of the Advisory Board of certain Fidelity® funds (2018-2020), Chief Investment Officer of the New York State Common Retirement Fund (2012-2018) and held a variety of positions at AllianceBernstein L.P. (global asset management, 1985-2012), including Managing Director (2006-2012) and Senior Vice President and Senior Portfolio Manager (2001-2006). Ms. Fuller currently serves as a member of the Board, Audit Committee and Nominating and Governance Committee of The Williams Companies, Inc. (natural gas infrastructure, 2018-present) and as a member of the Board of Treliant, LLC (consulting, 2019-present).
Patricia L. Kampling (1959)
Year of Election or Appointment: 2020
Trustee
Ms. Kampling also serves as Trustee of other Fidelity® funds. Prior to her retirement, Ms. Kampling served as Chairman of the Board and Chief Executive Officer (2012-2019), President and Chief Operating Officer (2011-2012) and Executive Vice President and Chief Financial Officer (2010-2011) of Alliant Energy Corporation. Ms. Kampling currently serves as a member of the Board, Compensation Committee and Executive Committee and as Chair of the Audit Committee of Briggs & Stratton Corporation (manufacturing, 2011-present) and as a member of the Board, Audit, Finance and Risk Committee and Safety, Environmental, Technology and Operations Committee of American Water Works Company, Inc. (utilities company, 2019-present). In addition, Ms. Kampling currently serves as a member of the Board of the Nature Conservancy, Wisconsin Chapter (2019-present). Previously, Ms. Kampling served as a Member of the Advisory Board of certain Fidelity® funds (2020), a member of the Board of Interstate Power and Light Company (2012-2019) and Wisconsin Power and Light Company (2012-2019) (each a subsidiary of Alliant Energy Corporation) and as a member of the Board and Workforce Development Committee of the Business Roundtable (2018-2019).
Alan J. Lacy (1953)
Year of Election or Appointment: 2008
Trustee
Mr. Lacy also serves as Trustee of other Fidelity® funds. Previously, Mr. Lacy served as Senior Adviser (2007-2014) of Oak Hill Capital Partners, L.P. (private equity), Chief Executive Officer (2005) and Vice Chairman (2005-2006) of Sears Holdings Corporation (retail), Chief Executive Officer and Chairman of the Board of Sears, Roebuck and Co. (retail, 2000-2005), Chairman (2014-2017) and a member of the Board (2010-2017) of Dave & Buster’s Entertainment, Inc. (restaurant and entertainment complexes) and a member of the Board of Bristol-Myers Squibb Company (global pharmaceuticals, 2008-2020). Mr. Lacy currently serves as a Trustee of the California Chapter of The Nature Conservancy (2015-present) and a member of the Board of the Center for Advanced Study in the Behavioral Sciences at Stanford University (2015-present).
Ned C. Lautenbach (1944)
Year of Election or Appointment: 2000
Trustee
Co-Lead Independent Trustee
Mr. Lautenbach also serves as Trustee of other Fidelity® funds. Mr. Lautenbach currently serves as Chair of the Board of Governors, State University System of Florida (2013-present) and is a member of the Council on Foreign Relations (1994-present). He is also a member and has in the past served as Chairman of the Board of Directors of Artis-Naples (2012-present). Previously, Mr. Lautenbach served as a member and then Lead Director of the Board of Directors of Eaton Corporation (diversified industrial, 1997-2016). He was also a Partner at Clayton, Dubilier & Rice, LLC (private equity investment, 1998-2010); as well as Director of Sony Corporation (2006-2007). In addition, Mr. Lautenbach had a 30-year career with IBM (technology company), during which time he served as Senior Vice President and as a member of the Corporate Executive Committee (1968-1998).
Joseph Mauriello (1944)
Year of Election or Appointment: 2008
Trustee
Mr. Mauriello also serves as Trustee of other Fidelity® funds. Prior to his retirement in January 2006, Mr. Mauriello served in numerous senior management positions including Deputy Chairman and Chief Operating Officer (2004-2005), and Vice Chairman of Financial Services (2002-2004) of KPMG LLP US (professional services, 1965-2005). Mr. Mauriello currently serves as a member of the Independent Directors Council Governing Council (2015-present). Previously, Mr. Mauriello served as a member of the Board of XL Group plc. (global insurance and re-insurance, 2006-2018).
Cornelia M. Small (1944)
Year of Election or Appointment: 2005
Trustee
Ms. Small also serves as Trustee of other Fidelity® funds. Previously, Ms. Small served as Chief Investment Officer, Director of Global Equity Investments and a member of Scudder, Stevens & Clark and Scudder Kemper Investments. Ms. Small previously served as a member of the Board (2009-2019) and Chair of the Investment Committee (2010-2019) of the Teagle Foundation and a member of the Investment Committee of the Berkshire Taconic Community Foundation (2008-2019).
Garnett A. Smith (1947)
Year of Election or Appointment: 2018
Trustee
Mr. Smith also serves as Trustee of other Fidelity® funds. Prior to his retirement, Mr. Smith served as Chairman and Chief Executive Officer (1990-1997) and President (1986-1990) of Inbrand Corp. (manufacturer of personal absorbent products). Prior to his employment with Inbrand Corp., he was employed by a retail fabric chain and North Carolina National Bank (now Bank of America). Mr. Smith previously served as a member of the Advisory Board of certain Fidelity® funds (2012-2013).
David M. Thomas (1949)
Year of Election or Appointment: 2008
Trustee
Co-Lead Independent Trustee
Mr. Thomas also serves as Trustee of other Fidelity® funds. Previously, Mr. Thomas served as Executive Chairman (2005-2006) and Chairman and Chief Executive Officer (2000-2005) of IMS Health, Inc. (pharmaceutical and healthcare information solutions). Mr. Thomas currently serves as Non-Executive Chairman of the Board of Fortune Brands Home and Security (home and security products, 2011-present), and a member of the Board (2004-present) and Presiding Director (2013-present) of Interpublic Group of Companies, Inc. (marketing communication).
Susan Tomasky (1953)
Year of Election or Appointment: 2020
Trustee
Ms. Tomasky also serves as Trustee of other Fidelity® funds. Prior to her retirement, Ms. Tomasky served in various executive officer positions at American Electric Power Company, Inc. (1998-2011), including most recently as President of AEP Transmission (2007-2011). Ms. Tomasky currently serves as a member of the Board and Sustainability Committee and as Chair of the Audit Committee of Marathon Petroleum Corporation (2018-present) and as a member of the Board, Corporate Governance Committee and Organization and Compensation Committee and as Chair of the Audit Committee of Public Service Enterprise Group, Inc. (utilities company, 2012-present). In addition, Ms. Tomasky currently serves as a member of the Board of the Columbus Regional Airport Authority (2007-present), as a member of the Board of the Royal Shakespeare Company – America (2009-present), as a member of the Board of the Columbus Association for the Performing Arts (2011-present) and as a member of the Board of Kenyon College (2016-present). Previously, Ms. Tomasky served as a Member of the Advisory Board of certain Fidelity® funds (2020), a member of the Board (2011-2019) and as Lead Independent Director (2015-2018) of Andeavor Corporation (previously Tesoro Corporation) (independent oil refiner and marketer) and as a member of the Board of Summit Midstream Partners LP (energy, 2012-2018).
Michael E. Wiley (1950)
Year of Election or Appointment: 2020
Trustee
Mr. Wiley also serves as Trustee of other Fidelity® funds. Previously, Mr. Wiley served as a member of the Advisory Board of certain Fidelity® funds (2018-2020), Chairman, President and CEO of Baker Hughes, Inc. (oilfield services, 2000-2004). Mr. Wiley also previously served as a member of the Board of Andeavor Corporation (independent oil refiner and marketer, 2005-2018), a member of the Board of Andeavor Logistics LP (natural resources logistics, 2015-2018) and a member of the Board of High Point Resources (exploration and production, 2005-2020).
+ The information includes the Trustee's principal occupation during the last five years and other information relating to the experience, attributes, and skills relevant to the Trustee's qualifications to serve as a Trustee, which led to the conclusion that the Trustee should serve as a Trustee for the fund.
Advisory Board Members and Officers:
Correspondence intended for a Member of the Advisory Board (if any) may be sent to Fidelity Investments, P.O. Box 55235, Boston, Massachusetts 02205-5235. Correspondence intended for an officer or Peter S. Lynch may be sent to Fidelity Investments, 245 Summer Street, Boston, Massachusetts 02210. Officers appear below in alphabetical order.
Name, Year of Birth; Principal Occupation
Peter S. Lynch (1944)
Year of Election or Appointment: 2003
Member of the Advisory Board
Mr. Lynch also serves as a Member of the Advisory Board of other Fidelity® funds. Mr. Lynch is Vice Chairman and a Director of Fidelity Management & Research Company LLC (investment adviser firm). In addition, Mr. Lynch serves as a Trustee of Boston College and as the Chairman of the Inner-City Scholarship Fund. Previously, Mr. Lynch served as Vice Chairman and a Director of FMR Co., Inc. (investment adviser firm) and on the Special Olympics International Board of Directors (1997-2006).
Elizabeth Paige Baumann (1968)
Year of Election or Appointment: 2017
Anti-Money Laundering (AML) Officer
Ms. Baumann also serves as AML Officer of other funds. She is Chief AML Officer (2012-present) and Senior Vice President (2014-present) of FMR LLC (diversified financial services company) and is an employee of Fidelity Investments. Previously, Ms. Baumann served as AML Officer of certain funds (2017-2019), as AML Officer of the funds (2012-2016), and Vice President (2007-2014) and Deputy Anti-Money Laundering Officer (2007-2012) of FMR LLC.
Craig S. Brown (1977)
Year of Election or Appointment: 2019
Assistant Treasurer
Mr. Brown also serves as Assistant Treasurer of other funds. Mr. Brown is an employee of Fidelity Investments (2013-present).
John J. Burke III (1964)
Year of Election or Appointment: 2018
Chief Financial Officer
Mr. Burke also serves as Chief Financial Officer of other funds. Mr. Burke serves as Head of Investment Operations for Fidelity Fund and Investment Operations (2018-present) and is an employee of Fidelity Investments (1998-present). Previously Mr. Burke served as head of Asset Management Investment Operations (2012-2018).
William C. Coffey (1969)
Year of Election or Appointment: 2019
Assistant Secretary
Mr. Coffey also serves as Assistant Secretary of other funds. He is Senior Vice President and Deputy General Counsel of FMR LLC (diversified financial services company, 2010-present), and is an employee of Fidelity Investments. Previously, Mr. Coffey served as Secretary and CLO of certain funds (2018-2019); CLO, Secretary, and Senior Vice President of Fidelity Management & Research Company and FMR Co., Inc. (investment adviser firms, 2018-2019); Secretary of Fidelity SelectCo, LLC and Fidelity Investments Money Management, Inc. (investment adviser firms, 2018-2019); CLO of Fidelity Management & Research (Hong Kong) Limited, FMR Investment Management (UK) Limited, and Fidelity Management & Research (Japan) Limited (investment adviser firms, 2018-2019); and Assistant Secretary of certain funds (2009-2018).
Timothy M. Cohen (1969)
Year of Election or Appointment: 2018
Vice President
Mr. Cohen also serves as Vice President of other funds. Mr. Cohen serves as Co-Head of Equity (2018-present), a Director of Fidelity Management & Research (Japan) Limited (investment adviser firm, 2016-present), and is an employee of Fidelity Investments. Previously, Mr. Cohen served as Executive Vice President of Fidelity SelectCo, LLC (2019), Head of Global Equity Research (2016-2018), Chief Investment Officer - Equity and a Director of Fidelity Management & Research (U.K.) Inc. (investment adviser firm, 2013-2015) and as a Director of Fidelity Management & Research (Hong Kong) Limited (investment adviser firm, 2017).
Jonathan Davis (1968)
Year of Election or Appointment: 2010
Assistant Treasurer
Mr. Davis also serves as Assistant Treasurer of other funds. Mr. Davis serves as Assistant Treasurer of FMR Capital, Inc. (2017-present) and is an employee of Fidelity Investments. Previously, Mr. Davis served as Vice President and Associate General Counsel of FMR LLC (diversified financial services company, 2003-2010).
Laura M. Del Prato (1964)
Year of Election or Appointment: 2018
Assistant Treasurer
Ms. Del Prato also serves as an officer of other funds. Ms. Del Prato is an employee of Fidelity Investments (2017-present). Previously, Ms. Del Prato served as President and Treasurer of The North Carolina Capital Management Trust: Cash Portfolio and Term Portfolio (2018-2020). Prior to joining Fidelity Investments, Ms. Del Prato served as a Managing Director and Treasurer of the JPMorgan Mutual Funds (2014-2017). Prior to JPMorgan, Ms. Del Prato served as a partner at Cohen Fund Audit Services (accounting firm, 2012-2013) and KPMG LLP (accounting firm, 2004-2012).
Colm A. Hogan (1973)
Year of Election or Appointment: 2020
Assistant Treasurer
Mr. Hogan also serves as an officer of other funds. Mr. Hogan serves as Assistant Treasurer of FMR Capital, Inc. (2017-present) and is an employee of Fidelity Investments (2005-present). Previously, Mr. Hogan served as Deputy Treasurer of certain Fidelity® funds (2016-2020) and Assistant Treasurer of certain Fidelity® funds (2016-2018).
Pamela R. Holding (1964)
Year of Election or Appointment: 2018
Vice President
Ms. Holding also serves as Vice President of other funds. Ms. Holding serves as Co-Head of Equity (2018-present) and is an employee of Fidelity Investments (2013-present). Previously, Ms. Holding served as Executive Vice President of Fidelity SelectCo, LLC (2019) and as Chief Investment Officer of Fidelity Institutional Asset Management (2013-2018).
Cynthia Lo Bessette (1969)
Year of Election or Appointment: 2019
Secretary and Chief Legal Officer (CLO)
Ms. Lo Bessette also serves as an officer of other funds. Ms. Lo Bessette serves as CLO, Secretary, and Senior Vice President of Fidelity Management & Research Company LLC (investment adviser firm, 2019-present); and CLO of Fidelity Management & Research (Hong Kong) Limited, FMR Investment Management (UK) Limited, and Fidelity Management & Research (Japan) Limited (investment adviser firms, 2019-present). She is a Senior Vice President and Deputy General Counsel of FMR LLC (diversified financial services company, 2019-present), and is an employee of Fidelity Investments. Previously, Ms. Lo Bessette served as CLO, Secretary, and Senior Vice President of FMR Co., Inc. (investment adviser firm, 2019); Secretary of Fidelity SelectCo, LLC and Fidelity Investments Money Management, Inc. (investment adviser firms, 2019). Prior to joining Fidelity Investments, Ms. Lo Bessette was Executive Vice President, General Counsel (2016-2019) and Senior Vice President, Deputy General Counsel (2015-2016) of OppenheimerFunds (investment management company) and Deputy Chief Legal Officer (2013-2015) of Jennison Associates LLC (investment adviser firm).
Chris Maher (1972)
Year of Election or Appointment: 2020
Deputy Treasurer
Mr. Maher also serves as an officer of other funds. Mr. Maher serves as Assistant Treasurer of FMR Capital, Inc. (2017-present), and is an employee of Fidelity Investments (2008-present). Previously, Mr. Maher served as Assistant Treasurer of certain funds (2013-2020); Vice President of Asset Management Compliance (2013), Vice President of the Program Management Group of FMR (investment adviser firm, 2010-2013), and Vice President of Valuation Oversight (2008-2010).
Jason P. Pogorelec (1975)
Year of Election or Appointment: 2020
Chief Compliance Officer
Mr. Pogorelec also serves as Chief Compliance Officer of other funds. Mr. Pogorelec is a senior Vice President of Asset Management Compliance for Fidelity Investments and is an employee of Fidelity Investments (2006-present). Previously, Mr. Pogorelec served as Vice President, Associate General Counsel for Fidelity Investments (2010-2020) and Assistant Secretary of certain Fidelity funds (2015-2020).
Stacie M. Smith (1974)
Year of Election or Appointment: 2016
President and Treasurer
Ms. Smith also serves as an officer of other funds. Ms. Smith serves as Assistant Treasurer of FMR Capital, Inc. (2017-present), is an employee of Fidelity Investments (2009-present), and has served in other fund officer roles. Prior to joining Fidelity Investments, Ms. Smith served as Senior Audit Manager of Ernst & Young LLP (accounting firm, 1996-2009). Previously, Ms. Smith served as Assistant Treasurer (2013-2019) and Deputy Treasurer (2013-2016) of certain Fidelity® funds.
Marc L. Spector (1972)
Year of Election or Appointment: 2016
Assistant Treasurer
Mr. Spector also serves as an officer of other funds. Mr. Spector serves as Assistant Treasurer of FMR Capital, Inc. (2017-present) and is an employee of Fidelity Investments (2016-present). Prior to joining Fidelity Investments, Mr. Spector served as Director at the Siegfried Group (accounting firm, 2013-2016), and prior to Siegfried Group as audit senior manager at Deloitte & Touche LLP (accounting firm, 2005-2013).
Jim Wegmann (1979)
Year of Election or Appointment: 2019
Assistant Treasurer
Mr. Wegmann also serves as Assistant Treasurer of other funds. Mr. Wegmann is an employee of Fidelity Investments (2011-present).
Shareholder Expense Example
As a shareholder, you incur two types of costs: (1) transaction costs, which may include sales charges (loads) on purchase payments or redemption proceeds, as applicable and (2) ongoing costs, which generally include management fees, distribution and/or service (12b-1) fees and other Fund expenses. This Example is intended to help you understand your ongoing costs (in dollars) of investing in a fund and to compare these costs with the ongoing costs of investing in other mutual funds.
The Example is based on an investment of $1,000 invested at the beginning of the period and held for the entire period (February 1, 2020 to July 31, 2020).
Actual Expenses
The first line of the accompanying table provides information about actual account values and actual expenses. You may use the information in this line, together with the amount you invested, to estimate the expenses that you paid over the period. Simply divide your account value by $1,000.00 (for example, an $8,600 account value divided by $1,000.00 = 8.6), then multiply the result by the number in the first line for a class/Fund under the heading entitled "Expenses Paid During Period" to estimate the expenses you paid on your account during this period. If any fund is a shareholder of any underlying mutual funds or exchange-traded funds (ETFs) (the Underlying Funds), such fund indirectly bears its proportional share of the expenses of the Underlying Funds in addition to the direct expenses incurred presented in the table. These fees and expenses are not included in the annualized expense ratio used to calculate the expense estimate in the table below.
Hypothetical Example for Comparison Purposes
The second line of the accompanying table provides information about hypothetical account values and hypothetical expenses based on the actual expense ratio and an assumed rate of return of 5% per year before expenses, which is not the actual return. The hypothetical account values and expenses may not be used to estimate the actual ending account balance or expenses you paid for the period. You may use this information to compare the ongoing costs of investing in the Fund and other funds. To do so, compare this 5% hypothetical example with the 5% hypothetical examples that appear in the shareholder reports of the other funds. If any fund is a shareholder of any Underlying Funds, such fund indirectly bears its proportional share of the expenses of the Underlying Funds in addition to the direct expenses as presented in the table. These fees and expenses are not included in the annualized expense ratio used to calculate the expense estimate in the table below.
Please note that the expenses shown in the table are meant to highlight your ongoing costs only and do not reflect any transaction costs. Therefore, the second line of the table is useful in comparing ongoing costs only, and will not help you determine the relative total costs of owning different funds.
| | Annualized Expense Ratio-A | Beginning
Account Value
February 1, 2020 | Ending
Account Value
July 31, 2020 | Expenses Paid
During Period-B
February 1, 2020
to July 31, 2020 |
| Fidelity Flex Intrinsic Opportunities Fund | - %-C | | | |
| Actual | | $1,000.00 | $954.20 | $--D |
| Hypothetical-E | | $1,000.00 | $1,024.86 | $--D |
A Annualized expense ratio reflects expenses net of applicable fee waivers.
B Expenses are equal to the annualized expense ratio, multiplied by the average account value over the period, multiplied by 182/ 366 (to reflect the one-half year period). The fees and expenses of any Underlying Funds are not included in each annualized expense ratio.
C Amount represents less than .005%.
D Amount represents less than $.005.
E 5% return per year before expenses
Distributions (Unaudited)
The fund designates 66% and 38% of the dividends distributed in September and December, respectively during the fiscal year as qualifying for the dividends–received deduction for corporate shareholders.
The fund designates 100% and 81% of the dividends distributed in September and December, respectively during the fiscal year as amounts which may be taken into account as a dividend for the purposes of the maximum rate under section 1(h)(11) of the Internal Revenue Code.
The fund will notify shareholders in January 2021 of amounts for use in preparing 2020 income tax returns.
Liquidity Risk Management Program
The Securities and Exchange Commission adopted Rule 22e-4 under the Investment Company Act of 1940 (the Liquidity Rule) to promote effective liquidity risk management throughout the open-end investment company industry, thereby reducing the risk that funds will be unable to meet their redemption obligations and mitigating dilution of the interests of fund shareholders.
The Fund has adopted and implemented a liquidity risk management program pursuant to the Liquidity Rule (the Program) effective December 1, 2018. The Program is reasonably designed to assess and manage the Fund’s liquidity risk and to comply with the requirements of the Liquidity Rule. The Fund’s Board of Trustees (the Board) has designated the Fund’s investment adviser as administrator of the Program. The Fidelity advisers have established a Liquidity Risk Management Committee (the LRM Committee) to manage the Program for each of the Fidelity Funds. The LRM Committee monitors the adequacy and effectiveness of implementation of the Program and on a periodic basis assesses each Fund’s liquidity risk based on a variety of factors including (1) the Fund’s investment strategy, (2) portfolio liquidity and cash flow projections during normal and reasonably foreseeable stressed conditions, (3) shareholder redemptions, (4) borrowings and other funding sources and (5) in the case of exchange-traded funds, certain additional factors including the effect of the Fund’s prices and spreads, market participants, and basket compositions on the overall liquidity of the Fund’s portfolio, as applicable.
In accordance with the Program, each of the Fund’s portfolio investments is classified into one of four liquidity categories described below based on a determination of a reasonable expectation for how long it would take to convert the investment to cash (or sell or dispose of the investment) without significantly changing its market value.
- Highly liquid investments – cash or convertible to cash within three business days or less
- Moderately liquid investments – convertible to cash in three to seven calendar days
- Less liquid investments – can be sold or disposed of, but not settled, within seven calendar days
- Illiquid investments – cannot be sold or disposed of within seven calendar days
Liquidity classification determinations take into account a variety of factors including various market, trading and investment-specific considerations, as well as market depth, and generally utilize analysis from a third-party liquidity metrics service.
The Liquidity Rule places a 15% limit on a fund’s illiquid investments and requires funds that do not primarily hold assets that are highly liquid investments to determine and maintain a minimum percentage of the fund’s net assets to be invested in highly liquid investments (highly liquid investment minimum or HLIM). The Program includes provisions reasonably designed to comply with the 15% limit on illiquid investments and for determining, periodically reviewing and complying with the HLIM requirement as applicable.
At a recent meeting of the Fund’s Board of Trustees, the LRM Committee provided a written report to the Board pertaining to the operation, adequacy, and effectiveness of implementation of the Program for the annual period from December 1, 2018 through November 30, 2019. The report concluded that the Program has been implemented and is operating effectively and is reasonably designed to assess and manage the Fund’s liquidity risk.
Proxy Voting Results
A special meeting of shareholders was held on June 9, 2020. The results of votes taken among shareholders on the proposal before them are reported below. Each vote reported represents one dollar of net asset value held on the record date for the meeting.
PROPOSAL 1
To elect a Board of Trustees.
| | # of
Votes | % of
Votes |
| Dennis J. Dirks |
| Affirmative | 51,196,847,491.427 | 94.398 |
| Withheld | 3,038,239,286.369 | 5.602 |
| TOTAL | 54,235,086,777.797 | 100.000 |
| Donald F. Donahue |
| Affirmative | 51,237,854,534.400 | 94.474 |
| Withheld | 2,997,232,243.397 | 5.526 |
| TOTAL | 54,235,086,777.797 | 100.000 |
| Bettina Doulton |
| Affirmative | 51,360,110,652.541 | 94.699 |
| Withheld | 2,874,976,125.255 | 5.301 |
| TOTAL | 54,235,086,777.797 | 100.000 |
| Vicki L. Fuller |
| Affirmative | 51,563,431,518.122 | 95.074 |
| Withheld | 2,671,655,259.675 | 4.926 |
| TOTAL | 54,235,086,777.797 | 100.000 |
| Patricia L. Kampling |
| Affirmative | 51,164,274,033.278 | 94.338 |
| Withheld | 3,070,812,744.518 | 5.662 |
| TOTAL | 54,235,086,777.797 | 100.000 |
| Alan J. Lacy |
| Affirmative | 50,656,049,520.376 | 93.401 |
| Withheld | 3,579,037,257.420 | 6.599 |
| TOTAL | 54,235,086,777.797 | 100.000 |
| Ned C. Lautenbach |
| Affirmative | 50,648,184,728.350 | 93.386 |
| Withheld | 3,586,902,049.447 | 6.614 |
| TOTAL | 54,235,086,777.797 | 100.000 |
| Robert A. Lawrence |
| Affirmative | 50,828,079,099.188 | 93.718 |
| Withheld | 3,407,007,678.608 | 6.282 |
| TOTAL | 54,235,086,777.797 | 100.000 |
| Joseph Mauriello |
| Affirmative | 50,733,010,817.685 | 93.543 |
| Withheld | 3,502,075,960.112 | 6.457 |
| TOTAL | 54,235,086,777.797 | 100.000 |
| Cornelia M. Small |
| Affirmative | 50,936,822,997.692 | 93.919 |
| Withheld | 3,298,263,780.105 | 6.081 |
| TOTAL | 54,235,086,777.797 | 100.000 |
| Garnett A. Smith |
| Affirmative | 50,777,344,834.274 | 93.625 |
| Withheld | 3,457,741,943.523 | 6.375 |
| TOTAL | 54,235,086,777.797 | 100.000 |
| David M. Thomas |
| Affirmative | 50,835,673,463.433 | 93.732 |
| Withheld | 3,399,413,314.364 | 6.268 |
| TOTAL | 54,235,086,777.797 | 100.000 |
| Susan Tomasky |
| Affirmative | 51,193,289,850.509 | 94.391 |
| Withheld | 3,041,796,927.288 | 5.609 |
| TOTAL | 54,235,086,777.797 | 100.000 |
| Michael E. Wiley |
| Affirmative | 50,830,132,792.508 | 93.722 |
| Withheld | 3,404,953,985.289 | 6.278 |
| TOTAL | 54,235,086,777.797 | 100.000 |
|
| Proposal 1 reflects trust wide proposal and voting results. |
ZTO-ANN-0920
1.9881591.103
Fidelity® Low-Priced Stock K6 Fund
Annual Report
July 31, 2020
See the inside front cover for important information about access to your fund’s shareholder reports.
Beginning on January 1, 2021, as permitted by regulations adopted by the Securities and Exchange Commission, paper copies of a fund’s shareholder reports will no longer be sent by mail, unless you specifically request paper copies of the reports from the fund or from your financial intermediary, such as a financial advisor, broker-dealer or bank. Instead, the reports will be made available on a website, and you will be notified by mail each time a report is posted and provided with a website link to access the report.
If you already elected to receive shareholder reports electronically, you will not be affected by this change and you need not take any action. You may elect to receive shareholder reports and other communications from a fund electronically, by contacting your financial intermediary. For Fidelity customers, visit Fidelity's web site or call Fidelity using the contact information listed below.
You may elect to receive all future reports in paper free of charge. If you wish to continue receiving paper copies of your shareholder reports, you may contact your financial intermediary or, if you are a Fidelity customer, visit Fidelity’s website, or call Fidelity at the applicable toll-free number listed below. Your election to receive reports in paper will apply to all funds held with the fund complex/your financial intermediary.
| Account Type | Website | Phone Number |
| Brokerage, Mutual Fund, or Annuity Contracts: | fidelity.com/mailpreferences | 1-800-343-3548 |
| Employer Provided Retirement Accounts: | netbenefits.fidelity.com/preferences (choose 'no' under Required Disclosures to continue to print) | 1-800-343-0860 |
| Advisor Sold Accounts Serviced Through Your Financial Intermediary: | Contact Your Financial Intermediary | Your Financial Intermediary's phone number |
| Advisor Sold Accounts Serviced by Fidelity: | institutional.fidelity.com | 1-877-208-0098 |
Contents
To view a fund's proxy voting guidelines and proxy voting record for the 12-month period ended June 30, visit http://www.fidelity.com/proxyvotingresults or visit the Securities and Exchange Commission's (SEC) web site at http://www.sec.gov.
You may also call 1-800-835-5092 to request a free copy of the proxy voting guidelines.
Standard & Poor's, S&P and S&P 500 are registered service marks of The McGraw-Hill Companies, Inc. and have been licensed for use by Fidelity Distributors Corporation.
Other third-party marks appearing herein are the property of their respective owners.
All other marks appearing herein are registered or unregistered trademarks or service marks of FMR LLC or an affiliated company. © 2020 FMR LLC. All rights reserved.
This report and the financial statements contained herein are submitted for the general information of the shareholders of the Fund. This report is not authorized for distribution to prospective investors in the Fund unless preceded or accompanied by an effective prospectus.
A fund files its complete schedule of portfolio holdings with the SEC for the first and third quarters of each fiscal year on Form N-PORT. Forms N-PORT are available on the SEC’s web site at http://www.sec.gov. A fund's Forms N-PORT may be reviewed and copied at the SEC’s Public Reference Room in Washington, DC. Information regarding the operation of the SEC's Public Reference Room may be obtained by calling 1-800-SEC-0330.
For a complete list of a fund's portfolio holdings, view the most recent holdings listing, semiannual report, or annual report on Fidelity's web site at http://www.fidelity.com, http://www.institutional.fidelity.com, or http://www.401k.com, as applicable.
NOT FDIC INSURED •MAY LOSE VALUE •NO BANK GUARANTEE
Neither the Fund nor Fidelity Distributors Corporation is a bank.
Note to Shareholders:
Early in 2020, the outbreak and spread of a new coronavirus emerged as a public health emergency that had a major influence on financial markets, primarily based on its impact on the global economy and the outlook for corporate earnings. The virus causes a respiratory disease known as COVID-19. On March 11, the World Health Organization declared the COVID-19 outbreak a pandemic, citing sustained risk of further global spread.
In the weeks following, as the crisis worsened, we witnessed an escalating human tragedy with wide-scale social and economic consequences from coronavirus-containment measures. The outbreak of COVID-19 prompted a number of measures to limit the spread, including travel and border restrictions, quarantines, and restrictions on large gatherings. In turn, these resulted in lower consumer activity, diminished demand for a wide range of products and services, disruption in manufacturing and supply chains, and – given the wide variability in outcomes regarding the outbreak – significant market uncertainty and volatility. Amid the turmoil, the U.S. government took unprecedented action – in concert with the U.S. Federal Reserve and central banks around the world – to help support consumers, businesses, and the broader economy, and to limit disruption to the financial system.
The situation continues to unfold, and the extent and duration of its impact on financial markets and the economy remain highly uncertain. Extreme events such as the coronavirus crisis are “exogenous shocks” that can have significant adverse effects on mutual funds and their investments. Although multiple asset classes may be affected by market disruption, the duration and impact may not be the same for all types of assets.
Fidelity is committed to helping you stay informed amid news about COVID-19 and during increased market volatility, and we’re taking extra steps to be responsive to customer needs. We encourage you to visit our websites, where we offer ongoing updates, commentary, and analysis on the markets and our funds.
Performance: The Bottom Line
Average annual total return reflects the change in the value of an investment, assuming reinvestment of distributions from dividend income and capital gains (the profits earned upon the sale of securities that have grown in value, if any) and assuming a constant rate of performance each year. The hypothetical investment and the average annual total returns do not reflect the deduction of taxes that a shareholder would pay on fund distributions or the redemption of fund shares. During periods of reimbursement by Fidelity, a fund’s total return will be greater than it would be had the reimbursement not occurred. How a fund did yesterday is no guarantee of how it will do tomorrow.
Average Annual Total Returns
| For the periods ended July 31, 2020 | Past 1 year | Life of fundA |
| Fidelity® Low-Priced Stock K6 Fund | (0.74)% | 4.27% |
A From May 26, 2017
$10,000 Over Life of Fund
Let's say hypothetically that $10,000 was invested in Fidelity® Low-Priced Stock K6 Fund on May 26, 2017, when the fund started.
The chart shows how the value of your investment would have changed, and also shows how the Russell 2000® Index performed over the same period.

| Period Ending Values |
| $11,425 | Fidelity® Low-Priced Stock K6 Fund |
| $11,190 | Russell 2000® Index |
Management's Discussion of Fund Performance
Market Recap: The S&P 500
® index gained 11.96% for the 12 months ending July 31, 2020, in what was a bumpy ride for U.S. equity investors, marked by a steep but brief decline due to the early-2020 outbreak and spread of the coronavirus, followed by a historic rebound. Declared a pandemic on March 11, the COVID-19 crisis and containment efforts caused broad contraction in economic activity, along with extreme uncertainty, volatility and dislocation in financial markets. By mid-March, U.S. stocks entered bear-market territory less than a month after hitting an all-time high and extending the longest-running bull market in American history. Stocks slid in late February, after a surge in COVID-19 cases outside China. The sudden downtrend continued in March (-12%), capping the index’s worst quarter since 2008. A historically rapid and expansive U.S. monetary/fiscal-policy response provided a partial offset to the economic disruption and fueled a sharp uptrend. Aggressive support for financial markets by the U.S. Federal Reserve, plans for reopening the economy and improving infection data boosted stocks in April (+13%) and May (+5%). In June and July, the index gained amid progress on potential treatments and signs of an early recovery in economic activity. For the full 12 months, growth stocks widely topped value, while large-caps handily bested smaller-caps. The information technology sector (+39%) led the way, followed by consumer discretionary (+22%). In contrast, energy (-38%) fell hard along with the price of crude oil.
Comments from Lead Manager Joel Tillinghast and Co-Managers Sam Chamovitz and Salim Hart: For the fiscal year ending July 31, 2020, the fund returned -0.74%, outperforming the -4.59% result of the benchmark Russell 2000
® Index. The top contributor to performance versus the benchmark was an underweighting in the financials sector, primarily driven by the banking industry. Stock selection in energy and an underweighting in real estate also bolstered performance. UnitedHealth Group, the fund's largest individual contributor, rose 23% this period. This was our largest holding. Our second-largest contributor was Ansys, which gained 53% the past 12 months. Another contributor this period was Best Buy. The stock gained 34% the past 12 months. This was among the biggest holdings in the fund. All of these contributors were non-benchmark positions. Foreign holdings contributed to fund performance, aided in part by favorable foreign exchange. Conversely, the largest detractor from performance versus the benchmark was an underweighting and security selection in the health care sector, primarily within the pharmaceuticals, biotechnology & life sciences industry. Weak picks in the consumer discretionary sector, especially within the consumer durables & apparel industry, also hampered the fund's relative result. Also hampering the fund's relative performance was an overweighting in energy. Our non-benchmark stake in Unum Group was the fund's largest individual relative detractor, due to its -43% result. Our second-largest relative detractor this period was avoiding Teladoc Health, a benchmark component that gained 183%. Another notable relative detractor was an out-of-benchmark stake in Synchrony Financial (-36%). Notable changes in positioning include increased exposure to the consumer staples sector and a lower allocation to energy. In addition, the fund’s stake in cash declined to about 5% at period end, from roughly 8% a year ago.
The views expressed above reflect those of the portfolio manager(s) only through the end of the period as stated on the cover of this report and do not necessarily represent the views of Fidelity or any other person in the Fidelity organization. Any such views are subject to change at any time based upon market or other conditions and Fidelity disclaims any responsibility to update such views. These views may not be relied on as investment advice and, because investment decisions for a Fidelity fund are based on numerous factors, may not be relied on as an indication of trading intent on behalf of any Fidelity fund.
Investment Summary (Unaudited)
Top Ten Stocks as of July 31, 2020
| | % of fund's net assets |
| UnitedHealth Group, Inc. | 5.5 |
| Metro, Inc. Class A (sub. vtg.) | 3.4 |
| AutoZone, Inc. | 3.3 |
| Ross Stores, Inc. | 3.2 |
| Next PLC | 2.7 |
| Best Buy Co., Inc. | 2.5 |
| Amgen, Inc. | 2.4 |
| MetLife, Inc. | 2.4 |
| Seagate Technology LLC | 2.3 |
| Monster Beverage Corp. | 2.2 |
| | 29.9 |
Top Five Market Sectors as of July 31, 2020
| | % of fund's net assets |
| Consumer Discretionary | 22.9 |
| Information Technology | 15.5 |
| Health Care | 13.3 |
| Consumer Staples | 12.6 |
| Financials | 11.7 |
Asset Allocation (% of fund's net assets)
| As of July 31, 2020* |
| | Stocks | 94.8% |
| | Short-Term Investments and Net Other Assets (Liabilities) | 5.2% |

* Foreign investments - 42.5%
Schedule of Investments July 31, 2020
Showing Percentage of Net Assets
| Common Stocks - 94.7% | | | |
| | | Shares | Value |
| COMMUNICATION SERVICES - 2.0% | | | |
| Diversified Telecommunication Services - 0.0% | | | |
| Iridium Communications, Inc. (a) | | 21,275 | $582,722 |
| Interactive Media & Services - 0.9% | | | |
| Yahoo! Japan Corp. | | 3,010,300 | 16,007,984 |
| Media - 1.1% | | | |
| AMC Networks, Inc. Class A (a)(b) | | 6,662 | 153,892 |
| Comcast Corp. Class A | | 143,001 | 6,120,443 |
| Corus Entertainment, Inc. Class B (non-vtg.) | | 42,192 | 75,599 |
| Discovery Communications, Inc.: | | | |
| Class A (a)(b) | | 209,415 | 4,418,657 |
| Class C (non-vtg.) (a) | | 52,377 | 992,544 |
| Gray Television, Inc. (a) | | 10,200 | 146,268 |
| Hyundai HCN | | 211,755 | 702,096 |
| Intage Holdings, Inc. | | 238,100 | 1,941,149 |
| MSG Network, Inc. Class A (a) | | 20,816 | 198,376 |
| Nexstar Broadcasting Group, Inc. Class A | | 3,993 | 349,986 |
| Pico Far East Holdings Ltd. | | 1,772,000 | 233,209 |
| Proto Corp. | | 14,300 | 140,494 |
| RKB Mainichi Broadcasting Corp. | | 2,800 | 147,598 |
| Saga Communications, Inc. Class A | | 29,975 | 700,816 |
| Sky Network Television Ltd. (a) | | 1,920,252 | 164,283 |
| Tegna, Inc. | | 131,236 | 1,545,960 |
| The New York Times Co. Class A | | 8,218 | 379,179 |
| TOW Co. Ltd. | | 263,400 | 646,960 |
| TVA Group, Inc. Class B (non-vtg.) (a) | | 204,775 | 206,388 |
| ViacomCBS, Inc. Class B | | 20,700 | 539,649 |
| WOWOW INC. | | 13,100 | 303,940 |
| | | | 20,107,486 |
|
| TOTAL COMMUNICATION SERVICES | | | 36,698,192 |
|
| CONSUMER DISCRETIONARY - 22.9% | | | |
| Auto Components - 1.1% | | | |
| Adient PLC (a) | | 44,001 | 732,177 |
| ASTI Corp. | | 12,900 | 145,019 |
| DaikyoNishikawa Corp. | | 19,200 | 80,170 |
| ElringKlinger AG (a)(b) | | 50,252 | 304,851 |
| G-Tekt Corp. | | 11,500 | 94,842 |
| Gentex Corp. | | 165,971 | 4,479,557 |
| GUD Holdings Ltd. | | 21,372 | 171,626 |
| Hi-Lex Corp. | | 110,000 | 1,139,956 |
| Lear Corp. | | 14,680 | 1,620,378 |
| Linamar Corp. | | 18,899 | 564,381 |
| Motonic Corp. | | 221,600 | 1,380,529 |
| Murakami Corp. | | 66,500 | 1,432,337 |
| Nippon Seiki Co. Ltd. | | 214,700 | 2,405,500 |
| Piolax, Inc. | | 147,500 | 2,026,026 |
| S&T Holdings Co. Ltd. | | 68,802 | 894,646 |
| Samsung Climate Control Co. Ltd. | | 28,201 | 148,568 |
| SJM Co. Ltd. | | 50 | 106 |
| Strattec Security Corp. | | 27,780 | 600,326 |
| Sungwoo Hitech Co. Ltd. | | 195,830 | 479,807 |
| TBK Co. Ltd. | | 54,800 | 218,983 |
| Yachiyo Industry Co. Ltd. | | 64,500 | 228,497 |
| Yutaka Giken Co. Ltd. | | 73,000 | 953,748 |
| | | | 20,102,030 |
| Automobiles - 0.0% | | | |
| Isuzu Motors Ltd. | | 24,200 | 197,387 |
| Kabe Husvagnar AB (B Shares) | | 19,905 | 355,920 |
| | | | 553,307 |
| Distributors - 0.1% | | | |
| Arata Corp. | | 6,600 | 312,994 |
| Central Automotive Products Ltd. | | 4,500 | 90,123 |
| LKQ Corp. (a) | | 9,000 | 253,710 |
| Nakayamafuku Co. Ltd. | | 39,500 | 169,038 |
| PALTAC Corp. | | 2,600 | 140,494 |
| SPK Corp. | | 36,800 | 465,150 |
| Uni-Select, Inc. | | 94,250 | 538,994 |
| | | | 1,970,503 |
| Diversified Consumer Services - 0.1% | | | |
| Clip Corp. | | 15,600 | 103,602 |
| Cross-Harbour Holdings Ltd. | | 165,000 | 229,927 |
| Estacio Participacoes SA | | 21,600 | 140,327 |
| Step Co. Ltd. | | 63,600 | 871,192 |
| | | | 1,345,048 |
| Hotels, Restaurants & Leisure - 0.2% | | | |
| Ark Restaurants Corp. | | 6,492 | 64,011 |
| Brinker International, Inc. | | 16,900 | 454,441 |
| Curves Holdings Co. Ltd. (a) | | 19,700 | 95,471 |
| Flanigans Enterprises, Inc. (a) | | 6,720 | 105,936 |
| Hiday Hidaka Corp. | | 103,492 | 1,436,208 |
| Ibersol SGPS SA (a) | | 65,695 | 417,881 |
| Koshidaka Holdings Co. Ltd. | | 19,700 | 61,786 |
| Sportscene Group, Inc. Class A | | 39,250 | 83,221 |
| The Monogatari Corp. | | 3,800 | 257,749 |
| The Restaurant Group PLC | | 1,204,412 | 696,846 |
| | | | 3,673,550 |
| Household Durables - 4.5% | | | |
| Barratt Developments PLC | | 4,809,417 | 32,144,960 |
| Bellway PLC | | 275,332 | 9,176,028 |
| D.R. Horton, Inc. | | 131,370 | 8,691,439 |
| Dorel Industries, Inc. Class B (sub. vtg.) (b) | | 121,346 | 877,855 |
| Emak SpA (a) | | 315,882 | 290,977 |
| First Juken Co. Ltd. | | 83,200 | 704,239 |
| Gree Electric Appliances, Inc. of Zhuhai (A Shares) | | 93,300 | 761,231 |
| Hamilton Beach Brands Holding Co.: | | | |
| Class A (b) | | 12,118 | 184,194 |
| Class B | | 4,742 | 72,078 |
| Helen of Troy Ltd. (a) | | 74,860 | 14,092,395 |
| Henry Boot PLC | | 161,445 | 528,329 |
| Iida Group Holdings Co. Ltd. | | 4,200 | 64,594 |
| iRobot Corp. (a)(b) | | 1,300 | 94,497 |
| Lennar Corp. Class A | | 4,600 | 332,810 |
| M/I Homes, Inc. (a) | | 74,133 | 3,086,157 |
| Mohawk Industries, Inc. (a) | | 75,728 | 6,046,881 |
| Q.E.P. Co., Inc. (a) | | 136 | 1,530 |
| Sanei Architecture Planning Co. Ltd. | | 71,700 | 807,391 |
| Taylor Morrison Home Corp. (a) | | 42,576 | 998,407 |
| Tempur Sealy International, Inc. (a) | | 2,600 | 210,470 |
| Token Corp. | | 49,400 | 3,136,063 |
| TopBuild Corp. (a) | | 1,200 | 158,304 |
| TRI Pointe Homes, Inc. (a) | | 17,000 | 284,240 |
| Whirlpool Corp. | | 1,400 | 228,368 |
| | | | 82,973,437 |
| Internet & Direct Marketing Retail - 0.2% | | | |
| Aucnet, Inc. | | 11,200 | 119,348 |
| Belluna Co. Ltd. | | 531,600 | 3,761,451 |
| Dustin Group AB (c) | | 23,262 | 140,680 |
| Moneysupermarket.com Group PLC | | 31,152 | 119,887 |
| | | | 4,141,366 |
| Leisure Products - 0.0% | | | |
| Mars Group Holdings Corp. | | 32,900 | 461,231 |
| Miroku Corp. | | 10,100 | 151,421 |
| | | | 612,652 |
| Multiline Retail - 3.1% | | | |
| Big Lots, Inc. (b) | | 132,737 | 5,221,874 |
| Lifestyle China Group Ltd. (a) | | 1,319,500 | 272,402 |
| Lifestyle International Holdings Ltd. | | 1,548,500 | 1,254,736 |
| Next PLC | | 715,941 | 51,075,589 |
| | | | 57,824,601 |
| Specialty Retail - 12.6% | | | |
| AT-Group Co. Ltd. | | 78,800 | 963,272 |
| AutoNation, Inc. (a) | | 15,168 | 778,725 |
| AutoZone, Inc. (a) | | 50,461 | 60,927,621 |
| Bed Bath & Beyond, Inc. (b) | | 932,042 | 10,084,694 |
| Best Buy Co., Inc. | | 466,909 | 46,499,467 |
| BMTC Group, Inc. | | 233,262 | 1,577,777 |
| Bonia Corp. Bhd | | 50 | 7 |
| Buffalo Co. Ltd. | | 5,700 | 53,955 |
| Burlington Stores, Inc. (a) | | 1,464 | 275,232 |
| Delek Automotive Systems Ltd. | | 53,055 | 247,749 |
| Foot Locker, Inc. | | 89,829 | 2,640,074 |
| GameStop Corp. Class A (a)(b) | | 164,337 | 658,991 |
| Genesco, Inc. (a) | | 42,087 | 654,453 |
| Goldlion Holdings Ltd. | | 1,579,000 | 299,489 |
| Guess?, Inc. | | 317,276 | 3,280,634 |
| Hibbett Sports, Inc. (a) | | 8,000 | 185,520 |
| Hour Glass Ltd. | | 1,123,200 | 553,018 |
| IA Group Corp. | | 6,900 | 206,632 |
| JB Hi-Fi Ltd. | | 7,489 | 244,358 |
| John David Group PLC | | 549,184 | 4,353,549 |
| Jumbo SA | | 594,913 | 11,639,919 |
| K's Holdings Corp. | | 268,400 | 3,448,340 |
| Ku Holdings Co. Ltd. | | 64,700 | 507,918 |
| Leon's Furniture Ltd. | | 17,385 | 173,792 |
| Mr. Bricolage SA (a)(b) | | 51,135 | 313,219 |
| Murphy U.S.A., Inc. (a) | | 5,624 | 744,674 |
| Nafco Co. Ltd. | | 115,100 | 2,006,136 |
| Ross Stores, Inc. | | 661,069 | 59,278,057 |
| Sally Beauty Holdings, Inc. (a) | | 336,868 | 3,911,037 |
| The Buckle, Inc. (b) | | 378,816 | 6,072,420 |
| Urban Outfitters, Inc. (a)(b) | | 154,038 | 2,547,789 |
| USS Co. Ltd. | | 337,200 | 5,004,404 |
| Williams-Sonoma, Inc. | | 48,916 | 4,261,562 |
| | | | 234,394,484 |
| Textiles, Apparel & Luxury Goods - 1.0% | | | |
| Best Pacific International Holdings Ltd. | | 368,000 | 49,856 |
| Capri Holdings Ltd. (a) | | 147,200 | 2,205,056 |
| CRG, Inc. BHD (a)(d) | | 200 | 4 |
| Deckers Outdoor Corp. (a) | | 1,400 | 292,950 |
| Embry Holdings Ltd. | | 126,000 | 17,070 |
| Ff Group (a)(d) | | 289,100 | 408,654 |
| Fossil Group, Inc. (a) | | 287,626 | 952,042 |
| Gildan Activewear, Inc. | | 549,200 | 9,746,153 |
| Handsome Co. Ltd. | | 89,900 | 2,277,834 |
| JLM Couture, Inc. (a)(d) | | 9,534 | 20,975 |
| McRae Industries, Inc. | | 1,668 | 30,274 |
| Steven Madden Ltd. | | 10,548 | 223,407 |
| Sun Hing Vision Group Holdings Ltd. | | 1,176,000 | 185,118 |
| Tapestry, Inc. | | 8,400 | 112,224 |
| Ted Baker PLC | | 336,358 | 323,615 |
| Texwinca Holdings Ltd. | | 3,522,000 | 499,877 |
| Victory City International Holdings Ltd. (a) | | 1,056,861 | 19,500 |
| Victory City International Holdings Ltd. rights 8/6/20 (a) | | 2,113,722 | 2,727 |
| Youngone Corp. | | 25,264 | 510,198 |
| Youngone Holdings Co. Ltd. | | 19 | 552 |
| Yue Yuen Industrial (Holdings) Ltd. | | 108,000 | 171,400 |
| | | | 18,049,486 |
|
| TOTAL CONSUMER DISCRETIONARY | | | 425,640,464 |
|
| CONSUMER STAPLES - 12.6% | | | |
| Beverages - 2.6% | | | |
| A.G. Barr PLC | | 198,851 | 1,119,273 |
| Britvic PLC | | 512,189 | 5,353,586 |
| Jinro Distillers Co. Ltd. | | 1,990 | 49,922 |
| Monster Beverage Corp. (a) | | 515,289 | 40,439,881 |
| Olvi PLC (A Shares) | | 5,723 | 286,510 |
| Spritzer Bhd | | 288,800 | 137,808 |
| Yantai Changyu Pioneer Wine Co. Ltd. (B Shares) | | 168,255 | 339,536 |
| | | | 47,726,516 |
| Food & Staples Retailing - 8.5% | | | |
| Amsterdam Commodities NV | | 10,348 | 229,893 |
| Aoki Super Co. Ltd. | | 7,000 | 191,507 |
| Belc Co. Ltd. | | 133,900 | 9,600,879 |
| BJ's Wholesale Club Holdings, Inc. (a) | | 4,400 | 176,220 |
| Casey's General Stores, Inc. | | 1,567 | 249,451 |
| Cosmos Pharmaceutical Corp. | | 153,300 | 27,993,850 |
| Create SD Holdings Co. Ltd. | | 318,400 | 11,414,936 |
| Daikokutenbussan Co. Ltd. | | 26,735 | 1,505,272 |
| Dong Suh Companies, Inc. | | 79,725 | 1,440,018 |
| Genky DrugStores Co. Ltd. | | 52,700 | 1,827,113 |
| Halows Co. Ltd. | | 106,800 | 3,617,004 |
| Jm Holdings Co. Ltd. | | 5,200 | 180,039 |
| Kirindo Holdings Co. Ltd. | | 9,900 | 251,580 |
| Kroger Co. | | 8,600 | 299,194 |
| Kusuri No Aoki Holdings Co. Ltd. | | 38,800 | 3,610,410 |
| McColl's Retail Group PLC | | 106,496 | 51,510 |
| Metro, Inc. Class A (sub. vtg.) | | 1,441,600 | 63,241,193 |
| Naked Wines PLC (b) | | 66,568 | 368,156 |
| North West Co., Inc. | | 8,893 | 197,851 |
| Qol Holdings Co. Ltd. | | 148,900 | 1,451,654 |
| Sundrug Co. Ltd. | | 254,900 | 8,692,920 |
| Total Produce PLC | | 642,358 | 808,119 |
| United Natural Foods, Inc. (a)(b) | | 13,100 | 260,035 |
| Valor Holdings Co. Ltd. | | 18,400 | 398,228 |
| Walgreens Boots Alliance, Inc. | | 341,001 | 13,882,151 |
| Yaoko Co. Ltd. | | 67,000 | 5,316,707 |
| | | | 157,255,890 |
| Food Products - 1.3% | | | |
| Carr's Group PLC | | 132,461 | 223,241 |
| Cranswick PLC | | 33,010 | 1,546,921 |
| Food Empire Holdings Ltd. | | 2,916,700 | 1,111,895 |
| Fresh Del Monte Produce, Inc. | | 301,561 | 6,809,247 |
| Hilton Food Group PLC | | 38,835 | 560,202 |
| Inghams Group Ltd. | | 72,697 | 172,435 |
| Ingredion, Inc. | | 32,722 | 2,830,453 |
| Kaveri Seed Co. Ltd. | | 4,300 | 34,684 |
| Lassonde Industries, Inc. Class A (sub. vtg.) | | 1,106 | 135,252 |
| Mitsui Sugar Co. Ltd. | | 25,300 | 458,892 |
| Nam Yang Dairy Products | | 631 | 160,407 |
| Origin Enterprises PLC | | 551,765 | 2,060,347 |
| Pacific Andes International Holdings Ltd. (d) | | 3,104,000 | 29,237 |
| Pickles Corp. | | 7,200 | 179,158 |
| Rocky Mountain Chocolate Factory, Inc. | | 34,322 | 113,949 |
| S Foods, Inc. | | 28,700 | 684,321 |
| Seaboard Corp. | | 2,800 | 7,569,100 |
| Thai President Foods PCL | | 36,780 | 229,949 |
| The Simply Good Foods Co. (a) | | 7,400 | 177,896 |
| | | | 25,087,586 |
| Personal Products - 0.1% | | | |
| Hengan International Group Co. Ltd. | | 34,500 | 289,566 |
| Sarantis SA | | 237,587 | 2,364,864 |
| | | | 2,654,430 |
| Tobacco - 0.1% | | | |
| Karelia Tobacco Co., Inc. (a) | | 97 | 28,794 |
| Scandinavian Tobacco Group A/S (c) | | 123,355 | 1,812,753 |
| | | | 1,841,547 |
|
| TOTAL CONSUMER STAPLES | | | 234,565,969 |
|
| ENERGY - 3.4% | | | |
| Energy Equipment & Services - 0.2% | | | |
| AKITA Drilling Ltd. Class A (non-vtg.) | | 97,582 | 24,406 |
| Bristow Group, Inc. (a) | | 5,246 | 83,988 |
| Cactus, Inc. | | 5,200 | 117,624 |
| Cathedral Energy Services Ltd. (a)(b) | | 78,887 | 8,834 |
| Championx Corp. (a) | | 28,900 | 274,839 |
| Geospace Technologies Corp. (a) | | 53,394 | 403,125 |
| Helix Energy Solutions Group, Inc. (a) | | 41,700 | 174,723 |
| John Wood Group PLC | | 57,935 | 144,886 |
| KS Energy Services Ltd. (a) | | 799,500 | 9,189 |
| Liberty Oilfield Services, Inc. Class A | | 254,134 | 1,435,857 |
| Oil States International, Inc. (a) | | 200,377 | 897,689 |
| PHX Energy Services Corp. (a) | | 93,745 | 72,787 |
| Smart Sand, Inc. (a) | | 7,400 | 8,658 |
| Solaris Oilfield Infrastructure, Inc. Class A | | 8,800 | 63,888 |
| Tidewater, Inc. warrants 11/14/24 (a) | | 2,789 | 1,032 |
| Total Energy Services, Inc. | | 121,070 | 189,814 |
| | | | 3,911,339 |
| Oil, Gas & Consumable Fuels - 3.2% | | | |
| Adams Resources & Energy, Inc. | | 8,483 | 179,585 |
| Beach Energy Ltd. | | 1,106,083 | 1,118,191 |
| Berry Petroleum Corp. | | 115,519 | 543,517 |
| Bonanza Creek Energy, Inc. (a) | | 102,130 | 1,857,745 |
| China Petroleum & Chemical Corp.: | | | |
| (H Shares) | | 174,000 | 74,128 |
| sponsored ADR (H Shares) | | 6,967 | 296,167 |
| Cimarex Energy Co. | | 3,791 | 92,728 |
| CNX Resources Corp. (a) | | 68,638 | 662,357 |
| ConocoPhillips Co. | | 2,000 | 74,780 |
| CONSOL Energy, Inc. (a) | | 5,500 | 32,340 |
| Contango Oil & Gas Co. (a)(b) | | 106,012 | 188,701 |
| Delek U.S. Holdings, Inc. | | 82,630 | 1,444,372 |
| Eni SpA | | 371,633 | 3,310,436 |
| Enterprise Products Partners LP | | 6,968 | 122,637 |
| EQT Corp. | | 423,505 | 6,149,293 |
| Fuji Kosan Co. Ltd. | | 19,400 | 76,057 |
| Great Eastern Shipping Co. Ltd. | | 365,452 | 1,104,112 |
| Hankook Shell Oil Co. Ltd. | | 3,600 | 707,441 |
| HollyFrontier Corp. | | 4,053 | 111,458 |
| Kyungdong Invest Co. Ltd. | | 4,756 | 109,170 |
| Marathon Oil Corp. | | 887,335 | 4,871,469 |
| Marathon Petroleum Corp. | | 164,586 | 6,287,185 |
| Murphy Oil Corp. (b) | | 938,422 | 12,396,555 |
| NACCO Industries, Inc. Class A | | 16,174 | 353,240 |
| Oil & Natural Gas Corp. Ltd. | | 2,999,469 | 3,134,789 |
| Ovintiv, Inc. (b) | | 143,557 | 1,391,067 |
| QEP Resources, Inc. | | 670,267 | 985,292 |
| Reliance Industries Ltd. | | 8,400 | 231,762 |
| Southwestern Energy Co. (a) | | 1,508,361 | 3,665,317 |
| Star Petroleum Refining PCL | | 804,400 | 179,243 |
| Thai Oil PCL (For. Reg.) | | 35,300 | 47,534 |
| Total SA sponsored ADR | | 131,554 | 4,954,324 |
| Whitecap Resources, Inc. | | 30,997 | 51,143 |
| World Fuel Services Corp. | | 91,266 | 2,147,489 |
| WPX Energy, Inc. (a) | | 51,700 | 308,649 |
| | | | 59,260,273 |
|
| TOTAL ENERGY | | | 63,171,612 |
|
| FINANCIALS - 11.7% | | | |
| Banks - 0.7% | | | |
| ACNB Corp. | | 6,831 | 140,719 |
| Bank Ireland Group PLC | | 858,210 | 1,769,125 |
| Bank of America Corp. | | 6,759 | 168,164 |
| Camden National Corp. | | 8,449 | 267,749 |
| Cathay General Bancorp | | 55,610 | 1,344,650 |
| Central Pacific Financial Corp. | | 5,000 | 77,800 |
| Central Valley Community Bancorp | | 7,575 | 99,536 |
| Codorus Valley Bancorp, Inc. | | 54,272 | 637,696 |
| Community Trust Bancorp, Inc. | | 5,367 | 164,284 |
| Dah Sing Banking Group Ltd. | | 117,200 | 105,854 |
| Dimeco, Inc. | | 2,243 | 78,617 |
| East West Bancorp, Inc. | | 31,390 | 1,087,977 |
| First Bancorp, Puerto Rico | | 117,437 | 638,857 |
| First Citizens Bancshares, Inc. | | 609 | 259,355 |
| First Hawaiian, Inc. | | 7,594 | 131,984 |
| FNB Corp., Pennsylvania | | 12,629 | 93,581 |
| Hanmi Financial Corp. | | 26,321 | 242,943 |
| Hope Bancorp, Inc. | | 110,105 | 928,185 |
| Independent Bank Corp. | | 10,735 | 149,914 |
| LCNB Corp. | | 7,700 | 96,404 |
| Meridian Bank/Malvern, PA (b) | | 10,236 | 153,745 |
| NIBC Holding NV (c) | | 17,788 | 153,169 |
| OFG Bancorp | | 29,289 | 383,100 |
| Sparebank 1 Sr Bank ASA (primary capital certificate) (a) | | 87,485 | 690,607 |
| Sparebanken More (primary capital certificate) | | 15,032 | 492,157 |
| Sparebanken Nord-Norge | | 173,032 | 1,190,066 |
| Trico Bancshares | | 2,018 | 56,504 |
| Van Lanschot NV (Bearer) | | 72,268 | 1,251,383 |
| Western Alliance Bancorp. | | 5,500 | 197,725 |
| | | | 13,051,850 |
| Capital Markets - 1.4% | | | |
| AllianceBernstein Holding LP | | 31,200 | 886,392 |
| Banca Generali SpA | | 4,089 | 121,379 |
| GAMCO Investors, Inc. Class A | | 8,999 | 106,098 |
| Hamilton Lane, Inc. Class A | | 4,265 | 308,104 |
| Lazard Ltd. Class A | | 188,543 | 5,528,081 |
| State Street Corp. | | 252,495 | 16,106,656 |
| Tullett Prebon PLC | | 40,122 | 174,155 |
| Waddell & Reed Financial, Inc. Class A (b) | | 191,677 | 2,796,567 |
| | | | 26,027,432 |
| Consumer Finance - 2.7% | | | |
| Aeon Credit Service (Asia) Co. Ltd. | | 916,000 | 631,129 |
| Cash Converters International Ltd. (a) | | 1,357,590 | 174,587 |
| Discover Financial Services | | 206,724 | 10,218,367 |
| H&T Group PLC | | 35,703 | 147,216 |
| Navient Corp. | | 70,551 | 561,586 |
| Nicholas Financial, Inc. (a) | | 16,464 | 134,346 |
| OneMain Holdings, Inc. | | 5,200 | 149,240 |
| Santander Consumer U.S.A. Holdings, Inc. | | 775,135 | 14,231,479 |
| Synchrony Financial | | 1,133,310 | 25,080,150 |
| | | | 51,328,100 |
| Diversified Financial Services - 0.1% | | | |
| Far East Horizon Ltd. | | 114,000 | 93,844 |
| Ricoh Leasing Co. Ltd. | | 57,400 | 1,441,304 |
| Voya Financial, Inc. | | 4,000 | 197,600 |
| | | | 1,732,748 |
| Insurance - 6.1% | | | |
| AEGON NV | | 3,273,374 | 9,592,257 |
| AFLAC, Inc. | | 11,181 | 397,708 |
| Allstate Corp. | | 3,146 | 296,951 |
| Amerisafe, Inc. | | 3,989 | 253,142 |
| ASR Nederland NV | | 43,169 | 1,389,756 |
| Chubb Ltd. | | 1,322 | 168,211 |
| FBD Holdings PLC (a) | | 8,633 | 67,524 |
| First American Financial Corp. | | 8,451 | 431,086 |
| Globe Life, Inc. | | 2,000 | 159,200 |
| Hartford Financial Services Group, Inc. | | 7,700 | 325,864 |
| Hiscox Ltd. | | 12,425 | 127,122 |
| Hyundai Fire & Marine Insurance Co. Ltd. | | 10,217 | 199,067 |
| Lincoln National Corp. | | 380,205 | 14,170,240 |
| MetLife, Inc. | | 1,183,302 | 44,787,981 |
| National Western Life Group, Inc. | | 9,983 | 1,944,589 |
| NN Group NV | | 94,242 | 3,441,383 |
| Old Republic International Corp. | | 8,000 | 128,560 |
| Primerica, Inc. | | 4,446 | 532,008 |
| Principal Financial Group, Inc. | | 14,055 | 596,354 |
| Prudential Financial, Inc. | | 32,635 | 2,068,080 |
| Reinsurance Group of America, Inc. | | 85,100 | 7,254,775 |
| RenaissanceRe Holdings Ltd. | | 35,151 | 6,340,537 |
| The Travelers Companies, Inc. | | 2,225 | 254,585 |
| Unum Group | | 1,102,074 | 18,988,735 |
| | | | 113,915,715 |
| Mortgage Real Estate Investment Trusts - 0.4% | | | |
| Annaly Capital Management, Inc. | | 907,299 | 6,723,086 |
| Thrifts & Mortgage Finance - 0.3% | | | |
| ASAX Co. Ltd. | | 26,900 | 166,195 |
| Genworth MI Canada, Inc. | | 194,086 | 4,809,223 |
| Genworth Mortgage Insurance Ltd. | | 306,210 | 370,818 |
| | | | 5,346,236 |
|
| TOTAL FINANCIALS | | | 218,125,167 |
|
| HEALTH CARE - 13.3% | | | |
| Biotechnology - 2.7% | | | |
| Alexion Pharmaceuticals, Inc. (a) | | 4,682 | 479,858 |
| Amgen, Inc. | | 183,652 | 44,934,135 |
| Biogen, Inc. (a) | | 10,619 | 2,916,933 |
| Cell Biotech Co. Ltd. | | 3,100 | 46,272 |
| Essex Bio-Technology Ltd. | | 98,900 | 62,783 |
| Gilead Sciences, Inc. | | 18,114 | 1,259,466 |
| | | | 49,699,447 |
| Health Care Equipment & Supplies - 0.4% | | | |
| Apex Biotechnology Corp. | | 58,900 | 53,460 |
| Arts Optical International Holdings Ltd. (a) | | 1,443,400 | 152,715 |
| Boston Scientific Corp. (a) | | 8,542 | 329,465 |
| Hoshiiryou Sanki Co. Ltd. | | 16,700 | 562,425 |
| Integra LifeSciences Holdings Corp. (a) | | 3,929 | 187,610 |
| Nakanishi, Inc. | | 36,300 | 569,593 |
| Prim SA | | 85,307 | 932,523 |
| ResMed, Inc. | | 3,141 | 636,084 |
| Shandong Weigao Medical Polymer Co. Ltd. (H Shares) | | 48,000 | 122,008 |
| St.Shine Optical Co. Ltd. | | 173,000 | 1,826,510 |
| Techno Medica Co. Ltd. | | 2,000 | 32,705 |
| Utah Medical Products, Inc. | | 19,965 | 1,627,148 |
| Vieworks Co. Ltd. | | 5,000 | 150,519 |
| | | | 7,182,765 |
| Health Care Providers & Services - 9.5% | | | |
| AmerisourceBergen Corp. | | 1,200 | 120,228 |
| Anthem, Inc. | | 147,068 | 40,267,218 |
| Cigna Corp. | | 1,470 | 253,854 |
| CVS Health Corp. | | 159,742 | 10,054,161 |
| DVx, Inc. | | 39,900 | 335,845 |
| Hi-Clearance, Inc. | | 112,000 | 410,054 |
| Humana, Inc. | | 1,013 | 397,552 |
| Laboratory Corp. of America Holdings (a) | | 21,429 | 4,134,083 |
| Medica Sur SA de CV (a) | | 19,825 | 13,977 |
| MEDNAX, Inc. (a) | | 101,975 | 2,037,461 |
| Patterson Companies, Inc. | | 5,800 | 154,048 |
| Quest Diagnostics, Inc. | | 5,545 | 704,603 |
| Ship Healthcare Holdings, Inc. | | 4,000 | 171,555 |
| Tokai Corp. | | 22,300 | 444,083 |
| Triple-S Management Corp. | | 124,317 | 2,419,209 |
| United Drug PLC (United Kingdom) | | 73,639 | 686,321 |
| UnitedHealth Group, Inc. | | 337,429 | 102,166,738 |
| Universal Health Services, Inc. Class B | | 104,318 | 11,464,548 |
| WIN-Partners Co. Ltd. | | 148,900 | 1,284,263 |
| | | | 177,519,801 |
| Health Care Technology - 0.0% | | | |
| Schrodinger, Inc. (b) | | 15,312 | 1,108,283 |
| Life Sciences Tools & Services - 0.0% | | | |
| Berkeley Lights, Inc. (a) | | 2,400 | 143,928 |
| Pharmaceuticals - 0.7% | | | |
| Bliss Gvs Pharma Ltd. (a) | | 287,698 | 412,039 |
| Bristol-Myers Squibb Co. | | 1,700 | 99,722 |
| Bristol-Myers Squibb Co. rights (a) | | 69,622 | 250,639 |
| Daewoong Co. Ltd. | | 21,038 | 450,364 |
| Daito Pharmaceutical Co. Ltd. | | 10,100 | 300,553 |
| Dawnrays Pharmaceutical Holdings Ltd. | | 2,577,200 | 295,951 |
| DongKook Pharmaceutical Co. Ltd. | | 796 | 97,648 |
| FDC Ltd. | | 219,011 | 874,495 |
| Fuji Pharma Co. Ltd. | | 46,600 | 462,676 |
| Genomma Lab Internacional SA de CV (a) | | 202,970 | 214,325 |
| Jazz Pharmaceuticals PLC (a) | | 1,500 | 162,375 |
| Korea United Pharm, Inc. | | 14,404 | 298,111 |
| Kyung Dong Pharmaceutical Co. Ltd. | | 74,604 | 782,935 |
| Lee's Pharmaceutical Holdings Ltd. | | 574,500 | 453,652 |
| Recordati SpA | | 117,520 | 6,262,695 |
| Royalty Pharma PLC | | 15,000 | 645,750 |
| Taro Pharmaceutical Industries Ltd. (a) | | 3,200 | 208,032 |
| Vivimed Labs Ltd. (a) | | 17,923 | 2,560 |
| Whanin Pharmaceutical Co. Ltd. | | 652 | 8,342 |
| | | | 12,282,864 |
|
| TOTAL HEALTH CARE | | | 247,937,088 |
|
| INDUSTRIALS - 7.2% | | | |
| Aerospace & Defense - 0.1% | | | |
| Curtiss-Wright Corp. | | 2,400 | 213,888 |
| Spirit AeroSystems Holdings, Inc. Class A | | 9,500 | 185,915 |
| Ultra Electronics Holdings PLC | | 6,118 | 190,762 |
| Vectrus, Inc. (a) | | 8,315 | 365,777 |
| | | | 956,342 |
| Air Freight & Logistics - 0.0% | | | |
| Air T Funding warrants 9/8/20 (a) | | 9,985 | 413 |
| Air T, Inc. (a)(b) | | 3,627 | 44,032 |
| FedEx Corp. | | 3,786 | 637,562 |
| | | | 682,007 |
| Building Products - 0.2% | | | |
| American Woodmark Corp. (a) | | 2,950 | 237,829 |
| Builders FirstSource, Inc. (a) | | 11,100 | 262,959 |
| Gibraltar Industries, Inc. (a) | | 5,249 | 271,478 |
| Jeld-Wen Holding, Inc. (a) | | 42,347 | 830,001 |
| Kondotec, Inc. | | 122,400 | 1,296,211 |
| Owens Corning | | 3,400 | 205,598 |
| | | | 3,104,076 |
| Commercial Services & Supplies - 0.4% | | | |
| Acme United Corp. | | 1,576 | 34,152 |
| Aeon Delight Co. Ltd. | | 6,100 | 182,963 |
| AJIS Co. Ltd. | | 53,100 | 1,176,823 |
| Asia File Corp. Bhd | | 252,700 | 110,677 |
| Calian Technologies Ltd. | | 40,485 | 1,790,837 |
| Civeo Corp. (a) | | 782,943 | 649,843 |
| Left Field Printing Group Ltd. | | 82,500 | 4,418 |
| Lion Rock Group Ltd. | | 1,320,000 | 117,518 |
| Mears Group PLC | | 56,892 | 102,026 |
| Mitie Group PLC (b) | | 2,304,537 | 986,441 |
| NICE Total Cash Management Co., Ltd. | | 79,711 | 418,598 |
| Prosegur Compania de Seguridad SA (Reg.) | | 61,664 | 161,981 |
| VICOM Ltd. | | 437,200 | 683,099 |
| VSE Corp. | | 53,674 | 1,509,850 |
| | | | 7,929,226 |
| Construction & Engineering - 0.9% | | | |
| AECOM (a) | | 142,470 | 5,155,989 |
| Arcadis NV | | 80,057 | 1,636,160 |
| Boustead Projs. Pte Ltd. | | 131,100 | 73,318 |
| Boustead Singapore Ltd. | | 275,600 | 142,843 |
| Comfort Systems U.S.A., Inc. | | 1,800 | 89,478 |
| Daiichi Kensetsu Corp. | | 102,400 | 1,657,089 |
| EMCOR Group, Inc. | | 6,774 | 464,019 |
| Geumhwa PSC Co. Ltd. | | 28,039 | 580,306 |
| Granite Construction, Inc. | | 39,169 | 664,306 |
| Kyeryong Construction Industrial Co. Ltd. | | 27,197 | 579,937 |
| Meisei Industrial Co. Ltd. | | 79,600 | 599,322 |
| Mirait Holdings Corp. | | 29,200 | 400,533 |
| Nippon Rietec Co. Ltd. | | 69,500 | 1,942,757 |
| Raiznext Corp. | | 84,600 | 948,658 |
| Severfield PLC | | 194,799 | 151,465 |
| Shinnihon Corp. | | 113,200 | 834,122 |
| United Integrated Services Co. | | 20,200 | 141,377 |
| Valmont Industries, Inc. | | 2,850 | 345,420 |
| | | | 16,407,099 |
| Electrical Equipment - 0.6% | | | |
| Acuity Brands, Inc. | | 10,545 | 1,045,010 |
| Aichi Electric Co. Ltd. | | 24,400 | 527,854 |
| Aros Quality Group AB | | 52,214 | 1,081,114 |
| Atkore International Group, Inc. (a) | | 3,900 | 104,013 |
| AZZ, Inc. | | 45,679 | 1,442,543 |
| Chiyoda Integre Co. Ltd. | | 23,700 | 379,719 |
| Eaton Corp. PLC | | 2,900 | 270,077 |
| Generac Holdings, Inc. (a) | | 3,343 | 526,790 |
| GrafTech International Ltd. | | 6,900 | 41,883 |
| Hammond Power Solutions, Inc. Class A | | 28,814 | 145,205 |
| I-Sheng Electric Wire & Cable Co. Ltd. | | 936,000 | 1,362,782 |
| Korea Electric Terminal Co. Ltd. | | 59,476 | 1,934,688 |
| Regal Beloit Corp. | | 2,137 | 196,540 |
| Sensata Technologies, Inc. PLC (a) | | 33,221 | 1,261,734 |
| Servotronics, Inc. | | 10,205 | 84,804 |
| TKH Group NV (depositary receipt) | | 14,441 | 565,098 |
| | | | 10,969,854 |
| Industrial Conglomerates - 0.8% | | | |
| DCC PLC (United Kingdom) | | 138,158 | 12,355,592 |
| General Electric Co. | | 45,964 | 279,001 |
| Lifco AB | | 31,861 | 2,431,223 |
| Mytilineos SA | | 59,636 | 550,746 |
| Reunert Ltd. | | 122,333 | 226,649 |
| | | | 15,843,211 |
| Machinery - 1.7% | | | |
| Aalberts Industries NV | | 539,936 | 19,201,372 |
| Allison Transmission Holdings, Inc. | | 27,021 | 1,009,505 |
| ASL Marine Holdings Ltd. (a) | | 3,252,700 | 67,760 |
| Colfax Corp. (a) | | 17,288 | 502,735 |
| Cummins, Inc. | | 940 | 181,664 |
| Daiwa Industries Ltd. | | 15,900 | 123,920 |
| Haitian International Holdings Ltd. | | 733,000 | 1,687,253 |
| Hurco Companies, Inc. | | 1,927 | 53,455 |
| Hyster-Yale Materials Handling Class A | | 41,867 | 1,562,058 |
| Ihara Science Corp. | | 70,700 | 940,396 |
| ITT, Inc. | | 6,094 | 351,807 |
| JOST Werke AG (a)(c) | | 6,900 | 252,370 |
| Kyowakogyosyo Co. Ltd. | | 2,800 | 104,483 |
| Luxfer Holdings PLC sponsored | | 12,958 | 164,567 |
| Maruzen Co. Ltd. | | 94,800 | 1,599,479 |
| Mincon Group PLC | | 146,654 | 143,383 |
| Nadex Co. Ltd. | | 47,400 | 298,671 |
| Nitchitsu Co. Ltd. | | 3,400 | 40,760 |
| Oshkosh Corp. | | 1,400 | 110,208 |
| Semperit AG Holding (a) | | 27,334 | 540,928 |
| SIMPAC, Inc. | | 80,000 | 161,892 |
| Stabilus SA | | 3,400 | 170,134 |
| Takamatsu Machinery Co. Ltd. | | 23,300 | 143,073 |
| Tocalo Co. Ltd. | | 185,900 | 2,067,019 |
| Trinity Industrial Corp. | | 58,100 | 328,770 |
| | | | 31,807,662 |
| Marine - 0.0% | | | |
| SITC International Holdings Co. Ltd. | | 327,000 | 327,831 |
| Tokyo Kisen Co. Ltd. | | 49,200 | 289,097 |
| | | | 616,928 |
| Professional Services - 0.1% | | | |
| Enento Group Oyj (c) | | 2,585 | 109,620 |
| McMillan Shakespeare Ltd. | | 116,305 | 732,890 |
| Nielsen Holdings PLC | | 50,295 | 725,757 |
| Persol Holdings Co., Ltd. | | 17,600 | 222,463 |
| Robert Half International, Inc. | | 6,200 | 315,394 |
| SHL-JAPAN Ltd. | | 7,300 | 144,269 |
| Sporton International, Inc. | | 6,000 | 50,780 |
| Synergie SA (a) | | 9,227 | 217,379 |
| TrueBlue, Inc. (a) | | 8,500 | 131,155 |
| | | | 2,649,707 |
| Road & Rail - 0.9% | | | |
| Alps Logistics Co. Ltd. | | 169,600 | 1,143,965 |
| Chilled & Frozen Logistics Holdings Co. Ltd. | | 85,100 | 1,249,307 |
| Daqin Railway Co. Ltd. (A Shares) | | 2,617,346 | 2,435,299 |
| Hamakyorex Co. Ltd. | | 116,200 | 3,441,377 |
| Higashi Twenty One Co. Ltd. | | 15,100 | 60,055 |
| Knight-Swift Transportation Holdings, Inc. Class A | | 4,949 | 215,232 |
| Ryder System, Inc. | | 14,233 | 521,355 |
| Sakai Moving Service Co. Ltd. | | 87,800 | 3,732,464 |
| Trancom Co. Ltd. | | 50,900 | 3,664,050 |
| | | | 16,463,104 |
| Trading Companies & Distributors - 1.4% | | | |
| AddTech AB (B Shares) | | 68,969 | 3,209,541 |
| AerCap Holdings NV (a) | | 8,036 | 216,409 |
| Alconix Corp. | | 139,354 | 1,592,918 |
| Applied Industrial Technologies, Inc. | | 3,038 | 191,759 |
| Chori Co. Ltd. | | 25,400 | 338,571 |
| GMS, Inc. (a) | | 8,903 | 208,597 |
| Goodfellow, Inc. | | 45,344 | 202,778 |
| HD Supply Holdings, Inc. (a) | | 37,173 | 1,304,772 |
| HERIGE (a) | | 4,435 | 120,157 |
| Houston Wire & Cable Co. (a) | | 6,507 | 16,333 |
| Itochu Corp. | | 334,300 | 7,329,970 |
| Lumax International Corp. Ltd. | | 158,000 | 361,072 |
| Meiwa Corp. | | 127,400 | 505,484 |
| Mitani Shoji Co. Ltd. | | 58,400 | 3,613,622 |
| MRC Global, Inc. (a) | | 122,739 | 730,297 |
| MSC Industrial Direct Co., Inc. Class A | | 1,900 | 125,419 |
| Otec Corp. | | 7,200 | 168,616 |
| Parker Corp. | | 132,200 | 553,253 |
| Richelieu Hardware Ltd. | | 56,424 | 1,398,542 |
| Senshu Electric Co. Ltd. | | 53,100 | 1,487,833 |
| Tanaka Co. Ltd. | | 1,900 | 12,205 |
| TECHNO ASSOCIE Co. Ltd. | | 18,600 | 156,735 |
| Totech Corp. | | 69,900 | 1,493,683 |
| | | | 25,338,566 |
| Transportation Infrastructure - 0.1% | | | |
| Anhui Expressway Co. Ltd. (H Shares) | | 702,000 | 336,947 |
| Isewan Terminal Service Co. Ltd. | | 93,100 | 673,701 |
| Meiko Transportation Co. Ltd. | | 59,600 | 642,422 |
| Qingdao Port International Co. Ltd. (H Shares) (c) | | 831,000 | 470,703 |
| Winas Ltd. (d) | | 1,396,900 | 8,133 |
| | | | 2,131,906 |
|
| TOTAL INDUSTRIALS | | | 134,899,688 |
|
| INFORMATION TECHNOLOGY - 15.5% | | | |
| Communications Equipment - 0.0% | | | |
| F5 Networks, Inc. (a) | | 4,053 | 550,803 |
| Electronic Equipment & Components - 5.8% | | | |
| A&D Co. Ltd. | | 43,200 | 256,290 |
| Amphenol Corp. Class A | | 5,079 | 537,155 |
| Arrow Electronics, Inc. (a) | | 3,100 | 222,022 |
| Avnet, Inc. | | 6,900 | 184,368 |
| CDW Corp. | | 9,685 | 1,125,881 |
| Daido Signal Co. Ltd. | | 6,100 | 35,325 |
| Dynapack International Technology Corp. | | 249,000 | 707,261 |
| Elec & Eltek International Co. Ltd. | | 72,300 | 165,015 |
| Elematec Corp. | | 183,100 | 1,465,077 |
| ePlus, Inc. (a) | | 7,130 | 531,470 |
| Fabrinet (a) | | 2,763 | 200,677 |
| Hi-P International Ltd. | | 859,100 | 805,428 |
| Hon Hai Precision Industry Co. Ltd. (Foxconn) | | 11,500,000 | 30,706,355 |
| IDIS Holdings Co. Ltd. | | 48,087 | 562,957 |
| Image Sensing Systems, Inc. (a) | | 3,805 | 13,888 |
| Insight Enterprises, Inc. (a) | | 33,499 | 1,669,590 |
| Jabil, Inc. | | 6,300 | 219,618 |
| Keysight Technologies, Inc. (a) | | 17,218 | 1,719,906 |
| Kingboard Chemical Holdings Ltd. | | 6,410,800 | 18,735,355 |
| Kingboard Laminates Holdings Ltd. | | 269,000 | 302,310 |
| Muramoto Electronic Thailand PCL (For. Reg.) | | 87,600 | 370,734 |
| Nippo Ltd. | | 50,500 | 206,093 |
| PAX Global Technology Ltd. | | 294,000 | 137,700 |
| Pinnacle Technology Holdings Ltd. | | 502,391 | 161,647 |
| Redington India Ltd. | | 2,089,461 | 2,523,975 |
| ScanSource, Inc. (a) | | 115,515 | 2,651,069 |
| Shibaura Electronics Co. Ltd. | | 37,200 | 710,580 |
| Sigmatron International, Inc. (a) | | 11,852 | 36,741 |
| Simplo Technology Co. Ltd. | | 434,000 | 4,818,609 |
| SYNNEX Corp. | | 225,908 | 28,179,764 |
| Tomen Devices Corp. | | 38,800 | 1,332,370 |
| Tripod Technology Corp. | | 73,000 | 315,748 |
| TTM Technologies, Inc. (a) | | 48,121 | 592,370 |
| UKC Holdings Corp. | | 66,400 | 1,162,337 |
| VST Holdings Ltd. | | 7,015,000 | 4,136,427 |
| Wayside Technology Group, Inc. | | 23,560 | 544,943 |
| Wireless Telecom Group, Inc. (a)(b) | | 15,723 | 17,295 |
| | | | 108,064,350 |
| IT Services - 3.7% | | | |
| ALTEN (a) | | 45,146 | 3,520,498 |
| Amdocs Ltd. | | 362,071 | 22,484,609 |
| Argo Graphics, Inc. | | 59,100 | 1,806,136 |
| CACI International, Inc. Class A (a) | | 4,194 | 871,597 |
| Computer Services, Inc. | | 40,417 | 2,313,873 |
| CSE Global Ltd. | | 2,413,800 | 843,968 |
| Data#3 Ltd. | | 191,815 | 774,289 |
| Dimerco Data System Corp. | | 30,000 | 54,662 |
| DXC Technology Co. | | 41,900 | 750,429 |
| E-Credible Co. Ltd. | | 7,775 | 153,763 |
| eClerx Services Ltd. | | 125,131 | 801,777 |
| EOH Holdings Ltd. (a) | | 460,125 | 130,820 |
| Estore Corp. | | 10,700 | 107,349 |
| ExlService Holdings, Inc. (a) | | 10,175 | 651,811 |
| Fiserv, Inc. (a) | | 5,148 | 513,719 |
| Gabia, Inc. | | 75,806 | 1,052,280 |
| Global Payments, Inc. | | 5,163 | 919,117 |
| Indra Sistemas SA (a) | | 978,800 | 7,344,466 |
| Know IT AB | | 112,953 | 2,325,878 |
| Leidos Holdings, Inc. | | 1,800 | 171,288 |
| Maximus, Inc. | | 2,500 | 185,525 |
| Net 1 UEPS Technologies, Inc. (a) | | 20,699 | 64,995 |
| NIC, Inc. | | 7,400 | 162,208 |
| Nice Information & Telecom, Inc. | | 9,680 | 191,842 |
| Perspecta, Inc. | | 37,362 | 799,547 |
| Science Applications International Corp. | | 11,338 | 906,813 |
| Societe Pour L'Informatique Industrielle SA | | 98,312 | 2,200,326 |
| Softcreate Co. Ltd. | | 43,400 | 940,938 |
| The Western Union Co. | | 657,497 | 15,964,027 |
| TravelSky Technology Ltd. (H Shares) | | 75,300 | 144,765 |
| WNS Holdings Ltd. sponsored ADR (a) | | 4,964 | 317,497 |
| | | | 69,470,812 |
| Semiconductors & Semiconductor Equipment - 0.7% | | | |
| Advanced Energy Industries, Inc. (a) | | 9,405 | 691,926 |
| ASM Pacific Technology Ltd. | | 11,200 | 125,869 |
| Axell Corp. | | 10,600 | 75,203 |
| Boe Varitronix Ltd. | | 354,000 | 96,376 |
| Cabot Microelectronics Corp. | | 4,417 | 665,730 |
| Diodes, Inc. (a) | | 9,324 | 479,720 |
| Entegris, Inc. | | 15,213 | 1,093,967 |
| Leeno Industrial, Inc. | | 41,662 | 4,769,394 |
| Melexis NV | | 23,000 | 1,960,168 |
| Miraial Co. Ltd. | | 9,800 | 93,320 |
| MKS Instruments, Inc. | | 6,715 | 855,760 |
| Powertech Technology, Inc. | | 738,000 | 2,468,211 |
| Renesas Electronics Corp. (a) | | 37,000 | 202,031 |
| Trio-Tech International (a) | | 13,688 | 51,741 |
| | | | 13,629,416 |
| Software - 2.5% | | | |
| AdaptIT Holdings Ltd. (a) | | 180,983 | 14,082 |
| Altair Engineering, Inc. Class A (a)(b) | | 8,731 | 351,859 |
| ANSYS, Inc. (a) | | 120,293 | 37,363,006 |
| Aspen Technology, Inc. (a) | | 4,248 | 413,160 |
| Cyient Ltd. | | 300,000 | 1,321,410 |
| Ebix, Inc. (b) | | 73,542 | 1,621,969 |
| ICT Automatisering NV (b) | | 35,290 | 308,448 |
| InfoVine Co. Ltd. | | 2,756 | 41,137 |
| KSK Co., Ltd. | | 31,300 | 576,295 |
| NetGem SA (a) | | 56,263 | 69,589 |
| Nucleus Software Exports Ltd. (a) | | 35,047 | 139,940 |
| Open Text Corp. | | 4,041 | 181,890 |
| Pegasystems, Inc. | | 5,634 | 658,558 |
| Pro-Ship, Inc. | | 32,800 | 423,886 |
| RealPage, Inc. (a) | | 8,727 | 549,888 |
| Vitec Software Group AB | | 32,833 | 1,004,027 |
| Zensar Technologies Ltd. | | 272,135 | 580,993 |
| | | | 45,620,137 |
| Technology Hardware, Storage & Peripherals - 2.8% | | | |
| Compal Electronics, Inc. | | 4,499,000 | 2,857,651 |
| HP, Inc. | | 205,621 | 3,614,817 |
| Seagate Technology LLC | | 939,246 | 42,472,704 |
| Super Micro Computer, Inc. (a)(b) | | 78,524 | 2,379,670 |
| Xerox Holdings Corp. | | 9,100 | 151,515 |
| | | | 51,476,357 |
|
| TOTAL INFORMATION TECHNOLOGY | | | 288,811,875 |
|
| MATERIALS - 3.6% | | | |
| Chemicals - 2.2% | | | |
| Axalta Coating Systems Ltd. (a) | | 25,671 | 569,896 |
| C. Uyemura & Co. Ltd. | | 29,800 | 1,753,852 |
| Chase Corp. | | 41,631 | 4,186,413 |
| Core Molding Technologies, Inc. (a) | | 50,075 | 230,345 |
| Deepak Fertilisers and Petrochemicals Corp. Ltd. | | 69,617 | 148,303 |
| DuPont de Nemours, Inc. | | 4,098 | 219,161 |
| EcoGreen International Group Ltd. | | 3,606,000 | 549,021 |
| FMC Corp. | | 89,036 | 9,442,268 |
| Fujikura Kasei Co., Ltd. | | 160,700 | 778,793 |
| Fuso Chemical Co. Ltd. | | 33,000 | 1,261,017 |
| Gujarat Narmada Valley Fertilizers Co. | | 373,242 | 818,273 |
| Gujarat State Fertilizers & Chemicals Ltd. | | 2,265,887 | 1,799,523 |
| Honshu Chemical Industry Co. Ltd. | | 54,800 | 602,073 |
| Huntsman Corp. | | 13,383 | 247,586 |
| Innospec, Inc. | | 48,827 | 3,670,326 |
| KPC Holdings Corp. | | 3,573 | 125,189 |
| Livent Corp. (a) | | 80,306 | 503,519 |
| Miwon Chemicals Co. Ltd. | | 3,108 | 134,626 |
| Miwon Commercial Co. Ltd. | | 5,067 | 346,596 |
| Muto Seiko Co. Ltd. | | 15,300 | 65,620 |
| Nihon Parkerizing Co. Ltd. | | 20,700 | 199,853 |
| Nippon Soda Co. Ltd. | | 22,800 | 581,335 |
| SK Kaken Co. Ltd. | | 3,900 | 1,381,607 |
| Soken Chemical & Engineer Co. Ltd. | | 39,600 | 432,082 |
| T&K Toka Co. Ltd. | | 97,100 | 713,654 |
| Thai Carbon Black PCL (For. Reg.) | | 826,000 | 1,046,072 |
| Thai Rayon PCL: | | | |
| (For. Reg.) | | 161,300 | 134,460 |
| NVDR | | 92,400 | 77,025 |
| The Chemours Co. LLC | | 19,162 | 355,072 |
| The Mosaic Co. | | 16,700 | 224,949 |
| Westlake Chemical Corp. | | 4,279 | 233,206 |
| Yara International ASA | | 162,063 | 6,771,432 |
| Yip's Chemical Holdings Ltd. | | 1,852,000 | 516,150 |
| | | | 40,119,297 |
| Construction Materials - 0.4% | | | |
| Brampton Brick Ltd. Class A (sub. vtg.) (a) | | 42,121 | 165,094 |
| Mitani Sekisan Co. Ltd. | | 120,600 | 6,220,547 |
| RHI Magnesita NV | | 7,897 | 250,573 |
| | | | 6,636,214 |
| Containers & Packaging - 0.3% | | | |
| AMVIG Holdings Ltd. | | 456,000 | 78,841 |
| Chuoh Pack Industry Co. Ltd. | | 24,900 | 258,750 |
| Kohsoku Corp. | | 103,300 | 1,339,860 |
| Mayr-Melnhof Karton AG | | 1,475 | 228,304 |
| Packaging Corp. of America | | 1,947 | 187,146 |
| Samhwa Crown & Closure Co. Ltd. | | 2,820 | 97,155 |
| Silgan Holdings, Inc. | | 17,300 | 661,725 |
| The Pack Corp. | | 116,400 | 2,896,392 |
| WestRock Co. | | 25,000 | 671,500 |
| | | | 6,419,673 |
| Metals & Mining - 0.6% | | | |
| Chubu Steel Plate Co. Ltd. | | 29,800 | 203,537 |
| Cleveland-Cliffs, Inc. (b) | | 958,285 | 4,963,916 |
| Compania de Minas Buenaventura SA sponsored ADR | | 174,918 | 2,074,527 |
| Granges AB | | 16,320 | 130,946 |
| Hill & Smith Holdings PLC | | 60,938 | 965,191 |
| Orvana Minerals Corp. (a) | | 42,129 | 7,863 |
| Perenti Global Ltd. | | 889,848 | 759,724 |
| Steel Dynamics, Inc. | | 4,249 | 116,465 |
| Tohoku Steel Co. Ltd. | | 37,200 | 492,697 |
| Tokyo Tekko Co. Ltd. | | 45,200 | 654,163 |
| Warrior Metropolitan Coal, Inc. | | 103,537 | 1,648,309 |
| Webco Industries, Inc. (a) | | 481 | 38,456 |
| | | | 12,055,794 |
| Paper & Forest Products - 0.1% | | | |
| Louisiana-Pacific Corp. | | 14,149 | 448,099 |
| Schweitzer-Mauduit International, Inc. | | 4,200 | 136,626 |
| Stella-Jones, Inc. | | 36,557 | 1,110,261 |
| Western Forest Products, Inc. | | 132,363 | 103,760 |
| | | | 1,798,746 |
|
| TOTAL MATERIALS | | | 67,029,724 |
|
| REAL ESTATE - 0.2% | | | |
| Equity Real Estate Investment Trusts (REITs) - 0.1% | | | |
| CoreCivic, Inc. | | 127,118 | 1,132,621 |
| CubeSmart | | 9,745 | 289,134 |
| NSI NV | | 520 | 18,560 |
| NSI NV rights (a)(e) | | 520 | 637 |
| | | | 1,440,952 |
| Real Estate Management & Development - 0.1% | | | |
| Anabuki Kosan, Inc. | | 4,700 | 62,205 |
| CBRE Group, Inc. (a) | | 3,200 | 140,192 |
| Century21 Real Estate Japan Ltd. | | 7,500 | 79,779 |
| IMMOFINANZ Immobilien Anlagen AG (a) | | 6,345 | 104,862 |
| Jones Lang LaSalle, Inc. | | 2,027 | 200,491 |
| LSL Property Services PLC | | 100,464 | 251,179 |
| Relo Group, Inc. | | 36,000 | 621,681 |
| Selvaag Bolig ASA | | 48,576 | 270,049 |
| Servcorp Ltd. | | 57,330 | 85,196 |
| Sino Land Ltd. | | 144,201 | 174,709 |
| Tejon Ranch Co. (a) | | 31,064 | 445,768 |
| Wing Tai Holdings Ltd. | | 117,130 | 145,893 |
| | | | 2,582,004 |
|
| TOTAL REAL ESTATE | | | 4,022,956 |
|
| UTILITIES - 2.3% | | | |
| Electric Utilities - 1.9% | | | |
| Exelon Corp. | | 57,064 | 2,203,241 |
| NRG Energy, Inc. | | 5,267 | 178,077 |
| PG&E Corp. (a) | | 9,000 | 84,150 |
| PG&E Corp. (f) | | 1,878,947 | 16,689,747 |
| PPL Corp. | | 646,826 | 17,218,508 |
| | | | 36,373,723 |
| Gas Utilities - 0.1% | | | |
| Busan City Gas Co. Ltd. | | 4,200 | 128,017 |
| China Resource Gas Group Ltd. | | 14,000 | 69,004 |
| Hokuriku Gas Co. | | 11,200 | 330,112 |
| K&O Energy Group, Inc. | | 19,200 | 271,345 |
| Keiyo Gas Co. Ltd. | | 8,100 | 247,159 |
| Star Gas Partners LP | | 15,355 | 144,644 |
| | | | 1,190,281 |
| Independent Power and Renewable Electricity Producers - 0.2% | | | |
| Mega First Corp. Bhd | | 2,370,802 | 3,754,045 |
| Vistra Corp. | | 9,503 | 177,326 |
| | | | 3,931,371 |
| Multi-Utilities - 0.1% | | | |
| CenterPoint Energy, Inc. | | 12,759 | 242,549 |
| CMS Energy Corp. | | 17,829 | 1,144,265 |
| | | | 1,386,814 |
| Water Utilities - 0.0% | | | |
| Manila Water Co., Inc. | | 404,500 | 105,661 |
|
| TOTAL UTILITIES | | | 42,987,850 |
|
| TOTAL COMMON STOCKS | | | |
| (Cost $1,784,702,387) | | | 1,763,890,585 |
|
| Nonconvertible Preferred Stocks - 0.1% | | | |
| CONSUMER STAPLES - 0.0% | | | |
| Food Products - 0.0% | | | |
| Nam Yang Dairy Products | | 400 | 62,884 |
| INDUSTRIALS - 0.0% | | | |
| Air Freight & Logistics - 0.0% | | | |
| Air T Funding 8.00% | | 191 | 4,011 |
| Industrial Conglomerates - 0.0% | | | |
| Steel Partners Holdings LP Series A, 6.00% | | 9,618 | 156,966 |
|
| TOTAL INDUSTRIALS | | | 160,977 |
|
| MATERIALS - 0.1% | | | |
| Construction Materials - 0.1% | | | |
| Buzzi Unicem SpA (Risparmio Shares) | | 111,590 | 1,430,148 |
| TOTAL NONCONVERTIBLE PREFERRED STOCKS | | | |
| (Cost $1,891,976) | | | 1,654,009 |
| | | Principal Amount | Value |
|
| Nonconvertible Bonds - 0.0% | | | |
| ENERGY - 0.0% | | | |
| Energy Equipment & Services - 0.0% | | | |
Bristow Group, Inc. 6.25% 10/15/22
(Cost $0)(d)(g) | | 388,666 | 0 |
| | | Shares | Value |
|
| Money Market Funds - 6.9% | | | |
| Fidelity Cash Central Fund 0.14% (h) | | 85,320,986 | 85,346,582 |
| Fidelity Securities Lending Cash Central Fund 0.13% (h)(i) | | 42,682,361 | 42,686,629 |
| TOTAL MONEY MARKET FUNDS | | | |
| (Cost $128,024,476) | | | 128,033,211 |
| TOTAL INVESTMENT IN SECURITIES - 101.7% | | | |
| (Cost $1,914,618,839) | | | 1,893,577,805 |
| NET OTHER ASSETS (LIABILITIES) - (1.7)% | | | (32,085,783) |
| NET ASSETS - 100% | | | $1,861,492,022 |
Legend
(a) Non-income producing
(b) Security or a portion of the security is on loan at period end.
(c) Security exempt from registration under Rule 144A of the Securities Act of 1933. These securities may be resold in transactions exempt from registration, normally to qualified institutional buyers. At the end of the period, the value of these securities amounted to $2,939,295 or 0.2% of net assets.
(d) Level 3 security
(e) Security or a portion of the security purchased on a delayed delivery or when-issued basis.
(f) Restricted securities (including private placements) - Investment in securities not registered under the Securities Act of 1933 (excluding 144A issues). At the end of the period, the value of restricted securities (excluding 144A issues) amounted to $16,689,747 or 0.9% of net assets.
(g) Non-income producing - Security is in default.
(h) Affiliated fund that is generally available only to investment companies and other accounts managed by Fidelity Investments. The rate quoted is the annualized seven-day yield of the fund at period end. A complete unaudited listing of the fund's holdings as of its most recent quarter end is available upon request. In addition, each Fidelity Central Fund's financial statements, which are not covered by the Fund's Report of Independent Registered Public Accounting Firm, are available on the SEC's website or upon request.
(i) Investment made with cash collateral received from securities on loan.
Additional information on each restricted holding is as follows:
| Security | Acquisition Date | Acquisition Cost |
| PG&E Corp. | 6/30/20 | $17,849,997 |
Affiliated Central Funds
Information regarding fiscal year to date income earned by the Fund from investments in Fidelity Central Funds is as follows:
| Fund | Income earned |
| Fidelity Cash Central Fund | $2,108,040 |
| Fidelity Securities Lending Cash Central Fund | 665,262 |
| Total | $2,773,302 |
Amounts in the income column in the above table include any capital gain distributions from underlying funds, which are presented in the corresponding line-item in the Statement of Operations, if applicable. Amount for Fidelity Securities Lending Cash Central Fund represents the income earned on investing cash collateral, less rebates paid to borrowers and any lending agent fees associated with the loan, plus any premium payments received for lending certain types of securities.
Investment Valuation
The following is a summary of the inputs used, as of July 31, 2020, involving the Fund's assets and liabilities carried at fair value. The inputs or methodology used for valuing securities may not be an indication of the risk associated with investing in those securities. For more information on valuation inputs, and their aggregation into the levels used below, please refer to the Investment Valuation section in the accompanying Notes to Financial Statements.
| | Valuation Inputs at Reporting Date: |
| Description | Total | Level 1 | Level 2 | Level 3 |
| Investments in Securities: | | | | |
| Equities: | | | | |
| Communication Services | $36,698,192 | $20,690,208 | $16,007,984 | $-- |
| Consumer Discretionary | 425,640,464 | 424,460,419 | 750,412 | 429,633 |
| Consumer Staples | 234,628,853 | 233,349,913 | 1,249,703 | 29,237 |
| Energy | 63,171,612 | 59,777,859 | 3,393,753 | -- |
| Financials | 218,125,167 | 208,532,910 | 9,592,257 | -- |
| Health Care | 247,937,088 | 247,937,088 | -- | -- |
| Industrials | 135,060,665 | 126,644,865 | 8,407,667 | 8,133 |
| Information Technology | 288,811,875 | 286,997,464 | 1,814,411 | -- |
| Materials | 68,459,872 | 68,459,872 | -- | -- |
| Real Estate | 4,022,956 | 3,877,063 | 145,893 | -- |
| Utilities | 42,987,850 | 22,438,397 | 20,549,453 | -- |
| Corporate Bonds | -- | -- | -- | 0 |
| Money Market Funds | 128,033,211 | 128,033,211 | -- | -- |
| Total Investments in Securities: | $1,893,577,805 | $1,831,199,269 | $61,911,533 | $467,003 |
Other Information
Distribution of investments by country or territory of incorporation, as a percentage of Total Net Assets, is as follows (Unaudited):
| United States of America | 57.5% |
| Japan | 12.0% |
| United Kingdom | 6.0% |
| Canada | 4.8% |
| Ireland | 3.3% |
| Taiwan | 2.5% |
| Netherlands | 2.1% |
| Cayman Islands | 1.8% |
| Bermuda | 1.6% |
| Bailiwick of Guernsey | 1.2% |
| Korea (South) | 1.2% |
| Others (Individually Less Than 1%) | 6.0% |
| | 100.0% |
See accompanying notes which are an integral part of the financial statements.
Financial Statements
Statement of Assets and Liabilities
| | | July 31, 2020 |
| Assets | | |
Investment in securities, at value (including securities loaned of $40,489,331) — See accompanying schedule:
Unaffiliated issuers (cost $1,786,594,363) | $1,765,544,594 | |
| Fidelity Central Funds (cost $128,024,476) | 128,033,211 | |
| Total Investment in Securities (cost $1,914,618,839) | | $1,893,577,805 |
| Foreign currency held at value (cost $656,312) | | 663,026 |
| Receivable for investments sold | | 8,917,516 |
| Receivable for fund shares sold | | 736,563 |
| Dividends receivable | | 3,332,915 |
| Interest receivable | | 1,715 |
| Distributions receivable from Fidelity Central Funds | | 136,211 |
| Other receivables | | 106,351 |
| Total assets | | 1,907,472,102 |
| Liabilities | | |
| Payable to custodian bank | $204,450 | |
| Payable for investments purchased | | |
| Regular delivery | 834,369 | |
| Delayed delivery | 637 | |
| Payable for fund shares redeemed | 1,474,422 | |
| Accrued management fee | 770,259 | |
| Other payables and accrued expenses | 10,005 | |
| Collateral on securities loaned | 42,685,938 | |
| Total liabilities | | 45,980,080 |
| Net Assets | | $1,861,492,022 |
| Net Assets consist of: | | |
| Paid in capital | | $1,928,083,793 |
| Total accumulated earnings (loss) | | (66,591,771) |
| Net Assets | | $1,861,492,022 |
| Net Asset Value, offering price and redemption price per share ($1,861,492,022 ÷ 171,976,295 shares) | | $10.82 |
See accompanying notes which are an integral part of the financial statements.
Statement of Operations
| | | Year ended July 31, 2020 |
| Investment Income | | |
| Dividends | | $43,120,598 |
| Interest | | 11,082 |
| Income from Fidelity Central Funds (including $665,262 from security lending) | | 2,773,302 |
| Total income | | 45,904,982 |
| Expenses | | |
| Management fee | $9,749,901 | |
| Independent trustees' fees and expenses | 12,376 | |
| Miscellaneous | 20,049 | |
| Total expenses before reductions | 9,782,326 | |
| Expense reductions | (93,517) | |
| Total expenses after reductions | | 9,688,809 |
| Net investment income (loss) | | 36,216,173 |
| Realized and Unrealized Gain (Loss) | | |
| Net realized gain (loss) on: | | |
| Investment securities: | | |
| Unaffiliated issuers (net of foreign taxes of $504) | (53,514,804) | |
| Fidelity Central Funds | (4,022) | |
| Foreign currency transactions | (6,740) | |
| Total net realized gain (loss) | | (53,525,566) |
| Change in net unrealized appreciation (depreciation) on: | | |
| Investment securities: | | |
| Unaffiliated issuers (net of decrease in deferred foreign taxes of $219) | (31,009,336) | |
| Fidelity Central Funds | 8,298 | |
| Assets and liabilities in foreign currencies | 59,285 | |
| Total change in net unrealized appreciation (depreciation) | | (30,941,753) |
| Net gain (loss) | | (84,467,319) |
| Net increase (decrease) in net assets resulting from operations | | $(48,251,146) |
See accompanying notes which are an integral part of the financial statements.
Statement of Changes in Net Assets
| | Year ended July 31, 2020 | Year ended July 31, 2019 |
| Increase (Decrease) in Net Assets | | |
| Operations | | |
| Net investment income (loss) | $36,216,173 | $36,487,825 |
| Net realized gain (loss) | (53,525,566) | 33,820,682 |
| Change in net unrealized appreciation (depreciation) | (30,941,753) | (85,520,494) |
| Net increase (decrease) in net assets resulting from operations | (48,251,146) | (15,211,987) |
| Distributions to shareholders | (51,263,392) | (42,521,469) |
| Share transactions | | |
| Proceeds from sales of shares | 718,795,421 | 479,262,838 |
| Reinvestment of distributions | 51,263,392 | 42,521,469 |
| Cost of shares redeemed | (732,369,550) | (633,492,375) |
| Net increase (decrease) in net assets resulting from share transactions | 37,689,263 | (111,708,068) |
| Total increase (decrease) in net assets | (61,825,275) | (169,441,524) |
| Net Assets | | |
| Beginning of period | 1,923,317,297 | 2,092,758,821 |
| End of period | $1,861,492,022 | $1,923,317,297 |
| Other Information | | |
| Shares | | |
| Sold | 65,370,553 | 44,077,943 |
| Issued in reinvestment of distributions | 4,541,122 | 3,927,749 |
| Redeemed | (69,800,041) | (57,839,109) |
| Net increase (decrease) | 111,634 | (9,833,417) |
See accompanying notes which are an integral part of the financial statements.
Financial Highlights
Fidelity Low-Priced Stock K6 Fund
| | | | | |
| Years ended July 31, | 2020 | 2019 | 2018 | 2017 A |
| Selected Per–Share Data | | | | |
| Net asset value, beginning of period | $11.19 | $11.52 | $10.23 | $10.00 |
| Income from Investment Operations | | | | |
| Net investment income (loss)B | .20 | .20 | .17 | –C |
| Net realized and unrealized gain (loss) | (.27) | (.29) | 1.19 | .23 |
| Total from investment operations | (.07) | (.09) | 1.36 | .23 |
| Distributions from net investment income | (.22) | (.17) | (.06) | – |
| Distributions from net realized gain | (.08) | (.06) | (.01) | – |
| Total distributions | (.30) | (.24)D | (.07) | – |
| Net asset value, end of period | $10.82 | $11.19 | $11.52 | $10.23 |
| Total ReturnE,F | (.74)% | (.73)% | 13.33% | 2.30% |
| Ratios to Average Net AssetsG,H | | | | |
| Expenses before reductions | .50% | .50% | .50% | .50%I |
| Expenses net of fee waivers, if any | .50% | .50% | .50% | .50%I |
| Expenses net of all reductions | .50% | .50% | .50% | .50%I |
| Net investment income (loss) | 1.86% | 1.85% | 1.54% | (.14)%I |
| Supplemental Data | | | | |
| Net assets, end of period (000 omitted) | $1,861,492 | $1,923,317 | $2,092,759 | $459,470 |
| Portfolio turnover rateJ,K | 21% | 20% | 23% | 3%L |
A For the period May 26, 2017 (commencement of operations) to July 31, 2017.
B Calculated based on average shares outstanding during the period.
C Amount represents less than $.005 per share.
D Total distributions of $.24 per share is comprised of distributions from net investment income of $.174 and distributions from net realized gain of $.063 per share.
E Total returns for periods of less than one year are not annualized.
F Total returns would have been lower if certain expenses had not been reduced during the applicable periods shown.
G Fees and expenses of any underlying mutual funds or exchange-traded funds (ETFs) are not included in the Fund's expense ratio. The Fund indirectly bears its proportionate share of these expenses. For additional expense information related to investments in Fidelity Central Funds, please refer to the "Investments in Fidelity Central Funds" note found in the Notes to Financial Statements section of the most recent Annual or Semi-Annual report.
H Expense ratios reflect operating expenses of the Fund. Expenses before reductions do not reflect amounts reimbursed by the investment adviser or reductions from brokerage service arrangements or reductions from other expense offset arrangements and do not represent the amount paid by the Fund during periods when reimbursements or reductions occur. Expenses net of fee waivers reflect expenses after reimbursement by the investment adviser but prior to reductions from brokerage service arrangements or other expense offset arrangements. Expenses net of all reductions represent the net expenses paid by the Fund.
I Annualized
J Amount does not include the portfolio activity of any underlying Fidelity Central Funds.
K Portfolio turnover rate excludes securities received or delivered in-kind.
L Amount not annualized.
See accompanying notes which are an integral part of the financial statements.
Notes to Financial Statements
For the period ended July 31, 2020
1. Organization.
Fidelity Low-Priced Stock K6 Fund (the Fund) is a fund of Fidelity Puritan Trust (the Trust) and is authorized to issue an unlimited number of shares. Share transactions on the Statement of Changes in Net Assets may contain exchanges between affiliated funds. The Trust is registered under the Investment Company Act of 1940, as amended (the 1940 Act), as an open-end management investment company organized as a Massachusetts business trust. Shares generally are available only to employer-sponsored retirement plans that are recordkept by Fidelity, or to certain employer-sponsored retirement plans that are not recordkept by Fidelity.
Effective January 1, 2020:
Investment advisers Fidelity Investments Money Management, Inc., FMR Co., Inc., and Fidelity SelectCo, LLC, merged with and into Fidelity Management & Research Company. In connection with the merger transactions, the resulting, merged investment adviser was then redomiciled from Massachusetts to Delaware, changed its corporate structure from a corporation to a limited liability company, and changed its name to "Fidelity Management & Research Company LLC".
2. Investments in Fidelity Central Funds.
The Fund invests in Fidelity Central Funds, which are open-end investment companies generally available only to other investment companies and accounts managed by the investment adviser and its affiliates. The Fund's Schedule of Investments lists each of the Fidelity Central Funds held as of period end, if any, as an investment of the Fund, but does not include the underlying holdings of each Fidelity Central Fund. As an Investing Fund, the Fund indirectly bears its proportionate share of the expenses of the underlying Fidelity Central Funds.
The Money Market Central Funds seek preservation of capital and current income and are managed by the investment adviser. Annualized expenses of the Money Market Central Funds as of their most recent shareholder report date ranged from less than .005% to .01%.
A complete unaudited list of holdings for each Fidelity Central Fund is available upon request or at the Securities and Exchange Commission (the SEC) website at www.sec.gov. In addition, the financial statements of the Fidelity Central Funds, which are not covered by the Fund's Report of Independent Registered Public Accounting Firm, are available on the SEC website or upon request.
3. Significant Accounting Policies.
The Fund is an investment company and applies the accounting and reporting guidance of the Financial Accounting Standards Board (FASB) Accounting Standards Codification Topic 946 Financial Services – Investment Companies. The financial statements have been prepared in conformity with accounting principles generally accepted in the United States of America (GAAP), which require management to make certain estimates and assumptions at the date of the financial statements. Actual results could differ from those estimates. Subsequent events, if any, through the date that the financial statements were issued have been evaluated in the preparation of the financial statements. The following summarizes the significant accounting policies of the Fund:
Investment Valuation. Investments are valued as of 4:00 p.m. Eastern time on the last calendar day of the period. The Board of Trustees (the Board) has delegated the day to day responsibility for the valuation of the Fund's investments to the Fair Value Committee (the Committee) established by the Fund's investment adviser. In accordance with valuation policies and procedures approved by the Board, the Fund attempts to obtain prices from one or more third party pricing vendors or brokers to value its investments. When current market prices, quotations or currency exchange rates are not readily available or reliable, investments will be fair valued in good faith by the Committee, in accordance with procedures adopted by the Board. Factors used in determining fair value vary by investment type and may include market or investment specific events, changes in interest rates and credit quality. The frequency with which these procedures are used cannot be predicted and they may be utilized to a significant extent. The Committee oversees the Fund's valuation policies and procedures and reports to the Board on the Committee's activities and fair value determinations. The Board monitors the appropriateness of the procedures used in valuing the Fund's investments and ratifies the fair value determinations of the Committee.
The Fund categorizes the inputs to valuation techniques used to value its investments into a disclosure hierarchy consisting of three levels as shown below:
- Level 1 – quoted prices in active markets for identical investments
- Level 2 – other significant observable inputs (including quoted prices for similar investments, interest rates, prepayment speeds, etc.)
- Level 3 – unobservable inputs (including the Fund's own assumptions based on the best information available)
Valuation techniques used to value the Fund's investments by major category are as follows:
Equity securities, including restricted securities, for which market quotations are readily available, are valued at the last reported sale price or official closing price as reported by a third party pricing vendor on the primary market or exchange on which they are traded and are categorized as Level 1 in the hierarchy. In the event there were no sales during the day or closing prices are not available, securities are valued at the last quoted bid price or may be valued using the last available price and are generally categorized as Level 2 in the hierarchy. For foreign equity securities, when market or security specific events arise, comparisons to the valuation of American Depositary Receipts (ADRs), futures contracts, Exchange-Traded Funds (ETFs) and certain indexes as well as quoted prices for similar securities may be used and would be categorized as Level 2 in the hierarchy. For equity securities, including restricted securities, where observable inputs are limited, assumptions about market activity and risk are used and these securities may be categorized as Level 3 in the hierarchy.
Debt securities, including restricted securities, are valued based on evaluated prices received from third party pricing vendors or from brokers who make markets in such securities. Corporate bonds are valued by pricing vendors who utilize matrix pricing which considers yield or price of bonds of comparable quality, coupon, maturity and type or by broker-supplied prices. When independent prices are unavailable or unreliable, debt securities may be valued utilizing pricing methodologies which consider similar factors that would be used by third party pricing vendors. Debt securities are generally categorized as Level 2 in the hierarchy but may be Level 3 depending on the circumstances.
Investments in open-end mutual funds, including the Fidelity Central Funds, are valued at their closing net asset value (NAV) each business day and are categorized as Level 1 in the hierarchy.
Changes in valuation techniques may result in transfers in or out of an assigned level within the disclosure hierarchy. The aggregate value of investments by input level as of July 31, 2020 is included at the end of the Fund's Schedule of Investments.
Foreign Currency. The Fund may use foreign currency contracts to facilitate transactions in foreign-denominated securities. Gains and losses from these transactions may arise from changes in the value of the foreign currency or if the counterparties do not perform under the contracts' terms.
Foreign-denominated assets, including investment securities, and liabilities are translated into U.S. dollars at the exchange rates at period end. Purchases and sales of investment securities, income and dividends received and expenses denominated in foreign currencies are translated into U.S. dollars at the exchange rate in effect on the transaction date.
The effects of exchange rate fluctuations on investments are included with the net realized and unrealized gain (loss) on investment securities. Other foreign currency transactions resulting in realized and unrealized gain (loss) are disclosed separately.
Investment Transactions and Income. For financial reporting purposes, the Fund's investment holdings and NAV include trades executed through the end of the last business day of the period. The NAV per share for processing shareholder transactions is calculated as of the close of business of the New York Stock Exchange (NYSE), normally 4:00 p.m. Eastern time and includes trades executed through the end of the prior business day. Gains and losses on securities sold are determined on the basis of identified cost and include proceeds received from litigation. Dividend income is recorded on the ex-dividend date, except for certain dividends from foreign securities where the ex-dividend date may have passed, which are recorded as soon as the Fund is informed of the ex-dividend date. Non-cash dividends included in dividend income, if any, are recorded at the fair market value of the securities received. Income and capital gain distributions from Fidelity Central Funds, if any, are recorded on the ex-dividend date. Certain distributions received by the Fund represent a return of capital or capital gain. The Fund determines the components of these distributions subsequent to the ex-dividend date, based upon receipt of tax filings or other correspondence relating to the underlying investment. These distributions are recorded as a reduction of cost of investments and/or as a realized gain. Interest income is accrued as earned and includes coupon interest and amortization of premium and accretion of discount on debt securities as applicable. Investment income is recorded net of foreign taxes withheld where recovery of such taxes is uncertain.
Expenses. Expenses directly attributable to a fund are charged to that fund. Expenses attributable to more than one fund are allocated among the respective funds on the basis of relative net assets or other appropriate methods. Expense estimates are accrued in the period to which they relate and adjustments are made when actual amounts are known.
Income Tax Information and Distributions to Shareholders. Each year, the Fund intends to qualify as a regulated investment company under Subchapter M of the Internal Revenue Code, including distributing substantially all of its taxable income and realized gains. As a result, no provision for U.S. Federal income taxes is required. As of July 31, 2020, the Fund did not have any unrecognized tax benefits in the financial statements; nor is the Fund aware of any tax positions for which it is reasonably possible that the total amounts of unrecognized tax benefits will significantly change in the next twelve months. The Fund files a U.S. federal tax return, in addition to state and local tax returns as required. The Fund's federal income tax returns are subject to examination by the Internal Revenue Service (IRS) for a period of three fiscal years after they are filed. State and local tax returns may be subject to examination for an additional fiscal year depending on the jurisdiction. Foreign taxes are provided for based on the Fund's understanding of the tax rules and rates that exist in the foreign markets in which it invests. The Fund is subject to a tax imposed on capital gains by certain countries in which it invests. An estimated deferred tax liability for net unrealized appreciation on the applicable securities is included in Other payables and accrued expenses on the Statement of Assets & Liabilities.
Distributions are declared and recorded on the ex-dividend date. Income and capital gain distributions are determined in accordance with income tax regulations, which may differ from GAAP.
Capital accounts within the financial statements are adjusted for permanent book-tax differences. These adjustments have no impact on net assets or the results of operations. Capital accounts are not adjusted for temporary book-tax differences which will reverse in a subsequent period.
Book-tax differences are primarily due to foreign currency transactions, certain foreign taxes, passive foreign investment companies (PFIC), market discount, equity-debt classifications, redemptions in kind, partnerships and losses deferred due to wash sales.
As of period end, the cost and unrealized appreciation (depreciation) in securities, and derivatives if applicable, for federal income tax purposes were as follows:
| Gross unrealized appreciation | $295,569,926 |
| Gross unrealized depreciation | (320,859,841) |
| Net unrealized appreciation (depreciation) | $(25,289,915) |
| Tax Cost | $1,918,867,720 |
The tax-based components of distributable earnings as of period end were as follows:
| Undistributed ordinary income | $19,290,717 |
| Capital loss carryforward | $(60,599,215) |
| Net unrealized appreciation (depreciation) on securities and other investments | $(25,273,683) |
Capital loss carryforwards are only available to offset future capital gains of the Fund to the extent provided by regulations and may be limited. The capital loss carryforward information presented below, including any applicable limitation, is estimated as of fiscal period end and is subject to adjustment.
| No expiration | |
| Short-term | $(29,260,134) |
| Long-term | (31,339,081) |
| Total capital loss carryforward | $(60,599,215) |
The tax character of distributions paid was as follows:
| | July 31, 2020 | July 31, 2019 |
| Ordinary Income | $40,773,456 | $ 36,433,800 |
| Long-term Capital Gains | 10,489,936 | 6,087,669 |
| Total | $51,263,392 | $ 42,521,469 |
Delayed Delivery Transactions and When-Issued Securities. During the period, the Fund transacted in securities on a delayed delivery or when-issued basis. Payment and delivery may take place after the customary settlement period for that security. The price of the underlying securities and the date when the securities will be delivered and paid for are fixed at the time the transaction is negotiated. The securities purchased on a delayed delivery or when-issued basis are identified as such in the Fund's Schedule of Investments. Losses may arise due to changes in the value of the underlying securities or if the counterparty does not perform under the contract's terms, or if the issuer does not issue the securities due to political, economic, or other factors.
Restricted Securities (including Private Placements). The Fund may invest in securities that are subject to legal or contractual restrictions on resale. These securities generally may be resold in transactions exempt from registration or to the public if the securities are registered. Disposal of these securities may involve time-consuming negotiations and expense, and prompt sale at an acceptable price may be difficult. Information regarding restricted securities is included at the end of the Fund's Schedule of Investments.
4. Purchases and Sales of Investments.
Purchases and sales of securities, other than short-term securities and in-kind transactions are noted in the table below.
| | Purchases ($) | Sales ($) |
| Fidelity Low-Priced Stock K6 Fund | 363,644,480 | 443,588,598 |
Unaffiliated Redemptions In-Kind. During the period, 3,929,798 shares of the Fund were redeemed in-kind for investments, including accrued interest, and cash with a value of $43,502,867. The net realized gain of $8,990,208 on investments delivered through in-kind redemptions is included in the accompanying Statement of Operations. The amount of the in-kind redemptions is included in share transactions in the accompanying Statement of Changes in Net Assets. The Fund recognized no gain or loss for federal income tax purposes.
Unaffiliated Exchanges In-Kind. During the period, the Fund received investments, including accrued interest, and cash valued at $224,490,934 in exchange for 19,957,245 shares of the Fund. The amount of in-kind exchanges is included in share transactions in the accompanying Statement of Changes in Net Assets.
Prior Fiscal Year Unaffiliated Redemptions In-Kind. During the prior period, shares of the Fidelity Low-Priced Stock K6 Fund were redeemed in-kind for investments. The amount of the in-kind redemptions is included in share transactions in the accompanying Statement of Changes in Net Assets. For additional information of the Fidelity Low-Priced Stock K6 Fund in-kind transactions, please refer to the Fidelity Low-Priced Stock K6 Fund prior annual shareholder report.
Prior Fiscal Year Unaffiliated Exchanges In-Kind. During the prior period, the Fidelity Low-Priced Stock K6 Fund received investments in exchange for shares of the Fidelity Low-Priced Stock K6 Fund. The amount of in-kind exchanges is included in share transactions in the accompanying Statement of Changes in Net Assets. For additional information of the Fidelity Low-Priced Stock K6 Fund in-kind transactions, please refer to the Fidelity Low-Priced Stock K6 Fund prior annual shareholder report.
5. Fees and Other Transactions with Affiliates.
Management Fee. Fidelity Management & Research Company LLC (the investment adviser) and its affiliates provide the Fund with investment management related services for which the Fund pays a monthly management fee that is based on an annual rate of .50% of average net assets. Under the management contract, the investment adviser or an affiliate pays all other expenses of the Fund, excluding fees and expenses of the independent Trustees, and certain miscellaneous expenses such as proxy and shareholder meeting expenses.
Brokerage Commissions. A portion of portfolio transactions were placed with brokerage firms which are affiliates of the investment adviser. Brokerage commissions are included in net realized gain (loss) and change in net unrealized appreciation (depreciation) in the Statement of Operations. The commissions paid to these affiliated firms were as follows:
| | Amount |
| Fidelity Low-Priced Stock K6 Fund | $11,094 |
Interfund Trades. Funds may purchase from or sell securities to other Fidelity Funds under procedures adopted by the Board. The procedures have been designed to ensure these interfund trades are executed in accordance with Rule 17a-7 of the 1940 Act. Interfund trades are included within the respective purchases and sales amounts shown in the Purchases and Sales of Investments note.
Other. During the period, the investment adviser reimbursed the Fund for certain losses in the amount of $3,222.
6. Committed Line of Credit.
Certain Funds participate with other funds managed by the investment adviser or an affiliate in a $4.25 billion credit facility (the "line of credit") to be utilized for temporary or emergency purposes to fund shareholder redemptions or for other short-term liquidity purposes. The participating funds have agreed to pay commitment fees on their pro-rata portion of the line of credit, which are reflected in Miscellaneous expenses on the Statement of Operations, and are as follows:
| | Amount |
| Fidelity Low-Priced Stock K6 Fund | $4,787 |
During the period, there were no borrowings on this line of credit.
7. Security Lending.
The Fund lends portfolio securities from time to time in order to earn additional income. Lending agents are used, including National Financial Services (NFS), an affiliate of the Fund. Pursuant to a securities lending agreement, NFS will receive a fee, which is capped at 9.9% of daily lending revenue, for its services as lending agent. The Fund may lend securities to certain qualified borrowers, including NFS. On the settlement date of the loan, the Fund receives collateral (in the form of U.S. Treasury obligations, letters of credit and/or cash) against the loaned securities and maintains collateral in an amount not less than 100% of the market value of the loaned securities during the period of the loan. The market value of the loaned securities is determined at the close of business of the Fund and any additional required collateral is delivered to the Fund on the next business day. The Fund or borrower may terminate the loan at any time, and if the borrower defaults on its obligation to return the securities loaned because of insolvency or other reasons, the Fund may apply collateral received from the borrower against the obligation. The Fund may experience delays and costs in recovering the securities loaned. Any cash collateral received is invested in the Fidelity Securities Lending Cash Central Fund. The value of loaned securities and cash collateral at period end are disclosed on the Fund's Statement of Assets and Liabilities. The value of securities loaned to NFS, as affiliated borrower, at period end was $51,278. Total fees paid by the Fund to NFS, as lending agent, amounted to $49,033. Security lending income represents the income earned on investing cash collateral, less rebates paid to borrowers and any lending agent fees associated with the loan, plus any premium payments received for lending certain types of securities. Net income from the Fidelity Securities Lending Cash Central Fund during the period is presented in the Statement of Operations as a component of income from Fidelity Central Funds (and includes $1,493 from securities loaned to NFS, as affiliated borrower).
8. Expense Reductions.
Commissions paid to certain brokers with whom the investment adviser, or its affiliates, places trades on behalf of the Fund include an amount in addition to trade execution, which may be rebated back to the Fund to offset certain expenses. This amount totaled $92,933 for the period. In addition, through arrangements with the Fund's custodian, credits realized as a result of certain uninvested cash balances were used to reduce the Fund's expenses by $584.
9. Other.
The Fund's organizational documents provide former and current trustees and officers with a limited indemnification against liabilities arising in connection with the performance of their duties to the Fund. In the normal course of business, the Fund may also enter into contracts that provide general indemnifications. The Fund's maximum exposure under these arrangements is unknown as this would be dependent on future claims that may be made against the Fund. The risk of material loss from such claims is considered remote.
10. Coronavirus (COVID-19) Pandemic.
An outbreak of COVID-19 first detected in China during December 2019 has since spread globally and was declared a pandemic by the World Health Organization during March 2020. Developments that disrupt global economies and financial markets, such as the COVID-19 pandemic, may magnify factors that affect the Fund's performance.
Report of Independent Registered Public Accounting Firm
To the Board of Trustees of Fidelity Puritan Trust and Shareholders of Fidelity Low-Priced Stock K6 Fund
Opinion on the Financial Statements
We have audited the accompanying statement of assets and liabilities, including the schedule of investments, of Fidelity Low-Priced Stock K6 Fund (one of the funds constituting Fidelity Puritan Trust, referred to hereafter as the “Fund”) as of July 31, 2020, the related statement of operations for the year ended July 31, 2020, the statement of changes in net assets for each of the two years in the period ended July 31, 2020, including the related notes, and the financial highlights for each of the three years in the period ended July 31, 2020 and for the period May 26, 2017 (commencement of operations) through July 31, 2017 (collectively referred to as the “financial statements”). In our opinion, the financial statements present fairly, in all material respects, the financial position of the Fund as of July 31, 2020, the results of its operations for the year then ended, the changes in its net assets for each of the two years in the period ended July 31, 2020 and the financial highlights for each of the three years in the period ended July 31, 2020 and for the period May 26, 2017 (commencement of operations) through July 31, 2017 in conformity with accounting principles generally accepted in the United States of America.
Basis for Opinion
These financial statements are the responsibility of the Fund’s management. Our responsibility is to express an opinion on the Fund’s financial statements based on our audits. We are a public accounting firm registered with the Public Company Accounting Oversight Board (United States) (PCAOB) and are required to be independent with respect to the Fund in accordance with the U.S. federal securities laws and the applicable rules and regulations of the Securities and Exchange Commission and the PCAOB.
We conducted our audits of these financial statements in accordance with the standards of the PCAOB. Those standards require that we plan and perform the audit to obtain reasonable assurance about whether the financial statements are free of material misstatement, whether due to error or fraud.
Our audits included performing procedures to assess the risks of material misstatement of the financial statements, whether due to error or fraud, and performing procedures that respond to those risks. Such procedures included examining, on a test basis, evidence regarding the amounts and disclosures in the financial statements. Our audits also included evaluating the accounting principles used and significant estimates made by management, as well as evaluating the overall presentation of the financial statements. Our procedures included confirmation of securities owned as of July 31, 2020 by correspondence with the custodian, issuers of privately offered securities and brokers; when replies were not received from brokers, we performed other auditing procedures. We believe that our audits provide a reasonable basis for our opinion.
/s/ PricewaterhouseCoopers LLP
Boston, Massachusetts
September 14, 2020
We have served as the auditor of one or more investment companies in the Fidelity group of funds since 1932.
Trustees and Officers
The Trustees, Members of the Advisory Board (if any), and officers of the trust and fund, as applicable, are listed below. The Board of Trustees governs the fund and is responsible for protecting the interests of shareholders. The Trustees are experienced executives who meet periodically throughout the year to oversee the fund's activities, review contractual arrangements with companies that provide services to the fund, oversee management of the risks associated with such activities and contractual arrangements, and review the fund's performance. Except for Jonathan Chiel, each of the Trustees oversees 311 funds. Mr. Chiel oversees 174 funds.
The Trustees hold office without limit in time except that (a) any Trustee may resign; (b) any Trustee may be removed by written instrument, signed by at least two-thirds of the number of Trustees prior to such removal; (c) any Trustee who requests to be retired or who has become incapacitated by illness or injury may be retired by written instrument signed by a majority of the other Trustees; and (d) any Trustee may be removed at any special meeting of shareholders by a two-thirds vote of the outstanding voting securities of the trust. Each Trustee who is not an interested person (as defined in the 1940 Act) of the trust and the fund is referred to herein as an Independent Trustee. Each Independent Trustee shall retire not later than the last day of the calendar year in which his or her 75th birthday occurs. The Independent Trustees may waive this mandatory retirement age policy with respect to individual Trustees. Officers and Advisory Board Members hold office without limit in time, except that any officer or Advisory Board Member may resign or may be removed by a vote of a majority of the Trustees at any regular meeting or any special meeting of the Trustees. Except as indicated, each individual has held the office shown or other offices in the same company for the past five years.
The fund’s Statement of Additional Information (SAI) includes more information about the Trustees. To request a free copy, call Fidelity at 1-800-835-5092.
Experience, Skills, Attributes, and Qualifications of the Trustees. The Governance and Nominating Committee has adopted a statement of policy that describes the experience, qualifications, attributes, and skills that are necessary and desirable for potential Independent Trustee candidates (Statement of Policy). The Board believes that each Trustee satisfied at the time he or she was initially elected or appointed a Trustee, and continues to satisfy, the standards contemplated by the Statement of Policy. The Governance and Nominating Committee also engages professional search firms to help identify potential Independent Trustee candidates who have the experience, qualifications, attributes, and skills consistent with the Statement of Policy. From time to time, additional criteria based on the composition and skills of the current Independent Trustees, as well as experience or skills that may be appropriate in light of future changes to board composition, business conditions, and regulatory or other developments, have also been considered by the professional search firms and the Governance and Nominating Committee. In addition, the Board takes into account the Trustees' commitment and participation in Board and committee meetings, as well as their leadership of standing and ad hoc committees throughout their tenure.
In determining that a particular Trustee was and continues to be qualified to serve as a Trustee, the Board has considered a variety of criteria, none of which, in isolation, was controlling. The Board believes that, collectively, the Trustees have balanced and diverse experience, qualifications, attributes, and skills, which allow the Board to operate effectively in governing the fund and protecting the interests of shareholders. Information about the specific experience, skills, attributes, and qualifications of each Trustee, which in each case led to the Board's conclusion that the Trustee should serve (or continue to serve) as a trustee of the fund, is provided below.
Board Structure and Oversight Function. Robert A. Lawrence is an interested person and currently serves as Acting Chairman. The Trustees have determined that an interested Chairman is appropriate and benefits shareholders because an interested Chairman has a personal and professional stake in the quality and continuity of services provided to the fund. Independent Trustees exercise their informed business judgment to appoint an individual of their choosing to serve as Chairman, regardless of whether the Trustee happens to be independent or a member of management. The Independent Trustees have determined that they can act independently and effectively without having an Independent Trustee serve as Chairman and that a key structural component for assuring that they are in a position to do so is for the Independent Trustees to constitute a substantial majority for the Board. The Independent Trustees also regularly meet in executive session. Ned C. Lautenbach and David M. Thomas serve as Co-Lead Independent Trustees and as such each (i) acts as a liaison between the Independent Trustees and management with respect to matters important to the Independent Trustees and (ii) with management prepares agendas for Board meetings.
Fidelity® funds are overseen by different Boards of Trustees. The fund's Board oversees Fidelity's high income and certain equity funds, and other Boards oversee Fidelity's investment-grade bond, money market, asset allocation, and other equity funds. The asset allocation funds may invest in Fidelity® funds overseen by the fund's Board. The use of separate Boards, each with its own committee structure, allows the Trustees of each group of Fidelity® funds to focus on the unique issues of the funds they oversee, including common research, investment, and operational issues. On occasion, the separate Boards establish joint committees to address issues of overlapping consequences for the Fidelity® funds overseen by each Board.
The Trustees operate using a system of committees to facilitate the timely and efficient consideration of all matters of importance to the Trustees, the fund, and fund shareholders and to facilitate compliance with legal and regulatory requirements and oversight of the fund's activities and associated risks. The Board, acting through its committees, has charged FMR and its affiliates with (i) identifying events or circumstances the occurrence of which could have demonstrably adverse effects on the fund's business and/or reputation; (ii) implementing processes and controls to lessen the possibility that such events or circumstances occur or to mitigate the effects of such events or circumstances if they do occur; and (iii) creating and maintaining a system designed to evaluate continuously business and market conditions in order to facilitate the identification and implementation processes described in (i) and (ii) above. Because the day-to-day operations and activities of the fund are carried out by or through FMR, its affiliates, and other service providers, the fund's exposure to risks is mitigated but not eliminated by the processes overseen by the Trustees. While each of the Board's committees has responsibility for overseeing different aspects of the fund's activities, oversight is exercised primarily through the Operations, Audit, and Compliance Committees. Appropriate personnel, including but not limited to the fund's Chief Compliance Officer (CCO), FMR's internal auditor, the independent accountants, the fund's Treasurer and portfolio management personnel, make periodic reports to the Board's committees, as appropriate, including an annual review of Fidelity's risk management program for the Fidelity® funds. The responsibilities of each standing committee, including their oversight responsibilities, are described further under "Standing Committees of the Trustees."
Interested Trustees*:
Correspondence intended for a Trustee who is an interested person may be sent to Fidelity Investments, 245 Summer Street, Boston, Massachusetts 02210.
Name, Year of Birth; Principal Occupations and Other Relevant Experience+
Jonathan Chiel (1957)
Year of Election or Appointment: 2016
Trustee
Mr. Chiel also serves as Trustee of other Fidelity® funds. Mr. Chiel is Executive Vice President and General Counsel for FMR LLC (diversified financial services company, 2012-present). Previously, Mr. Chiel served as general counsel (2004-2012) and senior vice president and deputy general counsel (2000-2004) for John Hancock Financial Services; a partner with Choate, Hall & Stewart (1996-2000) (law firm); and an Assistant United States Attorney for the United States Attorney’s Office of the District of Massachusetts (1986-95), including Chief of the Criminal Division (1993-1995). Mr. Chiel is a director on the boards of the Boston Bar Foundation and the Maimonides School.
Robert A. Lawrence (1952)
Year of Election or Appointment: 2020
Trustee
Acting Chairman of the Board of Trustees
Mr. Lawrence also serves as Trustee of other funds. Previously, Mr. Lawrence served as a Member of the Advisory Board of certain funds. Prior to his retirement in 2008, Mr. Lawrence served as Vice President of certain Fidelity® funds (2006-2008), Senior Vice President, Head of High Income Division of Fidelity Management & Research Company (investment adviser firm, 2006-2008), and President of Fidelity Strategic Investments (investment adviser firm, 2002-2005).
* Determined to be an “Interested Trustee” by virtue of, among other things, his or her affiliation with the trust or various entities under common control with FMR.
+ The information includes the Trustee's principal occupation during the last five years and other information relating to the experience, attributes, and skills relevant to the Trustee's qualifications to serve as a Trustee, which led to the conclusion that the Trustee should serve as a Trustee for the fund.
Independent Trustees:
Correspondence intended for an Independent Trustee may be sent to Fidelity Investments, P.O. Box 55235, Boston, Massachusetts 02205-5235.
Name, Year of Birth; Principal Occupations and Other Relevant Experience+
Dennis J. Dirks (1948)
Year of Election or Appointment: 2005
Trustee
Mr. Dirks also serves as Trustee of other Fidelity® funds. Prior to his retirement in May 2003, Mr. Dirks served as Chief Operating Officer and as a member of the Board of The Depository Trust & Clearing Corporation (financial markets infrastructure), President, Chief Operating Officer and a member of the Board of The Depository Trust Company (DTC), President and a member of the Board of the National Securities Clearing Corporation (NSCC), Chief Executive Officer and a member of the Board of the Government Securities Clearing Corporation and Chief Executive Officer and a member of the Board of the Mortgage-Backed Securities Clearing Corporation. Mr. Dirks currently serves as a member of the Finance Committee (2016-present) and Board (2017-present) and is Treasurer (2018-present) of the Asolo Repertory Theatre.
Donald F. Donahue (1950)
Year of Election or Appointment: 2018
Trustee
Mr. Donahue also serves as Trustee of other Fidelity® funds. Mr. Donahue serves as President and Chief Executive Officer of Miranda Partners, LLC (risk consulting for the financial services industry, 2012-present). Previously, Mr. Donahue served as Chief Executive Officer (2006-2012), Chief Operating Officer (2003-2006) and Managing Director, Customer Marketing and Development (1999-2003) of The Depository Trust & Clearing Corporation (financial markets infrastructure). Mr. Donahue currently serves as a member (2007-present) and Co-Chairman (2016-present) of the Board of United Way of New York, a member of the Board of NYC Leadership Academy (2012-present) and a member of the Board of Advisors of Ripple Labs, Inc. (financial services, 2015-present). Mr. Donahue previously served as a member of the Advisory Board of certain Fidelity® funds (2015-2018).
Vicki L. Fuller (1957)
Year of Election or Appointment: 2020
Trustee
Ms. Fuller also serves as Trustee of other Fidelity® funds. Previously, Ms. Fuller served as a member of the Advisory Board of certain Fidelity® funds (2018-2020), Chief Investment Officer of the New York State Common Retirement Fund (2012-2018) and held a variety of positions at AllianceBernstein L.P. (global asset management, 1985-2012), including Managing Director (2006-2012) and Senior Vice President and Senior Portfolio Manager (2001-2006). Ms. Fuller currently serves as a member of the Board, Audit Committee and Nominating and Governance Committee of The Williams Companies, Inc. (natural gas infrastructure, 2018-present) and as a member of the Board of Treliant, LLC (consulting, 2019-present).
Patricia L. Kampling (1959)
Year of Election or Appointment: 2020
Trustee
Ms. Kampling also serves as Trustee of other Fidelity® funds. Prior to her retirement, Ms. Kampling served as Chairman of the Board and Chief Executive Officer (2012-2019), President and Chief Operating Officer (2011-2012) and Executive Vice President and Chief Financial Officer (2010-2011) of Alliant Energy Corporation. Ms. Kampling currently serves as a member of the Board, Compensation Committee and Executive Committee and as Chair of the Audit Committee of Briggs & Stratton Corporation (manufacturing, 2011-present) and as a member of the Board, Audit, Finance and Risk Committee and Safety, Environmental, Technology and Operations Committee of American Water Works Company, Inc. (utilities company, 2019-present). In addition, Ms. Kampling currently serves as a member of the Board of the Nature Conservancy, Wisconsin Chapter (2019-present). Previously, Ms. Kampling served as a Member of the Advisory Board of certain Fidelity® funds (2020), a member of the Board of Interstate Power and Light Company (2012-2019) and Wisconsin Power and Light Company (2012-2019) (each a subsidiary of Alliant Energy Corporation) and as a member of the Board and Workforce Development Committee of the Business Roundtable (2018-2019).
Alan J. Lacy (1953)
Year of Election or Appointment: 2008
Trustee
Mr. Lacy also serves as Trustee of other Fidelity® funds. Previously, Mr. Lacy served as Senior Adviser (2007-2014) of Oak Hill Capital Partners, L.P. (private equity), Chief Executive Officer (2005) and Vice Chairman (2005-2006) of Sears Holdings Corporation (retail), Chief Executive Officer and Chairman of the Board of Sears, Roebuck and Co. (retail, 2000-2005), Chairman (2014-2017) and a member of the Board (2010-2017) of Dave & Buster’s Entertainment, Inc. (restaurant and entertainment complexes) and a member of the Board of Bristol-Myers Squibb Company (global pharmaceuticals, 2008-2020). Mr. Lacy currently serves as a Trustee of the California Chapter of The Nature Conservancy (2015-present) and a member of the Board of the Center for Advanced Study in the Behavioral Sciences at Stanford University (2015-present).
Ned C. Lautenbach (1944)
Year of Election or Appointment: 2000
Trustee
Co-Lead Independent Trustee
Mr. Lautenbach also serves as Trustee of other Fidelity® funds. Mr. Lautenbach currently serves as Chair of the Board of Governors, State University System of Florida (2013-present) and is a member of the Council on Foreign Relations (1994-present). He is also a member and has in the past served as Chairman of the Board of Directors of Artis-Naples (2012-present). Previously, Mr. Lautenbach served as a member and then Lead Director of the Board of Directors of Eaton Corporation (diversified industrial, 1997-2016). He was also a Partner at Clayton, Dubilier & Rice, LLC (private equity investment, 1998-2010); as well as Director of Sony Corporation (2006-2007). In addition, Mr. Lautenbach had a 30-year career with IBM (technology company), during which time he served as Senior Vice President and as a member of the Corporate Executive Committee (1968-1998).
Joseph Mauriello (1944)
Year of Election or Appointment: 2008
Trustee
Mr. Mauriello also serves as Trustee of other Fidelity® funds. Prior to his retirement in January 2006, Mr. Mauriello served in numerous senior management positions including Deputy Chairman and Chief Operating Officer (2004-2005), and Vice Chairman of Financial Services (2002-2004) of KPMG LLP US (professional services, 1965-2005). Mr. Mauriello currently serves as a member of the Independent Directors Council Governing Council (2015-present). Previously, Mr. Mauriello served as a member of the Board of XL Group plc. (global insurance and re-insurance, 2006-2018).
Cornelia M. Small (1944)
Year of Election or Appointment: 2005
Trustee
Ms. Small also serves as Trustee of other Fidelity® funds. Previously, Ms. Small served as Chief Investment Officer, Director of Global Equity Investments and a member of Scudder, Stevens & Clark and Scudder Kemper Investments. Ms. Small previously served as a member of the Board (2009-2019) and Chair of the Investment Committee (2010-2019) of the Teagle Foundation and a member of the Investment Committee of the Berkshire Taconic Community Foundation (2008-2019).
Garnett A. Smith (1947)
Year of Election or Appointment: 2018
Trustee
Mr. Smith also serves as Trustee of other Fidelity® funds. Prior to his retirement, Mr. Smith served as Chairman and Chief Executive Officer (1990-1997) and President (1986-1990) of Inbrand Corp. (manufacturer of personal absorbent products). Prior to his employment with Inbrand Corp., he was employed by a retail fabric chain and North Carolina National Bank (now Bank of America). Mr. Smith previously served as a member of the Advisory Board of certain Fidelity® funds (2012-2013).
David M. Thomas (1949)
Year of Election or Appointment: 2008
Trustee
Co-Lead Independent Trustee
Mr. Thomas also serves as Trustee of other Fidelity® funds. Previously, Mr. Thomas served as Executive Chairman (2005-2006) and Chairman and Chief Executive Officer (2000-2005) of IMS Health, Inc. (pharmaceutical and healthcare information solutions). Mr. Thomas currently serves as Non-Executive Chairman of the Board of Fortune Brands Home and Security (home and security products, 2011-present), and a member of the Board (2004-present) and Presiding Director (2013-present) of Interpublic Group of Companies, Inc. (marketing communication).
Susan Tomasky (1953)
Year of Election or Appointment: 2020
Trustee
Ms. Tomasky also serves as Trustee of other Fidelity® funds. Prior to her retirement, Ms. Tomasky served in various executive officer positions at American Electric Power Company, Inc. (1998-2011), including most recently as President of AEP Transmission (2007-2011). Ms. Tomasky currently serves as a member of the Board and Sustainability Committee and as Chair of the Audit Committee of Marathon Petroleum Corporation (2018-present) and as a member of the Board, Corporate Governance Committee and Organization and Compensation Committee and as Chair of the Audit Committee of Public Service Enterprise Group, Inc. (utilities company, 2012-present). In addition, Ms. Tomasky currently serves as a member of the Board of the Columbus Regional Airport Authority (2007-present), as a member of the Board of the Royal Shakespeare Company – America (2009-present), as a member of the Board of the Columbus Association for the Performing Arts (2011-present) and as a member of the Board of Kenyon College (2016-present). Previously, Ms. Tomasky served as a Member of the Advisory Board of certain Fidelity® funds (2020), a member of the Board (2011-2019) and as Lead Independent Director (2015-2018) of Andeavor Corporation (previously Tesoro Corporation) (independent oil refiner and marketer) and as a member of the Board of Summit Midstream Partners LP (energy, 2012-2018).
Michael E. Wiley (1950)
Year of Election or Appointment: 2020
Trustee
Mr. Wiley also serves as Trustee of other Fidelity® funds. Previously, Mr. Wiley served as a member of the Advisory Board of certain Fidelity® funds (2018-2020), Chairman, President and CEO of Baker Hughes, Inc. (oilfield services, 2000-2004). Mr. Wiley also previously served as a member of the Board of Andeavor Corporation (independent oil refiner and marketer, 2005-2018), a member of the Board of Andeavor Logistics LP (natural resources logistics, 2015-2018) and a member of the Board of High Point Resources (exploration and production, 2005-2020).
+ The information includes the Trustee's principal occupation during the last five years and other information relating to the experience, attributes, and skills relevant to the Trustee's qualifications to serve as a Trustee, which led to the conclusion that the Trustee should serve as a Trustee for the fund.
Advisory Board Members and Officers:
Correspondence intended for a Member of the Advisory Board (if any) may be sent to Fidelity Investments, P.O. Box 55235, Boston, Massachusetts 02205-5235. Correspondence intended for an officer or Peter S. Lynch may be sent to Fidelity Investments, 245 Summer Street, Boston, Massachusetts 02210. Officers appear below in alphabetical order.
Name, Year of Birth; Principal Occupation
Peter S. Lynch (1944)
Year of Election or Appointment: 2003
Member of the Advisory Board
Mr. Lynch also serves as a Member of the Advisory Board of other Fidelity® funds. Mr. Lynch is Vice Chairman and a Director of Fidelity Management & Research Company LLC (investment adviser firm). In addition, Mr. Lynch serves as a Trustee of Boston College and as the Chairman of the Inner-City Scholarship Fund. Previously, Mr. Lynch served as Vice Chairman and a Director of FMR Co., Inc. (investment adviser firm) and on the Special Olympics International Board of Directors (1997-2006).
Elizabeth Paige Baumann (1968)
Year of Election or Appointment: 2017
Anti-Money Laundering (AML) Officer
Ms. Baumann also serves as AML Officer of other funds. She is Chief AML Officer (2012-present) and Senior Vice President (2014-present) of FMR LLC (diversified financial services company) and is an employee of Fidelity Investments. Previously, Ms. Baumann served as AML Officer of certain funds (2017-2019), as AML Officer of the funds (2012-2016), and Vice President (2007-2014) and Deputy Anti-Money Laundering Officer (2007-2012) of FMR LLC.
Craig S. Brown (1977)
Year of Election or Appointment: 2019
Assistant Treasurer
Mr. Brown also serves as Assistant Treasurer of other funds. Mr. Brown is an employee of Fidelity Investments (2013-present).
John J. Burke III (1964)
Year of Election or Appointment: 2018
Chief Financial Officer
Mr. Burke also serves as Chief Financial Officer of other funds. Mr. Burke serves as Head of Investment Operations for Fidelity Fund and Investment Operations (2018-present) and is an employee of Fidelity Investments (1998-present). Previously Mr. Burke served as head of Asset Management Investment Operations (2012-2018).
William C. Coffey (1969)
Year of Election or Appointment: 2019
Assistant Secretary
Mr. Coffey also serves as Assistant Secretary of other funds. He is Senior Vice President and Deputy General Counsel of FMR LLC (diversified financial services company, 2010-present), and is an employee of Fidelity Investments. Previously, Mr. Coffey served as Secretary and CLO of certain funds (2018-2019); CLO, Secretary, and Senior Vice President of Fidelity Management & Research Company and FMR Co., Inc. (investment adviser firms, 2018-2019); Secretary of Fidelity SelectCo, LLC and Fidelity Investments Money Management, Inc. (investment adviser firms, 2018-2019); CLO of Fidelity Management & Research (Hong Kong) Limited, FMR Investment Management (UK) Limited, and Fidelity Management & Research (Japan) Limited (investment adviser firms, 2018-2019); and Assistant Secretary of certain funds (2009-2018).
Timothy M. Cohen (1969)
Year of Election or Appointment: 2018
Vice President
Mr. Cohen also serves as Vice President of other funds. Mr. Cohen serves as Co-Head of Equity (2018-present), a Director of Fidelity Management & Research (Japan) Limited (investment adviser firm, 2016-present), and is an employee of Fidelity Investments. Previously, Mr. Cohen served as Executive Vice President of Fidelity SelectCo, LLC (2019), Head of Global Equity Research (2016-2018), Chief Investment Officer - Equity and a Director of Fidelity Management & Research (U.K.) Inc. (investment adviser firm, 2013-2015) and as a Director of Fidelity Management & Research (Hong Kong) Limited (investment adviser firm, 2017).
Jonathan Davis (1968)
Year of Election or Appointment: 2010
Assistant Treasurer
Mr. Davis also serves as Assistant Treasurer of other funds. Mr. Davis serves as Assistant Treasurer of FMR Capital, Inc. (2017-present) and is an employee of Fidelity Investments. Previously, Mr. Davis served as Vice President and Associate General Counsel of FMR LLC (diversified financial services company, 2003-2010).
Laura M. Del Prato (1964)
Year of Election or Appointment: 2018
Assistant Treasurer
Ms. Del Prato also serves as an officer of other funds. Ms. Del Prato is an employee of Fidelity Investments (2017-present). Previously, Ms. Del Prato served as President and Treasurer of The North Carolina Capital Management Trust: Cash Portfolio and Term Portfolio (2018-2020). Prior to joining Fidelity Investments, Ms. Del Prato served as a Managing Director and Treasurer of the JPMorgan Mutual Funds (2014-2017). Prior to JPMorgan, Ms. Del Prato served as a partner at Cohen Fund Audit Services (accounting firm, 2012-2013) and KPMG LLP (accounting firm, 2004-2012).
Colm A. Hogan (1973)
Year of Election or Appointment: 2020
Assistant Treasurer
Mr. Hogan also serves as an officer of other funds. Mr. Hogan serves as Assistant Treasurer of FMR Capital, Inc. (2017-present) and is an employee of Fidelity Investments (2005-present). Previously, Mr. Hogan served as Deputy Treasurer of certain Fidelity® funds (2016-2020) and Assistant Treasurer of certain Fidelity® funds (2016-2018).
Pamela R. Holding (1964)
Year of Election or Appointment: 2018
Vice President
Ms. Holding also serves as Vice President of other funds. Ms. Holding serves as Co-Head of Equity (2018-present) and is an employee of Fidelity Investments (2013-present). Previously, Ms. Holding served as Executive Vice President of Fidelity SelectCo, LLC (2019) and as Chief Investment Officer of Fidelity Institutional Asset Management (2013-2018).
Cynthia Lo Bessette (1969)
Year of Election or Appointment: 2019
Secretary and Chief Legal Officer (CLO)
Ms. Lo Bessette also serves as an officer of other funds. Ms. Lo Bessette serves as CLO, Secretary, and Senior Vice President of Fidelity Management & Research Company LLC (investment adviser firm, 2019-present); and CLO of Fidelity Management & Research (Hong Kong) Limited, FMR Investment Management (UK) Limited, and Fidelity Management & Research (Japan) Limited (investment adviser firms, 2019-present). She is a Senior Vice President and Deputy General Counsel of FMR LLC (diversified financial services company, 2019-present), and is an employee of Fidelity Investments. Previously, Ms. Lo Bessette served as CLO, Secretary, and Senior Vice President of FMR Co., Inc. (investment adviser firm, 2019); Secretary of Fidelity SelectCo, LLC and Fidelity Investments Money Management, Inc. (investment adviser firms, 2019). Prior to joining Fidelity Investments, Ms. Lo Bessette was Executive Vice President, General Counsel (2016-2019) and Senior Vice President, Deputy General Counsel (2015-2016) of OppenheimerFunds (investment management company) and Deputy Chief Legal Officer (2013-2015) of Jennison Associates LLC (investment adviser firm).
Chris Maher (1972)
Year of Election or Appointment: 2020
Deputy Treasurer
Mr. Maher also serves as an officer of other funds. Mr. Maher serves as Assistant Treasurer of FMR Capital, Inc. (2017-present), and is an employee of Fidelity Investments (2008-present). Previously, Mr. Maher served as Assistant Treasurer of certain funds (2013-2020); Vice President of Asset Management Compliance (2013), Vice President of the Program Management Group of FMR (investment adviser firm, 2010-2013), and Vice President of Valuation Oversight (2008-2010).
Jason P. Pogorelec (1975)
Year of Election or Appointment: 2020
Chief Compliance Officer
Mr. Pogorelec also serves as Chief Compliance Officer of other funds. Mr. Pogorelec is a senior Vice President of Asset Management Compliance for Fidelity Investments and is an employee of Fidelity Investments (2006-present). Previously, Mr. Pogorelec served as Vice President, Associate General Counsel for Fidelity Investments (2010-2020) and Assistant Secretary of certain Fidelity funds (2015-2020).
Stacie M. Smith (1974)
Year of Election or Appointment: 2016
President and Treasurer
Ms. Smith also serves as an officer of other funds. Ms. Smith serves as Assistant Treasurer of FMR Capital, Inc. (2017-present), is an employee of Fidelity Investments (2009-present), and has served in other fund officer roles. Prior to joining Fidelity Investments, Ms. Smith served as Senior Audit Manager of Ernst & Young LLP (accounting firm, 1996-2009). Previously, Ms. Smith served as Assistant Treasurer (2013-2019) and Deputy Treasurer (2013-2016) of certain Fidelity® funds.
Marc L. Spector (1972)
Year of Election or Appointment: 2016
Assistant Treasurer
Mr. Spector also serves as an officer of other funds. Mr. Spector serves as Assistant Treasurer of FMR Capital, Inc. (2017-present) and is an employee of Fidelity Investments (2016-present). Prior to joining Fidelity Investments, Mr. Spector served as Director at the Siegfried Group (accounting firm, 2013-2016), and prior to Siegfried Group as audit senior manager at Deloitte & Touche LLP (accounting firm, 2005-2013).
Jim Wegmann (1979)
Year of Election or Appointment: 2019
Assistant Treasurer
Mr. Wegmann also serves as Assistant Treasurer of other funds. Mr. Wegmann is an employee of Fidelity Investments (2011-present).
Shareholder Expense Example
As a shareholder, you incur two types of costs: (1) transaction costs, which may include sales charges (loads) on purchase payments or redemption proceeds, as applicable and (2) ongoing costs, which generally include management fees, distribution and/or service (12b-1) fees and other Fund expenses. This Example is intended to help you understand your ongoing costs (in dollars) of investing in a fund and to compare these costs with the ongoing costs of investing in other mutual funds.
The Example is based on an investment of $1,000 invested at the beginning of the period and held for the entire period (February 1, 2020 to July 31, 2020).
Actual Expenses
The first line of the accompanying table provides information about actual account values and actual expenses. You may use the information in this line, together with the amount you invested, to estimate the expenses that you paid over the period. Simply divide your account value by $1,000.00 (for example, an $8,600 account value divided by $1,000.00 = 8.6), then multiply the result by the number in the first line for a class/Fund under the heading entitled "Expenses Paid During Period" to estimate the expenses you paid on your account during this period. If any fund is a shareholder of any underlying mutual funds or exchange-traded funds (ETFs) (the Underlying Funds), such fund indirectly bears its proportional share of the expenses of the Underlying Funds in addition to the direct expenses incurred presented in the table. These fees and expenses are not included in the annualized expense ratio used to calculate the expense estimate in the table below.
Hypothetical Example for Comparison Purposes
The second line of the accompanying table provides information about hypothetical account values and hypothetical expenses based on the actual expense ratio and an assumed rate of return of 5% per year before expenses, which is not the actual return. The hypothetical account values and expenses may not be used to estimate the actual ending account balance or expenses you paid for the period. You may use this information to compare the ongoing costs of investing in the Fund and other funds. To do so, compare this 5% hypothetical example with the 5% hypothetical examples that appear in the shareholder reports of the other funds. If any fund is a shareholder of any Underlying Funds, such fund indirectly bears its proportional share of the expenses of the Underlying Funds in addition to the direct expenses as presented in the table. These fees and expenses are not included in the annualized expense ratio used to calculate the expense estimate in the table below.
Please note that the expenses shown in the table are meant to highlight your ongoing costs only and do not reflect any transaction costs. Therefore, the second line of the table is useful in comparing ongoing costs only, and will not help you determine the relative total costs of owning different funds.
| | Annualized Expense Ratio-A | Beginning
Account Value
February 1, 2020 | Ending
Account Value
July 31, 2020 | Expenses Paid
During Period-B
February 1, 2020
to July 31, 2020 |
| Fidelity Low-Priced Stock K6 Fund | .50% | | | |
| Actual | | $1,000.00 | $936.00 | $2.41 |
| Hypothetical-C | | $1,000.00 | $1,022.38 | $2.51 |
A Annualized expense ratio reflects expenses net of applicable fee waivers.
B Expenses are equal to the annualized expense ratio, multiplied by the average account value over the period, multiplied by 182/ 366 (to reflect the one-half year period). The fees and expenses of any Underlying Funds are not included in each annualized expense ratio.
C 5% return per year before expenses
Distributions (Unaudited)
The fund designates 44% and 46% of the dividends distributed in September and December, respectively during the fiscal year as qualifying for the dividends–received deduction for corporate shareholders.
The fund designates 85% and 97% of the dividends distributed in September and December, respectively during the fiscal year as amounts which may be taken into account as a dividend for the purposes of the maximum rate under section 1(h)(11) of the Internal Revenue Code.
The fund designates 4% and 3% of the dividends distributed in September and December, respectively during the fiscal year as a section 199A dividend.
The fund will notify shareholders in January 2021 of amounts for use in preparing 2020 income tax returns.
Liquidity Risk Management Program
The Securities and Exchange Commission adopted Rule 22e-4 under the Investment Company Act of 1940 (the Liquidity Rule) to promote effective liquidity risk management throughout the open-end investment company industry, thereby reducing the risk that funds will be unable to meet their redemption obligations and mitigating dilution of the interests of fund shareholders.
The Fund has adopted and implemented a liquidity risk management program pursuant to the Liquidity Rule (the Program) effective December 1, 2018. The Program is reasonably designed to assess and manage the Fund’s liquidity risk and to comply with the requirements of the Liquidity Rule. The Fund’s Board of Trustees (the Board) has designated the Fund’s investment adviser as administrator of the Program. The Fidelity advisers have established a Liquidity Risk Management Committee (the LRM Committee) to manage the Program for each of the Fidelity Funds. The LRM Committee monitors the adequacy and effectiveness of implementation of the Program and on a periodic basis assesses each Fund’s liquidity risk based on a variety of factors including (1) the Fund’s investment strategy, (2) portfolio liquidity and cash flow projections during normal and reasonably foreseeable stressed conditions, (3) shareholder redemptions, (4) borrowings and other funding sources and (5) in the case of exchange-traded funds, certain additional factors including the effect of the Fund’s prices and spreads, market participants, and basket compositions on the overall liquidity of the Fund’s portfolio, as applicable.
In accordance with the Program, each of the Fund’s portfolio investments is classified into one of four liquidity categories described below based on a determination of a reasonable expectation for how long it would take to convert the investment to cash (or sell or dispose of the investment) without significantly changing its market value.
- Highly liquid investments – cash or convertible to cash within three business days or less
- Moderately liquid investments – convertible to cash in three to seven calendar days
- Less liquid investments – can be sold or disposed of, but not settled, within seven calendar days
- Illiquid investments – cannot be sold or disposed of within seven calendar days
Liquidity classification determinations take into account a variety of factors including various market, trading and investment-specific considerations, as well as market depth, and generally utilize analysis from a third-party liquidity metrics service.
The Liquidity Rule places a 15% limit on a fund’s illiquid investments and requires funds that do not primarily hold assets that are highly liquid investments to determine and maintain a minimum percentage of the fund’s net assets to be invested in highly liquid investments (highly liquid investment minimum or HLIM). The Program includes provisions reasonably designed to comply with the 15% limit on illiquid investments and for determining, periodically reviewing and complying with the HLIM requirement as applicable.
At a recent meeting of the Fund’s Board of Trustees, the LRM Committee provided a written report to the Board pertaining to the operation, adequacy, and effectiveness of implementation of the Program for the annual period from December 1, 2018 through November 30, 2019. The report concluded that the Program has been implemented and is operating effectively and is reasonably designed to assess and manage the Fund’s liquidity risk.
Proxy Voting Results
A special meeting of shareholders was held on June 9, 2020. The results of votes taken among shareholders on the proposal before them are reported below. Each vote reported represents one dollar of net asset value held on the record date for the meeting.
PROPOSAL 1
To elect a Board of Trustees.
| | # of
Votes | % of
Votes |
| Dennis J. Dirks |
| Affirmative | 51,196,847,491.427 | 94.398 |
| Withheld | 3,038,239,286.369 | 5.602 |
| TOTAL | 54,235,086,777.797 | 100.000 |
| Donald F. Donahue |
| Affirmative | 51,237,854,534.400 | 94.474 |
| Withheld | 2,997,232,243.397 | 5.526 |
| TOTAL | 54,235,086,777.797 | 100.000 |
| Bettina Doulton |
| Affirmative | 51,360,110,652.541 | 94.699 |
| Withheld | 2,874,976,125.255 | 5.301 |
| TOTAL | 54,235,086,777.797 | 100.000 |
| Vicki L. Fuller |
| Affirmative | 51,563,431,518.122 | 95.074 |
| Withheld | 2,671,655,259.675 | 4.926 |
| TOTAL | 54,235,086,777.797 | 100.000 |
| Patricia L. Kampling |
| Affirmative | 51,164,274,033.278 | 94.338 |
| Withheld | 3,070,812,744.518 | 5.662 |
| TOTAL | 54,235,086,777.797 | 100.000 |
| Alan J. Lacy |
| Affirmative | 50,656,049,520.376 | 93.401 |
| Withheld | 3,579,037,257.420 | 6.599 |
| TOTAL | 54,235,086,777.797 | 100.000 |
| Ned C. Lautenbach |
| Affirmative | 50,648,184,728.350 | 93.386 |
| Withheld | 3,586,902,049.447 | 6.614 |
| TOTAL | 54,235,086,777.797 | 100.000 |
| Robert A. Lawrence |
| Affirmative | 50,828,079,099.188 | 93.718 |
| Withheld | 3,407,007,678.608 | 6.282 |
| TOTAL | 54,235,086,777.797 | 100.000 |
| Joseph Mauriello |
| Affirmative | 50,733,010,817.685 | 93.543 |
| Withheld | 3,502,075,960.112 | 6.457 |
| TOTAL | 54,235,086,777.797 | 100.000 |
| Cornelia M. Small |
| Affirmative | 50,936,822,997.692 | 93.919 |
| Withheld | 3,298,263,780.105 | 6.081 |
| TOTAL | 54,235,086,777.797 | 100.000 |
| Garnett A. Smith |
| Affirmative | 50,777,344,834.274 | 93.625 |
| Withheld | 3,457,741,943.523 | 6.375 |
| TOTAL | 54,235,086,777.797 | 100.000 |
| David M. Thomas |
| Affirmative | 50,835,673,463.433 | 93.732 |
| Withheld | 3,399,413,314.364 | 6.268 |
| TOTAL | 54,235,086,777.797 | 100.000 |
| Susan Tomasky |
| Affirmative | 51,193,289,850.509 | 94.391 |
| Withheld | 3,041,796,927.288 | 5.609 |
| TOTAL | 54,235,086,777.797 | 100.000 |
| Michael E. Wiley |
| Affirmative | 50,830,132,792.508 | 93.722 |
| Withheld | 3,404,953,985.289 | 6.278 |
| TOTAL | 54,235,086,777.797 | 100.000 |
|
| Proposal 1 reflects trust wide proposal and voting results. |
LPSK6-ANN-0920
1.9883999.103
Fidelity® Value Discovery K6 Fund
Annual Report
July 31, 2020
See the inside front cover for important information about access to your fund’s shareholder reports.
Beginning on January 1, 2021, as permitted by regulations adopted by the Securities and Exchange Commission, paper copies of a fund’s shareholder reports will no longer be sent by mail, unless you specifically request paper copies of the reports from the fund or from your financial intermediary, such as a financial advisor, broker-dealer or bank. Instead, the reports will be made available on a website, and you will be notified by mail each time a report is posted and provided with a website link to access the report.
If you already elected to receive shareholder reports electronically, you will not be affected by this change and you need not take any action. You may elect to receive shareholder reports and other communications from a fund electronically, by contacting your financial intermediary. For Fidelity customers, visit Fidelity's web site or call Fidelity using the contact information listed below.
You may elect to receive all future reports in paper free of charge. If you wish to continue receiving paper copies of your shareholder reports, you may contact your financial intermediary or, if you are a Fidelity customer, visit Fidelity’s website, or call Fidelity at the applicable toll-free number listed below. Your election to receive reports in paper will apply to all funds held with the fund complex/your financial intermediary.
| Account Type | Website | Phone Number |
| Brokerage, Mutual Fund, or Annuity Contracts: | fidelity.com/mailpreferences | 1-800-343-3548 |
| Employer Provided Retirement Accounts: | netbenefits.fidelity.com/preferences (choose 'no' under Required Disclosures to continue to print) | 1-800-343-0860 |
| Advisor Sold Accounts Serviced Through Your Financial Intermediary: | Contact Your Financial Intermediary | Your Financial Intermediary's phone number |
| Advisor Sold Accounts Serviced by Fidelity: | institutional.fidelity.com | 1-877-208-0098 |
Contents
To view a fund's proxy voting guidelines and proxy voting record for the 12-month period ended June 30, visit http://www.fidelity.com/proxyvotingresults or visit the Securities and Exchange Commission's (SEC) web site at http://www.sec.gov.
You may also call 1-800-835-5092 to request a free copy of the proxy voting guidelines.
Standard & Poor's, S&P and S&P 500 are registered service marks of The McGraw-Hill Companies, Inc. and have been licensed for use by Fidelity Distributors Corporation.
Other third-party marks appearing herein are the property of their respective owners.
All other marks appearing herein are registered or unregistered trademarks or service marks of FMR LLC or an affiliated company. © 2020 FMR LLC. All rights reserved.
This report and the financial statements contained herein are submitted for the general information of the shareholders of the Fund. This report is not authorized for distribution to prospective investors in the Fund unless preceded or accompanied by an effective prospectus.
A fund files its complete schedule of portfolio holdings with the SEC for the first and third quarters of each fiscal year on Form N-PORT. Forms N-PORT are available on the SEC’s web site at http://www.sec.gov. A fund's Forms N-PORT may be reviewed and copied at the SEC’s Public Reference Room in Washington, DC. Information regarding the operation of the SEC's Public Reference Room may be obtained by calling 1-800-SEC-0330.
For a complete list of a fund's portfolio holdings, view the most recent holdings listing, semiannual report, or annual report on Fidelity's web site at http://www.fidelity.com, http://www.institutional.fidelity.com, or http://www.401k.com, as applicable.
NOT FDIC INSURED •MAY LOSE VALUE •NO BANK GUARANTEE
Neither the Fund nor Fidelity Distributors Corporation is a bank.
Note to Shareholders:
Early in 2020, the outbreak and spread of a new coronavirus emerged as a public health emergency that had a major influence on financial markets, primarily based on its impact on the global economy and the outlook for corporate earnings. The virus causes a respiratory disease known as COVID-19. On March 11, the World Health Organization declared the COVID-19 outbreak a pandemic, citing sustained risk of further global spread.
In the weeks following, as the crisis worsened, we witnessed an escalating human tragedy with wide-scale social and economic consequences from coronavirus-containment measures. The outbreak of COVID-19 prompted a number of measures to limit the spread, including travel and border restrictions, quarantines, and restrictions on large gatherings. In turn, these resulted in lower consumer activity, diminished demand for a wide range of products and services, disruption in manufacturing and supply chains, and – given the wide variability in outcomes regarding the outbreak – significant market uncertainty and volatility. Amid the turmoil, the U.S. government took unprecedented action – in concert with the U.S. Federal Reserve and central banks around the world – to help support consumers, businesses, and the broader economy, and to limit disruption to the financial system.
The situation continues to unfold, and the extent and duration of its impact on financial markets and the economy remain highly uncertain. Extreme events such as the coronavirus crisis are “exogenous shocks” that can have significant adverse effects on mutual funds and their investments. Although multiple asset classes may be affected by market disruption, the duration and impact may not be the same for all types of assets.
Fidelity is committed to helping you stay informed amid news about COVID-19 and during increased market volatility, and we’re taking extra steps to be responsive to customer needs. We encourage you to visit our websites, where we offer ongoing updates, commentary, and analysis on the markets and our funds.
Performance: The Bottom Line
Average annual total return reflects the change in the value of an investment, assuming reinvestment of distributions from dividend income and capital gains (the profits earned upon the sale of securities that have grown in value, if any) and assuming a constant rate of performance each year. The hypothetical investment and the average annual total returns do not reflect the deduction of taxes that a shareholder would pay on fund distributions or the redemption of fund shares. During periods of reimbursement by Fidelity, a fund’s total return will be greater than it would be had the reimbursement not occurred. How a fund did yesterday is no guarantee of how it will do tomorrow.
Average Annual Total Returns
| For the periods ended July 31, 2020 | Past 1 year | Life of fundA |
| Fidelity® Value Discovery K6 Fund | (3.80)% | 2.92% |
A From May 25, 2017
$10,000 Over Life of Fund
Let's say hypothetically that $10,000 was invested in Fidelity® Value Discovery K6 Fund on May 25, 2017, when the fund started.
The chart shows how the value of your investment would have changed, and also shows how the Russell 3000® Value Index performed over the same period.
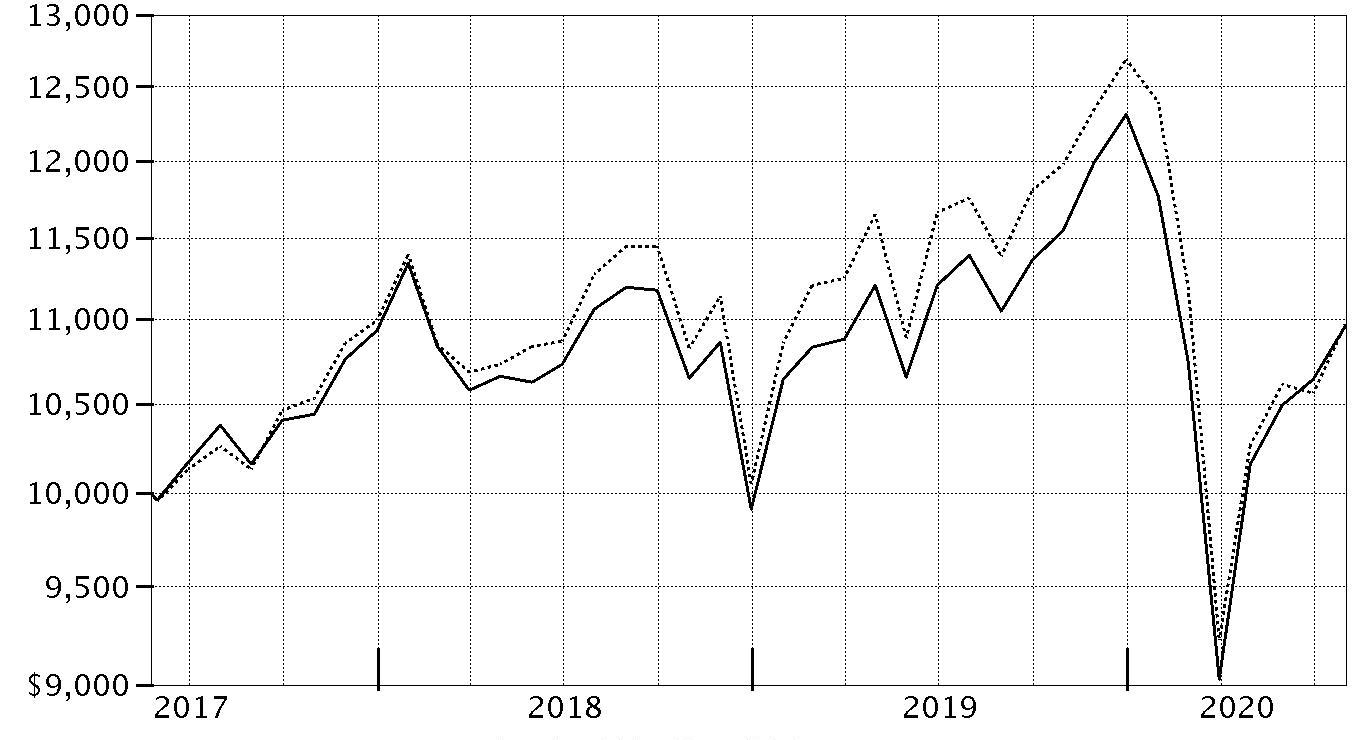
| Period Ending Values |
| $10,960 | Fidelity® Value Discovery K6 Fund |
| $10,971 | Russell 3000® Value Index |
Management's Discussion of Fund Performance
Market Recap: The S&P 500
® index gained 11.96% for the 12 months ending July 31, 2020, in what was a bumpy ride for U.S. equity investors, marked by a steep but brief decline due to the early-2020 outbreak and spread of the coronavirus, followed by a historic rebound. Declared a pandemic on March 11, the COVID-19 crisis and containment efforts caused broad contraction in economic activity, along with extreme uncertainty, volatility and dislocation in financial markets. By mid-March, U.S. stocks entered bear-market territory less than a month after hitting an all-time high and extending the longest-running bull market in American history. Stocks slid in late February, after a surge in COVID-19 cases outside China. The sudden downtrend continued in March (-12%), capping the index’s worst quarter since 2008. A historically rapid and expansive U.S. monetary/fiscal-policy response provided a partial offset to the economic disruption and fueled a sharp uptrend. Aggressive support for financial markets by the U.S. Federal Reserve, plans for reopening the economy and improving infection data boosted stocks in April (+13%) and May (+5%). In June and July, the index gained amid progress on potential treatments and signs of an early recovery in economic activity. For the full 12 months, growth stocks widely topped value, while large-caps handily bested smaller-caps. The information technology sector (+39%) led the way, followed by consumer discretionary (+22%). In contrast, energy (-38%) fell hard along with the price of crude oil.
Comments from Portfolio Manager Sean Gavin: For the fiscal year ending July 31, 2020, the fund returned -3.80%, outperforming the -6.67% result of the benchmark Russell 3000
® Value Index. The top contributor to performance versus the benchmark was an overweighting and stock picks in health care. The biggest individual relative contributor was an overweight position in Newmont (+79%). Newmont was among the largest holdings as of July 31. Also adding value was our outsized stake in Amgen, which gained 34%. Amgen was one of the biggest holdings in the fund this period. Another notable relative contributor was an overweighting in Centene (+24%). This period we increased our stake. Conversely, the largest detractor from performance versus the benchmark was security selection in the financials sector, primarily within the banks industry. Weak stock picks in consumer staples and real estate also hampered relative performance. The fund's largest individual relative detractor was an outsized stake in Wells Fargo, which returned -47% the past 12 months. The company was among our biggest holdings. Also hampering performance was an underweighting in Intel, which returned -7%. This was a position we established the past year. Another notable relative detractor was an out-of-benchmark stake in Golar LNG Partners (-73%). Notable changes in positioning include a higher allocation to the information technology and industrials sectors.
The views expressed above reflect those of the portfolio manager(s) only through the end of the period as stated on the cover of this report and do not necessarily represent the views of Fidelity or any other person in the Fidelity organization. Any such views are subject to change at any time based upon market or other conditions and Fidelity disclaims any responsibility to update such views. These views may not be relied on as investment advice and, because investment decisions for a Fidelity fund are based on numerous factors, may not be relied on as an indication of trading intent on behalf of any Fidelity fund.
Investment Summary (Unaudited)
Top Ten Stocks as of July 31, 2020
| | % of fund's net assets |
| Berkshire Hathaway, Inc. Class B | 3.4 |
| Comcast Corp. Class A | 2.9 |
| Cisco Systems, Inc. | 2.7 |
| Centene Corp. | 2.3 |
| Wells Fargo & Co. | 2.2 |
| Cigna Corp. | 2.2 |
| Bristol-Myers Squibb Co. | 2.2 |
| UnitedHealth Group, Inc. | 2.1 |
| Newmont Corp. | 2.1 |
| DuPont de Nemours, Inc. | 2.0 |
| | 24.1 |
Top Five Market Sectors as of July 31, 2020
| | % of fund's net assets |
| Health Care | 18.0 |
| Financials | 17.6 |
| Industrials | 15.0 |
| Information Technology | 11.0 |
| Communication Services | 9.8 |
Asset Allocation (% of fund's net assets)
| As of July 31, 2020* |
| | Stocks | 99.6% |
| | Short-Term Investments and Net Other Assets (Liabilities) | 0.4% |

* Foreign investments - 17.7%
Schedule of Investments July 31, 2020
Showing Percentage of Net Assets
| Common Stocks - 98.2% | | | |
| | | Shares | Value |
| COMMUNICATION SERVICES - 9.8% | | | |
| Entertainment - 0.2% | | | |
| Lions Gate Entertainment Corp. Class B (a) | | 52,189 | $371,064 |
| Interactive Media & Services - 3.0% | | | |
| Alphabet, Inc. Class A (a) | | 1,963 | 2,920,846 |
| Facebook, Inc. Class A (a) | | 7,700 | 1,953,259 |
| | | | 4,874,105 |
| Media - 4.9% | | | |
| Comcast Corp. Class A | | 112,197 | 4,802,032 |
| Fox Corp. Class A | | 19,928 | 513,545 |
| Interpublic Group of Companies, Inc. | | 105,855 | 1,910,683 |
| WPP PLC | | 103,100 | 764,620 |
| | | | 7,990,880 |
| Wireless Telecommunication Services - 1.7% | | | |
| T-Mobile U.S., Inc. | | 26,600 | 2,856,308 |
|
| TOTAL COMMUNICATION SERVICES | | | 16,092,357 |
|
| CONSUMER DISCRETIONARY - 8.1% | | | |
| Auto Components - 0.7% | | | |
| Lear Corp. | | 10,900 | 1,203,142 |
| Household Durables - 1.2% | | | |
| Newell Brands, Inc. | | 26,300 | 431,320 |
| Whirlpool Corp. | | 9,400 | 1,533,328 |
| | | | 1,964,648 |
| Multiline Retail - 1.0% | | | |
| Dollar General Corp. | | 8,400 | 1,599,360 |
| Specialty Retail - 3.9% | | | |
| Best Buy Co., Inc. | | 20,400 | 2,031,636 |
| Dick's Sporting Goods, Inc. | | 17,300 | 789,226 |
| Lowe's Companies, Inc. | | 17,400 | 2,591,034 |
| Tiffany & Co., Inc. | | 3,300 | 413,688 |
| Urban Outfitters, Inc. (a) | | 9,500 | 157,130 |
| Williams-Sonoma, Inc. | | 5,300 | 461,736 |
| | | | 6,444,450 |
| Textiles, Apparel & Luxury Goods - 1.3% | | | |
| PVH Corp. | | 29,925 | 1,456,151 |
| Tapestry, Inc. | | 49,600 | 662,656 |
| | | | 2,118,807 |
|
| TOTAL CONSUMER DISCRETIONARY | | | 13,330,407 |
|
| CONSUMER STAPLES - 4.7% | | | |
| Beverages - 0.5% | | | |
| C&C Group PLC (United Kingdom) | | 290,700 | 880,918 |
| Food & Staples Retailing - 2.9% | | | |
| Performance Food Group Co. (a) | | 40,000 | 1,120,800 |
| Sysco Corp. | | 29,006 | 1,532,967 |
| U.S. Foods Holding Corp. (a) | | 103,600 | 2,103,080 |
| | | | 4,756,847 |
| Food Products - 0.3% | | | |
| Tyson Foods, Inc. Class A | | 7,600 | 467,020 |
| Household Products - 0.2% | | | |
| Spectrum Brands Holdings, Inc. | | 6,000 | 324,960 |
| Tobacco - 0.8% | | | |
| Altria Group, Inc. | | 32,700 | 1,345,605 |
|
| TOTAL CONSUMER STAPLES | | | 7,775,350 |
|
| ENERGY - 3.5% | | | |
| Energy Equipment & Services - 0.2% | | | |
| Hoegh LNG Partners LP | | 31,411 | 323,533 |
| Oil, Gas & Consumable Fuels - 3.3% | | | |
| BP PLC sponsored ADR | | 22,400 | 493,696 |
| Cabot Oil & Gas Corp. | | 71,800 | 1,342,660 |
| GasLog Partners LP (b) | | 11,500 | 43,930 |
| Golar LNG Partners LP | | 75,729 | 197,653 |
| Parex Resources, Inc. (a) | | 125,400 | 1,516,652 |
| Teekay LNG Partners LP | | 66,916 | 728,046 |
| Total SA sponsored ADR | | 18,100 | 681,646 |
| Valero Energy Corp. | | 8,500 | 477,955 |
| | | | 5,482,238 |
|
| TOTAL ENERGY | | | 5,805,771 |
|
| FINANCIALS - 17.6% | | | |
| Banks - 6.4% | | | |
| Bank of America Corp. | | 113,500 | 2,823,880 |
| CIT Group, Inc. | | 19,300 | 366,121 |
| Cullen/Frost Bankers, Inc. | | 5,500 | 396,330 |
| JPMorgan Chase & Co. | | 20,900 | 2,019,776 |
| M&T Bank Corp. | | 7,700 | 815,815 |
| Truist Financial Corp. | | 12,858 | 481,661 |
| Wells Fargo & Co. | | 150,750 | 3,657,195 |
| | | | 10,560,778 |
| Capital Markets - 1.2% | | | |
| Affiliated Managers Group, Inc. | | 10,400 | 715,416 |
| BlackRock, Inc. Class A | | 1,000 | 575,010 |
| Invesco Ltd. | | 19,300 | 193,772 |
| State Street Corp. | | 7,081 | 451,697 |
| | | | 1,935,895 |
| Consumer Finance - 2.5% | | | |
| Capital One Financial Corp. | | 28,682 | 1,829,912 |
| Discover Financial Services | | 44,853 | 2,217,084 |
| | | | 4,046,996 |
| Diversified Financial Services - 3.4% | | | |
| Berkshire Hathaway, Inc. Class B (a) | | 28,975 | 5,672,722 |
| Insurance - 3.4% | | | |
| Allstate Corp. | | 5,145 | 485,637 |
| American International Group, Inc. | | 22,200 | 713,508 |
| Chubb Ltd. | | 15,288 | 1,945,245 |
| MetLife, Inc. | | 8,900 | 336,865 |
| The Travelers Companies, Inc. | | 18,241 | 2,087,135 |
| | | | 5,568,390 |
| Mortgage Real Estate Investment Trusts - 0.2% | | | |
| AGNC Investment Corp. | | 24,200 | 329,120 |
| Thrifts & Mortgage Finance - 0.5% | | | |
| Essent Group Ltd. | | 14,100 | 505,203 |
| MGIC Investment Corp. | | 35,100 | 290,277 |
| | | | 795,480 |
|
| TOTAL FINANCIALS | | | 28,909,381 |
|
| HEALTH CARE - 18.0% | | | |
| Biotechnology - 3.6% | | | |
| Alexion Pharmaceuticals, Inc. (a) | | 13,100 | 1,342,619 |
| Amgen, Inc. | | 11,375 | 2,783,121 |
| Regeneron Pharmaceuticals, Inc. (a) | | 2,900 | 1,833,003 |
| | | | 5,958,743 |
| Health Care Providers & Services - 9.4% | | | |
| Anthem, Inc. | | 6,833 | 1,870,875 |
| Centene Corp. (a) | | 58,100 | 3,791,025 |
| Cigna Corp. | | 20,685 | 3,572,093 |
| CVS Health Corp. | | 31,919 | 2,008,982 |
| Humana, Inc. | | 1,800 | 706,410 |
| UnitedHealth Group, Inc. | | 11,500 | 3,481,970 |
| | | | 15,431,355 |
| Pharmaceuticals - 5.0% | | | |
| Bristol-Myers Squibb Co. | | 60,600 | 3,554,796 |
| Bristol-Myers Squibb Co. rights (a) | | 34,600 | 124,560 |
| Roche Holding AG (participation certificate) | | 7,846 | 2,717,514 |
| Sanofi SA sponsored ADR | | 35,159 | 1,844,090 |
| | | | 8,240,960 |
|
| TOTAL HEALTH CARE | | | 29,631,058 |
|
| INDUSTRIALS - 15.0% | | | |
| Aerospace & Defense - 2.5% | | | |
| Airbus Group NV | | 16,100 | 1,178,455 |
| General Dynamics Corp. | | 13,500 | 1,980,990 |
| Raytheon Technologies Corp. | | 15,500 | 878,540 |
| | | | 4,037,985 |
| Air Freight & Logistics - 0.5% | | | |
| Deutsche Post AG | | 13,600 | 552,027 |
| XPO Logistics, Inc. (a) | | 4,700 | 352,594 |
| | | | 904,621 |
| Airlines - 0.8% | | | |
| Alaska Air Group, Inc. | | 20,700 | 712,908 |
| Copa Holdings SA Class A | | 14,600 | 605,024 |
| | | | 1,317,932 |
| Building Products - 2.3% | | | |
| Carrier Global Corp. | | 15,900 | 433,116 |
| Jeld-Wen Holding, Inc. (a) | | 14,500 | 284,200 |
| Owens Corning | | 29,200 | 1,765,724 |
| Trane Technologies PLC | | 11,700 | 1,308,879 |
| | | | 3,791,919 |
| Commercial Services & Supplies - 0.0% | | | |
| Steelcase, Inc. Class A | | 8,200 | 87,986 |
| Electrical Equipment - 2.9% | | | |
| Acuity Brands, Inc. | | 14,900 | 1,476,590 |
| Regal Beloit Corp. | | 15,000 | 1,379,550 |
| Vestas Wind Systems A/S | | 15,100 | 1,935,593 |
| | | | 4,791,733 |
| Industrial Conglomerates - 1.3% | | | |
| Siemens AG | | 16,400 | 2,089,951 |
| Machinery - 3.3% | | | |
| Gardner Denver Holdings, Inc. (a) | | 17,253 | 545,022 |
| ITT, Inc. | | 5,300 | 305,969 |
| Oshkosh Corp. | | 23,300 | 1,834,176 |
| Otis Worldwide Corp. | | 11,150 | 699,551 |
| Stanley Black & Decker, Inc. | | 12,900 | 1,977,828 |
| | | | 5,362,546 |
| Trading Companies & Distributors - 1.4% | | | |
| Beacon Roofing Supply, Inc. (a) | | 5,300 | 165,148 |
| HD Supply Holdings, Inc. (a) | | 43,000 | 1,509,300 |
| United Rentals, Inc. (a) | | 3,600 | 559,332 |
| | | | 2,233,780 |
|
| TOTAL INDUSTRIALS | | | 24,618,453 |
|
| INFORMATION TECHNOLOGY - 9.6% | | | |
| Communications Equipment - 2.8% | | | |
| Cisco Systems, Inc. | | 93,700 | 4,413,270 |
| CommScope Holding Co., Inc. (a) | | 18,500 | 171,680 |
| | | | 4,584,950 |
| Electronic Equipment & Components - 1.3% | | | |
| Avnet, Inc. | | 2,500 | 66,800 |
| TE Connectivity Ltd. | | 23,917 | 2,130,287 |
| | | | 2,197,087 |
| IT Services - 2.1% | | | |
| Amdocs Ltd. | | 15,869 | 985,465 |
| Capgemini SA | | 6,100 | 786,812 |
| Cognizant Technology Solutions Corp. Class A | | 24,443 | 1,669,946 |
| | | | 3,442,223 |
| Semiconductors & Semiconductor Equipment - 2.9% | | | |
| Broadcom, Inc. | | 600 | 190,050 |
| Intel Corp. | | 66,500 | 3,174,045 |
| NXP Semiconductors NV | | 9,300 | 1,093,029 |
| ON Semiconductor Corp. (a) | | 10,100 | 208,060 |
| | | | 4,665,184 |
| Software - 0.5% | | | |
| Nortonlifelock, Inc. | | 37,500 | 804,375 |
|
| TOTAL INFORMATION TECHNOLOGY | | | 15,693,819 |
|
| MATERIALS - 5.2% | | | |
| Chemicals - 2.5% | | | |
| Albemarle Corp. U.S. | | 10,100 | 832,846 |
| DuPont de Nemours, Inc. | | 61,400 | 3,283,672 |
| | | | 4,116,518 |
| Metals & Mining - 2.7% | | | |
| BHP Billiton Ltd. sponsored ADR | | 3,400 | 179,656 |
| Lundin Mining Corp. | | 165,400 | 926,126 |
| Newmont Corp. | | 49,100 | 3,397,720 |
| | | | 4,503,502 |
|
| TOTAL MATERIALS | | | 8,620,020 |
|
| REAL ESTATE - 1.9% | | | |
| Equity Real Estate Investment Trusts (REITs) - 0.5% | | | |
| Simon Property Group, Inc. | | 12,500 | 779,375 |
| Real Estate Management & Development - 1.4% | | | |
| CBRE Group, Inc. (a) | | 51,638 | 2,262,261 |
|
| TOTAL REAL ESTATE | | | 3,041,636 |
|
| UTILITIES - 4.8% | | | |
| Electric Utilities - 3.7% | | | |
| Exelon Corp. | | 51,189 | 1,976,407 |
| PG&E Corp. (a) | | 149,500 | 1,397,825 |
| Southern Co. | | 48,300 | 2,637,663 |
| | | | 6,011,895 |
| Multi-Utilities - 1.1% | | | |
| Dominion Energy, Inc. | | 22,700 | 1,839,381 |
|
| TOTAL UTILITIES | | | 7,851,276 |
|
| TOTAL COMMON STOCKS | | | |
| (Cost $153,190,906) | | | 161,369,528 |
|
| Nonconvertible Preferred Stocks - 1.4% | | | |
| INFORMATION TECHNOLOGY - 1.4% | | | |
| Technology Hardware, Storage & Peripherals - 1.4% | | | |
| Samsung Electronics Co. Ltd. | | | |
| (Cost $2,217,088) | | 55,190 | 2,284,469 |
|
| Money Market Funds - 0.4% | | | |
| Fidelity Cash Central Fund 0.14% (c) | | 704,465 | 704,677 |
| Fidelity Securities Lending Cash Central Fund 0.13% (c)(d) | | 4,751 | 4,752 |
| TOTAL MONEY MARKET FUNDS | | | |
| (Cost $709,361) | | | 709,429 |
| TOTAL INVESTMENT IN SECURITIES - 100.0% | | | |
| (Cost $156,117,355) | | | 164,363,426 |
| NET OTHER ASSETS (LIABILITIES) - 0.0% | | | 29,071 |
| NET ASSETS - 100% | | | $164,392,497 |
Legend
(a) Non-income producing
(b) Security or a portion of the security is on loan at period end.
(c) Affiliated fund that is generally available only to investment companies and other accounts managed by Fidelity Investments. The rate quoted is the annualized seven-day yield of the fund at period end. A complete unaudited listing of the fund's holdings as of its most recent quarter end is available upon request. In addition, each Fidelity Central Fund's financial statements, which are not covered by the Fund's Report of Independent Registered Public Accounting Firm, are available on the SEC's website or upon request.
(d) Investment made with cash collateral received from securities on loan.
Affiliated Central Funds
Information regarding fiscal year to date income earned by the Fund from investments in Fidelity Central Funds is as follows:
| Fund | Income earned |
| Fidelity Cash Central Fund | $69,325 |
| Fidelity Securities Lending Cash Central Fund | 6,242 |
| Total | $75,567 |
Amounts in the income column in the above table include any capital gain distributions from underlying funds, which are presented in the corresponding line-item in the Statement of Operations, if applicable. Amount for Fidelity Securities Lending Cash Central Fund represents the income earned on investing cash collateral, less rebates paid to borrowers and any lending agent fees associated with the loan, plus any premium payments received for lending certain types of securities.
Investment Valuation
The following is a summary of the inputs used, as of July 31, 2020, involving the Fund's assets and liabilities carried at fair value. The inputs or methodology used for valuing securities may not be an indication of the risk associated with investing in those securities. For more information on valuation inputs, and their aggregation into the levels used below, please refer to the Investment Valuation section in the accompanying Notes to Financial Statements.
| | Valuation Inputs at Reporting Date: |
| Description | Total | Level 1 | Level 2 | Level 3 |
| Investments in Securities: | | | | |
| Equities: | | | | |
| Communication Services | $16,092,357 | $15,327,737 | $764,620 | $-- |
| Consumer Discretionary | 13,330,407 | 13,330,407 | -- | -- |
| Consumer Staples | 7,775,350 | 7,775,350 | -- | -- |
| Energy | 5,805,771 | 5,805,771 | -- | -- |
| Financials | 28,909,381 | 28,909,381 | -- | -- |
| Health Care | 29,631,058 | 26,913,544 | 2,717,514 | -- |
| Industrials | 24,618,453 | 18,862,427 | 5,756,026 | -- |
| Information Technology | 17,978,288 | 17,978,288 | -- | -- |
| Materials | 8,620,020 | 8,620,020 | -- | -- |
| Real Estate | 3,041,636 | 3,041,636 | -- | -- |
| Utilities | 7,851,276 | 7,851,276 | -- | -- |
| Money Market Funds | 709,429 | 709,429 | -- | -- |
| Total Investments in Securities: | $164,363,426 | $155,125,266 | $9,238,160 | $-- |
Other Information
Distribution of investments by country or territory of incorporation, as a percentage of Total Net Assets, is as follows (Unaudited):
| United States of America | 82.3% |
| Switzerland | 4.1% |
| France | 2.0% |
| Canada | 1.6% |
| Germany | 1.6% |
| Korea (South) | 1.4% |
| Netherlands | 1.4% |
| Ireland | 1.3% |
| Denmark | 1.2% |
| Others (Individually Less Than 1%) | 3.1% |
| | 100.0% |
See accompanying notes which are an integral part of the financial statements.
Financial Statements
Statement of Assets and Liabilities
| | | July 31, 2020 |
| Assets | | |
Investment in securities, at value (including securities loaned of $4,584) — See accompanying schedule:
Unaffiliated issuers (cost $155,407,994) | $163,653,997 | |
| Fidelity Central Funds (cost $709,361) | 709,429 | |
| Total Investment in Securities (cost $156,117,355) | | $164,363,426 |
| Foreign currency held at value (cost $86) | | 86 |
| Receivable for fund shares sold | | 89,955 |
| Dividends receivable | | 188,357 |
| Distributions receivable from Fidelity Central Funds | | 1,067 |
| Other receivables | | 14,891 |
| Total assets | | 164,657,782 |
| Liabilities | | |
| Payable for fund shares redeemed | $195,898 | |
| Accrued management fee | 61,274 | |
| Other payables and accrued expenses | 3,313 | |
| Collateral on securities loaned | 4,800 | |
| Total liabilities | | 265,285 |
| Net Assets | | $164,392,497 |
| Net Assets consist of: | | |
| Paid in capital | | $164,979,936 |
| Total accumulated earnings (loss) | | (587,439) |
| Net Assets | | $164,392,497 |
| Net Asset Value, offering price and redemption price per share ($164,392,497 ÷ 16,199,040 shares) | | $10.15 |
See accompanying notes which are an integral part of the financial statements.
Statement of Operations
| | | Year ended July 31, 2020 |
| Investment Income | | |
| Dividends | | $4,086,494 |
| Special dividends | | 585,600 |
| Income from Fidelity Central Funds (including $6,242 from security lending) | | 75,567 |
| Total income | | 4,747,661 |
| Expenses | | |
| Management fee | $790,570 | |
| Independent trustees' fees and expenses | 1,148 | |
| Interest | 699 | |
| Miscellaneous | 5,818 | |
| Total expenses before reductions | 798,235 | |
| Expense reductions | (28,713) | |
| Total expenses after reductions | | 769,522 |
| Net investment income (loss) | | 3,978,139 |
| Realized and Unrealized Gain (Loss) | | |
| Net realized gain (loss) on: | | |
| Investment securities: | | |
| Unaffiliated issuers | (8,634,905) | |
| Fidelity Central Funds | 272 | |
| Foreign currency transactions | 13 | |
| Total net realized gain (loss) | | (8,634,620) |
| Change in net unrealized appreciation (depreciation) on: | | |
| Investment securities: | | |
| Unaffiliated issuers (net of decrease in deferred foreign taxes of $6,165) | (2,853,810) | |
| Fidelity Central Funds | 68 | |
| Assets and liabilities in foreign currencies | 3,696 | |
| Total change in net unrealized appreciation (depreciation) | | (2,850,046) |
| Net gain (loss) | | (11,484,666) |
| Net increase (decrease) in net assets resulting from operations | | $(7,506,527) |
See accompanying notes which are an integral part of the financial statements.
Statement of Changes in Net Assets
| | Year ended July 31, 2020 | Year ended July 31, 2019 |
| Increase (Decrease) in Net Assets | | |
| Operations | | |
| Net investment income (loss) | $3,978,139 | $4,849,577 |
| Net realized gain (loss) | (8,634,620) | 4,040,900 |
| Change in net unrealized appreciation (depreciation) | (2,850,046) | (4,316,297) |
| Net increase (decrease) in net assets resulting from operations | (7,506,527) | 4,574,180 |
| Distributions to shareholders | (6,868,130) | (7,450,300) |
| Share transactions | | |
| Proceeds from sales of shares | 62,134,131 | 36,653,686 |
| Reinvestment of distributions | 6,868,130 | 7,450,300 |
| Cost of shares redeemed | (81,936,188) | (115,742,244) |
| Net increase (decrease) in net assets resulting from share transactions | (12,933,927) | (71,638,258) |
| Total increase (decrease) in net assets | (27,308,584) | (74,514,378) |
| Net Assets | | |
| Beginning of period | 191,701,081 | 266,215,459 |
| End of period | $164,392,497 | $191,701,081 |
| Other Information | | |
| Shares | | |
| Sold | 6,095,665 | 3,496,072 |
| Issued in reinvestment of distributions | 624,873 | 716,537 |
| Redeemed | (8,047,567) | (10,936,457) |
| Net increase (decrease) | (1,327,029) | (6,723,848) |
See accompanying notes which are an integral part of the financial statements.
Financial Highlights
Fidelity Value Discovery K6 Fund
| | | | | |
| Years ended July 31, | 2020 | 2019 | 2018 | 2017 A |
| Selected Per–Share Data | | | | |
| Net asset value, beginning of period | $10.94 | $10.98 | $10.38 | $10.00 |
| Income from Investment Operations | | | | |
| Net investment income (loss)B | .23C | .22 | .19 | –D |
| Net realized and unrealized gain (loss) | (.62) | .09 | .49 | .38 |
| Total from investment operations | (.39) | .31 | .68 | .38 |
| Distributions from net investment income | (.23) | (.27) | (.08) | – |
| Distributions from net realized gain | (.17) | (.08) | – | – |
| Total distributions | (.40) | (.35) | (.08) | – |
| Net asset value, end of period | $10.15 | $10.94 | $10.98 | $10.38 |
| Total ReturnE,F | (3.80)% | 2.98% | 6.58% | 3.80% |
| Ratios to Average Net AssetsG,H | | | | |
| Expenses before reductions | .45% | .45% | .45% | .45%I |
| Expenses net of fee waivers, if any | .45% | .45% | .45% | .45%I |
| Expenses net of all reductions | .44% | .45% | .45% | .45%I |
| Net investment income (loss) | 2.27%C | 2.13% | 1.81% | (.28)%I |
| Supplemental Data | | | | |
| Net assets, end of period (000 omitted) | $164,392 | $191,701 | $266,215 | $297,069 |
| Portfolio turnover rateJ | 82% | 45% | 38%K | - %K,L |
A For the period May 25, 2017 (commencement of operations) to July 31, 2017.
B Calculated based on average shares outstanding during the period.
C Net investment income per share reflects a large, non-recurring dividend which amounted to $.03 per share. Excluding this non-recurring dividend, the ratio of net investment income (loss) to average net assets would have been 1.93%.
D Amount represents less than $.005 per share.
E Total returns for periods of less than one year are not annualized.
F Total returns would have been lower if certain expenses had not been reduced during the applicable periods shown.
G Fees and expenses of any underlying mutual funds or exchange-traded funds (ETFs) are not included in the Fund's expense ratio. The Fund indirectly bears its proportionate share of these expenses. For additional expense information related to investments in Fidelity Central Funds, please refer to the "Investments in Fidelity Central Funds" note found in the Notes to Financial Statements section of the most recent Annual or Semi-Annual report.
H Expense ratios reflect operating expenses of the Fund. Expenses before reductions do not reflect amounts reimbursed by the investment adviser or reductions from brokerage service arrangements or reductions from other expense offset arrangements and do not represent the amount paid by the Fund during periods when reimbursements or reductions occur. Expense ratios before reductions for start-up periods may not be representative of longer term operating periods. Expenses net of fee waivers reflect expenses after reimbursement by the investment adviser but prior to reductions from brokerage service arrangements or other expense offset arrangements. Expenses net of all reductions represent the net expenses paid by the Fund.
I Annualized
J Amount does not include the portfolio activity of any underlying Fidelity Central Funds.
K Portfolio turnover rate excludes securities received or delivered in-kind.
L Amount not annualized.
See accompanying notes which are an integral part of the financial statements.
Notes to Financial Statements
For the period ended July 31, 2020
1. Organization.
Fidelity Value Discovery K6 Fund (the Fund) is a fund of Fidelity Puritan Trust (the Trust) and is authorized to issue an unlimited number of shares. Share transactions on the Statement of Changes in Net Assets may contain exchanges between affiliated funds. The Trust is registered under the Investment Company Act of 1940, as amended (the 1940 Act), as an open-end management investment company organized as a Massachusetts business trust. Shares generally are available only to employer-sponsored retirement plans that are recordkept by Fidelity, or to certain employer-sponsored retirement plans that are not recordkept by Fidelity.
Effective January 1, 2020:
Investment advisers Fidelity Investments Money Management, Inc., FMR Co., Inc., and Fidelity SelectCo, LLC, merged with and into Fidelity Management & Research Company. In connection with the merger transactions, the resulting, merged investment adviser was then redomiciled from Massachusetts to Delaware, changed its corporate structure from a corporation to a limited liability company, and changed its name to "Fidelity Management & Research Company LLC".
2. Investments in Fidelity Central Funds.
The Fund invests in Fidelity Central Funds, which are open-end investment companies generally available only to other investment companies and accounts managed by the investment adviser and its affiliates. The Fund's Schedule of Investments lists each of the Fidelity Central Funds held as of period end, if any, as an investment of the Fund, but does not include the underlying holdings of each Fidelity Central Fund. As an Investing Fund, the Fund indirectly bears its proportionate share of the expenses of the underlying Fidelity Central Funds.
The Money Market Central Funds seek preservation of capital and current income and are managed by the investment adviser. Annualized expenses of the Money Market Central Funds as of their most recent shareholder report date ranged from less than .005% to .01%.
A complete unaudited list of holdings for each Fidelity Central Fund is available upon request or at the Securities and Exchange Commission (the SEC) website at www.sec.gov. In addition, the financial statements of the Fidelity Central Funds, which are not covered by the Fund's Report of Independent Registered Public Accounting Firm, are available on the SEC website or upon request.
3. Significant Accounting Policies.
The Fund is an investment company and applies the accounting and reporting guidance of the Financial Accounting Standards Board (FASB) Accounting Standards Codification Topic 946 Financial Services – Investment Companies. The financial statements have been prepared in conformity with accounting principles generally accepted in the United States of America (GAAP), which require management to make certain estimates and assumptions at the date of the financial statements. Actual results could differ from those estimates. Subsequent events, if any, through the date that the financial statements were issued have been evaluated in the preparation of the financial statements. The following summarizes the significant accounting policies of the Fund:
Investment Valuation. Investments are valued as of 4:00 p.m. Eastern time on the last calendar day of the period. The Board of Trustees (the Board) has delegated the day to day responsibility for the valuation of the Fund's investments to the Fair Value Committee (the Committee) established by the Fund's investment adviser. In accordance with valuation policies and procedures approved by the Board, the Fund attempts to obtain prices from one or more third party pricing vendors or brokers to value its investments. When current market prices, quotations or currency exchange rates are not readily available or reliable, investments will be fair valued in good faith by the Committee, in accordance with procedures adopted by the Board. Factors used in determining fair value vary by investment type and may include market or investment specific events. The frequency with which these procedures are used cannot be predicted and they may be utilized to a significant extent. The Committee oversees the Fund's valuation policies and procedures and reports to the Board on the Committee's activities and fair value determinations. The Board monitors the appropriateness of the procedures used in valuing the Fund's investments and ratifies the fair value determinations of the Committee.
The Fund categorizes the inputs to valuation techniques used to value its investments into a disclosure hierarchy consisting of three levels as shown below:
- Level 1 – quoted prices in active markets for identical investments
- Level 2 – other significant observable inputs (including quoted prices for similar investments, interest rates, prepayment speeds, etc.)
- Level 3 – unobservable inputs (including the Fund's own assumptions based on the best information available)
Valuation techniques used to value the Fund's investments by major category are as follows:
Equity securities, including restricted securities, for which market quotations are readily available, are valued at the last reported sale price or official closing price as reported by a third party pricing vendor on the primary market or exchange on which they are traded and are categorized as Level 1 in the hierarchy. In the event there were no sales during the day or closing prices are not available, securities are valued at the last quoted bid price or may be valued using the last available price and are generally categorized as Level 2 in the hierarchy. For foreign equity securities, when market or security specific events arise, comparisons to the valuation of American Depositary Receipts (ADRs), futures contracts, Exchange-Traded Funds (ETFs) and certain indexes as well as quoted prices for similar securities may be used and would be categorized as Level 2 in the hierarchy. For equity securities, including restricted securities, where observable inputs are limited, assumptions about market activity and risk are used and these securities may be categorized as Level 3 in the hierarchy.
Investments in open-end mutual funds, including the Fidelity Central Funds, are valued at their closing net asset value (NAV) each business day and are categorized as Level 1 in the hierarchy.
Changes in valuation techniques may result in transfers in or out of an assigned level within the disclosure hierarchy. The aggregate value of investments by input level as of July 31, 2020 is included at the end of the Fund's Schedule of Investments.
Foreign Currency. The Fund may use foreign currency contracts to facilitate transactions in foreign-denominated securities. Gains and losses from these transactions may arise from changes in the value of the foreign currency or if the counterparties do not perform under the contracts' terms.
Foreign-denominated assets, including investment securities, and liabilities are translated into U.S. dollars at the exchange rates at period end. Purchases and sales of investment securities, income and dividends received and expenses denominated in foreign currencies are translated into U.S. dollars at the exchange rate in effect on the transaction date.
The effects of exchange rate fluctuations on investments are included with the net realized and unrealized gain (loss) on investment securities. Other foreign currency transactions resulting in realized and unrealized gain (loss) are disclosed separately.
Investment Transactions and Income. For financial reporting purposes, the Fund's investment holdings and NAV include trades executed through the end of the last business day of the period. The NAV per share for processing shareholder transactions is calculated as of the close of business of the New York Stock Exchange (NYSE), normally 4:00 p.m. Eastern time and includes trades executed through the end of the prior business day. Gains and losses on securities sold are determined on the basis of identified cost and include proceeds received from litigation. Dividend income is recorded on the ex-dividend date, except for certain dividends from foreign securities where the ex-dividend date may have passed, which are recorded as soon as the Fund is informed of the ex-dividend date. Non-cash dividends included in dividend income, if any, are recorded at the fair market value of the securities received. Income and capital gain distributions from Fidelity Central Funds, if any, are recorded on the ex-dividend date. Certain distributions received by the Fund represent a return of capital or capital gain. The Fund determines the components of these distributions subsequent to the ex-dividend date, based upon receipt of tax filings or other correspondence relating to the underlying investment. These distributions are recorded as a reduction of cost of investments and/or as a realized gain. Large non-recurring dividends recognized by the Fund are presented separately on the Statement of Operations as "Special Dividends" and the impact of these dividends is presented in the Financial Highlights. Investment income is recorded net of foreign taxes withheld where recovery of such taxes is uncertain.
Expenses. Expenses directly attributable to a fund are charged to that fund. Expenses attributable to more than one fund are allocated among the respective funds on the basis of relative net assets or other appropriate methods. Expense estimates are accrued in the period to which they relate and adjustments are made when actual amounts are known.
Income Tax Information and Distributions to Shareholders. Each year, the Fund intends to qualify as a regulated investment company under Subchapter M of the Internal Revenue Code, including distributing substantially all of its taxable income and realized gains. As a result, no provision for U.S. Federal income taxes is required. As of July 31, 2020, the Fund did not have any unrecognized tax benefits in the financial statements; nor is the Fund aware of any tax positions for which it is reasonably possible that the total amounts of unrecognized tax benefits will significantly change in the next twelve months. The Fund files a U.S. federal tax return, in addition to state and local tax returns as required. The Fund's federal income tax returns are subject to examination by the Internal Revenue Service (IRS) for a period of three fiscal years after they are filed. State and local tax returns may be subject to examination for an additional fiscal year depending on the jurisdiction. Foreign taxes are provided for based on the Fund's understanding of the tax rules and rates that exist in the foreign markets in which it invests. The Fund is subject to a tax imposed on capital gains by certain countries in which it invests.
Distributions are declared and recorded on the ex-dividend date. Income and capital gain distributions are determined in accordance with income tax regulations, which may differ from GAAP.
Capital accounts within the financial statements are adjusted for permanent book-tax differences. These adjustments have no impact on net assets or the results of operations. Capital accounts are not adjusted for temporary book-tax differences which will reverse in a subsequent period.
Book-tax differences are primarily due to foreign currency transactions, certain foreign taxes, passive foreign investment companies (PFIC), excise tax regulations and losses deferred due to wash sales.
As of period end, the cost and unrealized appreciation (depreciation) in securities, and derivatives if applicable, for federal income tax purposes were as follows:
| Gross unrealized appreciation | $23,422,102 |
| Gross unrealized depreciation | (16,875,760) |
| Net unrealized appreciation (depreciation) | $6,546,342 |
| Tax Cost | $157,817,084 |
The tax-based components of distributable earnings as of period end were as follows:
| Undistributed tax-exempt income | $– |
| Undistributed ordinary income | $2,123,589 |
| Net unrealized appreciation (depreciation) on securities and other investments | $6,548,733 |
The Fund intends to elect to defer to its next fiscal year $9,259,760 of capital losses recognized during the period November 1, 2019 to July 31, 2020.
The tax character of distributions paid was as follows:
| | July 31, 2020 | July 31, 2019 |
| Ordinary Income | $4,466,081 | $ 5,952,188 |
| Long-term Capital Gains | 2,402,049 | 1,498,112 |
| Total | $6,868,130 | $ 7,450,300 |
4. Purchases and Sales of Investments.
Purchases and sales of securities, other than short-term securities are noted in the table below.
| | Purchases ($) | Sales ($) |
| Fidelity Value Discovery K6 Fund | 140,416,764 | 148,853,725 |
5. Fees and Other Transactions with Affiliates.
Management Fee. Fidelity Management & Research Company LLC (the investment adviser) and its affiliates provide the Fund with investment management related services for which the Fund pays a monthly management fee that is based on an annual rate of .45% of average net assets. Under the management contract, the investment adviser or an affiliate pays all other expenses of the Fund, excluding fees and expenses of the independent Trustees, and certain miscellaneous expenses such as proxy and shareholder meeting expenses.
Brokerage Commissions. A portion of portfolio transactions were placed with brokerage firms which are affiliates of the investment adviser. Brokerage commissions are included in net realized gain (loss) and change in net unrealized appreciation (depreciation) in the Statement of Operations. The commissions paid to these affiliated firms were as follows:
| | Amount |
| Fidelity Value Discovery K6 Fund | $3,988 |
Interfund Lending Program. Pursuant to an Exemptive Order issued by the SEC, the fund, along with other registered investment companies having management contracts with Fidelity Management & Research Company LLC (FMR), or other affiliated entities of FMR, may participate in an interfund lending program. This program provides an alternative credit facility allowing the fund to borrow from, or lend money to, other participating affiliated funds. At period end, there were no interfund loans outstanding. Activity in this program during the period for which loans were outstanding was as follows:
| | Borrower or Lender | Average Loan Balance | Weighted Average Interest Rate | Interest Expense |
| Fidelity Value Discovery K6 Fund | Borrower | $7,985,000 | 1.58% | $699 |
Interfund Trades. Funds may purchase from or sell securities to other Fidelity Funds under procedures adopted by the Board. The procedures have been designed to ensure these interfund trades are executed in accordance with Rule 17a-7 of the 1940 Act. Interfund trades are included within the respective purchases and sales amounts shown in the Purchases and Sales of Investments note.
Other. During the period, the investment adviser reimbursed the Fund for certain losses in the amount of $2,605.
6. Committed Line of Credit.
Certain Funds participate with other funds managed by the investment adviser or an affiliate in a $4.25 billion credit facility (the "line of credit") to be utilized for temporary or emergency purposes to fund shareholder redemptions or for other short-term liquidity purposes. The participating funds have agreed to pay commitment fees on their pro-rata portion of the line of credit, which are reflected in Miscellaneous expenses on the Statement of Operations, and are as follows:
| | Amount |
| Fidelity Value Discovery K6 Fund | $438 |
During the period, there were no borrowings on this line of credit.
7. Security Lending.
The Fund lends portfolio securities from time to time in order to earn additional income. Lending agents are used, including National Financial Services (NFS), an affiliate of the Fund. Pursuant to a securities lending agreement, NFS will receive a fee, which is capped at 9.9% of daily lending revenue, for its services as lending agent. The Fund may lend securities to certain qualified borrowers, including NFS. On the settlement date of the loan, the Fund receives collateral (in the form of U.S. Treasury obligations, letters of credit and/or cash) against the loaned securities and maintains collateral in an amount not less than 100% of the market value of the loaned securities during the period of the loan. The market value of the loaned securities is determined at the close of business of the Fund and any additional required collateral is delivered to the Fund on the next business day. The Fund or borrower may terminate the loan at any time, and if the borrower defaults on its obligation to return the securities loaned because of insolvency or other reasons, the Fund may apply collateral received from the borrower against the obligation. The Fund may experience delays and costs in recovering the securities loaned. Any cash collateral received is invested in the Fidelity Securities Lending Cash Central Fund. The value of loaned securities and cash collateral at period end are disclosed on the Fund's Statement of Assets and Liabilities. Total fees paid by the Fund to NFS, as lending agent, amounted to $595. Security lending income represents the income earned on investing cash collateral, less rebates paid to borrowers and any lending agent fees associated with the loan, plus any premium payments received for lending certain types of securities. Net income from the Fidelity Securities Lending Cash Central Fund during the period is presented in the Statement of Operations as a component of income from Fidelity Central Funds. During the period, there were no securities loaned to NFS.
8. Expense Reductions.
Commissions paid to certain brokers with whom the investment adviser, or its affiliates, places trades on behalf of the Fund include an amount in addition to trade execution, which may be rebated back to the Fund to offset certain expenses. This amount totaled $28,531 for the period. In addition, through arrangements with the Fund's custodian, credits realized as a result of certain uninvested cash balances were used to reduce the Fund's expenses by $182.
9. Other.
The Fund's organizational documents provide former and current trustees and officers with a limited indemnification against liabilities arising in connection with the performance of their duties to the Fund. In the normal course of business, the Fund may also enter into contracts that provide general indemnifications. The Fund's maximum exposure under these arrangements is unknown as this would be dependent on future claims that may be made against the Fund. The risk of material loss from such claims is considered remote.
10. Coronavirus (COVID-19) Pandemic.
An outbreak of COVID-19 first detected in China during December 2019 has since spread globally and was declared a pandemic by the World Health Organization during March 2020. Developments that disrupt global economies and financial markets, such as the COVID-19 pandemic, may magnify factors that affect the Fund's performance.
Report of Independent Registered Public Accounting Firm
To the Board of Trustees of Fidelity Puritan Trust and Shareholders of Fidelity Value Discovery K6 Fund:
Opinion on the Financial Statements and Financial Highlights
We have audited the accompanying statement of assets and liabilities of Fidelity Value Discovery K6 Fund (the "Fund"), a fund of Fidelity Puritan Trust, including the schedule of investments, as of July 31, 2020, the related statement of operations for the year then ended, the statement of changes in net assets for each of the two years in the period then ended, the financial highlights for each of the three years in the period then ended and for the period from May 25, 2017 (commencement of operations) to July 31, 2017, and the related notes. In our opinion, the financial statements and financial highlights present fairly, in all material respects, the financial position of the Fund as of July 31, 2020, and the results of its operations for the year then ended, the changes in its net assets for each of the two years in the period then ended, and the financial highlights for each of the three years in the period then ended and for the period from May 25, 2017 (commencement of operations) to July 31, 2017 in conformity with accounting principles generally accepted in the United States of America.
Basis for Opinion
These financial statements and financial highlights are the responsibility of the Fund's management. Our responsibility is to express an opinion on the Fund's financial statements and financial highlights based on our audits. We are a public accounting firm registered with the Public Company Accounting Oversight Board (United States) (PCAOB) and are required to be independent with respect to the Fund in accordance with the U.S. federal securities laws and the applicable rules and regulations of the Securities and Exchange Commission and the PCAOB.
We conducted our audits in accordance with the standards of the PCAOB. Those standards require that we plan and perform the audit to obtain reasonable assurance about whether the financial statements and financial highlights are free of material misstatement, whether due to error or fraud. The Fund is not required to have, nor were we engaged to perform, an audit of its internal control over financial reporting. As part of our audits we are required to obtain an understanding of internal control over financial reporting but not for the purpose of expressing an opinion on the effectiveness of the Fund’s internal control over financial reporting. Accordingly, we express no such opinion.
Our audits included performing procedures to assess the risks of material misstatement of the financial statements and financial highlights, whether due to error or fraud, and performing procedures that respond to those risks. Such procedures included examining, on a test basis, evidence regarding the amounts and disclosures in the financial statements and financial highlights. Our audits also included evaluating the accounting principles used and significant estimates made by management, as well as evaluating the overall presentation of the financial statements and financial highlights. Our procedures included confirmation of securities owned as of July 31, 2020, by correspondence with the custodian and brokers; when replies were not received from brokers, we performed other auditing procedures. We believe that our audits provide a reasonable basis for our opinion.
/s/ Deloitte & Touche LLP
Boston, Massachusetts
September 14, 2020
We have served as the auditor of one or more of the Fidelity investment companies since 1999.
Trustees and Officers
The Trustees, Members of the Advisory Board (if any), and officers of the trust and fund, as applicable, are listed below. The Board of Trustees governs the fund and is responsible for protecting the interests of shareholders. The Trustees are experienced executives who meet periodically throughout the year to oversee the fund's activities, review contractual arrangements with companies that provide services to the fund, oversee management of the risks associated with such activities and contractual arrangements, and review the fund's performance. Except for Jonathan Chiel, each of the Trustees oversees 311 funds. Mr. Chiel oversees 174 funds.
The Trustees hold office without limit in time except that (a) any Trustee may resign; (b) any Trustee may be removed by written instrument, signed by at least two-thirds of the number of Trustees prior to such removal; (c) any Trustee who requests to be retired or who has become incapacitated by illness or injury may be retired by written instrument signed by a majority of the other Trustees; and (d) any Trustee may be removed at any special meeting of shareholders by a two-thirds vote of the outstanding voting securities of the trust. Each Trustee who is not an interested person (as defined in the 1940 Act) of the trust and the fund is referred to herein as an Independent Trustee. Each Independent Trustee shall retire not later than the last day of the calendar year in which his or her 75th birthday occurs. The Independent Trustees may waive this mandatory retirement age policy with respect to individual Trustees. Officers and Advisory Board Members hold office without limit in time, except that any officer or Advisory Board Member may resign or may be removed by a vote of a majority of the Trustees at any regular meeting or any special meeting of the Trustees. Except as indicated, each individual has held the office shown or other offices in the same company for the past five years.
The fund’s Statement of Additional Information (SAI) includes more information about the Trustees. To request a free copy, call Fidelity at 1-800-835-5092.
Experience, Skills, Attributes, and Qualifications of the Trustees. The Governance and Nominating Committee has adopted a statement of policy that describes the experience, qualifications, attributes, and skills that are necessary and desirable for potential Independent Trustee candidates (Statement of Policy). The Board believes that each Trustee satisfied at the time he or she was initially elected or appointed a Trustee, and continues to satisfy, the standards contemplated by the Statement of Policy. The Governance and Nominating Committee also engages professional search firms to help identify potential Independent Trustee candidates who have the experience, qualifications, attributes, and skills consistent with the Statement of Policy. From time to time, additional criteria based on the composition and skills of the current Independent Trustees, as well as experience or skills that may be appropriate in light of future changes to board composition, business conditions, and regulatory or other developments, have also been considered by the professional search firms and the Governance and Nominating Committee. In addition, the Board takes into account the Trustees' commitment and participation in Board and committee meetings, as well as their leadership of standing and ad hoc committees throughout their tenure.
In determining that a particular Trustee was and continues to be qualified to serve as a Trustee, the Board has considered a variety of criteria, none of which, in isolation, was controlling. The Board believes that, collectively, the Trustees have balanced and diverse experience, qualifications, attributes, and skills, which allow the Board to operate effectively in governing the fund and protecting the interests of shareholders. Information about the specific experience, skills, attributes, and qualifications of each Trustee, which in each case led to the Board's conclusion that the Trustee should serve (or continue to serve) as a trustee of the fund, is provided below.
Board Structure and Oversight Function. Robert A. Lawrence is an interested person and currently serves as Acting Chairman. The Trustees have determined that an interested Chairman is appropriate and benefits shareholders because an interested Chairman has a personal and professional stake in the quality and continuity of services provided to the fund. Independent Trustees exercise their informed business judgment to appoint an individual of their choosing to serve as Chairman, regardless of whether the Trustee happens to be independent or a member of management. The Independent Trustees have determined that they can act independently and effectively without having an Independent Trustee serve as Chairman and that a key structural component for assuring that they are in a position to do so is for the Independent Trustees to constitute a substantial majority for the Board. The Independent Trustees also regularly meet in executive session. Ned C. Lautenbach and David M. Thomas serve as Co-Lead Independent Trustees and as such each (i) acts as a liaison between the Independent Trustees and management with respect to matters important to the Independent Trustees and (ii) with management prepares agendas for Board meetings.
Fidelity® funds are overseen by different Boards of Trustees. The fund's Board oversees Fidelity's high income and certain equity funds, and other Boards oversee Fidelity's investment-grade bond, money market, asset allocation, and other equity funds. The asset allocation funds may invest in Fidelity® funds overseen by the fund's Board. The use of separate Boards, each with its own committee structure, allows the Trustees of each group of Fidelity® funds to focus on the unique issues of the funds they oversee, including common research, investment, and operational issues. On occasion, the separate Boards establish joint committees to address issues of overlapping consequences for the Fidelity® funds overseen by each Board.
The Trustees operate using a system of committees to facilitate the timely and efficient consideration of all matters of importance to the Trustees, the fund, and fund shareholders and to facilitate compliance with legal and regulatory requirements and oversight of the fund's activities and associated risks. The Board, acting through its committees, has charged FMR and its affiliates with (i) identifying events or circumstances the occurrence of which could have demonstrably adverse effects on the fund's business and/or reputation; (ii) implementing processes and controls to lessen the possibility that such events or circumstances occur or to mitigate the effects of such events or circumstances if they do occur; and (iii) creating and maintaining a system designed to evaluate continuously business and market conditions in order to facilitate the identification and implementation processes described in (i) and (ii) above. Because the day-to-day operations and activities of the fund are carried out by or through FMR, its affiliates, and other service providers, the fund's exposure to risks is mitigated but not eliminated by the processes overseen by the Trustees. While each of the Board's committees has responsibility for overseeing different aspects of the fund's activities, oversight is exercised primarily through the Operations, Audit, and Compliance Committees. Appropriate personnel, including but not limited to the fund's Chief Compliance Officer (CCO), FMR's internal auditor, the independent accountants, the fund's Treasurer and portfolio management personnel, make periodic reports to the Board's committees, as appropriate, including an annual review of Fidelity's risk management program for the Fidelity® funds. The responsibilities of each standing committee, including their oversight responsibilities, are described further under "Standing Committees of the Trustees."
Interested Trustees*:
Correspondence intended for a Trustee who is an interested person may be sent to Fidelity Investments, 245 Summer Street, Boston, Massachusetts 02210.
Name, Year of Birth; Principal Occupations and Other Relevant Experience+
Jonathan Chiel (1957)
Year of Election or Appointment: 2016
Trustee
Mr. Chiel also serves as Trustee of other Fidelity® funds. Mr. Chiel is Executive Vice President and General Counsel for FMR LLC (diversified financial services company, 2012-present). Previously, Mr. Chiel served as general counsel (2004-2012) and senior vice president and deputy general counsel (2000-2004) for John Hancock Financial Services; a partner with Choate, Hall & Stewart (1996-2000) (law firm); and an Assistant United States Attorney for the United States Attorney’s Office of the District of Massachusetts (1986-95), including Chief of the Criminal Division (1993-1995). Mr. Chiel is a director on the boards of the Boston Bar Foundation and the Maimonides School.
Robert A. Lawrence (1952)
Year of Election or Appointment: 2020
Trustee
Acting Chairman of the Board of Trustees
Mr. Lawrence also serves as Trustee of other funds. Previously, Mr. Lawrence served as a Member of the Advisory Board of certain funds. Prior to his retirement in 2008, Mr. Lawrence served as Vice President of certain Fidelity® funds (2006-2008), Senior Vice President, Head of High Income Division of Fidelity Management & Research Company (investment adviser firm, 2006-2008), and President of Fidelity Strategic Investments (investment adviser firm, 2002-2005).
* Determined to be an “Interested Trustee” by virtue of, among other things, his or her affiliation with the trust or various entities under common control with FMR.
+ The information includes the Trustee's principal occupation during the last five years and other information relating to the experience, attributes, and skills relevant to the Trustee's qualifications to serve as a Trustee, which led to the conclusion that the Trustee should serve as a Trustee for the fund.
Independent Trustees:
Correspondence intended for an Independent Trustee may be sent to Fidelity Investments, P.O. Box 55235, Boston, Massachusetts 02205-5235.
Name, Year of Birth; Principal Occupations and Other Relevant Experience+
Dennis J. Dirks (1948)
Year of Election or Appointment: 2005
Trustee
Mr. Dirks also serves as Trustee of other Fidelity® funds. Prior to his retirement in May 2003, Mr. Dirks served as Chief Operating Officer and as a member of the Board of The Depository Trust & Clearing Corporation (financial markets infrastructure), President, Chief Operating Officer and a member of the Board of The Depository Trust Company (DTC), President and a member of the Board of the National Securities Clearing Corporation (NSCC), Chief Executive Officer and a member of the Board of the Government Securities Clearing Corporation and Chief Executive Officer and a member of the Board of the Mortgage-Backed Securities Clearing Corporation. Mr. Dirks currently serves as a member of the Finance Committee (2016-present) and Board (2017-present) and is Treasurer (2018-present) of the Asolo Repertory Theatre.
Donald F. Donahue (1950)
Year of Election or Appointment: 2018
Trustee
Mr. Donahue also serves as Trustee of other Fidelity® funds. Mr. Donahue serves as President and Chief Executive Officer of Miranda Partners, LLC (risk consulting for the financial services industry, 2012-present). Previously, Mr. Donahue served as Chief Executive Officer (2006-2012), Chief Operating Officer (2003-2006) and Managing Director, Customer Marketing and Development (1999-2003) of The Depository Trust & Clearing Corporation (financial markets infrastructure). Mr. Donahue currently serves as a member (2007-present) and Co-Chairman (2016-present) of the Board of United Way of New York, a member of the Board of NYC Leadership Academy (2012-present) and a member of the Board of Advisors of Ripple Labs, Inc. (financial services, 2015-present). Mr. Donahue previously served as a member of the Advisory Board of certain Fidelity® funds (2015-2018).
Vicki L. Fuller (1957)
Year of Election or Appointment: 2020
Trustee
Ms. Fuller also serves as Trustee of other Fidelity® funds. Previously, Ms. Fuller served as a member of the Advisory Board of certain Fidelity® funds (2018-2020), Chief Investment Officer of the New York State Common Retirement Fund (2012-2018) and held a variety of positions at AllianceBernstein L.P. (global asset management, 1985-2012), including Managing Director (2006-2012) and Senior Vice President and Senior Portfolio Manager (2001-2006). Ms. Fuller currently serves as a member of the Board, Audit Committee and Nominating and Governance Committee of The Williams Companies, Inc. (natural gas infrastructure, 2018-present) and as a member of the Board of Treliant, LLC (consulting, 2019-present).
Patricia L. Kampling (1959)
Year of Election or Appointment: 2020
Trustee
Ms. Kampling also serves as Trustee of other Fidelity® funds. Prior to her retirement, Ms. Kampling served as Chairman of the Board and Chief Executive Officer (2012-2019), President and Chief Operating Officer (2011-2012) and Executive Vice President and Chief Financial Officer (2010-2011) of Alliant Energy Corporation. Ms. Kampling currently serves as a member of the Board, Compensation Committee and Executive Committee and as Chair of the Audit Committee of Briggs & Stratton Corporation (manufacturing, 2011-present) and as a member of the Board, Audit, Finance and Risk Committee and Safety, Environmental, Technology and Operations Committee of American Water Works Company, Inc. (utilities company, 2019-present). In addition, Ms. Kampling currently serves as a member of the Board of the Nature Conservancy, Wisconsin Chapter (2019-present). Previously, Ms. Kampling served as a Member of the Advisory Board of certain Fidelity® funds (2020), a member of the Board of Interstate Power and Light Company (2012-2019) and Wisconsin Power and Light Company (2012-2019) (each a subsidiary of Alliant Energy Corporation) and as a member of the Board and Workforce Development Committee of the Business Roundtable (2018-2019).
Alan J. Lacy (1953)
Year of Election or Appointment: 2008
Trustee
Mr. Lacy also serves as Trustee of other Fidelity® funds. Previously, Mr. Lacy served as Senior Adviser (2007-2014) of Oak Hill Capital Partners, L.P. (private equity), Chief Executive Officer (2005) and Vice Chairman (2005-2006) of Sears Holdings Corporation (retail), Chief Executive Officer and Chairman of the Board of Sears, Roebuck and Co. (retail, 2000-2005), Chairman (2014-2017) and a member of the Board (2010-2017) of Dave & Buster’s Entertainment, Inc. (restaurant and entertainment complexes) and a member of the Board of Bristol-Myers Squibb Company (global pharmaceuticals, 2008-2020). Mr. Lacy currently serves as a Trustee of the California Chapter of The Nature Conservancy (2015-present) and a member of the Board of the Center for Advanced Study in the Behavioral Sciences at Stanford University (2015-present).
Ned C. Lautenbach (1944)
Year of Election or Appointment: 2000
Trustee
Co-Lead Independent Trustee
Mr. Lautenbach also serves as Trustee of other Fidelity® funds. Mr. Lautenbach currently serves as Chair of the Board of Governors, State University System of Florida (2013-present) and is a member of the Council on Foreign Relations (1994-present). He is also a member and has in the past served as Chairman of the Board of Directors of Artis-Naples (2012-present). Previously, Mr. Lautenbach served as a member and then Lead Director of the Board of Directors of Eaton Corporation (diversified industrial, 1997-2016). He was also a Partner at Clayton, Dubilier & Rice, LLC (private equity investment, 1998-2010); as well as Director of Sony Corporation (2006-2007). In addition, Mr. Lautenbach had a 30-year career with IBM (technology company), during which time he served as Senior Vice President and as a member of the Corporate Executive Committee (1968-1998).
Joseph Mauriello (1944)
Year of Election or Appointment: 2008
Trustee
Mr. Mauriello also serves as Trustee of other Fidelity® funds. Prior to his retirement in January 2006, Mr. Mauriello served in numerous senior management positions including Deputy Chairman and Chief Operating Officer (2004-2005), and Vice Chairman of Financial Services (2002-2004) of KPMG LLP US (professional services, 1965-2005). Mr. Mauriello currently serves as a member of the Independent Directors Council Governing Council (2015-present). Previously, Mr. Mauriello served as a member of the Board of XL Group plc. (global insurance and re-insurance, 2006-2018).
Cornelia M. Small (1944)
Year of Election or Appointment: 2005
Trustee
Ms. Small also serves as Trustee of other Fidelity® funds. Previously, Ms. Small served as Chief Investment Officer, Director of Global Equity Investments and a member of Scudder, Stevens & Clark and Scudder Kemper Investments. Ms. Small previously served as a member of the Board (2009-2019) and Chair of the Investment Committee (2010-2019) of the Teagle Foundation and a member of the Investment Committee of the Berkshire Taconic Community Foundation (2008-2019).
Garnett A. Smith (1947)
Year of Election or Appointment: 2018
Trustee
Mr. Smith also serves as Trustee of other Fidelity® funds. Prior to his retirement, Mr. Smith served as Chairman and Chief Executive Officer (1990-1997) and President (1986-1990) of Inbrand Corp. (manufacturer of personal absorbent products). Prior to his employment with Inbrand Corp., he was employed by a retail fabric chain and North Carolina National Bank (now Bank of America). Mr. Smith previously served as a member of the Advisory Board of certain Fidelity® funds (2012-2013).
David M. Thomas (1949)
Year of Election or Appointment: 2008
Trustee
Co-Lead Independent Trustee
Mr. Thomas also serves as Trustee of other Fidelity® funds. Previously, Mr. Thomas served as Executive Chairman (2005-2006) and Chairman and Chief Executive Officer (2000-2005) of IMS Health, Inc. (pharmaceutical and healthcare information solutions). Mr. Thomas currently serves as Non-Executive Chairman of the Board of Fortune Brands Home and Security (home and security products, 2011-present), and a member of the Board (2004-present) and Presiding Director (2013-present) of Interpublic Group of Companies, Inc. (marketing communication).
Susan Tomasky (1953)
Year of Election or Appointment: 2020
Trustee
Ms. Tomasky also serves as Trustee of other Fidelity® funds. Prior to her retirement, Ms. Tomasky served in various executive officer positions at American Electric Power Company, Inc. (1998-2011), including most recently as President of AEP Transmission (2007-2011). Ms. Tomasky currently serves as a member of the Board and Sustainability Committee and as Chair of the Audit Committee of Marathon Petroleum Corporation (2018-present) and as a member of the Board, Corporate Governance Committee and Organization and Compensation Committee and as Chair of the Audit Committee of Public Service Enterprise Group, Inc. (utilities company, 2012-present). In addition, Ms. Tomasky currently serves as a member of the Board of the Columbus Regional Airport Authority (2007-present), as a member of the Board of the Royal Shakespeare Company – America (2009-present), as a member of the Board of the Columbus Association for the Performing Arts (2011-present) and as a member of the Board of Kenyon College (2016-present). Previously, Ms. Tomasky served as a Member of the Advisory Board of certain Fidelity® funds (2020), a member of the Board (2011-2019) and as Lead Independent Director (2015-2018) of Andeavor Corporation (previously Tesoro Corporation) (independent oil refiner and marketer) and as a member of the Board of Summit Midstream Partners LP (energy, 2012-2018).
Michael E. Wiley (1950)
Year of Election or Appointment: 2020
Trustee
Mr. Wiley also serves as Trustee of other Fidelity® funds. Previously, Mr. Wiley served as a member of the Advisory Board of certain Fidelity® funds (2018-2020), Chairman, President and CEO of Baker Hughes, Inc. (oilfield services, 2000-2004). Mr. Wiley also previously served as a member of the Board of Andeavor Corporation (independent oil refiner and marketer, 2005-2018), a member of the Board of Andeavor Logistics LP (natural resources logistics, 2015-2018) and a member of the Board of High Point Resources (exploration and production, 2005-2020).
+ The information includes the Trustee's principal occupation during the last five years and other information relating to the experience, attributes, and skills relevant to the Trustee's qualifications to serve as a Trustee, which led to the conclusion that the Trustee should serve as a Trustee for the fund.
Advisory Board Members and Officers:
Correspondence intended for a Member of the Advisory Board (if any) may be sent to Fidelity Investments, P.O. Box 55235, Boston, Massachusetts 02205-5235. Correspondence intended for an officer or Peter S. Lynch may be sent to Fidelity Investments, 245 Summer Street, Boston, Massachusetts 02210. Officers appear below in alphabetical order.
Name, Year of Birth; Principal Occupation
Peter S. Lynch (1944)
Year of Election or Appointment: 2003
Member of the Advisory Board
Mr. Lynch also serves as a Member of the Advisory Board of other Fidelity® funds. Mr. Lynch is Vice Chairman and a Director of Fidelity Management & Research Company LLC (investment adviser firm). In addition, Mr. Lynch serves as a Trustee of Boston College and as the Chairman of the Inner-City Scholarship Fund. Previously, Mr. Lynch served as Vice Chairman and a Director of FMR Co., Inc. (investment adviser firm) and on the Special Olympics International Board of Directors (1997-2006).
Elizabeth Paige Baumann (1968)
Year of Election or Appointment: 2017
Anti-Money Laundering (AML) Officer
Ms. Baumann also serves as AML Officer of other funds. She is Chief AML Officer (2012-present) and Senior Vice President (2014-present) of FMR LLC (diversified financial services company) and is an employee of Fidelity Investments. Previously, Ms. Baumann served as AML Officer of certain funds (2017-2019), as AML Officer of the funds (2012-2016), and Vice President (2007-2014) and Deputy Anti-Money Laundering Officer (2007-2012) of FMR LLC.
Craig S. Brown (1977)
Year of Election or Appointment: 2019
Assistant Treasurer
Mr. Brown also serves as Assistant Treasurer of other funds. Mr. Brown is an employee of Fidelity Investments (2013-present).
John J. Burke III (1964)
Year of Election or Appointment: 2018
Chief Financial Officer
Mr. Burke also serves as Chief Financial Officer of other funds. Mr. Burke serves as Head of Investment Operations for Fidelity Fund and Investment Operations (2018-present) and is an employee of Fidelity Investments (1998-present). Previously Mr. Burke served as head of Asset Management Investment Operations (2012-2018).
William C. Coffey (1969)
Year of Election or Appointment: 2019
Assistant Secretary
Mr. Coffey also serves as Assistant Secretary of other funds. He is Senior Vice President and Deputy General Counsel of FMR LLC (diversified financial services company, 2010-present), and is an employee of Fidelity Investments. Previously, Mr. Coffey served as Secretary and CLO of certain funds (2018-2019); CLO, Secretary, and Senior Vice President of Fidelity Management & Research Company and FMR Co., Inc. (investment adviser firms, 2018-2019); Secretary of Fidelity SelectCo, LLC and Fidelity Investments Money Management, Inc. (investment adviser firms, 2018-2019); CLO of Fidelity Management & Research (Hong Kong) Limited, FMR Investment Management (UK) Limited, and Fidelity Management & Research (Japan) Limited (investment adviser firms, 2018-2019); and Assistant Secretary of certain funds (2009-2018).
Timothy M. Cohen (1969)
Year of Election or Appointment: 2018
Vice President
Mr. Cohen also serves as Vice President of other funds. Mr. Cohen serves as Co-Head of Equity (2018-present), a Director of Fidelity Management & Research (Japan) Limited (investment adviser firm, 2016-present), and is an employee of Fidelity Investments. Previously, Mr. Cohen served as Executive Vice President of Fidelity SelectCo, LLC (2019), Head of Global Equity Research (2016-2018), Chief Investment Officer - Equity and a Director of Fidelity Management & Research (U.K.) Inc. (investment adviser firm, 2013-2015) and as a Director of Fidelity Management & Research (Hong Kong) Limited (investment adviser firm, 2017).
Jonathan Davis (1968)
Year of Election or Appointment: 2010
Assistant Treasurer
Mr. Davis also serves as Assistant Treasurer of other funds. Mr. Davis serves as Assistant Treasurer of FMR Capital, Inc. (2017-present) and is an employee of Fidelity Investments. Previously, Mr. Davis served as Vice President and Associate General Counsel of FMR LLC (diversified financial services company, 2003-2010).
Laura M. Del Prato (1964)
Year of Election or Appointment: 2018
Assistant Treasurer
Ms. Del Prato also serves as an officer of other funds. Ms. Del Prato is an employee of Fidelity Investments (2017-present). Previously, Ms. Del Prato served as President and Treasurer of The North Carolina Capital Management Trust: Cash Portfolio and Term Portfolio (2018-2020). Prior to joining Fidelity Investments, Ms. Del Prato served as a Managing Director and Treasurer of the JPMorgan Mutual Funds (2014-2017). Prior to JPMorgan, Ms. Del Prato served as a partner at Cohen Fund Audit Services (accounting firm, 2012-2013) and KPMG LLP (accounting firm, 2004-2012).
Colm A. Hogan (1973)
Year of Election or Appointment: 2020
Assistant Treasurer
Mr. Hogan also serves as an officer of other funds. Mr. Hogan serves as Assistant Treasurer of FMR Capital, Inc. (2017-present) and is an employee of Fidelity Investments (2005-present). Previously, Mr. Hogan served as Deputy Treasurer of certain Fidelity® funds (2016-2020) and Assistant Treasurer of certain Fidelity® funds (2016-2018).
Pamela R. Holding (1964)
Year of Election or Appointment: 2018
Vice President
Ms. Holding also serves as Vice President of other funds. Ms. Holding serves as Co-Head of Equity (2018-present) and is an employee of Fidelity Investments (2013-present). Previously, Ms. Holding served as Executive Vice President of Fidelity SelectCo, LLC (2019) and as Chief Investment Officer of Fidelity Institutional Asset Management (2013-2018).
Cynthia Lo Bessette (1969)
Year of Election or Appointment: 2019
Secretary and Chief Legal Officer (CLO)
Ms. Lo Bessette also serves as an officer of other funds. Ms. Lo Bessette serves as CLO, Secretary, and Senior Vice President of Fidelity Management & Research Company LLC (investment adviser firm, 2019-present); and CLO of Fidelity Management & Research (Hong Kong) Limited, FMR Investment Management (UK) Limited, and Fidelity Management & Research (Japan) Limited (investment adviser firms, 2019-present). She is a Senior Vice President and Deputy General Counsel of FMR LLC (diversified financial services company, 2019-present), and is an employee of Fidelity Investments. Previously, Ms. Lo Bessette served as CLO, Secretary, and Senior Vice President of FMR Co., Inc. (investment adviser firm, 2019); Secretary of Fidelity SelectCo, LLC and Fidelity Investments Money Management, Inc. (investment adviser firms, 2019). Prior to joining Fidelity Investments, Ms. Lo Bessette was Executive Vice President, General Counsel (2016-2019) and Senior Vice President, Deputy General Counsel (2015-2016) of OppenheimerFunds (investment management company) and Deputy Chief Legal Officer (2013-2015) of Jennison Associates LLC (investment adviser firm).
Chris Maher (1972)
Year of Election or Appointment: 2020
Deputy Treasurer
Mr. Maher also serves as an officer of other funds. Mr. Maher serves as Assistant Treasurer of FMR Capital, Inc. (2017-present), and is an employee of Fidelity Investments (2008-present). Previously, Mr. Maher served as Assistant Treasurer of certain funds (2013-2020); Vice President of Asset Management Compliance (2013), Vice President of the Program Management Group of FMR (investment adviser firm, 2010-2013), and Vice President of Valuation Oversight (2008-2010).
Jason P. Pogorelec (1975)
Year of Election or Appointment: 2020
Chief Compliance Officer
Mr. Pogorelec also serves as Chief Compliance Officer of other funds. Mr. Pogorelec is a senior Vice President of Asset Management Compliance for Fidelity Investments and is an employee of Fidelity Investments (2006-present). Previously, Mr. Pogorelec served as Vice President, Associate General Counsel for Fidelity Investments (2010-2020) and Assistant Secretary of certain Fidelity funds (2015-2020).
Stacie M. Smith (1974)
Year of Election or Appointment: 2016
President and Treasurer
Ms. Smith also serves as an officer of other funds. Ms. Smith serves as Assistant Treasurer of FMR Capital, Inc. (2017-present), is an employee of Fidelity Investments (2009-present), and has served in other fund officer roles. Prior to joining Fidelity Investments, Ms. Smith served as Senior Audit Manager of Ernst & Young LLP (accounting firm, 1996-2009). Previously, Ms. Smith served as Assistant Treasurer (2013-2019) and Deputy Treasurer (2013-2016) of certain Fidelity® funds.
Marc L. Spector (1972)
Year of Election or Appointment: 2016
Assistant Treasurer
Mr. Spector also serves as an officer of other funds. Mr. Spector serves as Assistant Treasurer of FMR Capital, Inc. (2017-present) and is an employee of Fidelity Investments (2016-present). Prior to joining Fidelity Investments, Mr. Spector served as Director at the Siegfried Group (accounting firm, 2013-2016), and prior to Siegfried Group as audit senior manager at Deloitte & Touche LLP (accounting firm, 2005-2013).
Jim Wegmann (1979)
Year of Election or Appointment: 2019
Assistant Treasurer
Mr. Wegmann also serves as Assistant Treasurer of other funds. Mr. Wegmann is an employee of Fidelity Investments (2011-present).
Shareholder Expense Example
As a shareholder, you incur two types of costs: (1) transaction costs, which may include sales charges (loads) on purchase payments or redemption proceeds, as applicable and (2) ongoing costs, which generally include management fees, distribution and/or service (12b-1) fees and other Fund expenses. This Example is intended to help you understand your ongoing costs (in dollars) of investing in a fund and to compare these costs with the ongoing costs of investing in other mutual funds.
The Example is based on an investment of $1,000 invested at the beginning of the period and held for the entire period (February 1, 2020 to July 31, 2020).
Actual Expenses
The first line of the accompanying table provides information about actual account values and actual expenses. You may use the information in this line, together with the amount you invested, to estimate the expenses that you paid over the period. Simply divide your account value by $1,000.00 (for example, an $8,600 account value divided by $1,000.00 = 8.6), then multiply the result by the number in the first line for a class/Fund under the heading entitled "Expenses Paid During Period" to estimate the expenses you paid on your account during this period. If any fund is a shareholder of any underlying mutual funds or exchange-traded funds (ETFs) (the Underlying Funds), such fund indirectly bears its proportional share of the expenses of the Underlying Funds in addition to the direct expenses incurred presented in the table. These fees and expenses are not included in the annualized expense ratio used to calculate the expense estimate in the table below.
Hypothetical Example for Comparison Purposes
The second line of the accompanying table provides information about hypothetical account values and hypothetical expenses based on the actual expense ratio and an assumed rate of return of 5% per year before expenses, which is not the actual return. The hypothetical account values and expenses may not be used to estimate the actual ending account balance or expenses you paid for the period. You may use this information to compare the ongoing costs of investing in the Fund and other funds. To do so, compare this 5% hypothetical example with the 5% hypothetical examples that appear in the shareholder reports of the other funds. If any fund is a shareholder of any Underlying Funds, such fund indirectly bears its proportional share of the expenses of the Underlying Funds in addition to the direct expenses as presented in the table. These fees and expenses are not included in the annualized expense ratio used to calculate the expense estimate in the table below.
Please note that the expenses shown in the table are meant to highlight your ongoing costs only and do not reflect any transaction costs. Therefore, the second line of the table is useful in comparing ongoing costs only, and will not help you determine the relative total costs of owning different funds.
| | Annualized Expense Ratio-A | Beginning
Account Value
February 1, 2020 | Ending
Account Value
July 31, 2020 | Expenses Paid
During Period-B
February 1, 2020
to July 31, 2020 |
| Fidelity Value Discovery K6 Fund |
| Actual | .46% | $1,000.00 | $931.20 | $2.21 |
| Hypothetical-C | | $1,000.00 | $1,022.58 | $2.31 |
A Annualized expense ratio reflects expenses net of applicable fee waivers.
B Expenses are equal to the annualized expense ratio, multiplied by the average account value over the period, multiplied by 182/ 366 (to reflect the one-half year period). The fees and expenses of any Underlying Funds are not included in each annualized expense ratio.
C 5% return per year before expenses
Distributions (Unaudited)
The fund hereby designates as a capital gain dividend with respect to the taxable year ended July 31, 2020, $749,498, or, if subsequently determined to be different, the net capital gain of such year.
The fund designates 94% and 61% of the dividends distributed in September and December, respectively during the fiscal year as qualifying for the dividends–received deduction for corporate shareholders.
The fund designates 100% and 78% of the dividends distributed in September and December, respectively during the fiscal year as amounts which may be taken into account as a dividend for the purposes of the maximum rate under section 1(h)(11) of the Internal Reve nue Code.
The fund designates 1% and 9% of the dividends distributed in September and December, respectively during the fiscal year as a section 199A dividend.
The fund will notify shareholders in January 2021 of amounts for use in preparing 2020 income tax returns.
Liquidity Risk Management Program
The Securities and Exchange Commission adopted Rule 22e-4 under the Investment Company Act of 1940 (the Liquidity Rule) to promote effective liquidity risk management throughout the open-end investment company industry, thereby reducing the risk that funds will be unable to meet their redemption obligations and mitigating dilution of the interests of fund shareholders.
The Fund has adopted and implemented a liquidity risk management program pursuant to the Liquidity Rule (the Program) effective December 1, 2018. The Program is reasonably designed to assess and manage the Fund’s liquidity risk and to comply with the requirements of the Liquidity Rule. The Fund’s Board of Trustees (the Board) has designated the Fund’s investment adviser as administrator of the Program. The Fidelity advisers have established a Liquidity Risk Management Committee (the LRM Committee) to manage the Program for each of the Fidelity Funds. The LRM Committee monitors the adequacy and effectiveness of implementation of the Program and on a periodic basis assesses each Fund’s liquidity risk based on a variety of factors including (1) the Fund’s investment strategy, (2) portfolio liquidity and cash flow projections during normal and reasonably foreseeable stressed conditions, (3) shareholder redemptions, (4) borrowings and other funding sources and (5) in the case of exchange-traded funds, certain additional factors including the effect of the Fund’s prices and spreads, market participants, and basket compositions on the overall liquidity of the Fund’s portfolio, as applicable
In accordance with the Program, each of the Fund’s portfolio investments is classified into one of four liquidity categories described below based on a determination of a reasonable expectation for how long it would take to convert the investment to cash (or sell or dispose of the investment) without significantly changing its market value.
- Highly liquid investments – cash or convertible to cash within three business days or less
- Moderately liquid investments – convertible to cash in three to seven calendar days
- Less liquid investments – can be sold or disposed of, but not settled, within seven calendar days
- Illiquid investments – cannot be sold or disposed of within seven calendar days
Liquidity classification determinations take into account a variety of factors including various market, trading and investment-specific considerations, as well as market depth, and generally utilize analysis from a third-party liquidity metrics service.
The Liquidity Rule places a 15% limit on a fund’s illiquid investments and requires funds that do not primarily hold assets that are highly liquid investments to determine and maintain a minimum percentage of the fund’s net assets to be invested in highly liquid investments (highly liquid investment minimum or HLIM). The Program includes provisions reasonably designed to comply with the 15% limit on illiquid investments and for determining, periodically reviewing and complying with the HLIM requirement as applicable.
At a recent meeting of the Fund’s Board of Trustees, the LRM Committee provided a written report to the Board pertaining to the operation, adequacy, and effectiveness of implementation of the Program for the annual period from December 1, 2018 through November 30, 2019. The report concluded that the Program has been implemented and is operating effectively and is reasonably designed to assess and manage the Fund’s liquidity risk.
Proxy Voting Results
A special meeting of shareholders was held on June 9, 2020. The results of votes taken among shareholders on the proposals before them are reported below. Each vote reported represents one dollar of net asset value held on the record date for the meeting.
PROPOSAL 1
To elect a Board of Trustees.
| | # of
Votes | % of
Votes |
| Dennis J. Dirks |
| Affirmative | 51,196,847,491.427 | 94.398 |
| Withheld | 3,038,239,286.369 | 5.602 |
| TOTAL | 54,235,086,777.797 | 100.000 |
| Donald F. Donahue |
| Affirmative | 51,237,854,534.400 | 94.474 |
| Withheld | 2,997,232,243.397 | 5.526 |
| TOTAL | 54,235,086,777.797 | 100.000 |
| Bettina Doulton |
| Affirmative | 51,360,110,652.541 | 94.699 |
| Withheld | 2,874,976,125.255 | 5.301 |
| TOTAL | 54,235,086,777.797 | 100.000 |
| Vicki L. Fuller |
| Affirmative | 51,563,431,518.122 | 95.074 |
| Withheld | 2,671,655,259.675 | 4.926 |
| TOTAL | 54,235,086,777.797 | 100.000 |
| Patricia L. Kampling |
| Affirmative | 51,164,274,033.278 | 94.338 |
| Withheld | 3,070,812,744.518 | 5.662 |
| TOTAL | 54,235,086,777.797 | 100.000 |
| Alan J. Lacy |
| Affirmative | 50,656,049,520.376 | 93.401 |
| Withheld | 3,579,037,257.420 | 6.599 |
| TOTAL | 54,235,086,777.797 | 100.000 |
| Ned C. Lautenbach |
| Affirmative | 50,648,184,728.350 | 93.386 |
| Withheld | 3,586,902,049.447 | 6.614 |
| TOTAL | 54,235,086,777.797 | 100.000 |
| Robert A. Lawrence |
| Affirmative | 50,828,079,099.188 | 93.718 |
| Withheld | 3,407,007,678.608 | 6.282 |
| TOTAL | 54,235,086,777.797 | 100.000 |
| Joseph Mauriello |
| Affirmative | 50,733,010,817.685 | 93.543 |
| Withheld | 3,502,075,960.112 | 6.457 |
| TOTAL | 54,235,086,777.797 | 100.000 |
| Cornelia M. Small |
| Affirmative | 50,936,822,997.692 | 93.919 |
| Withheld | 3,298,263,780.105 | 6.081 |
| TOTAL | 54,235,086,777.797 | 100.000 |
| Garnett A. Smith |
| Affirmative | 50,777,344,834.274 | 93.625 |
| Withheld | 3,457,741,943.523 | 6.375 |
| TOTAL | 54,235,086,777.797 | 100.000 |
| David M. Thomas |
| Affirmative | 50,835,673,463.433 | 93.732 |
| Withheld | 3,399,413,314.364 | 6.268 |
| TOTAL | 54,235,086,777.797 | 100.000 |
| Susan Tomasky |
| Affirmative | 51,193,289,850.509 | 94.391 |
| Withheld | 3,041,796,927.288 | 5.609 |
| TOTAL | 54,235,086,777.797 | 100.000 |
| Michael E. Wiley |
| Affirmative | 50,830,132,792.508 | 93.722 |
| Withheld | 3,404,953,985.289 | 6.278 |
| TOTAL | 54,235,086,777.797 | 100.000 |
PROPOSAL 2
To convert a fundamental investment policy to a non-fundamental investment policy.
| | # of
Votes | % of
Votes |
| Affirmative | 109,359,879.773 | 85.543 |
| Against | 6,138,455.049 | 4.802 |
| Abstain | 12,343,609.014 | 9.655 |
| Broker Non-Vote | 0.000 | 0.00 |
| TOTAL | 127,841,943.835 | 100.000 |
|
| Proposal 1 reflects trust wide proposal and voting results. |
FVDK6-ANN-0920
1.9884003.103
Item 2.
Code of Ethics
As of the end of the period, July 31, 2020, Fidelity Puritan Trust (the trust) has adopted a code of ethics, as defined in Item 2 of Form N-CSR, that applies to its President and Treasurer and its Chief Financial Officer. A copy of the code of ethics is filed as an exhibit to this Form N-CSR.
Item 3.
Audit Committee Financial Expert
The Board of Trustees of the trust has determined that Joseph Mauriello is an audit committee financial expert, as defined in Item 3 of Form N-CSR. Mr. Mauriello is independent for purposes of Item 3 of Form N-CSR.
Item 4.
Principal Accountant Fees and Services
Fees and Services
The following table presents fees billed by Deloitte & Touche LLP, the member firms of Deloitte Touche Tohmatsu, and their respective affiliates (collectively, “Deloitte Entities”) in each of the last two fiscal years for services rendered to Fidelity Flex Intrinsic Opportunities Fund, Fidelity Series Intrinsic Opportunities Fund, Fidelity Value Discovery Fund and Fidelity Value Discovery K6 Fund (the “Funds”):
Services Billed by Deloitte Entities
July 31, 2020 FeesA
| | | | |
| Audit Fees | Audit-Related Fees | Tax Fees | All Other Fees |
Fidelity Flex Intrinsic Opportunities Fund | $53,900 | $- | $9,600 | $1,200 |
Fidelity Series Intrinsic Opportunities Fund | $53,900 | $- | $9,900 | $1,200 |
Fidelity Value Discovery Fund | $35,300 | $- | $8,000 | $800 |
Fidelity Value Discovery K6 Fund | $34,000 | $- | $8,500 | $800 |
| | | | |
| Audit Fees | Audit-Related Fees | Tax Fees | All Other Fees |
Fidelity Flex Intrinsic Opportunities Fund | $57,000 | $100 | $7,000 | $1,700 |
Fidelity Series Intrinsic Opportunities Fund | $64,000 | $100 | $6,800 | $1,700 |
Fidelity Value Discovery Fund | $52,000 | $100 | $5,500 | $1,100 |
Fidelity Value Discovery K6 Fund | $54,000 | $100 | $5,700 | $1,100 |
A Amounts may reflect rounding.
The following table presents fees billed by PricewaterhouseCoopers LLP (“PwC”) in each of the last two fiscal years for services rendered to Fidelity Low-Priced Stock Fund and Fidelity Low-Priced Stock K6 Fund (the “Funds”):
Services Billed by PwC
July 31, 2020 FeesA
| | | | |
| Audit Fees | Audit-Related Fees | Tax Fees | All Other Fees |
Fidelity Low-Priced Stock Fund | $96,600 | $6,100 | $15,400 | $2,500 |
Fidelity Low-Priced Stock K6 Fund | $70,300 | $5,200 | $10,800 | $2,100 |
| | | | |
| Audit Fees | Audit-Related Fees | Tax Fees | All Other Fees |
Fidelity Low-Priced Stock Fund | $128,000 | $7,600 | $40,700 | $3,600 |
Fidelity Low-Priced Stock K6 Fund | $81,000 | $5,100 | $4,800 | $2,400 |
A Amounts may reflect rounding.
The following table(s) present(s) fees billed by Deloitte Entities and PwC that were required to be approved by the Audit Committee for services that relate directly to the operations and financial reporting of the Fund(s) and that are rendered on behalf of Fidelity Management & Research Company LLC ("FMR") and entities controlling, controlled by, or under common control with FMR (not including any sub-adviser whose role is primarily portfolio management and is subcontracted with or overseen by another investment adviser) that provide ongoing services to the Fund(s) (“Fund Service Providers”):
Services Billed by Deloitte Entities
| | |
| July 31, 2020A | July 31, 2019A |
Audit-Related Fees | $- | $290,000 |
Tax Fees | $3,000 | $- |
All Other Fees | $- | $- |
A Amounts may reflect rounding.
Services Billed by PwC
| | |
| July 31, 2020A | July 31, 2019A |
Audit-Related Fees | $9,030,200 | $7,890,000 |
Tax Fees | $20,800 | $10,000 |
All Other Fees | $- | $- |
A Amounts may reflect rounding.
“Audit-Related Fees” represent fees billed for assurance and related services that are reasonably related to the performance of the fund audit or the review of the fund's financial statements and that are not reported under Audit Fees.
“Tax Fees” represent fees billed for tax compliance, tax advice or tax planning that relate directly to the operations and financial reporting of the fund.
“All Other Fees” represent fees billed for services provided to the fund or Fund Service Provider, a significant portion of which are assurance related, that relate directly to the operations and financial reporting of the fund, excluding those services that are reported under Audit Fees, Audit-Related Fees or Tax Fees.
Assurance services must be performed by an independent public accountant.
* * *
The aggregate non-audit fees billed by Deloitte Entities and PwC for services rendered to the Fund(s), FMR (not including any sub-adviser whose role is primarily portfolio management and is subcontracted with or overseen by another investment adviser), and any Fund Service Provider for each of the last two fiscal years of the Fund(s) are as follows:
| | |
Billed By | July 31, 2020A | July 31, 2019A |
Deloitte Entities | $544,600 | $730,000 |
PwC | $14,340,700 | $12,435,000 |
A Amounts may reflect rounding.
The trust's Audit Committee has considered non-audit services that were not pre-approved that were provided by Deloitte Entities and PwC to Fund Service Providers to be compatible with maintaining the independence of Deloitte Entities and PwC in its(their) audit of the Fund(s), taking into account representations from Deloitte Entities and PwC, in accordance with Public Company Accounting Oversight Board rules, regarding its independence from the Fund(s) and its(their) related entities and FMR’s review of the appropriateness and permissibility under applicable law of such non-audit services prior to their provision to the Fund(s) Service Providers.
Audit Committee Pre-Approval Policies and Procedures
The trust’s Audit Committee must pre-approve all audit and non-audit services provided by a fund’s independent registered public accounting firm relating to the operations or financial reporting of the fund. Prior to the commencement of any audit or non-audit services to a fund, the Audit Committee reviews the services to determine whether they are appropriate and permissible under applicable law.
The Audit Committee has adopted policies and procedures to, among other purposes, provide a framework for the Committee’s consideration of non-audit services by the audit firms that audit the Fidelity funds. The policies and procedures require that any non-audit service provided by a fund audit firm to a Fidelity fund and any non-audit service provided by a fund auditor to a Fund Service Provider that relates directly to the operations and financial reporting of a Fidelity fund (“Covered Service”) are subject to approval by the Audit Committee before such service is provided.
All Covered Services must be approved in advance of provision of the service either: (i) by formal resolution of the Audit Committee, or (ii) by oral or written approval of the service by the Chair of the Audit Committee (or if the Chair is unavailable, such other member of the Audit Committee as may be designated by the Chair to act in the Chair’s absence). The approval contemplated by (ii) above is permitted where the Treasurer determines that action on such an engagement is necessary before the next meeting of the Audit Committee.
Non-audit services provided by a fund audit firm to a Fund Service Provider that do not relate directly to the operations and financial reporting of a Fidelity fund are reported to the Audit Committee periodically.
Non-Audit Services Approved Pursuant to Rule 2-01(c)(7)(i)(C) and (ii) of Regulation S-X (“De Minimis Exception”)
There were no non-audit services approved or required to be approved by the Audit Committee pursuant to the De Minimis Exception during the Fund’s(s’) last two fiscal years relating to services provided to (i) the Fund(s) or (ii) any Fund Service Provider that relate directly to the operations and financial reporting of the Fund(s).
Item 5.
Audit Committee of Listed Registrants
Not applicable.
Item 6.
Investments
(a)
Not applicable.
(b)
Not applicable.
Item 7.
Disclosure of Proxy Voting Policies and Procedures for Closed-End Management Investment Companies
Not applicable.
Item 8.
Portfolio Managers of Closed-End Management Investment Companies
Not applicable.
Item 9.
Purchase of Equity Securities by Closed-End Management Investment Company and Affiliated Purchasers
Not applicable.
Item 10.
Submission of Matters to a Vote of Security Holders
There were no material changes to the procedures by which shareholders may recommend nominees to the trust’s Board of Trustees.
Item 11.
Controls and Procedures
(a)(i) The President and Treasurer and the Chief Financial Officer have concluded that the trust’s disclosure controls and procedures (as defined in Rule 30a-3(c) under the Investment Company Act) provide reasonable assurances that material information relating to the trust is made known to them by the appropriate persons, based on their evaluation of these controls and procedures as of a date within 90 days of the filing date of this report.
(a)(ii) There was no change in the trust’s internal control over financial reporting (as defined in Rule 30a-3(d) under the Investment Company Act) that occurred during the period covered by this report that has materially affected, or is reasonably likely to materially affect, the trust’s internal control over financial reporting.
Item 12.
Disclosure of Securities Lending Activities for Closed-End Management
Investment Companies
Not applicable.
Item 13.
Exhibits
SIGNATURES
Pursuant to the requirements of the Securities Exchange Act of 1934 and the Investment Company Act of 1940, the registrant has duly caused this report to be signed on its behalf by the undersigned, thereunto duly authorized.
Fidelity Puritan Trust
| |
By: | /s/Stacie M. Smith |
| Stacie M. Smith |
| President and Treasurer |
|
|
Date: | September 21, 2020 |
Pursuant to the requirements of the Securities Exchange Act of 1934 and the Investment Company Act of 1940, this report has been signed below by the following persons on behalf of the registrant and in the capacities and on the dates indicated.
| |
By: | /s/Stacie M. Smith |
| Stacie M. Smith |
| President and Treasurer |
|
|
Date: | September 21, 2020 |
| |
By: | /s/John J. Burke III |
| John J. Burke III |
| Chief Financial Officer |
|
|
Date: | September 21, 2020 |