Investor Presentation, Fourth Quarter 2007
0
About Us
RehabCare is a leading national provider of
physical rehabilitation services in conjunction with
more than 1,200 hospitals and skilled nursing
facilities in 42 states. We also own and/or operate
10 freestanding rehabilitation and long-term acute
care hospitals.
1
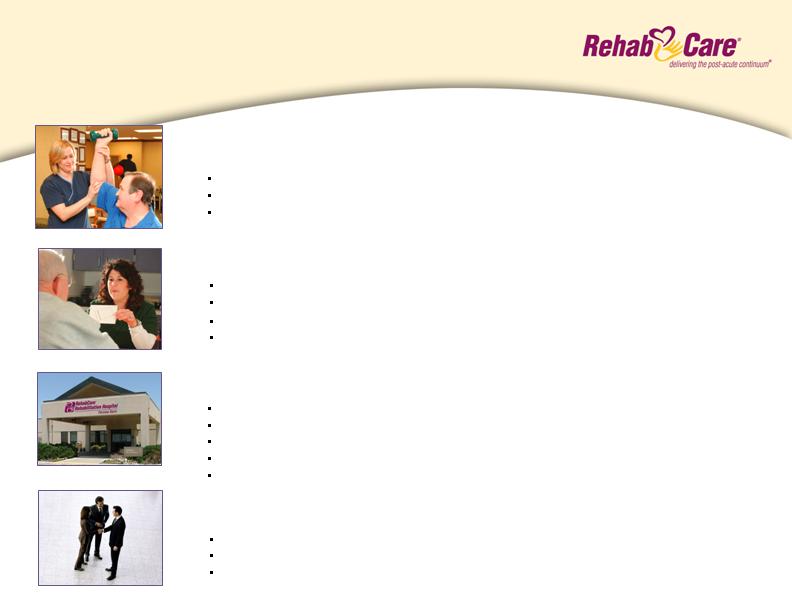
Service Lines
$712 million consolidated
revenues(1)
Contract Therapy Division
$401 million revenue - 56% of revenue (1)
1,064 skilled nursing facility programs
39 states
7.4 million annual patient visits
Hospital Rehabilitation Services Division
$164 million revenue - 23% of revenue (1)
154 hospital-based programs
31 states
45,000 inpatient and skilled nursing unit discharges/year
1.0 million annual outpatient visits
$103 million revenue - 15% of revenue (1)
Hospital Division
6 rehabilitation hospitals, 3 LTACHs
1 rehabilitation hospital minority owned (2)
5 states (3)
462 beds (3)
Approximately 6,500 annualized patient discharges (3)
Other Healthcare Services Division
$45 million revenue - 6% of revenue (1)
Phase 2 Consulting – consulting and care management for hospitals and health systems
Polaris Group – consulting for long-term care facilities
VTA Management Services – therapy and nurse staffing for New York
(1)
For twelve months ended 12/31/07
(2)
Not included in consolidated
revenues
(3)
These statistics include the
minority-owned rehab hospital
2
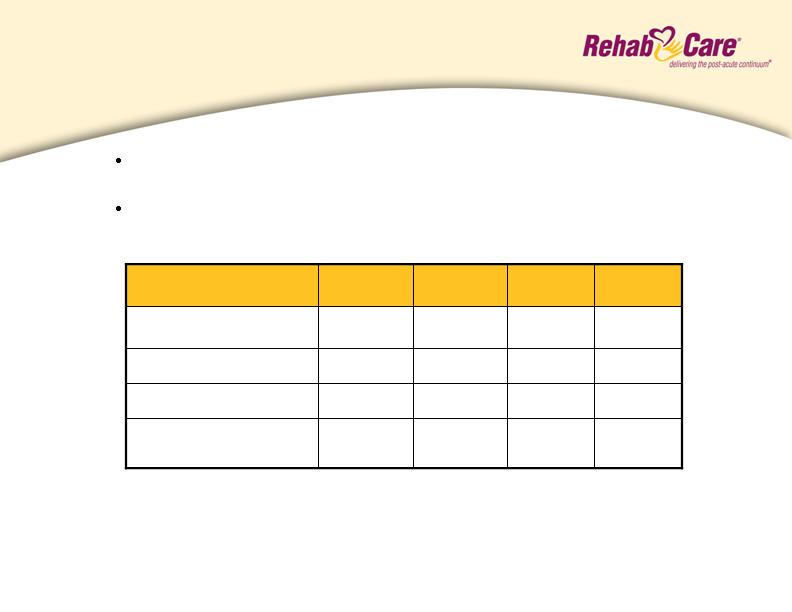
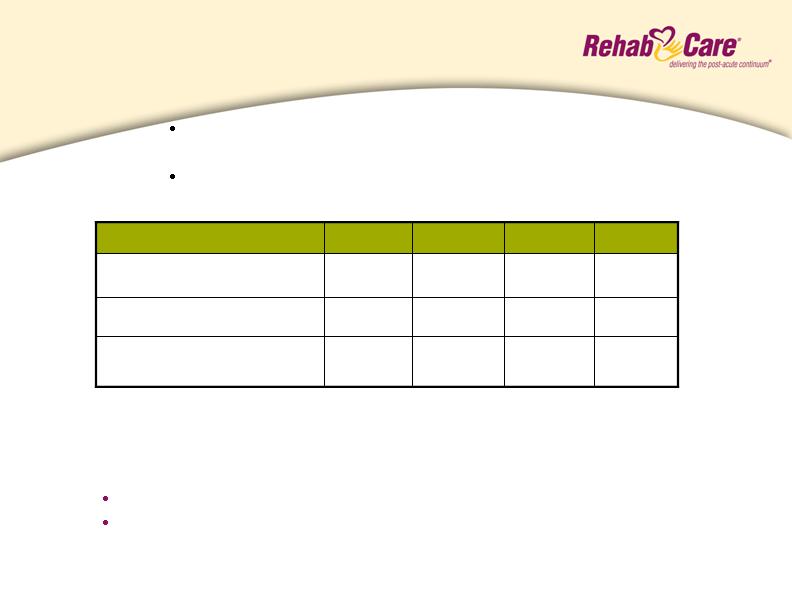
Financial Summary
$0.29(1)
5.1(1)
9.0(1)
$173.6
4Q 07
$0.12
2.0
5.5
$184.0
1Q 07
$0.09(2)
$0.22(1)
Diluted Earnings Per
Share
1.7(2)
3.9(1)
Net Earnings
4.2(2)
8.2(1)
Operating Earnings
$181.1
$172.9
Operating Revenues
2Q 07
3Q 07
(dollars in millions except per
share)
(1)
Includes favorable net self insurance costs of approximately $1.4 million and $1.2 million, or
$0.05 and $0.04 per diluted share after tax in Q4 and Q3, respectively, when compared to the
quarterly run rate for these costs in Q2.
(2)
Includes a pretax intangible asset impairment charge of $4.9 million ($2.9 million after tax), or
$0.17 per diluted share after tax.
Q4/07 EPS of $0.29 per diluted share and $0.73 for full year 2007,
74% higher than 2006
Lower operating revenues reflect elimination of programs that
don’t meet profit and credit objectives
3

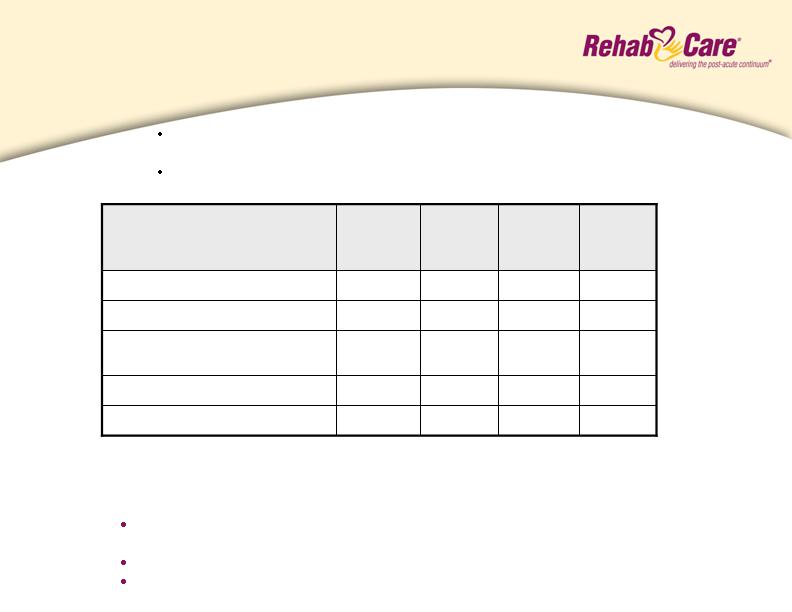
Consolidated Balance Sheet
(Dollars in thousands)
Cash and Cash Equivalents
Total Assets
Total Debt
Stockholders’ Equity
Percent of Debt to Total Capital
12/31/06
12/31/07
$ 9,430
428,296
120,559
$210,779
36%
$ 10,265
408,560
74,500
$244,022
23%
Cash flow from operations totaled $52.0 million for
twelve months ended December 31, 2007; $46.1
million debt repaid during this period
4

Contract Therapy
Market Overview
The Contract Therapy division manages skilled nursing facility rehab programs that are
designed to provide therapy intervention to both short-stay patients and long-term residents
with a wide range of conditions, including neurological, orthopedic and other conditions
common to the geriatric patient.
Market Size
17,000 Medicare certified skilled nursing facilities
Competitive Landscape
Owned
Self-Operation
Aegis (333)
Kindred - Peoplefirst (332)
Genesis (220)
Sundance (107)
Skilled Healthcare (74)
Managed
RehabCare (1,064)
Aegis (667)
Genesis (480)
Select Medical (400)
Sundance (309)
Kindred - Peoplefirst (298)
EnduraCare (270)
Skilled Healthcare (113)
Source: Information available from public filings or from company websites
5
Contract Therapy
Performance
Q1 07
Q2 07
Q3 07
Q4 07
Dollars in millions
1,064
$4.0 (1)
$99.4
1,146
$(2.2)
$102.8
1,110
1,085
Number of Locations End
of Period
$1.1
$3.2 (1)
Operating Earnings (loss)
$100.3
$98.3
Operating Revenues
Outlook (assumes Part B therapy cap exception remains in place for 2008)
4.5 - 5.5% operating earnings margins during 2008
Return to net additions in locations in 2008
Operating earnings have improved sequentially
each quarter since Q1/07
Lower operating revenues reflect elimination of programs
that don’t meet profit and credit objectives
(1)
Includes favorable net self insurance costs of approximately $0.4 million in both Q4 and Q3 when compared to the costs
incurred in Q2. Excluding the favorable adjustments for self insurance costs, operating earnings would have been $3.6 million and $2.8 million in Q4 and Q3, respectively.
incurred in Q2. Excluding the favorable adjustments for self insurance costs, operating earnings would have been $3.6
6

Contract Therapy
Legislative/Regulatory Environment
Part B Therapy Caps & Physician Fee Schedule (PFS)
The President signed into law the Medicare, Medicaid and SCHIP
Extension Act of 2007 (Extension Act) which includes:
A six-month extension of the exception process which
essentially eliminates the annual limit on therapies for Part B
Medicare beneficiaries - expires June 30, 2008
A 0.5% increase in the PFS, which serves as the charge
master for reimbursement for Part B therapy services, for the
next six-months, rather than the 10.1% scheduled reduction -
expires June 30, 2008
We are actively pursuing an 18-month extension of these
provisions
7

Hospital Rehabilitation Services
Market Overview
Acute care hospital-based inpatient rehabilitation facilities in RehabCare’s Hospital
Rehabilitation Services (HRS) division are for patients who require early, intensive therapies (at
least 3 hours/day 5 days/week) for recovery from stroke, brain injury, neurological disorders,
amputation and other disabling injuries and illnesses. Outpatient therapy programs provide
proactive, exercise-oriented therapy with hands-on treatment for individuals of all ages.
Market Size
5,000 acute care hospitals (approximately 1,000 hospital-based IRFs)
Competitive Landscape (Acute care hospital-based IRFs)
Self-Operation
RehabCare (107)
Horizon Health (Specialty Rehab Mgmt) (23)
HealthSouth (11)
Milestone(1)
TherEx (formerly National Rehab Partners)(1)
(1) Private company or a subsidiary of a public company; number of locations is not available
Source: Information available from public filings or from company websites
8
Hospital Rehab Services
Performance
63.0%
63.7%
64.9%
67.8%
75% Compliance Level (Avg)
Q1 07
Q2 07
Q3 07
Q4 07
Dollars in millions
10,190
154
$6.0 (1)
$38.8
11,093
10,786
10,173
IRF Discharges
164
$5.2
$43.3
161
154
Number of Locations End of
Period
$5.4
$6.3 (1)
Operating Earnings
$41.8
$40.3
Operating Revenues
Outlook
Modest increase in IRF units during 2008 (have already opened 3 IRFs in
2008 compared to 7 openings for the entire year of 2007)
Resumption of 3 – 5% growth in same store discharges during 2008
Continued 12 - 15% operating margins
Continued strong operating earnings performance through
focus on controlling costs
Lower operating revenues reflect impact of the 75% Rule and
reduction in units that don’t meet profit and credit objectives
(1)
Includes favorable net self insurance costs of approximately $0.6 million and $0.5 million in Q4 and Q3, respectively, when compared
to the costs incurred in Q2. Excluding the favorable adjustments for self insurance costs, operating earnings would have
been approximately $5.4 million and $5.8 million in Q4 and Q3, respectively.
9

Hospital Rehab Services
Legislative/Regulatory Environment
IRF 75% Rule
The Extension Act:
Permanently freezes the compliance threshold at 60%
for cost reporting periods starting July 1, 2006
Continues the use of comorbid conditions to qualify
patients and averts a planned cut in reimbursement rates
for lower extremity joint procedures
Requires HHS to conduct a study on patient access and
eligibility for rehabilitation services
Eliminates market basket updates through 2009
We believe the impact of the market basket elimination will be
mitigated through higher patient volumes resulting from the freeze
at 60%.
10
Inpatient rehabilitation facilities (IRFs) are equipped to treat patients with a wide range of
debilitating injuries and illnesses, offering inpatient and outpatient services in a home-like
environment. Long-term acute carehospitals(LTACHs) are specialty care hospitals
designed for extended stay patients with complex and chronic conditions.
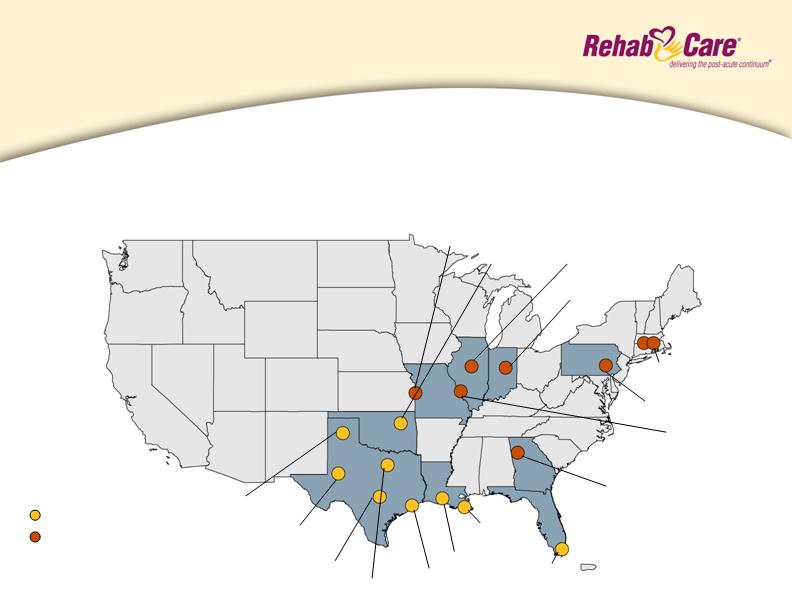
Hospital Division
Description and Locations
Arlington, TX
Providence, RI
St. Louis, MO
N. Kansas City, MO
Reading, PA
Tulsa, OK
Miami, FL
Houston, TX
New Orleans, LA
Amarillo, TX
Midland, TX
Austin, TX
Rome, GA
Lafayette, LA
Peoria, IL
9 current locations
8 future locations
Kokomo, IN
11
Hospital Division
Market Overview
Competitive Landscape
HealthSouth (94)
RehabCare (7)
Ernest Health (5)
Select Medical (4)
Vibra Healthcare (4)
Centerre (2)
Market Size:
240+ IRFs
Competitive Landscape
Select Medical (87)
Kindred (84)
Regency Hospital (23)
Triumph Healthcare (22)
LifeCare (20)
Vibra Healthcare (9)
Cornerstone Healthcare (9)
HealthSouth (6)
Ernest Health (6)
RehabCare (3)
Market Size:
460+ LTACHs
Freestanding IRFs
LTACHs
Source: Information available from public filings or from company websites
12
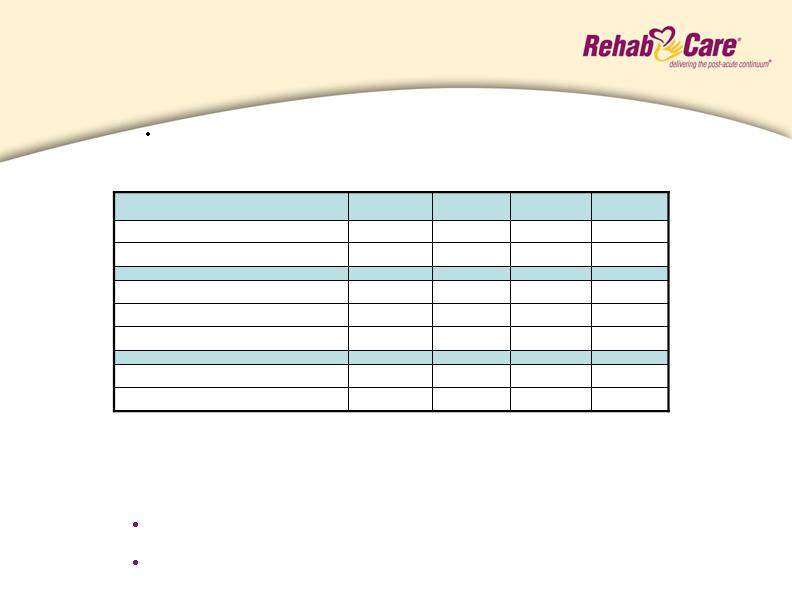
Hospital Division
Performance
3
3
3
3
Number of LTACHs End of Period
403
380
386
407
LTACH Patient Discharges
5
5
6
6
Number of IRFs End of Period
972
1,006
1,060
1,104
IRF Patient Discharges
59.0%
59.0%
63.7%
63.6%
75% Compliance Level (Avg)
Q1 07
Q2 07
Q3 07
Q4 07
Dollars in millions
$(0.8) (2)
$25.7
$1.9
$26.0
$(3.1) (1)
$(1.6) (2)
Operating Earnings (loss)
$27.0
$24.4
Operating Revenues
Outlook
13-15% EBITDA margins before corporate overhead in 2008 for group of
8 hospitals in operation more than one year
$4.5 - $5.5 million of net EBITDA drag in 2008 for group of 5 hospitals in
operation less than one year
Q4/07 operating results impacted by $800,000 start-up and $300,000
ramp-up costs at Central Texas Rehabilitation Hospital and investment
in additional infrastructure support
(1)
Includes a pretax impairment charge on a Louisiana Specialty Hospital intangible asset of $4.9 million, partially offset by net
favorable cost report/contractual adjustments of $0.9 million.
(2) Includes favorable net self insurance costs of approximately $0.2 million in both Q4 and Q3 when compared to the costs incurred in
Q2. In addition, Q3 contains unfavorable contractual allowance adjustments of approximately $1.4 million. Excluding the favorable
self insurance adjustments in Q4 and Q3 and the unfavorable contractual allowance adjustments in Q3, operating losses would
have been $1.0 million and $0.4 million in Q4 and Q3, respectively.
13
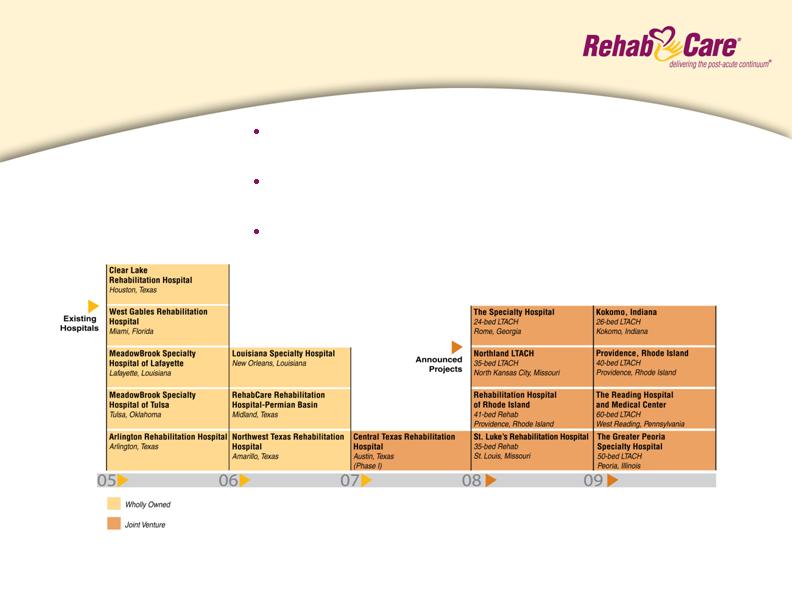
Hospital Division
Development Timeline
Division established in 2005 with the acquisition of
MeadowBrook Healthcare
9 existing hospitals, 6 in development, 2 awaiting State
Attorney General approval
Anticipated 4-6 new projects/year
14

Hospital Division
Legislative/Regulatory Environment
LTACH 25% Rule
The Extension Act:
Eliminates application of the 25% Rule for freestanding LTACHs and
grandfathered LTACHs for next three years
Eliminates the recent payment reductions for very short stay outlier cases for
a three-year period
Imposes a three-year moratorium on new LTACHs and new LTACH beds
with some exceptions – we believe all of our announced LTACH JVs will not
be subject to this moratorium
Requires a study by HHS to establish facility and patient criteria.
IRF 75% Rule
Freestanding Hospitals are subject to the same 75% Rule provisions as
previously discussed. The division managed its rehab hospitals to an
average compliance level of 63.6% during the fourth quarter.
15

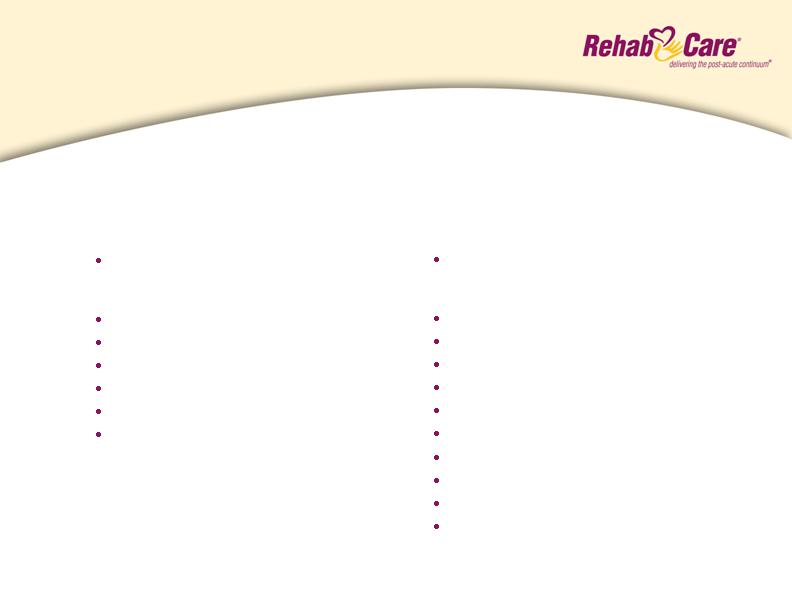
Continuous Improvement
Initiatives
Intermediate
Long-Term
Open 4-6 joint ventures
annually
Standardize care
management processes
across Hospitals and
ARUs
Implement IT roadmap for
improved clinical,
revenue cycle, and data
warehouse systems
Standardize and integrate
back office processes and
information systems
Implement centralized
support infrastructure
for Hospitals division
Build out continuum of
care delivery model
around key market
relationships
Implement electronic
medical record system
Continue to address
therapist supply issue
through innovative
programs like Allied
Health Research Institute
and partnerships with
the Universities of
Kansas and Missouri
2008 Initiatives
CT operating earnings
margins to 4.5% - 5.5%
HRS modest increase in
IRF units and resumption of
3-5% growth in same store
discharges
HRS product development
to better match long-term
client needs
Hospitals EBITDA margin to
13-15% target for group of
mature hospitals
Roll out PatientPlus
compensation program in
CT division
16
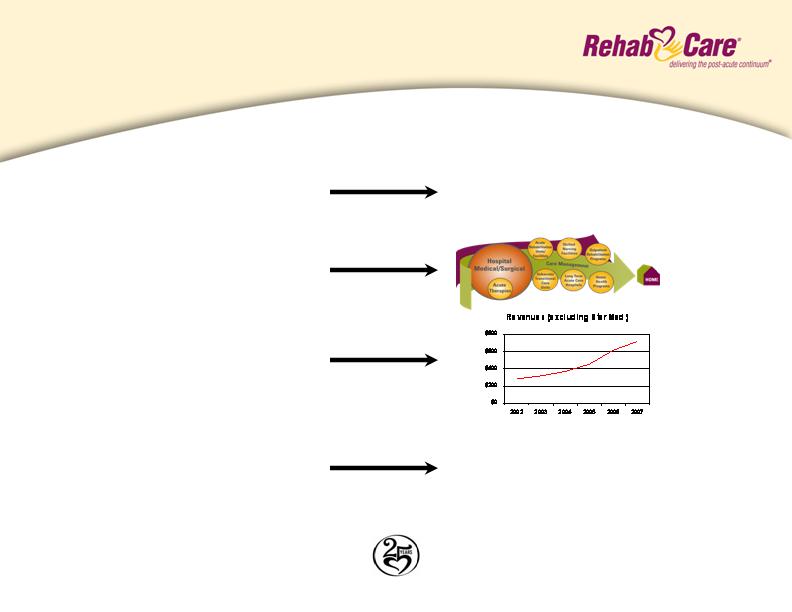
Investment Considerations
Why RehabCare?
Increasing market demand
Unique continuum of care model
Demonstrated ability to grow revenue
organically and through acquisitions
Proven ability to adapt to market
and regulatory changes
Expenditures for post-acute services:
Increase of 239% since 1998
Projected increase of 150% by 2016
Represents 12% of Medicare spending
75% rule, Part B therapy caps, LTACH
25% rule, physician fee schedule
(Annualized)
Celebrating 25 years as one of the longest tenured post-acute providers
of service in the industry
17

Safe Harbor
Forward-looking statements have been provided pursuant to the safe harbor provisions of the Private
Securities Litigation Reform Act of 1995. Such statements are based on the Company’s current
expectations and could be affected by numerous factors, risks and uncertainties discussed in the
Company’s filings with the Securities and Exchange Commission, including the Company’s most recent
annual report on Form 10-K, subsequent quarterly reports on Form 10-Q and current reports on Form
8-K. Do not rely on forward looking statements as the Company cannot predict or control many of the
factors that ultimately may affect the Company’s ability to achieve the results estimated. The Company
makes no promise to update any forward looking statements whether as a result of changes in
underlying factors, new information, future events or otherwise.
18