Washington, D.C. 20549
Capital World Bond Fund seeks to maximize long-term total return, consistent with prudent management, by investing primarily in a global portfolio of investment-grade bonds denominated in U.S. dollars and other currencies. The fund may also invest in lower quality, high-yield debt securities.
This fund is one of more than 40 offered by one of the nation’s largest mutual fund families, American Funds, from Capital Group. For more than 80 years, Capital has invested with a long-term focus based on thorough research and attention to risk.
Here are the average annual total returns on a $1,000 investment with all distributions reinvested for periods ended March 31, 2014:
For other share class results, visit americanfunds.com and americanfundsretirement.com.
The total annual fund operating expense ratio was 0.91% for Class A shares as of the prospectus dated December 1, 2013.
Investment results assume all distributions are reinvested and reflect applicable fees and expenses. When applicable, investment results reflect fee waivers, without which results would have been lower. Visit americanfunds.com for more information.
The return of principal for bond funds and for funds with significant underlying bond holdings is not guaranteed. Fund shares are subject to the same interest rate, inflation and credit risks associated with the underlying bond holdings. High-yield and lower rated bonds are subject to greater fluctuations in value and risk of loss of income and principal than investment-grade and higher rated bonds. Bond ratings, which typically range from Aaa/AAA (highest) to D (lowest), are assigned by credit rating agencies such as Moody’s, Standard & Poor’s and/or Fitch as an indication of an issuer’s creditworthiness. Investing in bonds issued outside the U.S. may be subject to additional risks. They include currency fluctuations, political and social instability, differing securities regulations and accounting standards, higher transaction costs, possible changes in taxation, illiquidity and price volatility. These risks may be heightened in connection with investments in developing countries. Refer to the fund prospectus and the Risk Factors section of this report for more information on these and other risks associated with investing in the fund.
The first half of Capital World Bond Fund’s fiscal year was a period in which many government bonds, corporate issues and other types of credit recorded gains. Against this supportive backdrop, the fund produced a total return of 3.04% for the six months ended March 31, 2014.
The fund’s result outpaced that of the unmanaged Barclays Global Aggregate Index, which generated a return of 1.95%. Fund investors received dividends totaling 35 cents a share; those who reinvested their dividends earned an income return of 1.73%, while investors who took their dividends in cash earned 1.72%. Relative to the market index, the fund’s six-month result was helped most by strong bond selection, including investments in certain peripheral European nations. Currency positioning was also helpful, with the portfolio’s lower relative exposure to the Japanese yen a notable positive.
Meanwhile, the Lipper Global Income Funds Index — a peer group measure — gained 2.86% over the six months. The fund’s longer term approach to investing has, we believe, helped sustain its 10-year advantage over its benchmark and peers (see table on page 1).
The domestic recovery continued, though there have been some ups and downs along the way. Severe cold weather at the end of 2013 appeared to temporarily disrupt the favorable trend in job growth. Meanwhile, the recovery in the U.S. housing market also lost some momentum recently due to a decline in affordability (as measured by a combination of home prices and mortgage rates).
The Federal Reserve announced in December 2013 that, starting January, it would reduce its $85 billion worth of monthly bond purchases by $10 billion each month —a change of tack that the market had been anticipating for quite some time.
Among U.S. Treasuries of short and intermediate maturity, yields (which move inversely to prices) generally moved higher over the six months through March 31, 2014. Still, bond market sentiment proved relatively resilient and demand for safe-haven assets increased at various junctures, boosted by disappointing economic data in the U.S. and in China, as well as escalating tensions between Ukraine and Russia.
U.S. investment-grade corporate bonds generated a 4.08% total return over the period as spreads narrowed by about 0.34 percentage points; high-yield (rated Ba/BB and below) corporates gained 6.67%.
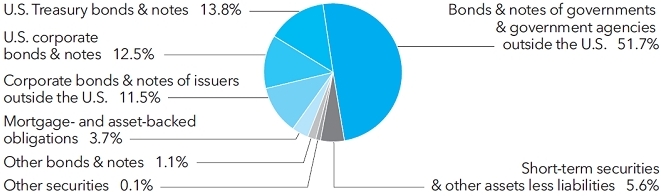
As of March 31, 2014, 12.5% of the portfolio was invested in corporate bonds from the U.S. (alongside 11.5% in corporates from elsewhere). Excluding cash, U.S.-dollar-denominated debt accounted for 43.6% of the fund’s portfolio, before currency hedging. This amount included 13.8% in U.S. Treasury bonds and notes. During the period, portfolio managers significantly reduced fund investments in mortgage-backed securities as valuations appeared unattractive given the Fed’s tapering and the possibility of higher interest rates.
The euro zone’s gradual recovery continued, with growth spreading to some peripheral nations. The most recent data indicated that the European economy grew at an annualized rate of 1.1% in the fourth quarter of 2013 — the third straight quarter of positive movement. However, unemployment remained near a record high of 12%.
Meanwhile, ongoing disinflation raised market expectations that the European Central Bank may consider quantitative easing — helping to keep yields broadly on a downward trend while driving peripheral spreads tighter. Spanish and Italian bonds posted among the highest returns in Europe as yields touched multi-year lows.
Investments in euro-zone bonds amounted to 24.1% of the fund’s portfolio (before currency hedging), at the end of the period. Government issues from Spain, Ireland, Germany, Portugal and Italy were among the larger holdings. The fund was also invested in a selection of other European countries. Over the period, portfolio managers increased the fund’s exposure to the euro, though — compared to the Barclays Global Aggregate Index — the fund’s exposure to the currency continued to be relatively low.
In absolute terms, the fund’s exposure to Japan (6.7%, before currency hedging) remains significant. That said, the fund’s smaller investment in Japanese government bonds compared to the market index helped its six-month result (as did its relatively low exposure to the yen). The yen weakened by about 5% versus the U.S. dollar, and Japanese bond returns were broadly negative for U.S. dollar-based investors.
Toward the end of the period, weaker-than-expected economic data added to concerns that April’s sales tax hike (to 8% from 5%) could derail Japan’s recovery. The Bank of Japan resisted calls for additional stimulus. Nevertheless, Prime Minister Shinzō Abe reiterated his government’s pledge to “take necessary measures” to reverse two decades of deflation.
Among developing-country bonds, six-month returns for U.S. dollar-denominated issues generally outpaced those of their local-currency counterparts. Many developing-country currencies appeared to stabilize against the U.S. dollar toward the end of the period; a few continued to come under pressure. In response, central banks in several countries — including Turkey and Russia — raised official interest rates.
At the end of the period, developing-country bonds amounted to 20.7% of the portfolio (before currency hedging), including 12.2% in local-currency bonds. Investments in Polish bonds were among the fund’s largest developing-country exposures. Mexican government bonds were also a significant holding; portfolio managers anticipate that domestic economic reforms and a potential strengthening of the U.S. recovery should be supportive of total returns.
In our view, the global economic environment is still improving. However, this overall trend is unfolding in a muted and unsynchronized manner. Favorable data in the U.S., Europe and some developed countries have been somewhat offset by disappointing figures from China and Japan. Meanwhile, certain other developing economies are contending with their own specific challenges, including significant current account or budget deficits and political upheaval.
In the near term, we remain cognizant of the possibility that key drivers of global growth could disappoint. Though employment gains and other positive economic signs are evident in the U.S., the tailwind to growth provided by housing appears to be weakening. And in Europe and Japan, economic growth is far from robust. We are also mindful that there could be bouts of volatility amid changing market expectations around monetary policy in the U.S. and elsewhere.
Given the possible fragility in the global outlook and varied country-specific risks, it seems timely to note that this fund’s portfolio avoids heavy concentrations. We believe that it makes a lot of sense to invest in bonds through a globally diversified, actively managed fund with many distinct potential sources of total return.
Thank you for your continued support. We look forward to reporting to you again in six months.
Mark H. Dalzell
President
This summary investment portfolio is designed to streamline the report and help investors better focus on the fund’s principal holdings. See the inside back cover for details on how to obtain a complete schedule of portfolio holdings.
As permitted by U.S. Securities and Exchange Commission regulations, “Miscellaneous” securities include holdings in their first year of acquisition that have not previously been publicly disclosed.
“Other securities” includes all issues that are not disclosed separately in the summary investment portfolio. Some of these securities (with an aggregate value of $1,257,294,000, which represented 9.86% of the net assets of the fund) were acquired in transactions exempt from registration under Rule 144A or section 4(2) of the Securities Act of 1933 and may be resold in the U.S. in transactions exempt from registration, normally to qualified institutional buyers. One of these securities (with a value of $1,455,000, a cost of $1,687,000, and which represented .01% of the net assets of the fund) was acquired from 3/10/2010 to 1/21/2011 through private placement transactions exempt from registration under the Securities Act of 1933, which may subject it to legal or contractual restrictions on resale. “Other securities” also includes loan participations and assignments, which may be subject to legal or contractual restrictions on resale. The total value of all such loans was $80,659,000, which represented .63% of the net assets of the fund. “Miscellaneous” and “Other securities” include securities which were valued under fair value procedures adopted by authority of the board of trustees. The total value of securities which were valued under fair value procedures was $3,348,000, which represented .03% of the net assets of the fund.
The fund has entered into forward currency contracts to purchase or sell currencies as shown in the following table. The average notional amount of open forward currency contracts was $1,654,610,000 over the prior 12-month period.
The following footnotes apply to either the individual securities noted or one or more of the securities aggregated and listed as a single line item.
* Additional information related to class-specific fees and expenses is included in the Notes to Financial Statements.
*Unaudited.
Capital World Bond Fund (the “fund”) is registered under the Investment Company Act of 1940 as an open-end, nondiversified management investment company. The fund seeks to maximize long-term total return, consistent with prudent management, by investing primarily in a global portfolio of investment-grade bonds denominated in U.S. dollars and other currencies. The fund may also invest in lower quality high-yield debt securities.
The fund has 16 share classes consisting of five retail share classes (Classes A, B and C, as well as two F share classes, F-1 and F-2), five 529 college savings plan share classes (Classes 529-A, 529-B, 529-C, 529-E and 529-F-1) and six retirement plan share classes (Classes R-1, R-2, R-3, R-4, R-5 and R-6). The 529 college savings plan share classes can be used to save for college education. The retirement plan share classes are generally offered only through eligible employer-sponsored retirement plans. The fund’s share classes are described further in the following table:
* Class B and 529-B shares of the fund are not available for purchase.
Holders of all share classes have equal pro rata rights to assets, dividends and liquidation proceeds. Each share class has identical voting rights, except for the exclusive right to vote on matters affecting only its class. Share classes have different fees and expenses (“class-specific fees and expenses”), primarily due to different arrangements for distribution, administrative and shareholder services. Differences in class-specific fees and expenses will result in differences in net investment income and, therefore, the payment of different per-share dividends by each share class.
The financial statements have been prepared to comply with accounting principles generally accepted in the United States of America. These principles require management to make estimates and assumptions that affect reported amounts and disclosures. Actual results could differ from those estimates. The fund follows the significant accounting policies described in this section, as well as the valuation policies described in the next section on valuation.
Capital Research and Management Company (“CRMC”), the fund’s investment adviser, values the fund’s investments at fair value as defined by accounting principles generally accepted in the United States of America. The net asset value of each share class of the fund is generally determined as of approximately 4:00 p.m. New York time each day the New York Stock Exchange is open.
Equity securities are generally valued at the official closing price of, or the last reported sale price on, the exchange or market on which such securities are traded, as of the close of business on the day the securities are being valued or, lacking any sales, at the last available bid price. Prices for each security are taken from the principal exchange or market on which the security trades.
Fixed-income securities, including short-term securities purchased with more than 60 days left to maturity, are generally valued at prices obtained from one or more pricing vendors. Vendors value such securities based on one or more of the inputs described in the following table. The table provides examples of inputs that are commonly relevant for valuing particular classes of fixed-income securities in which the fund is authorized to invest. However, these classifications are not exclusive, and any of the inputs may be used to value any other class of fixed-income security.
When the fund’s investment adviser deems it appropriate to do so (such as when vendor prices are unavailable or not deemed to be representative), fixed-income securities will be valued in good faith at the mean quoted bid and ask prices that are reasonably and timely available (or bid prices, if ask prices are not available) or at prices for securities of comparable maturity, quality and type.
Securities with both fixed-income and equity characteristics, or equity securities traded principally among fixed-income dealers, are generally valued in the manner described for either equity or fixed-income securities, depending on which method is deemed most appropriate by the fund’s investment adviser. Short-term securities purchased within 60 days to maturity are valued at amortized cost, which approximates fair value. The value of short-term securities originally purchased with maturities greater than 60 days is determined based on an amortized value to par when they reach 60 days. Forward currency contracts are valued at the mean of representative quoted bid and ask prices, generally based on prices supplied by one or more pricing vendors.
Securities and other assets for which representative market quotations are not readily available or are considered unreliable by the fund’s investment adviser are fair valued as determined in good faith under fair valuation guidelines adopted by authority of the fund’s board of trustees as further described. The investment adviser follows fair valuation guidelines, consistent with U.S. Securities and Exchange Commission rules and guidance, to consider relevant principles and factors when making fair value determinations. The investment adviser considers relevant indications of value that are reasonably and timely available to it in determining the fair value to be assigned to a particular security, such as the type and cost of the security; contractual or legal restrictions on resale of the security; relevant financial or business developments of the issuer; actively traded similar or related securities; conversion or exchange rights on the security; related corporate actions; significant events occurring after the close of trading in the security; and changes in overall market conditions. Fair valuations and valuations of investments that are not actively trading involve judgment and may differ materially from valuations that would have been used had greater market activity occurred.
the fair valuation guidelines to the board of trustees with supplemental information to support the changes. The fund’s board and audit committee also regularly review reports that describe fair value determinations and methods.
The fund’s investment adviser has also established a Fixed-Income Pricing Review Group to administer and oversee the fixed-income valuation process, including the use of fixed-income pricing vendors. This group regularly reviews pricing vendor information and market data. Pricing decisions, processes and controls over security valuation are also subject to additional internal reviews, including an annual control self-evaluation program facilitated by the investment adviser’s compliance group.
* Forward currency contracts are not included in the investment portfolio.
Investing in the fund may involve certain risks including, but not limited to, those described below.
Bonds and other debt securities are subject to credit risk, which is the possibility that the credit strength of an issuer will weaken and/or an issuer of a debt security will fail to make timely payments of principal or interest and the security will go into default. Credit risk is gauged, in part, by the credit ratings of the securities in which the fund invests. However, ratings are only the opinions of the rating agencies issuing them and are not guarantees as to credit quality or an evaluation of market risk. The fund’s investment adviser relies on its own credit analysts to research issuers and issues in seeking to mitigate various credit and default risks.
On a daily basis, the fund’s investment adviser values forward currency contracts and records unrealized appreciation or depreciation for open forward currency contracts in the fund’s statement of assets and liabilities. Realized gains or losses are recorded at the time the forward currency contract is closed or offset by another contract with the same broker for the same settlement date and currency.
Closed forward currency contracts that have not reached their settlement date are included in the respective receivables or payables for closed forward currency contracts in the fund’s statement of assets and liabilities. Net realized gains or losses from closed forward currency contracts and net unrealized appreciation or depreciation from open forward currency contracts are recorded in the fund’s statement of operations.
The following tables present the financial statement impacts resulting from the fund’s use of forward currency contracts as of March 31, 2014 (dollars in thousands):
The following table presents the fund’s forward currency contracts by counterparty, including those that are subject to potential offset on the statement of assets and liabilities as of March 31, 2014 (dollars in thousands):
As of and during the period ended March 31, 2014, the fund did not have a liability for any unrecognized tax benefits. The fund recognizes interest and penalties, if any, related to unrecognized tax benefits as income tax expense in the statement of operations. During the period, the fund did not incur any interest or penalties.
The fund is not subject to examination by U.S. federal tax authorities for tax years before 2009 and by state tax authorities and tax authorities outside the U.S. for tax years before 2008.
The components of distributable earnings on a tax basis are reported as of the fund’s most recent year-end. As of September 30, 2013, the fund had tax basis undistributed ordinary income of $104,002,000 and capital loss deferral of $30,434,000.
As of March 31, 2014, the tax basis unrealized appreciation (depreciation) and cost of investment securities were as follows (dollars in thousands):
The tax character of distributions paid to shareholders was as follows (dollars in thousands):
CRMC, the fund’s investment adviser, is the parent company of American Funds Distributors,® Inc. (“AFD”), the principal underwriter of the fund’s shares, and American Funds Service Company® (“AFS”), the fund’s transfer agent. CRMC, AFD and AFS are considered related parties to the fund.
For Class A and 529-A shares, distribution-related expenses include the reimbursement of dealer and wholesaler commissions paid by AFD for certain shares sold without a sales charge. These share classes reimburse AFD for amounts billed within the prior 15 months but only to the extent that the overall annual expense limit of 0.30% is not exceeded. As of March 31, 2014, there were no unreimbursed expenses subject to reimbursement for Class A or 529-A shares.
limited to, coordinating, monitoring, assisting and overseeing third parties that provide services to fund shareholders. Under the agreement, Class A shares pay an annual fee of 0.01% and Class C, F, 529 and R shares pay an annual fee of 0.05% of their respective average daily net assets.
For the six months ended March 31, 2014, class-specific expenses under the agreements were as follows (dollars in thousands):
Capital share transactions in the fund were as follows (dollars and shares in thousands):
The fund made purchases and sales of investment securities, excluding short-term securities and U.S. government obligations, if any, of $8,875,543,000 and $9,664,908,000, respectively, during the six months ended March 31, 2014.
See page 37 for footnotes.
See page 37 for footnotes.
As a fund shareholder, you incur two types of costs: (1) transaction costs, such as initial sales charges on purchase payments and contingent deferred sales charges on redemptions (loads), and (2) ongoing costs, including management fees, distribution and service (12b-1) fees, and other expenses. This example is intended to help you understand your ongoing costs (in dollars) of investing in the fund so you can compare these costs with the ongoing costs of investing in other mutual funds. The example is based on an investment of $1,000 invested at the beginning of the period and held for the entire six-month period (October 1, 2013, through March 31, 2014).
The first line of each share class in the table on the following page provides information about actual account values and actual expenses. You may use the information in this line, together with the amount you invested, to estimate the expenses that you paid over the period. Simply divide your account value by $1,000 (for example, an $8,600 account value divided by $1,000 = 8.6), then multiply the result by the number in the first line under the heading entitled “Expenses paid during period” to estimate the expenses you paid on your account during this period.
The second line of each share class in the table on the following page provides information about hypothetical account values and hypothetical expenses based on the actual expense ratio for the share class and an assumed rate of return of 5.00% per year before expenses, which is not the actual return of the share class. The hypothetical account values and expenses may not be used to estimate the actual ending account balance or expenses you paid for the period. You may use this information to compare the ongoing costs of investing in the fund and other funds. To do so, compare this 5.00% hypothetical example with the 5.00% hypothetical examples that appear in the shareholder reports of the other funds.
There are some account fees that are charged to certain types of accounts, such as individual retirement accounts and 529 college savings plan accounts (generally, a $10 fee is charged to set up the account and an additional $10 fee is charged to the account annually), that would increase the amount of expenses paid on your account. In addition, retirement plan participants may be subject to certain fees charged by the plan sponsor, and Class F-1, F-2 and 529-F-1 shareholders may be subject to fees charged by financial intermediaries, typically ranging from 0.75% to 1.50% of assets annually depending on services offered. You can estimate the impact of these fees by adding the amount of the fees to the total estimated expenses you paid on your account during the period as calculated above. In addition, your ending account value would be lower by the amount of these fees.
Note that the expenses shown in the table on the following page are meant to highlight your ongoing costs only and do not reflect any transactional costs, such as sales charges (loads). Therefore, the second line of each share class in the table is useful in comparing ongoing costs only and will not help you determine the relative total costs of owning different funds. In addition, if these transactional costs were included, your costs would have been higher.
Capital World Bond Fund’s board has approved the fund’s Investment Advisory and Service Agreement (the “agreement”) with Capital Research and Management Company (“CRMC”) for an additional one-year term through March 31, 2015. The board approved the agreement following the recommendation of the fund’s Contracts Committee (the “committee”), which is composed of all of the fund’s independent board members. The board and the committee determined that the fund’s advisory fee structure was fair and reasonable in relation to the services provided and that approving the agreement was in the best interests of the fund and its shareholders.
In reaching this decision, the board and the committee took into account information furnished to them throughout the year and otherwise provided to them, as well as information prepared specifically in connection with their review of the agreement, and were advised by their independent counsel. They considered the following factors, among others, but did not identify any single issue or particular piece of information that, in isolation, was the controlling factor, and each board and committee member did not necessarily attribute the same weight to each factor.
The board and the committee considered the depth and quality of CRMC’s investment management process, including its global research capabilities; the experience, capability and integrity of its senior management and other personnel; the low turnover rates of its key personnel; the overall financial strength and stability of its organization; and the ongoing evolution of CRMC’s organizational structure designed to maintain and strengthen these qualities. The board and the committee also considered the nature, extent and quality of administrative, compliance and shareholder services provided by CRMC to the fund under the agreement and other agreements, as well as the benefits to fund shareholders from investing in a fund that is part of a large family of funds. The board and the committee concluded that the nature, extent and quality of the services provided by CRMC have benefited and should continue to benefit the fund and its shareholders.
The board and the committee considered the investment results of the fund in light of its objective of providing over the long term a high level of total return consistent with prudent investment management. They compared the fund’s investment results with those of other relevant funds (including funds that form the basis of the Lipper index for the category in which the fund is included), and data such as relevant market and fund indexes, over various periods through September 30, 2013. This report, including the letter to shareholders and related disclosures, contains certain information about the fund’s investment results. The board and the committee reviewed the fund’s investment results measured against the Lipper Global Income Funds Average and the Barclays Global Aggregate Index. They noted that the investment
results of the fund were above the results of the Lipper average for the 10-year and lifetime periods (although below the results of the Lipper average for the nine-month, one-, three- and five-year periods), above the results of the Barclays index for the five-year and 10-year periods, and in line with or below the results of the Barclays index for the nine-month, one-, and three-year periods. They also noted that the Lipper category included funds with a broad range of mandates, certain of which were not very similar to the fund. The board and the committee concluded that the fund’s investment results have been satisfactory and that CRMC’s record in managing the fund indicated that its continued management should benefit the fund and its shareholders.
The board and the committee compared the advisory fees and total expense levels of the fund to those of other relevant funds. They observed that the fund’s advisory fees were below the median of the other funds in the Lipper Global Income Funds category, and although its total expenses were higher than the median of such funds, such expenses less distribution expenses were below the median. The board and the committee also considered the breakpoint discounts in the fund’s advisory fee structure that reduce the level of fees charged by CRMC to the fund as fund assets increase. In addition, they reviewed information regarding the effective advisory fees charged to non-mutual fund clients by CRMC and its affiliates. They noted that, to the extent there were differences between the advisory fees paid by the fund and the advisory fees paid by those clients, the differences appropriately reflected the investment, operational and regulatory differences between advising the fund and the other clients. The board and the committee concluded that the fund’s cost structure was fair and reasonable in relation to the services provided, and that the fund’s shareholders receive reasonable value in return for the advisory fees and other amounts paid to CRMC by the fund.
The board and the committee considered a variety of other benefits that CRMC and its affiliates receive as a result of CRMC’s relationship with the fund and the other American Funds, including fees for administrative services provided to certain share classes; fees paid to CRMC’s affiliated transfer agent; sales charges and distribution fees received and retained by the fund’s principal underwriter, an affiliate of CRMC; and possible ancillary benefits to CRMC and its institutional management affiliates in managing other investment vehicles. The board and the committee reviewed CRMC’s portfolio trading practices, noting that while CRMC receives the benefit of research provided by broker-dealers executing portfolio transactions on behalf of the fund, it does not obtain third-party research or other services in return for allocating brokerage to such broker-dealers. The board and the committee took these ancillary benefits into account in evaluating the reasonableness of the advisory fees and other amounts paid to CRMC by the fund.
The board and the committee reviewed information regarding CRMC’s costs of providing services to the American Funds, including personnel, systems and resources of investment, compliance, trading, accounting and other administrative operations. They considered CRMC’s costs and willingness to invest in technology, infrastructure and staff to maintain and expand services and capabilities, respond to industry and regulatory developments, and attract and retain qualified personnel. They noted information regarding the compensation structure for CRMC’s investment professionals. The board and the committee also compared CRMC’s profitability and compensation data to the reported results and data of several large, publicly-held investment management companies. The board and the committee noted the competitiveness and cyclicality of both the mutual fund industry and the capital markets, and the importance in that environment of CRMC’s long-term profitability for maintaining its independence, company culture and management continuity. They further considered the breakpoint discounts in the fund’s advisory fee structure. The board and the committee concluded that the fund’s advisory fee structure reflected a reasonable sharing of benefits between CRMC and the fund’s shareholders.
This page was intentionally left blank.
“American Funds Proxy Voting Procedures and Principles” — which describes how we vote proxies relating to portfolio securities — is available on the American Funds website or upon request by calling AFS. The fund files its proxy voting record with the U.S. Securities and Exchange Commission (SEC) for the 12 months ended June 30 by August 31. The proxy voting record is available free of charge on the SEC website at sec.gov and on the American Funds website.
A complete March 31, 2014, portfolio of Capital World Bond Fund’s investments is available free of charge by calling AFS or visiting the SEC website (where it is part of Form N-CSR).
Capital World Bond Fund files a complete list of its portfolio holdings with the SEC for the first and third quarters of each fiscal year on Form N-Q. This filing is available free of charge on the SEC website. You may also review or, for a fee, copy this filing at the SEC’s Public Reference Room in Washington, D.C. Additional information regarding the operation of the Public Reference Room may be obtained by calling the SEC’s Office of Investor Education and Advocacy at (800) SEC-0330. Additionally, the list of portfolio holdings is available by calling AFS.
This report is for the information of shareholders of Capital World Bond Fund, but it also may be used as sales literature when preceded or accompanied by the current prospectus or summary prospectus, which gives details about charges, expenses, investment objectives and operating policies of the fund. If used as sales material after June 30, 2014, this report must be accompanied by an American Funds statistical update for the most recently completed calendar quarter.
Since 1931, American Funds, part of Capital Group, has helped investors pursue long-term investment success. Our consistent approach — in combination with The Capital SystemSM — has resulted in a superior long-term track record.
Not applicable for filing of semi-annual reports to shareholders.
Not applicable for filing of semi-annual reports to shareholders.
Not applicable for filing of semi-annual reports to shareholders.
Not applicable to this Registrant, insofar as the Registrant is not a listed issuer as defined in Rule 10A-3 under the Securities Exchange Act of 1934.
| Bonds, notes & other debt instruments 94.38% | | |
| | Principal amount | Value |
| Euros 24.12% | (000) | (000) |
| | | |
| Spanish Government 5.50% 2017 | € 3,075 | US$ 4,818 |
| Spanish Government 3.75% 2018 | 3,390 | 5,089 |
| Spanish Government 4.50% 2018 | 235,480 | 360,793 |
| Spanish Government 5.85% 2022 | 83,675 | 139,807 |
| Spanish Government 5.40% 2023 | 296,080 | 481,736 |
| Spanish Government 3.80% 2024 | 46,430 | 67,041 |
| Spanish Government 5.15% 2044 | 24,350 | 38,638 |
| Irish Government 4.50% 2020 | 115,680 | 181,598 |
| Irish Government 3.40% 2024 | 141,705 | 201,668 |
| Irish Government 5.40% 2025 | 14,250 | 23,576 |
| German Government, Series 159, 2.00% 2016 | 42,755 | 60,985 |
| German Government, Series 164, 0.50% 2017 | 9,975 | 13,835 |
| German Government, Series 7, 4.00% 2018 | 56,085 | 87,865 |
| German Government 3.00% 2020 | 33,890 | 52,790 |
| German Government 1.50% 2023 | 5,450 | 7,578 |
| German Government 6.25% 2024 | 346 | 683 |
| German Government, Series 00, 5.50% 2031 | 5,150 | 10,331 |
| German Government 4.00% 2037 | 21,555 | 38,023 |
| German Government 3.25% 2042 | 4,753 | 7,669 |
| Portuguese Government 4.75% 2019 | 62,920 | 94,221 |
| Portuguese Government 3.85% 2021 | 19,350 | 27,391 |
| Portuguese Government 5.65% 2024 | 32,525 | 50,620 |
| Portuguese Government 4.10% 2037 | 39,825 | 51,097 |
| Italian Government 3.50% 2018 | 22,150 | 32,744 |
| Italian Government 4.50% 2019 | 9,540 | 14,773 |
| Italian Government 4.25% 2020 | 8,810 | 13,479 |
| Italian Government 5.00% 2022 | 41,595 | 65,899 |
| Italian Government 5.50% 2022 | 5,775 | 9,420 |
| Italian Government 4.50% 2024 | 42,600 | 64,757 |
| Italian Government 4.75% 2044 | 2,800 | 4,173 |
| Belgium (Kingdom of), Series 69, 1.25% 2018 | 16,900 | 23,723 |
| Belgium (Kingdom of), Series 67, 3.00% 2019 | 15,450 | 23,445 |
| Belgium (Kingdom of), Series 68, 2.25% 2023 | 14,320 | 20,140 |
| Belgium (Kingdom of), Series 72, 2.60% 2024 | 37,940 | 54,103 |
| Belgium (Kingdom of), Series 71, 3.75% 2045 | 6,860 | 10,538 |
| Greek Government 2.00%/3.00% 20231 | 4,320 | 4,695 |
| Greek Government 2.00%/3.00% 20241 | 4,320 | 4,569 |
| Greek Government 2.00%/3.00% 20251 | 4,320 | 4,490 |
| Greek Government 2.00%/3.00% 20261 | 4,320 | 4,406 |
| Greek Government 2.00%/3.00% 20271 | 4,315 | 4,328 |
| Greek Government 2.00%/3.00% 20281 | 4,325 | 4,259 |
| Greek Government 2.00%/3.00% 20291 | 4,320 | 4,198 |
| Greek Government 2.00%/3.00% 20301 | 4,320 | 4,148 |
| Greek Government 2.00%/3.00% 20311 | 4,320 | 4,102 |
| Bonds, notes & other debt instruments | | |
| | Principal amount | Value |
| Euros (continued) | (000) | (000) |
| | | |
| Greek Government 2.00%/3.00% 20321 | € 4,320 | US$ 4,063 |
| Greek Government 2.00%/3.00% 20331 | 4,320 | 4,021 |
| Greek Government 2.00%/3.00% 20341 | 4,320 | 3,991 |
| Greek Government 2.00%/3.00% 20351 | 4,320 | 3,969 |
| Greek Government 2.00%/3.00% 20361 | 6,070 | 5,564 |
| Greek Government 2.00%/3.00% 20371 | 6,420 | 5,874 |
| Greek Government 2.00%/3.00% 20381 | 5,220 | 4,768 |
| Greek Government 2.00%/3.00% 20391 | 4,320 | 3,933 |
| Greek Government 2.00%/3.00% 20401 | 6,970 | 6,342 |
| Greek Government 2.00%/3.00% 20411 | 9,370 | 8,508 |
| Greek Government 2.00%/3.00% 20421 | 5,220 | 4,755 |
| Hungarian Government 5.75% 2018 | 24,190 | 37,076 |
| Hungarian Government 6.00% 2019 | 23,625 | 36,765 |
| Hungarian Government 3.875% 2020 | 4,000 | 5,649 |
| Netherlands Government Eurobond 3.25% 2015 | 9,650 | 13,820 |
| Netherlands Government Eurobond 1.25% 2019 | 43,300 | 60,876 |
| Barclays Bank PLC 4.00% 20192 | 8,950 | 14,227 |
| Barclays Bank PLC 6.00% 2021 | 18,725 | 30,112 |
| Barclays Bank Plc 6.625% 2022 | 7,250 | 12,164 |
| HBOS PLC 4.375% 20193 | 885 | 1,230 |
| Lloyds TSB Bank PLC 6.50% 2020 | 26,550 | 43,946 |
| Slovenia (Republic of) 4.375% 2019 | 5,140 | 7,790 |
| Slovenia (Republic of) 4.125% 2020 | 7,780 | 11,581 |
| Slovenia (Republic of) 4.625% 2024 | 5,485 | 8,213 |
| Merrill Lynch & Co., Inc. 4.625% 2018 | 17,536 | 26,774 |
| HSBC Holdings PLC 6.00% 2019 | 13,950 | 22,732 |
| HSBC Bank PLC 4.00% 2021 | 1,000 | 1,584 |
| Imperial Tobacco Finance PLC 8.375% 2016 | 2,775 | 4,348 |
| Imperial Tobacco Finance PLC 5.00% 2019 | 12,425 | 19,906 |
| Aviva PLC, junior subordinated 5.70% (undated)3 | 13,020 | 18,663 |
| Latvia (Republic of) 2.625% 2021 | 12,360 | 17,397 |
| France Télécom 5.625% 2018 | 1,500 | 2,423 |
| France Télécom 3.125% 2024 | 9,500 | 13,650 |
| GE Capital European Funding 5.375% 2020 | 9,100 | 15,071 |
| Deutsche Genossenschaftsbank-Hypothekenbank AG, Series 1043, 4.00% 20162 | 9,750 | 14,664 |
| French Government O.A.T. Eurobond 3.25% 2045 | 9,990 | 14,166 |
| European Investment Bank 4.75% 2017 | 8,490 | 13,431 |
| CaixaBank, SA 5.00% 20233 | 8,500 | 12,380 |
| National Grid Transco PLC 5.00% 2018 | 3,275 | 5,204 |
| National Grid Transco PLC 4.375% 2020 | 4,000 | 6,339 |
| Schering-Plough Corp. 5.375% 2014 | 8,105 | 11,441 |
| Canadian Government 3.50% 2020 | 7,000 | 11,076 |
| BPCE SA group 4.625% 2023 | 6,000 | 9,032 |
| BPCE SA group 6.117% 20493 | 700 | 1,054 |
| Standard Chartered Bank 5.875% 2017 | 6,000 | 9,372 |
| Mondelez International, Inc. 2.375% 2021 | 6,300 | 8,764 |
| Assicurazioni Generali SPA 7.75% 20423 | 2,100 | 3,465 |
| Assicurazioni Generali SPA 10.125% 2042 | 2,700 | 4,994 |
| AT&T Inc. 6.125% 2015 | 4,500 | 6,548 |
| Daimler AG, Series 6, 4.125% 2017 | 3,725 | 5,599 |
| Volvo Treasury AB 5.00% 2017 | 3,500 | 5,389 |
| RCI Banque 2.875% 2018 | 3,700 | 5,350 |
| Cyprus (Republic of) 4.625% 2020 | 3,990 | 5,222 |
| Bonds, notes & other debt instruments | | |
| | Principal amount | Value |
| Euros (continued) | (000) | (000) |
| | | |
| Skandinaviska Enskilda 5.50% 2014 | €2,000 | US$ 2,769 |
| Skandinaviska Enskilda 4.25% 2018 | 1,500 | 2,304 |
| Shell International Finance BV 4.50% 2016 | 3,000 | 4,441 |
| Rabobank Nederland 3.875% 2023 | 2,925 | 4,263 |
| Gas Natural SGD, SA 4.125% 2018 | 2,750 | 4,174 |
| BBVA Senior Financial SA 3.75% 2018 | 2,800 | 4,170 |
| Svenska Handelsbanken AB 2.625% 2022 | 2,900 | 4,169 |
| DNB ASA 3.00% 2023 | 2,900 | 4,150 |
| Schaeffler Holding Finance BV 6.875% 20183,4 | 2,800 | 4,115 |
| BMW Group 3.875% 2017 | 2,000 | 2,987 |
| Red Eléctrica Financiaciones, SAU 4.75% 2018 | 1,800 | 2,803 |
| Telecom Italia SpA 7.75% 2033 | 1,500 | 2,508 |
| Anheuser-Busch InBev NV 8.625% 2017 | 1,375 | 2,321 |
| BNP Paribas 2.875% 2022 | 1,450 | 2,089 |
| Nordea Bank AB 4.625% 20223 | 1,375 | 2,047 |
| Novartis Finance SA, 4.25% 2016 | 1,250 | 1,861 |
| U.S. Coatings Acquisition Inc. (Flash Dutch 2 BV) 5.75% 2021 | 1,250 | 1,847 |
| CRH Finance BV 7.375% 20143 | 1,075 | 1,497 |
| Wind Acquisition SA 7.375% 2018 | 925 | 1,351 |
| | | 3,075,382 |
| Japanese yen 6.65% | | |
| | | |
| Japanese Government, Series 317, 0.10% 2014 | ¥ 8,426,200 | 81,650 |
| Japanese Government, Series 331, 0.10% 2015 | 2,075,000 | 20,113 |
| Japanese Government, Series 269, 1.30% 2015 | 15,039,000 | 147,462 |
| Japanese Government, Series 284, 1.70% 2016 | 7,700,000 | 77,832 |
| Japanese Government, Series 281, 2.00% 2016 | 1,415,000 | 14,288 |
| Japanese Government, Series 14, 1.20% 20175 | 1,272,000 | 14,211 |
| Japanese Government, Series 289, 1.50% 2017 | 2,993,000 | 30,459 |
| Japanese Government, Series 109, 0.10% 2018 | 2,795,000 | 27,026 |
| Japanese Government, Series 113, 0.30% 2018 | 5,000 | 49 |
| Japanese Government, Series 312, 1.20% 2020 | 4,862,650 | 49,820 |
| Japanese Government, Series 315, 1.20% 2021 | 11,129,800 | 114,079 |
| Japanese Government, Series 321, 1.00% 2022 | 990,000 | 9,990 |
| Japanese Government, Series 17, 0.10% 20235 | 2,791,120 | 29,134 |
| Japanese Government, Series 329, 0.80% 2023 | 1,750,000 | 17,294 |
| Japanese Government, Series 116, 2.20% 2030 | 1,985,000 | 22,206 |
| Japanese Government, Series 136, 1.60% 2032 | 6,778,250 | 68,494 |
| Japanese Government, Series 21, 2.30% 2035 | 8,435,000 | 92,339 |
| Japanese Government, Series 29, 2.40% 2038 | 927,600 | 10,340 |
| Japanese Government, Series 36, 2.00% 2042 | 1,395,000 | 14,453 |
| European Investment Bank 1.40% 2017 | 721,700 | 7,296 |
| | | 848,535 |
| Mexican pesos 3.80% | | |
| | | |
| United Mexican States Government, Series M10, 8.00% 2015 | MXN 331,000 | 27,045 |
| United Mexican States Government, Series M, 6.25% 2016 | 307,500 | 24,706 |
| United Mexican States Government, Series M, 5.00% 2017 | 640,000 | 50,039 |
| United Mexican States Government, Series M10, 7.75% 2017 | 876,000 | 74,102 |
| United Mexican States Government 3.50% 20175 | 272,263 | 22,295 |
| United Mexican States Government, Series M, 8.00% 2020 | 447,500 | 38,790 |
| United Mexican States Government, Series M, 6.50% 2021 | 1,162,500 | 93,310 |
| United Mexican States Government 2.00% 20225 | 460,634 | 34,120 |
| United Mexican States Government, Series M20, 10.00% 2024 | 252,500 | 25,078 |
| Bonds, notes & other debt instruments | | |
| | Principal amount | Value |
| Mexican pesos (continued) | (000) | (000) |
| | | |
| United Mexican States Government, Series M30, 10.00% 2036 | MXN561,400 | US$ 57,115 |
| United Mexican States Government 4.00% 20405 | 261,455 | 20,981 |
| United Mexican States Government, Series M, 7.75% 2042 | 166,000 | 13,638 |
| Red de Carreteras de Occidente 9.00% 20282 | 36,950 | 2,503 |
| América Móvil, SAB de CV 8.46% 2036 | 15,000 | 1,095 |
| | | 484,817 |
| Polish zloty 3.58% | | |
| | | |
| Polish Government, Series 1017, 5.25% 2017 | PLN532,915 | 187,447 |
| Polish Government, Series 0718, 2.50% 2018 | 106,000 | 33,662 |
| Polish Government, Series 1020, 5.25% 2020 | 217,150 | 77,357 |
| Polish Government, Series 1021, 5.75% 2021 | 175,895 | 64,511 |
| Polish Government, Series 0922, 5.75% 2022 | 228,285 | 83,961 |
| Polish Government, Series 102, 4.00% 2023 | 30,930 | 10,053 |
| | | 456,991 |
| British pounds 3.16% | | |
| | | |
| United Kingdom 2.75% 2015 | £15,605 | 26,504 |
| United Kingdom 3.75% 2020 | 45,000 | 82,064 |
| United Kingdom 3.75% 2021 | 31,400 | 57,219 |
| United Kingdom 1.75% 2022 | 7,300 | 11,399 |
| United Kingdom 2.25% 2023 | 15,350 | 24,549 |
| United Kingdom 4.75% 2030 | 5,435 | 10,825 |
| United Kingdom 4.50% 2034 | 4,170 | 8,094 |
| United Kingdom 4.25% 2040 | 11,945 | 22,576 |
| United Kingdom 3.25% 2044 | 4,185 | 6,635 |
| RSA Insurance Group PLC 9.375% 20393 | 6,583 | 13,401 |
| RSA Insurance Group PLC 8.50% (undated)3 | 26,434 | 45,998 |
| Telecom Italia SpA and Telecom Italia Finance SA, Series 9, 5.625% 2015 | 15,100 | 26,602 |
| Telecom Italia SpA 6.375% 2019 | 3,000 | 5,398 |
| France Télécom 5.00% 2016 | 10,225 | 18,166 |
| France Télécom 7.25% 2020 | 4,425 | 9,013 |
| Deutsche Telekom International Finance BV 6.50% 2022 | 7,050 | 14,029 |
| Bank of Scotland PLC 9.375% 2021 | 980 | 2,097 |
| Lloyds TSB Bank PLC 10.75% 20213 | 1,025 | 2,048 |
| SLM Student Loan Trust, Series 2003-10, Class A-4, 5.15% 20392,6 | 2,400 | 3,845 |
| National Grid Transco PLC 4.00% 2027 | 2,250 | 3,674 |
| BNP Paribas 5.75% 2022 | 1,100 | 2,032 |
| Wal-Mart Stores, Inc. 5.625% 2034 | 1,000 | 2,008 |
| Tesco PLC 5.50% 2033 | 890 | 1,548 |
| Nestlé Finance International Ltd. 2.25% 2023 | 1,000 | 1,541 |
| General Electric Capital Corp. 5.625% 2031 | 750 | 1,451 |
| | | 402,716 |
| Swedish kronor 1.32% | | |
| | | |
| Swedish Government, Series 1041, 6.75% 2014 | SKr 11,040 | 1,715 |
| Swedish Government 3.50% 20155 | 38,727 | 6,391 |
| Swedish Government, Series 1050, 3.00% 2016 | 181,300 | 29,415 |
| Swedish Government, Series 1051, 3.75% 2017 | 198,570 | 33,402 |
| Swedish Government, Series 1047, 5.00% 2020 | 36,050 | 6,712 |
| Swedish Government, Series 105, 3.50% 2022 | 290,745 | 50,193 |
| Swedish Government, Series 3104, 3.50% 20285 | 158,496 | 33,486 |
| Nordea Hypotek AB 4.00% 20142 | 45,800 | 7,125 |
| | | 168,439 |
| Bonds, notes & other debt instruments | | |
| | Principal amount | Value |
| South Korean won 1.24% | (000) | (000) |
| | | |
| South Korean Government 5.50% 2017 | KRW76,543,470 | US$ 77,772 |
| South Korean Government, Series 2206, 3.75% 2022 | 54,961,550 | 52,814 |
| South Korean Government, Series 2303, 3.00% 2023 | 29,548,210 | 26,783 |
| | | 157,369 |
| Colombian pesos 1.22% | | |
| | | |
| Colombia (Republic of) Global 12.00% 2015 | COP 11,075,000 | 6,266 |
| Colombia (Republic of), Series B, 5.00% 2018 | 138,191,300 | 68,947 |
| Colombia (Republic of), Series B, 7.00% 2022 | 72,761,500 | 38,491 |
| Colombia (Republic of), Series B, 10.00% 2024 | 8,962,000 | 5,709 |
| Colombia (Republic of) Global 9.85% 2027 | 8,064,000 | 5,341 |
| Colombia (Republic of), Series B, 6.00% 2028 | 66,471,100 | 31,192 |
| | | 155,946 |
| Hungarian forints 0.76% | | |
| | | |
| Hungarian Government, Series 19/A, 6.50% 2019 | HUF8,035,750 | 38,783 |
| Hungarian Government, Series 20A, 7.50% 2020 | 9,587,250 | 48,863 |
| Hungarian Government, Series 22A, 7.00% 2022 | 1,300,000 | 6,466 |
| Hungarian Government, Series 23A, 6.00% 2023 | 365,510 | 1,713 |
| Hungarian Government, Series 25B, 5.50% 2025 | 279,490 | 1,243 |
| | | 97,068 |
| Russian rubles 0.70% | | |
| | | |
| Russian Federation 6.20% 2018 | RUB 841,350 | 22,677 |
| Russian Federation 7.50% 2018 | 2,237,850 | 62,188 |
| Russian Federation 7.60% 2022 | 180,000 | 4,792 |
| | | 89,657 |
| Brazilian reais 0.68% | | |
| | | |
| Brazil (Federal Republic of) 10.00% 2017 | BRL 19,000 | 7,926 |
| Brazil (Federal Republic of) 6.00% 20175 | 31,676 | 13,837 |
| Brazil (Federal Republic of) 6.00% 20185 | 133,924 | 57,975 |
| Brazil (Federal Republic of) 6.00% 20225 | 11,685 | 4,973 |
| Brazil (Federal Republic of) 10.00% 2023 | 6,000 | 2,281 |
| | | 86,992 |
| Norwegian kroner 0.65% | | |
| | | |
| Norwegian Government 4.25% 2017 | NKr193,500 | 34,801 |
| Norwegian Government 4.50% 2019 | 135,430 | 25,177 |
| Norwegian Government 3.75% 2021 | 126,000 | 22,666 |
| | | 82,644 |
| Canadian dollars 0.60% | | |
| | | |
| Canadian Government 2.00% 2014 | C$ 5,700 | 5,192 |
| Canadian Government 2.00% 2016 | 3,500 | 3,229 |
| Canadian Government 1.25% 2018 | 23,711 | 21,252 |
| Canadian Government 3.25% 2021 | 26,610 | 25,993 |
| Canadian Government 8.00% 2023 | 1,000 | 1,330 |
| Canadian Government 5.75% 2029 | 2,000 | 2,483 |
| Canadian Government 5.00% 2037 | 2,650 | 3,236 |
| Canada Housing Trust 3.35% 2020 | 10,000 | 9,642 |
| Hydro One Inc. 5.49% 2040 | 2,000 | 2,166 |
| Rogers Communications Inc. 5.80% 2016 | 1,750 | 1,713 |
| | | 76,236 |
| Bonds, notes & other debt instruments | | |
| | Principal amount | Value |
| Israeli shekels 0.50% | (000) | (000) |
| | | |
| Israeli Government 5.50% 2017 | ILS 40,890 | US$ 13,120 |
| Israeli Government 4.25% 2023 | 161,550 | 49,932 |
| | | 63,052 |
| South African rand 0.43% | | |
| | | |
| South Africa (Republic of), Series R-2023, 7.75% 2023 | ZAR358,250 | 32,907 |
| South Africa (Republic of), Series R-213, 7.00% 2031 | 155,950 | 12,538 |
| South Africa (Republic of), Series R-214, 6.50% 2041 | 134,000 | 9,561 |
| | | 55,006 |
| Turkish lira 0.31% | | |
| | | |
| Turkey (Republic of) 10.00% 2015 | TRY12,500 | 5,795 |
| Turkey (Republic of) 9.00% 2016 | 6,900 | 3,159 |
| Turkey (Republic of) 10.50% 2020 | 32,025 | 15,289 |
| Turkey (Republic of) 3.00% 20215 | 27,979 | 12,586 |
| Turkey (Republic of) 9.50% 2022 | 6,500 | 2,939 |
| | | 39,768 |
| Australian dollars 0.30% | | |
| | | |
| Queensland Treasury Corp., Series 15, 6.00% 2015 | A$ 2,500 | 2,430 |
| Queensland Treasury Corp., Series 17, 6.00% 2017 | 3,500 | 3,533 |
| Queensland Treasury Corp., Series 24, 5.75% 2024 | 25,625 | 25,941 |
| Australian Government, Series 133, 5.50% 2023 | 3,500 | 3,617 |
| Australian Government, Series 136, 4.75% 2027 | 2,200 | 2,126 |
| | | 37,647 |
| Malaysian ringgits 0.24% | | |
| | | |
| Malaysian Government, Series 0113, 3.172% 2016 | MYR23,500 | 7,173 |
| Malaysian Government, Series 0210, 4.012% 2017 | 14,000 | 4,349 |
| Malaysian Government, Series 0213, 3.26% 2018 | 43,490 | 13,129 |
| Malaysian Government, Series 0203, 4.24% 2018 | 17,500 | 5,484 |
| | | 30,135 |
| Philippine pesos 0.19% | | |
| | | |
| Philippines (Republic of) 4.95% 2021 | PHP114,000 | 2,633 |
| Philippines (Republic of) 6.375% 2022 | 170,000 | 4,411 |
| Philippines (Republic of) 6.25% 2036 | 758,000 | 17,146 |
| | | 24,190 |
| Peru nuevos soles 0.11% | | |
| | | |
| Peru (Republic of) 5.20% 2023 | PEN43,000 | 14,450 |
| Indonesian rupiah 0.09% | | |
| | | |
| Indonesia (Republic of) 7.875% 2019 | IDR123,000,000 | 10,947 |
| Chilean pesos 0.08% | | |
| | | |
| Chilean Government 5.50% 2020 | CLP5,808,500 | 10,730 |
| Singapore dollars 0.04% | | |
| | | |
| Singapore (Republic of) 3.25% 2020 | S$6,200 | 5,313 |
| Bonds, notes & other debt instruments | | |
| | Principal amount | Value |
| Nigerian naira 0.03% | (000) | (000) |
| | | |
| Nigeria (Republic of) 10.00% 2030 | NGN941,000 | US$ 4,326 |
| U.S. dollars 43.58% | | |
| | | |
| U.S. Treasury 0.50% 2014 | US$ 2,495 | 2,499 |
| U.S. Treasury 2.625% 2014 | 2,500 | 2,521 |
| U.S. Treasury 0.25% 2015 | 140 | 140 |
| U.S. Treasury 0.375% 2015 | 46,470 | 46,591 |
| U.S. Treasury 0.25% 2016 | 27,525 | 27,385 |
| U.S. Treasury 0.375% 2016 | 16,500 | 16,491 |
| U.S. Treasury 0.625% 2016 | 4,250 | 4,253 |
| U.S. Treasury 1.00% 2016 | 33,130 | 33,410 |
| U.S. Treasury 1.50% 20167 | 22,000 | 22,466 |
| U.S. Treasury 1.50% 2016 | 3,530 | 3,606 |
| U.S. Treasury 1.75% 2016 | 2,500 | 2,567 |
| U.S. Treasury 2.00% 20167 | 26,500 | 27,296 |
| U.S. Treasury 4.625% 2016 | 6,375 | 7,025 |
| U.S. Treasury 5.125% 2016 | 6,375 | 7,001 |
| U.S. Treasury 7.50% 2016 | 5,875 | 6,911 |
| U.S. Treasury 1.00% 2017 | 196,400 | 196,960 |
| U.S. Treasury 2.75% 2017 | 54,950 | 57,981 |
| U.S. Treasury 0.625% 2018 | 15,600 | 15,118 |
| U.S. Treasury 1.375% 2018 | 8,825 | 8,751 |
| U.S. Treasury 2.625% 2018 | 2,500 | 2,623 |
| U.S. Treasury 3.50% 2018 | 35,600 | 38,552 |
| U.S. Treasury 1.125% 2020 | 82,925 | 78,540 |
| U.S. Treasury 1.25% 2020 | 41,075 | 39,261 |
| U.S. Treasury 1.375% 2020 | 122,200 | 117,069 |
| U.S. Treasury 2.00% 2020 | 3,050 | 3,015 |
| U.S. Treasury 1.625% 2022 | 210,860 | 195,147 |
| U.S. Treasury 1.625% 2022 | 51,250 | 47,659 |
| U.S. Treasury 1.75% 2023 | 43,000 | 39,837 |
| U.S. Treasury 2.00% 2023 | 48,500 | 46,126 |
| U.S. Treasury 2.50% 2023 | 189,728 | 187,055 |
| U.S. Treasury 2.75% 2023 | 112,300 | 112,819 |
| U.S. Treasury 5.25% 2029 | 38,100 | 47,670 |
| U.S. Treasury 4.75% 2037 | 33,000 | 40,105 |
| U.S. Treasury 5.00% 2037 | 32,000 | 40,193 |
| U.S. Treasury 4.375% 2038 | 34,750 | 40,052 |
| U.S. Treasury 4.375% 2040 | 11,500 | 13,281 |
| U.S. Treasury 3.75% 2041 | 39,900 | 41,577 |
| U.S. Treasury 2.75% 2042 | 500 | 426 |
| U.S. Treasury 2.875% 2043 | 25,945 | 22,647 |
| U.S. Treasury 3.625% 2043 | 2,450 | 2,480 |
| U.S. Treasury 3.75% 2043 | 750 | 777 |
| U.S. Treasury Inflation-Protected Security 1.875% 20155 | 27,656 | 29,019 |
| U.S. Treasury Inflation-Protected Security 0.125% 20175 | 3,089 | 3,180 |
| U.S. Treasury Inflation-Protected Security 0.125% 20185 | 6,071 | 6,217 |
| U.S. Treasury Inflation-Protected Security 0.375% 20235 | 13,327 | 13,191 |
| U.S. Treasury Inflation-Protected Security 0.625% 20245 | 56,555 | 56,791 |
| U.S. Treasury Inflation-Protected Security 2.375% 20255 | 6,824 | 8,046 |
| U.S. Treasury Inflation-Protected Security 0.75% 20425 | 3,105 | 2,712 |
| Fannie Mae, Series 2012-M17, Class A2, multifamily 2.184% 20222 | 7,000 | 6,508 |
| Fannie Mae, Series 2012-M9, Class A2, multifamily 2.482% 20222 | 6,989 | 6,727 |
| Bonds, notes & other debt instruments | | |
| | Principal amount | Value |
| U.S. dollars (continued) | (000) | (000) |
| | | |
| Fannie Mae 4.00% 20242 | US$ 909 | US$ 965 |
| Fannie Mae 4.00% 20242 | 780 | 828 |
| Fannie Mae 4.00% 20252 | 983 | 1,043 |
| Fannie Mae, Series 2001-4, Class GA, 9.513% 20252,3 | 4 | 5 |
| Fannie Mae 2.50% 20262 | 652 | 655 |
| Fannie Mae 2.50% 20262 | 370 | 371 |
| Fannie Mae 6.00% 20262 | 288 | 318 |
| Fannie Mae 2.50% 20272 | 909 | 911 |
| Fannie Mae 2.50% 20272 | 591 | 594 |
| Fannie Mae 2.50% 20272 | 97 | 98 |
| Fannie Mae 2.50% 20272 | 46 | 46 |
| Fannie Mae 2.50% 20272 | 43 | 44 |
| Fannie Mae 2.50% 20272 | 43 | 43 |
| Fannie Mae 2.50% 20282 | 9,735 | 9,755 |
| Fannie Mae 2.50% 20282 | 3,305 | 3,307 |
| Fannie Mae 2.50% 20282 | 1,753 | 1,754 |
| Fannie Mae 2.50% 20282 | 1,399 | 1,402 |
| Fannie Mae 2.50% 20282 | 1,064 | 1,066 |
| Fannie Mae 2.50% 20282 | 1,055 | 1,057 |
| Fannie Mae 2.50% 20282 | 1,044 | 1,047 |
| Fannie Mae 2.50% 20282 | 1,033 | 1,035 |
| Fannie Mae 2.50% 20282 | 1,019 | 1,022 |
| Fannie Mae 2.50% 20282 | 1,019 | 1,021 |
| Fannie Mae 2.50% 20282 | 977 | 979 |
| Fannie Mae 2.50% 20282 | 976 | 978 |
| Fannie Mae 2.50% 20282 | 976 | 978 |
| Fannie Mae 2.50% 20282 | 973 | 975 |
| Fannie Mae 2.50% 20282 | 969 | 971 |
| Fannie Mae 2.50% 20282 | 952 | 954 |
| Fannie Mae 2.50% 20282 | 948 | 950 |
| Fannie Mae 2.50% 20282 | 948 | 950 |
| Fannie Mae 2.50% 20282 | 946 | 948 |
| Fannie Mae 2.50% 20282 | 921 | 922 |
| Fannie Mae 2.50% 20282 | 916 | 917 |
| Fannie Mae 2.50% 20282 | 914 | 915 |
| Fannie Mae 2.50% 20282 | 910 | 912 |
| Fannie Mae 2.50% 20282 | 908 | 910 |
| Fannie Mae 2.50% 20282 | 906 | 907 |
| Fannie Mae 2.50% 20282 | 895 | 895 |
| Fannie Mae 2.50% 20282 | 882 | 884 |
| Fannie Mae 2.50% 20282 | 850 | 852 |
| Fannie Mae 2.50% 20282 | 831 | 833 |
| Fannie Mae 2.50% 20282 | 827 | 829 |
| Fannie Mae 2.50% 20282 | 810 | 811 |
| Fannie Mae 2.50% 20282 | 801 | 803 |
| Fannie Mae 2.50% 20282 | 794 | 796 |
| Fannie Mae 2.50% 20282 | 772 | 774 |
| Fannie Mae 2.50% 20282 | 762 | 764 |
| Fannie Mae 2.50% 20282 | 742 | 743 |
| Fannie Mae 2.50% 20282 | 742 | 743 |
| Fannie Mae 2.50% 20282 | 631 | 633 |
| Fannie Mae 2.50% 20282 | 608 | 609 |
| Fannie Mae 2.50% 20282 | 606 | 607 |
| Fannie Mae 2.50% 20282 | 600 | 601 |
| Bonds, notes & other debt instruments | | |
| | Principal amount | Value |
| U.S. dollars (continued) | (000) | (000) |
| | | |
| Fannie Mae 2.50% 20282 | US$544 | US$545 |
| Fannie Mae 2.50% 20282 | 521 | 522 |
| Fannie Mae 2.50% 20282 | 515 | 516 |
| Fannie Mae 2.50% 20282 | 507 | 508 |
| Fannie Mae 2.50% 20282 | 502 | 503 |
| Fannie Mae 2.50% 20282 | 502 | 503 |
| Fannie Mae 2.50% 20282 | 496 | 497 |
| Fannie Mae 2.50% 20282 | 489 | 490 |
| Fannie Mae 2.50% 20282 | 489 | 490 |
| Fannie Mae 2.50% 20282 | 481 | 482 |
| Fannie Mae 2.50% 20282 | 478 | 479 |
| Fannie Mae 2.50% 20282 | 475 | 476 |
| Fannie Mae 2.50% 20282 | 468 | 469 |
| Fannie Mae 2.50% 20282 | 460 | 461 |
| Fannie Mae 2.50% 20282 | 459 | 460 |
| Fannie Mae 2.50% 20282 | 434 | 435 |
| Fannie Mae 2.50% 20282 | 416 | 417 |
| Fannie Mae 2.50% 20282 | 394 | 395 |
| Fannie Mae 2.50% 20282 | 389 | 389 |
| Fannie Mae 2.50% 20282 | 387 | 387 |
| Fannie Mae 2.50% 20282 | 383 | 384 |
| Fannie Mae 2.50% 20282 | 381 | 382 |
| Fannie Mae 2.50% 20282 | 338 | 339 |
| Fannie Mae 2.50% 20282 | 335 | 336 |
| Fannie Mae 2.50% 20282 | 335 | 335 |
| Fannie Mae 2.50% 20282 | 328 | 329 |
| Fannie Mae 2.50% 20282 | 323 | 324 |
| Fannie Mae 2.50% 20282 | 320 | 320 |
| Fannie Mae 2.50% 20282 | 317 | 318 |
| Fannie Mae 2.50% 20282 | 314 | 315 |
| Fannie Mae 2.50% 20282 | 313 | 314 |
| Fannie Mae 2.50% 20282 | 312 | 313 |
| Fannie Mae 2.50% 20282 | 302 | 303 |
| Fannie Mae 2.50% 20282 | 299 | 299 |
| Fannie Mae 2.50% 20282 | 281 | 281 |
| Fannie Mae 2.50% 20282 | 280 | 280 |
| Fannie Mae 2.50% 20282 | 257 | 257 |
| Fannie Mae 2.50% 20282 | 245 | 246 |
| Fannie Mae 2.50% 20282 | 239 | 240 |
| Fannie Mae 2.50% 20282 | 237 | 237 |
| Fannie Mae 2.50% 20282 | 236 | 236 |
| Fannie Mae 2.50% 20282 | 235 | 235 |
| Fannie Mae 2.50% 20282 | 232 | 232 |
| Fannie Mae 2.50% 20282 | 202 | 202 |
| Fannie Mae 2.50% 20282 | 193 | 193 |
| Fannie Mae 2.50% 20282 | 191 | 191 |
| Fannie Mae 2.50% 20282 | 189 | 189 |
| Fannie Mae 2.50% 20282 | 186 | 187 |
| Fannie Mae 2.50% 20282 | 182 | 183 |
| Fannie Mae 2.50% 20282 | 166 | 167 |
| Fannie Mae 2.50% 20282 | 163 | 164 |
| Fannie Mae 2.50% 20282 | 152 | 152 |
| Fannie Mae 2.50% 20282 | 151 | 151 |
| Fannie Mae 2.50% 20282 | 149 | 149 |
| Bonds, notes & other debt instruments | | |
| | Principal amount | Value |
| U.S. dollars (continued) | (000) | (000) |
| | | |
| Fannie Mae 2.50% 20282 | US$ 148 | US$ 148 |
| Fannie Mae 2.50% 20282 | 147 | 147 |
| Fannie Mae 2.50% 20282 | 144 | 144 |
| Fannie Mae 2.50% 20282 | 136 | 136 |
| Fannie Mae 2.50% 20282 | 122 | 123 |
| Fannie Mae 2.50% 20282 | 117 | 117 |
| Fannie Mae 2.50% 20282 | 116 | 116 |
| Fannie Mae 2.50% 20282 | 109 | 109 |
| Fannie Mae 2.50% 20282 | 104 | 105 |
| Fannie Mae 2.50% 20282 | 96 | 96 |
| Fannie Mae 2.50% 20282 | 95 | 95 |
| Fannie Mae 2.50% 20282 | 95 | 95 |
| Fannie Mae 2.50% 20282 | 95 | 95 |
| Fannie Mae 2.50% 20282 | 94 | 95 |
| Fannie Mae 2.50% 20282 | 88 | 89 |
| Fannie Mae 2.50% 20282 | 66 | 66 |
| Fannie Mae 2.50% 20282 | 64 | 64 |
| Fannie Mae 2.50% 20282 | 59 | 59 |
| Fannie Mae 2.50% 20282 | 56 | 56 |
| Fannie Mae 2.50% 20282 | 45 | 45 |
| Fannie Mae 2.50% 20282 | 39 | 39 |
| Fannie Mae 2.50% 20282 | 36 | 36 |
| Fannie Mae 2.50% 20282 | 36 | 36 |
| Fannie Mae 5.50% 20332 | 3,190 | 3,549 |
| Fannie Mae 6.00% 20352 | 185 | 207 |
| Fannie Mae, Series 2006-56, Class OG, principal only, 0% 20362 | 1,479 | 1,322 |
| Fannie Mae, Series 2006-49, Class PA, 6.00% 20362 | 383 | 421 |
| Fannie Mae 2.382% 20382,3 | 1,653 | 1,760 |
| Fannie Mae 5.50% 20382 | 2,625 | 2,901 |
| Fannie Mae 3.506% 20392,3 | 721 | 754 |
| Fannie Mae 3.566% 20392,3 | 553 | 579 |
| Fannie Mae 3.802% 20392,3 | 233 | 245 |
| Fannie Mae 3.942% 20392,3 | 239 | 252 |
| Fannie Mae 3.943% 20392,3 | 195 | 205 |
| Fannie Mae 3.962% 20392,3 | 244 | 259 |
| Fannie Mae 3.992% 20392,3 | 314 | 332 |
| Fannie Mae 4.39% 20402,3 | 1,500 | 1,603 |
| Fannie Mae 3.555% 20412,3 | 5,839 | 6,111 |
| Fannie Mae 4.00% 20412 | 820 | 854 |
| Fannie Mae 5.00% 20412 | 11,311 | 12,410 |
| Fannie Mae 5.00% 20412 | 3,790 | 4,144 |
| Fannie Mae 4.00% 20422 | 7,585 | 7,898 |
| Fannie Mae 3.00% 20432 | 12,091 | 11,711 |
| Fannie Mae 3.00% 20432 | 9,532 | 9,232 |
| Fannie Mae 3.00% 20432 | 6,462 | 6,258 |
| Fannie Mae 3.00% 20432 | 5,028 | 4,870 |
| Fannie Mae 3.00% 20432 | 726 | 702 |
| Fannie Mae 3.00% 20432 | 489 | 474 |
| Fannie Mae 3.00% 20432 | 458 | 444 |
| Fannie Mae 4.00% 20432 | 26,039 | 27,165 |
| Fannie Mae 4.00% 20432 | 2,341 | 2,442 |
| Fannie Mae 4.00% 20432 | 1,132 | 1,182 |
| Fannie Mae 4.00% 20432 | 1,131 | 1,178 |
| Fannie Mae 6.50% 20472 | 153 | 167 |
| Bonds, notes & other debt instruments | | |
| | Principal amount | Value |
| U.S. dollars (continued) | (000) | (000) |
| | | |
| Fannie Mae 6.50% 20472 | US$ 126 | US$ 138 |
| Fannie Mae 6.50% 20472 | 75 | 82 |
| Fannie Mae 7.00% 20472 | 176 | 194 |
| Fannie Mae 6.50% 20482 | 79 | 86 |
| Hungarian Government 4.125% 2018 | 13,780 | 14,044 |
| Hungarian Government 6.25% 2020 | 35,195 | 38,583 |
| Hungarian Government 5.375% 2023 | 72,300 | 73,815 |
| Hungarian Government 5.75% 2023 | 2,300 | 2,386 |
| Hungarian Government 5.375% 2024 | 710 | 713 |
| Hungarian Government 7.625% 2041 | 2,760 | 3,195 |
| Verizon Communications Inc. 1.003% 20193 | 2,091 | 2,112 |
| Verizon Communications Inc. 2.55% 2019 | 1,605 | 1,617 |
| Verizon Communications Inc. 3.45% 2021 | 6,840 | 6,946 |
| Verizon Communications Inc. 5.15% 2023 | 25,920 | 28,422 |
| Verizon Communications Inc. 4.15% 2024 | 20,380 | 20,750 |
| Verizon Communications Inc. 5.05% 2034 | 10,690 | 11,001 |
| Verizon Communications Inc. 6.55% 2043 | 17,689 | 21,604 |
| Polish Government 6.375% 2019 | 24,960 | 29,347 |
| Polish Government 5.125% 2021 | 15,300 | 16,933 |
| Polish Government 5.00% 2022 | 13,400 | 14,656 |
| Polish Government 4.00% 2024 | 27,335 | 27,615 |
| Latvia (Republic of) 2.75% 2020 | 39,140 | 37,780 |
| Latvia (Republic of) 5.25% 2021 | 28,750 | 31,390 |
| Slovenia (Republic of) 4.75% 20186 | 6,960 | 7,465 |
| Slovenia (Republic of) 4.125% 20196 | 5,790 | 6,001 |
| Slovenia (Republic of) 5.50% 20226 | 7,600 | 8,132 |
| Slovenia (Republic of) 5.85% 20236 | 33,715 | 36,918 |
| Slovenia (Republic of) 5.85% 2023 | 9,475 | 10,375 |
| State of California, Various Purpose General Obligation Bonds, 6.20% 2019 | 18,700 | 22,140 |
| State of California, Various Purpose General Obligation Bonds, 7.30% 20392 | 1,310 | 1,766 |
| State of California, Various Purpose General Obligation Bonds, 7.55% 2039 | 2,720 | 3,805 |
| State of California, Various Purpose General Obligation Bonds, 7.60% 2040 | 12,910 | 18,244 |
| State of California, Various Purpose General Obligation Bonds, 7.625% 20402 | 11,850 | 16,593 |
| JPMorgan Chase & Co. 1.35% 2017 | 14,600 | 14,601 |
| JPMorgan Chase & Co. 1.625% 2018 | 2,790 | 2,743 |
| JPMorgan Chase & Co. 3.25% 2022 | 19,791 | 19,534 |
| JPMorgan Chase & Co. 3.20% 2023 | 15,750 | 15,303 |
| JPMorgan Chase & Co. 3.875% 2024 | 3,500 | 3,539 |
| JPMorgan Chase & Co., Series-U, junior subordinated, perpetual, 6.125% (undated)3 | 440 | 435 |
| Freddie Mac 0.75% 2018 | 11,300 | 11,054 |
| Freddie Mac, Series K711, Class A2, multifamily 1.73% 20192 | 7,000 | 6,872 |
| Freddie Mac, Series K712, Class A2, multifamily 1.869% 20192 | 4,590 | 4,509 |
| Freddie Mac, Series K710, Class A2, multifamily 1.883% 20192 | 5,372 | 5,326 |
| Freddie Mac, Series K019, Class A2, multifamily 2.272% 20222 | 5,500 | 5,261 |
| Freddie Mac, Series K021, Class A2, multifamily 2.396% 20222 | 6,440 | 6,170 |
| Freddie Mac, Series K025, Class A2, multifamily 2.682% 20222 | 6,000 | 5,836 |
| Freddie Mac, Series 3213, Class OG, principal only, 0% 20362 | 2,473 | 2,248 |
| Freddie Mac, Series 3292, Class BO, principal only, 0% 20372 | 399 | 365 |
| Freddie Mac 6.00% 20382 | 144 | 160 |
| Freddie Mac 3.763% 20392,3 | 338 | 360 |
| Freddie Mac 4.00% 20432 | 2,238 | 2,328 |
| Freddie Mac 4.00% 20432 | 1,297 | 1,349 |
| Freddie Mac 4.00% 20432 | 1,263 | 1,317 |
| Ford Motor Credit Co. 2.375% 2018 | 31,025 | 31,322 |
| Ford Motor Credit Co. 2.375% 2019 | 19,825 | 19,701 |
| Bonds, notes & other debt instruments | | |
| | Principal amount | Value |
| U.S. dollars (continued) | (000) | (000) |
| | | |
| Government National Mortgage Assn. 2.50% 20282 | US$ 3,777 | US$ 3,840 |
| Government National Mortgage Assn. 3.50% 20432 | 35,728 | 36,519 |
| Government National Mortgage Assn. 4.50% 20432 | 7,589 | 8,191 |
| Indonesia (Republic of) 5.875% 2020 | 25,077 | 27,522 |
| Indonesia (Republic of) 5.875% 20206 | 5,625 | 6,173 |
| Indonesia (Republic of) 4.875% 20216 | 3,835 | 3,950 |
| Indonesia (Republic of) 4.875% 2021 | 2,800 | 2,884 |
| Indonesia (Republic of) 3.75% 2022 | 4,175 | 3,961 |
| Indonesia (Republic of) 3.375% 20236 | 2,000 | 1,795 |
| Indonesia (Republic of) 4.625% 2043 | 1,380 | 1,163 |
| Indonesia (Republic of) 6.75% 20446 | 925 | 1,014 |
| Kinder Morgan Energy Partners, LP 2.65% 2019 | 670 | 670 |
| Kinder Morgan Energy Partners, LP 3.50% 2021 | 3,960 | 3,951 |
| Kinder Morgan Energy Partners, LP 3.45% 2023 | 7,500 | 7,163 |
| Kinder Morgan Energy Partners, LP 3.50% 2023 | 4,490 | 4,248 |
| Kinder Morgan Energy Partners, LP 4.15% 2024 | 14,720 | 14,663 |
| Kinder Morgan Energy Partners, LP 5.50% 2044 | 12,610 | 12,943 |
| Bermudan Government 5.603% 20206 | 17,985 | 19,891 |
| Bermudan Government 5.603% 2020 | 1,800 | 1,991 |
| Bermudan Government 4.138% 20236 | 4,900 | 4,831 |
| Bermudan Government 4.854% 20246 | 15,475 | 15,791 |
| Lithuania (Republic of) 7.375% 2020 | 11,550 | 13,975 |
| Lithuania (Republic of) 6.125% 20216 | 7,155 | 8,212 |
| Lithuania (Republic of) 6.625% 2022 | 11,600 | 13,740 |
| Lithuania (Republic of) 6.625% 20226 | 4,750 | 5,626 |
| HSBC Holdings PLC 4.125% 20206 | 3,577 | 3,798 |
| HSBC Bank PLC 4.75% 20216 | 2,150 | 2,358 |
| HSBC Holdings PLC 4.00% 2022 | 6,105 | 6,352 |
| HSBC Holdings PLC 4.25% 2024 | 21,205 | 21,277 |
| HSBC Holdings PLC 5.25% 2044 | 7,250 | 7,359 |
| Goldman Sachs Group, Inc. 2.625% 2019 | 14,620 | 14,603 |
| Goldman Sachs Group, Inc. 4.00% 2024 | 23,800 | 23,746 |
| Goldman Sachs Group, Inc. 6.25% 2041 | 1,160 | 1,382 |
| J.P. Morgan Chase Commercial Mortgage Securities Corp., Series 2006-CB15, Class A-4, 5.814% 20432,3 | 1,241 | 1,341 |
| J.P. Morgan Chase Commercial Mortgage Securities Corp., Series 2006-CB-16, Class A1A, 5.546% 20452 | 2,092 | 2,280 |
| J.P. Morgan Chase Commercial Mortgage Securities Corp., Series 2006-LDP7, Class A-4, 5.845% 20452,3 | 3,830 | 4,166 |
| J.P. Morgan Chase Commercial Mortgage Securities Corp., Series 2011-C4, Class A-2, 3.341% 20462,6 | 6,750 | 7,046 |
| J.P. Morgan Chase Commercial Mortgage Securities Corp., Series 2011-C3A, Class A-2, 3.673% 20462,6 | 8,500 | 8,877 |
| J.P. Morgan Chase Commercial Mortgage Securities Corp., Series 2007-CB19, Class A-4, 5.698% 20492,3 | 11,145 | 12,369 |
| J.P. Morgan Chase Commercial Mortgage Securities Corp., Series 2007-C1, Class A-4, 5.716% 20512 | 3,000 | 3,321 |
| Petróleos Mexicanos 3.50% 2018 | 1,500 | 1,560 |
| Petróleos Mexicanos 8.00% 2019 | 6,400 | 7,840 |
| Petróleos Mexicanos 5.50% 2021 | 1,070 | 1,174 |
| Petróleos Mexicanos 4.875% 2022 | 8,960 | 9,386 |
| Petróleos Mexicanos 4.875% 2024 | 420 | 435 |
| Pemex Project Funding Master Trust, Series 13, 6.625% 2035 | 6,750 | 7,526 |
| Petróleos Mexicanos 6.50% 2041 | 2,470 | 2,717 |
| Petróleos Mexicanos 6.375% 20456 | 7,000 | 7,569 |
| DaimlerChrysler North America Holding Corp. 2.625% 20166 | 3,000 | 3,112 |
| DaimlerChrysler North America Holding Corp. 2.40% 20176 | 5,000 | 5,148 |
| DaimlerChrysler North America Holding Corp. 2.375% 20186 | 4,000 | 4,042 |
| DaimlerChrysler North America Holding Corp. 2.875% 20216 | 9,950 | 9,868 |
| DaimlerChrysler North America Holding Corp. 8.50% 2031 | 7,850 | 11,689 |
| Bonds, notes & other debt instruments | | |
| | Principal amount | Value |
| U.S. dollars (continued) | (000) | (000) |
| | | |
| Developers Diversified Realty Corp. 5.50% 2015 | US$ 5,190 | US$ 5,434 |
| Developers Diversified Realty Corp. 9.625% 2016 | 8,360 | 9,688 |
| Developers Diversified Realty Corp. 7.50% 2017 | 10,885 | 12,614 |
| Developers Diversified Realty Corp. 4.75% 2018 | 475 | 516 |
| Developers Diversified Realty Corp. 7.875% 2020 | 4,170 | 5,188 |
| Bank of America Corp. 5.65% 2018 | 990 | 1,120 |
| Bank of America Corp., Series L, 2.65% 2019 | 8,400 | 8,439 |
| Bank of America Corp. 4.00% 2024 | 18,120 | 18,138 |
| Bank of America Corp. 4.125% 2024 | 4,710 | 4,773 |
| Greenwich Capital Commercial Funding Corp., Series 2006-GG7, Class A-4, 5.82% 20382,3 | 3,701 | 4,025 |
| Greenwich Capital Commercial Funding Corp., Series 2007-GG9, Class A-4, 5.444% 20392 | 12,250 | 13,438 |
| Greenwich Capital Commercial Funding Corp., Series 2007-GG11, Class A-1-A, 5.704% 20492 | 8,144 | 9,163 |
| Greenwich Capital Commercial Funding Corp., Series 2007-GG11, Class A-M, 5.867% 20492,3 | 4,945 | 5,445 |
| StatoilHydro ASA 1.80% 2016 | 4,000 | 4,101 |
| Statoil ASA 0.526% 20183 | 5,460 | 5,459 |
| Statoil ASA 1.95% 2018 | 4,515 | 4,525 |
| Statoil ASA 3.15% 2022 | 6,000 | 6,030 |
| Statoil ASA 3.70% 2024 | 6,325 | 6,458 |
| Statoil ASA 4.25% 2041 | 3,000 | 2,933 |
| Williams Partners LP 4.125% 2020 | 1,625 | 1,690 |
| Williams Partners LP 5.25% 2020 | 10,405 | 11,475 |
| Williams Partners LP 3.35% 2022 | 1,750 | 1,680 |
| Williams Partners LP 4.50% 2023 | 6,440 | 6,603 |
| Williams Partners LP 4.30% 2024 | 7,235 | 7,283 |
| Sprint Capital Corp. 6.90% 2019 | 11,750 | 12,954 |
| Sprint Nextel Corp. 7.00% 2020 | 3,950 | 4,325 |
| Sprint Corp. 7.875% 20236 | 9,800 | 10,804 |
| Morgan Stanley 3.80% 2016 | 7,500 | 7,904 |
| Morgan Stanley 2.125% 2018 | 5,125 | 5,120 |
| Morgan Stanley 2.50% 2019 | 14,625 | 14,605 |
| NBC Universal Enterprise, Inc. 0.924% 20183,6 | 5,785 | 5,825 |
| NBC Universal Enterprise, Inc. 1.974% 20196 | 18,100 | 17,728 |
| NBC Universal Enterprise, Inc. 5.25% (undated)6 | 2,335 | 2,370 |
| Israeli Government 4.00% 2022 | 13,050 | 13,689 |
| Israeli Government 3.15% 2023 | 10,700 | 10,416 |
| Israeli Government 4.50% 2043 | 1,890 | 1,760 |
| Citigroup Inc. 4.75% 2015 | 4,247 | 4,436 |
| Citigroup Inc. 3.875% 2023 | 21,135 | 21,030 |
| Gaz Capital SA, Series 7, 6.212% 2016 | 1,850 | 1,970 |
| Gazprom OJSC 3.85% 20206 | 400 | 377 |
| Gazprom OJSC 5.999% 20216 | 3,900 | 3,993 |
| Gazprom OJSC, Series 9, 6.51% 2022 | 18,225 | 18,863 |
| First Data Holdings, Inc. 14.50% 20194,6 | 6,000 | 5,663 |
| First Data Corp. 11.75% 2021 | 6,000 | 6,330 |
| First Data Corp. 12.625% 2021 | 10,511 | 12,561 |
| Prologis, Inc. 6.125% 2016 | 1,550 | 1,737 |
| Prologis, Inc. 2.75% 2019 | 1,000 | 1,005 |
| Prologis, Inc. 3.35% 2021 | 10,095 | 10,005 |
| Prologis, Inc. 4.25% 2023 | 11,545 | 11,766 |
| CEMEX España, SA 9.25% 20206 | 12,799 | 14,111 |
| CEMEX Finance LLC 7.25% 20216 | 5,000 | 5,475 |
| CEMEX Finance LLC 9.375% 20226 | 4,060 | 4,786 |
| AbbVie Inc. 1.75% 2017 | 8,280 | 8,315 |
| AbbVie Inc. 2.90% 2022 | 9,360 | 9,029 |
| Bonds, notes & other debt instruments | | |
| | Principal amount | Value |
| U.S. dollars (continued) | (000) | (000) |
| | | |
| AbbVie Inc. 4.40% 2042 | US$ 7,095 | US$ 6,969 |
| AXA SA 8.60% 2030 | 18,550 | 23,976 |
| BPCE SA group 2.50% 2018 | 3,000 | 3,018 |
| BPCE SA group 5.70% 20236 | 2,905 | 3,026 |
| BPCE SA group 5.15% 20246 | 17,775 | 17,721 |
| Croatian Government 6.75% 20196 | 2,300 | 2,544 |
| Croatian Government 6.625% 20206 | 7,095 | 7,797 |
| Croatian Government 6.375% 20216 | 6,880 | 7,448 |
| Croatian Government 5.50% 20236 | 5,195 | 5,276 |
| Total Capital International 1.55% 2017 | 1,800 | 1,819 |
| Total Capital International 2.875% 2022 | 1,115 | 1,094 |
| Total Capital International 3.75% 2024 | 19,350 | 19,806 |
| Odebrecht Drilling Norbe VIII/IX Ltd 6.35% 20212,6 | 6,300 | 6,568 |
| Odebrecht Offshore Drilling Finance Ltd. 6.75% 20222,6 | 15,109 | 15,714 |
| Enel Finance International SA 3.875% 20146 | 3,000 | 3,046 |
| Enel Finance International SA 6.00% 20396 | 1,445 | 1,515 |
| Enel Società per Azioni 8.75% 20733,6 | 15,000 | 16,888 |
| Abu Dhabi National Energy Co. PJSC (TAQA) 5.875% 20166 | 5,500 | 6,112 |
| Abu Dhabi National Energy Co. PJSC (TAQA) 7.25% 20186 | 8,000 | 9,574 |
| Abu Dhabi National Energy Co. PJSC (TAQA) 5.875% 20216 | 3,275 | 3,770 |
| Abu Dhabi National Energy Co. PJSC (TAQA) 3.625% 20236 | 1,135 | 1,119 |
| Anheuser-Busch InBev NV 6.875% 2019 | 14,400 | 17,631 |
| Anheuser-Busch InBev NV 3.70% 2024 | 2,760 | 2,795 |
| Deutsche Telekom International Finance BV 3.125% 20166 | 2,715 | 2,832 |
| Deutsche Telekom International Finance BV 9.25% 2032 | 11,340 | 17,574 |
| Iberdrola Finance Ireland 3.80% 20146 | 1,185 | 1,201 |
| Scottish Power PLC 5.375% 2015 | 8,200 | 8,548 |
| Iberdrola Finance Ireland 5.00% 20196 | 6,970 | 7,668 |
| Scottish Power PLC 5.81% 2025 | 2,500 | 2,703 |
| Dollar General Corp. 1.875% 2018 | 4,388 | 4,317 |
| Dollar General Corp. 3.25% 2023 | 16,589 | 15,692 |
| General Electric Capital Corp. 2.45% 2017 | 13,150 | 13,595 |
| General Electric Co. 2.70% 2022 | 3,000 | 2,913 |
| General Electric Capital Corp. 3.10% 2023 | 3,180 | 3,118 |
| Turkey (Republic of) 4.557% 20186 | 5,065 | 5,174 |
| Turkey (Republic of) 5.625% 2021 | 8,700 | 9,118 |
| Turkey (Republic of) 6.25% 2022 | 4,915 | 5,293 |
| MetroPCS Wireless, Inc. 6.25% 2021 | 6,925 | 7,349 |
| T-Mobile US, Inc. 6.731% 2022 | 2,500 | 2,687 |
| MetroPCS Wireless, Inc. 6.625% 2023 | 8,425 | 8,973 |
| Morocco Government 4.25% 2022 | 5,700 | 5,540 |
| Morocco Government 4.25% 20226 | 2,500 | 2,430 |
| Morocco Government 5.50% 2042 | 10,000 | 9,390 |
| Morocco Government 5.50% 20426 | 1,500 | 1,409 |
| Wells Fargo & Co., Series I, 3.50% 2022 | 18,350 | 18,762 |
| Westfield Group 5.70% 20166 | 2,200 | 2,443 |
| Westfield Group 7.125% 20186 | 8,630 | 10,269 |
| Westfield Group 6.75% 20196 | 2,250 | 2,709 |
| Westfield Group 4.625% 20216 | 1,220 | 1,337 |
| Westfield Group 3.375% 20226 | 1,850 | 1,851 |
| Comcast Corp. 6.40% 2038 | 1,750 | 2,159 |
| Comcast Corp. 4.65% 2042 | 10,550 | 10,564 |
| Comcast Corp. 4.75% 2044 | 5,695 | 5,804 |
| Bonds, notes & other debt instruments | | |
| | Principal amount | Value |
| U.S. dollars (continued) | (000) | (000) |
| | | |
| Enbridge Energy Partners, LP, Series B, 6.50% 2018 | US$ 5,320 | US$ 6,147 |
| Enbridge Energy Partners, LP 9.875% 2019 | 3,250 | 4,263 |
| Enbridge Energy Partners, LP 5.20% 2020 | 7,335 | 8,020 |
| Standard Chartered PLC 3.85% 20156 | 5,830 | 6,024 |
| Standard Chartered PLC 3.20% 20166 | 10,865 | 11,346 |
| Barclays Bank PLC 2.50% 2019 | 16,570 | 16,623 |
| Union Pacific Corp. 2.25% 2019 | 1,375 | 1,377 |
| Union Pacific Corp. 2.75% 2023 | 12,000 | 11,257 |
| Union Pacific Corp. 3.646% 2024 | 1,850 | 1,848 |
| Union Pacific Corp. 4.821% 2044 | 1,990 | 2,084 |
| Burlington Northern Santa Fe LLC 3.05% 2022 | 5,815 | 5,581 |
| Burlington Northern Santa Fe LLC 3.00% 2023 | 4,750 | 4,492 |
| Burlington Northern Santa Fe LLC 3.75% 2024 | 5,575 | 5,603 |
| Burlington Northern Santa Fe LLC 4.90% 2044 | 565 | 585 |
| Gilead Sciences, Inc. 2.40% 2014 | 735 | 744 |
| Gilead Sciences, Inc. 3.05% 2016 | 5,250 | 5,525 |
| Gilead Sciences, Inc. 3.70% 2024 | 5,680 | 5,695 |
| Gilead Sciences, Inc. 4.80% 2044 | 3,950 | 4,082 |
| Electricité de France SA 1.15% 20176 | 7,000 | 6,995 |
| Electricité de France SA 4.60% 20206 | 2,200 | 2,399 |
| Electricité de France SA 6.95% 20396 | 1,325 | 1,686 |
| Electricité de France SA 4.875% 20446 | 4,460 | 4,462 |
| Rabobank Nederland 4.625% 2023 | 14,905 | 15,370 |
| American International Group, Inc. 3.80% 2017 | 5,500 | 5,889 |
| American International Group, Inc. 3.375% 2020 | 6,000 | 6,136 |
| American International Group, Inc. 4.125% 2024 | 3,120 | 3,193 |
| Hilton USA Trust, Series 2013-HLF-AFX, 2.662% 20302,6 | 15,106 | 15,164 |
| CEZ, a s 4.25% 20226 | 14,475 | 14,845 |
| Intelsat Jackson Holding Co. 7.25% 2020 | 1,100 | 1,198 |
| Intelsat Jackson Holding Co. 6.625% 20226 | 11,375 | 11,887 |
| Intelsat Jackson Holding Co. 6.625% 2022 | 1,575 | 1,646 |
| Bahrain Government 5.50% 2020 | 12,870 | 13,884 |
| Bahrain Government 5.50% 20206 | 630 | 680 |
| Altria Group, Inc. 9.95% 2038 | 2,500 | 4,023 |
| Altria Group, Inc. 4.50% 2043 | 8,500 | 7,838 |
| Altria Group, Inc. 5.375% 2044 | 2,250 | 2,361 |
| Kimco Realty Corp., Series C, 4.904% 2015 | 1,360 | 1,409 |
| Kimco Realty Corp. 5.584% 2015 | 2,003 | 2,152 |
| Kimco Realty Corp. 5.70% 2017 | 500 | 558 |
| Kimco Realty Corp. 4.30% 2018 | 500 | 539 |
| Kimco Realty Corp. 6.875% 2019 | 8,010 | 9,554 |
| Volvo Treasury AB 5.95% 20156 | 13,390 | 14,061 |
| MidAmerican Energy Holdings Co. 3.75% 20236 | 11,830 | 11,794 |
| MidAmerican Energy Holdings Co. 5.15% 20436 | 1,995 | 2,134 |
| Banc of America Commercial Mortgage Inc., Series 2006-3, Class A-4, 5.889% 20442,3 | 1,476 | 1,598 |
| Banc of America Commercial Mortgage Inc., Series 2006-1, Class A1A, 5.378% 20452,3 | 4,620 | 4,941 |
| Banc of America Commercial Mortgage Inc., Series 2007-3, Class A-4, 5.598% 20492,3 | 1,120 | 1,235 |
| Banc of America Commercial Mortgage Inc., Series 2007-4, Class A-M, 5.892% 20512,3 | 3,020 | 3,359 |
| Banc of America Commercial Mortgage Inc., Series 2008-1, Class A-4, 6.246% 20512,3 | 2,315 | 2,638 |
| Korea Development Bank 3.875% 2017 | 12,800 | 13,715 |
| Telecom Italia Capital SA 7.175% 2019 | 3,695 | 4,254 |
| Telecom Italia Capital SA 7.20% 2036 | 9,168 | 9,386 |
| ERP Operating LP 5.125% 2016 | 1,110 | 1,201 |
| ERP Operating LP 4.75% 2020 | 9,200 | 10,093 |
| Bonds, notes & other debt instruments | | |
| | Principal amount | Value |
| U.S. dollars (continued) | (000) | (000) |
| | | |
| ERP Operating LP 4.625% 2021 | US$ 2,020 | US$ 2,187 |
| Novartis Capital Corp. 3.40% 2024 | 11,330 | 11,342 |
| Novartis Capital Corp. 4.40% 2044 | 1,750 | 1,773 |
| Gabonese Republic 6.375% 20242,6 | 12,190 | 12,952 |
| Reynolds Group Inc. 9.00% 2019 | 3,500 | 3,762 |
| Reynolds Group Inc. 9.875% 2019 | 1,635 | 1,835 |
| Reynolds Group Inc. 5.75% 2020 | 6,900 | 7,262 |
| Rio Tinto Finance (USA) Ltd. 2.50% 2016 | 3,000 | 3,099 |
| Rio Tinto Finance (USA) Ltd. 2.25% 2018 | 6,425 | 6,433 |
| Rio Tinto Finance (USA) Ltd. 2.875% 2022 | 3,340 | 3,185 |
| National Rural Utilities Cooperative Finance Corp. 3.875% 2015 | 7,750 | 8,118 |
| National Rural Utilities Cooperative Finance Corp. 10.375% 2018 | 3,250 | 4,387 |
| Holcim Ltd. 6.00% 20196 | 3,222 | 3,673 |
| Holcim Ltd. 5.15% 20236 | 8,230 | 8,811 |
| Australia Government Agency-Guaranteed, Commonwealth Bank of Australia 2.90% 20146 | 6,365 | 6,439 |
| Commonwealth Bank of Australia 0.75% 20172,6 | 6,000 | 6,009 |
| TransCanada PipeLines Ltd. 6.50% 2018 | 5,000 | 5,904 |
| TransCanada PipeLines Ltd. 7.125% 2019 | 3,035 | 3,685 |
| TransCanada PipeLines Ltd. 7.625% 2039 | 2,000 | 2,802 |
| Xstrata Canada Financial Corp. 2.70% 20173,6 | 2,125 | 2,153 |
| Glencore Xstrata LLC 1.599% 20193,6 | 8,725 | 8,760 |
| Glencore Xstrata LLC 4.125% 20236 | 1,370 | 1,311 |
| Neiman Marcus, Term Loan B, 4.25% 20202,3,8 | 4,389 | 4,411 |
| Neiman Marcus Group LTD Inc. 8.00% 20216 | 2,175 | 2,401 |
| Neiman Marcus Group LTD Inc. 8.75% 20213,4,6 | 4,825 | 5,356 |
| CS First Boston Mortgage Securities Corp., Series 2006-C5, Class A-3, 5.311% 20392 | 7,165 | 7,771 |
| CS First Boston Mortgage Securities Corp., Series 2007-C5, Class A4, 5.695% 20402,3 | 3,000 | 3,317 |
| CS First Boston Mortgage Securities Corp., Series 2007-C2, Class A-M, 5.549% 20492,3 | 840 | 908 |
| Hospitality Properties Trust 6.30% 2016 | 1,000 | 1,076 |
| Hospitality Properties Trust 6.70% 2018 | 8,805 | 9,857 |
| Hospitality Properties Trust 5.00% 2022 | 250 | 260 |
| Hospitality Properties Trust 4.50% 2023 | 690 | 685 |
| Consumers Energy Co., First Mortgage Bonds, 6.125% 2019 | 1,325 | 1,561 |
| CMS Energy Corp. 8.75% 2019 | 1,182 | 1,519 |
| CMS Energy Corp. 6.25% 2020 | 130 | 153 |
| CMS Energy Corp. 5.05% 2022 | 7,298 | 8,132 |
| CMS Energy Corp. 3.875% 2024 | 480 | 487 |
| National Grid PLC 6.30% 2016 | 10,575 | 11,811 |
| Dell, Inc. Term Loan B, 4.50% 20202,3,8 | 11,721 | 11,656 |
| CVS Caremark Corp. 4.00% 2023 | 11,375 | 11,646 |
| Ras Laffan Liquefied Natural Gas II 5.298% 20202,6 | 2,647 | 2,861 |
| Ras Laffan Liquefied Natural Gas III 5.838% 20272,6 | 8,000 | 8,685 |
| First Quantum Minerals Ltd. 6.75% 20206 | 5,642 | 5,741 |
| First Quantum Minerals Ltd. 7.00% 20216 | 5,642 | 5,769 |
| HSBK (Europe) BV 7.25% 20176 | 1,865 | 1,993 |
| HSBK (Europe) BV 7.25% 20216 | 8,975 | 9,426 |
| Argentina (Republic of) 7.00% 2015 | 5,800 | 5,617 |
| Argentina (Republic of) 7.00% 2017 | 6,400 | 5,735 |
| Time Warner Inc. 4.05% 2023 | 9,575 | 9,848 |
| Time Warner Inc. 6.25% 2041 | 1,165 | 1,370 |
| Transocean Inc. 5.05% 2016 | 2,640 | 2,874 |
| Transocean Inc. 2.50% 2017 | 5,200 | 5,239 |
| Transocean Inc. 6.375% 2021 | 2,060 | 2,319 |
| Transocean Inc. 3.80% 2022 | 785 | 752 |
| Bonds, notes & other debt instruments | | |
| | Principal amount | Value |
| U.S. dollars (continued) | (000) | (000) |
| | | |
| Citigroup-Deutsche Bank Commercial Mortgage Trust, Series 2005-CD1, Class A-4, 5.216% 20442,3 | US$ 5,042 | US$ 5,296 |
| Citigroup-Deutsche Bank Commercial Mortgage Trust, Series 2006-CD3, Class A-5, 5.617% 20482 | 5,260 | 5,708 |
| Digicel Group Ltd. 10.50% 20186 | 850 | 905 |
| Digicel Group Ltd. 8.25% 20206 | 7,750 | 8,312 |
| Digicel Group Ltd. 7.125% 20226 | 1,700 | 1,723 |
| BHP Billiton Finance (USA) Ltd. 3.85% 2023 | 9,325 | 9,573 |
| BHP Billiton Finance (USA) Ltd. 5.00% 2043 | 1,150 | 1,222 |
| Express Scripts Inc. 3.125% 2016 | 10,250 | 10,685 |
| Cox Communications, Inc. 2.95% 20236 | 11,575 | 10,586 |
| Wachovia Bank Commercial Mortgage Trust, Series 2007-C30, Class A-5, 5.342% 20432 | 250 | 274 |
| Wachovia Bank Commercial Mortgage Trust, Series 2006-C25, Class A1A, 5.717% 20432,3 | 6,780 | 7,392 |
| Wachovia Bank Commercial Mortgage Trust, Series 2007-C31, Class A-5, 5.50% 20472 | 900 | 997 |
| Wachovia Bank Commercial Mortgage Trust, Series 2007-C31, Class A-M, 5.591% 20472,3 | 1,270 | 1,395 |
| Wachovia Bank Commercial Mortgage Trust, Series 2007-C32, Class A-3, 5.724% 20492,3 | 400 | 442 |
| International Business Machines Corp. 1.95% 2016 | 9,965 | 10,260 |
| Kinetic Concepts, Inc., Term Loan E1, 4.00% 20182,3,8 | 1,070 | 1,074 |
| Kinetic Concepts, Inc. 10.50% 2018 | 3,845 | 4,441 |
| Kinetic Concepts, Inc. 12.50% 2019 | 4,000 | 4,690 |
| BP Capital Markets PLC 0.656% 20163 | 10,000 | 10,048 |
| Thomson Reuters Corp. 1.30% 2017 | 2,525 | 2,514 |
| Thomson Reuters Corp. 4.30% 2023 | 4,250 | 4,362 |
| Thomson Reuters Corp. 5.65% 2043 | 2,980 | 3,162 |
| Volkswagen International Finance NV 2.875% 20166 | 1,900 | 1,974 |
| Volkswagen International Finance NV 2.375% 20176 | 2,500 | 2,576 |
| Volkswagen International Finance NV 4.00% 20206 | 5,000 | 5,362 |
| Frontier Communications Corp. 8.50% 2020 | 1,775 | 2,072 |
| Frontier Communications Corp. 9.25% 2021 | 6,525 | 7,765 |
| British American Tobacco International Finance PLC 9.50% 20186 | 7,485 | 9,777 |
| McKesson Corp. 3.25% 2016 | 740 | 771 |
| McKesson Corp. 2.284% 2019 | 4,610 | 4,579 |
| McKesson Corp. 3.796% 2024 | 2,920 | 2,929 |
| McKesson Corp. 4.883% 2044 | 1,305 | 1,328 |
| Tennessee Valley Authority 5.88% 2036 | 2,250 | 2,762 |
| Tennessee Valley Authority 5.25% 2039 | 6,000 | 6,794 |
| SBC Communications Inc. 5.10% 2014 | 3,909 | 3,991 |
| Cricket Communications, Inc. 7.75% 2020 | 3,475 | 3,978 |
| AT&T Inc. 4.30% 2042 | 1,625 | 1,446 |
| Bank of New York Mellon Corp. 3.65% 2024 | 9,300 | 9,393 |
| Boyd Gaming Corp. 9.125% 2018 | 2,000 | 2,178 |
| Boyd Gaming Corp. 9.00% 2020 | 6,475 | 7,195 |
| RCI Banque 3.50% 20186 | 9,000 | 9,346 |
| Citigroup Commercial Mortgage Trust, Series 2014-CG19, Class A-1, 1.199% 20472 | 2,135 | 2,129 |
| Citigroup Commercial Mortgage Trust, Series 2006-C5, Class A-4, 5.431% 20492 | 6,500 | 7,102 |
| Forest Laboratories, Inc. 4.375% 20196 | 1,185 | 1,249 |
| Forest Laboratories, Inc. 5.00% 20216 | 7,435 | 7,881 |
| Commercial Mortgage Trust, Series 2006-C8, Class A1A, 5.292% 20462 | 4,793 | 5,260 |
| Commercial Mortgage Trust, Series 2014-UBS2, Class A-1, 1.298% 20472 | 3,825 | 3,811 |
| Colbun SA 6.00% 20206 | 8,150 | 8,993 |
| Transportadora de Gas Peru SA 4.25% 20282,6 | 9,810 | 8,976 |
| CEVA Group PLC, Term Loan B, 6.50% 20212,3,8 | 3,575 | 3,568 |
| CEVA Group PLC 7.00% 20216 | 3,550 | 3,630 |
| CEVA Group PLC 9.00% 20216 | 1,700 | 1,747 |
| PNC Financial Services Group, Inc. 2.854% 2022 | 9,210 | 8,799 |
| Imperial Tobacco Finance PLC 3.50% 20236 | 9,050 | 8,697 |
| Bonds, notes & other debt instruments | | |
| | Principal amount | Value |
| U.S. dollars (continued) | (000) | (000) |
| | | |
| Mediacom LLC and Mediacom Capital Corp. 7.25% 2022 | US$5,000 | US$5,475 |
| Mediacom Broadband LLC and Mediacom Broadband Corp. 6.375% 2023 | 3,000 | 3,195 |
| Colombia (Republic of) Global 4.375% 2021 | 8,300 | 8,653 |
| American Express Co. 1.55% 2018 | 8,750 | 8,601 |
| Freescale Semiconductor, Inc., Term Loan B4, 4.25% 20202,3,8 | 2,750 | 2,762 |
| Freescale Semiconductor, Inc. 6.00% 20226 | 5,450 | 5,797 |
| E.ON International Finance BV 5.80% 20186 | 7,500 | 8,530 |
| Norfolk Southern Corp. 5.75% 2016 | 4,265 | 4,616 |
| Norfolk Southern Corp. 3.00% 2022 | 4,000 | 3,903 |
| McDonald’s Corp. 3.50% 2020 | 8,005 | 8,420 |
| Reynolds American Inc. 4.85% 2023 | 2,480 | 2,603 |
| Reynolds American Inc. 6.15% 2043 | 4,990 | 5,650 |
| Allstate Corp. 3.15% 2023 | 8,360 | 8,230 |
| Progress Energy, Inc. 7.05% 2019 | 4,380 | 5,250 |
| Progress Energy, Inc. 7.75% 2031 | 1,990 | 2,727 |
| United Mexican States Government Global, Series A, 3.625% 2022 | 7,800 | 7,827 |
| NII Capital Corp. 10.00% 2016 | 125 | 52 |
| NII Capital Corp. 7.875% 20196 | 4,150 | 2,843 |
| NII Capital Corp. 8.875% 2019 | 2,625 | 1,188 |
| NII Capital Corp. 11.375% 20196 | 1,600 | 1,136 |
| NII Capital Corp. 7.625% 2021 | 9,000 | 2,565 |
| Enbridge Inc. 4.00% 2023 | 7,750 | 7,782 |
| ABB Finance (USA) Inc. 1.625% 2017 | 3,000 | 3,023 |
| ABB Finance (USA) Inc. 2.875% 2022 | 4,830 | 4,706 |
| UniCredito Italiano SpA 6.00% 20176 | 7,125 | 7,714 |
| Nordea Bank, Series 2, 3.70% 20146 | 5,000 | 5,100 |
| Nordea Bank AB 1.625% 20186 | 2,645 | 2,605 |
| Post Holdings, Inc. 6.75% 20216 | 4,650 | 4,935 |
| Post Holdings, Inc. 7.375% 2022 | 2,500 | 2,700 |
| DBUBS Mortgage Trust, Series 2011-LC1A, Class A1, 3.742% 20462,6 | 4,088 | 4,271 |
| DBUBS Mortgage Trust, Series 2011-LC1A, Class A3, 5.002% 20462,6 | 3,000 | 3,356 |
| inVentiv Health Inc. 9.00% 20186 | 7,000 | 7,455 |
| Banco de Crédito del Perú 5.375% 20206 | 7,000 | 7,446 |
| Roche Holdings, Inc. 7.00% 20396 | 5,290 | 7,413 |
| Ply Gem Industries, Inc., Term Loan B1, 4.00% 20212,3,8 | 3,825 | 3,835 |
| Ply Gem Industries, Inc. 6.50% 20226 | 3,525 | 3,573 |
| NGPL PipeCo LLC 9.625% 20196 | 6,900 | 7,400 |
| Pernod Ricard SA 2.95% 20176 | 2,000 | 2,074 |
| Pernod Ricard SA 4.45% 20226 | 4,945 | 5,181 |
| Orange SA 2.75% 2019 | 4,760 | 4,827 |
| Orange SA 5.50% 2044 | 2,250 | 2,365 |
| ENA Norte Trust 4.95% 20282,6 | 7,024 | 7,107 |
| R.R. Donnelley & Sons Co. 7.875% 2021 | 3,400 | 3,910 |
| R.R. Donnelley & Sons Co. 6.50% 2023 | 3,000 | 3,184 |
| Select Medical Holdings Corp. 6.375% 2021 | 6,910 | 7,048 |
| LightSquared, Term Loan B, 12.00% 20142,4,8,9 | 5,845 | 6,985 |
| BBVA Bancomer SA 4.50% 20166 | 2,975 | 3,161 |
| BBVA Bancomer SA, junior subordinated 7.25% 20206 | 2,010 | 2,234 |
| BBVA Bancomer SA 6.50% 20216 | 1,455 | 1,580 |
| VEB Finance Ltd. 6.902% 20206 | 6,600 | 6,954 |
| EDP Finance BV 6.00% 20186 | 4,000 | 4,350 |
| EDP Finance BV 5.25% 20216 | 2,500 | 2,585 |
| Realogy Corp. 3.375% 20166 | 2,750 | 2,777 |
| Realogy Corp., Letter of Credit, 4.50% 20162,3,8 | 113 | 113 |
| Bonds, notes & other debt instruments | | |
| | Principal amount | Value |
| U.S. dollars (continued) | (000) | (000) |
| | | |
| Realogy Corp. 7.875% 20196 | US$3,725 | US$4,037 |
| ConAgra Foods, Inc. 1.30% 2016 | 2,800 | 2,820 |
| ConAgra Foods, Inc. 3.20% 2023 | 4,210 | 4,029 |
| Baxter International Inc. 1.85% 2018 | 2,995 | 2,982 |
| Baxter International Inc. 3.20% 2023 | 3,875 | 3,788 |
| Fiat SpA, Second Lien, 8.25% 20216 | 5,800 | 6,590 |
| GlaxoSmithKline Capital Inc. 1.50% 2017 | 6,500 | 6,544 |
| Arch Coal, Inc., Term Loan B1, 6.25% 20182,3,8 | 4,477 | 4,423 |
| Arch Coal, Inc. 7.00% 2019 | 2,675 | 2,080 |
| Spectra Energy Partners, LP 4.75% 2024 | 6,090 | 6,430 |
| QGOG Atlantic/Alaskan Rigs Ltd. 5.25% 20192,6 | 6,131 | 6,364 |
| Anadarko Petroleum Corp. 5.95% 2016 | 2,250 | 2,498 |
| Anadarko Petroleum Corp. 8.70% 2019 | 3,000 | 3,808 |
| Carnival Corp. 3.95% 2020 | 6,150 | 6,281 |
| Jaguar Land Rover PLC 8.125% 20216 | 5,500 | 6,270 |
| Pacific Rubiales Energy Corp. 5.375% 20196 | 6,000 | 6,240 |
| ConvaTec Finance International SA 8.25% 20194,6 | 6,020 | 6,216 |
| France Government Agency-Guaranteed, Société Finance 2.875% 20146 | 6,070 | 6,144 |
| LB-UBS Commercial Mortgage Trust, Series 2007-C2, Class A-3, 5.43% 20402 | 2,884 | 3,181 |
| LB-UBS Commercial Mortgage Trust, Series 2007-C6, Class A-M, 6.114% 20402,3 | 460 | 510 |
| LB-UBS Commercial Mortgage Trust, Series 2007-C7, Class A-M, 6.15% 20452,3 | 2,110 | 2,410 |
| Tenet Healthcare Corp. 8.125% 2022 | 5,230 | 5,858 |
| US Investigations Services, Inc., Term Loan B, 5.00% 20152,3,8 | 1,205 | 1,183 |
| US Investigations Services, Inc., Term Loan D, 7.75% 20152,3,8 | 2,086 | 2,063 |
| US Investigations Services, Inc. 10.50% 20156 | 1,900 | 1,760 |
| US Investigations Services, Inc. 11.75% 20166 | 1,035 | 776 |
| Macy’s Retail Holdings, Inc. 7.875% 20153 | 2,857 | 3,103 |
| Macy’s Retail Holdings, Inc. 4.375% 2023 | 2,550 | 2,645 |
| Altice Finco SA 6.50% 20226 | 3,900 | 4,124 |
| Altice Finco SA 8.125% 20246 | 1,475 | 1,597 |
| Gardner Denver, Inc. Term Loan B, 4.25% 20202,3,8 | 5,715 | 5,720 |
| iStar Financial Inc., Term Loan B, 4.50% 20172,3,8 | 536 | 539 |
| iStar Financial Inc. 4.875% 2018 | 5,000 | 5,150 |
| JBS SA 7.75% 20206 | 5,300 | 5,618 |
| Citycenter, Term Loan B, 5.00% 20202,3,8 | 5,561 | 5,614 |
| Merrill Lynch Mortgage Trust, Series 2004-BPC1, Class A-5, 4.855% 20412,3 | 3,386 | 3,412 |
| Merrill Lynch Mortgage Trust, Series 2007-C1, Class A-4, 5.841% 20502,3 | 1,950 | 2,173 |
| United Rentals, Inc. 7.375% 2020 | 5,000 | 5,544 |
| Cequel Communications Holdings I, LLC and Cequel Capital Corp. 6.375% 20206 | 5,200 | 5,460 |
| VPI Escrow Corp. 6.375% 20206 | 1,475 | 1,600 |
| VPI Escrow Corp. 7.50% 20216 | 3,410 | 3,853 |
| Devon Energy Corp. 2.25% 2018 | 520 | 518 |
| Devon Energy Corp. 3.25% 2022 | 4,985 | 4,919 |
| Caesars Entertainment Operating Co. 9.00% 2020 | 3,975 | 3,587 |
| Caesars Entertainment Operating Co. 9.00% 2020 | 2,025 | 1,828 |
| Morgan Stanley Capital I Trust, Series 2006-IQ12, Class A1A, 5.319% 20432 | 3,716 | 4,062 |
| Morgan Stanley Capital I Trust, Series 2007-IQ13, Class A-M, 5.406% 20442 | 965 | 1,053 |
| Morgan Stanley Capital I Trust, Series 2007-IQ15, Class A-4, 5.908% 20492,3 | 266 | 297 |
| Samson Investment Co. 10.50% 20206 | 4,915 | 5,382 |
| SRA International, Inc., Term Loan B, 6.50% 20182,3,8 | 5,333 | 5,359 |
| QGOG Constellation SA 6.25% 20196 | 5,350 | 5,357 |
| Exxon Mobil Corp. 1.819% 2019 | 3,500 | 3,480 |
| Exxon Mobil Corp. 3.176% 2024 | 1,850 | 1,848 |
| Slovakia Government 4.375% 20226 | 5,000 | 5,316 |
| Bonds, notes & other debt instruments | | |
| | Principal amount | Value |
| U.S. dollars (continued) | (000) | (000) |
| | | |
| Puget Sound Energy, Inc., First Lien, 6.50% 2020 | US$1,475 | US$1,723 |
| Puget Sound Energy, Inc., First Lien, 6.00% 2021 | 1,095 | 1,264 |
| Puget Sound Energy, Inc., First Lien, 5.625% 2022 | 2,040 | 2,329 |
| Coca-Cola Co. 3.20% 2023 | 5,370 | 5,292 |
| PDC Energy Inc. 7.75% 2022 | 4,750 | 5,225 |
| Toronto-Dominion Bank 2.375% 2016 | 5,000 | 5,188 |
| HCA Inc. 5.00% 2024 | 5,100 | 5,122 |
| BNP Paribas 5.00% 2021 | 1,500 | 1,667 |
| BNP Paribas, junior subordinated 7.195% (undated)3,6 | 3,200 | 3,432 |
| Wind Acquisition SA 11.75% 20176 | 2,750 | 2,901 |
| Wind Acquisition SA 7.25% 20186 | 2,050 | 2,173 |
| Target Corp. 6.00% 2018 | 4,375 | 5,041 |
| Marks and Spencer Group PLC 6.25% 20176 | 4,500 | 5,035 |
| Nigeria (Republic of) 5.125% 20186 | 3,400 | 3,486 |
| Nigeria (Republic of) 6.375% 20236 | 1,425 | 1,477 |
| JMC Steel Group Inc. 8.25% 20186 | 4,800 | 4,926 |
| Michaels Stores, Inc. 7.50% 20183,4,6 | 1,700 | 1,760 |
| Michaels Stores, Inc. 7.75% 2018 | 2,900 | 3,114 |
| Schering-Plough Corp. 6.00% 2017 | 3,275 | 3,774 |
| Merck & Co., Inc. 2.80% 2023 | 1,100 | 1,047 |
| Needle Merger Sub Corp. 8.125% 20196 | 4,565 | 4,759 |
| Alexandria Real Estate Equities, Inc. 3.90% 2023 | 4,900 | 4,742 |
| New Zealand Government Agency-Guaranteed, Westpac Securities Co. 3.45% 20146 | 4,655 | 4,702 |
| Corporate Office Properties Trust 3.60% 2023 | 5,065 | 4,692 |
| Bear Stearns Commercial Mortgage Securities Trust, Series 2007-PW17, Class A-4, 5.694% 20502,3 | 1,750 | 1,960 |
| Bear Stearns Commercial Mortgage Securities Trust, Series 2007-PW18, Class A-M, 6.084% 20502,3 | 2,375 | 2,697 |
| Regions Financial Corp. 7.75% 2014 | 103 | 107 |
| Regions Financial Corp., Series A-I, 5.20% 2015 | 200 | 208 |
| Regions Financial Corp. 5.75% 2015 | 295 | 311 |
| Regions Financial Corp. 2.00% 2018 | 4,100 | 4,023 |
| Royal Bank of Scotland PLC 4.375% 2016 | 3,000 | 3,191 |
| Royal Bank of Scotland PLC 5.625% 2020 | 1,195 | 1,352 |
| CRC Health Corp, Term Loan, 5.25% 20212,3,8 | 2,200 | 2,217 |
| CRC Health Corp, Term Loan B, 9.00% 20212,3,8 | 2,300 | 2,310 |
| Dominican Republic 7.50% 20212,6 | 4,000 | 4,480 |
| Univision Communications Inc., Term Loan C3, 4.00% 20202,3,8 | 566 | 570 |
| Univision Communications Inc. 8.50% 20216 | 3,500 | 3,894 |
| PTT Exploration & Production Ltd. 5.692% 20216 | 4,045 | 4,446 |
| Builders Firstsource 7.625% 20216 | 4,075 | 4,421 |
| CoBank, ACB 7.875% 20186 | 430 | 515 |
| CoBank, ACB 0.833% 20223,6 | 4,275 | 3,901 |
| Export-Import Bank of Korea 4.375% 2021 | 4,000 | 4,304 |
| McClatchy Co. 9.00% 2022 | 3,650 | 4,266 |
| Alcatel-Lucent USA Inc. 4.625% 20176 | 2,075 | 2,142 |
| Alcatel-Lucent USA Inc. 6.75% 20206 | 800 | 850 |
| Alcatel-Lucent USA Inc. 8.875% 20206 | 1,075 | 1,226 |
| AvalonBay Communities, Inc. 3.625% 2020 | 1,450 | 1,494 |
| AvalonBay Communities, Inc. 2.85% 2023 | 2,875 | 2,701 |
| Royal Bank of Canada 1.50% 2018 | 4,150 | 4,120 |
| Credit Suisse Group AG 4.375% 2020 | 3,760 | 4,068 |
| Unum Group 5.625% 2020 | 3,600 | 4,058 |
| Stater Bros. Holdings Inc. 7.75% 2015 | 4,025 | 4,045 |
| Simon Property Group, LP 10.35% 2019 | 2,975 | 4,031 |
| Bonds, notes & other debt instruments | | |
| | Principal amount | Value |
| U.S. dollars (continued) | (000) | (000) |
| | | |
| Kindred Healthcare Inc., Term Loan B, 4.00% 20212,3,8 | US$4,000 | US$4,020 |
| Intercontinentalexchange, Inc. 4.00% 2023 | 3,860 | 4,013 |
| DJO Finance LLC 9.75% 2017 | 1,095 | 1,166 |
| DJO Finance LLC 7.75% 2018 | 910 | 962 |
| DJO Finance LLC 8.75% 2018 | 425 | 464 |
| DJO Finance LLC 9.875% 2018 | 1,215 | 1,330 |
| Teekay Corp. 8.50% 2020 | 3,400 | 3,885 |
| Philip Morris International Inc. 1.875% 2019 | 3,925 | 3,880 |
| Chevron Corp. 1.718% 2018 | 1,010 | 1,008 |
| Chevron Corp. 3.191% 2023 | 2,900 | 2,871 |
| Pacific Gas and Electric Co. 3.25% 2023 | 2,565 | 2,486 |
| Pacific Gas and Electric Co. 3.85% 2023 | 1,335 | 1,349 |
| State of Qatar 4.50% 20226 | 3,500 | 3,824 |
| Samsung Electronics America, Inc. 1.75% 20176 | 3,800 | 3,811 |
| Consolidated Edison Company of New York, Inc. 4.45% 2044 | 3,775 | 3,756 |
| EnLink Midstream Partners, LP 2.70% 2019 | 495 | 497 |
| EnLink Midstream Partners, LP 4.40% 2024 | 975 | 996 |
| EnLink Midstream Partners, LP 5.60% 2044 | 2,100 | 2,226 |
| Banco Mercantil del Norte, SA, junior subordinated 6.862% 20213,6 | 3,500 | 3,705 |
| Playa Resorts Holding BV, Term Loan B, 4.00% 20192,3,8 | 721 | 726 |
| Playa Resorts Holding BV 8.00% 20206 | 2,725 | 2,957 |
| Warner Music Group 6.75% 20226 | 3,550 | 3,590 |
| TransDigm Inc. 7.75% 2018 | 2,750 | 2,963 |
| TransDigm Inc. 5.50% 2020 | 600 | 614 |
| Comision Federal de Electricidad 4.875% 20246 | 3,500 | 3,561 |
| CenterPoint Energy Resources Corp. 4.50% 2021 | 3,225 | 3,489 |
| Continental Airlines, Inc., Series 1997-4, Class A, 6.90% 20192 | 601 | 651 |
| Continental Airlines, Inc., Series 1999-1, Class A, 6.545% 20202 | 189 | 210 |
| Continental Airlines, Inc., Series 2000-2, Class A-1, 7.707% 20222 | 2,298 | 2,624 |
| Veolia Environnement 6.00% 2018 | 1,500 | 1,700 |
| Veolia Environnement 6.75% 2038 | 1,500 | 1,776 |
| Iron Mountain Inc. 5.75% 2024 | 3,550 | 3,475 |
| QBE Insurance Group Ltd. 2.40% 20186 | 3,500 | 3,427 |
| Kraft Foods Inc. 2.25% 2017 | 1,590 | 1,631 |
| Kraft Foods Inc. 5.375% 2020 | 1,570 | 1,793 |
| South Korean Government 5.75% 2014 | 3,400 | 3,405 |
| Patheon Inc., Term Loan B, 4.25% 20212,3,8 | 2,890 | 2,880 |
| Patheon Inc. 7.50% 20226 | 445 | 460 |
| Nortek Inc. 10.00% 2018 | 2,050 | 2,260 |
| Nortek Inc. 8.50% 2021 | 950 | 1,066 |
| Teco Finance, Inc. 4.00% 2016 | 20 | 21 |
| Teco Finance, Inc. 5.15% 2020 | 270 | 299 |
| Tampa Electric Co. 4.10% 2042 | 3,140 | 2,998 |
| Brandywine Operating Partnership, LP 5.40% 2014 | 2,500 | 2,563 |
| Brandywine Operating Partnership, LP 5.70% 2017 | 15 | 17 |
| Brandywine Operating Partnership, LP 3.95% 2023 | 750 | 738 |
| Academy Sports 9.25% 20196 | 3,000 | 3,289 |
| ACE INA Holdings Inc. 5.875% 2014 | 1,510 | 1,526 |
| ACE INA Holdings Inc. 2.60% 2015 | 1,625 | 1,674 |
| Associated Materials, LLC and AMH New Finance, Inc. 9.125% 2017 | 3,000 | 3,173 |
| Silver II Borrower S.C.A./Silver II U.S. Holdings, LLC 7.75% 20206 | 2,915 | 3,155 |
| Thermo Fisher Scientific Inc. 4.15% 2024 | 3,030 | 3,124 |
| U.S. Coatings Acquisition Inc. (Flash Dutch 2 BV) 7.375% 20216 | 2,840 | 3,103 |
| Bonds, notes & other debt instruments | | |
| | Principal amount | Value |
| U.S. dollars (continued) | (000) | (000) |
| | | |
| Viacom Inc. 5.85% 2043 | US$2,675 | US$2,950 |
| LSB Industries, Inc. 7.75% 20196 | 2,735 | 2,947 |
| American Electric Power Co. 1.65% 2017 | 2,960 | 2,944 |
| Catalent Pharma Solutions Inc., Term Loan, 6.50% 20172,3,8 | 2,810 | 2,850 |
| Hughes Satellite Systems Corp. 7.625% 2021 | 2,500 | 2,831 |
| UDR, Inc., Series A, 5.25% 2015 | 2,680 | 2,773 |
| FMG Resources 8.25% 20196 | 2,500 | 2,759 |
| Petrobras International Finance Co. 5.375% 2021 | 695 | 706 |
| Petrobras Global Finance Co. 6.25% 2024 | 900 | 930 |
| Petrobras International Finance Co. 6.75% 2041 | 1,000 | 974 |
| Petrobras Global Finance Co. 5.625% 2043 | 175 | 149 |
| Schlumberger Investment SA 3.65% 2023 | 2,660 | 2,704 |
| DCT Industrial Trust Inc. 4.50% 20236 | 2,700 | 2,698 |
| Essex Portfolio L.P. 3.25% 2023 | 2,870 | 2,695 |
| UnitedHealth Group Inc. 2.875% 2023 | 2,825 | 2,685 |
| Toys “R” Us-Delaware, Inc. 7.375% 20166 | 2,000 | 1,865 |
| Toys “R” Us-Delaware, Inc., Term Loan B2, 5.25% 20182,3,8 | 958 | 804 |
| WellPoint, Inc. 2.30% 2018 | 2,645 | 2,656 |
| PRA Holdings, Inc. 9.50% 20236 | 2,335 | 2,583 |
| CenterPoint Energy Transition Bond Co. III, LLC, Series 2008, Class A-2, 5.234% 20232 | 2,225 | 2,529 |
| Cumulus Media Inc., Term Loan B, 4.25% 20202,3,8 | 2,493 | 2,516 |
| Denbury Resources Inc. 8.25% 2020 | 2,292 | 2,504 |
| Genworth Holdings, Inc. 4.90% 2023 | 2,300 | 2,417 |
| Schaeffler Holding Finance BV 6.875% 20183,4,6 | 2,225 | 2,378 |
| Serena Software, Inc. 10.375% 2016 | 2,356 | 2,374 |
| Enterprise Products Operating LLC 3.90% 2024 | 1,980 | 1,995 |
| Enterprise Products Operating LLC 4.85% 2044 | 300 | 300 |
| WM. Wrigley Jr. Co 3.375% 20206 | 2,215 | 2,240 |
| American Campus Communities, Inc. 3.75% 2023 | 2,340 | 2,236 |
| Delhaize Group 5.70% 2040 | 2,129 | 2,173 |
| Del Monte Corp. 7.625% 2019 | 2,077 | 2,167 |
| AES Panamá, SA 6.35% 20166 | 2,000 | 2,163 |
| CEC Entertainment, Inc. 8.00% 20226 | 2,075 | 2,158 |
| Canadian Natural Resources Ltd. 5.70% 2017 | 1,500 | 1,690 |
| Canadian Natural Resources Ltd. 3.80% 2024 | 425 | 428 |
| Development Bank of Kazakhstan 5.50% 20156 | 1,984 | 2,078 |
| CNA Financial Corp. 7.35% 2019 | 1,200 | 1,474 |
| CNA Financial Corp. 3.95% 2024 | 585 | 589 |
| Walter Energy, Inc. 9.50% 20196 | 2,000 | 2,043 |
| Goodman Funding Pty Ltd. 6.375% 20206 | 1,760 | 2,003 |
| CME Group Inc. 5.30% 2043 | 1,733 | 1,947 |
| International Paper Co. 7.30% 2039 | 1,410 | 1,846 |
| IMS Health Inc. 7.375% 20184,6 | 1,775 | 1,811 |
| Berkshire Hathaway Inc. 2.00% 2018 | 1,785 | 1,798 |
| Milacron LLC 7.75% 20216 | 1,650 | 1,790 |
| Leucadia National Corp. 5.50% 2023 | 1,685 | 1,759 |
| Cenovus Energy Inc. 3.00% 2022 | 1,312 | 1,258 |
| Cenovus Energy Inc. 3.80% 2023 | 500 | 499 |
| Community Health Systems, Inc., Term Loan D1, 4.25% 20212,3,8 | 1,736 | 1,752 |
| TRAC Intermodal 11.00% 2019 | 1,525 | 1,746 |
| Venezuela (Republic of) 9.25% 2027 | 2,315 | 1,736 |
| SABMiller Holdings Inc. 4.95% 20426 | 1,645 | 1,729 |
| Ecopetrol SA 7.625% 2019 | 275 | 331 |
| Ecopetrol SA 5.875% 2023 | 1,250 | 1,369 |
| Bonds, notes & other debt instruments | | |
| | Principal amount | Value |
| U.S. dollars (continued) | (000) | (000) |
| | | |
| Newcrest Finance Pty Ltd. 4.45% 20216 | US$1,890 | US$ 1,695 |
| HBOS PLC 6.75% 20186 | 1,490 | 1,692 |
| Sabine Pass Liquefaction, LLC 5.625% 2021 | 1,600 | 1,658 |
| TNK-BP Finance SA 7.50% 20166 | 1,500 | 1,631 |
| Alpha Natural Resources, Inc. 6.00% 2019 | 2,050 | 1,584 |
| CNOOC Finance (2013) Ltd. 3.00% 2023 | 1,600 | 1,451 |
| Rosetta Resources Inc. 5.625% 2021 | 1,350 | 1,387 |
| Western Gas Partners LP 2.60% 2018 | 130 | 131 |
| Western Gas Partners LP 4.00% 2022 | 1,250 | 1,241 |
| Endo Pharmaceuticals Holdings Inc. 5.75% 20226 | 1,315 | 1,351 |
| Diamond Offshore Drilling, Inc. 4.875% 2043 | 1,350 | 1,322 |
| Husky Energy Inc. 5.90% 2014 | 1,300 | 1,314 |
| Amgen Inc. 2.50% 2016 | 1,205 | 1,246 |
| News America Inc. 5.40% 2043 | 1,150 | 1,243 |
| Kroger Co. 6.80% 2018 | 1,000 | 1,189 |
| DISH DBS Corp. 4.625% 2017 | 1,100 | 1,174 |
| Piedmont Operating Partnership LP 3.40% 2023 | 1,250 | 1,160 |
| TitleMax Finance Corp. 8.50% 20186 | 1,050 | 1,155 |
| Odebrecht Finance Ltd 7.125% 20426 | 1,135 | 1,112 |
| Marfrig Holdings (Europe) BV 8.375% 2018 | 800 | 802 |
| Marfrig Overseas Ltd. 9.50% 20206 | 180 | 182 |
| Marfrig Overseas Ltd. 9.50% 2020 | 100 | 101 |
| Teve Pharmaceutical Finance Company BV, 2.95% 2022 | 1,145 | 1,066 |
| Vodafone Group PLC 2.50% 2022 | 1,136 | 1,042 |
| ML-CFC Commercial Mortgage Trust, Series 2007-8, Class A-3, 5.894% 20492,3 | 890 | 996 |
| Grifols Worldwide Operations Ltd. 5.25% 20226 | 950 | 974 |
| Modular Space Corp., Second Lien, 10.25% 20196 | 825 | 860 |
| Northwest Airlines, Inc., Term Loan A, 1.99% 20182,3,8 | 734 | 683 |
| Crescent Resources 10.25% 20176 | 475 | 536 |
| Time Warner Cable Inc. 4.00% 2021 | 500 | 520 |
| Navios Maritime Holdings Inc. and Navios Maritime Finance II (US) Inc. 8.125% 2019 | 500 | 508 |
| Santander Issuances, SA Unipersonal 6.50% 20193,6 | 400 | 402 |
| Iraq (Republic of) 5.80% 20282,6 | 250 | 222 |
| Hawker Beechcraft Acquisition Co., LLC, Letter of Credit, 0.009% 20142,3,8 | 49 | 26 |
| | | 5,557,976 |
| Total bonds, notes & other debt instruments (cost: $11,728,273,000) | | 12,036,332 |
| Convertible securities 0.02% | | |
| | | |
| U.S. dollars 0.01% | Shares | |
| | | |
| CEVA Group PLC, Series A-2, 2.226% convertible preferred10,11 | 1,141 | 1,455 |
| Miscellaneous 0.01% | | |
| | | |
| Other convertible securities in initial period of acquisition | | 1,221 |
| Total convertible securities (cost: $2,416,000) | | 2,676 |
| Preferred securities 0.04% | | |
| | | Value |
| U.S. dollars 0.01% | Shares | (000) |
| | | |
| Goldman Sachs Group, Inc., Series J, 5.50% depositary shares | 51,450 | US$ 1,231 |
| Miscellaneous 0.03% | | |
| | | |
| Other preferred securities in initial period of acquisition | | 3,433 |
| Total preferred securities (cost: $4,648,000) | | 4,664 |
| Common stocks 0.01% | | |
| | | |
| U.S. dollars 0.01% | | |
| | | |
| CEVA Group PLC6,10,12 | 527 | 672 |
| Atrium Corp.6,10,12 | 191 | — |
| Total common stocks (cost: $736,000) | | 672 |
| | Principal amount | |
| Short-term securities 4.83% | (000) | |
| | | |
| Freddie Mac 0.09%–0.17% due 5/2–10/23/2014 | US$147,300 | 147,242 |
| Federal Home Loan Bank 0.06%–0.065% due 4/11–6/25/2014 | 106,600 | 106,592 |
| Fannie Mae 0.13% due 6/2/2014 | 50,000 | 49,995 |
| Toronto-Dominion Holdings USA Inc. 0.16% due 6/20/20146 | 50,000 | 49,984 |
| Sumitomo Mitsui Banking Corp. 0.20% due 6/10/20146 | 50,000 | 49,980 |
| Victory Receivables Corp. 0.05%–0.16% due 4/1–5/28/20146 | 48,950 | 48,945 |
| Société Générale North America, Inc. 0.18% due 5/5/2014 | 42,600 | 42,593 |
| BNP Paribas Finance Inc. 0.07% due 4/1/2014 | 41,900 | 41,900 |
| Chevron Corp. 0.10% due 5/13/20146 | 23,100 | 23,096 |
| GlaxoSmithKline Finance PLC 0.11% due 5/20/20146 | 23,100 | 23,094 |
| Nordea Bank AB 0.165% due 6/16/20146 | 20,000 | 19,993 |
| Australia & New Zealand Banking Group, Ltd. 0.14% due 5/7/20146 | 13,200 | 13,198 |
| Total short-term securities (cost: $616,601,000) | | 616,612 |
| Total investment securities (cost: $12,352,674,000) | | 12,660,956 |
| Other assets less liabilities | | 92,191 |
| Net assets | | $12,753,147 |
As permitted by U.S. Securities and Exchange Commission regulations, “Miscellaneous” securities include holdings in their first year of acquisition that have not previously been publicly disclosed.
Investments are not FDIC-insured, nor are they deposits of or guaranteed by a bank or any other entity, so they may lose value.
Investors should carefully consider investment objectives, risks, charges and expenses. This and other important information is contained in the fund prospectus and summary prospectus, which can be obtained from your financial professional and should be read carefully before investing. You may also call American Funds Service Company (AFS) at (800) 421-4225 or visit the American Funds website at americanfunds.com.
ITEM 7 – Disclosure of Proxy Voting Policies and Procedures for Closed-End Management Investment Companies
Not applicable to this Registrant, insofar as the Registrant is not a closed-end management investment company.
Not applicable to this Registrant, insofar as the Registrant is not a closed-end management investment company.
ITEM 9 – Purchases of Equity Securities by Closed-End Management Investment Company and Affiliated Purchasers
Not applicable to this Registrant, insofar as the Registrant is not a closed-end management investment company.
There have been no material changes to the procedures by which shareholders may recommend nominees to the Registrant’s board of trustees since the Registrant last submitted a proxy statement to its shareholders. The procedures are as follows. The Registrant has a nominating and governance committee comprised solely of persons who are not considered ‘‘interested persons’’ of the Registrant within the meaning of the Investment Company Act of 1940, as amended. The committee periodically reviews such issues as the board’s composition, responsibilities, committees, compensation and other relevant issues, and recommends any appropriate changes to the full board of trustees. While the committee normally is able to identify from its own resources an ample number of qualified candidates, it will consider shareholder suggestions of persons to be considered as nominees to fill future vacancies on the board. Such suggestions must be sent in writing to the nominating and governance committee of the Registrant, c/o the Registrant’s Secretary, and must be accompanied by complete biographical and occupational data on the prospective nominee, along with a written consent of the prospective nominee for consideration of his or her name by the nominating and governance committee.
Pursuant to the requirements of the Securities Exchange Act of 1934 and the Investment Company Act of 1940, the Registrant has duly caused this report to be signed on its behalf by the undersigned, thereunto duly authorized.
Pursuant to the requirements of the Securities Exchange Act of 1934 and the Investment Company Act of 1940, this report has been signed below by the following persons on behalf of the Registrant and in the capacities and on the dates indicated.