UNITED STATES
SECURITIES AND EXCHANGE COMMISSION
Washington, D.C. 20549
FORM N-CSR
Certified Shareholder Report of
Registered Management Investment Companies
Investment Company Act File Number: 811-05104
Capital World Bond Fund
(Exact Name of Registrant as Specified in Charter)
333 South Hope Street
Los Angeles, California 90071
(Address of Principal Executive Offices)
Registrant's telephone number, including area code: (213) 486-9200
Date of fiscal year end: September 30
Date of reporting period: March 31, 2015
Steven I. Koszalka
Capital World Bond Fund
333 South Hope Street
Los Angeles, California 90071
(Name and Address of Agent for Service)
Copies to:
Michael Glazer
Morgan, Lewis & Bockius LLP
355 South Grand Avenue, Suite 4400
Los Angeles, California 90071
(Counsel for the Registrant)
ITEM 1 – Reports to Stockholders

| |  | | Capital World Bond Fund®
Semi-annual report
for the six months ended
March 31, 2015 |
Capital World Bond Fund seeks to maximize long-term total return, consistent with prudent management, by investing primarily in a global portfolio of investment-grade bonds denominated in U.S. dollars and other currencies. The fund may also invest in lower quality, high-yield debt securities.
This fund is one of more than 40 offered by one of the nation’s largest mutual fund families, American Funds, from Capital Group. For more than 80 years, Capital has invested with a long-term focus based on thorough research and attention to risk.
Fund results shown in this report, unless otherwise indicated, are for Class A shares at net asset value. If a sales charge (maximum 3.75%) had been deducted, the results would have been lower. Results are for past periods and are not predictive of results for future periods. Current and future results may be lower or higher than those shown. Share prices and returns will vary, so investors may lose money. Investing for short periods makes losses more likely. Investments are not FDIC-insured, nor are they deposits of or guaranteed by a bank or any other entity, so they may lose value. For current information and month-end results, visit americanfunds.com.
Here are the average annual total returns on a $1,000 investment with all distributions reinvested for periods ended March 31, 2015:
| Class A shares | | 1 year | | | 5 years | | | 10 years | |
| | | | | | | | | | |
| Reflecting 3.75% maximum sales charge | | | –5.39% | | | | 1.94% | | | | 3.56% | |
For other share class results, visit americanfunds.com and americanfundsretirement.com.
The total annual fund operating expense ratio was 0.90% for Class A shares as of the prospectus dated December 1, 2014.
Investment results assume all distributions are reinvested and reflect applicable fees and expenses. When applicable, investment results reflect fee waivers, without which results would have been lower. Visit americanfunds.com for more information.
The return of principal for bond funds and for funds with significant underlying bond holdings is not guaranteed. Fund shares are subject to the same interest rate, inflation and credit risks associated with the underlying bond holdings. High-yield and lower rated bonds are subject to greater fluctuations in value and risk of loss of income and principal than investment-grade and higher rated bonds. Bond ratings, which typically range from AAA/Aaa (highest) to D (lowest), are assigned by credit rating agencies such as Standard & Poor’s, Moody’s and/or Fitch as an indication of an issuer’s creditworthiness. Investing in bonds issued outside the U.S. may be subject to additional risks. They include currency fluctuations, political and social instability, differing securities regulations and accounting standards, higher transaction costs, possible changes in taxation, illiquidity and price volatility. These risks may be heightened in connection with investments in developing countries. Refer to the fund prospectus and the Risk Factors section of this report for more information on these and other risks associated with investing in the fund.

Fellow investors:
During the first half of Capital World Bond Fund’s fiscal year, bond yields (which move inversely to prices) generally declined amid uneven global economic growth and large-scale bond buying by central banks in Japan and the euro zone. Most currencies weakened substantially against the U.S. dollar as the recovery in the U.S. continued, taking a heavy toll on total returns for dollar-based investors in many bond markets.
Even so, active management of currency exposures helped the fund to outpace the broader market. The fund declined 1.66% for the six months ended March 31, 2015, a period during which the unmanaged Barclays Global Aggregate Index recorded a loss of 2.94%. Lower exposure to the euro, which declined about 15% against the U.S. dollar, was particularly helpful. Strong bond selection — including investments in U.S. corporate bonds — also contributed to
Results at a glance
For periods ended March 31, 2015, with all distributions reinvested
| | | Cumulative total returns | | Average annual total returns |
| | | 6 months | | 1 year | | 5 years | | 10 years | | Lifetime1 |
| | | | | | | | | | | |
| Capital World Bond Fund (Class A shares) | | | –1.66 | % | | | –1.71 | % | | | 2.72 | % | | | 3.96 | % | | | 6.53 | % |
| Barclays Global Aggregate Index2 | | | –2.94 | | | | –3.66 | | | | 2.31 | | | | 3.61 | | | | 6.39 | |
| Lipper Global Income Funds Index | | | –0.45 | | | | 0.53 | | | | 3.83 | | | | 4.36 | | | | — | 3 |
| 1 | Since August 4, 1987. |
| 2 | The Barclays Global Aggregate Index began on December 31, 1989. For the period August 4, 1987, to December 31, 1989, the Citigroup World Government Bond Index was used. The indexes are unmanaged and, therefore, have no expenses. Investors cannot invest directly in an index. |
| 3 | This index did not exist prior to December 30, 1988. |
the fund’s relative result, as did investments in European government bonds (after currency hedging).
The Lipper Global Income Funds Index, a peer group measure, declined 0.45% for the same period. It’s important to note that, as a fund category, Global Income includes a broad spectrum of funds, with significant variation in terms of objectives and risk-return profiles. In what has been an occasionally challenging environment, this fund has maintained its disciplined approach to investing which is designed to deliver a consistently high level of relative return to fund investors over time. For longer term results see the table on the previous page.
A capital gain of 28 cents a share was paid in December, and fund investors also received dividends totaling just below 17 cents a share. Those investors who reinvested their dividends earned an income return of 0.81%, about the same as those who took their dividends in cash. We decided that lower dividends were necessary this year in light of the dollar’s unusually rapid appreciation at a time when yields among the fund’s holdings were declining. If, as we expect, the global recovery gains speed toward year-end, bond yields are likely to gradually rise and this should give us more latitude to increase the dividend.
United States
Economic data was mostly solid over the period and the U.S. maintained a steady pace of growth. By February 2015, the unemployment rate had fallen to 5.5% — the lowest level since 2008. Still, having earlier cited sluggish wage growth and low inflation as concerns, Federal Reserve Chair Janet Yellen reiterated in March that the central bank would proceed slowly in hiking rates. Bonds rallied, with investors favoring U.S. issues for their relative value as yields in Europe and Japan hit record lows. Though inflation remained weak, Treasury Inflation-Protected Securities (TIPS) notched a 1.40% gain. U.S. investment-grade (rated BBB/Baa and above) corporate bonds generated a 4.12% total return. High-yield (rated BB/Ba and below) corporates gained 1.49%, but were volatile; plummeting oil prices prompted a sell-off of energy-related issuers’ bonds earlier in the period.
Portfolio managers significantly increased fund investments in Treasuries because of relatively attractive valuations. We also added to holdings of TIPS, and increased investments in corporate issues from, among others, the health care, pharmaceuticals and energy sectors. Excluding cash, U.S.-dollar denominated debt accounted for 57.3% of the fund’s portfolio, before currency hedging.
Europe
Investor optimism was bolstered by the start of the European Central Bank’s (ECB) €60-billion-a-month bond-buying initiative, which is designed to encourage
lending and stimulate economic growth and inflation. Recently, signs of a brighter outlook emerged in the form of accelerating retail sales, rising export activity and improved credit availability for businesses and households. As of March 31, the yield on Germany’s benchmark 10-year bund stood at 0.18%, and short-term yields had turned negative in several other European markets following interest rate cuts.
Investments in euro-zone bonds amounted to 15.6% of the fund’s portfolio (before currency hedging) at the end of the period. Government issues from Spain, Ireland, Italy and Germany were among the larger holdings. Mindful of the possibility of further depreciation of euro-zone currency (as the ECB, in effect, pumps hundreds of billions of euros into the financial system), portfolio managers decreased the fund’s exposure to the euro.
Other developed markets
In the final quarter of calendar year 2014, the Japanese economy exited a recession sparked by the earlier sales tax hike in April. Amid recent signs of a tepid recovery and fading hopes of achieving its 2% inflation target, the Bank of Japan left its stimulus program unchanged. The fund’s smaller investment in Japanese government bonds compared to the market index helped its six-month result (as did its relatively low exposure to the yen, which weakened by 8.53% versus the U.S. dollar). The fund’s exposure to Japan remains meaningful in absolute terms: 4.4%, before currency hedging.
Developing markets
Dollar-denominated markets generally advanced, while currency weakness pushed many local currency markets into loss. More broadly, commodity price weakness continued to dim the economic outlook for net exporters, while certain markets appeared to benefit from a search for yield as the ECB commenced its bond-buying program. As of March 31, 2015, developing-country bonds amounted to 20.1% of the portfolio (before currency hedging). Investments in government issues from Hungary, Poland, Mexico and India were among the largest exposures.
Looking ahead
Substantial appreciation of the dollar has been a major factor in the recent investment environment. Though dollar strength may continue in coming years, the magnitude of the recent moves suggests any further appreciation could be more limited in nature. In coming months, Greece’s ability to service its debt is a source of potential volatility for European currencies and bond markets. Over time, however, we believe that the ECB’s commitment to buy up to €1.1 trillion of bonds will foster stability. Indeed, the dollar may even reverse course for a period — if
growth accelerates due to extraordinary central bank policies in the euro zone and Japan.
Across the globe, we are seeing some attractive value in currencies and bonds. And even if bond yields trend higher in the U.S. or elsewhere, this fund has the flexibility to confront that challenge. The fund can, for example, invest more heavily in shorter maturity bonds, inflation-linked bonds and other types of issues whose values tend to be more resilient amid rising interest rates. Consistent with investment guidelines, we are also able to make selective use of swaps to adjust the interest-rate sensitivity of portfolio holdings.
Finally, we are very pleased to welcome London-based Mark Brett to the portfolio manager lineup. The fund has benefitted greatly from Mark’s currency analysis over the last two decades, and we are excited that the fund will now more directly reap the benefit of his 36 years of investment experience. At the same time, we’d like to take this opportunity to thank portfolio manager Mark Dalzell, who has retired, for his many years of service to this fund and its investors.
Thank you for your continued support. We look forward to reporting to you again in six months.
Cordially,

Thomas H. Høgh
President
May 11, 2015
For current information about the fund, visit americanfunds.com.
The fund’s 30-day yield for Class A shares as of April 30, 2015, calculated in accordance with the U.S. Securities and Exchange Commission (SEC) formula, was 1.62%. The fund’s 12-month distribution rate for Class A shares as of that date was 1.17%. Both reflect the 3.75% maximum sales charge. The SEC yield reflects the rate at which the fund is earning income on its current portfolio of securities, while the distribution rate reflects the fund’s past dividends paid to shareholders. Accordingly, the fund’s SEC yield and distribution rate may differ.
| Portfolio summary March 31, 2015 | unaudited |
| Portfolio by type of security | Percent of net assets |
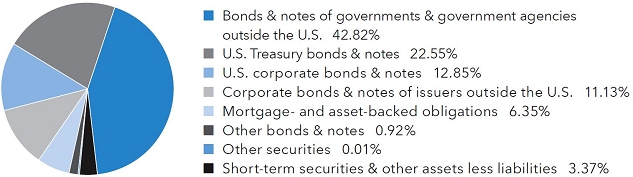
Bonds & notes of governments &
government agencies outside the U.S. | | | | | Percent of net assets |
| Euro zone*: | | | | | | | | |
| Spain | | | 3.86 | % | | | | |
| Ireland | | | 2.85 | | | | | |
| Italy | | | 2.23 | | | | | |
| Germany | | | 1.60 | | | | | |
| Slovenia | | | 0.85 | | | | | |
| Netherlands | | | 0.58 | | | | | |
| France | | | 0.53 | | | | | |
| Latvia | | | 0.08 | | | | 12.58 | % |
| Japan | | | | | | | 4.33 | |
| Hungary | | | | | | | 4.22 | |
| United Kingdom | | | | | | | 3.92 | |
| Mexico | | | | | | | 3.85 | |
| Poland | | | | | | | 2.21 | |
| India | | | | | | | 1.99 | |
| Norway | | | | | | | 1.72 | |
| Colombia | | | | | | | 1.41 | |
| Indonesia | | | | | | | 1.28 | |
| Other | | | | | | | 5.31 | |
| | | | | | | | 42.82 | % |
| * | Countries using the euro as a common currency: Austria, Belgium, Cyprus, Estonia, Finland, France, Germany, Greece, Ireland, Italy, Latvia, Lithuania, Luxembourg, Malta, the Netherlands, Portugal, Slovakia, Slovenia and Spain. |
Where the fund’s assets are invested … and how those markets have done over the past six months as of March 31, 2015.
| | | Capital World Bond Fund | | Bond market total returns1
six months ended
March 31, 2015 |
| Currency weighting by country | | Before
forward
contracts | | After
forward
contracts | | In local
currency | | In U.S.
dollars |
| United States2 | | | 57.3 | % | | | 53.2 | % | | | 3.3 | % | | | 3.3 | % |
| EMU3 | | | 15.6 | | | | 14.6 | | | | 5.5 | | | | –10.3 | |
| United Kingdom | | | 4.8 | | | | 1.0 | | | | 8.7 | | | | –0.5 | |
| Japan | | | 4.4 | | | | 10.2 | | | | 1.7 | | | | –7.0 | |
| Mexico | | | 3.5 | | | | 3.9 | | | | 4.4 | | | | –8.0 | |
| Hungary | | | 2.8 | | | | 4.4 | | | | 6.1 | 4 | | | –6.5 | 4 |
| Poland | | | 2.2 | | | | 3.6 | | | | 3.4 | | | | –9.8 | |
| India | | | 2.0 | | | | 2.0 | | | | 10.2 | 4 | | | 8.7 | 4 |
| Norway | | | 1.7 | | | | 0.1 | | | | 4.3 | | | | –16.9 | |
| Colombia | | | 1.4 | | | | 1.1 | | | | 3.1 | 4 | | | –19.8 | 4 |
| Indonesia | | | 0.8 | | | | 0.9 | | | | 12.4 | 4 | | | 4.8 | 4 |
| Australia | | | 0.7 | | | | 1.2 | | | | 7.3 | | | | –6.3 | |
| Canada | | | 0.6 | | | | 1.4 | | | | 7.2 | | | | –5.4 | |
| Sweden | | | 0.6 | | | | 1.2 | | | | 4.0 | | | | –13.1 | |
| Malaysia | | | 0.5 | | | | 0.2 | | | | 2.4 | | | | –9.3 | |
| South Africa | | | 0.5 | | | | 0.5 | | | | 7.2 | | | | 0.0 | |
| Turkey | | | 0.4 | | | | 0.4 | | | | 9.3 | 4 | | | –4.0 | 4 |
| Brazil | | | 0.1 | | | | 0.0 | | | | 3.9 | 4 | | | –20.4 | 4 |
| Ghana | | | 0.1 | | | | 0.1 | | | | — | 5 | | | — | 5 |
| 1 | Source: Barclays Global Aggregate Index. |
| 2 | Includes U.S. dollar-denominated debt of other countries, totaling 15.0%. |
| 3 | Countries using the euro as a common currency: Austria, Belgium, Cyprus, Estonia, Finland, France, Germany, Greece, Ireland, Italy, Latvia, Lithuania, Luxembourg, Malta, the Netherlands, Portugal, Slovakia, Slovenia and Spain. Euro-denominated debt includes corporate and European government debt. |
| 4 | Source: JP Morgan GBI-EM Broad Diversified Index. |
| 5 | This market is not included in the Barclays Global Aggregate Index or the JP Morgan GBI-EM Broad Diversified Index. |
| Summary investment portfolio March 31, 2015 | unaudited |
| Bonds, notes & other debt instruments 96.62% | | Principal amount
(000) | | | Value
(000) | |
| Euros 15.67% | | | | | | | | |
| German Government 0.10% 20231 | | € | 66,204 | | | $ | 78,622 | |
| German Government 1.50%–6.25% 2024–2046 | | | 85,385 | | | | 131,525 | |
| Hungarian Government 3.88%–6.00% 2018–2020 | | | 53,295 | | | | 66,690 | |
| Irish Government 3.90% 2023 | | | 94,720 | | | | 128,466 | |
| Irish Government 3.40% 2024 | | | 97,420 | | | | 129,717 | |
| Irish Government 2.00%–5.40% 2020–2045 | | | 87,780 | | | | 117,321 | |
| Italian Government 2.15% 2021 | | | 139,110 | | | | 161,814 | |
| Italian Government 2.35%–4.75% 2023–20441 | | | 94,901 | | | | 131,147 | |
| Spanish Government 5.85% 2022 | | | 65,065 | | | | 93,113 | |
| Spanish Government 5.15% 2044 | | | 132,080 | | | | 241,884 | |
| Spanish Government 1.00%–5.40% 2020–20301 | | | 138,997 | | | | 173,261 | |
| Other securities | | | | | | | 607,701 | |
| | | | | | | | 2,061,261 | |
| | | | | | | | | |
| British pounds 4.78% | | | | | | | | |
| United Kingdom 2.25% 2023 | | £ | 68,045 | | | | 106,907 | |
| United Kingdom 2.75% 2024 | | | 88,175 | | | | 144,102 | |
| United Kingdom 3.25% 2044 | | | 51,670 | | | | 91,733 | |
| United Kingdom 1.00%–4.25% 2016–2040 | | | 111,480 | | | | 173,612 | |
| Other securities | | | | | | | 112,419 | |
| | | | | | | | 628,773 | |
| | | | | | | | | |
| Japanese yen 4.37% | | | | | | | | |
| Japanese Government, Series 19, 0.10% 20241 | | ¥ | 11,724,230 | | | | 105,624 | |
| Japanese Government, Series 18, 0.10% 20241 | | | 11,476,040 | | | | 102,807 | |
| Japanese Government 0.10%–2.30% 2018–20441 | | | 39,591,110 | | | | 360,643 | |
| Other securities | | | | | | | 6,236 | |
| | | | | | | | 575,310 | |
| | | | | | | | | |
| Mexican pesos 3.49% | | | | | | | | |
| United Mexican States Government, Series M, 5.00% 2017 | | MXN | 970,000 | | | | 64,992 | |
| United Mexican States Government, Series M, 6.50% 2021 | | | 1,784,500 | | | | 123,002 | |
| United Mexican States Government 4.50% 20251 | | | 972,799 | | | | 72,985 | |
| United Mexican States Government 2.00%–10.00% 2015–20421 | | | 2,591,540 | | | | 193,171 | |
| Other securities | | | | | | | 5,279 | |
| | | | | | | | 459,429 | |
| | | | | | | | | |
| Hungarian forints 2.76% | | | | | | | | |
| Hungarian Government, Series 19/A, 6.50% 2019 | | HUF | 15,108,380 | | | | 62,857 | |
| Hungarian Government, Series 20A, 7.50% 2020 | | | 42,222,330 | | | | 188,341 | |
| Hungarian Government 3.50%–7.00% 2018–2025 | | | 26,501,900 | | | | 111,777 | |
| | | | | | | | 362,975 | |
| | | | | | | | | |
| Polish zloty 2.17% | | | | | | | | |
| Polish Government, Series 0922, 5.75% 2022 | | PLN | 195,355 | | | | 64,387 | |
| Polish Government 0.00%–5.75% 2016–20231 | | | 744,963 | | | | 221,462 | |
| | | | | | | | 285,849 | |
| Bonds, notes & other debt instruments (continued) | | Principal amount
(000) | | | Value
(000) | |
| Indian rupees 1.99% | | | | | | | | |
| India (Republic of) 7.28% 2019 | | INR | 8,790,000 | | | $ | 138,570 | |
| India (Republic of) 8.83% 2023 | | | 4,410,000 | | | | 74,626 | |
| India (Republic of) 8.60%–9.20% 2028–2030 | | | 2,790,000 | | | | 48,676 | |
| | | | | | | | 261,872 | |
| | | | | | | | | |
| Norwegian kroner 1.72% | | | | | | | | |
| Norwegian Government 4.50% 2019 | | NKr | 26,700 | | | | 3,783 | |
| Norwegian Government 3.75% 2021 | | | 946,490 | | | | 134,999 | |
| Norwegian Government 3.00% 2024 | | | 619,900 | | | | 87,327 | |
| | | | | | | | 226,109 | |
| | | | | | | | | |
| Colombian pesos 1.37% | | | | | | | | |
| Colombia (Republic of), Series B, 5.00% 2018 | | COP | 173,154,800 | | | | 65,796 | |
| Colombia (Republic of) 6.00%–10.00% 2024–2030 | | | 290,826,500 | | | | 114,944 | |
| | | | | | | | 180,740 | |
| | | | | | | | | |
| Indonesian rupiah 0.86% | | | | | | | | |
| Indonesia (Republic of) 8.375% 2034 | | IDR | 914,328,000 | | | | 74,556 | |
| Indonesia (Republic of) 7.88%–9.00% 2019–2029 | | | 473,360,000 | | | | 38,369 | |
| | | | | | | | 112,925 | |
| | | | | | | | | |
| Swedish kronor 0.56% | | | | | | | | |
| Swedish Government, Series 105, 3.50% 2022 | | SKr | 516,980 | | | | 74,193 | |
|
| | | | | | | | | |
| Malaysian ringgits 0.50% | | | | | | | | |
| Malaysian Government, Series 0310, 4.498% 2030 | | MYR | 226,750 | | | | 63,628 | |
| Other securities | | | | | | | 1,743 | |
| | | | | | | | 65,371 | |
| | | | | | | | | |
| U.S. dollars 53.86% | | | | | | | | |
| Colombia (Republic of) 5.00% 2045 | | $ | 4,175 | | | | 4,311 | |
| Fannie Mae 3.50% 20452,3 | | | 212,900 | | | | 223,146 | |
| Fannie Mae 0%–9.42% 2022–20482,3,4 | | | 155,131 | | | | 164,457 | |
| Freddie Mac 0%–6.00% 2018–20452,3 | | | 71,864 | | | | 74,131 | |
| Government National Mortgage Assn. 3.50% 20452,3 | | | 92,200 | | | | 96,565 | |
| Government National Mortgage Assn. 4.00% 20452,3 | | | 36,750 | | | | 39,122 | |
| Hungarian Government 4.00%–7.63% 2018–2041 | | | 108,260 | | | | 125,706 | |
| Indonesia (Republic of) 3.38%–6.88% 2018–20455 | | | 51,160 | | | | 55,115 | |
| Polish Government 5.00% 2022 | | | 4,300 | | | | 4,950 | |
| U.S. Treasury 1.25% 2018 | | | 163,150 | | | | 164,036 | |
| U.S. Treasury 1.375% 2018 | | | 68,750 | | | | 69,556 | |
| U.S. Treasury 1.50% 2018 | | | 193,750 | | | | 196,716 | |
| U.S. Treasury 1.00% 2019 | | | 120,750 | | | | 119,528 | |
| U.S. Treasury 1.625% 20196 | | | 235,450 | | | | 239,128 | |
| U.S. Treasury 1.625% 2019 | | | 232,446 | | | | 235,805 | |
| U.S. Treasury 1.625% 2019 | | | 81,150 | | | | 82,517 | |
| U.S. Treasury 1.75% 2019 | | | 92,650 | | | | 94,427 | |
| U.S. Treasury 1.125% 2020 | | | 128,100 | | | | 126,564 | |
| U.S. Treasury 1.25% 2020 | | | 152,460 | | | | 151,650 | |
| U.S. Treasury 1.375% 2020 | | | 155,750 | | | | 155,459 | |
| U.S. Treasury 2.50% 2024 | | | 140,415 | | | | 147,499 | |
| U.S. Treasury 2.00% 2025 | | | 67,253 | | | | 67,679 | |
| | | Principal amount
(000) | | | Value
(000) | |
| U.S. Treasury 2.50% 2045 | | $ | 64,000 | | | $ | 63,424 | |
| U.S. Treasury 0.38%–8.00% 2015–2044 | | | 471,362 | | | | 481,042 | |
| U.S. Treasury Inflation-Protected Security 0.625% 20241 | | | 213,367 | | | | 222,650 | |
| U.S. Treasury Inflation-Protected Security 0.25% 20251 | | | 144,851 | | | | 147,616 | |
| U.S. Treasury Inflation-Protected Security 1.375% 20441 | | | 78,013 | | | | 91,981 | |
| U.S. Treasury Inflation-Protected Security 0.13%–2.38% 2017–20451 | | | 104,993 | | | | 108,343 | |
| United Mexican States Government Global 3.60%–5.13% 2020–2044 | | | 49,860 | | | | 52,613 | |
| Other securities | | | | | | | 3,279,407 | |
| | | | | | | | 7,085,143 | |
| | | | | | | | | |
| Other currencies 2.52% | | | | | | | | |
| Other securities | | | | | | | 329,372 | |
| | | | | | | | | |
| Total bonds, notes & other debt instruments (cost: $12,919,580,000) | | | | | | | 12,709,322 | |
| | | | | | | | | |
| Convertible stocks 0.01% | | | | | | | | |
| U.S. dollars 0.01% | | | | | | | | |
| Other securities | | | | | | | 1,546 | |
| | | | | | | | | |
| Total convertible stocks (cost: $2,416,000) | | | | | | | 1,546 | |
| |
| Common stocks 0.00% | | | Shares | | | | | |
| U.S. dollars 0.00% | | | | | | | | |
| Other securities | | | | | | | 382 | |
| | | | | | | | | |
| Total common stocks (cost: $736,000) | | | | | | | 382 | |
| |
| Short-term securities 6.05% | | | Principal amount
(000) | | | | | |
| Electricité de France 0.18% due 5/8/2015–6/2/20155 | | | 85,500 | | | | 85,480 | |
| Fannie Mae 0.11%–0.22% due 5/18/2015–1/4/2016 | | | 28,000 | | | | 27,954 | |
| Federal Home Loan Bank 0.07%–0.15% due 6/5/2015–11/2/2015 | | | 104,200 | | | | 104,099 | |
| Freddie Mac 0.10%–0.18% due 6/9/2015–12/15/2015 | | | 174,600 | | | | 174,467 | |
| Nordea Bank AB 0.18% due 6/1/2015–6/8/20155 | | | 71,500 | | | | 71,476 | |
| Svenska Handelsbanken Inc. 0.20%–0.21% due 5/13/2015–7/2/20155 | | | 88,500 | | | | 88,470 | |
| Toronto-Dominion Holdings USA Inc. 0.19% due 7/23/20155 | | | 75,000 | | | | 74,950 | |
| Other securities | | | | | | | 168,781 | |
| |
| Total short-term securities (cost: $795,710,000) | | | | | | | 795,677 | |
| Total investment securities 102.68% (cost: $13,718,442,000) | | | | | | | 13,506,927 | |
| Other assets less liabilities (2.68)% | | | | | | | (352,501 | ) |
| |
| Net assets 100.00% | | | | | | $ | 13,154,426 | |
This summary investment portfolio is designed to streamline the report and help investors better focus on the fund’s principal holdings. See the inside back cover for details on how to obtain a complete schedule of portfolio holdings.
“Other securities” includes all issues that are not disclosed separately in the summary investment portfolio, including securities which were valued under fair value procedures adopted by authority of the board of trustees. The total value of securities which were valued under fair value procedures was $9,880,000, which represented .08% of the net assets of the fund. Some of these securities (with an aggregate value of $827,000, an aggregate cost of $1,687,000, and which represented .01% of the net assets of the fund) were acquired from 3/10/2010 to 1/21/2011 through private placement transactions exempt from registration under the Securities Act of 1933, which may subject them to legal or contractual restrictions on resale. “Other securities” also includes loan participations and assignments which may be subject to legal or contractual restrictions on resale. The total value of all such loans was $35,763,000, which represented ..27% of the net assets of the fund.
Forward currency contracts
The fund has entered into forward currency contracts as shown in the following table. The average notional amount of open forward currency contracts was $2,487,682,000 over the prior 12-month period.
| | | | | | | | | | | Unrealized | |
| | | | | | | | | | | (depreciation) | |
| | | | | | | Contract amount | | appreciation | |
| | | | | | | Receive | | Deliver | | at 3/31/2015 | |
| | | Settlement date | | Counterparty | | (000) | | (000) | | (000) | |
| Purchases: | | | | | | | | | | | | |
| Australian dollars | | 4/27/2015 | | Citibank | | A$149,852 | | $117,000 | | | | $ (3,054 | ) |
| Canadian dollars | | 4/9/2015 | | JPMorgan Chase | | C$1,592 | | $1,271 | | | (15 | ) |
| Canadian dollars | | 4/16/2015 | | HSBC Bank | | C$1,433 | | $1,127 | | | 4 | |
| Canadian dollars | | 4/23/2015 | | Citibank | | C$2,531 | | $1,986 | | | 11 | |
| Canadian dollars | | 4/27/2015 | | JPMorgan Chase | | C$146,754 | | $117,000 | | | (1,169 | ) |
| Euros | | 4/9/2015 | | Citibank | | €50,451 | | $57,261 | | | (3,006 | ) |
| Euros | | 4/24/2015 | | JPMorgan Chase | | €52,757 | | $57,900 | | | (1,154 | ) |
| Euros | | 5/26/2015 | | UBS AG | | €80,681 | | $88,664 | | | (1,846 | ) |
| Hungarian forints | | 4/27/2015 | | Bank of America, N.A. | | HUF15,752,669 | | $57,940 | | | (1,603 | ) |
| Hungarian forints | | 5/6/2015 | | HSBC Bank | | HUF15,988,101 | | $57,900 | | | (731 | ) |
| Japanese yen | | 4/10/2015 | | Barclays Bank PLC | | ¥5,160,129 | | $43,118 | | | (87 | ) |
| Japanese yen | | 4/16/2015 | | UBS AG | | ¥9,149,064 | | $75,700 | | | 602 | |
| Japanese yen | | 4/20/2015 | | HSBC Bank | | ¥8,606,916 | | $70,956 | | | 830 | |
| Japanese yen | | 4/23/2015 | | Bank of New York Mellon | | ¥9,328,840 | | $77,257 | | | 554 | |
| Japanese yen | | 4/24/2015 | | Citibank | | ¥16,139,814 | | $134,380 | | | 243 | |
| Japanese yen | | 4/24/2015 | | HSBC Bank | | ¥4,375,377 | | $36,447 | | | 48 | |
| Japanese yen | | 4/27/2015 | | Citibank | | ¥8,178,075 | | $68,295 | | | (78 | ) |
| Japanese yen | | 4/27/2015 | | HSBC Bank | | ¥21,681,145 | | $181,149 | | | (297 | ) |
| Japanese yen | | 4/28/2015 | | UBS AG | | ¥4,740,156 | | $39,586 | | | (45 | ) |
| Japanese yen | | 5/11/2015 | | UBS AG | | ¥7,357,223 | | $61,880 | | | (500 | ) |
| Mexican pesos | | 4/27/2015 | | Citibank | | MXN1,169,207 | | $78,081 | | | (1,570 | ) |
| Polish zloty | | 4/27/2015 | | UBS AG | | PLN215,824 | | $57,940 | | | (1,042 | ) |
| | | | | | | | | | | | $(13,905 | ) |
| Sales: | | | | | | | | | | | | |
| Australian dollars | | 4/24/2015 | | Citibank | | $37,838 | | A$49,800 | | | (37 | ) |
| Australian dollars | | 4/27/2015 | | UBS AG | | $4,906 | | A$6,250 | | | 153 | |
| Brazilian reais | | 4/10/2015 | | JPMorgan Chase | | $3,696 | | BRL11,416 | | | 128 | |
| Brazilian reais | | 4/14/2015 | | Citibank | | $3,859 | | BRL11,347 | | | 316 | |
| British pounds | | 4/9/2015 | | HSBC Bank | | $13,367 | | £8,700 | | | 462 | |
| British pounds | | 4/13/2015 | | UBS AG | | $52,911 | | £34,450 | | | 1,813 | |
| 10 | Capital World Bond Fund |
| | | | | | | | | | | Unrealized | |
| | | | | | | | | | | (depreciation) | |
| | | | | | | Contract amount | | appreciation | |
| | | | | | | Receive | | Deliver | | at 3/31/2015 | |
| | | Settlement date | | Counterparty | | (000) | | (000) | | (000) | |
| British pounds | | 4/13/2015 | | HSBC Bank | | $11,221 | | £7,375 | | | $ 282 | |
| British pounds | | 4/13/2015 | | UBS AG | | $13,077 | | £8,675 | | | 209 | |
| British pounds | | 4/14/2015 | | UBS AG | | $3,587 | | £2,400 | | | 28 | |
| British pounds | | 4/16/2015 | | Bank of America, N.A. | | $14,178 | | £9,530 | | | 42 | |
| British pounds | | 4/20/2015 | | HSBC Bank | | $19,617 | | £13,300 | | | (109 | ) |
| British pounds | | 4/23/2015 | | JPMorgan Chase | | $14,024 | | £9,500 | | | (66 | ) |
| British pounds | | 4/23/2015 | | HSBC Bank | | $25,377 | | £17,250 | | | (207 | ) |
| British pounds | | 4/24/2015 | | Bank of New York Mellon | | $29,801 | | £19,900 | | | 287 | |
| British pounds | | 4/24/2015 | | Bank of New York Mellon | | $6,020 | | £4,020 | | | 58 | |
| British pounds | | 4/24/2015 | | Bank of New York Mellon | | $3,744 | | £2,500 | | | 36 | |
| British pounds | | 4/24/2015 | | Bank of America, N.A. | | $3,444 | | £2,300 | | | 33 | |
| British pounds | | 4/24/2015 | | HSBC Bank | | €119,850 | | £88,325 | | | (2,087 | ) |
| British pounds | | 5/7/2015 | | UBS AG | | $57,774 | | £38,900 | | | 84 | |
| British pounds | | 5/8/2015 | | HSBC Bank | | $38,368 | | £25,900 | | | (42 | ) |
| British pounds | | 5/12/2015 | | HSBC Bank | | $38,681 | | £25,360 | | | 1,073 | |
| British pounds | | 6/8/2015 | | UBS AG | | $26,306 | | £17,250 | | | 730 | |
| Canadian dollars | | 4/29/2015 | | UBS AG | | $17,890 | | C$22,810 | | | (112 | ) |
| Colombian pesos | | 4/14/2015 | | JPMorgan Chase | | $11,572 | | COP29,875,360 | | | 103 | |
| Colombian pesos | | 4/20/2015 | | UBS AG | | $7,769 | | COP20,422,000 | | | (65 | ) |
| Colombian pesos | | 4/20/2015 | | Citibank | | $12,082 | | COP32,560,000 | | | (409 | ) |
| Colombian pesos | | 5/4/2015 | | Citibank | | $2,408 | | COP6,200,000 | | | 33 | |
| Euros | | 4/10/2015 | | JPMorgan Chase | | $46,906 | | €41,870 | | | 1,879 | |
| Euros | | 4/10/2015 | | UBS AG | | $27,184 | | €24,000 | | | 1,375 | |
| Euros | | 4/10/2015 | | Citibank | | $11,180 | | €9,980 | | | 448 | |
| Euros | | 4/13/2015 | | UBS AG | | $21,851 | | €18,500 | | | 1,955 | |
| Euros | | 4/15/2015 | | Citibank | | $7,086 | | €6,430 | | | 171 | |
| Euros | | 4/24/2015 | | JPMorgan Chase | | PLN366,278 | | €86,250 | | | 3,802 | |
| Euros | | 4/24/2015 | | Bank of America, N.A. | | HUF16,209,440 | | €52,000 | | | 2,043 | |
| Euros | | 4/24/2015 | | HSBC Bank | | SKr963,445 | | €103,500 | | | 586 | |
| Euros | | 4/24/2015 | | Citibank | | PLN146,715 | | €35,775 | | | 203 | |
| Euros | | 4/24/2015 | | JPMorgan Chase | | HUF10,730,604 | | €35,775 | | | (101 | ) |
| Euros | | 4/27/2015 | | Bank of America, N.A. | | $10,110 | | €9,250 | | | 160 | |
| Euros | | 4/27/2015 | | Citibank | | $961 | | €880 | | | 14 | |
| Euros | | 5/4/2015 | | HSBC Bank | | $7,245 | | €6,400 | | | 360 | |
| Euros | | 5/4/2015 | | Citibank | | $1,448 | | €1,320 | | | 28 | |
| Euros | | 5/5/2015 | | Citibank | | $10,915 | | €9,500 | | | 696 | |
| Euros | | 5/28/2015 | | HSBC Bank | | ¥6,320,693 | | €46,750 | | | 2,435 | |
| Euros | | 6/17/2015 | | Citibank | | $18,676 | | €17,775 | | | (458 | ) |
| Japanese yen | | 4/10/2015 | | Bank of America, N.A. | | $68,263 | | ¥8,159,204 | | | 223 | |
| Japanese yen | | 5/7/2015 | | Barclays Bank PLC | | $10,007 | | ¥1,200,000 | | | (4 | ) |
| Malaysian ringgits | | 4/9/2015 | | Citibank | | $14,837 | | MYR54,130 | | | 234 | |
| Malaysian ringgits | | 4/30/2015 | | JPMorgan Chase | | $22,845 | | MYR84,300 | | | 148 | |
| Mexican pesos | | 4/9/2015 | | HSBC Bank | | $1,962 | | MXN29,595 | | | 23 | |
| Mexican pesos | | 4/10/2015 | | Bank of America, N.A. | | $11,736 | | MXN182,220 | | | (202 | ) |
| Mexican pesos | | 4/23/2015 | | HSBC Bank | | $10,515 | | MXN160,895 | | | (16 | ) |
| Norwegian kroner | | 4/13/2015 | | JPMorgan Chase | | €11,629 | | NKr100,000 | | | 98 | |
| Norwegian kroner | | 4/13/2015 | | HSBC Bank | | €8,068 | | NKr70,000 | | | (9 | ) |
| Capital World Bond Fund | 11 |
| | | | | | | | | | | Unrealized | |
| | | | | | | | | | | (depreciation) | |
| | | | | | | Contract amount | | appreciation | |
| | | | | | | Receive | | Deliver | | at 3/31/2015 | |
| | | Settlement date | | Counterparty | | (000) | | (000) | | (000) | |
| Norwegian kroner | | 4/15/2015 | | Citibank | | $38,037 | | NKr296,800 | | | $ 1,210 | |
| Norwegian kroner | | 4/15/2015 | | Citibank | | $37,755 | | NKr296,300 | | | 990 | |
| Norwegian kroner | | 4/16/2015 | | JPMorgan Chase | | €52,218 | | NKr450,101 | | | 313 | |
| Norwegian kroner | | 4/16/2015 | | JPMorgan Chase | | €1,813 | | NKr15,650 | | | 8 | |
| Norwegian kroner | | 4/20/2015 | | JPMorgan Chase | | SKr228,270 | | NKr219,000 | | | (656 | ) |
| Norwegian kroner | | 4/23/2015 | | Citibank | | $17,934 | | NKr145,400 | | | (102 | ) |
| Norwegian kroner | | 4/27/2015 | | Citibank | | $18,505 | | NKr145,400 | | | 470 | |
| Swedish kronor | | 4/13/2015 | | Bank of America, N.A. | | $38,940 | | SKr329,000 | | | 732 | |
| Swedish kronor | | 4/22/2015 | | Citibank | | $19,439 | | SKr169,270 | | | (223 | ) |
| | | | | | | | | | | | $ 21,569 | |
| Forward currency contracts — net | | | | | | | $ 7,664 | |
Interest rate swaps
The fund has entered into interest rate swaps as shown in the following table. The average notional amount of interest rate swaps was $1,776,756,000 over the prior nine-month period.
| | | | | | | | | | | | | | | Unrealized | |
| | | | | | | | | | | | Notional | | depreciation | |
| Pay/receive | | | | | | Fixed | | | Expiration | | amount | | at 3/31/2015 | |
| fixed rate | | Clearinghouse | | Floating rate index | | rate | | | date | | (000) | | | (000) | |
| Pay | | LCH.Clearnet | | 3-month USD-LIBOR | | 2.6655 | % | | 9/26/2024 | | $ | 30,000 | | | $(1,768 | ) |
| Pay | | LCH.Clearnet | | 6-month EURIBOR | | 0.6922 | | | 1/27/2025 | | | 28,000 | | | (437 | ) |
| Pay | | LCH.Clearnet | | 3-month USD-LIBOR | | 2.219 | | | 2/19/2025 | | | 70,000 | | | (1,259 | ) |
| Pay | | LCH.Clearnet | | 6-month JPY-LIBOR | | 0.5725 | | | 3/5/2025 | | | 12,600,000 | | | (27 | ) |
| Pay | | LCH.Clearnet | | 6-month EURIBOR | | 1.4385 | | | 11/6/2029 | | | 14,900 | | | (1,675 | ) |
| Pay | | LCH.Clearnet | | 6-month EURIBOR | | 1.4217 | | | 11/24/2029 | | | 27,000 | | | (2,971 | ) |
| | | | | | | | | | | | | | | | $(8,137 | ) |
| 12 | Capital World Bond Fund |
The following footnotes apply to either the individual securities noted or one or more of the securities aggregated and listed as a single line item.
| 1 | Index-linked bond whose principal amount moves with a government price index. |
| 2 | Principal payments may be made periodically. Therefore, the effective maturity date may be earlier than the stated maturity date. |
| 3 | Purchased on a TBA basis. |
| 4 | Coupon rate may change periodically. |
| 5 | Acquired in a transaction exempt from registration under Rule 144A or Section 4(2) of the Securities Act of 1933. May be resold in the U.S. in transactions exempt from registration, normally to qualified institutional buyers. The total value of all such securities, including those in “Other securities,” was $1,519,434,000, which represented 11.55% of the net assets of the fund. |
| 6 | A portion of this security was pledged as collateral. The total value of pledged collateral was $12,825,000, which represented .10% of the net assets of the fund. |
Key to abbreviation
TBA = To be announced
See Notes to Financial Statements
| Capital World Bond Fund | 13 |
Financial statements
| Statement of assets and liabilities | | unaudited | |
| at March 31, 2015 | | (dollars in thousands) | |
| | | | | | | | | |
| Assets: | | | | | | | | |
| Investment securities, at value (cost: $13,718,442) | | | | | | $ | 13,506,927 | |
| Cash denominated in currencies other than U.S. dollars (cost: $4,564) | | | | | | | 4,564 | |
| Unrealized appreciation on open forward currency contracts | | | | | | | 28,766 | |
| Receivables for: | | | | | | | | |
| Sales of investments | | $ | 866,846 | | | | | |
| Sales of fund’s shares | | | 20,937 | | | | | |
| Closed forward currency contracts | | | 16,136 | | | | | |
| Interest | | | 131,618 | | | | | |
| Other | | | 7 | | | | 1,035,544 | |
| | | | | | | | 14,575,801 | |
| Liabilities: | | | | | | | | |
| Unrealized depreciation on open forward currency contracts | | | | | | | 21,102 | |
| Payables for: | | | | | | | | |
| Purchases of investments | | | 1,348,152 | | | | | |
| Repurchases of fund’s shares | | | 21,744 | | | | | |
| Closed forward currency contracts | | | 10,878 | | | | | |
| Investment advisory services | | | 4,887 | | | | | |
| Services provided by related parties | | | 4,510 | | | | | |
| Trustees’ deferred compensation | | | 210 | | | | | |
| Variation margin | | | 261 | | | | | |
| Bank overdraft | | | 84 | | | | | |
| Other | | | 9,547 | | | | 1,400,273 | |
| Net assets at March 31, 2015 | | | | | | $ | 13,154,426 | |
| | | | | | | | | |
| Net assets consist of: | | | | | | | | |
| Capital paid in on shares of beneficial interest | | | | | | $ | 13,413,212 | |
| Undistributed net investment income | | | | | | | 16,587 | |
| Accumulated net realized loss | | | | | | | (55,563 | ) |
| Net unrealized depreciation | | | | | | | (219,810 | ) |
| Net assets at March 31, 2015 | | | | | | $ | 13,154,426 | |
See Notes to Financial Statements
| 14 | Capital World Bond Fund |
(dollars and shares in thousands, except per-share amounts)
Shares of beneficial interest issued and outstanding (no stated par value) —
unlimited shares authorized (668,403 total shares outstanding)
| | | Net assets | | | Shares
outstanding | | | Net asset
value per share | |
| Class A | | $ | 6,880,439 | | | | 348,976 | | | $ | 19.72 | |
| Class B | | | 48,126 | | | | 2,456 | | | | 19.59 | |
| Class C | | | 498,637 | | | | 25,667 | | | | 19.43 | |
| Class F-1 | | | 2,040,921 | | | | 104,167 | | | | 19.59 | |
| Class F-2 | | | 911,329 | | | | 46,294 | | | | 19.69 | |
| Class 529-A | | | 342,402 | | | | 17,320 | | | | 19.77 | |
| Class 529-B | | | 4,472 | | | | 228 | | | | 19.66 | |
| Class 529-C | | | 143,889 | | | | 7,354 | | | | 19.57 | |
| Class 529-E | | | 17,981 | | | | 915 | | | | 19.65 | |
| Class 529-F-1 | | | 43,657 | | | | 2,221 | | | | 19.65 | |
| Class R-1 | | | 15,542 | | | | 795 | | | | 19.56 | |
| Class R-2 | | | 159,454 | | | | 8,156 | | | | 19.55 | |
| Class R-2E | | | 9 | | | | — | * | | | 19.70 | |
| Class R-3 | | | 163,310 | | | | 8,295 | | | | 19.69 | |
| Class R-4 | | | 103,297 | | | | 5,243 | | | | 19.70 | |
| Class R-5 | | | 160,007 | | | | 8,110 | | | | 19.73 | |
| Class R-6 | | | 1,620,954 | | | | 82,206 | | | | 19.72 | |
| * | Amount less than one thousand. |
See Notes to Financial Statements
| Capital World Bond Fund | 15 |
| Statement of operations | | unaudited | |
| for the six months ended March 31, 2015 | | (dollars in thousands) | |
| | | | |
| Investment income: | | | | | | | | |
| Income: | | | | | | | | |
| Interest (net of non-U.S. taxes of $1,135) | | | | | | $ | 179,816 | |
| Fees and expenses*: | | | | | | | | |
| Investment advisory services | | $ | 28,844 | | | | | |
| Distribution services | | | 16,476 | | | | | |
| Transfer agent services | | | 10,937 | | | | | |
| Administrative services | | | 1,874 | | | | | |
| Reports to shareholders | | | 738 | | | | | |
| Registration statement and prospectus | | | 675 | | | | | |
| Trustees’ compensation | | | 52 | | | | | |
| Auditing and legal | | | 31 | | | | | |
| Custodian | | | 1,028 | | | | | |
| Other | | | 1,240 | | | | 61,895 | |
| Net investment income | | | | | | | 117,921 | |
| | | | | | | | | |
| Net realized loss and unrealized depreciation on investments, forward currency contracts, interest rate swaps and currency: | | | | | | | | |
| Net realized (loss) gain on: | | | | | | | | |
| Investments (net of non-U.S. taxes of $246) | | | (139,607 | ) | | | | |
| Forward currency contracts | | | 77,067 | | | | | |
| Interest rate swaps | | | (7,257 | ) | | | | |
| Currency transactions | | | (12,926 | ) | | | (82,723 | ) |
| Net unrealized (depreciation) appreciation on: | | | | | | | | |
| Investments (net of non-U.S. taxes of $2,499) | | | (234,951 | ) | | | | |
| Forward currency contracts | | | (13,014 | ) | | | | |
| Interest rate swaps | | | (5,146 | ) | | | | |
| Currency translations | | | 636 | | | | (252,475 | ) |
| Net realized loss and unrealized depreciation on investments, forward currency contracts, interest rate swaps and currency | | | | | | | (335,198 | ) |
| Net decrease in net assets resulting from operations | | | | | | $ | (217,277 | ) |
| * | Additional information related to class-specific fees and expenses is included in the Notes to Financial Statement. |
See Notes to Financial Statements
| 16 | Capital World Bond Fund |
Statements of changes in net assets
(dollars in thousands)
| | | Six months ended | | | Year ended | |
| | | March 31,
2015* | | | September 30,
2014 | |
| Operations: | | | | | | | | |
| Net investment income | | $ | 117,921 | | | $ | 290,420 | |
| Net realized (loss) gain on investments, forward currency contracts, interest rate swaps and currency transactions | | | (82,723 | ) | | | 156,838 | |
| Net unrealized depreciation on investments, forward currency contracts, interest rate swaps and currency translations | | | (252,475 | ) | | | (85,950 | ) |
| Net (decrease) increase in net assets resulting from operations | | | (217,277 | ) | | | 361,308 | |
| | | | | | | | | |
| Dividends and distributions paid to shareholders: | | | | | | | | |
| Dividends from net investment income | | | (109,345 | ) | | | (264,369 | ) |
| Distributions from net realized gain on investments | | | (182,169 | ) | | | — | |
| Total dividends and distributions paid to shareholders | | | (291,514 | ) | | | (264,369 | ) |
| | | | | | | | | |
| Net capital share transactions | | | 456,657 | | | | 456,041 | |
| | | | | | | | | |
| Total (decrease) increase in net assets | | | (52,134 | ) | | | 552,980 | |
| | | | | | | | | |
| Net assets: | | | | | | | | |
| Beginning of period | | | 13,206,560 | | | | 12,653,580 | |
| End of period (including undistributed net investment income: $16,587 and $8,011, respectively) | | $ | 13,154,426 | | | $ | 13,206,560 | |
See Notes to Financial Statements
| Capital World Bond Fund | 17 |
| Notes to financial statements | unaudited |
1. Organization
Capital World Bond Fund (the “fund”) is registered under the Investment Company Act of 1940 as an open-end, nondiversified investment company. The fund seeks to maximize long-term total return, consistent with prudent management, by investing primarily in a global portfolio of investment-grade bonds denominated in U.S. dollars and other currencies. The fund may also invest in lower quality, high-yield debt securities.
The fund has 17 share classes consisting of five retail share classes (Classes A, B and C, as well as two F share classes, F-1 and F-2), five 529 college savings plan share classes (Classes 529-A, 529-B, 529-C, 529-E and 529-F-1) and seven retirement plan share classes (Classes R-1, R-2, R-2E, R-3, R-4, R-5 and R-6). The 529 college savings plan share classes can be used to save for college education. The retirement plan share classes are generally offered only through eligible employer-sponsored retirement plans. The fund’s share classes are described further in the following table:
| Share class | | Initial sales charge | | Contingent deferred sales
charge upon redemption | | Conversion feature | |
| Classes A and 529-A | | Up to 3.75% | | None (except 1% for certain redemptions within one year of purchase without an initial sales charge) | | None | |
| Classes B and 529-B* | | None | | Declines from 5% to 0% for redemptions within six years of purchase | | Classes B and 529-B convert to Classes A and 529-A, respectively, after eight years | |
| Class C | | None | | 1% for redemptions within one year of purchase | | Class C converts to Class F-1 after 10 years | |
| Class 529-C | | None | | 1% for redemptions within one year of purchase | | None | |
| Class 529-E | | None | | None | | None | |
Classes F-1, F-2 and
529-F-1 | | None | | None | | None | |
| Classes R-1, R-2, R-2E, R-3, R-4, R-5 and R-6 | | None | | None | | None | |
| * | Class B and 529-B shares of the fund are not available for purchase. |
Holders of all share classes have equal pro rata rights to the assets, dividends and liquidation proceeds of the fund. Each share class has identical voting rights, except for the exclusive right to vote on matters affecting only its class. Share classes have different fees and expenses (“class-specific fees and expenses”), primarily due to different arrangements for distribution, transfer agent and administrative services. Differences in class-specific fees and expenses will result in differences in net investment income and, therefore, the payment of different per-share dividends by each share class.
| 18 | Capital World Bond Fund |
2. Significant accounting policies
The fund is an investment company that applies the accounting and reporting guidance issued in Topic 946 by the U.S. Financial Accounting Standards Board. The fund’s financial statements have been prepared to comply with U.S. generally accepted accounting principles (“U.S. GAAP”). These principles require the fund’s investment adviser to make estimates and assumptions that affect reported amounts and disclosures. Actual results could differ from those estimates. The fund follows the significant accounting policies described in this section, as well as the valuation policies described in the next section on valuation.
Security transactions and related investment income — Security transactions are recorded by the fund as of the date the trades are executed with brokers. Realized gains and losses from security transactions are determined based on the specific identified cost of the securities. In the event a security is purchased with a delayed payment date, the fund will segregate liquid assets sufficient to meet its payment obligations. Interest income is recognized on an accrual basis. Market discounts, premiums and original issue discounts on fixed-income securities are amortized daily over the expected life of the security.
Class allocations — Income, fees and expenses (other than class-specific fees and expenses) and realized and unrealized gains and losses are allocated daily among the various share classes based on their relative net assets. Class-specific fees and expenses, such as distribution, transfer agent and administrative services, are charged directly to the respective share class.
Dividends and distributions to shareholders — Dividends and distributions to shareholders are recorded on the ex-dividend date.
Currency translation — Assets and liabilities, including investment securities, denominated in currencies other than U.S. dollars are translated into U.S. dollars at the exchange rates supplied by one or more pricing vendors on the valuation date. Purchases and sales of investment securities and income and expenses are translated into U.S. dollars at the exchange rates on the dates of such transactions. The effects of changes in exchange rates on investment securities are included with the net realized gain or loss and net unrealized appreciation or depreciation on investments in the fund’s statement of operations. The realized gain or loss and unrealized appreciation or depreciation resulting from all other transactions denominated in currencies other than U.S. dollars are disclosed separately.
3. Valuation
Capital Research and Management Company (“CRMC”), the fund’s investment adviser, values the fund’s investments at fair value as defined by U.S. GAAP. The net asset value of each share class of the fund is generally determined as of approximately 4:00 p.m. New York time each day the New York Stock Exchange is open.
| Capital World Bond Fund | 19 |
Methods and inputs — The fund’s investment adviser uses the following methods and inputs to establish the fair value of the fund’s assets and liabilities. Use of particular methods and inputs may vary over time based on availability and relevance as market and economic conditions evolve.
Equity securities are generally valued at the official closing price of, or the last reported sale price on, the exchange or market on which such securities are traded, as of the close of business on the day the securities are being valued or, lacking any sales, at the last available bid price. Prices for each security are taken from the principal exchange or market on which the security trades.
Fixed-income securities, including short-term securities, are generally valued at prices obtained from one or more pricing vendors. Vendors value such securities based on one or more of the inputs described in the following table. The table provides examples of inputs that are commonly relevant for valuing particular classes of fixed-income securities in which the fund is authorized to invest. However, these classifications are not exclusive, and any of the inputs may be used to value any other class of fixed-income security.
| Fixed-income class | Examples of standard inputs |
| All | Benchmark yields, transactions, bids, offers, quotations from dealers and trading systems, new issues, spreads and other relationships observed in the markets among comparable securities; and proprietary pricing models such as yield measures calculated using factors such as cash flows, financial or collateral performance and other reference data (collectively referred to as “standard inputs”) |
| Corporate bonds & notes; convertible securities | Standard inputs and underlying equity of the issuer |
| Bonds & notes of governments & government agencies | Standard inputs and interest rate volatilities |
| Mortgage-backed; asset-backed obligations | Standard inputs and cash flows, prepayment information, default rates, delinquency and loss assumptions, collateral characteristics, credit enhancements and specific deal information |
| Municipal securities | Standard inputs and, for certain distressed securities, cash flows or liquidation values using a net present value calculation based on inputs that include, but are not limited to, financial statements and debt contracts |
When the fund’s investment adviser deems it appropriate to do so (such as when vendor prices are unavailable or deemed to be not representative), fixed-income securities will be valued in good faith at the mean quoted bid and ask prices that are reasonably and timely available (or bid prices, if ask prices are not available) or at prices for securities of comparable maturity, quality and type.
Securities with both fixed-income and equity characteristics, or equity securities traded principally among fixed-income dealers, are generally valued in the manner described for either equity or fixed-income securities, depending on which method is deemed most
| 20 | Capital World Bond Fund |
appropriate by the fund’s investment adviser. Forward currency contracts are valued at the mean of representative quoted bid and ask prices, generally based on prices supplied by one or more pricing vendors. Interest rate swaps are generally valued by pricing vendors based on market inputs that include the index and term of index, reset frequency, payer/receiver, currency and pay frequency.
Securities and other assets for which representative market quotations are not readily available or are considered unreliable by the fund’s investment adviser are fair valued as determined in good faith under fair valuation guidelines adopted by authority of the fund’s board of trustees as further described. The investment adviser follows fair valuation guidelines, consistent with U.S. Securities and Exchange Commission rules and guidance, to consider relevant principles and factors when making fair value determinations. The investment adviser considers relevant indications of value that are reasonably and timely available to it in determining the fair value to be assigned to a particular security, such as the type and cost of the security; contractual or legal restrictions on resale of the security; relevant financial or business developments of the issuer; actively traded similar or related securities; conversion or exchange rights on the security; related corporate actions; significant events occurring after the close of trading in the security; and changes in overall market conditions. In addition, the closing prices of equity securities that trade in markets outside U.S. time zones may be adjusted to reflect significant events that occur after the close of local trading but before the net asset value of each share class of the fund is determined. Fair valuations and valuations of investments that are not actively trading involve judgment and may differ materially from valuations that would have been used had greater market activity occurred.
Processes and structure — The fund’s board of trustees has delegated authority to the fund’s investment adviser to make fair value determinations, subject to board oversight. The investment adviser has established a Joint Fair Valuation Committee (the “Fair Valuation Committee”) to administer, implement and oversee the fair valuation process, and to make fair value decisions. The Fair Valuation Committee regularly reviews its own fair value decisions, as well as decisions made under its standing instructions to the investment adviser’s valuation teams. The Fair Valuation Committee reviews changes in fair value measurements from period to period and may, as deemed appropriate, update the fair valuation guidelines to better reflect the results of back testing and address new or evolving issues. The Fair Valuation Committee reports any changes to the fair valuation guidelines to the board of trustees with supplemental information to support the changes. The fund’s board and audit committee also regularly review reports that describe fair value determinations and methods.
The fund’s investment adviser has also established a Fixed-Income Pricing Review Group to administer and oversee the fixed-income valuation process, including the use of fixed-income pricing vendors. This group regularly reviews pricing vendor information and market data. Pricing decisions, processes and controls over security valuation are also subject to additional internal reviews, including an annual control self-evaluation program facilitated by the investment adviser’s compliance group.
| Capital World Bond Fund | 21 |
Classifications — The fund’s investment adviser classifies the fund’s assets and liabilities into three levels based on the inputs used to value the assets or liabilities. Level 1 values are based on quoted prices in active markets for identical securities. Level 2 values are based on significant observable market inputs, such as quoted prices for similar securities and quoted prices in inactive markets. Certain securities trading outside the U.S. may transfer between Level 1 and Level 2 due to valuation adjustments resulting from significant market movements following the close of local trading. Level 3 values are based on significant unobservable inputs that reflect the investment adviser’s determination of assumptions that market participants might reasonably use in valuing the securities. The valuation levels are not necessarily an indication of the risk or liquidity associated with the underlying investment. For example, U.S. government securities are reflected as Level 2 because the inputs used to determine fair value may not always be quoted prices in an active market. The following tables present the fund’s valuation levels as of March 31, 2015 (dollars in thousands):
| | | Investment securities | |
| | | Level 1 | | | Level 2 | | | Level 3 | | | Total | |
| Assets: | | | | | | | | | | | | | | | | |
| Bonds, notes & other debt instruments: | | | | | | | | | | | | | | | | |
| Euros | | $ | — | | | $ | 2,061,261 | | | $ | — | | | $ | 2,061,261 | |
| British pounds | | | — | | | | 628,773 | | | | — | | | | 628,773 | |
| Japanese yen | | | — | | | | 575,310 | | | | — | | | | 575,310 | |
| Mexican pesos | | | — | | | | 459,429 | | | | — | | | | 459,429 | |
| Hungarian forints | | | — | | | | 362,975 | | | | — | | | | 362,975 | |
| Polish zloty | | | — | | | | 285,849 | | | | — | | | | 285,849 | |
| Indian rupees | | | — | | | | 261,872 | | | | — | | | | 261,872 | |
| Norwegian kroner | | | — | | | | 226,109 | | | | — | | | | 226,109 | |
| Colombian pesos | | | — | | | | 180,740 | | | | — | | | | 180,740 | |
| Indonesian rupiah | | | — | | | | 112,925 | | | | — | | | | 112,925 | |
| Swedish kronor | | | — | | | | 74,193 | | | | — | | | | 74,193 | |
| Malaysian ringgits | | | — | | | | 65,371 | | | | — | | | | 65,371 | |
| U.S. dollars | | | — | | | | 7,078,821 | | | | 6,322 | | | | 7,085,143 | |
| Other | | | — | | | | 329,372 | | | | — | | | | 329,372 | |
| Convertible stocks | | | — | | | | 1,546 | | | | — | | | | 1,546 | |
| Common stocks | | | — | | | | 382 | | | | — | | | | 382 | |
| Short-term securities | | | — | | | | 795,677 | | | | — | | | | 795,677 | |
| Total | | $ | — | | | $ | 13,500,605 | | | $ | 6,322 | | | $ | 13,506,927 | |
| 22 | Capital World Bond Fund |
| | | Other investments* | |
| | | | Level 1 | | | | Level 2 | | | | Level 3 | | | | Total | |
| Assets: | | | | | | | | | | | | | | | | |
| Unrealized appreciation on open forward currency contracts | | $ | — | | | $ | 28,766 | | | $ | — | | | $ | 28,766 | |
| Liabilities: | | | | | | | | | | | | | | | | |
| Unrealized depreciation on open forward currency contracts | | | — | | | | (21,102 | ) | | | — | | | | (21,102 | ) |
| Unrealized depreciation on interest rate swaps | | | — | | | | (8,137 | ) | | | — | | | | (8,137 | ) |
| Total | | $ | — | | | $ | (473 | ) | | $ | — | | | $ | (473 | ) |
| * | Forward currency contracts and interest rate swaps are not included in the investment portfolio. |
4. Risk factors
Investing in the fund may involve certain risks including, but not limited to, those described below.
Market conditions — The prices of, and the income generated by, the securities held by the fund may decline – sometimes rapidly or unpredictably – due to various factors, including events or conditions affecting the general economy or particular industries; overall market changes; local, regional or global political, social or economic instability; governmental or governmental agency responses to economic conditions; and currency exchange rate, interest rate and commodity price fluctuations.
Issuer risks — The prices of, and the income generated by, securities held by the fund may also decline in response to various factors directly related to the issuers of such securities, including reduced demand for an issuer’s goods or services, poor management performance and strategic initiatives such as mergers, acquisitions or dispositions and the market response to any such initiatives.
Investing in debt instruments — The prices of, and the income generated by, bonds and other debt securities held by the fund may be affected by changing interest rates and by changes in the effective maturities and credit ratings of these securities.
Rising interest rates will generally cause the prices of bonds and other debt securities to fall. Falling interest rates may cause an issuer to redeem, call or refinance a debt security before its stated maturity, which may result in the fund having to reinvest the proceeds in lower yielding securities. Longer maturity debt securities generally have greater sensitivity to changes in interest rates and may be subject to greater price fluctuations than shorter maturity debt securities.
Bonds and other debt securities are also subject to credit risk, which is the possibility that the credit strength of an issuer will weaken and/or an issuer of a debt security will fail to make timely payments of principal or interest and the security will go into default. Lower
| Capital World Bond Fund | 23 |
quality debt securities generally have higher rates of interest and may be subject to greater price fluctuations than higher quality debt securities. Credit risk is gauged, in part, by the credit ratings of the debt securities in which the fund invests. However, ratings are only the opinions of the rating agencies issuing them and are not guarantees as to credit quality or an evaluation of market risk. The fund’s investment adviser relies on its own credit analysts to research issuers and issues in seeking to mitigate various credit and default risks.
Thinly traded securities — There may be little trading in the secondary market for particular bonds or other debt securities, which may make them more difficult to value, acquire or sell.
Investing in lower rated bonds — Lower rated bonds and other lower rated debt securities generally have higher rates of interest and involve greater risk of default or price declines due to changes in the issuer’s creditworthiness than those of higher quality debt securities. The market prices of these securities may fluctuate more than the prices of higher quality debt securities and may decline significantly in periods of general economic difficulty. These risks may be increased with respect to investments in junk bonds.
Currency — The prices of, and the income generated by, many debt securities held by the fund may also be affected by changes in relative currency values. If the U.S. dollar appreciates against foreign currencies, the value in U.S. dollars of the fund’s securities denominated in such currencies would generally fall and vice versa. U.S. dollar-denominated securities of foreign issuers may also be affected by changes in relative currency values.
Investing outside the U.S. — Securities of issuers domiciled outside the U.S., or with significant operations outside the U.S., may lose value because of adverse political, social, economic or market developments (including social instability, regional conflicts, terrorism and war) in the countries or regions in which the issuers are domiciled or operate. These securities may also lose value due to changes in foreign currency exchange rates against the U.S. dollar and/or currencies of other countries. Securities markets in certain countries may be more volatile and/or less liquid than those in the U.S. Investments outside the U.S. may also be subject to different accounting practices and different regulatory, legal and reporting standards, and may be more difficult to value, than those in the U.S. In addition, the value of investments outside the U.S. may be reduced by foreign taxes, including foreign withholding taxes on interest and dividends. Further, there may be increased risks of delayed settlement of securities purchased or sold by the fund. The risks of investing outside the U.S. may be heightened in connection with investments in emerging markets.
Investing in emerging markets — Investing in emerging markets may involve risks in addition to and greater than those generally associated with investing in the securities markets of developed countries. For instance, developing countries may have less developed legal and accounting systems than those in developed countries. The
| 24 | Capital World Bond Fund |
governments of these countries may be less stable and more likely to impose capital controls, nationalize a company or industry, place restrictions on foreign ownership and on withdrawing sale proceeds of securities from the country, and/or impose punitive taxes that could adversely affect the prices of securities. In addition, the economies of these countries may be dependent on relatively few industries that are more susceptible to local and global changes. Securities markets in these countries can also be relatively small and have substantially lower trading volumes. As a result, securities issued in these countries may be more volatile and less liquid, and may be more difficult to value, than securities issued in countries with more developed economies and/or markets. Less certainty with respect to security valuations may lead to additional challenges and risks in calculating the fund’s net asset value. Additionally, there may be increased settlement risks for transactions in local securities.
Nondiversification risk — As a nondiversified fund, the fund has the ability to invest a larger percentage of its assets in the securities of a smaller number of issuers than a diversified fund. Although the fund does not intend to limit its investments to the securities of a small number of issuers, if it were to do so, poor performance by a single large holding could adversely impact the fund’s investment results more than if the fund were invested in a larger number of issuers.
Management — The investment adviser to the fund actively manages the fund’s investments. Consequently, the fund is subject to the risk that the methods and analyses employed by the investment adviser in this process may not produce the desired results. This could cause the fund to lose value or its investment results to lag relevant benchmarks or other funds with similar objectives.
5. Certain investment techniques
Mortgage dollar rolls — The fund has entered into mortgage dollar roll transactions in which the fund sells a mortgage-backed security to a counterparty and simultaneously enters into an agreement with the same counterparty to buy back a similar security on a specific future date at a predetermined price. Mortgage dollar rolls are accounted for as purchase and sale transactions, which may increase the fund’s portfolio turnover rate.
Loan transactions — The fund has entered into loan transactions in which the fund acquires a loan either through an agent, by assignment from another holder, or as a participation interest in another holder’s portion of a loan. The loan is often administered by a financial institution that acts as agent for the holders of the loan, and the fund may be required to receive approval from the agent and/or borrower prior to the sale of the investment. The loan’s interest rate and maturity date may change based on the terms of the loan, including potential early payments of principal.
Unfunded commitments — The fund has participated in transactions that involve unfunded commitments, which may obligate the fund to lend additional sums based upon the terms of the loan agreement. As of March 31, 2015, the fund’s maximum exposure of unfunded loan commitments was $3,033,000, which would represent less than .01% of the net assets of the fund should such commitments become due.
| Capital World Bond Fund | 25 |
Forward currency contracts — The fund has entered into forward currency contracts, which represent agreements to exchange currencies on specific future dates at predetermined rates. The fund’s investment adviser uses forward currency contracts to manage the fund’s exposure to changes in exchange rates. Upon entering into these contracts, risks may arise from the potential inability of counterparties to meet the terms of their contracts and from possible movements in exchange rates.
On a daily basis, the fund’s investment adviser values forward currency contracts and records unrealized appreciation or depreciation for open forward currency contracts in the fund’s statement of assets and liabilities. Realized gains or losses are recorded at the time the forward currency contract is closed or offset by another contract with the same broker for the same settlement date and currency.
Closed forward currency contracts that have not reached their settlement date are included in the respective receivables or payables for closed forward currency contracts in the fund’s statement of assets and liabilities. Net realized gains or losses from closed forward currency contracts and net unrealized appreciation or depreciation from open forward currency contracts are recorded in the fund’s statement of operations.
Interest rate swaps — The fund has entered into interest rate swap contracts, which are agreements to exchange one stream of future interest payments for another based on a specified notional amount. Typically, interest rate swaps exchange a fixed interest rate for a payment that floats relative to a benchmark or vice versa. The fund’s investment adviser uses interest rate swaps to manage the interest rate sensitivity of the fund by increasing or decreasing the duration of the fund or a portion of the fund’s portfolio. Risks may arise as a result of the fund’s investment adviser incorrectly anticipating changes in interest rates, increased volatility, reduced liquidity and the potential inability of counterparties to meet the terms of their agreements.
Upon entering into an interest rate swap contract, the fund is required to deposit cash, U.S. government securities or other liquid securities, which is known as “initial margin.” Generally, the initial margin required for a particular interest rate swap is set and held as collateral by the clearinghouse on which the contract is cleared. The amount of initial margin required may be significantly modified from time to time by the clearinghouse during the term of the contract.
On a daily basis, the fund’s investment adviser records daily interest accruals related to the exchange of future payments as a receivable and payable in the fund’s statement of assets and liabilities. The fund also pays or receives a “variation margin” based on the increase or decrease in the value of the interest rate swaps, including accrued interest, and records variation margin on interest rate swaps in the statement of assets and liabilities. The fund records realized gains and losses on both the net accrued interest and any gain or loss recognized at the time the interest rate swap is closed or expires. Net realized gains or losses, as well as any net unrealized appreciation or depreciation, from interest rate swaps are recorded in the fund’s statement of operations.
| 26 | Capital World Bond Fund |
The following tables present the financial statement impacts resulting from the fund’s use of forward currency contracts and interest rate swaps as of or for the six months ended March 31, 2015 (dollars in thousands):
| | | Assets | | | Liabilities | |
| Contract | | Location on statement of
assets and liabilities | | Value | | | Location on statement of
assets and liabilities | | Value | |
| Forward currency | | Unrealized appreciation on open forward currency contracts | | $ | 28,766 | | | Unrealized depreciation on open forward currency contracts | | $ | 21,102 | |
| Forward currency | | Receivables for closed forward currency contracts | | | 16,136 | | | Payables for closed forward currency contracts | | | 10,878 | |
| Interest rate swaps | | Variation margin | | | — | | | Variation margin | | | 261 | |
| | | | | $ | 44,902 | | | | | $ | 32,241 | |
| | | | | | | | | | | | | |
| | | Net realized gain (loss) | | | Net unrealized depreciation | |
| Contract | | Location on statement of
operations | | Value | | | Location on statement of
operations | | Value | |
| Forward currency | | Net realized gain on forward currency contracts | | $ | 77,067 | | | Net unrealized depreciation on forward currency contracts | | $ | (13,014 | ) |
| Interest rate swaps | | Net realized loss on interest rate swaps | | | (7,257 | ) | | Net unrealized depreciation on interest rate swaps | | | (5,146 | ) |
| | | | | $ | 69,810 | | | | | $ | (18,160 | ) |
Collateral — The fund participates in a collateral program due to its use of forward currency contracts and interest rate swaps. For forward currency contracts, the program calls for the fund to either receive or pledge collateral based on the net gain or loss on unsettled forward currency contracts by counterparty. For interest rate swaps, the program calls for the fund to pledge collateral for initial and variation margin by contract. The purpose of the collateral is to cover potential losses that could occur in the event that either party cannot meet its contractual obligations.
Rights of offset — The fund has entered into enforceable master netting agreements with certain counterparties for forward currency contracts, where on any date amounts payable by each party to the other (in the same currency with respect to the same transaction) may be closed or offset by each party’s payment obligation. If an early termination date occurs under these agreements following an event of default or termination event, all obligations of each party to its counterparty are settled net through a single payment in a single currency (“close-out netting”). For financial reporting purposes, the fund does not offset financial assets and financial liabilities that are subject to these master netting arrangements in the statement of assets and liabilities.
| Capital World Bond Fund | 27 |
The following table presents the fund’s forward currency contracts by counterparty that are subject to master netting agreements but that are not offset in the fund’s statement of assets and liabilities. The net amount column shows the impact of offsetting on the fund’s statement of assets and liabilities as of March 31, 2015 (dollars in thousands) if close-out netting was exercised:
| | | | | | Gross amounts not offset in the | | | | |
| | | Gross amounts | | | statement of assets and liabilities and | | | | |
| | | recognized in the | | | subject to a master netting agreement | | | | |
| | | statement of assets | | | Available | | | Non-cash | | | Cash | | | Net | |
| Counterparty | | and liabilities | | | to offset | | | collateral* | | | collateral | | | amount | |
| Assets: | | | | | | | | | | | | | | | | | | | | |
| Bank of America, N.A. | | $ | 6,111 | | | $ | (1,804 | ) | | $ | (2,822 | ) | | $ | — | | | $ | 1,485 | |
| Bank of New York Mellon | | | 935 | | | | (935 | ) | | | — | | | | — | | | | — | |
| Barclays Bank PLC | | | — | | | | — | | | | — | | | | — | | | | — | |
| Citibank | | | 9,438 | | | | (5,069 | ) | | | — | | | | — | | | | 4,369 | |
| HSBC Bank | | | 11,035 | | | | (3,498 | ) | | | (7,537 | ) | | | — | | | | — | |
| JPMorgan Chase | | | 9,971 | | | | (3,160 | ) | | | (6,431 | ) | | | — | | | | 380 | |
| UBS AG | | | 7,412 | | | | (3,612 | ) | | | (2,551 | ) | | | — | | | | 1,249 | |
| | | $ | 44,902 | | | $ | (18,078 | ) | | $ | (19,341 | ) | | $ | — | | | $ | 7,483 | |
| Liabilities: | | | | | | | | | | | | | | | | | | | | |
| Bank of America, N.A. | | $ | 3,370 | | | $ | (1,804 | ) | | $ | — | | | $ | — | | | $ | 1,566 | |
| Bank of New York Mellon | | | 1,436 | | | | (935 | ) | | | (79 | ) | | | — | | | | 422 | |
| Barclays Bank PLC | | | 91 | | | | — | | | | — | | | | — | | | | 91 | |
| Citibank | | | 13,882 | | | | (5,069 | ) | | | (3,122 | ) | | | — | | | | 5,691 | |
| HSBC Bank | | | 3,498 | | | | (3,498 | ) | | | — | | | | — | | | | — | |
| JPMorgan Chase | | | 3,356 | | | | (3,160 | ) | | | — | | | | — | | | | 196 | |
| UBS AG | | | 6,347 | | | | (3,612 | ) | | | — | | | | — | | | | 2,735 | |
| | | $ | 31,980 | | | $ | (18,078 | ) | | $ | (3,201 | ) | | $ | — | | | $ | 10,701 | |
| * | Non-cash collateral is shown on a settlement basis. |
6. Taxation and distributions
Federal income taxation — The fund complies with the requirements under Subchapter M of the Internal Revenue Code applicable to mutual funds and intends to distribute substantially all of its net taxable income and net capital gains each year. The fund is not subject to income taxes to the extent such distributions are made. Therefore, no federal income tax provision is required.
As of and during the period ended March 31, 2015, the fund did not have a liability for any unrecognized tax benefits. The fund recognizes interest and penalties, if any, related to unrecognized tax benefits as income tax expense in the statement of operations. During the period, the fund did not incur any interest or penalties.
The fund is not subject to examination by U.S. federal tax authorities for tax years before 2010 and by state tax authorities for tax years before 2009.
| 28 | Capital World Bond Fund |
Non-U.S. taxation — Interest income is recorded net of non-U.S. taxes paid. Gains realized by the fund on the sale of securities in certain countries are subject to non-U.S. taxes. The fund records a liability based on unrealized gains to provide for potential non-U.S. taxes payable upon the sale of these securities.
Distributions — Distributions paid to shareholders are based on net investment income and net realized gains determined on a tax basis, which may differ from net investment income and net realized gains for financial reporting purposes. These differences are due primarily to different treatment for items such as currency gains and losses; short-term capital gains and losses; capital losses related to sales of certain securities within 30 days of purchase; cost of investments sold; amortization of premiums and discounts; and income on certain investments. The fiscal year in which amounts are distributed may differ from the year in which the net investment income and net realized gains are recorded by the fund for financial reporting purposes.
The components of distributable earnings on a tax basis are reported as of the fund’s most recent year-end. As of September 30, 2014, the components of distributable earnings on a tax basis were as follows (dollars in thousands):
| Undistributed ordinary income | $126,544 | |
| Undistributed long-term capital gains | 120,696 | |
As of March 31, 2015, the tax basis unrealized appreciation (depreciation) and cost of investment securities were as follows (dollars in thousands):
| Gross unrealized appreciation on investment securities | | $ | 263,940 | |
| Gross unrealized depreciation on investment securities | | | (488,572 | ) |
| Net unrealized depreciation on investment securities | | | (224,632 | ) |
| Cost of investment securities | | | 13,731,559 | |
| Capital World Bond Fund | 29 |
The tax character of distributions paid to shareholders was as follows (dollars in thousands):
| | | Six months ended March 31, 2015 | | | Year ended September 30, 2014 | |
| Share class | | Ordinary
income | | | Long-term
capital gains | | | Total
distributions
paid | | | Ordinary
income | | | Long-term
capital gains | | | Total
distributions
paid | |
| Class A | | $ | 90,540 | | | $ | 64,961 | | | $ | 155,501 | | | $ | 151,925 | | | $ | — | | | $ | 151,925 | |
| Class B | | | 452 | | | | 520 | | | | 972 | | | | 1,073 | | | | — | | | | 1,073 | |
| Class C | | | 4,212 | | | | 4,943 | | | | 9,155 | | | | 7,962 | | | | — | | | | 7,962 | |
| Class F-1 | | | 25,944 | | | | 18,473 | | | | 44,417 | | | | 40,698 | | | | — | | | | 40,698 | |
| Class F-2 | | | 14,346 | | | | 8,710 | | | | 23,056 | | | | 17,372 | | | | — | | | | 17,372 | |
| Class 529-A | | | 4,270 | | | | 3,217 | | | | 7,487 | | | | 7,381 | | | | — | | | | 7,381 | |
| Class 529-B | | | 38 | | | | 49 | | | | 87 | | | | 97 | | | | — | | | | 97 | |
| Class 529-C | | | 1,113 | | | | 1,378 | | | | 2,491 | | | | 1,996 | | | | — | | | | 1,996 | |
| Class 529-E | | | 201 | | | | 172 | | | | 373 | | | | 349 | | | | — | | | | 349 | |
| Class 529-F-1 | | | 620 | | | | 409 | | | | 1,029 | | | | 938 | | | | — | | | | 938 | |
| Class R-1 | | | 131 | | | | 149 | | | | 280 | | | | 224 | | | | — | | | | 224 | |
| Class R-2 | | | 1,285 | | | | 1,518 | | | | 2,803 | | | | 2,275 | | | | — | | | | 2,275 | |
| Class R-2E* | | | — | † | | | — | † | | | — | † | | | — | | | | — | | | | — | |
| Class R-3 | | | 1,814 | | | | 1,567 | | | | 3,381 | | | | 3,254 | | | | — | | | | 3,254 | |
| Class R-4 | | | 1,437 | | | | 997 | | | | 2,434 | | | | 2,350 | | | | — | | | | 2,350 | |
| Class R-5 | | | 2,441 | | | | 1,428 | | | | 3,869 | | | | 4,516 | | | | — | | | | 4,516 | |
| Class R-6 | | | 21,658 | | | | 12,521 | | | | 34,179 | | | | 21,959 | | | | — | | | | 21,959 | |
| Total | | $ | 170,502 | | | $ | 121,012 | | | $ | 291,514 | | | $ | 264,369 | | | $ | — | | | $ | 264,369 | |
| * | Class R-2E shares were offered beginning August 29, 2014. |
| † | Amount less than one thousand. |
7. Fees and transactions with related parties
CRMC, the fund’s investment adviser, is the parent company of American Funds Distributors,® Inc. (“AFD”), the principal underwriter of the fund’s shares, and American Funds Service Company® (“AFS”), the fund’s transfer agent. CRMC, AFD and AFS are considered related parties to the fund.
Investment advisory services — The fund has an investment advisory and service agreement with CRMC that provides for monthly fees accrued daily. These fees are based on a series of decreasing annual rates beginning with 0.570% on the first $1 billion of daily net assets and decreasing to 0.360% on such assets in excess of $15 billion. For the six months ended March 31, 2015, the investment advisory services fee was $28,844,000, which was equivalent to an annualized rate of 0.437% of average daily net assets.
| 30 | Capital World Bond Fund |
Class-specific fees and expenses — Expenses that are specific to individual share classes are accrued directly to the respective share class. The principal class-specific fees and expenses are further described below:
Distribution services — The fund has plans of distribution for all share classes, except Class F-2, R-5 and R-6 shares. Under the plans, the board of trustees approves certain categories of expenses that are used to finance activities primarily intended to sell fund shares and service existing accounts. The plans provide for payments, based on an annualized percentage of average daily net assets, ranging from 0.30% to 1.00% as noted in this section. In some cases, the board of trustees has limited the amounts that may be paid to less than the maximum allowed by the plans. All share classes with a plan may use up to 0.25% of average daily net assets to pay service fees, or to compensate AFD for paying service fees, to firms that have entered into agreements with AFD to provide certain shareholder services. The remaining amounts available to be paid under each plan are paid to dealers to compensate them for their sales activities.
For Class A and 529-A shares, distribution-related expenses include the reimbursement of dealer and wholesaler commissions paid by AFD for certain shares sold without a sales charge. These share classes reimburse AFD for amounts billed within the prior 15 months but only to the extent that the overall annual expense limit of 0.30% is not exceeded. As of March 31, 2015, there were no unreimbursed expenses subject to reimbursement for Class A or 529-A shares.
| Share class | | Currently approved limits | | Plan limits |
| Class A | | 0.30 | % | | 0.30 | % |
| Class 529-A | | 0.30 | | | 0.50 | |
| Classes B and 529-B | | 1.00 | | | 1.00 | |
| Classes C, 529-C and R-1 | | 1.00 | | | 1.00 | |
| Class R-2 | | 0.75 | | | 1.00 | |
| Class R-2E | | 0.60 | | | 0.85 | |
| Classes 529-E and R-3 | | 0.50 | | | 0.75 | |
| Classes F-1, 529-F-1 and R-4 | | 0.25 | | | 0.50 | |
Transfer agent services — The fund has a shareholder services agreement with AFS under which the fund compensates AFS for providing transfer agent services to each of the fund’s share classes. These services include recordkeeping, shareholder communications and transaction processing. In addition, the fund reimburses AFS for amounts paid to third parties for performing transfer agent services on behalf of fund shareholders.
Administrative services — The fund has an administrative services agreement with CRMC under which the fund compensates CRMC for providing administrative services to Class A, C, F, 529 and R shares. These services include, but are not limited to, coordinating, monitoring, assisting and overseeing third parties that provide
| Capital World Bond Fund | 31 |
services to fund shareholders. Under the agreement, Class A shares pay an annual fee of 0.01% and Class C, F, 529 and R shares pay an annual fee of 0.05% of their respective average daily net assets.
529 plan services — Each 529 share class is subject to service fees to compensate the Virginia College Savings Plan (“Virginia529”) for its oversight and administration of the 529 college savings plan. The quarterly fee is based on a series of decreasing annual rates beginning with 0.10% on the first $30 billion of the net assets invested in Class 529 shares of the American Funds and decreasing to 0.05% on such assets in excess of $70 billion. The fee for any given calendar quarter is accrued and calculated on the basis of the average net assets of Class 529 shares of the American Funds for the last month of the prior calendar quarter. The fee is included in other expenses in the fund’s statement of operations. Virginia529 is not considered a related party to the fund.
For the six months ended March 31, 2015, class-specific expenses under the agreements were as follows (dollars in thousands):
| Share class | | Distribution
services | | Transfer agent
services | | Administrative
services | | 529 plan
services |
| Class A | | $8,650 | | $7,332 | | $352 | | Not applicable |
| Class B | | 276 | | 60 | | Not applicable | | Not applicable |
| Class C | | 2,623 | | 551 | | 132 | | Not applicable |
| Class F-1 | | 2,492 | | 1,294 | | 499 | | Not applicable |
| Class F-2 | | Not applicable | | 569 | | 236 | | Not applicable |
| Class 529-A | | 393 | | 311 | | 88 | | $156 |
| Class 529-B | | 26 | | 6 | | 1 | | 2 |
| Class 529-C | | 732 | | 139 | | 37 | | 66 |
| Class 529-E | | 46 | | 10 | | 5 | | 8 |
| Class 529-F-1 | | — | | 39 | | 11 | | 20 |
| Class R-1 | | 80 | | 11 | | 4 | | Not applicable |
| Class R-2 | | 605 | | 357 | | 41 | | Not applicable |
| Class R-2E | | — | | —* | | —* | | Not applicable |
| Class R-3 | | 420 | | 161 | | 42 | | Not applicable |
| Class R-4 | | 133 | | 54 | | 27 | | Not applicable |
| Class R-5 | | Not applicable | | 37 | | 39 | | Not applicable |
| Class R-6 | | Not applicable | | 6 | | 360 | | Not applicable |
| Total class-specific expenses | | $16,476 | | $10,937 | | $1,874 | | $252 |
*Amount less than one thousand.
Trustees’ deferred compensation — Trustees who are unaffiliated with CRMC may elect to defer the cash payment of part or all of their compensation. These deferred amounts, which remain as liabilities of the fund, are treated as if invested in shares of the fund or other American Funds. These amounts represent general, unsecured liabilities of the fund and vary according to the total returns of the selected funds. Trustees’ compensation of $52,000 in the fund’s statement of operations includes $46,000 in current fees (either paid in cash or deferred) and a net increase of $6,000 in the value of the deferred amounts.
| 32 | Capital World Bond Fund |
Affiliated officers and trustees — Officers and certain trustees of the fund are or may be considered to be affiliated with CRMC, AFD and AFS. No affiliated officers or trustees received any compensation directly from the fund.
8. Capital share transactions
Capital share transactions in the fund were as follows (dollars and shares in thousands):
| | | Sales1 | | | Reinvestments of
dividends and
distributions | | | Repurchases1 | | | Net (decrease)
increase | |
| Share class | | Amount | | | Shares | | | Amount | | | Shares | | | Amount | | | Shares | | | Amount | | | Shares | |
| | | | | | | | | | | | | | | | | | | |
| Six months ended March 31, 2015 | | | | | | | | | | | | | | | | | | |
| | | | | | | | | | | | | | | | | | | |
| Class A | | $ | 462,744 | | | | 23,015 | | | $ | 153,166 | | | | 7,671 | | | $ | (639,601 | ) | | | (31,876 | ) | | $ | (23,691 | ) | | | (1,190 | ) |
| Class B | | | 788 | | | | 39 | | | | 961 | | | | 48 | | | | (14,363 | ) | | | (720 | ) | | | (12,614 | ) | | | (633 | ) |
| Class C | | | 33,190 | | | | 1,675 | | | | 8,990 | | | | 457 | | | | (75,408 | ) | | | (3,813 | ) | | | (33,228 | ) | | | (1,681 | ) |
| Class F-1 | | | 278,072 | | | | 13,930 | | | | 44,256 | | | | 2,231 | | | | (154,650 | ) | | | (7,759 | ) | | | 167,678 | | | | 8,402 | |
| Class F-2 | | | 113,222 | | | | 5,648 | | | | 22,051 | | | | 1,105 | | | | (176,869 | ) | | | (8,813 | ) | | | (41,596 | ) | | | (2,060 | ) |
| Class 529-A | | | 21,758 | | | | 1,081 | | | | 7,483 | | | | 374 | | | | (31,838 | ) | | | (1,582 | ) | | | (2,597 | ) | | | (127 | ) |
| Class 529-B | | | 109 | | | | 6 | | | | 87 | | | | 4 | | | | (1,608 | ) | | | (80 | ) | | | (1,412 | ) | | | (70 | ) |
| Class 529-C | | | 10,427 | | | | 524 | | | | 2,490 | | | | 126 | | | | (15,751 | ) | | | (792 | ) | | | (2,834 | ) | | | (142 | ) |
| Class 529-E | | | 1,226 | | | | 61 | | | | 371 | | | | 19 | | | | (1,900 | ) | | | (95 | ) | | | (303 | ) | | | (15 | ) |
| Class 529-F-1 | | | 6,159 | | | | 308 | | | | 1,029 | | | | 51 | | | | (6,360 | ) | | | (318 | ) | | | 828 | | | | 41 | |
| Class R-1 | | | 1,532 | | | | 77 | | | | 279 | | | | 14 | | | | (2,181 | ) | | | (110 | ) | | | (370 | ) | | | (19 | ) |
| Class R-2 | | | 20,549 | | | | 1,033 | | | | 2,798 | | | | 142 | | | | (25,970 | ) | | | (1,305 | ) | | | (2,623 | ) | | | (130 | ) |
| Class R-2E | | | — | | | | — | | | | — | | | | — | | | | — | | | | — | | | | — | | | | — | |
| Class R-3 | | | 22,569 | | | | 1,126 | | | | 3,377 | | | | 170 | | | | (30,220 | ) | | | (1,509 | ) | | | (4,274 | ) | | | (213 | ) |
| Class R-4 | | | 14,758 | | | | 734 | | | | 2,431 | | | | 122 | | | | (21,626 | ) | | | (1,076 | ) | | | (4,437 | ) | | | (220 | ) |
| Class R-5 | | | 26,174 | | | | 1,305 | | | | 3,866 | | | | 193 | | | | (26,249 | ) | | | (1,299 | ) | | | 3,791 | | | | 199 | |
| Class R-6 | | | 428,124 | | | | 21,389 | | | | 34,178 | | | | 1,712 | | | | (47,963 | ) | | | (2,409 | ) | | | 414,339 | | | | 20,692 | |
| Total net increase (decrease) | | $ | 1,441,401 | | | | 71,951 | | | $ | 287,813 | | | | 14,439 | | | $ | (1,272,557 | ) | | | (63,556 | ) | | $ | 456,657 | | | | 22,834 | |
See page 34 for footnote.
| Capital World Bond Fund | 33 |
| | | Sales1 | | | Reinvestments of
dividends and
distributions | | | Repurchases1 | | | Net (decrease)
increase | |
| Share class | | Amount | | | Shares | | | Amount | | | Shares | | | Amount | | | Shares | | | Amount | | | Shares | |
| | | | | | | | | | | | | | | | | | | | | | | | | |
| Year ended September 30, 2014 | | | | | | | | | | | | | | | | | | | | | | | | | | | | | |
| | | | | | | | | | | | | | | | | | | | | | | | | | | | | | | | | |
| Class A | | $ | 992,656 | | | | 48,064 | | | $ | 148,647 | | | | 7,285 | | | $ | (1,408,767 | ) | | | (68,563 | ) | | $ | (267,464 | ) | | | (13,214 | ) |
| Class B | | | 2,837 | | | | 139 | | | | 1,058 | | | | 52 | | | | (34,098 | ) | | | (1,668 | ) | | | (30,203 | ) | | | (1,477 | ) |
| Class C | | | 72,081 | | | | 3,542 | | | | 7,740 | | | | 386 | | | | (188,167 | ) | | | (9,292 | ) | | | (108,346 | ) | | | (5,364 | ) |
| Class F-1 | | | 729,295 | | | | 35,590 | | | | 40,506 | | | | 1,996 | | | | (732,814 | ) | | | (35,667 | ) | | | 36,987 | | | | 1,919 | |
| Class F-2 | | | 575,894 | | | | 27,829 | | | | 15,665 | | | | 767 | | | | (221,703 | ) | | | (10,833 | ) | | | 369,856 | | | | 17,763 | |
| Class 529-A | | | 49,511 | | | | 2,397 | | | | 7,377 | | | | 361 | | | | (73,548 | ) | | | (3,567 | ) | | | (16,660 | ) | | | (809 | ) |
| Class 529-B | | | 369 | | | | 18 | | | | 96 | | | | 5 | | | | (3,580 | ) | | | (175 | ) | | | (3,115 | ) | | | (152 | ) |
| Class 529-C | | | 22,866 | | | | 1,117 | | | | 1,994 | | | | 99 | | | | (38,944 | ) | | | (1,908 | ) | | | (14,084 | ) | | | (692 | ) |
| Class 529-E | | | 3,334 | | | | 163 | | | | 349 | | | | 17 | | | | (4,398 | ) | | | (216 | ) | | | (715 | ) | | | (36 | ) |
| Class 529-F-1 | | | 13,268 | | | | 647 | | | | 938 | | | | 47 | | | | (8,900 | ) | | | (436 | ) | | | 5,306 | | | | 258 | |
| Class R-1 | | | 3,830 | | | | 188 | | | | 222 | | | | 11 | | | | (4,545 | ) | | | (223 | ) | | | (493 | ) | | | (24 | ) |
| Class R-2 | | | 42,460 | | | | 2,079 | | | | 2,272 | | | | 112 | | | | (54,764 | ) | | | (2,685 | ) | | | (10,032 | ) | | | (494 | ) |
| Class R-2E2 | | | 10 | | | | — | 3 | | | — | | | | — | | | | — | | | | — | | | | 10 | | | | — | 3 |
| Class R-3 | | | 49,106 | | | | 2,387 | | | | 3,249 | | | | 159 | | | | (63,722 | ) | | | (3,100 | ) | | | (11,367 | ) | | | (554 | ) |
| Class R-4 | | | 37,076 | | | | 1,802 | | | | 2,348 | | | | 115 | | | | (36,901 | ) | | | (1,795 | ) | | | 2,523 | | | | 122 | |
| Class R-5 | | | 50,909 | | | | 2,474 | | | | 4,513 | | | | 221 | | | | (84,631 | ) | | | (4,078 | ) | | | (29,209 | ) | | | (1,383 | ) |
| Class R-6 | | | 568,675 | | | | 27,497 | | | | 21,959 | | | | 1,073 | | | | (57,587 | ) | | | (2,799 | ) | | | 533,047 | | | | 25,771 | |
| Total net increase (decrease) | | $ | 3,214,177 | | | | 155,933 | | | $ | 258,933 | | | | 12,706 | | | $ | (3,017,069 | ) | | | (147,005 | ) | | $ | 456,041 | | | | 21,634 | |
| 1 | Includes exchanges between share classes of the fund. |
| 2 | Class R-2E shares were offered beginning August 29, 2014. |
| 3 | Amount less than one thousand. |
| 34 | Capital World Bond Fund |
9. Investment transactions
The fund made purchases and sales of investment securities, excluding short-term securities and U.S. government obligations, if any, of $12,932,635,000 and $12,521,700,000, respectively, during the six months ended March 31, 2015.
| Capital World Bond Fund | 35 |
Financial highlights
| | | | | | (Loss) income from investment operations1 | |
| | | | | | | | | Net (losses) | | | | |
| | | Net asset | | | | | | gains on | | | | |
| | | value, | | | Net | | | securities (both | | | Total from | |
| | | beginning | | | investment | | | realized and | | | investment | |
| | | of period | | | income | | | unrealized) | | | operations | |
| Class A: | | | | | | | | | | | | | | | | |
| Six months ended 3/31/20155,6 | | $ | 20.49 | | | $ | .18 | | | $ | (.50 | ) | | $ | (.32 | ) |
| Year ended 9/30/2014 | | | 20.32 | | | | .47 | | | | .13 | | | | .60 | |
| Year ended 9/30/2013 | | | 21.63 | | | | .43 | | | | (1.02 | ) | | | (.59 | ) |
| Year ended 9/30/2012 | | | 20.48 | | | | .51 | | | | 1.08 | | | | 1.59 | |
| Year ended 9/30/2011 | | | 21.03 | | | | .68 | | | | (.41 | ) | | | .27 | |
| Year ended 9/30/2010 | | | 20.28 | | | | .71 | | | | .80 | | | | 1.51 | |
| Class B: | | | | | | | | | | | | | | | | |
| Six months ended 3/31/20155,6 | | | 20.34 | | | | .10 | | | | (.51 | ) | | | (.41 | ) |
| Year ended 9/30/2014 | | | 20.16 | | | | .32 | | | | .12 | | | | .44 | |
| Year ended 9/30/2013 | | | 21.46 | | | | .27 | | | | (1.02 | ) | | | (.75 | ) |
| Year ended 9/30/2012 | | | 20.35 | | | | .35 | | | | 1.08 | | | | 1.43 | |
| Year ended 9/30/2011 | | | 20.89 | | | | .52 | | | | (.41 | ) | | | .11 | |
| Year ended 9/30/2010 | | | 20.15 | | | | .56 | | | | .78 | | | | 1.34 | |
| Class C: | | | | | | | | | | | | | | | | |
| Six months ended 3/31/20155,6 | | | 20.18 | | | | .10 | | | | (.51 | ) | | | (.41 | ) |
| Year ended 9/30/2014 | | | 20.01 | | | | .30 | | | | .13 | | | | .43 | |
| Year ended 9/30/2013 | | | 21.30 | | | | .26 | | | | (1.00 | ) | | | (.74 | ) |
| Year ended 9/30/2012 | | | 20.21 | | | | .34 | | | | 1.07 | | | | 1.41 | |
| Year ended 9/30/2011 | | | 20.77 | | | | .51 | | | | (.42 | ) | | | .09 | |
| Year ended 9/30/2010 | | | 20.04 | | | | .54 | | | | .79 | | | | 1.33 | |
| Class F-1: | | | | | | | | | | | | | | | | |
| Six months ended 3/31/20155,6 | | | 20.37 | | | | .18 | | | | (.51 | ) | | | (.33 | ) |
| Year ended 9/30/2014 | | | 20.20 | | | | .47 | | | | .13 | | | | .60 | |
| Year ended 9/30/2013 | | | 21.51 | | | | .43 | | | | (1.02 | ) | | | (.59 | ) |
| Year ended 9/30/2012 | | | 20.37 | | | | .50 | | | | 1.09 | | | | 1.59 | |
| Year ended 9/30/2011 | | | 20.92 | | | | .67 | | | | (.41 | ) | | | .26 | |
| Year ended 9/30/2010 | | | 20.18 | | | | .71 | | | | .78 | | | | 1.49 | |
| Class F-2: | | | | | | | | | | | | | | | | |
| Six months ended 3/31/20155,6 | | | 20.48 | | | | .21 | | | | (.51 | ) | | | (.30 | ) |
| Year ended 9/30/2014 | | | 20.31 | | | | .52 | | | | .14 | | | | .66 | |
| Year ended 9/30/2013 | | | 21.62 | | | | .49 | | | | (1.02 | ) | | | (.53 | ) |
| Year ended 9/30/2012 | | | 20.45 | | | | .56 | | | | 1.10 | | | | 1.66 | |
| Year ended 9/30/2011 | | | 21.01 | | | | .73 | | | | (.42 | ) | | | .31 | |
| Year ended 9/30/2010 | | | 20.25 | | | | .76 | | | | .81 | | | | 1.57 | |
| Class 529-A: | | | | | | | | | | | | | | | | |
| Six months ended 3/31/20155,6 | | | 20.54 | | | | .17 | | | | (.51 | ) | | | (.34 | ) |
| Year ended 9/30/2014 | | | 20.37 | | | | .45 | | | | .13 | | | | .58 | |
| Year ended 9/30/2013 | | | 21.68 | | | | .42 | | | | (1.03 | ) | | | (.61 | ) |
| Year ended 9/30/2012 | | | 20.53 | | | | .49 | | | | 1.09 | | | | 1.58 | |
| Year ended 9/30/2011 | | | 21.08 | | | | .67 | | | | (.41 | ) | | | .26 | |
| Year ended 9/30/2010 | | | 20.32 | | | | .70 | | | | .81 | | | | 1.51 | |
| 36 | Capital World Bond Fund |
| Dividends and distributions | | | | | | | | | | | | | | | | | | | |
Dividends
(from net
investment
income) | | | Distributions
(from capital
gains) | | | Total
dividends
and
distributions | | | Net asset
value, end
of period | | | Total
return2,3,4 | | | Net assets,
end of
period
(in millions) | | | Ratio of
expenses to
average net
assets before
reimbursements | | | Ratio of
expenses to
average net
assets after
reimbursements4 | | | Ratio of
net income
to average
net assets4 | |
| | | | | | | | | | | | | | | | | | | | | | | | | | | | | | | | | | | |
| $ | (.17 | ) | | $ | (.28 | ) | | $ | (.45 | ) | | $ | 19.72 | | | | (1.66 | )% | | $ | 6,880 | | | | .95 | %7 | | | .95 | %7 | | | 1.77 | %7 |
| | (.43 | ) | | | — | | | | (.43 | ) | | | 20.49 | | | | 2.98 | | | | 7,176 | | | | .90 | | | | .90 | | | | 2.27 | |
| | (.44 | ) | | | (.28 | ) | | | (.72 | ) | | | 20.32 | | | | (2.80 | ) | | | 7,384 | | | | .91 | | | | .91 | | | | 2.09 | |
| | (.44 | ) | | | — | | | | (.44 | ) | | | 21.63 | | | | 7.89 | | | | 8,306 | | | | .89 | | | | .89 | | | | 2.43 | |
| | (.82 | ) | | | — | | | | (.82 | ) | | | 20.48 | | | | 1.32 | | | | 7,868 | | | | .87 | | | | .87 | | | | 3.26 | |
| | (.76 | ) | | | — | | | | (.76 | ) | | | 21.03 | | | | 7.63 | | | | 7,679 | | | | .88 | | | | .88 | | | | 3.52 | |
| | | | | | | | | | | | | | | | | | | | | | | | | | | | | | | | | | | |
| | (.06 | ) | | | (.28 | ) | | | (.34 | ) | | | 19.59 | | | | (2.02 | ) | | | 48 | | | | 1.70 | 7 | | | 1.70 | 7 | | | 1.03 | 7 |
| | (.26 | ) | | | — | | | | (.26 | ) | | | 20.34 | | | | 2.22 | | | | 63 | | | | 1.66 | | | | 1.66 | | | | 1.54 | |
| | (.27 | ) | | | (.28 | ) | | | (.55 | ) | | | 20.16 | | | | (3.56 | ) | | | 92 | | | | 1.67 | | | | 1.67 | | | | 1.32 | |
| | (.32 | ) | | | — | | | | (.32 | ) | | | 21.46 | | | | 7.09 | | | | 142 | | | | 1.65 | | | | 1.65 | | | | 1.70 | |
| | (.65 | ) | | | — | | | | (.65 | ) | | | 20.35 | | | | .56 | | | | 186 | | | | 1.64 | | | | 1.64 | | | | 2.49 | |
| | (.60 | ) | | | — | | | | (.60 | ) | | | 20.89 | | | | 6.79 | | | | 242 | | | | 1.64 | | | | 1.64 | | | | 2.76 | |
| | | | | | | | | | | | | | | | | | | | | | | | | | | | | | | | | | | |
| | (.06 | ) | | | (.28 | ) | | | (.34 | ) | | | 19.43 | | | | (2.03 | ) | | | 499 | | | | 1.75 | 7 | | | 1.75 | 7 | | | .98 | 7 |
| | (.26 | ) | | | — | | | | (.26 | ) | | | 20.18 | | | | 2.17 | | | | 552 | | | | 1.70 | | | | 1.70 | | | | 1.49 | |
| | (.27 | ) | | | (.28 | ) | | | (.55 | ) | | | 20.01 | | | | (3.55 | ) | | | 654 | | | | 1.71 | | | | 1.71 | | | | 1.28 | |
| | (.32 | ) | | | — | | | | (.32 | ) | | | 21.30 | | | | 7.05 | | | | 813 | | | | 1.68 | | | | 1.68 | | | | 1.63 | |
| | (.65 | ) | | | — | | | | (.65 | ) | | | 20.21 | | | | .48 | | | | 822 | | | | 1.66 | | | | 1.66 | | | | 2.47 | |
| | (.60 | ) | | | — | | | | (.60 | ) | | | 20.77 | | | | 6.79 | | | | 862 | | | | 1.67 | | | | 1.67 | | | | 2.73 | |
| | | | | | | | | | | | | | | | | | | | | | | | | | | | | | | | | | | |
| | (.17 | ) | | | (.28 | ) | | | (.45 | ) | | | 19.59 | | | | (1.65 | ) | | | 2,041 | | | | .92 | 7 | | | .92 | 7 | | | 1.81 | 7 |
| | (.43 | ) | | | — | | | | (.43 | ) | | | 20.37 | | | | 3.01 | | | | 1,951 | | | | .90 | | | | .90 | | | | 2.27 | |
| | (.44 | ) | | | (.28 | ) | | | (.72 | ) | | | 20.20 | | | | (2.81 | ) | | | 1,896 | | | | .91 | | | | .91 | | | | 2.09 | |
| | (.45 | ) | | | — | | | | (.45 | ) | | | 21.51 | | | | 7.91 | | | | 1,849 | | | | .88 | | | | .88 | | | | 2.39 | |
| | (.81 | ) | | | — | | | | (.81 | ) | | | 20.37 | | | | 1.31 | | | | 1,324 | | | | .89 | | | | .89 | | | | 3.24 | |
| | (.75 | ) | | | — | | | | (.75 | ) | | | 20.92 | | | | 7.61 | | | | 1,307 | | | | .88 | | | | .88 | | | | 3.51 | |
| | | | | | | | | | | | | | | | | | | | | | | | | | | | | | | | | | | |
| | (.21 | ) | | | (.28 | ) | | | (.49 | ) | | | 19.69 | | | | (1.53 | ) | | | 911 | | | | .66 | 7 | | | .66 | 7 | | | 2.07 | 7 |
| | (.49 | ) | | | — | | | | (.49 | ) | | | 20.48 | | | | 3.29 | | | | 990 | | | | .61 | | | | .61 | | | | 2.54 | |
| | (.50 | ) | | | (.28 | ) | | | (.78 | ) | | | 20.31 | | | | (2.53 | ) | | | 621 | | | | .64 | | | | .64 | | | | 2.35 | |
| | (.49 | ) | | | — | | | | (.49 | ) | | | 21.62 | | | | 8.23 | | | | 723 | | | | .62 | | | | .62 | | | | 2.67 | |
| | (.87 | ) | | | — | | | | (.87 | ) | | | 20.45 | | | | 1.52 | | | | 524 | | | | .63 | | | | .63 | | | | 3.50 | |
| | (.81 | ) | | | — | | | | (.81 | ) | | | 21.01 | | | | 7.97 | | | | 468 | | | | .62 | | | | .62 | | | | 3.77 | |
| | | | | | | | | | | | | | | | | | | | | | | | | | | | | | | | | | | |
| | (.15 | ) | | | (.28 | ) | | | (.43 | ) | | | 19.77 | | | | (1.67 | ) | | | 342 | | | | 1.03 | 7 | | | 1.03 | 7 | | | 1.70 | 7 |
| | (.41 | ) | | | — | | | | (.41 | ) | | | 20.54 | | | | 2.88 | | | | 358 | | | | .99 | | | | .99 | | | | 2.19 | |
| | (.42 | ) | | | (.28 | ) | | | (.70 | ) | | | 20.37 | | | | (2.87 | ) | | | 372 | | | | .99 | | | | .99 | | | | 2.01 | |
| | (.43 | ) | | | — | | | | (.43 | ) | | | 21.68 | | | | 7.81 | | | | 401 | | | | .97 | | | | .97 | | | | 2.34 | |
| | (.81 | ) | | | — | | | | (.81 | ) | | | 20.53 | | | | 1.26 | | | | 344 | | | | .93 | | | | .93 | | | | 3.19 | |
| | (.75 | ) | | | — | | | | (.75 | ) | | | 21.08 | | | | 7.62 | | | | 292 | | | | .93 | | | | .93 | | | | 3.46 | |
See page 41 for footnotes.
| Capital World Bond Fund | 37 |
Financial highlights (continued)
| | | | | | (Loss) income from investment operations1 | |
| | | | | | | | | Net (losses) | | | | |
| | | Net asset | | | | | | gains on | | | | |
| | | value, | | | Net | | | securities (both | | | Total from | |
| | | beginning | | | investment | | | realized and | | | investment | |
| | | of period | | | income | | | unrealized) | | | operations | |
| Class 529-B: | | | | | | | | | | | | | | | | |
| Six months ended 3/31/20155,6 | | $ | 20.40 | | | $ | .09 | | | $ | (.50 | ) | | $ | (.41 | ) |
| Year ended 9/30/2014 | | | 20.22 | | | | .29 | | | | .13 | | | | .42 | |
| Year ended 9/30/2013 | | | 21.52 | | | | .25 | | | | (1.03 | ) | | | (.78 | ) |
| Year ended 9/30/2012 | | | 20.41 | | | | .33 | | | | 1.08 | | | | 1.41 | |
| Year ended 9/30/2011 | | | 20.95 | | | | .50 | | | | (.41 | ) | | | .09 | |
| Year ended 9/30/2010 | | | 20.21 | | | | .54 | | | | .78 | | | | 1.32 | |
| Class 529-C: | | | | | | | | | | | | | | | | |
| Six months ended 3/31/20155,6 | | | 20.32 | | | | .09 | | | | (.50 | ) | | | (.41 | ) |
| Year ended 9/30/2014 | | | 20.14 | | | | .29 | | | | .14 | | | | .43 | |
| Year ended 9/30/2013 | | | 21.45 | | | | .25 | | | | (1.02 | ) | | | (.77 | ) |
| Year ended 9/30/2012 | | | 20.35 | | | | .32 | | | | 1.09 | | | | 1.41 | |
| Year ended 9/30/2011 | | | 20.91 | | | | .50 | | | | (.42 | ) | | | .08 | |
| Year ended 9/30/2010 | | | 20.17 | | | | .54 | | | | .79 | | | | 1.33 | |
| Class 529-E: | | | | | | | | | | | | | | | | |
| Six months ended 3/31/20155,6 | | | 20.41 | | | | .15 | | | | (.51 | ) | | | (.36 | ) |
| Year ended 9/30/2014 | | | 20.24 | | | | .41 | | | | .13 | | | | .54 | |
| Year ended 9/30/2013 | | | 21.55 | | | | .37 | | | | (1.02 | ) | | | (.65 | ) |
| Year ended 9/30/2012 | | | 20.42 | | | | .44 | | | | 1.08 | | | | 1.52 | |
| Year ended 9/30/2011 | | | 20.97 | | | | .61 | | | | (.41 | ) | | | .20 | |
| Year ended 9/30/2010 | | | 20.22 | | | | .64 | | | | .80 | | | | 1.44 | |
| Class 529-F-1: | | | | | | | | | | | | | | | | |
| Six months ended 3/31/20155,6 | | | 20.44 | | | | .19 | | | | (.51 | ) | | | (.32 | ) |
| Year ended 9/30/2014 | | | 20.27 | | | | .49 | | | | .14 | | | | .63 | |
| Year ended 9/30/2013 | | | 21.58 | | | | .46 | | | | (1.02 | ) | | | (.56 | ) |
| Year ended 9/30/2012 | | | 20.42 | | | | .53 | | | | 1.09 | | | | 1.62 | |
| Year ended 9/30/2011 | | | 20.98 | | | | .71 | | | | (.42 | ) | | | .29 | |
| Year ended 9/30/2010 | | | 20.23 | | | | .74 | | | | .80 | | | | 1.54 | |
| Class R-1: | | | | | | | | | | | | | | | | |
| Six months ended 3/31/20155,6 | | | 20.31 | | | | .11 | | | | (.51 | ) | | | (.40 | ) |
| Year ended 9/30/2014 | | | 20.14 | | | | .31 | | | | .14 | | | | .45 | |
| Year ended 9/30/2013 | | | 21.44 | | | | .28 | | | | (1.02 | ) | | | (.74 | ) |
| Year ended 9/30/2012 | | | 20.33 | | | | .35 | | | | 1.09 | | | | 1.44 | |
| Year ended 9/30/2011 | | | 20.89 | | | | .51 | | | | (.42 | ) | | | .09 | |
| Year ended 9/30/2010 | | | 20.15 | | | | .55 | | | | .79 | | | | 1.34 | |
| Class R-2: | | | | | | | | | | | | | | | | |
| Six months ended 3/31/20155,6 | | | 20.30 | | | | .10 | | | | (.51 | ) | | | (.41 | ) |
| Year ended 9/30/2014 | | | 20.13 | | | | .30 | | | | .14 | | | | .44 | |
| Year ended 9/30/2013 | | | 21.43 | | | | .27 | | | | (1.01 | ) | | | (.74 | ) |
| Year ended 9/30/2012 | | | 20.33 | | | | .34 | | | | 1.08 | | | | 1.42 | |
| Year ended 9/30/2011 | | | 20.89 | | | | .52 | | | | (.42 | ) | | | .10 | |
| Year ended 9/30/2010 | | | 20.15 | | | | .55 | | | | .79 | | | | 1.34 | |
| 38 | Capital World Bond Fund |
| Dividends and distributions | | | | | | | | | | | | | | | | | | | |
Dividends
(from net
investment
income) | | | Distributions
(from capital
gains) | | | Total
dividends
and
distributions | | | Net asset
value, end
of period | | | Total
return2,3,4 | | | Net assets,
end of
period
(in millions) | | | Ratio of
expenses to
average net
assets before
reimbursements | | | Ratio of
expenses to
average net
assets after
reimbursements4 | | | Ratio of
net income
to average
net assets4 | |
| | | | | | | | | | | | | | | | | | | | | | | | | | | | | | | | | | | |
| $ | (.05 | ) | | $ | (.28 | ) | | $ | (.33 | ) | | $ | 19.66 | | | | (2.09 | )% | | $ | 4 | | | | 1.82 | %7 | | | 1.82 | %7 | | | .91 | %7 |
| | (.24 | ) | | | — | | | | (.24 | ) | | | 20.40 | | | | 2.13 | | | | 6 | | | | 1.78 | | | | 1.78 | | | | 1.42 | |
| | (.24 | ) | | | (.28 | ) | | | (.52 | ) | | | 20.22 | | | | (3.68 | ) | | | 9 | | | | 1.78 | | | | 1.78 | | | | 1.20 | |
| | (.30 | ) | | | — | | | | (.30 | ) | | | 21.52 | | | | 6.97 | | | | 15 | | | | 1.77 | | | | 1.77 | | | | 1.57 | |
| | (.63 | ) | | | — | | | | (.63 | ) | | | 20.41 | | | | .46 | | | | 18 | | | | 1.74 | | | | 1.74 | | | | 2.39 | |
| | (.58 | ) | | | — | | | | (.58 | ) | | | 20.95 | | | | 6.69 | | | | 22 | | | | 1.74 | | | | 1.74 | | | | 2.66 | |
| | | | | | | | | | | | | | | | | | | | | | | | | | | | | | | | | | | |
| | (.06 | ) | | | (.28 | ) | | | (.34 | ) | | | 19.57 | | | | (2.10 | ) | | | 144 | | | | 1.81 | 7 | | | 1.81 | 7 | | | .92 | 7 |
| | (.25 | ) | | | — | | | | (.25 | ) | | | 20.32 | | | | 2.15 | | | | 152 | | | | 1.77 | | | | 1.77 | | | | 1.41 | |
| | (.26 | ) | | | (.28 | ) | | | (.54 | ) | | | 20.14 | | | | (3.67 | ) | | | 165 | | | | 1.77 | | | | 1.77 | | | | 1.22 | |
| | (.31 | ) | | | — | | | | (.31 | ) | | | 21.45 | | | | 7.00 | | | | 183 | | | | 1.76 | | | | 1.76 | | | | 1.55 | |
| | (.64 | ) | | | — | | | | (.64 | ) | | | 20.35 | | | | .42 | | | | 168 | | | | 1.73 | | | | 1.73 | | | | 2.39 | |
| | (.59 | ) | | | — | | | | (.59 | ) | | | 20.91 | | | | 6.75 | | | | 148 | | | | 1.73 | | | | 1.73 | | | | 2.66 | |
| | | | | | | | | | | | | | | | | | | | | | | | | | | | | | | | | | | |
| | (.12 | ) | | | (.28 | ) | | | (.40 | ) | | | 19.65 | | | | (1.77 | ) | | | 18 | | | | 1.23 | 7 | | | 1.23 | 7 | | | 1.50 | 7 |
| | (.37 | ) | | | — | | | | (.37 | ) | | | 20.41 | | | | 2.69 | | | | 19 | | | | 1.20 | | | | 1.20 | | | | 1.98 | |
| | (.38 | ) | | | (.28 | ) | | | (.66 | ) | | | 20.24 | | | | (3.11 | ) | | | 20 | | | | 1.21 | | | | 1.21 | | | | 1.79 | |
| | (.39 | ) | | | — | | | | (.39 | ) | | | 21.55 | | | | 7.56 | | | | 21 | | | | 1.21 | | | | 1.21 | | | | 2.09 | |
| | (.75 | ) | | | — | | | | (.75 | ) | | | 20.42 | | | | .98 | | | | 18 | | | | 1.21 | | | | 1.21 | | | | 2.91 | |
| | (.69 | ) | | | — | | | | (.69 | ) | | | 20.97 | | | | 7.30 | | | | 16 | | | | 1.22 | | | | 1.22 | | | | 3.17 | |
| | | | | | | | | | | | | | | | | | | | | | | | | | | | | | | | | | | |
| | (.19 | ) | | | (.28 | ) | | | (.47 | ) | | | 19.65 | | | | (1.60 | ) | | | 44 | | | | .81 | 7 | | | .81 | 7 | | | 1.92 | 7 |
| | (.46 | ) | | | — | | | | (.46 | ) | | | 20.44 | | | | 3.13 | | | | 45 | | | | .77 | | | | .77 | | | | 2.40 | |
| | (.47 | ) | | | (.28 | ) | | | (.75 | ) | | | 20.27 | | | | (2.67 | ) | | | 39 | | | | .77 | | | | .77 | | | | 2.23 | |
| | (.46 | ) | | | — | | | | (.46 | ) | | | 21.58 | | | | 8.08 | | | | 37 | | | | .75 | | | | .75 | | | | 2.55 | |
| | (.85 | ) | | | — | | | | (.85 | ) | | | 20.42 | | | | 1.42 | | | | 31 | | | | .73 | | | | .73 | | | | 3.40 | |
| | (.79 | ) | | | — | | | | (.79 | ) | | | 20.98 | | | | 7.82 | | | | 25 | | | | .72 | | | | .72 | | | | 3.67 | |
| | | | | | | | | | | | | | | | | | | | | | | | | | | | | | | | | | | |
| | (.07 | ) | | | (.28 | ) | | | (.35 | ) | | | 19.56 | | | | (2.04 | ) | | | 16 | | | | 1.67 | 7 | | | 1.67 | 7 | | | 1.06 | 7 |
| | (.28 | ) | | | — | | | | (.28 | ) | | | 20.31 | | | | 2.24 | | | | 17 | | | | 1.65 | | | | 1.65 | | | | 1.53 | |
| | (.28 | ) | | | (.28 | ) | | | (.56 | ) | | | 20.14 | | | | (3.52 | ) | | | 17 | | | | 1.64 | | | | 1.64 | | | | 1.35 | |
| | (.33 | ) | | | — | | | | (.33 | ) | | | 21.44 | | | | 7.14 | | | | 21 | | | | 1.63 | | | | 1.63 | | | | 1.69 | |
| | (.65 | ) | | | — | | | | (.65 | ) | | | 20.33 | | | | .47 | | | | 21 | | | | 1.66 | | | | 1.66 | | | | 2.47 | |
| | (.60 | ) | | | — | | | | (.60 | ) | | | 20.89 | | | | 6.80 | | | | 21 | | | | 1.67 | | | | 1.67 | | | | 2.72 | |
| | | | | | | | | | | | | | | | | | | | | | | | | | | | | | | | | | | |
| | (.06 | ) | | | (.28 | ) | | | (.34 | ) | | | 19.55 | | | | (2.02 | ) | | | 160 | | | | 1.72 | 7 | | | 1.72 | 7 | | | 1.01 | 7 |
| | (.27 | ) | | | — | | | | (.27 | ) | | | 20.30 | | | | 2.19 | | | | 168 | | | | 1.71 | | | | 1.71 | | | | 1.47 | |
| | (.28 | ) | | | (.28 | ) | | | (.56 | ) | | | 20.13 | | | | (3.54 | ) | | | 177 | | | | 1.67 | | | | 1.67 | | | | 1.32 | |
| | (.32 | ) | | | — | | | | (.32 | ) | | | 21.43 | | | | 7.05 | | | | 193 | | | | 1.70 | | | | 1.70 | | | | 1.62 | |
| | (.66 | ) | | | — | | | | (.66 | ) | | | 20.33 | | | | .50 | | | | 185 | | | | 1.72 | | | | 1.64 | | | | 2.48 | |
| | (.60 | ) | | | — | | | | (.60 | ) | | | 20.89 | | | | 6.83 | | | | 173 | | | | 1.73 | | | | 1.65 | | | | 2.74 | |
See page 41 for footnotes.
| Capital World Bond Fund | 39 |
Financial highlights (continued)
| | | | | | (Loss) income from investment operations1 | |
| | | | | | | | | Net (losses) | | | | |
| | | Net asset | | | | | | gains on | | | | |
| | | value, | | | Net | | | securities (both | | | Total from | |
| | | beginning | | | investment | | | realized and | | | investment | |
| | | of period | | | income | | | unrealized) | | | operations | |
| Class R-2E: | | | | | | | | | | | | | | | | |
| Six months ended 3/31/20155,6 | | $ | 20.50 | | | $ | .19 | | | $ | (.51 | ) | | $ | (.32 | ) |
| Period from 8/29/2014 to 9/30/20145,10 | | | 21.00 | | | | .04 | | | | (.54 | ) | | | (.50 | ) |
| Class R-3: | | | | | | | | | | | | | | | | |
| Six months ended 3/31/20155,6 | | | 20.45 | | | | .15 | | | | (.51 | ) | | | (.36 | ) |
| Year ended 9/30/2014 | | | 20.28 | | | | .41 | | | | .13 | | | | .54 | |
| Year ended 9/30/2013 | | | 21.58 | | | | .37 | | | | (1.02 | ) | | | (.65 | ) |
| Year ended 9/30/2012 | | | 20.45 | | | | .44 | | | | 1.08 | | | | 1.52 | |
| Year ended 9/30/2011 | | | 21.00 | | | | .61 | | | | (.41 | ) | | | .20 | |
| Year ended 9/30/2010 | | | 20.25 | | | | .64 | | | | .80 | | | | 1.44 | |
| Class R-4: | | | | | | | | | | | | | | | | |
| Six months ended 3/31/20155,6 | | | 20.48 | | | | .18 | | | | (.51 | ) | | | (.33 | ) |
| Year ended 9/30/2014 | | | 20.31 | | | | .47 | | | | .14 | | | | .61 | |
| Year ended 9/30/2013 | | | 21.62 | | | | .44 | | | | (1.03 | ) | | | (.59 | ) |
| Year ended 9/30/2012 | | | 20.46 | | | | .51 | | | | 1.09 | | | | 1.60 | |
| Year ended 9/30/2011 | | | 21.02 | | | | .68 | | | | (.42 | ) | | | .26 | |
| Year ended 9/30/2010 | | | 20.26 | | | | .71 | | | | .80 | | | | 1.51 | |
| Class R-5: | | | | | | | | | | | | | | | | |
| Six months ended 3/31/20155,6 | | | 20.52 | | | | .21 | | | | (.50 | ) | | | (.29 | ) |
| Year ended 9/30/2014 | | | 20.35 | | | | .54 | | | | .13 | | | | .67 | |
| Year ended 9/30/2013 | | | 21.66 | | | | .50 | | | | (1.02 | ) | | | (.52 | ) |
| Year ended 9/30/2012 | | | 20.49 | | | | .57 | | | | 1.09 | | | | 1.66 | |
| Year ended 9/30/2011 | | | 21.04 | | | | .74 | | | | (.41 | ) | | | .33 | |
| Year ended 9/30/2010 | | | 20.29 | | | | .77 | | | | .79 | | | | 1.56 | |
| Class R-6: | | | | | | | | | | | | | | | | |
| Six months ended 3/31/20155,6 | | | 20.52 | | | | .22 | | | | (.51 | ) | | | (.29 | ) |
| Year ended 9/30/2014 | | | 20.34 | | | | .54 | | | | .15 | | | | .69 | |
| Year ended 9/30/2013 | | | 21.66 | | | | .52 | | | | (1.04 | ) | | | (.52 | ) |
| Year ended 9/30/2012 | | | 20.48 | | | | .58 | | | | 1.10 | | | | 1.68 | |
| Year ended 9/30/2011 | | | 21.03 | | | | .75 | | | | (.41 | ) | | | .34 | |
| Year ended 9/30/2010 | | | 20.28 | | | | .78 | | | | .79 | | | | 1.57 | |
| | | Six months | | | | | | | | | | | | | | | | | | | | |
| | | ended | | | | | | | | | | | | | | | | | | | | |
| | | March 31, | | Year ended September 30 | |
| Portfolio turnover rate for all share classes11 | | 20153, 5, 6 | | 2014 | | 2013 | | 2012 | | 2011 | | 2010 |
| Including mortgage dollar roll transactions | | | 108% | | 205% | | 199% | | 142% | | 95% | | 80% |
| Excluding mortgage dollar roll transactions | | | 61% | | | Not available |
See Notes to Financial Statements
| 40 | Capital World Bond Fund |
| Dividends and distributions | | | | | | | | | | | | | | | | | | | |
Dividends
(from net
investment
income) | | | Distributions
(from capital
gains) | | | Total
dividends
and
distributions | | | Net asset
value, end
of period | | | Total
return2,3,4 | | | Net assets,
end of
period
(in millions) | | | Ratio of
expenses to
average net
assets before
reimbursements | | | Ratio of
expenses to
average net
assets after
reimbursements4 | | | Ratio of
net income
to average
net assets4 | |
| | | | | | | | | | | | | | | | | | | | | | | | | | | | | | | | | | | |
| $ | (.20 | ) | | $ | (.28 | ) | | $ | (.48 | ) | | $ | 19.70 | | | | (1.58 | )%8 | | $ | — | 9 | | | .78 | %7,8 | | | .78 | %7,8 | | | 1.92 | %7,8 |
| | — | | | | — | | | | — | | | | 20.50 | | | | (2.38 | )8 | | | — | 9 | | | .06 | 3,8 | | | .06 | 3,8 | | | .17 | 3,8 |
| | | | | | | | | | | | | | | | | | | | | | | | | | | | | | | | | | | |
| | (.12 | ) | | | (.28 | ) | | | (.40 | ) | | | 19.69 | | | | (1.77 | ) | | | 163 | | | | 1.23 | 7 | | | 1.23 | 7 | | | 1.50 | 7 |
| | (.37 | ) | | | — | | | | (.37 | ) | | | 20.45 | | | | 2.67 | | | | 174 | | | | 1.21 | | | | 1.21 | | | | 1.97 | |
| | (.37 | ) | | | (.28 | ) | | | (.65 | ) | | | 20.28 | | | | (3.06 | ) | | | 184 | | | | 1.21 | | | | 1.21 | | | | 1.79 | |
| | (.39 | ) | | | — | | | | (.39 | ) | | | 21.58 | | | | 7.54 | | | | 206 | | | | 1.21 | | | | 1.21 | | | | 2.10 | |
| | (.75 | ) | | | — | | | | (.75 | ) | | | 20.45 | | | | .98 | | | | 202 | | | | 1.21 | | | | 1.21 | | | | 2.92 | |
| | (.69 | ) | | | — | | | | (.69 | ) | | | 21.00 | | | | 7.28 | | | | 186 | | | | 1.22 | | | | 1.22 | | | | 3.17 | |
| | | | | | | | | | | | | | | | | | | | | | | | | | | | | | | | | | | |
| | (.17 | ) | | | (.28 | ) | | | (.45 | ) | | | 19.70 | | | | (1.62 | ) | | | 103 | | | | .89 | 7 | | | .89 | 7 | | | 1.84 | 7 |
| | (.44 | ) | | | — | | | | (.44 | ) | | | 20.48 | | | | 3.02 | | | | 112 | | | | .87 | | | | .87 | | | | 2.30 | |
| | (.44 | ) | | | (.28 | ) | | | (.72 | ) | | | 20.31 | | | | (2.78 | ) | | | 108 | | | | .88 | | | | .88 | | | | 2.12 | |
| | (.44 | ) | | | — | | | | (.44 | ) | | | 21.62 | | | | 7.96 | | | | 115 | | | | .87 | | | | .87 | | | | 2.45 | |
| | (.82 | ) | | | — | | | | (.82 | ) | | | 20.46 | | | | 1.26 | | | | 117 | | | | .88 | | | | .88 | | | | 3.25 | |
| | (.75 | ) | | | — | | | | (.75 | ) | | | 21.02 | | | | 7.68 | | | | 114 | | | | .89 | | | | .89 | | | | 3.51 | |
| | | | | | | | | | | | | | | | | | | | | | | | | | | | | | | | | | | |
| | (.22 | ) | | | (.28 | ) | | | (.50 | ) | | | 19.73 | | | | (1.44 | ) | | | 160 | | | | .59 | 7 | | | .59 | 7 | | | 2.14 | 7 |
| | (.50 | ) | | | — | | | | (.50 | ) | | | 20.52 | | | | 3.32 | | | | 162 | | | | .57 | | | | .57 | | | | 2.62 | |
| | (.51 | ) | | | (.28 | ) | | | (.79 | ) | | | 20.35 | | | | (2.47 | ) | | | 189 | | | | .57 | | | | .57 | | | | 2.42 | |
| | (.49 | ) | | | — | | | | (.49 | ) | | | 21.66 | | | | 8.24 | | | | 219 | | | | .57 | | | | .57 | | | | 2.72 | |
| | (.88 | ) | | | — | | | | (.88 | ) | | | 20.49 | | | | 1.61 | | | | 174 | | | | .58 | | | | .58 | | | | 3.55 | |
| | (.81 | ) | | | — | | | | (.81 | ) | | | 21.04 | | | | 7.93 | | | | 146 | | | | .59 | | | | .59 | | | | 3.80 | |
| | | | | | | | | | | | | | | | | | | | | | | | | | | | | | | | | | | |
| | (.23 | ) | | | (.28 | ) | | | (.51 | ) | | | 19.72 | | | | (1.45 | ) | | | 1,621 | | | | .54 | 7 | | | .54 | 7 | | | 2.18 | 7 |
| | (.51 | ) | | | — | | | | (.51 | ) | | | 20.52 | | | | 3.44 | | | | 1,262 | | | | .52 | | | | .52 | | | | 2.63 | |
| | (.52 | ) | | | (.28 | ) | | | (.80 | ) | | | 20.34 | | | | (2.47 | ) | | | 727 | | | | .52 | | | | .52 | | | | 2.51 | |
| | (.50 | ) | | | — | | | | (.50 | ) | | | 21.66 | | | | 8.33 | | | | 398 | | | | .52 | | | | .52 | | | | 2.76 | |
| | (.89 | ) | | | — | | | | (.89 | ) | | | 20.48 | | | | 1.62 | | | | 280 | | | | .53 | | | | .53 | | | | 3.60 | |
| | (.82 | ) | | | — | | | | (.82 | ) | | | 21.03 | | | | 8.04 | | | | 218 | | | | .54 | | | | .54 | | | | 3.85 | |
| 1 | Based on average shares outstanding. |
| 2 | Total returns exclude any applicable sales charges, including contingent deferred sales charges. |
| 3 | Not annualized. |
| 4 | This column reflects the impact, if any, of certain reimbursements from CRMC. During some of the periods shown, CRMC paid a portion of the fund’s transfer agent fees for certain retirement plan share classes. |
| 5 | Based on operations for the period shown and, accordingly, is not representative of a full year. |
| 6 | Unaudited. |
| 7 | Annualized. |
| 8 | Class R-2E assets consisted solely of seed capital invested by CRMC; therefore, certain fees were not accrued. |
| 9 | Amount less than $1 million. |
| 10 | Class R-2E shares were offered beginning August 29, 2014. |
| 11 | Refer to Note 5 for more information on mortgage dollar rolls. |
| Capital World Bond Fund | 41 |
As a fund shareholder, you incur two types of costs: (1) transaction costs, such as initial sales charges on purchase payments and contingent deferred sales charges on redemptions (loads), and (2) ongoing costs, including management fees, distribution and service (12b-1) fees, and other expenses. This example is intended to help you understand your ongoing costs (in dollars) of investing in the fund so you can compare these costs with the ongoing costs of investing in other mutual funds. The example is based on an investment of $1,000 invested at the beginning of the period and held for the entire six-month period (October 1, 2014, through March 31, 2015).
Actual expenses:
The first line of each share class in the table on the following page provides information about actual account values and actual expenses. You may use the information in this line, together with the amount you invested, to estimate the expenses that you paid over the period. Simply divide your account value by $1,000 (for example, an $8,600 account value divided by $1,000 = 8.6), then multiply the result by the number in the first line under the heading entitled “Expenses paid during period” to estimate the expenses you paid on your account during this period.
Hypothetical example for comparison purposes:
The second line of each share class in the table on the following page provides information about hypothetical account values and hypothetical expenses based on the actual expense ratio for the share class and an assumed rate of return of 5.00% per year before expenses, which is not the actual return of the share class. The hypothetical account values and expenses may not be used to estimate the actual ending account balance or expenses you paid for the period. You may use this information to compare the ongoing costs of investing in the fund and other funds. To do so, compare this 5.00% hypothetical example with the 5.00% hypothetical examples that appear in the shareholder reports of the other funds.
Notes:
Retirement plan participants may be subject to certain fees charged by the plan sponsor, and Class F-1, F-2 and 529-F-1 shareholders may be subject to fees charged by financial intermediaries, typically ranging from 0.75% to 1.50% of assets annually depending on services offered. You can estimate the impact of these fees by adding the amount of the fees to the total estimated expenses you paid on your account during the period as calculated above. In addition, your ending account value would be lower by the amount of these fees.
Note that the expenses shown in the table on the following page are meant to highlight your ongoing costs only and do not reflect any transactional costs, such as sales charges (loads). Therefore, the second line of each share class in the table is useful in comparing ongoing costs only and will not help you determine the relative total costs of owning different funds. In addition, if these transactional costs were included, your costs would have been higher.
| 42 | Capital World Bond Fund |
| | | Beginning
account value
10/1/2014 | | | Ending
account value
3/31/2015 | | | Expenses paid
during period* | | | Annualized
expense ratio | |
| Class A - actual return | | $ | 1,000.00 | | | $ | 983.43 | | | $ | 4.70 | | | | .95 | % |
| Class A - assumed 5% return | | | 1,000.00 | | | | 1,020.19 | | | | 4.78 | | | | .95 | |
| Class B - actual return | | | 1,000.00 | | | | 979.83 | | | | 8.39 | | | | 1.70 | |
| Class B - assumed 5% return | | | 1,000.00 | | | | 1,016.45 | | | | 8.55 | | | | 1.70 | |
| Class C - actual return | | | 1,000.00 | | | | 979.70 | | | | 8.64 | | | | 1.75 | |
| Class C - assumed 5% return | | | 1,000.00 | | | | 1,016.21 | | | | 8.80 | | | | 1.75 | |
| Class F-1 - actual return | | | 1,000.00 | | | | 983.54 | | | | 4.55 | | | | .92 | |
| Class F-1 - assumed 5% return | | | 1,000.00 | | | | 1,020.34 | | | | 4.63 | | | | .92 | |
| Class F-2 - actual return | | | 1,000.00 | | | | 984.69 | | | | 3.27 | | | | .66 | |
| Class F-2 - assumed 5% return | | | 1,000.00 | | | | 1,021.64 | | | | 3.33 | | | | .66 | |
| Class 529-A - actual return | | | 1,000.00 | | | | 983.34 | | | | 5.09 | | | | 1.03 | |
| Class 529-A - assumed 5% return | | | 1,000.00 | | | | 1,019.80 | | | | 5.19 | | | | 1.03 | |
| Class 529-B - actual return | | | 1,000.00 | | | | 979.11 | | | | 8.98 | | | | 1.82 | |
| Class 529-B - assumed 5% return | | | 1,000.00 | | | | 1,015.86 | | | | 9.15 | | | | 1.82 | |
| Class 529-C - actual return | | | 1,000.00 | | | | 978.98 | | | | 8.93 | | | | 1.81 | |
| Class 529-C - assumed 5% return | | | 1,000.00 | | | | 1,015.91 | | | | 9.10 | | | | 1.81 | |
| Class 529-E - actual return | | | 1,000.00 | | | | 982.30 | | | | 6.08 | | | | 1.23 | |
| Class 529-E - assumed 5% return | | | 1,000.00 | | | | 1,018.80 | | | | 6.19 | | | | 1.23 | |
| Class 529-F-1 - actual return | | | 1,000.00 | | | | 984.03 | | | | 4.01 | | | | .81 | |
| Class 529-F-1 - assumed 5% return | | | 1,000.00 | | | | 1,020.89 | | | | 4.08 | | | | .81 | |
| Class R-1 - actual return | | | 1,000.00 | | | | 979.63 | | | | 8.24 | | | | 1.67 | |
| Class R-1 - assumed 5% return | | | 1,000.00 | | | | 1,016.60 | | | | 8.40 | | | | 1.67 | |
| Class R-2 - actual return | | | 1,000.00 | | | | 979.77 | | | | 8.49 | | | | 1.72 | |
| Class R-2 - assumed 5% return | | | 1,000.00 | | | | 1,016.36 | | | | 8.65 | | | | 1.72 | |
| Class R-2E - actual return | | | 1,000.00 | | | | 984.19 | | | | 3.86 | | | | .78 | |
| Class R-2E - assumed 5% return | | | 1,000.00 | | | | 1,021.04 | | | | 3.93 | | | | .78 | |
| Class R-3 - actual return | | | 1,000.00 | | | | 982.28 | | | | 6.08 | | | | 1.23 | |
| Class R-3 - assumed 5% return | | | 1,000.00 | | | | 1,018.80 | | | | 6.19 | | | | 1.23 | |
| Class R-4 - actual return | | | 1,000.00 | | | | 983.82 | | | | 4.40 | | | | .89 | |
| Class R-4 - assumed 5% return | | | 1,000.00 | | | | 1,020.49 | | | | 4.48 | | | | .89 | |
| Class R-5 - actual return | | | 1,000.00 | | | | 985.63 | | | | 2.92 | | | | .59 | |
| Class R-5 - assumed 5% return | | | 1,000.00 | | | | 1,021.99 | | | | 2.97 | | | | .59 | |
| Class R-6 - actual return | | | 1,000.00 | | | | 985.55 | | | | 2.67 | | | | .54 | |
| Class R-6 - assumed 5% return | | | 1,000.00 | | | | 1,022.24 | | | | 2.72 | | | | .54 | |
| * | The “expenses paid during period” are equal to the “annualized expense ratio,” multiplied by the average account value over the period, multiplied by the number of days in the period, and divided by 365 (to reflect the one-half year period). |
| Capital World Bond Fund | 43 |
Approval of Investment Advisory and Service Agreement
The Capital World Bond Fund’s board has approved the fund’s Investment Advisory and Service Agreement (the “agreement”) with Capital Research and Management Company (“CRMC”) through April 30, 2016. The board approved the agreement following the recommendation of the fund’s Contracts Committee (the “committee”), which is composed of all of the fund’s independent board members. The board and the committee determined that the fund’s advisory fee structure was fair and reasonable in relation to the services provided and that approving the agreement was in the best interests of the fund and its shareholders.
In reaching this decision, the board and the committee took into account information furnished to them throughout the year and otherwise provided to them, as well as information prepared specifically in connection with their review of the agreement, and were advised by their independent counsel. They considered the following factors, among others, but did not identify any single issue or particular piece of information that, in isolation, was the controlling factor, and each board and committee member did not necessarily attribute the same weight to each factor.
1. Nature, extent and quality of services
The board and the committee considered the depth and quality of CRMC’s investment management process, including its global research capabilities; the experience, capability and integrity of its senior management and other personnel; the low turnover rates of its key personnel; the overall financial strength and stability of CRMC and the Capital Group organization; and the ongoing evolution of CRMC’s organizational structure designed to maintain and strengthen these qualities. The board and the committee also considered the nature, extent and quality of administrative, compliance and shareholder services provided by CRMC to the fund under the agreement and other agreements, as well as the benefits to fund shareholders from investing in a fund that is part of a large family of funds. The board and the committee concluded that the nature, extent and quality of the services provided by CRMC have benefited and should continue to benefit the fund and its shareholders.
2. Investment results
The board and the committee considered the investment results of the fund in light of its objective of providing over the long term a high level of total return consistent with prudent investment management. They compared the fund’s investment results with those of other relevant funds (including funds that form the basis of the Lipper index for the category in which the fund is included), and data such as relevant market and fund indexes, over various periods through September 30, 2014. This report, including the letter to shareholders and related disclosures, contains certain information about the fund’s investment results. The board and the committee reviewed the fund’s investment results measured against the Lipper Global Income Funds Average and the Barclays Global Aggregate Index. They noted that the investment
| 44 | Capital World Bond Fund |
results of the fund were above the results of the Lipper average for the 10-year period and were in line with the Lipper average since inception (although below the results of the Lipper average for the nine-month, one-year, three-year and five-year periods), and above the results of the Barclays index for all periods considered. They also noted that the Lipper category included funds with a broad range of mandates, certain of which were not very similar to the fund. The board and the committee concluded that the fund’s investment results have been satisfactory for renewal of the agreement and that CRMC’s record in managing the fund indicated that its continued management should benefit the fund and its shareholders.
3. Advisory fees and total expenses
The board and the committee compared the advisory fees and total expense levels of the fund to those of other relevant funds. They observed that of the 30 largest global income funds included in the Lipper Global Income Funds category, the fund’s advisory fees were below the median of such other funds in the Lipper Global Income Funds category, and although its total expenses were higher than the median of such funds, such expenses less distribution expenses were below the median. The board and the committee also considered the breakpoint discounts in the fund’s advisory fee structure that reduce the level of fees charged by CRMC to the fund as fund assets increase. In addition, they reviewed information regarding the effective advisory fees charged to non-mutual fund clients by CRMC and its affiliates. They noted that, to the extent there were differences between the advisory fees paid by the fund and the advisory fees paid by those clients, the differences appropriately reflected the investment, operational and regulatory differences between advising the fund and the other clients. The board and the committee concluded that the fund’s cost structure was fair and reasonable in relation to the services provided, and that the fund’s shareholders receive reasonable value in return for the advisory fees and other amounts paid to CRMC by the fund.
4. Ancillary benefits
The board and the committee considered a variety of other benefits that CRMC and its affiliates receive as a result of CRMC’s relationship with the fund and the other American Funds, including fees for administrative services provided to certain share classes; fees paid to CRMC’s affiliated transfer agent; sales charges and distribution fees received and retained by the fund’s principal underwriter, an affiliate of CRMC; and possible ancillary benefits to CRMC and its institutional management affiliates in managing other investment vehicles. The board and the committee reviewed CRMC’s portfolio trading practices, noting the potential benefits CRMC receives from the research obtained with commissions from portfolio transactions made on behalf of the fund. The board and the committee took these ancillary benefits into account in evaluating the reasonableness of the advisory fees and other amounts paid to CRMC by the fund.
| Capital World Bond Fund | 45 |
5. Adviser financial information
The board and the committee reviewed information regarding CRMC’s costs of providing services to the American Funds, including personnel, systems and resources of investment, compliance, trading, accounting and other administrative operations. They considered CRMC’s costs and willingness to invest in technology, infrastructure and staff to maintain and expand services and capabilities, respond to industry and regulatory developments, and attract and retain qualified personnel. They noted information regarding the compensation structure for CRMC’s investment professionals. The board and the committee also compared CRMC’s profitability and compensation data to the reported results and data of several large, publicly-held investment management companies. The board and the committee noted the competitiveness and cyclicality of both the mutual fund industry and the capital markets, and the importance in that environment of CRMC’s long-term profitability for maintaining its independence, company culture and management continuity. They further considered the breakpoint discounts in the fund’s advisory fee structure. The board and the committee concluded that the fund’s advisory fee structure reflected a reasonable sharing of benefits between CRMC and the fund’s shareholders.
| 46 | Capital World Bond Fund |
This page was intentionally left blank.
| Capital World Bond Fund | 47 |
This page was intentionally left blank.
| 48 | Capital World Bond Fund |
This page was intentionally left blank.
| Capital World Bond Fund | 49 |
This page was intentionally left blank.
| 50 | Capital World Bond Fund |
This page was intentionally left blank.
| Capital World Bond Fund | 51 |
Offices of the fund and of the investment adviser
Capital Research and Management Company
333 South Hope Street
Los Angeles, CA 90071-1406
6455 Irvine Center Drive
Irvine, CA 92618-4518
Transfer agent for shareholder accounts
American Funds Service Company
(Write to the address near you.)
P.O. Box 6007
Indianapolis, IN 46206-6007
P.O. Box 2280
Norfolk, VA 23501-2280
Custodian of assets
JPMorgan Chase Bank
270 Park Avenue
New York, NY 10017-2070
Counsel
Morgan, Lewis & Bockius LLP
355 South Grand Avenue, Suite 4400
Los Angeles, CA 90071-3106
Independent registered public accounting firm
Deloitte & Touche LLP
695 Town Center Drive
Suite 1200
Costa Mesa, CA 92626-7188
Principal underwriter
American Funds Distributors, Inc.
333 South Hope Street
Los Angeles, CA 90071-1406
| 52 | Capital World Bond Fund |
Investors should carefully consider investment objectives, risks, charges and expenses. This and other important information is contained in the fund prospectus and summary prospectus, which can be obtained from your financial professional and should be read carefully before investing. You may also call American Funds Service Company (AFS) at (800) 421-4225 or visit the American Funds website at americanfunds.com.
“American Funds Proxy Voting Procedures and Principles” — which describes how we vote proxies relating to portfolio securities — is available on the American Funds website or upon request by calling AFS. The fund files its proxy voting record with the U.S. Securities and Exchange Commission (SEC) for the 12 months ended June 30 by August 31. The proxy voting record is available free of charge on the SEC website at sec.gov and on the American Funds website.
A complete March 31, 2015, portfolio of Capital World Bond Fund’s investments is available free of charge by calling AFS or visiting the SEC website (where it is part of Form N-CSR).
Capital World Bond Fund files a complete list of its portfolio holdings with the SEC for the first and third quarters of each fiscal year on Form N-Q. This filing is available free of charge on the SEC website. You may also review or, for a fee, copy this filing at the SEC’s Public Reference Room in Washington, D.C. Additional information regarding the operation of the Public Reference Room may be obtained by calling the SEC’s Office of Investor Education and Advocacy at (800) SEC-0330. Additionally, the list of portfolio holdings is available by calling AFS.
This report is for the information of shareholders of Capital World Bond Fund, but it also may be used as sales literature when preceded or accompanied by the current prospectus or summary prospectus, which gives details about charges, expenses, investment objectives and operating policies of the fund. If used as sales material after June 30, 2015, this report must be accompanied by an American Funds statistical update for the most recently completed calendar quarter.
The American Funds Advantage
Since 1931, American Funds, part of Capital Group, has helped investors pursue long-term investment success. Our consistent approach — in combination with The Capital SystemSM — has resulted in a superior long-term track record.
| | Aligned with investor success |
| | We base our decisions on a long-term perspective, which we believe aligns our goals with the interests of our clients. Our portfolio managers average 27 years of investment experience, including 22 years at our company, reflecting a career commitment to our long-term approach.1 |
| | |
| | The Capital SystemSM |
| | Our investment process, The Capital System, combines individual accountability with team-work. Each fund is divided into portions that are managed independently by investment professionals with diverse backgrounds, ages and investment approaches. An extensive global research effort is the backbone of our system. |
| | |
| | Superior long-term track record |
| | Our equity funds have beaten their Lipper peer indexes in 91% of 10-year periods and 96% of 20-year periods. Our fixed-income funds have beaten their Lipper indexes in 54% of 10-year periods and 57% of 20-year periods.2 Our fund management fees have been among the lowest in the industry.3 |
| | 1 | Portfolio manager experience as of December 31, 2014. |
| | 2 | Based on Class A share results for rolling periods through December 31, 2014. Periods covered are the shorter of the fund’s lifetime or since the comparable Lipper index inception date (except SMALLCAP World Fund, for which the Lipper average was used). |
| | 3 | On average, our management fees were in the lowest quintile 70% of the time, based on the 20-year period ended December 31, 2014, versus comparable Lipper categories, excluding funds of funds. |

ITEM 2 – Code of Ethics
Not applicable for filing of semi-annual reports to shareholders.
ITEM 3 – Audit Committee Financial Expert
Not applicable for filing of semi-annual reports to shareholders.
ITEM 4 – Principal Accountant Fees and Services
Not applicable for filing of semi-annual reports to shareholders.
ITEM 5 – Audit Committee of Listed Registrants
Not applicable to this Registrant, insofar as the Registrant is not a listed issuer as defined in Rule 10A-3 under the Securities Exchange Act of 1934.
ITEM 6 – Schedule of Investments
Capital World Bond Fund®
Investment portfolio
March 31, 2015
Bonds, notes & other debt instruments 96.62%
Euros 15.67% | Principal amount
(000) | Value
(000) |
| Allianz SE, 5.625% 20421 | €4,500 | $6,079 |
| Allianz SE, 4.75% (undated)1 | 16,800 | 21,137 |
| Anheuser-Busch InBev NV 8.625% 2017 | 1,375 | 1,706 |
| Assicurazioni Generali SPA 7.75% 20421 | 4,700 | 6,573 |
| Assicurazioni Generali SPA 10.125% 2042 | 5,700 | 8,719 |
| AT&T Inc. 6.125% 2015 | 4,500 | 4,839 |
| Aviva PLC 6.125% 20431 | 13,000 | 17,708 |
| Banco Bilbao Vizcaya Argentaria SA 3.50% 20241 | 27,800 | 31,625 |
| Barclays Bank PLC 4.00% 20192 | 8,950 | 11,292 |
| Barclays Bank PLC 6.00% 2021 | 6,975 | 9,276 |
| Barclays Bank PLC 6.625% 2022 | 4,750 | 6,674 |
| Belgium (Kingdom of), Series 68, 2.25% 2023 | 7 | 9 |
| BNP Paribas 2.875% 20261 | 25,275 | 28,564 |
| BPCE SA group 4.625% 2023 | 6,000 | 7,803 |
| CaixaBank, SA 5.00% 20231 | 48,600 | 56,798 |
| Canadian Government 3.50% 2020 | 7,000 | 8,801 |
| France Télécom 5.625% 2018 | 1,500 | 1,880 |
| France Télécom 3.125% 2024 | 4,300 | 5,441 |
| French Government O.A.T. Eurobond 0.50% 2019 | 32,000 | 35,211 |
| French Government O.A.T. Eurobond 2.25% 2022 | 8,130 | 10,065 |
| French Government O.A.T. Eurobond 3.25% 2045 | 14,865 | 24,791 |
| GE Capital European Funding 5.375% 2020 | 9,100 | 12,028 |
| German Government 0.10% 20233 | 66,204 | 78,622 |
| German Government 1.50% 2024 | 29,260 | 35,371 |
| German Government 6.25% 2024 | 5,875 | 9,747 |
| German Government 5.625% 2028 | 14,525 | 26,051 |
| German Government 3.25% 2042 | 3,375 | 6,082 |
| German Government 2.50% 2044 | 22,100 | 36,012 |
| German Government 2.50% 2046 | 5,100 | 8,434 |
| German Government, Series 00, 5.50% 2031 | 5,150 | 9,828 |
| HSBC Holdings PLC 3.375% 20241 | 7,600 | 8,753 |
| Hungarian Government 5.75% 2018 | 29,190 | 36,003 |
| Hungarian Government 6.00% 2019 | 22,105 | 28,255 |
| Hungarian Government 3.875% 2020 | 2,000 | 2,432 |
| Imperial Tobacco Finance PLC 5.00% 2019 | 12,425 | 15,904 |
| Intesa Sanpaolo SpA 6.625% 2023 | 22,535 | 31,164 |
| Irish Government 4.50% 2020 | 37,010 | 48,316 |
| Irish Government 5.00% 2020 | 9,720 | 13,157 |
| Irish Government 3.90% 2023 | 94,720 | 128,466 |
| Irish Government 3.40% 2024 | 97,420 | 129,717 |
| Irish Government 5.40% 2025 | 14,250 | 22,127 |
| Irish Government 2.40% 2030 | 14,000 | 17,948 |
| Irish Government 2.00% 2045 | 12,800 | 15,773 |
| Italian Government 2.15% 2021 | 139,110 | 161,814 |
| Italian Government 4.75% 2023 | 16,900 | 23,458 |
| Italian Government 2.35% 20243 | 12,066 | 16,047 |
| Italian Government 4.50% 2024 | 21,350 | 29,405 |
Capital World Bond Fund — Page 1 of 25
Bonds, notes & other debt instruments
Euros (continued) | Principal amount
(000) | Value
(000) |
| Italian Government 3.50% 2030 | €38,610 | $51,983 |
| Italian Government 4.75% 2044 | 5,975 | 10,254 |
| Lloyds Banking Group PLC 6.50% 2020 | 11,950 | 16,017 |
| Merrill Lynch & Co., Inc. 4.625% 2018 | 17,536 | 21,234 |
| Mondelez International, Inc. 2.375% 2021 | 2,900 | 3,392 |
| Netherlands Government Eurobond 4.00% 2019 | 38,500 | 48,668 |
| Netherlands Government Eurobond 2.25% 2022 | 8,300 | 10,304 |
| Netherlands Government Eurobond 2.00% 2024 | 14,175 | 17,672 |
| NN Group NV, 4.625% 2044 | 10,425 | 12,639 |
| NN Group NV, 4.50% (undated)1 | 32,580 | 38,281 |
| Novartis Finance SA, 4.25% 2016 | 1,250 | 1,412 |
| Orange SA 4.25% (undated) | 5,700 | 6,570 |
| Orange SA 5.00% (undated)1 | 10,700 | 13,152 |
| Rabobank Nederland 3.875% 2023 | 21,500 | 27,176 |
| Spanish Government 1.40% 2020 | 46,675 | 52,323 |
| Spanish Government 5.85% 2022 | 65,065 | 93,113 |
| Spanish Government 5.40% 2023 | 26,350 | 37,714 |
| Spanish Government 2.75% 2024 | 19,810 | 24,314 |
| Spanish Government 3.80% 2024 | 700 | 925 |
| Spanish Government 1.60% 2025 | 14,425 | 16,090 |
| Spanish Government 5.15% 2028 | 15,920 | 24,706 |
| Spanish Government 1.00% 20303 | 2,967 | 3,538 |
| Spanish Government 1.95% 2030 | 12,150 | 13,651 |
| Spanish Government 5.15% 2044 | 132,080 | 241,884 |
| Svenska Handelsbanken AB 2.656% 20241 | 16,225 | 18,344 |
| | | 2,061,261 |
| British pounds 4.78% | | |
| Aviva PLC, subordinated 6.875% 20581 | £8,730 | 16,613 |
| AXA SA, junior subordinated 5.453% (undated)1 | 6,095 | 9,674 |
| Bank of Scotland PLC 9.375% 2021 | 4,160 | 8,189 |
| Barclays Bank PLC 10.00% 2021 | 9,200 | 18,590 |
| BNP Paribas 5.75% 2022 | 1,100 | 1,894 |
| Deutsche Telekom International Finance BV 6.50% 2022 | 3,746 | 7,071 |
| Electricité de France SA 6.00% 2114 | 4,100 | 8,549 |
| France Télécom 7.25% 2020 | 4,425 | 8,377 |
| France Télécom 5.375% 2050 | 3,050 | 5,856 |
| Lloyds Banking Group PLC 7.625 % 2025 | 2,875 | 5,675 |
| Lloyds TSB Bank PLC 10.75% 20211 | 1,025 | 1,751 |
| National Grid Transco PLC 4.00% 2027 | 2,700 | 4,569 |
| Nestlé Finance International Ltd. 2.25% 2023 | 1,000 | 1,522 |
| RSA Insurance Group PLC 9.375% 20391 | 6,583 | 12,016 |
| United Kingdom 2.00% 2016 | 24,000 | 36,075 |
| United Kingdom 1.00% 2017 | 26,400 | 39,586 |
| United Kingdom 1.75% 2019 | 17,825 | 27,274 |
| United Kingdom 2.00% 2020 | 8,400 | 12,980 |
| United Kingdom 3.75% 2020 | 1,750 | 2,953 |
| United Kingdom 1.75% 2022 | 24,750 | 37,586 |
| United Kingdom 2.25% 2023 | 68,045 | 106,907 |
| United Kingdom 2.75% 2024 | 88,175 | 144,102 |
| United Kingdom 4.25% 2040 | 8,355 | 17,158 |
| United Kingdom 3.25% 2044 | 51,670 | 91,733 |
| Wal-Mart Stores, Inc. 5.625% 2034 | 1,000 | 2,073 |
| | | 628,773 |
Capital World Bond Fund — Page 2 of 25
Bonds, notes & other debt instruments
Japanese yen 4.37% | Principal amount
(000) | Value
(000) |
| European Investment Bank 1.40% 2017 | ¥721,700 | $6,236 |
| Japanese Government, Series 113, 0.30% 2018 | 5,175,000 | 43,471 |
| Japanese Government, Series 312, 1.20% 2020 | 2,310,000 | 20,416 |
| Japanese Government, Series 319, 1.10% 2021 | 1,130,000 | 10,007 |
| Japanese Government, Series 315, 1.20% 2021 | 5,522,800 | 49,022 |
| Japanese Government, Series 326, 0.70% 2022 | 1,160,000 | 10,017 |
| Japanese Government, Series 323, 0.90% 2022 | 5,305,000 | 46,470 |
| Japanese Government, Series 17, 0.10% 20233 | 2,855,060 | 25,579 |
| Japanese Government, Series 19, 0.10% 20243 | 11,724,230 | 105,624 |
| Japanese Government, Series 18, 0.10% 20243 | 11,476,040 | 102,807 |
| Japanese Government, Series 116, 2.20% 2030 | 4,260,000 | 42,728 |
| Japanese Government, Series 145, 1.70% 2033 | 4,840,000 | 45,035 |
| Japanese Government, Series 148, 1.50% 2034 | 825,000 | 7,399 |
| Japanese Government, Series 21, 2.30% 2035 | 4,200,000 | 42,233 |
| Japanese Government, Series 37, 1.90% 2042 | 263,250 | 2,486 |
| Japanese Government, Series 42, 1.70% 2044 | 1,745,000 | 15,780 |
| | | 575,310 |
| Mexican pesos 3.49% | | |
| América Móvil, SAB de CV 7.125% 2024 | MXN30,000 | 1,953 |
| América Móvil, SAB de CV 8.46% 2036 | 15,000 | 984 |
| Red de Carreteras de Occidente 9.00% 20282 | 36,950 | 2,342 |
| United Mexican States Government 4.00% 20193 | 318,081 | 22,383 |
| United Mexican States Government 2.50% 20203 | 53,014 | 3,485 |
| United Mexican States Government 2.00% 20223 | 487,725 | 30,663 |
| United Mexican States Government 4.50% 20253 | 972,799 | 72,985 |
| United Mexican States Government 4.00% 20403 | 311,720 | 22,461 |
| United Mexican States Government, Series M10, 8.00% 2015 | 153,000 | 10,361 |
| United Mexican States Government, Series M, 6.25% 2016 | 307,500 | 20,797 |
| United Mexican States Government, Series M, 5.00% 2017 | 970,000 | 64,992 |
| United Mexican States Government, Series M, 6.50% 2021 | 1,784,500 | 123,002 |
| United Mexican States Government, Series M20, 10.00% 2024 | 588,000 | 50,159 |
| United Mexican States Government, Series M30, 10.00% 2036 | 270,000 | 25,052 |
| United Mexican States Government, Series M, 7.75% 2042 | 102,500 | 7,810 |
| | | 459,429 |
| Hungarian forints 2.76% | | |
| Hungarian Government, Series 18/A, 5.50% 2018 | HUF3,920,000 | 15,640 |
| Hungarian Government, Series 19/A, 6.50% 2019 | 15,108,380 | 62,857 |
| Hungarian Government, Series 20B, 3.50% 2020 | 3,575,000 | 13,390 |
| Hungarian Government, Series 20A, 7.50% 2020 | 42,222,330 | 188,341 |
| Hungarian Government, Series 22A, 7.00% 2022 | 5,073,200 | 22,658 |
| Hungarian Government, Series 23A, 6.00% 2023 | 10,785,700 | 46,695 |
| Hungarian Government, Series 25B, 5.50% 2025 | 3,148,000 | 13,394 |
| | | 362,975 |
| Polish zloty 2.17% | | |
| Polish Government, Series 116, 0% 2016 | PLN147,075 | 38,339 |
| Polish Government, Series 1017, 5.25% 2017 | 134,100 | 38,570 |
| Polish Government, Series 1020, 5.25% 2020 | 168,150 | 52,007 |
| Polish Government, Series 1021, 5.75% 2021 | 154,770 | 50,114 |
| Polish Government, Series 0922, 5.75% 2022 | 195,355 | 64,387 |
Capital World Bond Fund — Page 3 of 25
Bonds, notes & other debt instruments
Polish zloty (continued) | Principal amount
(000) | Value
(000) |
| Polish Government 2.75% 20233 | PLN17,538 | $5,284 |
| Polish Government, Series 102, 4.00% 2023 | 123,330 | 37,148 |
| | | 285,849 |
| Indian rupees 1.99% | | |
| India (Republic of) 7.28% 2019 | INR8,790,000 | 138,570 |
| India (Republic of) 8.83% 2023 | 4,410,000 | 74,626 |
| India (Republic of) 8.60% 2028 | 1,610,000 | 27,455 |
| India (Republic of) 9.20% 2030 | 1,180,000 | 21,221 |
| | | 261,872 |
| Norwegian kroner 1.72% | | |
| Norwegian Government 4.50% 2019 | NKr26,700 | 3,783 |
| Norwegian Government 3.75% 2021 | 946,490 | 134,999 |
| Norwegian Government 3.00% 2024 | 619,900 | 87,327 |
| | | 226,109 |
| Colombian pesos 1.37% | | |
| Colombia (Republic of), Series B, 5.00% 2018 | COP173,154,800 | 65,796 |
| Colombia (Republic of), Series B, 10.00% 2024 | 130,723,000 | 60,515 |
| Colombia (Republic of), Series B, 6.00% 2028 | 149,577,800 | 50,345 |
| Colombia (Republic of), Series B, 7.75% 2030 | 10,525,700 | 4,084 |
| | | 180,740 |
| Indonesian rupiah 0.86% | | |
| Indonesia (Republic of) 7.875% 2019 | IDR245,700,000 | 19,271 |
| Indonesia (Republic of) 8.375% 2024 | 107,500,000 | 8,758 |
| Indonesia (Republic of) 8.375% 2034 | 914,328,000 | 74,556 |
| Indonesia (Republic of), Series 71, 9.00% 2029 | 120,160,000 | 10,340 |
| | | 112,925 |
| Australian dollars 0.70% | | |
| Australian Government, Series 134, 4.75% 2015 | A$2,000 | 1,548 |
| Australian Government, Series 122, 5.25% 2019 | 3,250 | 2,807 |
| Australian Government, Series 133, 5.50% 2023 | 55,750 | 52,779 |
| Australian Government, Series 136, 4.75% 2027 | 7,750 | 7,316 |
| Queensland Treasury Corp., Series 17, 6.00% 2017 | 4,000 | 3,346 |
| Queensland Treasury Corp., Series 24, 5.75% 2024 | 25,625 | 24,231 |
| | | 92,027 |
| Canadian dollars 0.63% | | |
| Canada Housing Trust 3.35% 2020 | C$10,000 | 8,849 |
| Canadian Government 1.50% 2015 | 6,000 | 4,754 |
| Canadian Government 1.00% 2016 | 2,000 | 1,588 |
| Canadian Government 1.25% 2018 | 5,000 | 4,035 |
| Canadian Government 1.75% 2019 | 28,250 | 23,329 |
| Canadian Government 2.75% 2022 | 22,940 | 20,276 |
| Canadian Government 2.50% 2024 | 6,800 | 5,946 |
| Canadian Government 5.75% 2029 | 3,000 | 3,588 |
| Canadian Government 5.00% 2037 | 5,200 | 6,362 |
| Hydro One Inc. 5.49% 2040 | 2,000 | 2,146 |
| Rogers Communications Inc. 5.80% 2016 | 1,750 | 1,451 |
| | | 82,324 |
Capital World Bond Fund — Page 4 of 25
Bonds, notes & other debt instruments
Swedish kronor 0.56% | Principal amount
(000) | Value
(000) |
| Swedish Government, Series 105, 3.50% 2022 | SKr516,980 | $74,193 |
| Malaysian ringgits 0.50% | | |
| Malaysian Government, Series 0114, 4.181% 2024 | MYR5,400 | 1,487 |
| Malaysian Government, Series 0310, 4.498% 2030 | 226,750 | 63,628 |
| Malaysian Government, Series 0413, 3.844% 2033 | 1,000 | 256 |
| | | 65,371 |
| South African rand 0.50% | | |
| South Africa (Republic of), Series R-208, 6.75% 2021 | ZAR284,550 | 22,774 |
| South Africa (Republic of), Series R-2023, 7.75% 2023 | 132,800 | 11,066 |
| South Africa (Republic of), Series R-214, 6.50% 2041 | 473,900 | 31,476 |
| | | 65,316 |
| Turkish lira 0.41% | | |
| Turkey (Republic of) 9.00% 2016 | TRY9,800 | 3,778 |
| Turkey (Republic of) 3.50% 20193 | 9,465 | 3,893 |
| Turkey (Republic of) 9.50% 2022 | 6,500 | 2,657 |
| Turkey (Republic of) 2.80% 20233 | 14,166 | 5,844 |
| Turkey (Republic of) 8.80% 2023 | 11,160 | 4,432 |
| Turkey (Republic of) 2.00% 20243 | 12,153 | 4,716 |
| Turkey (Republic of) 9.00% 2024 | 71,500 | 28,764 |
| | | 54,084 |
| Brazilian reais 0.10% | | |
| Brazil (Federal Republic of) 6.00% 20173 | BRL13,179 | 4,063 |
| Brazil (Federal Republic of) 10.00% 2017 | 10,000 | 2,979 |
| Brazil (Federal Republic of) 6.00% 20183 | 15,814 | 4,838 |
| Brazil (Federal Republic of) 10.00% 2025 | 2,000 | 528 |
| | | 12,408 |
| Ghana cedi 0.09% | | |
| Ghana Government Bond 16.90% 2016 | GHS5,080 | 1,261 |
| Ghana Government Bond 23.00% 2017 | 8,730 | 2,367 |
| Ghana Government Bond 25.40% 2017 | 2,985 | 843 |
| Ghana Government Bond 25.48% 2017 | 6,720 | 1,894 |
| Ghana Government Bond 26.00% 2017 | 15,315 | 4,320 |
| Ghana Government Bond 21.00% 2020 | 5,620 | 1,479 |
| | | 12,164 |
| Peruvian nuevos soles 0.05% | | |
| Peru (Republic of) 5.70% 2024 | PEN11,910 | 3,790 |
| Peru (Republic of) 6.95% 2031 | 7,000 | 2,330 |
| | | 6,120 |
| South Korean won 0.04% | | |
| South Korean Government 2.75% 20173 | KRW2,782,393 | 2,576 |
| South Korean Government 1.125% 20233 | 2,707,347 | 2,353 |
| | | 4,929 |
| U.S. dollars 53.86% | | |
| ABB Finance (USA) Inc. 1.625% 2017 | $2,000 | 2,022 |
| ABB Finance (USA) Inc. 2.875% 2022 | 3,830 | 3,914 |
| AbbVie Inc. 2.90% 2022 | 10,640 | 10,594 |
Capital World Bond Fund — Page 5 of 25
Bonds, notes & other debt instruments
U.S. dollars (continued) | Principal amount
(000) | Value
(000) |
| AbbVie Inc. 4.40% 2042 | $4,330 | $4,498 |
| Abu Dhabi National Energy Co. PJSC (TAQA) 7.25% 20184 | 8,000 | 9,306 |
| Abu Dhabi National Energy Co. PJSC (TAQA) 5.875% 20214 | 2,000 | 2,345 |
| Abu Dhabi National Energy Co. PJSC (TAQA) 3.625% 20234 | 1,135 | 1,159 |
| ACE INA Holdings Inc. 2.60% 2015 | 1,625 | 1,644 |
| ACE INA Holdings Inc. 3.35% 2024 | 3,110 | 3,248 |
| Actavis Funding SCS 2.35% 2018 | 15,550 | 15,769 |
| Actavis Funding SCS 3.00% 2020 | 16,660 | 17,087 |
| Actavis Funding SCS 3.45% 2022 | 10,170 | 10,432 |
| Actavis Funding SCS 3.80% 2025 | 20,930 | 21,627 |
| Actavis Funding SCS 4.55% 2035 | 15,180 | 15,875 |
| Actavis Funding SCS 4.75% 2045 | 4,690 | 4,997 |
| ADT Corp. 4.125% 2019 | 2,025 | 2,068 |
| AECOM Technology Corp. 5.75% 20224 | 1,450 | 1,504 |
| Alcatel-Lucent USA Inc. 4.625% 20174 | 2,075 | 2,129 |
| Alcatel-Lucent USA Inc. 6.75% 20204 | 2,500 | 2,675 |
| Alcatel-Lucent USA Inc. 8.875% 20204 | 3,475 | 3,805 |
| Alexandria Real Estate Equities, Inc. 2.75% 2020 | 1,030 | 1,034 |
| Alexandria Real Estate Equities, Inc. 3.90% 2023 | 1,750 | 1,810 |
| Alexandria Real Estate Equities, Inc. 4.50% 2029 | 300 | 318 |
| Alpha Natural Resources, Inc. 7.50% 20204 | 5,200 | 2,183 |
| Alpha Natural Resources, Inc. 7.50% 20204,5 | 746 | 313 |
| Altegrity, Inc. 9.50% 20194 | 4,500 | 4,342 |
| Altice Financing SA 6.625% 20234 | 1,400 | 1,449 |
| Altria Group, Inc. 2.625% 2020 | 8,200 | 8,330 |
| Altria Group, Inc. 9.95% 2038 | 2,500 | 4,352 |
| Altria Group, Inc. 4.50% 2043 | 8,500 | 8,828 |
| Altria Group, Inc. 5.375% 2044 | 2,250 | 2,642 |
| American Campus Communities, Inc. 3.75% 2023 | 11,360 | 11,533 |
| American Campus Communities, Inc. 4.125% 2024 | 5,185 | 5,387 |
| American Electric Power Co. 1.65% 2017 | 2,960 | 2,979 |
| American Energy (Marcellus), Term Loan B, 5.25% 20201,2,6 | 2,550 | 2,171 |
| American Energy (Marcellus), Term Loan A, 8.50% 20211,2,6 | 1,650 | 1,244 |
| American Energy (Permian Basin) 7.125% 20204 | 2,025 | 1,564 |
| American Energy (Permian Basin) 7.375% 20214 | 1,225 | 937 |
| American Express Co. 1.55% 2018 | 8,750 | 8,754 |
| American International Group, Inc. 2.30% 2019 | 1,745 | 1,773 |
| American International Group, Inc. 3.375% 2020 | 6,000 | 6,339 |
| American International Group, Inc. 4.50% 2044 | 2,050 | 2,210 |
| AmerisourceBergen Corp. 3.25% 2025 | 715 | 726 |
| AmerisourceBergen Corp. 4.25% 2045 | 675 | 712 |
| Anadarko Petroleum Corp. 5.95% 2016 | 2,250 | 2,401 |
| Anadarko Petroleum Corp. 8.70% 2019 | 2,810 | 3,438 |
| APT Pipelines Ltd. 4.20% 20254 | 1,280 | 1,298 |
| ArcelorMittal 6.25% 20211 | 1,400 | 1,493 |
| ArcelorMittal 7.50% 20411 | 6,020 | 6,291 |
| Arch Coal, Inc. 7.00% 2019 | 2,675 | 642 |
| Argentina (Republic of) 7.00% 2017 | 10,720 | 10,159 |
| Armenia (Republic of) 7.15% 20254 | 8,120 | 7,958 |
| Associated Materials, LLC and AMH New Finance, Inc. 9.125% 2017 | 4,025 | 3,532 |
| AT&T Inc. 4.30% 2042 | 1,335 | 1,278 |
| AT&T Inc. 4.80% 2044 | 1,442 | 1,485 |
| AvalonBay Communities, Inc. 3.625% 2020 | 1,450 | 1,538 |
| AvalonBay Communities, Inc. 2.85% 2023 | 2,875 | 2,838 |
| AXA SA 8.60% 2030 | 18,550 | 26,007 |
Capital World Bond Fund — Page 6 of 25
Bonds, notes & other debt instruments
U.S. dollars (continued) | Principal amount
(000) | Value
(000) |
| Banc of America Commercial Mortgage Inc., Series 2006-3, Class A-4, 5.889% 20441,2 | $1,393 | $1,453 |
| Banc of America Commercial Mortgage Inc., Series 2006-1, Class A1A, 5.378% 20451,2 | 4,472 | 4,582 |
| Banc of America Commercial Mortgage Inc., Series 2007-3, Class A-4, 5.735% 20491,2 | 1,120 | 1,196 |
| Banc of America Commercial Mortgage Inc., Series 2007-4, Class A-M, 6.011% 20511,2 | 3,020 | 3,285 |
| Banc of America Commercial Mortgage Inc., Series 2008-1, Class A-4, 6.43% 20511,2 | 1,919 | 2,114 |
| Banco de Crédito del Perú 5.375% 20204 | 7,000 | 7,700 |
| Bank of America Corp. 2.60% 2019 | 2,000 | 2,037 |
| Bank of America Corp., Series L, 2.65% 2019 | 2,000 | 2,040 |
| Bank of America Corp. 4.00% 2024 | 13,085 | 13,940 |
| Bank of America Corp. 4.00% 2025 | 2,500 | 2,538 |
| Barclays Bank PLC 2.50% 2019 | 1,410 | 1,439 |
| Barclays Bank PLC 3.65% 2025 | 13,730 | 13,801 |
| Baxter International Inc. 1.85% 2018 | 2,995 | 3,016 |
| Bayer AG 2.375% 20194 | 1,450 | 1,476 |
| BBVA Bancomer SA 6.50% 20214 | 1,455 | 1,618 |
| Bear Stearns Commercial Mortgage Securities Trust, Series 2007-PW17, Class A-4, 5.694% 20501,2 | 1,750 | 1,893 |
| Bear Stearns Commercial Mortgage Securities Trust, Series 2007-PW18, Class A-M, 6.084% 20501,2 | 2,375 | 2,615 |
| Becton, Dickinson and Co. 1.80% 2017 | 6,000 | 6,049 |
| Becton, Dickinson and Co. 2.675% 2019 | 3,195 | 3,273 |
| Becton, Dickinson and Co. 3.734% 2024 | 14,670 | 15,396 |
| Becton, Dickinson and Co. 4.685% 2044 | 675 | 741 |
| Berkshire Hathaway Energy Co. 3.50% 2025 | 1,585 | 1,654 |
| Berkshire Hathaway Inc. 4.50% 2043 | 2,900 | 3,280 |
| Bermuda Government 5.603% 20204 | 4,935 | 5,478 |
| Bermuda Government 5.603% 2020 | 1,800 | 1,998 |
| Bermuda Government 4.138% 20234 | 4,900 | 4,888 |
| Bermuda Government 4.854% 20244 | 17,675 | 18,669 |
| Boardwalk Pipeline Partners 3.375% 2023 | 2,000 | 1,852 |
| Boardwalk Pipelines, LP 4.95% 2024 | 2,100 | 2,121 |
| Bonanza Creek Energy, Inc. 6.75% 2021 | 675 | 660 |
| Bonanza Creek Energy, Inc. 5.75% 2023 | 925 | 856 |
| Boyd Gaming Corp. 9.125% 2018 | 2,000 | 2,095 |
| BP Capital Markets PLC 0.676% 20161 | 10,000 | 10,024 |
| BPCE SA group 5.70% 20234 | 26,555 | 29,454 |
| BPCE SA group 4.50% 20254 | 9,545 | 9,733 |
| Brandywine Operating Partnership, LP 5.70% 2017 | 15 | 16 |
| Brandywine Operating Partnership, LP 3.95% 2023 | 750 | 763 |
| Brazil (Federal Republic of) Global 4.25% 2025 | 2,215 | 2,173 |
| British American Tobacco International Finance PLC 9.50% 20184 | 7,485 | 9,479 |
| Builders Firstsource 7.625% 20214 | 4,075 | 4,116 |
| Burlington Northern Santa Fe LLC 3.40% 2024 | 4,755 | 4,973 |
| Burlington Northern Santa Fe LLC 3.75% 2024 | 2,980 | 3,186 |
| Burlington Northern Santa Fe LLC 4.15% 2045 | 280 | 293 |
| Canadian Natural Resources Ltd. 5.70% 2017 | 1,500 | 1,624 |
| Canadian Natural Resources Ltd. 3.80% 2024 | 425 | 426 |
| Celgene Corp. 3.625% 2024 | 2,210 | 2,301 |
| Celgene Corp. 4.625% 2044 | 1,450 | 1,549 |
| CEMEX Finance LLC 9.375% 20224 | 1,635 | 1,864 |
| Cenovus Energy Inc. 3.00% 2022 | 1,312 | 1,245 |
| Cenovus Energy Inc. 3.80% 2023 | 2,880 | 2,865 |
| Centene Corp. 4.75% 2022 | 5,875 | 6,103 |
| CenterPoint Energy Resources Corp. 4.50% 2021 | 3,225 | 3,605 |
| CenterPoint Energy Transition Bond Co. III, LLC, Series 2008, Class A-2, 5.234% 20232 | 2,225 | 2,493 |
| Cequel Communications Holdings I, LLC and Cequel Capital Corp. 6.375% 20204 | 9,450 | 10,005 |
| CEVA Group PLC 4.00% 20184 | 3,000 | 2,737 |
Capital World Bond Fund — Page 7 of 25
Bonds, notes & other debt instruments
U.S. dollars (continued) | Principal amount
(000) | Value
(000) |
| CEVA Group PLC 7.00% 20214 | $3,550 | $3,461 |
| CEVA Group PLC, LOC, 6.345% 20211,2,6 | 969 | 909 |
| CEVA Group PLC, Term Loan B, 6.50% 20211,2,6 | 1,395 | 1,308 |
| CEVA Group PLC, Term Loan, 6.50% 20211,2,6 | 1,011 | 949 |
| CEVA Group PLC, Term Loan, 6.50% 20211,2,6 | 174 | 164 |
| CEZ, a s 4.25% 20224 | 11,975 | 13,025 |
| Charter Communications Operating, LLC and Charter Communications Operating Capital Corp. 5.50% 2022 | 2,900 | 2,972 |
| Chevron Corp. 1.961% 2020 | 9,980 | 10,051 |
| Chevron Corp. 2.411% 2022 | 1,145 | 1,148 |
| CIT Group Inc. 3.875% 2019 | 8,400 | 8,337 |
| Citigroup Commercial Mortgage Trust, Series 2014-CG19, Class A-1, 1.199% 20472 | 1,810 | 1,811 |
| Citigroup Commercial Mortgage Trust, Series 2006-C5, Class A-4, 5.431% 20492 | 6,500 | 6,839 |
| Citigroup Inc. 2.55% 2019 | 13,535 | 13,811 |
| Citigroup Inc. 2.40% 2020 | 27,700 | 27,831 |
| Citigroup Inc. 3.75% 2024 | 15,875 | 16,650 |
| Citigroup Inc. 3.875% 2025 | 2,200 | 2,216 |
| Citigroup-Deutsche Bank Commercial Mortgage Trust, Series 2005-CD1, Class A-4, 5.396% 20441,2 | 4,565 | 4,588 |
| Citigroup-Deutsche Bank Commercial Mortgage Trust, Series 2006-CD3, Class A-5, 5.617% 20482 | 4,417 | 4,614 |
| CME Group Inc. 5.30% 2043 | 1,185 | 1,477 |
| CMS Energy Corp. 8.75% 2019 | 1,312 | 1,660 |
| CMS Energy Corp. 5.05% 2022 | 1,458 | 1,670 |
| CMS Energy Corp. 3.875% 2024 | 480 | 514 |
| CMS Energy Corp. 4.70% 2043 | 1,900 | 2,157 |
| CMS Energy Corp. 4.875% 2044 | 3,146 | 3,679 |
| CNA Financial Corp. 7.35% 2019 | 1,200 | 1,446 |
| CNOOC Finance (2013) Ltd. 3.00% 2023 | 1,600 | 1,566 |
| CoBank, ACB 7.875% 20184 | 430 | 501 |
| CoBank, ACB 0.871% 20221,4 | 4,275 | 3,997 |
| Colbun SA 6.00% 20204 | 5,150 | 5,740 |
| Colbun SA 4.50% 20244 | 1,800 | 1,862 |
| Colombia (Republic of) 5.00% 2045 | 4,175 | 4,311 |
| Comcast Corp. 6.40% 2038 | 1,750 | 2,379 |
| Comcast Corp. 4.65% 2042 | 10,550 | 11,847 |
| Comcast Corp. 4.75% 2044 | 6,695 | 7,724 |
| Comision Federal de Electricidad 4.875% 20244 | 3,500 | 3,736 |
| Commercial Mortgage Trust, Series 2006-C8, Class A1A, 5.292% 20462 | 4,503 | 4,782 |
| Commercial Mortgage Trust, Series 2014-UBS2, Class A-1, 1.298% 20472 | 3,316 | 3,334 |
| Commercial Mortgage Trust, Series 2007-C9, Class A-1-A, 5.989% 20491,2 | 389 | 422 |
| Commonwealth Bank of Australia 0.75% 20162,4 | 6,000 | 6,007 |
| ConAgra Foods, Inc. 1.30% 2016 | 2,800 | 2,808 |
| ConAgra Foods, Inc. 3.20% 2023 | 3,046 | 3,004 |
| CONSOL Energy Inc. 5.875% 2022 | 750 | 683 |
| Continental Airlines, Inc., Series 1997-4, Class A, 6.90% 20192 | 397 | 422 |
| Continental Airlines, Inc., Series 1999-1, Class A, 6.545% 20202 | 175 | 194 |
| Continental Airlines, Inc., Series 2000-2, Class A-1, 7.707% 20222 | 1,895 | 2,125 |
| ConvaTec Finance International SA 8.25% 20191,4,7 | 3,520 | 3,566 |
| Core Industrial Trust, Series 2015-CALW, Class A, 3.04% 20342,4 | 21,545 | 22,163 |
| Corporate Office Properties Trust 3.60% 2023 | 1,610 | 1,565 |
| Cox Communications, Inc. 2.95% 20234 | 6,250 | 6,167 |
| Credit Agricole SA 4.375% 20254 | 9,875 | 10,005 |
| Credit Suisse Group AG 1.375% 2017 | 8,150 | 8,166 |
| Credit Suisse Group AG 2.30% 2019 | 8,150 | 8,238 |
| Credit Suisse Group AG 3.625% 2024 | 4,500 | 4,657 |
| Crescent Resources 10.25% 20174 | 700 | 753 |
| Croatian Government 6.75% 20194 | 1,300 | 1,448 |
Capital World Bond Fund — Page 8 of 25
Bonds, notes & other debt instruments
U.S. dollars (continued) | Principal amount
(000) | Value
(000) |
| CS First Boston Mortgage Securities Corp., Series 2006-C5, Class A-3, 5.311% 20392 | $7,035 | $7,351 |
| CS First Boston Mortgage Securities Corp., Series 2006-C4, Class A1A, 5.46% 20392 | 6,645 | 6,965 |
| CS First Boston Mortgage Securities Corp., Series 2007-C5, Class A4, 5.695% 20401,2 | 3,000 | 3,225 |
| CS First Boston Mortgage Securities Corp., Series 2007-C2, Class A-M, 5.615% 20491,2 | 840 | 901 |
| Cumulus Media Inc., Term Loan B, 4.25% 20201,2,6 | 1,053 | 1,036 |
| CVS Caremark Corp. 2.25% 2019 | 2,245 | 2,282 |
| DaimlerChrysler North America Holding Corp. 2.625% 20164 | 2,000 | 2,044 |
| DaimlerChrysler North America Holding Corp. 1.375% 20174 | 2,455 | 2,457 |
| DaimlerChrysler North America Holding Corp. 2.40% 20174 | 2,500 | 2,562 |
| DaimlerChrysler North America Holding Corp. 2.375% 20184 | 4,000 | 4,103 |
| DaimlerChrysler North America Holding Corp. 2.25% 20204 | 11,700 | 11,789 |
| DaimlerChrysler North America Holding Corp. 2.875% 20214 | 9,950 | 10,287 |
| DaimlerChrysler North America Holding Corp. 3.25% 20244 | 1,135 | 1,182 |
| DaimlerChrysler North America Holding Corp. 8.50% 2031 | 7,850 | 12,459 |
| DBUBS Mortgage Trust, Series 2011-LC1A, Class A1, 3.742% 20462,4 | 3,959 | 4,027 |
| DBUBS Mortgage Trust, Series 2011-LC1A, Class A3, 5.002% 20462,4 | 1,500 | 1,715 |
| DCT Industrial Trust Inc. 4.50% 2023 | 3,135 | 3,341 |
| DDR Corp. 3.625% 2025 | 3,870 | 3,870 |
| Delhaize Group 5.70% 2040 | 2,129 | 2,361 |
| Denbury Resources Inc. 4.625% 2023 | 1,025 | 884 |
| Deutsche Telekom International Finance BV 3.125% 20164 | 2,715 | 2,774 |
| Deutsche Telekom International Finance BV 9.25% 2032 | 11,340 | 18,555 |
| Developers Diversified Realty Corp. 5.50% 2015 | 5,190 | 5,207 |
| Developers Diversified Realty Corp. 9.625% 2016 | 3,410 | 3,679 |
| Developers Diversified Realty Corp. 7.50% 2017 | 3,260 | 3,625 |
| Developers Diversified Realty Corp. 4.75% 2018 | 475 | 512 |
| Developers Diversified Realty Corp. 7.875% 2020 | 4,170 | 5,203 |
| Devon Energy Corp. 3.25% 2022 | 810 | 819 |
| Diamond Offshore Drilling, Inc. 4.875% 2043 | 5,100 | 4,297 |
| Digicel Group Ltd. 8.25% 20204 | 11,075 | 11,147 |
| Digicel Group Ltd. 7.125% 20224 | 2,175 | 1,995 |
| Discover Card Execution Note Trust, Series 2015-A-1, Class A-1, 0.525% 20201,2 | 18,990 | 19,014 |
| DISH DBS Corp. 5.125% 2020 | 11,200 | 11,312 |
| DJO Finance LLC 9.75% 2017 | 2,795 | 2,879 |
| DJO Finance LLC 7.75% 2018 | 3,585 | 3,657 |
| DJO Finance LLC 8.75% 2018 | 580 | 610 |
| DJO Finance LLC 9.875% 2018 | 1,910 | 1,996 |
| Dominican Republic 7.50% 20212,4 | 4,000 | 4,492 |
| Dominican Republic 7.45% 2044 | 4,000 | 4,530 |
| Dominican Republic 6.85% 20454 | 2,555 | 2,696 |
| Dominion Gas Holdings LLC 2.50% 2019 | 6,735 | 6,870 |
| Dominion Gas Holdings LLC 3.60% 2024 | 2,375 | 2,495 |
| Dominion Gas Holdings LLC 4.60% 2044 | 4,000 | 4,329 |
| Dynegy Finance Inc. 7.375% 20224 | 1,380 | 1,456 |
| Dynegy Finance Inc. 7.625% 20244 | 2,290 | 2,407 |
| Ecopetrol SA 5.875% 2045 | 8,898 | 8,386 |
| EDP Finance BV 6.00% 20184 | 4,000 | 4,360 |
| EDP Finance BV 4.125% 20204 | 3,000 | 3,110 |
| EDP Finance BV 5.25% 20214 | 2,500 | 2,716 |
| Electricité de France SA 1.15% 20174 | 2,000 | 2,008 |
| Electricité de France SA 4.60% 20204 | 2,900 | 3,237 |
| Electricité de France SA 6.95% 20394 | 1,325 | 1,860 |
| Electricité de France SA 4.875% 20444 | 9,060 | 10,310 |
| Electricité de France SA 5.25% (undated)1,4 | 3,150 | 3,295 |
| EMD Finance LLC 2.40% 20204 | 11,450 | 11,592 |
Capital World Bond Fund — Page 9 of 25
Bonds, notes & other debt instruments
U.S. dollars (continued) | Principal amount
(000) | Value
(000) |
| EMD Finance LLC 2.95% 20224 | $4,745 | $4,808 |
| EMD Finance LLC 3.25% 20254 | 15,675 | 15,865 |
| Empresa Nacional de Electricidad SA 4.25% 2024 | 2,100 | 2,184 |
| ENA Norte Trust 4.95% 20282,4 | 6,728 | 6,897 |
| Enbridge Energy Partners, LP 9.875% 2019 | 3,250 | 4,096 |
| Enbridge Energy Partners, LP 5.20% 2020 | 7,335 | 8,092 |
| Enbridge Energy Partners, LP, Series B, 6.50% 2018 | 5,320 | 5,930 |
| Enbridge Inc. 4.00% 2023 | 7,750 | 7,895 |
| Enbridge Inc. 4.50% 2044 | 2,550 | 2,376 |
| Enel Finance International SA 6.00% 20394 | 4,740 | 5,775 |
| Enel Società per Azioni 8.75% 20731,4 | 10,000 | 12,073 |
| EnLink Midstream Partners, LP 2.70% 2019 | 495 | 495 |
| EnLink Midstream Partners, LP 4.40% 2024 | 1,430 | 1,506 |
| EnLink Midstream Partners, LP 5.05% 2045 | 1,410 | 1,440 |
| Ensco PLC, 5.20% 2025 | 265 | 267 |
| Ensco PLC, 5.75% 2044 | 1,225 | 1,202 |
| Enterprise Products Operating LLC 2.55% 2019 | 1,905 | 1,933 |
| Enterprise Products Operating LLC 3.90% 2024 | 3,430 | 3,595 |
| Enterprise Products Operating LLC 3.75% 2025 | 7,460 | 7,732 |
| Enterprise Products Operating LLC 4.85% 2044 | 3,050 | 3,301 |
| Enterprise Products Operating LLC 5.10% 2045 | 1,590 | 1,789 |
| EPR Properties 4.50% 2025 | 1,645 | 1,676 |
EQTY 2014-INNS Mortgage Trust Commercial Mortgage Pass-Through Certificates,
Series 2014-A, 1.025% 20311,2,4 | 8,162 | 8,169 |
| ERP Operating LP 5.125% 2016 | 1,110 | 1,154 |
| ERP Operating LP 4.625% 2021 | 2,020 | 2,259 |
| Essex Portfolio L.P. 3.625% 2022 | 1,420 | 1,467 |
| Essex Portfolio L.P. 3.25% 2023 | 2,870 | 2,871 |
| Essex Portfolio L.P. 3.875% 2024 | 3,360 | 3,521 |
| Essex Portfolio L.P. 3.50% 2025 | 9,565 | 9,736 |
| Ethiopia (Republic of) 6.625% 2024 | 5,455 | 5,373 |
| Ethiopia (Republic of) 6.625% 20244 | 5,295 | 5,216 |
| Euramax International, Inc. 9.50% 2016 | 5,600 | 5,292 |
| Export-Import Bank of Korea 4.375% 2021 | 4,000 | 4,469 |
| Express Scripts Inc. 3.125% 2016 | 10,250 | 10,501 |
| Exxon Mobil Corp. 1.819% 2019 | 1,500 | 1,521 |
| Exxon Mobil Corp. 2.709% 2025 | 820 | 829 |
| Exxon Mobil Corp. 3.567% 2045 | 255 | 265 |
| Fannie Mae 2.50% 20262 | 554 | 571 |
| Fannie Mae 2.50% 20262 | 314 | 324 |
| Fannie Mae 6.00% 20262 | 222 | 253 |
| Fannie Mae 2.50% 20272 | 631 | 648 |
| Fannie Mae 2.50% 20272 | 510 | 525 |
| Fannie Mae 2.50% 20272 | 85 | 88 |
| Fannie Mae 2.50% 20272 | 43 | 44 |
| Fannie Mae 2.50% 20272 | 40 | 41 |
| Fannie Mae 2.50% 20272 | 39 | 40 |
| Fannie Mae 2.50% 20282 | 8,739 | 8,993 |
| Fannie Mae 2.50% 20282 | 1,246 | 1,283 |
| Fannie Mae 2.50% 20282 | 973 | 1,001 |
| Fannie Mae 2.50% 20282 | 970 | 998 |
| Fannie Mae 2.50% 20282 | 961 | 988 |
| Fannie Mae 2.50% 20282 | 950 | 978 |
| Fannie Mae 2.50% 20282 | 919 | 945 |
| Fannie Mae 2.50% 20282 | 918 | 945 |
Capital World Bond Fund — Page 10 of 25
Bonds, notes & other debt instruments
U.S. dollars (continued) | Principal amount
(000) | Value
(000) |
| Fannie Mae 2.50% 20282 | $912 | $938 |
| Fannie Mae 2.50% 20282 | 910 | 937 |
| Fannie Mae 2.50% 20282 | 907 | 934 |
| Fannie Mae 2.50% 20282 | 890 | 916 |
| Fannie Mae 2.50% 20282 | 883 | 908 |
| Fannie Mae 2.50% 20282 | 865 | 890 |
| Fannie Mae 2.50% 20282 | 847 | 871 |
| Fannie Mae 2.50% 20282 | 846 | 871 |
| Fannie Mae 2.50% 20282 | 842 | 867 |
| Fannie Mae 2.50% 20282 | 840 | 864 |
| Fannie Mae 2.50% 20282 | 832 | 856 |
| Fannie Mae 2.50% 20282 | 823 | 847 |
| Fannie Mae 2.50% 20282 | 814 | 838 |
| Fannie Mae 2.50% 20282 | 807 | 830 |
| Fannie Mae 2.50% 20282 | 801 | 824 |
| Fannie Mae 2.50% 20282 | 799 | 822 |
| Fannie Mae 2.50% 20282 | 790 | 813 |
| Fannie Mae 2.50% 20282 | 784 | 807 |
| Fannie Mae 2.50% 20282 | 758 | 780 |
| Fannie Mae 2.50% 20282 | 747 | 769 |
| Fannie Mae 2.50% 20282 | 741 | 762 |
| Fannie Mae 2.50% 20282 | 724 | 745 |
| Fannie Mae 2.50% 20282 | 715 | 736 |
| Fannie Mae 2.50% 20282 | 713 | 734 |
| Fannie Mae 2.50% 20282 | 692 | 712 |
| Fannie Mae 2.50% 20282 | 645 | 664 |
| Fannie Mae 2.50% 20282 | 614 | 632 |
| Fannie Mae 2.50% 20282 | 593 | 610 |
| Fannie Mae 2.50% 20282 | 565 | 581 |
| Fannie Mae 2.50% 20282 | 564 | 581 |
| Fannie Mae 2.50% 20282 | 543 | 559 |
| Fannie Mae 2.50% 20282 | 480 | 494 |
| Fannie Mae 2.50% 20282 | 467 | 481 |
| Fannie Mae 2.50% 20282 | 466 | 479 |
| Fannie Mae 2.50% 20282 | 459 | 472 |
| Fannie Mae 2.50% 20282 | 456 | 469 |
| Fannie Mae 2.50% 20282 | 455 | 468 |
| Fannie Mae 2.50% 20282 | 454 | 467 |
| Fannie Mae 2.50% 20282 | 446 | 459 |
| Fannie Mae 2.50% 20282 | 442 | 455 |
| Fannie Mae 2.50% 20282 | 434 | 446 |
| Fannie Mae 2.50% 20282 | 428 | 440 |
| Fannie Mae 2.50% 20282 | 427 | 440 |
| Fannie Mae 2.50% 20282 | 410 | 422 |
| Fannie Mae 2.50% 20282 | 408 | 420 |
| Fannie Mae 2.50% 20282 | 395 | 406 |
| Fannie Mae 2.50% 20282 | 386 | 397 |
| Fannie Mae 2.50% 20282 | 367 | 377 |
| Fannie Mae 2.50% 20282 | 347 | 357 |
| Fannie Mae 2.50% 20282 | 343 | 353 |
| Fannie Mae 2.50% 20282 | 341 | 351 |
| Fannie Mae 2.50% 20282 | 339 | 349 |
| Fannie Mae 2.50% 20282 | 336 | 346 |
| Fannie Mae 2.50% 20282 | 315 | 324 |
| Fannie Mae 2.50% 20282 | 314 | 323 |
Capital World Bond Fund — Page 11 of 25
Bonds, notes & other debt instruments
U.S. dollars (continued) | Principal amount
(000) | Value
(000) |
| Fannie Mae 2.50% 20282 | $302 | $311 |
| Fannie Mae 2.50% 20282 | 301 | 310 |
| Fannie Mae 2.50% 20282 | 293 | 301 |
| Fannie Mae 2.50% 20282 | 290 | 299 |
| Fannie Mae 2.50% 20282 | 283 | 291 |
| Fannie Mae 2.50% 20282 | 272 | 280 |
| Fannie Mae 2.50% 20282 | 272 | 279 |
| Fannie Mae 2.50% 20282 | 271 | 279 |
| Fannie Mae 2.50% 20282 | 265 | 273 |
| Fannie Mae 2.50% 20282 | 257 | 265 |
| Fannie Mae 2.50% 20282 | 253 | 261 |
| Fannie Mae 2.50% 20282 | 244 | 252 |
| Fannie Mae 2.50% 20282 | 242 | 249 |
| Fannie Mae 2.50% 20282 | 220 | 226 |
| Fannie Mae 2.50% 20282 | 214 | 220 |
| Fannie Mae 2.50% 20282 | 213 | 219 |
| Fannie Mae 2.50% 20282 | 213 | 219 |
| Fannie Mae 2.50% 20282 | 211 | 217 |
| Fannie Mae 2.50% 20282 | 211 | 217 |
| Fannie Mae 2.50% 20282 | 185 | 190 |
| Fannie Mae 2.50% 20282 | 175 | 180 |
| Fannie Mae 2.50% 20282 | 175 | 180 |
| Fannie Mae 2.50% 20282 | 168 | 173 |
| Fannie Mae 2.50% 20282 | 167 | 172 |
| Fannie Mae 2.50% 20282 | 156 | 161 |
| Fannie Mae 2.50% 20282 | 146 | 150 |
| Fannie Mae 2.50% 20282 | 140 | 144 |
| Fannie Mae 2.50% 20282 | 135 | 139 |
| Fannie Mae 2.50% 20282 | 134 | 137 |
| Fannie Mae 2.50% 20282 | 133 | 137 |
| Fannie Mae 2.50% 20282 | 132 | 136 |
| Fannie Mae 2.50% 20282 | 131 | 135 |
| Fannie Mae 2.50% 20282 | 130 | 134 |
| Fannie Mae 2.50% 20282 | 114 | 118 |
| Fannie Mae 2.50% 20282 | 113 | 117 |
| Fannie Mae 2.50% 20282 | 105 | 108 |
| Fannie Mae 2.50% 20282 | 100 | 103 |
| Fannie Mae 2.50% 20282 | 98 | 101 |
| Fannie Mae 2.50% 20282 | 96 | 99 |
| Fannie Mae 2.50% 20282 | 91 | 93 |
| Fannie Mae 2.50% 20282 | 86 | 89 |
| Fannie Mae 2.50% 20282 | 86 | 88 |
| Fannie Mae 2.50% 20282 | 86 | 88 |
| Fannie Mae 2.50% 20282 | 85 | 88 |
| Fannie Mae 2.50% 20282 | 83 | 85 |
| Fannie Mae 2.50% 20282 | 58 | 60 |
| Fannie Mae 2.50% 20282 | 57 | 58 |
| Fannie Mae 2.50% 20282 | 52 | 54 |
| Fannie Mae 2.50% 20282 | 50 | 52 |
| Fannie Mae 2.50% 20282 | 42 | 44 |
| Fannie Mae 2.50% 20282 | 35 | 36 |
| Fannie Mae 2.50% 20282 | 34 | 34 |
| Fannie Mae 2.50% 20282 | 31 | 32 |
| Fannie Mae 5.50% 20332 | 2,569 | 2,912 |
| Fannie Mae 6.00% 20352 | 160 | 182 |
Capital World Bond Fund — Page 12 of 25
Bonds, notes & other debt instruments
U.S. dollars (continued) | Principal amount
(000) | Value
(000) |
| Fannie Mae 5.50% 20382 | $2,297 | $2,599 |
| Fannie Mae 4.00% 20412 | 727 | 780 |
| Fannie Mae 5.00% 20412 | 9,661 | 10,906 |
| Fannie Mae 5.00% 20412 | 3,287 | 3,693 |
| Fannie Mae 4.00% 20422 | 6,718 | 7,272 |
| Fannie Mae 4.00% 20432 | 1,075 | 1,163 |
| Fannie Mae 6.50% 20472 | 74 | 83 |
| Fannie Mae 7.00% 20472 | 106 | 120 |
| Fannie Mae 6.50% 20482 | 78 | 88 |
| Fannie Mae 4.00% 20432 | 2,155 | 2,343 |
| Fannie Mae 4.00% 20432 | 1,060 | 1,157 |
| Fannie Mae 3.50% 20452,8 | 212,900 | 223,146 |
| Fannie Mae 4.00% 20452,8 | 12,675 | 13,554 |
| Fannie Mae 4.50% 20452,8 | 36,800 | 40,054 |
| Fannie Mae 6.50% 20472 | 94 | 105 |
| Fannie Mae 6.50% 20472 | 90 | 101 |
| Fannie Mae, Series 2012-M17, Class A2, multifamily 2.184% 20222 | 7,000 | 6,975 |
| Fannie Mae, Series 2012-M9, Class A2, multifamily 2.482% 20222 | 6,989 | 7,130 |
| Fannie Mae, Series 2001-4, Class GA, 9.424% 20251,2 | 3 | 3 |
| Fannie Mae, Series 2006-56, Class OG, principal only, 0% 20362 | 1,143 | 1,063 |
| Fannie Mae, Series 2006-49, Class PA, 6.00% 20362 | 299 | 333 |
| First Data Corp. 11.75% 2021 | 3,894 | 4,522 |
| First Data Corp. 12.625% 2021 | 10,511 | 12,482 |
| First Quantum Minerals Ltd. 6.75% 20204 | 7,717 | 7,177 |
| First Quantum Minerals Ltd. 7.00% 20214 | 7,642 | 7,126 |
| FMG Resources 6.00% 20174 | 9,000 | 8,938 |
| FMG Resources 6.875% 20182,4 | 5,522 | 5,426 |
| Ford Motor Credit Co. 2.375% 2018 | 5,525 | 5,625 |
| Ford Motor Credit Co. 2.375% 2019 | 19,825 | 20,074 |
| Ford Motor Credit Co. 2.597% 2019 | 8,485 | 8,606 |
| France Télécom 9.00% 2031 | 11,336 | 17,544 |
| Freddie Mac 6.00% 20382 | 118 | 135 |
| Freddie Mac 0.75% 2018 | 11,300 | 11,252 |
| Freddie Mac 4.00% 20432 | 2,071 | 2,237 |
| Freddie Mac 4.00% 20432 | 1,215 | 1,317 |
| Freddie Mac 4.00% 20432 | 1,209 | 1,314 |
| Freddie Mac 3.50% 20452,8 | 41,500 | 43,406 |
| Freddie Mac, Series K711, Class A2, multifamily 1.73% 20192 | 3,500 | 3,529 |
| Freddie Mac, Series K710, Class A2, multifamily 1.883% 20192 | 2,692 | 2,731 |
| Freddie Mac, Series K019, Class A2, multifamily 2.272% 20222 | 2,750 | 2,786 |
| Freddie Mac, Series K021, Class A2, multifamily 2.396% 20222 | 3,220 | 3,277 |
| Freddie Mac, Series 3213, Class OG, principal only, 0% 20362 | 1,979 | 1,865 |
| Freddie Mac, Series 3292, Class BO, principal only, 0% 20372 | 310 | 282 |
| Freescale Semiconductor, Inc. 6.00% 20224 | 4,400 | 4,785 |
| Freescale Semiconductor, Inc., Term Loan B4, 4.25% 20201,2,6 | 7,818 | 7,845 |
| Frontier Communications Corp. 8.50% 2020 | 1,775 | 2,001 |
| Frontier Communications Corp. 6.25% 2021 | 3,475 | 3,501 |
| Frontier Communications Corp. 9.25% 2021 | 6,525 | 7,593 |
| Gabonese Republic 6.375% 20242,4 | 6,490 | 6,149 |
| Gannett Co., Inc. 4.875% 20214 | 635 | 649 |
| Gazprom OJSC 5.999% 20214 | 3,900 | 3,706 |
| General Electric Co. 2.70% 2022 | 340 | 346 |
| Georgia Gulf Corp. 4.625% 2021 | 2,300 | 2,283 |
| Ghana (Republic of) 8.50% 2017 | 1,000 | 1,030 |
| Ghana (Republic of) 7.875% 2023 | 715 | 681 |
Capital World Bond Fund — Page 13 of 25
Bonds, notes & other debt instruments
U.S. dollars (continued) | Principal amount
(000) | Value
(000) |
| Ghana (Republic of) 7.875% 20234 | $645 | $615 |
| Ghana (Republic of) 8.125% 20262 | 8,885 | 8,457 |
| Ghana (Republic of) 8.125% 20262,4 | 8,480 | 8,072 |
| Gilead Sciences, Inc. 3.05% 2016 | 2,920 | 3,023 |
| Gilead Sciences, Inc. 3.50% 2025 | 14,390 | 15,218 |
| Gilead Sciences, Inc. 4.80% 2044 | 3,330 | 3,847 |
| Gilead Sciences, Inc. 4.50% 2045 | 1,610 | 1,792 |
| Goldman Sachs Group, Inc. 1.071% 20171 | 1,200 | 1,206 |
| Goldman Sachs Group, Inc. 2.55% 2019 | 8,295 | 8,421 |
| Goldman Sachs Group, Inc. 2.60% 2020 | 1,680 | 1,700 |
| Goldman Sachs Group, Inc. 3.85% 2024 | 11,430 | 11,976 |
| Goldman Sachs Group, Inc. 3.50% 2025 | 33,345 | 34,068 |
| Goldman Sachs Group, Inc. 4.80% 2044 | 1,360 | 1,517 |
| Goodman Funding Pty Ltd. 6.375% 20204 | 1,760 | 2,063 |
| Government National Mortgage Assn. 3.50% 20452,8 | 92,200 | 96,565 |
| Government National Mortgage Assn. 4.00% 20452,8 | 36,750 | 39,122 |
| Greenwich Capital Commercial Funding Corp., Series 2006-GG7, Class A-1-A, 6.014% 20381,2 | 5,682 | 5,903 |
| Greenwich Capital Commercial Funding Corp., Series 2006-GG7, Class A-4, 6.014% 20381,2 | 3,628 | 3,762 |
| Greenwich Capital Commercial Funding Corp., Series 2007-GG9, Class A-1-A, 5.426% 20392 | 6,462 | 6,880 |
| Greenwich Capital Commercial Funding Corp., Series 2007-GG9, Class A-4, 5.444% 20392 | 12,250 | 12,937 |
| Greenwich Capital Commercial Funding Corp., Series 2007-GG11, Class A-1-A, 5.704% 20492 | 8,138 | 8,864 |
| Greenwich Capital Commercial Funding Corp., Series 2007-GG11, Class A-M, 5.867% 20491,2 | 4,945 | 5,359 |
| GS Mortgage Securities Corp. II, Series 2007-GG10, Class A-1-A, 5.989% 20451,2 | 1,331 | 1,442 |
| Hardwoods Acquisition Inc 7.50% 20214 | 2,200 | 2,112 |
| Hawker Beechcraft Acquisition Co., LLC, LOC, 0.05% 20151,2,5,6,9 | 24 | 23 |
| HBOS PLC 6.75% 20184 | 1,490 | 1,671 |
| HCA Inc. 3.75% 2019 | 5,674 | 5,764 |
| HD Supply, Inc. 7.50% 2020 | 4,550 | 4,891 |
| HD Supply, Inc. 5.25% 20214 | 3,550 | 3,665 |
| HDTFS Inc. 5.875% 2020 | 475 | 490 |
| Hilton USA Trust, Series 2013-HLF-AFX, 2.662% 20302,4 | 15,106 | 15,151 |
| Holcim Ltd. 6.00% 20194 | 3,222 | 3,724 |
| Holcim Ltd. 5.15% 20234 | 8,230 | 9,342 |
| Hospitality Properties Trust 6.30% 2016 | 1,000 | 1,033 |
| Hospitality Properties Trust 6.70% 2018 | 7,580 | 8,345 |
| Hospitality Properties Trust 5.00% 2022 | 250 | 266 |
| Hospitality Properties Trust 4.50% 2023 | 690 | 716 |
| Hospitality Properties Trust 4.50% 2025 | 935 | 959 |
| HSBC Bank PLC 4.75% 20214 | 650 | 731 |
| HSBC Holdings PLC 4.125% 20204 | 3,295 | 3,597 |
| HSBC Holdings PLC 4.00% 2022 | 6,105 | 6,577 |
| HSBC Holdings PLC 4.25% 2024 | 3,305 | 3,475 |
| HSBC Holdings PLC 6.10% 2042 | 6,751 | 8,983 |
| Humana Inc. 2.625% 2019 | 1,070 | 1,092 |
| Humana Inc. 3.85% 2024 | 4,000 | 4,189 |
| Humana Inc. 4.95% 2044 | 4,000 | 4,420 |
| Hungarian Government 4.125% 2018 | 11,130 | 11,686 |
| Hungarian Government 4.00% 2019 | 29,300 | 30,633 |
| Hungarian Government 6.25% 2020 | 3,590 | 4,103 |
| Hungarian Government 5.375% 2023 | 3,610 | 4,054 |
| Hungarian Government 5.75% 2023 | 2,300 | 2,656 |
| Hungarian Government 5.375% 2024 | 36,860 | 41,421 |
| Hungarian Government 7.625% 2041 | 21,470 | 31,153 |
| Hyundai Capital America 2.60% 20204 | 2,675 | 2,706 |
| Hyundai Capital Services Inc. 2.625% 20204 | 3,165 | 3,182 |
Capital World Bond Fund — Page 14 of 25
Bonds, notes & other debt instruments
U.S. dollars (continued) | Principal amount
(000) | Value
(000) |
| Iberdrola Finance Ireland 5.00% 20194 | $5,000 | $5,583 |
| Icahn Enterprises Finance Corp. 3.50% 2017 | 6,100 | 6,161 |
| iHeartCommunications, Inc. 10.625% 20234 | 1,640 | 1,644 |
| Imperial Tobacco Finance PLC 3.50% 20234 | 9,050 | 9,205 |
| Indonesia (Republic of) 6.875% 2018 | 4,750 | 5,367 |
| Indonesia (Republic of) 5.875% 20204 | 5,625 | 6,391 |
| Indonesia (Republic of) 4.875% 2021 | 2,600 | 2,844 |
| Indonesia (Republic of) 3.75% 2022 | 15,795 | 16,150 |
| Indonesia (Republic of) 3.375% 2023 | 2,600 | 2,561 |
| Indonesia (Republic of) 4.125% 20254 | 10,150 | 10,467 |
| Indonesia (Republic of) 4.625% 2043 | 1,380 | 1,354 |
| Indonesia (Republic of) 6.75% 2044 | 4,675 | 5,990 |
| Indonesia (Republic of) 6.75% 20444 | 925 | 1,185 |
| Indonesia (Republic of) 5.125% 20454 | 2,660 | 2,806 |
| Intelsat Jackson Holding Co. 7.25% 2020 | 1,625 | 1,678 |
| Intelsat Jackson Holding Co. 6.625% 2022 | 10,375 | 10,064 |
| International Paper Co. 7.30% 2039 | 1,410 | 1,888 |
| Intesa Sanpaolo SpA 5.017% 20244 | 17,435 | 17,877 |
| inVentiv Health Inc, Term Loan B4, 7.75% 20181,2,6 | 4,040 | 4,060 |
| inVentiv Health Inc. 9.00% 20184 | 10,525 | 11,104 |
| inVentiv Health Inc. 11.00% 20184 | 637 | 615 |
| inVentiv Health Inc. 11.00% 20184 | 319 | 305 |
| inVentiv Health Inc. 12.00% 20181,4,7 | 1,462 | 1,466 |
| iStar Financial Inc. 4.875% 2018 | 5,000 | 5,044 |
| iStar Financial Inc. 5.00% 2019 | 5,600 | 5,621 |
| Ivory Coast Governement 5.75% 20322 | 10,300 | 9,889 |
J.P. Morgan Chase Commercial Mortgage Securities Corp.,
Series 2006-CB15, Class A-1-A, 5.811% 20431,2 | 630 | 656 |
| J.P. Morgan Chase Commercial Mortgage Securities Corp., Series 2006-CB15, Class A-4, 5.814% 20431,2 | 1,207 | 1,253 |
| J.P. Morgan Chase Commercial Mortgage Securities Corp., Series 2006-CB-16, Class A1A, 5.546% 20452 | 2,042 | 2,148 |
| J.P. Morgan Chase Commercial Mortgage Securities Corp., Series 2006-LDP7, Class A-4, 6.057% 20451,2 | 3,830 | 3,954 |
| J.P. Morgan Chase Commercial Mortgage Securities Corp., Series 2007-CB18, Class A-1-A, 5.431% 20471,2 | 6,701 | 7,107 |
| J.P. Morgan Chase Commercial Mortgage Securities Corp., Series 2007-LDPX, Class A-1-A, 5.439% 20492 | 6,767 | 7,250 |
| J.P. Morgan Chase Commercial Mortgage Securities Corp., Series 2007-CB19, Class A-4, 5.885% 20491,2 | 11,145 | 12,011 |
J.P. Morgan Chase Commercial Mortgage Securities Corp.,
Series 2007-CB19, Class A-1-A, 5.885% 20491,2 | 9,001 | 9,664 |
| J.P. Morgan Chase Commercial Mortgage Securities Corp., Series 2007-C1, Class A-4, 5.716% 20512 | 2,972 | 3,165 |
| J.P. Morgan Chase Commercial Mortgage Securities Corp., Series 2007-LD12, Class A-1-A, 5.85% 20511,2 | 2,467 | 2,682 |
| Jaguar Holding Co. 9.375% 20171,4,7 | 13,000 | 13,325 |
| JMC Steel Group Inc. 8.25% 20184 | 5,825 | 4,915 |
| JPMorgan Chase & Co. 2.25% 2020 | 15,850 | 15,895 |
| JPMorgan Chase & Co. 3.25% 2022 | 19,791 | 20,274 |
| JPMorgan Chase & Co. 3.125% 2025 | 17,662 | 17,707 |
| Kenya (Rebulic of) 5.875 20194 | 600 | 619 |
| Kenya (Republic of) 6.875% 20244 | 17,740 | 18,614 |
| Kenya (Republic of) 6.875% 2024 | 4,950 | 5,194 |
| Kimco Realty Corp. 5.584% 2015 | 2,003 | 2,064 |
| Kimco Realty Corp. 5.70% 2017 | 500 | 542 |
| Kimco Realty Corp. 4.30% 2018 | 500 | 538 |
| Kimco Realty Corp. 6.875% 2019 | 8,010 | 9,542 |
| Kinder Morgan Energy Partners, LP 2.65% 2019 | 670 | 672 |
| Kinder Morgan Energy Partners, LP 3.50% 2021 | 3,960 | 3,997 |
| Kinder Morgan Energy Partners, LP 3.45% 2023 | 7,500 | 7,386 |
| Kinder Morgan Energy Partners, LP 3.50% 2023 | 4,490 | 4,410 |
| Kinder Morgan Energy Partners, LP 4.15% 2024 | 10,200 | 10,445 |
Capital World Bond Fund — Page 15 of 25
Bonds, notes & other debt instruments
U.S. dollars (continued) | Principal amount
(000) | Value
(000) |
| Kinder Morgan Energy Partners, LP 4.25% 2024 | $1,960 | $2,008 |
| Kinder Morgan Energy Partners, LP 5.50% 2044 | 14,349 | 15,065 |
| Kinder Morgan, Inc. 4.30% 2025 | 14,265 | 14,672 |
| Kinder Morgan, Inc. 5.30% 2034 | 1,150 | 1,192 |
| Kinder Morgan, Inc. 5.55% 2045 | 7,850 | 8,308 |
| Kindred Healthcare, Inc. 8.00% 20204 | 1,375 | 1,482 |
| Kinetic Concepts, Inc. 10.50% 2018 | 5,970 | 6,477 |
| Kinetic Concepts, Inc. 12.50% 2019 | 7,850 | 8,615 |
| KLX Inc. 5.875% 20224 | 1,365 | 1,365 |
| Kraft Foods Inc. 2.25% 2017 | 1,590 | 1,619 |
| Kraft Foods Inc. 5.375% 2020 | 1,570 | 1,787 |
| Kroger Co. 6.80% 2018 | 1,000 | 1,176 |
| Laredo Petroleum, Inc. 9.50% 2019 | 2,475 | 2,593 |
| Latvia (Republic of) 5.25% 2021 | 9,000 | 10,373 |
| LB Commercial Mortgage Trust, Series 2007-C3, Class A-1-A, multifamily 6.065% 20441,2 | 347 | 378 |
| LB-UBS Commercial Mortgage Trust, Series 2007-C2, Class A-3, 5.43% 20402 | 2,857 | 3,049 |
| LB-UBS Commercial Mortgage Trust, Series 2007-C6, Class A-M, 6.114% 20401,2 | 460 | 499 |
| LB-UBS Commercial Mortgage Trust, Series 2007-C7, Class A-M, 6.369% 20451,2 | 2,110 | 2,341 |
| Leucadia National Corp. 5.50% 2023 | 1,375 | 1,423 |
| LightSquared, Term Loan, 9.00% 20151,2,5,6,7 | 2,728 | 2,728 |
| Lithuania (Republic of) 6.625% 20224 | 2,000 | 2,499 |
| Macy’s Retail Holdings, Inc. 4.375% 2023 | 2,550 | 2,813 |
| Magyar Export-Import Bank 4.00% 20204 | 2,595 | 2,660 |
| Marks and Spencer Group PLC 6.25% 20174 | 4,500 | 4,988 |
| McClatchy Co. 9.00% 2022 | 5,200 | 5,044 |
| McKesson Corp. 3.25% 2016 | 740 | 755 |
| McKesson Corp. 2.284% 2019 | 4,610 | 4,666 |
| McKesson Corp. 3.796% 2024 | 2,920 | 3,087 |
| McKesson Corp. 4.883% 2044 | 1,305 | 1,504 |
| Mediacom Broadband LLC and Mediacom Broadband Corp. 5.50% 2021 | 3,000 | 3,041 |
| Mediacom Broadband LLC and Mediacom Broadband Corp. 6.375% 2023 | 4,000 | 4,220 |
| Mediacom LLC and Mediacom Capital Corp. 7.25% 2022 | 5,000 | 5,400 |
| Medtronic, Inc. 2.50% 20204 | 6,460 | 6,605 |
| Medtronic, Inc. 3.50% 20254 | 32,540 | 34,089 |
| Medtronic, Inc. 4.625% 20454 | 3,000 | 3,410 |
| Merck & Co., Inc. 2.75% 2025 | 1,885 | 1,888 |
| Merrill Lynch Mortgage Trust, Series 2007-C1, Class A-4, 6.029% 20501,2 | 1,950 | 2,100 |
| MetroPCS Wireless, Inc. 6.25% 2021 | 5,875 | 6,132 |
| MetroPCS Wireless, Inc. 6.625% 2023 | 6,150 | 6,473 |
| MidAmerican Energy Co. 4.40% 2044 | 1,063 | 1,210 |
| ML-CFC Commercial Mortgage Trust, Series 2007-8, Class A-3, 6.077% 20491,2 | 890 | 966 |
| Morgan Stanley 2.125% 2018 | 5,125 | 5,184 |
| Morgan Stanley 2.375% 2019 | 1,575 | 1,588 |
| Morgan Stanley 2.50% 2019 | 13,050 | 13,308 |
| Morgan Stanley 2.65% 2020 | 2,690 | 2,735 |
| Morgan Stanley 3.70% 2024 | 4,230 | 4,419 |
| Morgan Stanley Capital I Trust, Series 2006-IQ12, Class A1A, 5.319% 20432 | 3,443 | 3,639 |
| Morgan Stanley Capital I Trust, Series 2007-IQ13, Class A-M, 5.406% 20442 | 965 | 1,029 |
| Morgan Stanley Capital I Trust, Series 2007-IQ15, Class A-4, 6.104% 20491,2 | 258 | 280 |
| Morocco Government 4.25% 2022 | 5,700 | 5,885 |
| Morocco Government 4.25% 20224 | 2,500 | 2,581 |
| Morocco Government 5.50% 2042 | 10,000 | 11,275 |
| Morocco Government 5.50% 20424 | 1,500 | 1,691 |
| National Rural Utilities Cooperative Finance Corp. 10.375% 2018 | 3,250 | 4,214 |
| Navios Maritime Holdings Inc. 7.375% 20224 | 9,700 | 9,094 |
Capital World Bond Fund — Page 16 of 25
Bonds, notes & other debt instruments
U.S. dollars (continued) | Principal amount
(000) | Value
(000) |
| Navios Maritime Holdings Inc. and Navios Maritime Finance II (US) Inc. 8.125% 2019 | $500 | $435 |
| NBC Universal Enterprise, Inc. 0.938% 20181,4 | 5,785 | 5,832 |
| NBC Universal Enterprise, Inc. 1.974% 20194 | 3,600 | 3,626 |
| NBC Universal Enterprise, Inc. 5.25% (undated)4 | 2,335 | 2,487 |
| Needle Merger Sub Corp. 8.125% 20194 | 3,065 | 3,096 |
| Neiman Marcus Group LTD Inc. 8.00% 20214 | 3,925 | 4,180 |
| Neiman Marcus Group LTD Inc. 8.75% 20211,4,7 | 4,825 | 5,139 |
| NGL Energy Partners LP 6.875% 2021 | 1,150 | 1,208 |
| NGPL PipeCo LLC 7.119% 20174 | 1,500 | 1,493 |
| NGPL PipeCo LLC 9.625% 20194 | 6,900 | 6,878 |
| Niagara Mohawk Power Corp. 4.278% 20344 | 6,560 | 7,172 |
| Niagara Mohawk Power Corp. 3.508% 20244 | 2,715 | 2,856 |
| Nielsen Finance LLC and Nielsen Finance Co. 5.50% 20214 | 4,550 | 4,721 |
| Nigeria (Republic of) 5.125% 20184 | 3,400 | 3,333 |
| Nigeria (Republic of) 6.375% 2023 | 5,950 | 6,004 |
| Nigeria (Republic of) 6.375% 20234 | 1,425 | 1,438 |
| NII Capital Corp. 10.00% 20169 | 125 | 61 |
| NII Capital Corp. 7.875% 20194,9 | 4,150 | 3,870 |
| NII Capital Corp. 8.875% 20199 | 2,625 | 1,260 |
| NII Capital Corp. 11.375% 20194,9 | 1,600 | 1,528 |
| NII Capital Corp. 7.625% 20219 | 9,000 | 2,835 |
| NII Holdings, Term Loan-DIP, 8.00% 20161,2,5,6,7 | 3,080 | 3,080 |
| Noble Corp. PLC 4.00% 2018 | 140 | 141 |
| Noble Corp. PLC 5.95% 2025 | 1,180 | 1,154 |
| Noble Corp. PLC 6.95% 2045 | 1,770 | 1,683 |
| Nordea Bank AB 1.625% 20184 | 2,645 | 2,648 |
| Nordea Bank AB 4.875% 20214 | 3,675 | 4,035 |
| Nordea Bank AB 4.25% 20224 | 10,050 | 10,646 |
| Norfolk Southern Corp. 5.75% 2016 | 2,465 | 2,560 |
| Nortek Inc. 10.00% 2018 | 2,050 | 2,175 |
| Nortek Inc. 8.50% 2021 | 6,075 | 6,531 |
| Novartis Capital Corp. 3.40% 2024 | 6,530 | 6,983 |
| Numericable Group SA 4.875% 20194 | 10,550 | 10,537 |
| NXP BV and NXP Funding LLC 3.75% 20184 | 1,700 | 1,738 |
| Oasis Petroleum Inc. 6.875% 2022 | 2,000 | 1,960 |
| Odebrecht Drilling Norbe VIII/IX Ltd 6.35% 20212,4 | 5,950 | 5,162 |
| Odebrecht Offshore Drilling Finance Ltd. 6.75% 20222,4 | 4,553 | 3,550 |
| Oracle Corp. 3.40% 2024 | 2,725 | 2,868 |
| Ortho-Clinical Diagnostics Inc., Term Loan B, 4.75% 20211,2,6 | 3,413 | 3,387 |
| Pacific Gas and Electric Co. 3.25% 2023 | 2,565 | 2,656 |
| Pacific Gas and Electric Co. 3.85% 2023 | 1,335 | 1,428 |
| Pacific Gas and Electric Co. 3.75% 2042 | 2,840 | 2,848 |
| PacifiCorp., First Mortgage Bonds, 3.60% 2024 | 3,230 | 3,465 |
| PDC Energy Inc. 7.75% 2022 | 2,850 | 3,007 |
| Peabody Energy Corp. 6.00% 2018 | 17,373 | 13,638 |
| Pemex Project Funding Master Trust, Series 13, 6.625% 2035 | 3,885 | 4,468 |
| Pernod Ricard SA 4.45% 20224 | 10,465 | 11,359 |
| Peru (Republic of) 5.625% 2050 | 1,665 | 2,040 |
| PETCO Animal Supplies, Inc. 9.25% 20184 | 2,550 | 2,684 |
| Petrobras Global Finance Co. 6.25% 2024 | 2,750 | 2,600 |
| Petrobras Global Finance Co. 5.625% 2043 | 175 | 143 |
| Petrobras International Finance Co. 3.875% 2016 | 740 | 728 |
| Petrobras International Finance Co. 5.375% 2021 | 345 | 315 |
| Petrobras International Finance Co. 6.75% 2041 | 250 | 222 |
| Petróleos Mexicanos 3.50% 2018 | 1,500 | 1,564 |
Capital World Bond Fund — Page 17 of 25
Bonds, notes & other debt instruments
U.S. dollars (continued) | Principal amount
(000) | Value
(000) |
| Petróleos Mexicanos 8.00% 2019 | $6,400 | $7,688 |
| Petróleos Mexicanos 5.50% 2021 | 1,070 | 1,180 |
| Petróleos Mexicanos 4.875% 2022 | 8,800 | 9,361 |
| Petróleos Mexicanos 4.50% 20264 | 3,000 | 3,064 |
| Petróleos Mexicanos 6.50% 2041 | 2,470 | 2,810 |
| Petróleos Mexicanos 5.50% 2044 | 3,270 | 3,315 |
| Petróleos Mexicanos 5.50% 20444 | 2,250 | 2,281 |
| Petróleos Mexicanos 6.375% 2045 | 7,000 | 7,843 |
| Petróleos Mexicanos 5.625% 20464 | 6,225 | 6,348 |
| PETsMART, Inc. 7.125% 20234 | 775 | 805 |
| Pfizer Inc. 7.20% 2039 | 282 | 416 |
| Pfizer Inc. 4.40% 2044 | 4,038 | 4,453 |
| Philip Morris International Inc. 4.25% 2044 | 10,125 | 10,647 |
| Phillips 66 Partners LP 3.605% 2025 | 275 | 276 |
| Phillips 66 Partners LP 4.68% 2045 | 565 | 569 |
| Piedmont Operating Partnership LP 3.40% 2023 | 1,250 | 1,226 |
| Ply Gem Industries, Inc. 6.50% 2022 | 4,550 | 4,453 |
| Ply Gem Industries, Inc. 6.50% 2022 | 3,025 | 2,889 |
| PNC Bank 2.40% 2019 | 10,000 | 10,198 |
| PNC Financial Services Group, Inc. 3.90% 2024 | 3,975 | 4,172 |
| PNC Funding Corp. 3.30% 2022 | 5,090 | 5,369 |
| Polish Government 5.00% 2022 | 4,300 | 4,950 |
| Popular, Inc. 7.00% 2019 | 1,001 | 997 |
| PRA Holdings, Inc. 9.50% 20234 | 1,953 | 2,178 |
| Progress Energy, Inc. 7.05% 2019 | 4,380 | 5,231 |
| Progress Energy, Inc. 7.75% 2031 | 1,990 | 2,888 |
| Prologis, Inc. 3.35% 2021 | 1,500 | 1,559 |
| Prologis, Inc. 4.25% 2023 | 11,545 | 12,435 |
| Puget Sound Energy, Inc., First Lien, 6.50% 2020 | 1,475 | 1,775 |
| Puget Sound Energy, Inc., First Lien, 6.00% 2021 | 4,629 | 5,473 |
| Puget Sound Energy, Inc., First Lien, 5.625% 2022 | 2,120 | 2,470 |
| QGOG Atlantic/Alaskan Rigs Ltd. 5.25% 20192,4 | 4,778 | 4,162 |
| QGOG Constellation SA 6.25% 20194 | 5,350 | 3,063 |
| R.R. Donnelley & Sons Co. 7.875% 2021 | 2,775 | 3,188 |
| R.R. Donnelley & Sons Co. 6.50% 2023 | 3,525 | 3,763 |
| Rabobank Nederland 4.625% 2023 | 14,905 | 16,142 |
| Ras Laffan Liquefied Natural Gas III 5.838% 20272,4 | 8,000 | 9,242 |
| RCI Banque 3.50% 20184 | 9,000 | 9,412 |
| Realogy Corp. 5.25% 20214 | 1,125 | 1,150 |
| Realogy Corp., LOC, 4.40% 20161,2,6 | 52 | 52 |
| Regions Financial Corp., Series A-I, 5.20% 2015 | 200 | 200 |
| Regions Financial Corp. 5.75% 2015 | 295 | 298 |
| Regions Financial Corp. 2.00% 2018 | 4,100 | 4,099 |
| Reynolds American Inc. 6.15% 2043 | 3,750 | 4,651 |
| Reynolds Group Inc. 5.75% 2020 | 11,470 | 11,886 |
| Rice Energy Inc. 6.25% 2022 | 6,175 | 6,051 |
| Rice Energy Inc. 7.25% 20234 | 375 | 375 |
| Rio Tinto Finance (USA) Ltd. 2.875% 2022 | 3,340 | 3,323 |
| Roche Holdings, Inc. 2.25% 20194 | 11,100 | 11,270 |
| Roche Holdings, Inc. 2.875% 20214 | 9,150 | 9,482 |
| Roche Holdings, Inc. 3.35% 20244 | 10,575 | 11,103 |
| Ryerson Inc. 11.25% 2018 | 1,925 | 1,963 |
| Sabine Pass Liquefaction, LLC 5.625% 2021 | 1,600 | 1,616 |
| SABMiller Holdings Inc. 4.95% 20424 | 1,645 | 1,856 |
| Scentre Group 2.375% 20194 | 1,210 | 1,224 |
Capital World Bond Fund — Page 18 of 25
Bonds, notes & other debt instruments
U.S. dollars (continued) | Principal amount
(000) | Value
(000) |
| Scentre Group 3.50% 20254 | $5,140 | $5,265 |
| Scottish Power PLC 5.81% 2025 | 2,500 | 2,969 |
| Select Income REIT 2.85% 2018 | 2,800 | 2,825 |
| Select Income REIT 3.60% 2020 | 520 | 534 |
| Select Income REIT 4.15% 2022 | 1,815 | 1,825 |
| Select Income REIT 4.50% 2025 | 540 | 542 |
| Silver II Borrower S.C.A./Silver II U.S. Holdings, LLC 7.75% 20204 | 5,740 | 5,152 |
| Simon Property Group, LP 10.35% 2019 | 2,975 | 3,859 |
| Slovak (Republic of) 4.375% 20224 | 5,000 | 5,580 |
| Slovenia (Republic of) 4.75% 20184 | 2,905 | 3,120 |
| Slovenia (Republic of) 4.125% 20194 | 4,565 | 4,838 |
| Slovenia (Republic of) 5.50% 2022 | 46,940 | 54,276 |
| Slovenia (Republic of) 5.50% 20224 | 1,600 | 1,850 |
| Slovenia (Republic of) 5.85% 2023 | 34,945 | 41,497 |
| Slovenia (Republic of) 5.85% 20234 | 1,010 | 1,199 |
| Slovenia (Republic of) 5.25% 2024 | 4,160 | 4,795 |
| SoftBank Corp. 4.50% 20204 | 2,275 | 2,332 |
| Sotheby’s Holdings, Inc. 5.25% 20224 | 350 | 346 |
| Southwestern Energy Co. 4.95% 2025 | 1,715 | 1,748 |
| Spectra Energy Partners, LP 4.75% 2024 | 610 | 671 |
| Sprint Nextel Corp. 7.00% 2020 | 2,170 | 2,215 |
| Sprint Nextel Corp. 7.25% 2021 | 5,075 | 5,119 |
| Sprint Nextel Corp. 7.875% 2023 | 8,725 | 8,943 |
| SRA International, Inc., Term Loan B, 6.50% 20181,2,6 | 5,034 | 5,064 |
| Stackpole Intl. 7.75% 20214 | 2,925 | 2,910 |
| Standard Chartered PLC 3.85% 20154 | 5,830 | 5,846 |
| Standard Chartered PLC 3.20% 20164 | 3,365 | 3,441 |
| State of Qatar 4.50% 20224 | 3,500 | 3,916 |
| Statoil ASA 0.547% 20181 | 5,460 | 5,446 |
| Statoil ASA 1.95% 2018 | 4,515 | 4,580 |
| Statoil ASA 2.75% 2021 | 3,550 | 3,637 |
| Statoil ASA 3.25% 2024 | 2,355 | 2,431 |
| Statoil ASA 3.70% 2024 | 6,325 | 6,769 |
| Statoil ASA 4.25% 2041 | 1,500 | 1,614 |
| Targa Resources Corp. 4.125% 20194 | 1,200 | 1,200 |
| Targa Resources Partners LP 5.00% 20184 | 1,150 | 1,187 |
| TC PipeLines, LP 4.375% 2025 | 1,405 | 1,422 |
| Teco Finance, Inc. 5.15% 2020 | 270 | 306 |
| Teekay Corp. 8.50% 2020 | 3,400 | 3,833 |
| Tenet Healthcare Corp., First Lien, 4.75% 2020 | 2,050 | 2,088 |
| Tenet Healthcare Corp., First Lien, 4.50% 2021 | 9,950 | 9,788 |
| Tennessee Valley Authority 5.88% 2036 | 2,250 | 3,173 |
| Tennessee Valley Authority 5.25% 2039 | 6,000 | 7,865 |
| Tesoro Logistics LP 5.50% 20194 | 925 | 957 |
| Thermo Fisher Scientific Inc. 4.15% 2024 | 3,030 | 3,278 |
| Thomson Reuters Corp. 1.65% 2017 | 4,605 | 4,616 |
| Thomson Reuters Corp. 4.30% 2023 | 4,250 | 4,577 |
| Thomson Reuters Corp. 5.65% 2043 | 2,980 | 3,549 |
| TIBCO Software, Inc., Term Loan B, 6.50% 20201,2,6 | 1,250 | 1,252 |
| T-Mobile US, Inc. 6.731% 2022 | 2,500 | 2,641 |
| T-Mobile US, Inc. 6.375% 2025 | 1,800 | 1,862 |
| Total Capital International 1.55% 2017 | 1,800 | 1,821 |
| Total Capital International 2.875% 2022 | 1,115 | 1,144 |
| Toyota Motor Credit Corp. 1.45% 2018 | 750 | 755 |
| Toyota Motor Credit Corp. 2.125% 2019 | 4,000 | 4,066 |
Capital World Bond Fund — Page 19 of 25
Bonds, notes & other debt instruments
U.S. dollars (continued) | Principal amount
(000) | Value
(000) |
| Toyota Motor Credit Corp. 2.15% 2020 | $3,500 | $3,535 |
| TRAC Intermodal 11.00% 2019 | 1,525 | 1,677 |
| TransCanada PipeLines Ltd. 6.50% 2018 | 5,000 | 5,718 |
| TransCanada PipeLines Ltd. 7.125% 2019 | 3,035 | 3,582 |
| TransCanada PipeLines Ltd. 7.625% 2039 | 2,000 | 2,890 |
| Transocean Inc. 5.05% 2016 | 1,520 | 1,541 |
| Transocean Inc. 2.50% 2017 | 380 | 350 |
| Transocean Inc. 6.375% 2021 | 2,060 | 1,730 |
| Transportadora de Gas Peru SA 4.25% 20282,4 | 8,960 | 8,957 |
| Turkey (Republic of) 4.557% 2018 | 9,200 | 9,683 |
| Turkey (Republic of) 4.557% 20184 | 5,065 | 5,331 |
| Turkey (Republic of) 7.00% 2019 | 5,000 | 5,693 |
| Turkey (Republic of) 6.25% 2022 | 7,565 | 8,624 |
| Tyson Foods, Inc. 3.95% 2024 | 3,000 | 3,176 |
| U.S. Treasury 0.375% 2015 | 27,930 | 27,964 |
| U.S. Treasury 0.625% 2016 | 22,100 | 22,149 |
| U.S. Treasury 0.625% 2016 | 15,650 | 15,696 |
| U.S. Treasury 0.625% 2017 | 10,850 | 10,829 |
| U.S. Treasury 0.75% 2017 | 60,975 | 60,849 |
| U.S. Treasury 0.875% 2017 | 36,450 | 36,610 |
| U.S. Treasury 0.625% 2018 | 15,600 | 15,456 |
| U.S. Treasury 0.875% 2018 | 3,171 | 3,174 |
| U.S. Treasury 1.00% 2018 | 2,837 | 2,847 |
| U.S. Treasury 1.25% 2018 | 163,150 | 164,036 |
| U.S. Treasury 1.375% 2018 | 68,750 | 69,556 |
| U.S. Treasury 1.375% 2018 | 13,150 | 13,288 |
| U.S. Treasury 1.50% 2018 | 193,750 | 196,716 |
| U.S. Treasury 2.625% 2018 | 2,500 | 2,629 |
| U.S. Treasury 1.00% 2019 | 120,750 | 119,528 |
| U.S. Treasury 1.50% 2019 | 61,075 | 61,867 |
| U.S. Treasury 1.50% 2019 | 40,125 | 40,554 |
| U.S. Treasury 1.50% 2019 | 1,950 | 1,965 |
| U.S. Treasury 1.625% 201910 | 235,450 | 239,128 |
| U.S. Treasury 1.625% 2019 | 232,446 | 235,805 |
| U.S. Treasury 1.625% 2019 | 81,150 | 82,517 |
| U.S. Treasury 1.625% 2019 | 19,900 | 20,196 |
| U.S. Treasury 1.75% 2019 | 92,650 | 94,427 |
| U.S. Treasury 1.125% 2020 | 128,100 | 126,564 |
| U.S. Treasury 1.25% 2020 | 152,460 | 151,650 |
| U.S. Treasury 1.25% 2020 | 41,075 | 40,861 |
| U.S. Treasury 1.375% 2020 | 155,750 | 155,459 |
| U.S. Treasury 1.375% 2020 | 3,074 | 3,074 |
| U.S. Treasury 2.00% 2020 | 8,300 | 8,526 |
| U.S. Treasury 2.00% 2021 | 1,100 | 1,122 |
| U.S. Treasury 2.125% 2021 | 20,000 | 20,570 |
| U.S. Treasury 8.00% 2021 | 5,800 | 8,107 |
| U.S. Treasury 2.375% 2024 | 1,550 | 1,611 |
| U.S. Treasury 2.50% 2024 | 140,415 | 147,499 |
| U.S. Treasury 2.00% 2025 | 67,253 | 67,679 |
| U.S. Treasury 2.875% 2043 | 38,500 | 41,027 |
| U.S. Treasury 3.625% 2043 | 5,400 | 6,596 |
| U.S. Treasury 3.00% 2044 | 12,300 | 13,475 |
| U.S. Treasury 2.50% 2045 | 64,000 | 63,424 |
| U.S. Treasury Inflation-Protected Security 0.125% 20173 | 3,087 | 3,143 |
| U.S. Treasury Inflation-Protected Security 0.125% 20183 | 6,067 | 6,191 |
Capital World Bond Fund — Page 20 of 25
Bonds, notes & other debt instruments
U.S. dollars (continued) | Principal amount
(000) | Value
(000) |
| U.S. Treasury Inflation-Protected Security 0.125% 20193 | $38,904 | $39,673 |
| U.S. Treasury Inflation-Protected Security 0.125% 20243 | 40,607 | 40,673 |
| U.S. Treasury Inflation-Protected Security 0.625% 20243 | 213,367 | 222,650 |
| U.S. Treasury Inflation-Protected Security 0.25% 20253 | 144,851 | 147,616 |
| U.S. Treasury Inflation-Protected Security 2.375% 20253 | 6,820 | 8,283 |
| U.S. Treasury Inflation-Protected Security 2.00% 20263 | 4,122 | 4,893 |
| U.S. Treasury Inflation-Protected Security 0.75% 20423 | 3,103 | 3,148 |
| U.S. Treasury Inflation-Protected Security 1.375% 20443 | 78,013 | 91,981 |
| U.S. Treasury Inflation-Protected Security 0.75% 20453 | 2,283 | 2,339 |
| United Mexican States Government Global 3.60% 2025 | 20,760 | 21,409 |
| United Mexican States Government Global 4.75% 2044 | 6,000 | 6,330 |
| United Mexican States Government Global, Series A, 5.125% 2020 | 8,300 | 9,325 |
| United Mexican States Government Global, Series A, 3.625% 2022 | 7,800 | 8,120 |
| United Mexican States Government Global, Series A, 4.00% 2023 | 7,000 | 7,429 |
| US Investigations Services, Inc. 13.00% 20204,5,7,9 | 1,970 | 1,143 |
| US Investigations Services, Inc. 14.00% 20204,5,7,9 | 216 | 127 |
| US Investigations Services, Inc. 15.00% 20214,5,7,9 | 521 | 47 |
| US Investigations Services, Inc., Term Loan DD, 12.00% 20152,5,6,7 | 491 | 491 |
| State of California, Various Purpose G.O. Bonds, 6.20% 2019 | 18,700 | 22,161 |
| State of California, Various Purpose G.O. Bonds, 7.30% 20392 | 1,310 | 1,957 |
| State of California, Various Purpose G.O. Bonds, 7.55% 2039 | 2,720 | 4,258 |
| State of California, Various Purpose G.O. Bonds, 7.60% 2040 | 12,910 | 20,773 |
| State of California, Various Purpose G.O. Bonds, 7.625% 2040 | 11,850 | 18,480 |
| VEB Finance Ltd. 6.902% 20204 | 6,600 | 6,105 |
| Verizon Communications Inc. 2.625% 2020 | 6,460 | 6,584 |
| Verizon Communications Inc. 3.50% 2024 | 33,743 | 34,601 |
| Verizon Communications Inc. 4.272% 20364 | 38,219 | 38,060 |
| Verizon Communications Inc. 4.522% 20484 | 19,389 | 19,320 |
| Viacom Inc. 2.75% 2019 | 840 | 854 |
| Viacom Inc. 4.85% 2034 | 2,020 | 2,094 |
| Viacom Inc. 5.85% 2043 | 2,675 | 3,023 |
| Volkswagen Group of America Finance, LLC 2.45% 20194 | 4,400 | 4,492 |
| Volkswagen International Finance NV 4.00% 20204 | 4,000 | 4,369 |
| Volvo Treasury AB 5.95% 20154 | 12,390 | 12,390 |
| VPI Escrow Corp. 6.375% 20204 | 2,160 | 2,252 |
| VPI Escrow Corp. 7.50% 20214 | 5,000 | 5,427 |
| VRX Escrow Corp. 6.125% 20254 | 3,770 | 3,916 |
| VWR Funding, Inc. 7.25% 2017 | 7,387 | 7,738 |
| Wachovia Bank Commercial Mortgage Trust, Series 2007-C30, Class A-5, 5.342% 20432 | 250 | 266 |
| Wachovia Bank Commercial Mortgage Trust, Series 2006-C25, Class A1A, 5.891% 20431,2 | 6,682 | 6,920 |
| Wachovia Bank Commercial Mortgage Trust, Series 2007-C31, Class A-5, 5.50% 20472 | 900 | 968 |
| Wachovia Bank Commercial Mortgage Trust, Series 2007-C31, Class A-M, 5.591% 20471,2 | 1,270 | 1,357 |
| Wachovia Bank Commercial Mortgage Trust, Series 2007-C32, Class A-3, 5.903% 20491,2 | 400 | 428 |
| Walter Energy, Inc. 9.50% 20194 | 6,825 | 4,129 |
| Warner Music Group 5.625% 20224 | 75 | 75 |
| WEA Finance LLC 1.75% 20174 | 5,435 | 5,465 |
| WEA Finance LLC 2.70% 20194 | 9,285 | 9,409 |
| WEA Finance LLC 3.75% 20244 | 4,480 | 4,643 |
| WellPoint, Inc. 2.30% 2018 | 2,645 | 2,685 |
| Wells Fargo & Co. 2.15% 2020 | 4,970 | 4,999 |
| Wells Fargo & Co. 3.30% 2024 | 20,000 | 20,682 |
| Western Gas Partners LP 2.60% 2018 | 130 | 132 |
| WFLD Mortgage Trust, Series 2014-MONT, Class D, 3.880% 20311,2,4 | 1,500 | 1,505 |
| WFLD Mortgage Trust, Series 2014-MONT, Class B, 3.880% 20311,2,4 | 1,000 | 1,059 |
| WFLD Mortgage Trust, Series 2014-MONT, Class C, 3.880% 20311,2,4 | 1,000 | 1,039 |
Capital World Bond Fund — Page 21 of 25
Bonds, notes & other debt instruments
U.S. dollars (continued) | Principal amount
(000) | Value
(000) |
| WFLD Mortgage Trust, Series 2014-MONT, Class A, 3.88% 20311,2,4 | $650 | $704 |
| Williams Partners LP 4.125% 2020 | 1,625 | 1,695 |
| Williams Partners LP 5.25% 2020 | 10,405 | 11,468 |
| Williams Partners LP 4.50% 2023 | 3,860 | 4,009 |
| Williams Partners LP 4.30% 2024 | 7,235 | 7,233 |
| Williams Partners LP 3.90% 2025 | 3,765 | 3,689 |
| Williams Partners LP 4.00% 2025 | 2,000 | 1,966 |
| Williams Partners LP 4.90% 2045 | 1,670 | 1,572 |
| Williams Partners LP 5.10% 2045 | 655 | 634 |
| Wind Acquisition SA 4.75% 20204 | 6,300 | 6,331 |
| Wind Acquisition SA 7.375% 20214 | 5,125 | 5,330 |
| WM. Wrigley Jr. Co 3.375% 20204 | 5,215 | 5,472 |
| WPP Finance 2010 3.75% 2024 | 4,000 | 4,182 |
| Xstrata Canada Financial Corp. 2.70% 20171,4 | 2,125 | 2,157 |
| Zambia (Republic of) 5.375% 20224 | 3,225 | 2,976 |
| Zambia (Republic of) 5.375% 2022 | 1,850 | 1,707 |
| Zambia (Republic of) 8.50% 20244 | 3,100 | 3,292 |
| Zimmer Holdings, Inc. 3.55% 2025 | 13,000 | 13,275 |
| Zimmer Holdings, Inc. 4.25% 2035 | 950 | 982 |
| Zimmer Holdings, Inc. 4.45% 2045 | 2,850 | 2,969 |
| | | 7,085,143 |
| Total bonds, notes & other debt instruments (cost: $12,919,580,000) | | 12,709,322 |
Convertible stocks 0.01%
U.S. dollars 0.01% | Shares | |
| CEVA Group PLC, Series A-2, 2.275% convertible preferred5,11 | 1,141 | 827 |
| CEVA Group PLC, Series A-1, 3.275% convertible preferred5 | 719 | 719 |
| Total convertible stocks (cost: $2,416,000) | | 1,546 |
Common stocks 0.00%
U.S. dollars 0.00% | | |
| CEVA Group PLC4,5,12 | 527 | 382 |
| Atrium Corp.4,5,12 | 191 | — |
| Total common stocks (cost: $736,000) | | 382 |
| Short-term securities 6.05% | Principal amount
(000) | |
| Electricité de France 0.18% due 5/8/2015–6/2/20154 | $ 85,500 | 85,480 |
| Fannie Mae 0.11%–0.22% due 5/18/2015–1/4/2016 | 28,000 | 27,954 |
| Federal Home Loan Bank 0.07%–0.15% due 6/5/2015–11/2/2015 | 104,200 | 104,099 |
| Freddie Mac 0.10%–0.18% due 6/9/2015–12/15/2015 | 174,600 | 174,467 |
| General Electric Capital Corp. 0.20% due 4/2/2015 | 50,000 | 50,000 |
| National Australia Bank Ltd. 0.16% due 6/2/20154 | 21,200 | 21,194 |
| Nordea Bank AB 0.18% due 6/1/2015–6/8/20154 | 71,500 | 71,476 |
| Sumitomo Mitsui Banking Corp. 0.15% due 4/22/20154 | 57,000 | 56,994 |
| Svenska Handelsbanken Inc. 0.20%–0.21% due 5/13/2015–7/2/20154 | 88,500 | 88,470 |
Capital World Bond Fund — Page 22 of 25
| Short-term securities | Principal amount
(000) | Value
(000) |
| Toronto-Dominion Holdings USA Inc. 0.19% due 7/23/20154 | $75,000 | $74,950 |
| Westpac Banking Corp. 0.23% due 5/27/20154 | 40,600 | 40,593 |
| Total short-term securities (cost: $795,710,000) | | 795,677 |
| Total investment securities 102.68% (cost: $13,718,442,000) | | 13,506,927 |
| Other assets less liabilities (2.68)% | | (352,501) |
| Net assets 100.00% | | $13,154,426 |
Forward currency contracts
The fund has entered into forward currency contracts as shown in the following table. The average notional amount of open forward currency contracts was $2,487,682,000 over the prior 12-month period.
| | Settlement
date | Counterparty | Contract amount | Unrealized
(depreciation)
appreciation
at 3/31/2015
(000) |
Receive
(000) | Deliver
(000) |
| Purchases: | | | | | |
| Australian dollars | 4/27/2015 | Citibank | A$149,852 | $117,000 | $(3,054) |
| Canadian dollars | 4/9/2015 | JPMorgan Chase | C$1,592 | $1,271 | (15) |
| Canadian dollars | 4/16/2015 | HSBC Bank | C$1,433 | $1,127 | 4 |
| Canadian dollars | 4/23/2015 | Citibank | C$2,531 | $1,986 | 11 |
| Canadian dollars | 4/27/2015 | JPMorgan Chase | C$146,754 | $117,000 | (1,169) |
| Euros | 4/9/2015 | Citibank | €50,451 | $57,261 | (3,006) |
| Euros | 4/24/2015 | JPMorgan Chase | €52,757 | $57,900 | (1,154) |
| Euros | 5/26/2015 | UBS AG | €80,681 | $88,664 | (1,846) |
| Hungarian forints | 4/27/2015 | Bank of America, N.A. | HUF15,752,669 | $57,940 | (1,603) |
| Hungarian forints | 5/6/2015 | HSBC Bank | HUF15,988,101 | $57,900 | (731) |
| Japanese yen | 4/10/2015 | Barclays Bank PLC | ¥5,160,129 | $43,118 | (87) |
| Japanese yen | 4/16/2015 | UBS AG | ¥9,149,064 | $75,700 | 602 |
| Japanese yen | 4/20/2015 | HSBC Bank | ¥8,606,916 | $70,956 | 830 |
| Japanese yen | 4/23/2015 | Bank of New York Mellon | ¥9,328,840 | $77,257 | 554 |
| Japanese yen | 4/24/2015 | Citibank | ¥16,139,814 | $134,380 | 243 |
| Japanese yen | 4/24/2015 | HSBC Bank | ¥4,375,377 | $36,447 | 48 |
| Japanese yen | 4/27/2015 | Citibank | ¥8,178,075 | $68,295 | (78) |
| Japanese yen | 4/27/2015 | HSBC Bank | ¥21,681,145 | $181,149 | (297) |
| Japanese yen | 4/28/2015 | UBS AG | ¥4,740,156 | $39,586 | (45) |
| Japanese yen | 5/11/2015 | UBS AG | ¥7,357,223 | $61,880 | (500) |
| Mexican pesos | 4/27/2015 | Citibank | MXN1,169,207 | $78,081 | (1,570) |
| Polish zloty | 4/27/2015 | UBS AG | PLN215,824 | $57,940 | (1,042) |
| | | | | | $(13,905) |
| Sales: | | | | | |
| Australian dollars | 4/24/2015 | Citibank | $37,838 | A$49,800 | $(37) |
| Australian dollars | 4/27/2015 | UBS AG | $4,906 | A$6,250 | 153 |
| Brazilian reais | 4/10/2015 | JPMorgan Chase | $3,696 | BRL11,416 | 128 |
| Brazilian reais | 4/14/2015 | Citibank | $3,859 | BRL11,347 | 316 |
| British pounds | 4/9/2015 | HSBC Bank | $13,367 | £8,700 | 462 |
| British pounds | 4/13/2015 | UBS AG | $52,911 | £34,450 | 1,813 |
| British pounds | 4/13/2015 | HSBC Bank | $11,221 | £7,375 | 282 |
| British pounds | 4/13/2015 | UBS AG | $13,077 | £8,675 | 209 |
| British pounds | 4/14/2015 | UBS AG | $3,587 | £2,400 | 28 |
| British pounds | 4/16/2015 | Bank of America, N.A. | $14,178 | £9,530 | 42 |
| British pounds | 4/20/2015 | HSBC Bank | $19,617 | £13,300 | (109) |
| British pounds | 4/23/2015 | JPMorgan Chase | $14,024 | £9,500 | (66) |
Capital World Bond Fund — Page 23 of 25
| | Settlement
date | Counterparty | Contract amount | Unrealized
(depreciation)
appreciation
at 3/31/2015
(000) |
Receive
(000) | Deliver
(000) |
| British pounds | 4/23/2015 | HSBC Bank | $25,377 | £17,250 | $(207) |
| British pounds | 4/24/2015 | Bank of New York Mellon | $29,801 | £19,900 | 287 |
| British pounds | 4/24/2015 | Bank of New York Mellon | $6,020 | £4,020 | 58 |
| British pounds | 4/24/2015 | Bank of New York Mellon | $3,744 | £2,500 | 36 |
| British pounds | 4/24/2015 | Bank of America, N.A. | $3,444 | £2,300 | 33 |
| British pounds | 4/24/2015 | HSBC Bank | €119,850 | £88,325 | (2,087) |
| British pounds | 5/7/2015 | UBS AG | $57,774 | £38,900 | 84 |
| British pounds | 5/8/2015 | HSBC Bank | $38,368 | £25,900 | (42) |
| British pounds | 5/12/2015 | HSBC Bank | $38,681 | £25,360 | 1,073 |
| British pounds | 6/8/2015 | UBS AG | $26,306 | £17,250 | 730 |
| Canadian dollars | 4/29/2015 | UBS AG | $17,890 | C$22,810 | (112) |
| Colombian pesos | 4/14/2015 | JPMorgan Chase | $11,572 | COP29,875,360 | 103 |
| Colombian pesos | 4/20/2015 | UBS AG | $7,769 | COP20,422,000 | (65) |
| Colombian pesos | 4/20/2015 | Citibank | $12,082 | COP32,560,000 | (409) |
| Colombian pesos | 5/4/2015 | Citibank | $2,408 | COP6,200,000 | 33 |
| Euros | 4/10/2015 | JPMorgan Chase | $46,906 | €41,870 | 1,879 |
| Euros | 4/10/2015 | UBS AG | $27,184 | €24,000 | 1,375 |
| Euros | 4/10/2015 | Citibank | $11,180 | €9,980 | 448 |
| Euros | 4/13/2015 | UBS AG | $21,851 | €18,500 | 1,955 |
| Euros | 4/15/2015 | Citibank | $7,086 | €6,430 | 171 |
| Euros | 4/24/2015 | JPMorgan Chase | PLN366,278 | €86,250 | 3,802 |
| Euros | 4/24/2015 | Bank of America, N.A. | HUF16,209,440 | €52,000 | 2,043 |
| Euros | 4/24/2015 | HSBC Bank | SKr963,445 | €103,500 | 586 |
| Euros | 4/24/2015 | Citibank | PLN146,715 | €35,775 | 203 |
| Euros | 4/24/2015 | JPMorgan Chase | HUF10,730,604 | €35,775 | (101) |
| Euros | 4/27/2015 | Bank of America, N.A. | $10,110 | €9,250 | 160 |
| Euros | 4/27/2015 | Citibank | $961 | €880 | 14 |
| Euros | 5/4/2015 | HSBC Bank | $7,245 | €6,400 | 360 |
| Euros | 5/4/2015 | Citibank | $1,448 | €1,320 | 28 |
| Euros | 5/5/2015 | Citibank | $10,915 | €9,500 | 696 |
| Euros | 5/28/2015 | HSBC Bank | ¥6,320,693 | €46,750 | 2,435 |
| Euros | 6/17/2015 | Citibank | $18,676 | €17,775 | (458) |
| Japanese yen | 4/10/2015 | Bank of America, N.A. | $68,263 | ¥8,159,204 | 223 |
| Japanese yen | 5/7/2015 | Barclays Bank PLC | $10,007 | ¥1,200,000 | (4) |
| Malaysian ringgits | 4/9/2015 | Citibank | $14,837 | MYR54,130 | 234 |
| Malaysian ringgits | 4/30/2015 | JPMorgan Chase | $22,845 | MYR84,300 | 148 |
| Mexican pesos | 4/9/2015 | HSBC Bank | $1,962 | MXN29,595 | 23 |
| Mexican pesos | 4/10/2015 | Bank of America, N.A. | $11,736 | MXN182,220 | (202) |
| Mexican pesos | 4/23/2015 | HSBC Bank | $10,515 | MXN160,895 | (16) |
| Norwegian kroner | 4/13/2015 | JPMorgan Chase | €11,629 | NKr100,000 | 98 |
| Norwegian kroner | 4/13/2015 | HSBC Bank | €8,068 | NKr70,000 | (9) |
| Norwegian kroner | 4/15/2015 | Citibank | $38,037 | NKr296,800 | 1,210 |
| Norwegian kroner | 4/15/2015 | Citibank | $37,755 | NKr296,300 | 990 |
| Norwegian kroner | 4/16/2015 | JPMorgan Chase | €52,218 | NKr450,101 | 313 |
| Norwegian kroner | 4/16/2015 | JPMorgan Chase | €1,813 | NKr15,650 | 8 |
| Norwegian kroner | 4/20/2015 | JPMorgan Chase | SKr228,270 | NKr219,000 | (656) |
| Norwegian kroner | 4/23/2015 | Citibank | $17,934 | NKr145,400 | (102) |
| Norwegian kroner | 4/27/2015 | Citibank | $18,505 | NKr145,400 | 470 |
| Swedish kronor | 4/13/2015 | Bank of America, N.A. | $38,940 | SKr329,000 | 732 |
| Swedish kronor | 4/22/2015 | Citibank | $19,439 | SKr169,270 | (223) |
| | | | | | $21,569 |
| Forward currency contracts — net | $7,664 |
Capital World Bond Fund — Page 24 of 25
Interest rate swaps
The fund has entered into interest rate swaps as shown in the following table. The average notional amount of interest rate swaps was $1,776,756,000 over the prior nine-month period.
Pay/receive
fixed rate | Clearinghouse | Floating rate index | Fixed
rate | Expiration
date | Notional
amount
(000) | Unrealized
depreciation
at 3/31/2015
(000) |
| Pay | LCH.Clearnet | 3-month USD-LIBOR | 2.6655% | 9/26/2024 | $30,000 | $(1,768) |
| Pay | LCH.Clearnet | 6-month EURIBOR | 0.6922 | 1/27/2025 | 28,000 | (437) |
| Pay | LCH.Clearnet | 3-month USD-LIBOR | 2.219 | 2/19/2025 | 70,000 | (1,259) |
| Pay | LCH.Clearnet | 6-month JPY-LIBOR | 0.5725 | 3/5/2025 | 12,600,000 | (27) |
| Pay | LCH.Clearnet | 6-month EURIBOR | 1.4385 | 11/6/2029 | 14,900 | (1,675) |
| Pay | LCH.Clearnet | 6-month EURIBOR | 1.4217 | 11/24/2029 | 27,000 | (2,971) |
| | | | | | | $(8,137) |
| 1 | Coupon rate may change periodically. |
| 2 | Principal payments may be made periodically. Therefore, the effective maturity date may be earlier than the stated maturity date. |
| 3 | Index-linked bond whose principal amount moves with a government price index. |
| 4 | Acquired in a transaction exempt from registration under Rule 144A or Section 4(2) of the Securities Act of 1933. May be resold in the U.S. in transactions exempt from registration, normally to qualified institutional buyers. The total value of all such securities was $1,519,434,000, which represented 11.55% of the net assets of the fund. |
| 5 | Valued under fair value procedures adopted by authority of the board of trustees. The total value of all such securities, including those in “Miscellaneous,“ was $9,880,000, which represented .08% of the net assets of the fund. This entire amount relates to certain securities trading outside the U.S. whose values were adjusted as a result of significant market movements following the close of local trading. |
| 6 | Loan participations and assignments; may be subject to legal or contractual restrictions on resale. The total value of all such loans was $35,763,000, which represented 0.27% of the net assets of the fund. |
| 7 | Payment in kind; the issuer has the option of paying additional securities in lieu of cash. |
| 8 | Purchased on a TBA basis. |
| 9 | Scheduled interest and/or principal payment was not received. |
| 10 | A portion of this security was pledged as collateral. The total value of pledged collateral was $12,825,000, which represented .10% of the net assets of the fund. |
| 11 | Acquired through a private placement transaction exempt from registration under the Securities Act of 1933. May be subject to legal or contractual restrictions on resale. Further details on these holdings appear below. |
| 12 | Security did not produce income during the last 12 months. |
| Private placement security | Acquisition
dates | Cost
(000) | Value
(000) | Percent
of net
assets |
| CEVA Group PLC, Series A-2, 2.275% convertible preferred | 3/10/2010-1/21/2011 | $1,687 | $827 | .01% |
| Key to abbreviations |
| G.O. = General Obligation |
| LOC = Letter of Credit |
| TBA = To be announced |
Investments are not FDIC-insured, nor are they deposits of or guaranteed by a bank or any other entity, so they may lose value.
Investors should carefully consider investment objectives, risks, charges and expenses. This and other important information is contained in the fund prospectus and summary prospectus, which can be obtained from your financial professional and should be read carefully before investing. You may also call American Funds Service Company (AFS) at (800) 421-4225 or visit the American Funds website at americanfunds.com.
| MFGEFPX-031-0515O-S42176 | Capital World Bond Fund — Page 25 of 25 |
ITEM 7 – Disclosure of Proxy Voting Policies and Procedures for Closed-End Management Investment Companies
Not applicable to this Registrant, insofar as the Registrant is not a closed-end management investment company.
ITEM 8 – Portfolio Managers of Closed-End Management Investment Companies
Not applicable to this Registrant, insofar as the Registrant is not a closed-end management investment company.
ITEM 9 – Purchases of Equity Securities by Closed-End Management Investment Company and Affiliated Purchasers
Not applicable to this Registrant, insofar as the Registrant is not a closed-end management investment company.
ITEM 10 – Submission of Matters to a Vote of Security Holders
There have been no material changes to the procedures by which shareholders may recommend nominees to the Registrant’s board of trustees since the Registrant last submitted a proxy statement to its shareholders. The procedures are as follows. The Registrant has a nominating and governance committee comprised solely of persons who are not considered ‘‘interested persons’’ of the Registrant within the meaning of the Investment Company Act of 1940, as amended. The committee periodically reviews such issues as the board’s composition, responsibilities, committees, compensation and other relevant issues, and recommends any appropriate changes to the full board of trustees. While the committee normally is able to identify from its own resources an ample number of qualified candidates, it will consider shareholder suggestions of persons to be considered as nominees to fill future vacancies on the board. Such suggestions must be sent in writing to the nominating and governance committee of the Registrant, c/o the Registrant’s Secretary, and must be accompanied by complete biographical and occupational data on the prospective nominee, along with a written consent of the prospective nominee for consideration of his or her name by the nominating and governance committee.
ITEM 11 – Controls and Procedures
| (a) | The Registrant’s Principal Executive Officer and Principal Financial Officer have concluded, based on their evaluation of the Registrant’s disclosure controls and procedures (as such term is defined in Rule 30a-3 under the Investment Company Act of 1940), that such controls and procedures are adequate and reasonably designed to achieve the purposes described in paragraph (c) of such rule. |
| | |
| (b) | There were no changes in our internal control over financial reporting during the quarter ended March 31, 2015, which were identified in connection with management's evaluation required by paragraph (d) of Rule 13a-15 and 15d-15 under the Exchange Act, that have materially affected, or are reasonably likely to materially affect, our internal control over financial reporting, other than as provided below. Effective November 10, 2014, the Capital World Bond Fund’s investment adviser implemented a new accounting system. In connection with introducing this new system, additional automated and manual controls were implemented and some existing controls were modified. None of these changes were in response to any identified deficiency or weakness in the Capital World Bond Fund’s internal control over financial reporting. |
ITEM 12 – Exhibits
| (a)(1) | Not applicable for filing of semi-annual reports to shareholders. |
| | |
| (a)(2) | The certifications required by Rule 30a-2 of the Investment Company Act of 1940 and Sections 302 and 906 of the Sarbanes-Oxley Act of 2002 are attached as exhibits hereto. |
SIGNATURES
Pursuant to the requirements of the Securities Exchange Act of 1934 and the Investment Company Act of 1940, the Registrant has duly caused this report to be signed on its behalf by the undersigned, thereunto duly authorized.
| | CAPITAL WORLD BOND FUND |
| | |
| | By /s/Thomas Høgh |
| | Thomas Høgh, President and Principal Executive Officer |
| | |
| | Date: May 29, 2015 |
Pursuant to the requirements of the Securities Exchange Act of 1934 and the Investment Company Act of 1940, this report has been signed below by the following persons on behalf of the Registrant and in the capacities and on the dates indicated.
| By /s/Thomas Høgh |
Thomas Høgh, President and Principal Executive Officer |
| |
| Date: May 29, 2015 |
| By /s/ Brian C. Janssen |
Brian C. Janssen, Treasurer and Principal Financial Officer |
| |
| Date: May 29, 2015 |