UNITED STATES
SECURITIES AND EXCHANGE COMMISSION
Washington, D.C. 20549
FORM N-CSR
Certified Shareholder Report of
Registered Management Investment Companies
Investment Company Act File Number: 811-05104
Capital World Bond Fund
(Exact Name of Registrant as Specified in Charter)
333 South Hope Street
Los Angeles, California 90071
(Address of Principal Executive Offices)
Registrant's telephone number, including area code: (213) 486-9200
Date of fiscal year end: September 30
Date of reporting period: September 30, 2014
Courtney R. Taylor
Capital World Bond Fund
333 South Hope Street
Los Angeles, California 90071
(Name and Address of Agent for Service)
Copies to:
Michael Glazer
Morgan, Lewis & Bockius LLP
355 South Grand Avenue, Suite 4400
Los Angeles, California 90071
(Counsel for the Registrant)
ITEM 1 – Reports to Stockholders

Find opportunities
in a diverging
global economy.
Special feature page 4
 | Capital World Bond Fund® Annual report
for the year ended
September 30, 2014 |
Capital World Bond Fund seeks to maximize long-term total return, consistent with prudent management, by investing primarily in a global portfolio of investment-grade bonds denominated in U.S. dollars and other currencies. The fund may also invest in lower quality, high-yield debt securities.
This fund is one of more than 40 offered by one of the nation’s largest mutual fund families, American Funds, from Capital Group. For more than 80 years, Capital has invested with a long-term focus based on thorough research and attention to risk.
Fund results shown in this report, unless otherwise indicated, are for Class A shares at net asset value. If a sales charge (maximum 3.75%) had been deducted, the results would have been lower. Results are for past periods and are not predictive of results for future periods. Current and future results may be lower or higher than those shown. Share prices and returns will vary, so investors may lose money. Investing for short periods makes losses more likely. Investments are not FDIC-insured, nor are they deposits of or guaranteed by a bank or any other entity, so they may lose value. For current information and month-end results, visit americanfunds.com.
See page 3 for Class A share results with relevant sales charges deducted. For other share class results, visit americanfunds.com and americanfundsretirement.com.
Investment results assume all distributions are reinvested and reflect applicable fees and expenses. When applicable, investment results reflect fee waivers, without which results would have been lower. Visit americanfunds.com for more information.
The fund’s 30-day yield for Class A shares as of October 31, 2014, calculated in accordance with the U.S. Securities and Exchange Commission (SEC) formula, was 1.59%. The fund’s 12-month distribution rate for Class A shares as of that date was 1.93%. Both reflect the 3.75% maximum sales charge. The SEC yield reflects the rate at which the fund is earning income on its current portfolio of securities, while the distribution rate reflects the fund’s past dividends paid to shareholders. Accordingly, the fund’s SEC yield and distribution rate may differ.
The return of principal for bond funds and for funds with significant underlying bond holdings is not guaranteed. Fund shares are subject to the same interest rate, inflation and credit risks associated with the underlying bond holdings. High-yield and lower rated bonds are subject to greater fluctuations in value and risk of loss of income and principal than investment-grade and higher rated bonds. Bond ratings, which typically range from AAA/Aaa (highest) to D (lowest), are assigned by credit rating agencies such as Standard & Poor’s, Moody’s and/or Fitch as an indication of an issuer’s creditworthiness. Investing in bonds issued outside the U.S. may be subject to additional risks. They include currency fluctuations, political and social instability, differing securities regulations and accounting standards, higher transaction costs, possible changes in taxation, illiquidity and price volatility. These risks may be heightened in connection with investments in developing countries. Refer to the fund prospectus and the Risk Factors section of this report for more information on these and other risks associated with investing in the fund.

Special feature
Contents
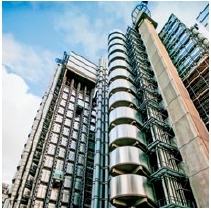
On the cover:
Reichstag building in Berlin.
Fellow investors:
Capital World Bond Fund’s past fiscal year was a period in which global bond market returns ebbed and flowed amid shifting economic expectations and elevated tensions in the Middle East and Ukraine. Bond yields (which move inversely to prices) generally declined, but broad dollar strength took a heavy toll on total returns for U.S. dollar-based investors in the Japanese and euro-zone markets.
In this sometimes challenging environment, the fund generated a total return of 2.98% for the 12 months ended September 30, 2014. The fund’s result outpaced that of the unmanaged Barclays Global Aggregate Index, which recorded a gain of 1.19%.
The fund’s return lagged the 3.87% gain recorded by Lipper Global Income Funds Index, a peer group measure including some funds that — unlike Capital World Bond Fund — invest proportionately more of their assets in bonds that may involve a relatively higher level of risk. In contrast, our investment approach emphasizes lower risk, diversification and a longer term perspective. We invite investors to read the feature starting on page 4, to learn more about why today’s global backdrop underscores the potential benefits of a flexible, but disciplined, approach to bond investing. For longer term results, see the table below.
Fund investors received dividends totaling 43 cents a share; those who reinvested their dividends earned an income return of 2.13%, while investors who took their dividends in cash earned 2.12%. Relative to the market index, currency positioning helped the fund’s 12-month result most —particularly lower relative exposure to the Japanese yen and euro. Strong bond selection was also a notable positive, including investments in certain peripheral European nations.
United States
Toward the end of the fund’s fiscal year, there were some signs that domestic growth was accelerating — a hopeful finish to a period that included many ups and downs. Severe cold weather at the end of 2013 and start of 2014 temporarily disrupted favorable economic trends, prompting a decline in the first-quarter growth rate. The rebound was swift, however, and solid job growth has been
Results at a glance
For periods ended September 30, 2014, with all distributions reinvested
| | | Cumulative total returns | | Average annual total returns |
| | | 1 year | | 5 years | | 10 years | | Lifetime1 |
| | | | | | | | | |
| Capital World Bond Fund (Class A shares) | | | 2.98 | % | | | 3.32 | % | | | 4.78 | % | | | 6.72 | % |
| Barclays Global Aggregate Index2 | | | 1.19 | | | | 2.69 | | | | 4.38 | | | | 6.62 | |
| Lipper Global Income Funds Index | | | 3.87 | | | | 4.69 | | | | 4.85 | | | | — | 3 |
| 1 | Since August 4, 1987. |
| 2 | The Barclays Global Aggregate Index began on December 31, 1989. For the period August 4, 1987, to December 31, 1989, the Citigroup World Government Bond Index was used. The indexes are unmanaged and, therefore, have no expenses. Investors cannot invest directly in an index. |
| 3 | This index did not exist prior to December 30, 1988. |
evident for much of the interim. Lately, home price gains and sales have decelerated, and some other data have also disappointed. Still, there’s been positive news on corporate profits and retail sales. And, in September, second-quarter growth was revised upward to 4.6%. The Federal Reserve has been reducing its $85 billion worth of monthly bond purchases by $10 billion each month, and is expected to end its buying completely by October; this policy of quantitative easing has sought to stimulate growth by increasing the amount of money in the financial system. Investment-grade (rated BBB/Baa and above) corporate bonds outpaced the broader U.S. market, gaining 6.77%; high-yield (rated BB/Ba and below) corporates advanced 7.20%.
Excluding cash, U.S.-dollar-denominated debt accounted for 53.2% of the fund’s portfolio as of September 30, 2014, before currency hedging. This amount included 17.1% in U.S. Treasury bonds and notes, and 10.7% in U.S. corporate bonds. During the period, portfolio managers reduced fund investments in U.S. corporates and mortgage-backed securities as valuations appeared unattractive.
Europe
The period began positively, with the euro zone growing at an annualized rate of 1.1% in the fourth quarter of 2013 — the third straight quarter of positive movement. However, slowing growth and low inflation prompted the European Central Bank (ECB) to announce in June a program designed to encourage private-sector lending by enabling euro-zone banks to borrow cheaply from the ECB. Ongoing weak growth, mounting deflationary pressures and the euro’s recent slide have all shaken confidence in the recovery’s longevity. Following a rate cut in June 2014, deteriorating conditions prompted the ECB to cut its primary lending rate once again to 0.05% in September; it also announced its intention to embark on a program of buying asset-backed securities in a bid to boost growth and counter falling inflation.
Reflecting this ongoing central bank support, euro-zone government bond yields declined substantially, with several markets touching record lows. As of September 30, 2014, investments in euro-zone bonds amounted to 21.8% of the fund’s portfolio (before currency hedging). Government issues from Spain, Italy, Portugal, Ireland and Germany were among the larger holdings. The fund was also invested in a selection of other European countries.
Other developed markets
The fund’s smaller investment in Japanese government bonds compared to the market index helped its 12-month result. It should be noted, however, the fund’s exposure to Japan (3.9%, before currency hedging) remains significant in absolute terms. Though yields moved lower, Japanese bonds recorded among the largest 12-month losses as the yen’s 10.55% decline against the dollar weighed on total returns for U.S. dollar-based investors.
As was the case with Europe, earlier optimism gave way to concern. Weak economic data has stoked fears that it would be difficult for the nation to achieve its 2% inflation target by next year. Consumer inflation eased in August, while household spending and industrial production also fell. April’s tax hike weighed heavily on the nation’s economy: second-quarter GDP was revised down to an annualized decline of 7.1%, reflecting a large drop in investment.
Developing markets
Among developing-country bonds, U.S. dollar-denominated issues recorded sizeable gains. Meanwhile widespread currency weakness meant that total returns for local-currency issues were broadly negative. In a bid to stabilize their currencies, central banks in several countries — including Turkey and Brazil — raised official interest rates. At the end of the period, developing-country bonds amounted to 17.7% of the portfolio (before currency hedging), including 12.4% in local-currency bonds.
Investments in Polish and Mexican government bonds were significant holdings. In Mexico, portfolio managers anticipate that domestic reforms and the U.S. recovery should be supportive of total returns.
Looking ahead
It’s fair to say that economic conditions in the U.S. currently present a far more convincing case for a constructive economic outlook than is evident in the euro zone or Japan. This mixed backdrop adds up to a subdued global growth outlook and limited scope for inflation to increase substantially. Outside of the U.S., there are many countries in which inflation is falling.
What does this all mean for global bonds? Arguably, it underscores the fact that historically low yields in certain markets don’t tell the whole story. After adjusting for inflation, these yields often don’t look so low – suggesting that there may be more “value” in bonds than many investors might assume. With economies and policies diverging, we believe that investing in bonds through a fund that is globally diversified and actively managed is an attractive option.
Thank you for your continued support. We look forward to reporting to you again in six months.
Cordially,

Mark H. Dalzell
President
November 6, 2014
For current information about the fund, visit americanfunds.com.
The value of a long-term perspective
Fund results shown reflect deduction of the maximum sales charge of 3.75% on the $10,000 investment.1 Thus, the net amount invested was $9,625.2
How a $10,000 investment has grown over the fund’s lifetime

| 1 | As outlined in the prospectus, the sales charge is reduced for accounts (and aggregated investments) of $100,000 or more and is eliminated for purchases of $1 million or more. There is no sales charge on dividends or capital gain distributions that are reinvested in additional shares. |
| 2 | The maximum initial sales charge was 4.75% prior to January 10, 2000. |
| 3 | With dividends and capital gains reinvested or interest compounded. Results of the Citigroup World Government Bond Index are represented by the purple line. |
| 4 | Barclays Global Aggregate Index did not exist until December 31, 1989. For the period of August 4, 1987, through December 31, 1989, the Citigroup World Government Bond Index results were used. |
| 5 | Computed from data supplied by the U.S. Department of Labor, Bureau of Labor Statistics. |
| 6 | For the period of August 4, 1987, commencement of operations, through September 30, 1987. |
| | |
| | The market indexes are unmanaged and, therefore, have no expenses. Investors cannot invest directly in an index. Past results are not predictive of results for future periods. The results shown are before taxes on fund distributions and sale of fund shares. |
Average annual total returns based on a $1,000 investment
For periods ended September 30, 2014*
| | 1 year | 5 years | 10 years |
| | | | |
| Class A shares | –0.88% | 2.54% | 4.38% |
*Assumes reinvestment of all distributions and payment of the maximum 3.75% sales charge.
The total annual fund operating expense ratio is 0.90% for Class A shares as of the prospectus dated December 1, 2014 (unaudited).
Investment results assume all distributions are reinvested and reflect applicable fees and expenses. When applicable, investment results reflect fee waivers, without which results would have been lower. Visit americanfunds.com for more information.
Find opportunities in a diverging global economy.
Economic growth, inflation and central bank policy may be about to diverge more significantly, creating a complex and challenging environment for global bond investors. Here, the fund’s portfolio managers share their perspectives on the global backdrop, highlight some of the key risks that they foresee, and explain why this divergence and a disciplined approach to bond investing offers the fund new investment opportunities.
At the end of August, many of the world’s leading economists and policy makers were making their way toward the Great Plains. Their destination was the famous annual conference in Jackson Hole, hosted by the Federal Reserve. In recent years their convergence on the picturesque valley in Wyoming sometimes symbolized a coming together and coordination of economic policy – not so anymore.
This year’s get-together underscored a growing sense of divergence. The coordinated efforts and shared challenges in the wake of the 2007 financial crisis and subsequent global recession are becoming a distant memory. Federal Reserve Chair Janet Yellen, European Central Bank (ECB) President Mario Draghi and Bank of Japan’s Haruhiko Kuroda shared experiences – each confronting very different domestic challenges, and contemplating quite different paths for monetary policy.
“Clearly, we’re at a critical juncture for the global economy. The Fed is about to end its bond buying and has raised the prospect of higher short-term interest rates as growth continues,” says portfolio manager Mark Dalzell. “But it’s a different story elsewhere. The prospects for export-driven growth in the euro zone are unconvincing, the ECB has repeatedly cut rates and now looks set to embark on its own version of bond buying. And in Japan, massive official asset purchases alongside reforms have led to hopeful signs, but there’s a long way to go for the economy.”
The world just became more complicated
The crosscurrents arising from varying economic fortunes, policy responses and currency moves across the globe are having a profound effect on markets. For example, yields (which move inversely to prices) on U.S. Treasuries of shorter and intermediate maturity have risen over the past 12 months. Five-year yields moved about one-third of a percentage point higher to 1.78%. Meanwhile, longer maturity yields declined; 30-year Treasury yields ended the period about half a percentage point lower at 3.21%. This “flattening of the yield curve” is indicative of moderate growth expectations, and a degree of confidence that the Fed will raise rates in a manner that keeps inflation in check.
In the euro zone, both the currency and bond yields have moved down decisively amid ongoing central bank support and flagging growth. At fiscal-year end, the yield on Germany’s 10-year government bond stood at 0.95% — about half the level of a year earlier. Yields in several core and peripheral markets have touched record lows in recent months; yields on the 10-year government bonds of some euro-zone nations have now moved below the 2.52% yielded by U.S. Treasuries of comparable maturity.
It was a similar story in Japan, where yields on government bonds of shorter and intermediate maturity moved lower. In simple terms, declining bond yields tend to mean positive bond returns. However, the yen’s precipitous declines, at the end of 2013 and again in September 2014, meant that — for U.S. dollar-based investors — Japan generated some of the worst 12-month bond market returns.
“The flexibility of this fund’s investment approach helps us to navigate challenges such as rising short-term rates in the U.S., or large currency moves,” says Mark. “Portfolio managers can actively manage exposure to interest rates, sectors, countries and currencies, and seek a variety of opportunities around the globe.”
The fund’s results in the recent market environment demonstrate the potential benefits of active management — particularly in regard to currencies. “Active management of many of the currency exposures
Clearly, we’re at a critical juncture for the global economy. The Fed is about to end its bond buying and has raised the prospect of higher short-term interest rates as growth continues.
Mark Dalzell
Portfolio manager

Rising Treasury yields are bad news?
Some bond fund investors may feel concerned by the possibility of rising Treasury yields. However, history offers some food for thought. In three past periods during the fund’s lifetime when the official U.S. short-term interest rate (the federal funds target rate) was raised and five-year Treasury yields rose more than two percentage points, global market returns (from the start of each period, through one year after the period ended) were generally positive. What’s more, rising yields may actually benefit an actively managed bond fund — enabling the portfolio managers to reinvest in bonds that generate greater income and offer potentially higher total returns.
Market index total returns through three prominent periods of rising yields* (results encompass cumulative total return from start of period through one year after the period)

| * | Five-year Treasury yields rose by more than two percentage points, low to high, over a period lasting more than 12 months. Treasury yields have risen by more than two percentage points in periods other than those presented above. |
| † | Inception date of index was after first rising yield period shown. |
associated with the fund’s bond investments has proven particularly valuable lately,” says portfolio manager Robert Neithart. “Less-than-benchmark exposures to the yen and euro, for instance, have helped the fund deliver solid results to its investors, despite the broad dollar strength that has acted as a headwind for international market returns.” The yen and euro weakened by 10.55% and 6.68%, respectively, during the fund’s past fiscal year.
There are bright spots in Europe
In the euro zone, active currency management has enabled the portfolio managers to hone in on attractive bond investment opportunities, while reducing exposure to the euro. Over the last year, the fund’s exposure to government bonds from Ireland, Portugal and Italy has increased significantly. On the ground research, as well as insights from sophisticated quantitative and qualitative analyses, indicated that rebounding growth could prompt rapid improvements in fiscal health and employment in certain peripheral euro-zone countries.
Spanish government bonds — one of the fund’s larger holdings at fiscal-year end —advanced 8.1% (in U.S. dollar terms) during the 12 months through September 30, 2014. In Spain, the property market is beginning to heal, private-sector deleveraging is underway, economic reform efforts look hopeful and export prospects are strong. “Our research suggested that Spanish bonds, among others, could be a source of particularly attractive risk-adjusted returns as yields normalize,” says portfolio manager Thomas Høgh. “Broadly, that’s what has happened in the past 12 months. Valuations are now less attractive than they were, but I believe that selective investments in peripherals should continue to be a source of attractive return potential.”
Spain’s recent economic acceleration stands in stark contrast to what’s happening in large parts of the euro zone. Recent data showed that growth remained flat in
the second quarter of 2014, largely due to a decline in Germany’s output. Despite “accommodative” monetary policy in the shape of multiple official interest rate cuts alongside other measures, growth remains fragile and inflation (the costs of goods and services) has continued to fall.
Meanwhile, the market is awaiting more details on the ECB’s plans in regard to the purchase of asset-backed securities, its targeted longer term refinancing operations (or TLTROs, a program that seeks to encourage private-sector lending by enabling euro-zone banks to borrow cheaply from the ECB), and the outcome of its so-called bank stress tests in late October. Positive results of the financial health check of euro-zone banks could greatly help both sentiment and recovery.
“There’s much debate about how quickly Europe can turn itself around. I’m still hopeful that the outlook will improve by 2015. Portugal and Ireland have accelerating job growth already, and further positive news around business confidence and other measures could pick up across Europe as the impact of the ECB’s efforts are felt,” says Thomas. “Though the euro zone has disappointed with growth and reforms, it shouldn’t be a surprise. After all, there are setbacks early on in most recoveries.”
In the U.S., normalization beckons …
Just as the euro zone’s recovery falters and central bankers are deciding to throw further extraordinary measures into the policy mix, U.S. growth has shown some signs of picking up and the Fed has reached a critical stage in its pullback from unconventional monetary policy. Stronger data in July and August buoyed optimism, and in September second-quarter growth was revised upward to 4.6%, a big jump from the first quarter’s 2.1% decline amid unusually cold weather. The Commerce Department reported that second-quarter corporate profits rose 8.4% from the first quarter —the biggest advance since 2010. August
An extensive global research effort is the backbone of our approach.
Capital Group is one of the larger investors in non-U.S. bonds. Fundamental research is crucial for identifying investment opportunities and risks, and is the foundation of our investment process — The Capital SystemSM:
| | • | Fundamental research (issuer-specific and macro-economic) |
| | • | Interest rate, yield curve and credit spread analyses |
| | • | Individual investment professionals collaborate closely, but also act on their highest convictions, informed by investment guidance from the Portfolio Strategy Group |
| | • | Overarching emphasis on risk management and disciplined portfolio construction |

Divergent economic and policy cycles mean that [developing-country bond] yields won’t necessarily take the lead from any upward move in U.S. Treasury yields.
Robert Neithart
Portfolio manager
retail sales were the strongest in four months. Amid these encouraging developments, the Fed is expected to end its bond buying in October — a first step toward policy normalization.
“Recent home sales data have fallen short, but on balance, U.S. growth appears likely to improve. Currently, the scope for significant increases in domestic inflation seems limited, and bond prices reflect that benign outlook,” says Mark. “Still, we are mindful of the possibility that inflation could rise more quickly than widely anticipated.” In recent months, the fund’s holdings of Treasury Inflation-Protected Securities (TIPS) have grown. Issued by the U.S. Treasury, the values of TIPS are directly linked to an index of consumer prices.
Below-investment-grade (that is, high-yield — rated BB/Ba and below) bonds are another part of the U.S. bond market that has often generated relatively resilient returns amid accelerating domestic growth or an uptick in inflation. Lately, however, there has been some increased volatility as high-yield market participants appeared to fret about whether the sector had become overvalued. Even so, the robust pace of issuance has continued and overall leverage hasn’t risen that much. The fund’s investment professionals have continued to find attractive longer term investment opportunities. The fund’s investments in high-yield corporate issues were a meaningful positive for its overall 12-month result.
The portion of the portfolio invested in investment-grade (rated BBB/Baa and above) corporates has declined over the past 12 months. “Compared to some government bonds, broad valuations among corporates in the U.S. and elsewhere aren’t particularly compelling, though our research has continued to find some areas of relative value,” says investment analyst Vantil Charles, who spearheads the research portfolio — the portion of the fund’s assets managed by a group of analysts. European banks and insurers are among the corporate sectors where the fund’s holdings have increased over the past fiscal year.
… While in Japan, policy makers persevere
Inflation is also in the spotlight in Japan, with recent economic weakness raising further questions about whether the 2% target for inflation in April 2015 will be met. Early last year, the government and central bank embarked on what has come to be known as Abenomics — an ambitious policy framework championed by Prime Minister Shinzō Abe that encompasses three core elements (so-called “arrows”): asset purchases, flexible fiscal policy and structural economic reform. The goal is to end deflation (falling costs of goods and services), promote durable growth and, ultimately, lower Japan’s debt burden.
Unfortunately, optimism earlier in the year has given way to concern. Declines in spending and inflation have been evident following a hike in the consumption tax from 5% to 8% in April. “Further increases in the consumption tax — in addition to growth, and expenditure cuts — may ultimately be required if Japan is to reduce its deficit,” says Mark, who met with senior central bankers, government advisors and economists in Tokyo while on a research trip in September.
The continuation of official bond buying in Japan should keep a lid on yields, so investments in government bonds could serve as a source of stability in the fund’s portfolio, should yields in the U.S. and other developed countries rise. The fund’s investment professionals are weighing this potential benefit against longer terms concerns, such as the sustainability of the mounting debt burden. Recent estimates have put Japan’s public-sector debt as a percentage of GDP at 240% on a gross basis, or about 134% net of assets owned by the government.
Developing economies diverge, too
Recent developing-country bond returns in a number of markets have suffered
amid country-specific concerns, currency weakness and some disappointing economic data from Europe and China. Certain larger markets — including Russia, Brazil and Turkey — are grappling with deteriorating economic conditions and high inflation, as well as rapid depreciation; the ruble, real and lira shed 18.12%, 9.13% and 11.31%, respectively, over the fund’s past fiscal year.
Meanwhile, other countries are doing relatively well. “Mexico has improving credit fundamentals and sound growth prospects. It also has a well-developed bond market, so you can manage risk and return in a nuanced way,” says Rob. Past reforms appear to be bearing fruit in terms of growth, and that could be just the start. In August, President Enrique Peña Nieto signed into law comprehensive energy sector reforms that should be of profound benefit to future economic activity. Mexican government bonds remain one of the fund’s larger holdings.
A more recent addition to the fund’s diversified portfolio are its investments in Indian government bonds. Following reform-minded Prime Minister Narendra Modi’s election in May, the outlook has brightened, with better-than-expected economic growth.
“Developing-country bonds offer an important source of potential diversification for the fund. Divergent economic and policy cycles mean that their yields won’t necessarily take the lead from any upward move in U.S. Treasury yields,” says Rob.
Why global bonds? The answer remains the same: income and diversification.
European yields are at record lows. High-yield and developing-country bond returns have suffered some setbacks. Many currencies have weakened versus the dollar. The media spotlight on these recent developments may have raised some concern among investors about the outlook. What better time, then, to revisit the potential benefits that an actively managed global bond fund may bring to your wider investment mix?
Global bonds can offer a source of income, while potentially adding diversification and a measure of stability to a fund investor’s broader portfolio. Historically, this fund has demonstrated resilience when stocks have declined sharply. And, even in challenging periods for bond markets, the fund’s downside has compared favorably with some global stock market declines witnessed during the bear markets of recent decades.
As economies diverge and markets readjust, Mark believes that the fund’s diversified and active approach to investing should continue to prove its mettle. “A diverging world means that, at different times, some places will fare better than others. As a global fund, we have the scope to potentially benefit from divergence — using research to uncover opportunities, and various investment strategies to seek attractive risk-adjusted returns while attempting to avoid losses,” he explains. “However the global environment evolves, our investment approach is flexible — allowing us to adapt in ways that have the potential to help the fund continue its track record of delivering a consistently high level of return to its investors.”
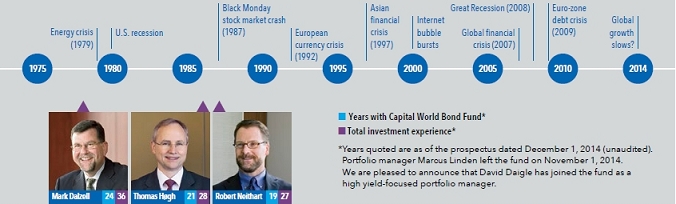
Your fund’s portfolio managers are experienced, active global bond investors.
Investing amid challenging market conditions is nothing new for the portfolio managers, each of whom independently manages a portion of the fund’s assets, subject to its objectives and overall guidelines. Collectively, the investment team — including a group of analysts that manages a portion of total assets — brings together multiple areas of knowledge and experience, over many market cycles.
About your fund
Capital World Bond Fund offers shareholders a selection of global bonds that is unparalleled among the other fixed-income funds of the American Funds family. It may invest in virtually any bond market in the world and in bonds denominated in any currency. This broad mandate allows the fund to seek a high level of total return through capital appreciation, through a wide range of income opportunities and from changing currency relationships.
Where the fund’s assets are invested …… and how those markets have done over the past year
unaudited
September 30, 2014
| | | Capital World Bond Fund | | Bond market total returns1
12 months ended
September 30, 2014 |
| Currency weighting by country: | | Before forward
contracts | | After forward
contracts | | In local
currency | | In U.S.
dollars | |
| United States2 | | | 53.2 | % | | | 59.9 | % | | | 4.1 | % | | | 4.1 | % | |
| EMU3 | | | 21.8 | | | | 19.6 | | | | 9.8 | | | | 2.5 | | |
| United Kingdom | | | 5.9 | | | | 2.4 | | | | 6.4 | | | | 6.6 | | |
| Japan | | | 3.9 | | | | 8.2 | | | | 2.2 | | | | –8.6 | | |
| Mexico | | | 3.2 | | | | 1.5 | | | | 6.5 | | | | 4.4 | | |
| Poland | | | 2.4 | | | | 2.1 | | | | 9.7 | | | | 3.5 | | |
| Hungary | | | 1.2 | | | | 1.1 | | | | 11.0 | 4 | | | –0.8 | 4 | |
| Colombia | | | 1.1 | | | | 0.8 | | | | 6.3 | 4 | | | 0.4 | 4 | |
| India | | | 1.0 | | | | 1.0 | | | | 11.9 | 4 | | | 13.4 | 4 | |
| Norway | | | 0.8 | | | | 0.2 | | | | 5.4 | | | | –1.3 | | |
| South Korea | | | 0.7 | | | | 0.7 | | | | 6.3 | | | | 8.2 | | |
| Brazil | | | 0.6 | | | | 0.2 | | | | 10.1 | 4 | | | 0.1 | 4 | |
| Canada | | | 0.6 | | | | 0.5 | | | | 6.3 | | | | –2.2 | | |
| Sweden | | | 0.5 | | | | 0.1 | | | | 6.7 | | | | –4.9 | | |
| Russian Federation | | | 0.5 | | | | 0.0 | | | | –1.3 | 4 | | | –19.1 | 4 | |
| Israel | | | 0.5 | | | | 0.3 | | | | — | 5 | | | — | 5 | |
| South Africa | | | 0.5 | | | | 0.5 | | | | 6.4 | | | | –5.2 | | |
| Turkey | | | 0.4 | | | | 0.2 | | | | 6.2 | 4 | | | –5.8 | 4 | |
| Indonesia | | | 0.4 | | | | 0.1 | | | | 7.3 | 4 | | | 0.6 | 4 | |
| Australia | | | 0.3 | | | | 0.1 | | | | 6.4 | | | | –0.5 | | |
| Malaysia | | | 0.3 | | | | 0.3 | | | | 3.7 | | | | 3.0 | | |
| Philippines | | | 0.1 | | | | 0.1 | | | | 1.1 | 4 | | | –2.0 | 4 | |
| Chile | | | 0.1 | | | | 0.1 | | | | 7.9 | | | | –9.1 | | |
| 1 | Source: Barclays Global Aggregate Index. |
| 2 | Includes U.S. dollar-denominated debt of other countries, totaling 12.3%. |
| 3 | Countries using the euro as a common currency: Austria, Belgium, Cyprus, Estonia, Finland, France, Germany, Greece, Ireland, Italy, Latvia, Luxembourg, Malta, the Netherlands, Portugal, Slovakia, Slovenia and Spain. Euro-denominated debt includes corporate and European government debt. |
| 4 | Source: JP Morgan GBI–EM Broad Diversified Index. |
| 5 | This market is not included in the Barclays Global Aggregate Index or the JP Morgan GBI–EM Broad Diversified Index. |
Capital World Bond Fund net assets
unaudited
| September 30, 2014 | | | | | | |
| Currency weighting by region: | | Before forward
contracts | | After forward
contracts |
| United States | | | 53.2 | % | | | 59.9 | % |
| Europe | | | 33.5 | | | | 25.7 | |
| Asia/Pacific Basin | | | 6.7 | | | | 10.5 | |
| Other* | | | 6.6 | | | | 3.9 | |
* Brazil, Canada, Colombia, Chile, Israel, Mexico and South Africa.
| 10 | Capital World Bond Fund |
Portfolio summary September 30, 2014
| Portfolio by type of security | Percent of net assets |

| Bonds & notes of governments & government agencies outside the U.S. | | | | Percent of net assets |
| Euro zone*: | | | | | | | | |
| Spain | | | 5.57 | % | | | | |
| Ireland | | | 2.53 | | | | | |
| Portugal | | | 2.50 | | | | | |
| Italy | | | 2.19 | | | | | |
| Germany | | | 1.10 | | | | | |
| Slovenia | | | 1.02 | | | | | |
| Belgium | | | 0.80 | | | | | |
| Netherlands | | | 0.67 | | | | | |
| Greece | | | 0.65 | | | | | |
| France | | | 0.38 | | | | | |
| Other | | | 0.06 | | | | 17.47 | % |
| United Kingdom | | | | | | | 5.20 | |
| Japan | | | | | | | 3.88 | |
| Mexico | | | | | | | 3.28 | |
| Poland | | | | | | | 2.64 | |
| Hungary | | | | | | | 2.30 | |
| Colombia | | | | | | | 1.13 | |
| India | | | | | | | 1.03 | |
| Norway | | | | | | | 0.85 | |
| South Korea | | | | | | | 0.66 | |
| Other | | | | | | | 6.60 | |
| | | | | | | | 45.04 | % |
| * | Countries using the euro as a common currency: Austria, Belgium, Cyprus, Estonia, Finland, France, Germany, Greece, Ireland, Italy, Latvia, Luxembourg, Malta, the Netherlands, Portugal, Slovakia, Slovenia and Spain. |
Net assets and portfolio turnover rate
| Fiscal year | | Fund net assets
(millions) | | Portfolio
turnover rate |
| 2014 | | $ | 13,207 | | | | 205 | % |
| 2013 | | | 12,654 | | | | 199 | |
| 2012 | | | 13,642 | | | | 142 | |
| 2011 | | | 12,282 | | | | 95 | |
| 2010 | | | 11,919 | | | | 80 | |
Expense ratios
as of September 30, 2014
| Capital World Bond Fund (Class A shares) | | | 0.90 | % |
| Lipper Global Income Funds Average (front-end load funds only, excluding funds of funds) | | | 1.05 | |
| Capital World Bond Fund | 11 |
Summary investment portfolio September 30, 2014
| Bonds, notes & other debt instruments 91.91% | | Principal amount
(000) | | | Value
(000) | |
| Euros 21.80% | | | | | | | | |
| Belgium (Kingdom of), Series 61, 4.25% 2021 | | € | 47,660 | | | $ | 74,921 | |
| German Government 0.75%—6.25% 2018—20441 | | | 100,849 | | | | 145,964 | |
| Hungarian Government 3.88%—6.00% 2018—2020 | | | 61,315 | | | | 88,745 | |
| Irish Government 3.90% 2023 | | | 44,930 | | | | 67,701 | |
| Irish Government 3.40% 2024 | | | 136,240 | | | | 198,196 | |
| Irish Government 4.50%—5.40% 2020—2025 | | | 43,020 | | | | 67,810 | |
| Italian Government 4.50% 2023 | | | 39,225 | | | | 58,848 | |
| Italian Government 4.50% 2024 | | | 44,350 | | | | 66,705 | |
| Italian Government 2.15%—5.50% 2017—2044 | | | 111,215 | | | | 163,822 | |
| Portuguese Government 3.85% 2021 | | | 126,830 | | | | 175,165 | |
| Portuguese Government 4.95% 2023 | | | 47,825 | | | | 69,550 | |
| Portuguese Government 3.88%—5.65% 2018—2030 | | | 61,080 | | | | 85,040 | |
| Slovenia (Republic of) 4.13%—4.63% 2020—2024 | | | 49,580 | | | | 71,734 | |
| Spanish Government 1.40% 2020 | | | 43,000 | | | | 55,406 | |
| Spanish Government 5.85% 2022 | | | 130,530 | | | | 214,494 | |
| Spanish Government 5.40% 2023 | | | 106,225 | | | | 171,505 | |
| Spanish Government 2.75% 2024 | | | 60,715 | | | | 80,596 | |
| Spanish Government 3.80% 2024 | | | 50,831 | | | | 73,863 | |
| Spanish Government 5.15% 2044 | | | 84,460 | | | | 139,234 | |
| Other securities | | | | | | | 809,525 | |
| | | | | | | | 2,878,824 | |
| | | | | | | | | |
| British pounds 5.89% | | | | | | | | |
| United Kingdom 1.75% 2019 | | £ | 37,925 | | | | 61,416 | |
| United Kingdom 2.00% 2020 | | | 131,270 | | | | 213,393 | |
| United Kingdom 3.75% 2020 | | | 50,900 | | | | 90,999 | |
| United Kingdom 2.25% 2023 | | | 47,945 | | | | 77,364 | |
| United Kingdom 1.75%—4.75% 2015—2044 | | | 136,315 | | | | 243,288 | |
| Other securities | | | | | | | 92,032 | |
| | | | | | | | 778,492 | |
| | | | | | | | | |
| Japanese yen 3.93% | | | | | | | | |
| Japanese Government, Series 315, 1.20% 2021 | | ¥ | 12,707,800 | | | | 123,172 | |
| Japanese Government, Series 145, 1.70% 2033 | | | 6,000,000 | | | | 58,808 | |
| Japanese Government, Series 21, 2.30% 2035 | | | 8,040,000 | | | | 85,259 | |
| Japanese Government 0.10%—2.40% 2016—20421 | | | 24,972,582 | | | | 244,732 | |
| Other securities | | | | | | | 6,835 | |
| | | | | | | | 518,806 | |
| | | | | | | | | |
| Mexican pesos 3.17% | | | | | | | | |
| United Mexican States Government, Series M, 5.00% 2017 | | | MXN970,000 | | | | 73,508 | |
| United Mexican States Government, Series M, 6.50% 2021 | | | 1,327,500 | | | | 103,557 | |
| United Mexican States Government 2.00%—10.00% 2015—20421 | | | 2,842,483 | | | | 237,652 | |
| Other securities | | | | | | | 3,741 | |
| | | | | | | | 418,458 | |
| | | | | | | | | |
| Polish zloty 2.38% | | | | | | | | |
| Polish Government, Series 1020, 5.25% 2020 | | | PLN183,150 | | | | 63,656 | |
| Polish Government, Series 1021, 5.75% 2021 | | | 460,395 | | | | 165,598 | |
| Polish Government 4.00%—5.75% 2017—2023 | | | 247,547 | | | | 85,458 | |
| | | | | | | | 314,712 | |
| | | | | | | | | |
| Hungarian forints 1.19% | | | | | | | | |
| Hungarian Government, Series 20A, 7.50% 2020 | | | HUF22,700,000 | | | | 109,961 | |
| Hungarian Government 5.50%—7.00% 2022—2025 | | | 10,557,440 | | | | 47,551 | |
| | | | | | | | 157,512 | |
| | | | | | | | | |
| Colombian pesos 1.15% | | | | | | | | |
| Colombia (Republic of), Series B, 5.00% 2018 | | | COP134,824,800 | | | | 65,070 | |
| Colombia (Republic of), Series B, 6.00% 2028 | | | 135,577,800 | | | | 59,962 | |
| Colombia (Republic of) 7.00%—10.00% 2022—2024 | | | 44,091,400 | | | | 23,655 | |
| Colombia (Republic of) Global 9.85%—12.00% 2015—2027 | | | 1,807,000 | | | | 1,069 | |
| Other securities | | | | | | | 2,337 | |
| | | | | | | | 152,093 | |
| 12 | Capital World Bond Fund |
| | | Principal amount
(000) | | | Value
(000) | |
| Indian rupees 1.03% | | | | | | | | |
| India (Republic of) 7.28% 2019 | | INR | 8,790,000 | | | $ | 136,432 | |
| | | | | | | | | |
| Norwegian kroner 0.86% | | | | | | | | |
| Norwegian Government 3.75% 2021 | | NKr | 378,640 | | | | 65,519 | |
| Other securities | | | | | | | 47,532 | |
| | | | | | | | 113,051 | |
| | | | | | | | | |
| South Korean won 0.66% | | | | | | | | |
| South Korean Government 5.50% 2017 | | KRW | 70,413,470 | | | | 72,746 | |
| Other securities | | | | | | | 13,989 | |
| | | | | | | | 86,735 | |
| | | | | | | | | |
| Russian rubles 0.50% | | | | | | | | |
| Russian Federation 7.50% 2018 | | RUB | 2,751,750 | | | | 66,195 | |
| | | | | | | | | |
| U.S. dollars 45.07% | | | | | | | | |
| Fannie Mae 4.00% 20442,3 | | $ | 119,876 | | | | 125,973 | |
| Fannie Mae 4.50% 20442,3 | | | 423,990 | | | | 456,377 | |
| Fannie Mae 0%—9.45% 2022—20482,3,4 | | | 223,264 | | | | 231,165 | |
| Freddie Mac 0%—6.00% 2018—20432,4 | | | 34,099 | | | | 33,721 | |
| Hungarian Government 4.00%—7.62% 2018—2041 | | | 50,609 | | | | 57,311 | |
| Polish Government 5.00%—6.38% 2019—2022 | | | 30,210 | | | | 34,116 | |
| Slovenia (Republic of) 4.13%—5.85% 2018—20245 | | | 56,910 | | | | 62,395 | |
| U.S. Treasury 0.625% 2017 | | | 62,930 | | | | 62,104 | |
| U.S. Treasury 1.25% 2018 | | | 122,400 | | | | 120,903 | |
| U.S. Treasury 1.50% 2018 | | | 292,250 | | | | 292,215 | |
| U.S. Treasury 1.50% 2019 | | | 61,075 | | | | 60,720 | |
| U.S. Treasury 1.625% 20196 | | | 200,150 | | | | 199,173 | |
| U.S. Treasury 1.625% 2019 | | | 162,365 | | | | 161,324 | |
| U.S. Treasury 1.625% 2019 | | | 81,150 | | | | 80,957 | |
| U.S. Treasury 1.125% 2020 | | | 128,100 | | | | 122,804 | |
| U.S. Treasury 1.375% 2020 | | | 168,900 | | | | 163,642 | |
| U.S. Treasury 2.50% 2023 | | | 77,900 | | | | 78,385 | |
| U.S. Treasury 2.50% 2024 | | | 91,143 | | | | 91,230 | |
| U.S. Treasury 0.38%—8.00% 2015—2044 | | | 302,993 | | | | 303,399 | |
| U.S. Treasury Inflation-Protected Security 0.125% 20191 | | | 167,689 | | | | 168,203 | |
| U.S. Treasury Inflation-Protected Security 0.625% 20241 | | | 211,562 | | | | 212,880 | |
| U.S. Treasury Inflation-Protected Security 1.375% 20441 | | | 77,055 | | | | 82,544 | |
| U.S. Treasury Inflation-Protected Security 0.13%—2.38% 2017—20421 | | | 58,280 | | | | 58,185 | |
| United Mexican States Government Global 3.63%—5.55% 2020—2045 | | | 17,240 | | | | 18,454 | |
| Other securities | | | | | | | 2,673,897 | |
| | | | | | | | 5,952,077 | |
| | | | | | | | | |
| Other 4.28% | | | | | | | | |
| Other securities | | | | | | | 564,537 | |
| | | | | | | | | |
| Total bonds, notes & other debt instruments (cost: $12,116,792,000) | | | | | | | 12,137,924 | |
| | | | | | | | | |
| Convertible stocks 0.02% | | Shares | | | | |
| U.S. dollars 0.02% | | | | | | | |
| Other securities | | | | | | | 2,369 | |
| | | | | | | | | |
| Total convertible stocks (cost: $2,416,000) | | | | | | | 2,369 | |
| | | | | | | | | |
| Common stocks 0.00% | | | | | | | | |
| U.S. dollars 0.00% | | | | | | | | |
| Other securities | | | | | | | 580 | |
| | | | | | | | | |
| Total common stocks (cost: $736,000) | | | | | | | 580 | |
| Capital World Bond Fund | 13 |
| Short-term securities 9.63% | | Principal amount
(000) | | | Value
(000) | |
| Fannie Mae 0.06%—0.10% due 11/4/2014—2/17/2015 | | $ | 225,200 | | | $ | 225,184 | |
| Federal Home Loan Bank 0.05%—0.10% due 10/1/2014—2/4/2015 | | | 209,200 | | | | 209,187 | |
| Freddie Mac 0.09%—0.14% due 10/23/2014—8/4/2015 | | | 308,125 | | | | 307,970 | |
| Sumitomo Mitsui Banking Corp. 0.15%—0.22% due 10/15/2014—1/16/20155 | | | 100,300 | | | | 100,261 | |
| Other securities | | | | | | | 429,417 | |
| | | | | | | | | |
| Total short-term securities (cost: $1,271,886,000) | | | | | | | 1,272,019 | |
| Total investment securities 101.56% (cost: $13,391,830,000) | | | | | | | 13,412,892 | |
| Other assets less liabilities (1.56)% | | | | | | | (206,332 | ) |
| | | | | | | | | |
| Net assets 100.00% | | | | | | $ | 13,206,560 | |
This summary investment portfolio is designed to streamline the report and help investors better focus on the fund’s principal holdings. See the inside back cover for details on how to obtain a complete schedule of portfolio holdings.
“Other securities” includes all issues that are not disclosed separately in the summary investment portfolio, including securities which were valued under fair value procedures adopted by authority of the board of trustees. The total value of securities which were valued under fair value procedures was $2,978,000, which represented .02% of the net assets of the fund. One of these securities (with a value of $1,255,000, a cost of $1,687,000, and which represented less than .01% of the net assets of the fund) was acquired from 3/10/2010 to 1/21/2011 through private placement transactions exempt from registration under the Securities Act of 1933, which may subject it to legal or contractual restrictions on resale. “Other securities” also includes loan participations and assignments, which may be subject to legal or contractual restrictions on resale. The total value of all such loans was $68,770,000, which represented ..52% of the net assets of the fund.
Forward currency contracts
The fund has entered into forward currency contracts to purchase or sell currencies as shown in the following table. The average notional amount of open forward currency contracts was $1,863,525,000 over the prior 12-month period.
| | | | | | | | | | | Unrealized | |
| | | | | | | | | (depreciation) | |
| | | | | | | Contract amount | | appreciation | |
| | | Settlement date | | Counterparty | | Receive
(000) | | Deliver
(000) | | at 9/30/2014
( 000) | |
| Purchases: | | | | | | | | | | | | |
| Colombian pesos | | 10/27/2014 | | Citibank | | COP10,346,247 | | $5,140 | | | $ (42 | ) |
| Japanese yen | | 10/6/2014 | | UBS AG | | ¥3,065,621 | | $29,134 | | | (1,215 | ) |
| Japanese yen | | 10/20/2014 | | UBS AG | | ¥8,010,156 | | $74,804 | | | (1,758 | ) |
| Japanese yen | | 10/20/2014 | | Citibank | | ¥8,178,076 | | $76,378 | | | (1,801 | ) |
| Japanese yen | | 10/22/2014 | | Barclays Bank PLC | | ¥5,160,129 | | $47,472 | | | (415 | ) |
| Japanese yen | | 10/24/2014 | | HSBC Bank | | ¥4,211,171 | | $41,500 | | | (3,097 | ) |
| Japanese yen | | 10/27/2014 | | Citibank | | ¥16,139,814 | | $159,275 | | | (12,086 | ) |
| Japanese yen | | 10/27/2014 | | Bank of New York Mellon | | ¥11,793,873 | | $108,395 | | | (839 | ) |
| Japanese yen | | 11/25/2014 | | UBS AG | | ¥2,742,208 | | $26,552 | | | (1,539 | ) |
| Japanese yen | | 12/3/2014 | | JPMorgan Chase | | ¥4,281,235 | | $41,160 | | | (2,105 | ) |
| | | | | | | | | | | | $(24,897 | ) |
| Sales: | | | | | | | | | | | | |
| Australian dollars | | 10/23/2014 | | HSBC Bank | | $2,740 | | A$3,000 | | | 79 | |
| Australian dollars | | 12/3/2014 | | Citibank | | $25,918 | | A$27,980 | | | 1,488 | |
| Brazilian reais | | 10/6/2014 | | Citibank | | $25,132 | | BRL56,625 | | | 2,041 | |
| Brazilian reais | | 10/15/2014 | | Citibank | | $11,991 | | BRL27,747 | | | 705 | |
| Brazilian reais | | 10/17/2014 | | Citibank | | $10,159 | | BRL23,375 | | | 656 | |
| Brazilian reais | | 12/12/2014 | | Barclays Bank PLC | | $20,183 | | BRL47,550 | | | 1,144 | |
| British pounds | | 10/10/2014 | | UBS AG | | $3,365 | | £2,000 | | | 123 | |
| British pounds | | 10/16/2014 | | UBS AG | | $1,126 | | £700 | | | (9 | ) |
| British pounds | | 10/17/2014 | | Bank of New York Mellon | | $11,473 | | £7,100 | | | (35 | ) |
| British pounds | | 10/17/2014 | | Bank of New York Mellon | | $20,773 | | £12,800 | | | 25 | |
| British pounds | | 10/20/2014 | | HSBC Bank | | $2,033 | | £1,250 | | | 7 | |
| British pounds | | 10/22/2014 | | UBS AG | | $55,017 | | £33,340 | | | 979 | |
| British pounds | | 10/27/2014 | | Barclays Bank PLC | | €20,558 | | £16,270 | | | (399 | ) |
| British pounds | | 10/29/2014 | | Barclays Bank PLC | | $39,757 | | £24,400 | | | 212 | |
| British pounds | | 10/29/2014 | | HSBC Bank | | $12,022 | | £7,375 | | | 69 | |
| British pounds | | 12/4/2014 | | UBS AG | | €27,148 | | £21,650 | | | (772 | ) |
| British pounds | | 12/4/2014 | | UBS AG | | $8,718 | | £5,140 | | | 139 | |
| British pounds | | 12/5/2014 | | Barclays Bank PLC | | €108,967 | | £87,200 | | | (3,585 | ) |
| British pounds | | 12/17/2014 | | Barclays Bank PLC | | €94,528 | | £75,275 | | | (2,482 | ) |
| British pounds | | 12/22/2014 | | Bank of New York Mellon | | $4,098 | | £2,500 | | | 48 | |
| 14 | Capital World Bond Fund |
| | | | | | | | | | | Unrealized | |
| | | | | | | | | | | (depreciation) | |
| | | | | | | Contract amount | | appreciation | |
| | | Settlement date | | Counterparty | | Receive
(000) | | Deliver
(000) | | at 9/30/2014
(000) | |
| Canadian dollars | | 10/21/2014 | | HSBC Bank | | $3,621 | | C$4,000 | | | $ 51 | |
| Colombian pesos | | 10/6/2014 | | Citibank | | $29,352 | | COP56,964,825 | | | 1,235 | |
| Colombian pesos | | 10/15/2014 | | Citibank | | $12,265 | | COP24,376,882 | | | 242 | |
| Colombian pesos | | 10/17/2014 | | Citibank | | $11,860 | | COP23,376,375 | | | 333 | |
| Euros | | 10/3/2014 | | Bank of New York Mellon | | ¥1,545,124 | | €11,120 | | | 43 | |
| Euros | | 10/6/2014 | | HSBC Bank | | $502 | | €375 | | | 28 | |
| Euros | | 10/9/2014 | | Citibank | | $12,527 | | €7,855 | | | 770 | |
| Euros | | 10/10/2014 | | UBS AG | | $32,059 | | €24,000 | | | 1,744 | |
| Euros | | 10/10/2014 | | UBS AG | | $54,415 | | €39,970 | | | 3,927 | |
| Euros | | 10/15/2014 | | Bank of America, N.A. | | $5,219 | | €4,041 | | | 114 | |
| Euros | | 10/16/2014 | | UBS AG | | $1,996 | | €1,500 | | | 43 | |
| Euros | | 10/20/2014 | | HSBC Bank | | $519 | | €400 | | | 14 | |
| Euros | | 10/21/2014 | | Citibank | | $11,727 | | €9,050 | | | 295 | |
| Euros | | 10/23/2014 | | Bank of America, N.A. | | $41,546 | | €31,040 | | | 2,335 | |
| Euros | | 10/23/2014 | | Citibank | | $12,500 | | €9,240 | | | 828 | |
| Euros | | 10/23/2014 | | Bank of America, N.A. | | $27,530 | | €20,590 | | | 1,520 | |
| Euros | | 10/27/2014 | | Bank of America, N.A. | | $127,879 | | €94,375 | | | 7,215 | |
| Euros | | 10/27/2014 | | Barclays Bank PLC | | $26,422 | | €20,550 | | | 461 | |
| Euros | | 11/3/2014 | | HSBC Bank | | $2,410 | | €1,800 | | | 136 | |
| Euros | | 11/3/2014 | | HSBC Bank | | $8,563 | | €6,400 | | | 478 | |
| Euros | | 11/5/2014 | | Citibank | | $12,764 | | €9,500 | | | 762 | |
| Euros | | 11/18/2014 | | UBS AG | | $3,470 | | €2,675 | | | 91 | |
| Euros | | 12/3/2014 | | JPMorgan Chase | | $82,483 | | €62,500 | | | 3,506 | |
| Euros | | 12/3/2014 | | Barclays Bank PLC | | $55,281 | | €41,870 | | | 2,372 | |
| Euros | | 12/4/2014 | | Barclays Bank PLC | | $24,675 | | €18,690 | | | 1,058 | |
| Euros | | 12/5/2014 | | Barclays Bank PLC | | $61,867 | | €46,950 | | | 2,430 | |
| Euros | | 12/17/2014 | | Citibank | | $9,939 | | €7,675 | | | 240 | |
| Euros | | 12/17/2014 | | Citibank | | $12,864 | | €10,100 | | | 100 | |
| Euros | | 12/22/2014 | | Citibank | | £10,327 | | €13,130 | | | 136 | |
| Euros | | 12/23/2014 | | Bank of America, N.A. | | $6,769 | | €5,270 | | | 109 | |
| Euros | | 1/7/2015 | | UBS AG | | $2,995 | | €2,350 | | | 25 | |
| Euros | | 1/7/2015 | | Barclays Bank PLC | | $48,495 | | €38,200 | | | 211 | |
| Euros | | 1/8/2015 | | Bank of America, N.A. | | $26,935 | | €21,320 | | | (13 | ) |
| Hungarian forints | | 10/20/2014 | | HSBC Bank | | $11,101 | | HUF2,701,600 | | | 125 | |
| Indonesian rupiah | | 12/16/2014 | | JPMorgan Chase | | $20,033 | | IDR241,677,628 | | | 471 | |
| Indonesian rupiah | | 12/16/2014 | | JPMorgan Chase | | $19,623 | | IDR239,500,000 | | | 237 | |
| Israeli shekels | | 12/12/2014 | | Barclays Bank PLC | | €20,099 | | ILS93,800 | | | (89 | ) |
| Japanese yen | | 10/20/2014 | | HSBC Bank | | $10,026 | | ¥1,035,000 | | | 227 | |
| Japanese yen | | 10/22/2014 | | JPMorgan Chase | | $16,606 | | ¥1,685,000 | | | 1,240 | |
| Mexican pesos | | 10/16/2014 | | Citibank | | $120,517 | | MXN1,587,275 | | | 2,472 | |
| Mexican pesos | | 10/22/2014 | | Bank of America, N.A. | | $39,807 | | MXN529,800 | | | 424 | |
| Mexican pesos | | 12/10/2014 | | Bank of America, N.A. | | $41,251 | | MXN547,640 | | | 676 | |
| Mexican pesos | | 12/11/2014 | | Citibank | | $27,095 | | MXN359,810 | | | 439 | |
| Norwegian kroner | | 10/9/2014 | | Barclays Bank PLC | | $32,278 | | NKr201,000 | | | 1,003 | |
| Norwegian kroner | | 10/9/2014 | | Barclays Bank PLC | | $7,872 | | NKr50,000 | | | 92 | |
| Norwegian kroner | | 10/24/2014 | | HSBC Bank | | €2,449 | | NKr20,000 | | | (17 | ) |
| Norwegian kroner | | 10/27/2014 | | HSBC Bank | | €30,919 | | NKr253,000 | | | (280 | ) |
| Polish zloty | | 10/20/2014 | | Citibank | | $40,077 | | PLN130,600 | | | 674 | |
| Russian rubles | | 10/6/2014 | | JPMorgan Chase | | $50,982 | | RUB1,895,875 | | | 3,156 | |
| Russian rubles | | 10/15/2014 | | Citibank | | $13,720 | | RUB523,400 | | | 542 | |
| Swedish kronor | | 10/29/2014 | | JPMorgan Chase | | €4,135 | | SKr37,880 | | | (25 | ) |
| Swedish kronor | | 12/12/2014 | | UBS AG | | €9,371 | | SKr86,000 | | | (74 | ) |
| Swedish kronor | | 12/17/2014 | | Citibank | | $23,769 | | SKr169,270 | | | 317 | |
| Swedish kronor | | 12/17/2014 | | HSBC Bank | | €4,014 | | SKr37,020 | | | (57 | ) |
| Swedish kronor | | 1/7/2015 | | UBS AG | | €8,686 | | SKr79,970 | | | (100 | ) |
| Turkish lira | | 10/8/2014 | | JPMorgan Chase | | $14,873 | | TRY32,400 | | | 671 | |
| Turkish lira | | 10/16/2014 | | UBS AG | | $5,809 | | TRY12,875 | | | 179 | |
| | | | | | | | | | | | $45,575 | |
| Forward currency contracts - net | | | | | | | | | $20,678 | |
| Capital World Bond Fund | 15 |
Interest rate swaps
The fund has entered into interest rate swaps as shown in the following table. The fund entered into interest rate swaps beginning July 2014. The average notional amount of interest rate swaps was $483,333,000 over the prior three-month period.
Pay/receive
floating rate | | Clearinghouse | | | Floating rate
index | | | Fixed
rate | | | Expiration
date | | | Notional
amount
(000) | | | Unrealized
depreciation at
9/30/2014
(000) | |
| Pay | | | LCH.Clearnet | | | | 3-month USD-LIBOR | | | | 1.8065 | % | | | 7/29/2019 | | | $ | 225,000 | | | $ | (988 | ) |
| Receive | | | LCH.Clearnet | | | | 3-month USD-LIBOR | | | | 2.718 | | | | 7/9/2024 | | | | 235,000 | | | | (1,889 | ) |
| Receive | | | LCH.Clearnet | | | | 3-month USD-LIBOR | | | | 2.6655 | | | | 9/26/2024 | | | | 70,000 | | | | (114 | ) |
| | | | | | | | | | | | | | | | | | | | | | | $ | (2,991 | ) |
The following footnotes apply to either the individual securities noted or one or more of the securities aggregated and listed as a single line item.
| 1 | Index-linked bond whose principal amount moves with a government price index. |
| 2 | Principal payments may be made periodically. Therefore, the effective maturity date may be earlier than the stated maturity date. |
| 3 | A portion or all of this security purchased on a TBA basis. |
| 4 | Coupon rate may change periodically. |
| 5 | Acquired in a transaction exempt from registration under Rule 144A or Section 4(2) of the Securities Act of 1933. May be resold in the U.S. in transactions exempt from registration, normally to qualified institutional buyers. The total value of all such securities, including those in “Other securities,” was $1,283,213,000, which represented 9.72% of the net assets of the fund. |
| 6 | A portion of this security was pledged as collateral. The total value of pledged collateral was $14,198,000, which represented .11% of the net assets of the fund. |
Key to abbreviation
TBA = To be announced
See Notes to Financial Statements
| 16 | Capital World Bond Fund |
Financial statements
Statement of assets and liabilities
at September 30, 2014 | | (dollars in thousands) | |
| | | | | | | |
| Assets: | | | | | | | | |
| Investment securities, at value (cost: $13,391,830) | | | | | | $ | 13,412,892 | |
| Cash denominated in currencies other than U.S. dollars (cost: $1,481) | | | | | | | 1,479 | |
| Cash | | | | | | | 341 | |
| Unrealized appreciation on open forward currency contracts | | | | | | | 53,512 | |
| Receivables for: | | | | | | | | |
| Sales of investments | | $ | 1,758,313 | | | | | |
| Sales of fund’s shares | | | 22,318 | | | | | |
| Closed forward currency contracts | | | 19,822 | | | | | |
| Interest | | | 146,654 | | | | 1,947,107 | |
| | | | | | | | 15,415,331 | |
| Liabilities: | | | | | | | | |
| Unrealized depreciation on open forward currency contracts | | | | | | | 32,834 | |
| Payables for: | | | | | | | | |
| Purchases of investments | | | 2,143,446 | | | | | |
| Repurchases of fund’s shares | | | 13,839 | | | | | |
| Closed forward currency contracts | | | 2,071 | | | | | |
| Investment advisory services | | | 4,785 | | | | | |
| Services provided by related parties | | | 4,522 | | | | | |
| Trustees’ deferred compensation | | | 206 | | | | | |
| Variation margin | | | 546 | | | | | |
| Other | | | 6,522 | | | | 2,175,937 | |
| Net assets at September 30, 2014 | | | | | | $ | 13,206,560 | |
| | | | | | | | | |
| Net assets consist of: | | | | | | | | |
| Capital paid in on shares of beneficial interest | | | | | | $ | 12,956,555 | |
| Undistributed net investment income | | | | | | | 8,011 | |
| Undistributed net realized gain | | | | | | | 209,329 | |
| Net unrealized appreciation | | | | | | | 32,665 | |
| Net assets at September 30, 2014 | | | | | | $ | 13,206,560 | |
(dollars and shares in thousands, except per-share amounts)
Shares of beneficial interest issued and outstanding (no stated par value) —
unlimited shares authorized (645,569 total shares outstanding)
| | | | | | Shares | | | Net asset value | |
| | | Net assets | | | outstanding | | | per share | |
| Class A | | $ | 7,175,945 | | | | 350,166 | | | $ | 20.49 | |
| Class B | | | 62,826 | | | | 3,089 | | | | 20.34 | |
| Class C | | | 551,779 | | | | 27,348 | | | | 20.18 | |
| Class F-1 | | | 1,950,554 | | | | 95,765 | | | | 20.37 | |
| Class F-2 | | | 990,192 | | | | 48,354 | | | | 20.48 | |
| Class 529-A | | | 358,407 | | | | 17,447 | | | | 20.54 | |
| Class 529-B | | | 6,082 | | | | 298 | | | | 20.40 | |
| Class 529-C | | | 152,285 | | | | 7,496 | | | | 20.32 | |
| Class 529-E | | | 18,985 | | | | 930 | | | | 20.41 | |
| Class 529-F-1 | | | 44,546 | | | | 2,180 | | | | 20.44 | |
| Class R-1 | | | 16,518 | | | | 814 | | | | 20.31 | |
| Class R-2 | | | 168,190 | | | | 8,286 | | | | 20.30 | |
| Class R-2E | | | 10 | | | | — | * | | | 20.50 | |
| Class R-3 | | | 173,973 | | | | 8,508 | | | | 20.45 | |
| Class R-4 | | | 111,890 | | | | 5,463 | | | | 20.48 | |
| Class R-5 | | | 162,351 | | | | 7,911 | | | | 20.52 | |
| Class R-6 | | | 1,262,027 | | | | 61,514 | | | | 20.52 | |
*Amount less than one thousand.
See Notes to Financial Statements
| Capital World Bond Fund | 17 |
Statement of operations
for the year ended September 30, 2014 | | (dollars in thousands) | |
| | | | |
| Investment income: | | | | | | | | |
| Income: | | | | | | | | |
| Interest (net of non-U.S. taxes of $2,281) | | $ | 409,029 | | | | | |
| Dividends | | | 389 | | | $ | 409,418 | |
| Fees and expenses*: | | | | | | | | |
| Investment advisory services | | | 56,600 | | | | | |
| Distribution services | | | 34,153 | | | | | |
| Transfer agent services | | | 20,251 | | | | | |
| Administrative services | | | 3,563 | | | | | |
| Reports to shareholders | | | 1,061 | | | | | |
| Registration statement and prospectus | | | 404 | | | | | |
| Trustees’ compensation | | | 115 | | | | | |
| Auditing and legal | | | 150 | | | | | |
| Custodian | | | 1,954 | | | | | |
| State and local taxes | | | 1 | | | | | |
| Other | | | 746 | | | | 118,998 | |
| Net investment income | | | | | | | 290,420 | |
| | | | | | | | | |
| Net realized gain and unrealized depreciation on investments, forward currency contracts, interest rate swaps and currency: | | | | | | | | |
| Net realized gain (loss) on: | | | | | | | | |
| Investments (net of non-U.S. taxes of $25) | | | 169,252 | | | | | |
| Forward currency contracts | | | (5,936 | ) | | | | |
| Interest rate swaps | | | (733 | ) | | | | |
| Currency transactions | | | (5,745 | ) | | | 156,838 | |
| Net unrealized (depreciation) appreciation on: | | | | | | | | |
| Investments (net of non-U.S. taxes of $125) | | | (93,646 | ) | | | | |
| Forward currency contracts | | | 18,455 | | | | | |
| Interest rate swaps | | | (2,991 | ) | | | | |
| Currency translations | | | (7,768 | ) | | | (85,950 | ) |
| Net realized gain and unrealized depreciation on investments, forward currency contracts, interest rate swaps and currency | | | | | | | 70,888 | |
| | | | | | | | | |
| Net increase in net assets resulting from operations | | | | | | $ | 361,308 | |
*Additional information related to class-specific fees and expenses is included in the Notes to Financial Statements.
See Notes to Financial Statements
| 18 | Capital World Bond Fund |
| Statements of changes in net assets | | | | | | |
| | | (dollars in thousands) | |
| | | | |
| | | Year ended September 30 | |
| | | 2014 | | | 2013 | |
| | | | | | | |
| Operations: | | | | | | | | |
| Net investment income | | $ | 290,420 | | | $ | 274,908 | |
| Net realized gain on investments, forward currency contracts, interest rate swaps and currency transactions | | | 156,838 | | | | 14,158 | |
| Net unrealized depreciation on investments, forward currency contracts, interest rate swaps and currency translations | | | (85,950 | ) | | | (696,072 | ) |
| Net increase (decrease) in net assets resulting from operations | | | 361,308 | | | | (407,006 | ) |
| | | | | | | | | |
| Dividends and distributions paid to shareholders: | | | | | | | | |
| Dividends from net investment income | | | (264,369 | ) | | | (277,351 | ) |
| Distributions from net realized gain on investments | | | — | | | | (179,986 | ) |
| Total dividends and distributions paid to shareholders | | | (264,369 | ) | | | (457,337 | ) |
| | | | | | | | | |
| Net capital share transactions | | | 456,041 | | | | (123,804 | ) |
| | | | | | | | | |
| Total increase (decrease) in net assets | | | 552,980 | | | | (988,147 | ) |
| | | | | | | | | |
| Net assets: | | | | | | | | |
| Beginning of year | | | 12,653,580 | | | | 13,641,727 | |
| End of year (including undistributed net investment income: $8,011 and $94,532, respectively) | | $ | 13,206,560 | | | $ | 12,653,580 | |
See Notes to Financial Statements
| Capital World Bond Fund | 19 |
Notes to financial statements
1. Organization
Capital World Bond Fund (the “fund”) is registered under the Investment Company Act of 1940 as an open-end, nondiversified management investment company. The fund seeks to maximize long-term total return, consistent with prudent management, by investing primarily in a global portfolio of investment-grade bonds denominated in U.S. dollars and other currencies. The fund may also invest in lower quality, high-yield debt securities.
The fund has 17 share classes consisting of five retail share classes (Classes A, B and C, as well as two F share classes, F-1 and F-2), five 529 college savings plan share classes (Classes 529-A, 529-B, 529-C, 529-E and 529-F-1) and seven retirement plan share classes (Classes R-1, R-2, R-2E, R-3, R-4, R-5 and R-6). The 529 college savings plan share classes can be used to save for college education. The retirement plan share classes are generally offered only through eligible employer-sponsored retirement plans. The fund’s share classes are described further in the following table:
| Share class | | Initial sales
charge | | Contingent deferred sales
charge upon redemption | | Conversion feature | |
| Classes A and 529-A | | Up to 3.75% | | None (except 1% for certain redemptions within one year of purchase without an initial sales charge) | | None | |
| Classes B and 529-B* | | None | | Declines from 5% to 0% for redemptions within six years of purchase | | Classes B and 529-B convert to Classes A and 529-A, respectively, after eight years | |
| Class C | | None | | 1% for redemptions within one year of purchase | | Class C converts to Class F-1 after 10 years | |
| Class 529-C | | None | | 1% for redemptions within one year of purchase | | None | |
| Class 529-E | | None | | None | | None | |
| Classes F-1, F-2 and 529-F-1 | | None | | None | | None | |
| Classes R-1, R-2, R-2E, R-3, R-4, R-5 and R-6 | | None | | None | | None | |
*Class B and 529-B shares of the fund are not available for purchase.
On August 29, 2014, the fund made an additional retirement plan share class (Class R-2E) available for sale pursuant to an amendment to its registration statement filed with the U.S. Securities and Exchange Commission. Refer to the fund’s prospectus for more details.
Holders of all share classes have equal pro rata rights to the assets, dividends and liquidation proceeds of the fund. Each share class has identical voting rights, except for the exclusive right to vote on matters affecting only its class. Share classes have different fees and expenses (“class-specific fees and expenses”), primarily due to different arrangements for distribution, transfer agent and administrative services. Differences in class-specific fees and expenses will result in differences in net investment income and, therefore, the payment of different per-share dividends by each share class.
2. Significant accounting policies
The fund is an investment company that applies the accounting and reporting guidance issued in Topic 946 by the U.S. Financial Accounting Standards Board. The fund’s financial statements have been prepared to comply with U.S. generally accepted accounting principles (“U.S. GAAP”). These principles require the fund’s investment adviser to make estimates and assumptions that affect reported amounts and disclosures. Actual results could differ from those estimates. The fund follows the significant accounting policies described in this section, as well as the valuation policies described in the next section on valuation.
Security transactions and related investment income — Security transactions are recorded by the fund as of the date the trades are executed with brokers. Realized gains and losses from security transactions are determined based on the specific identified cost of the securities. In the event a security is purchased with a delayed payment date, the fund will segregate liquid assets sufficient to meet its payment obligations. Dividend income is recognized on the ex-dividend date and interest income is recognized on an accrual basis. Market discounts, premiums and original issue discounts on fixed-income securities are amortized daily over the expected life of the security.
| 20 | Capital World Bond Fund |
Class allocations — Income, fees and expenses (other than class-specific fees and expenses) and realized and unrealized gains and losses are allocated daily among the various share classes based on their relative net assets. Class-specific fees and expenses, such as distribution, transfer agent and administrative services, are charged directly to the respective share class.
Dividends and distributions to shareholders — Dividends and distributions to shareholders are recorded on the ex-dividend date.
Currency translation — Assets and liabilities, including investment securities, denominated in currencies other than U.S. dollars are translated into U.S. dollars at the exchange rates supplied by one or more pricing vendors on the valuation date. Purchases and sales of investment securities and income and expenses are translated into U.S. dollars at the exchange rates on the dates of such transactions. The effects of changes in exchange rates on investment securities are included with the net realized gain or loss and net unrealized appreciation or depreciation on investments in the fund’s statement of operations. The realized gain or loss and unrealized appreciation or depreciation resulting from all other transactions denominated in currencies other than U.S. dollars are disclosed separately.
3. Valuation
Capital Research and Management Company (“CRMC”), the fund’s investment adviser, values the fund’s investments at fair value as defined by U.S. GAAP. The net asset value of each share class of the fund is generally determined as of approximately 4:00 p.m. New York time each day the New York Stock Exchange is open.
Methods and inputs — The fund’s investment adviser uses the following methods and inputs to establish the fair value of the fund’s assets and liabilities. Use of particular methods and inputs may vary over time based on availability and relevance as market and economic conditions evolve.
Equity securities are generally valued at the official closing price of, or the last reported sale price on, the exchange or market on which such securities are traded, as of the close of business on the day the securities are being valued or, lacking any sales, at the last available bid price. Prices for each security are taken from the principal exchange or market on which the security trades.
Fixed-income securities, including short-term securities, are generally valued at prices obtained from one or more pricing vendors. Vendors value such securities based on one or more of the inputs described in the following table. The table provides examples of inputs that are commonly relevant for valuing particular classes of fixed-income securities in which the fund is authorized to invest. However, these classifications are not exclusive, and any of the inputs may be used to value any other class of fixed-income security.
| Fixed-income class | Examples of standard inputs |
| All | Benchmark yields, transactions, bids, offers, quotations from dealers and trading systems, new issues, spreads and other relationships observed in the markets among comparable securities; and proprietary pricing models such as yield measures calculated using factors such as cash flows, financial or collateral performance and other reference data (collectively referred to as “standard inputs”) |
| Corporate bonds & notes; convertible securities | Standard inputs and underlying equity of the issuer |
| Bonds & notes of governments & government agencies | Standard inputs and interest rate volatilities |
| Mortgage-backed; asset-backed obligations | Standard inputs and cash flows, prepayment information, default rates, delinquency and loss assumptions, collateral characteristics, credit enhancements and specific deal information |
| Municipal securities | Standard inputs and, for certain distressed securities, cash flows or liquidation values using a net present value calculation based on inputs that include, but are not limited to, financial statements and debt contracts |
When the fund’s investment adviser deems it appropriate to do so (such as when vendor prices are unavailable or deemed to be not representative), fixed-income securities will be valued in good faith at the mean quoted bid and ask prices that are reasonably and timely available (or bid prices, if ask prices are not available) or at prices for securities of comparable maturity, quality and type.
Securities with both fixed-income and equity characteristics, or equity securities traded principally among fixed-income dealers, are generally valued in the manner described for either equity or fixed-income securities, depending on which method is deemed most appropriate by the fund’s investment adviser. Forward currency contracts are valued at the mean of representative quoted bid and ask prices, generally based on prices supplied by one or more pricing vendors. Interest rate swaps are generally valued by pricing vendors based on market inputs that include the index and term of index, reset frequency, payer/receiver, currency, and pay frequency.
| Capital World Bond Fund | 21 |
Securities and other assets for which representative market quotations are not readily available or are considered unreliable by the fund’s investment adviser are fair valued as determined in good faith under fair valuation guidelines adopted by authority of the fund’s board of trustees as further described. The investment adviser follows fair valuation guidelines, consistent with U.S. Securities and Exchange Commission rules and guidance, to consider relevant principles and factors when making fair value determinations. The investment adviser considers relevant indications of value that are reasonably and timely available to it in determining the fair value to be assigned to a particular security, such as the type and cost of the security; contractual or legal restrictions on resale of the security; relevant financial or business developments of the issuer; actively traded similar or related securities; conversion or exchange rights on the security; related corporate actions; significant events occurring after the close of trading in the security; and changes in overall market conditions. Fair valuations and valuations of investments that are not actively trading involve judgment and may differ materially from valuations that would have been used had greater market activity occurred.
Processes and structure — The fund’s board of trustees has delegated authority to the fund’s investment adviser to make fair value determinations, subject to board oversight. The investment adviser has established a Joint Fair Valuation Committee (the “Fair Valuation Committee”) to administer, implement and oversee the fair valuation process, and to make fair value decisions. The Fair Valuation Committee regularly reviews its own fair value decisions, as well as decisions made under its standing instructions to the investment adviser’s valuation teams. The Fair Valuation Committee reviews changes in fair value measurements from period to period and may, as deemed appropriate, update the fair valuation guidelines to better reflect the results of back testing and address new or evolving issues. The Fair Valuation Committee reports any changes to the fair valuation guidelines to the board of trustees with supplemental information to support the changes. The fund’s board and audit committee also regularly review reports that describe fair value determinations and methods.
The fund’s investment adviser has also established a Fixed-Income Pricing Review Group to administer and oversee the fixed-income valuation process, including the use of fixed-income pricing vendors. This group regularly reviews pricing vendor information and market data. Pricing decisions, processes and controls over security valuation are also subject to additional internal reviews, including an annual control self-evaluation program facilitated by the investment adviser’s compliance group.
Classifications — The fund’s investment adviser classifies the fund’s assets and liabilities into three levels based on the inputs used to value the assets or liabilities. Level 1 values are based on quoted prices in active markets for identical securities. Level 2 values are based on significant observable market inputs, such as quoted prices for similar securities and quoted prices in inactive markets. Level 3 values are based on significant unobservable inputs that reflect the investment adviser’s determination of assumptions that market participants might reasonably use in valuing the securities. The valuation levels are not necessarily an indication of the risk or liquidity associated with the underlying investment. For example, U.S. government securities are reflected as Level 2 because the inputs used to determine fair value may not always be quoted prices in an active market. The following tables present the fund’s valuation levels as of September 30, 2014 (dollars in thousands):
| | | Investment securities |
| | | Level 1 | | | Level 2 | | | Level 3 | | | Total | |
| Assets: | | | | | | | | | | | | | | | | |
| Bonds, notes & other debt instruments: | | | | | | | | | | | | | | | | |
| Euros | | $ | — | | | $ | 2,878,824 | | | $ | — | | | $ | 2,878,824 | |
| British pounds | | | — | | | | 778,492 | | | | — | | | | 778,492 | |
| Japanese yen | | | — | | | | 518,806 | | | | — | | | | 518,806 | |
| Mexican pesos | | | — | | | | 418,458 | | | | — | | | | 418,458 | |
| Polish zloty | | | — | | | | 314,712 | | | | — | | | | 314,712 | |
| Hungarian forints | | | — | | | | 157,512 | | | | — | | | | 157,512 | |
| Colombian pesos | | | — | | | | 152,093 | | | | — | | | | 152,093 | |
| Indian rupees | | | — | | | | 136,432 | | | | — | | | | 136,432 | |
| Norwegian kroner | | | — | | | | 113,051 | | | | — | | | | 113,051 | |
| U.S. dollars | | | — | | | | 5,952,048 | | | | 29 | | | | 5,952,077 | |
| Other | | | — | | | | 717,467 | | | | — | | | | 717,467 | |
| Convertible stocks | | | — | | | | 2,369 | | | | — | | | | 2,369 | |
| Common stocks | | | — | | | | 580 | | | | — | | | | 580 | |
| Short-term securities | | | — | | | | 1,272,019 | | | | — | | | | 1,272,019 | |
| Total | | $ | — | | | $ | 13,412,863 | | | $ | 29 | | | $ | 13,412,892 | |
| 22 | Capital World Bond Fund |
| | Other investments* |
| | | Level 1 | | | Level 2 | | | Level 3 | | | Total | |
| Assets: | | | | | | | | | | | | | | | | |
| Unrealized appreciation on open forward currency contracts | | $ | — | | | $ | 53,512 | | | $ | — | | | $ | 53,512 | |
| Liabilities: | | | | | | | | | | | | | | | | |
| Unrealized depreciation on open forward currency contracts | | | — | | | | (32,834 | ) | | | — | | | | (32,834 | ) |
| Unrealized depreciation on interest rate swaps | | | — | | | | (2,991 | ) | | | — | | | | (2,991 | ) |
| Total | | $ | — | | | $ | 17,687 | | | $ | — | | | $ | 17,687 | |
| * | Forward currency contracts and interest rate swaps are not included in the investment portfolio. |
4. Risk factors
Investing in the fund may involve certain risks including, but not limited to, those described below.
Market conditions — The prices of, and the income generated by, the securities held by the fund may decline – sometimes rapidly or unpredictably – due to various factors, including events or conditions affecting the general economy or particular industries; overall market changes; local, regional or global political, social or economic instability; governmental or governmental agency responses to economic conditions; and currency, interest rate and commodity price fluctuations.
Issuer risks — The prices of, and the income generated by, securities held by the fund may also decline in response to various factors directly related to the issuers of such securities, including reduced demand for an issuer’s goods or services, poor management performance and strategic initiatives such as mergers, acquisitions or dispositions and the market response to any such initiatives.
Investing in debt instruments — The prices of, and the income generated by, bonds and other debt securities held by the fund may be affected by changing interest rates and by changes in the effective maturities and credit ratings of these securities.
Rising interest rates will generally cause the prices of bonds and other debt securities to fall. Falling interest rates may cause an issuer to redeem, call or refinance a debt security before its stated maturity, which may result in the fund having to reinvest the proceeds in lower yielding securities. Longer maturity debt securities generally have greater sensitivity to changes in interest rates and may be subject to greater price fluctuations than shorter maturity debt securities.
Bonds and other debt securities are also subject to credit risk, which is the possibility that the credit strength of an issuer will weaken and/or an issuer of a debt security will fail to make timely payments of principal or interest and the security will go into default. Lower quality debt securities generally have higher rates of interest and may be subject to greater price fluctuations than higher quality debt securities. Credit risk is gauged, in part, by the credit ratings of the debt securities in which the fund invests. However, ratings are only the opinions of the rating agencies issuing them and are not guarantees as to credit quality or an evaluation of market risk. The fund’s investment adviser relies on its own credit analysts to research issuers and issues in seeking to mitigate various credit and default risks.
Thinly traded securities — There may be little trading in the secondary market for particular bonds or other debt securities, which may make them more difficult to value, acquire or sell.
Investing in lower rated bonds — Lower rated bonds and other lower rated debt securities generally have higher rates of interest and involve greater risk of default or price declines due to changes in the issuer’s creditworthiness than those of higher quality debt securities. The market prices of these securities may fluctuate more than the prices of higher quality debt securities and may decline significantly in periods of general economic difficulty. These risks may be increased with respect to investments in junk bonds.
Currency — The prices of, and the income generated by, many debt securities held by the fund may also be affected by changes in relative currency values. If the U.S. dollar appreciates against foreign currencies, the value in U.S. dollars of the fund’s securities denominated in such currencies would generally fall and vice versa. U.S. dollar-denominated securities of foreign issuers may also be affected by changes in relative currency values.
Investing outside the U.S. — Securities of issuers domiciled outside the U.S., or with significant operations outside the U.S., may lose value because of adverse political, social, economic or market developments (including social instability, regional conflicts, terrorism and war) in the countries or regions in which the issuers are domiciled or operate. These securities may also lose value due to changes in foreign
| Capital World Bond Fund | 23 |
currency exchange rates against the U.S. dollar and/or currencies of other countries. Securities markets in certain countries may be more volatile and/or less liquid than those in the U.S. Investments outside the U.S. may also be subject to different accounting practices and different regulatory, legal and reporting standards, and may be more difficult to value, than those in the U.S. In addition, the value of investments outside the U.S. may be reduced by foreign taxes, including foreign withholding taxes on interest and dividends. Further, there may be increased risks of delayed settlement of securities purchased or sold by the fund. The risks of investing outside the U.S. may be heightened in connection with investments in emerging markets.
Investing in emerging markets — Investing in emerging markets may involve risks in addition to and greater than those generally associated with investing in the securities markets of developed countries. For instance, developing countries may have less developed legal and accounting systems than those in developed countries. The governments of these countries may be less stable and more likely to impose capital controls, nationalize a company or industry, place restrictions on foreign ownership and on withdrawing sale proceeds of securities from the country, and/or impose punitive taxes that could adversely affect the prices of securities. In addition, the economies of these countries may be dependent on relatively few industries that are more susceptible to local and global changes. Securities markets in these countries can also be relatively small and have substantially lower trading volumes. As a result, securities issued in these countries may be more volatile and less liquid, and may be more difficult to value, than securities issued in countries with more developed economies and/or markets. Less certainty with respect to security valuations may lead to additional challenges and risks in calculating the fund’s net asset value. Additionally, there may be increased settlement risks for transactions in local securities.
Nondiversification risk — As a nondiversified fund, the fund has the ability to invest a larger percentage of its assets in the securities of a smaller number of issuers than a diversified fund. Although the fund does not intend to limit its investments to the securities of a small number of issuers, if it were to do so, poor performance by a single large holding could adversely impact the fund’s investment results more than if the fund were invested in a larger number of issuers.
Management — The investment adviser to the fund actively manages the fund’s investments. Consequently, the fund is subject to the risk that the methods and analyses employed by the investment adviser in this process may not produce the desired results. This could cause the fund to lose value or its investment results to lag relevant benchmarks or other funds with similar objectives.
5. Certain investment techniques
Mortgage dollar rolls — The fund has entered into mortgage dollar roll transactions in which the fund sells a mortgage-backed security to a counterparty and simultaneously enters into an agreement with the same counterparty to buy back a similar security on a specific future date at a predetermined price. Mortgage dollar rolls are accounted for as purchase and sale transactions, which may increase the fund’s portfolio turnover rate.
Loan transactions — The fund has entered into loan transactions in which the fund acquires a loan either through an agent, by assignment from another holder, or as a participation interest in another holder’s portion of a loan. The loan is often administered by a financial institution that acts as agent for the holders of the loan, and the fund may be required to receive approval from the agent and/or borrower prior to the sale of the investment. The loan’s interest rate and maturity date may change based on the terms of the loan, including potential early payments of principal.
Forward currency contracts — The fund has entered into forward currency contracts, which represent agreements to exchange currencies on specific future dates at predetermined rates. The fund’s investment adviser uses forward currency contracts to manage the fund’s exposure to changes in exchange rates. Upon entering into these contracts, risks may arise from the potential inability of counterparties to meet the terms of their contracts and from possible movements in exchange rates.
On a daily basis, the fund’s investment adviser values forward currency contracts and records unrealized appreciation or depreciation for open forward currency contracts in the fund’s statement of assets and liabilities. Realized gains or losses are recorded at the time the forward currency contract is closed or offset by another contract with the same broker for the same settlement date and currency.
Closed forward currency contracts that have not reached their settlement date are included in the respective receivables or payables for closed forward currency contracts in the fund’s statement of assets and liabilities. Net realized gains or losses from closed forward currency contracts and net unrealized appreciation or depreciation from open forward currency contracts are recorded in the fund’s statement of operations.
Interest rate swaps — The fund has entered into interest rate swap contracts, which are agreements to exchange one stream of future interest payments for another based on a specified notional amount. Typically, interest rate swaps exchange a fixed interest rate for a payment that floats relative to a benchmark or vice versa. The fund’s investment adviser uses interest rate swaps to manage the interest
| 24 | Capital World Bond Fund |
rate sensitivity of the fund by increasing or decreasing the duration of the fund or a portion of the fund’s portfolio. Risks may arise as a result of the fund’s investment adviser incorrectly anticipating changes in interest rates, increased volatility, reduced liquidity and the potential inability of counterparties to meet the terms of their agreements.
Upon entering into an interest rate swap contract, the fund is required to deposit cash, U.S. government securities or other liquid securities, which is known as “initial margin.” Generally, the initial margin required for a particular interest rate swap is set and held as collateral by the clearinghouse on which the contract is cleared. The amount of initial margin required may be significantly modified from time to time by the clearinghouse during the term of the contract.
On a daily basis, the fund’s investment adviser records daily interest accruals related to the exchange of future payments as a receivable and payable in the fund’s statement of assets and liabilities. The fund also pays or receives a “variation margin” based on the increase or decrease in the value of the interest rate swaps, including accrued interest, and records variation margin on interest rate swaps in the statement of assets and liabilities. The fund records realized gains and losses on both the net accrued interest and any gain or loss recognized at the time the interest rate swap is closed or expires. Net realized gains or losses, as well as any net unrealized appreciation or depreciation, from interest rate swaps are recorded in the fund’s statement of operations.
The following tables present the financial statement impacts resulting from the fund’s use of forward currency contracts and interest rate swaps as of September 30, 2014 (dollars in thousands):
| | | Assets | | | Liabilities | |
| Contract | | Location on statement of
assets and liabilities | | Value | | | Location on statement of
assets and liabilities | | Value | |
| Forward currency | | Unrealized appreciation on open forward currency contracts | | $ | 53,512 | | | Unrealized depreciation on open forward currency contracts | | $ | 32,834 | |
| Forward currency | | Receivables for closed forward currency contracts | | | 19,822 | | | Payables for closed forward currency contracts | | | 2,071 | |
| Interest rate swaps | | Variation margin | | | — | | | Variation margin | | | 546 | |
| | | | | $ | 73,334 | | | | | $ | 35,451 | |
| | | | | | | | | | | | | |
| | | Net realized loss | | | Net unrealized appreciation (depreciation) | |
| Contract | | Location on statement of
operations | | | Value | | | Location on statement of
operations | | | Value | |
| Forward currency | | Net realized loss on forward currency contracts | | $ | (5,936 | ) | | Net unrealized appreciation on forward currency contracts | | $ | 18,455 | |
| Interest rate swaps | | Net realized loss on interest rate swaps | | | (733 | ) | | Net unrealized depreciation on interest rate swaps | | | (2,991 | ) |
| | | | | $ | (6,669 | ) | | | | $ | 15,464 | |
Collateral – The fund participates in a collateral program due to its use of forward currency contracts and interest rate swaps. For forward currency contracts, the program calls for the fund to either receive or pledge collateral based on the net gain or loss on unsettled forward currency contracts by counterparty. For interest rate swaps, the program calls for the fund to pledge collateral for initial and variation margin by contract. The purpose of the collateral is to cover potential losses that could occur in the event that either party cannot meet its contractual obligations.
Rights of offset — The fund has entered into enforceable master netting agreements with certain counterparties for forward currency contracts, where amounts payable by each party to the other in the same currency, with the same settlement date and with the same counterparty are settled net of each party’s payment obligation. For financial reporting purposes, the fund does not offset financial assets and financial liabilities that are subject to netting arrangements in the statement of assets and liabilities.
| Capital World Bond Fund | 25 |
The following table presents the fund’s forward currency contracts by counterparty, including those that are subject to potential offset on the statement of assets and liabilities as of September 30, 2014 (dollars in thousands):
| | | | | | Gross amounts not offset in the | | | | |
| | | Gross amounts | | | statement of assets and liabilities and | | | | |
| | | recognized in the | | | subject to a master netting agreement | | | | |
| Counterparty | | statement of assets
and liabilities | | | Available
to offset | | | Non-cash
collateral* | | | Cash
collateral | | | Net
amount | |
| | | | | | | | | | | | | | | | |
| Assets: | | | | | | | | | | | | | | | | | | | | |
| Bank of America, N.A. | | $ | 20,242 | | | $ | (145 | ) | | $ | (19,412 | ) | | $ | — | | | $ | 685 | |
| Bank of New York Mellon | | | 116 | | | | (116 | ) | | | — | | | | — | | | | — | |
| Barclays Bank PLC | | | 11,440 | | | | (7,335 | ) | | | (4,105 | ) | | | — | | | | — | |
| Citibank | | | 16,916 | | | | (14,099 | ) | | | (2,569 | ) | | | — | | | | 248 | |
| HSBC Bank | | | 2,570 | | | | (2,570 | ) | | | — | | | | — | | | | — | |
| JPMorgan Chase | | | 9,867 | | | | (2,130 | ) | | | (6,511 | ) | | | — | | | | 1,226 | |
| UBS AG | | | 12,183 | | | | (5,691 | ) | | | (6,492 | ) | | | — | | | | — | |
| Total | | $ | 73,334 | | | $ | (32,086 | ) | | $ | (39,089 | ) | | $ | — | | | $ | 2,159 | |
| | | | | | | | | | | | | | | | | | | | | |
| Liabilities: | | | | | | | | | | | | | | | | | | | | |
| Bank of America, N.A. | | $ | 145 | | | $ | (145 | ) | | $ | — | | | $ | — | | | $ | — | |
| Bank of New York Mellon | | | 874 | | | | (116 | ) | | | (451 | ) | | | — | | | | 307 | |
| Barclays Bank PLC | | | 7,335 | | | | (7,335 | ) | | | — | | | | — | | | | — | |
| Citibank | | | 14,099 | | | | (14,099 | ) | | | — | | | | — | | | | — | |
| HSBC Bank | | | 4,631 | | | | (2,570 | ) | | | (1,415 | ) | | | — | | | | 646 | |
| JPMorgan Chase | | | 2,130 | | | | (2,130 | ) | | | — | | | | — | | | | — | |
| UBS AG | | | 5,691 | | | | (5,691 | ) | | | — | | | | — | | | | — | |
| Total | | $ | 34,905 | | | $ | (32,086 | ) | | $ | (1,866 | ) | | $ | — | | | $ | 953 | |
| * | Non-cash collateral is shown on a settlement basis. |
6. Taxation and distributions
Federal income taxation — The fund complies with the requirements under Subchapter M of the Internal Revenue Code applicable to mutual funds and intends to distribute substantially all of its net taxable income and net capital gains each year. The fund is not subject to income taxes to the extent such distributions are made. Therefore, no federal income tax provision is required.
As of and during the period ended September 30, 2014, the fund did not have a liability for any unrecognized tax benefits. The fund recognizes interest and penalties, if any, related to unrecognized tax benefits as income tax expense in the statement of operations. During the period, the fund did not incur any significant interest or penalties.
The fund is not subject to examination by U.S. federal tax authorities for tax years before 2010 and by state tax authorities and tax authorities outside the U.S. for tax years before 2009.
Non-U.S. taxation — Dividend and interest income are recorded net of non-U.S. taxes paid.
Distributions — Distributions paid to shareholders are based on net investment income and net realized gains determined on a tax basis, which may differ from net investment income and net realized gains for financial reporting purposes. These differences are due primarily to different treatment for items such as currency gains and losses; short-term capital gains and losses; capital losses related to sales of certain securities within 30 days of purchase; cost of investments sold; and income on certain investments. The fiscal year in which amounts are distributed may differ from the year in which the net investment income and net realized gains are recorded by the fund for financial reporting purposes. The fund may also designate a portion of the amount paid to redeeming shareholders as a distribution for tax purposes.
During the year ended September 30, 2014, the fund reclassified $21,000 from undistributed net investment income to capital paid in on shares of beneficial interest, $112,551,000 from undistributed net investment income to undistributed net realized gain and $14,694,000 from undistributed net realized gain to capital paid in on shares of beneficial interest to align financial reporting with tax reporting.
| 26 | Capital World Bond Fund |
As of September 30, 2014, the tax basis components of distributable earnings, unrealized appreciation (depreciation) and cost of investment securities were as follows (dollars in thousands):
| Undistributed ordinary income | | $ | 126,544 | |
| Undistributed long-term capital gains | | | 120,696 | |
| Gross unrealized appreciation on investment securities | | | 233,388 | |
| Gross unrealized depreciation on investment securities | | | (225,512 | ) |
| Net unrealized appreciation on investment securities | | | 7,876 | |
| Cost of investment securities | | | 13,405,016 | |
The tax character of distributions paid to shareholders was as follows (dollars in thousands):
| | | Year ended September 30, 2014 | | | Year ended September 30, 2013 | |
| | | | | | | | | Total | | | | | | | | | Total | |
| | | Ordinary | | | Long-term | | | distributions | | | Ordinary | | | Long-term | | | distributions | |
| Share class | | income | | | capital gains | | | paid | | | income | | | capital gains | | | paid | |
| Class A | | $ | 151,925 | | | $ | — | | | $ | 151,925 | | | $ | 208,759 | | | $ | 70,583 | | | $ | 279,342 | |
| Class B | | | 1,073 | | | | — | | | | 1,073 | | | | 2,235 | | | | 1,126 | | | | 3,361 | |
| Class C | | | 7,962 | | | | — | | | | 7,962 | | | | 13,930 | | | | 6,908 | | | | 20,838 | |
| Class F-1 | | | 40,698 | | | | — | | | | 40,698 | | | | 46,446 | | | | 15,240 | | | | 61,686 | |
| Class F-2 | | | 17,372 | | | | — | | | | 17,372 | | | | 22,536 | | | | 6,937 | | | | 29,473 | |
| Class 529-A | | | 7,381 | | | | — | | | | 7,381 | | | | 9,848 | | | | 3,412 | | | | 13,260 | |
| Class 529-B | | | 97 | | | | — | | | | 97 | | | | 203 | | | | 110 | | | | 313 | |
| Class 529-C | | | 1,996 | | | | — | | | | 1,996 | | | | 3,085 | | | | 1,560 | | | | 4,645 | |
| Class 529-E | | | 349 | | | | — | | | | 349 | | | | 475 | | | | 180 | | | | 655 | |
| Class 529-F-1 | | | 938 | | | | — | | | | 938 | | | | 1,022 | | | | 315 | | | | 1,337 | |
| Class R-1 | | | 224 | | | | — | | | | 224 | | | | 362 | | | | 175 | | | | 537 | |
| Class R-2 | | | 2,275 | | | | — | | | | 2,275 | | | | 3,433 | | | | 1,663 | | | | 5,096 | |
| Class R-2E* | | | — | | | | — | | | | — | | | | | | | | | | | | | |
| Class R-3 | | | 3,254 | | | | — | | | | 3,254 | | | | 4,546 | | | | 1,739 | | | | 6,285 | |
| Class R-4 | | | 2,350 | | | | — | | | | 2,350 | | | | 3,008 | | | | 999 | | | | 4,007 | |
| Class R-5 | | | 4,516 | | | | — | | | | 4,516 | | | | 5,777 | | | | 1,670 | | | | 7,447 | |
| Class R-6 | | | 21,959 | | | | — | | | | 21,959 | | | | 15,097 | | | | 3,958 | | | | 19,055 | |
| Total | | $ | 264,369 | | | $ | — | | | $ | 264,369 | | | $ | 340,762 | | | $ | 116,575 | | | $ | 457,337 | |
| * | Class R-2E shares were offered beginning August 29, 2014. |
7. Fees and transactions with related parties
CRMC, the fund’s investment adviser, is the parent company of American Funds Distributors,® Inc. (“AFD”), the principal underwriter of the fund’s shares, and American Funds Service Company® (“AFS”), the fund’s transfer agent. CRMC, AFD and AFS are considered related parties to the fund.
Investment advisory services — The fund has an investment advisory and service agreement with CRMC that provides for monthly fees accrued daily. These fees are based on a series of decreasing annual rates beginning with 0.570% on the first $1 billion of daily net assets and decreasing to 0.360% on such assets in excess of $15 billion. For the year ended September 30, 2014, the investment advisory services fee was $56,600,000, which was equivalent to an annualized rate of 0.439% of average daily net assets.
Class-specific fees and expenses — Expenses that are specific to individual share classes are accrued directly to the respective share class. The principal class-specific fees and expenses are further described below:
Distribution services — The fund has plans of distribution for all share classes, except Class F-2, R-5 and R-6 shares. Under the plans, the board of trustees approves certain categories of expenses that are used to finance activities primarily intended to sell fund shares and service existing accounts. The plans provide for payments, based on an annualized percentage of average daily net assets, ranging from 0.30% to 1.00% as noted in this section. In some cases, the board of trustees has limited the amounts that may be paid to less than the maximum allowed by the plans. All share classes with a plan may use up to 0.25% of average daily net assets to pay service fees, or to compensate AFD for paying service fees, to firms that have entered into agreements with AFD to provide certain shareholder services. The remaining amounts available to be paid under each plan are paid to dealers to compensate them for their sales activities.
| Capital World Bond Fund | 27 |
For Class A and 529-A shares, distribution-related expenses include the reimbursement of dealer and wholesaler commissions paid by AFD for certain shares sold without a sales charge. These share classes reimburse AFD for amounts billed within the prior 15 months but only to the extent that the overall annual expense limit of 0.30% is not exceeded. As of September 30, 2014, there were no unreimbursed expenses subject to reimbursement for Class A or 529-A shares.
| Share class | | Currently approved limits | | Plan limits |
| Class A | | | 0.30 | % | | | 0.30 | % |
| Class 529-A | | | 0.30 | | | | 0.50 | |
| Classes B and 529-B | | | 1.00 | | | | 1.00 | |
| Classes C, 529-C and R-1 | | | 1.00 | | | | 1.00 | |
| Class R-2 | | | 0.75 | | | | 1.00 | |
| Class R-2E | | | 0.60 | | | | 0.85 | |
| Classes 529-E and R-3 | | | 0.50 | | | | 0.75 | |
| Classes F-1, 529-F-1 and R-4 | | | 0.25 | | | | 0.50 | |
Transfer agent services — The fund has a shareholder services agreement with AFS under which the fund compensates AFS for providing transfer agent services to each of the fund’s share classes. These services include recordkeeping, shareholder communications and transaction processing. In addition, the fund reimburses AFS for amounts paid to third parties for performing transfer agent services on behalf of fund shareholders.
Administrative services — The fund has an administrative services agreement with CRMC under which the fund compensates CRMC for providing administrative services to Class A, C, F, 529 and R shares. These services include, but are not limited to, coordinating, monitoring, assisting and overseeing third parties that provide services to fund shareholders. Under the agreement, Class A shares pay an annual fee of 0.01% and Class C, F, 529 and R shares pay an annual fee of 0.05% of their respective average daily net assets.
529 plan services — Each 529 share class is subject to service fees to compensate the Virginia College Savings Plan (“Virginia529”) for its oversight and administration of the 529 college savings plan. During the period October 1, 2013, to March 31, 2014, the quarterly fee was based on a series of decreasing annual rates beginning with 0.10% on the first $30 billion of the net assets invested in Class 529 shares of the American Funds and decreasing to 0.06% on such assets between $120 billion and $150 billion. Effective April 1, 2014, the quarterly fee was amended to provide for reduced annual rates of 0.07%, 0.06% and 0.05% over $30 billion, $50 billion and $70 billion, respectively, of the net assets invested in Class 529 shares of the American Funds. The fee for any given calendar quarter is accrued and calculated on the basis of the average net assets of Class 529 shares of the American Funds for the last month of the prior calendar quarter. The fee is included in other expenses in the fund’s statement of operations. Virginia529 is not considered a related party to the fund.
For the year ended September 30, 2014, class-specific expenses under the agreements were as follows (dollars in thousands):
| | | | Distribution | | | Transfer agent | | | Administrative | | | 529 plan |
| | Share class | | services | | | services | | | services | | | services |
| | Class A | | | $17,397 | | | | $13,441 | | | | $724 | | | Not applicable |
| | Class B | | | 763 | | | | 145 | | | | Not applicable | | | Not applicable |
| | Class C | | | 5,920 | | | | 1,104 | | | | 297 | | | Not applicable |
| | Class F-1 | | | 4,900 | | | | 2,589 | | | | 980 | | | Not applicable |
| | Class F-2 | | | Not applicable | | | | 646 | | | | 440 | | | Not applicable |
| | Class 529-A | | | 817 | | | | 588 | | | | 184 | | | $343 |
| | Class 529-B | | | 75 | | | | 14 | | | | 4 | | | 7 |
| | Class 529-C | | | 1,578 | | | | 270 | | | | 80 | | | 149 |
| | Class 529-E | | | 96 | | | | 18 | | | | 9 | | | 18 |
| | Class 529-F-1 | | | — | | | | 68 | | | | 21 | | | 40 |
| | Class R-1 | | | 164 | | | | 22 | | | | 8 | | | Not applicable |
| | Class R-2 | | | 1,276 | | | | 775 | | | | 86 | | | Not applicable |
| | Class R-2E* | | | — | | | | — | † | | | — | † | | Not applicable |
| | Class R-3 | | | 891 | | | | 345 | | | | 90 | | | Not applicable |
| | Class R-4 | | | 276 | | | | 120 | | | | 56 | | | Not applicable |
| | Class R-5 | | | Not applicable | | | | 98 | | | | 91 | | | Not applicable |
| | Class R-6 | | | Not applicable | | | | 8 | | | | 493 | | | Not applicable |
| | Total class-specific expenses | | | $34,153 | | | | $20,251 | | | | $3,563 | | | $557 |
| * | Class R-2E shares were offered beginning August 29, 2014. |
| † | Amount less than one thousand. |
| 28 | Capital World Bond Fund |
Trustees’ deferred compensation — Trustees who are unaffiliated with CRMC may elect to defer the cash payment of part or all of their compensation. These deferred amounts, which remain as liabilities of the fund, are treated as if invested in shares of the fund or other American Funds. These amounts represent general, unsecured liabilities of the fund and vary according to the total returns of the selected funds. Trustees’ compensation of $115,000 in the fund’s statement of operations includes $79,000 in current fees (either paid in cash or deferred) and a net increase of $36,000 in the value of the deferred amounts.
Affiliated officers and trustees — Officers and certain trustees of the fund are or may be considered to be affiliated with CRMC, AFD and AFS. No affiliated officers or trustees received any compensation directly from the fund.
8. Capital share transactions
Capital share transactions in the fund were as follows (dollars and shares in thousands):
| | | Sales1 | | | Reinvestments of
dividends and distributions | | | Repurchases1 | | | Net (decrease)
increase | |
| Share class | | Amount | | | Shares | | | Amount | | | Shares | | | Amount | | | Shares | | | Amount | | | Shares | |
| | | | | | | | | | | | | | | | | | | | | | | | | |
| Year ended September 30, 2014 | | | | | | | | | | | | | | | | | | | | |
| | | | | | | | | | | | | | | | | | | | | |
| Class A | | $ | 992,656 | | | | 48,064 | | | $ | 148,647 | | | | 7,285 | | | $ | (1,408,767 | ) | | | (68,563 | ) | | $ | (267,464 | ) | | | (13,214 | ) |
| Class B | | | 2,837 | | | | 139 | | | | 1,058 | | | | 52 | | | | (34,098 | ) | | | (1,668 | ) | | | (30,203 | ) | | | (1,477 | ) |
| Class C | | | 72,081 | | | | 3,542 | | | | 7,740 | | | | 386 | | | | (188,167 | ) | | | (9,292 | ) | | | (108,346 | ) | | | (5,364 | ) |
| Class F-1 | | | 729,295 | | | | 35,590 | | | | 40,506 | | | | 1,996 | | | | (732,814 | ) | | | (35,667 | ) | | | 36,987 | | | | 1,919 | |
| Class F-2 | | | 575,894 | | | | 27,829 | | | | 15,665 | | | | 767 | | | | (221,703 | ) | | | (10,833 | ) | | | 369,856 | | | | 17,763 | |
| Class 529-A | | | 49,511 | | | | 2,397 | | | | 7,377 | | | | 361 | | | | (73,548 | ) | | | (3,567 | ) | | | (16,660 | ) | | | (809 | ) |
| Class 529-B | | | 369 | | | | 18 | | | | 96 | | | | 5 | | | | (3,580 | ) | | | (175 | ) | | | (3,115 | ) | | | (152 | ) |
| Class 529-C | | | 22,866 | | | | 1,117 | | | | 1,994 | | | | 99 | | | | (38,944 | ) | | | (1,908 | ) | | | (14,084 | ) | | | (692 | ) |
| Class 529-E | | | 3,334 | | | | 163 | | | | 349 | | | | 17 | | | | (4,398 | ) | | | (216 | ) | | | (715 | ) | | | (36 | ) |
| Class 529-F-1 | | | 13,268 | | | | 647 | | | | 938 | | | | 47 | | | | (8,900 | ) | | | (436 | ) | | | 5,306 | | | | 258 | |
| Class R-1 | | | 3,830 | | | | 188 | | | | 222 | | | | 11 | | | | (4,545 | ) | | | (223 | ) | | | (493 | ) | | | (24 | ) |
| Class R-2 | | | 42,460 | | | | 2,079 | | | | 2,272 | | | | 112 | | | | (54,764 | ) | | | (2,685 | ) | | | (10,032 | ) | | | (494 | ) |
| Class R-2E2 | | | 10 | | | | — | 3 | | | — | | | | — | | | | — | | | | — | | | | 10 | | | | — | 3 |
| Class R-3 | | | 49,106 | | | | 2,387 | | | | 3,249 | | | | 159 | | | | (63,722 | ) | | | (3,100 | ) | | | (11,367 | ) | | | (554 | ) |
| Class R-4 | | | 37,076 | | | | 1,802 | | | | 2,348 | | | | 115 | | | | (36,901 | ) | | | (1,795 | ) | | | 2,523 | | | | 122 | |
| Class R-5 | | | 50,909 | | | | 2,474 | | | | 4,513 | | | | 221 | | | | (84,631 | ) | | | (4,078 | ) | | | (29,209 | ) | | | (1,383 | ) |
| Class R-6 | | | 568,675 | | | | 27,497 | | | | 21,959 | | | | 1,073 | | | | (57,587 | ) | | | (2,799 | ) | | | 533,047 | | | | 25,771 | |
Total net increase
(decrease) | | $ | 3,214,177 | | | | 155,933 | | | $ | 258,933 | | | | 12,706 | | | $ | (3,017,069 | ) | | | (147,005 | ) | | $ | 456,041 | | | | 21,634 | |
| | | | | | | | | | | | | | | | | | | | | | | | | | | | | | | | | |
| Year ended September 30, 2013 | | | | | | | | | | | | | | | | |
| | | | | | | | | | | | | | | | | |
| Class A | | $ | 1,348,596 | | | | 64,414 | | | $ | 273,174 | | | | 13,005 | | | $ | (2,024,612 | ) | | | (98,041 | ) | | $ | (402,842 | ) | | | (20,622 | ) |
| Class B | | | 8,263 | | | | 395 | | | | 3,307 | | | | 157 | | | | (54,040 | ) | | | (2,616 | ) | | | (42,470 | ) | | | (2,064 | ) |
| Class C | | | 122,696 | | | | 5,940 | | | | 20,246 | | | | 974 | | | | (251,659 | ) | | | (12,354 | ) | | | (108,717 | ) | | | (5,440 | ) |
| Class F-1 | | | 664,129 | | | | 32,317 | | | | 61,370 | | | | 2,940 | | | | (565,077 | ) | | | (27,377 | ) | | | 160,422 | | | | 7,880 | |
| Class F-2 | | | 317,447 | | | | 15,110 | | | | 27,507 | | | | 1,313 | | | | (392,594 | ) | | | (19,258 | ) | | | (47,640 | ) | | | (2,835 | ) |
| Class 529-A | | | 69,746 | | | | 3,320 | | | | 13,253 | | | | 630 | | | | (86,969 | ) | | | (4,195 | ) | | | (3,970 | ) | | | (245 | ) |
| Class 529-B | | | 860 | | | | 41 | | | | 313 | | | | 15 | | | | (5,752 | ) | | | (277 | ) | | | (4,579 | ) | | | (221 | ) |
| Class 529-C | | | 33,925 | | | | 1,631 | | | | 4,641 | | | | 222 | | | | (44,857 | ) | | | (2,187 | ) | | | (6,291 | ) | | | (334 | ) |
| Class 529-E | | | 4,159 | | | | 200 | | | | 654 | | | | 31 | | | | (5,122 | ) | | | (248 | ) | | | (309 | ) | | | (17 | ) |
| Class 529-F-1 | | | 12,416 | | | | 597 | | | | 1,337 | | | | 64 | | | | (9,200 | ) | | | (445 | ) | | | 4,553 | | | | 216 | |
| Class R-1 | | | 4,519 | | | | 219 | | | | 534 | | | | 26 | | | | (8,325 | ) | | | (404 | ) | | | (3,272 | ) | | | (159 | ) |
| Class R-2 | | | 57,637 | | | | 2,782 | | | | 5,094 | | | | 244 | | | | (66,634 | ) | | | (3,237 | ) | | | (3,903 | ) | | | (211 | ) |
| Class R-3 | | | 71,198 | | | | 3,413 | | | | 6,276 | | | | 299 | | | | (87,245 | ) | | | (4,212 | ) | | | (9,771 | ) | | | (500 | ) |
| Class R-4 | | | 45,171 | | | | 2,160 | | | | 4,007 | | | | 191 | | | | (48,501 | ) | | | (2,339 | ) | | | 677 | | | | 12 | |
| Class R-5 | | | 64,401 | | | | 3,092 | | | | 7,442 | | | | 355 | | | | (89,014 | ) | | | (4,262 | ) | | | (17,171 | ) | | | (815 | ) |
| Class R-6 | | | 408,170 | | | | 19,640 | | | | 19,054 | | | | 912 | | | | (65,745 | ) | | | (3,188 | ) | | | 361,479 | | | | 17,364 | |
Total net increase
(decrease) | | $ | 3,233,333 | | | | 155,271 | | | $ | 448,209 | | | | 21,378 | | | $ | (3,805,346 | ) | | | (184,640 | ) | | $ | (123,804 | ) | | | (7,991 | ) |
| 1 | Includes exchanges between share classes of the fund. |
| 2 | Class R-2E shares were offered beginning August 29, 2014. |
| 3 | Amount less than one thousand. |
| Capital World Bond Fund | 29 |
9. Investment transactions
The fund made purchases and sales of investment securities, excluding short-term securities and U.S. government obligations, if any, of $20,319,854,000 and $21,288,404,000, respectively, during the year ended September 30, 2014.
| 30 | Capital World Bond Fund |
Financial highlights
| | | | | Income (loss) from
investment operations1 | | | Dividends and distributions | | | | | | | | | | | | | | | | | |
| | | Net asset
value,
beginning
of period | | Net
investment
income
(loss) | | | Net gains
(losses) on
securities
(both
realized and
unrealized) | | | Total from
investment
operations | | | Dividends
(from net
investment
income) | | | Distributions
(from capital
gains) | | | Total
dividends
and
distributions | | | Net asset
value,
end
of period | | Total
return2,3 | | | Net assets,
end of period
(in millions) | | Ratio of
expenses to
average net
assets before
reimbursements | | | Ratio of
expenses to
average net
assets after
reimbursements3 | | | Ratio of
net income
(loss) to
average
net assets3 | |
| Class A: | | | | | | | | | | | | | | | | | | | | | | | | | | | | | | | | | | | | | | | | | | | | | | | | | |
| Year ended 9/30/2014 | | $ | 20.32 | | $ | .47 | | | $ | .13 | | | $ | .60 | | | $ | (.43 | ) | | $ | — | | | $ | (.43 | ) | | $ | 20.49 | | | 2.98 | % | | $ | 7,176 | | | .90 | % | | | .90 | % | | | 2.27 | % |
| Year ended 9/30/2013 | | | 21.63 | | | .43 | | | | (1.02 | ) | | | (.59 | ) | | | (.44 | ) | | | (.28 | ) | | | (.72 | ) | | | 20.32 | | | (2.80 | ) | | | 7,384 | | | .91 | | | | .91 | | | | 2.09 | |
| Year ended 9/30/2012 | | | 20.48 | | | .51 | | | | 1.08 | | | | 1.59 | | | | (.44 | ) | | | — | | | | (.44 | ) | | | 21.63 | | | 7.89 | | | | 8,306 | | | .89 | | | | .89 | | | | 2.43 | |
| Year ended 9/30/2011 | | | 21.03 | | | .68 | | | | (.41 | ) | | | .27 | | | | (.82 | ) | | | — | | | | (.82 | ) | | | 20.48 | | | 1.32 | | | | 7,868 | | | .87 | | | | .87 | | | | 3.26 | |
| Year ended 9/30/2010 | | | 20.28 | | | .71 | | | | .80 | | | | 1.51 | | | | (.76 | ) | | | — | | | | (.76 | ) | | | 21.03 | | | 7.63 | | | | 7,679 | | | .88 | | | | .88 | | | | 3.52 | |
| Class B: | | | | | | | | | | | | | | | | | | | | | | | | | | | | | | | | | | | | | | | | | | | | | | | | | |
| Year ended 9/30/2014 | | | 20.16 | | | .32 | | | | .12 | | | | .44 | | | | (.26 | ) | | | — | | | | (.26 | ) | | | 20.34 | | | 2.22 | | | | 63 | | | 1.66 | | | | 1.66 | | | | 1.54 | |
| Year ended 9/30/2013 | | | 21.46 | | | .27 | | | | (1.02 | ) | | | (.75 | ) | | | (.27 | ) | | | (.28 | ) | | | (.55 | ) | | | 20.16 | | | (3.56 | ) | | | 92 | | | 1.67 | | | | 1.67 | | | | 1.32 | |
| Year ended 9/30/2012 | | | 20.35 | | | .35 | | | | 1.08 | | | | 1.43 | | | | (.32 | ) | | | — | | | | (.32 | ) | | | 21.46 | | | 7.09 | | | | 142 | | | 1.65 | | | | 1.65 | | | | 1.70 | |
| Year ended 9/30/2011 | | | 20.89 | | | .52 | | | | (.41 | ) | | | .11 | | | | (.65 | ) | | | — | | | | (.65 | ) | | | 20.35 | | | .56 | | | | 186 | | | 1.64 | | | | 1.64 | | | | 2.49 | |
| Year ended 9/30/2010 | | | 20.15 | | | .56 | | | | .78 | | | | 1.34 | | | | (.60 | ) | | | — | | | | (.60 | ) | | | 20.89 | | | 6.79 | | | | 242 | | | 1.64 | | | | 1.64 | | | | 2.76 | |
| Class C: | | | | | | | | | | | | | | | | | | | | | | | | | | | | | | | | | | | | | | | | | | | | | | | | | |
| Year ended 9/30/2014 | | | 20.01 | | | .30 | | | | .13 | | | | .43 | | | | (.26 | ) | | | — | | | | (.26 | ) | | | 20.18 | | | 2.17 | | | | 552 | | | 1.70 | | | | 1.70 | | | | 1.49 | |
| Year ended 9/30/2013 | | | 21.30 | | | .26 | | | | (1.00 | ) | | | (.74 | ) | | | (.27 | ) | | | (.28 | ) | | | (.55 | ) | | | 20.01 | | | (3.55 | ) | | | 654 | | | 1.71 | | | | 1.71 | | | | 1.28 | |
| Year ended 9/30/2012 | | | 20.21 | | | .34 | | | | 1.07 | | | | 1.41 | | | | (.32 | ) | | | — | | | | (.32 | ) | | | 21.30 | | | 7.05 | | | | 813 | | | 1.68 | | | | 1.68 | | | | 1.63 | |
| Year ended 9/30/2011 | | | 20.77 | | | .51 | | | | (.42 | ) | | | .09 | | | | (.65 | ) | | | — | | | | (.65 | ) | | | 20.21 | | | .48 | | | | 822 | | | 1.66 | | | | 1.66 | | | | 2.47 | |
| Year ended 9/30/2010 | | | 20.04 | | | .54 | | | | .79 | | | | 1.33 | | | | (.60 | ) | | | — | | | | (.60 | ) | | | 20.77 | | | 6.79 | | | | 862 | | | 1.67 | | | | 1.67 | | | | 2.73 | |
| Class F-1: | | | | | | | | | | | | | | | | | | | | | | | | | | | | | | | | | | | | | | | | | | | | | | | | | |
| Year ended 9/30/2014 | | | 20.20 | | | .47 | | | | .13 | | | | .60 | | | | (.43 | ) | | | — | | | | (.43 | ) | | | 20.37 | | | 3.01 | | | | 1,951 | | | .90 | | | | .90 | | | | 2.27 | |
| Year ended 9/30/2013 | | | 21.51 | | | .43 | | | | (1.02 | ) | | | (.59 | ) | | | (.44 | ) | | | (.28 | ) | | | (.72 | ) | | | 20.20 | | | (2.81 | ) | | | 1,896 | | | .91 | | | | .91 | | | | 2.09 | |
| Year ended 9/30/2012 | | | 20.37 | | | .50 | | | | 1.09 | | | | 1.59 | | | | (.45 | ) | | | — | | | | (.45 | ) | | | 21.51 | | | 7.91 | | | | 1,849 | | | .88 | | | | .88 | | | | 2.39 | |
| Year ended 9/30/2011 | | | 20.92 | | | .67 | | | | (.41 | ) | | | .26 | | | | (.81 | ) | | | — | | | | (.81 | ) | | | 20.37 | | | 1.31 | | | | 1,324 | | | .89 | | | | .89 | | | | 3.24 | |
| Year ended 9/30/2010 | | | 20.18 | | | .71 | | | | .78 | | | | 1.49 | | | | (.75 | ) | | | — | | | | (.75 | ) | | | 20.92 | | | 7.61 | | | | 1,307 | | | .88 | | | | .88 | | | | 3.51 | |
| Class F-2: | | | | | | | | | | | | | | | | | | | | | | | | | | | | | | | | | | | | | | | | | | | | | | | | | |
| Year ended 9/30/2014 | | | 20.31 | | | .52 | | | | .14 | | | | .66 | | | | (.49 | ) | | | — | | | | (.49 | ) | | | 20.48 | | | 3.29 | | | | 990 | | | .61 | | | | .61 | | | | 2.54 | |
| Year ended 9/30/2013 | | | 21.62 | | | .49 | | | | (1.02 | ) | | | (.53 | ) | | | (.50 | ) | | | (.28 | ) | | | (.78 | ) | | | 20.31 | | | (2.53 | ) | | | 621 | | | .64 | | | | .64 | | | | 2.35 | |
| Year ended 9/30/2012 | | | 20.45 | | | .56 | | | | 1.10 | | | | 1.66 | | | | (.49 | ) | | | — | | | | (.49 | ) | | | 21.62 | | | 8.23 | | | | 723 | | | .62 | | | | .62 | | | | 2.67 | |
| Year ended 9/30/2011 | | | 21.01 | | | .73 | | | | (.42 | ) | | | .31 | | | | (.87 | ) | | | — | | | | (.87 | ) | | | 20.45 | | | 1.52 | | | | 524 | | | .63 | | | | .63 | | | | 3.50 | |
| Year ended 9/30/2010 | | | 20.25 | | | .76 | | | | .81 | | | | 1.57 | | | | (.81 | ) | | | — | | | | (.81 | ) | | | 21.01 | | | 7.97 | | | | 468 | | | .62 | | | | .62 | | | | 3.77 | |
| Class 529-A: | | | | | | | | | | | | | | | | | | | | | | | | | | | | | | | | | | | | | | | | | | | | | | | | | |
| Year ended 9/30/2014 | | | 20.37 | | | .45 | | | | .13 | | | | .58 | | | | (.41 | ) | | | — | | | | (.41 | ) | | | 20.54 | | | 2.88 | | | | 358 | | | .99 | | | | .99 | | | | 2.19 | |
| Year ended 9/30/2013 | | | 21.68 | | | .42 | | | | (1.03 | ) | | | (.61 | ) | | | (.42 | ) | | | (.28 | ) | | | (.70 | ) | | | 20.37 | | | (2.87 | ) | | | 372 | | | .99 | | | | .99 | | | | 2.01 | |
| Year ended 9/30/2012 | | | 20.53 | | | .49 | | | | 1.09 | | | | 1.58 | | | | (.43 | ) | | | — | | | | (.43 | ) | | | 21.68 | | | 7.81 | | | | 401 | | | .97 | | | | .97 | | | | 2.34 | |
| Year ended 9/30/2011 | | | 21.08 | | | .67 | | | | (.41 | ) | | | .26 | | | | (.81 | ) | | | — | | | | (.81 | ) | | | 20.53 | | | 1.26 | | | | 344 | | | .93 | | | | .93 | | | | 3.19 | |
| Year ended 9/30/2010 | | | 20.32 | | | .70 | | | | .81 | | | | 1.51 | | | | (.75 | ) | | | — | | | | (.75 | ) | | | 21.08 | | | 7.62 | | | | 292 | | | .93 | | | | .93 | | | | 3.46 | |
| Class 529-B: | | | | | | | | | | | | | | | | | | | | | | | | | | | | | | | | | | | | | | | | | | | | | | | | | |
| Year ended 9/30/2014 | | | 20.22 | | | .29 | | | | .13 | | | | .42 | | | | (.24 | ) | | | — | | | | (.24 | ) | | | 20.40 | | | 2.13 | | | | 6 | | | 1.78 | | | | 1.78 | | | | 1.42 | |
| Year ended 9/30/2013 | | | 21.52 | | | .25 | | | | (1.03 | ) | | | (.78 | ) | | | (.24 | ) | | | (.28 | ) | | | (.52 | ) | | | 20.22 | | | (3.68 | ) | | | 9 | | | 1.78 | | | | 1.78 | | | | 1.20 | |
| Year ended 9/30/2012 | | | 20.41 | | | .33 | | | | 1.08 | | | | 1.41 | | | | (.30 | ) | | | — | | | | (.30 | ) | | | 21.52 | | | 6.97 | | | | 15 | | | 1.77 | | | | 1.77 | | | | 1.57 | |
| Year ended 9/30/2011 | | | 20.95 | | | .50 | | | | (.41 | ) | | | .09 | | | | (.63 | ) | | | — | | | | (.63 | ) | | | 20.41 | | | .46 | | | | 18 | | | 1.74 | | | | 1.74 | | | | 2.39 | |
| Year ended 9/30/2010 | | | 20.21 | | | .54 | | | | .78 | | | | 1.32 | | | | (.58 | ) | | | — | | | | (.58 | ) | | | 20.95 | | | 6.69 | | | | 22 | | | 1.74 | | | | 1.74 | | | | 2.66 | |
See page 33 for footnotes.
| Capital World Bond Fund | 31 |
Financial highlights (continued)
| | | | | Income (loss) from
investment operations1 | | | Dividends and distributions | | | | | | | | | | | | | | | | | |
| | | Net asset
value,
beginning
of period | | Net
investment
income
(loss) | | | Net gains
(losses) on
securities
(both
realized and
unrealized) | | | Total from
investment
operations | | | Dividends
(from net
investment
income) | | | Distributions
(from capital
gains) | | | Total
dividends
and
distributions | | | Net asset
value,
end
of period | | Total
return2,3 | | | Net assets,
end of period
(in millions) | | Ratio of
expenses to
average net
assets before
reimbursements | | | Ratio of
expenses to
average net
assets after
reimbursements3 | | | Ratio of
net income
(loss) to
average
net assets3 | |
| Class 529-C: | | | | | | | | | | | | | | | | | | | | | | | | | | | | | | | | | | | | | | | | | | | | | | | | | |
| Year ended 9/30/2014 | | $ | 20.14 | | $ | .29 | | | $ | .14 | | | $ | .43 | | | $ | (.25 | ) | | $ | — | | | $ | (.25 | ) | | $ | 20.32 | | | 2.15 | % | | $ | 152 | | | 1.77 | % | | | 1.77 | % | | | 1.41 | % |
| Year ended 9/30/2013 | | | 21.45 | | | .25 | | | | (1.02 | ) | | | (.77 | ) | | | (.26 | ) | | | (.28 | ) | | | (.54 | ) | | | 20.14 | | | (3.67 | ) | | | 165 | | | 1.77 | | | | 1.77 | | | | 1.22 | |
| Year ended 9/30/2012 | | | 20.35 | | | .32 | | | | 1.09 | | | | 1.41 | | | | (.31 | ) | | | — | | | | (.31 | ) | | | 21.45 | | | 7.00 | | | | 183 | | | 1.76 | | | | 1.76 | | | | 1.55 | |
| Year ended 9/30/2011 | | | 20.91 | | | .50 | | | | (.42 | ) | | | .08 | | | | (.64 | ) | | | — | | | | (.64 | ) | | | 20.35 | | | .42 | | | | 168 | | | 1.73 | | | | 1.73 | | | | 2.39 | |
| Year ended 9/30/2010 | | | 20.17 | | | .54 | | | | .79 | | | | 1.33 | | | | (.59 | ) | | | — | | | | (.59 | ) | | | 20.91 | | | 6.75 | | | | 148 | | | 1.73 | | | | 1.73 | | | | 2.66 | |
| Class 529-E: | | | | | | | | | | | | | | | | | | | | | | | | | | | | | | | | | | | | | | | | | | | | | | | | | |
| Year ended 9/30/2014 | | | 20.24 | | | .41 | | | | .13 | | | | .54 | | | | (.37 | ) | | | — | | | | (.37 | ) | | | 20.41 | | | 2.69 | | | | 19 | | | 1.20 | | | | 1.20 | | | | 1.98 | |
| Year ended 9/30/2013 | | | 21.55 | | | .37 | | | | (1.02 | ) | | | (.65 | ) | | | (.38 | ) | | | (.28 | ) | | | (.66 | ) | | | 20.24 | | | (3.11 | ) | | | 20 | | | 1.21 | | | | 1.21 | | | | 1.79 | |
| Year ended 9/30/2012 | | | 20.42 | | | .44 | | | | 1.08 | | | | 1.52 | | | | (.39 | ) | | | — | | | | (.39 | ) | | | 21.55 | | | 7.56 | | | | 21 | | | 1.21 | | | | 1.21 | | | | 2.09 | |
| Year ended 9/30/2011 | | | 20.97 | | | .61 | | | | (.41 | ) | | | .20 | | | | (.75 | ) | | | — | | | | (.75 | ) | | | 20.42 | | | .98 | | | | 18 | | | 1.21 | | | | 1.21 | | | | 2.91 | |
| Year ended 9/30/2010 | | | 20.22 | | | .64 | | | | .80 | | | | 1.44 | | | | (.69 | ) | | | — | | | | (.69 | ) | | | 20.97 | | | 7.30 | | | | 16 | | | 1.22 | | | | 1.22 | | | | 3.17 | |
| Class 529-F-1: | | | | | | | | | | | | | | | | | | | | | | | | | | | | | | | | | | | | | | | | | | | | | | | | | |
| Year ended 9/30/2014 | | | 20.27 | | | .49 | | | | .14 | | | | .63 | | | | (.46 | ) | | | — | | | | (.46 | ) | | | 20.44 | | | 3.13 | | | | 45 | | | .77 | | | | .77 | | | | 2.40 | |
| Year ended 9/30/2013 | | | 21.58 | | | .46 | | | | (1.02 | ) | | | (.56 | ) | | | (.47 | ) | | | (.28 | ) | | | (.75 | ) | | | 20.27 | | | (2.67 | ) | | | 39 | | | .77 | | | | .77 | | | | 2.23 | |
| Year ended 9/30/2012 | | | 20.42 | | | .53 | | | | 1.09 | | | | 1.62 | | | | (.46 | ) | | | — | | | | (.46 | ) | | | 21.58 | | | 8.08 | | | | 37 | | | .75 | | | | .75 | | | | 2.55 | |
| Year ended 9/30/2011 | | | 20.98 | | | .71 | | | | (.42 | ) | | | .29 | | | | (.85 | ) | | | — | | | | (.85 | ) | | | 20.42 | | | 1.42 | | | | 31 | | | .73 | | | | .73 | | | | 3.40 | |
| Year ended 9/30/2010 | | | 20.23 | | | .74 | | | | .80 | | | | 1.54 | | | | (.79 | ) | | | — | | | | (.79 | ) | | | 20.98 | | | 7.82 | | | | 25 | | | .72 | | | | .72 | | | | 3.67 | |
| Class R-1: | | | | | | | | | | | | | | | | | | | | | | | | | | | | | | | | | | | | | | | | | | | | | | | | | |
| Year ended 9/30/2014 | | | 20.14 | | | .31 | | | | .14 | | | | .45 | | | | (.28 | ) | | | — | | | | (.28 | ) | | | 20.31 | | | 2.24 | | | | 17 | | | 1.65 | | | | 1.65 | | | | 1.53 | |
| Year ended 9/30/2013 | | | 21.44 | | | .28 | | | | (1.02 | ) | | | (.74 | ) | | | (.28 | ) | | | (.28 | ) | | | (.56 | ) | | | 20.14 | | | (3.52 | ) | | | 17 | | | 1.64 | | | | 1.64 | | | | 1.35 | |
| Year ended 9/30/2012 | | | 20.33 | | | .35 | | | | 1.09 | | | | 1.44 | | | | (.33 | ) | | | — | | | | (.33 | ) | | | 21.44 | | | 7.14 | | | | 21 | | | 1.63 | | | | 1.63 | | | | 1.69 | |
| Year ended 9/30/2011 | | | 20.89 | | | .51 | | | | (.42 | ) | | | .09 | | | | (.65 | ) | | | — | | | | (.65 | ) | | | 20.33 | | | .47 | | | | 21 | | | 1.66 | | | | 1.66 | | | | 2.47 | |
| Year ended 9/30/2010 | | | 20.15 | | | .55 | | | | .79 | | | | 1.34 | | | | (.60 | ) | | | — | | | | (.60 | ) | | | 20.89 | | | 6.80 | | | | 21 | | | 1.67 | | | | 1.67 | | | | 2.72 | |
| Class R-2: | | | | | | | | | | | | | | | | | | | | | | | | | | | | | | | | | | | | | | | | | | | | | | | | | |
| Year ended 9/30/2014 | | | 20.13 | | | .30 | | | | .14 | | | | .44 | | | | (.27 | ) | | | — | | | | (.27 | ) | | | 20.30 | | | 2.19 | | | | 168 | | | 1.71 | | | | 1.71 | | | | 1.47 | |
| Year ended 9/30/2013 | | | 21.43 | | | .27 | | | | (1.01 | ) | | | (.74 | ) | | | (.28 | ) | | | (.28 | ) | | | (.56 | ) | | | 20.13 | | | (3.54 | ) | | | 177 | | | 1.67 | | | | 1.67 | | | | 1.32 | |
| Year ended 9/30/2012 | | | 20.33 | | | .34 | | | | 1.08 | | | | 1.42 | | | | (.32 | ) | | | — | | | | (.32 | ) | | | 21.43 | | | 7.05 | | | | 193 | | | 1.70 | | | | 1.70 | | | | 1.62 | |
| Year ended 9/30/2011 | | | 20.89 | | | .52 | | | | (.42 | ) | | | .10 | | | | (.66 | ) | | | — | | | | (.66 | ) | | | 20.33 | | | .50 | | | | 185 | | | 1.72 | | | | 1.64 | | | | 2.48 | |
| Year ended 9/30/2010 | | | 20.15 | | | .55 | | | | .79 | | | | 1.34 | | | | (.60 | ) | | | — | | | | (.60 | ) | | | 20.89 | | | 6.83 | | | | 173 | | | 1.73 | | | | 1.65 | | | | 2.74 | |
| Class R-2E: | | | | | | | | | | | | | | | | | | | | | | | | | | | | | | | | | | | | | | | | | | | | | | | | | |
| Period from 8/29/2014 to 9/30/20144,5 | | | 21.00 | | | .04 | | | | (.54 | ) | | | (.50 | ) | | | — | | | | — | | | | — | | | | 20.50 | | | (2.38 | ) | | | — | 6 | | .06 | 7 | | | .06 | 7 | | | .17 | 7 |
| Class R-3: | | | | | | | | | | | | | | | | | | | | | | | | | | | | | | | | | | | | | | | | | | | | | | | | | |
| Year ended 9/30/2014 | | | 20.28 | | | .41 | | | | .13 | | | | .54 | | | | (.37 | ) | | | — | | | | (.37 | ) | | | 20.45 | | | 2.67 | | | | 174 | | | 1.21 | | | | 1.21 | | | | 1.97 | |
| Year ended 9/30/2013 | | | 21.58 | | | .37 | | | | (1.02 | ) | | | (.65 | ) | | | (.37 | ) | | | (.28 | ) | | | (.65 | ) | | | 20.28 | | | (3.06 | ) | | | 184 | | | 1.21 | | | | 1.21 | | | | 1.79 | |
| Year ended 9/30/2012 | | | 20.45 | | | .44 | | | | 1.08 | | | | 1.52 | | | | (.39 | ) | | | — | | | | (.39 | ) | | | 21.58 | | | 7.54 | | | | 206 | | | 1.21 | | | | 1.21 | | | | 2.10 | |
| Year ended 9/30/2011 | | | 21.00 | | | .61 | | | | (.41 | ) | | | .20 | | | | (.75 | ) | | | — | | | | (.75 | ) | | | 20.45 | | | .98 | | | | 202 | | | 1.21 | | | | 1.21 | | | | 2.92 | |
| Year ended 9/30/2010 | | | 20.25 | | | .64 | | | | .80 | | | | 1.44 | | | | (.69 | ) | | | — | | | | (.69 | ) | | | 21.00 | | | 7.28 | | | | 186 | | | 1.22 | | | | 1.22 | | | | 3.17 | |
| 32 | Capital World Bond Fund |
| | | | | Income (loss) from
investment operations1 | | | Dividends and distributions | | | | | | | | | | | | | | | | | |
| | | Net asset
value,
beginning
of period | | Net
investment
income
(loss) | | | Net gains
(losses) on
securities
(both
realized and
unrealized) | | | Total from
investment
operations | | | Dividends
(from net
investment
income) | | | Distributions
(from capital
gains) | | | Total
dividends
and
distributions | | | Net asset
value,
end
of period | | Total
return2,3 | | | Net assets,
end of period
(in millions) | | Ratio of
expenses to
average net
assets before
reimbursements | | | Ratio of
expenses to
average net
assets after
reimbursements3 | | | Ratio of
net income
(loss) to
average
net assets3 | |
| Class R-4: | | | | | | | | | | | | | | | | | | | | | | | | | | | | | | | | | | | | | | | | | | | | | | | | | |
| Year ended 9/30/2014 | | $ | 20.31 | | $ | .47 | | | $ | .14 | | | $ | .61 | | | $ | (.44 | ) | | $ | — | | | $ | (.44 | ) | | $ | 20.48 | | | 3.02 | % | | $ | 112 | | | .87 | % | | | .87 | % | | | 2.30 | % |
| Year ended 9/30/2013 | | | 21.62 | | | .44 | | | | (1.03 | ) | | | (.59 | ) | | | (.44 | ) | | | (.28 | ) | | | (.72 | ) | | | 20.31 | | | (2.78 | ) | | | 108 | | | .88 | | | | .88 | | | | 2.12 | |
| Year ended 9/30/2012 | | | 20.46 | | | .51 | | | | 1.09 | | | | 1.60 | | | | (.44 | ) | | | — | | | | (.44 | ) | | | 21.62 | | | 7.96 | | | | 115 | | | .87 | | | | .87 | | | | 2.45 | |
| Year ended 9/30/2011 | | | 21.02 | | | .68 | | | | (.42 | ) | | | .26 | | | | (.82 | ) | | | — | | | | (.82 | ) | | | 20.46 | | | 1.26 | | | | 117 | | | .88 | | | | .88 | | | | 3.25 | |
| Year ended 9/30/2010 | | | 20.26 | | | .71 | | | | .80 | | | | 1.51 | | | | (.75 | ) | | | — | | | | (.75 | ) | | | 21.02 | | | 7.68 | | | | 114 | | | .89 | | | | .89 | | | | 3.51 | |
| Class R-5: | | | | | | | | | | | | | | | | | | | | | | | | | | | | | | | | | | | | | | | | | | | | | | | | | |
| Year ended 9/30/2014 | | | 20.35 | | | .54 | | | | .13 | | | | .67 | | | | (.50 | ) | | | — | | | | (.50 | ) | | | 20.52 | | | 3.32 | | | | 162 | | | .57 | | | | .57 | | | | 2.62 | |
| Year ended 9/30/2013 | | | 21.66 | | | .50 | | | | (1.02 | ) | | | (.52 | ) | | | (.51 | ) | | | (.28 | ) | | | (.79 | ) | | | 20.35 | | | (2.47 | ) | | | 189 | | | .57 | | | | .57 | | | | 2.42 | |
| Year ended 9/30/2012 | | | 20.49 | | | .57 | | | | 1.09 | | | | 1.66 | | | | (.49 | ) | | | — | | | | (.49 | ) | | | 21.66 | | | 8.24 | | | | 219 | | | .57 | | | | .57 | | | | 2.72 | |
| Year ended 9/30/2011 | | | 21.04 | | | .74 | | | | (.41 | ) | | | .33 | | | | (.88 | ) | | | — | | | | (.88 | ) | | | 20.49 | | | 1.61 | | | | 174 | | | .58 | | | | .58 | | | | 3.55 | |
| Year ended 9/30/2010 | | | 20.29 | | | .77 | | | | .79 | | | | 1.56 | | | | (.81 | ) | | | — | | | | (.81 | ) | | | 21.04 | | | 7.93 | | | | 146 | | | .59 | | | | .59 | | | | 3.80 | |
| Class R-6: | | | | | | | | | | | | | | | | | | | | | | | | | | | | | | | | | | | | | | | | | | | | | | | | | |
| Year ended 9/30/2014 | | | 20.34 | | | .54 | | | | .15 | | | | .69 | | | | (.51 | ) | | | — | | | | (.51 | ) | | | 20.52 | | | 3.44 | | | | 1,262 | | | .52 | | | | .52 | | | | 2.63 | |
| Year ended 9/30/2013 | | | 21.66 | | | .52 | | | | (1.04 | ) | | | (.52 | ) | | | (.52 | ) | | | (.28 | ) | | | (.80 | ) | | | 20.34 | | | (2.47 | ) | | | 727 | | | .52 | | | | .52 | | | | 2.51 | |
| Year ended 9/30/2012 | | | 20.48 | | | .58 | | | | 1.10 | | | | 1.68 | | | | (.50 | ) | | | — | | | | (.50 | ) | | | 21.66 | | | 8.33 | | | | 398 | | | .52 | | | | .52 | | | | 2.76 | |
| Year ended 9/30/2011 | | | 21.03 | | | .75 | | | | (.41 | ) | | | .34 | | | | (.89 | ) | | | — | | | | (.89 | ) | | | 20.48 | | | 1.62 | | | | 280 | | | .53 | | | | .53 | | | | 3.60 | |
| Year ended 9/30/2010 | | | 20.28 | | | .78 | | | | .79 | | | | 1.57 | | | | (.82 | ) | | | — | | | | (.82 | ) | | | 21.03 | | | 8.04 | | | | 218 | | | .54 | | | | .54 | | | | 3.85 | |
| | | Year ended September 30 |
| | | 2014 | | 2013 | | 2012 | | 2011 | | 2010 | |
| Portfolio turnover rate for all share classes | | 205% | | 199% | | 142% | | 95% | | 80% | |
| 1 | Based on average shares outstanding. |
| 2 | Total returns exclude any applicable sales charges, including contingent deferred sales charges. |
| 3 | This column reflects the impact, if any, of certain reimbursements from CRMC. During some of the periods shown, CRMC paid a portion of the fund’s transfer agent fees for certain retirement plan share classes. |
| 4 | Class R-2E shares were offered beginning August 29, 2014. |
| 5 | Based on operations for the period shown and, accordingly, is not representative of a full year. |
| 6 | Amount less than $1 million. |
| 7 | Class R-2E assets consisted solely of seed capital invested by CRMC; therefore, certain fees were not accrued. |
See Notes to Financial Statements
| Capital World Bond Fund | 33 |
Report of Independent Registered Public Accounting Firm
To the Shareholders and Board of Trustees of Capital World Bond Fund:
We have audited the accompanying statement of assets and liabilities of Capital World Bond Fund (the “Fund”), including the summary investment portfolio, as of September 30, 2014, and the related statement of operations for the year then ended, the statements of changes in net assets for each of the two years in the period then ended, and the financial highlights for each of the periods presented. These financial statements and financial highlights are the responsibility of the Fund’s management. Our responsibility is to express an opinion on these financial statements and financial highlights based on our audits.
We conducted our audits in accordance with the standards of the Public Company Accounting Oversight Board (United States). Those standards require that we plan and perform the audit to obtain reasonable assurance about whether the financial statements and financial highlights are free of material misstatement. The Fund is not required to have, nor were we engaged to perform, an audit of its internal control over financial reporting. Our audits included consideration of internal control over financial reporting as a basis for designing audit procedures that are appropriate in the circumstances, but not for the purpose of expressing an opinion on the effectiveness of the Fund’s internal control over financial reporting. Accordingly, we express no such opinion. An audit also includes examining, on a test basis, evidence supporting the amounts and disclosures in the financial statements, assessing the accounting principles used and significant estimates made by management, as well as evaluating the overall financial statement presentation. Our procedures included confirmation of securities owned as of September 30, 2014, by correspondence with the custodian and brokers; where replies were not received from brokers, we performed other auditing procedures. We believe that our audits provide a reasonable basis for our opinion.
In our opinion, such financial statements and financial highlights referred to above present fairly, in all material respects, the financial position of Capital World Bond Fund as of September 30, 2014, the results of its operations for the year then ended, the changes in its net assets for each of the two years in the period then ended, and the financial highlights for each of the periods presented, in conformity with accounting principles generally accepted in the United States of America.
Deloitte & Touche LLP
Costa Mesa, California
November 7, 2014
| 34 | Capital World Bond Fund |
As a fund shareholder, you incur two types of costs: (1) transaction costs, such as initial sales charges on purchase payments and contingent deferred sales charges on redemptions (loads), and (2) ongoing costs, including management fees, distribution and service (12b-1) fees, and other expenses. This example is intended to help you understand your ongoing costs (in dollars) of investing in the fund so you can compare these costs with the ongoing costs of investing in other mutual funds. The example is based on an investment of $1,000 invested at the beginning of the period and held for the entire six-month period (April 1, 2014, through September 30, 2014).
Actual expenses:
The first line of each share class in the table on the following page provides information about actual account values and actual expenses. You may use the information in this line, together with the amount you invested, to estimate the expenses that you paid over the period. Simply divide your account value by $1,000 (for example, an $8,600 account value divided by $1,000 = 8.6), then multiply the result by the number in the first line under the heading entitled “Expenses paid during period” to estimate the expenses you paid on your account during this period.
Hypothetical example for comparison purposes:
The second line of each share class in the table on the following page provides information about hypothetical account values and hypothetical expenses based on the actual expense ratio for the share class and an assumed rate of return of 5.00% per year before expenses, which is not the actual return of the share class. The hypothetical account values and expenses may not be used to estimate the actual ending account balance or expenses you paid for the period. You may use this information to compare the ongoing costs of investing in the fund and other funds. To do so, compare this 5.00% hypothetical example with the 5.00% hypothetical examples that appear in the shareholder reports of the other funds.
Notes:
Retirement plan participants may be subject to certain fees charged by the plan sponsor, and Class F-1, F-2 and 529-F-1 shareholders may be subject to fees charged by financial intermediaries, typically ranging from 0.75% to 1.50% of assets annually depending on services offered. You can estimate the impact of these fees by adding the amount of the fees to the total estimated expenses you paid on your account during the period as calculated above. In addition, your ending account value would be lower by the amount of these fees.
Note that the expenses shown in the table on the following page are meant to highlight your ongoing costs only and do not reflect any transactional costs, such as sales charges (loads). Therefore, the second line of each share class in the table is useful in comparing ongoing costs only and will not help you determine the relative total costs of owning different funds. In addition, if these transactional costs were included, your costs would have been higher.
| Capital World Bond Fund | 35 |
| | | Beginning
account value
4/1/2014 | | | Ending
account value
9/30/2014 | | | Expenses paid
during period* | | | Annualized
expense ratio | |
| Class A - actual return | | $ | 1,000.00 | | | $ | 999.42 | | | $ | 4.51 | | | | .90 | % |
| Class A - assumed 5% return | | | 1,000.00 | | | | 1,020.56 | | | | 4.56 | | | | .90 | |
| Class B - actual return | | | 1,000.00 | | | | 995.48 | | | | 8.25 | | | | 1.65 | |
| Class B - assumed 5% return | | | 1,000.00 | | | | 1,016.80 | | | | 8.34 | | | | 1.65 | |
| Class C - actual return | | | 1,000.00 | | | | 995.46 | | | | 8.45 | | | | 1.69 | |
| Class C - assumed 5% return | | | 1,000.00 | | | | 1,016.60 | | | | 8.54 | | | | 1.69 | |
| Class F-1 - actual return | | | 1,000.00 | | | | 999.45 | | | | 4.51 | | | | .90 | |
| Class F-1 - assumed 5% return | | | 1,000.00 | | | | 1,020.56 | | | | 4.56 | | | | .90 | |
| Class F-2 - actual return | | | 1,000.00 | | | | 1,001.19 | | | | 3.06 | | | | .61 | |
| Class F-2 - assumed 5% return | | | 1,000.00 | | | | 1,022.01 | | | | 3.09 | | | | .61 | |
| Class 529-A - actual return | | | 1,000.00 | | | | 998.74 | | | | 4.96 | | | | .99 | |
| Class 529-A - assumed 5% return | | | 1,000.00 | | | | 1,020.10 | | | | 5.01 | | | | .99 | |
| Class 529-B - actual return | | | 1,000.00 | | | | 995.17 | | | | 8.85 | | | | 1.77 | |
| Class 529-B - assumed 5% return | | | 1,000.00 | | | | 1,016.19 | | | | 8.95 | | | | 1.77 | |
| Class 529-C - actual return | | | 1,000.00 | | | | 995.38 | | | | 8.80 | | | | 1.76 | |
| Class 529-C - assumed 5% return | | | 1,000.00 | | | | 1,016.24 | | | | 8.90 | | | | 1.76 | |
| Class 529-E - actual return | | | 1,000.00 | | | | 997.76 | | | | 5.96 | | | | 1.19 | |
| Class 529-E - assumed 5% return | | | 1,000.00 | | | | 1,019.10 | | | | 6.02 | | | | 1.19 | |
| Class 529-F-1 - actual return | | | 1,000.00 | | | | 1,000.27 | | | | 3.81 | | | | .76 | |
| Class 529-F-1 - assumed 5% return | | | 1,000.00 | | | | 1,021.26 | | | | 3.85 | | | | .76 | |
| Class R-1 - actual return | | | 1,000.00 | | | | 995.66 | | | | 8.20 | | | | 1.64 | |
| Class R-1 - assumed 5% return | | | 1,000.00 | | | | 1,016.85 | | | | 8.29 | | | | 1.64 | |
| Class R-2 - actual return | | | 1,000.00 | | | | 995.45 | | | | 8.55 | | | | 1.71 | |
| Class R-2 - assumed 5% return | | | 1,000.00 | | | | 1,016.50 | | | | 8.64 | | | | 1.71 | |
| Class R-2E - actual return† | | | 1,000.00 | | | | 976.19 | | | | .64 | | | | .74 | |
| Class R-2E - assumed 5% return† | | | 1,000.00 | | | | 1,021.36 | | | | 3.75 | | | | .74 | |
| Class R-3 - actual return | | | 1,000.00 | | | | 998.21 | | | | 6.06 | | | | 1.21 | |
| Class R-3 - assumed 5% return | | | 1,000.00 | | | | 1,019.00 | | | | 6.12 | | | | 1.21 | |
| Class R-4 - actual return | | | 1,000.00 | | | | 999.53 | | | | 4.36 | | | | .87 | |
| Class R-4 - assumed 5% return | | | 1,000.00 | | | | 1,020.71 | | | | 4.41 | | | | .87 | |
| Class R-5 - actual return | | | 1,000.00 | | | | 1,000.74 | | | | 2.86 | | | | .57 | |
| Class R-5 - assumed 5% return | | | 1,000.00 | | | | 1,022.21 | | | | 2.89 | | | | .57 | |
| Class R-6 - actual return | | | 1,000.00 | | | | 1,001.40 | | | | 2.61 | | | | .52 | |
| Class R-6 - assumed 5% return | | | 1,000.00 | | | | 1,022.46 | | | | 2.64 | | | | .52 | |
| * | The “expenses paid during period” are equal to the “annualized expense ratio,” multiplied by the average account value over the period, multiplied by the number of days in the period, and divided by 365 (to reflect the one-half year period). |
| † | The period for the “annualized expense ratio” and “actual return” line is based on the number of days since the initial sale of the share class on August 29, 2014. The “assumed 5% return” line is based on 183 days. |
| 36 | Capital World Bond Fund |
We are required to advise you of the federal tax status of certain distributions received by shareholders during the fiscal year. The fund hereby designates the following amounts for the fund’s fiscal year ended September 30, 2014:
| Foreign taxes | | $0.003 per share | |
| Foreign source income | | $0.45 per share | |
| Qualified dividend income | | $5,850,000 | |
| U.S. government income that may be exempt from state taxation | | $2,004,000 | |
Individual shareholders should refer to their Form 1099 or other tax information, which will be mailed in January 2015, to determine the calendar year amounts to be included on their 2014 tax returns. Shareholders should consult their tax advisors.
| Capital World Bond Fund | 37 |
Board of trustees and other officers
“Independent” trustees1
| Name and age | | Year first
elected
a trustee
of the fund2 | | Principal occupation(s) during past five years | | Number of
portfolios in fund
complex overseen
by trustee | | Other directorships3
held by trustee |
| William H. Baribault, 69 | | 2010 | | CEO and President, Richard Nixon Foundation; former Chairman of the Board and CEO, Oakwood Enterprises (private investment and consulting) | | 70 | | None |
| James G. Ellis, 67 | | 2006 | | Dean and Professor of Marketing, Marshall School of Business, University of Southern California | | 70 | | Mercury General Corp. |
| Leonard R. Fuller, 68 | | 1994 | | President and CEO, Fuller Consulting (financial management consulting firm) | | 70 | | None |
R. Clark Hooper, 68
Chairman of the Board
(Independent and Non-Executive) | | 2005 | | Private investor | | 72 | | The Swiss Helvetia Fund, Inc. |
| Merit E. Janow, 56 | | 2010 | | Dean and Professor, Columbia University, School of International and Public Affairs | | 69 | | MasterCard Incorporated;
The NASDAQ Stock Market LLC;
Trimble Navigation Limited |
| Laurel B. Mitchell, Ph.D., 59 | | 2010 | | Clinical Professor and Director, Accounting Program, University of Redlands | | 66 | | None |
| Frank M. Sanchez, 71 | | 1999 | | Principal, The Sanchez Family Corporation dba McDonald’s Restaurants (McDonald’s licensee) | | 66 | | None |
| Margaret Spellings, 57 | | 2010 | | President, George W. Bush Foundation; former President and CEO, Margaret Spellings & Company (public policy and strategic consulting); former President, U.S. Chamber Foundation and Senior Advisor to the President and CEO, U.S. Chamber of Commerce; former U.S. Secretary of Education, U.S. Department of Education | | 70 | | None |
| Steadman Upham, Ph.D., 65 | | 2007 | | President and University Professor, The University of Tulsa | | 69 | | None |
“Interested” trustee4,5
Name, age and
position with fund | | Year first
elected
a trustee
or officer
of the fund2 | | Principal occupation(s) during past five years
and positions held with affiliated entities or
the principal underwriter of the fund | | Number of
portfolios in fund
complex overseen
by trustee | | Other directorships3 held by trustee |
John H. Smet, 58
Vice Chairman of the Board | | 2011 | | Senior Vice President — Capital Fixed Income Investors, Capital Research and Management Company; Director, Capital Research and Management Company | | 20 | | None |
The fund’s statement of additional information includes further details about fund trustees and is available without charge upon request by calling American Funds Service Company at (800) 421-4225 or by visiting the American Funds website at americanfunds.com. The address for all trustees and officers of the fund is 333 South Hope Street, Los Angeles, CA 90071, Attention: Secretary.
| 38 | Capital World Bond Fund |
Other officers5
Name, age and
position with fund | | Year first
elected
an officer
of the fund2 | | Principal occupation(s) during past five years and positions held with affiliated entities
or the principal underwriter of the fund |
Mark H. Dalzell, 60
President | | 1998 | | Senior Vice President — Capital Fixed Income Investors, Capital Research and Management Company |
Thomas H. Høgh, 51
Senior Vice President | | 2001 | | Senior Vice President — Capital Fixed Income Investors, Capital Research Company6 |
Robert H. Neithart, 49
Senior Vice President | | 2011 | | Senior Vice President — Capital Fixed Income Investors, Capital Research and Management Company; Director, The Capital Group Companies, Inc.;6
Chairman of the Board, Capital Strategy Research, Inc.6 |
Kristine M. Nishiyama, 44
Senior Vice President | | 2003 | | Senior Vice President and Senior Counsel — Fund Business Management Group, Capital Research and Management Company; Senior Vice President and General Counsel, Capital Bank and Trust Company6 |
Courtney R. Taylor, 39
Secretary | | 2006 | | Assistant Vice President — Fund Business Management Group, Capital Research and Management Company |
Brian C. Janssen, 42
Treasurer | | 2012 | | Vice President — Investment Operations, Capital Research and Management Company |
Steven I. Koszalka, 50
Assistant Secretary | | 2010 | | Vice President — Fund Business Management Group, Capital Research and Management Company |
Dori Laskin, 63
Assistant Treasurer | | 2010 | | Vice President — Investment Operations, Capital Research and Management Company |
Ari M. Vinocor, 40
Assistant Treasurer | | 2007 | | Vice President — Investment Operations, Capital Research and Management Company |
| 1 | The term “independent” trustee refers to a trustee who is not an “interested person” of the fund within the meaning of the Investment Company Act of 1940. |
| 2 | Trustees and officers of the fund serve until their resignation, removal or retirement. |
| 3 | This includes all directorships/trusteeships (other than those in the American Funds or other funds managed by Capital Research and Management Company or its affiliates) that are held by each trustee as a trustee or director of a public company or a registered investment company. |
| 4 | The term “interested” trustee refers to a trustee who is an “interested person” within the meaning of the Investment Company Act of 1940, on the basis of their affiliation with the fund’s investment adviser, Capital Research and Management Company, or affiliated entities (including the fund’s principal underwriter). |
| 5 | All of the directors/trustees and/or officers listed are officers and/or directors/trustees of one or more of the other funds for which Capital Research and Management Company serves as investment adviser. |
| 6 | Company affiliated with Capital Research and Management Company. |
| Capital World Bond Fund | 39 |
Offices of the fund and of the investment adviser
Capital Research and Management Company
333 South Hope Street
Los Angeles, CA 90071-1406
6455 Irvine Center Drive
Irvine, CA 92618-4518
Transfer agent for shareholder accounts
American Funds Service Company
(Write to the address near you.)
P.O. Box 6007
Indianapolis, IN 46206-6007
P.O. Box 2280
Norfolk, VA 23501-2280
Custodian of assets
JPMorgan Chase Bank
270 Park Avenue
New York, NY 10017-2070
Counsel
Bingham McCutchen LLP
355 South Grand Avenue, Suite 4400
Los Angeles, CA 90071-3106
Independent registered public accounting firm
Deloitte & Touche LLP
695 Town Center Drive
Suite 1200
Costa Mesa, CA 92626-7188
Principal underwriter
American Funds Distributors, Inc.
333 South Hope Street
Los Angeles, CA 90071-1406
| 40 | Capital World Bond Fund |
Investors should carefully consider investment objectives, risks, charges and expenses. This and other important information is contained in the fund prospectus and summary prospectus, which can be obtained from your financial professional and should be read carefully before investing. You may also call American Funds Service Company (AFS) at (800) 421-4225 or visit the American Funds website at americanfunds.com.
“American Funds Proxy Voting Procedures and Principles” — which describes how we vote proxies relating to portfolio securities — is available on the American Funds website or upon request by calling AFS. The fund files its proxy voting record with the U.S. Securities and Exchange Commission (SEC) for the 12 months ended June 30 by August 31. The proxy voting record is available free of charge on the SEC website at sec.gov and on the American Funds website.
A complete September 30, 2014, portfolio of Capital World Bond Fund’s investments is available free of charge by calling AFS or visiting the SEC website (where it is part of Form N-CSR).
Capital World Bond Fund files a complete list of its portfolio holdings with the SEC for the first and third quarters of each fiscal year on Form N-Q. This filing is available free of charge on the SEC website. You may also review or, for a fee, copy this filing at the SEC’s Public Reference Room in Washington, D.C. Additional information regarding the operation of the Public Reference Room may be obtained by calling the SEC’s Office of Investor Education and Advocacy at (800) SEC-0330. Additionally, the list of portfolio holdings is available by calling AFS.
This report is for the information of shareholders of Capital World Bond Fund, but it also may be used as sales literature when preceded or accompanied by the current prospectus or summary prospectus, which gives details about charges, expenses, investment objectives and operating policies of the fund. If used as sales material after December 31, 2014, this report must be accompanied by an American Funds statistical update for the most recently completed calendar quarter.
The American Funds Advantage
Since 1931, American Funds, part of Capital Group, has helped investors pursue long-term investment success. Our consistent approach — in combination with The Capital SystemSM — has resulted in a superior long-term track record.
| | Aligned with investor success |
| | We base our decisions on a long-term perspective, which we believe aligns our goals with the interests of our clients. Our portfolio managers average 26 years of investment experience, including 21 years at our company, reflecting a career commitment to our long-term approach.1 |
| | |
| | The Capital SystemSM |
| | Our investment process, The Capital System, combines individual accountability with teamwork. Each fund is divided into portions that are managed independently by investment professionals with diverse backgrounds, ages and investment approaches. An extensive global research effort is the backbone of our system. |
| | |
| | Superior long-term track record |
| | Our equity funds have beaten their Lipper peer indexes in 90% of 10-year periods and 96% of 20-year periods. Our fixed-income funds have beaten their Lipper indexes in 56% of 10-year periods and 57% of 20-year periods.2 Our fund management fees have been among the lowest in the industry.3 |
| | 1 | Portfolio manager experience as of December 31, 2013. |
| | 2 | Based on Class A share results for rolling periods through December 31, 2013. Periods covered are the shorter of the fund’s lifetime or since the comparable Lipper index inception date (except SMALLCAP World Fund, for which the Lipper average was used). |
| | 3 | Based on management fees for the 20-year period ended December 31, 2013, versus comparable Lipper categories, excluding funds of funds. |

ITEM 2 – Code of Ethics
The Registrant has adopted a Code of Ethics that applies to its Principal Executive Officer and Principal Financial Officer. The Registrant undertakes to provide to any person without charge, upon request, a copy of the Code of Ethics. Such request can be made to American Funds Service Company at 800/421-9225 or to the Secretary of the Registrant, 333 South Hope Street, Los Angeles, California 90071.
ITEM 3 – Audit Committee Financial Expert
The Registrant’s board has determined that Laurel B. Mitchell, a member of the Registrant’s audit committee, is an “audit committee financial expert” and "independent," as such terms are defined in this Item. This designation will not increase the designee’s duties, obligations or liability as compared to his or her duties, obligations and liability as a member of the audit committee and of the board, nor will it reduce the responsibility of the other audit committee members. There may be other individuals who, through education or experience, would qualify as "audit committee financial experts" if the board had designated them as such. Most importantly, the board believes each member of the audit committee contributes significantly to the effective oversight of the Registrant’s financial statements and condition.
ITEM 4 – Principal Accountant Fees and Services
| | Registrant: |
| | | a) Audit Fees: |
| | | | 2013 | $ 128,000 |
| | | | 2014 | $ 134,000 |
| | | | |
| | | b) Audit-Related Fees: |
| | | | 2013 | $ 5,000 |
| | | | 2014 | $ 3,000 |
| | | | The audit-related fees consist of assurance and related services relating to the examination of the Registrant’s investment adviser conducted in accordance with Statement on Standards for Attestation Engagements Number 16 issued by the American Institute of Certified Public Accountants. |
| | | | |
| | | c) Tax Fees: |
| | | | 2013 | $ 7,000 |
| | | | 2014 | $ 7,000 |
| | | | The tax fees consist of professional services relating to the preparation of the Registrant’s tax returns including returns relating to the Registrant’s investments in non-U.S. jurisdictions. |
| | | | |
| | | d) All Other Fees: |
| | | | 2013 | None |
| | | | 2014 | None |
| | | | |
| | Adviser and affiliates (includes only fees for non-audit services billed to the adviser and affiliates for engagements that relate directly to the operations and financial reporting of the Registrant and were subject to the pre-approval policies described below): |
| | | a) Audit Fees: |
| | | | Not Applicable |
| | | | |
| | | b) Audit-Related Fees: |
| | | | 2013 | $ 1,046,000 |
| | | | 2014 | $ 993,000 |
| | | | The audit-related fees consist of assurance and related services relating to the examination of the Registrant’s transfer agent, principal underwriter and investment adviser conducted in accordance with Statement on Standards for Attestation Engagements Number 16 issued by the American Institute of Certified Public Accountants. |
| | | | |
| | | c) Tax Fees: |
| | | | 2013 | $ 28,000 |
| | | | 2014 | $ 41,000 |
| | | | The tax fees consist of consulting services relating to the Registrant’s investments. |
| | | | |
| | | d) All Other Fees: |
| | | | 2013 | $ 2,000 |
| | | | 2014 | $ 3,000 |
| | | | The other fees consist of subscription services related to an accounting research tool. |
| | | | |
All audit and permissible non-audit services that the Registrant’s audit committee considers compatible with maintaining the independent registered public accounting firm’s independence are required to be pre-approved by the committee. The pre-approval requirement will extend to all non-audit services provided to the Registrant, the investment adviser, and any entity controlling, controlled by, or under common control with the investment adviser that provides ongoing services to the Registrant, if the engagement relates directly to the operations and financial reporting of the Registrant. The committee will not delegate its responsibility to pre-approve these services to the investment adviser. The committee may delegate to one or more committee members the authority to review and pre-approve audit and permissible non-audit services. Actions taken under any such delegation will be reported to the full committee at its next meeting. The pre-approval requirement is waived with respect to non-audit services if certain conditions are met. The pre-approval requirement was not waived for any of the non-audit services listed above provided to the Registrant, adviser and affiliates.
Aggregate non-audit fees paid to the Registrant’s auditors, including fees for all services billed to the Registrant, adviser and affiliates that provide ongoing services to the Registrant, were $1,542,000 for fiscal year 2013 and $1,388,000 for fiscal year 2014. The non-audit services represented by these amounts were brought to the attention of the committee and considered to be compatible with maintaining the auditors’ independence.
ITEM 5 – Audit Committee of Listed Registrants
Not applicable to this Registrant, insofar as the Registrant is not a listed issuer as defined in Rule 10A-3 under the Securities Exchange Act of 1934.
ITEM 6 – Schedule of Investments
Capital World Bond Fund®
Investment portfolio
September 30, 2014
Bonds, notes & other debt instruments 91.91%
Euros 21.80% | Principal amount
(000) | Value
(000) |
| Allianz SE, 4.75% (undated)1 | €13,400 | $18,249 |
| Altice Finco SA, First Lien, 7.25% 2022 | 1,500 | 1,968 |
| Anheuser-Busch InBev NV 8.625% 2017 | 1,375 | 2,078 |
| Assicurazioni Generali SPA 10.125% 2042 | 2,700 | 4,698 |
| Assicurazioni Generali SPA 7.75% 20421 | 4,700 | 7,350 |
| AT&T Inc. 6.125% 2015 | 4,500 | 5,856 |
| Aviva PLC 6.125% 20431 | 13,000 | 19,313 |
| Aviva PLC, junior subordinated 5.70% (undated)1 | 5,460 | 7,092 |
| Banco Bilbao Vizcaya Argentaria SA 3.50% 20241 | 25,500 | 33,190 |
| Barclays Bank PLC 4.00% 20192 | 8,950 | 13,305 |
| Barclays Bank PLC 6.00% 2021 | 18,725 | 28,461 |
| Barclays Bank PLC 6.625% 2022 | 7,250 | 11,498 |
| Belgium (Kingdom of), Series 67, 3.00% 2019 | 7,520 | 10,779 |
| Belgium (Kingdom of), Series 61, 4.25% 2021 | 47,660 | 74,921 |
| Belgium (Kingdom of), Series 68, 2.25% 2023 | 7 | 10 |
| Belgium (Kingdom of), Series 72, 2.60% 2024 | 14,100 | 20,067 |
| BMW Group 3.875% 2017 | 2,000 | 2,727 |
| BNP Paribas 2.875% 20261 | 15,250 | 19,879 |
| BPCE SA group 4.625% 2023 | 6,000 | 8,702 |
| BPCE SA group 6.117% (undated)1 | 700 | 978 |
| CaixaBank, SA 5.00% 20231 | 33,500 | 45,357 |
| Canadian Government 3.50% 2020 | 7,000 | 10,347 |
| European Investment Bank 4.75% 2017 | 8,490 | 12,267 |
| Finland (Republic of) 2.75% 2028 | 2,500 | 3,663 |
| France Télécom 5.625% 2018 | 1,500 | 2,234 |
| France Télécom 3.125% 2024 | 5,800 | 8,219 |
| French Government O.A.T. Eurobond 0.50% 2019 | 32,000 | 40,763 |
| French Government O.A.T. Eurobond 2.25% 2024 | 6,630 | 9,191 |
| GE Capital European Funding 5.375% 2020 | 9,100 | 14,286 |
| German Government, Series 7, 4.00% 2018 | 11,175 | 15,981 |
| German Government 0.75% 20183 | 28,053 | 37,253 |
| German Government 3.00% 2020 | 25,200 | 36,861 |
| German Government 1.50% 2023 | 5,450 | 7,334 |
| German Government 6.25% 2024 | 346 | 651 |
| German Government, Series 00, 5.50% 2031 | 5,150 | 10,212 |
| German Government 3.25% 2042 | 3,375 | 5,592 |
| German Government 2.50% 2044 | 22,100 | 32,080 |
| Greek Government 2.00%/3.00% 20234 | 3,830 | 3,863 |
| Greek Government 2.00%/3.00% 20244 | 3,830 | 3,772 |
| Greek Government 2.00%/3.00% 20254 | 3,830 | 3,629 |
| Greek Government 2.00%/3.00% 20264 | 3,830 | 3,505 |
| Greek Government 2.00%/3.00% 20274 | 3,825 | 3,416 |
| Greek Government 2.00%/3.00% 20284 | 3,835 | 3,339 |
| Greek Government 2.00%/3.00% 20294 | 4,585 | 3,933 |
| Greek Government 2.00%/3.00% 20304 | 4,585 | 3,852 |
| Greek Government 2.00%/3.00% 20314 | 4,585 | 3,794 |
| Greek Government 2.00%/3.00% 20324 | 4,585 | 3,733 |
Capital World Bond Fund — Page 1 of 23
Bonds, notes & other debt instruments
Euros (continued) | Principal amount
(000) | Value
(000) |
| Greek Government 2.00%/3.00% 20334 | €4,585 | $3,688 |
| Greek Government 2.00%/3.00% 20344 | 4,585 | 3,636 |
| Greek Government 2.00%/3.00% 20354 | 4,585 | 3,614 |
| Greek Government 2.00%/3.00% 20364 | 6,935 | 5,401 |
| Greek Government 2.00%/3.00% 20374 | 7,285 | 5,643 |
| Greek Government 2.00%/3.00% 20384 | 6,085 | 4,675 |
| Greek Government 2.00%/3.00% 20394 | 5,185 | 3,953 |
| Greek Government 2.00%/3.00% 20404 | 7,835 | 5,970 |
| Greek Government 2.00%/3.00% 20414 | 10,235 | 7,805 |
| Greek Government 2.00%/3.00% 20424 | 6,085 | 4,641 |
| HBOS PLC 4.375% 20191 | 885 | 1,122 |
| HSBC Bank PLC 4.00% 2021 | 1,000 | 1,512 |
| HSBC Holdings PLC 3.375% 20241 | 15,975 | 21,487 |
| Hungarian Government 5.75% 2018 | 35,690 | 51,133 |
| Hungarian Government 6.00% 2019 | 23,625 | 34,870 |
| Hungarian Government 3.875% 2020 | 2,000 | 2,742 |
| Imperial Tobacco Finance PLC 5.00% 2019 | 12,425 | 18,665 |
| Intesa Sanpaolo SpA 6.625% 2023 | 20,260 | 31,086 |
| Irish Government 4.50% 2020 | 28,770 | 43,816 |
| Irish Government 3.90% 2023 | 44,930 | 67,701 |
| Irish Government 3.40% 2024 | 136,240 | 198,196 |
| Irish Government 5.40% 2025 | 14,250 | 23,994 |
| Italian Government 4.75% 2017 | 7,000 | 9,798 |
| Italian Government 4.50% 2019 | 14,870 | 21,712 |
| Italian Government 4.25% 2020 | 32,250 | 47,327 |
| Italian Government 2.15% 2021 | 19,150 | 24,852 |
| Italian Government 5.50% 2022 | 35,020 | 55,690 |
| Italian Government 4.50% 2023 | 39,225 | 58,848 |
| Italian Government 4.50% 2024 | 44,350 | 66,705 |
| Italian Government 4.75% 2044 | 2,925 | 4,443 |
| Lloyds Banking Group PLC 6.50% 2020 | 26,550 | 41,235 |
| Merrill Lynch & Co., Inc. 4.625% 2018 | 17,536 | 25,071 |
| Mondelez International, Inc. 2.375% 2021 | 6,300 | 8,486 |
| Netherlands Government Eurobond 4.00% 2019 | 38,500 | 57,373 |
| Netherlands Government Eurobond 2.25% 2022 | 8,300 | 11,665 |
| Netherlands Government Eurobond 2.00% 2024 | 14,175 | 19,420 |
| NN Group NV, 4.625% 2044 | 10,425 | 13,498 |
| NN Group NV, 4.50% (undated)1 | 21,300 | 25,863 |
| Novartis Finance SA, 4.25% 2016 | 1,250 | 1,687 |
| Portuguese Government 4.45% 2018 | 8,050 | 11,289 |
| Portuguese Government 3.85% 2021 | 126,830 | 175,165 |
| Portuguese Government 4.95% 2023 | 47,825 | 69,550 |
| Portuguese Government 5.65% 2024 | 24,430 | 37,123 |
| Portuguese Government 3.875% 2030 | 28,600 | 36,628 |
| Rabobank Nederland 3.875% 2023 | 21,500 | 30,188 |
| RCI Banque 2.875% 2018 | 3,700 | 4,985 |
| Schaeffler Holding Finance BV 6.875% 20181,5 | 2,800 | 3,715 |
| Schering-Plough Corp. 5.375% 2014 | 8,105 | 10,237 |
| Skandinaviska Enskilda 4.25% 2018 | 1,500 | 2,134 |
| Slovenia (Republic of) 4.125% 2020 | 29,155 | 41,533 |
| Slovenia (Republic of) 4.625% 2024 | 20,425 | 30,201 |
| Spanish Government 1.40% 2020 | 43,000 | 55,406 |
| Spanish Government 5.85% 2022 | 130,530 | 214,494 |
| Spanish Government 5.40% 2023 | 106,225 | 171,505 |
| Spanish Government 3.80% 2024 | 50,831 | 73,863 |
Capital World Bond Fund — Page 2 of 23
Bonds, notes & other debt instruments
Euros (continued) | Principal amount
(000) | Value
(000) |
| Spanish Government 2.75% 2024 | €60,715 | $80,596 |
| Spanish Government 5.15% 2044 | 84,460 | 139,234 |
| Standard Chartered Bank 5.875% 2017 | 6,000 | 8,615 |
| Svenska Handelsbanken AB 2.656% 20241 | 16,225 | 21,416 |
| U.S. Coatings Acquisition Inc. (Flash Dutch 2 BV) 5.75% 2021 | 1,250 | 1,676 |
| | | 2,878,824 |
| British pounds 5.89% | | |
| Bank of Scotland PLC 9.375% 2021 | £4,160 | 8,735 |
| Barclays Bank PLC 10.00% 2021 | 4,000 | 8,564 |
| BNP Paribas 5.75% 2022 | 1,100 | 1,996 |
| Deutsche Telekom International Finance BV 6.50% 2022 | 4,606 | 9,093 |
| Electricité de France SA 6.00% 2114 | 2,000 | 4,014 |
| France Télécom 7.25% 2020 | 4,425 | 8,845 |
| General Electric Capital Corp. 5.625% 2031 | 750 | 1,491 |
| Lloyds Banking Group PLC 7.625 % 2025 | 2,550 | 5,176 |
| Lloyds TSB Bank PLC 10.75% 20211 | 1,025 | 1,936 |
| National Grid Transco PLC 4.00% 2027 | 2,250 | 3,750 |
| Nestlé Finance International Ltd. 2.25% 2023 | 1,000 | 1,567 |
| RSA Insurance Group PLC 9.375% 20391 | 6,583 | 13,011 |
| RSA Insurance Group PLC 8.50% (undated)1 | 6,900 | 11,315 |
| SLM Student Loan Trust, Series 2003-10, Class A-4, 5.15% 20392,6 | 2,400 | 3,703 |
| Telecom Italia SpA 6.375% 2019 | 3,000 | 5,295 |
| Tesco PLC 5.50% 2033 | 890 | 1,466 |
| United Kingdom 2.75% 2015 | 9,650 | 15,758 |
| United Kingdom 2.00% 2016 | 24,000 | 39,583 |
| United Kingdom 1.75% 2019 | 37,925 | 61,416 |
| United Kingdom 2.00% 2020 | 131,270 | 213,393 |
| United Kingdom 3.75% 2020 | 50,900 | 90,999 |
| United Kingdom 3.75% 2021 | 25,900 | 46,604 |
| United Kingdom 1.75% 2022 | 4,750 | 7,450 |
| United Kingdom 2.25% 2023 | 47,945 | 77,364 |
| United Kingdom 4.75% 2030 | 25,185 | 51,291 |
| United Kingdom 4.50% 2034 | 4,170 | 8,374 |
| United Kingdom 4.25% 2040 | 8,355 | 16,559 |
| United Kingdom 3.25% 2044 | 34,305 | 57,669 |
| Wal-Mart Stores, Inc. 5.625% 2034 | 1,000 | 2,075 |
| | | 778,492 |
| Japanese yen 3.93% | | |
| European Investment Bank 1.40% 2017 | ¥721,700 | 6,835 |
| Japanese Government, Series 340, 0.10% 2016 | 700,000 | 6,386 |
| Japanese Government, Series 14, 1.20% 20173 | 1,311,432 | 13,501 |
| Japanese Government, Series 289, 1.50% 2017 | 2,993,000 | 28,516 |
| Japanese Government, Series 113, 0.30% 2018 | 3,455,000 | 31,716 |
| Japanese Government, Series 312, 1.20% 2020 | 1,940,000 | 18,754 |
| Japanese Government, Series 315, 1.20% 2021 | 12,707,800 | 123,172 |
| Japanese Government, Series 319, 1.10% 2021 | 1,130,000 | 10,899 |
| Japanese Government, Series 323, 0.90% 2022 | 5,305,000 | 50,455 |
| Japanese Government, Series 17, 0.10% 20233 | 2,877,300 | 28,292 |
| Japanese Government, Series 116, 2.20% 2030 | 4,070,000 | 43,654 |
| Japanese Government, Series 145, 1.70% 2033 | 6,000,000 | 58,808 |
| Japanese Government, Series 21, 2.30% 2035 | 8,040,000 | 85,259 |
Capital World Bond Fund — Page 3 of 23
Bonds, notes & other debt instruments
Japanese yen (continued) | Principal amount
(000) | Value
(000) |
| Japanese Government, Series 29, 2.40% 2038 | ¥927,600 | $9,986 |
| Japanese Government, Series 37, 1.90% 2042 | 263,250 | 2,573 |
| | | 518,806 |
| Mexican pesos 3.17% | | |
| América Móvil, SAB de CV 8.46% 2036 | MXN15,000 | 1,093 |
| Red de Carreteras de Occidente 9.00% 20282 | 36,950 | 2,648 |
| United Mexican States Government, Series M10, 8.00% 2015 | 341,000 | 26,799 |
| United Mexican States Government, Series M, 6.25% 2016 | 307,500 | 23,938 |
| United Mexican States Government, Series M, 5.00% 2017 | 970,000 | 73,508 |
| United Mexican States Government 4.00% 20193 | 310,852 | 25,658 |
| United Mexican States Government, Series M, 8.00% 2020 | 230,000 | 19,327 |
| United Mexican States Government 2.50% 20203 | 51,809 | 3,932 |
| United Mexican States Government, Series M, 6.50% 2021 | 1,327,500 | 103,557 |
| United Mexican States Government 2.00% 20223 | 463,687 | 33,624 |
| United Mexican States Government, Series M20, 10.00% 2024 | 430,500 | 41,468 |
| United Mexican States Government, Series M30, 10.00% 2036 | 300,000 | 30,259 |
| United Mexican States Government 4.00% 20403 | 304,635 | 24,266 |
| United Mexican States Government, Series M, 7.75% 2042 | 102,500 | 8,381 |
| | | 418,458 |
| Polish zloty 2.38% | | |
| Polish Government, Series 1017, 5.25% 2017 | PLN58,262 | 19,233 |
| Polish Government, Series 1020, 5.25% 2020 | 183,150 | 63,656 |
| Polish Government, Series 1021, 5.75% 2021 | 460,395 | 165,598 |
| Polish Government, Series 0922, 5.75% 2022 | 119,755 | 43,538 |
| Polish Government, Series 102, 4.00% 2023 | 69,530 | 22,687 |
| | | 314,712 |
| Hungarian forints 1.19% | | |
| Hungarian Government, Series 20A, 7.50% 2020 | HUF22,700,000 | 109,961 |
| Hungarian Government, Series 22A, 7.00% 2022 | 1,300,000 | 6,196 |
| Hungarian Government, Series 23A, 6.00% 2023 | 6,470,700 | 29,208 |
| Hungarian Government, Series 25B, 5.50% 2025 | 2,786,740 | 12,147 |
| | | 157,512 |
| Colombian pesos 1.15% | | |
| Colombia (Republic of), Series B, 5.00% 2018 | COP134,824,800 | 65,070 |
| Colombia (Republic of), Series B, 7.00% 2022 | 29,429,400 | 14,804 |
| Colombia (Republic of), Series B, 10.00% 2024 | 14,662,000 | 8,851 |
| Colombia (Republic of), Series B, 6.00% 2028 | 135,577,800 | 59,962 |
| Colombia (Republic of) Global 12.00% 2015 | 643,000 | 341 |
| Colombia (Republic of) Global 9.85% 2027 | 1,164,000 | 728 |
| Financiera de Desarrollo Territorial 7.875% 2024 | 4,626,000 | 2,337 |
| | | 152,093 |
| Indian rupees 1.03% | | |
| India (Republic of) 7.28% 2019 | INR8,790,000 | 136,432 |
Capital World Bond Fund — Page 4 of 23
Bonds, notes & other debt instruments
Norwegian kroner 0.86% | Principal amount
(000) | Value
(000) |
| Norwegian Government 4.50% 2019 | NKr26,700 | $4,672 |
| Norwegian Government 3.75% 2021 | 378,640 | 65,519 |
| Norwegian Government 3.00% 2024 | 258,700 | 42,860 |
| | | 113,051 |
| South Korean won 0.66% | | |
| South Korean Government 5.50% 2017 | KRW70,413,470 | 72,746 |
| South Korean Government, Series 2303, 3.00% 2023 | 14,548,210 | 13,989 |
| | | 86,735 |
| Brazilian reais 0.63% | | |
| Brazil (Federal Republic of) 10.00% 2017 | BRL28,000 | 10,932 |
| Brazil (Federal Republic of) 6.00% 20173 | 59,978 | 24,609 |
| Brazil (Federal Republic of) 6.00% 20183 | 59,766 | 24,322 |
| Brazil (Federal Republic of) 6.00% 20223 | 11,978 | 4,868 |
| Brazil (Federal Republic of) 10.00% 2025 | 53,000 | 18,798 |
| | | 83,529 |
| Canadian dollars 0.56% | | |
| Canada Housing Trust 3.35% 2020 | C$10,000 | 9,585 |
| Canadian Government 2.00% 2014 | 5,700 | 5,099 |
| Canadian Government 1.50% 2015 | 3,500 | 3,140 |
| Canadian Government 1.25% 2018 | 1,000 | 890 |
| Canadian Government 1.75% 2019 | 28,250 | 25,490 |
| Canadian Government 2.75% 2022 | 18,440 | 17,439 |
| Canadian Government 2.50% 2024 | 3,000 | 2,765 |
| Canadian Government 5.75% 2029 | 2,000 | 2,517 |
| Canadian Government 5.00% 2037 | 2,650 | 3,322 |
| Hydro One Inc. 5.49% 2040 | 2,000 | 2,199 |
| Rogers Communications Inc. 5.80% 2016 | 1,750 | 1,660 |
| | | 74,106 |
| Swedish kronor 0.55% | | |
| Swedish Government, Series 1047, 5.00% 2020 | SKr183,600 | 31,667 |
| Swedish Government, Series 105, 3.50% 2022 | 251,980 | 40,919 |
| | | 72,586 |
| Russian rubles 0.50% | | |
| Russian Federation 7.50% 2018 | RUB2,751,750 | 66,195 |
| Israeli shekels 0.48% | | |
| Israeli Government 5.50% 2017 | ILS40,890 | 12,442 |
| Israeli Government 4.25% 2023 | 161,550 | 50,884 |
| | | 63,326 |
| South African rand 0.47% | | |
| South Africa (Republic of), Series R-208, 6.75% 2021 | ZAR351,550 | 29,388 |
| South Africa (Republic of), Series R-214, 6.50% 2041 | 495,800 | 33,098 |
| | | 62,486 |
Capital World Bond Fund — Page 5 of 23
Bonds, notes & other debt instruments
Turkish lira 0.39% | Principal amount
(000) | Value
(000) |
| Turkey (Republic of) 9.00% 2016 | TRY3,900 | $1,701 |
| Turkey (Republic of) 6.30% 2018 | 10,100 | 4,040 |
| Turkey (Republic of) 3.50% 20193 | 18,485 | 8,672 |
| Turkey (Republic of) 10.50% 2020 | 25,125 | 11,539 |
| Turkey (Republic of) 3.00% 20213 | 29,133 | 13,514 |
| Turkey (Republic of) 9.50% 2022 | 6,500 | 2,831 |
| Turkey (Republic of) 8.80% 2023 | 11,160 | 4,630 |
| Turkey (Republic of) 2.80% 20233 | 10,596 | 4,934 |
| | | 51,861 |
| Indonesian rupiah 0.38% | | |
| Indonesia (Republic of) 7.875% 2019 | IDR242,200,000 | 19,628 |
| Indonesia (Republic of) 8.375% 2034 | 393,779,000 | 30,616 |
| | | 50,244 |
| Australian dollars 0.28% | | |
| Australian Government, Series 122, 5.25% 2019 | A$1,500 | 1,442 |
| Australian Government, Series 136, 4.75% 2027 | 4,600 | 4,461 |
| Queensland Treasury Corp., Series 15, 6.00% 2015 | 2,150 | 1,947 |
| Queensland Treasury Corp., Series 17, 6.00% 2017 | 3,500 | 3,338 |
| Queensland Treasury Corp., Series 24, 5.75% 2024 | 25,625 | 25,677 |
| | | 36,865 |
| Malaysian ringgits 0.27% | | |
| Malaysian Government, Series 0113, 3.172% 2016 | MYR26,250 | 7,982 |
| Malaysian Government, Series 0214, 3.394% 2017 | 44,900 | 13,663 |
| Malaysian Government, Series 0613, 3.889% 2020 | 44,000 | 13,486 |
| | | 35,131 |
| Philippine pesos 0.15% | | |
| Philippines (Republic of), Series 751, 5.00% 2018 | PHP155,750 | 3,707 |
| Philippines (Republic of) 4.95% 2021 | 114,000 | 2,690 |
| Philippines (Republic of) 6.25% 2036 | 548,000 | 12,888 |
| | | 19,285 |
| Chilean pesos 0.08% | | |
| Chilean Government 5.50% 2020 | CLP5,808,500 | 10,271 |
| Nigerian naira 0.04% | | |
| Nigeria (Republic of) 10.00% 2030 | NGN941,000 | 4,847 |
| U.S. dollars 45.07% | | |
| 21st Century Fox America, Inc. 3.70% 20246 | $1,555 | 1,545 |
| 21st Century Fox America, Inc. 4.75% 20446 | 1,910 | 1,925 |
| AAF Holdings LLC 12.75% 20191,2,5,6 | 1,700 | 1,679 |
| ABB Finance (USA) Inc. 1.625% 2017 | 2,000 | 2,013 |
| ABB Finance (USA) Inc. 2.875% 2022 | 3,830 | 3,793 |
| AbbVie Inc. 2.90% 2022 | 5,110 | 4,896 |
| Abu Dhabi National Energy Co. PJSC (TAQA) 7.25% 20186 | 8,000 | 9,424 |
| Abu Dhabi National Energy Co. PJSC (TAQA) 5.875% 20216 | 2,000 | 2,337 |
| Abu Dhabi National Energy Co. PJSC (TAQA) 3.625% 20236 | 1,135 | 1,122 |
| Academy Sports 9.25% 20196 | 3,000 | 3,187 |
| ACE INA Holdings Inc. 2.60% 2015 | 1,625 | 1,660 |
Capital World Bond Fund — Page 6 of 23
Bonds, notes & other debt instruments
U.S. dollars (continued) | Principal amount
(000) | Value
(000) |
| ACE INA Holdings Inc. 3.35% 2024 | $3,110 | $3,110 |
| AECOM Technology Corp. 5.75% 20226 | 1,175 | 1,190 |
| Alcatel-Lucent USA Inc. 4.625% 20176 | 2,075 | 2,109 |
| Alcatel-Lucent USA Inc. 8.875% 20206 | 1,425 | 1,550 |
| Alcatel-Lucent USA Inc. 6.75% 20206 | 2,500 | 2,556 |
| Alexandria Real Estate Equities, Inc. 2.75% 2020 | 1,030 | 1,022 |
| Alexandria Real Estate Equities, Inc. 3.90% 2023 | 1,750 | 1,747 |
| Alexandria Real Estate Equities, Inc. 4.50% 2029 | 300 | 301 |
| Allegiant Travel Co. 5.50% 2019 | 6,250 | 6,406 |
| Alpha Natural Resources, Inc. 6.00% 2019 | 2,050 | 1,250 |
| Alpha Natural Resources, Inc. 7.50% 20206 | 1,550 | 1,391 |
| Altegrity, Inc. 9.50% 20196 | 4,500 | 4,162 |
| Altice Finco SA 6.50% 20226 | 3,900 | 4,007 |
| Altice Finco SA, First Lien, 7.75% 20226 | 3,025 | 3,131 |
| Altice Finco SA 8.125% 20246 | 1,475 | 1,586 |
| Altria Group, Inc. 9.95% 2038 | 2,500 | 4,146 |
| Altria Group, Inc. 4.50% 2043 | 8,500 | 8,056 |
| Altria Group, Inc. 5.375% 2044 | 2,250 | 2,406 |
| American Campus Communities, Inc. 3.75% 2023 | 3,090 | 3,052 |
| American Campus Communities, Inc. 4.125% 2024 | 635 | 638 |
| American Electric Power Co. 1.65% 2017 | 2,960 | 2,961 |
| American Energy (Marcellus), Term Loan B, 5.25% 20201,2,7 | 1,700 | 1,690 |
| American Energy (Marcellus), Term Loan A, 8.50% 20211,2,7 | 1,650 | 1,643 |
| American Energy (Permian Basin) 7.125% 20206 | 2,025 | 1,863 |
| American Energy (Permian Basin) 7.375% 20216 | 1,225 | 1,127 |
| American Energy (Woodford LLC), 9.00% 20226 | 2,925 | 2,728 |
| American Express Co. 1.55% 2018 | 8,750 | 8,630 |
| American International Group, Inc. 2.30% 2019 | 1,745 | 1,735 |
| American International Group, Inc. 3.375% 2020 | 6,000 | 6,189 |
| American International Group, Inc. 4.50% 2044 | 2,050 | 2,034 |
| Amgen Inc. 2.20% 2019 | 140 | 139 |
| Anadarko Petroleum Corp. 5.95% 2016 | 2,250 | 2,455 |
| Anadarko Petroleum Corp. 8.70% 2019 | 3,000 | 3,778 |
| Anadarko Petroleum Corp. 3.45% 2024 | 2,250 | 2,215 |
| Arch Coal, Inc. 7.00% 2019 | 2,675 | 1,434 |
| Arch Coal, Inc., Term Loan B1, 6.25% 20181,2,7 | 4,455 | 4,084 |
| Argentina (Republic of) 7.00% 2017 | 5,700 | 4,900 |
| Associated Materials, LLC and AMH New Finance, Inc. 9.125% 2017 | 4,025 | 3,960 |
| AT&T Inc. 4.80% 2044 | 1,800 | 1,778 |
| Athlon Energy Inc. 6.00% 20226 | 4,300 | 4,622 |
| AvalonBay Communities, Inc. 3.625% 2020 | 1,450 | 1,509 |
| AvalonBay Communities, Inc. 2.85% 2023 | 2,875 | 2,759 |
| AXA SA 8.60% 2030 | 18,550 | 24,996 |
| Banc of America Commercial Mortgage Inc., Series 2006-3, Class A-4, 5.889% 20441,2 | 1,464 | 1,561 |
| Banc of America Commercial Mortgage Inc., Series 2006-1, Class A1A, 5.378% 20451,2 | 4,512 | 4,724 |
| Banc of America Commercial Mortgage Inc., Series 2007-3, Class A-4, 5.79% 20491,2 | 1,120 | 1,215 |
| Banc of America Commercial Mortgage Inc., Series 2007-4, Class A-M, 6.015% 20511,2 | 3,020 | 3,330 |
| Banc of America Commercial Mortgage Inc., Series 2008-1, Class A-4, 6.427% 20511,2 | 2,315 | 2,589 |
| Banco de Crédito del Perú 5.375% 20206 | 7,000 | 7,577 |
| Bank of America Corp. 1.70% 2017 | 3,500 | 3,492 |
| Bank of America Corp. 2.60% 2019 | 2,000 | 1,998 |
| Bank of America Corp., Series L, 2.65% 2019 | 2,000 | 1,998 |
| Bank of America Corp. 4.00% 2024 | 16,090 | 16,281 |
| Barclays Bank PLC 2.50% 2019 | 1,410 | 1,414 |
| Baxter International Inc. 1.85% 2018 | 2,995 | 2,986 |
Capital World Bond Fund — Page 7 of 23
Bonds, notes & other debt instruments
U.S. dollars (continued) | Principal amount
(000) | Value
(000) |
| Baxter International Inc. 3.20% 2023 | $2,616 | $2,587 |
| BBVA Bancomer SA 6.50% 20216 | 1,455 | 1,593 |
| BE Aerospace, Inc. 5.25% 2022 | 2,600 | 2,814 |
| Bear Stearns Commercial Mortgage Securities Trust, Series 2007-PW17, Class A-4, 5.694% 20501,2 | 1,750 | 1,915 |
| Bear Stearns Commercial Mortgage Securities Trust, Series 2007-PW18, Class A-M, 6.084% 20501,2 | 2,375 | 2,646 |
| Bermuda Government 5.603% 20206 | 4,935 | 5,429 |
| Bermuda Government 5.603% 2020 | 1,800 | 1,980 |
| Bermuda Government 4.138% 20236 | 4,900 | 4,851 |
| Bermuda Government 4.854% 20246 | 15,475 | 16,055 |
| BHP Billiton Finance (USA) Ltd. 5.00% 2043 | 1,150 | 1,267 |
| Boardwalk Pipeline Partners 3.375% 2023 | 2,000 | 1,865 |
| Boyd Gaming Corp. 9.125% 2018 | 2,000 | 2,095 |
| Boyd Gaming Corp. 9.00% 2020 | 6,475 | 6,823 |
| BP Capital Markets PLC 0.657% 20161 | 10,000 | 10,020 |
| BPCE SA group 5.70% 20236 | 17,930 | 19,130 |
| BPCE SA group 4.625% 20246 | 2,000 | 1,961 |
| BPCE SA group 4.50% 20256 | 5,575 | 5,426 |
| Brandywine Operating Partnership, LP 5.40% 2014 | 2,500 | 2,508 |
| Brandywine Operating Partnership, LP 5.70% 2017 | 15 | 16 |
| Brandywine Operating Partnership, LP 3.95% 2023 | 750 | 751 |
| British American Tobacco International Finance PLC 9.50% 20186 | 7,485 | 9,584 |
| Builders Firstsource 7.625% 20216 | 4,075 | 4,156 |
| Burger King Corp. 6.00% 20226 | 2,900 | 2,896 |
| Burlington Northern Santa Fe LLC 3.05% 2022 | 5,815 | 5,747 |
| Burlington Northern Santa Fe LLC 3.00% 2023 | 2,375 | 2,309 |
| Burlington Northern Santa Fe LLC 3.75% 2024 | 3,975 | 4,058 |
| Burlington Northern Santa Fe LLC 3.40% 2024 | 5,920 | 5,851 |
| Burlington Northern Santa Fe LLC 4.90% 2044 | 565 | 596 |
| Burlington Northern Santa Fe LLC 4.55% 2044 | 360 | 361 |
| Caesars Entertainment Operating Co. 9.00% 2020 | 2,725 | 2,098 |
| Canadian Natural Resources Ltd. 5.70% 2017 | 1,500 | 1,660 |
| Canadian Natural Resources Ltd. 3.80% 2024 | 425 | 431 |
| Carnival Corp. 3.95% 2020 | 1,200 | 1,258 |
| Catalent Pharma Solutions Inc., Term Loan, 6.50% 20171,2,7 | 414 | 415 |
| CEC Entertainment, Inc. 8.00% 20226 | 2,075 | 1,950 |
| Celgene Corp 3.625% 2024 | 6,760 | 6,703 |
| Celgene Corp 4.625% 2044 | 3,740 | 3,684 |
| CEMEX Finance LLC 9.375% 20226 | 1,635 | 1,852 |
| Cenovus Energy Inc. 3.00% 2022 | 1,312 | 1,284 |
| Cenovus Energy Inc. 3.80% 2023 | 4,350 | 4,453 |
| CenterPoint Energy Resources Corp. 4.50% 2021 | 3,225 | 3,532 |
| CenterPoint Energy Transition Bond Co. III, LLC, Series 2008, Class A-2, 5.234% 20232 | 2,225 | 2,490 |
| Cequel Communications Holdings I, LLC and Cequel Capital Corp. 6.375% 20206 | 9,450 | 9,769 |
| Ceridian LLC / Comdata Inc. 8.125% 20176 | 3,125 | 3,137 |
| CEVA Group PLC 4.00% 20186 | 3,000 | 2,816 |
| CEVA Group PLC 7.00% 20216 | 3,550 | 3,568 |
| CEVA Group PLC 9.00% 20216 | 1,700 | 1,700 |
| CEVA Group PLC, LOC, 6.50% 20211,2,7 | 969 | 941 |
| CEVA Group PLC, Term Loan B, 6.50% 20211,2,7 | 1,402 | 1,362 |
| CEVA Group PLC, Term Loan, 6.50% 20211,2,7 | 1,016 | 988 |
| CEVA Group PLC, Term Loan, 6.50% 20211,2,7 | 175 | 170 |
| CEZ, a s 4.25% 20226 | 11,975 | 12,695 |
| Chevron Corp. 3.191% 2023 | 1,750 | 1,766 |
| Citigroup Commercial Mortgage Trust, Series 2014-CG19, Class A-1, 1.199% 20472 | 1,982 | 1,974 |
| Citigroup Commercial Mortgage Trust, Series 2006-C5, Class A-4, 5.431% 20492 | 6,500 | 6,976 |
Capital World Bond Fund — Page 8 of 23
Bonds, notes & other debt instruments
U.S. dollars (continued) | Principal amount
(000) | Value
(000) |
| Citigroup Inc. 2.55% 2019 | $13,535 | $13,542 |
| Citigroup Inc. 2.50% 2019 | 13,000 | 12,896 |
| Citigroup Inc. 3.75% 2024 | 20,945 | 20,895 |
| Citigroup-Deutsche Bank Commercial Mortgage Trust, Series 2005-CD1, Class A-4, 5.40% 20441,2 | 4,807 | 4,939 |
| Citigroup-Deutsche Bank Commercial Mortgage Trust, Series 2006-CD3, Class A-5, 5.617% 20482 | 4,705 | 4,992 |
| CME Group Inc. 5.30% 2043 | 1,185 | 1,361 |
| CMS Energy Corp. 8.75% 2019 | 1,312 | 1,668 |
| CMS Energy Corp. 5.05% 2022 | 1,458 | 1,632 |
| CMS Energy Corp. 3.875% 2024 | 480 | 492 |
| CMS Energy Corp. 4.70% 2043 | 1,900 | 1,927 |
| CMS Energy Corp. 4.875% 2044 | 3,146 | 3,277 |
| CNA Financial Corp. 7.35% 2019 | 1,200 | 1,446 |
| CNOOC Finance (2013) Ltd. 3.00% 2023 | 1,600 | 1,490 |
| CoBank, ACB 7.875% 20186 | 430 | 505 |
| CoBank, ACB 0.834% 20221,6 | 4,275 | 4,019 |
| Colbun SA 6.00% 20206 | 5,150 | 5,703 |
| Colbun SA 4.50% 20246 | 1,800 | 1,794 |
| Comcast Corp. 6.40% 2038 | 1,750 | 2,240 |
| Comcast Corp. 4.65% 2042 | 10,550 | 10,937 |
| Comcast Corp. 4.75% 2044 | 5,695 | 6,032 |
| Comision Federal de Electricidad 4.875% 20246 | 3,500 | 3,687 |
| Commercial Mortgage Trust, Series 2006-C8, Class A1A, 5.292% 20462 | 4,771 | 5,134 |
| Commercial Mortgage Trust, Series 2014-UBS2, Class A-1, 1.298% 20472 | 3,585 | 3,565 |
| Commonwealth Bank of Australia 0.75% 20162,6 | 6,000 | 6,006 |
| ConAgra Foods, Inc. 1.30% 2016 | 2,800 | 2,812 |
| ConAgra Foods, Inc. 3.20% 2023 | 3,046 | 2,927 |
| Continental Airlines, Inc., Series 1997-4, Class A, 6.90% 20192 | 594 | 631 |
| Continental Airlines, Inc., Series 1999-1, Class A, 6.545% 20202 | 189 | 210 |
| Continental Airlines, Inc., Series 2000-2, Class A-1, 7.707% 20222 | 2,259 | 2,548 |
| ConvaTec Finance International SA 8.25% 20191,5,6 | 6,020 | 6,129 |
| Corporate Office Properties Trust 3.60% 2023 | 1,610 | 1,543 |
| Cox Communications, Inc. 2.95% 20236 | 6,250 | 5,863 |
| CRC Health Corp, Term Loan, 5.25% 20211,2,7 | 1,259 | 1,256 |
| Credit Suisse Group AG 1.375% 2017 | 8,150 | 8,110 |
| Credit Suisse Group AG 2.30% 2019 | 8,150 | 8,076 |
| Crescent Resources 10.25% 20176 | 475 | 518 |
| Croatian Government 6.75% 20196 | 1,300 | 1,440 |
| CS First Boston Mortgage Securities Corp., Series 2006-C5, Class A-3, 5.311% 20392 | 7,155 | 7,645 |
| CS First Boston Mortgage Securities Corp., Series 2007-C5, Class A4, 5.695% 20401,2 | 3,000 | 3,263 |
| CS First Boston Mortgage Securities Corp., Series 2007-C2, Class A-M, 5.615% 20491,2 | 840 | 911 |
| CSX Corp. 3.40% 2024 | 1,720 | 1,719 |
| Cumulus Media Holdings Inc. 7.75% 2019 | 2,920 | 3,004 |
| Cumulus Media Inc., Term Loan B, 4.25% 20201,2,7 | 1,525 | 1,502 |
| CVS Caremark Corp. 2.25% 2019 | 2,245 | 2,224 |
| CVS Caremark Corp. 3.375% 2024 | 487 | 481 |
| DaimlerChrysler North America Holding Corp. 2.625% 20166 | 2,000 | 2,059 |
| DaimlerChrysler North America Holding Corp. 2.40% 20176 | 2,500 | 2,570 |
| DaimlerChrysler North America Holding Corp. 1.375% 20176 | 2,455 | 2,445 |
| DaimlerChrysler North America Holding Corp. 2.375% 20186 | 4,000 | 4,053 |
| DaimlerChrysler North America Holding Corp. 2.875% 20216 | 9,950 | 10,017 |
| DaimlerChrysler North America Holding Corp. 3.25% 20246 | 1,135 | 1,120 |
| DaimlerChrysler North America Holding Corp. 8.50% 2031 | 7,850 | 11,889 |
| DBUBS Mortgage Trust, Series 2011-LC1A, Class A1, 3.742% 20462,6 | 4,026 | 4,159 |
| DBUBS Mortgage Trust, Series 2011-LC1A, Class A3, 5.002% 20462,6 | 3,000 | 3,357 |
| DCT Industrial Trust Inc. 4.50% 2023 | 3,135 | 3,204 |
Capital World Bond Fund — Page 9 of 23
Bonds, notes & other debt instruments
U.S. dollars (continued) | Principal amount
(000) | Value
(000) |
| Del Monte Corp. 7.625% 2019 | $2,077 | $2,064 |
| Delhaize Group 5.70% 2040 | 2,129 | 2,267 |
| Dell, Inc. Term Loan B, 4.50% 20201,2,7 | 4,273 | 4,248 |
| Delta 2 (Formula One), Term Loan B, 4.75% 20211,2,7 | 1,075 | 1,062 |
| Delta 2 (Formula One), Term Loan B, 7.75% 20221,2,7 | 3,500 | 3,493 |
| Deutsche Telekom International Finance BV 3.125% 20166 | 2,715 | 2,803 |
| Deutsche Telekom International Finance BV 9.25% 2032 | 11,340 | 18,064 |
| Developers Diversified Realty Corp. 5.50% 2015 | 5,190 | 5,323 |
| Developers Diversified Realty Corp. 9.625% 2016 | 3,410 | 3,829 |
| Developers Diversified Realty Corp. 7.50% 2017 | 3,260 | 3,710 |
| Developers Diversified Realty Corp. 4.75% 2018 | 475 | 513 |
| Developers Diversified Realty Corp. 7.875% 2020 | 4,170 | 5,189 |
| Devon Energy Corp. 2.25% 2018 | 520 | 519 |
| Devon Energy Corp. 3.25% 2022 | 3,535 | 3,516 |
| Devon Energy Corp. 4.75% 2042 | 725 | 724 |
| Diamond Offshore Drilling, Inc. 4.875% 2043 | 3,770 | 3,508 |
| Digicel Group Ltd. 8.25% 20206 | 7,750 | 8,022 |
| Digicel Group Ltd. 7.125% 20226 | 1,200 | 1,201 |
| DISH DBS Corp. 4.625% 2017 | 725 | 741 |
| DJO Finance LLC 9.75% 2017 | 2,795 | 2,851 |
| DJO Finance LLC 8.75% 2018 | 425 | 450 |
| DJO Finance LLC 7.75% 2018 | 910 | 919 |
| DJO Finance LLC 9.875% 2018 | 1,215 | 1,279 |
| Dollar General Corp. 1.875% 2018 | 4,388 | 4,230 |
| Dollar General Corp. 3.25% 2023 | 8,492 | 7,602 |
| Dominican Republic 7.50% 20212,6 | 4,000 | 4,520 |
| Ecopetrol SA 5.875% 2045 | 60 | 61 |
| EDP Finance BV 6.00% 20186 | 4,000 | 4,314 |
| EDP Finance BV 5.25% 20216 | 2,500 | 2,605 |
| Electricité de France SA 1.15% 20176 | 4,000 | 3,992 |
| Electricité de France SA 4.60% 20206 | 2,200 | 2,432 |
| Electricité de France SA 6.95% 20396 | 1,325 | 1,767 |
| Electricité de France SA 4.875% 20446 | 5,410 | 5,739 |
| Empresa Nacional de Electricidad SA 4.25% 2024 | 2,100 | 2,111 |
| ENA Norte Trust 4.95% 20282,6 | 6,879 | 7,160 |
| Enbridge Energy Partners, LP, Series B, 6.50% 2018 | 5,320 | 6,094 |
| Enbridge Energy Partners, LP 9.875% 2019 | 3,250 | 4,215 |
| Enbridge Energy Partners, LP 5.20% 2020 | 7,335 | 8,169 |
| Enbridge Inc. 4.00% 2023 | 7,750 | 8,041 |
| Enbridge Inc. 4.50% 2044 | 1,100 | 1,075 |
| Endo Pharmaceuticals Holdings Inc. 5.75% 20226 | 6,315 | 6,252 |
| Enel Finance International SA 6.00% 20396 | 4,740 | 5,417 |
| Enel Società per Azioni 8.75% 20731,6 | 10,000 | 11,675 |
| EnLink Midstream Partners, LP 2.70% 2019 | 495 | 499 |
| EnLink Midstream Partners, LP 4.40% 2024 | 975 | 1,014 |
| Enterprise Products Operating LLC 3.90% 2024 | 3,430 | 3,488 |
| Enterprise Products Operating LLC 4.85% 2044 | 300 | 306 |
| Enterprise Products Operating LLC 5.10% 2045 | 1,590 | 1,684 |
EQTY 2014-INNS Mortgage Trust Commercial Mortgage Pass-Through Certificates,
Series 2014-A, 1.006% 20311,2,6 | 10,670 | 10,677 |
| ERP Operating LP 5.125% 2016 | 1,110 | 1,179 |
| ERP Operating LP 4.625% 2021 | 2,020 | 2,207 |
| Essex Portfolio L.P. 3.25% 2023 | 2,870 | 2,784 |
| Essex Portfolio L.P. 3.875% 2024 | 3,360 | 3,372 |
| Export-Import Bank of Korea 4.375% 2021 | 4,000 | 4,326 |
Capital World Bond Fund — Page 10 of 23
Bonds, notes & other debt instruments
U.S. dollars (continued) | Principal amount
(000) | Value
(000) |
| Express Scripts Inc. 3.125% 2016 | $10,250 | $10,620 |
| Exxon Mobil Corp. 1.819% 2019 | 3,500 | 3,503 |
| Exxon Mobil Corp. 3.176% 2024 | 2,900 | 2,962 |
| Fannie Mae, Series 2012-M9, Class A2, multifamily 2.482% 20222 | 6,989 | 6,864 |
| Fannie Mae, Series 2012-M17, Class A2, multifamily 2.184% 20222 | 7,000 | 6,682 |
| Fannie Mae, Series 2001-4, Class GA, 9.449% 20251,2 | 4 | 4 |
| Fannie Mae 6.00% 20262 | 251 | 284 |
| Fannie Mae 2.50% 20262 | 603 | 610 |
| Fannie Mae 2.50% 20262 | 339 | 343 |
| Fannie Mae 2.50% 20272 | 543 | 550 |
| Fannie Mae 2.50% 20272 | 42 | 42 |
| Fannie Mae 2.50% 20272 | 880 | 891 |
| Fannie Mae 2.50% 20272 | 91 | 92 |
| Fannie Mae 2.50% 20272 | 44 | 45 |
| Fannie Mae 2.50% 20272 | 41 | 41 |
| Fannie Mae 2.50% 20282 | 106 | 107 |
| Fannie Mae 2.50% 20282 | 862 | 873 |
| Fannie Mae 2.50% 20282 | 359 | 364 |
| Fannie Mae 2.50% 20282 | 182 | 185 |
| Fannie Mae 2.50% 20282 | 90 | 92 |
| Fannie Mae 2.50% 20282 | 460 | 466 |
| Fannie Mae 2.50% 20282 | 154 | 156 |
| Fannie Mae 2.50% 20282 | 941 | 952 |
| Fannie Mae 2.50% 20282 | 690 | 699 |
| Fannie Mae 2.50% 20282 | 455 | 461 |
| Fannie Mae 2.50% 20282 | 369 | 373 |
| Fannie Mae 2.50% 20282 | 225 | 227 |
| Fannie Mae 2.50% 20282 | 103 | 104 |
| Fannie Mae 2.50% 20282 | 55 | 56 |
| Fannie Mae 2.50% 20282 | 850 | 860 |
| Fannie Mae 2.50% 20282 | 838 | 848 |
| Fannie Mae 2.50% 20282 | 727 | 735 |
| Fannie Mae 2.50% 20282 | 226 | 229 |
| Fannie Mae 2.50% 20282 | 178 | 181 |
| Fannie Mae 2.50% 20282 | 90 | 91 |
| Fannie Mae 2.50% 20282 | 1,319 | 1,335 |
| Fannie Mae 2.50% 20282 | 877 | 888 |
| Fannie Mae 2.50% 20282 | 875 | 886 |
| Fannie Mae 2.50% 20282 | 826 | 835 |
| Fannie Mae 2.50% 20282 | 486 | 492 |
| Fannie Mae 2.50% 20282 | 438 | 443 |
| Fannie Mae 2.50% 20282 | 368 | 373 |
| Fannie Mae 2.50% 20282 | 174 | 176 |
| Fannie Mae 2.50% 20282 | 142 | 144 |
| Fannie Mae 2.50% 20282 | 135 | 137 |
| Fannie Mae 2.50% 20282 | 1,002 | 1,015 |
| Fannie Mae 2.50% 20282 | 956 | 967 |
| Fannie Mae 2.50% 20282 | 898 | 909 |
| Fannie Mae 2.50% 20282 | 874 | 884 |
| Fannie Mae 2.50% 20282 | 863 | 874 |
| Fannie Mae 2.50% 20282 | 859 | 869 |
| Fannie Mae 2.50% 20282 | 761 | 770 |
| Fannie Mae 2.50% 20282 | 738 | 747 |
| Fannie Mae 2.50% 20282 | 479 | 484 |
| Fannie Mae 2.50% 20282 | 470 | 476 |
Capital World Bond Fund — Page 11 of 23
Bonds, notes & other debt instruments
U.S. dollars (continued) | Principal amount
(000) | Value
(000) |
| Fannie Mae 2.50% 20282 | $457 | $463 |
| Fannie Mae 2.50% 20282 | 452 | 458 |
| Fannie Mae 2.50% 20282 | 368 | 373 |
| Fannie Mae 2.50% 20282 | 301 | 305 |
| Fannie Mae 2.50% 20282 | 289 | 293 |
| Fannie Mae 2.50% 20282 | 286 | 289 |
| Fannie Mae 2.50% 20282 | 280 | 283 |
| Fannie Mae 2.50% 20282 | 249 | 251 |
| Fannie Mae 2.50% 20282 | 227 | 230 |
| Fannie Mae 2.50% 20282 | 181 | 183 |
| Fannie Mae 2.50% 20282 | 176 | 178 |
| Fannie Mae 2.50% 20282 | 158 | 160 |
| Fannie Mae 2.50% 20282 | 144 | 146 |
| Fannie Mae 2.50% 20282 | 140 | 142 |
| Fannie Mae 2.50% 20282 | 94 | 95 |
| Fannie Mae 2.50% 20282 | 60 | 61 |
| Fannie Mae 2.50% 20282 | 953 | 965 |
| Fannie Mae 2.50% 20282 | 891 | 902 |
| Fannie Mae 2.50% 20282 | 791 | 801 |
| Fannie Mae 2.50% 20282 | 633 | 638 |
| Fannie Mae 2.50% 20282 | 585 | 592 |
| Fannie Mae 2.50% 20282 | 583 | 587 |
| Fannie Mae 2.50% 20282 | 514 | 520 |
| Fannie Mae 2.50% 20282 | 486 | 491 |
| Fannie Mae 2.50% 20282 | 461 | 466 |
| Fannie Mae 2.50% 20282 | 434 | 439 |
| Fannie Mae 2.50% 20282 | 399 | 404 |
| Fannie Mae 2.50% 20282 | 378 | 381 |
| Fannie Mae 2.50% 20282 | 327 | 331 |
| Fannie Mae 2.50% 20282 | 325 | 329 |
| Fannie Mae 2.50% 20282 | 313 | 317 |
| Fannie Mae 2.50% 20282 | 299 | 303 |
| Fannie Mae 2.50% 20282 | 281 | 284 |
| Fannie Mae 2.50% 20282 | 267 | 270 |
| Fannie Mae 2.50% 20282 | 232 | 235 |
| Fannie Mae 2.50% 20282 | 223 | 226 |
| Fannie Mae 2.50% 20282 | 191 | 193 |
| Fannie Mae 2.50% 20282 | 138 | 140 |
| Fannie Mae 2.50% 20282 | 118 | 119 |
| Fannie Mae 2.50% 20282 | 110 | 112 |
| Fannie Mae 2.50% 20282 | 101 | 102 |
| Fannie Mae 2.50% 20282 | 90 | 91 |
| Fannie Mae 2.50% 20282 | 61 | 62 |
| Fannie Mae 2.50% 20282 | 53 | 54 |
| Fannie Mae 2.50% 20282 | 38 | 38 |
| Fannie Mae 2.50% 20282 | 35 | 35 |
| Fannie Mae 2.50% 20282 | 34 | 34 |
| Fannie Mae 2.50% 20282 | 9,241 | 9,308 |
| Fannie Mae 2.50% 20282 | 1,002 | 1,009 |
| Fannie Mae 2.50% 20282 | 990 | 997 |
| Fannie Mae 2.50% 20282 | 950 | 956 |
| Fannie Mae 2.50% 20282 | 946 | 953 |
| Fannie Mae 2.50% 20282 | 937 | 944 |
| Fannie Mae 2.50% 20282 | 891 | 901 |
| Fannie Mae 2.50% 20282 | 783 | 792 |
Capital World Bond Fund — Page 12 of 23
Bonds, notes & other debt instruments
U.S. dollars (continued) | Principal amount
(000) | Value
(000) |
| Fannie Mae 2.50% 20282 | $764 | $770 |
| Fannie Mae 2.50% 20282 | 612 | 617 |
| Fannie Mae 2.50% 20282 | 589 | 596 |
| Fannie Mae 2.50% 20282 | 483 | 488 |
| Fannie Mae 2.50% 20282 | 475 | 478 |
| Fannie Mae 2.50% 20282 | 421 | 426 |
| Fannie Mae 2.50% 20282 | 324 | 326 |
| Fannie Mae 2.50% 20282 | 316 | 320 |
| Fannie Mae 2.50% 20282 | 302 | 305 |
| Fannie Mae 2.50% 20282 | 255 | 258 |
| Fannie Mae 2.50% 20282 | 228 | 230 |
| Fannie Mae 2.50% 20282 | 143 | 145 |
| Fannie Mae 2.50% 20282 | 128 | 129 |
| Fannie Mae 2.50% 20282 | 90 | 91 |
| Fannie Mae 2.50% 20282 | 86 | 87 |
| Fannie Mae 2.50% 20282 | 44 | 44 |
| Fannie Mae 2.50% 20282 | 1,013 | 1,025 |
| Fannie Mae 2.50% 20282 | 947 | 954 |
| Fannie Mae 2.50% 20282 | 917 | 924 |
| Fannie Mae 2.50% 20282 | 748 | 754 |
| Fannie Mae 2.50% 20282 | 480 | 486 |
| Fannie Mae 5.50% 20332 | 2,897 | 3,254 |
| Fannie Mae 6.00% 20352 | 183 | 208 |
| Fannie Mae, Series 2006-49, Class PA, 6.00% 20362 | 336 | 373 |
| Fannie Mae, Series 2006-56, Class OG, principal only, 0% 20362 | 1,297 | 1,176 |
| Fannie Mae 5.50% 20382 | 2,500 | 2,794 |
| Fannie Mae 2.25% 20391,2 | 205 | 219 |
| Fannie Mae 2.28% 20391,2 | 189 | 203 |
| Fannie Mae 2.335% 20391,2 | 189 | 203 |
| Fannie Mae 3.21% 20391,2 | 635 | 672 |
| Fannie Mae 3.446% 20391,2 | 499 | 533 |
| Fannie Mae 3.937% 20391,2 | 266 | 280 |
| Fannie Mae 3.961% 20391,2 | 201 | 210 |
| Fannie Mae 4.378% 20401,2 | 1,308 | 1,391 |
| Fannie Mae 4.00% 20412 | 782 | 826 |
| Fannie Mae 5.00% 20412 | 3,526 | 3,911 |
| Fannie Mae 5.00% 20412 | 10,616 | 11,798 |
| Fannie Mae 3.547% 20411,2 | 5,283 | 5,528 |
| Fannie Mae 4.00% 20422 | 7,198 | 7,620 |
| Fannie Mae 4.00% 20432 | 24,703 | 26,208 |
| Fannie Mae 4.00% 20432 | 2,238 | 2,374 |
| Fannie Mae 4.00% 20432 | 1,105 | 1,174 |
| Fannie Mae 4.00% 20432 | 1,108 | 1,173 |
| Fannie Mae 3.50% 20442,8 | 2,940 | 3,005 |
| Fannie Mae 4.00% 20442,8 | 34,714 | 36,588 |
| Fannie Mae 3.50% 20442,8 | 40,160 | 40,935 |
| Fannie Mae 4.00% 20442,8 | 119,876 | 125,973 |
| Fannie Mae 4.50% 20442,8 | 423,990 | 456,377 |
| Fannie Mae 6.50% 20472 | 90 | 101 |
| Fannie Mae 7.00% 20472 | 175 | 198 |
| Fannie Mae 6.50% 20472 | 129 | 144 |
| Fannie Mae 6.50% 20472 | 75 | 83 |
| Fannie Mae 6.50% 20482 | 79 | 88 |
| Fiat SpA 8.25% 2021 | 5,800 | 6,351 |
| First Data Corp. 14.50% 20195,6 | 914 | 962 |
Capital World Bond Fund — Page 13 of 23
Bonds, notes & other debt instruments
U.S. dollars (continued) | Principal amount
(000) | Value
(000) |
| First Data Corp. 6.75% 20206 | $3,950 | $4,197 |
| First Data Corp. 12.625% 2021 | 10,511 | 12,613 |
| First Data Corp. 11.75% 2021 | 3,894 | 4,527 |
| First Quantum Minerals Ltd. 6.75% 20206 | 5,642 | 5,769 |
| First Quantum Minerals Ltd. 7.00% 20216 | 5,642 | 5,748 |
| Ford Motor Credit Co. 2.375% 2018 | 5,525 | 5,581 |
| Ford Motor Credit Co. 2.375% 2019 | 19,825 | 19,649 |
| Forest Laboratories, Inc. 5.00% 20216 | 2,405 | 2,575 |
| Freddie Mac 0.75% 2018 | 11,300 | 11,087 |
| Freddie Mac, Series K710, Class A2, multifamily 1.883% 20192 | 2,692 | 2,677 |
| Freddie Mac, Series K711, Class A2, multifamily 1.73% 20192 | 3,500 | 3,448 |
| Freddie Mac, Series K019, Class A2, multifamily 2.272% 20222 | 2,750 | 2,678 |
| Freddie Mac, Series K021, Class A2, multifamily 2.396% 20222 | 3,220 | 3,153 |
| Freddie Mac, Series K025, Class A2, multifamily 2.682% 20222 | 3,000 | 2,970 |
| Freddie Mac, Series 3213, Class OG, principal only, 0% 20362 | 2,178 | 1,980 |
| Freddie Mac, Series 3292, Class BO, principal only, 0% 20372 | 350 | 317 |
| Freddie Mac 6.00% 20382 | 119 | 135 |
| Freddie Mac 3.347% 20391,2 | 280 | 293 |
| Freddie Mac 4.00% 20432 | 2,205 | 2,331 |
| Freddie Mac 4.00% 20432 | 1,271 | 1,345 |
| Freddie Mac 4.00% 20432 | 1,234 | 1,307 |
| Freescale Semiconductor, Inc. 6.00% 20226 | 4,600 | 4,680 |
| Freescale Semiconductor, Inc., Term Loan B4, 4.25% 20201,2,7 | 1,358 | 1,339 |
| Frontier Communications Corp. 8.50% 2020 | 1,775 | 1,979 |
| Frontier Communications Corp. 9.25% 2021 | 6,525 | 7,479 |
| Frontier Communications Corp. 6.25% 2021 | 3,475 | 3,460 |
| Gabonese Republic 6.375% 20242,6 | 6,490 | 6,944 |
| Gannett Co., Inc. 4.875% 20216 | 470 | 456 |
| Gardner Denver, Inc. Term Loan B, 4.25% 20201,2,7 | 5,262 | 5,167 |
| Gates Global LLC 6.00% 20226 | 3,875 | 3,662 |
| Gates Global LLC, Term Loan B, 4.25% 20211,2,7 | 2,450 | 2,412 |
| Gazprom OJSC 5.999% 20216 | 3,900 | 3,939 |
| Gazprom OJSC, Series 9, 6.51% 2022 | 2,650 | 2,710 |
| General Electric Capital Corp. 3.45% 2024 | 1,650 | 1,657 |
| General Electric Co. 2.70% 2022 | 3,000 | 2,921 |
| Ghana (Republic of) 8.50% 2017 | 1,000 | 1,078 |
| Ghana (Republic of) 8.125% 20262,6 | 4,125 | 4,146 |
| Gilead Sciences, Inc. 2.40% 2014 | 735 | 738 |
| Gilead Sciences, Inc. 3.05% 2016 | 2,920 | 3,042 |
| Gilead Sciences, Inc. 3.70% 2024 | 4,680 | 4,776 |
| Gilead Sciences, Inc. 4.80% 2044 | 4,710 | 4,994 |
| Glencore Xstrata LLC 1.594% 20191,6 | 8,725 | 8,800 |
| Goldman Sachs Group, Inc. 5.125% 2015 | 2,914 | 2,953 |
| Goldman Sachs Group, Inc. 2.625% 2019 | 8,145 | 8,131 |
| Goldman Sachs Group, Inc. 4.00% 2024 | 16,800 | 16,945 |
| Goldman Sachs Group, Inc. 3.85% 2024 | 14,410 | 14,352 |
| Goldman Sachs Group, Inc. 4.80% 2044 | 1,710 | 1,726 |
| Goodman Funding Pty Ltd. 6.375% 20206 | 1,760 | 2,048 |
| Greenwich Capital Commercial Funding Corp., Series 2006-GG7, Class A-4, 6.014% 20381,2 | 3,661 | 3,888 |
| Greenwich Capital Commercial Funding Corp., Series 2007-GG9, Class A-1-A, 5.426% 20392 | 6,481 | 7,005 |
| Greenwich Capital Commercial Funding Corp., Series 2007-GG9, Class A-4, 5.444% 20392 | 12,250 | 13,207 |
| Greenwich Capital Commercial Funding Corp., Series 2007-GG11, Class A-1-A, 5.704% 20492 | 8,141 | 8,975 |
| Greenwich Capital Commercial Funding Corp., Series 2007-GG11, Class A-M, 5.867% 20491,2 | 4,945 | 5,407 |
| Hawker Beechcraft Acquisition Co., LLC, LOC, 0.009% 20151,2,7,9 | 31 | 29 |
| HBOS PLC 6.75% 20186 | 1,490 | 1,688 |
Capital World Bond Fund — Page 14 of 23
Bonds, notes & other debt instruments
U.S. dollars (continued) | Principal amount
(000) | Value
(000) |
| HCA Inc. 5.00% 2024 | $2,850 | $2,811 |
| Hilton USA Trust, Series 2013-HLF-AFX, 2.662% 20302,6 | 15,106 | 15,186 |
| Holcim Ltd. 6.00% 20196 | 3,222 | 3,708 |
| Holcim Ltd. 5.15% 20236 | 8,230 | 9,027 |
| Home Depot, Inc. 4.40% 2045 | 4,710 | 4,782 |
| Hospitality Properties Trust 6.30% 2016 | 1,000 | 1,057 |
| Hospitality Properties Trust 6.70% 2018 | 7,580 | 8,466 |
| Hospitality Properties Trust 5.00% 2022 | 250 | 264 |
| Hospitality Properties Trust 4.50% 2023 | 690 | 700 |
| Hospitality Properties Trust 4.50% 2025 | 935 | 924 |
| HSBC Bank PLC 4.75% 20216 | 2,150 | 2,388 |
| HSBC Holdings PLC 4.125% 20206 | 3,577 | 3,854 |
| HSBC Holdings PLC 4.00% 2022 | 6,105 | 6,437 |
| HSBC Holdings PLC 4.25% 2024 | 15,205 | 15,454 |
| HSBC Holdings PLC 5.25% 2044 | 7,250 | 7,727 |
| Hughes Satellite Systems Corp. 7.625% 2021 | 2,500 | 2,762 |
| Humana Inc. 2.625% 2019 | 1,070 | 1,071 |
| Humana Inc. 3.85% 2024 | 4,000 | 4,007 |
| Humana Inc. 4.95% 2044 | 4,000 | 4,025 |
| Hungarian Government 4.125% 2018 | 11,130 | 11,575 |
| Hungarian Government 4.00% 2019 | 10,750 | 10,992 |
| Hungarian Government 6.25% 2020 | 3,975 | 4,437 |
| Hungarian Government 5.375% 2023 | 3,610 | 3,840 |
| Hungarian Government 5.75% 2023 | 2,300 | 2,504 |
| Hungarian Government 5.375% 2024 | 710 | 751 |
| Hungarian Government 7.625% 2041 | 18,134 | 23,212 |
| Iberdrola Finance Ireland 5.00% 20196 | 5,000 | 5,541 |
| Imperial Tobacco Finance PLC 3.50% 20236 | 9,050 | 8,864 |
| Indonesia (Republic of) 6.875% 2018 | 4,750 | 5,373 |
| Indonesia (Republic of) 5.875% 20206 | 5,625 | 6,195 |
| Indonesia (Republic of) 5.875% 2020 | 395 | 435 |
| Indonesia (Republic of) 4.875% 2021 | 2,800 | 2,926 |
| Indonesia (Republic of) 3.75% 2022 | 4,175 | 4,050 |
| Indonesia (Republic of) 4.625% 2043 | 1,380 | 1,221 |
| Indonesia (Republic of) 6.75% 2044 | 4,675 | 5,481 |
| Indonesia (Republic of) 6.75% 20446 | 925 | 1,085 |
| Intelsat Jackson Holding Co. 7.25% 2020 | 1,100 | 1,163 |
| Intelsat Jackson Holding Co. 6.625% 2022 | 12,950 | 13,209 |
| International Paper Co. 7.30% 2039 | 1,410 | 1,820 |
| Intesa Sanpaolo SpA 5.017% 20246 | 17,435 | 16,973 |
| inVentiv Health Inc, Term Loan B4, 7.75% 20181,2,7 | 3,060 | 3,047 |
| inVentiv Health Inc. 9.00% 20186 | 7,000 | 7,297 |
| Iraq (Republic of) 5.80% 20282,6 | 250 | 226 |
| Iron Mountain Inc. 5.75% 2024 | 3,550 | 3,501 |
| iStar Financial Inc. 4.875% 2018 | 5,000 | 4,887 |
| iStar Financial Inc. 5.00% 2019 | 5,600 | 5,418 |
| J.P. Morgan Chase Commercial Mortgage Securities Corp., Series 2006-CB15, Class A-4, 5.814% 20431,2 | 1,229 | 1,308 |
| J.P. Morgan Chase Commercial Mortgage Securities Corp., Series 2006-LDP7, Class A-4, 6.508% 20451,2 | 3,830 | 4,067 |
| J.P. Morgan Chase Commercial Mortgage Securities Corp., Series 2006-CB-16, Class A1A, 5.546% 20452 | 2,056 | 2,198 |
| J.P. Morgan Chase Commercial Mortgage Securities Corp., Series 2011-C3A, Class A-2, 3.673% 20462,6 | 5,964 | 6,180 |
| J.P. Morgan Chase Commercial Mortgage Securities Corp., Series 2011-C4, Class A-2, 3.341% 20462,6 | 6,697 | 6,920 |
| J.P. Morgan Chase Commercial Mortgage Securities Corp., Series 2007-CB19, Class A-4, 5.892% 20491,2 | 11,145 | 12,129 |
| J.P. Morgan Chase Commercial Mortgage Securities Corp., Series 2007-C1, Class A-4, 5.716% 20512 | 3,000 | 3,265 |
| Jaguar Holding Co. 9.375% 20175,6 | 13,000 | 13,162 |
| Jaguar Land Rover PLC 8.125% 20216 | 5,500 | 6,043 |
Capital World Bond Fund — Page 15 of 23
Bonds, notes & other debt instruments
U.S. dollars (continued) | Principal amount
(000) | Value
(000) |
| JMC Steel Group Inc. 8.25% 20186 | $4,800 | $4,866 |
| JPMorgan Chase & Co. 3.25% 2022 | 19,791 | 19,518 |
| JPMorgan Chase & Co. 3.625% 2024 | 17,685 | 17,679 |
| JPMorgan Chase & Co. 3.875% 2024 | 8,920 | 8,740 |
| JPMorgan Chase & Co., Series-V, junior subordinated, perpetual, 5.00% (undated)1 | 3,000 | 2,936 |
| Jupiter Resources Inc. 8.50% 20226 | 3,000 | 2,670 |
| Kenya (Rebulic of) 5.875 20196 | 600 | 619 |
| Kenya (Republic of) 6.875% 20246 | 10,550 | 11,125 |
| Kimco Realty Corp., Series C, 4.904% 2015 | 1,360 | 1,381 |
| Kimco Realty Corp. 5.584% 2015 | 2,003 | 2,108 |
| Kimco Realty Corp. 5.70% 2017 | 500 | 553 |
| Kimco Realty Corp. 4.30% 2018 | 500 | 538 |
| Kimco Realty Corp. 6.875% 2019 | 8,010 | 9,528 |
| Kinder Morgan Energy Partners, LP 2.65% 2019 | 670 | 669 |
| Kinder Morgan Energy Partners, LP 3.50% 2021 | 3,960 | 3,980 |
| Kinder Morgan Energy Partners, LP 3.45% 2023 | 7,500 | 7,181 |
| Kinder Morgan Energy Partners, LP 3.50% 2023 | 4,490 | 4,273 |
| Kinder Morgan Energy Partners, LP 4.15% 2024 | 9,450 | 9,392 |
| Kinder Morgan Energy Partners, LP 4.25% 2024 | 1,960 | 1,943 |
| Kinder Morgan Energy Partners, LP 5.50% 2044 | 14,349 | 14,433 |
| Kindred Healthcare Inc., Term Loan B, 4.00% 20211,2,7 | 4,628 | 4,556 |
| Kinetic Concepts, Inc. 10.50% 2018 | 3,845 | 4,191 |
| Kinetic Concepts, Inc. 12.50% 2019 | 4,500 | 5,029 |
| Kraft Foods Inc. 2.25% 2017 | 1,590 | 1,621 |
| Kraft Foods Inc. 5.375% 2020 | 1,570 | 1,771 |
| Kroger Co. 6.80% 2018 | 1,000 | 1,179 |
| Latvia (Republic of) 2.75% 2020 | 12,415 | 12,244 |
| Latvia (Republic of) 5.25% 2021 | 19,950 | 22,201 |
| LB-UBS Commercial Mortgage Trust, Series 2007-C2, Class A-3, 5.43% 20402 | 2,865 | 3,105 |
| LB-UBS Commercial Mortgage Trust, Series 2007-C6, Class A-M, 6.114% 20401,2 | 460 | 504 |
| LB-UBS Commercial Mortgage Trust, Series 2007-C7, Class A-M, 6.37% 20451,2 | 2,110 | 2,375 |
| Leucadia National Corp. 5.50% 2023 | 1,375 | 1,442 |
| LightSquared, Term Loan B, 12.00% 20142,5,7,10 | 4,676 | 6,429 |
| Lithuania (Republic of) 7.375% 2020 | 11,550 | 13,976 |
| Lithuania (Republic of) 6.625% 20226 | 2,000 | 2,388 |
| LMI Aerospace Inc. 7.375% 20196 | 1,825 | 1,834 |
| LSB Industries, Inc. 7.75% 2019 | 2,735 | 2,913 |
| Macy’s Retail Holdings, Inc. 7.875% 20151 | 1,327 | 1,402 |
| Macy’s Retail Holdings, Inc. 4.375% 2023 | 2,550 | 2,696 |
| Magyar Export-Import Bank 4.00% 20206 | 2,595 | 2,580 |
| Marks and Spencer Group PLC 6.25% 20176 | 4,500 | 5,010 |
| McClatchy Co. 9.00% 2022 | 3,650 | 3,960 |
| McKesson Corp. 3.25% 2016 | 740 | 764 |
| McKesson Corp. 2.284% 2019 | 4,610 | 4,582 |
| McKesson Corp. 3.796% 2024 | 2,920 | 2,951 |
| McKesson Corp. 4.883% 2044 | 1,305 | 1,349 |
| Mediacom Broadband LLC and Mediacom Broadband Corp. 5.50% 20216 | 3,000 | 2,978 |
| Mediacom Broadband LLC and Mediacom Broadband Corp. 6.375% 2023 | 4,000 | 4,100 |
| Mediacom LLC and Mediacom Capital Corp. 7.25% 2022 | 5,000 | 5,275 |
| Merck & Co., Inc. 2.80% 2023 | 235 | 229 |
| Merrill Lynch Mortgage Trust, Series 2004-BPC1, Class A-5, 4.855% 20411,2 | 124 | 124 |
| Merrill Lynch Mortgage Trust, Series 2007-C1, Class A-4, 6.028% 20501,2 | 1,950 | 2,142 |
| MetroPCS Wireless, Inc. 6.25% 2021 | 6,925 | 7,020 |
| MetroPCS Wireless, Inc. 6.625% 2023 | 8,425 | 8,657 |
| Michaels Stores, Inc. 7.50% 20181,5,6 | 766 | 783 |
Capital World Bond Fund — Page 16 of 23
Bonds, notes & other debt instruments
U.S. dollars (continued) | Principal amount
(000) | Value
(000) |
| MidAmerican Energy Co. 4.40% 2044 | $1,063 | $1,099 |
| MidAmerican Energy Holdings Co. 3.75% 2023 | 3,230 | 3,321 |
| Milacron LLC 7.75% 20216 | 1,650 | 1,745 |
| ML-CFC Commercial Mortgage Trust, Series 2007-8, Class A-3, 6.079% 20491,2 | 890 | 976 |
| Morgan Stanley 2.125% 2018 | 5,125 | 5,130 |
| Morgan Stanley 2.50% 2019 | 13,050 | 13,067 |
| Morgan Stanley 2.375% 2019 | 12,075 | 11,889 |
| Morgan Stanley, Series F, 3.875% 2024 | 1,880 | 1,882 |
| Morgan Stanley 4.35% 2026 | 3,765 | 3,710 |
| Morgan Stanley Capital I Trust, Series 2006-IQ12, Class A1A, 5.319% 20432 | 3,555 | 3,824 |
| Morgan Stanley Capital I Trust, Series 2007-IQ13, Class A-M, 5.406% 20442 | 965 | 1,040 |
| Morgan Stanley Capital I Trust, Series 2007-IQ15, Class A-4, 6.105% 20491,2 | 263 | 289 |
| Morocco Government 4.25% 2022 | 5,700 | 5,682 |
| Morocco Government 4.25% 20226 | 2,500 | 2,492 |
| Morocco Government 5.50% 2042 | 10,000 | 10,038 |
| Morocco Government 5.50% 20426 | 1,500 | 1,506 |
| National Grid PLC 6.30% 2016 | 5,825 | 6,385 |
| National Rural Utilities Cooperative Finance Corp. 10.375% 2018 | 3,250 | 4,284 |
| NBC Universal Enterprise, Inc. 0.919% 20181,6 | 5,785 | 5,848 |
| NBC Universal Enterprise, Inc. 1.974% 20196 | 3,600 | 3,557 |
| NBC Universal Enterprise, Inc. 5.25% (undated)6 | 2,335 | 2,440 |
| Needle Merger Sub Corp. 8.125% 20196 | 4,565 | 4,360 |
| Neiman Marcus Group LTD Inc. 8.00% 20216 | 3,925 | 4,102 |
| Neiman Marcus Group LTD Inc. 8.75% 20211,5,6 | 4,825 | 5,102 |
| Neiman Marcus, Term Loan B, 4.25% 20201,2,7 | 3,719 | 3,661 |
| NGPL PipeCo LLC 7.119% 20176 | 1,500 | 1,508 |
| NGPL PipeCo LLC 9.625% 20196 | 6,900 | 7,349 |
| Niagara Mohawk Power Corp. 3.508% 20246 | 1,455 | 1,467 |
| Niagara Mohawk Power Corp. 4.278% 20346 | 5,860 | 5,914 |
| Nigeria (Republic of) 5.125% 20186 | 3,400 | 3,521 |
| Nigeria (Republic of) 6.375% 2023 | 4,450 | 4,789 |
| Nigeria (Republic of) 6.375% 20236 | 1,425 | 1,534 |
| NII Capital Corp. 10.00% 201610 | 125 | 37 |
| NII Capital Corp. 7.875% 20196,10 | 4,150 | 2,812 |
| NII Capital Corp. 11.375% 20196,10 | 1,600 | 1,084 |
| NII Capital Corp. 8.875% 2019 | 2,625 | 788 |
| NII Capital Corp. 7.625% 2021 | 9,000 | 1,755 |
| Nordea Bank, Series 2, 3.70% 20146 | 5,000 | 5,020 |
| Nordea Bank AB 1.625% 20186 | 2,645 | 2,619 |
| Nordea Bank AB 4.875% 20216 | 2,975 | 3,200 |
| Nordea Bank AB 4.25% 20226 | 10,050 | 10,352 |
| Norfolk Southern Corp. 5.75% 2016 | 4,265 | 4,528 |
| Norfolk Southern Corp. 3.00% 2022 | 4,000 | 3,990 |
| Nortek Inc. 10.00% 2018 | 2,050 | 2,168 |
| Nortek Inc. 8.50% 2021 | 1,925 | 2,079 |
| Novartis Capital Corp. 3.40% 2024 | 6,580 | 6,699 |
| Novartis Capital Corp. 4.40% 2044 | 1,000 | 1,044 |
| Numerical Group SA, First Lien, 4.875% 20196 | 700 | 694 |
| Numerical Group SA, First Lien, 6.00% 20226 | 5,850 | 5,901 |
| Numerical Group SA, First Lien, 6.25% 20246 | 2,400 | 2,397 |
| Odebrecht Drilling Norbe VIII/IX Ltd 6.35% 20212,6 | 6,125 | 6,333 |
| Odebrecht Offshore Drilling Finance Ltd. 6.75% 20222,6 | 8,078 | 8,401 |
| Oracle Corp. 3.40% 2024 | 2,725 | 2,718 |
| Orange SA 5.50% 2044 | 2,250 | 2,459 |
| Ortho-Clinical Diagnostics Inc. 6.625% 20226 | 5,910 | 5,393 |
Capital World Bond Fund — Page 17 of 23
Bonds, notes & other debt instruments
U.S. dollars (continued) | Principal amount
(000) | Value
(000) |
| Ortho-Clinical Diagnostics Inc., Term Loan B, 4.75% 20211,2,7 | $3,990 | $3,952 |
| Pacific Gas and Electric Co. 3.25% 2023 | 2,565 | 2,545 |
| Pacific Gas and Electric Co. 3.85% 2023 | 1,335 | 1,387 |
| Patheon Inc. 7.50% 20226 | 445 | 451 |
| Patheon Inc., Term Loan B, 4.25% 20211,2,7 | 2,883 | 2,830 |
| PDC Energy Inc. 7.75% 2022 | 4,850 | 5,214 |
| Pemex Project Funding Master Trust, Series 13, 6.625% 2035 | 3,885 | 4,528 |
| Pernod Ricard SA 4.45% 20226 | 7,565 | 8,009 |
| Petrobras Global Finance Co. 5.625% 2043 | 175 | 156 |
| Petrobras International Finance Co. 5.375% 2021 | 345 | 350 |
| Petrobras International Finance Co. 6.75% 2041 | 250 | 253 |
| Petróleos Mexicanos 3.50% 2018 | 1,500 | 1,559 |
| Petróleos Mexicanos 8.00% 2019 | 6,400 | 7,805 |
| Petróleos Mexicanos 5.50% 2021 | 1,070 | 1,183 |
| Petróleos Mexicanos 4.875% 2022 | 8,800 | 9,372 |
| Petróleos Mexicanos 6.50% 2041 | 2,470 | 2,869 |
| Petróleos Mexicanos 5.50% 2044 | 3,270 | 3,354 |
| Petróleos Mexicanos 6.375% 20456 | 7,000 | 7,933 |
| Pfizer Inc. 3.40% 2024 | 4,050 | 4,053 |
| Pfizer Inc. 4.40% 2044 | 750 | 759 |
| Philip Morris International Inc. 1.875% 2019 | 3,925 | 3,892 |
| Piedmont Operating Partnership LP 3.40% 2023 | 1,250 | 1,184 |
| Playa Resorts Holding BV 8.00% 20206 | 5,725 | 6,011 |
| Ply Gem Industries, Inc. 6.50% 2022 | 3,525 | 3,362 |
| Ply Gem Industries, Inc. 6.50% 20226 | 1,550 | 1,478 |
| Ply Gem Industries, Inc., Term Loan B1, 4.00% 20211,2,7 | 3,806 | 3,746 |
| PNC Financial Services Group, Inc. 3.90% 2024 | 3,975 | 3,978 |
| PNC Funding Corp. 3.30% 2022 | 5,090 | 5,127 |
| Polish Government 6.375% 2019 | 11,110 | 13,082 |
| Polish Government 5.00% 2022 | 19,100 | 21,034 |
| Popular, Inc. 7.00% 2019 | 2,785 | 2,802 |
| Post Holdings, Inc. 6.75% 20216 | 1,150 | 1,093 |
| Post Holdings, Inc. 7.375% 2022 | 2,500 | 2,481 |
| PRA Holdings, Inc. 9.50% 20236 | 2,335 | 2,557 |
| Progress Energy, Inc. 7.05% 2019 | 4,380 | 5,257 |
| Progress Energy, Inc. 7.75% 2031 | 1,990 | 2,804 |
| Prologis, Inc. 3.35% 2021 | 1,500 | 1,499 |
| Prologis, Inc. 4.25% 2023 | 11,545 | 11,942 |
| Province of Manitoba 3.05% 2024 | 1,350 | 1,368 |
| Puget Sound Energy, Inc., First Lien, 6.50% 2020 | 1,475 | 1,748 |
| Puget Sound Energy, Inc., First Lien, 6.00% 2021 | 4,629 | 5,391 |
| Puget Sound Energy, Inc., First Lien, 5.625% 2022 | 2,120 | 2,437 |
| QBE Insurance Group Ltd. 2.40% 20186 | 3,500 | 3,505 |
| QGOG Atlantic/Alaskan Rigs Ltd. 5.25% 20192,6 | 5,461 | 5,693 |
| QGOG Constellation SA 6.25% 20196 | 5,350 | 5,363 |
| R.R. Donnelley & Sons Co. 7.875% 2021 | 2,775 | 3,059 |
| R.R. Donnelley & Sons Co. 6.50% 2023 | 2,625 | 2,632 |
| Rabobank Nederland 4.625% 2023 | 14,905 | 15,475 |
| Ras Laffan Liquefied Natural Gas II 5.298% 20202,6 | 2,465 | 2,675 |
| Ras Laffan Liquefied Natural Gas III 5.838% 20272,6 | 8,000 | 9,025 |
| RCI Banque 3.50% 20186 | 9,000 | 9,312 |
| Realogy Corp., LOC, 4.50% 20161,2,7 | 53 | 52 |
| Regions Financial Corp. 7.75% 2014 | 103 | 104 |
| Regions Financial Corp., Series A-I, 5.20% 2015 | 200 | 204 |
| Regions Financial Corp. 5.75% 2015 | 295 | 304 |
Capital World Bond Fund — Page 18 of 23
Bonds, notes & other debt instruments
U.S. dollars (continued) | Principal amount
(000) | Value
(000) |
| Regions Financial Corp. 2.00% 2018 | $4,100 | $4,056 |
| Reynolds American Inc. 4.85% 2023 | 510 | 544 |
| Reynolds American Inc. 6.15% 2043 | 4,230 | 4,856 |
| Reynolds Group Inc. 9.00% 2019 | 3,500 | 3,662 |
| Reynolds Group Inc. 9.875% 2019 | 1,635 | 1,768 |
| Reynolds Group Inc. 5.75% 2020 | 10,795 | 11,038 |
| Rice Energy Inc. 6.25% 20226 | 6,175 | 6,052 |
| Rio Tinto Finance (USA) Ltd. 2.875% 2022 | 3,340 | 3,231 |
| Roche Holdings, Inc. 2.25% 20196 | 11,750 | 11,718 |
| Roche Holdings, Inc. 2.875% 20216 | 10,250 | 10,254 |
| Roche Holdings, Inc. 3.35% 20246 | 3,075 | 3,088 |
| Roche Holdings, Inc. 7.00% 20396 | 5,290 | 7,411 |
| Royal Bank of Scotland PLC 4.375% 2016 | 3,000 | 3,144 |
| Royal Bank of Scotland PLC 5.625% 2020 | 1,195 | 1,362 |
| RSP Permian Inc 6.625% 20226 | 1,975 | 1,990 |
| Sabine Pass Liquefaction, LLC 5.625% 2021 | 1,600 | 1,652 |
| Sabine Pass Liquefaction, LLC 5.75% 20246 | 2,825 | 2,878 |
| SABMiller Holdings Inc. 4.95% 20426 | 1,645 | 1,718 |
| Samson Investment Co. 9.75% 2020 | 8,590 | 7,838 |
| Schaeffler Holding Finance BV 6.875% 20181,5,6 | 2,425 | 2,534 |
| Schering-Plough Corp. 6.00% 2017 | 3,275 | 3,708 |
| Schlumberger Investment SA 3.65% 2023 | 2,435 | 2,525 |
| Scottish Power PLC 5.81% 2025 | 2,500 | 2,866 |
| Select Medical Holdings Corp. 6.375% 2021 | 6,910 | 6,945 |
| Serbia (Republic of) 4.875% 2020 | 2,090 | 2,087 |
| Serbia (Republic of) 7.25% 2021 | 6,330 | 7,086 |
| Serena Software, Inc. Term Loan B 7.50% 20201,2,7 | 2,750 | 2,765 |
| Silver II Borrower S.C.A./Silver II U.S. Holdings, LLC 7.75% 20206 | 3,315 | 3,456 |
| Simon Property Group, LP 10.35% 2019 | 2,975 | 3,957 |
| Slovenia (Republic of) 4.75% 20186 | 5,745 | 6,154 |
| Slovenia (Republic of) 4.125% 20196 | 4,565 | 4,765 |
| Slovenia (Republic of) 4.375% 20226 | 5,000 | 5,338 |
| Slovenia (Republic of) 5.50% 2022 | 12,990 | 14,159 |
| Slovenia (Republic of) 5.50% 20226 | 1,600 | 1,744 |
| Slovenia (Republic of) 5.85% 2023 | 17,695 | 19,774 |
| Slovenia (Republic of) 5.85% 20236 | 10,155 | 11,348 |
| Slovenia (Republic of) 5.25% 2024 | 4,160 | 4,451 |
| Spectra Energy Partners, LP 4.75% 2024 | 610 | 656 |
| Sprint Corp. 7.875% 20236 | 9,800 | 10,437 |
| SRA International, Inc., Term Loan B, 6.50% 20181,2,7 | 5,034 | 5,041 |
| Standard Chartered PLC 3.85% 20156 | 5,830 | 5,943 |
| Standard Chartered PLC 3.20% 20166 | 3,365 | 3,485 |
| State of Qatar 4.50% 20226 | 3,500 | 3,811 |
| Station Casinos LLC 7.50% 2021 | 650 | 681 |
| Statoil ASA 0.524% 20181 | 5,460 | 5,465 |
| Statoil ASA 1.95% 2018 | 4,515 | 4,537 |
| Statoil ASA 3.70% 2024 | 6,325 | 6,570 |
| Statoil ASA 4.25% 2041 | 3,000 | 3,010 |
| StatoilHydro ASA 1.80% 2016 | 2,000 | 2,038 |
| Tampa Electric Co. 4.10% 2042 | 3,140 | 3,115 |
| Tampa Electric Co. 4.35% 2044 | 1,620 | 1,674 |
| Teco Finance, Inc. 4.00% 2016 | 20 | 21 |
| Teco Finance, Inc. 5.15% 2020 | 270 | 301 |
| Teekay Corp. 8.50% 2020 | 3,400 | 3,791 |
| Telecom Italia Capital SA 7.175% 2019 | 2,245 | 2,545 |
Capital World Bond Fund — Page 19 of 23
Bonds, notes & other debt instruments
U.S. dollars (continued) | Principal amount
(000) | Value
(000) |
| Telecom Italia Capital SA 5.303% 20246 | $8,000 | $7,870 |
| Tenet Healthcare Corp. 8.125% 2022 | 5,230 | 5,753 |
| Tennessee Valley Authority 5.88% 2036 | 2,250 | 2,935 |
| Tennessee Valley Authority 5.25% 2039 | 6,000 | 7,323 |
| Thermo Fisher Scientific Inc. 4.15% 2024 | 3,030 | 3,144 |
| Thomson Reuters Corp. 1.65% 2017 | 4,605 | 4,602 |
| Thomson Reuters Corp. 4.30% 2023 | 4,250 | 4,446 |
| Thomson Reuters Corp. 5.65% 2043 | 2,980 | 3,323 |
| Time Inc. 5.75% 20226 | 1,575 | 1,512 |
| T-Mobile US, Inc. 6.731% 2022 | 2,500 | 2,566 |
| T-Mobile US, Inc. 6.375% 2025 | 1,800 | 1,800 |
| Toronto-Dominion Bank 2.375% 2016 | 2,500 | 2,571 |
| Total Capital International 1.55% 2017 | 1,800 | 1,814 |
| Total Capital International 2.10% 2019 | 2,400 | 2,393 |
| Total Capital International 2.875% 2022 | 1,115 | 1,112 |
| Toyota Motor Credit Corp. 2.125% 2019 | 4,000 | 3,992 |
| Toys "R" Us-Delaware, Inc. 7.375% 20166 | 2,000 | 2,000 |
| Toys "R" Us-Delaware, Inc., Term Loan B2, 5.25% 20181,2,7 | 953 | 890 |
| TRAC Intermodal 11.00% 2019 | 1,525 | 1,693 |
| TransCanada PipeLines Ltd. 6.50% 2018 | 5,000 | 5,801 |
| TransCanada PipeLines Ltd. 7.125% 2019 | 3,035 | 3,650 |
| TransCanada PipeLines Ltd. 7.625% 2039 | 2,000 | 2,802 |
| TransDigm Inc. 5.50% 2020 | 3,100 | 3,023 |
| Transocean Inc. 5.05% 2016 | 1,520 | 1,621 |
| Transocean Inc. 2.50% 2017 | 6,415 | 6,419 |
| Transocean Inc. 6.375% 2021 | 2,060 | 2,195 |
| Transportadora de Gas Peru SA 4.25% 20282,6 | 8,960 | 8,534 |
| Turkey (Republic of) 4.557% 20186 | 5,065 | 5,236 |
| Turkey (Republic of) 7.00% 2019 | 5,000 | 5,619 |
| Turkey (Republic of) 6.25% 2022 | 4,915 | 5,419 |
| U.S. Coatings Acquisition Inc. (Flash Dutch 2 BV) 7.375% 20216 | 2,840 | 3,060 |
| U.S. Treasury 0.375% 2015 | 46,670 | 46,791 |
| U.S. Treasury 1.50% 2016 | 3,530 | 3,593 |
| U.S. Treasury 0.625% 2016 | 6,400 | 6,409 |
| U.S. Treasury 0.625% 2016 | 41,000 | 40,916 |
| U.S. Treasury 0.875% 2017 | 16,450 | 16,374 |
| U.S. Treasury 0.625% 2017 | 62,930 | 62,104 |
| U.S. Treasury 3.50% 2018 | 35,600 | 38,196 |
| U.S. Treasury 0.625% 2018 | 15,600 | 15,194 |
| U.S. Treasury 2.625% 2018 | 2,500 | 2,610 |
| U.S. Treasury 1.50% 2018 | 292,250 | 292,215 |
| U.S. Treasury 1.375% 2018 | 20,900 | 20,778 |
| U.S. Treasury 1.25% 2018 | 122,400 | 120,903 |
| U.S. Treasury 1.50% 2019 | 61,075 | 60,720 |
| U.S. Treasury 1.625% 2019 | 81,150 | 80,957 |
| U.S. Treasury 1.50% 2019 | 40,125 | 39,724 |
| U.S. Treasury 1.625% 201911 | 200,150 | 199,173 |
| U.S. Treasury 1.625% 2019 | 162,365 | 161,324 |
| U.S. Treasury 1.25% 2020 | 41,075 | 39,710 |
| U.S. Treasury 1.125% 2020 | 128,100 | 122,804 |
| U.S. Treasury 1.375% 2020 | 168,900 | 163,642 |
| U.S. Treasury 2.00% 2020 | 4,700 | 4,688 |
| U.S. Treasury 8.00% 2021 | 1,200 | 1,662 |
| U.S. Treasury 2.50% 2023 | 77,900 | 78,385 |
| U.S. Treasury 2.50% 2024 | 91,143 | 91,230 |
Capital World Bond Fund — Page 20 of 23
Bonds, notes & other debt instruments
U.S. dollars (continued) | Principal amount
(000) | Value
(000) |
| U.S. Treasury 2.875% 2043 | $17,993 | $16,863 |
| U.S. Treasury 3.625% 2043 | 5,850 | 6,325 |
| U.S. Treasury 3.625% 2044 | 1,150 | 1,243 |
| U.S. Treasury 3.375% 2044 | 2,250 | 2,323 |
| U.S. Treasury Inflation-Protected Security 0.125% 20173 | 10,123 | 10,265 |
| U.S. Treasury Inflation-Protected Security 0.125% 20183 | 6,184 | 6,238 |
| U.S. Treasury Inflation-Protected Security 0.125% 20193 | 167,689 | 168,203 |
| U.S. Treasury Inflation-Protected Security 0.625% 20243 | 211,562 | 212,880 |
| U.S. Treasury Inflation-Protected Security 0.125% 20243 | 31,858 | 30,623 |
| U.S. Treasury Inflation-Protected Security 2.375% 20253 | 6,952 | 8,155 |
| U.S. Treasury Inflation-Protected Security 0.75% 20423 | 3,163 | 2,904 |
| U.S. Treasury Inflation-Protected Security 1.375% 20443 | 77,055 | 82,544 |
| UDR, Inc., Series A, 5.25% 2015 | 2,680 | 2,716 |
| Union Pacific Corp. 3.646% 2024 | 1,850 | 1,916 |
| Union Pacific Corp. 4.821% 2044 | 1,990 | 2,168 |
| United Mexican States Government Global, Series A, 5.125% 2020 | 5,440 | 6,052 |
| United Mexican States Government Global, Series A, 3.625% 2022 | 7,800 | 7,948 |
| United Mexican States Government Global 5.55% 2045 | 4,000 | 4,454 |
| United Rentals, Inc. 7.375% 2020 | 5,000 | 5,338 |
| Univision Communications Inc. 8.50% 20216 | 3,500 | 3,719 |
| US Investigations Services, Inc. 13.00% 20205,6 | 1,970 | 822 |
| US Investigations Services, Inc. 14.00% 20205,6 | 216 | 90 |
| US Investigations Services, Inc. 15.00% 20215,6 | 521 | 150 |
| Various Purpose G.O. Bonds, 6.20% 2019 | 18,700 | 22,313 |
| Various Purpose G.O. Bonds, 7.30% 20392 | 1,310 | 1,832 |
| Various Purpose G.O. Bonds, 7.55% 2039 | 2,720 | 3,984 |
| Various Purpose G.O. Bonds, 7.60% 2040 | 12,910 | 19,162 |
| Various Purpose G.O. Bonds, 7.625% 2040 | 11,850 | 17,263 |
| VEB Finance Ltd. 6.902% 20206 | 6,600 | 6,699 |
| Verizon Communications Inc. 0.632% 20171 | 1,200 | 1,204 |
| Verizon Communications Inc. 1.35% 2017 | 1,360 | 1,354 |
| Verizon Communications Inc. 2.625% 20206 | 7,135 | 7,056 |
| Verizon Communications Inc. 5.15% 2023 | 18,550 | 20,532 |
| Verizon Communications Inc. 4.15% 2024 | 15,630 | 16,143 |
| Verizon Communications Inc. 5.05% 2034 | 8,190 | 8,694 |
| Verizon Communications Inc. 6.55% 2043 | 10,144 | 12,692 |
| Verizon Communications Inc. 4.862% 20466 | 4,257 | 4,279 |
| Verizon Communications Inc. 5.012% 20546 | 10,177 | 10,270 |
| Viacom Inc. 5.85% 2043 | 2,675 | 2,983 |
| Vodafone Group PLC 2.50% 2022 | 1,136 | 1,053 |
| Volkswagen International Finance NV 2.875% 20166 | 1,900 | 1,958 |
| Volkswagen International Finance NV 4.00% 20206 | 4,000 | 4,272 |
| Volvo Treasury AB 5.95% 20156 | 12,390 | 12,712 |
| VPI Escrow Corp. 6.375% 20206 | 1,475 | 1,521 |
| VPI Escrow Corp. 7.50% 20216 | 3,410 | 3,661 |
| Wachovia Bank Commercial Mortgage Trust, Series 2006-C25, Class A1A, 5.891% 20431,2 | 6,732 | 7,160 |
| Wachovia Bank Commercial Mortgage Trust, Series 2007-C30, Class A-5, 5.342% 20432 | 250 | 270 |
| Wachovia Bank Commercial Mortgage Trust, Series 2007-C31, Class A-5, 5.50% 20472 | 900 | 980 |
| Wachovia Bank Commercial Mortgage Trust, Series 2007-C31, Class A-M, 5.591% 20471,2 | 1,270 | 1,382 |
| Wachovia Bank Commercial Mortgage Trust, Series 2007-C32, Class A-3, 5.933% 20491,2 | 400 | 433 |
| Walter Energy, Inc. 9.50% 20196 | 2,000 | 1,810 |
| Warner Music Group 6.75% 20226 | 6,375 | 6,136 |
| WEA Finance LLC 1.75% 20176 | 5,435 | 5,447 |
| WEA Finance LLC 2.70% 20196 | 7,785 | 7,814 |
| WEA Finance LLC 3.75% 20246 | 3,880 | 3,879 |
Capital World Bond Fund — Page 21 of 23
Bonds, notes & other debt instruments
U.S. dollars (continued) | Principal amount
(000) | Value
(000) |
| WellPoint, Inc. 2.30% 2018 | $2,645 | $2,655 |
| Wells Fargo & Co. 3.30% 2024 | 27,900 | 27,414 |
| Western Gas Partners LP 2.60% 2018 | 130 | 131 |
| Western Gas Partners LP 4.00% 2022 | 1,250 | 1,281 |
| WFLD Mortgage Trust, Series 2014-MONT, Class B, 3.88% 20241,2,6 | 1,000 | 1,016 |
| WFLD Mortgage Trust, Series 2014-MONT, Class D, 3.88% 20241,2,6 | 1,500 | 1,424 |
| WFLD Mortgage Trust, Series 2014-MONT, Class C, 3.88% 20241,2,6 | 1,000 | 991 |
| WFLD Mortgage Trust, Series 2014-MONT, Class A, 3.88% 20241,2,6 | 650 | 671 |
| Williams Partners LP 5.25% 2020 | 10,405 | 11,571 |
| Williams Partners LP 4.125% 2020 | 1,625 | 1,704 |
| Williams Partners LP 4.50% 2023 | 3,860 | 4,042 |
| Williams Partners LP 4.30% 2024 | 7,235 | 7,396 |
| Williams Partners LP 3.90% 2025 | 1,750 | 1,722 |
| Wind Acquisition SA 7.375% 20216 | 2,950 | 2,972 |
| WM. Wrigley Jr. Co 3.375% 20206 | 2,215 | 2,252 |
| WPP Finance 2010 3.75% 2024 | 4,000 | 3,954 |
| Xstrata Canada Financial Corp. 2.70% 20171,6 | 2,125 | 2,162 |
| Zambia (Republic of) 5.375% 2022 | 5,500 | 5,253 |
| Zambia (Republic of) 5.375% 20226 | 3,225 | 3,080 |
| Zambia (Republic of) 8.50% 20246 | 4,950 | 5,634 |
| | | 5,952,077 |
| Total bonds, notes & other debt instruments (cost: $12,116,792,000) | | 12,137,924 |
Convertible stocks 0.02%
U.S. dollars 0.02% | Shares | |
| CEVA Group PLC, Series A-2, 2.23% convertible preferred9,12 | 1,141 | 1,255 |
| CEVA Group PLC, Series A-1, 3.23% convertible preferred9 | 718 | 1,114 |
| Total convertible stocks (cost: $2,416,000) | | 2,369 |
Common stocks 0.00%
U.S. dollars 0.00% | | |
| CEVA Group PLC6,9,13 | 527 | 580 |
| Atrium Corp.6,9,13 | 191 | — |
| Total common stocks (cost: $736,000) | | 580 |
| Short-term securities 9.63% | Principal amount
(000) | |
| American Honda Finance Corp. 0.11% due 12/9/2014 | $ 39,335 | 39,325 |
| CAFCO, LLC 0.21% due 3/9/2015 | 55,000 | 54,945 |
| Fannie Mae 0.06%—0.10% due 11/4/2014—2/17/2015 | 225,200 | 225,184 |
| Federal Farm Credit Banks 0.11% due 4/16/2015 | 31,900 | 31,889 |
| Federal Home Loan Bank 0.05%—0.10% due 10/1/2014—2/4/2015 | 209,200 | 209,187 |
| Freddie Mac 0.09%—0.14% due 10/23/2014—8/4/2015 | 308,125 | 307,970 |
| General Electric Co. 0.06% due 10/1/2014 | 45,700 | 45,700 |
| GlaxoSmithKline Finance PLC 0.11% due 11/25/20146 | 40,000 | 39,990 |
| Mizuho Funding LLC 0.19%—0.20% due 10/8/2014—11/4/20146 | 52,500 | 52,494 |
| Nordea Bank AB 0.18% due 1/29/20156 | 30,000 | 29,982 |
| Québec (Province of) 0.06%—0.10% due 10/7/2014—10/23/20146 | 58,600 | 58,598 |
| Reckitt Benckiser Treasury Services PLC 0.22% due 11/24/20146 | 20,000 | 19,995 |
| Sumitomo Mitsui Banking Corp. 0.15%—0.22% due 10/15/2014—1/16/20156 | 100,300 | 100,261 |
Capital World Bond Fund — Page 22 of 23
| Short-term securities | Principal amount
(000) | Value
(000) |
| Toronto-Dominion Holdings USA Inc. 0.14% due 10/6/20146 | $36,500 | $36,500 |
| Victory Receivables Corp. 0.15% due 10/8/20146 | 20,000 | 19,999 |
| Total short-term securities (cost: $1,271,886,000) | | 1,272,019 |
| Total investment securities 101.56% (cost: $13,391,830,000) | | 13,412,892 |
| Other assets less liabilities (1.56%) | | (206,332) |
| Net assets 100.00% | | $13,206,560 |
| 1 | Coupon rate may change periodically. |
| 2 | Principal payments may be made periodically. Therefore, the effective maturity date may be earlier than the stated maturity date. |
| 3 | Index-linked bond whose principal amount moves with a government price index. |
| 4 | Step bond; coupon rate will increase at a later date. |
| 5 | Payment in kind; the issuer has the option of paying additional securities in lieu of cash. |
| 6 | Acquired in a transaction exempt from registration under Rule 144A or Section 4(2) of the Securities Act of 1933. May be resold in the U.S. in transactions exempt from registration, normally to qualified institutional buyers. The total value of all such securities was $1,283,213,000, which represented 9.72% of the net assets of the fund. |
| 7 | Loan participations and assignments; may be subject to legal or contractual restrictions on resale. The total value of all such loans was $68,770,000, which represented .52% of the net assets of the fund. |
| 8 | A portion or all of this security purchased on a TBA basis. |
| 9 | Valued under fair value procedures adopted by authority of the board of trustees. The total value of all such securities was $2,978,000, which represented .02% of the net assets of the fund. |
| 10 | Scheduled interest and/or principal payment was not received. |
| 11 | A portion of this security was pledged as collateral. The total value of pledged collateral was $14,198,000, which represented .11% of the net assets of the fund. |
| 12 | Acquired through a private placement transaction exempt from registration under the Securities Act of 1933. May be subject to legal or contractual restrictions on resale. Further details on this holding appear below. |
| 13 | Security did not produce income during the last 12 months. |
| Private placement securities | Acquisition
dates | Cost
(000) | Value
(000) | Percent
of net
assets | |
| CEVA Group PLC, Series A-2, 2.23% convertible preferred | 3/10/2010-1/21/2011 | $1,687 | $1,255 | .00% | |
| Key to abbreviations |
| G.O. = General Obligation |
| TBA = To be announced |
Investments are not FDIC-insured, nor are they deposits of or guaranteed by a bank or any other entity, so they may lose value.
Investors should carefully consider investment objectives, risks, charges and expenses. This and other important information is contained in the fund prospectus and summary prospectus, which can be obtained from your financial professional and should be read carefully before investing. You may also call American Funds Service Company (AFS) at (800) 421-4225 or visit the American Funds website at americanfunds.com.
| MFGEFPX-031-1114O-S42221 | Capital World Bond Fund — Page 23 of 23 |
REPORT OF INDEPENDENT REGISTERED PUBLIC ACCOUNTING FIRM
To the Shareholders and Board of Trustees of
Capital World Bond Fund:
We have audited the accompanying statement of assets and liabilities of Capital World Bond Fund (the “Fund”), including the summary schedule of investments, as of September 30, 2014, and the related statements of operations for the year then ended, the statements of changes in net assets for each of the two years in the period then ended (collectively, the “financial statements”), the financial highlights for each of the five years in the period then ended (the financial statements and financial highlights are included in Item 1 of this Form N-CSR), and the schedule of investments in securities as of September 30, 2014 (included in Item 6 of this Form N-CSR). These financial statements, financial highlights, and schedule of investments in securities are the responsibility of the Fund’s management. Our responsibility is to express an opinion on these financial statements, financial highlights, and schedule of investments in securities based on our audits.
We conducted our audits in accordance with the standards of the Public Company Accounting Oversight Board (United States). Those standards require that we plan and perform the audit to obtain reasonable assurance about whether the financial statements, financial highlights, and schedule of investments in securities are free of material misstatement. An audit includes examining, on a test basis, evidence supporting the amounts and disclosures in the financial statements and schedule of investments in securities. Our procedures included confirmation of securities owned as of September 30, 2014, by correspondence with the custodian and brokers; where replies were not received from brokers, we performed other auditing procedures. An audit also includes assessing the accounting principles used and significant estimates made by management, as well as evaluating the overall financial statement presentation. We believe that our audits provide a reasonable basis for our opinion.
In our opinion, the financial statements, financial highlights, and schedule of investments in securities referred to above present fairly, in all material respects, the financial position of Capital World Bond Fund as of September 30, 2014, and the results of its operations for the year then ended, the changes in its net assets for each of the two years in the period then ended, and the financial highlights for each of the five years in the period then ended, in conformity with accounting principles generally accepted in the United States of America.
DELOITTE & TOUCHE LLP
Costa Mesa, California
November 7, 2014
ITEM 7 – Disclosure of Proxy Voting Policies and Procedures for Closed-End Management Investment Companies
Not applicable to this Registrant, insofar as the Registrant is not a closed-end management investment company.
ITEM 8 – Portfolio Managers of Closed-End Management Investment Companies
Not applicable to this Registrant, insofar as the Registrant is not a closed-end management investment company.
ITEM 9 – Purchases of Equity Securities by Closed-End Management Investment Company and Affiliated Purchasers
Not applicable to this Registrant, insofar as the Registrant is not a closed-end management investment company.
ITEM 10 – Submission of Matters to a Vote of Security Holders
There have been no material changes to the procedures by which shareholders may recommend nominees to the Registrant’s board of trustees since the Registrant last submitted a proxy statement to its shareholders. The procedures are as follows. The Registrant has a nominating and governance committee comprised solely of persons who are not considered ‘‘interested persons’’ of the Registrant within the meaning of the Investment Company Act of 1940, as amended. The committee periodically reviews such issues as the board’s composition, responsibilities, committees, compensation and other relevant issues, and recommends any appropriate changes to the full board of trustees. While the committee normally is able to identify from its own resources an ample number of qualified candidates, it will consider shareholder suggestions of persons to be considered as nominees to fill future vacancies on the board. Such suggestions must be sent in writing to the nominating and governance committee of the Registrant, c/o the Registrant’s Secretary, and must be accompanied by complete biographical and occupational data on the prospective nominee, along with a written consent of the prospective nominee for consideration of his or her name by the nominating and governance committee.
ITEM 11 – Controls and Procedures
| (a) | The Registrant’s Principal Executive Officer and Principal Financial Officer have concluded, based on their evaluation of the Registrant’s disclosure controls and procedures (as such term is defined in Rule 30a-3 under the Investment Company Act of 1940), that such controls and procedures are adequate and reasonably designed to achieve the purposes described in paragraph (c) of such rule. |
| | |
| (b) | There were no changes in the Registrant’s internal controls over financial reporting (as defined in Rule 30a-3(d) under the Investment Company Act of 1940) that occurred during the Registrant’s second fiscal quarter of the period covered by this report that has materially affected, or is reasonably likely to materially affect, the Registrant’s internal control over financial reporting. |
ITEM 12 – Exhibits
| (a)(1) | The Code of Ethics that is the subject of the disclosure required by Item 2 is attached as an exhibit hereto. |
| | |
| (a)(2) | The certifications required by Rule 30a-2 of the Investment Company Act of 1940 and Sections 302 and 906 of the Sarbanes-Oxley Act of 2002 are attached as exhibits hereto. |
SIGNATURES
Pursuant to the requirements of the Securities Exchange Act of 1934 and the Investment Company Act of 1940, the Registrant has duly caused this report to be signed on its behalf by the undersigned, thereunto duly authorized.
| | CAPITAL WORLD BOND FUND |
| | |
| | By /s/ Mark H. Dalzell |
| | Mark H. Dalzell, President and Principal Executive Officer |
| | |
| | Date: November 28, 2014 |
Pursuant to the requirements of the Securities Exchange Act of 1934 and the Investment Company Act of 1940, this report has been signed below by the following persons on behalf of the Registrant and in the capacities and on the dates indicated.
| By /s/ Mark H. Dalzell |
Mark H. Dalzell, President and Principal Executive Officer |
| |
| Date: November 28, 2014 |
| By /s/ Brian C. Janssen |
Brian C. Janssen, Treasurer and Principal Financial Officer |
| |
| Date: November 28, 2014 |