UNITED STATES
SECURITIES AND EXCHANGE COMMISSION
Washington, D.C. 20549
FORM N-CSR
Certified Shareholder Report of
Registered Management Investment Companies
Investment Company Act File Number: 811-05104
Capital World Bond Fund
(Exact Name of Registrant as Specified in Charter)
333 South Hope Street
Los Angeles, California 90071
(Address of Principal Executive Offices)
Registrant's telephone number, including area code: (213) 486-9200
Date of fiscal year end: December 31
Date of reporting period: December 31, 2016
Steven I. Koszalka
Capital World Bond Fund
333 South Hope Street
Los Angeles, California 90071
(Name and Address of Agent for Service)
ITEM 1 – Reports to Stockholders

Find opportunities
in global bonds
 | Capital World Bond Fund® Annual report
for the period ended
December 31, 2016 |
Capital World Bond Fund seeks to provide you, over the long term, with a high level of total return consistent with prudent investment management. Total return comprises the income generated by the fund and the changes in the market value of the fund’s investments.
This fund is one of more than 40 offered by one of the nation’s largest mutual fund families, American Funds, from Capital Group. For more than 85 years, Capital has invested with a long-term focus based on thorough research and attention to risk.
Fund results shown in this report, unless otherwise indicated, are for Class A shares at net asset value. If a sales charge (maximum 3.75%) had been deducted, the results would have been lower. Results are for past periods and are not predictive of results for future periods. Current and future results may be lower or higher than those shown. Share prices and returns will vary, so investors may lose money. Investing for short periods makes losses more likely. Investments are not FDIC-insured, nor are they deposits of or guaranteed by a bank or any other entity, so they may lose value. For current information and month-end results, visit americanfunds.com.
Here are the average annual total returns on a $1,000 investment with all distributions reinvested for periods ended December 31, 2016:
| Class A shares | 1 year | 5 years | 10 years |
| | | | |
| Reflecting 3.75% maximum sales charge | –1.58% | –0.02% | 2.76% |
For other share class results, visit americanfunds.com and americanfundsretirement.com.
The total annual fund operating expense ratio was 0.95% for Class A shares as of the prospectus dated March 1, 2017 (unaudited).
Investment results assume all distributions are reinvested and reflect applicable fees and expenses. When applicable, investment results reflect fee waivers, without which results would have been lower. Visit americanfunds.com for more information.
The fund’s 30-day yield for Class A shares as of January 31, 2017, calculated in accordance with the U.S. Securities and Exchange Commission (SEC) formula, was 1.80%. The fund’s 12-month distribution rate for Class A shares as of that date was 1.60%. Both reflect the 3.75% maximum sales charge. The SEC yield reflects the rate at which the fund is earning income on its current portfolio of securities, while the distribution rate reflects the fund’s past dividends paid to shareholders. Accordingly, the fund’s SEC yield and distribution rate may differ.
The return of principal for bond funds and for funds with significant underlying bond holdings is not guaranteed. Fund shares are subject to the same interest rate, inflation and credit risks associated with the underlying bond holdings. High-yield and lower rated bonds are subject to greater fluctuations in value and risk of loss of income and principal than investment-grade and higher rated bonds. Bond ratings, which typically range from AAA/Aaa (highest) to D (lowest), are assigned by credit rating agencies such as Standard & Poor’s, Moody’s and/or Fitch as an indication of an issuer’s creditworthiness. Investing in bonds issued outside the U.S. may be subject to additional risks. They include currency fluctuations, political and social instability, differing securities regulations and accounting standards, higher transaction costs, possible changes in taxation, illiquidity and price volatility. These risks may be heightened in connection with investments in developing countries. Refer to the fund prospectus and the Risk Factors section of this report for more information on these and other risks associated with investing in the fund.

Fellow investors:
Not long has passed since our last letter, though much has happened in recent months. So, as we write to let you know that Capital World Bond Fund’s fiscal year-end has shifted to coincide with the calendar year-end, we’re also offering an update on market developments and our latest thinking.
Over the 12-month period ended December 31, 2016, bond prices and currencies fluctuated considerably. In addition to Donald Trump’s victory in November’s U.S. presidential election, divergent central bank actions had a profound impact on markets.
Bond yields (which move inversely to prices) moved sharply higher in November and December. Many currencies weakened against the dollar, which acted as a further drag on returns in certain non-U.S. markets.
The fund recorded a 12-month total return of 2.27%. The result outpaced the unmanaged Bloomberg Barclays Global Aggregate Index, which rose 2.09%. Favorable bond selection contributed most to relative results. Decisions in regard to emphasizing certain bond sectors and countries in the portfolio also helped. Less-than-index exposure to the British pound was a significant positive, though overall currency exposure detracted from relative results.
As always, Capital World Bond Fund has maintained its disciplined diversified relative value approach to investing, designed to deliver a consistently high level of total return to fund investors over time. For longer term results see the table below. Dividends were paid in March, June, October and December, totaling 32 cents a share, including about 4 cents in return of capital. Fund investors who
Results at a glance
For periods ended December 31, 2016, with all distributions reinvested
| | | Cumulative total returns | | Average annual total returns |
| | | 6 months | | 1 year | | 5 years | | 10 years | | Lifetime1 |
| | | | | | | | | | | | | | | | | | | | | |
| Capital World Bond Fund (Class A shares) | | | –5.12 | % | | | 2.27 | % | | | 0.75 | % | | | 3.15 | % | | | 6.08 | % |
| Bloomberg Barclays Global Aggregate Index2 | | | –6.31 | | | | 2.09 | | | | 0.21 | | | | 3.29 | | | | 6.02 | % |
| Lipper Global Income Funds Average3 | | | –2.43 | | | | 3.54 | | | | 1.48 | | | | 3.61 | | | | 6.13 | % |
| 2 | Bloomberg Barclays source: Bloomberg Index Services Ltd. The Bloomberg Barclays Global Aggregate Index began on December 31, 1989. For the period August 4, 1987, to December 31, 1989, the Citigroup World Government Bond Index was used. The indexes are unmanaged and, therefore, have no expenses. Investors cannot invest directly in an index. Citigroup data: ©2017 Citigroup Index LLC. All rights reserved. |
| 3 | Source: Thomson Reuters Lipper. Lipper averages reflect the current composition of all eligible mutual funds (all share classes) within a given category. |
On the cover:
Shibuya Crossing, Tokyo

reinvested their dividends earned an income return of 1.70%, or 1.47% excluding return of capital. For those taking their dividends in cash, the figure was 1.69%, or 1.46% excluding return of capital.
The fund’s result lagged the Lipper Global Income Funds Average, a measure of comparable funds, which rose 3.54%. As a fund category, “Global Income” includes a broad spectrum of funds, such as those that fully hedge currency exposure, and others with substantial investments in emerging markets bonds or high-yield bonds (rated BB/Ba and below); lower rated corporates were one of the few areas that rallied amid the late-2016 bond selloff.
United States
The Federal Reserve held rates steady at its July and September meetings, but gave a generally upbeat verdict on the economy. By December, the Fed was ready to act and the federal funds target rate was raised by a quarter of a percentage point to a range of 0.50% to 0.75%.
However, the hawkishness of the Fed’s outlook seemed to surprise markets and yields moved even higher, reflecting stronger growth and inflation expectations for 2017.
The yield on the benchmark 10-year U.S. Treasury note ended the 12-month period at 2.45% — 0.18 percentage points higher than a year earlier, and well above the record low of 1.37% reached in July. Investment-grade (rated BBB/Baa and above) corporate bonds notched a 6.1% gain. Treasury Inflation Protected Securities (TIPS) advanced 4.7%, helped by higher actual and expected inflation. TIPS are a significant fund holding.
One important driver of higher inflation has been rising oil prices. After hitting a 13-year low of $26 per barrel in February, crude oil mostly traded in a range of $40-$55 per barrel toward the end of 2016. The recovery in oil prices helped boost the fund’s Investments in corporate bonds from the energy sector.
Excluding cash, U.S. dollar-denominated debt accounted for 50.2% of the fund’s portfolio as of December 31, 2016, before currency hedging; this amount included 16.7% in Treasury bonds and notes.
Europe
In March, ECB President Mario Draghi announced a series of policy actions that included reductions in three key lending rates, some of which were already in negative territory. The ECB also expanded its bond-buying program to €80 billion a month (from €60 billion) and pledged to buy corporate bonds in addition to government bonds.
The U.K.’s “Brexit” vote in June weakened the British pound and sent European bond yields into uncharted negative territory as investors sought safe-haven assets. By year-end, however, sub-zero yields had become less prevalent.
In December, encouraging economic data prompted a change of tack by the ECB. The central bank announced that it would extend its program into 2017, while dialing purchases back down to €60 billion each month. The yield on
| 2 | Capital World Bond Fund |
Germany’s benchmark 10-year note ended 2016 at 0.20%, while the euro shed 3.00% over the 12 months.
Euro-zone bonds accounted for 10.6% of the fund’s portfolio (before currency hedging) as of December 31. Holdings of government issues from Poland, Hungary and Germany are among the larger exposures.
Other developed markets
The Bank of Japan surprised markets twice over the fund’s fiscal year. In late January 2016, the central bank sought to kick-start growth and spark inflation by adopting negative short-term interest rates. Then, in September, it announced that it would tailor its official bond purchases in a bid to push 10-year government bond yields back up to around zero.
The fund’s exposure to Japan is much less than that of the index. That said, Japanese investments — including a sizable amount of inflation-linked issues — remain meaningful in absolute terms: 8.3%, before currency hedging.
Developing markets
Despite the sharp selloff in the final few months of 2016, developing country bonds notched a 10% gain over the 12-month period. In the near term, rebounding prices for certain commodities and stimulus measures in the euro zone, Japan and China all seem supportive, as do reform efforts in select markets.
We remain mindful that future U.S. interest rate increases may dampen investor enthusiasm. As of December 31, 2016, developing country bonds amounted to 22.5% of the portfolio (before currency hedging).
Looking ahead
The global outlook has brightened somewhat. Growth and inflation have picked up and manufacturing activity also seems to be recovering after an extended slump. While some major central banks have maintained accommodative policies, the Fed is tightening. Gradual increases in U.S. interest rates seem likely in 2017. However, the Fed’s stance may evolve as clarity on the new administration’s policy priorities around infrastructure spending, tax cuts and trade policy develops.
Still, concerns about global growth persist. The possibility of more protectionist trade policies in the U.S. and political uncertainty about Brexit and euro zone elections may be sources of volatility.
Near-term dollar strength also seems quite possible — even though valuations for some currencies appear quite low. In recent months, managers increased the portfolio’s less-than-index stance in the euro and reduced the underweight in the British pound. Yen exposure has decreased from neutral to modestly below-index.
Active management of exposure to currencies — as well as countries, interest rates and sectors — is a hallmark of this fund’s flexible research-driven approach. Research has helped us uncover attractive bonds among diverse areas — ranging from Danish mortgage-backed securities and Hungarian government issues, to Malaysian government bonds — and shaped longer term strategic thinking.
We expect broad dollar strength to relent in the next year or so. We see sustained relative value in central Europe and Scandinavia, where higher growth economies adjacent to the euro zone offer European exposure with some positive twists. We also see some great opportunities in emerging markets. For instance, we recently added to investments in Brazil — mindful that bonds there could rally further, if disappointing growth prompts the central bank to cut rates more aggressively than is widely anticipated.
Thank you for your continued commitment to long-term investing. We look forward to reporting to you again in six months.
Cordially,

Thomas H. Høgh
President
February 13, 2017
For current information about the fund, visit americanfunds.com.
The value of a long-term perspective
Fund results shown reflect deduction of the maximum sales charge of 3.75% on the $10,000 investment.1 Thus, the net amount invested was $9,625.2
How a $10,000 investment has grown over the fund’s lifetime
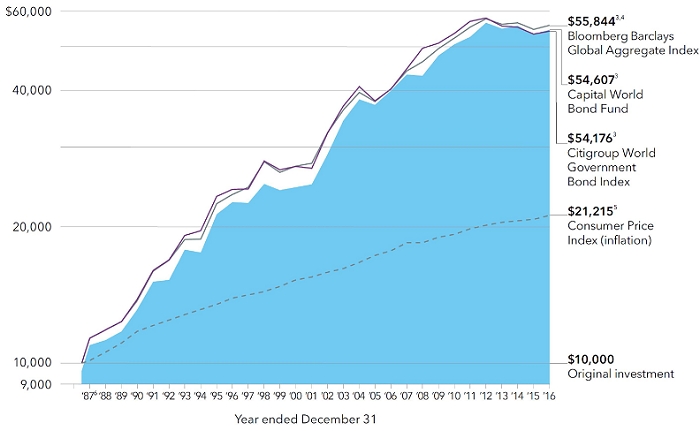
| 1 | As outlined in the prospectus, the sales charge is reduced for accounts (and aggregated investments) of $100,000 or more and is eliminated for purchases of $1 million or more. There is no sales charge on dividends or capital gain distributions that are reinvested in additional shares. |
| 2 | The maximum initial sales charge was 4.75% prior to January 10, 2000. |
| 3 | With dividends and capital gains reinvested or interest compounded. Results of the Citigroup World Government Bond Index are represented by the purple line. Citigroup data: ©2017 Citigroup Index LLC. All rights reserved. |
| 4 | Bloomberg Barclays Global Aggregate Index did not exist until December 31, 1989. For the period of August 4, 1987, through December 31, 1989, the Citigroup World Government Bond Index results were used. Bloomberg Barclays source: Bloomberg Index Services Ltd. |
| 5 | Computed from data supplied by the U.S. Department of Labor, Bureau of Labor Statistics. |
| 6 | For the period of August 4, 1987, commencement of operations, through December 31, 1987. |
The market indexes are unmanaged and, therefore, have no expenses. Investors cannot invest directly in an index.
Past results are not predictive of results for future periods. The results shown are before taxes on fund distributions and sale of fund shares.
Average annual total returns based on a $1,000 investment
| For periods ended December 31, 2016* | | | |
| | | | |
| | 1 year | 5 years | 10 years |
| | | | |
| Class A shares | –1.58% | –0.02% | 2.76% |
| | | | |
| * | Assumes reinvestment of all distributions and payment of the maximum 3.75% sales charge. |
The total annual fund operating expense ratio is 0.95% for Class A shares as of the prospectus dated March 1, 2017 (unaudited).
Investment results assume all distributions are reinvested and reflect applicable fees and expenses. When applicable, investment results reflect fee waivers, without which results would have been lower. Visit americanfunds.com for more information.
About your fund
Capital World Bond Fund offers shareholders a selection of global bonds that is unparalleled among the other fixed income funds of the American Funds family. It may invest in virtually any bond market in the world and in bonds denominated in any currency. This broad mandate allows the fund to seek a high level of total return through capital appreciation, through a wide range of income opportunities and from changing currency relationships.
Where the fund’s assets are invested … and how those markets have done over the past year
unaudited
| | | | | | | | | Bond market total returns1 |
| | | Capital World Bond Fund | | 12 months ended |
| | | December 31, 2016 | | December 31, 2016 |
| | | Before forward | | After forward | | In local | | In U.S. |
| Currency weighting by country: | | contracts | | contracts | | currency | | dollars |
| United States2 | | | 50.2 | | | | 46.0 | | | | 2.8 | % | | | 2.8 | % |
| Euro zone3 | | | 10.6 | | | | 11.4 | | | | 3.2 | | | | 0.3 | |
| Japan | | | 8.3 | | | | 14.4 | | | | 2.7 | | | | 6.2 | |
| Hungary | | | 4.7 | | | | 4.6 | | | | 6.8 | 4 | | | 6.1 | 4 |
| Poland | | | 4.6 | | | | 4.2 | | | | 0.2 | | | | –5.0 | |
| Mexico | | | 4.4 | | | | 4.4 | | | | –1.2 | | | | –16.8 | |
| United Kingdom | | | 2.6 | | | | 3.8 | | | | 11.3 | | | | –7.1 | |
| Malaysia | | | 2.6 | | | | 2.4 | | | | 2.9 | | | | –1.1 | |
| Denmark | | | 2.3 | | | | 2.3 | | | | 5.1 | | | | 2.5 | |
| India | | | 1.8 | | | | 1.2 | | | | 15.3 | 4 | | | 12.4 | 4 |
| Brazil | | | 1.4 | | | | 1.1 | | | | 29.8 | 4 | | | 57.8 | 4 |
| Australia | | | 1.2 | | | | 0.1 | | | | 2.9 | | | | 2.4 | |
| Chile | | | 0.8 | | | | 0.0 | | | | 6.4 | | | | 12.7 | |
| Canada | | | 0.7 | | | | 0.2 | | | | 1.4 | | | | 5.1 | |
| Norway | | | 0.6 | | | | 1.1 | | | | 0.4 | | | | 3.3 | |
| Thailand | | | 0.5 | | | | 0.5 | | | | 0.9 | | | | 1.6 | |
| South Africa | | | 0.5 | | | | 0.4 | | | | 13.2 | | | | 29.7 | |
| Argentina | | | 0.4 | | | | 0.4 | | | | — | 5 | | | — | 5 |
| Colombia | | | 0.4 | | | | 0.1 | | | | 15.3 | 4 | | | 21.9 | 4 |
| Sweden | | | 0.4 | | | | 1.2 | | | | 2.7 | | | | –4.8 | |
| Israel | | | 0.4 | | | | 0.1 | | | | — | 5 | | | — | 5 |
| Turkey | | | 0.2 | | | | 0.2 | | | | 9.4 | 4 | | | –9.2 | 4 |
| Philippines | | | 0.2 | | | | 0.2 | | | | 3.7 | 4 | | | –1.9 | 4 |
| Ghana | | | 0.1 | | | | 0.1 | | | | — | 5 | | | — | 5 |
| New Zealand | | | 0.1 | | | | –0.5 | | | | 3.6 | | | | 5.5 | |
| Czech Republic | | | 0.0 | | | | 0.1 | | | | 1.6 | | | | –1.3 | |
| | |
| 1 | Bloomberg Barclays source: Bloomberg Index Services Ltd. Data source: Bloomberg Barclays Global Aggregate Index. |
| 2 | Includes U.S. dollar-denominated debt of other countries, totaling 17.3%. |
| 3 | Countries using the euro as a common currency: Austria, Belgium, Cyprus, Estonia, Finland, France, Germany, Greece, Ireland, Italy, Latvia, Lithuania, Luxembourg, Malta, the Netherlands, Portugal, Slovakia, Slovenia and Spain. |
| 4 | Data source: JP Morgan GBI–EM Broad Diversified Index. |
| 5 | This market is not included in the Bloomberg Barclays Global Aggregate Index or the JP Morgan GBI–EM Broad Diversified Index. |
| | |
| | | Before forward | | After forward |
| Currency weighting by region: | | contracts | | contracts |
| United States | | | 50.2 | % | | | 46.0 | % |
| Europe | | | 26.0 | | | | 28.9 | |
| Asia/Pacific Basin | | | 14.7 | | | | 18.3 | |
| Other* | | | 9.1 | | | | 6.8 | |
| | |
| * | Argentina, Brazil, Canada, Chile, Colombia, Ghana, Israel, Mexico and South Africa. |
| | |
Portfolio summary December 31, 2016
| Investment mix by security type | Percent of net assets |
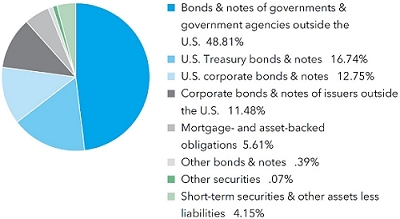
Bonds & notes of governments & government agencies outside the U.S.
| | | | | | Percent of net assets | |
| Euro zone*: | | | | | | | | |
| Germany | | | 1.86 | % | | | | |
| Ireland | | | 1.69 | | | | | |
| Italy | | | 1.36 | | | | | |
| Spain | | | 1.10 | | | | | |
| Belgium | | | .89 | | | | | |
| Slovenia | | | .73 | | | | | |
| France | | | .25 | | | | | |
| Other | | | .17 | | | | 8.05 | % |
| Japan | | | | | | | 8.26 | |
| Hungary | | | | | | | 5.34 | |
| Poland | | | | | | | 4.52 | |
| Mexico | | | | | | | 4.46 | |
| Malaysia | | | | | | | 2.58 | |
| United Kingdom | | | | | | | 2.13 | |
| India | | | | | | | 1.77 | |
| Brazil | | | | | | | 1.44 | |
| Argentina | | | | | | | 1.39 | |
| Australia | | | | | | | 1.23 | |
| Other | | | | | | | 7.64 | |
| | | | | | | | 48.81 | % |
| | |
| * | Countries using the euro as a common currency: Austria, Belgium, Cyprus, Estonia, Finland, France, Germany, Greece, Ireland, Italy, Latvia, Lithuania, Luxembourg, Malta, the Netherlands, Portugal, Slovakia, Slovenia and Spain. |
Net assets and portfolio turnover rate
| | | Fund net assets | | Portfolio |
| Fiscal period end | | (millions) | | turnover rate |
| 12/31/2016* | | $ | 11,939 | | | | 19 | %† |
| 9/30/2016 | | | 12,621 | | | | 138 | |
| 9/30/2015 | | | 12,629 | | | | 185 | |
| 9/30/2014 | | | 13,207 | | | | 205 | |
| 9/30/2013 | | | 12,654 | | | | 199 | |
| 9/30/2012 | | | 12,629 | | | | 142 | |
| | |
| * | In 2016, the fund changed its fiscal year-end from September to December. |
| † | Not annualized. |
Expense ratios
| Capital WorldBond Fund (Class A shares) | | | .95 | %* |
| Lipper Global Income Funds Average (front-end load funds only, excluding funds of funds) | | | 1.02 | † |
| | |
| * | As of the prospectus dated March 1, 2017 (unaudited). |
| † | As of December 31, 2016. |
| | |
Summary investment portfolio December 31, 2016
| Bonds, notes & other debt instruments 95.78% | Principal amount
(000) | | | Value
(000) | |
| Euros 10.43% | | | | | | | | |
| Belgium (Kingdom of), Series 77, 1.00% 2026 | | € | 75,500 | | | $ | 82,886 | |
| Germany (Federal Republic of) 2.50% 2046 | | | 99,925 | | | | 148,104 | |
| Germany (Federal Republic of) 0.10%–4.00% 2020–20371 | | | 63,335 | | | | 74,294 | |
| Ireland (Republic of) 3.90% 2023 | | | 49,920 | | | | 65,040 | |
| Ireland (Republic of) 1.00%–5.40% 2024–2045 | | | 110,425 | | | | 136,204 | |
| Italy (Republic of) 0.95%–4.75% 2021–2025 | | | 141,025 | | | | 162,108 | |
| Spain (Kingdom of) 1.30% 2026 | | | 49,500 | | | | 51,805 | |
| Spain (Kingdom of) 0.75%–5.15% 2021–2046 | | | 64,730 | | | | 79,953 | |
| Other securities | | | | | | | 444,999 | |
| | | | | | | | 1,245,393 | |
| | | | | | | | | |
| Japanese yen 8.26% | | | | | | | | |
| Japan, Series 326, 0.70% 2022 | | ¥ | 9,825,000 | | | | 88,028 | |
| Japan, Series 18, 0.10% 20241 | | | 21,135,360 | | | | 190,512 | |
| Japan, Series 19, 0.10% 20241 | | | 13,077,480 | | | | 118,886 | |
| Japan, Series 336, 0.50% 2024 | | | 6,255,000 | | | | 55,742 | |
| Japan, Series 145, 1.70% 2033 | | | 6,955,000 | | | | 72,125 | |
| Japan, Series 42, 1.70% 2044 | | | 7,940,000 | | | | 85,150 | |
| Japan 0.10%–2.20% 2018–20451 | | | 40,249,510 | | | | 375,312 | |
| | | | | | | | 985,755 | |
| | | | | | | | | |
| Hungarian forints 4.62% | | | | | | | | |
| Hungary, Series C, 2.00% 2019 | | HUF | 29,556,570 | | | | 104,117 | |
| Hungary, Series A, 6.50% 2019 | | | 32,438,230 | | | | 125,988 | |
| Hungary, Series A, 7.50% 2020 | | | 40,559,270 | | | | 170,465 | |
| Hungary, Series B, 5.50% 2025 | | | 12,474,160 | | | | 50,905 | |
| Hungary 3.50%–7.00% 2018–2023 | | | 24,912,550 | | | | 100,215 | |
| | | | | | | | 551,690 | |
| | | | | | | | | |
| Polish zloty 4.52% | | | | | | | | |
| Poland (Republic of), Series 0420, 1.50% 2020 | | PLN | 729,525 | | | | 168,825 | |
| Poland (Republic of), Series 1020, 5.25% 2020 | | | 333,450 | | | | 87,119 | |
| Poland (Republic of), Series 0421, 2.00% 2021 | | | 443,750 | | | | 102,691 | |
| Poland (Republic of), Series 0922, 5.75% 2022 | | | 256,955 | | | | 69,730 | |
| Poland (Republic of) 2.75%–5.75% 2021–20251 | | | 436,336 | | | | 110,915 | |
| | | | | | | | 539,280 | |
| | | | | | | | | |
| Mexican pesos 4.40% | | | | | | | | |
| United Mexican States, Series M, 6.50% 2021 | | MXN | 5,449,000 | | | | 256,561 | |
| United Mexican States, Series M20, 10.00% 2024 | | | 1,093,500 | | | | 61,129 | |
| United Mexican States, Series M, 5.75% 2026 | | | 2,463,000 | | | | 105,602 | |
| United Mexican States 4.00%–10.00% 2017–20421 | | | 1,871,027 | | | | 93,738 | |
| Other securities | | | | | | | 8,475 | |
| | | | | | | | 525,505 | |
| | | | | | | | | |
| British pounds 2.58% | | | | | | | | |
| United Kingdom 1.75% 2022 | | £ | 60,850 | | | | 79,481 | |
| United Kingdom 1.00%–3.50% 2017–2045 | | | 129,075 | | | | 173,995 | |
| Other securities | | | | | | | 55,183 | |
| | | | | | | | 308,659 | |
| | | | | | | | | |
| Malaysian ringgits 2.57% | | | | | | | | |
| Malaysia (Federation of), Series 0315, 3.659% 2020 | | MYR | 498,636 | | | | 111,113 | |
| Malaysia (Federation of) 3.58%–4.79% 2018–2035 | | | 894,854 | | | | 196,130 | |
| | | | | | | | 307,243 | |
| | | | | | | | | |
| Danish kroner 2.27% | | | | | | | | |
| Nykredit Realkredit AS, Series 01E, 2.00% 20372 | | DKr | 977,559 | | | | 141,149 | |
| Nykredit Realkredit AS, Series 01E, 2.50% 20472 | | | 86,254 | | | | 12,356 | |
| Realkredit Danmark AS, Series 22S, 2.00% 20372 | | | 581,961 | | | | 83,638 | |
| Other securities | | | | | | | 33,527 | |
| | | | | | | | 270,670 | |
| Bonds, notes & other debt instruments (continued) | Principal amount
(000) | | | Value
(000) | |
| Indian rupees 1.77% | | | | | | | | |
| India (Republic of) 7.80% 2021 | | INR | 5,196,610 | | | $ | 80,097 | |
| India (Republic of) 8.83% 2023 | | | 4,774,600 | | | | 78,270 | |
| India (Republic of) 7.28%–9.20% 2019–2030 | | | 3,372,290 | | | | 53,324 | |
| | | | | | | | 211,691 | |
| | | | | | | | | |
| Brazilian reais 1.41% | | | | | | | | |
| Brazil (Federative Republic of) 0% 2020 | | BRL | 406,000 | | | | 91,019 | |
| Brazil (Federative Republic of) 0%–10.00% 2017–20271 | | | 271,824 | | | | 77,205 | |
| | | | | | | | 168,224 | |
| | | | | | | | | |
| Australian dollars 1.23% | | | | | | | | |
| Australia (Commonwealth of), Series 124, 5.75% 2021 | | A$ | 109,800 | | | | 91,021 | |
| Australia (Commonwealth of) 3.25%–5.50% 2023–2029 | | | 71,500 | | | | 55,695 | |
| | | | | | | | 146,716 | |
| | | | | | | | | |
| Chilean pesos 0.79% | | | | | | | | |
| Chile (Banco Central de) 4.50% 2021 | | CLP | 61,335,000 | | | | 94,088 | |
| | | | | | | | | |
| Canadian dollars 0.67% | | | | | | | | |
| Canada 2.25% 2025 | | C$ | 78,040 | | | | 60,957 | |
| Other securities | | | | | | | 18,999 | |
| | | | | | | | 79,956 | |
| | | | | | | | | |
| Argentine pesos 0.43% | | | | | | | | |
| Argentina (Central Bank of) 0% 2017 | | ARS | 11,400 | | | | 710 | |
| Argentine Republic 2.50%–22.75% 2018–20261 | | | 814,006 | | | | 51,063 | |
| | | | | | | | 51,773 | |
| | | | | | | | | |
| Israeli shekels 0.41% | | | | | | | | |
| Israel (State of) 5.50% 2042 | | ILS | 137,250 | | | | 49,340 | |
| | | | | | | | | |
| U.S. dollars 46.45% | | | | | | | | |
| Argentine Republic 6.63%–8.28% 2021–20462,3,4 | | $ | 109,587 | | | | 112,607 | |
| Brazil (Federative Republic of) 4.25% 2025 | | | 3,545 | | | | 3,319 | |
| Freddie Mac 4.00% 20462 | | | 46,791 | | | | 49,173 | |
| Hungary 5.38%–7.63% 2020–2041 | | | 72,848 | | | | 86,087 | |
| Slovenia (Republic of) 5.50% 2022 | | | 46,940 | | | | 51,973 | |
| U.S. Treasury 1.625% 20195 | | | 125,550 | | | | 126,507 | |
| U.S. Treasury 1.75% 2019 | | | 74,350 | | | | 75,082 | |
| U.S. Treasury 1.375% 20205 | | | 120,450 | | | | 119,697 | |
| U.S. Treasury 1.125% 2021 | | | 334,210 | | | | 325,229 | |
| U.S. Treasury 2.00% 2021 | | | 82,150 | | | | 82,484 | |
| U.S. Treasury 2.50% 2024 | | | 76,900 | | | | 78,087 | |
| U.S. Treasury 3.00% 2045 | | | 61,450 | | | | 60,443 | |
| U.S. Treasury 2.875% 2046 | | | 136,775 | | | | 131,692 | |
| U.S. Treasury 0.75%–8.00% 2017–2046 | | | 505,359 | | | | 499,197 | |
| U.S. Treasury Inflation-Protected Security 0.625% 20241 | | | 152,423 | | | | 155,306 | |
| U.S. Treasury Inflation-Protected Security 0.625% 20261 | | | 55,442 | | | | 55,973 | |
| U.S. Treasury Inflation-Protected Security 1.00% 20461 | | | 144,770 | | | | 145,692 | |
| U.S. Treasury Inflation-Protected Securities 0.13%–2.38% 2024–20451 | | | 139,852 | | | | 143,573 | |
| United Mexican States 3.63%–5.13% 2020–2044 | | | 18,100 | | | | 16,921 | |
| Other securities | | | | | | | 3,226,282 | |
| | | | | | | | 5,545,324 | |
| | | | | | | | | |
| Other 2.97% | | | | | | | | |
| Other securities | | | | | | | 354,337 | |
| | | | | | | | | |
| Total bonds, notes & other debt instruments (cost: $11,954,146,000) | | | | | | | 11,435,644 | |
| | | | | | | | | |
| Convertible stocks 0.03% | | Shares | | | Value
(000) | |
| U.S. dollars 0.01% | | | | | | |
| Other securities | | | | | | $ | 537 | |
| | | | | | | | | |
| Miscellaneous 0.02% | | | | | | | | |
| Other convertible stocks in initial period of acquisition | | | | | | | 2,640 | |
| | | | | | | | | |
| Total convertible stocks (cost: $5,056,000) | | | | | | | 3,177 | |
| | | | | | | | | |
| Common stocks 0.04% | | | | | | | | |
| U.S. dollars 0.04% | | | | | | | | |
| Other securities | | | | | | | 4,642 | |
| | | | | | | | | |
| Total common stocks (cost: $9,903,000) | | | | | | | 4,642 | |
| | | | | | | | | |
| Short-term securities 4.26% | Principal amount
(000) | | | | | |
| Bank of Nova Scotia 1.03% due 1/17/20173 | | $ | 52,100 | | | | 52,085 | |
| Bank of Tokyo-Mitsubishi UFJ, Ltd. 0.65%–0.72% due 1/4/2017–2/1/2017 | | | 72,600 | | | | 72,583 | |
| JPMorgan Chase & Co. 1.03% due 3/13/2017 | | | 50,000 | | | | 50,017 | |
| Liberty Street Funding Corp. 0.97% due 3/8/20173 | | | 40,000 | | | | 39,938 | |
| Mizuho Bank, Ltd. 0.70%–0.89% due 1/30/2017–2/21/20173 | | | 80,000 | | | | 79,926 | |
| Toronto-Dominion Holdings USA Inc. 0.60%–0.69% due 1/10/2017–1/31/20173 | | | 75,000 | | | | 74,979 | |
| U.S. Treasury Bills 0.44% due 2/16/2017 | | | 5,000 | | | | 4,997 | |
| Victory Receivables Corp. 1.10% due 3/10/20173 | | | 50,000 | | | | 49,918 | |
| Other securities | | | | | | | 84,256 | |
| | | | | | | | | |
| Total short-term securities (cost: $508,635,000) | | | | | | | 508,699 | |
| Total investment securities 100.11% (cost: $12,477,740,000) | | | | | | | 11,952,162 | |
| Other assets less liabilities (0.11)% | | | | | | | (13,122 | ) |
| | | | | | | | | |
| Net assets 100.00% | | | | | | $ | 11,939,040 | |
This summary investment portfolio is designed to streamline the report and help investors better focus on the fund’s principal holdings. See the inside back cover for details on how to obtain a complete schedule of portfolio holdings.
As permitted by U.S. Securities and Exchange Commission regulations, “Miscellaneous” securities include holdings in their first year of acquisition that have not previously been publicly disclosed.
“Other securities” includes all issues that are not disclosed separately in the summary investment portfolio. “Miscellaneous” and “Other securities” includes securities which were valued under fair value procedures adopted by authority of the board of trustees. The total value of securities which were valued under fair value procedures was $7,672,000, which represented .06% of the net assets of the fund. “Other securities” also includes loan participations and assignments, which may be subject to legal or contractual restrictions on resale. The total value of all such loans was $24,208,000, which represented .20% of the net assets of the fund. Some securities in “Other securities” (with aggregate value of $669,000, an aggregate cost of $3,135,000, and which represented .01% of the net assets of the fund) were acquired from 3/10/2010 to 8/27/2013 through private placement transactions exempt from registration under the Securities Act of 1933, which may subject them to legal or contractual restrictions on resale.
Forward currency contracts
The fund has entered into forward currency contracts as shown in the following table. The average month-end notional amount of open forward currency contracts while held was $2,468,225,000.
| | | | | | | | | | | Unrealized | |
| | | | | | | | | (depreciation) | |
| | | | | | | Contract amount | | appreciation | |
| | | | | | | Receive | | Deliver | | at 12/31/2016 | |
| | | Settlement date | | Counterparty | | (000) | | (000) | | (000) | |
| Purchases: | | | | | | | | | | | | | |
| Euros | | 1/6/2017 | | UBS AG | | €74,700 | | $81,619 | | | $ | (2,945 | ) |
| Euros | | 1/9/2017 | | Citibank | | €45,000 | | $48,623 | | | | (1,222 | ) |
| Euros | | 1/10/2017 | | HSBC Bank | | €50,979 | | $55,043 | | | | (1,341 | ) |
| Euros | | 1/12/2017 | | Barclays Bank PLC | | €32,924 | | $35,078 | | | | (391 | ) |
| Euros | | 1/19/2017 | | Bank of America, N.A. | | €47,856 | | $51,451 | | | | (1,017 | ) |
| Japanese yen | | 1/6/2017 | | JPMorgan Chase | | ¥15,248,338 | | $137,500 | | | | (6,953 | ) |
| Japanese yen | | 1/11/2017 | | HSBC Bank | | ¥11,675,659 | | $103,150 | | | | (3,165 | ) |
| Japanese yen | | 1/12/2017 | | JPMorgan Chase | | ¥1,246,991 | | $12,050 | | | | (1,371 | ) |
| | | | | | | | | | | | | | |
Forward currency contracts (continued)
| | | | | | | | | | | Unrealized | |
| | | | | | | | | (depreciation) | |
| | | | | | | Contract amount | | appreciation | |
| | | | | | | Receive | | Deliver | | at 12/31/2016 | |
| | | Settlement date | | Counterparty | | (000) | | (000) | | (000) | |
| Japanese yen | | 1/19/2017 | | JPMorgan Chase | | ¥17,090,369 | | $150,708 | | | $ | (4,293 | ) |
| Japanese yen | | 1/20/2017 | | JPMorgan Chase | | ¥6,522,912 | | $56,800 | | | | (915 | ) |
| Japanese yen | | 1/20/2017 | | JPMorgan Chase | | ¥4,075,718 | | $35,836 | | | | (918 | ) |
| Japanese yen | | 1/26/2017 | | Bank of America, N.A. | | ¥10,852,733 | | $94,550 | | | | (1,540 | ) |
| Japanese yen | | 2/16/2017 | | HSBC Bank | | ¥12,195,000 | | $106,108 | | | | (1,508 | ) |
| Japanese yen | | 2/24/2017 | | HSBC Bank | | ¥4,334,444 | | $36,867 | | | | 322 | |
| Norwegian kroner | | 1/13/2017 | | Bank of America, N.A. | | NKr213,338 | | $25,269 | | | | (560 | ) |
| Norwegian kroner | | 1/24/2017 | | Barclays Bank PLC | | NKr207,685 | | $23,985 | | | | 72 | |
| South African rand | | 1/26/2017 | | Bank of America, N.A. | | ZAR26,104 | | $1,842 | | | | 48 | |
| Swedish kronor | | 1/24/2017 | | Barclays Bank PLC | | SKr197,119 | | $21,046 | | | | 628 | |
| Swedish kronor | | 2/16/2017 | | Barclays Bank PLC | | SKr154,107 | | $16,879 | | | | 87 | |
| | | | | | | | | | | | $ | (26,982 | ) |
| | | | | | | | | | | | | | |
| Sales: | | | | | | | | | | | | | |
| Australian dollars | | 1/9/2017 | | JPMorgan Chase | | $16,829 | | A$22,500 | | | | 597 | |
| Australian dollars | | 1/11/2017 | | Bank of America, N.A. | | $31,412 | | A$42,550 | | | | 716 | |
| Australian dollars | | 1/19/2017 | | JPMorgan Chase | | $2,434 | | A$3,200 | | | | 126 | |
| Australian dollars | | 1/20/2017 | | JPMorgan Chase | | $11,163 | | A$15,000 | | | | 345 | |
| Australian dollars | | 1/20/2017 | | JPMorgan Chase | | $4,480 | | A$6,000 | | | | 152 | |
| Australian dollars | | 1/25/2017 | | UBS AG | | $69,411 | | A$95,300 | | | | 687 | |
| Australian dollars | | 1/25/2017 | | JPMorgan Chase | | €7,025 | | A$10,000 | | | | 194 | |
| Brazilian reais | | 4/3/2017 | | Citibank | | $12 | | BRL41 | | | | — | 6 |
| Brazilian reais | | 4/3/2017 | | Citibank | | $1,024 | | BRL3,600 | | | | (54 | ) |
| Brazilian reais | | 4/3/2017 | | Citibank | | $34,605 | | BRL121,400 | | | | (1,749 | ) |
| British pounds | | 1/9/2017 | | Bank of America, N.A. | | $5,483 | | £4,300 | | | | 181 | |
| British pounds | | 1/10/2017 | | HSBC Bank | | €20,181 | | £17,100 | | | | 177 | |
| British pounds | | 1/24/2017 | | Bank of New York Mellon | | $8,349 | | £6,700 | | | | 86 | |
| British pounds | | 1/26/2017 | | Bank of America, N.A. | | $4,446 | | £3,500 | | | | 129 | |
| British pounds | | 2/17/2017 | | Bank of New York Mellon | | $18,451 | | £14,800 | | | | 189 | |
| Canadian dollars | | 1/10/2017 | | JPMorgan Chase | | $3,775 | | C$5,000 | | | | 51 | |
| Canadian dollars | | 1/20/2017 | | Barclays Bank PLC | | $8,286 | | C$11,000 | | | | 91 | |
| Canadian dollars | | 1/23/2017 | | JPMorgan Chase | | €11,489 | | C$16,000 | | | | 190 | |
| Canadian dollars | | 1/23/2017 | | Bank of America, N.A. | | €11,488 | | C$16,000 | | | | 189 | |
| Canadian dollars | | 1/23/2017 | | Bank of America, N.A. | | $23,337 | | C$31,150 | | | | 129 | |
| Chilean pesos | | 1/20/2017 | | Citibank | | $94,295 | | CLP62,796,000 | | | | 691 | |
| Colombian pesos | | 1/11/2017 | | JPMorgan Chase | | $14,836 | | COP45,946,200 | | | | (433 | ) |
| Colombian pesos | | 1/11/2017 | | Citibank | | $20,591 | | COP63,665,807 | | | | (567 | ) |
| Colombian pesos | | 1/13/2017 | | Bank of America, N.A. | | $375 | | COP1,158,000 | | | | (10 | ) |
| Euros | | 1/6/2017 | | JPMorgan Chase | | $45,149 | | €42,700 | | | | 178 | |
| Euros | | 1/9/2017 | | Citibank | | SKr227,831 | | €23,200 | | | | 590 | |
| Euros | | 1/9/2017 | | UBS AG | | $8,292 | | €7,680 | | | | 203 | |
| Euros | | 1/11/2017 | | Citibank | | NKr90,454 | | €10,000 | | | | (58 | ) |
| Euros | | 1/12/2017 | | HSBC Bank | | ¥4,109,404 | | €33,800 | | | | (416 | ) |
| Euros | | 1/13/2017 | | HSBC Bank | | NKr38,866 | | €4,325 | | | | (55 | ) |
| Euros | | 1/19/2017 | | Bank of America, N.A. | | $8,843 | | €8,250 | | | | 148 | |
| Euros | | 1/19/2017 | | UBS AG | | $3,057 | | €2,830 | | | | 75 | |
| Euros | | 1/19/2017 | | Bank of America, N.A. | | $100,865 | | €97,025 | | | | (1,387 | ) |
| Euros | | 1/20/2017 | | Citibank | | SKr117,089 | | €12,000 | | | | 224 | |
| Euros | | 1/20/2017 | | Citibank | | £80,649 | | €96,000 | | | | (1,722 | ) |
| Euros | | 1/23/2017 | | JPMorgan Chase | | £52,915 | | €62,850 | | | | (990 | ) |
| Euros | | 1/24/2017 | | Bank of America, N.A. | | CZK269,450 | | €10,000 | | | | (31 | ) |
| Euros | | 1/26/2017 | | Citibank | | SKr181,406 | | €18,550 | | | | 393 | |
| Euros | | 2/3/2017 | | Citibank | | $10,526 | | €9,500 | | | | 507 | |
| Euros | | 2/7/2017 | | HSBC Bank | | $5,018 | | €4,500 | | | | 272 | |
| Euros | | 2/17/2017 | | Citibank | | $11,355 | | €10,730 | | | | 32 | |
| Euros | | 2/24/2017 | | Citibank | | $2,672 | | €2,500 | | | | 33 | |
| Euros | | 2/24/2017 | | Bank of America, N.A. | | $25,098 | | €24,000 | | | | (235 | ) |
| Euros | | 3/15/2017 | | Citibank | | $18,954 | | €17,775 | | | | 172 | |
| Hungarian forints | | 1/10/2017 | | HSBC Bank | | €14,316 | | HUF4,500,000 | | | | (243 | ) |
| Indian rupees | | 1/11/2017 | | UBS AG | | $31,951 | | INR2,200,000 | | | | (426 | ) |
| Indian rupees | | 1/11/2017 | | JPMorgan Chase | | $38,134 | | INR2,625,500 | | | | (506 | ) |
| Indonesian rupiah | | 1/13/2017 | | JPMorgan Chase | | $2,141 | | IDR28,589,600 | | | | 23 | |
| Israeli shekels | | 1/9/2017 | | Bank of America, N.A. | | $2,393 | | ILS9,100 | | | | 31 | |
| | | | | | | | | | | | | | |
| 10 | Capital World Bond Fund |
| | | | | | | | | | | Unrealized | |
| | | | | | | | | (depreciation) | |
| | | | | | | Contract amount | | appreciation | |
| | | | | | | Receive | | Deliver | | at 12/31/2016 | |
| | | Settlement date | | Counterparty | | (000) | | (000) | | (000) | |
| Israeli shekels | | 1/23/2017 | | Citibank | | $32,103 | | ILS123,500 | | | $ | 23 | |
| Israeli shekels | | 1/26/2017 | | HSBC Bank | | $3,645 | | ILS14,100 | | | | (18 | ) |
| Japanese yen | | 1/10/2017 | | Citibank | | $11,791 | | ¥1,335,000 | | | | 359 | |
| Japanese yen | | 1/10/2017 | | Bank of America, N.A. | | $46 | | ¥5,204 | | | | 1 | |
| Malaysian ringgits | | 1/13/2017 | | UBS AG | | $25,206 | | MYR111,600 | | | | 342 | |
| Malaysian ringgits | | 1/13/2017 | | Citibank | | $5,657 | | MYR25,000 | | | | 88 | |
| Mexican pesos | | 1/12/2017 | | HSBC Bank | | $4,601 | | MXN95,800 | | | | (11 | ) |
| New Zealand dollars | | 1/13/2017 | | Citibank | | £26,853 | | NZ$48,050 | | | | (254 | ) |
| New Zealand dollars | | 1/19/2017 | | JPMorgan Chase | | $2,133 | | NZ$3,000 | | | | 51 | |
| New Zealand dollars | | 1/20/2017 | | JPMorgan Chase | | $2,142 | | NZ$3,000 | | | | 60 | |
| New Zealand dollars | | 1/24/2017 | | JPMorgan Chase | | $23,889 | | NZ$34,000 | | | | 291 | |
| New Zealand dollars | | 1/26/2017 | | JPMorgan Chase | | €10,112 | | NZ$15,000 | | | | 250 | |
| Polish zloty | | 1/10/2017 | | JPMorgan Chase | | $35,762 | | PLN149,385 | | | | 72 | |
| Polish zloty | | 1/26/2017 | | Citibank | | €6,768 | | PLN30,000 | | | | (30 | ) |
| South African rand | | 1/10/2017 | | JPMorgan Chase | | $615 | | ZAR8,500 | | | | (3 | ) |
| South African rand | | 1/12/2017 | | JPMorgan Chase | | $9,351 | | ZAR133,200 | | | | (324 | ) |
| Turkish lira | | 1/19/2017 | | Barclays Bank PLC | | $2,921 | | TRY10,275 | | | | 20 | |
| | | | | | | | | | | | $ | (164 | ) |
| Forward currency contracts — net | | | | $ | (27,146 | ) |
Interest rate swaps
The fund has entered into interest rate swaps as shown in the following table. The average month-end notional amount of interest rate swaps while held was $964,270,000.
| | | | | | | | | | | | | Unrealized | |
| | | | | | | | | | | | | (depreciation) | |
| | | | | | | | | | | | | appreciation | |
| Pay/receive | | | | | | Fixed | | Expiration | | Notional | | at 12/31/2016 | |
| fixed rate | | Clearinghouse | | Floating rate index | | rate | | date | | (000) | | (000) | |
| Receive | | LCH | | 3-month USD-LIBOR | | 1.384 | % | 12/15/2018 | | $270,000 | | | $ | (327 | ) |
| Receive | | LCH | | 6-month NOK-NIBOR | | 1.345 | | 12/16/2019 | | NKr350,000 | | | | — | |
| Pay | | LCH | | 6-month EURIBOR | | (0.1003 | ) | 12/16/2019 | | €32,000 | | | | (109 | ) |
| Receive | | LCH | | 6-month NOK-NIBOR | | 1.36 | | 12/19/2019 | | NKr500,000 | | | | 21 | |
| Receive | | LCH | | 3-month SEK-STIBOR | | 0.5725 | | 7/24/2020 | | SKr43,250 | | | | 104 | |
| Receive | | LCH | | 3-month USD-LIBOR | | 1.572 | | 9/16/2020 | | $60,000 | | | | (501 | ) |
| Receive | | LCH | | 3-month SEK-STIBOR | | 0.4825 | | 9/22/2020 | | SKr300,000 | | | | 607 | |
| Receive | | LCH | | 3-month Canada BA | | 1.0625 | | 11/5/2020 | | C$80,000 | | | | (633 | ) |
| Receive | | LCH | | 6-month AUD-BBSW Benchmark Rate | | 2.22 | | 11/7/2020 | | A$80,000 | | | | (612 | ) |
| Pay | | LCH | | 3-month USD-LIBOR | | 1.358 | | 11/8/2020 | | $60,000 | | | | 980 | |
| Pay | | LCH | | 3-month USD-LIBOR | | 1.365 | | 11/8/2020 | | 60,000 | | | | 972 | |
| Pay | | LCH | | 3-month USD-LIBOR | | 1.67 | | 11/14/2020 | | 55,000 | | | | 575 | |
| Receive | | LCH | | 3-month NZD-BBR-FRA | | 2.86 | | 11/14/2020 | | NZ$80,000 | | | | (476 | ) |
| Receive | | LCH | | 3-month USD-LIBOR | | 1.2185 | | 2/8/2021 | | $70,000 | | | | (1,784 | ) |
| Receive | | LCH | | 3-month USD-LIBOR | | 1.8855 | | 12/15/2021 | | 108,000 | | | | (406 | ) |
| Receive | | LCH | | 3-month USD-LIBOR | | 1.885 | | 12/15/2021 | | 542,000 | | | | (2,054 | ) |
| Pay | | LCH | | 3-month USD-LIBOR | | 2.1955 | | 5/6/2025 | | 60,000 | | | | 235 | |
| Pay | | LCH | | 3-month USD-LIBOR | | 1.5075 | | 9/22/2026 | | 9,600 | | | | 696 | |
| Pay | | LCH | | 3-month USD-LIBOR | | 1.9815 | | 11/14/2026 | | 20,000 | | | | 625 | |
| Pay | | LCH | | 3-month USD-LIBOR | | 2.468 | | 12/19/2026 | | 40,000 | | | | (493 | ) |
| Pay | | LCH | | 6-month EURIBOR | | 0.7962 | | 9/22/2036 | | €14,700 | | | | 1,049 | |
| Receive | | LCH | | 6-month EURIBOR | | 1.6073 | | 7/9/2045 | | 6,000 | | | | 610 | |
| Pay | | LCH | | 3-month USD-LIBOR | | 2.562 | | 11/4/2045 | | $20,000 | | | | 84 | |
| Pay | | LCH | | 3-month USD-LIBOR | | 2.52611 | | 11/24/2045 | | 67,000 | | | | 799 | |
| Pay | | LCH | | 3-month USD-LIBOR | | 2.535 | | 11/24/2045 | | 8,000 | | | | 80 | |
| Pay | | LCH | | 3-month USD-LIBOR | | 2.556 | | 11/27/2045 | | 47,000 | | | | 258 | |
| Pay | | LCH | | 3-month USD-LIBOR | | 2.354 | | 1/29/2046 | | 30,000 | | | | 1,466 | |
| Pay | | LCH | | 3-month USD-LIBOR | | 2.116 | | 4/15/2046 | | 25,000 | | | | 2,522 | |
| | | | | | | | | | | | | | | | |
| Capital World Bond Fund | 11 |
Interest rate swaps (continued)
| | | | | | | | | | | | | Unrealized | |
| | | | | | | | | | | | | (depreciation) | |
| | | | | | | | | | | | | appreciation | |
| Pay/receive | | | | | | Fixed | | Expiration | | Notional | | at 12/31/2016 | |
| fixed rate | | Clearinghouse | | Floating rate index | | rate | | date | | (000) | | (000) | |
| Pay | | LCH | | 3-month USD-LIBOR | | 1.794 | % | 8/3/2046 | | $50,000 | | | $ | 8,594 | |
| Pay | | LCH | | 3-month USD-LIBOR | | 1.9095 | | 10/11/2046 | | 30,000 | | | | 4,421 | |
| | | | | | | | | | | | | | $ | 17,303 | |
Futures contracts
The fund has entered into futures contracts as shown in the following table. The average month-end notional amount of open futures contracts while held was $16,880,000.
| | | | | | | | | | | | | Unrealized | |
| | | | | | | | | | | | | appreciation | |
| | | | | | | | | | | Notional | | (depreciation) | |
| | | | | | | Number of | | | | amount | | at 12/31/2016 | |
| Contracts | | Clearinghouse | | Type | | contracts | | Expiration | | (000) | | (000) | |
| 10 Year Euro-Bund Futures | | Eurex | | Long | | 37 | | March 2017 | | $6,345 | | | $ | 48 | |
| 10 Year U.S. Treasury Note Futures | | CME | | Long | | 48 | | March 2017 | | 5,997 | | | | (31 | ) |
| 30 Year Ultra U.S. Treasury Bond Futures | | CME | | Long | | 35 | | March 2017 | | 5,677 | | | | (68 | ) |
| | | | | | | | | | | | | | $ | (51 | ) |
The following footnotes apply to either the individual securities noted or one or more of the securities aggregated and listed as a single line item.
| 1 | Index-linked bond whose principal amount moves with a government price index. |
| 2 | Principal payments may be made periodically. Therefore, the effective maturity date may be earlier than the stated maturity date. |
| 3 | Acquired in a transaction exempt from registration under Rule 144A or Section 4(2) of the Securities Act of 1933. May be resold in the U.S. in transactions exempt from registration, normally to qualified institutional buyers. The total value of all such securities, including those in “Other securities,” was $1,387,965,000, which represented 11.63% of the net assets of the fund. |
| 4 | Payment in kind; the issuer has the option of paying additional securities in lieu of cash. |
| 5 | A portion of this security was pledged as collateral. The total value of pledged collateral was $70,420,000, which represented .59% of the net assets of the fund. |
| 6 | Amount less than one thousand. |
Key to abbreviations and symbols
AUD/A$ = Australian dollars
ARS = Argentine pesos
BA = Banker’s acceptances
BBR = Bank base rate
BBSW = Bank Bill Swap
BRL = Brazilian reais
C$ = Canadian dollars
CLP = Chilean pesos
CME = CME Group
COP = Colombian pesos
CZK = Czech korunas
DKr = Danish kroner
EUREX = Eurex Exchange
€ = Euros
EURIBOR = Euro Interbank Offered Rate
FRA = Forward rate agreement
£ = British pounds
HUF = Hungarian forints
IDR = Indonesian rupiah
ILS = Israeli shekels
INR = Indian rupees
¥ = Japanese yen
LCH = LCH.Clearnet
LIBOR = London Interbank Offered Rate
MXN = Mexican pesos
MYR = Malaysian ringgits
NIBOR = Norway Interbank Offered Rate
NOK/NKr = Norwegian kroner
NZD/NZ$ = New Zealand dollars
PLN = Polish zloty
SEK/SKr = Swedish kronor
STIBOR = Stockholm Interbank Offered Rate
TRY = Turkish lira
ZAR = South African rand
See Notes to Financial Statements
| 12 | Capital World Bond Fund |
Financial statements
Statement of assets and liabilities
at December 31, 2016 | | (dollars in thousands) |
| | | | | | | |
| Assets: | | | | | | |
| Investment securities, at value (cost: $12,477,740) | | | | | | $ | 11,952,162 | |
| Cash | | | | | | | 167 | |
| Cash denominated in currencies other than U.S. dollars (cost: $12,789) | | | | | | | 12,819 | |
| Unrealized appreciation on open forward currency contracts | | | | | | | 10,515 | |
| Receivables for: | | | | | | | | |
| Sales of investments | | $ | 38,123 | | | | | |
| Sales of fund’s shares | | | 26,732 | | | | | |
| Closed forward currency contracts | | | 1,279 | | | | | |
| Variation margin | | | 1,058 | | | | | |
| Interest | | | 109,692 | | | | | |
| Other | | | 415 | | | | 177,299 | |
| | | | | | | | 12,152,962 | |
| Liabilities: | | | | | | | | |
| Unrealized depreciation on open forward currency contracts | | | | | | | 37,661 | |
| Payables for: | | | | | | | | |
| Purchases of investments | | | 131,892 | | | | | |
| Repurchases of fund’s shares | | | 24,889 | | | | | |
| Closed forward currency contracts | | | 6,217 | | | | | |
| Investment advisory services | | | 4,476 | | | | | |
| Services provided by related parties | | | 2,494 | | | | | |
| Trustees’ deferred compensation | | | 212 | | | | | |
| Variation margin | | | 2,644 | | | | | |
| Other | | | 3,437 | | | | 176,261 | |
| Net assets at December 31, 2016 | | | | | | $ | 11,939,040 | |
| | | | | | | | | |
| Net assets consist of: | | | | | | | | |
| Capital paid in on shares of beneficial interest | | | | | | $ | 12,652,008 | |
| Distributions in excess of net investment income | | | | | | | (21,724 | ) |
| Accumulated net realized loss | | | | | | | (153,140 | ) |
| Net unrealized depreciation | | | | | | | (538,104 | ) |
| Net assets at December 31, 2016 | | | | | | $ | 11,939,040 | |
(dollars and shares in thousands, except per-share amounts)
Shares of beneficial interest issued and outstanding (no stated par value) —
unlimited shares authorized (630,318 total shares outstanding)
| | | Net assets | | | Shares
outstanding | | | Net asset value
per share | |
| Class A | | $ | 5,824,352 | | | | 307,183 | | | $ | 18.96 | |
| Class B | | | 4,171 | | | | 221 | | | | 18.88 | |
| Class C | | | 336,480 | | | | 18,048 | | | | 18.64 | |
| Class F-1 | | | 322,229 | | | | 17,035 | | | | 18.92 | |
| Class F-2 | | | 1,933,044 | | | | 102,134 | | | | 18.93 | |
| Class 529-A | | | 288,499 | | | | 15,174 | | | | 19.01 | |
| Class 529-B | | | 400 | | | | 21 | | | | 18.94 | |
| Class 529-C | | | 109,110 | | | | 5,812 | | | | 18.77 | |
| Class 529-E | | | 15,440 | | | | 817 | | | | 18.89 | |
| Class 529-F-1 | | | 34,618 | | | | 1,832 | | | | 18.90 | |
| Class R-1 | | | 10,806 | | | | 576 | | | | 18.77 | |
| Class R-2 | | | 133,335 | | | | 7,106 | | | | 18.76 | |
| Class R-2E | | | 1,995 | | | | 105 | | | | 18.93 | |
| Class R-3 | | | 139,893 | | | | 7,388 | | | | 18.93 | |
| Class R-4 | | | 106,619 | | | | 5,627 | | | | 18.95 | |
| Class R-5E | | | 10 | | | | 1 | | | | 18.94 | |
| Class R-5 | | | 76,106 | | | | 4,012 | | | | 18.97 | |
| Class R-6 | | | 2,601,933 | | | | 137,226 | | | | 18.96 | |
See Notes to Financial Statements
| Capital World Bond Fund | 13 |
| Statements of operations | |
| | (dollars in thousands) |
| | | Three months ended
December 31, 20161 | | | Year ended
September 30, 2016 | |
| Investment income: | | | | | | | | | | | | | | | | |
| Income: | | | | | | | | | | | | | | | | |
| Interest (net of non-U.S. taxes of $666) | | | | | | $ | 92,307 | | | | | | | $ | 361,773 | |
| Fees and expenses2: | | | | | | | | | | | | | | | | |
| Investment advisory services | | $ | 13,574 | | | | | | | $ | 55,307 | | | | | |
| Distribution services | | | 5,972 | | | | | | | | 26,674 | | | | | |
| Transfer agent services | | | 4,427 | | | | | | | | 20,491 | | | | | |
| Administrative services | | | 918 | | | | | | | | 3,721 | | | | | |
| Reports to shareholders | | | 329 | | | | | | | | 1,246 | | | | | |
| Registration statement and prospectus | | | 238 | | | | | | | | 818 | | | | | |
| Trustees’ compensation | | | 23 | | | | | | | | 118 | | | | | |
| Auditing and legal | | | 11 | | | | | | | | 170 | | | | | |
| Custodian | | | 714 | | | | | | | | 2,341 | | | | | |
| Other | | | 132 | | | | | | | | 525 | | | | | |
| Total fees and expenses before reimbursements | | | 26,338 | | | | | | | | 111,411 | | | | | |
| Less transfer agent services reimbursements | | | — | 3 | | | | | | | — | | | | | |
| Total fees and expenses after reimbursements | | | | | | | 26,338 | | | | | | | | 111,411 | |
| Net investment income | | | | | | | 65,969 | | | | | | | | 250,362 | |
| | | | | | | | | | | | | | | | | |
| Net realized (loss) gain and unrealized (depreciation) appreciation: | | | | | | | | | | | | | | | | |
| Net realized (loss) gain on: | | | | | | | | | | | | | | | | |
| Investments (net of non-U.S. taxes of $305 and $544, respectively) | | | (61,149 | ) | | | | | | | (75,290 | ) | | | | |
| Forward currency contracts | | | (94,887 | ) | | | | | | | 104,146 | | | | | |
| Interest rate swaps | | | (591 | ) | | | | | | | (16,431 | ) | | | | |
| Futures contracts | | | (934 | ) | | | | | | | — | | | | | |
| Currency transactions | | | (4,000 | ) | | | (161,561 | ) | | | (10,659 | ) | | | 1,766 | |
| Net unrealized (depreciation) appreciation on: | | | | | | | | | | | | | | | | |
| Investments (net of non-U.S. taxes of $936 and $1,068, respectively) | | | (746,526 | ) | | | | | | | 767,278 | | | | | |
| Forward currency contracts | | | (22,078 | ) | | | | | | | (13,892 | ) | | | | |
| Interest rate swaps | | | 46,655 | | | | | | | | (35,558 | ) | | | | |
| Futures contracts | | | (89 | ) | | | | | | | 38 | | | | | |
| Currency translations | | | (2,203 | ) | | | (724,241 | ) | | | 2,133 | | | | 719,999 | |
| Net realized (loss) gain and unrealized (depreciation) appreciation | | | | | | | (885,802 | ) | | | | | | | 721,765 | |
| | | | | | | | | | | | | | | | | |
| Net (decrease) increase in net assets resulting from operations | | | | | | $ | (819,833 | ) | | | | | | $ | 972,127 | |
| 1 | In 2016, the fund changed its fiscal year-end from September to December. |
| 2 | Additional information related to class-specific fees and expenses is included in the Notes to Financial Statements. |
| 3 | Amount less than one thousand. |
See Notes to Financial Statements
| 14 | Capital World Bond Fund |
Statements of changes in net assets
(dollars in thousands)
| | | | Three months ended | | | | | | | |
| | | | December 31, | | | Year ended September 30 | |
| | | | 2016* | | | | 2016 | | | | 2015 | |
| Operations: | | | | | | | | | | | | | |
| Net investment income | | | $ | 65,969 | | | $ | 250,362 | | | $ | 263,682 | |
| Net realized (loss) gain | | | | (161,561 | ) | | | 1,766 | | | | (233,968 | ) |
| Net unrealized (depreciation) appreciation | | | | (724,241 | ) | | | 719,999 | | | | (566,527 | ) |
| Net (decrease) increase in net assets resulting from operations | | | | (819,833 | ) | | | 972,127 | | | | (536,813 | ) |
| | | | | | | | | | | | | | |
| Dividends and distributions paid to shareholders: | | | | | | | | | | | | | |
| Dividends from net investment income | | | | (76,502 | ) | | | (152,624 | ) | | | (124,011 | ) |
| Distributions from net realized gain on investments | | | | (42,817 | ) | | | — | | | | (182,169 | ) |
| Return of capital | | | | (28,799 | ) | | | — | | | | — | |
| Total dividends and distributions paid to shareholders | | | | (148,118 | ) | | | (152,624 | ) | | | (306,180 | ) |
| | | | | | | | | | | | | | |
| Net capital share transactions | | | | 285,846 | | | | (827,841 | ) | | | 265,916 | |
| | | | | | | | | | | | | | |
| Total decrease in net assets | | | | (682,105 | ) | | | (8,338 | ) | | | (577,077 | ) |
| | | | | | | | | | | | | | |
| Net assets: | | | | | | | | | | | | | |
| Beginning of period | | | | 12,621,145 | | | | 12,629,483 | | | | 13,206,560 | |
| End of period (including distributions in excess of net investment income and undistributed net investment income: $(21,724), $(7,752) and $30,277, respectively) | | | $ | 11,939,040 | | | $ | 12,621,145 | | | $ | 12,629,483 | |
| * | In 2016, the fund changed its fiscal year-end from September to December. |
See Notes to Financial Statements
| Capital World Bond Fund | 15 |
Notes to financial statements
1. Organization
Capital World Bond Fund (the “fund”) is registered under the Investment Company Act of 1940 as an open-end, nondiversified management investment company. The fund seeks to provide, over the long term, a high level of total return consistent with prudent investment management. Total return comprises the income generated by the fund and the changes in the market value of the fund’s investments.
On January 27, 2016, the fund’s board of trustees changed the fund’s next fiscal year-end from September 30 to December 31.
The fund has 18 share classes consisting of five retail share classes (Classes A, B and C, as well as two F share classes, F-1 and F-2), five 529 college savings plan share classes (Classes 529-A, 529-B, 529-C, 529-E and 529-F-1) and eight retirement plan share classes (Classes R-1, R-2, R-2E, R-3, R-4, R-5E, R-5 and R-6). The 529 college savings plan share classes can be used to save for college education. The retirement plan share classes are generally offered only through eligible employer-sponsored retirement plans. The fund’s share classes are described further in the following table:
| Share class | | Initial sales charge | | Contingent deferred sales
charge upon redemption | | Conversion feature |
| Classes A and 529-A | | Up to 3.75% | | None (except 1% for certain redemptions within one year of purchase without an initial sales charge) | | None |
| Classes B and 529-B* | | None | | Declines from 5% to 0% for redemptions within six years of purchase | | Classes B and 529-B convert to Classes A and 529-A, respectively, after eight years |
| Class C | | None | | 1% for redemptions within one year of purchase | | Class C converts to Class F-1 after 10 years |
| Class 529-C | | None | | 1% for redemptions within one year of purchase | | None |
| Class 529-E | | None | | None | | None |
| Classes F-1, F-2 and 529-F-1 | | None | | None | | None |
| Classes R-1, R-2, R-2E, R-3, R-4, R-5E, R-5 and R-6 | | None | | None | | None |
* Class B and 529-B shares of the fund are not available for purchase.
Holders of all share classes have equal pro rata rights to the assets, dividends and liquidation proceeds of the fund. Each share class has identical voting rights, except for the exclusive right to vote on matters affecting only its class. Share classes have different fees and expenses (“class-specific fees and expenses”), primarily due to different arrangements for distribution, transfer agent and administrative services. Differences in class-specific fees and expenses will result in differences in net investment income and, therefore, the payment of different per-share dividends by each share class.
2. Significant accounting policies
The fund is an investment company that applies the accounting and reporting guidance issued in Topic 946 by the U.S. Financial Accounting Standards Board. The fund’s financial statements have been prepared to comply with U.S. generally accepted accounting principles (“U.S. GAAP”). These principles require the fund’s investment adviser to make estimates and assumptions that affect reported amounts and disclosures. Actual results could differ from those estimates. Subsequent events, if any, have been evaluated through the date of issuance in the preparation of the financial statements. The fund follows the significant accounting policies described in this section, as well as the valuation policies described in the next section on valuation.
Security transactions and related investment income — Security transactions are recorded by the fund as of the date the trades are executed with brokers. Realized gains and losses from security transactions are determined based on the specific identified cost of the securities. In the event a security is purchased with a delayed payment date, the fund will segregate liquid assets sufficient to meet its payment obligations. Interest income is recognized on an accrual basis. Market discounts, premiums and original issue discounts on fixed-income securities are amortized daily over the expected life of the security.
| 16 | Capital World Bond Fund |
Class allocations — Income, fees and expenses (other than class-specific fees and expenses) and realized and unrealized gains and losses are allocated daily among the various share classes based on their relative net assets. Class-specific fees and expenses, such as distribution, transfer agent and administrative services, are charged directly to the respective share class.
Dividends and distributions to shareholders — Dividends and distributions to shareholders are recorded on the ex-dividend date.
Currency translation — Assets and liabilities, including investment securities, denominated in currencies other than U.S. dollars are translated into U.S. dollars at the exchange rates supplied by one or more pricing vendors on the valuation date. Purchases and sales of investment securities and income and expenses are translated into U.S. dollars at the exchange rates on the dates of such transactions. The effects of changes in exchange rates on investment securities are included with the net realized gain or loss and net unrealized appreciation or depreciation on investments in the fund’s statement of operations. The realized gain or loss and unrealized appreciation or depreciation resulting from all other transactions denominated in currencies other than U.S. dollars are disclosed separately.
3. Valuation
Capital Research and Management Company (“CRMC”), the fund’s investment adviser, values the fund’s investments at fair value as defined by U.S. GAAP. The net asset value of each share class of the fund is generally determined as of approximately 4:00 p.m. New York time each day the New York Stock Exchange is open.
Methods and inputs — The fund’s investment adviser uses the following methods and inputs to establish the fair value of the fund’s assets and liabilities. Use of particular methods and inputs may vary over time based on availability and relevance as market and economic conditions evolve.
Equity securities are generally valued at the official closing price of, or the last reported sale price on, the exchange or market on which such securities are traded, as of the close of business on the day the securities are being valued or, lacking any sales, at the last available bid price. Prices for each security are taken from the principal exchange or market on which the security trades.
Fixed-income securities, including short-term securities, are generally valued at prices obtained from one or more pricing vendors. Vendors value such securities based on one or more of the inputs described in the following table. The table provides examples of inputs that are commonly relevant for valuing particular classes of fixed-income securities in which the fund is authorized to invest. However, these classifications are not exclusive, and any of the inputs may be used to value any other class of fixed-income security.
| Fixed-income class | | Examples of standard inputs |
| All | | Benchmark yields, transactions, bids, offers, quotations from dealers and trading systems, new issues, spreads and other relationships observed in the markets among comparable securities; and proprietary pricing models such as yield measures calculated using factors such as cash flows, financial or collateral performance and other reference data (collectively referred to as “standard inputs”) |
| Corporate bonds & notes; convertible securities | | Standard inputs and underlying equity of the issuer |
| Bonds & notes of governments & government agencies | | Standard inputs and interest rate volatilities |
| Mortgage-backed; asset-backed obligations | | Standard inputs and cash flows, prepayment information, default rates, delinquency and loss assumptions, collateral characteristics, credit enhancements and specific deal information |
| Municipal securities | | Standard inputs and, for certain distressed securities, cash flows or liquidation values using a net present value calculation based on inputs that include, but are not limited to, financial statements and debt contracts |
When the fund’s investment adviser deems it appropriate to do so (such as when vendor prices are unavailable or deemed to be not representative), fixed-income securities will be valued in good faith at the mean quoted bid and ask prices that are reasonably and timely available (or bid prices, if ask prices are not available) or at prices for securities of comparable maturity, quality and type.
Securities with both fixed-income and equity characteristics, or equity securities traded principally among fixed-income dealers, are generally valued in the manner described for either equity or fixed-income securities, depending on which method is deemed most appropriate by the fund’s investment adviser. Forward currency contracts are valued at the mean of representative quoted bid and ask prices, generally based on prices supplied by one or more pricing vendors. Interest rate swaps are generally valued by pricing vendors based on market inputs that include the index and term of index, reset frequency, payer/receiver, currency and pay frequency.
| Capital World Bond Fund | 17 |
Exchange-traded futures are generally valued at the official settlement price of, or the last reported sale price on, the exchange or market on which such instruments are traded, as of the close of business on the day the futures are being valued or, lacking any sales, at the last available bid price. Prices for each future are taken from the exchange or market on which the security trades.
Securities and other assets for which representative market quotations are not readily available or are considered unreliable by the fund’s investment adviser are fair valued as determined in good faith under fair valuation guidelines adopted by authority of the fund’s board of trustees as further described. The investment adviser follows fair valuation guidelines, consistent with U.S. Securities and Exchange Commission rules and guidance, to consider relevant principles and factors when making fair value determinations. The investment adviser considers relevant indications of value that are reasonably and timely available to it in determining the fair value to be assigned to a particular security, such as the type and cost of the security; contractual or legal restrictions on resale of the security; relevant financial or business developments of the issuer; actively traded similar or related securities; conversion or exchange rights on the security; related corporate actions; significant events occurring after the close of trading in the security; and changes in overall market conditions. In addition, the closing prices of equity securities that trade in markets outside U.S. time zones may be adjusted to reflect significant events that occur after the close of local trading but before the net asset value of each share class of the fund is determined. Fair valuations and valuations of investments that are not actively trading involve judgment and may differ materially from valuations that would have been used had greater market activity occurred.
Processes and structure — The fund’s board of trustees has delegated authority to the fund’s investment adviser to make fair value determinations, subject to board oversight. The investment adviser has established a Joint Fair Valuation Committee (the “Fair Valuation Committee”) to administer, implement and oversee the fair valuation process, and to make fair value decisions. The Fair Valuation Committee regularly reviews its own fair value decisions, as well as decisions made under its standing instructions to the investment adviser’s valuation teams. The Fair Valuation Committee reviews changes in fair value measurements from period to period and may, as deemed appropriate, update the fair valuation guidelines to better reflect the results of back testing and address new or evolving issues. The Fair Valuation Committee reports any changes to the fair valuation guidelines to the board of trustees with supplemental information to support the changes. The fund’s board and audit committee also regularly review reports that describe fair value determinations and methods.
The fund’s investment adviser has also established a Fixed-Income Pricing Review Group to administer and oversee the fixed-income valuation process, including the use of fixed-income pricing vendors. This group regularly reviews pricing vendor information and market data. Pricing decisions, processes and controls over security valuation are also subject to additional internal reviews, including an annual control self-evaluation program facilitated by the investment adviser’s compliance group.
| 18 | Capital World Bond Fund |
Classifications — The fund’s investment adviser classifies the fund’s assets and liabilities into three levels based on the inputs used to value the assets or liabilities. Level 1 values are based on quoted prices in active markets for identical securities. Level 2 values are based on significant observable market inputs, such as quoted prices for similar securities and quoted prices in inactive markets. Certain securities trading outside the U.S. may transfer between Level 1 and Level 2 due to valuation adjustments resulting from significant market movements following the close of local trading. Level 3 values are based on significant unobservable inputs that reflect the investment adviser’s determination of assumptions that market participants might reasonably use in valuing the securities. The valuation levels are not necessarily an indication of the risk or liquidity associated with the underlying investment. For example, U.S. government securities are reflected as Level 2 because the inputs used to determine fair value may not always be quoted prices in an active market. The following tables present the fund’s valuation levels as of December 31, 2016 (dollars in thousands):
| | | Investment securities |
| | | Level 1 | | | Level 2 | | | Level 3 | | | Total | |
| Assets: | | | | | | | | | | | | | | | | |
| Bonds, notes & other debt instruments: | | | | | | | | | | | | | | | | |
| Euros | | $ | — | | | $ | 1,245,393 | | | $ | — | | | $ | 1,245,393 | |
| Japanese yen | | | — | | | | 985,755 | | | | — | | | | 985,755 | |
| Hungarian forints | | | — | | | | 551,690 | | | | — | | | | 551,690 | |
| Polish zloty | | | — | | | | 539,280 | | | | — | | | | 539,280 | |
| Mexican pesos | | | — | | | | 525,505 | | | | — | | | | 525,505 | |
| British pounds | | | — | | | | 308,659 | | | | — | | | | 308,659 | |
| Malaysian ringgits | | | — | | | | 307,243 | | | | — | | | | 307,243 | |
| Danish kroner | | | — | | | | 270,670 | | | | — | | | | 270,670 | |
| Indian rupees | | | — | | | | 211,691 | | | | — | | | | 211,691 | |
| Brazilian reais | | | — | | | | 168,224 | | | | — | | | | 168,224 | |
| Australian dollars | | | — | | | | 146,716 | | | | — | | | | 146,716 | |
| Chilean pesos | | | — | | | | 94,088 | | | | — | | | | 94,088 | |
| Canadian dollars | | | — | | | | 79,956 | | | | — | | | | 79,956 | |
| Argentine pesos | | | — | | | | 51,773 | | | | — | | | | 51,773 | |
| Israeli shekels | | | — | | | | 49,340 | | | | — | | | | 49,340 | |
| U.S. dollars | | | — | | | | 5,544,675 | | | | 649 | | | | 5,545,324 | |
| Other | | | — | | | | 354,337 | | | | — | | | | 354,337 | |
| Convertible stocks | | | — | | | | 537 | | | | 2,640 | | | | 3,177 | |
| Common stocks | | | 796 | | | | 2,804 | | | | 1,042 | | | | 4,642 | |
| Short-term securities | | | — | | | | 508,699 | | | | — | | | | 508,699 | |
| Total | | $ | 796 | | | $ | 11,947,035 | | | $ | 4,331 | | | $ | 11,952,162 | |
| | | Other investments* |
| | | Level 1 | | | Level 2 | | | Level 3 | | | Total | |
|
| Assets: | | | | | | | | | | | | | | | | |
| Unrealized appreciation on open forward currency contracts | | $ | — | | | $ | 10,515 | | | $ | — | | | $ | 10,515 | |
| Unrealized appreciation on interest rate swaps | | | — | | | | 24,698 | | | | — | | | | 24,698 | |
| Unrealized appreciation on futures contracts | | | 48 | | | | — | | | | — | | | | 48 | |
| Liabilities: | | | | | | | | | | | | | | | | |
| Unrealized depreciation on open forward currency contracts | | | — | | | | (37,661 | ) | | | — | | | | (37,661 | ) |
| Unrealized depreciation on interest rate swaps | | | — | | | | (7,395 | ) | | | — | | | | (7,395 | ) |
| Unrealized depreciation on futures contracts | | | (99 | ) | | | — | | | | — | | | | (99 | ) |
| Total | | $ | (51 | ) | | $ | (9,843 | ) | | $ | — | | | $ | (9,894 | ) |
* Forward currency contracts, interest rate swaps, and futures contracts are not included in the investment portfolio.
4. Risk factors
Investing in the fund may involve certain risks including, but not limited to, those described below.
Market conditions — The prices of, and the income generated by, the securities held by the fund may decline — sometimes rapidly or unpredictably — due to various factors, including events or conditions affecting the general economy or particular industries; overall market changes; local, regional or global political, social or economic instability; governmental or governmental agency responses to economic conditions; and currency exchange rate, interest rate and commodity price fluctuations.
| Capital World Bond Fund | 19 |
Issuer risks — The prices of, and the income generated by, securities held by the fund may decline in response to various factors directly related to the issuers of such securities, including reduced demand for an issuer’s goods or services, poor management performance and strategic initiatives such as mergers, acquisitions or dispositions and the market response to any such initiatives.
Investing in debt instruments — The prices of, and the income generated by, bonds and other debt securities held by the fund may be affected by changing interest rates and by changes in the effective maturities and credit ratings of these securities.
Rising interest rates will generally cause the prices of bonds and other debt securities to fall. Falling interest rates may cause an issuer to redeem, call or refinance a debt security before its stated maturity, which may result in the fund having to reinvest the proceeds in lower yielding securities. Longer maturity debt securities generally have greater sensitivity to changes in interest rates and may be subject to greater price fluctuations than shorter maturity debt securities.
Bonds and other debt securities are also subject to credit risk, which is the possibility that the credit strength of an issuer will weaken and/or an issuer of a debt security will fail to make timely payments of principal or interest and the security will go into default. Lower quality debt securities generally have higher rates of interest and may be subject to greater price fluctuations than higher quality debt securities. Credit risk is gauged, in part, by the credit ratings of the debt securities in which the fund invests. However, ratings are only the opinions of the rating agencies issuing them and are not guarantees as to credit quality or an evaluation of market risk. The fund’s investment adviser relies on its own credit analysts to research issuers and issues in seeking to mitigate various credit and default risks.
Liquidity risk — Certain fund holdings may be deemed to be less liquid or illiquid because they cannot be readily sold without significantly impacting the value of the holdings. Liquidity risk may result from the lack of an active market for a holding, legal or contractual restrictions on resale or the reduced number and capacity of market participants to make a market in such holding. Market prices for less liquid or illiquid holdings may be volatile, and reduced liquidity may have an adverse impact on the market price of such holdings. Additionally, the sale of less liquid or illiquid holdings may involve substantial delays (including delays in settlement) and additional costs and the fund may be unable to sell such holdings when necessary to meet its liquidity needs.
Investing in lower rated debt instruments — Lower rated bonds and other lower rated debt securities generally have higher rates of interest and involve greater risk of default or price declines due to changes in the issuer’s creditworthiness than those of higher quality debt securities. The market prices of these securities may fluctuate more than the prices of higher quality debt securities and may decline significantly in periods of general economic difficulty. These risks may be increased with respect to investments in junk bonds.
Currency — The prices of, and the income generated by, many debt securities held by the fund may also be affected by changes in relative currency values. If the U.S. dollar appreciates against foreign currencies, the value in U.S. dollars of the fund’s securities denominated in such currencies would generally fall and vice versa. U.S. dollar-denominated securities of foreign issuers may also be affected by changes in relative currency values.
Investing in derivatives — The use of derivatives involves a variety of risks, which may be different from, or greater than, the risks associated with investing in traditional cash securities, such as stocks and bonds. Changes in the value of a derivative may not correlate perfectly with, and may be more sensitive to market events than, the underlying asset, rate or index, and a derivative instrument may expose the fund to losses in excess of its initial investment. Derivatives may be difficult for the fund to buy or sell at an opportune time or price and may be difficult to terminate or otherwise offset. The fund’s use of derivatives may result in losses to the fund, and investing in derivatives may reduce the fund’s returns and increase the fund’s price volatility. The fund’s counterparty to a derivative transaction (including, if applicable, the fund’s clearing broker, the derivatives exchange or the clearinghouse) may be unable or unwilling to honor its financial obligations in respect of the transaction.
Investing outside the U.S. — Securities of issuers domiciled outside the U.S., or with significant operations or revenues outside the U.S., may lose value because of adverse political, social, economic or market developments (including social instability, regional conflicts, terrorism and war) in the countries or regions in which the issuers operate or generate revenue. These securities may also lose value due to changes in foreign currency exchange rates against the U.S. dollar and/or currencies of other countries. Issuers of these securities may be more susceptible to actions of foreign governments, such as the imposition of price controls or punitive taxes, that could adversely impact the value of these securities. Securities markets in certain countries may be more volatile and/or less liquid than those in the U.S. Investments outside the U.S. may also be subject to different accounting practices and different regulatory, legal and reporting standards and practices, and may be more difficult to value, than those in the U.S. In addition, the value of investments outside the U.S. may be reduced by foreign taxes, including foreign withholding taxes on interest and dividends. Further, there may be increased risks of delayed settlement of securities purchased or sold by the fund. The risks of investing outside the U.S. may be heightened in connection with investments in emerging markets.
| 20 | Capital World Bond Fund |
Investing in emerging markets — Investing in emerging markets may involve risks in addition to and greater than those generally associated with investing in the securities markets of developed countries. For instance, developing countries may have less developed legal and accounting systems than those in developed countries. The governments of these countries may be less stable and more likely to impose capital controls, nationalize a company or industry, place restrictions on foreign ownership and on withdrawing sale proceeds of securities from the country, and/or impose punitive taxes that could adversely affect the prices of securities. In addition, the economies of these countries may be dependent on relatively few industries that are more susceptible to local and global changes. Securities markets in these countries can also be relatively small and have substantially lower trading volumes. As a result, securities issued in these countries may be more volatile and less liquid, and may be more difficult to value, than securities issued in countries with more developed economies and/or markets. Less certainty with respect to security valuations may lead to additional challenges and risks in calculating the fund’s net asset value. Additionally, there may be increased settlement risks for transactions in local securities.
Nondiversification risk — As a nondiversified fund, the fund has the ability to invest a larger percentage of its assets in the securities of a smaller number of issuers than a diversified fund. Although the fund does not intend to limit its investments to the securities of a small number of issuers, if it were to do so, poor performance by a single large holding could adversely impact the fund’s investment results more than if the fund were invested in a larger number of issuers.
Management — The investment adviser to the fund actively manages the fund’s investments. Consequently, the fund is subject to the risk that the methods and analyses employed by the investment adviser in this process may not produce the desired results. This could cause the fund to lose value or its investment results to lag relevant benchmarks or other funds with similar objectives.
5. Certain investment techniques
Index-linked bonds — The fund has invested in index-linked bonds, which are fixed-income securities whose principal value is periodically adjusted to a government price index. Over the life of an index-linked bond, interest is paid on the adjusted principal value. Increases or decreases in the principal value of index-linked bonds are recorded as interest income in the fund’s statement of operations.
Mortgage dollar rolls — The fund has entered into mortgage dollar roll transactions in which the fund sells a mortgage-backed security to a counterparty and simultaneously enters into an agreement with the same counterparty to buy back a similar security on a specific future date at a predetermined price. Mortgage dollar rolls are accounted for as purchase and sale transactions, which may increase the fund’s portfolio turnover rate.
Loan transactions — The fund has entered into loan transactions in which the fund acquires a loan either through an agent, by assignment from another holder, or as a participation interest in another holder’s portion of a loan. The loan is often administered by a financial institution that acts as agent for the holders of the loan, and the fund may be required to receive approval from the agent and/or borrower prior to the sale of the investment. The loan’s interest rate and maturity date may change based on the terms of the loan, including potential early payments of principal.
Unfunded commitments — The fund has participated in a transaction that involves unfunded commitments, which may obligate the fund to purchase additional shares of the applicable issuer. Under the terms of the commitments, which will expire no later than April 1, 2021, the maximum potential exposure as of December 31, 2016, was $345,000. Should such commitments become due in full, these amounts would represent less than .01% of the net assets of the fund as of December 31, 2016.
Forward currency contracts — The fund has entered into forward currency contracts, which represent agreements to exchange currencies on specific future dates at predetermined rates. The fund’s investment adviser uses forward currency contracts to manage the fund’s exposure to changes in exchange rates. Upon entering into these contracts, risks may arise from the potential inability of counterparties to meet the terms of their contracts and from possible movements in exchange rates.
On a daily basis, the fund’s investment adviser values forward currency contracts and records unrealized appreciation or depreciation for open forward currency contracts in the fund’s statement of assets and liabilities. Realized gains or losses are recorded at the time the forward currency contract is closed or offset by another contract with the same broker for the same settlement date and currency.
Closed forward currency contracts that have not reached their settlement date are included in the respective receivables or payables for closed forward currency contracts in the fund’s statement of assets and liabilities. Net realized gains or losses from closed forward currency contracts and net unrealized appreciation or depreciation from open forward currency contracts are recorded in the fund’s statement of operations.
Interest rate swaps — The fund has entered into interest rate swap contracts, which are agreements to exchange one stream of future interest payments for another based on a specified notional amount. Typically, interest rate swaps exchange a fixed interest rate for a
| Capital World Bond Fund | 21 |
payment that floats relative to a benchmark or vice versa. The fund’s investment adviser uses interest rate swaps to seek to manage the interest rate sensitivity of the fund by increasing or decreasing the duration of the fund or a portion of the fund’s portfolio. Risks may arise as a result of the fund’s investment adviser incorrectly anticipating changes in interest rates, increased volatility, reduced liquidity and the potential inability of counterparties to meet the terms of their agreements.
Upon entering into an interest rate swap contract, the fund is required to deposit cash, U.S. government securities or other liquid securities, which is known as “initial margin.” Generally, the initial margin required for a particular interest rate swap is set and held as collateral by the clearinghouse on which the contract is cleared. The amount of initial margin required may be significantly modified from time to time by the clearinghouse during the term of the contract.
On a daily basis, the fund’s investment adviser records daily interest accruals related to the exchange of future payments as a receivable and payable in the fund’s statement of assets and liabilities. The fund also pays or receives a “variation margin” based on the increase or decrease in the value of the interest rate swaps, including accrued interest, and records variation margin on interest rate swaps in the statement of assets and liabilities. The fund records realized gains and losses on both the net accrued interest and any gain or loss recognized at the time the interest rate swap is closed or expires. Net realized gains or losses, as well as any net unrealized appreciation or depreciation, from interest rate swaps are recorded in the fund’s statement of operations.
Futures contracts — The fund has entered into futures contracts, which provide for the future sale by one party and purchase by another party of a specified amount of a specific financial instrument for a specified price, date, time and place designated at the time the contract is made. Futures contracts are used to strategically manage portfolio volatility and downside equity risk.
Upon entering into futures contracts, and to maintain the fund’s open positions in futures contracts, the fund is required to deposit with a futures broker, or FCM, in a segregated account in the name of the FCM an amount of cash, U.S. government securities, suitable money market instruments, or other liquid securities, known as initial margin. The margin required for a particular futures contract is set by the exchange on which the contract is traded to serve as collateral, and may be significantly modified from time to time by the exchange during the term of the contract. When initial margin is deposited with brokers, a receivable is recorded in the fund’s statement of assets and liabilities.
On a daily basis, the fund pays or receives variation margin based on the increase or decrease in the value of the futures contracts and records variation margin on futures contracts in the statement of assets and liabilities. In addition, the fund segregates liquid assets equivalent to the fund’s outstanding obligations under the contract in excess of the initial margin and variation margin, if any. Futures contracts may involve a risk of loss in excess of the variation margin shown on the fund’s statement of assets and liabilities. The fund records realized gains or losses at the time the futures contract is closed or expires. Net realized gains or losses and net unrealized appreciation or depreciation from futures contracts are recorded in the fund’s statement of operations.
The following tables present the financial statement impacts resulting from the fund’s use of forward currency contracts, interest rate swaps and futures contracts as of, or for the period ended, December 31, 2016 (dollars in thousands):
| | | | | Assets | | | Liabilities | |
| Contract | | Risk type | | Location on statement of
assets and liabilities | | Value | | | Location on statement of
assets and liabilities | | Value | |
| Forward currency | | Currency | | Unrealized appreciation on open forward currency contracts | | $ | 10,515 | | | Unrealized depreciation on open forward currency contracts | | $ | 37,661 | |
| Forward currency | | Currency | | Receivables for closed forward currency contracts | | | 1,279 | | | Payables for closed forward currency contracts | | | 6,217 | |
| Interest rate swaps | | Interest | | Net unrealized appreciation* | | | 24,698 | | | Net unrealized depreciation* | | | 7,395 | |
| Futures contracts | | Interest | | Net unrealized appreciation* | | | 48 | | | Net unrealized depreciation* | | | 99 | |
| | | | | | | $ | 36,540 | | | | | $ | 51,372 | |
| 22 | Capital World Bond Fund |
| | | | | Net realized loss | | | Net unrealized (depreciation) appreciation | |
| Contract | | Risk type | | Location on statement of
operations | | Value | | | Location on statement of
operations | | Value | |
| Forward currency | | Currency | | Net realized loss on forward currency contracts | | $ | (94,887 | ) | | Net unrealized depreciation on forward currency contracts | | $ | (22,078 | ) |
| Interest rate swaps | | Interest | | Net realized loss on interest rate swaps | | | (591 | ) | | Net unrealized appreciation on interest rate swaps | | | 46,655 | |
| Futures contracts | | Interest | | Net realized loss on futures contracts | | | (934 | ) | | Net unrealized depreciation on futures contracts | | | (89 | ) |
| | | | | | | $ | (96,412 | ) | | | | $ | 24,488 | |
The following table presents the financial statement impacts resulting from the fund’s use of forward currency contracts, interest rate swaps and futures contracts for the year ended September 30, 2016 (dollars in thousands):
| | | | | Net realized gain (loss) | | | Net unrealized (depreciation) appreciation | |
| Contract | | Risk type | | Location on statement of
operations | | Value | | | Location on statement of
operations | | Value | |
| Forward currency | | Currency | | Net realized gain on forward currency contracts | | $ | 104,146 | | | Net unrealized depreciation on forward currency contracts | | $ | (13,892 | ) |
| Interest rate swaps | | Interest | | Net realized loss on interest rate swaps | | | (16,431 | ) | | Net unrealized depreciation on interest rate swaps | | | (35,558 | ) |
| Futures contracts | | Interest | | Net realized gain on futures contracts | | | — | | | Net unrealized appreciation on futures | | | 38 | |
| | | | | | | $ | 87,715 | | | | | $ | (49,412 | ) |
Collateral — The fund participates in a collateral program due to its use of forward currency contracts, interest rate swaps, futures contracts and future delivery contracts. For forward currency contracts, the program calls for the fund to either receive or pledge collateral based on the net gain or loss on unsettled forward currency contracts by counterparty. For interest rate swaps and futures contracts, the program calls for the fund to pledge collateral for initial and variation margin by contract. For future delivery contracts, the program calls for the fund to either receive or pledge collateral based on the net gain or loss on unsettled contracts by certain counterparties. The purpose of the collateral is to cover potential losses that could occur in the event that either party cannot meet its contractual obligations.
| Capital World Bond Fund | 23 |
Rights of offset — The fund has entered into enforceable master netting agreements with certain counterparties for forward currency contracts, where on any date amounts payable by each party to the other (in the same currency with respect to the same transaction) may be closed or offset by each party’s payment obligation. If an early termination date occurs under these agreements following an event of default or termination event, all obligations of each party to its counterparty are settled net through a single payment in a single currency (“close-out netting”). For financial reporting purposes, the fund does not offset financial assets and financial liabilities that are subject to these master netting arrangements in the statement of assets and liabilities.
The following table presents the fund’s forward currency contracts by counterparty that are subject to master netting agreements but that are not offset in the fund’s statement of assets and liabilities. The net amount column shows the impact of offsetting on the fund’s statement of assets and liabilities as of December 31, 2016, if close-out netting was exercised (dollars in thousands):
| | | | | | Gross amounts not offset in the | | | | |
| | | Gross amounts | | | statement of assets and liabilities and | | | | |
| | | recognized in the | | | subject to a master netting agreement | | | | |
| Counterparty | | statement of assets
and liabilities | | | Available to offset | | | Non-cash collateral* | | | Cash collateral | | | Net
amount | |
| Assets: | | | | | | | | | | | | | | | | | | | | |
| Bank of America, N.A. | | $ | 2,289 | | | $ | (2,289 | ) | | $ | — | | | $ | — | | | $ | — | |
| Bank of New York Mellon | | | 275 | | | | — | | | | (275 | ) | | | — | | | | — | |
| Barclays Bank PLC | | | 898 | | | | (391 | ) | | | — | | | | — | | | | 507 | |
| Citibank | | | 3,124 | | | | (3,124 | ) | | | — | | | | — | | | | — | |
| HSBC Bank | | | 796 | | | | (796 | ) | | | — | | | | — | | | | — | |
| JPMorgan Chase | | | 3,105 | | | | (3,105 | ) | | | — | | | | — | | | | — | |
| UBS AG | | | 1,307 | | | | (1,307 | ) | | | — | | | | — | | | | — | |
| Total | | $ | 11,794 | | | $ | (11,012 | ) | | $ | (275 | ) | | $ | — | | | $ | 507 | |
| Liabilities: | | | | | | | | | | | | | | | | | | | | |
| Bank of America, N.A. | | $ | 4,780 | | | $ | (2,289 | ) | | $ | (1,614 | ) | | $ | — | | | $ | 877 | |
| Barclays Bank PLC | | | 391 | | | | (391 | ) | | | — | | | | — | | | | — | |
| Citibank | | | 10,481 | | | | (3,124 | ) | | | (6,533 | ) | | | — | | | | 824 | |
| HSBC Bank | | | 8,075 | | | | (796 | ) | | | (7,279 | ) | | | — | | | | — | |
| JPMorgan Chase | | | 16,780 | | | | (3,105 | ) | | | (13,197 | ) | | | — | | | | 478 | |
| UBS AG | | | 3,371 | | | | (1,307 | ) | | | (2,064 | ) | | | — | | | | — | |
| Total | | $ | 43,878 | | | $ | (11,012 | ) | | $ | (30,687 | ) | | $ | — | | | $ | 2,179 | |
| * | Non-cash collateral is shown on a settlement basis. |
6. Taxation and distributions
Federal income taxation — The fund complies with the requirements under Subchapter M of the Internal Revenue Code applicable to mutual funds and intends to distribute substantially all of its net taxable income and net capital gains each year. The fund is not subject to income taxes to the extent such distributions are made. Therefore, no federal income tax provision is required.
As of and during the period ended December 31, 2016, the fund did not have a liability for any unrecognized tax benefits. The fund recognizes interest and penalties, if any, related to unrecognized tax benefits as income tax expense in the statement of operations. During the period, the fund did not incur any interest or penalties.
The fund is not subject to examination by U.S. federal tax authorities for tax years before 2012, by state tax authorities for tax years before 2011 and by tax authorities outside the U.S. for tax years before 2014.
Non-U.S. taxation — Interest income is recorded net of non-U.S. taxes paid. The fund may file withholding tax reclaims in certain jurisdictions to recover a portion of amounts previously withheld. These reclaims are recorded when the amount is known and there are no significant uncertainties on collectability. Gains realized by the fund on the sale of securities in certain countries are subject to non-U.S. taxes. The fund records an estimated deferred tax liability based on unrealized gains to provide for potential non-U.S. taxes payable upon the sale of these securities.
Distributions — Distributions paid to shareholders are based on net investment income and net realized gains determined on a tax basis, which may differ from net investment income and net realized gains for financial reporting purposes. These differences are due primarily to different treatment for items such as currency gains and losses; short-term capital gains and losses; capital losses related to sales of certain securities within 30 days of purchase; deferred expenses; cost of investments sold; paydowns on fixed-income securities; net
| 24 | Capital World Bond Fund |
capital losses; non-U.S. taxes on capital gains; and income on certain investments. The fiscal year in which amounts are distributed may differ from the year in which the net investment income and net realized gains are recorded by the fund for financial reporting purposes.
During the year ended December 31, 2016, the fund reclassified $3,439,000 from distributions in excess of net investment income to accumulated net realized loss to align financial reporting with tax reporting.
As of December 31, 2016, the tax basis unrealized appreciation (depreciation) and cost of investment securities were as follows (dollars in thousands):
| Gross unrealized appreciation on investment securities | | $ | 163,253 | |
| Gross unrealized depreciation on investment securities | | | (703,034 | ) |
| Net unrealized depreciation on investment securities | | | (539,781 | ) |
| Cost of investment securities | | | 12,491,943 | |
For the period ended December 31, 2016, the fund’s distributions exceeded total taxable income and net realized gains or losses resulting in a return of capital for tax purposes. The tax character of distributions paid to shareholders was as follows (dollars in thousands):
| | | Period ended December 31, 2016 | |
| Share class | | Ordinary
income | | | Long-term
capital gains | | | Return of
capital | | | Total
dividends
and
distributions
paid | |
| Class A | | $ | 36,287 | | | $ | 21,022 | | | $ | 13,660 | | | $ | 70,969 | |
| Class B | | | 8 | | | | 15 | | | | 3 | | | | 26 | |
| Class C | | | 1,098 | | | | 1,239 | | | | 413 | | | | 2,750 | |
| Class F-1 | | | 2,068 | | | | 1,179 | | | | 778 | | | | 4,025 | |
| Class F-2 | | | 13,269 | | | | 6,851 | | | | 4,995 | | | | 25,115 | |
| Class 529-A | | | 1,691 | | | | 1,033 | | | | 636 | | | | 3,360 | |
| Class 529-B | | | 1 | | | | 1 | | | | — | * | | | 2 | |
| Class 529-C | | | 328 | | | | 400 | | | | 124 | | | | 852 | |
| Class 529-E | | | 82 | | | | 56 | | | | 31 | | | | 169 | |
| Class 529-F-1 | | | 242 | | | | 127 | | | | 91 | | | | 460 | |
| Class R-1 | | | 36 | | | | 39 | | | | 14 | | | | 89 | |
| Class R-2 | | | 487 | | | | 486 | | | | 183 | | | | 1,156 | |
| Class R-2E | | | 8 | | | | 7 | | | | 3 | | | | 18 | |
| Class R-3 | | | 733 | | | | 505 | | | | 276 | | | | 1,514 | |
| Class R-4 | | | 689 | | | | 383 | | | | 260 | | | | 1,332 | |
| Class R-5E | | | — | * | | | — | * | | | — | * | | | — | * |
| Class R-5 | | | 562 | | | | 274 | | | | 212 | | | | 1,048 | |
| Class R-6 | | | 18,913 | | | | 9,200 | | | | 7,120 | | | | 35,233 | |
| Total | | $ | 76,502 | | | $ | 42,817 | | | $ | 28,799 | | | $ | 148,118 | |
| Capital World Bond Fund | 25 |
| | | Year ended September 30, 2016 | | | Year ended September 30, 2015 | |
| Share class | | | Ordinary
income | | | | Long-term
capital gains | | | | Total
dividends
paid | | | Ordinary
income | | | | Long-term
capital gains | | | | Total
dividends and
distributions
paid | |
| Class A | | $ | 74,286 | | | | $ | — | | | | $ | 74,286 | | | $ | 97,397 | | | | $ | 64,961 | | | | $ | 162,358 | |
| Class B | | | 75 | | | | | — | | | | | 75 | | | | 452 | | | | | 520 | | | | | 972 | |
| Class C | | | 1,919 | | | | | — | | | | | 1,919 | | | | 4,212 | | | | | 4,943 | | | | | 9,155 | |
| Class F-1 | | | 9,419 | | | | | — | | | | | 9,419 | | | | 28,181 | | | | | 18,473 | | | | | 46,654 | |
| Class F-2 | | | 25,227 | | | | | — | | | | | 25,227 | | | | 15,798 | | | | | 8,710 | | | | | 24,508 | |
| Class 529-A | | | 3,366 | | | | | — | | | | | 3,366 | | | | 4,542 | | | | | 3,217 | | | | | 7,759 | |
| Class 529-B | | | 5 | | | | | — | | | | | 5 | | | | 38 | | | | | 49 | | | | | 87 | |
| Class 529-C | | | 517 | | | | | — | | | | | 517 | | | | 1,112 | | | | | 1,378 | | | | | 2,490 | |
| Class 529-E | | | 152 | | | | | — | | | | | 152 | | | | 205 | | | | | 172 | | | | | 377 | |
| Class 529-F-1 | | | 523 | | | | | — | | | | | 523 | | | | 681 | | | | | 409 | | | | | 1,090 | |
| Class R-1 | | | 66 | | | | | — | | | | | 66 | | | | 131 | | | | | 149 | | | | | 280 | |
| Class R-2 | | | 717 | | | | | — | | | | | 717 | | | | 1,285 | | | | | 1,518 | | | | | 2,803 | |
| Class R-2E | | | 4 | | | | | — | | | | | 4 | | | | — | * | | | | — | * | | | | — | * |
| Class R-3 | | | 1,303 | | | | | — | | | | | 1,303 | | | | 1,853 | | | | | 1,567 | | | | | 3,420 | |
| Class R-4 | | | 1,240 | | | | | — | | | | | 1,240 | | | | 1,544 | | | | | 997 | | | | | 2,541 | |
| Class R-5E† | | | — | * | | | | — | | | | | — | * | | | | | | | | | | | | | | |
| Class R-5 | | | 2,329 | | | | | — | | | | | 2,329 | | | | 2,725 | | | | | 1,428 | | | | | 4,153 | |
| Class R-6 | | | 31,476 | | | | | — | | | | | 31,476 | | | | 25,012 | | | | | 12,521 | | | | | 37,533 | |
| Total | | $ | 152,624 | | | | $ | — | | | | $ | 152,624 | | | $ | 185,168 | | | | $ | 121,012 | | | | $ | 306,180 | |
| * | Amount less than one thousand. |
| † | Class R-5E shares were offered beginning November 20, 2015. |
7. Fees and transactions with related parties
CRMC, the fund’s investment adviser, is the parent company of American Funds Distributors,® Inc. (“AFD”), the principal underwriter of the fund’s shares, and American Funds Service Company® (“AFS”), the fund’s transfer agent. CRMC, AFD and AFS are considered related parties to the fund.
Investment advisory services — The fund has an investment advisory and service agreement with CRMC that provides for monthly fees accrued daily. These fees are based on a series of decreasing annual rates beginning with 0.570% on the first $1 billion of daily net assets and decreasing to 0.360% on such assets in excess of $15 billion. For the period ended December 31, 2016, the investment advisory services fee was $13,574,000, which was equivalent to an annualized rate of 0.442% of average daily net assets. For the year ended September 30, 2016, the investment advisory services fee was $55,307,000, which was equivalent to an annualized rate of 0.441% of average daily net assets.
Class-specific fees and expenses — Expenses that are specific to individual share classes are accrued directly to the respective share class. The principal class-specific fees and expenses are further described below:
Distribution services — The fund has plans of distribution for all share classes, except Class F-2, R-5E, R-5 and R-6 shares. Under the plans, the board of trustees approves certain categories of expenses that are used to finance activities primarily intended to sell fund shares and service existing accounts. The plans provide for payments, based on an annualized percentage of average daily net assets, ranging from 0.30% to 1.00% as noted in this section. In some cases, the board of trustees has limited the amounts that may be paid to less than the maximum allowed by the plans. All share classes with a plan may use up to 0.25% of average daily net assets to pay service fees, or to compensate AFD for paying service fees, to firms that have entered into agreements with AFD to provide certain shareholder services. The remaining amounts available to be paid under each plan are paid to dealers to compensate them for their sales activities.
For Class A and 529-A shares, distribution-related expenses include the reimbursement of dealer and wholesaler commissions paid by AFD for certain shares sold without a sales charge. These share classes reimburse AFD for amounts billed within the prior
| 26 | Capital World Bond Fund |
15 months but only to the extent that the overall annual expense limit of 0.30% is not exceeded. As of December 31, 2016, there were no unreimbursed expenses subject to reimbursement for Class A or 529-A shares.
| Share class | | Currently approved limits | | Plan limits |
| Class A | | | 0.30 | % | | | 0.30 | % |
| Class 529-A | | | 0.30 | | | | 0.50 | |
| Classes B and 529-B | | | 1.00 | | | | 1.00 | |
| Classes C, 529-C and R-1 | | | 1.00 | | | | 1.00 | |
| Class R-2 | | | 0.75 | | | | 1.00 | |
| Class R-2E | | | 0.60 | | | | 0.85 | |
| Classes 529-E and R-3 | | | 0.50 | | | | 0.75 | |
| Classes F-1, 529-F-1 and R-4 | | | 0.25 | | | | 0.50 | |
Transfer agent services — The fund has a shareholder services agreement with AFS under which the fund compensates AFS for providing transfer agent services to each of the fund’s share classes. These services include recordkeeping, shareholder communications and transaction processing. In addition, the fund reimburses AFS for amounts paid to third parties for performing transfer agent services on behalf of fund shareholders.
Administrative services — The fund has an administrative services agreement with CRMC under which the fund compensates CRMC for providing administrative services to Class A, C, F, 529 and R shares. These services include, but are not limited to, coordinating, monitoring, assisting and overseeing third parties that provide services to fund shareholders. Under the agreement, Class A shares pay an annual fee of 0.01% and Class C, F, 529 and R shares pay an annual fee of 0.05% of their respective average daily net assets.
529 plan services — Each 529 share class is subject to service fees to compensate the Virginia College Savings Plan (“Virginia529”) for its oversight and administration of the 529 college savings plan. From January 1, 2016 to June 30, 2016, the quarterly fee was based on a series of decreasing annual rates beginning with 0.10% on the first $30 billion of the net assets invested in Class 529 shares of the American Funds and decreasing to 0.05% on such assets in excess of $70 billion. Effective July 1, 2016, the quarterly fee was amended to annual rates of 0.10% on the first $20 billion of the net assets invested in the Class 529 shares of the American Funds, 0.05% on such assets between $20 billion and $100 billion, and 0.03% on such assets over $100 billion. The fee for any given calendar quarter is accrued and calculated on the basis of the average net assets of Class 529 shares of the American Funds for the last month of the prior calendar quarter. The fee is included in other expenses in the fund’s statement of operations. Virginia529 is not considered a related party to the fund.
For the period ended December 31, 2016, class-specific expenses under the agreements were as follows (dollars in thousands):
| Share class | | Distribution
services | | Transfer agent
services | | Administrative
services | | 529 plan
services | |
| Class A | | $3,815 | | $3,223 | | $154 | | Not applicable | |
| Class B | | 14 | | 3 | | Not applicable | | Not applicable | |
| Class C | | 904 | | 191 | | 45 | | Not applicable | |
| Class F-1 | | 215 | | 88 | | 43 | | Not applicable | |
| Class F-2 | | Not applicable | | 495 | | 240 | | Not applicable | |
| Class 529-A | | 176 | | 144 | | 38 | | $52 | |
| Class 529-B | | 1 | | — | * | — | * | — | * |
| Class 529-C | | 286 | | 57 | | 15 | | 20 | |
| Class 529-E | | 20 | | 4 | | 2 | | 3 | |
| Class 529-F-1 | | — | | 18 | | 5 | | 7 | |
| Class R-1 | | 28 | | 3 | | 1 | | Not applicable | |
| Class R-2 | | 259 | | 132 | | 18 | | Not applicable | |
| Class R-2E | | 3 | | 1 | | — | * | Not applicable | |
| Class R-3 | | 181 | | 45 | | 18 | | Not applicable | |
| Class R-4 | | 70 | | 21 | | 14 | | Not applicable | |
| Class R-5E | | Not applicable | | — | * | — | * | Not applicable | |
| Class R-5 | | Not applicable | | 2 | | 10 | | Not applicable | |
| Class R-6 | | Not applicable | | — | | 315 | | Not applicable | |
| Total class-specific expenses | | $5,972 | | $4,427 | | $918 | | $82 | |
| Capital World Bond Fund | 27 |
For the year ended ended September 30, 2016, class-specific expenses under the agreements were as follows (dollars in thousands):
| Share class | | Distribution
services | | Transfer agent
services | | Administrative
services | | 529 plan
services | |
| Class A | | $15,329 | | $13,693 | | $637 | | Not applicable | |
| Class B | | 219 | | 55 | | Not applicable | | Not applicable | |
| Class C | | 4,022 | | 885 | | 202 | | Not applicable | |
| Class F-1 | | 2,865 | | 1,855 | | 573 | | Not applicable | |
| Class F-2 | | Not applicable | | 1,864 | | 758 | | Not applicable | |
| Class 529-A | | 707 | | 603 | | 156 | | $262 | |
| Class 529-B | | 20 | | 5 | | 1 | | 2 | |
| Class 529-C | | 1,228 | | 254 | | 62 | | 104 | |
| Class 529-E | | 82 | | 17 | | 8 | | 14 | |
| Class 529-F-1 | | — | | 78 | | 20 | | 34 | |
| Class R-1 | | 126 | | 19 | | 7 | | Not applicable | |
| Class R-2 | | 1,083 | | 620 | | 73 | | Not applicable | |
| Class R-2E | | 3 | | 1 | | — | * | Not applicable | |
| Class R-3 | | 737 | | 305 | | 74 | | Not applicable | |
| Class R-4 | | 253 | | 121 | | 51 | | Not applicable | |
| Class R-5E | | Not applicable | | — | * | — | * | Not applicable | |
| Class R-5 | | Not applicable | | 85 | | 66 | | Not applicable | |
| Class R-6 | | Not applicable | | 31 | | 1,033 | | Not applicable | |
| Total class-specific expenses | | $26,674 | | $20,491 | | $3,721 | | $416 | |
| * | Amount less than one thousand. |
Trustees’ deferred compensation — Trustees who are unaffiliated with CRMC may elect to defer the cash payment of part or all of their compensation. These deferred amounts, which remain as liabilities of the fund, are treated as if invested in shares of the fund or other American Funds. These amounts represent general, unsecured liabilities of the fund and vary according to the total returns of the selected funds. For the period ended December 31, 2016, trustees’ compensation in the fund’s statement of operations reflects $23,000 in current fees (either paid in cash or deferred) and a net increase of less than $1,000 in the value of the deferred amounts. For the year ended September 30, 2016, trustees’ compensation of $118,000 in the fund’s statement of operations reflects $102,000 in current fees (either paid in cash or deferred) and a net increase of $16,000 in the value of the deferred amounts.
Affiliated officers and trustees — Officers and certain trustees of the fund are or may be considered to be affiliated with CRMC, AFD and AFS. No affiliated officers or trustees received any compensation directly from the fund.
Security transactions with related funds — The fund may purchase from, or sell securities to, other CRMC-managed funds (or funds managed by certain affiliates of CRMC) under procedures adopted by the fund’s board of trustees. The funds involved in such transactions are considered related by virtue of having a common investment adviser (or affiliated investment advisers), common trustees and/or common officers. When such transactions occur, each transaction is executed at the current market price of the security and no brokerage commissions or fees are paid in accordance with Rule 17a-7 of the 1940 Act.
| 28 | Capital World Bond Fund |
8. Capital share transactions
Capital share transactions in the fund were as follows (dollars and shares in thousands):
| | | | | | | | | Reinvestments of | | | | | | | | | Net (decrease) | |
| | | Sales1 | | | dividends and distributions | | | Repurchases1 | | | increase | |
| Share class | | Amount | | | Shares | | | Amount | | | Shares | | | Amount | | | Shares | | | Amount | | | Shares | |
| | | | | | | | | | | | | | | | | |
| Period ended December 31, 2016 | | | | | | | | | | | | | | | | |
| | | | | | | | | | | | | | | | | | | | | | | | | | | | | | | | | |
| Class A | | $ | 209,057 | | | | 10,685 | | | $ | 69,870 | | | | 3,617 | | | $ | (460,612 | ) | | | (23,674 | ) | | $ | (181,685 | ) | | | (9,372 | ) |
| Class B | | | 21 | | | | 1 | | | | 27 | | | | 2 | | | | (3,811 | ) | | | (195 | ) | | | (3,763 | ) | | | (192 | ) |
| Class C | | | 9,806 | | | | 510 | | | | 2,704 | | | | 143 | | | | (37,905 | ) | | | (1,981 | ) | | | (25,395 | ) | | | (1,328 | ) |
| Class F-1 | | | 19,200 | | | | 980 | | | | 3,951 | | | | 205 | | | | (40,997 | ) | | | (2,112 | ) | | | (17,846 | ) | | | (927 | ) |
| Class F-2 | | | 364,484 | | | | 18,651 | | | | 24,470 | | | | 1,271 | | | | (181,293 | ) | | | (9,352 | ) | | | 207,661 | | | | 10,570 | |
| Class 529-A | | | 9,225 | | | | 474 | | | | 3,359 | | | | 174 | | | | (14,802 | ) | | | (764 | ) | | | (2,218 | ) | | | (116 | ) |
| Class 529-B | | | 7 | | | | — | 2 | | | 2 | | | | — | 2 | | | (476 | ) | | | (24 | ) | | | (467 | ) | | | (24 | ) |
| Class 529-C | | | 3,231 | | | | 167 | | | | 852 | | | | 45 | | | | (7,783 | ) | | | (408 | ) | | | (3,700 | ) | | | (196 | ) |
| Class 529-E | | | 552 | | | | 28 | | | | 168 | | | | 9 | | | | (909 | ) | | | (47 | ) | | | (189 | ) | | | (10 | ) |
| Class 529-F-1 | | | 1,612 | | | | 84 | | | | 458 | | | | 24 | | | | (3,662 | ) | | | (191 | ) | | | (1,592 | ) | | | (83 | ) |
| Class R-1 | | | 458 | | | | 24 | | | | 88 | | | | 5 | | | | (719 | ) | | | (37 | ) | | | (173 | ) | | | (8 | ) |
| Class R-2 | | | 8,755 | | | | 454 | | | | 1,154 | | | | 61 | | | | (13,494 | ) | | | (700 | ) | | | (3,585 | ) | | | (185 | ) |
| Class R-2E | | | 987 | | | | 49 | | | | 18 | | | | 1 | | | | (100 | ) | | | (5 | ) | | | 905 | | | | 45 | |
| Class R-3 | | | 11,038 | | | | 565 | | | | 1,511 | | | | 78 | | | | (12,466 | ) | | | (642 | ) | | | 83 | | | | 1 | |
| Class R-4 | | | 8,947 | | | | 459 | | | | 1,330 | | | | 69 | | | | (12,579 | ) | | | (646 | ) | | | (2,302 | ) | | | (118 | ) |
| Class R-5E | | | — | | | | — | | | | — | | | | — | | | | — | | | | — | | | | — | | | | — | |
| Class R-5 | | | 7,120 | | | | 362 | | | | 1,048 | | | | 54 | | | | (4,644 | ) | | | (240 | ) | | | 3,524 | | | | 176 | |
| Class R-6 | | | 305,750 | | | | 15,767 | | | | 35,167 | | | | 1,821 | | | | (24,329 | ) | | | (1,245 | ) | | | 316,588 | | | | 16,343 | |
| Total net increase (decrease) | | $ | 960,250 | | | | 49,260 | | | $ | 146,177 | | | | 7,579 | | | $ | (820,581 | ) | | | (42,263 | ) | | $ | 285,846 | | | | 14,576 | |
| | | | | | | | | | | | | | | | | | | | | | | | | | | | | | | | | |
| Year ended September 30, 2016 | | | | | | | | | | | | | | | | | | | | | | |
| | | | | | | | | | | | | | | | | | | | | | | | | | | | | | | | | |
| Class A | | $ | 853,814 | | | | 43,280 | | | $ | 72,934 | | | | 3,719 | | | $ | (1,241,238 | ) | | | (63,140 | ) | | $ | (314,490 | ) | | | (16,141 | ) |
| Class B | | | 561 | | | | 29 | | | | 74 | | | | 4 | | | | (28,837 | ) | | | (1,474 | ) | | | (28,202 | ) | | | (1,441 | ) |
| Class C | | | 47,499 | | | | 2,450 | | | | 1,877 | | | | 96 | | | | (115,371 | ) | | | (5,974 | ) | | | (65,995 | ) | | | (3,428 | ) |
| Class F-1 | | | 269,616 | | | | 14,009 | | | | 9,371 | | | | 493 | | | | (2,073,036 | ) | | | (106,840 | ) | | | (1,794,049 | ) | | | (92,338 | ) |
| Class F-2 | | | 2,588,506 | | | | 131,684 | | | | 24,363 | | | | 1,238 | | | | (1,662,752 | ) | | | (83,619 | ) | | | 950,117 | | | | 49,303 | |
| Class 529-A | | | 34,708 | | | | 1,758 | | | | 3,365 | | | | 171 | | | | (59,360 | ) | | | (3,009 | ) | | | (21,287 | ) | | | (1,080 | ) |
| Class 529-B | | | 103 | | | | 5 | | | | 5 | | | | — | 2 | | | (2,520 | ) | | | (128 | ) | | | (2,412 | ) | | | (123 | ) |
| Class 529-C | | | 15,473 | | | | 794 | | | | 517 | | | | 27 | | | | (30,573 | ) | | | (1,571 | ) | | | (14,583 | ) | | | (750 | ) |
| Class 529-E | | | 1,997 | | | | 101 | | | | 151 | | | | 8 | | | | (2,755 | ) | | | (140 | ) | | | (607 | ) | | | (31 | ) |
| Class 529-F-1 | | | 6,464 | | | | 328 | | | | 523 | | | | 27 | | | | (12,519 | ) | | | (640 | ) | | | (5,532 | ) | | | (285 | ) |
| Class R-1 | | | 2,007 | | | | 103 | | | | 66 | | | | 3 | | | | (5,079 | ) | | | (262 | ) | | | (3,006 | ) | | | (156 | ) |
| Class R-2 | | | 34,469 | | | | 1,771 | | | | 717 | | | | 36 | | | | (45,267 | ) | | | (2,330 | ) | | | (10,081 | ) | | | (523 | ) |
| Class R-2E | | | 1,323 | | | | 68 | | | | 4 | | | | — | 2 | | | (154 | ) | | | (8 | ) | | | 1,173 | | | | 60 | |
| Class R-3 | | | 39,795 | | | | 2,022 | | | | 1,301 | | | | 66 | | | | (50,703 | ) | | | (2,585 | ) | | | (9,607 | ) | | | (497 | ) |
| Class R-4 | | | 40,159 | | | | 2,014 | | | | 1,239 | | | | 63 | | | | (29,994 | ) | | | (1,526 | ) | | | 11,404 | | | | 551 | |
| Class R-5E3 | | | 10 | | | | 1 | | | | — | | | | — | | | | — | | | | — | | | | 10 | | | | 1 | |
| Class R-5 | | | 36,589 | | | | 1,871 | | | | 2,329 | | | | 119 | | | | (120,056 | ) | | | (6,034 | ) | | | (81,138 | ) | | | (4,044 | ) |
| Class R-6 | | | 648,058 | | | | 32,722 | | | | 31,445 | | | | 1,605 | | | | (119,059 | ) | | | (6,136 | ) | | | 560,444 | | | | 28,191 | |
| Total net increase (decrease) | | $ | 4,621,151 | | | | 235,010 | | | $ | 150,281 | | | | 7,675 | | | $ | (5,599,273 | ) | | | (285,416 | ) | | $ | (827,841 | ) | | | (42,731 | ) |
| Capital World Bond Fund | 29 |
| | | Sales1 | | | Reinvestments of
dividends and distributions | | | Repurchases1 | | | Net (decrease)
increase | |
| Share class | | Amount | | | Shares | | | Amount | | | Shares | | | Amount | | | Shares | | | Amount | | | Shares | |
| | | | | | | | | | | | | | | | | | | | | | | |
| Year ended September 30, 2015 | | | | | | | | | | | | | | | | | | | | | | |
| | | | | | | | | | | | | | | | | | | | | | | | | | | | | | | | | |
| Class A | | $ | 819,019 | | | | 41,336 | | | $ | 159,894 | | | | 8,018 | | | $ | (1,318,066 | ) | | | (66,824 | ) | | $ | (339,153 | ) | | | (17,470 | ) |
| Class B | | | 1,193 | | | | 60 | | | | 961 | | | | 48 | | | | (26,379 | ) | | | (1,343 | ) | | | (24,225 | ) | | | (1,235 | ) |
| Class C | | | 56,416 | | | | 2,888 | | | | 8,990 | | | | 458 | | | | (153,317 | ) | | | (7,890 | ) | | | (87,911 | ) | | | (4,544 | ) |
| Class F-1 | | | 565,853 | | | | 28,847 | | | | 46,485 | | | | 2,346 | | | | (326,409 | ) | | | (16,658 | ) | | | 285,929 | | | | 14,535 | |
| Class F-2 | | | 218,568 | | | | 11,077 | | | | 23,400 | | | | 1,175 | | | | (361,800 | ) | | | (18,345 | ) | | | (119,832 | ) | | | (6,093 | ) |
| Class 529-A | | | 38,122 | | | | 1,920 | | | | 7,754 | | | | 388 | | | | (66,827 | ) | | | (3,385 | ) | | | (20,951 | ) | | | (1,077 | ) |
| Class 529-B | | | 206 | | | | 11 | | | | 88 | | | | 4 | | | | (2,858 | ) | | | (145 | ) | | | (2,564 | ) | | | (130 | ) |
| Class 529-C | | | 17,524 | | | | 892 | | | | 2,490 | | | | 126 | | | | (34,271 | ) | | | (1,756 | ) | | | (14,257 | ) | | | (738 | ) |
| Class 529-E | | | 2,414 | | | | 123 | | | | 376 | | | | 19 | | | | (4,195 | ) | | | (214 | ) | | | (1,405 | ) | | | (72 | ) |
| Class 529-F-1 | | | 10,549 | | | | 534 | | | | 1,089 | | | | 55 | | | | (11,208 | ) | | | (569 | ) | | | 430 | | | | 20 | |
| Class R-1 | | | 2,808 | | | | 143 | | | | 279 | | | | 14 | | | | (4,523 | ) | | | (231 | ) | | | (1,436 | ) | | | (74 | ) |
| Class R-2 | | | 38,492 | | | | 1,967 | | | | 2,797 | | | | 141 | | | | (50,466 | ) | | | (2,580 | ) | | | (9,177 | ) | | | (472 | ) |
| Class R-2E | | | — | | | | — | | | | — | | | | — | | | | — | | | | — | | | | — | | | | — | |
| Class R-3 | | | 42,256 | | | | 2,143 | | | | 3,416 | | | | 171 | | | | (57,918 | ) | | | (2,938 | ) | | | (12,246 | ) | | | (624 | ) |
| Class R-4 | | | 31,418 | | | | 1,591 | | | | 2,537 | | | | 128 | | | | (39,315 | ) | | | (1,988 | ) | | | (5,360 | ) | | | (269 | ) |
| Class R-5 | | | 41,483 | | | | 2,093 | | | | 4,150 | | | | 208 | | | | (46,310 | ) | | | (2,332 | ) | | | (677 | ) | | | (31 | ) |
| Class R-6 | | | 674,095 | | | | 34,018 | | | | 37,532 | | | | 1,885 | | | | (92,876 | ) | | | (4,725 | ) | | | 618,751 | | | | 31,178 | |
| Total net increase (decrease) | | $ | 2,560,416 | | | | 129,643 | | | $ | 302,238 | | | | 15,184 | | | $ | (2,596,738 | ) | | | (131,923 | ) | | $ | 265,916 | | | | 12,904 | |
| 1 | Includes exchanges between share classes of the fund. |
| 2 | Amount less than one thousand. |
| 3 | Class R-5E shares were offered beginning November 20, 2015. |
9. Investment transactions
The fund made purchases and sales of investment securities, excluding short-term securities and U.S. government obligations, if any, of $1,779,604,000 and $1,800,152,000, respectively, during the period ended December 31, 2016.
| 30 | Capital World Bond Fund |
Financial highlights
| | | | | | (Loss) income from
investment operations1 | | | Dividends, distributions and return on capital | | | | | | | | | | | | | | | | | | | |
| Period ended | | Net asset
value,
beginning
of period | | | Net
investment
income | | | Net (losses)
gains on
securities
(both
realized and
unrealized) | | | Total from
investment
operations | | | Dividends
(from net
investment
income) | | | Distributions
(from capital
gains) | | | Return of
capital | | | Total
dividends,
distributions
and return
on capital | | | Net asset
value,
end
of period | | | Total
return2,3 | | | Net assets,
end of period
(in millions) | | | Ratio of
expenses to
average net
assets before
reimburse-
ments | | | Ratio of
expenses to
average net
assets after
reimburse-
ments3 | | | Ratio of
net income
to average
net assets3 | |
| Class A: | | | | | | | | | | | | | | | | | | | | | | | | | | | | | | | | | | | | | | | | | | | | | | | | | | | | | | | | |
| 12/31/20164,5 | | $ | 20.51 | | | $ | .10 | | | $ | (1.42 | ) | | $ | (1.32 | ) | | $ | (.12 | ) | | $ | (.07 | ) | | $ | (.04 | ) | | $ | (.23 | ) | | $ | 18.96 | | | | (6.51 | )%6 | | $ | 5,824 | | | | .24 | %6 | | | .24 | %6 | | | .52 | %6 |
| 9/30/2016 | | | 19.21 | | | | .38 | | | | 1.15 | | | | 1.53 | | | | (.23 | ) | | | — | | | | — | | | | (.23 | ) | | | 20.51 | | | | 8.08 | | | | 6,494 | | | | .94 | | | | .94 | | | | 1.94 | |
| 9/30/2015 | | | 20.49 | | | | .39 | | | | (1.20 | ) | | | (.81 | ) | | | (.19 | ) | | | (.28 | ) | | | — | | | | (.47 | ) | | | 19.21 | | | | (4.05 | ) | | | 6,393 | | | | .93 | | | | .93 | | | | 1.99 | |
| 9/30/2014 | | | 20.32 | | | | .47 | | | | .13 | | | | .60 | | | | (.43 | ) | | | — | | | | — | | | | (.43 | ) | | | 20.49 | | | | 2.98 | | | | 7,176 | | | | .90 | | | | .90 | | | | 2.27 | |
| 9/30/2013 | | | 21.63 | | | | .43 | | | | (1.02 | ) | | | (.59 | ) | | | (.44 | ) | | | (.28 | ) | | | — | | | | (.72 | ) | | | 20.32 | | | | (2.80 | ) | | | 7,384 | | | | .91 | | | | .91 | | | | 2.09 | |
| 9/30/2012 | | | 20.48 | | | | .51 | | | | 1.08 | | | | 1.59 | | | | (.44 | ) | | | — | | | | — | | | | (.44 | ) | | | 21.63 | | | | 7.89 | | | | 8,306 | | | | .89 | | | | .89 | | | | 2.43 | |
| Class B: | | | | | | | | | | | | | | | | | | | | | | | | | | | | | | | | | | | | | | | | | | | | | | | | | | | | | | | | |
| 12/31/20164,5 | | | 20.34 | | | | .06 | | | | (1.41 | ) | | | (1.35 | ) | | | (.03 | ) | | | (.07 | ) | | | (.01 | ) | | | (.11 | ) | | | 18.88 | | | | (6.65 | )6 | | | 4 | | | | .43 | 6 | | | .43 | 6 | | | .32 | 6 |
| 9/30/2016 | | | 19.04 | | | | .23 | | | | 1.14 | | | | 1.37 | | | | (.07 | ) | | | — | | | | — | | | | (.07 | ) | | | 20.34 | | | | 7.21 | | | | 8 | | | | 1.72 | | | | 1.72 | | | | 1.18 | |
| 9/30/2015 | | | 20.34 | | | | .24 | | | | (1.20 | ) | | | (.96 | ) | | | (.06 | ) | | | (.28 | ) | | | — | | | | (.34 | ) | | | 19.04 | | | | (4.77 | ) | | | 35 | | | | 1.68 | | | | 1.68 | | | | 1.23 | |
| 9/30/2014 | | | 20.16 | | | | .32 | | | | .12 | | | | .44 | | | | (.26 | ) | | | — | | | | — | | | | (.26 | ) | | | 20.34 | | | | 2.22 | | | | 63 | | | | 1.66 | | | | 1.66 | | | | 1.54 | |
| 9/30/2013 | | | 21.46 | | | | .27 | | | | (1.02 | ) | | | (.75 | ) | | | (.27 | ) | | | (.28 | ) | | | — | | | | (.55 | ) | | | 20.16 | | | | (3.56 | ) | | | 92 | | | | 1.67 | | | | 1.67 | | | | 1.32 | |
| 9/30/2012 | | | 20.35 | | | | .35 | | | | 1.08 | | | | 1.43 | | | | (.32 | ) | | | — | | | | — | | | | (.32 | ) | | | 21.46 | | | | 7.09 | | | | 142 | | | | 1.65 | | | | 1.65 | | | | 1.70 | |
| Class C: | | | | | | | | | | | | | | | | | | | | | | | | | | | | | | | | | | | | | | | | | | | | | | | | | | | | | | | | |
| 12/31/20164,5 | | | 20.13 | | | | .06 | | | | (1.40 | ) | | | (1.34 | ) | | | (.06 | ) | | | (.07 | ) | | | (.02 | ) | | | (.15 | ) | | | 18.64 | | | | (6.72 | )6 | | | 337 | | | | .44 | 6 | | | .44 | 6 | | | .32 | 6 |
| 9/30/2016 | | | 18.88 | | | | .22 | | | | 1.12 | | | | 1.34 | | | | (.09 | ) | | | — | | | | — | | | | (.09 | ) | | | 20.13 | | | | 7.19 | | | | 390 | | | | 1.74 | | | | 1.74 | | | | 1.14 | |
| 9/30/2015 | | | 20.18 | | | | .23 | | | | (1.19 | ) | | | (.96 | ) | | | (.06 | ) | | | (.28 | ) | | | — | | | | (.34 | ) | | | 18.88 | | | | (4.80 | ) | | | 431 | | | | 1.73 | | | | 1.73 | | | | 1.19 | |
| 9/30/2014 | | | 20.01 | | | | .30 | | | | .13 | | | | .43 | | | | (.26 | ) | | | — | | | | — | | | | (.26 | ) | | | 20.18 | | | | 2.17 | | | | 552 | | | | 1.70 | | | | 1.70 | | | | 1.49 | |
| 9/30/2013 | | | 21.30 | | | | .26 | | | | (1.00 | ) | | | (.74 | ) | | | (.27 | ) | | | (.28 | ) | | | — | | | | (.55 | ) | | | 20.01 | | | | (3.55 | ) | | | 654 | | | | 1.71 | | | | 1.71 | | | | 1.28 | |
| 9/30/2012 | | | 20.21 | | | | .34 | | | | 1.07 | | | | 1.41 | | | | (.32 | ) | | | — | | | | — | | | | (.32 | ) | | | 21.30 | | | | 7.05 | | | | 813 | | | | 1.68 | | | | 1.68 | | | | 1.63 | |
| Class F-1: | | | | | | | | | | | | | | | | | | | | | | | | | | | | | | | | | | | | | | | | | | | | | | | | | | | | | | | | |
| 12/31/20164,5 | | | 20.46 | | | | .10 | | | | (1.41 | ) | | | (1.31 | ) | | | (.12 | ) | | | (.07 | ) | | | (.04 | ) | | | (.23 | ) | | | 18.92 | | | | (6.47 | )6 | | | 322 | | | | .22 | 6 | | | .22 | 6 | | | .53 | 6 |
| 9/30/2016 | | | 19.09 | | | | .38 | | | | 1.13 | | | | 1.51 | | | | (.14 | ) | | | — | | | | — | | | | (.14 | ) | | | 20.46 | | | | 8.01 | | | | 368 | | | | .94 | | | | .94 | | | | 1.98 | |
| 9/30/2015 | | | 20.37 | | | | .40 | | | | (1.21 | ) | | | (.81 | ) | | | (.19 | ) | | | (.28 | ) | | | — | | | | (.47 | ) | | | 19.09 | | | | (4.05 | ) | | | 2,106 | | | | .91 | | | | .91 | | | | 2.03 | |
| 9/30/2014 | | | 20.20 | | | | .47 | | | | .13 | | | | .60 | | | | (.43 | ) | | | — | | | | — | | | | (.43 | ) | | | 20.37 | | | | 3.01 | | | | 1,951 | | | | .90 | | | | .90 | | | | 2.27 | |
| 9/30/2013 | | | 21.51 | | | | .43 | | | | (1.02 | ) | | | (.59 | ) | | | (.44 | ) | | | (.28 | ) | | | — | | | | (.72 | ) | | | 20.20 | | | | (2.81 | ) | | | 1,896 | | | | .91 | | | | .91 | | | | 2.09 | |
| 9/30/2012 | | | 20.37 | | | | .50 | | | | 1.09 | | | | 1.59 | | | | (.45 | ) | | | — | | | | — | | | | (.45 | ) | | | 21.51 | | | | 7.91 | | | | 1,849 | | | | .88 | | | | .88 | | | | 2.39 | |
| Class F-2: | | | | | | | | | | | | | | | | | | | | | | | | | | | | | | | | | | | | | | | | | | | | | | | | | | | | | | | | |
| 12/31/20164,5 | | | 20.49 | | | | .12 | | | | (1.42 | ) | | | (1.30 | ) | | | (.14 | ) | | | (.07 | ) | | | (.05 | ) | | | (.26 | ) | | | 18.93 | | | | (6.42 | )6 | | | 1,933 | | | | .16 | 6 | | | .16 | 6 | | | .60 | 6 |
| 9/30/2016 | | | 19.20 | | | | .44 | | | | 1.14 | | | | 1.58 | | | | (.29 | ) | | | — | | | | — | | | | (.29 | ) | | | 20.49 | | | | 8.37 | | | | 1,876 | | | | .65 | | | | .65 | | | | 2.21 | |
| 9/30/2015 | | | 20.48 | | | | .45 | | | | (1.21 | ) | | | (.76 | ) | | | (.24 | ) | | | (.28 | ) | | | — | | | | (.52 | ) | | | 19.20 | | | | (3.77 | ) | | | 811 | | | | .65 | | | | .65 | | | | 2.28 | |
| 9/30/2014 | | | 20.31 | | | | .52 | | | | .14 | | | | .66 | | | | (.49 | ) | | | — | | | | — | | | | (.49 | ) | | | 20.48 | | | | 3.29 | | | | 990 | | | | .61 | | | | .61 | | | | 2.54 | |
| 9/30/2013 | | | 21.62 | | | | .49 | | | | (1.02 | ) | | | (.53 | ) | | | (.50 | ) | | | (.28 | ) | | | — | | | | (.78 | ) | | | 20.31 | | | | (2.53 | ) | | | 621 | | | | .64 | | | | .64 | | | | 2.35 | |
| 9/30/2012 | | | 20.45 | | | | .56 | | | | 1.10 | | | | 1.66 | | | | (.49 | ) | | | — | | | | — | | | | (.49 | ) | | | 21.62 | | | | 8.23 | | | | 723 | | | | .62 | | | | .62 | | | | 2.67 | |
| Class 529-A: | | | | | | | | | | | | | | | | | | | | | | | | | | | | | | | | | | | | | | | | | | | | | | | | | | | | | | | | |
| 12/31/20164,5 | | | 20.57 | | | | .10 | | | | (1.44 | ) | | | (1.34 | ) | | | (.11 | ) | | | (.07 | ) | | | (.04 | ) | | | (.22 | ) | | | 19.01 | | | | (6.53 | )6 | | | 289 | | | | .26 | 6 | | | .26 | 6 | | | .50 | 6 |
| 9/30/2016 | | | 19.26 | | | | .37 | | | | 1.15 | | | | 1.52 | | | | (.21 | ) | | | — | | | | — | | | | (.21 | ) | | | 20.57 | | | | 7.95 | | | | 314 | | | | 1.03 | | | | 1.03 | | | | 1.85 | |
| 9/30/2015 | | | 20.54 | | | | .38 | | | | (1.21 | ) | | | (.83 | ) | | | (.17 | ) | | | (.28 | ) | | | — | | | | (.45 | ) | | | 19.26 | | | | (4.12 | ) | | | 315 | | | | 1.02 | | | | 1.02 | | | | 1.91 | |
| 9/30/2014 | | | 20.37 | | | | .45 | | | | .13 | | | | .58 | | | | (.41 | ) | | | — | | | | — | | | | (.41 | ) | | | 20.54 | | | | 2.88 | | | | 358 | | | | .99 | | | | .99 | | | | 2.19 | |
| 9/30/2013 | | | 21.68 | | | | .42 | | | | (1.03 | ) | | | (.61 | ) | | | (.42 | ) | | | (.28 | ) | | | — | | | | (.70 | ) | | | 20.37 | | | | (2.87 | ) | | | 372 | | | | .99 | | | | .99 | | | | 2.01 | |
| 9/30/2012 | | | 20.53 | | | | .49 | | | | 1.09 | | | | 1.58 | | | | (.43 | ) | | | — | | | | — | | | | (.43 | ) | | | 21.68 | | | | 7.81 | | | | 401 | | | | .97 | | | | .97 | | | | 2.34 | |
| Class 529-B: | | | | | | | | | | | | | | | | | | | | | | | | | | | | | | | | | | | | | | | | | | | | | | | | | | | | | | | | |
| 12/31/20164,5 | | | 20.39 | | | | .06 | | | | (1.42 | ) | | | (1.36 | ) | | | (.01 | ) | | | (.07 | ) | | | (.01 | ) | | | (.09 | ) | | | 18.94 | | | | (6.71 | )6 | | | — | 7 | | | .46 | 6 | | | .45 | 6 | | | .29 | 6 |
| 9/30/2016 | | | 19.10 | | | | .21 | | | | 1.13 | | | | 1.34 | | | | (.05 | ) | | | — | | | | — | | | | (.05 | ) | | | 20.39 | | | | 7.09 | | | | 1 | | | | 1.85 | | | | 1.85 | | | | 1.06 | |
| 9/30/2015 | | | 20.40 | | | | .22 | | | | (1.19 | ) | | | (.97 | ) | | | (.05 | ) | | | (.28 | ) | | | — | | | | (.33 | ) | | | 19.10 | | | | (4.88 | ) | | | 3 | | | | 1.80 | | | | 1.80 | | | | 1.10 | |
| 9/30/2014 | | | 20.22 | | | | .29 | | | | .13 | | | | .42 | | | | (.24 | ) | | | — | | | | — | | | | (.24 | ) | | | 20.40 | | | | 2.13 | | | | 6 | | | | 1.78 | | | | 1.78 | | | | 1.42 | |
| 9/30/2013 | | | 21.52 | | | | .25 | | | | (1.03 | ) | | | (.78 | ) | | | (.24 | ) | | | (.28 | ) | | | — | | | | (.52 | ) | | | 20.22 | | | | (3.68 | ) | | | 9 | | | | 1.78 | | | | 1.78 | | | | 1.20 | |
| 9/30/2012 | | | 20.41 | | | | .33 | | | | 1.08 | | | | 1.41 | | | | (.30 | ) | | | — | | | | — | | | | (.30 | ) | | | 21.52 | | | | 6.97 | | | | 15 | | | | 1.77 | | | | 1.77 | | | | 1.57 | |
See page 33 for footnotes.
| Capital World Bond Fund | 31 |
Financial highlights (continued)
| | | | | | (Loss) income from
investment operations1 | | | Dividends, distributions and return on capital | | | | | | | | | | | | | | | | | | | |
| Period ended | | Net asset
value,
beginning
of period | | | Net
investment
income | | | Net (losses)
gains on
securities
(both
realized and
unrealized) | | | Total from
investment
operations | | | Dividends
(from net
investment
income) | | | Distributions
(from capital
gains) | | | Return of
capital | | | Total
dividends,
distributions
and return
on capital | | | Net asset
value,
end
of period | | | Total
return2,3 | | | Net assets,
end of period
(in millions) | | | Ratio of
expenses to
average net
assets before
reimburse-
ments | | | Ratio of
expenses to
average net
assets after
reimburse-
ments3 | | | Ratio of
net income
to average
net assets3 | |
| Class 529-C: | | | | | | | | | | | | | | | | | | | | | | | | | | | | | | | | | | | | | | | | | | | | | | | | | | | | | | | | |
| 12/31/20164,5 | | $ | 20.27 | | | $ | .06 | | | $ | (1.41 | ) | | $ | (1.35 | ) | | $ | (.06 | ) | | $ | (.07 | ) | | $ | (.02 | ) | | $ | (.15 | ) | | $ | 18.77 | | | | (6.74 | )%6 | | $ | 109 | | | | .45 | %6 | | | .45 | %6 | | | .31 | %6 |
| 9/30/2016 | | | 19.00 | | | | .21 | | | | 1.14 | | | | 1.35 | | | | (.08 | ) | | | — | | | | — | | | | (.08 | ) | | | 20.27 | | | | 7.19 | | | | 122 | | | | 1.80 | | | | 1.80 | | | | 1.08 | |
| 9/30/2015 | | | 20.32 | | | | .22 | | | | (1.20 | ) | | | (.98 | ) | | | (.06 | ) | | | (.28 | ) | | | — | | | | (.34 | ) | | | 19.00 | | | | (4.91 | ) | | | 128 | | | | 1.79 | | | | 1.79 | | | | 1.14 | |
| 9/30/2014 | | | 20.14 | | | | .29 | | | | .14 | | | | .43 | | | | (.25 | ) | | | — | | | | — | | | | (.25 | ) | | | 20.32 | | | | 2.15 | | | | 152 | | | | 1.77 | | | | 1.77 | | | | 1.41 | |
| 9/30/2013 | | | 21.45 | | | | .25 | | | | (1.02 | ) | | | (.77 | ) | | | (.26 | ) | | | (.28 | ) | | | — | | | | (.54 | ) | | | 20.14 | | | | (3.67 | ) | | | 165 | | | | 1.77 | | | | 1.77 | | | | 1.22 | |
| 9/30/2012 | | | 20.35 | | | | .32 | | | | 1.09 | | | | 1.41 | | | | (.31 | ) | | | — | | | | — | | | | (.31 | ) | | | 21.45 | | | | 7.00 | | | | 183 | | | | 1.76 | | | | 1.76 | | | | 1.55 | |
| Class 529-E: | | | | | | | | | | | | | | | | | | | | | | | | | | | | | | | | | | | | | | | | | | | | | | | | | | | | | | | | |
| 12/31/20164,5 | | | 20.43 | | | | .09 | | | | (1.42 | ) | | | (1.33 | ) | | | (.10 | ) | | | (.07 | ) | | | (.04 | ) | | | (.21 | ) | | | 18.89 | | | | (6.59 | )6 | | | 15 | | | | .30 | 6 | | | .30 | 6 | | | .46 | 6 |
| 9/30/2016 | | | 19.14 | | | | .33 | | | | 1.14 | | | | 1.47 | | | | (.18 | ) | | | — | | | | — | | | | (.18 | ) | | | 20.43 | | | | 7.77 | | | | 17 | | | | 1.21 | | | | 1.21 | | | | 1.68 | |
| 9/30/2015 | | | 20.41 | | | | .34 | | | | (1.20 | ) | | | (.86 | ) | | | (.13 | ) | | | (.28 | ) | | | — | | | | (.41 | ) | | | 19.14 | | | | (4.29 | ) | | | 16 | | | | 1.21 | | | | 1.21 | | | | 1.72 | |
| 9/30/2014 | | | 20.24 | | | | .41 | | | | .13 | | | | .54 | | | | (.37 | ) | | | — | | | | — | | | | (.37 | ) | | | 20.41 | | | | 2.69 | | | | 19 | | | | 1.20 | | | | 1.20 | | | | 1.98 | |
| 9/30/2013 | | | 21.55 | | | | .37 | | | | (1.02 | ) | | | (.65 | ) | | | (.38 | ) | | | (.28 | ) | | | — | | | | (.66 | ) | | | 20.24 | | | | (3.11 | ) | | | 20 | | | | 1.21 | | | | 1.21 | | | | 1.79 | |
| 9/30/2012 | | | 20.42 | | | | .44 | | | | 1.08 | | | | 1.52 | | | | (.39 | ) | | | — | | | | — | | | | (.39 | ) | | | 21.55 | | | | 7.56 | | | | 21 | | | | 1.21 | | | | 1.21 | | | | 2.09 | |
| Class 529-F-1: | | | | | | | | | | | | | | | | | | | | | | | | | | | | | | | | | | | | | | | | | | | | | | | | | | | | | | | | |
| 12/31/20164,5 | | | 20.46 | | | | .11 | | | | (1.42 | ) | | | (1.31 | ) | | | (.13 | ) | | | (.07 | ) | | | (.05 | ) | | | (.25 | ) | | | 18.90 | | | | (6.45 | )6 | | | 35 | | | | .20 | 6 | | | .20 | 6 | | | .56 | 6 |
| 9/30/2016 | | | 19.16 | | | | .41 | | | | 1.15 | | | | 1.56 | | | | (.26 | ) | | | — | | | | — | | | | (.26 | ) | | | 20.46 | | | | 8.18 | | | | 39 | | | | .81 | | | | .81 | | | | 2.08 | |
| 9/30/2015 | | | 20.44 | | | | .42 | | | | (1.20 | ) | | | (.78 | ) | | | (.22 | ) | | | (.28 | ) | | | — | | | | (.50 | ) | | | 19.16 | | | | (3.92 | ) | | | 42 | | | | .79 | | | | .79 | | | | 2.14 | |
| 9/30/2014 | | | 20.27 | | | | .49 | | | | .14 | | | | .63 | | | | (.46 | ) | | | — | | | | — | | | | (.46 | ) | | | 20.44 | | | | 3.13 | | | | 45 | | | | .77 | | | | .77 | | | | 2.40 | |
| 9/30/2013 | | | 21.58 | | | | .46 | | | | (1.02 | ) | | | (.56 | ) | | | (.47 | ) | | | (.28 | ) | | | — | | | | (.75 | ) | | | 20.27 | | | | (2.67 | ) | | | 39 | | | | .77 | | | | .77 | | | | 2.23 | |
| 9/30/2012 | | | 20.42 | | | | .53 | | | | 1.09 | | | | 1.62 | | | | (.46 | ) | | | — | | | | — | | | | (.46 | ) | | | 21.58 | | | | 8.08 | | | | 37 | | | | .75 | | | | .75 | | | | 2.55 | |
| Class R-1: | | | | | | | | | | | | | | | | | | | | | | | | | | | | | | | | | | | | | | | | | | | | | | | | | | | | | | | | |
| 12/31/20164,5 | | | 20.27 | | | | .07 | | | | (1.41 | ) | | | (1.34 | ) | | | (.07 | ) | | | (.07 | ) | | | (.02 | ) | | | (.16 | ) | | | 18.77 | | | | (6.69 | )6 | | | 11 | | | | .42 | 6 | | | .42 | 6 | | | .34 | 6 |
| 9/30/2016 | | | 19.01 | | | | .23 | | | | 1.13 | | | | 1.36 | | | | (.10 | ) | | | — | | | | — | | | | (.10 | ) | | | 20.27 | | | | 7.24 | | | | 12 | | | | 1.68 | | | | 1.68 | | | | 1.20 | |
| 9/30/2015 | | | 20.31 | | | | .25 | | | | (1.20 | ) | | | (.95 | ) | | | (.07 | ) | | | (.28 | ) | | | — | | | | (.35 | ) | | | 19.01 | | | | (4.74 | ) | | | 14 | | | | 1.66 | | | | 1.66 | | | | 1.26 | |
| 9/30/2014 | | | 20.14 | | | | .31 | | | | .14 | | | | .45 | | | | (.28 | ) | | | — | | | | — | | | | (.28 | ) | | | 20.31 | | | | 2.24 | | | | 17 | | | | 1.65 | | | | 1.65 | | | | 1.53 | |
| 9/30/2013 | | | 21.44 | | | | .28 | | | | (1.02 | ) | | | (.74 | ) | | | (.28 | ) | | | (.28 | ) | | | — | | | | (.56 | ) | | | 20.14 | | | | (3.52 | ) | | | 17 | | | | 1.64 | | | | 1.64 | | | | 1.35 | |
| 9/30/2012 | | | 20.33 | | | | .35 | | | | 1.09 | | | | 1.44 | | | | (.33 | ) | | | — | | | | — | | | | (.33 | ) | | | 21.44 | | | | 7.14 | | | | 21 | | | | 1.63 | | | | 1.63 | | | | 1.69 | |
| Class R-2: | | | | | | | | | | | | | | | | | | | | | | | | | | | | | | | | | | | | | | | | | | | | | | | | | | | | | | | | |
| 12/31/20164,5 | | | 20.27 | | | | .07 | | | | (1.42 | ) | | | (1.35 | ) | | | (.06 | ) | | | (.07 | ) | | | (.03 | ) | | | (.16 | ) | | | 18.76 | | | | (6.71 | )6 | | | 133 | | | | .42 | 6 | | | .42 | 6 | | | .34 | 6 |
| 9/30/2016 | | | 19.00 | | | | .23 | | | | 1.14 | | | | 1.37 | | | | (.10 | ) | | | — | | | | — | | | | (.10 | ) | | | 20.27 | | | | 7.26 | | | | 148 | | | | 1.70 | | | | 1.70 | | | | 1.18 | |
| 9/30/2015 | | | 20.30 | | | | .24 | | | | (1.20 | ) | | | (.96 | ) | | | (.06 | ) | | | (.28 | ) | | | — | | | | (.34 | ) | | | 19.00 | | | | (4.78 | ) | | | 149 | | | | 1.70 | | | | 1.70 | | | | 1.23 | |
| 9/30/2014 | | | 20.13 | | | | .30 | | | | .14 | | | | .44 | | | | (.27 | ) | | | — | | | | — | | | | (.27 | ) | | | 20.30 | | | | 2.19 | | | | 168 | | | | 1.71 | | | | 1.71 | | | | 1.47 | |
| 9/30/2013 | | | 21.43 | | | | .27 | | | | (1.01 | ) | | | (.74 | ) | | | (.28 | ) | | | (.28 | ) | | | — | | | | (.56 | ) | | | 20.13 | | | | (3.54 | ) | | | 177 | | | | 1.67 | | | | 1.67 | | | | 1.32 | |
| 9/30/2012 | | | 20.33 | | | | .34 | | | | 1.08 | | | | 1.42 | | | | (.32 | ) | | | — | | | | — | | | | (.32 | ) | | | 21.43 | | | | 7.05 | | | | 193 | | | | 1.70 | | | | 1.70 | | | | 1.62 | |
| Class R-2E: | | | | | | | | | | | | | | | | | | | | | | | | | | | | | | | | | | | | | | | | | | | | | | | | | | | | | | | | |
| 12/31/20164,5 | | | 20.47 | | | | .08 | | | | (1.42 | ) | | | (1.34 | ) | | | (.09 | ) | | | (.07 | ) | | | (.04 | ) | | | (.20 | ) | | | 18.93 | | | | (6.57 | )6 | | | 2 | | | | .34 | 6 | | | .34 | 6 | | | .42 | 6 |
| 9/30/2016 | | | 19.20 | | | | .30 | | | | 1.18 | | | | 1.48 | | | | (.21 | ) | | | — | | | | — | | | | (.21 | ) | | | 20.47 | | | | 7.75 | | | | 1 | | | | 1.33 | | | | 1.33 | | | | 1.53 | |
| 9/30/2015 | | | 20.50 | | | | .42 | | | | (1.21 | ) | | | (.79 | ) | | | (.23 | ) | | | (.28 | ) | | | — | | | | (.51 | ) | | | 19.20 | | | | (3.94 | )8 | | | — | 7 | | | .78 | 8 | | | .788 | | | | 2.13 | 8 |
| 9/30/20144,9 | | | 21.00 | | | | .04 | | | | (.54 | ) | | | (.50 | ) | | | — | | | | — | | | | — | | | | — | | | | 20.50 | | | | (2.38 | )6,8 | | | — | 7 | | | .06 | 6,8 | | | .06 | 6,8 | | | .17 | 6,8 |
| Class R-3: | | | | | | | | | | | | | | | | | | | | | | | | | | | | | | | | | | | | | | | | | | | | | | | | | | | | | | | | |
| 12/31/20164,5 | | | 20.47 | | | | .09 | | | | (1.42 | ) | | | (1.33 | ) | | | (.10 | ) | | | (.07 | ) | | | (.04 | ) | | | (.21 | ) | | | 18.93 | | | | (6.58 | )6 | | | 140 | | | | .29 | 6 | | | .29 | 6 | | | .47 | 6 |
| 9/30/2016 | | | 19.17 | | | | .32 | | | | 1.15 | | | | 1.47 | | | | (.17 | ) | | | — | | | | — | | | | (.17 | ) | | | 20.47 | | | | 7.78 | | | | 151 | | | | 1.23 | | | | 1.23 | | | | 1.65 | |
| 9/30/2015 | | | 20.45 | | | | .34 | | | | (1.21 | ) | | | (.87 | ) | | | (.13 | ) | | | (.28 | ) | | | — | | | | (.41 | ) | | | 19.17 | | | | (4.34 | ) | | | 151 | | | | 1.22 | | | | 1.22 | | | | 1.71 | |
| 9/30/2014 | | | 20.28 | | | | .41 | | | | .13 | | | | .54 | | | | (.37 | ) | | | — | | | | — | | | | (.37 | ) | | | 20.45 | | | | 2.67 | | | | 174 | | | | 1.21 | | | | 1.21 | | | | 1.97 | |
| 9/30/2013 | | | 21.58 | | | | .37 | | | | (1.02 | ) | | | (.65 | ) | | | (.37 | ) | | | (.28 | ) | | | — | | | | (.65 | ) | | | 20.28 | | | | (3.06 | ) | | | 184 | | | | 1.21 | | | | 1.21 | | | | 1.79 | |
| 9/30/2012 | | | 20.45 | | | | .44 | | | | 1.08 | | | | 1.52 | | | | (.39 | ) | | | — | | | | — | | | | (.39 | ) | | | 21.58 | | | | 7.54 | | | | 206 | | | | 1.21 | | | | 1.21 | | | | 2.10 | |
| 32 | Capital World Bond Fund |
| | | | | | (Loss) income from
investment operations1 | | | Dividends, distributions and return on capital | | | | | | | | | | | | | | | | | | | |
| Period ended | | Net asset
value,
beginning
of period | | | Net
investment
income | | | Net (losses)
gains on
securities
(both
realized and
unrealized) | | | Total from
investment
operations | | | Dividends
(from net
investment
income) | | | Distributions
(from capital
gains) | | | Return of
capital | | | Total
dividends,
distributions
and return
on capital | | | Net asset
value,
end
of period | | | Total
return2,3 | | | Net assets,
end of period
(in millions) | | | Ratio of
expenses to
average net
assets before
reimburse-
ments | | | Ratio of
expenses to
average net
assets after
reimburse-
ments3 | | | Ratio of
net income
to average
net assets3 | |
| Class R-4: | | | | | | | | | | | | | | | | | | | | | | | | | | | | | | | | | | | | | | | | | | | | | | | | | | | | | | | | |
| 12/31/20164,5 | | $ | 20.50 | | | $ | .11 | | | $ | (1.42 | ) | | $ | (1.31 | ) | | $ | (.12 | ) | | $ | (.07 | ) | | $ | (.05 | ) | | $ | (.24 | ) | | $ | 18.95 | | | | (6.48 | )%6 | | $ | 107 | | | | .22 | %6 | | | .22 | %6 | | | .54 | %6 |
| 9/30/2016 | | | 19.21 | | | | .39 | | | | 1.14 | | | | 1.53 | | | | (.24 | ) | | | — | | | | — | | | | (.24 | ) | | | 20.50 | | | | 8.09 | | | | 118 | | | | .90 | | | | .90 | | | | 1.98 | |
| 9/30/2015 | | | 20.48 | | | | .40 | | | | (1.20 | ) | | | (.80 | ) | | | (.19 | ) | | | (.28 | ) | | | — | | | | (.47 | ) | | | 19.21 | | | | (3.96 | ) | | | 100 | | | | .88 | | | | .88 | | | | 2.05 | |
| 9/30/2014 | | | 20.31 | | | | .47 | | | | .14 | | | | .61 | | | | (.44 | ) | | | — | | | | — | | | | (.44 | ) | | | 20.48 | | | | 3.02 | | | | 112 | | | | .87 | | | | .87 | | | | 2.30 | |
| 9/30/2013 | | | 21.62 | | | | .44 | | | | (1.03 | ) | | | (.59 | ) | | | (.44 | ) | | | (.28 | ) | | | — | | | | (.72 | ) | | | 20.31 | | | | (2.78 | ) | | | 108 | | | | .88 | | | | .88 | | | | 2.12 | |
| 9/30/2012 | | | 20.46 | | | | .51 | | | | 1.09 | | | | 1.60 | | | | (.44 | ) | | | — | | | | — | | | | (.44 | ) | | | 21.62 | | | | 7.96 | | | | 115 | | | | .87 | | | | .87 | | | | 2.45 | |
| Class R-5E: | | | | | | | | | | | | | | | | | | | | | | | | | | | | | | | | | | | | | | | | | | | | | | | | | | | | | | | | |
| 12/31/20164,5 | | | 20.50 | | | | .11 | | | | (1.42 | ) | | | (1.31 | ) | | | (.13 | ) | | | (.07 | ) | | | (.05 | ) | | | (.25 | ) | | | 18.94 | | | | (6.45 | )6 | | | — | 7 | | | .19 | 6 | | | .19 | 6 | | | .56 | 6 |
| 9/30/20164,10 | | | 19.02 | | | | .36 | | | | 1.37 | | | | 1.73 | | | | (.25 | ) | | | — | | | | — | | | | (.25 | ) | | | 20.50 | | | | 9.216 | | | | — | 7 | | | .72 | 11 | | | .72 | | | | 2.12 | 11 |
| Class R-5: | | | | | | | | | | | | | | | | | | | | | | | | | | | | | | | | | | | | | | | | | | | | | | | | | | | | | | | | |
| 12/31/20164,5 | | | 20.54 | | | | .12 | | | | (1.42 | ) | | | (1.30 | ) | | | (.15 | ) | | | (.07 | ) | | | (.05 | ) | | | (.27 | ) | | | 18.97 | | | | (6.42 | )6 | | | 76 | | | | .14 | 6 | | | .14 | 6 | | | .62 | 6 |
| 9/30/2016 | | | 19.24 | | | | .45 | | | | 1.15 | | | | 1.60 | | | | (.30 | ) | | | — | | | | — | | | | (.30 | ) | | | 20.54 | | | | 8.45 | | | | 79 | | | | .59 | | | | .59 | | | | 2.29 | |
| 9/30/2015 | | | 20.52 | | | | .47 | | | | (1.22 | ) | | | (.75 | ) | | | (.25 | ) | | | (.28 | ) | | | — | | | | (.53 | ) | | | 19.24 | | | | (3.71 | ) | | | 152 | | | | .58 | | | | .58 | | | | 2.35 | |
| 9/30/2014 | | | 20.35 | | | | .54 | | | | .13 | | | | .67 | | | | (.50 | ) | | | — | | | | — | | | | (.50 | ) | | | 20.52 | | | | 3.32 | | | | 162 | | | | .57 | | | | .57 | | | | 2.62 | |
| 9/30/2013 | | | 21.66 | | | | .50 | | | | (1.02 | ) | | | (.52 | ) | | | (.51 | ) | | | (.28 | ) | | | — | | | | (.79 | ) | | | 20.35 | | | | (2.47 | ) | | | 189 | | | | .57 | | | | .57 | | | | 2.42 | |
| 9/30/2012 | | | 20.49 | | | | .57 | | | | 1.09 | | | | 1.66 | | | | (.49 | ) | | | — | | | | — | | | | (.49 | ) | | | 21.66 | | | | 8.24 | | | | 219 | | | | .57 | | | | .57 | | | | 2.72 | |
| Class R-6: | | | | | | | | | | | | | | | | | | | | | | | | | | | | | | | | | | | | | | | | | | | | | | | | | | | | | | | | |
| 12/31/20164,5 | | | 20.54 | | | | .12 | | | | (1.43 | ) | | | (1.31 | ) | | | (.14 | ) | | | (.07 | ) | | | (.06 | ) | | | (.27 | ) | | | 18.96 | | | | (6.43 | )6 | | | 2,602 | | | | .14 | 6 | | | .14 | 6 | | | .62 | 6 |
| 9/30/2016 | | | 19.24 | | | | .46 | | | | 1.15 | | | | 1.61 | | | | (.31 | ) | | | — | | | | — | | | | (.31 | ) | | | 20.54 | | | | 8.51 | | | | 2,483 | | | | .53 | | | | .53 | | | | 2.35 | |
| 9/30/2015 | | | 20.52 | | | | .48 | | | | (1.22 | ) | | | (.74 | ) | | | (.26 | ) | | | (.28 | ) | | | — | | | | (.54 | ) | | | 19.24 | | | | (3.66 | ) | | | 1,783 | | | | .53 | | | | .53 | | | | 2.42 | |
| 9/30/2014 | | | 20.34 | | | | .54 | | | | .15 | | | | .69 | | | | (.51 | ) | | | — | | | | — | | | | (.51 | ) | | | 20.52 | | | | 3.44 | | | | 1,262 | | | | .52 | | | | .52 | | | | 2.63 | |
| 9/30/2013 | | | 21.66 | | | | .52 | | | | (1.04 | ) | | | (.52 | ) | | | (.52 | ) | | | (.28 | ) | | | — | | | | (.80 | ) | | | 20.34 | | | | (2.47 | ) | | | 727 | | | | .52 | | | | .52 | | | | 2.51 | |
| 9/30/2012 | | | 20.48 | | | | .58 | | | | 1.10 | | | | 1.68 | | | | (.50 | ) | | | — | | | | — | | | | (.50 | ) | | | 21.66 | | | | 8.33 | | | | 398 | | | | .52 | | | | .52 | | | | 2.76 | |
| | | Three months | | | | | | | | | | |
| | | ended | | |
| | | December 31 | | Year ended September 30 |
| Portfolio turnover rate for all share classes12 | | 20164,5,6 | | 2016 | | 2015 | | 2014 | | 2013 | | 2012 |
| Including mortgage dollar roll transactions | | | 19 | % | | | 138 | % | | | 185 | % | | | 205 | % | | | 199 | % | | | 142 | % |
| Excluding mortgage dollar roll transactions | | | 15 | % | | | 91 | % | | | 106 | % | | Not available |
| 1 | Based on average shares outstanding. |
| 2 | Total returns exclude any applicable sales charges, including contingent deferred sales charges. |
| 3 | This column reflects the impact, if any, of certain reimbursements from CRMC. During one of the periods shown, CRMC paid a portion of the fund’s transfer agent fees for certain retirement plan share classes. |
| 4 | Based on operations for the period shown and, accordingly, is not representative of a full year. |
| 5 | In 2016, the fund changed its fiscal year-end from September to December. |
| 6 | Not annualized. |
| 7 | Amount less than $1 million. |
| 8 | All or a significant portion of assets in this class consisted of seed capital invested by CRMC and/or its affiliates. Fees for distribution services are not charged or accrued on these seed capital assets. If such fees were paid by the fund on seed capital assets, fund expenses would have been higher and net income and total return would have been lower. |
| 9 | Class R-2E shares were offered beginning August 29, 2014. |
| 10 | Class R-5E shares were offered beginning November 20, 2015. |
| 11 | Annualized. |
| 12 | Refer to Note 5 for more information on mortgage dollar rolls. |
See Notes to Financial Statements
| Capital World Bond Fund | 33 |
Report of Independent Registered Public Accounting Firm
To the Shareholders and Board of Trustees of CapitalWorld Bond Fund:
We have audited the accompanying statement of assets and liabilities of CapitalWorld Bond Fund (the “Fund”), including the investment portfolio and the summary investment portfolio, as of December 31, 2016, and the related statement of operations for the three months ended December 31, 2016, and for the year ended September 30, 2016, the changes in net assets for the three months ended December 31, 2016, and for the two years ended September 30, 2016, and the financial highlights for the periods presented. These financial statements and financial highlights are the responsibility of the Fund’s management. Our responsibility is to express an opinion on these financial statements and financial highlights based on our audits.
We conducted our audits in accordance with the standards of the Public Company Accounting Oversight Board (United States). Those standards require that we plan and perform the audit to obtain reasonable assurance about whether the financial statements and financial highlights are free of material misstatement. The Fund is not required to have, nor were we engaged to perform, an audit of its internal control over financial reporting. Our audits included consideration of internal control over financial reporting as a basis for designing audit procedures that are appropriate in the circumstances, but not for the purpose of expressing an opinion on the effectiveness of the Fund’s internal control over financial reporting. Accordingly, we express no such opinion. An audit also includes examining, on a test basis, evidence supporting the amounts and disclosures in the financial statements, assessing the accounting principles used and significant estimates made by management, as well as evaluating the overall financial statement presentation. Our procedures included confirmation of securities owned as of December 31, 2016, by correspondence with the custodian and brokers; where replies were not received from brokers, we performed other auditing procedures. We believe that our audits provide a reasonable basis for our opinion.
In our opinion, such financial statements and financial highlights referred to above present fairly, in all material respects, the financial position of CapitalWorld Bond Fund as of December 31, 2016, the results of its operations for the three months ended December 31, 2016, and for the year ended September 30, 2016, the changes in its net assets for the three months ended December 31, 2016, and for the two years ended September 30, 2016, and the financial highlights for the periods presented, in conformity with accounting principles generally accepted in the United States of America.
Deloitte & Touche LLP
Costa Mesa, California
February 13, 2017
| 34 | Capital World Bond Fund |
As a fund shareholder, you incur two types of costs: (1) transaction costs, such as initial sales charges on purchase payments and contingent deferred sales charges on redemptions (loads), and (2) ongoing costs, including management fees, distribution and service (12b-1) fees, and other expenses. This example is intended to help you understand your ongoing costs (in dollars) of investing in the fund so you can compare these costs with the ongoing costs of investing in other mutual funds. The example is based on an investment of $1,000 invested at the beginning of the period and held for the entire six-month period (July 1, 2016, through December 31, 2016).
Actual expenses:
The first line of each share class in the table on the following page provides information about actual account values and actual expenses. You may use the information in this line, together with the amount you invested, to estimate the expenses that you paid over the period. Simply divide your account value by $1,000 (for example, an $8,600 account value divided by $1,000 = 8.6), then multiply the result by the number in the first line under the heading titled “Expenses paid during period” to estimate the expenses you paid on your account during this period.
Hypothetical example for comparison purposes:
The second line of each share class in the table on the following page provides information about hypothetical account values and hypothetical expenses based on the actual expense ratio for the share class and an assumed rate of return of 5.00% per year before expenses, which is not the actual return of the share class. The hypothetical account values and expenses may not be used to estimate the actual ending account balance or expenses you paid for the period. You may use this information to compare the ongoing costs of investing in the fund and other funds. To do so, compare this 5.00% hypothetical example with the 5.00% hypothetical examples that appear in the shareholder reports of the other funds.
Notes:
Retirement plan participants may be subject to certain fees charged by the plan sponsor, and Class F-1, F-2 and 529-F-1 shareholders may be subject to fees charged by financial intermediaries, typically ranging from 0.75% to 1.50% of assets annually depending on services offered. You can estimate the impact of these fees by adding the amount of the fees to the total estimated expenses you paid on your account during the period as calculated above. In addition, your ending account value would be lower by the amount of these fees.
Note that the expenses shown in the table on the following page are meant to highlight your ongoing costs only and do not reflect any transactional costs, such as sales charges (loads). Therefore, the second line of each share class in the table is useful in comparing ongoing costs only and will not help you determine the relative total costs of owning different funds. In addition, if these transactional costs were included, your costs would have been higher.
| Capital World Bond Fund | 35 |
| | | Beginning
account value
7/1/2016 | | | Ending
account value
12/31/2016 | | | Expenses paid
during period* | | | Annualized
expense ratio |
| Class A - actual return | | $ | 1,000.00 | | | $ | 948.82 | | | $ | 4.69 | | | | .95 | % |
| Class A - assumed 5% return | | | 1,000.00 | | | | 1,020.39 | | | | 4.86 | | | | .95 | |
| Class B - actual return | | | 1,000.00 | | | | 945.08 | | | | 8.50 | | | | 1.73 | |
| Class B - assumed 5% return | | | 1,000.00 | | | | 1,016.47 | | | | 8.81 | | | | 1.73 | |
| Class C - actual return | | | 1,000.00 | | | | 945.07 | | | | 8.53 | | | | 1.74 | |
| Class C - assumed 5% return | | | 1,000.00 | | | | 1,016.44 | | | | 8.84 | | | | 1.74 | |
| Class F-1 - actual return | | | 1,000.00 | | | | 949.29 | | | | 4.63 | | | | .94 | |
| Class F-1 - assumed 5% return | | | 1,000.00 | | | | 1,020.45 | | | | 4.80 | | | | .94 | |
| Class F-2 - actual return | | | 1,000.00 | | | | 950.19 | | | | 3.25 | | | | .66 | |
| Class F-2 - assumed 5% return | | | 1,000.00 | | | | 1,021.88 | | | | 3.37 | | | | .66 | |
| Class 529-A - actual return | | | 1,000.00 | | | | 948.14 | | | | 5.03 | | | | 1.02 | |
| Class 529-A - assumed 5% return | | | 1,000.00 | | | | 1,020.05 | | | | 5.21 | | | | 1.02 | |
| Class 529-B - actual return | | | 1,000.00 | | | | 944.94 | | | | 8.99 | | | | 1.83 | |
| Class 529-B - assumed 5% return | | | 1,000.00 | | | | 1,015.96 | | | | 9.32 | | | | 1.83 | |
| Class 529-C - actual return | | | 1,000.00 | | | | 944.71 | | | | 8.74 | | | | 1.78 | |
| Class 529-C - assumed 5% return | | | 1,000.00 | | | | 1,016.21 | | | | 9.07 | | | | 1.78 | |
| Class 529-E - actual return | | | 1,000.00 | | | | 947.50 | | | | 5.84 | | | | 1.19 | |
| Class 529-E - assumed 5% return | | | 1,000.00 | | | | 1,019.21 | | | | 6.05 | | | | 1.19 | |
| Class 529-F-1 - actual return | | | 1,000.00 | | | | 949.44 | | | | 3.89 | | | | .79 | |
| Class 529-F-1 - assumed 5% return | | | 1,000.00 | | | | 1,021.22 | | | | 4.03 | | | | .79 | |
| Class R-1 - actual return | | | 1,000.00 | | | | 945.22 | | | | 8.25 | | | | 1.68 | |
| Class R-1 - assumed 5% return | | | 1,000.00 | | | | 1,016.72 | | | | 8.55 | | | | 1.68 | |
| Class R-2 - actual return | | | 1,000.00 | | | | 945.02 | | | | 8.16 | | | | 1.66 | |
| Class R-2 - assumed 5% return | | | 1,000.00 | | | | 1,016.81 | | | | 8.46 | | | | 1.66 | |
| Class R-2E - actual return | | | 1,000.00 | | | | 947.24 | | | | 6.62 | | | | 1.35 | |
| Class R-2E - assumed 5% return | | | 1,000.00 | | | | 1,018.41 | | | | 6.86 | | | | 1.35 | |
| Class R-3 - actual return | | | 1,000.00 | | | | 947.12 | | | | 5.97 | | | | 1.22 | |
| Class R-3 - assumed 5% return | | | 1,000.00 | | | | 1,019.08 | | | | 6.19 | | | | 1.22 | |
| Class R-4 - actual return | | | 1,000.00 | | | | 949.13 | | | | 4.42 | | | | .90 | |
| Class R-4 - assumed 5% return | | | 1,000.00 | | | | 1,020.67 | | | | 4.58 | | | | .90 | |
| Class R-5E - actual return | | | 1,000.00 | | | | 949.86 | | | | 3.62 | | | | .74 | |
| Class R-5E - assumed 5% return | | | 1,000.00 | | | | 1,021.49 | | | | 3.76 | | | | .74 | |
| Class R-5 - actual return | | | 1,000.00 | | | | 950.15 | | | | 3.01 | | | | .61 | |
| Class R-5 - assumed 5% return | | | 1,000.00 | | | | 1,022.12 | | | | 3.12 | | | | .61 | |
| Class R-6 - actual return | | | 1,000.00 | | | | 950.92 | | | | 2.63 | | | | .54 | |
| Class R-6 - assumed 5% return | | | 1,000.00 | | | | 1,022.51 | | | | 2.73 | | | | .54 | |
| * | The “expenses paid during period” are equal to the “annualized expense ratio,” multiplied by the average account value over the period, multiplied by the number of days in the period, and divided by 365 (to reflect the one-half year period). |
We are required to advise you of the federal tax status of certain distributions received by shareholders during the fiscal year. The fund hereby designates the following amounts for the fund’s fiscal year ended December 31, 2016:
| Foreign taxes | | | $0.002 per share |
| Foreign source income | | | $0.10 per share |
| Long-term capital gains | | | $42,665,000 |
| Qualified dividend income | | | $1,966,000 |
| U.S. government income that may be exempt from state taxation | | | $6,833,000 |
Individual shareholders should refer to their Form 1099 or other tax information, which was mailed in January 2017, to determine the calendar year amounts to be included on their 2016 tax returns. Shareholders should consult their tax advisors.
| 36 | Capital World Bond Fund |
Board of trustees and other officers
Independent trustees1
| Name and year of birth | | Year first
elected
a trustee
of the fund2 | | Principal occupation(s) during past five years | | Number of
portfolios in fund
complex overseen
by trustee | | Other directorships3
held by trustee |
| William H. Baribault, 1945 | | 2010 | | CEO and President, Richard Nixon Foundation; Chairman of the Board and CEO, Oakwood Enterprises (private investment and consulting) | | 81 | | General Finance Corporation |
| James G. Ellis, 1947 | | 2006 | | Dean and Professor of Marketing, Marshall School of Business, University of Southern California | | 81 | | Mercury General Corporation |
| Leonard R. Fuller, 1946 | | 1994 | | Private investor; former President and CEO, Fuller Consulting (financial management consulting) | | 81 | | None |
R. Clark Hooper, 1946
Chairman of the Board (Independent and Non-Executive) | | 2005 | | Private investor | | 81 | | None |
| Merit E. Janow, 1958 | | 2010 | | Dean and Professor, Columbia University, School of International and Public Affairs | | 80 | | MasterCard Incorporated; Trimble Inc. |
| Laurel B. Mitchell, PhD, 1955 | | 2010 | | Distinguished Professor of Accounting, University of Redlands; former Director, Accounting Program, University of Redlands | | 77 | | None |
| Frank M. Sanchez, 1943 | | 1999 | | Principal, The Sanchez Family Corporation dba McDonald’s Restaurants (McDonald’s licensee) | | 77 | | None |
| Margaret Spellings, 1957 | | 2010 | | President, The University of North Carolina; former President, George W. Bush Foundation; former President and CEO, Margaret Spellings & Company (public policy and strategic consulting); former President, U.S. Chamber Foundation and Senior Advisor to the President and CEO, U.S. Chamber of Commerce | | 82 | | ClubCorp Holdings, Inc. |
| Steadman Upham, PhD, 1949 | | 2007 | | President Emeritus and University Professor, The University of Tulsa | | 80 | | None |
Interested trustees4,5
| Name, year of birth and position with fund | | Year first
elected a trustee
or officer
of the fund2 | | Principal occupation(s) during past five years and
positions held with affiliated entities or the principal
underwriter of the fund | | Number of
portfolios in fund
complex overseen
by trustee | | Other directorships3
held by trustee |
John H. Smet, 1956
Vice Chairman of the Board | | 2011 | | Partner — Capital Fixed Income Investors, Capital Research and Management Company; Director, Capital Research and Management Company | | 23 | | None |
| Michael C. Gitlin, 1970 | | 2015 | | Partner — Capital Fixed Income Investors, Capital Research and Management Company; Director, The Capital Group Companies, Inc.;6 served as Head of Fixed Income at a large investment management firm prior to joining Capital Research and Management Company in 2015 | | 19 | | None |
The fund’s statement of additional information includes further details about fund trustees and is available without charge upon request by calling American Funds Service Company at (800) 421-4225 or by visiting the American Funds website at americanfunds.com. The address for all trustees and officers of the fund is 333 South Hope Street, Los Angeles, CA 90071, Attention: Secretary.
See page 38 for footnotes.
| Capital World Bond Fund | 37 |
Other officers5
Name, year of birth and
position with fund | | Year first
elected
an officer
of the fund2 | | Principal occupation(s) during past five years and positions held with affiliated entities
or the principal underwriter of the fund |
Thomas H. Høgh, 1963
President | | 2001 | | Partner — Capital Fixed Income Investors, Capital Research Company6 |
Mark A. Brett, 1958
Senior Vice President | | 2017 | | Partner — Capital Fixed Income Investors, Capital Bank and Trust Company;6
Partner — Capital Fixed Income Investors, Capital International Limited;6
Senior Vice President, Capital International Limited;6
Senior Vice President, Capital International Sàrl;6
Director, Capital Strategy Research, Inc.6 |
David A. Daigle, 1967
Senior Vice President | | 2015 | | Partner — Capital Fixed Income Investors, Capital Research and Management Company;
Partner — Capital Fixed Income Investors, Capital Bank and Trust Company6 |
Robert H. Neithart, 1965
Senior Vice President | | 2011 | | Partner — Capital Fixed Income Investors, Capital Research and Management Company;
Chairman of the Board, Capital Strategy Research, Inc.6 |
Kristine M. Nishiyama, 1970
Senior Vice President | | 2003 | | Senior Vice President and Senior Counsel — Fund Business Management Group, Capital Research and
Management Company; Senior Vice President and General Counsel, Capital Bank and Trust Company6 |
Steven I. Koszalka, 1964
Secretary | | 2010 | | Vice President — Fund Business Management Group, Capital Research and Management Company |
Brian C. Janssen, 1972
Treasurer | | 2012 | | Vice President — Investment Operations, Capital Research and Management Company |
Jane Y. Chung, 1974
Assistant Secretary | | 2014 | | Associate — Fund Business Management Group, Capital Research and Management Company |
Dori Laskin, 1951
Assistant Treasurer | | 2010 | | Vice President — Investment Operations, Capital Research and Management Company |
Gregory F. Niland, 1971
Assistant Treasurer | | 2015 | | Vice President — Investment Operations, Capital Research and Management Company |
| 1 | The term independent trustee refers to a trustee who is not an “interested person” of the fund within the meaning of the Investment Company Act of 1940. |
| 2 | Trustees and officers of the fund serve until their resignation, removal or retirement. |
| 3 | This includes all directorships/trusteeships (other than those in the American Funds or other funds managed by Capital Research and Management Company or its affiliates) that are held by each trustee as a trustee or director of a public company or a registered investment company. |
| 4 | The term interested trustee refers to a trustee who is an “interested person” within the meaning of the Investment Company Act of 1940, on the basis of their affiliation with the fund’s investment adviser, Capital Research and Management Company, or affiliated entities (including the fund’s principal underwriter). |
| 5 | All of the trustees and/or officers listed are officers and/or directors/trustees of one or more of the other funds for which Capital Research and Management Company serves as investment adviser. |
| 6 | Company affiliated with Capital Research and Management Company. |
| 38 | Capital World Bond Fund |
This page was intentionally left blank.
| Capital World Bond Fund | 39 |
This page was intentionally left blank.
| 40 | Capital World Bond Fund |
This page was intentionally left blank.
| Capital World Bond Fund | 41 |
This page was intentionally left blank.
| 42 | Capital World Bond Fund |
This page was intentionally left blank.
| Capital World Bond Fund | 43 |
Offices of the fund and of the investment adviser
Capital Research and Management Company
333 South Hope Street
Los Angeles, CA 90071-1406
6455 Irvine Center Drive
Irvine, CA 92618-4518
Transfer agent for shareholder accounts
American Funds Service Company
(Write to the address near you.)
P.O. Box 6007
Indianapolis, IN 46206-6007
P.O. Box 2280
Norfolk, VA 23501-2280
Custodian of assets
JPMorgan Chase Bank
270 Park Avenue
New York, NY 10017-2070
Counsel
Morgan, Lewis & Bockius LLP
300 South Grand Avenue, 22nd Floor
Los Angeles, CA 90071-3132
Independent registered public accounting firm
Deloitte & Touche LLP
695 Town Center Drive
Suite 1200
Costa Mesa, CA 92626-7188
Principal underwriter
American Funds Distributors, Inc.
333 South Hope Street
Los Angeles, CA 90071-1406
| 44 | Capital World Bond Fund |
Investors should carefully consider investment objectives, risks, charges and expenses. This and other important information is contained in the fund prospectus and summary prospectus, which can be obtained from your financial professional and should be read carefully before investing. You may also call American Funds Service Company (AFS) at (800) 421-4225 or visit the American Funds website at americanfunds.com.
“American Funds Proxy Voting Procedures and Principles” — which describes how we vote proxies relating to portfolio securities — is available on the American Funds website or upon request by calling AFS. The fund files its proxy voting record with the U.S. Securities and Exchange Commission (SEC) for the 12 months ended June 30 by August 31. The proxy voting record is available free of charge on the SEC website at sec.gov and on the American Funds website.
A complete December 31, 2016, portfolio of Capital World Bond Fund’s investments is available free of charge by calling AFS or visiting the SEC website (where it is part of Form N-CSR).
Capital World Bond Fund files a complete list of its portfolio holdings with the SEC for the first and third quarters of each fiscal year on Form N-Q. This filing is available free of charge on the SEC website. You may also review or, for a fee, copy this filing at the SEC’s Public Reference Room in Washington, D.C. Additional information regarding the operation of the Public Reference Room may be obtained by calling the SEC’s Office of Investor Education and Advocacy at (800) SEC-0330. Additionally, the list of portfolio holdings is available by calling AFS.
This report is for the information of shareholders of Capital World Bond Fund, but it also may be used as sales literature when preceded or accompanied by the current prospectus or summary prospectus, which gives details about charges, expenses, investment objectives and operating policies of the fund. If used as sales material after March 31, 2017, this report must be accompanied by an American Funds statistical update for the most recently completed calendar quarter.
Bloomberg® is a trademark of Bloomberg Finance L.P. (collectively with its affiliates, “Bloomberg”). Barclays® is a trademark of Barclays Bank Plc (collectively with its affiliates, “Barclays”), used under license. Neither Bloomberg nor Barclays approves or endorses this material, guarantees the accuracy or completeness of any information herein and, to the maximum extent allowed by law, neither shall have any liability or responsibility for injury or damages arising in connection therewith.
MCSI has not approved, reviewed or produced this report, makes no express or implied warranties or representations and is not liable whatsoever for any data in the report. You may not redistribute the MSCI data or use it as a basis for other indices or investment products.
This report, and any product, index or fund referred to herein, is not sponsored, endorsed or promoted in any way by J.P. Morgan or any of its affiliates who provide no warranties whatsoever, express or implied, and shall have no liability to any prospective investor, in connection with this report. J.P. Morgan disclaimer: http://www.jpmorgan.com/pages/jpmorgan/ib/girg.
American Funds from Capital Group
The Capital AdvantageSM
Since 1931, American Funds, part of Capital Group, has helped investors pursue long-term investment success. Our consistent approach — in combination with The Capital SystemSM — has resulted in a superior long-term track record.
| | Aligned with investor success |
| | We base our decisions on a long-term perspective, which we believe aligns our goals with the interests of our clients. Our portfolio managers average 27 years of investment experience, including 22 years at our company, reflecting a career commitment to our long-term approach.1 |
| | |
| | The Capital SystemSM |
| | The Capital System combines individual accountability with teamwork. Funds using The Capital System are divided into portions that are managed independently by investment professionals with diverse backgrounds, ages and investment approaches. An extensive global research effort is the backbone of our system. |
| | |
| | American Funds’ superior long-term track record |
| | Equity funds have beaten their Lipper peer indexes in 91% of 10-year periods and 95% of 20-year periods. Fixed income funds have beaten their Lipper indexes in 58% of 10-year periods and 58% of 20-year periods.2 Fund management fees have been among the lowest in the industry.3 |
| | 1 | Portfolio manager experience as of December 31, 2015. |
| | 2 | Based on Class A share results for rolling periods through December 31, 2015. Periods covered are the shorter of the fund’s lifetime or since the comparable Lipper index inception date (except Capital Income Builder and SMALLCAP World Fund, for which the Lipper average was used). Expenses differ for each share class, so results will vary. |
| | 3 | On average, our management fees were in the lowest quintile 68% of the time, based on the 20-year period ended December 31, 2015, versus comparable Lipper categories, excluding funds of funds. |

ITEM 2 – Code of Ethics
The Registrant has adopted a Code of Ethics that applies to its Principal Executive Officer and Principal Financial Officer. The Registrant undertakes to provide to any person without charge, upon request, a copy of the Code of Ethics. Such request can be made to American Funds Service Company at 800/421-9225 or to the Secretary of the Registrant, 333 South Hope Street, Los Angeles, California 90071.
ITEM 3 – Audit Committee Financial Expert
The Registrant’s board has determined that Laurel B. Mitchell, a member of the Registrant’s audit committee, is an “audit committee financial expert” and "independent," as such terms are defined in this Item. This designation will not increase the designee’s duties, obligations or liability as compared to his or her duties, obligations and liability as a member of the audit committee and of the board, nor will it reduce the responsibility of the other audit committee members. There may be other individuals who, through education or experience, would qualify as "audit committee financial experts" if the board had designated them as such. Most importantly, the board believes each member of the audit committee contributes significantly to the effective oversight of the Registrant’s financial statements and condition.
| ITEM 4 – Principal Accountant Fees and Services | |
| | | |
| Registrant: | |
| a) Audit Fees: | |
| | 2016* | $158,000 |
| | 2016** | $5,000 |
| | | |
| b) Audit-Related Fees: | |
| | 2016* | $4,000 |
| | 2016** | None |
| | | |
| c) Tax Fees: | |
| | 2016* | $8,000 |
| | 2016** | None |
| | The tax fees consist of professional services relating to the preparation of the Registrant’s tax returns. |
| | | |
| d) All Other Fees: | |
| | 2016* | None |
| | 2016** | None |
| | | |
| | Adviser and affiliates (includes only fees for non-audit services billed to the adviser and affiliates for engagements that relate directly to the operations and financial reporting of the Registrant and were subject to the pre-approval policies described below): |
| a) Audit Fees: | |
| | Not Applicable | |
| | | |
| b) Audit-Related Fees: | |
| | 2016* | $1,169,000 |
| | 2016** | None |
| | The audit-related fees consist of assurance and related services relating to the examination of the Registrant’s transfer agent, principal underwriter and investment adviser conducted in accordance with Statement on Standards for Attestation Engagements Number 16 issued by the American Institute of Certified Public Accountants. |
| | | |
| c) Tax Fees: | |
| | 2016* | None |
| | 2016** | None |
| | The tax fees consist of consulting services relating to the Registrant’s investments. |
| | | |
| d) All Other Fees: | |
| | 2016* | $3,000 |
| | 2016** | None |
| | The other fees consist of subscription services related to an accounting research tool. |
| | | |
| All audit and permissible non-audit services that the Registrant’s audit committee considers compatible with maintaining the independent registered public accounting firm’s independence are required to be pre-approved by the committee. The pre-approval requirement will extend to all non-audit services provided to the Registrant, the investment adviser, and any entity controlling, controlled by, or under common control with the investment adviser that provides ongoing services to the Registrant, if the engagement relates directly to the operations and financial reporting of the Registrant. The committee will not delegate its responsibility to pre-approve these services to the investment adviser. The committee may delegate to one or more committee members the authority to review and pre-approve audit and permissible non-audit services. Actions taken under any such delegation will be reported to the full committee at its next meeting. The pre-approval requirement is waived with respect to non-audit services if certain conditions are met. The pre-approval requirement was not waived for any of the non-audit services listed above provided to the Registrant, adviser and affiliates. |
| | | |
| Aggregate non-audit fees paid to the Registrant’s auditors, including fees for all services billed to the Registrant, adviser and affiliates that provide ongoing services to the Registrant, were $1,233,000 for fiscal year 2016* and $105,000 for stub period 2016**. The non-audit services represented by these amounts were brought to the attention of the committee and considered to be compatible with maintaining the auditors’ independence. |
*Represents fisal year 10/01/2015 - 09/30/2016 | |
| **Represents stub period 10/01/2016 - 12/31/2016 due to fiscal year-end change |
ITEM 5 – Audit Committee of Listed Registrants
Not applicable to this Registrant, insofar as the Registrant is not a listed issuer as defined in Rule 10A-3 under the Securities Exchange Act of 1934.
ITEM 6 – Schedule of Investments
Capital World Bond Fund®
Investment portfolio
December 31, 2016
Bonds, notes & other debt instruments 95.78%
Euros 10.43% | Principal amount
(000) | Value
(000) |
| Allianz SE, 5.625% 2042 | €4,500 | $5,613 |
| Allianz SE, 4.75% 2049 | 24,900 | 28,999 |
| Assicurazioni Generali SPA 7.75% 2042 | 5,300 | 6,660 |
| Assicurazioni Generali SPA 10.125% 2042 | 6,000 | 8,236 |
| Aviva PLC 6.125% 2043 | 13,750 | 16,880 |
| Banco Bilbao Vizcaya Argentaria SA 3.50% 2024 | 23,900 | 26,264 |
| Barclays Bank PLC 4.00% 20191 | 5,450 | 6,387 |
| Barclays Bank PLC 6.625% 2022 | 4,750 | 6,138 |
| Belgium (Kingdom of), Series 79, 0.20% 2023 | 18,000 | 19,189 |
| Belgium (Kingdom of), Series 68, 2.25% 2023 | 7 | 8 |
| Belgium (Kingdom of), Series 77, 1.00% 2026 | 75,500 | 82,886 |
| Belgium (Kingdom of), Series 78, 1.60% 2047 | 4,800 | 5,083 |
| BNP Paribas 2.875% 2026 | 15,400 | 16,907 |
| BPCE SA group 4.625% 2023 | 6,000 | 7,443 |
| CaixaBank, SA 5.00% 2023 | 19,100 | 21,219 |
| Croatia (Republic of) 3.00% 2025 | 16,250 | 17,266 |
| France Télécom 5.625% 2018 | 1,500 | 1,705 |
| France Télécom 3.125% 2024 | 4,300 | 5,277 |
| French Republic O.A.T. 1.75% 2024 | 22,485 | 26,444 |
| French Republic O.A.T. 3.25% 2045 | 2,600 | 3,775 |
| Germany (Federal Republic of) 1.75% 20202 | 15,429 | 18,037 |
| Germany (Federal Republic of) 2.00% 2022 | 10,200 | 12,094 |
| Germany (Federal Republic of) 0.10% 20232 | 6,406 | 7,398 |
| Germany (Federal Republic of) 0.50% 2026 | 27,000 | 29,451 |
| Germany (Federal Republic of) 4.00% 2037 | 4,300 | 7,314 |
| Germany (Federal Republic of) 2.50% 2046 | 99,925 | 148,104 |
| Greece (Hellenic Republic of) 3.375% 2017 | 635 | 657 |
| Greece (Hellenic Republic of) 3.00% 20233 | 820 | 707 |
| Greece (Hellenic Republic of) 3.00% 20243 | 820 | 693 |
| Greece (Hellenic Republic of) 3.00% 20253 | 820 | 681 |
| Greece (Hellenic Republic of) 3.00% 20263 | 820 | 672 |
| Greece (Hellenic Republic of) 3.00% 20273 | 820 | 661 |
| Greece (Hellenic Republic of) 3.00% 20283 | 820 | 636 |
| Greece (Hellenic Republic of) 3.00% 20293 | 820 | 619 |
| Greece (Hellenic Republic of) 3.00% 20303 | 820 | 608 |
| Greece (Hellenic Republic of) 3.00% 20313 | 820 | 597 |
| Greece (Hellenic Republic of) 3.00% 20323 | 820 | 587 |
| Greece (Hellenic Republic of) 3.00% 20333 | 820 | 576 |
| Greece (Hellenic Republic of) 3.00% 20343 | 820 | 564 |
| Greece (Hellenic Republic of) 3.00% 20353 | 820 | 557 |
| Greece (Hellenic Republic of) 3.00% 20363 | 820 | 548 |
| Greece (Hellenic Republic of) 3.00% 20373 | 820 | 547 |
| Greece (Hellenic Republic of) 3.00% 20383 | 820 | 541 |
| Greece (Hellenic Republic of) 3.00% 20393 | 820 | 543 |
| Greece (Hellenic Republic of) 3.00% 20403 | 820 | 539 |
| Greece (Hellenic Republic of) 3.00% 20413 | 820 | 542 |
| Greece (Hellenic Republic of) 3.00% 20423 | 820 | 542 |
Capital World Bond Fund — Page 1 of 27
Bonds, notes & other debt instruments
Euros (continued) | Principal amount
(000) | Value
(000) |
| HSBC Holdings PLC 3.375% 2024 | €20,910 | $23,071 |
| Imperial Tobacco Finance PLC 5.00% 2019 | 12,425 | 14,942 |
| Indonesia (Republic of) 3.375% 2025 | 1,400 | 1,514 |
| Intesa Sanpaolo SpA 6.625% 2023 | 28,755 | 35,918 |
| Ireland (Republic of) 3.90% 2023 | 49,920 | 65,040 |
| Ireland (Republic of) 3.40% 2024 | 24,120 | 30,911 |
| Ireland (Republic of) 5.40% 2025 | 29,170 | 42,625 |
| Ireland (Republic of) 1.00% 2026 | 43,430 | 46,764 |
| Ireland (Republic of) 2.40% 2030 | 5,005 | 6,075 |
| Ireland (Republic of) 2.00% 2045 | 8,700 | 9,829 |
| Italy (Republic of) 3.75% 2021 | 37,300 | 44,732 |
| Italy (Republic of) 1.45% 2022 | 40,775 | 44,280 |
| Italy (Republic of) 0.95% 2023 | 27,000 | 28,280 |
| Italy (Republic of) 4.75% 2023 | 13,200 | 17,137 |
| Italy (Republic of) 4.50% 2024 | 16,350 | 20,973 |
| Italy (Republic of) 1.50% 2025 | 6,400 | 6,706 |
| Lloyds Banking Group PLC 6.50% 2020 | 4,850 | 6,006 |
| Merrill Lynch & Co., Inc. 4.625% 2018 | 17,536 | 19,881 |
| NN Group NV, 4.625% 2044 | 10,425 | 11,519 |
| NN Group NV, 4.50% 2049 | 32,580 | 34,360 |
| Orange SA 5.00% 2049 | 11,200 | 12,449 |
| Portuguese Government 2.875% 2025 | 4,800 | 4,806 |
| Rabobank Nederland 3.875% 2023 | 22,000 | 26,673 |
| Spain (Kingdom of) 0.75% 2021 | 12,700 | 13,666 |
| Spain (Kingdom of) 3.80% 2024 | 22,640 | 28,553 |
| Spain (Kingdom of) 2.15% 2025 | 3,500 | 3,953 |
| Spain (Kingdom of) 1.30% 2026 | 49,500 | 51,805 |
| Spain (Kingdom of) 1.95% 2026 | 7,700 | 8,550 |
| Spain (Kingdom of) 5.15% 2028 | 14,290 | 20,861 |
| Spain (Kingdom of) 2.90% 2046 | 3,900 | 4,370 |
| Svenska Handelsbanken AB 2.656% 2024 | 9,650 | 10,646 |
| Veolia Environnement 4.247% 2021 | 900 | 1,104 |
| | | 1,245,393 |
| Japanese yen 8.26% | | |
| Japan, Series 113, 0.30% 2018 | ¥3,335,000 | 28,756 |
| Japan, Series 312, 1.20% 2020 | 2,395,000 | 21,565 |
| Japan, Series 128, 0.10% 2021 | 3,275,000 | 28,285 |
| Japan, Series 315, 1.20% 2021 | 3,987,800 | 36,121 |
| Japan, Series 326, 0.70% 2022 | 9,825,000 | 88,028 |
| Japan, Series 17, 0.10% 20232 | 2,863,400 | 25,786 |
| Japan, Series 329, 0.80% 2023 | 5,195,000 | 46,967 |
| Japan, Series 18, 0.10% 20242 | 21,135,360 | 190,512 |
| Japan, Series 19, 0.10% 20242 | 13,077,480 | 118,886 |
| Japan, Series 337, 0.30% 2024 | 3,350,000 | 29,397 |
| Japan, Series 336, 0.50% 2024 | 6,255,000 | 55,742 |
| Japan, Series 20, 0.10% 20252 | 3,338,310 | 30,391 |
| Japan, Series 340, 0.40% 2025 | 1,390,000 | 12,307 |
| Japan, Series 116, 2.20% 2030 | 4,260,000 | 46,031 |
| Japan, Series 145, 1.70% 2033 | 6,955,000 | 72,125 |
| Japan, Series 150, 1.40% 2034 | 4,370,000 | 43,441 |
| Japan, Series 42, 1.70% 2044 | 7,940,000 | 85,150 |
| Japan, Series 47, 1.60% 2045 | 2,490,000 | 26,265 |
| | | 985,755 |
Capital World Bond Fund — Page 2 of 27
Bonds, notes & other debt instruments
Hungarian forints 4.62% | Principal amount
(000) | Value
(000) |
| Hungary, Series A, 5.50% 2018 | HUF2,150,000 | $8,063 |
| Hungary, Series C, 2.00% 2019 | 29,556,570 | 104,117 |
| Hungary, Series A, 6.50% 2019 | 32,438,230 | 125,988 |
| Hungary, Series B, 3.50% 2020 | 7,621,650 | 28,018 |
| Hungary, Series A, 7.50% 2020 | 40,559,270 | 170,465 |
| Hungary, Series A, 7.00% 2022 | 4,355,200 | 18,771 |
| Hungary, Series A, 6.00% 2023 | 10,785,700 | 45,363 |
| Hungary, Series B, 5.50% 2025 | 12,474,160 | 50,905 |
| | | 551,690 |
| Polish zloty 4.52% | | |
| Poland (Republic of) 2.75% 20232 | PLN17,486 | 4,536 |
| Poland (Republic of), Series 0420, 1.50% 2020 | 729,525 | 168,825 |
| Poland (Republic of), Series 1020, 5.25% 2020 | 333,450 | 87,119 |
| Poland (Republic of), Series 0421, 2.00% 2021 | 443,750 | 102,691 |
| Poland (Republic of), Series 1021, 5.75% 2021 | 178,270 | 48,054 |
| Poland (Republic of), Series 0922, 5.75% 2022 | 256,955 | 69,730 |
| Poland (Republic of), Series 1023, 4.00% 2023 | 131,830 | 32,803 |
| Poland (Republic of), Series 0725, 3.25% 2025 | 108,750 | 25,522 |
| | | 539,280 |
| Mexican pesos 4.40% | | |
| América Móvil, SAB de CV 8.46% 2036 | MXN15,000 | 637 |
| Petróleos Mexicanos 7.19% 2024 | 133,000 | 5,470 |
| Petróleos Mexicanos 7.47% 2026 | 18,000 | 717 |
| Red de Carreteras de Occidente 9.00% 20281 | 36,950 | 1,651 |
| United Mexican States 4.00% 20192 | 334,033 | 16,769 |
| United Mexican States 4.50% 20252 | 139,180 | 7,547 |
| United Mexican States 4.00% 20402 | 282,814 | 14,115 |
| United Mexican States, Series M, 5.00% 2017 | 357,500 | 17,154 |
| United Mexican States, Series M, 5.00% 2019 | 365,000 | 16,718 |
| United Mexican States, Series M, 6.50% 2021 | 5,449,000 | 256,561 |
| United Mexican States, Series M, 6.50% 2022 | 40,000 | 1,865 |
| United Mexican States, Series M20, 10.00% 2024 | 1,093,500 | 61,129 |
| United Mexican States, Series M, 5.75% 2026 | 2,463,000 | 105,602 |
| United Mexican States, Series M30, 10.00% 2036 | 250,000 | 14,689 |
| United Mexican States, Series M, 7.75% 2042 | 102,500 | 4,881 |
| | | 525,505 |
| British pounds 2.58% | | |
| Apple Inc. 3.05% 2029 | £2,000 | 2,669 |
| Aviva PLC, subordinated 6.875% 2058 | 2,110 | 3,059 |
| AXA SA, junior subordinated 5.453% 2049 | 6,095 | 7,699 |
| Bank of Scotland PLC 9.375% 2021 | 6,680 | 10,616 |
| Barclays Bank PLC 10.00% 2021 | 400 | 629 |
| Deutsche Telekom International Finance BV 6.50% 2022 | 3,746 | 5,798 |
| Electricité de France SA 6.00% 2114 | 1,400 | 2,400 |
| France Télécom 5.375% 2050 | 1,550 | 2,746 |
| Lloyds Banking Group PLC 7.625 % 2025 | 2,875 | 4,574 |
| National Grid Transco PLC 4.00% 2027 | 2,700 | 3,890 |
| Nestlé Finance International Ltd. 2.25% 2023 | 1,800 | 2,365 |
| RSA Insurance Group PLC 9.375% 2039 | 4,833 | 6,957 |
| United Kingdom 1.00% 2017 | 38,700 | 48,017 |
| United Kingdom 1.50% 2021 | 15,200 | 19,545 |
| United Kingdom 1.75% 2022 | 60,850 | 79,481 |
Capital World Bond Fund — Page 3 of 27
Bonds, notes & other debt instruments
British pounds (continued) | Principal amount
(000) | Value
(000) |
| United Kingdom 2.25% 2023 | £10,900 | $14,702 |
| United Kingdom 1.50% 2026 | 35,300 | 44,532 |
| United Kingdom 3.25% 2044 | 15,575 | 24,820 |
| United Kingdom 3.50% 2045 | 13,400 | 22,379 |
| Wal-Mart Stores, Inc. 5.625% 2034 | 1,000 | 1,781 |
| | | 308,659 |
| Malaysian ringgits 2.57% | | |
| Malaysia (Federation of), Series 0511, 3.58% 2018 | MYR27,055 | 6,025 |
| Malaysia (Federation of), Series 0203, 4.24% 2018 | 3,299 | 742 |
| Malaysia (Federation of), Series 0515, 3.759% 2019 | 75,050 | 16,820 |
| Malaysia (Federation of), Series 0315, 3.659% 2020 | 498,636 | 111,113 |
| Malaysia (Federation of), Series 0416, 3.62% 2021 | 104,000 | 23,131 |
| Malaysia (Federation of), Series 0314, 4.048% 2021 | 36,250 | 8,115 |
| Malaysia (Federation of), Series 0215, 3.795% 2022 | 70,400 | 15,454 |
| Malaysia (Federation of), Series 0116, 3.80% 2023 | 114,550 | 25,086 |
| Malaysia (Federation of), Series 0115, 3.955% 2025 | 157,250 | 34,017 |
| Malaysia (Federation of), Series 0415, 3.99% 2025 | 11,500 | 2,488 |
| Malaysia (Federation of), Series 0316, 3.90% 2026 | 60,000 | 13,020 |
| Malaysia (Federation of), Series 0310, 4.498% 2030 | 194,100 | 42,233 |
| Malaysia (Federation of), Series 0415, 4.254% 2035 | 23,400 | 4,938 |
| Malaysia (Federation of), Series 0615, 4.786% 2035 | 18,000 | 4,061 |
| | | 307,243 |
| Danish kroner 2.27% | | |
| Nordea Kredit 2.00% 20371 | DKr231,971 | 33,527 |
| Nykredit Realkredit AS, Series 01E, 2.00% 20371 | 977,559 | 141,149 |
| Nykredit Realkredit AS, Series 01E, 2.50% 20471 | 86,254 | 12,356 |
| Realkredit Danmark AS, Series 22S, 2.00% 20371 | 581,961 | 83,638 |
| | | 270,670 |
| Indian rupees 1.77% | | |
| India (Republic of) 7.28% 2019 | INR2,249,600 | 33,825 |
| India (Republic of) 7.80% 2021 | 5,196,610 | 80,097 |
| India (Republic of) 8.83% 2023 | 4,774,600 | 78,270 |
| India (Republic of) 9.20% 2030 | 1,122,690 | 19,499 |
| | | 211,691 |
| Brazilian reais 1.41% | | |
| Brazil (Federative Republic of) 0% 2017 | BRL125,041 | 37,276 |
| Brazil (Federative Republic of) 0% 2018 | 32,000 | 8,411 |
| Brazil (Federative Republic of) 0% 2018 | 13,200 | 3,643 |
| Brazil (Federative Republic of) 10.00% 2018 | 3,090 | 940 |
| Brazil (Federative Republic of) 0% 2019 | 48,500 | 12,122 |
| Brazil (Federative Republic of) 10.00% 2019 | 7,000 | 2,118 |
| Brazil (Federative Republic of) 0% 2020 | 406,000 | 91,019 |
| Brazil (Federative Republic of) 10.00% 2021 | 18,000 | 5,340 |
| Brazil (Federative Republic of) 10.00% 2023 | 12,000 | 3,478 |
| Brazil (Federative Republic of) 6.00% 20242 | 8,993 | 2,742 |
| Brazil (Federative Republic of) 10.00% 2027 | 4,000 | 1,135 |
| | | 168,224 |
Capital World Bond Fund — Page 4 of 27
Bonds, notes & other debt instruments
Australian dollars 1.23% | Principal amount
(000) | Value
(000) |
| Australia (Commonwealth of), Series 124, 5.75% 2021 | A$109,800 | $91,021 |
| Australia (Commonwealth of), Series 133, 5.50% 2023 | 24,400 | 20,752 |
| Australia (Commonwealth of), Series 138, 3.25% 2029 | 47,100 | 34,943 |
| | | 146,716 |
| Chilean pesos 0.79% | | |
| Chile (Banco Central de) 4.50% 2021 | CLP61,335,000 | 94,088 |
| Canadian dollars 0.67% | | |
| Canada 0.75% 2021 | C$14,000 | 10,295 |
| Canada 2.25% 2025 | 78,040 | 60,957 |
| Canada 1.50% 2026 | 10,000 | 7,315 |
| Canada 3.50% 2045 | 1,500 | 1,389 |
| | | 79,956 |
| Norwegian kroner 0.53% | | |
| Norway (Kingdom of) 3.75% 2021 | NKr151,300 | 19,519 |
| Norway (Kingdom of) 2.00% 2023 | 109,100 | 13,128 |
| Norway (Kingdom of) 3.00% 2024 | 241,450 | 30,853 |
| | | 63,500 |
| Thai baht 0.52% | | |
| Thailand (Kingdom of) 1.875% 2022 | THB1,342,400 | 36,744 |
| Thailand (Kingdom of) 3.85% 2025 | 359,500 | 10,993 |
| Thailand (Kingdom of) 2.125% 2026 | 528,000 | 14,063 |
| | | 61,800 |
| South African rand 0.50% | | |
| South Africa (Republic of), Series R-203, 8.25% 2017 | ZAR13,500 | 988 |
| South Africa (Republic of), Series R-208, 6.75% 2021 | 92,650 | 6,386 |
| South Africa (Republic of), Series R-2023, 7.75% 2023 | 268,540 | 18,758 |
| South Africa (Republic of), Series R-214, 6.50% 2041 | 639,350 | 33,168 |
| | | 59,300 |
| Argentine pesos 0.43% | | |
| Argentina (Central Bank of) 0% 2017 | ARS7,370 | 461 |
| Argentina (Central Bank of) 0% 2017 | 4,030 | 249 |
| Argentine Republic 21.20% 2018 | 32,615 | 2,098 |
| Argentine Republic 22.75% 2018 | 14,230 | 906 |
| Argentine Republic 2.50% 20212 | 49,321 | 3,162 |
| Argentine Republic 18.20% 2021 | 302,380 | 19,523 |
| Argentine Republic 16.00% 2023 | 30,860 | 1,881 |
| Argentine Republic 15.50% 2026 | 384,600 | 23,493 |
| | | 51,773 |
| Colombian pesos 0.42% | | |
| Colombia (Republic of), Series UVL, 3.50% 20212 | COP20,284,012 | 7,036 |
| Colombia (Republic of), Series B, 10.00% 2024 | 8,947,000 | 3,526 |
| Colombia (Republic of), Series B, 7.50% 2026 | 81,850,000 | 28,148 |
| Colombia (Republic of), Series B, 6.00% 2028 | 39,454,600 | 11,934 |
| | | 50,644 |
Capital World Bond Fund — Page 5 of 27
Bonds, notes & other debt instruments
Swedish kronor 0.42% | Principal amount
(000) | Value
(000) |
| Sweden (Kingdom of), Series 1054, 3.50% 2022 | SKr181,570 | $23,858 |
| Sweden (Kingdom of), Series 1057, 1.50% 2023 | 215,000 | 25,817 |
| | | 49,675 |
| Israeli shekels 0.41% | | |
| Israel (State of) 5.50% 2042 | ILS137,250 | 49,340 |
| Turkish lira 0.18% | | |
| Turkey (Republic of) 10.50% 2020 | TRY51,450 | 14,646 |
| Turkey (Republic of) 9.20% 2021 | 9,400 | 2,504 |
| Turkey (Republic of) 8.50% 2022 | 6,500 | 1,646 |
| Turkey (Republic of) 2.80% 20232 | 3,719 | 1,054 |
| Turkey (Republic of) 2.00% 20242 | 8,715 | 2,360 |
| | | 22,210 |
| Philippine pesos 0.17% | | |
| Philippines (Republic of the) 4.95% 2021 | PHP616,000 | 12,480 |
| Philippines (Republic of the) 3.90% 2022 | 377,000 | 7,202 |
| Philippines (Republic of the) 6.25% 2036 | 40,000 | 864 |
| | | 20,546 |
| Ghana cedi 0.12% | | |
| Ghana (Republic of) 24.75% 2021 | GHS45,000 | 12,379 |
| Ghana (Republic of) 19.00% 2026 | 6,395 | 1,518 |
| | | 13,897 |
| New Zealand dollars 0.08% | | |
| New Zealand 6.00% 2021 | NZ$4,725 | 3,730 |
| New Zealand 5.50% 2023 | 7,250 | 5,768 |
| | | 9,498 |
| Indonesian rupiah 0.03% | | |
| Indonesia (Republic of), Series 68, 8.375% 2034 | IDR43,665,000 | 3,267 |
| U.S. dollars 46.45% | | |
| ABB Finance (USA) Inc. 1.625% 2017 | $2,000 | 2,003 |
| ABB Finance (USA) Inc. 2.875% 2022 | 2,000 | 2,020 |
| Abbott Laboratories 2.35% 2019 | 2,400 | 2,403 |
| Abbott Laboratories 2.90% 2021 | 1,825 | 1,823 |
| Abbott Laboratories 3.40% 2023 | 1,475 | 1,470 |
| Abbott Laboratories 3.75% 2026 | 5,440 | 5,411 |
| Abbott Laboratories 4.75% 2036 | 1,555 | 1,583 |
| Abbott Laboratories 4.90% 2046 | 3,115 | 3,203 |
| AbbVie Inc. 1.80% 2018 | 2,700 | 2,703 |
| AbbVie Inc. 2.50% 2020 | 15,915 | 15,923 |
| AbbVie Inc. 2.90% 2022 | 9,060 | 8,951 |
| AbbVie Inc. 3.20% 2022 | 1,335 | 1,336 |
| AbbVie Inc. 3.60% 2025 | 16,200 | 16,054 |
| AbbVie Inc. 4.50% 2035 | 4,065 | 4,000 |
| AbbVie Inc. 4.45% 2046 | 4,795 | 4,601 |
| Abu Dhabi National Energy Co. PJSC (TAQA) 5.875% 20214 | 2,000 | 2,218 |
| Abu Dhabi National Energy Co. PJSC (TAQA) 3.625% 20234 | 20,735 | 20,683 |
| ACE INA Holdings Inc. 2.30% 2020 | 855 | 855 |
Capital World Bond Fund — Page 6 of 27
Bonds, notes & other debt instruments
U.S. dollars (continued) | Principal amount
(000) | Value
(000) |
| ACE INA Holdings Inc. 2.875% 2022 | $1,660 | $1,673 |
| ACE INA Holdings Inc. 3.35% 2026 | 1,660 | 1,681 |
| ACE INA Holdings Inc. 4.35% 2045 | 3,040 | 3,213 |
| AES Corp. 5.50% 2025 | 2,800 | 2,814 |
| AES Corp. 6.00% 2026 | 825 | 842 |
| Aetna Inc. 1.70% 2018 | 1,495 | 1,494 |
| Aetna Inc. 1.90% 2019 | 1,675 | 1,672 |
| Aetna Inc. 2.40% 2021 | 505 | 503 |
| Aetna Inc. 2.80% 2023 | 2,730 | 2,690 |
| Aetna Inc. 3.20% 2026 | 17,395 | 17,218 |
| Aetna Inc. 4.25% 2036 | 7,540 | 7,572 |
| Aetna Inc. 4.375% 2046 | 7,500 | 7,547 |
| Alexandria Real Estate Equities, Inc. 2.75% 2020 | 790 | 788 |
| Alexandria Real Estate Equities, Inc. 3.90% 2023 | 1,350 | 1,371 |
| Alexandria Real Estate Equities, Inc. 4.50% 2029 | 300 | 300 |
| Allergan PLC 2.35% 2018 | 12,750 | 12,826 |
| Allergan PLC 3.00% 2020 | 14,460 | 14,664 |
| Allergan PLC 3.45% 2022 | 9,170 | 9,309 |
| Allergan PLC 3.80% 2025 | 24,430 | 24,470 |
| Allergan PLC 4.55% 2035 | 6,490 | 6,434 |
| Allergan PLC 4.75% 2045 | 8,340 | 8,203 |
| Allison Transmission Holdings, Inc. 5.00% 20244 | 475 | 481 |
| Altria Group, Inc. 2.625% 2020 | 8,200 | 8,295 |
| Altria Group, Inc. 4.50% 2043 | 4,250 | 4,328 |
| American Campus Communities, Inc. 3.35% 2020 | 2,000 | 2,033 |
| American Campus Communities, Inc. 3.75% 2023 | 11,360 | 11,466 |
| American Campus Communities, Inc. 4.125% 2024 | 6,130 | 6,288 |
| American Electric Power Co., Inc. 1.65% 2017 | 2,960 | 2,961 |
| American Electric Power Co., Inc. 2.75% 2026 | 3,950 | 3,729 |
| American Energy (Marcellus), Term Loan A, 8.50% 20211,5,6 | 2,882 | 360 |
| American Energy (Marcellus), Term Loan B, 5.25% 20201,5,6 | 4,075 | 2,262 |
| American Energy (Permian Basin) 7.125% 20204 | 3,660 | 3,148 |
| American Energy (Permian Basin) 7.375% 20214 | 695 | 592 |
| American Honda Finance Corp. 1.65% 2021 | 1,420 | 1,367 |
| American Honda Finance Corp. 2.30% 2026 | 425 | 397 |
| Amgen Inc. 1.85% 2021 | 1,985 | 1,913 |
| Amgen Inc. 2.25% 2023 | 17,300 | 16,280 |
| Amgen Inc. 4.40% 2045 | 7,390 | 7,106 |
| Anadarko Petroleum Corp. 4.85% 2021 | 265 | 284 |
| Anadarko Petroleum Corp. 5.55% 2026 | 1,330 | 1,489 |
| Anadarko Petroleum Corp. 6.60% 2046 | 1,030 | 1,273 |
| Anglo American Capital PLC 4.125% 20214 | 575 | 588 |
| Anheuser-Busch InBev NV 3.30% 2023 | 5,235 | 5,329 |
| Anheuser-Busch InBev NV 3.65% 2026 | 2,000 | 2,031 |
| Anheuser-Busch InBev NV 4.95% 2042 | 2,545 | 2,778 |
| Anheuser-Busch InBev NV 4.90% 2046 | 3,330 | 3,590 |
| APT Pipelines Ltd. 4.20% 20254 | 1,090 | 1,087 |
| ArcelorMittal 7.75% 2041 | 6,445 | 6,896 |
| Argentine Republic 6.875% 20214 | 12,515 | 13,360 |
| Argentine Republic 7.50% 20264 | 43,215 | 45,484 |
| Argentine Republic 6.625% 20284 | 15,000 | 14,742 |
| Argentine Republic 8.28% 20331,7 | 1,437 | 1,541 |
| Argentine Republic 7.125% 20364 | 685 | 653 |
| Argentine Republic 7.625% 20464 | 36,735 | 36,827 |
| Armenia (Republic of) 7.15% 20254 | 1,060 | 1,118 |
Capital World Bond Fund — Page 7 of 27
Bonds, notes & other debt instruments
U.S. dollars (continued) | Principal amount
(000) | Value
(000) |
| Associated Materials, LLC 9.00% 20244 | $7,850 | $7,889 |
| AT&T Inc. 2.80% 2021 | 14,400 | 14,288 |
| AT&T Inc. 3.00% 2022 | 17,225 | 16,911 |
| AT&T Inc. 8.25% 2031 | 764 | 1,063 |
| AT&T Inc. 4.50% 2048 | 1,100 | 996 |
| Autoridad del Canal de Panama 4.95% 20351,4 | 3,200 | 3,396 |
| AXA SA 8.60% 2030 | 18,550 | 25,553 |
| Ball Corp. 4.375% 2020 | 1,350 | 1,416 |
| Banc of America Commercial Mortgage Inc., Series 2006-3, Class A4, 5.889% 20441,6 | 20 | 20 |
| Banc of America Commercial Mortgage Inc., Series 2007-3, Class A4, 5.548% 20491,6 | 477 | 480 |
| Banc of America Commercial Mortgage Inc., Series 2007-4, Class AM, 5.814% 20511,6 | 3,020 | 3,076 |
| Banc of America Commercial Mortgage Inc., Series 2008-1, Class A4, 6.235% 20511,6 | 1,555 | 1,596 |
| Banco Nacional de Comercio Exterior SNC 3.80% 20264 | 10,420 | 9,782 |
| Bank of America Corp. 2.625% 2020 | 6,875 | 6,880 |
| Bank of America Corp. 2.625% 2021 | 1,200 | 1,192 |
| Bank of America Corp. 3.875% 2025 | 11,045 | 11,236 |
| Bank of America Corp. 3.248% 2027 | 5,432 | 5,189 |
| Barclays Bank PLC 3.65% 2025 | 4,875 | 4,731 |
| Baxalta Inc. 4.00% 2025 | 8,760 | 8,790 |
| Bayer AG 3.375% 20244 | 3,720 | 3,701 |
| Bayerische Motoren Werke AG 2.00% 20214 | 2,000 | 1,962 |
| Bayerische Motoren Werke AG 2.25% 20234 | 1,000 | 958 |
| BBVA Bancomer SA 6.50% 20214 | 1,455 | 1,574 |
| Bear Stearns Commercial Mortgage Securities Trust, Series 2007-PW17, Class A4, 5.694% 20501,6 | 1,467 | 1,493 |
| Bear Stearns Commercial Mortgage Securities Trust, Series 2007-PW18, Class AM, 6.084% 20501,6 | 2,375 | 2,450 |
| Becton, Dickinson and Co. 2.675% 2019 | 2,784 | 2,825 |
| Becton, Dickinson and Co. 3.734% 2024 | 5,427 | 5,554 |
| Berkshire Hathaway Inc. 4.50% 2043 | 2,900 | 3,085 |
| Bermuda 4.138% 20234 | 4,900 | 5,048 |
| Bermuda 4.854% 20244 | 17,675 | 18,456 |
| BHP Billiton Finance (USA) Ltd. 3.85% 2023 | 5,200 | 5,502 |
| BHP Billiton Finance Ltd. 6.25% 20754 | 1,400 | 1,521 |
| BHP Billiton Finance Ltd. 6.75% 20754 | 3,290 | 3,701 |
| BMC Software, Inc. 8.125% 20214 | 2,650 | 2,489 |
| Boardwalk Pipeline Partners, LP 3.375% 2023 | 1,500 | 1,428 |
| Boardwalk Pipeline Partners, LP 4.95% 2024 | 2,100 | 2,157 |
| BPCE SA group 2.75% 2021 | 4,000 | 3,960 |
| BPCE SA group 5.70% 20234 | 33,705 | 35,519 |
| BPCE SA group 4.50% 20254 | 9,545 | 9,304 |
| BPCE SA group 4.875% 20264 | 5,000 | 4,999 |
| Brandywine Operating Partnership, LP 5.70% 2017 | 15 | 15 |
| Brandywine Operating Partnership, LP 3.95% 2023 | 750 | 747 |
| Brazil (Federative Republic of) 4.25% 2025 | 3,545 | 3,319 |
| British American Tobacco International Finance PLC 2.75% 20204 | 2,350 | 2,362 |
| British American Tobacco International Finance PLC 3.50% 20224 | 1,705 | 1,747 |
| Buenos Aires (City of) 8.95% 20211 | 2,580 | 2,890 |
| Builders FirstSource, Inc. 5.625% 20244 | 1,000 | 1,009 |
| Cablevision Systems Corp. 6.75% 2021 | 3,700 | 3,987 |
| Calpine Corp. 5.375% 2023 | 350 | 344 |
| Canadian National Railway Co. 3.20% 2046 | 790 | 695 |
| Canadian Natural Resources Ltd. 5.70% 2017 | 1,500 | 1,522 |
| Canadian Natural Resources Ltd. 3.80% 2024 | 425 | 424 |
| CCO Holdings LLC and CCO Holdings Capital Corp. 3.579% 2020 | 4,315 | 4,403 |
| CCO Holdings LLC and CCO Holdings Capital Corp. 4.464% 2022 | 2,715 | 2,838 |
| CCO Holdings LLC and CCO Holdings Capital Corp. 4.908% 2025 | 2,200 | 2,320 |
Capital World Bond Fund — Page 8 of 27
Bonds, notes & other debt instruments
U.S. dollars (continued) | Principal amount
(000) | Value
(000) |
| CCO Holdings LLC and CCO Holdings Capital Corp. 5.75% 20264 | $3,250 | $3,372 |
| Celgene Corp. 3.625% 2024 | 2,210 | 2,222 |
| Celgene Corp. 3.875% 2025 | 8,545 | 8,671 |
| Celgene Corp. 4.625% 2044 | 665 | 652 |
| Celgene Corp. 5.00% 2045 | 660 | 688 |
| Cenovus Energy Inc. 3.00% 2022 | 1,312 | 1,269 |
| Cenovus Energy Inc. 3.80% 2023 | 2,880 | 2,812 |
| Centene Corp. 4.75% 2022 | 7,005 | 7,110 |
| Centene Corp. 4.75% 2025 | 1,250 | 1,223 |
| CenterPoint Energy Transition Bond Co. III, LLC, Series 2008, Class A2, 5.234% 20231 | 2,225 | 2,347 |
| Cequel Communications Holdings I, LLC and Cequel Capital Corp. 6.375% 20204 | 4,035 | 4,166 |
| CEVA Group PLC 7.00% 20214 | 3,550 | 2,875 |
| CEVA Group PLC, Apollo Global Securities LLC LOC, 5.969% 20211,5,6 | 969 | 793 |
| CEVA Logistics Canada, ULC, Term Loan, 6.50% 20211,5,6 | 171 | 140 |
| CEVA Logistics Holdings BV, Term Loan, 6.50% 20211,5,6 | 993 | 813 |
| CEVA Logistics U.S. Holdings Inc., Term Loan B, 6.50% 20211,5,6 | 1,370 | 1,121 |
| CF Industries, Inc. 4.50% 20264 | 1,090 | 1,072 |
| CF Industries, Inc. 4.95% 2043 | 3,385 | 2,784 |
| Chemours Co. 6.625% 2023 | 4,872 | 4,848 |
| Chemours Co. 7.00% 2025 | 3,320 | 3,287 |
| Chesapeake Energy Corp. 4.13% 20196 | 2,700 | 2,727 |
| Chesapeake Energy Corp. 4.875% 2022 | 2,450 | 2,230 |
| Chesapeake Energy Corp. 8.00% 20254 | 1,025 | 1,049 |
| Chesapeake Energy Corp., Term Loan, 8.50% 20211,5,6 | 1,200 | 1,310 |
| Chile (Republic of) 3.125% 2025 | 1,055 | 1,047 |
| Chile (Republic of) 3.125% 2026 | 3,945 | 3,896 |
| CIT Group Inc. 3.875% 2019 | 8,705 | 8,912 |
| Citigroup Commercial Mortgage Trust, Series 2014-CG19, Class A1, 1.199% 20471 | 586 | 585 |
| Citigroup Inc. 1.70% 2018 | 1,818 | 1,814 |
| Citigroup Inc. 2.55% 2019 | 13,535 | 13,647 |
| Citigroup Inc. 2.021% 20216 | 2,020 | 2,029 |
| Citigroup Inc. 2.35% 2021 | 7,000 | 6,848 |
| Citigroup Inc. 2.90% 2021 | 8,500 | 8,478 |
| Citigroup Inc. 3.20% 2026 | 1,295 | 1,239 |
| Clear Channel Worldwide Holdings, Inc. 7.625% 2020 | 6,550 | 6,570 |
| Cliffs Natural Resources Inc. 8.00% 20204 | 300 | 314 |
| Cliffs Natural Resources Inc. 8.25% 20204 | 4,075 | 4,482 |
| CMS Energy Corp. 8.75% 2019 | 1,312 | 1,515 |
| CMS Energy Corp. 5.05% 2022 | 1,458 | 1,597 |
| CMS Energy Corp. 3.875% 2024 | 480 | 499 |
| CMS Energy Corp. 4.70% 2043 | 1,900 | 1,990 |
| CMS Energy Corp. 4.875% 2044 | 3,146 | 3,379 |
| CoBank, ACB 1.563% 20224,6 | 2,525 | 2,430 |
| Colbun SA 6.00% 20204 | 5,150 | 5,568 |
| Colbun SA 4.50% 20244 | 1,800 | 1,820 |
| Colombia (Republic of) 4.50% 2026 | 1,000 | 1,034 |
| Columbia Pipeline Partners LP 2.45% 2018 | 2,700 | 2,714 |
| Columbia Pipeline Partners LP 3.30% 2020 | 395 | 402 |
| Columbia Pipeline Partners LP 4.50% 2025 | 490 | 515 |
| Columbia Pipeline Partners LP 5.80% 2045 | 770 | 887 |
| Comcast Corp. 2.35% 2027 | 2,610 | 2,412 |
| Comcast Corp. 6.40% 2038 | 1,750 | 2,242 |
| Comcast Corp. 4.75% 2044 | 1,545 | 1,658 |
| Comision Federal de Electricidad 4.875% 20244 | 3,500 | 3,496 |
| Comision Federal de Electricidad 4.75% 20274 | 4,550 | 4,379 |
Capital World Bond Fund — Page 9 of 27
Bonds, notes & other debt instruments
U.S. dollars (continued) | Principal amount
(000) | Value
(000) |
| Comision Federal de Electricidad 6.125% 20454 | $3,700 | $3,561 |
| Commercial Mortgage Trust, Series 2014-UBS2, Class A1, 1.298% 20471 | 2,170 | 2,160 |
| Commercial Mortgage Trust, Series 2007-C9, Class A1A, 5.812% 20491,6 | 354 | 358 |
| Communications Sales & Leasing, Inc. 6.00% 20234 | 2,225 | 2,303 |
| Communications Sales & Leasing, Inc. 8.25% 2023 | 3,122 | 3,325 |
| Community Health Systems Inc. 5.125% 2021 | 2,035 | 1,893 |
| Concordia Healthcare Corp., Term Loan B, 5.25% 20211,5,6 | 349 | 274 |
| Concordia Healthcare Corp. 9.50% 20224 | 1,800 | 648 |
| Concordia Healthcare Corp. 7.00% 20234 | 3,260 | 1,043 |
| ConocoPhillips 4.20% 2021 | 1,840 | 1,955 |
| ConocoPhillips 4.95% 2026 | 1,355 | 1,497 |
| ConocoPhillips 5.95% 2046 | 1,360 | 1,686 |
| CONSOL Energy Inc. 5.875% 2022 | 7,200 | 7,092 |
| Continental Airlines, Inc., Series 1997-4, Class A, 6.90% 20191 | 161 | 163 |
| Continental Airlines, Inc., Series 1999-1, Class A, 6.545% 20201 | 151 | 158 |
| Continental Airlines, Inc., Series 2000-2, Class A1, 7.707% 20221 | 1,155 | 1,246 |
| Core Industrial Trust, Series 2015-CALW, Class A, 3.04% 20341,4 | 6,725 | 6,866 |
| Corporate Office Properties LP 3.60% 2023 | 1,610 | 1,550 |
| Corporate Office Properties LP 5.25% 2024 | 325 | 339 |
| Corporate Office Properties LP 5.00% 2025 | 120 | 123 |
| Corporate Risk Holdings LLC 9.50% 20194 | 4,059 | 4,191 |
| Corporate Risk Holdings LLC 13.50% 20204,7,8 | 584 | 649 |
| Credit Agricole SA 4.375% 20254 | 9,875 | 9,717 |
| CRH America, Inc. 3.875% 20254 | 3,000 | 3,056 |
| CRH America, Inc. 5.125% 20454 | 3,000 | 3,130 |
| Croatian Government 6.375% 2021 | 9,000 | 9,809 |
| CS First Boston Mortgage Securities Corp., Series 2007-C5, Class A4, 5.695% 20401,6 | 1,980 | 2,008 |
| CS First Boston Mortgage Securities Corp., Series 2007-C2, Class AM, 5.615% 20491,6 | 840 | 847 |
| CVS Health Corp. 1.90% 2018 | 1,900 | 1,908 |
| CVS Health Corp. 2.80% 2020 | 1,900 | 1,929 |
| CVS Health Corp. 3.50% 2022 | 1,900 | 1,953 |
| CVS Caremark Corp. 5.125% 2045 | 3,700 | 4,132 |
| DaimlerChrysler North America Holding Corp. 2.375% 20184 | 4,000 | 4,030 |
| DaimlerChrysler North America Holding Corp. 2.25% 20204 | 11,700 | 11,644 |
| DaimlerChrysler North America Holding Corp. 2.00% 20214 | 10,500 | 10,193 |
| DaimlerChrysler North America Holding Corp. 2.875% 20214 | 9,950 | 10,009 |
| DaimlerChrysler North America Holding Corp. 3.30% 20254 | 2,000 | 1,980 |
| DaimlerChrysler North America Holding Corp. 8.50% 2031 | 7,850 | 11,820 |
| Danske Bank AS 2.00% 20214 | 10,255 | 9,968 |
| DaVita HealthCare Partners Inc. 5.00% 2025 | 1,660 | 1,637 |
| DBUBS Mortgage Trust, Series 2011-LC1A, Class A3, 5.002% 20461,4 | 1,500 | 1,627 |
| DCP Midstream Operating LP 4.95% 2022 | 2,280 | 2,348 |
| DCT Industrial Trust Inc. 4.50% 2023 | 3,135 | 3,183 |
| DDR Corp. 3.625% 2025 | 1,770 | 1,713 |
| Dell Inc. 8.35% 20464 | 1,695 | 2,090 |
| Deutsche Telekom International Finance BV 9.25% 2032 | 11,340 | 17,514 |
| Developers Diversified Realty Corp. 7.50% 2017 | 385 | 390 |
| Developers Diversified Realty Corp. 4.75% 2018 | 475 | 489 |
| Developers Diversified Realty Corp. 7.875% 2020 | 895 | 1,042 |
| Devon Energy Corp. 3.25% 2022 | 810 | 805 |
| Devon Energy Corp. 5.00% 2045 | 1,495 | 1,471 |
| Diamond Offshore Drilling, Inc. 4.875% 2043 | 6,995 | 5,004 |
| Digicel Group Ltd. 8.25% 20204 | 9,425 | 8,133 |
| Digicel Group Ltd. 7.125% 20224 | 2,175 | 1,698 |
| DISH DBS Corp. 4.25% 2018 | 2,650 | 2,724 |
Capital World Bond Fund — Page 10 of 27
Bonds, notes & other debt instruments
U.S. dollars (continued) | Principal amount
(000) | Value
(000) |
| DJO Finance LLC 10.75% 2020 | $2,795 | $2,362 |
| DJO Finco Inc. 8.125% 20214 | 5,335 | 4,655 |
| Dominican Republic 7.50% 20211,4 | 10,500 | 11,424 |
| Dominican Republic 5.50% 20254 | 6,500 | 6,300 |
| Dominican Republic 6.875% 2026 | 3,500 | 3,651 |
| Dominican Republic 8.625% 20271,4 | 1,000 | 1,131 |
| Dominican Republic 6.85% 20454 | 2,555 | 2,427 |
| Duke Energy Corp. 3.75% 2024 | 2,350 | 2,424 |
| Duke Energy Corp. 2.65% 2026 | 12,700 | 11,860 |
| Duke Energy Corp. 3.75% 2046 | 1,500 | 1,353 |
| Dynegy Finance Inc. 6.75% 2019 | 500 | 511 |
| EchoStar Corp. 6.625% 20264 | 2,550 | 2,569 |
| Ecopetrol SA 5.875% 2023 | 1,235 | 1,310 |
| Ecopetrol SA 5.375% 2026 | 1,020 | 1,017 |
| Ecopetrol SA 5.875% 2045 | 2,553 | 2,219 |
| EDP Finance BV 6.00% 20184 | 4,000 | 4,150 |
| EDP Finance BV 4.125% 20204 | 3,000 | 3,074 |
| EDP Finance BV 5.25% 20214 | 2,500 | 2,647 |
| Egypt (Arab Republic of) 5.875% 2025 | 4,650 | 4,239 |
| Electricité de France SA 1.15% 20174 | 2,000 | 2,000 |
| Electricité de France SA 3.625% 20254 | 2,250 | 2,244 |
| Electricité de France SA 6.95% 20394 | 1,325 | 1,664 |
| Electricité de France SA 4.875% 20444 | 6,420 | 6,435 |
| Electricité de France SA 5.25% 20494 | 3,150 | 2,973 |
| EMD Finance LLC 2.40% 20204 | 9,685 | 9,629 |
| EMD Finance LLC 2.95% 20224 | 4,185 | 4,168 |
| EMD Finance LLC 3.25% 20254 | 15,675 | 15,331 |
| Empresa Nacional de Electricidad SA 4.25% 2024 | 3,300 | 3,306 |
| ENA Norte Trust 4.95% 20281,4 | 6,073 | 6,316 |
| Enbridge Energy Partners, LP 9.875% 2019 | 3,250 | 3,694 |
| Enbridge Energy Partners, LP 4.375% 2020 | 3,385 | 3,534 |
| Enbridge Energy Partners, LP 5.20% 2020 | 7,335 | 7,812 |
| Enbridge Energy Partners, LP 5.875% 2025 | 2,990 | 3,335 |
| Enbridge Energy Partners, LP 7.375% 2045 | 4,990 | 6,200 |
| Enbridge Energy Partners, LP, Series B, 6.50% 2018 | 5,320 | 5,599 |
| Enbridge Inc. 4.00% 2023 | 7,095 | 7,206 |
| Enbridge Inc. 4.25% 2026 | 1,660 | 1,701 |
| Enbridge Inc. 4.50% 2044 | 1,000 | 931 |
| Enbridge Inc. 5.50% 2046 | 375 | 404 |
| Endo Pharmaceuticals Holdings Inc. 5.75% 20224 | 1,110 | 993 |
| Enel Finance International SA 6.00% 20394 | 4,740 | 5,304 |
| Enel Società per Azioni 8.75% 20734 | 10,000 | 11,350 |
| Energy Transfer Partners, LP 5.875% 2024 | 2,175 | 2,257 |
| Energy Transfer Partners, LP 5.50% 2027 | 3,995 | 3,915 |
| Energy Transfer Partners, LP 6.125% 2045 | 1,730 | 1,844 |
| Enersis Américas SA 4.00% 2026 | 4,260 | 4,074 |
| EnLink Midstream Partners, LP 2.70% 2019 | 495 | 495 |
| EnLink Midstream Partners, LP 4.40% 2024 | 845 | 840 |
| EnLink Midstream Partners, LP 4.15% 2025 | 1,135 | 1,102 |
| EnLink Midstream Partners, LP 5.05% 2045 | 1,410 | 1,281 |
| Ensco PLC 5.20% 2025 | 670 | 582 |
| Ensco PLC 5.75% 2044 | 3,645 | 2,661 |
| Enterprise Products Operating LLC 3.90% 2024 | 870 | 898 |
| Enterprise Products Operating LLC 3.70% 2026 | 85 | 85 |
| Enterprise Products Operating LLC 3.95% 2027 | 475 | 487 |
Capital World Bond Fund — Page 11 of 27
Bonds, notes & other debt instruments
U.S. dollars (continued) | Principal amount
(000) | Value
(000) |
| Enterprise Products Operating LLC 4.85% 2044 | $2,100 | $2,124 |
| EPR Properties 4.50% 2025 | 2,110 | 2,085 |
| EPR Properties 4.75% 2026 | 1,475 | 1,461 |
EQTY 2014-INNS Mortgage Trust Commercial Mortgage Pass-Through Certificates, Series 2014-A,
1.499% 20311,4,6 | 7,868 | 7,874 |
| Essex Portfolio L.P. 3.625% 2022 | 1,420 | 1,453 |
| Essex Portfolio L.P. 3.25% 2023 | 3,870 | 3,857 |
| Essex Portfolio L.P. 3.875% 2024 | 3,360 | 3,422 |
| Essex Portfolio L.P. 3.50% 2025 | 9,565 | 9,425 |
| Essex Portfolio L.P. 3.375% 2026 | 5,130 | 4,963 |
| Euramax International, Inc. 12.00% 20204 | 3,150 | 3,418 |
| Exelon Corp. 3.40% 2026 | 6,000 | 5,890 |
| Export Credit Bank of Turkey 5.375% 20214 | 4,660 | 4,572 |
| Exxon Mobil Corp. 2.222% 2021 | 2,755 | 2,756 |
| Fannie Mae 5.50% 20331 | 1,503 | 1,686 |
| Fannie Mae 6.00% 20351 | 96 | 109 |
| Fannie Mae 5.50% 20381 | 1,486 | 1,678 |
| Fannie Mae 4.00% 20461 | 6,280 | 6,608 |
| Fannie Mae 4.00% 20461 | 1,716 | 1,805 |
| Fannie Mae 3.50% 20471,9 | 6,400 | 6,556 |
| Fannie Mae 4.00% 20471,9 | 20,950 | 22,016 |
| Fannie Mae 4.50% 20471,9 | 21,675 | 23,308 |
| Fannie Mae 4.50% 20471,9 | 13,550 | 14,555 |
| Fannie Mae 6.50% 20471 | 73 | 81 |
| Fannie Mae 6.50% 20471 | 46 | 52 |
| Fannie Mae 6.50% 20471 | 39 | 43 |
| Fannie Mae 7.00% 20471 | 52 | 59 |
| Fannie Mae 6.50% 20481 | 36 | 40 |
| Fannie Mae, Series 2012-M17, Class A2, multifamily 2.184% 20221 | 3,500 | 3,418 |
| Fannie Mae, Series 2012-M9, Class A2, multifamily 2.482% 20221 | 3,494 | 3,484 |
| Fannie Mae, Series 2001-4, Class GA, 9.349% 20251,6 | 1 | 2 |
| Fannie Mae, Series 2006-56, Class OG, principal only, 0% 20361 | 721 | 641 |
| First Data Corp. 5.375% 20234 | 1,000 | 1,040 |
| First Data Corp. 5.00% 20244 | 1,850 | 1,867 |
| First Quantum Minerals Ltd. 6.75% 20204 | 3,292 | 3,300 |
| First Quantum Minerals Ltd. 7.00% 20214 | 11,492 | 11,487 |
| First Quantum Minerals Ltd. 7.25% 20224 | 1,125 | 1,114 |
| FMG Resources 9.75% 20224 | 4,755 | 5,540 |
| Ford Motor Co. 4.346% 2026 | 2,000 | 2,022 |
| Ford Motor Credit Co. 2.375% 2019 | 15,325 | 15,318 |
| Ford Motor Credit Co. 2.597% 2019 | 8,485 | 8,474 |
| Ford Motor Credit Co. 3.20% 2021 | 13,920 | 13,942 |
| France Télécom 9.00% 2031 | 11,336 | 17,055 |
| Freddie Mac 6.00% 20381 | 67 | 76 |
| Freddie Mac 4.00% 20461 | 46,791 | 49,173 |
| Freddie Mac 4.00% 20471,9 | 22,000 | 23,097 |
| Freddie Mac, Series K052, Class A1, multifamily 2.598% 20251 | 4,577 | 4,618 |
| Freddie Mac, Series 3213, Class OG, principal only, 0% 20361 | 1,340 | 1,230 |
| Freddie Mac, Series 3292, Class BO, principal only, 0% 20371 | 183 | 156 |
| Freeport-McMoRan Copper & Gold Inc. 3.55% 2022 | 3,015 | 2,819 |
| Frontier Communications Corp. 10.50% 2022 | 1,600 | 1,688 |
| Frontier Communications Corp. 11.00% 2025 | 4,725 | 4,896 |
| Gardner Denver, Inc. 6.875% 20214 | 445 | 445 |
| Gazprom OJSC 5.999% 20214 | 3,900 | 4,220 |
| General Motors Co. 6.60% 2036 | 815 | 933 |
Capital World Bond Fund — Page 12 of 27
Bonds, notes & other debt instruments
U.S. dollars (continued) | Principal amount
(000) | Value
(000) |
| General Motors Co. 6.75% 2046 | $1,955 | $2,297 |
| General Motors Financial Co. 2.40% 2019 | 9,495 | 9,471 |
| General Motors Financial Co. 3.70% 2020 | 2,725 | 2,772 |
| General Motors Financial Co. 4.00% 2026 | 2,000 | 1,925 |
| Genesis Energy, LP 6.75% 2022 | 2,275 | 2,375 |
| Georgia Gulf Corp. 4.625% 2021 | 2,200 | 2,261 |
| Ghana (Republic of) 8.125% 20261 | 1,500 | 1,485 |
| Gilead Sciences, Inc. 3.65% 2026 | 1,800 | 1,825 |
| Gilead Sciences, Inc. 2.95% 2027 | 2,875 | 2,751 |
| Gilead Sciences, Inc. 4.15% 2047 | 925 | 879 |
| Glencore Xstrata LLC 4.625% 20244 | 1,570 | 1,611 |
| Gogo Inc. 12.50% 20224 | 6,750 | 7,341 |
| Goldman Sachs Group, Inc. 2.00% 2019 | 3,975 | 3,960 |
| Goldman Sachs Group, Inc. 2.30% 2019 | 4,500 | 4,499 |
| Goldman Sachs Group, Inc. 2.55% 2019 | 8,295 | 8,358 |
| Goldman Sachs Group, Inc. 2.242% 20216 | 856 | 868 |
| Goldman Sachs Group, Inc. 2.35% 2021 | 2,700 | 2,624 |
| Goldman Sachs Group, Inc. 2.875% 2021 | 17,279 | 17,361 |
| Goldman Sachs Group, Inc. 3.50% 2025 | 3,400 | 3,356 |
| Goldman Sachs Group, Inc. 3.50% 2026 | 2,550 | 2,503 |
| Goldman Sachs Group, Inc. 3.75% 2026 | 5,958 | 5,979 |
| Goldman Sachs Group, Inc. 4.75% 2045 | 8,665 | 9,154 |
| Government National Mortgage Assn. 4.00% 20451 | 16,667 | 17,717 |
| Government National Mortgage Assn. 4.50% 20451 | 27,942 | 29,854 |
| Government National Mortgage Assn. 4.50% 20451 | 25,214 | 26,937 |
| Government National Mortgage Assn. 4.50% 20451 | 19,834 | 21,191 |
| Government National Mortgage Assn. 4.50% 20451 | 9,235 | 9,867 |
| Greenwich Capital Commercial Funding Corp., Series 2007-GG11, Class A1A, 5.704% 20491 | 7,562 | 7,666 |
| Greenwich Capital Commercial Funding Corp., Series 2007-GG11, Class AM, 5.867% 20491,6 | 4,945 | 5,054 |
| GS Mortgage Securities Corp. II, Series 2007-GG10, Class A1A, 5.793% 20451,6 | 1,231 | 1,244 |
| Halliburton Co. 3.80% 2025 | 10,055 | 10,220 |
| Halliburton Co. 4.85% 2035 | 390 | 412 |
| Halliburton Co. 5.00% 2045 | 650 | 706 |
| Hardwoods Acquisition Inc 7.50% 20214 | 2,700 | 2,295 |
| Harris Corp. 1.999% 2018 | 3,100 | 3,102 |
| Harris Corp. 2.70% 2020 | 680 | 679 |
| Harris Corp. 3.832% 2025 | 460 | 468 |
| HCA Inc. 5.25% 2026 | 975 | 1,010 |
| HDTFS Inc. 5.875% 2020 | 3,425 | 3,365 |
| HDTFS Inc. 5.50% 20244 | 1,325 | 1,164 |
| Healthsouth Corp. 5.75% 2024 | 950 | 967 |
| Healthsouth Corp. 5.75% 2025 | 1,580 | 1,580 |
| Hertz Vehicle Financing LLC, Rental Car Asset-backed Notes, Series 2015-1, Class A, 2.73% 20211,4 | 17,610 | 17,500 |
| Holcim Ltd. 6.00% 20194 | 3,222 | 3,531 |
| Holcim Ltd. 5.15% 20234 | 8,230 | 8,928 |
| Hospitality Properties Trust 6.70% 2018 | 6,360 | 6,521 |
| Hospitality Properties Trust 5.00% 2022 | 250 | 264 |
| Hospitality Properties Trust 4.50% 2023 | 690 | 688 |
| Hospitality Properties Trust 4.50% 2025 | 935 | 912 |
| Host Hotels & Resorts LP 4.50% 2026 | 175 | 177 |
| HSBC Bank PLC 4.75% 20214 | 650 | 696 |
| HSBC Holdings PLC 4.125% 20204 | 3,295 | 3,458 |
| HSBC Holdings PLC 2.95% 2021 | 3,355 | 3,353 |
| HSBC Holdings PLC 4.00% 2022 | 2,275 | 2,352 |
| HSBC Holdings PLC 3.90% 2026 | 4,645 | 4,676 |
Capital World Bond Fund — Page 13 of 27
Bonds, notes & other debt instruments
U.S. dollars (continued) | Principal amount
(000) | Value
(000) |
| HSBC Holdings PLC 4.30% 2026 | $5,835 | $6,049 |
| Humana Inc. 3.85% 2024 | 4,000 | 4,097 |
| Humana Inc. 4.95% 2044 | 4,000 | 4,212 |
| Hungary 6.25% 2020 | 11,890 | 13,033 |
| Hungary 5.375% 2023 | 2,040 | 2,219 |
| Hungary 5.375% 2024 | 38,150 | 41,703 |
| Hungary 7.625% 2041 | 20,768 | 29,132 |
| Huntsman International LLC 4.875% 2020 | 2,615 | 2,723 |
| Hyundai Capital America 3.00% 20204 | 2,000 | 2,000 |
| Hyundai Capital Services Inc. 2.625% 20204 | 2,375 | 2,352 |
| Iberdrola Finance Ireland 5.00% 20194 | 5,000 | 5,338 |
| Icahn Enterprises Finance Corp. 3.50% 2017 | 4,125 | 4,135 |
| iHeartCommunications, Inc. 9.00% 2019 | 2,375 | 1,950 |
| Immucor, Inc. 11.125% 2019 | 530 | 501 |
| Imperial Tobacco Finance PLC 3.50% 20234 | 9,050 | 9,129 |
| Indonesia (Republic of) 4.875% 2021 | 4,300 | 4,563 |
| Indonesia (Republic of) 3.70% 20224 | 8,470 | 8,510 |
| Indonesia (Republic of) 3.75% 2022 | 23,845 | 23,994 |
| Indonesia (Republic of) 3.375% 2023 | 2,600 | 2,543 |
| Indonesia (Republic of) 4.125% 2025 | 4,750 | 4,718 |
| Indonesia (Republic of) 4.75% 2026 | 24,100 | 24,938 |
| Indonesia (Republic of) 6.75% 2044 | 950 | 1,152 |
| Indonesia (Republic of) 6.75% 20444 | 925 | 1,122 |
| Inmarsat PLC 4.875% 20224 | 2,875 | 2,810 |
| Inmarsat PLC 6.50% 20244 | 1,525 | 1,552 |
| Intelsat Jackson Holding Co. 7.25% 2019 | 4,625 | 3,908 |
| Intelsat Jackson Holding Co. 7.25% 2020 | 4,625 | 3,607 |
| International Paper Co. 7.30% 2039 | 1,410 | 1,799 |
| Intesa Sanpaolo SpA 5.017% 20244 | 22,455 | 20,761 |
| inVentiv Health, Inc. 9.00% 20184 | 6,305 | 6,318 |
| iStar Financial Inc. 4.00% 2017 | 3,300 | 3,325 |
| J.P. Morgan Chase Commercial Mortgage Securities Corp., Series 2007-CB18, Class A1A, 5.431% 20471,6 | 1,815 | 1,814 |
| J.P. Morgan Chase Commercial Mortgage Securities Corp., Series 2007-LDPX, Class A1A, 5.439% 20491 | 1,552 | 1,556 |
| J.P. Morgan Chase Commercial Mortgage Securities Corp., Series 2007-CB19, Class A1A, 5.713% 20491,6 | 6,471 | 6,516 |
| J.P. Morgan Chase Commercial Mortgage Securities Corp., Series 2007-CB19, Class A4, 5.713% 20491,6 | 6,366 | 6,405 |
| J.P. Morgan Chase Commercial Mortgage Securities Corp., Series 2007-C1, Class A4, 5.716% 20511 | 2,234 | 2,284 |
| J.P. Morgan Chase Commercial Mortgage Securities Corp., Series 2007-LD12, Class A1A, 5.85% 20511,6 | 2,076 | 2,099 |
| Johnson & Johnson 2.45% 2026 | 965 | 923 |
| Jordan (Hashemite Kingdom of) 6.125% 20264 | 325 | 329 |
| Jordan (Hashemite Kingdom of) 5.75% 20274 | 6,390 | 6,069 |
| JPMorgan Chase & Co. 2.40% 2021 | 2,200 | 2,179 |
| JPMorgan Chase & Co. 2.55% 2021 | 38,940 | 38,803 |
| JPMorgan Chase & Co. 2.70% 2023 | 9,525 | 9,317 |
| JPMorgan Chase & Co. 3.125% 2025 | 1,100 | 1,075 |
| Jupiter Resources Inc. 8.50% 20224 | 2,000 | 1,735 |
| Kenya (Republic of) 6.875% 2024 | 1,400 | 1,329 |
| Kimco Realty Corp. 6.875% 2019 | 6,875 | 7,703 |
| Kimco Realty Corp. 3.40% 2022 | 775 | 787 |
| Kimco Realty Corp. 2.70% 2024 | 2,750 | 2,632 |
| Kinder Morgan Energy Partners, LP 2.65% 2019 | 670 | 674 |
| Kinder Morgan Energy Partners, LP 3.50% 2021 | 3,960 | 4,021 |
| Kinder Morgan Energy Partners, LP 3.45% 2023 | 7,500 | 7,442 |
| Kinder Morgan Energy Partners, LP 3.50% 2023 | 3,990 | 3,943 |
| Kinder Morgan Energy Partners, LP 4.15% 2024 | 6,160 | 6,271 |
| Kinder Morgan Energy Partners, LP 4.25% 2024 | 70 | 72 |
Capital World Bond Fund — Page 14 of 27
Bonds, notes & other debt instruments
U.S. dollars (continued) | Principal amount
(000) | Value
(000) |
| Kinder Morgan Energy Partners, LP 5.50% 2044 | $12,650 | $12,920 |
| Kinder Morgan Finance Co. 5.05% 2046 | 1,233 | 1,223 |
| Kinder Morgan, Inc. 4.30% 2025 | 9,860 | 10,156 |
| Kinder Morgan, Inc. 5.55% 2045 | 7,850 | 8,271 |
| Kinetic Concepts, Inc. 9.625% 20214 | 3,000 | 3,187 |
| Kinetic Concepts, Inc. 12.50% 20214 | 10,425 | 10,972 |
| Korea Housing Finance Corp. 2.50% 20201,4 | 10,700 | 10,596 |
| Korea Housing Finance Corp. 2.00% 20211,4 | 15,625 | 14,982 |
| Kraft Heinz Co. 3.00% 2026 | 3,000 | 2,818 |
| Kraft Heinz Co. 4.375% 2046 | 4,120 | 3,885 |
| Kroger Co. 6.80% 2018 | 1,000 | 1,095 |
| Kronos Inc., Term Loan B, 9.25% 20241,5,6 | 2,350 | 2,426 |
| Laboratory Corporation of America Holdings 3.60% 2025 | 3,875 | 3,860 |
| LB Commercial Mortgage Trust, Series 2007-C3, Class A1A, multifamily 5.873% 20441,6 | 328 | 332 |
| LB-UBS Commercial Mortgage Trust, Series 2007-C2, Class A3, 5.43% 20401 | 690 | 691 |
| LB-UBS Commercial Mortgage Trust, Series 2007-C6, Class AM, 6.114% 20401,6 | 460 | 472 |
| LB-UBS Commercial Mortgage Trust, Series 2007-C7, Class AM, 6.159% 20451,6 | 2,110 | 2,179 |
| Leucadia National Corp. 5.50% 2023 | 1,375 | 1,457 |
| Ligado Networks, Term Loan, 9.75% 20201,5,6,7 | 14,201 | 13,195 |
| Lima Metro Line Finance Ltd. 5.875% 20341,4 | 9,385 | 9,948 |
| Limited Brands, Inc. 6.875% 2035 | 2,575 | 2,639 |
| Lithuania (Republic of) 7.375% 2020 | 11,200 | 12,793 |
| Lithuania (Republic of) 6.625% 20224 | 2,000 | 2,326 |
| Lockheed Martin Corp. 2.50% 2020 | 940 | 948 |
| Lockheed Martin Corp. 3.10% 2023 | 740 | 748 |
| Lockheed Martin Corp. 3.55% 2026 | 1,190 | 1,216 |
| LSC Communications, Inc. 8.75% 20234 | 1,025 | 1,033 |
| Macy’s Retail Holdings, Inc. 4.375% 2023 | 2,550 | 2,623 |
| Mallinckrodt PLC 4.875% 20204 | 3,810 | 3,843 |
| McClatchy Co. 9.00% 2022 | 1,925 | 2,060 |
| McDonald’s Corp. 3.70% 2026 | 2,860 | 2,913 |
| McDonald’s Corp. 4.70% 2035 | 1,245 | 1,319 |
| McDonald’s Corp. 4.875% 2045 | 925 | 993 |
| Medtronic, Inc. 3.50% 2025 | 15,800 | 16,266 |
| Medtronic, Inc. 4.625% 2045 | 3,000 | 3,246 |
| Merrill Lynch Mortgage Trust, Series 2007-C1, Class A4, 5.826% 20501,6 | 1,814 | 1,829 |
| MetroPCS Wireless, Inc. 6.25% 2021 | 2,850 | 2,971 |
| MetroPCS Wireless, Inc. 6.625% 2023 | 3,325 | 3,533 |
| Microsoft Corp. 2.40% 2026 | 6,730 | 6,360 |
| Microsoft Corp. 3.70% 2046 | 3,370 | 3,174 |
| MidAmerican Energy Co. 4.40% 2044 | 1,063 | 1,130 |
| ML-CFC Commercial Mortgage Trust, Series 2007-8, Class A3, 6.852% 20491,6 | 821 | 831 |
| Molina Healthcare, Inc. 5.375% 2022 | 3,955 | 4,034 |
| Morgan Stanley 2.625% 2021 | 2,000 | 1,976 |
| Morgan Stanley 3.125% 2026 | 5,740 | 5,487 |
| Morgan Stanley Capital I Trust, Series 2007-IQ13, Class AM, 5.406% 20441 | 965 | 964 |
| Morgan Stanley Capital I Trust, Series 2007-IQ15, Class A4, 5.902% 20491,6 | 175 | 178 |
| Morocco (Kingdom of) 4.25% 2022 | 5,700 | 5,839 |
| Morocco (Kingdom of) 4.25% 20224 | 2,500 | 2,561 |
| Morocco (Kingdom of) 5.50% 2042 | 10,000 | 10,287 |
| Morocco (Kingdom of) 5.50% 20424 | 1,500 | 1,543 |
| National Rural Utilities Cooperative Finance Corp. 10.375% 2018 | 3,250 | 3,748 |
| Navient Corp. 4.875% 2019 | 2,325 | 2,412 |
| Navient Corp. 5.50% 2023 | 240 | 234 |
| Navios Maritime Acquisition Corp. and Navios Acquisition Finance (US) Inc. 8.125% 20214 | 2,500 | 2,138 |
Capital World Bond Fund — Page 15 of 27
Bonds, notes & other debt instruments
U.S. dollars (continued) | Principal amount
(000) | Value
(000) |
| Navios Maritime Holdings Inc. 7.375% 20224 | $10,000 | $6,050 |
| NBC Universal Enterprise, Inc. 1.565% 20184,6 | 5,785 | 5,822 |
| NBC Universal Enterprise, Inc. 5.25% 20494 | 2,335 | 2,458 |
| Needle Merger Sub Corp. 8.125% 20194 | 1,207 | 1,204 |
| Neiman Marcus Group LTD Inc. 8.00% 20214 | 630 | 471 |
| New York State Electric & Gas Corp. 3.25% 20264 | 3,000 | 2,986 |
| Newell Rubbermaid Inc. 3.85% 2023 | 7,900 | 8,197 |
| Newell Rubbermaid Inc. 4.20% 2026 | 19,775 | 20,636 |
| Newell Rubbermaid Inc. 5.50% 2046 | 1,835 | 2,107 |
| NGL Energy Partners LP 6.875% 2021 | 5,550 | 5,703 |
| NGPL PipeCo LLC 9.625% 20194 | 6,440 | 6,778 |
| Niagara Mohawk Power Corp. 3.508% 20244 | 2,715 | 2,765 |
| Niagara Mohawk Power Corp. 4.278% 20344 | 6,670 | 6,790 |
| Nigeria (Federal Republic of) 6.375% 2023 | 4,925 | 4,784 |
| Noble Corp. PLC 5.25% 2018 | 140 | 140 |
| Noble Corp. PLC 7.20% 2025 | 2,230 | 2,102 |
| Noble Corp. PLC 8.20% 2045 | 3,170 | 2,655 |
| Novelis Corp. 5.875% 20264 | 1,125 | 1,139 |
| NRG Energy, Inc. 6.25% 2022 | 2,990 | 3,012 |
| NRG Energy, Inc. 6.625% 20274 | 2,775 | 2,636 |
| Odebrecht Drilling Norbe VIII/IX Ltd 6.35% 20211,4 | 5,005 | 2,290 |
| Odebrecht Offshore Drilling Finance Ltd. 6.75% 20221,4 | 4,118 | 1,132 |
| Pacific Gas and Electric Co. 3.25% 2023 | 2,565 | 2,618 |
| Pacific Gas and Electric Co. 3.85% 2023 | 1,335 | 1,409 |
| Pacific Gas and Electric Co. 2.95% 2026 | 3,015 | 2,955 |
| Pacific Gas and Electric Co. 3.75% 2042 | 2,840 | 2,670 |
| Pacific Gas and Electric Co. 4.25% 2046 | 9,100 | 9,267 |
| PacifiCorp. 3.35% 2025 | 3,230 | 3,277 |
| Pakistan (Islamic Republic of) 5.50% 20214 | 16,105 | 16,385 |
| Pakistan (Islamic Republic of) 8.25% 2024 | 6,800 | 7,386 |
| Pakistan (Islamic Republic of) 8.25% 2025 | 8,705 | 9,552 |
| Pemex Project Funding Master Trust, Series 13, 6.625% 2035 | 3,885 | 3,846 |
| PepsiCo, Inc. 1.70% 2021 | 2,900 | 2,819 |
| PepsiCo, Inc. 3.45% 2046 | 600 | 547 |
| Pernod Ricard SA 4.45% 20224 | 11,465 | 12,166 |
| Peru (Republic of) 4.125% 2027 | 6,710 | 7,004 |
| Peru (Republic of) 5.625% 2050 | 1,275 | 1,447 |
| Petrobras Global Finance Co. 8.75% 2026 | 6,850 | 7,407 |
| Petrobras Global Finance Co. 6.85% 2115 | 9,620 | 7,840 |
| Petrobras International Finance Co. 5.75% 2020 | 2,600 | 2,639 |
| Petrobras International Finance Co. 6.75% 2041 | 250 | 211 |
| Petróleos Mexicanos 5.50% 2021 | 1,070 | 1,102 |
| Petróleos Mexicanos 6.375% 20214 | 1,455 | 1,553 |
| Petróleos Mexicanos 4.875% 2022 | 5,665 | 5,696 |
| Petróleos Mexicanos 5.375% 20224 | 1,110 | 1,138 |
| Petróleos Mexicanos 4.875% 2024 | 1,115 | 1,084 |
| Petróleos Mexicanos 4.50% 2026 | 3,000 | 2,740 |
| Petróleos Mexicanos 6.875% 20264 | 4,875 | 5,155 |
| Petróleos Mexicanos 6.50% 20274 | 2,930 | 3,026 |
| Petróleos Mexicanos 6.50% 2041 | 2,470 | 2,326 |
| Petróleos Mexicanos 5.50% 2044 | 1,765 | 1,478 |
| Petróleos Mexicanos 6.375% 2045 | 7,000 | 6,405 |
| Petróleos Mexicanos 5.625% 2046 | 10,225 | 8,525 |
| Petróleos Mexicanos 6.75% 20474 | 3,760 | 3,562 |
| Pfizer Inc. 7.20% 2039 | 107 | 155 |
Capital World Bond Fund — Page 16 of 27
Bonds, notes & other debt instruments
U.S. dollars (continued) | Principal amount
(000) | Value
(000) |
| Philip Morris International Inc. 4.25% 2044 | $2,125 | $2,099 |
| Philippines (Republic of the) 4.20% 2024 | 9,100 | 9,800 |
| Philippines (Republic of the) 9.50% 2030 | 2,071 | 3,271 |
| Philippines (Republic of the) 7.75% 2031 | 2,366 | 3,338 |
| Phillips 66 Partners LP 3.605% 2025 | 275 | 269 |
| Phillips 66 Partners LP 3.55% 2026 | 225 | 218 |
| Phillips 66 Partners LP 4.68% 2045 | 565 | 526 |
| Phillips 66 Partners LP 4.90% 2046 | 185 | 178 |
| Pioneer Natural Resources Co. 3.45% 2021 | 350 | 358 |
| Ply Gem Industries, Inc. 6.50% 2022 | 3,550 | 3,679 |
| PNC Bank 2.40% 2019 | 8,000 | 8,073 |
| PNC Bank 2.30% 2020 | 3,820 | 3,818 |
| PNC Bank 2.60% 2020 | 1,250 | 1,260 |
| PNC Funding Corp. 3.30% 2022 | 4,000 | 4,111 |
| Progress Energy, Inc. 7.05% 2019 | 4,380 | 4,843 |
| Progress Energy, Inc. 7.75% 2031 | 1,990 | 2,740 |
| Prologis, Inc. 3.35% 2021 | 1,100 | 1,132 |
| Prologis, Inc. 4.25% 2023 | 10,295 | 10,933 |
| Prologis, Inc. 3.75% 2025 | 2,790 | 2,860 |
| Puget Energy, Inc. 6.50% 2020 | 1,475 | 1,663 |
| Puget Energy, Inc. 6.00% 2021 | 4,629 | 5,185 |
| Puget Energy, Inc. 5.625% 2022 | 2,120 | 2,348 |
| Qatar (State of) 4.50% 20224 | 3,500 | 3,749 |
| QGOG Atlantic/Alaskan Rigs Ltd. 5.25% 20191,4 | 1,859 | 1,784 |
| QGOG Constellation SA 6.25% 20194 | 5,350 | 3,558 |
| Qorvo, Inc. 7.00% 2025 | 2,375 | 2,642 |
| Quintiles Transnational Corp. 4.875% 20234 | 1,995 | 2,035 |
| R.R. Donnelley & Sons Co. 7.875% 2021 | 1,750 | 1,811 |
| R.R. Donnelley & Sons Co. 6.50% 2023 | 2,475 | 2,422 |
| Rabobank Nederland 4.625% 2023 | 12,180 | 12,820 |
| Ras Laffan Liquefied Natural Gas III 5.838% 20271,4 | 8,000 | 8,960 |
| Rayonier Advanced Materials Inc. 5.50% 20244 | 1,570 | 1,476 |
| RCI Banque 3.50% 20184 | 9,400 | 9,570 |
| Reynolds American Inc. 2.30% 2018 | 1,020 | 1,027 |
| Reynolds American Inc. 3.25% 2020 | 2,830 | 2,900 |
| Reynolds American Inc. 4.00% 2022 | 4,050 | 4,237 |
| Reynolds American Inc. 4.45% 2025 | 17,085 | 18,047 |
| Reynolds American Inc. 5.70% 2035 | 215 | 247 |
| Reynolds American Inc. 6.15% 2043 | 3,750 | 4,533 |
| Reynolds American Inc. 5.85% 2045 | 1,840 | 2,183 |
| Reynolds Group Inc. 5.75% 2020 | 2,020 | 2,086 |
| Rio Tinto Finance PLC 3.75% 2025 | 8,990 | 9,262 |
| Rio Tinto PLC 4.125% 2042 | 1,500 | 1,476 |
| Roche Holdings, Inc. 2.25% 20194 | 750 | 756 |
| Roche Holdings, Inc. 2.875% 20214 | 6,350 | 6,457 |
| Roche Holdings, Inc. 3.35% 20244 | 8,475 | 8,673 |
| Roche Holdings, Inc. 2.375% 20274 | 4,475 | 4,187 |
| Rowan Companies Inc. 7.375% 2025 | 325 | 332 |
| Royal Dutch Shell PLC 1.375% 2019 | 9,000 | 8,873 |
| Royal Dutch Shell PLC 1.75% 2021 | 8,920 | 8,666 |
| Royal Dutch Shell PLC 2.50% 2026 | 85 | 80 |
| Royal Dutch Shell PLC 3.75% 2046 | 770 | 709 |
| Ryerson Inc. 11.00% 20224 | 5,690 | 6,273 |
| Sabine Pass Liquefaction, LLC 5.625% 2021 | 4,325 | 4,649 |
| Sabine Pass Liquefaction, LLC 5.75% 2024 | 1,750 | 1,886 |
Capital World Bond Fund — Page 17 of 27
Bonds, notes & other debt instruments
U.S. dollars (continued) | Principal amount
(000) | Value
(000) |
| Sabine Pass Liquefaction, LLC 5.625% 2025 | $1,890 | $2,029 |
| Sabine Pass Liquefaction, LLC 5.00% 20274 | 1,225 | 1,240 |
| Saudi Arabia (Kingdom of) 2.375% 20214 | 3,975 | 3,863 |
| Saudi Arabia (Kingdom of) 3.25% 20264 | 17,880 | 16,975 |
| Scentre Group 2.375% 20214 | 1,425 | 1,402 |
| Scentre Group 3.25% 20254 | 1,395 | 1,347 |
| Scentre Group 3.50% 20254 | 3,800 | 3,751 |
| Schlumberger BV 4.00% 20254 | 8,105 | 8,492 |
| Scottish Power PLC 5.81% 2025 | 2,500 | 2,781 |
| Seagate Technology LLC 4.75% 2023 | 2,275 | 2,257 |
| Select Income REIT 4.15% 2022 | 1,815 | 1,798 |
| Shell International Finance BV 3.25% 2025 | 825 | 824 |
| Shell International Finance BV 2.875% 2026 | 1,655 | 1,600 |
| Shire PLC 1.90% 2019 | 9,000 | 8,888 |
| Shire PLC 2.40% 2021 | 21,065 | 20,352 |
| Shire PLC 2.875% 2023 | 4,625 | 4,397 |
| Shire PLC 3.20% 2026 | 3,890 | 3,638 |
| Siemens AG 2.35% 20264 | 1,500 | 1,388 |
| Siemens AG 4.40% 20454 | 3,000 | 3,162 |
| Silver II Borrower S.C.A./Silver II U.S. Holdings, LLC 7.75% 20204 | 5,390 | 4,514 |
| Skandinaviska Enskilda Banken AB 2.625% 2021 | 10,975 | 10,983 |
| Slovenia (Republic of) 4.75% 20184 | 1,215 | 1,260 |
| Slovenia (Republic of) 5.50% 2022 | 46,940 | 51,973 |
| Slovenia (Republic of) 5.85% 2023 | 25,550 | 28,826 |
| Slovenia (Republic of) 5.25% 2024 | 4,160 | 4,568 |
| SM Energy Co. 5.625% 2025 | 1,450 | 1,407 |
| SoftBank Corp. 4.50% 20204 | 5,550 | 5,703 |
| Solera Holdings, Inc. 10.50% 20244 | 1,125 | 1,271 |
| Sotheby’s Holdings, Inc. 5.25% 20224 | 1,530 | 1,511 |
| South Korea (Republic of) 7.125% 2019 | 1,080 | 1,212 |
| Southwestern Energy Co. 4.10% 2022 | 4,840 | 4,597 |
| Spectra Energy Partners, LP 3.375% 2026 | 510 | 488 |
| Starwood Property Trust, Inc. 5.00% 20214 | 500 | 508 |
| Statoil ASA 2.75% 2021 | 465 | 469 |
| Statoil ASA 3.25% 2024 | 1,500 | 1,520 |
| Statoil ASA 3.70% 2024 | 6,325 | 6,619 |
| Statoil ASA 4.25% 2041 | 1,500 | 1,498 |
| Sunoco LP 6.25% 2021 | 2,730 | 2,788 |
| Sweden (Kingdom of) 1.125% 20194 | 11,760 | 11,587 |
| Talen Energy Corp. 4.625% 20194 | 2,150 | 2,048 |
| Targa Resources Corp. 4.125% 2019 | 3,175 | 3,231 |
| Targa Resources Partners LP 6.75% 2024 | 1,815 | 1,956 |
| TC PipeLines, LP 4.375% 2025 | 1,405 | 1,417 |
| Teco Finance, Inc. 5.15% 2020 | 270 | 287 |
| Teekay Corp. 8.50% 2020 | 9,109 | 8,699 |
| Tenet Healthcare Corp. 4.375% 2021 | 1,200 | 1,188 |
| Tenet Healthcare Corp., First Lien, 4.75% 2020 | 1,450 | 1,465 |
| Tenet Healthcare Corp., First Lien, 6.00% 2020 | 1,525 | 1,594 |
| Tenet Healthcare Corp., First Lien, 4.50% 2021 | 5,600 | 5,600 |
| Tennessee Valley Authority 5.88% 2036 | 2,250 | 2,982 |
| Tennessee Valley Authority 5.25% 2039 | 6,000 | 7,546 |
| Tesoro Logistics LP 5.50% 2019 | 1,930 | 2,051 |
| Tesoro Logistics LP 5.25% 2025 | 975 | 999 |
| Teva Pharmaceutical Finance Company BV 1.40% 2018 | 1,710 | 1,696 |
| Teva Pharmaceutical Finance Company BV 2.20% 2021 | 3,320 | 3,177 |
Capital World Bond Fund — Page 18 of 27
Bonds, notes & other debt instruments
U.S. dollars (continued) | Principal amount
(000) | Value
(000) |
| Teva Pharmaceutical Finance Company BV 2.80% 2023 | $1,460 | $1,382 |
| Teva Pharmaceutical Finance Company BV 3.15% 2026 | 2,855 | 2,634 |
| Teva Pharmaceutical Finance Company BV 4.10% 2046 | 4,420 | 3,795 |
| TEX Operations Co. LLC, Term Loan B, 5.00% 20231,5,6 | 1,221 | 1,233 |
| TEX Operations Co. LLC, Term Loan C, 5.00% 20231,5,6 | 279 | 281 |
| Thermo Fisher Scientific Inc. 2.40% 2019 | 1,725 | 1,738 |
| Thomson Reuters Corp. 4.30% 2023 | 4,250 | 4,448 |
| Thomson Reuters Corp. 5.65% 2043 | 2,980 | 3,289 |
| TI Automotive Ltd. 8.75% 20234 | 2,335 | 2,452 |
| T-Mobile US, Inc. 6.50% 2026 | 550 | 596 |
| Total Capital International 2.875% 2022 | 1,115 | 1,123 |
| Toyota Motor Credit Corp. 1.45% 2018 | 1,450 | 1,450 |
| Toyota Motor Credit Corp. 1.55% 2019 | 600 | 593 |
| Toyota Motor Credit Corp. 1.70% 2019 | 3,000 | 2,990 |
| Toyota Motor Credit Corp. 2.15% 2020 | 3,500 | 3,493 |
| TransCanada PipeLines Ltd. 6.50% 2018 | 5,000 | 5,351 |
| TransCanada PipeLines Ltd. 7.125% 2019 | 3,035 | 3,331 |
| TransCanada PipeLines Ltd. 7.625% 2039 | 2,000 | 2,864 |
| TransCanada PipeLines Ltd., junior subordinated 5.625% 2075 | 650 | 658 |
| Transocean Inc. 9.00% 20234 | 875 | 901 |
| Transportadora de Gas Peru SA 4.25% 20281,4 | 7,560 | 7,484 |
| Trilogy International Partners, LLC 13.375% 20194 | 7,175 | 7,390 |
| Turkey (Republic of) 6.25% 2022 | 6,285 | 6,548 |
| Turkey (Republic of) 4.875% 2026 | 7,400 | 6,866 |
| U.S. Treasury 1.875% 2017 | 16,500 | 16,621 |
| U.S. Treasury 0.75% 2018 | 25,000 | 24,821 |
| U.S. Treasury 1.00% 2018 | 9,900 | 9,869 |
| U.S. Treasury 1.375% 2018 | 5,450 | 5,471 |
| U.S. Treasury 0.75% 2019 | 17,000 | 16,740 |
| U.S. Treasury 1.375% 2019 | 1,510 | 1,506 |
| U.S. Treasury 1.50% 2019 | 28,750 | 28,820 |
| U.S. Treasury 1.625% 201910 | 125,550 | 126,507 |
| U.S. Treasury 1.625% 2019 | 4,746 | 4,779 |
| U.S. Treasury 1.75% 2019 | 74,350 | 75,082 |
| U.S. Treasury 1.25% 2020 | 33,610 | 33,363 |
| U.S. Treasury 1.375% 202010 | 120,450 | 119,697 |
| U.S. Treasury 1.50% 2020 | 13,000 | 12,961 |
| U.S. Treasury 1.625% 2020 | 20,000 | 19,988 |
| U.S. Treasury 1.625% 2020 | 4,030 | 4,032 |
| U.S. Treasury 1.75% 2020 | 34,200 | 34,192 |
| U.S. Treasury 2.00% 2020 | 10,800 | 10,923 |
| U.S. Treasury 2.125% 2020 | 18,300 | 18,595 |
| U.S. Treasury 1.125% 2021 | 334,210 | 325,229 |
| U.S. Treasury 1.125% 2021 | 28,100 | 27,164 |
| U.S. Treasury 1.125% 2021 | 2,900 | 2,807 |
| U.S. Treasury 1.25% 2021 | 6,600 | 6,400 |
| U.S. Treasury 1.75% 2021 | 33,800 | 33,552 |
| U.S. Treasury 2.00% 2021 | 82,150 | 82,484 |
| U.S. Treasury 2.00% 2021 | 94 | 94 |
| U.S. Treasury 2.125% 2021 | 13,900 | 14,024 |
| U.S. Treasury 8.00% 2021 | 21,900 | 28,049 |
| U.S. Treasury 2.125% 2022 | 6,300 | 6,323 |
| U.S. Treasury 1.375% 2023 | 13,200 | 12,511 |
| U.S. Treasury 1.375% 2023 | 6,900 | 6,536 |
| U.S. Treasury 1.375% 2023 | 5,100 | 4,846 |
Capital World Bond Fund — Page 19 of 27
Bonds, notes & other debt instruments
U.S. dollars (continued) | Principal amount
(000) | Value
(000) |
| U.S. Treasury 1.75% 2023 | $1,750 | $1,710 |
| U.S. Treasury 2.125% 2023 | 10,200 | 10,136 |
| U.S. Treasury 2.50% 2024 | 76,900 | 78,087 |
| U.S. Treasury 2.25% 2025 | 12,600 | 12,442 |
| U.S. Treasury 2.00% 2026 | 17,330 | 16,680 |
| U.S. Treasury 2.875% 2043 | 30,630 | 29,537 |
| U.S. Treasury 3.00% 2045 | 61,450 | 60,443 |
| U.S. Treasury 2.25% 2046 | 35,959 | 30,148 |
| U.S. Treasury 2.50% 2046 | 8,000 | 7,089 |
| U.S. Treasury 2.50% 2046 | 7,300 | 6,468 |
| U.S. Treasury 2.875% 2046 | 136,775 | 131,692 |
| U.S. Treasury Inflation-Protected Security 0.125% 20242 | 28,046 | 27,593 |
| U.S. Treasury Inflation-Protected Security 0.625% 20242 | 152,423 | 155,306 |
| U.S. Treasury Inflation-Protected Security 0.25% 20252 | 29,943 | 29,482 |
| U.S. Treasury Inflation-Protected Security 0.375% 20252 | 27,011 | 26,891 |
| U.S. Treasury Inflation-Protected Security 2.375% 20252 | 7,053 | 8,102 |
| U.S. Treasury Inflation-Protected Security 0.625% 20262 | 55,442 | 55,973 |
| U.S. Treasury Inflation-Protected Security 1.375% 20442 | 42,482 | 46,482 |
| U.S. Treasury Inflation-Protected Security 0.75% 20452 | 5,317 | 5,023 |
| U.S. Treasury Inflation-Protected Security 1.00% 20462 | 144,770 | 145,692 |
| United Mexican States 5.125% 2020 | 300 | 323 |
| United Mexican States 3.625% 2022 | 4,020 | 4,038 |
| United Mexican States 4.75% 2044 | 13,780 | 12,560 |
| United Rentals, Inc. 5.50% 2025 | 1,025 | 1,049 |
| UnitedHealth Group Inc. 2.70% 2020 | 2,330 | 2,365 |
| UnitedHealth Group Inc. 3.75% 2025 | 2,160 | 2,236 |
| Vale Overseas Ltd. 5.875% 2021 | 845 | 887 |
| Vale Overseas Ltd. 4.375% 2022 | 255 | 251 |
| Vale Overseas Ltd. 6.25% 2026 | 7,690 | 8,017 |
| Valero Energy Partners LP 4.375% 2026 | 955 | 968 |
| State of California, Various Purpose G.O. Bonds, 7.55% 2039 | 2,720 | 4,050 |
| State of California, Various Purpose G.O. Bonds, 7.60% 2040 | 7,770 | 11,724 |
| State of California, Various Purpose G.O. Bonds, 7.625% 2040 | 11,850 | 17,453 |
| VEB Finance Ltd. 6.902% 20204 | 6,600 | 7,150 |
| Venezuela (Bolivarian Republic of) 12.75% 20221 | 340 | 213 |
| Venezuela (Bolivarian Republic of) 8.25% 2024 | 1,035 | 486 |
| Venezuela (Bolivarian Republic of) 7.65% 2025 | 400 | 184 |
| Venezuela (Bolivarian Republic of) 11.75% 2026 | 675 | 385 |
| Venezuela (Bolivarian Republic of) 9.25% 2027 | 1,540 | 789 |
| Venezuela (Bolivarian Republic of) 9.25% 2028 | 170 | 79 |
| Venezuela (Bolivarian Republic of) 11.95% 20311 | 980 | 551 |
| Venezuela (Bolivarian Republic of) 9.375% 2034 | 155 | 72 |
| Venezuela (Bolivarian Republic of) 7.00% 2038 | 220 | 94 |
| Verizon Communications Inc. 1.351% 20176 | 2,010 | 2,012 |
| Verizon Communications Inc. 1.75% 2021 | 200 | 192 |
| Verizon Communications Inc. 2.625% 2026 | 2,495 | 2,298 |
| Verizon Communications Inc. 4.272% 2036 | 14,748 | 14,138 |
| Verizon Communications Inc. 3.85% 2042 | 6,036 | 5,241 |
| Verizon Communications Inc. 4.522% 2048 | 9,780 | 9,398 |
| Verizon Owner Trust, Series 2016-1A, Class A, 1.42% 20211,4 | 1,610 | 1,600 |
| Virgin Australia Holdings Ltd. 8.50% 20194 | 1,150 | 1,197 |
| Volkswagen Group of America Finance, LLC 2.45% 20194 | 2,320 | 2,315 |
| VPI Escrow Corp. 6.75% 20184 | 1,275 | 1,214 |
| VPI Escrow Corp. 6.375% 20204 | 10,625 | 9,181 |
| Wachovia Bank Commercial Mortgage Trust, Series 2007-C30, Class A5, 5.342% 20431 | 66 | 66 |
Capital World Bond Fund — Page 20 of 27
Bonds, notes & other debt instruments
U.S. dollars (continued) | Principal amount
(000) | Value
(000) |
| Wachovia Bank Commercial Mortgage Trust, Series 2007-C31, Class A5, 5.50% 20471 | $900 | $905 |
| Wachovia Bank Commercial Mortgage Trust, Series 2007-C31, Class AM, 5.591% 20471,6 | 1,270 | 1,278 |
| Wachovia Bank Commercial Mortgage Trust, Series 2007-C32, Class A3, 5.707% 20491,6 | 390 | 393 |
| Walgreens Boots Alliance, Inc. 1.75% 2018 | 5,300 | 5,306 |
| Walgreens Boots Alliance, Inc. 2.60% 2021 | 1,650 | 1,640 |
| Walgreens Boots Alliance, Inc. 3.10% 2023 | 1,445 | 1,436 |
| WEA Finance LLC 1.75% 20174 | 5,435 | 5,439 |
| WEA Finance LLC 2.70% 20194 | 9,285 | 9,393 |
| WEA Finance LLC 3.25% 20204 | 10,190 | 10,368 |
| WEA Finance LLC 3.75% 20244 | 3,380 | 3,418 |
| Weatherford International PLC 4.50% 2022 | 3,260 | 2,844 |
| Weatherford International PLC 8.25% 2023 | 2,575 | 2,626 |
| Weatherford International PLC 9.875% 20244 | 1,350 | 1,442 |
| Weatherford International PLC 6.50% 2036 | 1,325 | 1,070 |
| Weatherford International PLC 6.75% 2040 | 3,560 | 2,866 |
| Weingarten Realty Investors 3.25% 2026 | 255 | 241 |
| WellPoint, Inc. 2.30% 2018 | 2,645 | 2,663 |
| Wells Fargo & Co. 2.50% 2021 | 877 | 870 |
| Wells Fargo & Co. 3.00% 2026 | 1,500 | 1,428 |
| Western Digital Corp. 7.375% 20234 | 1,425 | 1,571 |
| Western Gas Partners LP 2.60% 2018 | 130 | 130 |
| Western Gas Partners LP 3.95% 2025 | 455 | 449 |
| Western Gas Partners LP 4.65% 2026 | 855 | 886 |
| Whiting Petroleum Corp. 6.50% 2018 | 360 | 360 |
| Williams Companies, Inc. 3.70% 2023 | 3,280 | 3,182 |
| Williams Partners LP 4.125% 2020 | 1,625 | 1,690 |
| Williams Partners LP 5.25% 2020 | 10,405 | 11,118 |
| Williams Partners LP 4.50% 2023 | 3,860 | 3,967 |
| Williams Partners LP 4.30% 2024 | 6,735 | 6,804 |
| Williams Partners LP 3.90% 2025 | 1,925 | 1,889 |
| Williams Partners LP 4.00% 2025 | 965 | 955 |
| Williams Partners LP 4.90% 2045 | 1,670 | 1,546 |
| Williams Partners LP 5.10% 2045 | 1,152 | 1,097 |
| Wind Acquisition SA 4.75% 20204 | 1,000 | 1,013 |
| Wind Acquisition SA 7.375% 20214 | 8,375 | 8,731 |
| Windstream Holdings, Inc. 7.75% 2021 | 6,575 | 6,792 |
| WM. Wrigley Jr. Co 3.375% 20204 | 5,270 | 5,418 |
| WPP Finance 2010 3.75% 2024 | 4,000 | 4,028 |
| Wynn Las Vegas, LLC and Wynn Capital Corp. 4.25% 20234 | 1,750 | 1,673 |
| Wynn Las Vegas, LLC and Wynn Capital Corp. 5.50% 20254 | 575 | 572 |
| Wynn Macau, Ltd. 5.25% 20214 | 4,600 | 4,657 |
| Xstrata Canada Financial Corp. 4.95% 20214 | 2,500 | 2,678 |
| Zambia (Republic of) 8.97% 20271,4 | 15,230 | 15,078 |
| ZF Friedrichshafen AG 4.50% 20224 | 755 | 781 |
| ZF Friedrichshafen AG 4.75% 20254 | 2,225 | 2,272 |
| Ziggo Bond Finance BV 5.50% 20274 | 2,925 | 2,859 |
| Zimmer Holdings, Inc. 3.15% 2022 | 3,530 | 3,521 |
| | | 5,545,324 |
| Total bonds, notes & other debt instruments (cost: $11,954,146,000) | | 11,435,644 |
Capital World Bond Fund — Page 21 of 27
Convertible stocks 0.03%
U.S. dollars 0.01% | Shares | Value
(000) |
| CEVA Group PLC, Series A-2, 3.022% convertible preferred6,8,11 | 1,141 | $285 |
| CEVA Group PLC, Series A-1, 4.022% convertible preferred6,8,11 | 719 | 252 |
| | | 537 |
| Miscellaneous 0.02% | | |
| Other convertible stocks in initial period of acquisition | | 2,640 |
| Total convertible stocks (cost: $5,056,000) | | 3,177 |
Common stocks 0.04%
U.S. dollars 0.04% | | |
| Warrior Met Coal, LLC, Class B4,8,12 | 5,787 | 1,997 |
| Warrior Met Coal, LLC, Class A4,8,12 | 1,957 | 675 |
| Corporate Risk Holdings I, Inc.8,12 | 91,424 | 1,042 |
| Corporate Risk Holdings Corp.8,12 | 462 | — |
| NII Holdings, Inc.12 | 370,274 | 796 |
| CEVA Group PLC8,11,12 | 527 | 132 |
| Atrium Corp.4,8,12 | 191 | — |
| Total common stocks (cost: $9,903,000) | | 4,642 |
Rights & warrants 0.00%
Miscellaneous 0.00% | | |
| Other rights & warrants in initial period of acquisition | | — |
| Total rights & warrants (cost: $0) | | — |
| Short-term securities 4.26% | Principal amount
(000) | |
| Bank of Montreal 1.08% due 3/21/2017 | $ 40,000 | 39,908 |
| Bank of Nova Scotia 1.03% due 1/17/20174 | 52,100 | 52,085 |
| Bank of Tokyo-Mitsubishi UFJ, Ltd. 0.65%–0.72% due 1/4/2017–2/1/2017 | 72,600 | 72,583 |
| General Electric Co. 0.60% due 1/3/2017 | 4,450 | 4,450 |
| JPMorgan Chase & Co. 1.03% due 3/13/2017 | 50,000 | 50,017 |
| Liberty Street Funding Corp. 0.97% due 3/8/20174 | 40,000 | 39,938 |
| Mizuho Bank, Ltd. 0.70%–0.89% due 1/30/2017–2/21/20174 | 80,000 | 79,926 |
| Sumitomo Mitsui Banking Corp. 1.00% due 4/4/20174 | 40,000 | 39,898 |
| Toronto-Dominion Holdings USA Inc. 0.60%–0.69% due 1/10/2017–1/31/20174 | 75,000 | 74,979 |
| U.S. Treasury Bills 0.44% due 2/16/2017 | 5,000 | 4,997 |
| Victory Receivables Corp. 1.10% due 3/10/20174 | 50,000 | 49,918 |
| Total short-term securities (cost: $508,635,000) | | 508,699 |
| Total investment securities 100.11% (cost: $12,477,740,000) | | 11,952,162 |
| Other assets less liabilities (0.11)% | | (13,122) |
| Net assets 100.00% | | $11,939,040 |
Capital World Bond Fund — Page 22 of 27
Forward currency contracts
The fund has entered into forward currency contracts as shown in the following table. The average month-end notional amount of open forward currency contracts while held was $2,468,225,000.
| | Settlement
date | Counterparty | Contract amount | Unrealized
(depreciation)
appreciation
at 12/31/2016
(000) |
Receive
(000) | Deliver
(000) |
| Purchases: | | | | | |
| Euros | 1/6/2017 | UBS AG | €74,700 | $81,619 | $(2,945) |
| Euros | 1/9/2017 | Citibank | €45,000 | $48,623 | (1,222) |
| Euros | 1/10/2017 | HSBC Bank | €50,979 | $55,043 | (1,341) |
| Euros | 1/12/2017 | Barclays Bank PLC | €32,924 | $35,078 | (391) |
| Euros | 1/19/2017 | Bank of America, N.A. | €47,856 | $51,451 | (1,017) |
| Japanese yen | 1/6/2017 | JPMorgan Chase | ¥15,248,338 | $137,500 | (6,953) |
| Japanese yen | 1/11/2017 | HSBC Bank | ¥11,675,659 | $103,150 | (3,165) |
| Japanese yen | 1/12/2017 | JPMorgan Chase | ¥1,246,991 | $12,050 | (1,371) |
| Japanese yen | 1/19/2017 | JPMorgan Chase | ¥17,090,369 | $150,708 | (4,293) |
| Japanese yen | 1/20/2017 | JPMorgan Chase | ¥6,522,912 | $56,800 | (915) |
| Japanese yen | 1/20/2017 | JPMorgan Chase | ¥4,075,718 | $35,836 | (918) |
| Japanese yen | 1/26/2017 | Bank of America, N.A. | ¥10,852,733 | $94,550 | (1,540) |
| Japanese yen | 2/16/2017 | HSBC Bank | ¥12,195,000 | $106,108 | (1,508) |
| Japanese yen | 2/24/2017 | HSBC Bank | ¥4,334,444 | $36,867 | 322 |
| Norwegian kroner | 1/13/2017 | Bank of America, N.A. | NKr213,338 | $25,269 | (560) |
| Norwegian kroner | 1/24/2017 | Barclays Bank PLC | NKr207,685 | $23,985 | 72 |
| South African rand | 1/26/2017 | Bank of America, N.A. | ZAR26,104 | $1,842 | 48 |
| Swedish kronor | 1/24/2017 | Barclays Bank PLC | SKr197,119 | $21,046 | 628 |
| Swedish kronor | 2/16/2017 | Barclays Bank PLC | SKr154,107 | $16,879 | 87 |
| | | | | | $(26,982) |
| Sales: | | | | | |
| Australian dollars | 1/9/2017 | JPMorgan Chase | $16,829 | A$22,500 | $597 |
| Australian dollars | 1/11/2017 | Bank of America, N.A. | $31,412 | A$42,550 | 716 |
| Australian dollars | 1/19/2017 | JPMorgan Chase | $2,434 | A$3,200 | 126 |
| Australian dollars | 1/20/2017 | JPMorgan Chase | $11,163 | A$15,000 | 345 |
| Australian dollars | 1/20/2017 | JPMorgan Chase | $4,480 | A$6,000 | 152 |
| Australian dollars | 1/25/2017 | UBS AG | $69,411 | A$95,300 | 687 |
| Australian dollars | 1/25/2017 | JPMorgan Chase | €7,025 | A$10,000 | 194 |
| Brazilian reais | 4/3/2017 | Citibank | $12 | BRL41 | —13 |
| Brazilian reais | 4/3/2017 | Citibank | $1,024 | BRL3,600 | (54) |
| Brazilian reais | 4/3/2017 | Citibank | $34,605 | BRL121,400 | (1,749) |
| British pounds | 1/9/2017 | Bank of America, N.A. | $5,483 | £4,300 | 181 |
| British pounds | 1/10/2017 | HSBC Bank | €20,181 | £17,100 | 177 |
| British pounds | 1/24/2017 | Bank of New York Mellon | $8,349 | £6,700 | 86 |
| British pounds | 1/26/2017 | Bank of America, N.A. | $4,446 | £3,500 | 129 |
| British pounds | 2/17/2017 | Bank of New York Mellon | $18,451 | £14,800 | 189 |
| Canadian dollars | 1/10/2017 | JPMorgan Chase | $3,775 | C$5,000 | 51 |
| Canadian dollars | 1/20/2017 | Barclays Bank PLC | $8,286 | C$11,000 | 91 |
| Canadian dollars | 1/23/2017 | JPMorgan Chase | €11,489 | C$16,000 | 190 |
| Canadian dollars | 1/23/2017 | Bank of America, N.A. | €11,488 | C$16,000 | 189 |
| Canadian dollars | 1/23/2017 | Bank of America, N.A. | $23,337 | C$31,150 | 129 |
| Chilean pesos | 1/20/2017 | Citibank | $94,295 | CLP62,796,000 | 691 |
| Colombian pesos | 1/11/2017 | JPMorgan Chase | $14,836 | COP45,946,200 | (433) |
| Colombian pesos | 1/11/2017 | Citibank | $20,591 | COP63,665,807 | (567) |
| Colombian pesos | 1/13/2017 | Bank of America, N.A. | $375 | COP1,158,000 | (10) |
| Euros | 1/6/2017 | JPMorgan Chase | $45,149 | €42,700 | 178 |
| Euros | 1/9/2017 | Citibank | SKr227,831 | €23,200 | 590 |
| Euros | 1/9/2017 | UBS AG | $8,292 | €7,680 | 203 |
Capital World Bond Fund — Page 23 of 27
| | Settlement
date | Counterparty | Contract amount | Unrealized
(depreciation)
appreciation
at 12/31/2016
(000) |
Receive
(000) | Deliver
(000) |
| Euros | 1/11/2017 | Citibank | NKr90,454 | €10,000 | $(58) |
| Euros | 1/12/2017 | HSBC Bank | ¥4,109,404 | €33,800 | (416) |
| Euros | 1/13/2017 | HSBC Bank | NKr38,866 | €4,325 | (55) |
| Euros | 1/19/2017 | Bank of America, N.A. | $8,843 | €8,250 | 148 |
| Euros | 1/19/2017 | UBS AG | $3,057 | €2,830 | 75 |
| Euros | 1/19/2017 | Bank of America, N.A. | $100,865 | €97,025 | (1,387) |
| Euros | 1/20/2017 | Citibank | SKr117,089 | €12,000 | 224 |
| Euros | 1/20/2017 | Citibank | £80,649 | €96,000 | (1,722) |
| Euros | 1/23/2017 | JPMorgan Chase | £52,915 | €62,850 | (990) |
| Euros | 1/24/2017 | Bank of America, N.A. | CZK269,450 | €10,000 | (31) |
| Euros | 1/26/2017 | Citibank | SKr181,406 | €18,550 | 393 |
| Euros | 2/3/2017 | Citibank | $10,526 | €9,500 | 507 |
| Euros | 2/7/2017 | HSBC Bank | $5,018 | €4,500 | 272 |
| Euros | 2/17/2017 | Citibank | $11,355 | €10,730 | 32 |
| Euros | 2/24/2017 | Citibank | $2,672 | €2,500 | 33 |
| Euros | 2/24/2017 | Bank of America, N.A. | $25,098 | €24,000 | (235) |
| Euros | 3/15/2017 | Citibank | $18,954 | €17,775 | 172 |
| Hungarian forints | 1/10/2017 | HSBC Bank | €14,316 | HUF4,500,000 | (243) |
| Indian rupees | 1/11/2017 | UBS AG | $31,951 | INR2,200,000 | (426) |
| Indian rupees | 1/11/2017 | JPMorgan Chase | $38,134 | INR2,625,500 | (506) |
| Indonesian rupiah | 1/13/2017 | JPMorgan Chase | $2,141 | IDR28,589,600 | 23 |
| Israeli shekels | 1/9/2017 | Bank of America, N.A. | $2,393 | ILS9,100 | 31 |
| Israeli shekels | 1/23/2017 | Citibank | $32,103 | ILS123,500 | 23 |
| Israeli shekels | 1/26/2017 | HSBC Bank | $3,645 | ILS14,100 | (18) |
| Japanese yen | 1/10/2017 | Citibank | $11,791 | ¥1,335,000 | 359 |
| Japanese yen | 1/10/2017 | Bank of America, N.A. | $46 | ¥5,204 | 1 |
| Malaysian ringgits | 1/13/2017 | UBS AG | $25,206 | MYR111,600 | 342 |
| Malaysian ringgits | 1/13/2017 | Citibank | $5,657 | MYR25,000 | 88 |
| Mexican pesos | 1/12/2017 | HSBC Bank | $4,601 | MXN95,800 | (11) |
| New Zealand dollars | 1/13/2017 | Citibank | £26,853 | NZ$48,050 | (254) |
| New Zealand dollars | 1/19/2017 | JPMorgan Chase | $2,133 | NZ$3,000 | 51 |
| New Zealand dollars | 1/20/2017 | JPMorgan Chase | $2,142 | NZ$3,000 | 60 |
| New Zealand dollars | 1/24/2017 | JPMorgan Chase | $23,889 | NZ$34,000 | 291 |
| New Zealand dollars | 1/26/2017 | JPMorgan Chase | €10,112 | NZ$15,000 | 250 |
| Polish zloty | 1/10/2017 | JPMorgan Chase | $35,762 | PLN149,385 | 72 |
| Polish zloty | 1/26/2017 | Citibank | €6,768 | PLN30,000 | (30) |
| South African rand | 1/10/2017 | JPMorgan Chase | $615 | ZAR8,500 | (3) |
| South African rand | 1/12/2017 | JPMorgan Chase | $9,351 | ZAR133,200 | (324) |
| Turkish lira | 1/19/2017 | Barclays Bank PLC | $2,921 | TRY10,275 | 20 |
| | | | | | $(164) |
| Forward currency contracts — net | $(27,146) |
Capital World Bond Fund — Page 24 of 27
Interest rate swaps
The fund has entered into interest rate swaps as shown in the following table. The average month-end notional amount of interest rate swaps while held was $964,270,000.
Pay/receive
fixed rate | Clearinghouse | Floating rate index | Fixed
rate | Expiration
date | Notional
(000) | Unrealized
(depreciation)
appreciation
at 12/31/2016
(000) |
| Receive | LCH | 3-month USD-LIBOR | 1.384% | 12/15/2018 | $270,000 | $(327) |
| Receive | LCH | 6-month NOK NIBOR | 1.345 | 12/16/2019 | NKr350,000 | — |
| Pay | LCH | 6-month EURIBOR | (0.1003) | 12/16/2019 | €32,000 | (109) |
| Receive | LCH | 6-month NOK NIBOR | 1.36 | 12/19/2019 | NKr500,000 | 21 |
| Receive | LCH | 3-month SEK STIBOR | 0.5725 | 7/24/2020 | SKr43,250 | 104 |
| Receive | LCH | 3-month USD-LIBOR | 1.572 | 9/16/2020 | $60,000 | (501) |
| Receive | LCH | 3-month SEK STIBOR | 0.4825 | 9/22/2020 | SKr300,000 | 607 |
| Receive | LCH | 3-month Canada BA | 1.0625 | 11/5/2020 | C$80,000 | (633) |
| Receive | LCH | 6-month AUD BBSW Benchmark Rate | 2.22 | 11/7/2020 | A$80,000 | (612) |
| Pay | LCH | 3-month USD-LIBOR | 1.358 | 11/8/2020 | $60,000 | 980 |
| Pay | LCH | 3-month USD-LIBOR | 1.365 | 11/8/2020 | 60,000 | 972 |
| Pay | LCH | 3-month USD-LIBOR | 1.67 | 11/14/2020 | 55,000 | 575 |
| Receive | LCH | 3-month NZD-BBR-FRA | 2.86 | 11/14/2020 | NZ$80,000 | (476) |
| Receive | LCH | 3-month USD-LIBOR | 1.2185 | 2/8/2021 | $70,000 | (1,784) |
| Receive | LCH | 3-month USD-LIBOR | 1.8855 | 12/15/2021 | 108,000 | (406) |
| Receive | LCH | 3-month USD-LIBOR | 1.885 | 12/15/2021 | 542,000 | (2,054) |
| Pay | LCH | 3-month USD-LIBOR | 2.1955 | 5/6/2025 | 60,000 | 235 |
| Pay | LCH | 3-month USD-LIBOR | 1.5075 | 9/22/2026 | 9,600 | 696 |
| Pay | LCH | 3-month USD-LIBOR | 1.9815 | 11/14/2026 | 20,000 | 625 |
| Pay | LCH | 3-month USD-LIBOR | 2.468 | 12/19/2026 | 40,000 | (493) |
| Pay | LCH | 6-month EURIBOR | 0.7962 | 9/22/2036 | €14,700 | 1,049 |
| Receive | LCH | 6-month EURIBOR | 1.6073 | 7/9/2045 | 6,000 | 610 |
| Pay | LCH | 3-month USD-LIBOR | 2.562 | 11/4/2045 | $20,000 | 84 |
| Pay | LCH | 3-month USD-LIBOR | 2.52611 | 11/24/2045 | 67,000 | 799 |
| Pay | LCH | 3-month USD-LIBOR | 2.535 | 11/24/2045 | 8,000 | 80 |
| Pay | LCH | 3-month USD-LIBOR | 2.556 | 11/27/2045 | 47,000 | 258 |
| Pay | LCH | 3-month USD-LIBOR | 2.354 | 1/29/2046 | 30,000 | 1,466 |
| Pay | LCH | 3-month USD-LIBOR | 2.116 | 4/15/2046 | 25,000 | 2,522 |
| Pay | LCH | 3-month USD-LIBOR | 1.794 | 8/3/2046 | 50,000 | 8,594 |
| Pay | LCH | 3-month USD-LIBOR | 1.9095 | 10/11/2046 | 30,000 | 4,421 |
| | | | | | | $17,303 |
Capital World Bond Fund — Page 25 of 27
Futures contracts
The fund has entered into futures contracts as shown in the following table. The average month-end notional amount of open futures contracts while held was $16,880,000.
| Contracts | Clearinghouse | Type | Number of
contracts | Expiration | Notional
amount
(000) | Unrealized
appreciation
(depreciation)
at 12/31/2016
(000) |
| 10 Year Euro-Bund Futures | Eurex | Long | 37 | March 2017 | $6,345 | $48 |
| 10 Year U.S. Treasury Note Futures | CME | Long | 48 | March 2017 | 5,997 | (31) |
| 30 Year Ultra U.S. Treasury Bond Futures | CME | Long | 35 | March 2017 | 5,677 | (68) |
| | | | | | | $(51) |
The following footnotes apply to either the individual securities noted or one or more of the securities aggregated and listed as a single line item.
| 1 | Principal payments may be made periodically. Therefore, the effective maturity date may be earlier than the stated maturity date. |
| 2 | Index-linked bond whose principal amount moves with a government price index. |
| 3 | Step bond; coupon rate will increase at a later date. |
| 4 | Acquired in a transaction exempt from registration under Rule 144A or Section 4(2) of the Securities Act of 1933. May be resold in the U.S. in transactions exempt from registration, normally to qualified institutional buyers. The total value of all such securities was $1,387,965,000, which represented 11.63% of the net assets of the fund. |
| 5 | Loan participations and assignments; may be subject to legal or contractual restrictions on resale. The total value of all such loans was $24,208,000, which represented .20% of the net assets of the fund. |
| 6 | Coupon rate may change periodically. |
| 7 | Payment in kind; the issuer has the option of paying additional securities in lieu of cash. |
| 8 | Valued under fair value procedures adopted by authority of the board of trustees. The total value of all such securities, including those in “Miscellaneous,“ was $7,672,000, which represented .06% of the net assets of the fund. |
| 9 | Purchased on a TBA basis. |
| 10 | A portion of this security was pledged as collateral. The total value of pledged collateral was $70,420,000, which represented .59% of the net assets of the fund. |
| 11 | Acquired through a private placement transaction exempt from registration under the Securities Act of 1933. May be subject to legal or contractual restrictions on resale. Further details on these holdings appear below. |
| 12 | Security did not produce income during the last 12 months. |
| 13 | Amount less than one thousand. |
| Private placement securities | Acquisition
dates | Cost
(000) | Value
(000) | Percent
of net
assets |
| CEVA Group PLC, Series A-2, 3.022% convertible preferred | 3/10/2010-5/2/2013 | $1,687 | $285 | .01% |
| CEVA Group PLC, Series A-1, 4.022% convertible preferred | 4/3/2013-8/27/2013 | 729 | 252 | .00 |
| CEVA Group PLC | 3/10/2010-5/2/2013 | 719 | 132 | .00 |
| Total private placement securities | | $ 3,135 | $ 669 | .01% |
Capital World Bond Fund — Page 26 of 27
| Key to abbreviations and symbols | | |
| AUD/A$ = Australian dollars | IDR = Indonesian rupiah | |
| ARS = Argentine pesos | ILS = Israeli shekels | |
| BA = Banker’s acceptances | INR = Indian rupees | |
| BBR = Bank base rate | ¥ = Japanese yen | |
| BBSW = Bank Bill Swap | LCH = LCH.Clearnet | |
| BRL = Brazilian reais | LIBOR = London Interbank Offered Rate | |
| C$ = Canadian dollars | MXN = Mexican pesos | |
| CLP = Chilean pesos | MYR = Malaysian ringgits | |
| CME = CME Group | NIBOR = Norway Interbank Offered Rate | |
| COP = Colombian pesos | NOK/NKr = Norwegian kroner | |
| CZK = Czech korunas | NZD/NZ$ = New Zealand dollars | |
| DKr = Danish kroner | PHP = Philippine pesos | |
| EUREX = Eurex Exchange | PLN = Polish zloty | |
| € = Euros | SEK/SKr = Swedish kronor | |
| EURIBOR = Euro Interbank Offered Rate | STIBOR = Stockholm Interbank Offered Rate | |
| FRA = Forward rate agreement | TBA = To-be-announced | |
| £ = British pounds | THB = Thai baht | |
| GHS = Ghanaian cedi | TRY = Turkish lira | |
| G.O. = General Obligation | ZAR = South African rand | |
| HUF = Hungarian forints | | |
Refer to the fund’s current shareholder report for additional disclosures.
Investments are not FDIC-insured, nor are they deposits of or guaranteed by a bank or any other entity, so they may lose value.
Investors should carefully consider investment objectives, risks, charges and expenses. This and other important information is contained in the fund prospectus and summary prospectus, which can be obtained from your financial professional and should be read carefully before investing. You may also call American Funds Service Company (AFS) at (800) 421-4225 or visit the American Funds website at americanfunds.com.
| MFGEFPX-031-0217O-S54091 | Capital World Bond Fund — Page 27 of 27 |
REPORT OF INDEPENDENT REGISTERED PUBLIC ACCOUNTING FIRM
To the Shareholders and Board of Trustees of
Capital World Bond Fund:
We have audited the accompanying statement of assets and liabilities of Capital World Bond Fund (the “Fund”), including the summary schedule of investments, as of December 31, 2016, and the related statement of operations for the three months ended December 31, 2016 and for the year ended September 30, 2016, the changes in net assets for the three months ended December 31, 2016 and for the two years ended September 30, 2016 (collectively, the “financial statements”), the financial highlights for the periods presented (the financial statements and financial highlights are included in Item 1 of this Form N-CSR), and the schedule of investments in securities as of December 31, 2016 (included in Item 6 of this Form N-CSR). These financial statements, financial highlights, and schedule of investments in securities are the responsibility of the Fund’s management. Our responsibility is to express an opinion on these financial statements, financial highlights, and schedule of investments in securities based on our audits.
We conducted our audits in accordance with the standards of the Public Company Accounting Oversight Board (United States). Those standards require that we plan and perform the audit to obtain reasonable assurance about whether the financial statements, financial highlights, and schedule of investments in securities are free of material misstatement. An audit includes examining, on a test basis, evidence supporting the amounts and disclosures in the financial statements and schedule of investments in securities, assessing the accounting principles used and significant estimates made by management, as well as evaluating the overall financial statement presentation. Our procedures included confirmation of securities owned as of December 31, 2016, by correspondence with the custodian and brokers; where replies were not received from brokers, we performed other auditing procedures. We believe that our audits provide a reasonable basis for our opinion.
In our opinion, the financial statements, financial highlights, and schedule of investments in securities referred to above present fairly, in all material respects, the financial position of Capital World Bond Fund as of December 31, 2016, the results of its operations for the three months ended December 31, 2016 and for the year ended September 30, 2016, the changes in its net assets for the three months ended December 31, 2016 and for the two years ended September 30, 2016, and the financial highlights for the periods presented, in conformity with accounting principles generally accepted in the United States of America.
DELOITTE & TOUCHE LLP
Costa Mesa, California
February 13, 2017
ITEM 7 – Disclosure of Proxy Voting Policies and Procedures for Closed-End Management Investment Companies
Not applicable to this Registrant, insofar as the Registrant is not a closed-end management investment company.
ITEM 8 – Portfolio Managers of Closed-End Management Investment Companies
Not applicable to this Registrant, insofar as the Registrant is not a closed-end management investment company.
ITEM 9 – Purchases of Equity Securities by Closed-End Management Investment Company and Affiliated Purchasers
Not applicable to this Registrant, insofar as the Registrant is not a closed-end management investment company.
ITEM 10 – Submission of Matters to a Vote of Security Holders
There have been no material changes to the procedures by which shareholders may recommend nominees to the Registrant’s board of trustees since the Registrant last submitted a proxy statement to its shareholders. The procedures are as follows. The Registrant has a nominating and governance committee comprised solely of persons who are not considered ‘‘interested persons’’ of the Registrant within the meaning of the Investment Company Act of 1940, as amended. The committee periodically reviews such issues as the board’s composition, responsibilities, committees, compensation and other relevant issues, and recommends any appropriate changes to the full board of trustees. While the committee normally is able to identify from its own resources an ample number of qualified candidates, it will consider shareholder suggestions of persons to be considered as nominees to fill future vacancies on the board. Such suggestions must be sent in writing to the nominating and governance committee of the Registrant, c/o the Registrant’s Secretary, and must be accompanied by complete biographical and occupational data on the prospective nominee, along with a written consent of the prospective nominee for consideration of his or her name by the nominating and governance committee.
ITEM 11 – Controls and Procedures
| (a) | The Registrant’s Principal Executive Officer and Principal Financial Officer have concluded, based on their evaluation of the Registrant’s disclosure controls and procedures (as such term is defined in Rule 30a-3 under the Investment Company Act of 1940), that such controls and procedures are adequate and reasonably designed to achieve the purposes described in paragraph (c) of such rule. |
| | |
| (b) | There were no changes in the Registrant’s internal controls over financial reporting (as defined in Rule 30a-3(d) under the Investment Company Act of 1940) that occurred during the Registrant’s second fiscal quarter of the period covered by this report that has materially affected, or is reasonably likely to materially affect, the Registrant’s internal control over financial reporting. |
ITEM 12 – Exhibits
| (a)(1) | The Code of Ethics that is the subject of the disclosure required by Item 2 is attached as an exhibit hereto. |
| | |
| (a)(2) | The certifications required by Rule 30a-2 of the Investment Company Act of 1940 and Sections 302 and 906 of the Sarbanes-Oxley Act of 2002 are attached as exhibits hereto. |
SIGNATURES
Pursuant to the requirements of the Securities Exchange Act of 1934 and the Investment Company Act of 1940, the Registrant has duly caused this report to be signed on its behalf by the undersigned, thereunto duly authorized.
| | CAPITAL WORLD BOND FUND |
| | |
| | By /s/ Thomas H. Høgh |
| | Thomas H. Høgh, President and Principal Executive Officer |
| | |
| | Date: February 28, 2017 |
Pursuant to the requirements of the Securities Exchange Act of 1934 and the Investment Company Act of 1940, this report has been signed below by the following persons on behalf of the Registrant and in the capacities and on the dates indicated.
| By /s/ Thomas H. Høgh |
Thomas H. Høgh, President and Principal Executive Officer |
| |
| Date: February 28, 2017 |
| By /s/ Brian C. Janssen |
Brian C. Janssen, Treasurer and Principal Financial Officer |
| |
| Date: February 28, 2017 |
