UNITED STATES
SECURITIES AND EXCHANGE COMMISSION
Washington, D.C. 20549
FORM N-CSR
CERTIFIED SHAREHOLDER REPORT OF REGISTERED
MANAGEMENT INVESTMENT COMPANIES
Investment Company Act file number: (811- 2280 )
Exact name of registrant as specified in charter: Putnam Convertible Income-Growth Trust
Address of principal executive offices: One Post Office Square, Boston, Massachusetts 02109
| Name and address of agent for service: | Beth S. Mazor, Vice President |
| | One Post Office Square |
| | Boston, Massachusetts 02109 |
| |
| Copy to: | John W. Gerstmayr, Esq. |
| | Ropes & Gray LLP |
| | One International Place |
| | Boston, Massachusetts 02110 |
| |
| Registrant’s telephone number, including area code: | (617) 292-1000 |
Date of fiscal year end: October 31, 2006
Date of reporting period: November 1, 2005—October 31, 2006
Item 1. Report to Stockholders:
The following is a copy of the report transmitted to stockholders pursuant to Rule 30e-1 under the Investment Company Act of 1940:
What makes
Putnam different? |
A time-honored tradition in
money management |
Since 1937, our values have been rooted in a profound sense of responsibility for the money entrusted to us.
A prudent approach to investing
We use a research-driven team approach to seek consistent, dependable, superior investment results over time, although there is no guarantee a fund will meet its objectives.
Funds for every investment goal
We offer a broad range of mutual funds and other financial products so investors and their financial representatives can build diversified portfolios.
A commitment to doing what’s right
for investors |
We have below-average expenses and stringent investor protections, and provide a wealth of information about the Putnam funds.
Industry-leading service
We help investors, along with their financial representatives, make informed investment decisions with confidence.

In 1830, Massachusetts Supreme Judicial Court Justice Samuel Putnam established The Prudent Man Rule, a legal foundation for responsible money management.
THE PRUDENT MAN RULE
All that can be required of a trustee to invest is that he shall conduct himself faithfully and exercise a sound discretion. He is to observe how men of prudence, discretion, and intelligence manage their own affairs, not in regard to speculation, but in regard to the permanent disposition of their funds, considering the probable income, as well as the probable safety of the capital to be invested.

Putnam
Convertible
Income-Growth
Trust |
| Message from the Trustees | 1 |
| About the fund | 2 |
| Report from the fund managers | 5 |
| Performance | 9 |
| Expenses | 11 |
| Portfolio turnover | 13 |
| Risk | 13 |
| Your fund’s management | 14 |
| Terms and definitions | 16 |
| Trustee approval of management contract | 17 |
| Other information for shareholders | 20 |
| Financial statements | 21 |
| Federal tax information | 38 |
| Brokerage commissions | 38 |
| About the Trustees | 39 |
| Officers | 43 |
Cover photograph: © White-Packert Photography
Message from the Trustees
Dear Fellow Shareholder:
Beginning in May 2006, leading economic indicators began to point toward slower growth and sparked a correction that undercut much of the market advance achieved in previous months. However, once the Federal Reserve (the Fed) halted its series of interest-rate increases in August, the combination of continued strong corporate profits and a fall in energy and commodity prices contributed to a more favorable market environment. In addition, U.S. export growth is currently strong, thanks to robust economic growth abroad. Growth in exports, combined with the effects of lower energy and commodity prices and recent stock market gains, may offset the economic impact of the housing sector’s continuing slowdown. This may set the stage for stronger domestic economic growth in 2007, which would bode well for markets going forward.
We would like to take this opportunity to announce that a new independent Trustee, Kenneth R. Leibler, has joined your fund’s Board of Trustees. Mr. Leibler has had a distinguished career as a leader in the investment management industry. He is the founding Chairman of the Boston Options Exchange, the nation’s newest electronic marketplace for the trading of derivative securities. He currently serves as a Trustee of Beth Israel Deaconess Hospital in Boston; a lead director of Ruder Finn Group, a global communications and advertising firm; and a director of the Optimum Funds group.
We would also like to announce the retirement of one of your fund’s Trustees, John Mullin, an independent Trustee of the Putnam funds since 1997. We thank him for his service.
In the following pages, members of your fund’s management team discuss the fund’s performance and strategies for the fiscal period ended October 31, 2006, and provide their outlook for the months ahead. As always, we thank you for your support of the Putnam funds.

Putnam Convertible Income-Growth Trust:
seeking opportunities in bond/stock hybrids |
The differences between bonds and stocks seem fairly clear-cut. Stocks provide an ownership stake in a company; bonds provide a claim on the interest paid by a company or other entity on its debt. Stocks are traded on markets, and their value rises and falls with such factors as investor sentiment, company news, and economic conditions; bonds are issued by a government, agency, company, or public utility that typically promises to pay the bearer a fixed rate of interest at specified intervals and to return a set amount of money at a specified end date (the maturity date). A bond’s yield is often influenced by interest-rate levels.
A third type of security, however, is a hybrid of a stock and a bond. A convertible security offers a set rate of interest, like a bond; but unlike a bond, it has a built-in option that, under certain circumstances, allows the investor to exchange (or convert) the security for a fixed number of shares of stock. This feature offers the potential for capital appreciation, since the pre-set conversion price does not change as the underlying stock’s price increases or decreases.
Convertibles are issued by companies and can offer greater returns than high-quality bonds — but they also carry a greater potential for risk, such as the risk of corporate default or periodic illiquidity. Issuers range from large, well-known S&P 500 corporations, to small, rapidly growing companies, to companies in cyclically depressed industries such as airlines, autos, and utilities.
Constructing a portfolio that maintains an appropriate balance of risk and return potential requires intensive research and analysis. Putnam’s global equity and credit research analysts conduct rigorous fundamental and quantitative research, seeking to determine the true worth of the issuing company’s business.
Putnam Convertible Income-Growth Trust’s management team then constructs a portfolio that it believes offers the best return potential without undue risk.
This fund invests some or all of its assets in small and/or midsize companies. Such investments increase the risk of greater fluctuations in the value of your investment. Lower-rated bonds may offer higher yields in return for more risk. The fund may also have a significant portion of its holdings in bonds. Mutual funds that invest in bonds are subject to certain risks, including interest-rate risk, credit risk, and inflation risk. As interest rates rise, the prices of bonds fall. Long-term bonds are more exposed to interest-rate risk than short-term bonds. Unlike bonds, bond funds have ongoing fees and expenses. Although value investing targets stocks believed to be priced too low, there is no guarantee they will appreciate.
The “busted” convertible
One kind of security in which your fund may invest is the “busted” convertible. “Busted” refers to a security whose underlying stock price has fallen signifi-cantly below the conversion price. It becomes much less sensitive to the volatility of the underlying stock and is more bond-like, responding to interest-rate changes. A busted convertible may pay a higher yield than other convertibles, but may also carry a higher level of risk. (Some companies in this situation may eventually default on their bonds.)
The objective of buying a busted convertible is to take advantage of a company’s eventual turnaround despite its present challenges. For example, a company undergoing management turmoil may draw negative investor reactions, causing its stock price to tumble. However, if intensive research determines that the management crisis is likely to be resolved, the fund manager could buy the security at a steep discount. The goal is to sell the security at a higher price when the credit improves or when the stock revives.
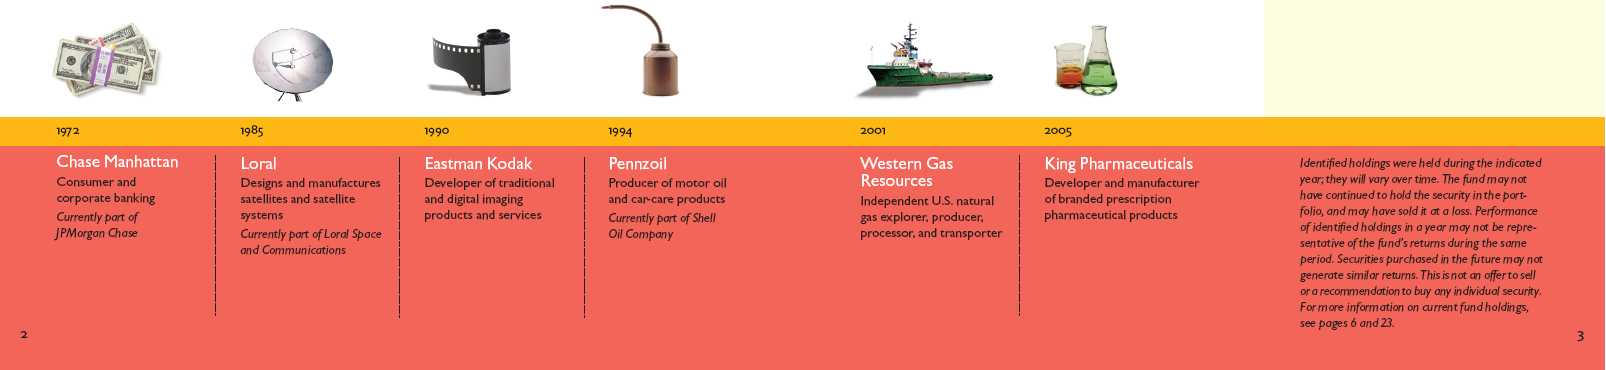
Putnam Convertible Income-Growth Trust’s holdings
have spanned sectors and industries over time. |
Putnam Convertible Income-Growth Trust pursues current income and capital appreciation by investing primarily in convertible securities — corporate bonds and preferred stocks that are convertible into common stock. Its secondary objective is conservation of capital. It may be an appropriate fund for investors who want to participate in the potential capital gains of higher-growth sectors, while also benefiting from fixed-income payments.
Highlights
• For the 12 months ended October 31, 2006, Putnam Convertible Income-Growth Trust’s class A shares returned 14.52% without sales charges.
• The fund’s benchmark, the Goldman Sachs Convertible 100 Index, returned 12.07% .
• The average return for the fund’s Lipper category, Convertible Securities Funds, was 11.59% .
• Additional fund performance, comparative performance, and Lipper data can be found in the performance section beginning on page 9.
Performance
Total return for class A shares for periods ended 10/31/06
Since the fund’s inception (6/29/72), average annual return is 10.84% at NAV and 10.67% at POP. |
| | Average annual return | Cumulative return |
| | NAV | POP | NAV | POP |
|
| 10 years | 7.36% | 6.78% | 103.49% | 92.78% |
|
| 5 years | 11.34 | 10.14 | 71.12 | 62.11 |
|
| 3 years | 10.56 | 8.59 | 35.16 | 28.04 |
|
| 1 year | 14.52 | 8.50 | 14.52 | 8.50 |
|
Data is historical. Past performance does not guarantee future results. More recent returns may be less or more than those shown. Investment return and principal value will fluctuate, and you may have a gain or a loss when you sell your shares. Performance assumes reinvestment of distributions and does not account for taxes. Returns at NAV do not reflect a sales charge of 5.25% . For the most recent month-end performance, visit www.putnam.com. For a portion of the period, this fund limited expenses, without which returns would have been lower. A 1% short-term trading fee may apply.
4
Report from the fund managers
The year in review |
We are pleased to report that your fund outperformed both its benchmark and the average return for funds in its Lipper peer group for the 12 months ended October 31, 2006. This is based on results at net asset value (NAV, or before sales charges). We attribute this outperformance to strong security selection across sectors. In fact, none of the sectors represented in your fund’s portfolio delivered negative results. Particularly robust performance came from portfolio holdings in capital goods (defense), health care (pharmaceuticals), and transportation (airlines). Stocks within the diverse consumer cyclicals sector also aided returns, due in large part to the team’s intensive bottom-up analysis.
Market overview
The beginning of the fund’s fiscal year coincided with the aftermath of Hurricane Katrina, as interest rates rose and oil prices skyrocketed. The equity markets seemed unable to overcome widespread fears of rising inflation and general economic concerns; for the majority of the fund’s fiscal year, U.S. markets had lukewarm returns.
By fiscal year-end, however, a series of economic events had fueled investor optimism. Foremost among them was an apparent end to the Fed’s tightening policy, breaking a string of 17 consecutive interest-rate increases spanning more than two years. Optimism for a soft economic landing was further boosted by an upward revision to second-quarter GDP (gross domestic product) growth, and the highest level of consumer spending since January. A final push sent most areas of the market to new highs: the S&P 500 and Nasdaq Composite indexes rose to their highest levels in more than five years and the Dow Jones Industrial Average surpassed 12,000 for the first time in the history of the index.
The convertible market similarly began the period in recovery mode, still absorbing the after-effects of the General Motors and Ford downgrades in early 2005. As the
Market sector performance
These indexes provide an overview of performance in different
market sectors for the 12 months ended 10/31/06. |
| Equities | |
|
| Goldman Sachs Convertible 100 Index | |
| (convertible securities) | 12.07% |
|
| S&P 500 Index (broad stock market) | 16.34% |
|
| Russell 2000 Growth Index | |
| (small-company growth stocks) | 17.07% |
|
| MSCI World Ex-U.S. Index | |
| (international stocks) | 27.46% |
|
| Bonds | |
|
| Citigroup World Government Bond Index | |
| (global government bonds) | 5.12% |
|
| Lehman Government Bond Index | |
| (U.S. Treasury and agency securities) | 4.58% |
|
| JPMorgan Global High Yield Index | |
| (global high-yield corporate bonds) | 10.11% |
5
period wore on, convertibles regained their equilibrium, with very few defaults, and delivered solid returns.
It may be surprising that two factors that influenced most investments — the Fed’s rate increases and the flat-tening yield curve — did not have a significant impact on the convertible market. The two classic drivers of the convertible market are narrowing credit spreads (the difference between higher- and lower-quality bonds) and a rising equity market. Since spreads did not change signifi-cantly and the stock market advanced, the result was a favorable environment for convertibles.
Strategy overview
During the period, we continued to follow our strategy of pursuing returns that are higher than those of the benchmark by investing in what we believed were the most promising securities, whether or not they are actually part of the benchmark itself. The fund’s benchmark, the Goldman Sachs Convertible 100 Index, contains, as its name indicates, 100 securities. Our approach with the fund’s portfolio typically involves maintaining exposure to between 80 and 100 companies. However, the number of securities the fund owns will normally be greater than the number of companies to which it is exposed because we frequently hold multiple classes of securities issued by a particular company.
During the period, we kept the portfolio’s overall credit quality at a relatively high level. Bond yields decline as their prices rise, and among lower-quality convertibles, rising prices have caused yields to contract to levels that do not fully compensate investors for the additional risk they assume when choosing a lower-quality investment. Consequently, throughout the period we continued to focus on higher-quality securities that are more sensitive to movements in the equity markets rather than the fixed-income markets.
Your fund’s holdings
While some convertible fund portfolios rely on non-convertible securities like common stocks and real estate investment trusts to gain returns, our strategy is to focus primarily on the convertible market. This single-mindedness proved advantageous during the fiscal year and was aided by favorable security selection. We had no negative returns from any sector and had no defaults within the portfolio.
In the capital goods sector, ongoing exposure to defense-related securities such as Lockheed Martin were generally rewarding. Convertibles issued by smaller defense companies also performed well, including United Industrial, which produces defense and training systems, including automatic test equipment. By the end of the period, we had sold the fund’s position, taking profits.
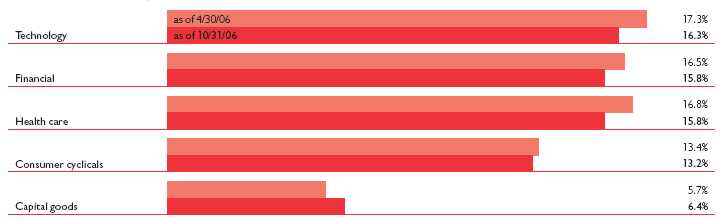
Comparison of top sector weightings
This chart shows how the fund’s top weightings have changed
over the last six months. Weightings are shown as a percentage of
net assets. Holdings will vary over time. |
Health-care companies are frequent issuers of convertibles. We benefited both from the fund’s slight underweight to this sector, relative to the benchmark index, as well as from successful selection. Among the stronger performers was New River Pharmaceuticals, a developer of specialty drugs. New River recently received FDA approval for a drug to treat Attention-Deficit/ Hyperactivity Disorder (ADHD) in children and the stock rose significantly.
Convertibles issued by companies in the transportation sector, though not a major portfolio weighting, nonetheless boosted the fund’s results. American Airlines convertibles performed well and we sold the fund’s position in its parent company, AMR, midway through the fiscal year. Pinnacle Airlines, a feeder to Northwest Airlines, also contributed to performance. When Northwest went bankrupt, investors feared that Pinnacle would suffer the same fate. Our research indicated otherwise, and we maintained the fund’s position. Over the last six months, Northwest has surprised investors by recovering; building on that success, Pinnacle subsequently rallied.
Consumer cyclicals is a broad category, and some long-term positions garnered positive results, including The Pantry (independently operated convenience store operator) and Hilton Hotels. We sold the fund’s position in home improvement retailer Lowe’s, taking profits toward the top of its cycle, since we believed that the housing market was softening. Another beneficial area was specialty retail. The fund held convertibles issued by Dick’s Sporting Goods and Retail Ventures, which performed well. We also held convertibles from Men’s Wearhouse, though these were called immediately following the fiscal year-end and were subsequently sold. Our choice of these securities did not reflect any particular forecast of consumer activity, but resulted from our intensive bottom-up analysis, which delves into the financial underpinnings, management, and competitive environment of the issuing companies.
Although no holdings significantly detracted from returns during the period, there were opportunities in the market that the fund did not participate in. The fund had no exposure to General Motors convertibles, nor to those issued by AMD (which outperformed fund holding Intel). In addition, we sold our position in convertibles issued by Qwest Communications early in the period, missing their recovery as the year wore on. We believe that these missed opportunities were more than offset by the fund’s large number of outperforming holdings.
Please note that the holdings discussed in this report may not have been held by the fund for the entire period. Portfolio composition is subject to review in accordance with the fund’s investment strategy and may vary in the future.
Top holdings
This table shows the fund’s top holdings, and the percentage of
the fund’s net assets that each comprised, as of 10/31/06. The fund’s
holdings will change over time. |
| Holding (percent of fund’s net assets) | Security information | Industry or sector |
|
| Devon Energy Corp. (2.2%) | cv. debs, 4.9%, 2008 | Oil and gas |
|
| Lockheed Martin Corp. (2.1%) | cv. sr. notes FRN 5.155%, 2033 | Aerospace and defense |
|
| Chesapeake Energy Corp. (2.1%) | 6.25% cv. pfd. | Oil and gas |
|
| Fannie Mae (2.0%) | Ser. 04-1, 5.375% cv. pfd. | Financial |
|
| Citigroup Funding, Inc. (1.9%) | FRN Ser. GNW, 5.02% cv. pfd. | Insurance |
|
| Washington Mutual Capital Trust I (1.6%) | $2.688 cum. cv. pfd. | Banking |
|
| Tyco International Group SA (Luxembourg) (1.6%) | cv. unsub. sr. company guaranty 3.125%, 2023 | Conglomerates |
|
| Freeport-McMoRan Copper & Gold, Inc. (1.5%) | 5.50% cv. pfd. | Metals |
|
| Wyeth (1.5%) | cv. sr. notes FRN 5.109%, 2024 | Pharmaceuticals |
|
| Alza Corp. (1.5%) | cv. sub. debs. zero %, 2020 | Pharmaceuticals |
|
7
The outlook for your fund
The following commentary reflects anticipated developments that could affect your fund over the next six months, as well as your management team’s plans for responding to them.
Our asset allocation specialists believe that today’s relatively benign macroeconomic backdrop will permit continued gradual equity-market appreciation, as investors acknowledge record levels of corporate profitability around the world. But we also believe that valuations, having risen, are no longer as supportive of continued market advances.
As the robust health of the U.S. corporate sector has become increasingly recognized by investors, U.S. stock valuations have become more competitive with those of overseas markets. We expect the recent performance leadership of large-cap companies to become more strongly entrenched. Yet several risks confront equity markets, including stubbornly strong inflation data, soft housing markets, and a potential resumption of Fed rate tightening.
In terms of the convertible market, at this time we do not anticipate any major roadblocks in the fiscal year ahead, but we also do not expect the recent strength of convertibles to continue at current levels. We believe that the outlook for credit remains benign and we anticipate a more normal, moderate level for the convertible market going forward.
The views expressed in this report are exclusively those of Putnam Management. They are not meant as investment advice.
The fund invests some or all of its assets in small and/or midsize companies. Such investments increase the risk of fluctuations in the value of your investment. Lower-rated bonds may offer higher yields in return for more risk. This fund may have a significant portion of its holdings in bonds. Mutual funds that invest in bonds are subject to certain risks, including interest-rate risk, credit risk, and inflation risk. As interest rates rise, the prices of bonds fall. Long-term bonds are more exposed to interest-rate risk than short-term bonds. Unlike bonds, bond funds have ongoing fees and expenses. Although value investing targets stocks believed to be priced too low, there is no guarantee they will appreciate.
8
Your fund’s performance
This section shows your fund’s performance for periods ended October 31, 2006, the end of its fiscal year. In accordance with regulatory requirements for mutual funds, we also include performance as of the most recent calendar quarter-end. Performance should always be considered in light of a fund’s investment strategy. Data represents past performance. Past performance does not guarantee future results. More recent returns may be less or more than those shown. Investment return and principal value will fluctuate, and you may have a gain or a loss when you sell your shares. For the most recent month-end performance, please visit www.putnam.com or call Putnam at 1-800-225-1581. Class Y shares are generally only available to corporate and institutional clients. See the Terms and Definitions section in this report for definitions of the share classes offered by your fund.
Fund performance Total return for periods ended 10/31/06
| | | Class A | | Class B | | Class C | | Class M | | Class R | Class Y |
|
| (inception dates) | | (6/29/72) | | (7/15/93) | | (7/26/99) | | (3/13/95) | | (12/1/03) | (12/30/98) |
|
| | | NAV | POP | NAV | CDSC | NAV | CDSC | NAV | POP | NAV | NAV |
| Annual average | | | | | | | | | | | |
| (life of fund) | | 10.84% | 10.67% | 9.86% | 9.86% | 10.01% | 10.01% | 10.14% | 10.04% | 10.56% | 10.90% |
|
| 10 years | | 103.49 | 92.78 | 88.79 | 88.79 | 88.85 | 88.85 | 93.95 | 87.65 | 98.55 | 107.55 |
| Annual average | | 7.36 | 6.78 | 6.56 | 6.56 | 6.56 | 6.56 | 6.85 | 6.50 | 7.10 | 7.58 |
|
| 5 years | | 71.12 | 62.11 | 64.88 | 62.88 | 64.95 | 64.95 | 66.90 | 61.53 | 69.03 | 73.30 |
| Annual average | | 11.34 | 10.14 | 10.52 | 10.25 | 10.53 | 10.53 | 10.79 | 10.07 | 11.07 | 11.62 |
|
| 3 years | | 35.16 | 28.04 | 32.17 | 29.17 | 32.21 | 32.21 | 33.10 | 28.74 | 34.22 | 36.20 |
| Annual average | | 10.56 | 8.59 | 9.74 | 8.91 | 9.75 | 9.75 | 10.00 | 8.79 | 10.31 | 10.85 |
|
| 1 year | | 14.52 | 8.50 | 13.68 | 8.68 | 13.73 | 12.73 | 14.01 | 10.31 | 14.27 | 14.81 |
|
Performance assumes reinvestment of distributions and does not account for taxes. Returns at public offering price (POP) for class A and M shares reflect a sales charge of 5.25% and 3.25%, respectively. Class B share returns reflect the applicable contingent deferred sales charge (CDSC), which is 5% in the first year, declining to 1% in the sixth year, and is eliminated thereafter. Class C shares reflect a 1% CDSC the first year that is eliminated thereafter. Class R and Y shares have no initial sales charge or CDSC. Performance for class B, C, M, R, and Y shares before their inception is derived from the historical performance of class A shares, adjusted for the applicable sales charge (or CDSC) and, except for class Y shares, the higher operating expenses for such shares.
For a portion of the period, this fund limited expenses, without which returns would have been lower.
A 1% short-term trading fee may apply.
Change in the value of a $10,000 investment ($9,475 after sales charge)
Cumulative total return from 10/31/96 to 10/31/06 |
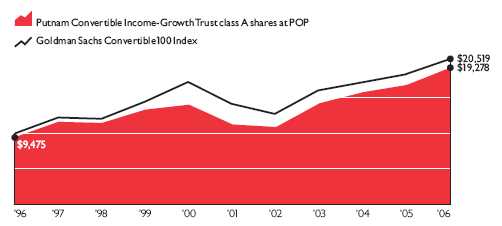
Past performance does not indicate future results. At the end of the same time period, a $10,000 investment in the fund’s class B and class C shares would have been valued at $18,879 and $18,885, respectively, and no contingent deferred sales charges would apply. A $10,000 investment in the fund’s class M shares ($9,675 after sales charge) would have been valued at $18,765 at public offering price. A $10,000 investment in the fund’s class R and class Y shares would have been valued at $19,855 and $20,755, respectively.
9
Comparative index returns For periods ended 10/31/06
| | Goldman Sachs | Lipper Convertible Securities |
| | Convertible 100 Index | Funds category average* |
|
| Annual average | | |
| (life of fund) | —† | 10.69% |
|
| 10 years | 105.19% | 115.67 |
| Annual average | 7.45 | 7.88 |
|
| 5 years | 44.67 | 49.62 |
| Annual average | 7.67 | 8.32 |
|
| 3 years | 27.72 | 28.16 |
| Annual average | 8.50 | 8.59 |
|
| 1 year | 12.07 | 11.59 |
|
Index and Lipper results should be compared to fund performance at net asset value.
* Over the 1-, 3-, 5-, and 10-year periods ended 10/31/06, there were 61, 59, 51, and 32 funds, respectively, in this Lipper category.
† The index’s inception date was 12/31/84, after the fund’s inception.
Fund price and distribution information For the 12-month period ended 10/31/06
| Distributions | Class A | | Class B | Class C | Class M | | Class R | Class Y |
|
| Number | 4 | | 4 | 4 | 4 | | 4 | 4 |
|
| Income | $0.528 | $0.389 | $0.397 | $0.439 | $0.505 | $0.574 |
|
| Capital gains | — | | — | — | — | | — | — |
|
| Total | $0.528 | $0.389 | $0.397 | $0.439 | $0.505 | $0.574 |
|
| Share value: | NAV | POP | NAV | NAV | NAV | POP | NAV | NAV |
| 10/31/05 | $17.13 | $18.08 | $16.86 | $17.01 | $16.99 | $17.56 | $17.11 | $17.13 |
|
| 10/31/06 | 19.05 | 20.11 | 18.75 | 18.92 | 18.90 | 19.53 | 19.01 | 19.05 |
|
| Current yield (end of period) | | | | | | | | |
| Current dividend rate1 | 2.77% | 2.63% | 2.07% | 2.09% | 2.33% | 2.25% | 2.59% | 3.00% |
|
| Current 30-day SEC yield2 | 2.48 | 2.35 | 1.74 | 1.74 | 1.99 | 1.92 | 2.24 | 2.73 |
|
1 Most recent distribution, excluding capital gains, annualized and divided by NAV or POP at end of period.
2 Based only on investment income, calculated using SEC guidelines.
Fund performance as of most recent calendar quarter Total return for periods ended 9/30/06
| | | Class A | | Class B | | Class C | | Class M | | Class R | Class Y |
| (inception dates) | | (6/29/72) | | (7/15/93) | | (7/26/99) | | (3/13/95) | | (12/1/03) | (12/30/98) |
| | | NAV | POP | NAV | CDSC | NAV | CDSC | NAV | POP | NAV | NAV |
|
| Annual average | | | | | | | | | | | |
| (life of fund) | | 10.79% | 10.62% | 9.81% | 9.81% | 9.96% | 9.96% | 10.09% | 9.98% | 10.51% | 10.85% |
|
| 10 years | | 99.98 | 89.46 | 85.47 | 85.47 | 85.54 | 85.54 | 90.58 | 84.35 | 95.10 | 103.85 |
| Annual average | | 7.18 | 6.60 | 6.37 | 6.37 | 6.38 | 6.38 | 6.66 | 6.31 | 6.91 | 7.38 |
|
| 5 years | | 69.57 | 60.63 | 63.32 | 61.32 | 63.28 | 63.28 | 65.34 | 59.94 | 67.48 | 71.63 |
| Annual average | | 11.14 | 9.94 | 10.31 | 10.04 | 10.30 | 10.30 | 10.58 | 9.85 | 10.86 | 11.41 |
|
| 3 years | | 37.52 | 30.31 | 34.40 | 31.40 | 34.41 | 34.41 | 35.42 | 31.06 | 36.46 | 38.50 |
| Annual average | | 11.20 | 9.23 | 10.36 | 9.53 | 10.36 | 10.36 | 10.64 | 9.44 | 10.92 | 11.47 |
|
| 1 year | | 9.52 | 3.76 | 8.63 | 3.63 | 8.66 | 7.66 | 8.93 | 5.40 | 9.21 | 9.74 |
|
10
Your fund’s expenses
As a mutual fund investor, you pay ongoing expenses, such as management fees, distribution fees (12b-1 fees), and other expenses. In the most recent six-month period, your fund limited these expenses; had it not done so, expenses would have been higher. Using the information below, you can estimate how these expenses affect your investment and compare them with the expenses of other funds. You may also pay one-time transaction expenses, including sales charges (loads) and redemption fees, which are not shown in this section and would have resulted in higher total expenses. For more information, see your fund’s prospectus or talk to your financial advisor.
Review your fund’s expenses
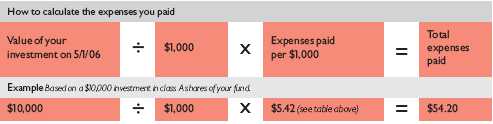
The table below shows the expenses you would have paid on a $1,000 investment in Putnam Convertible Income-Growth Trust from May 1, 2006, to October 31, 2006. It also shows how much a $1,000 investment would be worth at the close of the period, assuming actual returns and expenses.
| | Class A | Class B | Class C | Class M | Class R | Class Y |
|
| Expenses paid per $1,000* | $ 5.42 | $ 9.27 | $ 9.27 | $ 7.98 | $ 6.70 | $ 4.13 |
|
| Ending value (after expenses) | $1,046.50 | $1,042.50 | $1,042.40 | $1,043.70 | $1,045.10 | $1,047.80 |
|
* Expenses for each share class are calculated using the fund’s annualized expense ratio for each class, which represents the ongoing expenses as a percentage of average net assets for the six months ended 10/31/06. The expense ratio may differ for each share class (see the last table in this section). Expenses are calculated by multiplying the expense ratio by the average account value for the period; then multiplying the result by the number of days in the period; and then dividing that result by the number of days in the year. Does not reflect the effect of a non-recurring reimbursement by Putnam. If this amount had been reflected in the table above, expenses for each share class would have been lower.
Estimate the expenses you paid
To estimate the ongoing expenses you paid for the six months ended October 31, 2006, use the calculation method below. To find the value of your investment on May 1, 2006, go to www.putnam.com and log on to your account. Click on the “Transaction History” tab in your Daily Statement and enter 05/01/2006 in both the “from” and “to” fields. Alternatively, call Putnam at 1-800-225-1581.
Compare expenses using the SEC’s method
The Securities and Exchange Commission (SEC) has established guidelines to help investors assess fund expenses. Per these guidelines, the table below shows your fund’s expenses based on a $1,000 investment, assuming a hypothetical 5% annualized return. You can use this information to compare the ongoing expenses (but not transaction expenses or total costs) of investing in the fund with those of other funds. All mutual fund shareholder reports will provide this information to help you make this comparison. Please note that you cannot use this information to estimate your actual ending account balance and expenses paid during the period.
| | Class A | Class B | Class C | Class M | Class R | Class Y |
|
| Expenses paid per $1,000* | $ 5.35 | $ 9.15 | $ 9.15 | $ 7.88 | $ 6.61 | $ 4.08 |
|
| Ending value (after expenses) | $1,019.91 | $1,016.13 | $1,016.13 | $1,017.39 | $1,018.65 | $1,021.17 |
|
* Expenses for each share class are calculated using the fund’s annualized expense ratio for each class, which represents the ongoing expenses as a percentage of average net assets for the six months ended 10/31/06. The expense ratio may differ for each share class (see the last table in this section). Expenses are calculated by multiplying the expense ratio by the average account value for the period; then multiplying the result by the number of days in the period; and then dividing that result by the number of days in the year. Does not reflect the effect of a non-recurring reimbursement by Putnam. If this amount had been reflected in the table above, expenses for each share class would have been lower.
11
Compare expenses using industry averages
You can also compare your fund’s expenses with the average of its peer group, as defined by Lipper, an independent fund-rating agency that ranks funds relative to others that Lipper considers to have similar investment styles or objectives. The expense ratio for each share class shown below indicates how much of your fund’s net assets have been used to pay ongoing expenses during the period.
| | Class A | Class B | Class C | Class M | Class R | Class Y |
|
| Your fund’s annualized expense ratio* | 1.05% | 1.80% | 1.80% | 1.55% | 1.30% | 0.80% |
|
| Average annualized expense ratio for Lipper peer group† | 1.18% | 1.93% | 1.93% | 1.68% | 1.43% | 0.93% |
|
* For the fund’s most recent fiscal half year; may differ from expense ratios based on one-year data in the financial highlights. Does not reflect the effect of a non-recurring reimbursement by Putnam. If this amount had been reflected in the table above, the expense ratio for each share class would have been lower.
† Simple average of the expenses of all front-end load funds in the fund’s Lipper peer group, calculated in accordance with Lipper’s standard method for comparing fund expenses (excluding 12b-1 fees and without giving effect to any expense offset and brokerage service arrangements that may reduce fund expenses). This average reflects each fund’s expenses for its most recent fiscal year available to Lipper as of 9/30/06. To facilitate comparison, Putnam has adjusted this average to reflect the 12b-1 fees carried by each class of shares other than class Y shares, which do not incur 12b-1 fees. The peer group may include funds that are significantly smaller or larger than the fund, which may limit the comparability of the fund’s expenses to the simple average, which typically is higher than the asset-weighted average.
12
Your fund’s portfolio turnover
and Overall Morningstar® Risk |
Putnam funds are actively managed by teams of experts who buy and sell securities based on intensive analysis of companies, industries, economies, and markets. Portfolio turnover is a measure of how often a fund’s managers buy and sell securities for your fund. A portfolio turnover of 100%, for example, means that the managers sold and replaced securities valued at 100% of a fund’s assets within a one-year period. Funds with high turnover may be more likely to generate capital gains and dividends that must be distributed to shareholders as taxable income. High turnover may also cause a fund to pay more brokerage commissions and other transaction costs, which may detract from performance.
Funds that invest in bonds or other fixed-income instruments may have higher turnover than funds that invest only in stocks. Short-term bond funds tend to have higher turnover than longer-term bond funds, because shorter-term bonds will mature or be sold more frequently than longer-term bonds. You can use the table below to compare your fund’s turnover with the average turnover for funds in its Lipper category.
Turnover comparisons
Percentage of holdings that change every year |
| | | 2006 | 2005 | 2004 | 2003 | 2002 |
| Putnam Convertible Income-Growth Trust | | 64% | 66% | 53% | 94% | 116% |
|
| Lipper Convertible Securities Funds category average | | 71% | 77% | 103% | 93% | 100% |
|
Turnover data for the fund is calculated based on the fund’s fiscal-year period, which ends on October 31. Turnover data for the fund’s Lipper category is calculated based on the average of the turnover of each fund in the category for its fiscal year ended during the indicated year. Fiscal years vary across funds in the Lipper category, which may limit the comparability of the fund’s portfolio turnover rate to the Lipper average. Comparative data for 2006 is based on information available as of 10/31/06.
Your fund’s Overall Morningstar® Risk
This risk comparison is designed to help you understand how your fund compares with other funds. The comparison utilizes a risk measure developed by Morningstar, an independent fund-rating agency. This risk measure is referred to as the fund’s Overall Morningstar Risk.
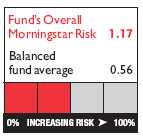
Your fund’s Overall Morningstar Risk is shown alongside that of the average fund in its broad asset class, as determined by Morningstar. The risk bar broadens the comparison by translating the fund’s Overall Morningstar Risk into a percentile, which is based on the fund’s ranking among all funds rated by Morningstar as of September 30, 2006. A higher Overall Morningstar Risk generally indicates that a fund’s monthly returns have varied more widely.
Morningstar determines a fund’s Overall Morningstar Risk by assessing variations in the fund’s monthly returns — with an emphasis on downside variations — over 3-, 5-, and 10-year periods, if available. Those measures are weighted and averaged to produce the fund’s Overall Morningstar Risk. The information shown is provided for the fund’s class A shares only; information for other classes may vary. Overall Morningstar Risk is based on historical data and does not indicate future results. Morningstar does not purport to measure the risk associated with a current investment in a fund, either on an absolute basis or on a relative basis. Low Overall Morningstar Risk does not mean that you cannot lose money on an investment in a fund. Copyright 2006 Morningstar, Inc. All Rights Reserved. The information contained herein (1) is proprietary to Morningstar and/or its content providers; (2) may not be copied or distributed; and (3) is not warran ted to be accurate, complete, or timely. Neither Morningstar nor its content providers are responsible for any damages or losses arising from any use of this information.
13
Your fund’s management
Your fund is managed by the members of the Putnam Large-Cap Value and Core Fixed-Income High-Yield teams. David King is the Portfolio Leader. Robert Salvin is a Portfolio Member of the fund. The Portfolio Leader and Portfolio Member coordinate the teams’ management of the fund.
For a complete listing of the members of the Putnam Large-Cap Value and Core Fixed-Income High-Yield teams, including those who are not Portfolio Leaders or Portfolio Members of your fund, visit Putnam’s Individual Investor Web site at www.putnam.com.
Investment team fund ownership
The table below shows how much the fund’s current Portfolio Leader and Portfolio Member have invested in the fund and in all Putnam mutual funds (in dollar ranges). Information shown is as of October 31, 2006, and October 31, 2005.
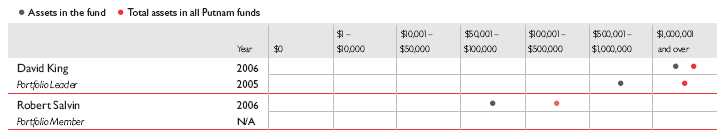
N/A indicates the individual was not a Portfolio Leader or Portfolio Member as of 10/31/05.
Trustee and Putnam employee fund ownership
As of October 31, 2006, all of the Trustees on the Board of the Putnam funds owned fund shares. The table below shows the approximate value of investments in the fund and all Putnam funds as of that date by the Trustees and Putnam employees. These amounts include investments by the Trustees’ and employees’ immediate family members and investments through retirement and deferred compensation plans.
| | | Total assets in |
| | Assets in the fund | all Putnam funds |
|
| Trustees | $ 839,000 | $ 92,000,000 |
|
| Putnam employees | $3,876,000 | $427,000,000 |
|
Fund manager compensation
The total 2005 fund manager compensation that is attributable to your fund is approximately $450,000. This amount includes a portion of 2005 compensation paid by Putnam Management to the fund managers listed in this section for their portfolio management responsibilities, calculated based on the fund assets they manage taken as a percentage of the total assets they manage. The compensation amount also includes a portion of the 2005 compensation paid to the Group Chief Investment Officer of the fund’s broader investment category for his oversight responsibilities, calculated based on the fund assets he oversees taken as a percentage of the total assets he oversees. This amount does not include compensation of other personnel involved in research, trading, administration, systems, compliance, or fund operations; nor does it include non-compensation costs. These percentages are determined as of the fund’s fiscal period-end. For personnel who joined Putnam Management during or after 2005, the calculation reflects annualized 2005 compensation or an estimate of 2006 compensation, as applicable.
14
Other Putnam funds managed by the Portfolio Leader and Portfolio Member
David King is also a Portfolio Leader of Putnam High Income Securities Fund and Putnam New Value Fund, and a Portfolio Member of The Putnam Fund for Growth and Income.
Robert Salvin is also a Portfolio Leader of Putnam High Income Securities Fund and a Portfolio Member of Putnam High Yield Advantage Fund, and Putnam High Yield Trust.
David King and Robert Salvin may also manage other accounts and variable trust funds advised by Putnam Management or an affiliate.
Changes in your fund’s Portfolio Leader and Portfolio Member
During the year ended October 31, 2006, Portfolio Member Robert Salvin joined your fund’s management team.
Putnam fund ownership by Putnam’s Executive Board
The table below shows how much the members of Putnam’s Executive Board have invested in all Putnam mutual funds (in dollar ranges). Information shown is as of October 31, 2006, and October 31, 2005.
| | | | | $1 – | $10,001 – | $50,001 – | $100,001 – | $500,001 – | $1,000,001 |
| | | Year | $0 | $10,000 | $50,000 | $100,000 | $500,000 | $1,000,000 | and over |
|
| Philippe Bibi | | 2006 | | | | | | | • |
|
|
| Chief Technology Officer | | 2005 | | | | | | | • |
|
| Joshua Brooks | | 2006 | | | | | | | • |
|
|
| Deputy Head of Investments | | 2005 | | | | | | | • |
|
| William Connolly | | 2006 | | | | | | | • |
|
|
| Head of Retail Management | | 2005 | | | | | | | • |
|
| Kevin Cronin | | 2006 | | | | | | | • |
|
|
| Head of Investments | | 2005 | | | | | | | • |
|
| Charles Haldeman, Jr. | | 2006 | | | | | | | • |
|
|
| President and CEO | | 2005 | | | | | | | • |
|
| Amrit Kanwal | | 2006 | | | | | | • | |
|
|
| Chief Financial Officer | | 2005 | | | | | | • | |
|
| Steven Krichmar | | 2006 | | | | | | • | |
|
|
| Chief of Operations | | 2005 | | | | | | | • |
|
| Francis McNamara, III | | 2006 | | | | | | | • |
|
|
| General Counsel | | 2005 | | | | | | | • |
|
| Jeffrey Peters | | 2006 | | | | | | | • |
|
|
| Head of International Business | | N/A | | | | | | | |
|
| Richard Robie, III | | 2006 | | | | | | • | |
|
|
| Chief Administrative Officer | | 2005 | | | | | | • | |
|
| Edward Shadek | | 2006 | | | | | | | • |
|
|
| Deputy Head of Investments | | 2005 | | | | | | | • |
|
| Sandra Whiston | | 2006 | | | | | | • | |
|
|
| Head of Institutional Management | | 2005 | | | | | | • | |
|
N/A indicates the individual was not a member of Putnam’s Executive Board as of 10/31/05.
15
Terms and definitions
Important terms
Total return shows how the value of the fund’s shares changed over time, assuming you held the shares through the entire period and reinvested all distributions in the fund.
Net asset value (NAV) is the price, or value, of one share of a mutual fund, without a sales charge. NAVs fluctuate with market conditions. NAV is calculated by dividing the net assets of each class of shares by the number of outstanding shares in the class.
Public offering price (POP) is the price of a mutual fund share plus the maximum sales charge levied at the time of purchase. POP performance figures shown here assume the 5.25% maximum sales charge for class A shares and 3.25% for class M shares.
Contingent deferred sales charge (CDSC) is generally a charge applied at the time of the redemption of class B or C shares and assumes redemption at the end of the period. Your fund’s class B CDSC declines from a 5% maximum during the first year to 1% during the sixth year. After the sixth year, the CDSC no longer applies. The CDSC for class C shares is 1% for one year after purchase.
Share classes
Class A shares are generally subject to an initial sales charge and no CDSC (except on certain redemptions of shares bought without an initial sales charge).
Class B shares are not subject to an initial sales charge. They may be subject to a CDSC.
Class C shares are not subject to an initial sales charge and are subject to a CDSC only if the shares are redeemed during the first year.
Class M shares have a lower initial sales charge and a higher 12b-1 fee than class A shares and no CDSC (except on certain redemptions of shares bought without an initial sales charge).
Class R shares are not subject to an initial sales charge or CDSC and are available only to certain defined contribution plans.
Class Y shares are not subject to an initial sales charge or CDSC, and carry no 12b-1 fee. They are only available to eligible purchasers, including eligible defined contribution plans or corporate IRAs.
Comparative indexes
Citigroup World Government Bond Index is an unmanaged index of global investment-grade fixed-income securities.
Goldman Sachs Convertible 100 Index is an unmanaged index of convertible and convertible preferred securities.
JPMorgan Global High Yield Index is an unmanaged index of global high-yield fixed-income securities.
Lehman Government Bond Index is an unmanaged index of U.S. Treasury and agency securities.
Morgan Stanley Capital International (MSCI) World Ex-U.S. Index is an unmanaged index of equity securities from developed countries, excluding the United States.
Russell 2000 Growth Index is an unmanaged index of those companies in the small-cap Russell 2000 Index chosen for their growth orientation.
S&P 500 Index is an unmanaged index of common stock performance.
Indexes assume reinvestment of all distributions and do not account for fees. Securities and performance of a fund and an index will differ. You cannot invest directly in an index.
Lipper is a third-party industry-ranking entity that ranks mutual funds. Its rankings do not reflect sales charges. Lipper rankings are based on total return at net asset value relative to other funds that have similar current investment styles or objectives as determined by Lipper. Lipper may change a fund’s category assignment at its discretion. Lipper category averages reflect performance trends for funds within a category.
16
Trustee approval
of management contract |
General conclusions
The Board of Trustees of the Putnam funds oversees the management of each fund and, as required by law, determines annually whether to approve the continuance of your fund’s management contract with Putnam Management. In this regard, the Board of Trustees, with the assistance of its Contract Committee consisting solely of Trustees who are not “interested persons” (as such term is defined in the Investment Company Act of 1940, as amended) of the Putnam funds (the “Independent Trustees”), requests and evaluates all information it deems reasonably necessary under the circumstances. Over the course of several months ending in June 2006, the Contract Committee met four times to consider the information provided by Putnam Management and other information developed with the assistance of the Board’s independent counsel and independent staff. The Contract Committee reviewed and discussed key aspects of this information with all of the Independe nt Trustees. Upon completion of this review, the Contract Committee recommended, and the Independent Trustees approved, the continuance of your fund’s management contract, effective July 1, 2006.
This approval was based on the following conclusions:
• That the fee schedule in effect for your fund represents reasonable compensation in light of the nature and quality of the services being provided to the fund, the fees paid by competitive funds and the costs incurred by Putnam Management in providing such services, and
• That such fee schedule represents an appropriate sharing between fund shareholders and Putnam Management of such economies of scale as may exist in the management of the fund at current asset levels.
These conclusions were based on a comprehensive consideration of all information provided to the Trustees and were not the result of any single factor. Some of the factors that figured particularly in the Trustees’ deliberations and how the Trustees considered these factors are described below, although individual Trustees may have evaluated the information presented differently, giving different weights to various factors. It is also important to recognize that the fee arrangements for your fund and the other Putnam funds are the result of many years of review and discussion between the Independent Trustees and Putnam Management, that certain aspects of such arrangements may receive greater scrutiny in some years than others, and that the Trustees’ conclusions may be based, in part, on their consideration of these same arrangements in prior years.
Management fee schedules and categories; total expenses
The Trustees reviewed the management fee schedules in effect for all Putnam funds, including fee levels and breakpoints, and the assignment of funds to particular fee categories. In reviewing fees and expenses, the Trustees generally focused their attention on material changes in circumstances — for example, changes in a fund’s size or investment style, changes in Putnam Management’s operating costs, or changes in competitive practices in the mutual fund industry — that suggest that consideration of fee changes might be warranted. The Trustees concluded that the circumstances did not warrant changes to the management fee structure of your fund, which had been carefully developed over the years, re-examined on many occasions and adjusted where appropriate. The Trustees focused on two areas of particular interest, as discussed further below:
• Competitiveness. The Trustees reviewed comparative fee and expense information for competitive funds, which indicated that, in a custom peer group of competitive funds selected by Lipper Inc., your fund ranked in the 33rd percentile in management fees and in the 13th percentile in total expenses (less any applicable 12b-1 fees) as of December 31, 2005 (the first percentile being the least expensive funds and the 100th percentile being the most expensive funds). (Because the fund’s custom peer group is smaller than the fund’s broad Lipper Inc. peer group, this expense information may differ from the Lipper peer expense information found elsewhere in this report.) The Trustees noted that expense ratios for a number of Putnam funds, which show the percentage of fund assets used to pay for management and administrative services, distribution (12b- 1) fees and other expenses, had been increasing recently as a result of declining net assets and the natural operation of fee breakpoints.
The Trustees noted that the expense ratio increases described above were currently being controlled by expense limitations implemented in January 2004 and which Putnam Management, in consultation with the Contract Committee, has committed to maintain at least through 2007. These expense limitations give effect to a commitment by Putnam Management that the expense ratio of each open-end fund would be no higher than the average expense ratio of the competitive funds included in the fund’s relevant Lipper universe (exclusive of any applicable 12b-1 charges in each case). The Trustees observed that this
17
commitment to limit fund expenses has served shareholders well since its inception. In order to ensure that the expenses of the Putnam funds continue to meet evolving competitive standards, the Trustees requested, and Putnam Management agreed, to implement an additional expense limitation for certain funds for the twelve months beginning January 1, 2007 equal to the average expense ratio (exclusive of 12b-1 charges) of a custom peer group of competitive funds selected by Lipper based on the size of the fund. This additional expense limitation will be applied to those open-end funds that had above-average expense ratios (exclusive of 12b-1 charges) based on the Lipper custom peer group data for the period ended December 31, 2005. This additional expense limitation will not be applied to your fund.
• Economies of scale. Your fund currently has the benefit of breakpoints in its management fee that provide shareholders with significant economies of scale, which means that the effective management fee rate of a fund (as a percentage of fund assets) declines as a fund grows in size and crosses specified asset thresholds. Conversely, as a fund shrinks in size — as has been the case for many Putnam funds in recent years — these breakpoints result in increasing fee levels. In recent years, the Trustees have examined the operation of the existing breakpoint structure during periods of both growth and decline in asset levels. The Trustees concluded that the fee schedules in effect for the funds represented an appropriate sharing of economies of scale at current asset levels. In reaching this conclusion, the Trustees considered the Contract C ommittee’s stated intent to continue to work with Putnam Management to plan for an eventual resumption in the growth of assets, including a study of potential economies that might be produced under various growth assumptions.
In connection with their review of the management fees and total expenses of the Putnam funds, the Trustees also reviewed the costs of the services to be provided and profits to be realized by Putnam Management and its affiliates from the relationship with the funds. This information included trends in revenues, expenses and profitability of Putnam Management and its affiliates relating to the investment management and distribution services provided to the funds. In this regard, the Trustees also reviewed an analysis of Putnam Management’s revenues, expenses and profitability with respect to the funds’ management contracts, allocated on a fund-by-fund basis. Because many of the costs incurred by Putnam Management in managing the funds are not readily identifiable to particular funds, the Trustees observed that the methodology for allocating costs is an important factor in evaluating Putnam Management’s costs and profitability, both as to the Putnam fu nds in the aggregate and as to individual funds. The Trustees reviewed Putnam Management’s cost allocation methodology with the assistance of independent consultants and concluded that this methodology was reasonable and well-considered.
Investment performance
The quality of the investment process provided by Putnam Management represented a major factor in the Trustees’ evaluation of the quality of services provided by Putnam Management under your fund’s management contract. The Trustees were assisted in their review of the Putnam funds’ investment process and performance by the work of the Investment Process Committee of the Trustees and the Investment Oversight Committee of the Trustees, which meet on a regular monthly basis with the funds’ portfolio teams throughout the year. The Trustees concluded that Putnam Management generally provides a high-quality investment process — as measured by the experience and skills of the individuals assigned to the management of fund portfolios, the resources made available to such personnel, and in general the ability of Putnam Management to attract and retain high-quality personnel — but also recognize that this does not guarantee favorable investment r esults for every fund in every time period. The Trustees considered the investment performance of each fund over multiple time periods and considered information comparing each fund’s performance with various benchmarks and with the performance of competitive funds.
The Trustees noted the satisfactory investment performance of many Putnam funds. They also noted the disappointing investment performance of certain funds in recent years and discussed with senior management of Putnam Management the factors contributing to such underperformance and actions being taken to improve performance. The Trustees recognized that, in recent years, Putnam Management has made significant changes in its investment personnel and processes and in the fund product line to address areas of underperformance. In particular, they noted the important contributions of Putnam Management’s leadership in attracting, retaining and supporting high-quality investment professionals and in systematically implementing an investment process that seeks to merge the best features of fundamental and quantitative analysis. The Trustees indicated their intention to continue to monitor performance trends to assess the effectiveness of these changes and to evaluate whether additional changes to address areas of underperformance are warranted.
18
In the case of your fund, the Trustees considered that your fund’s class A share cumulative total return performance at net asset value was in the following percentiles of its Lipper Inc. peer group (Lipper Convertible Securities Funds) for the one-, three- and five-year periods ended March 31, 2006 (the first percentile being the best performing funds and the 100th percentile being the worst performing funds):
| One-year period | Three-year period | Five-year period |
|
| 52nd | 25th | 16th |
(Because of the passage of time, these performance results may differ from the performance results for more recent periods shown elsewhere in this report. Over the one-, three- and five-year periods ended March 31, 2006, there were 75, 60, and 57 funds, respectively, in your fund’s Lipper peer group.* Past performance is no guarantee of future performance.)
As a general matter, the Trustees concluded that cooperative efforts between the Trustees and Putnam Management represent the most effective way to address investment performance problems. The Trustees noted that investors in the Putnam funds have, in effect, placed their trust in the Putnam organization, under the oversight of the funds’ Trustees, to make appropriate decisions regarding the management of the funds. Based on the responsiveness of Putnam Management in the recent past to Trustee concerns about investment performance, the Trustees concluded that it is preferable to seek change within Putnam Management to address performance shortcomings. In the Trustees’ view, the alternative of terminating a management contract and engaging a new investment adviser for an underperforming fund would entail significant disruptions and would not provide any greater assurance of improved investment performance.
Brokerage and soft-dollar allocations; other benefits
The Trustees considered various potential benefits that Putnam Management may receive in connection with the services it provides under the management contract with your fund. These include benefits related to brokerage and soft-dollar allocations, whereby a portion of the commissions paid by a fund for brokerage may be used to acquire research services that may be useful to Putnam Management in managing the assets of the fund and of other clients. The Trustees indicated their continued intent to monitor the potential benefits associated with the allocation of fund brokerage to ensure that the principle of seeking “best price and execution” remains paramount in the portfolio trading process. The Trustees’ annual review of your fund’s management contract also included the review of its distributor’s contract and distribution plan with Putnam Retail Management Limited Partnership and the custodian agreement and investor servicing agreement with Putnam Fiduciary Trust Company, all of which provide benefits to affiliates of Putnam Management.
Comparison of retail and institutional fee schedules
The information examined by the Trustees as part of their annual contract review has included for many years information regarding fees charged by Putnam Management and its affiliates to institutional clients such as defined benefit pension plans, college endowments, etc. This information included comparison of such fees with fees charged to the funds, as well as a detailed assessment of the differences in the services provided to these two types of clients. The Trustees observed, in this regard, that the differences in fee rates between institutional clients and the mutual funds are by no means uniform when examined by individual asset sectors, suggesting that differences in the pricing of investment management services to these types of clients reflect to a substantial degree historical competitive forces operating in separate market places. The Trustees considered the fact that fee rates across all asset sectors are higher on a verage for mutual funds than for institutional clients, as well as the differences between the services that Putnam Management provides to the Putnam funds and those that it provides to institutional clients of the firm, but did not rely on such comparisons to any significant extent in concluding that the management fees paid by your fund are reasonable.
* The percentile rankings for your fund’s class A share annualized total return performance in the Lipper Convertible Securities Funds category for the one-, five- and ten-year periods ended September 30, 2006, were 12%, 9%, and 53%, respectively. Over the one-, five- and ten-year periods ended September 30, 2006, the fund ranked 8th out of 70, 5th out of 55, and 19th out of 35 funds, respectively. Note that this more recent information was not available when the Trustees approved the continuance of your fund’s management contract.
19
Other information for shareholders
Putnam’s policy on confidentiality
In order to conduct business with our shareholders, we must obtain certain personal information such as account holders’ addresses, telephone numbers, Social Security numbers, and the names of their financial advisors. We use this information to assign an account number and to help us maintain accurate records of transactions and account balances. It is our policy to protect the confidentiality of your information, whether or not you currently own shares of our funds, and in particular, not to sell information about you or your accounts to outside marketing firms. We have safeguards in place designed to prevent unauthorized access to our computer systems and procedures to protect personal information from unauthorized use. Under certain circumstances, we share this information with outside vendors who provide services to us, such as mailing and proxy solicitation. In those cases, the service providers enter into confidentiali ty agreements with us, and we provide only the information necessary to process transactions and perform other services related to your account. We may also share this information with our Putnam affiliates to service your account or provide you with information about other Putnam products or services. It is also our policy to share account information with your financial advisor, if you’ve listed one on your Putnam account. If you would like clarification about our confidentiality policies or have any questions or concerns, please don’t hesitate to contact us at 1-800-225-1581, Monday through Friday, 8:30 a.m. to 7:00 p.m., or Saturdays from 9:00 a.m. to 5:00 p.m. Eastern Time.
Proxy voting
Putnam is committed to managing our mutual funds in the best interests of our shareholders. The Putnam funds’ proxy voting guidelines and procedures, as well as information regarding how your fund voted proxies relating to portfolio securities during the 12-month period ended June 30, 2006, are available on the Putnam Individual Investor Web site, www.putnam.com/individual, and on the SEC’s Web site, www.sec.gov. If you have questions about finding forms on the SEC’s Web site, you may call the SEC at 1-800-SEC-0330. You may also obtain the Putnam funds’ proxy voting guidelines and procedures at no charge by calling Putnam’s Shareholder Services at 1-800-225-1581.
Fund portfolio holdings
The fund will file a complete schedule of its portfolio holdings with the SEC for the first and third quarters of each fiscal year on Form N-Q. Shareholders may obtain the fund’s Forms N-Q on the SEC’s Web site at www.sec.gov. In addition, the fund’s Forms N-Q may be reviewed and copied at the SEC’s Public Reference Room in Washington, D.C. You may call the SEC at 1-800-SEC-0330 for information about the SEC’s Web site or the operation of the Public Reference Room.
20
Financial statements
These sections of the report, as well as the accompanying Notes, preceded by the Report of Independent Registered Public Accounting Firm, constitute the fund’s financial statements.
The fund’s portfolio lists all the fund’s investments and their values as of the last day of the reporting period. Holdings are organized by asset type and industry sector, country, or state to show areas of concentration and diversification.
Statement of assets and liabilities shows how the fund’s net assets and share price are determined. All investment and non-investment assets are added together. Any unpaid expenses and other liabilities are subtracted from this total. The result is divided by the number of shares to determine the net asset value per share, which is calculated separately for each class of shares. (For funds with preferred shares, the amount subtracted from total assets includes the liquidation preference of preferred shares.)
Statement of operations shows the fund’s net investment gain or loss. This is done by first adding up all the fund’s earnings — from dividends and interest income — and subtracting its operating expenses to determine net investment income (or loss). Then, any net gain or loss the fund realized on the sales of its holdings — as well as any unrealized gains or losses over the period — is added to or subtracted from the net investment result to determine the fund’s net gain or loss for the fiscal year.
Statement of changes in net assets shows how the fund’s net assets were affected by the fund’s net investment gain or loss, by distributions to shareholders, and by changes in the number of the fund’s shares. It lists distributions and their sources (net investment income or realized capital gains) over the current reporting period and the most recent fiscal year-end. The distributions listed here may not match the sources listed in the Statement of operations because the distributions are determined on a tax basis and may be paid in a different period from the one in which they were earned.
Financial highlights provide an overview of the fund’s investment results, per-share distributions, expense ratios, net investment income ratios, and portfolio turnover in one summary table, reflecting the five most recent reporting periods. In a semiannual report, the highlight table also includes the current reporting period.
21
Report of Independent Registered Public Accounting Firm
The Board of Trustees and Shareholders
Putnam Convertible Income-Growth Trust:
We have audited the accompanying statement of assets and liabilities of Putnam Convertible Income-Growth Trust, including the fund’s portfolio, as of October 31, 2006, and the related statement of operations for the year then ended, the statements of changes in net assets for each of the two years in the period then ended and the financial highlights for each of the five years or periods in the period then ended. These financial statements and financial highlights are the responsibility of the fund’s management. Our responsibility is to express an opinion on these financial statements and financial highlights based on our audits.
We conducted our audits in accordance with the standards of the Public Company Accounting Oversight Board (United States). Those standards require that we plan and perform our audit to obtain reasonable assurance about whether the financial statements and financial highlights are free of material misstatement. An audit includes examining, on a test basis, evidence supporting the amounts and disclosures in the financial statements. Our procedures included confirmation of securities owned as of October 31, 2006 by correspondence with the custodian and brokers or by other appropriate auditing procedures. An audit also includes assessing the accounting principles used and significant estimates made by management, as well as evaluating the overall financial statement presentation. We believe that our audits provide a reasonable basis for our opinion.
In our opinion, the financial statements and financial highlights referred to above present fairly, in all material respects, the financial position of Putnam Convertible Income-Growth Trust as of October 31, 2006, the results of its operations for the year then ended, the changes in its net assets for each of the two years in the period then ended, and the financial highlights for each of the five years or periods in the period then ended, in conformity with U.S. generally accepted accounting principles.

Boston, Massachusetts
December 11, 2006 |
22
The fund’s portfolio 10/31/06
| CONVERTIBLE BONDS AND NOTES (67.0%)* | | |
|
| | | Principal amount | | Value |
|
| Aerospace and Defense (3.6%) | | | | |
| Armor Holdings, Inc. cv. sr. sub. notes | | | |
| stepped-coupon 2s (zero %, | | | | |
| 11/1/11) 2024 †† | $ | 4,400,000 | $ | 5,093,000 |
| Lockheed Martin Corp. cv. sr. notes | | | |
| FRN 5.155s, 2033 | | 11,900,000 | | 15,108,240 |
| Triumph Group, Inc. 144A cv. sr. | | | | |
| sub. notes 2 5/8s, 2026 | | 5,000,000 | | 5,531,250 |
| | | | | 25,732,490 |
|
| |
| Airlines (1.4%) | | | | |
| Pinnacle Airlines Corp. cv. sr. notes | | | |
| 3 1/4s, 2025 | | 9,800,000 | | 9,591,750 |
|
| |
| Automotive (2.2%) | | | | |
| ArvinMeritor, Inc. 144A cv. unsec. | | | | |
| sr. notes stepped-coupon 4 5/8s | | | | |
| (zero %, 3/1/16) 2026 †† | | 6,850,000 | | 6,927,060 |
| United Auto Group, Inc. | | | | |
| 144A cv. sr. sub. notes | | | | |
| 3 1/2s, 2026 | | 7,800,000 | | 8,901,750 |
| | | | | 15,828,810 |
|
| |
| Biotechnology (5.2%) | | | | |
| Amgen, Inc. 144A cv. sr. notes | | | | |
| 3/8s, 2013 | | 10,000,000 | | 10,450,000 |
| Amylin Pharmaceuticals, Inc. | | | | |
| cv. sr. notes 2 1/2s, 2011 | | 740,000 | | 1,091,500 |
| Amylin Pharmaceuticals, Inc. | | | | |
| 144A cv. sr. notes 2 1/2s, 2011 | | 2,500,000 | | 3,687,500 |
| Connetics Corp. 144A cv. | | | | |
| sr. notes 2s, 2015 | | 4,000,000 | | 3,910,000 |
| Cubist Pharmaceuticals, Inc. | | | | |
| cv. sub. notes 2 1/4s, 2013 | | 6,000,000 | | 5,932,500 |
| Genzyme Corp. (General Division) | | | |
| cv. sr. notes 1 1/4s, 2023 | | 7,900,000 | | 8,581,375 |
| MGI Pharma, Inc. 144A cv. | | | | |
| sr. sub. notes stepped-coupon | | | | |
| 1.682s (zero %, 3/2/11) 2024 †† | | 5,350,000 | | 3,584,500 |
| | | | | 37,237,375 |
|
| |
| Broadcasting (1.0%) | | | | |
| Sinclair Broadcast Group, Inc. | | | | |
| cv. bonds 6s, 2012 | | 8,010,000 | | 7,229,025 |
|
| |
| Building Materials (1.0%) | | | | |
| Masco Corp. cv. sr. notes Ser. B, | | | | |
| zero %, 2031 | | 14,600,000 | | 6,807,250 |
|
| |
| Cable Television (0.6%) | | | | |
| Charter Communications, Inc. | | | | |
| cv. sr. notes 5 7/8s, 2009 | | 3,200,000 | | 3,696,000 |
| Charter Communications, Inc. | | | | |
| 144A cv. sr. notes 5 7/8s, 2009 | | 658,000 | | 759,990 |
| | | | | 4,455,990 |
|
| |
| Commercial and Consumer Services (0.5%) | | |
| Euronet Worldwide, Inc. | | | | |
| 144A cv. debs. 3 1/2s, 2025 | | 3,400,000 | | 3,646,500 |
|
| CONVERTIBLE BONDS AND NOTES (67.0%)* continued | | |
|
| | | | | Value |
|
| Communications Equipment (0.9%) | | | | |
| Andrew Corp. cv. sub. notes | | | | |
| 3 1/4s, 2013 | $ | 6,700,000 | $ | 6,641,375 |
|
| |
| Components (0.4%) | | | | |
| Coherent, Inc. 144A cv. sub. bonds | | | | |
| 2 3/4s, 2011 | | 2,500,000 | | 2,718,750 |
|
| |
| Computers (3.7%) | | | | |
| Anixter International, Inc. cv. Liquid | | | | |
| Yield Option Notes (LYON) Ser. * | | | | |
| zero %, 2033 | | 11,500,000 | | 10,393,125 |
| Cray, Inc. cv. sr. sub. notes 3s, 2024 | | 2,000,000 | | 1,727,500 |
| Cray, Inc. 144A cv. sr. sub. notes | | | | |
| 3s, 2024 | | 4,600,000 | | 3,973,250 |
| Gateway, Inc. 144A cv. sr. notes | | | | |
| 2s, 2011 | | 2,400,000 | | 1,926,000 |
| Gateway, Inc. 144A cv. sr. notes | | | | |
| 1 1/2s, 2009 | | 2,500,000 | | 2,125,000 |
| Open Solutions, Inc. 144A cv. sr. sub. | | | | |
| notes stepped-coupon | | | | |
| 1.467s (zero %, 2/2/12) 2035 †† | | 4,000,000 | | 3,075,000 |
| SafeNet, Inc. 144A cv. sub. notes | | | | |
| 2 1/2s, 2010 | | 3,000,000 | | 2,850,000 |
| | | | | 26,069,875 |
|
| |
| Conglomerates (1.6%) | | | | |
| Tyco International Group | | | | |
| SA cv. unsub. sr. company | | | | |
| guaranty Ser. B, 3 1/8s, 2023 | | | | |
| (Luxembourg) | | 8,100,000 | | 11,147,625 |
|
| |
| Consumer Services (0.6%) | | | | |
| FTI Consulting, Inc. 144A cv. | | | | |
| sr. sub. notes 3 3/4s, 2012 | | 3,600,000 | | 4,171,500 |
|
| |
| Electric Utilities (1.1%) | | | | |
| CenterPoint Energy, Inc. cv. unsec. sub | | | | |
| notes FRN 2s, 2029 | | 204,900 | | 7,458,360 |
|
| |
| Electrical Equipment (0.8%) | | | | |
| WESCO International, Inc. cv. debs. | | | | |
| Ser. *, 2 5/8s, 2025 | | 400,000 | | 679,500 |
| WESCO International, Inc. | | | | |
| 144A cv. debs. Ser. B, 2 5/8s, 2025 | | 2,900,000 | | 4,926,375 |
| | | | | 5,605,875 |
|
| |
| Electronics (7.0%) | | | | |
| Agere Systems, Inc. cv. sub. notes | | | | |
| 6 1/2s, 2009 | | 7,300,000 | | 7,345,625 |
| Diodes, Inc. cv. sr. notes 2 1/4s, 2026 | | 3,000,000 | | 3,191,250 |
| Flextronics International, | | | | |
| Ltd. cv. sub. notes 1s, 2010 | | | | |
| (Singapore) | | 6,800,000 | | 6,621,500 |
| Intel Corp. 144A cv. sub. bonds | | | | |
| 2.95s, 2035 | | 10,700,000 | | 9,710,250 |
| Itron, Inc. cv. sr. sub. notes | | | | |
| 2 1/2s, 2026 | | 2,500,000 | | 2,775,000 |
23
| CONVERTIBLE BONDS AND NOTES (67.0%)* continued | | |
|
| | | Principal amount | | Value |
|
| Electronics continued | | | | |
| KEMET Corp. 144A cv. sr. notes | | | | |
| 2 1/4s, 2026 | $ | 4,000,000 | $ | 4,100,000 |
| Liberty Media Corp. cv. sr. notes | | | | |
| 3 1/2s, 2031 | | 6,900,000 | | 7,193,250 |
| LSI Logic Corp. cv. sub. notes | | | | |
| 4s, 2010 | | 8,000,000 | | 8,530,000 |
| | | | | 49,466,875 |
|
| |
| Energy (1.5%) | | | | |
| Cal Dive International, Inc. | | | | |
| 144A cv. sr. notes 3 1/4s, 2025 | | 3,800,000 | | 4,935,250 |
| Pride International, Inc. cv. sr. notes | | | | |
| 3 1/4s, 2033 | | 4,700,000 | | 5,687,000 |
| | | | | 10,622,250 |
|
| |
| Entertainment (1.5%) | | | | |
| Lions Gate Entertainment Corp. | | | | |
| cv. sr. bonds stepped-coupon | | | | |
| 3 5/8s (3 1/8s, | | | | |
| 3/15/12) 2025 (Canada) †† | | 1,300,000 | | 1,275,625 |
| Lions Gate Entertainment Corp. | | | | |
| 144A cv. sr. sub. bonds 3 5/8s, | | | | |
| 2025 (Canada) | | 5,800,000 | | 5,691,250 |
| Macrovision Corp. 144A | | | | |
| cv. sr. notes 2 5/8s, 2011 | | 3,000,000 | | 3,532,500 |
| | | | | 10,499,375 |
|
| |
| Gaming & Lottery (0.7%) | | | | |
| Scientific Games Corp. 144A cv. | | | | |
| company guaranty 3/4s, 2024 | | 4,400,000 | | 4,801,500 |
|
| |
| Health Care Services (1.9%) | | | | |
| Manor Care, Inc. cv. sr. notes | | | | |
| stepped-coupon 2 1/8s (1 7/8s, | | | | |
| 8/10/10) 2035 †† | | 5,700,000 | | 6,604,875 |
| Per-Se Technologies, Inc. | | | | |
| 144A cv. notes 3 1/4s, 2024 | | 2,200,000 | | 3,256,000 |
| United Therapeutics Corp. | | | | |
| 144A cv. sr. notes 1/2s, 2011 | | 3,500,000 | | 3,478,125 |
| | | | | 13,339,000 |
|
| |
| Insurance (1.4%) | | | | |
| Prudential Financial, Inc. cv. unsec. sub | | | | |
| notes FRN 2.645s, 2035 | | 10,300,000 | | 10,215,540 |
|
| |
| Lodging/Tourism (2.2%) | | | | |
| Carnival Corp. cv. debs. 2s, 2021 | | | | |
| (Panama) | | 7,000,000 | | 8,925,000 |
| Hilton Hotels Corp. 144A cv. | | | | |
| notes 3 3/8s, 2023 | | 5,100,000 | | 6,840,375 |
| | | | | 15,765,375 |
|
| |
| Manufacturing (1.0%) | | | | |
| Trinity Industries, Inc. cv. sub. notes | | | | |
| 3 7/8s, 2036 | | 7,000,000 | | 7,245,000 |
|
| |
| Media (1.1%) | | | | |
| Walt Disney Co. (The) | | | | |
| cv. sr. notes 2 1/8s, 2023 | | 6,800,000 | | 7,726,500 |
|
| CONVERTIBLE BONDS AND NOTES (67.0%)* continued | | |
|
| | | Principal amount | | Value |
|
| Medical Technology (3.1%) | | | | |
| Atherogenics, Inc. 144A cv. | | | | |
| sr. notes 1 1/2s, 2012 | $ | 3,720,000 | $ | 2,934,150 |
| Cytyc Corp. 144A cv. sr. notes | | | | |
| 2 1/4s, 2024 | | 3,650,000 | | 3,809,688 |
| EPIX Medical, Inc. cv. sr. notes | | | | |
| 3s, 2024 | | 3,300,000 | | 2,112,000 |
| EPIX Medical, Inc. | | | | |
| 144A cv. sr. notes 3s, 2024 | | 4,300,000 | | 2,752,000 |
| Medtronic, Inc. cv. sr. notes | | | | |
| 1 5/8s, 2013 | | 2,200,000 | | 2,208,250 |
| Medtronic, Inc. 144A cv. | | | | |
| sr. notes 1 5/8s, 2013 | | 8,500,000 | | 8,531,875 |
| | | | | 22,347,963 |
|
| |
| Oil & Gas (2.6%) | | | | |
| Devon Energy Corp. cv. debs. | | | | |
| 4.9s, 2008 | | 11,900,000 | | 15,291,500 |
| McMoran Exploration Co. | | | | |
| 144A cv. notes 6s, 2008 | | 2,300,000 | | 2,849,125 |
| | | | | 18,140,625 |
|
| |
| Pharmaceuticals (5.5%) | | | | |
| Alza Corp. cv. sub. debs. | | | | |
| zero %, 2020 | | 11,400,000 | | 10,559,250 |
| CV Therapeutics, Inc. cv. sub. notes | | | | |
| 3 1/4s, 2013 | | 4,200,000 | | 3,570,000 |
| New River Pharmaceuticals, Inc. | | | | |
| 144A cv. sub. notes 3 1/2s, 2013 | | 3,500,000 | | 5,919,375 |
| Watson Pharmaceuticals, Inc. | | | | |
| cv. debs. 1 3/4s, 2023 | | 9,100,000 | | 8,428,875 |
| Wyeth cv. sr. notes FRN | | | | |
| 5.109s, 2024 | | 9,700,000 | | 10,574,940 |
| | | | | 39,052,440 |
|
| |
| Real Estate (1.0%) | | | | |
| Corporate Office Properties LP | | | | |
| 144A cv. company guaranty 3 1/2s, | | | | |
| 2026 (R) | | 3,400,000 | | 3,451,000 |
| Forest City Enterprises, Inc. | | | | |
| 144A cv. notes 3 5/8s, 2011 (R) | | 3,500,000 | | 3,563,438 |
| | | | | 7,014,438 |
|
| |
| Retail (3.1%) | | | | |
| Dick’s Sporting Goods, Inc. | | | | |
| cv. sr. notes stepped-coupon | | | | |
| 1.606s (zero %, 2/18/09) 2024 †† | | 4,400,000 | | 4,009,500 |
| Men’s Wearhouse, Inc. | | | | |
| (The) cv. sr. notes 3 1/8s, 2023 | | 5,000,000 | | 7,037,500 |
| Nash Finch Co. cv. sr. sub. notes | | | | |
| stepped-coupon 1.631s (zero %, | | | | |
| 3/15/13) 2035 †† | | 10,085,000 | | 4,172,669 |
| Nash Finch Co. 144A cv. sr. sub. notes | | | | |
| stepped-coupon 1.631s (zero %, | | | | |
| 3/15/13) 2035 †† | | 8,500,000 | | 3,516,875 |
| Pantry, Inc. (The) 144A | | | | |
| cv. sub. notes 3s, 2012 | | 2,600,000 | | 3,448,250 |
| | | | | 22,184,794 |
|
24
| CONVERTIBLE BONDS AND NOTES (67.0%)* continued | | |
|
| | | Principal amount | | Value |
|
| Semiconductor Production Equipment (0.9%) | | |
| Kulicke & Soffa Industries, Inc. | | | | |
| cv. sub. notes 1/2s, 2008 | $ | 7,300,000 | $ | 6,442,250 |
|
| |
| Technology (0.9%) | | | | |
| ON Semiconductor Corp. cv. | | | | |
| company guaranty Ser. B, zero %, 2024 | | 7,500,000 | | 6,759,375 |
|
| |
| Technology Services (2.2%) | | | | |
| DST Systems, Inc. 144A cv. | | | | |
| sr. notes Ser. A, 4 1/8s, 2023 | | 5,000,000 | | 6,887,500 |
| Safeguard Scientifics, Inc. | | | | |
| 144A cv. sr. notes 2 5/8s, 2024 | | 10,500,000 | | 8,505,000 |
| | | | | 15,392,500 |
|
| |
| Telecommunications (3.8%) | | | | |
| American Tower Corp. cv. sr. notes | | | | |
| 3s, 2012 | | 4,300,000 | | 7,965,750 |
| Dobson Communications Corp. | | | | |
| 144A cv. sr. notes 1 1/2s, 2025 | | 7,000,000 | | 7,157,500 |
| Level 3 Communications, Inc. | | | | |
| cv. sr. notes 3 1/2s, 2012 | | 3,000,000 | | 3,577,500 |
| NII Holdings, Inc. 144A cv. | | | | |
| sr. unsec. notes 2 3/4s, 2025 | | 5,500,000 | | 8,043,750 |
| | | | | 26,744,500 |
|
| |
| Waste Management (1.0%) | | | | |
| Waste Connections, Inc. cv. sr. notes | | | | |
| 3 3/4s, 2026 | | 4,900,000 | | 5,089,875 |
| Waste Connections, Inc. 144A cv. | | | | |
| sr. notes 3 3/4s, 2026 | | 2,000,000 | | 2,077,500 |
| | | | | 7,167,375 |
|
| |
| Total convertible bonds and notes | | | | |
| (cost $438,935,810) | | | $ | 475,270,225 |
|
| |
| |
| CONVERTIBLE PREFERRED STOCKS (25.4%)* | | |
|
| | | Shares | | Value |
|
| Banking (2.9%) | | | | |
| Marshall & Ilsley Corp. $1.625 cv. pfd. | | 322,900 | $ | 8,769,964 |
| Washington Mutual Capital Trust I | | | | |
| $2.688 cum. cv. pfd. | | 210,500 | | 11,434,360 |
| | | | | 20,204,324 |
|
| |
| Broadcasting (0.4%) | | | | |
| Emmis Communications Corp. Ser. A, | | | | |
| $3.125 cum. cv. pfd. | | 73,119 | | 2,860,781 |
|
| |
| Chemicals (0.9%) | | | | |
| Huntsman Corp. $2.50 cv. pfd. | | 173,575 | | 6,639,244 |
|
| |
| Electric Utilities (1.0%) | | | | |
| Entergy Corp. $3.813 cv. pfd. | | 125,000 | | 7,062,500 |
|
| |
| Financial (2.0%) | | | | |
| Fannie Mae Ser. 04-1, 5.375% cv. pfd. | | 148 | | 14,300,482 |
|
| CONVERTIBLE PREFERRED STOCKS (25.4%)* continued | | |
|
| | | Shares | | Value |
|
| Forest Products and Packaging (1.1%) | | | | |
| Smurfit-Stone Container Corp. | | | | |
| Ser. A, $1.75 cum. cv. pfd. | | 326,900 | $ | 7,682,150 |
|
| |
| Insurance (5.2%) | | | | |
| Alleghany Corp. 5.75% cv. pfd. | | 24,023 | | 7,101,799 |
| Citigroup Funding, Inc. FRN | | | | |
| Ser. GNW, 5.02% cv. pfd. | | 418,900 | | 13,182,783 |
| Conseco, Inc. $1.375 cum. cv. pfd. | | 267,500 | | 6,654,063 |
| IPC Holdings, Ltd. 7.25% cv. pfd. | | | | |
| (Bermuda) | | 124,300 | | 3,666,850 |
| Platinum Underwriters Holdings, | | | | |
| Ltd. Ser. A, 6.00% cv. pfd. (Bermuda) | | 226,400 | | 6,650,500 |
| | | | | 37,255,995 |
|
| |
| Investment Banking/Brokerage (1.6%) | | | | |
| Affiliated Managers Group, Inc. | | | | |
| 144A $2.55 cv. pfd. | | 138,000 | | 7,055,250 |
| Merrill Lynch & Co., Inc. | | | | |
| Ser. JNC, 6.75% cv. pfd. | | 102,940 | | 4,444,949 |
| | | | | 11,500,199 |
|
| |
| Metals (1.5%) | | | | |
| Freeport-McMoRan Copper & Gold, Inc. | | | | |
| 5.50% cv. pfd. | | 7,800 | | 10,669,425 |
|
| |
| Natural Gas Utilities (2.1%) | | | | |
| El Paso Corp. 144A 4.99% cv. pfd. | | 6,550 | | 8,048,313 |
| Southern Union Co. $2.50 cv. pfd. | | 124,700 | | 6,952,025 |
| | | | | 15,000,338 |
|
| |
| Oil & Gas (2.1%) | | | | |
| Chesapeake Energy Corp. 6.25% cv. pfd. | | 54,515 | | 14,903,038 |
|
| |
| Power Producers (1.0%) | | | | |
| NRG Energy, Inc. 5.75% cv. pfd. | | 29,500 | | 7,282,813 |
|
| |
| Real Estate (1.4%) | | | | |
| Simon Property Group, Inc. $3.00 cv. pfd. | | 122,200 | | 9,653,800 |
|
| |
| Retail (1.2%) | | | | |
| Retail Ventures, Inc. $3.312 cv. pfd. (S) | | 79,940 | | 5,026,228 |
| Rite Aid Corp. $1.375 cum. cv. pfd. | | 142,200 | | 3,609,036 |
| | | | | 8,635,264 |
|
| |
| Tobacco (1.0%) | | | | |
| Universal Corp. 6.75% cv. pfd. | | 6,888 | | 6,948,270 |
|
| |
| Total convertible preferred stocks | | | | |
| (cost $171,807,529) | | | $ | 180,598,623 |
25
| COMMON STOCKS (2.7%)* | | | |
|
| | Shares | | Value |
|
| CSX Corp. | 210,200 | $ | 7,497,834 |
| FutureFuel Corp. † | 200,000 | | 1,560,000 |
| Masco Corp. (S) | 106,400 | | 2,941,960 |
| U.S. Bancorp | 220,600 | | 7,465,104 |
|
| Total common stocks (cost $18,431,761) | | $ | 19,464,898 |
|
| |
| UNITS (1.3%)* | | | |
|
| | Units | | Value |
|
| Acquicor Technology, Inc. † | 325,000 | $ | 2,145,000 |
| Elf Special Financing, Ltd. | | | |
| 144A cv. units FRN Ser. B, 5.74s, | | | |
| 2009 (Cayman Islands) | 65 | | 7,399,600 |
|
| Total units (cost $8,441,598) | | $ | 9,544,600 |
| WARRANTS (0.1%)* † (cost $66,000) | | | |
|
| Expiration date | Strike Price | Warrants | | Value |
|
| FutureFuel Corp. | 7/12/10 | $6.00 | 200,000 | $ | 470,000 |
|
| |
| SHORT-TERM INVESTMENTS (4.8%)* | | | |
|
| | | | Principal amount/shares | | Value |
|
| Putnam Prime Money | | | | |
| Market Fund (e) | | | 26,863,315 | $ | 26,863,315 |
| Short-term investments held as | | | | |
| collateral for loaned securities | | | | |
| with yields ranging from 5.27% | | | | |
| to 5.44% and due dates ranging | | | | |
| from November 1, 2006 to | | | | |
| December 22, 2006 (d) | $ | 7,512,984 | | 7,492,200 |
|
| Total short-term investments (cost $34,355,515) | $ | 34,355,515 |
|
| |
| TOTAL INVESTMENTS | | | | |
| Total investments (cost $672,038,213) | | $ | 719,703,861 |
* Percentages indicated are based on net assets of $709,715,992.
† Non-income-producing security.
†† The interest rate and date shown parenthetically represent the new interest rate to be paid and the date the fund will begin accruing interest at this rate.
(d) See Note 1 to the financial statements.
(e) See Note 5 to the financial statements regarding investments in Putnam Prime Money Market Fund.
(R) Real Estate Investment Trust.
(S) Securities on loan, in part or in entirety, at October 31, 2006.
144A after the name of an issuer represents securities exempt from registration under Rule 144A under the Securities Act of 1933, as amended. These securities may be resold in transactions exempt from registration, normally to qualified institutional buyers.
The rates shown on Floating Rate Notes (FRN) are the current interest rates at October 31, 2006.
The dates shown on debt obligations are the original maturity dates.
The accompanying notes are an integral part of these financial statements.
26
Statement of assets and liabilities 10/31/06
| ASSETS | |
|
| Investment in securities, at value, including $7,300,855 of securities on loan (Note 1): | |
| Unaffiliated issuers (identified cost $645,174,898) | $ 692,840,546 |
| Affiliated issuers (identified cost $26,863,315) (Note 5) | 26,863,315 |
|
| Cash | 155 |
|
| Dividends, interest and other receivables | 3,988,914 |
|
| Receivable for shares of the fund sold | 1,042,748 |
|
| Receivable for securities sold | 2,116,577 |
|
| Total assets | 726,852,255 |
|
| |
| LIABILITIES | |
|
| Payable for securities purchased | 7,570,355 |
|
| Payable for shares of the fund repurchased | 393,938 |
|
| Payable for compensation of Manager (Notes 2 and 5) | 1,068,157 |
|
| Payable for investor servicing and custodian fees (Note 2) | 146,727 |
|
| Payable for Trustee compensation and expenses (Note 2) | 149,508 |
|
| Payable for administrative services (Note 2) | 3,266 |
|
| Payable for distribution fees (Note 2) | 191,192 |
|
| Collateral on securities loaned, at value (Note 1) | 7,492,200 |
|
| Other accrued expenses | 120,920 |
|
| Total liabilities | 17,136,263 |
|
| Net assets | $ 709,715,992 |
|
| |
| REPRESENTED BY | |
|
| Paid-in capital (Unlimited shares authorized) (Notes 1 and 4) | $781,219,179 |
|
| Undistributed net investment income (Note 1) | 11,137,234 |
|
| Accumulated net realized loss on investments (Note 1) | (130,306,069) |
|
| Net unrealized appreciation of investments | 47,665,648 |
|
| Total — Representing net assets applicable to capital shares outstanding | $ 709,715,992 |
|
| |
| COMPUTATION OF NET ASSET VALUE AND OFFERING PRICE | |
|
| Net asset value and redemption price per class A share ($608,770,921 divided by 31,950,537 shares) | $19.05 |
|
| Offering price per class A share (100/94.75 of $19.05)* | $20.11 |
|
| Net asset value and offering price per class B share ($47,842,441 divided by 2,551,515 shares)** | $18.75 |
|
| Net asset value and offering price per class C share ($22,010,303 divided by 1,163,470 shares)** | $18.92 |
|
| Net asset value and redemption price per class M share ($5,607,128 divided by 296,634 shares) | $18.90 |
|
| Offering price per class M share (100/96.75 of $18.90)* | $19.53 |
|
| Net asset value, offering price and redemption price per class R share ($1,027,409 divided by 54,045 shares) | $19.01 |
|
| Net asset value, offering price and redemption price per class Y share ($24,457,790 divided by 1,283,619 shares) | $19.05 |
|
* On single retail sales of less than $50,000. On sales of $50,000 or more the offering price is reduced.
** Redemption price per share is equal to net asset value less any applicable contingent deferred sales charge. |
The accompanying notes are an integral part of these financial statements.
27
Statement of operations Year ended 10/31/06
| INVESTMENT INCOME | |
|
| Interest (including interest income of $417,631 from investments in affiliated issuers) (Note 5) | $13,474,174 |
|
| Dividends | 11,332,834 |
|
| Securities lending | 119,067 |
|
| Total investment income | 24,926,075 |
|
| |
| EXPENSES | |
|
| Compensation of Manager (Note 2) | 4,241,816 |
|
| Investor servicing fees (Note 2) | 781,757 |
|
| Custodian fees (Note 2) | 137,389 |
|
| Trustee compensation and expenses (Note 2) | 46,513 |
|
| Administrative services (Note 2) | 26,437 |
|
| Distribution fees — Class A (Note 2) | 1,441,622 |
|
| Distribution fees — Class B (Note 2) | 560,085 |
|
| Distribution fees — Class C (Note 2) | 190,266 |
|
| Distribution fees — Class M (Note 2) | 41,341 |
|
| Distribution fees — Class R (Note 2) | 2,631 |
|
| Other | 212,463 |
|
| Non-recurring costs (Notes 2 and 6) | 8,155 |
|
| Costs assumed by Manager (Notes 2 and 6) | (8,155) |
|
| Fees waived and reimbursed by Manager or affiliate (Notes 5 and 6) | (106,900) |
|
| Total expenses | 7,575,420 |
|
| Expense reduction (Note 2) | (43,733) |
|
| Net expenses | 7,531,687 |
|
| Net investment income | 17,394,388 |
|
| Net realized gain on investments (Notes 1 and 3) | 46,211,632 |
|
| Net unrealized appreciation of investments during the year | 28,969,312 |
|
| Net gain on investments | 75,180,944 |
|
| Net increase in net assets resulting from operations | $92,575,332 |
The accompanying notes are an integral part of these financial statements.
28
Statement of changes in net assets
| INCREASE (DECREASE) IN NET ASSETS | | |
|
| | Year ended | Year ended |
| | 10/31/06 | 10/31/05 |
|
| Operations: | | |
| Net investment income | $ 17,394,388 | $ 20,297,346 |
|
| Net realized gain on investments | 46,211,632 | 59,635,268 |
|
| Net unrealized appreciation (depreciation) of investments | 28,969,312 | (35,815,826) |
|
| Net increase in net assets resulting from operations | 92,575,332 | 44,116,788 |
|
| Distributions to shareholders: (Note 1) | | |
|
| From ordinary income | | |
|
| Net investment income | | |
|
| Class A | (16,629,867) | (18,117,886) |
|
| Class B | (1,229,140) | (1,931,698) |
|
| Class C | (417,362) | (367,307) |
|
| Class M | (134,215) | (165,203) |
|
| Class R | (15,046) | (1,867) |
|
| Class Y | (753,674) | (950,786) |
|
| Redemption fees (Note 1) | 63 | 320 |
|
| Decrease from capital share transactions (Note 4) | (41,605,385) | (84,797,819) |
|
| Total increase (decrease) in net assets | 31,790,706 | (62,215,458) |
|
| |
| NET ASSETS | | |
|
| Beginning of year | 677,925,286 | 740,140,744 |
|
| End of year (including undistributed net investment income of $11,137,234 and $11,310,971, respectively) | $709,715,992 | $677,925,286 |
The accompanying notes are an integral part of these financial statements.
29
Financial highlights (For a common share outstanding throughout the period)
| INVESTMENT OPERATIONS: | | | | | LESS DISTRIBUTIONS: | | | | RATIOS AND SUPPLEMENTAL DATA: | | |
| | | | Net | | | | | | Total | | | Ratio of net | |
| | Net asset | | realized and | Total | From | | | Net asset | return | Net | Ratio of | investment | |
| | value, | Net | unrealized | from | net | | | value, | at net | assets, | expenses to | income (loss) | Portfolio |
| | beginning | investment | gain (loss) on | investment | investment | Total | Redemption | end | asset | end of period | average net | to average | turnover |
| Period ended | of period | income (loss)(a) | investments | operations | income | distributions | fees | of period | value (%)(b) | (in thousands) | assets (%)(c) | net assets (%) | (%) |
|
| CLASS A | | | | | | | | | | | | | |
| October 31, 2006 | $17.13 | .48(d,e) | 1.97 | 2.45 | (.53) | (.53) | —(f) | $19.05 | 14.52 | $608,771 | 1.03(d,e) | 2.64(d,e) | 63.63 |
| October 31, 2005 | 16.60 | .50(d,g) | .56 | 1.06 | (.53) | (.53) | —(f) | 17.13 | 6.41 | 564,822 | 1.03(d) | 2.91(d,g) | 66.46 |
| October 31, 2004 | 15.46 | .51(d) | 1.17 | 1.68 | (.54) | (.54) | —(f) | 16.60 | 10.92 | 592,537 | 1.09(d) | 3.09(d) | 52.98 |
| October 31, 2003 | 12.32 | .58 | 3.14 | 3.72 | (.58) | (.58) | — | 15.46 | 30.79 | 645,260 | 1.07 | 4.20 | 93.66 |
| October 31, 2002 | 13.32 | .63(h) | (1.01)(h) | (.38) | (.62) | (.62) | — | 12.32 | (3.20) | 542,156 | 1.08 | 4.63(h) | 116.36 |
|
| |
| CLASS B | | | | | | | | | | | | | |
| October 31, 2006 | $16.86 | .34(d,e) | 1.94 | 2.28 | (.39) | (.39) | —(f) | $18.75 | 13.68 | $47,842 | 1.78(d,e) | 1.89(d,e) | 63.63 |
| October 31, 2005 | 16.34 | .36(d,g) | .55 | .91 | (.39) | (.39) | —(f) | 16.86 | 5.61 | 65,205 | 1.78(d) | 2.16(d,g) | 66.46 |
| October 31, 2004 | 15.22 | .38(d) | 1.15 | 1.53 | (.41) | (.41) | —(f) | 16.34 | 10.10 | 99,042 | 1.84(d) | 2.34(d) | 52.98 |
| October 31, 2003 | 12.14 | .47 | 3.09 | 3.56 | (.48) | (.48) | — | 15.22 | 29.82 | 129,317 | 1.82 | 3.45 | 93.66 |
| October 31, 2002 | 13.13 | .52(h) | (.99)(h) | (.47) | (.52) | (.52) | — | 12.14 | (3.91) | 106,343 | 1.83 | 3.88(h) | 116.36 |
|
| |
| CLASS C | | | | | | | | | | | | | |
| October 31, 2006 | $17.01 | .34(d,e) | 1.97 | 2.31 | (.40) | (.40) | —(f) | $18.92 | 13.73 | $22,010 | 1.78(d,e) | 1.89(d,e) | 63.63 |
| October 31, 2005 | 16.50 | .37(d,g) | .55 | .92 | (.41) | (.41) | —(f) | 17.01 | 5.60 | 17,952 | 1.78(d) | 2.17(d,g) | 66.46 |
| October 31, 2004 | 15.38 | .38(d) | 1.16 | 1.54 | (.42) | (.42) | —(f) | 16.50 | 10.09 | 11,587 | 1.84(d) | 2.32(d) | 52.98 |
| October 31, 2003 | 12.27 | .47 | 3.13 | 3.60 | (.49) | (.49) | — | 15.38 | 29.79 | 7,178 | 1.82 | 3.34 | 93.66 |
| October 31, 2002 | 13.26 | .52(h) | (.99)(h) | (.47) | (.52) | (.52) | — | 12.27 | (3.87) | 3,999 | 1.83 | 3.87(h) | 116.36 |
|
| |
| CLASS M | | | | | | | | | | | | | |
| October 31, 2006 | $16.99 | .38(d,e) | 1.97 | 2.35 | (.44) | (.44) | —(f) | $18.90 | 14.01 | $5,607 | 1.53(d,e) | 2.14(d,e) | 63.63 |
| October 31, 2005 | 16.48 | .41(d,g) | .54 | .95 | (.44) | (.44) | —(f) | 16.99 | 5.79 | 5,662 | 1.53(d) | 2.41(d,g) | 66.46 |
| October 31, 2004 | 15.35 | .42(d) | 1.16 | 1.58 | (.45) | (.45) | —(f) | 16.48 | 10.36 | 6,790 | 1.59(d) | 2.59(d) | 52.98 |
| October 31, 2003 | 12.24 | .51 | 3.12 | 3.63 | (.52) | (.52) | — | 15.35 | 30.14 | 9,248 | 1.57 | 3.65 | 93.66 |
| October 31, 2002 | 13.23 | .56(h) | (1.00)(h) | (.44) | (.55) | (.55) | — | 12.24 | (3.65) | 6,861 | 1.58 | 4.13(h) | 116.36 |
|
| |
| CLASS R | | | | | | | | | | | | | |
| October 31, 2006 | $17.11 | .43(d,e) | 1.98 | 2.41 | (.51) | (.51) | —(f) | $19.01 | 14.27 | $1,027 | 1.28(d,e) | 2.35(d,e) | 63.63 |
| October 31, 2005 | 16.60 | .46(d,g) | .54 | 1.00 | (.49) | (.49) | —(f) | 17.11 | 6.07 | 87 | 1.28(d) | 2.67(d,g) | 66.46 |
| October 31, 2004† | 15.79 | .43(d) | .89 | 1.32 | (.51) | (.51) | — | 16.60 | 8.43* | 47 | 1.23*(d) | 2.60*(d) | 52.98 |
|
| |
| CLASS Y | | | | | | | | | | | | | |
| October 31, 2006 | $17.13 | .52(d,e) | 1.97 | 2.49 | (.57) | (.57) | —(f) | $19.05 | 14.81 | $24,458 | .78(d,e) | 2.88(d,e) | 63.63 |
| October 31, 2005 | 16.60 | .54(d,g) | .56 | 1.10 | (.57) | (.57) | —(f) | 17.13 | 6.68 | 24,197 | .78(d) | 3.15(d,g) | 66.46 |
| October 31, 2004 | 15.46 | .53(d) | 1.19 | 1.72 | (.58) | (.58) | —(f) | 16.60 | 11.21 | 30,138 | .84(d) | 3.35(d) | 52.98 |
| October 31, 2003 | 12.32 | .62 | 3.13 | 3.75 | (.61) | (.61) | — | 15.46 | 31.11 | 40,883 | .82 | 4.46 | 93.66 |
| October 31, 2002 | 13.32 | .66(h) | (1.00)(h) | (.34) | (.66) | (.66) | — | 12.32 | (2.96) | 36,910 | .83 | 4.87(h) | 116.36 |
|
See notes to financial highlights at the end of this section.
The accompanying notes are an integral part of these financial statements.
30
Financial highlights (Continued)
* Not annualized.
† For the period December 1, 2003 (commencement of operations) to October 31, 2004.
(a) Per share net investment income (loss) has been determined on the basis of the weighted average number of shares outstanding during the period.
(b) Total return assumes dividend reinvestment and does not reflect the effect of sales charges.
(c) Includes amounts paid through expense offset and brokerage service arrangements (Note 2).
(d) Reflects waivers of certain fund expenses in connection with investments in Putnam Prime Money Market Fund during the period. As a result of such waivers, the expenses of each class, as a percentage of its average net assets, reflect a reduction of the following amounts (Note 5):
| | | 10/31/06 | 10/31/05 | 10/31/04 |
|
| Class A | | <0.01% | <0.01% | <0.01% |
|
| Class B | | <0.01 | <0.01 | <0.01 |
|
| Class C | | <0.01 | <0.01 | <0.01 |
|
| Class M | | <0.01 | <0.01 | <0.01 |
|
| Class R | | <0.01 | <0.01 | <0.01 |
|
| Class Y | | <0.01 | <0.01 | <0.01 |
|
(e) Reflects a non-recurring reimbursement from Putnam Investments relating to the calculation of certain amounts paid by the fund to Putnam in previous years for transfer agent services which amounted to less than $0.01 per share and 0.01% of average net assets for the period ended October 31, 2006 (Note 6).
(f) Amount represents less than $0.01 per share.
(g) Reflects a non-recurring accrual related to Putnam Management’s settlement with the SEC regarding brokerage allocation practices, which amounted to the following amounts (Note 6):
| | | Percentage |
| | | of average |
| | Per share | net assets |
|
| Class A | <$0.01 | 0.02% |
|
| Class B | <0.01 | 0.03 |
|
| Class C | <0.01 | 0.02 |
|
| Class M | <0.01 | 0.03 |
|
| Class R | <0.01 | 0.02 |
|
| Class Y | <0.01 | 0.03 |
|
(h) As required, effective November 1, 2001, the fund adopted the provisions of the AICPA Audit and Accounting Guide, Audits of Investment Companies, and began amortizing premium on its fixed-income securities. The effects from this change for the year ended October 31, 2002 were a decrease to net investment income per share of $0.02, a decrease to net realized and unrealized losses per share of $0.02 and a decrease to the ratio of net investment income to average net assets of 0.13% for class A, B, C, M and Y shares.
The accompanying notes are an integral part of these financial statements.
32
Notes to financial statements 10/31/06
Note 1: Significant accounting policies
Putnam Convertible Income-Growth Trust (“the fund”), a Massachusetts business trust, is registered under the Investment Company Act of 1940, as amended, as a diversified, open-end management investment company. The fund seeks, with equal emphasis, current income and capital appreciation by investing primarily in U.S. securities that can be converted or exchanged for common stock. The fund’s secondary objective is conservation of capital. The fund invests in higher yielding, lower rated bonds that may have a higher rate of default.
The fund offers class A, class B, class C, class M, class R and class Y shares. Class A and class M shares are sold with a maximum front-end sales charge of 5.25% and 3.25%, respectively, and generally do not pay a contingent deferred sales charge. Class B shares, which convert to class A shares after approximately eight years, do not pay a front-end sales charge and are subject to a contingent deferred sales charge, if those shares are redeemed within six years of purchase. Class C shares have a one-year 1.00% contingent deferred sales charge and do not convert to class A shares. Class R shares, which are offered to qualified employee-benefit plans, are sold without a front-end sales charge or a contingent deferred sales charge. The expenses for class A, class B, class C, class M and class R shares may differ based on the distribution fee of each class, which is identified in Note 2. Class Y shares, which are sold at net asset value, are generally subject to the sa me expenses as class A, class B, class C, class M and class R shares, but do not bear a distribution fee. Class Y shares are sold to certain eligible purchasers including certain defined contribution plans (including corporate IRAs), bank trust departments and trust companies.
Effective October 2, 2006, a 1.00% redemption fee may apply on any shares purchased on or after such date that are redeemed (either by selling or exchanging into another fund) within 7 days of purchase. The redemption fee is accounted for as an addition to paid-in-capital. Prior to October 2, 2006, a 2.00% redemption fee applied to any shares that were redeemed (either by selling or exchanging into another fund) within 5 days of purchase.
Investment income, realized and unrealized gains and losses and expenses of the fund are borne pro-rata based on the relative net assets of each class to the total net assets of the fund, except that each class bears expenses unique to that class (including the distribution fees applicable to such classes). Each class votes as a class only with respect to its own distri bution plan or other matters on which a class vote is required by law or determined by the Trustees. Shares of each class would receive their pro rata share of the net assets of the fund, if the fund were liquidated. In addition, the Trustees declare separate dividends on each class of shares.
In the normal course of business, the fund enters into contracts that may include agreements to indemnify another party under given circumstances. The fund’s maximum exposure under these arrangements is unknown as this would involve future claims that may be, but have not yet been, made against the fund. However, the fund expects the risk of material loss to be remote.
The following is a summary of significant accounting policies consistently followed by the fund in the preparation of its financial statements. The preparation of financial statements is in conformity with accounting principles generally accepted in the United States of America and requires management to make estimates and assumptions that affect the reported amounts of assets and liabilities in the financial statements and the reported amounts of increases and decreases in net assets from operations during the reporting period. Actual results could differ from those estimates.
A) Security valuation Investments for which market quotations are readily available are valued at the last reported sales price on their principal exchange, or official closing price for certain markets. If no sales are reported — as in the case of some securities traded over-the-counter — a security is valued at its last reported bid price. Market quotations are not considered to be readily available for certain debt obligations; such investments are valued on the basis of valuations furnished by an independent pricing service approved by the Trustees or dealers selected by Putnam Investment Management, LLC (“Putnam Management”), the fund’s manager, an indirect wholly-owned subsidiary of Putnam, LLC. Such services or dealers determine valuations for normal institutional-size trading units of such securities using methods based on market transactions for comparable securities and various relationships, gen erally recognized by institutional traders, between securities. Many securities markets and exchanges outside the U.S. close prior to the close of the New York Stock Exchange and therefore the closing prices for securities in such markets or on such exchanges may not fully reflect events that occur after such close but before the close of the New York Stock Exchange. Accordingly, on certain days, the fund will fair value foreign equity securities taking into account multiple factors, including movements in the U.S. securities markets. The number of days on which fair value prices will be used will depend on market activity and it is possible that fair value prices will be used by the fund to a significant extent. Securities quoted in foreign currencies, if any, are translated into U.S. dollars at the current exchange rate. Certain investments, including certain restricted securities, are also valued at fair value following procedures approved by the Trustees. Such valuations and procedures are reviewed perio dically by the Trustees. The fair value of securities is generally determined as the amount that the fund could reasonably expect to realize from an orderly disposition of such securities over a reasonable period of time. By its nature, a fair value price is a good faith estimate of the value of a security at a given point in time and does not reflect an actual market price, which may be different by a material amount.
B) Joint trading account Pursuant to an exemptive order from the Securities and Exchange Commission, the fund may transfer uninvested cash balances, including cash collateral received under security lending arrangements, into a joint trading account along with the cash of other registered investment companies and certain other accounts managed by Putnam Management. These balances may be invested in issues of high-grade short-term investments having maturities of up to 397 days for collateral received under security lending arrangements and up to 90 days for other cash investments.
C) Repurchase agreements The fund, or any joint trading account, through its custodian, receives delivery of the underlying securities, the market value of which at the time of purchase is required to be in an amount at least equal to the resale price, including accrued interest. Collateral for certain tri-party repurchase agreements is held at the counterparty’s custodian in a segregated account for the benefit of the fund and the counterparty. Putnam Management is responsible for
33
determining that the value of these underlying securities is at all times at least equal to the resale price, including accrued interest.
D) Security transactions and related investment income Security transactions are recorded on the trade date (the date the order to buy or sell is executed). Gains or losses on securities sold are determined on the identified cost basis.
Interest income is recorded on the accrual basis. Dividend income, net of applicable withholding taxes, is recognized on the ex-dividend date except that certain dividends from foreign securities, if any, are recognized as soon as the fund is informed of the ex-dividend date. Non-cash dividends, if any, are recorded at the fair market value of the securities received. Dividends representing a return of capital or capital gains, if any, are reflected as a reduction of cost and/or as a realized gain.
All premiums/discounts are amortized/accreted on a yield-to-maturity basis.
E) Securities lending The fund may lend securities, through its agents, to qualified borrowers in order to earn additional income. The loans are collateralized by cash and/or securities in an amount at least equal to the market value of the securities loaned. The market value of securities loaned is determined daily and any additional required collateral is allocated to the fund on the next business day. The risk of borrower default will be borne by the fund’s agents; the fund will bear the risk of loss with respect to the investment of the cash collateral. Income from securities lending is included in investment income on the statement of operations. At October 31, 2006, the value of securities loaned amounted to $7,300,855. The fund received cash collateral of $7,492,200 which is pooled with collateral of other Putnam funds into 42 issues of high grade short-term investments.
F) Federal taxes It is the policy of the fund to distribute all of its taxable income within the prescribed time and otherwise comply with the provisions of the Internal Revenue Code of 1986 (the “Code”) applicable to regulated investment companies. It is also the intention of the fund to distribute an amount sufficient to avoid imposition of any excise tax under Section 4982 of the Code, as amended. Therefore, no provision has been made for federal taxes on income, capital gains or unrealized appreciation on securities held nor for excise tax on income and capital gains.
At October 31, 2006, the fund had a capital loss carryover of $130,306,068 available to the extent allowed by the Code to offset future net capital gain, if any. The amount of the carryover and the expiration dates are:
| Loss Carryover | Expiration |
|
| $43,579,052 | October 31, 2009 |
|
| 86,727,016 | October 31, 2010 |
|
G) Distributions to shareholders Distributions to shareholders from net investment income are recorded by the fund on the ex-dividend date. Distributions from capital gains, if any, are recorded on the ex-dividend date and paid at least annually. The amount and character of income and gains to be distributed are determined in accordance with income tax regulations, which may differ from generally accepted accounting principles. These differences include temporary and permanent differences of amortization and accretion. Reclassifications are made to the fund’s capital accounts to reflect income and gains available for distribution (or available capital loss carryovers) under income tax regulations. For the year ended October 31, 2006, the fund reclassified $1,611,179 to increase undistributed net investment income with an increase to accumulated net realized losses of $1,611,179.
The tax basis components of distributable earnings and the federal tax cost as of October 31, 2006 were as follows:
| Unrealized appreciation | $ 62,882,166 |
| Unrealized depreciation | (15,216,518) |
| | ——————-——————— |
| Net unrealized appreciation | 47,665,648 |
| Undistributed ordinary income | 12,648,231 |
| Capital loss carryforward | (130,306,068) |
| Cost for federal income tax purposes | $ 672,038,213 |
Note 2: Management fee, administrative services
and other transactions
Putnam Management is paid for management and investment advisory services quarterly based on the average net assets of the fund. Such fee is based on the following annual rates: 0.65% of the first $500 million of average net assets, 0.55% of the next $500 million, 0.50% of the next $500 million, 0.45% of the next $5 billion, 0.425% of the next $5 billion, 0.405% of the next $5 billion, 0.39% of the next $5 billion, and 0.38% thereafter.
Putnam Management has agreed to waive fees and reimburse expenses of the fund through October 31, 2007 to the extent necessary to ensure that the fund’s expenses do not exceed the simple average of the expenses of all front-end load funds viewed by Lipper Inc. as having the same investment classification or objective as the fund. The expense reimbursement is based on a comparison of the fund’s expenses with the average annualized operating expenses of the funds in its Lipper peer group for each calendar quarter during the fund’s last fiscal year, excluding 12b-1 fees and without giving effect to any expense offset and brokerage service arrangements that may reduce fund expenses. For the year ended October 31, 2006, Putnam Management did not waive any of its management fee from the fund.
For the year ended October 31, 2006, Putnam Management has assumed $8,155 of legal, shareholder servicing and communication, audit and Trustee fees incurred by the fund in connection with certain legal and regulatory matters (including those described in Note 6).
The fund reimburses Putnam Management an allocated amount for the compensation and related expenses of certain officers of the fund and their staff who provide administrative services to the fund. The aggregate amount of all such reimbursements is determined annually by the Trustees.
Custodial functions for the fund’s assets are provided by Putnam Fiduciary Trust Company (“PFTC”), a subsidiary of Putnam, LLC. PFTC receives fees for custody services based on the fund’s asset level, the number of its security holdings and transaction volumes. Putnam Investor Services, a division of PFTC, provides investor servicing agent functions to the fund. Putnam Investor Services receives fees for investor servicing based on the number of shareholder accounts in the fund and the level of defined contribution plan assets in the fund. During the year ended October 31, 2006, the fund incurred $919,146 for these services.
The fund has entered into an arrangement with PFTC whereby credits realized as a result of uninvested cash balances are used to reduce a portion of the fund’s expenses. The fund also reduced expenses through brokerage service arrangements. For the year ended October 31, 2006, the fund’s expenses were reduced by $43,733 under these arrangements.
34
Each independent Trustee of the fund receives an annual Trustee fee, of which $376, as a quarterly retainer, has been allocated to the fund, and an additional fee for each Trustees meeting attended. Trustees receive additional fees for attendance at certain committee meetings, industry seminars and for certain compliance-related matters. Trustees also are reimbursed for expenses they incur relating to their services as Trustees. George Putnam, III, who is not an independent Trustee, also receives the foregoing fees for his services as Trustee.
The fund has adopted a Trustee Fee Deferral Plan (the “Deferral Plan”) which allows the Trustees to defer the receipt of all or a portion of Trustees fees payable on or after July 1, 1995. The deferred fees remain invested in certain Putnam funds until distribution in accordance with the Deferral Plan.
The fund has adopted an unfunded noncontributory defined benefit pension plan (the “Pension Plan”) covering all Trustees of the fund who have served as a Trustee for at least five years and were first elected prior to 2004. Benefits under the Pension Plan are equal to 50% of the Trustee’s average annual attendance and retainer fees for the three years ended December 31, 2005. The retirement benefit is payable during a Trustee’s lifetime, beginning the year following retirement, for the number of years of service through December 31, 2006. Pension expense for the fund is included in Trustee compensation and expenses in the statement of operations. Accrued pension liability is included in Payable for Trustee compensation and expenses in the statement of assets and liabilities. The Trustees have terminated the Pension Plan with respect to any Trustee first elected after 2003.
The fund has adopted distribution plans (the “Plans”) with respect to its class A, class B, class C, class M and class R shares pursuant to Rule 12b-1 under the Investment Company Act of 1940. The purpose of the Plans is to compensate Putnam Retail Management, a wholly-owned subsidiary of Putnam, LLC and Putnam Retail Management GP, Inc., for services provided and expenses incurred in distributing shares of the fund. The Plans provide for payments by the fund to Putnam Retail Management at an annual rate of up to 0.35%, 1.00%, 1.00%, 1.00% and 1.00% of the average net assets attributable to class A, class B, class C, class M and class R shares, respectively. The Trustees have approved payment by the fund at an annual rate of 0.25%, 1.00%, 1.00%, 0.75% and 0.50% of the average net assets attributable to class A, class B, class C, class M and class R shares, respectively.
For the year ended October 31, 2006, Putnam Retail Management, acting as underwriter, received net commissions of $15,205 and $276 from the sale of class A and class M shares, respectively, and received $48,533 and $612 in contingent deferred sales charges from redemptions of class B and class C shares, respectively.
A deferred sales charge of up to 1.00% and 0.65% is assessed on certain redemptions of class A and class M shares, respectively. For the year ended October 31, 2006, Putnam Retail Management, acting as underwriter, received $5,758 and no monies on class A and class M redemptions, respectively.
Note 3: Purchases and sales of securities
During the year ended October 31, 2006, cost of purchases and proceeds from sales of investment securities other than short-term investments aggregated $426,416,845 and $493,531,738, respectively. There were no purchases or sales of U.S. government securities.
Note 4: Capital shares
At October 31, 2006, there was an unlimited number of shares of beneficial interest authorized. Transactions in capital shares were as follows:
| CLASS A | Shares | Amount |
|
| Year ended 10/31/06: | | |
| Shares sold | 3,995,714 | $ 72,830,680 |
|
| Shares issued in connection with | | |
| reinvestment of distributions | 784,042 | 14,067,436 |
|
| | 4,779,756 | 86,898,116 |
|
| Shares repurchased | (5,810,704) | (105,025,174) |
|
| Net decrease | (1,030,948) | $ (18,127,058) |
| |
| Year ended 10/31/05: | | |
| Shares sold | 4,325,413 | $ 73,946,315 |
|
| Shares issued in connection with | | |
| reinvestment of distributions | 685,380 | 11,792,814 |
|
| | 5,010,793 | 85,739,129 |
|
| Shares repurchased | (7,719,342) | (131,680,703) |
|
| Net decrease | (2,708,549) | $ (45,941,574) |
|
| |
| CLASS B | Shares | Amount |
|
| Year ended 10/31/06: | | |
| Shares sold | 306,081 | $ 5,464,442 |
|
| Shares issued in connection with | | |
| reinvestment of distributions | 54,283 | 957,590 |
|
| | 360,364 | 6,422,032 |
|
| Shares repurchased | (1,677,356) | (29,829,520) |
|
| Net decrease | (1,316,992) | $(23,407,488) |
| |
| Year ended 10/31/05: | | |
| Shares sold | 607,922 | $ 10,226,518 |
|
| Shares issued in connection with | | |
| reinvestment of distributions | 71,636 | 1,211,223 |
|
| | 679,558 | 11,437,741 |
|
| Shares repurchased | (2,871,154) | (48,160,114) |
|
| Net decrease | (2,191,596) | $(36,722,373) |
35
| CLASS C | Shares | Amount |
|
| Year ended 10/31/06: | | |
| Shares sold | 323,943 | $ 5,889,508 |
|
| Shares issued in connection with | | |
| reinvestment of distributions | 13,659 | 243,766 |
|
| | 337,602 | 6,133,274 |
|
| Shares repurchased | (229,512) | (4,123,515) |
|
| Net increase | 108,090 | $ 2,009,759 |
| |
| Year ended 10/31/05: | | |
| Shares sold | 551,925 | $ 9,360,785 |
|
| Shares issued in connection with | | |
| reinvestment of distributions | 9,839 | 167,528 |
|
| | 561,764 | 9,528,313 |
|
| Shares repurchased | (208,404) | (3,519,609) |
|
| Net increase | 353,360 | $ 6,008,704 |
|
| |
| CLASS M | Shares | Amount |
| Year ended 10/31/06: | | |
| Shares sold | 46,137 | 837,067 |
|
| Shares issued in connection with | | |
| reinvestment of distributions | 6,175 | 109,972 |
|
| | 52,312 | 947,039 |
|
| Shares repurchased | (88,848) | (1,604,992) |
|
| Net decrease | (36,536) | $(657,953) |
| |
| Year ended 10/31/05: | | |
| Shares sold | 38,787 | $660,507 |
|
| Shares issued in connection with | | |
| reinvestment of distributions | 6,335 | 107,838 |
|
| | 45,122 | 768,345 |
|
| Shares repurchased | (124,038) | (2,089,163) |
|
| Net decrease | (78,916) | $(1,320,818) |
|
| |
| CLASS R | Shares | Amount |
| Year ended 10/31/06: | | |
| Shares sold | 48,814 | $890,634 |
|
| Shares issued in connection with | | |
| reinvestment of distributions | 832 | 15,046 |
|
| | 49,646 | 905,680 |
|
| Shares repurchased | (697) | (12,384) |
|
| Net increase | 48,949 | $893,296 |
| |
| Year ended 10/31/05: | | |
| Shares sold | 2,366 | $ 40,344 |
|
| Shares issued in connection with | | |
| reinvestment of distributions | 73 | 1,252 |
|
| | 2,439 | 41,596 |
|
| Shares repurchased | (153) | (2,612) |
|
| Net increase | 2,286 | $ 38,984 |
| CLASS Y | Shares | Amount |
| Year ended 10/31/06: | | |
| Shares sold | 63,412 | $1,150,275 |
|
| Shares issued in connection with | | |
| reinvestment of distributions | 41,693 | 747,775 |
|
| | 105,105 | 1,898,050 |
|
| Shares repurchased | (234,321) | (4,213,991) |
|
| Net decrease | (129,216) | $(2,315,941) |
| |
| Year ended 10/31/05: | | |
| Shares sold | 140,229 | $2,404,173 |
|
| Shares issued in connection with | | |
| reinvestment of distributions | 55,488 | 950,786 |
|
| | 195,717 | 3,354,959 |
|
| Shares repurchased | (597,942) | (10,215,701) |
|
| Net decrease | (402,225) | $(6,860,742) |
Note 5: Investment in Putnam Prime Money Market Fund
The fund invests in Putnam Prime Money Market Fund, an open-end management investment company managed by Putnam Management. Investments in Putnam Prime Money Market Fund are valued at its closing net asset value each business day. Management fees paid by the fund are reduced by an amount equal to the management and administrative services fees paid by Putnam Prime Money Market Fund with respect to assets invested by the fund in Putnam Prime Money Market Fund. For the year ended October 31, 2006, management fees paid were reduced by $10,200 relating to the fund’s investment in Putnam Prime Money Market Fund. Income distributions earned by the fund are recorded as income in the statement of operations and totaled $417,631 for the year ended October 31, 2006. During the year ended October 31, 2006, cost of purchases and proceeds of sales of investments in Putnam Prime Money Market Fund aggregated $242,431,868 and $219,540,104, respectively.
Note 6: Regulatory matters and litigation
Putnam Management has entered into agreements with the Securities and Exchange Commission and the Massachusetts Securities Division settling charges connected with excessive short-term trading by Putnam employees and, in the case of the charges brought by the Massachusetts Securities Division, by participants in some Putnam-administered 401(k) plans. Pursuant to these settlement agreements, Putnam Management will pay a total of $193.5 million in penalties and restitution, with $153.5 million being paid to certain open-end funds and their shareholders. The amount will be allocated to shareholders and funds pursuant to a plan developed by an independent consultant, and will be paid following approval of the plan by the SEC and the Massachusetts Securities Division.
The Securities and Exchange Commission’s and Massachusetts Securities Division’s allegations and related matters also serve as the general basis for numerous lawsuits, including purported class action lawsuits filed against Putnam Management and certain related parties, including certain Putnam funds. Putnam Management will bear any costs incurred by Putnam funds in connection with these lawsuits. Putnam Management believes that the likelihood that the pending private lawsuits and purported class action lawsuits will have a material adverse financial
36
impact on the fund is remote, and the pending actions are not likely to materially affect its ability to provide investment management services to its clients, including the Putnam funds.
Pursuant to a settlement with the Securities and Exchange Commission relating to Putnam Management’s brokerage allocation practices, on October 13, 2005 the fund received $175,813 in proceeds paid by Putnam Management.
In connection with a settlement between Putnam and the fund’s Trustees in September 2006, the fund received $96,700 from Putnam to address issues relating to the calculation of certain amounts paid by the Putnam mutual funds to Putnam for transfer agent services. This amount is included in Fees waived and reimbursed by Manager or affiliate on the Statement of operations.
Putnam Management and Putnam Retail Management are named as defendants in a civil suit in which the plaintiffs allege that the management and distribution fees paid by certain Putnam funds were excessive and seek recovery under the Investment Company Act of 1940. Putnam Management and Putnam Retail Management have contested the plaintiffs’ claims and the matter is currently pending in the U.S. District Court for the District of Massachusetts. Based on currently available information, Putnam Management believes that this action is without merit and that it is unlikely to have a material effect on Putnam Management’s and Putnam Retail Management’s ability to provide services to their clients, including the fund.
Note 7: New accounting pronouncements
In June 2006, the Financial Accounting Standards Board (“FASB”) issued Interpretation No. 48, Accounting for Uncertainty in Income Taxes (the “Interpretation”). The Interpretation prescribes a minimum threshold for financial statement recognition of the benefit of a tax position taken or expected to be taken by a filer in the filer’s tax return. The Interpretation will become effective for fiscal years beginning after December 15, 2006 but will also apply to tax positions reflected in the fund’s financial statements as of that date. No determination has been made whether the adoption of the Interpretation will require the fund to make any adjustments to its net assets or have any other effect on the fund’s financial statements.
In September 2006, the FASB issued Statement of Financial Accounting Standards No. 157, Fair Value Measurements (the “Standard”). The Standard defines fair value, sets out a framework for measuring fair value and requires additional disclosures about fair value measurements. The Standard applies to fair value measurements already required or permitted by existing standards. The Standard is effective for financial statements issued for fiscal years beginning after November 15, 2007 and interim periods within those fiscal years. Putnam Management is currently evaluating what impact the adoption of the Standard will have on the fund’s financial statements.
37
Federal tax information and brokerage
commissions (Unaudited) |
Federal tax information
The fund designated 54.93% of ordinary income distributions as qualifying for the dividends received deduction for corporations.
For its tax year ended October 31, 2006, the fund hereby designates 58.98%, or the maximum amount allowable, of its taxable ordinary income distributions as qualified dividends taxed at the individual net capital gain rates.
The Form 1099 you receive in January 2007 will show the tax status of all distributions paid to your account in calendar 2006.
Brokerage commissions
Brokerage commissions are paid to firms that execute trades on behalf of your fund. When choosing these firms, Putnam is required by law to seek the best execution of the trades, taking all relevant factors into consideration, including expected quality of execution and commission rate. Listed below are the largest relationships based upon brokerage commissions for your fund and the other funds in Putnam’s Large-Cap Value group for the year ended October 31, 2006. The other Putnam mutual funds in this group are The George Putnam Fund of Boston, Putnam Classic Equity Fund, Putnam Equity Income Fund, The Putnam Fund for Growth and Income, Putnam New Value Fund, Putnam VT Equity Income Fund, Putnam VT The George Putnam Fund of Boston, Putnam VT Growth and Income Fund, and Putnam VT New Value Fund.
The top five firms that received brokerage commissions for trades executed for the Large-Cap Value group are (in descending order) Goldman Sachs, Citigroup Global Markets, Merrill Lynch, UBS Warburg, and Deutsche Bank Securities. Commissions paid to these firms together represented approximately 45% of the total brokerage commissions paid for the year ended October 31, 2006.
Commissions paid to the next 10 firms together represented approximately 36% of the total brokerage commissions paid during the period. These firms are (in alphabetical order) Bank of America, Bear Stearns & Company, Credit Suisse First Boston, JPMorgan Clearing, Lazard Freres & Co., Lehman Brothers, Morgan Stanley Dean Witter, RBC Capital Markets, Sanford Bernstein, and Wachovia Securities.
Commission amounts do not include “mark-ups” paid on bond or derivative trades made directly with a dealer. Additional information about brokerage commissions is available on the Securities and Exchange Commission (SEC) Web site at www.sec.gov. Putnam funds disclose commissions by firm to the SEC in semiannual filings on Form N-SAR.
38
About the Trustees
Jameson A. Baxter (Born 1943), Trustee since 1994, Vice Chairman since 2005
Ms. Baxter is the President of Baxter Associates, Inc., a private investment firm that she founded in 1986.
Ms. Baxter serves as a Director of ASHTA Chemicals, Inc., Banta Corporation (a printing and digital imaging firm), Ryerson Tull, Inc. (a steel service corporation), the Mutual Fund Directors Forum, Advocate Health Care and BoardSource, formerly the National Center for Nonprofit Boards. She is Chairman Emeritus of the Board of Trustees, Mount Holyoke College, having served as Chairman for five years and as a board member for thirteen years. Until 2002, Ms. Baxter was a Director of Intermatic Corporation (a manufacturer of energy control products).
Ms. Baxter has held various positions in investment banking and corporate finance, including Vice President and Principal of the Regency Group, and Vice President of and Consultant to First Boston Corporation. She is a graduate of Mount Holyoke College.
Charles B. Curtis (Born 1940), Trustee since 2001
Mr. Curtis is President and Chief Operating Officer of the Nuclear Threat Initiative (a private foundation dealing with national security issues) and serves as Senior Advisor to the United Nations Foundation.
Mr. Curtis is a member of the Council on Foreign Relations and the Trustee Advisory Council of the Applied Physics Laboratory, Johns Hopkins University. Until 2003, Mr. Curtis was a member of the Electric Power Research Institute Advisory Council and the University of Chicago Board of Governors for Argonne National Laboratory. Prior to 2002, Mr. Curtis was a Member of the Board of Directors of the Gas Technology Institute and the Board of Directors of the Environment and Natural Resources Program Steering Committee, John F. Kennedy School of Government, Harvard University. Until 2001, Mr. Curtis was a member of the Department of Defense Policy Board and Director of EG&G Technical Services, Inc. (a fossil energy research and development support company).
From August 1997 to December 1999, Mr. Curtis was a Partner at Hogan & Hartson L.L.P., a Washington, D.C. law firm. Prior to May 1997, Mr. Curtis was Deputy Secretary of Energy and Under Secretary of the U.S. Department of Energy. He served as Chairman of the Federal Energy Regulatory Commission from 1977 to 1981 and has held positions on the staff of the U.S. House of Representatives, the U.S. Treasury Department, and the SEC.
Myra R. Drucker (Born 1948), Trustee since 2004
Ms. Drucker is Chair of the Board of Trustees of Commonfund (a not-for-profit firm specializing in asset management for educational endowments and foundations), Vice Chair of the Board of Trustees of Sarah Lawrence College, and a member of the Investment Committee of the Kresge Foundation (a charitable trust). She is also a director of New York Stock Exchange LLC, a wholly-owned subsidiary of the publicly-traded NYSE Group, Inc. She is an advisor to Hamilton Lane LLC and RCM Capital Management (investment management firms).
Ms. Drucker is an ex-officio member of the New York Stock Exchange (NYSE) Pension Managers Advisory Committee, having served as Chair for seven years and a member of the Executive Committee of the Committee on Investment of Employee Benefit Assets.
Until August 31, 2004, Ms. Drucker was Managing Director and a member of the Board of Directors of General Motors Asset Management and Chief Investment Officer of General Motors Trust Bank. Ms. Drucker also served as a member of the NYSE Corporate Accountability and Listing Standards Committee and the NYSE/NASD IPO Advisory Committee.
Prior to joining General Motors Asset Management in 2001, Ms. Drucker held various executive positions in the investment management industry. Ms. Drucker served as Chief Investment Officer of Xerox Corporation (a technology and service company in the document industry), where she was responsible for the investment of the company’s pension assets. Ms. Drucker was also Staff Vice President and Director of Trust Investments for International Paper (a paper, paper distribution, packaging and forest products company) and previously served as Manager of Trust Investments for Xerox Corporation. Ms. Drucker received a B.A. degree in Literature and Psychology from Sarah Lawrence College and pursued graduate studies in economics, statistics and portfolio theory at Temple University.
John A. Hill (Born 1942), Trustee since 1985 and Chairman since 2000
Mr. Hill is Vice Chairman of First Reserve Corporation, a private equity buyout firm that specializes in energy investments in the diversified worldwide energy industry.
39
Mr. Hill is a Director of Devon Energy Corporation, TransMontaigne Oil Company and various private companies controlled by First Reserve Corporation, as well as Chairman of TH Lee, Putnam Investment Trust (a closed-end investment company advised by an affiliate of Putnam Management). He is also a Trustee of Sarah Lawrence College. Until 2005, he was a Director of Continuum Health Partners of New York.
Prior to acquiring First Reserve Corporation in 1983, Mr. Hill held executive positions in investment banking and investment management with several firms and with the federal government, including Deputy Associate Director of the Office of Management and Budget and Deputy Director of the Federal Energy Administration. He is active in various business associations, including the Economic Club of New York, and lectures on energy issues in the United States and Europe. Mr. Hill holds a B.A. degree in Economics from Southern Methodist University and pursued graduate studies there as a Woodrow Wilson Fellow.
Paul L. Joskow (Born 1947), Trustee since 1997
Dr. Joskow is the Elizabeth and James Killian Professor of Economics and Management, and Director of the Center for Energy and Environmental Policy Research at the Massachusetts Institute of Technology.
Dr. Joskow serves as a Director of National Grid plc (a UK-based holding company with interests in electric and gas transmission and distribution and telecommunications infrastructure) and TransCanada Corporation (an energy company focused on natural gas transmission and power services). He also serves on the Board of Overseers of the Boston Symphony Orchestra. Prior to February 2005, he served on the board of the Whitehead Institute for Biomedical Research (a non-profit research institution) and has been President of the Yale University Council since 1993. Prior to February 2002, he was a Director of State Farm Indemnity Company (an automobile insurance company), and, prior to March 2000, he was a Director of New England Electric System (a public utility holding company).
Dr. Joskow has published five books and numerous articles on topics in industrial organization, government regulation of industry, and competition policy. He is active in industry restructuring, environmental, energy, competition and privatization policies — serving as an advisor to governments and corporations worldwide. Dr. Joskow holds a Ph.D. and M. Phil from Yale University and a B.A. from Cornell University.
Elizabeth T. Kennan (Born 1938), Trustee since 1992
Dr. Kennan is a Partner of Cambus-Kenneth Farm (thoroughbred horse and cattle breeding). She is President Emeritus of Mount Holyoke College.
Dr. Kennan served as Chairman and is now Lead Director of Northeast Utilities. Until 2005, she was a Director of Talbots, Inc. She has served as Director on a number of other boards, including Bell Atlantic, Chastain Real Estate, Shawmut Bank, Berkshire Life Insurance and Kentucky Home Life Insurance. She is a Trustee of the National Trust for Historic Preservation, of Centre College and of Midway College in Midway, Kentucky. Until 2006, she was a member of The Trustees of Reservations. Dr. Kennan has served on the oversight committee of the Folger Shakespeare Library, as President of Five Colleges Incorporated, as a Trustee of Notre Dame University and is active in various educational and civic associations.
As a member of the faculty of Catholic University for twelve years, until 1978, Dr. Kennan directed the post-doctoral program in Patristic and Medieval Studies, taught history and published numerous articles. Dr. Kennan holds a Ph.D. from the University of Washington in Seattle, an M.S. from St. Hilda’s College at Oxford University and an A.B. from Mount Holyoke College. She holds several honorary doctorates.
Kenneth R. Leibler (Born 1949), Trustee since 2006
Mr. Leibler is founding Chairman of the Boston Options Exchange, the nation’s newest electronic marketplace for the trading of derivative securities.
Mr. Leibler currently serves as a Trustee of Beth Israel Deaconess Hospital in Boston. He is also lead director of Ruder Finn Group, a global communications and advertising firm. Since 2003, he has served as a director of the Optimum Funds group. Prior to October 2006, he served as a director of ISO New England, the organization responsible for the operation of the electric generation system in the New England states. Prior to 2000, Mr. Leibler was a director of the Investment Company Institute in Washington, D.C.
Prior to January 2005, Mr. Leibler served as Chairman and Chief Executive Officer of the Boston Stock Exchange. Prior to January 2000, he served as President and Chief Executive Officer of Liberty Financial Companies, a publicly traded diversified asset management organization. Prior to June 1990, he served as President and Chief Operating Officer of the American Stock Exchange, and is the youngest person in Exchange history to hold
40
the title of President. Prior to serving as Amex President, he held the position of Chief Financial Officer, and headed its management and marketing operations. Mr. Leibler graduated magna cum laude with a degree in economics from Syracuse University, where he was elected Phi Beta Kappa.
Robert E. Patterson (Born 1945), Trustee since 1984
Mr. Patterson is Senior Partner of Cabot Properties, L.P. and Chairman of Cabot Properties, Inc. (a private equity firm investing in commercial real estate).
Mr. Patterson serves as Chairman Emeritus and Trustee of the Joslin Diabetes Center and as a Director of Brandywine Trust Group, LLC. Prior to June 2003, he was a Trustee of Sea Education Association. Prior to December 2001, he was President and Trustee of Cabot Industrial Trust (a publicly traded real estate investment trust). Prior to February 1998, he was Executive Vice President and Director of Acquisitions of Cabot Partners Limited Partnership (a registered investment adviser involved in institutional real estate investments). Prior to 1990, he served as Executive Vice President of Cabot, Cabot & Forbes Realty Advisors, Inc. (the predecessor company of Cabot Partners).
Mr. Patterson practiced law and held various positions in state government and was the founding Executive Director of the Massachusetts Industrial Finance Agency. Mr. Patterson is a graduate of Harvard College and Harvard Law School.
W. Thomas Stephens (Born 1942), Trustee since 1997
Mr. Stephens is Chairman and Chief Executive Officer of Boise Cascade, L.L.C. (a paper, forest products and timberland assets company).
Until 2005, Mr. Stephens was a director of TransCanadaPipelines, Ltd. Until 2004, Mr. Stephens was a Director of Xcel Energy Incorporated (a public utility company), Qwest Communications, and Norske Canada, Inc. (a paper manufacturer). Until 2003, Mr. Stephens was a Director of Mail-Well, Inc. (a diversified printing company). He served as Chairman of Mail-Well until 2001 and as CEO of MacMillan-Bloedel, Ltd. (a forest products company) until 1999.
Prior to 1996, Mr. Stephens was Chairman and Chief Executive Officer of Johns Manville Corporation. He holds B.S. and M.S. degrees from the University of Arkansas.
Richard B. Worley (Born 1945), Trustee since 2004
Mr. Worley is Managing Partner of Permit Capital LLC, an investment management firm.
Mr. Worley serves on the Executive Committee of the University of Pennsylvania Medical Center, is a Trustee of The Robert Wood Johnson Foundation (a philanthropic organization devoted to health care issues) and is a Director of The Colonial Williamsburg Foundation (a historical preservation organization). Mr. Worley also serves on the investment committees of Mount Holyoke College and World Wildlife Fund (a wildlife conservation organization).
Prior to joining Permit Capital LLC in 2002, Mr. Worley served as Chief Strategic Officer of Morgan Stanley Investment Management. He previously served as President, Chief Executive Officer and Chief Investment Officer of Morgan Stanley Dean Witter Investment Management and as a Managing Director of Morgan Stanley, a financial services firm.
Mr. Worley also was the Chairman of Miller Anderson & Sherrerd, an investment management firm. Mr. Worley holds a B.S. degree from University of Tennessee and pursued graduate studies in economics at the University of Texas.
Charles E. Haldeman, Jr.* (Born 1948), Trustee since 2004
Mr. Haldeman is President and Chief Executive Officer of Putnam, LLC (“Putnam Investments”). He is a member of Putnam Investments’ Executive Board of Directors and Advisory Council. Prior to November 2003, Mr. Haldeman served as Co-Head of Putnam Investments’ Investment Division.
Prior to joining Putnam Investments in 2002, Mr. Haldeman held executive positions in the investment management industry. He previously served as Chief Executive Officer of Delaware Investments and President & Chief Operating Officer of United Asset Management. Mr. Haldeman was also a partner and director of Cooke & Bieler, Inc. (an investment management firm).
Mr. Haldeman currently serves on the Board of Governors of the Investment Company Institute and as a Trustee of Dartmouth College, and he is a member of the Partners HealthCare Systems Investment Committee. He is a graduate of Dartmouth College, Harvard Law School and Harvard Business School. Mr. Haldeman is also a Chartered Financial Analyst (CFA) charterholder.
41
George Putnam, III* (Born 1951), Trustee since 1984 and President since 2000
Mr. Putnam is President of New Generation Research, Inc. (a publisher of financial advisory and other research services), and of New Generation Advisers, Inc. (a registered investment advisor to private funds). Mr. Putnam founded the New Generation companies in 1986.
Mr. Putnam is a Director of The Boston Family Office, LLC (a registered investment adviser). He is a Trustee of St. Mark’s School and Shore Country Day School, and until 2002 was a Trustee of the Sea Education Association.
Mr. Putnam previously worked as an attorney with the law firm of Dechert LLP (formerly known as Dechert Price & Rhoads) in Philadelphia. He is a graduate of Harvard College, Harvard Business School and Harvard Law School.
The address of each Trustee is One Post Office Square, Boston, MA 02109.
As of October 31, 2006, there were 107 Putnam Funds. All Trustees serve as Trustees of all Putnam funds. Each Trustee serves for an indefinite term, until his or her resignation, retirement at age 72, death, or removal.
* Trustees who are or may be deemed to be “interested persons” (as defined in the Investment Company Act of 1940) of the fund, Putnam Management, Putnam Retail Management, or Marsh & McLennan Companies, Inc., the parent company of Putnam, LLC and its affiliated companies. Messrs. Haldeman and Putnam, III are deemed “interested persons” by virtue of their positions as officers of the fund, Putnam Management or Putnam Retail Management and as shareholders of Marsh & McLennan Companies, Inc. Mr. Putnam, III is the President of your fund and each of the other Putnam funds. Mr. Haldeman is President and Chief Executive Officer of Putnam Investments.
42
Officers
In addition to George Putnam, III, the other officers of the fund are shown below:
| Charles E. Porter (Born 1938) | Richard S. Robie, III (Born 1960) |
| Executive Vice President, Principal Executive Officer, Associate | Vice President |
| Treasurer, and Compliance Liaison | Since 2004 |
| Since 1989 | |
| Senior Managing Director, Putnam Investments, Putnam Management |
| Jonathan S. Horwitz (Born 1955) | and Putnam Retail Management. Prior to 2003, Senior Vice President, |
| Senior Vice President and Treasurer | United Asset Management Corporation |
| Since 2004 | |
| Francis J. McNamara, III (Born 1955) |
| Prior to 2004, Managing Director, | Vice President and Chief Legal Officer |
| Putnam Investments | Since 2004 |
| |
| Steven D. Krichmar (Born 1958) | Senior Managing Director, Putnam Investments, Putnam Management |
| Vice President and Principal Financial Officer | and Putnam Retail Management. Prior to 2004, General Counsel, |
| Since 2002 | State Street Research & Management Company |
| |
| Senior Managing Director, Putnam Investments. | Charles A. Ruys de Perez (Born 1957) |
| Prior to July 2001, Partner, PricewaterhouseCoopers LLP | Vice President and Chief Compliance Officer |
| Since 2004 |
| Michael T. Healy (Born 1958) | |
| Assistant Treasurer and Principal Accounting Officer | Managing Director, Putnam Investments |
| Since 2000 | |
| Mark C. Trenchard (Born 1962) |
| Managing Director, Putnam Investments | Vice President and BSA Compliance Officer |
| Since 2002 |
| Beth S. Mazor (Born 1958) | |
| Vice President | Managing Director, Putnam Investments |
| Since 2002 | |
| Judith Cohen (Born 1945) |
| Managing Director, Putnam Investments | Vice President, Clerk and Assistant Treasurer |
| Since 1993 |
| James P. Pappas (Born 1953) | |
| Vice President | Wanda M. McManus (Born 1947) |
| Since 2004 | Vice President, Senior Associate Treasurer and Assistant Clerk |
| Since 2005 |
| Managing Director, Putnam Investments and Putnam Management. | |
| During 2002, Chief Operating Officer, Atalanta/Sosnoff Management | Nancy E. Florek (Born 1957) |
| Corporation; prior to 2001, President and Chief Executive Officer, | Vice President, Assistant Clerk, Assistant Treasurer |
| UAM Investment Services, Inc. | and Proxy Manager |
| Since 2005 |
| | |
The address of each Officer is One Post Office Square, Boston, MA 02109.
43
The Putnam Family of Funds
The following is a list of Putnam’s open-end mutual funds offered to the public. Investors should carefully consider the investment objective, risks, charges, and expenses of a fund before investing. For a prospectus containing this and other information for any Putnam fund or product, call your financial advisor at 1-800-225-1581 and ask for a prospectus. Please read the prospectus carefully before investing.
| Growth funds | Tax-free income funds |
| Discovery Growth Fund | AMT-Free Insured Municipal Fund |
| Growth Opportunities Fund | Tax Exempt Income Fund |
| Health Sciences Trust | Tax Exempt Money Market Fund§ |
| International New Opportunities Fund* | Tax-Free High Yield Fund |
| New Opportunities Fund | |
| OTC & Emerging Growth Fund | State tax-free income funds: |
| Small Cap Growth Fund* | Arizona, California, Florida, Massachusetts, Michigan, Minnesota, |
| Vista Fund | New Jersey, New York, Ohio, and Pennsylvania |
| Voyager Fund | |
| Asset allocation funds |
| Blend funds | Income Strategies Fund |
| Capital Appreciation Fund | Putnam Asset Allocation Funds — three investment portfolios that |
| Capital Opportunities Fund* | spread your money across a variety of stocks, bonds, and money |
| Europe Equity Fund* | market investments. |
| Global Equity Fund* | |
| Global Natural Resources Fund* | The three portfolios: |
| International Capital Opportunities Fund* | Asset Allocation: Balanced Portfolio |
| International Equity Fund* | Asset Allocation: Conservative Portfolio |
| Investors Fund | Asset Allocation: Growth Portfolio |
| Research Fund | Putnam RetirementReady® Funds |
| Tax Smart Equity Fund® | |
| Utilities Growth and Income Fund | Putnam RetirementReady Funds — ten investment portfolios that |
| offer diversification among stocks, bonds, and money market instru- |
| Value funds | ments and adjust to become more conservative over time based on a |
| Classic Equity Fund | target date for withdrawing assets. |
| Convertible Income-Growth Trust | |
| Equity Income Fund | The ten funds: |
| The George Putnam Fund of Boston | Putnam RetirementReady 2050 Fund |
| The Putnam Fund for Growth and Income | Putnam RetirementReady 2045 Fund |
| International Growth and Income Fund* | Putnam RetirementReady 2040 Fund |
| Mid Cap Value Fund | Putnam RetirementReady 2035 Fund |
| New Value Fund | Putnam RetirementReady 2030 Fund |
| Small Cap Value Fund*† | Putnam RetirementReady 2025 Fund |
| Putnam RetirementReady 2020 Fund |
| Income funds | Putnam RetirementReady 2015 Fund |
| American Government Income Fund | Putnam RetirementReady 2010 Fund |
| Diversified Income Trust | Putnam RetirementReady Maturity Fund |
| Floating Rate Income Fund | |
| Global Income Trust* | |
| High Yield Advantage Fund*† | * A 1% redemption fee on total assets redeemed or exchanged within 90 days |
| High Yield Trust* | of purchase may be imposed for all share classes of these funds. |
| Income Fund | |
| Limited Duration Government Income Fund | † Closed to new investors. |
| Money Market Fund‡ | |
| U.S. Government Income Trust | ‡ An investment in a money market fund is not insured or guaranteed by the Federal |
| Deposit Insurance Corporation or any other government agency. Although the fund |
| | seeks to preserve your investment at $1.00 per share, it is possible to lose money by |
| investing in the fund. |
| |
| With the exception of money market funds, a 1% redemption fee may be applied |
| | to shares exchanged or sold within 7 days of purchase (90 days, for certain funds). |
| | Check your account balances and the most recent month-end performance at |
| | www.putnam.com. |
Fund information
Founded over 65 years ago, Putnam Investments was built around the concept that a balance between risk and reward is the hallmark of a well-rounded financial program. We manage over 100 mutual funds in growth, value, blend, fixed income, and international.
| Investment Manager | Officers | Judith Cohen |
| Putnam Investment | George Putnam, III | Vice President, Clerk and Assistant Treasurer |
| Management, LLC | | |
| One Post Office Square | President | Wanda M. McManus |
| Boston, MA 02109 | Charles E. Porter | Vice President, Senior Associate Treasurer |
| Executive Vice President, Principal | and Assistant Clerk |
| Marketing Services | Executive Officer, Associate Treasurer, | |
| Putnam Retail Management | and Compliance Liaison | Nancy E. Florek |
| One Post Office Square | | Vice President, Assistant Clerk, |
| Boston, MA 02109 | Jonathan S. Horwitz | Assistant Treasurer and Proxy Manager |
| Senior Vice President and Treasurer | |
| Custodian | | |
| Putnam Fiduciary Trust Company | Steven D. Krichmar | |
| Vice President and Principal Financial Officer | |
| Legal Counsel | | |
| Ropes & Gray LLP | Michael T. Healy | |
| Independent Registered Public | Assistant Treasurer and Principal | |
| Accounting Officer | |
| Accounting Firm | | |
| KPMG LLP | Beth S. Mazor | |
| Vice President | |
| Trustees | | |
| John A. Hill, Chairman | James P. Pappas | |
| Jameson Adkins Baxter, Vice Chairman | Vice President | |
| Charles B. Curtis | | |
| Myra R. Drucker | Richard S. Robie, III | |
| Charles E. Haldeman, Jr. | Vice President | |
| Paul L. Joskow | | |
| Elizabeth T. Kennan | Francis J. McNamara, III | |
| Kenneth R. Leibler | Vice President and Chief Legal Officer | |
| Robert E. Patterson | | |
| George Putnam, III | Charles A. Ruys de Perez | |
| W. Thomas Stephens | Vice President and Chief Compliance Officer | |
| Richard B. Worley | | |
| Mark C. Trenchard | |
| Vice President and BSA Compliance Officer | |
| | |
This report is for the information of shareholders of Putnam Convertible Income-Growth Trust. It may also be used as sales literature when preceded or accompanied by the current prospectus, the most recent copy of Putnam’s Quarterly Performance Summary, and Putnam’s Quarterly Ranking Summary. For more recent performance, please visit www.putnam.com. Investors should carefully consider the investment objective, risks, charges, and expenses of a fund, which are described in its prospectus. For this and other information or to request a prospectus, call 1-800-225-1581 toll free. Please read the prospectus carefully before investing. The fund’s Statement of Additional Information contains additional information about the fund’s Trustees and is available without charge upon request by calling 1-800-225-1581.

Item 2. Code of Ethics:
(a) The fund’s principal executive, financial and accounting officers are employees of Putnam Investment Management, LLC, the Fund's investment manager. As such they are subject to a comprehensive Code of Ethics adopted and administered by Putnam Investments which is designed to protect the interests of the firm and its clients. The Fund has adopted a Code of Ethics which incorporates the Code of Ethics of Putnam Investments with respect to all of its officers and Trustees who are employees of Putnam Investment Management, LLC. For this reason, the Fund has not adopted a separate code of ethics governing its principal executive, financial and accounting officers.
(c) None
Item 3. Audit Committee Financial Expert:
The Funds' Audit and Compliance Committee is comprised solely of Trustees who are "independent" (as such term has been defined by the Securities and Exchange Commission ("SEC") in regulations implementing Section 407 of the Sarbanes-Oxley Act (the "Regulations")). The Trustees believe that each of the members of the Audit and Compliance Committee also possess a combination of knowledge and experience with respect to financial accounting matters, as well as other attributes, that qualify them for service on the Committee. In addition, the Trustees have determined that each of Mr. Patterson, Mr. Stephens, Mr. Leibler and Mr. Hill meets the financial literacy requirements of the New York Stock Exchange's rules and qualifies as an "audit committee financial expert" (as such term has been defined by the Regulations) based on their review of his pertinent experience and education. Certain other Trustees, although not on the Audit and Compliance Committee, would also quali fy as "audit committee financial experts." The SEC has stated that the designation or identification of a person as an audit committee financial expert pursuant to this Item 3 of Form N-CSR does not impose on such person any duties, obligations or liability that are greater than the duties, obligations and liability imposed on such person as a member of the Audit and Compliance Committee and the Board of Trustees in the absence of such designation or identification.
Item 4. Principal Accountant Fees and Services:
The following table presents fees billed in each of the last two fiscal years for services rendered to the fund by the fund’s independent auditor:
| Fiscal | | Audit- | | |
| year | Audit | Related | Tax | All Other |
| ended | Fees | Fees | Fees | Fees |
| |
| October 31, 2006 | $38,777* | $-- | $3,050 | $440 |
| October 31, 2005 | $29,528 | $-- | $2,828 | $ - |
* Includes fees of $6,427 billed by the fund’s independent auditor to the fund for audit procedures necessitated by regulatory and litigation matters for the fiscal year ended October 31, 2006. These fees were reimbursed to the fund by Putnam Investment Management, LLC (“Putnam Management”).
For the fiscal years ended October 31, 2006 and October 31, 2005, the fund’s independent auditor billed aggregate non-audit fees in the amounts of $3,490 and $2,828 respectively, to the fund, Putnam Management and any entity controlling, controlled by or under common control with Putnam Management that provides ongoing services to the fund.
Audit Fees represent fees billed for the fund’s last two fiscal years.
Audit-Related Fees represent fees billed in the fund’s last two fiscal years for services traditionally performed by the fund’s auditor, including accounting consultation for proposed transactions or concerning financial accounting and reporting standards and other audit or attest services not required by statute or regulation.
Tax Fees represent fees billed in the fund’s last two fiscal years for tax compliance, tax planning and tax advice services. Tax planning and tax advice services include assistance with tax audits, employee benefit plans and requests for rulings or technical advice from taxing authorities.
All Other Fees represent fees billed for services relating to expense allocation methodology.
Pre-Approval Policies of the Audit and Compliance Committee. The Audit and Compliance Committee of the Putnam funds has determined that, as a matter of policy, all work performed for the funds by the funds’ independent auditors will be pre-approved by the Committee itself and thus will generally not be subject to pre-approval procedures.
The Audit and Compliance Committee also has adopted a policy to pre-approve the engagement by Putnam Management and certain of its affiliates of the funds’ independent auditors, even in circumstances where pre-approval is not required by applicable law. Any such requests by Putnam Management or certain of its affiliates are typically submitted in writing to the Committee and explain, among other things, the nature of the proposed engagement, the estimated fees, and why this work should be performed by that particular audit firm as opposed to another one. In reviewing such requests, the Committee considers, among other things, whether the provision of such services by the audit firm are compatible with the independence of the audit firm.
The following table presents fees billed by the fund’s independent auditor for services required to be approved pursuant to paragraph (c)(7)(ii) of Rule 2-01 of Regulation S-X.
| Fiscal | Audit- | | All | Total |
| year | Related | Tax | Other | Non-Audit |
| ended | Fees | Fees | Fees | Fees |
| | | | | |
| October 31, | | | | |
| 2006 | $ - | $ - | $ - | $ - |
| October | | | | |
| 31, 2005 | $ - | $ - | $ - | $ - |
Item 5. Audit Committee of Listed Registrants
Not applicable
Item 6. Schedule of Investments:
The registrant’s schedule of investments in unaffiliated issuers is included in the report to shareholders in Item 1 above.
Item 7. Disclosure of Proxy Voting Policies and Procedures For Closed-End Management
Investment Companies:
Not applicable
Item 8. Portfolio Managers of Closed-End Investment Companies
Not Applicable
Item 9. Purchases of Equity Securities by Closed-End Management Investment Companies and
Affiliated Purchasers:
Not applicable
Item 10. Submission of Matters to a Vote of Security Holders:
Not applicable
Item 11. Controls and Procedures:
(a) The registrant's principal executive officer and principal financial officer have concluded, based on their evaluation of the effectiveness of the design and operation of the registrant's disclosure controls and procedures as of a date within 90 days of the filing date of this report, that the design and operation of such procedures are generally effective to provide reasonable assurance that information required to be disclosed by the registrant in this report is recorded, processed, summarized and reported within the time periods specified in the Commission's rules and forms.
(b) Changes in internal control over financial reporting: Not applicable
Item 12. Exhibits:
(a)(1) The Code of Ethics of The Putnam Funds, which incorporates the Code of Ethics of Putnam Investments, is filed herewith.
(a)(2) Separate certifications for the principal executive officer and principal financial officer of the registrant as required by Rule 30a-2(a) under the Investment Company Act of 1940, as amended, are filed herewith.
(b) The certifications required by Rule 30a-2(b) under the Investment Company Act of 1940, as amended, are filed herewith.
SIGNATURES
Pursuant to the requirements of the Securities Exchange Act of 1934 and the Investment Company Act of 1940, the registrant has duly caused this report to be signed on its behalf by the undersigned, thereunto duly authorized.
Putnam Convertible Income-Growth Trust
By (Signature and Title):
/s/Michael T. Healy
Michael T. Healy
Principal Accounting Officer
Date: December 28, 2006
Pursuant to the requirements of the Securities Exchange Act of 1934 and the Investment Company Act of 1940, this report has been signed below by the following persons on behalf of the registrant and in the capacities and on the dates indicated.
By (Signature and Title):
/s/Charles E. Porter
Charles E. Porter
Principal Executive Officer
Date: December 28, 2006
By (Signature and Title):
/s/Steven D. Krichmar
Steven D. Krichmar
Principal Financial Officer
Date: December 28, 2006