| | | |
| | |
| UNITED STATES |
| SECURITIES AND EXCHANGE COMMISSION |
| Washington, D.C. 20549 |
| |
| FORM N-CSR |
| |
| CERTIFIED SHAREHOLDER REPORT OF REGISTERED |
| MANAGEMENT INVESTMENT COMPANIES |
| | |
| Investment Company Act file number: (811-02280) | |
| |
| Exact name of registrant as specified in charter: | Putnam Convertible Income-Growth Trust |
| |
| Address of principal executive offices: One Post Office Square, Boston, Massachusetts 02109 |
| | |
| Name and address of agent for service: | | Beth S. Mazor, Vice President |
| | One Post Office Square |
| | Boston, Massachusetts 02109 |
| | |
| Copy to: | | John W. Gerstmayr, Esq. |
| | Ropes & Gray LLP |
| | One International Place |
| | Boston, Massachusetts 02110 |
| | |
| Registrant’s telephone number, including area code: | (617) 292-1000 |
| | | |
| Date of fiscal year end: October 31, 2009 | | |
| |
| Date of reporting period: November 1, 2008 — October 31, 2009 |
Item 1. Report to Stockholders:
The following is a copy of the report transmitted to stockholders pursuant to Rule 30e-1 under the Investment Company Act of 1940:

A BALANCED APPROACH
Since 1937, when George Putnam created a diverse mix of stocks and bonds in a single, professionally managed portfolio, Putnam has championed the balanced approach.
A WORLD OF INVESTING
Today, we offer investors a world of equity, fixed-income, multi-asset, and absolute-return portfolios to suit a range of financial goals.
A COMMITMENT TO EXCELLENCE
Our portfolio managers seek superior results over time, backed by original, fundamental research on a global scale. We believe in the value of experienced financial advice, in providing exemplary service, and in putting clients first in all we do.

Putnam Convertible
Income-Growth
Trust
Annual report
10|31|09
| |
| Message from the Trustees | 1 |
| About the fund | 2 |
| Performance and portfolio snapshots | 4 |
| Interview with your fund’s portfolio managers | 5 |
| Your fund’s performance | 8 |
| Your fund’s expenses | 10 |
| Terms and definitions | 11 |
| Trustee approval of management contract | 12 |
| Other information for shareholders | 19 |
| Financial statements | 20 |
| Federal tax information | 36 |
| About the Trustees | 37 |
| Officers | 41 |
Message from the Trustees
Dear Fellow Shareholder:
The stock market’s performance since March has helped restore investor confidence and rebuild portfolios. While this upward trend is welcome, investors should not be surprised if this rate of appreciation levels off in coming months. Time-tested investment principles, such as diversification, asset allocation, and a long-term perspective, apply now more than ever.
In this improved climate, we are pleased to report that many Putnam mutual funds have delivered strong and competitive results over the past year. This performance reflects the intense efforts of an investment team infused with a determination to excel and strengthened by the arrival of several senior portfolio managers, research analysts, and traders.
In another development, Charles E. “Ed” Haldeman, Jr. has stepped down as President of the Putnam Funds and as a member of the Board of Trustees of the Funds to become Chief Executive Officer of the Federal Home Loan Mortgage Corporation (FHLMC), also known as Freddie Mac. Effective July 2009, Robert L. Reynolds, President and Chief Executive Officer of Putnam Investments and a Trustee of the Putnam Funds, replaced Mr. Haldeman as President of the Putnam Funds.
We would like to thank all shareholders who took the time to vote by proxy on a number of issues, including shareholder-friendly fee changes, at this fall’s Putnam Funds’ shareholder meetings. We also would like to take this opportunity to welcome new shareholders to the fund and to thank all our investors for your continued confidence in Putnam.
About the fund
Offering investors the diverse benefits of convertible securities
The differences between bonds and stocks seem fairly clear-cut. Stocks provide an ownership stake in a company; bonds provide a claim on the interest paid by a company or other entity on its debt. The value of stocks rises and falls with factors such as investor sentiment, company news, and economic conditions; bonds are issued by a government, agency, company, or public utility that typically promises to pay the bearer a fixed rate of interest at specified intervals and to return a set amount of money at a specified end date (the maturity date). A bond’s yield is often influenced by interest-rate levels.
A third type of security is a hybrid of a stock and a bond. Like a bond, a convertible security offers a set rate of interest, but unlike a bond, it has a built-in option that, under certain circumstances, allows the investor to exchange (or convert) the security for a fixed number of shares of stock. This feature offers the potential for capital appreciation, since the preset conversion price does not change as the underlying stock’s price increases or decreases.
Convertibles are issued by companies and can offer greater returns than high-quality bonds — but they also carry a greater risk potential, such as the risk of default or periodic illiquidity. Issuers range from large, well-known S&P 500 corporations, and small, rapidly growing companies, to companies in cyclically depressed industries.
Constructing a portfolio that maintains an appropriate balance of risk and return potential requires intensive research and analysis. Putnam’s analysts conduct rigorous fundamental research, seeking to determine the true worth of the issuing company’s business. Putnam Convertible Income-Growth Trust’s portfolio managers then construct a portfolio that they believe offers the best return potential without undue risk.
Consider these risks before investing: This fund invests some or all of its assets in small and/or midsize companies. Such investments increase the risk of greater fluctuations in the value of your investment. The fund may also have a significant portion of its holdings in bonds. Mutual funds that invest in bonds are subject to certain risks, including interest-rate risk, credit risk, and inflation risk. As interest rates rise, the prices of bonds fall. Long-term bonds are more exposed to interest-rate risk than short-term bonds. Lower-rated bonds may offer higher yields in return for more risk. Unlike bonds, bond funds have ongoing fees and expenses. Value investing seeks underpriced stocks, but there is no guarantee that a stock’s price will rise.
The “busted” convertible
One kind of security in which your fund may invest is the “busted” convertible. “Busted” refers to a security whose underlying stock price has fallen significantly below the conversion price. It becomes much less sensitive to the volatility of the underlying stock and is more bond-like, responding to interest-rate changes. A busted convertible may pay a higher yield than other convertibles, but may also carry a higher level of risk. (Some companies in this situation may eventually default on their bonds.)
The objective of buying a busted convertible is to take advantage of a company’s eventual turnaround despite its present challenges. For example, a company undergoing management turmoil may draw negative investor reactions, causing its stock price to tumble. However, if intensive research determines that the management crisis is likely to be resolved, the fund manager could buy the security at a steep discount. The goal is to sell the security at a higher price when the credit improves or when the stock revives.
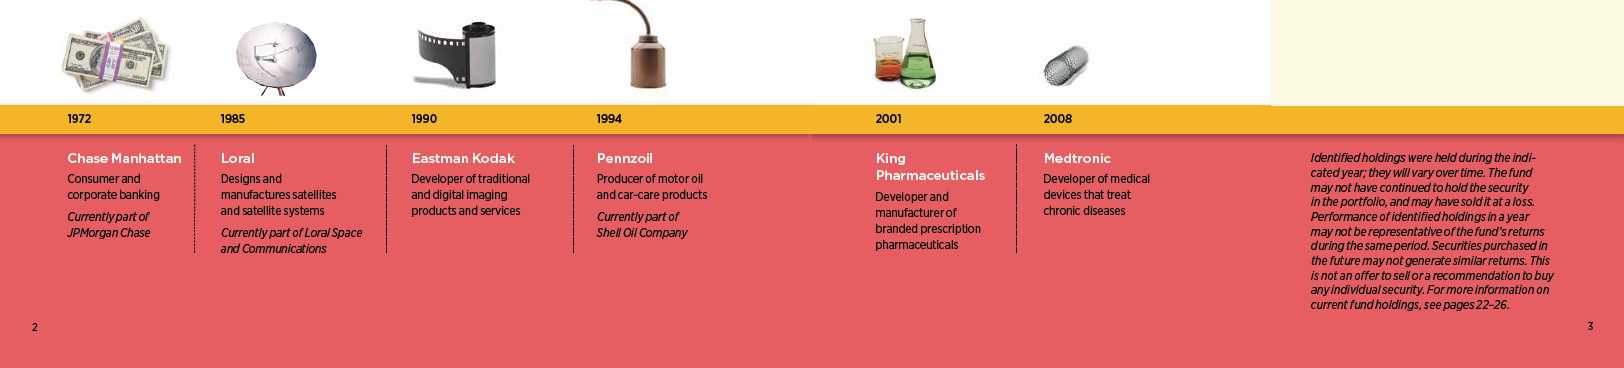
Putnam Convertible Income-Growth Trust’s holdings
have spanned sectors and industries over time.
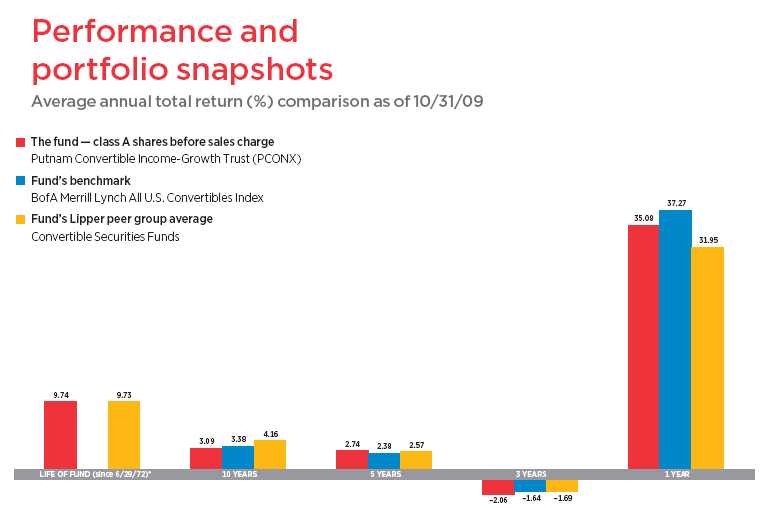
Current performance may be lower or higher than the quoted past performance, which cannot guarantee future results. Share price, principal value, and return will fluctuate, and you may have a gain or a loss when you sell your shares. Performance of class A shares assumes reinvestment of distributions and does not account for taxes. Fund returns in the bar chart do not reflect a sales charge of 5.75%; had they, returns would have been lower. See pages 5 and 8–9 for additional performance information. For a portion of the periods, this fund may have limited expenses, without which returns would have been lower. Due to market volatility, current performance may be higher or lower than performance shown. A 1% short-term trading fee may apply. To obtain the most recent month-end performance, visit putnam.com.
* The fund’s benchmark, the BofA Merrill Lynch All U.S. Convertibles Index, was introduced on 12/31/87, which post-dates the inception date of the fund���s class A shares.
“As earnings visibility and prospects for an
economic recovery become clearer, we believe
further appreciation in the convertibles market
could be realized.”
Robert Salvin, Portfolio Manager, Putnam Convertible Income-Growth Trust
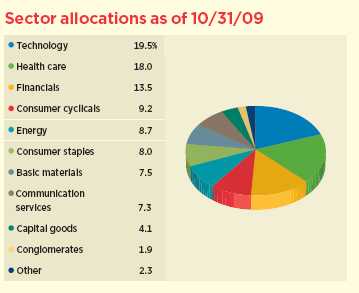
Allocations are represented as a percentage of the fund’s portfolio value and exclude short-term investments. Holdings and allocations will vary over time.
Interview with your
fund’s portfolio managers
Robert (Rob) Salvin and Eric Harthun
How did Putnam Convertible Income-Growth Trust perform for the period?
Rob: It was a rewarding period for convertible securities. For the fiscal year ended October 31, 2009, Putnam Convertible Income-Growth Trust rose 35.08%, outperforming the average 31.95% return for its Lipper peer group, Convertible Securities Funds. The fund trailed the BofA Merrill Lynch All U.S. Convertibles Index, which returned 37.27%. We believe the fund’s underperformance relative to its benchmark reflects the fund’s relatively higher concentration in the financials and basic materials sectors, as well as its larger positioning in lower-rated convertible securities during the market’s steep decline in November and December 2008, when investors sold investments indiscriminately in the rush to safe-haven securities. While many of these holdings have not fully recouped their pre-correction price levels, they have made substantial improvement as the financial markets rallied in 2009.
What factors helped convertible securities post such strong returns for the reporting period?
Eric: It’s important to look back over the entire reporting period to get a proper perspective on the recovery in the convertibles market. In November and December 2008, a downturn in corporate business fundamentals and a contraction in the credit markets led to sharply deteriorating economic prospects around the world. With a widespread loss of confidence, the prices of securities with any perceived risk or economic sensitivity fell precipitously regardless of their underlying fundamentals. The yield spreads on lower-quality, higher-yielding bonds widened to all-time levels versus high-quality U.S. Treasuries, as investors demanded increasingly higher premiums for assuming any type of credit risk. In the convertibles market, forced selling by hedge fund managers in order to meet anticipated investor redemptions further depressed prices of these securities.
To steady the financial markets, thaw credit markets, and restore confidence, the Fed [Federal Reserve Board] and U.S. Treasury introduced wide-ranging policy initiatives. By mid March, leading economic indicators showed signs of stabilizing, as the government’s stimulus measures began to take effect. Then, in an extraordinary change of heart from the beginning of the period, investors — concluding that the worst-case scenario was unlikely to occur — regained their appetite for risk. With more than half of the convertibles market composed of below-investment-grade issuers, bargain-hunting investors were drawn to the attractive prices and
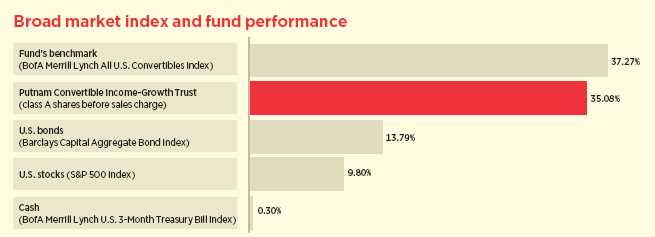
This comparison shows your fund’s performance in the context of broad market indexes for the 12 months ended 10/31/09. See the previous page and pages 8–9 for additional fund performance information. Index descriptions can be found on page 11.
high yields offered by these securities. The increased demand helped to fuel a rally for the balance of the period.
During the period, fundamentals across the convertible securities market strengthened, as corporate earnings, access to capital, and market liquidity improved. By the close of the fiscal year, yield spreads on high-yield bonds had tightened dramatically, reflecting the willingness of investors to take on risk.
IN THE NEWS
It took over a year for the Dow Jones Industrial Average to return to the 10000-point level. In October 2009, the index reclaimed the threshold, capping off a seven-month rally during which the Dow bounced back more than 53%. Round numbers like 10000 have historically served as key psychological milestones. In 1966, the Dow first hit 1000, but spent the next 16 years trading mostly below that number. In 1999, when the Dow crossed 10000 for the first time, it just kept rising. While it is impossible to predict where the Dow will go from here, the 10000 mark, combined with persistently low interest rates on many traditional savings vehicles, might motivate some investors sitting in cash to jump back into the market, pushing stocks higher.
How did you adjust the portfolio given these changing market conditions?
Rob: With the increased risk of defaults in the financials sector in late 2008, financially related holdings fell sharply in the early months of the reporting period — weighing heavily on performance during this time. However, our decision to underweight investments in the automobile industry relative to the benchmark and ultimately sell in early 2009 was positive and helped to offset the losses in financials. As fears of defaults decreased and investors’ risk appetite increased in the second half of the reporting period, the convertibles market, which had been oversold, recovered sharply. The fund’s positioning in health care, basic materials, and technology proved to be particularly rewarding for the fiscal year.
What holdings helped performance?
Eric: The best-performing holding was Dendreon Corp., which has had considerable success with a treatment for late-stage prostate cancer that no longer responds to hormone therapy. This biotechnology company continues to pioneer cancer solutions with the use of low toxicity therapies that stimulate an immune response. In the telecommunications industry, Crown Castle International Corp., which owns, operates, and leases cellphone towers, is experiencing
Top 10 holdings
| | | | |
| HOLDING (percentage of fund’s net assets) | | SECURITY INFORMATION | | SECTOR/INDUSTRY |
|
| Bank of America Corp. (2.0%) | | Ser. L, 7.25% cv. pfd. (United States) | | Financials/Banking |
|
| Freeport-McMoRan Copper & Gold, Inc. (1.8%) | | $6.75 cv. pfd. (United States) | | Basic materials/Metals |
|
| Safeguard Scientifics, Inc. (1.6%) | | 144A cv. sr. unsec. notes 2.625%, 2024 | | Technology/Software |
| | | (United States) | | |
|
| Virgin Media, Inc. (1.5%) | | 144A cv. sr. unsec. notes 6.50%, 2016 | | Consumer cyclicals/Media |
| | | (United States) | | |
|
| Advanced Micro Devices, Inc. (1.4%) | | cv. sr. unsec. notes 5.75%, 2012 (United States) | | Technology/Electronics |
|
| Teva Pharmaceutical Finance, LLC (1.3%) | | cv. company guaranty sr. unsec. debs Ser. C, | | Health care/Pharmaceuticals |
| | | 0.25%, 2026 (Israel) | | |
|
| Wells Fargo & Co. (1.3%) | | Ser. L, 7.50% cv. pfd. (United States) | | Financials/Banking |
|
| Crown Castle International Corp. (1.3%) | | $3.125 cum. cv. pfd. (United States) | | Communication services/Telecommunications |
|
| Transocean, Inc. (1.3%) | | cv. sr. unsec. unsub. notes Ser. C, 1.50%, | | Energy/Energy (oil field) |
| | | 2037 (Switzerland) | | |
|
| Symantec Corp. (1.3%) | | cv. sr. unsec. notes 1.00%, 2013 (United States) | | Technology/Software |
|
This table shows the fund’s top 10 holdings and the percentage of the fund’s net assets that each represented as of 10/31/09. Short-term holdings are excluded. Holdings will vary over time.
growth despite the downturn as a result of increased investment by wireless communications companies that are upgrading their networks. As the world’s lowest-cost producer of copper, Freeport-McMoRan Copper and Gold performed well during the rally. Even with a slower global economy, the rapid industrialization of China is proving to be a strong driver of the company’s growth.
What holdings detracted from performance?
Eric: During the downturn, we became concerned about the viability of some of the fund’s holdings in the financials sector and thought it would be prudent to trim the portfolio’s exposure early in 2009. However, our decision to sell Webster Financial Corp. and Citigroup at a loss detracted from performance given the financials sector’s recovery.
What is your outlook?
Rob: There are signs that a degree of confidence has returned to the financial markets as evidenced by the fervor of the rally and investors’ foray into higher-risk investments. As investors contemplate this rally, however, they should not lose sight of the problems still confronting the U.S. economy and the financial markets. As earnings visibility and prospects for an economic recovery become clearer, we believe further appreciation in the convertibles market could be realized.
What contributed to the fund’s dividend increase in March?
Eric: The fund’s quarterly dividend rate of $0.132 increased to $0.142 per class A shares, effective March 2009, due to the higher yields offered by convertible securities that were added to the portfolio during the first half of the reporting period. A decrease in portfolio expenses resulting from the depreciation of holdings during the first six months, particularly in the financials sector, also contributed to the increase in income distributable to common shareholders. Other share classes had similar increases.
Thank you, Rob and Eric, for your time and insights today.
The views expressed in this report are exclusively those of Putnam Management. They are not meant as investment advice.
Please note that the holdings discussed in this report may not have been held by the fund for the entire period. Portfolio composition is subject to review in accordance with the fund’s investment strategy and may vary in the future. Current and future portfolio holdings are subject to risk.

Portfolio Manager Robert Salvin has an M.B.A. from The University of Chicago Booth School of Business and a B.S. from the Wharton School of the University of Pennsylvania. He joined Putnam in 2000 and has been in the investment industry since 1986.

Portfolio Manager Eric Harthun has an M.B.A. from The University of Chicago Booth School of Business and a B.S. from San Diego State University. A CFA charterholder and Certified Public Accountant (inactive), Eric joined Putnam
in 2000 and has been in the investment industry since 1994.
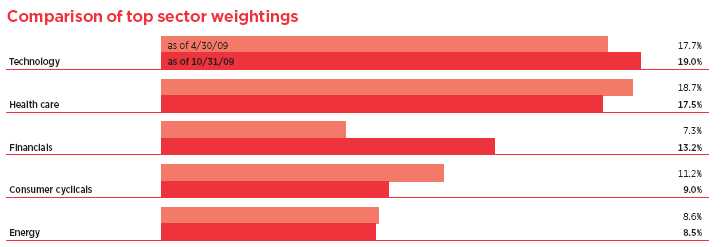
This chart shows how the fund’s top weightings have changed over the past six months. Weightings are shown as a percentage of net assets. Holdings will vary over time.
Your fund’s performance
This section shows your fund’s performance, price, and distribution information for periods ended October 31, 2009, the end of its most recent fiscal year. In accordance with regulatory requirements for mutual funds, we also include performance as of the most recent calendar quarter-end and expense information taken from the fund’s current prospectus. Performance should always be considered in light of a fund’s investment strategy. Data represents past performance. Past performance does not guarantee future results. More recent returns may be less or more than those shown. Investment return and principal value will fluctuate, and you may have a gain or a loss when you sell your shares. Performance information does not reflect any deduction for taxes a shareholder may owe on fund distributions or on the redemption of fund shares. For the most recent month-end performance, please visit the Individual Inv estors section at putnam.com or call Putnam at 1-800-225-1581. Class Y shares are generally only available to corporate and institutional clients and clients in other approved programs. See the Terms and Definitions section in this report for definitions of the share classes offered by your fund.
Fund performance Total return for periods ended 10/31/09
| | | | | | | | | | |
| | Class A | Class B | Class C | Class M | Class R | Class Y |
| (inception dates) | (6/29/72) | (7/15/93) | (7/26/99) | (3/13/95) | (12/1/03) | (12/30/98) |
|
| | NAV | POP | NAV | CDSC | NAV | CDSC | NAV | POP | NAV | NAV |
|
| Annual average (life of fund) | 9.74% | 9.57% | 8.79% | 8.79% | 8.92% | 8.92% | 9.07% | 8.96% | 9.47% | 9.83% |
|
| 10 years | 35.53 | 27.71 | 25.74 | 25.74 | 25.75 | 25.75 | 29.00 | 24.48 | 32.25 | 39.02 |
| Annual average | 3.09 | 2.48 | 2.32 | 2.32 | 2.32 | 2.32 | 2.58 | 2.21 | 2.83 | 3.35 |
|
| 5 years | 14.49 | 7.93 | 10.27 | 8.31 | 10.27 | 10.27 | 11.63 | 7.70 | 13.03 | 15.97 |
| Annual average | 2.74 | 1.54 | 1.97 | 1.61 | 1.97 | 1.97 | 2.22 | 1.49 | 2.48 | 3.01 |
|
| 3 years | –6.04 | –11.43 | –8.15 | –10.71 | –8.18 | –8.18 | –7.45 | –10.71 | –6.74 | –5.31 |
| Annual average | –2.06 | –3.97 | –2.79 | –3.71 | –2.80 | –2.80 | –2.55 | –3.71 | –2.30 | –1.80 |
|
| 1 year | 35.08 | 27.27 | 34.12 | 29.12 | 34.12 | 33.12 | 34.41 | 29.72 | 34.79 | 35.43 |
|
Current performance may be lower or higher than the quoted past performance, which cannot guarantee future results. After-sales-charge returns (public offering price, or POP) for class A and M shares reflect a maximum 5.75% and 3.50% load, respectively. Class B share returns reflect the applicable contingent deferred sales charge (CDSC), which is 5% in the first year, declining to 1% in the sixth year, and is eliminated thereafter. Class C shares reflect a 1% CDSC for the first year that is eliminated thereafter. Class R and Y shares have no initial sales charge or CDSC. Performance for class B, C, M, R, and Y shares before their inception is derived from the historical performance of class A shares, adjusted for the applicable sales charge (or CDSC) and, except for class Y shares, the higher operating expenses for such shares.
For a portion of the periods, this fund may have limited expenses, without which returns would have been lower.
Due to market volatility, current performance may be higher or lower than performance shown. A 1% short-term trading fee may be applied to shares exchanged or sold within 7 days of purchase.
Change in the value of a $10,000 investment ($9,425 after sales charge) Cumulative total return from 10/31/99 to 10/31/09
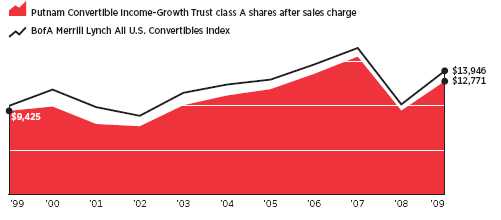
Past performance does not indicate future results. At the end of the same time period, a $10,000 investment in the fund’s class B and class C shares would have been valued at $12,574 and $12,575, respectively, and no contingent deferred sales charges would apply. A $10,000 investment in the fund’s class M shares ($9,650 after sales charge) would have been valued at $ 12,448 at public offering price. A $10,000 investment in the fund’s class R and class Y shares would have been valued at $13,225 and $13,902, respectively.
Comparative index returns For periods ended 10/31/09
| | |
| | | Lipper Convertible Securities Funds |
| | BofA Merrill Lynch All U.S. Convertibles Index | category average* |
|
| Annual average (life of fund) | —† | 9.73% |
|
| 10 years | 39.46% | 51.64 |
| Annual average | 3.38 | 4.16 |
|
| 5 years | 12.49 | 13.79 |
| Annual average | 2.38 | 2.57 |
|
| 3 years | –4.85 | –4.79 |
| Annual average | –1.64 | –1.69 |
|
| 1 year | 37.27 | 31.95 |
|
Index and Lipper results should be compared to fund performance at net asset value.
* Over the 1-year, 3-year, 5-year, 10-year, and life-of-fund periods ended 10/31/09, there were 69, 58, 55, 41, and 2 funds, respectively, in this Lipper category.
† The fund’s benchmark, the BofA Merrill Lynch All U.S Convertibles Index, was introduced on 12/31/87, which post-dates the inception date of the fund’s class A shares.
Fund price and distribution information For the 12-month period ended 10/31/09
| | | | | | | | |
| Distributions | Class A | Class B | Class C | Class M | Class R | Class Y |
|
| Number | 4 | 4 | 4 | 4 | 4 | 4 |
|
| Income | $0.558 | $0.453 | $0.462 | $0.495 | $0.525 | $0.593 |
|
| Capital gains | — | — | — | — | — | — |
|
| Total | $0.558 | $0.453 | $0.462 | $0.495 | $0.525 | $0.593 |
|
| Share value | NAV | POP | NAV | NAV | NAV | POP | NAV | NAV |
|
| 10/31/08 | $12.55 | $13.32 | $12.35 | $12.44 | $12.45 | $12.90 | $12.51 | $12.55 |
|
| 10/31/09 | 16.27 | 17.26 | 16.01 | 16.12 | 16.13 | 16.72 | 16.22 | 16.27 |
|
| Current yield (end of period) | NAV | POP | NAV | NAV | NAV | POP | NAV | NAV |
|
| Current dividend rate 1 | 3.49% | 3.29% | 2.80% | 2.83% | 3.10% | 2.99% | 3.26% | 3.74% |
|
| Current 30-day SEC yield 2,3 | N/A | 2.94% | 2.35% | 2.36% | N/A | 2.51% | 2.87% | 3.38% |
|
The classification of distributions, if any, is an estimate. Final distribution information will appear on your year-end tax forms.
1 Most recent distribution, excluding capital gains, annualized and divided by NAV or POP at end of period.
2 For a portion of the period, this fund may have limited expenses, without which yields would have been lower.
3 Based only on investment income, and calculated using the maximum offering price for each share class, in accordance with SEC guidelines.
Fund performance as of most recent calendar quarter Total return for periods ended 9/30/09
| | | | | | | | | | |
| | Class A | Class B | Class C | Class M | Class R | Class Y |
| (inception dates) | (6/29/72) | (7/15/93) | (7/26/99) | (3/13/95) | (12/1/03) | (12/30/98) |
|
| | NAV | POP | NAV | CDSC | NAV | CDSC | NAV | POP | NAV | NAV |
|
| Annual average (life of fund) | 9.83% | 9.65% | 8.87% | 8.87% | 9.00% | 9.00% | 9.15% | 9.04% | 9.55% | 9.91% |
|
| 10 years | 42.56 | 34.36 | 32.31 | 32.31 | 32.33 | 32.33 | 35.76 | 31.00 | 39.09 | 46.25 |
| Annual average | 3.61 | 3.00 | 2.84 | 2.84 | 2.84 | 2.84 | 3.10 | 2.74 | 3.35 | 3.87 |
|
| 5 years | 17.59 | 10.80 | 13.31 | 11.31 | 13.28 | 13.28 | 14.75 | 10.76 | 16.10 | 19.11 |
| Annual average | 3.29 | 2.07 | 2.53 | 2.17 | 2.53 | 2.53 | 2.79 | 2.06 | 3.03 | 3.56 |
|
| 3 years | –1.71 | –7.35 | –3.84 | –6.52 | –3.91 | –3.91 | –3.14 | –6.53 | –2.44 | –0.90 |
| Annual average | –0.57 | –2.51 | –1.30 | –2.22 | –1.32 | –1.32 | –1.06 | –2.23 | –0.82 | –0.30 |
|
| 1 year | 7.57 | 1.38 | 6.79 | 1.79 | 6.81 | 5.81 | 7.06 | 3.31 | 7.33 | 7.91 |
|
Your fund’s expenses
As a mutual fund investor, you pay ongoing expenses, such as management fees, distribution fees (12b-1 fees), and other expenses. In the most recent six-month period, your fund limited these expenses; had it not done so, expenses would have been higher. Using the following information, you can estimate how these expenses affect your investment and compare them with the expenses of other funds. You may also pay one-time transaction expenses, including sales charges (loads) and redemption fees, which are not shown in this section and would have resulted in higher total expenses. For more information, see your fund’s prospectus or talk to your financial representative.
Expense ratios
| | | | | | |
| | Class A | Class B | Class C | Class M | Class R | Class Y |
|
| Total annual operating expenses for the fiscal | | | | | | |
| year ended 10/31/08 | 1.06% | 1.81% | 1.81% | 1.56% | 1.31% | 0.81% |
|
| Annualized expense ratio for the six-month | | | | | | |
| period ended 10/31/09 * | 1.22% | 1.97% | 1.97% | 1.72% | 1.47% | 0.97% |
|
Fiscal-year expense information in this table is taken from the most recent prospectus, is subject to change, and may differ from that shown for the annualized expense ratio and in the financial highlights of this report. Expenses are shown as a percentage of average net assets.
* For the fund’s most recent fiscal half year; may differ from expense ratios based on one-year data in the financial highlights.
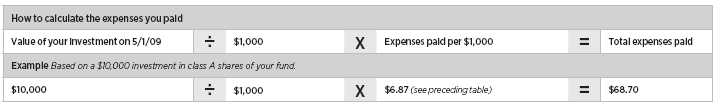
Expenses per $1,000
The following table shows the expenses you would have paid on a $1,000 investment in Putnam Convertible Income-Growth Trust from May 1, 2009, to October 31, 2009. It also shows how much a $1,000 investment would be worth at the close of the period, assuming actual returns and expenses.
| | | | | | |
| | Class A | Class B | Class C | Class M | Class R | Class Y |
|
| Expenses paid per $1,000 *† | $6.87 | $11.07 | $11.07 | $9.67 | $8.27 | $5.47 |
|
| Ending value (after expenses) | $1,233.90 | $1,229.30 | $1,229.60 | $1,230.90 | $1,232.40 | $1,236.30 |
|
* Expenses for each share class are calculated using the fund’s annualized expense ratio for each class, which represents the ongoing expenses as a percentage of average net assets for the six months ended 10/31/09. The expense ratio may differ for each share class.
† Expenses are calculated by multiplying the expense ratio by the average account value for the period; then multiplying the result by the number of days in the period; and then dividing that result by the number of days in the year.
Estimate the expenses you paid
To estimate the ongoing expenses you paid for the six months ended October 31, 2009, use the following calculation method. To find the value of your investment on May 1, 2009, call Putnam at 1-800-225-1581.
Compare expenses using the SEC’s method
The Securities and Exchange Commission (SEC) has established guidelines to help investors assess fund expenses. Per these guidelines, the following table shows your fund’s expenses based on a $1,000 investment, assuming a hypothetical 5% annualized return. You can use this information to compare the ongoing expenses (but not transaction expenses or total costs) of investing in the fund with those of other funds. All mutual fund shareholder reports will provide this information to help you make this comparison. Please note that you cannot use this information to estimate your actual ending account balance and expenses paid during the period.
| | | | | | |
| | Class A | Class B | Class C | Class M | Class R | Class Y |
|
| Expenses paid per $1,000 *† | $6.21 | $10.01 | $10.01 | $8.74 | $7.48 | $4.94 |
|
| Ending value (after expenses) | $1,019.06 | $1,015.27 | $1,015.27 | $1,016.53 | $1,017.80 | $1,020.32 |
|
* Expenses for each share class are calculated using the fund’s annualized expense ratio for each class, which represents the ongoing expenses as a percentage of average net assets for the six months ended 10/31/09. The expense ratio may differ for each share class.
† Expenses are calculated by multiplying the expense ratio by the average account value for the period; then multiplying the result by the number of days in the period; and then dividing that result by the number of days in the year.
Terms and definitions
Important terms
Total return shows how the value of the fund’s shares changed over time, assuming you held the shares through the entire period and reinvested all distributions in the fund.
Net asset value (NAV) is the price, or value, of one share of a mutual fund, without a sales charge. NAVs fluctuate with market conditions. NAV is calculated by dividing the net assets of each class of shares by the number of outstanding shares in the class.
Public offering price (POP) is the price of a mutual fund share plus the maximum sales charge levied at the time of purchase. POP performance figures shown here assume the 5.75% maximum sales charge for class A shares and 3.50% for class M shares.
Contingent deferred sales charge (CDSC) is generally a charge applied at the time of the redemption of class B or C shares and assumes redemption at the end of the period. Your fund’s class B CDSC declines from a 5% maximum during the first year to 1% during the sixth year. After the sixth year, the CDSC no longer applies. The CDSC for class C shares is 1% for one year after purchase.
Current yield is the annual rate of return earned from dividends or interest of an investment. Current yield is expressed as a percentage of the price of a security, fund share, or principal investment.
Share classes
Class A shares are generally subject to an initial sales charge and no CDSC (except on certain redemptions of shares bought without an initial sales charge).
Class B shares are not subject to an initial sales charge. They may be subject to a CDSC.
Class C shares are not subject to an initial sales charge and are subject to a CDSC only if the shares are redeemed during the first year.
Class M shares have a lower initial sales charge and a higher 12b-1 fee than class A shares and no CDSC (except on certain redemptions of shares bought without an initial sales charge).
Class R shares are not subject to an initial sales charge or CDSC and are available only to certain defined contribution plans.
Class Y shares are not subject to an initial sales charge or CDSC, and carry no 12b-1 fee. They are generally only available to corporate and institutional clients and clients in other approved programs.
Comparative indexes
Barclays Capital Aggregate Bond Index is an unmanaged index of U.S. investment-grade fixed-income securities.
BofA Merrill Lynch U.S. 3-Month Treasury Bill Index is an unmanaged index that seeks to measure the performance of U.S. Treasury bills available in the marketplace.
BofA Merrill Lynch All U.S. Convertibles Index is an unmanaged index of high-yield U.S. convertible securities.
S&P 500 Index is an unmanaged index of common stock performance.
Indexes assume reinvestment of all distributions and do not account for fees. Securities and performance of a fund and an index will differ. You cannot invest directly in an index.
Lipper is a third-party industry-ranking entity that ranks mutual funds. Its rankings do not reflect sales charges. Lipper rankings are based on total return at net asset value relative to other funds that have similar current investment styles or objectives as determined by Lipper. Lipper may change a fund’s category assignment at its discretion. Lipper category averages reflect performance trends for funds within a category.
Trustee approval of management contract
General conclusions
The Board of Trustees of the Putnam funds oversees the management of each fund and, as required by law, determines annually whether to approve the continuance of your fund’s management contract with Putnam Investment Management (“Putnam Management”).
In this regard, the Board of Trustees, with the assistance of its Contract Committee consisting solely of Trustees who are not “interested persons” (as such term is defined in the Investment Company Act of 1940, as amended) of the Putnam funds (the “Independent Trustees”), requests and evaluates all information it deems reasonably necessary under the circumstances. Over the course of several months ending in June 2009, the Contract Committee met several times to consider the information provided by Putnam Management and other information developed with the assistance of the Board’s independent counsel and independent staff. The Contract Committee reviewed and discussed key aspects of this information with all of the Independent Trustees. At the Trustees’ June 12, 2009 meeting, the Contract Committee recommended, and the Independent Trustees approved, the continuance of your fund’s management contract, effective July 1 , 2009. In addition, at the Trustees’ September 11, 2009 meeting, the Contract Committee recommended, and the Independent Trustees approved, a sub-management contract with respect to your fund between Putnam Management and its affiliate, Putnam Investments Limited (“PIL”), to be effective February 28, 2010. (Because PIL is an affiliate of Putnam Management and Putnam Management remains fully responsible for all services provided by PIL, the Trustees have not evaluated PIL as a separate entity, and all subsequent references to Putnam Management below should be deemed to include reference to PIL as necessary or appropriate in the context.)
The Independent Trustees’ approval was based on the following conclusions:
• That the fee schedule in effect for your fund represented reasonable compensation in light of the nature and quality of the services being provided to the fund, the fees paid by competitive funds and the costs incurred by Putnam Management in providing such services, and
• That such fee schedule represented an appropriate sharing between fund shareholders and Putnam Management of such economies of scale as may exist in the management of the fund at current asset levels.
These conclusions were based on a comprehensive consideration of all information provided to the Trustees, were subject to the continued application of certain expense reductions and waivers pending other considerations noted below, and were not the result of any single factor. Some of the factors that figured particularly in the Trustees’ deliberations and how the Trustees considered these factors are described below, although individual Trustees may have evaluated the information presented differently, giving different weights to various factors. It is also important to recognize that the fee arrangements for your fund and the other Putnam funds are the result of many years of review and discussion between the Independent Trustees and Putnam Management, that certain aspects of the arrangements may receive greater scrutiny in some years than others, and that the Trustees’ conclusions may be based, in part, on their consideration of these sam e arrangements in prior years.
Consideration of strategic pricing proposal
The Trustees considered that the Contract Committee had been engaged in a detailed review of Putnam Management’s strategic pricing proposal that was first presented to the Committee at its May 2009 meeting. The proposal included proposed changes to the basic structure of the management fees in place for all open-end funds (except the Putnam RetirementReady® Funds and Putnam Money Market Liquidity Fund), including implementation of a breakpoint structure based on the aggregate net assets of all such funds in lieu of the individual breakpoint structures in place for each fund, as well as implementation of performance fees for certain funds. In addition, the proposal recommended substituting separate expense limitations on investor servicing fees and on other expenses as a group in lieu of the total expense limitations in place for many funds.
While the Contract Committee noted the likelihood that the Trustees and Putnam Management would reach agreement on the strategic pricing matters in later months, the terms of the management contracts required that the Trustees approve the continuance of the contracts in order to prevent their expiration at June 30, 2009. The Contract Committee’s recommendations in June reflect its conclusion that the terms of the contractual arrangements for your fund continued to be appropriate for the upcoming term, absent any possible agreement with respect to the matters addressed in Putnam Management’s proposal.
The Trustees were mindful of the signifi-cant changes that had occurred at Putnam Management in the past two years, including a change of ownership, the installation of a new senior management team at Putnam Management, the substantial decline in assets under management resulting from extraordinary market forces as well as continued net redemptions in many funds, the introduction of new fund products representing novel investment strategies and the introduction of performance fees for certain new funds. The Trustees were also mindful that many other leading firms in the industry had also been experiencing significant challenges due to the changing financial and competitive environment. For these reasons, even though the Trustees believed that the current contractual arrangements in place between the funds and Putnam Management and its affiliates have served shareholders well and continued to be appropriate for the
near term, the Trustees believed that it was an appropriate time to reconsider the current structure of the funds’ contractual arrangements with Putnam Management with a view to possible changes that might better serve the interests of shareholders in this new environment. The Trustees concluded their review of Putnam Management’s strategic pricing proposal in July 2009, and their considerations regarding the proposal are discussed below under the heading “Subsequent approval of strategic pricing proposal.” With the exception of the discussion under this heading, the following discussion generally addresses only the Trustees’ reasons for recommending the continuance of the current contractual arrangements (and the new sub-management contract between Putnam Management and PIL, which the Trustees evaluated in large part based on their review of contractual arrangements in June 2009) as, at the time the Trustees determined to make this recommendation, the Trustees had not yet reached any conclusions with respect to the strategic pricing proposal.
Management fee schedules and categories; total expenses
The Trustees reviewed the management fee schedules in effect for all Putnam funds, including fee levels and breakpoints, and the assignment of funds to particular fee categories. The general fee structure has been carefully developed over the years and re-examined on many occasions and adjusted where appropriate. In this regard, the Trustees noted that shareholders of all funds voted by overwhelming majorities in 2007 to approve new management contracts containing identical fee schedules.
In reviewing fees and expenses, the Trustees generally focused their attention on material changes in circumstances — for example, changes in a fund’s size or investment style, changes in Putnam Management’s operating costs, or changes in competitive practices in the mutual fund industry — that suggest that consideration of fee changes might be warranted. The Trustees concluded that the circumstances did not warrant changes to the management fee structure of your fund at that time but, as indicated above, based on their detailed review of the current fee structure, were prepared to consider possible changes to this arrangement that might better serve the interests of shareholders in the future. The Trustees focused on two areas of particular interest, as discussed further below:
• Competitiveness. The Trustees reviewed comparative fee and expense information for competitive funds, which indicated that, in a custom peer group of competitive funds selected by Lipper Inc., your fund ranked in the 50th percentile in management fees and in the 21st percentile in total expenses (less any applicable 12b-1 fees) as of December 31, 2008 (the first percentile being the least expensive funds and the 100th percentile being the most expensive funds).
The Trustees noted that expense ratios for a number of Putnam funds, which show the percentage of fund assets used to pay for management and administrative services, distribution (12b-1) fees (as applicable) and other expenses, had been increasing recently as a result of declining net assets and the natural operation of fee breakpoints. The Trustees expressed their intention to monitor the funds’ percentile rankings in management fees and in total expenses to ensure that fees and expenses of the funds continue to meet evolving competitive standards.
The Trustees noted that the expense ratio increases described above were being controlled by expense limitations initially implemented in January 2004. These expense limitations give effect to a commitment by Putnam Management that the expense ratio of each open-end fund would be no higher than the average expense ratio of the competitive funds included in the fund’s relevant Lipper universe (exclusive of any applicable 12b-1 charges in each case). The Trustees observed that this commitment to limit fund expenses has served shareholders well since its inception and, while the Contract Committee was reviewing proposed alternative expense limitation arrangements as noted above, the Trustees received a commitment from Putnam Management and its parent company to continue this program through at least June 30, 2010, or such earlier time as the Trustees and Putnam Management reach agreement on alternative arrang ements.
In order to ensure that the expenses of the Putnam funds continue to meet evolving competitive standards, the Trustees requested, and Putnam Management agreed, to extend for the twelve months beginning July 1, 2009, or until such earlier time as the Trustees and Putnam Management reach agreement on alternative expense limitation arrangements, an additional expense limitation for certain funds at an amount equal to the average expense ratio (exclusive of 12b-1 charges) of a custom peer group of competitive funds selected by Lipper to correspond to the size of the fund. This additional expense limitation is applicable to those open-end funds that had above-average expense ratios (exclusive of 12b-1 charges) based on the custom peer group data for the period ended December 31, 2007. This additional expense limitation was not applied to your fund because it had a below-average expense ratio relative to its custom peer group.
• Economies of scale. Your fund currently has the benefit of breakpoints in its management fee that provide shareholders with significant economies of scale, which means that the effective management fee rate of the fund (as a percentage of fund assets) declines as the fund grows in size and crosses specified asset thresholds. Conversely, as the fund shrinks in size — as has been the case for many Putnam funds in recent years — these breakpoints result in increasing fee levels. In recent years, the Trustees have examined the operation of the existing breakpoint structure during periods of both growth and decline in asset levels. The Trustees concluded that the fee schedule in effect for your fund represented an appropriate sharing of economies of scale at that time but, as noted above, were in the process of reviewing a prop osal to eliminate individual fund breakpoints for all of the open-end funds (except for the Putnam RetirementReady® Funds and Putnam Money Market Liquidity Fund) in
favor of a breakpoint structure based on the aggregate net assets of all such funds.
In connection with their review of the management fees and total expenses of the Putnam funds, the Trustees also reviewed the costs of the services provided and profits realized by Putnam Management and its affiliates from their contractual relationships with the funds. This information included trends in revenues, expenses and profitability of Putnam Management and its affiliates relating to the investment management and distribution services provided to the funds. In this regard, the Trustees also reviewed an analysis of Putnam Management’s revenues, expenses and profitability with respect to the funds’ management contracts, allocated on a fund-by-fund basis.
Investment performance
The quality of the investment process provided by Putnam Management represented a major factor in the Trustees’ evaluation of the quality of services provided by Putnam Management under your fund’s management contract. The Trustees were assisted in their review of the Putnam funds’ investment process and performance by the work of the Investment Oversight Coordinating Committee of the Trustees and the Investment Oversight Committees of the Trustees, which had met on a regular monthly basis with the funds’ portfolio teams throughout the year. The Trustees concluded that Putnam Management generally provides a high-quality investment process — as measured by the experience and skills of the individuals assigned to the management of fund portfolios, the resources made available to such personnel, and in general the ability of Putnam Management to attract and retain high-quality personnel — but also recognized that this does no t guarantee favorable investment results for every fund in every time period. The Trustees considered the investment performance of each fund over multiple time periods and considered information comparing each fund’s performance with various benchmarks and with the performance of competitive funds.
The Trustees noted the disappointing investment performance of many of the funds for periods ended March 31, 2009. They discussed with senior management of Putnam Management the factors contributing to such underperformance and the actions being taken to improve performance. The Trustees recognized that, in recent years, Putnam Management has taken steps to strengthen its investment personnel and processes to address areas of underperformance, including Putnam Management’s continuing efforts to strengthen the equity research function, recent changes in portfolio managers including increased accountability of individual managers rather than teams, recent changes in Putnam Management’s approach to incentive compensation, including emphasis on top quartile performance over a rolling three-year period, and the recent arrival of a new chief investment officer. The Trustees also recognized the substantial improvement in performance of many funds si nce the implementation of those changes. The Trustees indicated their intention to continue to monitor performance trends to assess the effectiveness of these efforts and to evaluate whether additional changes to address areas of underperformance are warranted.
In the case of your fund, the Trustees considered that your fund’s class A share cumulative total return performance at net asset value was in the following percentiles of its Lipper Inc. peer group (Lipper Convertible Securities Funds) for the one-year, three-year and five-year periods ended March 31, 2009 (the first percentile being the best-performing funds and the 100th percentile being the worst-performing funds):
| | | |
| One-year period | 71st | | |
| | |
| Three-year period | 65th | | |
| | |
| Five-year period | 64th | | |
| | |
Over the one-year, three-year and five-year periods ended March 31, 2009, there were 73, 63 and 60 funds, respectively, in your fund’s Lipper peer group. Past performance is no guarantee of future results.
As a general matter, the Trustees believe that cooperative efforts between the Trustees and Putnam Management represent the most effective way to address investment performance problems. The Trustees noted that investors in the Putnam funds have, in effect, placed their trust in the Putnam organization, under the oversight of the funds’ Trustees, to make appropriate decisions regarding the management of the funds. Based on the responsiveness of Putnam Management in the recent past to Trustee concerns about investment performance, the Trustees concluded that it is preferable to seek change within Putnam Management to address performance shortcomings. In the Trustees’ view, the alternative of engaging a new investment adviser for an underperforming fund would entail significant disruptions and would not provide any greater assurance of improved investment performance.
Brokerage and soft-dollar allocations; other benefits
The Trustees considered various potential benefits that Putnam Management may receive in connection with the services it provides under the management contract with your fund. These include benefits related to brokerage and soft-dollar allocations, whereby a portion of the commissions paid by a fund for brokerage may be used to acquire research services that may be useful to Putnam Management in managing the assets of the fund and of other clients. The Trustees considered a change made, at Putnam Management’s request, to the Putnam funds’ brokerage allocation policy commencing in 2009, which increased the permitted soft dollar allocation to third-party services over what had been authorized in previous years. The Trustees noted that a portion of available soft dollars continue to be allocated to the payment of fund expenses, although the amount allocated for this purpose has declined in recent years. The Trustees indicated their continued int ent to monitor regulatory developments in this area with the assistance of their Brokerage Committee and also indicated their continued intent to monitor the potential benefits associated with the allocation of fund brokerage and trends in industry practice to ensure that the principle of seeking best price
14
and execution remains paramount in the portfolio trading process.
The Trustees’ annual review of your fund’s management contract also included the review of the investor servicing agreement with Putnam Investor Services, Inc. (“PSERV”), which agreement provides benefits to an affiliate of Putnam Management. The Trustees considered that effective January 1, 2009, the Trustees, PSERV and Putnam Fiduciary Trust Company entered into a new fee schedule that includes for the open-end funds (other than funds of Putnam Variable Trust and Putnam Money Market Liquidity Fund) an expense limitation but, as noted above, also considered that this expense limitation is subject to review as part of the Trustees’ pending review of Putnam’s strategic pricing proposal.
In the case of your fund, the Trustees’ annual review of the fund’s management contract also included the review of the fund’s distributor’s contract and distribution plans with Putnam Retail Management Limited Partnership, which contract and plans also provide benefits to an affiliate of Putnam Management.
Comparison of retail and institutional fee schedules
The information examined by the Trustees as part of their annual contract review has included for many years information regarding fees charged by Putnam Management and its affiliates to institutional clients such as defined benefit pension plans, college endowments, etc. This information included comparisons of such fees with fees charged to the funds, as well as a detailed assessment of the differences in the services provided to these two types of clients. The Trustees observed, in this regard, that the differences in fee rates between institutional clients and mutual funds are by no means uniform when examined by individual asset sectors, suggesting that differences in the pricing of investment management services to these types of clients reflect to a substantial degree historical competitive forces operating in separate market places. The Trustees considered the fact that fee rates across different asset classe s are typically higher on average for mutual funds than for institutional clients, as well as the differences between the services that Putnam Management provides to the Putnam funds and those that it provides to institutional clients of the firm, but did not rely on such comparisons to any significant extent in concluding that the management fees paid by your fund are reasonable.
Subsequent approval of strategic pricing proposal
As mentioned above, at a series of meetings beginning in May 2009 and ending on July 10, 2009, the Contract Committee and the Trustees engaged in a detailed review of Putnam Management’s strategic pricing proposal. Following this review, the Trustees of each fund, including all of the Independent Trustees, voted unanimously on July 10, 2009 to approve proposed management contracts reflecting the proposal, as modified based on discussions between the Independent Trustees and Putnam Management, for each fund. In considering the proposed contracts, the Independent Trustees focused largely on the specific proposed changes described below relating to management fees. They also took into account the factors that they considered in connection with their most recent annual approval on June 12, 2009 of the continuance of the funds’ current management contracts and the extensive materials that they had reviewed in connection with that approval process, as described above.
At a meeting held on November 19, 2009, shareholders approved the proposed management contract for your fund. Subject to shareholder approval of similar management contracts for substantially all of the other Putnam funds, the new management contract is expected to be implemented on January 1, 2010 (but no later than February 1, 2010).
• Considerations relating to Fund Family fee rate calculations. The Independent Trustees considered that the proposed management contracts would change the manner in which fund shareholders share in potential economies of scale associated with the management of the funds. Under the current management contracts, shareholders of a fund (other than Putnam Money Market Liquidity Fund and the Putnam RetirementReady® Funds) benefit from increased fund size through reductions in the effective management fee paid to Putnam Management once the fund’s net assets exceed the first breakpoint in the fund’s fee schedule ($500 million for most funds). Conversely, in the case of funds with net assets above the level of the first breakpoint, the effective management fee increases as the fund’s average net assets decline below a bre akpoint. These breakpoints are measured solely by the net assets of each individual fund and are not affected by possible growth (or decline) of net assets of other funds in the Fund Family. (“Fund Family” for purposes of this discussion refers to all open-end mutual funds sponsored by Putnam Management, except for the Putnam RetirementReady® Funds and Putnam Money Market Liquidity Fund.) Under the proposed management contracts, potential economies of scale would be shared ratably among shareholders of all funds, regardless of their size. The management fees paid by a fund (and indirectly by shareholders) would no longer be affected by the growth (or decline) of assets of the particular fund, but rather would be affected solely by the growth (or decline) of the aggregate net assets of all funds in the Fund Family, regardless of whether the net assets of the particular fund are growing or declining.
The table that follows shows the proposed effective management fee rate for your fund, based on June 30, 2009 net assets of the Fund Family ($52.3 billion). This table also shows the effective management fee rate payable by your fund under its current management contract, based on the net assets of the fund as of June 30, 2009. Finally, this table shows the difference in the effective management fees, based on net assets as of June 30, 2009, between the proposed management contract and the current contract.
| | | |
| Name of Fund | Proposed Effective Contractual Rate | Current Effective Contractual Rate | Difference |
|
| Putnam Convertible Income-Growth Trust | 0.642% | 0.640% | 0.002% |
As shown in the foregoing table, based on June 30, 2009 net asset levels, the proposed management contract would provide for payment of a management fee rate that is slightly higher for your fund than the management fee rate payable under the current management contract. For a small number of funds, including your fund, the management fee rate would be slightly higher under the proposed contract at June 30, 2009 net asset levels, but by only immaterial amounts. Most funds, however, would experience a management fee reduction under the proposed management contracts. In the aggregate, the financial impact on Putnam Management of implementing this proposed change for all funds at June 30, 2009 net asset levels is a reduction in annual management fee revenue of approximately $24.0 million. (Putnam Management has already incurred a significant portion of this revenue reduction through the waiver of a portion of its current management fees for certain funds pending shareholder consideration of the proposed management contracts. Putnam is not obliged to continue such waivers beyond July 31, 2010 in the event that the proposed contracts are not approved by shareholders.) The Independent Trustees carefully considered the implications of this proposed change under a variety of economic circumstances. They considered the fact that at current asset levels the management fees paid by the funds under the proposed contract would be lower for almost all funds, and would not be materially higher for any fund. They considered the possibility that under some circumstances, the current management contract could result in a lower fee for a particular fund than the proposed management contract. Such circumstances might occur, for example, if the aggregate net assets of the Fund Family remain largely unchanged and the net assets of an individual fund grew substantially, or if the net assets of an individual fund remain largely unchanged and the aggregate net assets of the Fund Family declined substantially.
The Independent Trustees noted that future changes in the net assets of individual funds are inherently unpredictable and that experience has shown that funds often grow in size and decline in size over time depending on market conditions and the changing popularity of particular investment styles and asset classes. They noted that, while the aggregate net assets of the Fund Family have changed substantially over time, basing a management fee on the aggregate level of assets of the Fund Family would likely reduce fluctuations in costs paid by individual funds and lead to greater stability and predictability of fund operating costs over time.
The Independent Trustees considered that the proposed management contract would likely be advantageous for newly organized funds that have yet to attract significant assets and for funds in specialty asset classes that are unlikely to grow to a significant size. In each case, such funds would participate in the benefits of scale made possible by the aggregate size of the Fund Family to an extent that would not be possible based solely on their individual size.
The Independent Trustees also considered that for funds that have achieved or are likely to achieve considerable scale on their own, the proposed management contract could result in sharing of economies which might lead to slightly higher costs under some circumstances, but they noted that any such increases are immaterial at current asset levels and that over time such funds are likely to realize offsetting benefits from their opportunity to participate, both through the exchange privilege and through the Fund Family breakpoint fee structure, in the improved growth prospects of a diversified Fund Family able to offer competitively priced products.
The Independent Trustees noted that the implementation of the proposed management contracts would result in a reduction in aggregate fee revenues for Putnam Management at current asset levels. They also noted that applying various projections of growth equally to the aggregate net assets of the Fund Family and to the net assets of individual funds also showed revenue reductions for Putnam Management. They recognized, however, the possibility that under some scenarios Putnam Management might realize greater future revenues, with respect to certain funds, under the proposed contracts than under the current contracts, but considered such circumstances to be both less likely and inherently unpredictable.
The Independent Trustees considered the extent to which Putnam Management may realize economies of scale in connection with the management of the funds. In this regard, they considered the possibility that such economies of scale as may exist in the management of mutual funds may be associated more closely with the size of the aggregate assets of the mutual fund complex than with the size of any individual fund. In this regard the Independent Trustees considered the financial information provided to them by Putnam Management over a period of many years regarding the allocation of costs involved in calculating the profitability of its mutual fund business as a whole and the profitability of individual funds. The Independent Trustees noted that the methodologies for such cost allocations had been reviewed on a number of occasions in the past by independent financial consultants engaged by the Independent Trustees. The Independent Trustees noted that thes e methodologies support Putnam Management’s assertion that many of its operating costs and any associated economies of scale are related more to the aggregate net assets under management in various sectors of its business than to the size of individual funds. They noted that on a number of occasions in the past the Independent Trustees had separately considered the possibility of calculating management fees in whole or in part based on aggregate net assets of the Putnam funds.
The Independent Trustees considered the fact that the proposed contracts would result in a sharing among the affected funds of economies of scale that for the most
part are now enjoyed by the larger funds, without materially increasing the current costs of any of the larger funds. They concluded that this sharing of economies among funds was appropriate in light of the diverse investment opportunities available to shareholders of all funds through the existence of the exchange privilege. They also considered that the proposed change in management fee structure would allow Putnam Management to introduce new investment products at more attractive pricing levels than may be currently be the case.
After considering all of the foregoing, the Independent Trustees concluded that the proposed calculation of management fees based on the aggregate net assets of the Fund Family represented a fair and reasonable means of sharing possible economies of scale among the shareholders of all funds.
• Considerations relating to addition of fee rate adjustments based on investment performance for certain funds. The Independent Trustees considered that Putnam’s proposal to add fee rate adjustments based on investment performance to the management contracts of certain funds reflected a desire by Putnam Management to align its fee revenues more closely with investment performance in the case of certain funds. They noted that Putnam Management already has a significant financial interest in achieving good performance results for the funds it manages. Putnam Management’s fees are based on the assets under its management (whether calculated on an individual fund or complex-wide basis). Good performance results in higher asset levels and therefore higher revenues to Putnam Management. Moreover, good performance also tends to at tract additional investors to particular funds or the complex generally, also resulting in higher revenues. Nevertheless, the Independent Trustees concluded that adjusting management fees based on performance for certain selected funds could provide additional benefits to shareholders.
The Independent Trustees noted that Putnam Management proposed the addition of performance adjustments only for certain of the funds (performance adjustments were not proposed for your fund) and considered whether similar adjustments might be appropriate for other funds. In this regard, they considered Putnam Management’s belief that the addition of performance adjustments would be most appropriate for shareholders of U.S. growth funds, international equity funds and Putnam Global Equity Fund. They also considered Putnam Management’s view that it would continue to monitor whether performance fees would be appropriate for other funds. Accordingly, the Independent Trustees concluded that it would be desirable to gain further experience with the operation of performance adjustments for certain funds and the market’s receptivity to such fee structures before giving further consideration to whether similar performance adjustments would be appropriate for other funds as well.
• Considerations relating to standardization of payment terms. The proposed management contracts for all funds provide that management fees will be computed and paid monthly within 15 days after the end of each month. The current contracts of the funds contain quarterly computation and payment terms in some cases. These differences largely reflect practices in place at earlier times when many of the funds were first organized. Under the proposed contract, certain funds would make payments to Putnam Management earlier than they do under their current contract. This would reduce a fund’s opportunity to earn income on accrued but unpaid management fees by a small amount, but would not have a material effect on a fund’s operating costs.
The Independent Trustees considered the fact that standardizing the payment terms for all funds would involve an acceleration in the timing of payments to Putnam Management for some funds and a corresponding loss of a potential opportunity for such funds to earn income on accrued but unpaid management fees. The Independent Trustees did not view this change as having a material impact on shareholders of any fund. In this regard, the Independent Trustees noted that the proposed contracts conform to the payment terms included in management contracts for all Putnam funds organized in recent years and that standardizing payment terms across all funds would reduce administrative burdens for both the funds and Putnam Management.
• Considerations relating to comparisons with management fees and total expenses of competitive funds. As part of their evaluation of the proposed management contracts, the Independent Trustees also reviewed the general approach taken by Putnam Management and the Independent Trustees in recent years in imposing appropriate limits on total fund expenses. As part of the annual contract review process in recent years, Putnam Management agreed to waive fees as needed to limit total fund expenses to a maximum level equal to the average total expenses of comparable competitive funds in the mutual fund industry. In connection with its proposal to implement new management contracts, Putnam Management also proposed, and the Independent Trustees approved, certain changes in this approach that shift the focus from controlling total expenses to imposing separate limits on certain c ategories of expenses, as required. As a general matter, Putnam Management and the Independent Trustees concluded that management fees for the Putnam funds are competitive with the fees charged by comparable funds in the industry. Nevertheless, the Independent Trustees considered specific management fee waivers proposed to be implemented as of August 1, 2009 by Putnam Management with respect to the current management fees of certain funds, as well as projected reductions in management fees for almost all funds that would result under the proposed contracts. Putnam Management and the Independent Trustees also agreed to impose separate expense limitations of 37.5 basis points on the general category of shareholder servicing expenses and 20 basis points on the general category of other ordinary operating expenses. These new expense limitations, as well as the fee waivers, were implemented for all funds effective as of August 1, 2009, replacing the expense limitation referred to above.
These changes resulted in lower total expenses for many funds, but in the case of some funds total expenses increased after application of the new waivers and expense limitations (as compared with the results obtained using the expense limitation method previously in place). In this regard, the Independent Trustees considered the likelihood that total expenses for most of these funds would have increased in any event in the normal course under the previous expense limitation arrangement, as the reported total expense levels of many competitive funds increased in response to the major decline in asset values that began in September 2008. These new waivers and expense limitations will continue in effect until at least July 31, 2010 and will be re-evaluated by the Independent Trustees as part of the annual contract review process prior to their scheduled expiration. However, the management fee waivers referred to above would largely become permanent reduc tions in fees as a result of the implementation of the proposed management contracts.
Under these new expense limitation arrangements effective August 1, 2009, your fund is subject to expense limitations of 37.5 basis points on the category of shareholder servicing fees and 20 basis points on the general category of other ordinary operating expenses.
Other information for shareholders
Putnam’s policy on confidentiality
In order to conduct business with our shareholders, we must obtain certain personal information such as account holders’ addresses, telephone numbers, Social Security numbers, and the names of their financial representatives. We use this information to assign an account number and to help us maintain accurate records of transactions and account balances. It is our policy to protect the confidentiality of your information, whether or not you currently own shares of our funds, and, in particular, not to sell information about you or your accounts to outside marketing firms. We have safeguards in place designed to prevent unauthorized access to our computer systems and procedures to protect personal information from unauthorized use. Under certain circumstances, we share this information with outside vendors who provide services to us, such as mailing and proxy solicitation. In those cases, the service providers enter into confidentiality agreements with us, and we provide only the information necessary to process transactions and perform other services related to your account. We may also share this information with our Putnam affiliates to service your account or provide you with information about other Putnam products or services. It is also our policy to share account information with your financial representative, if you’ve listed one on your Putnam account. If you would like clarification about our confidentiality policies or have any questions or concerns, please don’t hesitate to contact us at 1-800-225-1581, Monday through Friday, 8:00 a.m. to 8:00 p.m. Eastern Time.
Proxy voting
Putnam is committed to managing our mutual funds in the best interests of our shareholders. The Putnam funds’ proxy voting guidelines and procedures, as well as information regarding how your fund voted proxies relating to portfolio securities during the 12-month period ended June 30, 2009, are available in the Individual Investors section at putnam.com, and on the SEC’s Web site, www.sec.gov. If you have questions about finding forms on the SEC’s Web site, you may call the SEC at 1-800-SEC-0330. You may also obtain the Putnam funds’ proxy voting guidelines and procedures at no charge by calling Putnam’s Shareholder Services at 1-800-225-1581.
Fund portfolio holdings
The fund will file a complete schedule of its portfolio holdings with the SEC for the first and third quarters of each fiscal year on Form N-Q. Shareholders may obtain the fund’s Forms N-Q on the SEC’s Web site at www.sec.gov. In addition, the fund’s Forms N-Q may be reviewed and copied at the SEC’s Public Reference Room in Washington, D.C. You may call the SEC at 1-800-SEC-0330 for information about the SEC’s Web site or the operation of the Public Reference Room.
Trustee and employee fund ownership
Putnam employees and members of the Board of Trustees place their faith, confidence, and, most importantly, investment dollars in Putnam mutual funds. As of October 31, 2009, Putnam employees had approximately $303,000,000 and the Trustees had approximately $40,000,000 invested in Putnam mutual funds. These amounts include investments by the Trustees’ and employees’ immediate family members as well as investments through retirement and deferred compensation plans.
Financial statements
These sections of the report, as well as the accompanying Notes, preceded by the Report of Independent Registered Public Accounting Firm, constitute the fund’s financial statements.
The fund’s portfolio lists all the fund’s investments and their values as of the last day of the reporting period. Holdings are organized by asset type and industry sector, country, or state to show areas of concentration and diversification.
Statement of assets and liabilities shows how the fund’s net assets and share price are determined. All investment and noninvestment assets are added together. Any unpaid expenses and other liabilities are subtracted from this total. The result is divided by the number of shares to determine the net asset value per share, which is calculated separately for each class of shares. (For funds with preferred shares, the amount subtracted from total assets includes the liquidation preference of preferred shares.)
Statement of operations shows the fund’s net investment gain or loss. This is done by first adding up all the fund’s earnings —from dividends and interest income — and subtracting its operating expenses to determine net investment income (or loss). Then, any net gain or loss the fund realized on the sales of its holdings — as well as any unrealized gains or losses over the period — is added to or subtracted from the net investment result to determine the fund’s net gain or loss for the fiscal year.
Statement of changes in net assets shows how the fund’s net assets were affected by the fund’s net investment gain or loss, by distributions to shareholders, and by changes in the number of the fund’s shares. It lists distributions and their sources (net investment income or realized capital gains) over the current reporting period and the most recent fiscal year-end. The distributions listed here may not match the sources listed in the Statement of operations because the distributions are determined on a tax basis and may be paid in a different period from the one in which they were earned.
Financial highlights provide an overview of the fund’s investment results, per-share distributions, expense ratios, net investment income ratios, and portfolio turnover in one summary table, reflecting the five most recent reporting periods. In a semi-annual report, the highlights table also includes the current reporting period.
Report of Independent Registered Public Accounting Firm
The Board of Trustees and Shareholders
Putnam Convertible Income-Growth Trust:
We have audited the accompanying statement of assets and liabilities of Putnam Convertible Income-Growth Trust (the “fund”), including the fund’s portfolio, as of October 31, 2009, and the related statement of operations for the year then ended, the statements of changes in net assets for each of the two years in the period then ended and the financial highlights for each of the five years in the period then ended. These financial statements and financial highlights are the responsibility of the fund’s management. Our responsibility is to express an opinion on these financial statements and financial highlights based on our audits.
We conducted our audits in accordance with the standards of the Public Company Accounting Oversight Board (United States). Those standards require that we plan and perform our audit to obtain reasonable assurance about whether the financial statements and financial highlights are free of material misstatement. An audit includes examining, on a test basis, evidence supporting the amounts and disclosures in the financial statements. Our procedures included confirmation of securities owned as of October 31, 2009 by correspondence with the custodian and brokers or by other appropriate auditing procedures. An audit also includes assessing the accounting principles used and significant estimates made by management, as well as evaluating the overall financial statement presentation. We believe that our audits provide a reasonable basis for our opinion.
In our opinion, the financial statements and financial highlights referred to above present fairly, in all material respects, the financial position of Putnam Convertible Income-Growth Trust as of October 31, 2009, the results of its operations for the year then ended, the changes in its net assets for each of the two years in the period then ended, and the financial highlights for each of the five years in the period then ended, in conformity with U.S. generally accepted accounting principles.

Boston, Massachusetts
December 10, 2009
The fund’s portfolio 10/31/09
| | |
| CONVERTIBLE BONDS | Principal | |
| AND NOTES (73.8%)* | amount | Value |
|
| Aerospace and defense (2.1%) | | |
| L-1 Identity | | |
| Solutions, Inc. cv. sr. unsec. | | |
| notes 3 3/4s, 2027 | $2,200,000 | $1,974,500 |
|
| L-1 Identity Solutions, Inc. | | |
| 144A cv. sr. unsec. notes 3 3/4s, 2027 | 5,870,000 | 5,268,325 |
|
| Triumph Group, Inc. cv. sr. unsec. | | |
| sub. notes 2 5/8s, 2026 | 1,500,000 | 1,610,625 |
|
| Triumph Group, Inc. | | |
| 144A cv. sr. sub. notes 2 5/8s, 2026 | 3,800,000 | 4,080,250 |
|
| | | 12,933,700 |
| Airlines (0.9%) | | |
| Pinnacle Airlines Corp. cv. sr. unsec. | | |
| notes 3 1/4s, 2025 | 3,700,000 | 3,556,625 |
|
| UAL Corp. cv. company | | |
| guaranty sr. sub. notes 4 1/2s, 2021 | 2,500,000 | 1,868,750 |
|
| | | 5,425,375 |
| Automotive (0.3%) | | |
| BorgWarner, Inc. cv. sr. unsec. | | |
| notes 3 1/2s, 2012 | 1,590,000 | 1,915,950 |
|
| | | 1,915,950 |
| Beverage (0.9%) | | |
| Molson Coors Brewing Co. cv. company | | |
| guaranty sr. unsec. | | |
| unsub. notes 2 1/2s, 2013 | 4,700,000 | 5,328,625 |
|
| | | 5,328,625 |
| Biotechnology (5.3%) | | |
| Amgen, Inc. cv. sr. unsec. | | |
| notes 3/8s, 2013 | 4,400,000 | 4,328,500 |
|
| Amgen, Inc. 144A cv. sr. unsec. | | |
| notes 3/8s, 2013 | 1,900,000 | 1,869,125 |
|
| Amylin Pharmaceuticals, Inc. | | |
| cv. sr. unsec. notes 3s, 2014 | 2,700,000 | 2,052,000 |
|
| Dendreon Corp. 144A cv. sr. unsec. | | |
| sub. notes 4 3/4s, 2014 | 1,165,000 | 3,033,369 |
|
| Invitrogen Corp. cv. sr. unsec. | | |
| unsub. notes Ser. *, 1 1/2s, 2024 | 5,100,000 | 5,705,625 |
|
| Kendle International, Inc. cv. sr. unsec. | | |
| notes 3 3/8s, 2012 | 3,800,000 | 3,355,210 |
|
| MannKind Corp. cv. sr. unsec. | | |
| notes 3 3/4s, 2013 | 1,000,000 | 612,660 |
|
| OSI Pharmaceuticals, Inc. | | |
| cv. sr. unsec. sub. notes 3s, 2038 | 2,800,000 | 2,513,000 |
|
| United Therapeutics Corp. cv. sr. unsec. | | |
| notes 1/2s, 2011 | 500,000 | 611,875 |
|
| United Therapeutics Corp. | | |
| 144A cv. sr. unsec. notes 1/2s, 2011 | 3,500,000 | 4,283,125 |
|
| Viropharma, Inc. cv. sr. unsec. | | |
| notes 2s, 2017 | 6,300,000 | 4,362,750 |
|
| | | 32,727,239 |
| Broadcasting (1.0%) | | |
| Sirius Satellite Radio, Inc. cv. sr. unsec. | | |
| notes 3 1/4s, 2011 | 5,215,000 | 4,510,975 |
|
| XM Satellite Radio Holdings, Inc. | | |
| 144A cv. sr. unsec. sub. notes 7s, 2014 | 2,128,000 | 1,540,140 |
|
| | | 6,051,115 |
| Business services (0.6%) | | |
| SAVVIS, Inc. cv. sr. unsec. notes 3s, 2012 | 4,377,000 | 3,835,346 |
|
| | | 3,835,346 |
| Chemicals (0.6%) | | |
| ShengdaTech, Inc. | | |
| 144A cv. sr. notes 6s, 2018 (China) | 4,000,000 | 3,705,200 |
|
| | | 3,705,200 |
| | |
| CONVERTIBLE BONDS | Principal | |
| AND NOTES (73.8%)* cont. | amount | Value |
|
| Coal (0.7%) | | |
| Alpha Natural Resources, Inc. | | |
| cv. sr. unsec. notes 2 3/8s, 2015 | $3,200,000 | $2,992,000 |
|
| Patriot Coal Corp. cv. sr. unsec. | | |
| notes 3 1/4s, 2013 | 2,100,000 | 1,617,000 |
|
| | | 4,609,000 |
| Commercial and consumer services (2.0%) | | |
| Alliance Data Systems Corp. | | |
| 144A cv. sr. notes 4 3/4s, 2014 | 3,900,000 | 5,345,340 |
|
| Live Nation, Inc. cv. sr. unsec. | | |
| notes 2 7/8s, 2027 | 2,700,000 | 1,927,125 |
|
| Live Nation, Inc. | | |
| 144A cv. sr. notes 2 7/8s, 2027 | 4,000,000 | 2,855,000 |
|
| PHH Corp. 144A cv. sr. unsec. | | |
| notes 4s, 2014 | 2,294,000 | 2,130,300 |
|
| | | 12,257,765 |
| Communications equipment (1.4%) | | |
| ADC Telecommunications, Inc. cv. unsec. | | |
| sub notes FRN 1.593s, 2013 | 5,162,000 | 4,013,455 |
|
| ARRIS Group, Inc. cv. sr. unsec. | | |
| notes 2s, 2026 | 5,000,000 | 4,681,000 |
|
| | | 8,694,455 |
| Computers (2.7%) | | |
| EMC Corp. 144A cv. sr. unsec. | | |
| notes 1 3/4s, 2013 | 5,800,000 | 6,960,000 |
|
| Maxtor Corp. cv. company guaranty | | |
| sr. unsec. unsub. deb. 2 3/8s, 2012 | 3,600,000 | 3,685,500 |
|
| SPSS, Inc. 144A cv. unsec. | | |
| sub. notes 2 1/2s, 2012 | 4,800,000 | 5,828,256 |
|
| | | 16,473,756 |
| Conglomerates (0.9%) | | |
| Textron, Inc. cv. sr. unsec. | | |
| notes Ser. TXT, 4 1/2s, 2013 | 3,400,000 | 5,278,500 |
|
| | | 5,278,500 |
| Consumer finance (0.8%) | | |
| Dollar Financial Corp. | | |
| 144A cv. sr. unsec. notes 2 7/8s, 2027 | 6,000,000 | 4,927,500 |
|
| | | 4,927,500 |
| Consumer goods (1.3%) | | |
| Chattem, Inc. cv. sr. unsec. | | |
| unsub. notes 1 5/8s, 2014 | 3,100,000 | 3,082,563 |
|
| Chattem, Inc. 144A cv. sr. unsec. | | |
| unsub. notes 1 5/8s, 2014 | 2,000,000 | 1,988,750 |
|
| Newell Rubbermaid, Inc. cv. sr. | | |
| unsec. bonds 5 1/2s, 2014 | 1,581,000 | 2,930,779 |
|
| | | 8,002,092 |
| Consumer services (0.7%) | | |
| Avis Budget Group, Inc. | | |
| 144A cv. sr. notes 3 1/2s, 2014 | 4,950,000 | 4,331,250 |
|
| | | 4,331,250 |
| Electrical equipment (1.0%) | | |
| WESCO International, Inc. cv. company | | |
| guaranty sr. unsec. notes 6s, 2029 | 5,184,000 | 6,153,408 |
|
| | | 6,153,408 |
| Electronics (5.1%) | | |
| Advanced Micro Devices, Inc. | | |
| cv. sr. unsec. notes 5 3/4s, 2012 | 10,200,000 | 8,593,500 |
|
| Intel Corp. 144A cv. jr. | | |
| sub. notes 3 1/4s, 2039 | 7,365,000 | 7,887,105 |
|
| Kulicke & Soffa Industries, Inc. cv. | | |
| unsec. sub. notes 7/8s, 2012 | 7,800,000 | 6,522,750 |
|
| SanDisk Corp. cv. sr. unsec. | | |
| unsub. notes 1s, 2013 | 3,800,000 | 2,935,500 |
|
| TTM Technologies, Inc. cv. sr. unsec. | | |
| notes 3 1/4s, 2015 | 5,800,000 | 5,314,250 |
|
| | | 31,253,105 |
| | |
| CONVERTIBLE BONDS | Principal | |
| AND NOTES (73.8%)* cont. | amount | Value |
|
| Energy (oil field) (1.6%) | | |
| Global Industries, Ltd. | | |
| 144A cv. unsec. notes 2 3/4s, 2027 | $3,000,000 | $1,863,750 |
|
| Transocean, Inc. cv. sr. unsec. | | |
| unsub. notes Ser. C, 1 1/2s, 2037 | | |
| (Switzerland) | 8,350,000 | 8,016,000 |
|
| | | 9,879,750 |
| Energy (other) (0.5%) | | |
| Covanta Holding Corp. cv. sr. unsec. | | |
| debs. 1s, 2027 | 3,700,000 | 3,343,875 |
|
| | | 3,343,875 |
| Entertainment (1.0%) | | |
| Lions Gate Entertainment Corp. | | |
| cv. sr. unsec. sub. notes stepped-coupon | | |
| 3 5/8s (3 1/8s, 3/15/12), 2025 †† | 1,300,000 | 1,166,750 |
|
| Lions Gate Entertainment Corp. | | |
| 144A cv. sr. unsec. | | |
| sub. notes stepped-coupon 3 5/8s | | |
| (3 1/8s, 3/15/12), 2025 †† | 5,800,000 | 5,205,500 |
|
| | | 6,372,250 |
| Food (0.7%) | | |
| Tyson Foods, Inc. cv. sr. unsec. | | |
| notes 3 1/4s, 2013 | 4,035,000 | 4,296,065 |
|
| | | 4,296,065 |
| Gaming and lottery (1.2%) | | |
| International Game Technology | | |
| 144A cv. sr. unsec. notes | | |
| 3 1/4s, 2014 | 6,270,000 | 7,372,266 |
|
| | | 7,372,266 |
| Health-care services (4.4%) | | |
| Health Management Associates, Inc. | | |
| 144A cv. sr. sub. notes 3 3/4s, 2028 | 4,400,000 | 4,119,896 |
|
| LifePoint Hospitals, Inc. cv. sr. sub. | | |
| notes 3 1/2s, 2014 | 4,600,000 | 4,117,000 |
|
| Lincare Holdings, Inc. cv. sr. unsec. | | |
| unsub. notes 2 3/4s, 2037 | 4,500,000 | 4,471,875 |
|
| Omnicare, Inc. cv. company | | |
| guaranty sr. unsec. debs Ser. OCR, | | |
| 3 1/4s, 2035 | 9,300,000 | 7,405,125 |
|
| Stewart Enterprises, Inc. cv. sr. unsec. | | |
| notes 3 3/8s, 2016 | 8,100,000 | 6,773,625 |
|
| | | 26,887,521 |
| Investment banking/Brokerage (1.8%) | | |
| Affiliated Managers | | |
| Group, Inc. cv. sr. unsec. | | |
| unsub. notes 3.95s, 2038 | 6,000,000 | 5,643,780 |
|
| KKR Financial Holdings, LLC | | |
| cv. sr. sec. notes 7s, 2012 | 6,210,000 | 5,620,050 |
|
| | | 11,263,830 |
| Media (2.6%) | | |
| Interpublic Group of Companies, Inc. | | |
| (The) cv. sr. unsec. notes 4 1/4s, 2023 | 7,300,000 | 7,035,375 |
|
| Virgin Media, Inc. 144A cv. sr. unsec. | | |
| notes 6 1/2s, 2016 | 8,800,000 | 9,306,000 |
|
| | | 16,341,375 |
| Medical technology (3.2%) | | |
| China Medical Technologies, Inc. | | |
| cv. sr. unsec. bonds Ser. CMT, 4s, | | |
| 2013 (China) | 3,900,000 | 2,842,125 |
|
| Conmed Corp. cv. sr. sub. notes | | |
| 2 1/2s, 2024 | 4,500,000 | 4,168,125 |
|
| Hologic, Inc. cv. sr. unsec. | | |
| unsub. notes stepped-coupon 2s (zero %, | | |
| 12/15/13), 2037 †† | 7,700,000 | 6,246,625 |
|
| | |
| CONVERTIBLE BONDS | Principal | |
| AND NOTES (73.8%)* cont. | amount | Value |
|
| Medical technology cont | | |
| Medtronic, Inc. cv. sr. unsec. | | |
| notes 1 5/8s, 2013 | $3,600,000 | $3,501,000 |
|
| Medtronic, Inc. 144A cv. sr. unsec. | | |
| notes 1 5/8s, 2013 | 2,800,000 | 2,728,600 |
|
| | | 19,486,475 |
| Metals (3.2%) | | |
| ArcelorMittal cv. sr. unsec. unsub. | | |
| notes 5s, 2014 (Luxembourg) | 2,120,000 | 2,883,200 |
|
| Goldcorp, Inc. 144A cv. sr. notes 2s, | | |
| 2014 (Canada) | 4,227,000 | 4,602,358 |
|
| Jaguar Minning, Inc. | | |
| 144A cv. sr. notes 4 1/2s, 2014 | 1,765,000 | 1,659,630 |
|
| Newmont Mining Corp. cv. sr. | | |
| notes 3s, 2012 | 3,600,000 | 4,333,500 |
|
| Steel Dynamics, Inc. cv. sr. | | |
| notes 5 1/8s, 2014 | 2,450,000 | 2,636,813 |
|
| United States Steel Corp. | | |
| cv. sr. unsec. notes 4s, 2014 | 1,920,000 | 2,544,000 |
|
| USEC, Inc. cv. sr. unsec. notes | | |
| 3s, 2014 | 2,000,000 | 1,248,380 |
|
| | | 19,907,881 |
| Oil and gas (4.0%) | | |
| Carrizo Oil & Gas, Inc. cv. sr. unsec. | | |
| unsub. notes 4 3/8s, 2028 | 6,200,000 | 5,138,250 |
|
| Chesapeake Energy Corp. cv. sr. unsec. | | |
| notes company guaranty 2 1/4s, 2038 | 9,400,000 | 7,026,500 |
|
| Penn Virginia Corp. cv. sr. unsec. | | |
| sub. notes 4 1/2s, 2012 | 7,590,000 | 6,920,942 |
|
| St. Mary Land & Exploration Co. | | |
| cv. sr. unsec. notes 3 1/2s, 2027 | 5,500,000 | 5,376,250 |
|
| | | 24,461,942 |
| Pharmaceuticals (3.7%) | | |
| Biovail Corp. 144A cv. sr. notes | | |
| 5 3/8s, 2014 (Canada) | 2,700,000 | 3,090,285 |
|
| Cephalon, Inc. cv. sr. sub. notes | | |
| 2 1/2s, 2014 | 5,880,000 | 5,880,000 |
|
| King Pharmaceuticals, Inc. cv. company | | |
| guaranty sr. unsub. notes | | |
| 1 1/4s, 2026 | 6,200,000 | 5,301,000 |
|
| Teva Pharmaceutical Finance, LLC | | |
| cv. company guaranty sr. unsec. | | |
| debs Ser. C, 1/4s, 2026 (Israel) | 7,300,000 | 8,276,375 |
|
| | | 22,547,660 |
| Real estate (2.2%) | | |
| Alexandria Real Estate Equities, Inc. | | |
| 144A cv. company guaranty sr. unsec. | | |
| notes 3.7s, 2027 R | 5,300,000 | 4,889,250 |
|
| Digital Realty Trust LP | | |
| 144A cv. sr. unsec. notes 5 1/2s, 2029 R | 4,900,000 | 6,038,760 |
|
| General Growth Properties, Inc. | | |
| 144A cv. sr. notes 3.98s, | | |
| 2027 (In default) † R | 3,600,000 | 2,610,000 |
|
| | | 13,538,010 |
| Retail (2.1%) | | |
| Iconix Brand Group, Inc. cv. sr. sub. | | |
| notes 1 7/8s, 2012 | 3,200,000 | 2,768,000 |
|
| Pantry, Inc. (The) cv. company | | |
| guaranty sr. unsec. sub. notes | | |
| 3s, 2012 | 4,400,000 | 3,624,500 |
|
| Pantry, Inc. (The) | | |
| 144A cv. sr. sub. notes 3s, 2012 | 2,600,000 | 2,141,750 |
|
| | |
| CONVERTIBLE BONDS | Principal | |
| AND NOTES (73.8%)* cont. | amount | Value |
|
| Retail cont. | | |
| Rite Aid Corp. cv. sr. unsec. | | |
| unsub. notes 8 1/2s, 2015 | $3,885,000 | $3,593,625 |
|
| Sonic Automotive, Inc. cv. | | |
| sr. unsec. notes 5s, 2029 | 700,000 | 677,425 |
|
| | | 12,805,300 |
| Semiconductor (0.3%) | | |
| Verigy, Ltd. 144A cv. sr. unsec. unsub. | | |
| notes 5 1/4s, 2014 (Singapore) | 1,940,000 | 2,021,461 |
|
| | | 2,021,461 |
| Software (6.2%) | | |
| Cadence Design Systems, Inc. cv. sr. | | |
| unsec. notes 1 1/2s, 2013 | 2,100,000 | 1,732,500 |
|
| Cadence Design Systems, Inc. | | |
| 144A cv. sr. unsec. notes | | |
| 1 1/2s, 2013 | 5,100,000 | 4,207,500 |
|
| Macrovision Corp. cv. sr. unsec. | | |
| notes 2 5/8s, 2011 | 3,770,000 | 4,297,800 |
|
| Macrovision Corp. 144A cv. sr. unsec. | | |
| notes 2 5/8s, 2011 | 3,000,000 | 3,420,000 |
|
| Safeguard Scientifics, Inc. 144A | | |
| cv. sr. unsec. notes 2 5/8s, 2024 | 10,500,000 | 9,870,000 |
|
| Sybase, Inc. 144A cv. sr. unsec. | | |
| unsub. notes 3 1/2s, 2029 | 5,935,000 | 6,587,850 |
|
| Symantec Corp. cv. sr. unsec. | | |
| notes 1s, 2013 | 7,100,000 | 7,907,625 |
|
| | | 38,023,275 |
| Technology (2.6%) | | |
| Acquicor Technology, Inc. | | |
| 144A cv. notes 8s, 2011 | 3,422,000 | 2,326,960 |
|
| CACI International, Inc. cv. sr. unsec. | | |
| sub. notes 2 1/8s, 2014 | 2,100,000 | 2,186,625 |
|
| CACI International, Inc. 144A cv. | | |
| sr. unsec. sub. notes 2 1/8s, 2014 | 3,720,000 | 3,873,450 |
|
| ON Semiconductor Corp. cv. company | | |
| guaranty sr. unsec. sub. notes | | |
| 2 5/8s, 2026 | 785,000 | 743,788 |
|
| ON Semiconductor Corp. | | |
| 144A cv. company guaranty sr. unsec. | | |
| sub. notes 2 5/8s, 2026 | 7,000,000 | 6,632,500 |
|
| | | 15,763,323 |
| Telecommunications (1.5%) | | |
| Level 3 Communications, Inc. | | |
| cv. sr. unsec. unsub. notes 3 1/2s, 2012 | 7,675,000 | 6,437,406 |
|
| NII Holdings, Inc. 144A cv. sr. | | |
| unsec. notes 3 1/8s, 2012 | 3,500,000 | 3,101,875 |
|
| | | 9,539,281 |
| Telephone (1.8%) | | |
| Leap Wireless International, Inc. | | |
| cv. sr. unsec. notes 4 1/2s, 2014 | 7,210,000 | 5,615,509 |
|
| Qwest Communications | | |
| International, Inc. cv. sr. unsec. | | |
| notes 3 1/2s, 2025 | 5,800,000 | 5,763,750 |
|
| | | 11,379,259 |
| Waste Management (0.9%) | | |
| Waste Connections, Inc. cv. sr. unsec. | | |
| unsub. notes 3 3/4s, 2026 | 4,900,000 | 5,126,625 |
|
| Waste Connections, Inc. | | |
| 144A cv. sr. unsec. notes 3 3/4s, 2026 | 427,000 | 446,749 |
|
| | | 5,573,374 |
| |
| Total convertible bonds and notes (cost $437,006,524) | $454,707,554 |
| | |
| CONVERTIBLE PREFERRED | | |
| SECURITIES (16.0%)* | Shares | Value |
|
| Automotive (0.5%) | | |
| Ford Motor Co. Capital Trust II $3.25 | | |
| cum. cv. pfd. | 102,000 | $2,938,875 |
|
| | | 2,938,875 |
| Banking (3.3%) | | |
| Bank of America Corp. Ser. L, | | |
| 7.25% cv. pfd. | 14,700 | 12,182,619 |
|
| Wells Fargo & Co. Ser. L, | | |
| 7.50% cv. pfd. | 9,175 | 8,211,625 |
|
| | | 20,394,244 |
| Building materials (0.7%) | | |
| Stanley Works (The) 5.125% | | |
| units cv. ARP | 5,531,000 | 4,517,002 |
|
| | | 4,517,002 |
| Chemicals (0.6%) | | |
| Celanese Corp. $1.063 cum. cv. pfd. | 112,400 | 3,920,512 |
|
| | | 3,920,512 |
| Conglomerates (1.0%) | | |
| Dole Food Automatic Exchange 144A | | |
| 7.00% cv. pfd. | 510,505 | 6,166,900 |
|
| | | 6,166,900 |
| Electric utilities (1.2%) | | |
| Great Plains Energy, Inc. | | |
| $6.00 cv. pfd. S | 120,339 | 7,373,171 |
|
| | | 7,373,171 |
| Financial (0.1%) | | |
| Fannie Mae Ser. 04-1, 5.375% cv. pfd. | 100 | 325,000 |
|
| | | 325,000 |
| Food (0.9%) | | |
| Bunge, Ltd. 5.125% cum. cv. pfd. | 9,300 | 5,440,277 |
|
| | | 5,440,277 |
| Insurance (1.9%) | | |
| Assured Guaranty, Ltd. | | |
| zero % cv. pfd. (Bermuda) | 59,800 | 4,297,228 |
|
| XL Capital, Ltd. $2.687 cv. pfd. | 290,400 | 7,448,760 |
|
| | | 11,745,988 |
| Investment banking/Brokerage (—%) | | |
| Lehman Brothers Holdings, Inc. Ser. P, | | |
| 7.25% cv. pfd. (In default) † | 13,400 | 90,450 |
|
| | | 90,450 |
| Metals (2.9%) | | |
| Freeport-McMoRan Copper & Gold, Inc. | | |
| $6.75 cv. pfd. | 101,000 | 10,781,750 |
|
| Vale Capital, Ltd. Ser. RIO, | | |
| $2.75 cv. pfd. (Brazil) | 136,760 | 6,742,268 |
|
| | | 17,524,018 |
| Oil and gas (0.7%) | | |
| Whiting Petroleum Corp. $6.25 | | |
| cum. cv. pfd | 26,600 | 3,985,013 |
|
| | | 3,985,013 |
| Power producers (0.1%) | | |
| AES Trust III $3.375 cv. pfd. | 19,600 | 835,450 |
|
| | | 835,450 |
| Telecommunications (1.3%) | | |
| Crown Castle International Corp. | | |
| $3.125 cum. cv. pfd. | 150,000 | 8,100,000 |
|
| | | 8,100,000 |
| Tobacco (0.8%) | | |
| Universal Corp. 6.75% cv. pfd. | 4,788 | 4,889,745 |
|
| | | 4,889,745 |
| |
| Total convertible preferred securities (cost $116,783,445) | $98,246,645 |
| | |
| COMMON STOCKS (7.5%)* | Shares | Value |
|
| Banking (1.6%) | | |
| Bank of America Corp. | 359,900 | $5,247,342 |
|
| Wells Fargo & Co. | 160,000 | 4,403,200 |
|
| | | 9,650,542 |
| Cable television (1.5%) | | |
| DIRECTV Group, Inc. (The) † S | 178,900 | 4,705,070 |
|
| Time Warner Cable, Inc. S | 116,600 | 4,598,704 |
|
| | | 9,303,774 |
| Conglomerates (—%) | | |
| Brazil Ethanol, Inc. 144A (Unit) † | 312,500 | 3,125 |
|
| | | 3,125 |
| Insurance (0.7%) | | |
| Aflac, Inc. | 105,400 | 4,373,046 |
|
| | | 4,373,046 |
| Investment banking/Brokerage (0.8%) | | |
| Goldman Sachs Group, Inc. (The) | 28,300 | 4,815,811 |
|
| | | 4,815,811 |
| Medical technology (1.0%) | | |
| Epix Medical, Inc. Contingent Value | | |
| (acquired various dates between 6/21/04 | | |
| and 3/14/05, cost $—) F ‡ | 7,600 | — |
|
| Medtronic, Inc. S | 173,100 | 6,179,670 |
|
| | | 6,179,670 |
| Oil and gas (1.0%) | | |
| XTO Energy, Inc. | 142,000 | 5,901,520 |
|
| | | 5,901,520 |
| Telecommunications (0.9%) | | |
| NII Holdings, Inc. † | 211,000 | 5,682,230 |
|
| | | 5,682,230 |
| |
| Total common stocks (cost $50,715,817) | | $45,909,718 |
| | |
| CORPORATE BONDS | Principal | |
| AND NOTES (0.2%)* | amount | Value |
|
| Unisys Corp. 144A company | | |
| guaranty sr. sub. notes 14 1/4s, | | |
| 2015 | $1,012,000 | $1,092,960 |
|
| Total corporate bonds and notes (cost $1,098,020) | $1,092,960 |
| |
| | Principal | |
| SHORT-TERM INVESTMENTS (3.5%)* | amount/shares | Value |
|
| Putnam Money Market Liquidity Fund e | 9,319,405 | $9,319,405 |
|
| Short-term investments held as | | |
| collateral for loaned securities with | | |
| a yield of 0.35% and a due date | | |
| of November 2, 2009 d | $12,095,485 | 12,095,250 |
|
| Total short-term investments (cost $21,414,655) | $21,414,655 |
|
| |
| TOTAL INVESTMENTS | | |
|
| Total investments (cost $627,018,461) | | $621,371,532 |
Key to holding’s abbreviations
| | | | | | | | |
| ARP | Adjustable Rate Preferred Stock | | | | | | | |
| FRN | Floating Rate Notes | | | | | | | |
* Percentages indicated are based on net assets of $615,877,546.
† Non-income-producing security.
†† The interest rate and date shown parenthetically represent the new interest rate to be paid and the date the fund will begin accruing interest at this rate.
‡ Restricted, excluding 144A securities, as to public resale. The total market value of restricted securities held at October 31, 2009 was $—.
d See Note 1 to the financial statements.
e See Note 6 to the financial statements regarding investments in Putnam Money Market Liquidity Fund.
F Is valued at fair value following procedures approved by the Trustees. Securities may be classified as a Level 2 or Level 3 for Accounting Standards Codification ASC 820 Fair Value Measurements and Disclosures (” ASC 820” ) disclosures based on the securities valuation inputs.
R Real Estate Investment Trust.
S Securities on loan, in part or in entirety, at October 31, 2009.
Debt obligations are considered secured unless otherwise indicated.
144A after the name of an issuer represents securities exempt from registration under Rule 144A under the Securities Act of 1933, as amended. These securities may be resold in transactions exempt from registration, normally to qualified institutional buyers.
The rates shown on ARP and FRN are the current interest rates at October 31, 2009.
The dates shown on debt obligations are the original maturity dates.
In September 2006, ASC 820 was issued. ASC 820 is effective for financial statements issued for fiscal years beginning after November 15, 2007 and interim periods within those fiscal years. While the adoption of ASC 820 does not have a material effect on the fund’s net asset value, it does require additional disclosures about fair value measurements. ASC 820 establishes a three-level hierarchy for disclosure of fair value measurements. The valuation hierarchy is based upon the transparency of inputs to the valuation of the fund’s investments. The three levels are defined as follows:
Level 1 — Valuations based on quoted prices for identical securities in active markets.
Level 2 — Valuations based on quoted prices in markets that are not active or for which all significant inputs are observable, either directly or indirectly.
Level 3 — Valuations based on inputs that are unobservable and significant to the fair value measurement.
The following is a summary of the inputs used to value the fund’s net assets as of October 31, 2009:
| | | |
| | | Valuation inputs | |
|
| Investments in securities: | Level 1 | Level 2 | Level 3 |
|
| Common stocks: | | | |
|
| Communication services | $14,986,004 | $— | $— |
|
| Conglomerates | — | 3,125 | — |
|
| Energy | 5,901,520 | — | — |
|
| Financial | 18,839,399 | — | — |
|
| Health care | 6,179,670 | — | — |
|
| Total common stocks | 45,906,593 | 3,125 | — |
|
| Convertible bonds and notes | — | 454,707,554 | — |
|
| Convertible preferred stocks | — | 98,246,645 | — |
|
| Corporate bonds and notes | — | 1,092,960 | — |
|
| Short-term investments | 9,319,405 | 12,095,250 | — |
|
| Totals by level | $55,225,998 | $566,145,534 | $— |
The accompanying notes are an integral part of these financial statements.
Statement of assets and liabilities 10/31/09
| |
| ASSETS | |
|
| Investment in securities, at value, including $11,634,776 | |
| of securities on loan (Note 1): | |
| Unaffiliated issuers (identified cost $617,699,056) | $612,052,127 |
| Affiliated issuers (identified cost $9,319,405) (Note 6) | 9,319,405 |
|
| Cash | 5,828,232 |
|
| Dividends, interest and other receivables | 5,395,833 |
|
| Receivable for shares of the fund sold | 494,114 |
|
| Receivable for investments sold | 417,513 |
|
| Total assets | 633,507,224 |
| |
| |
| LIABILITIES | |
|
| Payable for investments purchased | 2,110,376 |
|
| Payable for shares of the fund repurchased | 1,801,968 |
|
| Payable for compensation of Manager (Note 2) | 991,911 |
|
| Payable for investor servicing fees (Note 2) | 135,984 |
|
| Payable for custodian fees (Note 2) | 4,356 |
|
| Payable for Trustee compensation and expenses (Note 2) | 144,360 |
|
| Payable for administrative services (Note 2) | 2,016 |
|
| Payable for distribution fees (Note 2) | 168,598 |
|
| Collateral on securities loaned, at value (Note 1) | 12,095,250 |
|
| Other accrued expenses | 174,859 |
|
| Total liabilities | 17,629,678 |
| |
| Net assets | $615,877,546 |
|
| |
| REPRESENTED BY | |
|
| Paid-in capital (Unlimited shares authorized) (Notes 1 and 4) | $807,079,531 |
|
| Undistributed net investment income (Note 1) | 12,236,542 |
|
| Accumulated net realized loss on investments (Note 1) | (197,791,598) |
|
| Net unrealized depreciation of investments | (5,646,929) |
|
| Total — Representing net assets applicable to | |
| capital shares outstanding | $615,877,546 |
| |
| |
| COMPUTATION OF NET ASSET VALUE AND OFFERING PRICE | |
|
| Net asset value and redemption price per class A share | |
| ($467,668,517 divided by 28,739,358 shares) | $16.27 |
|
| Offering price per class A share (100/94.25 of $16.27)* | $17.26 |
|
| Net asset value and offering price per class B share | |
| ($14,350,925 divided by 896,233 shares)** | $16.01 |
|
| Net asset value and offering price per class C share | |
| ($56,130,530 divided by 3,481,594 shares)** | $16.12 |
|
| Net asset value and redemption price per class M share | |
| ($4,382,779 divided by 271,688 shares) | $16.13 |
|
| Offering price per class M share (100/96.50 of $16.13)* | $16.72 |
|
| Net asset value, offering price and redemption price per | |
| class R share ($2,684,755 divided by 165,524 shares) | $16.22 |
|
| Net asset value, offering price and redemption price per | |
| class Y share ($70,660,040 divided by 4,343,486 shares) | $16.27 |
|
* On single retail sales of less than $50,000. On sales of $50,000 or more the offering price is reduced.
** Redemption price per share is equal to net asset value less any applicable contingent deferred sales charge.
The accompanying notes are an integral part of these financial statements.
| |
| Statement of operations Year ended 10/31/09 | |
| |
| INVESTMENT INCOME | |
|
| Interest (including interest income of $38,673 from | |
| investments in affiliated issuers) (Note 6) | $20,985,391 |
|
| Dividends | 5,990,010 |
|
| Total investment income | 26,975,401 |
| |
| |
| EXPENSES | |
|
| Compensation of Manager (Note 2) | 3,352,002 |
|
| Investor servicing fees (Note 2) | 1,516,435 |
|
| Custodian fees (Note 2) | 12,386 |
|
| Trustee compensation and expenses (Note 2) | 46,752 |
|
| Administrative services (Note 2) | 28,210 |
|
| Distribution fees — Class A (Note 2) | 1,055,201 |
|
| Distribution fees — Class B (Note 2) | 137,692 |
|
| Distribution fees — Class C (Note 2) | 428,983 |
|
| Distribution fees — Class M (Note 2) | 28,480 |
|
| Distribution fees — Class R (Note 2) | 11,606 |
|
| Other | 297,717 |
|
| Fees waived and reimbursed by Manager (Note 2) | (299,828) |
|
| Total expenses | 6,615,636 |
| | |
| Expense reduction (Note 2) | (36,056) |
|
| Net expenses | 6,579,580 |
| |
| Net investment income | 20,395,821 |
|
| Net realized loss on investments (Notes 1 and 3) | (106,417,418) |
|
| Net increase from payments by affiliates (Note 2) | 101,075 |
|
| Net unrealized appreciation of investments during the year | 248,720,550 |
|
| Net gain on investments | 142,404,207 |
|
| Net increase in net assets resulting from operations | $162,800,028 |
| | |
| Statement of changes in net assets | |
| |
| INCREASE (DECREASE) IN NET ASSETS | | |
| | Year ended | Year ended |
| | 10/31/09 | 10/31/08 |
|
| Operations: | | |
|
| Net investment income | $20,395,821 | $19,600,938 |
|
| Net realized loss on investments | (106,316,343) | (29,495,784) |
|
| Net unrealized appreciation | | |
| (depreciation) of investments | 248,720,550 | (311,210,354) |
|
| Net increase (decrease) in net assets | | |
| resulting from operations | 162,800,028 | (321,105,200) |
|
| Distributions to shareholders (Note 1): | | |
|
| From ordinary income | | |
|
| Net investment income | | |
|
| Class A | (17,157,229) | (17,717,092) |
|
| Class B | (459,958) | (567,796) |
|
| Class C | (1,449,088) | (936,355) |
|
| Class M | (138,859) | (113,204) |
|
| Class R | (89,957) | (81,722) |
|
| Class Y | (1,470,069) | (849,417) |
|
| Redemption fees (Note 1) | 1,880 | 2,982 |
|
| Increase (decrease) from capital share | | |
| transactions (Note 4) | (3,906,655) | 9,584,775 |
|
| Total increase (decrease) in net assets | 138,130,093 | (331,783,029) |
|
| |
| NET ASSETS | | |
|
| Beginning of year | 477,747,453 | 809,530,482 |
|
| End of year (including undistributed net | | |
| investment income of $12,236,542 and | | |
| $12,660,364, respectively) | $615,877,546 | $477,747,453 |
The accompanying notes are an integral part of these financial statements.
|
| This page left blank intentionally. |
Financial highlights (For a common share outstanding throughout the period)
| | | | | | | | | | | | | |
| INVESTMENT OPERATIONS: | | LESS DISTRIBUTIONS: | | RATIOS AND SUPPLEMENTAL DATA: |
|
| | | | | | | | | | | | | Ratio of net | |
| | | Net | Net realized and | Total from | From net | | | | Total return | Net assets, | Ratio of expenses | investment income | |
| | Net asset value, | investment | unrealized gain (loss) | investment | investment | Total | Redemption | Net asset value, | at net asset | end of period | to average | (loss) to average | Portfolio |
| Period ended | beginning of period | income (loss) a | on investments | operations | income | distributions | fees b | end of period | value (%) c | (in thousands) | net assets (%) d,e | net assets (%) d | turnover (%) |
|
| Class A | | | | | | | | | | | | | |
| October 31, 2009 | $12.55 | .55 | 3.73 | 4.28 | (.56) | (.56) | — | $16.27 | 35.08 | $467,669 | 1.20 | 4.00 | 74.36 |
| October 31, 2008 | 21.21 | .51 | (8.64) | (8.13) | (.53) | (.53) | — | 12.55 | (39.13) | 402,408 | 1.06 | 2.73 | 68.19 |
| October 31, 2007 | 19.05 | .51 | 2.18 | 2.69 | (.53) | (.53) | — | 21.21 | 14.27 | 697,830 | 1.04 | 2.50 | 70.61 |
| October 31, 2006 | 17.13 | .48 f | 1.97 | 2.45 | (.53) | (.53) | — | 19.05 | 14.52 | 608,771 | 1.03 f | 2.64 f | 63.63 |
| October 31, 2005 | 16.60 | .50 g | .56 | 1.06 | (.53) | (.53) | — | 17.13 | 6.41 | 564,822 | 1.03 | 2.91 g | 66.46 |
|
| Class B | | | | | | | | | | | | | |
| October 31, 2009 | $12.35 | .44 | 3.67 | 4.11 | (.45) | (.45) | — | $16.01 | 34.12 | $14,351 | 1.95 | 3.30 | 74.36 |
| October 31, 2008 | 20.87 | .36 | (8.51) | (8.15) | (.37) | (.37) | — | 12.35 | (39.61) | 15,297 | 1.81 | 1.96 | 68.19 |
| October 31, 2007 | 18.75 | .35 | 2.14 | 2.49 | (.37) | (.37) | — | 20.87 | 13.40 | 37,930 | 1.79 | 1.77 | 70.61 |
| October 31, 2006 | 16.86 | .34 f | 1.94 | 2.28 | (.39) | (.39) | — | 18.75 | 13.68 | 47,842 | 1.78 f | 1.89 f | 63.63 |
| October 31, 2005 | 16.34 | .36 g | .55 | .91 | (.39) | (.39) | — | 16.86 | 5.61 | 65,205 | 1.78 | 2.16 g | 66.46 |
|
| Class C | | | | | | | | | | | | | |
| October 31, 2009 | $12.44 | .43 | 3.71 | 4.14 | (.46) | (.46) | — | $16.12 | 34.12 | $56,131 | 1.95 | 3.13 | 74.36 |
| October 31, 2008 | 21.04 | .37 | (8.58) | (8.21) | (.39) | (.39) | — | 12.44 | (39.60) | 33,539 | 1.81 | 2.00 | 68.19 |
| October 31, 2007 | 18.92 | .35 | 2.16 | 2.51 | (.39) | (.39) | — | 21.04 | 13.36 | 38,347 | 1.79 | 1.73 | 70.61 |
| October 31, 2006 | 17.01 | .34 f | 1.97 | 2.31 | (.40) | (.40) | — | 18.92 | 13.73 | 22,010 | 1.78 f | 1.89 f | 63.63 |
| October 31, 2005 | 16.50 | .37 g | .55 | .92 | (.41) | (.41) | — | 17.01 | 5.60 | 17,952 | 1.78 | 2.17 g | 66.46 |
|
| Class M | | | | | | | | | | | | | |
| October 31, 2009 | $12.45 | .47 | 3.71 | 4.18 | (.50) | (.50) | — | $16.13 | 34.41 | $4,383 | 1.70 | 3.40 | 74.36 |
| October 31, 2008 | 21.04 | .41 | (8.57) | (8.16) | (.43) | (.43) | — | 12.45 | (39.44) | 3,133 | 1.56 | 2.22 | 68.19 |
| October 31, 2007 | 18.90 | .40 | 2.17 | 2.57 | (.43) | (.43) | — | 21.04 | 13.70 | 6,175 | 1.54 | 2.00 | 70.61 |
| October 31, 2006 | 16.99 | .38 f | 1.97 | 2.35 | (.44) | (.44) | — | 18.90 | 14.01 | 5,607 | 1.53 f | 2.14 f | 63.63 |
| October 31, 2005 | 16.48 | .41 g | .54 | .95 | (.44) | (.44) | — | 16.99 | 5.79 | 5,662 | 1.53 | 2.41 g | 66.46 |
|
| Class R | | | | | | | | | | | | | |
| October 31, 2009 | $12.51 | .51 | 3.73 | 4.24 | (.53) | (.53) | — | $16.22 | 34.79 | $2,685 | 1.45 | 3.73 | 74.36 |
| October 31, 2008 | 21.15 | .47 | (8.62) | (8.15) | (.49) | (.49) | — | 12.51 | (39.29) | 2,255 | 1.31 | 2.50 | 68.19 |
| October 31, 2007 | 19.01 | .45 | 2.18 | 2.63 | (.49) | (.49) | — | 21.15 | 13.96 | 2,164 | 1.29 | 2.20 | 70.61 |
| October 31, 2006 | 17.11 | .43 f | 1.98 | 2.41 | (.51) | (.51) | — | 19.01 | 14.27 | 1,027 | 1.28 f | 2.35 f | 63.63 |
| October 31, 2005 | 16.60 | .46 g | .54 | 1.00 | (.49) | (.49) | — | 17.11 | 6.07 | 87 | 1.28 | 2.67 g | 66.46 |
|
| Class Y | | | | | | | | | | | | | |
| October 31, 2009 | $12.55 | .57 | 3.74 | 4.31 | (.59) | (.59) | — | $16.27 | 35.43 | $70,660 | .95 | 3.93 | 74.36 |
| October 31, 2008 | 21.21 | .56 | (8.64) | (8.08) | (.58) | (.58) | — | 12.55 | (38.97) | 21,115 | .81 | 3.00 | 68.19 |
| October 31, 2007 | 19.05 | .56 | 2.18 | 2.74 | (.58) | (.58) | — | 21.21 | 14.56 | 27,084 | .79 | 2.75 | 70.61 |
| October 31, 2006 | 17.13 | .52 f | 1.97 | 2.49 | (.57) | (.57) | — | 19.05 | 14.81 | 24,458 | .78 f | 2.88 f | 63.63 |
| October 31, 2005 | 16.60 | .54 g | .56 | 1.10 | (.57) | (.57) | — | 17.13 | 6.68 | 24,197 | .78 | 3.15 g | 66.46 |
|
a Per share net investment income (loss) has been determined on the basis of the weighted average number of shares outstanding during the period.
b Amount represents less than $0.01 per share.
c Total return assumes dividend reinvestment and does not reflect the effect of sales charges.
d Reflects an involuntary contractual expense limitation in effect during the period. For periods prior to October 31, 2009, certain fund expenses were waived in connection with the fund’s investment in Putnam Prime Money Market Fund. As a result of such limitation and/or waivers, the expenses of each class reflect a reduction of the following amounts (Note 2):
| | | |
| | | Percentage of average net assets | |
| |
| October 31, 2009 | | 0.06% | |
| October 31, 2008 | | <0.01 | |
| |
| October 31, 2007 | | <0.01 | |
| |
| October 31, 2006 | | <0.01 | |
| |
| October 31, 2005 | | <0.01 | |
| |
e Includes amounts paid through expense offset and brokerage/service arrangements (Note 2).
f Reflects a non-recurring reimbursement from Putnam Investments relating to the calculation of certain amounts paid by the fund to Putnam in previous years for transfer agent services, which amounted to less than $0.01 per share and 0.01% of average net assets for the period ended October 31, 2006.
g Reflects a non-recurring accrual related to Putnam Management’s settlement with the Securities and Exchange Commission (the “SEC”) regarding brokerage allocation practices, which amounted to the following amounts:
| | | |
| | | Percentage | |
| | | of average | |
| | Per share | net assets | |
| |
| Class A | <$0.01 | 0.02% | |
| |
| Class B | <0.01 | 0.03 | |
| |
| Class C | <0.01 | 0.02 | |
| |
| Class M | <0.01 | 0.03 | |
| |
| Class R | <0.01 | 0.02 | |
| |
| Class Y | <0.01 | 0.03 | |
| |
The accompanying notes are an integral part of these financial statements.
Notes to financial statements 10/31/09
Note 1: Significant accounting policies
Putnam Convertible Income-Growth Trust (the “fund”) is a Massachusetts business trust, which is registered under the Investment Company Act of 1940, as amended, as a diversified open-end management investment company. The investment objective of the fund is to seek, with equal emphasis, current income and capital appreciation by investing primarily in U.S. securities that can be converted into or exchanged for common stock. The fund’s secondary objective is conservation of capital. The fund may invest in higher yielding, lower rated bonds that may have a higher rate of default.
The fund offers class A, class B, class C, class M, class R and class Y shares. Class A and class M shares are sold with a maximum front-end sales charge of 5.75% and 3.50%, respectively, and generally do not pay a contingent deferred sales charge. Class B shares, which convert to class A shares after approximately eight years, do not pay a front-end sales charge and are subject to a contingent deferred sales charge, if those shares are redeemed within six years of purchase. Class C shares have a one-year 1.00% contingent deferred sales charge and do not convert to class A shares. Class R shares, which are offered to qualified employee-benefit plans, are sold at net asset value. The expenses for class A, class B, class C, class M and class R shares may differ based on the distribution fee of each class, which is identi-fied in Note 2. Class Y shares, which are sold at net asset value, are generally subject to the same expenses as class A, class B, clas s C, class M and class R shares, but do not bear a distribution fee. Class Y shares are generally only available to corporate and institutional clients and clients in other approved programs.
A 1.00% redemption fee may apply on any shares that are redeemed (either by selling or exchanging into another fund) within 7 days of purchase. The redemption fee is accounted for as an addition to paid-in-capital.
Investment income, realized and unrealized gains and losses and expenses of the fund are borne pro-rata based on the relative net assets of each class to the total net assets of the fund, except that each class bears expenses unique to that class (including the distribution fees applicable to such classes). Each class votes as a class only with respect to its own distribution plan or other matters on which a class vote is required by law or determined by the Trustees. If the fund were liquidated, shares of each class would receive their pro-rata share of the net assets of the fund. In addition, the Trustees declare separate dividends on each class of shares.
In the normal course of business, the fund enters into contracts that may include agreements to indemnify another party under given circumstances. The fund’s maximum exposure under these arrangements is unknown as this would involve future claims that may be, but have not yet been, made against the fund. However, the fund’s management team expects the risk of material loss to be remote.
The following is a summary of significant accounting policies consistently followed by the fund in the preparation of its financial statements. The preparation of financial statements is in conformity with accounting principles generally accepted in the United States of America and requires management to make estimates and assumptions that affect the reported amounts of assets and liabilities in the financial statements and the reported amounts of increases and decreases in net assets from operations during the reporting period. Actual results could differ from those estimates. Subsequent events after the Statement of assets and liabilities date through the date that the financial statements were issued, December 10, 2009, have been evaluated in the preparation of the financial statements.
A) Security valuation Investments for which market quotations are readily available are valued at the last reported sales price on their principal exchange, or official closing price for certain markets. If no sales are reported — as in the case of some securities traded over-the-counter — a security is valued at its last reported bid price. Market quotations are not considered to be readily available for certain debt obligations; such investments are valued on the basis of valuations furnished by an independent pricing service approved by the Trustees or dealers selected by Putnam Investment Management, LLC (“Putnam Management”), the fund’s manager, an indirect wholly-owned subsidiary of Putnam Investments, LLC. Such services or dealers determine valuations for normal institutional-size trading units of such securities using methods based on market transactions for comparable securities and various relationships, generally recognized by institutional traders, between securities (which considers such factors as security prices, yields, maturities and ratings) . Many securities markets and exchanges outside the U.S. close prior to the close of the New York Stock Exchange and therefore the closing prices for securities in such markets or on such exchanges may not fully reflect events that occur after such close but before the close of the New York Stock Exchange. Accordingly, on certain days, the fund will fair value foreign equity securities taking into account multiple factors, including movements in the U.S. securities markets. The number of days on which fair value prices will be used will depend on market activity and it is possible that fair value prices will be used by the fund to a significant extent. Securities quoted in foreign currencies, if any, are translated into U.S. dollars at the current exchange rate. To the extent a pricing s ervice or dealer is unable to value a security or provides a valuation that Putnam Management does not believe accurately reflects the security’s fair value, the security will be valued at fair value by Putnam Management. Certain investments, including certain restricted and illiquid securities and derivatives, are also valued at fair value following procedures approved by the Trustees. Such valuations and procedures are reviewed periodically by the Trustees. The fair value of securities is generally determined as the amount that the fund could reasonably expect to realize from an orderly disposition of such securities over a reasonable period of time. By its nature, a fair value price is a good faith estimate of the value of a security in a current sale and does not reflect an actual market price, which may be different by a material amount.
B) Joint trading account Pursuant to an exemptive order from the Securities and Exchange Commission (the “SEC”), the fund may transfer uninvested cash balances, including cash collateral received under security lending arrangements, into a joint trading account along with the cash of other registered investment companies and certain other accounts managed by Putnam Management. These balances may be invested in issues of short-term investments having maturities of up to 397 days for collateral received under security lending arrangements and up to 90 days for other cash investments.
C) Repurchase agreements The fund, or any joint trading account, through its custodian, receives delivery of the underlying securities, the market value of which at the time of purchase is required to be in an amount at least equal to the resale price, including accrued interest. Collateral for certain tri-party repurchase agreements is held at the counterparty’s custodian in a segregated account for the benefit of the fund and the counterparty. Putnam Management is responsible for determining that the value of these underlying securities is at all times at least equal to the resale price, including accrued interest. In the event of default or bankruptcy by the other party to the agreement, retention of the collateral may be subject to legal proceedings.
D) Security transactions and related investment income Security transactions are recorded on the trade date (the date the order to buy or sell is executed). Gains or losses on securities sold are determined on the identified cost basis.
Interest income is recorded on the accrual basis. Dividend income, net of applicable withholding taxes, is recognized on the ex-dividend date except that certain dividends from foreign securities, if any, are recognized as soon as the fund is informed of the ex-dividend date. Non-cash dividends, if any, are recorded at the fair market value of the securities received. Dividends representing a return of capital or capital gains, if any, are reflected as a reduction of cost and/or as a realized gain.
All premiums/discounts are amortized/accreted on a yield-to-maturity basis.
E) Securities lending The fund may lend securities, through its agents, to qualified borrowers in order to earn additional income. The loans are collateralized by cash and/or securities in an amount at least equal to the market value of the securities loaned. The market value of securities loaned is determined daily and any additional required collateral is allocated to the fund on the next business day. The risk of borrower default will be borne by the fund’s agents; the fund will bear the risk of loss with respect to the investment of the cash collateral. Income from securities lending is included in investment income on the Statement of operations. At October 31, 2009, the value of securities loaned amounted to $11,634,776. The fund received cash collateral of $12,095,250 which is pooled with collateral of other Putnam funds into a single broker cash account covered under the FDIC Temporary Liquidity G uarantee Program.
F) Federal taxes It is the policy of the fund to distribute all of its taxable income within the prescribed time and otherwise comply with the provisions of the Internal Revenue Code of 1986, as amended (the “Code”), applicable to regulated investment companies. It is also the intention of the fund to distribute an amount sufficient to avoid imposition of any excise tax under Section 4982 of the Code. The fund is subject to the provisions of ASC 740 Income Taxes (“ASC 740”). ASC 740 sets forth a minimum threshold for financial statement recognition of the benefit of a tax position taken or expected to be taken in a tax return. The fund did not have any unrecognized tax benefits in the accompanying financial statements. No provision has been made for federal taxes on income, capital gains or unrealized appreciatio n on securities held nor for excise tax on income and capital gains. Each of the fund’s federal tax returns for the prior three fiscal years remains subject to examination by the Internal Revenue Service and state departments of revenue.
At October 31, 2009, the fund had a capital loss carryover of $197,791,598 available to the extent allowed by the Code to offset future net capital gain, if any. The amounts of the carryovers and the expiration dates are:
| | | |
| Loss Carryover | Expiration | | |
| | |
| $60,611,354 | October 31, 2010 | | |
| | |
| 30,918,383 | October 31, 2016 | | |
| | |
| 106,261,861 | October 31, 2017 | | |
| | |
G) Distributions to shareholders Distributions to shareholders from net investment income are recorded by the fund on the ex-dividend date. Distributions from capital gains, if any, are recorded on the ex-dividend date and paid at least annually. The amount and character of income and gains to be distributed are determined in accordance with income tax regulations, which may differ from generally accepted accounting principles. These differences include temporary and/or permanent differences of amortization and accretion and nontaxable income. Reclassifications are made to the fund’s capital accounts to reflect income and gains available for distribution (or available capital loss carryovers) under income tax regulations. For the year ended October 31, 2009, the fund reclassified $54,483 to decrease undistributed net investment income with a decrease to accumulated net realized losses of $54,483.
The tax basis components of distributable earnings and the federal tax cost as of October 31, 2009 as follows:
| | | |
| Unrealized appreciation | $51,533,898 | | |
| Unrealized depreciation | (58,483,372) | | |
| | |
| Net unrealized depreciation | (6,949,474) | | |
| Undistributed ordinary income | 13,539,087 | | |
| Capital loss carryforward | (197,791,598) | | |
| | |
| Cost for federal income tax purposes | $628,321,006 | | |
Note 2: Management fee, administrative services and other transactions
The fund pays Putnam Management for management and investment advisory services quarterly based on the average net assets of the fund. Such fee is based on the following annual rates: 0.65% of the first $500 million of average net assets, 0.55% of the next $500 million, 0.50% of the next $500 million, 0.45% of the next $5 billion, 0.425% of the next $5 billion, 0.405% of the next $5 billion, 0.39% of the next $5 billion, and 0.38% thereafter.
Putnam Management had agreed to waive fees and reimburse expenses of the fund through July 31, 2009 to the extent necessary to ensure that the fund’s expenses do not exceed the simple average of the expenses of all front-end load funds viewed by Lipper Inc. as having the same investment classification or objective as the fund. The expense reimbursement is based on a comparison of the fund’s expenses with the average annualized operating expenses of the funds in its Lipper peer group for each calendar quarter during the fund’s last fiscal year, excluding 12b-1 fees and without giving effect to any expense offset and brokerage/service arrangements that may reduce fund expenses. During the year ended October 31, 2009, the fund’s expenses were reduced by $299,828 as a result of this limit.
Effective August 1, 2009 through July 31, 2010, Putnam Management has also contractually agreed to reimburse the fund’s expenses to the extent necessary to limit the cumulative expenses of the fund, exclusive of brokerage, interest, taxes, investment-related expenses, extraordinary expenses and payments under the fund’s investor servicing contract, investment management contract and distribution plans, on a fiscal year-to-date basis (or from August 1, 2009 through the fund’s next fiscal year end, as applicable), to an annual rate of 0.20% of the fund’s average net assets over such fiscal year-to-date period (or since August 1, 2009, as applicable). During the year ended October 31, 2009, the fund’s expenses were not reduced as a result of this limit.
Putnam Management voluntarily reimbursed the fund $101,075 for a trading error which occurred during the period. The effect of the loss incurred and the reimbursement by Putnam Management of such amounts had no impact on total return.
The fund reimburses Putnam Management an allocated amount for the compensation and related expenses of certain officers of the fund and their staff who provide administrative services to the fund. The aggregate amount of all such reimbursements is determined annually by the Trustees.
Custodial functions for the fund’s assets are provided by State Street Bank and Trust Company (“State Street”). Custody fees are based on the fund’s asset level, the number of its security holdings and transaction volumes.
Putnam Investor Services, Inc., an affiliate of Putnam Management, provided investor servicing agent functions to the fund. Prior to December 31, 2008, these services were provided by Putnam Investor Services, a division of Putnam Fiduciary Trust Company (“PFTC”), which is an affiliate of Putnam Management. Putnam Investor Services, Inc. and Putnam Investor Services received fees for investor servicing, subject to certain limitations, based on the fund’s retail asset level, the number of shareholder accounts in the fund and the level of defined contribution plan assets in the fund. The amounts incurred for investor servicing agent functions provided by affiliates of Putnam Management during the year ended October 31, 2009 are included in Investor servicing fees in the Statement of operations.
The fund has entered into expense offset arrangements with PFTC and State Street whereby PFTC’s and State Street’s fees are reduced by credits allowed on cash balances. The fund also reduced expenses through brokerage/service arrangements. For the year ended October 31, 2009, the fund’s expenses were reduced by $1,211 under the expense offset arrangements and by $34,845 under the brokerage/service arrangements.
Each independent Trustee of the fund receives an annual Trustee fee, of which $473, as a quarterly retainer, has been allocated to the fund, and an additional fee for each Trustees meeting attended. Trustees receive additional fees for attendance at certain committee meetings and industry seminars and for certain compliance-related matters. Trustees also are reimbursed for expenses they incur relating to their services as Trustees.
The fund has adopted a Trustee Fee Deferral Plan (the “Deferral Plan”) which allows the Trustees to defer the receipt of all or a portion of Trustees fees payable on or after July 1, 1995. The deferred fees remain invested in certain Putnam funds until distribution in accordance with the Deferral Plan.
The fund has adopted an unfunded noncontributory defined benefit pension plan (the “Pension Plan”) covering all Trustees of the fund who have served as a Trustee for at least five years and were first elected prior to 2004. Benefits under the Pension Plan are equal to 50% of the Trustee’s average annual attendance and retainer fees for the three years ended December 31, 2005. The retirement benefit is payable during a Trustee’s lifetime, beginning the year following retirement, for the number of years of service through December 31, 2006. Pension expense for the fund is included in Trustee compensation and expenses in the Statement of operations. Accrued pension liability is included in Payable for Trustee compensation and expenses in the Statement of assets and liabilities. The Trustees have terminated the Pension Plan with respect to any Trustee first elected after 2003.
The fund has adopted distribution plans (the “Plans”) with respect to its class A, class B, class C, class M and class R shares pursuant to Rule 12b-1 under the Investment Company Act of 1940. The purpose of the Plans is to compensate Putnam Retail Management Limited Partnership, a wholly-owned subsidiary of Putnam Investments, LLC and Putnam Retail Management GP, Inc., for services provided and expenses incurred in distributing shares of the fund. The Plans provide for payments by the fund to Putnam Retail Management Limited Partnership at an annual rate of up to 0.35%, 1.00%, 1.00%, 1.00% and 1.00% of the average net assets attributable to class A, class B, class C, class M and class R shares, respectively. The Trustees have approved payment by the fund at an annual rate of 0.25%, 1.00%, 1.00%, 0.75% and 0.50% of the average net assets attributable to class A, class B, class C, class M and class R shares, respectively.
For the year ended October 31, 2009, Putnam Retail Management Limited Partnership, acting as underwriter, received net commissions of $55,886 and $512 from the sale of class A and class M shares, respectively, and received $15,852 and $7,275 in contingent deferred sales charges from redemptions of class B and class C shares, respectively.
A deferred sales charge of up to 1.00% and 0.65% is assessed on certain redemptions of class A and class M shares, respectively. For the year ended October 31, 2009, Putnam Retail Management Limited Partnership, acting as underwriter, received $18,780 and no monies on class A and class M redemptions, respectively.
Note 3: Purchases and sales of securities
During the year ended October 31, 2009, cost of purchases and proceeds from sales of investment securities other than short-term investments aggregated $376,347,273 and $369,549,278, respectively. There were no purchases or sales of U.S. government securities.
Note 4: Capital shares
At October 31, 2009, there was an unlimited number of shares of beneficial interest authorized. Transactions in capital shares were as follows:
| | | | |
| | Year ended 10/31/09 | Year ended 10/31/08 |
|
| Class A | Shares | Amount | Shares | Amount |
|
| Shares sold | 7,390,655 | $94,867,615 | 7,926,226 | $150,436,431 |
|
| Shares issued in | | | | |
| connection with | | | | |
| reinvestment of | | | | |
| distributions | 990,049 | 13,331,758 | 794,123 | 14,762,990 |
|
| | 8,380,704 | 108,199,373 | 8,720,349 | 165,199,421 |
|
| Shares | | | | |
| repurchased | (11,709,379) | (155,524,573) | (9,553,286) | (170,970,134) |
|
| Net decrease | (3,328,675) | $(47,325,200) | (832,937) | $(5,770,713) |
|
| |
| | Year ended 10/31/09 | Year ended 10/31/08 |
|
| Class B | Shares | Amount | Shares | Amount |
|
| Shares sold | 187,380 | $2,480,046 | 380,986 | $7,135,814 |
|
| Shares issued in | | | | |
| connection with | | | | |
| reinvestment of | | | | |
| distributions | 25,915 | 339,236 | 23,347 | 429,982 |
|
| | 213,295 | 2,819,282 | 404,333 | 7,565,796 |
|
| Shares | | | | |
| repurchased | (555,275) | (7,265,671) | (983,441) | (18,160,060) |
|
| Net decrease | (341,980) | $(4,446,389) | (579,108) | $(10,594,264) |
| |
| |
| | Year ended 10/31/09 | Year ended 10/31/08 |
|
| Class C | Shares | Amount | Shares | Amount |
|
| Shares sold | 1,820,929 | $24,060,853 | 1,495,041 | $28,326,427 |
|
| Shares issued in | | | | |
| connection with | | | | |
| reinvestment of | | | | |
| distributions | 53,698 | 725,497 | 28,606 | 524,221 |
|
| | 1,874,627 | 24,786,350 | 1,523,647 | 28,850,648 |
|
| Shares | | | | |
| repurchased | (1,088,196) | (14,570,144) | (650,744) | (11,200,195) |
|
| Net increase | 786,431 | $10,216,206 | 872,903 | $17,650,453 |
|
| |
| | Year ended 10/31/09 | Year ended 10/31/08 |
|
| Class M | Shares | Amount | Shares | Amount |
|
| Shares sold | 141,545 | $1,929,497 | 54,195 | $1,012,376 |
|
| Shares issued in | | | | |
| connection with | | | | |
| reinvestment of | | | | |
| distributions | 7,724 | 104,656 | 5,199 | 96,071 |
|
| | 149,269 | 2,034,153 | 59,394 | 1,108,447 |
|
| Shares | | | | |
| repurchased | (129,223) | (1,873,118) | (101,268) | (1,910,523) |
|
| Net increase | | | | |
| (decrease) | 20,046 | $161,035 | (41,874) | $(802,076) |
|
| | | | |
| | Year ended 10/31/09 | Year ended 10/31/08 |
|
| Class R | Shares | Amount | Shares | Amount |
|
| Shares sold | 49,672 | $661,054 | 115,502 | $2,237,457 |
|
| Shares issued in | | | | |
| connection with | | | | |
| reinvestment of | | | | |
| distributions | 5,694 | 77,016 | 3,624 | 66,901 |
|
| | 55,366 | 738,070 | 119,126 | 2,304,358 |
|
| Shares | | | | |
| repurchased | (70,101) | (932,508) | (41,195) | (670,569) |
|
| Net increase | | | | |
| (decrease) | (14,735) | $(194,438) | 77,931 | $1,633,789 |
|
| |
| | Year ended 10/31/09 | Year ended 10/31/08 |
|
| Class Y | Shares | Amount | Shares | Amount |
|
| Shares sold | 3,455,114 | $48,818,687 | 646,559 | $11,774,373 |
|
| Shares issued in | | | | |
| connection with | | | | |
| reinvestment of | | | | |
| distributions | 79,057 | 1,078,765 | 45,023 | 833,603 |
|
| | 3,534,171 | 49,897,452 | 691,582 | 12,607,976 |
|
| Shares | | | | |
| repurchased | (873,692) | (12,215,321) | (285,551) | (5,140,390) |
|
| Net increase | 2,660,479 | $37,682,131 | 406,031 | $7,467,586 |
|
Note 5: Summary of Derivative Activity
For the year ended October 31, 2009, the fund did not hold any derivative instruments.
Note 6: Investment in Putnam Money Market Liquidity Fund
The fund invested in Putnam Money Market Liquidity Fund, an open-end management investment company managed by Putnam Management. Investments in Putnam Money Market Liquidity Fund are valued at its closing net asset value each business day. Income distributions earned by the fund are recorded as interest income in the Statement of operations and totaled $38,673 for the year ended October 31, 2009. During the year ended October 31, 2009, cost of purchases and proceeds of sales of investments in Putnam Money Market Liquidity Fund aggregated $167,062,642 and $157,743,237, respectively. Management fees charged to Putnam Money Market Liquidity Fund have been waived by Putnam Management.
Note 7: Regulatory matters and litigation
In late 2003 and 2004, Putnam Management settled charges brought by the SEC and the Massachusetts Securities Division in connection with excessive short-term trading in Putnam funds. Distribution of payments from Putnam Management to certain open-end Putnam funds and their shareholders is expected to be completed in the next several months. These allegations and related matters have served as the general basis for certain lawsuits, including purported class action lawsuits against Putnam Management and, in a limited number of cases, some Putnam funds. Putnam Management believes that these lawsuits will have no material adverse effect on the funds or on Putnam Management’s ability to provide investment management services. In addition, Putnam Management has agreed to bear any costs incurred by the Putnam funds as a result of these matters.
Note 8: Other
At a meeting on November 19, 2009, shareholders approved a new management contract for your fund. Subject to shareholder approval of similar management contracts for substantially all of the other Putnam funds, the new management contract is expected to be implemented on January 1, 2010 (but no later than February 1, 2010). Under the new management contract, management fee breakpoints would be determined by reference to the assets of all of the open-end Putnam funds, rather than only the assets of the fund.
Note 9: Market and credit risk
In the normal course of business, the fund trades financial instruments and enters into financial transactions where risk of potential loss exists due to changes in the market (market risk) or failure of the contracting party to the transaction to perform (credit risk). The fund may be exposed to additional credit risk that an institution or other entity with which the fund has unsettled or open transactions will default.
Federal tax information (unaudited)
The fund designated 21.64% of ordinary income distributions as qualifying for the dividends received deduction for corporations.
For its tax year ended October 31, 2009, the fund hereby designates 26.92%, or the maximum amount allowable, of its taxable ordinary income distributions as qualified dividends taxed at the individual net capital gain rates.
For the tax year ended October 31, 2009, pursuant to §871(k) of the Internal Revenue Code, the fund hereby designates $17,020,753 of distributions paid as qualifying to be taxed as interest-related dividends, and no monies to be taxed as short-term capital gain dividends for nonresident alien shareholders.
The Form 1099 you receive in January 2010 will show the tax status of all distributions paid to your account in calendar 2009.
About the Trustees
Ravi Akhoury
Born 1947, Trustee since 2009
Mr. Akhoury serves as Advisor to New York Life Insurance Company. He is also a Director of Jacob Ballas Capital India (a non-banking finance company focused on private equity advisory services) and is a member of its Compensation Committee. He also serves as a Trustee of American India Foundation and of the Rubin Museum.
Previously, Mr. Akhoury was a Director and on the Compensation Committee of MaxIndia/New York Life Insurance Company in India. He was also Vice President and Investment Policy Committee Member of Fischer, Francis, Trees and Watts (a fixed-income portfolio management firm). He has also served on the Board of Bharti Telecom (an Indian telecommunications company), serving as a member of its Audit and Compensation committees, and as a member of the Audit Committee on the Board of Thompson Press (a publishing company). From 1992 to 2007, he was Chairman and CEO of MacKay Shields, a multi-product investment management firm with over $40 billion in assets under management.
Mr. Akhoury graduated from the Indian Institute of Technology with a B.S. in Engineering and obtained an M.S. in Quantitative Methods from SUNY at Stony Brook.
Jameson A. Baxter
Born 1943, Trustee since 1994 and Vice Chairman since 2005
Ms. Baxter is the President of Baxter Associates, Inc., a private investment firm.
Ms. Baxter serves as a Director of ASHTA Chemicals, Inc., and the Mutual Fund Directors Forum. Until 2007, she was a Director of Banta Corporation (a printing and supply chain management company), Ryerson, Inc. (a metals service corporation), and Advocate Health Care. Until 2004, she was a Director of BoardSource (formerly the National Center for Nonprofit Boards), and until 2002, she was a Director of Intermatic Corporation (a manufacturer of energy control products). She is Chairman Emeritus of the Board of Trustees of Mount Holyoke College, having served as Chairman for five years.
Ms. Baxter has held various positions in investment banking and corporate finance, including Vice President of and Consultant to First Boston Corporation and Vice President and Principal of the Regency Group. She is a graduate of Mount Holyoke College.
Charles B. Curtis
Born 1940, Trustee since 2001
Mr. Curtis is President and Chief Operating Officer of the Nuclear Threat Initiative (a private foundation dealing with national security issues), and serves as Senior Advisor to the United Nations Foundation.
Mr. Curtis is a member of the Council on Foreign Relations and the National Petroleum Council. He also serves as Director of Edison International and Southern California Edison. Until 2006, Mr. Curtis served as a member of the Trustee Advisory Council of the Applied Physics Laboratory, Johns Hopkins University.
From August 1997 to December 1999, Mr. Curtis was a Partner at Hogan & Hartson LLP, an international law firm headquartered in Washington, D.C. Prior to May 1997, Mr. Curtis was Deputy Secretary of Energy and Under Secretary of the U.S. Department of Energy. He was a founding member of the law firm of Van Ness Feldman. Mr. Curtis served as Chairman of the Federal Energy Regulatory Commission from 1977 to 1981 and has held positions on the staff of the U.S. House of Representatives, the U.S. Treasury Department, and the Securities and Exchange Commission.
Robert J. Darretta
Born 1946, Trustee since 2007
Mr. Darretta serves as Director of United-Health Group, a diversified health-care company.
Until April 2007, Mr. Darretta was Vice Chairman of the Board of Directors of Johnson & Johnson, one of the world’s largest and most broadly based health-care companies. Prior to 2007, he had responsibility for Johnson & Johnson’s finance, investor relations, information technology, and procurement function. He served as Johnson & Johnson Chief Financial Officer for a decade, prior to which he spent two years as Treasurer of the corporation and over ten years leading various Johnson & Johnson operating companies.
Mr. Darretta received a B.S. in Economics from Villanova University.
Myra R. Drucker
Born 1948, Trustee since 2004
Ms. Drucker is Chair of the Board of Trustees of Commonfund (a not-for-profit firm managing assets for educational endowments and foundations), Vice Chair of the Board of Trustees of Sarah Lawrence College, and a member of the Investment Committee of the Kresge Foundation (a charitable trust). She is also a Director of Interactive Data Corporation (a provider of financial market data and analytics to financial institutions and investors).
Ms. Drucker is an ex-officio member of the New York Stock Exchange Pension Managers Advisory Committee, having served as Chair for seven years. She serves as an advisor to RCM Capital Management (an investment management firm) and to the Employee Benefits Investment Committee of The Boeing Company (an aerospace firm).
From November 2001 until August 2004, Ms. Drucker was Managing Director and a member of the Board of Directors of General Motors Asset Management and Chief Investment Officer of General Motors Trust Bank. From December 1992 to November 2001, Ms. Drucker served as Chief Investment Officer of Xerox Corporation (a document company).
Prior to December 1992, Ms. Drucker was Staff Vice President and Director of Trust Investments for International Paper (a paper and packaging company).
Ms. Drucker received a B.A. in Literature and Psychology from Sarah Lawrence College and pursued graduate studies in economics, statistics, and portfolio theory at Temple University.
John A. Hill
Born 1942, Trustee since 1985 and Chairman since 2000
Mr. Hill is founder and Vice-Chairman of First Reserve Corporation, the leading private equity buyout firm specializing in the worldwide energy industry, with offices in Greenwich, Connecticut; Houston, Texas; London, England; and Shanghai, China. The firm’s investments on behalf of some of the nation’s largest pension and endowment funds are currently concentrated in 31 companies with annual revenues in excess of $15 billion, which employ over 100,000 people in 23 countries.
Mr. Hill is a Director of Devon Energy Corporation and various private companies owned by First Reserve, and serves as a Trustee of Sarah Lawrence College where he serves as Chairman and also chairs the Investment Committee. He is also a member of the Advisory Board of the Millstein Center for Corporate Governance and Performance at the Yale School of Management.
Prior to forming First Reserve in 1983, Mr. Hill served as President of F. Eberstadt and Company, an investment banking and investment management firm. Between 1969 and 1976, Mr. Hill held various senior positions in Washington, D.C. with the federal government, including Deputy Associate Director of the Office of Management and Budget and Deputy Administrator of the Federal Energy Administration during the Ford Administration.
Born and raised in Midland, Texas, he received his B.A. in Economics from Southern Methodist University and pursued graduate studies as a Woodrow Wilson Fellow.
Paul L. Joskow
Born 1947, Trustee since 1997
Dr. Joskow is an economist and President of the Alfred P. Sloan Foundation (a philanthropic institution focused primarily on research and education on issues related to science, technology, and economic performance). He is on leave from his position as the Elizabeth and James Killian Professor of Economics and Management at the Massachusetts Institute of Technology (MIT), where he has been on the faculty since 1972. Dr. Joskow was the Director of the Center for Energy and Environmental Policy Research at MIT from 1999 through 2007.
Dr. Joskow serves as a Trustee of Yale University, as a Director of TransCanada Corporation (an energy company focused on natural gas transmission and power services) and of Exelon Corporation (an energy company focused on power services), and as a member of the Board of Overseers of the Boston Symphony Orchestra. Prior to August 2007, he served as a Director of National Grid (a UK-based holding company with interests in electric and gas transmission and distribution and telecommunications infrastructure). Prior to July 2006, he served as President of the Yale University Council. Prior to February 2005, he served on the board of the Whitehead Institute for Biomedical Research (a non-profit research institution). Prior to February 2002, he was a Director of State Farm Indemnity Company (an automobile insurance company), and prior to March 2000, he was a Director of New England Electric System (a public utility holding company).
Dr. Joskow has published six books and numerous articles on industrial organization, government regulation of industry, and competition policy. He is active in industry restructuring, environmental, energy, competition, and privatization policies —serving as an advisor to governments and corporations worldwide. Dr. Joskow holds a Ph.D. and M.Phil. from Yale University and a B.A. from Cornell University.
Elizabeth T. Kennan
Born 1938, Trustee since 1992
Dr. Kennan is a Partner of Cambus-Kenneth Farm (thoroughbred horse and cattle breeding). She is President Emeritus of Mount Holyoke College.
Dr. Kennan served as Chairman and is now Lead Director of Northeast Utilities. She is a Trustee of the National Trust for Historic Preservation and of Centre College. Until 2006, she was a member of The Trustees of Reservations. Prior to 2001, Dr. Kennan served on the oversight committee of the Folger Shakespeare Library. Prior to June 2005, she was a Director of Talbots, Inc., and she has served as Director on a number of other boards, including Bell Atlantic, Chastain Real Estate, Shawmut Bank, Berkshire Life Insurance, and Kentucky Home Life Insurance. Dr. Kennan has also served as President of Five Colleges Incorporated and as a Trustee of the University of Notre Dame, and is active in various educational and civic associations.
As a member of the faculty of Catholic University for twelve years, until 1978, Dr. Kennan directed the post-doctoral program in Patristic and Medieval Studies, taught history, and published numerous articles and two books. Dr. Kennan holds a Ph.D. from the University of Washington in Seattle, an M.A. from Oxford University, and an A.B. from Mount Holyoke College. She holds several honorary doctorates.
Kenneth R. Leibler
Born 1949, Trustee since 2006
Mr. Leibler is a founder and former Chairman of the Boston Options Exchange, an electronic marketplace for the trading of derivative securities.
Mr. Leibler currently serves as a Trustee of Beth Israel Deaconess Hospital in Boston. He is also Lead Director of Ruder Finn Group, a global communications and advertising firm, and a Director of Northeast Utilities, which operates New
England’s largest energy delivery system. Prior to December 2006, he served as a Director of the Optimum Funds group. Prior to October 2006, he served as a Director of ISO New England, the organization responsible for the operation of the electric generation system in the New England states. Prior to 2000, Mr. Leibler was a Director of the Investment Company Institute in Washington, D.C.
Prior to January 2005, Mr. Leibler served as Chairman and Chief Executive Officer of the Boston Stock Exchange. Prior to January 2000, he served as President and Chief Executive Officer of Liberty Financial Companies, a publicly traded diversified asset management organization. Prior to June 1990, Mr. Leibler served as President and Chief Operating Officer of the American Stock Exchange (AMEX), and at the time was the youngest person in AMEX history to hold the title of President. Prior to serving as AMEX President, he held the position of Chief Financial Officer, and headed its management and marketing operations. Mr. Leibler graduated with a degree in Economics from Syracuse University.
Robert E. Patterson
Born 1945, Trustee since 1984
Mr. Patterson is Senior Partner of Cabot Properties, LP and Chairman of Cabot Properties, Inc. (a private equity firm investing in commercial real estate).
Mr. Patterson serves as Chairman Emeritus and Trustee of the Joslin Diabetes Center. Prior to June 2003, he was a Trustee of the Sea Education Association. Prior to December 2001, Mr. Patterson was President and Trustee of Cabot Industrial Trust (a publicly traded real estate investment trust). Prior to February 1998, he was Executive Vice President and Director of Acquisitions of Cabot Partners Limited Partnership (a registered investment adviser involved in institutional real estate investments). Prior to 1990, he served as Executive Vice President of Cabot, Cabot & Forbes Realty Advisors, Inc. (the predecessor company of Cabot Partners).
Mr. Patterson practiced law and held various positions in state government, and was the founding Executive Director of the Massachusetts Industrial Finance Agency. Mr. Patterson is a graduate of Harvard College and Harvard Law School.
George Putnam, III
Born 1951, Trustee since 1984
Mr. Putnam is Chairman of New Generation Research, Inc. (a publisher of financial advisory and other research services), and President of New Generation Advisors, LLC (a registered investment adviser to private funds). Mr. Putnam founded the New Generation companies in 1986.
Mr. Putnam is a Director of The Boston Family Office, LLC (a registered investment adviser). He is a Trustee of St. Mark’s School, a Trustee of Epiphany School, and a Trustee of the Marine Biological Laboratory in Woods Hole, Massachusetts. Until 2006, he was a Trustee of Shore Country Day School, and until 2002, was a Trustee of the Sea Education Association.
Mr. Putnam previously worked as an attorney with the law firm of Dechert LLP (formerly known as Dechert Price & Rhoads) in Philadelphia. He is a graduate of Harvard College, Harvard Business School, and Harvard Law School.
Robert L. Reynolds*
Born 1952, Trustee since 2008 and President of the Putnam Funds since July 2009
Mr. Reynolds is President and Chief Executive Officer of Putnam Investments, a member of Putnam Investments’ Executive Board of Directors, and President of the Putnam Funds. He has more than 30 years of investment and financial services experience.
Prior to joining Putnam Investments in 2008, Mr. Reynolds was Vice Chairman and Chief Operating Officer of Fidelity Investments from 2000 to 2007. During this time, he served on the Board of Directors for FMR Corporation, Fidelity Investments Insurance Ltd., Fidelity Investments Canada Ltd., and Fidelity Management Trust Company. He was also a Trustee of the Fidelity Family of Funds. From 1984 to 2000, Mr. Reynolds served in a number of increasingly responsible leadership roles at Fidelity.
Mr. Reynolds serves on several not-for-profit boards, including those of the West Virginia University Foundation, Concord Museum, Dana-Farber Cancer Institute, Lahey Clinic, and Initiative for a Competitive Inner City in Boston. He is a member of the Chief Executives Club of Boston, the National Innovation Initiative, and the Council on Competitiveness.
Mr. Reynolds received a B.S. in Business Administration/Finance from West Virginia University.
W. Thomas Stephens
Born 1942, Trustee since 2009
Mr. Stephens retired as Chairman and Chief Executive Officer of Boise Cascade, L.L.C. (a paper, forest products and timberland assets company) in December 2008.
Mr. Stephens is a Director of TransCanada Pipelines, Ltd. (an energy infrastructure company). From 1997 to 2008, Mr. Stephens served as a Trustee on the Board of the Putnam Funds, which he rejoined as a Trustee in 2009. Until 2004, Mr. Stephens was a Director of Xcel Energy Incorporated (a public utility company), Qwest Communications and Norske Canada, Inc. (a paper manufacturer). Until 2003, Mr. Stephens was a Director of Mail-Well, Inc. (a diversified printing company). He served as Chairman of Mail-Well until 2001 and as CEO of MacMillan-Bloedel, Ltd. (a forest products company) until 1999.
Prior to 1996, Mr. Stephens was Chairman and Chief Executive Officer of Johns Manville Corporation. He holds B.S. and M.S. degrees from the University of Arkansas.
Richard B. Worley
Born 1945, Trustee since 2004
Mr. Worley is Managing Partner of Permit Capital LLC, an investment management firm.
Mr. Worley serves as a Trustee of the University of Pennsylvania Medical Center, The Robert Wood Johnson Foundation (a philanthropic organization devoted to health-care issues), and the National Constitution Center. He is also a Director of The Colonial Williamsburg Foundation (a historical preservation organization), and the Philadelphia Orchestra Association. Mr. Worley also serves on the investment committees of Mount Holyoke College and World Wildlife Fund (a wildlife conservation organization).
Prior to joining Permit Capital LLC in 2002, Mr. Worley served as President, Chief Executive Officer, and Chief Investment Officer of Morgan Stanley Dean Witter Investment Management and as a Managing Director of Morgan Stanley, a financial services firm. Mr. Worley also was the Chairman of Miller Anderson & Sherrerd, an investment management firm that was acquired by Morgan Stanley in 1996.
Mr. Worley holds a B.S. degree from the University of Tennessee and pursued graduate studies in economics at the University of Texas.
The address of each Trustee is One Post Office Square, Boston, MA 02109.
As of October 31, 2009, there were over 100 Putnam funds. All Trustees serve as Trustees of all Putnam funds. Each Trustee serves for an indefinite term, until his or her resignation, retirement at age 72, death, or removal.
* Trustee who is an “interested person” (as defined in the Investment Company Act of 1940) of the fund, Putnam Management, and/or Putnam Retail Management.
Mr. Reynolds is President and Chief Executive Officer of Putnam Investments, as well as the President of your fund and each of the other Putnam funds.
Officers
In addition to Robert L. Reynolds, the other officers of the fund are shown below:
| | |
| Charles E. Porter (Born 1938) | James P. Pappas (Born 1953) | Wanda M. McManus (Born 1947) |
| Executive Vice President, Principal | Vice President | Vice President, Senior Associate |
| Executive Officer, Associate Treasurer, | Since 2004 | Treasurer and Assistant Clerk |
| and Compliance Liaison | Managing Director, Putnam Investments | Since 2005 |
| Since 1989 | and Putnam Management | |
| | Nancy E. Florek (Born 1957) |
| Jonathan S. Horwitz (Born 1955) | Francis J. McNamara, III (Born 1955) | Vice President, Assistant Clerk, |
| Senior Vice President and Treasurer | Vice President and Chief Legal Officer | Assistant Treasurer and Proxy Manager |
| Since 2004 | Since 2004 | Since 2005 |
| | Senior Managing Director, Putnam | |
| Steven D. Krichmar (Born 1958) | Investments, Putnam Management and | |
| Vice President and | Putnam Retail Management | |
| Principal Financial Officer | | |
| Since 2002 | Robert R. Leveille (Born 1969) | |
| Senior Managing Director, | Vice President and | |
| Putnam Investments | Chief Compliance Officer | |
| | Since 2007 | |
| Janet C. Smith (Born 1965) | Managing Director, Putnam Investments, | |
| Vice President, Principal Accounting | Putnam Management, and Putnam | |
| Officer and Assistant Treasurer | Retail Management | |
| Since 2007 | | |
| Managing Director, Putnam Investments | Mark C. Trenchard (Born 1962) | |
| and Putnam Management | Vice President and | |
| | BSA Compliance Officer | |
| Susan G. Malloy (Born 1957) | Since 2002 | |
| Vice President and Assistant Treasurer | Managing Director, Putnam Investments | |
| Since 2007 | | |
| Managing Director, Putnam Investments | Judith Cohen (Born 1945) | |
| Vice President, | |
| Beth S. Mazor (Born 1958) | Clerk and Assistant Treasurer | |
| Vice President | Since 1993 | |
| Since 2002 | | |
| Managing Director, Putnam Investments | | |
The principal occupations of the officers for the past five years have been with the employers as shown above although in some cases, they have held different positions with such employers. The address of each Officer is One Post Office Square, Boston, MA 02109.
The Putnam Family of Funds
The following is a list of Putnam’s open-end mutual funds offered to the public. Investors should carefully consider the investment objective, risks, charges, and expenses of a fund before investing. For a prospectus containing this and other information for any Putnam fund or product, call your financial advisor at 1-800-225-1581 and ask for a prospectus. Please read the prospectus carefully before investing.
Growth
Growth Opportunities Fund
International New Opportunities Fund*
New Opportunities Fund
Small Cap Growth Fund*
Vista Fund
Voyager Fund
Blend
Asia Pacific Equity Fund*
Capital Opportunities Fund*
Capital Spectrum Fund‡
Emerging Markets Equity Fund*
Equity Spectrum Fund‡
Europe Equity Fund*
Global Equity Fund*
International Capital Opportunities Fund*
International Equity Fund*
Investors Fund
Research Fund
Value
Convertible Income-Growth Trust
Equity Income Fund
The George Putnam Fund of Boston
The Putnam Fund for Growth and Income
International Growth and Income Fund*
Mid Cap Value Fund
Small Cap Value Fund*
Income
American Government Income Fund
Diversified Income Trust
Floating Rate Income Fund
Global Income Trust*
High Yield Advantage Fund*
High Yield Trust*
Income Fund
Money Market Fund†
U.S. Government Income Trust
Tax-free income
AMT-Free Municipal Fund
Tax Exempt Income Fund
Tax Exempt Money Market Fund†
Tax-Free High Yield Fund
State tax-free income funds:
Arizona, California, Massachusetts, Michigan, Minnesota,
New Jersey, New York, Ohio, and Pennsylvania
Absolute Return
Absolute Return 100 Fund
Absolute Return 300 Fund
Absolute Return 500 Fund
Absolute Return 700 Fund
Global Sector*
Global Consumer Fund
Global Energy Fund
Global Financials Fund
Global Health Care Fund**
Global Industrials Fund
Global Natural Resources Fund
Global Technology Fund
Global Telecommunications Fund
Global Utilities Fund††
Asset allocation
Income Strategies Fund
Putnam Asset Allocation Funds — three investment portfolios that spread your money across a variety of stocks, bonds, and money market investments.
The three portfolios:
Asset Allocation: Balanced Portfolio
Asset Allocation: Conservative Portfolio
Asset Allocation: Growth Portfolio
Putnam RetirementReady®
Putnam RetirementReady Funds — 10 investment portfolios that
offer diversification among stocks, bonds, and money market
instruments and adjust to become more conservative over time
based on a target date for withdrawing assets.
The 10 funds:
Putnam RetirementReady 2050 Fund
Putnam RetirementReady 2045 Fund
Putnam RetirementReady 2040 Fund
Putnam RetirementReady 2035 Fund
Putnam RetirementReady 2030 Fund
Putnam RetirementReady 2025 Fund
Putnam RetirementReady 2020 Fund
Putnam RetirementReady 2015 Fund
Putnam RetirementReady 2010 Fund
Putnam RetirementReady Maturity Fund
* A 1% redemption fee on total assets redeemed or exchanged within 90 days of purchase may be imposed for all share classes of these funds.
† An investment in a money market fund is not insured or guaranteed by the Federal Deposit Insurance Corporation or any other government agency.
Although the fund seeks to preserve the value of your investment at $1.00 per share, it is possible to lose money by investing in the fund.
‡ A 1% redemption fee on total assets redeemed or exchanged within 30 days of purchase may be imposed for all share classes of these funds.
** Prior to January 2, 2009, the fund was known as Putnam Health Sciences Trust.
Prior to January 2, 2009, the fund was known as Putnam Utilities Growth and Income Fund.
With the exception of money market funds, a 1% redemption fee may be applied to shares exchanged or sold within 7 days of purchase (90 days, for certain funds).
Check your account balances and the most recent month-end performance in the Individual Investors section at putnam.com.
Services for shareholders
Investor services
Systematic investment plan Tell us how much you wish to invest regularly — weekly, semimonthly, or monthly — and the amount you choose will be transferred automatically from your checking or savings account. There’s no additional fee for this service, and you can suspend it at any time. This plan may be a great way to save for college expenses or to plan for your retirement.
Please note that regular investing does not guarantee a profit or protect against loss in a declining market. Before arranging a systematic investment plan, consider your financial ability to continue making purchases in periods when prices are low.
Systematic exchange You can make regular transfers from one Putnam fund to another Putnam fund. There are no additional fees for this service, and you can cancel or change your options at any time.
Dividends PLUS You can choose to have the dividend distributions from one of your Putnam funds automatically reinvested in another Putnam fund at no additional charge.
Free exchange privilege You can exchange money between Putnam funds free of charge, as long as they are the same class of shares. A signature guarantee is required if you are exchanging more than $500,000.
Reinstatement privilege If you’ve sold Putnam shares or received a check for a dividend or capital gain, you may reinvest the proceeds with Putnam within 90 days of the transaction and they will be reinvested at the fund’s current net asset value — with no sales charge. However, reinstatement of class B shares may have special tax consequences. Ask your financial or tax representative for details.
Check-writing service You have ready access to many Putnam accounts. It’s as simple as writing a check, and there are no special fees or service charges. For more information about the check-writing service, call Putnam or visit our Web site.
Dollar cost averaging When you’re investing for long-term goals, it’s time, not timing, that counts. Investing on a systematic basis is a better strategy than trying to figure out when the markets will go up or down. This means investing the same amount of money regularly over a long period. This method of investing is called dollar cost averaging. When a fund’s share price declines, your investment dollars buy more shares at lower prices. When it increases, they buy fewer shares. Over time, you will pay a lower average price per share.
For more information
Visit the Individual Investors section at putnam.com
A secure section of our Web site contains complete information on your account, including balances and transactions, updated daily. You may also conduct transactions, such as exchanges, additional investments, and address changes. Log on today to get your password.
Call us toll free at 1-800-225-1581 Ask a helpful Putnam representative or your financial advisor for details about any of these or other services, or see your prospectus.
Fund information
Founded over 70 years ago, Putnam Investments was built around the concept that a balance between risk and reward is the hallmark of a well-rounded financial program. We manage over 100 funds across income, value, blend, growth, asset allocation, absolute return, and global sector categories.
| | |
| Investment Manager | Officers | Judith Cohen |
| Putnam Investment | Robert L. Reynolds | Vice President, Clerk |
| Management, LLC | President | and Assistant Treasurer |
| One Post Office Square | | |
| Boston, MA 02109 | Charles E. Porter | Wanda M. McManus |
| Executive Vice President, Principal | Vice President, Senior Associate Treasurer |
| Marketing Services | Executive Officer, Associate Treasurer | and Assistant Clerk |
| Putnam Retail Management | and Compliance Liaison | |
| One Post Office Square | | Nancy E. Florek |
| Boston, MA 02109 | Jonathan S. Horwitz | Vice President, Assistant Clerk, |
| Senior Vice President and Treasurer | Assistant Treasurer and Proxy Manager |
| Custodian | | |
| State Street Bank and Trust Company | Steven D. Krichmar | |
| | Vice President and Principal | |
| Legal Counsel | Financial Officer | |
| Ropes & Gray LLP | | |
| Janet C. Smith | |
| Independent Registered Public | Vice President, Principal Accounting | |
| Accounting Firm | Officer and Assistant Treasurer | |
| KPMG LLP | | |
| | Susan G. Malloy | |
| Trustees | Vice President and Assistant Treasurer | |
| John A. Hill, Chairman | | |
| Jameson A. Baxter, Vice Chairman | Beth S. Mazor | |
| Ravi Akhoury | Vice President | |
| Charles B. Curtis | | |
| Robert J. Darretta | James P. Pappas | |
| Myra R. Drucker | Vice President | |
| Paul L. Joskow | | |
| Elizabeth T. Kennan | Francis J. McNamara, III | |
| Kenneth R. Leibler | Vice President and Chief Legal Officer | |
| Robert E. Patterson | | |
| George Putnam, III | Robert R. Leveille | |
| Robert L. Reynolds | Vice President and Chief | |
| W. Thomas Stephens | Compliance Officer | |
| Richard B. Worley | | |
| Mark C. Trenchard | |
| Vice President and BSA Compliance Officer | |
| | |
This report is for the information of shareholders of Putnam Convertible Income-Growth Trust. It may also be used as sales literature when preceded or accompanied by the current prospectus, the most recent copy of Putnam’s Quarterly Performance Summary, and Putnam’s Quarterly Ranking Summary. For more recent performance, please visit putnam.com. Investors should carefully consider the investment objective, risks, charges, and expenses of a fund, which are described in its prospectus. For this and other information or to request a prospectus, call 1-800-225-1581 toll free. Please read the prospectus carefully before investing. The fund’s Statement of Additional Information contains additional information about the fund’s Trustees and is available without charge upon request by calling 1-800-225-1581.

Item 2. Code of Ethics:
(a) The fund’s principal executive, financial and accounting officers are employees of Putnam Investment Management, LLC, the Fund's investment manager. As such they are subject to a comprehensive Code of Ethics adopted and administered by Putnam Investments which is designed to protect the interests of the firm and its clients. The Fund has adopted a Code of Ethics which incorporates the Code of Ethics of Putnam Investments with respect to all of its officers and Trustees who are employees of Putnam Investment Management, LLC. For this reason, the Fund has not adopted a separate code of ethics governing its principal executive, financial and accounting officers.
(c) In May 2008, the Code of Ethics of Putnam Investment Management, LLC was updated in its entirety to include the amendments adopted in August 2007 as well as a several additional technical, administrative and non-substantive changes. In May of 2009, the Code of Ethics of Putnam Investment Management, LLC was amended to reflect that all employees will now be subject to a 90-day blackout restriction on holding Putnam open-end funds, except for portfolio managers and their supervisors (and each of their immediate family members), who will be subject to a one-year blackout restriction on the funds that they manage or supervise.
Item 3. Audit Committee Financial Expert:
The Funds' Audit and Compliance Committee is comprised solely of Trustees who are "independent" (as such term has been defined by the Securities and Exchange Commission ("SEC") in regulations implementing Section 407 of the Sarbanes-Oxley Act (the "Regulations")). The Trustees believe that each of the members of the Audit and Compliance Committee also possess a combination of knowledge and experience with respect to financial accounting matters, as well as other attributes, that qualify them for service on the Committee. In addition, the Trustees have determined that each of Mr. Patterson, Mr. Leibler, Mr. Hill, Mr. Darretta and Mr. Stephens qualifies as an "audit committee financial expert" (as such term has been defined by the Regulations) based on their review of his pertinent experience and education. The SEC has stated that the designation or identification of a person as an audit committee financial expert pursuant to this Item 3 of Form N-CSR do es not impose on such person any duties, obligations or liability that are greater than the duties, obligations and liability imposed on such person as a member of the Audit and Compliance Committee and the Board of Trustees in the absence of such designation or identification.
Item 4. Principal Accountant Fees and Services:
The following table presents fees billed in each of the last two fiscal years for services rendered to the fund by the fund’s independent auditor:
| | | | |
| Fiscal | | Audit- | | |
| year | Audit | Related | Tax | All Other |
| ended | Fees | Fees | Fees | Fees |
| |
| October 31, 2009 | $38,389 | $-- | $3,800 | $- |
| October 31, 2008 | $40,600 | $-- | $3,900 | $- |
For the fiscal years ended October 31, 2009 and October 31, 2008, the fund’s independent auditor billed aggregate non-audit fees in the amounts of $ 3,800 and $ 72,633 respectively, to the fund, Putnam Management and any entity controlling, controlled by or under common control with Putnam Management that provides ongoing services to the fund.
Audit Fees represent fees billed for the fund's last two fiscal years relating to the audit and review of the financial statements included in annual reports and registration statements, and other services that are normally provided in connection with statutory and regulatory filings or engagements.
Audit-Related Fees represent fees billed in the fund’s last two fiscal years for services traditionally performed by the fund’s auditor, including accounting consultation for proposed transactions or concerning financial accounting and reporting standards and other audit or attest services not required by statute or regulation.
Tax Fees represent fees billed in the fund’s last two fiscal years for tax compliance, tax planning and tax advice services. Tax planning and tax advice services include assistance with tax audits, employee benefit plans and requests for rulings or technical advice from taxing authorities.
Pre-Approval Policies of the Audit and Compliance Committee. The Audit and Compliance Committee of the Putnam funds has determined that, as a matter of policy, all work performed for the funds by the funds’ independent auditors will be pre-approved by the Committee itself and thus will generally not be subject to pre-approval procedures.
The Audit and Compliance Committee also has adopted a policy to pre-approve the engagement by Putnam Management and certain of its affiliates of the funds’ independent auditors, even in circumstances where pre-approval is not required by applicable law. Any such requests by Putnam Management or certain of its affiliates are typically submitted in writing to the Committee and explain, among other things, the nature of the proposed engagement, the estimated fees, and why this work should be performed by that particular audit firm as opposed to another one. In reviewing such requests, the Committee considers, among other things, whether the provision of such services by the audit firm are compatible with the independence of the audit firm.
The following table presents fees billed by the fund’s independent auditor for services required to be approved pursuant to paragraph (c)(7)(ii) of Rule 2-01 of Regulation S-X.
| | | | |
| Fiscal | Audit- | | All | Total |
| year | Related | Tax | Other | Non-Audit |
| ended | Fees | Fees | Fees | Fees |
| |
| October 31, 2009 | $ - | $ - | $ - | $ - |
| October 31, 2008 | $ - | $ - | $ - | $ - |
Item 5. Audit Committee of Listed Registrants
Not applicable
Item 6. Schedule of Investments:
The registrant’s schedule of investments in unaffiliated issuers is included in the report to shareholders in Item 1 above.
Item 7. Disclosure of Proxy Voting Policies and Procedures For Closed-End Management Investment Companies:
Not applicable
Item 8. Portfolio Managers of Closed-End Investment Companies
Not Applicable
Item 9. Purchases of Equity Securities by Closed-End Management Investment Companies and Affiliated Purchasers:
Not applicable
Item 10. Submission of Matters to a Vote of Security Holders:
Not applicable
Item 11. Controls and Procedures:
(a) The registrant's principal executive officer and principal financial officer have concluded, based on their evaluation of the effectiveness of the design and operation of the registrant's disclosure controls and procedures as of a date within 90 days of the filing date of this report, that the design and operation of such procedures are generally effective to provide reasonable assurance that information required to be disclosed by the registrant in this report is recorded, processed, summarized and reported within the time periods specified in the Commission's rules and forms.
(b) Changes in internal control over financial reporting: Not applicable
Item 12. Exhibits:
(a)(1) The Code of Ethics of The Putnam Funds, which incorporates the Code of Ethics of Putnam Investments, is filed herewith.
(a)(2) Separate certifications for the principal executive officer and principal financial officer of the registrant as required by Rule 30a-2(a) under the Investment Company Act of 1940, as amended, are filed herewith.
(b) The certifications required by Rule 30a-2(b) under the Investment Company Act of 1940, as amended, are filed herewith.
SIGNATURES
Pursuant to the requirements of the Securities Exchange Act of 1934 and the Investment Company Act of 1940, the registrant has duly caused this report to be signed on its behalf by the undersigned, thereunto duly authorized.
Putnam Convertible Income-Growth Trust
By (Signature and Title):
/s/Janet C. Smith
Janet C. Smith
Principal Accounting Officer
Date: December 30, 2009
Pursuant to the requirements of the Securities Exchange Act of 1934 and the Investment Company Act of 1940, this report has been signed below by the following persons on behalf of the registrant and in the capacities and on the dates indicated.
By (Signature and Title):
/s/Charles E. Porter
Charles E. Porter
Principal Executive Officer
Date: December 30, 2009
By (Signature and Title):
/s/Steven D. Krichmar
Steven D. Krichmar
Principal Financial Officer
Date: December 30, 2009