| | | |
| | |
| UNITED STATES |
| SECURITIES AND EXCHANGE COMMISSION |
| Washington, D.C. 20549 |
| |
| FORM N-CSR |
| |
| CERTIFIED SHAREHOLDER REPORT OF REGISTERED |
| MANAGEMENT INVESTMENT COMPANIES |
| | |
| Investment Company Act file number: (811-02280) | |
| |
| Exact name of registrant as specified in charter: | Putnam Convertible Securities Fund |
| |
| Address of principal executive offices: One Post Office Square, Boston, Massachusetts 02109 |
| | |
| Name and address of agent for service: | Beth S. Mazor, Vice President |
| | One Post Office Square |
| | Boston, Massachusetts 02109 |
| | |
| Copy to: | | John W. Gerstmayr, Esq. |
| | Ropes & Gray LLP |
| | 800 Boylston Street |
| | Boston, Massachusetts 02199-3600 |
| | |
| Registrant’s telephone number, including area code: | (617) 292-1000 |
| | | |
| Date of fiscal year end: October 31, 2010 | | |
| |
| Date of reporting period: November 1, 2009 — October 31, 2010 |
Item 1. Report to Stockholders:
The following is a copy of the report transmitted to stockholders pursuant to Rule 30e-1 under the Investment Company Act of 1940:

Putnam
Convertible
Securities Fund
Annual report
10 | 31 | 10
| | | |
| Message from the Trustees | 1 | | |
| | |
| About the fund | 2 | | |
| | |
| Performance snapshot | 4 | | |
| | |
| Interview with your fund’s portfolio managers | 5 | | |
| | |
| Your fund’s performance | 10 | | |
| | |
| Your fund’s expenses | 13 | | |
| | |
| Terms and definitions | 15 | | |
| | |
| Trustee approval of management contract | 16 | | |
| | |
| Other information for shareholders | 20 | | |
| | |
| Financial statements | 21 | | |
| | |
| Federal tax information | 44 | | |
| | |
| Shareholder meeting results | 45 | | |
| | |
| About the Trustees | 46 | | |
| | |
| Officers | 48 | | |
| | |
Message from the Trustees
Dear Fellow Shareholder:
Stock markets around the world rallied strongly over the past few months, riding a rising tide of strengthening investor confidence and slowly improving economic and corporate data. Indeed, U.S. stocks delivered their best September in 71 years, and continued to add to those gains in October. Bond markets also have generated positive results for much of 2010 and continue to be a source of refuge for risk-averse investors.
It is important to recognize, however, that we may see periods of heightened market volatility as markets and economies seek more solid ground. The slow pace of the U.S. economic recovery and ongoing European sovereign debt concerns have made markets more susceptible to disappointing news. We believe, however, that Putnam’s research-intensive, actively managed investment approach is well suited for this environment.
In developments affecting oversight of your fund, Barbara M. Baumann has been elected to the Board of Trustees of the Putnam Funds, effective July 1, 2010. Ms. Baumann is president and owner of Cross Creek Energy Corporation of Denver, Colorado, a strategic consultant to domestic energy firms and direct investor in energy assets. We also want to thank Elizabeth T. Kennan, who has retired from the Board of Trustees, for her many years of dedicated and thoughtful leadership.
Lastly, we would like to take this opportunity to welcome new shareholders to the fund and to thank all of our investors for your continued confidence in Putnam.

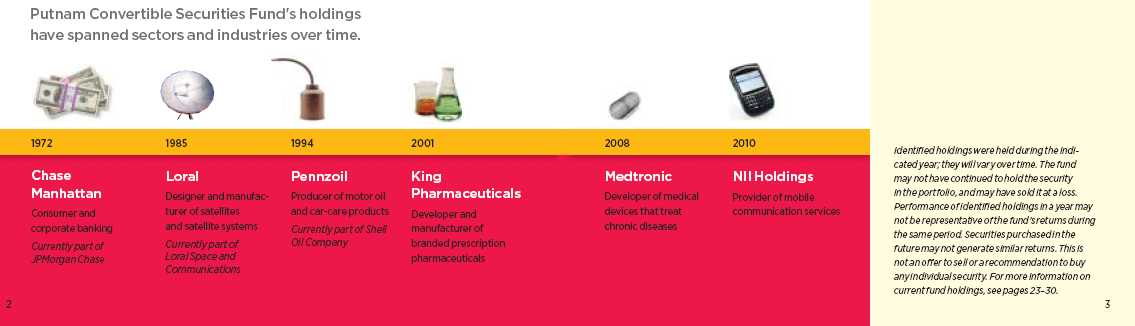
About the fund
Seeking undervalued companies before their potential is recognized
The differences between bonds and stocks seem fairly clear-cut. Stocks provide an ownership stake in a company; bonds provide a claim on the interest paid by a company or other entity on its debt. The value of stocks rises and falls with factors such as investor sentiment, company news, and economic conditions; bonds are issued by a government, agency, company, or public utility that typically promises to pay the bearer a fixed rate of interest at specified intervals and to return a set amount of money at a specified end date (the maturity date). A bond’s yield and its price are often influenced by interest-rate levels and the issuer’s credit quality.
A third type of security is a hybrid of a stock and a bond. Like a bond, a convertible security offers a set rate of interest, but unlike a bond, it has a built-in option that, under certain circumstances, allows the investor to exchange (or convert) the security for a fixed number of shares of stock. This feature of fers the potential for capital appreciation, since the preset conversion price does not change as the underlying stock price increases or decreases.
Convertibles are issued by companies and can offer greater returns than high-quality bonds — but they also carry greater risk potential, such as the risk of default or periodic illiquidity. Issuers range from large, well-known S&P 500 corporations and small, rapidly growing companies, to companies in cyclically depressed industries.
Constructing a portfolio that maintains an appropriate balance of risk and return potential requires intensive research and analysis. Putnam’s analysts conduct rigorous fundamental research, seeking to determine the true worth of the issuing company’s business. Putnam Convertible Securities Fund's portfolio managers then construct a portfolio that they believe offers the best return potential without undue risk.
Consider these risks before investing:
The fund may invest a portion of its assets in small and/or midsize companies. Such investments increase the risk of greater price fluctuations. Lower-rated bonds may offer higher yields in return for more risk. Funds that invest in bonds are subject to certain risks including interest-rate risk, credit risk, and inflation risk. As interest rates rise, the prices of bonds fall. Long-term bonds are more exposed to interest-rate risk than short-term bonds. Unlike bonds, bond funds have ongoing fees and expenses.
The “busted” convertible
One kind of security in which your fund may invest is the “busted” convertible. “Busted” refers to a security whose underlying stock price has fallen significantly below the conversion price. It becomes much less sensitive to the volatility of the underlying stock and is more bond-like, responding to interest-rate changes. A busted convertible may pay a higher yield than other convertibles, but may also carry a higher level of risk. (Some companies in this situation may eventually default on their bonds.)
The objective of buying a busted convertible is to take advantage of a company’s eventual turnaround despite its present challenges. For example, a company undergoing management turmoil may draw negative investor reactions, causing its stock price to tumble. However, if intens ive research determines that the management crisis is likely to be resolved, the fund manager could buy the security at a steep discount. The goal is to sell the security at a higher price when the credit improves or when the stock revives.
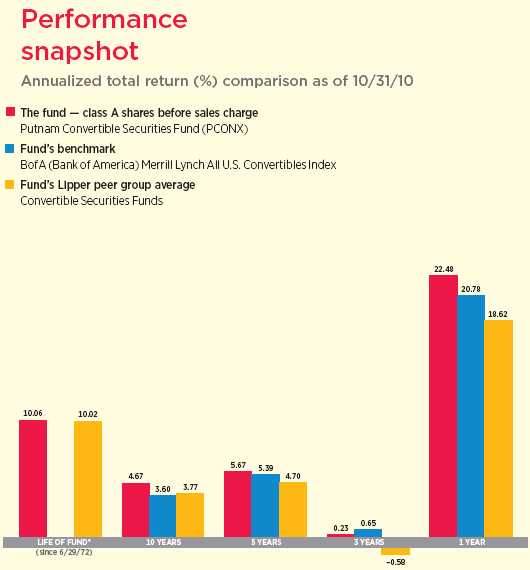
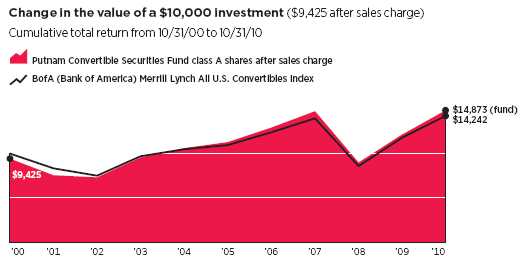
Current performance may be lower or higher than the quoted past performance, which cannot guarantee future results. Share price, principal value, and return will fluctuate, and you may have a gain or a loss when you sell your shares. Performance of class A shares assumes reinvestment of distributions and does not account for taxes. Fund returns in the bar chart do not reflect a sales charge of 5.75%; had they, returns would have been lower. See pages 5 and 10–12 for additional performance information. For a portion of the periods, the fund may have had expense limitations, without which returns would have been lower. A short-term trading fee of 1% may apply to redemptions or exchanges from certain funds within the time period specified in the fund’s prospectus. To obtain the most recent month-end performance, visit putnam.com.
* The fund’s benchmark, the BofA (Bank of America) Merrill Lynch All U.S. Convertibles Index, was introduced on 12/31/87, which post-dates the inception of the fund’s class A shares.
4
Interview with your fund’s portfolio managers
Eric Harthun and Robert Salvin
How did the fund perform for the year ended October 31, 2010?
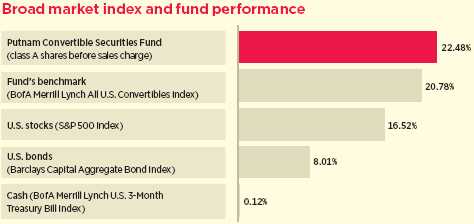
Eric: I’m pleased to report that Putnam Convertible Securities Fund’s class A shares returned 22.48%, outperforming both its benchmark, the BofA Merrill Lynch All U.S. Convertibles Index, which advanced 20.78%, and the average return of its Lipper peer group, Convertible Securities Funds, which finished at 18.62%.
How would you characterize the market environment during this period?
Rob: Supportive equity and fixed-income markets buoyed convertible securities during the past 12 months. Despite bouts of volatility, major U.S. stock market indexes recorded double-digit gains during the period, lifted by economic optimism, encouraging earnings reports, and a wave of corporate mergers. Aside from a January dip, stocks trended upward for the first half of the period amid indications that the Great Recession was over. However, in April, lingering high unemployment and heightened concern over European sovereign debt sent equities falling. Markets regrouped in July, but fell again in August on mixed economic data. The final two months of the period brought renewed optimism, with the S&P 500 Index posting its best September/October performance since 1998. For the period, mid- and small - -cap stocks outpaced large caps, which benefited the fund, given its bias toward smaller and midsize companies.
Corporate credit spreads — or the yield advantage corporate bonds offer over U.S. Treasuries — narrowed during the period as bond prices rose. Corporate bonds in both the investment-grade and high-yield markets were helped by better profitability, stronger balance sheets, and improved borrowing conditions for corporations.
This comparison shows your fund’s performance in the context of broad market indexes for the 12 months ended 10/31/10. See pages 4 and 10–12 for additional fund performance information. Index descriptions can be found on page 15.
5
In the convertibles market, the rally by lower-credit-quality issuers that began in 2009 continued throughout this period. We believed that some of the greatest inefficiencies were in this area of the market, and as a result, the fund benefited from our holdings in several companies with below-investment-grade credit ratings. In addition, given the combination of equity-market appreciation and tightening yield spreads, the trade-off between yield and equity sensitivity — always a significant investment dynamic with convertibles — was more balanced than it had been prior to this period. Market liquidity improved as convertibles continued to attract “crossover” equity and corporate bond investors seeking higher yields, while also benefiting from strong demand from traditional investors in the sector.
What were the key factors that enabled the fund to outperform?
Eric: Solid security selection in four primary sectors — technology, energy, capital goods, and communication services — drove the fund’s outperformance. The top individual contributor was an out-of-benchmark investment in Virgin Media, a provider of cable television, broadband Internet, and telephone services in the United Kingdom. Like many other holdings in the fund, Virgin’s convertibles rebounded strongly from the depths of the recession. In addition, the company’s fortunes benefited from a U.K. economy that is slowly improving as the effects of fiscal austerity begin to take hold.
An overweight position in Safeguard Scientifics was another leading contributor. Safeguard is a private equity and venture capital firm specializing in expansion and early-stage financing, and growth capital for technology companies. Safeguard began to reap the benefits from many of the companies it has helped finance, and the cash flows it received from its investments boosted the company’s credit profile and its securities.
Interpublic Group, one of the world’s largest organizations of advertising agencies and
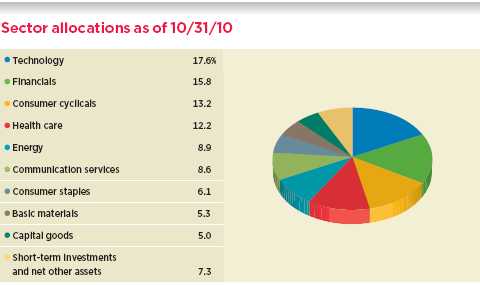
Allocations are represented as a percentage of the fund’s net assets. Summary information may differ from the portfolio schedule included in the financial statements due to the inclusion of derivative securities and the exclusion of as-of trades, if any, and the use of different classifications of securities for presentation purposes. Holdings and allocations may vary over time.
6
marketing communications companies, also aided results. Demand for the company’s convertibles grew, thanks to operational improvements and the cyclical recovery in advertising spending.

Overweighting convertibles issued by ADC Telecommunications proved to be the right strategy as the supplier of fiber optics, network equipment, software, and integration services for broadband and multi-service networks agreed to be acquired by Tyco Electronics. Consequently, we sold the position during the period.
Underweighting convertibles issued by Transocean, the world’s largest offshore drilling company, also helped. Transocean’s stock and convertibles plummeted from late April until early June as its Deepwater Horizon rig burned and sank in the Gulf of Mexico. We liquidated the fund’s position during the period.
Underweighting biotechnology giant Amgen was another helpful decision. The company’s convertibles underperformed due to investors’ concern that changes in government reimbursement policies resulting from U.S. health-care reform could negatively affect Amgen’s revenues and profitability.
Which positions weren’t as productive?
Rob: A key tenet in our strategy has been to seek to control the fund’s risk by keeping the portfolio broadly diversified. This approach typically prevents us from taking index-sized positions in many of the benchmark’s largest constituents. For example, we held a significantly underweighted stake in the convertibles of Ford Motor. Ford’s convertible shares — whose prices advanced substantially during the period — are heavily represented in the index, and therefore
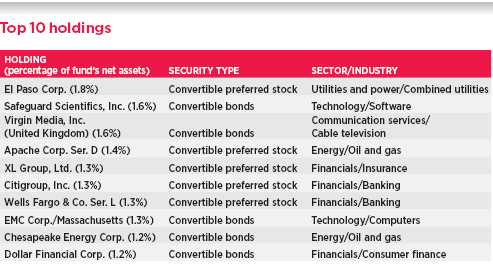
This table shows the fund’s top 10 individual holdings and the percentage of the fund’s net assets that each represented as of 10/31/10. Short-term holdings are excluded. Holdings will vary over time.
7
our underweighted exposure detracted from performance.
Underweighting United Continental Holdings, the parent company of United Airlines and Continental Airlines — which merged during the period — also hurt. Airlines were one of the best-performing industries in the convertibles market during this period, due in part to merger-related transactions. However, we maintained a cautious approach to airlines, given their capital-intensive, high-cost business models, and the shifting influence of fuel costs on their profitability. We sold United Continental during the period.
An overweight position in Dole Food disappointed. Despite favorable expectations for the securities of this producer and marketer of fresh fruits and vegetables, Dole’s business fundamentals did not materialize as we had hoped. Specifically, adverse trends in banana pricing weighed on the company’s bottom line.
Largely avoiding Gilead Sciences, a biotechnology firm focusing on AIDS drugs, also detracted, as did underweighting Host Hotels & Resorts, which operates luxury and upscale hotels. We steered clear of Gilead and underweighted Host because we believed their securities did not offer favorable risk/reward trade-offs.
What is your outlook for the economy, the convertibles market, and the fund over the coming months?
Eric: Following the September/October rally, we believe the upward momentum in U.S. stocks can continue. Our indicators suggest that domestic equities remain fairly but not excessively valued in absolute terms, and compare favorably with bonds in relative terms.
With respect to convertibles, we evaluate the market by looking at three key factors: fundamentals, valuation, and “technicals,” or the balance of supply and demand. As of now, we are positive on fundamentals and technicals, and neutral on valuation.
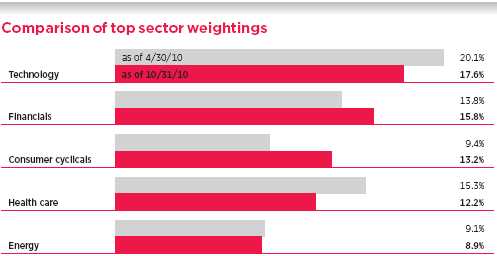
This chart shows how the fund’s top weightings have changed over the past six months. Weightings are shown as a percentage of net assets. Summary information may differ from the portfolio schedule included in the financial statements due to the inclusion of derivative securities and the exclusion of as-of trades, if any, and the use of different classifications of securities for presentation purposes. Holdings will vary over time.
Data in the chart reflect a new calculation methodology placed in effect within the past six months.
8
Looking first at fundamentals, we believe the U.S. economy will continue to slowly improve, and we anticipate that corporate earnings will continue to benefit from the stringent cost-cutting measures implemented in 2009, combined with recovering demand.
Regarding technicals, in our view, the environment remains supportive. Convertibles continued to attract equity and fixed-income investors seeking better risk-adjusted total returns, while the supply of new securities remains constrained.
As for valuation, convertibles have advanced markedly from the historically cheap valuations reached during the height of the credit crisis. So, while convertible valuations are somewhat higher, we believe there are still pockets of value to be uncovered due to ongoing inefficiencies in the market. And it’s these inefficiencies that provide us with a continual stream of investment opportunities that we seek to capitalize on through our bottom-up research process that combines equity, fixed-income, and structural analysis.
Thanks for bringing us up to date, gentlemen.
The views expressed in this report are exclusively those of Putnam Management. They are not meant as investment advice.
Please note that the holdings discussed in this report may not have been held by the fund for the entire period. Portfolio composition is subject to review in accordance with the fund’s investment strategy and may vary in the future. Current and future portfolio holdings are subject to risk.

Portfolio Manager Eric Harthun has an M.B.A. from The University of Chicago Booth School of Business and a B.S. from San Diego State University. A CFA charterholder, Eric joined Putnam in 2000 and has been in the investment industry since 1994.

Portfolio Manager Robert Salvin has an M.B.A. from The University of Chicago Booth School of Business and a B.S. from the Wharton School of the University of Pennsylvania. He joined Putnam in 2000 and has been in the investment industry since 1986.
IN THE NEWS
The Federal Reserve’s “QE2” has set sail. In light of what has been a tepid economic recovery, in October the Fed announced a second round of monetary stimulus via quantitative easing — dubbed QE2 by the media — involving the purchase of an additional $600 billion of U.S. Treasury bonds through the end of June 2011. The Fed has suggested in recent months that it is particularly concerned about the prospect of deflation, which has plagued the Japanese economy for the better part of the past decade. By purchasing Treasuries, the central bank could drive down already low yields by injecting about $75 billion a month into the capital markets. The idea behind QE2 is that the money would then be reinvested, and the expected upward pressure on asset prices could create inflationary expectations sufficient to prevent deflation from becoming a problem.
9
Your fund’s performance
This section shows your fund’s performance, price, and distribution information for periods ended October 31, 2010, the end of its most recent fiscal year. In accordance with regulatory requirements for mutual funds, we also include performance as of the most recent calendar quarter-end and expense information taken from the fund’s current prospectus. Performance should always be considered in light of a fund’s investment strategy. Data represents past performance. Past performance does not guarantee future results. More recent returns may be less or more than those shown. Investment return and principal value will fluctuate, and you may have a gain or a loss when you sell your shares. Performance information does not reflect any deduction for taxes a shareholder may owe on fund distributions or on the redemption of fund shares. For the most recent month-end performance, please visit the Individual Investors section at putnam.com or call Putnam at 1-800-225-1581. Class Y shares are generally only available to corporate and institutional clients and clients in other approved programs. See the Terms and Definitions section in this report for definitions of the share classes offered by your fund.
Fund performance Total return for periods ended 10/31/10
| | | | | | | | | | |
| | Class A | Class B | Class C | Class M | Class R | Class Y |
| (inception dates) | (6/29/72) | (7/15/93) | (7/26/99) | (3/13/95) | (12/1/03) | (12/30/98) |
|
| | NAV | POP | NAV | CDSC | NAV | CDSC | NAV | POP | NAV | NAV |
|
| Annual average | | | | | | | | | | |
| (life of fund) | 10.06% | 9.89% | 9.10% | 9.10% | 9.23% | 9.23% | 9.38% | 9.28% | 9.78% | 10.14% |
|
| 10 years | 57.83 | 48.73 | 46.38 | 46.38 | 46.37 | 46.37 | 50.08 | 44.84 | 53.94 | 61.76 |
| Annual average | 4.67 | 4.05 | 3.88 | 3.88 | 3.88 | 3.88 | 4.14 | 3.77 | 4.41 | 4.93 |
|
| 5 years | 31.78 | 24.17 | 26.88 | 24.88 | 26.96 | 26.96 | 28.57 | 24.05 | 30.13 | 33.42 |
| Annual average | 5.67 | 4.42 | 4.88 | 4.54 | 4.89 | 4.89 | 5.15 | 4.40 | 5.41 | 5.94 |
|
| 3 years | 0.70 | –5.07 | –1.57 | –4.30 | –1.52 | –1.52 | –0.81 | –4.28 | –0.07 | 1.43 |
| Annual average | 0.23 | –1.72 | –0.53 | –1.45 | –0.51 | –0.51 | –0.27 | –1.45 | –0.02 | 0.47 |
|
| 1 year | 22.48 | 15.45 | 21.52 | 16.52 | 21.58 | 20.57 | 21.85 | 17.55 | 22.12 | 22.73 |
|
Current performance may be lower or higher than the quoted past performance, which cannot guarantee future results. After-sales-charge returns (public offering price, or POP) for class A and M shares reflect a maximum 5.75% and 3.50% load, respectively. Class B share returns reflect the applicable contingent deferred sales charge (CDSC), which is 5% in the first year, declining to 1% in the sixth year, and is eliminated thereafter. Class C shares reflect a 1% CDSC for the first year that is eliminated thereafter. Class R and Y shares have no initial sales charge or CDSC. Performance for class B, C, M, R, and Y shares before their inception is derived from the historical performance of class A shares, adjusted for the applicable sales charge (or CDSC) and the higher operating expenses for such shares, except for class Y shares, for which 12b-1 fees are not applicable.
For a portion of the periods, the fund may have had expense limitations, without which returns would have been lower.
Class B share performance does not reflect conversion to class A shares.
A short-term trading fee of 1% may apply to redemptions or exchanges from certain funds within the time period specified in the fund’s prospectus.
10
Comparative index returns For periods ended 10/31/10
| | |
| | BofA (Bank of America) | Lipper Convertible Securities |
| | Merrill Lynch All U.S. Convertibles Index | Funds category average* |
|
| Annual average (life of fund) | —† | 10.02% |
|
| 10 years | 42.42% | 45.75 |
| Annual average | 3.60 | 3.77 |
|
| 5 years | 30.01 | 26.17 |
| Annual average | 5.39 | 4.70 |
|
| 3 years | 1.96 | –1.57 |
| Annual average | 0.65 | –0.58 |
|
| 1 year | 20.78 | 18.62 |
|
Index and Lipper results should be compared to fund performance at net asset value.
* Over the 1-year, 3-year, 5-year, 10-year, and life-of-fund periods ended 10/31/10, there were 66, 54, 49, 42, and 2 funds, respectively, in this Lipper category.
† The fund’s benchmark, the BofA (Bank of America) Merrill Lynch All U.S. Convertibles Index, was introduced on 12/31/87, which post-dates the inception of the fund’s class A shares.
Past performance does not indicate future results. At the end of the same time period, a $10,000 investment in the fund’s class B and class C shares would have been valued at $14,638 and $14,637, respectively, and no contingent deferred sales charges would apply. A $10,000 investment in the fund’s class M shares ($9,650 after sales charge) would have been valued at $14,484 at public offering price. A $10,000 investment in the fund’s class R and class Y shares would have been valued at $15,394 and $16,176, respectively.
11
Fund price and distribution information For the 12-month period ended 10/31/10
| | | | | | | | |
| Distributions | Class A | Class B | Class C | Class M | Class R | Class Y |
|
| Number | 4 | 4 | 4 | 4 | 4 | 4 |
|
| Income | $0.568 | $0.430 | $0.432 | $0.475 | $0.524 | $0.614 |
|
| Capital gains | — | — | — | — | — | — |
|
| Total | $0.568 | $0.430 | $0.432 | $0.475 | $0.524 | $0.614 |
|
| Share value | NAV | POP | NAV | NAV | NAV | POP | NAV | NAV |
|
| 10/31/09 | $16.27 | $17.26 | $16.01 | $16.12 | $16.13 | $16.72 | $16.22 | $16.27 |
|
| 10/31/10 | 19.31 | 20.49 | 18.99 | 19.13 | 19.14 | 19.83 | 19.24 | 19.30 |
|
| Current yield (end of period) | NAV | POP | NAV | NAV | NAV | POP | NAV | NAV |
|
| Current dividend rate 1 | 2.94% | 2.77% | 2.23% | 2.24% | 2.47% | 2.38% | 2.72% | 3.19% |
|
| Current 30-day SEC yield 2 | N/A | 2.63 | 2.05 | 2.05 | N/A | 2.22 | 2.54 | 3.03 |
|
The classification of distributions, if any, is an estimate. Final distribution information will appear on your year-end tax forms.
1 Most recent distribution, excluding capital gains, annualized and divided by NAV or POP at end of period.
2 Based only on investment income and calculated using the maximum offering price for each share class, in accordance with SEC guidelines.
Fund performance as of most recent calendar quarter
Total return for periods ended 9/30/10
| | | | | | | | | | |
| | Class A | Class B | Class C | Class M | Class R | Class Y |
| (inception dates) | (6/29/72) | (7/15/93) | (7/26/99) | (3/13/95) | (12/1/03) | (12/30/98) |
|
| | NAV | POP | NAV | CDSC | NAV | CDSC | NAV | POP | NAV | NAV |
|
| Annual average | | | | | | | | | | |
| (life of fund) | 10.01% | 9.84% | 9.05% | 9.05% | 9.18% | 9.18% | 9.33% | 9.23% | 9.73% | 10.09% |
|
| 10 years | 48.41 | 39.85 | 37.59 | 37.59 | 37.57 | 37.57 | 41.13 | 36.16 | 44.79 | 52.09 |
| Annual average | 4.03 | 3.41 | 3.24 | 3.24 | 3.24 | 3.24 | 3.51 | 3.13 | 3.77 | 4.28 |
|
| 5 years | 25.87 | 18.61 | 21.16 | 19.15 | 21.14 | 21.14 | 22.69 | 18.39 | 24.28 | 27.43 |
| Annual average | 4.71 | 3.47 | 3.91 | 3.57 | 3.91 | 3.91 | 4.17 | 3.43 | 4.44 | 4.97 |
|
| 3 years | –0.21 | –5.94 | –2.47 | –5.17 | –2.47 | –2.47 | –1.72 | –5.16 | –0.97 | 0.51 |
| Annual average | –0.07 | –2.02 | –0.83 | –1.75 | –0.83 | –0.83 | –0.58 | –1.75 | –0.32 | 0.17 |
|
| 1 year | 16.93 | 10.23 | 15.99 | 10.99 | 16.01 | 15.01 | 16.28 | 12.19 | 16.64 | 17.17 |
|
12
Your fund’s expenses
As a mutual fund investor, you pay ongoing expenses, such as management fees, distribution fees (12b-1 fees), and other expenses. Using the following information, you can estimate how these expenses affect your investment and compare them with the expenses of other funds. You may also pay one-time transaction expenses, including sales charges (loads) and redemption fees, which are not shown in this section and would have resulted in higher total expenses. For more information, see your fund’s prospectus or talk to your financial representative.
Expense ratios
| | | | | | |
| | Class A | Class B | Class C | Class M | Class R | Class Y |
|
| Total annual operating expenses for the fiscal year | | | | | | |
| ended 10/31/09* | 1.23% | 1.98% | 1.98% | 1.73% | 1.48% | 0.98% |
|
| Annualized expense ratio for the six-month period | | | | | | |
| ended 10/31/10† | 1.17% | 1.92% | 1.92% | 1.67% | 1.42% | 0.92% |
|
Fiscal-year expense information in this table is taken from the most recent prospectus, is subject to change, and may differ from that shown for the annualized expense ratio and in the financial highlights of this report. Expenses are shown as a percentage of average net assets.
* Reflects projected expenses under a new management contract effective 1/1/10 and a new expense arrangement.
† For the fund’s most recent fiscal half year; may differ from expense ratios based on one-year data in the financial highlights.
Expenses per $1,000
The following table shows the expenses you would have paid on a $1,000 investment in Putnam Convertible Securities Fund from May 1, 2010, to October 31, 2010. It also shows how much a $1,000 investment would be worth at the close of the period, assuming actual returns and expenses.
| | | | | | |
| | Class A | Class B | Class C | Class M | Class R | Class Y |
|
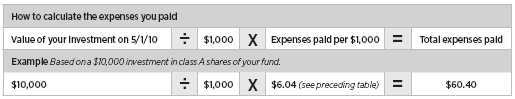
| Expenses paid per $1,000*† | $6.04 | $9.90 | $9.90 | $8.61 | $7.33 | $4.75 |
|
| Ending value (after expenses) | $1,049.40 | $1,044.90 | $1,045.80 | $1,046.60 | $1,047.80 | $1,050.30 |
|
* Expenses for each share class are calculated using the fund’s annualized expense ratio for each class, which represents the ongoing expenses as a percentage of average net assets for the six months ended 10/31/10. The expense ratio may differ for each share class.
† Expenses are calculated by multiplying the expense ratio by the average account value for the period; then multiplying the result by the number of days in the period; and then dividing that result by the number of days in the year.
13
Estimate the expenses you paid
To estimate the ongoing expenses you paid for the six months ended October 31, 2010, use the following calculation method. To find the value of your investment on May 1, 2010, call Putnam at 1-800-225-1581.
Compare expenses using the SEC’s method
The Securities and Exchange Commission (SEC) has established guidelines to help investors assess fund expenses. Per these guidelines, the following table shows your fund’s expenses based on a $1,000 investment, assuming a hypothetical 5% annualized return. You can use this information to compare the ongoing expenses (but not transaction expenses or total costs) of investing in the fund with those of other funds. All mutual fund shareholder reports will provide this information to help you make this comparison. Please note that you cannot use this information to estimate your actual ending account balance and expenses paid during the period.
| | | | | | |
| | Class A | Class B | Class C | Class M | Class R | Class Y |
|
| Expenses paid per $1,000*† | $5.96 | $9.75 | $9.75 | $8.49 | $7.22 | $4.69 |
|
| Ending value (after expenses) | $1,019.31 | $1,015.53 | $1,015.53 | $1,016.79 | $1,018.05 | $1,020.57 |
|
* Expenses for each share class are calculated using the fund’s annualized expense ratio for each class, which represents the ongoing expenses as a percentage of average net assets for the six months ended 10/31/10. The expense ratio may differ for each share class.
† Expenses are calculated by multiplying the expense ratio by the average account value for the period; then multiplying the result by the number of days in the period; and then dividing that result by the number of days in the year.
14
Terms and definitions
Important terms
Total return shows how the value of the fund’s shares changed over time, assuming you held the shares through the entire period and reinvested all distributions in the fund.
Net asset value (NAV) is the price, or value, of one share of a mutual fund, without a sales charge. NAVs fluctuate with market conditions. NAV is calculated by dividing the net assets of each class of shares by the number of outstanding shares in the class.
Public offering price (POP) is the price of a mutual fund share plus the maximum sales charge levied at the time of purchase. POP performance figures shown here assume the 5.75% maximum sales charge for class A shares and 3.50% for class M shares.
Contingent deferred sales charge (CDSC) is generally a charge applied at the time of the redemption of class B or C shares and assumes redemption at the end of the period. Your fund’s class B CDSC declines from a 5% maximum during the first year to 1% during the sixth year. After the sixth year, the CDSC no longer applies. The CDSC for class C shares is 1% for one year after purchase.
Current yield is the annual rate of return earned from dividends or interest of an investment. Current yield is expressed as a percentage of the price of a security, fund share, or principal investment.
Share classes
Class A shares are generally subject to an initial sales charge and no CDSC (except on certain redemptions of shares bought without an initial sales charge).
Class B shares are not subject to an initial sales charge. They may be subject to a CDSC.
Class C shares are not subject to an initial sales charge and are subject to a CDSC only if the shares are redeemed during the first year.
Class M shares have a lower initial sales charge and a higher 12b-1 fee than class A shares and no CDSC (except on certain redemptions of shares bought without an initial sales charge).
Class R shares are not subject to an initial sales charge or CDSC and are available only to certain defined contribution plans.
Class Y shares are not subject to an initial sales charge or CDSC, and carry no 12b-1 fee. They are generally only available to corporate and institutional clients and clients in other approved programs.
Comparative indexes
Barclays Capital Aggregate Bond Index is an unmanaged index of U.S. investment-grade fixed-income securities.
BofA (Bank of America) Merrill Lynch All U.S.
Convertibles Index is an unmanaged index of high-yield U.S. convertible securities.
BofA (Bank of America) Merrill Lynch U.S.
3-Month Treasury Bill Index is an unmanaged index that seeks to measure the performance of U.S. Treasury bills available in the marketplace.
S&P 500 Index is an unmanaged index of common stock performance.
Indexes assume reinvestment of all distributions and do not account for fees. Securities and performance of a fund and an index will differ. You cannot invest directly in an index.
Lipper is a third-party industry-ranking entity that ranks mutual funds. Its rankings do not reflect sales charges. Lipper rankings are based on total return at net asset value relative to other funds that have similar current investment styles or objectives as determined by Lipper. Lipper may change a fund’s category assignment at its discretion. Lipper category averages reflect performance trends for funds within a category.
15
Trustee approval of management contract
General conclusions
The Board of Trustees of the Putnam funds oversees the management of each fund and, as required by law, determines annually whether to approve the continuance of your fund’s management contract with Putnam Investment Management (“Putnam Management”) and the sub-management contract with respect to your fund between Putnam Management and its affiliate, Putnam Investments Limited (“PIL”).
In this regard, the Board of Trustees, with the assistance of its Contract Committee consisting solely of Trustees who are not “interested persons” (as this term is defined in the Investment Company Act of 1940, as amended) of the Putnam funds (the “Independent Trustees”), requests and evaluates all information it deems reasonably necessary under the circumstances. Over the course of several months ending in June 2010, the Contract Committee met on a number of occasions with representatives of Putnam Management and in executive session to consider the information provided by Putnam Management and other information developed with the assistance of the Board’s independent counsel and independent staff. The Contract Committee reviewed and discussed key aspects of this information with all of the Independent Trustees. At the Trustees’ June 11, 2010 meeting, the Contract Committee recommended, and the Independent Trustees appro ved, the continuance of your fund’s management contract, and sub-management contracts, effective July 1, 2010. (Because PIL is an affiliate of Putnam Management and Putnam Management remains fully responsible for all services provided by PIL, the Trustees have not evaluated PIL as a separate entity, and all subsequent references to Putnam Management below should be deemed to include reference to PIL as necessary or appropriate in the context.)
The Independent Trustees’ approval was based on the following conclusions:
• That the fee schedule in effect for your fund represented reasonable compensation in light of the nature and quality of the services being provided to the fund, the fees paid by competitive funds, and the costs incurred by Putnam Management in providing such services, and
• That the fee schedule represented an appropriate sharing between fund shareholders and Putnam Management of such economies of scale as may exist in the management of the fund at current asset levels.
These conclusions were based on a comprehensive consideration of all information provided to the Trustees and were not the result of any single factor. Some of the factors that figured particularly in the Trustees’ deliberations and how the Trustees considered these factors are described below, although individual Trustees may have evaluated the information presented differently, giving different weights to various factors. It is also important to recognize that the fee arrangements for your fund and the other Putnam funds are the result of many years of review and discussion between the Independent Trustees and Putnam Management, that certain aspects of the arrangements may receive greater scrutiny in some years than others, and that the Trustees’ conclusions may be based, in part, on their consideration of fee arrangements in prior years.
Consideration of implementation of strategic pricing initiative
The Trustees were mindful that new management contracts had been implemented for all but a few funds at the beginning of 2010 as part of Putnam Management’s strategic pricing initiative. These new management contracts reflected the implementation of more competitive fee levels for many funds,
16
complex-wide breakpoints for the open-end funds and performance fees for some funds. The Trustees had approved these new management contracts on July 10, 2009 and submitted them to shareholder meetings of the affected funds in late 2009, where the contracts were in all cases approved by overwhelming majorities of the shares voted.
Because the management contracts had been implemented only recently, the Contract Committee had limited practical experience with the operation of the new fee structures. The financial data available to the Committee reflected actual operations under the prior contracts; information was also available on a pro forma basis, adjusted to reflect the fees payable under the new management contracts. In light of the limited information available regarding operations under the new management contracts, in recommending the continuation of the new management contracts in June 2010, the Contract Committee relied to a considerable extent on its review of the financial information and analysis that formed the basis of the Board’s approval of the new management contracts on July 10, 2009.
Management fee schedules and categories; total expenses
The Trustees reviewed the management fee schedules in effect for all Putnam funds, including fee levels and breakpoints. In reviewing management fees, the Trustees generally focus their attention on material changes in circumstances — for example, changes in assets under management or investment style, changes in Putnam Management’s operating costs, or changes in competitive practices in the mutual fund industry — that suggest that consideration of fee changes might be warranted. The Trustees concluded that the circumstances did not warrant changes to the management fee structure of your fund.
As in the past, the Trustees continued to focus on the competitiveness of the total expense ratio of each fund. In order to ensure that expenses of the Putnam funds continue to meet evolving competitive standards, the Trustees and Putnam Management agreed in 2009 to implement certain expense limitations. Most funds, including your fund, had sufficiently low expenses that these expense limitations did not apply. The expense limitations were: (i) a contractual expense limitation applicable to all retail open-end funds of 37.5 basis points on investor servicing fees and expenses and (ii) a contractual expense limitation applicable to all open-end funds of 20 basis points on so-called “other expenses” (i.e., all expenses exclusive of management fees, investor servicing fees, distribution fees, taxes, brokerage commissions and extraordinary expenses). These expense limitations serve in particular to maintain competitive expense levels for fun ds with large numbers of small shareholder accounts and funds with relatively small net assets.
The Trustees reviewed comparative fee and expense information for a custom group of competitive funds selected by Lipper Inc. This comparative information included your fund’s percentile ranking for effective management fees and total expenses (excluding any applicable 12b-1 fee), which provides a general indication of your fund’s relative standing. In the custom peer group, your fund ranked in the 3rd quintile in effective management fees (determined for your fund and the other funds in the custom peer group based on fund asset size and the applicable contractual management fee schedule) and in the 3rd quintile in total expenses (excluding any applicable 12b-1 fees) as of December 31, 2009 (the first quintile representing the least expensive funds and the fifth quintile the most expensive funds). The Trustees also considered that your fund ranked in the 3rd quintile in effective management fees, on a pro forma basis adjusted to reflect
17
the impact of the strategic pricing initiative discussed above, as of December 31, 2009.
Your fund currently has the benefit of breakpoints in its management fee that provide shareholders with significant economies of scale in the form of reduced fee levels as assets under management in the Putnam family of funds increase. The Contract Committee observed that the complex-wide breakpoints of the open-end funds have only been in place for a short while, and the Trustees will examine the operation of this new breakpoint structure in future years in light of actual experience.
In connection with their review of the management fees and total expenses of the Putnam funds, the Trustees also reviewed the costs of the services provided and the profits realized by Putnam Management and its affiliates from their contractual relationships with the funds. This information included trends in revenues, expenses and profitability of Putnam Management and its affiliates relating to the investment management, investor servicing and distribution services provided to the funds. In this regard, the Trustees also reviewed an analysis of Putnam Management’s revenues, expenses and profitability, allocated on a fund-by-fund basis, with respect to the funds’ management, distribution, and investor servicing contracts. For each fund, the analysis presented information about revenues, expenses and profitability for each of the agreements separately and for the agreements taken together on a combined basis. The Trustees concluded that, at c urrent asset levels, the fee schedules currently in place represented an appropriate sharing of economies of scale at that time.
The information examined by the Trustees as part of their annual contract review for the Putnam funds has included for many years information regarding fees charged by Putnam Management and its affiliates to institutional clients such as defined benefit pension plans, college endowments, and the like. This information included comparisons of such fees with fees charged to the funds, as well as an assessment of the differences in the services provided to these two types of clients. The Trustees observed, in this regard, that the differences in fee rates between institutional clients and mutual funds are by no means uniform when examined by individual asset sectors, suggesting that differences in the pricing of investment management services to these types of clients may reflect historical competitive forces operating in separate market places. The Trustees considered the fact that fee rates across different asset clas ses are typically higher on average for mutual funds than for institutional clients, as well as the differences between the services that Putnam Management provides to the Putnam funds and those that it provides to its institutional clients, and did not rely on these comparisons to any significant extent in concluding that the management fees paid by your fund are reasonable.
Investment performance
The quality of the investment process provided by Putnam Management represented a major factor in the Trustees’ evaluation of the quality of services provided by Putnam Management under your fund’s management contract. The Trustees were assisted in their review of the Putnam funds’ investment process and performance by the work of the Investment Oversight Coordinating Committee of the Trustees and the Investment Oversight Committees of the Trustees, which met on a regular basis with the funds’ portfolio teams throughout the year. The Trustees concluded that Putnam Management generally provides a high-quality investment process — based on the experience and skills of the individuals assigned to the management of fund portfolios, the resources made available to them, and in general Putnam Management’s ability to attract and retain high-quality personnel — but also recognized that this does not guarantee favorable invest ment results for every fund in every time period. The Trustees
18
considered the investment performance of each fund over multiple time periods and considered information comparing each fund’s performance with various benchmarks and with the performance of competitive funds.
The Committee noted the substantial improvement in the performance of most Putnam funds during 2009. The Committee also noted the disappointing investment performance of a number of the funds for periods ended December 31, 2009 and considered information provided by Putnam Management regarding the factors contributing to the underperformance and actions being taken to improve performance. The Trustees indicated their intention to continue to monitor performance trends to assess the effectiveness of these efforts and to evaluate whether additional changes to address areas of underperformance are warranted.
In the case of your fund, the Trustees considered that your fund’s class A share cumulative total return performance at net asset value was in the following quartiles of its Lipper Inc. peer group (Lipper Convertible Securities Funds) for the one-year, three-year and five-year periods ended December 31, 2009 (the first quartile representing the best-performing funds and the fourth quartile the worst-performing funds):
| | | |
| One-year period | 1st | | |
| | |
| Three-year period | 3rd | | |
| | |
| Five-year period | 2nd | | |
| | |
Over the one-year, three-year and five-year periods ended December 31, 2009, there were 62, 51 and 48 funds, respectively, in your fund’s Lipper peer group. (When considering performance information, shareholders should be mindful that past performance is not a guarantee of future results.)
Brokerage and soft-dollar allocations; investor servicing
The Trustees considered various potential benefits that Putnam Management may receive in connection with the services it provides under the management contract with your fund. These include benefits related to brokerage and soft-dollar allocations, whereby a portion of the commissions paid by a fund for brokerage may be used to acquire research services that are expected to be useful to Putnam Management in managing the assets of the fund and of other clients. The Trustees considered a change made, at Putnam Management’s request, to the Putnam funds’ brokerage allocation policies commencing in 2010, which increased the permitted soft dollar allocation to third-party services over what had been authorized in previous years. The Trustees noted that a portion of available soft dollars continues to be allocated to the payment of fund expenses. The Trustees indicated their continued intent to monitor regulatory developments in this area with the assistance of their Brokerage Committee and also indicated their continued intent to monitor the potential benefits associated with fund brokerage and soft-dollar allocations and trends in industry practices to ensure that the principle of seeking best price and execution remains paramount in the portfolio trading process.
Putnam Management may also receive benefits from payments that the funds make to Putnam Management’s affiliates for investor or distribution services. In conjunction with the annual review of your fund’s management contract, the Trustees reviewed your fund’s investor servicing agreement with Putnam Investor Services, Inc. (“PSERV”) and its distributor’s contracts and distribution plans with Putnam Retail Management Limited Partnership (“PRM”), both of which are affiliates of Putnam Management. The Trustees concluded that the fees payable by the funds to PSERV and PRM, as applicable, for such services are reasonable in relation to the nature and quality of such services.
19
Other information for shareholders
Important notice regarding Putnam’s privacy policy
In order to conduct business with our shareholders, we must obtain certain personal information such as account holders’ names, addresses, Social Security numbers, and dates of birth. Using this information, we are able to maintain accurate records of accounts and transactions.
It is our policy to protect the confidentiality of our shareholder information, whether or not a shareholder currently owns shares of our funds. In particular, it is our policy not to sell information about you or your accounts to outside marketing firms. We have safeguards in place designed to prevent unauthorized access to our computer systems and procedures to protect personal information from unauthorized use.
Under certain circumstances, we must share account information with outside vendors who provide services to us, such as mailings and proxy solicitations. In these cases, the service providers enter into confidentiality agreements with us, and we provide only the information necessary to process transactions and perform other services related to your account. Finally, it is our policy to share account information with your financial representative, if you’ve listed one on your Putnam account.
Proxy voting
Putnam is committed to managing our mutual funds in the best interests of our shareholders. The Putnam funds’ proxy voting guidelines and procedures, as well as information regarding how your fund voted proxies relating to portfolio securities during the 12-month period ended June 30, 2010, are available in the Individual Investors section at putnam.com, and on the SEC’s Web site, www.sec.gov. If you have questions about finding forms on the SEC’s Web site, you may call the SEC at 1-800-SEC-0330. You may also obtain the Putnam funds’ proxy voting guidelines and procedures at no charge by calling Putnam’s Shareholder Services at 1-800-225-1581.
Fund portfolio holdings
The fund will file a complete schedule of its portfolio holdings with the SEC for the first and third quarters of each fiscal year on Form N-Q. Shareholders may obtain the fund’s Forms N-Q on the SEC’s Web site at www.sec.gov. In addition, the fund’s Forms N-Q may be reviewed and copied at the SEC’s Public Reference Room in Washington, D.C. You may call the SEC at 1-800-SEC-0330 for information about the SEC’s Web site or the operation of the Public Reference Room.
Trustee and employee fund ownership
Putnam employees and members of the Board of Trustees place their faith, confidence, and, most importantly, investment dollars in Putnam mutual funds. As of October 31, 2010, Putnam employees had approximately $324,000,000 and the Trustees had approximately $68,000,000 invested in Putnam mutual funds. These amounts include investments by the Trustees’ and employees’ immediate family members as well as investments through retirement and deferred compensation plans.
20
Financial statements
These sections of the report, as well as the accompanying Notes, preceded by the Report of Independent Registered Public Accounting Firm, constitute the fund’s financial statements.
The fund’s portfolio lists all the fund’s investments and their values as of the last day of the reporting period. Holdings are organized by asset type and industry sector, country, or state to show areas of concentration and diversification.
Statement of assets and liabilities shows how the fund’s net assets and share price are determined. All investment and non-investment assets are added together. Any unpaid expenses and other liabilities are subtracted from this total. The result is divided by the number of shares to determine the net asset value per share, which is calculated separately for each class of shares. (For funds with preferred shares, the amount subtracted from total assets includes the liquidation preference of preferred shares.)
Statement of operations shows the fund’s net investment gain or loss. This is done by first adding up all the fund’s earnings — from dividends and interest income — and subtracting its operating expenses to determine net investment income (or loss). Then, any net gain or loss the fund realized on the sales of its holdings — as well as any unrealized gains or losses over the period — is added to or subtracted from the net investment result to determine the fund’s net gain or loss for the fiscal year.
Statement of changes in net assets shows how the fund’s net assets were affected by the fund’s net investment gain or loss, by distributions to shareholders, and by changes in the number of the fund’s shares. It lists distributions and their sources (net investment income or realized capital gains) over the current reporting period and the most recent fiscal year-end. The distributions listed here may not match the sources listed in the Statement of operations because the distributions are determined on a tax basis and may be paid in a different period from the one in which they were earned.
Financial highlights provide an overview of the fund’s investment results, per-share distributions, expense ratios, net investment income ratios, and portfolio turnover in one summary table, reflecting the five most recent reporting periods. In a semiannual report, the highlights table also includes the current reporting period.
21
Report of Independent Registered Public Accounting Firm
The Board of Trustees and Shareholders
Putnam Convertible Securities Fund:
We have audited the accompanying statement of assets and liabilities of Putnam Convertible Securities Fund (formerly Putnam Convertible Income-Growth Trust) (the fund), including the fund’s portfolio, as of October 31, 2010, and the related statement of operations for the year then ended, the statements of changes in net assets for each of the two years in the period then ended and the financial highlights for each of the five years in the period then ended. These financial statements and financial highlights are the responsibility of the fund’s management. Our responsibility is to express an opinion on these financial statements and financial highlights based on our audits.
We conducted our audits in accordance with the standards of the Public Company Accounting Oversight Board (United States). Those standards require that we plan and perform our audit to obtain reasonable assurance about whether the financial statements and financial highlights are free of material misstatement. An audit includes examining, on a test basis, evidence supporting the amounts and disclosures in the financial statements. Our procedures included confirmation of securities owned as of October 31, 2010 by correspondence with the custodian and brokers or by other appropriate auditing procedures. An audit also includes assessing the accounting principles used and significant estimates made by management, as well as evaluating the overall financial statement presentation. We believe that our audits provide a reasonable basis for our opinion.
In our opinion, the financial statements and financial highlights referred to above present fairly, in all material respects, the financial position of Putnam Convertible Securities Fund as of October 31, 2010, the results of its operations for the year then ended, the changes in its net assets for each of the two years in the period then ended, and the financial highlights for each of the five years in the period then ended, in conformity with U.S. generally accepted accounting principles.

Boston, Massachusetts
December 13, 2010
22
The fund’s portfolio 10/31/10
| | |
| CONVERTIBLE BONDS AND NOTES (69.5%)* | Principal amount | Value |
|
| Aerospace and defense (1.4%) | | |
| AAR CORP. 144A cv. sr. unsec. notes 2 1/4s, 2016 | $5,600,000 | $5,124,000 |
|
| Triumph Group, Inc. 144A cv. sr. sub. notes 2 5/8s, 2026 | 2,700,000 | 4,218,750 |
|
| | | 9,342,750 |
| Automotive (2.0%) | | |
| Ford Motor Co. cv. sr. unsec. notes 4 1/4s, 2016 | 4,290,000 | 7,461,597 |
|
| TRW Automotive, Inc. 144A cv. company | | |
| guaranty sr. notes 3 1/2s, 2015 | 3,500,000 | 5,985,000 |
|
| | | 13,446,597 |
| Beverage (0.8%) | | |
| Molson Coors Brewing Co. cv. company guaranty sr. unsec. | | |
| unsub. notes 2 1/2s, 2013 | 4,700,000 | 5,275,750 |
|
| | | 5,275,750 |
| Biotechnology (3.7%) | | |
| Amgen, Inc. cv. sr. unsec. notes 3/8s, 2013 | 4,400,000 | 4,411,000 |
|
| Amylin Pharmaceuticals, Inc. cv. sr. unsec. notes 3s, 2014 | 5,300,000 | 4,571,250 |
|
| Dendreon Corp. 144A cv. sr. unsec. sub. notes 4 3/4s, 2014 | 565,000 | 2,073,550 |
|
| Kendle International, Inc. cv. sr. unsec. notes 3 3/8s, 2012 | 3,800,000 | 3,491,250 |
|
| United Therapeutics Corp. cv. sr. unsec. notes 1/2s, 2011 | 500,000 | 805,625 |
|
| United Therapeutics Corp. 144A cv. sr. unsec. notes 1/2s, 2011 | 3,500,000 | 5,639,375 |
|
| Viropharma, Inc. cv. sr. unsec. notes 2s, 2017 | 3,000,000 | 3,330,000 |
|
| | | 24,322,050 |
| Broadcasting (0.9%) | | |
| XM Satellite Radio Holdings, Inc. 144A cv. sr. unsec. | | |
| sub. notes 7s, 2014 | 4,728,000 | 5,618,282 |
|
| | | 5,618,282 |
| Cable television (1.6%) | | |
| Virgin Media, Inc. cv. sr. unsec. notes 6 1/2s, 2016 | | |
| (United Kingdom) | 6,400,000 | 10,208,000 |
|
| | | 10,208,000 |
| Coal (2.4%) | | |
| International Coal Group, Inc. cv. company guaranty | | |
| sr. unsec. notes 4s, 2017 | 3,243,000 | 3,973,648 |
|
| James River Coal Co. 144A cv. sr. unsec. notes 4 1/2s, 2015 | 3,249,000 | 3,270,119 |
|
| Peabody Energy Corp. cv. jr. unsec. sub. debs. 4 3/4s, 2041 | 3,000,000 | 3,566,250 |
|
| Penn Virginia Corp. cv. sr. unsec. sub. notes 4 1/2s, 2012 | 4,890,000 | 4,792,200 |
|
| | | 15,602,217 |
| Commercial and consumer services (3.6%) | | |
| Alliance Data Systems Corp. cv. sr. unsec. notes 1 3/4s, 2013 | 6,300,000 | 6,378,750 |
|
| CBIZ, Inc. 144A cv. sr. sub. notes 4 7/8s, 2015 | 2,162,000 | 2,322,799 |
|
| Icahn Enterprises LP 144A cv. sr. unsec. notes FRN 4s, 2013 | 5,400,000 | 5,130,000 |
|
| Icahn Enterprises LP/Icahn Enterprises Finance Corp. | | |
| cv. sr. unsec. notes FRN 4s, 2013 | 765,000 | 726,750 |
|
| Live Nation Entertainment, Inc. cv. sr. unsec. notes 2 7/8s, 2027 | 2,700,000 | 2,328,750 |
|
| Live Nation Entertainment, Inc. 144A cv. sr. notes 2 7/8s, 2027 | 4,000,000 | 3,450,000 |
|
| Priceline.com, Inc. 144A cv. sr. unsec. notes 1 1/4s, 2015 | 2,519,000 | 3,621,063 |
|
| | | 23,958,112 |
| Communications equipment (0.8%) | | |
| ARRIS Group, Inc. cv. sr. unsec. notes 2s, 2026 | 5,000,000 | 4,946,875 |
|
| | | 4,946,875 |
23
| | |
| CONVERTIBLE BONDS AND NOTES (69.5%)* cont. | Principal amount | Value |
|
| Computers (2.5%) | | |
| EMC Corp./Massachusetts cv. sr. unsec. notes 1 3/4s, 2013 | $2,040,000 | $2,909,550 |
|
| EMC Corp./Massachusetts 144A cv. sr. unsec. notes 1 3/4s, 2013 | 5,800,000 | 8,272,250 |
|
| TeleCommunication Systems, Inc. 144A cv. sr. unsec. | | |
| notes 4 1/2s, 2014 | 5,205,000 | 4,970,775 |
|
| | | 16,152,575 |
| Conglomerates (0.5%) | | |
| Textron, Inc. cv. sr. unsec. notes Ser. TXT, 4 1/2s, 2013 | 1,800,000 | 3,100,320 |
|
| | | 3,100,320 |
| Consumer (1.0%) | | |
| Stanley Black & Decker, Inc. cv. sr. unsec. unsub. notes | | |
| FRN zero %, 2012 | 5,701,000 | 6,568,692 |
|
| | | 6,568,692 |
| Consumer finance (1.2%) | | |
| Dollar Financial Corp. cv. sr. notes 3s, 2028 | 6,900,000 | 7,814,250 |
|
| | | 7,814,250 |
| Consumer services (1.7%) | | |
| Avis Budget Group, Inc. cv. sr. notes 3 1/2s, 2014 | 4,105,000 | 4,325,644 |
|
| Hertz Global Holdings, Inc. cv. sr. unsec. notes 5 1/4s, 2014 | 4,445,000 | 6,923,088 |
|
| | | 11,248,732 |
| Containers (0.7%) | | |
| Owens Brockway Glass Container, Inc. 144A cv. company | | |
| guaranty sr. unsec. notes 3s, 2015 | 4,931,000 | 4,916,207 |
|
| | | 4,916,207 |
| Distribution (0.5%) | | |
| Spartan Stores, Inc. cv. sr. unsec. notes 3 3/8s, 2027 | 3,297,000 | 3,070,331 |
|
| | | 3,070,331 |
| Electrical equipment (0.7%) | | |
| WESCO International, Inc. cv. company guaranty sr. unsec. | | |
| notes 6s, 2029 | 2,484,000 | 4,301,294 |
|
| | | 4,301,294 |
| Electronics (3.5%) | | |
| Advanced Micro Devices, Inc. cv. sr. unsec. notes 6s, 2015 | 1,811,000 | 1,799,681 |
|
| EnerSys cv. sr. unsec. notes stepped-coupon 3 3/8s (zero %, | | |
| 6/1/15) 2038 †† | 3,617,000 | 3,743,595 |
|
| Intel Corp. cv. jr. sub. notes 3 1/4s, 2039 | 5,265,000 | 6,265,350 |
|
| Micron Technology, Inc. cv. sr. unsec. unsub. notes 1 7/8s, 2014 | 5,000,000 | 4,787,500 |
|
| TTM Technologies, Inc. cv. sr. unsec. notes 3 1/4s, 2015 | 6,300,000 | 6,323,940 |
|
| | | 22,920,066 |
| Energy (oil field) (0.9%) | | |
| Helix Energy Solutions Group, Inc. cv. sr. unsec. | | |
| unsub. notes 3 1/4s, 2025 | 3,600,000 | 3,429,000 |
|
| Global Industries, Ltd. 144A cv. unsec. notes 2 3/4s, 2027 | 3,000,000 | 2,175,000 |
|
| | | 5,604,000 |
| Energy (other) (0.5%) | | |
| Covanta Holding Corp. cv. sr. unsec. notes 3 1/4s, 2014 | 3,000,000 | 3,393,750 |
|
| | | 3,393,750 |
| Financial (1.2%) | | |
| CapitalSource, Inc. cv. company guaranty sr. unsec. | | |
| sub. notes 7 1/4s, 2037 | 2,700,000 | 2,727,000 |
|
| Digital Realty Trust LP 144A cv. sr. unsec. notes 5 1/2s, 2029 R | 2,300,000 | 3,441,375 |
|
| MGIC Investment Corp. cv. sr. notes 5s, 2017 | 1,698,000 | 1,893,440 |
|
| | | 8,061,815 |
24
| | |
| CONVERTIBLE BONDS AND NOTES (69.5%)* cont. | Principal amount | Value |
|
| Gaming and lottery (0.7%) | | |
| International Game Technology 144A cv. sr. unsec. | | |
| notes 3 1/4s, 2014 | $3,970,000 | $4,423,771 |
|
| | | 4,423,771 |
| Health-care services (2.8%) | | |
| Fisher Scientific International, Inc. cv. company | | |
| guaranty sr. sub. notes 3 1/4s, 2024 | 3,400,000 | 4,505,000 |
|
| Health Management Associates, Inc. | | |
| 144A cv. sr. sub. notes 3 3/4s, 2028 | 4,600,000 | 4,933,500 |
|
| LifePoint Hospitals, Inc. cv. sr. sub. notes 3 1/2s, 2014 | 3,300,000 | 3,279,375 |
|
| Omnicare, Inc. cv. company guaranty sr. unsec. debs | | |
| Ser. OCR, 3 1/4s, 2035 | 3,690,000 | 3,288,713 |
|
| Providence Service Corp. (The) cv. sr. unsec. | | |
| sub. notes 6 1/2s, 2014 | 2,493,000 | 2,477,419 |
|
| | | 18,484,007 |
| Insurance (1.5%) | | |
| American Equity Investment Life Holding Co. | | |
| 144A cv. sr. unsec. notes 3 1/2s, 2015 | 3,074,000 | 3,269,968 |
|
| Old Republic International Corp. cv. sr. unsec. | | |
| unsub. notes 8s, 2012 | 5,285,000 | 6,665,706 |
|
| | | 9,935,674 |
| Investment banking/Brokerage (0.5%) | | |
| KKR Financial Holdings, LLC cv. sr. unsec. notes 7 1/2s, 2017 | 2,600,000 | 3,427,125 |
|
| | | 3,427,125 |
| Lodging/Tourism (0.5%) | | |
| Host Hotels & Resorts LP 144A cv. company | | |
| guaranty sr. unsec. notes 2 1/2s, 2029 R | 2,465,000 | 3,238,394 |
|
| | | 3,238,394 |
| Manufacturing (2.2%) | | |
| General Cable Corp. cv. unsec. sub. notes stepped-coupon | | |
| 4 1/2s (2 1/4s, 11/15/19) 2029 †† | 6,580,000 | 6,793,850 |
|
| Griffon Corp. 144A cv. sub. notes 4s, 2017 | 2,658,000 | 2,754,485 |
|
| Teleflex, Inc. cv. sr. unsec. sub. notes 3 7/8s, 2017 | 4,415,000 | 4,839,944 |
|
| | | 14,388,279 |
| Media (0.8%) | | |
| Liberty Media, LLC cv. sr. unsec. unsub. notes 3 1/2s, 2031 | 10,300,000 | 5,550,155 |
|
| | | 5,550,155 |
| Medical technology (3.2%) | | |
| China Medical Technologies, Inc. cv. sr. unsec. | | |
| bonds Ser. CMT, 4s, 2013 (China) | 4,100,000 | 3,290,250 |
|
| Hologic, Inc. cv. sr. unsec. unsub. notes stepped-coupon 2s | | |
| (zero %, 12/15/13) 2037 †† | 5,400,000 | 5,089,500 |
|
| Life Technologies Corp. cv. sr. unsec. unsub. notes 1 1/2s, 2024 | 5,900,000 | 6,866,125 |
|
| Medtronic, Inc. cv. sr. unsec. notes 1 5/8s, 2013 | 3,600,000 | 3,622,500 |
|
| Medtronic, Inc. 144A cv. sr. unsec. notes 1 5/8s, 2013 | 1,900,000 | 1,911,875 |
|
| | | 20,780,250 |
| Metals (3.6%) | | |
| Goldcorp, Inc. cv. sr. notes 2s, 2014 (Canada) | 5,727,000 | 7,058,528 |
|
| Newmont Mining Corp. cv. company | | |
| guaranty sr. unsub. notes 1 5/8s, 2017 | 3,900,000 | 5,616,000 |
|
| Steel Dynamics, Inc. cv. sr. notes 5 1/8s, 2014 | 4,260,000 | 4,899,000 |
|
| U.S. Steel Corp. cv. sr. unsec. notes 4s, 2014 | 2,820,000 | 4,289,925 |
|
| USEC, Inc. cv. sr. unsec. notes 3s, 2014 | 2,000,000 | 1,680,000 |
|
| | | 23,543,453 |
25
| | |
| CONVERTIBLE BONDS AND NOTES (69.5%)* cont. | Principal amount | Value |
|
| Oil and gas (2.9%) | | |
| Carrizo Oil & Gas, Inc. cv. sr. unsec. unsub. notes 4 3/8s, 2028 | $6,200,000 | $6,161,250 |
|
| Chesapeake Energy Corp. cv. sr. unsec. notes company | | |
| guaranty 2 1/2s, 2037 | 9,400,000 | 8,095,750 |
|
| SM Energy Co. cv. sr. unsec. notes 3 1/2s, 2027 | 4,500,000 | 4,798,125 |
|
| | | 19,055,125 |
| Pharmaceuticals (1.7%) | | |
| Teva Pharmaceutical Finance, LLC cv. company | | |
| guaranty sr. unsec. debs Ser. C, 1/4s, 2026 (Israel) | 5,400,000 | 6,358,500 |
|
| Valeant Pharmaceuticals International, Inc. | | |
| 144A cv. sr. notes 5 3/8s, 2014 (Canada) | 2,300,000 | 4,510,875 |
|
| | | 10,869,375 |
| Real estate (1.1%) | | |
| Annaly Capital Management, Inc. cv. sr. unsec. | | |
| unsub. notes 4s, 2015 R | 3,200,000 | 3,568,000 |
|
| General Growth Properties, Inc. 144A cv. sr. notes 3.98s, | | |
| 2027 (In default) † R | 3,600,000 | 3,870,000 |
|
| | | 7,438,000 |
| Retail (2.1%) | | |
| Charming Shoppes, Inc. cv. sr. unsec. notes 1 1/8s, 2014 | 4,100,000 | 3,403,000 |
|
| Iconix Brand Group, Inc. cv. sr. sub. notes 1 7/8s, 2012 | 3,200,000 | 3,108,000 |
|
| Pantry, Inc. (The) cv. company guaranty sr. unsec. | | |
| sub. notes 3s, 2012 | 4,300,000 | 4,095,750 |
|
| Pantry, Inc. (The) 144A cv. sr. sub. notes 3s, 2012 | 500,000 | 476,250 |
|
| Rite Aid Corp. cv. sr. unsec. unsub. notes 8 1/2s, 2015 | 3,185,000 | 2,985,938 |
|
| | | 14,068,938 |
| Semiconductor (1.1%) | | |
| Linear Technology Corp. cv. sr. unsec. unsub. notes Ser. A, | | |
| 3s, 2027 | 6,700,000 | 6,934,500 |
|
| | | 6,934,500 |
| Shipping (0.7%) | | |
| Genco Shipping & Trading, Ltd. cv. sr. unsec. notes 5s, 2015 | 4,400,000 | 4,862,000 |
|
| | | 4,862,000 |
| Software (5.4%) | | |
| Cadence Design Systems, Inc. cv. sr. unsec. notes 1 1/2s, 2013 | 500,000 | 461,250 |
|
| Cadence Design Systems, Inc. 144A cv. sr. unsec. | | |
| notes 1 1/2s, 2013 | 3,100,000 | 2,859,750 |
|
| Microsoft Corp. 144A cv. sr. unsec. notes zero %, 2013 | 3,961,000 | 4,149,148 |
|
| Rovi Corp. 144A cv. sr. unsec. unsub. notes 2 5/8s, 2040 | 4,240,000 | 5,339,750 |
|
| Safeguard Scientifics, Inc. cv. sr. unsec. | | |
| sub. notes 10 1/8s, 2014 | 8,600,000 | 10,750,000 |
|
| Symantec Corp. cv. sr. unsec. notes 1s, 2013 | 5,000,000 | 5,606,250 |
|
| SYNNEX Corp. 144A cv. sr. notes 4s, 2018 | 5,845,000 | 6,970,163 |
|
| | | 36,136,311 |
| Technology (2.0%) | | |
| CACI International, Inc. cv. sr. unsec. sub. notes 2 1/8s, 2014 | 2,100,000 | 2,367,750 |
|
| CACI International, Inc. 144A cv. sr. unsec. sub. notes 2 1/8s, 2014 | 3,720,000 | 4,194,300 |
|
| ON Semiconductor Corp. cv. company guaranty sr. unsec. | | |
| sub. notes 2 5/8s, 2026 | 785,000 | 820,325 |
|
| ON Semiconductor Corp. 144A cv. company guaranty sr. unsec. | | |
| sub. notes 2 5/8s, 2026 | 5,300,000 | 5,538,500 |
|
| | | 12,920,875 |
26
| | |
| CONVERTIBLE BONDS AND NOTES (69.5%)* cont. | Principal amount | Value |
|
| Technology services (1.0%) | | |
| CSG Systems International, Inc. 144A cv. sr. unsec. | | |
| sub. notes 3s, 2017 | $3,138,000 | $3,243,908 |
|
| Salesforce.com, Inc. 144A cv. sr. unsec. unsub. notes 3/4s, 2015 | 2,100,000 | 3,134,040 |
|
| | | 6,377,948 |
| Telecommunications (2.9%) | | |
| Cogent Communication Group, Inc. cv. sr. unsec. notes 1s, 2027 | 3,563,000 | 2,975,105 |
|
| Level 3 Communications, Inc. cv. sr. unsec. | | |
| unsub. notes 3 1/2s, 2012 | 7,675,000 | 7,147,344 |
|
| NII Holdings, Inc. 144A cv. sr. unsec. notes 3 1/8s, 2012 | 2,600,000 | 2,535,000 |
|
| SBA Communications Corp. cv. sr. unsec. notes 1 7/8s, 2013 | 5,800,000 | 6,416,250 |
|
| | | 19,073,699 |
| Telephone (0.7%) | | |
| Leap Wireless International, Inc. cv. sr. unsec. | | |
| notes 4 1/2s, 2014 | 5,110,000 | 4,605,388 |
|
| | | 4,605,388 |
| Total convertible bonds and notes (cost $403,073,538) | | $455,985,932 |
| | | |
| | |
| CONVERTIBLE PREFERRED STOCKS (20.9%)* | Shares | Value |
|
| Automotive (0.8%) | | |
| Ford Motor Co. Capital Trust II $3.25 cum. cv. pfd. S | 99,040 | $4,933,430 |
|
| | | 4,933,430 |
| Banking (4.2%) | | |
| Bank of America Corp. Ser. L, 7.25% cv. pfd. | 7,925 | 7,489,125 |
|
| Citigroup, Inc. $7.50 cv. pfd. | 69,000 | 8,524,260 |
|
| Huntington Bancshares Ser. A, 8.50% cv. pfd. | 3,200 | 3,221,600 |
|
| Wells Fargo & Co. Ser. L, 7.50% cv. pfd. | 8,425 | 8,425,000 |
|
| | | 27,659,985 |
| Combined utilities (1.8%) | | |
| El Paso Corp. 4.99% cv. pfd. | 10,200 | 12,099,743 |
|
| | | 12,099,743 |
| Consumer goods (0.4%) | | |
| Newell Financial Trust I $2.625 cum. cv. pfd. | 58,712 | 2,465,904 |
|
| | | 2,465,904 |
| Electric utilities (2.1%) | | |
| Great Plains Energy, Inc. $6.00 cv. pfd. | 118,674 | 7,563,094 |
|
| PPL Corp. $4.75 cv. pfd. | 113,845 | 6,402,643 |
|
| | | 13,965,737 |
| Financial (0.5%) | | |
| AMG Capital Trust II $2.575 cv. pfd. | 87,115 | 3,353,928 |
|
| | | 3,353,928 |
| Food (1.3%) | | |
| Bunge, Ltd. $4.875 cv. pfd. | 43,885 | 3,927,708 |
|
| Dole Food Automatic Exchange 144A 7.00% cv. pfd. | 510,505 | 4,870,218 |
|
| | | 8,797,926 |
| Insurance (2.9%) | | |
| Assured Guaranty, Ltd. $4.25 cv. pfd. (Bermuda) | 51,500 | 4,093,220 |
|
| Hartford Financial Services Group, Inc. (The) | | |
| $1.182 cv. pfd. S | 245,423 | 6,035,884 |
|
| XL Group, Ltd. $2.688 cv. pfd. | 295,455 | 8,822,286 |
|
| | | 18,951,390 |
| Investment banking/Brokerage (—%) | | |
| Lehman Brothers Holdings, Inc. Ser. P, | | |
| 7.25% cv. pfd. (In default) † | 13,400 | 12,060 |
|
| | | 12,060 |
27
| | |
| CONVERTIBLE PREFERRED STOCKS (20.9%)* cont. | Shares | Value |
|
| Lodging/Tourism (0.1%) | | |
| FelCor Lodging Trust, Inc. Ser. A, $0.488 cum. cv. pfd. R | 18,304 | $434,149 |
|
| | | 434,149 |
| Media (1.1%) | | |
| Interpublic Group of Cos., Inc. (The) Ser. B, 5.25% cv. pfd. | 7,165 | 7,227,694 |
|
| | | 7,227,694 |
| Metals (1.1%) | | |
| Vale Capital II $3.375 cv. pfd. (Cayman Islands) | 81,200 | 7,358,750 |
|
| | | 7,358,750 |
| Oil and gas (1.4%) | | |
| Apache Corp. Ser. D, $3.00 cv. pfd. S | 159,446 | 9,313,241 |
|
| | | 9,313,241 |
| Power producers (0.4%) | | |
| AES Trust III $3.375 cv. pfd. | 59,600 | 2,886,875 |
|
| | | 2,886,875 |
| Real estate (1.6%) | | |
| Alexandria Real Estate Equities, Inc. Ser. D, $1.75 cv. pfd. | 170,550 | 4,135,838 |
|
| Entertainment Properties Trust Ser. C, $1.438 cum. cv. pfd. | 314,100 | 6,223,703 |
|
| | | 10,359,541 |
| Telecommunications (1.2%) | | |
| Crown Castle International Corp. $3.125 cum. cv. pfd. | 126,241 | 7,669,141 |
|
| | | 7,669,141 |
| Total convertible preferred stocks (cost $135,061,588) | | $137,489,494 |
| | | |
| | |
| COMMON STOCKS (5.5%)* | Shares | Value |
|
| Banking (0.3%) | | |
| Wells Fargo & Co. | 78,700 | $2,052,496 |
|
| | | 2,052,496 |
| Biotechnology (0.1%) | | |
| Dendreon Corp. † | 15,400 | 562,100 |
|
| | | 562,100 |
| Cable television (0.5%) | | |
| DIRECTV Class A † | 76,500 | 3,324,690 |
|
| | | 3,324,690 |
| Chemicals (0.3%) | | |
| Celanese Corp. Ser. A | 49,524 | 1,765,531 |
|
| | | 1,765,531 |
| Computers (0.3%) | | |
| Hewlett-Packard Co. | 40,800 | 1,716,048 |
|
| | | 1,716,048 |
| Consumer goods (0.3%) | | |
| Newell Rubbermaid, Inc. | 98,100 | 1,731,465 |
|
| | | 1,731,465 |
| Energy (other) (—%) | | |
| Brazil Ethanol, Inc. 144A (Unit) † | 312,500 | 3,125 |
|
| | | 3,125 |
| Insurance (0.5%) | | |
| Aflac, Inc. | 62,300 | 3,481,947 |
|
| | | 3,481,947 |
| Medical technology (0.5%) | | |
| Medtronic, Inc. | 96,500 | 3,397,765 |
|
| | | 3,397,765 |
| Metals (0.3%) | | |
| Freeport-McMoRan Copper & Gold, Inc. Class B | 22,658 | 2,145,259 |
|
| | | 2,145,259 |
| Oil and gas (0.8%) | | |
| EOG Resources, Inc. | 53,200 | 5,092,304 |
|
| | | 5,092,304 |
28
| | |
| COMMON STOCKS (5.5%)* cont. | Shares | Value |
|
| Retail (0.5%) | | |
| Bed Bath & Beyond, Inc. † | 74,915 | $3,288,769 |
|
| | | 3,288,769 |
| Telecommunications (0.9%) | | |
| NII Holdings, Inc. † | 78,000 | 3,261,180 |
|
| Sprint Nextel Corp. † | 638,500 | 2,630,620 |
|
| | | 5,891,800 |
| Telephone (0.2%) | | |
| Leap Wireless International, Inc. † | 133,500 | 1,523,235 |
|
| | | 1,523,235 |
| Total common stocks (cost $35,722,554) | | $35,976,534 |
| | | |
| | |
| CORPORATE BONDS AND NOTES (2.4%)* | Principal amount | Value |
|
| Affinion Group Holdings, Inc. 144A company | | |
| guaranty sr. notes 11 5/8s, 2015 | $1,585,000 | $1,630,569 |
|
| Clearwire Communications, LLC/Clearwire Finance, Inc. 144A | | |
| company guaranty sr. notes 12s, 2015 | 1,290,000 | 1,428,675 |
|
| Integra Telecom Holdings, Inc. 144A sr. notes 10 3/4s, 2016 | 1,310,000 | 1,385,325 |
|
| Intelsat Luxembourg SA company guaranty sr. unsec. | | |
| notes 11 1/4s, 2017 (Luxembourg) | 1,265,000 | 1,355,131 |
|
| Jazz Technologies, Inc. 144A notes 8s, 2015 F | 4,020,000 | 3,457,200 |
|
| Provident Funding Associates 144A sr. notes 10 1/4s, 2017 | 1,305,000 | 1,357,200 |
|
| Surgical Care Affiliates, Inc. 144A sr. sub. notes 10s, 2017 | 1,320,000 | 1,359,600 |
|
| Unisys Corp. 144A company guaranty sr. sub. notes 14 1/4s, 2015 | 2,900,000 | 3,509,000 |
|
| Total corporate bonds and notes (cost $14,773,555) | | $15,482,700 |
| | | |
| | | | |
| WARRANTS (—%)* † | Expiration | Strike | | |
| | date | price | Warrants | Value |
|
| Tower Semiconductor, Ltd. 144A (Israel) F | 6/30/15 | $0.01 | 1,085,630 | $195,413 |
|
| Total warrants (cost $217,126) | | | | $195,413 |
| | | |
| | |
| SHORT-TERM INVESTMENTS (2.4%)* | Shares | Value |
|
| Putnam Cash Collateral Pool, LLC 0.21% d | 13,712,525 | $13,712,525 |
|
| Putnam Money Market Liquidity Fund 0.16% e | 1,831,209 | 1,831,209 |
|
| Total short-term investments (cost $15,543,734) | | $15,543,734 |
| | | |
| |
| TOTAL INVESTMENTS | |
|
| Total investments (cost $604,392,095) | $660,673,807 |
Key to holding’s abbreviations
Notes to the fund’s portfolio
Unless noted otherwise, the notes to the fund’s portfolio are for the close of the fund’s reporting period, which ran from November 1, 2009 through October 31, 2010 (the reporting period).
* Percentages indicated are based on net assets of $656,421,938.
† Non-income-producing security.
†† The interest rate and date shown parenthetically represent the new interest rate to be paid and the date the fund will begin accruing interest at this rate.
29
d See Note 1 to the financial statements regarding securities lending. The rate quoted in the security description is the annualized 7-day yield of the fund at the close of the reporting period.
e See Note 6 to the financial statements regarding investments in Putnam Money Market Liquidity Fund. The rate quoted in the security description is the annualized 7-day yield of the fund at the close of the reporting period.
F Is valued at fair value following procedures approved by the Trustees. Securities may be classified as Level 2 or Level 3 for Accounting Standards Codification ASC 820 Fair Value Measurements and Disclosures (ASC 820) based on the securities’ valuation inputs.
R Real Estate Investment Trust.
S Securities on loan, in part or in entirety, at the close of the reporting period.
Debt obligations are considered secured unless otherwise indicated.
144A after the name of an issuer represents securities exempt from registration under Rule 144A under the Securities Act of 1933, as amended. These securities may be resold in transactions exempt from registration, normally to qualified institutional buyers.
The rates shown on FRN are the current interest rates at the close of the reporting period.
The dates shown on debt obligations are the original maturity dates.
ASC 820 establishes a three-level hierarchy for disclosure of fair value measurements. The valuation hierarchy is based upon the transparency of inputs to the valuation of the fund’s investments. The three levels are defined as follows:
Level 1 — Valuations based on quoted prices for identical securities in active markets.
Level 2 — Valuations based on quoted prices in markets that are not active or for which all significant inputs are observable, either directly or indirectly.
Level 3 — Valuations based on inputs that are unobservable and significant to the fair value measurement.
The following is a summary of the inputs used to value the fund’s net assets as of the close of the reporting period:
| | | | |
| | | |
| | | Valuation inputs | |
|
| Investments in securities: | Level 1 | Level 2 | Level 3 |
|
| Common stocks: | | | |
|
| Basic materials | $3,910,790 | $— | $— |
|
| Communication services | 10,739,725 | — | — |
|
| Consumer cyclicals | 3,288,769 | — | — |
|
| Consumer staples | 1,731,465 | — | — |
|
| Energy | 5,092,304 | 3,125 | — |
|
| Financial | 5,534,443 | — | — |
|
| Health care | 3,959,865 | — | — |
|
| Technology | 1,716,048 | — | — |
|
| Total common stocks | 35,973,409 | 3,125 | — |
| Convertible bonds and notes | — | 455,985,932 | — |
|
| Convertible preferred stocks | — | 137,489,494 | — |
|
| Corporate bonds and notes | — | 12,025,500 | 3,457,200 |
|
| Warrants | — | — | 195,413 |
|
| Short-term investments | 1,831,209 | 13,712,525 | — |
|
| Totals by level | $37,804,618 | $619,216,576 | $3,652,613 |
At the start and/or close of the reporting period, Level 3 investments in securities were not considered a significant portion of the fund’s portfolio.
The accompanying notes are an integral part of these financial statements.
30
Statement of assets and liabilities 10/31/10
| |
| ASSETS | |
|
| Investment in securities, at value, including $13,384,095 of securities on loan (Note 1): | |
| Unaffiliated issuers (identified cost $588,848,361) | $645,130,073 |
| Affiliated issuers (identified cost $15,543,734) (Notes 1 and 6) | 15,543,734 |
|
| Dividends, interest and other receivables | 5,744,069 |
|
| Receivable for shares of the fund sold | 1,238,954 |
|
| Receivable for investments sold | 9,548,712 |
|
| Total assets | 677,205,542 |
|
| |
| LIABILITIES | |
|
| Payable for investments purchased | 5,463,134 |
|
| Payable for shares of the fund repurchased | 700,500 |
|
| Payable for compensation of Manager (Note 2) | 350,105 |
|
| Payable for investor servicing fees (Note 2) | 126,162 |
|
| Payable for custodian fees (Note 2) | 6,386 |
|
| Payable for Trustee compensation and expenses (Note 2) | 149,413 |
|
| Payable for administrative services (Note 2) | 2,452 |
|
| Payable for distribution fees (Note 2) | 167,402 |
|
| Collateral on securities loaned, at value (Note 1) | 13,712,525 |
|
| Other accrued expenses | 105,525 |
|
| Total liabilities | 20,783,604 |
| |
| Net assets | $656,421,938 |
|
| |
| REPRESENTED BY | |
|
| Paid-in capital (Unlimited shares authorized) (Notes 1 and 4) | $724,623,476 |
|
| Undistributed net investment income (Note 1) | 12,755,035 |
|
| Accumulated net realized loss on investments (Note 1) | (137,238,285) |
|
| Net unrealized appreciation of investments | 56,281,712 |
|
| Total — Representing net assets applicable to capital shares outstanding | $656,421,938 |
|
| |
| COMPUTATION OF NET ASSET VALUE AND OFFERING PRICE | |
|
| Net asset value and redemption price per class A share ($495,949,148 divided by 25,685,956 shares) | $19.31 |
|
| Offering price per class A share (100/94.25 of $19.31)* | $20.49 |
|
| Net asset value and offering price per class B share ($12,204,807 divided by 642,534 shares)** | $18.99 |
|
| Net asset value and offering price per class C share ($57,210,762 divided by 2,991,253 shares)** | $19.13 |
|
| Net asset value and redemption price per class M share ($4,597,974 divided by 240,237 shares) | $19.14 |
|
| Offering price per class M share (100/96.50 of $19.14)* | $19.83 |
|
| Net asset value, offering price and redemption price per class R share | |
| ($3,434,424 divided by 178,488 shares) | $19.24 |
|
| Net asset value, offering price and redemption price per class Y share | |
| ($83,024,823 divided by 4,301,293 shares) | $19.30 |
|
* On single retail sales of less than $50,000. On sales of $50,000 or more the offering price is reduced.
** Redemption price per share is equal to net asset value less any applicable contingent deferred sales charge.
The accompanying notes are an integral part of these financial statements.
31
Statement of operations Year ended 10/31/10
| |
| INVESTMENT INCOME | |
|
| Interest (including interest income of $18,747 from investments in affiliated issuers) (Note 6) | $17,978,123 |
|
| Dividends | 8,630,015 |
|
| Securities lending | 4,528 |
|
| Total investment income | 26,612,666 |
|
| |
| EXPENSES | |
|
| Compensation of Manager (Note 2) | 4,007,308 |
|
| Investor servicing fees (Note 2) | 1,572,721 |
|
| Custodian fees (Note 2) | 13,978 |
|
| Trustee compensation and expenses (Note 2) | 45,471 |
|
| Administrative services (Note 2) | 31,036 |
|
| Distribution fees — Class A (Note 2) | 1,204,458 |
|
| Distribution fees — Class B (Note 2) | 132,459 |
|
| Distribution fees — Class C (Note 2) | 566,537 |
|
| Distribution fees — Class M (Note 2) | 33,425 |
|
| Distribution fees — Class R (Note 2) | 15,215 |
|
| Other | 230,256 |
|
| Total expenses | 7,852,864 |
| | |
| Expense reduction (Note 2) | (17,781) |
|
| Net expenses | 7,835,083 |
| |
| Net investment income | 18,777,583 |
|
| |
| Net realized gain on investments (Notes 1 and 3) | 46,664,163 |
|
| Net unrealized appreciation of investments during the year | 61,928,641 |
|
| Net gain on investments | 108,592,804 |
| |
| Net increase in net assets resulting from operations | $127,370,387 |
|
The accompanying notes are an integral part of these financial statements.
32
Statement of changes in net assets
| | |
| INCREASE IN NET ASSETS | Year ended 10/31/10 | Year ended 10/31/09 |
|
| Operations: | | |
| Net investment income | $18,777,583 | $20,395,821 |
|
| Net realized gain (loss) on investments | 46,664,163 | (106,316,343) |
|
| Net unrealized appreciation of investments | 61,928,641 | 248,720,550 |
|
| Net increase in net assets resulting from operations | 127,370,387 | 162,800,028 |
|
| Distributions to shareholders (Note 1): | | |
| From ordinary income | | |
| Net investment income | | |
|
| Class A | (15,141,336) | (17,157,229) |
|
| Class B | (321,042) | (459,958) |
|
| Class C | (1,373,878) | (1,449,088) |
|
| Class M | (117,726) | (138,859) |
|
| Class R | (89,090) | (89,957) |
|
| Class Y | (2,551,626) | (1,470,069) |
|
| Increase in capital from settlement payments | 7,986 | — |
|
| Redemption fees (Note 1) | 1,447 | 1,880 |
|
| Decrease from capital share transactions (Note 4) | (67,240,730) | (3,906,655) |
|
| Total increase in net assets | 40,544,392 | 138,130,093 |
|
| |
| NET ASSETS | | |
|
| Beginning of year | 615,877,546 | 477,747,453 |
|
| End of year (including undistributed net investment income | | |
| of $12,755,035 and $12,236,542, respectively) | $656,421,938 | $615,877,546 |
|
The accompanying notes are an integral part of these financial statements.
33
Financial highlights (For a common share outstanding throughout the period)
| | | | | | | | | | | | | | |
| INVESTMENT OPERATIONS: | | LESS DISTRIBUTIONS: | | RATIOS AND SUPPLEMENTAL DATA: |
|
| | | | | | | | | | | | | Ratio | Ratio | |
| | | | Net realized | | | | | | | | | of expenses | of net investment | |
| | Net asset value, | | and unrealized | Total from | From | | | | | Total return | Net assets, | to average | income (loss) | Portfolio |
| | beginning | Net investment | gain (loss) | investment | net investment | Total | Redemption | Non-recurring | Net asset value, | at net asset | end of period | net assets | to average | turnover |
| Period ended | of period | income (loss) a | on investments | operations | income | distributions | fees b | reimbursements | end of period | value (%) c | (in thousands) | (%) d | net assets (%) | (%) |
|
| Class A | | | | | | | | | | | | | | |
| October 31, 2010 | $16.27 | .54 | 3.07 | 3.61 | (.57) | (.57) | — | — b,e | $19.31 | 22.48 | $495,949 | 1.18 | 3.03 | 71.03 |
| October 31, 2009 | 12.55 | .55 | 3.73 | 4.28 | (.56) | (.56) | — | — | 16.27 | 35.08 | 467,669 | 1.20 f | 4.00 f | 74.36 |
| October 31, 2008 | 21.21 | .51 | (8.64) | (8.13) | (.53) | (.53) | — | — | 12.55 | (39.13) | 402,408 | 1.06 f | 2.73 f | 68.19 |
| October 31, 2007 | 19.05 | .51 | 2.18 | 2.69 | (.53) | (.53) | — | — | 21.21 | 14.27 | 697,830 | 1.04 f | 2.50 f | 70.61 |
| October 31, 2006 | 17.13 | .48 g | 1.97 | 2.45 | (.53) | (.53) | — | — | 19.05 | 14.52 | 608,771 | 1.03 f,g | 2.64 f,g | 63.63 |
|
| Class B | | | | | | | | | | | | | | |
| October 31, 2010 | $16.01 | .40 | 3.01 | 3.41 | (.43) | (.43) | — | — b,e | $18.99 | 21.52 | $12,205 | 1.93 | 2.28 | 71.03 |
| October 31, 2009 | 12.35 | .44 | 3.67 | 4.11 | (.45) | (.45) | — | — | 16.01 | 34.12 | 14,351 | 1.95 f | 3.30 f | 74.36 |
| October 31, 2008 | 20.87 | .36 | (8.51) | (8.15) | (.37) | (.37) | — | — | 12.35 | (39.61) | 15,297 | 1.81 f | 1.96 f | 68.19 |
| October 31, 2007 | 18.75 | .35 | 2.14 | 2.49 | (.37) | (.37) | — | — | 20.87 | 13.40 | 37,930 | 1.79 f | 1.77 f | 70.61 |
| October 31, 2006 | 16.86 | .34 g | 1.94 | 2.28 | (.39) | (.39) | — | — | 18.75 | 13.68 | 47,842 | 1.78 f,g | 1.89 f,g | 63.63 |
|
| Class C | | | | | | | | | | | | | | |
| October 31, 2010 | $16.12 | .40 | 3.04 | 3.44 | (.43) | (.43) | — | — b,e | $19.13 | 21.58 | $57,211 | 1.93 | 2.27 | 71.03 |
| October 31, 2009 | 12.44 | .43 | 3.71 | 4.14 | (.46) | (.46) | — | — | 16.12 | 34.12 | 56,131 | 1.95 f | 3.13 f | 74.36 |
| October 31, 2008 | 21.04 | .37 | (8.58) | (8.21) | (.39) | (.39) | — | — | 12.44 | (39.60) | 33,539 | 1.81 f | 2.00 f | 68.19 |
| October 31, 2007 | 18.92 | .35 | 2.16 | 2.51 | (.39) | (.39) | — | — | 21.04 | 13.36 | 38,347 | 1.79 f | 1.73 f | 70.61 |
| October 31, 2006 | 17.01 | .34 g | 1.97 | 2.31 | (.40) | (.40) | — | — | 18.92 | 13.73 | 22,010 | 1.78 f,g | 1.89 f,g | 63.63 |
|
| Class M | | | | | | | | | | | | | | |
| October 31, 2010 | $16.13 | .45 | 3.04 | 3.49 | (.48) | (.48) | — | — b,e | $19.14 | 21.85 | $4,598 | 1.68 | 2.53 | 71.03 |
| October 31, 2009 | 12.45 | .47 | 3.71 | 4.18 | (.50) | (.50) | — | — | 16.13 | 34.41 | 4,383 | 1.70 f | 3.40 f | 74.36 |
| October 31, 2008 | 21.04 | .41 | (8.57) | (8.16) | (.43) | (.43) | — | — | 12.45 | (39.44) | 3,133 | 1.56 f | 2.22 f | 68.19 |
| October 31, 2007 | 18.90 | .40 | 2.17 | 2.57 | (.43) | (.43) | — | — | 21.04 | 13.70 | 6,175 | 1.54 f | 2.00 f | 70.61 |
| October 31, 2006 | 16.99 | .38 g | 1.97 | 2.35 | (.44) | (.44) | — | — | 18.90 | 14.01 | 5,607 | 1.53 f,g | 2.14 f,g | 63.63 |
|
| Class R | | | | | | | | | | | | | | |
| October 31, 2010 | $16.22 | .50 | 3.04 | 3.54 | (.52) | (.52) | — | — b,e | $19.24 | 22.12 | $3,434 | 1.43 | 2.77 | 71.03 |
| October 31, 2009 | 12.51 | .51 | 3.73 | 4.24 | (.53) | (.53) | — | — | 16.22 | 34.79 | 2,685 | 1.45 f | 3.73 f | 74.36 |
| October 31, 2008 | 21.15 | .47 | (8.62) | (8.15) | (.49) | (.49) | — | — | 12.51 | (39.29) | 2,255 | 1.31 f | 2.50 f | 68.19 |
| October 31, 2007 | 19.01 | .45 | 2.18 | 2.63 | (.49) | (.49) | — | — | 21.15 | 13.96 | 2,164 | 1.29 f | 2.20 f | 70.61 |
| October 31, 2006 | 17.11 | .43 g | 1.98 | 2.41 | (.51) | (.51) | — | — | 19.01 | 14.27 | 1,027 | 1.28 f,g | 2.35 f,g | 63.63 |
|
| Class Y | | | | | | | | | | | | | | |
| October 31, 2010 | $16.27 | .59 | 3.05 | 3.64 | (.61) | (.61) | — | — b,e | $19.30 | 22.73 | $83,025 | .93 | 3.27 | 71.03 |
| October 31, 2009 | 12.55 | .57 | 3.74 | 4.31 | (.59) | (.59) | — | — | 16.27 | 35.43 | 70,660 | .95 f | 3.93 f | 74.36 |
| October 31, 2008 | 21.21 | .56 | (8.64) | (8.08) | (.58) | (.58) | — | — | 12.55 | (38.97) | 21,115 | .81 f | 3.00 f | 68.19 |
| October 31, 2007 | 19.05 | .56 | 2.18 | 2.74 | (.58) | (.58) | — | — | 21.21 | 14.56 | 27,084 | .79 f | 2.75 f | 70.61 |
| October 31, 2006 | 17.13 | .52 g | 1.97 | 2.49 | (.57) | (.57) | — | — | 19.05 | 14.81 | 24,458 | .78 f,g | 2.88 f,g | 63.63 |
|
See notes to financial highlights at the end of this section.
The accompanying notes are an integral part of these financial statements.
Financial highlights (Continued)
a Per share net investment income (loss) has been determined on the basis of the weighted average number of shares outstanding during the period.
b Amount represents less than $0.01 per share.
c Total return assumes dividend reinvestment and does not reflect the effect of sales charges.
d Includes amounts paid through expense offset and brokerage/service arrangements (Note 2).
e Reflects a non-recurring reimbursement pursuant to a settlement between the Securities and Exchange Commission (the SEC) and Prudential Securities, Inc., which amounted to less than $0.01 per share outstanding on March 30, 2010.
f Reflects an involuntary contractual expense limitation in effect during the period. For periods prior to October 31, 2009, certain fund expenses were waived in connection with the fund’s investment in Putnam Prime Money Market Fund. As a result of such limitation and/or waivers, the expenses of each class reflect a reduction of the following amounts (Note 2):
| |
| | Percentage of |
| | average net assets |
|
| October 31, 2009 | 0.06% |
|
| October 31, 2008 | <0.01 |
|
| October 31, 2007 | <0.01 |
|
| October 31, 2006 | <0.01 |
|
g Reflects a non-recurring reimbursement from Putnam Investments relating to the calculation of certain amounts paid by the fund to Putnam in previous years for transfer agent services, which amounted to less than $0.01 per share and 0.01% of average net assets for the period ended October 31, 2006.
The accompanying notes are an integral part of these financial statements.
36
Notes to financial statements 10/31/10
Note 1: Significant accounting policies
Putnam Convertible Securities Fund (formerly Putnam Convertible Income-Growth Trust) (the fund), is a Massachusetts business trust, which is registered under the Investment Company Act of 1940, as amended, as a diversified open-end management investment company. The investment objective of the fund is to seek with equal emphasis, current income and capital appreciation by investing primarily in U.S. securities that can be converted into or exchanged for common stock. The fund’s secondary objective is conservation of capital. The fund may invest in higher yielding, lower rated bonds that may have a higher rate of default.
The fund offers class A, class B, class C, class M, class R and class Y shares. Class A and class M shares are sold with a maximum front-end sales charge of 5.75% and 3.50%, respectively, and generally do not pay a contingent deferred sales charge. Class B shares, which convert to class A shares after approximately eight years, do not pay a front-end sales charge and are subject to a contingent deferred sales charge if those shares are redeemed within six years of purchase. Class C shares have a one-year 1.00% contingent deferred sales charge and do not convert to class A shares. Class R shares, which are offered to qualified employee-benefit plans, are sold at net asset value. The expenses for class A, class B, class C, class M and class R shares may differ based on the distribution fee of each class, which is identified in Note 2. Class Y shares, which are sold at net asset value, are generally subject to the same expenses as class A, class B, class C, class M and class R shares, but do not bear a distribution fee. Class Y shares are generally only available to corporate and institutional clients and clients in other approved programs.
Prior to August 2, 2010, a 1.00% redemption fee applied on any shares that were redeemed (either by selling or exchanging into another fund) within 7 days of purchase. Effective August 2, 2010, this redemption fee may apply on any shares that are redeemed (either by selling or exchanging into another fund) within 30 days of purchase. The redemption fee is accounted for as an addition to paid-in-capital.
Investment income, realized and unrealized gains and losses and expenses of the fund are borne pro-rata based on the relative net assets of each class to the total net assets of the fund, except that each class bears expenses unique to that class (including the distribution fees applicable to such classes). Each class votes as a class only with respect to its own distribution plan or other matters on which a class vote is required by law or determined by the Trustees. If the fund were liquidated, shares of each class would receive their pro-rata share of the net assets of the fund. In addition, the Trustees declare separate dividends on each class of shares.
In the normal course of business, the fund enters into contracts that may include agreements to indemnify another party under given circumstances. The fund’s maximum exposure under these arrangements is unknown as this would involve future claims that may be, but have not yet been, made against the fund. However, the fund’s management team expects the risk of material loss to be remote.
The following is a summary of significant accounting policies consistently followed by the fund in the preparation of its financial statements. The preparation of financial statements is in conformity with accounting principles generally accepted in the United States of America and requires management to make estimates and assumptions that affect the reported amounts of assets and liabilities in the financial statements and the reported amounts of increases and decreases in net assets from operations. Actual results could differ from those estimates. Subsequent events after the Statement of assets and liabilities date through the date that the financial statements were issued have been evaluated in the preparation of the financial statements. Unless otherwise noted, the “reporting period” represents the period from November 1, 2009 through October 31, 2010.
A) Security valuation Investments for which market quotations are readily available are valued at the last reported sales price on their principal exchange, or official closing price for certain markets and are classified as Level 1 securities. If no sales are reported — as in the case of some securities traded over-the-counter — a security is valued at its last reported bid price and is generally categorized as a Level 2 security.
Market quotations are not considered to be readily available for certain debt obligations; such investments are valued on the basis of valuations furnished by an independent pricing service approved by the Trustees or dealers selected by Putnam Investment Management, LLC (Putnam Management), the fund’s manager, an indirect wholly-owned subsidiary of Putnam Investments, LLC. Such services or dealers determine valuations for normal institutional-size trading units of such securities using methods based on market transactions for comparable securities and various relationships, generally recognized by institutional traders, between securities (which considers such factors as security prices, yields, maturities and ratings). These securities will generally be categorized as Level 2.
37
Many securities markets and exchanges outside the U.S. close prior to the close of the New York Stock Exchange and therefore the closing prices for securities in such markets or on such exchanges may not fully reflect events that occur after such close but before the close of the New York Stock Exchange. Accordingly, on certain days, the fund will fair value foreign equity securities taking into account multiple factors including movements in the U.S. securities markets, currency valuations and comparisons to the valuation of American Depository Receipts, exchange-traded funds and futures contracts. These securities, which will generally represent a transfer from a Level 1 to a Level 2 security, will be classified as Level 2. The number of days on which fair value prices will be used will depend on market activity and it is possible that fair value prices will be used by the fund to a significant extent. Securities quoted in foreign currencies, if any, are translated into U.S. dollars at the current exchange rate.
To the extent a pricing service or dealer is unable to value a security or provides a valuation that Putnam Management does not believe accurately reflects the security’s fair value, the security will be valued at fair value by Putnam Management. Certain investments, including certain restricted and illiquid securities and derivatives, are also valued at fair value following procedures approved by the Trustees. These valuations consider such factors as significant market or specific security events such as interest rate or credit quality changes, various relationships with other securities, discount rates, U.S. Treasury, U.S. swap and credit yields, index levels, convexity exposures and recovery rates. These securities are classified as Level 2 or as Level 3 depending on the priority of the significant inputs.
Such valuations and procedures are reviewed periodically by the Trustees. The fair value of securities is generally determined as the amount that the fund could reasonably expect to realize from an orderly disposition of such securities over a reasonable period of time. By its nature, a fair value price is a good faith estimate of the value of a security in a current sale and does not reflect an actual market price, which may be different by a material amount.
B) Joint trading account Pursuant to an exemptive order from the Securities and Exchange Commission (the SEC), the fund may transfer uninvested cash balances, including cash collateral received under security lending arrangements, into a joint trading account along with the cash of other registered investment companies and certain other accounts managed by Putnam Management. These balances may be invested in issues of short-term investments having maturities of up to 397 days for collateral received under security lending arrangements and up to 90 days for other cash investments.
C) Security transactions and related investment income Security transactions are recorded on the trade date (the date the order to buy or sell is executed). Gains or losses on securities sold are determined on the identified cost basis.
Interest income is recorded on the accrual basis. Dividend income, net of applicable withholding taxes, is recognized on the ex-dividend date except that certain dividends from foreign securities, if any, are recognized as soon as the fund is informed of the ex-dividend date. Non-cash dividends, if any, are recorded at the fair market value of the securities received. Dividends representing a return of capital or capital gains, if any, are reflected as a reduction of cost and/or as a realized gain. All premiums/discounts are amortized/accreted on a yield-to-maturity basis.
D) Securities lending The fund may lend securities, through its agent, to qualified borrowers in order to earn additional income. The loans are collateralized by cash in an amount at least equal to the market value of the securities loaned. The market value of securities loaned is determined daily and any additional required collateral is allocated to the fund on the next business day. The risk of borrower default will be borne by the fund’s agent; the fund will bear the risk of loss with respect to the investment of the cash collateral. Income from securities lending is included in investment income on the Statement of operations. Effective August 2010, cash collateral is invested in Putnam Cash Collateral Pool, LLC, a limited liability company managed by an affiliate of Putnam Management and is valued at its closing net asset value each business day. There are no management fees charged by Putnam Cash C ollateral Pool, LLC. At the close of the reporting period, the value of securities loaned amounted to $13,384,095 and the fund received cash collateral of $13,712,525.
E) Interfund lending Effective July 2010, the fund, along with other Putnam funds, may participate in an interfund lending program pursuant to an exemptive order issued by the SEC. This program allows the fund to borrow from or lend to other Putnam funds that permit such transactions. Interfund lending transactions are subject to each fund’s investment policies and borrowing and lending limits. Interest earned or paid on the interfund lending transaction will be based on the average of certain current market rates. During the reporting period, the fund did not utilize the program.
F) Line of credit Effective July 2010, the fund participates, along with other Putnam funds, in a $285 million unsecured committed line of credit and a $165 million unsecured uncommitted line of credit, both provided by State Street Bank and Trust Company (State Street). Borrowings may be made for temporary or emergency purposes,
38
including the funding of shareholder redemption requests and trade settlements. Interest is charged to the fund based on the fund’s borrowing at a rate equal to the Federal Funds rate plus 1.25% for the committed line of credit and the Federal Funds rate plus 1.30% for the uncommitted line of credit. A closing fee equal to 0.03% of the committed line of credit and $100,000 for the uncommitted line of credit has been paid by the participating funds. In addition, a commitment fee of 0.15% per annum on any unutilized portion of the committed line of credit is allocated to the participating funds based on their relative net assets and paid quarterly. During the reporting period, the fund had no borrowings against these arrangements.
G) Federal taxes It is the policy of the fund to distribute all of its taxable income within the prescribed time period and otherwise comply with the provisions of the Internal Revenue Code of 1986, as amended (the Code), applicable to regulated investment companies. It is also the intention of the fund to distribute an amount sufficient to avoid imposition of any excise tax under Section 4982 of the Code. The fund is subject to the provisions of Accounting Standards Codification ASC 740 Income Taxes (ASC 740). ASC 740 sets forth a minimum threshold for financial statement recognition of the benefit of a tax position taken or expected to be taken in a tax return. The fund did not have a liability to record for any unrecognized tax benefits in the accompanying financial statements. No provision has been made for federal taxes on inco me, capital gains or unrealized appreciation on securities held nor for excise tax on income and capital gains. Each of the fund’s federal tax returns for the prior three fiscal years remains subject to examination by the Internal Revenue Service.
At October 31, 2010, the fund had a capital loss carryover of $137,180,244 available to the extent allowed by the Code to offset future net capital gain, if any. The amounts of the carryovers and the expiration dates are:
| | |
| Loss carryover | | Expiration |
|
| $30,918,383 | | October 31, 2016 |
|
| 106,261,861 | | October 31, 2017 |
|
H) Distributions to shareholders Distributions to shareholders from net investment income are recorded by the fund on the ex-dividend date. Distributions from capital gains, if any, are recorded on the ex-dividend date and paid at least annually. The amount and character of income and gains to be distributed are determined in accordance with income tax regulations, which may differ from generally accepted accounting principles. These differences include temporary and/or permanent differences of the expiration of a capital loss carryover, defaulted bond interest and amortization and accretion. Reclassifications are made to the fund’s capital accounts to reflect income and gains available for distribution (or available capital loss carryovers) under income tax regulations. For the reporting period ended, the fund reclassified $1,335,608 to increase undistributed net investment income and $15,224,758 to decrease paid-in-capital, with a decrease to accumulated net rea lized losses of $13,889,150.
The tax basis components of distributable earnings and the federal tax cost as of the close of the reporting period were as follows:
| |
| Unrealized appreciation | $82,385,274 |
| Unrealized depreciation | (26,161,603) |
|
| Net unrealized appreciation | 56,223,671 |
| Undistributed ordinary income | 15,064,136 |
| Capital loss carryforward | (137,180,244) |
| Cost for federal income tax purposes | $604,450,136 |
Note 2: Management fee, administrative services and other transactions
Effective January 1, 2010, the fund pays Putnam Management a management fee (based on the fund’s average net assets and computed and paid monthly) at annual rates that may vary based on the average of the aggregate net assets of most open-end funds, as defined in the fund’s management contract, sponsored by Putnam Management. Such annual rates may vary as follows: 0.780% of the first $5 billion, 0.730% of the next $5 billion, 0.680% of the next $10 billion, 0.630% of the next $10 billion, 0.580% of the next $50 billion, 0.560% of the next $50 billion, 0.550% of the next $100 billion, and 0.545% of any excess thereafter.
Prior to January 1, 2010, the fund paid Putnam Management for management and investment advisory services quarterly based on the average net assets of the fund. Such fee was based on the following annual rates: 0.65% of the first $500 million of average net assets, 0.55% of the next $500 million, 0.50% of the next $500 million, 0.45%
39
of the next $5 billion, 0.425% of the next $5 billion, 0.405% of the next $5 billion, 0.39% of the next $5 billion, and 0.38% of any excess thereafter.
Putnam Management has contractually agreed, through June 30, 2011, to waive fees or reimburse the fund’s expenses to the extent necessary to limit the cumulative expenses of the fund, exclusive of brokerage, interest, taxes, investment-related expenses, extraordinary expenses and payments under the fund’s investor servicing contract, investment management contract and distribution plans, on a fiscal year-to-date basis to an annual rate of 0.20% of the fund’s average net assets over such fiscal year-to-date period. During the reporting period, the fund’s expenses were not reduced as a result of this limit.
Effective February 28, 2010, Putnam Investments Limited (PIL), an affiliate of Putnam Management, is authorized by the Trustees to manage a separate portion of the assets of the fund as determined by Putnam Management from time to time. Putnam Management pays a quarterly sub-management fee to PIL for its services at an annual rate of 0.35% of the average net assets of the portion of the fund managed by PIL.
The fund reimburses Putnam Management an allocated amount for the compensation and related expenses of certain officers of the fund and their staff who provide administrative services to the fund. The aggregate amount of all such reimbursements is determined annually by the Trustees.
Custodial functions for the fund’s assets are provided by State Street. Custody fees are based on the fund’s asset level, the number of its security holdings and transaction volumes.
Putnam Investor Services, Inc., an affiliate of Putnam Management, provides investor servicing agent functions to the fund. Putnam Investor Services, Inc. received fees for investor servicing based on the fund’s retail asset level, the number of shareholder accounts in the fund and the level of defined contribution plan assets in the fund. Investor servicing fees will not exceed an annual rate of 0.375% of the fund’s average net assets. The amounts incurred for investor servicing agent functions during the reporting period are included in Investor servicing fees in the Statement of operations.
The fund has entered into expense offset arrangements with Putnam Investor Services, Inc. and State Street whereby Putnam Investor Services, Inc.’s and State Street’s fees are reduced by credits allowed on cash balances. The fund also reduced expenses through brokerage/service arrangements. For the reporting period, the fund’s expenses were reduced by $3,094 under the expense offset arrangements and by $14,687 under the brokerage/ service arrangements.
Each independent Trustee of the fund receives an annual Trustee fee, of which $448, as a quarterly retainer, has been allocated to the fund, and an additional fee for each Trustees meeting attended. Trustees also are reimbursed for expenses they incur relating to their services as Trustees.
The fund has adopted a Trustee Fee Deferral Plan (the Deferral Plan) which allows the Trustees to defer the receipt of all or a portion of Trustees fees payable on or after July 1, 1995. The deferred fees remain invested in certain Putnam funds until distribution in accordance with the Deferral Plan.
The fund has adopted an unfunded noncontributory defined benefit pension plan (the Pension Plan) covering all Trustees of the fund who have served as a Trustee for at least five years and were first elected prior to 2004. Benefits under the Pension Plan are equal to 50% of the Trustee’s average annual attendance and retainer fees for the three years ended December 31, 2005. The retirement benefit is payable during a Trustee’s lifetime, beginning the year following retirement, for the number of years of service through December 31, 2006. Pension expense for the fund is included in Trustee compensation and expenses in the Statement of operations. Accrued pension liability is included in Payable for Trustee compensation and expenses in the Statement of assets and liabilities. The Trustees have terminated the Pension Plan with respect to any Trustee first elected after 2003.
The fund has adopted distribution plans (the Plans) with respect to its class A, class B, class C, class M and class R shares pursuant to Rule 12b-1 under the Investment Company Act of 1940. The purpose of the Plans is to compensate Putnam Retail Management Limited Partnership, a wholly-owned subsidiary of Putnam Investments, LLC and Putnam Retail Management GP, Inc., for services provided and expenses incurred in distributing shares of the fund. The Plans provide for payments by the fund to Putnam Retail Management Limited Partnership at an annual rate of up to 0.35%, 1.00%, 1.00%, 1.00% and 1.00% of the average net assets attributable to class A, class B, class C, class M and class R shares, respectively. The Trustees have approved payment by the fund at an annual rate of 0.25%, 1.00%, 1.00%, 0.75% and 0.50% of the average net assets attributable to class A, class B, class C, class M and class R shares, respectively.
40
For the reporting period, Putnam Retail Management Limited Partnership, acting as underwriter, received net commissions of $62,160 and $619 from the sale of class A and class M shares, respectively, and received $10,949 and $2,916 in contingent deferred sales charges from redemptions of class B and class C shares, respectively.
A deferred sales charge of up to 1.00% and 0.65% is assessed on certain redemptions of class A and class M shares, respectively. For the reporting period, Putnam Retail Management Limited Partnership, acting as underwriter, received $333 and no monies on class A and class M redemptions, respectively.
Note 3: Purchases and sales of securities
During the reporting period, cost of purchases and proceeds from sales of investment securities other than short-term investments aggregated $437,474,523 and $508,542,840, respectively. There were no purchases or proceeds from sales of long-term U.S. government securities.
Note 4: Capital shares
At the close of the reporting period, there was an unlimited number of shares of beneficial interest authorized.
Transactions in capital shares were as follows:
| | | | |
| | Year ended 10/31/10 | Year ended 10/31/09 |
|
| Class A | Shares | Amount | Shares | Amount |
|
| Shares sold | 2,541,182 | $45,844,454 | 7,390,655 | $94,867,615 |
|
| Shares issued in connection with | | | | |
| reinvestment of distributions | 700,776 | 12,605,015 | 990,049 | 13,331,758 |
|
| | 3,241,958 | 58,449,469 | 8,380,704 | 108,199,373 |
|
| Shares repurchased | (6,295,360) | (112,190,720) | (11,709,379) | (155,524,573) |
|
| Net decrease | (3,053,402) | $(53,741,251) | (3,328,675) | $(47,325,200) |
|
| |
| | Year ended 10/31/10 | Year ended 10/31/09 |
|
| Class B | Shares | Amount | Shares | Amount |
|
| Shares sold | 82,899 | $1,470,768 | 187,380 | $2,480,046 |
|
| Shares issued in connection with | | | | |
| reinvestment of distributions | 12,951 | 228,871 | 25,915 | 339,236 |
|
| | 95,850 | 1,699,639 | 213,295 | 2,819,282 |
|
| Shares repurchased | (349,549) | (6,131,790) | (555,275) | (7,265,671) |
|
| Net decrease | (253,699) | $(4,432,151) | (341,980) | $(4,446,389) |
|
| |
| | Year ended 10/31/10 | Year ended 10/31/09 |
|
| Class C | Shares | Amount | Shares | Amount |
|
| Shares sold | 515,068 | $9,195,663 | 1,820,929 | $24,060,853 |
|
| Shares issued in connection with | | | | |
| reinvestment of distributions | 33,555 | 598,295 | 53,698 | 725,497 |
|
| | 548,623 | 9,793,958 | 1,874,627 | 24,786,350 |
|
| Shares repurchased | (1,038,964) | (18,372,050) | (1,088,196) | (14,570,144) |
|
| Net increase (decrease) | (490,341) | $(8,578,092) | 786,431 | $10,216,206 |
|
41
| | | | |
| | Year ended 10/31/10 | Year ended 10/31/09 |
|
| Class M | Shares | Amount | Shares | Amount |
|
| Shares sold | 33,786 | $598,285 | 141,545 | $1,929,497 |
|
| Shares issued in connection with | | | | |
| reinvestment of distributions | 5,817 | 103,770 | 7,724 | 104,656 |
|
| | 39,603 | 702,055 | 149,269 | 2,034,153 |
|
| Shares repurchased | (71,054) | (1,255,034) | (129,223) | (1,873,118) |
|
| Net increase (decrease) | (31,451) | $(552,979) | 20,046 | $161,035 |
|
| |
| | Year ended 10/31/10 | Year ended 10/31/09 |
|
| Class R | Shares | Amount | Shares | Amount |
|
| Shares sold | 63,606 | $1,136,196 | 49,672 | $661,054 |
|
| Shares issued in connection with | | | | |
| reinvestment of distributions | 4,814 | 86,441 | 5,694 | 77,016 |
|
| | 68,420 | 1,222,637 | 55,366 | 738,070 |
|
| Shares repurchased | (55,456) | (993,788) | (70,101) | (932,508) |
|
| Net increase (decrease) | 12,964 | $228,849 | (14,735) | $(194,438) |
|
| |
| | Year ended 10/31/10 | Year ended 10/31/09 |
|
| Class Y | Shares | Amount | Shares | Amount |
|
| Shares sold | 1,777,906 | $32,235,455 | 3,455,114 | $48,818,687 |
|
| Shares issued in connection with | | | | |
| reinvestment of distributions | 55,252 | 994,380 | 79,057 | 1,078,765 |
|
| | 1,833,158 | 33,229,835 | 3,534,171 | 49,897,452 |
|
| Shares repurchased | (1,875,351) | (33,394,941) | (873,692) | (12,215,321) |
|
| Net increase (decrease) | (42,193) | $(165,106) | 2,660,479 | $37,682,131 |
|
Note 5: Summary of derivative activity
The following is a summary of the market values of derivative instruments as of the close of the reporting period:
Market values of derivative instruments as of the close of the reporting period
| | | | |
| | Asset derivatives | Liability derivatives |
|
| Derivatives not | | | | |
| accounted for as | Statement of | | Statement of | |
| hedging instruments | assets and | | assets and | |
| under ASC 815 | liabilities location | Market value | liabilities location | Market value |
|
| |
| Equity contracts | Investments | $195,413 | Payables | $— |
|
| Total | | $195,413 | | $— |
|
The following is a summary of change in unrealized gains or losses of derivative instruments on the Statement of operations for the reporting period (see Note 1) (there were no realized gains or losses on derivative instruments):
Change in unrealized appreciation or (depreciation) on derivatives recognized in net gain or (loss) on investments
| | |
| Derivatives not accounted for as hedging | | |
| instruments under ASC 815 | Warrants | Total |
|
| Equity contracts | $(21,713) | $(21,713) |
|
| Total | $(21,713) | $(21,713) |
|
42
Note 6: Investment in Putnam Money Market Liquidity Fund
The fund invested in Putnam Money Market Liquidity Fund, an open-end management investment company managed by Putnam Management. Investments in Putnam Money Market Liquidity Fund are valued at its closing net asset value each business day. Income distributions earned by the fund are recorded as interest income in the Statement of operations and totaled $18,747 for the reporting period. During the reporting period, cost of purchases and proceeds of sales of investments in Putnam Money Market Liquidity Fund aggregated $223,882,885 and $231,371,081, respectively. Management fees charged to Putnam Money Market Liquidity Fund have been waived by Putnam Management.
Note 7: Regulatory matters and litigation
In late 2003 and 2004, Putnam Management settled charges brought by the SEC and the Massachusetts Securities Division in connection with excessive short-term trading in Putnam funds. Distribution of payments from Putnam Management to certain open-end Putnam funds and their shareholders is expected to be completed in the next several months. These allegations and related matters have served as the general basis for certain lawsuits, including purported class action lawsuits against Putnam Management and, in a limited number of cases, some Putnam funds. Putnam Management believes that these lawsuits will have no material adverse effect on the funds or on Putnam Management’s ability to provide investment management services. In addition, Putnam Management has agreed to bear any costs incurred by the Putnam funds as a result of these matters.
Note 8: Market and credit risk
In the normal course of business, the fund trades financial instruments and enters into financial transactions where risk of potential loss exists due to changes in the market (market risk) or failure of the contracting party to the transaction to perform (credit risk). The fund may be exposed to additional credit risk that an institution or other entity with which the fund has unsettled or open transactions will default.
43
Federal tax information (Unaudited)
The fund designated 34.23% of ordinary income distributions as qualifying for the dividends received deduction for corporations.
For its tax year ended October 31, 2010, the fund hereby designates 40.36%, or the maximum amount allowable, of its taxable ordinary income distributions as qualified dividends taxed at the individual net capital gain rates.
For the tax year ended October 31, 2010, pursuant to §871(k) of the Internal Revenue Code, the fund hereby designates $14,578,509 of distributions paid as qualifying to be taxed as interest-related dividends, and no monies to be taxed as short-term capital gain dividends for nonresident alien shareholders.
The Form 1099 that will be mailed to you in January 2011 will show the tax status of all distributions paid to your account in calendar 2010.
44
Shareholder meeting results (Unaudited)
November 19, 2009 meeting
At the meeting, each of the nominees for Trustees was elected, as follows:
| | |
| | Votes for | Votes withheld |
|
| Ravi Akhoury | 30,343,121 | 1,074,427 |
|
| Jameson A. Baxter | 30,342,110 | 1,075,438 |
|
| Charles B. Curtis | 30,331,098 | 1,086,450 |
|
| Robert J. Darretta | 30,356,867 | 1,060,681 |
|
| Myra R. Drucker | 30,341,334 | 1,076,214 |
|
| John A. Hill | 30,326,341 | 1,091,207 |
|
| Paul L. Joskow | 30,330,984 | 1,086,564 |
|
| Elizabeth T. Kennan* | 30,327,589 | 1,089,959 |
|
| Kenneth R. Leibler | 30,326,722 | 1,090,826 |
|
| Robert E. Patterson | 30,341,154 | 1,076,394 |
|
| George Putnam, III | 30,334,470 | 1,083,078 |
|
| Robert L. Reynolds | 30,348,125 | 1,069,423 |
|
| W. Thomas Stephens | 30,330,792 | 1,086,756 |
|
| Richard B. Worley | 30,339,947 | 1,077,601 |
|
* Dr. Kennan retired from the Board of Trustees of the Putnam funds effective June 30, 2010.
A proposal to approve a new management contract between the fund and Putnam Management was approved as follows:
| | | |
| Votes | Votes | | Broker |
| for | against | Abstentions | non-votes |
|
| 19,979,861 | 755,728 | 824,262 | 9,857,697 |
|
All tabulations are rounded to the nearest whole number.
45
About the Trustees
Independent Trustees
| | |
| Name | | |
| Year of birth | | |
| Position held | Principal occupations during past five years | Other directorships |
|
| Ravi Akhoury | Advisor to New York Life Insurance Company. Trustee of | Jacob Ballas Capital |
| Born 1947 | American India Foundation and of the Rubin Museum. | India, a non-banking |
| Trustee since 2009 | From 1992 to 2007, was Chairman and CEO of MacKay | finance company |
| | Shields, a multi-product investment management firm | focused on private |
| | with over $40 billion in assets under management. | equity advisory services |
|
| Barbara M. Baumann | President and Owner of Cross Creek Energy Corporation, | SM Energy Company, |
| Born 1955 | a strategic consultant to domestic energy firms and direct | a publicly held energy |
| Trustee since 2010 | investor in energy assets. Trustee, and Co-Chair of the | company focused on |
| | Finance Committee, of Mount Holyoke College. Former | natural gas and crude |
| | Chair and current board member of Girls Incorporated of | oil in the United States; |
| | Metro Denver. Member of the Finance Committee, The | UniSource Energy |
| | Children’s Hospital of Denver. | Corporation, a publicly |
| | | held provider of natural |
| | | gas and electric service |
| | | across Arizona; Cody |
| | | Resources Management, |
| | | LLP, a privately held |
| | | energy, ranching, and |
| | | commercial real estate |
| | | company |
|
| Jameson A. Baxter | President of Baxter Associates, Inc., a private investment | ASHTA Chemicals, Inc. |
| Born 1943 | firm. Chairman of Mutual Fund Directors Forum. | |
| Trustee since 1994 and | Chairman Emeritus of the Board of Trustees of Mount | |
| Vice Chairman since 2005 | Holyoke College. | |
|
| Charles B. Curtis | President Emeritus of the Nuclear Threat Initiative, a | Edison International; |
| Born 1940 | private foundation dealing with national security issues. | Southern California |
| Trustee since 2001 | Senior Advisor to the United Nations Foundation. Senior | Edison |
| | Advisor to the Center for Strategic and International | |
| Studies. Member of the Council on Foreign Relations and | |
| | the National Petroleum Council. | |
|
| Robert J. Darretta | Health Care Industry Advisor to Permira, a global private | United-Health |
| Born 1946 | equity firm. Until April 2007, was Vice Chairman of the | Group, a diversified |
| Trustee since 2007 | Board of Directors of Johnson & Johnson. Served as | health-care company |
| Johnson & Johnson’s Chief Financial Officer for a decade. | |
|
| Myra R. Drucker | Vice Chair of the Board of Trustees of Sarah Lawrence | Grantham, Mayo, |
| Born 1948 | College, and a member of the Investment Committee of | Van Otterloo & Co., |
| Trustee since 2004 | the Kresge Foundation, a charitable trust. Advisor to the | LLC, an investment |
| | Employee Benefits Investment Committee of The Boeing | management company |
| Company. Retired in 2009 as Chair of the Board of Trustees | |
| of Commonfund, a not-for-profit firm that manages assets | |
| for educational endowments and foundations. Until July | |
| 2010, Advisor to RCM Capital Management and member of | |
| | the Board of Interactive Data Corporation. | |
|
| John A. Hill | Founder and Vice-Chairman of First Reserve | Devon Energy |
| Born 1942 | Corporation, the leading private equity buyout firm | Corporation, a leading |
| Trustee since 1985 and | focused on the worldwide energy industry. Serves as a | independent natural gas |
| Chairman since 2000 | Trustee and Chairman of the Board of Trustees of Sarah | and oil exploration and |
| | Lawrence College. Also a member of the Advisory Board | production company |
| | of the Millstein Center for Corporate Governance and | |
| | Performance at the Yale School of Management. | |
|
46
| | |
| Name | | |
| Year of birth | | |
| Position held | Principal occupations during past five years | Other directorships |
|
| Paul L. Joskow | Economist and President of the Alfred P. Sloan | TransCanada |
| Born 1947 | Foundation, a philanthropic institution focused primarily | Corporation, an energy |
| Trustee since 1997 | on research and education on issues related to science, | company focused on |
| | technology, and economic performance. Elizabeth and | natural gas transmission |
| | James Killian Professor of Economics and Management, | and power services; |
| | Emeritus at the Massachusetts Institute of Technology | Exelon Corporation, an |
| | (MIT). Prior to 2007, served as the Director of the Center | energy company focused |
| | for Energy and Environmental Policy Research at MIT. | on power services |
|
| Kenneth R. Leibler | Founder and former Chairman of Boston Options | Northeast Utilities, |
| Born 1949 | Exchange, an electronic marketplace for the trading | which operates New |
| Trustee since 2006 | of derivative securities. Vice Chairman of the Board of | England’s largest energy |
| | Trustees of Beth Israel Deaconess Hospital in Boston, | delivery system |
| Massachusetts. Until November 2010, director of Ruder | |
| Finn Group, a global communications and advertising firm. | |
|
| Robert E. Patterson | Senior Partner of Cabot Properties, LP and Co-Chairman | None |
| Born 1945 | of Cabot Properties, Inc., a private equity firm investing in | |
| Trustee since 1984 | commercial real estate. Past Chairman and Trustee of the | |
| | Joslin Diabetes Center. | |
|
| George Putnam, III | Chairman of New Generation Research, Inc., a publisher | None |
| Born 1951 | of financial advisory and other research services, and | |
| Trustee since 1984 | founder and President of New Generation Advisors, LLC, | |
| | a registered investment advisor to private funds. | |
| Director of The Boston Family Office, LLC, a registered | |
| | investment advisor. | |
|
| W. Thomas Stephens | Retired as Chairman and Chief Executive Officer of Boise | TransCanada |
| Born 1942 | Cascade, LLC, a paper, forest products, and timberland | Corporation, an energy |
| Trustee from 1997 to 2008 | assets company, in December 2008. | company focused on |
| and since 2009 | | natural gas transmission |
| | | and power services |
|
| Richard B. Worley | Managing Partner of Permit Capital LLC, an investment | Neuberger Berman, |
| Born 1945 | management firm. Serves as a Trustee of the University of | an investment |
| Trustee since 2004 | Pennsylvania Medical Center, the Robert Wood Johnson | management firm |
| | Foundation, a philanthropic organization devoted to | |
| health-care issues, and the National Constitution Center. | |
| | Also serves as a Director of the Colonial Williamsburg | |
| Foundation, a historical preservation organization, and as | |
| | Chairman of the Philadelphia Orchestra Association. | |
|
| Interested Trustee | | |
|
| Robert L. Reynolds* | President and Chief Executive Officer of Putnam | None |
| Born 1952 | Investments since 2008. Prior to joining Putnam | |
| Trustee since 2008 and | Investments, served as Vice Chairman and Chief | |
| President of the Putnam | Operating Officer of Fidelity Investments from | |
| Funds since July 2009 | 2000 to 2007. | |
|
The address of each Trustee is One Post Office Square, Boston, MA 02109.
As of October 31, 2010, there were 104 Putnam funds. All Trustees serve as Trustees of all Putnam funds.
Each Trustee serves for an indefinite term, until his or her resignation, retirement at age 72, removal, or death.
* Mr. Reynolds is an “interested person” (as defined in the Investment Company Act of 1940) of the fund, Putnam Management, and/or Putnam Retail Management. He is President and Chief Executive Officer of Putnam Investments, as well as the President of your fund and each of the other Putnam funds.
47
Officers
In addition to Robert L. Reynolds, the other officers of the fund are shown below:
| |
| Jonathan S. Horwitz (Born 1955) | Francis J. McNamara, III (Born 1955) |
| Executive Vice President, Principal Executive | Vice President and Chief Legal Officer |
| Officer, Treasurer and Compliance Liaison | Since 2004 |
| Since 2004 | Senior Managing Director, Putnam Investments |
| Senior Vice President and Treasurer, | and Putnam Management |
| The Putnam Funds | |
| | James P. Pappas (Born 1953) |
| Steven D. Krichmar (Born 1958) | Vice President |
| Vice President and Principal Financial Officer | Since 2004 |
| Since 2002 | Managing Director, Putnam Investments and |
| Senior Managing Director, Putnam Investments | Putnam Management |
| and Putnam Management | |
| | Judith Cohen (Born 1945) |
| Janet C. Smith (Born 1965) | Vice President, Clerk and Assistant Treasurer |
| Vice President, Assistant Treasurer and Principal | Since 1993 |
| Accounting Officer | Vice President, Clerk and Assistant Treasurer, |
| Since 2007 | The Putnam Funds |
| Managing Director, Putnam Investments and | |
| Putnam Management | Michael Higgins (Born 1976) |
| | Vice President, Senior Associate Treasurer and |
| Beth S. Mazor (Born 1958) | Assistant Clerk |
| Vice President | Since 2010 |
| Since 2002 | Manager of Finance, Dunkin’ Brands (2008– |
| Managing Director, Putnam Investments and | 2010); Senior Financial Analyst, Old Mutual Asset |
| Putnam Management | Management (2007–2008); Senior Financial |
| | Analyst, Putnam Investments (1999–2007) |
| Robert R. Leveille (Born 1969) | |
| Vice President and Chief Compliance Officer | Nancy E. Florek (Born 1957) |
| Since 2007 | Vice President, Assistant Clerk, |
| Managing Director, Putnam Investments, | Assistant Treasurer and Proxy Manager |
| Putnam Management and Putnam | Since 2000 |
| Retail Management | Vice President, Assistant Clerk, |
| | Assistant Treasurer and Proxy Manager, |
| Mark C. Trenchard (Born 1962) | The Putnam Funds |
| Vice President and BSA Compliance Officer | |
| Since 2002 | Susan G. Malloy (Born 1957) |
| Managing Director, Putnam Investments and | Vice President and Assistant Treasurer |
| Putnam Retail Management | Since 2007 |
| | Managing Director, Putnam Management |
The principal occupations of the officers for the past five years have been with the employers as shown above although in some cases, they have held different positions with such employers. The address of each Officer is One Post Office Square, Boston, MA 02109.
48
Services for shareholders
Investor services
Systematic investment plan Tell us how much you wish to invest regularly — weekly, semimonthly, or monthly — and the amount you choose will be transferred automatically from your checking or savings account. There’s no additional fee for this service, and you can suspend it at any time. This plan may be a great way to save for college expenses or to plan for your retirement.
Please note that regular investing does not guarantee a profit or protect against loss in a declining market. Before arranging a systematic investment plan, consider your financial ability to continue making purchases in periods when prices are low.
Systematic exchange You can make regular transfers from one Putnam fund to another Putnam fund. There are no additional fees for this service, and you can cancel or change your options at any time.
Dividends PLUS You can choose to have the dividend distributions from one of your Putnam funds automatically reinvested in another Putnam fund at no additional charge.
Free exchange privilege You can exchange money between Putnam funds free of charge, as long as they are the same class of shares. A signature guarantee is required if you are exchanging more than $500,000. The fund reserves the right to revise or terminate the exchange privilege.
Reinstatement privilege If you’ve sold Putnam shares or received a check for a dividend or capital gain, you may reinvest the proceeds with Putnam within 90 days of the transaction and they will be reinvested at the fund’s current net asset value — with no sales charge. However, reinstatement of class B shares may have special tax consequences. Ask your financial or tax representative for details.
Check-writing service You have ready access to many Putnam accounts. It’s as simple as writing a check, and there are no special fees or service charges. For more information about the check-writing service, call Putnam or visit our Web site.
Dollar cost averaging When you’re investing for long-term goals, it’s time, not timing, that counts. Investing on a systematic basis is a better strategy than trying to figure out when the markets will go up or down. This means investing the same amount of money regularly over a long period. This method of investing is called dollar cost averaging. When a fund’s share price declines, your investment dollars buy more shares at lower prices. When it increases, they buy fewer shares. Over time, you will pay a lower average price per share.
For more information
Visit the Individual Investors section at putnam.com A secure section of our Web site contains complete information on your account, including balances and transactions, updated daily. You may also conduct transactions, such as exchanges, additional investments, and address changes. Log on today to get your password.
Call us toll free at 1-800-225-1581 Ask a helpful Putnam representative or your financial advisor for details about any of these or other services, or see your prospectus.
49
The Putnam family of funds
The following is a list of Putnam’s open-end mutual funds offered to the public. Investors should carefully consider the investment objective, risks, charges, and expenses of a fund before investing. For a prospectus, or a summary prospectus if available, containing this and other information for any Putnam fund or product, call your financial advisor at 1-800-225-1581 and ask for a prospectus. Please read the prospectus carefully before investing.
| |
| Growth | Value |
| Growth Opportunities Fund | Convertible Securities Fund |
| International Growth Fund | Prior to September 30, 2010, the fund was known as |
| Prior to January 1, 2010, the fund was known as | Putnam Convertible Income-Growth Trust |
| Putnam International New Opportunities Fund | Equity Income Fund |
| Multi-Cap Growth Fund | George Putnam Balanced Fund |
| Prior to September 1, 2010, the fund was known as | Prior to September 30, 2010, the fund was known as |
| Putnam New Opportunities Fund | The George Putnam Fund of Boston |
| Small Cap Growth Fund | The Putnam Fund for Growth and Income |
| Voyager Fund | International Value Fund |
| | Prior to January 1, 2010, the fund was known as |
| Blend | Putnam International Growth and Income Fund |
| Asia Pacific Equity Fund | Multi-Cap Value Fund |
| Capital Opportunities Fund | Prior to September 1, 2010, the fund was known as |
| Capital Spectrum Fund | Putnam Mid Cap Value Fund |
| Emerging Markets Equity Fund | Small Cap Value Fund |
| Equity Spectrum Fund | |
| Europe Equity Fund | Income |
| Global Equity Fund | American Government Income Fund |
| International Capital Opportunities Fund | Diversified Income Trust |
| International Equity Fund | Floating Rate Income Fund |
| Investors Fund | Global Income Trust |
| Multi-Cap Core Fund | High Yield Advantage Fund |
| Research Fund | High Yield Trust |
| Income Fund |
| | Money Market Fund* |
| | U.S. Government Income Trust |
* An investment in a money market fund is not insured or guaranteed by the Federal Deposit Insurance Corporation or any other government agency. Although the fund seeks to preserve the value of your investment at $1.00 per share, it is possible to lose money by investing in the fund.
50
| |
| Tax-free income | Asset allocation |
| AMT-Free Municipal Fund | Income Strategies Fund |
| Tax Exempt Income Fund | Putnam Asset Allocation Funds — three |
| Tax Exempt Money Market Fund* | investment portfolios that spread your |
| Tax-Free High Yield Fund | money across a variety of stocks, bonds, |
| State tax-free income funds: | and money market investments. |
| Arizona, California, Massachusetts, Michigan, | |
| Minnesota, New Jersey, New York, Ohio, | The three portfolios: |
| and Pennsylvania | Asset Allocation: Balanced Portfolio |
| Asset Allocation: Conservative Portfolio |
| Absolute Return | Asset Allocation: Growth Portfolio |
| Absolute Return 100 Fund | |
| Absolute Return 300 Fund | Putnam RetirementReady® |
| Absolute Return 500 Fund | Putnam RetirementReady Funds — 10 |
| Absolute Return 700 Fund | investment portfolios that offer diversifi- |
| | cation among stocks, bonds, and money |
| Global Sector | market instruments and adjust to become |
| Global Consumer Fund | more conservative over time based on a |
| Global Energy Fund | target date for withdrawing assets. |
| Global Financials Fund | |
| Global Health Care Fund | The 10 funds: |
| Global Industrials Fund | Putnam RetirementReady 2055 Fund |
| Global Natural Resources Fund | Putnam RetirementReady 2050 Fund |
| Global Sector Fund | Putnam RetirementReady 2045 Fund |
| Global Technology Fund | Putnam RetirementReady 2040 Fund |
| Global Telecommunications Fund | Putnam RetirementReady 2035 Fund |
| Global Utilities Fund | Putnam RetirementReady 2030 Fund |
| Putnam RetirementReady 2025 Fund |
| | Putnam RetirementReady 2020 Fund |
| | Putnam RetirementReady 2015 Fund |
| | Putnam RetirementReady Maturity Fund |
A short-term trading fee of 1% may apply to redemptions or exchanges from certain funds within the time period specified in the fund's prospectus.
Check your account balances and the most recent month-end performance in the Individual Investors section at putnam.com.
51
Fund information
Founded over 70 years ago, Putnam Investments was built around the concept that a balance between risk and reward is the hallmark of a well-rounded financial program. We manage over 100 funds across income, value, blend, growth, asset allocation, absolute return, and global sector categories.
| | |
| Investment Manager | Myra R. Drucker | Mark C. Trenchard |
| Putnam Investment | Paul L. Joskow | Vice President and |
| Management, LLC | Kenneth R. Leibler | BSA Compliance Officer |
| One Post Office Square | Robert E. Patterson | |
| Boston, MA 02109 | George Putnam, III | Francis J. McNamara, III |
| | Robert L. Reynolds | Vice President and |
| Investment Sub-Manager | W. Thomas Stephens | Chief Legal Officer |
| Putnam Investments Limited | Richard B. Worley | |
| 57–59 St James’s Street | | James P. Pappas |
| London, England SW1A 1LD | Officers | Vice President |
| | Robert L. Reynolds | |
| Marketing Services | President | Judith Cohen |
| Putnam Retail Management | | Vice President, Clerk and |
| One Post Office Square | Jonathan S. Horwitz | Assistant Treasurer |
| Boston, MA 02109 | Executive Vice President, | |
| | Principal Executive | Michael Higgins |
| Custodian | Officer, Treasurer and | Vice President, Senior Associate |
| State Street Bank | Compliance Liaison | Treasurer and Assistant Clerk |
| and Trust Company | | |
| | Steven D. Krichmar | Nancy E. Florek |
| Legal Counsel | Vice President and | Vice President, Assistant Clerk, |
| Ropes & Gray LLP | Principal Financial Officer | Assistant Treasurer and |
| | | Proxy Manager |
| Independent Registered | Janet C. Smith | |
| Public Accounting Firm | Vice President, Assistant | Susan G. Malloy |
| KPMG LLP | Treasurer and Principal | Vice President and |
| | Accounting Officer | Assistant Treasurer |
| Trustees | | |
| John A. Hill, Chairman | Beth S. Mazor | |
| Jameson A. Baxter, | Vice President | |
| Vice Chairman | | |
| Ravi Akhoury | Robert R. Leveille | |
| Barbara M. Baumann | Vice President and | |
| Charles B. Curtis | Chief Compliance Officer | |
| Robert J. Darretta | | |
This report is for the information of shareholders of Putnam Convertible Securities Fund. It may also be used as sales literature when preceded or accompanied by the current prospectus, the most recent copy of Putnam’s Quarterly Performance Summary, and Putnam’s Quarterly Ranking Summary. For more recent performance, please visit putnam.com. Investors should carefully consider the investment objective, risks, charges, and expenses of a fund, which are described in its prospectus. For this and other information or to request a prospectus, or a summary prospectus if available, call 1-800-225-1581 toll free. Please read the prospectus carefully before investing. The fund’s Statement of Additional Information contains additional information about the fund’s Trustees and is available without charge upon request by calling 1-800-225-1581.
52
Item 2. Code of Ethics:
(a) The fund’s principal executive, financial and accounting officers are employees of Putnam Investment Management, LLC, the Fund's investment manager. As such they are subject to a comprehensive Code of Ethics adopted and administered by Putnam Investments which is designed to protect the interests of the firm and its clients. The Fund has adopted a Code of Ethics which incorporates the Code of Ethics of Putnam Investments with respect to all of its officers and Trustees who are employees of Putnam Investment Management, LLC. For this reason, the Fund has not adopted a separate code of ethics governing its principal executive, financial and accounting officers.
(c) In May 2008, the Code of Ethics of Putnam Investment Management, LLC was updated in its entirety to include the amendments adopted in August 2007 as well as a several additional technical, administrative and non-substantive changes. In May of 2009, the Code of Ethics of Putnam Investment Management, LLC was amended to reflect that all employees will now be subject to a 90-day blackout restriction on holding Putnam open-end funds, except for portfolio managers and their supervisors (and each of their immediate family members), who will be subject to a one-year blackout restriction on the funds that they manage or supervise. In June 2010, the Code of Ethics of Putnam Investments was updated in its entirety to include the amendments adopted in May of 2009 and to change certain rules and limits contained in the Code of Ethics. In addition, the updated Code of Ethics included numerous technical, administrative and non-substantive changes, which were int ended primarily to make the document easier to navigate and understand.
Item 3. Audit Committee Financial Expert:
The Funds' Audit and Compliance Committee is comprised solely of Trustees who are "independent" (as such term has been defined by the Securities and Exchange Commission ("SEC") in regulations implementing Section 407 of the Sarbanes-Oxley Act (the "Regulations")). The Trustees believe that each of the members of the Audit and Compliance Committee also possess a combination of knowledge and experience with respect to financial accounting matters, as well as other attributes, that qualify them for service on the Committee. In addition, the Trustees have determined that each of Mr. Patterson, Mr. Leibler, Mr. Hill, Mr. Darretta and Ms. Baumann qualifies as an "audit committee financial expert" (as such term has been defined by the Regulations) based on their review of his or her pertinent experience and education. The SEC has stated that the designation or identification of a person as an audit committee financial expert pursuant to this Item 3 of Form N- CSR does not impose on such person any duties, obligations or liability that are greater than the duties, obligations and liability imposed on such person as a member of the Audit and Compliance Committee and the Board of Trustees in the absence of such designation or identification.
Item 4. Principal Accountant Fees and Services:
The following table presents fees billed in each of the last two fiscal years for services rendered to the fund by the fund’s independent auditor:
| | | | |
| Fiscal | | Audit- | | |
| year | Audit | Related | Tax | All Other |
| ended | Fees | Fees | Fees | Fees |
| |
| October 31, 2010 | $38,072 | $-- | $3,800 | $- |
| October 31, 2009 | $38,389 | $-- | $3,800 | $- |
For the fiscal years ended October 31, 2010 and October 31, 2009, the fund’s independent auditor billed aggregate non-audit fees in the amounts of $ 3,800 and $3,800 respectively, to the fund, Putnam Management and any entity controlling, controlled by or under common control with Putnam Management that provides ongoing services to the fund.
Audit Fees represent fees billed for the fund's last two fiscal years relating to the audit and review of the financial statements included in annual reports and registration statements, and other services that are normally provided in connection with statutory and regulatory filings or engagements.
Audit-Related Fees represent fees billed in the fund’s last two fiscal years for services traditionally performed by the fund’s auditor, including accounting consultation for proposed transactions or concerning financial accounting and reporting standards and other audit or attest services not required by statute or regulation.
Tax Fees represent fees billed in the fund’s last two fiscal years for tax compliance, tax planning and tax advice services. Tax planning and tax advice services include assistance with tax audits, employee benefit plans and requests for rulings or technical advice from taxing authorities.
Pre-Approval Policies of the Audit and Compliance Committee. The Audit and Compliance Committee of the Putnam funds has determined that, as a matter of policy, all work performed for the funds by the funds’ independent auditors will be pre-approved by the Committee itself and thus will generally not be subject to pre-approval procedures.
The Audit and Compliance Committee also has adopted a policy to pre-approve the engagement by Putnam Management and certain of its affiliates of the funds’ independent auditors, even in circumstances where pre-approval is not required by applicable law. Any such requests by Putnam Management or certain of its affiliates are typically submitted in writing to the Committee and explain, among other things, the nature of the proposed engagement, the estimated fees, and why this work should be performed by that particular audit firm as opposed to another one. In reviewing such requests, the Committee considers, among other things, whether the provision of such services by the audit firm are compatible with the independence of the audit firm.
The following table presents fees billed by the fund’s independent auditor for services required to be approved pursuant to paragraph (c)(7)(ii) of Rule 2-01 of Regulation S-X.
| | | | |
| Fiscal | Audit- | | All | Total |
| year | Related | Tax | Other | Non-Audit |
| ended | Fees | Fees | Fees | Fees |
| |
| October 31, 2010 | $ - | $ - | $ - | $ - |
| October 31, 2009 | $ - | $ - | $ - | $ - |
Item 5. Audit Committee of Listed Registrants
Not applicable
Item 6. Schedule of Investments:
The registrant’s schedule of investments in unaffiliated issuers is included in the report to shareholders in Item 1 above.
Item 7. Disclosure of Proxy Voting Policies and Procedures For Closed-End Management Investment Companies:
Not applicable
Item 8. Portfolio Managers of Closed-End Investment Companies
Not Applicable
Item 9. Purchases of Equity Securities by Closed-End Management Investment Companies and Affiliated Purchasers:
Not applicable
Item 10. Submission of Matters to a Vote of Security Holders:
Not applicable
Item 11. Controls and Procedures:
(a) The registrant's principal executive officer and principal financial officer have concluded, based on their evaluation of the effectiveness of the design and operation of the registrant's disclosure controls and procedures as of a date within 90 days of the filing date of this report, that the design and operation of such procedures are generally effective to provide reasonable assurance that information required to be disclosed by the registrant in this report is recorded, processed, summarized and reported within the time periods specified in the Commission's rules and forms.
(b) Changes in internal control over financial reporting: Not applicable
Item 12. Exhibits:
(a)(1) The Code of Ethics of The Putnam Funds, which incorporates the Code of Ethics of Putnam Investments, is filed herewith.
(a)(2) Separate certifications for the principal executive officer and principal financial officer of the registrant as required by Rule 30a-2(a) under the Investment Company Act of 1940, as amended, are filed herewith.
(b) The certifications required by Rule 30a-2(b) under the Investment Company Act of 1940, as amended, are filed herewith.
SIGNATURES
Pursuant to the requirements of the Securities Exchange Act of 1934 and the Investment Company Act of 1940, the registrant has duly caused this report to be signed on its behalf by the undersigned, thereunto duly authorized.
Putnam Convertible Securities Fund
By (Signature and Title):
/s/Janet C. Smith
Janet C. Smith
Principal Accounting Officer
Date: December 29, 2010
Pursuant to the requirements of the Securities Exchange Act of 1934 and the Investment Company Act of 1940, this report has been signed below by the following persons on behalf of the registrant and in the capacities and on the dates indicated.
By (Signature and Title):
/s/Jonathan S. Horwitz
Jonathan S. Horwitz
Principal Executive Officer
Date: December 29, 2010
By (Signature and Title):
/s/Steven D. Krichmar
Steven D. Krichmar
Principal Financial Officer
Date: December 29, 2010