| | |
| UNITED STATES
SECURITIES AND EXCHANGE COMMISSION |
| | |
| CERTIFIED SHAREHOLDER REPORT OF REGISTERED
MANAGEMENT INVESTMENT COMPANIES
|
| | |
| Investment Company Act file number: | (811-02280) |
| | |
| Exact name of registrant as specified in charter: | Putnam Convertible Securities Fund |
| | |
| Address of principal executive offices: | One Post Office Square, Boston, Massachusetts 02109 |
| | |
| Name and address of agent for service: | Robert T. Burns, Vice President
One Post Office Square
Boston, Massachusetts 02109 |
| | |
| Copy to: | John W. Gerstmayr, Esq.
Ropes & Gray LLP
800 Boylston Street
Boston, Massachusetts 02199-3600 |
| | |
| Registrant’s telephone number, including area code: | (617) 292-1000 |
| | |
| Date of fiscal year end: | October 31, 2013 |
| | |
| Date of reporting period : | November 1, 2012 — October 31, 2013 |
| | |
|
Item 1. Report to Stockholders: | |
| | |
| The following is a copy of the report transmitted to stockholders pursuant to Rule 30e-1 under the Investment Company Act of 1940: | |
Putnam
Convertible
Securities Fund
Annual report
10 | 31 | 13
| | | |
| Message from the Trustees | 1 | | |
| | |
| About the fund | 2 | | |
| | |
| Performance snapshot | 4 | | |
| | |
| Interview with your fund’s portfolio managers | 5 | | |
| | |
| Your fund’s performance | 11 | | |
| | |
| Your fund’s expenses | 14 | | |
| | |
| Terms and definitions | 16 | | |
| | |
| Other information for shareholders | 17 | | |
| | |
| Important notice regarding Putnam’s privacy policy | 18 | | |
| | |
| Trustee approval of management contract | 19 | | |
| | |
| Financial statements | 25 | | |
| | |
| Federal tax information | 49 | | |
| | |
| About the Trustees | 50 | | |
| | |
| Officers | 52 | | |
| | |
Consider these risks before investing: Convertible securities prices may fall or fail to rise over time for several reasons, including both general financial market conditions and factors related to a specific company issuer or industry. These risks are generally greater for convertible securities issued by small and/or midsize companies. Convertible securities’ prices may be adversely affected by underlying common stock price changes. While convertible securities tend to provide higher yields than common stocks, the higher yield may not protect against the risk of loss or mitigate any loss associated with a convertible security’s price decline. Convertible securities are subject to credit risk, which is the risk that an issuer of the fund’s investments may default on payment of interest or principal. Credit risk is greater for below-investment-grade convertible securities. Convertible securities may be less sensitive to interest-rate changes than non-convertible bonds because of their structural features (e.g., convertibility, “put” features). Interest-rate risk is generally greater, however, for longer-term bonds and convertible securities whose underlying stock price has fallen significantly below the conversion price. You can lose money by investing in the fund.
Message from the Trustees
Dear Fellow Shareholder:
In the final months of 2013, we continue to see business conditions as generally positive for well-diversified investment portfolios. Financial markets have shown surprising resilience in the face of recent headwinds, most notably the confrontation over the federal budget and debt ceiling, which took a toll on the economy during October. With Congressional negotiations now continuing into 2014, there is hope that lawmakers may reach an agreement beneficial to the economy, even as investors remain alert to the risk of additional disruption.
Fortunately, equity markets have easily overcome recent obstacles. Supported by generally solid corporate earnings and healthy balance sheets, stock market gains to this point are far above the long-term average for a single year. International stocks have also performed well, particularly in Europe and Japan. While bonds have lagged behind stocks, many fixed-income sectors have advanced, reminding investors of the need for flexible and selective approaches. The sting of rising interest rates has been felt primarily by Treasuries and other government bonds.
At Putnam, we believe markets in flux can often provide the best opportunity for realizing the benefits of financial advice and active portfolio management. An experienced advisor can help investors stay focused on their long-term goals without getting distracted by daily economic and political events. Challenging times also call for innovative and alternative investment strategies managed by experts. In seeking returns for fund shareholders, Putnam’s investment professionals engage in fundamental research, active investing, and risk management strategies.
We would like to welcome new shareholders of the fund and to thank you for investing with Putnam. We would also like to extend our thanks to Elizabeth Kennan, who has retired from the Board of Trustees, for her 20 years of dedicated service.

About the fund
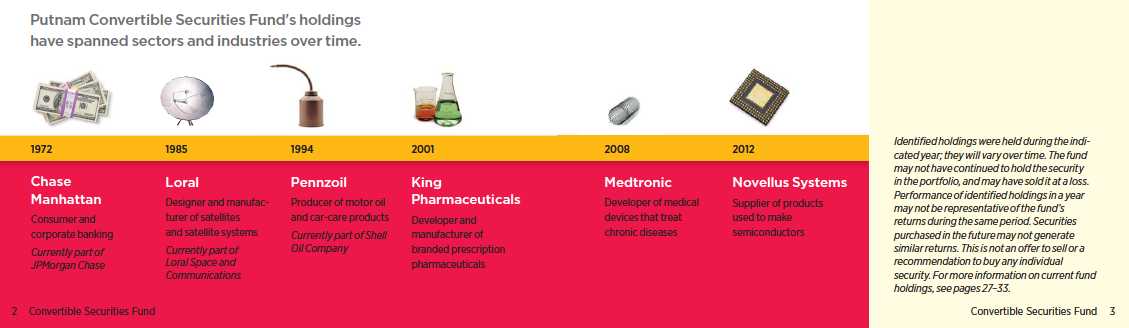
Seeking undervalued companies before their potential is recognized
The differences between bonds and stocks seem fairly clear-cut. Stocks provide an ownership stake in a company; bonds provide a claim on the interest paid by a company or other entity on its debt. The value of stocks rises and falls with factors such as investor sentiment, company news, and economic conditions; bonds are issued by a government, agency, company, or public utility that typically promises to pay the bearer a fixed rate of interest at specified intervals and to return a set amount of money at a specified end date (the maturity date). A bond’s yield and its price are often influenced by interest-rate levels and the issuer’s credit quality.
A convertible security is a hybrid of a stock and a bond. Like a bond, it offers a set rate of interest, but unlike a bond, it has a built-in option that, under certain circumstances, allows the investor to exchange (or convert) the security for a fixed number of shares of stock. This feature offers the potential for capital appreciation, since the preset conversion price does not change as the underlying stock price increases or decreases.
Convertibles are issued by companies and can offer greater returns than high-quality bonds — but they also carry greater risk potential, such as the risk of default or periodic illiquidity. Issuers range from large, well-known S&P 500 corporations and small, rapidly growing companies, to companies in cyclically depressed industries.
Investing successfully in convertible securities requires intensive research and analysis. The fund’s managers are supported by analysts who conduct rigorous fundamental research, seeking to determine the true worth of the issuing company’s business. The managers then construct a portfolio that they believe offers the best return potential while being mindful of risk.
The “busted” convertible
One kind of security in which your fund may invest is the “busted” convertible. “Busted” refers to a security whose underlying stock price has fallen significantly below the conversion price. It becomes much less sensitive to the volatility of the underlying stock and is more bond-like, responding to interest-rate changes. A busted convertible may pay a higher yield than other convertibles, but may also carry a higher level of risk. (Some companies in this situation may eventually default on their bonds.)
The objective of buying a busted convertible is to take advantage of a company’s eventual turnaround despite its present challenges. For example, a company undergoing management turmoil may draw negative investor reactions, causing its stock price to tumble. However, if intensive research determines that the management crisis is likely to be resolved, the fund managers could buy the security at a steep discount. The goal is to sell the security at a higher price when the credit improves or when the stock revives.
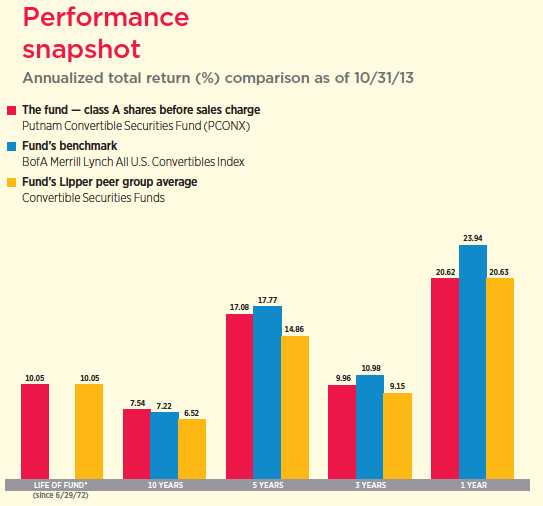
Current performance may be lower or higher than the quoted past performance, which cannot guarantee future results. Share price, principal value, and return will fluctuate, and you may have a gain or a loss when you sell your shares. Performance of class A shares assumes reinvestment of distributions and does not account for taxes. Fund returns in the bar chart do not reflect a sales charge of 5.75%; had they, returns would have been lower. See pages 5 and 11–13 for additional performance information. For a portion of the periods, the fund had expense limitations, without which returns would have been lower. To obtain the most recent month-end performance, visit putnam.com.
* The fund’s benchmark, the BofA Merrill Lynch All U.S. Convertibles Index, was introduced on 12/31/87, which post-dates the inception of the fund’s class A shares.
| |
| 4 | Convertible Securities Fund |
Interview with your fund’s portfolio managers

Convertible bonds showed resiliency amid a rising-interest-rate environment. How did Putnam Convertible Securities Fund perform for the fiscal year ended October 31, 2013?
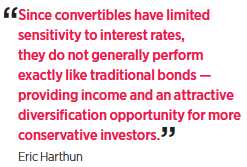
Eric: Convertible bonds rode a wave of rising stock prices to post favorable gains for the period. These gains came despite investor concerns about the pace and eventual withdrawal of the Federal Reserve’s quantitative easing [QE] program and the uptick in interest rates that occurred in the second half of the fiscal year. Since this past May, when the Fed began to hint about plans to draw down its stimulative bond-buying program, convertible securities have proved more resilient than their pure-bond counterparts given their equity-like behavior, which allowed them to capture most of the upside potential of stocks. Furthermore, since convertibles have limited sensitivity to interest rates, they do not generally perform exactly like traditional bonds do and can provide more conservative investors with an attractive opportunity for income and diversification.
For the 12 months ended October 31, 2013, the fund’s class A shares delivered strong double-digit performance that was in line with the average return for its Lipper peer group. However, the fund lagged its benchmark, the BofA Merrill Lynch All U.S. Convertibles Index. We attribute this result to disappointing security selection in the health-care, energy,
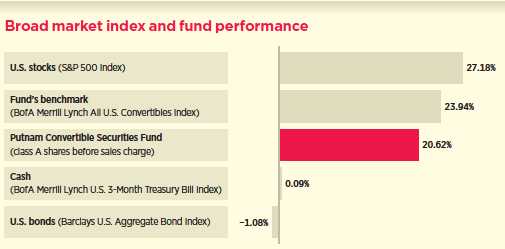
This comparison shows your fund’s performance in the context of broad market indexes for the 12 months ended 10/31/13. See pages 4 and 11–13 for additional fund performance information. Index descriptions can be found on page 17.
| |
| Convertible Securities Fund | 5 |
and consumer cyclicals sectors. Our decision to limit the portfolio’s exposure to health-care investments relative to the benchmark also detracted from performance. However, we thought it would be prudent to limit the portfolio’s exposure to smaller biotechnology companies, since they tend to have limited earnings history and can experience significant spikes or declines in their stock prices in response to announcements about clinical trials and the Food and Drug Administration’s approval processes.
The fund’s overall sector positioning was positive, with momentum coming from an underweight exposure to basic materials, which lagged in response to sluggish global demand. The fund also benefited from strong security selection in communications services and basic materials during the period.
Given the rally in convertible bonds, did you make any significant changes in the fund’s strategy during the period?
Rob: Our strategy for finding attractive investments remained the same, but some of our investment decisions did affect a couple of notable shifts in the portfolio’s sector allocation. During the course of the year, the fund’s weighting in health care increased, although that exposure still remained below that of the benchmark at period-end. We also added to the fund’s holdings in the technology sector. In this sector as with others, we have seen increased convertible bond issuance as a growing number of companies access this market. With the uptick in interest rates this past summer and the rally in equity markets, traditional corporate debt issuance became a slightly less attractive financing option for companies. Alternatively, companies have been turning to convertibles in increasing numbers to finance share
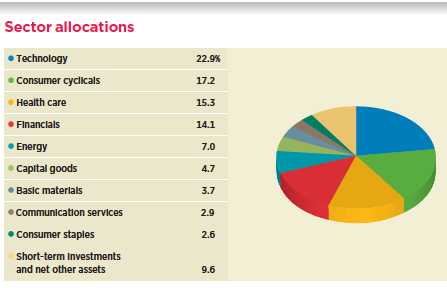
Allocations are shown as a percentage of the fund’s net assets as of 10/31/13. Short-term investments and net other assets, if any, represent the market value weights of cash, derivatives, short-term securities, and other unclassified assets in the portfolio. Summary information may differ from the portfolio schedule included in the financial statements due to the inclusion of derivative securities, any interest accruals, the exclusion of as-of trades, if any, and the use of different classifications of securities for presentation purposes. Holdings and allocations may vary over time.
| |
| 6 | Convertible Securities Fund |
buybacks, merger and acquisition activity, and capital expenditures.
Over the course of the period, we also trimmed the fund’s exposure to financials amid a banner year of performance. The sector enjoyed strong performance for several reasons. First, the eurozone sovereign debt crisis showed signs of improvement, and while the European Union’s recovery remains fragile, we believe the region’s headline risk has eased considerably. Second, U.S. economic growth improved and appears to be edging higher — albeit less robust than many hoped, especially on the jobs front. Improving growth can translate into greater prosperity, creating more demand for financial services.
Third, with the uptick in interest rates since this past spring, the difference between the near-zero rates that financial institutions are still paying for their deposits and the rising rates that they are now earning from their lending activities has produced a generous spread income that has favorably enhanced their profit margins. Finally, accommodative monetary policy across major world economies was supportive of the equity and fixed-income markets.
All these factors created a tailwind for financials during the period and solidified investor interest in the sector. However, with some valuations approaching fair
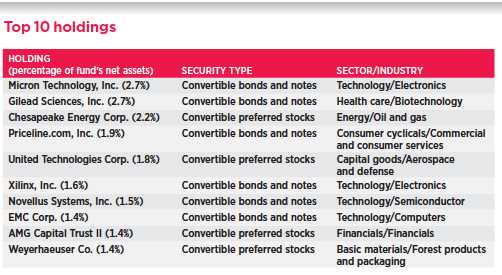
This table shows the fund’s top 10 individual holdings and the percentage of the fund’s net assets that each represented as of 10/31/13. Short-term holdings and derivatives, if any, are excluded. Holdings may vary over time.
| |
| Convertible Securities Fund | 7 |
value and the underlying strength of the U.S. economy making it more likely that interest rates may continue to march higher and potentially depress bond prices, we thought it would be prudent to realize those gains and redistribute the proceeds of those sales to less interest-rate-sensitive investment opportunities.
Could you highlight some holdings or strategies that contributed positively to the fund’s performance for the period?
Eric: As part of our day-to-day management, we attempt to add incremental value by analyzing each holding on its own fundamental merits and then deciding whether to overweight or underweight it in the portfolio relative to the benchmark. Accordingly, two of the fund’s best-performing holdings for the period were products of this approach. That is, our decision to limit the portfolio’s exposure to these two investments, which produced underwhelming performance, helped the fund’s relative performance.
As one of the largest issuers in the convertibles market, Wells Fargo is widely held, and the fund held a noteworthy position in its 7.50% convertible preferred stock earlier in the period. However, with the risk of interest rates rising in the future should the Fed scale back QE, we thought it would be prudent to pare back the position to minimize the price volatility that would likely ensue. This proved wise as the security underperformed for the period.
The stock of Equinix, a global interconnection and data center company, posted disappointing results for the period because of high expectations for growth that were not met. The fund’s convertible position in Equinix has a high correlation, or delta, with the performance of the underlying stock. Thus, our decision to trim the position during the
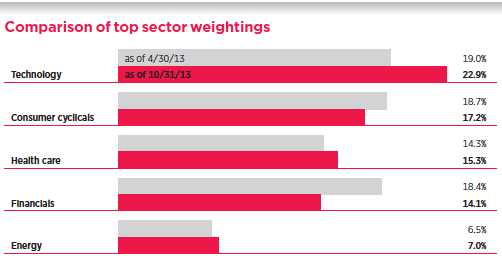
This chart shows the fund’s largest allocation shifts, by percentage, over the past six months. Allocations are shown as a percentage of the fund’s net assets. Current period summary information may differ from the portfolio schedule included in the financial statements due to the inclusion of derivative securities, any interest accruals, the exclusion of as-of trades, if any, and the use of different classifications of securities for presentation purposes. Holdings and allocations may vary over time.
| |
| 8 | Convertible Securities Fund |
course of the year and eventually liquidate the holding was advantageous.
The fund’s investments in Swift Mandatory Common Exchange Trust benefited from stronger-than-expected activity in the shipping/transportation market. Strong operation discipline and effective fleet efficiency also contributed to better earnings.
What holdings or strategies proved most disappointing during the period?
Rob: The fund’s three biggest disappointments also were products of our allocation strategy. In these cases, our concern for company fundamentals or price volatility led us to limit or avoid exposure to an issue that outperformed the market.
The fund’s investment in the outperforming convertible preferred security issued by Gilead Sciences, a biopharmaceutical company, was positive for the fund as the company benefited from a flow of positive data from its human papillomavirus [HPV] pipeline drug. However, our decision to restrict the portfolio’s exposure to Gilead, the largest issuer in the convertible market, limited the fund’s participation in the underlying stock’s positive performance. We had concerns about the company’s near-term prospects due to a looming patent cliff of its preexisting HIV drugs. In addition, the efficacy of the company’s pipeline drugs for Hepatitis C was still undetermined in our opinion, with FDA approval in question.
The stock of Priceline, the leader in online travel, surged during the period on the strength of its European web property, Bookings.com, and in September 2013 it became the first S&P 500 company to hit a four-digit price. While the company is a large convertible issuer with issuance totaling about three percent of the benchmark, we have kept the fund’s exposure limited — focusing primarily on the more balanced convertible bond issue that, we expect, would experience less volatility than the higher-yielding, higher-delta issue.
Finally, we decided to not invest in the volatile, equity-like convertible security issued by Incyte, which delivered strong performance for the period. This small biopharmaceutical firm launched a new drug in 2011 to treat the rare blood cancer myelofibrosis and has many other promising therapies in development. Throughout the period, Incyte raised revenue guidance as a result of better patient acceptance of its drugs in clinical trials.
What is your outlook for convertibles over the next few months?
Eric: Equity returns were a major factor in the fund’s positive performance for the fiscal year, the summer sell-off notwithstanding, and follow on the heels of a general upward trend in the equity markets since 2009. However, we believe there are still pockets of value to be uncovered due to ongoing inefficiencies in the market. Moreover, the revival of issuance in the convertibles market by large- and small-cap companies across a wide spectrum of sectors is creating a diverse pool of investment opportunities.
Regardless of how the equity and credit markets perform in the coming months, we believe the hybrid nature of convertibles offers investors a unique opportunity to tap into the best of both worlds. Convertibles can benefit from both the income and downside protection offered by the convertible’s fixed-income portion, a benefit that eludes investors in common stock. At the same time, convertibles can profit from the potential price appreciation of the issuer’s common stock, a benefit not available to corporate bond investors.
Thank you, Eric and Rob, for your time and insights today.
| |
| Convertible Securities Fund | 9 |
The views expressed in this report are exclusively those of Putnam Management and are subject to change. They are not meant as investment advice.
Please note that the holdings discussed in this report may not have been held by the fund for the entire period. Portfolio composition is subject to review in accordance with the fund’s investment strategy and may vary in the future. Current and future portfolio holdings are subject to risk.
Portfolio Manager Eric N. Harthun has an M.B.A. from The University of Chicago Booth School of Business and a B.S. from San Diego State University. A CFA charterholder, Eric joined Putnam in 2000 and has been in the investment industry since 1994.
Portfolio Manager Robert L. Salvin has an M.B.A. from The University of Chicago Booth School of Business and a B.S. from the Wharton School of the University of Pennsylvania. He joined Putnam in 2000 and has been in the investment industry since 1986.
IN THE NEWS
With stocks rallying and interest rates increasingly volatile, investors are pouring money into equity-based mutual funds. For the first nine months of 2013, inflows into stock funds more than quadrupled, compared with the same time period in 2012, according to the Strategic Insight Monthly Fund Industry Review. U.S. equity funds attracted over $168 billion versus $31 billion during the first three quarters of 2012, while international stock funds garnered over $163 billion in comparison with nearly $50 billion a year ago. Investors are on track in 2013 to invest the most money in equity mutual funds since 2000, according to investment research firm TrimTabs. Meanwhile, fixed-income investors have tapped the brakes, with year-to-date inflows of about $27 billion as of September 30, down from over $290 billion a year ago.
| |
| 10 | Convertible Securities Fund |
Your fund’s performance
This section shows your fund’s performance, price, and distribution information for periods ended October 31, 2013, the end of its most recent fiscal year. In accordance with regulatory requirements for mutual funds, we also include performance information as of the most recent calendar quarter-end and expense information taken from the fund’s current prospectus. Performance should always be considered in light of a fund’s investment strategy. Data represent past performance. Past performance does not guarantee future results. More recent returns may be less or more than those shown. Investment return and principal value will fluctuate, and you may have a gain or a loss when you sell your shares. Performance information does not reflect any deduction for taxes a shareholder may owe on fund distributions or on the redemption of fund shares. For the most recent month-end performance, please visit the Individual Investors section at putnam.com or call Putnam at 1-800-225-1581. Class R and class Y shares are not available to all investors. See the Terms and Definitions section in this report for definitions of the share classes offered by your fund.
Fund performance Total return for periods ended 10/31/13
| | | | | | | | | | |
| | Class A | Class B | Class C | Class M | Class R | Class Y |
| (inception dates) | (6/29/72) | (7/15/93) | (7/26/99) | (3/13/95) | (12/1/03) | (12/30/98) |
|
| | Before | After | | | | | Before | After | Net | Net |
| | sales | sales | Before | After | Before | After | sales | sales | asset | asset |
| | charge | charge | CDSC | CDSC | CDSC | CDSC | charge | charge | value | value |
|
| Annual average | | | | | | | | | | |
| (life of fund) | 10.05% | 9.89% | 9.11% | 9.11% | 9.23% | 9.23% | 9.38% | 9.29% | 9.78% | 10.15% |
|
| 10 years | 106.82 | 94.93 | 91.83 | 91.83 | 91.81 | 91.81 | 96.62 | 89.74 | 101.80 | 112.08 |
| Annual average | 7.54 | 6.90 | 6.73 | 6.73 | 6.73 | 6.73 | 7.00 | 6.61 | 7.27 | 7.81 |
|
| 5 years | 119.99 | 107.34 | 111.92 | 109.92 | 111.91 | 111.91 | 114.54 | 107.03 | 117.31 | 122.71 |
| Annual average | 17.08 | 15.70 | 16.21 | 15.99 | 16.21 | 16.21 | 16.49 | 15.67 | 16.79 | 17.37 |
|
| 3 years | 32.97 | 25.33 | 30.03 | 27.03 | 29.97 | 29.97 | 30.99 | 26.41 | 32.02 | 34.00 |
| Annual average | 9.96 | 7.82 | 9.15 | 8.30 | 9.13 | 9.13 | 9.42 | 8.12 | 9.70 | 10.25 |
|
| 1 year | 20.62 | 13.68 | 19.68 | 14.68 | 19.68 | 18.68 | 20.01 | 15.81 | 20.30 | 20.93 |
|
Current performance may be lower or higher than the quoted past performance, which cannot guarantee future results. After-sales-charge returns for class A and M shares reflect the deduction of the maximum 5.75% and 3.50% sales charge, respectively, levied at the time of purchase. Class B share returns after contingent deferred sales charge (CDSC) reflect the applicable CDSC, which is 5% in the first year, declining over time to 1% in the sixth year, and is eliminated thereafter. Class C share returns after CDSC reflect a 1% CDSC for the first year that is eliminated thereafter. Class R, and Y shares have no initial sales charge or CDSC. Performance for class B, C, M, R, and Y shares before their inception is derived from the historical performance of class A shares, adjusted for the applicable sales charge (or CDSC) and the higher operating expenses for such shares, except for class Y shares, for which 12b-1 fees are not applicable.
For a portion of the periods, the fund had expense limitations, without which returns would have been lower.
Class B share performance does not reflect conversion to class A shares.
| |
| Convertible Securities Fund | 11 |
Comparative index returns For periods ended 10/31/13
| | |
| | BofA Merrill Lynch All | Lipper Convertible Securities |
| | U.S. Convertibles Index | Funds category average* |
|
| Annual average (life of fund) | —† | 10.05% |
|
| 10 years | 100.75% | 89.54 |
| Annual average | 7.22 | 6.52 |
|
| 5 years | 126.58 | 100.64 |
| Annual average | 17.77 | 14.86 |
|
| 3 years | 36.67 | 30.18 |
| Annual average | 10.98 | 9.15 |
|
| 1 year | 23.94 | 20.63 |
|
Index and Lipper results should be compared with fund performance before sales charge, before CDSC, or at net asset value.
* Over the 1-year, 3-year, 5-year, 10-year, and life-of-fund periods ended 10/31/13, there were 74, 62, 47, 36, and 1 fund(s), respectively, in this Lipper category.
† The fund’s benchmark, the BofA Merrill Lynch All U.S. Convertibles Index, was introduced on 12/31/87, which post-dates the inception of the fund’s class A shares.

Past performance does not indicate future results. At the end of the same time period, a $10,000 investment in the fund’s class B and class C shares would have been valued at $19,183 and $19,181 respectively, and no contingent deferred sales charges would apply. A $10,000 investment in the fund’s class M shares ($9,650 after sales charge) would have been valued at $18,974. A $10,000 investment in the fund’s class R and Y shares would have been valued at $20,180 and $21,208, respectively.
| |
| 12 | Convertible Securities Fund |
Fund price and distribution information For the 12-month period ended 10/31/13
| | | | | | | | |
| Distributions | Class A | Class B | Class C | Class M | Class R | Class Y |
|
| Number | 4 | 4 | 4 | 4 | 4 | 4 |
|
| Income | $0.601 | $0.442 | $0.443 | $0.494 | $0.549 | $0.655 |
|
| Capital gains | — | — | — | — | — | — |
|
| Total | $0.601 | $0.442 | $0.443 | $0.494 | $0.549 | $0.655 |
|
| | Before | After | Net | Net | Before | After | Net | Net |
| | sales | sales | asset | asset | sales | sales | asset | asset |
| Share value | charge | charge | value | value | charge | charge | value | value |
|
| 10/31/12 | $20.09 | $21.32 | $19.75 | $19.90 | $19.91 | $20.63 | $20.02 | $20.08 |
|
| 10/31/13 | 23.57 | 25.01 | 23.15 | 23.33 | 23.35 | 24.20 | 23.48 | 23.56 |
|
| | Before | After | Net | Net | Before | After | Net | Net |
| | sales | sales | asset | asset | sales | sales | asset | asset |
| Current rate (end of period) | charge | charge | value | value | charge | charge | value | value |
|
| Current dividend rate 1 | 2.41% | 2.27% | 1.73% | 1.75% | 1.95% | 1.88% | 2.18% | 2.65% |
|
| Current 30-day SEC yield 2 | N/A | 1.25 | 0.59 | 0.59 | N/A | 0.80 | 1.08 | 1.57 |
|
The classification of distributions, if any, is an estimate. Before-sales-charge share value and current dividend rate for class A and M shares, if applicable, do not take into account any sales charge levied at the time of purchase. After-sales-charge share value, current dividend rate, and current 30-day SEC yield, if applicable, are calculated assuming that the maximum sales charge (5.75% for class A shares and 3.50% for class M shares) was levied at the time of purchase. Final distribution information will appear on your year-end tax forms.
1 Most recent distribution, including any return of capital and excluding capital gains, annualized and divided by share price before or after sales charge at period-end.
2 Based only on investment income and calculated using the maximum offering price for each share class, in accordance with SEC guidelines.
Fund performance as of most recent calendar quarter
Total return for periods ended 9/30/13
| | | | | | | | | | |
| | Class A | Class B | Class C | Class M | Class R | Class Y |
| (inception dates) | (6/29/72) | (7/15/93) | (7/26/99) | (3/13/95) | (12/1/03) | (12/30/98) |
|
| | Before | After | | | | | Before | After | Net | Net |
| | sales | sales | Before | After | Before | After | sales | sales | asset | asset |
| | charge | charge | CDSC | CDSC | CDSC | CDSC | charge | charge | value | value |
|
| Annual average | | | | | | | | | | |
| (life of fund) | 10.02% | 9.86% | 9.07% | 9.07% | 9.19% | 9.19% | 9.35% | 9.25% | 9.74% | 10.11% |
|
| 10 years | 111.09 | 98.95 | 95.83 | 95.83 | 95.67 | 95.67 | 100.74 | 93.71 | 105.90 | 116.45 |
| Annual average | 7.76 | 7.12 | 6.95 | 6.95 | 6.94 | 6.94 | 7.22 | 6.84 | 7.49 | 8.03 |
|
| 5 years | 67.98 | 58.32 | 61.80 | 59.80 | 61.80 | 61.80 | 63.85 | 58.11 | 65.98 | 70.16 |
| Annual average | 10.93 | 9.62 | 10.10 | 9.83 | 10.10 | 10.10 | 10.38 | 9.60 | 10.67 | 11.22 |
|
| 3 years | 33.55 | 25.87 | 30.64 | 27.64 | 30.58 | 30.58 | 31.61 | 27.00 | 32.58 | 34.58 |
| Annual average | 10.12 | 7.97 | 9.32 | 8.47 | 9.30 | 9.30 | 9.59 | 8.29 | 9.86 | 10.41 |
|
| 1 year | 17.95 | 11.17 | 17.08 | 12.08 | 17.05 | 16.05 | 17.37 | 13.26 | 17.68 | 18.25 |
|
See the discussion following the Fund performance table on page 11 for information about the calculation of fund performance.
| |
| Convertible Securities Fund | 13 |
Your fund’s expenses
As a mutual fund investor, you pay ongoing expenses, such as management fees, distribution fees (12b-1 fees), and other expenses. Using the following information, you can estimate how these expenses affect your investment and compare them with the expenses of other funds. You may also pay one-time transaction expenses, including sales charges (loads) and redemption fees, which are not shown in this section and would have resulted in higher total expenses. For more information, see your fund’s prospectus or talk to your financial representative.
Expense ratios
| | | | | | |
| | Class A | Class B | Class C | Class M | Class R | Class Y |
|
| Total annual operating expenses | | | | | | |
| for the fiscal year ended | | | | | | |
| 10/31/12 | 1.11% | 1.86% | 1.86% | 1.61% | 1.36% | 0.86% |
|
| Annualized expense ratio for | | | | | | |
| the six-month period ended | | | | | | |
| 10/31/13* | 1.07% | 1.82% | 1.82% | 1.57% | 1.32% | 0.82% |
|
Fiscal-year expense information in this table is taken from the most recent prospectus, is subject to change, and may differ from that shown for the annualized expense ratio and in the financial highlights of this report. Expenses are shown as a percentage of average net assets.
* For the fund’s most recent fiscal half year; may differ from expense ratios based on one-year data in the financial highlights.
Expenses per $1,000
The following table shows the expenses you would have paid on a $1,000 investment in the fund from May 1, 2013, to October 31, 2013. It also shows how much a $1,000 investment would be worth at the close of the period, assuming actual returns and expenses.
| | | | | | |
| | Class A | Class B | Class C | Class M | Class R | Class Y |
|
| Expenses paid per $1,000*† | $5.62 | $9.55 | $9.55 | $8.24 | $6.93 | $4.31 |
|
| Ending value (after expenses) | $1,085.50 | $1,081.00 | $1,081.00 | $1,082.60 | $1,084.00 | $1,086.30 |
|
* Expenses for each share class are calculated using the fund’s annualized expense ratio for each class, which represents the ongoing expenses as a percentage of average net assets for the six months ended 10/31/13. The expense ratio may differ for each share class.
† Expenses are calculated by multiplying the expense ratio by the average account value for the period; then multiplying the result by the number of days in the period; and then dividing that result by the number of days in the year.
| |
| 14 | Convertible Securities Fund |
Estimate the expenses you paid
To estimate the ongoing expenses you paid for the six months ended October 31, 2013, use the following calculation method. To find the value of your investment on May 1, 2013, call Putnam at 1-800-225-1581.
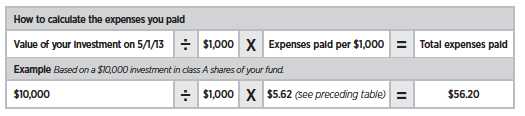
Compare expenses using the SEC’s method
The Securities and Exchange Commission (SEC) has established guidelines to help investors assess fund expenses. Per these guidelines, the following table shows your fund’s expenses based on a $1,000 investment, assuming a hypothetical 5% annualized return. You can use this information to compare the ongoing expenses (but not transaction expenses or total costs) of investing in the fund with those of other funds. All mutual fund shareholder reports will provide this information to help you make this comparison. Please note that you cannot use this information to estimate your actual ending account balance and expenses paid during the period.
| | | | | | |
| | Class A | Class B | Class C | Class M | Class R | Class Y |
|
| Expenses paid per $1,000*† | $5.45 | $9.25 | $9.25 | $7.98 | $6.72 | $4.18 |
|
| Ending value (after expenses) | $1,019.81 | $1,016.03 | $1,016.03 | $1,017.29 | $1,018.55 | $1,021.07 |
|
* Expenses for each share class are calculated using the fund’s annualized expense ratio for each class, which represents the ongoing expenses as a percentage of average net assets for the six months ended 10/31/13. The expense ratio may differ for each share class.
† Expenses are calculated by multiplying the expense ratio by the average account value for the six-month period; then multiplying the result by the number of days in the six-month period; and then dividing that result by the number of days in the year.
| |
| Convertible Securities Fund | 15 |
Terms and definitions
Important terms
Total return shows how the value of the fund’s shares changed over time, assuming you held the shares through the entire period and reinvested all distributions in the fund.
Before sales charge, or net asset value, is the price, or value, of one share of a mutual fund, without a sales charge. Before-sales-charge figures fluctuate with market conditions, and are calculated by dividing the net assets of each class of shares by the number of outstanding shares in the class.
After sales charge is the price of a mutual fund share plus the maximum sales charge levied at the time of purchase. After-sales-charge performance figures shown here assume the 5.75% maximum sales charge for class A shares and 3.50% for class M shares.
Contingent deferred sales charge (CDSC) is generally a charge applied at the time of the redemption of class B or C shares and assumes redemption at the end of the period. Your fund’s class B CDSC declines over time from a 5% maximum during the first year to 1% during the sixth year. After the sixth year, the CDSC no longer applies. The CDSC for class C shares is 1% for one year after purchase.
Share classes
Class A shares are generally subject to an initial sales charge and no CDSC (except on certain redemptions of shares bought without an initial sales charge).
Class B shares are not subject to an initial sales charge. They may be subject to a CDSC.
Class C shares are not subject to an initial sales charge and are subject to a CDSC only if the shares are redeemed during the first year.
Class M shares have a lower initial sales charge and a higher 12b-1 fee than class A shares and no CDSC (except on certain redemptions of shares bought without an initial sales charge).
Class R shares are not subject to an initial sales charge or CDSC and are available only to certain defined contribution plans.
Class Y shares are not subject to an initial sales charge or CDSC, and carry no 12b-1 fee. They are generally only available to corporate and institutional clients and clients in other approved programs.
Fixed-income terms
Current rate is the annual rate of return earned from dividends or interest of an investment. Current rate is expressed as a percentage of the price of a security, fund share, or principal investment.
Mortgage-backed security (MBS), also known as a mortgage “pass-through,” is a type of asset-backed security that is secured by a mortgage or collection of mortgages. The following are types of MBSs:
• Agency “pass-through” has its principal and interest backed by a U.S. government agency, such as the Federal National Mortgage Association (Fannie Mae), Government National Mortgage Association (Ginnie Mae), and Federal Home Loan Mortgage Corporation (Freddie Mac).
• Collateralized mortgage obligation (CMO) represents claims to specific cash flows from pools of home mortgages. The streams of principal and interest payments on the mortgages are distributed to the different classes of CMO interests in “tranches.” Each tranche may have different principal balances, coupon rates, prepayment risks, and maturity dates. A CMO is highly sensitive to changes in interest rates and any resulting change in the rate at which homeowners sell their properties, refinance, or otherwise prepay loans. CMOs are subject to prepayment, market, and liquidity risks.
• Interest-only (IO) security is a type of CMO in which the underlying asset is the interest portion of mortgage, Treasury, or bond payments.
• Non-agency residential mortgage-backed security (RMBS) is an MBS not backed by Fannie Mae, Ginnie Mae, or Freddie Mac. One type of RMBS is an Alt-A mortgage-backed security.
• Commercial mortgage-backed security (CMBS) is secured by the loan on a commercial property.
Yield curve is a graph that plots the yields of bonds with equal credit quality against their differing maturity dates, ranging from shortest to longest. It is used as a benchmark for other debt, such as mortgage or bank lending rates.
| |
| 16 | Convertible Securities Fund |
Comparative indexes
Barclays U.S. Aggregate Bond Index is an unmanaged index of U.S. investment-grade fixed-income securities.
BofA Merrill Lynch U.S. 3-Month Treasury Bill Index is an unmanaged index that seeks to measure the performance of U.S. Treasury bills available in the marketplace.
BofA Merrill Lynch All U.S. Convertibles Index is an unmanaged index of high-yield U.S. convertible securities.
S&P 500 Index is an unmanaged index of common stock performance.
Indexes assume reinvestment of all distributions and do not account for fees. Securities and performance of a fund and an index will differ. You cannot invest directly in an index.
Lipper is a third-party industry-ranking entity that ranks mutual funds. Its rankings do not reflect sales charges. Lipper rankings are based on total return at net asset value relative to other funds that have similar current investment styles or objectives as determined by Lipper. Lipper may change a fund’s category assignment at its discretion. Lipper category averages reflect performance trends for funds within a category.
Other information for shareholders
Proxy voting
Putnam is committed to managing our mutual funds in the best interests of our shareholders. The Putnam funds’ proxy voting guidelines and procedures, as well as information regarding how your fund voted proxies relating to portfolio securities during the 12-month period ended June 30, 2013, are available in the Individual Investors section of putnam.com, and on the Securities and Exchange Commission (SEC) website, www.sec.gov. If you have questions about finding forms on the SEC’s website, you may call the SEC at 1-800-SEC-0330. You may also obtain the Putnam funds’ proxy voting guidelines and procedures at no charge by calling Putnam’s Shareholder Services at 1-800-225-1581.
Fund portfolio holdings
The fund will file a complete schedule of its portfolio holdings with the SEC for the first and third quarters of each fiscal year on Form N-Q. Shareholders may obtain the fund’s Forms N-Q on the SEC’s website at www.sec.gov. In addition, the fund’s Forms N-Q may be reviewed and copied at the SEC’s Public Reference Room in Washington, D.C. You may call the SEC at 1-800-SEC-0330 for information about the SEC’s website or the operation of the Public Reference Room.
Trustee and employee fund ownership
Putnam employees and members of the Board of Trustees place their faith, confidence, and, most importantly, investment dollars in Putnam mutual funds. As of October 31, 2013, Putnam employees had approximately $414,000,000 and the Trustees had approximately $99,000,000 invested in Putnam mutual funds. These amounts include investments by the Trustees’ and employees’ immediate family members as well as investments through retirement and deferred compensation plans.
| |
| Convertible Securities Fund | 17 |
Important notice regarding Putnam’s privacy policy
In order to conduct business with our shareholders, we must obtain certain personal information such as account holders’ names, addresses, Social Security numbers, and dates of birth. Using this information, we are able to maintain accurate records of accounts and transactions.
It is our policy to protect the confidentiality of our shareholder information, whether or not a shareholder currently owns shares of our funds. In particular, it is our policy not to sell information about you or your accounts to outside marketing firms. We have safeguards in place designed to prevent unauthorized access to our computer systems and procedures to protect personal information from unauthorized use.
Under certain circumstances, we must share account information with outside vendors who provide services to us, such as mailings and proxy solicitations. In these cases, the service providers enter into confidentiality agreements with us, and we provide only the information necessary to process transactions and perform other services related to your account. Finally, it is our policy to share account information with your financial representative, if you’ve listed one on your Putnam account.
| |
| 18 | Convertible Securities Fund |
Trustee approval of management contract
General conclusions
The Board of Trustees of the Putnam funds oversees the management of each fund and, as required by law, determines annually whether to approve the continuance of your fund’s management contract with Putnam Investment Management (“Putnam Management”) and the sub-management contract with respect to your fund between Putnam Management and its affiliate, Putnam Investments Limited (“PIL”). The Board of Trustees, with the assistance of its Contract Committee, requests and evaluates all information it deems reasonably necessary under the circumstances in connection with its annual contract review. The Contract Committee consists solely of Trustees who are not “interested persons” (as this term is defined in the Investment Company Act of 1940, as amended (the “1940 Act”)) of the Putnam funds (“Independent Trustees”).
At the outset of the review process, members of the Board’s independent staff and independent legal counsel met with representatives of Putnam Management to review the annual contract review materials furnished to the Contract Committee during the course of the previous year’s review and to discuss possible changes in these materials that might be necessary or desirable for the coming year. Following these discussions and in consultation with the Contract Committee, the Independent Trustees’ independent legal counsel requested that Putnam Management furnish specified information, together with any additional information that Putnam Management considered relevant, to the Contract Committee. Over the course of several months ending in June 2013, the Contract Committee met on a number of occasions with representatives of Putnam Management, and separately in executive session, to consider the information that Putnam Management provided. Throughout this process, the Contract Committee was assisted by the members of the Board’s independent staff and by independent legal counsel for the Putnam funds and the Independent Trustees.
In May 2013, the Contract Committee met in executive session to discuss and consider its preliminary recommendations with respect to the continuance of the contracts. At the Trustees’ June 20, 2013 meeting, the Contract Committee met in executive session with the other Independent Trustees to review a summary of the key financial data that the Contract Committee considered in the course of its review. The Contract Committee then presented its written report, which summarized the key factors that the Committee had considered and set forth its final recommendations. The Contract Committee then recommended, and the Independent Trustees approved, the continuance of your fund’s management and sub-management contracts, effective July 1, 2013, subject to certain changes in the sub-management contract noted below. (Because PIL is an affiliate of Putnam Management and Putnam Management remains fully responsible for all services provided by PIL, the Trustees have not evaluated PIL as a separate entity, and all subsequent references to Putnam Management below should be deemed to include reference to PIL as necessary or appropriate in the context.)
The Independent Trustees’ approval was based on the following conclusions:
• That the fee schedule in effect for your fund represented reasonable compensation in light of the nature and quality of the services being provided to the fund, the fees paid by competitive funds, and the costs incurred by Putnam Management in providing services to the fund, and
| |
| Convertible Securities Fund | 19 |
• That the fee schedule represented an appropriate sharing between fund shareholders and Putnam Management of such economies of scale as may exist in the management of the fund at current asset levels.
These conclusions were based on a comprehensive consideration of all information provided to the Trustees and were not the result of any single factor. Some of the factors that figured particularly in the Trustees’ deliberations and how the Trustees considered these factors are described below, although individual Trustees may have evaluated the information presented differently, giving different weights to various factors. It is also important to recognize that the management arrangements for your fund and the other Putnam funds are the result of many years of review and discussion between the Independent Trustees and Putnam Management, that some aspects of the arrangements may receive greater scrutiny in some years than others, and that the Trustees’ conclusions may be based, in part, on their consideration of fee arrangements in previous years. For example, with some minor exceptions, the current fee arrangements in the management contracts for the Putnam funds were implemented at the beginning of 2010 following extensive review and discussion by the Trustees, as well as approval by shareholders.
As noted above, the Trustees considered administrative revisions to your fund’s sub-management contract. Putnam Management recommended that the sub-management contract be revised to reduce the sub-management fee that Putnam Management pays to PIL with respect to the portion of the portfolios of certain funds, but not your fund, that may be allocated to PIL from time to time. The Independent Trustees’ approval of this recommendation was based on their conclusion that these changes would have no practical effect on Putnam Management’s continued responsibility for the management of these funds or the costs borne by fund shareholders and would not result in any reduction in the nature and quality of services provided to the funds.
Management fee schedules and total expenses
The Trustees reviewed the management fee schedules in effect for all Putnam funds, including fee levels and breakpoints. The Trustees also reviewed the total expenses of each Putnam fund, recognizing that in most cases management fees represented the major, but not the sole, determinant of total costs to shareholders.
In reviewing fees and expenses, the Trustees generally focus their attention on material changes in circumstances — for example, changes in assets under management, changes in a fund’s investment style, changes in Putnam Management’s operating costs or profitability, or changes in competitive practices in the mutual fund industry — that suggest that consideration of fee changes might be warranted. The Trustees concluded that the circumstances did not warrant changes to the management fee structure of your fund.
Under its management contract, your fund has the benefit of breakpoints in its management fee schedule that provide shareholders with economies of scale in the form of reduced fee levels as assets under management in the Putnam family of funds increase. The Trustees concluded that the fee schedule in effect for your fund represented an appropriate sharing of economies of scale between fund shareholders and Putnam Management.
As in the past, the Trustees also focused on the competitiveness of each fund’s total expense ratio. In order to ensure that expenses of the Putnam funds continue to meet competitive standards, the Trustees and Putnam Management have implemented certain expense limitations. These expense limitations were: (i) a contractual expense limitation applicable
| |
| 20 | Convertible Securities Fund |
to all retail open-end funds of 32 basis points on investor servicing fees and expenses and (ii) a contractual expense limitation applicable to all open-end funds of 20 basis points on so-called “other expenses” (i.e., all expenses exclusive of management fees, investor servicing fees, distribution fees, investment-related expenses, interest, taxes, brokerage commissions, extraordinary expenses and acquired fund fees and expenses). These expense limitations serve in particular to maintain competitive expense levels for funds with large numbers of small shareholder accounts and funds with relatively small net assets. Most funds, including your fund, had sufficiently low expenses that these expense limitations did not apply. Putnam Management’s support for these expense limitations was an important factor in the Trustees’ decision to approve the continuance of your fund’s management and sub-management contracts.
The Trustees reviewed comparative fee and expense information for a custom group of competitive funds selected by Lipper Inc. This comparative information included your fund’s percentile ranking for effective management fees and total expenses (excluding any applicable 12b-1 fee), which provides a general indication of your fund’s relative standing. In the custom peer group, your fund ranked in the third quintile in effective management fees (determined for your fund and the other funds in the custom peer group based on fund asset size and the applicable contractual management fee schedule) and in the fourth quintile in total expenses (excluding any applicable 12b-1 fees) as of December 31, 2012 (the first quintile representing the least expensive funds and the fifth quintile the most expensive funds). The fee and expense data reported by Lipper as of December 31, 2012 reflected the most recent fiscal year-end data available in Lipper’s database at that time.
In connection with their review of the management fees and total expenses of the Putnam funds, the Trustees also reviewed the costs of the services provided and the profits realized by Putnam Management and its affiliates from their contractual relationships with the funds. This information included trends in revenues, expenses and profitability of Putnam Management and its affiliates relating to the investment management, investor servicing and distribution services provided to the funds. In this regard, the Trustees also reviewed an analysis of Putnam Management’s revenues, expenses and profitability, allocated on a fund-by-fund basis, with respect to the funds’ management, distribution, and investor servicing contracts. For each fund, the analysis presented information about revenues, expenses and profitability for each of the agreements separately and for the agreements taken together on a combined basis. The Trustees concluded that, at current asset levels, the fee schedules in place represented reasonable compensation for the services being provided and represented an appropriate sharing of such economies of scale as may exist in the management of the Putnam funds at that time.
The information examined by the Trustees as part of their annual contract review for the Putnam funds has included for many years information regarding fees charged by Putnam Management and its affiliates to institutional clients such as defined benefit pension plans, college endowments, and the like. This information included comparisons of those fees with fees charged to the funds, as well as an assessment of the differences in the services provided to these different types of clients. The Trustees observed that the differences in fee rates between institutional clients and mutual funds are by no means uniform when examined by individual asset sectors, suggesting that differences in the pricing of investment management services to these types of clients may reflect historical competitive forces operating
| |
| Convertible Securities Fund | 21 |
in separate markets. The Trustees considered the fact that in many cases fee rates across different asset classes are higher on average for mutual funds than for institutional clients, as well as the differences between the services that Putnam Management provides to the Putnam funds and those that it provides to its institutional clients. The Trustees did not rely on these comparisons to any significant extent in concluding that the management fees paid by your fund are reasonable.
Investment performance
The quality of the investment process provided by Putnam Management represented a major factor in the Trustees’ evaluation of the quality of services provided by Putnam Management under your fund’s management contract. The Trustees were assisted in their review of the Putnam funds’ investment process and performance by the work of the investment oversight committees of the Trustees, which meet on a regular basis with the funds’ portfolio teams and with the Chief Investment Officer and other senior members of Putnam Management’s Investment Division throughout the year. The Trustees concluded that Putnam Management generally provides a high-quality investment process — based on the experience and skills of the individuals assigned to the management of fund portfolios, the resources made available to them, and in general Putnam Management’s ability to attract and retain high-quality personnel — but also recognized that this does not guarantee favorable investment results for every fund in every time period.
The Trustees considered that 2012 was a year of strong competitive performance for many of the Putnam funds, with only a relatively small number of exceptions. They noted that this strong performance was exemplified by the fact that the Putnam funds were recognized by Barron’s as the best performing mutual fund complex for 2012 — the second time in four years that Putnam Management has achieved this distinction for the Putnam funds. They also noted, however, the disappointing investment performance of some funds for periods ended December 31, 2012 and considered information provided by Putnam Management regarding the factors contributing to the underperformance and actions being taken to improve the performance of these particular funds. The Trustees indicated their intention to continue to monitor performance trends to assess the effectiveness of these efforts and to evaluate whether additional actions to address areas of underperformance are warranted.
For purposes of evaluating investment performance, the Trustees generally focus on competitive industry rankings for the one-year, three-year, and five-year periods. For a number of Putnam funds with relatively unique investment mandates, the Trustees evaluated performance based on comparisons of their total returns with the returns of selected investment benchmarks or targeted returns. In the case of your fund, the Trustees considered that its class A share cumulative total return performance at net asset value was in the following quartiles of its Lipper Inc. peer group (Lipper Convertible Securities Funds) for the one-year, three-year and five-year periods ended December 31, 2012 (the first quartile representing the best-performing funds and the fourth quartile the worst-performing funds):
| | | |
| One-year period | 1st | | |
| | |
| Three-year period | 1st | | |
| | |
| Five-year period | 2nd | | |
| | |
Over the one-year, three-year and five-year periods ended December 31, 2012, there were 75, 55 and 44 funds, respectively, in your fund’s Lipper peer group. (When considering performance information, shareholders should be mindful that past performance is not a guarantee of future results.)
| |
| 22 | Convertible Securities Fund |
Brokerage and soft-dollar allocations; investor servicing
The Trustees considered various potential benefits that Putnam Management may receive in connection with the services it provides under the management contract with your fund. These include benefits related to brokerage allocation and the use of soft dollars, whereby a portion of the commissions paid by a fund for brokerage may be used to acquire research services that are expected to be useful to Putnam Management in managing the assets of the fund and of other clients. Subject to policies established by the Trustees, soft dollars generated by these means are used primarily to acquire brokerage and research services that enhance Putnam Management’s investment capabilities and supplement Putnam Management’s internal research efforts. However, the Trustees noted that a portion of available soft dollars continues to be used to pay fund expenses. The Trustees indicated their continued intent to monitor regulatory and industry developments in this area with the assistance of their Brokerage Committee and also indicated their continued intent to monitor the allocation of the Putnam funds’ brokerage in order to ensure that the principle of seeking best price and execution remains paramount in the portfolio trading process.
Putnam Management may also receive benefits from payments that the funds make to Putnam Management’s affiliates for investor or distribution services. In conjunction with the annual review of your fund’s management and sub-management contracts, the Trustees reviewed your fund’s investor servicing agreement with Putnam Investor Services, Inc. (“PSERV”) and its distributor’s contracts and distribution plans with Putnam Retail Management Limited Partnership (“PRM”), both of which are affiliates of Putnam Management. The Trustees concluded that the fees payable by the funds to PSERV and PRM, as applicable, for such services are reasonable in relation to the nature and quality of such services, the fees paid by competitive funds, and the costs incurred by PSERV and PRM, as applicable, in providing such services.
Consideration of your fund’s interim management contract and the continuance of the fund’s sub-management contract
Following the Trustees’ approval of the continuance of your fund’s management and sub-management contracts, on October 8, 2013, The Honourable Paul G. Desmarais passed away. Mr. Desmarais, both directly and though holding companies, controlled a majority of the voting shares of Power Corporation of Canada, the ultimate parent company of Putnam Management. Upon his death, Mr. Desmarais’ voting control of shares of Power Corporation of Canada was transferred to The Desmarais Family Residuary Trust (the “Transfer”). As a technical matter, the Transfer may have constituted an “assignment” within the meaning of the Investment Company Act of 1940, causing the fund’s existing management and sub-management contracts to terminate automatically. On October 18, 2013, the Trustees approved your fund’s interim management contract and the continuance of your fund’s sub-management contract to address this possibility and to avoid disruption of investment advisory and other services provided to your fund. At a subsequent meeting on November 22, 2013, the Trustees, including all of the Independent Trustees, approved new definitive management contracts between the Putnam funds and Putnam Management and determined to recommend their approval to the shareholders of the Putnam funds at a shareholder meeting to be held in early 2014.
In considering whether to approve your fund’s interim management contract and new definitive management contract and the continuance of your fund’s sub-management contract, the Trustees took into account that
| |
| Convertible Securities Fund | 23 |
they had most recently approved the annual continuation of the fund’s previous management and sub-management contracts at their meeting in June 2013, as described above. The Trustees considered that the terms of the interim management contract and new definitive management contract were identical to the previous management contract, except for the effective dates and initial terms and for certain non-substantive changes. They also considered that the sub-management contract was identical to the previous sub-management contract, except for the effective dates and initial terms. Because the proposed contracts were substantially identical to the previous versions of these contracts approved by the Trustees at their June 2013 meeting, the Trustees relied to a considerable extent on their prior approval of these contracts. In addition, the Trustees considered a number other factors relating to the Transfer, including, but not limited to, the following:
• Information about the operations of The Desmarais Family Residuary Trust, including that Paul Desmarais, Jr. and André Desmarais, Mr.Desmarais’ sons, were expected to exercise, jointly, voting control over the Power Corporation of Canada shares controlled by The Desmarais Family Residuary Trust.
• That Paul Desmarais, Jr. and André Desmarais had been playing active managerial roles at Power Corporation of Canada, with responsibility for the oversight of Power Corporation of Canada’s subsidiaries, including Putnam Investments, since Power Corporation of Canada had acquired Putnam Investments in 2007, including serving as Directors of Putnam Investments, and that the Transfer would not affect their responsibilities as officers of Power Corporation of Canada.
• The intention expressed by representatives of Power Corporation of Canada and its subsidiaries, Power Financial Corporation and Great-West Lifeco, that there would be no change to the operations or management of Putnam Investments, to Putnam Management’s management of the funds or to investment, advisory and other services provided to the funds by Putnam Management and its affiliates as a result of the Transfer.
• Putnam Management’s assurances that, following the Transfer, Putnam Management would continue to provide the same level of services to each fund and that the Transfer will not have an adverse impact on the ability of Putnam Management and its affiliates to continue to provide high quality investment advisory and other services to the funds.
• Putnam Management’s assurances that there are no current plans to make any changes to the operations of the funds, existing management fees, expense limitations, distribution arrangements, or the quality of any services provided to the funds or their shareholders, as a result of the Transfer.
• The benefits that the funds have received and may potentially receive as a result of Putnam Management being a member of the Power Corporation of Canada group of companies, which promotes the stability of the Putnam organization.
| |
| 24 | Convertible Securities Fund |
Financial statements
These sections of the report, as well as the accompanying Notes, preceded by the Report of Independent Registered Public Accounting Firm, constitute the fund’s financial statements.
The fund’s portfolio lists all the fund’s investments and their values as of the last day of the reporting period. Holdings are organized by asset type and industry sector, country, or state to show areas of concentration and diversification.
Statement of assets and liabilities shows how the fund’s net assets and share price are determined. All investment and non-investment assets are added together. Any unpaid expenses and other liabilities are subtracted from this total. The result is divided by the number of shares to determine the net asset value per share, which is calculated separately for each class of shares. (For funds with preferred shares, the amount subtracted from total assets includes the liquidation preference of preferred shares.)
Statement of operations shows the fund’s net investment gain or loss. This is done by first adding up all the fund’s earnings — from dividends and interest income — and subtracting its operating expenses to determine net investment income (or loss). Then, any net gain or loss the fund realized on the sales of its holdings — as well as any unrealized gains or losses over the period — is added to or subtracted from the net investment result to determine the fund’s net gain or loss for the fiscal year.
Statement of changes in net assets shows how the fund’s net assets were affected by the fund’s net investment gain or loss, by distributions to shareholders, and by changes in the number of the fund’s shares. It lists distributions and their sources (net investment income or realized capital gains) over the current reporting period and the most recent fiscal year-end. The distributions listed here may not match the sources listed in the Statement of operations because the distributions are determined on a tax basis and may be paid in a different period from the one in which they were earned.
Financial highlights provide an overview of the fund’s investment results, per-share distributions, expense ratios, net investment income ratios, and portfolio turnover in one summary table, reflecting the five most recent reporting periods. In a semiannual report, the highlights table also includes the current reporting period.
| |
| Convertible Securities Fund | 25 |
Report of Independent Registered Public Accounting Firm
The Board of Trustees and
Shareholders Putnam Convertible Securities Fund:
We have audited the accompanying statement of assets and liabilities of Putnam Convertible Securities Fund (the fund), including the fund’s portfolio, as of October 31, 2013, and the related statement of operations for the year then ended, the statements of changes in net assets for each of the years in the two-year period then ended, and the financial highlights for each of the years in the five-year period then ended. These financial statements and financial highlights are the responsibility of the fund’s management. Our responsibility is to express an opinion on these financial statements and financial highlights based on our audits.
We conducted our audits in accordance with the standards of the Public Company Accounting Oversight Board (United States). Those standards require that we plan and perform the audit to obtain reasonable assurance about whether the financial statements and financial highlights are free of material misstatement. An audit includes examining, on a test basis, evidence supporting the amounts and disclosures in the financial statements. Our procedures included confirmation of securities owned as of October 31, 2013, by correspondence with the custodian and brokers or by other appropriate auditing procedures. An audit also includes assessing the accounting principles used and significant estimates made by management, as well as evaluating the overall financial statement presentation. We believe that our audits provide a reasonable basis for our opinion.
In our opinion, the financial statements and financial highlights referred to above present fairly, in all material respects, the financial position of Putnam Convertible Securities Fund as of October 31, 2013, the results of its operations for the year then ended, the changes in its net assets for each of the years in the two-year period then ended, and the financial highlights for each of the years in the five-year period then ended, in conformity with U.S. generally accepted accounting principles.

Boston, Massachusetts
December 13, 2013
| |
| 26 | Convertible Securities Fund |
The fund’s portfolio 10/31/13
| | | |
| CONVERTIBLE BONDS AND NOTES (67.5%)* | | Principal amount | Value |
|
| Aerospace and defense (0.4%) | | | |
| Triumph Group, Inc. cv. sr. unsec. sub. notes 2 5/8s, 2026 | | $1,130,000 | $2,995,206 |
|
| | | | 2,995,206 |
| Airlines (—%) | | | |
| Lufthansa Malta Blues LP 144A cv. sr. unsec. notes 0 3/4s, | | | |
| 2017 (Malta) | EUR | 17,000 | 28,222 |
|
| | | | 28,222 |
| Automotive (0.5%) | | | |
| TRW Automotive, Inc. cv. company guaranty sr. unsec. notes | | | |
| 3 1/2s, 2015 | | $1,775,000 | 4,563,969 |
|
| | | | 4,563,969 |
| Biotechnology (6.5%) | | | |
| Auxilium Pharmaceuticals, Inc. cv. sr. unsec. notes 1 1/2s, 2018 | | 4,385,000 | 4,489,144 |
|
| BioMarin Pharmaceutical, Inc. cv. sr. unsec. sub. notes | | | |
| 1 1/2s, 2020 | | 2,304,000 | 2,364,480 |
|
| BioMarin Pharmaceutical, Inc. cv. sr. unsec. sub. notes | | | |
| 0 3/4s, 2018 | | 2,304,000 | 2,386,080 |
|
| Cubist Pharmaceuticals, Inc. cv. sr. unsec. notes 2 1/2s, 2017 | | 3,150,000 | 6,963,469 |
|
| Cubist Pharmaceuticals, Inc. 144A cv. sr. unsec. notes | | | |
| 1 1/8s, 2018 | | 3,879,000 | 4,189,320 |
|
| Gilead Sciences, Inc. cv. sr. unsec. notes 1 5/8s, 2016 | | 7,175,000 | 22,473,535 |
|
| Medicines Co. (The) 144A cv. sr. unsec. notes 1 3/8s, 2017 | | 4,561,000 | 6,220,292 |
|
| PDL BioPharma, Inc. cv. sr. unsec. notes 3 3/4s, 2015 | | 3,633,000 | 4,697,923 |
|
| | | | 53,784,243 |
| Broadcasting (1.3%) | | | |
| Liberty Media Corp. 144A cv. sr. unsec. notes 1 3/8s, 2023 | | 6,451,000 | 6,814,191 |
|
| XM Satellite Radio, Inc. 144A cv. company guaranty sr. unsec. | | | |
| sub. notes 7s, 2014 | | 1,858,000 | 3,900,639 |
|
| | | | 10,714,830 |
| Commercial and consumer services (2.4%) | | | |
| CBIZ, Inc. 144A cv. sr. sub. notes 4 7/8s, 2015 | | 3,660,000 | 4,513,238 |
|
| Priceline.com, Inc. cv. sr. unsec. unsub. notes 1s, 2018 | | 12,001,000 | 15,893,824 |
|
| | | | 20,407,062 |
| Communications equipment (1.1%) | | | |
| Ciena, Inc. 144A cv. sr. unsec. notes 3 3/4s, 2018 | | 4,054,000 | 5,766,815 |
|
| Outerwall, Inc. cv. sr. unsec. unsub. notes 4s, 2014 | | 2,300,000 | 3,671,375 |
|
| | | | 9,438,190 |
| Computers (4.2%) | | | |
| Bottomline Technologies (DE), Inc. cv. sr. unsec. unsub. notes | | | |
| 1 1/2s, 2017 | | 4,139,000 | 5,114,252 |
|
| EMC Corp. cv. sr. unsec. notes 1 3/4s, 2013 | | 7,610,000 | 11,500,613 |
|
| Infinera Corp. 144A cv. sr. unsec. unsub. notes 1 3/4s, 2018 | | 3,572,000 | 3,907,054 |
|
| SanDisk Corp. cv. sr. unsec. notes 1 1/2s, 2017 | | 4,260,000 | 6,246,225 |
|
| SanDisk Corp. 144A cv. sr. unsec. notes 0 1/2s, 2020 | | 7,671,000 | 7,816,749 |
|
| | | | 34,584,893 |
| Conglomerates (0.8%) | | | |
| Siemens Financieringsmaatschappij N.V. cv. company guaranty | | | |
| sr. unsec. bonds 1.65s, 2019 (Netherlands) | | 6,000,000 | 6,825,300 |
|
| | | | 6,825,300 |
| Construction (0.6%) | | | |
| Cemex SAB de CV cv. unsec. sub. notes 4 7/8s, 2015 (Mexico) | | 4,300,000 | 4,977,250 |
|
| | | | 4,977,250 |
| |
| Convertible Securities Fund | 27 |
| | |
| CONVERTIBLE BONDS AND NOTES (67.5%)* cont. | Principal amount | Value |
|
| Consumer (1.0%) | | |
| Jarden Corp. 144A cv. company guaranty sr. unsec. sub. notes | | |
| 1 7/8s, 2018 | $6,451,000 | $8,578,540 |
|
| | | 8,578,540 |
| Consumer finance (2.3%) | | |
| DFC Global Corp. cv. sr. unsec. unsub. notes 3 1/4s, 2017 | 4,924,000 | 4,597,046 |
|
| Encore Capital Group, Inc. 144A cv. company guaranty sr. unsec. | | |
| notes 3s, 2020 | 4,443,000 | 5,515,096 |
|
| Portfolio Recovery Associates, Inc. 144A cv. sr. unsec. unsub. | | |
| notes 3s, 2020 | 2,736,000 | 3,131,626 |
|
| Walter Investment Management Corp. cv. sr. unsec. sub. notes | | |
| 4 1/2s, 2019 | 5,170,000 | 5,373,569 |
|
| | | 18,617,337 |
| Consumer services (0.8%) | | |
| Hertz Global Holdings, Inc. cv. sr. unsec. notes 5 1/4s, 2014 | 950,000 | 2,649,313 |
|
| Shutterfly, Inc. 144A cv. sr. unsec. notes 0 1/4s, 2018 | 3,630,000 | 3,868,219 |
|
| | | 6,517,532 |
| Electronics (7.8%) | | |
| GT Advanced Technologies, Inc. cv. sr. unsec. unsub. | | |
| notes 3s, 2017 | 3,100,000 | 3,832,375 |
|
| Intel Corp. cv. jr. sub. notes 3 1/4s, 2039 | 5,930,000 | 7,757,181 |
|
| L-3 Communications Holdings, Inc. cv. company guaranty sr. | | |
| unsec. bonds 3s, 2035 | 5,260,000 | 6,002,975 |
|
| Mentor Graphics Corp. cv. sub. unsec. notes 4s, 2031 | 5,055,000 | 6,413,531 |
|
| Micron Technology, Inc. 144A cv. sr. unsec. notes 1 5/8s, 2033 | 13,148,000 | 22,598,782 |
|
| Vishay Intertechnology, Inc. 144A cv. sr. unsec. notes | | |
| 2 1/4s, 2041 | 6,180,000 | 5,059,875 |
|
| Xilinx, Inc. cv. sr. unsec. notes 2 5/8s, 2017 | 8,215,000 | 13,061,850 |
|
| | | 64,726,569 |
| Energy (oil field) (1.4%) | | |
| Hornbeck Offshore Services, Inc. cv. company guaranty sr. | | |
| unsec. notes 1 1/2s, 2019 | 4,399,000 | 5,572,983 |
|
| SEACOR Holdings, Inc. 144A cv. sr. unsec. unsub. notes | | |
| 2 1/2s, 2027 | 4,623,000 | 5,943,444 |
|
| | | 11,516,427 |
| Entertainment (0.6%) | | |
| TiVo, Inc. 144A cv. sr. unsec. notes 4s, 2016 | 3,453,000 | 4,739,243 |
|
| | | 4,739,243 |
| Financial (0.6%) | | |
| Radian Group, Inc. cv. sr. unsec. unsub. notes 3s, 2017 | 3,555,000 | 5,161,416 |
|
| | | 5,161,416 |
| Health-care services (3.3%) | | |
| Allscripts Healthcare Solutions, Inc. 144A cv. sr. unsec. notes | | |
| 1 1/4s, 2020 | 5,307,000 | 5,622,103 |
|
| Brookdale Senior Living, Inc. cv. sr. unsec. unsub. notes | | |
| 2 3/4s, 2018 | 8,472,000 | 10,256,415 |
|
| Medidata Solutions, Inc. 144A cv. sr. unsec. notes 1s, 2018 | 4,998,000 | 6,054,077 |
|
| WellPoint, Inc. 144A cv. sr. unsec. notes 2 3/4s, 2042 | 4,120,000 | 5,350,850 |
|
| | | 27,283,445 |
| Homebuilding (1.9%) | | |
| Forestar Group, Inc. cv. sr. unsec. unsub. notes 3 3/4s, 2020 | 3,348,000 | 3,961,103 |
|
| Lennar Corp. 144A cv. sr. notes 2 3/4s, 2020 | 1,934,000 | 3,291,426 |
|
| M/I Homes, Inc. cv. company guaranty sr. sub. notes 3s, 2018 | 3,946,000 | 4,084,110 |
|
| Standard Pacific Corp. cv. company guaranty sr. unsec. unsub. | | |
| notes 1 1/4s, 2032 | 3,490,000 | 4,336,325 |
|
| | | 15,672,964 |
| |
| 28 | Convertible Securities Fund |
| | |
| CONVERTIBLE BONDS AND NOTES (67.5%)* cont. | Principal amount | Value |
|
| Insurance (0.8%) | | |
| Fidelity National Financial, Inc. cv. sr. unsec. unsub. notes | | |
| 4 1/4s, 2018 | $4,330,000 | $6,392,163 |
|
| | | 6,392,163 |
| Investment banking/Brokerage (1.0%) | | |
| Ares Capital Corp. cv. sr. unsec. notes 5 3/4s, 2016 | 7,383,000 | 7,969,949 |
|
| | | 7,969,949 |
| Lodging/Tourism (2.3%) | | |
| Host Hotels & Resorts LP 144A cv. company guaranty sr. unsec. | | |
| notes 2 1/2s, 2029 R | 6,275,000 | 9,137,969 |
|
| MGM Resorts International Co. cv. company guaranty sr. unsec. | | |
| notes 4 1/4s, 2015 | 8,255,000 | 10,112,375 |
|
| | | 19,250,344 |
| Manufacturing (1.6%) | | |
| General Cable Corp. cv. unsec. sub. notes stepped-coupon 5s | | |
| (2 1/4s, 11/15/19) 2029 †† | 5,106,000 | 5,922,960 |
|
| MasTec, Inc. cv. company guaranty sr. unsec. unsub. notes | | |
| 4 1/4s, 2014 | 885,000 | 1,853,522 |
|
| Trinity Industries, Inc. cv. unsec. sub. notes 3 7/8s, 2036 | 3,985,000 | 5,190,463 |
|
| | | 12,966,945 |
| Media (2.9%) | | |
| Liberty Interactive, LLC cv. sr. unsec. unsub. notes 3 1/2s, 2031 | 15,055,000 | 7,828,600 |
|
| Liberty Interactive, LLC 144A cv. sr. unsec. notes 1s, 2043 | 5,810,000 | 5,962,513 |
|
| Liberty Interactive, LLC 144A cv. sr. unsec. unsub. notes | | |
| 0 3/4s, 2043 | 8,359,000 | 9,999,872 |
|
| | | 23,790,985 |
| Medical technology (2.5%) | | |
| China Medical Technologies, Inc. cv. sr. unsec. bonds Ser. CMT, | | |
| 4s, 2014 (China) (In default) † F | 3,213,000 | 257,040 |
|
| China Medical Technologies, Inc. 144A cv. sr. unsec. notes | | |
| 6 1/4s, 2016 (China) (In default) † F | 3,544,000 | 248,080 |
|
| Hologic, Inc. cv. sr. unsec. unsub. notes stepped-coupon 2s | | |
| (0s, 3/1/18) 2042 †† | 5,185,000 | 5,421,566 |
|
| Insulet Corp. cv. sr. unsec. notes 3 3/4s, 2016 | 1,980,000 | 3,045,488 |
|
| Teleflex, Inc. cv. sr. unsec. sub. notes 3 7/8s, 2017 | 3,966,000 | 6,162,173 |
|
| Wright Medical Group, Inc. cv. sr. unsec. unsub. notes 2s, 2017 | 4,260,000 | 5,356,950 |
|
| | | 20,491,297 |
| Metals (0.5%) | | |
| Newmont Mining Corp. cv. company guaranty sr. unsub. notes | | |
| 1 5/8s, 2017 | 3,915,000 | 4,237,988 |
|
| | | 4,237,988 |
| Oil and gas (2.5%) | | |
| Chesapeake Energy Corp. cv. company guaranty sr. unsec. | | |
| notes 2 1/2s, 2037 | 5,165,000 | 5,242,475 |
|
| Cobalt International Energy, Inc. cv. sr. unsec. unsub. notes | | |
| 2 5/8s, 2019 | 7,862,000 | 8,063,464 |
|
| Goodrich Petroleum Corp. cv. company guaranty sr. unsub. | | |
| notes 5s, 2032 | 2,788,000 | 3,065,058 |
|
| Vantage Drilling Co. cv. sr. unsec. unsub. notes 7 7/8s, 2042 | 3,601,000 | 4,173,559 |
|
| | | 20,544,556 |
| Pharmaceuticals (1.3%) | | |
| Endo Pharmaceuticals Holdings, Inc. cv. sr. unsec. sub. notes | | |
| 1 3/4s, 2015 | 3,643,000 | 5,598,836 |
|
| ViroPharma, Inc. cv. sr. unsec. notes 2s, 2017 | 2,252,000 | 4,779,870 |
|
| | | 10,378,706 |
| |
| Convertible Securities Fund | 29 |
| | |
| CONVERTIBLE BONDS AND NOTES (67.5%)* cont. | Principal amount | Value |
|
| Real estate (2.4%) | | |
| Forest City Enterprises, Inc. cv. sr. unsec. notes 4 1/4s, 2018 | $8,170,000 | $9,339,331 |
|
| iStar Financial, Inc. cv. sr. unsec. unsub. notes 3s, 2016 R | 6,036,000 | 7,726,080 |
|
| Morgans Hotel Group Co. cv. sr. sub. notes 2 3/8s, 2014 R | 2,444,000 | 2,337,075 |
|
| | | 19,402,486 |
| Semiconductor (2.8%) | | |
| Linear Technology Corp. cv. sr. unsec. unsub. notes | | |
| Ser. A, 3s, 2027 | 6,940,000 | 7,430,138 |
|
| Novellus Systems, Inc. cv. sr. unsec. notes 2 5/8s, 2041 | 7,405,000 | 12,333,953 |
|
| Photronics, Inc. cv. sr. unsec. notes 3 1/4s, 2016 | 3,253,000 | 3,710,453 |
|
| | | 23,474,544 |
| Software (2.8%) | | |
| Concur Technologies, Inc. 144A cv. sr. unsec. unsub. notes | | |
| 0 1/2s, 2018 | 4,465,000 | 5,268,700 |
|
| Dealertrack Technologies, Inc. cv. company guaranty sr. unsec. | | |
| notes 1 1/2s, 2017 | 5,468,000 | 6,486,415 |
|
| Safeguard Scientifics, Inc. 144A cv. sr. unsec. notes 5 1/4s, 2018 | 5,615,000 | 6,483,079 |
|
| TeleCommunication Systems, Inc. cv. sr. unsec. notes | | |
| 7 3/4s, 2018 | 3,005,000 | 2,944,900 |
|
| Workday, Inc. 144A cv. sr. unsec. unsub. notes 0 3/4s, 2018 | 1,772,000 | 2,003,468 |
|
| | | 23,186,562 |
| Technology (1.2%) | | |
| ON Semiconductor Corp. cv. company guaranty sr. unsec. sub. | | |
| notes Ser. B, 2 5/8s, 2026 | 8,827,000 | 9,527,643 |
|
| | | 9,527,643 |
| Technology services (2.2%) | | |
| Blucora, Inc. 144A cv. sr. unsec. unsub. notes 4 1/4s, 2019 | 4,115,000 | 5,269,772 |
|
| Salesforce.com, Inc. 144A cv. sr. unsec. unsub. notes | | |
| 0 1/4s, 2018 | 8,070,000 | 8,816,475 |
|
| Web.com Group, Inc. cv. sr. unsec. unsub. notes 1s, 2018 | 3,960,000 | 4,128,300 |
|
| | | 18,214,547 |
| Telecommunications (1.7%) | | |
| Level 3 Communications, Inc. cv. sr. unsec. unsub. notes | | |
| 6 1/2s, 2016 | 4,325,000 | 7,174,094 |
|
| Powerwave Technologies, Inc. cv. sr. unsec. sub. notes 3 7/8s, | | |
| 2027 (In default) † | 5,121,000 | 25,605 |
|
| SBA Communications Corp. cv. sr. unsec. notes 4s, 2014 | 2,397,000 | 6,903,360 |
|
| | | 14,103,059 |
| Tobacco (0.9%) | | |
| Vector Group Ltd. cv. sr. unsec. FRN notes 2 1/2s, 2019 | 6,605,000 | 7,703,814 |
|
| | | 7,703,814 |
| Waste Management (0.6%) | | |
| Covanta Holding Corp. cv. sr. unsec. notes 3 1/4s, 2014 | 4,135,000 | 4,680,303 |
|
| | | 4,680,303 |
| | | |
| Total convertible bonds and notes (cost $486,952,124) | | $557,448,529 |
| |
| CONVERTIBLE PREFERRED STOCKS (23.7%)* | Shares | Value |
|
| Aerospace and defense (1.8%) | | |
| United Technologies Corp. $3.75 cv. pfd. | 236,060 | $14,937,877 |
|
| | | 14,937,877 |
| Airlines (0.6%) | | |
| Continental Financial Trust II $3.00 cv. pfd. | 123,410 | 5,568,876 |
|
| | | 5,568,876 |
| |
| 30 | Convertible Securities Fund |
| | |
| CONVERTIBLE PREFERRED STOCKS (23.7%)* cont. | Shares | Value |
|
| Automotive (1.2%) | | |
| General Motors Co. Ser. B, $2.375 cv. pfd. | 187,915 | $9,689,367 |
|
| | | 9,689,367 |
| Banking (2.9%) | | |
| Bank of America Corp. Ser. L, 7.25% cv. pfd. | 7,680 | 8,275,200 |
|
| OFG Bancorp Ser. C, 8.75% cv. pfd. (Puerto Rico) | 2,637 | 3,910,671 |
|
| Wells Fargo & Co. Ser. L, 7.50% cv. pfd. | 5,265 | 6,005,391 |
|
| Wintrust Financial Corp. $3.75 cv. pfd. | 93,135 | 5,490,308 |
|
| | | 23,681,570 |
| Consumer (1.0%) | | |
| Stanley Black & Decker, Inc. $4.75 cv. pfd. | 68,216 | 8,589,077 |
|
| | | 8,589,077 |
| Electric utilities (2.4%) | | |
| Dominion Resources, Inc. Ser. A, $3.063 cv. pfd. | 124,190 | 6,727,372 |
|
| NextEra Energy, Inc. $2.799 cv. pfd. | 123,200 | 7,081,536 |
|
| PPL Corp. $4.375 cv. pfd. | 120,590 | 6,367,152 |
|
| | | 20,176,060 |
| Financial (1.4%) | | |
| AMG Capital Trust II $2.575 cv. pfd. | 190,390 | 11,459,098 |
|
| | | 11,459,098 |
| Food (0.8%) | | |
| Post Holdings, Inc. 144A $3.75 cv. pfd. | 63,100 | 6,854,553 |
|
| | | 6,854,553 |
| Forest products and packaging (1.4%) | | |
| Weyerhaeuser Co. Ser. A, $3.188 cv. pfd. R | 202,369 | 11,206,183 |
|
| | | 11,206,183 |
| Health-care services (0.6%) | | |
| HealthSouth Corp. Ser. A, 6.50% cv. pfd. | 3,615 | 4,746,947 |
|
| | | 4,746,947 |
| Insurance (1.1%) | | |
| Maiden Holdings, Ltd. Ser. B, $7.25 cv. pfd. (Bermuda) † | 81,042 | 3,760,349 |
|
| MetLife, Inc. $3.75 cv. pfd. | 183,613 | 5,273,365 |
|
| | | 9,033,714 |
| Metals (1.2%) | | |
| ArcelorMittal Ser. MTUS, $1.50 cv. pfd. (France) | 408,875 | 9,776,201 |
|
| | | 9,776,201 |
| Oil and gas (2.9%) | | |
| Chesapeake Energy Corp. 144A 5.75% cv. pfd. | 15,243 | 17,862,891 |
|
| Halcon Resources Corp. Ser. A, 5.75% cv. pfd. | 5,669 | 6,028,245 |
|
| | | 23,891,136 |
| Railroads (0.9%) | | |
| Genesee & Wyoming, Inc. $5.00 cv. pfd. | 54,578 | 7,269,790 |
|
| | | 7,269,790 |
| Real estate (0.8%) | | |
| Alexandria Real Estate Equities, Inc. Ser. D, $1.75 cv. pfd. R | 274,995 | 6,926,437 |
|
| | | 6,926,437 |
| Shipping (0.7%) | | |
| Swift Mandatory Common Exchange Security Trust 144A 6.00% cv. pfd. | 307,370 | 5,486,555 |
|
| | | 5,486,555 |
| Technology services (0.2%) | | |
| Unisys Corp. Ser. A, 6.25% cv. pfd. | 26,410 | 1,899,869 |
|
| | | 1,899,869 |
| Telecommunications (1.2%) | | |
| Crown Castle International Corp. Ser. A, $2.25 cv. pfd. † | 70,067 | 7,171,357 |
|
| Iridium Communications, Inc. 144A $7.00 cv. pfd. | 33,766 | 3,072,706 |
|
| | | 10,244,063 |
| |
| Convertible Securities Fund | 31 |
| | | | |
| CONVERTIBLE PREFERRED STOCKS (23.7%)* cont. | | Shares | Value |
|
| Tire and rubber (0.6%) | | | | |
| Goodyear Tire & Rubber Co. (The) $1.469 cv. pfd. | | 76,480 | $4,584,211 |
|
| | | | | 4,584,211 |
| | | | | |
| Total convertible preferred stocks (cost $180,699,191) | | | $196,021,584 |
| |
| COMMON STOCKS (4.1%)* | | | Shares | Value |
|
| Actavis PLC † | | | 14,620 | $2,259,960 |
|
| Allergan, Inc. | | | 17,950 | 1,626,450 |
|
| Apple, Inc. | | | 4,130 | 2,157,306 |
|
| Brazil Ethanol, Inc. 144A (Unit) † F | | | 312,500 | 31 |
|
| Celgene Corp. † | | | 15,435 | 2,291,943 |
|
| Ford Motor Co. | | | 232,940 | 3,985,603 |
|
| General Motors Co. † | | | 152,620 | 5,639,309 |
|
| Hartford Financial Services Group, Inc. (The) | | | 67,700 | 2,281,490 |
|
| Interpublic Group of Companies, Inc. (The) | | | 1 | 16 |
|
| Jazz Pharmaceuticals PLC † | | | 26,030 | 2,361,962 |
|
| MetLife, Inc. | | | 87,304 | 4,130,352 |
|
| PulteGroup, Inc. | | | 84,525 | 1,491,866 |
|
| SanDisk Corp. | | | 20,800 | 1,445,600 |
|
| Suncor Energy, Inc. (Canada) | | | 54,982 | 1,998,596 |
|
| United Technologies Corp. | | | 19,100 | 2,029,366 |
|
| Total common stocks (cost $32,893,490) | | | | $33,699,850 |
| |
| CORPORATE BONDS AND NOTES (0.5%)* | | Principal amount | Value |
|
| Jazz Technologies, Inc. company guaranty sr. unsec. | | | |
| notes 8s, 2015 | | $2,278,000 | $2,169,795 |
|
| Provident Funding Associates LP/PFG Finance Corp. 144A sr. | | | |
| notes 10 1/8s, 2019 | | | 1,840,000 | 2,047,000 |
|
| Total corporate bonds and notes (cost $3,951,835) | | | $4,216,795 |
| |
| WARRANTS (—%)*† | Expiration | Strike | | |
| | date | price | Warrants | Value |
|
| Tower Semiconductor, Ltd. 144A (Israel) F | 6/30/15 | $0.01 | 1,085,630 | $— |
|
| Total warrants (cost $217,126) | | | | $— |
| |
| SHORT-TERM INVESTMENTS (3.2%)* | | | Shares | Value |
|
| Putnam Short Term Investment Fund 0.07% L | | 26,804,657 | $26,804,657 |
|
| Total short-term investments (cost $26,804,657) | | | $26,804,657 |
| |
| TOTAL INVESTMENTS | | | | |
|
| Total investments (cost $731,518,423) | | | | $818,191,415 |
Key to holding’s currency abbreviations
| |
| EUR | Euro |
| USD/$ | United States Dollar |
Key to holding’s abbreviations
FRN Floating Rate Notes: the rate shown is the current interest rate at the close of the reporting period
| |
| 32 | Convertible Securities Fund |
Notes to the fund’s portfolio
Unless noted otherwise, the notes to the fund’s portfolio are for the close of the fund’s reporting period, which ran from November 1, 2012 through October 31, 2013 (the reporting period). Within the following notes to the portfolio, references to “ASC 820” represent Accounting Standards Codification 820 Fair Value Measurements and Disclosures and references to “OTC”, if any, represent over-the-counter.
* Percentages indicated are based on net assets of $825,485,402.
† Non-income-producing security.
†† The interest rate and date shown parenthetically represent the new interest rate to be paid and the date the fund will begin accruing interest at this rate.
F Is valued at fair value following procedures approved by the Trustees. Securities may be classified as Level 2 or Level 3 for ASC 820 based on the securities’ valuation inputs.
L Affiliated company (Note 5). The rate quoted in the security description is the annualized 7-day yield of the fund at the close of the reporting period.
R Real Estate Investment Trust.
Debt obligations are considered secured unless otherwise indicated.
144A after the name of an issuer represents securities exempt from registration under Rule 144A under the Securities Act of 1933, as amended. These securities may be resold in transactions exempt from registration, normally to qualified institutional buyers.
The dates shown on debt obligations are the original maturity dates.
ASC 820 establishes a three-level hierarchy for disclosure of fair value measurements. The valuation hierarchy is based upon the transparency of inputs to the valuation of the fund’s investments. The three levels are defined as follows:
Level 1: Valuations based on quoted prices for identical securities in active markets.
Level 2: Valuations based on quoted prices in markets that are not active or for which all significant inputs are observable, either directly or indirectly.
Level 3: Valuations based on inputs that are unobservable and significant to the fair value measurement.
The following is a summary of the inputs used to value the fund’s net assets as of the close of the reporting period:
| | | |
| | | Valuation inputs | |
|
| Investments in securities: | Level 1 | Level 2 | Level 3 |
|
| Common stocks*: | | | |
|
| Capital goods | $2,029,366 | $— | $— |
|
| Consumer cyclicals | 11,116,794 | — | — |
|
| Energy | 1,998,596 | — | 31 |
|
| Financials | 6,411,842 | — | — |
|
| Health care | 8,540,315 | — | — |
|
| Technology | 3,602,906 | — | — |
|
| Total common stocks | 33,699,819 | — | 31 |
| | | | |
| Convertible bonds and notes | — | 556,943,409 | 505,120 |
|
| Convertible preferred stocks | 26,249,460 | 169,772,124 | — |
|
| Corporate bonds and notes | — | 4,216,795 | — |
|
| Warrants | — | — | — |
|
| Short-term investments | 26,804,657 | — | — |
|
| Totals by level | $86,753,936 | $730,932,328 | $505,151 |
* Common stock classifications are presented at the sector level, which may differ from the fund’s portfolio presentation.
At the start and close of the reporting period, Level 3 investments in securities were not considered a significant portion of the fund’s portfolio.
The accompanying notes are an integral part of these financial statements.
| |
| Convertible Securities Fund | 33 |
Statement of assets and liabilities 10/31/13
| |
| ASSETS | |
|
| Investment in securities, at value (Note 1): | |
| Unaffiliated issuers (identified cost $704,713,766) | $791,386,758 |
| Affiliated issuers (identified cost $26,804,657) (Notes 1 and 5) | 26,804,657 |
|
| Dividends, interest and other receivables | 4,508,889 |
|
| Receivable for shares of the fund sold | 1,367,257 |
|
| Receivable for investments sold | 7,335,462 |
|
| Total assets | 831,403,023 |
| |
| LIABILITIES | |
|
| Payable for investments purchased | 4,124,285 |
|
| Payable for shares of the fund repurchased | 670,578 |
|
| Payable for compensation of Manager (Note 2) | 434,136 |
|
| Payable for custodian fees (Note 2) | 5,312 |
|
| Payable for investor servicing fees (Note 2) | 195,431 |
|
| Payable for Trustee compensation and expenses (Note 2) | 218,193 |
|
| Payable for administrative services (Note 2) | 2,963 |
|
| Payable for distribution fees (Note 2) | 174,627 |
|
| Other accrued expenses | 92,096 |
|
| Total liabilities | 5,917,621 |
| | |
| Net assets | $825,485,402 |
|
| |
| REPRESENTED BY | |
|
| Paid-in capital (Unlimited shares authorized) (Notes 1 and 4) | $763,748,257 |
|
| Undistributed net investment income (Note 1) | 14,907,046 |
|
| Accumulated net realized loss on investments and foreign currency transactions (Note 1) | (39,842,896) |
|
| Net unrealized appreciation of investments and assets and liabilities in foreign currencies | 86,672,995 |
|
| Total — Representing net assets applicable to capital shares outstanding | $825,485,402 |
| |
| COMPUTATION OF NET ASSET VALUE AND OFFERING PRICE | |
|
| Net asset value and redemption price per class A share | |
| ($556,643,355 divided by 23,621,316 shares) | $23.57 |
|
| Offering price per class A share (100/94.25 of $23.57)* | $25.01 |
|
| Net asset value and offering price per class B share ($12,009,337 divided by 518,742 shares)** | $23.15 |
|
| Net asset value and offering price per class C share ($50,931,415 divided by 2,182,998 shares)** | $23.33 |
|
| Net asset value and redemption price per class M share ($3,885,172 divided by 166,396 shares) | $23.35 |
|
| Offering price per class M share (100/96.50 of $23.35)* | $24.20 |
|
| Net asset value, offering price and redemption price per class R share | |
| ($5,616,891 divided by 239,255 shares) | $23.48 |
|
| Net asset value, offering price and redemption price per class Y share | |
| ($196,399,232 divided by 8,336,737 shares) | $23.56 |
|
* On single retail sales of less than $50,000. On sales of $50,000 or more the offering price is reduced.
** Redemption price per share is equal to net asset value less any applicable contingent deferred sales charge.
The accompanying notes are an integral part of these financial statements.
| |
| 34 | Convertible Securities Fund |
Statement of operations Year ended 10/31/13
| |
| INVESTMENT INCOME | |
|
| Interest (including interest income of $21,684 from investments in affiliated issuers) (Note 5) | $9,846,660 |
|
| Dividends (net of foreign tax of $25,014) | 9,756,733 |
|
| Securities lending (Note 1) | 15 |
|
| Total investment income | 19,603,408 |
| |
| EXPENSES | |
|
| Compensation of Manager (Note 2) | 4,471,111 |
|
| Investor servicing fees (Note 2) | 1,133,981 |
|
| Custodian fees (Note 2) | 15,510 |
|
| Trustee compensation and expenses (Note 2) | 62,457 |
|
| Distribution fees (Note 2) | 1,845,027 |
|
| Administrative services (Note 2) | 20,045 |
|
| Other | 202,433 |
|
| Total expenses | 7,750,564 |
| | |
| Expense reduction (Note 2) | (8,246) |
|
| Net expenses | 7,742,318 |
| | |
| Net investment income | 11,861,090 |
|
| |
| Net realized gain on investments (Notes 1 and 3) | 47,619,492 |
|
| Net increase from payments by affiliates (Note 2) | 59,294 |
|
| Net realized gain on foreign currency transactions (Note 1) | 2 |
|
| Net unrealized appreciation of assets and liabilities in foreign currencies during the year | 1 |
|
| Net unrealized appreciation of investments during the year | 70,637,583 |
|
| Net gain on investments | 118,316,372 |
| | |
| Net increase in net assets resulting from operations | $130,177,462 |
|
|
| The accompanying notes are an integral part of these financial statements. |
| |
| Convertible Securities Fund | 35 |
Statement of changes in net assets
| | |
| INCREASE (DECREASE) IN NET ASSETS | Year ended 10/31/13 | Year ended 10/31/12 |
|
| Operations: | | |
| Net investment income | $11,861,090 | $11,705,189 |
|
| Net realized gain on investments | | |
| and foreign currency transactions | 47,678,788 | 36,583,352 |
|
| Net unrealized appreciation of investments and assets | | |
| and liabilities in foreign currencies | 70,637,584 | 5,740,236 |
|
| Net increase in net assets resulting from operations | 130,177,462 | 54,028,777 |
|
| Distributions to shareholders (Note 1): | | |
| From ordinary income | | |
| Net investment income | | |
|
| Class A | (13,700,234) | (13,634,928) |
|
| Class B | (226,051) | (250,624) |
|
| Class C | (860,253) | (982,153) |
|
| Class M | (82,308) | (86,266) |
|
| Class R | (122,562) | (105,901) |
|
| Class Y | (4,225,952) | (3,296,242) |
|
| Redemption fees (Note 1) | 9,964 | 14,102 |
|
| Increase (decrease) from capital share transactions (Note 4) | 84,367,098 | (68,913,098) |
|
| Total increase (decrease) in net assets | 195,337,164 | (33,226,333) |
| |
| NET ASSETS | | |
|
| Beginning of year | 630,148,238 | 663,374,571 |
|
| End of year (including undistributed net investment income | | |
| of $14,907,046 and $17,872,624, respectively) | $825,485,402 | $630,148,238 |
|
The accompanying notes are an integral part of these financial statements.
| |
| 36 | Convertible Securities Fund |
|
| This page left blank intentionally. |
| |
| Convertible Securities Fund | 37 |
Financial highlights (For a common share outstanding throughout the period)
| | | | | | | | | | | | | | |
| INVESTMENT OPERATIONS: | | | LESS DISTRIBUTIONS: | | | | RATIOS AND SUPPLEMENTAL DATA: |
|
| | | | | | | | | | | | | Ratio | Ratio | |
| | | | Net realized | | | | | | | | | of expenses | of net investment | |
| | Net asset value, | | and unrealized | Total from | From | | | | | Total return | Net assets, | to average | income (loss) | Portfolio |
| | beginning | Net investment | gain (loss) | investment | net investment | Total | Redemption | Non-recurring | Net asset value, | at net asset | end of period | net assets | to average | turnover |
| Period ended | of period | income (loss) a | on investments | operations | income | distributions | fees b | reimbursements | end of period | value (%) c | (in thousands) | (%) d | net assets (%) | (%) |
|
| Class A | | | | | | | | | | | | | | |
| October 31, 2013 | $20.09 | .37 | 3.71 | 4.08 | (.60) | (.60) | — | — | $23.57 | 20.62 | $556,643 | 1.08 | 1.69 | 72 |
| October 31, 2012 | 18.97 | .36 | 1.33 | 1.69 | (.57) | (.57) | — | — | 20.09 | 9.07 | 466,910 | 1.11 | 1.87 | 59 |
| October 31, 2011 | 19.31 | .39 | (.16) | .23 | (.57) | (.57) | — | — b,e | 18.97 | 1.08 | 484,050 | 1.12 | 1.94 | 79 |
| October 31, 2010 | 16.27 | .54 | 3.07 | 3.61 | (.57) | (.57) | — | — b,f | 19.31 | 22.48 | 495,949 | 1.18 | 3.03 | 71 |
| October 31, 2009 | 12.55 | .55 | 3.73 | 4.28 | (.56) | (.56) | — | — | 16.27 | 35.08 | 467,669 | 1.20 g | 4.00 g | 74 |
|
| Class B | | | | | | | | | | | | | | |
| October 31, 2013 | $19.75 | .20 | 3.64 | 3.84 | (.44) | (.44) | — | — | $23.15 | 19.68 | $12,009 | 1.83 | .95 | 72 |
| October 31, 2012 | 18.66 | .21 | 1.30 | 1.51 | (.42) | (.42) | — | — | 19.75 | 8.22 | 10,315 | 1.86 | 1.10 | 59 |
| October 31, 2011 | 18.99 | .23 | (.14) | .09 | (.42) | (.42) | — | — b,e | 18.66 | .40 | 12,281 | 1.87 | 1.19 | 79 |
| October 31, 2010 | 16.01 | .40 | 3.01 | 3.41 | (.43) | (.43) | — | — b,f | 18.99 | 21.52 | 12,205 | 1.93 | 2.28 | 71 |
| October 31, 2009 | 12.35 | .44 | 3.67 | 4.11 | (.45) | (.45) | — | — | 16.01 | 34.12 | 14,351 | 1.95 g | 3.30 g | 74 |
|
| Class C | | | | | | | | | | | | | | |
| October 31, 2013 | $19.90 | .20 | 3.67 | 3.87 | (.44) | (.44) | — | — | $23.33 | 19.68 | $50,931 | 1.83 | .93 | 72 |
| October 31, 2012 | 18.79 | .21 | 1.32 | 1.53 | (.42) | (.42) | — | — | 19.90 | 8.24 | 38,875 | 1.86 | 1.10 | 59 |
| October 31, 2011 | 19.13 | .24 | (.16) | .08 | (.42) | (.42) | — | — b,e | 18.79 | .32 | 53,696 | 1.87 | 1.19 | 79 |
| October 31, 2010 | 16.12 | .40 | 3.04 | 3.44 | (.43) | (.43) | — | — b,f | 19.13 | 21.58 | 57,211 | 1.93 | 2.27 | 71 |
| October 31, 2009 | 12.44 | .43 | 3.71 | 4.14 | (.46) | (.46) | — | — | 16.12 | 34.12 | 56,131 | 1.95 g | 3.13 g | 74 |
|
| Class M | | | | | | | | | | | | | | |
| October 31, 2013 | $19.91 | .26 | 3.67 | 3.93 | (.49) | (.49) | — | — | $23.35 | 20.01 | $3,885 | 1.58 | 1.20 | 72 |
| October 31, 2012 | 18.81 | .26 | 1.31 | 1.57 | (.47) | (.47) | — | — | 19.91 | 8.49 | 3,406 | 1.61 | 1.36 | 59 |
| October 31, 2011 | 19.14 | .29 | (.16) | .13 | (.46) | (.46) | — | — b,e | 18.81 | .61 | 3,546 | 1.62 | 1.46 | 79 |
| October 31, 2010 | 16.13 | .45 | 3.04 | 3.49 | (.48) | (.48) | — | — b,f | 19.14 | 21.85 | 4,598 | 1.68 | 2.53 | 71 |
| October 31, 2009 | 12.45 | .47 | 3.71 | 4.18 | (.50) | (.50) | — | — | 16.13 | 34.41 | 4,383 | 1.70 g | 3.40 g | 74 |
|
| Class R | | | | | | | | | | | | | | |
| October 31, 2013 | $20.02 | .31 | 3.70 | 4.01 | (.55) | (.55) | — | — | $23.48 | 20.30 | $5,617 | 1.33 | 1.43 | 72 |
| October 31, 2012 | 18.91 | .31 | 1.32 | 1.63 | (.52) | (.52) | — | — | 20.02 | 8.78 | 4,059 | 1.36 | 1.61 | 59 |
| October 31, 2011 | 19.24 | .34 | (.15) | .19 | (.52) | (.52) | — | — b,e | 18.91 | .88 | 3,595 | 1.37 | 1.69 | 79 |
| October 31, 2010 | 16.22 | .50 | 3.04 | 3.54 | (.52) | (.52) | — | — b,f | 19.24 | 22.12 | 3,434 | 1.43 | 2.77 | 71 |
| October 31, 2009 | 12.51 | .51 | 3.73 | 4.24 | (.53) | (.53) | — | — | 16.22 | 34.79 | 2,685 | 1.45 g | 3.73 g | 74 |
|
| Class Y | | | | | | | | | | | | | | |
| October 31, 2013 | $20.08 | .42 | 3.72 | 4.14 | (.66) | (.66) | — | — | $23.56 | 20.93 | $196,399 | .83 | 1.89 | 72 |
| October 31, 2012 | 18.97 | .41 | 1.32 | 1.73 | (.62) | (.62) | — | — | 20.08 | 9.28 | 106,584 | .86 | 2.12 | 59 |
| October 31, 2011 | 19.30 | .44 | (.15) | .29 | (.62) | (.62) | — | — b,e | 18.97 | 1.40 | 106,207 | .87 | 2.17 | 79 |
| October 31, 2010 | 16.27 | .59 | 3.05 | 3.64 | (.61) | (.61) | — | — b,f | 19.30 | 22.73 | 83,025 | .93 | 3.27 | 71 |
| October 31, 2009 | 12.55 | .57 | 3.74 | 4.31 | (.59) | (.59) | — | — | 16.27 | 35.43 | 70,660 | .95 g | 3.93 g | 74 |
|
See notes to financial highlights at the end of this section.
The accompanying notes are an integral part of these financial statements.
| | | |
| 38 | Convertible Securities Fund | Convertible Securities Fund | 39 |
Financial highlights (Continued)
a Per share net investment income (loss) has been determined on the basis of the weighted average number of shares outstanding during the period.
b Amount represents less than $0.01 per share.
c Total return assumes dividend reinvestment and does not reflect the effect of sales charges.
d Includes amounts paid through expense offset and brokerage/service arrangements (Note 2).
e Reflects a non-recurring reimbursement related to restitution amounts in connection with a distribution plan approved by the Securities and Exchange Commission (the SEC) which amounted to less than $0.01 per share outstanding on July 21, 2011. Also reflects a non-recurring reimbursement related to short-term trading related lawsuits, which amounted to less than $0.01 per share outstanding on May 11, 2011.
f Reflects a non-recurring reimbursement pursuant to a settlement between the SEC and Prudential Securities, Inc., which amounted to less than $0.01 per share outstanding on March 30, 2010.
g Reflects an involuntary contractual expense limitation in effect during the period. As a result of such limitation and/or waivers, the expenses of each class reflect a reduction of the following amounts:
| |
| | Percentage of |
| | average net assets |
|
| October 31, 2009 | 0.06% |
|
The accompanying notes are an integral part of these financial statements.
| |
| 40 | Convertible Securities Fund |
Notes to financial statements 10/31/13
Within the following Notes to financial statements, references to “State Street” represent State Street Bank and Trust Company, references to “the SEC” represent the Securities and Exchange Commission, references to “Putnam Management” represent Putnam Investment Management, LLC, the fund’s manager, an indirect wholly-owned subsidiary of Putnam Investments, LLC and references to “OTC”, if any, represent over-the-counter. Unless otherwise noted, the “reporting period” represents the period from November 1, 2012 through October 31, 2013.
Putnam Convertible Securities Fund (the fund) is a Massachusetts business trust, which is registered under the Investment Company Act of 1940, as amended, as a diversified open-end management investment company. The fund seeks, with equal emphasis, current income and capital appreciation. The fund’s secondary objective is conservation of capital. The fund invests mainly in convertible securities of U.S. companies. Convertible securities combine the investment characteristics of bonds and common stocks. Convertible securities include bonds, preferred stocks and other instruments that can be converted into or exchanged for common stock or equivalent value. A significant portion of the convertible securities the fund buys are below-investment-grade. The convertible bonds the fund buys usually have intermediate-to long-term stated maturities (three years or longer), but often contain “put” features, which allow bondholders to sell the bond back to the company under specified circumstances, that result in shorter effective maturities. When deciding whether to buy or sell investments, Putnam Management may consider, among other factors: (i) a security’s structural features, such as its position in a company’s capital structure and “put” and “call” features (a company’s right to repurchase the security under specified circumstances is a “call” feature); (ii) credit and prepayment risks; and (iii) with respect to a company’s common stock underlying a convertible security, the stock’s valuation and the company’s financial strength, growth potential, competitive position in its industry, projected future earnings, cash flows and dividends.
The fund offers class A, class B, class C, class M, class R and class Y shares. Class A and class M shares are sold with a maximum front-end sales charge of 5.75% and 3.50%, respectively, and generally do not pay a contingent deferred sales charge. Class B shares, which convert to class A shares after approximately eight years, do not pay a front-end sales charge and are subject to a contingent deferred sales charge if those shares are redeemed within six years of purchase. Class C shares have a one-year 1.00% contingent deferred sales charge and do not convert to class A shares. Class R shares, which are not available to all investors, are sold at net asset value. The expenses for class A, class B, class C, class M and class R shares may differ based on the distribution fee of each class, which is identified in Note 2. Class Y shares, which are sold at net asset value, are generally subject to the same expenses as class A, class B, class C, class M and class R shares, but do not bear a distribution fee. Class Y shares are not available to all investors.
In the normal course of business, the fund enters into contracts that may include agreements to indemnify another party under given circumstances. The fund’s maximum exposure under these arrangements is unknown as this would involve future claims that may be, but have not yet been, made against the fund. However, the fund’s management team expects the risk of material loss to be remote.
Note 1: Significant accounting policies
The following is a summary of significant accounting policies consistently followed by the fund in the preparation of its financial statements. The preparation of financial statements is in conformity with accounting principles generally accepted in the United States of America and requires management to make estimates and assumptions that affect the reported amounts of assets and liabilities in the financial statements and the reported amounts of increases and decreases in net assets from operations. Actual results could differ from those estimates. Subsequent events after the Statement of assets and liabilities date through the date that the financial statements were issued have been evaluated in the preparation of the financial statements.
A short-term trading fee of 1.00% may have applied to redemptions (including exchanges into another fund) of shares purchased before June 24, 2013 and held for 30 days or less. The short-term trading fee was accounted for as an addition to paid-in-capital. No short-term trading fee applies to shares purchased on or after June 24, 2013.
Investment income, realized and unrealized gains and losses and expenses of the fund are borne pro-rata based on the relative net assets of each class to the total net assets of the fund, except that each class bears expenses unique to that class (including the distribution fees applicable to such classes). Each class votes as a class only with respect to its own distribution plan or other matters on which a class vote is required by law or determined by the Trustees. If the fund were liquidated, shares of each class would receive their pro-rata share of the net assets of the fund. In addition, the Trustees declare separate dividends on each class of shares.
| |
| Convertible Securities Fund | 41 |
Security valuation Investments for which market quotations are readily available are valued at the last reported sales price on their principal exchange, or official closing price for certain markets, and are classified as Level 1 securities under Accounting Standards Codification 820 Fair Value Measurements and Disclosures (ASC 820). If no sales are reported, as in the case of some securities that are traded OTC, a security is valued at its last reported bid price and is generally categorized as a Level 2 security.
Investments in open-end investment companies (excluding exchange traded funds), if any, which can be classified as Level 1 or Level 2 securities, are valued based on their net asset value. The net asset value of such investment companies equals the total value of their assets less their liabilities and divided by the number of their outstanding shares.
Market quotations are not considered to be readily available for certain debt obligations and other investments; such investments are valued on the basis of valuations furnished by an independent pricing service approved by the Trustees or dealers selected by Putnam Management. Such services or dealers determine valuations for normal institutional-size trading units of such securities using methods based on market transactions for comparable securities and various relationships, generally recognized by institutional traders, between securities (which consider such factors as security prices, yields, maturities and ratings). These securities will generally be categorized as Level 2.
Many securities markets and exchanges outside the U.S. close prior to the close of the New York Stock Exchange and therefore the closing prices for securities in such markets or on such exchanges may not fully reflect events that occur after such close but before the close of the New York Stock Exchange. Accordingly, on certain days, the fund will fair value foreign equity securities taking into account multiple factors including movements in the U.S. securities markets, currency valuations and comparisons to the valuation of American Depository Receipts, exchange-traded funds and futures contracts. These securities, which would generally be classified as Level 1 securities, will be transferred to Level 2 of the fair value hierarchy when they are valued at fair value. The number of days on which fair value prices will be used will depend on market activity and it is possible that fair value prices will be used by the fund to a significant extent. Securities quoted in foreign currencies, if any, are translated into U.S. dollars at the current exchange rate.
To the extent a pricing service or dealer is unable to value a security or provides a valuation that Putnam Management does not believe accurately reflects the security’s fair value, the security will be valued at fair value by Putnam Management in accordance with policies and procedures approved by the Trustees. Certain investments, including certain restricted and illiquid securities and derivatives, are also valued at fair value following procedures approved by the Trustees. These valuations consider such factors as significant market or specific security events such as interest rate or credit quality changes, various relationships with other securities, discount rates, U.S. Treasury, U.S. swap and credit yields, index levels, convexity exposures and recovery rates. These securities are classified as Level 2 or as Level 3 depending on the priority of the significant inputs.
Such valuations and procedures are reviewed periodically by the Trustees. The fair value of securities is generally determined as the amount that the fund could reasonably expect to realize from an orderly disposition of such securities over a reasonable period of time. By its nature, a fair value price is a good faith estimate of the value of a security in a current sale and does not reflect an actual market price, which may be different by a material amount.
Security transactions and related investment income Security transactions are recorded on the trade date (the date the order to buy or sell is executed). Gains or losses on securities sold are determined on the identified cost basis.
Interest income, net of any applicable withholding taxes, is recorded on the accrual basis. Dividend income, net of any applicable withholding taxes, is recognized on the ex-dividend date except that certain dividends from foreign securities, if any, are recognized as soon as the fund is informed of the ex-dividend date. Non-cash dividends, if any, are recorded at the fair market value of the securities received. Dividends representing a return of capital or capital gains, if any, are reflected as a reduction of cost and/or as a realized gain.
All premiums/discounts are amortized/accreted on a yield-to-maturity basis.
The fund earned certain fees in connection with its senior loan purchasing activities. These fees are treated as market discount and are amortized into income in the Statement of operations.
Foreign currency translation The accounting records of the fund are maintained in U.S. dollars. The market value of foreign securities, currency holdings, and other assets and liabilities is recorded in the books and records of the
| |
| 42 | Convertible Securities Fund |
fund after translation to U.S. dollars based on the exchange rates on that day. The cost of each security is determined using historical exchange rates. Income and withholding taxes are translated at prevailing exchange rates when earned or incurred. The fund does not isolate that portion of realized or unrealized gains or losses resulting from changes in the foreign exchange rate on investments from fluctuations arising from changes in the market prices of the securities. Such gains and losses are included with the net realized and unrealized gain or loss on investments. Net realized gains and losses on foreign currency transactions represent net realized exchange gains or losses on closed forward currency contracts, disposition of foreign currencies, currency gains and losses realized between the trade and settlement dates on securities transactions and the difference between the amount of investment income and foreign withholding taxes recorded on the fund’s books and the U.S. dollar equivalent amounts actually received or paid. Net unrealized appreciation and depreciation of assets and liabilities in foreign currencies arise from changes in the value of open forward currency contracts and assets and liabilities other than investments at the period end, resulting from changes in the exchange rate.
Securities lending The fund may lend securities, through its agent, to qualified borrowers in order to earn additional income. The loans are collateralized by cash in an amount at least equal to the market value of the securities loaned. The market value of securities loaned is determined daily and any additional required collateral is allocated to the fund on the next business day. The risk of borrower default will be borne by the fund’s agent; the fund will bear the risk of loss with respect to the investment of the cash collateral. Income from securities lending is included in investment income on the Statement of operations. Cash collateral is invested in Putnam Cash Collateral Pool, LLC, a limited liability company managed by an affiliate of Putnam Management. Investments in Putnam Cash Collateral Pool, LLC are valued at its closing net asset value each business day. There are no management fees charged to Putnam Cash Collateral Pool, LLC. At the close of the reporting period, the fund had no securities out on loan.
Interfund lending The fund, along with other Putnam funds, may participate in an interfund lending program pursuant to an exemptive order issued by the SEC. This program allows the fund to borrow from or lend to other Putnam funds that permit such transactions. Interfund lending transactions are subject to each fund’s investment policies and borrowing and lending limits. Interest earned or paid on the interfund lending transaction will be based on the average of certain current market rates. During the reporting period, the fund did not utilize the program.
Line of credit The fund participates, along with other Putnam funds, in a $315 million unsecured committed line of credit and a $185 million unsecured uncommitted line of credit, both provided by State Street. Borrowings may be made for temporary or emergency purposes, including the funding of shareholder redemption requests and trade settlements. Interest is charged to the fund based on the fund’s borrowing at a rate equal to the Federal Funds rate plus 1.25% for the committed line of credit and the Federal Funds rate plus 1.30% for the uncommitted line of credit. A closing fee equal to 0.02% of the committed line of credit and $50,000 for the uncommitted line of credit has been paid by the participating funds. In addition, a commitment fee of 0.11% per annum on any unutilized portion of the committed line of credit is allocated to the participating funds based on their relative net assets and paid quarterly. During the reporting period, the fund had no borrowings against these arrangements.
Federal taxes It is the policy of the fund to distribute all of its taxable income within the prescribed time period and otherwise comply with the provisions of the Internal Revenue Code of 1986, as amended (the Code), applicable to regulated investment companies. It is also the intention of the fund to distribute an amount sufficient to avoid imposition of any excise tax under Section 4982 of the Code.
The fund is subject to the provisions of Accounting Standards Codification 740 Income Taxes (ASC 740). ASC 740 sets forth a minimum threshold for financial statement recognition of the benefit of a tax position taken or expected to be taken in a tax return. The fund did not have a liability to record for any unrecognized tax benefits in the accompanying financial statements. No provision has been made for federal taxes on income, capital gains or unrealized appreciation on securities held nor for excise tax on income and capital gains. Each of the fund’s federal tax returns for the prior three fiscal years remains subject to examination by the Internal Revenue Service.
The fund may also be subject to taxes imposed by governments of countries in which it invests. Such taxes are generally based on either income or gains earned or repatriated. The fund accrues and applies such taxes to net investment income, net realized gains and net unrealized gains as income and/or capital gains are earned. In some cases, the fund may be entitled to reclaim all or a portion of such taxes, and such reclaim amounts, if any, are reflected as an asset on the fund’s books. In many cases, however, the fund may not receive such amounts for an extended period of time, depending on the country of investment.
| |
| Convertible Securities Fund | 43 |
At October 31, 2013, the fund had a capital loss carryover of $35,362,328 available to the extent allowed by the Code to offset future net capital gain, if any. The amounts of the carryovers and the expiration dates are:
| | | |
| Loss carryover |
|
| Short-term | Long-term | Total | Expiration |
|
| $35,362,328 | N/A | $35,362,328 | October 31, 2017 |
|
Under the Regulated Investment Company Modernization Act of 2010, the fund will be permitted to carry forward capital losses incurred in taxable years beginning after December 22, 2010 for an unlimited period. However, any losses incurred will be required to be utilized prior to the losses incurred in pre-enactment tax years. As a result of this ordering rule, pre-enactment capital loss carryforwards may be more likely to expire unused. Additionally, post-enactment capital losses that are carried forward will retain their character as either short-term or long-term capital losses rather than being considered all short-term as under previous law.
Distributions to shareholders Distributions to shareholders from net investment income are recorded by the fund on the ex-dividend date. Distributions from capital gains, if any, are recorded on the ex-dividend date and paid at least annually. The amount and character of income and gains to be distributed are determined in accordance with income tax regulations, which may differ from generally accepted accounting principles. These differences include temporary and/or permanent differences from nontaxable dividends, from amortization and accretion and from convertible preferred income. Reclassifications are made to the fund’s capital accounts to reflect income and gains available for distribution (or available capital loss carryovers) under income tax regulations. At the close of the reporting period, the fund reclassified $4,390,692 to increase undistributed net investment income and $4,390,692 to increase accumulated net realized loss.
The tax basis components of distributable earnings and the federal tax cost as of the close of the reporting period were as follows:
| |
| Unrealized appreciation | $106,945,240 |
| Unrealized depreciation | (20,108,349) |
|
| Net unrealized appreciation | 86,836,891 |
| Undistributed ordinary income | 15,280,518 |
| Capital loss carryforward | (35,362,328) |
| Cost for federal income tax purposes | $731,354,524 |
Note 2: Management fee, administrative services and other transactions
The fund pays Putnam Management a management fee (based on the fund’s average net assets and computed and paid monthly) at annual rates that may vary based on the average of the aggregate net assets of most open-end funds, as defined in the fund’s management contract, sponsored by Putnam Management. Such annual rates may vary as follows:
| | | | |
| 0.780% | of the first $5 billion, | | 0.580% | of the next $50 billion, |
| |
|
| 0.730% | of the next $5 billion, | | 0.560% | of the next $50 billion, |
| |
|
| 0.680% | of the next $10 billion, | | 0.550% | of the next $100 billion and |
| |
|
| 0.630% | of the next $10 billion, | | 0.545% | of any excess thereafter. |
| |
|
Following the death on October 8, 2013 of The Honourable Paul G. Desmarais, who controlled directly and indirectly a majority of the voting shares of Power Corporation of Canada, the ultimate parent company of Putnam Management, the Trustees of the fund approved an interim management contract with Putnam Management. Consistent with Rule 15a–4 under the Investment Company Act of 1940, the interim management contract will remain in effect until the earlier to occur of (i) approval by the fund’s shareholders of a new management contract and (ii) March 7, 2014. Except with respect to termination, the substantive terms of the interim management contract, including terms relating to fees payable to Putnam Management, are identical to the terms of the fund’s previous management contract with Putnam Management. The Trustees of the fund also approved the continuance, effective October 8, 2013, of the sub-management contract between Putnam Management and Putnam Investments Limited (PIL) described below, for a term no longer than March 7, 2014. The Trustees of the fund have called a shareholder meeting for February 27, 2014, at which shareholders of the fund will consider approval of
| |
| 44 | Convertible Securities Fund |
a proposed new management contract between the fund and Putnam Management. The substantive terms of the proposed new management contract, including terms relating to fees, are identical to the terms of the fund’s previous management contract.
Putnam Management has contractually agreed, through June 30, 2014, to waive fees or reimburse the fund’s expenses to the extent necessary to limit the cumulative expenses of the fund, exclusive of brokerage, interest, taxes, investment-related expenses, extraordinary expenses, acquired fund fees and expenses and payments under the fund’s investor servicing contract, investment management contract and distribution plans, on a fiscal year-to-date basis to an annual rate of 0.20% of the fund’s average net assets over such fiscal year-to-date period. This expense limitation remains in place under the interim management contract described above. During the reporting period, the fund’s expenses were not reduced as a result of this limit.
PIL, an affiliate of Putnam Management, is authorized by the Trustees to manage a separate portion of the assets of the fund as determined by Putnam Management from time to time. Putnam Management pays a quarterly sub-management fee to PIL for its services at an annual rate of 0.35% of the average net assets of the portion of the fund managed by PIL.
Putnam Management voluntarily reimbursed the fund $59,294 for a trading error which occurred during the reporting period. The effect of the loss incurred and the reimbursement by Putnam Management of such amounts had no material impact on total return.
The fund reimburses Putnam Management an allocated amount for the compensation and related expenses of certain officers of the fund and their staff who provide administrative services to the fund. The aggregate amount of all such reimbursements is determined annually by the Trustees.
Custodial functions for the fund’s assets are provided by State Street. Custody fees are based on the fund’s asset level, the number of its security holdings and transaction volumes.
Putnam Investor Services, Inc., an affiliate of Putnam Management, provides investor servicing agent functions to the fund. Putnam Investor Services, Inc. received fees for investor servicing based on the fund’s retail asset level, the number of shareholder accounts in the fund and the level of defined contribution plan assets in the fund. Investor servicing fees will not exceed an annual rate of 0.32% of the fund’s average net assets. During the reporting period, the expenses for each class of shares related to investor servicing fees were as follows:
| | | | |
| Class A | $808,126 | | Class R | 7,975 |
| |
|
| Class B | 17,617 | | Class Y | 226,841 |
| |
|
| Class C | 67,626 | | Total | $1,133,981 |
| |
|
| Class M | 5,796 | | | |
| | |
The fund has entered into expense offset arrangements with Putnam Investor Services, Inc. and State Street whereby Putnam Investor Services, Inc.’s and State Street’s fees are reduced by credits allowed on cash balances. The fund also reduced expenses through brokerage/service arrangements. For the reporting period, the fund’s expenses were reduced by $1,395 under the expense offset arrangements and by $6,851 under the brokerage/service arrangements.
Each independent Trustee of the fund receives an annual Trustee fee, of which $549, as a quarterly retainer, has been allocated to the fund, and an additional fee for each Trustees meeting attended. Trustees also are reimbursed for expenses they incur relating to their services as Trustees.
The fund has adopted a Trustee Fee Deferral Plan (the Deferral Plan) which allows the Trustees to defer the receipt of all or a portion of Trustees fees payable on or after July 1, 1995. The deferred fees remain invested in certain Putnam funds until distribution in accordance with the Deferral Plan.
The fund has adopted an unfunded noncontributory defined benefit pension plan (the Pension Plan) covering all Trustees of the fund who have served as a Trustee for at least five years and were first elected prior to 2004. Benefits under the Pension Plan are equal to 50% of the Trustee’s average annual attendance and retainer fees for the three years ended December 31, 2005. The retirement benefit is payable during a Trustee’s lifetime, beginning the year following retirement, for the number of years of service through December 31, 2006. Pension expense for the fund is included in Trustee compensation and expenses in the Statement of operations. Accrued pension liability is included in Payable for Trustee compensation and expenses in the Statement of assets and liabilities. The Trustees have terminated the Pension Plan with respect to any Trustee first elected after 2003.
| |
| Convertible Securities Fund | 45 |
The fund has adopted distribution plans (the Plans) with respect to its class A, class B, class C, class M and class R shares pursuant to Rule 12b–1 under the Investment Company Act of 1940. The purpose of the Plans is to compensate Putnam Retail Management Limited Partnership, an indirect wholly-owned subsidiary of Putnam Investments, LLC, for services provided and expenses incurred in distributing shares of the fund. The Plans provide for payments by the fund to Putnam Retail Management Limited Partnership at an annual rate of up to 0.35%, 1.00%, 1.00%, 1.00% and 1.00% of the average net assets attributable to class A, class B, class C, class M and class R shares, respectively. The Trustees have approved payment by the fund at an annual rate of 0.25%, 1.00%, 1.00%, 0.75% and 0.50% of the average net assets attributable to class A, class B, class C, class M and class R shares, respectively. During the reporting period, the class specific expenses related to distribution fees were as follows:
| | | | |
| Class A | $1,260,646 | | Class M | 27,089 |
| |
|
| Class B | 109,879 | | Class R | 24,906 |
| |
|
| Class C | 422,507 | | Total | $1,845,027 |
| |
|
For the reporting period, Putnam Retail Management Limited Partnership, acting as underwriter, received net commissions of $84,995 and $304 from the sale of class A and class M shares, respectively, and received $3,466 and $702 in contingent deferred sales charges from redemptions of class B and class C shares, respectively.
A deferred sales charge of up to 1.00% and 0.65% is assessed on certain redemptions of class A and class M shares, respectively. For the reporting period, Putnam Retail Management Limited Partnership, acting as underwriter, received no monies on class A and class M redemptions.
Note 3: Purchases and sales of securities
During the reporting period, cost of purchases and proceeds from sales of investment securities other than short-term investments aggregated $579,429,176 and $490,002,704, respectively. There were no purchases or proceeds from sales of long-term U.S. government securities.
Note 4: Capital shares
At the close of the reporting period, there was an unlimited number of shares of beneficial interest authorized. Transactions in capital shares were as follows:
| | | | |
| | Year ended 10/31/13 | Year ended 10/31/12 |
|
| Class A | Shares | Amount | Shares | Amount |
|
| Shares sold | 7,005,486 | $155,432,666 | 2,936,632 | $57,790,909 |
|
| Shares issued in connection with | | | | |
| reinvestment of distributions | 577,732 | 12,495,300 | 623,372 | 11,995,946 |
|
| | 7,583,218 | 167,927,966 | 3,560,004 | 69,786,855 |
|
| Shares repurchased | (7,203,893) | (157,488,928) | (5,830,241) | (112,648,930) |
|
| Net increase (decrease) | 379,325 | $10,439,038 | (2,270,237) | $(42,862,075) |
|
| |
| | Year ended 10/31/13 | Year ended 10/31/12 |
|
| Class B | Shares | Amount | Shares | Amount |
|
| Shares sold | 107,953 | $2,329,343 | 86,808 | $1,665,446 |
|
| Shares issued in connection with | | | | |
| reinvestment of distributions | 7,340 | 155,688 | 8,506 | 160,838 |
|
| | 115,293 | 2,485,031 | 95,314 | 1,826,284 |
|
| Shares repurchased | (118,900) | (2,545,488) | (231,219) | (4,452,569) |
|
| Net decrease | (3,607) | $(60,457) | (135,905) | $(2,626,285) |
|
| |
| 46 | Convertible Securities Fund |
| | | | |
| | Year ended 10/31/13 | Year ended 10/31/12 |
|
| Class C | Shares | Amount | Shares | Amount |
|
| Shares sold | 636,042 | $13,997,960 | 210,612 | $4,046,214 |
|
| Shares issued in connection with | | | | |
| reinvestment of distributions | 27,816 | 595,312 | 31,579 | 601,452 |
|
| | 663,858 | 14,593,272 | 242,191 | 4,647,666 |
|
| Shares repurchased | (434,555) | (9,214,181) | (1,145,945) | (22,111,018) |
|
| Net increase (decrease) | 229,303 | $5,379,091 | (903,754) | $(17,463,352) |
|
| |
| | Year ended 10/31/13 | Year ended 10/31/12 |
|
| Class M | Shares | Amount | Shares | Amount |
|
| Shares sold | 18,038 | $396,720 | 16,874 | $322,889 |
|
| Shares issued in connection with | | | | |
| reinvestment of distributions | 3,670 | 78,530 | 4,159 | 79,346 |
|
| | 21,708 | 475,250 | 21,033 | 402,235 |
|
| Shares repurchased | (26,372) | (567,356) | (38,517) | (737,551) |
|
| Net decrease | (4,664) | $(92,106) | (17,484) | $(335,316) |
|
| |
| | Year ended 10/31/13 | Year ended 10/31/12 |
|
| Class R | Shares | Amount | Shares | Amount |
|
| Shares sold | 90,520 | $1,960,750 | 56,938 | $1,095,237 |
|
| Shares issued in connection with | | | | |
| reinvestment of distributions | 5,560 | 120,030 | 5,422 | 104,037 |
|
| | 96,080 | 2,080,780 | 62,360 | 1,199,274 |
|
| Shares repurchased | (59,618) | (1,310,201) | (49,713) | (965,629) |
|
| Net increase | 36,462 | $770,579 | 12,647 | $233,645 |
|
| |
| | Year ended 10/31/13 | Year ended 10/31/12 |
|
| Class Y | Shares | Amount | Shares | Amount |
|
| Shares sold | 5,087,709 | $112,527,075 | 2,417,276 | $46,869,261 |
|
| Shares issued in connection with | | | | |
| reinvestment of distributions | 126,445 | 2,754,373 | 95,728 | 1,846,426 |
|
| | 5,214,154 | 115,281,448 | 2,513,004 | 48,715,687 |
|
| Shares repurchased | (2,184,792) | (47,350,495) | (2,805,251) | (54,575,402) |
|
| Net increase (decrease) | 3,029,362 | $67,930,953 | (292,247) | $(5,859,715) |
|
| |
| Convertible Securities Fund | 47 |
Note 5: Affiliated transactions
Transactions during the reporting period with Putnam Money Market Liquidity Fund and Putnam Short Term Investment Fund, which are under common ownership or control, were as follows:
| | | | | |
| | Market value at | | | | Market value |
| | the beginning | | | | at the end of |
| | of the reporting | | | Investment | the reporting |
| Name of affiliate | period | Purchase cost | Sale proceeds | income | period |
|
| Putnam Money Market | | | | | |
| Liquidity Fund* | $25,560,409 | $90,316,671 | $115,877,080 | $9,277 | $— |
|
| Putnam Short Term | | | | | |
| Investment Fund* | — | 279,455,953 | 252,651,296 | 12,407 | 26,804,657 |
|
| Totals | $25,560,409 | $369,772,624 | $368,528,376 | $21,684 | $26,804,657 |
|
* Management fees charged to Putnam Money Market Liquidity Fund and Putnam Short Term Investment Fund have been waived by Putnam Management.
Note 6: Senior loan commitments
Senior loans are purchased or sold on a when-issued or delayed delivery basis and may be settled a month or more after the trade date, which from time to time can delay the actual investment of available cash balances; interest income is accrued based on the terms of the securities. Senior loans can be acquired through an agent, by assignment from another holder of the loan, or as a participation interest in another holder’s portion of the loan. When the fund invests in a loan or participation, the fund is subject to the risk that an intermediate participant between the fund and the borrower will fail to meet its obligations to the fund, in addition to the risk that the borrower under the loan may default on its obligations.
Note 7: Market, credit and other risks
In the normal course of business, the fund trades financial instruments and enters into financial transactions where risk of potential loss exists due to changes in the market (market risk) or failure of the contracting party to the transaction to perform (credit risk). The fund may be exposed to additional credit risk that an institution or other entity with which the fund has unsettled or open transactions will default. Investments in foreign securities involve certain risks, including those related to economic instability, unfavorable political developments, and currency fluctuations.
Note 8: Summary of derivative activity
The volume of activity for the reporting period for any derivative type that was held during the period is listed below and was as follows based on an average of the holdings at the end of each fiscal quarter:
| |
| Warrants (number of warrants) | 1,100,000 |
|
The following is a summary of the market values of derivative instruments as of the close of the reporting period:
Market values of derivative instruments as of the close of the reporting period
| | | | |
| | Asset derivatives | Liability derivatives |
|
| Derivatives not | | | | |
| accounted for as | Statement of | | Statement of | |
| hedging instruments | assets and | | assets and | |
| under ASC 815 | liabilities location | Market value | liabilities location | Market value |
|
| Equity contracts | Investments | $— | Payables | $— |
|
| Total | | $— | | $— |
|
| |
| 48 | Convertible Securities Fund |
The following is a summary of change in unrealized gains or losses of derivative instruments on the Statement of operations for the reporting period (see Note 1) (there were no realized gains or losses on derivative instruments):
Change in unrealized appreciation or (depreciation) on derivatives recognized in net gain or (loss) on investments
| | |
| Derivatives not accounted for as hedging | | |
| instruments under ASC 815 | Warrants | Total |
|
| Equity contracts | $(217,126) | $(217,126) |
|
| Total | $(217,126) | $(217,126) |
|
Note 9: New accounting pronouncement
In January 2013, ASU 2013–01, “Clarifying the Scope of Disclosures about Offsetting Assets and Liabilities,” amended ASU No. 2011–11, “Disclosures about Offsetting Assets and Liabilities.” The ASUs create new disclosure requirements requiring entities to disclose both gross and net information for derivatives and other financial instruments that are either offset in the Statement of assets and liabilities or subject to an enforceable master netting arrangement or similar agreement. The disclosure requirements are effective for annual reporting periods beginning on or after January 1, 2013 and interim periods within those annual periods. Putnam Management is currently evaluating the application of ASUs 2013–01 and 2011–11 and their impact, if any, on the fund’s financial statements.
Federal tax information (Unaudited)
The fund designated 26.12% of ordinary income distributions as qualifying for the dividends received deduction for corporations.
For the reporting period, the fund hereby designates 27.62%, or the maximum amount allowable, of its taxable ordinary income distributions as qualified dividends taxed at the individual net capital gain rates.
For the reporting period, pursuant to §871(k) of the Internal Revenue Code, the fund hereby designates $9,720,478 of distributions paid as qualifying to be taxed as interest-related dividends, and no monies to be taxed as short-term capital gain dividends for nonresident alien shareholders.
The Form 1099 that will be mailed to you in January 2014 will show the tax status of all distributions paid to your account in calendar 2013.
| |
| Convertible Securities Fund | 49 |
About the Trustees
Independent Trustees
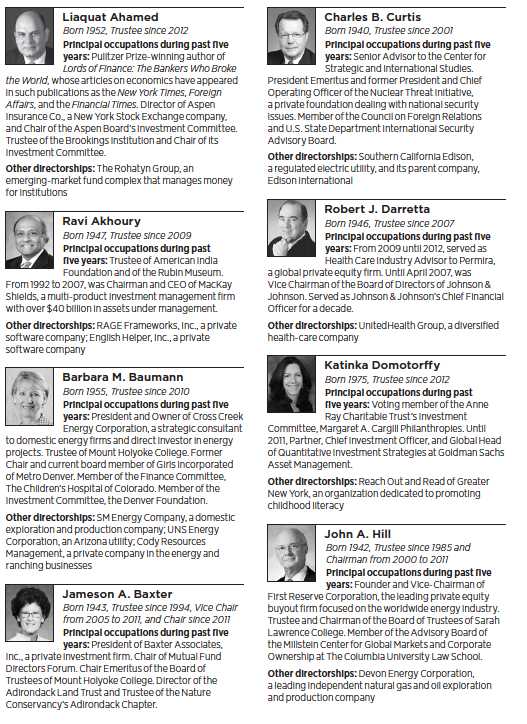
| |
| 50 | Convertible Securities Fund |
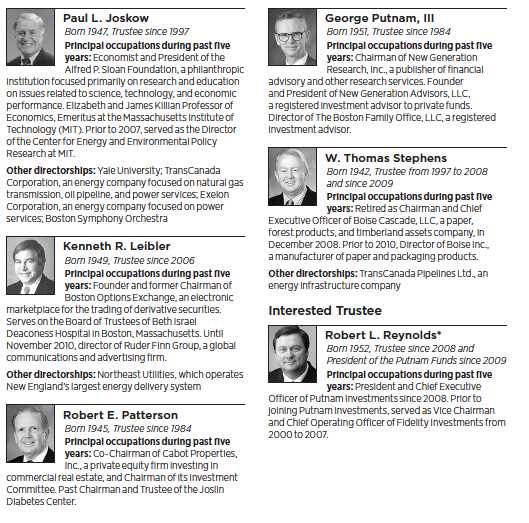
* Mr. Reynolds is an “interested person” (as defined in the Investment Company Act of 1940) of the fund and Putnam Investments. He is President and Chief Executive Officer of Putnam Investments, as well as the President of your fund and each of the other Putnam funds.
The address of each Trustee is One Post Office Square, Boston, MA 02109.
As of October 31, 2013, there were 116 Putnam funds. All Trustees serve as Trustees of all Putnam funds.
Each Trustee serves for an indefinite term, until his or her resignation, retirement at age 75, removal, or death.
| |
| Convertible Securities Fund | 51 |
Officers
In addition to Robert L. Reynolds, the other officers of the fund are shown below:
| |
| Jonathan S. Horwitz (Born 1955) | Janet C. Smith (Born 1965) |
| Executive Vice President, Principal Executive | Vice President, Principal Accounting Officer, |
| Officer, and Compliance Liaison | and Assistant Treasurer |
| Since 2004 | Since 2007 |
| Director of Fund Administration Services, |
| Steven D. Krichmar (Born 1958) | Putnam Investments and Putnam Management |
| Vice President and Principal Financial Officer | |
| Since 2002 | Susan G. Malloy (Born 1957) |
| Chief of Operations, Putnam Investments and | Vice President and Assistant Treasurer |
| Putnam Management | Since 2007 |
| Director of Accounting & Control Services, |
| Robert T. Burns (Born 1961) | Putnam Investments and Putnam Management |
| Vice President and Chief Legal Officer | |
| Since 2011 | James P. Pappas (Born 1953) |
| General Counsel, Putnam Investments, Putnam | Vice President |
| Management, and Putnam Retail Management | Since 2004 |
| Director of Trustee Relations, |
| Robert R. Leveille (Born 1969) | Putnam Investments and Putnam Management |
| Vice President and Chief Compliance Officer | |
| Since 2007 | Mark C. Trenchard (Born 1962) |
| Chief Compliance Officer, Putnam Investments, | Vice President and BSA Compliance Officer |
| Putnam Management, and Putnam Retail | Since 2002 |
| Management | Director of Operational Compliance, |
| Putnam Investments and Putnam |
| Michael J. Higgins (Born 1976) | Retail Management |
| Vice President, Treasurer, and Clerk | |
| Since 2010 | Nancy E. Florek (Born 1957) |
| Manager of Finance, Dunkin’ Brands (2008– | Vice President, Director of Proxy Voting and |
| 2010); Senior Financial Analyst, Old Mutual Asset | Corporate Governance, Assistant Clerk, |
| Management (2007–2008); Senior Financial | and Associate Treasurer |
| Analyst, Putnam Investments (1999–2007) | Since 2000 |
The principal occupations of the officers for the past five years have been with the employers as shown above, although in some cases they have held different positions with such employers. The address of each Officer is One Post Office Square, Boston, MA 02109.
| |
| 52 | Convertible Securities Fund |
Fund information
Founded over 75 years ago, Putnam Investments was built around the concept that a balance between risk and reward is the hallmark of a well-rounded financial program. We manage over 100 funds across income, value, blend, growth, asset allocation, absolute return, and global sector categories.
| | |
| Investment Manager | Trustees | Robert R. Leveille |
| Putnam Investment | Jameson A. Baxter, Chair | Vice President and |
| Management, LLC | Liaquat Ahamed | Chief Compliance Officer |
| One Post Office Square | Ravi Akhoury | |
| Boston, MA 02109 | Barbara M. Baumann | Michael J. Higgins |
| | Charles B. Curtis | Vice President, Treasurer, |
| Investment Sub-Manager | Robert J. Darretta | and Clerk |
| Putnam Investments Limited | Katinka Domotorffy | |
| 57–59 St James’s Street | John A. Hill | Janet C. Smith |
| London, England SW1A 1LD | Paul L. Joskow | Vice President, |
| | Kenneth R. Leibler | Principal Accounting Officer, |
| Marketing Services | Robert E. Patterson | and Assistant Treasurer |
| Putnam Retail Management | George Putnam, III | |
| One Post Office Square | Robert L. Reynolds | Susan G. Malloy |
| Boston, MA 02109 | W. Thomas Stephens | Vice President and |
| | | Assistant Treasurer |
| Custodian | Officers | |
| State Street Bank | Robert L. Reynolds | James P. Pappas |
| and Trust Company | President | Vice President |
| | | |
| Legal Counsel | Jonathan S. Horwitz | Mark C. Trenchard |
| Ropes & Gray LLP | Executive Vice President, | Vice President and |
| | Principal Executive Officer, and | BSA Compliance Officer |
| Independent Registered | Compliance Liaison | |
| Public Accounting Firm | | Nancy E. Florek |
| KPMG LLP | Steven D. Krichmar | Vice President, Director of |
| | Vice President and | Proxy Voting and Corporate |
| | Principal Financial Officer | Governance, Assistant Clerk, |
| | | and Associate Treasurer |
| | Robert T. Burns | |
| | Vice President and | |
| | Chief Legal Officer | |
This report is for the information of shareholders of Putnam Convertible Securities Fund. It may also be used as sales literature when preceded or accompanied by the current prospectus, the most recent copy of Putnam’s Quarterly Performance Summary, and Putnam’s Quarterly Ranking Summary. For more recent performance, please visit putnam.com. Investors should carefully consider the investment objectives, risks, charges, and expenses of a fund, which are described in its prospectus. For this and other information or to request a prospectus or summary prospectus, call 1-800-225-1581 toll free. Please read the prospectus carefully before investing. The fund’s Statement of Additional Information contains additional information about the fund’s Trustees and is available without charge upon request by calling 1-800-225-1581.
| |
| (a) The fund’s principal executive, financial and accounting officers are employees of Putnam Investment Management, LLC, the Fund’s investment manager. As such they are subject to a comprehensive Code of Ethics adopted and administered by Putnam Investments which is designed to protect the interests of the firm and its clients. The Fund has adopted a Code of Ethics which incorporates the Code of Ethics of Putnam Investments with respect to all of its officers and Trustees who are employees of Putnam Investment Management, LLC. For this reason, the Fund has not adopted a separate code of ethics governing its principal executive, financial and accounting officers. |
| |
| (c) In July 2013, the Code of Ethics of Putnam Investment Management, LLC was amended. The changes to the Code of Ethics were as follows: (i) eliminating the requirement for employees to hold their shares of Putnam mutual funds for specified periods of time, (ii) removing the requirement to preclear transactions in certain kinds of exchange-traded funds and exchange-traded notes, although reporting of all such instruments remains required; (iii) eliminating the excessive trading rule related to employee transactions in securities requiring preclearance under the Code; (iv) adding provisions related to monitoring of employee trading; (v) changing from a set number of shares to a set dollar value of stock of mid- and large-cap companies on the Restricted List that can be purchased or sold; (vi) adding a requirement starting in March 2014 for employees to generally use certain approved brokers that provide Putnam with an electronic feed of transactions and statements for their personal brokerage accounts; and (vii) certain other changes. |
| |
| Item 3. Audit Committee Financial Expert: |
| |
| The Funds’ Audit and Compliance Committee is comprised solely of Trustees who are “independent” (as such term has been defined by the Securities and Exchange Commission (“SEC”) in regulations implementing Section 407 of the Sarbanes-Oxley Act (the “Regulations”)). The Trustees believe that each of the members of the Audit and Compliance Committee also possess a combination of knowledge and experience with respect to financial accounting matters, as well as other attributes, that qualify them for service on the Committee. In addition, the Trustees have determined that each of Mr. Leibler, Mr. Hill, Mr. Darretta and Ms. Baumann qualifies as an “audit committee financial expert” (as such term has been defined by the Regulations) based on their review of his or her pertinent experience and education. The SEC has stated that the designation or identification of a person as an audit committee financial expert pursuant to this Item 3 of Form N-CSR does not impose on such person any duties, obligations or liability that are greater than the duties, obligations and liability imposed on such person as a member of the Audit and Compliance Committee and the Board of Trustees in the absence of such designation or identification. |
| |
| Item 4. Principal Accountant Fees and Services: |
| |
| The following table presents fees billed in each of the last two fiscal years for services rendered to the fund by the fund’s independent auditor: |
| | | | | |
| Fiscal year ended | Audit Fees | Audit-Related Fees | Tax Fees | All Other Fees |
|
|
| | | | | |
| October 31, 2013 | $37,656 | $ — | $4,200 | $ — |
| October 31, 2012 | $36,744 | $ — | $4,100 | $ — |
| |
| For the fiscal years ended October 31, 2013 and October 31, 2012, the fund’s independent auditor billed aggregate non-audit fees in the amounts of $4,200 and $ 4,100 respectively, to the fund, Putnam Management and any entity controlling, controlled by or under common control with Putnam Management that provides ongoing services to the fund. |
| |
| Audit Fees represent fees billed for the fund’s last two fiscal years relating to the audit and review of the financial statements included in annual reports and registration statements, and other services that are normally provided in connection with statutory and regulatory filings or engagements. |
| |
| Audit-Related Fees represent fees billed in the fund’s last two fiscal years for services traditionally performed by the fund’s auditor, including accounting consultation for proposed transactions or concerning financial accounting and reporting standards and other audit or attest services not required by statute or regulation. |
| |
| Tax Fees represent fees billed in the fund’s last two fiscal years for tax compliance, tax planning and tax advice services. Tax planning and tax advice services include assistance with tax audits, employee benefit plans and requests for rulings or technical advice from taxing authorities. |
| |
| Pre-Approval Policies of the Audit and Compliance Committee. The Audit and Compliance Committee of the Putnam funds has determined that, as a matter of policy, all work performed for the funds by the funds’ independent auditors will be pre-approved by the Committee itself and thus will generally not be subject to pre-approval procedures. |
| |
| The Audit and Compliance Committee also has adopted a policy to pre-approve the engagement by Putnam Management and certain of its affiliates of the funds’ independent auditors, even in circumstances where pre-approval is not required by applicable law. Any such requests by Putnam Management or certain of its affiliates are typically submitted in writing to the Committee and explain, among other things, the nature of the proposed engagement, the estimated fees, and why this work should be performed by that particular audit firm as opposed to another one. In reviewing such requests, the Committee considers, among other things, whether the provision of such services by the audit firm are compatible with the independence of the audit firm. |
| |
| The following table presents fees billed by the fund’s independent auditor for services required to be approved pursuant to paragraph (c)(7)(ii) of Rule 2-01 of Regulation S-X. |
| | | | | |
| Fiscal year ended | Audit-Related Fees | Tax Fees | All Other Fees | Total Non-Audit Fees |
|
|
| | | | | |
| October 31, 2013 | $ — | $ — | $ — | $ — |
| | | | | |
| October 31, 2012 | $ — | $ — | $ — | $ — |
| |
| Item 5. Audit Committee of Listed Registrants |
| |
| Item 6. Schedule of Investments: |
| |
| The registrant’s schedule of investments in unaffiliated issuers is included in the report to shareholders in Item 1 above. |
| |
| Item 7. Disclosure of Proxy Voting Policies and Procedures For Closed-End Management Investment Companies: |
| |
| Item 8. Portfolio Managers of Closed-End Investment Companies |
| |
| Item 9. Purchases of Equity Securities by Closed-End Management Investment Companies and Affiliated Purchasers: |
| |
| Item 10. Submission of Matters to a Vote of Security Holders: |
| |
| Item 11. Controls and Procedures: |
| |
| (a) The registrant’s principal executive officer and principal financial officer have concluded, based on their evaluation of the effectiveness of the design and operation of the registrant’s disclosure controls and procedures as of a date within 90 days of the filing date of this report, that the design and operation of such procedures are generally effective to provide reasonable assurance that information required to be disclosed by the registrant in this report is recorded, processed, summarized and reported within the time periods specified in the Commission’s rules and forms. |
| |
| (b) Changes in internal control over financial reporting: Not applicable |
| |
| (a)(1) The Code of Ethics of The Putnam Funds, which incorporates the Code of Ethics of Putnam Investments, is filed herewith. |
| |
| (a)(2) Separate certifications for the principal executive officer and principal financial officer of the registrant as required by Rule 30a-2(a) under the Investment Company Act of 1940, as amended, are filed herewith. |
| |
| (b) The certifications required by Rule 30a-2(b) under the Investment Company Act of 1940, as amended, are filed herewith. |
| |
| Pursuant to the requirements of the Securities Exchange Act of 1934 and the Investment Company Act of 1940, the registrant has duly caused this report to be signed on its behalf by the undersigned, thereunto duly authorized. |
| |
| Putnam Convertible Securities Fund |
| |
| By (Signature and Title): |
| |
| /s/Janet C. Smith
Janet C. Smith
Principal Accounting Officer
|
| |
| Pursuant to the requirements of the Securities Exchange Act of 1934 and the Investment Company Act of 1940, this report has been signed below by the following persons on behalf of the registrant and in the capacities and on the dates indicated. |
| |
| By (Signature and Title): |
| |
| /s/Jonathan S. Horwitz
Jonathan S. Horwitz
Principal Executive Officer
|
| |
| By (Signature and Title): |
| |
| /s/Steven D. Krichmar
Steven D. Krichmar
Principal Financial Officer
|