CERTIFIED SHAREHOLDER REPORT OF REGISTERED MANAGEMENT INVESTMENT COMPANIES
Investment Company Act file number:
(811-02280)
Exact name of registrant as specified in charter:
Putnam Convertible Securities Fund
Address of principal executive offices:
One Post Office Square, Boston, Massachusetts 02109
Name and address of agent for service:
Robert T. Burns, Vice President One Post Office Square Boston, Massachusetts 02109
Copy to:
Bryan Chegwidden, Esq. Ropes & Gray LLP 1211 Avenue of the Americas New York, New York 10036
Registrant’s telephone number, including area code:
(617) 292-1000
Date of fiscal year end:
October 31, 2014
Date of reporting period :
November 1, 2013 — October 31, 2014
Item 1. Report to Stockholders:
The following is a copy of the report transmitted to stockholders pursuant to Rule 30e-1 under the Investment Company Act of 1940:
Putnam Convertible Securities Fund
Putnam Convertible Securities Fund
Annual report 10 | 31 | 14
Message from the Trustees
1
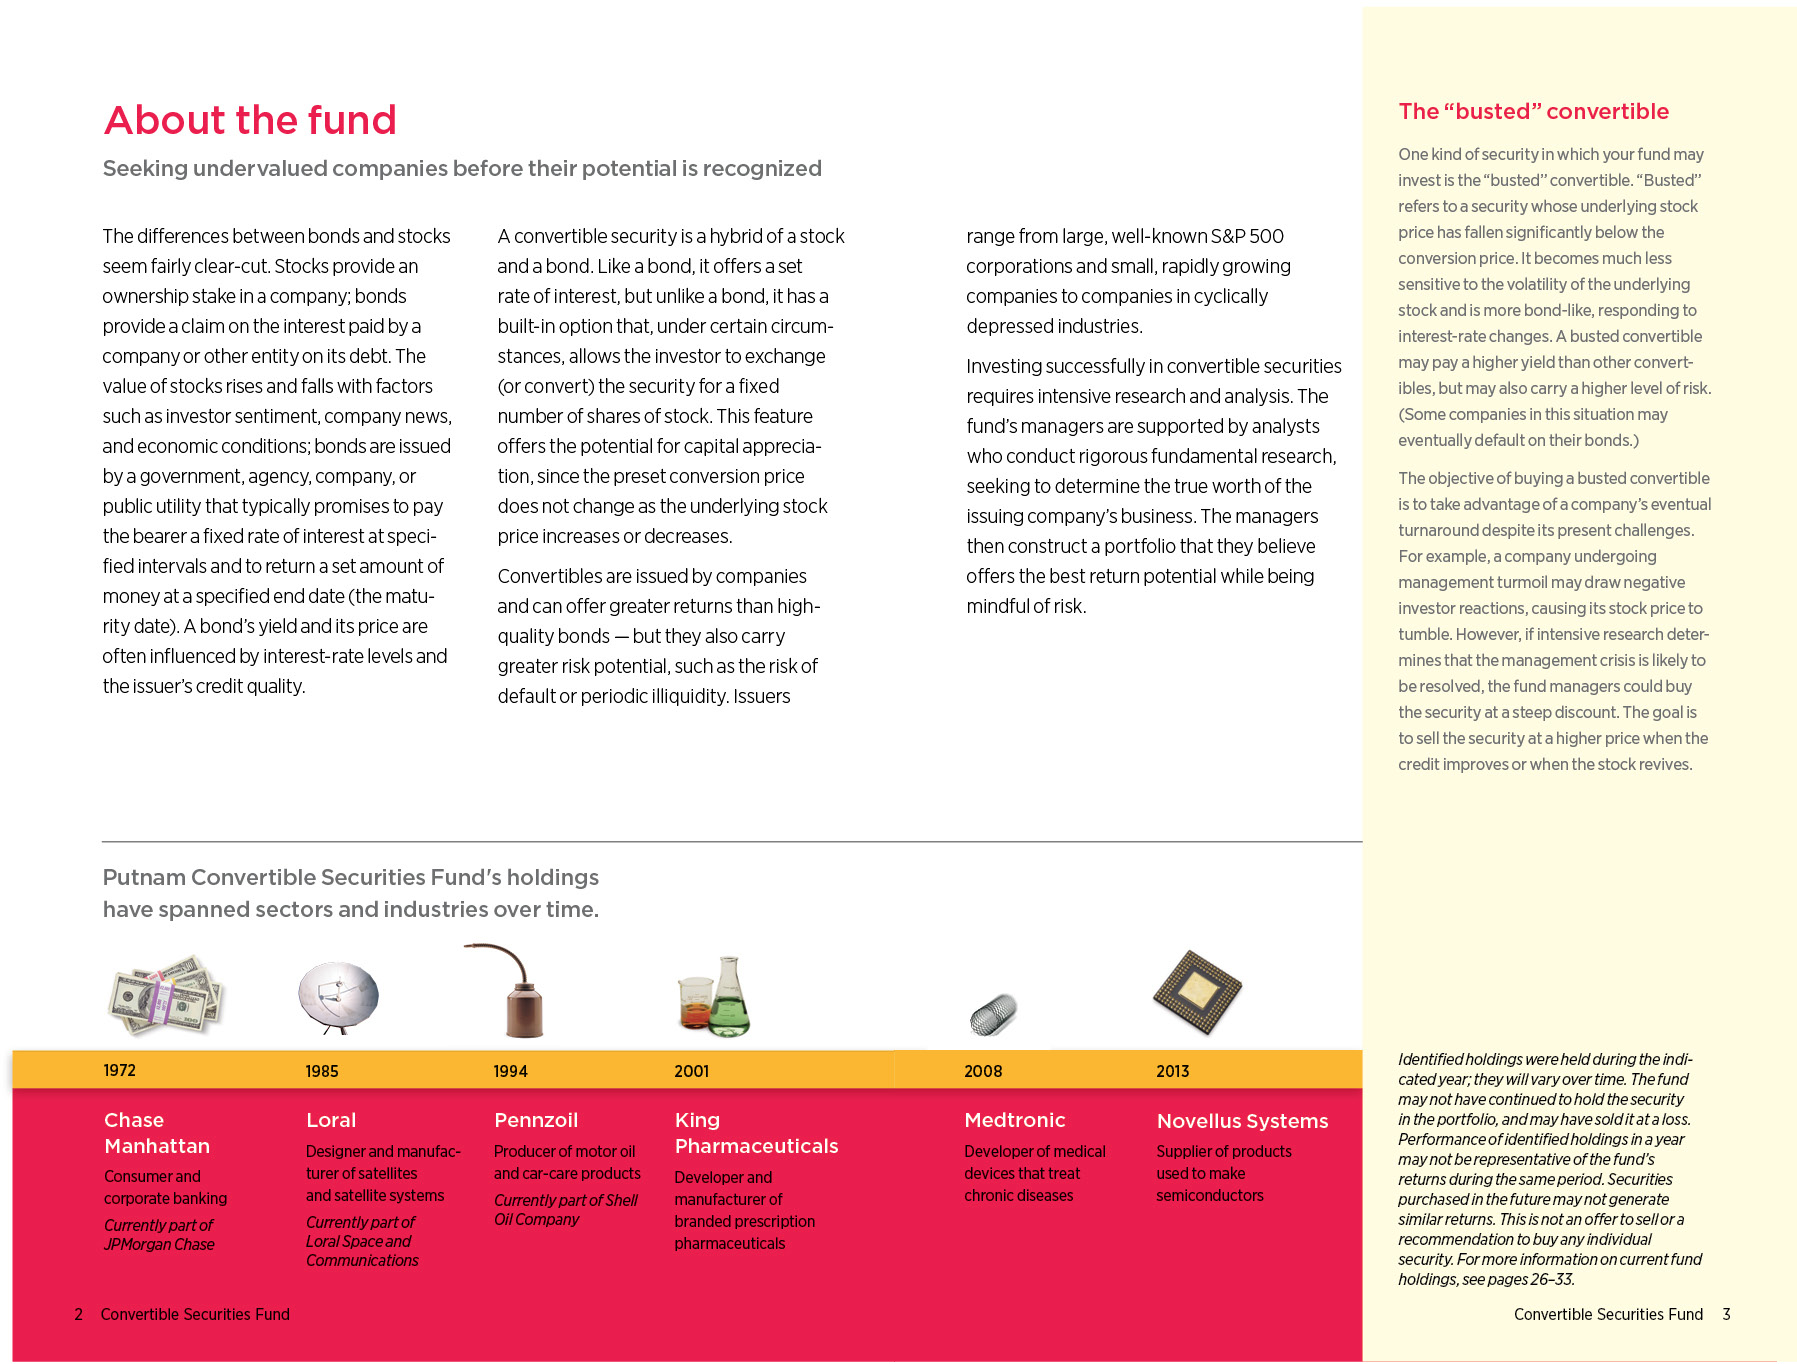
About the fund
2
Performance snapshot
4
Interview with your fund’s portfolio managers
5
Your fund’s performance
11
Your fund’s expenses
14
Terms and definitions
16
Other information for shareholders
17
Important notice regarding Putnam’s privacy policy
18
Trustee approval of management contract
19
Financial statements
24
Federal tax information
48
Shareholder meeting results
49
About the Trustees
50
Officers
52
Consider these risks before investing: Convertible securities prices may fall or fail to rise over time for a variety of reasons, including general financial market conditions, changing market perceptions of the risk of default, changes in government intervention, and factors related to a specific issuer or industry. These risks are generally greater for convertible securities issued by small and/or midsize companies. Convertible securities’ prices may be adversely affected by underlying common stock price changes. While convertible securities tend to provide higher yields than common stocks, the higher yield may not protect against the risk of loss or mitigate any loss associated with a convertible security’s price decline. Convertible securities are subject to credit risk, which is the risk that an issuer of the fund’s investments may default on payment of interest or principal. Credit risk is greater for below-investment-grade convertible securities. Convertible securities may be less sensitive to interest-rate changes than non-convertible bonds because of their structural features (e.g., convertibility, “put” features). Interest-rate risk is generally greater, however, for longer-term bonds and convertible securities whose underlying stock price has fallen significantly below the conversion price. You can lose money by investing in the fund.
Message from the Trustees
Dear Fellow Shareholder:
The U.S. economic recovery has been steadily gaining momentum all year, thanks to positive developments in the key areas of employment, corporate earnings, consumer spending, and energy costs. With the U.S. midterm elections behind us, major stock market indexes achieved record highs in early November.
In October, the nation’s unemployment rate dropped to the lowest level since July 2008. Moreover, third-quarter earnings left investors feeling more confident about equity values and the overall health of corporations. For fixed-income markets, the outlook is more muted. The U.S. Federal Reserve ended its record bond-buying stimulus program in October, and appears to be on track to raise short-term interest rates in mid-2015.
While hardly booming, the U.S. economy has nevertheless emerged as a pillar of strength in the global economy. Meanwhile, the rest of the world may need to do more to nurture growth. Central banks in Europe, Japan, and China have recently augmented their stimulus policies, intending to shore up faltering recoveries. While risks have emerged, it is important to note that markets encountering adversity can still harbor investment potential.
As we head into the new year, it may be an appropriate time for you to meet with your financial advisor to ensure that your portfolio is properly diversified and aligned with your objectives and risk tolerance. Putnam offers a wide range of strategies for all environments, as well as new ways of thinking about building portfolios for today’s markets.
As always, thank you for investing with Putnam.
Respectfully yours,
Robert L. Reynolds President and Chief Executive Officer Putnam Investments
Jameson A. Baxter Chair, Board of Trustees
December 16, 2014
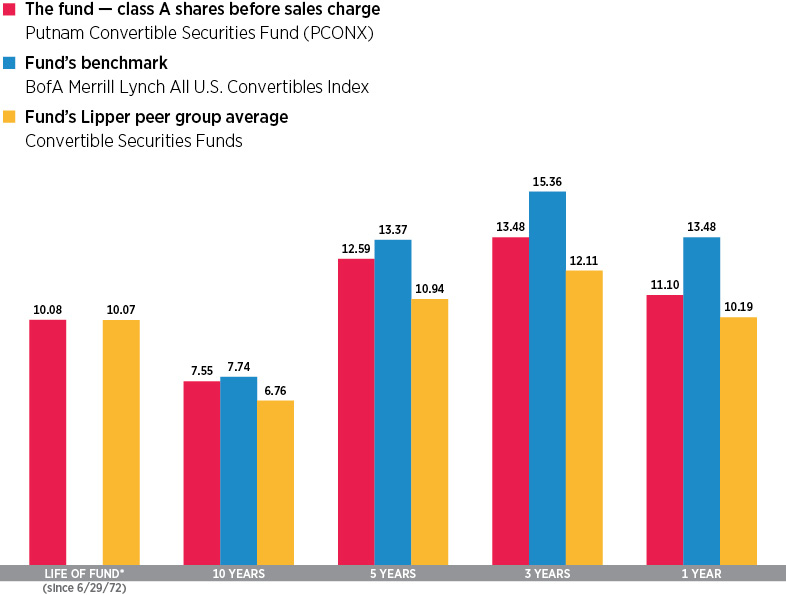
Performance snapshot
Annualized total return (%) comparison as of 10/31/14
Current performance may be lower or higher than the quoted past performance, which cannot guarantee future results. Share price, principal value, and return will fluctuate, and you may have a gain or a loss when you sell your shares. Performance of class A shares assumes reinvestment of distributions and does not account for taxes. Fund returns in the bar chart do not reflect a sales charge of 5.75%; had they, returns would have been lower. See pages 5 and 11–13 for additional performance information. For a portion of the periods, the fund had expense limitations, without which returns would have been lower. To obtain the most recent month-end performance, visit putnam.com.
*The fund’s benchmark, the BofA Merrill Lynch All U.S. Convertibles Index, was introduced on 12/31/87, which post-dates the inception of the fund’s class A shares.
4 Convertible Securities Fund
Interview with your fund’s portfolio managers
Eric N. Harthun, CFA
Robert L. Salvin
What was the market environment like for convertible securities during the 12 months ended October 31, 2014?
Eric: With the economic backdrop improving during the period, convertible securities enjoyed solid performance and proved to be well suited to an environment of rising equity prices and tightening credit spreads [the difference in yield between Treasuries and corporate bonds]. While the overarching trend of performance was upward, investor sentiment swung between the relative safety and income of bonds and the growth potential of stocks — contributing to considerable market volatility in the second half of the reporting period. This risk pendulum was driven in part by questions about the perceived strength of the U.S. economy and the timing and pace of the Federal Reserve’s withdrawal of its stimulus program — as well as the effectiveness of pro-growth monetary policies emanating from central banks in the eurozone, China, and Japan. Geopolitical tensions in the Middle East and Ukraine also added to bouts of investor uncertainty.
In October, changing views on global economic growth and central bank policy generated high volatility, which at times saw the U.S. stock market approaching 2008 financial crisis levels. However, in a memorable turnaround late in the month, U.S. stocks more than recouped their losses to set new records, helped in part by the Bank of Japan’s decision to increase its bond
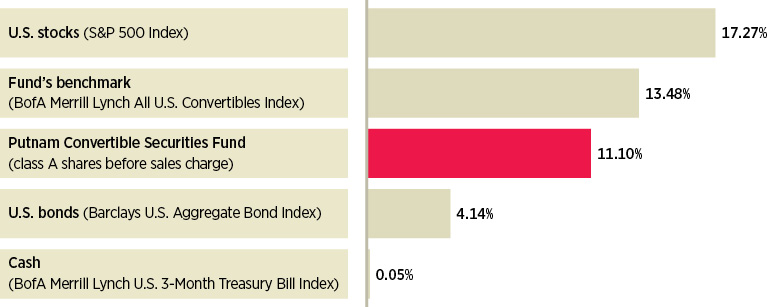
Broad market index and fund performance
This comparison shows your fund’s performance in the context of broad market indexes for the 12 months ended 10/31/14. See pages 4 and 11–13 for additional fund performance information. Index descriptions can be found on page 17.
Convertible Securities Fund 5
and asset purchases to stimulate growth and the Fed’s announcement to end its own bond-buying program.
How did Putnam Convertible Securities Fund perform in this environment?
Rob: For the annual period, stocks strongly outperformed bonds, and the fund’s underlying equity sensitivity helped it to capture much of the upside of rising stock prices. However, while the fund’s class A shares outperformed the average return of its Lipper peer group, they lagged its benchmark, the BofA Merrill Lynch All U.S. Convertibles Index.
Overall, solid positioning in consumer staples, capital goods, and basic materials contributed most to performance relative to the benchmark, while transportation, technology, and financials detracted. From a sector perspective, our decision to underweight energy and capital goods and overweight transportation was rewarding. Security selection in the consumer staples and basic materials sectors augmented performance relative to the benchmark. However, unfavorable selection in the transportation and financials sectors constrained returns.
Did you adjust your investment strategy in light of the run-up in equity prices?
Eric: We have expressed concern for some time about overvaluation in several areas of the convertible bond market given the duration and breadth of the rally in the equity markets. As we mentioned in the fund’s most recent semiannual report, we began to trim positions in industries that had experienced significant outperformance and sold holdings that had met our investment expectations. This fine-tuning entailed redeploying proceeds from the sale of convertible bonds in the biotechnology industry, as well as in airline and trucking companies within the transportation
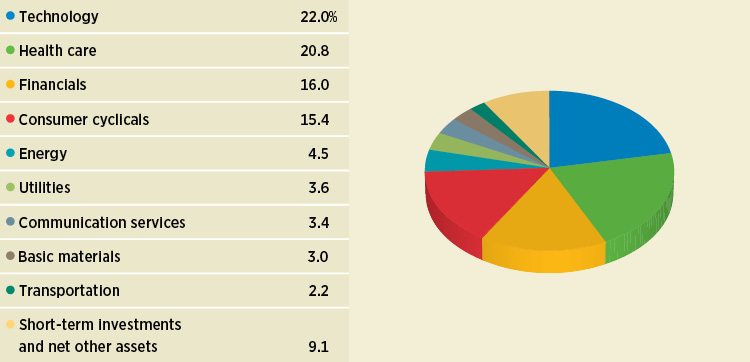
Sector allocations
Allocations are shown as a percentage of the fund’s net assets as of 10/31/14. Short-term investments and net other assets, if any, represent the market value weights of cash, derivatives, short-term securities, and other unclassified assets in the portfolio. Summary information may differ from the portfolio schedule included in the financial statements due to the inclusion of derivative securities, any interest accruals, the exclusion of as-of trades, if any, and the use of different classifications of securities for presentation purposes. Holdings and allocations may vary over time.
6 Convertible Securities Fund
“We are upbeat in our outlook for convertible bonds.”
Eric Hartun
industry. We moved assets into what we considered to be more balanced convertibles with more attractive risk/return characteristics.
In her semiannual testimony before the Senate Banking Committee this past July, Fed Chair Janet Yellen expressed concern about overvaluation in some pockets of the U.S. financial markets. Yellen’s unusually targeted comments about risk-taking, especially in the stocks of smaller companies as well as those of social media and biotechnology companies, unnerved a broad swath of investors. Given their equity sensitivity, the more speculative convertible bonds with ties to the industries that Yellen highlighted experienced selling pressure. Our efforts to minimize the portfolio’s volatility by limiting its exposure to convertibles that we believed were most susceptible to stock market volatility was helpful, but many of the fund’s holdings were nevertheless tarnished in the rush to judgment following her comments. By the close of the period, the fund had more than recouped those losses as confidence returned to the markets.
What other trends defined the convertible bond market during the period?
Rob: In addition to the significant run-up in prices in biotechnology and other sectors of the health-care market since the beginning of 2013, we saw a meaningful uptick in convertible bond issuance in the third quarter of 2014. If this pace of issuance continues, 2014 may close out the year in the neighborhood of $55 billion to $60 billion — well in excess of the $49 billion in new convertible issuance that defined 2013. The rise in issuance has contributed to a diverse pool of investment
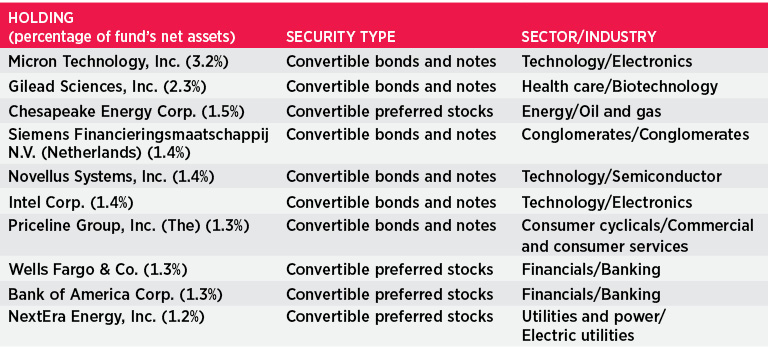
Top 10 holdings
This table shows the fund’s top 10 individual holdings and the percentage of the fund’s net assets that each represented as of 10/31/14. Short-term holdings, TBA commitments, and derivatives, if any, are excluded. Holdings may vary over time.
Convertible Securities Fund 7
opportunities, which in turn has been met with strong demand for the unique attributes of these hybrid securities.
Which holdings positively influenced performance?
Eric: Some of the fund’s biggest winners hailed from the pharmaceutical industry, and our decision to overweight them relative to the BofA Merrill Lynch All U.S. Convertibles Index contributed favorably to results. AMAG Pharmaceuticals acquired privately held Lumara Health in the third quarter of 2014, sending its shares to a four-year high. The acquisition gives AMAG access to Lumara’s “Makena,” the only approved drug designed to lower the risk of preterm birth, as well as an entry into the women’s health business that we believe could be transformative for the company’s earnings potential in the coming years.
An out-of-benchmark position in the stock of biotech Jazz Pharmaceuticals proved rewarding. Management made some acquisitions that were viewed positively by investors since they can leverage the favorable tax structure of the acquisitions as well as create organic growth. The biopharmaceutical company, Medivation, received U.S. Food and Drug Administration approval for Xtandi in September to treat late-stage prostate cancer. We think the company is making a reputation for itself as a developer of novel therapies to treat serious diseases for which there are limited treatment options.
Which holdings detracted from performance results?
Rob: A lighter-than-benchmark allocation in the strongly performing Illumina worked against the fund. The company, which is focused on advancing human health by unlocking the power of the human genome,
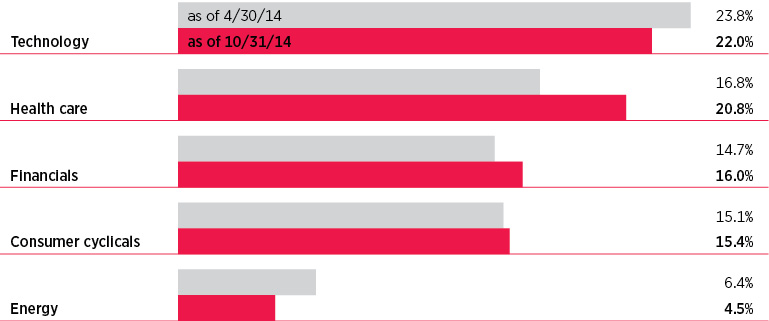
Comparison of top sector weightings
This chart shows how the fund’s top weightings have changed over the past six months. Allocations are shown as a percentage of the fund’s net assets. Current period summary information may differ from the portfolio schedule included in the financial statements due to the inclusion of derivative securities, any interest accruals, the exclusion of as-of trades, if any, and the use of different classifications of securities for presentation purposes. Holdings and allocations may vary over time.
8 Convertible Securities Fund
enjoyed strong demand for its new products because of the increased use of genetics in research and development within biotechnology companies. Illumina’s stock also rallied in response to the company’s decision to increase its share-repurchase program. We believe it is likely that Illumina’s technologies will be used to help treat and cure diseases in the future, but our decision to underweight the portfolio’s exposure was due to our belief that the stock’s current valuation reflects an overly bullish outlook for the company’s prospects.
The fund’s out-of-benchmark position in GT Advanced Technologies suffered when Apple announced this past September that its new smartwatch would feature GT’s sapphire cover, but the iPhone 6 would not. This was a setback for GT, and the stock traded down as the announcement came on the heels of the company’s October filing for Chapter 11 bankruptcy protection citing “a severe liquidity crisis.” Investments in Xilinx lost value in the aftermath of the company’s April release of guidance for the second quarter, which consensus estimates suggested were too high.
What is your outlook for the convertible bond market as we approach 2015?
Eric: With the economic backdrop improving and the equity market climbing on the back of strong earnings growth rather than on investor optimism, we are upbeat in our outlook for convertible bonds. However, we believe equity valuations, while not extreme by any means, are more expensive than they have been in the past couple of years and are in the top half of their average historic range. As long as there is some growth in earnings to support equity prices, we believe increases in the equity component of convertible bonds will offset declines in the bond component driven by rising bond yields.
Fed Chair Yellen has emphasized that interest rates would remain low by historic standards to help reduce long-term unemployment. The exact timing of a rate increase is still a bit uncertain and will be dependent on the U.S. economic recovery, wage growth, and business and household confidence. However, most analysts expect that the Fed will begin normalizing monetary policy toward mid-2015, with the introduction of the first increase in its short-term interest rate since 2006. Historically, the financial markets have tended to price in Fed policy changes in advance of the central bank’s formal announcements. So we would not be surprised to see some market volatility in the coming months as investors ferret out the Fed’s intentions.
Thank you, gentlemen, for your time and insights today.
The views expressed in this report are exclusively those of Putnam Management and are subject to change. They are not meant as investment advice.
Please note that the holdings discussed in this report may not have been held by the fund for the entire period. Portfolio composition is subject to review in accordance with the fund’s investment strategy and may vary in the future. Current and future portfolio holdings are subject to risk.
Portfolio Manager Eric N. Harthun has an M.B.A. from the Booth School of Business at the University of Chicago and a B.S. from San Diego State University. He joined Putnam in 2000 and has been in the investment industry since 1994.
Portfolio Manager Robert L. Salvin has an M.B.A. from the Booth School of Business at the University of Chicago and a B.S. from the Wharton School of Business at the University of Pennsylvania. He joined Putnam in 2000 and has been in the investment industry since 1986.
Convertible Securities Fund 9
IN THE NEWS
In the aftermath of November’s U.S. elections, it’s worth noting that U.S. stocks have gained during every six-month period following midterm votes since 1940. During the past 74 years, 18 midterm elections have been held. In every instance, stocks, as measured by the S&P 500 Index*, have delivered a positive return for the November 1–April 30 period. Gains have often been significant, with stocks delivering an average 17.91% return. The biggest advance of 26.88% took place in 1970–1971. The second biggest return — 26.57% — occurred in 1942–1943. The lowest return was 0.75% in 1946–1947. Why has the market consistently advanced following every midterm election, despite varying economic conditions across these periods? Many market observers believe that it comes down to clarity — in other words, each instance might be considered a “relief rally,” as election-related uncertainty tends to diminish.
*Returns for 1966 and earlier based on Ibbotson U.S. Large Stock Total Return Extended Index.
10 Convertible Securities Fund
Your fund’s performance
This section shows your fund’s performance, price, and distribution information for periods ended October 31, 2014, the end of its most recent fiscal year. In accordance with regulatory requirements for mutual funds, we also include performance information as of the most recent calendar quarter-end and expense information taken from the fund’s current prospectus. Performance should always be considered in light of a fund’s investment strategy. Data represent past performance. Past performance does not guarantee future results. More recent returns may be less or more than those shown. Investment return and principal value will fluctuate, and you may have a gain or a loss when you sell your shares. Performance information does not reflect any deduction for taxes a shareholder may owe on fund distributions or on the redemption of fund shares. For the most recent month-end performance, please visit the Individual Investors section at putnam.com or call Putnam at 1-800-225-1581. Class R and Y shares are not available to all investors. See the Terms and Definitions section in this report for definitions of the share classes offered by your fund.
Fund performance Total return for periods ended 10/31/14
Class A
Class B
Class C
Class M
Class R
Class Y
(inception dates)
(6/29/72)
(7/15/93)
(7/26/99)
(3/13/95)
(12/1/03)
(12/30/98)
Before sales charge
After sales charge
Before CDSC
After CDSC
Before CDSC
After CDSC
Before sales charge
After sales charge
Net asset value
Net asset value
Annual average
(life of fund)
10.08%
9.92%
9.87%
9.87%
9.25%
9.25%
9.41%
9.32%
9.80%
10.18%
10 years
107.15
95.24
95.10
95.10
92.12
92.12
96.95
90.06
101.97
112.41
Annual average
7.55
6.92
6.91
6.91
6.75
6.75
7.01
6.63
7.28
7.82
5 years
80.94
70.53
74.24
72.24
74.22
74.22
76.44
70.26
78.69
83.16
Annual average
12.59
11.27
11.74
11.49
11.74
11.74
12.03
11.23
12.31
12.87
3 years
46.15
37.75
42.81
39.81
42.85
42.85
43.92
38.88
45.04
47.19
Annual average
13.48
11.27
12.61
11.82
12.62
12.62
12.90
11.57
13.19
13.75
1 year
11.10
4.71
10.27
5.27
10.27
9.27
10.54
6.67
10.83
11.38
Current performance may be lower or higher than the quoted past performance, which cannot guarantee future results. After-sales-charge returns for class A and M shares reflect the deduction of the maximum 5.75% and 3.50% sales charge, respectively, levied at the time of purchase. Class B share returns after contingent deferred sales charge (CDSC) reflect the applicable CDSC, which is 5% in the first year, declining over time to 1% in the sixth year, and is eliminated thereafter. Class C share returns after CDSC reflect a 1% CDSC for the first year that is eliminated thereafter. Class R and Y shares have no initial sales charge or CDSC. Performance for class B, C, M, R, and Y shares before their inception is derived from the historical performance of class A shares, adjusted for the applicable sales charge (or CDSC) and the higher operating expenses for such shares, except for class Y shares, for which 12b-1 fees are not applicable.
For a portion of the periods, the fund had expense limitations, without which returns would have been lower.
Class B share performance reflects conversion to class A shares after eight years.
Convertible Securities Fund 11
Comparative index returns For periods ended 10/31/14
Index and Lipper results should be compared with fund performance before sales charge, before CDSC, or at net asset value.
*Over the 1-year, 3-year, 5-year, 10-year, and life-of-fund periods ended 10/31/14, there were 76, 70, 54, 37, and 1 fund(s), respectively, in this Lipper category.
†The fund’s benchmark, the BofA Merrill Lynch All U.S. Convertibles Index, was introduced on 12/31/87, which post-dates the inception of the fund’s class A shares.
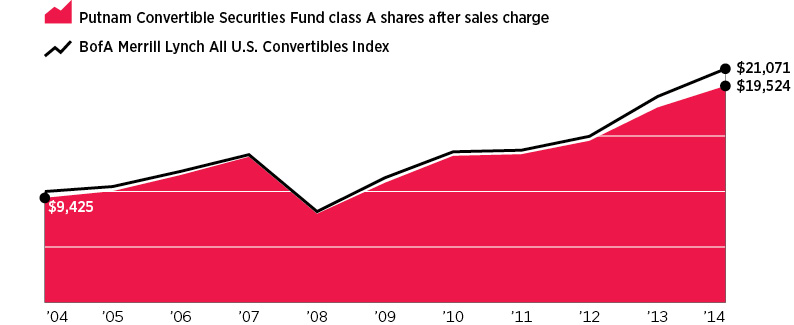
Change in the value of a $10,000 investment ($9,425 after sales charge)
Cumulative total return from 10/31/04 to 10/31/14
Past performance does not indicate future results. At the end of the same time period, a $10,000 investment in the fund’s class B and class C shares would have been valued at $19,510 and $19,212, respectively, and no contingent deferred sales charges would apply. A $10,000 investment in the fund’s class M shares ($9,650 after sales charge) would have been valued at $19,006. A $10,000 investment in the fund’s class R and Y shares would have been valued at $20,197 and $21,241, respectively.
12 Convertible Securities Fund
Fund price and distribution information For the 12-month period ended 10/31/14
Distributions
Class A
Class B
Class C
Class M
Class R
Class Y
Number
4
4
4
4
4
4
Income
$0.568
$0.386
$0.394
$0.448
$0.508
$0.630
Capital gains
—
—
—
—
—
—
Total
$0.568
$0.386
$0.394
$0.448
$0.508
$0.630
Share value
Before sales charge
After sales charge
Net asset value
Net asset value
Before sales charge
After sales charge
Net asset value
Net asset value
10/31/13
$23.57
$25.01
$23.15
$23.33
$23.35
$24.20
$23.48
$23.56
10/31/14
25.60
27.16
25.13
25.32
25.35
26.27
25.50
25.59
Current rate (end of period)
Before sales charge
After sales charge
Net asset value
Net asset value
Before sales charge
After sales charge
Net asset value
Net asset value
Current dividend rate 1
2.22%
2.09%
1.51%
1.53%
1.77%
1.71%
1.99%
2.49%
Current 30-day SEC yield 2
N/A
0.85
0.19
0.19
N/A
0.41
0.67
1.14
The classification of distributions, if any, is an estimate. Before-sales-charge share value and current dividend rate for class A and M shares, if applicable, do not take into account any sales charge levied at the time of purchase. After-sales-charge share value, current dividend rate, and current 30-day SEC yield, if applicable, are calculated assuming that the maximum sales charge (5.75% for class A shares and 3.50% for class M shares) was levied at the time of purchase. Final distribution information will appear on your year-end tax forms.
1Most recent distribution, including any return of capital and excluding capital gains, annualized and divided by share price before or after sales charge at period-end.
2Based only on investment income and calculated using the maximum offering price for each share class, in accordance with SEC guidelines.
Fund performance as of most recent calendar quarter Total return for periods ended 9/30/14
Class A
Class B
Class C
Class M
Class R
Class Y
(inception dates)
(6/29/72)
(7/15/93)
(7/26/99)
(3/13/95)
(12/1/03)
(12/30/98)
Before sales charge
After sales charge
Before CDSC
After CDSC
Before CDSC
After CDSC
Before sales charge
After sales charge
Net asset value
Net asset value
Annual average
(life of fund)
10.07%
9.92%
9.86%
9.86%
9.24%
9.24%
9.40%
9.31%
9.80%
10.17%
10 years
106.34
94.47
94.33
94.33
91.38
91.38
96.32
89.45
101.16
111.57
Annual average
7.51
6.88
6.87
6.87
6.71
6.71
6.98
6.60
7.24
7.78
5 years
75.47
65.38
68.98
66.98
68.94
68.94
71.09
65.10
73.27
77.63
Annual average
11.90
10.59
11.06
10.80
11.06
11.06
11.34
10.55
11.62
12.18
3 years
54.38
45.50
50.91
47.91
50.92
50.92
52.04
46.72
53.22
55.56
Annual average
15.57
13.32
14.70
13.94
14.70
14.70
14.99
13.63
15.29
15.87
1 year
12.36
5.90
11.53
6.53
11.52
10.52
11.80
7.88
12.05
12.64
See the discussion following the fund performance table on page 11 for information about the calculation of fund performance.
Convertible Securities Fund 13
Your fund’s expenses
As a mutual fund investor, you pay ongoing expenses, such as management fees, distribution fees (12b-1 fees), and other expenses. Using the following information, you can estimate how these expenses affect your investment and compare them with the expenses of other funds. You may also pay one-time transaction expenses, including sales charges (loads) and redemption fees, which are not shown in this section and would have resulted in higher total expenses. For more information, see your fund’s prospectus or talk to your financial representative.
Expense ratios
Class A
Class B
Class C
Class M
Class R
Class Y
Total annual operating expenses for the fiscal year ended 10/31/13
1.08%
1.83%
1.83%
1.58%
1.33%
0.83%
Annualized expense ratio for the six-month period ended 10/31/14*
1.04%
1.79%
1.79%
1.54%
1.29%
0.79%
Fiscal-year expense information in this table is taken from the most recent prospectus, is subject to change, and may differ from that shown for the annualized expense ratio and in the financial highlights of this report.
Expenses are shown as a percentage of average net assets.
*For the fund’s most recent fiscal half year; may differ from expense ratios based on one-year data in the financial highlights.
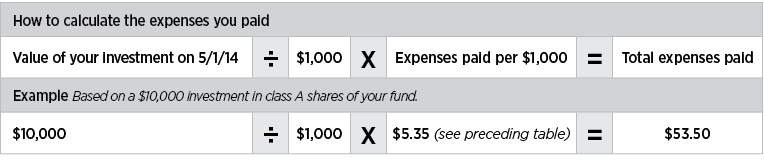
Expenses per $1,000
The following table shows the expenses you would have paid on a $1,000 investment in the fund from May 1, 2014, to October 31, 2014. It also shows how much a $1,000 investment would be worth at the close of the period, assuming actual returns and expenses.
Class A
Class B
Class C
Class M
Class R
Class Y
Expenses paid per $1,000*†
$5.35
$9.19
$9.19
$7.92
$6.64
$4.07
Ending value (after expenses)
$1,042.10
$1,037.70
$1,037.60
$1,039.20
$1,040.60
$1,043.00
*Expenses for each share class are calculated using the fund’s annualized expense ratio for each class, which represents the ongoing expenses as a percentage of average net assets for the six months ended 10/31/14. The expense ratio may differ for each share class.
†Expenses are calculated by multiplying the expense ratio by the average account value for the period; then multiplying the result by the number of days in the period; and then dividing that result by the number of days in the year.
14 Convertible Securities Fund
Estimate the expenses you paid
To estimate the ongoing expenses you paid for the six months ended October 31, 2014, use the following calculation method. To find the value of your investment on May 1, 2014, call Putnam at 1-800-225-1581.
Compare expenses using the SEC’s method
The Securities and Exchange Commission (SEC) has established guidelines to help investors assess fund expenses. Per these guidelines, the following table shows your fund’s expenses based on a $1,000 investment, assuming a hypothetical 5% annualized return. You can use this information to compare the ongoing expenses (but not transaction expenses or total costs) of investing in the fund with those of other funds. All mutual fund shareholder reports will provide this information to help you make this comparison. Please note that you cannot use this information to estimate your actual ending account balance and expenses paid during the period.
Class A
Class B
Class C
Class M
Class R
Class Y
Expenses paid per $1,000*†
$5.30
$9.10
$9.10
$7.83
$6.56
$4.02
Ending value (after expenses)
$1,019.96
$1,016.18
$1,016.18
$1,017.44
$1,018.70
$1,021.22
*Expenses for each share class are calculated using the fund’s annualized expense ratio for each class, which represents the ongoing expenses as a percentage of average net assets for the six months ended 10/31/14. The expense ratio may differ for each share class.
†Expenses are calculated by multiplying the expense ratio by the average account value for the six-month period; then multiplying the result by the number of days in the six-month period; and then dividing that result by the number of days in the year.
Convertible Securities Fund 15
Terms and definitions
Important terms
Total return shows how the value of the fund’s shares changed over time, assuming you held the shares through the entire period and reinvested all distributions in the fund.
Before sales charge, or net asset value, is the price, or value, of one share of a mutual fund, without a sales charge. Before-sales-charge figures fluctuate with market conditions, and are calculated by dividing the net assets of each class of shares by the number of outstanding shares in the class.
After sales charge is the price of a mutual fund share plus the maximum sales charge levied at the time of purchase. After-sales-charge performance figures shown here assume the 5.75% maximum sales charge for class A shares and 3.50% for class M shares.
Contingent deferred sales charge (CDSC) is generally a charge applied at the time of the redemption of class B or C shares and assumes redemption at the end of the period. Your fund’s class B CDSC declines over time from a 5% maximum during the first year to 1% during the sixth year. After the sixth year, the CDSC no longer applies. The CDSC for class C shares is 1% for one year after purchase.
Share classes
Class A shares are generally subject to an initial sales charge and no CDSC (except on certain redemptions of shares bought without an initial sales charge).
Class B shares are not subject to an initial sales charge and may be subject to a CDSC.
Class C shares are not subject to an initial sales charge and are subject to a CDSC only if the shares are redeemed during the first year.
Class M shares have a lower initial sales charge and a higher 12b-1 fee than class A shares and no CDSC (except on certain redemptions of shares bought without an initial sales charge).
Class R shares are not subject to an initial sales charge or CDSC and are available only to certain employer-sponsored retirement plans.
Class Y shares are not subject to an initial sales charge or CDSC, and carry no 12b-1 fee. They are generally only available to corporate and institutional clients and clients in other approved programs.
Fixed-income terms
Current rate is the annual rate of return earned from dividends or interest of an investment. Current rate is expressed as a percentage of the price of a security, fund share, or principal investment.
Mortgage-backed security (MBS), also known as a mortgage “pass-through,” is a type of asset-backed security that is secured by a mortgage or collection of mortgages. The following are types of MBSs:
•Agency “pass-through” has its principal and interest backed by a U.S. government agency, such as the Federal National Mortgage Association (Fannie Mae), Government National Mortgage Association (Ginnie Mae), and Federal Home Loan Mortgage Corporation (Freddie Mac).
•Collateralized mortgage obligation (CMO) represents claims to specific cash flows from pools of home mortgages. The streams of principal and interest payments on the mortgages are distributed to the different classes of CMO interests in “tranches.” Each tranche may have different principal balances, coupon rates, prepayment risks, and maturity dates. A CMO is highly sensitive to changes in interest rates and any resulting change in the rate at which homeowners sell their properties, refinance, or otherwise prepay loans. CMOs are subject to prepayment, market, and liquidity risks.
•Interest-only (IO) security is a type of CMO in which the underlying asset is the interest portion of mortgage, Treasury, or bond payments.
•Non-agency residential mortgage-backed security (RMBS) is an MBS not backed by Fannie Mae, Ginnie Mae, or Freddie Mac. One type of RMBS is an Alt-A mortgage-backed security.
•Commercial mortgage-backed security (CMBS) is secured by the loan on a commercial property.
Yield curve is a graph that plots the yields of bonds with equal credit quality against their differing maturity dates, ranging from shortest to longest. It is used as a benchmark for other debt, such as mortgage or bank lending rates.
16 Convertible Securities Fund
Comparative indexes
Barclays U.S. Aggregate Bond Index is an unmanaged index of U.S. investment-grade fixed-income securities.
BofA Merrill Lynch U.S. 3-Month Treasury Bill Index is an unmanaged index that seeks to measure the performance of U.S. Treasury bills available in the marketplace.
BofA Merrill Lynch All U.S. Convertibles Index is an unmanaged index of high-yield U.S. convertible securities.
S&P 500 Index is an unmanaged index of common stock performance.
Indexes assume reinvestment of all distributions and do not account for fees. Securities and performance of a fund and an index will differ. You cannot invest directly in an index.
Lipper is a third-party industry-ranking entity that ranks mutual funds. Its rankings do not reflect sales charges. Lipper rankings are based on total return at net asset value relative to other funds that have similar current investment styles or objectives as determined by Lipper. Lipper may change a fund’s category assignment at its discretion. Lipper category averages reflect performance trends for funds within a category.
Other information for shareholders
Proxy voting
Putnam is committed to managing our mutual funds in the best interests of our shareholders. The Putnam funds’ proxy voting guidelines and procedures, as well as information regarding how your fund voted proxies relating to portfolio securities during the 12-month period ended June 30, 2014, are available in the Individual Investors section of putnam.com, and on the Securities and Exchange Commission (SEC) website, www.sec.gov. If you have questions about finding forms on the SEC’s website, you may call the SEC at 1-800-SEC-0330. You may also obtain the Putnam funds’ proxy voting guidelines and procedures at no charge by calling Putnam’s Shareholder Services at 1-800-225-1581.
Fund portfolio holdings
The fund will file a complete schedule of its portfolio holdings with the SEC for the first and third quarters of each fiscal year on Form N-Q. Shareholders may obtain the fund’s Form N-Q on the SEC’s website at www.sec.gov. In addition, the fund’s Form N-Q may be reviewed and copied at the SEC’s Public Reference Room in Washington, D.C. You may call the SEC at 1-800-SEC-0330 for information about the SEC’s website or the operation of the Public Reference Room.
Trustee and employee fund ownership
Putnam employees and members of the Board of Trustees place their faith, confidence, and, most importantly, investment dollars in Putnam mutual funds. As of October 31, 2014, Putnam employees had approximately $494,000,000 and the Trustees had approximately $139,000,000 invested in Putnam mutual funds. These amounts include investments by the Trustees’ and employees’ immediate family members as well as investments through retirement and deferred compensation plans.
Convertible Securities Fund 17
Important notice regarding Putnam’s privacy policy
In order to conduct business with our shareholders, we must obtain certain personal information such as account holders’ names, addresses, Social Security numbers, and dates of birth. Using this information, we are able to maintain accurate records of accounts and transactions.
It is our policy to protect the confidentiality of our shareholder information, whether or not a shareholder currently owns shares of our funds. In particular, it is our policy not to sell information about you or your accounts to outside marketing firms. We have safeguards in place designed to prevent unauthorized access to our computer systems and procedures to protect personal information from unauthorized use.
Under certain circumstances, we must share account information with outside vendors who provide services to us, such as mailings and proxy solicitations. In these cases, the service providers enter into confidentiality agreements with us, and we provide only the information necessary to process transactions and perform other services related to your account. Finally, it is our policy to share account information with your financial representative, if you’ve listed one on your Putnam account.
18 Convertible Securities Fund
Trustee approval of management contract
General conclusions
The Board of Trustees of the Putnam funds oversees the management of each fund and, as required by law, determines annually whether to approve the continuance of your fund’s management contract with Putnam Investment Management, LLC (“Putnam Management”) and the sub-management contract with respect to your fund between Putnam Management and its affiliate, Putnam Investments Limited (“PIL”). The Board of Trustees, with the assistance of its Contract Committee, requests and evaluates all information it deems reasonably necessary under the circumstances in connection with its annual contract review. The Contract Committee consists solely of Trustees who are not “interested persons” (as this term is defined in the Investment Company Act of 1940, as amended (the “1940 Act”)) of the Putnam funds (“Independent Trustees”).
At the outset of the review process, members of the Board’s independent staff and independent legal counsel met with representatives of Putnam Management to review the annual contract review materials furnished to the Contract Committee during the course of the previous year’s review and to discuss possible changes in these materials that might be necessary or desirable for the coming year. Following these discussions and in consultation with the Contract Committee, the Independent Trustees’ independent legal counsel requested that Putnam Management furnish specified information, together with any additional information that Putnam Management considered relevant, to the Contract Committee. Over the course of several months ending in June 2014, the Contract Committee met on a number of occasions with representatives of Putnam Management, and separately in executive session, to consider the information that Putnam Management provided, as well as supplemental information provided in response to additional requests made by the Contract Committee. Throughout this process, the Contract Committee was assisted by the members of the Board’s independent staff and by independent legal counsel for the Putnam funds and the Independent Trustees.
In May 2014, the Contract Committee met in executive session to discuss and consider its preliminary recommendations with respect to the continuance of the contracts. At the Trustees’ June 20, 2014 meeting, the Contract Committee met in executive session with the other Independent Trustees to review a summary of the key financial, performance and other data that the Contract Committee considered in the course of its review. The Contract Committee then presented its written report, which summarized the key factors that the Committee had considered and set forth its final recommendations. The Contract Committee then recommended, and the Independent Trustees approved, the continuance of your fund’s management and sub-management contracts, effective July 1, 2014. (Because PIL is an affiliate of Putnam Management and Putnam Management remains fully responsible for all services provided by PIL, the Trustees have not attempted to evaluate PIL as a separate entity, and all subsequent references to Putnam Management below should be deemed to include reference to PIL as necessary or appropriate in the context.)
The Independent Trustees’ approval was based on the following conclusions:
•That the fee schedule in effect for your fund represented reasonable compensation in light of the nature and quality of the services being provided to the fund, the fees paid by competitive funds, and the costs incurred by Putnam Management in providing services to the fund; and
Convertible Securities Fund 19
•That the fee schedule in effect for your fund represented an appropriate sharing between fund shareholders and Putnam Management of such economies of scale as may exist in the management of the fund at current asset levels.
These conclusions were based on a comprehensive consideration of all information provided to the Trustees and were not the result of any single factor. Some of the factors that figured particularly in the Trustees’ deliberations and how the Trustees considered these factors are described below, although individual Trustees may have evaluated the information presented differently, giving different weights to various factors. It is also important to recognize that the management arrangements for your fund and the other Putnam funds are the result of many years of review and discussion between the Independent Trustees and Putnam Management, that some aspects of the arrangements may receive greater scrutiny in some years than others, and that the Trustees’ conclusions may be based, in part, on their consideration of fee arrangements in previous years. For example, with some minor exceptions, the current fee arrangements under the management contracts for the Putnam funds were implemented at the beginning of 2010 following extensive review by the Contract Committee and discussions with representatives of Putnam Management, as well as approval by shareholders. Shareholders also voted overwhelmingly to approve these fee arrangements in early 2014, when they were asked to approve new management contracts (with the same fees and substantially identical other provisions) following the possible termination of the previous management contracts as a result of the death of the Honorable Paul G. Desmarais. (Mr. Desmarais, both directly and through holding companies, controlled a majority of the voting shares of Power Corporation of Canada, which (directly and indirectly) is the majority owner of Putnam Management. Mr. Desmarais’ voting control of shares of Power Corporation of Canada was transferred to The Desmarais Family Residuary Trust upon his death and this transfer, as a technical matter, may have constituted an “assignment” within the meaning of the 1940 Act, causing the Putnam funds’ management contracts to terminate automatically.)
Management fee schedules and total expenses
The Trustees reviewed the management fee schedules in effect for all Putnam funds, including fee levels and breakpoints. The Trustees also reviewed the total expenses of each Putnam fund, recognizing that in most cases management fees represented the major, but not the sole, determinant of total costs to shareholders.
In reviewing fees and expenses, the Trustees generally focus their attention on material changes in circumstances — for example, changes in assets under management, changes in a fund’s investment style, changes in Putnam Management’s operating costs or profitability, or changes in competitive practices in the mutual fund industry — that suggest that consideration of fee changes might be warranted. The Trustees concluded that the circumstances did not warrant changes to the management fee structure of your fund.
Under its management contract, your fund has the benefit of breakpoints in its management fee schedule that provide shareholders with economies of scale in the form of reduced fee levels as assets under management in the Putnam family of funds increase. The Trustees concluded that the fee schedule in effect for your fund represented an appropriate sharing of economies of scale between fund shareholders and Putnam Management.
As in the past, the Trustees also focused on the competitiveness of each fund’s total expense ratio. In order to ensure that expenses of the Putnam funds continue to meet competitive standards, the Trustees and Putnam
20 Convertible Securities Fund
Management have implemented certain expense limitations. These expense limitations were: (i) a contractual expense limitation applicable to all retail open-end funds of 32 basis points on investor servicing fees and expenses and (ii) a contractual expense limitation applicable to all open-end funds of 20 basis points on so-called “other expenses” (i.e., all expenses exclusive of management fees, investor servicing fees, distribution fees, investment-related expenses, interest, taxes, brokerage commissions, extraordinary expenses and acquired fund fees and expenses). These expense limitations serve in particular to maintain competitive expense levels for funds with large numbers of small shareholder accounts and funds with relatively small net assets. Most funds, including your fund, had sufficiently low expenses that these expense limitations did not apply. Putnam Management’s support for these expense limitation arrangements was an important factor in the Trustees’ decision to approve the continuance of your fund’s management and sub-management contracts.
The Trustees reviewed comparative fee and expense information for a custom group of competitive funds selected by Lipper Inc. (“Lipper”). This comparative information included your fund’s percentile ranking for effective management fees and total expenses (excluding any applicable 12b-1 fee), which provides a general indication of your fund’s relative standing. In the custom peer group, your fund ranked in the third quintile in effective management fees (determined for your fund and the other funds in the custom peer group based on fund asset size and the applicable contractual management fee schedule) and in the third quintile in total expenses (excluding any applicable 12b-1 fees) as of December 31, 2013 (the first quintile representing the least expensive funds and the fifth quintile the most expensive funds). The fee and expense data reported by Lipper as of December 31, 2013 reflected the most recent fiscal year-end data available in Lipper’s database at that time.
In connection with their review of the management fees and total expenses of the Putnam funds, the Trustees also reviewed the costs of the services provided and the profits realized by Putnam Management and its affiliates from their contractual relationships with the funds. This information included trends in revenues, expenses and profitability of Putnam Management and its affiliates relating to the investment management, investor servicing and distribution services provided to the funds. In this regard, the Trustees also reviewed an analysis of Putnam Management’s revenues, expenses and profitability, allocated on a fund-by-fund basis, with respect to the funds’ management, distribution, and investor servicing contracts. For each fund, the analysis presented information about revenues, expenses and profitability for each of the agreements separately and for the agreements taken together on a combined basis. The Trustees concluded that, at current asset levels, the fee schedules in place represented reasonable compensation for the services being provided and represented an appropriate sharing of such economies of scale as may exist in the management of the Putnam funds at that time.
The information examined by the Trustees as part of their annual contract review for the Putnam funds has included for many years information regarding fees charged by Putnam Management and its affiliates to institutional clients such as defined benefit pension plans, college endowments, and the like. This information included comparisons of those fees with fees charged to the Putnam funds, as well as an assessment of the differences in the services provided to these different types of clients. The Trustees observed that the differences in fee rates between institutional clients and mutual funds are by no means uniform when examined by individual asset sectors, suggesting that
Convertible Securities Fund 21
differences in the pricing of investment management services to these types of clients may reflect historical competitive forces operating in separate markets. The Trustees considered the fact that in many cases fee rates across different asset classes are higher on average for mutual funds than for institutional clients, as well as the differences between the services that Putnam Management provides to the Putnam funds and those that it provides to its institutional clients. The Trustees did not rely on these comparisons to any significant extent in concluding that the management fees paid by your fund are reasonable.
Investment performance
The quality of the investment process provided by Putnam Management represented a major factor in the Trustees’ evaluation of the quality of services provided by Putnam Management under your fund’s management contract. The Trustees were assisted in their review of the Putnam funds’ investment process and performance by the work of the investment oversight committees of the Trustees, which meet on a regular basis with the funds’ portfolio teams and with the Chief Investment Officer and other senior members of Putnam Management’s Investment Division throughout the year. The Trustees concluded that Putnam Management generally provides a high-quality investment process — based on the experience and skills of the individuals assigned to the management of fund portfolios, the resources made available to them, and in general Putnam Management’s ability to attract and retain high-quality personnel — but also recognized that this does not guarantee favorable investment results for every fund in every time period.
The Trustees considered that 2013 was a year of strong competitive performance for many of the Putnam funds, with only a relatively small number of exceptions. They noted that this strong performance was exemplified by the fact that the Putnam funds were recognized by Barron’s as the second-best performing mutual fund complex for both 2013 and the five-year period ended December 31, 2013. They also noted, however, the disappointing investment performance of some funds for periods ended December 31, 2013 and considered information provided by Putnam Management regarding the factors contributing to the underperformance and actions being taken to improve the performance of these particular funds. The Trustees indicated their intention to continue to monitor performance trends to assess the effectiveness of these efforts and to evaluate whether additional actions to address areas of underperformance are warranted. For purposes of evaluating investment performance, the Trustees generally focus on competitive industry rankings for the one-year, three-year and five-year periods. For a number of Putnam funds with relatively unique investment mandates for which meaningful competitive performance rankings are not considered available, the Trustees evaluated performance based on comparisons of fund returns with the returns of selected investment benchmarks. In the case of your fund, the Trustees considered that its class A share cumulative total return performance at net asset value was in the following quartiles of its Lipper peer group (Lipper Convertible Securities Funds) for the one-year, three-year and five-year periods ended December 31, 2013 (the first quartile representing the best-performing funds and the fourth quartile the worst-performing funds):
One-year period
3rd
Three-year period
2nd
Five-year period
1st
For the five-year period ended December 31, 2013, your fund’s performance was in the top decile of its Lipper peer group. Over the one-year, three-year and five-year periods ended December 31, 2013, there were 76, 63 and 48 funds, respectively, in your fund’s Lipper peer group. (When considering performance information, shareholders should be mindful
22 Convertible Securities Fund
that past performance is not a guarantee of future results.)
Brokerage and soft-dollar allocations; investor servicing
The Trustees considered various potential benefits that Putnam Management may receive in connection with the services it provides under the management contract with your fund. These include benefits related to brokerage allocation and the use of soft dollars, whereby a portion of the commissions paid by a fund for brokerage may be used to acquire research services that are expected to be useful to Putnam Management in managing the assets of the fund and of other clients. Subject to policies established by the Trustees, soft dollars generated by these means are used primarily to acquire brokerage and research services that enhance Putnam Management’s investment capabilities and supplement Putnam Management’s internal research efforts. However, the Trustees noted that a portion of available soft dollars continues to be used to pay fund expenses. The Trustees indicated their continued intent to monitor regulatory and industry developments in this area with the assistance of their Brokerage Committee and also indicated their continued intent to monitor the allocation of the Putnam funds’ brokerage in order to ensure that the principle of seeking best price and execution remains paramount in the portfolio trading process.
Putnam Management may also receive benefits from payments that the funds make to Putnam Management’s affiliates for investor or distribution services. In conjunction with the annual review of your fund’s management and sub-management contracts, the Trustees reviewed your fund’s investor servicing agreement with Putnam Investor Services, Inc. (“PSERV”) and its distributor’s contracts and distribution plans with Putnam Retail Management Limited Partnership (“PRM”), both of which are affiliates of Putnam Management. The Trustees concluded that the fees payable by the funds to PSERV and PRM, as applicable, for such services are reasonable in relation to the nature and quality of such services, the fees paid by competitive funds, and the costs incurred by PSERV and PRM, as applicable, in providing such services.
Convertible Securities Fund 23
Financial statements
These sections of the report, as well as the accompanying Notes, preceded by the Report of Independent Registered Public Accounting Firm, constitute the fund’s financial statements.
The fund’s portfolio lists all the fund’s investments and their values as of the last day of the reporting period. Holdings are organized by asset type and industry sector, country, or state to show areas of concentration and diversification.
Statement of assets and liabilities shows how the fund’s net assets and share price are determined. All investment and non-investment assets are added together. Any unpaid expenses and other liabilities are subtracted from this total. The result is divided by the number of shares to determine the net asset value per share, which is calculated separately for each class of shares. (For funds with preferred shares, the amount subtracted from total assets includes the liquidation preference of preferred shares.)
Statement of operations shows the fund’s net investment gain or loss. This is done by first adding up all the fund’s earnings — from dividends and interest income — and subtracting its operating expenses to determine net investment income (or loss). Then, any net gain or loss the fund realized on the sales of its holdings — as well as any unrealized gains or losses over the period — is added to or subtracted from the net investment result to determine the fund’s net gain or loss for the fiscal year.
Statement of changes in net assets shows how the fund’s net assets were affected by the fund’s net investment gain or loss, by distributions to shareholders, and by changes in the number of the fund’s shares. It lists distributions and their sources (net investment income or realized capital gains) over the current reporting period and the most recent fiscal year-end. The distributions listed here may not match the sources listed in the Statement of operations because the distributions are determined on a tax basis and may be paid in a different period from the one in which they were earned.
Financial highlights provide an overview of the fund’s investment results, per-share distributions, expense ratios, net investment income ratios, and portfolio turnover in one summary table, reflecting the five most recent reporting periods. In a semiannual report, the highlights table also includes the current reporting period.
24 Convertible Securities Fund
Report of Independent Registered Public Accounting Firm
The Board of Trustees and Shareholders Putnam Convertible Securities Fund:
We have audited the accompanying statement of assets and liabilities of Putnam Convertible Securities Fund (the fund), including the fund’s portfolio, as of October 31, 2014, and the related statement of operations for the year then ended, the statements of changes in net assets for each of the years in the two-year period then ended, and the financial highlights for each of the years in the five-year period then ended. These financial statements and financial highlights are the responsibility of the fund’s management. Our responsibility is to express an opinion on these financial statements and financial highlights based on our audits.
We conducted our audits in accordance with the standards of the Public Company Accounting Oversight Board (United States). Those standards require that we plan and perform the audit to obtain reasonable assurance about whether the financial statements and financial highlights are free of material misstatement. An audit includes examining, on a test basis, evidence supporting the amounts and disclosures in the financial statements. Our procedures included confirmation of securities owned as of October 31, 2014, by correspondence with the custodian and brokers or by other appropriate auditing procedures. An audit also includes assessing the accounting principles used and significant estimates made by management, as well as evaluating the overall financial statement presentation. We believe that our audits provide a reasonable basis for our opinion.
In our opinion, the financial statements and financial highlights referred to above present fairly, in all material respects, the financial position of Putnam Convertible Securities Fund as of October 31, 2014, the results of its operations for the year then ended, the changes in its net assets for each of the years in the two-year period then ended, and the financial highlights for each of the years in the five-year period then ended, in conformity with U.S. generally accepted accounting principles.
Boston, Massachusetts December 16, 2014
Convertible Securities Fund 25
The fund’s portfolio 10/31/14
CONVERTIBLE BONDS AND NOTES (73.0%)*
Principal amount
Value
Airlines (—%)
Lufthansa Malta Blues LP 144A cv. sr. unsec. notes 0 3/4s, 2017 (Malta)
Liberty Interactive, LLC 144A cv. sr. unsec. notes 1s, 2043
4,135,000
4,408,944
19,393,533
Medical technology (2.5%)
Cepheid, Inc. 144A cv. sr. unsec. notes 1 1/4s, 2021
5,143,000
5,625,156
China Medical Technologies, Inc. cv. sr. unsec. bonds Ser. CMT, 4s, 2016 (acquired from 8/12/08 to 10/7/10, cost $3,031,442) (China) (In default) †ΔΔ F
3,213,000
257,040
China Medical Technologies, Inc. 144A cv. sr. unsec. notes 6 1/4s, 2016 (China) (In default) † F
Total convertible bonds and notes (cost $608,412,119)
$693,649,195
CONVERTIBLE PREFERRED STOCKS (19.5%)*
Shares
Value
Aerospace and defense (1.0%)
United Technologies Corp. $3.75 cv. pfd.
159,370
$9,326,332
9,326,332
Banking (3.2%)
Banc of California, Inc. 4.00% cv. pfd.
39,830
2,296,598
Bank of America Corp. Ser. L, 7.25% cv. pfd.
10,500
11,943,750
OFG Bancorp Ser. C, 8.75% cv. pfd. (Puerto Rico)
2,637
3,905,397
Wells Fargo & Co. Ser. L, 7.50% cv. pfd.
9,930
11,953,238
30,098,983
Consumer (0.8%)
Stanley Black & Decker, Inc. $6.25 cv. pfd.
68,260
7,920,208
7,920,208
Electric utilities (2.9%)
Dominion Resources, Inc./VA $3.188 cv. pfd.
136,873
6,891,556
Exelon Corp. $3.25 cv. pfd.
162,113
8,551,461
NextEra Energy, Inc. cv. pfd. zero %
212,285
11,771,203
27,214,220
Energy (oil field) (0.3%)
McDermott International, Inc. $1.563 cv. pfd.
167,996
2,650,977
2,650,977
Financial (1.2%)
AMG Capital Trust II $2.575 cv. pfd.
187,160
11,498,643
11,498,643
Food (1.2%)
Post Holdings, Inc. 144A $3.75 cv. pfd.
47,289
4,226,691
Tyson Foods, Inc. $2.375 cv. pfd.
151,173
7,640,283
11,866,974
Forest products and packaging (0.8%)
Weyerhaeuser Co. Ser. A, $3.188 cv. pfd. R
139,369
7,883,059
7,883,059
Health-care services (0.4%)
AmSurg Corp. Ser. A-1, $5.25 cv. pfd.
30,928
3,460,070
3,460,070
Insurance (0.6%)
Maiden Holdings, Ltd. Ser. B, $3.625 cv. pfd. (Bermuda)
127,032
5,936,205
5,936,205
30 Convertible Securities Fund
CONVERTIBLE PREFERRED STOCKS (19.5%)* cont.
Shares
Value
Metals (0.7%)
Alcoa, Inc. $2.688 Ser. 1, cv. pfd. †
132,452
$6,900,749
6,900,749
Oil and gas (1.8%)
Chesapeake Energy Corp. 144A 5.75% cv. pfd.
13,053
14,186,979
Halcon Resources Corp. Ser. A, 5.75% cv. pfd.
3,717
2,471,805
16,658,784
Power producers (0.7%)
Dynegy, Inc. cv. pfd. Ser. A, $5.375 †
66,603
6,693,602
6,693,602
Railroads (0.8%)
Genesee & Wyoming, Inc. $5.00 cv. pfd.
60,023
7,490,870
7,490,870
Real estate (1.0%)
Alexandria Real Estate Equities, Inc. Ser. D, $1.75 cv. pfd. R
356,636
9,673,752
9,673,752
Telecommunications (2.1%)
American Tower Corp. Ser. A, $5.25 cv. pfd. R
67,135
7,191,837
Crown Castle International Corp. Ser. A, Class A, $4.50 cv. pfd. R
67,322
6,805,581
Iridium Communications, Inc. Ser. B, 6.75% cv. pfd.
5,147
1,842,626
Iridium Communications, Inc. 144A $7.00 cv. pfd.
33,766
3,937,960
19,778,004
Total convertible preferred stocks (cost $177,159,753)
$185,051,432
COMMON STOCKS (2.6%)*
Shares
Value
Actavis PLC †
10,405
$2,525,710
Brazil Ethanol, Inc. 144A (Unit) † F
312,500
31
DISH Network Corp. Class A †
35,855
2,282,171
Exxon Mobil Corp.
22,805
2,205,472
General Motors Co.
61,387
1,927,552
Hartford Financial Services Group, Inc. (The)
125,800
4,979,164
Jazz Pharmaceuticals PLC †
14,985
2,530,067
Live Nation Entertainment, Inc. †
102,875
2,674,750
Priceline Group, Inc. (The) †
2,935
3,540,226
PulteGroup, Inc.
114,395
2,195,240
Total common stocks (cost $22,834,395)
$24,860,383
CORPORATE BONDS AND NOTES (—%)*
Principal amount
Value
First Data Holdings, Inc. 144A sr. unsec. notes 14 1/2s, 2019 ‡‡
$171,249
$180,240
Total corporate bonds and notes (cost $163,274)
$180,240
WARRANTS (—%)* †
Expiration date
Strike price
Warrants
Value
Tower Semiconductor, Ltd. 144A (Israel) F
6/30/15
$1.70
1,085,630
$—
Total warrants (cost $217,126)
$—
SHORT-TERM INVESTMENTS (4.3%)*
Shares
Value
Putnam Short Term Investment Fund 0.09% L
40,401,678
$40,401,678
Total short-term investments (cost $40,401,678)
$40,401,678
TOTAL INVESTMENTS
Total investments (cost $849,188,345)
$944,142,928
Convertible Securities Fund 31
Key to holding’s currency abbreviations
EUR
Euro
USD/$
United States Dollar
Key to holding’s abbreviations
FRN
Floating Rate Notes: the rate shown is the current interest rate at the close of the reporting period
Notes to the fund’s portfolio
Unless noted otherwise, the notes to the fund’s portfolio are for the close of the fund’s reporting period, which ran from November 1, 2013 through October 31, 2014 (the reporting period). Within the following notes to the portfolio, references to “ASC 820” represent Accounting Standards Codification 820 Fair Value Measurements and Disclosures and references to “OTC”, if any, represent over-the-counter.
*
Percentages indicated are based on net assets of $950,240,312.
†
Non-income-producing security.
††
The interest rate and date shown parenthetically represent the new interest rate to be paid and the date the fund will begin accruing interest at this rate.
ΔΔ
Security is restricted with regard to public resale. The total fair value of this security and any other restricted securities (excluding 144A securities), if any, held at the close of the reporting period was $257,040, or less than 0.1% of net assets.
‡‡
Income may be received in cash or additional securities at the discretion of the issuer.
F
Security is valued at fair value following procedures approved by the Trustees. Securities may be classified as Level 2 or Level 3 for ASC 820 based on the securities’ valuation inputs (Note 1).
L
Affiliated company (Note 5). The rate quoted in the security description is the annualized 7-day yield of the fund at the close of the reporting period.
R
Real Estate Investment Trust.
At the close of the reporting period, the fund maintained liquid assets totaling $3,059,000 to cover the settlement of certain securities.
Debt obligations are considered secured unless otherwise indicated.
144A after the name of an issuer represents securities exempt from registration under Rule 144A under the Securities Act of 1933, as amended. These securities may be resold in transactions exempt from registration, normally to qualified institutional buyers.
The dates shown on debt obligations are the original maturity dates.
32 Convertible Securities Fund
ASC 820 establishes a three-level hierarchy for disclosure of fair value measurements. The valuation hierarchy is based upon the transparency of inputs to the valuation of the fund’s investments. The three levels are defined as follows:
Level 1: Valuations based on quoted prices for identical securities in active markets.
Level 2: Valuations based on quoted prices in markets that are not active or for which all significant inputs are observable, either directly or indirectly.
Level 3: Valuations based on inputs that are unobservable and significant to the fair value measurement.
The following is a summary of the inputs used to value the fund’s net assets as of the close of the reporting period:
Valuation inputs
Investments in securities:
Level 1
Level 2
Level 3
Common stocks*:
Communication services
$2,282,171
$—
$—
Consumer cyclicals
10,337,768
—
—
Energy
2,205,472
—
31
Financials
4,979,164
—
—
Health care
5,055,777
—
—
Total common stocks
24,860,352
—
31
Convertible bonds and notes
—
693,143,563
505,632
Convertible preferred stocks
11,771,203
173,280,229
—
Corporate bonds and notes
—
180,240
—
Warrants
—
—
—
Short-term investments
40,401,678
—
—
Totals by level
$77,033,233
$866,604,032
$505,663
*Common stock classifications are presented at the sector level, which may differ from the fund’s portfolio presentation.
During the reporting period, transfers within the fair value hierarchy, if any, (other than certain transfers involving non-U.S. equity securities as described in Note 1) did not represent, in the aggregate, more than 1% of the fund’s net assets measured as of the end of the period.
At the start and close of the reporting period, Level 3 investments in securities represented less than 1% of the fund’s net assets and were not considered a significant portion of the fund’s portfolio.
The accompanying notes are an integral part of these financial statements.
Affiliated issuers (identified cost $40,401,678) (Notes 1 and 5)
40,401,678
Dividends, interest and other receivables
4,157,047
Receivable for shares of the fund sold
3,204,284
Receivable for investments sold
13,942,884
Prepaid assets
35,198
Total assets
965,482,341
LIABILITIES
Payable for investments purchased
13,318,916
Payable for shares of the fund repurchased
674,690
Payable for compensation of Manager (Note 2)
483,037
Payable for custodian fees (Note 2)
7,427
Payable for investor servicing fees (Note 2)
213,339
Payable for Trustee compensation and expenses (Note 2)
234,344
Payable for administrative services (Note 2)
2,642
Payable for distribution fees (Note 2)
195,123
Other accrued expenses
112,511
Total liabilities
15,242,029
Net assets
$950,240,312
REPRESENTED BY
Paid-in capital (Unlimited shares authorized) (Notes 1 and 4)
$816,304,835
Undistributed net investment income (Note 1)
9,775,186
Accumulated net realized gain on investments and foreign currency transactions (Note 1)
29,205,715
Net unrealized appreciation of investments and assets and liabilities in foreign currencies
94,954,576
Total — Representing net assets applicable to capital shares outstanding
$950,240,312
COMPUTATION OF NET ASSET VALUE AND OFFERING PRICE
Net asset value and redemption price per class A share ($578,715,965 divided by 22,609,315 shares)
$25.60
Offering price per class A share (100/94.25 of $25.60)*
$27.16
Net asset value and offering price per class B share ($13,228,375 divided by 526,335 shares)**
$25.13
Net asset value and offering price per class C share ($73,451,282 divided by 2,900,522 shares)**
$25.32
Net asset value and redemption price per class M share ($4,582,777 divided by 180,767 shares)
$25.35
Offering price per class M share (100/96.50 of $25.35)*
$26.27
Net asset value, offering price and redemption price per class R share ($6,568,775 divided by 257,648 shares)
$25.50
Net asset value, offering price and redemption price per class Y share ($273,693,138 divided by 10,695,406 shares)
$25.59
*
On single retail sales of less than $50,000. On sales of $50,000 or more the offering price is reduced.
**
Redemption price per share is equal to net asset value less any applicable contingent deferred sales charge.
The accompanying notes are an integral part of these financial statements.
34 Convertible Securities Fund
Statement of operations Year ended 10/31/14
INVESTMENT INCOME
Dividends (net of foreign tax of $28,222)
$9,813,831
Interest (including interest income of $20,990 from investments in affiliated issuers) (Note 5)
6,420,826
Securities lending (Note 1)
656
Total investment income
16,235,313
EXPENSES
Compensation of Manager (Note 2)
5,690,426
Investor servicing fees (Note 2)
1,249,170
Custodian fees (Note 2)
21,433
Trustee compensation and expenses (Note 2)
51,973
Distribution fees (Note 2)
2,303,913
Administrative services (Note 2)
22,348
Other
383,024
Total expenses
9,722,287
Expense reduction (Note 2)
(9,019)
Net expenses
9,713,268
Net investment income
6,522,045
Net realized gain on investments (Notes 1 and 3)
78,421,608
Net realized gain on foreign currency transactions (Note 1)
44
Net unrealized depreciation of assets and liabilities in foreign currencies during the year
(10)
Net unrealized appreciation of investments during the year
8,281,591
Net gain on investments
86,703,233
Net increase in net assets resulting from operations
$93,225,278
The accompanying notes are an integral part of these financial statements.
Convertible Securities Fund 35
Statement of changes in net assets
INCREASE IN NET ASSETS
Year ended 10/31/14
Year ended 10/31/13
Operations:
Net investment income
$6,522,045
$11,861,090
Net realized gain on investments and foreign currency transactions
78,421,652
47,678,788
Net unrealized appreciation of investments and assets and liabilities in foreign currencies
8,281,581
70,637,584
Net increase in net assets resulting from operations
93,225,278
130,177,462
Distributions to shareholders (Note 1):
From ordinary income
Net investment income
Class A
(13,464,353)
(13,700,234)
Class B
(201,341)
(226,051)
Class C
(1,020,922)
(860,253)
Class M
(77,628)
(82,308)
Class R
(132,175)
(122,562)
Class Y
(6,076,627)
(4,225,952)
Redemption fees (Note 1)
—
9,964
Increase from capital share transactions (Note 4)
52,502,678
84,367,098
Total increase in net assets
124,754,910
195,337,164
NET ASSETS
Beginning of year
825,485,402
630,148,238
End of year (including undistributed net investment income of $9,775,186 and $14,907,046, respectively)
$950,240,312
$825,485,402
The accompanying notes are an integral part of these financial statements.
36 Convertible Securities Fund
This page left blank intentionally.
Convertible Securities Fund 37
Financial highlights (For a common share outstanding throughout the period)
INVESTMENT OPERATIONS:
LESS DISTRIBUTIONS:
RATIOS AND SUPPLEMENTAL DATA:
Period ended
Net asset value, beginning of period
Net investment income (loss)a
Net realized and unrealized gain (loss) on investments
Total from investment operations
From net investment income
Total distributions
Redemption fees
Non-recurring reimbursements
Net asset value, end of period
Total return at net asset value (%)b
Net assets, end of period (in thousands)
Ratio of expenses to average net assets (%)c
Ratio of net investment income (loss) to average net assets (%)
Portfolio turnover (%)
Class A
October 31, 2014
$23.57
.18
2.42
2.60
(.57)
(.57)
—
—
$25.60
11.10
$578,716
1.06
.72
63
October 31, 2013
20.09
.37
3.71
4.08
(.60)
(.60)
—d
—
23.57
20.62
556,643
1.08
1.69
72
October 31, 2012
18.97
.36
1.33
1.69
(.57)
(.57)
—d
—
20.09
9.07
466,910
1.11
1.87
59
October 31, 2011
19.31
.39
(.16)
.23
(.57)
(.57)
—d
—d,e
18.97
1.08
484,050
1.12
1.94
79
October 31, 2010
16.27
.54
3.07
3.61
(.57)
(.57)
—d
—d,f
19.31
22.48
495,949
1.18
3.03
71
Class B
October 31, 2014
$23.15
(.01)
2.38
2.37
(.39)
(.39)
—
—
$25.13
10.27
$13,228
1.81
(.04)
63
October 31, 2013
19.75
.20
3.64
3.84
(.44)
(.44)
—d
—
23.15
19.68
12,009
1.83
.95
72
October 31, 2012
18.66
.21
1.30
1.51
(.42)
(.42)
—d
—
19.75
8.22
10,315
1.86
1.10
59
October 31, 2011
18.99
.23
(.14)
.09
(.42)
(.42)
—d
—d,e
18.66
.40
12,281
1.87
1.19
79
October 31, 2010
16.01
.40
3.01
3.41
(.43)
(.43)
—d
—d,f
18.99
21.52
12,205
1.93
2.28
71
Class C
October 31, 2014
$23.33
(.01)
2.39
2.38
(.39)
(.39)
—
—
$25.32
10.27
$73,451
1.81
(.06)
63
October 31, 2013
19.90
.20
3.67
3.87
(.44)
(.44)
—d
—
23.33
19.68
50,931
1.83
.93
72
October 31, 2012
18.79
.21
1.32
1.53
(.42)
(.42)
—d
—
19.90
8.24
38,875
1.86
1.10
59
October 31, 2011
19.13
.24
(.16)
.08
(.42)
(.42)
—d
—d,e
18.79
.32
53,696
1.87
1.19
79
October 31, 2010
16.12
.40
3.04
3.44
(.43)
(.43)
—d
—d,f
19.13
21.58
57,211
1.93
2.27
71
Class M
October 31, 2014
$23.35
.05
2.40
2.45
(.45)
(.45)
—
—
$25.35
10.54
$4,583
1.56
.21
63
October 31, 2013
19.91
.26
3.67
3.93
(.49)
(.49)
—d
—
23.35
20.01
3,885
1.58
1.20
72
October 31, 2012
18.81
.26
1.31
1.57
(.47)
(.47)
—d
—
19.91
8.49
3,406
1.61
1.36
59
October 31, 2011
19.14
.29
(.16)
.13
(.46)
(.46)
—d
—d,e
18.81
.61
3,546
1.62
1.46
79
October 31, 2010
16.13
.45
3.04
3.49
(.48)
(.48)
—d
—d,f
19.14
21.85
4,598
1.68
2.53
71
Class R
October 31, 2014
$23.48
.12
2.41
2.53
(.51)
(.51)
—
—
$25.50
10.83
$6,569
1.31
.46
63
October 31, 2013
20.02
.31
3.70
4.01
(.55)
(.55)
—d
—
23.48
20.30
5,617
1.33
1.43
72
October 31, 2012
18.91
.31
1.32
1.63
(.52)
(.52)
—d
—
20.02
8.78
4,059
1.36
1.61
59
October 31, 2011
19.24
.34
(.15)
.19
(.52)
(.52)
—d
—d,e
18.91
.88
3,595
1.37
1.69
79
October 31, 2010
16.22
.50
3.04
3.54
(.52)
(.52)
—d
—d,f
19.24
22.12
3,434
1.43
2.77
71
Class Y
October 31, 2014
$23.56
.24
2.42
2.66
(.63)
(.63)
—
—
$25.59
11.38
$273,693
.81
.95
63
October 31, 2013
20.08
.42
3.72
4.14
(.66)
(.66)
—d
—
23.56
20.93
196,399
.83
1.89
72
October 31, 2012
18.97
.41
1.32
1.73
(.62)
(.62)
—d
—
20.08
9.28
106,584
.86
2.12
59
October 31, 2011
19.30
.44
(.15)
.29
(.62)
(.62)
—d
—d,e
18.97
1.40
106,207
.87
2.17
79
October 31, 2010
16.27
.59
3.05
3.64
(.61)
(.61)
—d
—d,f
19.30
22.73
83,025
.93
3.27
71
See notes to financial highlights at the end of this section.
The accompanying notes are an integral part of these financial statements.
38
Convertible Securities Fund
Convertible Securities Fund
39
Financial highlights (Continued)
a Per share net investment income (loss) has been determined on the basis of the weighted average number of shares outstanding during the period.
b Total return assumes dividend reinvestment and does not reflect the effect of sales charges.
c Includes amounts paid through expense offset and/or brokerage/service arrangements, if any (Note 2). Also excludes acquired fund fees and expenses, if any.
d Amount represents less than $0.01 per share.
e Reflects a non-recurring reimbursement related to restitution amounts in connection with a distribution plan approved by the Securities and Exchange Commission (the SEC) which amounted to less than $0.01 per share outstanding on July 21, 2011. Also reflects a non-recurring reimbursement related to short-term trading related lawsuits, which amounted to less than $0.01 per share outstanding on May 11, 2011.
f Reflects a non-recurring reimbursement pursuant to a settlement between the SEC and Prudential Securities, Inc., which amounted to less than $0.01 per share outstanding on March 30, 2010.
The accompanying notes are an integral part of these financial statements.
40 Convertible Securities Fund
Notes to financial statements 10/31/14
Within the following Notes to financial statements, references to “State Street” represent State Street Bank and Trust Company, references to “the SEC” represent the Securities and Exchange Commission, references to “Putnam Management” represent Putnam Investment Management, LLC, the fund’s manager, an indirect wholly-owned subsidiary of Putnam Investments, LLC and references to “OTC”, if any, represent over-the-counter. Unless otherwise noted, the “reporting period” represents the period from November 1, 2013 through October 31, 2014.
Putnam Convertible Securities Fund (the fund) is a Massachusetts business trust, which is registered under the Investment Company Act of 1940, as amended, as a diversified open-end management investment company. The goal of the fund is to seek, with equal emphasis, current income and capital appreciation. The fund’s secondary goal is conservation of capital. The fund invests mainly in convertible securities of U.S. companies. Convertible securities combine the investment characteristics of bonds and common stocks. Convertible securities include bonds, preferred stocks and other instruments that can be converted into or exchanged for common stock or equivalent value. A significant portion of the convertible securities the fund buys are below-investment-grade. The convertible bonds the fund buys usually have intermediate-to long-term stated maturities (three years or longer), but often contain “put” features, which allow bondholders to sell the bond back to the company under specified circumstances, that result in shorter effective maturities. When deciding whether to buy or sell investments, Putnam Management may consider, among other factors: (i) a security’s structural features, such as its position in a company’s capital structure and “put” and “call” features (a company’s right to repurchase the security under specified circumstances is a “call” feature); (ii) credit and prepayment risks; and (iii) with respect to a company’s common stock underlying a convertible security, the stock’s valuation and the company’s financial strength, growth potential, competitive position in its industry, projected future earnings, cash flows and dividends.
The fund offers class A, class B, class C, class M, class R and class Y shares. Class A and class M shares are sold with a maximum front-end sales charge of 5.75% and 3.50%, respectively, and generally do not pay a contingent deferred sales charge. Class B shares, which convert to class A shares after approximately eight years, do not pay a front-end sales charge and are subject to a contingent deferred sales charge if those shares are redeemed within six years of purchase. Class C shares have a one-year 1.00% contingent deferred sales charge and do not convert to class A shares. Class R shares, which are not available to all investors, are sold at net asset value. The expenses for class A, class B, class C, class M and class R shares may differ based on the distribution fee of each class, which is identified in Note 2. Class Y shares, which are sold at net asset value, are generally subject to the same expenses as class A, class B, class C, class M and class R shares, but do not bear a distribution fee. Class Y shares are not available to all investors.
In the normal course of business, the fund enters into contracts that may include agreements to indemnify another party under given circumstances. The fund’s maximum exposure under these arrangements is unknown as this would involve future claims that may be, but have not yet been, made against the fund. However, the fund’s management team expects the risk of material loss to be remote.
Note 1: Significant accounting policies
The following is a summary of significant accounting policies consistently followed by the fund in the preparation of its financial statements. The preparation of financial statements is in conformity with accounting principles generally accepted in the United States of America and requires management to make estimates and assumptions that affect the reported amounts of assets and liabilities in the financial statements and the reported amounts of increases and decreases in net assets from operations. Actual results could differ from those estimates. Subsequent events after the Statement of assets and liabilities date through the date that the financial statements were issued have been evaluated in the preparation of the financial statements.
A short-term trading fee of 1.00% may have applied to redemptions (including exchanges into another fund) of shares purchased before June 24, 2013 and held for 30 days or less. The short-term trading fee was accounted for as an addition to paid-in-capital. No short-term trading fee applies to shares purchased on or after June 24, 2013.
Investment income, realized and unrealized gains and losses and expenses of the fund are borne pro-rata based on the relative net assets of each class to the total net assets of the fund, except that each class bears expenses unique to that class (including the distribution fees applicable to such classes). Each class votes as a class only with respect to its own distribution plan or other matters on which a class vote is required by law or determined by the Trustees. If the fund were liquidated, shares of each class would receive their pro-rata share of the net assets of the fund. In addition, the Trustees declare separate dividends on each class of shares.
Convertible Securities Fund 41
Security valuation Investments for which market quotations are readily available are valued at the last reported sales price on their principal exchange, or official closing price for certain markets, and are classified as Level 1 securities under Accounting Standards Codification 820 Fair Value Measurements and Disclosures (ASC 820). If no sales are reported, as in the case of some securities that are traded OTC, a security is valued at its last reported bid price and is generally categorized as a Level 2 security.
Investments in open-end investment companies (excluding exchange traded funds), if any, which can be classified as Level 1 or Level 2 securities, are valued based on their net asset value. The net asset value of such investment companies equals the total value of their assets less their liabilities and divided by the number of their outstanding shares.
Market quotations are not considered to be readily available for certain debt obligations and other investments; such investments are valued on the basis of valuations furnished by an independent pricing service approved by the Trustees or dealers selected by Putnam Management. Such services or dealers determine valuations for normal institutional-size trading units of such securities using methods based on market transactions for comparable securities and various relationships, generally recognized by institutional traders, between securities (which consider such factors as security prices, yields, maturities and ratings). These securities will generally be categorized as Level 2. Short-term securities with remaining maturities of 60 days or less may be valued at amortized cost, which approximates fair value and are classified as Level 2 securities.
Many securities markets and exchanges outside the U.S. close prior to the close of the New York Stock Exchange and therefore the closing prices for securities in such markets or on such exchanges may not fully reflect events that occur after such close but before the close of the New York Stock Exchange. Accordingly, on certain days, the fund will fair value foreign equity securities taking into account multiple factors including movements in the U.S. securities markets, currency valuations and comparisons to the valuation of American Depository Receipts, exchange-traded funds and futures contracts. These securities, which would generally be classified as Level 1 securities, will be transferred to Level 2 of the fair value hierarchy when they are valued at fair value. The number of days on which fair value prices will be used will depend on market activity and it is possible that fair value prices will be used by the fund to a significant extent. Securities quoted in foreign currencies, if any, are translated into U.S. dollars at the current exchange rate.
To the extent a pricing service or dealer is unable to value a security or provides a valuation that Putnam Management does not believe accurately reflects the security’s fair value, the security will be valued at fair value by Putnam Management in accordance with policies and procedures approved by the Trustees. Certain investments, including certain restricted and illiquid securities and derivatives, are also valued at fair value following procedures approved by the Trustees. These valuations consider such factors as significant market or specific security events such as interest rate or credit quality changes, various relationships with other securities, discount rates, U.S. Treasury, U.S. swap and credit yields, index levels, convexity exposures and recovery rates. These securities are classified as Level 2 or as Level 3 depending on the priority of the significant inputs.
Such valuations and procedures are reviewed periodically by the Trustees. The fair value of securities is generally determined as the amount that the fund could reasonably expect to realize from an orderly disposition of such securities over a reasonable period of time. By its nature, a fair value price is a good faith estimate of the value of a security in a current sale and does not reflect an actual market price, which may be different by a material amount.
Security transactions and related investment income Security transactions are recorded on the trade date (the date the order to buy or sell is executed). Gains or losses on securities sold are determined on the identified cost basis.
Interest income, net of any applicable withholding taxes, is recorded on the accrual basis. Dividend income, net of any applicable withholding taxes, is recognized on the ex-dividend date except that certain dividends from foreign securities, if any, are recognized as soon as the fund is informed of the ex-dividend date. Non-cash dividends, if any, are recorded at the fair value of the securities received. Dividends representing a return of capital or capital gains, if any, are reflected as a reduction of cost and/or as a realized gain.
All premiums/discounts are amortized/accreted on a yield-to-maturity basis.
Foreign currency translation The accounting records of the fund are maintained in U.S. dollars. The fair value of foreign securities, currency holdings, and other assets and liabilities is recorded in the books and records of the fund after translation to U.S. dollars based on the exchange rates on that day. The cost of each security is determined using historical exchange rates. Income and withholding taxes are translated at prevailing exchange rates when earned or incurred. The fund does not isolate that portion of realized or unrealized gains or losses resulting from changes in the foreign exchange rate on investments from fluctuations arising from changes in the
42 Convertible Securities Fund
market prices of the securities. Such gains and losses are included with the net realized and unrealized gain or loss on investments. Net realized gains and losses on foreign currency transactions represent net realized exchange gains or losses on closed forward currency contracts, disposition of foreign currencies, currency gains and losses realized between the trade and settlement dates on securities transactions and the difference between the amount of investment income and foreign withholding taxes recorded on the fund’s books and the U.S. dollar equivalent amounts actually received or paid. Net unrealized appreciation and depreciation of assets and liabilities in foreign currencies arise from changes in the value of open forward currency contracts and assets and liabilities other than investments at the period end, resulting from changes in the exchange rate.
Securities lending The fund may lend securities, through its agent, to qualified borrowers in order to earn additional income. The loans are collateralized by cash in an amount at least equal to the fair value of the securities loaned. The fair value of securities loaned is determined daily and any additional required collateral is allocated to the fund on the next business day. The risk of borrower default will be borne by the fund’s agent; the fund will bear the risk of loss with respect to the investment of the cash collateral. Income from securities lending is included in investment income on the Statement of operations. Cash collateral is invested in Putnam Cash Collateral Pool, LLC, a limited liability company managed by an affiliate of Putnam Management. Investments in Putnam Cash Collateral Pool, LLC are valued at its closing net asset value each business day. There are no management fees charged to Putnam Cash Collateral Pool, LLC. At the close of the reporting period, the fund had no securities out on loan.
Interfund lending The fund, along with other Putnam funds, may participate in an interfund lending program pursuant to an exemptive order issued by the SEC. This program allows the fund to borrow from or lend to other Putnam funds that permit such transactions. Interfund lending transactions are subject to each fund’s investment policies and borrowing and lending limits. Interest earned or paid on the interfund lending transaction will be based on the average of certain current market rates. During the reporting period, the fund did not utilize the program.
Lines of credit The fund participates, along with other Putnam funds, in a $392.5 million unsecured committed line of credit and a $235.5 million unsecured uncommitted line of credit, both provided by State Street. Borrowings may be made for temporary or emergency purposes, including the funding of shareholder redemption requests and trade settlements. Interest is charged to the fund based on the fund’s borrowing at a rate equal to the Federal Funds rate plus 1.25% for the committed line of credit and the Federal Funds rate plus 1.30% for the uncommitted line of credit. A closing fee equal to 0.04% of the committed line of credit and 0.04% of the uncommitted line of credit has been paid by the participating funds. In addition, a commitment fee of 0.11% per annum on any unutilized portion of the committed line of credit is allocated to the participating funds based on their relative net assets and paid quarterly. During the reporting period, the fund had no borrowings against these arrangements.
Federal taxes It is the policy of the fund to distribute all of its taxable income within the prescribed time period and otherwise comply with the provisions of the Internal Revenue Code of 1986, as amended (the Code), applicable to regulated investment companies. It is also the intention of the fund to distribute an amount sufficient to avoid imposition of any excise tax under Section 4982 of the Code.
The fund is subject to the provisions of Accounting Standards Codification 740 Income Taxes (ASC 740). ASC 740 sets forth a minimum threshold for financial statement recognition of the benefit of a tax position taken or expected to be taken in a tax return. The fund did not have a liability to record for any unrecognized tax benefits in the accompanying financial statements. No provision has been made for federal taxes on income, capital gains or unrealized appreciation on securities held nor for excise tax on income and capital gains. Each of the fund’s federal tax returns for the prior three fiscal years remains subject to examination by the Internal Revenue Service.
The fund may also be subject to taxes imposed by governments of countries in which it invests. Such taxes are generally based on either income or gains earned or repatriated. The fund accrues and applies such taxes to net investment income, net realized gains and net unrealized gains as income and/or capital gains are earned. In some cases, the fund may be entitled to reclaim all or a portion of such taxes, and such reclaim amounts, if any, are reflected as an asset on the fund’s books. In many cases, however, the fund may not receive such amounts for an extended period of time, depending on the country of investment.
Distributions to shareholders Distributions to shareholders from net investment income are recorded by the fund on the ex-dividend date. Distributions from capital gains, if any, are recorded on the ex-dividend date and paid at least annually. The amount and character of income and gains to be distributed are determined in accordance with income tax regulations, which may differ from generally accepted accounting principles. These differences include temporary and/or permanent differences from nontaxable dividends, from amortization and accretion, from convertible preferred income and from deemed distributions. Reclassifications are made to the fund’s capital accounts to reflect income and gains available for distribution (or available capital loss carryovers) under income
Convertible Securities Fund 43
tax regulations. At the close of the reporting period, the fund reclassified $9,319,141 to increase undistributed net investment income, $53,900 to increase paid-in-capital and $9,373,041 to decrease accumulated net realized gain.
The tax basis components of distributable earnings and the federal tax cost as of the close of the reporting period were as follows:
Unrealized appreciation
$125,498,249
Unrealized depreciation
(31,437,941)
Net unrealized appreciation
94,060,308
Undistributed ordinary income
10,153,660
Undistributed long-term gain
38,094,833
Cost for federal income tax purposes
$850,082,620
Note 2: Management fee, administrative services and other transactions
The fund pays Putnam Management a management fee (based on the fund’s average net assets and computed and paid monthly) at annual rates that may vary based on the average of the aggregate net assets of most open-end funds, as defined in the fund’s management contract, sponsored by Putnam Management. Such annual rates may vary as follows:
0.780%
of the first $5 billion,
0.730%
of the next $5 billion,
0.680%
of the next $10 billion,
0.630%
of the next $10 billion,
0.580%
of the next $50 billion,
0.560%
of the next $50 billion,
0.550%
of the next $100 billion and
0.545%
of any excess thereafter.
The fund’s shareholders approved the fund’s current management contract with Putnam Management effective February 27, 2014. Shareholders were asked to approve the fund’s management contract following the death on October 8, 2013 of The Honourable Paul G. Desmarais, who had controlled directly and indirectly a majority of the voting shares of Power Corporation of Canada, the ultimate parent company of Putnam Management. The substantive terms of the management contract, including terms relating to fees, are identical to the terms of the fund’s previous management contract and reflect the rates provided in the table above.
Putnam Management has contractually agreed, through June 30, 2015, to waive fees or reimburse the fund’s expenses to the extent necessary to limit the cumulative expenses of the fund, exclusive of brokerage, interest, taxes, investment-related expenses, extraordinary expenses, acquired fund fees and expenses and payments under the fund’s investor servicing contract, investment management contract and distribution plans, on a fiscal year-to-date basis to an annual rate of 0.20% of the fund’s average net assets over such fiscal year-to-date period. During the reporting period, the fund’s expenses were not reduced as a result of this limit.
Putnam Investments Limited (PIL), an affiliate of Putnam Management, is authorized by the Trustees to manage a separate portion of the assets of the fund as determined by Putnam Management from time to time. Putnam Management pays a quarterly sub-management fee to PIL for its services at an annual rate of 0.35% of the average net assets of the portion of the fund managed by PIL.
The fund reimburses Putnam Management an allocated amount for the compensation and related expenses of certain officers of the fund and their staff who provide administrative services to the fund. The aggregate amount of all such reimbursements is determined annually by the Trustees.
Custodial functions for the fund’s assets are provided by State Street. Custody fees are based on the fund’s asset level, the number of its security holdings and transaction volumes.
Putnam Investor Services, Inc., an affiliate of Putnam Management, provides investor servicing agent functions to the fund. Putnam Investor Services, Inc. received fees for investor servicing based on the fund’s retail asset level, the number of shareholder accounts in the fund and the level of defined contribution plan assets in the fund.
44 Convertible Securities Fund
Investor servicing fees will not exceed an annual rate of 0.32% of the fund’s average net assets. During the reporting period, the expenses for each class of shares related to investor servicing fees were as follows:
Class A
$806,042
Class B
17,509
Class C
86,499
Class M
5,807
Class R
8,812
Class Y
324,501
Total
$1,249,170
The fund has entered into expense offset arrangements with Putnam Investor Services, Inc. and State Street whereby Putnam Investor Services, Inc.’s and State Street’s fees are reduced by credits allowed on cash balances. The fund also reduced expenses through brokerage/service arrangements. For the reporting period, the fund’s expenses were reduced by $2,143 under the expense offset arrangements and by $6,876 under the brokerage/service arrangements.
Each Independent Trustee of the fund receives an annual Trustee fee, of which $543, as a quarterly retainer, has been allocated to the fund, and an additional fee for each Trustees meeting attended. Trustees also are reimbursed for expenses they incur relating to their services as Trustees.
The fund has adopted a Trustee Fee Deferral Plan (the Deferral Plan) which allows the Trustees to defer the receipt of all or a portion of Trustees fees payable on or after July 1, 1995. The deferred fees remain invested in certain Putnam funds until distribution in accordance with the Deferral Plan.
The fund has adopted an unfunded noncontributory defined benefit pension plan (the Pension Plan) covering all Trustees of the fund who have served as a Trustee for at least five years and were first elected prior to 2004. Benefits under the Pension Plan are equal to 50% of the Trustee’s average annual attendance and retainer fees for the three years ended December 31, 2005. The retirement benefit is payable during a Trustee’s lifetime, beginning the year following retirement, for the number of years of service through December 31, 2006. Pension expense for the fund is included in Trustee compensation and expenses in the Statement of operations. Accrued pension liability is included in Payable for Trustee compensation and expenses in the Statement of assets and liabilities. The Trustees have terminated the Pension Plan with respect to any Trustee first elected after 2003.
The fund has adopted distribution plans (the Plans) with respect to its class A, class B, class C, class M and class R shares pursuant to Rule 12b–1 under the Investment Company Act of 1940. The purpose of the Plans is to compensate Putnam Retail Management Limited Partnership, an indirect wholly-owned subsidiary of Putnam Investments, LLC, for services provided and expenses incurred in distributing shares of the fund. The Plans provide for payments by the fund to Putnam Retail Management Limited Partnership at an annual rate of up to 0.35%, 1.00%, 1.00%, 1.00% and 1.00% of the average net assets attributable to class A, class B, class C, class M and class R shares, respectively. The Trustees have approved payment by the fund at an annual rate of 0.25%, 1.00%, 1.00%, 0.75% and 0.50% of the average net assets attributable to class A, class B, class C, class M and class R shares, respectively. During the reporting period, the class specific expenses related to distribution fees were as follows:
Class A
$1,477,011
Class B
128,349
Class C
634,326
Class M
31,929
Class R
32,298
Total
$2,303,913
For the reporting period, Putnam Retail Management Limited Partnership, acting as underwriter, received net commissions of $90,360 and $1,007 from the sale of class A and class M shares, respectively, and received $3,328 and $1,004 in contingent deferred sales charges from redemptions of class B and class C shares, respectively.
A deferred sales charge of up to 1.00% and 0.65% is assessed on certain redemptions of class A and class M shares, respectively. For the reporting period, Putnam Retail Management Limited Partnership, acting as underwriter, received $590 and no monies on class A and class M redemptions, respectively.
Convertible Securities Fund 45
Note 3: Purchases and sales of securities
During the reporting period, cost of purchases and proceeds from sales, excluding short-term investments were as follows:
Cost of purchases
Proceeds from sales
Investments in securities (Long-term)
$610,796,387
$556,492,815
U.S. government securities (Long-term)
—
—
Total
$610,796,387
$556,492,815
Note 4: Capital shares
At the close of the reporting period, there was an unlimited number of shares of beneficial interest authorized. Transactions in capital shares were as follows:
Year ended 10/31/14
Year ended 10/31/13
Class A
Shares
Amount
Shares
Amount
Shares sold
6,486,030
$161,807,856
7,005,486
$155,432,666
Shares issued in connection with reinvestment of distributions
484,788
12,125,165
577,732
12,495,300
6,970,818
173,933,021
7,583,218
167,927,966
Shares repurchased
(7,982,819)
(199,814,297)
(7,203,893)
(157,488,928)
Net increase (decrease)
(1,012,001)
$(25,881,276)
379,325
$10,439,038
Year ended 10/31/14
Year ended 10/31/13
Class B
Shares
Amount
Shares
Amount
Shares sold
107,860
$2,641,805
107,953
$2,329,343
Shares issued in connection with reinvestment of distributions
5,452
133,967
7,340
155,688
113,312
2,775,772
115,293
2,485,031
Shares repurchased
(105,719)
(2,584,626)
(118,900)
(2,545,488)
Net increase (decrease)
7,593
$191,146
(3,607)
$(60,457)
Year ended 10/31/14
Year ended 10/31/13
Class C
Shares
Amount
Shares
Amount
Shares sold
1,004,390
$24,793,508
636,042
$13,997,960
Shares issued in connection with reinvestment of distributions
26,922
667,626
27,816
595,312
1,031,312
25,461,134
663,858
14,593,272
Shares repurchased
(313,788)
(7,757,872)
(434,555)
(9,214,181)
Net increase
717,524
$17,703,262
229,303
$5,379,091
Year ended 10/31/14
Year ended 10/31/13
Class M
Shares
Amount
Shares
Amount
Shares sold
41,541
$1,027,188
18,038
$396,720
Shares issued in connection with reinvestment of distributions
3,021
74,932
3,670
78,530
44,562
1,102,120
21,708
475,250
Shares repurchased
(30,191)
(750,056)
(26,372)
(567,356)
Net increase (decrease)
14,371
$352,064
(4,664)
$(92,106)
46 Convertible Securities Fund
Year ended 10/31/14
Year ended 10/31/13
Class R
Shares
Amount
Shares
Amount
Shares sold
99,488
$2,461,647
90,520
$1,960,750
Shares issued in connection with reinvestment of distributions
5,085
126,813
5,560
120,030
104,573
2,588,460
96,080
2,080,780
Shares repurchased
(86,180)
(2,125,631)
(59,618)
(1,310,201)
Net increase
18,393
$462,829
36,462
$770,579
Year ended 10/31/14
Year ended 10/31/13
Class Y
Shares
Amount
Shares
Amount
Shares sold
5,167,700
$129,692,264
5,087,709
$112,527,075
Shares issued in connection with reinvestment of distributions
170,905
4,278,856
126,445
2,754,373
5,338,605
133,971,120
5,214,154
115,281,448
Shares repurchased
(2,979,936)
(74,296,467)
(2,184,792)
(47,350,495)
Net increase
2,358,669
$59,674,653
3,029,362
$67,930,953
Note 5: Affiliated transactions
Transactions during the reporting period with Putnam Short Term Investment Fund, which is under common ownership and control, were as follows:
Name of affiliate
Fair value at the beginning of the reporting period
Purchase cost
Sale proceeds
Investment income
Fair value at the end of the reporting period
Putnam Short Term Investment Fund*
$26,804,657
$381,686,823
$368,089,802
$20,990
$40,401,678
Totals
$26,804,657
$381,686,823
$368,089,802
$20,990
$40,401,678
*Management fees charged to Putnam Short Term Investment Fund have been waived by Putnam Management.
Note 6: Market, credit and other risks
In the normal course of business, the fund trades financial instruments and enters into financial transactions where risk of potential loss exists due to changes in the market (market risk) or failure of the contracting party to the transaction to perform (credit risk). The fund may be exposed to additional credit risk that an institution or other entity with which the fund has unsettled or open transactions will default. Investments in foreign securities involve certain risks, including those related to economic instability, unfavorable political developments, and currency fluctuations.
Note 7: Summary of derivative activity
The volume of activity for the reporting period for any derivative type that was held during the period is listed below and was as follows based on an average of the holdings at the end of each fiscal quarter:
Warrants (number of warrants)
1,100,000
Convertible Securities Fund 47
The following is a summary of the fair value of derivative instruments as of the close of the reporting period:
Fair value of derivative instruments as of the close of the reporting period
Asset derivatives
Liability derivatives
Derivatives not accounted for as hedging instruments under ASC 815
Statement of assets and liabilities location
Fair value
Statement of assets and liabilities location
Fair value
Equity contracts
Investments
$—*
Payables
$—
Total
$—
$—
* Warrants held at period end had a fair value of $—.
The following is a summary of change in unrealized gains or losses of derivative instruments on the Statement of operations for the reporting period (see Note 1) (there were no realized gains or losses on derivative instruments):
Change in unrealized appreciation or (depreciation) on derivatives recognized in net gain or (loss) on investments
Derivatives not accounted for as hedging instruments under ASC 815
Warrants
Total
Equity contracts
$—
$—
Total
$—
$—
Federal tax information (Unaudited)
Pursuant to §852 of the Internal Revenue Code, as amended, the fund hereby designates $41,904,316 as a capital gain dividend with respect to the taxable year ended October 31, 2014, or, if subsequently determined to be different, the net capital gain of such year.
The fund designated 26.12% of ordinary income distributions as qualifying for the dividends received deduction for corporations.
For the reporting period, the fund hereby designates 30.11%, or the maximum amount allowable, of its taxable ordinary income distributions as qualified dividends taxed at the individual net capital gain rates.
For the reporting period, pursuant to §871(k) of the Internal Revenue Code, the fund hereby designates $8,552,010 of distributions paid as qualifying to be taxed as interest-related dividends, and no monies to be taxed as short-term capital gain dividends for nonresident alien shareholders.
48 Convertible Securities Fund
Shareholder meeting results (Unaudited)
February 27, 2014 special meeting
At the meeting, each of the nominees for Trustees was elected, as follows:
Votes for
Votes withheld
Liaquat Ahamed
23,718,253
806,484
Ravi Akhoury
23,725,064
799,673
Barbara M. Baumann
23,805,248
719,489
Jameson A. Baxter
23,755,326
769,411
Charles B. Curtis
23,767,797
756,940
Robert J. Darretta
23,792,502
732,235
Katinka Domotorffy
23,773,693
751,044
John A. Hill
23,774,768
749,969
Paul L. Joskow
23,796,121
728,616
Kenneth R. Leibler
23,805,626
719,111
Robert E. Patterson
23,786,642
738,095
George Putnam, III
23,761,451
763,286
Robert L. Reynolds
23,784,192
740,545
W. Thomas Stephens
23,771,122
753,615
A proposal to approve a new management contract between the fund and Putnam Management was approved as follows:
Votes for
Votes against
Abstentions
Broker non-votes
19,840,098
547,778
914,824
3,222,037
A proposal to adopt an Amended and Restated Declaration of Trust was approved as follows:
Votes for
Votes against
Abstentions
Broker non-votes
18,651,116
1,651,091
1,000,488
3,222,043
All tabulations are rounded to the nearest whole number.
Convertible Securities Fund 49
About the Trustees
Independent Trustees
Liaquat Ahamed
Born 1952, Trustee since 2012
Principal occupations during past five years: Pulitzer Prize-winning author of Lords of Finance: The Bankers Who Broke the World, whose articles on economics have appeared in such publications as the New York Times, Foreign Affairs, and the Financial Times. Director of Aspen Insurance Co., a New York Stock Exchange company, and Chair of the Aspen Board’s Investment Committee. Trustee of the Brookings Institution and Chair of its Investment Committee.
Other directorships: The Rohatyn Group, an emerging-market fund complex that manages money for institutions
Ravi Akhoury
Born 1947, Trustee since 2009
Principal occupations during past five years: Trustee of American India Foundation and of the Rubin Museum. From 1992 to 2007, was Chairman and CEO of MacKay Shields, a multi-product investment management firm.
Other directorships: RAGE Frameworks, Inc., a private software company; English Helper, Inc., a private software company
Barbara M. Baumann
Born 1955, Trustee since 2010
Principal occupations during past five years: President and Owner of Cross Creek Energy Corporation, a strategic consultant to domestic energy firms and direct investor in energy projects. Current Board member of The Denver Foundation. Former Chair and current Board member of Girls Incorporated of Metro Denver. Member of the Finance Committee, the Children’s Hospital of Colorado.
Other directorships: Buckeye Partners, L.P., a publicly traded master limited partnership focused on pipeline transport, storage, and distribution of petroleum products; Devon Energy Corporation, a leading independent natural gas and oil exploration and production company
Jameson A. Baxter
Born 1943, Trustee since 1994, Vice Chair from 2005 to 2011, and Chair since 2011
Principal occupations during past five years: President of Baxter Associates, Inc., a private investment firm. Chair of Mutual Fund Directors Forum. Chair Emeritus of the Board of Trustees of Mount Holyoke College. Director of the Adirondack Land Trust and Trustee of the Nature Conservancy’s Adirondack Chapter.
Charles B. Curtis
Born 1940, Trustee since 2001
Principal occupations during past five years: Senior Advisor to the Center for Strategic and International Studies. President Emeritus and former President and Chief Operating Officer of the Nuclear Threat Initiative, a private foundation dealing with national security issues. Member of the Council on Foreign Relations and U.S. State Department International Security Advisory Board.
Robert J. Darretta
Born 1946, Trustee since 2007
Principal occupations during past five years: From 2009 until 2012, served as Health Care Industry Advisor to Permira, a global private equity firm. Until April 2007, was Vice Chairman of the Board of Directors of Johnson & Johnson. Served as Johnson & Johnson’s Chief Financial Officer for a decade.
Other directorships: UnitedHealth Group, a diversified health-care company
Katinka Domotorffy
Born 1975, Trustee since 2012
Principal occupations during past five years: Voting member of the Investment Committees of the Anne Ray Charitable Trust and Margaret A. Cargill Foundation, part of the Margaret A. Cargill Philanthropies. Until 2011, Partner, Chief Investment Officer, and Global Head of Quantitative Investment Strategies at Goldman Sachs Asset Management.
Other directorships: Reach Out and Read of Greater New York, an organization dedicated to promoting childhood literacy
John A. Hill
Born 1942, Trustee since 1985 and Chairman from 2000 to 2011
Principal occupations during past five years: Founder and Vice-Chairman of First Reserve Corporation, the leading private equity buyout firm focused on the worldwide energy industry. Trustee and Chairman of the Board of Trustees of Sarah Lawrence College. Member of the Advisory Board of the Millstein Center for Global Markets and Corporate Ownership at The Columbia University Law School.
Other directorships: Devon Energy Corporation, a leading independent natural gas and oil exploration and production company
50 Convertible Securities Fund
Paul L. Joskow
Born 1947, Trustee since 1997
Principal occupations during past five years: Economist and President of the Alfred P. Sloan Foundation, a philanthropic institution focused primarily on research and education on issues related to science, technology, and economic performance. Elizabeth and James Killian Professor of Economics, Emeritus at the Massachusetts Institute of Technology (MIT). Prior to 2007, served as the Director of the Center for Energy and Environmental Policy Research at MIT.
Other directorships: Yale University; Exelon Corporation, an energy company focused on power services; Boston Symphony Orchestra; Prior to April 2013, served as Director of TransCanada Corporation and TransCanada Pipelines Ltd., energy companies focused on natural gas transmission, oil pipelines and power services
Kenneth R. Leibler
Born 1949, Trustee since 2006
Principal occupations during past five years: Founder and former Chairman of Boston Options Exchange, an electronic marketplace for the trading of derivative securities. Serves on the Board of Trustees of Beth Israel Deaconess Hospital in Boston, Massachusetts. Director of Beth Israel Deaconess Care Organization. Until November 2010, director of Ruder Finn Group, a global communications and advertising firm.
Other directorships: Northeast Utilities, which operates New England’s largest energy delivery system
Robert E. Patterson
Born 1945, Trustee since 1984
Principal occupations during past five years: Co-Chairman of Cabot Properties, Inc., a private equity firm investing in commercial real estate, and Chairman of its Investment Committee. Past Chairman and Trustee of the Joslin Diabetes Center.
George Putnam, III
Born 1951, Trustee since 1984
Principal occupations during past five years: Chairman of New Generation Research, Inc., a publisher of financial advisory and other research services. Founder and President of New Generation Advisors, LLC, a registered investment advisor to private funds. Director of The Boston Family Office, LLC, a registered investment advisor.
W. Thomas Stephens
Born 1942, Trustee from 1997 to 2008 and since 2009
Principal occupations during past five years: Retired as Chairman and Chief Executive Officer of Boise Cascade, LLC, a paper, forest products, and timberland assets company, in December 2008. Prior to 2010, Director of Boise Inc., a manufacturer of paper and packaging products.
Other directorships: TransCanada Pipelines Ltd., an energy infrastructure company
Interested Trustee
Robert L. Reynolds*
Born 1952, Trustee since 2008 and President of the Putnam Funds since 2009
Principal occupations during past five years: President and Chief Executive Officer of Putnam Investments since 2008 and, since 2014, President and Chief Executive Officer of Great-West Financial, a financial services company that provides retirement savings plans, life insurance, and annuity and executive benefits products, and of Great-West Lifeco U.S. Inc., a holding company that owns Putnam Investments and Great-West Financial. Prior to joining Putnam Investments, served as Vice Chairman and Chief Operating Officer of Fidelity Investments from 2000 to 2007.
*Mr. Reynolds is an “interested person” (as defined in the Investment Company Act of 1940) of the fund and Putnam Investments. He is President and Chief Executive Officer of Putnam Investments, as well as the President of your fund and each of the other Putnam funds.
The address of each Trustee is One Post Office Square, Boston, MA 02109.
As of October 31, 2014, there were 116 Putnam funds. All Trustees serve as Trustees of all Putnam funds.
Each Trustee serves for an indefinite term, until his or her resignation, retirement at age 75, removal, or death.
Convertible Securities Fund 51
Officers
In addition to Robert L. Reynolds, the other officers of the fund are shown below:
Jonathan S. Horwitz (Born 1955)
Executive Vice President, Principal Executive Officer, and Compliance Liaison
Since 2004
Steven D. Krichmar (Born 1958)
Vice President and Principal Financial Officer
Since 2002
Chief of Operations, Putnam Investments and Putnam Management
Robert T. Burns (Born 1961)
Vice President and Chief Legal Officer
Since 2011
General Counsel, Putnam Investments, Putnam Management, and Putnam Retail Management
Manager of Finance, Dunkin’ Brands (2008–2010); Senior Financial Analyst, Old Mutual Asset Management (2007–2008); Senior Financial Analyst, Putnam Investments (1999–2007)
Janet C. Smith (Born 1965)
Vice President, Principal Accounting Officer, and Assistant Treasurer
Since 2007
Director of Fund Administration Services, Putnam Investments and Putnam Management
Susan G. Malloy (Born 1957)
Vice President and Assistant Treasurer
Since 2007
Director of Accounting & Control Services, Putnam Investments and Putnam Management
James P. Pappas (Born 1953)
Vice President
Since 2004
Director of Trustee Relations, Putnam Investments and Putnam Management
Mark C. Trenchard (Born 1962)
Vice President and BSA Compliance Officer
Since 2002
Director of Operational Compliance, Putnam Investments and Putnam Retail Management
Nancy E. Florek (Born 1957)
Vice President, Director of Proxy Voting and Corporate Governance, Assistant Clerk, and Associate Treasurer
Since 2000
The principal occupations of the officers for the past five years have been with the employers as shown above, although in some cases they have held different positions with such employers. The address of each officer is One Post Office Square, Boston, MA 02109.
52 Convertible Securities Fund
Fund information
Founded over 75 years ago, Putnam Investments was built around the concept that a balance between risk and reward is the hallmark of a well-rounded financial program. We manage over 100 funds across income, value, blend, growth, asset allocation, absolute return, and global sector categories.
Investment Manager
Putnam Investment Management, LLC One Post Office Square Boston, MA 02109
Investment Sub-Manager
Putnam Investments Limited 57–59 St James’s Street London, England SW1A 1LD
Marketing Services
Putnam Retail Management One Post Office Square Boston, MA 02109
Custodian
State Street Bank and Trust Company
Legal Counsel
Ropes & Gray LLP
Independent Registered Public Accounting Firm
KPMG LLP
Trustees
Jameson A. Baxter, Chair Liaquat Ahamed Ravi Akhoury Barbara M. Baumann Charles B. Curtis Robert J. Darretta Katinka Domotorffy John A. Hill Paul L. Joskow Kenneth R. Leibler Robert E. Patterson George Putnam, III Robert L. Reynolds W. Thomas Stephens
Officers
Robert L. Reynolds President
Jonathan S. Horwitz Executive Vice President, Principal Executive Officer, and Compliance Liaison
Steven D. Krichmar Vice President and Principal Financial Officer
Robert T. Burns Vice President and Chief Legal Officer
Robert R. Leveille Vice President and Chief Compliance Officer
Michael J. Higgins Vice President, Treasurer, and Clerk
Janet C. Smith Vice President, Principal Accounting Officer, and Assistant Treasurer
Susan G. Malloy Vice President and Assistant Treasurer
James P. Pappas Vice President
Mark C. Trenchard Vice President and BSA Compliance Officer
Nancy E. Florek Vice President, Director of Proxy Voting and Corporate Governance, Assistant Clerk, and Associate Treasurer
This report is for the information of shareholders of Putnam Convertible Securities Fund. It may also be used as sales literature when preceded or accompanied by the current prospectus, the most recent copy of Putnam’s Quarterly Performance Summary, and Putnam’s Quarterly Ranking Summary. For more recent performance, please visit putnam.com. Investors should carefully consider the investment objectives, risks, charges, and expenses of a fund, which are described in its prospectus. For this and other information or to request a prospectus or summary prospectus, call 1-800-225-1581 toll free. Please read the prospectus carefully before investing. The fund’s Statement of Additional Information contains additional information about the fund’s Trustees and is available without charge upon request by calling 1-800-225-1581.
Item 2. Code of Ethics:
(a) The fund’s principal executive, financial and accounting officers are employees of Putnam Investment Management, LLC, the Fund’s investment manager. As such they are subject to a comprehensive Code of Ethics adopted and administered by Putnam Investments which is designed to protect the interests of the firm and its clients. The Fund has adopted a Code of Ethics which incorporates the Code of Ethics of Putnam Investments with respect to all of its officers and Trustees who are employees of Putnam Investment Management, LLC. For this reason, the Fund has not adopted a separate code of ethics governing its principal executive, financial and accounting officers.
(c) In July 2013, the Code of Ethics of Putnam Investment Management, LLC was amended. The changes to the Code of Ethics were as follows: (i) eliminating the requirement for employees to hold their shares of Putnam mutual funds for specified periods of time, (ii) removing the requirement to preclear transactions in certain kinds of exchange-traded funds and exchange-traded notes, although reporting of all such instruments remains required; (iii) eliminating the excessive trading rule related to employee transactions in securities requiring preclearance under the Code; (iv) adding provisions related to monitoring of employee trading; (v) changing from a set number of shares to a set dollar value of stock of mid- and large-cap companies on the Restricted List that can be purchased or sold; (vi) adding a requirement starting in March 2014 for employees to generally use certain approved brokers that provide Putnam with an electronic feed of transactions and statements for their personal brokerage accounts; and (vii) certain other changes.
Item 3. Audit Committee Financial Expert:
The Funds’ Audit and Compliance Committee is comprised solely of Trustees who are “independent” (as such term has been defined by the Securities and Exchange Commission (“SEC”) in regulations implementing Section 407 of the Sarbanes-Oxley Act (the “Regulations”)). The Trustees believe that each of the members of the Audit and Compliance Committee also possess a combination of knowledge and experience with respect to financial accounting matters, as well as other attributes, that qualify them for service on the Committee. In addition, the Trustees have determined that each of Mr. Leibler, Mr. Hill, Mr. Darretta, and Ms. Baumann qualifies as an “audit committee financial expert” (as such term has been defined by the Regulations) based on their review of his or her pertinent experience and education. The SEC has stated, and the funds’ amended and restated agreement and Declaration of Trust provides, that the designation or identification of a person as an audit committee financial expert pursuant to this Item 3 of Form N-CSR does not impose on such person any duties, obligations or liability that are greater than the duties, obligations and liability imposed on such person as a member of the Audit and Compliance Committee and the Board of Trustees in the absence of such designation or identification.
Item 4. Principal Accountant Fees and Services:
The following table presents fees billed in each of the last two fiscal years for services rendered to the fund by the fund’s independent auditor:
Fiscal year ended
Audit Fees
Audit-Related Fees
Tax Fees
All Other Fees
October 31, 2014
$38,844
$ —
$4,285
$ —
October 31, 2013
$37,656
$ —
$4,200
$ —
For the fiscal years ended October 31, 2014 and October 31, 2013, the fund’s independent auditor billed aggregate non-audit fees in the amounts of $4,285 and $4,200 respectively, to the fund, Putnam Management and any entity controlling, controlled by or under common control with Putnam Management that provides ongoing services to the fund.
Audit Fees represent fees billed for the fund’s last two fiscal years relating to the audit and review of the financial statements included in annual reports and registration statements, and other services that are normally provided in connection with statutory and regulatory filings or engagements.
Audit-Related Fees represent fees billed in the fund’s last two fiscal years for services traditionally performed by the fund’s auditor, including accounting consultation for proposed transactions or concerning financial accounting and reporting standards and other audit or attest services not required by statute or regulation.
Tax Fees represent fees billed in the fund’s last two fiscal years for tax compliance, tax planning and tax advice services. Tax planning and tax advice services include assistance with tax audits, employee benefit plans and requests for rulings or technical advice from taxing authorities.
Pre-Approval Policies of the Audit and Compliance Committee. The Audit and Compliance Committee of the Putnam funds has determined that, as a matter of policy, all work performed for the funds by the funds’ independent auditors will be pre-approved by the Committee itself and thus will generally not be subject to pre-approval procedures.
The Audit and Compliance Committee also has adopted a policy to pre-approve the engagement by Putnam Management and certain of its affiliates of the funds’ independent auditors, even in circumstances where pre-approval is not required by applicable law. Any such requests by Putnam Management or certain of its affiliates are typically submitted in writing to the Committee and explain, among other things, the nature of the proposed engagement, the estimated fees, and why this work should be performed by that particular audit firm as opposed to another one. In reviewing such requests, the Committee considers, among other things, whether the provision of such services by the audit firm are compatible with the independence of the audit firm.
The following table presents fees billed by the fund’s independent auditor for services required to be approved pursuant to paragraph (c)(7)(ii) of Rule 2-01 of Regulation S-X.
Fiscal year ended
Audit-Related Fees
Tax Fees
All Other Fees
Total Non-Audit Fees
October 31, 2014
$ —
$ —
$ —
$ —
October 31, 2013
$ —
$ —
$ —
$ —
Item 5. Audit Committee of Listed Registrants
Not applicable
Item 6. Schedule of Investments:
The registrant’s schedule of investments in unaffiliated issuers is included in the report to shareholders in Item 1 above.
Item 7. Disclosure of Proxy Voting Policies and Procedures For Closed-End Management Investment Companies:
Not applicable
Item 8. Portfolio Managers of Closed-End Investment Companies
Not Applicable
Item 9. Purchases of Equity Securities by Closed-End Management Investment Companies and Affiliated Purchasers:
Not applicable
Item 10. Submission of Matters to a Vote of Security Holders:
Not applicable
Item 11. Controls and Procedures:
(a) The registrant’s principal executive officer and principal financial officer have concluded, based on their evaluation of the effectiveness of the design and operation of the registrant’s disclosure controls and procedures as of a date within 90 days of the filing date of this report, that the design and operation of such procedures are generally effective to provide reasonable assurance that information required to be disclosed by the registrant in this report is recorded, processed, summarized and reported within the time periods specified in the Commission’s rules and forms.
(b) Changes in internal control over financial reporting: Not applicable
Item 12. Exhibits:
(a)(1) The Code of Ethics of The Putnam Funds, which incorporates the Code of Ethics of Putnam Investments, is filed herewith.
(a)(2) Separate certifications for the principal executive officer and principal financial officer of the registrant as required by Rule 30a-2(a) under the Investment Company Act of 1940, as amended, are filed herewith.
(b) The certifications required by Rule 30a-2(b) under the Investment Company Act of 1940, as amended, are filed herewith.
SIGNATURES
Pursuant to the requirements of the Securities Exchange Act of 1934 and the Investment Company Act of 1940, the registrant has duly caused this report to be signed on its behalf by the undersigned, thereunto duly authorized.
Putnam Convertible Securities Fund
By (Signature and Title):
/s/ Janet C. Smith Janet C. Smith Principal Accounting Officer
Date: December 29, 2014
Pursuant to the requirements of the Securities Exchange Act of 1934 and the Investment Company Act of 1940, this report has been signed below by the following persons on behalf of the registrant and in the capacities and on the dates indicated.
By (Signature and Title):
/s/ Jonathan S. Horwitz Jonathan S. Horwitz Principal Executive Officer
Date: December 29, 2014
By (Signature and Title):
/s/ Steven D. Krichmar Steven D. Krichmar Principal Financial Officer
Date: December 29, 2014
We use cookies on this site to provide a more responsive and personalized service. Continuing to browse, clicking I Agree, or closing this banner indicates agreement. See our Cookie Policy for more information.