| | |
| UNITED STATES
SECURITIES AND EXCHANGE COMMISSION |
| | |
| CERTIFIED SHAREHOLDER REPORT OF REGISTERED
MANAGEMENT INVESTMENT COMPANIES
|
| | |
| Investment Company Act file number: | (811-02280) |
| | |
| Exact name of registrant as specified in charter: | Putnam Convertible Securities Fund |
| | |
| Address of principal executive offices: | One Post Office Square, Boston, Massachusetts 02109 |
| | |
| Name and address of agent for service: | Robert T. Burns, Vice President
One Post Office Square
Boston, Massachusetts 02109 |
| | |
| Copy to: | Bryan Chegwidden, Esq.
Ropes & Gray LLP
1211 Avenue of the Americas
New York, New York 10036 |
| | |
| Registrant's telephone number, including area code: | (617) 292-1000 |
| | |
| Date of fiscal year end: | October 31, 2016 |
| | |
| Date of reporting period : | November 1, 2015 — October 31, 2016 |
| | |
|
Item 1. Report to Stockholders: | |
| | |
| The following is a copy of the report transmitted to stockholders pursuant to Rule 30e-1 under the Investment Company Act of 1940: | |
Putnam
Convertible Securities
Fund
Annual report
10 | 31 | 16
| | | |
| Message from the Trustees | 1 | | |
| | |
| Interview with your fund’s portfolio managers | 3 | | |
| | |
| Your fund’s performance | 8 | | |
| | |
| Your fund’s expenses | 11 | | |
| | |
| Terms and definitions | 13 | | |
| | |
| Other information for shareholders | 15 | | |
| | |
| Important notice regarding Putnam’s privacy policy | 16 | | |
| | |
| Trustee approval of management contract | 17 | | |
| | |
| Financial statements | 22 | | |
| | |
| Federal tax information | 48 | | |
| | |
| About the Trustees | 49 | | |
| | |
| Officers | 51 | | |
Consider these risks before investing: Convertible securities prices may fall or fail to rise over time for several reasons, including general financial market conditions, factors related to a specific company or industry, changing market perceptions of the risk of default, and changes in government intervention in the financial markets. These factors may also lead to increased volatility and reduced liquidity in the markets for convertible securities. These risks are generally greater for convertible securities issued by small and/or midsize companies. Convertible securities’ prices may be adversely affected by underlying common stock price changes. While convertible securities tend to provide higher yields than common stocks, the higher yield may not protect against the risk of loss or mitigate any loss associated with a convertible security’s price decline. Convertible securities are subject to credit risk, which is the risk that an issuer of the fund’s investments may default on payment of interest or principal. Credit risk is greater for below-investment-grade convertible securities. Convertible securities may be less sensitive to interest-rate changes than non-convertible bonds because of their structural features (e.g., convertibility, “put” features). Interest-rate risk is generally greater, however, for longer-term bonds and convertible securities whose underlying stock price has fallen significantly below the conversion price. You can lose money by investing in the fund.
Message from the Trustees
December 14, 2016
Dear Fellow Shareholder:
The U.S. presidential election is now behind us, but the transitional period in Washington, D.C., may bring bouts of volatility to the financial markets. Election campaigns are often followed by uncertainty regarding the new administration, and new presidents may seek to make legislative changes to economic policies.
If recent history is a worthy guide, we believe it is important for investors to remain well diversified, maintain a long-term view, and not overreact to volatile markets. To help ensure that your portfolio is aligned with your individual goals, time horizon, and tolerance for risk, we believe it is a good idea to speak regularly with your financial advisor.
In today’s environment, we favor the investment approach practiced at Putnam — active strategies based on fundamental research. Putnam portfolio managers, backed by a network of global analysts, bring years of experience to navigating changing market conditions and pursuing investment opportunities. In the following pages, you will find an overview of your fund’s performance for the reporting period ended October 31, 2016, as well as an outlook for the coming months.
Thank you for investing with Putnam.

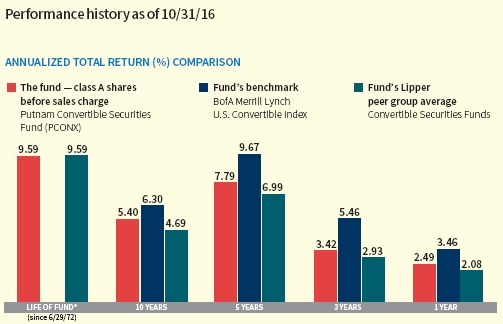
Current performance may be lower or higher than the quoted past performance, which cannot guarantee future results. Share price, principal value, and return will fluctuate, and you may have a gain or a loss when you sell your shares. Performance of class A shares assumes reinvestment of distributions and does not account for taxes. Fund returns in the bar chart do not reflect a sales charge of 5.75%; had they, returns would have been lower. See below and pages 8–11 for additional performance information. For a portion of the periods, the fund had expense limitations, without which returns would have been lower. To obtain the most recent month-end performance, visit putnam.com.
* The fund’s benchmark, the BofA Merrill Lynch U.S. Convertible Index, was introduced on 12/31/87, which post-dates the inception of the fund’s class A shares.
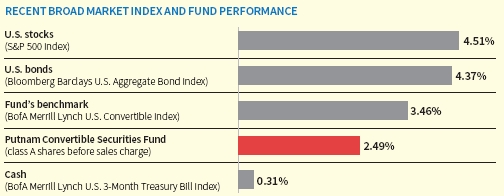
This comparison shows your fund’s performance in the context of broad market indexes for the 12 months ended 10/31/16. See above and pages 8–11 for additional fund performance information. Index descriptions can be found on page 14.
|
| 2 Convertible Securities Fund |

Eric has an M.B.A. from the Booth School of Business at the University of Chicago and a B.S. from San Diego State University. He joined Putnam in 2000 and has been in the investment industry since 1994.

Rob has an M.B.A. from the Booth School of Business at the University of Chicago and a B.S. from the Wharton School at the University of Pennsylvania. He joined Putnam in 2000 and has been in the investment industry since 1986.
How was the market environment for U.S. convertible securities during the 12-month reporting period ended October 31, 2016?
ERIC While U.S. convertible securities enjoyed periods of solid performance during the reporting period, macroeconomic events also contributed to bouts of heightened volatility and a risk-averse sentiment that weighed on performance at times. The November 2015 to mid-February 2016 time frame was especially challenging, when convertibles sold off as a result of falling oil prices, questions about high drug prices, tightening central bank policy, and the economic slowdown in China. The energy and utilities sectors were especially hard hit. Toward mid-February, however, with major stock indexes at multiyear lows, a handful of upbeat U.S. corporate earnings reports, rumblings of constraints on oil production, and a belief that the markets were oversold, market sentiment improved, and higher-risk assets rallied.
Given the sensitivity of convertible securities to their underlying stocks, the asset class performed well during much of the second and third quarters of 2016, despite the volatility associated with the United Kingdom’s vote to
|
| Convertible Securities Fund 3 |
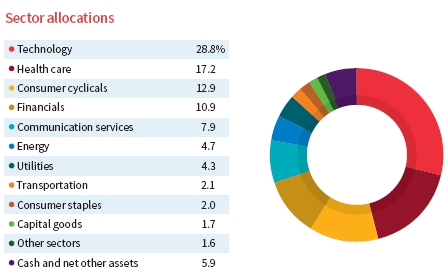
Allocations are shown as a percentage of the fund’s net assets as of 10/31/16. Cash and net other assets, if any, represent the market value weights of cash, derivatives, short-term securities, and other unclassified assets in the portfolio. Summary information may differ from the portfolio schedule included in the financial statements due to the inclusion of derivative securities, any interest accruals, the exclusion of as-of trades, if any, the use of different classifications of securities for presentation purposes, and rounding. Holdings and allocations may vary over time.
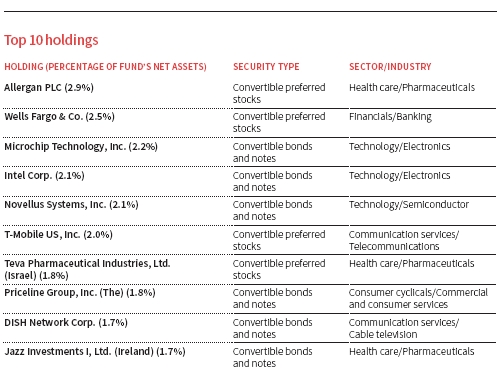
This table shows the fund’s top 10 individual holdings and the percentage of the fund’s net assets that each represented as of 10/31/16. Short-term investments and derivatives, if any, are excluded. Holdings may vary over time.
| |
| 4 Convertible Securities Fund |
leave the European Union. Diminished expectations for near-term interest-rate increases by the Federal Reserve and expectations for a more gradual pace of future hikes also helped to support convertible bond prices. July was especially rewarding, with the BofA Merrill Lynch U.S. Convertibles Index [the convertibles index] rising 4.55% for the month and 6.02% for the third calendar quarter. The rally was driven by small-cap stocks and below-investment-grade assets, particularly within the energy and technology sectors.
How did Putnam Convertible Securities Fund perform in this environment?
ROB For the 12-month reporting period ended October 31, 2016, the fund underperformed its benchmark, the convertibles index, but outperformed its Lipper peer group.
At the sector level, underweight positioning and security selection within energy relative to the convertibles index, particularly SunEdison and Cobalt International Energy, were the top contributors to relative returns, as commodity prices rebounded significantly after the February 11, 2016 market inflection point. Security selection within consumer cyclicals and underweight exposure and security selection within the volatile biotechnology sector also added to performance during the reporting period.
Underweight positioning and security selection within technology was the largest detractor at the sector level relative to the convertibles index, as the sector staged a significant rebound during the March to October 2016 time frame. Overweight exposure and security selection in transportation, along with underweight exposure and security selection within utilities, also negatively influenced performance during the reporting period.
What holdings helped the fund’s performance relative to the benchmark during the reporting period?
ERIC From an issuer perspective, the fund’s underweight exposure to commodity-sensitive holdings, such as SunEdison and Cobalt International Energy, were top contributors to performance. Our decision to sell the poorly performing SunEdison early in the reporting period was especially beneficial for performance. Investor sentiment declined in response to project cancellations, increased liquidity concerns, and investigations by the Department of Justice and the Securities and Exchange Commission. Cobalt was sold from the portfolio prior to period-end as well.
With the Fed holding off raising interest rates during the period, rate-sensitive investments outperformed. On the heels of a rate rally, the fund’s overweight positioning in Alexandria Real Estate Equities, a biotechnology real estate investment trust [REIT], was beneficial for performance. Typically, in markets where U.S. Treasury yields decline, REITs tend to outperform.
Within the health-care sector, Ariad Pharmaceuticals saw a steep rise in its underlying stock due to rumors of a potential buyout. As a result, the fund’s overweight position in this biotechnology firm contributed to performance.
What holdings detracted most from the fund’s performance relative to the benchmark during the reporting period?
ROB Two of the fund’s leading detractors suffered in response to the decline in crude-oil prices in the early months of the reporting period before they recovered and settled into a range of $40 to $50 a barrel for the balance of the period. Oil prices strengthened at times during the reporting period due to efforts by the Organization of the Petroleum Exporting
|
| Convertible Securities Fund 5 |
Countries [OPEC] to limit production. But with some members seeking exemptions from cuts in output, OPEC failed to finalize a deal to end a two-year policy of pumping without limits before the close of the reporting period. Consequently, investments in Scorpio Tankers, a shipping company for crude oil and other petroleum products, and Hess, an integrated oil company, weighed on performance results. Specifically, Scorpio Tankers underperformed because its contracts are tied to rates driven by commodity prices.
Finally, investments in Infinera, a manufacturer of high-capacity optical transmission equipment, sold off in response to management’s earnings guidance for the first and second quarters of 2016 that was lower than market expectations. With the company facing some potential complications, in our view, as a result of order delays following these announcements, we sold the holding from the portfolio.
What is your outlook for convertible securities as 2016 comes to a close?
ERIC Given low global rates and the sensitivity of convertibles to their underlying equities, the asset class performed well in the later months of the reporting period despite company and sector-specific volatility. The election of Donald Trump has heightened uncertainty, as his policies could have diverging effects on the economy, in our view. On the one hand, if his fiscal package comes to fruition, it could result in strong economic growth and some inflationary pressure. However, his protectionist trade policies, if enacted, could have a negative impact on economic growth. In either one of these scenarios, convertible securities could benefit from upside stock appreciation in a growing economy but also could provide downside protection if we see the economy decline.
Although there is increased uncertainty as a result of the election, in our view, recent economic data announcements have strengthened the argument that there may still be a December Fed rate hike. If interest rates
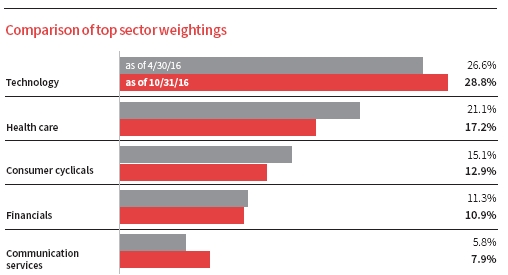
This chart shows how the fund’s top weightings have changed over the past six months. Allocations are shown as a percentage of the fund’s net assets. Current period summary information may differ from the portfolio schedule included in the financial statements due to the inclusion of derivative securities, any interest accruals, the exclusion of as-of trades, if any, the use of different classifications of securities for presentation purposes, and rounding. Holdings and allocations may vary over time.
|
| 6 Convertible Securities Fund |
continue to rise, which has occurred recently in anticipation of the Fed raising its benchmark interest rate, we expect convertible securities’ naturally shorter duration to support the asset class, which has historically performed well in rising-rate environments. Since the election, convertibles have demonstrated this characteristic, remaining in positive territory while Treasury yields soared on higher inflation expectations, infrastructure and bank stocks rallied, and rate-sensitive sectors such as real estate investment trusts and utilities sold off.
Given market expectations for rising interest rates, reduced regulation, and a pro-growth agenda from the incoming administration, we believe that this backdrop has the potential to contribute to increased earnings, robust merger and acquisition activity, and a higher level of new issue activity in the convertible market.
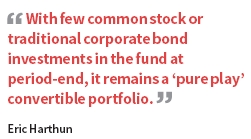
With few common stock or traditional corporate bond investments in the fund at period-end, it remains a “pure play” convertible portfolio, which we believe sets it apart from its peers. The fund had a portfolio delta, or equity sensitivity, of around 50 for most of the reporting period. We believe this represents a balanced profile of capital preservation and reduced volatility from the fund’s bond component and upside opportunity from convertibles’ equity-conversion option. We continue to believe this positioning is suitable for market conditions as 2016 comes to a close and should help the fund weather any potential short-term volatility in the coming months, aside from that driven by company-specific developments at the issuer level.
Thank you, gentlemen, for your time and insights today.
The views expressed in this report are exclusively those of Putnam Management and are subject to change. They are not meant as investment advice.
Please note that the holdings discussed in this report may not have been held by the fund for the entire period. Portfolio composition is subject to review in accordance with the fund’s investment strategy and may vary in the future. Current and future portfolio holdings are subject to risk.
|
| Convertible Securities Fund 7 |
Your fund’s performance
This section shows your fund’s performance, price, and distribution information for periods ended October 31, 2016, the end of its most recent fiscal year. In accordance with regulatory requirements for mutual funds, we also include performance information as of the most recent calendar quarter-end and expense information taken from the fund’s current prospectus. Performance should always be considered in light of a fund’s investment strategy. Data represent past performance. Past performance does not guarantee future results. More recent returns may be less or more than those shown. Investment return and principal value will fluctuate, and you may have a gain or a loss when you sell your shares. Performance information does not reflect any deduction for taxes a shareholder may owe on fund distributions or on the redemption of fund shares. For the most recent month-end performance, please visit the Individual Investors section at putnam.com or call Putnam at 1-800-225-1581. Class I, R, and Y shares are not available to all investors. See the Terms and Definitions section in this report for definitions of the share classes offered by your fund.
Fund performance Total return for periods ended 10/31/16
| | | | | | | | |
| | Annual average | | Annual | | Annual | | Annual | |
| | (life of fund) | 10 years | average | 5 years | average | 3 years | average | 1 year |
|
| Class A (6/29/72) | | | | | | | | |
| Before sales charge | 9.59% | 69.25% | 5.40% | 45.51% | 7.79% | 10.61% | 3.42% | 2.49% |
|
| After sales charge | 9.44 | 59.52 | 4.78 | 37.14 | 6.52 | 4.25 | 1.40 | –3.40 |
|
| Class B (7/15/93) | | | | | | | | |
| Before CDSC | 9.39 | 59.33 | 4.77 | 40.11 | 6.98 | 8.18 | 2.66 | 1.72 |
|
| After CDSC | 9.39 | 59.33 | 4.77 | 38.11 | 6.67 | 5.32 | 1.74 | –3.10 |
|
| Class C (7/26/99) | | | | | | | | |
| Before CDSC | 8.77 | 56.96 | 4.61 | 40.16 | 6.98 | 8.19 | 2.66 | 1.72 |
|
| After CDSC | 8.77 | 56.96 | 4.61 | 40.16 | 6.98 | 8.19 | 2.66 | 0.75 |
|
| Class I (3/3/15) | | | | | | | | |
| Net asset value | 9.71 | 73.94 | 5.69 | 47.62 | 8.10 | 11.70 | 3.76 | 2.87 |
|
| Class M (3/13/95) | | | | | | | | |
| Before sales charge | 8.93 | 60.97 | 4.88 | 41.87 | 7.24 | 8.96 | 2.90 | 1.95 |
|
| After sales charge | 8.84 | 55.33 | 4.50 | 36.90 | 6.48 | 5.15 | 1.69 | –1.61 |
|
| Class R (12/1/03) | | | | | | | | |
| Net asset value | 9.32 | 65.05 | 5.14 | 43.66 | 7.51 | 9.78 | 3.16 | 2.21 |
|
| Class Y (12/30/98) | | | | | | | | |
| Net asset value | 9.70 | 73.55 | 5.67 | 47.29 | 8.05 | 11.45 | 3.68 | 2.71 |
Current performance may be lower or higher than the quoted past performance, which cannot guarantee future results. After-sales-charge returns for class A and M shares reflect the deduction of the maximum 5.75% and 3.50% sales charge, respectively, levied at the time of purchase. Class B share returns after contingent deferred sales charge (CDSC) reflect the applicable CDSC, which is 5% in the first year, declining over time to 1% in the sixth year, and is eliminated thereafter. Class C share returns after CDSC reflect a 1% CDSC for the first year that is eliminated thereafter. Class I, R, and Y shares have no initial sales charge or CDSC. Performance for class B, C, M, R, and Y shares before their inception is derived from the historical performance of class A shares, adjusted for the applicable sales charge (or CDSC) and the higher operating expenses for such shares, except for class Y shares, for which 12b-1 fees are not applicable. Performance for class I shares prior to their inception is derived from the historical performance of class Y shares and has not been adjusted for the lower investor servicing fees applicable to class I shares; had it, returns would have been higher.
For a portion of the periods, the fund had expense limitations, without which returns would have been lower.
Class B share performance reflects conversion to class A shares after eight years.
| |
| 8 Convertible Securities Fund |
Comparative index returns For periods ended 10/31/16
| | | | | | | | |
| | Annual | | | | | | | |
| | average | | Annual | | Annual | | Annual | |
| | (life of fund) | 10 years | average | 5 years | average | 3 years | average | 1 year |
|
| BofA Merrill | | | | | | | | |
| Lynch U.S. | | | | | | | | |
| Convertible Index | — † | 84.22% | 6.30% | 58.67% | 9.67% | 17.29% | 5.46% | 3.46% |
|
| Lipper Convertible | | | | | | | | |
| Securities Funds | | | | | | | | |
| category average* | 9.59% | 59.35 | 4.69 | 40.51 | 6.99 | 9.15 | 2.93 | 2.08 |
Index and Lipper results should be compared with fund performance before sales charge, before CDSC, or at net asset value.
* Over the 1-year, 3-year, 5-year, 10-year, and life-of-fund periods ended 10/31/16, there were 93, 75, 69, 38, and 1 fund(s), respectively, in this Lipper category.
† The fund’s benchmark, the BofA Merrill Lynch U.S. Convertible Index, was introduced on 12/31/87, which post-dates the inception of the fund’s class A shares.
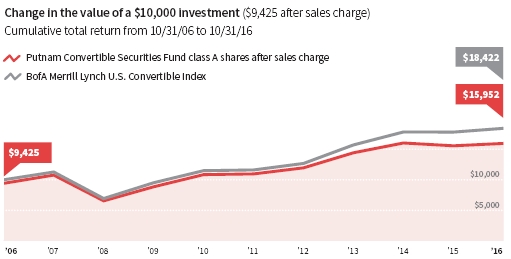
Past performance does not indicate future results. At the end of the same time period, a $10,000 investment in the fund’s class B and C shares would have been valued at $15,933 and $15,696, respectively, and no contingent deferred sales charges would apply. A $10,000 investment in the fund’s class M shares ($9,650 after sales charge) would have been valued at $15,533. A $10,000 investment in the fund’s class I, R, and Y shares would have been valued at $17,394, $16,505, and $17,355, respectively.
|
| Convertible Securities Fund 9 |
Fund price and distribution information For the 12-month period ended 10/31/16
| | | | | | | | | |
| Distributions | Class A | Class B | Class C | Class I | Class M | Class R | Class Y |
|
| Number | 4 | 4 | 4 | 4 | 4 | 4 | 4 |
|
| Income | $0.488411 | $0.307411 | $0.309411 | $0.563411 | $0.365411 | $0.426411 | $0.549411 |
|
| Capital gains | | | | | | | | | |
|
| Long-term gains | 0.850589 | 0.850589 | 0.850589 | 0.850589 | 0.850589 | 0.850589 | 0.850589 |
|
| Short-term gains | — | — | — | — | — | — | — |
|
| Total | $1.339000 | $1.158000 | $1.160000 | $1.414000 | $1.216000 | $1.277000 | $1.400000 |
|
| | Before | After | Net | Net | Net | Before | After | Net | Net |
| | sales | sales | asset | asset | asset | sales | sales | asset | asset |
| Share value | charge | charge | value | value | value | charge | charge | value | value |
|
| 10/31/15 | $23.37 | $24.80 | $22.93 | $23.11 | $23.38 | $23.14 | $23.98 | $23.28 | $23.37 |
|
| 10/31/16 | 22.55 | 23.93 | 22.10 | 22.29 | 22.55 | 22.31 | 23.12 | 22.45 | 22.54 |
|
| | Before | After | Net | Net | Net | Before | After | Net | Net |
| Current rate | sales | sales | asset | asset | asset | sales | sales | asset | asset |
| (end of period) | charge | charge | value | value | value | charge | charge | value | value |
|
| Current dividend rate 1 | 2.13% | 2.01% | 1.41% | 1.36% | 2.54% | 1.63% | 1.57% | 1.89% | 2.40% |
|
| Current 30-day | | | | | | | | | |
| SEC yield 2 | N/A | 1.28 | 0.61 | 0.61 | 1.79 | N/A | 0.83 | 1.11 | 1.61 |
The classification of distributions, if any, is an estimate. Before-sales-charge share value and current dividend rate for class A and M shares, if applicable, do not take into account any sales charge levied at the time of purchase. After-sales-charge share value, current dividend rate, and current 30-day SEC yield, if applicable, are calculated assuming that the maximum sales charge (5.75% for class A shares and 3.50% for class M shares) was levied at the time of purchase. Final distribution information will appear on your year-end tax forms.
1 Most recent distribution, including any return of capital and excluding capital gains, annualized and divided by NAV or market price at end of period.
2 Based only on investment income and calculated using the maximum offering price for each share class, in accordance with SEC guidelines.
| |
| 10 Convertible Securities Fund |
Fund performance as of most recent calendar quarter Total return for periods ended 9/30/16
| | | | | | | | |
| | Annual average | | Annual | | Annual | | Annual | |
| | (life of fund) | 10 years | average | 5 years | average | 3 years | average | 1 year |
|
| Class A (6/29/72) | | | | | | | | |
| Before sales charge | 9.66% | 76.84% | 5.87% | 58.29% | 9.62% | 15.21% | 4.83% | 8.24% |
|
| After sales charge | 9.51 | 66.67 | 5.24 | 49.19 | 8.33 | 8.58 | 2.78 | 2.02 |
|
| Class B (7/15/93) | | | | | | | | |
| Before CDSC | 9.46 | 66.62 | 5.24 | 52.39 | 8.79 | 12.62 | 4.04 | 7.44 |
|
| After CDSC | 9.46 | 66.62 | 5.24 | 50.39 | 8.50 | 9.64 | 3.12 | 2.44 |
|
| Class C (7/26/99) | | | | | | | | |
| Before CDSC | 8.83 | 63.98 | 5.07 | 52.43 | 8.80 | 12.64 | 4.05 | 7.40 |
|
| After CDSC | 8.83 | 63.98 | 5.07 | 52.43 | 8.80 | 12.64 | 4.05 | 6.40 |
|
| Class I (3/3/15) | | | | | | | | |
| Net asset value | 9.77 | 81.75 | 6.16 | 60.61 | 9.94 | 16.30 | 5.16 | 8.74 |
|
| Class M (3/13/95) | | | | | | | | |
| Before sales charge | 9.00 | 68.24 | 5.34 | 54.35 | 9.07 | 13.49 | 4.31 | 7.74 |
|
| After sales charge | 8.91 | 62.35 | 4.96 | 48.95 | 8.29 | 9.52 | 3.08 | 3.97 |
|
| Class R (12/1/03) | | | | | | | | |
| Net asset value | 9.38 | 72.48 | 5.60 | 56.33 | 9.35 | 14.32 | 4.56 | 7.97 |
|
| Class Y (12/30/98) | | | | | | | | |
| Net asset value | 9.77 | 81.35 | 6.13 | 60.25 | 9.89 | 16.04 | 5.08 | 8.52 |
See the discussion following the fund performance table on page 8 for information about the calculation of fund performance.
Your fund’s expenses
As a mutual fund investor, you pay ongoing expenses, such as management fees, distribution fees (12b-1 fees), and other expenses. Using the following information, you can estimate how these expenses affect your investment and compare them with the expenses of other funds. You may also pay one-time transaction expenses, including sales charges (loads) and redemption fees, which are not shown in this section and would have resulted in higher total expenses. For more information, see your fund’s prospectus or talk to your financial representative.
Expense ratios
| | | | | | | |
| | Class A | Class B | Class C | Class I | Class M | Class R | Class Y |
|
| Total annual operating expenses | | | | | | | |
| for the fiscal year ended 10/31/15 | 1.06% | 1.81% | 1.81% | 0.68%* | 1.56% | 1.31% | 0.81% |
|
| Annualized expense ratio for | | | | | | | |
| the six-month period ended | | | | | | | |
| 10/31/16† | 1.08% | 1.83% | 1.83% | 0.69% | 1.58% | 1.33% | 0.83% |
Fiscal-year expense information in this table is taken from the most recent prospectus, is subject to change, and may differ from that shown for the annualized expense ratio and in the financial highlights of this report.
Expenses are shown as a percentage of average net assets.
* Other expenses have been annualized.
† Expense ratios for each class are for the fund’s most recent fiscal half year. As a result of this, ratios may differ from expense ratios based on one-year data in the financial highlights.
|
| Convertible Securities Fund 11 |
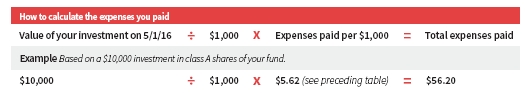
Expenses per $1,000
The following table shows the expenses you would have paid on a $1,000 investment in each class of the fund from 5/1/16 to 10/31/16. It also shows how much a $1,000 investment would be worth at the close of the period, assuming actual returns and expenses.
| | | | | | | |
| | Class A | Class B | Class C | Class I | Class M | Class R | Class Y |
|
| Expenses paid per $1,000 *† | $5.62 | $9.50 | $9.50 | $3.59 | $8.21 | $6.91 | $4.32 |
|
| Ending value (after expenses) | $1,069.70 | $1,065.60 | $1,065.80 | $1,071.40 | $1,066.70 | $1,068.20 | $1,070.70 |
* Expenses for each share class are calculated using the fund’s annualized expense ratio for each class, which represents the ongoing expenses as a percentage of average net assets for the six months ended 10/31/16. The expense ratio may differ for each share class.
† Expenses are calculated by multiplying the expense ratio by the average account value for the period; then multiplying the result by the number of days in the period; and then dividing that result by the number of days in the year.
Estimate the expenses you paid
To estimate the ongoing expenses you paid for the six months ended 10/31/16, use the following calculation method. To find the value of your investment on 5/1/16, call Putnam at 1-800-225-1581.
Compare expenses using the SEC’s method
The Securities and Exchange Commission (SEC) has established guidelines to help investors assess fund expenses. Per these guidelines, the following table shows your fund’s expenses based on a $1,000 investment, assuming a hypothetical 5% annualized return. You can use this information to compare the ongoing expenses (but not transaction expenses or total costs) of investing in the fund with those of other funds. All mutual fund shareholder reports will provide this information to help you make this comparison. Please note that you cannot use this information to estimate your actual ending account balance and expenses paid during the period.
| | | | | | | |
| | Class A | Class B | Class C | Class I | Class M | Class R | Class Y |
|
| Expenses paid per $1,000 *† | $5.48 | $9.27 | $9.27 | $3.51 | $8.01 | $6.75 | $4.22 |
|
| Ending value (after expenses) | $1,019.71 | $1,015.94 | $1,015.94 | $1,021.67 | $1,017.19 | $1,018.45 | $1,020.96 |
* Expenses for each share class are calculated using the fund’s annualized expense ratio for each class, which represents the ongoing expenses as a percentage of average net assets for the six months ended 10/31/16. The expense ratio may differ for each share class.
† Expenses are calculated by multiplying the expense ratio by the average account value for the six-month period; then multiplying the result by the number of days in the six-month period; and then dividing that result by the number of days in the year.
| |
| 12 Convertible Securities Fund |
Terms and definitions
Important terms
Total return shows how the value of the fund’s shares changed over time, assuming you held the shares through the entire period and reinvested all distributions in the fund.
Before sales charge, or net asset value, is the price, or value, of one share of a mutual fund, without a sales charge. Before-sales-charge figures fluctuate with market conditions, and are calculated by dividing the net assets of each class of shares by the number of outstanding shares in the class.
After sales charge is the price of a mutual fund share plus the maximum sales charge levied at the time of purchase. After-sales-charge performance figures shown here assume the 5.75% maximum sales charge for class A shares and 3.50% for class M shares.
Contingent deferred sales charge (CDSC) is generally a charge applied at the time of the redemption of class B or C shares and assumes redemption at the end of the period. Your fund’s class B CDSC declines over time from a 5% maximum during the first year to 1% during the sixth year. After the sixth year, the CDSC no longer applies. The CDSC for class C shares is 1% for one year after purchase.
Share classes
Class A shares are generally subject to an initial sales charge and no CDSC (except on certain redemptions of shares bought without an initial sales charge).
Class B shares are not subject to an initial sales charge and may be subject to a CDSC.
Class C shares are not subject to an initial sales charge and are subject to a CDSC only if the shares are redeemed during the first year.
Class I shares are not subject to an initial sales charge or CDSC, and carry no 12b-1 fee. They are only available to institutional clients and other investors who meet minimum investment requirements.
Class M shares have a lower initial sales charge and a higher 12b-1 fee than class A shares and no CDSC.
Class R shares are not subject to an initial sales charge or CDSC and are available only to employer-sponsored retirement plans.
Class Y shares are not subject to an initial sales charge or CDSC, and carry no 12b-1 fee. They are generally only available to corporate and institutional clients and clients in other approved programs.
Fixed-income terms
Current rate is the annual rate of return earned from dividends or interest of an investment. Current rate is expressed as a percentage of the price of a security, fund share, or principal investment.
Mortgage-backed security (MBS), also known as a mortgage “pass-through,” is a type of asset-backed security that is secured by a mortgage or collection of mortgages. The following are types of MBSs:
• Agency “pass-through” has its principal and interest backed by a U.S. government agency, such as the Federal National Mortgage Association (Fannie Mae), Government National Mortgage Association (Ginnie Mae), and Federal Home Loan Mortgage Corporation (Freddie Mac).
• Collateralized mortgage obligation (CMO) represents claims to specific cash flows from pools of home mortgages. The streams of principal and interest payments on the mortgages are distributed to the different classes of CMO interests in “tranches.” Each tranche may have different principal balances, coupon rates, prepayment risks, and maturity dates. A CMO is highly sensitive to changes in interest rates and any resulting change in the rate at
|
| Convertible Securities Fund 13 |
which homeowners sell their properties, refinance, or otherwise prepay loans. CMOs are subject to prepayment, market, and liquidity risks.
• Interest-only (IO) security is a type of CMO in which the underlying asset is the interest portion of mortgage, Treasury, or bond payments.
• Non-agency residential mortgage-backed security (RMBS) is an MBS not backed by Fannie Mae, Ginnie Mae, or Freddie Mac. One type of RMBS is an Alt-A mortgage-backed security.
• Commercial mortgage-backed security (CMBS) is secured by the loan on a commercial property.
Yield curve is a graph that plots the yields of bonds with equal credit quality against their differing maturity dates, ranging from shortest to longest. It is used as a benchmark for other debt, such as mortgage or bank lending rates.
Comparative indexes
Bloomberg Barclays U.S. Aggregate Bond Index is an unmanaged index of U.S. investment-grade fixed-income securities.
BofA Merrill Lynch U.S. 3-Month Treasury Bill Index is an unmanaged index that seeks to measure the performance of U.S. Treasury bills available in the marketplace.
BofA Merrill Lynch U.S. Convertible Index is an unmanaged index of high-yield U.S. convertible securities.
NASDAQ Biotechnology Index is an unmanaged index made up of securities of NASDAQ-listed companies classified according to the Industry Classification Benchmark as either biotechnology or pharmaceuticals which also meet other eligibility criteria.
S&P 500 Index is an unmanaged index of common stock performance.
Indexes assume reinvestment of all distributions and do not account for fees. Securities and performance of a fund and an index will differ. You cannot invest directly in an index.
Lipper is a third-party industry-ranking entity that ranks mutual funds. Its rankings do not reflect sales charges. Lipper rankings are based on total return at net asset value relative to other funds that have similar current investment styles or objectives as determined by Lipper. Lipper may change a fund’s category assignment at its discretion. Lipper category averages reflect performance trends for funds within a category.
| |
| 14 Convertible Securities Fund |
Other information for shareholders
Proxy voting
Putnam is committed to managing our mutual funds in the best interests of our shareholders. The Putnam funds’ proxy voting guidelines and procedures, as well as information regarding how your fund voted proxies relating to portfolio securities during the 12-month period ended June 30, 2016, are available in the Individual Investors section of putnam.com, and on the Securities and Exchange Commission (SEC) website, www.sec.gov. If you have questions about finding forms on the SEC’s website, you may call the SEC at 1-800-SEC-0330. You may also obtain the Putnam funds’ proxy voting guidelines and procedures at no charge by calling Putnam’s Shareholder Services at 1-800-225-1581.
Fund portfolio holdings
The fund will file a complete schedule of its portfolio holdings with the SEC for the first and third quarters of each fiscal year on Form N-Q. Shareholders may obtain the fund’s Form N-Q on the SEC’s website at www.sec.gov. In addition, the fund’s Form N-Q may be reviewed and copied at the SEC’s Public Reference Room in Washington, D.C. You may call the SEC at 1-800-SEC-0330 for information about the SEC’s website or the operation of the Public Reference Room.
Trustee and employee fund ownership
Putnam employees and members of the Board of Trustees place their faith, confidence, and, most importantly, investment dollars in Putnam mutual funds. As of October 31, 2016, Putnam employees had approximately $492,000,000 and the Trustees had approximately $132,000,000 invested in Putnam mutual funds. These amounts include investments by the Trustees’ and employees’ immediate family members as well as investments through retirement and deferred compensation plans.
|
| Convertible Securities Fund 15 |
Important notice regarding Putnam’s privacy policy
In order to conduct business with our shareholders, we must obtain certain personal information such as account holders’ names, addresses, Social Security numbers, and dates of birth. Using this information, we are able to maintain accurate records of accounts and transactions.
It is our policy to protect the confidentiality of our shareholder information, whether or not a shareholder currently owns shares of our funds. In particular, it is our policy not to sell information about you or your accounts to outside marketing firms. We have safeguards in place designed to prevent unauthorized access to our computer systems and procedures to protect personal information from unauthorized use.
Under certain circumstances, we must share account information with outside vendors who provide services to us, such as mailings and proxy solicitations. In these cases, the service providers enter into confidentiality agreements with us, and we provide only the information necessary to process transactions and perform other services related to your account. Finally, it is our policy to share account information with your financial representative, if you’ve listed one on your Putnam account.
| |
| 16 Convertible Securities Fund |
Trustee approval of management contract
General conclusions
The Board of Trustees of The Putnam Funds oversees the management of each fund and, as required by law, determines annually whether to approve the continuance of your fund’s management contract with Putnam Investment Management, LLC (“Putnam Management”) and the sub-management contract with respect to your fund between Putnam Management and its affiliate, Putnam Investments Limited (“PIL”). The Board, with the assistance of its Contract Committee, requests and evaluates all information it deems reasonably necessary under the circumstances in connection with its annual contract review. The Contract Committee consists solely of Trustees who are not “interested persons” (as this term is defined in the Investment Company Act of 1940, as amended (the “1940 Act”)) of The Putnam Funds (“Independent Trustees”).
At the outset of the review process, members of the Board’s independent staff and independent legal counsel discussed with representatives of Putnam Management the annual contract review materials furnished to the Contract Committee during the course of the previous year’s review, identifying possible changes in these materials that might be necessary or desirable for the coming year. Following these discussions and in consultation with the Contract Committee, the Independent Trustees’ independent legal counsel requested that Putnam Management and its affiliates furnish specified information, together with any additional information that Putnam Management considered relevant, to the Contract Committee. Over the course of several months ending in June 2016, the Contract Committee met on a number of occasions with representatives of Putnam Management, and separately in executive session, to consider the information that Putnam Management provided, as well as supplemental information provided in response to an additional request made by the Contract Committee. Throughout this process, the Contract Committee was assisted by the members of the Board’s independent staff and by independent legal counsel for The Putnam Funds and the Independent Trustees.
In May 2016, the Contract Committee met in executive session to discuss and consider its recommendations with respect to the continuance of the contracts. At the Trustees’ June 24, 2016 meeting, the Contract Committee met in executive session with the other Independent Trustees to review a summary of the key financial, performance and other data that the Contract Committee considered in the course of its review. The Contract Committee then presented its written report, which summarized the key factors that the Committee had considered and set forth its recommendations. The Contract Committee then recommended, and the Independent Trustees approved, the continuance of your fund’s management and sub-management contracts, effective July 1, 2016. (Because PIL is an affiliate of Putnam Management and Putnam Management remains fully responsible for all services provided by PIL, the Trustees have not attempted to evaluate PIL as a separate entity, and all subsequent references to Putnam Management below should be deemed to include reference to PIL as necessary or appropriate in the context.)
The Independent Trustees’ approval was based on the following conclusions:
• That the fee schedule in effect for your fund represented reasonable compensation in light of the nature and quality of the services being provided to the fund, the fees paid by competitive funds, the costs incurred by Putnam Management in providing services to the fund, and the continued application of certain reductions and waivers noted below; and
• That the fee schedule in effect for your fund represented an appropriate sharing between fund shareholders and Putnam Management of such economies of scale as may exist in the management of the fund at current asset levels.
These conclusions were based on a comprehensive consideration of all information provided to the Trustees and were not the result of any single factor. Some of the factors that figured particularly in the Trustees’ deliberations and how the Trustees considered these factors are described below, although individual Trustees may have evaluated the information presented differently, giving different weights to various factors. It is also important to recognize that the management arrangements for your fund and the other Putnam funds are the result of many years of review and discussion between the Independent Trustees and Putnam Management, that some aspects of the arrangements may receive greater scrutiny
|
| Convertible Securities Fund 17 |
in some years than others, and that the Trustees’ conclusions may be based, in part, on their consideration of fee arrangements in previous years. For example, with some minor exceptions, the funds’ current fee arrangements under the management contracts were first implemented at the beginning of 2010 following extensive review by the Contract Committee and discussions with representatives of Putnam Management, as well as approval by shareholders.
Management fee schedules and total expenses
The Trustees reviewed the management fee schedules in effect for all Putnam funds, including fee levels and breakpoints. The Trustees also reviewed the total expenses of each Putnam fund, recognizing that in most cases management fees represented the major, but not the sole, determinant of total costs to shareholders. (In a few instances, funds have implemented so-called “all-in” management fees covering substantially all routine fund operating costs.)
In reviewing fees and expenses, the Trustees generally focus their attention on material changes in circumstances — for example, changes in assets under management, changes in a fund’s investment style, changes in Putnam Management’s operating costs or profitability, or changes in competitive practices in the mutual fund industry — that suggest that consideration of fee changes might be warranted. The Trustees concluded that the circumstances did not indicate that changes to the management fee structure for your fund would be appropriate at this time.
Under its management contract, your fund has the benefit of breakpoints in its management fee schedule that provide shareholders with economies of scale in the form of reduced fee rates as assets under management in the Putnam family of funds increase. The Trustees concluded that the fee schedule in effect for your fund represented an appropriate sharing of economies of scale between fund shareholders and Putnam Management.
As in the past, the Trustees also focused on the competitiveness of each fund’s total expense ratio. In order to support the effort to have fund expenses meet competitive standards, the Trustees and Putnam Management have implemented certain expense limitations that were in effect during your fund’s fiscal year ending in 2015. These expense limitations were: (i) a contractual expense limitation applicable to specified retail open-end funds, including your fund, of 32 basis points on investor servicing fees and expenses and (ii) a contractual expense limitation applicable to specified open-end funds, including your fund, of 20 basis points on so-called “other expenses” (i.e., all expenses exclusive of management fees, distribution fees, investor servicing fees, investment-related expenses, interest, taxes, brokerage commissions, acquired fund fees and expenses and extraordinary expenses). These expense limitations attempt to maintain competitive expense levels for the funds. Most funds, including your fund, had sufficiently low expenses that these expense limitations were not operative during their fiscal years ending in 2015. Putnam Management has agreed to maintain these expense limitations until at least February 29, 2018 and to reduce the contractual expense limitation on investor servicing fees and expenses from 32 basis points to 25 basis points effective September 1, 2016. Putnam Management’s support for these expense limitation arrangements was an important factor in the Trustees’ decision to approve the continuance of your fund’s management and sub-management contracts.
The Trustees reviewed comparative fee and expense information for a custom group of competitive funds selected by Broadridge Financial Solutions, Inc. (“Broadridge”). This comparative information included your fund’s percentile ranking for effective management fees and total expenses (excluding any applicable 12b-1 fee), which provides a general indication of your fund’s relative standing. In the custom peer group, your fund ranked in the third quintile in effective management fees (determined for your fund and the other funds in the custom peer group based on fund asset size and the applicable contractual management fee schedule) and in the third quintile in total expenses (excluding any applicable 12b-1 fees) as of December 31, 2015. The first quintile represents the least expensive funds and the fifth quintile the most expensive funds. The fee and expense data reported by Broadridge as of December 31, 2015 reflected the most recent fiscal year-end data available in Broadridge’s database at that time.
In connection with their review of fund management fees and total expenses, the Trustees also reviewed the costs of the services provided and the profits realized by Putnam Management and its affiliates from their contractual relationships with the funds. This information included trends
| |
| 18 Convertible Securities Fund |
in revenues, expenses and profitability of Putnam Management and its affiliates relating to the investment management, investor servicing and distribution services provided to the funds. In this regard, the Trustees also reviewed an analysis of Putnam Management’s revenues, expenses and profitability, allocated on a fund-by-fund basis, with respect to the funds’ management, distribution, and investor servicing contracts. For each fund, the analysis presented information about revenues, expenses and profitability for each of the agreements separately and for the agreements taken together on a combined basis. The Trustees concluded that, at current asset levels, the fee schedules in place represented reasonable compensation for the services being provided and represented an appropriate sharing between fund shareholders and Putnam Management of such economies of scale as may exist in the management of the Putnam funds at that time.
The information examined by the Trustees as part of their annual contract review for the Putnam funds included information regarding fees charged by Putnam Management and its affiliates to institutional clients such as defined benefit pension plans, college endowments, sub-advised third-party mutual funds, and the like. This information included comparisons of those fees with fees charged to the Putnam funds, as well as an assessment of the differences in the services provided to these different types of clients. The Trustees observed that the differences in fee rates between these clients and the Putnam funds are by no means uniform when examined by individual asset sectors, suggesting that differences in the pricing of investment management services to these types of clients may reflect, among other things, historical competitive forces operating in separate markets. The Trustees considered the fact that in many cases fee rates across different asset classes are higher on average for mutual funds than for institutional clients, as well as the differences between the services that Putnam Management provides to the Putnam funds and those that it provides to its other clients. The Trustees did not rely on these comparisons to any significant extent in concluding that the management fees paid by your fund are reasonable.
Investment performance
The quality of the investment process provided by Putnam Management represented a major factor in the Trustees’ evaluation of the quality of services provided by Putnam Management under your fund’s management contract. The Trustees were assisted in their review of the Putnam funds’ investment process and performance by the work of the investment oversight committees of the Trustees, which meet on a regular basis with the funds’ portfolio teams and with the Chief Investment Officer and other senior members of Putnam Management’s Investment Division throughout the year. The Trustees concluded that Putnam Management generally provides a high-quality investment process — based on the experience and skills of the individuals assigned to the management of fund portfolios, the resources made available to them, and in general Putnam Management’s ability to attract and retain high-quality personnel — but also recognized that this does not guarantee favorable investment results for every fund in every time period.
The Trustees considered that 2015 was a year of mixed performance results for the Putnam funds, with generally strong results for the international equity, global sector and global asset allocation funds, but generally disappointing results for the U.S. and small-cap equity, Spectrum and fixed income funds. They noted that the longer-term performance of the Putnam funds generally continued to be strong, exemplified by the fact that the Putnam funds were ranked by the Barron’s/Lipper Fund Families survey as the 18th-best performing mutual fund complex out of 58 complexes for the five-year period ended December 31, 2015. They also noted, however, the disappointing investment performance of some funds for periods ended December 31, 2015 and considered information provided by Putnam Management regarding the factors contributing to the underperformance and actions being taken to improve the performance of these particular funds. The Trustees indicated their intention to continue to monitor performance trends to assess the effectiveness of these efforts and to evaluate whether additional actions to address areas of underperformance are warranted.
For purposes of evaluating investment performance, the Trustees generally focus on a competitive industry ranking of each fund’s total net return over a one-year, three-year and five-year period. For a number of Putnam funds with relatively unique investment mandates for which meaningful competitive performance rankings are not considered to be available, the Trustees evaluated performance based on their total gross and net returns and, in most cases,
|
| Convertible Securities Fund 19 |
comparisons of those returns with the returns of selected investment benchmarks. In the case of your fund, the Trustees considered that its class A share cumulative total return performance at net asset value was in the following quartiles of its Lipper Inc. (“Lipper”) peer group (Lipper Convertible Securities Funds) for the one-year, three-year and five-year periods ended December 31, 2015 (the first quartile representing the best-performing funds and the fourth quartile the worst-performing funds):
| |
| One-year period | 4th |
|
| Three-year period | 3rd |
|
| Five-year period | 2nd |
|
Over the one-year, three-year and five-year periods ended December 31, 2015, there were 81, 72 and 59 funds, respectively, in your fund’s Lipper peer group. (When considering performance information, shareholders should be mindful that past performance is not a guarantee of future results.) The Trustees expressed concern about your fund’s fourth quartile performance over the one-year period ended December 31, 2015 and considered the circumstances that may have contributed to this disappointing performance. The Trustees considered Putnam Management’s observation that the fund’s underperformance over the one-year period was due in significant part to security selection within the healthcare and technology sectors.
The Trustees considered that Putnam Management remained confident in the fund’s portfolio managers. The Trustees also considered Putnam Management’s continued efforts to support fund performance through initiatives including structuring compensation for portfolio managers and research analysts to enhance accountability for fund performance, emphasizing accountability in the portfolio management process, and affirming its commitment to a fundamental-driven approach to investing. The Trustees noted further that Putnam Management continued to strengthen its fundamental research capabilities by adding new investment personnel.
As a general matter, the Trustees believe that cooperative efforts between the Trustees and Putnam Management represent the most effective way to address investment performance issues that may arise from time to time. The Trustees noted that investors in the Putnam funds have, in effect, placed their trust in the Putnam organization, under the oversight of the funds’ Trustees, to make appropriate decisions regarding the management of the funds. Based on past responsiveness of Putnam Management to Trustee concerns about investment performance, the Trustees concluded that it is preferable to seek change within Putnam Management to address performance shortcomings. In the Trustees’ view, the alternative of engaging a new investment adviser for an underperforming fund would entail significant disruptions and would not likely provide any greater assurance of improved investment performance.
Brokerage and soft-dollar allocations; investor servicing
The Trustees considered various potential benefits that Putnam Management may receive in connection with the services it provides under the management contract with your fund. These include benefits related to brokerage allocation and the use of soft dollars, whereby a portion of the commissions paid by a fund for brokerage may be used to acquire research services that are expected to be useful to Putnam Management in managing the assets of the fund and of other clients. Subject to policies established by the Trustees, soft dollars generated by these means are used primarily to acquire brokerage and research services (including third-party research and market data) that enhance Putnam Management’s investment capabilities and supplement Putnam Management’s internal research efforts. However, the Trustees noted that a portion of available soft dollars continues to be used to pay fund expenses. The Trustees indicated their continued intent to monitor regulatory and industry developments in this area with the assistance of their Brokerage Committee and also indicated their continued intent to monitor the allocation of the Putnam funds’ brokerage in order to ensure that the principle of seeking best price and execution remains paramount in the portfolio trading process.
Putnam Management may also receive benefits from payments that the funds make to Putnam Management’s affiliates for investor or distribution services. In conjunction with the annual review of your fund’s management and sub-management contracts, the Trustees reviewed your fund’s investor servicing agreement with Putnam Investor Services, Inc. (“PSERV”) and its distributor’s contracts and distribution plans with Putnam Retail Management Limited Partnership (“PRM”), both of which are affiliates of Putnam
| |
| 20 Convertible Securities Fund |
Management. The Trustees concluded that the fees payable by the funds to PSERV and PRM, as applicable, for such services are reasonable in relation to the nature and quality of such services, the fees paid by competitive funds, and the costs incurred by PSERV and PRM, as applicable, in providing such services.
|
| Convertible Securities Fund 21 |
Financial statements
These sections of the report, as well as the accompanying Notes, preceded by the Report of Independent Registered Public Accounting Firm, constitute the fund’s financial statements.
The fund’s portfolio lists all the fund’s investments and their values as of the last day of the reporting period. Holdings are organized by asset type/and industry sector, country, or state to show areas of concentration and/diversification.
Statement of assets and liabilities shows how the fund’s net assets and share price are determined. All investment and non-investment assets are added together. Any unpaid expenses and other liabilities are subtracted from this total. The result is divided by the number of shares to determine the net asset value per share, which is calculated separately for each class of shares. (For funds with preferred shares, the amount subtracted from total assets includes the liquidation preference of preferred shares.)
Statement of operations shows the fund’s net investment gain or loss. This is done by first adding up all the fund’s earnings — from dividends and interest income — and subtracting its operating expenses to determine net investment income (or loss). Then, any net gain or loss the fund realized on the sales of its holdings — as well as any unrealized gains or losses over the period — is added to or subtracted from the net investment result to determine the fund’s net gain or loss for the fiscal year.
Statement of changes in net assets shows how the fund’s net assets were affected by the fund’s net investment gain or loss, by distributions to shareholders, and by changes in the number of the fund’s shares. It lists distributions and their sources (net investment income or realized capital gains) over the current reporting period and the most recent fiscal year-end. The distributions listed here may not match the sources listed in the Statement of operations because the distributions are determined on a tax basis and may be paid in a different period from the one in which they were/earned.
Financial highlights provide an overview of the fund’s investment results, per-share distributions, expense ratios, net investment income ratios, and portfolio turnover in one summary table, reflecting the five most recent reporting periods. In a semiannual report, the highlights table also includes the current reporting period.
| |
| 22 Convertible Securities Fund |
Report of Independent Registered Public Accounting Firm
The Board of Trustees and Shareholders
Putnam Convertible Securities Fund:
We have audited the accompanying statement of assets and liabilities of Putnam Convertible Securities Fund (the fund), including the fund’s portfolio, as of October 31, 2016, and the related statement of operations for the year then ended, the statements of changes in net assets for each of the years in the two-year period then ended, and the financial highlights for each of the years or periods in the five-year period then ended. These financial statements and financial highlights are the responsibility of the fund’s management. Our responsibility is to express an opinion on these financial statements and financial highlights based on our audits.
We conducted our audits in accordance with the standards of the Public Company Accounting Oversight Board (United States). Those standards require that we plan and perform the audit to obtain reasonable assurance about whether the financial statements and financial highlights are free of material misstatement. An audit includes examining, on a test basis, evidence supporting the amounts and disclosures in the financial statements. Our procedures included confirmation of securities owned as of October 31, 2016, by correspondence with the custodian and brokers or by other appropriate auditing procedures. An audit also includes assessing the accounting principles used and significant estimates made by management, as well as evaluating the overall financial statement presentation. We believe that our audits provide a reasonable basis for our opinion.
In our opinion, the financial statements and financial highlights referred to above present fairly, in all material respects, the financial position of Putnam Convertible Securities Fund as of October 31, 2016, the results of its operations for the year then ended, the changes in its net assets for each of the years in the two-year period then ended and the financial highlights for each of the years or periods in the five-year period then ended, in conformity with U.S. generally accepted accounting principles.

Boston, Massachusetts
December 14, 2016
|
| Convertible Securities Fund 23 |
The fund’s portfolio 10/31/16
| | |
| | Principal | |
| CONVERTIBLE BONDS AND NOTES (63.3%)* | amount | Value |
|
| Automotive (1.4%) | | |
|
| Navistar International Corp. cv. sr. unsec. sub. bonds | | |
| 4.75%, 4/15/19 | $6,436,000 | $5,945,255 |
|
| Tesla Motors, Inc. cv. sr. unsec. sub. notes 1.25%, 3/1/21 | 4,045,000 | 3,534,319 |
|
| | | 9,479,574 |
|
| Biotechnology (3.6%) | | |
|
| ARIAD Pharmaceuticals, Inc. 144A cv. sr. unsec. notes | | |
| 3.625%, 6/15/19 | 3,520,000 | 4,239,400 |
|
| BioMarin Pharmaceutical, Inc. cv. sr. unsec. sub. notes | | |
| 1.50%, 10/15/20 | 5,439,000 | 6,336,435 |
|
| Emergent BioSolutions, Inc. cv. sr. unsec. unsub. bonds | | |
| 2.875%, 1/15/21 | 3,135,000 | 3,562,144 |
|
| Illumina, Inc. cv. sr. unsec. sub. notes zero %, 6/15/19 | 3,375,000 | 3,282,188 |
|
| Medicines Co. (The) cv. sr. unsec. notes 2.50%, 1/15/22 | 3,220,000 | 3,813,688 |
|
| Merrimack Pharmaceuticals, Inc. cv. sr. unsec. unsub. notes | | |
| 4.50%, 7/15/20 | 2,734,000 | 3,075,750 |
|
| | | 24,309,605 |
|
| Broadcasting (2.1%) | | |
|
| Liberty Media Corp. cv. sr. unsec. bonds 1.375%, 10/15/23 | 8,801,000 | 9,004,523 |
|
| Liberty Media Corp. 144A cv. sr. unsec. unsub. bonds | | |
| 2.25%, 9/30/46 | 5,100,000 | 5,243,438 |
|
| | | 14,247,961 |
|
| Cable television (1.7%) | | |
|
| DISH Network Corp. 144A cv. sr. unsec. bonds 3.375%, 8/15/26 | 10,072,000 | 11,538,735 |
|
| | | 11,538,735 |
|
| Capital goods (0.9%) | | |
|
| Dycom Industries, Inc. cv. sr. unsec. notes 0.75%, 9/15/21 | 5,590,000 | 5,988,288 |
|
| | | 5,988,288 |
|
| Commercial and consumer services (5.1%) | | |
|
| Euronet Worldwide, Inc. cv. sr. unsec. bonds 1.50%, 10/1/44 | 5,289,000 | 6,535,221 |
|
| Huron Consulting Group, Inc. cv. sr. unsec. unsub. notes | | |
| 1.25%, 10/1/19 | 5,506,000 | 5,388,998 |
|
| Macquarie Infrastructure Corp. cv. sr. unsec. unsub. notes | | |
| 2.00%, 10/1/23 | 7,639,000 | 7,672,421 |
|
| Priceline Group, Inc. (The) cv. sr. unsec. Bonds 0.90%, 9/15/21 | 2,485,000 | 2,657,397 |
|
| Priceline Group, Inc. (The) cv. sr. unsec. unsub. notes | | |
| 1.00%, 3/15/18 | 7,421,000 | 11,762,285 |
|
| | | 34,016,322 |
|
| Communications equipment (0.8%) | | |
|
| Ciena Corp. 144A cv. sr. unsec. notes 3.75%, 10/15/18 | 2,574,000 | 3,056,625 |
|
| Novatel Wireless, Inc. cv. sr. unsec. unsub. notes 5.50%, 6/15/20 | 2,166,000 | 2,036,040 |
|
| | | 5,092,665 |
|
| Computers (6.6%) | | |
|
| Akamai Technologies, Inc. cv. sr. unsec. bonds zero %, 2/15/19 | 2,944,000 | 3,094,880 |
|
| Avid Technology, Inc. cv. sr. unsec. notes 2.00%, 6/15/20 | 5,874,000 | 4,511,966 |
|
| Brocade Communications Systems, Inc. cv. company guaranty sr. | | |
| unsec. notes 1.375%, 1/1/20 | 5,460,000 | 5,412,225 |
|
| Citrix Systems, Inc. cv. sr. unsec. notes 0.50%, 4/15/19 | 7,595,000 | 8,520,641 |
|
| |
| 24 Convertible Securities Fund |
| | |
| | Principal | |
| CONVERTIBLE BONDS AND NOTES (63.3%)* cont. | amount | Value |
|
| Computers cont. | | |
|
| Electronics For Imaging, Inc. cv. sr. unsec. unsub. bonds | | |
| 0.75%, 9/1/19 | $6,125,000 | $6,477,188 |
|
| ServiceNow, Inc. cv. sr. unsec. unsub. bonds zero %, 11/1/18 | 3,395,000 | 4,428,353 |
|
| Synchronoss Technologies, Inc. cv. sr. unsec. notes 0.75%, 8/15/19 | 5,127,000 | 5,284,014 |
|
| Verint Systems, Inc. cv. sr. unsec. notes 1.50%, 6/1/21 | 6,329,000 | 5,965,083 |
|
| | | 43,694,350 |
|
| Conglomerates (0.8%) | | |
|
| Siemens Financieringsmaatschappij NV cv. company guaranty sr. | | |
| unsec. bonds 1.65%, 8/16/19 (Netherlands) | 4,750,000 | 5,292,925 |
|
| | | 5,292,925 |
|
| Construction (0.8%) | | |
|
| Cemex SAB de CV cv. unsec. sub. notes 3.75%, 3/15/18 (Mexico) | 4,340,000 | 5,047,963 |
|
| | | 5,047,963 |
|
| Consumer finance (0.3%) | | |
|
| Encore Capital Group, Inc. cv. company guaranty sr. unsec. bonds | | |
| 3.00%, 7/1/20 | 2,618,000 | 2,195,848 |
|
| | | 2,195,848 |
|
| Electronics (9.6%) | | |
|
| GT Advanced Technologies, Inc. cv. sr. unsec. sub. notes | | |
| 3.00%, 12/15/20 F | 2,944,000 | 294 |
|
| Inphi Corp. 144A cv. sr. unsec. notes 0.75%, 9/1/21 | 4,420,000 | 4,395,138 |
|
| Intel Corp. cv. jr. unsec. sub. notes 3.25%, 8/1/39 | 8,075,000 | 13,843,578 |
|
| Microchip Technology, Inc. cv. sr. unsec. sub. bonds | | |
| 1.625%, 2/15/25 | 11,697,000 | 14,518,901 |
|
| Micron Technology, Inc. cv. sr. unsec. bonds 3.00%, 11/15/43 | 6,270,000 | 5,529,356 |
|
| Micron Technology, Inc. cv. sr. unsec. bonds Ser. E, 1.625%, 2/15/33 | 2,198,000 | 3,586,861 |
|
| NXP Semiconductors NV cv. sr. unsec. bonds 1.00%, 12/1/19 | 8,229,000 | 9,442,778 |
|
| ON Semiconductor Corp. cv. company guaranty sr. unsec. unsub. | | |
| notes 1.00%, 12/1/20 | 8,095,000 | 8,079,822 |
|
| TTM Technologies, Inc. cv. sr. unsec. notes 1.75%, 12/15/20 | 2,645,000 | 3,907,988 |
|
| | | 63,304,716 |
|
| Energy (oil field) (0.5%) | | |
|
| SEACOR Holdings, Inc. cv. sr. unsec. unsub. bonds 2.50%, 12/15/27 | 3,108,000 | 3,053,610 |
|
| | | 3,053,610 |
|
| Entertainment (0.6%) | | |
|
| Live Nation Entertainment, Inc. cv. sr. unsec. bonds 2.50%, 5/15/19 | 3,738,000 | 4,055,730 |
|
| | | 4,055,730 |
|
| Financial (0.7%) | | |
|
| Radian Group, Inc. cv. sr. unsec. notes 2.25%, 3/1/19 | 3,380,000 | 4,368,650 |
|
| | | 4,368,650 |
|
| Health-care services (2.2%) | | |
|
| Brookdale Senior Living, Inc. cv. sr. unsec. unsub. notes | | |
| 2.75%, 6/15/18 | 4,072,000 | 3,962,565 |
|
| HealthSouth Corp. cv. sr. unsec. sub. notes 2.00%, 12/1/43 | 4,759,000 | 5,532,338 |
|
| Medidata Solutions, Inc. cv. sr. unsec. notes 1.00%, 8/1/18 | 4,533,000 | 4,974,968 |
|
| | | 14,469,871 |
|
| Media (1.0%) | | |
|
| Liberty Interactive, LLC 144A cv. sr. unsec. bonds 1.75%, 9/30/46 | 6,465,000 | 6,497,325 |
|
| | | 6,497,325 |
|
| Convertible Securities Fund 25 |
| | |
| | Principal | |
| CONVERTIBLE BONDS AND NOTES (63.3%)* cont. | amount | Value |
|
| Medical technology (2.0%) | | |
|
| China Medical Technologies, Inc. cv. sr. unsec. bonds Ser. CMT, | | |
| 4.00%, 8/15/17 (China) (In default) † F | $3,213,000 | $257,040 |
|
| China Medical Technologies, Inc. 144A cv. sr. unsec. notes 6.25%, | | |
| 12/15/16 (China) (In default) † F | 3,544,000 | 248,080 |
|
| Hologic, Inc. cv. sr. unsec. unsub. notes stepped-coupon 2.00% | | |
| (zero %, 3/1/18) 3/1/42 †† | 4,390,000 | 5,602,738 |
|
| Nevro Corp. cv. sr. unsec. unsub. notes 1.75%, 6/1/21 | 1,323,000 | 1,578,504 |
|
| Wright Medical Group, Inc. cv. sr. unsec. notes 2.00%, 2/15/20 | 5,606,000 | 5,735,639 |
|
| | | 13,422,001 |
|
| Oil and gas (2.7%) | | |
|
| Chesapeake Energy Corp. 144A cv. sr. unsec. bonds 5.50%, 9/15/26 | 7,451,000 | 6,994,626 |
|
| Oasis Petroleum, Inc. cv. sr. unsec. notes 2.625%, 9/15/23 | 2,894,000 | 3,217,766 |
|
| Stone Energy Corp. cv. company guaranty sr. unsec. sub. notes | | |
| 1.75%, 3/1/17 (In default) † | 5,345,000 | 3,307,219 |
|
| Whiting Petroleum Corp. cv. company guaranty sr. unsec. unsub. | | |
| notes 1.25%, 4/1/20 | 5,042,000 | 4,228,978 |
|
| | | 17,748,589 |
|
| Pharmaceuticals (3.6%) | | |
|
| Clovis Oncology, Inc. cv. sr. unsec. notes 2.50%, 9/15/21 | 3,595,000 | 3,053,503 |
|
| Impax Laboratories, Inc. cv. sr. unsec. notes 2.00%, 6/15/22 | 6,665,000 | 5,781,888 |
|
| Jazz Investments I, Ltd. cv. company guaranty sr. unsec. sub. | | |
| bonds 1.875%, 8/15/21 (Ireland) | 11,131,000 | 11,033,604 |
|
| Teligent, Inc. cv. sr. unsec. notes 3.75%, 12/15/19 | 4,570,000 | 4,221,538 |
|
| | | 24,090,533 |
|
| Real estate (2.4%) | | |
|
| Blackstone Mortgage Trust, Inc. cv. sr. unsec. unsub. notes | | |
| 5.25%, 12/1/18 R | 7,500,000 | 8,362,500 |
|
| Starwood Property Trust, Inc. cv. sr. unsec. unsub. notes | | |
| 4.00%, 1/15/19 R | 6,825,000 | 7,631,203 |
|
| | | 15,993,703 |
|
| Retail (0.5%) | | |
|
| GNC Holdings, Inc. 144A cv. company guaranty sr. unsec. notes | | |
| 1.50%, 8/15/20 | 3,868,000 | 3,017,040 |
|
| | | 3,017,040 |
|
| Semiconductor (3.8%) | | |
|
| Cypress Semiconductor Corp. 144A cv. sr. unsec. notes | | |
| 4.50%, 1/15/22 | 3,401,000 | 3,568,924 |
|
| Integrated Device Technology, Inc. 144A cv. sr. unsec. unsub. notes | | |
| 0.875%, 11/15/22 | 5,680,000 | 5,498,950 |
|
| Jazz US Holdings, Inc. cv. company guaranty sr. unsec. notes | | |
| 8.00%, 12/31/18 | 1,523,000 | 2,479,634 |
|
| Novellus Systems, Inc. cv. company guaranty sr. unsec. notes | | |
| 2.625%, 5/15/41 | 4,815,000 | 13,707,703 |
|
| | | 25,255,211 |
|
| Shipping (1.1%) | | |
|
| Atlas Air Worldwide Holdings, Inc. cv. sr. unsec. bonds | | |
| 2.25%, 6/1/22 | 1,790,000 | 1,728,469 |
|
| Scorpio Tankers, Inc. 144A cv. sr. unsec. sub. notes 2.375%, 7/1/19 | 7,484,000 | 5,524,128 |
|
| | | 7,252,597 |
| |
| 26 Convertible Securities Fund |
| | |
| | Principal | |
| CONVERTIBLE BONDS AND NOTES (63.3%)* cont. | amount | Value |
|
| Software (1.6%) | | |
|
| Red Hat, Inc. cv. sr. unsec. unsub. bonds 0.25%, 10/1/19 | $5,525,000 | $6,840,641 |
|
| Safeguard Scientifics, Inc. cv. sr. unsec. bonds 5.25%, 5/15/18 | 3,545,000 | 3,553,863 |
|
| | | 10,394,504 |
|
| Technology services (4.9%) | | |
|
| Fidelity National Financial, Inc. cv. sr. unsec. unsub. notes | | |
| 4.25%, 8/15/18 | 2,935,000 | 5,866,331 |
|
| j2 Global, Inc. cv. sr. unsec. notes 3.25%, 6/15/29 | 6,115,000 | 7,399,150 |
|
| Proofpoint, Inc. cv. sr. unsec. unsub. notes 0.75%, 6/15/20 | 4,877,000 | 5,846,304 |
|
| salesforce.com, Inc. cv. sr. unsec. unsub. notes 0.25%, 4/1/18 | 4,320,000 | 5,316,300 |
|
| Twitter, Inc. cv. sr. unsec. unsub. bonds 1.00%, 9/15/21 | 4,740,000 | 4,363,763 |
|
| Yahoo!, Inc. cv. sr. unsec. bonds zero %, 12/1/18 | 3,300,000 | 3,339,188 |
|
| | | 32,131,036 |
|
| Telecommunications (0.4%) | | |
|
| CalAmp Corp. cv. sr. unsec. notes 1.625%, 5/15/20 | 2,860,000 | 2,683,038 |
|
| Powerwave Technologies, Inc. cv. unsec. sub. notes 3.875%, | | |
| 10/1/27 (In default) F† | 5,121,000 | 512 |
|
| | | 2,683,550 |
|
| Tobacco (0.7%) | | |
|
| Vector Group, Ltd. cv. sr. unsec. sub. notes 1.75%, 4/15/20 | 4,110,000 | 4,585,219 |
|
| | | 4,585,219 |
|
| Transportation services (0.9%) | | |
|
| Echo Global Logistics, Inc. cv. sr. unsec. notes 2.50%, 5/1/20 | 6,286,000 | 5,743,833 |
|
| | | 5,743,833 |
|
| Total convertible bonds and notes (cost $405,766,580) | | $418,971,954 |
|
| CONVERTIBLE PREFERRED STOCKS (28.1%)* | Shares | Value |
|
| Automotive (0.9%) | | |
|
| Fiat Chrysler Automobiles NV Ser. FCAU, $7.875 cv. pfd. (Italy) | 88,298 | $6,193,222 |
|
| | | 6,193,222 |
|
| Banking (3.6%) | | |
|
| Bank of America Corp. Ser. L, 7.25% cv. pfd. | 6,060 | 7,431,075 |
|
| Wells Fargo & Co. Ser. L, 7.50% cv. pfd. | 12,618 | 16,466,490 |
|
| | | 23,897,565 |
|
| Consumer (0.5%) | | |
|
| Stanley Black & Decker, Inc. $6.25 cv. pfd. | 31,710 | 3,706,265 |
|
| | | 3,706,265 |
|
| Electric utilities (3.9%) | | |
|
| DTE Energy Co. $3.25 cv. pfd. † | 156,490 | 8,179,732 |
|
| Exelon Corp. $3.25 cv. pfd. | 219,668 | 10,478,164 |
|
| NextEra Energy, Inc. $3.06 cv. pfd. | 138,465 | 7,027,099 |
|
| | | 25,684,995 |
|
| Financial (0.9%) | | |
|
| AMG Capital Trust II $2.575 cv. pfd. | 115,790 | 5,963,185 |
|
| | | 5,963,185 |
|
| Food (1.3%) | | |
|
| Tyson Foods, Inc. $2.375 cv. pfd. | 111,228 | 8,591,251 |
|
| | | 8,591,251 |
|
| Convertible Securities Fund 27 |
| | |
| CONVERTIBLE PREFERRED STOCKS (28.1%)* cont. | Shares | Value |
|
| Health-care services (1.0%) | | |
|
| Anthem, Inc. $2.63 cv. pfd. | 149,899 | $6,334,732 |
|
| | | 6,334,732 |
|
| Investment banking/Brokerage (0.8%) | | |
|
| Mandatory Exchangeable Trust 144A $5.75 cv. pfd. | 40,044 | 5,002,697 |
|
| | | 5,002,697 |
|
| Manufacturing (0.8%) | | |
|
| Belden, Inc. $6.75 cv. pfd. | 57,581 | 5,558,294 |
|
| | | 5,558,294 |
|
| Oil and gas (1.5%) | | |
|
| Hess Corp. $2.00 cv. pfd. | 119,075 | 7,043,286 |
|
| Southwestern Energy Co. Ser. B, $3.125 cv. pfd. | 117,678 | 2,950,187 |
|
| | | 9,993,473 |
|
| Pharmaceuticals (4.7%) | | |
|
| Allergan PLC Ser. A, 5.50% cv. pfd. | 25,065 | 19,274,985 |
|
| Teva Pharmaceutical Industries, Ltd. 7.00% cv. pfd. (Israel) | 15,943 | 12,095,954 |
|
| | | 31,370,939 |
|
| Power producers (0.4%) | | |
|
| Dynegy, Inc. $7.00 cv. pfd. | 32,928 | 2,461,368 |
|
| | | 2,461,368 |
|
| Real estate (2.2%) | | |
|
| Alexandria Real Estate Equities, Inc. Ser. D, $1.75 cv. pfd. R | 265,512 | 9,247,278 |
|
| iStar, Inc. $2.25 cv. pfd. R | 106,950 | 5,361,404 |
|
| | | 14,608,682 |
|
| Regional Bells (0.8%) | | |
|
| Cincinnati Bell, Inc. Ser. B, $3.378 cum. cv. pfd. | 190 | 9,625 |
|
| Frontier Communications Corp. Ser. A, $11.125 cum. cv. pfd. | 61,615 | 5,141,002 |
|
| | | 5,150,627 |
|
| Telecommunications (4.8%) | | |
|
| American Tower Corp. $5.50 cv. pfd. R | 96,900 | 10,768,013 |
|
| Crown Castle International Corp. Ser. A, $4.50 cv. pfd. R | 67,432 | 7,265,798 |
|
| T-Mobile US, Inc. Ser. A, $2.75 cv. pfd. | 162,401 | 13,437,059 |
|
| | | 31,470,870 |
|
| Total convertible preferred stocks (cost $184,268,998) | | $185,988,165 |
|
| COMMON STOCKS (2.6%)* | Shares | Value |
|
| Alphabet, Inc. Class C † | 1,740 | $1,365,100 |
|
| Amazon.com, Inc. † | 1,625 | 1,283,458 |
|
| Comcast Corp. Class A | 25,785 | 1,594,029 |
|
| GT Advanced Technologies, Inc. F | 476 | 5 |
|
| Live Nation Entertainment, Inc. † | 97,130 | 2,687,587 |
|
| NVIDIA Corp. S | 141,555 | 10,073,039 |
|
| Total common stocks (cost $15,573,726) | | $17,003,218 |
|
| | | | |
| | Expiration | Strike | | |
| WARRANTS (—%)* † | date | price | Warrants | Value |
|
| GT Advanced Technologies, Inc. F | 3/17/19 | $0.00 | 487 | $5 |
|
| GT Advanced Technologies, Inc. F | 3/17/19 | 0.00 | 331 | 3 |
|
| Total warrants (cost $91,926) | | | | $8 |
|
| |
| 28 Convertible Securities Fund |
| | |
| SHORT-TERM INVESTMENTS (7.1%)* | Shares | Value |
|
| Putnam Cash Collateral Pool, LLC 0.74% d | 9,165,600 | $9,165,600 |
|
| Putnam Short Term Investment Fund 0.50% L | 37,483,736 | 37,483,736 |
|
| Total short-term investments (cost $46,649,336) | | $46,649,336 |
|
| TOTAL INVESTMENTS | | |
|
| Total investments (cost $652,350,566) | | $668,612,681 |
|
Notes to the fund’s portfolio
Unless noted otherwise, the notes to the fund’s portfolio are for the close of the fund’s reporting period, which ran from November 1, 2015 through October 31, 2016 (the reporting period). Within the following notes to the portfolio, references to “ASC 820” represent Accounting Standards Codification 820 Fair Value Measurements and Disclosures and references to “OTC”, if any, represent over-the-counter.
* Percentages indicated are based on net assets of $661,632,264.
† This security is non-income-producing.
†† The interest rate and date shown parenthetically represent the new interest rate to be paid and the date the fund will begin accruing interest at this rate.
d Affiliated company. See Notes 1 and 5 to the financial statements regarding securities lending. The rate quoted in the security description is the annualized 7-day yield of the fund at the close of the reporting period.
F This security is valued by Putnam Management at fair value following procedures approved by the Trustees. Securities may be classified as Level 2 or Level 3 for ASC 820 based on the securities’ valuation inputs (Note 1).
L Affiliated company (Note 5). The rate quoted in the security description is the annualized 7-day yield of the fund at the close of the reporting period.
R Real Estate Investment Trust.
S Security on loan, in part or in entirety, at the close of the reporting period (Note 1).
Debt obligations are considered secured unless otherwise indicated.
144A after the name of an issuer represents securities exempt from registration under Rule 144A under the Securities Act of 1933, as amended. These securities may be resold in transactions exempt from registration, normally to qualified institutional buyers.
The dates shown on debt obligations are the original maturity dates.
|
| Convertible Securities Fund 29 |
ASC 820 establishes a three-level hierarchy for disclosure of fair value measurements. The valuation hierarchy is based upon the transparency of inputs to the valuation of the fund’s investments. The three levels are defined as follows:
Level 1: Valuations based on quoted prices for identical securities in active markets.
Level 2: Valuations based on quoted prices in markets that are not active or for which all significant inputs are observable, either directly or indirectly.
Level 3: Valuations based on inputs that are unobservable and significant to the fair value measurement.
The following is a summary of the inputs used to value the fund’s net assets as of the close of the reporting period:
| | | |
| | | Valuation inputs |
|
| Investments in securities: | Level 1 | Level 2 | Level 3 |
|
| Common stocks *: | | | |
|
| Communication services | $1,594,029 | $— | $— |
|
| Consumer cyclicals | 3,971,045 | — | — |
|
| Technology | 11,438,139 | — | 5 |
|
| Total common stocks | 17,003,213 | — | 5 |
| | | | |
| Convertible bonds and notes | — | 418,466,028 | 505,926 |
|
| Convertible preferred stocks | 17,020,572 | 168,967,593 | — |
|
| Warrants | — | — | 8 |
|
| Short-term investments | 37,483,736 | 9,165,600 | — |
|
| Totals by level | $71,507,521 | $596,599,221 | $505,939 |
* Common stock classifications are presented at the sector level, which may differ from the fund’s portfolio presentation.
Transfers between Level 1 and Level 2 during the reporting period, totaling $19,771,790, are the result of changing to a pricing service as the source for the securities prices. Transfers are accounted for using the end of period pricing valuation method.
At the start and close of the reporting period, Level 3 investments in securities represented less than 1% of the fund’s net assets and were not considered a significant portion of the fund’s portfolio.
The accompanying notes are an integral part of these financial statements.
|
| 30 Convertible Securities Fund |
Statement of assets and liabilities 10/31/16
| |
| ASSETS | |
|
| Investment in securities, at value, including $9,058,668 of securities on loan (Note 1): | |
| Unaffiliated issuers (identified cost $605,701,230) | $621,963,345 |
| Affiliated issuers (identified cost $46,649,336) (Notes 1 and 5) | 46,649,336 |
|
| Dividends, interest and other receivables | 2,708,663 |
|
| Receivable for shares of the fund sold | 669,526 |
|
| Receivable for investments sold | 2,129,844 |
|
| Prepaid assets | 39,885 |
|
| Total assets | 674,160,599 |
| |
| LIABILITIES | |
|
| Payable for investments purchased | 1,069,754 |
|
| Payable for shares of the fund repurchased | 1,266,026 |
|
| Payable for compensation of Manager (Note 2) | 355,937 |
|
| Payable for custodian fees (Note 2) | 8,977 |
|
| Payable for investor servicing fees (Note 2) | 161,282 |
|
| Payable for Trustee compensation and expenses (Note 2) | 250,548 |
|
| Payable for administrative services (Note 2) | 1,244 |
|
| Payable for distribution fees (Note 2) | 143,175 |
|
| Collateral on securities loaned, at value (Note 1) | 9,165,600 |
|
| Other accrued expenses | 105,792 |
|
| Total liabilities | 12,528,335 |
| | |
| Net assets | $661,632,264 |
|
| REPRESENTED BY | |
|
| Paid-in capital (Unlimited shares authorized) (Notes 1 and 4) | $653,949,723 |
|
| Undistributed net investment income (Note 1) | 12,232,279 |
|
| Accumulated net realized loss on investments (Note 1) | (20,811,853) |
|
| Net unrealized appreciation of investments | 16,262,115 |
|
| Total — Representing net assets applicable to capital shares outstanding | $661,632,264 |
|
(Continued on next page)
|
| Convertible Securities Fund 31 |
Statement of assets and liabilities cont.
| |
| COMPUTATION OF NET ASSET VALUE AND OFFERING PRICE | |
|
| Net asset value and redemption price per class A share | |
| ($404,100,855 divided by 17,920,629 shares) | $22.55 |
|
| Offering price per class A share (100/94.25 of $22.55)* | $23.93 |
|
| Net asset value and offering price per class B share ($9,017,741 divided by 408,101 shares)** | $22.10 |
|
| Net asset value and offering price per class C share ($50,826,538 divided by 2,280,553 shares)** | $22.29 |
|
| Net asset value, offering price and redemption price per class I share | |
| ($9,665 divided by 429 shares)† | $22.55 |
|
| Net asset value and redemption price per class M share ($3,590,233 divided by 160,909 shares) | $22.31 |
|
| Offering price per class M share (100/96.50 of $22.31)* | $23.12 |
|
| Net asset value, offering price and redemption price per class R share | |
| ($4,897,646 divided by 218,166 shares) | $22.45 |
|
| Net asset value, offering price and redemption price per class Y share | |
| ($189,189,586 divided by 8,393,082 shares) | $22.54 |
|
*On single retail sales of less than $50,000. On sales of $50,000 or more the offering price is reduced.
**Redemption price per share is equal to net asset value less any applicable contingent deferred sales charge.
†Net asset value may not recalculate due to rounding of fractional shares.
The accompanying notes are an integral part of these financial statements.
| |
| 32 Convertible Securities Fund |
Statement of operations Year ended 10/31/16
| |
| INVESTMENT INCOME | |
|
| Dividends (net of foreign tax of $125,202) | $11,341,078 |
|
| Interest (including interest income of $125,534 from investments in affiliated issuers) (Note 5) | 7,484,622 |
|
| Securities lending (net of expenses) (Notes 1 and 5) | 8,427 |
|
| Total investment income | 18,834,127 |
|
| EXPENSES | |
|
| Compensation of Manager (Note 2) | 4,400,828 |
|
| Investor servicing fees (Note 2) | 1,097,646 |
|
| Custodian fees (Note 2) | 15,131 |
|
| Trustee compensation and expenses (Note 2) | 53,884 |
|
| Distribution fees (Note 2) | 1,796,900 |
|
| Administrative services (Note 2) | 19,541 |
|
| Other | 322,437 |
|
| Fees waived and reimbursed by Manager (Note 2) | (11,226) |
|
| Total expenses | 7,695,141 |
|
| Expense reduction (Note 2) | (1,754) |
| |
|
| Net expenses | 7,693,387 |
| | |
| Net investment income | 11,140,740 |
|
| Net realized loss on investments (Notes 1 and 3) | (5,835,246) |
|
| Net unrealized depreciation of investments during the year | (678,068) |
|
| Net loss on investments | (6,513,314) |
| |
| Net increase in net assets resulting from operations | $4,627,426 |
|
The accompanying notes are an integral part of these financial statements.
|
| Convertible Securities Fund 33 |
Statement of changes in net assets
| | |
| DECREASE IN NET ASSETS | Year ended 10/31/16 | Year ended 10/31/15 |
|
| Operations | | |
|
| Net investment income | $11,140,740 | $9,972,115 |
|
| Net realized gain (loss) on investments | | |
| and foreign currency transactions | (5,835,246) | 41,140,285 |
|
| Net unrealized depreciation of investments and assets | | |
| and liabilities in foreign currencies | (678,068) | (78,014,393) |
|
| Net increase (decrease) in net assets resulting | | |
| from operations | 4,627,426 | (26,901,993) |
|
| Distributions to shareholders (Note 1): | | |
| From ordinary income | | |
| Net investment income | | |
|
| Class A | (9,161,647) | (11,770,478) |
|
| Class B | (140,515) | (171,303) |
|
| Class C | (813,337) | (1,027,055) |
|
| Class I | (237) | (169) |
|
| Class M | (60,684) | (70,197) |
|
| Class R | (90,919) | (119,195) |
|
| Class Y | (4,806,908) | (6,766,999) |
|
| From net realized long-term gain on investments | | |
| Class A | (18,198,242) | (23,443,814) |
|
| Class B | (417,431) | (543,196) |
|
| Class C | (2,554,123) | (3,033,358) |
|
| Class I | (342) | — |
|
| Class M | (143,679) | (185,973) |
|
| Class R | (181,132) | (266,502) |
|
| Class Y | (8,615,448) | (11,391,059) |
|
| Increase (decrease) from capital share transactions (Note 4) | (168,822,982) | 6,463,443 |
|
| Total decrease in net assets | (209,380,200) | (79,227,848) |
|
| NET ASSETS | | |
|
| Beginning of year | 871,012,464 | 950,240,312 |
|
| End of year (including undistributed net investment income | | |
| of $12,232,279 and $11,692,015, respectively) | $661,632,264 | $871,012,464 |
The accompanying notes are an integral part of these financial statements.
| |
| 34 Convertible Securities Fund |
|
| This page left blank intentionally. |
|
| Convertible Securities Fund 35 |
Financial highlights (For a common share outstanding throughout the period)
| | | | | | | | | | | | | | |
| | INVESTMENT OPERATIONS | | | LESS DISTRIBUTIONS | | | | | RATIOS AND SUPPLEMENTAL DATA | |
| |
|
| | | | | | | | | | | | | Ratio | Ratio of net | |
| | Net asset | | Net realized | | | From | | | | | | of expenses | investment | |
| | value, | | and unrealized | Total from | From | net realized | | | Net asset | Total return | Net assets, | to average | income (loss) | Portfolio |
| | beginning | Net investment | gain (loss) | investment | net investment | gain on | Total | Redemption | value, end | at net asset | end of period | net assets | to average | turnover |
| Period ended | of period | income (loss) a | on investments | operations | income | investments | distributions | fees | of period | value (%) b | (in thousands) | (%) c | net assets (%) | (%) |
|
| Class A | | | | | | | | | | | | | | |
|
| October 31, 2016 | $23.37 | .35 | .17 | .52 | (.49) | (.85) | (1.34) | — | $22.55 | 2.49 | $404,101 | 1.09d | 1.59d | 49 |
|
| October 31, 2015 | 25.60 | .26 | (.93) | (.67) | (.52) | (1.04) | (1.56) | — | 23.37 | (2.86) | 517,495 | 1.06 | 1.04 | 67 |
|
| October 31, 2014 | 23.57 | .18 | 2.42 | 2.60 | (.57) | — | (.57) | — | 25.60 | 11.10 | 578,716 | 1.06 | .72 | 63 |
|
| October 31, 2013 | 20.09 | .37 | 3.71 | 4.08 | (.60) | — | (.60) | —e | 23.57 | 20.62 | 556,643 | 1.08 | 1.69 | 72 |
|
| October 31, 2012 | 18.97 | .36 | 1.33 | 1.69 | (.57) | — | (.57) | —e | 20.09 | 9.07 | 466,910 | 1.11 | 1.87 | 59 |
|
| Class B | | | | | | | | | | | | | | |
|
| October 31, 2016 | $22.93 | .18 | .15 | .33 | (.31) | (.85) | (1.16) | — | $22.10 | 1.72 | $9,018 | 1.84d | .84d | 49 |
|
| October 31, 2015 | 25.13 | .07 | (.90) | (.83) | (.33) | (1.04) | (1.37) | — | 22.93 | (3.55) | 11,374 | 1.81 | .29 | 67 |
|
| October 31, 2014 | 23.15 | (.01) | 2.38 | 2.37 | (.39) | — | (.39) | — | 25.13 | 10.27 | 13,228 | 1.81 | (.04) | 63 |
|
| October 31, 2013 | 19.75 | .20 | 3.64 | 3.84 | (.44) | — | (.44) | —e | 23.15 | 19.68 | 12,009 | 1.83 | .95 | 72 |
|
| October 31, 2012 | 18.66 | .21 | 1.30 | 1.51 | (.42) | — | (.42) | —e | 19.75 | 8.22 | 10,315 | 1.86 | 1.10 | 59 |
|
| Class C | | | | | | | | | | | | | | |
|
| October 31, 2016 | $23.11 | .18 | .16 | .34 | (.31) | (.85) | (1.16) | — | $22.29 | 1.72 | $50,827 | 1.84d | .84d | 49 |
|
| October 31, 2015 | 25.32 | .07 | (.91) | (.84) | (.33) | (1.04) | (1.37) | — | 23.11 | (3.54) | 72,536 | 1.81 | .30 | 67 |
|
| October 31, 2014 | 23.33 | (.01) | 2.39 | 2.38 | (.39) | — | (.39) | — | 25.32 | 10.27 | 73,451 | 1.81 | (.06) | 63 |
|
| October 31, 2013 | 19.90 | .20 | 3.67 | 3.87 | (.44) | — | (.44) | —e | 23.33 | 19.68 | 50,931 | 1.83 | .93 | 72 |
|
| October 31, 2012 | 18.79 | .21 | 1.32 | 1.53 | (.42) | — | (.42) | —e | 19.90 | 8.24 | 38,875 | 1.86 | 1.10 | 59 |
|
| Class I | | | | | | | | | | | | | | |
|
| October 31, 2016 | $23.38 | .43 | .15 | .58 | (.56) | (.85) | (1.41) | — | $22.55 | 2.87 | $10 | .69d | 1.95d | 49 |
|
| October 31, 2015† | 25.33 | .25 | (1.77) | (1.52) | (.43) | — | (.43) | — | 23.38 | (6.05) * | 9 | .45* | .98* | 67 |
|
| Class M | | | | | | | | | | | | | | |
|
| October 31, 2016 | $23.14 | .23 | .16 | .39 | (.37) | (.85) | (1.22) | — | $22.31 | 1.95 | $3,590 | 1.59d | 1.07d | 49 |
|
| October 31, 2015 | 25.35 | .13 | (.91) | (.78) | (.39) | (1.04) | (1.43) | — | 23.14 | (3.32) | 3,951 | 1.56 | .54 | 67 |
|
| October 31, 2014 | 23.35 | .05 | 2.40 | 2.45 | (.45) | — | (.45) | — | 25.35 | 10.54 | 4,583 | 1.56 | .21 | 63 |
|
| October 31, 2013 | 19.91 | .26 | 3.67 | 3.93 | (.49) | — | (.49) | —e | 23.35 | 20.01 | 3,885 | 1.58 | 1.20 | 72 |
|
| October 31, 2012 | 18.81 | .26 | 1.31 | 1.57 | (.47) | — | (.47) | —e | 19.91 | 8.49 | 3,406 | 1.61 | 1.36 | 59 |
|
| Class R | | | | | | | | | | | | | | |
|
| October 31, 2016 | $23.28 | .29 | .16 | .45 | (.43) | (.85) | (1.28) | — | $22.45 | 2.21 | $4,898 | 1.34d | 1.32d | 49 |
|
| October 31, 2015 | 25.50 | .20 | (.93) | (.73) | (.45) | (1.04) | (1.49) | — | 23.28 | (3.09) | 4,972 | 1.31 | .79 | 67 |
|
| October 31, 2014 | 23.48 | .12 | 2.41 | 2.53 | (.51) | — | (.51) | — | 25.50 | 10.83 | 6,569 | 1.31 | .46 | 63 |
|
| October 31, 2013 | 20.02 | .31 | 3.70 | 4.01 | (.55) | — | (.55) | —e | 23.48 | 20.30 | 5,617 | 1.33 | 1.43 | 72 |
|
| October 31, 2012 | 18.91 | .31 | 1.32 | 1.63 | (.52) | — | (.52) | —e | 20.02 | 8.78 | 4,059 | 1.36 | 1.61 | 59 |
|
| Class Y | | | | | | | | | | | | | | |
|
| October 31, 2016 | $23.37 | .40 | .17 | .57 | (.55) | (.85) | (1.40) | — | $22.54 | 2.71 | $189,190 | .84d | 1.84d | 49 |
|
| October 31, 2015 | 25.59 | .32 | (.92) | (.60) | (.58) | (1.04) | (1.62) | — | 23.37 | (2.57) | 260,676 | .81 | 1.30 | 67 |
|
| October 31, 2014 | 23.56 | .24 | 2.42 | 2.66 | (.63) | — | (.63) | — | 25.59 | 11.38 | 273,693 | .81 | .95 | 63 |
|
| October 31, 2013 | 20.08 | .42 | 3.72 | 4.14 | (.66) | — | (.66) | —e | 23.56 | 20.93 | 196,399 | .83 | 1.89 | 72 |
|
| October 31, 2012 | 18.97 | .41 | 1.32 | 1.73 | (.62) | — | (.62) | —e | 20.08 | 9.28 | 106,584 | .86 | 2.12 | 59 |
See notes to financial highlights at the end of this section.
The accompanying notes are an integral part of these financial statements.
| |
| 36 Convertible Securities Fund | Convertible Securities Fund 37 |
Financial highlights cont.
* Not annualized.
† For the period March 3, 2015 (commencement of operations) to October 31, 2015.
a Per share net investment income (loss) has been determined on the basis of the weighted average number of shares outstanding during the period.
b Total return assumes dividend reinvestment and does not reflect the effect of sales charges.
c Includes amounts paid through expense offset and/or brokerage/service arrangements, if any (Note 2). Also excludes acquired fund fees and expenses, if any.
d Reflects a voluntary waiver of certain fund expenses in effect during the period. As a result of such waivers, the expenses of each class reflect a reduction of less than 0.01% as a percentage of average net assets (Note 2).
e Amount represents less than $0.01 per share.
The accompanying notes are an integral part of these financial statements.
| |
| 38 Convertible Securities Fund |
Notes to financial statements 10/31/16
Within the following Notes to financial statements, references to “State Street” represent State Street Bank and Trust Company, references to “the SEC” represent the Securities and Exchange Commission, references to “Putnam Management” represent Putnam Investment Management, LLC, the fund’s manager, an indirect wholly-owned subsidiary of Putnam Investments, LLC and references to “OTC”, if any, represent over-the-counter. Unless otherwise noted, the “reporting period” represents the period from November 1, 2015 through October 31, 2016.
Putnam Convertible Securities Fund (the fund) is a Massachusetts business trust, which is registered under the Investment Company Act of 1940, as amended, as a diversified open-end management investment company. The goal of the fund is to seek, with equal emphasis, current income and capital appreciation. The fund’s secondary goal is conservation of capital. The fund invests mainly in convertible securities of U.S. companies. Under normal circumstances, the fund invests at least 80% of the fund’s net assets in convertible securities. This policy may be changed only after 60 days’ notice to shareholders. Convertible securities combine the investment characteristics of bonds and common stocks. Convertible securities include bonds, preferred stocks and other instruments that can be converted into or exchanged for common stock or equivalent value. A significant portion of the convertible securities the fund buys are below-investment-grade (sometimes referred to as “junk bonds”). The convertible bonds the fund buys usually have intermediate-to long-term stated maturities (three years or longer), but often contain “put” features, which allow bondholders to sell the bond back to the company under specified circumstances, that result in shorter effective maturities. When deciding whether to buy or sell investments, Putnam Management may consider, among other factors: (i) a security’s structural features, such as its position in a company’s capital structure and “put” and “call” features (a company’s right to repurchase the security under specified circumstances is a “call” feature); (ii) credit and prepayment risks; and (iii) with respect to a company’s common stock underlying a convertible security, the stock’s valuation and the company’s financial strength, growth potential, competitive position in its industry, projected future earnings, cash flows and dividends.
The fund offers class A, class B, class C, class I, class M, class R and class Y shares. Class A and class M shares are sold with a maximum front-end sales charge of 5.75% and 3.50%, respectively. Class A shares generally are not subject to a contingent deferred sales charge, and class I, class M, class R and class Y shares are not subject to a contingent deferred sales charge. Class B shares, which convert to class A shares after approximately eight years, are not subject to a front-end sales charge and are subject to a contingent deferred sales charge if those shares are redeemed within six years of purchase. Class C shares are subject to a one-year 1.00% contingent deferred sales charge and do not convert to class A shares. Class R shares, which are not available to all investors, are sold at net asset value. The expenses for class A, class B, class C, class M and class R shares may differ based on the distribution fee of each class, which is identified in Note 2. Class I and class Y shares, which are sold at net asset value, are generally subject to the same expenses as class A, class B, class C, class M and class R shares, but do not bear a distribution fee and in the case of class I shares, bear a lower investor servicing fee, which is identified in Note 2. Class I and class Y shares are not available to all investors.
In the normal course of business, the fund enters into contracts that may include agreements to indemnify another party under given circumstances. The fund’s maximum exposure under these arrangements is unknown as this would involve future claims that may be, but have not yet been, made against the fund. However, the fund’s management team expects the risk of material loss to be remote.
The fund has entered into contractual arrangements with an investment adviser, administrator, distributor, shareholder servicing agent and custodian, who each provide services to the fund. Unless expressly stated otherwise, shareholders are not parties to, or intended beneficiaries of these contractual arrangements, and these contractual arrangements are not intended to create any shareholder right to enforce them against the service providers or to seek any remedy under them against the service providers, either directly or on behalf of the fund.
Under the fund’s Declaration of Trust, any claims asserted against or on behalf of the Putnam Funds, including claims against Trustees and Officers, must be brought in state and federal courts located within the Commonwealth of Massachusetts.
Note 1: Significant accounting policies
The following is a summary of significant accounting policies consistently followed by the fund in the preparation of its financial statements. The preparation of financial statements is in conformity with accounting principles generally accepted in the United States of America and requires management to make estimates and assumptions that affect the reported amounts of assets and liabilities in the financial statements and the reported amounts of increases and decreases in net assets from operations. Actual results could differ from those
|
| Convertible Securities Fund 39 |
estimates. Subsequent events after the Statement of assets and liabilities date through the date that the financial statements were issued have been evaluated in the preparation of the financial statements.
Investment income, realized and unrealized gains and losses and expenses of the fund are borne pro-rata based on the relative net assets of each class to the total net assets of the fund, except that each class bears expenses unique to that class (including the distribution fees applicable to such classes). Each class votes as a class only with respect to its own distribution plan or other matters on which a class vote is required by law or determined by the Trustees. If the fund were liquidated, shares of each class would receive their pro-rata share of the net assets of the fund. In addition, the Trustees declare separate dividends on each class of shares.
Security valuation Portfolio securities and other investments are valued using policies and procedures adopted by the Board of Trustees. The Trustees have formed a Pricing Committee to oversee the implementation of these procedures and have delegated responsibility for valuing the fund’s assets in accordance with these procedures to Putnam Management. Putnam Management has established an internal Valuation Committee that is responsible for making fair value determinations, evaluating the effectiveness of the pricing policies of the fund and reporting to the Pricing Committee.
Investments for which market quotations are readily available are valued at the last reported sales price on their principal exchange, or official closing price for certain markets, and are classified as Level 1 securities under Accounting Standards Codification 820 Fair Value Measurements and Disclosures (ASC 820). If no sales are reported, as in the case of some securities that are traded OTC, a security is valued at its last reported bid price and is generally categorized as a Level 2 security.
Investments in open-end investment companies (excluding exchange-traded funds), if any, which can be classified as Level 1 or Level 2 securities, are valued based on their net asset value. The net asset value of such investment companies equals the total value of their assets less their liabilities and divided by the number of their outstanding shares.
Many securities markets and exchanges outside the U.S. close prior to the scheduled close of the New York Stock Exchange and therefore the closing prices for securities in such markets or on such exchanges may not fully reflect events that occur after such close but before the scheduled close of the New York Stock Exchange. Accordingly, on certain days, the fund will fair value certain foreign equity securities taking into account multiple factors including movements in the U.S. securities markets, currency valuations and comparisons to the valuation of American Depository Receipts, exchange-traded funds and futures contracts. The foreign equity securities, which would generally be classified as Level 1 securities, will be transferred to Level 2 of the fair value hierarchy when they are valued at fair value. The number of days on which fair value prices will be used will depend on market activity and it is possible that fair value prices will be used by the fund to a significant extent. Securities quoted in foreign currencies, if any, are translated into U.S. dollars at the current exchange rate. Short-term securities with remaining maturities of 60 days or less are valued using an independent pricing service approved by the Trustees, and are classified as Level 2 securities.
To the extent a pricing service or dealer is unable to value a security or provides a valuation that Putnam Management does not believe accurately reflects the security’s fair value, the security will be valued at fair value by Putnam Management in accordance with policies and procedures approved by the Trustees. Certain investments, including certain restricted and illiquid securities and derivatives, are also valued at fair value following procedures approved by the Trustees. These valuations consider such factors as significant market or specific security events such as interest rate or credit quality changes, various relationships with other securities, discount rates, U.S. Treasury, U.S. swap and credit yields, index levels, convexity exposures, recovery rates, sales and other multiples and resale restrictions. These securities are classified as Level 2 or as Level 3 depending on the priority of the significant inputs.
To assess the continuing appropriateness of fair valuations, the Valuation Committee reviews and affirms the reasonableness of such valuations on a regular basis after considering all relevant information that is reasonably available. Such valuations and procedures are reviewed periodically by the Trustees. The fair value of securities is generally determined as the amount that the fund could reasonably expect to realize from an orderly disposition of such securities over a reasonable period of time. By its nature, a fair value price is a good faith estimate of the value of a security in a current sale and does not reflect an actual market price, which may be different by a material amount.
Security transactions and related investment income Security transactions are recorded on the trade date (the date the order to buy or sell is executed). Gains or losses on securities sold are determined on the identified cost basis.
| |
| 40 Convertible Securities Fund |
Interest income, net of any applicable withholding taxes, is recorded on the accrual basis. Dividend income, net of any applicable withholding taxes, is recognized on the ex-dividend date except that certain dividends from foreign securities, if any, are recognized as soon as the fund is informed of the ex-dividend date. Non-cash dividends, if any, are recorded at the fair value of the securities received. Dividends representing a return of capital or capital gains, if any, are reflected as a reduction of cost and/or as a realized gain.
All premiums/discounts are amortized/accreted on a yield-to-maturity basis.
Foreign currency translation The accounting records of the fund are maintained in U.S. dollars. The fair value of foreign securities, currency holdings, and other assets and liabilities is recorded in the books and records of the fund after translation to U.S. dollars based on the exchange rates on that day. The cost of each security is determined using historical exchange rates. Income and withholding taxes are translated at prevailing exchange rates when earned or incurred. The fund does not isolate that portion of realized or unrealized gains or losses resulting from changes in the foreign exchange rate on investments from fluctuations arising from changes in the market prices of the securities. Such gains and losses are included with the net realized and unrealized gain or loss on investments. Net realized gains and losses on foreign currency transactions represent net realized exchange gains or losses on closed forward currency contracts, disposition of foreign currencies, currency gains and losses realized between the trade and settlement dates on securities transactions and the difference between the amount of investment income and foreign withholding taxes recorded on the fund’s books and the U.S. dollar equivalent amounts actually received or paid. Net unrealized appreciation and depreciation of assets and liabilities in foreign currencies arise from changes in the value of open forward currency contracts and assets and liabilities other than investments at the period end, resulting from changes in the exchange rate.
Securities lending The fund may lend securities, through its agent, to qualified borrowers in order to earn additional income. The loans are collateralized by cash in an amount at least equal to the fair value of the securities loaned. The fair value of securities loaned is determined daily and any additional required collateral is allocated to the fund on the next business day. The remaining maturities of the securities lending transactions are considered overnight and continuous. The risk of borrower default will be borne by the fund’s agent; the fund will bear the risk of loss with respect to the investment of the cash collateral. Income from securities lending, net of expenses, is included in investment income on the Statement of operations. Cash collateral is invested in Putnam Cash Collateral Pool, LLC, a limited liability company managed by an affiliate of Putnam Management. Investments in Putnam Cash Collateral Pool, LLC are valued at its closing net asset value each business day. There are no management fees charged to Putnam Cash Collateral Pool, LLC. At the close of the reporting period, the fund received cash collateral of $9,165,600 and the value of securities loaned amounted to $9,058,668.
Interfund lending The fund, along with other Putnam funds, may participate in an interfund lending program pursuant to an exemptive order issued by the SEC. This program allows the fund to borrow from or lend to other Putnam funds that permit such transactions. Interfund lending transactions are subject to each fund’s investment policies and borrowing and lending limits. Interest earned or paid on the interfund lending transaction will be based on the average of certain current market rates. During the reporting period, the fund did not utilize the program.
Lines of credit The fund participates, along with other Putnam funds, in a $317.5 million unsecured committed line of credit and a $235.5 million unsecured uncommitted line of credit, both provided by State Street. Prior to September 22, 2016, the fund participated in a $392.5 million syndicated unsecured committed line of credit provided by State Street ($292.5 million) and Northern Trust Company ($100 million) and the same unsecured uncommitted line of credit. Borrowings may be made for temporary or emergency purposes, including the funding of shareholder redemption requests and trade settlements. Interest is charged to the fund based on the fund’s borrowing at a rate equal to the higher of (1) the Federal Funds rate and (2) the overnight LIBOR plus 1.25% for the committed line of credit and the Federal Funds rate plus 1.30% for the uncommitted line of credit. A closing fee equal to 0.04% of the committed line of credit plus a $25,000 flat fee (0.04% prior to September 22, 2016) and 0.04% of the uncommitted line of credit has been paid by the participating funds. In addition, a commitment fee of 0.21% (0.16% prior to September 22, 2016) per annum on any unutilized portion of the committed line of credit is allocated to the participating funds based on their relative net assets and paid quarterly. During the reporting period, the fund had no borrowings against these arrangements.
Federal taxes It is the policy of the fund to distribute all of its taxable income within the prescribed time period and otherwise comply with the provisions of the Internal Revenue Code of 1986, as amended (the Code), applicable to regulated investment companies. It is also the intention of the fund to distribute an amount sufficient to avoid imposition of any excise tax under Section 4982 of the Code.
|
| Convertible Securities Fund 41 |
The fund is subject to the provisions of Accounting Standards Codification 740 Income Taxes (ASC 740). ASC 740 sets forth a minimum threshold for financial statement recognition of the benefit of a tax position taken or expected to be taken in a tax return. The fund did not have a liability to record for any unrecognized tax benefits in the accompanying financial statements. No provision has been made for federal taxes on income, capital gains or unrealized appreciation on securities held nor for excise tax on income and capital gains. Each of the fund’s federal tax returns for the prior three fiscal years remains subject to examination by the Internal Revenue Service.
The fund may also be subject to taxes imposed by governments of countries in which it invests. Such taxes are generally based on either income or gains earned or repatriated. The fund accrues and applies such taxes to net investment income, net realized gains and net unrealized gains as income and/or capital gains are earned. In some cases, the fund may be entitled to reclaim all or a portion of such taxes, and such reclaim amounts, if any, are reflected as an asset on the fund’s books. In many cases, however, the fund may not receive such amounts for an extended period of time, depending on the country of investment.
Under the Regulated Investment Company Modernization Act of 2010, the fund will be permitted to carry forward capital losses incurred for an unlimited period and the carry forwards will retain their character as either short-term or long-term capital losses. At October 31, 2016, the fund had the following capital loss carryovers available, to the extent allowed by the Code, to offset future net capital gain, if any:
| | |
| | Loss carryover | |
|
| Short-term | Long-term | Total |
| $11,085,528 | $— | $11,085,528 |
|
Distributions to shareholders Distributions to shareholders from net investment income are recorded by the fund on the ex-dividend date. Distributions from capital gains, if any, are recorded on the ex-dividend date and paid at least annually. The amount and character of income and gains to be distributed are determined in accordance with income tax regulations, which may differ from generally accepted accounting principles. These differences include temporary and/or permanent differences from losses on wash sale transactions, from nontaxable dividends, from amortization and accretion, from a redesignation of taxable distributions and from convertible security taxable income. Reclassifications are made to the fund’s capital accounts to reflect income and gains available for distribution (or available capital loss carryovers) under income tax regulations. At the close of the reporting period, the fund reclassified $4,473,771 to increase undistributed net investment income and $4,473,771 to increase accumulated net realized loss.
The tax basis components of distributable earnings and the federal tax cost as of the close of the reporting period were as follows:
| |
| Unrealized appreciation | $50,491,211 |
|
| Unrealized depreciation | (43,955,422) |
|
| Net unrealized appreciation | 6,535,789 |
|
| Undistributed ordinary income | 12,420,791 |
| Capital loss carryforward | (11,085,528) |
|
| Cost for federal income tax purposes | $662,076,892 |
Note 2: Management fee, administrative services and other transactions
The fund pays Putnam Management a management fee (based on the fund’s average net assets and computed and paid monthly) at annual rates that may vary based on the average of the aggregate net assets of all open-end mutual funds sponsored by Putnam Management (excluding net assets of funds that are invested in, or that are invested in by, other Putnam funds to the extent necessary to avoid “double counting” of those assets). Such annual rates may vary as follows:
| | | | |
| 0.780% | of the first $5 billion, | | 0.580% | of the next $50 billion, |
| |
|
| 0.730% | of the next $5 billion, | | 0.560% | of the next $50 billion, |
| |
|
| 0.680% | of the next $10 billion, | | 0.550% | of the next $100 billion and |
| |
|
| 0.630% | of the next $10 billion, | | 0.545% | of any excess thereafter. |
For the reporting period, the management fee represented an effective rate (excluding the impact from any expense waivers in effect) of 0.625% of the fund’s average net assets.
| |
| 42 Convertible Securities Fund |
Putnam Management has contractually agreed, through February 28, 2018, to waive fees or reimburse the fund’s expenses to the extent necessary to limit the cumulative expenses of the fund, exclusive of brokerage, interest, taxes, investment-related expenses, extraordinary expenses, acquired fund fees and expenses and payments under the fund’s investor servicing contract, investment management contract and distribution plans, on a fiscal year-to-date basis to an annual rate of 0.20% of the fund’s average net assets over such fiscal year-to-date period. During the reporting period, the fund’s expenses were not reduced as a result of this limit.
Putnam Management may from time to time voluntarily undertake to waive fees and/or reimburse certain fund expenses. Any such waiver or reimbursement would be voluntary and may be modified or discontinued by Putnam Management at any time without notice. For the reporting period, Putnam Management voluntarily waived $11,226.
Putnam Investments Limited (PIL), an affiliate of Putnam Management, is authorized by the Trustees to manage a separate portion of the assets of the fund as determined by Putnam Management from time to time. PIL did not manage any portion of the assets of the fund during the reporting period. If Putnam Management were to engage the services of PIL, Putnam Management would pay a quarterly sub-management fee to PIL for its services at an annual rate of 0.35% of the average net assets of the portion of the fund managed by PIL.
The fund reimburses Putnam Management an allocated amount for the compensation and related expenses of certain officers of the fund and their staff who provide administrative services to the fund. The aggregate amount of all such reimbursements is determined annually by the Trustees.
Custodial functions for the fund’s assets are provided by State Street. Custody fees are based on the fund’s asset level, the number of its security holdings and transaction volumes.
Putnam Investor Services, Inc., an affiliate of Putnam Management, provides investor servicing agent functions to the fund. Putnam Investor Services, Inc. received fees for investor servicing for class A, class B, class C, class M, class R and class Y shares that included (1) a per account fee for each direct and underlying non-defined contribution account (“retail account”) of the fund; (2) a specified rate of the fund’s assets attributable to defined contribution plan accounts; and (3) a specified rate based on the average net assets in retail accounts. Putnam Investor Services has agreed that the aggregate investor servicing fees for each fund’s retail and defined contribution accounts for these share classes will not exceed an annual rate of 0.25% of the fund’s average assets attributable to such accounts.
Prior to September 1, 2016, Putnam Investor Services, Inc. received fees for investor servicing for class A, class B, class C, class M, class R and class Y shares that included (1) a per account fee for each retail account of the fund and each of the other funds in its specified category, which was totaled and then allocated to each fund in the category based on its average daily net assets; (2) a specified rate of the fund’s assets attributable to defined contribution plan accounts; and (3) a specified rate based on the average net assets in retail accounts. Prior to September 1, 2016, Putnam Investor Services had agreed that the aggregate investor servicing fees for each fund’s retail and defined contribution accounts for these share classes would not exceed an annual rate of 0.320% of the fund’s average assets attributable to such accounts.
Class I shares paid a monthly fee based on the average net assets of class I shares at an annual rate of 0.01%.
During the reporting period, the expenses for each class of shares related to investor servicing fees were as follows:
| | | | |
| Class A | $663,868 | | Class M | 5,669 |
| |
|
| Class B | 15,246 | | Class R | 7,339 |
| |
|
| Class C | 90,943 | | Class Y | 314,580 |
| |
|
| Class I | 1 | | Total | $1,097,646 |
The fund has entered into expense offset arrangements with Putnam Investor Services, Inc. and State Street whereby Putnam Investor Services, Inc.’s and State Street’s fees are reduced by credits allowed on cash balances. The fund also reduced expenses through brokerage/service arrangements. For the reporting period, the fund’s expenses were reduced by $890 under the expense offset arrangements and by $864 under the brokerage/ service arrangements.
Each Independent Trustee of the fund receives an annual Trustee fee, of which $518, as a quarterly retainer, has been allocated to the fund, and an additional fee for each Trustees meeting attended. Trustees also are reimbursed for expenses they incur relating to their services as Trustees.
|
| Convertible Securities Fund 43 |
The fund has adopted a Trustee Fee Deferral Plan (the Deferral Plan) which allows the Trustees to defer the receipt of all or a portion of Trustees fees payable on or after July 1, 1995. The deferred fees remain invested in certain Putnam funds until distribution in accordance with the Deferral Plan.
The fund has adopted an unfunded noncontributory defined benefit pension plan (the Pension Plan) covering all Trustees of the fund who have served as a Trustee for at least five years and were first elected prior to 2004. Benefits under the Pension Plan are equal to 50% of the Trustee’s average annual attendance and retainer fees for the three years ended December 31, 2005. The retirement benefit is payable during a Trustee’s lifetime, beginning the year following retirement, for the number of years of service through December 31, 2006. Pension expense for the fund is included in Trustee compensation and expenses in the Statement of operations. Accrued pension liability is included in Payable for Trustee compensation and expenses in the Statement of assets and liabilities. The Trustees have terminated the Pension Plan with respect to any Trustee first elected after 2003.
The fund has adopted distribution plans (the Plans) with respect to its class A, class B, class C, class M and class R shares pursuant to Rule 12b –1 under the Investment Company Act of 1940. The purpose of the Plans is to compensate Putnam Retail Management Limited Partnership, an indirect wholly-owned subsidiary of Putnam Investments, LLC, for services provided and expenses incurred in distributing shares of the fund. The Plans provide for payments by the fund to Putnam Retail Management Limited Partnership at an annual rate of up to 0.35%, 1.00%, 1.00%, 1.00% and 1.00% of the average net assets attributable to class A, class B, class C, class M and class R shares, respectively. The Trustees have approved payment by the fund at an annual rate of 0.25%, 1.00%, 1.00%, 0.75% and 0.50% of the average net assets attributable to class A, class B, class C, class M and class R shares, respectively. During the reporting period, the class specific expenses related to distribution fees were as follows:
| | | | |
| Class A | $1,065,103 | | Class M | 27,290 |
| |
|
| Class B | 97,800 | | Class R | 23,574 |
| |
|
| Class C | 583,133 | | Total | $1,796,900 |
| | | |
For the reporting period, Putnam Retail Management Limited Partnership, acting as underwriter, received net commissions of $23,245 and $86 from the sale of class A and class M shares, respectively, and received $3,495 and $1,114 in contingent deferred sales charges from redemptions of class B and class C shares, respectively.
A deferred sales charge of up to 1.00% is assessed on certain redemptions of class A shares. For the reporting period, Putnam Retail Management Limited Partnership, acting as underwriter, received $51 on class A redemptions.
Note 3: Purchases and sales of securities
During the reporting period, the cost of purchases and the proceeds from sales, excluding short-term investments, were as follows:
| | |
| | Cost of purchases | Proceeds from sales |
|
| Investments in securities (Long-term) | $331,134,341 | $504,255,441 |
|
| U.S. government securities (Long-term) | — | — |
|
| Total | $331,134,341 | $504,255,441 |
|
The fund may purchase or sell investments from or to other Putnam funds in the ordinary course of business, which can reduce the fund’s transaction costs, at prices determined in accordance with SEC requirements and policies approved by the Trustees. During the reporting period, purchases or sales of long-term securities from or to other Putnam funds, if any, did not represent more than 5% of the fund’s total cost of purchases and/or total proceeds from sales.
| |
| 44 Convertible Securities Fund |
Note 4: Capital shares
At the close of the reporting period, there were an unlimited number of shares of beneficial interest authorized. Transactions in capital shares were as follows:
| | | | |
| | YEAR ENDED 10/31/16 | YEAR ENDED 10/31/15 |
| Class A | Shares | Amount | Shares | Amount |
|
| Shares sold | 1,286,491 | $28,362,087 | 5,147,073 | $127,707,042 |
|
| Shares issued in connection with | | | | |
| reinvestment of distributions | 1,180,569 | 25,489,758 | 1,318,459 | 32,346,483 |
|
| | 2,467,060 | 53,851,845 | 6,465,532 | 160,053,525 |
|
| Shares repurchased | (6,686,319) | (143,338,958) | (6,934,959) | (171,500,072) |
|
| Net decrease | (4,219,259) | $(89,487,113) | (469,427) | $(11,446,547) |
| | | |
| |
| | YEAR ENDED 10/31/16 | YEAR ENDED 10/31/15 |
| Class B | Shares | Amount | Shares | Amount |
|
| Shares sold | 42,602 | $922,818 | 73,662 | $1,790,142 |
|
| Shares issued in connection with | | | | |
| reinvestment of distributions | 17,773 | 376,178 | 20,180 | 487,042 |
|
| | 60,375 | 1,298,996 | 93,842 | 2,277,184 |
|
| Shares repurchased | (148,330) | (3,135,601) | (124,121) | (2,991,491) |
|
| Net decrease | (87,955) | $(1,836,605) | (30,279) | $(714,307) |
| | | |
| |
| | YEAR ENDED 10/31/16 | YEAR ENDED 10/31/15 |
| Class C | Shares | Amount | Shares | Amount |
|
| Shares sold | 175,173 | $3,770,151 | 655,888 | $16,094,634 |
|
| Shares issued in connection with | | | | |
| reinvestment of distributions | 112,921 | 2,409,648 | 111,027 | 2,698,190 |
|
| | 288,094 | 6,179,799 | 766,915 | 18,792,824 |
|
| Shares repurchased | (1,146,332) | (24,471,301) | (528,646) | (12,827,775) |
|
| Net increase (decrease) | (858,238) | $(18,291,502) | 238,269 | $5,965,049 |
| | | |
| |
| | YEAR ENDED 10/31/16 | YEAR ENDED 10/31/15 |
| Class I | Shares | Amount | Shares | Amount |
|
| Shares sold | — | $— | 395 | $10,000 |
|
| Shares issued in connection with | | | | |
| reinvestment of distributions | 27 | 578 | 7 | 169 |
|
| | 27 | 578 | 402 | 10,169 |
|
| Shares repurchased | — | — | — | — |
|
| Net increase | 27 | $578 | 402 | $10,169 |
| | | |
| |
| | YEAR ENDED 10/31/16 | YEAR ENDED 10/31/15 |
| Class M | Shares | Amount | Shares | Amount |
|
| Shares sold | 10,515 | $219,796 | 18,853 | $466,635 |
|
| Shares issued in connection with | | | | |
| reinvestment of distributions | 9,459 | 202,137 | 10,266 | 249,813 |
|
| | 19,974 | 421,933 | 29,119 | 716,448 |
|
| Shares repurchased | (29,791) | (635,166) | (39,160) | (972,561) |
|
| Net decrease | (9,817) | $(213,233) | (10,041) | $(256,113) |
|
| Convertible Securities Fund 45 |
| | | | |
| | YEAR ENDED 10/31/16 | YEAR ENDED 10/31/15 |
| Class R | Shares | Amount | Shares | Amount |
|
| Shares sold | 58,758 | $1,265,333 | 80,137 | $1,964,692 |
|
| Shares issued in connection with | | | | |
| reinvestment of distributions | 11,233 | 241,582 | 14,900 | 364,624 |
|
| | 69,991 | 1,506,915 | 95,037 | 2,329,316 |
|
| Shares repurchased | (65,408) | (1,411,597) | (139,102) | (3,336,956) |
|
| Net increase (decrease) | 4,583 | $95,318 | (44,065) | $(1,007,640) |
| | | |
| |
| | YEAR ENDED 10/31/16 | YEAR ENDED 10/31/15 |
| Class Y | Shares | Amount | Shares | Amount |
|
| Shares sold | 2,417,132 | $52,513,689 | 4,910,078 | $122,223,808 |
|
| Shares issued in connection with | | | | |
| reinvestment of distributions | 480,361 | 10,367,362 | 556,282 | 13,626,388 |
|
| | 2,897,493 | 62,881,051 | 5,466,360 | 135,850,196 |
|
| Shares repurchased | (5,660,259) | (121,971,476) | (5,005,918) | (121,937,364) |
|
| Net increase (decrease) | (2,762,766) | $(59,090,425) | 460,442 | $13,912,832 |
At the close of the reporting period, Putnam Investments, LLC owned the following shares of the fund:
| | | |
| | Shares owned | Percentage of ownership | Value |
|
| Class I | 429 | 100% | $9,665 |
|
Note 5: Affiliated transactions
Transactions during the reporting period with any company which is under common ownership or control were as follows:
| | | | | |
| | Fair value at the | | | | Fair value at |
| | beginning of the | | | Investment | the end of the |
| Name of affiliate | reporting period | Purchase cost | Sale proceeds | income | reporting period |
|
| Putnam Cash Collateral | | | | | |
| Pool, LLC* | $223,500 | $41,409,875 | $32,467,775 | $11,954 | $9,165,600 |
|
| Putnam Short Term | | | | | |
| Investment Fund** | 43,173,386 | 252,378,929 | 258,068,579 | 125,534 | 37,483,736 |
|
| Totals | $43,396,886 | $293,788,804 | $290,536,354 | $137,488 | $46,649,336 |
* No management fees are charged to Putnam Cash Collateral Pool, LLC (See Note 1).
**Management fees charged to Putnam Short Term Investment Fund have been waived by Putnam Management.
Note 6: Market, credit and other risks
In the normal course of business, the fund trades financial instruments and enters into financial transactions where risk of potential loss exists due to changes in the market (market risk) or failure of the contracting party to the transaction to perform (credit risk). The fund may be exposed to additional credit risk that an institution or other entity with which the fund has unsettled or open transactions will default. Investments in foreign securities involve certain risks, including those related to economic instability, unfavorable political developments, and currency fluctuations.
Note 7: Summary of derivative activity
The volume of activity for the reporting period for any derivative type that was held during the period is listed below and was based on an average of the holdings at the end of each fiscal quarter:
| |
| Warrants (number of warrants) | 600 |
|
| |
| 46 Convertible Securities Fund |
The following is a summary of the fair value of derivative instruments as of the close of the reporting period:
| | | | |
| Fair value of derivative instruments as of the close of the reporting period | |
|
| | ASSET DERIVATIVES | | LIABILITY DERIVATIVES | |
|
| Derivatives not | | | | |
| accounted for as | Statement of | | Statement of | |
| hedging instruments | assets and | | assets and | |
| under ASC 815 | liabilities location | Fair value | liabilities location | Fair value |
|
| Equity contracts | Investments | $8 | Payables | $— |
|
| Total | | $8 | | $— |
The following is a summary of change in unrealized gains or losses of derivative instruments on the Statement of operations for the reporting period (see Note 1) (there were no realized gains or losses on derivative instruments):
| | |
| Change in unrealized appreciation or (depreciation) on derivatives recognized in net gain or (loss) |
| on investments | | |
|
| Derivatives not accounted for as hedging instruments under ASC 815 | Warrants | Total |
| Equity contracts | $(91,918) | $(91,918) |
|
| Total | $(91,918) | $(91,918) |
Note 8: New pronouncements
In October 2016, the Securities and Exchange Commission adopted amendments to rules under the Investment Company Act of 1940 (“final rules”) intended to modernize the reporting and disclosure of information by registered investment companies. The final rules amend Regulation S-X and require funds to provide standardized, enhanced derivative disclosure in fund financial statements in a format designed for individual investors. The amendments to Regulation S-X also update the disclosures for other investments and investments in, and advances to affiliates and amend the rules regarding the general form and content of fund financial statements. The compliance date for the amendments to Regulation S-X is August 1, 2017. Putnam Management is currently evaluating the amendments and their impact, if any, on the fund’s financial statements.
|
| Convertible Securities Fund 47 |
Federal tax information (Unaudited)
The fund designated 29.40% of ordinary income distributions as qualifying for the dividends received deduction for corporations.
For the reporting period, the fund hereby designates 36.95%, or the maximum amount allowable, of its taxable ordinary income distributions as qualified dividends taxed at the individual net capital gain rates.
For the reporting period, pursuant to §871(k) of the Internal Revenue Code, the fund hereby designates $7,117,026 of distributions paid as qualifying to be taxed as interest-related dividends, and no monies to be taxed as short-term capital gain dividends for nonresident alien shareholders.
The Form 1099 that will be mailed to you in January 2017 will show the tax status of all distributions paid to your account in calendar 2016.
| |
| 48 Convertible Securities Fund |
About the Trustees

|
| Convertible Securities Fund 49 |

* Mr. Reynolds is an “interested person” (as defined in the Investment Company Act of 1940) of the fund and Putnam Investments. He is President and Chief Executive Officer of Putnam Investments, as well as the President of your fund and each of the other Putnam funds.
The address of each Trustee is One Post Office Square, Boston, MA 02109.
As of October 31, 2016, there were 115 Putnam funds. All Trustees serve as Trustees of all Putnam funds.
Each Trustee serves for an indefinite term, until his or her resignation, retirement at age 75, removal, or death.
| |
| 50 Convertible Securities Fund |
Officers
In addition to Robert L. Reynolds, the other officers of the fund are shown below:
| |
| Jonathan S. Horwitz (Born 1955) | Janet C. Smith (Born 1965) |
| Executive Vice President, Principal Executive Officer, and | Vice President, Principal Financial Officer, Principal |
| Compliance Liaison | Financial Officer, Principal Accounting Officer, |
| Since 2004 | and Assistant Treasurer |
| | Since 2007 |
| Robert T. Burns (Born 1961) | Director of Fund Administration Services, |
| Vice President and Chief Legal Officer | Putnam Investments and Putnam Management |
| Since 2011 | |
| General Counsel, Putnam Investments, Putnam | Susan G. Malloy (Born 1957) |
| Management, and Putnam Retail Management | Vice President and Assistant Treasurer |
| | Since 2007 |
| James F. Clark (Born 1974) | Director of Accounting & Control Services, Putnam |
| Vice President and Chief Compliance Officer | Investments and Putnam Management |
| Since 2016 | |
| Chief Compliance Officer, Putnam Investments and | Mark C. Trenchard (Born 1962) |
| Putnam Management | Vice President and BSA Compliance Officer |
| | Since 2002 |
| Michael J. Higgins (Born 1976) | Director of Operational Compliance, |
| Vice President, Treasurer, and Clerk | Putnam Investments and Putnam Retail Management |
| Since 2010 | |
| | Nancy E. Florek (Born 1957) |
| | Vice President, Director of Proxy Voting and Corporate |
| | Governance, Assistant Clerk, and Associate Treasurer |
| | Since 2000 |
The principal occupations of the officers for the past five years have been with the employers as shown above, although in some cases they have held different positions with such employers. The address of each officer is One Post Office Square, Boston, MA 02109.
|
| Convertible Securities Fund 51 |
Services for shareholders
Investor services
Systematic investment plan Tell us how much you wish to invest regularly — weekly, semimonthly, or monthly — and the amount you choose will be transferred automatically from your checking or savings account. There’s no additional fee for this service, and you can suspend it at any time. This plan may be a great way to save for college expenses or to plan for your retirement.
Please note that regular investing does not guarantee a profit or protect against loss in a declining market. Before arranging a systematic investment plan, consider your financial ability to continue making purchases in periods when prices are low.
Systematic exchange You can make regular transfers from one Putnam fund to another Putnam fund. There are no additional fees for this service, and you can cancel or change your options at any time.
Dividends PLUS You can choose to have the dividend distributions from one of your Putnam funds automatically reinvested in another Putnam fund at no additional charge.
Free exchange privilege You can exchange money between Putnam funds free of charge, as long as they are the same class of shares. A signature guarantee is required if you are exchanging more than $500,000. The fund reserves the right to revise or terminate the exchange privilege.
Reinstatement privilege If you’ve sold Putnam shares or received a check for a dividend or capital gain, you may reinvest the proceeds with Putnam within 90 days of the transaction and they will be reinvested at the fund’s current net asset value — with no sales charge. However, reinstatement of class B shares may have special tax consequences. Ask your financial or tax representative for details.
Check-writing service You have ready access to many Putnam accounts. It’s as simple as writing a check, and there are no special fees or service charges. For more information about the check-writing service, call Putnam or visit our website.
Dollar cost averaging When you’re investing for long-term goals, it’s time, not timing, that counts. Investing on a systematic basis is a better strategy than trying to figure out when the markets will go up or down. This means investing the same amount of money regularly over a long period. This method of investing is called dollar cost averaging. When a fund’s share price declines, your investment dollars buy more shares at lower prices. When it increases, they buy fewer shares. Over time, you will pay a lower average price per share.
For more information
Visit the Individual Investors section at putnam.com A secure section of our website contains complete information on your account, including balances and transactions, updated daily. You may also conduct transactions, such as exchanges, additional investments, and address changes. Log on today to get your password.
Call us toll free at 1-800-225-1581 Ask a helpful Putnam representative or your financial advisor for details about any of these or other services, or see your prospectus.
| |
| 52 Convertible Securities Fund |
Fund information
Founded over 75 years ago, Putnam Investments was built around the concept that a balance between risk and reward is the hallmark of a well-rounded financial program. We manage over 100 funds across income, value, blend, growth, asset allocation, absolute return, and global sector categories.
| | |
| Investment Manager | Trustees | James F. Clark |
| Putnam Investment | Jameson A. Baxter, Chair | Vice President and |
| Management, LLC | Kenneth R. Leibler, Vice Chair | Chief Compliance Officer |
| One Post Office Square | Liaquat Ahamed | |
| Boston, MA 02109 | Ravi Akhoury | Michael J. Higgins |
| | Barbara M. Baumann | Vice President, Treasurer, |
| Investment Sub-Advisor | Robert J. Darretta | and Clerk |
| Putnam Investments Limited | Katinka Domotorffy | |
| 57–59 St James’s Street | John A. Hill | Janet C. Smith |
| London, England SW1A 1LD | Paul L. Joskow | Vice President, |
| | Robert E. Patterson | Principal Financial Officer, |
| Marketing Services | George Putnam, III | Principal Accounting Officer, |
| Putnam Retail Management | Robert L. Reynolds | and Assistant Treasurer |
| One Post Office Square | W. Thomas Stephens | |
| Boston, MA 02109 | | Susan G. Malloy |
| | Officers | Vice President and |
| Custodian | Robert L. Reynolds | Assistant Treasurer |
| State Street Bank | President | |
| and Trust Company | | Mark C. Trenchard |
| | Jonathan S. Horwitz | Vice President and |
| Legal Counsel | Executive Vice President, | BSA Compliance Officer |
| Ropes & Gray LLP | Principal Executive Officer, and | |
| | Compliance Liaison | Nancy E. Florek |
| Independent Registered | | Vice President, Director of |
| Public Accounting Firm | Robert T. Burns | Proxy Voting and Corporate |
| KPMG LLP | Vice President and | Governance, Assistant Clerk, |
| | Chief Legal Officer | and Associate Treasurer |
| | | |
This report is for the information of shareholders of Putnam Convertible Securities Fund. It may also be used as sales literature when preceded or accompanied by the current prospectus, the most recent copy of Putnam’s Quarterly Performance Summary, and Putnam’s Quarterly Ranking Summary. For more recent performance, please visit putnam.com. Investors should carefully consider the investment objectives, risks, charges, and expenses of a fund, which are described in its prospectus. For this and other information or to request a prospectus or summary prospectus, call 1-800-225-1581 toll free. Please read the prospectus carefully before investing. The fund’s Statement of Additional Information contains additional information about the fund’s Trustees and is available without charge upon request by calling 1-800-225-1581.

| |
| (a) The fund's principal executive, financial and accounting officers are employees of Putnam Investment Management, LLC, the Fund's investment manager. As such they are subject to a comprehensive Code of Ethics adopted and administered by Putnam Investments which is designed to protect the interests of the firm and its clients. The Fund has adopted a Code of Ethics which incorporates the Code of Ethics of Putnam Investments with respect to all of its officers and Trustees who are employees of Putnam Investment Management, LLC. For this reason, the Fund has not adopted a separate code of ethics governing its principal executive, financial and accounting officers. |
| |
| (c) In November 2015, the Code of Ethics of Putnam Investment Management, LLC was amended. The key changes to the Code of Ethics are as follows: (i) Non-Access Persons are no longer required to pre-clear their trades, (ii) a new provision governing conflicts of interest has been added, (iii) modifying certain provisions of the pre-clearance requirements, Contra-Trading Rule and 60-Day Short-Term Rule, (iv) modifying and adding language relating to reporting of unethical or illegal acts, including anti-retaliation provision, and (v) certain other changes. |
| |
| Item 3. Audit Committee Financial Expert: |
| |
| The Funds' Audit, Compliance and Distributions Committee is comprised solely of Trustees who are “independent” (as such term has been defined by the Securities and Exchange Commission (“SEC”) in regulations implementing Section 407 of the Sarbanes-Oxley Act (the “Regulations”)). The Trustees believe that each of the members of the Audit, Compliance and Distributions Committee also possess a combination of knowledge and experience with respect to financial accounting matters, as well as other attributes, that qualify them for service on the Committee. In addition, the Trustees have determined that each of Mr. Darretta, Mr. Patterson, Mr. Hill, and Ms. Baumann qualifies as an “audit committee financial expert” (as such term has been defined by the Regulations) based on their review of his or her pertinent experience and education. The SEC has stated, and the funds' amended and restated agreement and Declaration of Trust provides, that the designation or identification of a person as an audit committee financial expert pursuant to this Item 3 of Form N-CSR does not impose on such person any duties, obligations or liability that are greater than the duties, obligations and liability imposed on such person as a member of the Audit, Compliance and Distribution Committee and the Board of Trustees in the absence of such designation or identification. |
| |
| Item 4. Principal Accountant Fees and Services: |
| |
| The following table presents fees billed in each of the last two fiscal years for services rendered to the fund by the fund's independent auditor: |
| | | | | |
| Fiscal year ended | Audit Fees | Audit-Related Fees | Tax Fees | All Other Fees |
|
|
| | | | | |
| October 31, 2016 | $41,066 | $ — | $4,550 | $ — |
| October 31, 2015 | $39,766 | $ — | $4,400 | $ — |
| |
| For the fiscal years ended October 31, 2016 and October 31, 2015, the fund's independent auditor billed aggregate non-audit fees in the amounts of $4,550 and $4,400 respectively, to the fund, Putnam Management and any entity controlling, controlled by or under common control with Putnam Management that provides ongoing services to the fund. |
| |
| Audit Fees represent fees billed for the fund's last two fiscal years relating to the audit and review of the financial statements included in annual reports and registration statements, and other services that are normally provided in connection with statutory and regulatory filings or engagements. |
| |
| Audit-Related Fees represent fees billed in the fund's last two fiscal years for services traditionally performed by the fund's auditor, including accounting consultation for proposed transactions or concerning financial accounting and reporting standards and other audit or attest services not required by statute or regulation. |
| |
| Tax Fees represent fees billed in the fund's last two fiscal years for tax compliance, tax planning and tax advice services. Tax planning and tax advice services include assistance with tax audits, employee benefit plans and requests for rulings or technical advice from taxing authorities. |
| |
| Pre-Approval Policies of the Audit, Compliance and Distributions Committee. The Audit, Compliance and Distributions Committee of the Putnam funds has determined that, as a matter of policy, all work performed for the funds by the funds' independent auditors will be pre-approved by the Committee itself and thus will generally not be subject to pre-approval procedures. |
| |
| The Audit, Compliance and Distributions Committee also has adopted a policy to pre-approve the engagement by Putnam Management and certain of its affiliates of the funds' independent auditors, even in circumstances where pre-approval is not required by applicable law. Any such requests by Putnam Management or certain of its affiliates are typically submitted in writing to the Committee and explain, among other things, the nature of the proposed engagement, the estimated fees, and why this work should be performed by that particular audit firm as opposed to another one. In reviewing such requests, the Committee considers, among other things, whether the provision of such services by the audit firm are compatible with the independence of the audit firm. |
| |
| The following table presents fees billed by the fund's independent auditor for services required to be approved pursuant to paragraph (c)(7)(ii) of Rule 2-01 of Regulation S-X. |
| | | | | |
| Fiscal year ended | Audit-Related Fees | Tax Fees | All Other Fees | Total Non-Audit Fees |
|
|
| | | | | |
| October 31, 2016 | $ — | $ — | $ — | $ — |
| | | | | |
| October 31, 2015 | $ — | $ — | $ — | $ — |
| |
| Item 5. Audit Committee of Listed Registrants |
| |
| Item 6. Schedule of Investments: |
| |
| The registrant's schedule of investments in unaffiliated issuers is included in the report to shareholders in Item 1 above. |
| |
| Item 7. Disclosure of Proxy Voting Policies and Procedures For Closed-End Management Investment Companies: |
| |
| Item 8. Portfolio Managers of Closed-End Investment Companies |
| |
| Item 9. Purchases of Equity Securities by Closed-End Management Investment Companies and Affiliated Purchasers: |
| |
| Item 10. Submission of Matters to a Vote of Security Holders: |
| |
| Item 11. Controls and Procedures: |
| |
| (a) The registrant's principal executive officer and principal financial officer have concluded, based on their evaluation of the effectiveness of the design and operation of the registrant's disclosure controls and procedures as of a date within 90 days of the filing date of this report, that the design and operation of such procedures are generally effective to provide reasonable assurance that information required to be disclosed by the registrant in this report is recorded, processed, summarized and reported within the time periods specified in the Commission's rules and forms. |
| |
| (b) Changes in internal control over financial reporting: Not applicable |
| |
| (a)(1) The Code of Ethics of The Putnam Funds, which incorporates the Code of Ethics of Putnam Investments, is filed herewith. |
| |
| (a)(2) Separate certifications for the principal executive officer and principal financial officer of the registrant as required by Rule 30a-2(a) under the Investment Company Act of 1940, as amended, are filed herewith. |
| |
| (b) The certifications required by Rule 30a-2(b) under the Investment Company Act of 1940, as amended, are filed herewith. |
| |
| Pursuant to the requirements of the Securities Exchange Act of 1934 and the Investment Company Act of 1940, the registrant has duly caused this report to be signed on its behalf by the undersigned, thereunto duly authorized. |
| |
| Putnam Convertible Securities Fund |
| |
| By (Signature and Title): |
| |
| /s/ Janet C. Smith
Janet C. Smith
Principal Accounting Officer
|
| |
| Pursuant to the requirements of the Securities Exchange Act of 1934 and the Investment Company Act of 1940, this report has been signed below by the following persons on behalf of the registrant and in the capacities and on the dates indicated. |
| |
| By (Signature and Title): |
| |
| /s/ Jonathan S. Horwitz
Jonathan S. Horwitz
Principal Executive Officer
|
| |
| By (Signature and Title): |
| |
| /s/ Janet C. Smith
Janet C. Smith
Principal Financial Officer
|