| | |
| UNITED STATES
SECURITIES AND EXCHANGE COMMISSION |
| | |
| CERTIFIED SHAREHOLDER REPORT OF REGISTERED
MANAGEMENT INVESTMENT COMPANIES
|
| | |
| Investment Company Act file number: | (811-02280) |
| | |
| Exact name of registrant as specified in charter: | Putnam Convertible Securities Fund |
| | |
| Address of principal executive offices: | 100 Federal Street, Boston, Massachusetts 02110 |
| | |
| Name and address of agent for service: | Robert T. Burns, Vice President
100 Federal Street
Boston, Massachusetts 02110 |
| | |
| Copy to: | Bryan Chegwidden, Esq.
Ropes & Gray LLP
1211 Avenue of the Americas
New York, New York 10036 |
| | |
| Registrant's telephone number, including area code: | (617) 292-1000 |
| | |
| Date of fiscal year end: | October 31, 2021 |
| | |
| Date of reporting period: | November 1, 2020 — April 30, 2021 |
| | |
|
Item 1. Report to Stockholders: | |
| | |
| The following is a copy of the report transmitted to stockholders pursuant to Rule 30e-1 under the Investment Company Act of 1940: | |
Putnam
Convertible Securities
Fund
Semiannual report
4 | 30 | 21
Message from the Trustees
June 10, 2021
Dear Fellow Shareholder:
With summer at hand, it’s worth asking whether the economy has returned to normal. More than half of the 50 states have lifted pandemic-related restrictions. First-quarter growth in U.S. gross domestic product was 6%, reflecting a return nearly to pre-pandemic levels of economic output. The global economy is a different story. Beyond our shores, many nations lag the United States in vaccination rates and business activity.
While there are reasons to feel some relief, it’s important to recognize what may be a new normal. The pandemic is not in the past, and many of the changes precipitated by it could last. During this time, dynamic, well-managed companies have adapted to seize new, more sustainable growth opportunities.
Putnam’s active philosophy is well suited to this time. Putnam’s investment teams are analyzing companies, industries, consumers, and even governments. They try to understand the fundamentals of what has stayed the same and what has changed to uncover valuable investment insights or potential risks.
Thank you for investing with Putnam.


Two different investment objectives — seeking current income and seeking capital appreciation potential — typically dictate an investor’s preference for bonds or stocks. But with Putnam Convertible Securities Fund, investors can pursue both of these objectives at the same time.
Hybrid securities with the characteristics of stocks and bonds
Typically issued as bonds or preferred stock, convertibles offer investors exposure to the underlying equity of the security. This feature allows investors to profit from the potential price appreciation of the convertible issuer’s underlying stock. At the same time, convertibles offer both income potential and downside protection through their fixed-income characteristics.
Convertibles have helped investors participate in stock market rallies and avoid the worst of major stock declines (7/1/95–4/30/21)
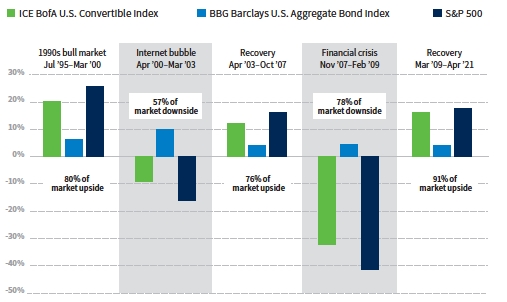
Source: Putnam, as of 4/30/21. All returns are annualized. Index performance is not indicative of Putnam fund performance or a guarantee of future results. You cannot invest in an index.
All Bloomberg Barclays indices provided by Bloomberg Index Services Limited.
|
| 2 Convertible Securities Fund |
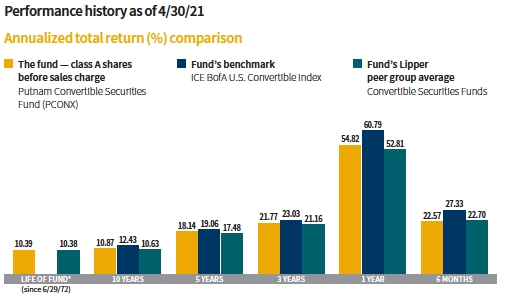
Current performance may be lower or higher than the quoted past performance, which cannot guarantee future results. Share price, principal value, and return will fluctuate, and you may have a gain or a loss when you sell your shares. Performance of class A shares assumes reinvestment of distributions and does not account for taxes. Fund returns in the bar chart do not reflect a sales charge of 5.75%; had they, returns would have been lower. See below and pages 9–11 for additional performance information. For a portion of the periods, the fund had expense limitations, without which returns would have been lower. To obtain the most recent month-end performance, visit putnam.com.
Returns for periods less than one year are cumulative.
Lipper peer group average provided by Lipper, a Refinitiv company.
* The fund’s benchmark, the ICE BofA U.S. Convertible Index, was introduced on 12/31/87, which post-dates the inception of the fund’s class A shares.
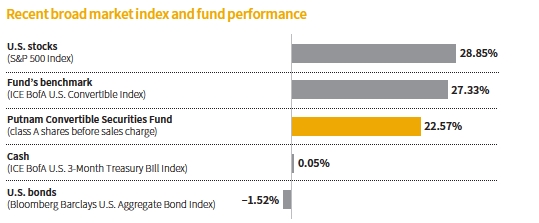
This comparison shows your fund’s performance in the context of broad market indexes for the six months ended 4/30/21. See above and pages 9–11 for additional fund performance information. Index descriptions can be found on pages 14–15.
All Bloomberg Barclays indices provided by Bloomberg Index Services Limited.
|
| Convertible Securities Fund 3 |


Please describe the market environment for the six-month reporting period ended April 30, 2021.
ROB Supported by the strength of their underlying equities, convertible securities posted robust gains for the period. The ICE BofA U.S. Convertible Index [the fund’s benchmark] rose 27.33%. Below the surface, the convertibles market saw a cyclical rotation out of growth sectors, such as technology and healthcare, into value sectors, such as industrials, energy, and financials. Value stocks surged as a result, strongly outpacing growth stocks. Small-cap stocks also had a strong showing, considerably outperforming large-cap stocks. The increased pace of Covid-19 vaccinations heightened investor optimism about the U.S. economy’s reopening. Expectations for additional stimulus, which ultimately came to pass in December 2020 with the $900 billion Covid-19 aid bill and in March 2021 with the $1.9 trillion American Rescue Plan, also fueled the rally.
In March 2021, convertibles reversed, driven by high equity valuations and concerns that further fiscal stimulus could result in higher interest rates and inflation. The sell-off in growth sectors, led by technology and other areas that
|
| 4 Convertible Securities Fund |

Allocations are shown as a percentage of the fund’s net assets as of 4/30/21. Cash and net other assets, if any, represent the market value weights of cash, derivatives, short-term securities, and other unclassified assets in the portfolio. Summary information may differ from the portfolio schedule included in the financial statements due to the inclusion of derivative securities, any interest accruals, the exclusion of as-of trades, if any, the use of different classifications of securities for presentation purposes, and rounding. Holdings and allocations may vary over time.
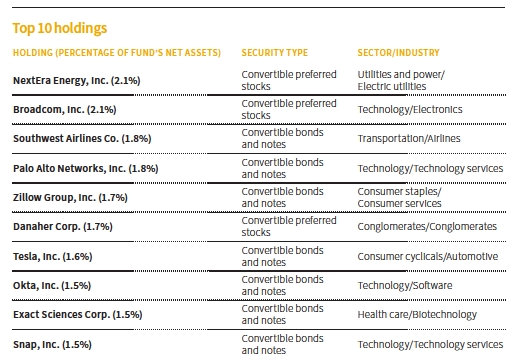
This table shows the fund’s top 10 individual holdings and the percentage of the fund’s net assets that each represented as of 4/30/21. Short-term investments and derivatives, if any, are excluded. Holdings may vary over time.
|
| Convertible Securities Fund 5 |
benefited from stay-at-home trends, particularly weighed on the performance of the asset class. As the month came to a close, President Biden provided details about his $2 trillion infrastructure proposal. To help pay for the plan, corporations may be facing higher taxes, which is a headwind for profits. Higher-wage earners may also be seeing higher income taxes. Against this backdrop, convertibles succumbed to their underlying equity sensitivity, with the convertibles benchmark returning –3.15% for the month of March. Much of this sell-off was reversed in April, with large-cap growth securities outperforming small-cap value securities.
In fixed-income markets, interest rates climbed to their highest level since February 2020. The yield on the bellwether 10-year U.S. Treasury note rose from 0.38% on October 30, 2020, to a high of 1.74% on March 19, 2021, before closing the period at 1.63%. As a result, the yield curve steepened as short-term interest rates remained near zero, anchored by the Federal Reserve’s commitment to keep rates low. Longer-term, rate-sensitive, fixed-income assets ended the period lower.
How did you manage the fund in light of these market dynamics?
ANTHONY First, we took advantage of select opportunities in the new-issue convertibles market, focusing on securities that were priced at what we believed were attractive valuations while avoiding securities selling at prices that we did not think reflected the future value of the issuer. Second, we sought reopening plays, that is, companies poised to benefit from increased vaccinations, a return to work and school, and targeted federal stimulus.
We also trimmed securities with higher valuations in favor of more balanced new issues at or near par. As part of this strategy, we reduced the portfolio’s exposure to rate-sensitive instruments, such as bank preferred securities, and to rate-sensitive sectors, such as financials and utilities. This resulted in a lower delta, or equity sensitivity, of the portfolio.

How did Putnam Convertible Securities Fund perform during the reporting period?
ROB The fund’s class A share performance at net asset value was 22.57%, which underper-formed the benchmark and the average return of its Lipper peer group.
At the sector level, underweight positioning and security selection within the financials sector was the top contributor to relative performance. Underweight exposure and security selection within consumer staples and healthcare also added to performance.
Security selection within the consumer discretionary sector was the largest detractor to relative performance. Overweight positioning and security selection within technology also detracted due to the rotation of market sentiment away from large-cap growth to more value-oriented securities during the period. Meanwhile, underweight exposure and security selection within industrials detracted from relative performance as value-oriented sectors, including industrials, performed well.
What investments aided the fund’s performance?
ANTHONY The fund saw strong performance from its positioning within financials, particularly its underweight exposure to rate-sensitive securities such as bank convertible preferred securities. Accordingly, the fund’s underweight exposure to Bank of America and Wells Fargo convertible preferred securities proved advantageous for relative performance when rates were rising.
|
| 6 Convertible Securities Fund |
Our decision to overweight investments in Bloomin’ Brands relative to the benchmark also was rewarding. Bloomin’ Brands owns several American casual dining restaurant chains, including Outback Steakhouse and Bonefish Grill. The company announced strong first quarter 2021 results. We believe it is in a good position to grow sales and capture additional market share as the economic recovery continues.
What investments detracted from returns relative to the benchmark?
ROB Our decision to underweight investments in Tesla relative to the benchmark was the biggest detractor from performance, given the strong outperformance of the underlying equity, which rose 77% during the period. In December 2020, the stock was added to the S&P 500 Index, which further increased interest in the company. With the underlying equity trading at extremely high valuations and the convertible at nearly a 100 delta, or 1:1 movement with the underlying equity, we did not believe the convertible’s risk/reward profile was favorably skewed.
The fund’s overweight exposure to Tandem Diabetes Care was another disappointment. Despite solid earnings results during the period, the underlying equity traded down. We believe investors had heightened expectations about the company’s prospects and although results were positive, they weren’t strong enough in the face of increasing competition.
As a beneficiary of vaccination progress and reopening trends, American Airlines Group delivered positive results. However, our decision to not invest in the airline weighed on relative performance results. This decision stemmed from our preference to invest in other securities within the airline industry.
What is your outlook for the coming months?
ANTHONY Our near-term outlook for equities and corporate credit is constructive. The vaccine rollout and further stimulus provide a positive backdrop for risk assets, in our view. In this environment, we believe there could be a continued rotation from growth companies to more value and cyclical companies. Should interest-rate and inflation concerns persist, the

This chart shows how the fund’s top weightings have changed over the past six months. Allocations are shown as a percentage of the fund’s net assets. Current period summary information may differ from the portfolio schedule included in the financial statements due to the inclusion of derivative securities, any interest accruals, the exclusion of as-of trades, if any, the use of different classifications of securities for presentation purposes, and rounding. Holdings and allocations may vary over time.
|
| Convertible Securities Fund 7 |
markets may continue to see bursts of volatility. However, convertible securities have performed relatively well in past rising-rate markets over time because they typically have low interest-rate sensitivity compared with other traditional fixed-income asset classes.
Our view of the convertibles market is also positive. Although growth companies are the largest style factor within the convertibles market, value and core companies have increased in size in recent months. Additionally, we believe the composition of the market has become more favorable, with more traditionally balanced convertibles representing a larger portion of the market relative to equity-sensitive convertibles. Ultimately, we believe these developments are creating a more robust and diverse universe of investment ideas.
Thank you, gentlemen, for your time and insights today.
The views expressed in this report are exclusively those of Putnam Management and are subject to change. They are not meant as investment advice.
Please note that the holdings discussed in this report may not have been held by the fund for the entire period. Portfolio composition is subject to review in accordance with the fund’s investment strategy and may vary in the future. Current and future portfolio holdings are subject to risk. Statements in the Q&A concerning the fund’s performance or portfolio composition relative to those of the fund’s Lipper peer group may reference information produced by Lipper Inc. or through a third party.
Of special interest
The fund’s quarterly dividend rate was reduced from $0.086 to $0.032 in March 2021 per class A share. This reduction was due to a decrease in income as a result of the low interest-rate environment, and yields falling fairly significantly. While fund holdings appreciated, these gains did not produce an increase in income in the fund. The investment team continues to seek equal emphasis on current income and capital appreciation. Similar reductions were made to other share classes.
|
| 8 Convertible Securities Fund |
Your fund’s performance
This section shows your fund’s performance, price, and distribution information for periods ended April 30, 2021, the end of the first half of its current fiscal year. In accordance with regulatory requirements for mutual funds, we also include performance information as of the most recent calendar quarter-end and expense information taken from the fund’s current prospectus. Performance should always be considered in light of a fund’s investment strategy. Data represent past performance. Past performance does not guarantee future results. More recent returns may be less or more than those shown. Investment return and principal value will fluctuate, and you may have a gain or a loss when you sell your shares. Performance information does not reflect any deduction for taxes a shareholder may owe on fund distributions or on the redemption of fund shares. For the most recent month-end performance, please visit the Individual Investors section at putnam.com or call Putnam at 1-800-225-1581. Class I, R, R6, and Y shares are not available to all investors. See the Terms and definitions section in this report for definitions of the share classes offered by your fund.
Fund performance Total return for periods ended 4/30/21
| | | | | | | | | |
| | Annual | | | | | | | | |
| | average | | Annual | | Annual | | Annual | | |
| | (life of fund) | 10 years | average | 5 years | average | 3 years | average | 1 year | 6 months |
| Class A (6/29/72) | | | | | | | | | |
| Before sales charge | 10.39% | 180.67% | 10.87% | 130.13% | 18.14% | 80.54% | 21.77% | 54.82% | 22.57% |
| After sales charge | 10.25 | 164.53 | 10.22 | 116.90 | 16.75 | 70.16 | 19.39 | 45.92 | 15.52 |
| Class B (7/15/93) | | | | | | | | | |
| Before CDSC | 10.20 | 164.21 | 10.20 | 121.66 | 17.26 | 76.59 | 20.87 | 53.69 | 22.14 |
| After CDSC | 10.20 | 164.21 | 10.20 | 119.66 | 17.04 | 73.59 | 20.18 | 48.69 | 17.14 |
| Class C (7/26/99) | | | | | | | | | |
| Before CDSC | 10.25 | 164.36 | 10.21 | 121.65 | 17.26 | 76.54 | 20.86 | 53.66 | 22.11 |
| After CDSC | 10.25 | 164.36 | 10.21 | 121.65 | 17.26 | 76.54 | 20.86 | 52.66 | 21.11 |
| Class I (3/3/15) | | | | | | | | | |
| Net asset value | 10.53 | 190.17 | 11.24 | 134.56 | 18.59 | 82.62 | 22.23 | 55.39 | 22.79 |
| Class R (12/1/03) | | | | | | | | | |
| Net asset value | 10.11 | 173.70 | 10.59 | 127.24 | 17.84 | 79.22 | 21.47 | 54.45 | 22.41 |
| Class R6 (5/22/18) | | | | | | | | | |
| Net asset value | 10.52 | 188.36 | 11.17 | 133.45 | 18.48 | 82.33 | 22.17 | 55.31 | 22.76 |
| Class Y (12/30/98) | | | | | | | | | |
| Net asset value | 10.52 | 187.84 | 11.15 | 133.03 | 18.44 | 82.00 | 22.09 | 55.25 | 22.74 |
Current performance may be lower or higher than the quoted past performance, which cannot guarantee future results. After-sales-charge returns for class A shares reflect the deduction of the maximum 5.75% sales charge, levied at the time of purchase. Class B share returns after contingent deferred sales charge (CDSC) reflect the applicable CDSC, which is 5% in the first year, declining over time to 1% in the sixth year, and is eliminated thereafter. Class C share returns after CDSC reflect a 1% CDSC for the first year that is eliminated thereafter. Class I, R, R6, and Y shares have no initial sales charge or CDSC. Performance for class B, C, R, and Y shares before their inception is derived from the historical performance of class A shares, adjusted for the applicable sales charge (or CDSC) and the higher operating expenses for such shares, except for class Y shares, for which 12b-1 fees are not applicable. Performance for class I and R6 shares prior to their inception is derived from the historical performance of class Y shares and has not been adjusted for the lower investor servicing fees applicable to class I and R6 shares; had it, returns would have been higher.
For a portion of the periods, the fund had expense limitations, without which returns would have been lower.
Class B and C share performance reflects conversion to class A shares after eight years.
|
| Convertible Securities Fund 9 |
Comparative index returns For periods ended 4/30/21
| | | | | | | | | |
| | Annual | | | | | | | | |
| | average | | Annual | | Annual | | Annual | | |
| | (life of fund) | 10 years | average | 5 years | average | 3 years | average | 1 year | 6 months |
| ICE BofA U.S. | | | | | | | | | |
| Convertible Index | —* | 222.70% | 12.43% | 139.24% | 19.06% | 86.22% | 23.03% | 60.79% | 27.33% |
| Lipper Convertible | | | | | | | | | |
| Securities Funds | 10.38% | 177.24 | 10.63 | 126.10 | 17.48 | 78.72 | 21.16 | 52.81 | 22.70 |
| category average† | | | | | | | | | |
Index and Lipper results should be compared with fund performance before sales charge, before CDSC, or at net asset value.
* The fund’s benchmark, the ICE BofA U.S. Convertible Index, was introduced on 12/31/87, which post-dates the inception of the fund’s class A shares.
† Over the 6-month, 1-year, 3-year, 5-year, 10-year, and life-of-fund periods ended 4/30/21, there were 77, 77, 72, 71, 50, and 1 funds, respectively, in this Lipper category.
Fund price and distribution information For the six-month period ended 4/30/21
| | | | | | | | |
| Distributions | Class A | Class B | Class C | Class I | Class R | Class R6 | Class Y |
| Number | 2 | 1 | 1 | 2 | 2 | 2 | 2 |
| Income | $0.118 | $0.023 | $0.025 | $0.174 | $0.078 | $0.168 | $0.160 |
| Capital gains | | | | | | | |
| Long-term gains | 2.432 | 2.432 | 2.432 | 2.432 | 2.432 | 2.432 | 2.432 |
| Short-term gains | 0.964 | 0.964 | 0.964 | 0.964 | 0.964 | 0.964 | 0.964 |
| Total | $3.514 | $3.419 | $3.421 | $3.570 | $3.474 | $3.564 | $3.556 |
| | Before | After | Net | Net | Net | Net | Net | Net |
| | sales | sales | asset | asset | asset | asset | asset | asset |
| Share value | charge | charge | value | value | value | value | value | value |
| 10/31/20 | $30.49 | $32.35 | $29.74 | $30.06 | $30.52 | $30.33 | $30.48 | $30.47 |
| 4/30/21 | 33.69 | 35.75 | 32.75 | 33.13 | 33.73 | 33.49 | 33.68 | 33.67 |
| | Before | After | Net | Net | Net | Net | Net | Net |
| Current rate | sales | sales | asset | asset | asset | asset | asset | asset |
| (end of period) | charge | charge | value | value | value | value | value | value |
| Current dividend rate1 | 0.38% | 0.36% | — | — | 0.71% | 0.14% | 0.68% | 0.63% |
| Current 30-day | | | | | | | | |
| SEC yield2 | N/A | –0.15 | –0.89% | –0.88% | 0.19 | –0.40 | 0.14 | 0.09 |
The classification of distributions, if any, is an estimate. Before-sales-charge share value and current dividend rate for class A shares, if applicable, do not take into account any sales charge levied at the time of purchase. After-sales-charge share value, current dividend rate, and current 30-day SEC yield, if applicable, are calculated assuming that the maximum sales charge (5.75% for class A shares) was levied at the time of purchase. Final distribution information will appear on your year-end tax forms.
1 Most recent distribution, including any return of capital and excluding capital gains, annualized and divided by NAV or market price at end of period.
2 Based only on investment income and calculated using the maximum offering price for each share class, in accordance with SEC guidelines.
|
| 10 Convertible Securities Fund |
Fund performance as of most recent calendar quarter Total return for periods ended 3/31/21
| | | | | | | | | |
| | Annual | | | | | | | | |
| | average | | Annual | | Annual | | Annual | | |
| | (life of fund) | 10 years | average | 5 years | average | 3 years | average | 1 year | 6 months |
| Class A (6/29/72) | | | | | | | | | |
| Before sales charge | 10.33% | 176.92% | 10.72% | 124.72% | 17.58% | 72.75% | 19.99% | 66.26% | 17.45% |
| After sales charge | 10.20 | 161.00 | 10.07 | 111.80 | 16.19 | 62.82 | 17.64 | 56.70 | 10.70 |
| Class B (7/15/93) | | | | | | | | | |
| Before CDSC | 10.15 | 160.76 | 10.06 | 116.45 | 16.70 | 68.92 | 19.10 | 65.01 | 17.00 |
| After CDSC | 10.15 | 160.76 | 10.06 | 114.45 | 16.48 | 65.92 | 18.39 | 60.01 | 12.00 |
| Class C (7/26/99) | | | | | | | | | |
| Before CDSC | 10.19 | 160.84 | 10.06 | 116.41 | 16.70 | 68.95 | 19.10 | 65.00 | 17.03 |
| After CDSC | 10.19 | 160.84 | 10.06 | 116.41 | 16.70 | 68.95 | 19.10 | 64.00 | 16.03 |
| Class I (3/3/15) | | | | | | | | | |
| Net asset value | 10.48 | 186.35 | 11.09 | 129.10 | 18.03 | 74.76 | 20.45 | 66.88 | 17.67 |
| Class R (12/1/03) | | | | | | | | | |
| Net asset value | 10.06 | 170.09 | 10.45 | 121.94 | 17.29 | 71.50 | 19.70 | 65.82 | 17.30 |
| Class R6 (5/22/18) | | | | | | | | | |
| Net asset value | 10.46 | 184.55 | 11.02 | 128.00 | 17.92 | 74.41 | 20.37 | 66.74 | 17.63 |
| Class Y (12/30/98) | | | | | | | | | |
| Net asset value | 10.46 | 184.04 | 11.00 | 127.59 | 17.88 | 74.09 | 20.30 | 66.68 | 17.61 |
See the discussion following the fund performance table on page 9 for information about the calculation of fund performance.
Your fund’s expenses
As a mutual fund investor, you pay ongoing expenses, such as management fees, distribution fees (12b-1 fees), and other expenses. Using the following information, you can estimate how these expenses affect your investment and compare them with the expenses of other funds. You may also pay one-time transaction expenses, including sales charges (loads) and redemption fees, which are not shown in this section and would have resulted in higher total expenses. For more information, see your fund’s prospectus or talk to your financial representative.
Expense ratios
| | | | | | | |
| | Class A | Class B | Class C | Class I | Class R | Class R6 | Class Y |
| Total annual operating expenses for the | | | | | | | |
| fiscal year ended 10/31/20 | 1.04% | 1.79% | 1.79% | 0.68% | 1.29% | 0.72% | 0.79% |
| Annualized expense ratio for the | | | | | | | |
| six-month period ended 4/30/21 | 1.01% | 1.76% | 1.76% | 0.67% | 1.26% | 0.71% | 0.76% |
Fiscal year expense information in this table is taken from the most recent prospectus, is subject to change, and may differ from that shown for the annualized expense ratio and in the financial highlights of this report.
Expenses are shown as a percentage of average net assets.
|
| Convertible Securities Fund 11 |
Expenses per $1,000
The following table shows the expenses you would have paid on a $1,000 investment in each class of the fund from 11/1/20 to 4/30/21. It also shows how much a $1,000 investment would be worth at the close of the period, assuming actual returns and expenses.
| | | | | | | |
| | Class A | Class B | Class C | Class I | Class R | Class R6 | Class Y |
| Expenses paid per $1,000*† | $5.57 | $9.69 | $9.69 | $3.70 | $6.95 | $3.92 | $4.20 |
| Ending value (after expenses) | $1,225.70 | $1,221.40 | $1,221.10 | $1,227.90 | $1,224.10 | $1,227.60 | $1,227.40 |
* Expenses for each share class are calculated using the fund’s annualized expense ratio for each class, which represents the ongoing expenses as a percentage of average net assets for the six months ended 4/30/21. The expense ratio may differ for each share class.
† Expenses are calculated by multiplying the expense ratio by the average account value for the period; then multiplying the result by the number of days in the period; and then dividing that result by the number of days in the year.
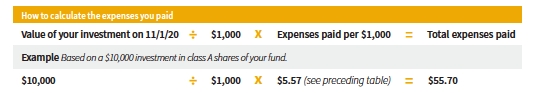
Estimate the expenses you paid
To estimate the ongoing expenses you paid for the six months ended 4/30/21, use the following calculation method. To find the value of your investment on 11/1/20, call Putnam at 1-800-225-1581.
Compare expenses using the SEC’s method
The Securities and Exchange Commission (SEC) has established guidelines to help investors assess fund expenses. Per these guidelines, the following table shows your fund’s expenses based on a $1,000 investment, assuming a hypothetical 5% annualized return. You can use this information to compare the ongoing expenses (but not transaction expenses or total costs) of investing in the fund with those of other funds. All mutual fund shareholder reports will provide this information to help you make this comparison. Please note that you cannot use this information to estimate your actual ending account balance and expenses paid during the period.
| | | | | | | |
| | Class A | Class B | Class C | Class I | Class R | Class R6 | Class Y |
| Expenses paid per $1,000*† | $5.06 | $8.80 | $8.80 | $3.36 | $6.31 | $3.56 | $3.81 |
| Ending value (after expenses) | $1,019.79 | $1,016.07 | $1,016.07 | $1,021.47 | $1,018.55 | $1,021.27 | $1,021.03 |
* Expenses for each share class are calculated using the fund’s annualized expense ratio for each class, which represents the ongoing expenses as a percentage of average net assets for the six months ended 4/30/21. The expense ratio may differ for each share class.
† Expenses are calculated by multiplying the expense ratio by the average account value for the six-month period; then multiplying the result by the number of days in the six-month period; and then dividing that result by the number of days in the year.
|
| 12 Convertible Securities Fund |
Consider these risks before investing
The value of investments in the fund’s portfolio may fall or fail to rise over extended periods of time for a variety of reasons, including general economic, political or financial market conditions, investor sentiment and market perceptions, government actions, geopolitical events or changes, and factors related to a specific issuer, geography, industry or sector. These and other factors may lead to increased volatility and reduced liquidity in the fund’s portfolio holdings. These risks are generally greater for convertible securities issued by small and/or midsize companies. Convertible securities’ prices may be adversely affected by underlying common stock price changes. While convertible securities tend to provide higher yields than common stocks, the higher yield may not protect against the risk of loss or mitigate any loss associated with a convertible security’s price decline. Convertible securities are subject to credit risk, which is the risk that an issuer of the fund’s investments may default on payment of interest or principal. Credit risk is generally greater for below-investment-grade convertible securities. Convertible securities may be less sensitive to interest-rate changes than non-convertible bonds because of their structural features (e.g., convertibility, “put” features). Interest-rate risk is generally greater, however, for longer-term bonds and convertible securities whose underlying stock price has fallen significantly below the conversion price. Our investment techniques, analyses, and judgments may not produce the intended outcome, and the investments we select for the fund may not perform as well as other securities that were not selected for the fund. We, or the fund’s other service providers, may experience disruptions or operating errors that could negatively impact the fund. You can lose money by investing in the fund.
|
| Convertible Securities Fund 13 |
Terms and definitions
Important terms
Total return shows how the value of the fund’s shares changed over time, assuming you held the shares through the entire period and reinvested all distributions in the fund.
Before sales charge, or net asset value, is the price, or value, of one share of a mutual fund, without a sales charge. Before-sales-charge figures fluctuate with market conditions, and are calculated by dividing the net assets of each class of shares by the number of outstanding shares in the class.
After sales charge is the price of a mutual fund share plus the maximum sales charge levied at the time of purchase. After-sales-charge performance figures shown here assume the 5.75% maximum sales charge for class A shares.
Contingent deferred sales charge (CDSC) is generally a charge applied at the time of the redemption of class B or C shares and assumes redemption at the end of the period. Your fund’s class B CDSC declines over time from a 5% maximum during the first year to 1% during the sixth year. After the sixth year, the CDSC no longer applies. The CDSC for class C shares is 1% for one year after purchase.
Share classes
Class A shares are generally subject to an initial sales charge and no CDSC (except on certain redemptions of shares bought without an initial sales charge).
Class B shares are closed to new investments and are only available by exchange from another Putnam fund or through dividend and/or capital gains reinvestment. They are not subject to an initial sales charge and may be subject to a CDSC.
Class C shares are not subject to an initial sales charge and are subject to a CDSC only if the shares are redeemed during the first year.
Class I shares are not subject to an initial sales charge or CDSC and carry no 12b-1 fee. They are only available to institutional clients and other investors who meet minimum investment requirements.
Class R shares are not subject to an initial sales charge or CDSC and are only available to employer-sponsored retirement plans.
Class R6 shares are not subject to an initial sales charge or CDSC and carry no 12b-1 fee. They are generally only available to employer-sponsored retirement plans, corporate and institutional clients, and clients in other approved programs.
Class Y shares are not subject to an initial sales charge or CDSC and carry no 12b-1 fee. They are generally only available to corporate and institutional clients and clients in other approved programs.
Fixed-income terms
Current rate is the annual rate of return earned from dividends or interest of an investment. Current rate is expressed as a percentage of the price of a security, fund share, or principal investment.
Yield curve is a graph that plots the yields of bonds with equal credit quality against their differing maturity dates, ranging from shortest to longest. It is used as a benchmark for other debt, such as mortgage or bank lending rates.
Comparative indexes
Bloomberg Barclays U.S. Aggregate Bond Index is an unmanaged index of U.S. investment-grade fixed-income securities.
ICE BofA (Intercontinental Exchange Bank of America) U.S. 3-Month Treasury Bill Index is an unmanaged index that seeks to measure the performance of U.S. Treasury bills available in the marketplace.
|
| 14 Convertible Securities Fund |
ICE BofA U.S. Convertible Index is an unmanaged index of high-yield U.S. convertible securities.
JPMorgan Developed High Yield Index is an unmanaged index of high-yield fixed-income securities issued in developed countries.
Russell 2000 Index is an unmanaged index of 2,000 small companies in the Russell 3000 Index.
S&P 500 Index is an unmanaged index of common stock performance.
Indexes assume reinvestment of all distributions and do not account for fees. Securities and performance of a fund and an index will differ. You cannot invest directly in an index.
BLOOMBERG® is a trademark and service mark of Bloomberg Finance L.P. and its affiliates (collectively “Bloomberg”). BARCLAYS® is a trademark and service mark of Barclays Bank Plc (collectively with its affiliates, “Barclays”), used under license. Bloomberg or Bloomberg’s licensors, including Barclays, own all proprietary rights in the Bloomberg Barclays Indices. Neither Bloomberg nor Barclays approves or endorses this material, or guarantees the accuracy or completeness of any information herein, or makes any warranty, express or limited, as to the results to be obtained therefrom, and to the maximum extent allowed by law, neither shall have any liability or responsibility for injury or damages arising in connection therewith.
ICE Data Indices, LLC (“ICE BofA”), used with permission. ICE BofA permits use of the ICE BofA indices and related data on an “as is” basis; makes no warranties regarding same; does not guarantee the suitability, quality, accuracy, timeliness, and/or completeness of the ICE BofA indices or any data included in, related to, or derived therefrom; assumes no liability in connection with the use of the foregoing; and does not sponsor, endorse, or recommend Putnam Investments, or any of its products or services.
Frank Russell Company is the source and owner of the trademarks, service marks, and copyrights related to the Russell Indexes. Russell® is a trademark of Frank Russell Company.
Lipper, a Refinitiv company, is a third-party industry-ranking entity that ranks mutual funds. Its rankings do not reflect sales charges. Lipper rankings are based on total return at net asset value relative to other funds that have similar current investment styles or objectives as determined by Lipper. Lipper may change a fund’s category assignment at its discretion. Lipper category averages reflect performance trends for funds within a category.
|
| Convertible Securities Fund 15 |
Other information for shareholders
Important notice regarding delivery of shareholder documents
In accordance with Securities and Exchange Commission (SEC) regulations, Putnam sends a single notice of internet availability, or a single printed copy, of annual and semiannual shareholder reports, prospectuses, and proxy statements to Putnam shareholders who share the same address, unless a shareholder requests otherwise. If you prefer to receive your own copy of these documents, please call Putnam at 1-800-225-1581, and Putnam will begin sending individual copies within 30 days.
Proxy voting
Putnam is committed to managing our mutual funds in the best interests of our shareholders. The Putnam funds’ proxy voting guidelines and procedures, as well as information regarding how your fund voted proxies relating to portfolio securities during the 12-month period ended June 30, 2020, are available in the Individual Investors section of putnam.com and on the SEC’s website, www.sec.gov. If you have questions about finding forms on the SEC’s website, you may call the SEC at 1-800-SEC-0330. You may also obtain the Putnam funds’ proxy voting guidelines and procedures at no charge by calling Putnam’s Shareholder Services at 1-800-225-1581.
Fund portfolio holdings
The fund will file a complete schedule of its portfolio holdings with the SEC for the first and third quarters of each fiscal year on Form N-PORT within 60 days of the end of such fiscal quarter. Shareholders may obtain the fund’s Form N-PORT on the SEC’s website at www.sec.gov.
Prior to its use of Form N-PORT, the fund filed its complete schedule of its portfolio holdings with the SEC on Form N-Q, which is available online at www.sec.gov.
Trustee and employee fund ownership
Putnam employees and members of the Board of Trustees place their faith, confidence, and, most importantly, investment dollars in Putnam mutual funds. As of April 30, 2021, Putnam employees had approximately $580,000,000 and the Trustees had approximately $81,000,000 invested in Putnam mutual funds. These amounts include investments by the Trustees’ and employees’ immediate family members as well as investments through retirement and deferred compensation plans.
Liquidity risk management program
Putnam, as the administrator of the fund’s liquidity risk management program (appointed by the Board of Trustees), presented the most recent annual report on the program to the Trustees in April 2021. The report covered the structure of the program, including the program documents and related policies and procedures adopted to comply with Rule 22e-4 under the Investment Company Act of 1940, and reviewed the operation of the program from January 2020 through December 2020. The report included a description of the annual liquidity assessment of the fund that Putnam performed in November 2020. The report noted that there were no material compliance exceptions identified under Rule 22e-4 during the period. The report included a review of the governance of the program and the methodology for classification of the fund’s investments. The report also included a discussion of liquidity monitoring during the period, including during the market liquidity challenges caused by the Covid-19 pandemic, and the impact those challenges had on the liquidity of the fund’s investments. Putnam concluded that the program has been operating effectively and adequately to ensure compliance with Rule 22e-4.
|
| 16 Convertible Securities Fund |
Financial statements
These sections of the report, as well as the accompanying Notes, constitute the fund’s financial statements.
The fund’s portfolio lists all the fund’s investments and their values as of the last day of the reporting period. Holdings are organized by asset type and industry sector, country, or state to show areas of concentration and diversification.
Statement of assets and liabilities shows how the fund’s net assets and share price are determined. All investment and non-investment assets are added together. Any unpaid expenses and other liabilities are subtracted from this total. The result is divided by the number of shares to determine the net asset value per share, which is calculated separately for each class of shares. (For funds with preferred shares, the amount subtracted from total assets includes the liquidation preference of preferred shares.)
Statement of operations shows the fund’s net investment gain or loss. This is done by first adding up all the fund’s earnings — from dividends and interest income — and subtracting its operating expenses to determine net investment income (or loss). Then, any net gain or loss the fund realized on the sales of its holdings — as well as any unrealized gains or losses over the period — is added to or subtracted from the net investment result to determine the fund’s net gain or loss for the fiscal period.
Statement of changes in net assets shows how the fund’s net assets were affected by the fund’s net investment gain or loss, by distributions to shareholders, and by changes in the number of the fund’s shares. It lists distributions and their sources (net investment income or realized capital gains) over the current reporting period and the most recent fiscal year-end. The distributions listed here may not match the sources listed in the Statement of operations because the distributions are determined on a tax basis and may be paid in a different period from the one in which they were earned. Dividend sources are estimated at the time of declaration. Actual results may vary. Any non-taxable return of capital cannot be determined until final tax calculations are completed after the end of the fund’s fiscal year.
Financial highlights provide an overview of the fund’s investment results, per-share distributions, expense ratios, net investment income ratios, and portfolio turnover in one summary table, reflecting the five most recent reporting periods. In a semiannual report, the highlights table also includes the current reporting period.
|
| Convertible Securities Fund 17 |
The fund’s portfolio 4/30/21 (Unaudited)
| | |
| | Principal | |
| CONVERTIBLE BONDS AND NOTES (81.0%)* | amount | Value |
| Airlines (2.3%) | | |
| JetBlue Airways Corp. 144A cv. sr. unsec. notes 0.50%, 4/1/26 | $4,685,000 | $5,118,363 |
| Southwest Airlines Co. cv. sr. unsec. notes 1.25%, 5/1/25 | 10,718,000 | 18,609,128 |
| | | 23,727,491 |
| Automotive (1.8%) | | |
| NIO, Inc. 144A cv. sr. unsec. notes 0.50%, 2/1/27, (China) | 2,588,000 | 2,158,392 |
| Tesla, Inc. cv. sr. unsec. notes 2.00%, 5/15/24 | 1,442,000 | 16,459,529 |
| | | 18,617,921 |
| Biotechnology (4.3%) | | |
| Exact Sciences Corp. cv. sr. unsec. notes 0.375%, 3/15/27 | 11,214,000 | 15,272,066 |
| Guardant Health, Inc. 144A cv. sr. unsec. sub. notes | | |
| zero %, 11/15/27 | 5,480,000 | 7,182,225 |
| Halozyme Therapeutics, Inc. 144A cv. sr. unsec. notes | | |
| 0.25%, 3/1/27 | 5,380,000 | 5,178,250 |
| Insmed, Inc. cv. sr. unsec. sub. notes 1.75%, 1/15/25 | 3,330,000 | 3,712,950 |
| Ironwood Pharmaceuticals, Inc. cv. sr. unsec. notes 1.50%, 6/15/26 | 5,830,000 | 6,509,529 |
| NeoGenomics, Inc. cv. sr. unsec. notes 0.25%, 1/15/28 | 6,845,000 | 6,913,607 |
| | | 44,768,627 |
| Cable television (3.4%) | | |
| Cable One, Inc. 144A company guaranty cv. sr. unsec. notes | | |
| 1.125%, 3/15/28 | 6,710,000 | 6,632,651 |
| DISH Network Corp. cv. sr. unsec. notes 3.375%, 8/15/26 | 5,277,000 | 5,554,043 |
| DISH Network Corp. 144A cv. sr. unsec. notes zero %, 12/15/25 | 4,410,000 | 5,389,020 |
| Liberty Media Corp. cv. sr. unsec. bonds 1.375%, 10/15/23 | 3,306,000 | 4,301,726 |
| Liberty Media Corp. cv. sr. unsec. unsub. bonds 0.50%, 12/1/50 | 5,116,000 | 5,714,572 |
| Liberty Media Corp. 144A cv. sr. unsec. unsub. bonds | | |
| 2.75%, 12/1/49 | 6,873,000 | 7,017,333 |
| | | 34,609,345 |
| Commercial and consumer services (4.4%) | | |
| Booking Holdings, Inc. 144A cv. sr. unsec. notes 0.75%, 5/1/25 | 6,495,000 | 9,820,440 |
| Expedia Group, Inc. 144A company guaranty cv. sr. unsec. unsub. | | |
| notes zero %, 2/15/26 | 7,128,000 | 7,726,752 |
| Shift4 Payments, Inc. 144A cv. sr. unsec. sub. notes | | |
| zero %, 12/15/25 | 5,988,000 | 8,405,954 |
| Square, Inc. cv. sr. unsec. notes 0.125%, 3/1/25 | 6,680,000 | 13,844,300 |
| Square, Inc. 144A cv. sr. unsec. sub. notes 0.25%, 11/1/27 | 4,981,000 | 5,852,675 |
| | | 45,650,121 |
| Communications equipment (0.8%) | | |
| Viavi Solutions, Inc. cv. sr. unsec. unsub. notes 1.00%, 3/1/24 | 5,825,000 | 7,852,683 |
| | | 7,852,683 |
| Computers (10.6%) | | |
| Akamai Technologies, Inc. cv. sr. unsec. notes 0.375%, 9/1/27 | 10,321,000 | 11,540,168 |
| Atlassian, Inc. cv. company guaranty sr. unsec. notes | | |
| 0.625%, 5/1/23 | 2,155,000 | 6,262,969 |
| Box, Inc. 144A cv. sr. unsec. notes zero %, 1/15/26 | 5,882,000 | 6,404,322 |
| Cloudflare, Inc. 144A cv. sr. unsec. notes 0.75%, 5/15/25 | 3,192,000 | 7,401,450 |
| CyberArk Software, Ltd. cv. sr. unsec. notes zero %, 11/15/24 (Israel) | 4,795,000 | 5,376,634 |
| Datadog, Inc. 144A cv. sr. unsec. notes 0.125%, 6/15/25 | 2,965,000 | 3,535,763 |
| Envestnet, Inc. 144A cv. company guaranty sr. unsec. notes | | |
| 0.75%, 8/15/25 | 5,289,000 | 5,257,724 |
|
| 18 Convertible Securities Fund |
| | |
| | Principal | |
| CONVERTIBLE BONDS AND NOTES (81.0%)* cont. | amount | Value |
| Computers cont. | | |
| Five9, Inc. 144A cv. sr. unsec. notes 0.50%, 6/1/25 | $6,617,000 | $10,047,454 |
| Lumentum Holdings, Inc. cv. sr. unsec. notes 0.50%, 12/15/26 | 6,030,000 | 6,655,914 |
| Nuance Communications, Inc. cv. sr. unsec. unsub. bonds | | |
| 1.00%, 12/15/35 | 2,345,000 | 5,148,682 |
| RingCentral, Inc. cv. sr. unsec. notes zero %, 3/1/25 | 12,866,000 | 14,568,017 |
| Splunk, Inc. cv. sr. unsec. notes 1.125%, 9/15/25 | 6,371,000 | 7,175,339 |
| Splunk, Inc. 144A cv. sr. unsec. notes 1.125%, 6/15/27 | 5,650,000 | 5,208,594 |
| Twilio, Inc. cv. sr. unsec. notes 0.25%, 6/1/23 | 1,415,000 | 7,333,238 |
| Zscaler, Inc. 144A cv. sr. unsec. notes 0.125%, 7/1/25 | 4,560,000 | 6,429,600 |
| | | 108,345,868 |
| Consumer services (8.5%) | | |
| Airbnb, Inc. 144A cv. sr. unsec. sub. notes zero %, 3/15/26 | 7,377,000 | 7,300,354 |
| Etsy, Inc. cv. sr. unsec. notes 0.125%, 10/1/26 | 1,174,000 | 2,742,758 |
| Etsy, Inc. 144A cv. sr. unsec. notes 0.125%, 9/1/27 | 5,750,000 | 7,428,281 |
| Fiverr International, Ltd. 144A cv. sr. unsec. notes zero %, | | |
| 11/1/25 (Israel) | 5,473,000 | 6,625,614 |
| IAC Financeco 2, Inc. 144A cv. company guaranty sr. unsec. notes | | |
| 0.875%, 6/15/26 | 6,138,000 | 11,305,489 |
| IAC FinanceCo, Inc. 144A cv. company guaranty sr. unsec. notes | | |
| 0.875%, 10/1/22 | 999,000 | 3,534,587 |
| Lyft, Inc. 144A cv. sr. unsec. notes 1.50%, 5/15/25 | 3,600,000 | 5,752,800 |
| Sea, Ltd. 144A cv. sr. unsec. notes 2.375%, 12/1/25 (Thailand) | 2,665,000 | 7,573,597 |
| Uber Technologies, Inc. 144A cv. sr. unsec. notes zero %, 12/15/25 | 7,211,000 | 7,564,535 |
| Wayfair, Inc. 144A cv. sr. unsec. notes 0.625%, 10/1/25 | 9,550,000 | 9,902,156 |
| Zillow Group, Inc. cv. sr. unsec. notes 2.75%, 5/15/25 | 8,667,000 | 17,902,772 |
| | | 87,632,943 |
| Electronics (2.4%) | | |
| Microchip Technology, Inc. cv. sr. unsec. sub. notes | | |
| 1.625%, 2/15/27 | 5,782,000 | 12,827,452 |
| ON Semiconductor Corp. cv. company guaranty sr. unsec. unsub. | | |
| notes 1.625%, 10/15/23 | 6,058,000 | 11,816,886 |
| | | 24,644,338 |
| Energy (other) (1.6%) | | |
| Enphase energy, Inc. 144A cv. sr. unsec. notes zero %, 3/1/28 | 4,890,000 | 4,288,262 |
| SolarEdge Technologies, Inc. 144A cv. sr. unsec. notes zero %, | | |
| 9/15/25 (Israel) | 5,614,000 | 6,798,554 |
| Sunrun, Inc. 144A cv. sr. unsec. notes zero %, 2/1/26 | 6,421,000 | 5,281,273 |
| | | 16,368,089 |
| Entertainment (3.3%) | | |
| Cinemark Holdings, Inc. 144A cv. sr. unsec. notes 4.50%, 8/15/25 | 1,627,000 | 2,797,423 |
| IMAX Corp. 144A cv. sr. unsec. unsub. notes 0.50%, 4/1/26 (Canada) | 5,311,000 | 5,506,272 |
| NCL Corp, Ltd. 144A cv. company guaranty notes 5.375%, 8/1/25 | 5,579,000 | 10,561,047 |
| Royal Caribbean Cruises, Ltd. 144A cv. sr. unsec. notes | | |
| 2.875%, 11/15/23 | 6,521,000 | 8,434,914 |
| Vail Resorts, Inc. 144A cv. sr. unsec. sub. notes zero %, 1/1/26 | 5,870,000 | 6,225,869 |
| | | 33,525,525 |
| Gaming and lottery (1.2%) | | |
| DraftKings, Inc. 144A cv. sr. unsec. unsub. notes zero %, 3/15/28 | 7,607,000 | 7,260,882 |
| Penn National Gaming, Inc. cv. sr. unsec. notes 2.75%, 5/15/26 | 1,255,000 | 4,847,438 |
| | | 12,108,320 |
|
| Convertible Securities Fund 19 |
| | |
| | Principal | |
| CONVERTIBLE BONDS AND NOTES (81.0%)* cont. | amount | Value |
| Health-care services (1.7%) | | |
| 1Life Healthcare, Inc. 144A cv. sr. unsec. notes 3.00%, 6/15/25 | $6,167,000 | $7,732,185 |
| Teladoc Health, Inc. 144A cv. sr. unsec. sub. notes 1.25%, 6/1/27 | 8,585,000 | 9,599,103 |
| | | 17,331,288 |
| Homebuilding (1.0%) | | |
| Horizon Global Corp. cv. sr. unsec. unsub. notes 2.75%, 7/1/22 | 4,018,000 | 3,766,503 |
| Winnebago Industries, Inc. cv. sr. unsec. notes 1.50%, 4/1/25 | 4,800,000 | 6,840,000 |
| | | 10,606,503 |
| Leisure (0.6%) | | |
| Callaway Golf Co. 144A cv. sr. unsec. notes 2.75%, 5/1/26 | 3,666,000 | 6,605,674 |
| | | 6,605,674 |
| Lodging/Tourism (0.3%) | | |
| Carnival Corp. company guaranty cv. sr. unsec. notes | | |
| 5.75%, 4/1/23 | 1,180,000 | 3,476,903 |
| | | 3,476,903 |
| Machinery (0.9%) | | |
| Middleby Corp. (The) 144A cv. sr. unsec. unsub. notes 1.00%, 9/1/25 | 6,146,000 | 9,206,708 |
| | | 9,206,708 |
| Media (0.6%) | | |
| Liberty Interactive, LLC 144A cv. sr. unsec. bonds 1.75%, 9/30/46 | 3,170,000 | 6,332,075 |
| | | 6,332,075 |
| Medical technology (6.0%) | | |
| China Medical Technologies, Inc. cv. sr. unsec. bonds Ser. CMT, | | |
| 4.00%, 8/15/21 (China) (In default) † F | 3,213,000 | 205,632 |
| China Medical Technologies, Inc. 144A cv. sr. unsec. notes 6.25%, | | |
| 12/17/21 (China) (In default) † F | 3,544,000 | 198,464 |
| CONMED Corp. cv. sr. unsec. notes 2.625%, 2/1/24 | 4,035,000 | 6,660,473 |
| Envista Holdings Corp. 144A cv. sr. unsec. notes 2.375%, 6/1/25 | 3,643,000 | 7,807,313 |
| Insulet Corp. cv. sr. unsec. notes 0.375%, 9/1/26 | 7,839,000 | 11,268,563 |
| Integra LifeSciences Holdings Corp. cv. sr. unsec. notes | | |
| 0.50%, 8/15/25 | 4,696,000 | 5,406,505 |
| Natera, Inc. cv. sr. unsec. notes 2.25%, 5/1/27 | 2,246,000 | 6,596,221 |
| Novocure, Ltd. 144A cv. sr. unsec. notes zero %, 11/1/25 (Jersey) | 4,176,000 | 5,937,750 |
| Omnicell, Inc. 144A cv. sr. unsec. notes 0.25%, 9/15/25 | 4,319,000 | 6,724,683 |
| Repligen Corp. cv. sr. unsec. notes 0.375%, 7/15/24 | 2,740,000 | 5,156,406 |
| Tandem Diabetes Care, Inc. 144A cv. sr. unsec. notes 1.50%, 5/1/25 | 4,947,000 | 5,451,099 |
| | | 61,413,109 |
| Oil and gas (1.2%) | | |
| Pioneer Natural Resources Co. 144A cv. sr. unsec. notes | | |
| 0.25%, 5/15/25 | 8,065,000 | 12,234,605 |
| | | 12,234,605 |
| Pharmaceuticals (2.3%) | | |
| DexCom, Inc. cv. sr. unsec. unsub. notes 0.75%, 12/1/23 | 1,178,000 | 2,777,135 |
| DexCom, Inc. 144A cv. sr. unsec. unsub. notes 0.25%, 11/15/25 | 6,725,000 | 6,725,000 |
| Pacira Pharmaceuticals, Inc. 144A cv. sr. unsec. notes | | |
| 0.75%, 8/1/25 | 5,855,000 | 6,491,731 |
| Revance Therapeutics, Inc. cv. sr. unsec. notes 1.75%, 2/15/27 | 6,386,000 | 7,331,926 |
| | | 23,325,792 |
|
| 20 Convertible Securities Fund |
| | |
| | Principal | |
| CONVERTIBLE BONDS AND NOTES (81.0%)* cont. | amount | Value |
| Real estate (0.6%) | | |
| Redfin Corp. 144A cv. sr. unsec. notes zero %, 10/15/25 | $4,850,000 | $5,839,400 |
| | | 5,839,400 |
| Restaurants (1.1%) | | |
| Bloomin’ Brands, Inc. 144A cv. sr. unsec. notes 5.00%, 5/1/25 | 2,056,000 | 5,678,415 |
| Shake Shack, Inc. 144A cv. sr. unsec. notes zero %, 3/1/28 | 6,230,000 | 5,891,244 |
| | | 11,569,659 |
| Retail (4.3%) | | |
| American Eagle Outfitters, Inc. cv. sr. unsec. unsub. notes | | |
| 3.75%, 4/15/25 | 1,985,000 | 7,989,625 |
| Burlington Stores, Inc. 144A cv. sr. unsec. notes 2.25%, 4/15/25 | 6,834,000 | 10,904,501 |
| Dick’s Sporting Goods, Inc. cv. sr. unsec. notes 3.25%, 4/15/25 | 2,310,000 | 5,671,050 |
| Guess?, Inc. cv. sr. unsec. sub. notes 2.00%, 4/15/24 | 3,451,000 | 4,311,593 |
| National Vision Holdings, Inc. 144A cv. sr. unsec. notes | | |
| 2.50%, 5/15/25 | 3,680,000 | 6,382,500 |
| RH cv. sr. unsec. notes zero %, 9/15/24 | 2,636,000 | 8,571,255 |
| | | 43,830,524 |
| Schools (0.9%) | | |
| Chegg, Inc. cv. sr. unsec. notes 0.125%, 3/15/25 | 839,000 | 1,525,302 |
| Chegg, Inc. 144A cv. sr. unsec. notes zero %, 9/1/26 | 6,583,000 | 7,231,426 |
| | | 8,756,728 |
| Semiconductor (0.5%) | | |
| Teradyne, Inc. cv. sr. unsec. notes 1.25%, 12/15/23 | 1,380,000 | 5,457,038 |
| | | 5,457,038 |
| Software (8.8%) | | |
| Bill.com Holdings, Inc. 144A cv. sr. unsec. notes zero %, 12/1/25 | 6,270,000 | 7,594,538 |
| Ceridian HCM Holding, Inc. 144A cv. sr. unsec. notes 0.25%, 3/15/26 | 7,851,000 | 7,811,745 |
| Coupa Software, Inc. 144A cv. sr. unsec. notes 0.375%, 6/15/26 | 11,144,000 | 12,843,460 |
| Everbridge, Inc. 144A cv. sr. unsec. notes zero %, 3/15/26 | 5,451,000 | 5,532,765 |
| HubSpot, Inc. 144A cv. sr. unsec. notes 0.375%, 6/1/25 | 3,767,000 | 7,279,728 |
| LivePerson, Inc. 144A cv. sr. unsec. notes zero %, 12/15/26 | 4,990,000 | 5,005,469 |
| MicroStrategy, Inc. 144A cv. sr. unsec. notes 0.75%, 12/15/25 | 550,000 | 1,014,750 |
| MicroStrategy, Inc. 144A cv. sr. unsec. notes zero %, 2/15/27 | 3,840,000 | 3,152,640 |
| Okta, Inc. 144A cv. sr. unsec. notes 0.375%, 6/15/26 | 11,771,000 | 15,442,081 |
| SailPoint Technologies Holding, Inc. cv. sr. unsec. notes | | |
| 0.125%, 9/15/24 | 2,248,000 | 4,053,144 |
| Shopify, Inc. cv. sr. unsec. notes 0.125%, 11/1/25 (Canada) | 5,430,000 | 6,363,281 |
| Zendesk, Inc. 144A cv. sr. unsec. notes 0.625%, 6/15/25 | 5,610,000 | 8,232,675 |
| Zynga, Inc. 144A cv. sr. unsec. unsub. notes zero %, 12/15/26 | 5,115,000 | 5,530,594 |
| | | 89,856,870 |
| Technology services (5.0%) | | |
| fuboTV, Inc. 144A cv. sr. unsec. notes 3.25%, 2/15/26 | 6,057,000 | 5,095,451 |
| Palo Alto Networks, Inc. 144A cv. sr. unsec. notes 0.375%, 6/1/25 | 13,895,000 | 18,119,080 |
| Snap, Inc. cv. sr. unsec. sub. notes 0.75%, 8/1/26 | 5,460,000 | 14,987,700 |
| Snap, Inc. 144A cv. sr. unsec. notes zero %, 5/1/27 | 1,491,000 | 1,525,479 |
| TechTarget, Inc. 144A cv. sr. unsec. sub. notes 0.125%, 12/15/25 | 5,496,000 | 6,884,290 |
| Twitter, Inc. 144A cv. sr. unsec. sub. notes zero %, 3/15/26 | 5,377,000 | 4,889,254 |
| | | 51,501,254 |
|
| Convertible Securities Fund 21 |
| | |
| | Principal | |
| CONVERTIBLE BONDS AND NOTES (81.0%)* cont. | amount | Value |
| Telecommunications (—%) | | |
| Powerwave Technologies, Inc. cv. unsec. sub. notes 3.875%, | | |
| 10/1/27 (In default) † F | $5,121,000 | $512 |
| | | 512 |
| Utilities and power (0.6%) | | |
| NextEra Energy Partners LP 144A company guaranty cv. sr. unsec. | | |
| notes zero %, 11/15/25 | 6,070,000 | 6,461,515 |
| | | 6,461,515 |
| Total convertible bonds and notes (cost $659,709,192) | | $831,657,428 |
| |
| CONVERTIBLE PREFERRED STOCKS (15.6%)* | Shares | Value |
| Commercial and consumer services (0.6%) | | |
| Sabre Corp. $6.50 cv. pfd. | 32,525 | $6,158,609 |
| | | 6,158,609 |
| Conglomerates (1.7%) | | |
| Danaher Corp. 5.00% cv. pfd. S | 12,585 | 17,837,979 |
| | | 17,837,979 |
| Consumer (1.3%) | | |
| Stanley Black & Decker, Inc. $5.25 cv. pfd. S | 106,090 | 13,003,451 |
| | | 13,003,451 |
| Electric utilities (3.4%) | | |
| Dominion Energy, Inc. $7.25 cv. pfd. | 63,345 | 6,534,037 |
| NextEra Energy, Inc. $2.436 cv. pfd. | 373,252 | 21,928,555 |
| PG&E Corp. $5.50 cv. pfd. | 57,695 | 6,368,951 |
| | | 34,831,543 |
| Electronics (2.1%) | | |
| Broadcom, Inc. 8.00% cv. pfd. | 14,632 | 21,208,352 |
| | | 21,208,352 |
| Financial (1.4%) | | |
| 2020 Mandatory Exchange 144A 6.50% cv. pfd. † | 2,700 | 4,904,280 |
| KKR & Co., Inc. $3.00 cv. pfd. S | 128,303 | 9,674,046 |
| | | 14,578,326 |
| Food (0.7%) | | |
| Bunge, Ltd. $4.88 cv. pfd. | 61,911 | 7,305,498 |
| | | 7,305,498 |
| Medical technology (1.9%) | | |
| Avantor, Inc. $3.13 cv. pfd. | 94,070 | 9,330,803 |
| Boston Scientific Corp. $5.50 cv. pfd. | 46,943 | 5,513,455 |
| Elanco Animal Health, Inc. $2.50 cv. pfd. | 98,887 | 4,830,630 |
| | | 19,674,888 |
| Regional Bells (—%) | | |
| Cincinnati Bell, Inc. Ser. B, $3.378 cum. cv. pfd. | 190 | 9,511 |
| | | 9,511 |
| Telecommunications (1.1%) | | |
| T-Mobile US, Inc. 144A 5.25% cv. pfd. † S | 9,965 | 11,702,198 |
| | | 11,702,198 |
| Trucks and parts (1.0%) | | |
| Aptiv PLC $5.50 cv. pfd. | 61,560 | 10,101,996 |
| | | 10,101,996 |
|
| 22 Convertible Securities Fund |
| | |
| CONVERTIBLE PREFERRED STOCKS (15.6%)* cont. | Shares | Value |
| Water Utilities (0.4%) | | |
| Essential Utilities, Inc. $3.00 cv. pfd. | 70,705 | $4,156,040 |
| | | 4,156,040 |
| Total convertible preferred stocks (cost $134,956,985) | | $160,568,391 |
| |
| COMMON STOCKS (1.9%)* | Shares | Value |
| Bank of America Corp. | 191,135 | $7,746,702 |
| DocuSign, Inc. † | 7,165 | 1,597,365 |
| Exxon Mobil Corp. | 41,375 | 2,368,305 |
| GT Advanced Technologies, Inc. † F | 552 | 29,664 |
| Lam Research Corp. | 4,420 | 2,742,389 |
| ServiceNow, Inc. † | 10,460 | 5,296,625 |
| Total common stocks (cost $16,249,236) | | $19,781,050 |
| |
| SHORT-TERM INVESTMENTS (5.3%)* | Shares | Value |
| Putnam Cash Collateral Pool, LLC 0.10% d | 39,357,702 | $39,357,702 |
| Putnam Short Term Investment Fund Class P 0.10% L | 15,025,563 | 15,025,563 |
| Total short-term investments (cost $54,383,265) | | $54,383,265 |
| |
| TOTAL INVESTMENTS | | |
| Total investments (cost $865,298,678) | | $1,066,390,134 |
Notes to the fund’s portfolio
Unless noted otherwise, the notes to the fund’s portfolio are for the close of the fund’s reporting period, which ran from November 1, 2020 through April 30, 2021 (the reporting period). Within the following notes to the portfolio, references to “Putnam Management” represent Putnam Investment Management, LLC, the fund’s manager, an indirect wholly-owned subsidiary of Putnam Investments, LLC and references to “ASC 820” represent Accounting Standards Codification 820 Fair Value Measurements and Disclosures.
* Percentages indicated are based on net assets of $1,026,799,232.
† This security is non-income-producing.
d Affiliated company. See Notes 1 and 5 to the financial statements regarding securities lending. The rate quoted in the security description is the annualized 7-day yield of the fund at the close of the reporting period.
F This security is valued by Putnam Management at fair value following procedures approved by the Trustees. Securities are classified as Level 3 for ASC 820 based on the securities’ valuation inputs (Note 1).
L Affiliated company (Note 5). The rate quoted in the security description is the annualized 7-day yield of the fund at the close of the reporting period.
S Security on loan, in part or in entirety, at the close of the reporting period (Note 1).
Debt obligations are considered secured unless otherwise indicated.
144A after the name of an issuer represents securities exempt from registration under Rule 144A of the Securities Act of 1933, as amended. These securities may be resold in transactions exempt from registration, normally to qualified institutional buyers.
|
| Convertible Securities Fund 23 |
ASC 820 establishes a three-level hierarchy for disclosure of fair value measurements. The valuation hierarchy is based upon the transparency of inputs to the valuation of the fund’s investments. The three levels are defined as follows:
Level 1: Valuations based on quoted prices for identical securities in active markets.
Level 2: Valuations based on quoted prices in markets that are not active or for which all significant inputs are observable, either directly or indirectly.
Level 3: Valuations based on inputs that are unobservable and significant to the fair value measurement.
The following is a summary of the inputs used to value the fund’s net assets as of the close of the reporting period:
| | | |
| | | | Valuation inputs | |
| Investments in securities: | Level 1 | Level 2 | Level 3 |
| Common stocks*: | | | |
| Energy | $2,368,305 | $— | $— |
| Financials | 7,746,702 | — | — |
| Technology | 9,636,379 | — | 29,664 |
| Total common stocks | 19,751,386 | — | 29,664 |
| Convertible bonds and notes | — | 831,252,820 | 404,608 |
| Convertible preferred stocks | 47,575,447 | 112,992,944 | — |
| Short-term investments | — | 54,383,265 | — |
| Totals by level | $67,326,833 | $998,629,029 | $434,272 |
* Common stock classifications are presented at the sector level, which may differ from the fund’s portfolio presentation.
At the start and close of the reporting period, Level 3 investments in securities represented less than 1% of the fund’s net assets and were not considered a significant portion of the fund’s portfolio.
The accompanying notes are an integral part of these financial statements.
|
| 24 Convertible Securities Fund |
Statement of assets and liabilities 4/30/21 (Unaudited)
| |
| ASSETS | |
| Investment in securities, at value, including $38,249,927 of securities on loan (Note 1): | |
| Unaffiliated issuers (identified cost $810,915,413) | $1,012,006,869 |
| Affiliated issuers (identified cost $54,383,265) (Notes 1 and 5) | 54,383,265 |
| Dividends, interest and other receivables | 1,780,666 |
| Receivable for shares of the fund sold | 517,284 |
| Receivable for investments sold | 3,868,811 |
| Prepaid assets | 67,000 |
| Total assets | 1,072,623,895 |
| |
| LIABILITIES | |
| Payable to custodian | 3,788,000 |
| Payable for shares of the fund repurchased | 1,509,984 |
| Payable for compensation of Manager (Note 2) | 516,229 |
| Payable for custodian fees (Note 2) | 10,384 |
| Payable for investor servicing fees (Note 2) | 169,262 |
| Payable for Trustee compensation and expenses (Note 2) | 220,391 |
| Payable for administrative services (Note 2) | 3,004 |
| Payable for distribution fees (Note 2) | 145,234 |
| Collateral on securities loaned, at value (Note 1) | 39,357,702 |
| Other accrued expenses | 104,473 |
| Total liabilities | 45,824,663 |
| | |
| Net assets | $1,026,799,232 |
| |
| REPRESENTED BY | |
| Paid-in capital (Unlimited shares authorized) (Notes 1 and 4) | $689,952,990 |
| Total distributable earnings (Note 1) | 336,846,242 |
| Total — Representing net assets applicable to capital shares outstanding | $1,026,799,232 |
| |
| COMPUTATION OF NET ASSET VALUE AND OFFERING PRICE | |
| Net asset value and redemption price per class A share | |
| ($569,141,094 divided by 16,891,621 shares) | $33.69 |
| Offering price per class A share (100/94.25 of $33.69)* | $35.75 |
| Net asset value and offering price per class B share ($3,772,022 divided by 115,193 shares)** | $32.75 |
| Net asset value and offering price per class C share ($27,979,316 divided by 844,491 shares)** | $33.13 |
| Net asset value and offering price per class I share ($21,156 divided by 627 shares)† | $33.73 |
| Net asset value, offering price and redemption price per class R share | |
| ($3,962,221 divided by 118,300 shares) | $33.49 |
| Net asset value, offering price and redemption price per class R6 share | |
| ($20,819,483 divided by 618,114 shares) | $33.68 |
| Net asset value, offering price and redemption price per class Y share | |
| ($401,103,940 divided by 11,914,014 shares) | $33.67 |
*On single retail sales of less than $50,000. On sales of $50,000 or more the offering price is reduced.
**Redemption price per share is equal to net asset value less any applicable contingent deferred sales charge.
†Net asset value may not recalculate due to rounding of fractional shares.
The accompanying notes are an integral part of these financial statements.
|
| Convertible Securities Fund 25 |
Statement of operations Six months ended 4/30/21 (Unaudited)
| |
| INVESTMENT INCOME | |
| Dividends (net of foreign tax of $308) | $3,954,220 |
| Interest (including interest income of $13,345 from investments in affiliated issuers) (Note 5) | 3,034,100 |
| Securities lending (net of expenses) (Notes 1 and 5) | 17,516 |
| Total investment income | 7,005,836 |
| |
| EXPENSES | |
| Compensation of Manager (Note 2) | 3,118,553 |
| Investor servicing fees (Note 2) | 507,211 |
| Custodian fees (Note 2) | 10,015 |
| Trustee compensation and expenses (Note 2) | 23,156 |
| Distribution fees (Note 2) | 878,143 |
| Administrative services (Note 2) | 17,480 |
| Other | 178,835 |
| Total expenses | 4,733,393 |
| Expense reduction (Note 2) | (467) |
| Net expenses | 4,732,926 |
| | |
| Net investment income | 2,272,910 |
| |
| REALIZED AND UNREALIZED GAIN (LOSS) | |
| Net realized gain (loss) on: | |
| Securities from unaffiliated issuers (Notes 1 and 3) | 136,839,616 |
| Foreign currency transactions (Note 1) | 1,130 |
| Total net realized gain | 136,840,746 |
| Change in net unrealized appreciation (depreciation) on: | |
| Securities from unaffiliated issuers | 61,310,946 |
| Assets and liabilities in foreign currencies | (595) |
| Total change in net unrealized appreciation | 61,310,351 |
| | |
| Net gain on investments | 198,151,097 |
| |
| Net increase in net assets resulting from operations | $200,424,007 |
The accompanying notes are an integral part of these financial statements.
|
| 26 Convertible Securities Fund |
Statement of changes in net assets
| | |
| INCREASE IN NET ASSETS | Six months ended 4/30/21* | Year ended 10/31/20 |
| Operations | | |
| Net investment income | $2,272,910 | $7,845,442 |
| Net realized gain on investments | | |
| and foreign currency transactions | 136,840,746 | 99,856,995 |
| Change in net unrealized appreciation of investments | | |
| and assets and liabilities in foreign currencies | 61,310,351 | 92,252,734 |
| Net increase in net assets resulting from operations | 200,424,007 | 199,955,171 |
| Distributions to shareholders (Note 1): | | |
| From ordinary income | | |
| Net investment income | | |
| Class A | (1,877,653) | (5,740,040) |
| Class B | (2,893) | (24,930) |
| Class C | (24,808) | (199,190) |
| Class I | (102) | (253) |
| Class R | (8,558) | (34,092) |
| Class R6 | (93,314) | (188,752) |
| Class Y | (1,922,899) | (4,917,067) |
| Net realized short-term gain on investments | | |
| Class A | (14,944,636) | (4,671,383) |
| Class B | (121,253) | (49,060) |
| Class C | (956,579) | (375,598) |
| Class I | (544) | (157) |
| Class R | (104,148) | (38,926) |
| Class R6 | (507,190) | (109,274) |
| Class Y | (11,556,418) | (3,439,484) |
| From net realized long-term gain on investments | | |
| Class A | (37,702,649) | (18,685,532) |
| Class B | (305,900) | (196,240) |
| Class C | (2,413,277) | (1,502,393) |
| Class I | (1,373) | (628) |
| Class R | (262,746) | (155,705) |
| Class R6 | (1,279,551) | (437,098) |
| Class Y | (29,154,780) | (13,757,937) |
| Increase from capital share transactions (Note 4) | 42,975,168 | 8,662,039 |
| Total increase in net assets | 140,157,904 | 154,093,471 |
| |
| NET ASSETS | | |
| Beginning of period | 886,641,328 | 732,547,857 |
| End of period | $1,026,799,232 | $886,641,328 |
*Unaudited.
The accompanying notes are an integral part of these financial statements.
|
| Convertible Securities Fund 27 |
Financial highlights (For a common share outstanding throughout the period)
| | | | | | | | | | | | | |
| | INVESTMENT OPERATIONS | LESS DISTRIBUTIONS | RATIOS AND SUPPLEMENTAL DATA |
| | | | | | | | | | | | | Ratio of net | |
| | Net asset | | Net realized | | | | | | | | Ratio | investment | |
| | value, | | and unrealized | Total from | From net | From net | | Net asset | Total return | Net assets, | of expenses | income (loss) | Portfolio |
| | beginning | Net investment | gain (loss) | investment | investment | realized gain | Total | value, end | at net asset | end of period | to average | to average | turnover |
| Period ended | of period | income (loss)a | on investments | operations | income | on investments | distributions | of period | value (%)b | (in thousands) | net assets (%)c | net assets (%) | (%) |
| Class A | | | | | | | | | | | | | |
| April 30, 2021** | $30.49 | .06 | 6.66 | 6.72 | (.12) | (3.40) | (3.52) | $33.69 | 22.57* | $569,141 | .50* | .18* | 49* |
| October 31, 2020 | 25.27 | .25 | 6.84 | 7.09 | (.37) | (1.50) | (1.87) | 30.49 | 29.69 | 478,030 | 1.04 | .93 | 98 |
| October 31, 2019 | 25.23 | .27 | 2.75 | 3.02 | (.45) | (2.53) | (2.98) | 25.27 | 14.11 | 394,780 | 1.05 | 1.08 | 60 |
| October 31, 2018 | 26.19 | .32 | (.27) | .05 | (.48) | (.53) | (1.01) | 25.23 | .13 | 371,067 | 1.05 | 1.22 | 68 |
| October 31, 2017 | 22.55 | .35 | 3.77 | 4.12 | (.48) | — | (.48) | 26.19 | 18.44 | 410,595 | 1.07 | 1.43 | 56 |
| October 31, 2016 | 23.37 | .35 | .17 | .52 | (.49) | (.85) | (1.34) | 22.55 | 2.49 | 404,101 | 1.09d | 1.59d | 49 |
| Class B | | | | | | | | | | | | | |
| April 30, 2021** | $29.74 | (.06) | 6.49 | 6.43 | (.02) | (3.40) | (3.42) | $32.75 | 22.14* | $3,772 | .87* | (.18)* | 49* |
| October 31, 2020 | 24.69 | .05 | 6.67 | 6.72 | (.17) | (1.50) | (1.67) | 29.74 | 28.69 | 4,118 | 1.79 | .19 | 98 |
| October 31, 2019 | 24.70 | .08 | 2.70 | 2.78 | (.26) | (2.53) | (2.79) | 24.69 | 13.29 | 4,244 | 1.80 | .35 | 60 |
| October 31, 2018 | 25.66 | .12 | (.27) | (.15) | (.28) | (.53) | (.81) | 24.70 | (.63) | 6,418 | 1.80 | .47 | 68 |
| October 31, 2017 | 22.10 | .16 | 3.70 | 3.86 | (.30) | — | (.30) | 25.66 | 17.56 | 8,201 | 1.82 | .68 | 56 |
| October 31, 2016 | 22.93 | .18 | .15 | .33 | (.31) | (.85) | (1.16) | 22.10 | 1.72 | 9,018 | 1.84d | .84d | 49 |
| Class C | | | | | | | | | | | | | |
| April 30, 2021** | $30.06 | (.06) | 6.56 | 6.50 | (.03) | (3.40) | (3.43) | $33.13 | 22.11* | $27,979 | .87* | (.18)* | 49* |
| October 31, 2020 | 24.93 | .05 | 6.74 | 6.79 | (.16) | (1.50) | (1.66) | 30.06 | 28.73 | 30,926 | 1.79 | .19 | 98 |
| October 31, 2019 | 24.93 | .08 | 2.72 | 2.80 | (.27) | (2.53) | (2.80) | 24.93 | 13.24 | 31,947 | 1.80 | .34 | 60 |
| October 31, 2018 | 25.88 | .12 | (.26) | (.14) | (.28) | (.53) | (.81) | 24.93 | (.59) | 34,353 | 1.80 | .47 | 68 |
| October 31, 2017 | 22.29 | .16 | 3.72 | 3.88 | (.29) | — | (.29) | 25.88 | 17.52 | 42,892 | 1.82 | .68 | 56 |
| October 31, 2016 | 23.11 | .18 | .16 | .34 | (.31) | (.85) | (1.16) | 22.29 | 1.72 | 50,827 | 1.84d | .84d | 49 |
| Class I | | | | | | | | | | | | | |
| April 30, 2021** | $30.52 | .12 | 6.66 | 6.78 | (.17) | (3.40) | (3.57) | $33.73 | 22.79* | $21 | .33* | .35* | 49* |
| October 31, 2020 | 25.29 | .35 | 6.84 | 7.19 | (.46) | (1.50) | (1.96) | 30.52 | 30.18 | 17 | .68 | 1.28 | 98 |
| October 31, 2019 | 25.24 | .36 | 2.76 | 3.12 | (.54) | (2.53) | (3.07) | 25.29 | 14.58 | 13 | .68 | 1.44 | 60 |
| October 31, 2018 | 26.20 | .42 | (.27) | .15 | (.58) | (.53) | (1.11) | 25.24 | .51 | 12 | .68 | 1.58 | 68 |
| October 31, 2017 | 22.55 | .45 | 3.77 | 4.22 | (.57) | — | (.57) | 26.20 | 18.93 | 11 | .69 | 1.80 | 56 |
| October 31, 2016 | 23.38 | .43 | .15 | .58 | (.56) | (.85) | (1.41) | 22.55 | 2.87 | 10 | .69d | 1.95d | 49 |
| Class R | | | | | | | | | | | | | |
| April 30, 2021** | $30.33 | .02 | 6.62 | 6.64 | (.08) | (3.40) | (3.48) | $33.49 | 22.41* | $3,962 | .62* | .06* | 49* |
| October 31, 2020 | 25.14 | .18 | 6.80 | 6.98 | (.29) | (1.50) | (1.79) | 30.33 | 29.37 | 3,249 | 1.29 | .69 | 98 |
| October 31, 2019 | 25.11 | .20 | 2.75 | 2.95 | (.39) | (2.53) | (2.92) | 25.14 | 13.84 | 3,343 | 1.30 | .84 | 60 |
| October 31, 2018 | 26.07 | .25 | (.27) | (.02) | (.41) | (.53) | (.94) | 25.11 | (.13) | 3,712 | 1.30 | .96 | 68 |
| October 31, 2017 | 22.45 | .29 | 3.75 | 4.04 | (.42) | — | (.42) | 26.07 | 18.15 | 4,940 | 1.32 | 1.18 | 56 |
| October 31, 2016 | 23.28 | .29 | .16 | .45 | (.43) | (.85) | (1.28) | 22.45 | 2.21 | 4,898 | 1.34d | 1.32d | 49 |
See notes to financial highlights at the end of this section.
The accompanying notes are an integral part of these financial statements.
| |
| 28 Convertible Securities Fund | Convertible Securities Fund 29 |
Financial highlights cont.
| | | | | | | | | | | | | |
| | INVESTMENT OPERATIONS | LESS DISTRIBUTIONS | RATIOS AND SUPPLEMENTAL DATA |
| | | | | | | | | | | | | Ratio of net | |
| | Net asset | | Net realized | | | | | | | | Ratio | investment | |
| | value, | | and unrealized | Total from | From net | From net | | Net asset | Total return | Net assets, | of expenses | income (loss) | Portfolio |
| | beginning | Net investment | gain (loss) | investment | investment | realized gain | Total | value, end | at net asset | end of period | to average | to average | turnover |
| Period ended | of period | income (loss)a | on investments | operations | income | on investments | distributions | of period | value (%)b | (in thousands) | net assets (%)c | net assets (%) | (%) |
| Class R6 | | | | | | | | | | | | | |
| April 30, 2021** | $30.48 | .11 | 6.66 | 6.77 | (.17) | (3.40) | (3.57) | $33.68 | 22.76* | $20,819 | .35* | .32* | 49* |
| October 31, 2020 | 25.27 | .33 | 6.83 | 7.16 | (.45) | (1.50) | (1.95) | 30.48 | 30.07 | 13,868 | .72 | 1.24 | 98 |
| October 31, 2019 | 25.23 | .34 | 2.77 | 3.11 | (.54) | (2.53) | (3.07) | 25.27 | 14.50 | 9,190 | .72 | 1.40 | 60 |
| October 31, 2018 † | 26.54 | .19 | (1.23) | (1.04) | (.27) | — | (.27) | 25.23 | (3.96)* | 7,372 | .32* | .71* | 68 |
| Class Y | | | | | | | | | | | | | |
| April 30, 2021** | $30.47 | .10 | 6.66 | 6.76 | (.16) | (3.40) | (3.56) | $33.67 | 22.74* | $401,104 | .38* | .31* | 49* |
| October 31, 2020 | 25.26 | .32 | 6.82 | 7.14 | (.43) | (1.50) | (1.93) | 30.47 | 30.00 | 356,432 | .79 | 1.18 | 98 |
| October 31, 2019 | 25.22 | .33 | 2.76 | 3.09 | (.52) | (2.53) | (3.05) | 25.26 | 14.42 | 285,817 | .80 | 1.33 | 60 |
| October 31, 2018 | 26.18 | .39 | (.27) | .12 | (.55) | (.53) | (1.08) | 25.22 | .39 | 268,362 | .80 | 1.47 | 68 |
| October 31, 2017 | 22.54 | .41 | 3.77 | 4.18 | (.54) | — | (.54) | 26.18 | 18.76 | 247,071 | .82 | 1.67 | 56 |
| October 31, 2016 | 23.37 | .40 | .17 | .57 | (.55) | (.85) | (1.40) | 22.54 | 2.71 | 189,190 | .84d | 1.84d | 49 |
* Not annualized.
** Unaudited.
† For the period May 22, 2018 (commencement of operations) to October 31, 2018.
a Per share net investment income (loss) has been determined on the basis of the weighted average number of shares outstanding during the period.
b Total return assumes dividend reinvestment and does not reflect the effect of sales charges.
c Includes amounts paid through expense offset and/or brokerage/service arrangements, if any (Note 2). Also excludes acquired fund fees and expenses, if any.
d Reflects a voluntary waiver of certain fund expenses in effect during the period. As a result of such waivers, the expenses of each class reflect a reduction of less than 0.01% as a percentage of average net assets.
The accompanying notes are an integral part of these financial statements.
| |
| 30 Convertible Securities Fund | Convertible Securities Fund 31 |
Notes to financial statements 4/30/21 (Unaudited)
Within the following Notes to financial statements, references to “State Street” represent State Street Bank and Trust Company, references to “the SEC” represent the Securities and Exchange Commission, references to “Putnam Management” represent Putnam Investment Management, LLC, the fund’s manager, an indirect wholly-owned subsidiary of Putnam Investments, LLC and references to “OTC”, if any, represent over-the-counter. Unless otherwise noted, the “reporting period” represents the period from November 1, 2020 through April 30, 2021.
Putnam Convertible Securities Fund (the fund) is a Massachusetts business trust, which is registered under the Investment Company Act of 1940, as amended, as a diversified open-end management investment company. The objective of the fund is to seek, with equal emphasis, current income and capital appreciation. The fund’s secondary objective is conservation of capital. The fund invests mainly in convertible securities of U.S. companies. Under normal circumstances, the fund invests at least 80% of the fund’s net assets in convertible securities. This policy may be changed only after 60 days’ notice to shareholders. Convertible securities combine the investment characteristics of bonds and common stocks. Convertible securities include bonds, preferred stocks and other instruments that can be converted into or exchanged for common stock or equivalent value. A significant portion of the convertible securities the fund buys are below-investment-grade (sometimes referred to as “junk bonds”). The convertible bonds the fund buys usually have intermediate-to long-term stated maturities (i.e., three years or longer), but often contain “put” features, which allow bondholders to sell the bond back to the company under specified circumstances, that result in shorter effective maturities. When deciding whether to buy or sell investments, Putnam Management may consider, among other factors: (i) a security’s structural features, such as its position in a company’s capital structure and “put” and “call” features (a company’s right to repurchase the security under specified circumstances is a “call” feature); (ii) credit and prepayment risks; and (iii) with respect to a company’s common stock underlying a convertible security, the stock’s valuation and the company’s financial strength, growth potential, competitive position in its industry, projected future earnings, cash flows and dividends.
The fund offers class A, class B, class C, class I, class R, class R6 and class Y shares. Purchases of class B shares are closed to new and existing investors except by exchange from class B shares of another Putnam fund or through dividend and/or capital gains reinvestment. Class A shares are sold with a maximum front-end sales charge of 5.75%. Class A shares generally are not subject to a contingent deferred sales charge, and class I, class R, class R6 and class Y shares are not subject to a contingent deferred sales charge. Class B shares, which convert to class A shares after approximately eight years, are not subject to a front-end sales charge and are subject to a contingent deferred sales charge if those shares are redeemed within six years of purchase. Class C shares are subject to a one-year 1.00% contingent deferred sales charge and generally convert to class A shares after approximately eight years. Prior to March 1, 2021, class C shares generally converted to class A shares after approximately ten years. Class R shares, which are not available to all investors, are sold at net asset value. The expenses for class A, class B, class C and class R shares may differ based on the distribution fee of each class, which is identified in Note 2. Class I, class R6 and class Y shares, which are sold at net asset value, are generally subject to the same expenses as class A, class B, class C and class R shares, but do not bear a distribution fee, and in the case of class I and class R6 shares, bear a lower investor servicing fee, which is identified in Note 2. Class I, class R6 and class Y shares are not available to all investors.
In the normal course of business, the fund enters into contracts that may include agreements to indemnify another party under given circumstances. The fund’s maximum exposure under these arrangements is unknown as this would involve future claims that may be, but have not yet been, made against the fund. However, the fund’s management team expects the risk of material loss to be remote.
The fund has entered into contractual arrangements with an investment adviser, administrator, distributor, shareholder servicing agent and custodian, who each provide services to the fund. Unless expressly stated otherwise, shareholders are not parties to, or intended beneficiaries of these contractual arrangements, and these contractual arrangements are not intended to create any shareholder right to enforce them against the service providers or to seek any remedy under them against the service providers, either directly or on behalf of the fund.
Under the fund’s Amended and Restated Agreement and Declaration of Trust, any claims asserted against or on behalf of the Putnam Funds, including claims against Trustees and Officers, must be brought in state and federal courts located within the Commonwealth of Massachusetts.
Note 1: Significant accounting policies
The following is a summary of significant accounting policies consistently followed by the fund in the preparation of its financial statements. The preparation of financial statements is in conformity with accounting principles
|
| 32 Convertible Securities Fund |
generally accepted in the United States of America and requires management to make estimates and assumptions that affect the reported amounts of assets and liabilities in the financial statements and the reported amounts of increases and decreases in net assets from operations. Actual results could differ from those estimates. Subsequent events after the Statement of assets and liabilities date through the date that the financial statements were issued have been evaluated in the preparation of the financial statements.
Investment income, realized and unrealized gains and losses and expenses of the fund are borne pro-rata based on the relative net assets of each class to the total net assets of the fund, except that each class bears expenses unique to that class (including the distribution fees applicable to such classes). Each class votes as a class only with respect to its own distribution plan or other matters on which a class vote is required by law or determined by the Trustees. If the fund were liquidated, shares of each class would receive their pro-rata share of the net assets of the fund. In addition, the Trustees declare separate dividends on each class of shares.
Security valuation Portfolio securities and other investments are valued using policies and procedures adopted by the Board of Trustees. The Trustees have formed a Pricing Committee to oversee the implementation of these procedures and have delegated responsibility for valuing the fund’s assets in accordance with these procedures to Putnam Management. Putnam Management has established an internal Valuation Committee that is responsible for making fair value determinations, evaluating the effectiveness of the pricing policies of the fund and reporting to the Pricing Committee.
Investments for which market quotations are readily available are valued at the last reported sales price on their principal exchange, or official closing price for certain markets, and are classified as Level 1 securities under Accounting Standards Codification 820 Fair Value Measurements and Disclosures (ASC 820). If no sales are reported, as in the case of some securities that are traded OTC, a security is valued at its last reported bid price and is generally categorized as a Level 2 security.
Investments in open-end investment companies (excluding exchange-traded funds), if any, which can be classified as Level 1 or Level 2 securities, are valued based on their net asset value. The net asset value of such investment companies equals the total value of their assets less their liabilities and divided by the number of their outstanding shares.
Market quotations are not considered to be readily available for certain debt obligations (including short-term investments with remaining maturities of 60 days or less) and other investments; such investments are valued on the basis of valuations furnished by an independent pricing service approved by the Trustees or dealers selected by Putnam Management. Such services or dealers determine valuations for normal institutional-size trading units of such securities using methods based on market transactions for comparable securities and various relationships, generally recognized by institutional traders, between securities (which consider such factors as security prices, yields, maturities and ratings). These securities will generally be categorized as Level 2.
Many securities markets and exchanges outside the U.S. close prior to the scheduled close of the New York Stock Exchange and therefore the closing prices for securities in such markets or on such exchanges may not fully reflect events that occur after such close but before the scheduled close of the New York Stock Exchange. Accordingly, on certain days, the fund will fair value certain foreign equity securities taking into account multiple factors including movements in the U.S. securities markets, currency valuations and comparisons to the valuation of American Depository Receipts, exchange-traded funds and futures contracts. The foreign equity securities, which would generally be classified as Level 1 securities, will be transferred to Level 2 of the fair value hierarchy when they are valued at fair value. The number of days on which fair value prices will be used will depend on market activity and it is possible that fair value prices will be used by the fund to a significant extent. Securities quoted in foreign currencies, if any, are translated into U.S. dollars at the current exchange rate.
To the extent a pricing service or dealer is unable to value a security or provides a valuation that Putnam Management does not believe accurately reflects the security’s fair value, the security will be valued at fair value by Putnam Management in accordance with policies and procedures approved by the Trustees. Certain investments, including certain restricted and illiquid securities and derivatives, are also valued at fair value following procedures approved by the Trustees. These valuations consider such factors as significant market or specific security events such as interest rate or credit quality changes, various relationships with other securities, discount rates, U.S. Treasury, U.S. swap and credit yields, index levels, convexity exposures, recovery rates, sales and other multiples and resale restrictions. These securities are classified as Level 2 or as Level 3 depending on the priority of the significant inputs.
|
| Convertible Securities Fund 33 |
To assess the continuing appropriateness of fair valuations, the Valuation Committee reviews and affirms the reasonableness of such valuations on a regular basis after considering all relevant information that is reasonably available. Such valuations and procedures are reviewed periodically by the Trustees. The fair value of securities is generally determined as the amount that the fund could reasonably expect to realize from an orderly disposition of such securities over a reasonable period of time. By its nature, a fair value price is a good faith estimate of the value of a security in a current sale and does not reflect an actual market price, which may be different by a material amount.
Security transactions and related investment income Security transactions are recorded on the trade date (the date the order to buy or sell is executed). Gains or losses on securities sold are determined on the identified cost basis.
Interest income, net of any applicable withholding taxes, if any, and including amortization and accretion of premiums and discounts on debt securities, is recorded on the accrual basis. Dividend income, net of any applicable withholding taxes, is recognized on the ex-dividend date except that certain dividends from foreign securities, if any, are recognized as soon as the fund is informed of the ex-dividend date. Non-cash dividends, if any, are recorded at the fair value of the securities received. Dividends representing a return of capital or capital gains, if any, are reflected as a reduction of cost and/or as a realized gain.
Foreign currency translation The accounting records of the fund are maintained in U.S. dollars. The fair value of foreign securities, currency holdings, and other assets and liabilities is recorded in the books and records of the fund after translation to U.S. dollars based on the exchange rates on that day. The cost of each security is determined using historical exchange rates. Income and withholding taxes are translated at prevailing exchange rates when earned or incurred. The fund does not isolate that portion of realized or unrealized gains or losses resulting from changes in the foreign exchange rate on investments from fluctuations arising from changes in the market prices of the securities. Such gains and losses are included with the net realized and unrealized gain or loss on investments. Net realized gains and losses on foreign currency transactions represent net realized exchange gains or losses on disposition of foreign currencies, currency gains and losses realized between the trade and settlement dates on securities transactions and the difference between the amount of investment income and foreign withholding taxes recorded on the fund’s books and the U.S. dollar equivalent amounts actually received or paid. Net unrealized appreciation and depreciation of assets and liabilities in foreign currencies arise from changes in the value of assets and liabilities other than investments at the period end, resulting from changes in the exchange rate.
Securities lending The fund may lend securities, through its agent, to qualified borrowers in order to earn additional income. The loans are collateralized by cash in an amount at least equal to the fair value of the securities loaned. The fair value of securities loaned is determined daily and any additional required collateral is allocated to the fund on the next business day. The remaining maturities of the securities lending transactions are considered overnight and continuous. The risk of borrower default will be borne by the fund’s agent; the fund will bear the risk of loss with respect to the investment of the cash collateral. Income from securities lending, net of expenses, is included in investment income on the Statement of operations. Cash collateral is invested in Putnam Cash Collateral Pool, LLC, a limited liability company managed by an affiliate of Putnam Management. Investments in Putnam Cash Collateral Pool, LLC are valued at its closing net asset value each business day. There are no management fees charged to Putnam Cash Collateral Pool, LLC. At the close of the reporting period, the fund received cash collateral of $39,357,702 and the value of securities loaned amounted to $38,249,927.
Interfund lending The fund, along with other Putnam funds, may participate in an interfund lending program pursuant to an exemptive order issued by the SEC. This program allows the fund to borrow from or lend to other Putnam funds that permit such transactions. Interfund lending transactions are subject to each fund’s investment policies and borrowing and lending limits. Interest earned or paid on the interfund lending transaction will be based on the average of certain current market rates. During the reporting period, the fund did not utilize the program.
Lines of credit The fund participates, along with other Putnam funds, in a $317.5 million unsecured committed line of credit and a $235.5 million unsecured uncommitted line of credit, both provided by State Street. Borrowings may be made for temporary or emergency purposes, including the funding of shareholder redemption requests and trade settlements. Interest is charged to the fund based on the fund’s borrowing at a rate equal to 1.25% plus the higher of (1) the Federal Funds rate and (2) the Overnight Bank Funding Rate for the committed line of credit and 1.30% plus the higher of (1) the Federal Funds rate and (2) the Overnight Bank Funding Rate for the uncommitted line of credit. A closing fee equal to 0.04% of the committed line of credit and 0.04% of the uncommitted line of credit has been paid by the participating funds. In addition, a commitment fee of 0.21% per
|
| 34 Convertible Securities Fund |
annum on any unutilized portion of the committed line of credit is allocated to the participating funds based on their relative net assets and paid quarterly. During the reporting period, the fund had no borrowings against these arrangements.
Federal taxes It is the policy of the fund to distribute all of its taxable income within the prescribed time period and otherwise comply with the provisions of the Internal Revenue Code of 1986, as amended (the Code), applicable to regulated investment companies. It is also the intention of the fund to distribute an amount sufficient to avoid imposition of any excise tax under Section 4982 of the Code.
The fund is subject to the provisions of Accounting Standards Codification 740 Income Taxes (ASC 740). ASC 740 sets forth a minimum threshold for financial statement recognition of the benefit of a tax position taken or expected to be taken in a tax return. The fund did not have a liability to record for any unrecognized tax benefits in the accompanying financial statements. No provision has been made for federal taxes on income, capital gains or unrealized appreciation on securities held nor for excise tax on income and capital gains. Each of the fund’s federal tax returns for the prior three fiscal years remains subject to examination by the Internal Revenue Service.
The fund may also be subject to taxes imposed by governments of countries in which it invests. Such taxes are generally based on either income or gains earned or repatriated. The fund accrues and applies such taxes to net investment income, net realized gains and net unrealized gains as income and/or capital gains are earned. In some cases, the fund may be entitled to reclaim all or a portion of such taxes, and such reclaim amounts, if any, are reflected as an asset on the fund’s books. In many cases, however, the fund may not receive such amounts for an extended period of time, depending on the country of investment.
Tax cost of investments includes adjustments to net unrealized appreciation (depreciation) which may not necessarily be final tax cost basis adjustments, but closely approximate the tax basis unrealized gains and losses that may be realized and distributed to shareholders. The aggregate identified cost on a tax basis is $866,543,780, resulting in gross unrealized appreciation and depreciation of $223,889,854 and $24,043,500, respectively, or net unrealized appreciation of $199,846,354.
Distributions to shareholders Distributions to shareholders from net investment income are recorded by the fund on the ex-dividend date. Distributions from capital gains, if any, are recorded on the ex-dividend date and paid at least annually. The amount and character of income and gains to be distributed are determined in accordance with income tax regulations, which may differ from generally accepted accounting principles. Dividend sources are estimated at the time of declaration. Actual results may vary. Any non-taxable return of capital cannot be determined until final tax calculations are completed after the end of the fund’s fiscal year. Reclassifications are made to the fund’s capital accounts to reflect income and gains available for distribution (or available capital loss carryovers) under income tax regulations.
Note 2: Management fee, administrative services and other transactions
The fund pays Putnam Management a management fee (based on the fund’s average net assets and computed and paid monthly) at annual rates that may vary based on the average of the aggregate net assets of all open-end mutual funds sponsored by Putnam Management (excluding net assets of funds that are invested in, or that are invested in by, other Putnam funds to the extent necessary to avoid “double counting” of those assets). Such annual rates may vary as follows:
| | | | |
| 0.780% | of the first $5 billion, | | 0.580% | of the next $50 billion, |
| 0.730% | of the next $5 billion, | | 0.560% | of the next $50 billion, |
| 0.680% | of the next $10 billion, | | 0.550% | of the next $100 billion and |
| 0.630% | of the next $10 billion, | | 0.545% | of any excess thereafter. |
For the reporting period, the management fee represented an effective rate (excluding the impact from any expense waivers in effect) of 0.304% of the fund’s average net assets.
Putnam Management has contractually agreed, through February 28, 2022, to waive fees and/or reimburse the fund’s expenses to the extent necessary to limit the cumulative expenses of the fund, exclusive of brokerage, interest, taxes, investment-related expenses, extraordinary expenses, acquired fund fees and expenses and payments under the fund’s investor servicing contract, investment management contract and distribution plans, on a fiscal year-to-date basis to an annual rate of 0.20% of the fund’s average net assets over such fiscal year-to-date period. During the reporting period, the fund’s expenses were not reduced as a result of this limit.
|
| Convertible Securities Fund 35 |
Putnam Investments Limited (PIL), an affiliate of Putnam Management, is authorized by the Trustees to manage a separate portion of the assets of the fund as determined by Putnam Management from time to time. PIL did not manage any portion of the assets of the fund during the reporting period. If Putnam Management were to engage the services of PIL, Putnam Management would pay a quarterly sub-management fee to PIL for its services at an annual rate of 0.35% of the average net assets of the portion of the fund managed by PIL.
The fund reimburses Putnam Management an allocated amount for the compensation and related expenses of certain officers of the fund and their staff who provide administrative services to the fund. The aggregate amount of all such reimbursements is determined annually by the Trustees.
Custodial functions for the fund’s assets are provided by State Street. Custody fees are based on the fund’s asset level, the number of its security holdings and transaction volumes.
Putnam Investor Services, Inc., an affiliate of Putnam Management, provides investor servicing agent functions to the fund. Putnam Investor Services, Inc. received fees for investor servicing for class A, class B, class C, class R and class Y shares that included (1) a per account fee for each direct and underlying non-defined contribution account (retail account) of the fund; (2) a specified rate of the fund’s assets attributable to defined contribution plan accounts; and (3) a specified rate based on the average net assets in retail accounts. Putnam Investor Services, Inc. has agreed that the aggregate investor servicing fees for each fund’s retail and defined contribution accounts for these share classes will not exceed an annual rate of 0.25% of the fund’s average assets attributable to such accounts.
Class I shares paid a monthly fee based on the average net assets of class I shares at an annual rate of 0.01%.
Class R6 shares paid a monthly fee based on the average net assets of class R6 shares at an annual rate of 0.05%.
During the reporting period, the expenses for each class of shares related to investor servicing fees were as follows:
| | | | |
| Class A | $277,459 | | Class R | 1,907 |
| Class B | 2,089 | | Class R6 | 4,743 |
| Class C | 16,017 | | Class Y | 204,995 |
| Class I | 1 | | Total | $507,211 |
The fund has entered into expense offset arrangements with Putnam Investor Services, Inc. and State Street whereby Putnam Investor Services, Inc.’s and State Street’s fees are reduced by credits allowed on cash balances. The fund also reduced expenses through brokerage/service arrangements. For the reporting period, the fund’s expenses were reduced by $467 under the expense offset arrangements and by no monies under the brokerage/ service arrangements.
Each Independent Trustee of the fund receives an annual Trustee fee, of which $669, as a quarterly retainer, has been allocated to the fund, and an additional fee for each Trustees meeting attended. Trustees also are reimbursed for expenses they incur relating to their services as Trustees.
The fund has adopted a Trustee Fee Deferral Plan (the Deferral Plan) which allows the Trustees to defer the receipt of all or a portion of Trustees fees payable on or after July 1, 1995. The deferred fees remain invested in certain Putnam funds until distribution in accordance with the Deferral Plan.
The fund has adopted an unfunded noncontributory defined benefit pension plan (the Pension Plan) covering all Trustees of the fund who have served as a Trustee for at least five years and were first elected prior to 2004. Benefits under the Pension Plan are equal to 50% of the Trustee’s average annual attendance and retainer fees for the three years ended December 31, 2005. The retirement benefit is payable during a Trustee’s lifetime, beginning the year following retirement, for the number of years of service through December 31, 2006. Pension expense for the fund is included in Trustee compensation and expenses in the Statement of operations. Accrued pension liability is included in Payable for Trustee compensation and expenses in the Statement of assets and liabilities. The Trustees have terminated the Pension Plan with respect to any Trustee first elected after 2003.
The fund has adopted distribution plans (the Plans) with respect to the following share classes pursuant to Rule 12b–1 under the Investment Company Act of 1940. The purpose of the Plans is to compensate Putnam Retail Management Limited Partnership, an indirect wholly-owned subsidiary of Putnam Investments, LLC, for services provided and expenses incurred in distributing shares of the fund. The Plans provide payments by the fund to Putnam Retail Management Limited Partnership at an annual rate of up to the following amounts (Maximum %)
|
| 36 Convertible Securities Fund |
of the average net assets attributable to each class. The Trustees have approved payment by the fund at the following annual rate (Approved %) of the average net assets attributable to each class. During the reporting period, the class-specific expenses related to distribution fees were as follows:
| | | |
| | Maximum % | Approved % | Amount |
| Class A | 0.35% | 0.25% | $688,894 |
| Class B | 1.00% | 1.00% | 20,735 |
| Class C | 1.00% | 1.00% | 159,042 |
| Class R | 1.00% | 0.50% | 9,472 |
| Total | | | $878,143 |
For the reporting period, Putnam Retail Management Limited Partnership, acting as underwriter, received net commissions of $29,202 from the sale of class A shares and received $168 and $40 in contingent deferred sales charges from redemptions of class B and class C shares, respectively.
A deferred sales charge of up to 1.00% is assessed on certain redemptions of class A shares. For the reporting period, Putnam Retail Management Limited Partnership, acting as underwriter, received no monies on class A redemptions.
Note 3: Purchases and sales of securities
During the reporting period, the cost of purchases and the proceeds from sales, excluding short-term investments, were as follows:
| | |
| | Cost of purchases | Proceeds from sales |
| Investments in securities (Long-term) | $476,814,050 | $529,224,582 |
| U.S. government securities (Long-term) | — | — |
| Total | $476,814,050 | $529,224,582 |
The fund may purchase or sell investments from or to other Putnam funds in the ordinary course of business, which can reduce the fund’s transaction costs, at prices determined in accordance with SEC requirements and policies approved by the Trustees. During the reporting period, purchases or sales of long-term securities from or to other Putnam funds, if any, did not represent more than 5% of the fund’s total cost of purchases and/or total proceeds from sales.
Note 4: Capital shares
At the close of the reporting period, there were an unlimited number of shares of beneficial interest authorized. Transactions, including, if applicable, direct exchanges pursuant to share conversions, in capital shares were as follows:
| | | | |
| | SIX MONTHS ENDED 4/30/21 | YEAR ENDED 10/31/20 |
| Class A | Shares | Amount | Shares | Amount |
| Shares sold | 915,769 | $30,499,219 | 1,320,550 | $35,732,109 |
| Shares issued in connection with | | | | |
| reinvestment of distributions | 1,588,184 | 51,125,845 | 1,092,974 | 27,482,711 |
| | 2,503,953 | 81,625,064 | 2,413,524 | 63,214,820 |
| Shares repurchased | (1,290,546) | (43,100,530) | (2,356,516) | (61,217,040) |
| Net increase | 1,213,407 | $38,524,534 | 57,008 | $1,997,780 |
|
| Convertible Securities Fund 37 |
| | | | |
| | SIX MONTHS ENDED 4/30/21 | YEAR ENDED 10/31/20 |
| Class B | Shares | Amount | Shares | Amount |
| Shares sold | 2,583 | $84,252 | 7,814 | $200,908 |
| Shares issued in connection with | | | | |
| reinvestment of distributions | 12,033 | 377,009 | 9,346 | 228,491 |
| | 14,616 | 461,261 | 17,160 | 429,399 |
| Shares repurchased | (37,915) | (1,225,718) | (50,570) | (1,262,134) |
| Net decrease | (23,299) | $(764,457) | (33,410) | $(832,735) |
| |
| | SIX MONTHS ENDED 4/30/21 | YEAR ENDED 10/31/20 |
| Class C | Shares | Amount | Shares | Amount |
| Shares sold | 74,870 | $2,479,525 | 190,421 | $5,028,023 |
| Shares issued in connection with | | | | |
| reinvestment of distributions | 101,152 | 3,206,521 | 69,802 | 1,724,423 |
| | 176,022 | 5,686,046 | 260,223 | 6,752,446 |
| Shares repurchased | (360,454) | (11,801,814) | (512,561) | (13,768,258) |
| Net decrease | (184,432) | $(6,115,768) | (252,338) | $(7,015,812) |
| |
| | SIX MONTHS ENDED 4/30/21 | YEAR ENDED 10/31/20 |
| Class I | Shares | Amount | Shares | Amount |
| Shares sold | — | $— | — | $— |
| Shares issued in connection with | | | | |
| reinvestment of distributions | 62 | 2,019 | 42 | 1,038 |
| | 62 | 2,019 | 42 | 1,038 |
| Shares repurchased | — | — | — | — |
| Net increase | 62 | $2,019 | 42 | $1,038 |
| |
| | | | YEAR ENDED 10/31/20* |
| Class M | | | Shares | Amount |
| Shares sold | | | 73 | $1,848 |
| Shares issued in connection with reinvestment of distributions | | — | — |
| | | | 73 | 1,848 |
| Shares repurchased | | | (128,873) | (3,317,119) |
| Net decrease | | | (128,800) | $(3,315,271) |
| |
| | SIX MONTHS ENDED 4/30/21 | YEAR ENDED 10/31/20 |
| Class R | Shares | Amount | Shares | Amount |
| Shares sold | 35,302 | $1,165,341 | 24,167 | $674,467 |
| Shares issued in connection with | | | | |
| reinvestment of distributions | 11,605 | 371,493 | 8,883 | 221,742 |
| | 46,907 | 1,536,834 | 33,050 | 896,209 |
| Shares repurchased | (35,751) | (1,167,356) | (58,869) | (1,493,314) |
| Net increase (decrease) | 11,156 | $369,478 | (25,819) | $(597,105) |
|
| 38 Convertible Securities Fund |
| | | | |
| | SIX MONTHS ENDED 4/30/21 | YEAR ENDED 10/31/20 |
| Class R6 | Shares | Amount | Shares | Amount |
| Shares sold | 160,700 | $5,399,454 | 149,474 | $3,911,496 |
| Shares issued in connection with | | | | |
| reinvestment of distributions | 58,437 | 1,880,055 | 29,173 | 735,124 |
| | 219,137 | 7,279,509 | 178,647 | 4,646,620 |
| Shares repurchased | (55,991) | (1,858,836) | (87,409) | (2,298,775) |
| Net increase | 163,146 | $5,420,673 | 91,238 | $2,347,845 |
| |
| | SIX MONTHS ENDED 4/30/21 | YEAR ENDED 10/31/20 |
| Class Y | Shares | Amount | Shares | Amount |
| Shares sold | 2,156,958 | $71,823,307 | 4,777,635 | $132,097,854 |
| Shares issued in connection with | | | | |
| reinvestment of distributions | 1,124,742 | 36,173,980 | 728,100 | 18,305,060 |
| | 3,281,700 | 107,997,287 | 5,505,735 | 150,402,914 |
| Shares repurchased | (3,066,145) | (102,458,598) | (5,124,448) | (134,326,615) |
| Net increase | 215,555 | $5,538,689 | 381,287 | $16,076,299 |
* Effective November 25, 2019, the fund converted all of its class M shares to class A shares and class M shares were no longer able to be purchased.
At the close of the reporting period, Putnam Investments, LLC owned the following shares of the fund:
| | | |
| | Shares owned | Percentage of ownership | Value |
| Class I | 627 | 100% | $21,156 |
Note 5: Affiliated transactions
Transactions during the reporting period with any company which is under common ownership or control were as follows:
| | | | | |
| | | | | | Shares |
| | | | | | outstanding |
| | | | | | and fair |
| | Fair value as | Purchase | Sale | Investment | value as |
| Name of affiliate | of 10/31/20 | cost | proceeds | income | of 4/30/21 |
| Short-term investments | | | | | |
| Putnam Cash Collateral | | | | | |
| Pool, LLC* | $16,242,955 | $113,505,310 | $90,390,563 | $21,707 | $39,357,702 |
| Putnam Short Term | | | | | |
| Investment Fund** | 22,121,198 | 251,237,812 | 258,333,447 | 13,345 | 15,025,563 |
| Total Short-term | | | | | |
| investments | $38,364,153 | $364,743,122 | $348,724,010 | $35,052 | $54,383,265 |
* No management fees are charged to Putnam Cash Collateral Pool, LLC (Note 1). Investment income shown is included in securities lending income on the Statement of operations. There were no realized or unrealized gains or losses during the period.
** Management fees charged to Putnam Short Term Investment Fund have been waived by Putnam Management. There were no realized or unrealized gains or losses during the period.
Note 6: Market, credit and other risks
In the normal course of business, the fund trades financial instruments and enters into financial transactions where risk of potential loss exists due to changes in the market (market risk) or failure of the contracting party to the transaction to perform (credit risk). The fund may be exposed to additional credit risk that an institution or
|
| Convertible Securities Fund 39 |
other entity with which the fund has unsettled or open transactions will default. Investments in foreign securities involve certain risks, including those related to economic instability, unfavorable political developments, and currency fluctuations.
On July 27, 2017, the United Kingdom’s Financial Conduct Authority (“FCA”), which regulates LIBOR, announced a desire to phase out the use of LIBOR by the end of 2021. In November 2020, this date was extended until June 30, 2023 for certain widely followed tenors (overnight and 1-, 3-, 6-, and 12-month U.S. dollar LIBOR). LIBOR has historically been a common benchmark interest rate index used to make adjustments to variable-rate loans. It is used throughout global banking and financial industries to determine interest rates for a variety of financial instruments and borrowing arrangements. The transition process might lead to increased volatility and illiquidity in markets that currently rely on LIBOR to determine interest rates. It could also lead to a reduction in the value of some LIBOR-based investments and reduce the effectiveness of new hedges placed against existing LIBOR-based investments. While some LIBOR-based instruments may contemplate a scenario where LIBOR is no longer available by providing for an alternative rate-setting methodology, not all may have such provisions and there may be significant uncertainty regarding the effectiveness of any such alternative methodologies. Since the usefulness of LIBOR as a benchmark could deteriorate during the transition period, these effects could occur prior to June 30, 2023.
Beginning in January 2020, global financial markets have experienced, and may continue to experience, significant volatility resulting from the spread of a virus known as Covid–19. The outbreak of Covid–19 has resulted in travel and border restrictions, quarantines, supply chain disruptions, lower consumer demand, and general market uncertainty. The effects of Covid–19 have adversely affected, and may continue to adversely affect, the global economy, the economies of certain nations, and individual issuers, all of which may negatively impact the fund’s performance.
Note 7: New accounting pronouncements
In March 2020, the Financial Accounting Standards Board (FASB) issued Accounting Standards Update (ASU) 2020–04, Reference Rate Reform (Topic 848) — Facilitation of the Effects of Reference Rate Reform on Financial Reporting. The amendments in ASU 2020–04 provide optional temporary financial reporting relief from the effect of certain types of contract modifications due to the planned discontinuation of LIBOR and other interbank-offered based reference rates as of the end of 2021. The discontinuation of LIBOR was subsequently extended to June 30, 2023. ASU 2020–04 is effective for certain reference rate-related contract modifications that occur during the period March 12, 2020 through December 31, 2022. Management is currently evaluating the impact, if any, of applying this provision.
|
| 40 Convertible Securities Fund |
Fund information
Founded over 80 years ago, Putnam Investments was built around the concept that a balance between risk and reward is the hallmark of a well-rounded financial program. We manage funds across income, value, blend, growth, sustainable, asset allocation, absolute return, and global sector categories.
| | |
| Investment Manager | Trustees | Michael J. Higgins |
| Putnam Investment | Kenneth R. Leibler, Chair | Vice President, Treasurer, |
| Management, LLC | Liaquat Ahamed | and Clerk |
| 100 Federal Street | Ravi Akhoury | |
| Boston, MA 02110 | Barbara M. Baumann | Jonathan S. Horwitz |
| | Katinka Domotorffy | Executive Vice President, |
| Investment Sub-Advisor | Catharine Bond Hill | Principal Executive Officer, |
| Putnam Investments Limited | Paul L. Joskow | and Compliance Liaison |
| 16 St James’s Street | George Putnam, III | |
| London, England SW1A 1ER | Robert L. Reynolds | Richard T. Kircher |
| | Manoj P. Singh | Vice President and BSA |
| Marketing Services | Mona K. Sutphen | Compliance Officer |
| Putnam Retail Management | | |
| 100 Federal Street | | Susan G. Malloy |
| Boston, MA 02110 | Officers | Vice President and |
| | Robert L. Reynolds | Assistant Treasurer |
| Custodian | President | |
| State Street Bank | | Denere P. Poulack |
| and Trust Company | Robert T. Burns | Assistant Vice President, Assistant |
| | Vice President and | Clerk, and Assistant Treasurer |
| Legal Counsel | Chief Legal Officer | |
| Ropes & Gray LLP | | Janet C. Smith |
| | James F. Clark | Vice President, |
| | Vice President, Chief Compliance | Principal Financial Officer, |
| | Officer, and Chief Risk Officer | Principal Accounting Officer, |
| | | and Assistant Treasurer |
| | Nancy E. Florek | |
| | Vice President, Director of | Mark C. Trenchard |
| | Proxy Voting and Corporate | Vice President |
| | Governance, Assistant Clerk, | |
| | and Assistant Treasurer | |
This report is for the information of shareholders of Putnam Convertible Securities Fund. It may also be used as sales literature when preceded or accompanied by the current prospectus, the most recent copy of Putnam’s Quarterly Performance Summary, and Putnam’s Quarterly Ranking Summary. For more recent performance, please visit putnam.com. Investors should carefully consider the investment objectives, risks, charges, and expenses of a fund, which are described in its prospectus. For this and other information or to request a prospectus or summary prospectus, call 1-800-225-1581 toll free. Please read the prospectus carefully before investing. The fund’s Statement of Additional Information contains additional information about the fund’s Trustees and is available without charge upon request by calling 1-800-225-1581.

| |
| Item 3. Audit Committee Financial Expert: |
| |
| Item 4. Principal Accountant Fees and Services: |
| |
| Item 5. Audit Committee of Listed Registrants |
| |
| Item 6. Schedule of Investments: |
| |
| The registrant's schedule of investments in unaffiliated issuers is included in the report to shareholders in Item 1 above. |
| |
| Item 7. Disclosure of Proxy Voting Policies and Procedures For Closed-End Management Investment Companies: |
| |
| Item 8. Portfolio Managers of Closed-End Investment Companies |
| |
| Item 9. Purchases of Equity Securities by Closed-End Management Investment Companies and Affiliated Purchasers: |
| |
| Item 10. Submission of Matters to a Vote of Security Holders: |
| |
| Item 11. Controls and Procedures: |
| |
| (a) The registrant's principal executive officer and principal financial officer have concluded, based on their evaluation of the effectiveness of the design and operation of the registrant's disclosure controls and procedures as of a date within 180 days of the filing date of this report, that the design and operation of such procedures are generally effective to provide reasonable assurance that information required to be disclosed by the registrant in this report is recorded, processed, summarized and reported within the time periods specified in the Commission's rules and forms. |
| |
| (b) Changes in internal control over financial reporting: Not applicable |
| |
| Item 12. Disclosures of Securities Lending Activities for Closed-End Investment Companies: |
| |
| Pursuant to the requirements of the Securities Exchange Act of 1934 and the Investment Company Act of 1940, the registrant has duly caused this report to be signed on its behalf by the undersigned, thereunto duly authorized. |
| |
| Putnam Convertible Securities Fund |
| |
| By (Signature and Title): |
| |
| /s/ Janet C. Smith
Janet C. Smith
Principal Accounting Officer
|
| |
| Pursuant to the requirements of the Securities Exchange Act of 1934 and the Investment Company Act of 1940, this report has been signed below by the following persons on behalf of the registrant and in the capacities and on the dates indicated. |
| |
| By (Signature and Title): |
| |
| /s/ Jonathan S. Horwitz
Jonathan S. Horwitz
Principal Executive Officer
|
| |
| By (Signature and Title): |
| |
| /s/ Janet C. Smith
Janet C. Smith
Principal Financial Officer
|