| | |
| UNITED STATES
SECURITIES AND EXCHANGE COMMISSION |
| | |
| CERTIFIED SHAREHOLDER REPORT OF REGISTERED
MANAGEMENT INVESTMENT COMPANIES
|
| | |
| Investment Company Act file number: | (811-02280) |
| | |
| Exact name of registrant as specified in charter: | Putnam Convertible Securities Fund |
| | |
| Address of principal executive offices: | One Post Office Square, Boston, Massachusetts 02109 |
| | |
| Name and address of agent for service: | Robert T. Burns, Vice President
One Post Office Square
Boston, Massachusetts 02109 |
| | |
| Copy to: | Bryan Chegwidden, Esq.
Ropes & Gray LLP
1211 Avenue of the Americas
New York, New York 10036 |
| | |
| Registrant's telephone number, including area code: | (617) 292-1000 |
| | |
| Date of fiscal year end: | October 31, 2018 |
| | |
| Date of reporting period: | November 1, 2017 — April 30, 2018 |
| | |
|
Item 1. Report to Stockholders: | |
| | |
| The following is a copy of the report transmitted to stockholders pursuant to Rule 30e-1 under the Investment Company Act of 1940: | |

Putnam
Convertible Securities
Fund
Semiannual report
4 | 30 | 18
Consider these risks before investing: Convertible securities prices may fall or fail to rise over time for several reasons, including general financial market conditions, changing market perceptions (including perceptions about the risk of default and expectations about monetary policy or interest rates), changes in government intervention in the financial markets, and factors related to a specific issuer or industry. These and other factors may lead to increased volatility and reduced liquidity in the fund’s portfolio holdings. These risks are generally greater for convertible securities issued by small and/or midsize companies. Convertible securities’ prices may be adversely affected by underlying common stock price changes. While convertible securities tend to provide higher yields than common stocks, the higher yield may not protect against the risk of loss or mitigate any loss associated with a convertible security’s price decline. Convertible securities are subject to credit risk, which is the risk that an issuer of the fund’s investments may default on payment of interest or principal. Credit risk is greater for below-investment-grade convertible securities. Convertible securities may be less sensitive to interest-rate changes than non-convertible bonds because of their structural features (e.g., convertibility, “put” features). Interest-rate risk is generally greater, however, for longer-term bonds and convertible securities whose underlying stock price has fallen significantly below the conversion price. You can lose money by investing in the fund.
Message from the Trustees
June 8, 2018
Dear Fellow Shareholder:
After an extended period of record advances and low volatility for global financial markets, the first half of 2018 has been considerably more challenging. Stocks began the year against a backdrop of optimism, but quickly lost ground in February with a sharp downturn that pushed the U.S. market into correction territory. Stocks subsequently recovered somewhat, but markets have remained choppy. Bond markets have also had a series of ups and downs, due in part to uncertainty surrounding trade policy and the trajectory of U.S. interest rates.
While volatility and declines can be unsettling, seasoned investors recognize that they are natural and ultimately can restore balance in the financial markets. In this changing environment, Putnam’s experienced investment professionals continue to monitor risks and seek opportunities. They take a research-intensive approach to investing that includes risk management strategies designed to serve investors in all types of markets.
As always, we believe investors should maintain a well-diversified portfolio, think about long-term goals, and speak regularly with their financial advisors. In the following pages, you will find an overview of your fund’s performance for the reporting period as well as an outlook for the coming months.
Thank you for investing with Putnam.


Two different investment objectives — seeking current income and seeking capital appreciation potential — typically dictate an investor’s preference for bonds or stocks. But with Putnam Convertible Securities Fund, investors can pursue both of these objectives at the same time.
Hybrid securities with the characteristics of stocks and bonds
Typically issued as bonds or preferred stock, convertibles offer investors the ability to “convert” their convertible shares into shares of common stock. This feature allows investors to profit from the potential price appreciation of the convertible issuer’s underlying stock. At the same time, convertibles offer both income potential and downside protection through their fixed-income characteristics.

Source: Putnam, as of 12/31/17. All returns are annualized. Index performance is not indicative of Putnam fund performance or a guarantee of future results. You cannot invest in an index.
|
| 2 Convertible Securities Fund |

Current performance may be lower or higher than the quoted past performance, which cannot guarantee future results. Share price, principal value, and return will fluctuate, and you may have a gain or a loss when you sell your shares. Performance of class A shares assumes reinvestment of distributions and does not account for taxes. Fund returns in the bar chart do not reflect a sales charge of 5.75%; had they, returns would have been lower. See below and pages 9–11 for additional performance information. For a portion of the periods, the fund had expense limitations, without which returns would have been lower. To obtain the most recent month-end performance, visit putnam.com.
* The fund’s benchmark, the ICE BofAML U.S. Convertible Index, was introduced on 12/31/87, which post-dates the inception of the fund’s class A shares.
† Returns for the six-month period are not annualized, but cumulative.

This comparison shows your fund’s performance in the context of broad market indexes for the six months ended 4/30/18. See above and pages 9–11 for additional fund performance information. Index descriptions can be found on page 14.
|
| Convertible Securities Fund 3 |

Robert L. Salvin
Portfolio Manager
Rob has an M.B.A. from the Booth School of Business, University of Chicago, and a B.S. from The Wharton School, University of Pennsylvania. He joined Putnam in 2000 and has been in the investment industry since 1986.

Anthony J. Daigle
Assistant Portfolio Manager
Anthony has a B.S. in International Business from Merrimack College. He has been in the investment industry since he joined Putnam in 2004.
What was the market environment like for U.S. convertible securities during the reporting period ended April 30, 2018?
ROB Investor optimism about U.S. tax reform, easing geopolitical tensions, and strong third-quarter corporate earnings contributed to a favorable environment for convertible securities in the closing months of 2017. Convertible securities tend to take on equity characteristics during rising markets, which helped the asset class enjoy solid performance at this time — led by better-than-expected results in the technology sector.
Stocks began 2018 on an upbeat note with optimism about the passage of the Tax Cuts and Jobs Act, which ushered in significant tax breaks for corporations. In February, however, rising wage inflation led to a sharp downturn in the equity markets. Stocks recovered but slid again in March when President Trump proposed tariffs on aluminum and steel imports, raising concerns about a trade war with China. The technology sector also struggled when a scandal alleging misuse of customer data by Facebook weighed on its stock — overshadowing what had so far been a solid earnings season. In this environment, convertibles
|
| 4 Convertible Securities Fund |
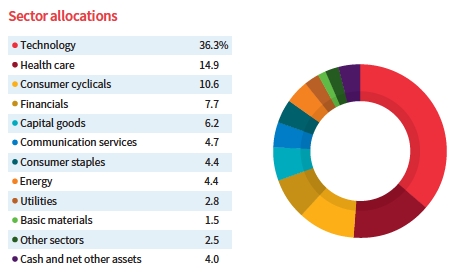
Allocations are shown as a percentage of the fund’s net assets as of 4/30/18. Cash and net other assets, if any, represent the market value weights of cash, derivatives, short-term securities, and other unclassified assets in the portfolio. Summary information may differ from the portfolio schedule included in the financial statements due to the inclusion of derivative securities, any interest accruals, the exclusion of as-of trades, if any, the use of different classifications of securities for presentation purposes, and rounding. Holdings and allocations may vary over time.

This table shows the fund’s top 10 individual holdings and the percentage of the fund’s net assets that each represented as of 4/30/18. Short-term investments, TBA commitments, and derivatives, if any, are excluded. Holdings may vary over time.
|
| Convertible Securities Fund 5 |
remained largely insulated with little exposure to the most volatile companies.
The Federal Reserve announced two interest-rate hikes during the period, raising the federal funds rate in December 2017 to a target range of 1.25% to 1.50% and in March 2018 to a target range of 1.50% to 1.75%. Against this backdrop, U.S. Treasuries experienced alternating bouts of selloffs and rallies, as investors grappled with these rate hikes and geopolitical concerns. Treasury yields rose sharply in the second half of the period, with the benchmark 10-year U.S. Treasury yield closing out the period at 2.95% and spreads widened for both investment-grade and high-yield convertible issuers, reflecting increased uncertainty. With the return for the broader fixed-income markets in negative territory, convertibles benefited from their underlying equity exposure.
How did Putnam Convertible Securities Fund perform?
ANTHONY For the six months ended April 30, 2018, the fund delivered positive performance but underperformed the ICE BofAML U.S. Convertible Index [the benchmark index] and the average return of funds in its Lipper peer group. At the sector level, overweight positioning within the technology sector was the largest positive contributor, particularly the fund’s overweight exposure to Everbridge and RealPage. Effective security selection within the utilities sector also added to relative performance.
Positive performance was offset by underweight positioning and security selection within the financials and consumer cyclicals sectors, which were the largest relative detractors at the sector level. Additionally, an overweight exposure to and security selection in capital goods detracted from performance.
Can you discuss some of the holdings that were notable contributors?
ROB The fund’s investments in the large-cap energy company, Hess, was rewarding during the period. The rally in energy prices contributed to stronger revenue growth, and the stock rallied as a result.
The fund’s overweight position in the small-cap technology company, Everbridge, augmented performance. The underlying equity of Everbridge, a global provider of emergency communications and enterprise safety solutions, surged on the news in December 2017 that the State of Vermont selected the company as its notification provider. The stock also rallied in the first quarter of 2018 after the company announced the acquisition of Unified Messaging Systems.
Finally, RealPage, a mid-cap company that provides property management software solutions for the multi-family, commercial, single-family, and vacation rental housing industries, was another strong contributor. The security’s outperformance was driven by strength in the underlying equity, which rallied in response to solid fourth-quarter 2017 earnings.
What were some holdings that detracted from returns during the period?
ANTHONY The greatest detractor to performance was Clovis Oncology, a development-stage biopharmaceutical company focused on cancer treatments. The stock’s underperformance was driven by multiple factors, including a lack of merger and acquisition interest in the biotechnology sector and the underperformance of the oncology drug manufacturing peer Tesaro.
Our decision to not invest in two mid-cap stocks that performed well also weighed on the fund’s performance. The mid-cap technology
|
| 6 Convertible Securities Fund |
company, Verisign, which provides domain registration services, benefited from strength in cloud computing in the fourth quarter of 2017, despite weakness in the broader technology sector. Herbalife Nutrition, a global producer of nutrition supplements, weight management, and personal-care products, rallied after an activist investor sold his position in the company’s stock. The stock rallied further when the company announced first-quarter 2018 earnings that beat market expectations.
What is your outlook for the second half of 2018?
ROB We have a constructive outlook for the U.S. convertibles market. Corporate earnings results for the fourth quarter of 2017 and first quarter of 2018 largely exceeded market expectations. Furthermore, we believe the benefits of tax reform are still percolating through the U.S. economy. In addition to the reduction in the corporate tax rate, the U.S. tax overhaul framework includes a lower repatriation rate, full expensing of capital expenditures, and the capping of interest-rate deductibility. On balance, we believe these changes will be positive for convertible issuers.
On the technical side, convertibles continue to witness what we believe is a healthy new-issue market, with year-to-date supply through April 30, 2018, up over 18% year-over-year. Increased supply has expanded the universe of investment options in the U.S. convertibles market, creating attractive associated return opportunities, in our view. We expect this robust environment for new issues to continue in the face of rising interest rates, barring any short-term volatility. Additionally, we believe that the new tax law increases the relative attractiveness of convertible market funding versus corporate debt, particularly for more highly levered companies — potentially creating additional demand for the asset class.
As central banks continue the process of normalizing monetary policy, which could cause unease in the equity markets, we believe convertible securities continue to be an attractive investment strategy. In addition, convertibles historically have performed well amid rising interest rates because of

This chart shows how the fund’s top weightings have changed over the past six months. Allocations are shown as a percentage of the fund’s net assets. Current period summary information may differ from the portfolio schedule included in the financial statements due to the inclusion of derivative securities, any interest accruals, the exclusion of as-of trades, if any, the use of different classifications of securities for presentation purposes, and rounding. Holdings and allocations may vary over time.
|
| Convertible Securities Fund 7 |
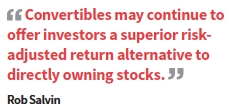
their sensitivity to underlying equities. By losing less ground in declining markets and capturing a significant portion of their upside performance over time, we believe convertibles may continue to offer investors a superior risk-adjusted return alternative to directly owning stocks.
Thank you, gentlemen, for your time and insights today.
The views expressed in this report are exclusively those of Putnam Management and are subject to change. They are not meant as investment advice.
Please note that the holdings discussed in this report may not have been held by the fund for the entire period. Portfolio composition is subject to review in accordance with the fund’s investment strategy and may vary in the future. Current and future portfolio holdings are subject to risk.
| |
| 8 Convertible Securities Fund |
Your fund’s performance
This section shows your fund’s performance, price, and distribution information for periods ended April 30, 2018, the end of the first half of its current fiscal year. In accordance with regulatory requirements for mutual funds, we also include performance information as of the most recent calendar quarter-end and expense information taken from the fund’s current prospectus. Performance should always be considered in light of a fund’s investment strategy. Data represent past performance. Past performance does not guarantee future results. More recent returns may be less or more than those shown. Investment return and principal value will fluctuate, and you may have a gain or a loss when you sell your shares. Performance information does not reflect any deduction for taxes a shareholder may owe on fund distributions or on the redemption of fund shares. For the most recent month-end performance, please visit the Individual Investors section at putnam.com or call Putnam at 1-800-225-1581. Class I, R, and Y shares are not available to all investors. See the Terms and definitions section in this report for definitions of the share classes offered by your fund.
Fund performance Total return for periods ended 4/30/18
| | | | | | | | | |
| | Annual | | | | | | | | |
| | average | | Annual | | Annual | | Annual | | |
| | (life of fund) | 10 years | average | 5 years | average | 3 years | average | 1 year | 6 months |
| Class A (6/29/72) | | | | | | | | | |
| Before sales charge | 9.68% | 86.23% | 6.42% | 43.06% | 7.43% | 14.81% | 4.71% | 8.57% | 0.60% |
| After sales charge | 9.54 | 75.52 | 5.79 | 34.84 | 6.16 | 8.20 | 2.66 | 2.33 | –5.18 |
| Class B (7/15/93) | | | | | | | | | |
| Before CDSC | 9.49 | 75.38 | 5.78 | 37.76 | 6.62 | 12.24 | 3.92 | 7.76 | 0.20 |
| After CDSC | 9.49 | 75.38 | 5.78 | 35.76 | 6.31 | 9.24 | 2.99 | 2.76 | –4.68 |
| Class C (7/26/99) | | | | | | | | | |
| Before CDSC | 9.50 | 72.71 | 5.62 | 37.78 | 6.62 | 12.22 | 3.92 | 7.77 | 0.24 |
| After CDSC | 9.50 | 72.71 | 5.62 | 37.78 | 6.62 | 12.22 | 3.92 | 6.77 | –0.74 |
| Class I (3/3/15) | | | | | | | | | |
| Net asset value | 9.81 | 91.81 | 6.73 | 45.47 | 7.78 | 16.12 | 5.11 | 9.02 | 0.79 |
| Class M (3/13/95) | | | | | | | | | |
| Before sales charge | 9.03 | 77.17 | 5.89 | 39.55 | 6.89 | 13.09 | 4.19 | 8.07 | 0.35 |
| After sales charge | 8.94 | 70.97 | 5.51 | 34.66 | 6.13 | 9.13 | 2.96 | 4.29 | –3.16 |
| Class R (12/1/03) | | | | | | | | | |
| Net asset value | 9.41 | 81.62 | 6.15 | 41.25 | 7.15 | 13.90 | 4.43 | 8.32 | 0.47 |
| Class Y (12/30/98) | | | | | | | | | |
| Net asset value | 9.80 | 90.92 | 6.68 | 44.79 | 7.68 | 15.62 | 4.96 | 8.85 | 0.70 |
Current performance may be lower or higher than the quoted past performance, which cannot guarantee future results. After-sales-charge returns for class A and M shares reflect the deduction of the maximum 5.75% and 3.50% sales charge, respectively, levied at the time of purchase. Class B share returns after contingent deferred sales charge (CDSC) reflect the applicable CDSC, which is 5% in the first year, declining over time to 1% in the sixth year, and is eliminated thereafter. Class C share returns after CDSC reflect a 1% CDSC for the first year that is eliminated thereafter. Class I, R, and Y shares have no initial sales charge or CDSC. Performance for class B, C, M, R, and Y shares before their inception is derived from the historical performance of class A shares, adjusted for the applicable sales charge (or CDSC) and the higher operating expenses for such shares, except for class Y shares, for which 12b-1 fees are not applicable. Performance for class I shares prior to their inception is derived from the historical performance of class Y
|
| Convertible Securities Fund 9 |
shares and has not been adjusted for the lower investor servicing fees applicable to class I shares; had it, returns would have been higher.
For a portion of the periods, the fund had expense limitations, without which returns would have been lower.
Class B share performance reflects conversion to class A shares after eight years.
Class C share performance reflects conversion to class A shares after ten years.
Comparative index returns For periods ended 4/30/18
| | | | | | | | | |
| | Annual | | | | | | | | |
| | average | | Annual | | Annual | | Annual | | |
| | (life of fund) | 10 years | average | 5 years | average | 3 years | average | 1 year | 6 months |
| ICE BofAML U.S. | | | | | | | | | |
| Convertible Index | —† | 109.10% | 7.66% | 55.56% | 9.24% | 19.94% | 6.25% | 9.14% | 2.11% |
| Lipper Convertible | | | | | | | | | |
| Securities Funds | 9.68% | 83.07 | 6.21 | 43.99 | 7.52 | 15.99 | 5.04 | 8.98 | 2.12 |
| category average* | | | | | | | | | |
Index and Lipper results should be compared with fund performance before sales charge, before CDSC, or at net asset value.
* Over the 6-month, 1-year, 3-year, 5-year, 10-year, and life-of-fund periods ended 4/30/18, there were 82, 82, 70, 61, 39, and 1 fund(s), respectively, in this Lipper category.
† The fund’s benchmark, the ICE BofAML U.S. Convertible Index, was introduced on 12/31/87, which post-dates the inception of the fund’s class A shares.
Fund price and distribution information For the six-month period ended 4/30/18
| | | | | | | | | |
| Distributions | Class A | Class B | Class C | Class I | Class M | Class R | Class Y |
| Number | 2 | 2 | 2 | 2 | 2 | 2 | 2 |
| Income | $0.240 | $0.144 | $0.145 | $0.289 | $0.173 | $0.204 | $0.274 |
| Capital gains | | | | | | | | | |
| Long-term gains | 0.526 | 0.526 | 0.526 | 0.526 | 0.526 | 0.526 | 0.526 |
| Short-term gains | — | — | — | — | — | — | — |
| Total | $0.766 | $0.670 | $0.671 | $0.815 | $0.699 | $0.730 | $0.800 |
| | Before | After | Net | Net | Net | Before | After | Net | Net |
| | sales | sales | asset | asset | asset | sales | sales | asset | asset |
| Share value | charge | charge | value | value | value | charge | charge | value | value |
| 10/31/17 | $26.19 | $27.79 | $25.66 | $25.88 | $26.20 | $25.91 | $26.85 | $26.07 | $26.18 |
| 4/30/18 | 25.58 | 27.14 | 25.04 | 25.27 | 25.59 | 25.30 | 26.22 | 25.46 | 25.56 |
| | Before | After | Net | Net | Net | Before | After | Net | Net |
| Current rate | sales | sales | asset | asset | asset | sales | sales | asset | asset |
| (end of period) | charge | charge | value | value | value | charge | charge | value | value |
| Current dividend | | | | | | | | | |
| rate1 | 1.88% | 1.77% | 1.15% | 1.17% | 2.25% | 1.39% | 1.34% | 1.65% | 2.14% |
| Current 30-day | | | | | | | | | |
| SEC yield2 | N/A | 0.78 | 0.07 | 0.06 | 1.22 | N/A | 0.31 | 0.57 | 1.07 |
The classification of distributions, if any, is an estimate. Before-sales-charge share value and current dividend rate for class A and M shares, if applicable, do not take into account any sales charge levied at the time of purchase.
After-sales-charge share value, current dividend rate, and current 30-day SEC yield, if applicable, are calculated assuming that the maximum sales charge (5.75% for class A shares and 3.50% for class M shares) was levied at the time of purchase. Final distribution information will appear on your year-end tax forms.
1 Most recent distribution, including any return of capital and excluding capital gains, annualized and divided by NAV or market price at end of period.
2 Based only on investment income and calculated using the maximum offering price for each share class, in accordance with SEC guidelines.
| |
| 10 Convertible Securities Fund |
Fund performance as of most recent calendar quarter Total return for periods ended 3/31/18
| | | | | | | | | |
| | Annual | | | | | | | | |
| | average | | Annual | | Annual | | Annual | | |
| | (life of fund) | 10 years | average | 5 years | average | 3 years | average | 1 year | 6 months |
| Class A (6/29/72) | | | | | | | | | |
| Before sales charge | 9.73% | 98.06% | 7.07% | 46.43% | 7.93% | 16.67% | 5.27% | 11.30% | 3.77% |
| After sales charge | 9.58 | 86.67 | 6.44 | 38.01 | 6.65 | 9.96 | 3.21 | 4.90 | –2.20 |
| Class B (7/15/93) | | | | | | | | | |
| Before CDSC | 9.53 | 86.52 | 6.43 | 40.99 | 7.11 | 14.04 | 4.48 | 10.44 | 3.37 |
| After CDSC | 9.53 | 86.52 | 6.43 | 38.99 | 6.81 | 11.04 | 3.55 | 5.44 | –1.63 |
| Class C (7/26/99) | | | | | | | | | |
| Before CDSC | 8.90 | 83.76 | 6.27 | 40.97 | 7.11 | 14.06 | 4.48 | 10.47 | 3.35 |
| After CDSC | 8.90 | 83.76 | 6.27 | 40.97 | 7.11 | 14.06 | 4.48 | 9.47 | 2.35 |
| Class I (3/3/15) | | | | | | | | | |
| Net asset value | 9.85 | 104.02 | 7.39 | 48.90 | 8.29 | 18.05 | 5.69 | 11.72 | 3.96 |
| Class M (3/13/95) | | | | | | | | | |
| Before sales charge | 9.07 | 88.42 | 6.54 | 42.79 | 7.38 | 14.89 | 4.74 | 10.73 | 3.46 |
| After sales charge | 8.99 | 81.83 | 6.16 | 37.80 | 6.62 | 10.87 | 3.50 | 6.85 | –0.16 |
| Class R (12/1/03) | | | | | | | | | |
| Net asset value | 9.45 | 93.20 | 6.81 | 44.52 | 7.64 | 15.75 | 5.00 | 11.02 | 3.60 |
| Class Y (12/30/98) | | | | | | | | | |
| Net asset value | 9.84 | 103.15 | 7.35 | 48.27 | 8.20 | 17.54 | 5.53 | 11.60 | 3.86 |
See the discussion following the fund performance table on page 9 for information about the calculation of fund performance.
Your fund’s expenses
As a mutual fund investor, you pay ongoing expenses, such as management fees, distribution fees (12b-1 fees), and other expenses. Using the following information, you can estimate how these expenses affect your investment and compare them with the expenses of other funds. You may also pay one-time transaction expenses, including sales charges (loads) and redemption fees, which are not shown in this section and would have resulted in higher total expenses. For more information, see your fund’s prospectus or talk to your financial representative.
Expense ratios
| | | | | | | |
| | Class A | Class B | Class C | Class I | Class M | Class R | Class Y |
| Total annual operating expenses for the | | | | | | | |
| fiscal year ended 10/31/17 | 1.07% | 1.82% | 1.82% | 0.69% | 1.57% | 1.32% | 0.82% |
| Annualized expense ratio for the | | | | | | | |
| six-month period ended 4/30/18 | 1.05% | 1.80% | 1.80% | 0.68% | 1.55% | 1.30% | 0.80% |
Fiscal-year expense information in this table is taken from the most recent prospectus, is subject to change, and may differ from that shown for the annualized expense ratio and in the financial highlights of this report.
Expenses are shown as a percentage of average net assets.
|
| Convertible Securities Fund 11 |
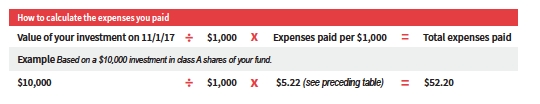
Expenses per $1,000
The following table shows the expenses you would have paid on a $1,000 investment in each class of the fund from 11/1/17 to 4/30/18. It also shows how much a $1,000 investment would be worth at the close of the period, assuming actual returns and expenses.
| | | | | | | |
| | Class A | Class B | Class C | Class I | Class M | Class R | Class Y |
| Expenses paid per $1,000 *† | $5.22 | $8.93 | $8.94 | $3.39 | $7.70 | $6.46 | $3.98 |
| Ending value (after expenses) | $1,006.00 | $1,002.00 | $1,002.40 | $1,007.90 | $1,003.50 | $1,004.70 | $1,007.00 |
* Expenses for each share class are calculated using the fund’s annualized expense ratio for each class, which represents the ongoing expenses as a percentage of average net assets for the six months ended 4/30/18. The expense ratio may differ for each share class.
† Expenses are calculated by multiplying the expense ratio by the average account value for the period; then multiplying the result by the number of days in the period; and then dividing that result by the number of days in the year.
Estimate the expenses you paid
To estimate the ongoing expenses you paid for the six months ended 4/30/18, use the following calculation method. To find the value of your investment on 11/1/17, call Putnam at 1-800-225-1581.
Compare expenses using the SEC’s method
The Securities and Exchange Commission (SEC) has established guidelines to help investors assess fund expenses. Per these guidelines, the following table shows your fund’s expenses based on a $1,000 investment, assuming a hypothetical 5% annualized return. You can use this information to compare the ongoing expenses (but not transaction expenses or total costs) of investing in the fund with those of other funds. All mutual fund shareholder reports will provide this information to help you make this comparison. Please note that you cannot use this information to estimate your actual ending account balance and expenses paid during the period.
| | | | | | | |
| | Class A | Class B | Class C | Class I | Class M | Class R | Class Y |
| Expenses paid per $1,000 *† | $5.26 | $9.00 | $9.00 | $3.41 | $7.75 | $6.51 | $4.01 |
| Ending value (after expenses) | $1,019.59 | $1,015.87 | $1,015.87 | $1,021.42 | $1,017.11 | $1,018.35 | $1,020.83 |
* Expenses for each share class are calculated using the fund’s annualized expense ratio for each class, which represents the ongoing expenses as a percentage of average net assets for the six months ended 4/30/18. The expense ratio may differ for each share class.
† Expenses are calculated by multiplying the expense ratio by the average account value for the six-month period; then multiplying the result by the number of days in the six-month period; and then dividing that result by the number of days in the year.
|
| 12 Convertible Securities Fund |
Terms and definitions
Important terms
Total return shows how the value of the fund’s shares changed over time, assuming you held the shares through the entire period and reinvested all distributions in the fund.
Before sales charge, or net asset value, is the price, or value, of one share of a mutual fund, without a sales charge. Before-sales-charge figures fluctuate with market conditions, and are calculated by dividing the net assets of each class of shares by the number of outstanding shares in the class.
After sales charge is the price of a mutual fund share plus the maximum sales charge levied at the time of purchase. After-sales-charge performance figures shown here assume the 5.75% maximum sales charge for class A shares and 3.50% for class M shares.
Contingent deferred sales charge (CDSC) is generally a charge applied at the time of the redemption of class B or C shares and assumes redemption at the end of the period. Your fund’s class B CDSC declines over time from a 5% maximum during the first year to 1% during the sixth year. After the sixth year, the CDSC no longer applies. The CDSC for class C shares is 1% for one year after purchase.
Share classes
Class A shares are generally subject to an initial sales charge and no CDSC (except on certain redemptions of shares bought without an initial sales charge).
Class B shares are closed to new investments and are only available by exchange from another Putnam fund or through dividend and/ or capital gains reinvestment. They are not subject to an initial sales charge and may be subject to a CDSC.
Class C shares are not subject to an initial sales charge and are subject to a CDSC only if the shares are redeemed during the first year.
Class I shares are not subject to an initial sales charge or CDSC, and carry no 12b-1 fee. They are only available to institutional clients and other investors who meet minimum investment requirements.
Class M shares have a lower initial sales charge and a higher 12b-1 fee than class A shares and no CDSC.
Class R shares are not subject to an initial sales charge or CDSC and are only available to employer-sponsored retirement plans.
Class Y shares are not subject to an initial sales charge or CDSC and carry no 12b-1 fee. They are generally only available to corporate and institutional clients and clients in other approved programs.
Fixed-income terms
Current rate is the annual rate of return earned from dividends or interest of an investment. Current rate is expressed as a percentage of the price of a security, fund share, or principal investment.
Mortgage-backed security (MBS), also known as a mortgage “pass-through,” is a type of asset-backed security that is secured by a mortgage or collection of mortgages. The following are types of MBSs:
• Agency “pass-through” has its principal and interest backed by a U.S. government agency, such as the Federal National Mortgage Association (Fannie Mae), Government National Mortgage Association (Ginnie Mae), and Federal Home Loan Mortgage Corporation (Freddie Mac).
• Collateralized mortgage obligation (CMO) represents claims to specific cash flows from pools of home mortgages.
The streams of principal and interest payments on the mortgages are distributed to the different classes of CMO interests in “tranches.” Each tranche may have different principal balances, coupon rates,
|
| Convertible Securities Fund 13 |
prepayment risks, and maturity dates. A CMO is highly sensitive to changes in interest rates and any resulting change in the rate at which homeowners sell their properties, refinance, or otherwise prepay loans. CMOs are subject to prepayment, market, and liquidity risks.
• Interest-only (IO) security is a type of CMO in which the underlying asset is the interest portion of mortgage, Treasury, or bond payments.
• Non-agency residential mortgage-backed security (RMBS) is an MBS not backed by Fannie Mae, Ginnie Mae, or Freddie Mac. One type of RMBS is an Alt-A mortgage-backed security.
• Commercial mortgage-backed security (CMBS) is secured by the loan on a commercial property.
Yield curve is a graph that plots the yields of bonds with equal credit quality against their differing maturity dates, ranging from shortest to longest. It is used as a benchmark for other debt, such as mortgage or bank lending rates.
Comparative indexes
Bloomberg Barclays U.S. Aggregate Bond Index is an unmanaged index of U.S. investment-grade fixed-income securities.
ICE BofAML (Intercontinental Exchange Bank of America Merrill Lynch) U.S. 3-Month Treasury Bill Index is an unmanaged index that seeks to measure the performance of U.S. Treasury bills available in the marketplace.
ICE BofAML U.S. Convertible Index is an unmanaged index of high-yield U.S. convertible securities.
S&P 500 Index is an unmanaged index of common stock performance.
ICE Data Indices, LLC (“ICE BofAML”), used with permission. ICE BofAML permits use of the ICE BofAML indices and related data on an “as is” basis; makes no warranties regarding same; does not guarantee the suitability, quality, accuracy, timeliness, and/or completeness of the ICE BofAML indices or any data included in, related to, or derived therefrom; assumes no liability in connection with the use of the foregoing; and does not sponsor, endorse, or recommend Putnam Investments, or any of its products or services.
Indexes assume reinvestment of all distributions and do not account for fees. Securities and performance of a fund and an index will differ. You cannot invest directly in an index.
Lipper is a third-party industry-ranking entity that ranks mutual funds. Its rankings do not reflect sales charges. Lipper rankings are based on total return at net asset value relative to other funds that have similar current investment styles or objectives as determined by Lipper. Lipper may change a fund’s category assignment at its discretion. Lipper category averages reflect performance trends for funds within a category.
| |
| 14 Convertible Securities Fund |
Other information for shareholders
Important notice regarding delivery of shareholder documents
In accordance with Securities and Exchange Commission (SEC) regulations, Putnam sends a single copy of annual and semiannual shareholder reports, prospectuses, and proxy statements to Putnam shareholders who share the same address, unless a shareholder requests otherwise. If you prefer to receive your own copy of these documents, please call Putnam at 1-800-225-1581, and Putnam will begin sending individual copies within 30 days.
Proxy voting
Putnam is committed to managing our mutual funds in the best interests of our shareholders. The Putnam funds’ proxy voting guidelines and procedures, as well as information regarding how your fund voted proxies relating to portfolio securities during the 12-month period ended June 30, 2017, are available in the Individual Investors section of putnam.com, and on the SEC’s website, www.sec.gov. If you have questions about finding forms on the SEC’s website, you may call the SEC at 1-800-SEC-0330. You may also obtain the Putnam funds’ proxy voting guidelines and procedures at no charge by calling Putnam’s Shareholder Services at 1-800-225-1581.
Fund portfolio holdings
The fund will file a complete schedule of its portfolio holdings with the SEC for the first and third quarters of each fiscal year on Form N-Q. Shareholders may obtain the fund’s Form N-Q on the SEC’s website at www.sec.gov. In addition, the fund’s Form N-Q may be reviewed and copied at the SEC’s Public Reference Room in Washington, D.C. You may call the SEC at 1-800-SEC-0330 for information about the SEC’s website or the operation of the Public Reference Room.
Trustee and employee fund ownership
Putnam employees and members of the Board of Trustees place their faith, confidence, and, most importantly, investment dollars in Putnam mutual funds. As of April 30, 2018, Putnam employees had approximately $510,000,000 and the Trustees had approximately $80,000,000 invested in Putnam mutual funds. These amounts include investments by the Trustees’ and employees’ immediate family members as well as investments through retirement and deferred compensation plans.
|
| Convertible Securities Fund 15 |
Financial statements
These sections of the report, as well as the accompanying Notes, constitute the fund’s financial statements.
The fund’s portfolio lists all the fund’s investments and their values as of the last day of the reporting period. Holdings are organized by asset type and industry sector, country, or state to show areas of concentration and diversification.
Statement of assets and liabilities shows how the fund’s net assets and share price are determined. All investment and non-investment assets are added together. Any unpaid expenses and other liabilities are subtracted from this total. The result is divided by the number of shares to determine the net asset value per share, which is calculated separately for each class of shares. (For funds with preferred shares, the amount subtracted from total assets includes the liquidation preference of preferred shares.)
Statement of operations shows the fund’s net investment gain or loss. This is done by first adding up all the fund’s earnings — from dividends and interest income — and subtracting its operating expenses to determine net investment income (or loss). Then, any net gain or loss the fund realized on the sales of its holdings — as well as any unrealized gains or losses over the period — is added to or subtracted from the net investment result to determine the fund’s net gain or loss for the fiscal period.
Statement of changes in net assets shows how the fund’s net assets were affected by the fund’s net investment gain or loss, by distributions to shareholders, and by changes in the number of the fund’s shares. It lists distributions and their sources (net investment income or realized capital gains) over the current reporting period and the most recent fiscal year-end. The distributions listed here may not match the sources listed in the Statement of operations because the distributions are determined on a tax basis and may be paid in a different period from the one in which they were earned. Dividend sources are estimated at the time of declaration. Actual results may vary. Any non-taxable return of capital cannot be determined until final tax calculations are completed after the end of the fund’s fiscal year.
Financial highlights provide an overview of the fund’s investment results, per-share distributions, expense ratios, net investment income ratios, and portfolio turnover in one summary table, reflecting the five most recent reporting periods. In a semiannual report, the highlights table also includes the current reporting period.
| |
| 16 Convertible Securities Fund |
The fund’s portfolio 4/30/18 (Unaudited)
| | |
| | Principal | |
| CONVERTIBLE BONDS AND NOTES (76.1%)* | amount | Value |
| Aerospace and defense (1.6%) | | |
| Aerojet Rocketdyne Holdings, Inc. cv. sr. unsec. sub. notes | | |
| 2.25%, 12/15/23 | $4,693,000 | $5,935,706 |
| Kaman Corp. 144A cv. sr. unsec. notes 3.25%, 5/1/24 | 4,800,000 | 5,382,542 |
| | | 11,318,248 |
| Biotechnology (4.4%) | | |
| BioMarin Pharmaceutical, Inc. cv. sr. unsec. sub. notes | | |
| 0.599%, 8/1/24 | 9,615,000 | 9,247,986 |
| Insmed, Inc. cv. sr. unsec. sub. notes 1.75%, 1/15/25 | 3,585,000 | 3,342,231 |
| Ironwood Pharmaceuticals, Inc. cv. sr. unsec. notes 2.25%, 6/15/22 | 3,495,000 | 4,567,528 |
| Medicines Co. (The) cv. sr. unsec. notes 2.50%, 1/15/22 | 7,730,000 | 8,475,535 |
| Neurocrine Biosciences, Inc. 144A cv. sr. unsec. notes | | |
| 2.25%, 5/15/24 | 4,195,000 | 5,424,110 |
| | | 31,057,390 |
| Broadcasting (2.4%) | | |
| Liberty Media Corp. cv. sr. unsec. bonds 1.375%, 10/15/23 | 8,206,000 | 9,413,103 |
| Liberty Media Corp. cv. sr. unsec. unsub. bonds 2.25%, 9/30/46 | 4,430,000 | 4,642,405 |
| Liberty Media Corp. 144A cv. sr. unsec. unsub. bonds | | |
| 2.125%, 3/31/48 | 3,241,000 | 3,194,411 |
| | | 17,249,919 |
| Cable television (1.8%) | | |
| DISH Network Corp. cv. sr. unsec. notes 3.375%, 8/15/26 | 13,887,000 | 12,654,529 |
| | | 12,654,529 |
| Capital goods (1.0%) | | |
| Dycom Industries, Inc. cv. sr. unsec. notes 0.75%, 9/15/21 | 5,990,000 | 7,393,906 |
| | | 7,393,906 |
| Commercial and consumer services (3.8%) | | |
| Euronet Worldwide, Inc. cv. sr. unsec. bonds 1.50%, 10/1/44 | 3,664,000 | 4,337,780 |
| Macquarie Infrastructure Corp. cv. sr. unsec. unsub. notes | | |
| 2.00%, 10/1/23 | 6,004,000 | 5,381,944 |
| Priceline Group, Inc. (The) cv. sr. unsec. unsub. notes | | |
| 0.35%, 6/15/20 | 7,140,000 | 11,937,652 |
| Square, Inc. cv. sr. unsec. unsub. notes 0.375%, 3/1/22 | 2,611,000 | 5,525,137 |
| | | 27,182,513 |
| Components (0.7%) | | |
| Finisar Corp. cv. sr. unsec. unsub. bonds 0.50%, 12/15/36 | 5,300,000 | 4,769,640 |
| | | 4,769,640 |
| Computers (6.7%) | | |
| Avid Technology, Inc. cv. sr. unsec. notes 2.00%, 6/15/20 | 5,874,000 | 4,806,694 |
| Citrix Systems, Inc. cv. sr. unsec. notes 0.50%, 4/15/19 | 3,105,000 | 4,457,203 |
| HubSpot, Inc. 144A cv. sr. unsec. notes 0.25%, 6/1/22 | 4,083,000 | 5,200,721 |
| Nuance Communications, Inc. cv. sr. unsec. notes 1.25%, 4/1/25 | 1,947,000 | 1,913,120 |
| Nutanix, Inc. 144A cv. sr. unsec. notes zero %, 1/15/23 | 3,229,000 | 3,989,107 |
| RealPage, Inc. 144A cv. sr. unsec. notes 1.50%, 11/15/22 | 7,345,000 | 10,255,456 |
| ServiceNow, Inc. cv. sr. unsec. unsub. bonds zero %, 11/1/18 | 2,885,000 | 6,461,246 |
| ServiceNow, Inc. 144A cv. sr. unsec. unsub. notes zero %, 6/1/22 | 3,265,000 | 4,372,488 |
| Western Digital Corp. 144A cv. company guaranty sr. unsec. notes | | |
| 1.50%, 2/1/24 | 5,385,000 | 5,619,188 |
| | | 47,075,223 |
|
| Convertible Securities Fund 17 |
| | |
| | Principal | |
| CONVERTIBLE BONDS AND NOTES (76.1%)* cont. | amount | Value |
| Conglomerates (0.7%) | | |
| Siemens Financieringsmaatschappij NV cv. company guaranty sr. | | |
| unsec. bonds 1.65%, 8/16/19, (Netherlands) | $4,750,000 | $5,224,240 |
| | | 5,224,240 |
| Construction (1.5%) | | |
| Cemex SAB de CV cv. unsec. sub. notes 3.72%, 3/15/20, (Mexico) | 5,425,000 | 5,574,188 |
| Patrick Industries, Inc. 144A cv. sr. unsec. notes 1.00%, 2/1/23 | 5,286,000 | 5,069,517 |
| | | 10,643,705 |
| Consumer services (3.6%) | | |
| Chegg, Inc. 144A cv. sr. unsec. notes 0.25%, 5/15/23 | 4,621,000 | 5,011,867 |
| IAC FinanceCo, Inc. 144A cv. company guaranty sr. unsec. notes | | |
| 0.875%, 10/1/22 | 7,384,000 | 9,041,834 |
| Liberty Expedia Holdings, Inc. cv. sr. unsec. unsub. bonds | | |
| 1.00%, 6/30/47 | 8,926,000 | 8,730,744 |
| Wayfair, Inc. 144A cv. sr. unsec. sub. notes 0.375%, 9/1/22 | 3,092,000 | 2,871,373 |
| | | 25,655,818 |
| Electrical equipment (0.5%) | | |
| II-VI, Inc. 144A cv. sr. unsec. notes 0.25%, 9/1/22 | 3,522,000 | 3,749,169 |
| | | 3,749,169 |
| Electronics (11.1%) | | |
| GT Advanced Technologies, Inc. cv. sr. unsec. sub. notes 3.00%, | | |
| 12/15/20, F | 2,944,000 | 294 |
| Inphi Corp. cv. sr. unsec. notes 0.75%, 9/1/21 | 6,040,000 | 5,556,426 |
| Intel Corp. cv. jr. unsec. sub. notes 3.25%, 8/1/39 | 5,655,000 | 14,083,212 |
| Microchip Technology, Inc. cv. sr. unsec. sub. notes | | |
| 1.625%, 2/15/27 | 20,187,000 | 22,716,431 |
| Micron Technology, Inc. cv. sr. unsec. bonds 3.00%, 11/15/43 | 10,110,000 | 16,004,807 |
| ON Semiconductor Corp. cv. company guaranty sr. unsec. unsub. | | |
| notes 1.625%, 10/15/23 | 4,623,000 | 5,957,891 |
| ON Semiconductor Corp. cv. company guaranty sr. unsec. unsub. | | |
| notes 1.00%, 12/1/20 | 4,291,000 | 5,674,268 |
| OSI Systems, Inc. cv. sr. unsec. unsub. notes 1.25%, 9/1/22 | 5,990,000 | 5,405,975 |
| TTM Technologies, Inc. cv. sr. unsec. notes 1.75%, 12/15/20 | 2,020,000 | 3,101,645 |
| | | 78,500,949 |
| Entertainment (0.8%) | | |
| Live Nation Entertainment, Inc. 144A cv. sr. unsec. notes | | |
| 2.50%, 3/15/23 | 5,720,000 | 5,631,397 |
| | | 5,631,397 |
| Gaming and lottery (0.9%) | | |
| Caesars Entertainment Corp. cv. sr. unsec. notes 5.00%, 10/1/24 | 3,510,850 | 6,157,329 |
| | | 6,157,329 |
| Health-care services (0.8%) | | |
| Teladoc, Inc. 144A cv. sr. unsec. notes 3.00%, 12/15/22 | 4,680,000 | 5,773,669 |
| | | 5,773,669 |
| Insurance (0.5%) | | |
| Heritage Insurance Holdings, Inc. 144A cv. company guaranty sr. | | |
| unsec. bonds 5.875%, 8/1/37 | 2,775,000 | 3,367,154 |
| | | 3,367,154 |
| Manufacturing (0.6%) | | |
| Greenbrier Cos., Inc. (The) cv. sr. unsec. notes 2.875%, 2/1/24 | 4,018,000 | 4,325,911 |
| | | 4,325,911 |
| |
| 18 Convertible Securities Fund |
| | |
| | Principal | |
| CONVERTIBLE BONDS AND NOTES (76.1%)* cont. | amount | Value |
| Media (1.1%) | | |
| Liberty Interactive, LLC 144A cv. sr. unsec. bonds 1.75%, 9/30/46 | $7,150,000 | $7,478,900 |
| | | 7,478,900 |
| Medical technology (1.8%) | | |
| China Medical Technologies, Inc. cv. sr. unsec. bonds Ser. CMT, | | |
| 4.00%, 8/15/18, (China) (In default) † F | 3,213,000 | 205,632 |
| China Medical Technologies, Inc. 144A cv. sr. unsec. notes 6.25%, | | |
| 12/17/18, (China) (In default) † F | 3,544,000 | 198,464 |
| Insulet Corp. 144A cv. sr. unsec. notes 1.375%, 11/15/24 | 2,525,000 | 2,856,406 |
| Nevro Corp. cv. sr. unsec. unsub. notes 1.75%, 6/1/21 | 4,188,000 | 4,885,432 |
| Wright Medical Group, Inc. cv. sr. unsec. notes 2.00%, 2/15/20 | 4,876,000 | 4,900,380 |
| | | 13,046,314 |
| Oil and gas (2.5%) | | |
| Chesapeake Energy Corp. cv. company guaranty sr. unsec. notes | | |
| 5.50%, 9/15/26 | 8,326,000 | 7,273,594 |
| Oasis Petroleum, Inc. cv. sr. unsec. notes 2.625%, 9/15/23 | 3,014,000 | 3,549,588 |
| Whiting Petroleum Corp. cv. company guaranty sr. unsec. unsub. | | |
| notes 1.25%, 4/1/20 | 7,347,000 | 6,998,054 |
| | | 17,821,236 |
| Pharmaceuticals (4.6%) | | |
| Clovis Oncology, Inc. cv. sr. unsec. notes 1.25%, 5/1/25 | 7,200,000 | 6,485,530 |
| Jazz Investments I, Ltd. cv. company guaranty sr. unsec. sub. | | |
| bonds 1.875%, 8/15/21, (Ireland) | 11,131,000 | 11,611,637 |
| Pacira Pharmaceuticals, Inc./Delaware cv. sr. unsec. sub. notes | | |
| 2.375%, 4/1/22 | 6,266,000 | 5,886,049 |
| Supernus Pharmaceuticals, Inc. 144A cv. sr. unsec. notes | | |
| 0.625%, 4/1/23 | 5,496,000 | 5,961,764 |
| Teligent, Inc. cv. sr. unsec. notes 3.75%, 12/15/19 | 2,975,000 | 2,811,369 |
| | | 32,756,349 |
| Real estate (2.4%) | | |
| Blackstone Mortgage Trust, Inc. cv. sr. unsec. notes | | |
| 4.75%, 3/15/23, R | 5,363,000 | 5,227,000 |
| IH Merger Sub, LLC cv. company guaranty sr. unsec. notes | | |
| 3.50%, 1/15/22, R | 6,927,000 | 7,839,037 |
| Starwood Property Trust, Inc. cv. sr. unsec. unsub. notes | | |
| 4.00%, 1/15/19, R | 3,385,000 | 3,622,641 |
| | | 16,688,678 |
| Semiconductor (4.6%) | | |
| Cypress Semiconductor Corp. cv. sr. unsec. notes 4.50%, 1/15/22 | 4,226,000 | 5,431,069 |
| Integrated Device Technology, Inc. cv. sr. unsec. unsub. notes | | |
| 0.875%, 11/15/22 | 5,669,000 | 6,118,563 |
| Jazz US Holdings, Inc. cv. company guaranty sr. unsec. notes | | |
| 8.00%, 12/31/18 | 1,008,000 | 2,614,248 |
| Novellus Systems, Inc. cv. company guaranty sr. unsec. notes | | |
| 2.625%, 5/15/41 | 2,275,000 | 12,563,221 |
| Teradyne, Inc. cv. sr. unsec. notes 1.25%, 12/15/23 | 4,845,000 | 5,910,730 |
| | | 32,637,831 |
| Shipping (1.3%) | | |
| Air Transport Services Group, Inc. 144A cv. sr. unsec. notes | | |
| 1.125%, 10/15/24 | 6,163,000 | 5,838,530 |
| Scorpio Tankers, Inc. 144A cv. sr. unsec. sub. notes 2.375%, 7/1/19 | 3,171,000 | 3,044,160 |
| | | 8,882,690 |
|
| Convertible Securities Fund 19 |
| | |
| | Principal | |
| CONVERTIBLE BONDS AND NOTES (76.1%)* cont. | amount | Value |
| Software (6.9%) | | |
| Apptio, Inc. 144A cv. sr. unsec. notes 0.875%, 4/1/23 | $5,130,000 | $5,206,950 |
| Coupa Software, Inc. 144A cv. sr. unsec. notes 0.375%, 1/15/23 | 5,171,000 | 6,294,824 |
| Everbridge, Inc. cv. sr. unsec. unsub. notes 1.50%, 11/1/22 | 5,358,000 | 6,764,700 |
| Nice Systems, Inc. cv. company guaranty sr. unsec. notes | | |
| 1.25%, 1/15/24 | 4,813,000 | 6,022,483 |
| Okta, Inc. 144A cv. sr. unsec. notes 0.25%, 2/15/23 | 6,623,000 | 7,576,884 |
| Red Hat, Inc. cv. sr. unsec. unsub. bonds 0.25%, 10/1/19 | 2,865,000 | 6,344,202 |
| Safeguard Scientifics, Inc. cv. sr. unsec. bonds 5.25%, 5/15/18 | 2,623,000 | 2,630,329 |
| Workday, Inc. 144A cv. sr. unsec. notes 0.25%, 10/1/22 | 7,676,000 | 8,282,404 |
| | | 49,122,776 |
| Technology services (5.0%) | | |
| Carbonite, Inc. cv. sr. unsec. unsub. notes 2.50%, 4/1/22, (acquired | | |
| various dates from 9/22/17 to 2/14/18, cost $4,080,806) ∆∆ | 3,610,000 | 4,964,411 |
| Fidelity National Financial, Inc. cv. sr. unsec. unsub. notes | | |
| 4.25%, 8/15/18 | 1,860,000 | 5,312,718 |
| j2 Global, Inc. cv. sr. unsec. notes 3.25%, 6/15/29 | 5,750,000 | 7,340,709 |
| Palo Alto Networks, Inc. cv. sr. unsec. notes zero %, 7/1/19 | 3,475,000 | 6,084,214 |
| Proofpoint, Inc. cv. sr. unsec. unsub. notes 0.75%, 6/15/20 | 4,607,000 | 6,950,977 |
| Twitter, Inc. cv. sr. unsec. unsub. bonds 1.00%, 9/15/21 | 4,650,000 | 4,363,197 |
| | | 35,016,226 |
| Telecommunications (1.2%) | | |
| CalAmp Corp. cv. sr. unsec. notes 1.625%, 5/15/20 | 3,005,000 | 3,034,449 |
| Powerwave Technologies, Inc. cv. unsec. sub. notes 3.875%, | | |
| 10/1/27, (In default) † F | 5,121,000 | 512 |
| RingCentral, Inc. 144A cv. sr. unsec. notes zero %, 3/15/23 | 5,388,000 | 5,608,908 |
| | | 8,643,869 |
| Tobacco (0.8%) | | |
| Vector Group, Ltd. cv. sr. unsec. sub. notes 1.75%, 4/15/20 | 5,295,000 | 5,615,348 |
| | | 5,615,348 |
| Trucks and parts (0.5%) | | |
| Horizon Global Corp. cv. sr. unsec. unsub. notes 2.75%, 7/1/22 | 4,018,000 | 3,238,303 |
| | | 3,238,303 |
| Total convertible bonds and notes (cost $495,389,299) | | $538,679,229 |
| |
| CONVERTIBLE PREFERRED STOCKS (17.5%)* | Shares | Value |
| Banking (2.0%) | | |
| Bank of America Corp. Ser. L, 7.25% cv. pfd. | 5,335 | $6,794,123 |
| Wells Fargo & Co. Ser. L, 7.50% cv. pfd. S | 5,588 | 7,153,646 |
| | | 13,947,769 |
| Consumer (1.3%) | | |
| Stanley Black & Decker, Inc. $5.375 cv. pfd. | 84,672 | 9,091,436 |
| | | 9,091,436 |
| Electric utilities (2.3%) | | |
| DTE Energy Co. $3.25 cv. pfd. | 132,395 | 6,916,315 |
| NextEra Energy, Inc. $3.06 cv. pfd. S | 165,980 | 9,583,320 |
| | | 16,499,635 |
| Financial (0.9%) | | |
| AMG Capital Trust II $2.575 cv. pfd. S | 102,985 | 6,187,267 |
| | | 6,187,267 |
| |
| 20 Convertible Securities Fund |
| | |
| CONVERTIBLE PREFERRED STOCKS (17.5%)* cont. | Shares | Value |
| Health-care services (1.1%) | | |
| Anthem, Inc. $2.63 cv. pfd. | 131,334 | $7,471,591 |
| | | 7,471,591 |
| Manufacturing (2.0%) | | |
| Belden, Inc. $6.75 cv. pfd. S | 59,316 | 5,049,666 |
| Rexnord Corp. Ser. A, $2.88 cv. pfd. | 152,028 | 9,062,450 |
| | | 14,112,116 |
| Medical technology (2.2%) | | |
| Becton Dickinson and Co. Ser. A, $3.063 cv. pfd. | 253,325 | 15,229,899 |
| | | 15,229,899 |
| Oil and gas (1.5%) | | |
| Hess Corp. $4.00 cv. pfd. | 164,495 | 10,716,866 |
| | | 10,716,866 |
| Power producers (0.4%) | | |
| Vistra Energy Corp. $7.00 cv. pfd. † | 32,928 | 3,082,061 |
| | | 3,082,061 |
| Real estate (1.1%) | | |
| Alexandria Real Estate Equities, Inc. Ser. D, $1.75 cv. pfd. R | 145,767 | 5,225,412 |
| iStar, Inc. Ser. J, $2.25 cv. pfd. R | 61,040 | 2,787,245 |
| | | 8,012,657 |
| Regional Bells (—%) | | |
| Cincinnati Bell, Inc. Ser. B, $3.378 cum. cv. pfd. | 190 | 9,313 |
| | | 9,313 |
| Technology services (1.3%) | | |
| Mandatory Exchangeable Trust 144A $5.75 cv. pfd. | 45,699 | 9,216,360 |
| | | 9,216,360 |
| Telecommunications (1.4%) | | |
| Crown Castle International Corp. Ser. A, 6.875% cv. pfd. | 9,853 | 10,093,831 |
| | | 10,093,831 |
| Total convertible preferred stocks (cost $110,894,858) | | $123,670,801 |
| |
| COMMON STOCKS (2.0%)* | Shares | Value |
| Bank of America Corp. | 142,415 | $4,261,057 |
| Citigroup, Inc. | 28,780 | 1,964,811 |
| Danaher Corp. | 29,310 | 2,940,379 |
| GT Advanced Technologies, Inc. F | 476 | 5 |
| Live Nation Entertainment, Inc. † | 51,255 | 2,023,035 |
| Stone Energy Corp. † | 32,868 | 1,170,101 |
| T-Mobile US, Inc. † | 29,411 | 1,779,656 |
| Total common stocks (cost $11,822,104) | | $14,139,044 |
| |
| | Principal | |
| CORPORATE BONDS AND NOTES (0.2%)* | amount | Value |
| Stone Energy Corp. company guaranty notes 7.50%, 5/31/22 | $1,088,508 | $1,107,557 |
| Total corporate bonds and notes (cost $1,219,919) | | $1,107,557 |
| | | | |
| | Expiration | Strike | | |
| WARRANTS (—%)* † | date | price | Warrants | Value |
| GT Advanced Technologies, Inc. F | 3/17/19 | $0.00 | 487 | $5 |
| GT Advanced Technologies, Inc. F | 3/17/19 | 0.00 | 331 | 3 |
| Total warrants (cost $91,926) | | | | $8 |
|
| Convertible Securities Fund 21 |
| | |
| SHORT-TERM INVESTMENTS (5.6%)* | Shares | Value |
| Putnam Short Term Investment Fund 1.88% L | 27,524,957 | $27,524,957 |
| Putnam Cash Collateral Pool, LLC 1.95% d | 12,277,687 | 12,277,687 |
| Total short-term investments (cost $39,802,644) | | $39,802,644 |
| |
| TOTAL INVESTMENTS | | |
| Total investments (cost $659,220,750) | | $717,399,283 |
Notes to the fund’s portfolio
Unless noted otherwise, the notes to the fund’s portfolio are for the close of the fund’s reporting period, which ran from November 1, 2017 through April 30, 2018 (the reporting period). Within the following notes to the portfolio, references to “Putnam Management” represent Putnam Investment Management, LLC, the fund’s manager, an indirect wholly-owned subsidiary of Putnam Investments, LLC and references to “ASC 820” represent Accounting Standards Codification 820 Fair Value Measurements and Disclosures.
* Percentages indicated are based on net assets of $707,985,713.
† This security is non-income-producing.
∆∆ This security is restricted with regard to public resale. The total fair value of this security and any other restricted securities (excluding 144A securities), if any, held at the close of the reporting period was $4,964,411, or 0.7% of net assets.
d Affiliated company. See Notes 1 and 5 to the financial statements regarding securities lending. The rate quoted in the security description is the annualized 7-day yield of the fund at the close of the reporting period.
F This security is valued by Putnam Management at fair value following procedures approved by the Trustees. Securities are classified as Level 3 for ASC 820 based on the securities’ valuation inputs (Note 1).
L Affiliated company (Note 5). The rate quoted in the security description is the annualized 7-day yield of the fund at the close of the reporting period.
R Real Estate Investment Trust.
S Security on loan, in part or in entirety, at the close of the reporting period (Note 1).
Debt obligations are considered secured unless otherwise indicated.
144A after the name of an issuer represents securities exempt from registration under Rule 144A of the Securities Act of 1933, as amended. These securities may be resold in transactions exempt from registration, normally to qualified institutional buyers.
The dates shown on debt obligations are the original maturity dates.
| |
| 22 Convertible Securities Fund |
ASC 820 establishes a three-level hierarchy for disclosure of fair value measurements. The valuation hierarchy is based upon the transparency of inputs to the valuation of the fund’s investments. The three levels are defined as follows:
Level 1: Valuations based on quoted prices for identical securities in active markets.
Level 2: Valuations based on quoted prices in markets that are not active or for which all significant inputs are observable, either directly or indirectly.
Level 3: Valuations based on inputs that are unobservable and significant to the fair value measurement.
The following is a summary of the inputs used to value the fund’s net assets as of the close of the reporting period:
| | | |
| | | Valuation inputs |
| Investments in securities: | Level 1 | Level 2 | Level 3 |
| Common stocks*: | | | |
| Communication services | $1,779,656 | $— | $— |
| Conglomerates | 2,940,379 | — | — |
| Consumer cyclicals | 2,023,035 | — | — |
| Energy | 1,170,101 | — | — |
| Financials | 6,225,868 | — | — |
| Technology | — | — | 5 |
| Total common stocks | 14,139,039 | — | 5 |
| | | | |
| Convertible bonds and notes | — | 538,274,327 | 404,902 |
| Convertible preferred stocks | — | 123,670,801 | — |
| Corporate bonds and notes | — | 1,107,557 | — |
| Warrants | — | — | 8 |
| Short-term investments | 27,524,957 | 12,277,687 | — |
| Totals by level | $41,663,996 | $675,330,372 | $404,915 |
* Common stock classifications are presented at the sector level, which may differ from the fund’s portfolio presentation.
During the reporting period, transfers within the fair value hierarchy, if any (other than certain transfers involving non-U.S. equity securities as described in Note 1), did not represent, in the aggregate, more than 1% of the fund’s net assets measured as of the end of the period. Transfers are accounted for using the end of period pricing valuation method.
At the start and close of the reporting period, Level 3 investments in securities represented less than 1% of the fund’s net assets and were not considered a significant portion of the fund’s portfolio.
The accompanying notes are an integral part of these financial statements.
|
| Convertible Securities Fund 23 |
Statement of assets and liabilities 4/30/18 (Unaudited)
| |
| ASSETS | |
| Investment in securities, at value, including $11,889,810 of securities on loan (Note 1): | |
| Unaffiliated issuers (identified cost $619,418,106) | $677,596,639 |
| Affiliated issuers (identified cost $39,802,644) (Notes 1 and 5) | 39,802,644 |
| Dividends, interest and other receivables | 2,985,138 |
| Receivable for shares of the fund sold | 1,081,439 |
| Receivable for investments sold | 2,098,613 |
| Prepaid assets | 60,106 |
| Total assets | 723,624,579 |
| |
| LIABILITIES | |
| Payable for investments purchased | 1,940,306 |
| Payable for shares of the fund repurchased | 433,222 |
| Payable for compensation of Manager (Note 2) | 366,394 |
| Payable for custodian fees (Note 2) | 4,880 |
| Payable for investor servicing fees (Note 2) | 155,700 |
| Payable for Trustee compensation and expenses (Note 2) | 239,125 |
| Payable for administrative services (Note 2) | 3,799 |
| Payable for distribution fees (Note 2) | 123,298 |
| Collateral on securities loaned, at value (Note 1) | 12,277,687 |
| Other accrued expenses | 94,455 |
| Total liabilities | 15,638,866 |
| | |
| Net assets | $707,985,713 |
| |
| REPRESENTED BY | |
| Paid-in capital (Unlimited shares authorized) (Notes 1 and 4) | $614,753,913 |
| Undistributed net investment income (Note 1) | 9,748,492 |
| Accumulated net realized gain on investments (Note 1) | 25,304,775 |
| Net unrealized appreciation of investments | 58,178,533 |
| Total — Representing net assets applicable to capital shares outstanding | $707,985,713 |
(Continued on next page)
| |
| 24 Convertible Securities Fund |
Statement of assets and liabilities cont.
| |
| COMPUTATION OF NET ASSET VALUE AND OFFERING PRICE | |
| Net asset value and redemption price per class A share | |
| ($388,976,462 divided by 15,207,602 shares) | $25.58 |
| Offering price per class A share (100/94.25 of $25.58)* | $27.14 |
| Net asset value and offering price per class B share ($7,429,008 divided by 296,664 shares)** | $25.04 |
| Net asset value and offering price per class C share ($37,678,386 divided by 1,491,045 shares)** | $25.27 |
| Net asset value and offering price per class I share ($11,586 divided by 453 shares)† | $25.59 |
| Net asset value and redemption price per class M share ($3,338,420 divided by 131,973 shares) | $25.30 |
| Offering price per class M share (100/96.50 of $25.30)* | $26.22 |
| Net asset value, offering price and redemption price per class R share | |
| ($4,050,916 divided by 159,105 shares) | $25.46 |
| Net asset value, offering price and redemption price per class Y share | |
| ($266,500,935 divided by 10,424,777 shares) | $25.56 |
* On single retail sales of less than $50,000. On sales of $50,000 or more the offering price is reduced.
** Redemption price per share is equal to net asset value less any applicable contingent deferred sales charge.
† Net asset value may not recalculate due to rounding of fractional shares.
The accompanying notes are an integral part of these financial statements.
|
| Convertible Securities Fund 25 |
Statement of operations Six months ended 4/30/18 (Unaudited)
| |
| INVESTMENT INCOME | |
| Interest (including interest income of $248,945 from investments in affiliated issuers) (Note 5) | $4,225,384 |
| Dividends | 4,087,468 |
| Securities lending (net of expenses) (Notes 1 and 5) | 42,466 |
| Total investment income | 8,355,318 |
| |
| EXPENSES | |
| Compensation of Manager (Note 2) | 2,210,194 |
| Investor servicing fees (Note 2) | 469,553 |
| Custodian fees (Note 2) | 6,973 |
| Trustee compensation and expenses (Note 2) | 13,249 |
| Distribution fees (Note 2) | 767,595 |
| Administrative services (Note 2) | 11,775 |
| Other | 148,480 |
| Total expenses | 3,627,819 |
| | |
| Expense reduction (Note 2) | (1,005) |
| Net expenses | 3,626,814 |
| | |
| Net investment income | 4,728,504 |
| |
| REALIZED AND UNREALIZED GAIN (LOSS) | |
| Net realized gain (loss) on: | |
| Securities from unaffiliated issuers (Notes 1 and 3) | 34,454,776 |
| Total net realized gain | 34,454,776 |
| Change in net unrealized appreciation (depreciation) on: | |
| Securities in unaffiliated issuers | (34,615,167) |
| Total change in net unrealized depreciation | (34,615,167) |
| Net loss on investments | (160,391) |
| |
| Net increase in net assets resulting from operations | $4,568,113 |
The accompanying notes are an integral part of these financial statements.
| |
| 26 Convertible Securities Fund |
Statement of changes in net assets
| | |
| INCREASE (DECREASE) IN NET ASSETS | Six months ended 4/30/18* | Year ended 10/31/17 |
| Operations | | |
| Net investment income | $4,728,504 | $9,830,033 |
| Net realized gain on investments | 34,454,776 | 29,135,804 |
| Net unrealized appreciation (depreciation) of investments | (34,615,167) | 76,531,585 |
| Net increase in net assets resulting from operations | 4,568,113 | 115,497,422 |
| Distributions to shareholders (Note 1): | | |
| From ordinary income | | |
| Net investment income | | |
| Class A | (3,670,610) | (7,923,900) |
| Class B | (44,104) | (106,310) |
| Class C | (237,197) | (556,131) |
| Class I | (128) | (248) |
| Class M | (22,793) | (55,057) |
| Class R | (32,986) | (85,268) |
| Class Y | (2,715,992) | (4,787,674) |
| From net realized long-term gain on investments | | |
| Class A | (8,069,942) | — |
| Class B | (163,298) | — |
| Class C | (849,537) | — |
| Class I | (231) | — |
| Class M | (69,658) | — |
| Class R | (86,617)�� | — |
| Class Y | (5,038,595) | — |
| Increase (decrease) from capital share transactions (Note 4) | 7,048,582 | (46,244,392) |
| Total increase (decrease) in net assets | (9,384,993) | 55,738,442 |
| |
| NET ASSETS | | |
| Beginning of period | 717,370,706 | 661,632,264 |
| End of period (including undistributed net investment | | |
| income of $9,748,492 and $11,743,798, respectively) | $707,985,713 | $717,370,706 |
* Unaudited.
The accompanying notes are an integral part of these financial statements.
|
| Convertible Securities Fund 27 |
Financial highlights (For a common share outstanding throughout the period)
| | | | | | | | | | | | | | |
| | INVESTMENT OPERATIONS | | | LESS DISTRIBUTIONS | | | | | RATIOS AND SUPPLEMENTAL DATA | |
| | | | | | | | | | | | | Ratio of | Ratio of net | |
| | Net asset | | Net realized | | | From | | | | | | expenses | investment | |
| | value, | | and unrealized | Total from | From | net realized | | | Net asset | Total return | Net assets, | to average | income (loss) | Portfolio |
| | beginning | Net investment | gain (loss) on | investment | net investment | gain on | Total | Redemption | value, end | at net asset | end of period | net assets | to average | turnover |
| Period ended | of period | income (loss) a | investments | operations | income | investments | distributions | fees | of period | value (%) b | (in thousands) | (%) c | net assets (%) | (%) |
| Class A | | | | | | | | | | | | | | |
| April 30, 2018** | $26.19 | .17 | (.01) | .16 | (.24) | (.53) | (.77) | — | $25.58 | .60* | $388,976 | .52* | .64* | 33* |
| October 31, 2017 | 22.55 | .35 | 3.77 | 4.12 | (.48) | — | (.48) | — | 26.19 | 18.44 | 410,595 | 1.07 | 1.43 | 56 |
| October 31, 2016 | 23.37 | .35 | .17 | .52 | (.49) | (.85) | (1.34) | — | 22.55 | 2.49 | 404,101 | 1.09d | 1.59d | 49 |
| October 31, 2015 | 25.60 | .26 | (.93) | (.67) | (.52) | (1.04) | (1.56) | — | 23.37 | (2.86) | 517,495 | 1.06 | 1.04 | 67 |
| October 31, 2014 | 23.57 | .18 | 2.42 | 2.60 | (.57) | — | (.57) | — | 25.60 | 11.10 | 578,716 | 1.06 | .72 | 63 |
| October 31, 2013 | 20.09 | .37 | 3.71 | 4.08 | (.60) | — | (.60) | —e | 23.57 | 20.62 | 556,643 | 1.08 | 1.69 | 72 |
| Class B | | | | | | | | | | | | | | |
| April 30, 2018** | $25.66 | .07 | (.02) | .05 | (.14) | (.53) | (.67) | — | $25.04 | .20* | $7,429 | .90 * | .27* | 33* |
| October 31, 2017 | 22.10 | .16 | 3.70 | 3.86 | (.30) | — | (.30) | — | 25.66 | 17.56 | 8,201 | 1.82 | .68 | 56 |
| October 31, 2016 | 22.93 | .18 | .15 | .33 | (.31) | (.85) | (1.16) | — | 22.10 | 1.72 | 9,018 | 1.84d | .84d | 49 |
| October 31, 2015 | 25.13 | .07 | (.90) | (.83) | (.33) | (1.04) | (1.37) | — | 22.93 | (3.55) | 11,374 | 1.81 | .29 | 67 |
| October 31, 2014 | 23.15 | (.01) | 2.38 | 2.37 | (.39) | — | (.39) | — | 25.13 | 10.27 | 13,228 | 1.81 | (.04) | 63 |
| October 31, 2013 | 19.75 | .20 | 3.64 | 3.84 | (.44) | — | (.44) | —e | 23.15 | 19.68 | 12,009 | 1.83 | .95 | 72 |
| Class C | | | | | | | | | | | | | | |
| April 30, 2018** | $25.88 | .07 | —e | .07 | (.15) | (.53) | (.68) | — | $25.27 | .24* | $37,678 | .90 * | .27* | 33* |
| October 31, 2017 | 22.29 | .16 | 3.72 | 3.88 | (.29) | — | (.29) | — | 25.88 | 17.52 | 42,892 | 1.82 | .68 | 56 |
| October 31, 2016 | 23.11 | .18 | .16 | .34 | (.31) | (.85) | (1.16) | — | 22.29 | 1.72 | 50,827 | 1.84d | .84d | 49 |
| October 31, 2015 | 25.32 | .07 | (.91) | (.84) | (.33) | (1.04) | (1.37) | — | 23.11 | (3.54) | 72,536 | 1.81 | .30 | 67 |
| October 31, 2014 | 23.33 | (.01) | 2.39 | 2.38 | (.39) | — | (.39) | — | 25.32 | 10.27 | 73,451 | 1.81 | (.06) | 63 |
| October 31, 2013 | 19.90 | .20 | 3.67 | 3.87 | (.44) | — | (.44) | —e | 23.33 | 19.68 | 50,931 | 1.83 | .93 | 72 |
| Class I | | | | | | | | | | | | | | |
| April 30, 2018** | $26.20 | .22 | (.01) | .21 | (.29) | (.53) | (.82) | — | $25.59 | .79* | $12 | .34* | .83* | 33* |
| October 31, 2017 | 22.55 | .45 | 3.77 | 4.22 | (.57) | — | (.57) | — | 26.20 | 18.93 | 11 | .69 | 1.80 | 56 |
| October 31, 2016 | 23.38 | .43 | .15 | .58 | (.56) | (.85) | (1.41) | — | 22.55 | 2.87 | 10 | .69d | 1.95d | 49 |
| October 31, 2015† | 25.33 | .25 | (1.77) | (1.52) | (.43) | — | (.43) | — | 23.38 | (6.05)* | 9 | .45* | .98 * | 67 |
| Class M | | | | | | | | | | | | | | |
| April 30, 2018** | $25.91 | .10 | (.01) | .09 | (.17) | (.53) | (.70) | — | $25.30 | .35* | $3,338 | .77* | .39 * | 33* |
| October 31, 2017 | 22.31 | .22 | 3.74 | 3.96 | (.36) | — | (.36) | — | 25.91 | 17.88 | 3,660 | 1.57 | .93 | 56 |
| October 31, 2016 | 23.14 | .23 | .16 | .39 | (.37) | (.85) | (1.22) | — | 22.31 | 1.95 | 3,590 | 1.59d | 1.07d | 49 |
| October 31, 2015 | 25.35 | .13 | (.91) | (.78) | (.39) | (1.04) | (1.43) | — | 23.14 | (3.32) | 3,951 | 1.56 | .54 | 67 |
| October 31, 2014 | 23.35 | .05 | 2.40 | 2.45 | (.45) | — | (.45) | — | 25.35 | 10.54 | 4,583 | 1.56 | .21 | 63 |
| October 31, 2013 | 19.91 | .26 | 3.67 | 3.93 | (.49) | — | (.49) | —e | 23.35 | 20.01 | 3,885 | 1.58 | 1.20 | 72 |
| Class R | | | | | | | | | | | | | | |
| April 30, 2018** | $26.07 | .13 | (.01) | .12 | (.20) | (.53) | (.73) | — | $25.46 | .47* | $4,051 | .65* | .52* | 33* |
| October 31, 2017 | 22.45 | .29 | 3.75 | 4.04 | (.42) | — | (.42) | — | 26.07 | 18.15 | 4,940 | 1.32 | 1.18 | 56 |
| October 31, 2016 | 23.28 | .29 | .16 | .45 | (.43) | (.85) | (1.28) | — | 22.45 | 2.21 | 4,898 | 1.34d | 1.32d | 49 |
| October 31, 2015 | 25.50 | .20 | (.93) | (.73) | (.45) | (1.04) | (1.49) | — | 23.28 | (3.09) | 4,972 | 1.31 | .79 | 67 |
| October 31, 2014 | 23.48 | .12 | 2.41 | 2.53 | (.51) | — | (.51) | — | 25.50 | 10.83 | 6,569 | 1.31 | .46 | 63 |
| October 31, 2013 | 20.02 | .31 | 3.70 | 4.01 | (.55) | — | (.55) | —e | 23.48 | 20.30 | 5,617 | 1.33 | 1.43 | 72 |
See notes to financial highlights at the end of this section.
The accompanying notes are an integral part of these financial statements.
| |
| 28 Convertible Securities Fund | Convertible Securities Fund 29 |
Financial highlights cont.
| | | | | | | | | | | | | | |
| | INVESTMENT OPERATIONS | | | LESS DISTRIBUTIONS | | | | | RATIOS AND SUPPLEMENTAL DATA | |
| | | | | | | | | | | | | Ratio of | Ratio of net | |
| | Net asset | | Net realized | | | From | | | | | | expenses | investment | |
| | value, | | and unrealized | Total from | From | net realized | | | Net asset | Total return | Net assets, | to average | income (loss) | Portfolio |
| | beginning | Net investment | gain (loss) on | investment | net investment | gain on | Total | Redemption | value, end | at net asset | end of period | net assets | to average | turnover |
| Period ended | of period | income (loss) a | investments | operations | income | investments | distributions | fees | of period | value (%) b | (in thousands) | (%) c | net assets (%) | (%) |
| Class Y | | | | | | | | | | | | | | |
| April 30, 2018** | $26.18 | .20 | (.02) | .18 | (.27) | (.53) | (.80) | — | $25.56 | .70* | $266,501 | .40 * | .77* | 33* |
| October 31, 2017 | 22.54 | .41 | 3.77 | 4.18 | (.54) | — | (.54) | — | 26.18 | 18.76 | 247,071 | .82 | 1.67 | 56 |
| October 31, 2016 | 23.37 | .40 | .17 | .57 | (.55) | (.85) | (1.40) | — | 22.54 | 2.71 | 189,190 | .84d | 1.84d | 49 |
| October 31, 2015 | 25.59 | .32 | (.92) | (.60) | (.58) | (1.04) | (1.62) | — | 23.37 | (2.57) | 260,676 | .81 | 1.30 | 67 |
| October 31, 2014 | 23.56 | .24 | 2.42 | 2.66 | (.63) | — | (.63) | — | 25.59 | 11.38 | 273,693 | .81 | .95 | 63 |
| October 31, 2013 | 20.08 | .42 | 3.72 | 4.14 | (.66) | — | (.66) | —e | 23.56 | 20.93 | 196,399 | .83 | 1.89 | 72 |
* Not annualized.
** Unaudited.
† For the period March 3, 2015 (commencement of operations) to October 31, 2015.
a Per share net investment income (loss) has been determined on the basis of the weighted average number of shares outstanding during the period.
b Total return assumes dividend reinvestment and does not reflect the effect of sales charges.
c Includes amounts paid through expense offset and/or brokerage/service arrangements, if any (Note 2). Also excludes acquired fund fees and expenses, if any.
d Reflects a voluntary waiver of certain fund expenses in effect during the period. As a result of such waivers, the expenses of each class reflect a reduction of less than 0.01% as a percentage of average net assets.
e Amount represents less than $0.01 per share.
The accompanying notes are an integral part of these financial statements.
| |
| 30 Convertible Securities Fund | Convertible Securities Fund 31 |
Notes to financial statements 4/30/18 (Unaudited)
Within the following Notes to financial statements, references to “State Street” represent State Street Bank and Trust Company, references to “the SEC” represent the Securities and Exchange Commission, references to “Putnam Management” represent Putnam Investment Management, LLC, the fund’s manager, an indirect wholly-owned subsidiary of Putnam Investments, LLC and references to “OTC”, if any, represent over-the-counter. Unless otherwise noted, the “reporting period” represents the period from November 1, 2017 through April 30, 2018.
Putnam Convertible Securities Fund (the fund) is a Massachusetts business trust, which is registered under the Investment Company Act of 1940, as amended, as a diversified open-end management investment company. The objective of the fund is to seek, with equal emphasis, current income and capital appreciation. The fund’s secondary objective is conservation of capital. The fund invests mainly in convertible securities of U.S. companies. Under normal circumstances, the fund invests at least 80% of the fund’s net assets in convertible securities. This policy may be changed only after 60 days’ notice to shareholders. Convertible securities combine the investment characteristics of bonds and common stocks. Convertible securities include bonds, preferred stocks and other instruments that can be converted into or exchanged for common stock or equivalent value. A significant portion of the convertible securities the fund buys are below-investment-grade (sometimes referred to as “junk bonds”). The convertible bonds the fund buys usually have intermediate-to long-term stated maturities (i.e. three years or longer), but often contain “put” features, which allow bondholders to sell the bond back to the company under specified circumstances, that result in shorter effective maturities. When deciding whether to buy or sell investments, Putnam Management may consider, among other factors: (i) a security’s structural features, such as its position in a company’s capital structure and “put” and “call” features (a company’s right to repurchase the security under specified circumstances is a “call” feature); (ii) credit and prepayment risks; and (iii) with respect to a company’s common stock underlying a convertible security, the stock’s valuation and the company’s financial strength, growth potential, competitive position in its industry, projected future earnings, cash flows and dividends.
The fund offers class A, class B, class C, class I, class M, class R and class Y shares. The fund registered class T shares in February 2017, however, as of the date of this report, class T shares had not commenced operations and are not available for purchase. Effective May 21, 2018, the fund began offering class R6 shares. Purchases of class B shares are closed to new and existing investors except by exchange from class B shares of another Putnam fund or through dividend and/or capital gains reinvestment. Class A and class M shares are sold with a maximum front-end sales charge of 5.75% and 3.50%, respectively. Class A shares generally are not subject to a contingent deferred sales charge, and class I, class M, class R and class Y shares are not subject to a contingent deferred sales charge. Class B shares, which convert to class A shares after approximately eight years, are not subject to a front-end sales charge and are subject to a contingent deferred sales charge if those shares are redeemed within six years of purchase. Class C shares are subject to a one-year 1.00% contingent deferred sales charge and generally convert to class A shares after approximately ten years. Prior to April 1, 2018, class C shares did not convert to class A shares. Class R shares, which are not available to all investors, are sold at net asset value. The expenses for class A, class B, class C, class M and class R shares may differ based on the distribution fee of each class, which is identified in Note 2. Class I and class Y shares, which are sold at net asset value, are generally subject to the same expenses as class A, class B, class C, class M and class R shares, but do not bear a distribution fee and in the case of class I shares, bear a lower investor servicing fee, which is identified in Note 2. Class I and class Y shares are not available to all investors.
In the normal course of business, the fund enters into contracts that may include agreements to indemnify another party under given circumstances. The fund’s maximum exposure under these arrangements is unknown as this would involve future claims that may be, but have not yet been, made against the fund. However, the fund’s management team expects the risk of material loss to be remote.
The fund has entered into contractual arrangements with an investment adviser, administrator, distributor, shareholder servicing agent and custodian, who each provide services to the fund. Unless expressly stated otherwise, shareholders are not parties to, or intended beneficiaries of these contractual arrangements, and these contractual arrangements are not intended to create any shareholder right to enforce them against the service providers or to seek any remedy under them against the service providers, either directly or on behalf of the fund.
Under the fund’s Agreement and Declaration of Trust, any claims asserted against or on behalf of the Putnam Funds, including claims against Trustees and Officers, must be brought in state and federal courts located within the Commonwealth of Massachusetts.
| |
| 32 Convertible Securities Fund |
Note 1: Significant accounting policies
The following is a summary of significant accounting policies consistently followed by the fund in the preparation of its financial statements. The preparation of financial statements is in conformity with accounting principles generally accepted in the United States of America and requires management to make estimates and assumptions that affect the reported amounts of assets and liabilities in the financial statements and the reported amounts of increases and decreases in net assets from operations. Actual results could differ from those estimates. Subsequent events after the Statement of assets and liabilities date through the date that the financial statements were issued have been evaluated in the preparation of the financial statements.
Investment income, realized and unrealized gains and losses and expenses of the fund are borne pro-rata based on the relative net assets of each class to the total net assets of the fund, except that each class bears expenses unique to that class (including the distribution fees applicable to such classes). Each class votes as a class only with respect to its own distribution plan or other matters on which a class vote is required by law or determined by the Trustees. If the fund were liquidated, shares of each class would receive their pro-rata share of the net assets of the fund. In addition, the Trustees declare separate dividends on each class of shares.
Security valuation Portfolio securities and other investments are valued using policies and procedures adopted by the Board of Trustees. The Trustees have formed a Pricing Committee to oversee the implementation of these procedures and have delegated responsibility for valuing the fund’s assets in accordance with these procedures to Putnam Management. Putnam Management has established an internal Valuation Committee that is responsible for making fair value determinations, evaluating the effectiveness of the pricing policies of the fund and reporting to the Pricing Committee.
Investments for which market quotations are readily available are valued at the last reported sales price on their principal exchange, or official closing price for certain markets, and are classified as Level 1 securities under Accounting Standards Codification 820 Fair Value Measurements and Disclosures (ASC 820). If no sales are reported, as in the case of some securities that are traded OTC, a security is valued at its last reported bid price and is generally categorized as a Level 2 security.
Investments in open-end investment companies (excluding exchange-traded funds), if any, which can be classified as Level 1 or Level 2 securities, are valued based on their net asset value. The net asset value of such investment companies equals the total value of their assets less their liabilities and divided by the number of their outstanding shares.
Market quotations are not considered to be readily available for certain debt obligations (including short-term investments with remaining maturities of 60 days or less) and other investments; such investments are valued on the basis of valuations furnished by an independent pricing service approved by the Trustees or dealers selected by Putnam Management. Such services or dealers determine valuations for normal institutional-size trading units of such securities using methods based on market transactions for comparable securities and various relationships, generally recognized by institutional traders, between securities (which consider such factors as security prices, yields, maturities and ratings). These securities will generally be categorized as Level 2.
Many securities markets and exchanges outside the U.S. close prior to the scheduled close of the New York Stock Exchange and therefore the closing prices for securities in such markets or on such exchanges may not fully reflect events that occur after such close but before the scheduled close of the New York Stock Exchange. Accordingly, on certain days, the fund will fair value certain foreign equity securities taking into account multiple factors including movements in the U.S. securities markets, currency valuations and comparisons to the valuation of American Depository Receipts, exchange-traded funds and futures contracts. The foreign equity securities, which would generally be classified as Level 1 securities, will be transferred to Level 2 of the fair value hierarchy when they are valued at fair value. The number of days on which fair value prices will be used will depend on market activity and it is possible that fair value prices will be used by the fund to a significant extent. Securities quoted in foreign currencies, if any, are translated into U.S. dollars at the current exchange rate.
To the extent a pricing service or dealer is unable to value a security or provides a valuation that Putnam Management does not believe accurately reflects the security’s fair value, the security will be valued at fair value by Putnam Management in accordance with policies and procedures approved by the Trustees. Certain investments, including certain restricted and illiquid securities and derivatives, are also valued at fair value following procedures approved by the Trustees. These valuations consider such factors as significant market or specific security events such as interest rate or credit quality changes, various relationships with other securities, discount rates, U.S. Treasury, U.S. swap and credit yields, index levels, convexity exposures, recovery rates, sales and other multiples and resale restrictions. These securities are classified as Level 2 or as Level 3 depending on the priority of the significant inputs.
|
| Convertible Securities Fund 33 |
To assess the continuing appropriateness of fair valuations, the Valuation Committee reviews and affirms the reasonableness of such valuations on a regular basis after considering all relevant information that is reasonably available. Such valuations and procedures are reviewed periodically by the Trustees. The fair value of securities is generally determined as the amount that the fund could reasonably expect to realize from an orderly disposition of such securities over a reasonable period of time. By its nature, a fair value price is a good faith estimate of the value of a security in a current sale and does not reflect an actual market price, which may be different by a material amount.
Security transactions and related investment income Security transactions are recorded on the trade date (the date the order to buy or sell is executed). Gains or losses on securities sold are determined on the identified cost basis.
Interest income, net of any applicable withholding taxes, is recorded on the accrual basis. Dividend income, net of any applicable withholding taxes, is recognized on the ex-dividend date except that certain dividends from foreign securities, if any, are recognized as soon as the fund is informed of the ex-dividend date. Non-cash dividends, if any, are recorded at the fair value of the securities received. Dividends representing a return of capital or capital gains, if any, are reflected as a reduction of cost and/or as a realized gain.
All premiums/discounts are amortized/accreted on a yield-to-maturity basis.
Securities lending The fund may lend securities, through its agent, to qualified borrowers in order to earn additional income. The loans are collateralized by cash in an amount at least equal to the fair value of the securities loaned. The fair value of securities loaned is determined daily and any additional required collateral is allocated to the fund on the next business day. The remaining maturities of the securities lending transactions are considered overnight and continuous. The risk of borrower default will be borne by the fund’s agent; the fund will bear the risk of loss with respect to the investment of the cash collateral. Income from securities lending, net of expenses, is included in investment income on the Statement of operations. Cash collateral is invested in Putnam Cash Collateral Pool, LLC, a limited liability company managed by an affiliate of Putnam Management. Investments in Putnam Cash Collateral Pool, LLC are valued at its closing net asset value each business day. There are no management fees charged to Putnam Cash Collateral Pool, LLC. At the close of the reporting period, the fund received cash collateral of $12,277,687 and the value of securities loaned amounted to $11,889,810.
Interfund lending The fund, along with other Putnam funds, may participate in an interfund lending program pursuant to an exemptive order issued by the SEC. This program allows the fund to borrow from or lend to other Putnam funds that permit such transactions. Interfund lending transactions are subject to each fund’s investment policies and borrowing and lending limits. Interest earned or paid on the interfund lending transaction will be based on the average of certain current market rates. During the reporting period, the fund did not utilize the program.
Lines of credit The fund participates, along with other Putnam funds, in a $317.5 million unsecured committed line of credit and a $235.5 million unsecured uncommitted line of credit, both provided by State Street. Borrowings may be made for temporary or emergency purposes, including the funding of shareholder redemption requests and trade settlements. Interest is charged to the fund based on the fund’s borrowing at a rate equal to 1.25% plus the higher of (1) the Federal Funds rate and (2) the overnight LIBOR for the committed line of credit and the Federal Funds rate plus 1.30% for the uncommitted line of credit. A closing fee equal to 0.04% of the committed line of credit plus a $25,000 flat fee and 0.04% of the uncommitted line of credit has been paid by the participating funds. In addition, a commitment fee of 0.21% per annum on any unutilized portion of the committed line of credit is allocated to the participating funds based on their relative net assets and paid quarterly. During the reporting period, the fund had no borrowings against these arrangements.
Federal taxes It is the policy of the fund to distribute all of its taxable income within the prescribed time period and otherwise comply with the provisions of the Internal Revenue Code of 1986, as amended (the Code), applicable to regulated investment companies. It is also the intention of the fund to distribute an amount sufficient to avoid imposition of any excise tax under Section 4982 of the Code.
The fund is subject to the provisions of Accounting Standards Codification 740 Income Taxes (ASC 740). ASC 740 sets forth a minimum threshold for financial statement recognition of the benefit of a tax position taken or expected to be taken in a tax return. The fund did not have a liability to record for any unrecognized tax benefits in the accompanying financial statements. No provision has been made for federal taxes on income, capital gains or unrealized appreciation on securities held nor for excise tax on income and capital gains. Each of the fund’s federal tax returns for the prior three fiscal years remains subject to examination by the Internal Revenue Service.
| |
| 34 Convertible Securities Fund |
Tax cost of investments includes adjustments to net unrealized appreciation (depreciation) which may not necessarily be final tax cost basis adjustments, but closely approximate the tax basis unrealized gains and losses that may be realized and distributed to shareholders. The aggregate identified cost on a tax basis is $668,185,158, resulting in gross unrealized appreciation and depreciation of $80,262,433 and $31,048,308, respectively, or net unrealized appreciation of $49,214,125.
Distributions to shareholders Distributions to shareholders from net investment income are recorded by the fund on the ex-dividend date. Distributions from capital gains, if any, are recorded on the ex-dividend date and paid at least annually. The amount and character of income and gains to be distributed are determined in accordance with income tax regulations, which may differ from generally accepted accounting principles. Dividend sources are estimated at the time of declaration. Actual results may vary. Any non-taxable return of capital cannot be determined until final tax calculations are completed after the end of the fund’s fiscal year. Reclassifications are made to the fund’s capital accounts to reflect income and gains available for distribution (or available capital loss carryovers) under income tax regulations.
Note 2: Management fee, administrative services and other transactions
The fund pays Putnam Management a management fee (based on the fund’s average net assets and computed and paid monthly) at annual rates that may vary based on the average of the aggregate net assets of all open-end mutual funds sponsored by Putnam Management (excluding net assets of funds that are invested in, or that are invested in by, other Putnam funds to the extent necessary to avoid “double counting” of those assets). Such annual rates may vary as follows:
| | | | |
| 0.780% | of the first $5 billion, | | 0.580% | of the next $50 billion, |
| 0.730% | of the next $5 billion, | | 0.560% | of the next $50 billion, |
| 0.680% | of the next $10 billion, | | 0.550% | of the next $100 billion and |
| 0.630% | of the next $10 billion, | | 0.545% | of any excess thereafter. |
For the reporting period, the management fee represented an effective rate (excluding the impact from any expense waivers in effect) of 0.309% of the fund’s average net assets.
Putnam Management has contractually agreed, through February 28, 2019, to waive fees or reimburse the fund’s expenses to the extent necessary to limit the cumulative expenses of the fund, exclusive of brokerage, interest, taxes, investment-related expenses, extraordinary expenses, acquired fund fees and expenses and payments under the fund’s investor servicing contract, investment management contract and distribution plans, on a fiscal year-to-date basis to an annual rate of 0.20% of the fund’s average net assets over such fiscal year-to-date period. During the reporting period, the fund’s expenses were not reduced as a result of this limit.
Putnam Investments Limited (PIL), an affiliate of Putnam Management, is authorized by the Trustees to manage a separate portion of the assets of the fund as determined by Putnam Management from time to time. PIL did not manage any portion of the assets of the fund during the reporting period. If Putnam Management were to engage the services of PIL, Putnam Management would pay a quarterly sub-management fee to PIL for its services at an annual rate of 0.35% of the average net assets of the portion of the fund managed by PIL.
The fund reimburses Putnam Management an allocated amount for the compensation and related expenses of certain officers of the fund and their staff who provide administrative services to the fund. The aggregate amount of all such reimbursements is determined annually by the Trustees.
Custodial functions for the fund’s assets are provided by State Street. Custody fees are based on the fund’s asset level, the number of its security holdings and transaction volumes.
Putnam Investor Services, Inc., an affiliate of Putnam Management, provides investor servicing agent functions to the fund. Putnam Investor Services, Inc. received fees for investor servicing for class A, class B, class C, class M, class R and class Y shares that included (1) a per account fee for each direct and underlying non-defined contribution account (retail account) of the fund; (2) a specified rate of the fund’s assets attributable to defined contribution plan accounts; and (3) a specified rate based on the average net assets in retail accounts. Putnam Investor Services, Inc. has agreed that the aggregate investor servicing fees for each fund’s retail and defined contribution accounts for these share classes will not exceed an annual rate of 0.25% of the fund’s average assets attributable to such accounts.
Class I shares paid a monthly fee based on the average net assets of class I shares at an annual rate of 0.01%.
|
| Convertible Securities Fund 35 |
During the reporting period, the expenses for each class of shares related to investor servicing fees were as follows:
| | | | |
| Class A | $263,419 | | Class M | 2,265 |
| Class B | 5,166 | | Class R | 2,808 |
| Class C | 27,369 | | Class Y | 168,525 |
| Class I | 1 | | Total | $469,553 |
The fund has entered into expense offset arrangements with Putnam Investor Services, Inc. and State Street whereby Putnam Investor Services, Inc.’s and State Street’s fees are reduced by credits allowed on cash balances. The fund also reduced expenses through brokerage/service arrangements. For the reporting period, the fund’s expenses were reduced by $1,005 under the expense offset arrangements and by no monies under the brokerage/service arrangements.
Each Independent Trustee of the fund receives an annual Trustee fee, of which $545, as a quarterly retainer, has been allocated to the fund, and an additional fee for each Trustees meeting attended. Trustees also are reimbursed for expenses they incur relating to their services as Trustees.
The fund has adopted a Trustee Fee Deferral Plan (the Deferral Plan) which allows the Trustees to defer the receipt of all or a portion of Trustees fees payable on or after July 1, 1995. The deferred fees remain invested in certain Putnam funds until distribution in accordance with the Deferral Plan.
The fund has adopted an unfunded noncontributory defined benefit pension plan (the Pension Plan) covering all Trustees of the fund who have served as a Trustee for at least five years and were first elected prior to 2004. Benefits under the Pension Plan are equal to 50% of the Trustee’s average annual attendance and retainer fees for the three years ended December 31, 2005. The retirement benefit is payable during a Trustee’s lifetime, beginning the year following retirement, for the number of years of service through December 31, 2006. Pension expense for the fund is included in Trustee compensation and expenses in the Statement of operations. Accrued pension liability is included in Payable for Trustee compensation and expenses in the Statement of assets and liabilities. The Trustees have terminated the Pension Plan with respect to any Trustee first elected after 2003.
The fund has adopted distribution plans (the Plans) with respect to the following share classes pursuant to Rule 12b–1 under the Investment Company Act of 1940. The purpose of the Plans is to compensate Putnam Retail Management Limited Partnership, an indirect wholly-owned subsidiary of Putnam Investments, LLC, for services provided and expenses incurred in distributing shares of the fund. The Plans provide payments by the fund to Putnam Retail Management Limited Partnership at an annual rate of up to the following amounts (Maximum %) of the average net assets attributable to each class. The Trustees have approved payment by the fund at the following annual rate (Approved %) of the average net assets attributable to each class. During the reporting period, the class-specific expenses related to distribution fees were as follows:
| | | |
| | Maximum % | Approved % | Amount |
| Class A | 0.35% | 0.25% | $498,067 |
| Class B | 1.00% | 1.00% | 39,064 |
| Class C | 1.00% | 1.00% | 206,990 |
| Class M | 1.00% | 0.75% | 12,844 |
| Class R | 1.00% | 0.50% | 10,630 |
| Total | | | $767,595 |
For the reporting period, Putnam Retail Management Limited Partnership, acting as underwriter, received net commissions of $12,399 and $49 from the sale of class A and class M shares, respectively, and received $1,734 and $289 in contingent deferred sales charges from redemptions of class B and class C shares, respectively.
A deferred sales charge of up to 1.00% is assessed on certain redemptions of class A shares. For the reporting period, Putnam Retail Management Limited Partnership, acting as underwriter, received no monies on class A redemptions.
| |
| 36 Convertible Securities Fund |
Note 3: Purchases and sales of securities
During the reporting period, the cost of purchases and the proceeds from sales, excluding short-term investments, were as follows:
| | |
| | Cost of purchases | Proceeds from sales |
| Investments in securities (Long-term) | $226,217,631 | $243,390,237 |
| U.S. government securities (Long-term) | — | — |
| Total | $226,217,631 | $243,390,237 |
The fund may purchase or sell investments from or to other Putnam funds in the ordinary course of business, which can reduce the fund’s transaction costs, at prices determined in accordance with SEC requirements and policies approved by the Trustees. During the reporting period, purchases or sales of long-term securities from or to other Putnam funds, if any, did not represent more than 5% of the fund’s total cost of purchases and/or total proceeds from sales.
Note 4: Capital shares
At the close of the reporting period, there were an unlimited number of shares of beneficial interest authorized. Transactions, including, if applicable, direct exchanges pursuant to share conversions, in capital shares were as follows:
| | | | |
| | SIX MONTHS ENDED 4/30/18 | YEAR ENDED 10/31/17 |
| Class A | Shares | Amount | Shares | Amount |
| Shares sold | 629,010 | $16,342,240 | 1,058,537 | $25,681,287 |
| Shares issued in connection with | | | | |
| reinvestment of distributions | 430,998 | 11,034,765 | 301,835 | 7,353,305 |
| | 1,060,008 | 27,377,005 | 1,360,372 | 33,034,592 |
| Shares repurchased | (1,530,515) | (39,803,483) | (3,602,892) | (87,115,303) |
| Net decrease | (470,507) | $(12,426,478) | (2,242,520) | $(54,080,711) |
| |
| | SIX MONTHS ENDED 4/30/18 | YEAR ENDED 10/31/17 |
| Class B | Shares | Amount | Shares | Amount |
| Shares sold | 9,683 | $247,050 | 12,205 | $279,839 |
| Shares issued in connection with | | | | |
| reinvestment of distributions | 6,013 | 150,746 | 3,119 | 74,347 |
| | 15,696 | 397,796 | 15,324 | 354,186 |
| Shares repurchased | (38,711) | (986,726) | (103,746) | (2,454,659) |
| Net decrease | (23,015) | $(588,930) | (88,422) | $(2,100,473) |
| |
| | SIX MONTHS ENDED 4/30/18 | YEAR ENDED 10/31/17 |
| Class C | Shares | Amount | Shares | Amount |
| Shares sold | 179,188 | $4,624,055 | 90,389 | $2,166,367 |
| Shares issued in connection with | | | | |
| reinvestment of distributions | 34,272 | 867,131 | 17,488 | 420,724 |
| | 213,460 | 5,491,186 | 107,877 | 2,587,091 |
| Shares repurchased | (379,493) | (9,716,282) | (731,352) | (17,436,163) |
| Net decrease | (166,033) | $(4,225,096) | (623,475) | $(14,849,072) |
|
| Convertible Securities Fund 37 |
| | | | |
| | SIX MONTHS ENDED 4/30/18 | YEAR ENDED 10/31/17 |
| Class I | Shares | Amount | Shares | Amount |
| Shares sold | — | $— | — | $— |
| Shares issued in connection with | | | | |
| reinvestment of distributions | 14 | 359 | 10 | 248 |
| | 14 | 359 | 10 | 248 |
| Shares repurchased | — | — | — | — |
| Net increase | 14 | $359 | 10 | $248 |
| |
| | SIX MONTHS ENDED 4/30/18 | YEAR ENDED 10/31/17 |
| Class M | Shares | Amount | Shares | Amount |
| Shares sold | 4,791 | $122,963 | 17,221 | $408,113 |
| Shares issued in connection with | | | | |
| reinvestment of distributions | 3,602 | 91,223 | 2,234 | 53,798 |
| | 8,393 | 214,186 | 19,455 | 461,911 |
| Shares repurchased | (17,702) | (456,512) | (39,082) | (944,144) |
| Net decrease | (9,309) | $(242,326) | (19,627) | $(482,233) |
| |
| | SIX MONTHS ENDED 4/30/18 | YEAR ENDED 10/31/17 |
| Class R | Shares | Amount | Shares | Amount |
| Shares sold | 17,226 | $446,409 | 45,875 | $1,107,333 |
| Shares issued in connection with | | | | |
| reinvestment of distributions | 4,142 | 105,572 | 3,041 | 73,749 |
| | 21,368 | 551,981 | 48,916 | 1,181,082 |
| Shares repurchased | (51,741) | (1,333,841) | (77,604) | (1,869,495) |
| Net decrease | (30,373) | $(781,860) | (28,688) | $(688,413) |
| |
| | SIX MONTHS ENDED 4/30/18 | YEAR ENDED 10/31/17 |
| Class Y | Shares | Amount | Shares | Amount |
| Shares sold | 1,929,249 | $49,927,636 | 3,202,852 | $77,964,571 |
| Shares issued in connection with | | | | |
| reinvestment of distributions | 240,758 | 6,160,739 | 151,237 | 3,692,655 |
| | 2,170,007 | 56,088,375 | 3,354,089 | 81,657,226 |
| Shares repurchased | (1,183,524) | (30,775,462) | (2,308,877) | (55,700,964) |
| Net increase | 986,483 | $25,312,913 | 1,045,212 | $25,956,262 |
At the close of the reporting period, Putnam Investments, LLC owned the following shares of the fund:
| | | |
| | Shares owned | Percentage of ownership | Value |
| Class I | 453 | 100% | $11,586 |
| |
| 38 Convertible Securities Fund |
Note 5: Affiliated transactions
Transactions during the reporting period with any company which is under common ownership or control were as follows:
| | | | | |
| | | | | | Shares |
| | | | | | outstanding |
| | | | | | and fair |
| | Fair value as | Purchase | Sale | Investment | value as |
| Name of affiliate | of 10/31/17 | cost | proceeds | income | of 4/30/18 |
| Short-term investments | | | | | |
| Putnam Cash Collateral | | | | | |
| Pool, LLC* | $18,807,175 | $86,487,100 | $93,016,588 | $127,025 | $12,277,687 |
| Putnam Short Term | | | | | |
| Investment Fund** | 20,689,743 | 146,193,886 | 139,358,672 | 248,945 | 27,524,957 |
| Total Short-term | | | | | |
| investments | $39,496,918 | $232,680,986 | $232,375,260 | $375,970 | $39,802,644 |
* No management fees are charged to Putnam Cash Collateral Pool, LLC (Note 1). Investment income shown is included in securities lending income on the Statement of operations. There were no realized or unrealized gains or losses during the period.
** Management fees charged to Putnam Short Term Investment Fund have been waived by Putnam Management.
There were no realized or unrealized gains or losses during the period.
Note 6: Market, credit and other risks
In the normal course of business, the fund trades financial instruments and enters into financial transactions where risk of potential loss exists due to changes in the market (market risk) or failure of the contracting party to the transaction to perform (credit risk). The fund may be exposed to additional credit risk that an institution or other entity with which the fund has unsettled or open transactions will default. Investments in foreign securities involve certain risks, including those related to economic instability, unfavorable political developments, and currency fluctuations.
Note 7: Summary of derivative activity
The volume of activity for the reporting period for any derivative type that was held during the period is listed below and was based on an average of the holdings at the end of each fiscal quarter:
| |
| Warrants (number of warrants) | 800 |
The following is a summary of the fair value of derivative instruments as of the close of the reporting period:
| | | | |
| Fair value of derivative instruments as of the close of the reporting period | |
| | ASSET DERIVATIVES | LIABILITY DERIVATIVES |
| Derivatives not | | | | |
| accounted for as | Statement of | | Statement of | |
| hedging instruments | assets and | | assets and | |
| under ASC 815 | liabilities location | Fair value | liabilities location | Fair value |
| Equity contracts | Investments | $8 | Payables | $— |
| Total | | $8 | | $— |
|
| Convertible Securities Fund 39 |
The following is a summary of change in unrealized gains or losses of derivative instruments on the Statement of operations for the reporting period (Note 1) (there were no realized gains or losses on derivative instruments):
| | |
| Change in unrealized appreciation or (depreciation) on derivatives recognized in net gain or (loss) | |
| on investments | | |
| Derivatives not accounted for as | | |
| hedging instruments under ASC 815 | Warrants | Total |
| Equity contracts | $— | $— |
| Total | $— | $— |
Note 8: New accounting pronouncements
In March 2017, the Financial Accounting Standards Board issued Accounting Standards Update (ASU) No. 2017–08, Receivables — Nonrefundable Fees and Other Costs (Subtopic 310–20): Premium Amortization on Purchased Callable Debt Securities. The amendments in the ASU shorten the amortization period for certain callable debt securities held at a premium, to be amortized to the earliest call date. The ASU is effective for fiscal years and interim periods within those fiscal years beginning after December 15, 2018. Management is currently evaluating the impact, if any, of applying this provision.
| |
| 40 Convertible Securities Fund |
Putnam family of funds
The following is a list of Putnam’s open-end mutual funds offered to the public. Investors should carefully consider the investment objective, risks, charges, and expenses of a fund before investing. For a prospectus, or a summary prospectus if available, containing this and other information for any Putnam fund or product, contact your financial advisor or call Putnam Investor Services at 1-800-225-1581. Please read the prospectus carefully before investing.
| |
| Blend | Value |
| Capital Opportunities Fund | Convertible Securities Fund |
| Capital Spectrum Fund | Equity Income Fund |
| Emerging Markets Equity Fund | International Value Fund |
| Equity Spectrum Fund | Small Cap Value Fund |
| Europe Equity Fund | |
| Global Equity Fund | Income |
| International Capital Opportunities Fund | Diversified Income Trust |
| International Equity Fund | Emerging Markets Income Fund |
| Investors Fund | Floating Rate Income Fund |
| Low Volatility Equity Fund | Global Income Trust |
| Multi-Cap Core Fund | Government Money Market Fund* |
| Research Fund | High Yield Fund |
| | Income Fund |
| Global Sector | Money Market Fund† |
| Global Consumer Fund | Mortgage Securities Fund |
| Global Financials Fund | Short Duration Income Fund |
| Global Health Care Fund | |
| Global Industrials Fund | Tax-free Income |
| Global Natural Resources Fund | AMT-Free Municipal Fund |
| Global Sector Fund | Intermediate-Term Municipal Income Fund |
| Global Technology Fund | Short-Term Municipal Income Fund |
| Global Telecommunications Fund | Tax Exempt Income Fund |
| Global Utilities Fund | Tax-Free High Yield Fund |
| | |
| Growth | State tax-free income funds‡ : |
| Growth Opportunities Fund | California, Massachusetts, Minnesota, |
| International Growth Fund | New Jersey, New York, Ohio, and Pennsylvania. |
| Small Cap Growth Fund | |
| Sustainable Future Fund | |
| Sustainable Leaders Fund | |
| |
| 41 Convertible Securities Fund |
| |
| Absolute Return | Asset Allocation |
| Absolute Return 100 Fund® | Dynamic Risk Allocation Fund |
| Fixed Income Absolute Return Fund | George Putnam Balanced Fund |
| Multi-Asset Absolute Return Fund | Dynamic Asset Allocation Balanced Fund |
| | |
| Putnam PanAgora** | Dynamic Asset Allocation Conservative Fund |
| Putnam PanAgora Managed Futures Strategy | Dynamic Asset Allocation Growth Fund |
| Putnam PanAgora Market Neutral Fund | |
| Putnam PanAgora Risk Parity Fund | Retirement Income Fund Lifestyle 1 |
| |
| | RetirementReady® 2060 Fund |
| | RetirementReady® 2055 Fund |
| | RetirementReady® 2050 Fund |
| | RetirementReady® 2045 Fund |
| | RetirementReady® 2040 Fund |
| | RetirementReady® 2035 Fund |
| | RetirementReady® 2030 Fund |
| | RetirementReady® 2025 Fund |
| | RetirementReady® 2020 Fund |
* You could lose money by investing in the fund. Although the fund seeks to preserve the value of your investment at $1.00 per share, it cannot guarantee it will do so. An investment in the fund is not insured or guaranteed by the Federal Deposit Insurance Corporation or any other government agency. The fund’s sponsor has no legal obligation to provide financial support to the fund, and you should not expect that the sponsor will provide financial support to the fund at any time.
† You could lose money by investing in the fund. Although the fund seeks to preserve the value of your investment at $1.00 per share, it cannot guarantee it will do so. The fund may impose a fee upon sale of your shares or may temporarily suspend your ability to sell shares if the fund’s liquidity falls below required minimums because of market conditions or other factors.
An investment in the fund is not insured or guaranteed by the Federal Deposit Insurance Corporation or any other government agency. The fund’s sponsor has no legal obligation to provide financial support to the fund, and you should not expect that the sponsor will provide financial support to the fund at any time.
‡ Not available in all states.
** Sub-advised by PanAgora Asset Management.
Check your account balances and the most recent month-end performance in the Individual Investors section at putnam.com.
|
| Convertible Securities Fund 42 |
Services for shareholders
Investor services
Systematic investment plan Tell us how much you wish to invest regularly — weekly, semimonthly, or monthly — and the amount you choose will be transferred automatically from your checking or savings account. There’s no additional fee for this service, and you can suspend it at any time. This plan may be a great way to save for college expenses or to plan for your retirement.
Please note that regular investing does not guarantee a profit or protect against loss in a declining market. Before arranging a systematic investment plan, consider your financial ability to continue making purchases in periods when prices are low.
Systematic exchange You can make regular transfers from one Putnam fund to another Putnam fund. There are no additional fees for this service, and you can cancel or change your options at any time.
Dividends PLUS You can choose to have the dividend distributions from one of your Putnam funds automatically reinvested in another Putnam fund at no additional charge.
Free exchange privilege You can exchange money between Putnam funds free of charge, as long as they are the same class of shares. A signature guarantee is required if you are exchanging more than $500,000. The fund reserves the right to revise or terminate the exchange privilege.
Reinstatement privilege If you’ve sold Putnam shares or received a check for a dividend or capital gain, you may reinvest the proceeds with Putnam within 90 days of the transaction and they will be reinvested at the fund’s current net asset value — with no sales charge. However, reinstatement of class B shares may have special tax consequences. Ask your financial or tax representative for details.
Check-writing service You have ready access to many Putnam accounts. It’s as simple as writing a check, and there are no special fees or service charges. For more information about the check-writing service, call Putnam or visit our website.
Dollar cost averaging When you’re investing for long-term goals, it’s time, not timing, that counts. Investing on a systematic basis is a better strategy than trying to figure out when the markets will go up or down. This means investing the same amount of money regularly over a long period. This method of investing is called dollar cost averaging. When a fund’s share price declines, your investment dollars buy more shares at lower prices. When it increases, they buy fewer shares. Over time, you will pay a lower average price per share.
For more information
Visit the Individual Investors section at putnam.com A secure section of our website contains complete information on your account, including balances and transactions, updated daily. You may also conduct transactions, such as exchanges, additional investments, and address changes. Log on today to get your password.
Call us toll free at 1-800-225-1581 Ask a helpful Putnam representative or your financial advisor for details about any of these or other services, or see your prospectus.
|
| 43 Convertible Securities Fund |
Putnam’s commitment to confidentiality
In order to conduct business with our shareholders, we must obtain certain personal information such as account holders’ names, addresses, Social Security numbers, and dates of birth. Using this information, we are able to maintain accurate records of accounts and transactions.
It is our policy to protect the confidentiality of our shareholder information, whether or not a shareholder currently owns shares of our funds. In particular, it is our policy not to sell information about you or your accounts to outside marketing firms. We have safeguards in place designed to prevent unauthorized access to our computer systems and procedures to protect personal information from unauthorized use.
Within the Putnam organization, your information is shared with those who need it to service your account or provide you with information about other Putnam products or services. Under certain circumstances, we must also share account information with outside vendors who provide services to us, such as mailings and proxy solicitations. In these cases, the service providers enter into confidentiality agreements with us, and we provide only the information necessary to process transactions and perform other services related to your account. It is also our policy to share account information with your financial advisor, if you've provided us with information about your advisor and that person is listed on your Putnam account.
If you would like clarification about our confidentiality policies or have any questions or concerns, please don't hesitate to contact us at 1-800-225-1581, Monday through Friday, 8:00 a.m. to 8:00 p.m. Eastern Time.
|
| Convertible Securities Fund 44 |
Fund information
Founded over 80 years ago, Putnam Investments was built around the concept that a balance between risk and reward is the hallmark of a well-rounded financial program. We manage over 100 funds across income, value, blend, growth, asset allocation, absolute return, and global sector categories.
| | |
| Investment Manager | Trustees | Michael J. Higgins |
| Putnam Investment | Jameson A. Baxter, Chair | Vice President, Treasurer, |
| Management, LLC | Kenneth R. Leibler, Vice Chair | and Clerk |
| One Post Office Square | Liaquat Ahamed | |
| Boston, MA 02109 | Ravi Akhoury | Janet C. Smith |
| | Barbara M. Baumann | Vice President, |
| Investment Sub-Advisor | Katinka Domotorffy | Principal Financial Officer, |
| Putnam Investments Limited | Catharine Bond Hill | Principal Accounting Officer, |
| 16 St James’s Street | Paul L. Joskow | and Assistant Treasurer |
| London, England SW1A 1ER | Robert E. Patterson | |
| | George Putnam, III | Susan G. Malloy |
| Marketing Services | Robert L. Reynolds | Vice President and |
| Putnam Retail Management | Manoj P. Singh | Assistant Treasurer |
| One Post Office Square | | |
| Boston, MA 02109 | Officers | Mark C. Trenchard |
| | Robert L. Reynolds | Vice President and |
| Custodian | President | BSA Compliance Officer |
| State Street Bank | | |
| and Trust Company | Jonathan S. Horwitz | Nancy E. Florek |
| | Executive Vice President, | Vice President, Director of |
| Legal Counsel | Principal Executive Officer, | Proxy Voting and Corporate |
| Ropes & Gray LLP | and Compliance Liaison | Governance, Assistant Clerk, |
| | | and Assistant Treasurer |
| | Robert T. Burns | |
| | Vice President and | Denere P. Poulack |
| | Chief Legal Officer | Assistant Vice President, Assistant |
| | | Clerk, and Assistant Treasurer |
| | James F. Clark | |
| | Vice President and | |
| | Chief Compliance Officer | |
This report is for the information of shareholders of Putnam Convertible Securities Fund. It may also be used as sales literature when preceded or accompanied by the current prospectus, the most recent copy of Putnam’s Quarterly Performance Summary, and Putnam’s Quarterly Ranking Summary. For more recent performance, please visit putnam.com. Investors should carefully consider the investment objectives, risks, charges, and expenses of a fund, which are described in its prospectus. For this and other information or to request a prospectus or summary prospectus, call 1-800-225-1581 toll free. Please read the prospectus carefully before investing. The fund’s Statement of Additional Information contains additional information about the fund’s Trustees and is available without charge upon request by calling 1-800-225-1581.

| |
|
Item 3. Audit Committee Financial Expert: |
| |
|
Item 4. Principal Accountant Fees and Services: |
| |
|
Item 5. Audit Committee of Listed Registrants |
| |
|
Item 6. Schedule of Investments: |
| |
| The registrant's schedule of investments in unaffiliated issuers is included in the report to shareholders in Item 1 above. |
| |
|
Item 7. Disclosure of Proxy Voting Policies and Procedures For Closed-End Management Investment Companies: |
| |
|
Item 8. Portfolio Managers of Closed-End Investment Companies |
| |
|
Item 9. Purchases of Equity Securities by Closed-End Management Investment Companies and Affiliated Purchasers: |
| |
|
Item 10. Submission of Matters to a Vote of Security Holders: |
| |
|
Item 11. Controls and Procedures: |
| |
| (a) The registrant's principal executive officer and principal financial officer have concluded, based on their evaluation of the effectiveness of the design and operation of the registrant's disclosure controls and procedures as of a date within 90 days of the filing date of this report, that the design and operation of such procedures are generally effective to provide reasonable assurance that information required to be disclosed by the registrant in this report is recorded, processed, summarized and reported within the time periods specified in the Commission's rules and forms. |
| |
| (b) Changes in internal control over financial reporting: Not applicable |
| |
| (a)(2) Separate certifications for the principal executive officer and principal financial officer of the registrant as required by Rule 30a-2(a) under the Investment Company Act of 1940, as amended, are filed herewith. |
| |
| (b) The certifications required by Rule 30a-2(b) under the Investment Company Act of 1940, as amended, are filed herewith. |
| |
| Pursuant to the requirements of the Securities Exchange Act of 1934 and the Investment Company Act of 1940, the registrant has duly caused this report to be signed on its behalf by the undersigned, thereunto duly authorized. |
| |
| Putnam Convertible Securities Fund |
| |
| By (Signature and Title): |
| |
| /s/ Janet C. Smith
Janet C. Smith
Principal Accounting Officer
|
| |
| Pursuant to the requirements of the Securities Exchange Act of 1934 and the Investment Company Act of 1940, this report has been signed below by the following persons on behalf of the registrant and in the capacities and on the dates indicated. |
| |
| By (Signature and Title): |
| |
| /s/ Jonathan S. Horwitz
Jonathan S. Horwitz
Principal Executive Officer
|
| |
| By (Signature and Title): |
| |
| /s/ Janet C. Smith
Janet C. Smith
Principal Financial Officer
|