CERTIFIED SHAREHOLDER REPORT OF REGISTERED MANAGEMENT INVESTMENT COMPANIES
Investment Company Act file number:
(811-02280)
Exact name of registrant as specified in charter:
Putnam Convertible Securities Fund
Address of principal executive offices:
One Post Office Square, Boston, Massachusetts 02109
Name and address of agent for service:
Robert T. Burns, Vice President One Post Office Square Boston, Massachusetts 02109
Copy to:
Bryan Chegwidden, Esq. Ropes & Gray LLP 1211 Avenue of the Americas New York, New York 10036
Registrant’s telephone number, including area code:
(617) 292-1000
Date of fiscal year end:
October 31, 2015
Date of reporting period:
November 1, 2014 – April 30, 2015
Item 1. Report to Stockholders:
The following is a copy of the report transmitted to stockholders pursuant to Rule 30e-1 under the Investment Company Act of 1940:
Putnam Convertible Securities Fund
Semiannual report 4 | 30 | 15
Message from the Trustees
1
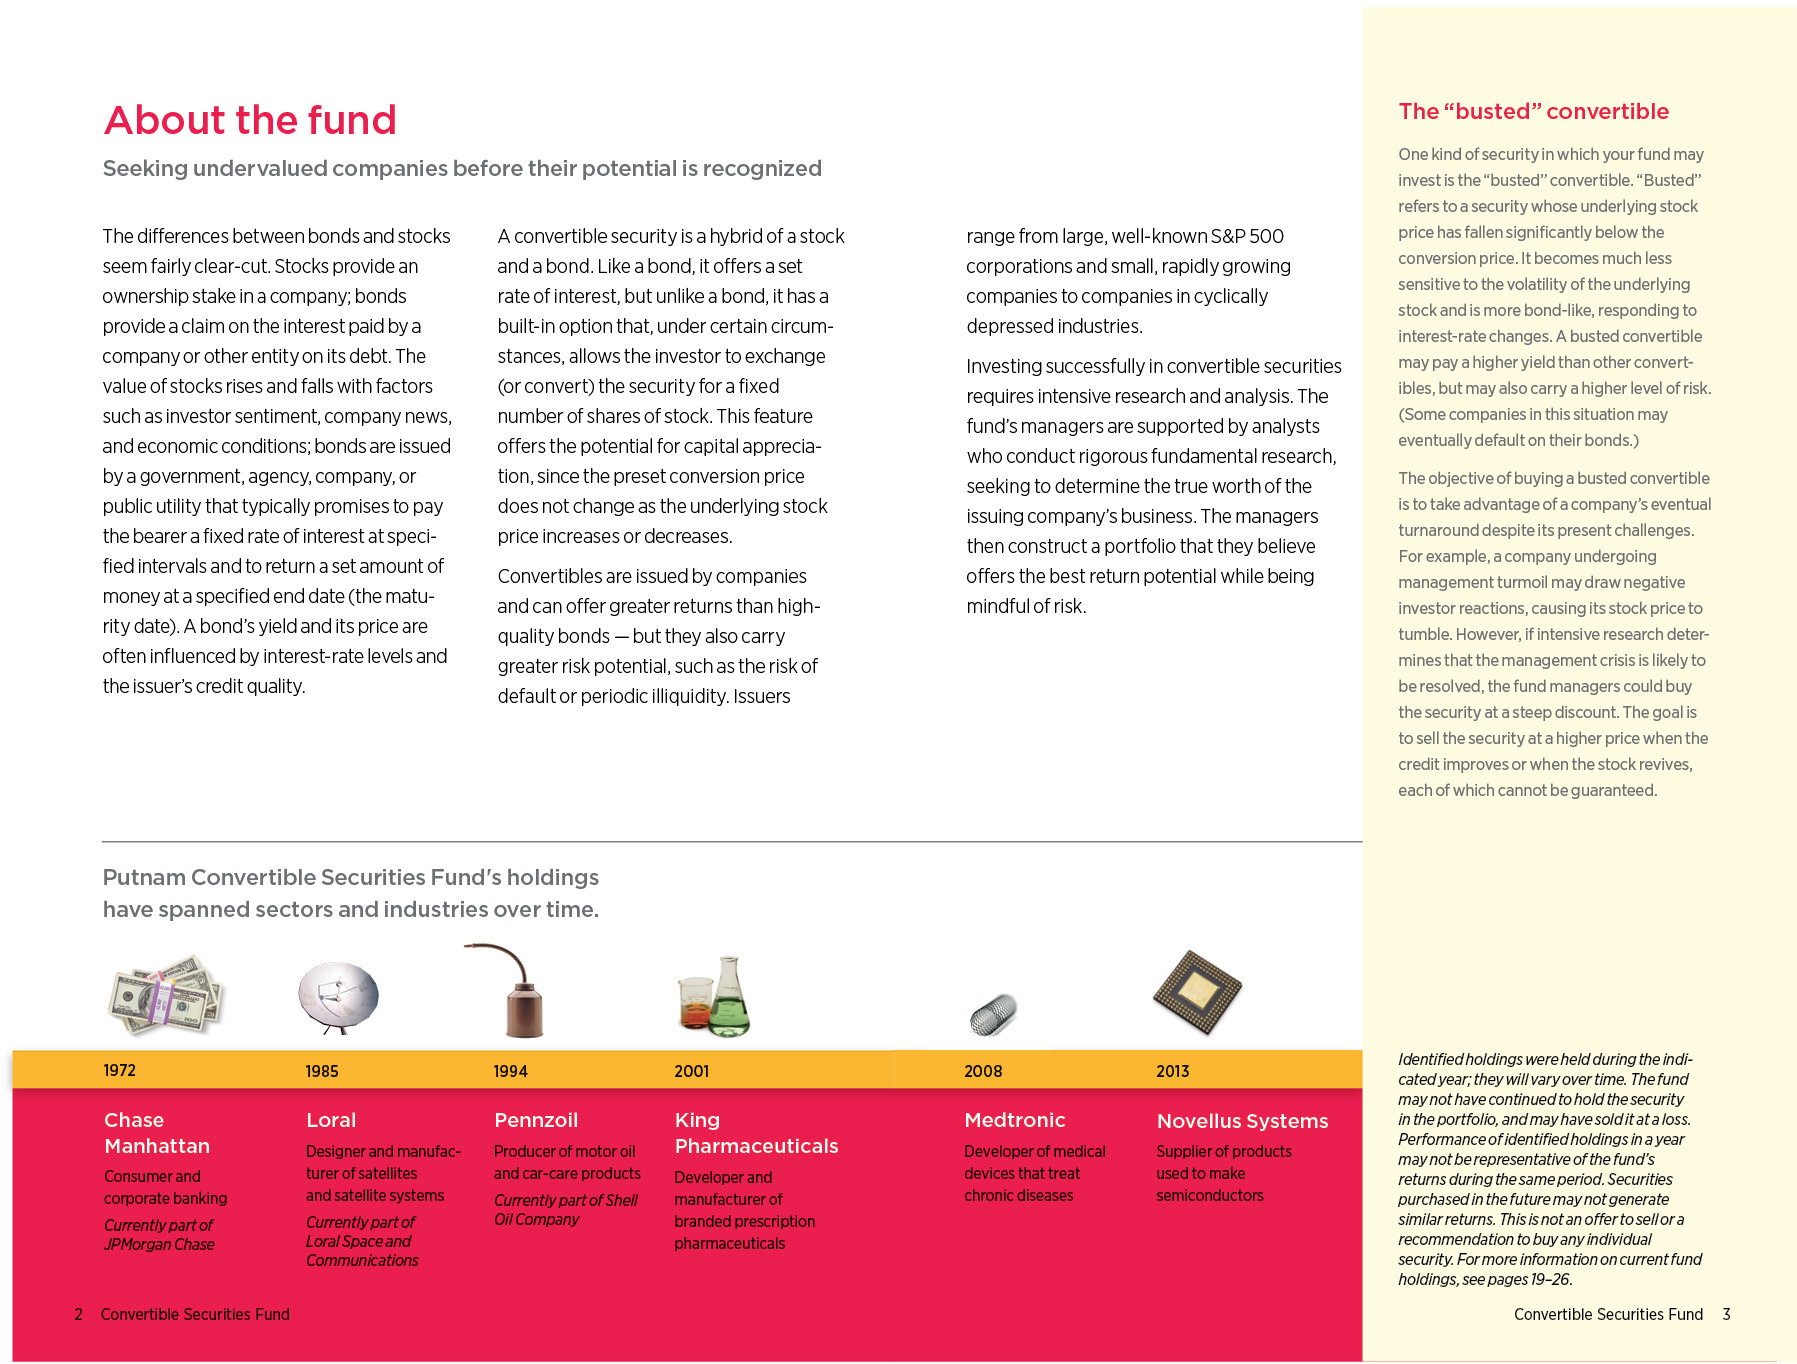
About the fund
2
Performance snapshot
4
Interview with your fund’s portfolio managers
5
Your fund’s performance
11
Your fund’s expenses
14
Terms and definitions
16
Other information for shareholders
17
Financial statements
18
Consider these risks before investing: Convertible securities prices may fall or fail to rise over time for several reasons, including general financial market conditions, factors related to a specific company or industry, changing market perceptions of the risk of default and changes in government intervention in the financial markets. These factors may also lead to increased volatility and reduced liquidity in the markets for convertible securities. These risks are generally greater for convertible securities issued by small and/or midsize companies. Convertible securities prices may be adversely affected by underlying common stock price changes. While convertible securities tend to provide higher yields than common stocks, the higher yield may not protect against the risk of loss or mitigate any loss associated with a convertible security’s price decline. Convertible securities are subject to credit risk, which is the risk that an issuer of the fund’s investments may default on payment of interest or principal. Credit risk is greater for below-investment-grade convertible securities. Convertible securities may be less sensitive to interest-rate changes than non-convertible bonds because of their structural features (e.g., convertibility, “put” features). Interest-rate risk is generally greater, however, for longer-term bonds and convertible securities whose underlying stock price has fallen significantly below the conversion price. You can lose money by investing in the fund.
Message from the Trustees
Dear Fellow Shareholder:
With the midway point of 2015 at hand, we note the sixth anniversary of the beginning of the U.S. economic expansion as dated by the National Bureau of Economic Research, which tracks the ups and downs of U.S. business cycles. It has also been six years since the beginning of the current bull market in U.S. stocks.
Both the expansion and the bull market are longer than average, and both appear to owe their longevity, to some degree, to the extraordinary policy measures undertaken by the Federal Reserve. Recently, however, the Fed has been preparing markets for a shift toward tighter monetary policy. Short-term interest rates could increase for the first time since 2006.
While higher interest rates can be a reflection of solid economic conditions, they can also pose a risk to fixed-income investments, and can have a less direct impact on stocks. International markets, which have performed well in early 2015, would also feel the effects of higher rates in the world’s largest economy. In the following pages, your fund’s portfolio managers provide a market outlook in addition to an update on your fund’s performance.
With the possibility that markets could begin to move in different directions, it might be a prudent time to consult your financial advisor to determine whether any adjustments or additions to your portfolio are warranted.
As the owner of a Putnam fund, you have put your investment in the hands of professional managers who pursue a consistent strategy and have experience in navigating changing market conditions. They, and we, share a deep conviction that an active approach based on fundamental research can play a valuable role in your portfolio.
As always, thank you for investing with Putnam.
Respectfully yours,
Robert L. Reynolds President and Chief Executive Officer Putnam Investments
Jameson A. Baxter Chair, Board of Trustees
June 10, 2015
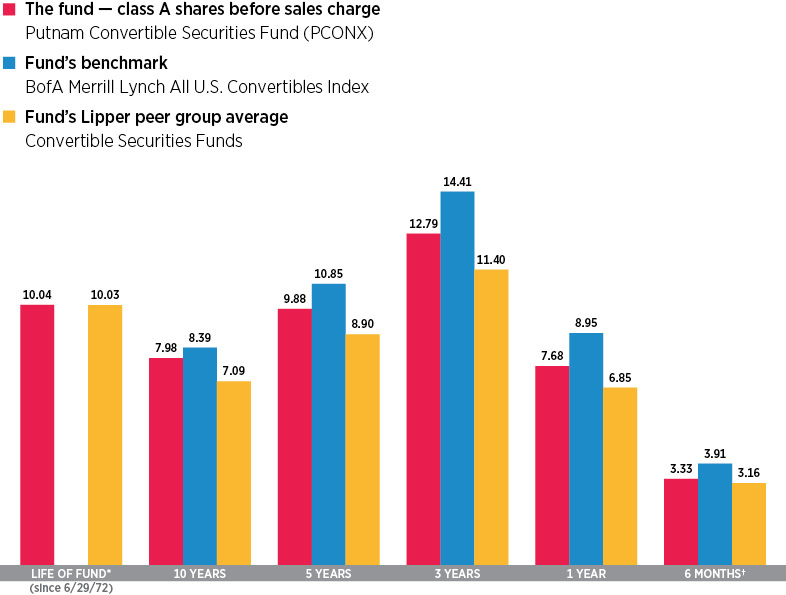
Performance snapshot
Annualized total return (%) comparison as of 4/30/15
Current performance may be lower or higher than the quoted past performance, which cannot guarantee future results. Share price, principal value, and return will fluctuate, and you may have a gain or a loss when you sell your shares. Performance of class A shares assumes reinvestment of distributions and does not account for taxes. Fund returns in the bar chart do not reflect a sales charge of 5.75%; had they, returns would have been lower. See pages 5 and 11–13 for additional performance information. For a portion of the periods, the fund had expense limitations, without which returns would have been lower. To obtain the most recent month-end performance, visit putnam.com.
*The fund’s benchmark, the BofA Merrill Lynch All U.S. Convertibles Index, was introduced on 12/31/87, which post-dates the inception of the fund’s class A shares.
†Returns for the six-month period are not annualized, but cumulative.
4 Convertible Securities Fund
Interview with your fund’s portfolio managers
Eric N. Harthun, CFA
Robert L. Salvin
What was the market environment like for convertible bonds during the six-month reporting period ended April 30, 2015?
Eric: Market conditions made for a bumpy ride, as investors absorbed mixed economic data and geopolitical developments. The timing of the Federal Reserve’s first interest-rate hike since June 2006, pace of global growth, sharp decline in oil prices, strengthening dollar, and instability in the Middle East all contributed to a complex backdrop. With the increased uncertainty, market sentiment shifted often and, at times, sharply — creating swings in the performance of equities and fixed-income securities, as risk preferences changed.
In spite of the marked volatility, stocks [S&P 500 Index] and bonds [Barclays Aggregate Bond Index] closed out the period in positive territory. With their ability to capture much of the upside of rising equity markets and limit losses in declining markets, convertible bonds [BofA Merrill Lynch All U.S. Convertibles Index] outperformed bonds during the period.
Clearly, the hybrid nature of convertible securities was beneficial during the period. Convertible bonds have dual potential because they pay a regular coupon like a bond but can be converted into a preset number of shares of the issuing company’s common stock. This conversion feature, or embedded equity option, provides upside
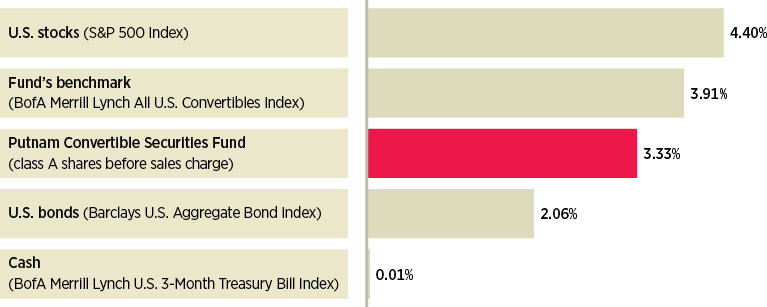
Broad market index and fund performance
This comparison shows your fund’s performance in the context of broad market indexes for the six months ended 4/30/15. See pages 4 and 11–13 for additional fund performance information. Index descriptions can be found on page 17.
Convertible Securities Fund 5
potential while the bond-like characteristics of convertible bonds can provide price support that stocks lack.
How did Putnam Convertible Securities Fund perform for the six months ended April 30, 2015?
Rob: The fund delivered positive performance that surpassed the average return of its Lipper peer group but lagged its benchmark, the BofA Merrill Lynch All U.S. Convertibles Index.
Solid security selection in financials, utilities, and capital goods was beneficial for performance. Our decision to emphasize investments in Fidelity National Financial was especially rewarding during the period. With regard to sector positioning, an underweight exposure relative to the benchmark to capital goods and energy — two sectors that struggled in response to slower global growth — was beneficial. On the other hand, security selection in consumer cyclicals was disappointing, particularly our decision to maintain an underweight position in Fiat Chrysler. The company has reaped the benefits of its 2014 acquisition of Chrysler and its strong growth in U.S. and Canadian markets. In the technology sector, not holding Electronic Arts, underweighting SunEdison, and overweighting Micron Technology were headwinds for fund performance. Finally, not holding JetBlue Airways detracted from benchmark-relative performance, as the airline has benefitted from the sharp drop in fuel prices.
What holdings or strategies aided the fund’s performance relative to the benchmark during the reporting period?
Eric: Security selection among pharmaceutical companies within the health-care sector was rewarding during the period, especially our decision to overweight AMAG Pharmaceuticals and Endo Health Solutions and underweight Cubist Pharmaceuticals.
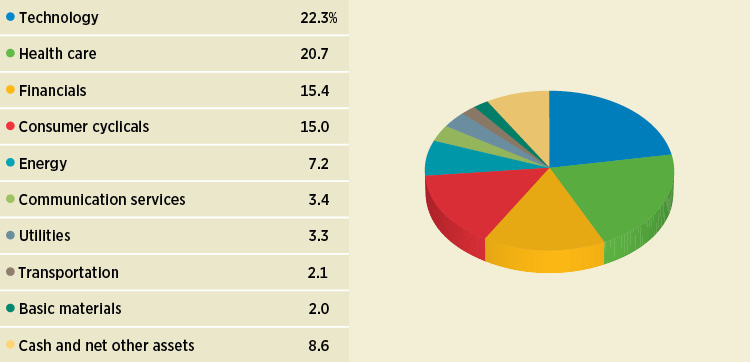
Sector allocations
Allocations are shown as a percentage of the fund’s net assets as of 4/30/15. Cash and net other assets, if any, represent the market value weights of cash, derivatives, short-term securities, and other unclassified assets in the portfolio. Summary information may differ from the portfolio schedule included in the financial statements due to the inclusion of derivative securities, any interest accruals, the exclusion of as-of trades, if any, and the use of different classifications of securities for presentation purposes. Holdings and allocations may vary over time.
6 Convertible Securities Fund
“The hybrid nature of convertible securities was beneficial during the period.”
Eric Harthun
AMAG benefited from strong results in the 2014 fourth quarter and its 2015 guidance that was better than Wall Street expectations. The fund’s investments in Endo Health rallied strongly in response to the company’s announcement of a number of acquisitions that the market viewed favorably. Endo Health and Cubist Pharmaceuticals were sold before period-end.
Given the sharp decline in the price of oil during the period, not investing in energy companies that were held by the benchmark augmented the fund’s relative performance. Two notable examples of this strategy were SandRidge Energy and Peabody Energy.
What holdings or strategies hampered the fund’s performance versus the benchmark during the reporting period?
Rob: Relative performance was held back by our decision to not invest in two top-performing convertible bonds that were in the benchmark. Incyte rallied on news of strong revenues from its drug Jakafi [ruxolitinib]. Jakafi is the first and only drug approved for treatment of myelofibrosis, a potentially life-threatening blood cancer. JetBlue Airways enjoyed strong operating performance in the first quarter of 2015 as a result of the unexpectedly steep decline in fuel prices, which, in turn, led to better-than-expected profit margins.
Our decision to maintain an overweight investment in AK Steel also was a notable detractor. This U.S. producer saw weaker-than-expected steel pricing, which was driven by challenging global economic conditions and cheap imports coming into the U.S.
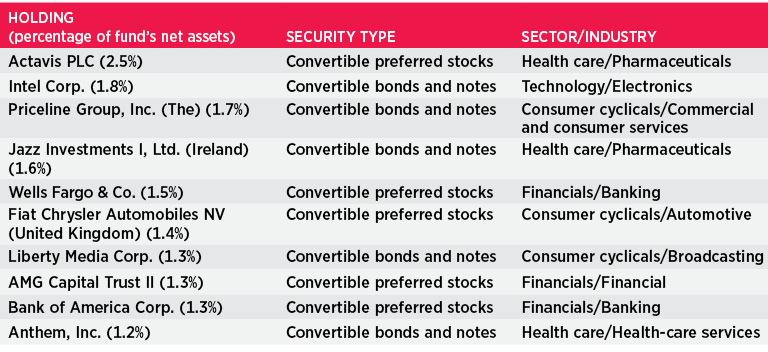
Top 10 holdings
This table shows the fund’s top 10 individual holdings and the percentage of the fund’s net assets that each represented as of 4/30/15. Short-term holdings, TBA commitments, and derivatives, if any, are excluded. Holdings may vary over time.
Convertible Securities Fund 7
market that are being subsidized by their respective governments.
The fund reduced its distribution rate during the reporting period. What led to that decision?
Eric: The fund, which seeks, with equal emphasis, current income and capital appreciation has maintained a stable dividend since March 2009. However, the lower yields on the convertible bonds held in the fund translated into less income earned in the portfolio given the low interest-rate environment. Accordingly, the fund’s quarterly distribution rate per class A shares was reduced from $0.142 to $0.127 in March 2015.
Has the strong pace of issuance that we saw in 2013 and 2014 continued into 2015?
Rob: During the first quarter, convertible bond issuance was robust at more than $15 billion. February was the largest month of new issuance since March 2011, with eight deals coming to market worth more than $9 billion collectively. In addition, many of the deals during the quarter were fueled by merger-and-acquisition [M&A] activity. Several of the issuers included large high-quality companies that were able to finance their M&A activity with attractive terms, in our opinion.
What is your outlook for the convertible bond market for the balance of 2015?
Eric: While we are generally positive about prospects for the convertible bond market, we are tempering our outlook with some caution given macroeconomic uncertainties. One of the biggest questions facing investors is the timing of a Fed interest-rate hike, which we believe is likely to dominate the public discourse and fuel market volatility until the central bank acts, as will the pace of the increases.
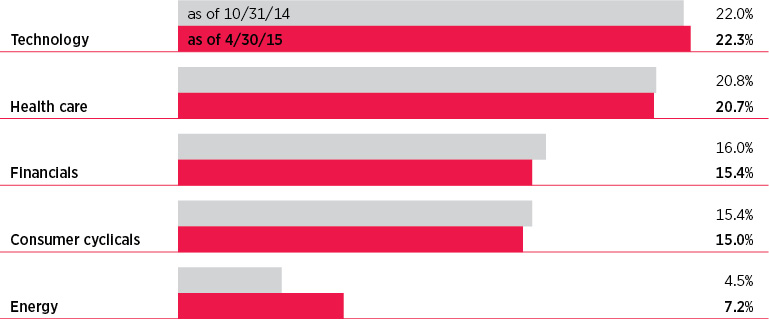
Comparison of top sector weightings
This chart shows how the fund’s top weightings have changed over the past six months. Allocations are shown as a percentage of the fund’s net assets. Current period summary information may differ from the portfolio schedule included in the financial statements due to the inclusion of derivative securities, any interest accruals, the exclusion of as-of trades, if any, and the use of different classifications of securities for presentation purposes. Holdings and allocations may vary over time.
8 Convertible Securities Fund
U.S. economic indicators have been mixed, although the unemployment rate declined to a post-financial-crisis low of 5.4% in April. Complicating the central bank’s effort is the strong U.S. dollar, which is suppressing already-low U.S. inflation while curbing economic growth. The strong dollar tends to hurt the earnings of U.S. companies that do business overseas by making exports of U.S.-produced goods more expensive and reducing the value of profits earned in foreign currencies. Lower oil prices are also creating a disinflationary effect, although they can stimulate consumption as well. Nevertheless, it is widely believed that the Fed will begin tightening interest rates later this year.
A common misperception of the convertibles market is that the returns of these securities are more dependent on interest rates than on other factors. Over time, however, data have suggested that convertibles are driven more by the strength or weakness of the equity markets and by corporate credit spreads. And because they are short-duration instruments, they generally have less interest-rate sensitivity than more traditional fixed-income investments. So we believe the convertible bond market may be a good asset class for investors who want an investment that can perform well in a rising-rate environment.
We think effective security selection will be key to performance in this more mature and delineated market. As such, our strategies will remain focused on limiting the fund’s susceptibility to stock market volatility by investing in convertible bonds with what we believe is an optimal balance of equity upside potential, yield, and low downside potential.
Thank you, gentlemen, for your time and insights today.
The views expressed in this report are exclusively those of Putnam Management and are subject to change. They are not meant as investment advice.
Please note that the holdings discussed in this report may not have been held by the fund for the entire period. Portfolio composition is subject to review in accordance with the fund’s investment strategy and may vary in the future. Current and future portfolio holdings are subject to risk.
Portfolio Manager Eric N. Harthun has an M.B.A. from The University of Chicago Booth School of Business and a B.S. from San Diego State University. He joined Putnam in 2000 and has been in the investment industry since 1994.
Portfolio Manager Robert L. Salvin has an M.B.A. from The University of Chicago Booth School of Business and a B.S. from The Wharton School of the University of Pennsylvania. He joined Putnam in 2000 and has been in the investment industry since 1986.
Convertible Securities Fund 9
IN THE NEWS
There seems to be momentum in the U.S. equities market, which is now in its third-longest bull run since 1928. Inflation, as measured by the Consumer Price Index, was –0.1% before seasonal adjustment for the 12 months ended March 31, 2015, according to the Bureau of Labor Statistics. Low inflation and a resilient U.S. economy generally provide a supportive environment for equities. However, investors appear to be more cautious than celebratory. Uncertainties include the timing of the Federal Reserve’s decision to implement the first hike in short-term interest rates since 2006 and whether the strong dollar could continue to worsen the trade balance, which could in turn reduce gross domestic product. In March, exports grew by less than 1%, according to the Bureau of Economic Analysis, compared with a 7.7% jump in imports in the same month. For now, the S&P 500 Index continues to hover around the 2100 mark. Investors should keep in mind that equities tend to perform well when short-term rates are rising from low levels. The reason is, in part, because rising rates typically signal an improving economy.
10 Convertible Securities Fund
Your fund’s performance
This section shows your fund’s performance, price, and distribution information for periods ended April 30, 2015, the end of the first half of its current fiscal year. In accordance with regulatory requirements for mutual funds, we also include performance information as of the most recent calendar quarter-end and expense information taken from the fund’s current prospectus. Performance should always be considered in light of a fund’s investment strategy. Data represent past performance. Past performance does not guarantee future results. More recent returns may be less or more than those shown. Investment return and principal value will fluctuate, and you may have a gain or a loss when you sell your shares. Performance information does not reflect any deduction for taxes a shareholder may owe on fund distributions or on the redemption of fund shares. For the most recent month-end performance, please visit the Individual Investors section at putnam.com or call Putnam at 1-800-225-1581. Class I, R, and Y shares are not available to all investors. See the Terms and Definitions section in this report for definitions of the share classes offered by your fund.
Fund performance Total return for periods ended 4/30/15
Class A
Class B
Class C
Class I
Class M
Class R
Class Y
(inception dates)
(6/29/72)
(7/15/93)
(7/26/99)
(3/3/15)
(3/13/95)
(12/1/03)
(12/30/98)
Before sales charge
After sales charge
Before CDSC
After CDSC
Before CDSC
After CDSC
Net asset value
Before sales charge
After sales charge
Net asset value
Net asset value
Annual average
(life of fund)
10.04%
9.89%
9.83%
9.83%
9.21%
9.21%
10.15%
9.37%
9.28%
9.76%
10.14%
10 years
115.49
103.10
102.99
102.99
99.88
99.88
121.12
104.95
97.78
110.21
121.05
Annual average
7.98
7.34
7.34
7.34
7.17
7.17
8.26
7.44
7.06
7.71
8.26
5 years
60.20
50.99
54.27
52.27
54.35
54.35
62.29
56.26
50.79
58.25
62.24
Annual average
9.88
8.59
9.06
8.77
9.07
9.07
10.17
9.34
8.56
9.61
10.16
3 years
43.51
35.25
40.37
37.37
40.36
40.36
44.70
41.44
36.49
42.48
44.65
Annual average
12.79
10.59
11.97
11.16
11.96
11.96
13.11
12.25
10.93
12.52
13.09
1 year
7.68
1.49
6.85
1.85
6.86
5.86
7.99
7.15
3.40
7.41
7.95
6 months
3.33
–2.61
2.97
–1.93
2.99
2.01
3.54
3.11
–0.50
3.22
3.50
Current performance may be lower or higher than the quoted past performance, which cannot guarantee future results. After-sales-charge returns for class A and M shares reflect the deduction of the maximum 5.75% and 3.50% sales charge, respectively, levied at the time of purchase. Class B share returns after contingent deferred sales charge (CDSC) reflect the applicable CDSC, which is 5% in the first year, declining over time to 1% in the sixth year, and is eliminated thereafter. Class C share returns after CDSC reflect a 1% CDSC for the first year that is eliminated thereafter. Class I, R, and Y shares have no initial sales charge or CDSC. Performance for class B, C, M, R, and Y shares before their inception is derived from the historical performance of class A shares, adjusted for the applicable sales charge (or CDSC) and the higher operating expenses for such shares, except for class Y shares, for which 12b-1 fees are not applicable. Performance for class I shares prior to their inception is derived from the historical performance of class Y shares and has not been adjusted for the lower investor servicing fees applicable to class I shares; had it, returns would have been higher.
For a portion of the periods, the fund had expense limitations, without which returns would have been lower.
Class B share performance reflects conversion to class A shares after eight years.
Convertible Securities Fund 11
Comparative index returns For periods ended 4/30/15
Index and Lipper results should be compared with fund performance before sales charge, before CDSC, or at net asset value.
*Over the 6-month, 1-year, 3-year, 5-year, 10-year, and life-of-fund periods ended 4/30/15, there were 78, 77, 73, 60, 37, and 1 fund(s), respectively, in this Lipper category.
†The fund’s benchmark, the BofA Merrill Lynch All U.S. Convertibles Index, was introduced on 12/31/87, which post-dates the inception of the fund’s class A shares.
Fund performance as of most recent calendar quarter Total return for periods ended 3/31/15
Class A
Class B
Class C
Class I
Class M
Class R
Class Y
(inception dates)
(6/29/72)
(7/15/93)
(7/26/99)
(3/3/15)
(3/13/95)
(12/1/03)
(12/30/98)
Before sales charge
After sales charge
Before CDSC
After CDSC
Before CDSC
After CDSC
Net asset value
Before sales charge
After sales charge
Net asset value
Net asset value
Annual average
(life of fund)
10.04%
9.89%
9.84%
9.84%
9.22%
9.22%
10.15%
9.38%
9.29%
9.77%
10.15%
10 years
106.50
94.62
94.54
94.54
91.56
91.56
111.85
96.53
89.65
101.42
111.86
Annual average
7.52
6.89
6.88
6.88
6.72
6.72
7.80
6.99
6.61
7.25
7.80
5 years
62.77
53.41
56.82
54.82
56.74
56.74
64.85
58.76
53.20
60.79
64.86
Annual average
10.23
8.94
9.42
9.14
9.40
9.40
10.51
9.69
8.91
9.96
10.52
3 years
40.13
32.07
37.05
34.05
37.01
37.01
41.18
38.07
33.24
39.11
41.19
Annual average
11.90
9.72
11.08
10.26
11.07
11.07
12.18
11.35
10.04
11.63
12.18
1 year
6.65
0.52
5.86
0.86
5.83
4.83
6.91
6.11
2.40
6.38
6.92
6 months
3.89
–2.08
3.50
–1.43
3.52
2.53
4.02
3.64
0.01
3.78
4.02
See the discussion following the fund performance table on page 11 for information about the calculation of fund performance.
12 Convertible Securities Fund
Fund price and distribution information For the six-month period ended 4/30/15
Distributions
Class A
Class B
Class C
Class I
Class M
Class R
Class Y
Number
2
2
2
1
2
2
2
Income
$0.269
$0.177
$0.178
$0.131
$0.208
$0.239
$0.300
Capital gains
Long-term gains
1.035
1.035
1.035
—
1.035
1.035
1.035
Short-term gains
—
—
—
—
—
—
—
Total
$1.304
$1.212
$1.213
$0.131
$1.243
$1.274
$1.335
Share value
Before sales charge
After sales charge
Net asset value
Net asset value
Net asset value
Before sales charge
After sales charge
Net asset value
Net asset value
10/31/14
$25.60
$27.16
$25.13
$25.32
—
$25.35
$26.27
$25.50
$25.59
3/3/15*
—
—
—
—
$25.33
—
—
—
—
4/30/15
25.12
26.65
24.64
24.84
25.14
24.87
25.77
25.02
25.12
Current rate (end of period)
Before sales charge
After sales charge
Net asset value
Net asset value
Net asset value
Before sales charge
After sales charge
Net asset value
Net asset value
Current dividend rate1
2.02%
1.91%
1.31%
1.32%
2.08%
1.56%
1.51%
1.81%
2.26%
Current 30-day SEC yield2
N/A
0.96
0.27
0.27
1.27
N/A
0.50
0.76
1.27
The classification of distributions, if any, is an estimate. Before-sales-charge share value and current dividend rate for class A and M shares, if applicable, do not take into account any sales charge levied at the time of purchase. After-sales-charge share value, current dividend rate, and current 30-day SEC yield, if applicable, are calculated assuming that the maximum sales charge (5.75% for class A shares and 3.50% for class M shares) was levied at the time of purchase. Final distribution information will appear on your year-end tax forms.
1Most recent distribution, including any return of capital and excluding capital gains, annualized and divided by NAV or market price at end of period.
2Based only on investment income and calculated using the maximum offering price for each share class, in accordance with SEC guidelines.
*Inception date of class I shares.
Convertible Securities Fund 13
Your fund’s expenses
As a mutual fund investor, you pay ongoing expenses, such as management fees, distribution fees (12b-1 fees), and other expenses. Using the following information, you can estimate how these expenses affect your investment and compare them with the expenses of other funds. You may also pay one-time transaction expenses, including sales charges (loads) and redemption fees, which are not shown in this section and would have resulted in higher total expenses. For more information, see your fund’s prospectus or talk to your financial representative.
Expense ratios
Class A
Class B
Class C
Class I
Class M
Class R
Class Y
Total annual operating expenses for the fiscal year ended 10/31/14
1.06%
1.81%
1.81%
0.68%*
1.56%
1.31%
0.81%
Annualized expense ratio for the six-month period ended 4/30/15†
1.05%
1.80%
1.80%
0.67%
1.55%
1.30%
0.80%
Fiscal-year expense information in this table is taken from the most recent prospectus, is subject to change, and may differ from that shown for the annualized expense ratio and in the financial highlights of this report.
Expenses are shown as a percentage of average net assets.
*Expenses for class I shares are based on the other expenses of class A shares for the fund’s last fiscal year, adjusted to reflect the lower investor servicing fees applicable to class I shares.
†For the fund’s most recent fiscal half year or, in the case of class I shares, for the period from 3/3/15 (commencement of operations) to 4/30/15.
Expenses per $1,000
The following table shows the expenses you would have paid on a $1,000 investment in the fund from November 1, 2014, (or, in the case of class I shares, from March 3, 2015 (commencement of operations)), to April 30, 2015. It also shows how much a $1,000 investment would be worth at the close of the period, assuming actual returns and expenses.
Class A
Class B
Class C
Class I
Class M
Class R
Class Y
Expenses paid per $1,000*†
$5.29
$9.06
$9.06
$1.08‡
$7.81
$6.55
$4.04
Ending value (after expenses)
$1,033.30
$1,029.70
$1,029.90
$997.70
$1,031.10
$1,032.20
$1,035.00
*Expenses for each share class are calculated using the fund’s annualized expense ratio for each class, which represents the ongoing expenses as a percentage of average net assets for the six months ended 4/30/15 (or, in the case of class I shares, the period from 3/3/15 (commencement of operations) to 4/30/15). The expense ratio may differ for each share class.
†Expenses are calculated by multiplying the expense ratio by the average account value for the period; then multiplying the result by the number of days in the period; and then dividing that result by the number of days in the year.
‡Had expenses for class I shares been shown for the entire period from 3/3/15 to 4/30/15, they would have been higher.
14 Convertible Securities Fund
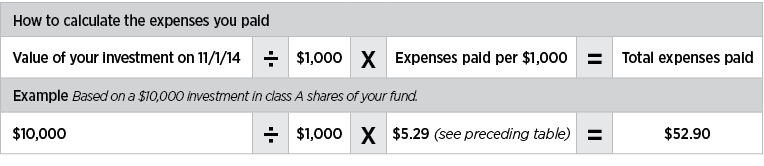
Estimate the expenses you paid
To estimate the ongoing expenses you paid for the six months ended April 30, 2015, use the following calculation method. To find the value of your investment on November 1, 2014, call Putnam at 1-800-225-1581.
Compare expenses using the SEC’s method
The Securities and Exchange Commission (SEC) has established guidelines to help investors assess fund expenses. Per these guidelines, the following table shows your fund’s expenses based on a $1,000 investment, assuming a hypothetical 5% annualized return. You can use this information to compare the ongoing expenses (but not transaction expenses or total costs) of investing in the fund with those of other funds. All mutual fund shareholder reports will provide this information to help you make this comparison. Please note that you cannot use this information to estimate your actual ending account balance and expenses paid during the period.
Class A
Class B
Class C
Class I
Class M
Class R
Class Y
Expenses paid per $1,000*†
$5.26
$9.00
$9.00
$3.36
$7.75
$6.51
$4.01
Ending value (after expenses)
$1,019.59
$1,015.87
$1,015.87
$1,021.47
$1,017.11
$1,018.35
$1,020.83
*Expenses for each share class are calculated using the fund’s annualized expense ratio for each class, which represents the ongoing expenses as a percentage of average net assets for the six months ended 4/30/15 (or, in the case of class I shares, the period from 3/3/15 (commencement of operations) to 4/30/15). The expense ratio may differ for each share class.
†Expenses are calculated by multiplying the expense ratio by the average account value for the six-month period; then multiplying the result by the number of days in the six-month period; and then dividing that result by the number of days in the year.
Convertible Securities Fund 15
Terms and definitions
Important terms
Total return shows how the value of the fund’s shares changed over time, assuming you held the shares through the entire period and reinvested all distributions in the fund.
Before sales charge, or net asset value, is the price, or value, of one share of a mutual fund, without a sales charge. Before-sales-charge figures fluctuate with market conditions, and are calculated by dividing the net assets of each class of shares by the number of outstanding shares in the class.
After sales charge is the price of a mutual fund share plus the maximum sales charge levied at the time of purchase. After-sales-charge performance figures shown here assume the 5.75% maximum sales charge for class A shares and 3.50% for class M shares.
Contingent deferred sales charge (CDSC) is generally a charge applied at the time of the redemption of class B or C shares and assumes redemption at the end of the period. Your fund’s class B CDSC declines over time from a 5% maximum during the first year to 1% during the sixth year. After the sixth year, the CDSC no longer applies. The CDSC for class C shares is 1% for one year after purchase.
Share classes
Class A shares are generally subject to an initial sales charge and no CDSC (except on certain redemptions of shares bought without an initial sales charge).
Class B shares are not subject to an initial sales charge and may be subject to a CDSC.
Class C shares are not subject to an initial sales charge and are subject to a CDSC only if the shares are redeemed during the first year.
Class I shares are not subject to an initial sales charge or CDSC, and carry no 12b-1 fee. They are only available to institutional clients and other investors who meet minimum investment requirements.
Class M shares have a lower initial sales charge and a higher 12b-1 fee than class A shares and no CDSC (except on certain redemptions of shares bought without an initial sales charge).
Class R shares are not subject to an initial sales charge or CDSC and are available only to employer-sponsored retirement plans.
Class Y shares are not subject to an initial sales charge or CDSC and carry no 12b-1 fee. They are generally only available to corporate and institutional clients and clients in other approved programs.
Fixed-income terms
Current rate is the annual rate of return earned from dividends or interest of an investment. Current yield is expressed as a percentage of the price of a security, fund share, or principal investment.
Mortgage-backed security (MBS), also known as a mortgage “pass-through,” is a type of asset-backed security that is secured by a mortgage or collection of mortgages. The following are types of MBSs:
• Agency “pass-through” has its principal and interest backed by a U.S. government agency, such as the Federal National Mortgage Association (Fannie Mae), Government National Mortgage Association (Ginnie Mae), and Federal Home Loan Mortgage Corporation (Freddie Mac).
• Collateralized mortgage obligation (CMO) represents claims to specific cash flows from pools of home mortgages. The streams of principal and interest payments on the mortgages are distributed to the different classes of CMO interests in “tranches.” Each tranche may have different principal balances, coupon rates, prepayment risks, and maturity dates. A CMO is highly sensitive to changes in interest rates and any resulting change in the rate at which homeowners sell their properties, refinance, or otherwise prepay loans. CMOs are subject to prepayment, market, and liquidity risks.
• Interest-only (IO) security is a type of CMO in which the underlying asset is the interest portion of mortgage, Treasury, or bond payments.
• Non-agency residential mortgage-backed security (RMBS) is an MBS not backed by Fannie Mae, Ginnie Mae, or Freddie Mac. One type of RMBS is an Alt-A mortgage-backed security.
• Commercial mortgage-backed security (CMBS) is secured by the loan on a commercial property.
16 Convertible Securities Fund
Yield curve is a graph that plots the yields of bonds with equal credit quality against their differing maturity dates, ranging from shortest to longest. It is used as a benchmark for other debt, such as mortgage or bank lending rates.
Comparative indexes
Barclays U.S. Aggregate Bond Index is an unmanaged index of U.S. investment-grade fixed-income securities.
BofA Merrill Lynch U.S. 3-Month Treasury Bill Index is an unmanaged index that seeks to measure the performance of U.S. Treasury bills available in the marketplace.
BofA Merrill Lynch All U.S. Convertibles Index is an unmanaged index of high-yield U.S. convertible securities.
S&P 500 Index is an unmanaged index of common stock performance.
Indexes assume reinvestment of all distributions and do not account for fees. Securities and performance of a fund and an index will differ. You cannot invest directly in an index.
Lipper is a third-party industry-ranking entity that ranks mutual funds. Its rankings do not reflect sales charges. Lipper rankings are based on total return at net asset value relative to other funds that have similar current investment styles or objectives as determined by Lipper. Lipper may change a fund’s category assignment at its discretion. Lipper category averages reflect performance trends for funds within a category.
Other information for shareholders
Important notice regarding delivery of shareholder documents
In accordance with Securities and Exchange Commission (SEC) regulations, Putnam sends a single copy of annual and semiannual shareholder reports, prospectuses, and proxy statements to Putnam shareholders who share the same address, unless a shareholder requests otherwise. If you prefer to receive your own copy of these documents, please call Putnam at 1-800-225-1581, and Putnam will begin sending individual copies within 30 days.
Proxy voting
Putnam is committed to managing our mutual funds in the best interests of our shareholders. The Putnam funds’ proxy voting guidelines and procedures, as well as information regarding how your fund voted proxies relating to portfolio securities during the 12-month period ended June 30, 2014, are available in the Individual Investors section of putnam.com, and on the SEC’s website, www.sec.gov. If you have questions about finding forms on the SEC’s website, you may call the SEC at 1-800-SEC-0330. You may also obtain the Putnam funds’ proxy voting guidelines and procedures at no charge by calling Putnam’s Shareholder Services at 1-800-225-1581.
Fund portfolio holdings
The fund will file a complete schedule of its portfolio holdings with the SEC for the first and third quarters of each fiscal year on Form N-Q. Shareholders may obtain the fund’s Form N-Q on the SEC’s website at www.sec.gov. In addition, the fund’s Form N-Q may be reviewed and copied at the SEC’s Public Reference Room in Washington, D.C. You may call the SEC at 1-800-SEC-0330 for information about the SEC’s website or the operation of the Public Reference Room.
Trustee and employee fund ownership
Putnam employees and members of the Board of Trustees place their faith, confidence, and, most importantly, investment dollars in Putnam mutual funds. As of April 30, 2015, Putnam employees had approximately $498,000,000 and the Trustees had approximately $142,000,000 invested in Putnam mutual funds. These amounts include investments by the Trustees’ and employees’ immediate family members as well as investments through retirement and deferred compensation plans.
Convertible Securities Fund 17
Financial statements
A guide to financial statements
These sections of the report, as well as the accompanying Notes, constitute the fund’s financial statements.
The fund’s portfolio lists all the fund’s investments and their values as of the last day of the reporting period. Holdings are organized by asset type and industry sector, country, or state to show areas of concentration and diversification.
Statement of assets and liabilities shows how the fund’s net assets and share price are determined. All investment and non-investment assets are added together. Any unpaid expenses and other liabilities are subtracted from this total. The result is divided by the number of shares to determine the net asset value per share, which is calculated separately for each class of shares. (For funds with preferred shares, the amount subtracted from total assets includes the liquidation preference of preferred shares.)
Statement of operations shows the fund’s net investment gain or loss. This is done by first adding up all the fund’s earnings — from dividends and interest income — and subtracting its operating expenses to determine net investment income (or loss). Then, any net gain or loss the fund realized on the sales of its holdings — as well as any unrealized gains or losses over the period — is added to or subtracted from the net investment result to determine the fund’s net gain or loss for the fiscal period.
Statement of changes in net assets shows how the fund’s net assets were affected by the fund’s net investment gain or loss, by distributions to shareholders, and by changes in the number of the fund’s shares. It lists distributions and their sources (net investment income or realized capital gains) over the current reporting period and the most recent fiscal year-end. The distributions listed here may not match the sources listed in the Statement of operations because the distributions are determined on a tax basis and may be paid in a different period from the one in which they were earned. Dividend sources are estimated at the time of declaration. Actual results may vary. Any non-taxable return of capital cannot be determined until final tax calculations are completed after the end of the fund’s fiscal year.
Financial highlights provide an overview of the fund’s investment results, per-share distributions, expense ratios, net investment income ratios, and portfolio turnover in one summary table, reflecting the five most recent reporting periods. In a semiannual report, the highlights table also includes the current reporting period.
18 Convertible Securities Fund
The fund’s portfolio 4/30/15 (Unaudited)
CONVERTIBLE BONDS AND NOTES (68.7%)*
Principal amount
Value
Airlines (—%)
Lufthansa Malta Blues LP 144A cv. sr. unsec. notes 0 3/4s, 2017 (Malta)
Total convertible bonds and notes (cost $599,462,464)
$670,581,745
CONVERTIBLE PREFERRED STOCKS (23.2%)*
Shares
Value
Aerospace and defense (0.9%)
United Technologies Corp. $3.75 cv. pfd.
152,110
$8,944,068
8,944,068
Automotive (1.3%)
Fiat Chrysler Automobiles NV Ser. FCAU, $7.875 cv. pfd. (United Kingdom) †
104,488
13,326,400
13,326,400
Banking (2.7%)
Bank of America Corp. Ser. L, 7.25% cv. pfd.
10,850
12,504,625
Wells Fargo & Co. Ser. L, 7.50% cv. pfd.
11,615
14,155,781
26,660,406
Consumer (0.7%)
Stanley Black & Decker, Inc. $6.25 cv. pfd.
59,780
6,881,874
6,881,874
Electric utilities (2.7%)
Dominion Resources, Inc./VA $3.188 cv. pfd.
128,368
6,373,471
Exelon Corp. $3.25 cv. pfd.
206,183
10,131,833
NextEra Energy, Inc. $2.90 cv. pfd.
186,380
10,498,785
27,004,089
Financial (1.3%)
AMG Capital Trust II $2.575 cv. pfd.
207,160
12,701,498
12,701,498
Food (0.8%)
Tyson Foods, Inc. $2.375 cv. pfd.
151,173
7,412,012
7,412,012
Forest products and packaging (0.6%)
Weyerhaeuser Co. Ser. A, $3.188 cv. pfd. R
105,184
5,640,492
5,640,492
Insurance (0.6%)
Maiden Holdings, Ltd. Ser. B, $3.625 cv. pfd. (Bermuda)
105,197
5,454,464
5,454,464
Medical technology (0.7%)
Alere, Inc. Ser. B, 3.00% cv. pfd.
18,445
6,509,932
6,509,932
Metals (0.5%)
Alcoa, Inc. Ser. 1, $2.688 cv. pfd.
97,307
4,430,504
4,430,504
Oil and gas (2.6%)
Chesapeake Energy Corp. 144A 5.75% cum. cv. pfd.
6,980
6,142,400
Chesapeake Energy Corp. 144A 5.75% cv. pfd.
12,478
10,738,879
Halcon Resources Corp. Ser. A, 5.75% cv. pfd.
3,717
1,080,485
Southwestern Energy Co. Ser. B, $3.125 cv. pfd.
130,073
7,715,930
25,677,694
Pharmaceuticals (2.5%)
Actavis PLC Ser. A, 5.50% cv. pfd. †
24,375
24,391,088
24,391,088
Convertible Securities Fund 23
CONVERTIBLE PREFERRED STOCKS (23.2%)* cont.
Shares
Value
Power producers (0.6%)
Dynegy, Inc. Ser. A, $5.375 cv. pfd.
49,979
$5,673,116
5,673,116
Railroads (0.5%)
Genesee & Wyoming, Inc. $5.00 cv. pfd.
41,023
4,826,356
4,826,356
Real estate (1.0%)
Alexandria Real Estate Equities, Inc. Ser. D, $1.75 cv. pfd. R
341,727
9,872,688
9,872,688
Telecommunications (3.2%)
American Tower Corp. $5.50 cv. pfd. † R
97,655
9,905,879
Crown Castle International Corp. Ser. A, $4.50 cv. pfd. R
78,952
8,266,274
Iridium Communications, Inc. Ser. B, 6.75% cv. pfd.
5,147
1,904,390
Iridium Communications, Inc. 144A $7.00 cv. pfd.
25,621
3,026,481
T-Mobile US, Inc. Ser. A, $2.75 cv. pfd.
133,341
8,313,811
31,416,835
Total convertible preferred stocks (cost $217,043,034)
$226,823,516
COMMON STOCKS (2.8%)*
Shares
Value
Brazil Ethanol, Inc. 144A (Unit) F
312,500
$31
Delta Air Lines, Inc.
31,015
1,384,510
DISH Network Corp. Class A †
33,560
2,270,670
Exxon Mobil Corp.
36,305
3,171,968
Jazz Pharmaceuticals PLC †
13,635
2,436,575
Micron Technology, Inc. †
81,735
2,299,206
Priceline Group, Inc. (The) †
2,125
2,630,346
PulteGroup, Inc.
117,095
2,259,934
Salesforce.com, Inc. †
74,335
5,413,075
Spirit Airlines, Inc. †
13,640
933,931
Teva Pharmaceutical Industries, Ltd. ADR (Israel)
80,340
4,854,143
Total common stocks (cost $28,211,134)
$27,654,389
WARRANTS (—%)* †
Expiration date
Strike price
Warrants
Value
Tower Semiconductor, Ltd. 144A (Israel) F
6/30/15
$1.70
1,085,630
$—
Total warrants (cost $217,126)
$—
SHORT-TERM INVESTMENTS (5.2%)*
Shares
Value
Putnam Short Term Investment Fund 0.07% L
51,236,681
$51,236,681
Total short-term investments (cost $51,236,681)
$51,236,681
TOTAL INVESTMENTS
Total investments (cost $896,170,439)
$976,296,331
Key to holding’s currency abbreviations
EUR
Euro
USD/$
United States Dollar
24 Convertible Securities Fund
Key to holding’s abbreviations
ADR
American Depository Receipts: represents ownership of foreign securities on deposit with a custodian bank
FRN
Floating Rate Notes: the rate shown is the current interest rate or yield at the close of the reporting period
Notes to the fund’s portfolio
Unless noted otherwise, the notes to the fund’s portfolio are for the close of the fund’s reporting period, which ran from November 1, 2014 through April 30, 2015 (the reporting period). Within the following notes to the portfolio, references to “ASC 820” represent Accounting Standards Codification 820 Fair Value Measurements and Disclosures and references to “OTC”, if any, represent over-the-counter.
*
Percentages indicated are based on net assets of $976,190,348.
†
This security is non-income-producing.
††
The interest rate and date shown parenthetically represent the new interest rate to be paid and the date the fund will begin accruing interest at this rate.
F
This security is valued at fair value following procedures approved by the Trustees. Securities may be classified as Level 2 or Level 3 for ASC 820 based on the securities’ valuation inputs (Note 1).
L
Affiliated company (Note 5). The rate quoted in the security description is the annualized 7-day yield of the fund at the close of the reporting period.
R
Real Estate Investment Trust.
Debt obligations are considered secured unless otherwise indicated.
144A after the name of an issuer represents securities exempt from registration under Rule 144A under the Securities Act of 1933, as amended. These securities may be resold in transactions exempt from registration, normally to qualified institutional buyers.
The dates shown on debt obligations are the original maturity dates.
Convertible Securities Fund 25
ASC 820 establishes a three-level hierarchy for disclosure of fair value measurements. The valuation hierarchy is based upon the transparency of inputs to the valuation of the fund’s investments. The three levels are defined as follows:
Level 1: Valuations based on quoted prices for identical securities in active markets.
Level 2: Valuations based on quoted prices in markets that are not active or for which all significant inputs are observable, either directly or indirectly.
Level 3: Valuations based on inputs that are unobservable and significant to the fair value measurement.
The following is a summary of the inputs used to value the fund’s net assets as of the close of the reporting period:
Valuation inputs
Investments in securities:
Level 1
Level 2
Level 3
Common stocks*:
Communication services
$2,270,670
$—
$—
Consumer cyclicals
4,890,280
—
—
Energy
3,171,968
—
31
Health care
7,290,718
—
—
Technology
7,712,281
—
—
Transportation
2,318,441
—
—
Total common stocks
27,654,358
—
31
Convertible bonds and notes
—
670,076,113
505,632
Convertible preferred stocks
46,563,229
180,260,287
—
Warrants
—
—
—
Short-term investments
51,236,681
—
—
Totals by level
$125,454,268
$850,336,400
$505,663
* Common stock classifications are presented at the sector level, which may differ from the fund’s portfolio presentation.
Transfers between level 1 and level 2 during the reporting period, totaling $10,498,785, are the result of changing to a pricing service as the source for the securities prices.
At the start and close of the reporting period, Level 3 investments in securities represented less than 1% of the fund’s net assets and were not considered a significant portion of the fund’s portfolio.
The accompanying notes are an integral part of these financial statements.
26 Convertible Securities Fund
Statement of assets and liabilities 4/30/15 (Unaudited)
Affiliated issuers (identified cost $51,236,681) (Notes 1 and 5)
51,236,681
Dividends, interest and other receivables
4,192,233
Receivable for shares of the fund sold
1,304,055
Receivable for investments sold
10,659,017
Prepaid assets
43,375
Total assets
992,495,011
LIABILITIES
Payable for investments purchased
12,979,098
Payable for shares of the fund repurchased
2,059,140
Payable for compensation of Manager (Note 2)
499,684
Payable for custodian fees (Note 2)
7,411
Payable for investor servicing fees (Note 2)
228,852
Payable for Trustee compensation and expenses (Note 2)
226,183
Payable for administrative services (Note 2)
2,939
Payable for distribution fees (Note 2)
200,826
Other accrued expenses
100,530
Total liabilities
16,304,663
Net assets
$976,190,348
REPRESENTED BY
Paid-in capital (Unlimited shares authorized) (Notes 1 and 4)
$859,390,677
Undistributed net investment income (Note 1)
4,211,532
Accumulated net realized gain on investments and foreign currency transactions (Note 1)
32,462,247
Net unrealized appreciation of investments and assets and liabilities in foreign currencies
80,125,892
Total — Representing net assets applicable to capital shares outstanding
$976,190,348
(Continued on next page)
The accompanying notes are an integral part of these financial statements.
Convertible Securities Fund 27
Statement of assets and liabilities (Continued)
COMPUTATION OF NET ASSET VALUE AND OFFERING PRICE
Net asset value and redemption price per class A share ($577,419,339 divided by 22,984,436 shares)
$25.12
Offering price per class A share (100/94.25 of $25.12)*
$26.65
Net asset value and offering price per class B share ($13,099,215 divided by 531,549 shares)**
$24.64
Net asset value and offering price per class C share ($77,559,700 divided by 3,122,526 shares)**
$24.84
Net asset value and offering price per class I share ($9,976 divided by 397 shares)†
$25.14
Net asset value and redemption price per class M share ($4,757,171 divided by 191,290 shares)
$24.87
Offering price per class M share (100/96.50 of $24.87)*
$25.77
Net asset value, offering price and redemption price per class R share ($6,559,344 divided by 262,210 shares)
$25.02
Net asset value, offering price and redemption price per class Y share ($296,785,603 divided by 11,816,302 shares)
$25.12
*
On single retail sales of less than $50,000. On sales of $50,000 or more the offering price is reduced.
**
Redemption price per share is equal to net asset value less any applicable contingent deferred sales charge.
†
Net asset value may not recalculate due to rounding of fractional shares.
The accompanying notes are an integral part of these financial statements.
28 Convertible Securities Fund
Statement of operations Six months ended 4/30/15 (Unaudited)
INVESTMENT INCOME
Dividends (net of foreign tax of $2,108)
$5,520,371
Interest (including interest income of $21,231 from investments in affiliated issuers) (Note 5)
4,268,286
Securities lending (Note 1)
1,229
Total investment income
9,789,886
EXPENSES
Compensation of Manager (Note 2)
2,960,658
Investor servicing fees (Note 2)
662,335
Custodian fees (Note 2)
10,859
Trustee compensation and expenses (Note 2)
15,104
Distribution fees (Note 2)
1,193,733
Administrative services (Note 2)
14,329
Other
172,058
Total expenses
5,029,076
Expense reduction (Note 2)
(4,525)
Net expenses
5,024,551
Net investment income
4,765,335
Net realized gain on investments (Notes 1 and 3)
42,120,457
Net realized loss on foreign currency transactions (Note 1)
(23)
Net unrealized appreciation of assets and liabilities in foreign currencies during the period
7
Net unrealized depreciation of investments during the period
(14,828,691)
Net gain on investments
27,291,750
Net increase in net assets resulting from operations
$32,057,085
The accompanying notes are an integral part of these financial statements.
Convertible Securities Fund 29
Statement of changes in net assets
INCREASE IN NET ASSETS
Six months ended 4/30/15*
Year ended 10/31/14
Operations:
Net investment income
$4,765,335
$6,522,045
Net realized gain on investments and foreign currency transactions
42,120,434
78,421,652
Net unrealized appreciation (depreciation) of investments and assets and liabilities in foreign currencies
(14,828,684)
8,281,581
Net increase in net assets resulting from operations
32,057,085
93,225,278
Distributions to shareholders (Note 1):
From ordinary income
Net investment income
Class A
(6,215,849)
(13,464,353)
Class B
(93,443)
(201,341)
Class C
(534,415)
(1,020,922)
Class I
(52)
—
Class M
(38,475)
(77,628)
Class R
(65,234)
(132,175)
Class Y
(3,381,521)
(6,076,627)
From net realized long-term gain on investments
Class A
(23,443,814)
—
Class B
(543,196)
—
Class C
(3,033,358)
—
Class M
(185,973)
—
Class R
(266,502)
—
Class Y
(11,391,059)
—
Increase from capital share transactions (Note 4)
43,085,842
52,502,678
Total increase in net assets
25,950,036
124,754,910
NET ASSETS
Beginning of period
950,240,312
825,485,402
End of period (including undistributed net investment income of $4,211,532 and $9,775,186, respectively)
$976,190,348
$950,240,312
*
Unaudited.
The accompanying notes are an integral part of these financial statements.
30 Convertible Securities Fund
This page left blank intentionally.
Convertible Securities Fund 31
Financial highlights (For a common share outstanding throughout the period)
INVESTMENT OPERATIONS:
LESS DISTRIBUTIONS:
RATIOS AND SUPPLEMENTAL DATA:
Period ended
Net asset value, beginning of period
Net investment income (loss)a
Net realized and unrealized gain (loss) on investments
Total from investment operations
From net investment income
From net realized gain on investments
Total distributions
Redemption fees
Non-recurring reimbursements
Net asset value, end of period
Total return at net asset value (%)b
Net assets, end of period (in thousands)
Ratio of expenses to average net assets (%)c
Ratio of net investment income (loss) to average net assets (%)
Portfolio turnover (%)
Class A
April 30, 2015**
$25.60
.12
.71
.83
(.27)
(1.04)
(1.31)
—
—
$25.12
3.33*
$577,419
.52*
.49*
35*
October 31, 2014
23.57
.18
2.42
2.60
(.57)
—
(.57)
—
—
25.60
11.10
578,716
1.06
.72
63
October 31, 2013
20.09
.37
3.71
4.08
(.60)
—
(.60)
—d
—
23.57
20.62
556,643
1.08
1.69
72
October 31, 2012
18.97
.36
1.33
1.69
(.57)
—
(.57)
—d
—
20.09
9.07
466,910
1.11
1.87
59
October 31, 2011
19.31
.39
(.16)
.23
(.57)
—
(.57)
—d
—d,e
18.97
1.08
484,050
1.12
1.94
79
October 31, 2010
16.27
.54
3.07
3.61
(.57)
—
(.57)
—d
—d,f
19.31
22.48
495,949
1.18
3.03
71
Class B
April 30, 2015**
$25.13
.03
.70
.73
(.18)
(1.04)
(1.22)
—
—
$24.64
2.97*
$13,099
.89*
.12*
35*
October 31, 2014
23.15
(.01)
2.38
2.37
(.39)
—
(.39)
—
—
25.13
10.27
13,228
1.81
(.04)
63
October 31, 2013
19.75
.20
3.64
3.84
(.44)
—
(.44)
—d
—
23.15
19.68
12,009
1.83
.95
72
October 31, 2012
18.66
.21
1.30
1.51
(.42)
—
(.42)
—d
—
19.75
8.22
10,315
1.86
1.10
59
October 31, 2011
18.99
.23
(.14)
.09
(.42)
—
(.42)
—d
—d,e
18.66
.40
12,281
1.87
1.19
79
October 31, 2010
16.01
.40
3.01
3.41
(.43)
—
(.43)
—d
—d,f
18.99
21.52
12,205
1.93
2.28
71
Class C
April 30, 2015**
$25.32
.03
.71
.74
(.18)
(1.04)
(1.22)
—
—
$24.84
2.99*
$77,560
.89*
.12*
35*
October 31, 2014
23.33
(.01)
2.39
2.38
(.39)
—
(.39)
—
—
25.32
10.27
73,451
1.81
(.06)
63
October 31, 2013
19.90
.20
3.67
3.87
(.44)
—
(.44)
—d
—
23.33
19.68
50,931
1.83
.93
72
October 31, 2012
18.79
.21
1.32
1.53
(.42)
—
(.42)
—d
—
19.90
8.24
38,875
1.86
1.10
59
October 31, 2011
19.13
.24
(.16)
.08
(.42)
—
(.42)
—d
—d,e
18.79
.32
53,696
1.87
1.19
79
October 31, 2010
16.12
.40
3.04
3.44
(.43)
—
(.43)
—d
—d,f
19.13
21.58
57,211
1.93
2.27
71
Class I
April 30, 2015**†
$25.33
.06
(.12)
(.06)
(.13)
—
(.13)
—
—
$25.14
(.23)*
$10
.11*
.23*
35*
Class M
April 30, 2015**
$25.35
.06
.71
.77
(.21)
(1.04)
(1.25)
—
—
$24.87
3.11*
$4,757
.77*
.24*
35*
October 31, 2014
23.35
.05
2.40
2.45
(.45)
—
(.45)
—
—
25.35
10.54
4,583
1.56
.21
63
October 31, 2013
19.91
.26
3.67
3.93
(.49)
—
(.49)
—d
—
23.35
20.01
3,885
1.58
1.20
72
October 31, 2012
18.81
.26
1.31
1.57
(.47)
—
(.47)
—d
—
19.91
8.49
3,406
1.61
1.36
59
October 31, 2011
19.14
.29
(.16)
.13
(.46)
—
(.46)
—d
—d,e
18.81
.61
3,546
1.62
1.46
79
October 31, 2010
16.13
.45
3.04
3.49
(.48)
—
(.48)
—d
—d,f
19.14
21.85
4,598
1.68
2.53
71
Class R
April 30, 2015**
$25.50
.09
.71
.80
(.24)
(1.04)
(1.28)
—
—
$25.02
3.22*
$6,559
.64*
.37*
35*
October 31, 2014
23.48
.12
2.41
2.53
(.51)
—
(.51)
—
—
25.50
10.83
6,569
1.31
.46
63
October 31, 2013
20.02
.31
3.70
4.01
(.55)
—
(.55)
—d
—
23.48
20.30
5,617
1.33
1.43
72
October 31, 2012
18.91
.31
1.32
1.63
(.52)
—
(.52)
—d
—
20.02
8.78
4,059
1.36
1.61
59
October 31, 2011
19.24
.34
(.15)
.19
(.52)
—
(.52)
—d
—d,e
18.91
.88
3,595
1.37
1.69
79
October 31, 2010
16.22
.50
3.04
3.54
(.52)
—
(.52)
—d
—d,f
19.24
22.12
3,434
1.43
2.77
71
Class Y
April 30, 2015**
$25.59
.15
.72
.87
(.30)
(1.04)
(1.34)
—
—
$25.12
3.50*
$296,786
.40*
.62*
35*
October 31, 2014
23.56
.24
2.42
2.66
(.63)
—
(.63)
—
—
25.59
11.38
273,693
.81
.95
63
October 31, 2013
20.08
.42
3.72
4.14
(.66)
—
(.66)
—d
—
23.56
20.93
196,399
.83
1.89
72
October 31, 2012
18.97
.41
1.32
1.73
(.62)
—
(.62)
—d
—
20.08
9.28
106,584
.86
2.12
59
October 31, 2011
19.30
.44
(.15)
.29
(.62)
—
(.62)
—d
—d,e
18.97
1.40
106,207
.87
2.17
79
October 31, 2010
16.27
.59
3.05
3.64
(.61)
—
(.61)
—d
—d,f
19.30
22.73
83,025
.93
3.27
71
See notes to financial highlights at the end of this section.
The accompanying notes are an integral part of these financial statements.
32
Convertible Securities Fund
Convertible Securities Fund
33
Financial highlights (Continued)
*Not annualized.
**Unaudited.
†For the period March 3, 2015 (commencement of operations) to April 30, 2015.
a Per share net investment income (loss) has been determined on the basis of the weighted average number of shares outstanding during the period.
b Total return assumes dividend reinvestment and does not reflect the effect of sales charges.
c Includes amounts paid through expense offset and/or brokerage/service arrangements, if any (Note 2). Also excludes acquired fund fees and expenses, if any.
d Amount represents less than $0.01 per share.
e Reflects a non-recurring reimbursement related to restitution amounts in connection with a distribution plan approved by the Securities and Exchange Commission (the SEC) which amounted to less than $0.01 per share outstanding on July 21, 2011. Also reflects a non-recurring reimbursement related to short-term trading related lawsuits, which amounted to less than $0.01 per share outstanding on May 11, 2011.
f Reflects a non-recurring reimbursement pursuant to a settlement between the SEC and Prudential Securities, Inc., which amounted to less than $0.01 per share outstanding on March 30, 2010.
The accompanying notes are an integral part of these financial statements.
34 Convertible Securities Fund
Notes to financial statements 4/30/15 (Unaudited)
Within the following Notes to financial statements, references to “State Street” represent State Street Bank and Trust Company, references to “the SEC” represent the Securities and Exchange Commission, references to “Putnam Management” represent Putnam Investment Management, LLC, the fund’s manager, an indirect wholly-owned subsidiary of Putnam Investments, LLC and references to “OTC”, if any, represent over-the-counter. Unless otherwise noted, the “reporting period” represents the period from November 1, 2014 through April 30, 2015.
Putnam Convertible Securities Fund (the fund) is a Massachusetts business trust, which is registered under the Investment Company Act of 1940, as amended, as a diversified open-end management investment company. The goal of the fund is to seek, with equal emphasis, current income and capital appreciation. The fund’s secondary goal is conservation of capital. The fund invests mainly in convertible securities of U.S. companies. Under normal market circumstances, the fund invests at least 80% of the fund’s net assets in convertible securities. Convertible securities combine the investment characteristics of bonds and common stocks. Convertible securities include bonds, preferred stocks and other instruments that can be converted into or exchanged for common stock or equivalent value. A significant portion of the convertible securities the fund buys are below-investment-grade, sometimes referred to as junk bonds. The convertible bonds the fund buys usually have intermediate-to long-term stated maturities (three years or longer), but often contain “put” features, which allow bondholders to sell the bond back to the company under specified circumstances, that result in shorter effective maturities. When deciding whether to buy or sell investments, Putnam Management may consider, among other factors: (i) a security’s structural features, such as its position in a company’s capital structure and “put” and “call” features (a company’s right to repurchase the security underspecified circumstances is a “call” feature); (ii) credit and prepayment risks; and (iii) with respect to a company’s common stock underlying a convertible security, the stock’s valuation and the company’s financial strength, growth potential, competitive position in its industry, projected future earnings, cash flows and dividends.
The fund offers class A, class B, class C, class I, class M, class R and class Y shares. The fund began offering class I shares on March 2, 2015. Class A and class M shares are sold with a maximum front-end sales charge of 5.75% and 3.50%, respectively, and generally do not pay a contingent deferred sales charge. Class B shares, which convert to class A shares after approximately eight years, do not pay a front-end sales charge and are subject to a contingent deferred sales charge if those shares are redeemed within six years of purchase. Class C shares have a one-year 1.00% contingent deferred sales charge and do not convert to class A shares. Class R shares, which are not available to all investors, are sold at net asset value. The expenses for class A, class B, class C, class M and class R shares may differ based on the distribution fee of each class, which is identified in Note 2. Class I and class Y shares, which are sold at net asset value, are generally subject to the same expenses as class A, class B, class C, class M and class R shares, but do not bear a distribution fee and in the case of class I shares, bear a lower investor servicing fee, which is identified in Note 2. Class I and class Y shares are not available to all investors.
In the normal course of business, the fund enters into contracts that may include agreements to indemnify another party under given circumstances. The fund’s maximum exposure under these arrangements is unknown as this would involve future claims that may be, but have not yet been, made against the fund. However, the fund’s management team expects the risk of material loss to be remote.
Note 1: Significant accounting policies
The following is a summary of significant accounting policies consistently followed by the fund in the preparation of its financial statements. The preparation of financial statements is in conformity with accounting principles generally accepted in the United States of America and requires management to make estimates and assumptions that affect the reported amounts of assets and liabilities in the financial statements and the reported amounts of increases and decreases in net assets from operations. Actual results could differ from those estimates. Subsequent events after the Statement of assets and liabilities date through the date that the financial statements were issued have been evaluated in the preparation of the financial statements.
Investment income, realized and unrealized gains and losses and expenses of the fund are borne pro-rata based on the relative net assets of each class to the total net assets of the fund, except that each class bears expenses unique to that class (including the distribution fees applicable to such classes). Each class votes as a class only with respect to its own distribution plan or other matters on which a class vote is required by law or determined by the Trustees. If the fund were liquidated, shares of each class would receive their pro-rata share of the net assets of the fund. In addition, the Trustees declare separate dividends on each class of shares.
Convertible Securities Fund 35
Security valuation Portfolio securities and other investments are valued using policies and procedures adopted by the Board of Trustees. The Trustees have formed a Pricing Committee to oversee the implementation of these procedures and have delegated responsibility for valuing the fund’s assets in accordance with these procedures to Putnam Management. Putnam Management has established an internal Valuation Committee that is responsible for making fair value determinations, evaluating the effectiveness of the pricing policies of the fund and reporting to the Pricing Committee.
Investments for which market quotations are readily available are valued at the last reported sales price on their principal exchange, or official closing price for certain markets, and are classified as Level 1 securities under Accounting Standards Codification 820 Fair Value Measurements and Disclosures (ASC 820). If no sales are reported, as in the case of some securities that are traded OTC, a security is valued at its last reported bid price and is generally categorized as a Level 2 security.
Investments in open-end investment companies (excluding exchange-traded funds), if any, which can be classified as Level 1 or Level 2 securities, are valued based on their net asset value. The net asset value of such investment companies equals the total value of their assets less their liabilities and divided by the number of their outstanding shares.
Market quotations are not considered to be readily available for certain debt obligations and other investments; such investments are valued on the basis of valuations furnished by an independent pricing service approved by the Trustees or dealers selected by Putnam Management. Such services or dealers determine valuations for normal institutional-size trading units of such securities using methods based on market transactions for comparable securities and various relationships, generally recognized by institutional traders, between securities (which consider such factors as security prices, yields, maturities and ratings). These securities will generally be categorized as Level 2. Short-term securities with remaining maturities of 60 days or less may be valued at amortized cost, which approximates fair value, and are classified as Level 2 securities.
Many securities markets and exchanges outside the U.S. close prior to the close of the New York Stock Exchange and therefore the closing prices for securities in such markets or on such exchanges may not fully reflect events that occur after such close but before the close of the New York Stock Exchange. Accordingly, on certain days, the fund will fair value foreign equity securities taking into account multiple factors including movements in the U.S. securities markets, currency valuations and comparisons to the valuation of American Depository Receipts, exchange-traded funds and futures contracts. These securities, which would generally be classified as Level 1 securities, will be transferred to Level 2 of the fair value hierarchy when they are valued at fair value. The number of days on which fair value prices will be used will depend on market activity and it is possible that fair value prices will be used by the fund to a significant extent. Securities quoted in foreign currencies, if any, are translated into U.S. dollars at the current exchange rate.
To the extent a pricing service or dealer is unable to value a security or provides a valuation that Putnam Management does not believe accurately reflects the security’s fair value, the security will be valued at fair value by Putnam Management in accordance with policies and procedures approved by the Trustees. Certain investments, including certain restricted and illiquid securities and derivatives, are also valued at fair value following procedures approved by the Trustees. These valuations consider such factors as significant market or specific security events such as interest rate or credit quality changes, various relationships with other securities, discount rates, U.S. Treasury, U.S. swap and credit yields, index levels, convexity exposures, recovery rates, sales and other multiples and resale restrictions. These securities are classified as Level 2 or as Level 3 depending on the priority of the significant inputs.
To assess the continuing appropriateness of fair valuations, the Valuation Committee reviews and affirms the reasonableness of such valuations on a regular basis after considering all relevant information that is reasonably available. Such valuations and procedures are reviewed periodically by the Trustees. The fair value of securities is generally determined as the amount that the fund could reasonably expect to realize from an orderly disposition of such securities over a reasonable period of time. By its nature, a fair value price is a good faith estimate of the value of a security in a current sale and does not reflect an actual market price, which may be different by a material amount.
Security transactions and related investment income Security transactions are recorded on the trade date (the date the order to buy or sell is executed). Gains or losses on securities sold are determined on the identified cost basis.
Interest income, net of any applicable withholding taxes, is recorded on the accrual basis. Dividend income, net of any applicable withholding taxes, is recognized on the ex-dividend date except that certain dividends from foreign securities, if any, are recognized as soon as the fund is informed of the ex-dividend date. Non-cash dividends, if any,
36 Convertible Securities Fund
are recorded at the fair value of the securities received. Dividends representing a return of capital or capital gains, if any, are reflected as a reduction of cost and/or as a realized gain.
All premiums/discounts are amortized/accreted on a yield-to-maturity basis.
Foreign currency translation The accounting records of the fund are maintained in U.S. dollars. The fair value of foreign securities, currency holdings, and other assets and liabilities is recorded in the books and records of the fund after translation to U.S. dollars based on the exchange rates on that day. The cost of each security is determined using historical exchange rates. Income and withholding taxes are translated at prevailing exchange rates when earned or incurred. The fund does not isolate that portion of realized or unrealized gains or losses resulting from changes in the foreign exchange rate on investments from fluctuations arising from changes in the market prices of the securities. Such gains and losses are included with the net realized and unrealized gain or loss on investments. Net realized gains and losses on foreign currency transactions represent net realized exchange gains or losses on closed forward currency contracts, disposition of foreign currencies, currency gains and losses realized between the trade and settlement dates on securities transactions and the difference between the amount of investment income and foreign withholding taxes recorded on the fund’s books and the U.S. dollar equivalent amounts actually received or paid. Net unrealized appreciation and depreciation of assets and liabilities in foreign currencies arise from changes in the value of open forward currency contracts and assets and liabilities other than investments at the period end, resulting from changes in the exchange rate.
Securities lending The fund may lend securities, through its agent, to qualified borrowers in order to earn additional income. The loans are collateralized by cash in an amount at least equal to the fair value of the securities loaned. The fair value of securities loaned is determined daily and any additional required collateral is allocated to the fund on the next business day. The risk of borrower default will be borne by the fund’s agent; the fund will bear the risk of loss with respect to the investment of the cash collateral. Income from securities lending is included in investment income on the Statement of operations. Cash collateral is invested in Putnam Cash Collateral Pool, LLC, a limited liability company managed by an affiliate of Putnam Management. Investments in Putnam Cash Collateral Pool, LLC are valued at its closing net asset value each business day. There are no management fees charged to Putnam Cash Collateral Pool, LLC. At the close of the reporting period, the fund had no securities out on loan.
Interfund lending The fund, along with other Putnam funds, may participate in an interfund lending program pursuant to an exemptive order issued by the SEC. This program allows the fund to borrow from or lend to other Putnam funds that permit such transactions. Interfund lending transactions are subject to each fund’s investment policies and borrowing and lending limits. Interest earned or paid on the interfund lending transaction will be based on the average of certain current market rates. During the reporting period, the fund did not utilize the program.
Lines of credit The fund participates, along with other Putnam funds, in a $392.5 million unsecured committed line of credit and a $235.5 million unsecured uncommitted line of credit, both provided by State Street. Borrowings may be made for temporary or emergency purposes, including the funding of shareholder redemption requests and trade settlements. Interest is charged to the fund based on the fund’s borrowing at a rate equal to the Federal Funds rate plus 1.25% for the committed line of credit and the Federal Funds rate plus 1.30% for the uncommitted line of credit. A closing fee equal to 0.04% of the committed line of credit and 0.04% of the uncommitted line of credit has been paid by the participating funds. In addition, a commitment fee of 0.11% per annum on any unutilized portion of the committed line of credit is allocated to the participating funds based on their relative net assets and paid quarterly. During the reporting period, the fund had no borrowings against these arrangements.
Federal taxes It is the policy of the fund to distribute all of its taxable income within the prescribed time period and otherwise comply with the provisions of the Internal Revenue Code of 1986, as amended (the Code), applicable to regulated investment companies. It is also the intention of the fund to distribute an amount sufficient to avoid imposition of any excise tax under Section 4982 of the Code.
The fund is subject to the provisions of Accounting Standards Codification 740 Income Taxes (ASC 740). ASC 740 sets forth a minimum threshold for financial statement recognition of the benefit of a tax position taken or expected to be taken in a tax return. The fund did not have a liability to record for any unrecognized tax benefits in the accompanying financial statements. No provision has been made for federal taxes on income, capital gains or unrealized appreciation on securities held nor for excise tax on income and capital gains. Each of the fund’s federal tax returns for the prior three fiscal years remains subject to examination by the Internal Revenue Service.
The fund may also be subject to taxes imposed by governments of countries in which it invests. Such taxes are generally based on either income or gains earned or repatriated. The fund accrues and applies such taxes to net investment income, net realized gains and net unrealized gains as income and/or capital gains are earned. In some
Convertible Securities Fund 37
cases, the fund may be entitled to reclaim all or a portion of such taxes, and such reclaim amounts, if any, are reflected as an asset on the fund’s books. In many cases, however, the fund may not receive such amounts for an extended period of time, depending on the country of investment.
The aggregate identified cost on a tax basis is $897,064,714, resulting in gross unrealized appreciation and depreciation of $113,971,975 and $34,740,358, respectively, or net unrealized appreciation of $79,231,617.
Distributions to shareholders Distributions to shareholders from net investment income are recorded by the fund on the ex-dividend date. Distributions from capital gains, if any, are recorded on the ex-dividend date and paid at least annually. The amount and character of income and gains to be distributed are determined in accordance with income tax regulations, which may differ from generally accepted accounting principles. Dividend sources are estimated at the time of declaration. Actual results may vary. Any non-taxable return of capital cannot be determined until final tax calculations are completed after the end of the fund’s fiscal year. Reclassifications are made to the fund’s capital accounts to reflect income and gains available for distribution (or available capital loss carryovers) under income tax regulations.
Note 2: Management fee, administrative services and other transactions
The fund pays Putnam Management a management fee (based on the fund’s average net assets and computed and paid monthly) at annual rates that may vary based on the average of the aggregate net assets of most open-end funds, as defined in the fund’s management contract, sponsored by Putnam Management. Such annual rates may vary as follows:
0.780%
of the first $5 billion,
0.730%
of the next $5 billion,
0.680%
of the next $10 billion,
0.630%
of the next $10 billion,
0.580%
of the next $50 billion,
0.560%
of the next $50 billion,
0.550%
of the next $100 billion and
0.545%
of any excess thereafter.
Putnam Management has contractually agreed, through June 30, 2015, to waive fees or reimburse the fund’s expenses to the extent necessary to limit the cumulative expenses of the fund, exclusive of brokerage, interest, taxes, investment-related expenses, extraordinary expenses, acquired fund fees and expenses and payments under the fund’s investor servicing contract, investment management contract and distribution plans, on a fiscal year-to-date basis to an annual rate of 0.20% of the fund’s average net assets over such fiscal year-to-date period. During the reporting period, the fund’s expenses were not reduced as a result of this limit.
Putnam Investments Limited (PIL), an affiliate of Putnam Management, is authorized by the Trustees to manage a separate portion of the assets of the fund as determined by Putnam Management from time to time. Putnam Management pays a quarterly sub-management fee to PIL for its services at an annual rate of 0.35% of the average net assets of the portion of the fund managed by PIL.
The fund reimburses Putnam Management an allocated amount for the compensation and related expenses of certain officers of the fund and their staff who provide administrative services to the fund. The aggregate amount of all such reimbursements is determined annually by the Trustees.
Custodial functions for the fund’s assets are provided by State Street. Custody fees are based on the fund’s asset level, the number of its security holdings and transaction volumes.
Putnam Investor Services, Inc., an affiliate of Putnam Management, provides investor servicing agent functions to the fund. Putnam Investor Services, Inc. received fees for investor servicing (except for class I shares) that included (1) a per account fee for each direct and underlying non-defined contribution account (“retail account”) of the fund and each of the other funds in its specified category, which was totaled and then allocated to each fund in the category based on its average daily net assets; (2) a specified rate of the fund’s assets attributable to defined contribution plan accounts; and (3) for the portion of the fund’s fiscal year beginning after January 1, 2015, a specified rate based on the average net assets in retail accounts. Putnam Investor Services has agreed that the aggregate investor servicing fees for each fund’s retail and defined contribution accounts will not exceed an annual rate of 0.320% of the fund’s average assets attributable to such accounts. Class I shares paid a monthly fee based on the
38 Convertible Securities Fund
average net assets of class I shares at an annual rate of 0.01%. During the reporting period, the expenses for each class of shares related to investor servicing fees were as follows:
Class A
$398,652
Class B
8,962
Class C
51,504
Class I
—
Class M
3,185
Class R
4,636
Class Y
195,396
Total
$662,335
The fund has entered into expense offset arrangements with Putnam Investor Services, Inc. and State Street whereby Putnam Investor Services, Inc.’s and State Street’s fees are reduced by credits allowed on cash balances. The fund also reduced expenses through brokerage/service arrangements. For the reporting period, the fund’s expenses were reduced by $1,148 under the expense offset arrangements and by $3,377 under the brokerage/service arrangements.
Each Independent Trustee of the fund receives an annual Trustee fee, of which $566, as a quarterly retainer, has been allocated to the fund, and an additional fee for each Trustees meeting attended. Trustees also are reimbursed for expenses they incur relating to their services as Trustees.
The fund has adopted a Trustee Fee Deferral Plan (the Deferral Plan) which allows the Trustees to defer the receipt of all or a portion of Trustees fees payable on or after July 1, 1995. The deferred fees remain invested in certain Putnam funds until distribution in accordance with the Deferral Plan.
The fund has adopted an unfunded noncontributory defined benefit pension plan (the Pension Plan) covering all Trustees of the fund who have served as a Trustee for at least five years and were first elected prior to 2004. Benefits under the Pension Plan are equal to 50% of the Trustee’s average annual attendance and retainer fees for the three years ended December 31, 2005. The retirement benefit is payable during a Trustee’s lifetime, beginning the year following retirement, for the number of years of service through December 31, 2006. Pension expense for the fund is included in Trustee compensation and expenses in the Statement of operations. Accrued pension liability is included in Payable for Trustee compensation and expenses in the Statement of assets and liabilities. The Trustees have terminated the Pension Plan with respect to any Trustee first elected after 2003.
The fund has adopted distribution plans (the Plans) with respect to its class A, class B, class C, class M and class R shares pursuant to Rule 12b–1 under the Investment Company Act of 1940. The purpose of the Plans is to compensate Putnam Retail Management Limited Partnership, an indirect wholly-owned subsidiary of Putnam Investments, LLC, for services provided and expenses incurred in distributing shares of the fund. The Plans provide for payments by the fund to Putnam Retail Management Limited Partnership at an annual rate of up to 0.35%, 1.00%, 1.00%, 1.00% and 1.00% of the average net assets attributable to class A, class B, class C, class M and class R shares, respectively. The Trustees have approved payment by the fund at an annual rate of 0.25%, 1.00%, 1.00%, 0.75% and 0.50% of the average net assets attributable to class A, class B, class C, class M and class R shares, respectively. During the reporting period, the class specific expenses related to distribution fees were as follows:
Class A
$721,883
Class B
64,932
Class C
372,857
Class M
17,291
Class R
16,770
Total
$1,193,733
For the reporting period, Putnam Retail Management Limited Partnership, acting as underwriter, received net commissions of $26,466 and $779 from the sale of class A and class M shares, respectively, and received $1,570 and $515 in contingent deferred sales charges from redemptions of class B and class C shares, respectively.
A deferred sales charge of up to 1.00% and 0.65% is assessed on certain redemptions of class A and class M shares, respectively. For the reporting period, Putnam Retail Management Limited Partnership, acting as underwriter, received $636 and no monies on class A and class M redemptions, respectively.
Convertible Securities Fund 39
Note 3: Purchases and sales of securities
During the reporting period, the cost of purchases and the proceeds from sales, excluding short-term investments, were as follows:
Cost of purchases
Proceeds from sales
Investments in securities (Long-term)
$323,336,872
$320,339,297
U.S. government securities (Long-term)
—
—
Total
$323,336,872
$320,339,297
Note 4: Capital shares
At the close of the reporting period, there were an unlimited number of shares of beneficial interest authorized. Transactions in capital shares were as follows:
Six months ended 4/30/15
Year ended 10/31/14
Class A
Shares
Amount
Shares
Amount
Shares sold
2,948,463
$74,225,524
6,486,030
$161,807,856
Shares issued in connection with reinvestment of distributions
1,103,314
27,237,448
484,788
12,125,165
4,051,777
101,462,972
6,970,818
173,933,021
Shares repurchased
(3,676,656)
(92,214,313)
(7,982,819)
(199,814,297)
Net increase (decrease)
375,121
$9,248,659
(1,012,001)
$(25,881,276)
Six months ended 4/30/15
Year ended 10/31/14
Class B
Shares
Amount
Shares
Amount
Shares sold
40,137
$987,225
107,860
$2,641,805
Shares issued in connection with reinvestment of distributions
17,924
434,301
5,452
133,967
58,061
1,421,526
113,312
2,775,772
Shares repurchased
(52,847)
(1,293,342)
(105,719)
(2,584,626)
Net increase
5,214
$128,184
7,593
$191,146
Six months ended 4/30/15
Year ended 10/31/14
Class C
Shares
Amount
Shares
Amount
Shares sold
330,603
$8,199,289
1,004,390
$24,793,508
Shares issued in connection with reinvestment of distributions
96,675
2,360,929
26,922
667,626
427,278
10,560,218
1,031,312
25,461,134
Shares repurchased
(205,274)
(5,076,758)
(313,788)
(7,757,872)
Net increase
222,004
$5,483,460
717,524
$17,703,262
For the period 3/3/15 (commencement of operations) to 4/30/15
Class I
Shares
Amount
Shares sold
395
$10,000
Shares issued in connection with reinvestment of distributions
2
52
397
10,052
Shares repurchased
—
—
Net increase
397
$10,052
40 Convertible Securities Fund
Six months ended 4/30/15
Year ended 10/31/14
Class M
Shares
Amount
Shares
Amount
Shares sold
13,068
$324,529
41,541
$1,027,188
Shares issued in connection with reinvestment of distributions
8,951
218,885
3,021
74,932
22,019
543,414
44,562
1,102,120
Shares repurchased
(11,496)
(286,953)
(30,191)
(750,056)
Net increase
10,523
$256,461
14,371
$352,064
Six months ended 4/30/15
Year ended 10/31/14
Class R
Shares
Amount
Shares
Amount
Shares sold
44,360
$1,104,279
99,488
$2,461,647
Shares issued in connection with reinvestment of distributions
12,772
314,145
5,085
126,813
57,132
1,418,424
104,573
2,588,460
Shares repurchased
(52,570)
(1,313,352)
(86,180)
(2,125,631)
Net increase
4,562
$105,072
18,393
$462,829
Six months ended 4/30/15
Year ended 10/31/14
Class Y
Shares
Amount
Shares
Amount
Shares sold
2,807,626
$70,374,247
5,167,700
$129,692,264
Shares issued in connection with reinvestment of distributions
447,523
11,043,757
170,905
4,278,856
3,255,149
81,418,004
5,338,605
133,971,120
Shares repurchased
(2,134,253)
(53,564,050)
(2,979,936)
(74,296,467)
Net increase
1,120,896
$27,853,954
2,358,669
$59,674,653
At the close of the reporting period, Putnam Investments, LLC owned the following class shares of the fund:
Shares owned
Percentage of ownership
Value
Class I
397
100.0%
$9,976
Note 5: Affiliated Transactions
Transactions during the reporting period with Putnam Short Term Investment Fund, which is under common ownership and control, were as follows:
Name of affiliate
Fair value at the beginning of the reporting period
Purchase cost
Sale proceeds
Investment income
Fair value at the end of the reporting period
Putnam Short Term Investment Fund*
$40,401,678
$183,745,078
$172,910,075
$21,231
$51,236,681
Totals
$40,401,678
$183,745,078
$172,910,075
$21,231
$51,236,681
*Management fees charged to Putnam Short Term Investment Fund have been waived by Putnam Management.
Convertible Securities Fund 41
Note 6: Market, credit and other risks
In the normal course of business, the fund trades financial instruments and enters into financial transactions where risk of potential loss exists due to changes in the market (market risk) or failure of the contracting party to the transaction to perform (credit risk). The fund may be exposed to additional credit risk that an institution or other entity with which the fund has unsettled or open transactions will default. Investments in foreign securities involve certain risks, including those related to economic instability, unfavorable political developments, and currency fluctuations.
Note 7: Summary of derivative activity
The volume of activity for the reporting period for any derivative type that was held during the period is listed below and was as follows based on an average of the holdings at the end of each fiscal quarter:
Warrants (number of warrants)
1,100,000
The following is a summary of the fair value of derivative instruments as of the close of the reporting period:
Fair value of derivative instruments as of the close of the reporting period
Asset derivatives
Liability derivatives
Derivatives not accounted for as hedging instruments under ASC 815
Statement of assets and liabilities location
Fair value
Statement of assets and liabilities location
Fair value
Equity contracts
Investments
$—*
Payables
$—
Total
$—
$—
*Warrants held at period end had a fair value of $— .
The following is a summary of change in unrealized gains or losses of derivative instruments on the Statement of operations for the reporting period (see Note 1) (there were no realized gains or losses on derivative instruments):
Change in unrealized appreciation or (depreciation) on derivatives recognized in net gain or (loss) on investments
Derivatives not accounted for as hedging instruments under ASC 815
Warrants
Total
Equity contracts
$—
$—
Total
$—
$—
42 Convertible Securities Fund
Putnam family of funds
The following is a list of Putnam’s open-end mutual funds offered to the public. Investors should carefully consider the investment objective, risks, charges, and expenses of a fund before investing. For a prospectus, or a summary prospectus if available, containing this and other information for any Putnam fund or product, contact your financial advisor or call Putnam Investor Services at 1-800-225-1581. Please read the prospectus carefully before investing.
Growth
Growth Opportunities Fund
International Growth Fund
Multi-Cap Growth Fund
Small Cap Growth Fund
Voyager Fund
Blend
Asia Pacific Equity Fund
Capital Opportunities Fund
Capital Spectrum Fund
Emerging Markets Equity Fund
Equity Spectrum Fund
Europe Equity Fund
Global Equity Fund
International Capital Opportunities Fund
International Equity Fund
Investors Fund
Low Volatility Equity Fund
Multi-Cap Core Fund
Research Fund
Strategic Volatility Equity Fund
Value
Convertible Securities Fund
Equity Income Fund
Global Dividend Fund
The Putnam Fund for Growth and Income
International Value Fund
Multi-Cap Value Fund
Small Cap Value Fund
Income
American Government Income Fund
Diversified Income Trust
Emerging Markets Income Fund
Floating Rate Income Fund
Global Income Trust
High Yield Advantage Fund
High Yield Trust
Income Fund
Money Market Fund*
Short Duration Income Fund
U.S. Government Income Trust
Tax-free Income
AMT-Free Municipal Fund
Intermediate-Term Municipal Income Fund
Short-Term Municipal Income Fund
Tax Exempt Income Fund
Tax Exempt Money Market Fund*
Tax-Free High Yield Fund
State tax-free income funds†:
Arizona, California, Massachusetts, Michigan, Minnesota, New Jersey, New York, Ohio, and Pennsylvania.
* An investment in a money market fund is not insured or guaranteed by the Federal Deposit Insurance Corporation or any other government agency. Although the fund seeks to preserve the value of your investment at $1.00 per share, it is possible to lose money by investing in the fund.
†Not available in all states.
Convertible Securities Fund 43
Absolute Return
Absolute Return 100 Fund®
Absolute Return 300 Fund®
Absolute Return 500 Fund®
Absolute Return 700 Fund®
Global Sector
Global Consumer Fund
Global Energy Fund
Global Financials Fund
Global Health Care Fund
Global Industrials Fund
Global Natural Resources Fund
Global Sector Fund
Global Technology Fund
Global Telecommunications Fund
Global Utilities Fund
Asset Allocation
George Putnam Balanced Fund
Global Asset Allocation Funds — four investment portfolios that spread your money across a variety of stocks, bonds, and money market instruments.
Dynamic Asset Allocation Balanced Fund
Dynamic Asset Allocation Conservative Fund
Dynamic Asset Allocation Growth Fund
Dynamic Risk Allocation Fund
Retirement Income Lifestyle Funds — portfolios with managed allocations to stocks, bonds, and money market investments to generate retirement income.
Retirement Income Fund Lifestyle 1
Retirement Income Fund Lifestyle 2
Retirement Income Fund Lifestyle 3
RetirementReady® Funds — portfolios with adjusting allocations to stocks, bonds, and money market instruments, becoming more conservative over time.
RetirementReady® 2055 Fund
RetirementReady® 2050 Fund
RetirementReady® 2045 Fund
RetirementReady® 2040 Fund
RetirementReady® 2035 Fund
RetirementReady® 2030 Fund
RetirementReady® 2025 Fund
RetirementReady® 2020 Fund
RetirementReady® 2015 Fund
Check your account balances and the most recent month-end performance in the Individual Investors section at putnam.com.
44 Convertible Securities Fund
Fund information
Founded over 75 years ago, Putnam Investments was built around the concept that a balance between risk and reward is the hallmark of a well-rounded financial program. We manage over 100 funds across income, value, blend, growth, asset allocation, absolute return, and global sector categories.
Investment Manager
Putnam Investment Management, LLC One Post Office Square Boston, MA 02109
Investment Sub-Manager
Putnam Investments Limited 57–59 St James’s Street London, England SW1A 1LD
Marketing Services
Putnam Retail Management One Post Office Square Boston, MA 02109
Custodian
State Street Bank and Trust Company
Legal Counsel
Ropes & Gray LLP
Trustees
Jameson A. Baxter, Chair Liaquat Ahamed Ravi Akhoury Barbara M. Baumann Charles B. Curtis Robert J. Darretta Katinka Domotorffy John A. Hill Paul L. Joskow Kenneth R. Leibler Robert E. Patterson George Putnam, III Robert L. Reynolds W. Thomas Stephens
Officers
Robert L. Reynolds President
Jonathan S. Horwitz Executive Vice President, Principal Executive Officer, and Compliance Liaison
Steven D. Krichmar Vice President and Principal Financial Officer
Robert T. Burns Vice President and Chief Legal Officer
Robert R. Leveille Vice President and Chief Compliance Officer
Michael J. Higgins Vice President, Treasurer, and Clerk
Janet C. Smith Vice President, Principal Accounting Officer, and Assistant Treasurer
Susan G. Malloy Vice President and Assistant Treasurer
James P. Pappas Vice President
Mark C. Trenchard Vice President and BSA Compliance Officer
Nancy E. Florek Vice President, Director of Proxy Voting and Corporate Governance, Assistant Clerk, and Associate Treasurer
This report is for the information of shareholders of Putnam Convertible Securities Fund. It may also be used as sales literature when preceded or accompanied by the current prospectus, the most recent copy of Putnam’s Quarterly Performance Summary, and Putnam’s Quarterly Ranking Summary. For more recent performance, please visit putnam.com. Investors should carefully consider the investment objectives, risks, charges, and expenses of a fund, which are described in its prospectus. For this and other information or to request a prospectus or summary prospectus, call 1-800-225-1581 toll free. Please read the prospectus carefully before investing. The fund’s Statement of Additional Information contains additional information about the fund’s Trustees and is available without charge upon request by calling 1-800-225-1581.
Item 2. Code of Ethics:
Not applicable
Item 3. Audit Committee Financial Expert:
Not applicable
Item 4. Principal Accountant Fees and Services:
Not applicable
Item 5. Audit Committee of Listed Registrants
Not applicable
Item 6. Schedule of Investments:
The registrant’s schedule of investments in unaffiliated issuers is included in the report to shareholders in Item 1 above.
Item 7. Disclosure of Proxy Voting Policies and Procedures For Closed-End Management Investment Companies:
Not applicable
Item 8. Portfolio Managers of Closed-End Investment Companies
Not Applicable
Item 9. Purchases of Equity Securities by Closed-End Management Investment Companies and Affiliated Purchasers:
Not applicable
Item 10. Submission of Matters to a Vote of Security Holders:
Not applicable
Item 11. Controls and Procedures:
(a) The registrant’s principal executive officer and principal financial officer have concluded, based on their evaluation of the effectiveness of the design and operation of the registrant’s disclosure controls and procedures as of a date within 90 days of the filing date of this report, that the design and operation of such procedures are generally effective to provide reasonable assurance that information required to be disclosed by the registrant in this report is recorded, processed, summarized and reported within the time periods specified in the Commission’s rules and forms.
(b) Changes in internal control over financial reporting: Not applicable
Item 12. Exhibits:
(a)(1) Not applicable
(a)(2) Separate certifications for the principal executive officer and principal financial officer of the registrant as required by Rule 30a-2(a) under the Investment Company Act of 1940, as amended, are filed herewith.
(b) The certifications required by Rule 30a-2(b) under the Investment Company Act of 1940, as amended, are filed herewith.
Putnam Convertible Securities Fund
By (Signature and Title):
/s/ Janet C. Smith Janet C. Smith Principal Accounting Officer
Date: June 26, 2015
Pursuant to the requirements of the Securities Exchange Act of 1934 and the Investment Company Act of 1940, this report has been signed below by the following persons on behalf of the registrant and in the capacities and on the dates indicated.
By (Signature and Title):
/s/ Jonathan S. Horwitz Jonathan S. Horwitz Principal Executive Officer
Date: June 26, 2015
By (Signature and Title):
/s/ Steven D. Krichmar Steven D. Krichmar Principal Financial Officer
Date: June 26, 2015
We use cookies on this site to provide a more responsive and personalized service. Continuing to browse, clicking I Agree, or closing this banner indicates agreement. See our Cookie Policy for more information.