| UNITED STATES SECURITIES AND EXCHANGE COMMISSION | ||
| Washington, D.C. 20549 | ||
FORM N-CSR | ||
| CERTIFIED SHAREHOLDER REPORT OF REGISTERED MANAGEMENT INVESTMENT COMPANIES | ||
| Investment Company Act file number: | (811-02280) |
| Exact name of registrant as specified in charter: | Putnam Convertible Securities Fund |
| Address of principal executive offices: | One Post Office Square, Boston, Massachusetts 02109 |
| Name and address of agent for service: | Robert T. Burns, Vice President One Post Office Square Boston, Massachusetts 02109 |
| Copy to: | John W. Gerstmayr, Esq. Ropes & Gray LLP 800 Boylston Street Boston, Massachusetts 02199-3600 |
| Registrant’s telephone number, including area code: | (617) 292-1000 |
| Date of fiscal year end: | October 31, 2012 |
| Date of reporting period: | November 1, 2011 — April 30, 2012 |
Item 1. Report to Stockholders: |
| The following is a copy of the report transmitted to stockholders pursuant to Rule 30e-1 under the Investment Company Act of 1940: | |||
Putnam
Convertible
Securities Fund
Semiannual report
4 | 30 | 12
| Message from the Trustees | 1 | |
| About the fund | 2 | |
| Performance snapshot | 4 | |
| Interview with your fund’s portfolio managers | 5 | |
| Your fund’s performance | 11 | |
| Your fund’s expenses | 13 | |
| Terms and definitions | 15 | |
| Other information for shareholders | 16 | |
| Financial statements | 17 | |
Consider these risks before investing: The prices of convertible securities in the fund’s portfolio may fall or fail to rise over extended periods of time for a variety of reasons, including both general financial market conditions and factors related to specific companies or industries. These risks are generally greater for convertible securities issued by small and midsize companies (which may constitute a significant portion of the fund’s investments from time to time). The prices of convertible securities may be adversely affected by changes in the prices of underlying common stocks. Convertible securities tend to provide higher yields than common stocks. However, a higher yield may not protect investors against the risk of loss or adequately mitigate any loss associated with a decline in the price of a convertible security. Convertible securities are subject to credit risk, which is the risk that an issuer of the fund’s investments may default on payment of interest or principal. Credit risk is generally greater for below-investment-grade convertible securities (a significant part of the fund’s investments). Generally, convertible securities may be less sensitive to interest-rate changes than non-convertible bonds as a result of convertible securities’ structural features (e.g., convertibility, “put” features). Interest-rate risk is generally greater, however, for longer-term bonds and convertible securities whose underlying stock price has fallen significantly below the conversion price.
Message from the Trustees
Dear Fellow Shareholder:
Since the start of 2012, the economic picture and market performance worldwide have been mixed and volatile, punctuated by periodic worries over Europe’s unresolved sovereign-debt troubles and China’s efforts to maintain its robust economic growth. The U.S. economy has shown signs of gathering steam, but continues to face the dual headwinds of tepid jobs growth and a burgeoning federal debt.
Putnam’s portfolio managers and analysts are trained to uncover opportunities that often emerge in this type of environment, while also seeking to guard against downside risk. During these times, your financial advisor also can be a valuable resource, helping you to maintain a long-term focus and a balanced investment approach.
In other news, please join us in welcoming the return of Elizabeth T. Kennan to the Board of Trustees. Dr. Kennan, who served as a Trustee from 1992 until 2010, has rejoined the Board, effective January 1, 2012. Dr. Kennan is a Partner of Cambus-Kenneth Farm (thoroughbred horse breeding and general farming), and is also President Emeritus of Mount Holyoke College.
We would also like to take this opportunity to welcome new shareholders to the fund and to thank all of our investors for your continued confidence in Putnam.

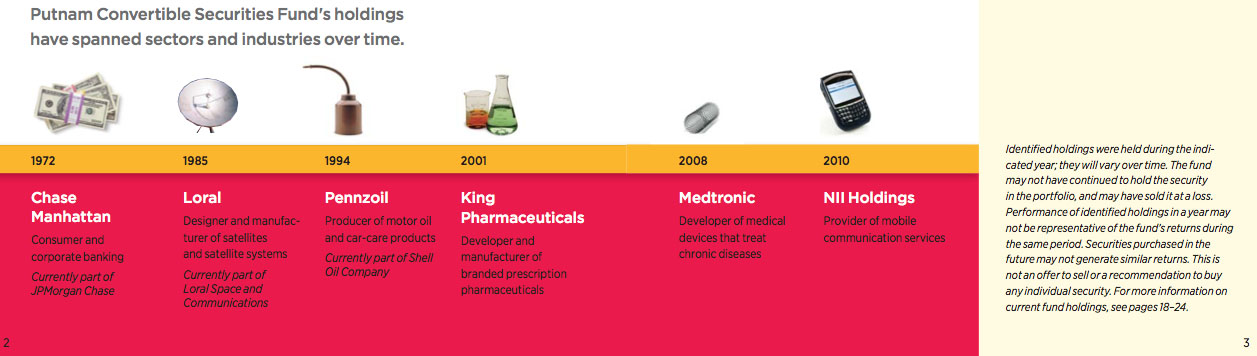
About the fund
Seeking undervalued companies before their potential is recognized
The differences between bonds and stocks seem fairly clear-cut. Stocks provide an ownership stake in a company; bonds provide a claim on the interest paid by a company or other entity on its debt. The value of stocks rises and falls with factors such as investor sentiment, company news, and economic conditions; bonds are issued by a government, agency, company, or public utility that typically promises to pay the bearer a fixed rate of interest at speci-fied intervals and to return a set amount of money at a specified end date (the maturity date). A bond’s yield and its price are often influenced by interest-rate levels and the issuer’s credit quality.
A convertible security is a hybrid of a stock and a bond. Like a bond, it offers a set rate of interest, but unlike a bond, it has a built-in option that, under certain circumstances, allows the investor to exchange (or convert) the security for a fixed number of shares of stock. This feature offers the potential for capital appreciation, since the preset conversion price does not change as the underlying stock price increases or decreases.
Convertibles are issued by companies and can offer greater returns than high-quality bonds — but they also carry greater risk potential, such as the risk of default or periodic illiquidity. Issuers range from large, well-known S&P 500 corporations and small, rapidly growing companies, to companies in cyclically depressed industries.
Investing successfully in convertible securities requires intensive research and analysis. The fund’s managers are supported by analysts who conduct rigorous fundamental research, seeking to determine the true worth of the issuing company’s business. The managers then construct a portfolio that they believe offers the best return potential while being mindful of risk.
The “busted” convertible
One kind of security in which your fund may invest is the “busted” convertible. “Busted” refers to a security whose underlying stock price has fallen significantly below the conversion price. It becomes much less sensitive to the volatility of the underlying stock and is more bond-like, responding to interest-rate changes. A busted convertible may pay a higher yield than other convertibles, but may also carry a higher level of risk. (Some companies in this situation may eventually default on their bonds.)
The objective of buying a busted convertible is to take advantage of a company’s eventual turnaround despite its present challenges. For example, a company undergoing management turmoil may draw negative investor reactions, causing its stock price to tumble. However, if intensive research determines that the management crisis is likely to be resolved, the fund managers could buy the security at a steep discount. The goal is to sell the security at a higher price when the credit improves or when the stock revives.

Current performance may be lower or higher than the quoted past performance, which cannot guarantee future results. Share price, principal value, and return will fluctuate, and you may have a gain or a loss when you sell your shares. Performance of class A shares assumes reinvestment of distributions and does not account for taxes. Fund returns in the bar chart do not reflect a sales charge of 5.75%; had they, returns would have been lower. See pages 5 and 11–13 for additional performance information. For a portion of the periods, the fund had expense limitations, without which returns would have been lower. A short-term trading fee of 1% may apply to redemptions or exchanges from certain funds within the time period specified in the fund’s prospectus. To obtain the most recent month-end performance, visit putnam.com.
* The fund’s benchmark, the BofA (Bank of America) Merrill Lynch All U.S. Convertibles Index, was introduced on 12/31/87, which post-dates the inception of the fund’s class A shares.
† Returns for the six-month period are not annualized, but cumulative.
4
Interview with your fund’s portfolio managers

How did Putnam Convertible Securities Fund perform for the six months ended April 30, 2012?
Eric: The fund produced a solid, single-digit return for the semiannual period. This return underperformed that of the fund’s benchmark, but it outpaced the average return of its Lipper peer group. Much of the fund’s underperformance occurred during the late fall of 2011. That was a period when global markets were selling off, mainly as a result of investors’ ongoing concerns about the European sovereign debt crisis.
The investment environment began to improve meaningfully as we entered 2012, however. The crisis in the eurozone began showing signs of stabilization; U.S. economic growth, while still slow, continued to move forward; and many corporate earnings reports began coming in strong. This brightening environment during the first quarter of 2012 helped push markets higher for the six months as a whole.
How did this volatile environment affect convertibles in particular?
Rob: The convertible securities market also sold off fairly dramatically during the latter part of 2011, but it, too, recovered during the opening months of 2012. Several factors helped drive the convertibles market forward. As Eric mentioned, the U.S. economic backdrop continued to exhibit modest improvement. Credit spreads on

This comparison shows your fund’s performance in the context of broad market indexes for the six months ended 4/30/12. See pages 4 and 11–13 for additional fund performance information. Index descriptions can be found on page 16.
5
high-yield corporate bonds began to narrow, a dynamic that tends to provide price support for convertible securities and for bonds in general. Perhaps most importantly, convertibles rebounded as a result of the gathering strength of the equities market during the first quarter of 2012.
When you own a convertible, you own two portions of a security. First, you own a steady income stream that generally provides more income than the dividend on the underlying equity. Second, you own a call option on the underlying equity, which is to say that you have the right, but not the obligation, to convert your holding into stock. In this way, investors can benefit from owning a convertible over most market cycles. Investors can participate in the upside potential of the underlying equity, which is what helped support the convertibles market during the early months of 2012, and they can benefit from the downside protection made available through the convertibles’ income stream.
What strategies did you pursue to take advantage of the improving investment environment?
Rob: We did not make any radical changes to our traditional investment strategy. What we saw early in the period was an environment in which we believed convertibles were trading cheaply relative to their theoretical valuations, and we believed that the market had overreacted. Thus, we began actively adding positions to the fund that we felt provided attractive risk-adjusted return potential. Some of these positions were added because we felt the underlying equities were undervalued in late 2011, and others because we felt the credit component of the convertible had been mispriced and thus offered higher yield potential. We added positions in the consumer discretionary, technology, and financials sectors, among others, which generally produced favorable results.
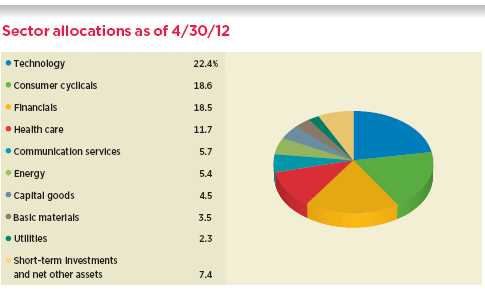
Allocations are represented as a percentage of the fund’s net assets. Summary information may differ from the portfolio schedule included in the financial statements due to the inclusion of derivative securities and the exclusion of as-of trades, if any. Holdings and allocations may vary over time.
6

Which holdings helped performance versus the fund’s benchmark index?
Eric: Equinix, a company that provides outsourced data centers and Internet exchanges for its corporate customers, performed well during the period, with its business enjoying cyclical and secular tailwinds as the data and connectivity needs of more and more companies increased. Equinix was an overweight position in the fund.
Another strong performer during the period was Interpublic Group of Companies, a global advertising holding company in which we held an overweight. Interpublic’s business benefited from increased advertising spending by its clients as the U.S. economy showed signs of improvement. The company also won several new client contracts during the period, thus adding to its earnings potential.
Novellus Systems, another overweight in the fund, was a strong contributor as well. Novellus, a leading supplier of products used in the manufacture of semiconductors, saw its securities perform well as the market first anticipated and then applauded the firm’s announced merger with Lam Research, also a supplier to semiconductor manufacturers.
The top-performing holding relative to the benchmark was Chesapeake Energy, a security in which we held an underweight compared with the benchmark. Chesapeake Energy, one of the largest natural gas and oil producers and distributors in the United States, performed poorly during the period,

This table shows the fund’s top 10 individual holdings and the percentage of the fund’s net assets that each represented as of 4/30/12. Short-term holdings are excluded. Holdings will vary over time.
7
as natural gas prices plunged to multi-year lows. By owning less of this security than is represented in the index, our underweighting actually made a positive contribution to relative performance.
Which holdings detracted from performance during the period?
Rob: Canada-based Goldcorp, one of the world’s largest gold mining companies, was a substantial detractor from relative results. The fund holds an out-of-benchmark position in this company, which hurt performance as improving economic growth caused gold prices to level off and then decline during the period. Although we continued to like the fundamentals of Goldcorp’s business, gold prices eased after a long period of rising, which presented what we believe may be a temporary headwind for this holding.
An overweight holding in Powerwave Technologies hurt performance as well. Powerwave is a provider of base stations and antennas for wireless networks. The company underperformed mainly as a result of a reduction in spending by major carriers like AT&T and some original equipment manufacturers like Nokia. We continue to hold an overweight in Powerwave based on our belief that capital expenditures by telecommunications carriers are likely to ramp up meaningfully in 2012 as these carriers invest in expanding their next-generation networks.
DFC Global, a provider of financial services for consumers with limited access to traditional banks and financial institutions in the United States, Canada, the United Kingdom, and eastern Europe, also proved to be a disappointing holding during the period. Investors seemed to be concerned about how potential regulatory changes, particularly in the United States, might affect the company’s business. We remain positive in our outlook for the company’s growth prospects, as the vast majority of DFC Global’s business is outside of the United States, where regulatory pressures on this industry appear to be more benign.

This chart shows how the fund’s top weightings have changed over the past six months. Weightings are shown as a percentage of net assets. Summary information may differ from the portfolio schedule included in the financial statements due to the inclusion of derivative securities, the exclusion of as-of trades, if any, and the use of different classifications of securities for presentation purposes. Holdings will vary over time.
8
The biggest source of underperformance came from the portfolio’s out-of-benchmark position in China Medical Technologies, a diagnostic medical device company based in China. This holding, which we have talked about in previous shareholder updates, performed poorly as the company recently failed to service its debt obligations.
What is your near-term outlook for convertible securities?
Eric: Overall, I would say we are guardedly optimistic. Our “guarded” posture mainly has to do with the ongoing storm clouds hanging over the eurozone and its protracted sovereign debt troubles. In our view, the potential of a serious financial shock still exists, given the enormity of the task to resolve the region’s debt issues.
On a more positive note, however, we are generally encouraged by the slowly improving economic backdrop in the United States. We believe that corporate credit spreads still have room to tighten, which, as Rob mentioned, would be supportive of convertible bond prices. Convertible valuations continue to be attractive in our view, and we believe that the profile of the convertibles market is now nicely balanced between current yield and capital appreciation potential.
In addition, we are beginning to see a slight return of new issue volume in convertible bonds, which historically has been a positive sign because new issues tend to perform well and provide a source of alpha, or excess performance. I would also mention that we currently are in a low-default environment for issuers of corporate credit. We believe that all of these factors represent tailwinds for convertible securities, contributing to our general optimism for this market over the next six months.
Gentlemen, thanks to you both for bringing us up to date.
The views expressed in this report are exclusively those of Putnam Management and are subject to change. They are not meant as investment advice.
Please note that the holdings discussed in this report may not have been held by the fund for the entire period. Portfolio composition is subject to review in accordance with the fund’s investment strategy and may vary in the future. Current and future portfolio holdings are subject to risk.
Portfolio Manager Eric N. Harthun has an M.B.A. from The University of Chicago Booth School of Business and a B.S. from San Diego State University. A CFA charterholder, Eric joined Putnam in 2000 and has been in the investment industry since 1994.
Portfolio Manager Robert L. Salvin has an M.B.A. from The University of Chicago Booth School of Business and a B.S. from the Wharton School of the University of Pennsylvania. He joined Putnam in 2000 and has been in the investment industry since 1986.
9
IN THE NEWS
Gasoline prices have dropped in recent weeks from the year-to-date high of $3.94 reached on April 2. As of June 4, 2012, the average price of a gallon of regular gasoline fell to $3.61, the U.S. Energy Information Administration reported. Driving the price declines were waning concerns over Iran’s nuclear program as well as sluggish demand from slow-growing economies in the United States and Europe. Meanwhile, the crude oil supply situation has improved, with some refineries that were slated for closure now coming back online. The recent drop in prices at the pump has led analysts to recalibrate their price predictions for the summer driving season. Just months ago, some predicted that gas prices could shoot above $4 a gallon and reach $5 by the summer. Now those price increases appear unlikely. Because high gas prices can hinder economic growth, falling prices could help by putting more money back into consumers’ pockets.
10
Your fund’s performance
This section shows your fund’s performance, price, and distribution information for periods ended April 30, 2012, the end of the first half of its current fiscal year. In accordance with regulatory requirements for mutual funds, we also include expense information taken from the fund’s current prospectus. Performance should always be considered in light of a fund’s investment strategy. Data represent past performance. Past performance does not guarantee future results. More recent returns may be less or more than those shown. Investment return and principal value will fluctuate, and you may have a gain or a loss when you sell your shares. Performance information does not reflect any deduction for taxes a shareholder may owe on fund distributions or on the redemption of fund shares. For the most recent month-end performance, please visit the Individual Investors section at putnam.com or call Putnam at 1-800-225-1581. Class R and class Y shares are not available to all investors. See the Terms and Definitions section in this report for definitions of the share classes offered by your fund.
Fund performance Total return for periods ended 4/30/12
| Class A | Class B | Class C | Class M | Class R | Class Y | |||||
| (inception dates) | (6/29/72) | (7/15/93) | (7/26/99) | (3/13/95) | (12/1/03) | (12/30/98) | ||||
| Before | After | Before | After | Net | Net | |||||
| sales | sales | Before | After | Before | After | sales | sales | asset | asset | |
| charge | charge | CDSC | CDSC | CDSC | CDSC | charge | charge | value | value | |
| Annual average | ||||||||||
| (life of fund) | 9.83% | 9.67% | 8.88% | 8.88% | 9.01% | 9.01% | 9.16% | 9.06% | 9.56% | 9.93% |
| 10 years | 88.53 | 77.73 | 74.84 | 74.84 | 74.83 | 74.83 | 79.28 | 73.02 | 83.88 | 93.32 |
| Annual average | 6.55 | 5.92 | 5.75 | 5.75 | 5.75 | 5.75 | 6.01 | 5.64 | 6.28 | 6.81 |
| 5 years | 12.31 | 5.85 | 8.13 | 6.22 | 8.16 | 8.16 | 9.52 | 5.67 | 10.96 | 13.71 |
| Annual average | 2.35 | 1.14 | 1.58 | 1.21 | 1.58 | 1.58 | 1.84 | 1.11 | 2.10 | 2.60 |
| 3 years | 60.76 | 51.51 | 57.12 | 54.12 | 57.20 | 57.20 | 58.32 | 52.82 | 59.54 | 62.04 |
| Annual average | 17.15 | 14.85 | 16.25 | 15.51 | 16.27 | 16.27 | 16.55 | 15.18 | 16.85 | 17.46 |
| 1 year | –5.64 | –11.06 | –6.41 | –10.98 | –6.35 | –7.27 | –6.13 | –9.41 | –5.89 | –5.44 |
| 6 months | 5.24 | –0.83 | 4.77 | –0.23 | 4.82 | 3.82 | 4.92 | 1.26 | 5.08 | 5.32 |
Current performance may be lower or higher than the quoted past performance, which cannot guarantee future results. After-sales-charge returns for class A and M shares reflect the deduction of the maximum 5.75% and 3.50% sales charge, respectively, levied at the time of purchase. Class B share returns after contingent deferred sales charge (CDSC) reflect the applicable CDSC, which is 5% in the first year, declining over time to 1% in the sixth year, and is eliminated thereafter. Class C share returns after CDSC reflect a 1% CDSC for the first year that is eliminated thereafter. Class R and Y shares have no initial sales charge or CDSC. Performance for class B, C, M, R, and Y shares before their inception is derived from the historical performance of class A shares, adjusted for the applicable sales charge (or CDSC) and the higher operating expenses for such shares, except for class Y shares, for which 12b-1 fees are not applicable.
For a portion of the periods, the fund had expense limitations, without which returns would have been lower.
Class B share performance does not reflect conversion to class A shares.
A short-term trading fee of 1% may apply to redemptions or exchanges from certain funds within the time period specified in the fund’s prospectus.
11
Comparative index returns For periods ended 4/30/12
| BofA (Bank of America) Merrill Lynch | Lipper Convertible Securities Funds | |
| All U.S. Convertibles Index | category average* | |
| Annual average (life of fund) | —† | 9.83% |
| 10 years | 79.72% | 72.56 |
| Annual average | 6.04 | 5.54 |
| 5 years | 15.16 | 12.18 |
| Annual average | 2.86 | 2.25 |
| 3 years | 60.00 | 51.46 |
| Annual average | 16.96 | 14.74 |
| 1 year | –3.53 | –5.93 |
| 6 months | 6.52 | 5.15 |
Index and Lipper results should be compared with fund performance before sales charge, before CDSC, or at net asset value.
* Over the 6-month, 1-year, 3-year, 5-year, 10-year, and life-of-fund periods ended 4/30/12, there were 72, 63, 54, 38, 31, and 1 fund(s), respectively, in this Lipper category.
† The fund’s benchmark, the BofA (Bank of America) Merrill Lynch All U.S. Convertibles Index, was introduced on 12/31/87, which post-dates the inception of the fund’s class A shares.
Fund price and distribution information For the six-month period ended 4/30/12
| Distributions | Class A | Class B | Class C | Class M | Class R | Class Y | ||
| Number | 2 | 2 | 2 | 2 | 2 | 2 | ||
| Income | $0.284 | $0.212 | $0.209 | $0.237 | $0.261 | $0.308 | ||
| Capital gains | — | — | — | — | — | — | ||
| Total | $0.284 | $0.212 | $0.209 | $0.237 | $0.261 | $0.308 | ||
| Before | After | Net | Net | Before | After | Net | Net | |
| sales | sales | asset | asset | sales | sales | asset | asset | |
| Share value | charge | charge | value | value | charge | charge | value | value |
| 10/31/11 | $18.97 | $20.13 | $18.66 | $18.79 | $18.81 | $19.49 | $18.91 | $18.97 |
| 4/30/12 | 19.67 | 20.87 | 19.33 | 19.48 | 19.49 | 20.20 | 19.60 | 19.66 |
| Before | After | Net | Net | Before | After | Net | Net | |
| sales | sales | asset | asset | sales | sales | asset | asset | |
| Current yield (end of period) | charge | charge | value | value | charge | charge | value | value |
| Current dividend rate 1 | 2.89% | 2.72% | 2.17% | 2.09% | 2.42% | 2.34% | 2.65% | 3.13% |
| Current 30-day SEC yield 2 | N/A | 2.12 | 1.51 | 1.51 | N/A | 1.69 | 2.00 | 2.50 |
The classification of distributions, if any, is an estimate. Before-sales-charge share value and current dividend rate for class A and M shares, if applicable, do not take into account any sales charge levied at the time of purchase. After-sales-charge share value, current dividend rate, and current 30-day SEC yield, if applicable, are calculated assuming that the maximum sales charge (5.75% for class A shares and 3.50% for class M shares) was levied at the time of purchase. Final distribution information will appear on your year-end tax forms.
1 Most recent distribution, excluding capital gains, annualized and divided by share price before or after sales charge at period-end.
2 Based only on investment income and calculated using the maximum offering price for each share class, in accordance with SEC guidelines.
12
Fund performance as of most recent calendar quarter
Total return for periods ended 3/31/12
| Class A | Class B | Class C | Class M | Class R | Class Y | |||||
| (inception dates) | (6/29/72) | (7/15/93) | (7/26/99) | (3/13/95) | (12/1/03) | (12/30/98) | ||||
| Before | After | Before | After | Net | Net | |||||
| sales | sales | Before | After | Before | After | sales | sales | asset | asset | |
| charge | charge | CDSC | CDSC | CDSC | CDSC | charge | charge | value | value | |
| Annual average | ||||||||||
| (life of fund) | 9.91% | 9.74% | 8.96% | 8.96% | 9.08% | 9.08% | 9.23% | 9.14% | 9.63% | 10.00% |
| 10 years | 88.43 | 77.60 | 74.84 | 74.84 | 74.84 | 74.84 | 79.29 | 73.02 | 83.80 | 93.22 |
| Annual average | 6.54 | 5.91 | 5.75 | 5.75 | 5.75 | 5.75 | 6.01 | 5.64 | 6.28 | 6.81 |
| 5 years | 17.39 | 10.64 | 13.01 | 11.01 | 13.00 | 13.00 | 14.47 | 10.46 | 15.89 | 18.87 |
| Annual average | 3.26 | 2.04 | 2.48 | 2.11 | 2.47 | 2.47 | 2.74 | 2.01 | 2.99 | 3.52 |
| 3 years | 79.71 | 69.33 | 75.61 | 72.61 | 75.71 | 75.71 | 76.95 | 70.77 | 78.27 | 81.14 |
| Annual average | 21.58 | 19.19 | 20.65 | 19.96 | 20.67 | 20.67 | 20.95 | 19.53 | 21.25 | 21.90 |
| 1 year | –1.94 | –7.57 | –2.73 | –7.48 | –2.69 | –3.65 | –2.47 | –5.90 | –2.20 | –1.69 |
| 6 months | 14.46 | 7.90 | 13.97 | 8.97 | 14.03 | 13.03 | 14.12 | 10.12 | 14.31 | 14.61 |
Your fund’s expenses
As a mutual fund investor, you pay ongoing expenses, such as management fees, distribution fees (12b-1 fees), and other expenses. Using the following information, you can estimate how these expenses affect your investment and compare them with the expenses of other funds. You may also pay one-time transaction expenses, including sales charges (loads) and redemption fees, which are not shown in this section and would have resulted in higher total expenses. For more information, see your fund’s prospectus or talk to your financial representative.
Expense ratios
| Class A | Class B | Class C | Class M | Class R | Class Y | |
| Total annual operating expenses for the fiscal year | ||||||
| ended 10/31/11 | 1.12% | 1.87% | 1.87% | 1.62% | 1.37% | 0.87% |
| Annualized expense ratio for the six-month period | ||||||
| ended 4/30/12 | 1.12% | 1.87% | 1.87% | 1.62% | 1.37% | 0.87% |
Fiscal-year expense information in this table is taken from the most recent prospectus, is subject to change, and may differ from that shown for the annualized expense ratio and in the financial highlights of this report. Expenses are shown as a percentage of average net assets.
13
Expenses per $1,000
The following table shows the expenses you would have paid on a $1,000 investment in the fund from November 1, 2011, to April 30, 2012. It also shows how much a $1,000 investment would be worth at the close of the period, assuming actual returns and expenses.
| Class A | Class B | Class C | Class M | Class R | Class Y | |
| Expenses paid per $1,000*† | $5.72 | $9.52 | $9.52 | $8.25 | $6.99 | $4.44 |
| Ending value (after expenses) | $1,052.40 | $1,047.70 | $1,048.20 | $1,049.20 | $1,050.80 | $1,053.20 |
* Expenses for each share class are calculated using the fund’s annualized expense ratio for each class, which represents the ongoing expenses as a percentage of average net assets for the six months ended 4/30/12. The expense ratio may differ for each share class.
† Expenses are calculated by multiplying the expense ratio by the average account value for the period; then multiplying the result by the number of days in the period; and then dividing that result by the number of days in the year.
Estimate the expenses you paid
To estimate the ongoing expenses you paid for the six months ended April 30, 2012, use the following calculation method. To find the value of your investment on November 1, 2011, call Putnam at 1-800-225-1581.

Compare expenses using the SEC’s method
The Securities and Exchange Commission (SEC) has established guidelines to help investors assess fund expenses. Per these guidelines, the following table shows your fund’s expenses based on a $1,000 investment, assuming a hypothetical 5% annualized return. You can use this information to compare the ongoing expenses (but not transaction expenses or total costs) of investing in the fund with those of other funds. All mutual fund shareholder reports will provide this information to help you make this comparison. Please note that you cannot use this information to estimate your actual ending account balance and expenses paid during the period.
| Class A | Class B | Class C | Class M | Class R | Class Y | |
| Expenses paid per $1,000*† | $5.62 | $9.37 | $9.37 | $8.12 | $6.87 | $4.37 |
| Ending value (after expenses) | $1,019.29 | $1,015.56 | $1,015.56 | $1,016.81 | $1,018.05 | $1,020.54 |
* Expenses for each share class are calculated using the fund’s annualized expense ratio for each class, which represents the ongoing expenses as a percentage of average net assets for the six months ended 4/30/12. The expense ratio may differ for each share class.
† Expenses are calculated by multiplying the expense ratio by the average account value for the period; then multiplying the result by the number of days in the period; and then dividing that result by the number of days in the year.
14
Terms and definitions
Important terms
Total return shows how the value of the fund’s shares changed over time, assuming you held the shares through the entire period and reinvested all distributions in the fund.
Before sales charge, or net asset value, is the price, or value, of one share of a mutual fund, without a sales charge. Before-sales-charge figures fluctuate with market conditions, and are calculated by dividing the net assets of each class of shares by the number of outstanding shares in the class.
After sales charge is the price of a mutual fund share plus the maximum sales charge levied at the time of purchase. After-sales-charge performance figures shown here assume the 5.75% maximum sales charge for class A shares and 3.50% for class M shares.
Contingent deferred sales charge (CDSC) is generally a charge applied at the time of the redemption of class B or C shares and assumes redemption at the end of the period. Your fund’s class B CDSC declines over time from a 5% maximum during the first year to 1% during the sixth year. After the sixth year, the CDSC no longer applies. The CDSC for class C shares is 1% for one year after purchase.
Share classes
Class A shares are generally subject to an initial sales charge and no CDSC (except on certain redemptions of shares bought without an initial sales charge).
Class B shares are not subject to an initial sales charge. They may be subject to a CDSC.
Class C shares are not subject to an initial sales charge and are subject to a CDSC only if the shares are redeemed during the first year.
Class M shares have a lower initial sales charge and a higher 12b-1 fee than class A shares and no CDSC (except on certain redemptions of shares bought without an initial sales charge).
Class R shares are not subject to an initial sales charge or CDSC and are available only to certain defined contribution plans.
Class Y shares are not subject to an initial sales charge or CDSC, and carry no 12b-1 fee. They are generally only available to corporate and institutional clients and clients in other approved programs.
Fixed-income terms
Current yield is the annual rate of return earned from dividends or interest of an investment. Current yield is expressed as a percentage of the price of a security, fund share, or principal investment.
Mortgage-backed security (MBS), also known as a mortgage “pass-through,” is a type of asset-backed security that is secured by a mortgage or collection of mortgages. The following are types of MBSs:
• Agency “pass-through” has its principal and interest backed by a U.S. government agency, such as the Federal National Mortgage Association (Fannie Mae), Government National Mortgage Association (Ginnie Mae), and Federal Home Loan Mortgage Corporation (Freddie Mac).
• Collateralized mortgage obligation (CMO) represents claims to specific cash flows from pools of home mortgages. The streams of principal and interest payments on the mortgages are distributed to the different classes of CMO interests in “tranches.” Each tranche may have different principal balances, coupon rates, prepayment risks, and maturity dates. A CMO is highly sensitive to changes in interest rates and any resulting change in the rate at which homeowners sell their properties, refinance, or otherwise prepay loans. CMOs are subject to prepayment, market, and liquidity risks.
• Interest-only (IO) security is a type of CMO in which the underlying asset is the interest portion of mortgage, Treasury, or bond payments.
• Non-agency residential mortgage-backed security (RMBS) is an MBS not backed by Fannie Mae, Ginnie Mae, or Freddie Mac. One type of RMBS is an Alt-A mortgage-backed security.
• Commercial mortgage-backed security (CMBS) is secured by the loan on a commercial property.
Yield curve is a graph that plots the yields of bonds with equal credit quality against their
15
differing maturity dates, ranging from shortest to longest. It is used as a benchmark for other debt, such as mortgage or bank lending rates.
Comparative indexes
Barclays U.S. Aggregate Bond Index is an unmanaged index of U.S. investment-grade fixed-income securities.
BofA (Bank of America) Merrill Lynch All U.S.
Convertibles Index is an unmanaged index of high-yield U.S. convertible securities.
BofA (Bank of America) Merrill Lynch U.S.
3-Month Treasury Bill Index is an unmanaged index that seeks to measure the performance of U.S. Treasury bills available in the marketplace.
S&P 500 Index is an unmanaged index of common stock performance.
Indexes assume reinvestment of all distributions and do not account for fees. Securities and performance of a fund and an index will differ. You cannot invest directly in an index.
Lipper is a third-party industry-ranking entity that ranks mutual funds. Its rankings do not reflect sales charges. Lipper rankings are based on total return at net asset value relative to other funds that have similar current investment styles or objectives as determined by Lipper. Lipper may change a fund’s category assignment at its discretion. Lipper category averages reflect performance trends for funds within a category.
Other information for shareholders
Important notice regarding delivery of shareholder documents
In accordance with Securities and Exchange Commission (SEC) regulations, Putnam sends a single copy of annual and semiannual shareholder reports, prospectuses, and proxy statements to Putnam shareholders who share the same address, unless a shareholder requests otherwise. If you prefer to receive your own copy of these documents, please call Putnam at 1-800-225-1581, and Putnam will begin sending individual copies within 30 days.
Proxy voting
Putnam is committed to managing our mutual funds in the best interests of our shareholders. The Putnam funds’ proxy voting guidelines and procedures, as well as information regarding how your fund voted proxies relating to portfolio securities during the 12-month period ended June 30, 2011, are available in the Individual Investors section of putnam.com, and on the SEC’s website, www.sec.gov. If you have questions about finding forms on the SEC’s website, you may call the SEC at 1-800-SEC-0330. You may also obtain the Putnam funds’ proxy voting guidelines and procedures at no charge by calling Putnam’s Shareholder Services at 1-800-225-1581.
Fund portfolio holdings
The fund will file a complete schedule of its portfolio holdings with the SEC for the first and third quarters of each fiscal year on Form N-Q. Shareholders may obtain the fund’s Forms N-Q on the SEC’s website at www.sec.gov. In addition, the fund’s Forms N-Q may be reviewed and copied at the SEC’s Public Reference Room in Washington, D.C. You may call the SEC at 1-800-SEC-0330 for information about the SEC’s website or the operation of the Public Reference Room.
Trustee and employee fund ownership
Putnam employees and members of the Board of Trustees place their faith, confidence, and, most importantly, investment dollars in Putnam mutual funds. As of April 30, 2012, Putnam employees had approximately $350,000,000 and the Trustees had approximately $80,000,000 invested in Putnam mutual funds. These amounts include investments by the Trustees’ and employees’ immediate family members as well as investments through retirement and deferred compensation plans.
16
Financial statements
A guide to financial statements
These sections of the report, as well as the accompanying Notes, constitute the fund’s financial statements.
The fund’s portfolio lists all the fund’s investments and their values as of the last day of the reporting period. Holdings are organized by asset type and industry sector, country, or state to show areas of concentration and diversification.
Statement of assets and liabilities shows how the fund’s net assets and share price are determined. All investment and non-investment assets are added together. Any unpaid expenses and other liabilities are subtracted from this total. The result is divided by the number of shares to determine the net asset value per share, which is calculated separately for each class of shares. (For funds with preferred shares, the amount subtracted from total assets includes the liquidation preference of preferred shares.)
Statement of operations shows the fund’s net investment gain or loss. This is done by first adding up all the fund’s earnings — from dividends and interest income — and subtracting its operating expenses to determine net investment income (or loss). Then, any net gain or loss the fund realized on the sales of its holdings — as well as any unrealized gains or losses over the period — is added to or subtracted from the net investment result to determine the fund’s net gain or loss for the fiscal period.
Statement of changes in net assets shows how the fund’s net assets were affected by the fund’s net investment gain or loss, by distributions to shareholders, and by changes in the number of the fund’s shares. It lists distributions and their sources (net investment income or realized capital gains) over the current reporting period and the most recent fiscal year-end. The distributions listed here may not match the sources listed in the Statement of operations because the distributions are determined on a tax basis and may be paid in a different period from the one in which they were earned. Dividend sources are estimated at the time of declaration. Actual results may vary. Any non-taxable return of capital cannot be determined until final tax calculations are completed after the end of the fund’s fiscal year.
Financial highlights provide an overview of the fund’s investment results, per-share distributions, expense ratios, net investment income ratios, and portfolio turnover in one summary table, reflecting the five most recent reporting periods. In a semiannual report, the highlights table also includes the current reporting period.
17
The fund’s portfolio 4/30/12 (Unaudited)
| CONVERTIBLE BONDS AND NOTES (71.2%)* | Principal amount | Value |
| Advertising and marketing services (0.5%) | ||
| Digital River, Inc. cv. sr. unsec. notes 2s, 2030 | $3,396,000 | $3,234,690 |
| 3,234,690 | ||
| Aerospace and defense (1.1%) | ||
| AAR Corp. cv. sr. unsec. notes 2 1/4s, 2016 | 4,490,000 | 4,041,000 |
| Triumph Group, Inc. 144A cv. sr. sub. notes 3.213s, 2026 | 1,305,000 | 3,012,919 |
| 7,053,919 | ||
| Airlines (0.4%) | ||
| Continental Airlines, Inc. cv. sr. unsec. unsub. notes 4 1/2s, 2015 | 2,010,000 | 2,761,238 |
| Lufthansa Malta Blue 144A cv. company guaranty sr. unsec. | ||
| notes 0 3/4s, 2017 | 17,000 | 22,825 |
| 2,784,063 | ||
| Automotive (1.9%) | ||
| Ford Motor Co. cv. sr. unsec. notes 4 1/4s, 2016 | 3,795,000 | 5,635,575 |
| Navistar International Corp. cv. sr. unsec. sub. notes 3s, 2014 | 2,895,000 | 2,985,469 |
| TRW Automotive, Inc. cv. company guaranty sr. unsec. | ||
| notes 3 1/2s, 2015 | 2,170,000 | 3,750,845 |
| 12,371,889 | ||
| Biotechnology (6.0%) | ||
| Amylin Pharmaceuticals, Inc. cv. sr. unsec. notes 3s, 2014 | 3,235,000 | 3,263,306 |
| Cubist Pharmaceuticals, Inc. cv. sr. unsec. notes 2 1/2s, 2017 | 3,160,000 | 4,961,200 |
| Dendreon Corp. cv. sr. unsec. notes 2 7/8s, 2016 | 5,970,000 | 4,790,925 |
| Gilead Sciences, Inc. cv. sr. unsec. notes 1 5/8s, 2016 | 6,740,000 | 8,938,588 |
| Illumina, Inc. 144A cv. sr. unsec. notes 0 1/4s, 2016 | 2,060,000 | 1,882,325 |
| Onyx Pharmaceuticals, Inc. cv. sr. unsec. notes 4s, 2016 | 2,160,000 | 2,975,400 |
| PDL BioPharma, Inc. cv. sr. unsec. notes 3 3/4s, 2015 | 3,205,000 | 3,301,150 |
| United Therapeutics Corp. 144A cv. sr. notes 1s, 2016 | 5,275,000 | 5,848,393 |
| Vertex Pharmaceuticals, Inc. cv. sr. unsec. sub. notes 3.35s, 2015 | 2,410,000 | 2,690,163 |
| 38,651,450 | ||
| Broadcasting (0.8%) | ||
| XM Satellite Radio, Inc. 144A cv. company | ||
| guaranty sr. unsec. sub. notes 7s, 2014 | 3,583,000 | 5,193,111 |
| 5,193,111 | ||
| Cable television (0.6%) | ||
| Virgin Media, Inc. cv. sr. unsec. notes 6 1/2s, 2016 (United Kingdom) | 2,410,000 | 3,645,125 |
| 3,645,125 | ||
| Coal (1.3%) | ||
| James River Coal Co. cv. sr. unsec. notes 3 1/8s, 2018 | 1,335,000 | 473,925 |
| Massey Energy Co. cv. company | ||
| guaranty sr. unsub. notes 3 1/4s, 2015 | 3,575,000 | 3,271,125 |
| Peabody Energy Corp. cv. jr. unsec. sub. debs. 4 3/4s, 2041 | 5,040,000 | 4,838,400 |
| 8,583,450 | ||
| Commercial and consumer services (3.2%) | ||
| Alliance Data Systems Corp. cv. sr. unsec. notes 1 3/4s, 2013 | 3,220,000 | 5,313,000 |
| CBIZ, Inc. 144A cv. sr. sub. notes 4 7/8s, 2015 | 3,660,000 | 3,852,150 |
| PHH Corp. cv. sr. unsec. notes 4s, 2014 | 4,395,000 | 4,241,175 |
| Priceline.com, Inc. 144A cv. sr. unsec. notes 1 1/4s, 2015 | 659,000 | 1,662,328 |
| Priceline.com, Inc. 144A cv. sr. unsec. unsub. notes 1s, 2018 | 5,304,000 | 5,886,910 |
| 20,955,563 | ||
| Communications equipment (0.5%) | ||
| Coinstar, Inc. cv. sr. unsec. unsub. notes 4s, 2014 | 1,935,000 | 3,250,800 |
| 3,250,800 | ||
18
| CONVERTIBLE BONDS AND NOTES (71.2%)* cont. | Principal amount | Value |
| Computers (2.9%) | ||
| EMC Corp. cv. sr. unsec. notes 1 3/4s, 2013 | $1,755,000 | $3,119,513 |
| EMC Corp. 144A cv. sr. unsec. notes 1 3/4s, 2013 | 5,360,000 | 9,527,400 |
| SanDisk Corp. cv. sr. unsec. notes 1 1/2s, 2017 | 6,085,000 | 6,305,581 |
| 18,952,494 | ||
| Consumer finance (1.0%) | ||
| DFC Global Corp. cv. sr. notes 3s, 2028 | 2,370,000 | 2,657,363 |
| DFC Global Corp. 144A cv. sr. unsec. unsub. notes 3 1/4s, 2017 | 3,794,000 | 3,993,185 |
| 6,650,548 | ||
| Consumer services (0.9%) | ||
| Hertz Global Holdings, Inc. cv. sr. unsec. notes 5 1/4s, 2014 | 2,970,000 | 5,784,075 |
| 5,784,075 | ||
| Electrical equipment (0.3%) | ||
| WESCO International, Inc. cv. company guaranty sr. unsec. | ||
| notes 6s, 2029 | 924,000 | 2,266,110 |
| 2,266,110 | ||
| Electronics (6.6%) | ||
| Advanced Micro Devices, Inc. cv. sr. unsec. notes 6s, 2015 | 7,391,000 | 7,612,730 |
| Intel Corp. cv. jr. sub. notes 3 1/4s, 2039 | 7,040,000 | 9,847,200 |
| Mentor Graphics Corp. cv. sub. unsec. notes 4s, 2031 | 4,175,000 | 4,446,375 |
| Micron Technology, Inc. 144A cv. sr. notes Ser. A, 1 1/2s, 2031 | 844,000 | 773,315 |
| Micron Technology, Inc. 144A cv. sr. unsec. notes 3 1/8s, 2032 | 3,276,000 | 3,101,963 |
| Micron Technology, Inc. 144A cv. sr. unsec. notes 2 3/8s, 2032 | 3,277,000 | 3,135,679 |
| TTM Technologies, Inc. cv. sr. unsec. notes 3 1/4s, 2015 | 5,930,000 | 6,159,788 |
| Vishay Intertechnology, Inc. 144A cv. sr. unsec. | ||
| notes 2 1/4s, 2041 | 4,660,000 | 3,757,125 |
| Xilinx, Inc. cv. sr. unsec. notes 2 5/8s, 2017 | 2,900,000 | 3,889,625 |
| 42,723,800 | ||
| Health-care services (2.5%) | ||
| Brookdale Senior Living, Inc. cv. sr. unsec. | ||
| unsub. notes 2 3/4s, 2018 | 5,522,000 | 5,204,485 |
| LifePoint Hospitals, Inc. cv. sr. sub. notes 3 1/2s, 2014 | 4,080,000 | 4,238,100 |
| Lincare Holdings, Inc. cv. sr. unsec. unsub. notes Ser. B, | ||
| 2 3/4s, 2037 | 4,065,000 | 4,344,469 |
| Providence Service Corp. (The) cv. sr. unsec. | ||
| sub. notes 6 1/2s, 2014 | 2,493,000 | 2,477,419 |
| 16,264,473 | ||
| Homebuilding (0.9%) | ||
| Lennar Corp. 144A cv. sr. notes 2 3/4s, 2020 | 3,967,000 | 5,648,016 |
| 5,648,016 | ||
| Insurance (1.1%) | ||
| Amtrust Financial Services, Inc. 144A cv. sr. unsec. | ||
| notes 5 1/2s, 2021 | 3,546,000 | 3,895,990 |
| Old Republic International Corp. cv. sr. unsec. | ||
| unsub. notes 8s, 2012 | 3,170,000 | 3,173,963 |
| 7,069,953 | ||
| Investment banking/Brokerage (1.8%) | ||
| Ares Capital Corp. 144A cv. sr. unsec. notes 5 3/4s, 2016 | 7,023,000 | 7,293,386 |
| KKR Financial Holdings, LLC cv. sr. unsec. notes 7 1/2s, 2017 | 3,255,000 | 4,536,656 |
| 11,830,042 | ||
19
| CONVERTIBLE BONDS AND NOTES (71.2%)* cont. | Principal amount | Value |
| Lodging/Tourism (2.9%) | ||
| Gaylord Entertainment Co. 144A cv. company | ||
| guaranty sr. unsec. notes 3 3/4s, 2014 | $3,125,000 | $4,058,594 |
| Host Hotels & Resorts LP 144A cv. company | ||
| guaranty sr. unsec. notes 2 1/2s, 2029 R | 5,030,000 | 6,777,925 |
| MGM Resorts International Co. cv. company | ||
| guaranty sr. unsec. notes 4 1/4s, 2015 | 7,825,000 | 8,284,719 |
| 19,121,238 | ||
| Manufacturing (1.5%) | ||
| General Cable Corp. cv. unsec. sub. notes stepped-coupon | ||
| 4 1/2s (2 1/4s, 11/15/19) 2029 †† | 4,205,000 | 4,504,817 |
| Trinity Industries, Inc. cv. unsec. sub. notes 3 7/8s, 2036 | 4,685,000 | 4,930,963 |
| 9,435,780 | ||
| Media (2.4%) | ||
| Liberty Interactive, LLC cv. sr. unsec. | ||
| unsub. notes 3 1/8s, 2023 | 5,590,000 | 6,694,025 |
| Liberty Media, LLC cv. sr. unsec. unsub. notes 3 1/2s, 2031 | 8,850,000 | 5,287,875 |
| MasTec, Inc. cv. company guaranty sr. unsec. | ||
| unsub. notes 4 1/4s, 2014 | 2,465,000 | 3,336,994 |
| 15,318,894 | ||
| Medical technology (2.2%) | ||
| China Medical Technologies, Inc. cv. sr. unsec. | ||
| bonds Ser. CMT, 4s, 2013 (China) (In default) † | 3,213,000 | 867,510 |
| China Medical Technologies, Inc. 144A cv. sr. unsec. | ||
| notes 6 1/4s, 2016 (China) (In default) † | 3,544,000 | 1,169,520 |
| Hologic, Inc. cv. sr. unsec. notes stepped-coupon 2s | ||
| (zero %, 12/15/16) 2037 †† | 5,070,000 | 5,462,925 |
| Teleflex, Inc. cv. sr. unsec. sub. notes 3 7/8s, 2017 | 5,606,000 | 6,636,103 |
| 14,136,058 | ||
| Metals (3.5%) | ||
| Goldcorp, Inc. cv. sr. notes 2s, 2014 (Canada) | 6,017,000 | 6,897,287 |
| Newmont Mining Corp. cv. company | ||
| guaranty sr. unsub. notes 1 5/8s, 2017 | 2,975,000 | 3,781,969 |
| Steel Dynamics, Inc. cv. sr. notes 5 1/8s, 2014 | 4,895,000 | 5,286,600 |
| U.S. Steel Corp. cv. sr. unsec. notes 4s, 2014 | 4,965,000 | 5,734,575 |
| USEC, Inc. cv. sr. unsec. notes 3s, 2014 | 2,000,000 | 820,000 |
| 22,520,431 | ||
| Oil and gas (2.3%) | ||
| Chesapeake Energy Corp. cv. sr. unsec. notes company | ||
| guaranty 2 1/2s, 2037 | 5,165,000 | 4,480,638 |
| Endeavour International Corp. 144A cv. company | ||
| guaranty sr. unsec. notes 5 1/2s, 2016 | 3,768,000 | 3,782,130 |
| Goodrich Petroleum Corp. cv. sr. unsec. unsub. notes 5s, 2029 | 3,485,000 | 3,363,025 |
| St. Mary Land & Exploration Co. cv. sr. unsec. notes 3.84s, 2027 | 2,480,000 | 3,003,900 |
| 14,629,693 | ||
| Pharmaceuticals (1.1%) | ||
| Endo Pharmaceuticals Holdings, Inc. cv. sr. unsec. | ||
| sub. notes 1 3/4s, 2015 | 5,360,000 | 7,061,800 |
| 7,061,800 | ||
| Real estate (2.1%) | ||
| Digital Realty Trust LP 144A cv. sr. unsec. notes 5 1/2s, 2029 R | 2,120,000 | 3,906,100 |
| iStar Financial, Inc. cv. sr. unsec. unsub. notes FRN 0.968s, 2012 R | 5,450,000 | 5,313,750 |
| Morgans Hotel Group Co. cv. sr. sub. notes 2 3/8s, 2014 | 5,145,000 | 4,463,288 |
| 13,683,138 | ||
20
| CONVERTIBLE BONDS AND NOTES (71.2%)* cont. | Principal amount | Value |
| Retail (1.0%) | ||
| Iconix Brand Group, Inc. 144A cv. sr. unsec. | ||
| sub. notes 2 1/2s, 2016 | $3,378,000 | $3,158,430 |
| Sonic Automotive, Inc. cv. sr. unsec. notes 5s, 2029 | 2,335,000 | 3,400,344 |
| 6,558,774 | ||
| Semiconductor (2.5%) | ||
| Linear Technology Corp. cv. sr. unsec. unsub. notes Ser. A, | ||
| 3s, 2027 | 4,685,000 | 4,919,250 |
| Novellus Systems, Inc. 144A cv. sr. notes 2 5/8s, 2041 | 4,965,000 | 6,604,940 |
| Photronics, Inc. 144A cv. sr. notes 3 1/4s, 2016 | 4,763,000 | 4,676,790 |
| 16,200,980 | ||
| Shipping (0.4%) | ||
| Genco Shipping & Trading, Ltd. cv. sr. unsec. notes 5s, 2015 | 4,400,000 | 2,832,500 |
| 2,832,500 | ||
| Software (5.2%) | ||
| DealerTrack Holdings, Inc 144A cv. company | ||
| guaranty sr. unsec. notes 1 1/2s, 2017 | 3,758,000 | 3,960,556 |
| Microsoft Corp. 144A cv. sr. unsec. notes zero %, 2013 | 6,671,000 | 7,271,390 |
| Safeguard Scientifics, Inc. cv. sr. unsec. | ||
| sub. notes 10 1/8s, 2014 | 8,600,000 | 11,233,750 |
| SYNNEX Corp. cv. sr. notes 4s, 2018 | 3,315,000 | 4,512,544 |
| TeleCommunication Systems, Inc. 144A cv. sr. unsec. | ||
| notes 4 1/2s, 2014 | 5,205,000 | 4,632,450 |
| TIBCO Software, Inc. 144A cv. sr. unsec. notes 2 1/4s, 2032 | 1,894,000 | 1,925,971 |
| 33,536,661 | ||
| Technology (2.1%) | ||
| CACI International, Inc. cv. sr. unsec. sub. notes 2 1/8s, 2014 | 4,090,000 | 4,989,800 |
| CACI International, Inc. 144A cv. sr. unsec. | ||
| sub. notes 2 1/8s, 2014 | 1,585,000 | 1,933,700 |
| ON Semiconductor Corp. cv. company guaranty sr. unsec. | ||
| sub. notes 2 5/8s, 2026 | 2,690,000 | 2,901,838 |
| ON Semiconductor Corp. 144A cv. company guaranty sr. unsec. | ||
| sub. notes 2 5/8s, 2026 | 3,645,000 | 3,932,044 |
| 13,757,382 | ||
| Technology services (1.3%) | ||
| DST Systems, Inc. cv. sr. unsec. unsub. bonds FRB Ser. C, | ||
| zero %, 2023 | 6,360,000 | 8,180,550 |
| 8,180,550 | ||
| Telecommunications (3.8%) | ||
| Equinix, Inc. cv. unsec. sub. notes 3s, 2014 | 4,885,000 | 7,706,088 |
| Level 3 Communications, Inc. cv. sr. unsec. | ||
| unsub. notes 6 1/2s, 2016 | 3,365,000 | 5,009,644 |
| Powerwave Technologies, Inc. cv. sr. unsec. | ||
| sub. notes 3 7/8s, 2027 | 5,121,000 | 1,421,078 |
| SBA Communications Corp. cv. sr. unsec. notes 1 7/8s, 2013 | 8,120,000 | 10,657,500 |
| 24,794,310 | ||
| Telephone (0.9%) | ||
| Leap Wireless International, Inc. cv. sr. unsec. | ||
| notes 4 1/2s, 2014 | 6,255,000 | 5,856,244 |
| 5,856,244 | ||
| Trucks and parts (1.0%) | ||
| Meritor, Inc. cv. company guaranty sr. unsec. | ||
| notes stepped-coupon 4 5/8s (zero %, 3/1/16) 2026 †† | 6,890,000 | 6,175,163 |
| 6,175,163 | ||
21
| CONVERTIBLE BONDS AND NOTES (71.2%)* cont. | Principal amount | Value |
| Waste Management (0.7%) | ||
| Covanta Holding Corp. cv. sr. unsec. notes 3 1/4s, 2014 | $3,790,000 | $4,287,424 |
| 4,287,424 | ||
| Total convertible bonds and notes (cost $436,890,904) | $461,000,591 | |
| CONVERTIBLE PREFERRED STOCKS (23.4%)* | Shares | Value |
| Automotive (1.2%) | ||
| General Motors Co. Ser. B, $2.375 cv. pfd. | 194,630 | $7,602,734 |
| 7,602,734 | ||
| Banking (5.9%) | ||
| Bank of America Corp. Ser. L, 7.25% cv. pfd. | 10,685 | 10,391,163 |
| Citigroup, Inc. $7.50 cv. pfd. | 119,560 | 11,616,450 |
| Huntington Bancshares Ser. A, 8.50% cv. pfd. | 1,827 | 2,097,396 |
| Wells Fargo & Co. Ser. L, 7.50% cv. pfd. | 12,415 | 13,904,800 |
| 38,009,809 | ||
| Communications equipment (0.8%) | ||
| Lucent Technologies Capital Trust I 7.75% cv. pfd. | 6,505 | 5,041,375 |
| 5,041,375 | ||
| Consumer (1.0%) | ||
| Stanley Black & Decker, Inc. $4.75 cv. pfd. | 54,941 | 6,565,450 |
| 6,565,450 | ||
| Electric utilities (2.3%) | ||
| Great Plains Energy, Inc. $6.00 cv. pfd. | 103,367 | 6,353,969 |
| PPL Corp. $4.375 cv. pfd. | 164,060 | 8,449,090 |
| 14,803,059 | ||
| Financial (1.3%) | ||
| AMG Capital Trust II $2.575 cv. pfd. | 190,390 | 8,174,871 |
| 8,174,871 | ||
| Food (0.6%) | ||
| Bunge, Ltd. $4.875 cv. pfd. | 43,885 | 4,174,561 |
| 4,174,561 | ||
| Insurance (2.0%) | ||
| Hartford Financial Services Group, Inc. (The) Ser. F, | ||
| $1.182 cv. pfd. | 204,583 | 4,398,535 |
| MetLife, Inc. $3.75 cv. pfd. | 120,713 | 8,303,847 |
| 12,702,382 | ||
| Media (2.5%) | ||
| Interpublic Group of Cos, Inc. (The) Ser. B, 5.25% cv. pfd. | 8,530 | 9,127,100 |
| Nielsen Holdings NV $3.125 cv. pfd. | 131,150 | 7,377,188 |
| 16,504,288 | ||
| Oil and gas (1.6%) | ||
| Apache Corp. Ser. D, $3.00 cv. pfd. | 138,636 | 7,347,708 |
| Chesapeake Energy Corp. 144A 5.75% cv. pfd. | 3,694 | 3,186,075 |
| 10,533,783 | ||
| Real estate (3.4%) | ||
| Alexandria Real Estate Equities, Inc. Ser. D, $1.75 cv. pfd. | 282,425 | 7,439,075 |
| Entertainment Properties Trust Ser. C, $1.438 cum. cv. pfd. | 325,175 | 6,721,985 |
| Health Care REIT, Inc. Ser. I, $3.25 cv. pfd. | 148,315 | 7,934,853 |
| 22,095,913 | ||
| Shipping (0.8%) | ||
| Swift Mandatory Common Exchange Security Trust 144A | ||
| 6.00% cv. pfd. | 505,665 | 5,124,253 |
| 5,124,253 | ||
| Total convertible preferred stocks (cost $154,214,725) | $151,332,478 | |
22
| COMMON STOCKS (1.3%)* | Shares | Value | ||
| Advanced Micro Devices, Inc. † | 192,010 | $1,413,194 | ||
| Bed Bath & Beyond, Inc. † | 22,620 | 1,592,222 | ||
| Brazil Ethanol, Inc. 144A (Unit) † | 312,500 | 3,125 | ||
| Comcast Corp. Class A | 50,645 | 1,536,063 | ||
| DISH Network Corp. Class A | 45,045 | 1,440,089 | ||
| Hess Corp. | 22,235 | 1,159,333 | ||
| Oracle Corp. | 47,350 | 1,391,617 | ||
| Total common stocks (cost $10,671,333) | $8,535,643 | |||
| CORPORATE BONDS AND NOTES (0.9%)* | Principal amount | Value | ||
| Clearwire Communications, LLC/Clearwire Finance, Inc. 144A | ||||
| company guaranty sr. notes 12s, 2017 | $2,787,000 | $2,076,315 | ||
| Jazz Technologies, Inc. company guaranty sr. unsec. | ||||
| notes 8s, 2015 | 2,857,000 | 2,289,171 | ||
| Provident Funding Associates LP/PFG Finance Corp. 144A | ||||
| sr. notes 10 1/8s, 2019 | 1,840,000 | 1,646,800 | ||
| Total corporate bonds and notes (cost $5,570,845) | $6,012,286 | |||
| WARRANTS (—%)* † | Expiration | Strike | ||
| date | price | Warrants | Value | |
| Tower Semiconductor, Ltd. 144A (Israel) F | 6/30/15 | $0.01 | 1,085,630 | $260,551 |
| Total warrants (cost $217,126) | $260,551 | |||
| SHORT-TERM INVESTMENTS (2.3%)* | Shares | Value | ||
| Putnam Money Market Liquidity Fund 0.10% e | 14,788,994 | $14,788,994 | ||
| Total short-term investments (cost $14,788,994) | $14,788,994 | |||
| TOTAL INVESTMENTS | ||||
| Total investments (cost $622,353,927) | $641,930,543 | |||
Key to holding’s abbreviations
| FRB | Floating Rate Bonds: the rate shown is the current interest rate at the close of the reporting period |
| FRN | Floating Rate Notes: the rate shown is the current interest rate at the close of the reporting period |
Notes to the fund’s portfolio
Unless noted otherwise, the notes to the fund’s portfolio are for the close of the fund’s reporting period, which ran from November 1, 2011 through April 30, 2012 (the reporting period). Within the following notes to the portfolio, references to “ASC 820” represent Accounting Standards Codification ASC 820 Fair Value Measurements and Disclosures.
* Percentages indicated are based on net assets of $647,496,845.
† Non-income-producing security.
†† The interest rate and date shown parenthetically represent the new interest rate to be paid and the date the fund will begin accruing interest at this rate.e See Note 6 to the financial statements regarding investments in Putnam Money Market Liquidity Fund. The rate quoted in the security description is the annualized 7-day yield of the fund at the close of the reporting period.
F Is valued at fair value following procedures approved by the Trustees. Securities may be classified as Level 2 or Level 3 for ASC 820 based on the securities’ valuation inputs.
R Real Estate Investment Trust.
Debt obligations are considered secured unless otherwise indicated.
23
144A after the name of an issuer represents securities exempt from registration under Rule 144A under the Securities Act of 1933, as amended. These securities may be resold in transactions exempt from registration, normally to qualified institutional buyers.
The dates shown on debt obligations are the original maturity dates.
ASC 820 establishes a three-level hierarchy for disclosure of fair value measurements. The valuation hierarchy is based upon the transparency of inputs to the valuation of the fund’s investments. The three levels are defined as follows:
Level 1: Valuations based on quoted prices for identical securities in active markets.
Level 2: Valuations based on quoted prices in markets that are not active or for which all significant inputs are observable, either directly or indirectly.
Level 3: Valuations based on inputs that are unobservable and significant to the fair value measurement.
The following is a summary of the inputs used to value the fund’s net assets as of the close of the reporting period:
| Valuation inputs | |||
| Investments in securities: | Level 1 | Level 2 | Level 3 |
| Common stocks: | |||
| Communication services | $2,976,152 | $— | $— |
| Consumer cyclicals | 1,592,222 | — | — |
| Energy | 1,159,333 | 3,125 | — |
| Technology | 2,804,811 | — | — |
| Total common stocks | 8,532,518 | 3,125 | — |
| Convertible bonds and notes | — | 461,000,591 | — |
| Convertible preferred stocks | — | 151,332,478 | — |
| Corporate bonds and notes | — | 6,012,286 | — |
| Warrants | — | — | 260,551 |
| Short-term investments | 14,788,994 | — | — |
| Totals by level | $23,321,512 | $618,348,480 | $260,551 |
At the start and/or close of the reporting period, Level 3 investments in securities were not considered a significant portion of the fund’s portfolio.
The accompanying notes are an integral part of these financial statements.
24
Statement of assets and liabilities 4/30/12 (Unaudited)
| ASSETS | |
| Investment in securities, at value (Note 1): | |
| Unaffiliated issuers (identified cost $607,564,933) | $627,141,549 |
| Affiliated issuers (identified cost $14,788,994) (Notes 1 and 6) | 14,788,994 |
| Dividends, interest and other receivables | 4,659,200 |
| Receivable for shares of the fund sold | 444,529 |
| Receivable for investments sold | 2,737,653 |
| Total assets | 649,771,925 |
| LIABILITIES | |
| Payable for shares of the fund repurchased | 1,442,392 |
| Payable for compensation of Manager (Note 2) | 339,446 |
| Payable for investor servicing fees (Note 2) | 96,143 |
| Payable for custodian fees (Note 2) | 5,827 |
| Payable for Trustee compensation and expenses (Note 2) | 166,792 |
| Payable for administrative services (Note 2) | 7,609 |
| Payable for distribution fees (Note 2) | 150,744 |
| Other accrued expenses | 66,127 |
| Total liabilities | 2,275,080 |
| Net assets | $647,496,845 |
| REPRESENTED BY | |
| Paid-in capital (Unlimited shares authorized) (Notes 1 and 4) | $709,143,096 |
| Undistributed net investment income (Note 1) | 12,620,569 |
| Accumulated net realized loss on investments and foreign currency transactions (Note 1) | (93,843,436) |
| Net unrealized appreciation of investments | 19,576,616 |
| Total — Representing net assets applicable to capital shares outstanding | $647,496,845 |
| COMPUTATION OF NET ASSET VALUE AND OFFERING PRICE | |
| Net asset value and redemption price per class A share | |
| ($480,872,403 divided by 24,453,119 shares) | $19.67 |
| Offering price per class A share (100/94.25 of $19.67)* | $20.87 |
| Net asset value and offering price per class B share ($11,609,274 divided by 600,491 shares)** | $19.33 |
| Net asset value and offering price per class C share ($45,646,929 divided by 2,343,546 shares)** | $19.48 |
| Net asset value and redemption price per class M share ($3,691,962 divided by 189,417 shares) | $19.49 |
| Offering price per class M share (100/96.50 of $19.49)* | $20.20 |
| Net asset value, offering price and redemption price per class R share | |
| ($4,021,478 divided by 205,227 shares) | $19.60 |
| Net asset value, offering price and redemption price per class Y share | |
| ($101,654,799 divided by 5,171,187 shares) | $19.66 |
* On single retail sales of less than $50,000. On sales of $50,000 or more the offering price is reduced.
** Redemption price per share is equal to net asset value less any applicable contingent deferred sales charge.
The accompanying notes are an integral part of these financial statements.
25
Statement of operations Six months ended 4/30/12 (Unaudited)
| INVESTMENT INCOME | |
| Dividends | $5,572,462 |
| Interest (including interest income of $6,729 from investments in affiliated issuers) (Note 6) | 3,922,349 |
| Securities lending (Note 1) | 19,343 |
| Total investment income | 9,514,154 |
| EXPENSES | |
| Compensation of Manager (Note 2) | 2,063,162 |
| Investor servicing fees (Note 2) | 604,999 |
| Custodian fees (Note 2) | 7,023 |
| Trustee compensation and expenses (Note 2) | 29,720 |
| Administrative services (Note 2) | 12,438 |
| Distribution fees — Class A (Note 2) | 594,557 |
| Distribution fees — Class B (Note 2) | 59,306 |
| Distribution fees — Class C (Note 2) | 248,463 |
| Distribution fees — Class M (Note 2) | 13,439 |
| Distribution fees — Class R (Note 2) | 9,479 |
| Other | 96,648 |
| Total expenses | 3,739,234 |
| Expense reduction (Note 2) | (5,033) |
| Net expenses | 3,734,201 |
| Net investment income | 5,779,953 |
| Net realized gain on investments (Notes 1 and 3) | 17,687,765 |
| Net realized loss on foreign currency transactions (Note 1) | (8,368) |
| Net unrealized appreciation of investments during the period | 9,281,441 |
| Net gain on investments | 26,960,838 |
| Net increase in net assets resulting from operations | $32,740,791 |
The accompanying notes are an integral part of these financial statements.
26
Statement of changes in net assets
| INCREASE (DECREASE) IN NET ASSETS | Six months ended 4/30/12* | Year ended 10/31/11 |
| Operations: | ||
| Net investment income | $5,779,953 | $13,500,069 |
| Net realized gain on investments | ||
| and foreign currency transactions | 17,679,397 | 35,377,995 |
| Net unrealized appreciation (depreciation) of investments | 9,281,441 | (45,986,537) |
| Net increase in net assets resulting from operations | 32,740,791 | 2,891,527 |
| Distributions to shareholders (Note 1): | ||
| From ordinary income | ||
| Net investment income | ||
| Class A | (7,029,034) | (14,640,547) |
| Class B | (132,191) | (272,720) |
| Class C | (543,291) | (1,274,396) |
| Class M | (44,655) | (95,274) |
| Class R | (52,132) | (95,658) |
| Class Y | (1,690,119) | (3,336,866) |
| Increase in capital from settlement payments (Note 8) | — | 129,793 |
| Redemption fees (Note 1) | 7,233 | 23,749 |
| Increase (decrease) from capital share transactions (Note 4) | (39,134,328) | 23,623,025 |
| Total increase (decrease) in net assets | (15,877,726) | 6,952,633 |
| NET ASSETS | ||
| Beginning of period | 663,374,571 | 656,421,938 |
| End of period (including undistributed net investment | ||
| income of $12,620,569 and $16,332,038, respectively) | $647,496,845 | $663,374,571 |
* Unaudited
The accompanying notes are an integral part of these financial statements.
27
Financial highlights (For a common share outstanding throughout the period)
| INVESTMENT OPERATIONS: | LESS DISTRIBUTIONS: | RATIOS AND SUPPLEMENTAL DATA: | ||||||||||||
| Ratio | Ratio | |||||||||||||
| Net realized | of expenses | of net investment | ||||||||||||
| Net asset value, | and unrealized | Total from | From | Total return | Net assets, | to average | income (loss) | Portfolio | ||||||
| beginning | Net investment | gain (loss) | investment | net investment | Total | Redemption | Non-recurring | Net asset value, | at net asset | end of period | net assets | to average | turnover | |
| Period ended | of period | income (loss) a | on investments | operations | income | distributions | fees b | reimbursements | end of period | value (%) c | (in thousands) | (%) d | net assets (%) | (%) |
| Class A | ||||||||||||||
| April 30, 2012** | $18.97 | .17 | .81 | .98 | (.28) | (.28) | — | — | $19.67 | 5.24* | $480,872 | .56* | .90* | 28* |
| October 31, 2011 | 19.31 | .39 | (.16) | .23 | (.57) | (.57) | — | — b,e | 18.97 | 1.08 | 484,050 | 1.12 | 1.94 | 79 |
| October 31, 2010 | 16.27 | .54 | 3.07 | 3.61 | (.57) | (.57) | — | — b,f | 19.31 | 22.48 | 495,949 | 1.18 | 3.03 | 71 |
| October 31, 2009 | 12.55 | .55 | 3.73 | 4.28 | (.56) | (.56) | — | — | 16.27 | 35.08 | 467,669 | 1.20 g | 4.00 g | 74 |
| October 31, 2008 | 21.21 | .51 | (8.64) | (8.13) | (.53) | (.53) | — | — | 12.55 | (39.13) | 402,408 | 1.06 g | 2.73 g | 68 |
| October 31, 2007 | 19.05 | .51 | 2.18 | 2.69 | (.53) | (.53) | — | — | 21.21 | 14.27 | 697,830 | 1.04 g | 2.50 g | 71 |
| Class B | ||||||||||||||
| April 30, 2012** | $18.66 | .10 | .78 | .88 | (.21) | (.21) | — | — | $19.33 | 4.77* | $11,609 | .93* | .53* | 28* |
| October 31, 2011 | 18.99 | .23 | (.14) | .09 | (.42) | (.42) | — | — b,e | 18.66 | .40 | 12,281 | 1.87 | 1.19 | 79 |
| October 31, 2010 | 16.01 | .40 | 3.01 | 3.41 | (.43) | (.43) | — | — b,f | 18.99 | 21.52 | 12,205 | 1.93 | 2.28 | 71 |
| October 31, 2009 | 12.35 | .44 | 3.67 | 4.11 | (.45) | (.45) | — | — | 16.01 | 34.12 | 14,351 | 1.95 g | 3.30 g | 74 |
| October 31, 2008 | 20.87 | .36 | (8.51) | (8.15) | (.37) | (.37) | — | — | 12.35 | (39.61) | 15,297 | 1.81 g | 1.96 g | 68 |
| October 31, 2007 | 18.75 | .35 | 2.14 | 2.49 | (.37) | (.37) | — | — | 20.87 | 13.40 | 37,930 | 1.79 g | 1.77 g | 71 |
| Class C | ||||||||||||||
| April 30, 2012** | $18.79 | .10 | .80 | .90 | (.21) | (.21) | — | — | $19.48 | 4.82* | $45,647 | .93* | .54* | 28* |
| October 31, 2011 | 19.13 | .24 | (.16) | .08 | (.42) | (.42) | — | — b,e | 18.79 | .32 | 53,696 | 1.87 | 1.19 | 79 |
| October 31, 2010 | 16.12 | .40 | 3.04 | 3.44 | (.43) | (.43) | — | — b,f | 19.13 | 21.58 | 57,211 | 1.93 | 2.27 | 71 |
| October 31, 2009 | 12.44 | .43 | 3.71 | 4.14 | (.46) | (.46) | — | — | 16.12 | 34.12 | 56,131 | 1.95 g | 3.13 g | 74 |
| October 31, 2008 | 21.04 | .37 | (8.58) | (8.21) | (.39) | (.39) | — | — | 12.44 | (39.60) | 33,539 | 1.81 g | 2.00 g | 68 |
| October 31, 2007 | 18.92 | .35 | 2.16 | 2.51 | (.39) | (.39) | — | — | 21.04 | 13.36 | 38,347 | 1.79 g | 1.73 g | 71 |
| Class M | ||||||||||||||
| April 30, 2012** | $18.81 | .12 | .80 | .92 | (.24) | (.24) | — | — | $19.49 | 4.92* | $3,692 | .80* | .65* | 28* |
| October 31, 2011 | 19.14 | .29 | (.16) | .13 | (.46) | (.46) | — | — b,e | 18.81 | .61 | 3,546 | 1.62 | 1.46 | 79 |
| October 31, 2010 | 16.13 | .45 | 3.04 | 3.49 | (.48) | (.48) | — | — b,f | 19.14 | 21.85 | 4,598 | 1.68 | 2.53 | 71 |
| October 31, 2009 | 12.45 | .47 | 3.71 | 4.18 | (.50) | (.50) | — | — | 16.13 | 34.41 | 4,383 | 1.70 g | 3.40 g | 74 |
| October 31, 2008 | 21.04 | .41 | (8.57) | (8.16) | (.43) | (.43) | — | — | 12.45 | (39.44) | 3,133 | 1.56 g | 2.22 g | 68 |
| October 31, 2007 | 18.90 | .40 | 2.17 | 2.57 | (.43) | (.43) | — | — | 21.04 | 13.70 | 6,175 | 1.54 g | 2.00 g | 71 |
| Class R | ||||||||||||||
| April 30, 2012** | $18.91 | .15 | .80 | .95 | (.26) | (.26) | — | — | $19.60 | 5.08* | $4,021 | .68* | .77* | 28* |
| October 31, 2011 | 19.24 | .34 | (.15) | .19 | (.52) | (.52) | — | — b,e | 18.91 | .88 | 3,595 | 1.37 | 1.69 | 79 |
| October 31, 2010 | 16.22 | .50 | 3.04 | 3.54 | (.52) | (.52) | — | — b,f | 19.24 | 22.12 | 3,434 | 1.43 | 2.77 | 71 |
| October 31, 2009 | 12.51 | .51 | 3.73 | 4.24 | (.53) | (.53) | — | — | 16.22 | 34.79 | 2,685 | 1.45 g | 3.73 g | 74 |
| October 31, 2008 | 21.15 | .47 | (8.62) | (8.15) | (.49) | (.49) | — | — | 12.51 | (39.29) | 2,255 | 1.31 g | 2.50 g | 68 |
| October 31, 2007 | 19.01 | .45 | 2.18 | 2.63 | (.49) | (.49) | — | — | 21.15 | 13.96 | 2,164 | 1.29 g | 2.20 g | 71 |
| Class Y | ||||||||||||||
| April 30, 2012** | $18.97 | .20 | .80 | 1.00 | (.31) | (.31) | — | — | $19.66 | 5.32* | $101,655 | .43* | 1.03* | 28* |
| October 31, 2011 | 19.30 | .44 | (.15) | .29 | (.62) | (.62) | — | — b,e | 18.97 | 1.40 | 106,207 | .87 | 2.17 | 79 |
| October 31, 2010 | 16.27 | .59 | 3.05 | 3.64 | (.61) | (.61) | — | — b,f | 19.30 | 22.73 | 83,025 | .93 | 3.27 | 71 |
| October 31, 2009 | 12.55 | .57 | 3.74 | 4.31 | (.59) | (.59) | — | — | 16.27 | 35.43 | 70,660 | .95 g | 3.93 g | 74 |
| October 31, 2008 | 21.21 | .56 | (8.64) | (8.08) | (.58) | (.58) | — | — | 12.55 | (38.97) | 21,115 | .81 g | 3.00 g | 68 |
| October 31, 2007 | 19.05 | .56 | 2.18 | 2.74 | (.58) | (.58) | — | — | 21.21 | 14.56 | 27,084 | .79 g | 2.75 g | 71 |
See notes to financial highlights at the end of this section.
The accompanying notes are an integral part of these financial statements.
| 28 | 29 |
Financial highlights (Continued)
* Not annualized.
** Unaudited.
a Per share net investment income (loss) has been determined on the basis of the weighted average number of shares outstanding during the period.
b Amount represents less than $0.01 per share.
c Total return assumes dividend reinvestment and does not reflect the effect of sales charges.
d Includes amounts paid through expense offset and brokerage/service arrangements (Note 2).
e Reflects a non-recurring reimbursement related to restitution amounts in connection with a distribution plan approved by the Securities and Exchange Commission (the SEC) which amounted to less than $0.01 per share outstanding on July 21, 2011. Also reflects a non-recurring reimbursement related to short-term trading related lawsuits, which amounted to less than $0.01 per share outstanding on May 11, 2011 (Note 8).
f Reflects a non-recurring reimbursement pursuant to a settlement between the SEC and Prudential Securities, Inc., which amounted to less than $0.01 per share outstanding on March 30, 2010.
g Reflects an involuntary contractual expense limitation in effect during the period. For periods prior to October 31, 2009, certain fund expenses were waived in connection with the fund’s investment in Putnam Prime Money Market Fund. As a result of such limitation and/or waivers, the expenses of each class reflect a reduction of the following amounts:
| Percentage of | |
| average net assets | |
| October 31, 2009 | 0.06% |
| October 31, 2008 | <0.01 |
| October 31, 2007 | <0.01 |
The accompanying notes are an integral part of these financial statements.
30
Notes to financial statements 4/30/12 (Unaudited)
Within the following Notes to financial statements, references to “State Street” represent State Street Bank and Trust Company, references to “the SEC” represent the Securities and Exchange Commission and references to “Putnam Management” represent Putnam Investment Management, LLC, the fund’s manager, an indirect wholly-owned subsidiary of Putnam Investments, LLC.
Putnam Convertible Securities Fund (the fund) is a Massachusetts business trust, which is registered under the Investment Company Act of 1940, as amended, as a diversified open-end management investment company. The fund seeks, with equal emphasis, current income and capital appreciation. Its secondary objective is conservation of capital. The fund invests mainly in convertible securities of U.S. companies. Convertible securities combine the investment characteristics of bonds and common stocks. Convertible securities include bonds, preferred stocks and other instruments that can be converted into or exchanged for common stock or equivalent value. Many convertible securities are below investment-grade and a significant portion of the convertible securities the fund buys are below investment-grade.
The fund offers class A, class B, class C, class M, class R and class Y shares. Class A and class M shares are sold with a maximum front-end sales charge of 5.75% and 3.50%, respectively, and generally do not pay a contingent deferred sales charge. Class B shares, which convert to class A shares after approximately eight years, do not pay a front-end sales charge and are subject to a contingent deferred sales charge if those shares are redeemed within six years of purchase. Class C shares have a one-year 1.00% contingent deferred sales charge and do not convert to class A shares. Class R shares, which are not available to all investors, are sold at net asset value. The expenses for class A, class B, class C, class M and class R shares may differ based on the distribution fee of each class, which is identified in Note 2. Class Y shares, which are sold at net asset value, are generally subject to the same expenses as class A, class B, class C, class M and class R shares, but do not bear a distribution fee. Class Y shares are not available to all investors.
In the normal course of business, the fund enters into contracts that may include agreements to indemnify another party under given circumstances. The fund’s maximum exposure under these arrangements is unknown as this would involve future claims that may be, but have not yet been, made against the fund. However, the fund’s management team expects the risk of material loss to be remote.
Note 1: Significant accounting policies
The following is a summary of significant accounting policies consistently followed by the fund in the preparation of its financial statements. The preparation of financial statements is in conformity with accounting principles generally accepted in the United States of America and requires management to make estimates and assumptions that affect the reported amounts of assets and liabilities in the financial statements and the reported amounts of increases and decreases in net assets from operations. Actual results could differ from those estimates. Subsequent events after the Statement of assets and liabilities date through the date that the financial statements were issued have been evaluated in the preparation of the financial statements. Unless otherwise noted, the “reporting period” represents the period from November 1, 2011 through April 30, 2012.
A 1.00% redemption fee may apply on any shares that are redeemed (either by selling or exchanging into another fund) within 30 days of purchase. The redemption fee is accounted for as an addition to paid-in-capital.
Investment income, realized and unrealized gains and losses and expenses of the fund are borne pro-rata based on the relative net assets of each class to the total net assets of the fund, except that each class bears expenses unique to that class (including the distribution fees applicable to such classes). Each class votes as a class only with respect to its own distribution plan or other matters on which a class vote is required by law or determined by the Trustees. If the fund were liquidated, shares of each class would receive their pro-rata share of the net assets of the fund. In addition, the Trustees declare separate dividends on each class of shares.
Security valuation Investments for which market quotations are readily available are valued at the last reported sales price on their principal exchange, or official closing price for certain markets, and are classified as Level 1 securities. If no sales are reported, as in the case of some securities traded over-the-counter, a security is valued at its last reported bid price and is generally categorized as a Level 2 security.
31
Investments in other open-end investment companies (excluding exchange traded funds), which are classified as Level 1 securities, are based on their net asset value. The net asset value of an investment company equals the total value of its assets less its liabilities and divided by the number of its outstanding shares. Shares are only valued as of the close of regular trading on the New York Stock Exchange each day that the exchange is open.
Market quotations are not considered to be readily available for certain debt obligations and other investments; such investments are valued on the basis of valuations furnished by an independent pricing service approved by the Trustees or dealers selected by Putnam Management. Such services or dealers determine valuations for normal institutional-size trading units of such securities using methods based on market transactions for comparable securities and various relationships, generally recognized by institutional traders, between securities (which consider such factors as security prices, yields, maturities and ratings). These securities will generally be categorized as Level 2.
Many securities markets and exchanges outside the U.S. close prior to the close of the New York Stock Exchange and therefore the closing prices for securities in such markets or on such exchanges may not fully reflect events that occur after such close but before the close of the New York Stock Exchange. Accordingly, on certain days, the fund will fair value foreign equity securities taking into account multiple factors including movements in the U.S. securities markets, currency valuations and comparisons to the valuation of American Depository Receipts, exchange-traded funds and futures contracts. These securities, which will generally represent a transfer from a Level 1 to a Level 2 security, will be classified as Level 2. The number of days on which fair value prices will be used will depend on market activity and it is possible that fair value prices will be used by the fund to a significant extent. Securities quoted in foreign currencies, if any, are translated into U.S. dollars at the current exchange rate.
To the extent a pricing service or dealer is unable to value a security or provides a valuation that Putnam Management does not believe accurately reflects the security’s fair value, the security will be valued at fair value by Putnam Management. Certain investments, including certain restricted and illiquid securities and derivatives, are also valued at fair value following procedures approved by the Trustees. These valuations consider such factors as significant market or specific security events such as interest rate or credit quality changes, various relationships with other securities, discount rates, U.S. Treasury, U.S. swap and credit yields, index levels, convexity exposures and recovery rates. These securities are classified as Level 2 or as Level 3 depending on the priority of the significant inputs.
Such valuations and procedures are reviewed periodically by the Trustees. The fair value of securities is generally determined as the amount that the fund could reasonably expect to realize from an orderly disposition of such securities over a reasonable period of time. By its nature, a fair value price is a good faith estimate of the value of a security in a current sale and does not reflect an actual market price, which may be different by a material amount.
Security transactions and related investment income Security transactions are recorded on the trade date (the date the order to buy or sell is executed). Gains or losses on securities sold are determined on the identified cost basis.
Interest income is recorded on the accrual basis. Dividend income, net of applicable withholding taxes, is recognized on the ex-dividend date except that certain dividends from foreign securities, if any, are recognized as soon as the fund is informed of the ex-dividend date. Non-cash dividends, if any, are recorded at the fair market value of the securities received. Dividends representing a return of capital or capital gains, if any, are reflected as a reduction of cost and/or as a realized gain.
All premiums/discounts are amortized/accreted on a yield-to-maturity basis.
Foreign currency translation The accounting records of the fund are maintained in U.S. dollars. The market value of foreign securities, currency holdings, and other assets and liabilities is recorded in the books and records of the fund after translation to U.S. dollars based on the exchange rates on that day. The cost of each security is determined using historical exchange rates. Income and withholding taxes are translated at prevailing exchange rates when earned or incurred. The fund does not isolate that portion of realized or unrealized gains or losses resulting from changes in the foreign exchange rate on investments from fluctuations arising from changes in the market prices of the securities. Such gains and losses are included with the net realized and unrealized gain or loss on investments. Net realized gains and losses on foreign currency transactions represent net realized exchange gains or losses on closed forward currency contracts, disposition of foreign currencies, currency gains and losses realized between the trade and settlement dates on securities transactions and the difference between the amount of investment income and foreign withholding taxes recorded on the fund’s books and the U.S. dollar equivalent amounts actually received or paid. Net unrealized appreciation and depreciation of assets and liabilities in foreign
32
currencies arise from changes in the value of open forward currency contracts and assets and liabilities other than investments at the period end, resulting from changes in the exchange rate.
Securities lending The fund may lend securities, through its agent, to qualified borrowers in order to earn additional income. The loans are collateralized by cash in an amount at least equal to the market value of the securities loaned. The market value of securities loaned is determined daily and any additional required collateral is allocated to the fund on the next business day. The risk of borrower default will be borne by the fund’s agent; the fund will bear the risk of loss with respect to the investment of the cash collateral. Income from securities lending is included in investment income on the Statement of operations. Cash collateral is invested in Putnam Cash Collateral Pool, LLC, a limited liability company managed by an affiliate of Putnam Management. Investments in Putnam Cash Collateral Pool, LLC are valued at its closing net asset value each business day. There are no management fees charged to Putnam Cash Collateral Pool, LLC. At the close of the reporting period, the fund had no securities out on loan.
Interfund lending The fund, along with other Putnam funds, may participate in an interfund lending program pursuant to an exemptive order issued by the SEC. This program allows the fund to borrow from or lend to other Putnam funds that permit such transactions. Interfund lending transactions are subject to each fund’s investment policies and borrowing and lending limits. Interest earned or paid on the interfund lending transaction will be based on the average of certain current market rates. During the reporting period, the fund did not utilize the program.
Line of credit The fund participates, along with other Putnam funds, in a $325 million unsecured committed line of credit and a $185 million unsecured uncommitted line of credit, both provided by State Street. Borrowings may be made for temporary or emergency purposes, including the funding of shareholder redemption requests and trade settlements. Interest is charged to the fund based on the fund’s borrowing at a rate equal to the Federal Funds rate plus 1.25% for the committed line of credit and the Federal Funds rate plus 1.30% for the uncommitted line of credit. A closing fee equal to 0.02% of the committed line of credit and $50,000 for the uncommitted line of credit has been paid by the participating funds. In addition, a commitment fee of 0.13% per annum on any unutilized portion of the committed line of credit is allocated to the participating funds based on their relative net assets and paid quarterly. During the reporting period, the fund had no borrowings against these arrangements.
Federal taxes It is the policy of the fund to distribute all of its taxable income within the prescribed time period and otherwise comply with the provisions of the Internal Revenue Code of 1986, as amended (the Code), applicable to regulated investment companies. It is also the intention of the fund to distribute an amount sufficient to avoid imposition of any excise tax under Section 4982 of the Code.
The fund is subject to the provisions of Accounting Standards Codification ASC 740 Income Taxes (ASC 740). ASC 740 sets forth a minimum threshold for financial statement recognition of the benefit of a tax position taken or expected to be taken in a tax return. The fund did not have a liability to record for any unrecognized tax benefits in the accompanying financial statements. No provision has been made for federal taxes on income, capital gains or unrealized appreciation on securities held nor for excise tax on income and capital gains. Each of the fund’s federal tax returns for the prior three fiscal years remains subject to examination by the Internal Revenue Service.
The fund may also be subject to taxes imposed by governments of countries in which it invests. Such taxes are generally based on either income or gains earned or repatriated. The fund accrues and applies such taxes to net investment income, net realized gains and net unrealized gains as income and/or capital gains are earned. In some cases, the fund may be entitled to reclaim all or a portion of such taxes, and such reclaim amounts, if any, are reflected as an asset on the fund’s books. In many cases, however, the fund may not receive such amounts for an extended period of time, depending on the country of investment.
At October 31, 2011, the fund had a short-term capital loss carryover of $103,060,454 available to the extent allowed by the Code to offset future net capital gain, if any. This capital loss carryover will expire on October 31, 2017. Under the recently enacted Regulated Investment Company Modernization Act of 2010, the fund will be permitted to carry forward capital losses incurred in taxable years beginning after December 22, 2010 for an unlimited period. However, any losses incurred during those future years will be required to be utilized prior to the losses incurred in pre-enactment tax years. As a result of this ordering rule, pre-enactment capital loss carryforwards may be more likely to expire unused. Additionally, post-enactment capital losses that are carried forward will retain their character as either short-term or long-term capital losses rather than being considered all short-term as under previous law.
The aggregate identified cost on a tax basis is $623,170,347, resulting in gross unrealized appreciation and depreciation of $55,523,979 and $36,763,783, respectively, or net unrealized appreciation of $18,760,196.
33
Distributions to shareholders Distributions to shareholders from net investment income are recorded by the fund on the ex-dividend date. Distributions from capital gains, if any, are recorded on the ex-dividend date and paid at least annually. The amount and character of income and gains to be distributed are determined in accordance with income tax regulations, which may differ from generally accepted accounting principles. Dividend sources are estimated at the time of declaration. Actual results may vary. Any non-taxable return of capital cannot be determined until final tax calculations are completed after the end of the fund’s fiscal year. Reclassifications are made to the fund’s capital accounts to reflect income and gains available for distribution (or available capital loss carryovers) under income tax regulations.
Note 2: Management fee, administrative services and other transactions
The fund pays Putnam Management a management fee (based on the fund’s average net assets and computed and paid monthly) at annual rates that may vary based on the average of the aggregate net assets of most open-end funds, as defined in the fund’s management contract, sponsored by Putnam Management. Such annual rates may vary as follows:
| 0.780% | of the first $5 billion, |
| 0.730% | of the next $5 billion, |
| 0.680% | of the next $10 billion, |
| 0.630% | of the next $10 billion, |
| 0.580% | of the next $50 billion, |
| 0.560% | of the next $50 billion, |
| 0.550% | of the next $100 billion and |
| 0.545% | of any excess thereafter. |
Putnam Management has contractually agreed, through June 30, 2012, to waive fees or reimburse the fund’s expenses to the extent necessary to limit the cumulative expenses of the fund, exclusive of brokerage, interest, taxes, investment-related expenses, extraordinary expenses and payments under the fund’s investor servicing contract, investment management contract and distribution plans, on a fiscal year-to-date basis to an annual rate of 0.20% of the fund’s average net assets over such fiscal year-to-date period. During the reporting period, the fund’s expenses were not reduced as a result of this limit.
Putnam Investments Limited (PIL), an affiliate of Putnam Management, is authorized by the Trustees to manage a separate portion of the assets of the fund as determined by Putnam Management from time to time. Putnam Management pays a quarterly sub-management fee to PIL for its services at an annual rate of 0.35% of the average net assets of the portion of the fund managed by PIL.
The fund reimburses Putnam Management an allocated amount for the compensation and related expenses of certain officers of the fund and their staff who provide administrative services to the fund. The aggregate amount of all such reimbursements is determined annually by the Trustees.
Custodial functions for the fund’s assets are provided by State Street. Custody fees are based on the fund’s asset level, the number of its security holdings and transaction volumes.
Putnam Investor Services, Inc., an affiliate of Putnam Management, provides investor servicing agent functions to the fund. Putnam Investor Services, Inc. received fees for investor servicing based on the fund’s retail asset level, the number of shareholder accounts in the fund and the level of defined contribution plan assets in the fund. Investor servicing fees will not exceed an annual rate of 0.32% of the fund’s average net assets. Prior to March 1, 2012, investor servicing fees could not exceed an annual rate of 0.375% of the fund’s average net assets. The amounts incurred for investor servicing agent functions during the reporting period are included in Investor servicing fees in the Statement of operations.
The fund has entered into expense offset arrangements with Putnam Investor Services, Inc. and State Street whereby Putnam Investor Services, Inc.’s and State Street’s fees are reduced by credits allowed on cash balances. The fund also reduced expenses through brokerage/service arrangements. For the reporting period, the fund’s expenses were reduced by $580 under the expense offset arrangements and by $4,453 under the brokerage/ service arrangements.
Each independent Trustee of the fund receives an annual Trustee fee, of which $514, as a quarterly retainer, has been allocated to the fund, and an additional fee for each Trustees meeting attended. Trustees also are reimbursed for expenses they incur relating to their services as Trustees.
34
The fund has adopted a Trustee Fee Deferral Plan (the Deferral Plan) which allows the Trustees to defer the receipt of all or a portion of Trustees fees payable on or after July 1, 1995. The deferred fees remain invested in certain Putnam funds until distribution in accordance with the Deferral Plan.
The fund has adopted an unfunded noncontributory defined benefit pension plan (the Pension Plan) covering all Trustees of the fund who have served as a Trustee for at least five years and were first elected prior to 2004. Benefits under the Pension Plan are equal to 50% of the Trustee’s average annual attendance and retainer fees for the three years ended December 31, 2005. The retirement benefit is payable during a Trustee’s lifetime, beginning the year following retirement, for the number of years of service through December 31, 2006. Pension expense for the fund is included in Trustee compensation and expenses in the Statement of operations. Accrued pension liability is included in Payable for Trustee compensation and expenses in the Statement of assets and liabilities. The Trustees have terminated the Pension Plan with respect to any Trustee first elected after 2003.
The fund has adopted distribution plans (the Plans) with respect to its class A, class B, class C, class M and class R shares pursuant to Rule 12b–1 under the Investment Company Act of 1940. The purpose of the Plans is to compensate Putnam Retail Management Limited Partnership, a wholly-owned subsidiary of Putnam Investments, LLC and Putnam Retail Management GP, Inc., for services provided and expenses incurred in distributing shares of the fund. The Plans provide for payments by the fund to Putnam Retail Management Limited Partnership at an annual rate of up to 0.35%, 1.00%, 1.00%, 1.00% and 1.00% of the average net assets attributable to class A, class B, class C, class M and class R shares, respectively. The Trustees have approved payment by the fund at an annual rate of 0.25%, 1.00%, 1.00%, 0.75% and 0.50% of the average net assets attributable to class A, class B, class C, class M and class R shares, respectively.
For the reporting period, Putnam Retail Management Limited Partnership, acting as underwriter, received net commissions of $16,763 and $74 from the sale of class A and class M shares, respectively, and received $5,903 and $889 in contingent deferred sales charges from redemptions of class B and class C shares, respectively.
A deferred sales charge of up to 1.00% and 0.65% is assessed on certain redemptions of class A and class M shares, respectively. For the reporting period, Putnam Retail Management Limited Partnership, acting as underwriter, received $69 and no monies on class A and class M redemptions, respectively.
Note 3: Purchases and sales of securities
During the reporting period, cost of purchases and proceeds from sales of investment securities other than short-term investments aggregated $176,511,959 and $215,029,368, respectively. There were no purchases or proceeds from sales of long-term U.S. government securities.
Note 4: Capital shares
At the close of the reporting period, there was an unlimited number of shares of beneficial interest authorized. Transactions in capital shares were as follows:
| Six months ended 4/30/12 | Year ended 10/31/11 | |||
| Class A | Shares | Amount | Shares | Amount |
| Shares sold | 1,703,517 | $33,282,607 | 4,725,246 | $95,829,490 |
| Shares issued in connection with | ||||
| reinvestment of distributions | 317,719 | 6,059,472 | 626,615 | 12,444,069 |
| 2,021,236 | 39,342,079 | 5,351,861 | 108,273,559 | |
| Shares repurchased | (3,080,345) | (59,234,019) | (5,525,589) | (110,169,839) |
| Net decrease | (1,059,109) | $(19,891,940) | (173,728) | $(1,896,280) |
35
| Six months ended 4/30/12 | Year ended 10/31/11 | |||
| Class B | Shares | Amount | Shares | Amount |
| Shares sold | 49,141 | $940,528 | 256,216 | $5,136,715 |
| Shares issued in connection with | ||||
| reinvestment of distributions | 4,430 | 82,998 | 9,396 | 183,675 |
| 53,571 | 1,023,526 | 265,612 | 5,320,390 | |
| Shares repurchased | (111,334) | (2,129,533) | (249,892) | (4,971,509) |
| Net increase (decrease) | (57,763) | $(1,106,007) | 15,720 | $348,881 |
| Six months ended 4/30/12 | Year ended 10/31/11 | |||
| Class C | Shares | Amount | Shares | Amount |
| Shares sold | 149,027 | $2,852,793 | 845,295 | $17,121,901 |
| Shares issued in connection with | ||||
| reinvestment of distributions | 16,396 | 309,428 | 32,341 | 635,848 |
| 165,423 | 3,162,221 | 877,636 | 17,757,749 | |
| Shares repurchased | (679,326) | (13,077,767) | (1,011,440) | (19,976,099) |
| Net decrease | (513,903) | $(9,915,546) | (133,804) | $(2,218,350) |
| Six months ended 4/30/12 | Year ended 10/31/11 | |||
| Class M | Shares | Amount | Shares | Amount |
| Shares sold | 12,468 | $237,985 | 25,046 | $497,284 |
| Shares issued in connection with | ||||
| reinvestment of distributions | 2,123 | 40,169 | 4,313 | 85,023 |
| 14,591 | 278,154 | 29,359 | 582,307 | |
| Shares repurchased | (13,718) | (260,113) | (81,052) | (1,637,546) |
| Net increase (decrease) | 873 | $18,041 | (51,693) | $(1,055,239) |
| Six months ended 4/30/12 | Year ended 10/31/11 | |||
| Class R | Shares | Amount | Shares | Amount |
| Shares sold | 37,824 | $722,545 | 58,220 | $1,169,136 |
| Shares issued in connection with | ||||
| reinvestment of distributions | 2,693 | 51,225 | 4,747 | 93,799 |
| 40,517 | 773,770 | 62,967 | 1,262,935 | |
| Shares repurchased | (25,436) | (488,334) | (51,309) | (1,039,689) |
| Net increase | 15,081 | $285,436 | 11,658 | $223,246 |
| Six months ended 4/30/12 | Year ended 10/31/11 | |||
| Class Y | Shares | Amount | Shares | Amount |
| Shares sold | 1,419,037 | $27,369,653 | 3,270,127 | $67,098,746 |
| Shares issued in connection with | ||||
| reinvestment of distributions | 46,330 | 887,053 | 76,711 | 1,521,249 |
| 1,465,367 | 28,256,706 | 3,346,838 | 68,619,995 | |
| Shares repurchased | (1,893,802) | (36,781,018) | (2,048,509) | (40,399,228) |
| Net increase (decrease) | (428,435) | $(8,524,312) | 1,298,329 | $28,220,767 |
36
Note 5: Summary of derivative activity
The following is a summary of the market values of derivative instruments as of the close of the reporting period:
Market values of derivative instruments as of the close of the reporting period
| Asset derivatives | Liability derivatives | |||
| Derivatives not | ||||
| accounted for as | Statement of | Statement of | ||
| hedging instruments | assets and | assets and | ||
| under ASC 815 | liabilities location | Market value | liabilities location | Market value |
| Equity contracts | Investments | $260,551 | $— | |
| Total | $260,551 | $— | ||
The following is a summary of change in unrealized gains or losses of derivative instruments on the Statement of operations for the reporting period (see Note 1) (there were no realized gains or losses on derivative instruments):
Change in unrealized appreciation or (depreciation) on derivatives recognized in net gain or (loss) on investments
| Derivatives not accounted for as hedging | ||
| instruments under ASC 815 | Warrants* | Total |
| Equity contracts | $— | $— |
| Total | $— | $— |
* For the reporting period, the transaction volume for warrants was minimal.
Note 6: Investment in Putnam Money Market Liquidity Fund
The fund invested in Putnam Money Market Liquidity Fund, an open-end management investment company managed by Putnam Management. Investments in Putnam Money Market Liquidity Fund are valued at its closing net asset value each business day. Income distributions earned by the fund are recorded as interest income in the Statement of operations and totaled $6,729 for the reporting period. During the reporting period, cost of purchases and proceeds of sales of investments in Putnam Money Market Liquidity Fund aggregated $113,687,945 and $111,190,280, respectively. Management fees charged to Putnam Money Market Liquidity Fund have been waived by Putnam Management.
Note 7: Market, credit and other risks
In the normal course of business, the fund trades financial instruments and enters into financial transactions where risk of potential loss exists due to changes in the market (market risk) or failure of the contracting party to the transaction to perform (credit risk). The fund may be exposed to additional credit risk that an institution or other entity with which the fund has unsettled or open transactions will default. Investments in foreign securities involve certain risks, including those related to economic instability, unfavorable political developments, and currency fluctuations, not present with domestic investments.
Note 8: Regulatory matters and litigation
In late 2003 and 2004, Putnam Management settled charges brought by the SEC and the Massachusetts Securities Division in connection with excessive short-term trading in Putnam funds. In July 2011, the fund recorded a receivable of $126,693 related to restitution amounts in connection with a distribution plan approved by the SEC. This amount, which was received by the fund in December 2011, is reported as part of Increase in capital from settlement payments on the Statement of changes in net assets. These allegations and related matters have served as the general basis for certain lawsuits, including purported class action lawsuits against Putnam Management and, in a limited number of cases, some Putnam funds. In May 2011, the fund received a payment of $3,100 related to settlement of those lawsuits. This amount is reported as a part of Increase in capital from settlement payments on the Statement of changes in net assets. Putnam Management has agreed to bear any costs incurred by the Putnam funds as a result of these matters.
37
Note 9: New accounting pronouncements
In May 2011, the Financial Accounting Standards Board (FASB) issued Accounting Standards Update (ASU) 2011–04 “Fair Value Measurements and Disclosures (Topic 820) — Amendments to Achieve Common Fair Value Measurement and Disclosure Requirements in U.S. GAAP and IFRS”. ASU 2011–04 amends FASB Topic 820 “Fair Value Measurement” and seeks to develop common requirements for measuring fair value and for disclosing information about fair value measurements in accordance with GAAP. ASU 2011–04 is effective for fiscal years and interim periods beginning after December 15, 2011. The application of ASU 2011–04 will not have a material impact on the fund’s financial statements.
In December 2011, the FASB issued ASU No. 2011–11 “Disclosures about Offsetting Assets and Liabilities”. The update creates new disclosure requirements requiring entities to disclose both gross and net information for derivatives and other financial instruments that are either offset in the Statement of assets and liabilities or subject to an enforceable master netting arrangement or similar agreement. The disclosure requirements are effective for annual reporting periods beginning on or after January 1, 2013 and interim periods within those annual periods. Putnam Management is currently evaluating the application of ASU 2011–11 and its impact, if any, on the fund’s financial statements.
38
Services for shareholders
Investor services
Systematic investment plan Tell us how much you wish to invest regularly — weekly, semimonthly, or monthly — and the amount you choose will be transferred automatically from your checking or savings account. There’s no additional fee for this service, and you can suspend it at any time. This plan may be a great way to save for college expenses or to plan for your retirement.
Please note that regular investing does not guarantee a profit or protect against loss in a declining market. Before arranging a systematic investment plan, consider your financial ability to continue making purchases in periods when prices are low.
Systematic exchange You can make regular transfers from one Putnam fund to another Putnam fund. There are no additional fees for this service, and you can cancel or change your options at any time.
Dividends PLUS You can choose to have the dividend distributions from one of your Putnam funds automatically reinvested in another Putnam fund at no additional charge.
Free exchange privilege You can exchange money between Putnam funds free of charge, as long as they are the same class of shares. A signature guarantee is required if you are exchanging more than $500,000. The fund reserves the right to revise or terminate the exchange privilege.
Reinstatement privilege If you’ve sold Putnam shares or received a check for a dividend or capital gain, you may reinvest the proceeds with Putnam within 90 days of the transaction and they will be reinvested at the fund’s current net asset value — with no sales charge. However, reinstatement of class B shares may have special tax consequences. Ask your financial or tax representative for details.
Check-writing service You have ready access to many Putnam accounts. It’s as simple as writing a check, and there are no special fees or service charges. For more information about the check-writing service, call Putnam or visit our website.
Dollar cost averaging When you’re investing for long-term goals, it’s time, not timing, that counts. Investing on a systematic basis is a better strategy than trying to figure out when the markets will go up or down. This means investing the same amount of money regularly over a long period. This method of investing is called dollar cost averaging. When a fund’s share price declines, your investment dollars buy more shares at lower prices. When it increases, they buy fewer shares. Over time, you will pay a lower average price per share.
For more information
Visit the Individual Investors section at putnam.com A secure section of our website contains complete information on your account, including balances and transactions, updated daily. You may also conduct transactions, such as exchanges, additional investments, and address changes. Log on today to get your password.
Call us toll free at 1-800-225-1581 Ask a helpful Putnam representative or your finan-cial advisor for details about any of these or other services, or see your prospectus.
39
The Putnam family of funds
The following is a list of Putnam’s open-end mutual funds offered to the public. Investors should carefully consider the investment objective, risks, charges, and expenses of a fund before investing. For a prospectus, or a summary prospectus if available, containing this and other information for any Putnam fund or product, call your financial advisor at 1-800-225-1581 and ask for a prospectus. Please read the prospectus carefully before investing.
| Growth | Income |
| Growth Opportunities Fund | American Government Income Fund |
| International Growth Fund | Diversified Income Trust |
| Multi-Cap Growth Fund | Floating Rate Income Fund |
| Small Cap Growth Fund | Global Income Trust |
| Voyager Fund | High Yield Advantage Fund |
| High Yield Trust | |
| Blend | Income Fund |
| Asia Pacific Equity Fund | Money Market Fund* |
| Capital Opportunities Fund | Short Duration Income Fund |
| Capital Spectrum Fund | U.S. Government Income Trust |
| Emerging Markets Equity Fund | |
| Equity Spectrum Fund | Tax-free income |
| Europe Equity Fund | AMT-Free Municipal Fund |
| Global Equity Fund | Tax Exempt Income Fund |
| International Capital Opportunities Fund | Tax Exempt Money Market Fund* |
| International Equity Fund | Tax-Free High Yield Fund |
| Investors Fund | State tax-free income funds: |
| Multi-Cap Core Fund | Arizona, California, Massachusetts, Michigan, |
| Research Fund | Minnesota, New Jersey, New York, Ohio, |
| and Pennsylvania. | |
| Value | |
| Convertible Securities Fund | Absolute Return |
| Equity Income Fund | Absolute Return 100 Fund |
| George Putnam Balanced Fund | Absolute Return 300 Fund |
| The Putnam Fund for Growth and Income | Absolute Return 500 Fund |
| International Value Fund | Absolute Return 700 Fund |
| Multi-Cap Value Fund | |
| Small Cap Value Fund |
* An investment in a money market fund is not insured or guaranteed by the Federal Deposit Insurance Corporation or any other government agency. Although the fund seeks to preserve the value of your investment at $1.00 per share, it is possible to lose money by investing in the fund.
40
| Global Sector | Putnam RetirementReady Funds — portfolios |
| Global Consumer Fund | with automatically adjusting allocations to |
| Global Energy Fund | stocks, bonds, and money market instruments, |
| Global Financials Fund | becoming more conservative over time. |
| Global Health Care Fund | |
| Global Industrials Fund | RetirementReady 2055 Fund |
| Global Natural Resources Fund | RetirementReady 2050 Fund |
| Global Sector Fund | RetirementReady 2045 Fund |
| Global Technology Fund | RetirementReady 2040 Fund |
| Global Telecommunications Fund | RetirementReady 2035 Fund |
| Global Utilities Fund | RetirementReady 2030 Fund |
| RetirementReady 2025 Fund | |
| Asset Allocation | RetirementReady 2020 Fund |
| Putnam Global Asset Allocation Funds — | RetirementReady 2015 Fund |
| portfolios with allocations to stocks, bonds, | |
| and money market instruments that are | Putnam Retirement Income Lifestyle |
| adjusted dynamically within specified ranges | Funds — portfolios with managed |
| as market conditions change. | allocations to stocks, bonds, and money |
| market investments to generate | |
| Dynamic Asset Allocation Balanced Fund | retirement income. |
| Prior to November 30, 2011, this fund was known as | |
| Putnam Asset Allocation: Balanced Portfolio. | Retirement Income Fund Lifestyle 1 |
| Dynamic Asset Allocation | Prior to June 16, 2011, this fund was known as |
| Conservative Fund | Putnam RetirementReady Maturity Fund. |
| Prior to November 30, 2011, this fund was known as | Retirement Income Fund Lifestyle 2 |
| Putnam Asset Allocation: Conservative Portfolio. | Retirement Income Fund Lifestyle 3 |
| Dynamic Asset Allocation Growth Fund | Prior to June 16, 2011, this fund was known as |
| Prior to November 30, 2011, this fund was known as | Putnam Income Strategies Fund. |
| Putnam Asset Allocation: Growth Portfolio. | |
| Dynamic Risk Allocation Fund | |
A short-term trading fee of 1% may apply to redemptions or exchanges from certain funds within the time period specified in the fund's prospectus.
Check your account balances and the most recent month-end performance in the Individual Investors section at putnam.com.
41
Putnam’s commitment to confidentiality
In order to conduct business with our shareholders, we must obtain certain personal information such as account holders’ names, addresses, Social Security numbers, and dates of birth. Using this information, we are able to maintain accurate records of accounts and transactions.
It is our policy to protect the confidentiality of our shareholder information, whether or not a shareholder currently owns shares of our funds. In particular, it is our policy not to sell information about you or your accounts to outside marketing firms. We have safeguards in place designed to prevent unauthorized access to our computer systems and procedures to protect personal information from unauthorized use.
Within the Putnam organization, your information is shared with those who need it to service your account or provide you with information about other Putnam products or services. Under certain circumstances, we must also share account information with outside vendors who provide services to us, such as mailings and proxy solicitations. In these cases, the service providers enter into confidentiality agreements with us, and we provide only the information necessary to process transactions and perform other services related to your account. It is also our policy to share account information with your financial advisor, if you've provided us with information about your advisor and that person is listed on your Putnam account.
If you would like clarification about our confidentiality policies or have any questions or concerns, please don't hesitate to contact us at 1-800-225-1581, Monday through Friday, 8:00 a.m. to 8:00 p.m. Eastern Time.
42
Fund information
Founded 75 years ago, Putnam Investments was built around the concept that a balance between risk and reward is the hallmark of a well-rounded financial program. We manage over 100 funds across income, value, blend, growth, asset allocation, absolute return, and global sector categories.
| Investment Manager | Paul L. Joskow | Mark C. Trenchard |
| Putnam Investment | Elizabeth T. Kennan | Vice President and |
| Management, LLC | Kenneth R. Leibler | BSA Compliance Officer |
| One Post Office Square | Robert E. Patterson | |
| Boston, MA 02109 | George Putnam, III | Robert T. Burns |
| Robert L. Reynolds | Vice President and | |
| Investment Sub-Manager | W. Thomas Stephens | Chief Legal Officer |
| Putnam Investments Limited | ||
| 57–59 St James’s Street | Officers | James P. Pappas |
| London, England SW1A 1LD | Robert L. Reynolds | Vice President |
| President | ||
| Marketing Services | Judith Cohen | |
| Putnam Retail Management | Jonathan S. Horwitz | Vice President, Clerk and |
| One Post Office Square | Executive Vice President, | Assistant Treasurer |
| Boston, MA 02109 | Principal Executive | |
| Officer, Treasurer and | Michael Higgins | |
| Custodian | Compliance Liaison | Vice President, Senior Associate |
| State Street Bank | Treasurer and Assistant Clerk | |
| and Trust Company | Steven D. Krichmar | |
| Vice President and | Nancy E. Florek | |
| Legal Counsel | Principal Financial Officer | Vice President, Assistant Clerk, |
| Ropes & Gray LLP | Assistant Treasurer and | |
| Janet C. Smith | Proxy Manager | |
| Trustees | Vice President, Assistant | |
| Jameson A. Baxter, Chair | Treasurer and Principal | Susan G. Malloy |
| Ravi Akhoury | Accounting Officer | Vice President and |
| Barbara M. Baumann | Assistant Treasurer | |
| Charles B. Curtis | Robert R. Leveille | |
| Robert J. Darretta | Vice President and | |
| John A. Hill | Chief Compliance Officer | |
43
This report is for the information of shareholders of Putnam Convertible Securities Fund. It may also be used as sales literature when preceded or accompanied by the current prospectus, the most recent copy of Putnam’s Quarterly Performance Summary, and Putnam’s Quarterly Ranking Summary. For more recent performance, please visit putnam.com. Investors should carefully consider the investment objectives, risks, charges, and expenses of a fund, which are described in its prospectus. For this and other information or to request a prospectus or summary prospectus, call 1-800-225-1581 toll free. Please read the prospectus carefully before investing. The fund’s Statement of Additional Information contains additional information about the fund’s Trustees and is available without charge upon request by calling 1-800-225-1581.
44

| Item 2. Code of Ethics: |
| Not applicable |
| Item 3. Audit Committee Financial Expert: |
| Not applicable |
| Item 4. Principal Accountant Fees and Services: |
| Not applicable |
| Item 5. Audit Committee of Listed Registrants |
| Not applicable |
| Item 6. Schedule of Investments: |
| The registrant’s schedule of investments in unaffiliated issuers is included in the report to shareholders in Item 1 above. |
| Item 7. Disclosure of Proxy Voting Policies and Procedures For Closed-End Management Investment Companies: |
| Not applicable |
| Item 8. Portfolio Managers of Closed-End Investment Companies |
| Not Applicable |
| Item 9. Purchases of Equity Securities by Closed-End Management Investment Companies and Affiliated Purchasers: |
| Not applicable |
| Item 10. Submission of Matters to a Vote of Security Holders: |
| Not applicable |
| Item 11. Controls and Procedures: |
| (a) The registrant’s principal executive officer and principal financial officer have concluded, based on their evaluation of the effectiveness of the design and operation of the registrant’s disclosure controls and procedures as of a date within 90 days of the filing date of this report, that the design and operation of such procedures are generally effective to provide reasonable assurance that information required to be disclosed by the registrant in this report is recorded, processed, summarized and reported within the time periods specified in the Commission’s rules and forms. |
| (b) Changes in internal control over financial reporting: Not applicable |
| Item 12. Exhibits: |
| (a)(1) Not applicable |
| (a)(2) Separate certifications for the principal executive officer and principal financial officer of the registrant as required by Rule 30a-2(a) under the Investment Company Act of 1940, as amended, are filed herewith. |
| (b) The certifications required by Rule 30a-2(b) under the Investment Company Act of 1940, as amended, are filed herewith. |
| Putnam Convertible Securities Fund |
| By (Signature and Title): |
| /s/Janet C. Smith Janet C. Smith Principal Accounting Officer |
| Date: June 28, 2012 |
| Pursuant to the requirements of the Securities Exchange Act of 1934 and the Investment Company Act of 1940, this report has been signed below by the following persons on behalf of the registrant and in the capacities and on the dates indicated. |
| By (Signature and Title): |
| /s/Jonathan S. Horwitz Jonathan S. Horwitz Principal Executive Officer |
| Date: June 28, 2012 |
| By (Signature and Title): |
| /s/Steven D. Krichmar Steven D. Krichmar Principal Financial Officer |
| Date: June 28, 2012 |