| |
| UNITED STATES |
| SECURITIES AND EXCHANGE COMMISSION |
| Washington, D.C. 20549 |
| |
| FORM N-CSR |
| |
| CERTIFIED SHAREHOLDER REPORT OF REGISTERED |
| MANAGEMENT INVESTMENT COMPANIES |
| | |
| Investment Company Act file number: (811- 02280) | |
| | |
| Exact name of registrant as specified in charter: | Putnam Convertible Income-Growth Trust |
| |
| Address of principal executive offices: One Post Office Square, Boston, Massachusetts 02109 |
| |
| Name and address of agent for service: | Beth S. Mazor, Vice President |
| | One Post Office Square |
| | Boston, Massachusetts 02109 |
| |
| Copy to: | John W. Gerstmayr, Esq. |
| | Ropes & Gray LLP |
| | One International Place |
| | Boston, Massachusetts 02110 |
| |
| Registrant’s telephone number, including area code: | (617) 292-1000 |
| |
| Date of fiscal year end: October 31, 2010 | |
|
| Date of reporting period: November 1, 2009 — April 30, 2010 |
Item 1. Report to Stockholders:
The following is a copy of the report transmitted to stockholders pursuant to Rule 30e-1 under the Investment Company Act of 1940:
Putnam Convertible
Income-Growth
Trust
Semiannual report
4 | 30 | 10
| | | |
| Message from the Trustees | 1 | | |
| About the fund | 2 | | |
| Performance snapshot | 4 | | |
| Interview with your fund’s portfolio managers | 5 | | |
| Your fund’s performance | 10 | | |
| Your fund’s expenses | 12 | | |
| Terms and definitions | 14 | | |
| Other information for shareholders | 15 | | |
| Financial statements | 16 | | |
| Shareholder meeting results | 36 | | |
Message from the Trustees
Dear Fellow Shareholder:
Volatility returned to global equity markets this spring. This change was to be expected after the remarkable advances of the past year, but the headlines from Europe added fuel.
If 2009 can be characterized as a rebound from the liquidity crisis, the investment environment for 2010 is shaping up to be somewhat more difficult, one that requires analysis, insight, innovation, and expertise.
These attributes form the very core of Putnam’s analytic, active-management approach, which seeks to weather short-term periods of market dislocation, while preparing for the expected return of a more positive investing environment. With volatility rising in fixed-income markets, bond investors should benefit from active management as well.
We would like to thank all shareholders who took the time to vote by proxy on a number of issues, including shareholder-friendly management fee changes, which went into effect earlier this year. We would also like to welcome new shareholders to the fund, and thank all of our investors for your continued confidence in Putnam.

About the fund
Seeking undervalued companies before their potential is recognized
The differences between bonds and stocks seem fairly clear-cut. Stocks provide an ownership stake in a company; bonds provide a claim on the interest paid by a company or other entity on its debt. The value of stocks rises and falls with factors such as investor sentiment, company news, and economic conditions; bonds are issued by a government, agency, company, or public utility that typically promises to pay the bearer a fixed rate of interest at specified intervals and to return a set amount of money at a specified end date (the maturity date). A bond’s yield is often influenced by interest-rate levels.
A third type of security is a hybrid of a stock and a bond. Like a bond, a convertible security offers a set rate of interest, but unlike a bond, it has a built-in option that, under certain circumstances, allows the investor to exchange (or convert) the security for a fixed number of shares of stock. This feature offers the potential for capital appreciation, since the preset conversion price does not change as the underlying stock price increases or decreases.
Convertibles are issued by companies and can offer greater returns than high-quality bonds — but they also carry a greater risk potential, such as the risk of default or periodic illiquidity. Issuers range from large, well-known S&P 500 corporations and small, rapidly growing companies, to companies in cyclically depressed industries.
Constructing a portfolio that maintains an appropriate balance of risk and return potential requires intensive research and analysis. Putnam’s analysts conduct rigorous fundamental research, seeking to determine the true worth of the issuing company’s business. Putnam Convertible Income-Growth Trust’s portfolio managers then construct a portfolio that they believe offers the best return potential without undue risk.
Of course, such changes can take time. As noted in the fund’s first report to shareholders, “Once a stock is in the portfolio, patience is called for while waiting for the positive change … this fund is most appropriate for those with long-term investment horizons.”
Consider these risks before investing: The fund may invest a portion of its assets in small and/or midsize companies. Such investments increase the risk of greater price fluctuations. Lower-rated bonds may offer higher yields in return for more risk. Funds that invest in bonds are subject to certain risks including interest-rate, credit and inflation risk. As interest rates rise, the prices of bonds fall. Long-term bonds are more exposed to interest-rate risk than short-term bonds. Unlike bonds, bond funds have ongoing fees and expenses.
The “busted” convertible
One kind of security in which your fund may invest is the “busted” convertible. “Busted” refers to a security whose underlying stock price has fallen significantly below the conversion price. It becomes much less sensitive to the volatility of the underlying stock and is more bond-like, responding to interest-rate changes. A busted convertible may pay a higher yield than other convertibles, but may also carry a higher level of risk. (Some companies in this situation may eventually default on their bonds.)
The objective of buying a busted convertible is to take advantage of a company’s eventual turnaround despite its present challenges. For example, a company undergoing management turmoil may draw negative investor reactions, causing its stock price to tumble. However, if intensive research determines that the management crisis is likely to be resolved, the fund manager could buy the security at a steep discount. The goal is to sell the security at a higher price when the credit improves or when the stock revives.
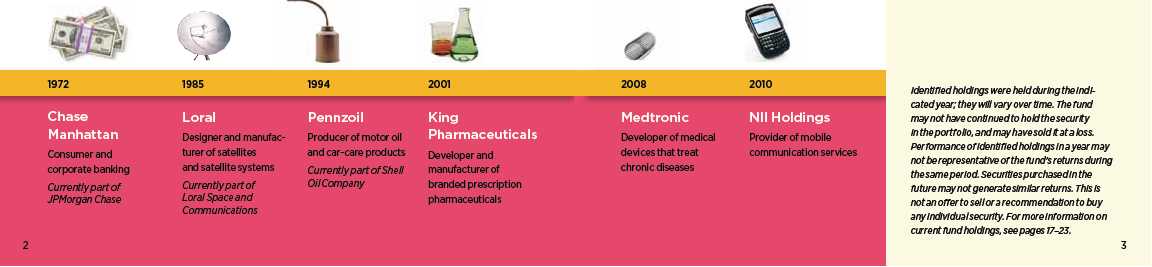
Putnam Convertible Income-Growth Trust’s holdings
have spanned sectors and industries over time.
Performance
snapshot
Annualized total return (%) comparison as of 4/30/10

Current performance may be lower or higher than the quoted past performance, which cannot guarantee future results. Share price, principal value, and return will fluctuate, and you may have a gain or a loss when you sell your shares. Performance of class A shares assumes reinvestment of distributions and does not account for taxes. Fund returns in the bar chart do not reflect a sales charge of 5.75%; had they, returns would have been lower. See pages 5 and 10–12 for additional performance information. For a portion of the periods, this fund may have limited expenses, without which returns would have been lower. A 1% short-term trading fee may apply. To obtain the most recent month-end performance, visit putnam.com.
* The fund’s benchmark, the BofA Merrill Lynch All U.S. Convertibles Index, was introduced on 12/31/87, which post-dates the inception date of the fund’s class A shares.
† Returns for the six-month period are not annualized, but cumulative.
4
Interview with your
fund’s portfolio managers
Eric Harthun and Robert Salvin
How did the fund perform for the six months
ended April 30, 2010?
Eric: Putnam Convertible Income-Growth Trust performed well, particularly against its Lipper peer group. Specifically, the fund’s class A shares returned 16.71% at net asset value versus 16.28% for the BofA Merrill Lynch All U.S. Convertibles Index, and the 14.20% average return for Lipper Convertible Securities Funds. The fund’s performance relative to its peer group placed it in the top quartile of competing funds.
How would you characterize the market
environment during this period?
Rob: The convertible-securities market continued to rebound, along with the broader equity and credit markets, and the overall economy. The Great Recession that began in late 2007 appeared to be waning by period-end, with several factors indicating a broadening recovery. These included continued incremental improvement in the global economy, led by gains in manufacturing activity and consumer spending. Job creation appears to have taken hold in the U.S. economy after two years of employment declines. The widely followed monthly payroll report showed that 290,000 jobs were created in April, marking the second month in a row of solid job growth. The Fed [Federal Reserve Board], despite winding down some extraordinary stimulus programs, reiterated its pledge to keep interest rates low for “an extended period.”
Financial conditions continued to improve as access to credit became cheaper and easier, particularly for corporations. Corporate earnings for the fourth quarter of 2009 beat expectations, and for the first time during the recovery, received a boost from sales growth as opposed to cost-cutting.
Broad market index and fund performance
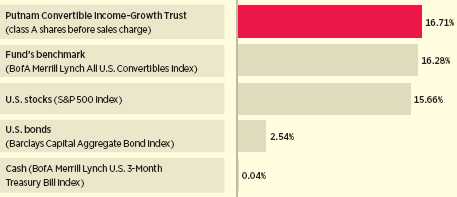
This comparison shows your fund’s performance in the context of broad market indexes for the six months ended 4/30/10. See pages 4 and 10–12 for additional fund performance information. Index descriptions can be found on page 14.
5
In the convertibles market specifically, the rally by lower-credit-quality issuers that began in early 2009 continued throughout this period. This trend helped the fund versus its peer group because its average credit quality is below that of the peer category. In addition, given the combination of equity-market appreciation and tightening yield spreads, the trade-off between yield and equity sensitivity — always a significant investment dynamic with convertibles — was more balanced than it had been prior to this period. Market liquidity improved as convertibles continued to attract “crossover” equity and corporate bond investors seeking higher yields, while also benefiting from strong demand from traditional investors in the sector.
What were the key factors that enabled the
fund to outperform?
Eric: Strong security selection combined with avoiding index components that we believed offered unfavorable risk/return prospects were the main drivers of the fund’s relative results. For example, two of the fund’s top contributors versus the benchmark were convertibles that we did not hold. These were AGCO, a major manufacturer of agricultural equipment such as tractors and combines, and Archer Daniels Midland [ADM], a market leader in agricultural processing and merchandising. AGCO’s convertibles sold off at the end of the period on weak sales in North America and Europe. ADM’s securities declined throughout the period due to disappointing sales and earnings.
Underweighting convertibles issued by Transocean, the world’s largest offshore drilling company, also proved advantageous. Transocean’s stock and convertibles plummeted late in the period as its Deepwater Horizon rig experienced an explosion, burned, and sank in the Gulf of Mexico in April. Underweighting biotechnology giant Amgen was another helpful decision. The company’s convertibles underperformed due to investors’ concern that changes in government reimbursement policies resulting from U.S. health-care reform could negatively affect Amgen’s revenues and profitability.
Looking at holdings in which we had greater-than-benchmark exposure, biotechnology company Dendreon was a top contributor. Dendreon has had considerable success with a treatment for late-stage prostate cancer that no longer responds to hormone therapy. The company continues to pioneer cancer
Sector allocations as of 4/30/10
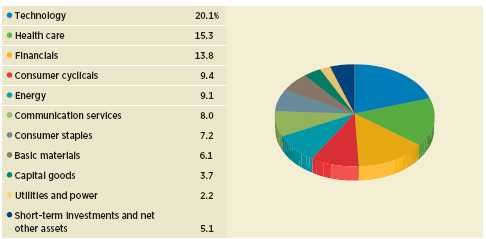
Allocations are represented as a percentage of the fund’s net assets. Holdings and allocations may vary over time.
6
“Strong security selection was one
of the main drivers of the fund’s
relative results.”
Eric Harthun
solutions that feature low-toxicity therapies designed to stimulate the patient’s immune system. Our investment in convertibles issued by NII Holdings, a wireless telecommunications provider with operations primarily in Central and South America, performed well as the company’s business fundamentals improved. Lastly, the fund benefited from holding securities issued by consumer products company Chattem when it was acquired by French pharmaceutical maker Sanofi-Aventis.
Which areas weren’t as productive?
Rob: Since we revamped the fund’s investment process in late 2008, a key tenet in our strategy has been to seek to control the fund’s risk by keeping the portfolio broadly diversified. This approach typically prevents us from taking index-sized positions in many of the benchmark’s largest constituents. For example, we held a significantly underweighted stake in the convertibles of Ford Motor. Ford’s convertible shares — whose prices advanced dramatically during the period — are heavily represented in the index and therefore our underweighted exposure detracted from performance.
Untimely ownership of convertibles issued by Salesforce.com, a leading provider of on-demand customer relationship management applications, also hurt. In addition, not holding real estate investment trusts Host Hotels & Resorts, which operates luxury and upscale hotels, and Annaly Capital Management, which owns and manages a large portfolio of government-agency mortgage-backed securities, dampened relative results. Avoiding strong-performing index component priceline.com, a leading provider of online travel services, was another detractor. However, we steered clear of Host, Annaly Capital, and priceline.com intentionally, believing their securities did not offer favorable risk/reward trade-offs.
What is your outlook for the economy, the
convertibles market, and the fund over the
coming months?
Eric: The U.S. economy is clearly in much better condition than it was a year ago, and
Top 10 holdings
| | |
| HOLDING (percentage of fund’s net assets) | SECURITY INFORMATION | SECTOR/INDUSTRY |
|
| Freeport-McMoRan Copper & Gold, | Convertible preferred stock | Basic materials/Metals |
| Inc. (2.0%) | | |
| Bank of America Corp. (1.9%) | Convertible preferred stock | Financials/Banking |
| Intel Corp. (1.6%) | Convertible bonds | Technology/Electronics |
| Safeguard Scientifics, Inc. (1.5%) | Convertible bonds | Technology/Software |
| Teva Pharmaceutical Finance, LLC | Convertible bonds | Health care/Pharmaceuticals |
| (Israel) (1.4%) | | |
| Wells Fargo & Co. (1.4%) | Convertible preferred stock | Financials/Banking |
| Virgin Media, Inc. (1.3%) | Convertible bonds | Communication services/ |
| | | Cable television |
| Crown Castle International Corp. (1.3%) | Convertible preferred stock | Communication services/ |
| | | Telecommunications |
| Advanced Micro Devices, Inc. (1.3%) | Convertible bonds | Technology/Electronics |
|
| Sybase, Inc. (1.2%) | Convertible bonds | Technology/Software |
This table shows the fund’s top 10 individual holdings and the percentage of the fund’s net assets that each represented as of 4/30/10. Short-term holdings are excluded. Holdings will vary over time.
7
we believe it should continue to recover at a moderate pace for the rest of the year. Companies worldwide have cut costs substantially, and sales are beginning to rebound, which should bode well for future earnings. As for the U.S. consumer, stronger employment and a more stable housing market are necessary for consumer spending to return to healthier levels. That said, if our expectations for the domestic economy in the months ahead prove accurate, the environment for investing in convertibles likely will remain favorable.
Despite convertibles’ strong returns since early 2009, we believe valuations at period-end remained attractive by historical standards. In our view, there are still solid investment opportunities to be found among both high-yield and equity-sensitive convertibles using our fundamental, bottom-up research process.
Thanks for bringing us up to date, gentlemen.
The views expressed in this report are exclusively those of Putnam Management. They are not meant as investment advice.
Please note that the holdings discussed in this report may not have been held by the fund for the entire period. Portfolio composition is subject to review in accordance with the fund’s investment strategy and may vary in the future. Current and future portfolio holdings are subject to risk.

Portfolio Manager Eric Harthun has an M.B.A. from The University of Chicago Booth School of Business and a B.S. from San Diego State University. A CFA charterholder, Eric joined Putnam in 2000 and has been in the investment industry since 1994.

Portfolio Manager Robert Salvin has an M.B.A. from The University of Chicago Booth School of Business and a B.S. from the Wharton School of the University of Pennsylvania. He joined Putnam in 2000 and has been in the investment industry since 1986.
Comparison of top sector weightings
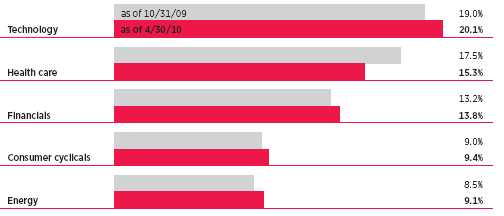
This chart shows how the fund’s top weightings have changed over the past six months. Weightings are shown as a percentage of net assets. Holdings will vary over time.
8
IN THE NEWS
The first-quarter earnings season was much better than expected. With virtually all of the S&P 500 companies reporting, 68% have beaten analysts’ expectations, according to Standard & Poor’s. In a typical quarter, 61% of companies beat estimates. Both top-lines (sales) and bottom-lines (profits) are coming in above expectations. Companies that undertook aggressive cost-cutting during the economic downturn have added to their bottom lines. Now many of those firms are experiencing rising sales, which is essential to sustained, long-term growth.
9
Your fund’s performance
This section shows your fund’s performance, price, and distribution information for periods ended April 30, 2010, the end of the first half of its current fiscal year. In accordance with regulatory requirements for mutual funds, we also include performance as of the most recent calendar quarter-end and expense information taken from the fund’s current prospectus. Performance should always be considered in light of a fund’s investment strategy. Data represents past performance. Past performance does not guarantee future results. More recent returns may be less or more than those shown. Investment return and principal value will fluctuate, and you may have a gain or a loss when you sell your shares. Performance information does not reflect any deduction for taxes a shareholder may owe on fund distributions or on the redemption of fund shares. For the most recent month-end performance, please visit the Individual Investors section at putnam .com or call Putnam at 1-800-225-1581. Class Y shares are generally only available to corporate and institutional clients and clients in other approved programs. See the Terms and Definitions section in this report for definitions of the share classes offered by your fund.
Fund performance Total return for periods ended 4/30/10
| | | | | | | | | | |
| | Class A | Class B | Class C | Class M | Class R | Class Y |
| (inception dates) | (6/29/72) | (7/15/93) | (7/26/99) | (3/13/95) | (12/1/03) | (12/30/98) |
|
| | NAV | POP | NAV | CDSC | NAV | CDSC | NAV | POP | NAV | NAV |
|
| Annual average | | | | | | | | | | |
| (life of fund) | 10.06% | 9.89% | 9.10% | 9.10% | 9.23% | 9.23% | 9.38% | 9.28% | 9.78% | 10.14% |
|
| 10 years | 47.20 | 38.72 | 36.62 | 36.62 | 36.51 | 36.51 | 40.12 | 35.23 | 43.64 | 51.01 |
| Annual average | 3.94 | 3.33 | 3.17 | 3.17 | 3.16 | 3.16 | 3.43 | 3.06 | 3.69 | 4.21 |
|
| 5 years | 34.52 | 26.79 | 29.61 | 27.61 | 29.49 | 29.49 | 31.16 | 26.60 | 32.83 | 36.25 |
| Annual average | 6.11 | 4.86 | 5.32 | 5.00 | 5.30 | 5.30 | 5.57 | 4.83 | 5.84 | 6.38 |
|
| 3 years | 0.60 | –5.18 | –1.61 | –4.35 | –1.65 | –1.65 | –0.86 | –4.35 | –0.10 | 1.38 |
| Annual average | 0.20 | –1.76 | –0.54 | –1.47 | –0.55 | –0.55 | –0.29 | –1.47 | –0.03 | 0.46 |
|
| 1 year | 44.01 | 35.72 | 42.96 | 37.95 | 42.94 | 41.94 | 43.31 | 38.33 | 43.64 | 44.47 |
|
| 6 months | 16.71 | 10.01 | 16.30 | 11.29 | 16.25 | 15.25 | 16.43 | 12.32 | 16.56 | 16.85 |
|
Current performance may be lower or higher than the quoted past performance, which cannot guarantee future results. After-sales-charge returns (public offering price, or POP) for class A and M shares reflect a maximum 5.75% and 3.50% load, respectively. Class B share returns reflect the applicable contingent deferred sales charge (CDSC), which is 5% in the first year, declining to 1% in the sixth year, and is eliminated thereafter. Class C shares reflect a 1% CDSC for the first year that is eliminated thereafter. Class R and Y shares have no initial sales charge or CDSC. Performance for class B, C, M, R, and Y shares before their inception is derived from the historical performance of class A shares, adjusted for the applicable sales charge (or CDSC) and, except for class Y shares, the higher operating expenses for such shares.
For a portion of the periods, this fund may have limited expenses, without which returns would have been lower.
A 1% short-term trading fee may be applied to shares exchanged or sold within 7 days of purchase.
10
Comparative index returns For periods ended 4/30/10
| | |
| | BofA Merrill Lynch | Lipper Convertible Securities Funds |
| | All U.S. Convertibles Index | category average* |
|
| Annual average (life of fund) | —† | 10.02% |
|
| 10 years | 33.96% | 39.40 |
| Annual average | 2.97 | 3.27 |
|
| 5 years | 33.64 | 29.77 |
| Annual average | 5.97 | 5.29 |
|
| 3 years | 3.02 | 1.18 |
| Annual average | 1.00 | 0.32 |
|
| 1 year | 43.15 | 38.18 |
|
| 6 months | 16.28 | 14.20 |
|
Index and Lipper results should be compared to fund performance at net asset value.
* Over the 6-month, 1-year, 3-year, 5-year, 10-year, and life-of-fund periods ended 4/30/10, there were 67, 67, 51, 49, 40, and 2 funds, respectively, in this Lipper category.
† The fund’s benchmark, the BofA Merrill Lynch All U.S. Convertibles Index, was introduced on 12/31/87, which postdates the inception date of the fund’s class A shares.
Fund price and distribution information For the six-month period ended 4/30/10
| | | | | | | | |
| Distributions | Class A | Class B | Class C | Class M | Class R | Class Y |
|
| Number | 2 | 2 | 2 | 2 | 2 | 2 |
|
| Income | $0.284 | $0.218 | $0.219 | $0.238 | $0.262 | $0.306 |
|
| Capital gains | — | — | — | — | — | — |
|
| Total | $0.284 | $0.218 | $0.219 | $0.238 | $0.262 | $0.306 |
|
| Share value | NAV | POP | NAV | NAV | NAV | POP | NAV | NAV |
|
| 10/31/09 | $16.27 | $17.26 | $16.01 | $16.12 | $16.13 | $16.72 | $16.22 | $16.27 |
|
| 4/30/10 | 18.69 | 19.83 | 18.39 | 18.51 | 18.53 | 19.20 | 18.63 | 18.69 |
|
| Current yield (end of period) | NAV | POP | NAV | NAV | NAV | POP | NAV | NAV |
|
| Current dividend rate 1 | 3.04% | 2.86% | 2.35% | 2.36% | 2.57% | 2.48% | 2.79% | 3.27% |
|
| Current 30-day SEC yield 2 | N/A | 2.39 | 1.79 | 1.79 | N/A | 1.97 | 2.29 | 2.78 |
|
The classification of distributions, if any, is an estimate. Final distribution information will appear on your year-end tax forms.
1 Most recent distribution, excluding capital gains, annualized and divided by NAV or POP at end of period.
2 Based only on investment income and calculated using the maximum offering price for each share class, in accordance with SEC guidelines.
11
Fund performance as of most recent calendar quarter
Total return for periods ended 3/31/10
| | | | | | | | | | |
| | Class A | Class B | Class C | Class M | Class R | Class Y |
| (inception dates) | (6/29/72) | (7/15/93) | (7/26/99) | (3/13/95) | (12/1/03) | (12/30/98) |
|
| | NAV | POP | NAV | CDSC | NAV | CDSC | NAV | POP | NAV | NAV |
|
| Annual average | | | | | | | | | | |
| (life of fund) | 10.02% | 9.85% | 9.06% | 9.06% | 9.19% | 9.19% | 9.34% | 9.24% | 9.75% | 10.10% |
|
| 10 years | 36.88 | 29.01 | 26.97 | 26.97 | 26.97 | 26.97 | 30.30 | 25.73 | 33.48 | 40.34 |
| Annual average | 3.19 | 2.58 | 2.42 | 2.42 | 2.42 | 2.42 | 2.68 | 2.32 | 2.93 | 3.45 |
|
| 5 years | 26.87 | 19.56 | 22.19 | 20.19 | 22.22 | 22.22 | 23.79 | 19.43 | 25.27 | 28.50 |
| Annual average | 4.87 | 3.64 | 4.09 | 3.75 | 4.09 | 4.09 | 4.36 | 3.62 | 4.61 | 5.14 |
|
| 3 years | 1.07 | –4.75 | –1.24 | –3.99 | –1.23 | –1.23 | –0.45 | –3.94 | 0.26 | 1.80 |
| Annual average | 0.36 | –1.61 | –0.42 | –1.35 | –0.41 | –0.41 | –0.15 | –1.33 | 0.09 | 0.60 |
|
| 1 year | 54.71 | 45.78 | 53.47 | 48.47 | 53.59 | 52.59 | 53.89 | 48.52 | 54.23 | 55.13 |
|
| 6 months | 12.00 | 5.58 | 11.52 | 6.52 | 11.57 | 10.57 | 11.69 | 7.76 | 11.84 | 12.08 |
|
Your fund’s expenses
As a mutual fund investor, you pay ongoing expenses, such as management fees, distribution fees (12b-1 fees), and other expenses. Using the following information, you can estimate how these expenses affect your investment and compare them with the expenses of other funds. You may also pay one-time transaction expenses, including sales charges (loads) and redemption fees, which are not shown in this section and would have resulted in higher total expenses. For more information, see your fund’s prospectus or talk to your financial representative.
Expense ratios
| | | | | | |
| | Class A | Class B | Class C | Class M | Class R | Class Y |
|
| Total annual operating expenses for the fiscal year | | | | | | |
| ended 10/31/09* | 1.23% | 1.98% | 1.98% | 1.73% | 1.48% | 0.98% |
|
| Annualized expense ratio for the six-month period | | | | | | |
| ended 4/30/10 | 1.19% | 1.94% | 1.94% | 1.69% | 1.44% | 0.94% |
|
Fiscal-year expense information in this table is taken from the most recent prospectus, is subject to change, and may differ from that shown for the annualized expense ratio and in the financial highlights of this report. Expenses are shown as a percentage of average net assets.
* Reflects projected expenses under a new management contract effective 1/1/10 and a new expense arrangement, which gives effect to changes in the allocation of certain expenses among the Putnam funds.
12
Expenses per $1,000
The following table shows the expenses you would have paid on a $1,000 investment in Putnam Convertible Income-Growth Trust from November 1, 2009, to April 30, 2010. It also shows how much a $1,000 investment would be worth at the close of the period, assuming actual returns and expenses.
| | | | | | |
| | Class A | Class B | Class C | Class M | Class R | Class Y |
|
| Expenses paid per $1,000*† | $6.39 | $10.40 | $10.40 | $9.07 | $7.73 | $5.05 |
|
| Ending value (after expenses) | $1,167.10 | $1,163.00 | $1,162.50 | $1,164.30 | $1,165.60 | $1,168.50 |
|
* Expenses for each share class are calculated using the fund’s annualized expense ratio for each class, which represents the ongoing expenses as a percentage of average net assets for the six months ended 4/30/10. The expense ratio may differ for each share class.
† Expenses are calculated by multiplying the expense ratio by the average account value for the period; then multiplying the result by the number of days in the period; and then dividing that result by the number of days in the year.
Estimate the expenses you paid
To estimate the ongoing expenses you paid for the six months ended April 30, 2010, use the following calculation method. To find the value of your investment on November 1, 2009, call Putnam at 1-800-225-1581.

Compare expenses using the SEC’s method
The Securities and Exchange Commission (SEC) has established guidelines to help investors assess fund expenses. Per these guidelines, the following table shows your fund’s expenses based on a $1,000 investment, assuming a hypothetical 5% annualized return. You can use this information to compare the ongoing expenses (but not transaction expenses or total costs) of investing in the fund with those of other funds. All mutual fund shareholder reports will provide this information to help you make this comparison. Please note that you cannot use this information to estimate your actual ending account balance and expenses paid during the period.
| | | | | | |
| | Class A | Class B | Class C | Class M | Class R | Class Y |
|
| Expenses paid per $1,000*† | $5.96 | $9.69 | $9.69 | $8.45 | $7.20 | $4.71 |
|
| Ending value (after expenses) | $1,018.89 | $1,015.17 | $1,015.17 | $1,016.41 | $1,017.65 | $1,020.13 |
|
* Expenses for each share class are calculated using the fund’s annualized expense ratio for each class, which represents the ongoing expenses as a percentage of average net assets for the six months ended 4/30/10. The expense ratio may differ for each share class.
† Expenses are calculated by multiplying the expense ratio by the average account value for the period; then multiplying the result by the number of days in the period; and then dividing that result by the number of days in the year.
13
Terms and definitions
Important terms
Total return shows how the value of the fund’s shares changed over time, assuming you held the shares through the entire period and reinvested all distributions in the fund.
Net asset value (NAV) is the price, or value, of one share of a mutual fund, without a sales charge. NAVs fluctuate with market conditions. NAV is calculated by dividing the net assets of each class of shares by the number of outstanding shares in the class.
Public offering price (POP) is the price of a mutual fund share plus the maximum sales charge levied at the time of purchase. POP performance figures shown here assume the 5.75% maximum sales charge for class A shares and 3.50% for class M shares.
Contingent deferred sales charge (CDSC) is generally a charge applied at the time of the redemption of class B or C shares and assumes redemption at the end of the period. Your fund’s class B CDSC declines from a 5% maximum during the first year to 1% during the sixth year. After the sixth year, the CDSC no longer applies. The CDSC for class C shares is 1% for one year after purchase.
Current yield is the annual rate of return earned from dividends or interest of an investment. Current yield is expressed as a percentage of the price of a security, fund share, or principal investment.
Share classes
Class A shares are generally subject to an initial sales charge and no CDSC (except on certain redemptions of shares bought without an initial sales charge).
Class B shares are not subject to an initial sales charge. They may be subject to a CDSC.
Class C shares are not subject to an initial sales charge and are subject to a CDSC only if the shares are redeemed during the first year.
Class M shares have a lower initial sales charge and a higher 12b-1 fee than class A shares and no CDSC (except on certain redemptions of shares bought without an initial sales charge).
Class R shares are not subject to an initial sales charge or CDSC and are available only to certain defined contribution plans.
Class Y shares are not subject to an initial sales charge or CDSC, and carry no 12b-1 fee. They are generally only available to corporate and institutional clients and clients in other approved programs.
Comparative indexes
Barclays Capital Aggregate Bond Index is an unmanaged index of U.S. investment-grade fixed-income securities.
BofA (Bank of America) Merrill Lynch All U.S. Convertibles Index is an unmanaged index of high-yield U.S. convertible securities.
BofA (Bank of America) Merrill Lynch U.S. 3-Month Treasury Bill Index is an unmanaged index that seeks to measure the performance of U.S. Treasury bills available in the marketplace.
S&P 500 Index is an unmanaged index of common stock performance.
Indexes assume reinvestment of all distributions and do not account for fees. Securities and performance of a fund and an index will differ. You cannot invest directly in an index.
Lipper is a third-party industry-ranking entity that ranks mutual funds. Its rankings do not reflect sales charges. Lipper rankings are based on total return at net asset value relative to other funds that have similar current investment styles or objectives as determined by Lipper. Lipper may change a fund’s category assignment at its discretion. Lipper category averages reflect performance trends for funds within a category.
14
Other information for shareholders
Important notice regarding delivery
of shareholder documents
In accordance with SEC regulations, Putnam sends a single copy of annual and semiannual shareholder reports, prospectuses, and proxy statements to Putnam shareholders who share the same address, unless a shareholder requests otherwise. If you prefer to receive your own copy of these documents, please call Putnam at 1-800-225-1581, and Putnam will begin sending individual copies within 30 days.
Proxy voting
Putnam is committed to managing our mutual funds in the best interests of our shareholders. The Putnam funds’ proxy voting guidelines and procedures, as well as information regarding how your fund voted proxies relating to portfolio securities during the 12-month period ended June 30, 2009, are available in the Individual Investors section of putnam.com, and on the SEC’s Web site, www.sec.gov. If you have questions about finding forms on the SEC’s Web site, you may call the SEC at 1-800-SEC-0330. You may also obtain the Putnam funds’ proxy voting guidelines and procedures at no charge by calling Putnam’s Shareholder Services at 1-800-225-1581.
Fund portfolio holdings
The fund will file a complete schedule of its portfolio holdings with the SEC for the first and third quarters of each fiscal year on Form N-Q. Shareholders may obtain the fund’s Forms N-Q on the SEC’s Web site at www.sec.gov. In addition, the fund’s Forms N-Q may be reviewed and copied at the SEC’s Public Reference Room in Washington, D.C. You may call the SEC at 1-800-SEC-0330 for information about the SEC’s Web site or the operation of the Public Reference Room.
Trustee and employee
fund ownership
Putnam employees and members of the Board of Trustees place their faith, confidence, and, most importantly, investment dollars in Putnam mutual funds. As of April 30, 2010, Putnam employees had approximately $347,000,000 and the Trustees had approximately $49,000,000 invested in Putnam mutual funds. These amounts include investments by the Trustees’ and employees’ immediate family members as well as investments through retirement and deferred compensation plans.
15
Financial statements
A guide to financial statements
These sections of the report, as well as the accompanying Notes, constitute the fund’s financial statements.
The fund’s portfolio lists all the fund’s investments and their values as of the last day of the reporting period. Holdings are organized by asset type and industry sector, country, or state to show areas of concentration and diversification.
Statement of assets and liabilities shows how the fund’s net assets and share price are determined. All investment and non-investment assets are added together. Any unpaid expenses and other liabilities are subtracted from this total. The result is divided by the number of shares to determine the net asset value per share, which is calculated separately for each class of shares. (For funds with preferred shares, the amount subtracted from total assets includes the liquidation preference of preferred shares.)
Statement of operations shows the fund’s net investment gain or loss. This is done by first adding up all the fund’s earnings — from dividends and interest income — and subtracting its operating expenses to determine net investment income (or loss). Then, any net gain or loss the fund realized on the sales of its holdings — as well as any unrealized gains or losses over the period — is added to or subtracted from the net investment result to determine the fund’s net gain or loss for the fiscal period.
Statement of changes in net assets shows how the fund’s net assets were affected by the fund’s net investment gain or loss, by distributions to shareholders, and by changes in the number of the fund’s shares. It lists distributions and their sources (net investment income or realized capital gains) over the current reporting period and the most recent fiscal year-end. The distributions listed here may not match the sources listed in the Statement of operations because the distributions are determined on a tax basis and may be paid in a different period from the one in which they were earned. Dividend sources are estimated at the time of declaration. Actual results may vary. Any non-taxable return of capital cannot be determined until final tax calculations are completed after the end of the fund’s fiscal year.
Financial highlights provide an overview of the fund’s investment results, per-share distributions, expense ratios, net investment income ratios, and portfolio turnover in one summary table, reflecting the five most recent reporting periods. In a semiannual report, the highlights table also includes the current reporting period.
16
The fund’s portfolio 4/30/10 (Unaudited)
| | |
| CONVERTIBLE BONDS AND NOTES (68.5%)* | Principal amount | Value |
|
| Aerospace and defense (1.7%) | | |
| L-1 Identity Solutions, Inc. cv. sr. unsec. notes 3 3/4s, 2027 | $2,200,000 | $2,090,000 |
|
| L-1 Identity Solutions, Inc. 144A cv. sr. unsec. | | |
| notes 3 3/4s, 2027 | 3,870,000 | 3,676,500 |
|
| Triumph Group, Inc. 144A cv. sr. sub. notes 2 5/8s, 2026 | 3,800,000 | 5,567,000 |
|
| | | 11,333,500 |
| Automotive (1.2%) | | |
| Ford Motor Co. cv. sr. unsec. notes 4 1/4s, 2016 | 1,245,000 | 1,935,477 |
|
| TRW Automotive, Inc. 144A cv. company | | |
| guaranty sr. notes 3 1/2s, 2015 | 4,400,000 | 5,698,000 |
|
| | | 7,633,477 |
| Beverage (0.8%) | | |
| Molson Coors Brewing Co. cv. company guaranty sr. unsec. | | |
| unsub. notes 2 1/2s, 2013 | 4,700,000 | 5,170,000 |
|
| | | 5,170,000 |
| Biotechnology (4.2%) | | |
| Amgen, Inc. cv. sr. unsec. notes 3/8s, 2013 | 4,400,000 | 4,427,500 |
|
| Amylin Pharmaceuticals, Inc. cv. sr. unsec. notes 3s, 2014 | 3,900,000 | 3,432,000 |
|
| Dendreon Corp. 144A cv. sr. unsec. sub. notes 4 3/4s, 2014 | 565,000 | 3,037,581 |
|
| Kendle International, Inc. cv. sr. unsec. notes 3 3/8s, 2012 | 3,800,000 | 3,595,750 |
|
| Theravance, Inc. cv. unsec. sub. notes 3s, 2015 | 2,603,000 | 2,469,596 |
|
| United Therapeutics Corp. cv. sr. unsec. notes 1/2s, 2011 | 500,000 | 764,375 |
|
| United Therapeutics Corp. 144A cv. sr. unsec. notes 1/2s, 2011 | 3,500,000 | 5,350,625 |
|
| Viropharma, Inc. cv. sr. unsec. notes 2s, 2017 | 5,000,000 | 4,675,000 |
|
| | | 27,752,427 |
| Broadcasting (0.8%) | | |
| XM Satellite Radio Holdings, Inc. 144A cv. sr. unsec. | | |
| sub. notes 7s, 2014 | 4,728,000 | 4,992,295 |
|
| | | 4,992,295 |
| Cable television (1.3%) | | |
| Virgin Media, Inc. cv. sr. unsec. notes 6 1/2s, 2016 | 7,000,000 | 8,723,750 |
|
| | | 8,723,750 |
| Chemicals (0.3%) | | |
| ShengdaTech, Inc. 144A cv. sr. notes 6s, 2018 (China) | 2,000,000 | 2,030,000 |
|
| | | 2,030,000 |
| Coal (1.3%) | | |
| International Coal Group, Inc. cv. company | | |
| guaranty sr. unsec. notes 4s, 2017 | 3,243,000 | 3,691,831 |
|
| James River Coal Co. 144A cv. sr. unsec. notes 4 1/2s, 2015 | 1,449,000 | 1,472,474 |
|
| Peabody Energy Corp. cv. jr. unsec. sub. debs. 4 3/4s, 2041 | 3,000,000 | 3,281,250 |
|
| | | 8,445,555 |
| Commercial and consumer services (2.8%) | | |
| Alliance Data Systems Corp. 144A cv. sr. notes 4 3/4s, 2014 | 2,900,000 | 4,955,375 |
|
| Icahn Enterprises LP 144A cv. sr. unsec. notes FRN 4s, 2013 | 5,400,000 | 4,738,500 |
|
| Live Nation, Inc. cv. sr. unsec. notes 2 7/8s, 2027 | 2,700,000 | 2,487,375 |
|
| Live Nation, Inc. 144A cv. sr. notes 2 7/8s, 2027 | 4,000,000 | 3,685,000 |
|
| PHH Corp. 144A cv. sr. unsec. notes 4s, 2014 | 2,294,000 | 2,532,003 |
|
| | | 18,398,253 |
| Communications equipment (1.6%) | | |
| ADC Telecommunications, Inc. cv. unsec. sub. notes 3 1/2s, 2017 | 6,900,000 | 5,356,125 |
|
| ARRIS Group, Inc. cv. sr. unsec. notes 2s, 2026 | 5,000,000 | 5,062,500 |
|
| | | 10,418,625 |
17
| | |
| CONVERTIBLE BONDS AND NOTES (68.5%)* cont. | Principal amount | Value |
|
| Computers (1.1%) | | |
| EMC Corp. 144A cv. sr. unsec. notes 1 3/4s, 2013 | $5,800,000 | $7,554,500 |
|
| | | 7,554,500 |
| Conglomerates (0.5%) | | |
| Textron, Inc. cv. sr. unsec. notes Ser. TXT, 4 1/2s, 2013 | 1,800,000 | 3,339,000 |
|
| | | 3,339,000 |
| Consumer finance (0.9%) | | |
| Dollar Financial Corp. cv. sr. notes 3s, 2028 | 6,000,000 | 6,022,500 |
|
| | | 6,022,500 |
| Consumer services (1.6%) | | |
| Avis Budget Group, Inc. 144A cv. sr. notes 3 1/2s, 2014 | 4,950,000 | 5,779,125 |
|
| Stewart Enterprises, Inc. cv. sr. unsec. notes 3 3/8s, 2016 | 5,700,000 | 5,080,125 |
|
| | | 10,859,250 |
| Distribution (0.4%) | | |
| Spartan Stores, Inc. cv. sr. unsec. notes 3 3/8s, 2027 | 3,297,000 | 2,909,603 |
|
| | | 2,909,603 |
| Electrical equipment (0.8%) | | |
| WESCO International, Inc. cv. company guaranty sr. unsec. | | |
| notes 6s, 2029 | 3,284,000 | 5,412,360 |
|
| | | 5,412,360 |
| Electronics (5.9%) | | |
| Advanced Micro Devices, Inc. cv. sr. unsec. notes 6s, 2015 | 8,900,000 | 8,577,375 |
|
| EnerSys cv. sr. unsec. notes stepped-coupon 3 3/8s | | |
| (zero%, 6/1/15) 2038 †† | 3,617,000 | 3,445,193 |
|
| Intel Corp. 144A cv. jr. sub. notes 3 1/4s, 2039 | 8,665,000 | 10,609,209 |
|
| Kulicke & Soffa Industries, Inc. cv. unsec. | | |
| sub. notes 7/8s, 2012 | 7,800,000 | 7,566,000 |
|
| SanDisk Corp. cv. sr. unsec. unsub. notes 1s, 2013 | 3,800,000 | 3,367,750 |
|
| TTM Technologies, Inc. cv. sr. unsec. notes 3 1/4s, 2015 | 5,800,000 | 5,604,250 |
|
| | | 39,169,777 |
| Energy (oil field) (2.0%) | | |
| Cal Dive International, Inc. cv. sr. unsec. | | |
| unsub. notes 3 1/4s, 2025 | 3,600,000 | 3,298,500 |
|
| Global Industries, Ltd. 144A cv. unsec. notes 2 3/4s, 2027 | 3,000,000 | 2,047,500 |
|
| Transocean, Inc. cv. sr. unsec. unsub. notes Ser. C, | | |
| 1 1/2s, 2037 (Switzerland) | 8,350,000 | 7,859,438 |
|
| | | 13,205,438 |
| Energy (other) (0.5%) | | |
| Covanta Holding Corp. 144A cv. sr. unsec. notes 3 1/4s, 2014 | 3,000,000 | 3,333,750 |
|
| | | 3,333,750 |
| Financial (1.2%) | | |
| CapitalSource, Inc. cv. company guaranty sr. unsec. | | |
| sub. notes 7 1/4s, 2037 | 2,700,000 | 2,646,000 |
|
| Digital Realty Trust LP 144A cv. sr. unsec. notes 5 1/2s, 2029 R | 2,300,000 | 3,353,688 |
|
| MGIC Investment Corp. cv. sr. notes 5s, 2017 | 1,698,000 | 1,899,892 |
|
| | | 7,899,580 |
| Food (0.8%) | | |
| Tyson Foods, Inc. cv. sr. unsec. notes 3 1/4s, 2013 | 4,035,000 | 5,255,789 |
|
| | | 5,255,789 |
| Gaming and lottery (0.9%) | | |
| International Game Technology 144A cv. sr. unsec. | | |
| notes 3 1/4s, 2014 | 4,670,000 | 5,927,164 |
|
| | | 5,927,164 |
18
| | |
| CONVERTIBLE BONDS AND NOTES (68.5%)* cont. | Principal amount | Value |
|
| Health-care services (2.5%) | | |
| Health Management Associates, Inc. | | |
| 144A cv. sr. sub. notes 3 3/4s, 2028 | $2,900,000 | $3,505,375 |
|
| LifePoint Hospitals, Inc. cv. sr. sub. notes 3 1/2s, 2014 | 3,300,000 | 3,423,750 |
|
| Lincare Holdings, Inc. cv. sr. unsec. unsub. notes 2 3/4s, 2037 | 4,500,000 | 5,332,500 |
|
| Omnicare, Inc. cv. company guaranty sr. unsec. debs | | |
| Ser. OCR, 3 1/4s, 2035 | 5,100,000 | 4,366,875 |
|
| | | 16,628,500 |
| Insurance (0.9%) | | |
| Old Republic International Corp. cv. sr. unsec. | | |
| unsub. notes 8s, 2012 | 4,100,000 | 5,658,000 |
|
| | | 5,658,000 |
| Investment banking/Brokerage (0.5%) | | |
| KKR Financial Holdings, LLC cv. sr. unsec. notes 7 1/2s, 2017 | 2,600,000 | 3,350,750 |
|
| | | 3,350,750 |
| Manufacturing (1.2%) | | |
| Griffon Corp. 144A cv. sub. notes 4s, 2017 | 2,658,000 | 3,105,341 |
|
| Titan International, Inc. 144A cv. sr. sub. notes 5 5/8s, 2017 | 3,445,000 | 4,819,900 |
|
| | | 7,925,241 |
| Medical technology (3.2%) | | |
| China Medical Technologies, Inc. cv. sr. unsec. | | |
| bonds Ser. CMT, 4s, 2013 (China) | 2,200,000 | 1,504,250 |
|
| Hologic, Inc. cv. sr. unsec. unsub. notes stepped-coupon 2s | | |
| (zero%, 12/15/13) 2037 †† | 7,700,000 | 6,930,000 |
|
| Invitrogen Corp. cv. sr. unsec. unsub. notes 1 1/2s, 2024 | 5,100,000 | 6,075,375 |
|
| Medtronic, Inc. cv. sr. unsec. notes 1 5/8s, 2013 | 3,600,000 | 3,811,500 |
|
| Medtronic, Inc. 144A cv. sr. unsec. notes 1 5/8s, 2013 | 2,800,000 | 2,964,500 |
|
| | | 21,285,625 |
| Metals (3.2%) | | |
| ArcelorMittal cv. sr. unsec. unsub. notes 5s, 2014 (Luxembourg) | 2,120,000 | 3,087,250 |
|
| Goldcorp, Inc. 144A cv. sr. notes 2s, 2014 (Canada) | 4,927,000 | 5,850,813 |
|
| Newmont Mining Corp. cv. company | | |
| guaranty sr. unsub. notes 1 5/8s, 2017 | 3,000,000 | 4,102,500 |
|
| Steel Dynamics, Inc. cv. sr. notes 5 1/8s, 2014 | 2,450,000 | 2,812,906 |
|
| United States Steel Corp. cv. sr. unsec. notes 4s, 2014 | 1,920,000 | 3,564,000 |
|
| USEC, Inc. cv. sr. unsec. notes 3s, 2014 | 2,000,000 | 1,605,000 |
|
| | | 21,022,469 |
| Oil and gas (3.6%) | | |
| Carrizo Oil & Gas, Inc. cv. sr. unsec. unsub. notes 4 3/8s, 2028 | 6,200,000 | 5,549,000 |
|
| Chesapeake Energy Corp. cv. sr. unsec. notes company | | |
| guaranty 2 1/4s, 2038 | 8,600,000 | 6,353,250 |
|
| Penn Virginia Corp. cv. sr. unsec. sub. notes 4 1/2s, 2012 | 6,590,000 | 6,252,263 |
|
| St. Mary Land & Exploration Co. cv. sr. unsec. | | |
| notes 3 1/2s, 2027 | 5,500,000 | 5,754,375 |
|
| | | 23,908,888 |
| Pharmaceuticals (3.6%) | | |
| Biovail Corp. 144A cv. sr. notes 5 3/8s, 2014 (Canada) | 2,700,000 | 3,489,750 |
|
| Cephalon, Inc. cv. sr. sub. notes 2 1/2s, 2014 | 5,880,000 | 6,578,250 |
|
| King Pharmaceuticals, Inc. cv. company | | |
| guaranty sr. unsub. notes 1 1/4s, 2026 | 5,400,000 | 4,833,000 |
|
| Teva Pharmaceutical Finance, LLC cv. company | | |
| guaranty sr. unsec. debs Ser. C, 1/4s, 2026 (Israel) | 7,300,000 | 9,188,875 |
|
| | | 24,089,875 |
19
| | |
| CONVERTIBLE BONDS AND NOTES (68.5%)* cont. | Principal amount | Value |
|
| Real estate (1.3%) | | |
| Alexandria Real Estate Equities, Inc. 144A cv. company | | |
| guaranty sr. unsec. notes 3.7s, 2027 R | $5,300,000 | $5,194,000 |
|
| General Growth Properties, Inc. 144A cv. sr. notes 3.98s, | | |
| 2027 (In default) † R | 3,600,000 | 3,726,000 |
|
| | | 8,920,000 |
| Retail (2.3%) | | |
| Charming Shoppes, Inc. cv. sr. unsec. notes 1 1/8s, 2014 | 2,900,000 | 2,345,375 |
|
| Iconix Brand Group, Inc. cv. sr. sub. notes 1 7/8s, 2012 | 3,200,000 | 3,060,000 |
|
| Pantry, Inc. (The) cv. company guaranty sr. unsec. | | |
| sub. notes 3s, 2012 | 4,400,000 | 3,943,500 |
|
| Pantry, Inc. (The) 144A cv. sr. sub. notes 3s, 2012 | 2,600,000 | 2,330,250 |
|
| Rite Aid Corp. cv. sr. unsec. unsub. notes 8 1/2s, 2015 | 3,185,000 | 3,324,344 |
|
| | | 15,003,469 |
| Semiconductor (1.0%) | | |
| Linear Technology Corp. cv. sr. unsec. unsub. notes Ser. A, | | |
| 3s, 2027 | 6,600,000 | 6,583,500 |
|
| | | 6,583,500 |
| Software (5.9%) | | |
| Cadence Design Systems, Inc. cv. sr. unsec. notes 1 1/2s, 2013 | 500,000 | 436,875 |
|
| Cadence Design Systems, Inc. 144A cv. sr. unsec. | | |
| notes 1 1/2s, 2013 | 3,100,000 | 2,708,625 |
|
| Macrovision Corp. cv. sr. unsec. notes 2 5/8s, 2011 | 1,180,000 | 1,678,550 |
|
| Rovi Corp. 144A cv. sr. unsec. unsub. notes 2 5/8s, 2040 | 6,540,000 | 6,740,288 |
|
| Safeguard Scientifics, Inc. cv. sr. unsec. | | |
| sub. notes 10 1/8s, 2014 | 8,600,000 | 9,890,000 |
|
| Sybase, Inc. 144A cv. sr. unsec. unsub. notes 3 1/2s, 2029 | 6,935,000 | 7,905,900 |
|
| Symantec Corp. cv. sr. unsec. notes 1s, 2013 | 4,400,000 | 4,708,000 |
|
| SYNNEX Corp. 144A cv. sr. notes 4s, 2018 | 4,100,000 | 4,730,375 |
|
| | | 38,798,613 |
| Technology (2.4%) | | |
| Acquicor Technology, Inc. 144A cv. notes 8s, 2011 | 3,422,000 | 3,327,895 |
|
| CACI International, Inc. cv. sr. unsec. sub. notes 2 1/8s, 2014 | 2,100,000 | 2,176,125 |
|
| CACI International, Inc. 144A cv. sr. unsec. | | |
| sub. notes 2 1/8s, 2014 | 3,720,000 | 3,854,850 |
|
| ON Semiconductor Corp. cv. company guaranty sr. unsec. | | |
| sub. notes 2 5/8s, 2026 | 785,000 | 807,569 |
|
| ON Semiconductor Corp. 144A cv. company guaranty sr. unsec. | | |
| sub. notes 2 5/8s, 2026 | 5,300,000 | 5,452,375 |
|
| | | 15,618,814 |
| Technology services (1.8%) | | |
| CSG Systems International, Inc. 144A cv. sr. sub. notes 3s, 2017 | 3,138,000 | 3,491,025 |
|
| Salesforce.com, Inc. 144A cv. sr. unsec. unsub. notes 3/4s, 2015 | 3,500,000 | 3,981,250 |
|
| SAVVIS, Inc. cv. sr. unsec. notes 3s, 2012 | 4,377,000 | 4,147,208 |
|
| | | 11,619,483 |
| Telecommunications (1.6%) | | |
| Level 3 Communications, Inc. cv. sr. unsec. | | |
| unsub. notes 3 1/2s, 2012 | 7,675,000 | 7,099,375 |
|
| NII Holdings, Inc. 144A cv. sr. unsec. notes 3 1/8s, 2012 | 3,500,000 | 3,325,000 |
|
| | | 10,424,375 |
| Telephone (0.9%) | | |
| Leap Wireless International, Inc. cv. sr. unsec. notes 4 1/2s, 2014 | 7,210,000 | 6,308,745 |
|
| | | 6,308,745 |
| Total convertible bonds and notes (cost $400,790,161) | | $452,932,940 |
20
| | |
| CONVERTIBLE PREFERRED SECURITIES (19.8%)* | Shares | Value |
|
| Automotive (0.7%) | | |
| Ford Motor Co. Capital Trust II $3.25 cum. cv. pfd. | 102,000 | $4,978,875 |
|
| | | 4,978,875 |
| Banking (4.3%) | | |
| Bank of America Corp. Ser. L, 7.25% cv. pfd. | 13,100 | 12,854,375 |
|
| Citigroup, Inc. $7.50 cv. pfd. | 47,500 | 6,261,450 |
|
| Popular, Inc. zero % cv. pfd. (Puerto Rico) | 8,000 | 272,240 |
|
| Seacoast Banking Corp. of Florida zero % cv. pfd. | 336 | 336,000 |
|
| Wells Fargo & Co. Ser. L, 7.50% cv. pfd. | 9,175 | 9,046,550 |
|
| | | 28,770,615 |
| Building materials (0.9%) | | |
| Stanley Works (The) 5.125% units cv. ARP | 5,531,000 | 5,890,515 |
|
| | | 5,890,515 |
| Combined utilities (1.1%) | | |
| El Paso Corp. 4.99% cv. pfd. | 6,900 | 7,245,000 |
|
| | | 7,245,000 |
| Conglomerates (1.1%) | | |
| Vale Capital II $3.375 cv. pfd. (Cayman Islands) | 81,200 | 7,064,400 |
|
| | | 7,064,400 |
| Electric utilities (0.9%) | | |
| Great Plains Energy, Inc. $6.00 cv. pfd. | 95,439 | 6,263,662 |
|
| | | 6,263,662 |
| Financial (0.1%) | | |
| Fannie Mae Ser. 04-1, 5.375% cv. pfd. | 100 | 350,000 |
|
| | | 350,000 |
| Food (1.6%) | | |
| Bunge, Ltd. 5.125% cum. cv. pfd. | 9,300 | 4,998,750 |
|
| Dole Food Automatic Exchange 144A 7.00% cv. pfd. | 510,505 | 5,875,913 |
|
| | | 10,874,663 |
| Health-care services (0.5%) | | |
| Omnicare Capital Trust II Ser. B, $2.00 cv. pfd. | 74,200 | 3,023,650 |
|
| | | 3,023,650 |
| Insurance (2.6%) | | |
| Assured Guaranty, Ltd. $4.25 cv. pfd. (Bermuda) | 51,500 | 4,580,410 |
|
| Hartford Financial Services Group, Inc. (The) | | |
| $1.182 cv. pfd. | 245,423 | 6,511,072 |
|
| XL Capital, Ltd. $2.687 cv. pfd. | 225,000 | 6,032,250 |
|
| | | 17,123,732 |
| Investment banking/Brokerage (—%) | | |
| Lehman Brothers Holdings, Inc. Ser. P, 7.25% cv. pfd. (In default) † | 13,400 | 20,100 |
|
| | | 20,100 |
| Media (1.2%) | | |
| Interpublic Group of Companies, Inc. (The) Ser. B, 5.25% cv. pfd. | 8,400 | 7,728,000 |
|
| | | 7,728,000 |
| Metals (2.0%) | | |
| Freeport-McMoRan Copper & Gold, Inc. $6.75 cv. pfd. | 124,000 | 13,004,500 |
|
| | | 13,004,500 |
| Oil and gas (0.9%) | | |
| Whiting Petroleum Corp. $6.25 cum. cv. pfd | 26,600 | 5,847,013 |
|
| | | 5,847,013 |
| Power producers (0.1%) | | |
| AES Trust III $3.375 cv. pfd. | 19,600 | 891,800 |
|
| | | 891,800 |
| Telecommunications (1.3%) | | |
| Crown Castle International Corp. $3.125 cum. cv. pfd. | 150,000 | 8,709,375 |
|
| | | 8,709,375 |
21
| | |
| CONVERTIBLE PREFERRED SECURITIES (19.8%)* cont. | Shares | Value |
|
| Tobacco (0.5%) | | |
| Universal Corp. 6.75% cv. pfd. | 2,688 | $3,252,480 |
|
| | | 3,252,480 |
| Total convertible preferred securities (cost $132,764,387) | | $131,038,380 |
|
| |
| COMMON STOCKS (6.7%)* | Shares | Value |
|
| Banking (0.8%) | | |
| Bank of America Corp. | 145,000 | $2,585,350 |
|
| Wells Fargo & Co. | 78,700 | 2,605,757 |
|
| | | 5,191,107 |
| Cable television (1.1%) | | |
| Comcast Corp. Class A | 197,700 | 3,902,598 |
|
| DIRECTV Class A † | 100,700 | 3,648,361 |
|
| | | 7,550,959 |
| Chemicals (0.7%) | | |
| Celanese Corp. Ser. A | 141,624 | 4,530,552 |
|
| | | 4,530,552 |
| Energy (other) (—%) | | |
| Brazil Ethanol, Inc. 144A (Unit) † | 312,500 | 3,125 |
|
| | | 3,125 |
| Insurance (0.7%) | | |
| Aflac, Inc. | 94,800 | 4,831,008 |
|
| | | 4,831,008 |
| Investment banking/Brokerage (0.3%) | | |
| Goldman Sachs Group, Inc. (The) | 13,900 | 2,018,280 |
|
| | | 2,018,280 |
| Medical technology (1.1%) | | |
| Medtronic, Inc. | 173,100 | 7,562,739 |
|
| | | 7,562,739 |
| Oil and gas (0.8%) | | |
| Newfield Exploration Co. † | 93,400 | 5,434,946 |
|
| | | 5,434,946 |
| Regional Bells (0.6%) | | |
| Qwest Communications International, Inc. | 722,100 | 3,776,583 |
|
| | | 3,776,583 |
| Telecommunications (0.6%) | | |
| NII Holdings, Inc. † | 85,600 | 3,631,152 |
|
| | | 3,631,152 |
| Total common stocks (cost $42,117,066) | | $44,530,451 |
|
| |
| CORPORATE BONDS AND NOTES (1.7%)* | Principal amount | Value |
|
| Clearwire Communications, LLC/Clearwire Finance, Inc. 144A | | |
| company guaranty sr. notes 12s, 2015 | $1,290,000 | $1,338,375 |
|
| Harrahs Operating Escrow, LLC/Harrahs Escrow Corp. 144A | | |
| sr. notes 12 3/4s, 2018 | 1,310,000 | 1,295,263 |
|
| Integra Telecom Holdings, Inc. 144A sr. notes 10 3/4s, 2016 | 1,310,000 | 1,336,200 |
|
| Intelsat Bermuda, Ltd. company guaranty sr. unsec. | | |
| notes 11 1/4s, 2017 (Bermuda) | 1,265,000 | 1,325,088 |
|
| Provident Funding Associates 144A sr. notes 10 1/4s, 2017 | 1,305,000 | 1,350,675 |
|
| Surgical Care Affiliates, Inc. 144A sr. sub. notes 10s, 2017 | 1,050,000 | 1,057,875 |
|
| Unisys Corp. 144A company guaranty sr. sub. notes 14 1/4s, 2015 | 2,900,000 | 3,494,500 |
|
| Total corporate bonds and notes (cost $10,927,835) | | $11,197,976 |
22
| | |
| SHORT-TERM INVESTMENTS (0.5%)* | Shares | Value |
|
| Putnam Money Market Liquidity Fund e | 3,284,478 | $3,284,478 |
|
| Total short-term investments (cost $3,284,478) | | $3,284,478 |
|
| TOTAL INVESTMENTS | | |
|
| Total investments (cost $589,883,927) | | $642,984,225 |
| |
| Key to holding’s abbreviations |
| ARP | Adjustable Rate Preferred Stock |
| FRN | Floating Rate Notes |
Notes to the fund’s portfolio
The notes to the fund’s portfolio are for the reporting period ended April 30, 2010.
* Percentages indicated are based on net assets of $661,487,393.
† Non-income-producing security.
†† The interest rate and date shown parenthetically represent the new interest rate to be paid and the date the fund will begin accruing interest at this rate.
e See Note 5 to the financial statements regarding investments in Putnam Money Market Liquidity Fund.
R Real Estate Investment Trust.
Debt obligations are considered secured unless otherwise indicated.
144A after the name of an issuer represents securities exempt from registration under Rule 144A under the Securities Act of 1933, as amended. These securities may be resold in transactions exempt from registration, normally to qualified institutional buyers.
The rates shown on ARP and FRN are the current interest rates at the close of the reporting period.
The dates shown on debt obligations are the original maturity dates.
Accounting Standards Codification ASC 820 Fair Value Measurements and Disclosures (ASC 820) establishes a three-level hierarchy for disclosure of fair value measurements. The valuation hierarchy is based upon the transparency of inputs to the valuation of the fund’s investments. The three levels are defined as follows:
Level 1 — Valuations based on quoted prices for identical securities in active markets.
Level 2 — Valuations based on quoted prices in markets that are not active or for which all significant inputs are observable, either directly or indirectly.
Level 3 — Valuations based on inputs that are unobservable and significant to the fair value measurement.
The following is a summary of the inputs used to value the fund’s net assets as of the close of the reporting period:
| | | |
| | | Valuation inputs |
|
| Investments in securities: | Level 1 | Level 2 | Level 3 |
|
| Common stocks: | | | |
|
| Basic materials | $4,530,552 | $— | $— |
|
| Communication services | 14,958,694 | — | — |
|
| Energy | 5,434,946 | 3,125 | — |
|
| Financial | 12,040,395 | — | — |
|
| Health care | 7,562,739 | — | — |
|
| Total common stocks | 44,527,326 | 3,125 | — |
| Convertible bonds and notes | — | 452,932,940 | — |
|
| Convertible preferred securities | — | 131,038,380 | — |
|
| Corporate bonds and notes | — | 11,197,976 | — |
|
| Short-term investments | 3,284,478 | — | — |
|
| Totals by level | $47,811,804 | $595,172,421 | $— |
The accompanying notes are an integral part of these financial statements.
23
| |
| Statement of assets and liabilities 4/30/10 (Unaudited) | |
|
| |
| ASSETS | |
|
| Investment in securities, at value (Note 1): | |
| Unaffiliated issuers (identified cost $586,599,449) | $639,699,747 |
| Affiliated issuers (identified cost $3,284,478) (Note 5) | 3,284,478 |
|
| Cash | 2,453,001 |
|
| Dividends, interest and other receivables | 5,662,245 |
|
| Receivable for shares of the fund sold | 1,036,329 |
|
| Receivable for investments sold | 21,960,532 |
|
| Total assets | 674,096,332 |
|
| |
| LIABILITIES | |
|
| Payable for investments purchased | 9,248,708 |
|
| Payable for shares of the fund repurchased | 2,475,419 |
|
| Payable for compensation of Manager (Note 2) | 345,291 |
|
| Payable for investor servicing fees (Note 2) | 123,944 |
|
| Payable for custodian fees (Note 2) | 3,763 |
|
| Payable for Trustee compensation and expenses (Note 2) | 144,009 |
|
| Payable for administrative services (Note 2) | 2,017 |
|
| Payable for distribution fees (Note 2) | 169,455 |
|
| Other accrued expenses | 96,333 |
|
| Total liabilities | 12,608,939 |
| |
| Net assets | $661,487,393 |
|
| |
| REPRESENTED BY | |
|
| Paid-in capital (Unlimited shares authorized) (Notes 1 and 4) | $764,773,185 |
|
| Undistributed net investment income (Note 1) | 11,513,724 |
|
| Accumulated net realized loss on investments (Note 1) | (167,899,814) |
|
| Net unrealized appreciation of investments | 53,100,298 |
|
| Total — Representing net assets applicable to capital shares outstanding | $661,487,393 |
|
| |
| COMPUTATION OF NET ASSET VALUE AND OFFERING PRICE | |
|
| Net asset value and redemption price per class A share | |
| ($503,879,364 divided by 26,958,829 shares) | $18.69 |
|
| Offering price per class A share (100/94.25 of $18.69)* | $19.83 |
|
| Net asset value and offering price per class B share ($14,026,678 divided by 762,846 shares)** | $18.39 |
|
| Net asset value and offering price per class C share ($59,141,858 divided by 3,194,413 shares)** | $18.51 |
|
| Net asset value and redemption price per class M share ($4,586,424 divided by 247,536 shares) | $18.53 |
|
| Offering price per class M share (100/96.50 of $18.53)* | $19.20 |
|
| Net asset value, offering price and redemption price per class R share | |
| ($3,086,807 divided by 165,704 shares) | $18.63 |
|
| Net asset value, offering price and redemption price per class Y share | |
| ($76,766,262 divided by 4,108,202 shares) | $18.69 |
|
* On single retail sales of less than $50,000. On sales of $50,000 or more the offering price is reduced.
** Redemption price per share is equal to net asset value less any applicable contingent deferred sales charge.
The accompanying notes are an integral part of these financial statements.
24
| |
| Statement of operations Six months ended 4/30/10 (Unaudited) | |
|
| |
| INVESTMENT INCOME | |
|
| Interest (including interest income of $9,516 from investments in affiliated issuers) (Note 5) | $9,387,699 |
|
| Dividends | 3,893,981 |
|
| Securities lending | 4,339 |
|
| Total investment income | 13,286,019 |
|
| |
| EXPENSES | |
|
| Compensation of Manager (Note 2) | 2,005,767 |
|
| Investor servicing fees (Note 2) | 793,160 |
|
| Custodian fees (Note 2) | 6,846 |
|
| Trustee compensation and expenses (Note 2) | 24,050 |
|
| Administrative services (Note 2) | 19,367 |
|
| Distribution fees — Class A (Note 2) | 604,361 |
|
| Distribution fees — Class B (Note 2) | 70,967 |
|
| Distribution fees — Class C (Note 2) | 289,045 |
|
| Distribution fees — Class M (Note 2) | 16,782 |
|
| Distribution fees — Class R (Note 2) | 7,339 |
|
| Other | 148,966 |
|
| Total expenses | 3,986,650 |
| | |
| Expense reduction (Note 2) | (7,779) |
|
| Net expenses | 3,978,871 |
| |
| Net investment income | 9,307,148 |
|
| |
| Net realized gain on investments (Notes 1 and 3) | 29,891,784 |
|
| Net unrealized appreciation of investments during the period | 58,747,227 |
|
| Net gain on investments | 88,639,011 |
| |
| Net increase in net assets resulting from operations | $97,946,159 |
|
The accompanying notes are an integral part of these financial statements.
25
| | |
| Statement of changes in net assets | | |
|
| |
| INCREASE IN NET ASSETS | Six months ended 4/30/10* | Year ended 10/31/09 |
|
| Operations: | | |
| Net investment income | $9,307,148 | $20,395,821 |
|
| Net realized gain (loss) on investments | 29,891,784 | (106,316,343) |
|
| Net unrealized appreciation of investments | 58,747,227 | 248,720,550 |
|
| Net increase in net assets resulting from operations | 97,946,159 | 162,800,028 |
|
| Distributions to shareholders (Note 1): | | |
| From ordinary income | | |
| Net investment income | | |
|
| Class A | (7,760,698) | (17,157,229) |
|
| Class B | (178,028) | (459,958) |
|
| Class C | (727,306) | (1,449,088) |
|
| Class M | (60,373) | (138,859) |
|
| Class R | (43,579) | (89,957) |
|
| Class Y | (1,259,982) | (1,470,069) |
|
| Increase in capital from settlement payments | 7,986 | — |
|
| Redemption fees (Note 1) | 423 | 1,880 |
|
| Decrease from capital share transactions (Note 4) | (42,314,755) | (3,906,655) |
|
| Total increase in net assets | 45,609,847 | 138,130,093 |
|
| |
| NET ASSETS | | |
|
| Beginning of period | 615,877,546 | 477,747,453 |
|
| End of period (including undistributed net investment | | |
| income of $11,513,724 and $12,236,542, respectively) | $661,487,393 | $615,877,546 |
|
* Unaudited
The accompanying notes are an integral part of these financial statements.
26
|
| This page left blank intentionally. |
27
Financial highlights (For a common share outstanding throughout the period)
| | | | | | | | | | | | | | |
| INVESTMENT OPERATIONS: | | LESS DISTRIBUTIONS: | | RATIOS AND SUPPLEMENTAL DATA: |
|
| | | | | | | | | | | | | | Ratio of net | |
| | | | Net realized | | | | | | | | | Ratio | investment | |
| | Net asset value, | | and unrealized | Total from | From net | | | Non-recurring | Net asset | Total return | Net assets, | of expenses | income (loss) | |
| | beginning | Net investment | gain (loss) on | investment | investment | Total | Redemption | reim- | value, end | at net asset | end of period | to average | to average | Portfolio |
| Period ended | of period | income (loss) a | investments | operations | income | distributions | fees b | bursements | of period | value (%) c | (in thousands) | net assets (%) d | net assets (%) | turnover (%) |
|
| Class A | | | | | | | | | | | | | | |
| April 30, 2010 ** | $16.27 | .26 | 2.44 | 2.70 | (.28) | (.28) | — | — b,e | $18.69 | 16.71 * | $503,879 | .59 * | 1.48 * | 30.52 * |
| October 31, 2009 | 12.55 | .55 | 3.73 | 4.28 | (.56) | (.56) | — | — | 16.27 | 35.08 | 467,669 | 1.20 f | 4.00 f | 74.36 |
| October 31, 2008 | 21.21 | .51 | (8.64) | (8.13) | (.53) | (.53) | — | — | 12.55 | (39.13) | 402,408 | 1.06 f | 2.73 f | 68.19 |
| October 31, 2007 | 19.05 | .51 | 2.18 | 2.69 | (.53) | (.53) | — | — | 21.21 | 14.27 | 697,830 | 1.04 f | 2.50 f | 70.61 |
| October 31, 2006 | 17.13 | .48 g | 1.97 | 2.45 | (.53) | (.53) | — | — | 19.05 | 14.52 | 608,771 | 1.03 f,g | 2.64 f,g | 63.63 |
| October 31, 2005 | 16.60 | .50 h | .56 | 1.06 | (.53) | (.53) | — | — | 17.13 | 6.41 | 564,822 | 1.03 f | 2.91 f,h | 66.46 |
|
| Class B | | | | | | | | | | | | | | |
| April 30, 2010 ** | $16.01 | .19 | 2.41 | 2.60 | (.22) | (.22) | — | — b,e | $18.39 | 16.30 * | $14,027 | .96 * | 1.12 * | 30.52 * |
| October 31, 2009 | 12.35 | .44 | 3.67 | 4.11 | (.45) | (.45) | — | — | 16.01 | 34.12 | 14,351 | 1.95 f | 3.30 f | 74.36 |
| October 31, 2008 | 20.87 | .36 | (8.51) | (8.15) | (.37) | (.37) | — | — | 12.35 | (39.61) | 15,297 | 1.81 f | 1.96 f | 68.19 |
| October 31, 2007 | 18.75 | .35 | 2.14 | 2.49 | (.37) | (.37) | — | — | 20.87 | 13.40 | 37,930 | 1.79 f | 1.77 f | 70.61 |
| October 31, 2006 | 16.86 | .34 g | 1.94 | 2.28 | (.39) | (.39) | — | — | 18.75 | 13.68 | 47,842 | 1.78 f,g | 1.89 f,g | 63.63 |
| October 31, 2005 | 16.34 | .36 h | .55 | .91 | (.39) | (.39) | — | — | 16.86 | 5.61 | 65,205 | 1.78 f | 2.16 f,h | 66.46 |
|
| Class C | | | | | | | | | | | | | | |
| April 30, 2010 ** | $16.12 | .19 | 2.42 | 2.61 | (.22) | (.22) | — | — b,e | $18.51 | 16.25 * | $59,142 | .96 * | 1.11 * | 30.52 * |
| October 31, 2009 | 12.44 | .43 | 3.71 | 4.14 | (.46) | (.46) | — | — | 16.12 | 34.12 | 56,131 | 1.95 f | 3.13 f | 74.36 |
| October 31, 2008 | 21.04 | .37 | (8.58) | (8.21) | (.39) | (.39) | — | — | 12.44 | (39.60) | 33,539 | 1.81 f | 2.00 f | 68.19 |
| October 31, 2007 | 18.92 | .35 | 2.16 | 2.51 | (.39) | (.39) | — | — | 21.04 | 13.36 | 38,347 | 1.79 f | 1.73 f | 70.61 |
| October 31, 2006 | 17.01 | .34 g | 1.97 | 2.31 | (.40) | (.40) | — | — | 18.92 | 13.73 | 22,010 | 1.78 f,g | 1.89 f,g | 63.63 |
| October 31, 2005 | 16.50 | .37 h | .55 | .92 | (.41) | (.41) | — | — | 17.01 | 5.60 | 17,952 | 1.78 f | 2.17 f,h | 66.46 |
|
| Class M | | | | | | | | | | | | | | |
| April 30, 2010 ** | $16.13 | .22 | 2.42 | 2.64 | (.24) | (.24) | — | — b,e | $18.53 | 16.43 * | $4,586 | .84 * | 1.24 * | 30.52 * |
| October 31, 2009 | 12.45 | .47 | 3.71 | 4.18 | (.50) | (.50) | — | — | 16.13 | 34.41 | 4,383 | 1.70 f | 3.40 f | 74.36 |
| October 31, 2008 | 21.04 | .41 | (8.57) | (8.16) | (.43) | (.43) | — | — | 12.45 | (39.44) | 3,133 | 1.56 f | 2.22 f | 68.19 |
| October 31, 2007 | 18.90 | .40 | 2.17 | 2.57 | (.43) | (.43) | — | — | 21.04 | 13.70 | 6,175 | 1.54 f | 2.00 f | 70.61 |
| October 31, 2006 | 16.99 | .38 g | 1.97 | 2.35 | (.44) | (.44) | — | — | 18.90 | 14.01 | 5,607 | 1.53 f,g | 2.14 f,g | 63.63 |
| October 31, 2005 | 16.48 | .41 h | .54 | .95 | (.44) | (.44) | — | — | 16.99 | 5.79 | 5,662 | 1.53 f | 2.41 f,h | 66.46 |
|
| Class R | | | | | | | | | | | | | | |
| April 30, 2010 ** | $16.22 | .24 | 2.43 | 2.67 | (.26) | (.26) | — | — b,e | $18.63 | 16.56 * | $3,087 | .72 * | 1.36 * | 30.52 * |
| October 31, 2009 | 12.51 | .51 | 3.73 | 4.24 | (.53) | (.53) | — | — | 16.22 | 34.79 | 2,685 | 1.45 f | 3.73 f | 74.36 |
| October 31, 2008 | 21.15 | .47 | (8.62) | (8.15) | (.49) | (.49) | — | — | 12.51 | (39.29) | 2,255 | 1.31 f | 2.50 f | 68.19 |
| October 31, 2007 | 19.01 | .45 | 2.18 | 2.63 | (.49) | (.49) | — | — | 21.15 | 13.96 | 2,164 | 1.29 f | 2.20 f | 70.61 |
| October 31, 2006 | 17.11 | .43 g | 1.98 | 2.41 | (.51) | (.51) | — | — | 19.01 | 14.27 | 1,027 | 1.28 f,g | 2.35 f,g | 63.63 |
| October 31, 2005 | 16.60 | .46 h | .54 | 1.00 | (.49) | (.49) | — | — | 17.11 | 6.07 | 87 | 1.28 f | 2.67 f,h | 66.46 |
|
| Class Y | | | | | | | | | | | | | | |
| April 30, 2010 ** | $16.27 | .28 | 2.45 | 2.73 | (.31) | (.31) | — | — b,e | $18.69 | 16.85 * | $76,766 | .47 * | 1.61 * | 30.52 * |
| October 31, 2009 | 12.55 | .57 | 3.74 | 4.31 | (.59) | (.59) | — | — | 16.27 | 35.43 | 70,660 | .95 f | 3.93 f | 74.36 |
| October 31, 2008 | 21.21 | .56 | (8.64) | (8.08) | (.58) | (.58) | — | — | 12.55 | (38.97) | 21,115 | .81 f | 3.00 f | 68.19 |
| October 31, 2007 | 19.05 | .56 | 2.18 | 2.74 | (.58) | (.58) | — | — | 21.21 | 14.56 | 27,084 | .79 f | 2.75 f | 70.61 |
| October 31, 2006 | 17.13 | .52 g | 1.97 | 2.49 | (.57) | (.57) | — | — | 19.05 | 14.81 | 24,458 | .78 f,g | 2.88 f,g | 63.63 |
| October 31, 2005 | 16.60 | .54 h | .56 | 1.10 | (.57) | (.57) | — | — | 17.13 | 6.68 | 24,197 | .78 f | 3.15 f,h | 66.46 |
|
See notes to financial highlights at the end of this section.
The accompanying notes are an integral part of these financial statements.
Financial highlights (Continued)
* Not annualized.
** Unaudited.
a Per share net investment income (loss) has been determined on the basis of the weighted average number of shares outstanding during the period.
b Amount represents less than $0.01 per share.
c Total return assumes dividend reinvestment and does not reflect the effect of sales charges.
d Includes amounts paid through expense offset and brokerage/service arrangements (Note 2).
e Reflects a non-recurring reimbursement pursuant to a settlement between the Securities and Exchange Commission (the SEC) and Prudential Securities, Inc., which amounted to less than $0.01 per share outstanding on March 30, 2010.
f Reflects an involuntary contractual expense limitation in effect during the period. For periods prior to October 31, 2009, certain fund expenses were waived in connection with the fund’s investment in Putnam Prime Money Market Fund. As a result of such limitation and/or waivers, the expenses of each class reflect a reduction of the following amounts (Note 2):
| |
| | Percentage of |
| | average net assets |
|
| October 31, 2009 | 0.06% |
|
| October 31, 2008 | <0.01 |
|
| October 31, 2007 | <0.01 |
|
| October 31, 2006 | <0.01 |
|
| October 31, 2005 | <0.01 |
|
g Reflects a non-recurring reimbursement from Putnam Investments relating to the calculation of certain amounts paid by the fund to Putnam in previous years for transfer agent services, which amounted to less than $0.01 per share and 0.01% of average net assets for the period ended October 31, 2006.
h Reflects a non-recurring accrual related to Putnam Management’s settlement with the SEC regarding brokerage allocation practices, which amounted to the following amounts:
| | |
| | | Percentage of |
| | Per share | average net assets |
|
| Class A | <$0.01 | 0.02% |
|
| Class B | <0.01 | 0.03 |
|
| Class C | <0.01 | 0.02 |
|
| Class M | <0.01 | 0.03 |
|
| Class R | <0.01 | 0.02 |
|
| Class Y | <0.01 | 0.03 |
|
The accompanying notes are an integral part of these financial statements.
30
Notes to financial statements 4/30/10 (Unaudited)
Note 1: Significant accounting policies
Putnam Convertible Income-Growth Trust (the fund), is a Massachusetts business trust, which is registered under the Investment Company Act of 1940, as amended, as a diversified open-end management investment company. The investment objective of the fund is to seek with equal emphasis, current income and capital appreciation by investing primarily in U.S. securities that can be converted into or exchanged for common stock. The fund’s secondary objective is conservation of capital. The fund may invest in higher yielding, lower rated bonds that may have a higher rate of default.
The fund offers class A, class B, class C, class M, class R and class Y shares. Class A and class M shares are sold with a maximum front-end sales charge of 5.75% and 3.50%, respectively, and generally do not pay a contingent deferred sales charge. Class B shares, which convert to class A shares after approximately eight years, do not pay a front-end sales charge and are subject to a contingent deferred sales charge, if those shares are redeemed within six years of purchase. Class C shares have a one-year 1.00% contingent deferred sales charge and do not convert to class A shares. Class R shares, which are offered to qualified employee-benefit plans, are sold at net asset value. The expenses for class A, class B, class C, class M and class R shares may differ based on the distribution fee of each class, which is identified in Note 2. Class Y shares, which are sold at net asset value, are generally subject to the same expenses as class A, class B, class C, class M and class R shares, but do not bear a distribution fee. Class Y shares are generally only available to corporate and institutional clients and clients in other approved programs.
A 1.00% redemption fee may apply on any shares that are redeemed (either by selling or exchanging into another fund) within 7 days of purchase. The redemption fee is accounted for as an addition to paid-in-capital.
Investment income, realized and unrealized gains and losses and expenses of the fund are borne pro-rata based on the relative net assets of each class to the total net assets of the fund, except that each class bears expenses unique to that class (including the distribution fees applicable to such classes). Each class votes as a class only with respect to its own distribution plan or other matters on which a class vote is required by law or determined by the Trustees. If the fund were liquidated, shares of each class would receive their pro-rata share of the net assets of the fund. In addition, the Trustees declare separate dividends on each class of shares.
In the normal course of business, the fund enters into contracts that may include agreements to indemnify another party under given circumstances. The fund’s maximum exposure under these arrangements is unknown as this would involve future claims that may be, but have not yet been, made against the fund. However, the fund’s management team expects the risk of material loss to be remote.
The following is a summary of significant accounting policies consistently followed by the fund in the preparation of its financial statements. The preparation of financial statements is in conformity with accounting principles generally accepted in the United States of America and requires management to make estimates and assumptions that affect the reported amounts of assets and liabilities in the financial statements and the reported amounts of increases and decreases in net assets from operations during the period from November 1, 2009 through April 30, 2010 (the reporting period). Actual results could differ from those estimates. Subsequent events after the Statement of assets and liabilities date through the date that the financial statements were issued, June 11, 2010, have been evaluated in the preparation of the financial statements.
A) Security valuation Investments for which market quotations are readily available are valued at the last reported sales price on their principal exchange, or official closing price for certain markets. If no sales are reported — as in the case of some securities traded over-the-counter — a security is valued at its last reported bid price. Market quotations are not considered to be readily available for certain debt obligations; such investments are valued on the basis of valuations furnished by an independent pricing service approved by the Trustees or dealers selected by Putnam Investment Management, LLC (Putnam Management), the fund’s manager, an indirect wholly-owned subsidiary of Putnam Investments, LLC. Such services or dealers determine valuations for normal institutional-size trading units of such securities using methods based on market transactions for comparable securities and vario us relationships, generally recognized by institutional traders, between securities (which considers such factors as security prices, yields, maturities and ratings). Many securities markets and exchanges outside the U.S. close prior to the close of the New York Stock Exchange and therefore the closing prices for securities in such markets or on such exchanges may not fully reflect events that occur after such close but before the close of the New York Stock Exchange. Accordingly, on certain days, the fund will fair value foreign equity securities taking into account multiple factors, including movements in the U.S. securities markets. The number of days on which fair value prices
31
will be used will depend on market activity and it is possible that fair value prices will be used by the fund to a significant extent. Securities quoted in foreign currencies, if any, are translated into U.S. dollars at the current exchange rate. To the extent a pricing service or dealer is unable to value a security or provides a valuation that Putnam Management does not believe accurately reflects the security’s fair value, the security will be valued at fair value by Putnam Management. Certain investments, including certain restricted and illiquid securities and derivatives, are also valued at fair value following procedures approved by the Trustees. Such valuations and procedures are reviewed periodically by the Trustees. The fair value of securities is generally determined as the amount that the fund could reasonably expect to realize from an orderly disposition of such securities over a reasonable period of time. By its nature, a fair value price is a good faith estimate of the value of a security in a current sale and does not reflect an actual market price, which may be different by a material amount.
B) Joint trading account Pursuant to an exemptive order from the Securities and Exchange Commission (the SEC), the fund may transfer uninvested cash balances, including cash collateral received under security lending arrangements, into a joint trading account along with the cash of other registered investment companies and certain other accounts managed by Putnam Management. These balances may be invested in issues of short-term investments having maturities of up to 397 days for collateral received under security lending arrangements and up to 90 days for other cash investments.
C) Security transactions and related investment income Security transactions are recorded on the trade date (the date the order to buy or sell is executed). Gains or losses on securities sold are determined on the identified cost basis.
Interest income is recorded on the accrual basis. Dividend income, net of applicable withholding taxes, is recognized on the ex-dividend date except that certain dividends from foreign securities, if any, are recognized as soon as the fund is informed of the ex-dividend date. Non-cash dividends, if any, are recorded at the fair market value of the securities received. Dividends representing a return of capital or capital gains, if any, are reflected as a reduction of cost and/or as a realized gain. All premiums/discounts are amortized/accreted on a yield-to-maturity basis.
D) Securities lending The fund may lend securities, through its agents, to qualified borrowers in order to earn additional income. The loans are collateralized by cash and/or securities in an amount at least equal to the market value of the securities loaned. The market value of securities loaned is determined daily and any additional required collateral is allocated to the fund on the next business day. The risk of borrower default will be borne by the fund’s agents; the fund will bear the risk of loss with respect to the investment of the cash collateral. Income from securities lending is included in investment income on the Statement of operations. At the close of the reporting period, the fund had no securities out on loan.
E) Federal taxes It is the policy of the fund to distribute all of its taxable income within the prescribed time and otherwise comply with the provisions of the Internal Revenue Code of 1986, as amended (the Code), applicable to regulated investment companies. It is also the intention of the fund to distribute an amount sufficient to avoid imposition of any excise tax under Section 4982 of the Code. The fund is subject to the provisions of Accounting Standards Codification ASC 740 Income Taxes (ASC 740). ASC 740 sets forth a minimum threshold for financial statement recognition of the benefit of a tax position taken or expected to be taken in a tax return. The fund did not have any unrecognized tax benefits in the accompanying financial statements. No provision has been made for federal taxes on income, capital gains or unrealized a ppreciation on securities held nor for excise tax on income and capital gains. Each of the fund’s federal tax returns for the prior three fiscal years remains subject to examination by the Internal Revenue Service and state departments of revenue.
At October 31, 2009, the fund had a capital loss carryover of $197,791,598 available to the extent allowed by the Code to offset future net capital gain, if any. The amounts of the carryovers and the expiration dates are:
| |
| Loss Carryover | Expiration |
|
| $60,611,354 | October 31, 2010 |
|
| 30,918,383 | October 31, 2016 |
|
| 106,261,861 | October 31, 2017 |
|
The aggregate identified cost on a tax basis is $591,186,472, resulting in gross unrealized appreciation and depreciation of $91,443,576 and $39,645,823, respectively, or net unrealized appreciation of $51,797,753.
F) Distributions to shareholders Distributions to shareholders from net investment income are recorded by the fund on the ex-dividend date. Distributions from capital gains, if any, are recorded on the ex-dividend date and paid
32
at least annually. The amount and character of income and gains to be distributed are determined in accordance with income tax regulations, which may differ from generally accepted accounting principles. Dividend sources are estimated at the time of declaration. Actual results may vary. Any non-taxable return of capital cannot be determined until final tax calculations are completed after the end of the fund’s fiscal year. Reclassifications are made to the fund’s capital accounts to reflect income and gains available for distribution (or available capital loss carryovers) under income tax regulations.
Note 2: Management fee, administrative services and other transactions
Effective January 1, 2010, the fund pays Putnam Management a management fee (based on the fund’s average net assets and computed and paid monthly) at annual rates that may vary based on the average of the aggregate net assets of most open-end funds, as defined in the fund’s management contract, sponsored by Putnam Management. Such annual rates may vary as follows: 0.78% of the first $5 billion, 0.73% of the next $5 billion, 0.68% of the next $10 billion, 0.63% of the next $10 billion, 0.58% of the next $50 billion, 0.56% of the next $50 billion, 0.55% of the next $100 billion, and 0.545% thereafter.
Prior to January 1, 2010, the fund paid Putnam Management for management and investment advisory services quarterly based on the average net assets of the fund. Such fee was based on the following annual rates: 0.65% of the first $500 million of average net assets, 0.55% of the next $500 million, 0.50% of the next $500 million, 0.45% of the next $5 billion, 0.425% of the next $5 billion, 0.405% of the next $5 billion, 0.39% of the next $5 billion, and 0.38% thereafter.
Effective August 1, 2009 through July 31, 2010, Putnam Management has contractually agreed to reimburse the fund’s expenses to the extent necessary to limit the cumulative expenses of the fund, exclusive of brokerage, interest, taxes, investment-related expenses, extraordinary expenses and payments under the fund’s investor servicing contract, investment management contract and distribution plans, on a fiscal year-to-date basis (or from August 1, 2009 through the fund’s next fiscal year end, as applicable), to an annual rate of 0.20% of the fund’s average net assets over such fiscal year-to-date period (or since August 1, 2009, as applicable). During the reporting period, the fund’s expenses were not reduced as a result of this limit.
Effective February 28, 2010, Putnam Investments Limited (PIL), an affiliate of Putnam Management, is authorized by the Trustees to manage a separate portion of the assets of the fund as determined by Putnam Management from time to time. Putnam Management pays a quarterly sub-management fee to PIL for its services at an annual rate of 0.35% of the average net assets of the portion of the fund managed by PIL.
The fund reimburses Putnam Management an allocated amount for the compensation and related expenses of certain officers of the fund and their staff who provide administrative services to the fund. The aggregate amount of all such reimbursements is determined annually by the Trustees.
Custodial functions for the fund’s assets are provided by State Street Bank and Trust Company (State Street). Custody fees are based on the fund’s asset level, the number of its security holdings and transaction volumes.
Putnam Investor Services, Inc., an affiliate of Putnam Management, provided investor servicing agent functions to the fund. Putnam Investor Services, Inc. received fees for investor servicing, subject to certain limitations, based on the fund’s retail asset level, the number of shareholder accounts in the fund and the level of defined contribution plan assets in the fund. The amounts incurred for investor servicing agent functions during the reporting period are included in Investor servicing fees in the Statement of operations.
The fund has entered into expense offset arrangements with Putnam Investor Services, Inc. and State Street whereby Putnam Investor Services, Inc.’s and State Street’s fees are reduced by credits allowed on cash balances. The fund also reduced expenses through brokerage/service arrangements. For the reporting period, the fund’s expenses were reduced by $1,323 under the expense offset arrangements and by $6,456 under the brokerage/service arrangements.
Each independent Trustee of the fund receives an annual Trustee fee, of which $459, as a quarterly retainer, has been allocated to the fund, and an additional fee for each Trustees meeting attended. Trustees receive additional fees for attendance at certain committee meetings and industry seminars and for certain compliance-related matters. Trustees also are reimbursed for expenses they incur relating to their services as Trustees.
The fund has adopted a Trustee Fee Deferral Plan (the Deferral Plan) which allows the Trustees to defer the receipt of all or a portion of Trustees fees payable on or after July 1, 1995. The deferred fees remain invested in certain Putnam funds until distribution in accordance with the Deferral Plan.
33
The fund has adopted an unfunded noncontributory defined benefit pension plan (the Pension Plan) covering all Trustees of the fund who have served as a Trustee for at least five years and were first elected prior to 2004. Benefits under the Pension Plan are equal to 50% of the Trustee’s average annual attendance and retainer fees for the three years ended December 31, 2005. The retirement benefit is payable during a Trustee’s lifetime, beginning the year following retirement, for the number of years of service through December 31, 2006. Pension expense for the fund is included in Trustee compensation and expenses in the Statement of operations. Accrued pension liability is included in Payable for Trustee compensation and expenses in the Statement of assets and liabilities. The Trustees have terminated the Pension Plan with respect to any Trustee first elected after 2003.
The fund has adopted distribution plans (the Plans) with respect to its class A, class B, class C, class M and class R shares pursuant to Rule 12b-1 under the Investment Company Act of 1940. The purpose of the Plans is to compensate Putnam Retail Management Limited Partnership, a wholly-owned subsidiary of Putnam Investments, LLC and Putnam Retail Management GP, Inc., for services provided and expenses incurred in distributing shares of the fund. The Plans provide for payments by the fund to Putnam Retail Management Limited Partnership at an annual rate of up to 0.35%, 1.00%, 1.00%, 1.00% and 1.00% of the average net assets attributable to class A, class B, class C, class M and class R shares, respectively. The Trustees have approved payment by the fund at an annual rate of 0.25%, 1.00%, 1.00%, 0.75% and 0.50% of the average net assets attributable to class A, class B, class C, class M and class R shares, respectively.
For the reporting period, Putnam Retail Management Limited Partnership, acting as underwriter, received net commissions of $31,443 and $394 from the sale of class A and class M shares, respectively, and received $5,950 and $1,555 in contingent deferred sales charges from redemptions of class B and class C shares, respectively.
A deferred sales charge of up to 1.00% and 0.65% is assessed on certain redemptions of class A and class M shares, respectively. For the reporting period, Putnam Retail Management Limited Partnership, acting as underwriter, received $333 and no monies on class A and class M redemptions, respectively.
Note 3: Purchases and sales of securities
During the reporting period, cost of purchases and proceeds from sales of investment securities other than short-term investments aggregated $189,416,360 and $239,834,952, respectively. There were no purchases or sales of U.S. government securities.
Note 4: Capital shares
At the close of the reporting period, there was an unlimited number of shares of beneficial interest authorized. Transactions in capital shares were as follows:
| | | | |
| | Six months ended 4/30/10 | Year ended 10/31/09 |
|
| Class A | Shares | Amount | Shares | Amount |
|
| Shares sold | 1,244,832 | $22,102,787 | 7,390,655 | $94,867,615 |
|
| Shares issued in connection with | | | | |
| reinvestment of distributions | 361,586 | 6,457,242 | 990,049 | 13,331,758 |
|
| | 1,606,418 | 28,560,029 | 8,380,704 | 108,199,373 |
|
| Shares repurchased | (3,386,947) | (59,403,277) | (11,709,379) | (155,524,573) |
|
| Net decrease | (1,780,529) | $(30,843,248) | (3,328,675) | $(47,325,200) |
|
| |
| | Six months ended 4/30/10 | Year ended 10/31/09 |
|
| Class B | Shares | Amount | Shares | Amount |
|
| Shares sold | 35,287 | $613,787 | 187,380 | $2,480,046 |
|
| Shares issued in connection with | | | | |
| reinvestment of distributions | 7,219 | 126,760 | 25,915 | 339,236 |
|
| | 42,506 | 740,547 | 213,295 | 2,819,282 |
|
| Shares repurchased | (175,893) | (3,047,236) | (555,275) | (7,265,671) |
|
| Net decrease | (133,387) | $(2,306,689) | (341,980) | $(4,446,389) |
|
34
| | | | |
| | Six months ended 4/30/10 | Year ended 10/31/09 |
|
| Class C | Shares | Amount | Shares | Amount |
|
| Shares sold | 318,314 | $5,621,790 | 1,820,929 | $24,060,853 |
|
| Shares issued in connection with | | | | |
| reinvestment of distributions | 17,577 | 311,004 | 53,698 | 725,497 |
|
| | 335,891 | 5,932,794 | 1,874,627 | 24,786,350 |
|
| Shares repurchased | (623,072) | (10,939,183) | (1,088,196) | (14,570,144) |
|
| Net increase (decrease) | (287,181) | $(5,006,389) | 786,431 | $10,216,206 |
|
| |
| | Six months ended 4/30/10 | Year ended 10/31/09 |
|
| Class M | Shares | Amount | Shares | Amount |
|
| Shares sold | 21,967 | $385,182 | 141,545 | $1,929,497 |
|
| Shares issued in connection with | | | | |
| reinvestment of distributions | 2,984 | 52,855 | 7,724 | 104,656 |
|
| | 24,951 | 438,037 | 149,269 | 2,034,153 |
|
| Shares repurchased | (49,103) | (858,531) | (129,223) | (1,873,118) |
|
| Net increase (decrease) | (24,152) | $(420,494) | 20,046 | $161,035 |
|
| |
| | Six months ended 4/30/10 | Year ended 10/31/09 |
|
| Class R | Shares | Amount | Shares | Amount |
|
| Shares sold | 33,451 | $591,348 | 49,672 | $661,054 |
|
| Shares issued in connection with | | | | |
| reinvestment of distributions | 2,344 | 41,741 | 5,694 | 77,016 |
|
| | 35,795 | 633,089 | 55,366 | 738,070 |
|
| Shares repurchased | (35,615) | (629,673) | (70,101) | (932,508) |
|
| Net increase (decrease) | 180 | $3,416 | (14,735) | $(194,438) |
|
| |
| | Six months ended 4/30/10 | Year ended 10/31/09 |
|
| Class Y | Shares | Amount | Shares | Amount |
|
| Shares sold | 702,249 | $12,425,138 | 3,455,114 | $48,818,687 |
|
| Shares issued in connection with | | | | |
| reinvestment of distributions | 28,922 | 516,386 | 79,057 | 1,078,765 |
|
| | 731,171 | 12,941,524 | 3,534,171 | 49,897,452 |
|
| Shares repurchased | (966,455) | (16,682,875) | (873,692) | (12,215,321) |
|
| Net increase (decrease) | (235,284) | $(3,741,351) | 2,660,479 | $37,682,131 |
|
Note 5: Investment in Putnam Money Market Liquidity Fund
The fund invested in Putnam Money Market Liquidity Fund, an open-end management investment company managed by Putnam Management. Investments in Putnam Money Market Liquidity Fund are valued at its closing net asset value each business day. Income distributions earned by the fund are recorded as interest income in the Statement of operations and totaled $9,516 for the reporting period. During the reporting period, cost of purchases and proceeds of sales of investments in Putnam Money Market Liquidity Fund aggregated $106,996,967 and $113,031,894, respectively. Management fees charged to Putnam Money Market Liquidity Fund have been waived by Putnam Management.
Note 6: Regulatory matters and litigation
In late 2003 and 2004, Putnam Management settled charges brought by the SEC and the Massachusetts Securities Division in connection with excessive short-term trading in Putnam funds. Distribution of payments from Putnam Management to certain open-end Putnam funds and their shareholders is expected to be completed in the next
35
several months. These allegations and related matters have served as the general basis for certain lawsuits, including purported class action lawsuits against Putnam Management and, in a limited number of cases, some Putnam funds. Putnam Management believes that these lawsuits will have no material adverse effect on the funds or on Putnam Management’s ability to provide investment management services. In addition, Putnam Management has agreed to bear any costs incurred by the Putnam funds as a result of these matters.
Note 7: Market and credit risk
In the normal course of business, the fund trades financial instruments and enters into financial transactions where risk of potential loss exists due to changes in the market (market risk) or failure of the contracting party to the transaction to perform (credit risk). The fund may be exposed to additional credit risk that an institution or other entity with which the fund has unsettled or open transactions will default.
Shareholder meeting results (Unaudited)
November 19, 2009 meeting
At the meeting, each of the nominees for Trustees was elected, as follows:
| | |
| | Votes for | Votes withheld |
|
| Ravi Akhoury | 30,343,121 | 1,074,427 |
|
| Jameson A. Baxter | 30,342,110 | 1,075,438 |
|
| Charles B. Curtis | 30,331,098 | 1,086,450 |
|
| Robert J. Darretta | 30,356,867 | 1,060,681 |
|
| Myra R. Drucker | 30,341,334 | 1,076,214 |
|
| John A. Hill | 30,326,341 | 1,091,207 |
|
| Paul L. Joskow | 30,330,984 | 1,086,564 |
|
| Elizabeth T. Kennan | 30,327,589 | 1,089,959 |
|
| Kenneth R. Leibler | 30,326,722 | 1,090,826 |
|
| Robert E. Patterson | 30,341,154 | 1,076,394 |
|
| George Putnam, III | 30,334,470 | 1,083,078 |
|
| Robert L. Reynolds | 30,348,125 | 1,069,423 |
|
| W. Thomas Stephens | 30,330,792 | 1,086,756 |
|
| Richard B. Worley | 30,339,947 | 1,077,601 |
|
A proposal to approve a new management contract between the fund and Putnam Management was approved as follows:
| | | |
| Votes | Votes | | Broker |
| for | against | Abstentions | non-votes |
|
| 19,979,861 | 755,728 | 824,262 | 9,857,697 |
|
All tabulations are rounded to the nearest whole number.
36
Fund information
Founded over 70 years ago, Putnam Investments was built around the concept that a balance between risk and reward is the hallmark of a well-rounded financial program. We manage over 100 funds across income, value, blend, growth, asset allocation, absolute return, and global sector categories.
| | |
| Investment Manager | Robert E. Patterson | James P. Pappas |
| Putnam Investment | George Putnam, III | Vice President |
| Management, LLC | Robert L. Reynolds | |
| One Post Office Square | W. Thomas Stephens | Francis J. McNamara, III |
| Boston, MA 02109 | Richard B. Worley | Vice President and Chief |
| | | Legal Officer |
| Investment Sub-Manager | Officers | |
| Putnam Investments Limited | Robert L. Reynolds | Robert R. Leveille |
| 57-59 St James Street | President | Vice President and |
| London, England SW1A 1LD | | Chief Compliance Officer |
| | Jonathan S. Horwitz | |
| Marketing Services | Executive Vice President, | Mark C. Trenchard |
| Putnam Retail Management | Principal Executive | Vice President and |
| One Post Office Square | Officer, Treasurer and | BSA Compliance Officer |
| Boston, MA 02109 | Compliance Liaison | |
| | | Judith Cohen |
| Custodian | Charles E. Porter | Vice President, Clerk and |
| State Street Bank | Senior Advisor to the Trustees | Assistant Treasurer |
| and Trust Company | | |
| | Steven D. Krichmar | Wanda M. McManus |
| Legal Counsel | Vice President and | Vice President, Senior Associate |
| Ropes & Gray LLP | Principal Financial Officer | Treasurer and Assistant Clerk |
| |
| Trustees | Janet C. Smith | Nancy E. Florek |
| John A. Hill, Chairman | Vice President, Principal | Vice President, Assistant Clerk, |
| Jameson A. Baxter, | Accounting Officer and | Assistant Treasurer and |
| Vice Chairman | Assistant Treasurer | Proxy Manager |
| Ravi Akhoury | | |
| Charles B. Curtis | Susan G. Malloy | |
| Robert J. Darretta | Vice President and | |
| Myra R. Drucker | Assistant Treasurer | |
| Paul L. Joskow | | |
| Elizabeth T. Kennan | Beth S. Mazor | |
| Kenneth R. Leibler | Vice President | |
| | |
This report is for the information of shareholders of Putnam Convertible Income-Growth Trust. It may also be used as sales literature when preceded or accompanied by the current prospectus, the most recent copy of Putnam’s Quarterly Performance Summary, and Putnam’s Quarterly Ranking Summary. For more recent performance, please visit putnam.com. Investors should carefully consider the investment objective, risks, charges, and expenses of a fund, which are described in its prospectus. For this and other information or to request a prospectus, or a summary prospectus if available, call 1-800-225-1581 toll free. Please read the prospectus carefully before investing. The fund’s Statement of Additional Information contains additional information about the fund’s Trustees and is available without charge upon request by calling 1-800-225-1581.
Item 2. Code of Ethics:
Not applicable
Item 3. Audit Committee Financial Expert:
Not applicable
Item 4. Principal Accountant Fees and Services:
Not applicable
Item 5. Audit Committee of Listed Registrants
Not applicable
Item 6. Schedule of Investments:
The registrant’s schedule of investments in unaffiliated issuers is included in the report to shareholders in Item 1 above.
Item 7. Disclosure of Proxy Voting Policies and Procedures For Closed- End Management Investment Companies:
Not applicable
Item 8. Portfolio Managers of Closed- End Investment Companies
Not Applicable
Item 9. Purchases of Equity Securities by Closed-End Management Investment Companies and Affiliated Purchasers:
Not applicable
Item 10. Submission of Matters to a Vote of Security Holders:
Not applicable
Item 11. Controls and Procedures:
(a) The registrant's principal executive officer and principal financial officer have concluded, based on their evaluation of the effectiveness of the design and operation of the registrant's disclosure controls and procedures as of a date within 90 days of the filing date of this report, that the design and operation of such procedures are generally effective to provide reasonable assurance that information required to be disclosed by the registrant in this report is recorded, processed, summarized and reported within the time periods specified in the Commission's rules and forms.
(b) Changes in internal control over financial reporting: Not applicable
Item 12. Exhibits:
(a)(1) Not applicable
(a)(2) Separate certifications for the principal executive officer and principal financial officer of the registrant as required by Rule 30a-2(a) under the Investment Company Act of 1940, as amended, are filed herewith.
(b) The certifications required by Rule 30a-2(b) under the Investment Company Act of 1940, as amended, are filed herewith.
Putnam Convertible Income-Growth Trust
By (Signature and Title):
/s/Janet C. Smith
Janet C. Smith
Principal Accounting Officer
Date: June 28, 2010
Pursuant to the requirements of the Securities Exchange Act of 1934 and the Investment Company Act of 1940, this report has been signed below by the following persons on behalf of the registrant and in the capacities and on the dates indicated.
By (Signature and Title):
/s/Jonathan S. Horwitz
Jonathan S. Horwitz
Principal Executive Officer
Date: June 28, 2010
By (Signature and Title):
/s/Steven D. Krichmar
Steven D. Krichmar
Principal Financial Officer
Date: June 28, 2010