| | |
| UNITED STATES |
| SECURITIES AND EXCHANGE COMMISSION |
| Washington, D.C. 20549 |
| |
| FORM N-CSR |
| |
| CERTIFIED SHAREHOLDER REPORT OF REGISTERED |
| MANAGEMENT INVESTMENT COMPANIES |
| | |
| Investment Company Act file number: (811- 02280) | |
| |
| Exact name of registrant as specified in charter: Putnam Convertible Income-Growth Trust |
| |
| Address of principal executive offices: One Post Office Square, Boston, Massachusetts 02109 |
| | |
| Name and address of agent for service: | Beth S. Mazor, Vice President |
| | One Post Office Square |
| | Boston, Massachusetts 02109 |
| |
| Copy to: | John W. Gerstmayr, Esq. |
| | Ropes & Gray LLP |
| | One International Place |
| | Boston, Massachusetts 02110 |
| | |
| Registrant’s telephone number, including area code: | (617) 292-1000 |
| | | |
| Date of fiscal year end: October 31, 2008 | | |
| |
| Date of reporting period: November 1, 2007 — April 30, 2008 |
Item 1. Report to Stockholders:
The following is a copy of the report transmitted to stockholders pursuant to Rule 30e-1 under the Investment Company Act of 1940:

What makes Putnam different?

In 1830, Massachusetts Supreme Judicial Court Justice Samuel Putnam established The Prudent Man Rule, a legal foundation for responsible money management.
THE PRUDENT MAN RULE
All that can be required of a trustee to invest is that he shall conduct himself faithfully and exercise a sound discretion. He is to observe how men of prudence, discretion, and intelligence manage their own affairs, not in regard to speculation, but in regard to the permanent disposition of their funds, considering the probable income, as well as the probable safety of the capital to be invested.

A time-honored tradition in money management
Since 1937, our values have been rooted in a profound sense of responsibility for the money entrusted to us.
A prudent approach to investing
We use a research-driven team approach to seek consistent, dependable, superior investment results over time, although there is no guarantee a fund will meet its objectives.
Funds for every investment goal
We offer a broad range of mutual funds and other financial products so investors and their financial representatives can build diversified portfolios.
A commitment to doing what’s right for investors
With a focus on investment performance, below-average expenses, and in-depth information about our funds, we put the interests of investors first and seek to set the standard for integrity and service.
Industry-leading service
We help investors, along with their financial representatives, make informed investment decisions with confidence.
Putnam Convertible
Income-Growth
Trust
4| 30| 08
Semiannual Report
| |
| Message from the Trustees | 2 |
| About the fund | 4 |
| Performance snapshot | 6 |
| Interview with your fund’s Portfolio Leader | 7 |
| Performance in depth | 12 |
| Expenses | 15 |
| Portfolio turnover | 17 |
| Risk | 18 |
| Your fund’s management | 19 |
| Terms and definitions | 21 |
| Trustee approval of management contract | 23 |
| Other information for shareholders | 28 |
| Financial statements | 29 |
| Brokerage commissions | 52 |
Cover photograph: White-Packert Photography
Message from the Trustees
Dear Fellow Shareholder:
The past six months have presented the economy with the most serious set of challenges in many years, and the financial markets have reflected the uncertainty of the situation. However, given the circumstances, the economy has held up relatively well. In fact, for late 2007 and early 2008, economic growth has held steady at a rate of 0.6% . To be sure, current economic indicators present a mixed picture, but another, more likely, outcome is that the economy will weather this rough patch. The Federal Reserve Board has cut interest rates sharply and provided financial markets with ample liquidity, while Congress and the White House have come forward with a timely fiscal package of tax rebates and investment incentives. A growing number of economists now believe that the economy may avert a recession.
It is always unsettling to see the markets and one’s investment returns declining. Times like these are a reminder of why it is important to keep a long-term perspective, ensure your portfolio is well diversified, and seek the counsel of your financial representative.
Starting this month, we have changed the portfolio manager’s commentary in this report to a question-and-answer format. We feel this new approach makes the information more readable and accessible, and we hope you think so as well.
2
Lastly, we would like to take this opportunity to welcome new shareholders to the fund and to thank all of our investors for your continued confidence in Putnam Investments.

Putnam Convertible Income-Growth Trust:
Offering investors the diverse benefits of convertible
securities since 1972
The differences between bonds and stocks seem fairly clear-cut. Stocks provide an ownership stake in a company; bonds provide a claim on the interest paid by a company or other entity on its debt. The value of stocks rises and falls with such factors as investor sentiment, company news, and economic conditions; bonds are issued by a government, agency, company, or public utility that typically promises to pay the bearer a fixed rate of interest at specified intervals and to return a set amount of money at a specified end date (the maturity date). A bond’s yield is often influenced by interest-rate levels.
A third type of security is a hybrid of a stock and bond. Like a bond, a convertible security offers a set rate of interest, but unlike a bond, it has a built-in option that, under certain circumstances, allows the investor to exchange(or convert) the security for a fixed number of shares of stock. This feature offers the potential for capital appreciation, since the pre-set conversion price does not change as the underlying stock’s price increases or decreases.
Convertibles are issued by companies and can offer greater returns than high-quality bonds — but they also carry a greater risk potential, such as the risk of default or periodic illiquidity. Issuers range from large, well-known S&P 500 corporations, to small, rapidly growing companies, to companies in cyclically depressed industries such as airlines, autos, and utilities.
Constructing a portfolio that maintains an appropriate balance of risk and return potential requires intensive research and analysis. Putnam’s analysts conduct rigorous fundamental and quantitative research, seekingto determine the true worth of the issuing company’s business. Putnam Convertible Income-Growth Trust’s management team then constructs a portfolio that it believes offers the best return potential without undue risk.
This fund invests some or all of its assets in small and/or midsize companies. Such investments increase the risk of greater fluctuations in the value of your investment. Lower-rated bonds may offer higher yields in return for more risk. The fund may also have a significant portion of its holdings in bonds. Mutual funds that invest in bonds are subject to certain risks, including interest-rate risk, credit risk, and inflation risk. As interest rates rise, the prices of bonds fall. Long-term bonds are more exposed to interest-rate risk than short-term bonds. Unlike bonds, bond funds have ongoing fees and expenses. Value investing seeks underpriced stocks, but there is no guarantee that a stock’s price will rise.
The “busted” convertible
One kind of security in which your fund may invest is the“busted” convertible. “Busted” refers to a security whose underlying stock price has fallen significantly below the conversion price. It becomes much less sensitive to the volatility of the underlying stock and is more bond-like, responding to interest-rate changes. A busted convertible may pay a higher yield than other convertibles, but may also carry a higher level of risk. (Some companies in this situation may eventually default on their bonds.)
The objective of buying a busted convertible is to take advantage of a company’s eventual turnaround despite its present challenges. For example, a company undergoing management turmoil may draw negative investor reactions, causing its stock price to tumble. However, if intensive research determines that the management crisis is likely to be resolved, the fund manager could buy the security at a steep discount. The goal is to sell the security at a higher price when the credit improves or when the stock revives.
Putnam Convertible Income-Growth Trust’s holdings have spanned sectors and industries over time.

Performance snapshot
Putnam Convertible
Income-Growth Trust
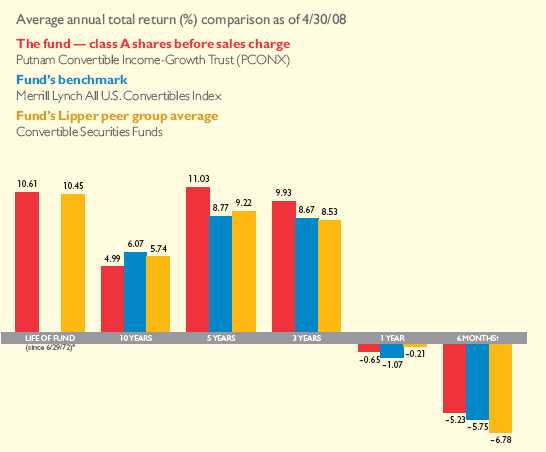
Current performance may be lower or higher than the quoted past performance, which cannot guarantee future results. Share price, principal value, and return will fluctuate, and you may have a gain or a loss when you sell your shares. Performance of class A shares assumes reinvestment of distributions and does not account for taxes. Fund returns in the bar chart do not reflect a sales charge of 5.75%; had they, returns would have been lower. See pages 7 and 12–14 for additional performance information.
For a portion of the periods, this fund may have limited expenses, without which returns would have been lower. A 1% short-term trading fee may apply. To obtain the most recent month-end performance, visit www.putnam.com.
* The inception date of the fund’s benchmark index was 12/31/87, after the fund’s inception.
† Returns for the six-month period are not annualized, but cumulative.
6

The period in review
David, thanks for spending time with us today. During the reporting period, the financial markets experienced great volatility. How did the fund perform?
It was a difficult environment for the financial markets, which were plagued by credit concerns, soaring energy prices, and recession fears. The fund had a loss of 5.23% during the first half of its fiscal year, which ended April 30, 2008 — holding up better than its benchmark, the Merrill Lynch All U.S. Convertibles Index [–5.75%], and the average of its peers [–6.78%], as measured by Lipper. We believe our decision to keep the portfolio’s emphasis on convertible securities while limiting its direct exposure to equities proved beneficial. Much like bonds, convertibles have defensive qualities that can help reduce volatility, and typically outperform stocks in a down market — as you can see in the chart below.
Broad market index and fund performance
This comparison shows your fund’s performance in the context of broad market indexes for the six months ended 4/30/08. See page 6 and pages 12–14 for additional fund performance information. Index descriptions can be found on page 22.

7
What were some of the concerns weighing on the financial markets?
The fund had very little exposure to subprime issues, but the severity of the crisis caused investors to reevaluate risk across all types of investments. Prices fell and yields rose on all but the highest-quality fixed-income securities, as investors demanded more yield on riskier bonds amid increased concerns that the economy might weaken. Stock prices also dropped sharply during the correction. Only AAA-rated government bonds and commodities were immune to the sell-off. Well-publicized difficulties at several major investment banks and among the insurers of repackaged loans added to investors’ uncertainty — as did angst about slower growth, inflation, and a weak U.S. dollar.
How did you limit the impact of these concerns on the portfolio?
We believe that our multifaceted investment approach was effective in minimizing their impact and differentiated the fund from many of its competitors. For example, some managers are equity-oriented and will not accept much credit risk. Their strategy is
Top 10 holdings
This table shows the fund’s top 10 holdings and the percentage of the fund’s net assets that each represented as of 4/30/08. Also shown is each holding’s market sector and the specific industry within that sector. Holdings will vary over time.
| | |
| HOLDING (percentage of fund’s net assets) | SECURITY INFORMATION | SECTOR/INDUSTRY |
|
| Ford Motor Co. (2.3%) | cv. sr. notes 4.25%, 2036 | Consumer cyclicals/ |
| | | Automotive |
|
| Transocean, Inc. (2.3%) | cv. sr. unsec. notes | Energy/Energy |
| | Ser. C, 1.50%, 2037 | |
|
| International Coal Group, Inc. (2.0%) | 144A cv. company | Energy/Coal |
| | guaranty 9.00%, 2012 | |
|
| MGIC Investment Corp. (1.8%) | 144A cv. jr. unsec. | Financials/Financials |
| | sub. debs. 9.00%, 2063 | |
|
| Chesapeake Energy Corp. (1.8%) | $4.50 cum. cv. pfd. | Energy/Oil and gas |
|
| Vale Capital, Ltd. (1.8%) | Ser. RIO, $2.75 cv. pfd. | Basic materials/Metals |
| (Cayman Islands) | |
|
| Lehman Brothers Holdings, Inc. (1.7%) | Ser. P, 7.25% cv. pfd. | Financials/Investment |
| | | banking/Brokerage |
|
| Freeport-McMoRan | $6.75 cv. pfd. | Basic materials/Metals |
| Copper & Gold, Inc. (1.7%) | | |
|
| Countrywide Financial Corp. (1.7%) | 144A cv. company guaranty | Financials/Consumer finance |
| | sr. unsec. notes FRN Ser. A, | |
| | zero %, 2037 | |
|
| Wachovia Corp. (1.6%) | Ser. L, Class A, 7.50% cv. pfd. | Financials/Banking |
|
8
to emphasize convertibles that have the potential to gain in value through an increase in the price of their underlying stock. Other managers focus on the statistical nature of convertibles without analyzing the growth potential of the issuing companies or their credit ratings. These investors hope to net returns by buying cheap convertible securities and selling expensive ones. Still other managers are credit-oriented and buy convertibles from issuers whose credit they believe has been misperceived as very risky. Typically, such securities will offer attractively high yields to compensate for this perceived risk.
We employ all three strategies, an approach that has resulted in an extended period of superior issue selection for the portfolio. And, in these more challenging times, it has resulted in a desirable level of resilience.
Which holdings had the greatest impact on performance?
The fund enjoyed strong performances in the energy and commodity sectors. Our decision to overweight investments in these sectors further augmented those gains. McMoRan Exploration, which is engaged in exploration, development, and production of oil and natural gas offshore in the Gulf of Mexico, has been successful in locating major new reserves. International Coal Group has consolidated many smaller coal mine operations in the Appalachian region with an eye toward greater efficiency and environmentally friendly
Comparison of top sector weightings
This chart shows how the fund’s top weightings have changed over the past six months. Weightings are shown as a percentage of net assets. Holdings will vary over time.

9
practices. CSX Corp., which hauls coal and grain by rail, also performed nicely. Given the strong appreciation of all three holdings, we pared back positions during the period to lock in gains and rebalance the portfolio.
We also emphasized investments in the consumer staples sector, which proved rewarding since they can be somewhat resilient in periods of slower growth. These holdings, which include Chiquita Brands International, tend to have a commodity focus. The fund also holds a valuable position in Universal Corp., which processes, packages, and stores tobacco leaf products.
Despite these and other successes, the tide of the market’s reversal had a greater impact on results, culminating in the fund’s negative absolute performance. Many holdings suffered unfairly when investors sold investments en masse to reduce risk in their portfolios. Despite the setback, we think these holdings still offer strategic value and long-term potential and we are maintaining them in the portfolio.
We are also optimistic about several companies in the financials sector, many of which had been at the heart of the correction. By the spring of 2007, when we foresaw that the problems in the mortgage market might spill over into the broader markets, we limited the fund’s exposure to financial service companies. However, in recent months, valuations of financial stocks have become compelling. We’ve been judiciously increasing the portfolio’s exposure to the financials sector through the convertibles market, which has seen increased issuance to meet the demands of the struggling sector as other traditional sources of funding have dried up. We think that prices of some financial companies have corrected to reflect market concerns while, in many cases, their fundamentals remain strong. In keeping with this thinking, we added positions in Countrywide Financial Corp., Boston Private Financial Holdings, General Growth Properties, Lehman Brothers, Wachovia Corp., and MGIC Investment Corp., all of which carry very attractive yields.
David, what is your outlook for the fund?
Unlike the recessions of 1991 and 2001, the current malaise is focused on the consumer sector. With flat wages and falling home and stock prices, consumers lack purchasing power to spend their way out of a recession. Given this backdrop, the current downturn could persist as long as real estate prices continue to fall. There is no quick fix to the problems of asset price deflation and the deleveraging of the financial system and of consumer balance sheets. These problems warrant caution and diversification in investment positioning.
We think that with continued uncertainty and volatility, convertible securities offer a unique diversification opportunity for income and growth-oriented investors
10
with a more conservative bent: capital preservation and reduced volatility from the bond component, and capital appreciation from the stock conversion option. Furthermore, with credit spreads widening, many convertibles have become more attractive on a security-by-security basis. Our challenge will be to pinpoint investments that have been unjustifiably hurt by risk aversion, versus those that have been affected by negative credit fundamentals. As this sorting-out process takes place, we believe that convertible securities, with their characteristics of both bonds and stocks, offer a number of ways to profit from the many opportunities created by the correction.
I N T H E N E W S
For the first time since the Great Depression, the Federal Reserve has extended financing to non-banks — specifically, primary dealers such as securities broker-dealers — as part of its ongoing attempt to inject liquidity into the struggling credit markets. The so-called Primary Dealer Credit Facility (PDCF), established in March, allows the Federal Reserve Bank of New York to provide overnight cash reserves to primary dealers in exchange for a broad range of collateral. The new credit facility aims to help primary dealers in providing financing to participants in capital markets and to promote an overall orderly functioning of the markets. The PDCF will remain in effect for six months and may be extended if the Fed deems it necessary.
Thank you, David, for your time and insights today.
The views expressed in this report are exclusively those of Putnam Management. They are not meant as investment advice.
This fund invests some or all of its assets in small and/or midsize companies. Such investments increase the risk of greater fluctuations in the value of your investment. Lower-rated bonds may offer higher yields in return for more risk. The fund may also have a significant portion of its holdings in bonds. Mutual funds that invest in bonds are subject to certain risks, including interest-rate risk, credit risk, and inflation risk. As interest rates rise, the prices of bonds fall. Long-term bonds are more exposed to interest-rate risk than short-term bonds. Unlike bonds, bond funds have ongoing fees and expenses. Value investing seeks under-priced stocks, but there is no guarantee that a stock’s price will rise.
Please note that the holdings discussed may not have been held by the fund for the entire period, and will vary in the future.
11
Your fund’s performance
This section shows your fund’s performance, price, and distribution information for periods ended April 30, 2008, the end of the first half of its current fiscal year. In accordance with regulatory requirements for mutual funds, we also include performance as of the most recent calendar quarter-end and expense information taken from the fund’s current prospectus. Performance should always be considered in light of a fund’s investment strategy. Data represents past performance. Past performance does not guarantee future results. More recent returns may be less or more than those shown. Investment return and principal value will fluctuate, and you may have a gain or a loss when you sell your shares. Performance information does not reflect any deduction for taxes a shareholder may owe on fund distributions or on the redemption of fund shares. For the most recent month-end performance, please visit the Individual Investors section of www.putnam.com or ca ll Putnam at 1-800-225-1581. Class Y shares are generally only available to corporate and institutional clients and clients in other approved programs. See the Terms and Definitions section in this report for definitions of the share classes offered by your fund.
Fund performance
Total return for periods ended 4/30/08
| | | | | | | | | | | | | | | | |
| | | | | | | | | | |
| | | Class A | | | Class B | | | Class C | | | Class M | | | Class R | | Class Y |
| (inception dates) | | (6/29/72) | | | (7/15/93) | | | (7/26/99) | | | (3/13/95) | | | (12/1/03) | | (12/30/98) |
| | NAV | POP | NAV | CDSC | NAV | CDSC | NAV | POP | NAV | NAV |
|
| Annual average | | | | | | | | | | |
| (life of fund) | 10.61% | 10.43% | 9.64% | 9.64% | 9.78% | 9.78% | 9.92% | 9.81% | 10.33% | 10.68% |
|
| 10 years | 62.72 | 53.35 | 51.07 | 51.07 | 51.01 | 51.01 | 55.10 | 49.63 | 58.70 | 66.60 |
| Annual average | 4.99 | 4.37 | 4.21 | 4.21 | 4.21 | 4.21 | 4.49 | 4.11 | 4.73 | 5.24 |
|
| 5 years | 68.75 | 58.99 | 62.64 | 60.64 | 62.56 | 62.56 | 64.61 | 58.88 | 66.67 | 70.89 |
| Annual average | 11.03 | 9.72 | 10.22 | 9.94 | 10.21 | 10.21 | 10.48 | 9.70 | 10.76 | 11.31 |
|
| 3 years | 32.84 | 25.21 | 29.95 | 26.95 | 29.88 | 29.88 | 30.83 | 26.28 | 31.83 | 33.86 |
| Annual average | 9.93 | 7.78 | 9.13 | 8.28 | 9.11 | 9.11 | 9.37 | 8.09 | 9.65 | 10.21 |
|
| 1 year | –0.65 | –6.36 | –1.35 | –6.19 | –1.36 | –2.32 | –1.12 | –4.60 | –0.86 | –0.40 |
|
| 6 months | –5.23 | –10.67 | –5.55 | –10.23 | –5.56 | –6.49 | –5.47 | –8.77 | –5.34 | –5.11 |
|
Current performance may be lower or higher than the quoted past performance, which cannot guarantee future results. After sales charge returns (public offering price, or POP) for class A and M shares reflect a maximum 5.75% and 3.50% load, respectively, as of 1/2/08. Class B share returns reflect the applicable contingent deferred sales charge (CDSC), which is 5% in the first year, declining to 1% in the sixth year, and is eliminated thereafter. Class C shares reflect a 1% CDSC for the first year and is eliminated thereafter. Class R and Y shares have no initial sales charge or CDSC. Performance for class B, C, M, R, and Y shares before their inception is derived from the historical performance of class A shares, adjusted for the applicable sales charge (or CDSC) and, except for class Y shares, the higher operating expenses for such shares.
For a portion of the periods, this fund may have limited expenses, without which returns would have been lower.
A 1% short-term trading fee may be applied to shares exchanged or sold within 7 days of purchase.
12
Comparative index returns
For periods ended 4/30/08
| | | | | | |
| | | | |
| | | Merrill Lynch | | | Lipper Convertible | |
| | | All U.S. Convertibles | | | Securities Funds | |
| | | Index | | | category average* | |
|
| Annual average | | | | |
| (life of fund) | —† | | 10.45% | |
|
| 10 years | 80.32% | | 76.42 | |
| Annual average | 6.07 | | 5.74 | |
|
| 5 years | 52.26 | | 55.73 | |
| Annual average | 8.77 | | 9.22 | |
|
| 3 years | 28.32 | | 27.96 | |
| Annual average | 8.67 | | 8.53 | |
|
| 1 year | –1.07 | | –0.21 | |
|
| 6 months | –5.75 | | –6.78 | |
|
Index and Lipper results should be compared to fund performance at net asset value.
* Over the 6-month, 1-year, 3-year, 5-year, 10-year, and life-of-fund periods ended 4/30/08, there were 68, 64, 60, 53, 37, and 2 funds, respectively, in this Lipper category.
† The inception date of the index was 12/31/87, after the fund’s inception.
Fund performance as of most recent calendar quarter
Total return for periods ended 3/31/08
| | | | | | | | | | | | | | | | |
| | | | | | | | | | |
| | | Class A | | | Class B | | | Class C | | | Class M | | | Class R | | Class Y |
| (inception dates) | | (6/29/72) | | | (7/15/93) | | | (7/26/99) | | | (3/13/95) | | | (12/1/03) | | (12/30/98) |
| | NAV | POP | NAV | CDSC | NAV | CDSC | NAV | POP | NAV | NAV |
|
| Annual average | | | | | | | | | | |
| (life of fund) | 10.48% | 10.30% | 9.51% | 9.51% | 9.65% | 9.65% | 9.79% | 9.68% | 10.20% | 10.55% |
|
| 10 years | 55.57 | 46.62 | 44.35 | 44.35 | 44.31 | 44.31 | 48.23 | 43.05 | 51.68 | 59.18 |
| Annual average | 4.52 | 3.90 | 3.74 | 3.74 | 3.74 | 3.74 | 4.01 | 3.65 | 4.25 | 4.76 |
|
| 5 years | 68.92 | 59.24 | 62.73 | 60.73 | 62.66 | 62.66 | 64.73 | 58.95 | 66.80 | 70.98 |
| Annual average | 11.05 | 9.75 | 10.23 | 9.96 | 10.22 | 10.22 | 10.50 | 9.71 | 10.77 | 11.32 |
|
| 3 years | 21.64 | 14.63 | 18.94 | 15.94 | 18.90 | 18.90 | 19.84 | 15.62 | 20.68 | 22.57 |
| Annual average | 6.75 | 4.66 | 5.95 | 5.05 | 5.94 | 5.94 | 6.22 | 4.96 | 6.47 | 7.02 |
|
| 1 year | –3.10 | –8.68 | –3.87 | –8.58 | –3.90 | –4.85 | –3.62 | –7.00 | –3.41 | –2.90 |
|
| 6 months | –8.36 | –13.62 | –8.71 | –13.23 | –8.74 | –9.64 | –8.62 | –11.81 | –8.52 | –8.29 |
|
13
Fund price and distribution information
For the six-month period ended 4/30/08
| | | | | | | | | | | | | |
| | | | | | | | | |
| | | | | | | |
| Distributions | | Class A | | Class B | | Class C | | Class M | | Class R | | Class Y | |
|
| Number | | 2 | 2 | 2 | 2 | 2 | 2 |
|
| Income | | $0.264 | $0.187 | $0.196 | $0.213 | $0.245 | $0.289 |
|
| Capital gains | | — | — | — | — | — | — |
|
| Total | | $0.264 | $0.187 | $0.196 | $0.213 | $0.245 | $0.289 |
|
| Share value: | | NAV | POP | NAV | NAV | NAV | POP | NAV | NAV |
|
| 10/31/07 | | $21.21 | $22.50* | $20.87 | $21.04 | $21.04 | $21.80* | $21.15 | $21.21 |
|
| 4/30/08 | | 19.83 | 21.04 | 19.52 | 19.67 | 19.67 | 20.38 | 19.77 | 19.83 |
|
| Current yield | | | | | | | | | |
| (end of period) | | | | | | | | | |
|
| Current | | | | | | | | | |
| dividend rate1 | | 2.66% | 2.51% | 1.91% | 2.01% | 2.20% | 2.12% | 2.43% | 2.90% |
|
| Current 30-day | | | | | | | | | |
| SEC yield | | | | | | | | | |
| (with expense | | | | | | | | | |
| limitation)2,3 | | N/A | 2.75 | 2.19 | 2.19 | N/A | 2.35 | 2.68 | 3.17 |
|
| Current 30-day | | | | | | | | | |
| SEC yield | | | | | | | | | |
| (without | | | | | | | | | |
| expense | | | | | | | | | |
| limitation)3 | | N/A | 2.75 | 2.19 | 2.19 | N/A | 2.34 | 2.68 | 3.17 |
|
The classification of distributions, if any, is an estimate. Final distribution information will appear on your year-end tax forms.
* Reflects an increase in sales charges that took effect on 1/2/08.
1 Most recent distribution, excluding capital gains, annualized and divided by NAV or POP at end of period.
2 For a portion of the period, this fund may have limited expenses, without which yields would have been lower.
3 Based only on investment income, and calculated using the maximum offering price for each share class, in accordance with SEC guidelines.
Fund’s annual operating expenses
For the fiscal year ended 10/31/07
| | | | | | | |
| | | Class A | Class B | Class C | Class M | Class R | Class Y |
|
| Total annual fund | | | | | | | |
| operating expenses | | 1.04% | 1.79% | 1.79% | 1.54% | 1.29% | 0.79% |
|
Expense information in this table is taken from the most recent prospectus, is subject to change, and may differ from that shown in the next section and in the financial highlights of this report. Expenses are shown as a percentage of average net assets.
14
Your fund’s expenses
As a mutual fund investor, you pay ongoing expenses, such as management fees, distribution fees (12b-1 fees), and other expenses. In the most recent six-month period, your fund limited these expenses; had it not done so, expenses would have been higher. Using the information below, you can estimate how these expenses affect your investment and compare them with the expenses of other funds. You may also pay one-time transaction expenses, including sales charges (loads) and redemption fees, which are not shown in this section and would have resulted in higher total expenses. For more information, see your fund’s prospectus or talk to your financial representative.
Review your fund’s expenses
The table below shows the expenses you would have paid on a $1,000 investment in Putnam Convertible Income-Growth Trust from November 1, 2007, to April 30, 2008. It also shows how much a $1,000 investment would be worth at the close of the period, assuming actual returns and expenses.
| | | | | | | |
| | | Class A | Class B | Class C | Class M | Class R | Class Y |
|
| Expenses paid per $1,000* | | $ 5.08 | $ 8.70 | $ 8.70 | $ 7.50 | $ 6.29 | $ 3.88 |
|
| Ending value (after expenses) | | $947.70 | $944.50 | $944.40 | $945.30 | $946.60 | $948.90 |
|
* Expenses for each share class are calculated using the fund’s annualized expense ratio for each class, which represents the ongoing expenses as a percentage of average net assets for the six months ended 4/30/08. The expense ratio may differ for each share class (see the last table in this section). Expenses are calculated by multiplying the expense ratio by the average account value for the period; then multiplying the result by the number of days in the period; and then dividing that result by the number of days in the year.
Estimate the expenses you paid
To estimate the ongoing expenses you paid for the six months ended April 30, 2008, use the calculation method below. To find the value of your investment on November 1, 2007, call Putnam at 1-800-225-1581.

15
Compare expenses using the SEC’s method
The Securities and Exchange Commission (SEC) has established guidelines to help investors assess fund expenses. Per these guidelines, the table below shows your fund’s expenses based on a $1,000 investment, assuming a hypothetical 5% annualized return. You can use this information to compare the ongoing expenses (but not transaction expenses or total costs) of investing in the fund with those of other funds. All mutual fund shareholder reports will provide this information to help you make this comparison. Please note that you cannot use this information to estimate your actual ending account balance and expenses paid during the period.
| | | | | | | | | | | | | |
| | | | | | | |
| | | | Class A | | Class B | | Class C | | Class M | | Class R | | Class Y |
|
| Expenses paid per $1,000* | | $ 5.27 | $ 9.02 | $ 9.02 | $ 7.77 | $ 6.52 | $ 4.02 |
|
| Ending value (after expenses) | | $1,019.64 | $1,015.91 | $1,015.91 | $1,017.16 | $1,018.40 | $1,020.89 |
|
* Expenses for each share class are calculated using the fund’s annualized expense ratio for each class, which represents the ongoing expenses as a percentage of average net assets for the six months ended 4/30/08. The expense ratio may differ for each share class (see the last table in this section). Expenses are calculated by multiplying the expense ratio by the average account value for the period; then multiplying the result by the number of days in the period; and then dividing that result by the number of days in the year.
Compare expenses using industry averages
You can also compare your fund’s expenses with the average of its peer group, as defined by Lipper, an independent fund-rating agency that ranks funds relative to others that Lipper considers to have similar investment styles or objectives. The expense ratio for each share class shown below indicates how much of your fund’s average net assets have been used to pay ongoing expenses during the period.
| | | | | | | |
| | | Class A | Class B | Class C | Class M | Class R | Class Y |
|
| Your fund’s annualized | | | | | | | |
| expense ratio | | 1.05% | 1.80% | 1.80% | 1.55% | 1.30% | 0.80% |
|
| Average annualized expense | | | | | | | |
| ratio for Lipper peer group* | | 1.16% | 1.91% | 1.91% | 1.66% | 1.41% | 0.91% |
|
* Putnam is committed to keeping fund expenses below the Lipper peer group average expense ratio and will limit fund expenses if they exceed the Lipper average. The Lipper average is a simple average of front-end load funds in the peer group that excludes 12b-1 fees as well as any expense offset and brokerage service arrangements that may reduce fund expenses. To facilitate the comparison in this presentation, Putnam has adjusted the Lipper average to reflect the 12b-1 fees carried by each class of shares other than class Y shares, which do not incur 12b-1 fees. Investors should note that the other funds in the peer group may be significantly smaller or larger than the fund, and that an asset-weighted average would likely be lower than the simple average. Also, the fund and Lipper report expense data at different times and for different periods. The fund’s expense ratio shown here is annualized data for the most rec ent six-month period, while the quarterly updated Lipper average is based on the most recent fiscal year-end data available for the peer group funds as of 3/31/08.
16
Your fund’s portfolio turnover
Putnam funds are actively managed by teams of experts who buy and sell securities based on intensive analysis of companies, industries, economies, and markets. Portfolio turnover is a measure of how often a fund’s managers buy and sell securities for your fund. A portfolio turnover of 100%, for example, means that the managers sold and replaced securities valued at 100% of a fund’s average portfolio value within a given period. Funds with high turnover may be more likely to generate capital gains that must be distributed to shareholders as taxable income. High turnover may also cause a fund to pay more brokerage commissions and other transaction costs, which may detract from performance.
Funds that invest in bonds or other fixed-income instruments may have higher turnover than funds that invest only in stocks. Short-term bond funds tend to have higher turnover than longer-term bond funds, because shorter-term bonds will mature or be sold more frequently than longer-term bonds. You can use the table below to compare your fund’s turnover with the average turnover for funds in its Lipper category.
Turnover comparisons
Percentage of holdings that change every year
| | | | | |
| | 2007 | 2006 | 2005 | 2004 | 2003 |
|
| Putnam Convertible | | | | | |
| Income-Growth Trust | 71% | 64% | 66% | 53% | 94% |
|
| Lipper Convertible Securities | | | | | |
| Funds category average | 71% | 72% | 77% | 103% | 93% |
|
Turnover data for the fund is calculated based on the fund’s fiscal-year period, which ends on October 31. Turnover data for the fund’s Lipper category is calculated based on the average of the turnover of each fund in the category for its fiscal year ended during the indicated year. Fiscal years vary across funds in the Lipper category, which may limit the comparability of the fund’s portfolio turnover rate to the Lipper average. Comparative data for 2007 is based on information available as of 12/31/07.
17
Your fund’s risk
This risk comparison is designed to help you understand how your fund compares with other funds. The comparison utilizes a risk measure developed by Morningstar, an independent fund-rating agency. This risk measure is referred to as the fund’s Morningstar Risk.
Your fund’s Morningstar® Risk

Your fund’s Morningstar Risk is shown alongside that of the average fund in its Morningstar category. The risk bar broadens the comparison by translating the fund’s Morningstar Risk into a percentile, which is based on the fund’s ranking among all funds rated by Morningstar as of March 31, 2008. A higher Morningstar Risk generally indicates that a fund’s monthly returns have varied more widely.
Morningstar determines a fund’s Morningstar Risk by assessing variations in the fund’s monthly returns — with an emphasis on downside variations — over a 3-year period, if available. Those measures are weighted and averaged to produce the fund’s Morningstar Risk. The information shown is provided for the fund’s class A shares only; information for other classes may vary. Morningstar Risk is based on historical data and does not indicate future results. Morningstar does not purport to measure the risk associated with a current investment in a fund, either on an absolute basis or on a relative basis. Low Morningstar Risk does not mean that you cannot lose money on an investment in a fund. Copyright 2008 Morningstar, Inc. All Rights Reserved. The information contained herein (1) is proprietary to Morningstar and/or its content providers; (2) may not be copied or distributed; and (3) is not warranted to be accurate, complete, or timely. Neither Morningstar nor its content providers are responsible for any damages or losses arising from any use of this information.
18
Your fund’s management
Your fund is managed by the members of the Putnam Large-Cap Value and Fixed-Income High-Yield teams. David King is the Portfolio Leader, and Robert Salvin is the Portfolio Member, of your fund. The Portfolio Leader and Portfolio Member coordinate the teams’ management of the fund.
For a complete listing of the members of the Putnam Large-Cap Value and Fixed-Income High-Yield teams, including those who are not Portfolio Leaders or Portfolio Members of your fund, please visit the Individual Investors section of www.putnam.com.
Investment team fund ownership
The table below shows how much the fund’s current Portfolio Leader and Portfolio Member have invested in the fund and in all Putnam mutual funds (in dollar ranges). Information shown is as of April 30, 2008, and April 30, 2007.

Trustee and Putnam employee fund ownership
As of April 30, 2008, all of the Trustees of the Putnam funds owned fund shares. The table below shows the approximate value of investments in the fund and all Putnam funds as of that date by the Trustees and Putnam employees. These amounts include investments by the Trustees’ and employees’ immediate family members and investments through retirement and deferred compensation plans.
| | | |
| | | Total assets in | |
| | Assets in the fund | all Putnam funds | |
|
| Trustees | $1,319,000 | $ 87,000,000 | |
|
| Putnam employees | $7,090,000 | $626,000,000 | |
|
19
Other Putnam funds managed by the Portfolio Leader and Portfolio Member
David King is also a Portfolio Leader of Putnam New Value Fund and Putnam High Income Securities Fund, and a Portfolio Member of The Putnam Fund for Growth and Income.
Robert Salvin is also a Portfolio Leader of Putnam High Income Securities Fund and a Portfolio Member of Putnam High Yield Trust, Putnam High Yield Advantage Fund, and Putnam Floating Rate Income Fund.
David King and Robert Salvin may also manage other accounts and variable trust funds advised by Putnam Management or an affiliate.
20
Terms and definitions
Important terms
Total return shows how the value of the fund’s shares changed over time, assuming you held the shares through the entire period and reinvested all distributions in the fund.
Net asset value (NAV) is the price, or value, of one share of a mutual fund, without a sales charge. NAVs fluctuate with market conditions. NAV is calculated by dividing the net assets of each class of shares by the number of outstanding shares in the class.
Public offering price (POP) is the price of a mutual fund share plus the maximum sales charge levied at the time of purchase. POP performance figures shown here assume the 5.75% maximum sales charge for class A shares and 3.50% for class M shares.
Contingent deferred sales charge (CDSC) is generally a charge applied at the time of the redemption of class B or C shares and assumes redemption at the end of the period. Your fund’s class B CDSC declines from a 5% maximum during the first year to 1% during the sixth year. After the sixth year, the CDSC no longer applies. The CDSC for class C shares is 1% for one year after purchase.
Current yield is the annual rate of return earned from dividends or interest of an investment. Current yield is expressed as a percentage of the price of a security, fund share, or principal investment.
Share classes
Class A shares are generally subject to an initial sales charge and no CDSC (except on certain redemptions of shares bought without an initial sales charge).
Class B shares are not subject to an initial sales charge. They may be subject to a CDSC.
Class C shares are not subject to an initial sales charge and are subject to a CDSC only if the shares are redeemed during the first year.
Class M shares have a lower initial sales charge and a higher 12b-1 fee than class A shares and no CDSC (except on certain redemptions of shares bought without an initial sales charge).
Class R shares are not subject to an initial sales charge or CDSC and are available only to certain defined contribution plans.
Class Y shares are not subject to an initial sales charge or CDSC, and carry no 12b-1 fee. They are generally only available to corporate and institutional clients and clients in other approved programs.
21
Comparative indexes
Lehman Aggregate Bond Index is an unmanaged index of U.S. investment-grade fixed-income securities.
Merrill Lynch 91-Day Treasury Bill Index is an unmanaged index that seeks to measure the performance of U.S. Treasury bills available in the marketplace.
Merrill Lynch All U.S. Convertibles Index is an unmanaged index of high-yield U.S. convertible securities.
S&P 500 Index is an unmanaged index of common stock performance.
Indexes assume reinvestment of all distributions and do not account for fees. Securities and performance of a fund and an index will differ. You cannot invest directly in an index.
Lipper is a third-party industry-ranking entity that ranks mutual funds. Its rankings do not reflect sales charges. Lipper rankings are based on total return at net asset value relative to other funds that have similar current investment styles or objectives as determined by Lipper. Lipper may change a fund’s category assignment at its discretion. Lipper category averages reflect performance trends for funds within a category.
22
Trustee approval of management contract
General conclusions
The Board of Trustees of the Putnam funds oversees the management of each fund and, as required by law, determines annually whether to approve the continuance of your fund’s management contract with Putnam Investment Management (“Putnam Management”). In this regard, the Board of Trustees, with the assistance of its Contract Committee consisting solely of Trustees who are not “interested persons” (as such term is defined in the Investment Company Act of 1940, as amended) of the Putnam funds (the “Independent Trustees”), requests and evaluates all information it deems reasonably necessary under the circumstances. Over the course of several months ending in June 2007, the Contract Committee met several times to consider the information provided by Putnam Management and other information developed with the assistance of the Board’s independent counsel and independent staff. The Contract Committee reviewed and discussed key aspects of this information with all of the Independent Trustees. The Contract Committee recommended, and the Independent Trustees approved, the continuance of your fund’s management contract, effective July 1, 2007.
In addition, in anticipation of the sale of Putnam Investments to Great-West Lifeco, at a series of meetings ending in March 2007, theTrustees reviewed and approved new management and distribution arrangements to take effect upon the change of control. Shareholders of all funds approved the management contracts in May 2007, and the change of control transaction was completed on August 3, 2007. Upon the change of control, the management contracts that were approved by the Trustees in June 2007 automatically terminated and were replaced by new contracts that had been approved by shareholders. In connection with their review for the June 2007 continuance of the Putnam funds’ management contracts, theTrustees did not identify any facts or circumstances that would alter the substance of the conclusions and recommendations they made in their review of the contracts to take effect upon the change of control.
The Independent Trustees’ approval was based on the following conclusions:
• That the fee schedule in effect for your fund represented reasonable compensation in light of the nature and quality of the services being provided to the fund, the fees paid by competitive funds and the costs incurred by Putnam Management in providing such services, and
• That this fee schedule represented an appropriate sharing between fund shareholders and Putnam Management of such economies of scale as may exist in the management of the fund at current asset levels.
These conclusions were based on a comprehensive consideration of all information provided to the Trustees and were not the result of any single factor. Some of the factors that figured particularly in the Trustees’ deliberations and how the Trustees considered these factors are described below, although individual Trustees may have evaluated the information presented differently, giving different weights to various factors. It is also important to recognize that the fee arrangements for your fund and the other Putnam funds are the result of many years of review and discussion between the Independent Trustees and Putnam Management, that
23
certain aspects of such arrangements may receive greater scrutiny in some years than others, and that the Trustees’ conclusions may be based, in part, on their consideration of these same arrangements in prior years.
Management fee schedules and categories; total expenses
The Trustees reviewed the management fee schedules in effect for all Putnam funds, including fee levels and breakpoints, and the assignment of funds to particular fee categories. In reviewing fees and expenses, the Trustees generally focused their attention on material changes in circumstances — for example, changes in a fund’s size or investment style, changes in Putnam Management’s operating costs or responsibilities, or changes in competitive practices in the mutual fund industry — that suggest that consideration of fee changes might be warranted. The Trustees concluded that the circumstances did not warrant changes to the management fee structure of your fund, which had been carefully developed over the years, re-examined on many occasions and adjusted where appropriate. The Trustees focused on two areas of particular interest, as discussed further below:
• Competitiveness. The Trustees reviewed comparative fee and expense information for competitive funds, which indicated that, in a custom peer group of competitive funds selected by Lipper Inc., your fund ranked in the 50th percentile in management fees and in the 17th percentile in total expenses (less any applicable 12b-1 fees) as of December 31, 2006 (the first percentile being the least expensive funds and the 100th percentile being the most expensive funds). (Because the fund’s custom peer group is smaller than the fund’s broad Lipper Inc. peer group, this expense information may differ from the Lipper peer expense information found elsewhere in this report.) The Trustees noted that expense ratios for a number of Putnam funds, which show the percentage of fund assets used to pay for management and administrative services, distribution (12b-1) fees and other expenses, h ad been increasing recently as a result of declining net assets and the natural operation of fee breakpoints.
The Trustees noted that the expense ratio increases described above were currently being controlled by expense limitations implemented in January 2004 and which Putnam Management had committed to maintain at least through 2007. In anticipation of the change of control of Putnam Investments, the Trustees requested, and received a commitment from Putnam Management and Great-West Lifeco, to extend this program through at least June 30, 2009. These expense limitations give effect to a commitment by Putnam Management that the expense ratio of each open-end fund would be no higher than the average expense ratio of the competitive funds included in the fund’s relevant Lipper universe (exclusive of any applicable 12b-1 charges in each case). The Trustees observed that this commitment to limit fund expenses has served shareholders well since its inception.
In order to ensure that the expenses of the Putnam funds continue to meet evolving competitive standards, the Trustees requested, and Putnam Management agreed, to extend for the twelve months beginning July 1, 2007, an additional expense limitation for certain funds at an
24
amount equal to the average expense ratio (exclusive of 12b-1 charges) of a custom peer group of competitive funds selected by Lipper to correspond to the size of the fund. This additional expense limitation will be applied to those open-end funds that had above-average expense ratios (exclusive of 12b-1 charges) based on the custom peer group data for the period ended December 31, 2006. This additional expense limitation will not be applied to your fund because it had a below-average expense ratio relative to its custom peer group.
• Economies of scale. Your fund currently has the benefit of breakpoints in its management fee that provide shareholders with significant economies of scale, which means that the effective management fee rate of a fund (as a percentage of fund assets) declines as a fund grows in size and crosses specified asset thresholds. Conversely, as a fund shrinks in size — as has been the case for many Putnam funds in recent years — these breakpoints result in increasing fee levels. In recent years, the Trustees have examined the operation of the existing breakpoint structure during periods of both growth and decline in asset levels. The Trustees concluded that the fee schedules in effect for the funds represented an appropriate sharing of economies of scale at current asset levels. In reaching this conclusion, the Trustees considered the Contract Committee’s stated intent to con tinue to work with Putnam Management to plan for an eventual resumption in the growth of assets, and to consider the potential economies that might be produced under various growth assumptions.
In connection with their review of the management fees and total expenses of the Putnam funds, the Trustees also reviewed the costs of the services to be provided and profits to be realized by Putnam Management and its affiliates from the relationship with the funds. This information included trends in revenues, expenses and profitability of Putnam Management and its affiliates relating to the investment management and distribution services provided to the funds. In this regard, the Trustees also reviewed an analysis of Putnam Management’s revenues, expenses and profitability with respect to the funds’ management contracts, allocated on a fund-by-fund basis.
Investment performance during the review period
The quality of the investment process provided by Putnam Management represented a major factor in the Trustees’ evaluation of the quality of services provided by Putnam Management under your fund’s management contract. The Trustees were assisted in their review of the Putnam funds’ investment process and performance by the work of the Investment Process Committee of the Trustees and the Investment Oversight Committees of the Trustees, which had met on a regular monthly basis with the funds’ portfolio teams throughout the year. The Trustees concluded that Putnam Management generally provides a high-quality investment process — as measured by the experience and skills of the individuals assigned to the management of fund portfolios, the resources made available to such personnel, and in general the ability of Putnam Management to attract and retain high-quality personnel — but also recognized that this does not guarantee favorable investm ent results for every fund in every time period. The Trustees considered the
25
investment performance of each fund over multiple time periods and considered information comparing each fund’s performance with various benchmarks and with the performance of competitive funds.
TheTrustees noted the satisfactory investment performance of many Putnam funds.They also noted the disappointing investment performance of certain funds in recent years and discussed with senior management of Putnam Management the factors contributing to such underperformance and actions being taken to improve performance.TheTrustees recognized that, in recent years, Putnam Management has made significant changes in its investment personnel and processes and in the fund product line to address areas of underperformance. In particular, they noted the important contributions of Putnam Management’s leadership in attracting, retaining and supporting high-quality investment professionals and in systematically implementing an investment process that seeks to merge the best features of fundamental and quantitative analysis.TheTrustees indicated their intention to continue to monitor performance trends to assess the effectiveness of these changes and to evaluate whethe r additional changes to address areas of underperformance are warranted.
In the case of your fund, the Trustees considered that your fund’s class A share cumulative total return performance at net asset value was in the following percentiles of its Lipper Inc. peer group (Lipper Convertible Securities Funds) for the one-, three-, and five-year periods ended March 31, 2007 (the first percentile being the best-performing funds and the 100th percentile being the worst-performing funds):
| | |
| One-year period | Three-year period | Five-year period |
|
| 13th | 22nd | 17th |
(Because of the passage of time, these performance results may differ from the performance results for more recent periods shown elsewhere in this report. Over the one-, three-, and five-year periods ended March 31, 2007, there were 62, 59, and 52 funds, respectively, in your fund’s Lipper peer group.* Past performance is no guarantee of future returns.)
As a general matter, the Trustees concluded that cooperative efforts between the Trustees and Putnam Management represent the most effective way to address investment performance problems. The Trustees noted that investors in the Putnam funds have, in effect, placed their trust in the Putnam organization, under the oversight of the funds’ Trustees, to make appropriate decisions regarding the management of the funds. Based on the responsiveness of Putnam Management in the recent past to Trustee concerns about investment performance, the Trustees concluded that it is preferable to seek change within Putnam Management to address performance shortcomings. In the Trustees’ view, the alternative of terminating a
* The percentile rankings for your fund’s class A share annualized total return performance in the Lipper Convertible Securities Funds category for the one-, five-, and ten-year periods ended March 31, 2008, were 59%, 13%, and 58%, respectively. Over the one-, five-, and ten-year periods ended March 31, 2008, the fund ranked 38th out of 64, 7th out of 53, and 22nd out of 37, respectively. Note that this more recent information was not available when the Trustees approved the continuance of your fund’s management contract.
26
management contract and engaging a new investment adviser for an underperforming fund would entail significant disruptions and would not provide any greater assurance of improved investment performance.
Brokerage and soft-dollar allocations; other benefits
The Trustees considered various potential benefits that Putnam Management may receive in connection with the services it provides under the management contract with your fund. These include benefits related to brokerage and soft-dollar allocations, whereby a portion of the commissions paid by a fund for brokerage may be used to acquire research services that may be useful to Putnam Management in managing the assets of the fund and of other clients. The Trustees indicated their continued intent to monitor the potential benefits associated with the allocation of fund brokerage to ensure that the principle of seeking “best price and execution” remains paramount in the portfolio trading process.
The Trustees’ annual review of your fund’s management contract also included the review of its distributor’s contract and distribution plan with Putnam Retail Management Limited Partnership and the custodian agreement and investor servicing agreement with Putnam Fiduciary Trust Company (“PFTC”), each of which provides benefits to affiliates of Putnam Management. In the case of the custodian agreement, the Trustees considered that, effective January 1, 2007, the Putnam funds had engaged State Street Bank and Trust Company as custodian and began to transition the responsibility for providing custody services away from PFTC.
Comparison of retail and institutional fee schedules
The information examined by the Trustees as part of their annual contract review has included for many years information regarding fees charged by Putnam Management and its affiliates to institutional clients such as defined benefit pension plans, college endowments, etc. This information included comparison of such fees with fees charged to the funds, as well as a detailed assessment of the differences in the services provided to these two types of clients. The Trustees observed, in this regard, that the differences in fee rates between institutional clients and the funds are by no means uniform when examined by individual asset sectors, suggesting that differences in the pricing of investment management services to these types of clients reflect to a substantial degree historical competitive forces operating in separate market places. The Trustees considered the fact that fee rates across all asset sectors are higher on average for funds than for institutional clients, as well as the differences between the services that Putnam Management provides to the Putnam funds and those that it provides to institutional clients of the firm, but did not rely on such comparisons to any significant extent in concluding that the management fees paid by your fund are reasonable.
27
Other information for shareholders
Important notice regarding delivery of shareholder documents
In accordance with SEC regulations, Putnam sends a single copy of annual and semiannual shareholder reports, prospectuses, and proxy statements to Putnam shareholders who share the same address, unless a shareholder requests otherwise. If you prefer to receive your own copy of these documents, please call Putnam at 1-800-225-1581, and Putnam will begin sending individual copies within 30 days.
Proxy voting
Putnam is committed to managing our mutual funds in the best interests of our shareholders. The Putnam funds’ proxy voting guidelines and procedures, as well as information regarding how your fund voted proxies relating to portfolio securities during the 12-month period ended June 30, 2007, are available in the Individual Investors section of www.putnam.com, and on the SEC’s Web site, www.sec.gov. If you have questions about finding forms on the SEC’s Web site, you may call the SEC at 1-800-SEC-0330. You may also obtain the Putnam funds’ proxy voting guidelines and procedures at no charge by calling Putnam’s Shareholder Services at 1-800-225-1581.
Fund portfolio holdings
The fund will file a complete schedule of its portfolio holdings with the SEC for the first and third quarters of each fiscal year on Form N-Q. Shareholders may obtain the fund’s Forms N-Q on the SEC’s Web site at www.sec.gov. In addition, the fund’s Forms N-Q may be reviewed and copied at the SEC’s Public Reference Room in Washington, D.C. You may call the SEC at 1-800-SEC-0330 for information about the SEC’s Web site or the operation of the Public Reference Room.
28
Financial statements
A guide to financial statements
These sections of the report, as well as the accompanying Notes, constitute the fund’s financial statements.
The fund’s portfolio lists all the fund’s investments and their values as of the last day of the reporting period. Holdings are organized by asset type and industry sector, country, or state to show areas of concentration and diversification.
Statement of assets and liabilities shows how the fund’s net assets and share price are determined. All investment and noninvestment assets are added together. Any unpaid expenses and other liabilities are subtracted from this total. The result is divided by the number of shares to determine the net asset value per share, which is calculated separately for each class of shares. (For funds with preferred shares, the amount subtracted from total assets includes the liquidation preference of preferred shares.)
Statement of operations shows the fund’s net investment gain or loss. This is done by first adding up all the fund’s earnings — from dividends and interest income — and subtracting its operating expenses to determine net investment income (or loss). Then, any net gain or loss the fund realized on the sales of its holdings — as well as any unrealized gains or losses over the period — is added to or subtracted from the net investment result to determine the fund’s net gain or loss for the fiscal period.
Statement of changes in net assets shows how the fund’s net assets were affected by the fund’s net investment gain or loss, by distributions to shareholders, and by changes in the number of the fund’s shares. It lists distributions and their sources (net investment income or realized capital gains) over the current reporting period and the most recent fiscal year-end. The distributions listed here may not match the sources listed in the Statement of operations because the distributions are determined on a tax basis and may be paid in a different period from the one in which they were earned. Dividend sources are estimated at the time of declaration. Actual results may vary. Any non-taxable return of capital cannot be determined until final tax calculations are completed after the end of the fund’s fiscal year.
Financial highlights provide an overview of the fund’s investment results, per-share distributions, expense ratios, net investment income ratios, and portfolio turnover in one summary table, reflecting the five most recent reporting periods. In a semiannual report, the highlight table also includes the current reporting period.
29
The fund’s portfolio 4/30/08 (Unaudited)
| | | | |
| CONVERTIBLE BONDS AND NOTES (68.0%)* | | | | |
|
| | | Principal amount | | Value |
|
| Aerospace and Defense (2.8%) | | | | |
| L-1 Identity Solutions, Inc. 144A cv. sr. notes 3 3/4s, 2027 | $ | 5,870,000 | $ | 5,077,550 |
| Lockheed Martin Corp. cv. sr. notes FRN 2.815s, 2033 | | 7,800,000 | | 11,356,800 |
| Triumph Group, Inc. cv. sr. unsec. sub. notes 2 5/8s, 2026 | | 730,000 | | 917,975 |
| Triumph Group, Inc. 144A cv. sr. sub. notes 2 5/8s, 2026 | | 3,800,000 | | 4,778,500 |
| | | | | 22,130,825 |
|
| |
| Airlines (0.4%) | | | | |
| Pinnacle Airlines Corp. cv. sr. notes 3 1/4s, 2025 | | 3,700,000 | | 3,154,250 |
|
| |
| Automotive (3.4%) | | | | |
| Ford Motor Co. cv. sr. notes 4 1/4s, 2036 | | 16,000,000 | | 17,779,998 |
| United Auto Group, Inc. 144A cv. sr. sub. notes 3 1/2s, 2026 | | 7,800,000 | | 8,482,500 |
| | | | | 26,262,498 |
|
| |
| Banking (1.0%) | | | | |
| Boston Private Financial Holdings, Inc. cv. sr. unsec. notes 3s, 2027 | | 3,100,000 | | 2,762,875 |
| Boston Private Financial Holdings, Inc. 144A cv. sr. unsec. | | | | |
| notes 3s, 2027 | | 5,800,000 | | 5,169,250 |
| | | | | 7,932,125 |
|
| |
| Beverage (1.6%) | | | | |
| Central European Distribution Corp. cv. sr. unsec. unsub. | | | | |
| notes 3s, 2013 | | 4,000,000 | | 4,420,000 |
| Molson Coors Brewing Co. cv. sr. unsec. notes 2 1/2s, 2013 | | 6,400,000 | | 8,056,000 |
| | | | | 12,476,000 |
|
| |
| Biotechnology (5.7%) | | | | |
| Amgen, Inc. 144A cv. sr. notes 3/8s, 2013 | | 8,800,000 | | 7,535,000 |
| Amylin Pharmaceuticals, Inc. 144A cv. sr. notes 3s, 2014 | | 4,100,000 | | 3,423,500 |
| Cubist Pharmaceuticals, Inc. cv. sub. notes 2 1/4s, 2013 | | 8,100,000 | | 7,512,750 |
| Genzyme Corp. (General Division) cv. sr. notes 1 1/4s, 2023 | | 7,900,000 | | 8,759,125 |
| Integra LifeSciences Holdings 144A cv. sr. notes 2 3/4s, 2010 | | 8,000,000 | | 7,530,000 |
| Kendle International, Inc. cv. sr. notes 3 3/8s, 2012 | | 6,700,000 | | 7,571,000 |
| MannKind Corp. cv. sr. unsec. notes 3 3/4s, 2013 | | 4,600,000 | | 2,110,250 |
| | | | | 44,441,625 |
|
| |
| Broadcasting (0.6%) | | | | |
| Central European Media Enterprises, Ltd. 144A cv. | | | | |
| company guaranty sr. sec. bond 3 1/2s, 2013 (Bermuda) | | 4,000,000 | | 4,865,000 |
|
| |
| Coal (2.1%) | | | | |
| International Coal Group, Inc. 144A cv. company guaranty 9s, 2012 | | 10,892,000 | | 15,937,008 |
|
| |
| Commercial and Consumer Services (1.6%) | | | | |
| Dollar Financial Corp. 144A cv. sr. notes 2 7/8s, 2027 | | 6,000,000 | | 4,792,254 |
| Euronet Worldwide, Inc. cv. debs. 3 1/2s, 2025 | | 2,100,000 | | 1,701,000 |
30
| | | | |
| CONVERTIBLE BONDS AND NOTES (68.0%)* continued | | | | |
|
| | | Principal amount | | Value |
|
| Commercial and Consumer Services continued | | | | |
| Euronet Worldwide, Inc. 144A cv. debs. 3 1/2s, 2025 | $ | 3,400,000 | $ | 2,754,000 |
| Live Nation, Inc. 144A cv. sr. notes 2 7/8s, 2027 | | 4,000,000 | | 3,310,000 |
| | | | | 12,557,254 |
|
| |
| Communications Equipment (0.5%) | | | | |
| Arris Group, Inc. cv. sr. unsec. notes 2s, 2026 | | 5,000,000 | | 4,062,500 |
|
| |
| Computers (3.3%) | | | | |
| Anixter International, Inc. 144A cv. sr. notes 1s, 2013 | | 6,800,000 | | 7,361,000 |
| Cray, Inc. cv. sr. sub. notes 3s, 2024 | | 2,000,000 | | 1,782,500 |
| Cray, Inc. 144A cv. sr. sub. notes 3s, 2024 | | 4,600,000 | | 4,099,750 |
| EMC Corp. 144A cv. sr. notes 1 3/4s, 2013 | | 5,800,000 | | 6,945,500 |
| SPSS, Inc. 144A cv. sub. notes 2 1/2s, 2012 | | 4,800,000 | | 5,454,000 |
| | | | | 25,642,750 |
|
| |
| Consumer Goods (0.7%) | | | | |
| Chattem, Inc. cv. sr. notes 1 5/8s, 2014 | | 3,100,000 | | 3,472,000 |
| Chattem, Inc. 144A cv. sr. notes 1 5/8s, 2014 | | 2,000,000 | | 2,240,000 |
| | | | | 5,712,000 |
|
| |
| Electrical Equipment (0.7%) | | | | |
| WESCO International, Inc. cv. sr. debs. Ser. *, 2 5/8s, 2025 | | 1,700,000 | | 1,880,625 |
| WESCO International, Inc. 144A cv. sr. debs. 2 5/8s, 2025 | | 2,900,000 | | 3,208,125 |
| | | | | 5,088,750 |
|
| |
| Electronics (4.2%) | | | | |
| Advanced Micro Devices, Inc. cv. sr. unsec. | | | | |
| notes 5 3/4s, 2012 | | 10,200,000 | | 7,446,000 |
| General Cable Corp. 144A cv. sr. notes 1s, 2012 | | 7,700,000 | | 8,017,625 |
| Intel Corp. 144A cv. sub. bonds 2.95s, 2035 | | 10,700,000 | | 10,619,750 |
| Liberty Media Corp. cv. sr. notes 3 1/2s, 2031 | | 6,900,000 | | 3,699,090 |
| RF Micro Devices, Inc. 144A cv. sub. notes 1s, 2014 | | 4,500,000 | | 3,071,250 |
| | | | | 32,853,715 |
|
| |
| Energy (3.4%) | | | | |
| Flotek Industries, Inc. cv. company guaranty sr. notes 5 1/4s, 2028 | | 4,000,000 | | 4,207,100 |
| Global Industries, Ltd. 144A cv. unsec. notes 2 3/4s, 2027 | | 6,000,000 | | 4,507,500 |
| Transocean, Inc. cv. sr. unsec. notes Ser. C, 1 1/2s, 2037 | | 15,650,000 | | 17,595,295 |
| | | | | 26,309,895 |
|
| |
| Energy (Other) (1.2%) | | | | |
| Covanta Holding Corp. cv. sr. debs. 1s, 2027 | | 3,700,000 | | 3,977,500 |
| Suntech Power Holdings Co., Ltd. 144A cv. sr. unsec. | | | | |
| notes 3s, 2013 (China) | | 4,000,000 | | 5,230,000 |
| | | | | 9,207,500 |
31
| | | | |
| CONVERTIBLE BONDS AND NOTES (68.0%)* continued | | | | |
| |
| | | Principal amount | | Value |
|
| Entertainment (1.7%) | | | | |
| Lions Gate Entertainment Corp. cv. sr. sub. bonds | | | | |
| stepped-coupon 3 5/8s (3 1/8s, 3/15/12) 2025 (Canada) †† | $ | 1,300,000 | $ | 1,283,750 |
| Lions Gate Entertainment Corp. 144A cv. sr. sub. bonds | | | | |
| stepped-coupon 3 5/8s (3 1/8s, 3/15/12) 2025 (Canada) †† | | 5,800,000 | | 5,727,500 |
| Macrovision Corp. cv. sr. notes 2 5/8s, 2011 | | 3,600,000 | | 3,208,500 |
| Macrovision Corp. 144A cv. sr. notes 2 5/8s, 2011 | | 3,000,000 | | 2,673,750 |
| | | | | 12,893,500 |
|
| |
| Financial (3.5%) | | | | |
| Countrywide Financial Corp. 144A cv. company | | | | |
| guaranty sr. unsec. notes FRN Ser. A, zero %, 2037 | | 14,100,000 | | 13,042,500 |
| MGIC Investment Corp. 144A cv. jr. unsec. sub. debs. 9s, 2063 | | 11,640,000 | | 14,171,700 |
| | | | | 27,214,200 |
|
| |
| Food (0.9%) | | | | |
| Chiquita Brands International cv. sr. unsec. notes 4 1/4s, 2016 | | 5,655,000 | | 6,925,113 |
|
| |
| Forest Products and Packaging (0.8%) | | | | |
| Rayonier TRS Holdings, Inc. 144A cv. sr. notes 3 3/4s, 2012 | | 5,900,000 | | 5,966,375 |
|
| |
| Gaming & Lottery (0.6%) | | | | |
| Scientific Games Corp. 144A cv. company guaranty 3/4s, 2024 | | 4,400,000 | | 4,972,000 |
|
| |
| Health Care Services (3.0%) | | | | |
| BioMarin Pharmaceuticals, Inc. cv. sr. sub. notes 1 7/8s, 2017 | | 2,900,000 | | 5,593,375 |
| Dendreon Corp. 144A cv. sr. sub. notes 4 3/4s, 2014 | | 4,000,000 | | 2,955,000 |
| LifePoint Hospitals, Inc. cv. sr. sub. notes 3 1/2s, 2014 | | 6,400,000 | | 5,496,000 |
| Molina Healthcare, Inc. cv. sr. notes Ser. MOH, 3 3/4s, 2014 | | 5,200,000 | | 4,446,000 |
| United Therapeutics Corp. cv. sr. notes 1/2s, 2011 | | 500,000 | | 635,000 |
| United Therapeutics Corp. 144A cv. sr. notes 1/2s, 2011 | | 3,500,000 | | 4,445,000 |
| | | | | 23,570,375 |
|
| |
| Investment Banking/Brokerage (1.0%) | | | | |
| KKR Financial Holdings, LLC 144A cv. sr. unsec. notes 7s, 2012 | | 8,810,000 | | 7,464,713 |
|
| |
| Media (0.9%) | | | | |
| Virgin Media, Inc. 144A cv. sr. unsec. notes 6 1/2s, 2016 | | 6,700,000 | | 6,728,140 |
|
| |
| Medical Technology (2.6%) | | | | |
| China Medical Technologies, Inc. | | | | |
| 144A cv. sr. sub. notes 3 1/2s, 2011 (China) | | 3,100,000 | | 4,247,000 |
| EPIX Medical, Inc. cv. sr. notes 3s, 2024 | | 3,300,000 | | 2,157,375 |
| EPIX Medical, Inc. 144A cv. sr. notes 3s, 2024 | | 4,300,000 | | 2,811,125 |
| Medtronic, Inc. cv. sr. notes 1 5/8s, 2013 | | 2,200,000 | | 2,277,000 |
| Medtronic, Inc. 144A cv. sr. notes 1 5/8s, 2013 | | 8,500,000 | | 8,797,500 |
| | | | | 20,290,000 |
|
| |
| Metal Fabricators (0.3%) | | | | |
| USEC, Inc. cv. unsec. sr. notes 3s, 2014 | | 4,100,000 | | 2,715,430 |
32
| | | | |
| CONVERTIBLE BONDS AND NOTES (68.0%)* continued | | | | |
| |
| | | Principal amount | | Value |
|
| Metals (0.8%) | | | | |
| Coeur d’Alene Mines Corp. cv. sr. unsec. notes 3 1/4s, 2028 | $ | 7,500,000 | $ | 6,365,625 |
|
| |
| Oil & Gas (1.6%) | | | | |
| Penn Virginia Corp. cv. sr. unsec. sub. notes 4 1/2s, 2012 | | 5,400,000 | | 6,358,500 |
| St. Mary Land & Exploration Co. cv. sr. notes 3 1/2s, 2027 | | 5,500,000 | | 5,836,875 |
| | | | | 12,195,375 |
|
| |
| Pharmaceuticals (0.8%) | | | | |
| CV Therapeutics, Inc. cv. sub. notes 3 1/4s, 2013 | | 8,609,000 | | 6,284,570 |
|
| |
| Real Estate (3.3%) | | | | |
| Alexandria Real Estate Equities, Inc. | | | | |
| 144A cv. sr. notes 3.7s, 2027 (R) | | 4,000,000 | | 4,145,000 |
| Corporate Office Properties LP 144A cv. company | | | | |
| guaranty 3 1/2s, 2026 (R) | | 3,400,000 | | 3,004,750 |
| Forest City Enterprises, Inc. cv. notes 3 5/8s, 2011 (R) | | 3,100,000 | | 2,678,710 |
| Forest City Enterprises, Inc. 144A cv. notes 3 5/8s, 2011 (R) | | 3,500,000 | | 3,024,350 |
| General Growth Properties, Inc. 144A cv. sr. notes 3.98s, 2027 | | 9,600,000 | | 7,776,000 |
| Sunstone Hotel Partnership, LLC 144A cv. company | | | | |
| guaranty 4.6s, 2027 (R) | | 6,200,000 | | 5,074,303 |
| | | | | 25,703,113 |
|
| |
| Retail (1.9%) | | | | |
| Charming Shoppes cv. sr. unsec. notes 1 1/8s, 2014 | | 1,800,000 | | 1,091,250 |
| Charming Shoppes 144A cv. sr. unsec. notes 1 1/8s, 2014 | | 3,800,000 | | 2,303,750 |
| Nash Finch Co. cv. sr. sub. notes stepped-coupon | | | | |
| 1.631s (zero %, 3/15/13) 2035 †† | | 6,447,000 | | 2,885,033 |
| Nash Finch Co. 144A cv. sr. sub. notes | | | | |
| stepped-coupon 1.631s (zero %, 3/15/13) 2035 †† | | 8,500,000 | | 3,803,750 |
| Pantry, Inc. (The) cv. sr. sub. notes 3s, 2012 | | 4,400,000 | | 2,887,500 |
| Pantry, Inc. (The) 144A cv. sr. sub. notes 3s, 2012 | | 2,600,000 | | 1,706,250 |
| | | | | 14,677,533 |
|
| |
| Software (2.3%) | | | | |
| Borland Software Corp. 144A cv. sr. notes 2 3/4s, 2012 | | 5,400,000 | | 3,672,000 |
| Cadence Design Systems, Inc. 144A cv. sr. notes 1 1/2s, 2013 | | 5,100,000 | | 4,379,625 |
| Symantec Corp. cv. sr. unsec. notes 1s, 2013 | | 9,300,000 | | 10,055,625 |
| | | | | 18,107,250 |
|
| |
| Technology (1.7%) | | | | |
| Acquicor Technology, Inc. 144A cv. notes 8s, 2011 | | 3,422,000 | | 2,549,390 |
| CACI International, Inc. 144A cv. sr. sub. notes 2 1/8s, 2014 | | 3,720,000 | | 4,078,050 |
| ON Semiconductor Corp. 144A cv. sr. sub. notes 2 5/8s, 2026 | | 7,000,000 | | 6,737,500 |
| | | | | 13,364,940 |
|
| |
| Technology Services (2.7%) | | | | |
| DST Systems, Inc. 144A cv. sr. notes Ser. A, 4 1/8s, 2023 | | 5,000,000 | | 6,700,000 |
| Safeguard Scientifics, Inc. 144A cv. sr. notes 2 5/8s, 2024 | | 10,500,000 | | 8,570,625 |
| Trizetto Group 144A cv. sr. notes 1 1/8s, 2012 | | 5,700,000 | | 6,049,125 |
| | | | | 21,319,750 |
33
| | | | |
| CONVERTIBLE BONDS AND NOTES (68.0%)* continued | | | | |
| |
| | | Principal amount | | Value |
|
| Telecommunications (3.4%) | | | | |
| Equinix, Inc. cv. sub. notes 3s, 2014 | $ | 3,900,000 | $ | 4,299,750 |
| Level 3 Communications, Inc. cv. sr. notes 3 1/2s, 2012 | | 6,700,000 | | 5,276,250 |
| NII Holdings, Inc. cv. sr. unsec. notes 2 3/4s, 2025 | | 2,000,000 | | 2,320,000 |
| NII Holdings, Inc. 144A cv. sr. unsec. notes 3 1/8s, 2012 | | 3,500,000 | | 2,922,500 |
| NII Holdings, Inc. 144A cv. sr. unsec. notes 2 3/4s, 2025 | | 3,800,000 | | 4,408,000 |
| SBA Communications Corp. cv. sr. notes 3/8s, 2010 | | 6,700,000 | | 7,395,125 |
| | | | | 26,621,625 |
|
| |
| Waste Management (1.0%) | | | | |
| Waste Connections, Inc. cv. sr. notes 3 3/4s, 2026 | | 4,900,000 | | 5,494,125 |
| Waste Connections, Inc. 144A cv. sr. notes 3 3/4s, 2026 | | 2,000,000 | | 2,242,500 |
| | | | | 7,736,625 |
|
| |
| Total convertible bonds and notes (cost $538,922,356) | | | $ | 529,749,947 |
|
| |
| |
| CONVERTIBLE PREFERRED SECURITIES (24.1%)* | | | | |
|
| | | Shares | | Value |
|
| Automotive (1.6%) | | | | |
| General Motors Corp. $1.563 cum. cv. pfd. | | 646,600 | $ | 12,083,338 |
|
| |
| Banking (2.3%) | | | | |
| Wachovia Corp. Ser. L, Class A, 7.50% cv. pfd. | | 10,740 | | 12,431,550 |
| Washington Mutual, Inc. Ser. R, 7.75% cv. pfd. | | 6,623 | | 5,778,568 |
| | | | | 18,210,118 |
|
| |
| Building Materials (0.6%) | | | | |
| Stanley Works (The) 5.125% units cv. ARP | | 5,531,000 | | 4,632,213 |
|
| |
| Chemicals (0.8%) | | | | |
| Celanese Corp. $1.063 cum. cv. pfd. | | 112,400 | | 6,420,850 |
|
| |
| Electric Utilities (1.0%) | | | | |
| Entergy Corp. $3.813 cv. pfd. | | 112,700 | | 7,691,775 |
|
| |
| Financial (0.4%) | | | | |
| Ambac Financial Group, Inc. $4.75 cv. pfd. | | 77,555 | | 3,170,061 |
|
| |
| Food (0.9%) | | | | |
| Bunge, Ltd. 4.875% cv. pfd. | | 50,254 | | 6,953,897 |
|
| |
| Insurance (2.7%) | | | | |
| Alleghany Corp. 5.75% cv. pfd. | | 19,175 | | 6,183,577 |
| Citigroup Funding, Inc. Ser. GNW, zero % cv. pfd. | | 326,600 | | 7,665,302 |
| Platinum Underwriters Holdings, Ltd. Ser. A, | | | | |
| 6.00% cv. pfd. (Bermuda) | | 232,236 | | 7,378,277 |
| | | | | 21,227,156 |
|
| |
| Investment Banking/Brokerage (1.7%) | | | | |
| Lehman Brothers Holdings, Inc. Ser. P, 7.25% cv. pfd. | | 11,067 | | 13,546,008 |
34
| | | | |
| CONVERTIBLE PREFERRED SECURITIES (24.1%)* continued | | | | |
| |
| | | Shares | | Value |
|
| Metals (3.5%) | | | | |
| Freeport-McMoRan Copper & Gold, Inc. $6.75 cv. pfd. | | 81,100 | $ | 13,199,025 |
| Vale Capital, Ltd. Ser. RIO, $2.75 cv. pfd. (Cayman Islands) | | 191,460 | | 14,120,175 |
| | | | | 27,319,200 |
|
| |
| Natural Gas Utilities (1.0%) | | | | |
| El Paso Corp. 144A 4.99% cv. pfd. | | 5,350 | | 7,443,188 |
|
| |
| Oil & Gas (3.7%) | | | | |
| Chesapeake Energy Corp. $4.50 cum. cv. pfd. (S) | | 111,000 | | 14,166,375 |
| Edge Petroleum Ser. A, $2.875 cum. cv. pfd. | | 62,700 | | 2,007,027 |
| McMoRan Exploration Co. $6.75 cum. cv. pfd. | | 67,500 | | 12,393,270 |
| | | | | 28,566,672 |
|
| |
| Pharmaceuticals (0.9%) | | | | |
| Mylan, Inc. 6.50% cv. pfd. | | 7,750 | | 7,246,839 |
|
| |
| Power Producers (1.0%) | | | | |
| NRG Energy, Inc. 5.75% cv. pfd. | | 20,300 | | 7,644,219 |
|
| |
| Real Estate (0.5%) | | | | |
| Digital Realty Trust, Inc. $1.094 cv. pfd. | | 186,500 | | 4,085,506 |
|
| |
| Retail (0.5%) | | | | |
| Retail Ventures, Inc. $3.312 cv. pfd. | | 123,200 | | 3,927,000 |
|
| |
| Tobacco (1.0%) | | | | |
| Universal Corp. 6.75% cv. pfd. | | 4,788 | | 7,313,670 |
|
| Total convertible preferred securities (cost $170,373,250) | | | $ | 187,481,710 |
|
| |
| COMMON STOCKS (5.0%)* | | | | |
|
| | | Shares | | Value |
|
| Advertising and Marketing Services (0.2%) | | | | |
| Information Services Group, Inc. (Unit) † | | 343,750 | $ | 1,890,625 |
|
| |
| Banking (1.1%) | | | | |
| U.S. Bancorp | | 250,200 | | 8,479,278 |
|
| |
| Broadcasting (0.5%) | | | | |
| Sinclair Broadcast Group, Inc. Class A | | 461,200 | | 4,053,948 |
|
| |
| Energy (Other) (0.4%) | | | | |
| Brazil Ethanol, Inc. 144A (Unit) † | | 312,500 | | 2,812,500 |
|
| |
| Miscellaneous (0.3%) | | | | |
| Trian Acquisition I Corp. (Unit) † | | 250,000 | | 2,450,000 |
|
| |
| Pharmaceuticals (1.4%) | | | | |
| Johnson & Johnson | | 156,710 | | 10,513,674 |
35
| | | | |
| COMMON STOCKS (5.0%)* continued | | | | |
| |
| | | Shares | | Value |
|
| Railroads (0.8%) | | | | |
| CSX Corp. | | 100,200 | $ | 6,307,590 |
|
| Telecommunications (0.3%) | | | | |
| Transforma Acquisition Group, Inc. (Unit) † | | 312,500 | | 2,456,250 |
|
| Total common stocks (cost $37,160,864) | | | $ | 38,963,865 |
|
| |
| UNITS (0.8%)* (cost $6,491,598) | | | | |
|
| | | Units | | Value |
|
| Elf Special Financing, Ltd. 144A cv. units FRN | | | | |
| Ser. B, 3.15s, 2009 (Cayman Islands) | | 65 | $ | 6,446,050 |
|
| |
| SHORT-TERM INVESTMENTS (2.6%)* | | | | |
| |
| | | Principal amount/shares | | Value |
|
| Putnam Prime Money Market Fund (e) | | 6,707,591 | $ | 6,707,591 |
| Short-term investments held as collateral for loaned | | | | |
| securities with yields ranging from 1.96% to 3.11% | | | | |
| and due dates ranging from May 1, 2008 to June 27, 2008 (d) | $ | 13,204,550 | | 13,186,800 |
|
| Total short-term investments (cost $19,894,391) | | | $ | 19,894,391 |
|
| TOTAL INVESTMENTS | | | | |
|
| Total investments (cost $772,842,459) | | | $ | 782,535,963 |
* Percentages indicated are based on net assets of $778,654,197.
† Non-income-producing security.
† † The interest rate and date shown parenthetically represent the new interest rate to be paid and the date the fund will begin accruing interest at this rate.
(d) See Note 1 to the financial statements.
(e) See Note 5 to the financial statements regarding investments in Putnam Prime Money Market Fund.
(R) Real Estate Investment Trust.
(S) Securities on loan, in part or in entirety, at April 30, 2008.
144A after the name of an issuer represents securities exempt from registration under Rule 144A under the Securities Act of 1933, as amended. These securities may be resold in transactions exempt from registration, normally to qualified institutional buyers.
The rates shown on Adjustable Rate Preferred Stock (ARP) and Floating Rate Notes (FRN) are the current interest rates at April 30, 2008.
The dates shown on debt obligations are the original maturity dates.
The accompanying notes are an integral part of these financial statements.
36
Statement of assets and liabilities 4/30/08 (Unaudited)
| |
| ASSETS | |
|
| Investment in securities, at value, including $12,837,150 of securities on loan (Note 1): | |
| Unaffiliated issuers (identified cost $766,134,868) | $775,828,372 |
| Affiliated issuers (identified cost $6,707,591) (Note 5) | 6,707,591 |
|
| Cash | 3,525,473 |
|
| Dividends, interest and other receivables | 4,913,181 |
|
| Receivable for shares of the fund sold | 1,602,543 |
|
| Receivable for securities sold | 2,583,475 |
|
| Total assets | 795,160,635 |
| |
| |
| LIABILITIES | |
|
| Payable for shares of the fund repurchased | 1,631,354 |
|
| Payable for compensation of Manager (Notes 2 and 5) | 1,146,721 |
|
| Payable for investor servicing fees (Note 2) | 85,638 |
|
| Payable for custodian fees (Note 2) | 3,898 |
|
| Payable for Trustee compensation and expenses (Note 2) | 157,802 |
|
| Payable for administrative services (Note 2) | 2,033 |
|
| Payable for distribution fees (Note 2) | 199,383 |
|
| Collateral on securities loaned, at value (Note 1) | 13,186,800 |
|
| Other accrued expenses | 92,809 |
|
| Total liabilities | 16,506,438 |
|
| Net assets | $778,654,197 |
| |
| |
| REPRESENTED BY | |
|
| Paid-in capital (Unlimited shares authorized) (Notes 1 and 4) | $822,992,259 |
|
| Undistributed net investment income (Note 1) | 11,443,123 |
|
| Accumulated net realized loss on investments (Note 1) | (65,474,689) |
|
| Net unrealized appreciation of investments | 9,693,504 |
|
| Total — Representing net assets applicable to capital shares outstanding | $778,654,197 |
(Continued on next page)
37
Statement of assets and liabilities (Continued)
| |
| COMPUTATION OF NET ASSET VALUE AND OFFERING PRICE | |
|
| Net asset value and redemption price per class A share | |
| ($667,220,845 divided by 33,643,274 shares) | $19.83 |
|
| Offering price per class A share | |
| (100/94.25 of $19.83)* | $21.04 |
|
| Net asset value and offering price per class B share | |
| ($29,495,292 divided by 1,511,351 shares)** | $19.52 |
|
| Net asset value and offering price per class C share | |
| ($45,314,347 divided by 2,303,863 shares)** | $19.67 |
|
| Net asset value and redemption price per class M share | |
| ($4,822,905 divided by 245,163 shares) | $19.67 |
|
| Offering price per class M share | |
| (100/96.50 of $19.67)* | $20.38 |
|
| Net asset value, offering price and redemption price per class R share | |
| ($3,366,893 divided by 170,280 shares) | $19.77 |
|
| Net asset value, offering price and redemption price per class Y share | |
| ($28,433,915 divided by 1,433,735 shares) | $19.83 |
* On single retail sales of less than $50,000. On sales of $50,000 or more the offering price is reduced.
** Redemption price per share is equal to net asset value less any applicable contingent deferred sales charge.
The accompanying notes are an integral part of these financial statements.
38
Statement of operations Six months ended 4/30/08 (Unaudited)
| |
| INVESTMENT INCOME | |
|
| Interest (including interest income of $288,263 from | |
| investments in affiliated issuers) (Note 5) | $ 8,385,499 |
|
| Dividends | 5,346,882 |
|
| Securities lending | 4,699 |
|
| Total investment income | 13,737,080 |
| |
| |
| EXPENSES | |
|
| Compensation of Manager (Note 2) | 2,338,999 |
|
| Investor servicing fees (Note 2) | 525,687 |
|
| Custodian fees (Note 2) | 8,720 |
|
| Trustee compensation and expenses (Note 2) | 21,352 |
|
| Administrative services (Note 2) | 18,330 |
|
| Distribution fees — Class A (Note 2) | 817,196 |
|
| Distribution fees — Class B (Note 2) | 161,863 |
|
| Distribution fees — Class C (Note 2) | 198,332 |
|
| Distribution fees — Class M (Note 2) | 19,917 |
|
| Distribution fees — Class R (Note 2) | 7,309 |
|
| Other | 132,924 |
|
| Non-recurring costs (Notes 2 and 6) | 1,313 |
|
| Costs assumed by Manager (Notes 2 and 6) | (1,313) |
|
| Fees waived and reimbursed by Manager (Note 5) | (6,125) |
|
| Total expenses | 4,244,504 |
|
| Expense reduction (Note 2) | (46,515) |
|
| Net expenses | 4,197,989 |
|
| Net investment income | 9,539,091 |
|
| Net realized loss on investments (Notes 1 and 3) | (4,863,336) |
|
| Net unrealized depreciation of investments during the period | (47,149,371) |
|
| Net loss on investments | (52,012,707) |
|
| Net decrease in net assets resulting from operations | $(42,473,616) |
The accompanying notes are an integral part of these financial statements.
39
Statement of changes in net assets
| | |
| INCREASE (DECREASE) IN NET ASSETS | | |
| |
| | Six months ended | Year ended |
| | 4/30/08* | 10/31/07 |
|
| Operations: | | |
| Net investment income | $ 9,539,091 | $ 18,458,048 |
|
| Net realized gain (loss) on investments | (4,863,336) | 71,205,711 |
|
| Net unrealized appreciation (depreciation) of investments | (47,149,371) | 9,177,227 |
|
| Net increase (decrease) in net assets | | |
| resulting from operations | (42,473,616) | 98,840,986 |
|
| Distributions to shareholders (Note 1): | | |
|
| From ordinary income | | |
|
| Net investment income | | |
|
| Class A | (8,786,943) | (16,969,054) |
|
| Class B | (310,881) | (804,060) |
|
| Class C | (404,475) | (546,345) |
|
| Class M | (57,863) | (124,315) |
|
| Class R | (37,459) | (38,167) |
|
| Class Y | (400,758) | (721,925) |
|
| Redemption fees (Note 1) | 620 | 775 |
|
| Increase from capital share transactions (Note 4) | 21,595,090 | 20,176,595 |
|
| Total increase (decrease) in net assets | (30,876,285) | 99,814,490 |
| |
| |
| NET ASSETS | | |
|
| Beginning of period | 809,530,482 | 709,715,992 |
|
| End of period (including undistributed net investment | | |
| income of $11,443,123 and $11,902,411, respectively) | $778,654,197 | $809,530,482 |
* Unaudited
The accompanying notes are an integral part of these financial statements.
40
This page left blank intentionally.
41
Financial highlights (For a common share outstanding throughout the period)
| | | | | | | | | | | | | | | | | | | | | | | | | | |
| INVESTMENT OPERATIONS: | | | | | | | | LESS DISTRIBUTIONS: | | | | | | | | RATIOS AND SUPPLEMENTAL DATA: | | |
|
| | | | | | | Net | | | | | | | | | | | | Total | | | | | | Ratio of net | | |
| | | Net asset | | | | realized and | | Total | | From | | | | | | Net asset | | return | | Net | | Ratio of | | investment | | |
| | | value, | | Net | | unrealized | | from | | net | | | | | | value, | | at net | | assets, | | expenses to | | income (loss) | | Portfolio |
| | | beginning | | investment | | gain (loss) on | | investment | | investment | | Total | | Redemption | | end | | asset | | end of period | | average net | | to average | | turnover |
| Period ended | | of period | | income (loss)(a) | | investments | | operations | | income | | distributions | | fees | | of period | | value (%)(b) | | (in thousands) | | assets (%)(c) | | net assets (%) | | (%) |
|
| CLASS A | | | | | | | | | | | | | | | | | | | | | | | | | | |
| April 30, 2008** | | $21.21 | | .25(d) | | (1.37) | | (1.12) | | (.26) | | (.26) | | —(e) | | $19.83 | | (5.23)* | | $667,221 | | .52*(d) | | 1.28*(d) | | 34.68* |
| October 31, 2007 | | 19.05 | | .51(d) | | 2.18 | | 2.69 | | (.53) | | (.53) | | —(e) | | 21.21 | | 14.27 | | 697,830 | | 1.04(d) | | 2.50(d) | | 70.61 |
| October 31, 2006 | | 17.13 | | .48(d,f) | | 1.97 | | 2.45 | | (.53) | | (.53) | | —(e) | | 19.05 | | 14.52 | | 608,771 | | 1.03(d,f) | | 2.64(d,f) | | 63.63 |
| October 31, 2005 | | 16.60 | | .50(d,g) | | .56 | | 1.06 | | (.53) | | (.53) | | —(e) | | 17.13 | | 6.41 | | 564,822 | | 1.03(d) | | 2.91(d,g) | | 66.46 |
| October 31, 2004 | | 15.46 | | .51(d) | | 1.17 | | 1.68 | | (.54) | | (.54) | | —(e) | | 16.60 | | 10.92 | | 592,537 | | 1.09(d) | | 3.09(d) | | 52.98 |
| October 31, 2003 | | 12.32 | | .58 | | 3.14 | | 3.72 | | (.58) | | (.58) | | — | | 15.46 | | 30.79 | | 645,260 | | 1.07 | | 4.20 | | 93.66 |
|
| |
| CLASS B | | | | | | | | | | | | | | | | | | | | | | | | | | |
| April 30, 2008** | | $20.87 | | .18(d) | | (1.34) | | (1.16) | | (.19) | | (.19) | | —(e) | | $19.52 | | (5.55)* | | $29,495 | | .90*(d) | | .91*(d) | | 34.68* |
| October 31, 2007 | | 18.75 | | .35(d) | | 2.14 | | 2.49 | | (.37) | | (.37) | | —(e) | | 20.87 | | 13.40 | | 37,930 | | 1.79(d) | | 1.77(d) | | 70.61 |
| October 31, 2006 | | 16.86 | | .34(d,f) | | 1.94 | | 2.28 | | (.39) | | (.39) | | —(e) | | 18.75 | | 13.68 | | 47,842 | | 1.78(d,f) | | 1.89(d,f) | | 63.63 |
| October 31, 2005 | | 16.34 | | .36(d,g) | | .55 | | .91 | | (.39) | | (.39) | | —(e) | | 16.86 | | 5.61 | | 65,205 | | 1.78(d) | | 2.16(d,g) | | 66.46 |
| October 31, 2004 | | 15.22 | | .38(d) | | 1.15 | | 1.53 | | (.41) | | (.41) | | —(e) | | 16.34 | | 10.10 | | 99,042 | | 1.84(d) | | 2.34(d) | | 52.98 |
| October 31, 2003 | | 12.14 | | .47 | | 3.09 | | 3.56 | | (.48) | | (.48) | | — | | 15.22 | | 29.82 | | 129,317 | | 1.82 | | 3.45 | | 93.66 |
|
| |
| CLASS C | | | | | | | | | | | | | | | | | | | | | | | | | | |
| April 30, 2008** | | $21.04 | | .18(d) | | (1.35) | | (1.17) | | (.20) | | (.20) | | —(e) | | $19.67 | | (5.56)* | | $45,314 | | .90*(d) | | .91*(d) | | 34.68* |
| October 31, 2007 | | 18.92 | | .35(d) | | 2.16 | | 2.51 | | (.39) | | (.39) | | —(e) | | 21.04 | | 13.36 | | 38,347 | | 1.79(d) | | 1.73(d) | | 70.61 |
| October 31, 2006 | | 17.01 | | .34(d,f) | | 1.97 | | 2.31 | | (.40) | | (.40) | | —(e) | | 18.92 | | 13.73 | | 22,010 | | 1.78(d,f) | | 1.89(d,f) | | 63.63 |
| October 31, 2005 | | 16.50 | | .37(d,g) | | .55 | | .92 | | (.41) | | (.41) | | —(e) | | 17.01 | | 5.60 | | 17,952 | | 1.78(d) | | 2.17(d,g) | | 66.46 |
| October 31, 2004 | | 15.38 | | .38(d) | | 1.16 | | 1.54 | | (.42) | | (.42) | | —(e) | | 16.50 | | 10.09 | | 11,587 | | 1.84(d) | | 2.32(d) | | 52.98 |
| October 31, 2003 | | 12.27 | | .47 | | 3.13 | | 3.60 | | (.49) | | (.49) | | — | | 15.38 | | 29.79 | | 7,178 | | 1.82 | | 3.34 | | 93.66 |
|
| |
| CLASS M | | | | | | | | | | | | | | | | | | | | | | | | | | |
| April 30, 2008** | | $21.04 | | .20(d) | | (1.36) | | (1.16) | | (.21) | | (.21) | | —(e) | | $19.67 | | (5.47)* | | $4,823 | | .77*(d) | | 1.03*(d) | | 34.68* |
| October 31, 2007 | | 18.90 | | .40(d) | | 2.17 | | 2.57 | | (.43) | | (.43) | | —(e) | | 21.04 | | 13.70 | | 6,175 | | 1.54(d) | | 2.00(d) | | 70.61 |
| October 31, 2006 | | 16.99 | | .38(d,f) | | 1.97 | | 2.35 | | (.44) | | (.44) | | —(e) | | 18.90 | | 14.01 | | 5,607 | | 1.53(d,f) | | 2.14(d,f) | | 63.63 |
| October 31, 2005 | | 16.48 | | .41(d,g) | | .54 | | .95 | | (.44) | | (.44) | | —(e) | | 16.99 | | 5.79 | | 5,662 | | 1.53(d) | | 2.41(d,g) | | 66.46 |
| October 31, 2004 | | 15.35 | | .42(d) | | 1.16 | | 1.58 | | (.45) | | (.45) | | —(e) | | 16.48 | | 10.36 | | 6,790 | | 1.59(d) | | 2.59(d) | | 52.98 |
| October 31, 2003 | | 12.24 | | .51 | | 3.12 | | 3.63 | | (.52) | | (.52) | | — | | 15.35 | | 30.14 | | 9,248 | | 1.57 | | 3.65 | | 93.66 |
|
| |
| CLASS R | | | | | | | | | | | | | | | | | | | | | | | | | | |
| April 30, 2008** | | $21.15 | | .23(d) | | (1.36) | | (1.13) | | (.25) | | (.25) | | —(e) | | $19.77 | | (5.34)* | | $3,367 | | .65*(d) | | 1.17*(d) | | 34.68* |
| October 31, 2007 | | 19.01 | | .45(d) | | 2.18 | | 2.63 | | (.49) | | (.49) | | —(e) | | 21.15 | | 13.96 | | 2,164 | | 1.29(d) | | 2.20(d) | | 70.61 |
| October 31, 2006 | | 17.11 | | .43(d,f) | | 1.98 | | 2.41 | | (.51) | | (.51) | | —(e) | | 19.01 | | 14.27 | | 1,027 | | 1.28(d,f) | | 2.35(d,f) | | 63.63 |
| October 31, 2005 | | 16.60 | | .46(d,g) | | .54 | | 1.00 | | (.49) | | (.49) | | —(e) | | 17.11 | | 6.07 | | 87 | | 1.28(d) | | 2.67(d,g) | | 66.46 |
| October 31, 2004† | | 15.79 | | .43(d) | | .89 | | 1.32 | | (.51) | | (.51) | | — | | 16.60 | | 8.43* | | 47 | | 1.23*(d) | | 2.60*(d) | | 52.98 |
|
| |
| CLASS Y | | | | | | | | | | | | | | | | | | | | | | | | | | |
| April 30, 2008** | | $21.21 | | .28(d) | | (1.37) | | (1.09) | | (.29) | | (.29) | | —(e) | | $19.83 | | (5.11)* | | $28,434 | | .40*(d) | | 1.41*(d) | | 34.68* |
| October 31, 2007 | | 19.05 | | .56(d) | | 2.18 | | 2.74 | | (.58) | | (.58) | | —(e) | | 21.21 | | 14.56 | | 27,084 | | .79(d) | | 2.75(d) | | 70.61 |
| October 31, 2006 | | 17.13 | | .52(d,f) | | 1.97 | | 2.49 | | (.57) | | (.57) | | —(e) | | 19.05 | | 14.81 | | 24,458 | | .78(d,f) | | 2.88(d,f) | | 63.63 |
| October 31, 2005 | | 16.60 | | .54(d,g) | | .56 | | 1.10 | | (.57) | | (.57) | | —(e) | | 17.13 | | 6.68 | | 24,197 | | .78(d) | | 3.15(d,g) | | 66.46 |
| October 31, 2004 | | 15.46 | | .53(d) | | 1.19 | | 1.72 | | (.58) | | (.58) | | —(e) | | 16.60 | | 11.21 | | 30,138 | | .84(d) | | 3.35(d) | | 52.98 |
| October 31, 2003 | | 12.32 | | .62 | | 3.13 | | 3.75 | | (.61) | | (.61) | | — | | 15.46 | | 31.11 | | 40,883 | | .82 | | 4.46 | | 93.66 |
|
See notes to financial highlights at the end of this section.
The accompanying notes are an integral part of these financial statements.
Financial highlights (Continued)
* Not annualized.
** Unaudited.
† For the period December 1, 2003 (commencement of operations) to October 31, 2004.
(a) Per share net investment income (loss) has been determined on the basis of the weighted average number of shares outstanding during the period.
(b) Total return assumes dividend reinvestment and does not reflect the effect of sales charges.
(c) Includes amounts paid through expense offset and brokerage/service arrangements (Note 2).
(d) Reflects an involuntary contractual expense limitation and/or waivers of certain fund expenses in connection with investments in Putnam Prime Money Market Fund in effect during the period. As a result of such limitation and/or waivers, the expenses of each class reflect a reduction of the following amounts (Notes 2 and 5):
| |
| | Percentage |
| | of average |
| | net assets |
|
| April 30, 2008 | <0.01% |
|
| October 31, 2007 | <0.01 |
|
| October 31, 2006 | <0.01 |
|
| October 31, 2005 | <0.01 |
|
| October 31, 2004 | <0.01 |
|
(e) Amount represents less than $0.01 per share.
(f) Reflects a non-recurring reimbursement from Putnam Investments relating to the calculation of certain amounts paid by the fund to Putnam in previous years for transfer agent services, which amounted to less than $0.01 per share and 0.01% of average net assets for the period ended October 31, 2006.
(g) Reflects a non-recurring accrual related to Putnam Management’s settlement with the SEC regarding brokerage allocation practices, which amounted to the following amounts:
| | |
| | | Percentage |
| | | of average |
| | Per share | net assets |
|
| Class A | <$0.01 | 0.02% |
|
| Class B | <0.01 | 0.03 |
|
| Class C | <0.01 | 0.02 |
|
| Class M | <0.01 | 0.03 |
|
| Class R | <0.01 | 0.02 |
|
| Class Y | <0.01 | 0.03 |
|
The accompanying notes are an integral part of these financial statements.
44
Notes to financial statements 4/30/08 (Unaudited)
Note 1: Significant accounting policies
Putnam Convertible Income-Growth Trust (the “fund”), a Massachusetts business trust, is registered under the Investment Company Act of 1940, as amended, as a diversified, open-end management investment company. The fund seeks, with equal emphasis, current income and capital appreciation by investing primarily in U.S. securities that can be converted into or exchanged for common stock. The fund’s secondary objective is conservation of capital. The fund may invest in higher yielding, lower rated bonds that may have a higher rate of default.
The fund offers class A, class B, class C, class M, class R and class Y shares. Class A and class M shares are sold with a maximum front-end sales charge of 5.75% and 3.50%, respectively, and generally do not pay a contingent deferred sales charge. Class B shares, which convert to class A shares after approximately eight years, do not pay a front-end sales charge and are subject to a contingent deferred sales charge, if those shares are redeemed within six years of purchase. Class C shares have a one-year 1.00% contingent deferred sales charge and do not convert to class A shares. Class R shares, which are offered to qualified employee-benefit plans, are sold at net asset value. The expenses for class A, class B, class C, class M and class R shares may differ based on the distribution fee of each class, which is identified in Note 2. Class Y shares, which are sold at net asset value, are generally subject to the same expenses as class A, class B, class C, class M an d class R shares, but do not bear a distribution fee. Class Y shares are generally only available to corporate and institutional clients and clients in other approved programs.
A 1.00% redemption fee may apply on any shares that are redeemed (either by selling or exchanging into another fund) within 7 days of purchase. The redemption fee is accounted for as an addition to paid-in-capital.
Investment income, realized and unrealized gains and losses and expenses of the fund are borne pro-rata based on the relative net assets of each class to the total net assets of the fund, except that each class bears expenses unique to that class (including the distribution fees applicable to such classes). Each class votes as a class only with respect to its own distribution plan or other matters on which a class vote is required by law or determined by the Trustees. If the fund were liquidated, shares of each class would receive their pro-rata share of the net assets of the fund. In addition, the Trustees declare separate dividends on each class of shares.
In the normal course of business, the fund enters into contracts that may include agreements to indemnify another party under given circumstances. The fund’s maximum exposure under these arrangements is unknown as this would involve future claims that may be, but have not yet been, made against the fund. However, the fund’s management team expects the risk of material loss to be remote.
The following is a summary of significant accounting policies consistently followed by the fund in the preparation of its financial statements. The preparation of financial statements is in conformity with accounting principles generally accepted in the United States of America and requires management to make estimates and assumptions that affect the reported amounts of assets and liabilities in the financial statements and the reported amounts of increases and decreases in net assets from operations during the reporting period. Actual results could differ from those estimates.
A) Security valuation Investments for which market quotations are readily available are valued at the last reported sales price on their principal exchange, or official closing price for certain markets. If no sales are reported— as in the case of some securities traded over-the-counter— a security is valued at its last reported bid price. Market quotations are not considered to be readily available for certain debt obligations; such investments are valued on the basis of valuations furnished by an independent pricing service approved by the Trustees or dealers selected by Putnam Investment
45
Management, LLC (“Putnam Management”), the fund’s manager, a wholly-owned subsidiary of Putnam, LLC. Such services or dealers determine valuations for normal institutional-size trading units of such securities using methods based on market transactions for comparable securities and various relationships, generally recognized by institutional traders, between securities. Many securities markets and exchanges outside the U.S. close prior to the close of the New York Stock Exchange and therefore the closing prices for securities in such markets or on such exchanges may not fully reflect events that occur after such close but before the close of the New York Stock Exchange. Accordingly, on certain days, the fund will fair value foreign equity securities taking into account multiple factors, including movements in the U.S. securities markets. The number of days on which fair value prices will be used will depend on market activity and it is possible that f air value prices will be used by the fund to a significant extent. Securities quoted in foreign currencies, if any, are translated into U.S. dollars at the current exchange rate. To the extent a pricing service or dealer is unable to value a security or provides a valuation which Putnam Management does not believe accurately reflects the security’s fair value, the security will be valued at fair value by Putnam Management. Certain investments, including certain restricted securities and derivatives, are also valued at fair value following procedures approved by the Trustees. Such valuations and procedures are reviewed periodically by the Trustees. The fair value of securities is generally determined as the amount that the fund could reasonably expect to realize from an orderly disposition of such securities over a reasonable period of time. By its nature, a fair value price is a good faith estimate of the value of a security at a given point in time and does not reflect an actual market price, which may be different by a material amount.
B) Joint trading account Pursuant to an exemptive order from the Securities and Exchange Commission (the “SEC”), the fund may transfer uninvested cash balances, including cash collateral received under security lending arrangements, into a joint trading account along with the cash of other registered investment companies and certain other accounts managed by Putnam Management. These balances may be invested in issues of short-term investments having maturities of up to 397 days for collateral received under security lending arrangements and up to 90 days for other cash investments.
C) Repurchase agreements The fund, or any joint trading account, through its custodian, receives delivery of the underlying securities, the market value of which at the time of purchase is required to be in an amount at least equal to the resale price, including accrued interest. Collateral for certain tri-party repurchase agreements is held at the counterparty’s custodian in a segregated account for the benefit of the fund and the counterparty. Putnam Management is responsible for determining that the value of these underlying securities is at all times at least equal to the resale price, including accrued interest.
D) Security transactions and related investment income Security transactions are recorded on the trade date (the date the order to buy or sell is executed). Gains or losses on securities sold are determined on the identified cost basis.
Interest income is recorded on the accrual basis. Dividend income, net of applicable withholding taxes, is recognized on the ex-dividend date except that certain dividends from foreign securities, if any, are recognized as soon as the fund is informed of the ex-dividend date. Non-cash dividends, if any, are recorded at the fair market value of the securities received. Dividends representing a return of capital or capital gains, if any, are reflected as a reduction of cost and/or as a realized gain.
All premiums/discounts are amortized/accreted on a yield-to-maturity basis.
E) Securities lending The fund may lend securities, through its agents, to qualified borrowers in order to earn additional income. The loans are collateralized by cash and/or securities in an
46
amount at least equal to the market value of the securities loaned. The market value of securities loaned is determined daily and any additional required collateral is allocated to the fund on the next business day. The risk of borrower default will be borne by the fund’s agents; the fund will bear the risk of loss with respect to the investment of the cash collateral. Income from securities lending is included in investment income on the Statement of operations. At April 30, 2008, the value of securities loaned amounted to $12,837,150. The fund received cash collateral of $13,186,800 which is pooled with collateral of other Putnam funds into 58 issues of short-term investments.
F) Federal taxes It is the policy of the fund to distribute all of its taxable income within the prescribed time and otherwise comply with the provisions of the Internal Revenue Code of 1986, as amended (the “Code”), applicable to regulated investment companies. It is also the intention of the fund to distribute an amount sufficient to avoid imposition of any excise tax under Section 4982 of the Code. Therefore, no provision has been made for federal taxes on income, capital gains or unrealized appreciation on securities held nor for excise tax on income and capital gains.
At October 31, 2007, the fund had a capital loss carryover of $60,611,353 available to the extent allowed by the Code to offset future net capital gain, if any. This capital loss carryover will expire on October 31, 2010.
The aggregate identified cost on a tax basis is $771,466,178, resulting in gross unrealized appreciation and depreciation of $73,963,903 and $62,894,118, respectively, or net unrealized appreciation of $11,069,785.
G) Distributions to shareholders Distributions to shareholders from net investment income are recorded by the fund on the ex-dividend date. Distributions from capital gains, if any, are recorded on the ex-dividend date and paid at least annually. The amount and character of income and gains to be distributed are determined in accordance with income tax regulations, which may differ from generally accepted accounting principles. Dividend sources are estimated at the time of declaration. Actual results may vary. Any non-taxable return of capital cannot be determined until final tax calculations are completed after the end of the fund’s fiscal year. Reclassifications are made to the fund’s capital accounts to reflect income and gains available for distribution (or available capital loss carryovers) under income tax regulations.
Note 2: Management fee, administrative services and other transactions
Putnam Management is paid for management and investment advisory services quarterly based on the average net assets of the fund. Such fee is based on the following annual rates: 0.65% of the first $500 million of average net assets, 0.55% of the next $500 million, 0.50% of the next $500 million, 0.45% of the next $5 billion, 0.425% of the next $5 billion, 0.405% of the next $5 billion, 0.39% of the next $5 billion, and 0.38% thereafter.
Putnam Management has agreed to waive fees and reimburse expenses of the fund through June 30, 2009 to the extent necessary to ensure that the fund’s expenses do not exceed the simple average of the expenses of all front-end load funds viewed by Lipper Inc. as having the same investment classification or objective as the fund. The expense reimbursement is based on a comparison of the fund’s expenses with the average annualized operating expenses of the funds in its Lipper peer group for each calendar quarter during the fund’s last fiscal year, excluding 12b-1 fees and without giving effect to any expense offset and brokerage service arrangements that may reduce fund expenses. For the period ended April 30, 2008, Putnam Management did not waive any of its management fee from the fund.
For the period ended April 30, 2008, Putnam Management has assumed $1,313 of legal, shareholder servicing and communication, audit and Trustee fees incurred by the fund in connection with certain legal and regulatory matters (including those described in Note 6).
47
The fund reimburses Putnam Management an allocated amount for the compensation and related expenses of certain officers of the fund and their staff who provide administrative services to the fund. The aggregate amount of all such reimbursements is determined annually by theTrustees.
Custodial services for the fund’s assets were provided by Putnam FiduciaryTrust Company (“PFTC”), an affiliate of Putnam Management, and by State Street Bank andTrust Company (“State Street”). Custody fees are based on the fund’s asset level, the number of its security holdings, transaction volumes and with respect to PFTC, certain fees related to the transition of assets to State Street. Putnam Investor Services, a division of PFTC, provided investor servicing agent functions to the fund. Putnam Investor Services received fees for investor servicing, subject to certain limitations, based on the number of shareholder accounts in the fund and the level of defined contribution plan assets in the fund. During the period ended April 30, 2008, the fund incurred $528,846 for custody and investor servicing agent functions provided by PFTC.
The fund has entered into expense offset arrangements with PFTC and State Street whereby PFTC’s and State Street’s fees are reduced by credits allowed on cash balances. The fund also reduced expenses through brokerage/service arrangements. For the six months ended April 30, 2008, the fund’s expenses were reduced by $38,998 under the expense offset arrangements and by $7,517 under the brokerage/service arrangements.
Each independent Trustee of the fund receives an annual Trustee fee, of which $440, as a quarterly retainer, has been allocated to the fund, and an additional fee for each Trustees meeting attended. Trustees receive additional fees for attendance at certain committee meetings and industry seminars and for certain compliance-related matters. Trustees also are reimbursed for expenses they incur relating to their services as Trustees.
The fund has adopted a Trustee Fee Deferral Plan (the “Deferral Plan”) which allows the Trustees to defer the receipt of all or a portion of Trustees fees payable on or after July 1, 1995. The deferred fees remain invested in certain Putnam funds until distribution in accordance with the Deferral Plan.
The fund has adopted an unfunded noncontributory defined benefit pension plan (the “Pension Plan”) covering all Trustees of the fund who have served as a Trustee for at least five years and were first elected prior to 2004. Benefits under the Pension Plan are equal to 50% of the Trustee’s average annual attendance and retainer fees for the three years ended December 31, 2005. The retirement benefit is payable during a Trustee’s lifetime, beginning the year following retirement, for the number of years of service through December 31, 2006. Pension expense for the fund is included in Trustee compensation and expenses in the Statement of operations. Accrued pension liability is included in Payable for Trustee compensation and expenses in the Statement of assets and liabilities. The Trustees have terminated the Pension Plan with respect to any Trustee first elected after 2003.
The fund has adopted distribution plans (the “Plans”) with respect to its class A, class B, class C, class M and class R shares pursuant to Rule 12b-1 under the Investment Company Act of 1940. The purpose of the Plans is to compensate Putnam Retail Management Limited Partnership, a wholly-owned subsidiary of Putnam, LLC and Putnam Retail Management GP, Inc., for services provided and expenses incurred in distributing shares of the fund. The Plans provide for payments by the fund to Putnam Retail Management Limited Partnership at an annual rate of up to 0.35%, 1.00%, 1.00%, 1.00% and 1.00% of the average net assets attributable to class A, class B, class C, class M and class R shares, respectively. The Trustees have approved payment by the fund at an annual rate of 0.25%, 1.00%, 1.00%, 0.75% and 0.50% of the average net assets attributable to class A, class B, class C, class M and class R shares, respectively.
For the six months ended April 30, 2008, Putnam Retail Management Limited Partnership, acting as underwriter, received net commissions of $55,293
48
and $139 from the sale of class A and class M shares, respectively, and received $10,162 and $9,191 in contingent deferred sales charges from redemptions of class B and class C shares, respectively.
A deferred sales charge of up to 1.00% and 0.65% is assessed on certain redemptions of class A and class M shares, respectively. For the six months ended April 30, 2008, Putnam Retail Management Limited Partnership, acting as underwriter, received $2,892 and no monies on class A and class M redemptions, respectively.
Note 3: Purchases and sales of securities
During the six months ended April 30, 2008, cost of purchases and proceeds from sales of investment securities other than short-term investments aggregated $289,065,807 and $261,244,388, respectively. There were no purchases or sales of U.S. government securities.
Note 4: Capital shares
At April 30, 2008, there was an unlimited number of shares of beneficial interest authorized. Transactions in capital shares were as follows:
| | | | | |
| CLASS A | | Shares | | Amount | |
| |
| Six months ended 4/30/08: | | | |
| | | | | | |
| Shares sold | | 4,024,198 | $ | 79,191,900 | |
| |
| Shares issued | | | | | |
| in connection | | | | | |
| with reinvestment | | | | | |
| of distributions | | 375,718 | | 7,299,942 | |
| |
| | | 4,399,916 | | 86,491,842 | |
| |
| Shares | | | | | |
| repurchased | | (3,657,612) | (71,904,266) | |
| |
| Net increase | | 742,304 | $ | 14,587,576 | |
| | |
| Year ended 10/31/07: | | | | | |
| | | | | | |
| Shares sold | | 6,058,600 | $ | 124,272,977 | |
| |
| Shares issued | | | | | |
| in connection | | | | | |
| with reinvestment | | | | | |
| of distributions | | 708,198 | | 14,332,911 | |
| |
| | | 6,766,798 | 138,605,888 | |
| |
| Shares | | | | | |
| repurchased | | (5,816,365) | (118,000,776) | |
| |
| Net increase | | 950,433 | $ | 20,605,112 | |
| | |
| | |
| CLASS B | | Shares | | Amount | |
| |
| Six months ended 4/30/08: | | | |
| | | | | | |
| Shares sold | | 188,476 | $ | 3,656,012 | |
| |
| Shares issued | | | | | |
| in connection | | | | | |
| with reinvestment | | | | | |
| of distributions | | 12,311 | | 235,952 | |
| |
| | | 200,787 | | 3,891,964 | |
| |
| Shares | | | | | |
| repurchased | | (506,757) | | (9,811,177) | |
| |
| Net decrease | | (305,970) | $ | (5,919,213) | |
| | |
| Year ended 10/31/07: | | | | | |
| | | | | | |
| Shares sold | | 371,992 | $ | 7,453,855 | |
| |
| Shares issued | | | | | |
| in connection | | | | | |
| with reinvestment | | | | | |
| of distributions | | 31,233 | | 620,357 | |
| |
| | | 403,225 | | 8,074,212 | |
| |
| Shares | | | | | |
| repurchased | | (1,137,419) | (22,685,793) | |
| |
| Net decrease | | (734,194) | $(14,611,581) | |
49
| | | | | | |
| CLASS C | | Shares | | Amount | |
| |
| Six months ended 4/30/08: | | | |
| | | | | | |
| Shares sold | | 696,115 | $ | 13,541,509 | |
| |
| Shares issued | | | | | |
| in connection | | | | | |
| with reinvestment | | | | | |
| of distributions | | 12,217 | | 235,310 | |
| |
| | | 708,332 | | 13,776,819 | |
| |
| Shares | | | | | |
| repurchased | | (226,729) | (4,405,722) | |
| |
| Net increase | | 481,603 | $ | 9,371,097 | |
| | |
| Year ended 10/31/07: | | | | | |
| | | | | | |
| Shares sold | | 840,584 | $ | 17,043,453 | |
| |
| Shares issued | | | | | |
| in connection | | | | | |
| with reinvestment | | | | | |
| of distributions | | 15,206 | | 305,723 | |
| |
| | | 855,790 | 17,349,176 | |
| |
| Shares | | | | | |
| repurchased | | (197,000) | (3,984,675) | |
| |
| Net increase | | 658,790 | $ | 13,364,501 | |
| | |
| | |
| CLASS M | | Shares | | Amount | |
| |
| Six months ended 4/30/08: | | | |
| Shares sold | | 17,280 | $ | 337,592 | |
| |
| Shares issued | | | | | |
| in connection | | | | | |
| with reinvestment | | | | | |
| of distributions | | 2,540 | | 48,966 | |
| |
| | | 19,820 | | 386,558 | |
| |
| Shares | | | | | |
| repurchased | | (68,173) | (1,341,756) | |
| |
| Net decrease | | (48,353) | $ | (955,198) | |
| | |
| Year ended 10/31/07: | | | | | |
| | | | | | |
| Shares sold | | 47,372 | $ | 956,549 | |
| |
| Shares issued | | | | | |
| in connection | | | | | |
| with reinvestment | | | | | |
| of distributions | | 5,118 | | 102,755 | |
| |
| | | 52,490 | | 1,059,304 | |
| |
| Shares | | | | | |
| repurchased | | (55,608) | | (1,127,969) | |
| |
| Net decrease | | (3,118) | $ | (68,665) | |
| | | | | |
| CLASS R | | Shares | | Amount | |
| |
| Six months ended 4 /30/08: | | | |
| | | | | | |
| Shares sold | | 82,349 | $ | 1,646,147 | |
| |
| Shares issued | | | | | |
| in connection | | | | | |
| with reinvestment | | | | | |
| of distributions | | 1,622 | | 31,409 | |
| |
| | | 83,971 | | 1,677,556 | |
| |
| Shares | | | | | |
| repurchased | | (16,019) | | (312,146) | |
| |
| Net increase | | 67,952 | $ | 1,365,410 | |
| | |
| Year ended 10/31/07: | | | | | |
| | | | | | |
| Shares sold | | 51,986 | $ | 1,056,367 | |
| |
| Shares issued | | | | | |
| in connection | | | | | |
| with reinvestment | | | | | |
| of distributions | | 1,581 | | 32,017 | |
| |
| | | 53,567 | | 1,088,384 | |
| |
| Shares | | | | | |
| repurchased | | (5,284) | | (107,171) | |
| |
| Net increase | | 48,283 | $ | 981,213 | |
| | |
| | |
| CLASS Y | | Shares | | Amount | |
| |
| Six months ended 4/30/08: | | | |
| | | | | | |
| Shares sold | | 237,799 | $ | 4,759,833 | |
| |
| Shares issued | | | | | |
| in connection | | | | | |
| with reinvestment | | | | | |
| of distributions | | 20,316 | | 394,474 | |
| |
| | | 258,115 | | 5,154,307 | |
| |
| Shares | | | | | |
| repurchased | | (101,356) | | (2,008,889) | |
| |
| Net increase | | 156,759 | $ | 3,145,418 | |
| | |
| Year ended 10/31/07: | | | | | |
| | | | | | |
| Shares sold | | 125,315 | $ | 2,568,522 | |
| |
| Shares issued | | | | | |
| in connection | | | | | |
| with reinvestment | | | | | |
| of distributions | | 35,371 | | 715,612 | |
| |
| | | 160,686 | | 3,284,134 | |
| |
| Shares | | | | | |
| repurchased | | (167,329) | | (3,378,119) | |
| |
| Net decrease | | (6,643) | $ | (93,985) | |
50
Note 5: Investment in Putnam Prime Money Market Fund
The fund invests in Putnam Prime Money Market Fund, an open-end management investment company managed by Putnam Management. Investments in Putnam Prime Money Market Fund are valued at its closing net asset value each business day. Management fees paid by the fund are reduced by an amount equal to the management fees paid by Putnam Prime Money Market Fund with respect to assets invested by the fund in Putnam Prime Money Market Fund. For the period ended April 30, 2008, management fees paid were reduced by $6,125 relating to the fund’s investment in Putnam Prime Money Market Fund. Income distributions earned by the fund are recorded as income in the Statement of operations and totaled $288,263 for the period ended April 30, 2008. During the period ended April 30, 2008, cost of purchases and proceeds of sales of investments in Putnam Prime Money Market Fund aggregated $136,555,994 and $137,785,892, respectively.
Note 6: Regulatory matters and litigation
In late 2003 and 2004, Putnam Management settled charges brought by the SEC and the Massachusetts Securities Division in connection with excessive short-term trading in Putnam funds. Payments from Putnam Management will be distributed to certain open-end Putnam funds and their shareholders. These allegations and related matters have served as the general basis for certain lawsuits, including purported class action lawsuits against Putnam Management and, in a limited number of cases, some Putnam funds. Putnam Management believes that these lawsuits will have no material adverse effect on the funds or on Putnam Management’s ability to provide investment management services. In addition, Putnam Management has agreed to bear any costs incurred by the Putnam funds as a result of these matters.
Note 7: New accounting pronouncements
In June 2006, the Financial Accounting Standards Board (“FASB”) issued Interpretation No. 48, Accounting for Uncertainty in Income Taxes (the “Interpretation”). The Interpretation prescribes a minimum threshold for financial statement recognition of the benefit of a tax position taken or expected to be taken by a filer in the filer’s tax return. Upon adoption, the Interpretation did not have a material effect on the fund’s financial statements. However, the conclusions regarding the Interpretation may be subject to review and adjustment at a later date based on factors including, but not limited to, further implementation guidance expected from the FASB, and on-going analysis of tax laws, regulations and interpretations thereof.
In September 2006, the FASB issued Statement of Financial Accounting Standards No. 157, Fair Value Measurements (the “Standard”). The Standard defines fair value, sets out a framework for measuring fair value and expands disclosures about fair value measurements. The Standard applies to fair value measurements already required or permitted by existing standards. The Standard is effective for fiscal years beginning after November 15, 2007 and interim periods within those fiscal years. Putnam Management does not believe the adoption of the Standard will impact the amounts reported in the financial statements; however, additional disclosures will be required about the inputs used to develop the measurements of fair value.
In March 2008, Statement of Financial Accounting Standards No. 161, Disclosures about Derivative Instruments and Hedging Activities (“SFAS 161”) — an amendment of FASB Statement No. 133 (“SFAS 133”), was issued and is effective for fiscal years beginning after November 15, 2008. SFAS 161 requires enhanced disclosures about how and why an entity uses derivative instruments and how derivative instruments affect an entity’s financial position. Putnam Management is currently evaluating the impact the adoption of SFAS 161 will have on the fund’s financial statement disclosures.
51
Brokerage commissions (unaudited)
Brokerage commissions are paid to firms that execute trades on behalf of your fund. When choosing these firms, Putnam is required by law to seek the best execution of the trades, taking all relevant factors into consideration, including expected quality of execution and commission rate. Listed below are the largest relationships based upon brokerage commissions for your fund and the other funds in Putnam’s Large-Cap Value group for the year ended April 30, 2008. The Putnam mutual funds in this group are The George Putnam Fund of Boston, Putnam Classic Equity Fund, Putnam Convertible Income-Growth Trust, Putnam Equity Income Fund, The Putnam Fund for Growth and Income, Putnam New Value Fund, Putnam VT Equity Income Fund, Putnam VT The George Putnam Fund of Boston, Putnam VT Growth and Income Fund, and Putnam VT New Value Fund.
The top five firms that received brokerage commissions for trades executed for the Large-Cap Value group are (in descending order) Merrill Lynch, Morgan Stanley Dean Witter, UBS Warburg, Goldman Sachs, and Credit Suisse First Boston. Commissions paid to these firms together represented approximately 55% of the total brokerage commissions paid for the year ended April 30, 2008.
Commissions paid to the next 10 firms together represented approximately 33% of the total brokerage commissions paid during the period. These firms are (in alphabetical order) Bear Stearn & Company, Citigroup Global Markets, Deutche Bank Securities, JPMorgan Clearing, Lehman Brothers, Pipeline, RBC Capital Markets, Sanford Bernstein, Wachovia Securities, and Weeden + Company.
Commission amounts do not include “mark-ups” paid on bond or derivative trades made directly with a dealer. Additional information about brokerage commissions is available on the Securities and Exchange Commission (SEC) Web site at www.sec.gov. Putnam funds disclose commissions by firm to the SEC in semiannual filings on Form N-SAR.
52
Fund information
Founded over 70 years ago, Putnam Investments was built around the concept that a balance between risk and reward is the hallmark of a well-rounded financial program. We manage over 100 mutual funds in growth, value, blend, fixed income, and international.
| | |
| Investment Manager | Officers | Francis J. McNamara, III |
| Putnam Investment | Charles E. Haldeman, Jr. | Vice President and |
| Management, LLC | President | Chief Legal Officer |
| One Post Office Square | | |
| Boston, MA 02109 | Charles E. Porter | Robert R. Leveille |
| Executive Vice President, | Vice President and |
| Marketing Services | Principal Executive Officer, | Chief Compliance Officer |
| Putnam Retail Management | Associate Treasurer and | |
| One Post Office Square | Compliance Liaison | Mark C. Trenchard |
| Boston, MA 02109 | | Vice President and |
| | Jonathan S. Horwitz | BSA Compliance Officer |
| Custodian | Senior Vice President | |
| State Street Bank | and Treasurer | Judith Cohen |
| and Trust Company | | Vice President, Clerk and |
| | Steven D. Krichmar | Assistant Treasurer |
| Legal Counsel | Vice President and | |
| Ropes & Gray LLP | Principal Financial Officer | Wanda M. McManus |
| | Vice President, Senior Associate |
| Trustees | Janet C. Smith | Treasurer and Assistant Clerk |
| John A. Hill, Chairman | Vice President, Principal | |
| Jameson Adkins Baxter, | Accounting Officer and | Nancy E. Florek |
| Vice Chairman | Assistant Treasurer | Vice President, Assistant Clerk, |
| Charles B. Curtis | | Assistant Treasurer and |
| Robert J. Darretta | Susan G. Malloy | Proxy Manager |
| Myra R. Drucker | Vice President and | |
| Charles E. Haldeman, Jr. | Assistant Treasurer | |
| Paul L. Joskow | | |
| Elizabeth T. Kennan | Beth S. Mazor | |
| Kenneth R. Leibler | Vice President | |
| Robert E. Patterson | | |
| George Putnam, III | James P. Pappas | |
| Richard B. Worley | Vice President | |
| | | |
This report is for the information of shareholders of Putnam Convertible Income-Growth Trust. It may also be used as sales literature when preceded or accompanied by the current prospectus, the most recent copy of Putnam’s Quarterly Performance Summary, and Putnam’s Quarterly Ranking Summary. For more recent performance, please visit www.putnam.com. Investors should carefully consider the investment objective, risks, charges, and expenses of a fund, which are described in its prospectus. For this and other information or to request a prospectus, call 1-800-225-1581 toll free. Please read the prospectus carefully before investing. The fund’s Statement of Additional Information contains additional information about the fund’s Trustees and is available without charge upon request by calling 1-800-225-1581.

Item 2. Code of Ethics:
Not applicable
Item 3. Audit Committee Financial Expert:
Not applicable
Item 4. Principal Accountant Fees and Services:
Not applicable
Item 5. Audit Committee of Listed Registrants
Not applicable
Item 6. Schedule of Investments:
The registrant’s schedule of investments in unaffiliated issuers is included in the report to shareholders in Item 1 above.
Item 7. Disclosure of Proxy Voting Policies and Procedures For Closed-End Management Investment Companies:
Not applicable
Item 8. Portfolio Managers of Closed-End Investment Companies
Not Applicable
Item 9. Purchases of Equity Securities by Closed-End Management Investment Companies and Affiliated Purchasers:
Not applicable
Item 10. Submission of Matters to a Vote of Security Holders:
Not applicable
Item 11. Controls and Procedures:
(a) The registrant's principal executive officer and principal financial officer have concluded, based on their evaluation of the effectiveness of the design and operation of the registrant's disclosure controls and procedures as of a date within 90 days of the filing date of this report, that the design and operation of such procedures are generally effective to provide reasonable assurance that information required to be disclosed by the registrant in this report is recorded, processed, summarized and reported within the time periods specified in the Commission's rules and forms.
(b) Changes in internal control over financial reporting: Not applicable
Item 12. Exhibits:
(a)(1) Not applicable
(a)(2) Separate certifications for the principal executive officer and principal financial officer of the registrant as required by Rule 30a-2(a) under the Investment Company Act of 1940, as amended, are filed herewith.
(b) The certifications required by Rule 30a-2(b) under the Investment Company Act of 1940, as amended, are filed herewith.
SIGNATURES
Pursuant to the requirements of the Securities Exchange Act of 1934 and the Investment Company Act of 1940, the registrant has duly caused this report to be signed on its behalf by the undersigned, thereunto duly authorized.
Putnam Convertible Income-Growth Trust
By (Signature and Title):
/s/ Janet C. Smith
Janet C. Smith
Principal Accounting Officer
Date: June 27, 2008
Pursuant to the requirements of the Securities Exchange Act of 1934 and the Investment Company Act of 1940, this report has been signed below by the following persons on behalf of the registrant and in the capacities and on the dates indicated.
By (Signature and Title):
/s/ Charles E. Porter
Charles E. Porter
Principal Executive Officer
Date: June 27, 2008
By (Signature and Title):
/s/ Steven D. Krichmar
Steven D. Krichmar
Principal Financial Officer
Date: June 27, 2008