| | | |
| UNITED STATES |
| SECURITIES AND EXCHANGE COMMISSION |
| Washington, D.C. 20549 |
| |
| FORM N-CSR |
| |
| CERTIFIED SHAREHOLDER REPORT OF REGISTERED |
| MANAGEMENT INVESTMENT COMPANIES |
| | |
| Investment Company Act file number: (811- 02280) | |
| | |
| Exact name of registrant as specified in charter: | Putnam Convertible Securities Fund |
| |
| Address of principal executive offices: One Post Office Square, Boston, Massachusetts 02109 |
| | |
| Name and address of agent for service: | Beth S. Mazor, Vice President |
| | One Post Office Square |
| | Boston, Massachusetts 02109 |
| | |
| Copy to: | | John W. Gerstmayr, Esq. |
| | Ropes & Gray LLP |
| | 800 Boylston Street |
| | Boston, Massachusetts 02199-3600 |
| | |
| Registrant’s telephone number, including area code: | (617) 292-1000 |
| | | |
| Date of fiscal year end: October 31, 2011 | | |
| |
| Date of reporting period: November 1, 2010 — April 30, 2011 |
Item 1. Report to Stockholders:
The following is a copy of the report transmitted to stockholders pursuant to Rule 30e-1 under the Investment Company Act of 1940:

Putnam
Convertible
Securities Fund
Semiannual report
4 | 30 | 11
| | | |
| Message from the Trustees | 1 | | |
| | |
| About the fund | 2 | | |
| | |
| Performance snapshot | 4 | | |
| | |
| Interview with your fund’s portfolio managers | 5 | | |
| | |
| Your fund’s performance | 10 | | |
| | |
| Your fund’s expenses | 12 | | |
| | |
| Terms and definitions | 14 | | |
| | |
| Other information for shareholders | 15 | | |
| | |
| Financial statements | 16 | | |
| | |
Message from the Trustees
Dear Fellow Shareholder:
Financial markets and economies around the world continue to show improvement and resilience in the face of many headwinds. While energy and commodity prices have been volatile, suggesting inflationary pressures, corporate profits are strong, merger-and-acquisition activity is recovering, and stock values and dividends are rising.
Putnam believes that markets will remain unsettled over the next several months, roiled by civil unrest in the Middle East and North Africa, sovereign debt issues in Europe, and the lingering economic impact of the disasters in Japan.
Putnam’s active, research-intensive investment approach is well suited to uncovering opportunities in this environment. We also believe this is an important time to talk to your financial advisor to determine if your investments are in line with your individual goals and appetite for risk.
In developments affecting oversight of your fund, we wish to thank Richard B. Worley and Myra R. Drucker, who have retired from the Board of Trustees, for their many years of dedicated and thoughtful leadership.
Lastly, we would like to take this opportunity to welcome new shareholders to the fund and to thank all of our investors for your continued confidence in Putnam.

About the fund
Seeking undervalued companies before their potential is recognized
The differences between bonds and stocks seem fairly clear-cut. Stocks provide an ownership stake in a company; bonds provide a claim on the interest paid by a company or other entity on its debt. The value of stocks rises and falls with factors such as investor sentiment, company news, and economic conditions; bonds are issued by a government, agency, company, or public utility that typically promises to pay the bearer a fixed rate of interest at specified intervals and to return a set amount of money at a specified end date (the maturity date). A bond’s yield and its price are often influenced by interest-rate levels and the issuer’s credit quality.
A convertible security is a hybrid of a stock and a bond. Like a bond, it offers a set rate of interest, but unlike a bond, it has a built-in option that, under certain circumstances, allows the investor to exchange (or convert) the security for a fixed number of shares of stock. This feature offers the potential for capital appreciation, since the preset conversion price does not change as the underlying stock price increases or decreases.
Convertibles are issued by companies and can offer greater returns than high-quality bonds — but they also carry greater risk potential, such as the risk of default or periodic illiquidity. Issuers range from large, well-known S&P 500 corporations and small, rapidly growing companies, to companies in cyclically depressed industries.
Investing successfully in convertible securities requires intensive research and analysis. The fund’s managers are supported by analysts who conduct rigorous fundamental research, seeking to determine the true worth of the issuing company’s business. The managers then construct a portfolio that they believe offers the best return potential without undue risk.
Consider these risks before investing: The fund may invest a portion of its assets in small and/or midsize companies. Such investments increase the risk of greater price fluctuations. Lower-rated bonds may offer higher yields in return for more risk. Funds that invest in bonds are subject to certain risks including interest-rate risk, credit risk, and inflation risk. As interest rates rise, the prices of bonds fall. Long-term bonds are more exposed to interest-rate risk than short-term bonds. Unlike bonds, bond funds have ongoing fees and expenses.
The “busted” convertible
One kind of security in which your fund may invest is the “busted” convertible. “Busted” refers to a security whose underlying stock price has fallen significantly below the conversion price. It becomes much less sensitive to the volatility of the underlying stock and is more bond-like, responding to interest-rate changes. A busted convertible may pay a higher yield than other convertibles, but may also carry a higher level of risk. (Some companies in this situation may eventually default on their bonds.)
The objective of buying a busted convertible is to take advantage of a company’s eventual turnaround despite its present challenges. For example, a company undergoing management turmoil may draw negative investor reactions, causing its stock price to tumble. However, if intensive research determines that the management crisis is likely to be resolved, the fund manager could buy the security at a steep discount. The goal is to sell the security at a higher price when the credit improves or when the stock revives.

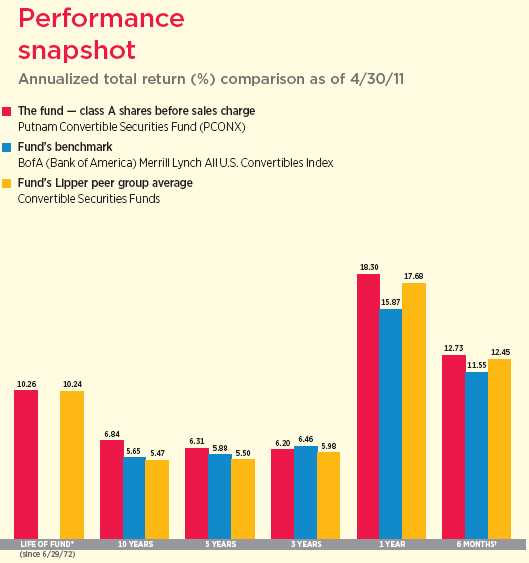
Current performance may be lower or higher than the quoted past performance, which cannot guarantee future results. Share price, principal value, and return will fluctuate, and you may have a gain or a loss when you sell your shares. Performance of class A shares assumes reinvestment of distributions and does not account for taxes. Fund returns in the bar chart do not reflect a sales charge of 5.75%; had they, returns would have been lower. See pages 5 and 10–12 for additional performance information. For a portion of the periods, the fund had expense limitations, without which returns would have been lower. A short-term trading fee of 1% may apply to redemptions or exchanges from certain funds within the time period specified in the fund’s prospectus. To obtain the most recent month-end performance, visit putnam.com.
* The fund’s benchmark, the BofA (Bank of America) Merrill Lynch All U.S. Convertibles Index, was introduced on 12/31/87, which post-dates the inception of the fund’s class A shares.
† Returns for the six-month period are not annualized, but cumulative.
4
Interview with your fund’s portfolio managers
Eric N. Harthun, CFA, and Robert L. Salvin
Putnam Convertible Securities Fund had another strong six months, besting both its benchmark index and Lipper peer group for the semiannual period, ended April 30, 2011. What was the key to your success?
Eric: The period was a strong one for both the fund as well as the overall convertible securities asset class. In terms of the fund, the majority of our return was the result of bottom-up security selection rather than top-down sector allocation bets, which is in line with how we like to manage the fund. Looking at the broader asset class, convertible securities benefited overall from a shift in the market. Whereas the start of 2010 was driven by recovering fixed-income markets, strong equity markets dominated the latter half of 2010 and beginning of 2011, fostered by growing confidence in a global economic recovery. That was great news for convertibles because the asset class has a high correlation to equities.
In late 2008, Putnam revamped the fund’s investment process, making risk control — via broad diversification — a key tenet of the fund’s strategy. How are you doing that now?
Rob: To rein in risk, we’re not willing to necessarily overweight or underweight based on sector calls. Instead, we focus on securities selection, which was our biggest contributor to performance in the recent six-month period. We feel that our depth of research capabilities allows us the ability to turn over every rock, focusing on disciplined, bottom-up research that identifies the best individual opportunities rather than making top-down, sector-wide bets.
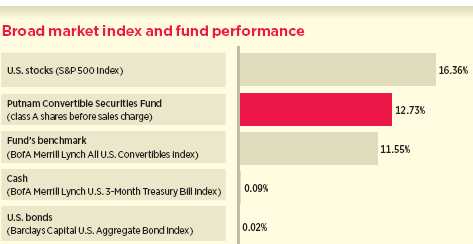
This comparison shows your fund’s performance in the context of broad market indexes for the six months ended 4/30/11. See pages 4 and 10–12 for additional fund performance information. Index descriptions can be found on page 14.
5
Second, we use both equity and fixed-income research to ensure we understand all angles of risk exposure for each security. In the end, managing risk properly in the convertibles market means not only understanding credit exposure, but also understanding fundamental equity exposures as well. That is where the depth of the Putnam research bench really affords us an advantage.
Could you highlight some holdings or strategies that contributed to the fund’s performance?
Eric: Our top security selections tended to emanate from a few sectors: consumer staples, energy, and consumer cyclicals. Our top contributor was an overweight position in General Cable. The Kentucky-based provider of copper, aluminum, and fiber-optic wire and cable worldwide benefited greatly from improved demand, sending its stock to a return of greater than 50% in the period.
The fund also was helped from an overweight in TTM Technologies, a maker of circuit boards based in Santa Ana, California. With growing demand for its products within the rapidly growing smartphone market, TTM saw its stock soar nearly 80% in the period.
A relative contributor to performance was our decision not to hold biopharmaceutical company Gilead Sciences. We chose not to own Gilead because we did not see anything in the company’s drug pipeline that would lead us to believe it was positioned well for growth above and beyond what the market was pricing in. During the time period, the firm experienced a couple of setbacks regarding products in the pipeline and issued conservative forward-looking guidance. The way the story unfolded is exactly why we avoided owning the security.
Another strong contributor was our overweight position in Hertz Global. There has been notable consolidation in the car rental industry in the past year, which has driven up stock prices in that industry based on speculation of potential deals. Hertz stock was certainly aided by that in the period, yet the
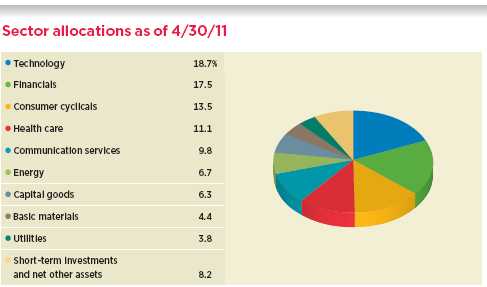
Allocations are represented as a percentage of the fund’s net assets. Summary information may differ from the portfolio schedule included in the financial statements due to the inclusion of derivative securities and the exclusion of as-of trades, if any, and the use of different classifications of securities for presentation purposes. Holdings and allocations may vary over time.
6
company also has continued to execute very well in this economy.

What were some holdings or strategies that detracted from performance?
Rob: The top detractor from performance was our decision not to own SandRidge Energy. In general, our benchmark is a large one, with more than 600 securities. In some instances, decisions to avoid certain companies simply come down to our belief that we have better ideas. SandRidge, which focuses on oil production in the U.S. Midwest, fell into that category, costing us when the company’s stock doubled in the period.
The second biggest detractor was an out-of-benchmark holding, Genco Shipping & Trading, which engages in the ocean transportation of dry bulk cargoes through the ownership and operation of dry bulk carrier vessels worldwide. In the period, Genco suffered industry-wide issues, including lower shipping rates and declining demand, as well as company financing issues. As a result, the company’s stock value dropped by nearly 50% in the period.
A third holding that dragged on performance was an overweight position in Ford Motor. Since the start of the economic recovery, Ford had delivered consistently strong numbers quarter after quarter, bolstering our confidence in the company’s ability to execute in this economic environment. However, Ford earnings in the fourth quarter of 2010 disappointed, driven by increased costs in the U.S. as well as lower profitability in Europe that surprised investors.
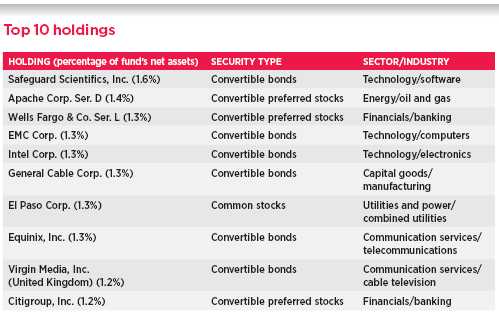
This table shows the fund’s top 10 individual holdings and the percentage of the fund’s net assets that each represented as of 4/30/11. Short-term holdings are excluded. Holdings will vary over time.
7
What is your outlook for the economy, the convertibles market, and the fund over the coming months?
Eric: We’re confident that the global economic recovery is strong and holding, based on the recent earnings releases and economic reports. We’re not expecting growth markets like 2009 and 2010, but we believe that there will be economic growth in 2011.
For convertibles, we see a couple of drivers for positive returns. First is the economy, which is one of the dominant factors in driving equity markets. Since convertibles historically are levered to equities, we believe that bodes well for the asset class.
Second, we believe the credit environment is favorable for convertibles. We believe there is room for high-yield spreads to tighten, which would be a positive driver for the fixed-income component of the convertibles. In some ways, we are seeing close to an ideal market for convertibles, with both fixed-income and equity markets providing tailwinds. While we remain diligent in managing risk throughout the portfolio, we believe the current environment bodes well for the fund.
Thank you, Eric and Rob, for your time and insights today.
The views expressed in this report are exclusively those of Putnam Management. They are not meant as investment advice.
Please note that the holdings discussed in this report may not have been held by the fund for the entire period. Portfolio composition is subject to review in accordance with the fund’s investment strategy and may vary in the future. Current and future portfolio holdings are subject to risk.

This chart shows how the fund’s top weightings have changed over the past six months. Weightings are shown as a percentage of net assets. Summary information may differ from the portfolio schedule included in the financial statements due to the inclusion of derivative securities and the exclusion of as-of trades, if any, and the use of different classifications of securities for presentation purposes. Holdings will vary over time.
8

Portfolio Manager Eric N. Harthun has an M.B.A. from The University of Chicago Booth School of Business and a B.S. from San Diego State University. A CFA charterholder, Eric joined Putnam in 2000 and has been in the investment industry since 1994.

Portfolio Manager Robert L. Salvin has an M.B.A. from The University of Chicago Booth School of Business and a B.S. from the Wharton School of the University of Pennsylvania. He joined Putnam in 2000 and has been in the investment industry since 1986.
IN THE NEWS
Citing the United States’s burgeoning federal deficit, Standard & Poor’s (S&P) recently lowered its long-term outlook for U.S. Treasuries from “stable” to “negative.” While maintaining its AAA rating for U.S. debt, S&P said the change to a negative outlook means that there is a one-in-three chance for a ratings downgrade over the next 24 months. If a downgrade were to take place, it could raise borrowing costs for both the U.S. government and American consumers. S&P’s negative outlook will likely put increased pressure on Washington lawmakers to reach a bipartisan solution to reduce the federal deficit and restore fiscal discipline. While the U.S. downgrade is unprecedented, it is important to note that S&P downgraded the outlook for the United Kingdom, another AAA-rated country, to “negative” in May 2009, and restored the “stable” outlook in 2010 once the country addressed its deficit.
9
Your fund’s performance
This section shows your fund’s performance, price, and distribution information for periods ended April 30, 2011, the end of the first half of its current fiscal year. In accordance with regulatory requirements for mutual funds, we also include performance as of the most recent calendar quarter-end and expense information taken from the fund’s current prospectus. Performance should always be considered in light of a fund’s investment strategy. Data represent past performance. Past performance does not guarantee future results. More recent returns may be less or more than those shown. Investment return and principal value will fluctuate, and you may have a gain or a loss when you sell your shares. Performance information does not reflect any deduction for taxes a shareholder may owe on fund distributions or on the redemption of fund shares. For the most recent month-end performance, please visit the Individual Investors section at putnam.com or call Putnam at 1-800-225-1581. Class R and class Y shares are not available to all investors. See the Terms and Definitions section in this report for definitions of the share classes offered by your fund.
Fund performance Total return for periods ended 4/30/11
| | | | | | | | | | |
| | Class A | Class B | Class C | Class M | Class R | Class Y |
| (inception dates) | (6/29/72) | (7/15/93) | (7/26/99) | (3/13/95) | (12/1/03) | (12/30/98) |
|
| | NAV | POP | NAV | CDSC | NAV | CDSC | NAV | POP | NAV | NAV |
|
| Annual average | | | | | | | | | | |
| (life of fund) | 10.26% | 10.10% | 9.31% | 9.31% | 9.44% | 9.44% | 9.59% | 9.49% | 9.99% | 10.35% |
|
| 10 years | 93.76 | 82.65 | 79.90 | 79.90 | 79.84 | 79.84 | 84.32 | 77.89 | 89.04 | 98.76 |
| Annual average | 6.84 | 6.21 | 6.05 | 6.05 | 6.04 | 6.04 | 6.31 | 5.93 | 6.58 | 7.11 |
|
| 5 years | 35.76 | 27.93 | 30.78 | 28.78 | 30.67 | 30.67 | 32.36 | 27.76 | 34.07 | 37.50 |
| Annual average | 6.31 | 5.05 | 5.51 | 5.19 | 5.50 | 5.50 | 5.77 | 5.02 | 6.04 | 6.58 |
|
| 3 years | 19.79 | 12.90 | 17.12 | 14.12 | 17.09 | 17.09 | 18.00 | 13.88 | 18.92 | 20.72 |
| Annual average | 6.20 | 4.13 | 5.41 | 4.50 | 5.40 | 5.40 | 5.67 | 4.43 | 5.95 | 6.48 |
|
| 1 year | 18.30 | 11.50 | 17.43 | 12.43 | 17.43 | 16.43 | 17.69 | 13.59 | 18.02 | 18.60 |
|
| 6 months | 12.73 | 6.24 | 12.38 | 7.38 | 12.29 | 11.29 | 12.45 | 8.54 | 12.64 | 12.93 |
|
Current performance may be lower or higher than the quoted past performance, which cannot guarantee future results. After-sales-charge returns (public offering price, or POP) for class A and M shares reflect a maximum 5.75% and 3.50% load, respectively. Class B share returns reflect the applicable contingent deferred sales charge (CDSC), which is 5% in the first year, declining over time to 1% in the sixth year, and is eliminated thereafter. Class C shares reflect a 1% CDSC for the first year that is eliminated thereafter. Class R and Y shares have no initial sales charge or CDSC. Performance for class B, C, M, R, and Y shares before their inception is derived from the historical performance of class A shares, adjusted for the applicable sales charge (or CDSC) and the higher operating expenses for such shares, except for class Y shares, for which 12b-1 fees are not applicable.
For a portion of the periods, the fund had expense limitations, without which returns would have been lower.
Class B share performance does not reflect conversion to class A shares.
A short-term trading fee of 1% may apply to redemptions or exchanges from certain funds within the time period specified in the fund’s prospectus.
10
Comparative index returns For periods ended 4/30/11
| | |
| | BofA (Bank of America) Merrill Lynch | Lipper Convertible Securities Funds |
| | All U.S. Convertibles Index | category average* |
|
| Annual average (life of fund) | —† | 10.24% |
|
| 10 years | 73.28% | 71.66 |
| Annual average | 5.65 | 5.47 |
|
| 5 years | 33.05 | 31.22 |
| Annual average | 5.88 | 5.50 |
|
| 3 years | 20.67 | 19.22 |
| Annual average | 6.46 | 5.98 |
|
| 1 year | 15.87 | 17.68 |
|
| 6 months | 11.55 | 12.45 |
|
Index and Lipper results should be compared to fund performance at net asset value.
* Over the 6-month, 1-year, 3-year, 5-year, 10-year, and life-of-fund periods ended 4/30/11, there were 73, 67, 53, 44, 37, and 2 funds, respectively, in this Lipper category.
† The fund’s benchmark, the BofA (Bank of America) Merrill Lynch All U.S. Convertibles Index, was introduced on 12/31/87, which post-dates the inception of the fund’s class A shares.
Fund price and distribution information For the six-month period ended 4/30/11
| | | | | | | | |
| Distributions | Class A | Class B | Class C | Class M | Class R | Class Y |
|
| Number | 2 | 2 | 2 | 2 | 2 | 2 |
|
| Income | $0.284 | $0.211 | $0.211 | $0.232 | $0.259 | $0.309 |
|
| Capital gains | — | — | — | — | — | — |
|
| Total | $0.284 | $0.211 | $0.211 | $0.232 | $0.259 | $0.309 |
|
| Share value | NAV | POP | NAV | NAV | NAV | POP | NAV | NAV |
|
| 10/31/10 | $19.31 | $20.49 | $18.99 | $19.13 | $19.14 | $19.83 | $19.24 | $19.30 |
|
| 4/30/11 | 21.47 | 22.78 | 21.12 | 21.26 | 21.28 | 22.05 | 21.40 | 21.47 |
|
| Current yield (end of period) | NAV | POP | NAV | NAV | NAV | POP | NAV | NAV |
|
| Current dividend rate 1 | 2.65% | 2.49% | 1.99% | 1.98% | 2.20% | 2.12% | 2.41% | 2.89% |
|
| Current 30-day SEC yield 2 | N/A | 1.66 | 1.03 | 1.03 | N/A | 1.23 | 1.52 | 2.01 |
|
The classification of distributions, if any, is an estimate. Final distribution information will appear on your year-end tax forms.
1 Most recent distribution, excluding capital gains, annualized and divided by NAV or POP at end of period.
2 Based only on investment income and calculated using the maximum offering price for each share class, in accordance with SEC guidelines.
11
Fund performance as of most recent calendar quarter
Total return for periods ended 3/31/11
| | | | | | | | | | |
| | Class A | Class B | Class C | Class M | Class R | Class Y |
| (inception dates) | (6/29/72) | (7/15/93) | (7/26/99) | (3/13/95) | (12/1/03) | (12/30/98) |
|
| | NAV | POP | NAV | CDSC | NAV | CDSC | NAV | POP | NAV | NAV |
|
| Annual average | | | | | | | | | | |
| (life of fund) | 10.23% | 10.06% | 9.28% | 9.28% | 9.40% | 9.40% | 9.55% | 9.45% | 9.96% | 10.32% |
|
| 10 years | 100.23 | 88.75 | 85.79 | 85.79 | 85.78 | 85.78 | 90.55 | 83.93 | 95.28 | 105.29 |
| Annual average | 7.19 | 6.56 | 6.39 | 6.39 | 6.39 | 6.39 | 6.66 | 6.28 | 6.92 | 7.46 |
|
| 5 years | 34.85 | 27.12 | 29.94 | 27.94 | 29.84 | 29.84 | 31.52 | 26.90 | 33.17 | 36.52 |
| Annual average | 6.16 | 4.92 | 5.38 | 5.05 | 5.36 | 5.36 | 5.63 | 4.88 | 5.90 | 6.42 |
|
| 3 years | 23.55 | 16.45 | 20.85 | 17.85 | 20.84 | 20.84 | 21.79 | 17.51 | 22.67 | 24.52 |
| Annual average | 7.30 | 5.21 | 6.52 | 5.63 | 6.51 | 6.51 | 6.79 | 5.53 | 7.05 | 7.58 |
|
| 1 year | 18.46 | 11.63 | 17.64 | 12.64 | 17.57 | 16.57 | 17.90 | 13.76 | 18.18 | 18.77 |
|
| 6 months | 13.47 | 6.93 | 13.12 | 8.11 | 13.07 | 12.07 | 13.24 | 9.26 | 13.32 | 13.61 |
|
Your fund’s expenses
As a mutual fund investor, you pay ongoing expenses, such as management fees, distribution fees (12b-1 fees), and other expenses. Using the following information, you can estimate how these expenses affect your investment and compare them with the expenses of other funds. You may also pay one-time transaction expenses, including sales charges (loads) and redemption fees, which are not shown in this section and would have resulted in higher total expenses. For more information, see your fund’s prospectus or talk to your financial representative.
Expense ratios
| | | | | | |
| | Class A | Class B | Class C | Class M | Class R | Class Y |
|
| Total annual operating expenses for the fiscal year | | | | | | |
| ended 10/31/10 | 1.18% | 1.93% | 1.93% | 1.68% | 1.43% | 0.93% |
|
| Annualized expense ratio for the six-month period | | | | | | |
| ended 4/30/11 | 1.13% | 1.88% | 1.88% | 1.63% | 1.38% | 0.88% |
|
Fiscal-year expense information in this table is taken from the most recent prospectus, is subject to change, and may differ from that shown for the annualized expense ratio and in the financial highlights of this report. Expenses are shown as a percentage of average net assets.
12
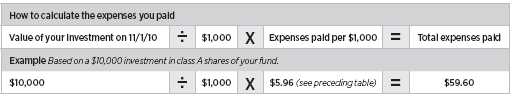
Expenses per $1,000
The following table shows the expenses you would have paid on a $1,000 investment in the fund from November 1, 2010, to April 30, 2011. It also shows how much a $1,000 investment would be worth at the close of the period, assuming actual returns and expenses.
| | | | | | |
| | Class A | Class B | Class C | Class M | Class R | Class Y |
|
| Expenses paid per $1,000*† | $5.96 | $9.90 | $9.90 | $8.59 | $7.28 | $4.65 |
|
| Ending value (after expenses) | $1,127.30 | $1,123.80 | $1,122.90 | $1,124.50 | $1,126.40 | $1,129.30 |
|
* Expenses for each share class are calculated using the fund’s annualized expense ratio for each class, which represents the ongoing expenses as a percentage of average net assets for the six months ended 4/30/11. The expense ratio may differ for each share class.
† Expenses are calculated by multiplying the expense ratio by the average account value for the period; then multiplying the result by the number of days in the period; and then dividing that result by the number of days in the year.
Estimate the expenses you paid
To estimate the ongoing expenses you paid for the six months ended April 30, 2011, use the following calculation method. To find the value of your investment on November 1, 2010, call Putnam at 1-800-225-1581.
Compare expenses using the SEC’s method
The Securities and Exchange Commission (SEC) has established guidelines to help investors assess fund expenses. Per these guidelines, the following table shows your fund’s expenses based on a $1,000 investment, assuming a hypothetical 5% annualized return. You can use this information to compare the ongoing expenses (but not transaction expenses or total costs) of investing in the fund with those of other funds. All mutual fund shareholder reports will provide this information to help you make this comparison. Please note that you cannot use this information to estimate your actual ending account balance and expenses paid during the period.
| | | | | | |
| | Class A | Class B | Class C | Class M | Class R | Class Y |
|
| Expenses paid per $1,000*† | $5.66 | $9.39 | $9.39 | $8.15 | $6.90 | $4.41 |
|
| Ending value (after expenses) | $1,019.19 | $1,015.47 | $1,015.47 | $1,016.71 | $1,017.95 | $1,020.43 |
|
* Expenses for each share class are calculated using the fund’s annualized expense ratio for each class, which represents the ongoing expenses as a percentage of average net assets for the six months ended 4/30/11. The expense ratio may differ for each share class.
† Expenses are calculated by multiplying the expense ratio by the average account value for the period; then multiplying the result by the number of days in the period; and then dividing that result by the number of days in the year.
13
Terms and definitions
Important terms
Total return shows how the value of the fund’s shares changed over time, assuming you held the shares through the entire period and reinvested all distributions in the fund.
Net asset value (NAV) is the price, or value, of one share of a mutual fund, without a sales charge. NAVs fluctuate with market conditions. NAV is calculated by dividing the net assets of each class of shares by the number of outstanding shares in the class.
Public offering price (POP) is the price of a mutual fund share plus the maximum sales charge levied at the time of purchase. POP performance figures shown here assume the 5.75% maximum sales charge for class A shares and 3.50% for class M shares.
Contingent deferred sales charge (CDSC) is generally a charge applied at the time of the redemption of class B or C shares and assumes redemption at the end of the period. Your fund’s class B CDSC declines over time from a 5% maximum during the first year to 1% during the sixth year. After the sixth year, the CDSC no longer applies. The CDSC for class C shares is 1% for one year after purchase.
Current yield is the annual rate of return earned from dividends or interest of an investment. Current yield is expressed as a percentage of the price of a security, fund share, or principal investment.
Share classes
Class A shares are generally subject to an initial sales charge and no CDSC (except on certain redemptions of shares bought without an initial sales charge).
Class B shares are not subject to an initial sales charge. They may be subject to a CDSC.
Class C shares are not subject to an initial sales charge and are subject to a CDSC only if the shares are redeemed during the first year.
Class M shares have a lower initial sales charge and a higher 12b-1 fee than class A shares and no CDSC (except on certain redemptions of shares bought without an initial sales charge).
Class R shares are not subject to an initial sales charge or CDSC and are available only to certain defined contribution plans.
Class Y shares are not subject to an initial sales charge or CDSC, and carry no 12b-1 fee. They are generally only available to corporate and institutional clients and clients in other approved programs.
Comparative indexes
Barclays Capital U.S. Aggregate Bond Index is an unmanaged index of U.S. investment-grade fixed-income securities.
BofA (Bank of America) Merrill Lynch All U.S. Convertibles Index is an unmanaged index of high-yield U.S. convertible securities.
BofA (Bank of America) Merrill Lynch U.S. 3-Month Treasury Bill Index is an unmanaged index that seeks to measure the performance of U.S. Treasury bills available in the marketplace.
S&P 500 Index is an unmanaged index of common stock performance.
Indexes assume reinvestment of all distributions and do not account for fees. Securities and performance of a fund and an index will differ. You cannot invest directly in an index.
Lipper is a third-party industry-ranking entity that ranks mutual funds. Its rankings do not reflect sales charges. Lipper rankings are based on total return at net asset value relative to other funds that have similar current investment styles or objectives as determined by Lipper. Lipper may change a fund’s category assignment at its discretion. Lipper category averages reflect performance trends for funds within a category.
14
Other information for shareholders
Important notice regarding delivery of shareholder documents
In accordance with SEC regulations, Putnam sends a single copy of annual and semiannual shareholder reports, prospectuses, and proxy statements to Putnam shareholders who share the same address, unless a shareholder requests otherwise. If you prefer to receive your own copy of these documents, please call Putnam at 1-800-225-1581, and Putnam will begin sending individual copies within 30 days.
Proxy voting
Putnam is committed to managing our mutual funds in the best interests of our shareholders. The Putnam funds’ proxy voting guidelines and procedures, as well as information regarding how your fund voted proxies relating to portfolio securities during the 12-month period ended June 30, 2010, are available in the Individual Investors section of putnam.com, and on the SEC’s website, www.sec.gov. If you have questions about finding forms on the SEC’s website, you may call the SEC at 1-800-SEC-0330. You may also obtain the Putnam funds’ proxy voting guidelines and procedures at no charge by calling Putnam’s Shareholder Services at 1-800-225-1581.
Fund portfolio holdings
The fund will file a complete schedule of its portfolio holdings with the SEC for the first and third quarters of each fiscal year on Form N-Q. Shareholders may obtain the fund’s Forms N-Q on the SEC’s website at www.sec.gov. In addition, the fund’s Forms N-Q may be reviewed and copied at the SEC’s Public Reference Room in Washington, D.C. You may call the SEC at 1-800-SEC-0330 for information about the SEC’s website or the operation of the Public Reference Room.
Trustee and employee fund ownership
Putnam employees and members of the Board of Trustees place their faith, confidence, and, most importantly, investment dollars in Putnam mutual funds. As of April 30, 2011, Putnam employees had approximately $382,000,000 and the Trustees had approximately $71,000,000 invested in Putnam mutual funds. These amounts include investments by the Trustees’ and employees’ immediate family members as well as investments through retirement and deferred compensation plans.
15
Financial statements
A guide to financial statements
These sections of the report, as well as the accompanying Notes, constitute the fund’s financial statements.
The fund’s portfolio lists all the fund’s investments and their values as of the last day of the reporting period. Holdings are organized by asset type and industry sector, country, or state to show areas of concentration and diversification.
Statement of assets and liabilities shows how the fund’s net assets and share price are determined. All investment and non-investment assets are added together. Any unpaid expenses and other liabilities are subtracted from this total. The result is divided by the number of shares to determine the net asset value per share, which is calculated separately for each class of shares. (For funds with preferred shares, the amount subtracted from total assets includes the liquidation preference of preferred shares.)
Statement of operations shows the fund’s net investment gain or loss. This is done by first adding up all the fund’s earnings — from dividends and interest income — and subtracting its operating expenses to determine net investment income (or loss). Then, any net gain or loss the fund realized on the sales of its holdings — as well as any unrealized gains or losses over the period — is added to or subtracted from the net investment result to determine the fund’s net gain or loss for the fiscal period.
Statement of changes in net assets shows how the fund’s net assets were affected by the fund’s net investment gain or loss, by distributions to shareholders, and by changes in the number of the fund’s shares. It lists distributions and their sources (net investment income or realized capital gains) over the current reporting period and the most recent fiscal year-end. The distributions listed here may not match the sources listed in the Statement of operations because the distributions are determined on a tax basis and may be paid in a different period from the one in which they were earned. Dividend sources are estimated at the time of declaration. Actual results may vary. Any non-taxable return of capital cannot be determined until final tax calculations are completed after the end of the fund’s fiscal year.
Financial highlights provide an overview of the fund’s investment results, per-share distributions, expense ratios, net investment income ratios, and portfolio turnover in one summary table, reflecting the five most recent reporting periods. In a semiannual report, the highlights table also includes the current reporting period.
16
The fund’s portfolio 4/30/11 (Unaudited)
| | |
| CONVERTIBLE BONDS AND NOTES (65.7%)* | Principal amount | Value |
|
| Aerospace and defense (1.6%) | | |
| AAR Corp. 144A cv. sr. unsec. notes 2 1/4s, 2016 | $5,600,000 | $5,523,000 |
|
| Kaman Corp. 144A cv. sr. unsec. notes 3 1/4s, 2017 | 3,225,000 | 4,103,813 |
|
| Triumph Group, Inc. 144A cv. sr. sub. notes 2 5/8s, 2026 | 2,030,000 | 3,222,625 |
|
| | | 12,849,438 |
| Airlines (0.6%) | | |
| AMR Corp. cv. company guaranty sr. unsub. notes 6 1/4s, 2014 | 1,695,000 | 1,682,288 |
|
| Continental Airlines, Inc. cv. sr. unsec. unsub. notes 4 1/2s, 2015 | 2,280,000 | 3,223,350 |
|
| | | 4,905,638 |
| Automotive (1.5%) | | |
| Ford Motor Co. cv. sr. unsec. notes 4 1/4s, 2016 | 3,905,000 | 7,309,379 |
|
| TRW Automotive, Inc. 144A cv. company guaranty sr. notes | | |
| 3 1/2s, 2015 | 2,055,000 | 4,217,888 |
|
| | | 11,527,267 |
| Beverage (0.6%) | | |
| Molson Coors Brewing Co. cv. company guaranty sr. unsec. | | |
| unsub. notes 2 1/2s, 2013 | 4,110,000 | 4,716,225 |
|
| | | 4,716,225 |
| Biotechnology (3.9%) | | |
| Amgen, Inc. cv. sr. unsec. notes 3/8s, 2013 | 4,400,000 | 4,389,000 |
|
| Amylin Pharmaceuticals, Inc. cv. sr. unsec. notes 3s, 2014 | 6,615,000 | 6,019,650 |
|
| Cubist Pharmaceuticals, Inc. cv. sr. unsec. notes 2 1/2s, 2017 | 5,215,000 | 6,962,025 |
|
| Dendreon Corp. 144A cv. sr. unsec. sub. notes 4 3/4s, 2014 | 565,000 | 2,445,744 |
|
| Kendle International, Inc. cv. sr. unsec. notes 3 3/8s, 2012 | 3,800,000 | 3,633,750 |
|
| United Therapeutics Corp. cv. sr. unsec. notes 1/2s, 2011 | 500,000 | 890,000 |
|
| United Therapeutics Corp. 144A cv. sr. unsec. notes 1/2s, 2011 | 3,500,000 | 6,230,000 |
|
| | | 30,570,169 |
| Broadcasting (0.8%) | | |
| XM Satellite Radio Holdings, Inc. 144A cv. sr. unsec. sub. notes | | |
| 7s, 2014 | 4,223,000 | 6,075,841 |
|
| | | 6,075,841 |
| Cable television (1.2%) | | |
| Virgin Media, Inc. cv. sr. unsec. notes 6 1/2s, 2016 (United Kingdom) | 5,450,000 | 9,850,875 |
|
| | | 9,850,875 |
| Coal (1.6%) | | |
| International Coal Group, Inc. cv. company guaranty sr. unsec. notes | | |
| 4s, 2017 | 1,513,000 | 3,117,990 |
|
| James River Coal Co. 144A cv. sr. unsec. notes 3 1/8s, 2018 | 3,962,000 | 4,116,122 |
|
| Peabody Energy Corp. cv. jr. unsec. sub. debs. 4 3/4s, 2041 | 4,220,000 | 5,412,150 |
|
| | | 12,646,262 |
| Commercial and consumer services (2.4%) | | |
| Alliance Data Systems Corp. cv. sr. unsec. notes 1 3/4s, 2013 | 6,300,000 | 8,087,625 |
|
| CBIZ, Inc. 144A cv. sr. sub. notes 4 7/8s, 2015 | 3,220,000 | 3,942,488 |
|
| Live Nation Entertainment, Inc. cv. sr. unsec. notes 2 7/8s, 2027 | 2,700,000 | 2,507,625 |
|
| Live Nation Entertainment, Inc. 144A cv. sr. notes 2 7/8s, 2027 | 1,170,000 | 1,086,638 |
|
| Priceline.com, Inc. 144A cv. sr. unsec. notes 1 1/4s, 2015 | 1,829,000 | 3,422,516 |
|
| | | 19,046,892 |
| Communications equipment (0.6%) | | |
| Powerwave Technologies, Inc. cv. sr. unsec. sub. notes 3 7/8s, 2027 | 5,121,000 | 4,903,358 |
|
| | | 4,903,358 |
17
| | |
| CONVERTIBLE BONDS AND NOTES (65.7%)* cont. | Principal amount | Value |
|
| Computers (3.3%) | | |
| EMC Corp. cv. sr. unsec. notes 1 3/4s, 2013 | $3,320,000 | $5,984,300 |
|
| EMC Corp. 144A cv. sr. unsec. notes 1 3/4s, 2013 | 5,800,000 | 10,454,500 |
|
| Quantum Corp. 144A cv. sr. unsec. sub. notes 3 1/2s, 2015 | 4,342,000 | 4,592,533 |
|
| TeleCommunication Systems, Inc. 144A cv. sr. unsec. notes | | |
| 4 1/2s, 2014 | 5,205,000 | 4,996,800 |
|
| | | 26,028,133 |
| Consumer finance (1.0%) | | |
| Dollar Financial Corp. cv. sr. notes 3s, 2028 | 6,035,000 | 8,177,425 |
|
| | | 8,177,425 |
| Consumer services (2.4%) | | |
| Avis Budget Group, Inc. cv. sr. notes 3 1/2s, 2014 | 2,950,000 | 4,000,938 |
|
| Hertz Global Holdings, Inc. cv. sr. unsec. notes 5 1/4s, 2014 | 4,320,000 | 9,471,600 |
|
| WebMD Health Corp. 144A cv. sr. notes 2 1/2s, 2018 | 5,274,000 | 5,597,033 |
|
| | | 19,069,571 |
| Containers (0.6%) | | |
| Owens Brockway Glass Container, Inc. 144A cv. company guaranty | | |
| sr. unsec. notes 3s, 2015 | 4,931,000 | 4,961,819 |
|
| | | 4,961,819 |
| Electrical equipment (0.5%) | | |
| WESCO International, Inc. cv. company guaranty sr. unsec. notes | | |
| 6s, 2029 | 1,624,000 | 3,815,263 |
|
| | | 3,815,263 |
| Electronics (4.3%) | | |
| Advanced Micro Devices, Inc. cv. sr. unsec. notes 6s, 2015 | 1,811,000 | 1,872,121 |
|
| EnerSys cv. sr. unsec. notes stepped-coupon 3 3/8s (zero %, | | |
| 6/1/15) 2038 †† | 2,637,000 | 3,095,179 |
|
| Intel Corp. cv. jr. sub. notes 3 1/4s, 2039 | 7,965,000 | 10,150,397 |
|
| SanDisk Corp. cv. sr. unsec. notes 1 1/2s, 2017 | 8,255,000 | 9,565,481 |
|
| TTM Technologies, Inc. cv. sr. unsec. notes 3 1/4s, 2015 | 6,300,000 | 8,926,313 |
|
| | | 33,609,491 |
| Energy (oil field) (0.3%) | | |
| Global Industries, Ltd. 144A cv. unsec. notes 2 3/4s, 2027 | 3,000,000 | 2,418,900 |
|
| | | 2,418,900 |
| Energy (other) (0.4%) | | |
| Covanta Holding Corp. cv. sr. unsec. notes 3 1/4s, 2014 | 3,000,000 | 3,521,250 |
|
| | | 3,521,250 |
| Financial (2.0%) | | |
| CapitalSource, Inc. cv. company guaranty sr. unsec. sub. notes | | |
| 7 1/4s, 2037 | 2,700,000 | 2,811,375 |
|
| Digital Realty Trust LP 144A cv. sr. unsec. notes 5 1/2s, 2029 R | 4,190,000 | 6,201,200 |
|
| MF Global Holdings Ltd. cv. sr. unsec. unsub. notes 1 7/8s, 2016 | 6,454,000 | 6,679,890 |
|
| | | 15,692,465 |
| Health-care services (2.4%) | | |
| Health Management Associates, Inc. 144A cv. sr. sub. notes | | |
| 3 3/4s, 2028 | 4,600,000 | 5,985,750 |
|
| LifePoint Hospitals, Inc. cv. sr. sub. notes 3 1/2s, 2014 | 4,675,000 | 5,037,313 |
|
| Lincare Holdings, Inc. cv. sr. unsec. unsub. notes Ser. B, 2 3/4s, 2037 | 4,630,000 | 5,781,713 |
|
| Providence Service Corp. (The) cv. sr. unsec. sub. notes 6 1/2s, 2014 | 2,493,000 | 2,477,419 |
|
| | | 19,282,195 |
| Homebuilding (0.6%) | | |
| Lennar Corp. 144A cv. sr. notes 2 3/4s, 2020 | 4,242,000 | 4,689,107 |
|
| | | 4,689,107 |
18
| | |
| CONVERTIBLE BONDS AND NOTES (65.7%)* cont. | Principal amount | Value |
|
| Insurance (0.7%) | | |
| Old Republic International Corp. cv. sr. unsec. unsub. notes 8s, 2012 | $4,395,000 | $5,180,606 |
|
| | | 5,180,606 |
| Investment banking/Brokerage (1.2%) | | |
| Ares Capital Corp. 144A cv. sr. unsec. notes 5 3/4s, 2016 | 5,016,000 | 5,327,494 |
|
| KKR Financial Holdings, LLC cv. sr. unsec. notes 7 1/2s, 2017 | 2,600,000 | 3,794,375 |
|
| | | 9,121,869 |
| Lodging/Tourism (1.0%) | | |
| Host Hotels & Resorts LP 144A cv. company guaranty sr. unsec. | | |
| notes 2 1/2s, 2029 R | 2,465,000 | 3,463,325 |
|
| Morgans Hotel Group Co. cv. sr. sub. notes 2 3/8s, 2014 | 5,145,000 | 4,559,756 |
|
| | | 8,023,081 |
| Machinery (0.5%) | | |
| Altra Holdings, Inc. 144A cv. company guaranty sr. unsec. notes | | |
| 2 3/4s, 2031 | 3,575,000 | 4,048,688 |
|
| | | 4,048,688 |
| Manufacturing (2.4%) | | |
| General Cable Corp. cv. unsec. sub. notes stepped-coupon 4 1/2s | | |
| (2 1/4s, 11/15/19) 2029 †† | 6,580,000 | 10,100,300 |
|
| Teleflex, Inc. cv. sr. unsec. sub. notes 3 7/8s, 2017 | 7,471,000 | 8,722,393 |
|
| | | 18,822,693 |
| Media (1.6%) | | |
| Liberty Media, LLC cv. sr. unsec. unsub. notes 3 1/2s, 2031 | 10,300,000 | 5,896,750 |
|
| MasTec, Inc. cv. company guaranty sr. unsec. unsub. notes | | |
| 4 1/4s, 2014 | 4,055,000 | 6,614,719 |
|
| | | 12,511,469 |
| Medical technology (3.5%) | | |
| China Medical Technologies, Inc. cv. sr. unsec. bonds Ser. CMT, | | |
| 4s, 2013 (China) | 4,100,000 | 3,628,500 |
|
| China Medical Technologies, Inc. 144A cv. sr. unsec. notes 6 1/4s, | | |
| 2016 (China) | 3,544,000 | 3,785,435 |
|
| Hologic, Inc. cv. sr. unsec. notes stepped-coupon 2s (zero%, | | |
| 12/15/16) 2037 †† | 5,070,000 | 6,115,688 |
|
| Invitrogen Corp. cv. sr. unsec. unsub. notes 1 1/2s, 2024 | 6,870,000 | 8,080,838 |
|
| Medtronic, Inc. cv. sr. unsec. notes 1 5/8s, 2013 | 3,600,000 | 3,712,500 |
|
| Medtronic, Inc. 144A cv. sr. unsec. notes 1 5/8s, 2013 | 1,900,000 | 1,959,375 |
|
| | | 27,282,336 |
| Metals (3.5%) | | |
| Goldcorp, Inc. cv. sr. notes 2s, 2014 (Canada) | 6,617,000 | 8,883,984 |
|
| Newmont Mining Corp. cv. company guaranty sr. unsub. notes | | |
| 1 5/8s, 2017 | 4,900,000 | 6,933,500 |
|
| Steel Dynamics, Inc. cv. sr. notes 5 1/8s, 2014 | 4,260,000 | 5,338,313 |
|
| U.S. Steel Corp. cv. sr. unsec. notes 4s, 2014 | 2,820,000 | 4,624,800 |
|
| USEC, Inc. cv. sr. unsec. notes 3s, 2014 | 2,000,000 | 1,597,500 |
|
| | | 27,378,097 |
| Oil and gas (1.4%) | | |
| Chesapeake Energy Corp. cv. sr. unsec. notes company guaranty | | |
| 2 1/2s, 2037 | 4,960,000 | 5,437,400 |
|
| St. Mary Land & Exploration Co. cv. sr. unsec. notes 3 1/2s, 2027 | 4,055,000 | 5,859,475 |
|
| | | 11,296,875 |
| Pharmaceuticals (0.7%) | | |
| Teva Pharmaceutical Finance, LLC cv. company guaranty sr. unsec. | | |
| debs Ser. C, 1/4s, 2026 (Israel) | 5,400,000 | 5,879,250 |
|
| | | 5,879,250 |
19
| | |
| CONVERTIBLE BONDS AND NOTES (65.7%)* cont. | Principal amount | Value |
|
| Real estate (0.6%) | | |
| General Growth Properties, Inc. 144A cv. escrow funding bonds | | |
| zero %, 2027 F R | $3,600,000 | $4,500 |
|
| iStar Financial, Inc. cv. sr. unsec. unsub. notes FRN 0.805s, 2012 R | 5,450,000 | 5,095,750 |
|
| | | 5,100,250 |
| Retail (0.5%) | | |
| Charming Shoppes, Inc. cv. sr. unsec. notes 1 1/8s, 2014 | 4,100,000 | 3,618,250 |
|
| | | 3,618,250 |
| Semiconductor (1.4%) | | |
| Linear Technology Corp. cv. sr. unsec. unsub. notes Ser. A, 3s, 2027 | 6,620,000 | 7,157,875 |
|
| Photronics, Inc. 144A cv. sr. notes 3 1/4s, 2016 | 3,169,000 | 3,618,047 |
|
| | | 10,775,922 |
| Shipping (0.5%) | | |
| Genco Shipping & Trading, Ltd. cv. sr. unsec. notes 5s, 2015 | 4,400,000 | 3,729,000 |
|
| | | 3,729,000 |
| Software (3.7%) | | |
| Microsoft Corp. 144A cv. sr. unsec. notes zero %, 2013 | 3,961,000 | 4,129,343 |
|
| Rovi Corp. cv. sr. unsec. unsub. notes 2 5/8s, 2040 | 4,240,000 | 5,209,900 |
|
| Safeguard Scientifics, Inc. cv. sr. unsec. sub. notes 10 1/8s, 2014 | 8,600,000 | 12,803,250 |
|
| SYNNEX Corp. cv. sr. notes 4s, 2018 | 5,650,000 | 7,373,250 |
|
| | | 29,515,743 |
| Technology (1.9%) | | |
| CACI International, Inc. cv. sr. unsec. sub. notes 2 1/8s, 2014 | 2,100,000 | 2,625,000 |
|
| CACI International, Inc. 144A cv. sr. unsec. sub. notes 2 1/8s, 2014 | 3,720,000 | 4,650,000 |
|
| ON Semiconductor Corp. cv. company guaranty sr. unsec. | | |
| sub. notes 2 5/8s, 2026 | 785,000 | 963,588 |
|
| ON Semiconductor Corp. 144A cv. company guaranty sr. unsec. | | |
| sub. notes 2 5/8s, 2026 | 5,300,000 | 6,505,750 |
|
| | | 14,744,338 |
| Technology services (1.5%) | | |
| CSG Systems International, Inc. 144A cv. sr. unsec. sub. notes | | |
| 3s, 2017 | 3,138,000 | 3,424,343 |
|
| DST Systems, Inc. cv. sr. unsec. unsub. bonds FRB Ser. C, | | |
| 4 1/8s, 2023 | 4,070,000 | 4,665,238 |
|
| Salesforce.com, Inc. cv. sr. unsec. unsub. notes 3/4s, 2015 | 2,100,000 | 3,598,875 |
|
| | | 11,688,456 |
| Telecommunications (5.1%) | | |
| Clearwire Communications, LLC/Clearwire Finance, Inc. | | |
| 144A cv. company guaranty sr. unsec. notes 8 1/4s, 2040 | 7,438,000 | 7,768,247 |
|
| Cogent Communication Group, Inc. cv. sr. unsec. notes 1s, 2027 | 4,267,000 | 3,744,293 |
|
| Equinix, Inc. cv. sr. unsec. sub. notes 4 3/4s, 2016 | 7,060,000 | 9,936,950 |
|
| Level 3 Communications, Inc. cv. sr. unsec. unsub. notes | | |
| 6 1/2s, 2016 | 4,185,000 | 6,392,588 |
|
| Level 3 Communications, Inc. cv. sr. unsec. unsub. notes | | |
| 3 1/2s, 2012 | 2,940,000 | 2,917,950 |
|
| SBA Communications Corp. cv. sr. unsec. notes 1 7/8s, 2013 | 8,120,000 | 9,023,350 |
|
| | | 39,783,378 |
| Telephone (0.8%) | | |
| Leap Wireless International, Inc. cv. sr. unsec. notes 4 1/2s, 2014 | 6,255,000 | 6,059,531 |
|
| | | 6,059,531 |
20
| | |
| CONVERTIBLE BONDS AND NOTES (65.7%)* cont. | Principal amount | Value |
|
| Trucks and parts (0.6%) | | |
| Meritor, Inc. cv. company guaranty sr. unsec. notes stepped-coupon | | |
| 4 5/8s (zero%, 3/1/16) 2026 †† | $4,460,000 | $5,101,125 |
|
| | | 5,101,125 |
| | | |
| Total convertible bonds and notes (cost $433,620,234) | | $518,018,541 |
| |
| |
| CONVERTIBLE PREFERRED STOCKS (24.9%)* | Shares | Value |
|
| Automotive (1.1%) | | |
| General Motors Co. Ser. B, $2.375 cv. pfd. | 184,725 | $9,190,069 |
|
| | | 9,190,069 |
| Banking (4.2%) | | |
| Bank of America Corp. Ser. L, 7.25% cv. pfd. | 9,245 | 9,649,469 |
|
| Citigroup, Inc. $7.50 cv. pfd. | 75,025 | 9,795,264 |
|
| Huntington Bancshares Ser. A, 8.50% cv. pfd. | 3,480 | 4,019,400 |
|
| Wells Fargo & Co. Ser. L, 7.50% cv. pfd. | 9,725 | 10,497,943 |
|
| | | 33,962,076 |
| Communications equipment (0.7%) | | |
| Lucent Technologies Capital Trust I 7.75% cv. pfd. | 6,505 | 6,464,344 |
|
| | | 6,464,344 |
| Consumer (0.9%) | | |
| Stanley Black & Decker, Inc. $4.75 cv. pfd. | 64,486 | 7,617,409 |
|
| | | 7,617,409 |
| Electric utilities (2.2%) | | |
| Great Plains Energy, Inc. $6.00 cv. pfd. | 148,567 | 9,789,080 |
|
| PPL Corp. $4.75 cv. pfd. | 128,835 | 7,258,564 |
|
| | | 17,047,644 |
| Financial (0.9%) | | |
| AMG Capital Trust II $2.575 cv. pfd. | 152,165 | 6,761,832 |
|
| | | 6,761,832 |
| Food (0.6%) | | |
| Bunge, Ltd. $4.875 cv. pfd. | 43,885 | 4,673,753 |
|
| | | 4,673,753 |
| Insurance (3.2%) | | |
| Assured Guaranty, Ltd. $4.25 cv. pfd. (Bermuda) | 62,685 | 4,415,531 |
|
| Hartford Financial Services Group, Inc. (The) $1.182 cv. pfd. | 162,848 | 4,396,896 |
|
| MetLife, Inc. $3.75 cv. pfd. | 102,898 | 9,026,213 |
|
| XL Group, Ltd. $2.688 cv. pfd. | 214,410 | 7,051,945 |
|
| | | 24,890,585 |
| Lodging/Tourism (0.1%) | | |
| FelCor Lodging Trust, Inc. Ser. A, $0.488 cum. cv. pfd. R | 18,304 | 493,064 |
|
| | | 493,064 |
| Media (2.3%) | | |
| Interpublic Group of Cos, Inc. (The) Ser. B, 5.25% cv. pfd. | 8,165 | 8,930,469 |
|
| Nielsen Holdings NV $3.125 cv. pfd. | 147,150 | 8,955,549 |
|
| | | 17,886,018 |
| Metals (1.0%) | | |
| Vale Capital II $3.375 cv. pfd. (Cayman Islands) | 81,200 | 7,531,300 |
|
| | | 7,531,300 |
| Natural gas utilities (—%) | | |
| El Paso Energy Capital Trust I $2.375 cv. pfd. | 6,056 | 267,978 |
|
| | | 267,978 |
| Oil and gas (1.9%) | | |
| Apache Corp. Ser. D, $3.00 cv. pfd. S | 156,361 | 10,999,996 |
|
| Chesapeake Energy Corp. 144A 5.75% cv. pfd. | 2,599 | 3,622,356 |
|
| | | 14,622,352 |
21
| | |
| CONVERTIBLE PREFERRED STOCKS (24.9%)* cont. | Shares | Value |
|
| Power producers (0.4%) | | |
| AES Trust III $3.375 cv. pfd. | 59,600 | $2,894,325 |
|
| | | 2,894,325 |
| Real estate (2.7%) | | |
| Alexandria Real Estate Equities, Inc. Ser. D, $1.75 cv. pfd. | 170,550 | 4,562,213 |
|
| Entertainment Properties Trust Ser. C, $1.438 cum. cv. pfd. | 388,350 | 7,873,330 |
|
| Health Care REIT, Inc. Ser. I, $3.25 cv. pfd. | 160,935 | 8,579,847 |
|
| | | 21,015,390 |
| Shipping (0.8%) | | |
| Swift Mandatory Common Exchange Security Trust 144A 6.00% cv. pfd. | 462,160 | 6,183,701 |
|
| | | 6,183,701 |
| Technology services (0.9%) | | |
| Unisys Corp. Ser. A, 6.25% cv. pfd. | 79,690 | 6,942,991 |
|
| | | 6,942,991 |
| Telecommunications (1.0%) | | |
| Crown Castle International Corp. $3.125 cum. cv. pfd. | 126,241 | 7,637,581 |
|
| | | 7,637,581 |
| | | |
| Total convertible preferred stocks (cost $173,169,295) | | $196,082,412 |
| |
| |
| COMMON STOCKS (5.3%)* | Shares | Value |
|
| Banking (0.7%) | | |
| JPMorgan Chase & Co. | 80,350 | $3,666,371 |
|
| Wells Fargo & Co. | 78,700 | 2,290,957 |
|
| | | 5,957,328 |
| Biotechnology (0.1%) | | |
| Dendreon Corp. † | 15,400 | 668,822 |
|
| | | 668,822 |
| Cable television (0.5%) | | |
| Comcast Corp. Class A | 147,375 | 3,867,120 |
|
| | | 3,867,120 |
| Combined utilities (1.3%) | | |
| El Paso Corp. | 518,596 | 10,065,948 |
|
| | | 10,065,948 |
| Energy (oil field) (0.5%) | | |
| National Oilwell Varco, Inc. | 52,445 | 4,022,007 |
|
| | | 4,022,007 |
| Energy (other) (—%) | | |
| Brazil Ethanol, Inc. 144A (Unit) † | 312,500 | 31,250 |
|
| | | 31,250 |
| Medical technology (0.3%) | | |
| Medtronic, Inc. | 48,280 | 2,015,690 |
|
| | | 2,015,690 |
| Oil and gas (0.5%) | | |
| Chevron Corp. | 37,530 | 4,107,283 |
|
| | | 4,107,283 |
| Regional Bells (0.5%) | | |
| Verizon Communications, Inc. | 96,610 | 3,649,926 |
|
| | | 3,649,926 |
| Retail (0.5%) | | |
| Bed Bath & Beyond, Inc. † | 74,915 | 4,204,230 |
|
| | | 4,204,230 |
| Telecommunications (0.4%) | | |
| NII Holdings, Inc. † | 78,000 | 3,243,228 |
|
| | | 3,243,228 |
| | | |
| Total common stocks (cost $37,036,254) | | $41,832,832 |
22
| | | | |
| CORPORATE BONDS AND NOTES (1.5%)* | | Principal amount | Value |
|
| Affinion Group Holdings, Inc. 144A company guaranty sr. notes | | | |
| 11 5/8s, 2015 | | $1,346,000 | $1,372,920 |
|
| Affinion Group, Inc. company guaranty sr. unsec. sub. notes | | | |
| 11 1/2s, 2015 | | | 179,000 | 186,160 |
|
| Clearwire Communications, LLC/Clearwire Finance, Inc. 144A | | | |
| company guaranty sr. notes 12s, 2015 | | | 1,290,000 | 1,402,875 |
|
| Intelsat Luxembourg SA company guaranty sr. unsec. notes 11 1/4s, | | | |
| 2017 (Luxembourg) | | | 1,265,000 | 1,380,431 |
|
| Jazz Technologies, Inc. company guaranty sr. unsec. notes 8s, 2015 F | | 2,857,000 | 2,778,433 |
|
| Provident Funding Associates 144A sr. notes 10 1/8s, 2019 | | 1,840,000 | 1,920,500 |
|
| Surgical Care Affiliates, Inc. 144A sr. sub. notes 10s, 2017 | | 1,320,000 | 1,362,900 |
|
| Swift Services Holdings, Inc. 144A company guaranty sr. notes | | | |
| 10s, 2018 | | | 1,470,000 | 1,613,325 |
|
| Total corporate bonds and notes (cost $11,259,838) | | | | $12,017,544 |
| |
| |
| WARRANTS (—%)* † | Expiration | Strike | | |
| | date | price | Warrants | Value |
|
| Tower Semiconductor, Ltd. 144A (Israel) F | 6/30/15 | $0.01 | 1,085,630 | $260,551 |
|
| Total warrants (cost $217,126) | | | | $260,551 |
| |
| |
| SHORT-TERM INVESTMENTS (2.9%)* | | | Shares | Value |
|
| Putnam Cash Collateral Pool, LLC 0.16% d | | | 9,870,000 | $9,870,000 |
|
| Putnam Money Market Liquidity Fund 0.08% e | | | 13,314,128 | 13,314,128 |
|
| Total short-term investments (cost $23,184,128) | | | | $23,184,128 |
| |
| |
| TOTAL INVESTMENTS | | | | |
|
| Total investments (cost $678,486,875) | | | | $791,396,008 |
| |
| Key to holding’s abbreviations |
| FRB | Floating Rate Bonds |
| FRN | Floating Rate Notes |
Notes to the fund’s portfolio
Unless noted otherwise, the notes to the fund’s portfolio are for the close of the fund’s reporting period, which ran from November 1, 2010 through April 30, 2011 (the reporting period).
* Percentages indicated are based on net assets of $788,083,970.
† Non-income-producing security.
†† The interest rate and date shown parenthetically represent the new interest rate to be paid and the date the fund will begin accruing interest at this rate.
d See Note 1 to the financial statements regarding securities lending. The rate quoted in the security description is the annualized 7-day yield of the fund at the close of the reporting period.
e See Note 6 to the financial statements regarding investments in Putnam Money Market Liquidity Fund. The rate quoted in the security description is the annualized 7-day yield of the fund at the close of the reporting period.
F Is valued at fair value following procedures approved by the Trustees. Securities may be classified as Level 2 or Level 3 for Accounting Standards Codification ASC 820 Fair Value Measurements and Disclosures (ASC 820) based on the securities’ valuation inputs.
R Real Estate Investment Trust.
S Securities on loan, in part or in entirety, at the close of the reporting period.
23
Debt obligations are considered secured unless otherwise indicated.
144A after the name of an issuer represents securities exempt from registration under Rule 144A under the Securities Act of 1933, as amended. These securities may be resold in transactions exempt from registration, normally to qualified institutional buyers.
The rates shown on FRB and FRN are the current interest rates at the close of the reporting period.
The dates shown on debt obligations are the original maturity dates.
ASC 820 establishes a three-level hierarchy for disclosure of fair value measurements. The valuation hierarchy is based upon the transparency of inputs to the valuation of the fund’s investments. The three levels are defined as follows:
Level 1 — Valuations based on quoted prices for identical securities in active markets.
Level 2 — Valuations based on quoted prices in markets that are not active or for which all significant inputs are observable, either directly or indirectly.
Level 3 — Valuations based on inputs that are unobservable and significant to the fair value measurement.
The following is a summary of the inputs used to value the fund’s net assets as of the close of the reporting period:
| | | | | | |
| | | | | Valuation inputs | |
|
| Investments in securities: | | Level 1 | Level 2 | Level 3 |
|
| Common stocks: | | | | |
|
| Communication services | | $10,760,274 | $— | $— |
|
| Consumer cyclicals | | 4,204,230 | — | — |
|
| Energy | | 8,129,290 | 31,250 | — |
|
| Financials | | 5,957,328 | — | — |
|
| Health care | | 2,684,512 | — | — |
|
| Utilities and power | | 10,065,948 | — | — |
|
| Total common stocks | | 41,801,582 | 31,250 | — |
| | | | | |
| Convertible bonds and notes | | — | 518,014,041 | 4,500 |
|
| Convertible preferred stocks | | — | 196,082,412 | — |
|
| Corporate bonds and notes | | — | 9,239,111 | 2,778,433 |
|
| Warrants | | — | — | 260,551 |
|
| Short-term investments | | 13,314,128 | 9,870,000 | — |
|
| Totals by level | | $55,115,710 | $733,236,814 | $3,043,484 |
At the start and/or close of the reporting period, Level 3 investments in securities were not considered a significant portion of the fund’s portfolio.
The accompanying notes are an integral part of these financial statements.
24
Statement of assets and liabilities 4/30/11 (Unaudited)
| |
| ASSETS | |
|
| Investment in securities, at value, including $9,651,600 of securities on loan (Note 1): | |
| Unaffiliated issuers (identified cost $655,302,747) | $768,211,880 |
| Affiliated issuers (identified cost $23,184,128) (Notes 1 and 6) | 23,184,128 |
|
| Cash | 9 |
|
| Dividends, interest and other receivables | 5,844,404 |
|
| Receivable for shares of the fund sold | 2,613,910 |
|
| Receivable for investments sold | 311,161 |
|
| Total assets | 800,165,492 |
|
| |
| LIABILITIES | |
|
| Payable for shares of the fund repurchased | 1,264,435 |
|
| Payable for compensation of Manager (Note 2) | 398,562 |
|
| Payable for investor servicing fees (Note 2) | 117,972 |
|
| Payable for custodian fees (Note 2) | 7,385 |
|
| Payable for Trustee compensation and expenses (Note 2) | 163,510 |
|
| Payable for administrative services (Note 2) | 2,632 |
|
| Payable for distribution fees (Note 2) | 184,530 |
|
| Collateral on securities loaned, at value (Note 1) | 9,870,000 |
|
| Other accrued expenses | 72,496 |
|
| Total liabilities | 12,081,522 |
| |
| Net assets | $788,083,970 |
|
| |
| REPRESENTED BY | |
|
| Paid-in capital (Unlimited shares authorized) (Notes 1 and 4) | $781,097,602 |
|
| Undistributed net investment income (Note 1) | 10,194,085 |
|
| Accumulated net realized loss on investments (Note 1) | (116,116,850) |
|
| Net unrealized appreciation of investments | 112,909,133 |
|
| Total — Representing net assets applicable to capital shares outstanding | $788,083,970 |
|
| |
| COMPUTATION OF NET ASSET VALUE AND OFFERING PRICE | |
|
| Net asset value and redemption price per class A share ($571,549,274 divided by 26,616,905 shares) | $21.47 |
|
| Offering price per class A share (100/94.25 of $21.47)* | $22.78 |
|
| Net asset value and offering price per class B share ($13,325,549 divided by 631,023 shares)** | $21.12 |
|
| Net asset value and offering price per class C share ($66,900,928 divided by 3,146,140 shares)** | $21.26 |
|
| Net asset value and redemption price per class M share ($4,187,057 divided by 196,721 shares) | $21.28 |
|
| Offering price per class M share (100/96.50 of $21.28)* | $22.05 |
|
| Net asset value, offering price and redemption price per class R share | |
| ($3,907,682 divided by 182,621 shares) | $21.40 |
|
| Net asset value, offering price and redemption price per class Y share | |
| ($128,213,480 divided by 5,972,423 shares) | $21.47 |
|
* On single retail sales of less than $50,000. On sales of $50,000 or more the offering price is reduced.
** Redemption price per share is equal to net asset value less any applicable contingent deferred sales charge.
The accompanying notes are an integral part of these financial statements.
25
Statement of operations Six months ended 4/30/11 (Unaudited)
| |
| INVESTMENT INCOME | |
|
| Interest (including interest income of $9,076 from investments in affiliated issuers) (Note 6) | $6,382,317 |
|
| Dividends | 4,957,426 |
|
| Securities lending (Note 1) | 14,270 |
|
| Total investment income | 11,354,013 |
|
| |
| EXPENSES | |
|
| Compensation of Manager (Note 2) | 2,243,747 |
|
| Investor servicing fees (Note 2) | 724,929 |
|
| Custodian fees (Note 2) | 7,807 |
|
| Trustee compensation and expenses (Note 2) | 36,847 |
|
| Administrative services (Note 2) | 11,833 |
|
| Distribution fees — Class A (Note 2) | 661,901 |
|
| Distribution fees — Class B (Note 2) | 63,168 |
|
| Distribution fees — Class C (Note 2) | 311,234 |
|
| Distribution fees — Class M (Note 2) | 16,968 |
|
| Distribution fees — Class R (Note 2) | 9,310 |
|
| Other | 104,939 |
|
| Total expenses | 4,192,683 |
| | |
| Expense reduction (Note 2) | (19,429) |
|
| Net expenses | 4,173,254 |
| |
| Net investment income | 7,180,759 |
|
| |
| Net realized gain on investments (Notes 1 and 3) | 21,121,435 |
|
| Net unrealized appreciation of investments during the period | 56,627,421 |
|
| Net gain on investments | 77,748,856 |
| |
| Net increase in net assets resulting from operations | $84,929,615 |
|
The accompanying notes are an integral part of these financial statements.
26
Statement of changes in net assets
| | |
| INCREASE IN NET ASSETS | Six months ended 4/30/11* | Year ended 10/31/10 |
|
| Operations: | | |
| Net investment income | $7,180,759 | $18,777,583 |
|
| Net realized gain on investments | 21,121,435 | 46,664,163 |
|
| Net unrealized appreciation of investments | 56,627,421 | 61,928,641 |
|
| Net increase in net assets resulting from operations | 84,929,615 | 127,370,387 |
|
| Distributions to shareholders (Note 1): | | |
| From ordinary income | | |
| Net investment income | | |
|
| Class A | (7,326,521) | (15,141,336) |
|
| Class B | (134,036) | (321,042) |
|
| Class C | (650,392) | (1,373,878) |
|
| Class M | (50,774) | (117,726) |
|
| Class R | (46,994) | (89,090) |
|
| Class Y | (1,532,992) | (2,551,626) |
|
| Increase in capital from settlement payments | — | 7,986 |
|
| Redemption fees (Note 1) | 5,993 | 1,447 |
|
| Increase (decrease) from capital share transactions (Note 4) | 56,468,133 | (67,240,730) |
|
| Total increase in net assets | 131,662,032 | 40,544,392 |
|
| |
| NET ASSETS | | |
|
| Beginning of period | 656,421,938 | 615,877,546 |
|
| End of period (including undistributed net investment | | |
| income of $10,194,085 and $12,755,035, respectively) | $788,083,970 | $656,421,938 |
|
* Unaudited
The accompanying notes are an integral part of these financial statements.
27
Financial highlights (For a common share outstanding throughout the period)
| | | | | | | | | | | | | | |
| INVESTMENT OPERATIONS: | | | | LESS DISTRIBUTIONS: | | | | | RATIOS AND SUPPLEMENTAL DATA: | |
|
| | | | | | | | | | | | | Ratio | Ratio | |
| | | | Net realized | | | | | | | | | of expenses | of net investment | |
| | Net asset value, | | and unrealized | Total from | From | | | | | Total return | Net assets, | to average | income (loss) | Portfolio |
| | beginning | Net investment | gain (loss) | investment | net investment | Total | Redemption | Non-recurring | Net asset value, | at net asset | end of period | net assets | to average | turnover |
| Period ended | of period | income (loss) a | on investments | operations | income | distributions | fees b | reimbursements | end of period | value (%) c | (in thousands) | (%) d | net assets (%) | (%) |
|
| Class A | | | | | | | | | | | | | | |
| April 30, 2011** | $19.31 | .21 | 2.23 | 2.44 | (.28) | (.28) | — | — | $21.47 | 12.73 * | $571,549 | .56* | 1.03* | 39* |
| October 31, 2010 | 16.27 | .54 | 3.07 | 3.61 | (.57) | (.57) | — | — b,e | 19.31 | 22.48 | 495,949 | 1.18 | 3.03 | 71 |
| October 31, 2009 | 12.55 | .55 | 3.73 | 4.28 | (.56) | (.56) | — | — | 16.27 | 35.08 | 467,669 | 1.20 f | 4.00 f | 74 |
| October 31, 2008 | 21.21 | .51 | (8.64) | (8.13) | (.53) | (.53) | — | — | 12.55 | (39.13) | 402,408 | 1.06 f | 2.73 f | 68 |
| October 31, 2007 | 19.05 | .51 | 2.18 | 2.69 | (.53) | (.53) | — | — | 21.21 | 14.27 | 697,830 | 1.04 f | 2.50 f | 71 |
| October 31, 2006 | 17.13 | .48 g | 1.97 | 2.45 | (.53) | (.53) | — | — | 19.05 | 14.52 | 608,771 | 1.03 f,g | 2.64 f,g | 64 |
|
| Class B | | | | | | | | | | | | | | |
| April 30, 2011** | $18.99 | .13 | 2.21 | 2.34 | (.21) | (.21) | — | — | $21.12 | 12.38 * | $13,326 | .93* | .65* | 39* |
| October 31, 2010 | 16.01 | .40 | 3.01 | 3.41 | (.43) | (.43) | — | — b,e | 18.99 | 21.52 | 12,205 | 1.93 | 2.28 | 71 |
| October 31, 2009 | 12.35 | .44 | 3.67 | 4.11 | (.45) | (.45) | — | — | 16.01 | 34.12 | 14,351 | 1.95 f | 3.30 f | 74 |
| October 31, 2008 | 20.87 | .36 | (8.51) | (8.15) | (.37) | (.37) | — | — | 12.35 | (39.61) | 15,297 | 1.81 f | 1.96 f | 68 |
| October 31, 2007 | 18.75 | .35 | 2.14 | 2.49 | (.37) | (.37) | — | — | 20.87 | 13.40 | 37,930 | 1.79 f | 1.77 f | 71 |
| October 31, 2006 | 16.86 | .34 g | 1.94 | 2.28 | (.39) | (.39) | — | — | 18.75 | 13.68 | 47,842 | 1.78 f,g | 1.89 f,g | 64 |
|
| Class C | | | | | | | | | | | | | | |
| April 30, 2011** | $19.13 | .13 | 2.21 | 2.34 | (.21) | (.21) | — | — | $21.26 | 12.29 * | $66,901 | .93* | .65* | 39* |
| October 31, 2010 | 16.12 | .40 | 3.04 | 3.44 | (.43) | (.43) | — | — b,e | 19.13 | 21.58 | 57,211 | 1.93 | 2.27 | 71 |
| October 31, 2009 | 12.44 | .43 | 3.71 | 4.14 | (.46) | (.46) | — | — | 16.12 | 34.12 | 56,131 | 1.95 f | 3.13 f | 74 |
| October 31, 2008 | 21.04 | .37 | (8.58) | (8.21) | (.39) | (.39) | — | — | 12.44 | (39.60) | 33,539 | 1.81 f | 2.00 f | 68 |
| October 31, 2007 | 18.92 | .35 | 2.16 | 2.51 | (.39) | (.39) | — | — | 21.04 | 13.36 | 38,347 | 1.79 f | 1.73 f | 71 |
| October 31, 2006 | 17.01 | .34 g | 1.97 | 2.31 | (.40) | (.40) | — | — | 18.92 | 13.73 | 22,010 | 1.78 f,g | 1.89 f,g | 64 |
|
| Class M | | | | | | | | | | | | | | |
| April 30, 2011** | $19.14 | .16 | 2.21 | 2.37 | (.23) | (.23) | — | — | $21.28 | 12.45 * | $4,187 | .81* | .78* | 39* |
| October 31, 2010 | 16.13 | .45 | 3.04 | 3.49 | (.48) | (.48) | — | — b,e | 19.14 | 21.85 | 4,598 | 1.68 | 2.53 | 71 |
| October 31, 2009 | 12.45 | .47 | 3.71 | 4.18 | (.50) | (.50) | — | — | 16.13 | 34.41 | 4,383 | 1.70 f | 3.40 f | 74 |
| October 31, 2008 | 21.04 | .41 | (8.57) | (8.16) | (.43) | (.43) | — | — | 12.45 | (39.44) | 3,133 | 1.56 f | 2.22 f | 68 |
| October 31, 2007 | 18.90 | .40 | 2.17 | 2.57 | (.43) | (.43) | — | — | 21.04 | 13.70 | 6,175 | 1.54 f | 2.00 f | 71 |
| October 31, 2006 | 16.99 | .38 g | 1.97 | 2.35 | (.44) | (.44) | — | — | 18.90 | 14.01 | 5,607 | 1.53 f,g | 2.14 f,g | 64 |
|
| Class R | | | | | | | | | | | | | | |
| April 30, 2011** | $19.24 | .18 | 2.24 | 2.42 | (.26) | (.26) | — | — | $21.40 | 12.64 * | $3,908 | .68* | .90* | 39* |
| October 31, 2010 | 16.22 | .50 | 3.04 | 3.54 | (.52) | (.52) | — | — b,e | 19.24 | 22.12 | 3,434 | 1.43 | 2.77 | 71 |
| October 31, 2009 | 12.51 | .51 | 3.73 | 4.24 | (.53) | (.53) | — | — | 16.22 | 34.79 | 2,685 | 1.45 f | 3.73 f | 74 |
| October 31, 2008 | 21.15 | .47 | (8.62) | (8.15) | (.49) | (.49) | — | — | 12.51 | (39.29) | 2,255 | 1.31 f | 2.50 f | 68 |
| October 31, 2007 | 19.01 | .45 | 2.18 | 2.63 | (.49) | (.49) | — | — | 21.15 | 13.96 | 2,164 | 1.29 f | 2.20 f | 71 |
| October 31, 2006 | 17.11 | .43 g | 1.98 | 2.41 | (.51) | (.51) | — | — | 19.01 | 14.27 | 1,027 | 1.28 f,g | 2.35 f,g | 64 |
|
| Class Y | | | | | | | | | | | | | | |
| April 30, 2011** | $19.30 | .23 | 2.25 | 2.48 | (.31) | (.31) | — | — | $21.47 | 12.93 * | $128,213 | .44* | 1.14* | 39* |
| October 31, 2010 | 16.27 | .59 | 3.05 | 3.64 | (.61) | (.61) | — | — b,e | 19.30 | 22.73 | 83,025 | .93 | 3.27 | 71 |
| October 31, 2009 | 12.55 | .57 | 3.74 | 4.31 | (.59) | (.59) | — | — | 16.27 | 35.43 | 70,660 | .95 f | 3.93 f | 74 |
| October 31, 2008 | 21.21 | .56 | (8.64) | (8.08) | (.58) | (.58) | — | — | 12.55 | (38.97) | 21,115 | .81 f | 3.00 f | 68 |
| October 31, 2007 | 19.05 | .56 | 2.18 | 2.74 | (.58) | (.58) | — | — | 21.21 | 14.56 | 27,084 | .79 f | 2.75 f | 71 |
| October 31, 2006 | 17.13 | .52 g | 1.97 | 2.49 | (.57) | (.57) | — | — | 19.05 | 14.81 | 24,458 | .78 f,g | 2.88 f,g | 64 |
|
See notes to financial highlights at the end of this section.
The accompanying notes are an integral part of these financial statements.
Financial highlights (Continued)
* Not annualized.
** Unaudited.
a Per share net investment income (loss) has been determined on the basis of the weighted average number of shares outstanding during the period.
b Amount represents less than $0.01 per share.
c Total return assumes dividend reinvestment and does not reflect the effect of sales charges.
d Includes amounts paid through expense offset and brokerage/service arrangements (Note 2).
e Reflects a non-recurring reimbursement pursuant to a settlement between the Securities and Exchange Commission (the SEC) and Prudential Securities, Inc., which amounted to less than $0.01 per share outstanding on March 30, 2010.
f Reflects an involuntary contractual expense limitation in effect during the period. For periods prior to October 31, 2009, certain fund expenses were waived in connection with the fund’s investment in Putnam Prime Money Market Fund. As a result of such limitation and/or waivers, the expenses of each class reflect a reduction of the following amounts:
| |
| | Percentage of |
| | average net assets |
|
| October 31, 2009 | 0.06% |
|
| October 31, 2008 | <0.01 |
|
| October 31, 2007 | <0.01 |
|
| October 31, 2006 | <0.01 |
|
g Reflects a non-recurring reimbursement from Putnam Investments relating to the calculation of certain amounts paid by the fund to Putnam in previous years for transfer agent services, which amounted to less than $0.01 per share and 0.01% of average net assets for the period ended October 31, 2006.
The accompanying notes are an integral part of these financial statements.
30
Notes to financial statements 4/30/11 (Unaudited)
Note 1: Significant accounting policies
Putnam Convertible Securities Fund (the fund), is a Massachusetts business trust, which is registered under the Investment Company Act of 1940, as amended, as a diversified open-end management investment company. The investment objective of the fund is to seek with equal emphasis, current income and capital appreciation by investing primarily in U.S. securities that can be converted into or exchanged for common stock. The fund’s secondary objective is conservation of capital. The fund may invest in higher yielding, lower rated bonds that may have a higher rate of default.
The fund offers class A, class B, class C, class M, class R and class Y shares. Class A and class M shares are sold with a maximum front-end sales charge of 5.75% and 3.50%, respectively, and generally do not pay a contingent deferred sales charge. Class B shares, which convert to class A shares after approximately eight years, do not pay a front-end sales charge and are subject to a contingent deferred sales charge if those shares are redeemed within six years of purchase. Class C shares have a one-year 1.00% contingent deferred sales charge and do not convert to class A shares. Class R shares, which are not available to all investors, are sold at net asset value. The expenses for class A, class B, class C, class M and class R shares may differ based on the distribution fee of each class, which is identified in Note 2. Class Y shares, which are sold at net asset value, are generally subject to the same expenses as class A, class B, class C, class M and class R shares, but do not bear a distribution fee. Class Y shares are not available to all investors.
Prior to August 2, 2010, a 1.00% redemption fee applied on any shares that were redeemed (either by selling or exchanging into another fund) within 7 days of purchase. Effective August 2, 2010, this redemption fee may apply on any shares that are redeemed (either by selling or exchanging into another fund) within 30 days of purchase. The redemption fee is accounted for as an addition to paid-in-capital.
Investment income, realized and unrealized gains and losses and expenses of the fund are borne pro-rata based on the relative net assets of each class to the total net assets of the fund, except that each class bears expenses unique to that class (including the distribution fees applicable to such classes). Each class votes as a class only with respect to its own distribution plan or other matters on which a class vote is required by law or determined by the Trustees. If the fund were liquidated, shares of each class would receive their pro-rata share of the net assets of the fund. In addition, the Trustees declare separate dividends on each class of shares.
In the normal course of business, the fund enters into contracts that may include agreements to indemnify another party under given circumstances. The fund’s maximum exposure under these arrangements is unknown as this would involve future claims that may be, but have not yet been, made against the fund. However, the fund’s management team expects the risk of material loss to be remote.
The following is a summary of significant accounting policies consistently followed by the fund in the preparation of its financial statements. The preparation of financial statements is in conformity with accounting principles generally accepted in the United States of America and requires management to make estimates and assumptions that affect the reported amounts of assets and liabilities in the financial statements and the reported amounts of increases and decreases in net assets from operations. Actual results could differ from those estimates. Subsequent events after the Statement of assets and liabilities date through the date that the financial statements were issued have been evaluated in the preparation of the financial statements. Unless otherwise noted, the “reporting period” represents the period from November 1, 2010 through April 30, 2011.
A) Security valuation Investments for which market quotations are readily available are valued at the last reported sales price on their principal exchange, or official closing price for certain markets, and are classified as Level 1 securities. If no sales are reported — as in the case of some securities traded over-the-counter — a security is valued at its last reported bid price and is generally categorized as a Level 2 security.
Market quotations are not considered to be readily available for certain debt obligations and other investments; such investments are valued on the basis of valuations furnished by an independent pricing service approved by the Trustees or dealers selected by Putnam Investment Management, LLC (Putnam Management), the fund’s manager, an indirect wholly-owned subsidiary of Putnam Investments, LLC. Such services or dealers determine valuations for normal institutional-size trading units of such securities using methods based on market transactions for comparable securities and various relationships, generally recognized by institutional traders, between securities (which considers such factors as security prices, yields, maturities and ratings). These securities will generally be categorized as Level 2.
Many securities markets and exchanges outside the U.S. close prior to the close of the New York Stock Exchange and therefore the closing prices for securities in such markets or on such exchanges may not fully reflect events
31
that occur after such close but before the close of the New York Stock Exchange. Accordingly, on certain days, the fund will fair value foreign equity securities taking into account multiple factors including movements in the U.S. securities markets, currency valuations and comparisons to the valuation of American Depository Receipts, exchange-traded funds and futures contracts. These securities, which will generally represent a transfer from a Level 1 to a Level 2 security, will be classified as Level 2. The number of days on which fair value prices will be used will depend on market activity and it is possible that fair value prices will be used by the fund to a significant extent. Securities quoted in foreign currencies, if any, are translated into U.S. dollars at the current exchange rate.
To the extent a pricing service or dealer is unable to value a security or provides a valuation that Putnam Management does not believe accurately reflects the security’s fair value, the security will be valued at fair value by Putnam Management. Certain investments, including certain restricted and illiquid securities and derivatives, are also valued at fair value following procedures approved by the Trustees. These valuations consider such factors as significant market or specific security events such as interest rate or credit quality changes, various relationships with other securities, discount rates, U.S. Treasury, U.S. swap and credit yields, index levels, convexity exposures and recovery rates. These securities are classified as Level 2 or as Level 3 depending on the priority of the significant inputs.
Such valuations and procedures are reviewed periodically by the Trustees. The fair value of securities is generally determined as the amount that the fund could reasonably expect to realize from an orderly disposition of such securities over a reasonable period of time. By its nature, a fair value price is a good faith estimate of the value of a security in a current sale and does not reflect an actual market price, which may be different by a material amount.
B) Security transactions and related investment income Security transactions are recorded on the trade date (the date the order to buy or sell is executed). Gains or losses on securities sold are determined on the identified cost basis.
Interest income is recorded on the accrual basis. Dividend income, net of applicable withholding taxes, is recognized on the ex-dividend date except that certain dividends from foreign securities, if any, are recognized as soon as the fund is informed of the ex-dividend date. Non-cash dividends, if any, are recorded at the fair market value of the securities received. Dividends representing a return of capital or capital gains, if any, are reflected as a reduction of cost and/or as a realized gain.
All premiums/discounts are amortized/accreted on a yield-to-maturity basis.
C) Securities lending The fund may lend securities, through its agent, to qualified borrowers in order to earn additional income. The loans are collateralized by cash in an amount at least equal to the market value of the securities loaned. The market value of securities loaned is determined daily and any additional required collateral is allocated to the fund on the next business day. The risk of borrower default will be borne by the fund’s agent; the fund will bear the risk of loss with respect to the investment of the cash collateral. Income from securities lending is included in investment income on the Statement of operations. Cash collateral is invested in Putnam Cash Collateral Pool, LLC, a limited liability company managed by an affiliate of Putnam Management. Investments in Putnam Cash Collateral Pool, LLC are valued at its closing net asset value each business day. There are no management fees charged by Putnam Cash Collateral Pool, LLC. At the close of the reporting period, the value of securities loaned amounted to $9,651,600 and the fund received cash collateral of $9,870,000.
D) Interfund lending The fund, along with other Putnam funds, may participate in an interfund lending program pursuant to an exemptive order issued by the Securities and Exchange Commission (the SEC). This program allows the fund to borrow from or lend to other Putnam funds that permit such transactions. Interfund lending transactions are subject to each fund’s investment policies and borrowing and lending limits. Interest earned or paid on the interfund lending transaction will be based on the average of certain current market rates. During the reporting period, the fund did not utilize the program.
E) Line of credit The fund participates, along with other Putnam funds, in a $285 million unsecured committed line of credit and a $165 million unsecured uncommitted line of credit, both provided by State Street Bank and Trust Company (State Street). Borrowings may be made for temporary or emergency purposes, including the funding of shareholder redemption requests and trade settlements. Interest is charged to the fund based on the fund’s borrowing at a rate equal to the Federal Funds rate plus 1.25% for the committed line of credit and the Federal Funds rate plus 1.30% for the uncommitted line of credit. A closing fee equal to 0.03% of the committed line of credit and $100,000 for the uncommitted line of credit has been paid by the participating funds. In addition, a commitment fee of 0.15% per annum on any unutilized portion of the committed line of credit is allocated to the participating funds based on their relative net assets and paid quarterly. During the reporting period, the fund had no borrowings against these arrangements.
32
F) Federal taxes It is the policy of the fund to distribute all of its taxable income within the prescribed time period and otherwise comply with the provisions of the Internal Revenue Code of 1986, as amended (the Code), applicable to regulated investment companies. It is also the intention of the fund to distribute an amount sufficient to avoid imposition of any excise tax under Section 4982 of the Code. The fund is subject to the provisions of Accounting Standards Codification ASC 740 Income Taxes (ASC 740). ASC 740 sets forth a minimum threshold for financial statement recognition of the benefit of a tax position taken or expected to be taken in a tax return. The fund did not have a liability to record for any unrecognized tax benefits in the accompanying financial statements. No provision has been made for federal taxes on income, capital gains or unrealized appreciation on securities held nor for excise tax on income and capital gains. Each of the fund’s federal tax returns for the prior three fiscal years remains subject to examination by the Internal Revenue Service.
At October 31, 2010, the fund had a capital loss carryover of $137,180,244 available to the extent allowed by the Code to offset future net capital gain, if any. The amounts of the carryovers and the expiration dates are:
| | |
| Loss carryover | Expiration |
|
| $30,918,383 | | October 31, 2016 |
|
| 106,261,861 | | October 31, 2017 |
|
Under the recently enacted Regulated Investment Company Modernization Act of 2010, the fund will be permitted to carry forward capital losses incurred in taxable years beginning after December 22, 2010 for an unlimited period. However, any losses incurred during those future years will be required to be utilized prior to the losses incurred in pre-enactment tax years. As a result of this ordering rule, pre-enactment capital loss carryforwards may be more likely to expire unused. Additionally, post-enactment capital losses that are carried forward will retain their character as either short-term or long-term capital losses rather than being considered all short-term as under previous law.
The aggregate identified cost on a tax basis is $678,544,916, resulting in gross unrealized appreciation and depreciation of $121,835,865 and $8,984,773, respectively, or net unrealized appreciation of $112,851,092.
G) Distributions to shareholders Distributions to shareholders from net investment income are recorded by the fund on the ex-dividend date. Distributions from capital gains, if any, are recorded on the ex-dividend date and paid at least annually. The amount and character of income and gains to be distributed are determined in accordance with income tax regulations, which may differ from generally accepted accounting principles. Dividend sources are estimated at the time of declaration. Actual results may vary. Any non-taxable return of capital cannot be determined until final tax calculations are completed after the end of the fund’s fiscal year. Reclassifications are made to the fund’s capital accounts to reflect income and gains available for distribution (or available capital loss carryovers) under income tax regulations.
Note 2: Management fee, administrative services and other transactions
The fund pays Putnam Management a management fee (based on the fund’s average net assets and computed and paid monthly) at annual rates that may vary based on the average of the aggregate net assets of most open-end funds, as defined in the fund’s management contract, sponsored by Putnam Management. Such annual rates may vary as follows:
| |
| 0.780% | of the first $5 billion, |
| 0.730% | of the next $5 billion, |
| 0.680% | of the next $10 billion, |
| 0.630% | of the next $10 billion, |
| 0.580% | of the next $50 billion, |
| 0.560% | of the next $50 billion, |
| 0.550% | of the next $100 billion, |
| 0.545% | of any excess thereafter. |
Putnam Management has contractually agreed, through June 30, 2011, to waive fees or reimburse the fund’s expenses to the extent necessary to limit the cumulative expenses of the fund, exclusive of brokerage, interest, taxes, investment-related expenses, extraordinary expenses and payments under the fund’s investor servicing contract, investment management contract and distribution plans, on a fiscal year-to-date basis to an annual rate of 0.20% of the fund’s average net assets over such fiscal year-to-date period. During the reporting period, the fund’s expenses were not reduced as a result of this limit.
33
Putnam Investments Limited (PIL), an affiliate of Putnam Management, is authorized by the Trustees to manage a separate portion of the assets of the fund as determined by Putnam Management from time to time. Putnam Management pays a quarterly sub-management fee to PIL for its services at an annual rate of 0.35% of the average net assets of the portion of the fund managed by PIL.
The fund reimburses Putnam Management an allocated amount for the compensation and related expenses of certain officers of the fund and their staff who provide administrative services to the fund. The aggregate amount of all such reimbursements is determined annually by the Trustees.
Custodial functions for the fund’s assets are provided by State Street. Custody fees are based on the fund’s asset level, the number of its security holdings and transaction volumes.
Putnam Investor Services, Inc., an affiliate of Putnam Management, provides investor servicing agent functions to the fund. Putnam Investor Services, Inc. received fees for investor servicing based on the fund’s retail asset level, the number of shareholder accounts in the fund and the level of defined contribution plan assets in the fund. Investor servicing fees will not exceed an annual rate of 0.375% of the fund’s average net assets. The amounts incurred for investor servicing agent functions during the reporting period are included in Investor servicing fees in the Statement of operations.
The fund has entered into expense offset arrangements with Putnam Investor Services, Inc. and State Street whereby Putnam Investor Services, Inc.’s and State Street’s fees are reduced by credits allowed on cash balances. The fund also reduced expenses through brokerage/service arrangements. For the reporting period, the fund’s expenses were reduced by $1,255 under the expense offset arrangements and by $18,174 under the brokerage/service arrangements.
Each independent Trustee of the fund receives an annual Trustee fee, of which $424, as a quarterly retainer, has been allocated to the fund, and an additional fee for each Trustees meeting attended. Trustees also are reimbursed for expenses they incur relating to their services as Trustees.
The fund has adopted a Trustee Fee Deferral Plan (the Deferral Plan) which allows the Trustees to defer the receipt of all or a portion of Trustees fees payable on or after July 1, 1995. The deferred fees remain invested in certain Putnam funds until distribution in accordance with the Deferral Plan.
The fund has adopted an unfunded noncontributory defined benefit pension plan (the Pension Plan) covering all Trustees of the fund who have served as a Trustee for at least five years and were first elected prior to 2004. Benefits under the Pension Plan are equal to 50% of the Trustee’s average annual attendance and retainer fees for the three years ended December 31, 2005. The retirement benefit is payable during a Trustee’s lifetime, beginning the year following retirement, for the number of years of service through December 31, 2006. Pension expense for the fund is included in Trustee compensation and expenses in the Statement of operations. Accrued pension liability is included in Payable for Trustee compensation and expenses in the Statement of assets and liabilities. The Trustees have terminated the Pension Plan with respect to any Trustee first elected after 2003.
The fund has adopted distribution plans (the Plans) with respect to its class A, class B, class C, class M and class R shares pursuant to Rule 12b-1 under the Investment Company Act of 1940. The purpose of the Plans is to compensate Putnam Retail Management Limited Partnership, a wholly-owned subsidiary of Putnam Investments, LLC and Putnam Retail Management GP, Inc., for services provided and expenses incurred in distributing shares of the fund. The Plans provide for payments by the fund to Putnam Retail Management Limited Partnership at an annual rate of up to 0.35%, 1.00%, 1.00%, 1.00% and 1.00% of the average net assets attributable to class A, class B, class C, class M and class R shares, respectively. The Trustees have approved payment by the fund at an annual rate of 0.25%, 1.00%, 1.00%, 0.75% and 0.50% of the average net assets attributable to class A, class B, class C, class M and class R shares, respectively.
For the reporting period, Putnam Retail Management Limited Partnership, acting as underwriter, received net commissions of $51,253 and $250 from the sale of class A and class M shares, respectively, and received $3,991 and $1,329 in contingent deferred sales charges from redemptions of class B and class C shares, respectively.
A deferred sales charge of up to 1.00% and 0.65% is assessed on certain redemptions of class A and class M shares, respectively. For the reporting period, Putnam Retail Management Limited Partnership, acting as underwriter, received $203 and no monies on class A and class M redemptions, respectively.
Note 3: Purchases and sales of securities
During the reporting period, cost of purchases and proceeds from sales of investment securities other than short-term investments aggregated $317,804,326 and $270,581,234, respectively. There were no purchases or proceeds from sales of long-term U.S. government securities.
34
Note 4: Capital shares
At the close of the reporting period, there was an unlimited number of shares of beneficial interest authorized. Transactions in capital shares were as follows:
| | | | |
| | Six months ended 4/30/11 | Year ended 10/31/10 |
|
| Class A | Shares | Amount | Shares | Amount |
|
| Shares sold | 2,821,428 | $58,313,526 | 2,541,182 | $45,844,454 |
|
| Shares issued in connection with | | | | |
| reinvestment of distributions | 300,749 | 6,163,636 | 700,776 | 12,605,015 |
|
| | 3,122,177 | 64,477,162 | 3,241,958 | 58,449,469 |
|
| Shares repurchased | (2,191,228) | (45,003,210) | (6,295,360) | (112,190,720) |
|
| Net increase (decrease) | 930,949 | $19,473,952 | (3,053,402) | $(53,741,251) |
|
| |
| | Six months ended 4/30/11 | Year ended 10/31/10 |
|
| Class B | Shares | Amount | Shares | Amount |
|
| Shares sold | 106,326 | $2,158,810 | 82,899 | $1,470,768 |
|
| Shares issued in connection with | | | | |
| reinvestment of distributions | 4,651 | 93,767 | 12,951 | 228,871 |
|
| | 110,977 | 2,252,577 | 95,850 | 1,699,639 |
|
| Shares repurchased | (122,488) | (2,482,217) | (349,549) | (6,131,790) |
|
| Net decrease | (11,511) | $(229,640) | (253,699) | $(4,432,151) |
|
| |
| | Six months ended 4/30/11 | Year ended 10/31/10 |
|
| Class C | Shares | Amount | Shares | Amount |
|
| Shares sold | 606,319 | $12,359,942 | 515,068 | $9,195,663 |
|
| Shares issued in connection with | | | | |
| reinvestment of distributions | 15,304 | 311,009 | 33,555 | 598,295 |
|
| | 621,623 | 12,670,951 | 548,623 | 9,793,958 |
|
| Shares repurchased | (466,736) | (9,544,914) | (1,038,964) | (18,372,050) |
|
| Net increase (decrease) | 154,887 | $3,126,037 | (490,341) | $(8,578,092) |
|
| |
| | Six months ended 4/30/11 | Year ended 10/31/10 |
|
| Class M | Shares | Amount | Shares | Amount |
|
| Shares sold | 15,799 | $322,356 | 33,786 | $598,285 |
|
| Shares issued in connection with | | | | |
| reinvestment of distributions | 2,218 | 45,065 | 5,817 | 103,770 |
|
| | 18,017 | 367,421 | 39,603 | 702,055 |
|
| Shares repurchased | (61,533) | (1,261,471) | (71,054) | (1,255,034) |
|
| Net decrease | (43,516) | $(894,050) | (31,451) | $(552,979) |
|
| |
| | Six months ended 4/30/11 | Year ended 10/31/10 |
|
| Class R | Shares | Amount | Shares | Amount |
|
| Shares sold | 28,295 | $581,318 | 63,606 | $1,136,196 |
|
| Shares issued in connection with | | | | |
| reinvestment of distributions | 2,231 | 45,568 | 4,814 | 86,441 |
|
| | 30,526 | 626,886 | 68,420 | 1,222,637 |
|
| Shares repurchased | (26,393) | (544,942) | (55,456) | (993,788) |
|
| Net increase | 4,133 | $81,944 | 12,964 | $228,849 |
|
35
| | | | |
| | Six months ended 4/30/11 | Year ended 10/31/10 |
|
| Class Y | Shares | Amount | Shares | Amount |
|
| Shares sold | 2,285,326 | $47,478,298 | 1,777,906 | $32,235,455 |
|
| Shares issued in connection with | | | | |
| reinvestment of distributions | 32,223 | 662,712 | 55,252 | 994,380 |
|
| | 2,317,549 | 48,141,010 | 1,833,158 | 33,229,835 |
|
| Shares repurchased | (646,419) | (13,231,120) | (1,875,351) | (33,394,941) |
|
| Net increase (decrease) | 1,671,130 | $34,909,890 | (42,193) | $(165,106) |
|
Note 5: Summary of derivative activity
The following is a summary of the market values of derivative instruments as of the close of the reporting period:
Market values of derivative instruments as of the close of the reporting period
| | | | |
| | Asset derivatives | Liability derivatives |
|
| Derivatives not | | | | |
| accounted for as | Statement of | | Statement of | |
| hedging instruments | assets and | | assets and | |
| under ASC 815 | liabilities location | Market value | liabilities location | Market value |
|
| |
| Equity contracts | Investments | $260,551 | Payables | $— |
|
| Total | | $260,551 | | $— |
|
The following is a summary of change in unrealized gains or losses of derivative instruments on the Statement of operations for the reporting period (see Note 1) (there were no realized gains or losses on derivative instruments):
Change in unrealized appreciation or (depreciation) on derivatives recognized in net gain or (loss) on investments
| | |
| Derivatives not accounted for as hedging | | |
| instruments under ASC 815 | Warrants | Total |
|
| Equity contracts | $65,138 | $65,138 |
|
| Total | $65,138 | $65,138 |
|
Note 6: Investment in Putnam Money Market Liquidity Fund
The fund invested in Putnam Money Market Liquidity Fund, an open-end management investment company managed by Putnam Management. Investments in Putnam Money Market Liquidity Fund are valued at its closing net asset value each business day. Income distributions earned by the fund are recorded as interest income in the Statement of operations and totaled $9,076 for the reporting period. During the reporting period, cost of purchases and proceeds of sales of investments in Putnam Money Market Liquidity Fund aggregated $168,546,252 and $157,063,333, respectively. Management fees charged to Putnam Money Market Liquidity Fund have been waived by Putnam Management.
Note 7: Regulatory matters and litigation
In late 2003 and 2004, Putnam Management settled charges brought by the SEC and the Massachusetts Securities Division in connection with excessive short-term trading in Putnam funds. Distribution of payments from Putnam Management to certain open-end Putnam funds and their shareholders is expected to be completed in the next several months. These allegations and related matters have served as the general basis for certain lawsuits, including purported class action lawsuits against Putnam Management and, in a limited number of cases, some Putnam funds. Putnam Management believes that these lawsuits will have no material adverse effect on the funds or on Putnam Management’s ability to provide investment management services. In addition, Putnam Management has agreed to bear any costs incurred by the Putnam funds as a result of these matters.
Note 8: Market and credit risk
In the normal course of business, the fund trades financial instruments and enters into financial transactions where risk of potential loss exists due to changes in the market (market risk) or failure of the contracting party to the transaction to perform (credit risk). The fund may be exposed to additional credit risk that an institution or other entity with which the fund has unsettled or open transactions will default.
36
Fund information
Founded over 70 years ago, Putnam Investments was built around the concept that a balance between risk and reward is the hallmark of a well-rounded financial program. We manage over 100 funds across income, value, blend, growth, asset allocation, absolute return, and global sector categories.
| | |
| Investment Manager | George Putnam, III | Robert T. Burns |
| Putnam Investment | Robert L. Reynolds | Vice President and |
| Management, LLC | W. Thomas Stephens | Chief Legal Officer |
| One Post Office Square | | |
| Boston, MA 02109 | Officers | James P. Pappas |
| | Robert L. Reynolds | Vice President |
| Investment Sub-Manager | President | |
| Putnam Investments Limited | | Judith Cohen |
| 57–59 St James’s Street | Jonathan S. Horwitz | Vice President, Clerk and |
| London, England SW1A 1LD | Executive Vice President, | Assistant Treasurer |
| | Principal Executive | |
| Marketing Services | Officer, Treasurer and | Michael Higgins |
| Putnam Retail Management | Compliance Liaison | Vice President, Senior Associate |
| One Post Office Square | | Treasurer and Assistant Clerk |
| Boston, MA 02109 | Steven D. Krichmar | |
| | Vice President and | Nancy E. Florek |
| Custodian | Principal Financial Officer | Vice President, Assistant Clerk, |
| State Street Bank | | Assistant Treasurer and |
| and Trust Company | Janet C. Smith | Proxy Manager |
| | Vice President, Assistant | |
| Legal Counsel | Treasurer and Principal | Susan G. Malloy |
| Ropes & Gray LLP | Accounting Officer | Vice President and |
| | | Assistant Treasurer |
| Trustees | Beth S. Mazor | |
| John A. Hill, Chairman | Vice President | |
| Jameson A. Baxter, | | |
| Vice Chairman | Robert R. Leveille | |
| Ravi Akhoury | Vice President and | |
| Barbara M. Baumann | Chief Compliance Officer | |
| Charles B. Curtis | | |
| Robert J. Darretta | Mark C. Trenchard | |
| Paul L. Joskow | Vice President and | |
| Kenneth R. Leibler | BSA Compliance Officer | |
| Robert E. Patterson | | |
This report is for the information of shareholders of Putnam Convertible Securities Fund. It may also be used as sales literature when preceded or accompanied by the current prospectus, the most recent copy of Putnam’s Quarterly Performance Summary, and Putnam’s Quarterly Ranking Summary. For more recent performance, please visit putnam.com. Investors should carefully consider the investment objectives, risks, charges, and expenses of a fund, which are described in its prospectus. For this and other information or to request a prospectus or summary prospectus, call 1-800-225-1581 toll free. Please read the prospectus carefully before investing. The fund’s Statement of Additional Information contains additional information about the fund’s Trustees and is available without charge upon request by calling 1-800-225-1581.
Item 2. Code of Ethics:
Not applicable
Item 3. Audit Committee Financial Expert:
Not applicable
Item 4. Principal Accountant Fees and Services:
Not applicable
Item 5. Audit Committee of Listed Registrants
Not applicable
Item 6. Schedule of Investments:
The registrant’s schedule of investments in unaffiliated issuers is included in the report to shareholders in Item 1 above.
Item 7. Disclosure of Proxy Voting Policies and Procedures For Closed-End Management Investment Companies:
Not applicable
Item 8. Portfolio Managers of Closed-End Investment Companies
Not Applicable
Item 9. Purchases of Equity Securities by Closed-End Management Investment Companies and Affiliated Purchasers:
Not applicable
Item 10. Submission of Matters to a Vote of Security Holders:
Not applicable
Item 11. Controls and Procedures:
(a) The registrant's principal executive officer and principal financial officer have concluded, based on their evaluation of the effectiveness of the design and operation of the registrant's disclosure controls and procedures as of a date within 90 days of the filing date of this report, that the design and operation of such procedures are generally effective to provide reasonable assurance that information required to be disclosed by the registrant in this report is recorded, processed, summarized and reported within the time periods specified in the Commission's rules and forms.
(b) Changes in internal control over financial reporting: Not applicable
Item 12. Exhibits:
(a)(1) Not applicable
(a)(2) Separate certifications for the principal executive officer and principal financial officer of the registrant as required by Rule 30a-2(a) under the Investment Company Act of 1940, as amended, are filed herewith.
(b) The certifications required by Rule 30a-2(b) under the Investment Company Act of 1940, as amended, are filed herewith.
Putnam Convertible Securities Fund
By (Signature and Title):
/s/Janet C. Smith
Janet C. Smith
Principal Accounting Officer
Date: June 28, 2011
Pursuant to the requirements of the Securities Exchange Act of 1934 and the Investment Company Act of 1940, this report has been signed below by the following persons on behalf of the registrant and in the capacities and on the dates indicated.
By (Signature and Title):
/s/Jonathan S. Horwitz
Jonathan S. Horwitz
Principal Executive Officer
Date: June 28, 2011
By (Signature and Title):
/s/Steven D. Krichmar
Steven D. Krichmar
Principal Financial Officer
Date: June 28, 2011