| | |
| UNITED STATES
SECURITIES AND EXCHANGE COMMISSION |
| | |
| CERTIFIED SHAREHOLDER REPORT OF REGISTERED
MANAGEMENT INVESTMENT COMPANIES
|
| | |
| Investment Company Act file number: | (811-02280) |
| | |
| Exact name of registrant as specified in charter: | Putnam Convertible Securities Fund |
| | |
| Address of principal executive offices: | One Post Office Square, Boston, Massachusetts 02109 |
| | |
| Name and address of agent for service: | Robert T. Burns, Vice President
One Post Office Square
Boston, Massachusetts 02109 |
| | |
| Copy to: | John W. Gerstmayr, Esq.
Ropes & Gray LLP
800 Boylston Street
Boston, Massachusetts 02199-3600 |
| | |
| Registrant’s telephone number, including area code: | (617) 292-1000 |
| | |
| Date of fiscal year end: | October 31, 2013 |
| | |
| Date of reporting period: | November 1, 2012 — April 30, 2013 |
| | |
|
Item 1. Report to Stockholders: | |
| | |
| The following is a copy of the report transmitted to stockholders pursuant to Rule 30e-1 under the Investment Company Act of 1940: | |
Putnam
Convertible
Securities Fund
Semiannual report
4 | 30 | 13
| | | |
| Message from the Trustees | 1 | | |
| | |
| About the fund | 2 | | |
| | |
| Performance snapshot | 4 | | |
| | |
| Interview with your fund’s portfolio managers | 5 | | |
| | |
| Your fund’s performance | 11 | | |
| | |
| Your fund’s expenses | 13 | | |
| | |
| Terms and definitions | 15 | | |
| | |
| Other information for shareholders | 16 | | |
| | |
| Financial statements | 17 | | |
| | |
Consider these risks before investing: The prices of convertible securities in the fund’s portfolio may fall or fail to rise over extended periods of time for a variety of reasons, including both general financial market conditions and factors related to specific companies or industries. These risks are generally greater for convertible securities issued by small and midsize companies. The prices of convertible securities may be adversely affected by changes in the prices of underlying common stocks. Convertible securities tend to provide higher yields than common stocks. However, a higher yield may not protect investors against the risk of loss or adequately mitigate any loss associated with a decline in the price of a convertible security. Convertible securities are subject to credit risk, which is the risk that an issuer of the fund’s investments may default on payment of interest or principal. Credit risk is generally greater for below-investment-grade convertible securities. Generally, convertible securities may be less sensitive to interest-rate changes than non-convertible bonds as a result of convertible securities’ structural features (e.g., convertibility, “put” features, etc.). Interest-rate risk is generally greater, however, for longer-term bonds and convertible securities whose underlying stock price has fallen significantly below the conversion price. You can lose money by investing in the fund.
Message from the Trustees
Dear Fellow Shareholder:
Equities around the world have generally demonstrated a positive trend in early 2013. However, after a strong 2012, fixed-income markets have been facing challenges and increased volatility in 2013.
Supportive macroeconomic data, notably better housing and employment data in the United States, and the coordinated stimulative monetary policies of central banks around the world are helping to boost equity values, although investor confidence remains tempered. Markets continue to confront a variety of macroeconomic and fiscal challenges worldwide — from budget concerns in the United States to the eurozone’s debt-related troubles.
Investor apprehension today can be linked to the heightened volatility that has challenged markets for over a decade. In this fundamentally changed environment, Putnam’s equity and fixed-income teams are focused on integrating innovative investing ideas into our more time-tested, traditional strategies. It is also important to rely on the guidance of your financial advisor, who can help ensure that your portfolio matches your individual goals and tolerance for risk.
We would like to extend a welcome to new shareholders of the fund and to thank you for investing with Putnam.

About the fund
Seeking undervalued companies before their potential is recognized
The differences between bonds and stocks seem fairly clear-cut. Stocks provide an ownership stake in a company; bonds provide a claim on the interest paid by a company or other entity on its debt. The value of stocks rises and falls with factors such as investor sentiment, company news, and economic conditions; bonds are issued by a government, agency, company, or public utility that typically promises to pay the bearer a fixed rate of interest at specified intervals and to return a set amount of money at a specified end date (the maturity date). A bond’s yield and its price are often influenced by interest-rate levels and the issuer’s credit quality.
A convertible security is a hybrid of a stock and a bond. Like a bond, it offers a set rate of interest, but unlike a bond, it has a built-in option that, under certain circumstances, allows the investor to exchange (or convert) the security for a fixed number of shares of stock. This feature offers the potential for capital appreciation, since the preset conversion price does not change as the underlying stock price increases or decreases.
Convertibles are issued by companies and can offer greater returns than high-quality bonds — but they also carry greater risk potential, such as the risk of default or periodic illiquidity. Issuers range from large, well-known S&P 500 corporations and small, rapidly growing companies, to companies in cyclically depressed industries.
Investing successfully in convertible securities requires intensive research and analysis. The fund’s managers are supported by analysts who conduct rigorous fundamental research, seeking to determine the true worth of the issuing company’s business. The managers then construct a portfolio that they believe offers the best return potential while being mindful of risk.
The “busted” convertible
One kind of security in which your fund may invest is the “busted” convertible. “Busted” refers to a security whose underlying stock price has fallen significantly below the conversion price. It becomes much less sensitive to the volatility of the underlying stock and is more bond-like, responding to interest-rate changes. A busted convertible may pay a higher yield than other convertibles, but may also carry a higher level of risk. (Some companies in this situation may eventually default on their bonds.)
The objective of buying a busted convertible is to take advantage of a company’s eventual turnaround despite its present challenges. For example, a company undergoing management turmoil may draw negative investor reactions, causing its stock price to tumble. However, if intensive research determines that the management crisis is likely to be resolved, the fund managers could buy the security at a steep discount. The goal is to sell the security at a higher price when the credit improves or when the stock revives.

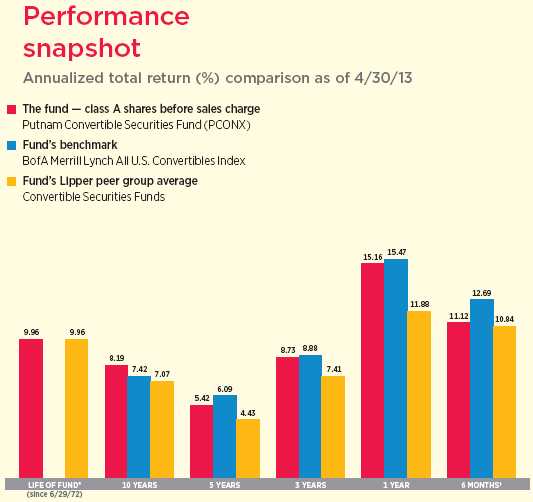
Current performance may be lower or higher than the quoted past performance, which cannot guarantee future results. Share price, principal value, and return will fluctuate, and you may have a gain or a loss when you sell your shares. Performance of class A shares assumes reinvestment of distributions and does not account for taxes. Fund returns in the bar chart do not reflect a sales charge of 5.75%; had they, returns would have been lower. See pages 5 and 11–13 for additional performance information. For a portion of the periods, the fund had expense limitations, without which returns would have been lower. To obtain the most recent month-end performance, visit putnam.com.
* The fund’s benchmark, the BofA Merrill Lynch All U.S. Convertibles Index, was introduced on 12/31/87, which post-dates the inception of the fund’s class A shares.
† Returns for the six-month period are not annualized, but cumulative.
| |
| 4 | Convertible Securities Fund |
Interview with your fund’s portfolio managers

Market conditions improved markedly during the reporting period. What contributed to the change in sentiment?
Eric: The equity markets staged an impressive rally during the six months ended April 30, 2013, with major U.S. stock market benchmarks testing new highs by the end of the period. The most credit-sensitive sectors of the fixed-income markets, such as high-yield corporate bonds and asset-backed securities, also rallied — driven in part, we believe, by yield-hungry investors willing to take on measured risk to increase income opportunities. Improvement in the employment rate and housing sector gave investors confidence that the U.S. economy was mending, and Washington averted a worst-case scenario in its fiscal cliff discussions. Concerns about global issues, such as the eurozone debt crisis and China’s slowdown, intermittently challenged the markets. But ongoing efforts by the central banks around the world to stimulate growth gave cautious investors the confidence to move off the sidelines and invest in the markets.
How did Putnam Convertible Securities Fund perform in this environment?
Rob: Convertible securities were active participants in the rally — generally beating bonds and performing competitively with U.S. stocks. Convertibles were able to capture most of the upside of the U.S. equity market, as well as most of the performance of the
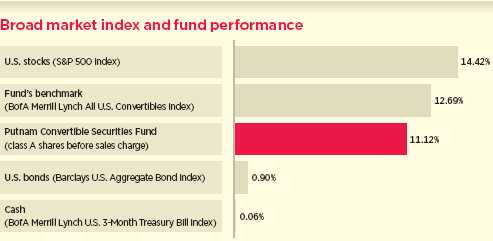
This comparison shows your fund’s performance in the context of broad market indexes for the six months ended 4/30/13. See pages 4 and 11–13 for additional fund performance information. Index descriptions can be found on page 16.
| |
| Convertible Securities Fund | 5 |
equities underlying the broad convertibles market, with enhanced downside protection. For the semiannual period, the fund’s class A shares surpassed the average return for its Lipper peer group but lagged its benchmark, the BofA Merrill Lynch All U.S. Convertibles Index.
Our decision to underweight investments in the lagging basic materials and technology sectors relative to the benchmark was prudent, as was our stock picking. We also had successful security selection in the capital goods sector. However, the fund’s underweight exposure to the strongly performing health-care sector was a drag on performance. Security selection in the health-care, financials, transportation, and energy sectors also weighed on results.
Is the economic recovery having a positive effect on issuance in the convertibles market?
Eric: We have seen a strong uptick in new convertible issuance so far in 2013. By the middle of March, new issuance was close to exceeding $10 billion, which is nearly half of 2012’s total issuance. New deals emerged across a variety of industries, and they generally appeared to offer attractive terms. Businesses have been more interested in mergers and acquisitions, and this has historically tended to give growth to the asset class.
We continue to find what we consider excellent value among convertibles in the financials, biotechnology, and energy sectors. The niche companies that are attempting to refinance debt, find creative ways to raise capital, or take shareholder-friendly actions like share buybacks have been increasingly looking to tap the convertibles market, and
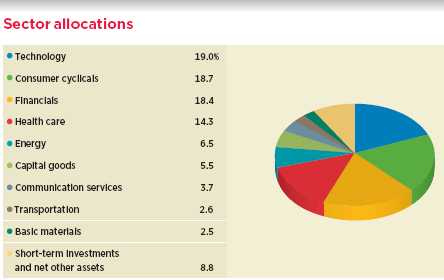
Allocations are represented as a percentage of the fund’s net assets as of 4/30/13. Short-term investments and net other assets, if any, represent the market value weights of cash, derivatives, short-term securities, and other unclassified assets in the portfolio. Summary information may differ from the portfolio schedule included in the financial statements due to the inclusion of derivative securities, any interest accruals, the exclusion of as-of trades, if any, and the use of different classifications of securities for presentation purposes. Holdings and allocations may vary over time.
| |
| 6 | Convertible Securities Fund |
we believe this bodes well for a continued boom in issuance.

What holdings made the greatest contribution to performance for the period?
Rob: The fund’s investments in the entertainment and communications services provider Virgin Media — which is based in the United Kingdom and is not in the benchmark — moved sharply higher in February when international cable company Liberty Global announced its intention to acquire the firm. We subsequently sold our Virgin Media investment, believing that the convertible’s elevated price reflected the full value of the proposed acquisition.
The fund’s overweight position in convertible bonds issued by The Medicines Company also augmented performance for the period. Medicines provides medical solutions to improve health outcomes for patients in acute- and intensive-care hospitals. This holding rallied on news that its Phase III FDA clinical trial of the drug Cangrelor, an antiplatelet therapy drug, has some positive results.
OFG Bancorp, which was formerly known as the Oriental Financial Group, is a financial holding company that provides various banking and financial services primarily to high-net-worth individuals, mainly in Puerto Rico. Prior to the reporting period in June 2012, OFG embarked upon an acquisition of retail banking assets from the
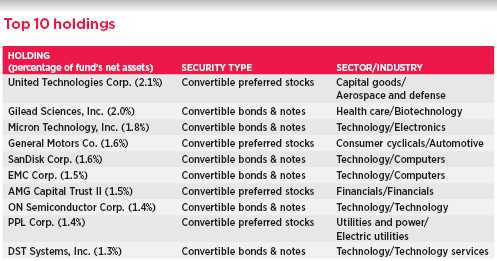
This table shows the fund’s top 10 individual holdings and the percentage of the fund’s net assets that each represented as of 4/30/13. Short-term holdings and derivatives, if any, are excluded. Holdings may vary over time.
| |
| Convertible Securities Fund | 7 |
struggling Spanish bank, BBVA. We were brought in to get a first look at the deal, and, as a result, have been involved since the beginning. In December 2012, the acquisition was approved by regulators, and OFG began the process of integrating BBVA’s assets. Investors viewed the acquisition positively, because it diversified OFG’s assets away from commercial banking into retail banking, and its stock price rose accordingly.
What stocks proved most disappointing?
Eric: The fund’s investments in two top-performing convertible preferred securities issued by Gilead Sciences were positive for the fund. However, our decision to restrict the portfolio’s exposure to Gilead, the largest issuer in the convertible market compared with the benchmark, limited the fund’s participation. We had concerns about the company’s near-term prospects due to a looming patent cliff of their preexisting HIV drugs. In addition, the efficacy of their pipeline drugs for Hepatitis C was still undetermined, in our opinion. Furthermore, we believe these two convertibles are highly equity sensitive and, consequently, can carry greater risk since they act more like a stock. We believe it was prudent to limit the fund’s exposure to these types of equity-like convertibles due to their market risk and inherent volatility, compared with a balanced convertible bond.
The global steel manufacturer ArcelorMittal brought to market the first and largest issuance early in 2013. We participated in the $2.25 billion offering given its attractive yield — a convertible coupon of 6% compared with the underlying stock’s yield of 1.57%. However, the Luxembourg-based steelmaker underperformed because of continuing weakness in overseas residential and commercial construction. ArcelorMittal’s underlying corporate fundamentals are
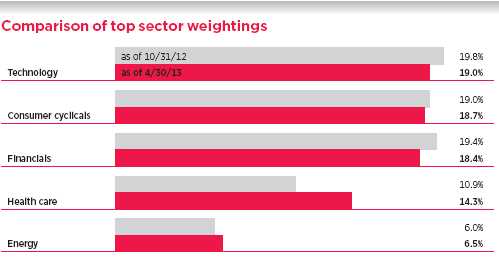
This chart shows how the fund’s top weightings have changed over the past six months. Allocations are represented as a percentage of the fund’s net assets. Current period summary information may differ from the portfolio schedule included in the financial statements due to the inclusion of derivative securities, any interest accruals, the exclusion of as-of trades, if any, and the use of different classifications of securities for presentation purposes. Holdings and allocations may vary over time.
| |
| 8 | Convertible Securities Fund |
sound in our estimation, and we remain confident in its ability to manage through the challenging economic environment abroad.
The fund’s out-of-benchmark investment in oil and gas exploration and development company, Endeavour International, proved disappointing. In our view, the company has attractive assets. However, operational missteps due to severe weather in the North Sea led to cash constraints and liquidity concerns, causing Endeavour’s convertibles to underperform. We view these developments as short term in nature and believe that the company’s longer-term prospects remain bright.
After such an impressive start to 2013, how are you approaching the coming months?
Rob: We are generally positive about prospects for the convertibles market, but are tempering that outlook with some caution given global macroeconomic uncertainties. In terms of the U.S. economy, we think we are in the middle stages of a recovery where earnings growth rates have converged, correlations have declined, and valuations are more similar across the market.
In our view, corporate credit spreads [the yield advantage corporate bonds offer over U.S. Treasuries] may remain relatively stable or move slightly tighter, particularly in the high-yield bond market, where, at period-end, spreads were near historical averages. From an equity standpoint, we believe corporate earnings may continue to improve in 2013, albeit at a moderate pace. What’s more, we believe that the stocks underlying the convertibles in the portfolio may have favorable growth prospects. There has been a sustained wave of corporate restructuring designed to improve profitability and efficiency, including workforce reductions and business-channel rationalizations.
The Fed’s stimulative bond-buying program, with its rate-dampening effect, has encouraged yield-hungry investors to seek higher-income alternatives in all areas of the financial markets, depending on their risk appetite. For investors who may decide they are overallocated to bonds, but are unwilling to go deeper into equities right away, convertibles may offer a compelling alternative.
Thank you, Eric and Rob, for your time and insights today.
The views expressed in this report are exclusively those of Putnam Management and are subject to change. They are not meant as investment advice.
Please note that the holdings discussed in this report may not have been held by the fund for the entire period. Portfolio composition is subject to review in accordance with the fund’s investment strategy and may vary in the future. Current and future portfolio holdings are subject to risk.
Portfolio Manager Eric N. Harthun has an M.B.A. from The University of Chicago Booth School of Business and a B.S. from San Diego State University. A CFA charterholder, Eric joined Putnam in 2000 and has been in the investment industry since 1994.
Portfolio Manager Robert L. Salvin has an M.B.A. from The University of Chicago Booth School of Business and a B.S. from the Wharton School of the University of Pennsylvania. He joined Putnam in 2000 and has been in the investment industry since 1986.
| |
| Convertible Securities Fund | 9 |
IN THE NEWS
The economic outlook for major industrialized nations is slowly improving, with the United States and Japan leading the way, according to a report by the Organisation for Economic Co-operation and Development (OECD). Economic expansion is also taking place in most major countries around the world, including the 17-nation eurozone, where Germany’s economy is growing and stabilization is occurring in Italy and France. Growth also is solidifying in Japan, whose new government has launched efforts to bring the country’s long-stagnant economy back to life through various stimulus efforts, and growth is picking up in China, where an economic hard landing has been avoided. The OECD sees growth weakening in India and normal, “around trend” growth taking place in Russia, Brazil, and the United Kingdom. Meanwhile, the World Trade Organization (WTO) has cut its overall 2013 forecast for global trade volume growth to 3.3% from 4.5%. Global trade grew by 2% in 2012, the second-worst figure since this economic statistic began to be tracked in 1981, according to the WTO. The worst trade figure came in 2009 during the global economic crisis.
| |
| 10 | Convertible Securities Fund |
Your fund’s performance
This section shows your fund’s performance, price, and distribution information for periods ended April 30, 2013, the end of the first half of its current fiscal year. In accordance with regulatory requirements for mutual funds, we also include performance information as of the most recent calendar quarter-end and expense information taken from the fund’s current prospectus. Performance should always be considered in light of a fund’s investment strategy. Data represent past performance. Past performance does not guarantee future results. More recent returns may be less or more than those shown. Investment return and principal value will fluctuate, and you may have a gain or a loss when you sell your shares. Performance information does not reflect any deduction for taxes a shareholder may owe on fund distributions or on the redemption of fund shares. For the most recent month-end performance, please visit the Individual Investors section at putnam.com or call Putnam at 1-800-225-1581. Class R and class Y shares are not available to all investors. See the Terms and Definitions section in this report for definitions of the share classes offered by your fund.
Fund performance Total return for periods ended 4/30/13
| | | | | | | | | | |
| | Class A | Class B | Class C | Class M | Class R | Class Y |
| (inception dates) | (6/29/72) | (7/15/93) | (7/26/99) | (3/13/95) | (12/1/03) | (12/30/98) |
|
| | Before | After | | | | | Before | After | Net | Net |
| | sales | sales | Before | After | Before | After | sales | sales | asset | asset |
| | charge | charge | CDSC | CDSC | CDSC | CDSC | charge | charge | value | value |
|
| Annual average | | | | | | | | | | |
| (life of fund) | 9.96% | 9.80% | 9.01% | 9.01% | 9.14% | 9.14% | 9.29% | 9.20% | 9.69% | 10.06% |
|
| 10 years | 119.66 | 107.03 | 103.87 | 103.87 | 103.78 | 103.78 | 108.99 | 101.68 | 114.30 | 125.33 |
| Annual average | 8.19 | 7.55 | 7.38 | 7.38 | 7.38 | 7.38 | 7.65 | 7.27 | 7.92 | 8.46 |
|
| 5 years | 30.17 | 22.69 | 25.36 | 23.36 | 25.36 | 25.36 | 26.96 | 22.52 | 28.58 | 31.86 |
| Annual average | 5.42 | 4.17 | 4.62 | 4.29 | 4.62 | 4.62 | 4.89 | 4.15 | 5.16 | 5.69 |
|
| 3 years | 28.56 | 21.17 | 25.69 | 22.69 | 25.73 | 25.73 | 26.63 | 22.20 | 27.60 | 29.55 |
| Annual average | 8.73 | 6.61 | 7.92 | 7.05 | 7.93 | 7.93 | 8.19 | 6.91 | 8.46 | 9.01 |
|
| 1 year | 15.16 | 8.54 | 14.36 | 9.36 | 14.33 | 13.33 | 14.63 | 10.61 | 14.89 | 15.51 |
|
| 6 months | 11.12 | 4.73 | 10.70 | 5.70 | 10.71 | 9.71 | 10.85 | 6.97 | 10.98 | 11.32 |
|
Current performance may be lower or higher than the quoted past performance, which cannot guarantee future results. After-sales-charge returns for class A and M shares reflect the deduction of the maximum 5.75% and 3.50% sales charge, respectively, levied at the time of purchase. Class B share returns after contingent deferred sales charge (CDSC) reflect the applicable CDSC, which is 5% in the first year, declining over time to 1% in the sixth year, and is eliminated thereafter. Class C share returns after CDSC reflect a 1% CDSC for the first year that is eliminated thereafter. Class R and Y shares have no initial sales charge or CDSC. Performance for class B, C, M, R, and Y shares before their inception is derived from the historical performance of class A shares, adjusted for the applicable sales charge (or CDSC) and the higher operating expenses for such shares, except for class Y shares, for which 12b-1 fees are not applicable.
For a portion of the periods, the fund had expense limitations, without which returns would have been lower.
Class B share performance does not reflect conversion to class A shares.
| |
| Convertible Securities Fund | 11 |
Comparative index returns For periods ended 4/30/13
| | |
| | BofA Merrill Lynch | Lipper Convertible Securities |
| | All U.S. Convertibles Index | Funds category average* |
|
| Annual average (life of fund) | —† | 9.96% |
|
| 10 years | 104.67% | 99.95 |
| Annual average | 7.42 | 7.07 |
|
| 5 years | 34.42 | 24.59 |
| Annual average | 6.09 | 4.43 |
|
| 3 years | 29.07 | 24.02 |
| Annual average | 8.88 | 7.41 |
|
| 1 year | 15.47 | 11.88 |
|
| 6 months | 12.69 | 10.84 |
|
Index and Lipper results should be compared with fund performance before sales charge, before CDSC, or at net asset value.
* Over the 6-month, 1-year, 3-year, 5-year, 10-year, and life-of-fund periods ended 4/30/13, there were 75, 74, 60, 46, 31, and 1 fund(s), respectively, in this Lipper category.
† The fund’s benchmark, the BofA Merrill Lynch All U.S. Convertibles Index, was introduced on 12/31/87, which post-dates the inception of the fund’s class A shares.
Fund price and distribution information For the six-month period ended 4/30/13
| | | | | | | | |
| Distributions | Class A | Class B | Class C | Class M | Class R | Class Y |
|
| Number | 2 | 2 | 2 | 2 | 2 | 2 |
|
| Income | $0.317 | $0.241 | $0.239 | $0.266 | $0.292 | $0.343 |
|
| Capital gains | — | — | — | — | — | — |
|
| Total | $0.317 | $0.241 | $0.239 | $0.266 | $0.292 | $0.343 |
|
| | Before | After | Net | Net | Before | After | Net | Net |
| | sales | sales | asset | asset | sales | sales | asset | asset |
| Share value | charge | charge | value | value | charge | charge | value | value |
|
| 10/31/12 | $20.09 | $21.32 | $19.75 | $19.90 | $19.91 | $20.63 | $20.02 | $20.08 |
|
| 4/30/13 | 21.99 | 23.33 | 21.61 | 21.78 | 21.79 | 22.58 | 21.91 | 21.99 |
|
| | Before | After | Net | Net | Before | After | Net | Net |
| | sales | sales | asset | asset | sales | sales | asset | asset |
| Current rate (end of period) | charge | charge | value | value | charge | charge | value | value |
|
| Current dividend rate 1 | 2.58% | 2.43% | 1.91% | 1.87% | 2.13% | 2.05% | 2.36% | 2.82% |
|
| Current 30-day SEC yield 2 | N/A | 1.53 | 0.89 | 0.89 | N/A | 1.10 | 1.38 | 1.87 |
|
The classification of distributions, if any, is an estimate. Before-sales-charge share value and current dividend rate for class A and M shares, if applicable, do not take into account any sales charge levied at the time of purchase. After-sales-charge share value, current dividend rate, and current 30-day SEC yield, if applicable, are calculated assuming that the maximum sales charge (5.75% for class A shares and 3.50% for class M shares) was levied at the time of purchase. Final distribution information will appear on your year-end tax forms.
1 Most recent distribution, including any return of capital and excluding capital gains, annualized and divided by share price before or after sales charge at period-end.
2 Based only on investment income and calculated using the maximum offering price for each share class, in accordance with SEC guidelines.
| |
| 12 | Convertible Securities Fund |
Fund performance as of most recent calendar quarter
Total return for periods ended 3/31/13
| | | | | | | | | | |
| | Class A | Class B | Class C | Class M | Class R | Class Y |
| (inception dates) | (6/29/72) | (7/15/93) | (7/26/99) | (3/13/95) | (12/1/03) | (12/30/98) |
|
| | Before | After | | | | | Before | After | Net | Net |
| | sales | sales | Before | After | Before | After | sales | sales | asset | asset |
| | charge | charge | CDSC | CDSC | CDSC | CDSC | charge | charge | value | value |
|
| Annual average | | | | | | | | | | |
| (life of fund) | 9.95% | 9.79% | 9.00% | 9.00% | 9.12% | 9.12% | 9.28% | 9.18% | 9.68% | 10.05% |
|
| 10 years | 128.48 | 115.34 | 112.05 | 112.05 | 112.02 | 112.02 | 117.37 | 109.77 | 122.98 | 134.27 |
| Annual average | 8.61 | 7.97 | 7.81 | 7.81 | 7.80 | 7.80 | 8.07 | 7.69 | 8.35 | 8.89 |
|
| 5 years | 35.26 | 27.48 | 30.31 | 28.31 | 30.35 | 30.35 | 31.95 | 27.33 | 33.68 | 37.02 |
| Annual average | 6.23 | 4.98 | 5.44 | 5.11 | 5.44 | 5.44 | 5.70 | 4.95 | 5.98 | 6.50 |
|
| 3 years | 29.69 | 22.23 | 26.85 | 23.85 | 26.82 | 26.82 | 27.74 | 23.27 | 28.78 | 30.70 |
| Annual average | 9.05 | 6.92 | 8.25 | 7.39 | 8.24 | 8.24 | 8.50 | 7.22 | 8.80 | 9.33 |
|
| 1 year | 11.65 | 5.23 | 10.86 | 5.86 | 10.85 | 9.85 | 11.09 | 7.20 | 11.42 | 11.93 |
|
| 6 months | 9.70 | 3.40 | 9.31 | 4.31 | 9.33 | 8.33 | 9.42 | 5.59 | 9.61 | 9.84 |
|
See the discussion following the Fund performance table on page 11 for information about the calculation of fund performance.
Your fund’s expenses
As a mutual fund investor, you pay ongoing expenses, such as management fees, distribution fees (12b-1 fees), and other expenses. Using the following information, you can estimate how these expenses affect your investment and compare them with the expenses of other funds. You may also pay one-time transaction expenses, including sales charges (loads) and redemption fees, which are not shown in this section and would have resulted in higher total expenses. For more information, see your fund’s prospectus or talk to your financial representative.
Expense ratios
| | | | | | |
| | Class A | Class B | Class C | Class M | Class R | Class Y |
|
| Total annual operating expenses | | | | | | |
| for the fiscal year ended 10/31/12 | 1.11% | 1.86% | 1.86% | 1.61% | 1.36% | 0.86% |
|
| Annualized expense ratio for the | | | | | | |
| six-month period ended 4/30/13 | 1.10% | 1.85% | 1.85% | 1.60% | 1.35% | 0.85% |
|
Fiscal-year expense information in this table is taken from the most recent prospectus, is subject to change, and may differ from that shown for the annualized expense ratio and in the financial highlights of this report. Expenses are shown as a percentage of average net assets.
| |
| Convertible Securities Fund | 13 |
Expenses per $1,000
The following table shows the expenses you would have paid on a $1,000 investment in the fund from November 1, 2012, to April 30, 2013. It also shows how much a $1,000 investment would be worth at the close of the period, assuming actual returns and expenses.
| | | | | | |
| | Class A | Class B | Class C | Class M | Class R | Class Y |
|
| Expenses paid per $1,000*† | $5.76 | $9.66 | $9.67 | $8.36 | $7.06 | $4.45 |
|
| Ending value (after expenses) | $1,111.20 | $1,107.00 | $1,107.10 | $1,108.50 | $1,109.80 | $1,113.20 |
|
* Expenses for each share class are calculated using the fund’s annualized expense ratio for each class, which represents the ongoing expenses as a percentage of average net assets for the six months ended 4/30/13. The expense ratio may differ for each share class.
† Expenses are calculated by multiplying the expense ratio by the average account value for the period; then multiplying the result by the number of days in the period; and then dividing that result by the number of days in the year.
Estimate the expenses you paid
To estimate the ongoing expenses you paid for the six months ended April 30, 2013, use the following calculation method. To find the value of your investment on November 1, 2012, call Putnam at 1-800-225-1581.

Compare expenses using the SEC’s method
The Securities and Exchange Commission (SEC) has established guidelines to help investors assess fund expenses. Per these guidelines, the following table shows your fund’s expenses based on a $1,000 investment, assuming a hypothetical 5% annualized return. You can use this information to compare the ongoing expenses (but not transaction expenses or total costs) of investing in the fund with those of other funds. All mutual fund shareholder reports will provide this information to help you make this comparison. Please note that you cannot use this information to estimate your actual ending account balance and expenses paid during the period.
| | | | | | |
| | Class A | Class B | Class C | Class M | Class R | Class Y |
|
| Expenses paid per $1,000*† | $5.51 | $9.25 | $9.25 | $8.00 | $6.76 | $4.26 |
|
| Ending value (after expenses) | $1,019.34 | $1,015.62 | $1,015.62 | $1,016.86 | $1,018.10 | $1,020.58 |
|
* Expenses for each share class are calculated using the fund’s annualized expense ratio for each class, which represents the ongoing expenses as a percentage of average net assets for the six months ended 4/30/13. The expense ratio may differ for each share class.
† Expenses are calculated by multiplying the expense ratio by the average account value for the period; then multiplying the result by the number of days in the period; and then dividing that result by the number of days in the year.
| |
| 14 | Convertible Securities Fund |
Terms and definitions
Important terms
Total return shows how the value of the fund’s shares changed over time, assuming you held the shares through the entire period and reinvested all distributions in the fund.
Before sales charge, or net asset value, is the price, or value, of one share of a mutual fund, without a sales charge. Before-sales-charge figures fluctuate with market conditions, and are calculated by dividing the net assets of each class of shares by the number of outstanding shares in the class.
After sales charge is the price of a mutual fund share plus the maximum sales charge levied at the time of purchase. After-sales-charge performance figures shown here assume the 5.75% maximum sales charge for class A shares and 3.50% for class M shares.
Contingent deferred sales charge (CDSC) is generally a charge applied at the time of the redemption of class B or C shares and assumes redemption at the end of the period. Your fund’s class B CDSC declines over time from a 5% maximum during the first year to 1% during the sixth year. After the sixth year, the CDSC no longer applies. The CDSC for class C shares is 1% for one year after purchase.
Share classes
Class A shares are generally subject to an initial sales charge and no CDSC (except on certain redemptions of shares bought without an initial sales charge).
Class B shares are not subject to an initial sales charge. They may be subject to a CDSC.
Class C shares are not subject to an initial sales charge and are subject to a CDSC only if the shares are redeemed during the first year.
Class M shares have a lower initial sales charge and a higher 12b-1 fee than class A shares and no CDSC (except on certain redemptions of shares bought without an initial sales charge).
Class R shares are not subject to an initial sales charge or CDSC and are available only to certain defined contribution plans.
Class Y shares are not subject to an initial sales charge or CDSC, and carry no 12b-1 fee. They are generally only available to corporate and institutional clients and clients in other approved programs.
Fixed-income terms
Current yield is the annual rate of return earned from dividends or interest of an investment. Current yield is expressed as a percentage of the price of a security, fund share, or principal investment.
Mortgage-backed security (MBS), also known as a mortgage “pass-through,” is a type of asset-backed security that is secured by a mortgage or collection of mortgages. The following are types of MBSs:
• Agency “pass-through” has its principal and interest backed by a U.S. government agency, such as the Federal National Mortgage Association (Fannie Mae), Government National Mortgage Association (Ginnie Mae), and Federal Home Loan Mortgage Corporation (Freddie Mac).
• Collateralized mortgage obligation (CMO) represents claims to specific cash flows from pools of home mortgages. The streams of principal and interest payments on the mortgages are distributed to the different classes of CMO interests in “tranches.” Each tranche may have different principal balances, coupon rates, prepayment risks, and maturity dates. A CMO is highly sensitive to changes in interest rates and any resulting change in the rate at which homeowners sell their properties, refinance, or otherwise prepay loans. CMOs are subject to prepayment, market, and liquidity risks.
• Interest-only (IO) security is a type of CMO in which the underlying asset is the interest portion of mortgage, Treasury, or bond payments.
• Non-agency residential mortgage-backed security (RMBS) is an MBS not backed by Fannie Mae, Ginnie Mae, or Freddie Mac. One type of RMBS is an Alt-A mortgage-backed security.
• Commercial mortgage-backed security (CMBS) is secured by the loan on a commercial property.
Yield curve is a graph that plots the yields of bonds with equal credit quality against their differing maturity dates, ranging from shortest to longest. It is used as a benchmark for other debt, such as mortgage or bank lending rates.
| |
| Convertible Securities Fund | 15 |
Comparative indexes
Barclays U.S. Aggregate Bond Index is an unmanaged index of U.S. investment-grade fixed-income securities.
BofA Merrill Lynch U.S. 3-Month Treasury Bill Index is an unmanaged index that seeks to measure the performance of U.S. Treasury bills available in the marketplace.
BofA Merrill Lynch All U.S. Convertibles Index is an unmanaged index of high-yield U.S. convertible securities.
S&P 500 Index is an unmanaged index of common stock performance.
Indexes assume reinvestment of all distributions and do not account for fees. Securities and performance of a fund and an index will differ. You cannot invest directly in an index.
Lipper is a third-party industry-ranking entity that ranks mutual funds. Its rankings do not reflect sales charges. Lipper rankings are based on total return at net asset value relative to other funds that have similar current investment styles or objectives as determined by Lipper. Lipper may change a fund’s category assignment at its discretion. Lipper category averages reflect performance trends for funds within a category.
Other information for shareholders
Important notice regarding delivery of shareholder documents
In accordance with Securities and Exchange Commission (SEC) regulations, Putnam sends a single copy of annual and semiannual shareholder reports, prospectuses, and proxy statements to Putnam shareholders who share the same address, unless a shareholder requests otherwise. If you prefer to receive your own copy of these documents, please call Putnam at 1-800-225-1581, and Putnam will begin sending individual copies within 30 days.
Proxy voting
Putnam is committed to managing our mutual funds in the best interests of our shareholders. The Putnam funds’ proxy voting guidelines and procedures, as well as information regarding how your fund voted proxies relating to portfolio securities during the 12-month period ended June 30, 2012, are available in the Individual Investors section of putnam.com, and on the SEC’s website, www.sec.gov. If you have questions about finding forms on the SEC’s website, you may call the SEC at 1-800-SEC-0330. You may also obtain the Putnam funds’ proxy voting guidelines and procedures at no charge by calling Putnam’s Shareholder Services at 1-800-225-1581.
Fund portfolio holdings
The fund will file a complete schedule of its portfolio holdings with the SEC for the first and third quarters of each fiscal year on Form N-Q. Shareholders may obtain the fund’s Forms N-Q on the SEC’s website at www.sec.gov. In addition, the fund’s Forms N-Q may be reviewed and copied at the SEC’s Public Reference Room in Washington, D.C. You may call the SEC at 1-800-SEC-0330 for information about the SEC’s website or the operation of the Public Reference Room.
Trustee and employee fund ownership
Putnam employees and members of the Board of Trustees place their faith, confidence, and, most importantly, investment dollars in Putnam mutual funds. As of April 30, 2013, Putnam employees had approximately $381,000,000 and the Trustees had approximately $91,000,000 invested in Putnam mutual funds. These amounts include investments by the Trustees’ and employees’ immediate family members as well as investments through retirement and deferred compensation plans.
| |
| 16 | Convertible Securities Fund |
Financial statements
A guide to financial statements
These sections of the report, as well as the accompanying Notes, constitute the fund’s financial statements.
The fund’s portfolio lists all the fund’s investments and their values as of the last day of the reporting period. Holdings are organized by asset type and industry sector, country, or state to show areas of concentration and diversification.
Statement of assets and liabilities shows how the fund’s net assets and share price are determined. All investment and non-investment assets are added together. Any unpaid expenses and other liabilities are subtracted from this total. The result is divided by the number of shares to determine the net asset value per share, which is calculated separately for each class of shares. (For funds with preferred shares, the amount subtracted from total assets includes the liquidation preference of preferred shares.)
Statement of operations shows the fund’s net investment gain or loss. This is done by first adding up all the fund’s earnings — from dividends and interest income — and subtracting its operating expenses to determine net investment income (or loss). Then, any net gain or loss the fund realized on the sales of its holdings — as well as any unrealized gains or losses over the period — is added to or subtracted from the net investment result to determine the fund’s net gain or loss for the fiscal period.
Statement of changes in net assets shows how the fund’s net assets were affected by the fund’s net investment gain or loss, by distributions to shareholders, and by changes in the number of the fund’s shares. It lists distributions and their sources (net investment income or realized capital gains) over the current reporting period and the most recent fiscal year-end. The distributions listed here may not match the sources listed in the Statement of operations because the distributions are determined on a tax basis and may be paid in a different period from the one in which they were earned. Dividend sources are estimated at the time of declaration. Actual results may vary. Any non-taxable return of capital cannot be determined until final tax calculations are completed after the end of the fund’s fiscal year.
Financial highlights provide an overview of the fund’s investment results, per-share distributions, expense ratios, net investment income ratios, and portfolio turnover in one summary table, reflecting the five most recent reporting periods. In a semiannual report, the highlights table also includes the current reporting period.
| |
| Convertible Securities Fund | 17 |
The fund’s portfolio 4/30/13 (Unaudited)
| | | |
| CONVERTIBLE BONDS AND NOTES (68.8%)* | | Principal amount | Value |
|
| Aerospace and defense (0.5%) | | | |
| Triumph Group, Inc. cv. sr. unsec. sub. notes 2 5/8s, 2026 | | $1,130,000 | $3,323,613 |
|
| | | | 3,323,613 |
| Airlines (—%) | | | |
| Lufthansa Malta Blues LP 144A cv. sr. unsec. notes 0 3/4s, | | | |
| 2017 (Malta) | EUR | 17,000 | 28,237 |
|
| | | | 28,237 |
| Automotive (1.3%) | | | |
| Ford Motor Co. cv. sr. unsec. notes 4 1/4s, 2016 | | $3,455,000 | 5,687,794 |
|
| TRW Automotive, Inc. cv. company guaranty sr. unsec. notes | | | |
| 3 1/2s, 2015 | | 1,775,000 | 3,725,193 |
|
| | | | 9,412,987 |
| Biotechnology (6.8%) | | | |
| Auxilium Pharmaceuticals, Inc. cv. sr. unsec. notes 1 1/2s, 2018 | | 5,048,000 | 4,701,202 |
|
| BioMarin Pharmaceuticals, Inc. cv. sr. sub. notes 1 7/8s, 2017 | | 620,000 | 2,013,450 |
|
| Cubist Pharmaceuticals, Inc. cv. sr. unsec. notes 2 1/2s, 2017 | | 3,775,000 | 6,384,469 |
|
| Dendreon Corp. cv. sr. unsec. notes 2 7/8s, 2016 | | 5,050,000 | 3,995,813 |
|
| Gilead Sciences, Inc. cv. sr. unsec. notes 1 5/8s, 2016 | | 6,195,000 | 13,913,970 |
|
| Medicines Co. (The) 144A cv. sr. unsec. notes 1 3/8s, 2017 | | 4,012,000 | 5,476,380 |
|
| Onyx Pharmaceuticals, Inc. cv. sr. unsec. notes 4s, 2016 | | 735,000 | 1,822,341 |
|
| PDL BioPharma, Inc. cv. sr. unsec. notes 3 3/4s, 2015 | | 4,570,000 | 5,683,938 |
|
| United Therapeutics Corp. cv. sr. unsec. notes 1s, 2016 | | 2,451,000 | 3,615,715 |
|
| | | | 47,607,278 |
| Broadcasting (0.8%) | | | |
| XM Satellite Radio, Inc. 144A cv. company guaranty sr. unsec. | | | |
| sub. notes 7s, 2014 | | 2,858,000 | 5,294,445 |
|
| | | | 5,294,445 |
| Coal (0.6%) | | | |
| Peabody Energy Corp. cv. jr. unsec. sub. debs. 4 3/4s, 2041 | | 5,415,000 | 4,392,919 |
|
| | | | 4,392,919 |
| Commercial and consumer services (2.1%) | | | |
| Alliance Data Systems Corp. cv. sr. unsec. notes 1 3/4s, 2013 | | 1,845,000 | 4,025,559 |
|
| CBIZ, Inc. 144A cv. sr. sub. notes 4 7/8s, 2015 | | 3,660,000 | 4,028,288 |
|
| Priceline.com, Inc. cv. sr. unsec. unsub. notes 1s, 2018 | | 5,784,000 | 6,579,300 |
|
| | | | 14,633,147 |
| Communications equipment (0.4%) | | | |
| Coinstar, Inc. cv. sr. unsec. unsub. notes 4s, 2014 | | 2,300,000 | 3,008,688 |
|
| | | | 3,008,688 |
| Computers (3.1%) | | | |
| EMC Corp. cv. sr. unsec. notes 1 3/4s, 2013 | | 7,610,000 | 10,720,588 |
|
| SanDisk Corp. cv. sr. unsec. notes 1 1/2s, 2017 | | 8,625,000 | 10,878,281 |
|
| | | | 21,598,869 |
| Conglomerates (0.8%) | | | |
| Siemens Financieringsmaatschappij N.V. cv. company guaranty | | | |
| sr. unsec. bonds 1.65s, 2019 (Netherlands) | | 5,250,000 | 5,577,075 |
|
| | | | 5,577,075 |
| Construction (0.8%) | | | |
| CEMEX SAB de CV cv. unsec. sub. notes 4 7/8s, 2015 (Mexico) | | 4,880,000 | 5,834,650 |
|
| | | | 5,834,650 |
| Consumer (0.8%) | | | |
| Jarden Corp. 144A cv. company guaranty sr. unsec. sub. notes | | | |
| 1 7/8s, 2018 | | 4,486,000 | 5,271,050 |
|
| | | | 5,271,050 |
| |
| 18 | Convertible Securities Fund |
| | |
| CONVERTIBLE BONDS AND NOTES (68.8%)* cont. | Principal amount | Value |
|
| Consumer finance (2.3%) | | |
| DFC Global Corp. 144A cv. sr. unsec. unsub. notes 3 1/4s, 2017 | $4,924,000 | $4,862,450 |
|
| Encore Capital Group, Inc. 144A cv. sr. unsec. unsub. | | |
| notes 3s, 2017 | 2,236,000 | 2,477,768 |
|
| PHH Corp. cv. sr. unsec. unsub. notes 6s, 2017 | 1,840,000 | 3,429,300 |
|
| Walter Investment Management Corp. cv. sr. unsec. sub. notes | | |
| 4 1/2s, 2019 | 4,845,000 | 5,154,111 |
|
| | | 15,923,629 |
| Consumer services (0.3%) | | |
| Hertz Global Holdings, Inc. cv. sr. unsec. notes 5 1/4s, 2014 | 770,000 | 2,254,175 |
|
| | | 2,254,175 |
| Electronics (5.6%) | | |
| Intel Corp. cv. jr. sub. notes 3 1/4s, 2039 | 5,805,000 | 7,444,913 |
|
| Mentor Graphics Corp. cv. sub. unsec. notes 4s, 2031 | 4,175,000 | 4,923,891 |
|
| Micron Technology, Inc. 144A cv. sr. unsec. notes 1 5/8s, 2033 | 10,853,000 | 12,311,372 |
|
| Vishay Intertechnology, Inc. 144A cv. sr. unsec. notes | | |
| 2 1/4s, 2041 | 6,180,000 | 5,816,925 |
|
| Xilinx, Inc. cv. sr. unsec. notes 2 5/8s, 2017 | 6,235,000 | 8,877,081 |
|
| | | 39,374,182 |
| Energy (oil field) (1.3%) | | |
| Hornbeck Offshore Services, Inc. 144A cv. company guaranty | | |
| sr. unsec. notes 1 1/2s, 2019 | 3,774,000 | 4,382,746 |
|
| SEACOR Holdings, Inc. 144A cv. sr. unsec. unsub. notes | | |
| 2 1/2s, 2027 | 4,623,000 | 5,056,406 |
|
| | | 9,439,152 |
| Health-care services (2.2%) | | |
| Brookdale Senior Living, Inc. cv. sr. unsec. unsub. notes | | |
| 2 3/4s, 2018 | 5,057,000 | 5,935,654 |
|
| Molina Healthcare, Inc. 144A cv. sr. unsec. notes 1 1/8s, 2020 | 3,185,000 | 3,360,175 |
|
| WellPoint, Inc. 144A cv. sr. unsec. notes 2 3/4s, 2042 | 5,075,000 | 6,074,141 |
|
| | | 15,369,970 |
| Homebuilding (5.0%) | | |
| Forest City Enterprises, Inc. cv. sr. unsec. notes 4 1/4s, 2018 | 8,170,000 | 9,226,994 |
|
| Forestar Group, Inc. cv. sr. unsec. unsub. notes 3 3/4s, 2020 | 3,348,000 | 3,931,808 |
|
| Lennar Corp. 144A cv. sr. notes 2 3/4s, 2020 | 1,934,000 | 3,728,994 |
|
| M/I Homes, Inc. cv. company guaranty sr. sub. notes 3s, 2018 | 4,836,000 | 5,162,430 |
|
| Ryland Group, Inc. (The) cv. company guaranty sr. unsub. notes | | |
| 1 5/8s, 2018 | 2,513,000 | 3,953,263 |
|
| Standard Pacific Corp. cv. company guaranty sr. unsec. unsub. | | |
| notes 1 1/4s, 2032 | 4,045,000 | 5,407,659 |
|
| Toll Brothers, Inc. 144A cv. company guaranty sr. unsec. notes | | |
| 0 1/2s, 2032 | 3,066,000 | 3,242,295 |
|
| | | 34,653,443 |
| Insurance (0.9%) | | |
| Fidelity National Financial, Inc. cv. sr. unsec. unsub. notes | | |
| 4 1/4s, 2018 | 4,690,000 | 6,618,763 |
|
| | | 6,618,763 |
| Investment banking/Brokerage (1.1%) | | |
| Ares Capital Corp. cv. sr. unsec. notes 5 3/4s, 2016 | 6,193,000 | 6,789,076 |
|
| Hercules Technology Growth Capital, Inc. cv. sr. unsec. | | |
| notes 6s, 2016 | 732,000 | 827,618 |
|
| | | 7,616,694 |
| |
| Convertible Securities Fund | 19 |
| | |
| CONVERTIBLE BONDS AND NOTES (68.8%)* cont. | Principal amount | Value |
|
| Lodging/Tourism (2.4%) | | |
| Host Hotels & Resorts LP 144A cv. company guaranty sr. unsec. | | |
| notes 2 1/2s, 2029 R | $5,475,000 | $7,870,313 |
|
| MGM Resorts International Co. cv. company guaranty sr. unsec. | | |
| notes 4 1/4s, 2015 | 8,255,000 | 9,137,253 |
|
| | | 17,007,566 |
| Machinery (0.3%) | | |
| Chart Industries, Inc. cv. srcv. sr. unsec. sub. notes 2s, 2018 | 1,290,000 | 1,827,027 |
|
| | | 1,827,027 |
| Manufacturing (1.8%) | | |
| General Cable Corp. cv. unsec. sub. notes stepped-coupon | | |
| stepped-coupon 4 1/2s (2 1/4s, 11/15/19) 2029 †† | 3,820,000 | 4,660,400 |
|
| MasTec, Inc. cv. company guaranty sr. unsec. unsub. notes | | |
| 4 1/4s, 2014 | 1,750,000 | 3,233,125 |
|
| Trinity Industries, Inc. cv. unsec. sub. notes 3 7/8s, 2036 | 4,185,000 | 4,967,072 |
|
| | | 12,860,597 |
| Media (2.7%) | | |
| Liberty Interactive, LLC cv. sr. unsec. unsub. notes 3 1/2s, 2031 | 15,055,000 | 7,772,144 |
|
| Liberty Interactive, LLC cv. sr. unsec. unsub. notes 3 1/8s, 2023 | 4,003,000 | 6,622,964 |
|
| Liberty Interactive, LLC 144A cv. sr. unsec. unsub. notes | | |
| 0 3/4s, 2043 | 4,452,000 | 4,622,066 |
|
| | | 19,017,174 |
| Medical technology (3.0%) | | |
| China Medical Technologies, Inc. cv. sr. unsec. bonds Ser. CMT, | | |
| 4s, 2013 (China) (In default) † F | 3,213,000 | 257,040 |
|
| China Medical Technologies, Inc. 144A cv. sr. unsec. notes | | |
| 6 1/4s, 2016 (China) (In default) † F | 3,544,000 | 248,080 |
|
| Hologic, Inc. cv. sr. unsec. unsub. notes stepped-coupon | | |
| stepped-coupon 2s (0s, 3/1/18) 2042 †† | 6,335,000 | 6,457,741 |
|
| Insulet Corp. cv. sr. unsec. notes 3 3/4s, 2016 | 2,860,000 | 3,355,138 |
|
| Teleflex, Inc. cv. sr. unsec. sub. notes 3 7/8s, 2017 | 4,211,000 | 5,769,070 |
|
| Volcano Corp. cv. sr. unsec. unsub. notes 1 3/4s, 2017 | 5,294,000 | 5,125,254 |
|
| | | 21,212,323 |
| Metals (0.7%) | | |
| Newmont Mining Corp. cv. company guaranty sr. unsub. notes | | |
| 1 5/8s, 2017 | 4,450,000 | 5,047,969 |
|
| | | 5,047,969 |
| Oil and gas (2.9%) | | |
| Chesapeake Energy Corp. cv. company guaranty sr. unsec. | | |
| notes 2 1/2s, 2037 | 5,165,000 | 4,987,453 |
|
| Cobalt International Energy, Inc. cv. sr. unsec. unsub. notes | | |
| 2 5/8s, 2019 | 5,958,000 | 6,661,789 |
|
| Endeavour International Corp. cv. company guaranty sr. unsec. | | |
| unsub. notes 5 1/2s, 2016 | 1,641,000 | 984,600 |
|
| Goodrich Petroleum Corp. cv. sr. unsec. unsub. notes 5s, 2029 | 3,525,000 | 3,505,172 |
|
| Vantage Drilling Co. cv. sr. unsec. unsub. notes 7 7/8s, 2042 | 3,601,000 | 4,080,293 |
|
| | | 20,219,307 |
| Pharmaceuticals (1.2%) | | |
| Endo Pharmaceuticals Holdings, Inc. cv. sr. unsec. sub. notes | | |
| 1 3/4s, 2015 | 4,320,000 | 5,826,600 |
|
| Opko Health, Inc. 144A cv. sr. unsec. notes 3s, 2033 | 2,755,000 | 2,736,059 |
|
| | | 8,562,659 |
| |
| 20 | Convertible Securities Fund |
| | |
| CONVERTIBLE BONDS AND NOTES (68.8%)* cont. | Principal amount | Value |
|
| Real estate (3.3%) | | |
| Digital Realty Trust LP 144A cv. sr. unsec. notes 5 1/2s, 2029 R | $2,120,000 | $3,736,500 |
|
| iStar Financial, Inc. cv. sr. unsec. unsub. notes 3s, 2016 R | 6,036,000 | 7,401,645 |
|
| Morgans Hotel Group Co. cv. sr. sub. notes 2 3/8s, 2014 R | 5,145,000 | 4,990,650 |
|
| RAIT Financial Trust cv. sr. unsec. unsub. notes 7s, 2031 R | 1,538,000 | 2,074,454 |
|
| Starwood Property Trust, Inc. cv. sr. unsec. unsub. notes | | |
| 4.55s, 2018 R | 4,107,000 | 4,548,503 |
|
| | | 22,751,752 |
| Semiconductor (2.8%) | | |
| Linear Technology Corp. cv. sr. unsec. unsub. notes | | |
| Ser. A, 3s, 2027 | 5,975,000 | 6,307,359 |
|
| Novellus Systems, Inc. cv. sr. unsec. notes 2 5/8s, 2041 | 5,430,000 | 8,084,184 |
|
| Photronics, Inc. cv. sr. unsec. notes 3 1/4s, 2016 | 4,763,000 | 5,248,231 |
|
| | | 19,639,774 |
| Shipping (0.1%) | | |
| Genco Shipping & Trading, Ltd. cv. sr. unsec. notes 5s, 2015 | 2,285,000 | 732,628 |
|
| | | 732,628 |
| Software (2.5%) | | |
| Dealertrack Technologies, Inc. cv. company guaranty sr. unsec. | | |
| notes 1 1/2s, 2017 | 5,468,000 | 5,765,323 |
|
| Safeguard Scientifics, Inc. 144A cv. sr. unsec. notes 5 1/4s, 2018 | 6,200,000 | 6,851,000 |
|
| SYNNEX Corp. cv. sr. notes 4s, 2018 | 963,000 | 1,122,497 |
|
| TeleCommunication Systems, Inc. 144A cv. sr. unsec. notes | | |
| 4 1/2s, 2014 | 3,640,000 | 3,494,400 |
|
| | | 17,233,220 |
| Technology (2.3%) | | |
| CACI International, Inc. cv. sr. unsec. sub. notes 2 1/8s, 2014 | 4,970,000 | 5,696,863 |
|
| ON Semiconductor Corp. cv. company guaranty sr. unsec. sub. | | |
| notes Ser. B, 2 5/8s, 2026 | 8,827,000 | 10,040,713 |
|
| | | 15,737,576 |
| Technology services (1.3%) | | |
| DST Systems, Inc. cv. sr. unsec. unsub. bonds FRB Ser. C, | | |
| 0.542s, 2023 | 6,360,000 | 9,353,175 |
|
| | | 9,353,175 |
| Telecommunications (2.3%) | | |
| Equinix, Inc. cv. sr. unsec. sub. notes 4 3/4s, 2016 | 1,355,000 | 3,528,928 |
|
| Level 3 Communications, Inc. cv. sr. unsec. unsub. notes | | |
| 6 1/2s, 2016 | 3,780,000 | 5,084,100 |
|
| Powerwave Technologies, Inc. cv. sr. unsec. sub. notes 3 7/8s, | | |
| 2027 (In default) † | 5,121,000 | 12,803 |
|
| SBA Communications Corp. cv. sr. unsec. notes 4s, 2014 | 2,765,000 | 7,235,659 |
|
| | | 15,861,490 |
| Telephone (0.5%) | | |
| Leap Wireless International, Inc. cv. sr. unsec. notes 4 1/2s, 2014 | 3,445,000 | 3,513,900 |
|
| | | 3,513,900 |
| Tobacco (1.1%) | | |
| Vector Group Ltd. cv. sr. unsec. FRN notes 2 1/2s, 2019 | 6,605,000 | 7,670,056 |
|
| | | 7,670,056 |
| Waste Management (0.9%) | | |
| Covanta Holding Corp. cv. sr. unsec. notes 3 1/4s, 2014 | 4,605,000 | 5,954,841 |
|
| | | 5,954,841 |
| | | |
| Total convertible bonds and notes (cost $433,704,193) | | $481,436,000 |
| |
| Convertible Securities Fund | 21 |
| | |
| CONVERTIBLE PREFERRED STOCKS (25.0%)* | Shares | Value |
|
| Aerospace and defense (2.1%) | | |
| United Technologies Corp. $3.75 cv. pfd. | 246,885 | $14,600,779 |
|
| | | 14,600,779 |
| Airlines (0.8%) | | |
| Continental Financial Trust II $3.00 cv. pfd. | 123,410 | 5,866,911 |
|
| | | 5,866,911 |
| Automotive (1.6%) | | |
| General Motors Co. Ser. B, $2.375 cv. pfd. | 235,750 | 10,962,375 |
|
| | | 10,962,375 |
| Banking (4.2%) | | |
| Bank of America Corp. Ser. L, 7.25% cv. pfd. | 7,150 | 8,888,344 |
|
| Huntington Bancshares Ser. A, 8.50% cv. pfd. | 2,707 | 3,643,622 |
|
| OFG Bancorp 144A Ser. C, 8.75% cv. pfd. (Puerto Rico) | 3,077 | 4,790,889 |
|
| Wells Fargo & Co. Ser. L, 7.50% cv. pfd. | 5,325 | 7,001,044 |
|
| Wintrust Financial Corp. $3.75 cv. pfd. | 93,135 | 4,931,498 |
|
| | | 29,255,397 |
| Consumer (1.1%) | | |
| Stanley Black & Decker, Inc. $4.75 cv. pfd. | 62,561 | 7,648,708 |
|
| | | 7,648,708 |
| Electric utilities (2.4%) | | |
| NextEra Energy, Inc. $2.799 cv. pfd. | 129,290 | 7,395,388 |
|
| PPL Corp. $4.375 cv. pfd. | 164,060 | 9,444,934 |
|
| | | 16,840,322 |
| Financial (1.5%) | | |
| AMG Capital Trust II $2.575 cv. pfd. | 190,390 | 10,233,463 |
|
| | | 10,233,463 |
| Food (0.7%) | | |
| Post Holdings, Inc. 144A $3.75 cv. pfd. | 45,185 | 4,987,520 |
|
| | | 4,987,520 |
| Health-care services (1.0%) | | |
| HealthSouth Corp. Ser. A, 6.50% cv. pfd. | 5,890 | 7,112,175 |
|
| | | 7,112,175 |
| Insurance (0.9%) | | |
| MetLife, Inc. $3.75 cv. pfd. | 127,133 | 6,352,836 |
|
| | | 6,352,836 |
| Media (0.6%) | | |
| Interpublic Group of Cos, Inc. (The) Ser. B, 5.25% cv. pfd. | 3,221 | 3,961,830 |
|
| | | 3,961,830 |
| Metals (0.9%) | | |
| ArcelorMittal Ser. MTUS, $1.50 cv. pfd. (France) | 289,390 | 5,952,752 |
|
| | | 5,952,752 |
| Oil and gas (1.7%) | | |
| Apache Corp. Ser. D, $3.00 cv. pfd. | 77,271 | 3,259,870 |
|
| Chesapeake Energy Corp. 144A 5.75% cv. pfd. | 8,384 | 8,478,320 |
|
| | | 11,738,190 |
| Railroads (1.0%) | | |
| Genesee & Wyoming, Inc. $5.00 cv. pfd. | 60,308 | 7,285,206 |
|
| | | 7,285,206 |
| Real estate (3.2%) | | |
| Alexandria Real Estate Equities, Inc. Ser. D, $1.75 cv. pfd. R | 252,280 | 6,953,468 |
|
| EPR Properties Ser. C, $1.44 cv. pfd. | 308,312 | 7,491,982 |
|
| Health Care REIT, Inc. Ser. I, $3.25 cv. pfd. R | 123,520 | 8,269,664 |
|
| | | 22,715,114 |
| |
| 22 | Convertible Securities Fund |
| | |
| CONVERTIBLE PREFERRED STOCKS (25.0%)* cont. | Shares | Value |
|
| Shipping (0.6%) | | |
| Swift Mandatory Common Exchange Security Trust 144A 6.00% cv. pfd. | 357,750 | $4,429,625 |
|
| | | 4,429,625 |
| Technology services (0.2%) | | |
| Unisys Corp. Ser. A, 6.25% cv. pfd. | 26,410 | 1,507,021 |
|
| | | 1,507,021 |
| Telecommunications (0.5%) | | |
| Iridium Communications, Inc. 144A $7.00 cv. pfd. | 33,766 | 3,254,198 |
|
| | | 3,254,198 |
| | | |
| Total convertible preferred stocks (cost $161,709,003) | | $174,704,422 |
| |
| |
| COMMON STOCKS (1.7%)* | Shares | Value |
|
| Brazil Ethanol, Inc. 144A (Unit) F | 312,500 | $31 |
|
| Citigroup, Inc. | 39,037 | 1,821,466 |
|
| DISH Network Corp. Class A | 22,320 | 874,721 |
|
| General Motors Co. † | 98,735 | 3,044,987 |
|
| Hartford Financial Services Group, Inc. (The) | 67,700 | 1,901,693 |
|
| Liberty Global, Inc. Ser. C † | 24,480 | 1,656,072 |
|
| MetLife, Inc. | 44,855 | 1,748,896 |
|
| Sprint Nextel Corp. † | 146,425 | 1,032,296 |
|
| Total common stocks (cost $13,135,623) | | $12,080,162 |
| | |
| CORPORATE BONDS AND NOTES (0.7%)* | Principal amount | Value |
|
| Jazz Technologies, Inc. company guaranty sr. unsec. | | |
| notes 8s, 2015 | $2,857,000 | $2,628,432 |
|
| Provident Funding Associates LP/PFG Finance Corp. 144A | | |
| sr. notes 10 1/8s, 2019 | 1,840,000 | 2,028,600 |
|
| Total corporate bonds and notes (cost $4,433,698) | | $4,657,032 |
| |
| |
| SENIOR LOANS (0.2%)* c | Principal amount | Value |
|
| Alcatel-Lucent USA, Inc. bank term loan FRN Ser. C, | | |
| 7 1/4s, 2018 | $1,421,438 | $1,455,863 |
|
| Total senior loans (cost $1,431,898) | | $1,455,863 |
| | | | |
| WARRANTS (—%)* † | Expiration | Strike | | |
| | date | price | Warrants | Value |
|
| Tower Semiconductor, Ltd. 144A (Israel) F | 6/30/15 | $0.01 | 1,085,630 | $10,718 |
|
| Total warrants (cost $217,126) | | | | $10,718 |
| | |
| SHORT-TERM INVESTMENTS (2.8%)* | Shares | Value |
|
| Putnam Short Term Investment Fund 0.04% L | 19,774,149 | $19,774,149 |
|
| Total short-term investments (cost $19,774,149) | | $19,774,149 |
| |
| TOTAL INVESTMENTS | | |
|
| Total investments (cost $634,405,690) | | $694,118,346 |
| |
| Convertible Securities Fund | 23 |
| |
| Key to holding’s currency abbreviations |
| EUR | Euro |
| USD/$ | United States Dollar |
| |
| Key to holding’s abbreviations |
| FRB | Floating Rate Bonds: the rate shown is the current interest rate at the close of the reporting period |
| FRN | Floating Rate Notes: the rate shown is the current interest rate at the close of the reporting period |
Notes to the fund’s portfolio
Unless noted otherwise, the notes to the fund’s portfolio are for the close of the fund’s reporting period, which ran from November 1, 2012 through April 30, 2013 (the reporting period). Within the following notes to the portfolio, references to “ASC 820” represent Accounting Standards Codification ASC 820 Fair Value Measurements and Disclosures and references to “OTC”, if any, represent over-the-counter.
* Percentages indicated are based on net assets of $699,395,818.
† Non-income-producing security.
†† The interest rate and date shown parenthetically represent the new interest rate to be paid and the date the fund will begin accruing interest at this rate.
c Senior loans are exempt from registration under the Securities Act of 1933, as amended, but contain certain restrictions on resale and cannot be sold publicly. These loans pay interest at rates which adjust periodically. The interest rates shown for senior loans are the current interest rates at the close of the reporting period. Senior loans are also subject to mandatory and/or optional prepayment which cannot be predicted. As a result, the remaining maturity may be substantially less than the stated maturity shown (Notes 1 and 7).
F Is valued at fair value following procedures approved by the Trustees. Securities may be classified as Level 2 or Level 3 for ASC 820 based on the securities’ valuation inputs.
L Affiliated company (Note 6). The rate quoted in the security description is the annualized 7-day yield of the fund at the close of the reporting period.
R Real Estate Investment Trust.
Debt obligations are considered secured unless otherwise indicated.
144A after the name of an issuer represents securities exempt from registration under Rule 144A under the Securities Act of 1933, as amended. These securities may be resold in transactions exempt from registration, normally to qualified institutional buyers.
The dates shown on debt obligations are the original maturity dates.
| |
| 24 | Convertible Securities Fund |
ASC 820 establishes a three-level hierarchy for disclosure of fair value measurements. The valuation hierarchy is based upon the transparency of inputs to the valuation of the fund’s investments. The three levels are defined as follows:
Level 1: Valuations based on quoted prices for identical securities in active markets.
Level 2: Valuations based on quoted prices in markets that are not active or for which all significant inputs are observable, either directly or indirectly.
Level 3: Valuations based on inputs that are unobservable and significant to the fair value measurement.
The following is a summary of the inputs used to value the fund’s net assets as of the close of the reporting period:
| | | |
| | | Valuation inputs | |
|
| Investments in securities: | Level 1 | Level 2 | Level 3 |
|
| Common stocks: | | | |
|
| Communication services | $3,563,089 | $— | $— |
|
| Consumer cyclicals | 3,044,987 | — | — |
|
| Energy | — | — | 31 |
|
| Financials | 5,472,055 | — | — |
|
| Total common stocks | 12,080,131 | — | 31 |
| | | | |
| Convertible bonds and notes | — | 480,930,880 | 505,120 |
|
| Convertible preferred stocks | 14,600,779 | 160,103,643 | — |
|
| Corporate bonds and notes | — | 4,657,032 | — |
|
| Senior loans | — | 1,455,863 | — |
|
| Warrants | — | 10,718 | — |
|
| Short-term investments | 19,774,149 | — | — |
|
| Totals by level | $46,455,059 | $647,158,136 | $505,151 |
At the start and close of the reporting period, Level 3 investments in securities were not considered a significant portion of the fund’s portfolio.
The accompanying notes are an integral part of these financial statements.
| |
| Convertible Securities Fund | 25 |
Statement of assets and liabilities 4/30/13 (Unaudited)
| |
| ASSETS | |
|
| Investment in securities, at value (Note 1): | |
| Unaffiliated issuers (identified cost $614,631,541) | $674,344,197 |
| Affiliated issuers (identified cost $19,774,149) (Notes 1 and 6) | 19,774,149 |
|
| Cash | 915,825 |
|
| Dividends, interest and other receivables | 4,132,865 |
|
| Receivable for shares of the fund sold | 1,910,900 |
|
| Receivable for investments sold | 778,772 |
|
| Total assets | 701,856,708 |
| |
| LIABILITIES | |
|
| Payable for investments purchased | 915,824 |
|
| Payable for shares of the fund repurchased | 674,764 |
|
| Payable for compensation of Manager (Note 2) | 358,628 |
|
| Payable for custodian fees (Note 2) | 4,611 |
|
| Payable for investor servicing fees (Note 2) | 91,682 |
|
| Payable for Trustee compensation and expenses (Note 2) | 198,099 |
|
| Payable for administrative services (Note 2) | 1,272 |
|
| Payable for distribution fees (Note 2) | 148,099 |
|
| Distributions payable to shareholders | 83 |
|
| Other accrued expenses | 67,828 |
|
| Total liabilities | 2,460,890 |
| | |
| Net assets | $699,395,818 |
|
| |
| REPRESENTED BY | |
|
| Paid-in capital (Unlimited shares authorized) (Notes 1 and 4) | $690,130,261 |
|
| Undistributed net investment income (Note 1) | 14,374,873 |
|
| Accumulated net realized loss on investments and foreign currency transactions (Note 1) | (64,821,972) |
|
| Net unrealized appreciation of investments | 59,712,656 |
|
| Total — Representing net assets applicable to capital shares outstanding | $699,395,818 |
| |
| COMPUTATION OF NET ASSET VALUE AND OFFERING PRICE | |
|
| Net asset value and redemption price per class A share | |
| ($505,511,007 divided by 22,983,156 shares) | $21.99 |
|
| Offering price per class A share (100/94.25 of $21.99)* | $23.33 |
|
| Net asset value and offering price per class B share ($10,878,710 divided by 503,331 shares)** | $21.61 |
|
| Net asset value and offering price per class C share ($40,530,888 divided by 1,860,661 shares)** | $21.78 |
|
| Net asset value and redemption price per class M share ($3,652,298 divided by 167,580 shares) | $21.79 |
|
| Offering price per class M share (100/96.50 of $21.79)* | $22.58 |
|
| Net asset value, offering price and redemption price per class R share | |
| ($5,120,559 divided by 233,676 shares) | $21.91 |
|
| Net asset value, offering price and redemption price per class Y share | |
| ($133,702,356 divided by 6,080,754 shares) | $21.99 |
|
* On single retail sales of less than $50,000. On sales of $50,000 or more the offering price is reduced.
** Redemption price per share is equal to net asset value less any applicable contingent deferred sales charge.
The accompanying notes are an integral part of these financial statements.
| |
| 26 | Convertible Securities Fund |
Statement of operations Six months ended 4/30/13 (Unaudited)
| |
| INVESTMENT INCOME | |
|
| Interest (including interest income of $12,704 from investments in affiliated issuers) (Note 6) | $5,079,156 |
|
| Dividends (net of foreign tax of $13,477) | 4,775,735 |
|
| Total investment income | 9,854,891 |
| |
| EXPENSES | |
|
| Compensation of Manager (Note 2) | 2,053,492 |
|
| Investor servicing fees (Note 2) | 542,646 |
|
| Custodian fees (Note 2) | 7,156 |
|
| Trustee compensation and expenses (Note 2) | 35,667 |
|
| Distribution fees (Note 2) | 861,662 |
|
| Administrative services (Note 2) | 11,644 |
|
| Other | 88,630 |
|
| Total expenses | 3,600,897 |
| | |
| Expense reduction (Note 2) | (4,497) |
|
| Net expenses | 3,596,400 |
| | |
| Net investment income | 6,258,491 |
|
| |
| Net realized gain on investments (Notes 1 and 3) | 18,249,724 |
|
| Net increase from payments by affiliates (Note 2) | 59,294 |
|
| Net realized gain on foreign currency transactions (Note 1) | 2 |
|
| Net unrealized depreciation of assets and liabilities in foreign currencies during the period | (2) |
|
| Net unrealized appreciation of investments during the period | 43,677,247 |
|
| Net gain on investments | 61,986,265 |
| | |
| Net increase in net assets resulting from operations | $68,244,756 |
|
The accompanying notes are an integral part of these financial statements.
| |
| Convertible Securities Fund | 27 |
Statement of changes in net assets
| | |
| INCREASE (DECREASE) IN NET ASSETS | Six months ended 4/30/13* | Year ended 10/31/12 |
|
| Operations: | | |
| Net investment income | $6,258,491 | $11,705,189 |
|
| Net realized gain on investments | | |
| and foreign currency transactions | 18,309,020 | 36,583,352 |
|
| Net unrealized appreciation of investments and assets | | |
| and liabilities in foreign currencies | 43,677,245 | 5,740,236 |
|
| Net increase in net assets resulting from operations | 68,244,756 | 54,028,777 |
|
| Distributions to shareholders (Note 1): | | |
| From ordinary income | | |
| Net investment income | | |
|
| Class A | (7,153,832) | (13,634,928) |
|
| Class B | (123,224) | (250,624) |
|
| Class C | (446,834) | (982,153) |
|
| Class M | (44,571) | (86,266) |
|
| Class R | (61,306) | (105,901) |
|
| Class Y | (1,926,475) | (3,296,242) |
|
| Redemption fees (Note 1) | 8,055 | 14,102 |
|
| Increase (decrease) from capital share transactions (Note 4) | 10,751,011 | (68,913,098) |
|
| Total increase (decrease) in net assets | 69,247,580 | (33,226,333) |
| |
| NET ASSETS | | |
|
| Beginning of period | 630,148,238 | 663,374,571 |
|
| End of period (including undistributed net investment | | |
| income of $14,374,873 and $17,872,624, respectively) | $699,395,818 | $630,148,238 |
|
* Unaudited
The accompanying notes are an integral part of these financial statements.
| |
| 28 | Convertible Securities Fund |
|
| This page left blank intentionally. |
| |
| Convertible Securities Fund | 29 |
Financial highlights (For a common share outstanding throughout the period)
| | | | | | | | | | | | | | |
| INVESTMENT OPERATIONS: | | LESS DISTRIBUTIONS: | | RATIOS AND SUPPLEMENTAL DATA: |
|
| | | | | | | | | | | | | Ratio | Ratio | |
| | | | Net realized | | | | | | | | | of expenses | of net investment | |
| | Net asset value, | | and unrealized | Total from | From | | | | | Total return | Net assets, | to average | income (loss) | Portfolio |
| | beginning | Net investment | gain (loss) | investment | net investment | Total | Redemption | Non-recurring | Net asset value, | at net asset | end of period | net assets | to average | turnover |
| Period ended | of period | income (loss) a | on investments | operations | income | distributions | fees b | reimbursements | end of period | value (%) c | (in thousands) | (%) d | net assets (%) | (%) |
|
| Class A | | | | | | | | | | | | | | |
| April 30, 2013** | $20.09 | .20 | 2.02 | 2.22 | (.32) | (.32) | — | — | $21.99 | 11.12* | $505,511 | .54* | .96* | 36* |
| October 31, 2012 | 18.97 | .36 | 1.33 | 1.69 | (.57) | (.57) | — | — | 20.09 | 9.07 | 466,910 | 1.11 | 1.87 | 59 |
| October 31, 2011 | 19.31 | .39 | (.16) | .23 | (.57) | (.57) | — | — b,e | 18.97 | 1.08 | 484,050 | 1.12 | 1.94 | 79 |
| October 31, 2010 | 16.27 | .54 | 3.07 | 3.61 | (.57) | (.57) | — | — b,f | 19.31 | 22.48 | 495,949 | 1.18 | 3.03 | 71 |
| October 31, 2009 | 12.55 | .55 | 3.73 | 4.28 | (.56) | (.56) | — | — | 16.27 | 35.08 | 467,669 | 1.20 g | 4.00 g | 74 |
| October 31, 2008 | 21.21 | .51 | (8.64) | (8.13) | (.53) | (.53) | — | — | 12.55 | (39.13) | 402,408 | 1.06 g | 2.73 g | 68 |
|
| Class B | | | | | | | | | | | | | | |
| April 30, 2013** | $19.75 | .12 | 1.98 | 2.10 | (.24) | (.24) | — | — | $21.61 | 10.70* | $10,879 | .91* | .59* | 36* |
| October 31, 2012 | 18.66 | .21 | 1.30 | 1.51 | (.42) | (.42) | — | — | 19.75 | 8.22 | 10,315 | 1.86 | 1.10 | 59 |
| October 31, 2011 | 18.99 | .23 | (.14) | .09 | (.42) | (.42) | — | — b,e | 18.66 | .40 | 12,281 | 1.87 | 1.19 | 79 |
| October 31, 2010 | 16.01 | .40 | 3.01 | 3.41 | (.43) | (.43) | — | — b,f | 18.99 | 21.52 | 12,205 | 1.93 | 2.28 | 71 |
| October 31, 2009 | 12.35 | .44 | 3.67 | 4.11 | (.45) | (.45) | — | — | 16.01 | 34.12 | 14,351 | 1.95 g | 3.30 g | 74 |
| October 31, 2008 | 20.87 | .36 | (8.51) | (8.15) | (.37) | (.37) | — | — | 12.35 | (39.61) | 15,297 | 1.81 g | 1.96 g | 68 |
|
| Class C | | | | | | | | | | | | | | |
| April 30, 2013** | $19.90 | .12 | 2.00 | 2.12 | (.24) | (.24) | — | — | $21.78 | 10.71* | $40,531 | .91* | .59* | 36* |
| October 31, 2012 | 18.79 | .21 | 1.32 | 1.53 | (.42) | (.42) | — | — | 19.90 | 8.24 | 38,875 | 1.86 | 1.10 | 59 |
| October 31, 2011 | 19.13 | .24 | (.16) | .08 | (.42) | (.42) | — | — b,e | 18.79 | .32 | 53,696 | 1.87 | 1.19 | 79 |
| October 31, 2010 | 16.12 | .40 | 3.04 | 3.44 | (.43) | (.43) | — | — b,f | 19.13 | 21.58 | 57,211 | 1.93 | 2.27 | 71 |
| October 31, 2009 | 12.44 | .43 | 3.71 | 4.14 | (.46) | (.46) | — | — | 16.12 | 34.12 | 56,131 | 1.95 g | 3.13 g | 74 |
| October 31, 2008 | 21.04 | .37 | (8.58) | (8.21) | (.39) | (.39) | — | — | 12.44 | (39.60) | 33,539 | 1.81 g | 2.00 g | 68 |
|
| Class M | | | | | | | | | | | | | | |
| April 30, 2013** | $19.91 | .15 | 2.00 | 2.15 | (.27) | (.27) | — | — | $21.79 | 10.85* | $3,652 | .79* | .72* | 36* |
| October 31, 2012 | 18.81 | .26 | 1.31 | 1.57 | (.47) | (.47) | — | — | 19.91 | 8.49 | 3,406 | 1.61 | 1.36 | 59 |
| October 31, 2011 | 19.14 | .29 | (.16) | .13 | (.46) | (.46) | — | — b,e | 18.81 | .61 | 3,546 | 1.62 | 1.46 | 79 |
| October 31, 2010 | 16.13 | .45 | 3.04 | 3.49 | (.48) | (.48) | — | — b,f | 19.14 | 21.85 | 4,598 | 1.68 | 2.53 | 71 |
| October 31, 2009 | 12.45 | .47 | 3.71 | 4.18 | (.50) | (.50) | — | — | 16.13 | 34.41 | 4,383 | 1.70 g | 3.40 g | 74 |
| October 31, 2008 | 21.04 | .41 | (8.57) | (8.16) | (.43) | (.43) | — | — | 12.45 | (39.44) | 3,133 | 1.56 g | 2.22 g | 68 |
|
| Class R | | | | | | | | | | | | | | |
| April 30, 2013** | $20.02 | .18 | 2.00 | 2.18 | (.29) | (.29) | — | — | $21.91 | 10.98* | $5,121 | .67* | .83* | 36* |
| October 31, 2012 | 18.91 | .31 | 1.32 | 1.63 | (.52) | (.52) | — | — | 20.02 | 8.78 | 4,059 | 1.36 | 1.61 | 59 |
| October 31, 2011 | 19.24 | .34 | (.15) | .19 | (.52) | (.52) | — | — b,e | 18.91 | .88 | 3,595 | 1.37 | 1.69 | 79 |
| October 31, 2010 | 16.22 | .50 | 3.04 | 3.54 | (.52) | (.52) | — | — b,f | 19.24 | 22.12 | 3,434 | 1.43 | 2.77 | 71 |
| October 31, 2009 | 12.51 | .51 | 3.73 | 4.24 | (.53) | (.53) | — | — | 16.22 | 34.79 | 2,685 | 1.45 g | 3.73 g | 74 |
| October 31, 2008 | 21.15 | .47 | (8.62) | (8.15) | (.49) | (.49) | — | — | 12.51 | (39.29) | 2,255 | 1.31 g | 2.50 g | 68 |
|
| Class Y | | | | | | | | | | | | | | |
| April 30, 2013** | $20.08 | .23 | 2.02 | 2.25 | (.34) | (.34) | — | — | $21.99 | 11.32* | $133,702 | .42* | 1.08* | 36* |
| October 31, 2012 | 18.97 | .41 | 1.32 | 1.73 | (.62) | (.62) | — | — | 20.08 | 9.28 | 106,584 | .86 | 2.12 | 59 |
| October 31, 2011 | 19.30 | .44 | (.15) | .29 | (.62) | (.62) | — | — b,e | 18.97 | 1.40 | 106,207 | .87 | 2.17 | 79 |
| October 31, 2010 | 16.27 | .59 | 3.05 | 3.64 | (.61) | (.61) | — | — b,f | 19.30 | 22.73 | 83,025 | .93 | 3.27 | 71 |
| October 31, 2009 | 12.55 | .57 | 3.74 | 4.31 | (.59) | (.59) | — | — | 16.27 | 35.43 | 70,660 | .95 g | 3.93 g | 74 |
| October 31, 2008 | 21.21 | .56 | (8.64) | (8.08) | (.58) | (.58) | — | — | 12.55 | (38.97) | 21,115 | .81 g | 3.00 g | 68 |
|
See notes to financial highlights at the end of this section.
The accompanying notes are an integral part of these financial statements.
| | | |
| 30 | Convertible Securities Fund | Convertible Securities Fund | 31 |
Financial highlights (Continued)
* Not annualized.
** Unaudited.
a Per share net investment income (loss) has been determined on the basis of the weighted average number of shares outstanding during the period.
b Amount represents less than $0.01 per share.
c Total return assumes dividend reinvestment and does not reflect the effect of sales charges.
d Includes amounts paid through expense offset and brokerage/service arrangements (Note 2).
e Reflects a non-recurring reimbursement related to restitution amounts in connection with a distribution plan approved by the Securities and Exchange Commission (the SEC) which amounted to less than $0.01 per share outstanding on July 21, 2011. Also reflects a non-recurring reimbursement related to short-term trading related lawsuits, which amounted to less than $0.01 per share outstanding on May 11, 2011.
f Reflects a non-recurring reimbursement pursuant to a settlement between the SEC and Prudential Securities, Inc., which amounted to less than $0.01 per share outstanding on March 30, 2010.
g Reflects an involuntary contractual expense limitation in effect during the period. For periods prior to October 31, 2009, certain fund expenses were waived in connection with the fund’s investment in Putnam Prime Money Market Fund. As a result of such limitation and/or waivers, the expenses of each class reflect a reduction of the following amounts:
| |
| | Percentage of |
| | average net assets |
|
| October 31, 2009 | 0.06% |
|
| October 31, 2008 | <0.01 |
|
The accompanying notes are an integral part of these financial statements.
| |
| 32 | Convertible Securities Fund |
Notes to financial statements 4/30/13 (Unaudited)
Within the following Notes to financial statements, references to “State Street” represent State Street Bank and Trust Company, references to “the SEC” represent the Securities and Exchange Commission, references to “Putnam Management” represent Putnam Investment Management, LLC, the fund’s manager, an indirect wholly-owned subsidiary of Putnam Investments, LLC and references to “OTC”, if any, represent over-the-counter. Unless otherwise noted, the “reporting period” represents the period from November 1, 2012 through April 30, 2013.
Putnam Convertible Securities Fund (the fund) is a Massachusetts business trust, which is registered under the Investment Company Act of 1940, as amended, as a diversified open-end management investment company. The fund seeks, with equal emphasis, current income and capital appreciation. The fund’s secondary objective is conservation of capital. The fund invests mainly in convertible securities of U.S. companies. Convertible securities combine the investment characteristics of bonds and common stocks. Convertible securities include bonds, preferred stocks and other instruments that can be converted into or exchanged for common stock or equivalent value. A significant portion of the convertible securities the fund buys are below investment-grade. The convertible bonds the fund buys usually have intermediate-to long-term stated maturities (three years or longer), but often contain “put” features, which allow bondholders to sell the bond back to the company under specified circumstances, that result in shorter effective maturities.
The fund offers class A, class B, class C, class M, class R and class Y shares. Class A and class M shares are sold with a maximum front-end sales charge of 5.75% and 3.50%, respectively, and generally do not pay a contingent deferred sales charge. Class B shares, which convert to class A shares after approximately eight years, do not pay a front-end sales charge and are subject to a contingent deferred sales charge if those shares are redeemed within six years of purchase. Class C shares have a one-year 1.00% contingent deferred sales charge and do not convert to class A shares. Class R shares, which are not available to all investors, are sold at net asset value. The expenses for class A, class B, class C, class M and class R shares may differ based on the distribution fee of each class, which is identified in Note 2. Class Y shares, which are sold at net asset value, are generally subject to the same expenses as class A, class B, class C, class M and class R shares, but do not bear a distribution fee. Class Y shares are not available to all investors.
In the normal course of business, the fund enters into contracts that may include agreements to indemnify another party under given circumstances. The fund’s maximum exposure under these arrangements is unknown as this would involve future claims that may be, but have not yet been, made against the fund. However, the fund’s management team expects the risk of material loss to be remote.
Note 1: Significant accounting policies
The following is a summary of significant accounting policies consistently followed by the fund in the preparation of its financial statements. The preparation of financial statements is in conformity with accounting principles generally accepted in the United States of America and requires management to make estimates and assumptions that affect the reported amounts of assets and liabilities in the financial statements and the reported amounts of increases and decreases in net assets from operations. Actual results could differ from those estimates. Subsequent events after the Statement of assets and liabilities date through the date that the financial statements were issued have been evaluated in the preparation of the financial statements.
For shares purchased before June 24, 2013, a 1.00% redemption fee may apply on shares that are redeemed (either by selling or exchanging into another fund) within 30 days of purchase. The redemption fee is accounted for as an addition to paid-in-capital. No redemption fee will apply to shares purchased on or after June 24, 2013.
Investment income, realized and unrealized gains and losses and expenses of the fund are borne pro-rata based on the relative net assets of each class to the total net assets of the fund, except that each class bears expenses unique to that class (including the distribution fees applicable to such classes). Each class votes as a class only with respect to its own distribution plan or other matters on which a class vote is required by law or determined by the Trustees. If the fund were liquidated, shares of each class would receive their pro-rata share of the net assets of the fund. In addition, the Trustees declare separate dividends on each class of shares.
Security valuation Investments for which market quotations are readily available are valued at the last reported sales price on their principal exchange, or official closing price for certain markets, and are classified as Level 1 securities under Accounting Standards Codification ASC 820 Fair Value Measurements and Disclosures (ASC 820). If no sales are reported, as in the case of some securities that are traded OTC, a security is valued at its last reported bid price and is generally categorized as a Level 2 security.
| |
| Convertible Securities Fund | 33 |
Investments in open-end investment companies (excluding exchange traded funds), if any, which can be classified as Level 1 or Level 2 securities, are based on their net asset value. The net asset value of such investment companies equals the total value of their assets less their liabilities and divided by the number of their outstanding shares.
Market quotations are not considered to be readily available for certain debt obligations and other investments; such investments are valued on the basis of valuations furnished by an independent pricing service approved by the Trustees or dealers selected by Putnam Management. Such services or dealers determine valuations for normal institutional-size trading units of such securities using methods based on market transactions for comparable securities and various relationships, generally recognized by institutional traders, between securities (which consider such factors as security prices, yields, maturities and ratings). These securities will generally be categorized as Level 2.
Many securities markets and exchanges outside the U.S. close prior to the close of the New York Stock Exchange and therefore the closing prices for securities in such markets or on such exchanges may not fully reflect events that occur after such close but before the close of the New York Stock Exchange. Accordingly, on certain days, the fund will fair value foreign equity securities taking into account multiple factors including movements in the U.S. securities markets, currency valuations and comparisons to the valuation of American Depository Receipts, exchange-traded funds and futures contracts. These securities, which would generally be classified as Level 1 securities, will be transferred to Level 2 of the fair value hierarchy when they are valued at fair value. The number of days on which fair value prices will be used will depend on market activity and it is possible that fair value prices will be used by the fund to a significant extent. Securities quoted in foreign currencies, if any, are translated into U.S. dollars at the current exchange rate.
To the extent a pricing service or dealer is unable to value a security or provides a valuation that Putnam Management does not believe accurately reflects the security’s fair value, the security will be valued at fair value by Putnam Management. Certain investments, including certain restricted and illiquid securities and derivatives, are also valued at fair value following procedures approved by the Trustees. These valuations consider such factors as significant market or specific security events such as interest rate or credit quality changes, various relationships with other securities, discount rates, U.S. Treasury, U.S. swap and credit yields, index levels, convexity exposures and recovery rates. These securities are classified as Level 2 or as Level 3 depending on the priority of the significant inputs.
Such valuations and procedures are reviewed periodically by the Trustees. The fair value of securities is generally determined as the amount that the fund could reasonably expect to realize from an orderly disposition of such securities over a reasonable period of time. By its nature, a fair value price is a good faith estimate of the value of a security in a current sale and does not reflect an actual market price, which may be different by a material amount.
Security transactions and related investment income Security transactions are recorded on the trade date (the date the order to buy or sell is executed). Gains or losses on securities sold are determined on the identified cost basis.
Interest income, net of any applicable withholding taxes, is recorded on the accrual basis. Dividend income, net of any applicable withholding taxes, is recognized on the ex-dividend date except that certain dividends from foreign securities, if any, are recognized as soon as the fund is informed of the ex-dividend date. Non-cash dividends, if any, are recorded at the fair market value of the securities received. Dividends representing a return of capital or capital gains, if any, are reflected as a reduction of cost and/or as a realized gain.
All premiums/discounts are amortized/accreted on a yield-to-maturity basis.
The fund earned certain fees in connection with its senior loan purchasing activities. These fees are treated as market discount and are amortized into income in the Statement of operations.
Foreign currency translation The accounting records of the fund are maintained in U.S. dollars. The market value of foreign securities, currency holdings, and other assets and liabilities is recorded in the books and records of the fund after translation to U.S. dollars based on the exchange rates on that day. The cost of each security is determined using historical exchange rates. Income and withholding taxes are translated at prevailing exchange rates when earned or incurred. The fund does not isolate that portion of realized or unrealized gains or losses resulting from changes in the foreign exchange rate on investments from fluctuations arising from changes in the market prices of the securities. Such gains and losses are included with the net realized and unrealized gain or loss on investments. Net realized gains and losses on foreign currency transactions represent net realized exchange gains or losses on closed forward currency contracts, disposition of foreign currencies, currency gains and losses realized between the trade and settlement dates on securities transactions and the difference between the amount of investment income and foreign withholding taxes recorded on the fund’s books and the U.S. dollar equivalent
| |
| 34 | Convertible Securities Fund |
amounts actually received or paid. Net unrealized appreciation and depreciation of assets and liabilities in foreign currencies arise from changes in the value of open forward currency contracts and assets and liabilities other than investments at the period end, resulting from changes in the exchange rate.
Interfund lending The fund, along with other Putnam funds, may participate in an interfund lending program pursuant to an exemptive order issued by the SEC. This program allows the fund to borrow from or lend to other Putnam funds that permit such transactions. Interfund lending transactions are subject to each fund’s investment policies and borrowing and lending limits. Interest earned or paid on the interfund lending transaction will be based on the average of certain current market rates. During the reporting period, the fund did not utilize the program.
Line of credit The fund participates, along with other Putnam funds, in a $315 million unsecured committed line of credit and a $185 million unsecured uncommitted line of credit, both provided by State Street. Borrowings may be made for temporary or emergency purposes, including the funding of shareholder redemption requests and trade settlements. Interest is charged to the fund based on the fund’s borrowing at a rate equal to the Federal Funds rate plus 1.25% for the committed line of credit and the Federal Funds rate plus 1.30% for the uncommitted line of credit. A closing fee equal to 0.02% of the committed line of credit and $50,000 for the uncommitted line of credit has been paid by the participating funds. In addition, a commitment fee of 0.11% per annum on any unutilized portion of the committed line of credit is allocated to the participating funds based on their relative net assets and paid quarterly. During the reporting period, the fund had no borrowings against these arrangements.
Federal taxes It is the policy of the fund to distribute all of its taxable income within the prescribed time period and otherwise comply with the provisions of the Internal Revenue Code of 1986, as amended (the Code), applicable to regulated investment companies. It is also the intention of the fund to distribute an amount sufficient to avoid imposition of any excise tax under Section 4982 of the Code.
The fund is subject to the provisions of Accounting Standards Codification ASC 740 Income Taxes (ASC 740). ASC 740 sets forth a minimum threshold for financial statement recognition of the benefit of a tax position taken or expected to be taken in a tax return. The fund did not have a liability to record for any unrecognized tax benefits in the accompanying financial statements. No provision has been made for federal taxes on income, capital gains or unrealized appreciation on securities held nor for excise tax on income and capital gains. Each of the fund’s federal tax returns for the prior three fiscal years remains subject to examination by the Internal Revenue Service.
The fund may also be subject to taxes imposed by governments of countries in which it invests. Such taxes are generally based on either income or gains earned or repatriated. The fund accrues and applies such taxes to net investment income, net realized gains and net unrealized gains as income and/or capital gains are earned. In some cases, the fund may be entitled to reclaim all or a portion of such taxes, and such reclaim amounts, if any, are reflected as an asset on the fund’s books. In many cases, however, the fund may not receive such amounts for an extended period of time, depending on the country of investment.
At October 31, 2012, the fund had a capital loss carryover of $74,855,800 available to the extent allowed by the Code to offset future net capital gain, if any. The amounts of the carryovers and the expiration dates are:
| | | |
| | Loss carryover | |
|
| Short-term | Long-term | Total | Expiration |
|
| $74,855,800 | N/A | $74,855,800 | October 31, 2017 |
|
Under the Regulated Investment Company Modernization Act of 2010, the fund will be permitted to carry forward capital losses incurred in taxable years beginning after December 22, 2010 for an unlimited period. However, any losses incurred will be required to be utilized prior to the losses incurred in pre-enactment tax years. As a result of this ordering rule, pre-enactment capital loss carryforwards may be more likely to expire unused. Additionally, post-enactment capital losses that are carried forward will retain their character as either short-term or long-term capital losses rather than being considered all short-term as under previous law.
The aggregate identified cost on a tax basis is $634,425,400, resulting in gross unrealized appreciation and depreciation of $87,223,496 and $27,530,550, respectively, or net unrealized appreciation of $59,692,946.
Distributions to shareholders Distributions to shareholders from net investment income are recorded by the fund on the ex-dividend date. Distributions from capital gains, if any, are recorded on the ex-dividend date and paid at least annually. The amount and character of income and gains to be distributed are determined in accordance with income tax regulations, which may differ from generally accepted accounting principles. Dividend sources are estimated at the time of declaration. Actual results may vary. Any non-taxable return of capital cannot be
| |
| Convertible Securities Fund | 35 |
determined until final tax calculations are completed after the end of the fund’s fiscal year. Reclassifications are made to the fund’s capital accounts to reflect income and gains available for distribution (or available capital loss carryovers) under income tax regulations.
Note 2: Management fee, administrative services and other transactions
The fund pays Putnam Management a management fee (based on the fund’s average net assets and computed and paid monthly) at annual rates that may vary based on the average of the aggregate net assets of most open-end funds, as defined in the fund’s management contract, sponsored by Putnam Management. Such annual rates may vary as follows:
| | | | |
| 0.780% | of the first $5 billion, | | 0.580% | of the next $50 billion, |
| |
|
| 0.730% | of the next $5 billion, | | 0.560% | of the next $50 billion, |
| |
|
| 0.680% | of the next $10 billion, | | 0.550% | of the next $100 billion and |
| |
|
| 0.630% | of the next $10 billion, | | 0.545% | of any excess thereafter. |
| |
|
Putnam Management has contractually agreed, through June 30, 2013, to waive fees or reimburse the fund’s expenses to the extent necessary to limit the cumulative expenses of the fund, exclusive of brokerage, interest, taxes, investment-related expenses, extraordinary expenses, acquired fund fees and expenses and payments under the fund’s investor servicing contract, investment management contract and distribution plans, on a fiscal year-to-date basis to an annual rate of 0.20% of the fund’s average net assets over such fiscal year-to-date period. During the reporting period, the fund’s expenses were not reduced as a result of this limit.
Putnam Investments Limited (PIL), an affiliate of Putnam Management, is authorized by the Trustees to manage a separate portion of the assets of the fund as determined by Putnam Management from time to time. Putnam Management pays a quarterly sub-management fee to PIL for its services at an annual rate of 0.35% of the average net assets of the portion of the fund managed by PIL.
Putnam Management voluntarily reimbursed the fund $59,294 for a trading error which occurred during the reporting period. The effect of the loss incurred and the reimbursement by Putnam Management of such amounts had no impact on total return.
The fund reimburses Putnam Management an allocated amount for the compensation and related expenses of certain officers of the fund and their staff who provide administrative services to the fund. The aggregate amount of all such reimbursements is determined annually by the Trustees.
Custodial functions for the fund’s assets are provided by State Street. Custody fees are based on the fund’s asset level, the number of its security holdings and transaction volumes.
Putnam Investor Services, Inc., an affiliate of Putnam Management, provides investor servicing agent functions to the fund. Putnam Investor Services, Inc. received fees for investor servicing based on the fund’s retail asset level, the number of shareholder accounts in the fund and the level of defined contribution plan assets in the fund. Investor servicing fees will not exceed an annual rate of 0.32% of the fund’s average net assets. During the reporting period, the expenses for each class of shares related to investor servicing fees were as follows:
| | | | |
| Class A | $396,027 | | Class R | 3,797 |
| |
|
| Class B | 8,779 | | Class Y | 98,716 |
| |
|
| Class C | 32,431 | | Total | $542,646 |
| |
|
| Class M | 2,896 | | | |
| | |
The fund has entered into expense offset arrangements with Putnam Investor Services, Inc. and State Street whereby Putnam Investor Services, Inc.’s and State Street’s fees are reduced by credits allowed on cash balances. The fund also reduced expenses through brokerage/service arrangements. For the reporting period, the fund’s expenses were reduced by $653 under the expense offset arrangements and by $3,844 under the brokerage/service arrangements.
Each independent Trustee of the fund receives an annual Trustee fee, of which $506, as a quarterly retainer, has been allocated to the fund, and an additional fee for each Trustees meeting attended. Trustees also are reimbursed for expenses they incur relating to their services as Trustees.
| |
| 36 | Convertible Securities Fund |
The fund has adopted a Trustee Fee Deferral Plan (the Deferral Plan) which allows the Trustees to defer the receipt of all or a portion of Trustees fees payable on or after July 1, 1995. The deferred fees remain invested in certain Putnam funds until distribution in accordance with the Deferral Plan.
The fund has adopted an unfunded noncontributory defined benefit pension plan (the Pension Plan) covering all Trustees of the fund who have served as a Trustee for at least five years and were first elected prior to 2004. Benefits under the Pension Plan are equal to 50% of the Trustee’s average annual attendance and retainer fees for the three years ended December 31, 2005. The retirement benefit is payable during a Trustee’s lifetime, beginning the year following retirement, for the number of years of service through December 31, 2006. Pension expense for the fund is included in Trustee compensation and expenses in the Statement of operations. Accrued pension liability is included in Payable for Trustee compensation and expenses in the Statement of assets and liabilities. The Trustees have terminated the Pension Plan with respect to any Trustee first elected after 2003.
The fund has adopted distribution plans (the Plans) with respect to its class A, class B, class C, class M and class R shares pursuant to Rule 12b–1 under the Investment Company Act of 1940. The purpose of the Plans is to compensate Putnam Retail Management Limited Partnership, an indirect wholly-owned subsidiary of Putnam Investments, LLC, for services provided and expenses incurred in distributing shares of the fund. The Plans provide for payments by the fund to Putnam Retail Management Limited Partnership at an annual rate of up to 0.35%, 1.00%, 1.00%, 1.00% and 1.00% of the average net assets attributable to class A, class B, class C, class M and class R shares, respectively. The Trustees have approved payment by the fund at an annual rate of 0.25%, 1.00%, 1.00%, 0.75% and 0.50% of the average net assets attributable to class A, class B, class C, class M and class R shares, respectively. During the reporting period, the class specific expenses related to distribution fees were as follows:
| | | | |
| Class A | $591,245 | | Class M | 12,973 |
| |
|
| Class B | 52,458 | | Class R | 11,344 |
| |
|
| Class C | 193,642 | | Total | $861,662 |
| |
|
For the reporting period, Putnam Retail Management Limited Partnership, acting as underwriter, received net commissions of $25,582 and $45 from the sale of class A and class M shares, respectively, and received $2,037 and $197 in contingent deferred sales charges from redemptions of class B and class C shares, respectively.
A deferred sales charge of up to 1.00% and 0.65% is assessed on certain redemptions of class A and class M shares, respectively. For the reporting period, Putnam Retail Management Limited Partnership, acting as underwriter, received no monies on class A and class M redemptions.
Note 3: Purchases and sales of securities
During the reporting period, cost of purchases and proceeds from sales of investment securities other than short-term investments aggregated $238,051,974 and $227,043,259, respectively. There were no purchases or proceeds from sales of long-term U.S. government securities.
Note 4: Capital shares
At the close of the reporting period, there was an unlimited number of shares of beneficial interest authorized. Transactions in capital shares were as follows:
| | | | |
| | Six months ended 4/30/13 | Year ended 10/31/12 |
|
| Class A | Shares | Amount | Shares | Amount |
|
| Shares sold | 2,635,073 | $56,114,872 | 2,936,632 | $57,790,909 |
|
| Shares issued in connection with | | | | |
| reinvestment of distributions | 312,467 | 6,537,903 | 623,372 | 11,995,946 |
|
| | 2,947,540 | 62,652,775 | 3,560,004 | 69,786,855 |
|
| Shares repurchased | (3,206,375) | (66,839,130) | (5,830,241) | (112,648,930) |
|
| Net decrease | (258,835) | $(4,186,355) | (2,270,237) | $(42,862,075) |
|
| |
| Convertible Securities Fund | 37 |
| | | | |
| | Six months ended 4/30/13 | Year ended 10/31/12 |
|
| Class B | Shares | Amount | Shares | Amount |
|
| Shares sold | 44,428 | $919,039 | 86,808 | $1,665,446 |
|
| Shares issued in connection with | | | | |
| reinvestment of distributions | 4,117 | 84,569 | 8,506 | 160,838 |
|
| | 48,545 | 1,003,608 | 95,314 | 1,826,284 |
|
| Shares repurchased | (67,563) | (1,395,963) | (231,219) | (4,452,569) |
|
| Net decrease | (19,018) | $(392,355) | (135,905) | $(2,626,285) |
|
| |
| | Six months ended 4/30/13 | Year ended 10/31/12 |
|
| Class C | Shares | Amount | Shares | Amount |
|
| Shares sold | 186,714 | $3,889,548 | 210,612 | $4,046,214 |
|
| Shares issued in connection with | | | | |
| reinvestment of distributions | 15,262 | 315,900 | 31,579 | 601,452 |
|
| | 201,976 | 4,205,448 | 242,191 | 4,647,666 |
|
| Shares repurchased | (295,010) | (6,089,756) | (1,145,945) | (22,111,018) |
|
| Net decrease | (93,034) | $(1,884,308) | (903,754) | $(17,463,352) |
|
| |
| | Six months ended 4/30/13 | Year ended 10/31/12 |
|
| Class M | Shares | Amount | Shares | Amount |
|
| Shares sold | 5,387 | $113,950 | 16,874 | $322,889 |
|
| Shares issued in connection with | | | | |
| reinvestment of distributions | 2,041 | 42,276 | 4,159 | 79,346 |
|
| | 7,428 | 156,226 | 21,033 | 402,235 |
|
| Shares repurchased | (10,908) | (224,612) | (38,517) | (737,551) |
|
| Net decrease | (3,480) | $(68,386) | (17,484) | $(335,316) |
|
| |
| | Six months ended 4/30/13 | Year ended 10/31/12 |
|
| Class R | Shares | Amount | Shares | Amount |
|
| Shares sold | 51,050 | $1,067,520 | 56,938 | $1,095,237 |
|
| Shares issued in connection with | | | | |
| reinvestment of distributions | 2,890 | 60,315 | 5,422 | 104,037 |
|
| | 53,940 | 1,127,835 | 62,360 | 1,199,274 |
|
| Shares repurchased | (23,057) | (482,717) | (49,713) | (965,629) |
|
| Net increase | 30,883 | $645,118 | 12,647 | $233,645 |
|
| |
| | Six months ended 4/30/13 | Year ended 10/31/12 |
|
| Class Y | Shares | Amount | Shares | Amount |
|
| Shares sold | 2,013,893 | $42,713,093 | 2,417,276 | $46,869,261 |
|
| Shares issued in connection with | | | | |
| reinvestment of distributions | 58,937 | 1,237,081 | 95,728 | 1,846,426 |
|
| | 2,072,830 | 43,950,174 | 2,513,004 | 48,715,687 |
|
| Shares repurchased | (1,299,451) | (27,312,877) | (2,805,251) | (54,575,402) |
|
| Net increase (decrease) | 773,379 | $16,637,297 | (292,247) | $(5,859,715) |
|
| |
| 38 | Convertible Securities Fund |
Note 5: Summary of derivative activity
The average volume of activity for the reporting period for any derivative type that was held during the period is listed below and was as follows:
| |
| Warrants (number of warrants) | 1,100,000 |
|
The following is a summary of the market values of derivative instruments as of the close of the reporting period:
| | | | |
| | Asset derivatives | Liability derivatives |
|
| Derivatives not | | | | |
| accounted for as | Statement of | | Statement of | |
| hedging instruments | assets and | | assets and | |
| under ASC 815 | liabilities location | Market value | liabilities location | Market value |
|
| Equity contracts | Investments | $10,718 | Payables | $— |
|
| Total | | $10,718 | | $— |
|
The following is a summary of change in unrealized gains or losses of derivative instruments on the Statement of operations for the reporting period (see Note 1) (there were no realized gains or losses on derivative instruments):
Change in unrealized appreciation or (depreciation) on derivatives recognized in net gain or (loss) on investments
| | |
| Derivatives not accounted for as hedging | | |
| instruments under ASC 815 | Warrants | Total |
|
| Equity contracts | $(206,408) | $(206,408) |
|
| Total | $(206,408) | $(206,408) |
|
Note 6: Transactions with affiliated issuers
Transactions during the reporting period with Putnam Money Market Liquidity Fund and Putnam Short Term Investment Fund, which are under common ownership or control, were as follows:
| | | | | |
| | Market value at | | | | Market value |
| | the beginning | | | | at the end of |
| | of the reporting | | | Investment | the reporting |
| Name of affiliate | period | Purchase cost | Sale proceeds | income | period |
|
| Putnam Money Market | | | | | |
| Liquidity Fund* | $25,560,409 | $90,316,671 | $115,877,080 | $9,277 | $— |
|
| Putnam Short Term | | | | | |
| Investment Fund* | — | 72,006,978 | 52,232,829 | 3,427 | 19,774,149 |
|
| Totals | $25,560,409 | $162,323,649 | $168,109,909 | $12,704 | $19,774,149 |
|
* Management fees charged to Putnam Money Market Liquidity and Putnam Short Term Investment Fund have been waived by Putnam Management.
Note 7: Senior loan commitments
Senior loans are purchased or sold on a when-issued or delayed delivery basis and may be settled a month or more after the trade date, which from time to time can delay the actual investment of available cash balances; interest income is accrued based on the terms of the securities. Senior loans can be acquired through an agent, by assignment from another holder of the loan, or as a participation interest in another holder’s portion of the loan. When the fund invests in a loan or participation, the fund is subject to the risk that an intermediate participant between the fund and the borrower will fail to meet its obligations to the fund, in addition to the risk that the borrower under the loan may default on its obligations.
| |
| Convertible Securities Fund | 39 |
Note 8: Market, credit and other risks
In the normal course of business, the fund trades financial instruments and enters into financial transactions where risk of potential loss exists due to changes in the market (market risk) or failure of the contracting party to the transaction to perform (credit risk). The fund may be exposed to additional credit risk that an institution or other entity with which the fund has unsettled or open transactions will default. Investments in foreign securities involve certain risks, including those related to economic instability, unfavorable political developments, and currency fluctuations.
Note 9: New accounting pronouncement
In January 2013, ASU 2013-01, “Clarifying the Scope of Disclosures about Offsetting Assets and Liabilities,” amended ASU No. 2011-11, “Disclosures about Offsetting Assets and Liabilities.” The ASUs create new disclosure requirements requiring entities to disclose both gross and net information for derivatives and other financial instruments that are either offset in the Statement of assets and liabilities or subject to an enforceable master netting arrangement or similar agreement. The disclosure requirements are effective for annual reporting periods beginning on or after January 1, 2013 and interim periods within those annual periods. Putnam Management is currently evaluating the application of ASU 2013-01 and ASU 2011-11 and their impact, if any, on the fund’s financial statements.
| |
| 40 | Convertible Securities Fund |
Fund information
Founded over 75 years ago, Putnam Investments was built around the concept that a balance between risk and reward is the hallmark of a well-rounded financial program. We manage over 100 funds across income, value, blend, growth, asset allocation, absolute return, and global sector categories.
| | |
| Investment Manager | Trustees | Robert T. Burns |
| Putnam Investment | Jameson A. Baxter, Chair | Vice President and |
| Management, LLC | Liaquat Ahamed | Chief Legal Officer |
| One Post Office Square | Ravi Akhoury | |
| Boston, MA 02109 | Barbara M. Baumann | Robert R. Leveille |
| | Charles B. Curtis | Vice President and |
| Investment Sub-Manager | Robert J. Darretta | Chief Compliance Officer |
| Putnam Investments Limited | Katinka Domotorffy | |
| 57–59 St James’s Street | John A. Hill | Michael J. Higgins |
| London, England SW1A 1LD | Paul L. Joskow | Vice President and Treasurer |
| | Elizabeth T. Kennan | |
| Marketing Services | Kenneth R. Leibler | Janet C. Smith |
| Putnam Retail Management | Robert E. Patterson | Vice President, |
| One Post Office Square | George Putnam, III | Principal Accounting Officer, |
| Boston, MA 02109 | Robert L. Reynolds | and Assistant Treasurer |
| | W. Thomas Stephens | |
| Custodian | | Susan G. Malloy |
| State Street Bank | Officers | Vice President and |
| and Trust Company | Robert L. Reynolds | Assistant Treasurer |
| | President | |
| Legal Counsel | | James P. Pappas |
| Ropes & Gray LLP | Jonathan S. Horwitz | Vice President |
| | Executive Vice President, | |
| | Principal Executive Officer, and | Mark C. Trenchard |
| | Compliance Liaison | Vice President and |
| | | BSA Compliance Officer |
| | Steven D. Krichmar | |
| | Vice President and | Nancy E. Florek |
| | Principal Financial Officer | Vice President, Proxy |
| | | Manager, Assistant Clerk, and |
| | | Associate Treasurer |
This report is for the information of shareholders of Putnam Convertible Securities Fund. It may also be used as sales literature when preceded or accompanied by the current prospectus, the most recent copy of Putnam’s Quarterly Performance Summary, and Putnam’s Quarterly Ranking Summary. For more recent performance, please visit putnam.com. Investors should carefully consider the investment objectives, risks, charges, and expenses of a fund, which are described in its prospectus. For this and other information or to request a prospectus or summary prospectus, call 1-800-225-1581 toll free. Please read the prospectus carefully before investing. The fund’s Statement of Additional Information contains additional information about the fund’s Trustees and is available without charge upon request by calling 1-800-225-1581.
| |
| Item 3. Audit Committee Financial Expert: |
| |
| Item 4. Principal Accountant Fees and Services: |
| |
| Item 5. Audit Committee of Listed Registrants |
| |
| Item 6. Schedule of Investments: |
| |
| The registrant’s schedule of investments in unaffiliated issuers is included in the report to shareholders in Item 1 above. |
| |
| Item 7. Disclosure of Proxy Voting Policies and Procedures For Closed-End Management Investment Companies: |
| |
| Item 8. Portfolio Managers of Closed-End Investment Companies |
| |
| Item 9. Purchases of Equity Securities by Closed-End Management Investment Companies and Affiliated Purchasers: |
| |
| Item 10. Submission of Matters to a Vote of Security Holders: |
| |
| Item 11. Controls and Procedures: |
| |
| (a) The registrant’s principal executive officer and principal financial officer have concluded, based on their evaluation of the effectiveness of the design and operation of the registrant’s disclosure controls and procedures as of a date within 90 days of the filing date of this report, that the design and operation of such procedures are generally effective to provide reasonable assurance that information required to be disclosed by the registrant in this report is recorded, processed, summarized and reported within the time periods specified in the Commission’s rules and forms. |
| |
| (b) Changes in internal control over financial reporting: Not applicable |
| |
| (a)(2) Separate certifications for the principal executive officer and principal financial officer of the registrant as required by Rule 30a-2(a) under the Investment Company Act of 1940, as amended, are filed herewith. |
| |
| (b) The certifications required by Rule 30a-2(b) under the Investment Company Act of 1940, as amended, are filed herewith. |
| |
| Putnam Convertible Securities Fund |
| |
| By (Signature and Title): |
| |
| /s/Janet C. Smith
Janet C. Smith
Principal Accounting Officer
|
| |
| Pursuant to the requirements of the Securities Exchange Act of 1934 and the Investment Company Act of 1940, this report has been signed below by the following persons on behalf of the registrant and in the capacities and on the dates indicated. |
| |
| By (Signature and Title): |
| |
| /s/Jonathan S. Horwitz
Jonathan S. Horwitz
Principal Executive Officer
|
| |
| By (Signature and Title): |
| |
| /s/Steven D. Krichmar
Steven D. Krichmar
Principal Financial Officer
|