| UNITED STATES SECURITIES AND EXCHANGE COMMISSION | ||
| Washington, D.C. 20549 | ||
FORM N-CSR | ||
| CERTIFIED SHAREHOLDER REPORT OF REGISTERED MANAGEMENT INVESTMENT COMPANIES | ||
| Investment Company Act file number: | (811-02280) |
| Exact name of registrant as specified in charter: | Putnam Convertible Securities Fund |
| Address of principal executive offices: | One Post Office Square, Boston, Massachusetts 02109 |
| Name and address of agent for service: | Robert T. Burns, Vice President One Post Office Square Boston, Massachusetts 02109 |
| Copy to: | Bryan Chegwidden, Esq. Ropes & Gray LLP 1211 Avenue of the Americas New York, New York 10036 |
| Registrant's telephone number, including area code: | (617) 292-1000 |
| Date of fiscal year end: | October 31, 2016 |
| Date of reporting period: | November 1, 2015 — April 30, 2016 |
Item 1. Report to Stockholders: |
| The following is a copy of the report transmitted to stockholders pursuant to Rule 30e-1 under the Investment Company Act of 1940: | |||
Putnam
Convertible
Securities Fund
Semiannual report
4 | 30 | 16
| Message from the Trustees | 1 | ||
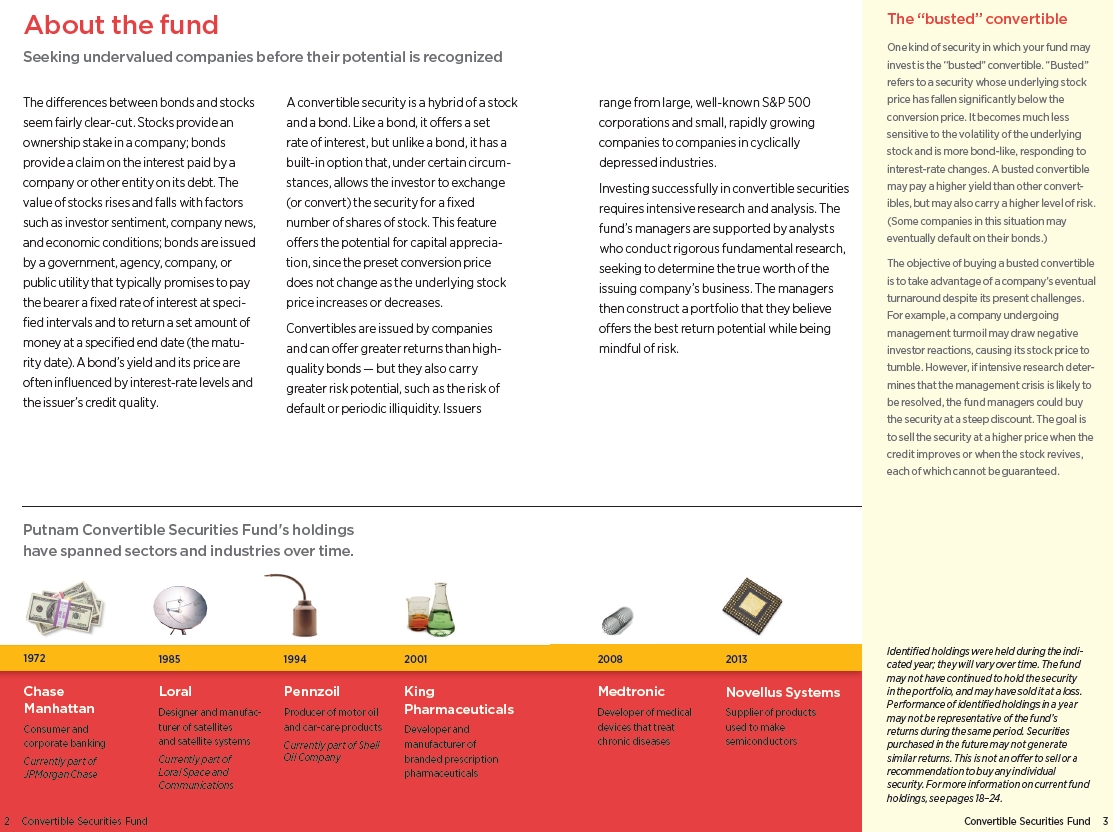
| About the fund | 2 | ||
| Performance snapshot | 4 | ||
| Interview with your fund’s portfolio managers | 5 | ||
| Your fund’s performance | 11 | ||
| Your fund’s expenses | 13 | ||
| Terms and definitions | 15 | ||
| Other information for shareholders | 16 | ||
| Financial statements | 17 | ||
Consider these risks before investing: Convertible securities prices may fall or fail to rise over time for several reasons, including general financial market conditions, factors related to a specific company or industry, changing market perceptions of the risk of default, and changes in government intervention in the financial markets. These factors may also lead to increased volatility and reduced liquidity in the markets for convertible securities. These risks are generally greater for convertible securities issued by small and/or midsize companies. Convertible securities’ prices may be adversely affected by underlying common stock price changes. While convertible securities tend to provide higher yields than common stocks, the higher yield may not protect against the risk of loss or mitigate any loss associated with a convertible security’s price decline. Convertible securities are subject to credit risk, which is the risk that an issuer of the fund’s investments may default on payment of interest or principal. Credit risk is greater for below-investment-grade convertible securities. Convertible securities may be less sensitive to interest-rate changes than non-convertible bonds because of their structural features (e.g., convertibility, “put” features). Interest-rate risk is generally greater, however, for longer-term bonds and convertible securities whose underlying stock price has fallen significantly below the conversion price. You can lose money by investing in the fund.
Message from the Trustees
Dear Fellow Shareholder:
The U.S. economy and markets appear to have hit a soft patch, as demonstrated by sluggish gross domestic product (GDP) growth in the first quarter, a lull in jobs expansion, and a continued slowdown in consumer spending. Moreover, corporate earnings have been tepid, leading the stock market to lose some of the momentum it showed from mid-February through the end of March.
Overseas, we believe that many potential headwinds exist. These include political pressures in the European Union and disappointing policy measures in Japan, as well as continuing unsteady growth in many emerging markets.
Despite the recent slowdown, we think the underpinnings of the U.S. economy remain strong. Unemployment remains at multiyear lows and, while first-quarter GDP expansion was weak, the U.S. economy continues to improve on the basis of generally strong fundamentals. Housing is a bright spot in the economy, boosted by low interest rates and robust demand as more Americans find work.
Putnam’s portfolio managers are positioned to maneuver in all types of markets with active investment strategies and support from teams of equity and fixed-income research analysts. The interview on the following pages provides an overview of your fund’s performance for the reporting period ended April 30, 2016, as well as an outlook for the coming months.
It may be a good time to consult your financial advisor, who can help ensure that your portfolio is aligned with your individual goals, risk tolerance, and investing time horizon.
As always, thank you for investing with Putnam.

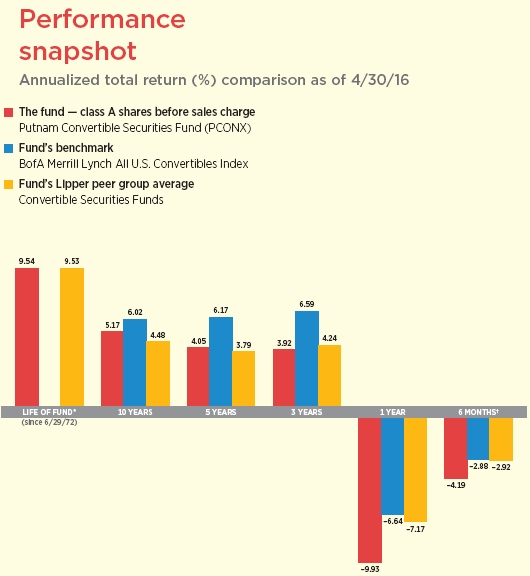
Current performance may be lower or higher than the quoted past performance, which cannot guarantee future results. Share price, principal value, and return will fluctuate, and you may have a gain or a loss when you sell your shares. Performance of class A shares assumes reinvestment of distributions and does not account for taxes. Fund returns in the bar chart do not reflect a sales charge of 5.75%; had they, returns would have been lower. See pages 5 and 11–13 for additional performance information. For a portion of the periods, the fund had expense limitations, without which returns would have been lower. To obtain the most recent month-end performance, visit putnam.com.
* The fund’s benchmark, the BofA Merrill Lynch All U.S. Convertibles Index, was introduced on 12/31/87, which post-dates the inception of the fund’s class A shares.
† Returns for the six-month period are not annualized, but cumulative.
| 4 | Convertible Securities Fund |
Interview with your fund’s portfolio managers

What was the market environment like for convertible securities during the six-month reporting period ended April 30, 2016?
Eric: During the early months of the reporting period, convertible securities struggled in response to a renewed slide in oil prices and China’s attempt to stabilize its currency and to manage its economic slowdown. With evidence of a resilient U.S. jobs market, the Federal Reserve took the widely expected first step on the path of gradual normalization of interest rates in December 2015. In January 2016, however, slower-than-forecasted U.S. wage growth and plunging commodity prices raised fears about disinflation and slowing growth globally — spurring questions about the Fed’s future rate policy. Consequently, investors flocked to safe-haven assets, such as gold and U.S. Treasuries, causing stocks and other credit-sensitive assets to sell off sharply. January proved to be the worst month for stocks since August 2015.
By mid-February, with stock indexes hitting multiyear lows, a handful of upbeat U.S. corporate earnings reports, speculation of a cap on oil production, and a belief that the markets were oversold contributed to a return of optimism to the markets, and risk assets rallied. At their March and April Federal Open Market Committee [FOMC] meetings, Fed officials acknowledged the weakness of the global economy, adding that they would remain patient and take a cautious approach to raising interest rates.

This comparison shows your fund’s performance in the context of broad market indexes for the six months ended 4/30/16. See pages 4 and 11–13 for additional fund performance information. Index descriptions can be found on page 16.
| Convertible Securities Fund | 5 |
As a result of the risk-off environment in the first part of the reporting period and other idiosyncratic risks related to the asset class, the BofA Merrill Lynch All U.S. Convertibles Index declined until February 11. From that date through the end of the reporting period on April 30, the index surged over 11%. However, the rally was not enough to erase earlier losses, particularly in the energy and utilities sectors. The asset class closed out the six-month reporting period down 2.88% — underperforming the Barclays U.S. Aggregate Bond Index [2.82%], the S&P 500 Index [0.43%], and the Russell 2000 Index [–1.90%], an index composed of small-cap stocks.
How did Putnam Convertible Securities Fund perform in this environment?
Rob: For the six-month reporting period ended April 30, 2016, the fund underperformed its benchmark, the BofA Merrill Lynch All U.S. Convertibles Index, and its Lipper peer group.
Did convertible security prices track the equity market or the bond market more closely during the reporting period?
Eric: By the end of the reporting period, convertible securities were acting less equity-like, continuing a trend that we have been seeing since the beginning of 2015. By April 30, 2016, the equity- and bond-like characteristics of convertibles were quite balanced, providing investors with better risk-adjusted return potential, in our view. This development is reflected by delta, a measurement of the equity sensitivity of convertible securities, which continued to correct during the first four months of 2016. The delta of convertible securities in the BofA Merrill Lynch All U.S. Convertibles Index declined from 60 at the beginning of 2015 to 53 by April 30, suggesting a more balanced profile for investors by the end of the reporting period.

Allocations are shown as a percentage of the fund’s net assets as of 4/30/16. Cash and net other assets, if any, represent the market value weights of cash, derivatives, short-term securities, and other unclassified assets in the portfolio. Summary information may differ from the portfolio schedule included in the financial statements due to the inclusion of derivative securities, any interest accruals, the exclusion of as-of trades, if any, the use of different classifications of securities for presentation purposes and rounding. Holdings and allocations may vary over time.
| 6 | Convertible Securities Fund |

What holdings or strategies helped the fund’s performance relative to the benchmark during the reporting period?
Rob: At the sector level, an underweight position and security selection within the energy sector were the largest contributors to returns. Oil prices declined approximately 36% from the start of the reporting period to February 11, 2016, before rebounding significantly in anticipation of a meeting of major oil suppliers to freeze output. Oil ultimately ended the reporting period down roughly 9% after the proposed deal to freeze crude oil production failed to materialize. Security selection within health care also benefited performance, although these gains were slightly offset by an overweight exposure to the sector, which struggled in early 2016. Finally, an overweight allocation and security selection within consumer cyclicals augmented performance returns.
From an issuer perspective, the fund’s underweight exposure to commodity-sensitive holdings, such as SunEdison and Chesapeake Energy, were the top contributors to performance. Our decision to sell the poorly performing SunEdison early in the period was especially beneficial for performance. Investor sentiment declined in response to more project cancellations, increased liquidity concerns, and investigations by the Department of Justice and the Securities and Exchange Commission. Finally, an underweight position in the biotech firm, Incyte, added to performance gains. The release of negative data on one of its compounds, combined with market volatility felt throughout the biotech industry
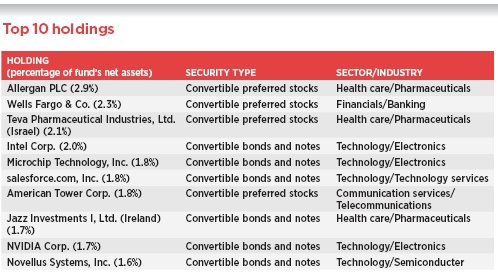
This table shows the fund’s top 10 individual holdings and the percentage of the fund’s net assets that each represented as of 4/30/16. Short-term investments, TBA commitments, and derivatives, if any, are excluded. Holdings may vary over time.
| Convertible Securities Fund | 7 |
as demonstrated by the –23% first-quarter return for the NASDAQ Biotechnology Index, weighed on the convertible security.
What strategies or holdings detracted most from the fund’s performance relative to the benchmark during the reporting period?
Eric: From a sector perspective, security selection in the technology sector weighed most on benchmark-relative performance. Our decision to underweight financials and basic materials also negatively impacted returns, as did security selection within these two sectors.
At the issuer level, an overweight exposure to the highly leveraged Stone Energy was the largest detractor on a relative basis. Given the prolonged weakness in commodity prices until mid-February, troubled companies, such as Stone Energy, were tapping into cash reserves available under their bank loan agreements to use for operation while they were still available. Investors generally see this strategy as maneuvering for a stronger negotiating position should energy prices not recover sufficiently and they have to file for bankruptcy. An overweight position in AMAG Pharmaceuticals detracted from results, as the firm lowered its 2015 sales estimate this past November and reported weaker earnings in February 2016. Finally, an overweight allocation to convertible bonds issued by Infinera, a manufacturer of high-capacity optical transmission equipment, negatively affected fund performance. The company sold off in response to an announcement by a competitor that forecasted weak revenue for the first quarter of 2016.
What is your outlook for convertible securities in the coming months?
Rob: When we consider how convertible securities may perform, we think it is more appropriate to focus on the performance of the specific stocks underlying these

This chart shows how the fund’s top weightings have changed over the past six months. Allocations are shown as a percentage of the fund’s net assets. Current period summary information may differ from the portfolio schedule included in the financial statements due to the inclusion of derivative securities, any interest accruals, the exclusion of as-of trades, if any, the use of different classifications of securities for presentation purposes and rounding. Holdings and allocations may vary over time.
| 8 | Convertible Securities Fund |
securities, rather than the broader stock market. We think this is important because the underlying stocks of the convertible securities universe comprise companies of all market capitalizations regardless of their growth or value prospects. On the other hand, the S&P 500 Index is constructed around a highly defined market capitalization, or in the case of the Russell 2000 Value or Growth Indexes, around a particular style of investing.
The underlying equities of convertible securities are currently trading at lower multiples of earnings and cash flow than the broader equity markets, suggesting that they have better growth prospects, in our opinion. This point is also supported by the fact that after steep declines in 2002, 2008, and 2011, the equities of convertible-issuing companies tended to perform well.
While the equity-like characteristics of convertibles have moderated somewhat, the current yields offered by these securities have increased. The yield for the BofA Merrill Lynch All U.S. Convertibles Index was 3.26% on April 30, 2016, which is currently more attractive than Treasury yields, while the convertibles’ underlying equities offer upside total return potential. Furthermore, convertible securities tend to have lower duration, or price sensitivity, to rising rates than other fixed-income assets.
Thus, barring any external shocks, such as a sudden spike in inflation or in global growth that would cause the Fed to become more hawkish, we believe the market environment could be positive for the convertible securities market.
Thank you, gentlemen, for your time and insights today.
The views expressed in this report are exclusively those of Putnam Management and are subject to change. They are not meant as investment advice.
Please note that the holdings discussed in this report may not have been held by the fund for the entire period. Portfolio composition is subject to review in accordance with the fund’s investment strategy and may vary in the future. Current and future portfolio holdings are subject to risk.
Portfolio Manager Eric N. Harthun has an M.B.A. from the Booth School of Business at the University of Chicago and a B.S. from San Diego State University. He joined Putnam in 2000 and has been in the investment industry since 1994.
Portfolio Manager Robert L. Salvin has an M.B.A. from the Booth School of Business at the University of Chicago and a B.S. from The Wharton School at the University of Pennsylvania. He joined Putnam in 2000 and has been in the investment industry since 1986.
| Convertible Securities Fund | 9 |
IN THE NEWS
Today’s bull market, which rose from the ashes of the Great Recession more than seven years ago, recently marked a major milestone. Although the market’s path has at times been volatile, the general upswing in U.S. stocks officially became the second-longest-running bull market in history on the final trading day of April 2016. A bull market is typically defined as a rally of 20% or more off a recent market low. From the trough of the market on March 9, 2009, through April 29, 2016, the S&P 500 Index rose 255%. At 2,608 days old, this up market for stocks still has a long way to go to catch the longest-running bull market on record, which lasted from 1987 to 2000 — 4,494 days — and delivered a whopping 844% return. Today’s record bull has been fed by low interest rates, positive momentum, and historically high levels of monetary and fiscal support from central banks worldwide.
| 10 | Convertible Securities Fund |
Your fund’s performance
This section shows your fund’s performance, price, and distribution information for periods ended April 30, 2016, the end of the first half of its current fiscal year. In accordance with regulatory requirements for mutual funds, we also include performance information as of the most recent calendar quarter-end and expense information taken from the fund’s current prospectus. Performance should always be considered in light of a fund’s investment strategy. Data represent past performance. Past performance does not guarantee future results. More recent returns may be less or more than those shown. Investment return and principal value will fluctuate, and you may have a gain or a loss when you sell your shares. Performance information does not reflect any deduction for taxes a shareholder may owe on fund distributions or on the redemption of fund shares. For the most recent month-end performance, please visit the Individual Investors section at putnam.com or call Putnam at 1-800-225-1581. Class I, R, and Y shares are not available to all investors. See the Terms and Definitions section in this report for definitions of the share classes offered by your fund.
Fund performance Total return for periods ended 4/30/16
| Class A | Class B | Class C | Class I | Class M | Class R | Class Y | |||||
| (inception dates) | (6/29/72) | (7/15/93) | (7/26/99) | (3/3/15) | (3/13/95) | (12/1/03) | (12/30/98) | ||||
| Before | After | Net | Before | After | Net | Net | |||||
| sales | sales | Before | After | Before | After | asset | sales | sales | asset | asset | |
| charge | charge | CDSC | CDSC | CDSC | CDSC | value | charge | charge | value | value | |
| Annual average | |||||||||||
| (life of fund) | 9.54% | 9.39% | 9.33% | 9.33% | 8.71% | 8.71% | 9.65% | 8.88% | 8.79% | 9.26% | 9.65% |
| 10 years | 65.57 | 56.05 | 55.93 | 55.93 | 53.52 | 53.52 | 70.10 | 57.49 | 51.98 | 61.47 | 69.85 |
| Annual average | 5.17 | 4.55 | 4.54 | 4.54 | 4.38 | 4.38 | 5.46 | 4.65 | 4.27 | 4.91 | 5.44 |
| 5 years | 21.96 | 14.95 | 17.47 | 15.49 | 17.49 | 17.49 | 23.71 | 18.98 | 14.82 | 20.44 | 23.52 |
| Annual average | 4.05 | 2.83 | 3.27 | 2.92 | 3.28 | 3.28 | 4.35 | 3.54 | 2.80 | 3.79 | 4.32 |
| 3 years | 12.23 | 5.78 | 9.75 | 6.85 | 9.73 | 9.73 | 13.26 | 10.58 | 6.71 | 11.40 | 13.09 |
| Annual average | 3.92 | 1.89 | 3.15 | 2.23 | 3.14 | 3.14 | 4.24 | 3.41 | 2.19 | 3.66 | 4.18 |
| 1 year | –9.93 | –15.11 | –10.58 | –14.82 | –10.62 | –11.46 | –9.60 | –10.38 | –13.52 | –10.17 | –9.70 |
| 6 months | –4.19 | –9.70 | –4.54 | –9.10 | –4.56 | –5.47 | –3.99 | –4.42 | –7.77 | –4.32 | –4.07 |
Current performance may be lower or higher than the quoted past performance, which cannot guarantee future results. After-sales-charge returns for class A and M shares reflect the deduction of the maximum 5.75% and 3.50% sales charge, respectively, levied at the time of purchase. Class B share returns after contingent deferred sales charge (CDSC) reflect the applicable CDSC, which is 5% in the first year, declining over time to 1% in the sixth year, and is eliminated thereafter. Class C share returns after CDSC reflect a 1% CDSC for the first year that is eliminated thereafter. Class I, R, and Y shares have no initial sales charge or CDSC. Performance for class B, C, M, R, and Y shares before their inception is derived from the historical performance of class A shares, adjusted for the applicable sales charge (or CDSC) and the higher operating expenses for such shares, except for class Y shares, for which 12b-1 fees are not applicable. Performance for class I shares prior to their inception is derived from the historical performance of class Y shares and has not been adjusted for the lower investor servicing fees applicable to class I shares; had it, returns would have been higher.
For a portion of the periods, the fund had expense limitations, without which returns would have been lower.
Class B share performance reflects conversion to class A shares after eight years.
| Convertible Securities Fund | 11 |
Comparative index returns For periods ended 4/30/16
| BofA Merrill Lynch All | Lipper Convertible Securities | |
| U.S. Convertibles Index | Funds category average* | |
| Annual average (life of fund) | —† | 9.53% |
| 10 years | 79.46% | 56.31 |
| Annual average | 6.02 | 4.48 |
| 5 years | 34.88 | 20.57 |
| Annual average | 6.17 | 3.79 |
| 3 years | 21.09 | 13.39 |
| Annual average | 6.59 | 4.24 |
| 1 year | –6.64 | –7.17 |
| 6 months | –2.88 | –2.92 |
Index and Lipper results should be compared with fund performance before sales charge, before CDSC, or at net asset value.
* Over the 6-month, 1-year, 3-year, 5-year, 10-year, and life-of-fund periods ended 4/30/16, there were 89, 81, 72, 59, 35, and 1 fund(s), respectively, in this Lipper category.
† The fund’s benchmark, the BofA Merrill Lynch All U.S. Convertibles Index, was introduced on 12/31/87, which post-dates the inception of the fund’s class A shares.
Fund price and distribution information For the six-month period ended 4/30/16
| Distributions | Class A | Class B | Class C | Class I | Class M | Class R | Class Y | ||
| Number | 2 | 2 | 2 | 2 | 2 | 2 | 2 | ||
| Income | $0.240 | $0.160 | $0.158 | $0.285 | $0.187 | $0.214 | $0.267 | ||
| Capital gains | |||||||||
| Long-term gains | 0.845 | 0.845 | 0.845 | 0.845 | 0.845 | 0.845 | 0.845 | ||
| Short-term gains | — | — | — | — | — | — | — | ||
| Total | $1.085 | $1.005 | $1.003 | $1.130 | $1.032 | $1.059 | $1.112 | ||
| Before | After | Net | Net | Net | Before | After | Net | Net | |
| sales | sales | asset | asset | asset | sales | sales | asset | asset | |
| Share value | charge | charge | value | value | value | charge | charge | value | value |
| 10/31/15 | $23.37 | $24.80 | $22.93 | $23.11 | $23.38 | $23.14 | $23.98 | $23.28 | $23.37 |
| 4/30/16 | 21.31 | 22.61 | 20.89 | 21.06 | 21.32 | 21.09 | 21.85 | 21.22 | 21.31 |
| Before | After | Net | Net | Net | Before | After | Net | Net | |
| Current rate | sales | sales | asset | asset | asset | sales | sales | asset | asset |
| (end of period) | charge | charge | value | value | value | charge | charge | value | value |
| Current dividend | |||||||||
| rate1 | 2.25% | 2.12% | 1.55% | 1.54% | 2.66% | 1.80% | 1.74% | 2.04% | 2.50% |
| Current 30-day | |||||||||
| SEC yield2 | N/A | 1.90 | 1.27 | 1.27 | 2.44 | N/A | 1.46 | 1.76 | 2.26 |
The classification of distributions, if any, is an estimate. Before-sales-charge share value and current dividend rate for class A and M shares, if applicable, do not take into account any sales charge levied at the time of purchase. After-sales-charge share value, current dividend rate, and current 30-day SEC yield, if applicable, are calculated assuming that the maximum sales charge (5.75% for class A shares and 3.50% for class M shares) was levied at the time of purchase. Final distribution information will appear on your year-end tax forms.
1 Most recent distribution, including any return of capital and excluding capital gains, annualized and divided by NAV or market price at end of period.
2 Based only on investment income and calculated using the maximum offering price for each share class, in accordance with SEC guidelines.
| 12 | Convertible Securities Fund |
Fund performance as of most recent calendar quarter
Total return for periods ended 3/31/16
| Class A | Class B | Class C | Class I | Class M | Class R | Class Y | |||||
| (inception dates) | (6/29/72) | (7/15/93) | (7/26/99) | (3/3/15) | (3/13/95) | (12/1/03) | (12/30/98) | ||||
| Before | After | Net | Before | After | Net | Net | |||||
| sales | sales | Before | After | Before | After | asset | sales | sales | asset | asset | |
| charge | charge | CDSC | CDSC | CDSC | CDSC | value | charge | charge | value | value | |
| Annual average | |||||||||||
| (life of fund) | 9.53% | 9.38% | 9.33% | 9.33% | 8.71% | 8.71% | 9.64% | 8.87% | 8.78% | 9.26% | 9.64% |
| 10 years | 66.18 | 56.62 | 56.52 | 56.52 | 54.14 | 54.14 | 70.64 | 58.05 | 52.52 | 62.06 | 70.39 |
| Annual average | 5.21 | 4.59 | 4.58 | 4.58 | 4.42 | 4.42 | 5.49 | 4.68 | 4.31 | 4.95 | 5.47 |
| 5 years | 23.23 | 16.14 | 18.65 | 16.65 | 18.71 | 18.71 | 24.99 | 20.17 | 15.97 | 21.70 | 24.80 |
| Annual average | 4.27 | 3.04 | 3.48 | 3.13 | 3.49 | 3.49 | 4.56 | 3.74 | 3.01 | 4.01 | 4.53 |
| 3 years | 12.56 | 6.09 | 10.03 | 7.12 | 10.06 | 10.06 | 13.59 | 10.91 | 7.03 | 11.68 | 13.42 |
| Annual average | 4.02 | 1.99 | 3.24 | 2.32 | 3.25 | 3.25 | 4.34 | 3.51 | 2.29 | 3.75 | 4.29 |
| 1 year | –10.32 | –15.47 | –11.00 | –15.22 | –10.95 | –11.80 | –9.95 | –10.76 | –13.88 | –10.55 | –10.09 |
| 6 months | –1.64 | –7.29 | –1.99 | –6.67 | –1.98 | –2.92 | –1.35 | –1.85 | –5.28 | –1.76 | –1.47 |
See the discussion following the fund performance table on page 11 for information about the calculation of fund performance.
Your fund’s expenses
As a mutual fund investor, you pay ongoing expenses, such as management fees, distribution fees (12b-1 fees), and other expenses. In the most recent six-month period, your fund’s expenses were limited; had expenses not been limited, they would have been higher. Using the following information, you can estimate how these expenses affect your investment and compare them with the expenses of other funds. You may also pay one-time transaction expenses, including sales charges (loads) and redemption fees, which are not shown in this section and would have resulted in higher total expenses. For more information, see your fund’s prospectus or talk to your financial representative.
Expense ratios
| Class A | Class B | Class C | Class I | Class M | Class R | Class Y | |
| Total annual operating | |||||||
| expenses for the fiscal year | |||||||
| ended 10/31/15 | 1.06% | 1.81% | 1.81% | 0.68%* | 1.56% | 1.31% | 0.81% |
| Annualized expense ratio for | |||||||
| the six-month period ended | |||||||
| 4/30/16 | 1.09% | 1.84% | 1.84% | 0.69% | 1.59% | 1.34% | 0.84% |
Fiscal-year expense information in this table is taken from the most recent prospectus, is subject to change, and may differ from that shown for the annualized expense ratio and in the financial highlights of this report.
Expenses are shown as a percentage of average net assets.
* Other expenses have been annualized.
| Convertible Securities Fund | 13 |
Expenses per $1,000
The following table shows the expenses you would have paid on a $1,000 investment in each class of the fund from 11/1/15 to 4/30/16. It also shows how much a $1,000 investment would be worth at the close of the period, assuming actual returns and expenses.
| Class A | Class B | Class C | Class I | Class M | Class R | Class Y | |
| Expenses paid | |||||||
| per $1,000*† | $5.31 | $8.94 | $8.94 | $3.36 | $7.73 | $6.52 | $4.09 |
| Ending value | |||||||
| (after expenses) | $958.10 | $954.60 | $954.40 | $960.10 | $955.80 | $956.80 | $959.30 |
* Expenses for each share class are calculated using the fund’s annualized expense ratio for each class, which represents the ongoing expenses as a percentage of average net assets for the six months ended 4/30/16. The expense ratio may differ for each share class.
† Expenses are calculated by multiplying the expense ratio by the average account value for the period; then multiplying the result by the number of days in the period; and then dividing that result by the number of days in the year.
Estimate the expenses you paid
To estimate the ongoing expenses you paid for the six months ended 4/30/16, use the following calculation method. To find the value of your investment on 11/1/15, call Putnam at 1-800-225-1581.

Compare expenses using the SEC’s method
The Securities and Exchange Commission (SEC) has established guidelines to help investors assess fund expenses. Per these guidelines, the following table shows your fund’s expenses based on a $1,000 investment, assuming a hypothetical 5% annualized return. You can use this information to compare the ongoing expenses (but not transaction expenses or total costs) of investing in the fund with those of other funds. All mutual fund shareholder reports will provide this information to help you make this comparison. Please note that you cannot use this information to estimate your actual ending account balance and expenses paid during the period.
| Class A | Class B | Class C | Class I | Class M | Class R | Class Y | |
| Expenses paid | |||||||
| per $1,000*† | $5.47 | $9.22 | $9.22 | $3.47 | $7.97 | $6.72 | $4.22 |
| Ending value | |||||||
| (after expenses) | $1,019.44 | $1,015.71 | $1,015.71 | $1,021.43 | $1,016.96 | $1,018.20 | $1,020.69 |
* Expenses for each share class are calculated using the fund’s annualized expense ratio for each class, which represents the ongoing expenses as a percentage of average net assets for the six months ended 4/30/16. The expense ratio may differ for each share class.
† Expenses are calculated by multiplying the expense ratio by the average account value for the six-month period; then multiplying the result by the number of days in the six-month period; and then dividing that result by the number of days in the year.
| 14 | Convertible Securities Fund |
Terms and definitions
Important terms
Total return shows how the value of the fund’s shares changed over time, assuming you held the shares through the entire period and reinvested all distributions in the fund.
Before sales charge, or net asset value, is the price, or value, of one share of a mutual fund, without a sales charge. Before-sales-charge figures fluctuate with market conditions, and are calculated by dividing the net assets of each class of shares by the number of outstanding shares in the class.
After sales charge is the price of a mutual fund share plus the maximum sales charge levied at the time of purchase. After-sales-charge performance figures shown here assume the 5.75% maximum sales charge for class A shares and 3.50% for class M shares.
Contingent deferred sales charge (CDSC) is generally a charge applied at the time of the redemption of class B or C shares and assumes redemption at the end of the period. Your fund’s class B CDSC declines over time from a 5% maximum during the first year to 1% during the sixth year. After the sixth year, the CDSC no longer applies. The CDSC for class C shares is 1% for one year after purchase.
Share classes
Class A shares are generally subject to an initial sales charge and no CDSC (except on certain redemptions of shares bought without an initial sales charge).
Class B shares are not subject to an initial sales charge and may be subject to a CDSC.
Class C shares are not subject to an initial sales charge and are subject to a CDSC only if the shares are redeemed during the first year.
Class I shares are not subject to an initial sales charge or CDSC, and carry no 12b-1 fee. They are only available to institutional clients and other investors who meet minimum investment requirements.
Class M shares have a lower initial sales charge and a higher 12b-1 fee than class A shares and no CDSC.
Class R shares are not subject to an initial sales charge or CDSC and are only available to employer-sponsored retirement plans.
Class Y shares are not subject to an initial sales charge or CDSC and carry no 12b-1 fee. They are generally only available to corporate and institutional clients and clients in other approved programs.
Fixed-income terms
Current rate is the annual rate of return earned from dividends or interest of an investment. Current rate is expressed as a percentage of the price of a security, fund share, or principal investment.
Mortgage-backed security (MBS), also known as a mortgage “pass-through,” is a type of asset-backed security that is secured by a mortgage or collection of mortgages. The following are types of MBSs:
• Agency “pass-through” has its principal and interest backed by a U.S. government agency, such as the Federal National Mortgage Association (Fannie Mae), Government National Mortgage Association (Ginnie Mae), and Federal Home Loan Mortgage Corporation (Freddie Mac).
• Collateralized mortgage obligation (CMO) represents claims to specific cash flows from pools of home mortgages. The streams of principal and interest payments on the mortgages are distributed to the different classes of CMO interests in “tranches.” Each tranche may have different principal balances, coupon rates, prepayment risks, and maturity dates. A CMO is highly sensitive to changes in interest rates and any resulting change in the rate at which homeowners sell their properties, refinance, or otherwise prepay loans. CMOs are subject to prepayment, market, and liquidity risks.
• Interest-only (IO) security is a type of CMO in which the underlying asset is the interest portion of mortgage, Treasury, or bond payments.
• Non-agency residential mortgage-backed security (RMBS) is an MBS not backed by Fannie Mae, Ginnie Mae, or Freddie Mac. One type of RMBS is an Alt-A mortgage-backed security.
• Commercial mortgage-backed security (CMBS) is secured by the loan on a commercial property.
Yield curve is a graph that plots the yields of bonds with equal credit quality against their
| Convertible Securities Fund | 15 |
differing maturity dates, ranging from shortest to longest. It is used as a benchmark for other debt, such as mortgage or bank lending rates.
Comparative indexes
Barclays U.S. Aggregate Bond Index is an unmanaged index of U.S. investment-grade fixed-income securities.
BofA Merrill Lynch U.S. 3-Month Treasury Bill Index is an unmanaged index that seeks to measure the performance of U.S. Treasury bills available in the marketplace.
BofA Merrill Lynch All U.S. Convertibles Index is an unmanaged index of high-yield U.S. convertible securities.
NASDAQ Biotechnology Index is an unmanaged index made up of securities of NASDAQ-listed companies classified according to the Industry Classification Benchmark as either biotechnology or pharmaceuticals which also meet other eligibility criteria.
Russell 2000 Index is an unmanaged index of the smallest 2,000 securities in the Russell 3000 Index.
S&P 500 Index is an unmanaged index of common stock performance.
Indexes assume reinvestment of all distributions and do not account for fees. Securities and performance of a fund and an index will differ. You cannot invest directly in an index.
Lipper is a third-party industry-ranking entity that ranks mutual funds. Its rankings do not reflect sales charges. Lipper rankings are based on total return at net asset value relative to other funds that have similar current investment styles or objectives as determined by Lipper. Lipper may change a fund’s category assignment at its discretion. Lipper category averages reflect performance trends for funds within a category.
Other information for shareholders
Important notice regarding delivery of shareholder documents
In accordance with Securities and Exchange Commission (SEC) regulations, Putnam sends a single copy of annual and semiannual shareholder reports, prospectuses, and proxy statements to Putnam shareholders who share the same address, unless a shareholder requests otherwise. If you prefer to receive your own copy of these documents, please call Putnam at 1-800-225-1581, and Putnam will begin sending individual copies within 30 days.
Proxy voting
Putnam is committed to managing our mutual funds in the best interests of our shareholders. The Putnam funds’ proxy voting guidelines and procedures, as well as information regarding how your fund voted proxies relating to portfolio securities during the 12-month period ended June 30, 2015, are available in the Individual Investors section of putnam.com, and on the SEC’s website, www.sec.gov. If you have questions about finding forms on the SEC’s website, you may call the SEC at 1-800-SEC-0330. You may also obtain the Putnam funds’ proxy voting guidelines and procedures at no charge by calling Putnam’s Shareholder Services at 1-800-225-1581.
Fund portfolio holdings
The fund will file a complete schedule of its portfolio holdings with the SEC for the first and third quarters of each fiscal year on Form N-Q. Shareholders may obtain the fund’s Form N-Q on the SEC’s website at www.sec.gov. In addition, the fund’s Form N-Q may be reviewed and copied at the SEC’s Public Reference Room in Washington, D.C. You may call the SEC at 1-800-SEC-0330 for information about the SEC’s website or the operation of the Public Reference Room.
Trustee and employee fund ownership
Putnam employees and members of the Board of Trustees place their faith, confidence, and, most importantly, investment dollars in Putnam mutual funds. As of April 30, 2016, Putnam employees had approximately $484,000,000 and the Trustees had approximately $128,000,000 invested in Putnam mutual funds. These amounts include investments by the Trustees’ and employees’ immediate family members as well as investments through retirement and deferred compensation plans.
| 16 | Convertible Securities Fund |
Financial statements
A guide to financial statements
These sections of the report, as well as the accompanying Notes, constitute the fund’s financial statements.
The fund’s portfolio lists all the fund’s investments and their values as of the last day of the reporting period. Holdings are organized by asset type and industry sector, country, or state to show areas of concentration and diversification.
Statement of assets and liabilities shows how the fund’s net assets and share price are determined. All investment and non-investment assets are added together. Any unpaid expenses and other liabilities are subtracted from this total. The result is divided by the number of shares to determine the net asset value per share, which is calculated separately for each class of shares. (For funds with preferred shares, the amount subtracted from total assets includes the liquidation preference of preferred shares.)
Statement of operations shows the fund’s net investment gain or loss. This is done by first adding up all the fund’s earnings — from dividends and interest income — and subtracting its operating expenses to determine net investment income (or loss). Then, any net gain or loss the fund realized on the sales of its holdings — as well as any unrealized gains or losses over the period — is added to or subtracted from the net investment result to determine the fund’s net gain or loss for the fiscal period.
Statement of changes in net assets shows how the fund’s net assets were affected by the fund’s net investment gain or loss, by distributions to shareholders, and by changes in the number of the fund’s shares. It lists distributions and their sources (net investment income or realized capital gains) over the current reporting period and the most recent fiscal year-end. The distributions listed here may not match the sources listed in the Statement of operations because the distributions are determined on a tax basis and may be paid in a different period from the one in which they were earned. Dividend sources are estimated at the time of declaration. Actual results may vary. Any non-taxable return of capital cannot be determined until final tax calculations are completed after the end of the fund’s fiscal year.
Financial highlights provide an overview of the fund’s investment results, per-share distributions, expense ratios, net investment income ratios, and portfolio turnover in one summary table, reflecting the five most recent reporting periods. In a semiannual report, the highlights table also includes the current reporting period.
| Convertible Securities Fund | 17 |
The fund’s portfolio 4/30/16 (Unaudited)
| CONVERTIBLE BONDS AND NOTES (68.3%)* | Principal amount | Value |
| Automotive (1.3%) | ||
| Navistar International Corp. cv. sr. unsec. sub. bonds | ||
| 4 3/4s, 2019 | $6,436,000 | $4,328,210 |
| Tesla Motors, Inc. cv. sr. unsec. sub. notes 1 1/4s, 2021 | 4,715,000 | 4,317,172 |
| 8,645,382 | ||
| Biotechnology (5.6%) | ||
| AMAG Pharmaceuticals, Inc. cv. sr. unsec. unsub. notes | ||
| 2 1/2s, 2019 | 3,235,000 | 3,839,541 |
| ARIAD Pharmaceuticals, Inc. 144A cv. sr. unsec. notes | ||
| 3 5/8s, 2019 | 5,400,000 | 5,565,375 |
| BioMarin Pharmaceutical, Inc. cv. sr. unsec. sub. notes | ||
| 1 1/2s, 2020 | 5,714,000 | 6,928,225 |
| Emergent BioSolutions, Inc. cv. sr. unsec. unsub. bonds | ||
| 2 7/8s, 2021 | 3,135,000 | 4,281,234 |
| Gilead Sciences, Inc. cv. sr. unsec. notes 1 5/8s, 2016 | 1,258,000 | 5,356,564 |
| Incyte Corp. cv. sr. unsec. notes 1 1/4s, 2020 | 1,345,000 | 2,126,781 |
| Medicines Co. (The) cv. sr. unsec. notes 2 1/2s, 2022 | 3,220,000 | 3,932,425 |
| Merrimack Pharmaceuticals, Inc. cv. sr. unsec. unsub. notes | ||
| 4 1/2s, 2020 | 2,734,000 | 3,653,308 |
| United Therapeutics Corp. cv. sr. unsec. notes 1s, 2016 | 905,000 | 1,985,344 |
| 37,668,797 | ||
| Broadcasting (1.3%) | ||
| Liberty Media Corp. cv. sr. unsec. bonds 1 3/8s, 2023 | 8,801,000 | 8,845,005 |
| 8,845,005 | ||
| Capital goods (0.9%) | ||
| Dycom Industries, Inc. 144A cv. sr. unsec. sub. notes | ||
| 0 3/4s, 2021 | 6,010,000 | 6,175,275 |
| 6,175,275 | ||
| Commercial and consumer services (5.7%) | ||
| Ctrip.com International, Ltd. 144A cv. sr. unsec. notes 1.99s, | ||
| 2025 (China) | 3,536,000 | 3,944,850 |
| Euronet Worldwide, Inc. cv. sr. unsec. bonds 1 1/2s, 2044 | 4,509,000 | 5,503,798 |
| Huron Consulting Group, Inc. cv. sr. unsec. unsub. notes | ||
| 1 1/4s, 2019 | 4,526,000 | 4,353,446 |
| Macquarie Infrastructure Corp. cv. sr. unsec. sub. notes | ||
| 2 7/8s, 2019 | 6,560,000 | 7,416,900 |
| Priceline Group, Inc. (The) cv. sr. unsec. Bonds 0.9s, 2021 | 7,205,000 | 7,439,163 |
| Priceline Group, Inc. (The) cv. sr. unsec. unsub. notes 1s, 2018 | 6,896,000 | 10,219,010 |
| 38,877,167 | ||
| Communications equipment (0.7%) | ||
| Ciena Corp. 144A cv. sr. unsec. notes 3 3/4s, 2018 | 3,249,000 | 3,647,003 |
| Novatel Wireless, Inc. 144A cv. sr. unsec. unsub. notes | ||
| 5 1/2s, 2020 | 2,166,000 | 1,296,893 |
| 4,943,896 | ||
| Computers (7.1%) | ||
| Akamai Technologies, Inc. cv. sr. unsec. bonds zero %, 2019 | 4,239,000 | 4,093,284 |
| Avid Technology, Inc. 144A cv. sr. unsec. notes 2s, 2020 | 5,874,000 | 3,641,880 |
| Brocade Communications Systems, Inc. cv. company guaranty | ||
| sr. unsec. notes 1 3/8s, 2020 | 6,630,000 | 6,418,669 |
| Citrix Systems, Inc. cv. sr. unsec. notes 0 1/2s, 2019 | 9,175,000 | 10,362,016 |
| Electronics For Imaging, Inc. cv. sr. unsec. unsub. bonds | ||
| 0 3/4s, 2019 | 6,880,000 | 7,047,700 |
| 18 | Convertible Securities Fund |
| CONVERTIBLE BONDS AND NOTES (68.3%)* cont. | Principal amount | Value |
| Computers cont. | ||
| Infinera Corp. 144A cv. sr. unsec. unsub. bonds 1 3/4s, 2018 | $3,552,000 | $4,124,760 |
| Spansion, LLC company guaranty cv. sr. unsec. bonds 2s, 2020 | 1,330,000 | 2,335,813 |
| Synchronoss Technologies, Inc. cv. sr. unsec. notes 0 3/4s, 2019 | 4,582,000 | 4,455,995 |
| Verint Systems, Inc. cv. sr. unsec. notes 1 1/2s, 2021 | 6,329,000 | 5,688,189 |
| 48,168,306 | ||
| Conglomerates (1.1%) | ||
| Siemens Financieringsmaatschappij NV cv. company guaranty | ||
| sr. unsec. bonds 1.65s, 2019 (Netherlands) | 6,750,000 | 7,283,250 |
| 7,283,250 | ||
| Construction (0.7%) | ||
| Cemex SAB de CV cv. unsec. sub. notes 3 3/4s, 2018 (Mexico) | 4,340,000 | 4,768,575 |
| 4,768,575 | ||
| Consumer (0.9%) | ||
| Jarden Corp. cv. company guaranty sr. unsec. sub. bonds | ||
| 1 1/8s, 2034 | 4,534,000 | 5,909,525 |
| 5,909,525 | ||
| Consumer finance (0.6%) | ||
| Encore Capital Group, Inc. cv. company guaranty sr. unsec. | ||
| bonds 3s, 2020 | 2,618,000 | 2,266,206 |
| PRA Group, Inc. cv. sr. unsec. unsub. bonds 3s, 2020 | 1,714,000 | 1,471,898 |
| 3,738,104 | ||
| Electronics (9.6%) | ||
| GT Advanced Technologies, Inc. cv. sr. unsec. sub. escrow | ||
| notes 3s, 2020 F | 2,944,000 | 294 |
| Intel Corp. cv. jr. unsec. sub. notes 3 1/4s, 2039 | 8,990,000 | 13,670,419 |
| Microchip Technology, Inc. cv. sr. unsec. sub. bonds 1 5/8s, 2025 | 11,697,000 | 12,128,327 |
| Micron Technology, Inc. cv. sr. unsec. bonds 3s, 2043 | 6,270,000 | 4,439,944 |
| Micron Technology, Inc. cv. sr. unsec. bonds Ser. E, 1 5/8s, 2033 | 2,198,000 | 2,622,489 |
| NVIDIA Corp. cv. sr. unsec. bonds 1s, 2018 | 6,401,000 | 11,405,782 |
| NXP Semiconductors NV cv. sr. unsec. bonds 1s, 2019 | 8,229,000 | 9,319,343 |
| ON Semiconductor Corp. cv. company guaranty sr. unsec. sub. | ||
| notes Ser. B, 2 5/8s, 2026 | 7,712,000 | 8,198,820 |
| TTM Technologies, Inc. cv. sr. unsec. notes 1 3/4s, 2020 | 3,495,000 | 3,119,288 |
| 64,904,706 | ||
| Energy (oil field) (0.9%) | ||
| Hornbeck Offshore Services, Inc. cv. company guaranty sr. | ||
| unsec. notes 1 1/2s, 2019 | 3,239,000 | 1,983,888 |
| SEACOR Holdings, Inc. cv. sr. unsec. unsub. bonds 2 1/2s, 2027 | 3,928,000 | 3,832,255 |
| 5,816,143 | ||
| Entertainment (1.8%) | ||
| Live Nation Entertainment, Inc. cv. sr. unsec. bonds 2 1/2s, 2019 | 10,653,000 | 10,606,393 |
| TiVo, Inc. cv. sr. unsec. bonds 2s, 2021 | 1,452,000 | 1,422,960 |
| 12,029,353 | ||
| Financial (0.9%) | ||
| Radian Group, Inc. cv. sr. unsec. notes 2 1/4s, 2019 | 4,880,000 | 6,167,100 |
| 6,167,100 | ||
| Health-care services (2.5%) | ||
| Brookdale Senior Living, Inc. cv. sr. unsec. unsub. notes | ||
| 2 3/4s, 2018 | 6,452,000 | 6,415,708 |
| HealthSouth Corp. cv. sr. unsec. sub. notes 2s, 2043 | 3,819,000 | 4,546,997 |
| Medidata Solutions, Inc. cv. sr. unsec. notes 1s, 2018 | 5,418,000 | 5,699,059 |
| 16,661,764 | ||
| Convertible Securities Fund | 19 |
| CONVERTIBLE BONDS AND NOTES (68.3%)* cont. | Principal amount | Value |
| Homebuilding (0.4%) | ||
| Lennar Corp. 144A cv. company guaranty sr. unsec. notes | ||
| 2 3/4s, 2020 | $1,184,000 | $2,433,860 |
| 2,433,860 | ||
| Insurance (0.9%) | ||
| Fidelity National Financial, Inc. cv. sr. unsec. unsub. notes | ||
| 4 1/4s, 2018 | 3,305,000 | 5,804,406 |
| 5,804,406 | ||
| Manufacturing (0.7%) | ||
| General Cable Corp. cv. unsec. sub. notes stepped-coupon | ||
| 4 1/2s (2 1/4s, 11/15/19) 2029 †† | 7,566,000 | 5,003,018 |
| 5,003,018 | ||
| Media (1.1%) | ||
| Liberty Interactive, LLC cv. sr. unsec. unsub. bonds 0 3/4s, 2043 | 4,404,000 | 7,588,643 |
| 7,588,643 | ||
| Medical technology (2.2%) | ||
| China Medical Technologies, Inc. cv. sr. unsec. bonds Ser. CMT, | ||
| 4s, 2016 (China) (In default) † F | 3,213,000 | 257,040 |
| China Medical Technologies, Inc. 144A cv. sr. unsec. notes | ||
| 6 1/4s, 2016 (China) (In default) † F | 3,544,000 | 248,080 |
| Hologic, Inc. cv. sr. unsec. unsub. notes stepped-coupon 2s (0s, | ||
| 3/1/18) 2042 †† | 4,390,000 | 5,550,606 |
| Insulet Corp. cv. sr. unsec. notes 2s, 2019 | 3,660,000 | 3,611,963 |
| Wright Medical Group, Inc. cv. sr. unsec. notes 2s, 2020 | 5,606,000 | 5,329,204 |
| 14,996,893 | ||
| Oil and gas (2.0%) | ||
| Chesapeake Energy Corp. cv. company guaranty sr. unsec. | ||
| notes 2 1/4s, 2038 | 6,599,000 | 4,256,355 |
| Cobalt International Energy, Inc. cv. sr. unsec. unsub. notes | ||
| 2 5/8s, 2019 | 3,967,000 | 1,995,897 |
| Stone Energy Corp. cv. company guaranty sr. unsec. sub. notes | ||
| 1 3/4s, 2017 | 5,345,000 | 1,780,553 |
| Whiting Petroleum Corp. 144A cv. company guaranty sr. unsec. | ||
| unsub. notes 1 1/4s, 2020 | 7,847,000 | 5,924,485 |
| 13,957,290 | ||
| Pharmaceuticals (4.2%) | ||
| Anacor Pharmaceuticals, Inc. 144A cv. sr. unsec. notes 2s, 2023 | 2,250,000 | 2,581,875 |
| Impax Laboratories, Inc. 144A cv. sr. unsec. notes 2s, 2022 | 8,495,000 | 7,863,184 |
| Jazz Investments I, Ltd. cv. company guaranty sr. unsec. sub. | ||
| bonds 1 7/8s, 2021 (Ireland) | 10,261,000 | 11,415,363 |
| Teligent, Inc. cv. sr. unsec. notes 3 3/4s, 2019 | 4,570,000 | 3,761,681 |
| TESARO, Inc. cv. sr. unsec. notes 3s, 2021 | 1,920,000 | 2,726,400 |
| 28,348,503 | ||
| Real estate (2.0%) | ||
| Blackstone Mortgage Trust, Inc. cv. sr. unsec. unsub. notes | ||
| 5 1/4s, 2018 R | 6,240,000 | 6,579,300 |
| Starwood Property Trust, Inc. cv. sr. unsec. unsub. | ||
| notes 4s, 2019 R | 6,825,000 | 6,970,031 |
| 13,549,331 | ||
| Retail (0.6%) | ||
| GNC Holdings, Inc. 144A cv. company guaranty sr. unsec. notes | ||
| 1 1/2s, 2020 | 4,763,000 | 3,724,071 |
| 3,724,071 | ||
| 20 | Convertible Securities Fund |
| CONVERTIBLE BONDS AND NOTES (68.3%)* cont. | Principal amount | Value |
| Semiconductor (1.9%) | ||
| Jazz US Holdings, Inc. cv. company guaranty sr. unsec. | ||
| notes 8s, 2018 | $1,523,000 | $2,098,884 |
| Novellus Systems, Inc. cv. company guaranty sr. unsec. notes | ||
| 2 5/8s, 2041 | 4,815,000 | 10,951,116 |
| 13,050,000 | ||
| Shipping (1.3%) | ||
| Atlas Air Worldwide Holdings, Inc. cv. sr. unsec. bonds | ||
| 2 1/4s, 2022 | 1,790,000 | 1,505,838 |
| Scorpio Tankers, Inc. 144A cv. sr. unsec. sub. notes 2 3/8s, 2019 | 8,811,000 | 7,571,953 |
| 9,077,791 | ||
| Software (1.7%) | ||
| Red Hat, Inc. cv. sr. unsec. unsub. bonds 0 1/4s, 2019 | 6,190,000 | 7,625,306 |
| Safeguard Scientifics, Inc. cv. sr. unsec. bonds 5 1/4s, 2018 | 3,545,000 | 3,626,978 |
| 11,252,284 | ||
| Staffing (0.3%) | ||
| Monster Worldwide, Inc. cv. sr. unsec. notes 3 1/2s, 2019 | 2,105,000 | 1,952,388 |
| 1,952,388 | ||
| Technology services (5.2%) | ||
| FireEye, Inc. 144A cv. sr. unsec. notes Ser. B, 1 5/8s, 2035 | 5,405,000 | 4,459,125 |
| j2 Global, Inc. cv. sr. unsec. notes 3 1/4s, 2029 | 6,115,000 | 6,707,391 |
| salesforce.com, Inc. cv. sr. unsec. unsub. notes 0 1/4s, 2018 | 9,610,000 | 12,120,613 |
| Twitter, Inc. cv. sr. unsec. unsub. bonds 1s, 2021 | 6,420,000 | 5,388,788 |
| Yahoo!, Inc. cv. sr. unsec. bonds zero %, 2018 | 6,405,000 | 6,437,025 |
| 35,112,942 | ||
| Telecommunications (0.4%) | ||
| CalAmp Corp. 144A cv. sr. unsec. notes 1 5/8s, 2020 | 2,860,000 | 2,593,663 |
| Powerwave Technologies, Inc. cv. unsec. sub. notes 3 7/8s, 2027 | ||
| (In default) † F | 5,121,000 | 512 |
| 2,594,175 | ||
| Tobacco (0.9%) | ||
| Vector Group, Ltd. cv. sr. unsec. sub. FRN 2 1/2s, 2019 | 4,355,000 | 6,109,368 |
| 6,109,368 | ||
| Transportation services (0.9%) | ||
| Echo Global Logistics, Inc. cv. sr. unsec. notes 2 1/2s, 2020 | 6,286,000 | 6,014,916 |
| 6,014,916 | ||
| Total convertible bonds and notes (cost $467,776,966) | $461,172,227 | |
| CONVERTIBLE PREFERRED STOCKS (25.4%)* | Shares | Value |
| Automotive (0.9%) | ||
| Fiat Chrysler Automobiles NV Ser. FCAU, $7.875 cv. pfd. (Italy) | 88,298 | $6,406,020 |
| 6,406,020 | ||
| Banking (3.4%) | ||
| Bank of America Corp. Ser. L, 7.25% cv. pfd. | 6,060 | 7,067,475 |
| Wells Fargo & Co. Ser. L, 7.50% cv. pfd. | 12,618 | 15,725,183 |
| 22,792,658 | ||
| Consumer (0.6%) | ||
| Stanley Black & Decker, Inc. $6.25 cv. pfd. | 31,710 | 3,747,805 |
| 3,747,805 | ||
| Electric utilities (2.4%) | ||
| Dominion Resources, Inc./VA $3.188 cv. pfd. | 111,643 | 5,507,349 |
| Exelon Corp. $3.25 cv. pfd. | 219,668 | 10,618,751 |
| 16,126,100 | ||
| Convertible Securities Fund | 21 |
| CONVERTIBLE PREFERRED STOCKS (25.4%)* cont. | Shares | Value |
| Financial (1.0%) | ||
| AMG Capital Trust II $2.575 cv. pfd. | 115,790 | $6,665,162 |
| 6,665,162 | ||
| Food (1.4%) | ||
| Tyson Foods, Inc. $2.375 cv. pfd. | 131,783 | 9,616,206 |
| 9,616,206 | ||
| Health-care services (1.2%) | ||
| Anthem, Inc. $2.63 cv. pfd. | 177,894 | 8,247,166 |
| 8,247,166 | ||
| Insurance (0.7%) | ||
| Maiden Holdings, Ltd. Ser. B, $3.625 cv. pfd. (Bermuda) | 105,197 | 4,982,130 |
| 4,982,130 | ||
| Oil and gas (0.6%) | ||
| Halcon Resources Corp. Ser. A, 5.75% cv. pfd. | 3,717 | 139,388 |
| Hess Corp. $4.00 cv. pfd. † | 16,790 | 1,276,376 |
| Southwestern Energy Co. Ser. B, $3.125 cv. pfd. | 92,223 | 2,922,547 |
| 4,338,311 | ||
| Pharmaceuticals (5.0%) | ||
| Allergan PLC Ser. A, 5.50% cv. pfd. | 24,170 | 19,613,713 |
| Teva Pharmaceutical Industries, Ltd. 7.00% cv. pfd. (Israel) | 15,943 | 14,267,869 |
| 33,881,582 | ||
| Power producers (0.5%) | ||
| Dynegy, Inc. Ser. A, $5.375 cv. pfd. | 49,979 | 3,245,636 |
| 3,245,636 | ||
| Real estate (1.9%) | ||
| Alexandria Real Estate Equities, Inc. Ser. D, $1.75 cv. pfd. R | 265,512 | 8,139,589 |
| iStar, Inc. $2.25 cv. pfd. R | 106,950 | 4,514,360 |
| 12,653,949 | ||
| Regional Bells (1.1%) | ||
| Frontier Communications Corp. Ser. A, $11.125 cum. cv. pfd. | 69,435 | 7,221,240 |
| 7,221,240 | ||
| Telecommunications (4.1%) | ||
| American Tower Corp. $5.50 cv. pfd. R | 116,265 | 11,924,138 |
| Crown Castle International Corp. Ser. A, $4.50 cv. pfd. R | 69,952 | 7,425,405 |
| T-Mobile US, Inc. Ser. A, $2.75 cv. pfd. | 125,631 | 8,515,269 |
| 27,864,812 | ||
| Waste Management (0.6%) | ||
| Stericycle, Inc. $5.25 cv. pfd. | 49,537 | 3,843,070 |
| 3,843,070 | ||
| Total convertible preferred stocks (cost $174,253,056) | $171,631,847 | |
| COMMON STOCKS (1.1%)* | Shares | Value |
| Alphabet, Inc. Class C † | 2,885 | $1,999,334 |
| Amazon.com, Inc. † | 3,215 | 2,120,582 |
| Brazil Ethanol, Inc. 144A (Units) † F | 312,500 | 31 |
| DISH Network Corp. Class A † | 27,215 | 1,341,427 |
| GT Advanced Technologies, Inc. † F | 476 | 5 |
| Gulfport Energy Corp. † | 69,600 | 2,178,480 |
| Total common stocks (cost $9,936,708) | $7,639,859 | |
| 22 | Convertible Securities Fund |
| WARRANTS (—%)* † | Expiration | Strike | ||
| date | price | Warrants | Value | |
| GT Advanced Technologies, Inc. F | 3/17/19 | $0.00 | 487 | $5 |
| GT Advanced Technologies, Inc. F | 3/17/19 | 0.00 | 331 | 3 |
| Total warrants (cost $91,926) | $8 | |||
| SHORT-TERM INVESTMENTS (3.9%)* | Shares | Value | ||
| Putnam Short Term Investment Fund 0.44% L | 26,583,706 | $26,583,706 | ||
| Total short-term investments (cost $26,583,706) | $26,583,706 | |||
| TOTAL INVESTMENTS | ||||
| Total investments (cost $678,642,362) | $667,027,647 | |||
Key to holding’s abbreviations
| FRN | Floating Rate Notes: the rate shown is the current interest rate or yield at the close of the reporting period |
Notes to the fund’s portfolio
Unless noted otherwise, the notes to the fund’s portfolio are for the close of the fund’s reporting period, which ran from November 1, 2015 through April 30, 2016 (the reporting period). Within the following notes to the portfolio, references to “ASC 820” represent Accounting Standards Codification 820 Fair Value Measurements and Disclosures and references to “OTC”, if any, represent over-the-counter.
* Percentages indicated are based on net assets of $674,888,963.
† This security is non-income-producing.
†† The interest rate and date shown parenthetically represent the new interest rate to be paid and the date the fund will begin accruing interest at this rate.
F This security is valued by Putnam Management at fair value following procedures approved by the Trustees. Securities may be classified as Level 2 or Level 3 for ASC 820 based on the securities’ valuation inputs (Note 1).
L Affiliated company (Note 5). The rate quoted in the security description is the annualized 7-day yield of the fund at the close of the reporting period.
R Real Estate Investment Trust.
Debt obligations are considered secured unless otherwise indicated.
144A after the name of an issuer represents securities exempt from registration under Rule 144A under the Securities Act of 1933, as amended. These securities may be resold in transactions exempt from registration, normally to qualified institutional buyers.
The dates shown on debt obligations are the original maturity dates.
| Convertible Securities Fund | 23 |
ASC 820 establishes a three-level hierarchy for disclosure of fair value measurements. The valuation hierarchy is based upon the transparency of inputs to the valuation of the fund’s investments. The three levels are defined as follows:
Level 1: Valuations based on quoted prices for identical securities in active markets.
Level 2: Valuations based on quoted prices in markets that are not active or for which all significant inputs are observable, either directly or indirectly.
Level 3: Valuations based on inputs that are unobservable and significant to the fair value measurement.
The following is a summary of the inputs used to value the fund’s net assets as of the close of the reporting period:
| Valuation inputs | ||||||
| Investments in securities: | Level 1 | Level 2 | Level 3 | |||
| Common stocks*: | ||||||
| Communication services | $1,341,427 | $— | $— | |||
| Consumer cyclicals | 2,120,582 | — | — | |||
| Energy | 2,178,480 | — | 31 | |||
| Technology | 1,999,334 | — | 5 | |||
| Total common stocks | 7,639,823 | — | 36 | |||
| Convertible bonds and notes | — | 460,666,301 | 505,926 | |||
| Convertible preferred stocks | 4,198,923 | 167,432,924 | — | |||
| Warrants | — | — | 8 | |||
| Short-term investments | 26,583,706 | — | — | |||
| Totals by level | $38,422,452 | $628,099,225 | $505,970 | |||
* Common stock classifications are presented at the sector level, which may differ from the fund’s portfolio presentation.
Transfers between Level 1 and Level 2 during the reporting period, totaling $16,762,435, are the result of changing to a pricing service as the source for the securities prices. Transfers are accounted for using the end of period pricing valuation method.
At the start and close of the reporting period, Level 3 investments in securities represented less than 1% of the fund’s net assets and were not considered a significant portion of the fund’s portfolio.
The accompanying notes are an integral part of these financial statements.
| 24 | Convertible Securities Fund |
Statement of assets and liabilities 4/30/16 (Unaudited)
| ASSETS | |
| Investment in securities, at value (Note 1): | |
| Unaffiliated issuers (identified cost $652,058,656) | $640,443,941 |
| Affiliated issuers (identified cost $26,583,706) (Notes 1 and 5) | 26,583,706 |
| Dividends, interest and other receivables | 3,311,828 |
| Receivable for shares of the fund sold | 372,904 |
| Receivable for investments sold | 11,842,205 |
| Prepaid assets | 43,858 |
| Total assets | 682,598,442 |
| LIABILITIES | |
| Payable for investments purchased | 5,804,628 |
| Payable for shares of the fund repurchased | 871,150 |
| Payable for compensation of Manager (Note 2) | 337,401 |
| Payable for custodian fees (Note 2) | 8,430 |
| Payable for investor servicing fees (Note 2) | 180,955 |
| Payable for Trustee compensation and expenses (Note 2) | 237,571 |
| Payable for administrative services (Note 2) | 2,828 |
| Payable for distribution fees (Note 2) | 143,528 |
| Other accrued expenses | 122,988 |
| Total liabilities | 7,709,479 |
| Net assets | $674,888,963 |
| REPRESENTED BY | |
| Paid-in capital (Unlimited shares authorized) (Notes 1 and 4) | $705,028,157 |
| Undistributed net investment income (Note 1) | 10,170,610 |
| Accumulated net realized loss on investments and foreign currency transactions (Note 1) | (28,695,089) |
| Net unrealized depreciation of investments | (11,614,715) |
| Total — Representing net assets applicable to capital shares outstanding | $674,888,963 |
| COMPUTATION OF NET ASSET VALUE AND OFFERING PRICE | |
| Net asset value and redemption price per class A share | |
| ($406,726,629 divided by 19,082,984 shares) | $21.31 |
| Offering price per class A share (100/94.25 of $21.31)* | $22.61 |
| Net asset value and offering price per class B share ($9,518,346 divided by 455,671 shares)** | $20.89 |
| Net asset value and offering price per class C share ($57,487,555 divided by 2,729,367 shares)** | $21.06 |
| Net asset value, offering price and redemption price per class I share | |
| ($9,018 divided by 423 shares) | $21.32 |
| Net asset value and redemption price per class M share ($3,622,158 divided by 171,749 shares) | $21.09 |
| Offering price per class M share (100/96.50 of $21.09)* | $21.85 |
| Net asset value, offering price and redemption price per class R share | |
| ($4,588,117 divided by 216,214 shares) | $21.22 |
| Net asset value, offering price and redemption price per class Y share | |
| ($192,937,140 divided by 9,055,192 shares) | $21.31 |
* On single retail sales of less than $50,000. On sales of $50,000 or more the offering price is reduced.
** Redemption price per share is equal to net asset value less any applicable contingent deferred sales charge.
The accompanying notes are an integral part of these financial statements.
| Convertible Securities Fund | 25 |
Statement of operations Six months ended 4/30/16 (Unaudited)
| INVESTMENT INCOME | |
| Dividends (net of foreign tax of $41,502) | $6,216,074 |
| Interest (including interest income of $54,572 from investments in affiliated issuers) (Note 5) | 4,357,348 |
| Securities lending (Note 1) | 128 |
| Total investment income | 10,573,550 |
| EXPENSES | |
| Compensation of Manager (Note 2) | 2,288,230 |
| Investor servicing fees (Note 2) | 580,733 |
| Custodian fees (Note 2) | 7,518 |
| Trustee compensation and expenses (Note 2) | 30,656 |
| Distribution fees (Note 2) | 935,675 |
| Administrative services (Note 2) | 12,224 |
| Other | 163,379 |
| Fees waived and reimbursed by Manager (Note 2) | (11,226) |
| Total expenses | 4,007,189 |
| Expense reduction (Note 2) | (654) |
| Net expenses | 4,006,535 |
| Net investment income | 6,567,015 |
| Net realized loss on investments (Notes 1 and 3) | (18,362,354) |
| Net unrealized depreciation of investments during the period | (28,554,898) |
| Net loss on investments | (46,917,252) |
| Net decrease in net assets resulting from operations | $(40,350,237) |
The accompanying notes are an integral part of these financial statements.
| 26 | Convertible Securities Fund |
Statement of changes in net assets
| DECREASE IN NET ASSETS | Six months ended 4/30/16* | Year ended 10/31/15 |
| Operations: | ||
| Net investment income | $6,567,015 | $9,972,115 |
| Net realized gain (loss) on investments | ||
| and foreign currency transactions | (18,362,354) | 41,140,285 |
| Net unrealized depreciation of investments and assets | ||
| and liabilities in foreign currencies | (28,554,898) | (78,014,393) |
| Net decrease in net assets resulting from operations | (40,350,237) | (26,901,993) |
| Distributions to shareholders (Note 1): | ||
| From ordinary income | ||
| Net investment income | ||
| Class A | (4,894,459) | (11,770,478) |
| Class B | (76,427) | (171,303) |
| Class C | (457,512) | (1,027,055) |
| Class I | (117) | (169) |
| Class M | (31,617) | (70,197) |
| Class R | (45,700) | (119,195) |
| Class Y | (2,582,588) | (6,766,999) |
| From net realized long-term gain on investments | ||
| Class A | (18,094,840) | (23,443,814) |
| Class B | (414,988) | (543,196) |
| Class C | (2,539,938) | (3,033,358) |
| Class I | (340) | — |
| Class M | (142,749) | (185,973) |
| Class R | (179,916) | (266,502) |
| Class Y | (8,567,525) | (11,391,059) |
| Increase (decrease) from capital share transactions (Note 4) | (117,744,548) | 6,463,443 |
| Total decrease in net assets | (196,123,501) | (79,227,848) |
| NET ASSETS | ||
| Beginning of period | 871,012,464 | 950,240,312 |
| End of period (including undistributed net investment | ||
| income of $10,170,610 and $11,692,015, respectively) | $674,888,963 | $871,012,464 |
* Unaudited.
The accompanying notes are an integral part of these financial statements.
| Convertible Securities Fund | 27 |
Financial highlights (For a common share outstanding throughout the period)
| INVESTMENT OPERATIONS: | LESS DISTRIBUTIONS: | RATIOS AND SUPPLEMENTAL DATA: | |||||||||||||
| Ratio | |||||||||||||||
| Net asset | Net realized | Ratio | of net investment | ||||||||||||
| value, | and unrealized | Total from | From | From | Total return | Net assets, | of expenses | income (loss) | |||||||
| beginning | Net investment | gain (loss) | investment | net investment | net realized gain | Total | Redemption | Non-recurring | Net asset value, | at net asset | end of period | to average | to average | Portfolio | |
| Period ended | of period | income (loss)a | on investments | operations | income | on investments | distributions | fees | reimbursements | end of period | value (%)b | (in thousands) | net assets (%)c | net assets (%) | turnover (%) |
| Class A | |||||||||||||||
| April 30, 2016** | $23.37 | .19 | (1.16) | (.97) | (.24) | (.85) | (1.09) | — | — | $21.31 | (4.19)* | $406,727 | .54*d | .89*d | 18* |
| October 31, 2015 | 25.60 | .26 | (.93) | (.67) | (.52) | (1.04) | (1.56) | — | — | 23.37 | (2.86) | 517,495 | 1.06 | 1.04 | 67 |
| October 31, 2014 | 23.57 | .18 | 2.42 | 2.60 | (.57) | — | (.57) | — | — | 25.60 | 11.10 | 578,716 | 1.06 | .72 | 63 |
| October 31, 2013 | 20.09 | .37 | 3.71 | 4.08 | (.60) | — | (.60) | —e | — | 23.57 | 20.62 | 556,643 | 1.08 | 1.69 | 72 |
| October 31, 2012 | 18.97 | .36 | 1.33 | 1.69 | (.57) | — | (.57) | —e | — | 20.09 | 9.07 | 466,910 | 1.11 | 1.87 | 59 |
| October 31, 2011 | 19.31 | .39 | (.16) | .23 | (.57) | — | (.57) | —e | —e,f | 18.97 | 1.08 | 484,050 | 1.12 | 1.94 | 79 |
| Class B | |||||||||||||||
| April 30, 2016** | $22.93 | .11 | (1.14) | (1.03) | (.16) | (.85) | (1.01) | — | — | $20.89 | (4.54)* | $9,518 | .91*d | .52*d | 18* |
| October 31, 2015 | 25.13 | .07 | (.90) | (.83) | (.33) | (1.04) | (1.37) | — | — | 22.93 | (3.55) | 11,374 | 1.81 | .29 | 67 |
| October 31, 2014 | 23.15 | (.01) | 2.38 | 2.37 | (.39) | — | (.39) | — | — | 25.13 | 10.27 | 13,228 | 1.81 | (.04) | 63 |
| October 31, 2013 | 19.75 | .20 | 3.64 | 3.84 | (.44) | — | (.44) | —e | — | 23.15 | 19.68 | 12,009 | 1.83 | .95 | 72 |
| October 31, 2012 | 18.66 | .21 | 1.30 | 1.51 | (.42) | — | (.42) | —e | — | 19.75 | 8.22 | 10,315 | 1.86 | 1.10 | 59 |
| October 31, 2011 | 18.99 | .23 | (.14) | .09 | (.42) | — | (.42) | —e | —e,f | 18.66 | .40 | 12,281 | 1.87 | 1.19 | 79 |
| Class C | |||||||||||||||
| April 30, 2016** | $23.11 | .11 | (1.15) | (1.04) | (.16) | (.85) | (1.01) | — | — | $21.06 | (4.56)* | $57,488 | .91*d | .52*d | 18* |
| October 31, 2015 | 25.32 | .07 | (.91) | (.84) | (.33) | (1.04) | (1.37) | — | — | 23.11 | (3.54) | 72,536 | 1.81 | .30 | 67 |
| October 31, 2014 | 23.33 | (.01) | 2.39 | 2.38 | (.39) | — | (.39) | — | — | 25.32 | 10.27 | 73,451 | 1.81 | (.06) | 63 |
| October 31, 2013 | 19.90 | .20 | 3.67 | 3.87 | (.44) | — | (.44) | —e | — | 23.33 | 19.68 | 50,931 | 1.83 | .93 | 72 |
| October 31, 2012 | 18.79 | .21 | 1.32 | 1.53 | (.42) | — | (.42) | —e | — | 19.90 | 8.24 | 38,875 | 1.86 | 1.10 | 59 |
| October 31, 2011 | 19.13 | .24 | (.16) | .08 | (.42) | — | (.42) | —e | —e,f | 18.79 | .32 | 53,696 | 1.87 | 1.19 | 79 |
| Class I | |||||||||||||||
| April 30, 2016** | $23.38 | .24 | (1.16) | (.92) | (.29) | (.85) | (1.14) | — | — | $21.32 | (3.99)* | $9 | .34*d | 1.08*d | 18* |
| October 31, 2015† | 25.33 | .25 | (1.77) | (1.52) | (.43) | — | (.43) | — | — | 23.38 | (6.05)* | 9 | .45* | .98* | 67 |
| Class M | |||||||||||||||
| April 30, 2016** | $23.14 | .14 | (1.15) | (1.01) | (.19) | (.85) | (1.04) | — | — | $21.09 | (4.42)* | $3,622 | .79*d | .64*d | 18* |
| October 31, 2015 | 25.35 | .13 | (.91) | (.78) | (.39) | (1.04) | (1.43) | — | — | 23.14 | (3.32) | 3,951 | 1.56 | .54 | 67 |
| October 31, 2014 | 23.35 | .05 | 2.40 | 2.45 | (.45) | — | (.45) | — | — | 25.35 | 10.54 | 4,583 | 1.56 | .21 | 63 |
| October 31, 2013 | 19.91 | .26 | 3.67 | 3.93 | (.49) | — | (.49) | —e | — | 23.35 | 20.01 | 3,885 | 1.58 | 1.20 | 72 |
| October 31, 2012 | 18.81 | .26 | 1.31 | 1.57 | (.47) | — | (.47) | —e | — | 19.91 | 8.49 | 3,406 | 1.61 | 1.36 | 59 |
| October 31, 2011 | 19.14 | .29 | (.16) | .13 | (.46) | — | (.46) | —e | —e,f | 18.81 | .61 | 3,546 | 1.62 | 1.46 | 79 |
| Class R | |||||||||||||||
| April 30, 2016** | $23.28 | .16 | (1.16) | (1.00) | (.21) | (.85) | (1.06) | — | — | $21.22 | (4.32)* | $4,588 | .67*d | .77*d | 18* |
| October 31, 2015 | 25.50 | .20 | (.93) | (.73) | (.45) | (1.04) | (1.49) | — | — | 23.28 | (3.09) | 4,972 | 1.31 | .79 | 67 |
| October 31, 2014 | 23.48 | .12 | 2.41 | 2.53 | (.51) | — | (.51) | — | — | 25.50 | 10.83 | 6,569 | 1.31 | .46 | 63 |
| October 31, 2013 | 20.02 | .31 | 3.70 | 4.01 | (.55) | — | (.55) | —e | — | 23.48 | 20.30 | 5,617 | 1.33 | 1.43 | 72 |
| October 31, 2012 | 18.91 | .31 | 1.32 | 1.63 | (.52) | — | (.52) | —e | — | 20.02 | 8.78 | 4,059 | 1.36 | 1.61 | 59 |
| October 31, 2011 | 19.24 | .34 | (.15) | .19 | (.52) | — | (.52) | —e | —e,f | 18.91 | .88 | 3,595 | 1.37 | 1.69 | 79 |
| Class Y | |||||||||||||||
| April 30, 2016** | $23.37 | .22 | (1.16) | (.94) | (.27) | (.85) | (1.12) | — | — | $21.31 | (4.07)* | $192,937 | .42*d | 1.02*d | 18* |
| October 31, 2015 | 25.59 | .32 | (.92) | (.60) | (.58) | (1.04) | (1.62) | — | — | 23.37 | (2.57) | 260,676 | .81 | 1.30 | 67 |
| October 31, 2014 | 23.56 | .24 | 2.42 | 2.66 | (.63) | — | (.63) | — | — | 25.59 | 11.38 | 273,693 | .81 | .95 | 63 |
| October 31, 2013 | 20.08 | .42 | 3.72 | 4.14 | (.66) | — | (.66) | —e | — | 23.56 | 20.93 | 196,399 | .83 | 1.89 | 72 |
| October 31, 2012 | 18.97 | .41 | 1.32 | 1.73 | (.62) | — | (.62) | —e | — | 20.08 | 9.28 | 106,584 | .86 | 2.12 | 59 |
| October 31, 2011 | 19.30 | .44 | (.15) | .29 | (.62) | — | (.62) | —e | —e,f | 18.97 | 1.40 | 106,207 | .87 | 2.17 | 79 |
See notes to financial highlights at the end of this section.
The accompanying notes are an integral part of these financial statements.
| 28 | Convertible Securities Fund | Convertible Securities Fund | 29 |
Financial highlights (Continued)
* Not annualized.
** Unaudited.
† For the period March 3, 2015 (commencement of operations) to October 31, 2015.
a Per share net investment income (loss) has been determined on the basis of the weighted average number of shares outstanding during the period.
b Total return assumes dividend reinvestment and does not reflect the effect of sales charges.
c Includes amounts paid through expense offset and/or brokerage/service arrangements, if any (Note 2). Also excludes acquired fund fees and expenses, if any.
d Reflects a voluntary waiver of certain fund expenses in effect during the period. As a result of such waivers, the expenses of each class reflect a reduction of less than 0.01% as a percentage of average net assets (Note 2):
e Amount represents less than $0.01 per share.
f Reflects a non-recurring reimbursement related to restitution amounts in connection with a distribution plan approved by the Securities and Exchange Commission (the SEC) which amounted to less than $0.01 per share outstanding on July 21, 2011. Also reflects a non-recurring reimbursement related to short-term trading related lawsuits, which amounted to less than $0.01 per share outstanding on May 11, 2011.
The accompanying notes are an integral part of these financial statements.
| 30 | Convertible Securities Fund |
Notes to financial statements 4/30/16 (Unaudited)
Within the following Notes to financial statements, references to “State Street” represent State Street Bank and Trust Company, references to “the SEC” represent the Securities and Exchange Commission, references to “Putnam Management” represent Putnam Investment Management, LLC, the fund’s manager, an indirect wholly-owned subsidiary of Putnam Investments, LLC and references to “OTC”, if any, represent over-the-counter. Unless otherwise noted, the “reporting period” represents the period from November 1, 2015 through April 30, 2016.
Putnam Convertible Securities Fund (the fund) is a Massachusetts business trust, which is registered under the Investment Company Act of 1940, as amended, as a diversified open-end management investment company. The goal of the fund is to seek, with equal emphasis, current income and capital appreciation. The fund’s secondary goal is conservation of capital. The fund invests mainly in convertible securities of U.S. companies. Under normal circumstances, the fund invests at least 80% of the fund’s net assets in convertible securities. This policy may be changed only after 60 days’ notice to shareholders. Convertible securities combine the investment characteristics of bonds and common stocks. Convertible securities include bonds, preferred stocks and other instruments that can be converted into or exchanged for common stock or equivalent value. A significant portion of the convertible securities the fund buys are below-investment-grade (sometimes referred to as “junk bonds”). The convertible bonds the fund buys usually have intermediate-to long-term stated maturities (three years or longer), but often contain “put” features, which allow bondholders to sell the bond back to the company under specified circumstances, that result in shorter effective maturities. When deciding whether to buy or sell investments, Putnam Management may consider, among other factors: (i) a security’s structural features, such as its position in a company’s capital structure and “put” and “call” features (a company’s right to repurchase the security under specified circumstances is a “call” feature); (ii) credit and prepayment risks; and (iii) with respect to a company’s common stock underlying a convertible security, the stock’s valuation and the company’s financial strength, growth potential, competitive position in its industry, projected future earnings, cash flows and dividends.
The fund offers class A, class B, class C, class I, class M, class R and class Y shares. Class A and class M shares are sold with a maximum front-end sales charge of 5.75% and 3.50%, respectively. Class A shares generally are not subject to a contingent deferred sales charge. Class B shares, which convert to class A shares after approximately eight years, do not pay a front-end sales charge and are subject to a contingent deferred sales charge if those shares are redeemed within six years of purchase. Class C shares have a one-year 1.00% contingent deferred sales charge and do not convert to class A shares. Class R shares, which are not available to all investors, are sold at net asset value. The expenses for class A, class B, class C, class M and class R shares may differ based on the distribution fee of each class, which is identified in Note 2. Class I and class Y shares, which are sold at net asset value, are generally subject to the same expenses as class A, class B, class C, class M and class R shares, but do not bear a distribution fee and in the case of class I shares, bear a lower investor servicing fee, which is identified in Note 2. Class I and class Y shares are not available to all investors.
In the normal course of business, the fund enters into contracts that may include agreements to indemnify another party under given circumstances. The fund’s maximum exposure under these arrangements is unknown as this would involve future claims that may be, but have not yet been, made against the fund. However, the fund’s management team expects the risk of material loss to be remote.
Note 1: Significant accounting policies
The following is a summary of significant accounting policies consistently followed by the fund in the preparation of its financial statements. The preparation of financial statements is in conformity with accounting principles generally accepted in the United States of America and requires management to make estimates and assumptions that affect the reported amounts of assets and liabilities in the financial statements and the reported amounts of increases and decreases in net assets from operations. Actual results could differ from those estimates. Subsequent events after the Statement of assets and liabilities date through the date that the financial statements were issued have been evaluated in the preparation of the financial statements.
Investment income, realized and unrealized gains and losses and expenses of the fund are borne pro-rata based on the relative net assets of each class to the total net assets of the fund, except that each class bears expenses unique to that class (including the distribution fees applicable to such classes). Each class votes as a class only with respect to its own distribution plan or other matters on which a class vote is required by law or determined by the Trustees. If the fund were liquidated, shares of each class would receive their pro-rata share of the net assets of the fund. In addition, the Trustees declare separate dividends on each class of shares.
| Convertible Securities Fund | 31 |
Security valuation Portfolio securities and other investments are valued using policies and procedures adopted by the Board of Trustees. The Trustees have formed a Pricing Committee to oversee the implementation of these procedures and have delegated responsibility for valuing the fund’s assets in accordance with these procedures to Putnam Management. Putnam Management has established an internal Valuation Committee that is responsible for making fair value determinations, evaluating the effectiveness of the pricing policies of the fund and reporting to the Pricing Committee.
Investments for which market quotations are readily available are valued at the last reported sales price on their principal exchange, or official closing price for certain markets, and are classified as Level 1 securities under Accounting Standards Codification 820 Fair Value Measurements and Disclosure s (ASC 820). If no sales are reported, as in the case of some securities that are traded OTC, a security is valued at its last reported bid price and is generally categorized as a Level 2 security.
Investments in open-end investment companies (excluding exchange-traded funds), if any, which can be classified as Level 1 or Level 2 securities, are valued based on their net asset value. The net asset value of such investment companies equals the total value of their assets less their liabilities and divided by the number of their outstanding shares.
Market quotations are not considered to be readily available for certain debt obligations (including short-term investments with remaining maturities of 60 days or less) and other investments; such investments are valued on the basis of valuations furnished by an independent pricing service approved by the Trustees or dealers selected by Putnam Management. Such services or dealers determine valuations for normal institutional-size trading units of such securities using methods based on market transactions for comparable securities and various relationships, generally recognized by institutional traders, between securities (which consider such factors as security prices, yields, maturities and ratings). These securities will generally be categorized as Level 2.
Many securities markets and exchanges outside the U.S. close prior to the scheduled close of the New York Stock Exchange and therefore the closing prices for securities in such markets or on such exchanges may not fully reflect events that occur after such close but before the scheduled close of the New York Stock Exchange. Accordingly, on certain days, the fund will fair value foreign equity securities taking into account multiple factors including movements in the U.S. securities markets, currency valuations and comparisons to the valuation of American Depository Receipts, exchange-traded funds and futures contracts. These securities, which would generally be classified as Level 1 securities, will be transferred to Level 2 of the fair value hierarchy when they are valued at fair value. The number of days on which fair value prices will be used will depend on market activity and it is possible that fair value prices will be used by the fund to a significant extent. Securities quoted in foreign currencies, if any, are translated into U.S. dollars at the current exchange rate.
To the extent a pricing service or dealer is unable to value a security or provides a valuation that Putnam Management does not believe accurately reflects the security’s fair value, the security will be valued at fair value by Putnam Management in accordance with policies and procedures approved by the Trustees. Certain investments, including certain restricted and illiquid securities and derivatives, are also valued at fair value following procedures approved by the Trustees. These valuations consider such factors as significant market or specific security events such as interest rate or credit quality changes, various relationships with other securities, discount rates, U.S. Treasury, U.S. swap and credit yields, index levels, convexity exposures, recovery rates, sales and other multiples and resale restrictions. These securities are classified as Level 2 or as Level 3 depending on the priority of the significant inputs.
To assess the continuing appropriateness of fair valuations, the Valuation Committee reviews and affirms the reasonableness of such valuations on a regular basis after considering all relevant information that is reasonably available. Such valuations and procedures are reviewed periodically by the Trustees. The fair value of securities is generally determined as the amount that the fund could reasonably expect to realize from an orderly disposition of such securities over a reasonable period of time. By its nature, a fair value price is a good faith estimate of the value of a security in a current sale and does not reflect an actual market price, which may be different by a material amount.
Security transactions and related investment income Security transactions are recorded on the trade date (the date the order to buy or sell is executed). Gains or losses on securities sold are determined on the identified cost basis.
Interest income, net of any applicable withholding taxes, is recorded on the accrual basis. Dividend income, net of any applicable withholding taxes, is recognized on the ex-dividend date except that certain dividends from foreign securities, if any, are recognized as soon as the fund is informed of the ex-dividend date. Non-cash dividends, if any,
| 32 | Convertible Securities Fund |
are recorded at the fair value of the securities received. Dividends representing a return of capital or capital gains, if any, are reflected as a reduction of cost and/or as a realized gain.
All premiums/discounts are amortized/accreted on a yield-to-maturity basis.
Securities lending The fund may lend securities, through its agent, to qualified borrowers in order to earn additional income. The loans are collateralized by cash in an amount at least equal to the fair value of the securities loaned. The fair value of securities loaned is determined daily and any additional required collateral is allocated to the fund on the next business day. The remaining maturities of the securities lending transactions are considered overnight and continuous. The risk of borrower default will be borne by the fund’s agent; the fund will bear the risk of loss with respect to the investment of the cash collateral. Income from securities lending is included in investment income on the Statement of operations. Cash collateral is invested in Putnam Cash Collateral Pool, LLC, a limited liability company managed by an affiliate of Putnam Management. Investments in Putnam Cash Collateral Pool, LLC are valued at its closing net asset value each business day. There are no management fees charged to Putnam Cash Collateral Pool, LLC. At the close of the reporting period, the fund had no securities out on loan.
Interfund lending The fund, along with other Putnam funds, may participate in an interfund lending program pursuant to an exemptive order issued by the SEC. This program allows the fund to borrow from or lend to other Putnam funds that permit such transactions. Interfund lending transactions are subject to each fund’s investment policies and borrowing and lending limits. Interest earned or paid on the interfund lending transaction will be based on the average of certain current market rates. During the reporting period, the fund did not utilize the program.
Lines of credit The fund participates, along with other Putnam funds, in a $392.5 million syndicated unsecured committed line of credit provided by State Street ($292.5 million) and Northern Trust Company ($100 million) and a $235.5 million unsecured uncommitted line of credit provided by State Street. Borrowings may be made for temporary or emergency purposes, including the funding of shareholder redemption requests and trade settlements. Interest is charged to the fund based on the fund’s borrowing at a rate equal to the higher of (1) the Federal Funds rate and (2) the overnight LIBOR plus 1.25% for the committed line of credit and the Federal Funds rate plus 1.30% for the uncommitted line of credit. A closing fee equal to 0.04% of the committed line of credit and 0.04% of the uncommitted line of credit has been paid by the participating funds. In addition, a commitment fee of 0.16% per annum on any unutilized portion of the committed line of credit is allocated to the participating funds based on their relative net assets and paid quarterly. During the reporting period, the fund had no borrowings against these arrangements.
Federal taxes It is the policy of the fund to distribute all of its taxable income within the prescribed time period and otherwise comply with the provisions of the Internal Revenue Code of 1986, as amended (the Code), applicable to regulated investment companies. It is also the intention of the fund to distribute an amount sufficient to avoid imposition of any excise tax under Section 4982 of the Code.
The fund is subject to the provisions of Accounting Standards Codification 740 Income Taxes (ASC 740). ASC 740 sets forth a minimum threshold for financial statement recognition of the benefit of a tax position taken or expected to be taken in a tax return. The fund did not have a liability to record for any unrecognized tax benefits in the accompanying financial statements. No provision has been made for federal taxes on income, capital gains or unrealized appreciation on securities held nor for excise tax on income and capital gains. Each of the fund’s federal tax returns for the prior three fiscal years remains subject to examination by the Internal Revenue Service.
The fund may also be subject to taxes imposed by governments of countries in which it invests. Such taxes are generally based on either income or gains earned or repatriated. The fund accrues and applies such taxes to net investment income, net realized gains and net unrealized gains as income and/or capital gains are earned. In some cases, the fund may be entitled to reclaim all or a portion of such taxes, and such reclaim amounts, if any, are reflected as an asset on the fund’s books. In many cases, however, the fund may not receive such amounts for an extended period of time, depending on the country of investment.
The aggregate identified cost on a tax basis is $680,654,273, resulting in gross unrealized appreciation and depreciation of $51,302,927 and $64,929,553, respectively, or net unrealized depreciation of $13,626,626.
Distributions to shareholders Distributions to shareholders from net investment income are recorded by the fund on the ex-dividend date. Distributions from capital gains, if any, are recorded on the ex-dividend date and paid at least annually. The amount and character of income and gains to be distributed are determined in accordance with income tax regulations, which may differ from generally accepted accounting principles. Dividend sources are estimated at the time of declaration. Actual results may vary. Any non-taxable return of capital cannot be determined until final tax calculations are completed after the end of the fund’s fiscal year. Reclassifications are made to the
| Convertible Securities Fund | 33 |
fund’s capital accounts to reflect income and gains available for distribution (or available capital loss carryovers) under income tax regulations.
Note 2: Management fee, administrative services and other transactions
The fund pays Putnam Management a management fee (based on the fund’s average net assets and computed and paid monthly) at annual rates that may vary based on the average of the aggregate net assets of all open-end funds sponsored by Putnam Management (excluding net assets of funds that are invested in or invested in by other Putnam Funds to avoid double counting of those assets). Such annual rates may vary as follows:
| 0.780% | of the first $5 billion, | 0.580% | of the next $50 billion, | |
| 0.730% | of the next $5 billion, | 0.560% | of the next $50 billion, | |
| 0.680% | of the next $10 billion, | 0.550% | of the next $100 billion and | |
| 0.630% | of the next $10 billion, | 0.545% | of any excess thereafter. | |
Putnam Management has contractually agreed, through February 28, 2017, to waive fees or reimburse the fund’s expenses to the extent necessary to limit the cumulative expenses of the fund, exclusive of brokerage, interest, taxes, investment-related expenses, extraordinary expenses, acquired fund fees and expenses and payments under the fund’s investor servicing contract, investment management contract and distribution plans, on a fiscal year-to-date basis to an annual rate of 0.20% of the fund’s average net assets over such fiscal year-to-date period. During the reporting period, the fund’s expenses were not reduced as a result of this limit.
Putnam Management may from time to time voluntarily undertake to waive fees and/or reimburse certain fund expense. Any such waiver or reimbursement would be voluntary and may be modified or discontinued by Putnam Management at any time without notice. For the reporting period, Putnam Management voluntarily waived $11,226.
Putnam Investments Limited (PIL), an affiliate of Putnam Management, is authorized by the Trustees to manage a separate portion of the assets of the fund as determined by Putnam Management from time to time. PIL did not manage any portion of the assets of the fund during the reporting period. If Putnam Management were to engage the services of PIL, Putnam Management would pay a quarterly sub-management fee to PIL for its services at an annual rate of 0.35% of the average net assets of the portion of the fund managed by PIL.
The fund reimburses Putnam Management an allocated amount for the compensation and related expenses of certain officers of the fund and their staff who provide administrative services to the fund. The aggregate amount of all such reimbursements is determined annually by the Trustees.
Custodial functions for the fund’s assets are provided by State Street. Custody fees are based on the fund’s asset level, the number of its security holdings and transaction volumes.
Putnam Investor Services, Inc., an affiliate of Putnam Management, provides investor servicing agent functions to the fund. Putnam Investor Services, Inc. received fees for investor servicing (except for class I shares) that included (1) a per account fee for each direct and underlying non-defined contribution account (“retail account”) of the fund and each of the other funds in its specified category, which was totaled and then allocated to each fund in the category based on its average daily net assets; (2) a specified rate of the fund’s assets attributable to defined contribution plan accounts; and (3) a specified rate based on the average net assets in retail accounts. Putnam Investor Services has agreed that the aggregate investor servicing fees for each fund’s retail and defined contribution accounts will not exceed an annual rate of 0.320% of the fund’s average assets attributable to such accounts. Class I shares paid a monthly fee based on the average net assets of class I shares at an annual rate of 0.01%. During the reporting period, the expenses for each class of shares related to investor servicing fees were as follows:
| Class A | $348,191 | Class M | 2,857 | |
| Class B | 8,016 | Class R | 3,605 | |
| Class C | 49,105 | Class Y | 168,959 | |
| Class I | —* | Total | $580,733 | |
* Amount is less than $1.00.
| 34 | Convertible Securities Fund |
The fund has entered into expense offset arrangements with Putnam Investor Services, Inc. and State Street whereby Putnam Investor Services, Inc.’s and State Street’s fees are reduced by credits allowed on cash balances. The fund also reduced expenses through brokerage/service arrangements. For the reporting period, the fund’s expenses were reduced by $508 under the expense offset arrangements and by $146 under the brokerage/service arrangements.
Each Independent Trustee of the fund receives an annual Trustee fee, of which $500, as a quarterly retainer, has been allocated to the fund, and an additional fee for each Trustees meeting attended. Trustees also are reimbursed for expenses they incur relating to their services as Trustees.
The fund has adopted a Trustee Fee Deferral Plan (the Deferral Plan) which allows the Trustees to defer the receipt of all or a portion of Trustees fees payable on or after July 1, 1995. The deferred fees remain invested in certain Putnam funds until distribution in accordance with the Deferral Plan.
The fund has adopted an unfunded noncontributory defined benefit pension plan (the Pension Plan) covering all Trustees of the fund who have served as a Trustee for at least five years and were first elected prior to 2004. Benefits under the Pension Plan are equal to 50% of the Trustee’s average annual attendance and retainer fees for the three years ended December 31, 2005. The retirement benefit is payable during a Trustee’s lifetime, beginning the year following retirement, for the number of years of service through December 31, 2006. Pension expense for the fund is included in Trustee compensation and expenses in the Statement of operations. Accrued pension liability is included in Payable for Trustee compensation and expenses in the Statement of assets and liabilities. The Trustees have terminated the Pension Plan with respect to any Trustee first elected after 2003.
The fund has adopted distribution plans (the Plans) with respect to its class A, class B, class C, class M and class R shares pursuant to Rule 12b–1 under the Investment Company Act of 1940. The purpose of the Plans is to compensate Putnam Retail Management Limited Partnership, an indirect wholly-owned subsidiary of Putnam Investments, LLC, for services provided and expenses incurred in distributing shares of the fund. The Plans provide for payments by the fund to Putnam Retail Management Limited Partnership at an annual rate of up to 0.35%, 1.00%, 1.00%, 1.00% and 1.00% of the average net assets attributable to class A, class B, class C, class M and class R shares, respectively. The Trustees have approved payment by the fund at an annual rate of 0.25%, 1.00%, 1.00%, 0.75% and 0.50% of the average net assets attributable to class A, class B, class C, class M and class R shares, respectively. During the reporting period, the class specific expenses related to distribution fees were as follows:
| Class A | $549,800 | Class M | 13,521 | |
| Class B | 50,622 | Class R | 11,372 | |
| Class C | 310,360 | Total | $935,675 | |
For the reporting period, Putnam Retail Management Limited Partnership, acting as underwriter, received net commissions of $13,211 and $52 from the sale of class A and class M shares, respectively, and received $1,891 and $730 in contingent deferred sales charges from redemptions of class B and class C shares, respectively.
A deferred sales charge of up to 1.00% is assessed on certain redemptions of class A shares. For the reporting period, Putnam Retail Management Limited Partnership, acting as underwriter, received $15 on class A redemptions.
Note 3: Purchases and sales of securities
During the reporting period, the cost of purchases and the proceeds from sales, excluding short-term investments, were as follows:
| Cost of purchases | Proceeds from sales | |
| Investments in securities (Long-term) | $126,452,190 | $257,703,222 |
| U.S. government securities (Long-term) | — | — |
| Total | $126,452,190 | $257,703,222 |
The fund may purchase or sell investments from or to other Putnam funds in the ordinary course of business, which can reduce the fund’s transaction costs, at prices determined in accordance with SEC requirements and policies approved by the Trustees. During the reporting period, purchases or sales from or to other Putnam funds, if any, did not represent more than 5% of the fund’s total cost of purchases and/or total proceeds from sales.
| Convertible Securities Fund | 35 |
Note 4: Capital shares
At the close of the reporting period, there were an unlimited number of shares of beneficial interest authorized. Transactions in capital shares were as follows:
| Six months ended 4/30/16 | Year ended 10/31/15 | |||
| Class A | Shares | Amount | Shares | Amount |
| Shares sold | 579,223 | $12,405,036 | 5,147,073 | $127,707,042 |
| Shares issued in connection with | ||||
| reinvestment of distributions | 998,051 | 21,464,378 | 1,318,459 | 32,346,483 |
| 1,577,274 | 33,869,414 | 6,465,532 | 160,053,525 | |
| Shares repurchased | (4,634,178) | (97,651,569) | (6,934,959) | (171,500,072) |
| Net decrease | (3,056,904) | $(63,782,155) | (469,427) | $(11,446,547) |
| Six months ended 4/30/16 | Year ended 10/31/15 | |||
| Class B | Shares | Amount | Shares | Amount |
| Shares sold | 33,723 | $728,240 | 73,662 | $1,790,142 |
| Shares issued in connection with | ||||
| reinvestment of distributions | 15,673 | 330,782 | 20,180 | 487,042 |
| 49,396 | 1,059,022 | 93,842 | 2,277,184 | |
| Shares repurchased | (89,781) | (1,860,899) | (124,121) | (2,991,491) |
| Net decrease | (40,385) | $(801,877) | (30,279) | $(714,307) |
| Six months ended 4/30/16 | Year ended 10/31/15 | |||
| Class C | Shares | Amount | Shares | Amount |
| Shares sold | 112,885 | $2,397,267 | 655,888 | $16,094,634 |
| Shares issued in connection with | ||||
| reinvestment of distributions | 100,481 | 2,138,575 | 111,027 | 2,698,190 |
| 213,366 | 4,535,842 | 766,915 | 18,792,824 | |
| Shares repurchased | (622,790) | (13,021,703) | (528,646) | (12,827,775) |
| Net increase (decrease) | (409,424) | $(8,485,861) | 238,269 | $5,965,049 |
| For the period 3/3/15 | ||||
| (commencement of operations) | ||||
| Six months ended 4/30/16 | to 10/31/15 | |||
| Class I | Shares | Amount | Shares | Amount |
| Shares sold | — | $— | 395 | $10,000 |
| Shares issued in connection with | ||||
| reinvestment of distributions | 21 | 457 | 7 | 169 |
| 21 | 457 | 402 | 10,169 | |
| Shares repurchased | — | — | — | — |
| Net increase | 21 | $457 | 402 | $10,169 |
| 36 | Convertible Securities Fund |
| Six months ended 4/30/16 | Year ended 10/31/15 | |||
| Class M | Shares | Amount | Shares | Amount |
| Shares sold | 7,482 | $154,005 | 18,853 | $466,635 |
| Shares issued in connection with | ||||
| reinvestment of distributions | 8,115 | 172,795 | 10,266 | 249,813 |
| 15,597 | 326,800 | 29,119 | 716,448 | |
| Shares repurchased | (14,574) | (300,569) | (39,160) | (972,561) |
| Net increase (decrease) | 1,023 | $26,231 | (10,041) | $(256,113) |
| Six months ended 4/30/16 | Year ended 10/31/15 | |||
| Class R | Shares | Amount | Shares | Amount |
| Shares sold | 35,840 | $759,569 | 80,137 | $1,964,692 |
| Shares issued in connection with | ||||
| reinvestment of distributions | 9,360 | 200,428 | 14,900 | 364,624 |
| 45,200 | 959,997 | 95,037 | 2,329,316 | |
| Shares repurchased | (42,569) | (903,294) | (139,102) | (3,336,956) |
| Net increase (decrease) | 2,631 | $56,703 | (44,065) | $(1,007,640) |
| Six months ended 4/30/16 | Year ended 10/31/15 | |||
| Class Y | Shares | Amount | Shares | Amount |
| Shares sold | 1,451,257 | $30,902,369 | 4,910,078 | $122,223,808 |
| Shares issued in connection with | ||||
| reinvestment of distributions | 400,413 | 8,603,897 | 556,282 | 13,626,388 |
| 1,851,670 | 39,506,266 | 5,466,360 | 135,850,196 | |
| Shares repurchased | (3,952,326) | (84,264,312) | (5,005,918) | (121,937,364) |
| Net increase (decrease) | (2,100,656) | $(44,758,046) | 460,442 | $13,912,832 |
At the close of the reporting period, Putnam Investments, LLC owned the following class shares of the fund:
| Shares owned | Percentage of ownership | Value | |
| Class I | 423 | 100% | $9,018 |
Note 5: Affiliated Transactions
Transactions during the reporting period with Putnam Short Term Investment Fund, which is under common ownership and control, were as follows:
| Fair value at the | Fair value at | ||||
| beginning of | the end of | ||||
| the reporting | Investment | the reporting | |||
| Name of affiliate | period | Purchase cost | Sale proceeds | income | period |
| Putnam Short Term | |||||
| Investment Fund* | $43,173,386 | $149,424,943 | $166,014,623 | $54,572 | $26,583,706 |
| Totals | $43,173,386 | $149,424,943 | $166,014,623 | $54,572 | $26,583,706 |
* Management fees charged to Putnam Short Term Investment Fund have been waived by Putnam Management.
| Convertible Securities Fund | 37 |
Note 6: Market, credit and other risks
In the normal course of business, the fund trades financial instruments and enters into financial transactions where risk of potential loss exists due to changes in the market (market risk) or failure of the contracting party to the transaction to perform (credit risk). The fund may be exposed to additional credit risk that an institution or other entity with which the fund has unsettled or open transactions will default. Investments in foreign securities involve certain risks, including those related to economic instability, unfavorable political developments, and currency fluctuations.
Note 7: Summary of derivative activity
The volume of activity for the reporting period for any derivative type that was held during the period is listed below and was based on an average of the holdings at the end of each fiscal quarter:
| Warrants (number of warrants) | 400 |
The following is a summary of the fair value of derivative instruments as of the close of the reporting period:
Fair value of derivative instruments as of the close of the reporting period
| Asset derivatives | Liability derivatives | |||
| Derivatives not | ||||
| accounted for as | Statement of | Statement of | ||
| hedging instruments | assets and | assets and | ||
| under ASC 815 | liabilities location | Fair value | liabilities location | Fair value |
| Equity contracts | Investments | $8 | Payables | $— |
| Total | $8 | $— | ||
The following is a summary of change in unrealized gains or losses of derivative instruments on the Statement of operations for the reporting period (see Note 1) (there were no realized gains or losses on derivative instruments):
Change in unrealized appreciation or (depreciation) on derivatives recognized in net gain or (loss) on investments
| Derivatives not accounted for as hedging | ||
| instruments under ASC 815 | Warrants | Total |
| Equity contracts | $(91,918) | $(91,918) |
| Total | $(91,918) | $(91,918) |
| 38 | Convertible Securities Fund |
Putnam family of funds
The following is a list of Putnam’s open-end mutual funds offered to the public. Investors should carefully consider the investment objective, risks, charges, and expenses of a fund before investing. For a prospectus, or a summary prospectus if available, containing this and other information for any Putnam fund or product, contact your financial advisor or call Putnam Investor Services at 1-800-225-1581. Please read the prospectus carefully before investing.
| Growth | International Value Fund |
| Growth Opportunities Fund | Multi-Cap Value Fund |
| International Growth Fund | Small Cap Value Fund |
| Multi-Cap Growth Fund | |
| Small Cap Growth Fund | Income |
| Voyager Fund | American Government Income Fund |
| Diversified Income Trust | |
| Blend | Emerging Markets Income Fund |
| Asia Pacific Equity Fund | Floating Rate Income Fund |
| Capital Opportunities Fund | Global Income Trust |
| Capital Spectrum Fund | Government Money Market Fund* |
| Emerging Markets Equity Fund | High Yield Advantage Fund |
| Equity Spectrum Fund | High Yield Trust |
| Europe Equity Fund | Income Fund |
| Global Equity Fund | Money Market Fund* |
| International Capital Opportunities Fund | Short Duration Income Fund |
| International Equity Fund | U.S. Government Income Trust |
| Investors Fund | |
| Low Volatility Equity Fund | Tax-free Income |
| Multi-Cap Core Fund | AMT-Free Municipal Fund |
| Research Fund | Intermediate-Term Municipal Income Fund |
| Strategic Volatility Equity Fund | Short-Term Municipal Income Fund |
| Tax Exempt Income Fund | |
| Value | Tax-Free High Yield Fund |
| Convertible Securities Fund | |
| Equity Income Fund | State tax-free income funds†: |
| Global Dividend Fund | Arizona, California, Massachusetts, Michigan, |
| The Putnam Fund for Growth and Income | Minnesota, New Jersey, New York, Ohio, |
| and Pennsylvania. |
| Convertible Securities Fund | 39 |
| Absolute Return | Retirement Income Lifestyle Funds — |
| Absolute Return 100 Fund® | portfolios with managed allocations to |
| Absolute Return 300 Fund® | stocks, bonds, and money market |
| Absolute Return 500 Fund® | investments to generate retirement income. |
| Absolute Return 700 Fund® | |
| Retirement Income Fund Lifestyle 1 | |
| Global Sector | Retirement Income Fund Lifestyle 2 |
| Global Consumer Fund | Retirement Income Fund Lifestyle 3 |
| Global Energy Fund | |
| Global Financials Fund | RetirementReady® Funds — portfolios with |
| Global Health Care Fund | adjusting allocations to stocks, bonds, and |
| Global Industrials Fund | money market instruments, becoming more |
| Global Natural Resources Fund | conservative over time. |
| Global Sector Fund | |
| Global Technology Fund | RetirementReady® 2060 Fund |
| Global Telecommunications Fund | RetirementReady® 2055 Fund |
| Global Utilities Fund | RetirementReady® 2050 Fund |
| RetirementReady® 2045 Fund | |
| Asset Allocation | RetirementReady® 2040 Fund |
| George Putnam Balanced Fund | RetirementReady® 2035 Fund |
| RetirementReady® 2030 Fund | |
| Global Asset Allocation Funds — four | RetirementReady® 2025 Fund |
| investment portfolios that spread your | RetirementReady® 2020 Fund |
| money across a variety of stocks, bonds, and | |
| money market instruments. | |
| Dynamic Asset Allocation Balanced Fund | |
| Dynamic Asset Allocation Conservative Fund | |
| Dynamic Asset Allocation Growth Fund | |
| Dynamic Risk Allocation Fund |
* An investment in a money market fund is not insured or guaranteed by the Federal Deposit Insurance Corporation or any other government agency. Although the fund seeks to preserve the value of your investment at $1.00 per share, it is possible to lose money by investing in the fund.
† Not available in all states.
Check your account balances and the most recent month-end performance in the Individual Investors section at putnam.com.
| 40 | Convertible Securities Fund |
Fund information
Founded over 75 years ago, Putnam Investments was built around the concept that a balance between risk and reward is the hallmark of a well-rounded financial program. We manage over 100 funds across income, value, blend, growth, asset allocation, absolute return, and global sector categories.
| Investment Manager | Trustees | Robert T. Burns |
| Putnam Investment | Jameson A. Baxter, Chair | Vice President and |
| Management, LLC | Liaquat Ahamed | Chief Legal Officer |
| One Post Office Square | Ravi Akhoury | |
| Boston, MA 02109 | Barbara M. Baumann | James F. Clark |
| Robert J. Darretta | Chief Compliance Officer | |
| Investment Sub-Manager | Katinka Domotorffy | |
| Putnam Investments Limited | John A. Hill | Michael J. Higgins |
| 57–59 St James’s Street | Paul L. Joskow | Vice President, Treasurer, |
| London, England SW1A 1LD | Kenneth R. Leibler | and Clerk |
| Robert E. Patterson | ||
| Marketing Services | George Putnam, III | Janet C. Smith |
| Putnam Retail Management | Robert L. Reynolds | Vice President, |
| One Post Office Square | W. Thomas Stephens | Principal Accounting Officer, |
| Boston, MA 02109 | and Assistant Treasurer | |
| Officers | ||
| Custodian | Robert L. Reynolds | Susan G. Malloy |
| State Street Bank | President | Vice President and |
| and Trust Company | Assistant Treasurer | |
| Jonathan S. Horwitz | ||
| Legal Counsel | Executive Vice President, | James P. Pappas |
| Ropes & Gray LLP | Principal Executive Officer, and | Vice President |
| Compliance Liaison | ||
| Mark C. Trenchard | ||
| Steven D. Krichmar | Vice President and | |
| Vice President and | BSA Compliance Officer | |
| Principal Financial Officer | ||
| Nancy E. Florek | ||
| Vice President, Director of | ||
| Proxy Voting and Corporate | ||
| Governance, Assistant Clerk, | ||
| and Associate Treasurer |
This report is for the information of shareholders of Putnam Convertible Securities Fund. It may also be used as sales literature when preceded or accompanied by the current prospectus, the most recent copy of Putnam’s Quarterly Performance Summary, and Putnam’s Quarterly Ranking Summary. For more recent performance, please visit putnam.com. Investors should carefully consider the investment objectives, risks, charges, and expenses of a fund, which are described in its prospectus. For this and other information or to request a prospectus or summary prospectus, call 1-800-225-1581 toll free. Please read the prospectus carefully before investing. The fund’s Statement of Additional Information contains additional information about the fund’s Trustees and is available without charge upon request by calling 1-800-225-1581.

| Item 2. Code of Ethics: |
| Not applicable |
| Item 3. Audit Committee Financial Expert: |
| Not applicable |
| Item 4. Principal Accountant Fees and Services: |
| Not applicable |
| Item 5. Audit Committee of Listed Registrants |
| Not applicable |
| Item 6. Schedule of Investments: |
| The registrant's schedule of investments in unaffiliated issuers is included in the report to shareholders in Item 1 above. |
| Item 7. Disclosure of Proxy Voting Policies and Procedures For Closed-End Management Investment Companies: |
| Not applicable |
| Item 8. Portfolio Managers of Closed-End Investment Companies |
| Not Applicable |
| Item 9. Purchases of Equity Securities by Closed-End Management Investment Companies and Affiliated Purchasers: |
| Not applicable |
| Item 10. Submission of Matters to a Vote of Security Holders: |
| Not applicable |
| Item 11. Controls and Procedures: |
| (a) The registrant's principal executive officer and principal financial officer have concluded, based on their evaluation of the effectiveness of the design and operation of the registrant's disclosure controls and procedures as of a date within 90 days of the filing date of this report, that the design and operation of such procedures are generally effective to provide reasonable assurance that information required to be disclosed by the registrant in this report is recorded, processed, summarized and reported within the time periods specified in the Commission's rules and forms. |
| (b) Changes in internal control over financial reporting: Not applicable |
| Item 12. Exhibits: |
| (a)(1) Not applicable |
| (a)(2) Separate certifications for the principal executive officer and principal financial officer of the registrant as required by Rule 30a-2(a) under the Investment Company Act of 1940, as amended, are filed herewith. |
| (b) The certifications required by Rule 30a-2(b) under the Investment Company Act of 1940, as amended, are filed herewith. |
| Putnam Convertible Securities Fund |
| By (Signature and Title): |
| /s/ Janet C. Smith Janet C. Smith Principal Accounting Officer |
| Date: June 28, 2016 |
| Pursuant to the requirements of the Securities Exchange Act of 1934 and the Investment Company Act of 1940, this report has been signed below by the following persons on behalf of the registrant and in the capacities and on the dates indicated. |
| By (Signature and Title): |
| /s/ Jonathan S. Horwitz Jonathan S. Horwitz Principal Executive Officer |
| Date: June 28, 2016 |
| By (Signature and Title): |
| /s/ Steven D. Krichmar Steven D. Krichmar Principal Financial Officer |
| Date: June 28, 2016 |