UNITED STATES
SECURITIES AND EXCHANGE COMMISSION
Washington, D.C. 20549
FORM N-CSR
CERTIFIED SHAREHOLDER REPORT OF REGISTERED
MANAGEMENT INVESTMENT COMPANIES
Investment Company Act file number: (811- 02608)
Exact name of registrant as specified in charter: Putnam Money Market Fund
Address of principal executive offices: One Post Office Square, Boston, Massachusetts 02109
| Name and address of agent for service: | Beth S. Mazor, Vice President | |
| One Post Office Square | ||
| Boston, Massachusetts 02109 | ||
| Copy to: | John W. Gerstmayr, Esq. | |
| Ropes & Gray LLP | ||
| One International Place | ||
| Boston, Massachusetts 02110 | ||
| Registrant’s telephone number, including area code: | (617) 292-1000 | |
Date of fiscal year end: September 30, 2007
Date of reporting period: October 1, 2006— September 30, 2007
Item 1. Report to Stockholders:
The following is a copy of the report transmitted to stockholders pursuant to Rule 30e-1 under the Investment Company Act of 1940:
What makes Putnam different?
A time-honored tradition in money management
Since 1937, our values have been rooted in a profound sense of responsibility for the money entrusted to us.
A prudent approach to investing
We use a research-driven team approach to seek consistent, dependable, superior investment results over time, although there is no guarantee a fund will meet its objectives.
Funds for every investment goal
We offer a broad range of mutual funds and other financial products so investors and their financial representatives can build diversified portfolios.
A commitment to doing what’s right for investors
With a focus on investment performance, below-average expenses, and in-depth information about our funds, we put the interests of investors first and seek to set the standard for integrity and service.
Industry-leading service
We help investors, along with their financial representatives, make informed investment decisions with confidence.

In 1830, Massachusetts Supreme Judicial Court Justice Samuel Putnam established The Prudent Man Rule, a legal foundation for responsible money management.
THE PRUDENT MAN RULE
All that can be required of a trustee to invest is that he shall conduct himself faithfully and exercise a sound discretion. He is to observe how men of prudence, discretion, and intelligence manage their own affairs, not in regard to speculation, but in regard to the permanent disposition of their funds, considering the probable income, as well as the probable safety of the capital to be invested.

Putnam
Money Market
Fund
9| 30| 07
Annual Report
| Message from the Trustees | 1 |
| About the fund | 2 |
| Performance and portfolio snapshots | 4 |
| Report from the fund managers | 5 |
| Performance in depth | 9 |
| Expenses | 11 |
| Your fund’s management | 13 |
| Terms and definitions | 14 |
| Trustee approval of management contract | 15 |
| Other information for shareholders | 19 |
| Financial statements | 20 |
| Federal tax information | 37 |
| Shareholder meeting results | 38 |
| About the Trustees | 39 |
| Officers | 43 |
Cover photograph: © Richard H. Johnson
Message from the Trustees
Dear Fellow Shareholder:
This November, Putnam Investments celebrates its 70th anniversary. From modest beginnings in Boston, Massachusetts, Putnam has grown into a global asset manager that serves millions of investors worldwide. Coincident with this anniversary, we are pleased to announce that Great-West Lifeco Inc. recently completed its purchase of Putnam Investments from Marsh & McLennan Companies, Inc. Great-West Lifeco is a financial services holding company with operations in Canada, the United States, and Europe and is a member of the Power Financial Corporation group of companies. With this change, Putnam becomes part of a successful organization with a longstanding commitment to high-quality investment management and financial services. The change in ownership is not expected to affect the Putnam funds, the way Putnam manages money, or the funds’ management teams.
We would also like to take this opportunity to announce that Putnam President and Chief Executive Officer Ed Haldeman, one of your fund’s Trustees since 2004, was recently named President of the Funds, assuming this role from George Putnam, III. This change, together with the completion of the transaction with Great-West Lifeco, has enabled George Putnam to become an independent Trustee of the funds. Both George and Ed will continue serving on the Board of Trustees in our collective role of overseeing the Putnam funds on your behalf.
Lastly, we are pleased to announce that a new independent Trustee, Robert J. Darretta, has joined your fund’s Board of Trustees. Mr. Darretta brings extensive leadership experience in corporate finance and accounting. He is a former Vice Chairman of the Board of Directors of Johnson & Johnson, one of the leading U.S. health-care and consumer products companies, where he also served as Chief Financial Officer, Executive Vice President, and Treasurer.
Although the mutual fund industry has undergone many changes since George Putnam introduced his innovative balanced fund in 1937, Putnam’s guiding principles have not. As we celebrate Putnam’s 70-year milestone, we look forward to Putnam continuing its long tradition of prudent money management and to the new chapter opened by its recent change in ownership. As always, we thank you for your support of the Putnam funds.

Putnam Money Market Fund: seeking to offer accessibility
and current income with relatively low risk
For most people, keeping part of their savings in a low-risk, easily accessible place is an essential part of their overall investment strategy. Putnam Money Market Fund can play a valuable role in many investors’ portfolios because it seeks to provide stability of principal and liquidity to meet short-term needs. In addition, the fund aims to provide investors with current income at short-term rates.

By investing in high-quality short-term money market instruments for which there are deep and liquid markets, the fund’s risk of losing principal is very low. Putnam Money Market Fund generally invests in securities that are rated by at least one nationally recognized rating service in its highest or second-highest categories.
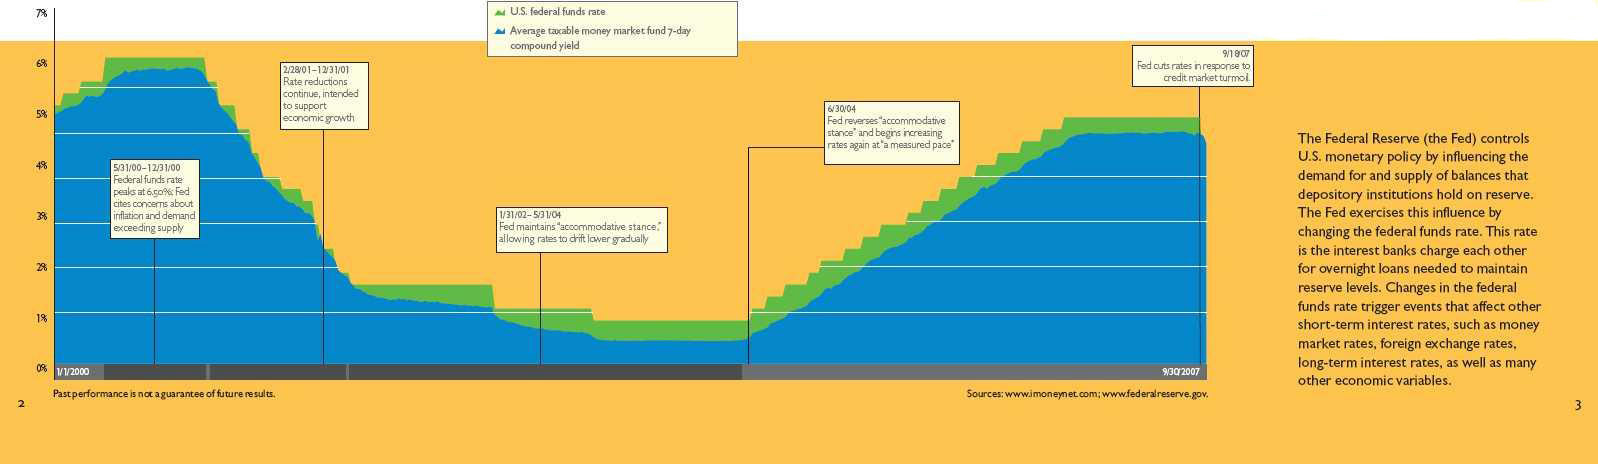
The fund seeks as high a rate of current income as Putnam believes is consistent with liquidity and preservation of principal. As illustrated below, money market fund yields typically rise and fall along with short-term interest rates. Money market funds may not track rates exactly, however, as securities in these funds mature and are replaced with newer instruments earning the most current interest rates.
Whether you want to earmark money for planned near-term expenses or future investment opportunities, or just stow away cash for an unforeseen “rainy day,” Putnam Money Market Fund can be an attractive choice.
An investment in this fund is not insured or guaranteed by the Federal Deposit Insurance Corporation or any other government agency. Although the fund seeks to preserve the value of your investment at $1.00 per share, it is possible to lose money by investing in the fund.
Types of money market securities
Money market securities are issued by governments, government agencies, financial institutions, and established non-financial companies. Typically, such instruments have a remaining maturity of 13 months or less. Securities your fund invests in include:
Commercial paper Short-term unsecured loans issued by large corporations, typically for financing accounts receivable and inventories
Bank certificates of deposit Direct obligations of the issuing commercial bank or savings and loan association
Repurchase agreements (repos) Contracts in which one party sells a security to another party and agrees to buy it back later at a specified price; acts in economic terms as a secured loan
Government securities Direct short-term obligations of governments or government agencies; for example, U.S. Treasury bills.
The average yield on money market funds tends to rise and fall with the federal funds rate.
Performance and portfolio snapshots
Putnam Money Market Fund
Current performance may be lower or higher than the quoted past performance, which cannot guarantee future results. Investment return will fluctuate. Performance of class A shares assumes reinvestment of distributions and does not account for taxes. See pages 9–10 for additional performance information.
For a portion of the periods, this fund may have limited expenses, without which returns would have been lower. Yield reflects current performance more closely than total return. To obtain the most recent month-end performance, visit www.putnam.com.
“In early 2007, when we foresaw that problems in the mortgage market might spill over into the money market sector, we avoided riskier areas of structured finance. Because of our emphasis on safety, the fund’s NAV remained stable and its total return surpassed the average return for the fund’s Lipper peer group.”
Joanne Driscoll, Portfolio Leader, Putnam Money Market Fund
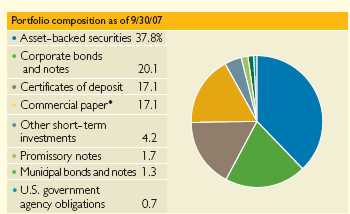
Allocations are represented as a percentage of portfolio market value. Holdings and allocations may vary over time.
* Excludes asset-backed securities.
4
Report from the fund managers
The year in review

For much of Putnam Money Market Fund’s 2007 fiscal year, which ended September 30, 2007, the Federal Reserve (the Fed) held short-term interest rates steady while keeping a sharp eye on inflationary pressures. However, by the summer months, concerns about rising defaults in the subprime mortgage market and a broadening credit crisis, which sharply curtailed financing for consumers and businesses, prompted the Fed to take action. In August, the Fed reduced its discount rate, the rate at which banks can borrow from the Fed. In September, the Fed reduced the federal funds rate, the interest rate banks charge each other for overnight loans needed to maintain reserve levels. Both actions had a positive impact on the market by boosting credit market liquidity. Nevertheless, some money-market-eligible securities suffered during the period. Our conservative style of management helped your fund avoid these investments. Because of our emphasis on safety, the fund’s net asset value remained stable at $1.00 a share during this turbulent period and for the fiscal year as a whole. The fund’s return also surpassed the average for its Lipper peer group for the 12-month period.
Market overview
The crisis in the subprime mortgage lending market and the resulting credit crunch weighed on the performance of many fixed-income sectors — including money market securities — during the year ended September 30, 2007. While the fund did not have any direct exposure to the subprime mortgage market, the subprime crisis caused bond investors to reevaluate risk across the fixed-income market. Yield spreads — which represent the yield premium for investing in bonds that are riskier than U.S. Treasuries, which carry virtually no credit risk — rose dramatically during the period as investors demanded more return on riskier bonds. Consequently, the “risk rally” that persisted in the bond market during the past two years, in which lower-quality issues traded at historically tight yield premiums to U.S. Treasuries and the London Interbank Offered Rate (LIBOR), came to an abrupt end. Despite the turmoil in the subp rime market, money market assets continued to grow. According to iMoneyNet, assets of all money market funds — taxable, institutional, and tax-free — rose to a record $2.835 trillion just following the close of the fiscal year on October 2, 2007.*
*Source: iMoneyNet, October 5, 2007.
Market sector and fund performance
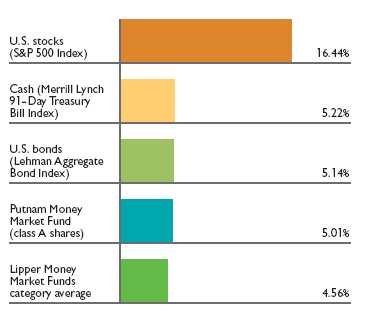
This comparison shows your fund’s performance in the context of different market sectors for the 12 months ended 9/30/07. See the previous page and pages 9–10 for additional fund performance information. Index descriptions can be found on page 14.
5
Strategy overview
In early 2007, when we foresaw that the problems in the mortgage market might spill over into the money market sector, we began to pay extra attention to structured finance and credit markets — well before the fallout began to dominate headlines in July. By combining our top-down macroeconomic research with strong bottom-up analysis that identifies issuers with the strongest fundamentals and highest credit ratings, we avoided exposing the fund to securities issued by structured investment vehicles (SIVs), complex financial entities that have come under tremendous scrutiny in recent months. We think our extensive review of potential holdings, which goes beyond the research provided by major credit-rating agencies, provides a powerful edge when it comes to selecting securities for your fund.
Given the dramatic widening of credit spreads during August and September and the uncertainty that still remained at the close of the fund’s fiscal year, our primary goal was to preserve the credit integrity of the fund while maintaining liquidity to meet investor redemptions. The fund’s weighted average days to maturity (WAM) fell during the fiscal year, but rose by the end of the period overall. WAM is calculated for all securities in a money market or bond fund. The maturity date is the date that a money market instrument or bond buyer will be repaid by the security’s issuer. The longer the average maturity, the more a fund’s share price will move up or down in response to changes in interest rates. Typically, when we expect the Fed to lower interest rates, as it did on September 18, we would extend the fund’s WAM in the weeks leading up to the anticipated rate cut by purchasing fixed-rate paper with a longer mat urity horizon. This may enable us to lock in higher yields that may be available in the market. Due to market volatility during the period, we instituted a barbell strategy, purchasing three-month asset-backed commercial paper (ABCP) multiseller conduits that offered good relative value while also building up a larger liquid position to meet potential redemptions. The portfolio’s WAM was 43 days at the end of the fund’s prior fiscal year, on September 30, 2006. It dropped to 39 days by the end of the fund’s semiannual fiscal period, on March 31, 2007, and rose to 45 days on September 30, 2007. The fund’s 7-day yield rose from 4.93% at the beginning of the fiscal year to 5.12% on September 30, 2007.
Your fund’s holdings
We continue to invest in first-tier corporate and asset-backed commercial paper (ABCP). The ABCP issuers that we consider high-quality investments are backed by trade receivables, commercial loans, student loans, equipment leases, auto loans, mortgage loans, and many other asset types. When screening ABCP for purchase, we focus on four criteria: (1) high-quality diversified assets; (2) appropriate
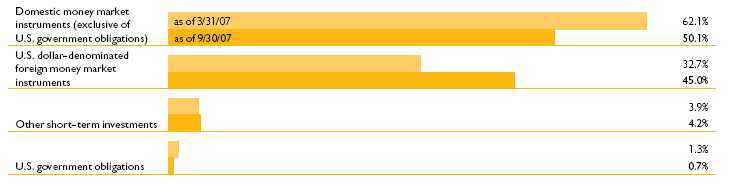
Portfolio composition comparison
This chart shows how the fund’s weightings have changed over the last six months. Weightings are shown as a percentage of portfolio market value. Holdings will vary over time.
6
credit enhancement features; (3) ample liquidity support; and (4) strong management and sponsorship. A good example of an ABCP issuer that meets our stringent criteria is Thunder Bay Funding, a financial entity that is sponsored by Canada’s largest bank, Royal Bank of Canada (RBC). Thunder Bay is backed by a very diversified pool of high-quality assets. This issuer’s credit enhancement includes a commitment from RBC to purchase a portion of Thunder Bay’s assets, which helps offset the risk carried by the assets backing its commercial paper. RBC provides impressive liquidity support, furthermore, as it is required to make funds available to back 100% of Thunder Bay’s issued ABCP if maturing ABCP cannot be repaid by reissuing in the market. We continue to view this type of ABCP structure as a safe and attractive investment.
In contrast, SIVs do not meet our investment criteria, and their securities have never been purchased by the fund. In our opinion, SIVs do not have appropriate structural features that ensure safety of invested principal. For example, we do not believe SIVs have ample alternative liquidity sources as they primarily depend on reissuing debt or liquidating their assets to repay maturing debt. The SIV model has proven to be flawed within the recent volatile credit market. As investors became concerned about the riskiness of SIVs, they have generally stopped repurchasing SIV debt. In the current stressed marketplace, furthermore, SIV managers have found it difficult to sell their underlying assets to repay their commercial paper.
Holdings in Societe Generale and Swedbank are examples of our continued investment in corporate debt issued by large banks. Societe Generale is a diversified French Bank with significant international operations. Swedbank operates primarily as a retail bank in its home country of Sweden.
Please note that the holdings discussed in this report may not have been held by the fund for the entire period. Portfolio composition is subject to review in accordance with the fund’s investment strategy and may vary in the future.
Of special interest
Among the funds in its Money Market Funds category, Lipper ranked Putnam Money Market Fund’s class A shares 44th out of 334, 40th out of 294, and 27th out of 188 funds for the 1-, 5-, and 10-year periods ended September 30, 2007, respectively. These rankings put the fund in the 14th, 14th, and 15th percentile for the same respective periods. The lower the percentile ranking, according to Lipper, the better the fund’s performance relative to its Lipper peers.
Lipper rankings do not reflect sales charges and are based on total return of funds with similar investment styles or objectives as determined by Lipper. Past performance does not guarantee future results.
Performance comparisons
As of 9/30/07
| Current yield† | |
| Regular savings account | 0.20% |
| Average taxable money market fund compound 7-day yield | 4.63†† |
| 3-month certificate of deposit | 5.46 |
| Putnam Money Market Fund* (7-day yield) | |
| Class A | 5.12 |
| Class B | 4.62 |
| Class C | 4.62 |
| Class M | 4.97 |
| Class R | 4.62 |
| Class T | 4.87 |
The net asset value of money market mutual funds is uninsured and designed to be fixed, while distributions vary daily. Investment returns will fluctuate. The principal value on regular savings accounts and on bank certificates of deposits (CDs) is generally insured up to certain limits by state and federal agencies. Unlike stocks, which incur more risk, CDs offer a fixed rate of return. Unlike money market funds, bank CDs may be subject to substantial penalties for early withdrawals.
* During the period, this fund may have limited expenses, without which yields would have been lower.
† Sources: Bank of America (regular savings account), iMoneyNet (average taxable money market fund compound 7-day yield), and Federal Reserve Board of Governors (3-month CDs).
†† Data as of 10/3/07.
7
The outlook for your fund
The following commentary reflects anticipated developments that could affect your fund over the next six months, as well as your management team’s plans for responding to them.
We are encouraged that the liquidity crisis affecting the fixed-income markets is being addressed by the Fed. Many analysts were pleasantly surprised by the amount of the reduction in the federal funds rate, which was cut by half a percentage point. The rate cut helped stabilize the financial markets and restored a level of confidence by demonstrating that the Fed is prepared to step in when extreme events disrupt the bond market’s normal balance of supply and demand.
We think the downturn in the housing market still poses a risk to the broader economy, as well as consumer spending, which is being closely monitored going into the year-end holiday season. If either of these factors causes the nation’s economic growth to slow too much, the Fed may see fit to reduce the federal funds rate again to stimulate growth.
While we expect to see continued volatility in the coming months, the silver lining in any market correction is that many securities may become available at attractive prices. We believe that is now the case in the commercial paper sector. Since we think that some investments in this arena may face challenges in the months ahead, we will be searching for money market securities that may be unfairly tarnished by credit concerns. As always, we will continue to seek to place high-quality issuers and securities in the fund to ensure that its credit quality remains strong and its holdings well diversified.
The views expressed in this report are exclusively those of Putnam Management. They are not meant as investment advice.
Money market funds are not insured or guaranteed by the Federal Deposit Insurance Corporation (FDIC) or any other governmental agency. Although the fund seeks to preserve the value of your investment at $1.00 per share, it is possible to lose money by investing in this fund.
8
Your fund’s performance
This section shows your fund’s performance for periods ended September 30, 2007, the end of its most recent fiscal year. In accordance with regulatory requirements for mutual funds, we also include expense information taken from the fund's current prospectus. Performance should always be considered in light of a fund’s investment strategy. Data represents past performance.
Past performance does not guarantee future results. More recent returns may be less or more than those shown. Investment return will fluctuate, and you may have a gain or a loss when you sell your shares. For the most recent month-end performance, please visit www.putnam.com or call Putnam at 1-800-225-1581.
| Fund performance Total return for periods ended 9/30/07 | ||||||||
| Class A | Class B | Class C | Class M | Class R | Class T | |||
| (inception dates) | (10/1/76) | (4/27/92) | (2/1/99) | (12/8/94) | (1/21/03) | (12/31/01) | ||
| NAV | NAV | CDSC | NAV | CDSC | NAV | NAV | NAV | |
| Annual average | ||||||||
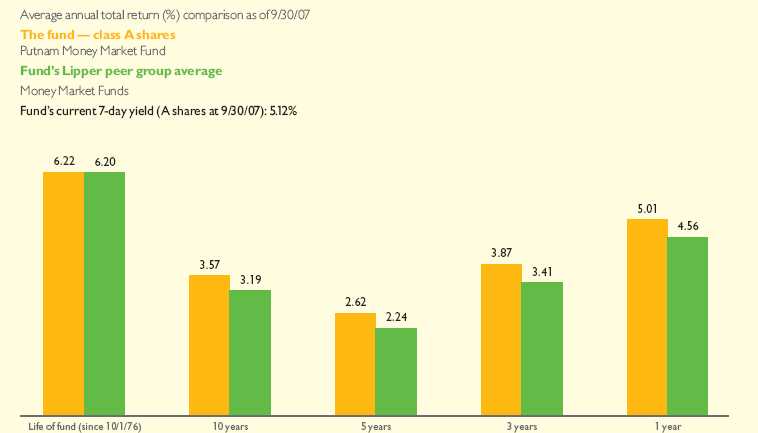
| (life of fund) | 6.22% | 5.69% | 5.69% | 5.69% | 5.69% | 6.06% | 5.68% | 5.95% |
| 10 years | 42.03 | 35.12 | 35.12 | 35.24 | 35.24 | 39.95 | 35.35 | 38.59 |
| Annual average | 3.57 | 3.06 | 3.06 | 3.06 | 3.06 | 3.42 | 3.07 | 3.32 |
| 5 years | 13.83 | 11.02 | 9.02 | 11.02 | 11.02 | 12.97 | 11.23 | 12.41 |
| Annual average | 2.62 | 2.11 | 1.74 | 2.11 | 2.11 | 2.47 | 2.15 | 2.37 |
| 3 years | 12.08 | 10.41 | 7.41 | 10.41 | 10.41 | 11.58 | 10.41 | 11.24 |
| Annual average | 3.87 | 3.36 | 2.41 | 3.36 | 3.36 | 3.72 | 3.36 | 3.61 |
| 1 year | 5.01 | 4.49 | -0.51 | 4.49 | 3.49 | 4.86 | 4.49 | 4.75 |
| Current yield (end of period)* | ||||||||
| Current 7-day yield | 5.12 | 4.62 | 4.62 | 4.97 | 4.62 | 4.87 | ||
| Current 30-day yield | 5.10 | 4.60 | 4.61 | 4.95 | 4.61 | 4.85 | ||
Current performance may be lower or higher than the quoted past performance, which cannot guarantee future results. None of the share classes carries an initial sales charge. Class B shares reflect the applicable contingent deferred sales charge (CDSC), which is 5% in the first year, declines to 1% in the sixth year, and is eliminated thereafter. Class C shares reflect a 1% CDSC for the first year that is eliminated thereafter. Class A, M, R, and T shares generally have no CDSC. Performance for class B, C, M, R, and T shares before their inception is derived from the historical performance of class A shares, adjusted for the applicable CDSC and higher operating expenses for such shares.
For a portion of the periods, this fund may have limited expenses, without which returns would have been lower.
* The 7-day and 30-day yields are the two most common gauges for measuring money market mutual fund performance. Yield reflects current performance more closely than total return.
| Comparative returns For periods ended 9/30/07 | |
| Lipper Money Market | |
| Funds category average* | |
| Annual average | |
| (life of fund) | 6.20% |
| 10 years | 37.03 |
| Annual average | 3.19 |
| 5 years | 11.71 |
| Annual average | 2.24 |
| 3 years | 10.60 |
| Annual average | 3.41 |
| 1 year | 4.56 |
Lipper results should be compared to fund performance at net asset value.
* Over the 1-year, 3-year, 5-year, 10-year, and life-of-fund periods ended 9/30/07, there were 334, 317, 294, 188, and 18 funds, respectively, in this Lipper category.
9
| Fund distribution information For the 12-month period ended 9/30/07 | |||||||
| Distributions | Class A | Class B | Class C | Class M | Class R | Class T | |
| Number | 12 | 12 | 12 | 12 | 12 | 12 | |
| Income | $0.048929 | $0.043937 | $0.043946 | $0.047431 | $0.043921 | $0.046430 | |
| Total | $0.048929 | $0.043937 | $0.043946 | $0.047431 | $0.043921 | $0.046430 | |
| Fund’s annual operating expenses For the fiscal year ended 9/30/06 | |||||||
| Class A | Class B | Class C | Class M | Class R | Class T | ||
| Total annual fund operating expenses | 0.55% | 1.05% | 1.05% | 0.70% | 1.05% | 0.80% | |
Expense information in this table is taken from the most recent prospectus, is subject to change, and may differ from that shown in the next section and in the financial highlights of this report. Expenses are shown as a percentage of average net assets.
10
Your fund’s expenses
As a mutual fund investor, you pay ongoing expenses, such as management fees, distribution fees (12b-1 fees), and other expenses. In the most recent six-month period, your fund limited these expenses; had it not done so, expenses would have been higher. Using the information below, you can estimate how these expenses affect your investment and compare them with the expenses of other funds. You may also pay one-time transaction expenses, including sales charges (loads) and redemption fees, which are not shown in this section and would have resulted in higher total expenses. For more information, see your fund’s prospectus or talk to your financial representative.
Review your fund’s expenses
The table below shows the expenses you would have paid on a $1,000 investment in Putnam Money Market Fund from April 1, 2007, to September 30, 2007. It also shows how much a $1,000 investment would be worth at the close of the period, assuming actual returns and expenses.
| Class A | Class B | Class C | Class M | Class R | Class T | ||
| Expenses paid per $1,000* | $ 2.74 | $ 5.27 | $ 5.27 | $ 3.50 | $ 5.27 | $ 4.01 | |
| Ending value (after expenses) | $1,024.90 | $1,022.30 | $1,022.30 | $1,024.10 | $1,022.30 | $1,023.60 | |
* Expenses for each share class are calculated using the fund’s annualized expense ratio for each class, which represents the ongoing expenses as a percentage of average net assets for the six months ended 9/30/07. The expense ratio may differ for each share class (see the last table in this section). Expenses are calculated by multiplying the expense ratio by the average account value for the period; then multiplying the result by the number of days in the period; and then dividing that result by the number of days in the year.
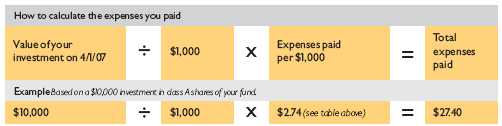
Estimate the expenses you paid
To estimate the ongoing expenses you paid for the six months ended September 30, 2007, use the calculation method below. To find the value of your investment on April 1, 2007, call Putnam at 1-800-225-1581.
Compare expenses using the SEC’s method
The Securities and Exchange Commission (SEC) has established guidelines to help investors assess fund expenses. Per these guidelines, the table below shows your fund’s expenses based on a $1,000 investment, assuming a hypothetical 5% annualized return. You can use this information to compare the ongoing expenses (but not transaction expenses or total costs) of investing in the fund with those of other funds. All mutual fund shareholder reports will provide this information to help you make this comparison. Please note that you cannot use this information to estimate your actual ending account balance and expenses paid during the period.
| Class A | Class B | Class C | Class M | Class R | Class T | ||
| Expenses paid per $1,000* | $ 2.74 | $ 5.27 | $ 5.27 | $ 3.50 | $ 5.27 | $ 4.00 | |
| Ending value (after expenses) | $1,022.36 | $1,019.85 | $1,019.85 | $1,021.61 | $1,019.85 | $1,021.11 | |
* Expenses for each share class are calculated using the fund’s annualized expense ratio for each class, which represents the ongoing expenses as a percentage of average net assets for the six months ended 9/30/07. The expense ratio may differ for each share class (see the last table in this section). Expenses are calculated by multiplying the expense ratio by the average account value for the period; then multiplying the result by the number of days in the period; and then dividing that result by the number of days in the year.
11
Compare expenses using industry averages
You can also compare your fund’s expenses with the average of its peer group, as defined by Lipper, an independent fund-rating agency that ranks funds relative to others that Lipper considers to have similar investment styles or objectives. The expense ratio for each share class shown below indicates how much of your fund’s average net assets have been used to pay ongoing expenses during the period.
| Class A | Class B | Class C | Class M | Class R | Class T | |
| Your fund's annualized expense ratio* | 0.54% | 1.04% | 1.04% | 0.69% | 1.04% | 0.79% |
| Average annualized expense ratio for Lipper peer group† | 0.60% | 1.10% | 1.10% | 0.75% | 1.10% | 0.85% |
* For the fund’s most recent fiscal half year; may differ from expense ratios based on one-year data in the financial highlights.
† Putnam is committed to keeping fund expenses below the Lipper peer group average expense ratio and will limit fund expenses if they exceed the Lipper average. The Lipper average is a simple average of funds in the peer group that excludes 12b-1 fees as well as any expense offset and brokerage service arrangements that may reduce fund expenses. To facilitate the comparison in this presentation, Putnam has adjusted the Lipper average to reflect the 12b-1 fees carried by each class of shares other than class A shares, which do not incur 12b-1 fees. Investors should note that the other funds in the peer group may be significantly smaller or larger than the fund, and that an asset-weighted average would likely be lower than the simple average. Also, the fund and Lipper report expense data at different times and for different periods. The fund’s expense ratio shown here is annualized data for the most recent six-mo nth period, while the quarterly updated Lipper average is based on the most recent fiscal year-end data available for the peer group funds as of 9/30/07.
12
Your fund’s management
Your fund is managed by the members of the Putnam Fixed-Income Money Market Team. Joanne Driscoll is the Portfolio Leader and Jonathan Topper is a Portfolio Member of the fund. The Portfolio Leader and Portfolio Member coordinate the team’s management of the fund.
For a complete listing of the members of the Putnam Fixed-Income Money Market Team, including those who are not Portfolio Leaders or Portfolio Members of your fund, visit Putnam’s Individual Investor Web site at www.putnam.com.
Other Putnam funds managed by the Portfolio Leader and Portfolio Member
Joanne Driscoll is also a Portfolio Leader of Putnam Prime Money Market Fund and Putnam Tax Exempt Money Market Fund.
Jonathan Topper is also a Portfolio Member of Putnam Prime Money Market Fund and Putnam Tax Exempt Money Market Fund.
Joanne Driscoll and Jonathan Topper may also manage other accounts and variable trust funds advised by Putnam Management or an affiliate.
Changes in your fund’s Portfolio Leader and Portfolio Member
Your fund’s Portfolio Leader and Portfolio Member did not change during the year ended September 30, 2007.
13
Terms and definitions
Important terms
Total return shows how the value of the fund’s shares changed over time, assuming you held the shares through the entire period and reinvested all distributions in the fund.
Net asset value (NAV) is the price, or value, of one share of a mutual fund, without a sales charge. NAVs fluctuate with market conditions. NAV is calculated by dividing the net assets of each class of shares by the number of outstanding shares in the class.
Contingent deferred sales charge (CDSC) is generally a charge applied at the time of the redemption of class B or C shares and assumes redemption at the end of the period. Your fund’s class B CDSC declines from a 5% maximum during the first year to 1% during the sixth year. After the sixth year, the CDSC no longer applies. The CDSC for class C shares is 1% for one year after purchase.
Current yield The annual rate of return earned from dividends or interest of an investment. Current yield is expressed as a percentage of the price of a security, fund share, or principal investment.
Share classes
Class A shares generally are fund shares purchased with an initial sales charge. In the case of your fund, which has no sales charge, the reference is to shares purchased or acquired through the exchange of class A shares from another Putnam fund. Exchange of your fund’s class A shares into another fund may involve a sales charge, however.
Class B shares are not subject to an initial sales charge. They may be subject to a CDSC.
Class C shares are not subject to an initial sales charge and are subject to a CDSC only if the shares are redeemed during the first year.
Class M shares have a lower initial sales charge and a higher 12b-1 fee than class A shares and no CDSC. In the case of your fund, which has no sales charge, the reference is to shares purchased or acquired through the exchange of class M shares from another Putnam fund. Exchange of your fund’s class M shares into another fund may involve a sales charge, however.
Class R shares are not subject to an initial sales charge or CDSC and are available only to certain defined contribution plans.
Class T shares are not subject to an initial sales charge or CDSC (except on certain redemptions of shares bought without an initial sales charge); however, they are subject to a 12b-1 fee.
Comparative indexes
Lehman Aggregate Bond Index is an unmanaged index of U.S. investment-grade fixed-income securities.
Lipper Money Market Funds category average is an arithmetic average of the total return of all money market mutual funds tracked by Lipper.
Merrill Lynch 91-Day Treasury Bill Index is an unmanaged index that seeks to measure the performance of U.S. Treasury bills available in the marketplace.
S&P 500 Index is an unmanaged index of common stock performance.
Indexes assume reinvestment of all distributions and do not account for fees. Securities and performance of a fund and an index will differ. You cannot invest directly in an index.
Lipper is a third-party industry-ranking entity that ranks mutual funds. Its rankings do not reflect sales charges. Lipper rankings are based on total return at net asset value relative to other funds that have similar current investment styles or objectives as determined by Lipper. Lipper may change a fund’s category assignment at its discretion. Lipper category averages reflect performance trends for funds within a category.
14
Trustee approval of management contract
General conclusions
The Board of Trustees of the Putnam funds oversees the management of each fund and, as required by law, determines annually whether to approve the continuance of your fund’s management contract with Putnam Investment Management (“Putnam Management”). In this regard, the Board of Trustees, with the assistance of its Contract Committee consisting solely of Trustees who are not “interested persons” (as such term is defined in the Investment Company Act of 1940, as amended) of the Putnam funds (the “Independent Trustees”), requests and evaluates all information it deems reasonably necessary under the circumstances. Over the course of several months ending in June 2007, the Contract Committee met several times to consider the information provided by Putnam Management and other information developed with the assistance of the Board’s independent counsel and independent staff. The Contract Committee reviewed and discussed key aspects of this information with all of the Independent Trustees. The Contract Committee recommended, and the Independent Trustees approved, the continuance of your fund’s management contract, effective July 1, 2007.
In addition, in anticipation of the sale of Putnam Investments to Great-West Lifeco, at a series of meetings ending in March 2007, the Trustees reviewed and approved new management and distribution arrangements to take effect upon the change of control. Shareholders of all funds approved the management contracts in May 2007, and the change of control transaction was completed on August 3, 2007. Upon the change of control, the management contracts that were approved by the Trustees in June 2007 automatically terminated and were replaced by new contracts that had been approved by shareholders. In connection with their review for the June 2007 continuance of the Putnam funds’ management contracts, the Trustees did not identify any facts or circumstances that would alter the substance of the conclusions and recommendations they made in their review of the contracts to take effect upon the change of control.
The Independent Trustees’ approval was based on the following conclusions:
• That the fee schedule in effect for your fund represented reasonable compensation in light of the nature and quality of the services being provided to the fund, the fees paid by competitive funds and the costs incurred by Putnam Management in providing such services, and
• That this fee schedule represented an appropriate sharing between fund shareholders and Putnam Management of such economies of scale as may exist in the management of the fund at current asset levels.
These conclusions were based on a comprehensive consideration of all information provided to the Trustees and were not the result of any single factor. Some of the factors that figured particularly in the Trustees’ deliberations and how the Trustees considered these factors are described below, although individual Trustees may have evaluated the information presented differently, giving different weights to various factors. It is also important to recognize that the fee arrangements for your fund and the other Putnam funds are the result of many years of review and discussion between the Independent Trustees and Putnam Management, that certain aspects of such arrangements may receive greater scrutiny in some years than others, and that the Trustees’ conclusions may be based, in part, on their consideration of these same arrangements in prior years.
Management fee schedules and categories; total expenses
The Trustees reviewed the management fee schedules in effect for all Putnam funds, including fee levels and breakpoints, and the assignment of funds to particular fee categories. In reviewing fees and expenses, the Trustees generally focused their attention on material changes in circumstances — for example, changes in a fund’s size or investment style, changes in Putnam Management’s operating costs or responsibilities, or changes in competitive practices in the mutual fund industry — that suggest that consideration of fee changes might be warranted. The Trustees concluded that the circumstances did not warrant changes to the management fee structure of your fund, which had been carefully developed over the years, re-examined on many occasions and adjusted where appropriate. The Trustees focused on two areas of particular interest, as discussed further below:
• Competitiveness. The Trustees reviewed comparative fee and expense information for competitive funds, which indicated that, in a custom peer group of competitive funds selected by Lipper Inc., your fund ranked in the 34th percentile in management fees and in the 14th percentile in total expenses (less any applicable 12b-1 fees) as of December 31, 2006 (the first percentile being the least expensive funds and the 100th percentile being the most
15
expensive funds). (Because the fund’s custom peer group is smaller than the fund’s broad Lipper Inc. peer group, this expense information may differ from the Lipper peer expense information found elsewhere in this report.) The Trustees noted that expense ratios for a number of Putnam funds, which show the percentage of fund assets used to pay for management and administrative services, distribution (12b-1) fees and other expenses, had been increasing recently as a result of declining net assets and the natural operation of fee breakpoints.
The Trustees noted that the expense ratio increases described above were currently being controlled by expense limitations implemented in January 2004 and which Putnam Management had committed to maintain at least through 2007. In anticipation of the change of control of Putnam Investments, the Trustees requested, and received a commitment from Putnam Management and Great-West Lifeco, to extend this program through at least June 30, 2009. These expense limitations give effect to a commitment by Putnam Management that the expense ratio of each open-end fund would be no higher than the average expense ratio of the competitive funds included in the fund’s relevant Lipper universe (exclusive of any applicable 12b-1 charges in each case). The Trustees observed that this commitment to limit fund expenses has served shareholders well since its inception.
In order to ensure that the expenses of the Putnam funds continue to meet evolving competitive standards, the Trustees requested, and Putnam Management agreed, to extend for the twelve months beginning July 1, 2007, an additional expense limitation for certain funds at an amount equal to the average expense ratio (exclusive of 12b-1 charges) of a custom peer group of competitive funds selected by Lipper to correspond to the size of the fund. This additional expense limitation will be applied to those open-end funds that had above-average expense ratios (exclusive of 12b-1 charges) based on the custom peer group data for the period ended December 31, 2006. This additional expense limitation will not be applied to your fund because it had a below-average expense ratio relative to its custom peer group.
• Economies of scale. Your fund currently has the benefit of breakpoints in its management fee that provide shareholders with significant economies of scale, which means that the effective management fee rate of a fund (as a percentage of fund assets) declines as a fund grows in size and crosses specified asset thresholds. Conversely, as a fund shrinks in size — as has been the case for many Putnam funds in recent years — these breakpoints result in increasing fee levels. In recent years, the Trustees have examined the operation of the existing breakpoint structure during periods of both growth and decline in asset levels. The Trustees concluded that the fee schedules in effect for the funds represented an appropriate sharing of economies of scale at current asset levels. In reaching this conclusion, the Trustees considered the Contract C ommittee’s stated intent to continue to work with Putnam Management to plan for an eventual resumption in the growth of assets, and to consider the potential economies that might be produced under various growth assumptions.
In connection with their review of the management fees and total expenses of the Putnam funds, the Trustees also reviewed the costs of the services to be provided and profits to be realized by Putnam Management and its affiliates from the relationship with the funds. This information included trends in revenues, expenses and profitability of Putnam Management and its affiliates relating to the investment management and distribution services provided to the funds. In this regard, the Trustees also reviewed an analysis of Putnam Management’s revenues, expenses and profitability with respect to the funds’ management contracts, allocated on a fund-by-fund basis.
Investment performance
The quality of the investment process provided by Putnam Management represented a major factor in the Trustees’ evaluation of the quality of services provided by Putnam Management under your fund’s management contract. The Trustees were assisted in their review of the Putnam funds’ investment process and performance by the work of the Investment Process Committee of the Trustees and the Investment Oversight Committees of the Trustees, which had met on a regular monthly basis with the funds’ portfolio teams throughout the year. The Trustees concluded that Putnam Management generally provides a high-quality investment process — as measured by the experience and skills of the individuals assigned to the management of fund portfolios, the resources made available to such personnel, and in general the ability of Putnam Management to attract and retain high-quality personnel — but also recognized that this does not guarantee favorable investment results for every fund in every time period. The Trustees considered the investment performance of each fund over multiple time periods and considered information comparing each fund’s performance with various benchmarks and with the performance of competitive funds.
16
The Trustees noted the satisfactory investment performance of many Putnam funds. They also noted the disappointing investment performance of certain funds in recent years and discussed with senior management of Putnam Management the factors contributing to such underperformance and actions being taken to improve performance. The Trustees recognized that, in recent years, Putnam Management has made significant changes in its investment personnel and processes and in the fund product line to address areas of underperformance. In particular, they noted the important contributions of Putnam Management’s leadership in attracting, retaining and supporting high-quality investment professionals and in systematically implementing an investment process that seeks to merge the best features of fundamental and quantitative analysis. The Trustees indicated their intention to continue to monitor performance trends to assess the effectiveness of these changes and to evaluate whether additional changes to address areas of underperformance are warranted.
In the case of your fund, the Trustees considered that your fund’s class A share cumulative total return performance at net asset value was in the following percentiles of its Lipper Inc. peer group (Lipper Money Market Funds) for the one-, three- and five-year periods ended March 31, 2007 (the first percentile being the best-performing funds and the 100th percentile being the worst-performing funds):
| One-year period | Three-year period | Five-year period |
| 13th | 13th | 15th |
(Because of the passage of time, these performance results may differ from the performance results for more recent periods shown elsewhere in this report. Over the one-, three- and five-year periods ended March 31, 2007, there were 340, 323, and 293 funds, respectively, in your fund’s Lipper peer group.* Past performance is no guarantee of future returns.)
As a general matter, the Trustees concluded that cooperative efforts between the Trustees and Putnam Management represent the most effective way to address investment performance problems. The Trustees noted that investors in the Putnam funds have, in effect, placed their trust in the Putnam organization, under the oversight of the funds’ Trustees, to make appropriate decisions regarding the management of the funds. Based on the responsiveness of Putnam Management in the recent past to Trustee concerns about investment performance, the Trustees concluded that it is preferable to seek change within Putnam Management to address performance shortcomings. In the Trustees’ view, the alternative of terminating a management contract and engaging a new investment adviser for an underperforming fund would entail significant disruptions and would not provide any greater assurance of improved investment performance.
Brokerage and soft-dollar allocations; other benefits
The Trustees considered various potential benefits that Putnam Management may receive in connection with the services it provides under the management contract with your fund. These include benefits related to brokerage and soft-dollar allocations, whereby a portion of the commissions paid by a fund for brokerage may be used to acquire research services that may be useful to Putnam Management in managing the assets of the fund and of other clients. The Trustees indicated their continued intent to monitor the potential benefits associated with the allocation of fund brokerage to ensure that the principle of seeking “best price and execution” remains paramount in the portfolio trading process.
The Trustees’ annual review of your fund’s management contract also included the review of its distributor’s contract and distribution plan with Putnam Retail Management Limited Partnership and the custodian agreement and investor servicing agreement with Putnam Fiduciary Trust Company (“PFTC”), each of which provides benefits to affiliates of Putnam Management. In the case of the custodian agreement, the Trustees considered that, effective January 1, 2007, the Putnam funds had engaged State Street Bank and Trust Company as custodian and began to transition the responsibility for providing custody services away from PFTC.
* The percentile rankings for your fund’s class A share annualized total return performance in the Lipper Money Market Funds category for the one-, five- and ten-year periods ended September 30, 2007 were 14%, 14%, and 15%, respectively. Over the one-, five- and ten-year periods ended September 30, 2007, the fund ranked 44th out of 334, 40th out of 294, and 27th out of 188 funds, respectively. Note that this more recent information was not available when the Trustees approved the continuance of your fund’s management contract.
17
Comparison of retail and institutional fee schedules
The information examined by the Trustees as part of their annual contract review has included for many years information regarding fees charged by Putnam Management and its affiliates to institutional clients such as defined benefit pension plans, college endowments, etc. This information included comparison of such fees with fees charged to the funds, as well as a detailed assessment of the differences in the services provided to these two types of clients. The Trustees observed, in this regard, that the differences in fee rates between institutional clients and the funds are by no means uniform when examined by individual asset sectors, suggesting that differences in the pricing of investment management services to these types of clients reflect to a substantial degree historical competitive forces operating in separate market places. The Trustees considered the fact that fee rates across all asset sectors are higher on average for funds than for institutional clients, as well as the differences between the services that Putnam Management provides to the Putnam funds and those that it provides to institutional clients of the firm, but did not rely on such comparisons to any significant extent in concluding that the management fees paid by your fund are reasonable.
18
Other information for shareholders
Putnam’s policy on confidentiality
In order to conduct business with our shareholders, we must obtain certain personal information such as account holders’ addresses, telephone numbers, Social Security numbers, and the names of their financial representatives. We use this information to assign an account number and to help us maintain accurate records of transactions and account balances. It is our policy to protect the confidentiality of your information, whether or not you currently own shares of our funds, and, in particular, not to sell information about you or your accounts to outside marketing firms. We have safeguards in place designed to prevent unauthorized access to our computer systems and procedures to protect personal information from unauthorized use. Under certain circumstances, we share this information with outside vendors who provide services to us, such as mailing and proxy solicitation. In those cases, the service providers enter into confidentiality agreements with us, and we provide only the information necessary to process transactions and perform other services related to your account. We may also share this information with our Putnam affiliates to service your account or provide you with information about other Putnam products or services. It is also our policy to share account information with your financial representative, if you’ve listed one on your Putnam account. If you would like clarification about our confidentiality policies or have any questions or concerns, please don’t hesitate to contact us at 1-800-225-1581, Monday through Friday, 8:30 a.m. to 7:00 p.m., or Saturdays from 9:00 a.m. to 5:00 p.m. Eastern Time.
Proxy voting
Putnam is committed to managing our mutual funds in the best interests of our shareholders. The Putnam funds’ proxy voting guidelines and procedures, as well as information regarding how your fund voted proxies relating to portfolio securities during the 12-month period ended June 30, 2007, are available on the Putnam Individual Investor Web site, www.putnam.com/individual, and on the SEC’s Web site, www.sec.gov. If you have questions about finding forms on the SEC’s Web site, you may call the SEC at 1-800-SEC-0330. You may also obtain the Putnam funds’ proxy voting guidelines and procedures at no charge by calling Putnam’s Shareholder Services at 1-800-225-1581.
Fund portfolio holdings
The fund will file a complete schedule of its portfolio holdings with the SEC for the first and third quarters of each fiscal year on Form N-Q. Shareholders may obtain the fund’s Forms N-Q on the SEC’s Web site at www.sec.gov. In addition, the fund’s Forms N-Q may be reviewed and copied at the SEC’s Public Reference Room in Washington, D.C. You may call the SEC at 1-800-SEC-0330 for information about the SEC’s Web site or the operation of the Public Reference Room.
19
Financial statements
These sections of the report, as well as the accompanying Notes, preceded by the Report of Independent Registered Public Accounting Firm, constitute the fund’s financial statements.
The fund’s portfolio lists all the fund’s investments and their values as of the last day of the reporting period. Holdings are organized by asset type and industry sector, country, or state to show areas of concentration and diversification.
Statement of assets and liabilities shows how the fund’s net assets and share price are determined. All investment and non-investment assets are added together. Any unpaid expenses and other liabilities are subtracted from this total. The result is divided by the number of shares to determine the net asset value per share, which is calculated separately for each class of shares. (For funds with preferred shares, the amount subtracted from total assets includes the liquidation preference of preferred shares.)
Statement of operations shows the fund’s net investment gain or loss. This is done by first adding up all the fund’s earnings — from dividends and interest income — and subtracting its operating expenses to determine net investment income (or loss). Then, any net gain or loss the fund realized on the sales of its holdings — as well as any unrealized gains or losses over the period — is added to or subtracted from the net investment result to determine the fund’s net gain or loss for the fiscal year.
Statement of changes in net assets shows how the fund’s net assets were affected by the fund’s net investment gain or loss, by distributions to shareholders, and by changes in the number of the fund’s shares. It lists distributions and their sources (net investment income or realized capital gains) over the current reporting period and the most recent fiscal year-end. The distributions listed here may not match the sources listed in the Statement of operations because the distributions are determined on a tax basis and may be paid in a different period from the one in which they were earned.
Financial highlights provide an overview of the fund’s investment results, per-share distributions, expense ratios, net investment income ratios, and portfolio turnover in one summary table, reflecting the five most recent reporting periods. In a semiannual report, the highlight table also includes the current reporting period.
20
Report of Independent Registered Public Accounting Firm
To the Trustees and Shareholders of
Putnam Money Market Fund:
In our opinion, the accompanying statement of assets and liabilities, including the fund’s portfolio, and the related statements of operations and of changes in net assets and the financial highlights present fairly, in all material respects, the financial position of Putnam Money Market Fund (the “fund”) at September 30, 2007 and the results of its operations, the changes in its net assets and the financial highlights for each of the periods indicated, in conformity with accounting principles generally accepted in the United States of America. These financial statements and financial highlights (hereafter referred to as “financial statements”) are the responsibility of the fund’s management. Our responsibility is to express an opinion on these financial statements based on our audits. We conducted our audits of these financial statements in accordance with the standards of the Public Company Accounting Oversight Board (United States). Those standa rds require that we plan and perform the audit to obtain reasonable assurance about whether the financial statements are free of material misstatement. An audit includes examining, on a test basis, evidence supporting the amounts and disclosures in the financial statements, assessing the accounting principles used and significant estimates made by management, and evaluating the overall financial statement presentation. We believe that our audits, which included confirmation of investments owned at September 30, 2007 by correspondence with the custodian and brokers provide a reasonable basis for our opinion.
PricewaterhouseCoopers LLP
Boston, Massachusetts
November 8, 2007
21
| The fund’s portfolio 9/30/07 | ||||
| ASSET-BACKED SECURITIES (38.0%)* | ||||
| Yield (%) | Maturity date | Principal amount | Value | |
| Commercial Paper (37.2%) | ||||
| Aegis Finance, LLC | 5.381 | 10/30/07 | $ 29,400,000 | $ 29,274,242 |
| Atlantic Asset Securitization, LLC | 5.968 | 10/5/07 | 27,900,000 | 27,881,555 |
| Atlantic Asset Securitization, LLC | 5.296 | 10/15/07 | 62,283,000 | 62,155,112 |
| Atlantic Asset Securitization, LLC | 5.249 | 12/21/07 | 30,000,000 | 29,650,350 |
| Atlantis One Funding Corp. | 5.349 | 12/18/07 | 13,000,000 | 12,852,407 |
| Atlantis One Funding Corp. | 5.348 | 10/26/07 | 11,441,000 | 11,399,050 |
| BA Credit Card Trust Emerald Notes | 5.340 | 10/3/07 | 20,900,000 | 20,893,881 |
| BA Credit Card Trust Emerald Notes | 5.331 | 10/23/07 | 22,250,000 | 22,178,547 |
| Bryant Park Funding, LLC | 6.384 | 10/4/07 | 8,939,000 | 8,934,270 |
| Bryant Park Funding, LLC | 6.378 | 10/1/07 | 9,946,000 | 9,946,000 |
| Bryant Park Funding, LLC | 6.092 | 12/13/07 | 21,000,000 | 20,744,500 |
| Bryant Park Funding, LLC | 5.321 | 10/25/07 | 20,000,000 | 19,930,000 |
| Bryant Park Funding, LLC | 5.194 | 12/17/07 | 26,993,000 | 26,696,819 |
| CAFCO, LLC. | 6.298 | 10/19/07 | 25,000,000 | 24,921,875 |
| CAFCO, LLC. | 6.164 | 12/14/07 | 22,000,000 | 21,725,953 |
| CAFCO, LLC. | 6.003 | 1/25/08 | 18,000,000 | 17,659,540 |
| CAFCO, LLC. | 5.238 | 11/13/07 | 30,350,000 | 30,161,493 |
| CHARTA, LLC | 6.112 | 1/15/08 | 18,000,000 | 17,683,060 |
| CHARTA, LLC | 5.318 | 10/22/07 | 38,000,000 | 37,883,625 |
| Citibank Credit Card Issuance Trust Dakota Notes | 5.340 | 10/4/07 | 25,000,000 | 24,989,021 |
| Citibank Credit Card Issuance Trust Dakota Notes | 5.330 | 10/1/07 | 30,000,000 | 30,000,000 |
| Citibank Credit Card Issuance Trust Dakota Notes | 5.320 | 10/9/07 | 32,000,000 | 31,962,667 |
| CRC Funding, LLC | 5.997 | 2/8/08 | 17,600,000 | 17,228,200 |
| CRC Funding, LLC | 5.968 | 12/3/07 | 18,000,000 | 17,815,095 |
| CRC Funding, LLC | 5.390 | 11/15/07 | 24,400,000 | 24,238,045 |
| CRC Funding, LLC | 5.355 | 11/6/07 | 15,000,000 | 14,920,800 |
| Curzon Funding, LLC | 5.879 | 11/8/07 | 20,000,000 | 19,877,556 |
| Curzon Funding, LLC | 5.353 | 11/6/07 | 30,000,000 | 29,841,750 |
| Curzon Funding, LLC | 5.336 | 11/29/07 | 34,945,000 | 34,647,477 |
| Curzon Funding, LLC | 5.321 | 10/24/07 | 20,000,000 | 19,932,917 |
| Falcon Asset Securitization Corp. | 6.232 | 12/11/07 | 24,000,000 | 23,709,847 |
| Falcon Asset Securitization Corp. | 5.416 | 10/15/07 | 11,364,000 | 11,340,312 |
| Gotham Funding Corp. | 5.323 | 10/25/07 | 7,000,000 | 6,975,267 |
| Govco, Inc. | 5.332 | 10/2/07 | 15,000,000 | 14,997,808 |
| Govco, Inc. | 5.321 | 10/9/07 | 30,000,000 | 29,965,000 |
| Govco, Inc. | 5.311 | 10/17/07 | 21,000,000 | 20,951,093 |
| Old Line Funding, LLC | 6.342 | 10/18/07 | 48,775,000 | 48,629,894 |
| Old Line Funding, LLC | 6.127 | 11/5/07 | 37,419,000 | 37,198,904 |
| Old Line Funding, LLC | 5.605 | 10/12/07 | 20,038,000 | 20,004,019 |
| Old Line Funding, LLC | 5.407 | 10/29/07 | 15,300,000 | 15,236,454 |
| Park Avenue Receivables Corp. | 6.220 | 11/15/07 | 25,000,000 | 24,807,813 |
| Ranger Funding Co., LLC | 6.243 | 10/29/07 | 21,216,000 | 21,114,022 |
| Ranger Funding Co., LLC | 5.393 | 11/6/07 | 20,000,000 | 19,893,600 |
| Thunder Bay Funding, Inc. | 6.391 | 10/16/07 | 13,373,000 | 13,337,617 |
| Thunder Bay Funding, Inc. | 6.221 | 12/7/07 | 11,898,000 | 11,762,260 |
| Thunder Bay Funding, Inc. | 6.182 | 11/7/07 | 16,000,000 | 15,899,689 |
| Thunder Bay Funding, Inc. | 6.039 | 11/14/07 | 12,000,000 | 11,912,733 |
| Thunder Bay Funding, Inc. | 5.323 | 10/24/07 | 47,000,000 | 46,840,853 |
| Thunder Bay Funding, Inc. | 5.321 | 10/10/07 | 20,000,000 | 19,973,750 |
| Thunder Bay Funding, Inc. | 5.235 | 1/15/08 | 20,000,000 | 19,696,722 |
| Tulip Funding Corp. | 5.326 | 10/30/07 | 5,124,000 | 5,102,123 |
| Windmill Funding Corp. | 6.296 | 10/11/07 | 27,000,000 | 26,953,125 |
| Windmill Funding Corp. | 5.248 | 11/28/07 | 6,155,000 | 6,103,435 |
| Working Capital Management Co., L.P. | 6.426 | 10/5/07 | 20,000,000 | 19,985,778 |
| Working Capital Management Co., L.P. | 5.434 | 10/31/07 | 66,000,000 | 65,663,832 |
| Yorktown Capital, LLC | 6.162 | 10/2/07 | 17,500,000 | 17,497,025 |
| Yorktown Capital, LLC | 6.155 | 11/9/07 | 43,000,000 | 42,716,773 |
| 1,336,295,555 | ||||
22
| ASSET-BACKED SECURITIES (38.0%)* continued | ||||
| Yield (%) | Maturity date | Principal amount | Value | |
| Other (0.8%) | ||||
| TIAA Real Estate CDO, Ltd. 144A FRB, | ||||
| Ser. 03-1A, Class A1MM, MBIA | ||||
| (Cayman Islands) (M) | 5.329 | 12/28/18 | $ 29,700,138 | $ 29,700,138 |
| Total asset-backed securities (cost $1,365,995,693) | $ 1,365,995,693 | |||
| CORPORATE BONDS AND NOTES (20.2%)* | ||||
| Yield (%) | Maturity date | Principal amount | Value | |
| Domestic (6.3%) | ||||
| Bank of America, N.A. FRN, Ser. BKNT | 5.380 | 8/11/08 | $ 22,000,000 | $ 22,000,000 |
| Bank of New York Co., Inc. (The) | ||||
| 144A sr. notes FRN, Ser. XMTN (M) | 5.820 | 3/10/15 | 20,000,000 | 20,000,000 |
| Citigroup Funding, Inc. company | ||||
| guaranty FRN, Ser. D | 5.500 | 8/13/08 | 35,000,000 | 35,000,000 |
| Lehman Brothers Holdings, Inc. FRN, Ser. MTNA | 5.190 | 8/27/08 | 15,400,000 | 15,400,000 |
| Merrill Lynch & Co., Inc. FRN, Ser. C | 5.893 | 8/14/08 | 14,500,000 | 14,500,000 |
| Merrill Lynch & Co., Inc. sr. unsec. notes FRN | 5.754 | 8/15/08 | 26,650,000 | 26,650,000 |
| Merrill Lynch & Co., Inc. sr. unsec. notes FRN, | ||||
| Ser. MTN | 5.276 | 8/22/08 | 30,000,000 | 30,000,000 |
| Morgan Stanley Dean Witter & Co. | ||||
| sr. notes FRN, Ser. F | 5.390 | 4/25/08 | 20,000,000 | 20,005,501 |
| Prudential Financial, Inc. FRN,Ser. MTN | 5.370 | 4/23/08 | 22,000,000 | 22,000,000 |
| Wachovia Bank, NA sr. notes FRN, Ser. BKNT | 5.190 | 6/27/08 | 20,000,000 | 19,976,898 |
| 225,532,399 | ||||
| Foreign (13.9%) | ||||
| Banco Espanol de Credito SA 144A | ||||
| sr. unsub. notes FRN (Spain) (M) | 5.350 | 4/18/12 | 19,000,000 | 19,000,000 |
| Banco Santander Totta SA 144A bank | ||||
| guaranty FRN (Portugal) | 5.819 | 9/5/08 | 29,200,000 | 29,200,000 |
| Bank of Ireland 144A unsec. notes FRN, | ||||
| Ser. XMTN (Ireland) | 5.506 | 9/19/08 | 23,000,000 | 23,000,000 |
| Bank of Scotland PLC 144A FRN, Ser. MTN | ||||
| (United Kingdom) | 5.810 | 11/7/08 | 25,000,000 | 25,000,000 |
| BNP Paribas 144A FRN (France) (M) | 5.500 | 5/19/11 | 20,000,000 | 20,000,000 |
| Caisse Nationale des Caisses d’Epargne et | ||||
| de Prevoyance 144A FRB (France) (M) | 5.350 | 5/10/12 | 27,000,000 | 27,000,000 |
| Calyon bank guaranty, Ser. MTN (France) | 5.425 | 5/9/08 | 27,000,000 | 27,000,000 |
| Credit Agricole S.A.144A FRN (France) (M) | 5.350 | 7/22/11 | 26,000,000 | 26,000,000 |
| Credit Agricole S.A. 144A FRN (France) (M) | 5.180 | 3/22/12 | 31,000,000 | 31,000,000 |
| Danske Bank A/S 144A FRN (Denmark) (M) | 5.466 | 3/20/13 | 19,000,000 | 19,000,000 |
| DnB NOR Bank ASA 144A FRN (Norway) (M) | 5.131 | 5/25/11 | 31,000,000 | 31,000,000 |
| HSBC Finance Corp. FRN, Ser. MTN (United Kingdom) | 5.400 | 10/4/07 | 15,000,000 | 15,000,082 |
| HSBC USA, Inc. sr. unsec. notes FRN, Ser. EXT | ||||
| (United Kingdom) (M) | 5.753 | 12/15/11 | 36,000,000 | 36,000,000 |
| Lloyds TSB Group PLC 144A FRN, Ser. EXT | ||||
| (United Kingdom) (M) | 5.658 | 6/5/12 | 27,500,000 | 27,500,000 |
| National Australia Bank 144A FRB (Australia) | 5.809 | 9/5/08 | 11,000,000 | 11,000,000 |
| Nordea Bank AB 144A FRN (Sweden) (M) | 5.844 | 8/11/10 | 20,000,000 | 20,000,000 |
| Societe Generale 144A unsec. notes FRN, | ||||
| Ser. MTN (France) (M) | 5.710 | 11/2/10 | 15,000,000 | 15,000,000 |
| Unicredito Italiano Bank (Ireland) PLC 144A bank | ||||
| guaranty FRN (Italy) (M) | 5.350 | 5/10/12 | 23,000,000 | 23,000,000 |
| Westpac Banking Corp. dep. notes FRN, | ||||
| Ser. DPNT (Australia) | 5.680 | 12/7/07 | 31,000,000 | 30,999,278 |
23
| CORPORATE BONDS AND NOTES (20.2%)* continued | ||||
| Yield (%) | Maturity date | Principal amount | Value | |
| Foreign continued | ||||
| Westpac Banking Corp. 144A FRN (Australia) | 5.778 | 9/5/08 | $ 21,000,000 | $ 21,000,000 |
| Westpac Banking Corp. 144A FRN (Australia) | 5.743 | 9/15/08 | 24,000,000 | 24,000,000 |
| 500,699,360 | ||||
| Total corporate bonds and notes (cost $726,231,759) | $ 726,231,759 | |||
| CERTIFICATES OF DEPOSIT (17.3%)* | ||||
| Yield (%) | Maturity date | Principal amount | Value | |
| Domestic (0.6%) | ||||
| Citibank, N.A. Ser. CD | 5.540 | 11/30/07 | $ 22,000,000 | $ 22,000,000 |
| Foreign (16.7%) | ||||
| Bank of Montreal FRN, Ser. YCD (Canada) | 5.601 | 3/18/08 | 18,000,000 | 18,007,095 |
| Bank of Nova Scotia FRN, Ser. YCD (Canada) | 5.074 | 12/31/07 | 66,000,000 | 65,996,317 |
| Barclays Bank PLC Ser. ECD (United Kingdom) | 5.555 | 3/14/08 | 21,000,000 | 21,000,936 |
| Barclays Bank PLC Ser. YCD (United Kingdom) | 5.410 | 6/2/08 | 21,000,000 | 21,000,000 |
| Barclays Bank PLC FRN, Ser. YCD | ||||
| (United Kingdom) | 5.714 | 3/17/08 | 25,000,000 | 24,998,425 |
| Calyon FRN, Ser. YCD (France) | 5.671 | 4/2/08 | 22,000,000 | 21,997,414 |
| Canadian Imperial Bank | ||||
| of Commerce FRN, Ser. YCD1 (Canada) | 5.136 | 9/22/08 | 31,000,000 | 31,000,000 |
| Deutsche Bank AG FRN, Ser. YCD (Germany) | 4.900 | 4/24/08 | 23,000,000 | 22,997,259 |
| Natixis Ser. YCD (France) | 5.430 | 7/1/08 | 45,400,000 | 45,400,000 |
| Natixis Ser. YCD (France) | 5.370 | 5/22/08 | 30,000,000 | 30,000,000 |
| Nordea Bank Finland PLC FRN, Ser. YCD (Sweden) | 5.064 | 7/29/08 | 22,000,000 | 21,962,948 |
| Royal Bank of Canada FRN, Ser. YCD (Canada) | 5.081 | 3/24/08 | 31,600,000 | 31,596,986 |
| Societe Generale FRN, Ser. YCD (France) | 4.865 | 11/27/07 | 40,000,000 | 40,000,000 |
| Societe Generale Ser. ECD (France) | 5.580 | 3/10/08 | 21,000,000 | 21,000,913 |
| Svenska Handelsbanken FRN, Ser. YCD (Sweden) | 5.665 | 10/4/07 | 19,000,000 | 18,999,969 |
| Swedbank FRN, Ser. YCD (Sweden) | 5.768 | 9/8/08 | 30,600,000 | 30,539,492 |
| Swedbank FRN, Ser. YCD (Sweden) | 5.680 | 2/4/08 | 10,000,000 | 9,992,283 |
| Swedbank FRN, Ser. YCD (Sweden) | 5.670 | 4/3/08 | 20,600,000 | 20,597,437 |
| UBS AG Ser. YCD (Switzerland) | 5.500 | 11/27/07 | 21,000,000 | 21,000,000 |
| UniCredito Italiano SpA FRN, Ser. YCD (Italy) | 5.710 | 5/2/08 | 30,000,000 | 29,999,948 |
| UniCredito Italiano SpA Ser. YCD (Italy) | 5.750 | 12/13/07 | 22,000,000 | 22,000,220 |
| UniCredito Italiano SpA Ser. YCD (Italy) | 5.510 | 1/22/08 | 28,000,000 | 28,000,000 |
| 598,087,642 | ||||
| Total certificates of deposit (cost $620,087,642) | $ 620,087,642 | |||
| COMMERCIAL PAPER (17.2%)* | ||||
| Yield (%) | Maturity date | Principal amount | Value | |
| Domestic (3.4%) | ||||
| Citigroup Funding, Inc. | 5.307 | 10/5/07 | $ 25,000,000 | $ 24,985,278 |
| NATC California, LLC (SunTrust Bank (Letter | ||||
| of Credit (LOC))) | 5.321 | 10/12/07 | 27,400,000 | 27,356,046 |
| NATC California, LLC (SunTrust Bank (LOC)) | 5.321 | 10/11/07 | 27,400,000 | 27,360,042 |
| Prudential Financial, Inc. | 5.978 | 11/30/07 | 42,000,000 | 41,587,000 |
| 121,288,366 | ||||
| Foreign (13.8%) | ||||
| Aegon Funding Corp. (Netherlands) | 5.516 | 12/18/07 | 50,000,000 | 49,410,667 |
| Aegon Funding Corp. (Netherlands) | 5.320 | 10/25/07 | 26,400,000 | 26,307,600 |
24
| COMMERCIAL PAPER (17.2%)* continued | |||||
| Yield (%) | Maturity date | Principal amount | Value | ||
| Foreign continued | |||||
| Danske Corp. (Denmark) | 5.597 | 11/5/07 | $ 26,000,000 | $ 25,859,961 | |
| HBOS Treasury Services PLC (United Kingdom) | 5.325 | 10/10/07 | 25,000,000 | 24,967,188 | |
| HBOS Treasury Services PLC (United Kingdom) | 5.324 | 10/22/07 | 30,000,000 | 29,908,125 | |
| ICICI Bank, Ltd. (Fortis Bank SA/NV (LOC)) (Belgium) | 5.268 | 12/14/07 | 71,700,000 | 70,945,537 | |
| Natixis (France) | 5.541 | 10/16/07 | 38,000,000 | 37,913,075 | |
| Societe Generale (France) | 5.321 | 10/5/07 | 25,000,000 | 24,985,417 | |
| Swedbank Mortgage AB (Sweden) | 5.691 | 11/30/07 | 25,000,000 | 24,766,247 | |
| Swedbank Mortgage AB (Sweden) | 5.649 | 12/3/07 | 20,000,000 | 19,805,050 | |
| Swedbank Mortgage AB (Sweden) | 5.332 | 11/8/07 | 35,000,000 | 34,805,672 | |
| UBS Finance (Delaware), LLC (Switzerland) | 5.339 | 11/2/07 | 30,000,000 | 29,859,467 | |
| UBS Finance (Delaware), LLC (Switzerland) | 5.316 | 10/12/07 | 26,000,000 | 25,958,331 | |
| UniCredito Italiano Bank (Ireland) PLC (Italy) | 5.350 | 11/27/07 | 16,400,000 | 16,264,193 | |
| Westpac Securities NZ, Ltd. (Australia) | 5.563 | 11/6/07 | 13,100,000 | 13,027,950 | |
| Westpac Securities NZ, Ltd. (Australia) | 5.341 | 11/30/07 | 20,000,000 | 19,826,667 | |
| Westpac Securities NZ, Ltd. (Australia) | 5.334 | 11/26/07 | 22,000,000 | 21,822,216 | |
| 496,433,363 | |||||
| Total commercial paper (cost $617,721,729) | $ 617,721,729 | ||||
| PROMISSORY NOTES (1.7%)* | |||||
| Yield (%) | Maturity date | Principal amount | Value | ||
| Goldman Sachs Group, Inc. (The) FRN | |||||
| (acquired 4/10/07, cost $30,000,000) ‡ | 5.850 | 4/10/08 | $ 30,000,000 | $ 30,000,000 | |
| Goldman Sachs Group, Inc. (The) FRN | |||||
| (acquired 2/28/07, cost $30,000,000) ‡ | 5.730 | 11/23/07 | 30,000,000 | 30,000,000 | |
| Total promissory notes (cost $60,000,000) | $ 60,000,000 | ||||
| MUNICIPAL BONDS AND NOTES (1.3%)* | |||||
| Yield (%) | Maturity date | Rating** | Principal amount | Value | |
| CO Hsg. & Fin. Auth. VRDN | |||||
| (Multi-Fam.), Ser. B-1, Class II, MBIA (M) | 5.250 | 10/1/44 | VMIG1 | $ 18,590,000 | $ 18,590,000 |
| (Single Fam.), Ser. A-1, Class I (M) | 5.250 | 11/1/34 | VMIG1 | 15,740,000 | 15,740,000 |
| (Single Fam. Mtge.), Ser. B-2 (M) | 5.250 | 11/1/33 | VMIG1 | 12,835,000 | 12,835,000 |
| Total municipal bonds and notes (cost $47,165,000) | $ 47,165,000 | ||||
| U.S. GOVERNMENT AGENCY OBLIGATIONS (0.7%)* (cost $26,000,000) | |||||
| Yield (%) | Maturity date | Principal amount | Value | ||
| Fannie Mae notes | 5.300 | 1/8/08 | $ 26,000,000 | $ 26,000,000 | |
25
| SHORT-TERM INVESTMENTS (4.2%)* | ||
| Principal amount/shares | Value | |
| Interest in $200,000,000 joint tri-party repurchase agreement dated September 28, 2007 | ||
| with Merrill Lynch Government Securities due October 1, 2007 with respect to various U.S. | ||
| Government obligations — maturity value of $35,015,604 for an effective yield of 5.35% | ||
| (collateralized by various corporate bonds and notes with coupon rates ranging from | ||
| 4.25% to 9.75% and due dates ranging from November 16, 2007 to September 30, 2066, | ||
| valued at $204,002,812) | $ 35,000,000 | $ 35,000,000 |
| Putnam Prime Money Market Fund (e) | 117,702,000 | 117,702,000 |
| Total short-term investments (cost $152,702,000) | $ 152,702,000 | |
| TOTAL INVESTMENTS | ||
| Total investments (cost $3,615,903,823) | $ 3,615,903,823 | |
* Percentages indicated are based on net assets of $3,593,282,985.
** The Moody’s or Standard & Poor’s ratings indicated are believed to be the most recent ratings available at September 30, 2007 for the securities listed. Ratings are generally ascribed to securities at the time of issuance. While the agencies may from time to time revise such ratings, they undertake no obligation to do so, and the ratings do not necessarily represent what the agencies would ascribe to these securities at September 30, 2007. Securities rated by Putnam are indicated by “/P.” Securities rated by Fitch are indicated by “/F.” Ratings are not covered by the Report of Independent Registered Public Accounting Firm. Security ratings are defined in the Statement of Additional Information.
‡ Restricted, excluding 144A securities, as to public resale. The total market value of restricted securities held at September 30, 2007 was $60,000,000 or 1.7% of net assets.
(e) See Note 5 to the financial statements regarding investments in Putnam Prime Money Market Fund.
(M) The security’s effective maturity date is less than one year.
144A after the name of an issuer represents securities exempt from registration under Rule 144A under the Securities Act of 1933, as amended. These securities may be resold in transactions exempt from registration, normally to qualified institutional buyers.
The rates shown on Variable Rate Demand Notes (VRDN), Floating Rate Bonds (FRB) and Floating Rate Notes (FRN) are the current interest rates at September 30, 2007.
MBIA represents MBIA Insurance Company.
The dates shown on debt obligations are the original maturity dates.
| DIVERSIFICATION BY COUNTRY | |
| Distribution of investments by country of issue at September 30, 2007 (as a percentage of Portfolio Value): | |
| Australia | 3.9% |
| Belgium | 2.0 |
| Canada | 4.1 |
| Cayman Islands | 0.8 |
| Denmark | 1.2 |
| France | 10.2 |
| Germany | 0.6 |
| Ireland | 0.6 |
| Italy | 3.3 |
| Netherlands | 2.1 |
| Norway | 0.9 |
| Portugal | 0.8 |
| Spain | 0.5 |
| Sweden | 5.6 |
| Switzerland | 2.1 |
| United Kingdom | 6.2 |
| United States | 55.1 |
| Total | 100.0% |
The accompanying notes are an integral part of these financial statements.
26
| Statement of assets and liabilities 9/30/07 | |
| ASSETS | |
| Investment in securities, at value (Note 1): | |
| Unaffiliated issuers (at amortized cost) | $3,498,201,823 |
| Affiliated issuers (identified cost $117,702,000) (Note 5) | 117,702,000 |
| Cash | 541,675 |
| Interest and other receivables | 12,780,277 |
| Receivable for shares of the fund sold | 14,224,429 |
| Total assets | 3,643,450,204 |
| LIABILITIES | |
| Distributions payable to shareholders | 993,593 |
| Payable for securities purchased | 31,429,324 |
| Payable for shares of the fund repurchased | 13,310,091 |
| Payable for compensation of Manager (Notes 2 and 5) | 2,638,337 |
| Payable for investor servicing fees (Note 2) | 1,090,333 |
| Payable for custodian fees (Note 2) | 15,637 |
| Payable for Trustee compensation and expenses (Note 2) | 343,074 |
| Payable for administrative services (Note 2) | 4,357 |
| Payable for distribution fees (Note 2) | 126,625 |
| Other accrued expenses | 215,848 |
| Total liabilities | 50,167,219 |
| Net assets | $3,593,282,985 |
| REPRESENTED BY | |
| Paid-in capital (Unlimited shares authorized) (Notes 1 and 4) | $3,594,316,211 |
| Distributions in excess of net investment income (Note 1) | (993,593) |
| Accumulated net realized loss on investments (Note 1) | (39,633) |
| Total — Representing net assets applicable to capital shares outstanding | $3,593,282,985 |
| COMPUTATION OF NET ASSET VALUE AND OFFERING PRICE | |
| Net asset value, offering price and redemption price per class A share ($3,394,995,896 divided by 3,396,048,104 shares) | $1.00 |
| Net asset value and offering price per class B share ($117,473,645 divided by 117,509,598 shares)* | $1.00 |
| Net asset value and offering price per class C share ($19,456,064 divided by 19,462,003 shares)* | $1.00 |
| Net asset value, offering price and redemption price per class M share ($42,640,795 divided by 42,654,048 shares) | $1.00 |
| Net asset value, offering price and redemption price per class R share ($3,973,547 divided by 3,979,231 shares) | $1.00 |
| Net asset value, offering price and redemption price per class T share ($14,743,038 divided by 14,744,753 shares) | $1.00 |
* Redemption price per share is equal to net asset value less any applicable contingent deferred sales charge.
The accompanying notes are an integral part of these financial statements.
27
| Statement of operations Year ended 9/30/07 | |
| INVESTMENT INCOME | |
| Interest (including interest income of $6,240,905 from investments in affiliated issuers) (Note 5) | $180,948,508 |
| EXPENSES | |
| Compensation of Manager (Note 2) | 10,169,794 |
| Investor servicing fees (Note 2) | 7,017,242 |
| Custodian fees (Note 2) | 80,602 |
| Trustee compensation and expenses (Note 2) | 123,782 |
| Administrative services (Note 2) | 61,413 |
| Distribution fees — Class B (Note 2) | 713,864 |
| Distribution fees — Class C (Note 2) | 82,424 |
| Distribution fees — Class M (Note 2) | 61,937 |
| Distribution fees — Class R (Note 2) | 627,473 |
| Distribution fees — Class T (Note 2) | 33,707 |
| Other | 733,204 |
| Non-recurring costs (Notes 2 and 6) | 1,969 |
| Costs assumed by Manager (Notes 2 and 6) | (1,969) |
| Fees waived and reimbursed by Manager (Note 5) | (101,635) |
| Total expenses | 19,603,807 |
| Expense reduction (Note 2) | (512,837) |
| Balance credits reallocation (Note 2) | 1,074,142 |
| Net expenses | 20,165,112 |
| Net investment income | 160,783,396 |
| Net realized loss on investments (Notes 1 and 3) | (39,633) |
| Net loss on investments | (39,633) |
| Net increase in net assets resulting from operations | $160,743,763 |
The accompanying notes are an integral part of these financial statements.
28
| Statement of changes in net assets | ||
| INCREASE (DECREASE) IN NET ASSETS | ||
| Year ended | Year ended | |
| 9/30/07 | 9/30/06 | |
| Operations: | ||
| Net investment income | $ 160,783,396 | $ 143,594,258 |
| Net realized loss on investments | (39,633) | — |
| Net increase in net assets resulting from operations | 160,743,763 | 143,594,258 |
| Distributions to shareholders: (Note 1) | ||
| From ordinary income | ||
| Net investment income | ||
| Class A | (147,009,453) | (126,306,853) |
| Class B | (6,156,419) | (8,114,894) |
| Class C | (720,950) | (696,392) |
| Class M | (1,922,833) | (1,710,470) |
| Class R | (5,406,047) | (2,360,486) |
| Class T | (642,813) | (4,405,163) |
| Increase (decrease) from capital share transactions (Note 4) | 328,148,464 | (371,534,730) |
| Total increase (decrease) in net assets | 327,033,712 | (371,534,730) |
| NET ASSETS | ||
| Beginning of year | 3,266,249,273 | 3,637,784,003 |
| End of year (including distributions in excess of net investment income of $993,593 and $— , respectively) | $ 3,593,282,985 | $ 3,266,249,273 |
The accompanying notes are an integral part of these financial statements.
29
| Financial highlights (For a common share outstanding throughout the period) | |||||||||||
| INVESTMENT OPERATIONS: | LESS DISTRIBUTIONS: | RATIOS AND SUPPLEMENTAL DATA: | |||||||||
| Total | Ratio of net | ||||||||||
| Net asset | Net | Total | From | Net asset | return | Net | Ratio of | investment | |||
| value, | Net | realized | from | net | value, | at net | assets, | expenses to | income (loss) | ||
| beginning | investment | gain (loss) on | investment | investment | Total | end | asset | end of period | average net | to average | |
| Period ended | of period | income (loss) | investments | operations | income | distributions | of period | value (%)(a) | (in thousands) | assets (%)(b) | net assets (%) |
| CLASS A | |||||||||||
| September 30, 2007 | $1.00 | .0486(c,d) | —(e) | .0486 | (.0489) | (.0489) | $1.00 | 5.01 | $3,394,996 | .54(c) | 4.84(c,d) |
| September 30, 2006 | 1.00 | .0425(c,f) | — | .0425 | (.0425) | (.0425) | 1.00 | 4.34 | 2,870,990 | .50(c,f) | 4.26(c,f) |
| September 30, 2005 | 1.00 | .0226(c) | — | .0226 | (.0226) | (.0226) | 1.00 | 2.29 | 3,087,756 | .53(c) | 2.21(c) |
| September 30, 2004 | 1.00 | .0068(c) | — | .0068 | (.0068) | (.0068) | 1.00 | .68 | 3,537,907 | .53(c) | .70(c) |
| September 30, 2003 | 1.00 | .0087 | —(e) | .0087 | (.0087) | (.0087) | 1.00 | .87 | 4,745,555 | .52 | .88 |
| CLASS B | |||||||||||
| September 30, 2007 | $1.00 | .0436(c,d) | —(e) | .0436 | (.0439) | (.0439) | $1.00 | 4.49 | $117,474 | 1.04(c) | 4.34(c,d) |
| September 30, 2006 | 1.00 | .0375(c,f) | — | .0375 | (.0375) | (.0375) | 1.00 | 3.82 | 174,158 | 1.00(c,f) | 3.70(c,f) |
| September 30, 2005 | 1.00 | .0176(c) | — | .0176 | (.0176) | (.0176) | 1.00 | 1.78 | 290,268 | 1.03(c) | 1.63(c) |
| September 30, 2004 | 1.00 | .0018(c) | — | .0018 | (.0018) | (.0018) | 1.00 | .18 | 520,456 | 1.03(c) | .19(c) |
| September 30, 2003 | 1.00 | .0037 | —(e) | .0037 | (.0037) | (.0037) | 1.00 | .37 | 874,069 | 1.02 | .39 |
| CLASS C | |||||||||||
| September 30, 2007 | $1.00 | .0436(c,d) | —(e) | .0436 | (.0439) | (.0439) | $1.00 | 4.49 | $19,456 | 1.04(c) | 4.34(c,d) |
| September 30, 2006 | 1.00 | .0375(c,f) | — | .0375 | (.0375) | (.0375) | 1.00 | 3.82 | 15,723 | 1.00(c,f) | 3.71(c,f) |
| September 30, 2005 | 1.00 | .0176(c) | — | .0176 | (.0176) | (.0176) | 1.00 | 1.78 | 33,259 | 1.03(c) | 1.64(c) |
| September 30, 2004 | 1.00 | .0018(c) | — | .0018 | (.0018) | (.0018) | 1.00 | .18 | 40,935 | 1.03(c) | .21(c) |
| September 30, 2003 | 1.00 | .0037 | —(e) | .0037 | (.0037) | (.0037) | 1.00 | .37 | 61,755 | 1.02 | .38 |
| CLASS M | |||||||||||
| September 30, 2007 | $1.00 | .0471(c,d) | —(e) | .0471 | (.0474) | (.0474) | $1.00 | 4.86 | $42,641 | .69(c) | 4.69(c,d) |
| September 30, 2006 | 1.00 | .0410(c,f) | — | .0410 | (.0410) | (.0410) | 1.00 | 4.19 | 41,887 | .65(c,f) | 4.11(c,f) |
| September 30, 2005 | 1.00 | .0211(c) | — | .0211 | (.0211) | (.0211) | 1.00 | 2.13 | 44,682 | .68(c) | 2.05(c) |
| September 30, 2004 | 1.00 | .0053(c) | — | .0053 | (.0053) | (.0053) | 1.00 | .53 | 54,390 | .68(c) | .55(c) |
| September 30, 2003 | 1.00 | .0072 | —(e) | .0072 | (.0072) | (.0072) | 1.00 | .72 | 74,921 | .67 | .74 |
| CLASS R | |||||||||||
| September 30, 2007 | $1.00 | .0436(c,d) | —(e) | .0436 | (.0439) | (.0439) | $1.00 | 4.49 | $3,974 | 1.04(c) | 4.32(c,d) |
| September 30, 2006 | 1.00 | .0375(c,f) | — | .0375 | (.0375) | (.0375) | 1.00 | 3.82 | 153,985 | 1.00(c,f) | 4.22(c,f) |
| September 30, 2005 | 1.00 | .0176(c) | — | .0176 | (.0176) | (.0176) | 1.00 | 1.78 | 1,687 | 1.03(c) | 1.99(c) |
| September 30, 2004 | 1.00 | .0027(c) | — | .0027 | (.0027) | (.0027) | 1.00 | .27 | 131 | 1.03(c) | .30(c) |
| September 30, 2003† | 1.00 | .0025 | —(e) | .0025 | (.0025) | (.0025) | 1.00 | .25* | 1 | .71* | .25* |
| CLASS T | |||||||||||
| September 30, 2007 | $1.00 | .0461(c,d) | —(e) | .0461 | (.0464) | (.0464) | $1.00 | 4.75 | $14,743 | .79(c) | 4.59(c,d) |
| September 30, 2006 | 1.00 | .0400(c,f) | — | .0400 | (.0400) | (.0400) | 1.00 | 4.08 | 9,507 | .75(c,f) | 3.77(c,f) |
| September 30, 2005 | 1.00 | .0201(c) | — | .0201 | (.0201) | (.0201) | 1.00 | 2.03 | 180,132 | .78(c) | 2.02(c) |
| September 30, 2004 | 1.00 | .0043(c) | — | .0043 | (.0043) | (.0043) | 1.00 | .43 | 124,394 | .78(c) | .46(c) |
| September 30, 2003 | 1.00 | .0062 | —(e) | .0062 | (.0062) | (.0062) | 1.00 | .62 | 95,779 | .77 | .52 |
See notes to financial highlights at the end of this section.
The accompanying notes are an integral part of these financial statements.
| 30 | 31 |
Financial highlights (Continued)
* Not annualized.
† For the period January 21, 2003 (commencement of operations) to September 30, 2003.
(a) Total return assumes dividend reinvestment and does not reflect the effect of sales charges.
(b) Includes amounts paid through expense offset arrangements (Note 2).
(c) Reflects waivers of certain fund expenses in connection with investments in Putnam Prime Money Market Fund during the period. As a result of such waivers, the expenses of each class reflect a reduction of the following amounts (Note 5):
| Percentage | |
| of average | |
| net assets | |
| September 30, 2007 | <0.01% |
| September 30, 2006 | <0.01 |
| September 30, 2005 | <0.01 |
| September 30, 2004 | <0.01 |
(d) Reflects a non-recurring reallocation of balance credits which amounted to $0.0003 per share and 0.03% of average net assets (Note 2).
(e) Amount represents less than $0.0001 per share.
(f) Reflects a non-recurring reimbursement from Putnam Investments relating to the calculation of certain amounts paid by the fund to Putnam in previous years for transfer agent services, which amounted to less than $0.01 per share and 0.04% of average net assets for the period ended September 30, 2006.
The accompanying notes are an integral part of these financial statements.
32
Notes to financial statements 9/30/07
Note 1: Significant accounting policies
Putnam Money Market Fund (the “fund”), a Massachusetts business trust, is registered under the Investment Company Act of 1940, as amended, as a diversified, open-end management investment company. The fund seeks to provide as high a rate of current income as Putnam Investment Management, LLC (“Putnam Management”), the fund’s manager, a wholly-owned subsidiary of Putnam, LLC, believes is consistent with preservation of capital and maintenance of liquidity by investing in a diversified portfolio of high-quality short-term debt obligations. The fund may invest up to 100% of its assets in money market instruments from the banking, the personal credit and the business credit industries.
The fund offers class A, class B, class C, class M, class R and class T shares. Each class of shares is sold without a front-end sales charge. Class A, class M, class R and class T shares also are generally not subject to a contingent deferred sales charge. In addition to the standard offering of class A shares, they are also sold to certain college savings plans and other Putnam funds. Class B shares convert to class A shares after approximately eight years and are subject to a contingent deferred sales charge, if those shares are redeemed within six years of purchase. Class C shares have a one-year 1.00% contingent deferred sales charge and do not convert to class A shares. Class R shares are offered to qualified employee-benefit plans. The expenses for class A, class B, class C, class M, class R and class T shares may differ based on each class’ distribution fee, which is identified in Note 2.
Investment income, realized gains and losses and expenses of the fund are borne pro-rata based on the relative net assets of each class to the total net assets of the fund, except that each class bears expenses unique to that class (including the distribution fees applicable to such classes). Each class votes as a class only with respect to its own distribution plan or other matters on which a class vote is required by law or determined by the Trustees. Shares of each class would receive their pro-rata share of the net assets of the fund, if the fund were liquidated. In addition, the Trustees declare separate dividends on each class of shares.
In the normal course of business, the fund enters into contracts that may include agreements to indemnify another party under given circumstances. The fund's maximum exposure under these arrangements is unknown as this would involve future claims that may be, but have not yet been, made against the fund. However, the fund expects the risk of material loss to be remote.
The following is a summary of significant accounting policies consistently followed by the fund in the preparation of its financial statements. The preparation of financial statements is in conformity with accounting principles generally accepted in the United States of America and requires management to make estimates and assumptions that affect the reported amounts of assets and liabilities in the financial statements and the reported amounts of increases and decreases in net assets from operations during the reporting period. Actual results could differ from those estimates.
A) Security valuation The valuation of the fund’s portfolio instruments is determined by means of the amortized cost method (which approximates market value) as set forth in Rule 2a-7 under the Investment Company Act of 1940. The amortized cost of an instrument is determined by valuing it at its original cost and thereafter amortizing any discount or premium from its face value at a constant rate until maturity.
B) Joint trading account Pursuant to an exemptive order from the Securities and Exchange Commission (the “SEC”), the fund may transfer uninvested cash balances into a joint trading account along with the cash of other registered investment companies and certain other accounts managed by Putnam Management. These balances may be invested in issues of high-grade short-term investments having maturities of up to 90 days.
C) Repurchase agreements The fund, or any joint trading account, through its custodian, receives delivery of the underlying securities, the market value of which at the time of purchase is required to be in an amount at least equal to the resale price, including accrued interest. Collateral for certain tri-party repurchase agreements is held at the counterparty’s custodian in a segregated account for the benefit of the fund and the counterparty. Putnam Management is responsible for determining that the value of these underlying securities is at all times at least equal to the resale price, including accrued interest.
D) Security transactions and related investment income Security transactions are recorded on the trade date (the date the order to buy or sell is executed). Interest income is recorded on the accrual basis. Premiums and discounts from purchases of short-term investments are amortized/accreted at a constant rate until maturity. Gains or losses on securities sold are determined on the identified cost basis.
E) Federal taxes It is the policy of the fund to distribute all of its taxable income within the prescribed time and otherwise comply with the provisions of the Internal Revenue Code of 1986 (the “Code”) applicable to regulated investment companies. It is also the intention of the fund to distribute an amount sufficient to avoid imposition of any excise tax under Section 4982 of the Code, as amended. Therefore, no provision has been made for federal taxes on income, capital gains or unrealized appreciation on securities held nor for excise tax on income and capital gains.
Pursuant to federal income tax regulations applicable to regulated investment companies, the fund has elected to defer to its fiscal year ending September 30, 2008 $39,633 of losses recognized during the period November 1, 2006 t0 September 30, 2007.
F) Distributions to shareholders Income dividends are recorded daily by the fund and are paid monthly. Distributions from capital gains, if any, are paid at least annually. The amount and character of income and gains to be distributed are determined in accordance with income tax regulations, which may differ from generally accepted accounting principles. For the year ended September 30, 2007, there were no temporary or permanent differences. Reclassifications are made to the fund’s capital accounts to reflect income and gains available for distribution (or available capital loss carryovers) under income tax regulations. For the year ended September 30, 2007, the fund reclassified $81,526 to decrease distributions in excess of net investment income and $81,526 to decrease paid-in-capital.
The tax basis components of distributable earnings as of September 30, 2007 were as follows:
Post-October loss $(39,633)
The aggregate identified cost on a financial reporting and tax basis is the same.
33
Note 2: Management fee, administrative services and other transactions
Putnam Management is paid for management and investment advisory services quarterly based on the average net assets of the fund. Such fee is based on the following annual rates: 0.50% of the first $100 million of average net assets, 0.40% of the next $100 million, 0.35% of the next $300 million, 0.325% of the next $500 million, 0.30% of the next $500 million, 0.275% of the next $2.5 billion, 0.25% of the next $2.5 billion, 0.225% of the next $5 billion, 0.205% of the next $5 billion, 0.19% of the next $5 billion and 0.18% thereafter.
Putnam Management has agreed to waive fees and reimburse expenses of the fund through June 30, 2009 to the extent necessary to ensure that the fund’s expenses do not exceed the simple average of the expenses of all funds viewed by Lipper Inc. as having the same investment classification or objective as the fund. The expense reimbursement is based on a comparison of the fund’s expenses with the average annualized operating expenses of the funds in its Lipper peer group for each calendar quarter during the fund’s last fiscal year, excluding 12b-1 fees and without giving effect to any expense offset and brokerage service arrangements that may reduce fund expenses. For the year ended September 30, 2007, Putnam Management did not waive any of its management fee from the fund.
Effective August 3, 2007, Marsh & McLennan Companies, Inc. sold its ownership interest in Putnam Management, its parent companies and affiliates to a wholly-owned subsidiary of Great-West Lifeco, Inc. The fund's shareholders have approved a new management contract for the fund that became effective upon the sale.
For the year ended September 30, 2007, Putnam Management has assumed $1,969 of legal, shareholder servicing and communication, audit and Trustee fees incurred by the fund in connection with certain legal and regulatory matters (including those described in Note 6).
The fund reimburses Putnam Management an allocated amount for the compensation and related expenses of certain officers of the fund and their staff who provide administrative services to the fund. The aggregate amount of all such reimbursements is determined annually by the Trustees.
Custodial services for the fund’s assets were provided by Putnam Fiduciary Trust Company (“PFTC”), an affiliate of Putnam Management, and by State Street Bank and Trust Company (“State Street”). Custody fees are based on the fund’s asset level, the number of its security holdings, transaction volumes and with respect to PFTC, certain fees related to the transition of assets to State Street. Putnam Investor Services, a division of PFTC, provided investor servicing agent functions to the fund. Putnam Investor Services received fees for investor servicing, subject to certain limitations, based on the number of shareholder accounts in the fund and the level of defined contribution plan assets in the fund. During the year ended September 30, 2007, the fund incurred $7,082,942 for custody and investor servicing agent functions provided by PFTC.
The fund has entered into arrangements with PFTC and State Street whereby PFTC’s and State Street’s fees are reduced by credits allowed on cash balances. For the year ended September 30, 2007, the fund’s expenses were reduced by $512,837 under these arrangements. In addition, the fund’s expenses were adjusted by the reallocation to other Putnam funds of $1,074,142 of balance credits, which had been incorrectly allocated to the fund between November 2003 and December 2006.
Each independent Trustee of the fund receives an annual Trustee fee, of which $902, as a quarterly retainer, has been allocated to the fund, and an additional fee for each Trustees meeting attended. Trustees receive additional fees for attendance at certain committee meetings and industry seminars and for certain compliance-related matters. Trustees also are reimbursed for expenses they incur relating to their services as Trustees. The fund has adopted a Trustee Fee Deferral Plan (the “Deferral Plan”) which allows the Trustees to defer the receipt of all or a portion of Trustees fees payable on or after July 1, 1995. The deferred fees remain invested in certain Putnam funds until distribution in accordance with the Deferral Plan.
The fund has adopted an unfunded noncontributory defined benefit pension plan (the “Pension Plan”) covering all Trustees of the fund who have served as a Trustee for at least five years and were first elected prior to 2004. Benefits under the Pension Plan are equal to 50% of the Trustee's average annual attendance and retainer fees for the three years ended December 31, 2005. The retirement benefit is payable during a Trustee’s lifetime, beginning the year following retirement, for the number of years of service through December 31, 2006. Pension expense for the fund is included in Trustee compensation and expenses in the Statement of operations. Accrued pension liability is included in Payable for Trustee compensation and expenses in the Statement of assets and liabilities. The Trustees have terminated the Pension Plan with respect to any Trustee first elected after 2003.
The fund has adopted distribution plans (the “Plans”) with respect to its class B, class C, class M, class R and class T shares pursuant to Rule 12b-1 under the Investment Company Act of 1940. The purpose of the Plans is to compensate Putnam Retail Management, a wholly-owned subsidiary of Putnam, LLC and Putnam Retail Management GP, Inc., for services provided and expenses incurred in distributing shares of the fund. The Plans provide for payments by the fund to Putnam Retail Management at an annual rate of up to 0.75%, 1.00%, 1.00%, 1.00% and 0.35% of the average net assets attributable to class B, class C, class M, class R and class T shares, respectively. The Trustees have approved payment by the fund at an annual rate of 0.50%, 0.50%, 0.15%, 0.50% and 0.25% of the average net assets attributable to class B, class C, class M, class R and class T shares, respectively.
For the year ended September 30, 2007, Putnam Retail Management, acting as underwriter, received net commissions of $326,107 and $6,415 in contingent deferred sales charges from redemptions of class B and class C shares, respectively.
A deferred sales charge of up to 1.00% for class A and class T shares and up to 0.15% for class M shares may be assessed on certain redemptions. For the year ended September 30, 2007, Putnam Retail Management, acting as underwriter, received no monies in contingent deferred sales charges from redemptions of class A, class M or class T shares acquired through an exchange from another fund.
Note 3: Purchases and sales of securities
During the year ended September 30, 2007, cost of purchases and proceeds from sales (including maturities) of investment securities (all short-term obligations) aggregated $17,264,710,817 and $17,055,937,459, respectively.
34
Note 4: Capital shares
At September 30, 2007, there was an unlimited number of shares of beneficial interest authorized. Transactions in capital shares at a constant net asset value of $1.00 per share were as follows:
| CLASS A | Shares | Amount |
| Year ended 9/30/07: | ||
| Shares sold | 2,375,555,569 | $ 2,375,555,569 |
| Shares issued in connection with | ||
| reinvestment of distributions | 144,337,582 | 144,337,582 |
| 2,519,893,151 | 2,519,893,151 | |
| Shares repurchased | (1,994,839,737) | (1,994,839,737) |
| Net increase | 525,053,414 | $ 525,053,414 |
| Year ended 9/30/06: | ||
| Shares sold | 2,038,691,580 | $ 2,038,691,580 |
| Shares issued in connection with | ||
| reinvestment of distributions | 122,576,479 | 122,576,479 |
| 2,161,268,059 | 2,161,268,059 | |
| Shares repurchased | (2,378,028,586) | (2,378,028,586) |
| Net decrease | (216,760,527) | $ (216,760,527) |
| CLASS B | Shares | Amount |
| Year ended 9/30/07: | ||
| Shares sold | 104,271,165 | $ 104,271,165 |
| Shares issued in connection with | ||
| reinvestment of distributions | 5,714,134 | 5,714,134 |
| 109,985,299 | 109,985,299 | |
| Shares repurchased | (166,626,034) | (166,626,034) |
| Net decrease | (56,640,735) | $ (56,640,735) |
| Year ended 9/30/06: | ||
| Shares sold | 134,473,082 | $ 134,473,082 |
| Shares issued in connection with | ||
| reinvestment of distributions | 7,465,930 | 7,465,930 |
| 141,939,012 | 141,939,012 | |
| Shares repurchased | (258,059,681) | (258,059,681) |
| Net decrease | (116,120,669) | $(116,120,669) |
| CLASS C | Shares | Amount |
| Year ended 9/30/07: | ||
| Shares sold | 28,720,995 | $ 28,720,995 |
| Shares issued in connection with | ||
| reinvestment of distributions | 654,277 | 654,277 |
| 29,375,272 | 29,375,272 | |
| Shares repurchased | (25,635,328) | (25,635,328) |
| Net increase | 3,739,944 | $ 3,739,944 |
| Year ended 9/30/06: | ||
| Shares sold | 37,702,615 | $ 37,702,615 |
| Shares issued in connection with | ||
| reinvestment of distributions | 640,250 | 640,250 |
| 38,342,865 | 38,342,865 | |
| Shares repurchased | (55,879,277) | (55,879,277) |
| Net decrease | (17,536,412) | $(17,536,412) |
| CLASS M | Shares | Amount |
| Year ended 9/30/07: | ||
| Shares sold | 48,969,725 | $ 48,969,725 |
| Shares issued in connection with | ||
| reinvestment of distributions | 1,882,252 | 1,882,252 |
| 50,851,977 | 50,851,977 | |
| Shares repurchased | (50,085,407) | (50,085,407) |
| Net increase | 766,570 | $766,570 |
| Year ended 9/30/06: | ||
| Shares sold | 51,297,792 | $ 51,297,792 |
| Shares issued in connection with | ||
| reinvestment of distributions | 1,654,422 | 1,654,422 |
| 52,952,214 | 52,952,214 | |
| Shares repurchased | (55,746,565) | (55,746,565) |
| Net decrease | (2,794,351) | $ (2,794,351) |
| CLASS R | Shares | Amount |
| Year ended 9/30/07: | ||
| Shares sold | 51,648,617 | $ 51,648,617 |
| Shares issued in connection with | ||
| reinvestment of distributions | 5,508,166 | 5,508,166 |
| 57,156,783 | 57,156,783 | |
| Shares repurchased | (207,165,716) | (207,165,716) |
| Net decrease | (150,008,933) | $(150,008,933) |
| Year ended 9/30/06: | ||
| Shares sold | 167,149,810 | $ 167,149,810 |
| Shares issued in connection with | ||
| reinvestment of distributions | 2,364,973 | 2,364,973 |
| 169,514,783 | 169,514,783 | |
| Shares repurchased | (17,213,567) | (17,213,567) |
| Net increase | 152,301,216 | $ 152,301,216 |
35
| CLASS T | Shares | Amount |
| Year ended 9/30/07: | ||
| Shares sold | 15,160,800 | $ 15,160,800 |
| Shares issued in connection with | ||
| reinvestment of distributions | 618,159 | 618,159 |
| 15,778,959 | 15,778,959 | |
| Shares repurchased | (10,540,755) | (10,540,755) |
| Net increase | 5,238,204 | $ 5,238,204 |
| Year ended 9/30/06: | ||
| Shares sold | 36,801,687 | $ 36,801,687 |
| Shares issued in connection with | ||
| reinvestment of distributions | 4,290,201 | 4,290,201 |
| 41,091,888 | 41,091,888 | |
| Shares repurchased | (211,715,875) | (211,715,875) |
| Net decrease | (170,623,987) | $(170,623,987) |
Note 5: Investment in Putnam Prime Money Market Fund
The fund invests in Putnam Prime Money Market Fund, an open-end management investment company managed by Putnam Management. Investments in Putnam Prime Money Market Fund are valued at its closing net asset value each business day. Management fees paid by the fund are reduced by an amount equal to the management and administrative services fees paid by Putnam Prime Money Market Fund with respect to assets invested by the fund in Putnam Prime Money Market Fund. For the year ended September 30, 2007, management fees paid were reduced by $101,635 relating to the fund's investment in Putnam Prime Money Market Fund. Income distributions earned by the fund are recorded as income in the Statement of operations and totaled $6,240,905 for the year ended September 30, 2007. During the year ended September 30, 2007, cost of purchases and proceeds of sales of investments in Putnam Prime Money Market Fund aggregated $1,638,420,607 and $1,695,218,607, respectively.
Note 6: Regulatory matters and litigation
In late 2003 and 2004, Putnam Management settled charges brought by the SEC and the Massachusetts Securities Division in connection with excessive short-term trading in Putnam funds. Payments from Putnam Management will be distributed to certain open-end Putnam funds and their shareholders. These allegations and related matters have served as the general basis for certain lawsuits, including purported class action lawsuits against Putnam Management and, in a limited number of cases, some Putnam funds. Putnam Management believes that these lawsuits will have no material adverse effect on the funds or on Putnam Management’s ability to provide investment management services. In addition, Putnam Management has agreed to bear any costs incurred by the Putnam funds as a result of these matters.
Putnam Management and Putnam Retail Management are named as defendants in a civil suit in which the plaintiffs allege that the management and distribution fees paid by certain Putnam funds were excessive and seek recovery under the Investment Company Act of 1940. Putnam Management and Putnam Retail Management have contested the plaintiffs’ claims and the matter is currently pending in the U.S. District Court for the District of Massachusetts. Based on currently available information, Putnam Management believes that this action is without merit and that it is unlikely to have a material effect on Putnam Management’s and Putnam Retail Management’s ability to provide services to their clients, including the fund.
Note 7: New accounting pronouncements
In June 2006, the Financial Accounting Standards Board (“FASB”) issued Interpretation No. 48, Accounting for Uncertainty in Income Taxes (the “Interpretation”). The Interpretation prescribes a minimum threshold for financial statement recognition of the benefit of a tax position taken or expected to be taken by a filer in the filer’s tax return. The Interpretation is not expected to have a material effect on the fund's financial statements. However, the conclusions regarding the Interpretation may be subject to review and adjustment at a later date based on factors including, but not limited to, further implementation guidance expected from the FASB, and on-going analysis of tax laws, regulations and interpretations thereof.
In September 2006, the FASB issued Statement of Financial Accounting Standards No. 157, Fair Value Measurements (the “Standard”). The Standard defines fair value, sets out a framework for measuring fair value and requires additional disclosures about fair value measurements. The Standard applies to fair value measurements already required or permitted by existing standards. The Standard is effective for financial statements issued for fiscal years beginning after November 15, 2007 and interim periods within those fiscal years. Putnam Management is currently evaluating what impact the adoption of the Standard will have on the fund’s financial statements.
36
Federal tax information (unaudited)
The Form 1099 you receive in January 2008 will show the tax status of all distributions paid to your account in calendar 2007.
37
Shareholder meeting results (unaudited)
May 15, 2007 meeting
A proposal to approve a new management contract between the fund and Putnam Investment Management, LLC was approved as follows:
| Votes for | Votes against | Abstentions |
| 2,027,529,106 | 90,968,593 | 76,634,458 |
All tabulations are rounded to the nearest whole number.
38
About the Trustees
Jameson A. Baxter (Born 1943), Trustee since 1994, Vice Chairman since 2005
Ms. Baxter is the President of Baxter Associates, Inc., a private investment firm.
Ms. Baxter serves as a Director of ASHTA Chemicals, Inc., Ryerson, Inc. (a metals service corporation), the Mutual Fund Directors Forum, and Advocate Health Care. She is Chairman Emeritus of the Board of Trustees, Mount Holyoke College, having served as Chairman for five years. Until 2007, she was a Director of Banta Corporation (a printing and supply chain management company). Until 2004, she was a Director of BoardSource (formerly the National Center for Nonprofit Boards), and until 2002, she was a Director of Intermatic Corporation (a manufacturer of energy control products).
Ms. Baxter has held various positions in investment banking and corporate finance, including Vice President and Principal of the Regency Group, and Vice President of and Consultant to First Boston Corporation. She is a graduate of Mount Holyoke College.
Charles B. Curtis (Born 1940), Trustee since 2001
Mr. Curtis is President and Chief Operating Officer of the Nuclear Threat Initiative (a private foundation dealing with national security issues) and serves as Senior Advisor to the United Nations Foundation.
Mr. Curtis is a member of the Council on Foreign Relations and serves as a Director of Edison International and Southern California Edison. Until 2006, Mr. Curtis served as a member of the Trustee Advisory Council of the Applied Physics Laboratory, Johns Hopkins University. Until 2003, Mr. Curtis was a member of the Electric Power Research Institute Advisory Council and the University of Chicago Board of Governors for Argonne National Laboratory. Prior to 2002, Mr. Curtis was a Member of the Board of Directors of the Gas Technology Institute and the Board of Directors of the Environment and Natural Resources Program Steering Committee, John F. Kennedy School of Government, Harvard University. Until 2001, Mr. Curtis was a member of the Department of Defense Policy Board and Director of EG&G Technical Services, Inc. (a fossil energy research and development support company).
From August 1997 to December 1999, Mr. Curtis was a Partner at Hogan & Hartson L.L.P., a Washington, D.C. law firm. Prior to May 1997, Mr. Curtis was Deputy Secretary of Energy and Under Secretary of the U.S. Department of Energy. He served as Chairman of the Federal Energy Regulatory Commission from 1977 to 1981 and has held positions on the staff of the U.S. House of Representatives, the U.S. Treasury Department, and the SEC.
Robert J. Darretta (Born 1946), Trustee since 2007
Mr. Darretta serves as Director of UnitedHealth Group, a diversified health-care conglomerate.
Until April 2007, Mr. Darretta was Vice Chairman of the Board of Directors of Johnson & Johnson, a diversified health-care conglomerate. Prior to 2007, Mr. Darretta held several accounting and finance positions with Johnson & Johnson, including Chief Financial Officer, Executive Vice President, and Treasurer.
Mr. Darretta received a B.S. in Economics from Villanova University.
Myra R. Drucker (Born 1948), Trustee since 2004
Ms. Drucker is Chair of the Board of Trustees of Commonfund (a not-for-profit firm specializing in asset management for educational endowments and foundations), Vice Chair of the Board of Trustees of Sarah Lawrence College, and a member of the Investment Committee of the Kresge Foundation (a charitable trust). She is also a director of New York Stock Exchange LLC, a wholly-owned subsidiary of the publicly-traded NYSE Group, Inc., a director of Interactive Data Corporation (a provider of financial market data, analytics, and related services to financial institutions and individual investors), and an advisor to RCM Capital Management (an investment management firm).
Ms. Drucker is an ex-officio member of the New York Stock Exchange (NYSE) Pension Managers Advisory Committee, having served as Chair for seven years.
Until August 31, 2004, Ms. Drucker was Managing Director and a member of the Board of Directors of General Motors Asset Management and Chief Investment Officer of General Motors Trust Bank. Ms. Drucker also served as a member of the NYSE Corporate Accountability and Listing Standards Committee and the NYSE/NASD IPO Advisory Committee.
Prior to joining General Motors Asset Management in 2001, Ms. Drucker held various executive positions in the investment management industry. Ms. Drucker served as Chief Investment Officer of Xerox Corporation (a technology and service company in the document industry), where she was responsible for the investment of the company’s pension assets. Ms. Drucker was also Staff Vice President and Director of Trust Investments for International Paper (a paper products, paper distribution, packaging and forest products company) and previously served as Manager of Trust Investments for Xerox Corporation. Ms. Drucker received a B.A. degree in Literature and Psychology from Sarah Lawrence College and pursued graduate studies in economics, statistics and portfolio theory at Temple University.
39
John A. Hill (Born 1942), Trustee since 1985 and Chairman since 2000
Mr. Hill is Vice Chairman of First Reserve Corporation, a private equity buyout firm that specializes in energy investments in the diversified worldwide energy industry.
Mr. Hill is a Director of Devon Energy Corporation and various private companies controlled by First Reserve Corporation, as well as Chairman of TH Lee, Putnam Investment Trust (a closed-end investment company advised by an affiliate of Putnam Management). He is also a Trustee of Sarah Lawrence College. Until 2005, he was a Director of Continuum Health Partners of New York.
Prior to acquiring First Reserve Corporation in 1983, Mr. Hill held executive positions in investment banking and investment management with several firms and with the federal government, including Deputy Associate Director of the Office of Management and Budget and Deputy Director of the Federal Energy Administration. He is active in various business associations, including the Economic Club of New York, and lectures on energy issues in the United States and Europe. Mr. Hill holds a B.A. degree in Economics from Southern Methodist University and pursued graduate studies there as a Woodrow Wilson Fellow.
Paul L. Joskow (Born 1947), Trustee since 1997
Dr. Joskow is the Elizabeth and James Killian Professor of Economics and Management, and Director of the Center for Energy and Environmental Policy Research at the Massachusetts Institute of Technology.
Dr. Joskow serves as a Director of TransCanada Corporation (an energy company focused on natural gas transmission and power services) and Exelon Corporation (an energy company focused on power services), and as a Member of the Board of Overseers of the Boston Symphony Orchestra. Prior to August 2007, he served as a Director of National Grid (a UK-based holding company with interests in electric and gas transmission and distribution and telecommunications infrastructure). Prior to July 2006, he served as President of the Yale University Council and continues to serve as a Member of the Council. Prior to February 2005, he served on the board of the Whitehead Institute for Biomedical Research (a non-profit research institution). Prior to February 2002, he was a Director of State Farm Indemnity Company (an automobile insurance company), and prior to March 2000, he was a Director of New England Electric System (a public utility holding company).
Dr. Joskow has published six books and numerous articles on topics in industrial organization, government regulation of industry, and competition policy. He is active in industry restructuring, environmental, energy, competition and privatization policies —serving as an advisor to governments and corporations worldwide. Dr. Joskow holds a Ph.D. and M. Phil from Yale University and a B.A. from Cornell University.
Elizabeth T. Kennan (Born 1938), Trustee since 1992
Dr. Kennan is a Partner of Cambus-Kenneth Farm (thoroughbred horse and cattle breeding). She is President Emeritus of Mount Holyoke College.
Dr. Kennan served as Chairman and is now Lead Director of Northeast Utilities. She is a Trustee of the National Trust for Historic Preservation, of Centre College and of Midway College in Midway, Kentucky. Until 2006, she was a member of The Trustees of Reservations. Prior to 2001, Dr. Kennan served on the oversight committee of the Folger Shakespeare Library. Prior to June 2005, she was a Director of Talbots, Inc., and she has served as Director on a number of other boards, including Bell Atlantic, Chastain Real Estate, Shawmut Bank, Berkshire Life Insurance, and Kentucky Home Life Insurance. Dr. Kennan has also served as President of Five Colleges Incorporated and as a Trustee of Notre Dame University, and is active in various educational and civic associations.
As a member of the faculty of Catholic University for twelve years, until 1978, Dr. Kennan directed the post-doctoral program in Patristic and Medieval Studies, taught history and published numerous articles. Dr. Kennan holds a Ph.D. from the University of Washington in Seattle, an M.S. from St. Hilda’s College at Oxford University and an A.B. from Mount Holyoke College. She holds several honorary doctorates.
Kenneth R. Leibler (Born 1949), Trustee since 2006
Mr. Leibler is a founding partner and former Chairman of the Boston Options Exchange, an electronic marketplace for the trading of listed derivative securities.
Mr. Leibler currently serves as a Trustee of Beth Israel Deaconess Hospital in Boston. He is also lead director of Ruder Finn Group, a global communications and advertising firm, and a director of Northeast Utilities, which operates New England’s largest energy delivery system. Prior to December 2006, he served as a director of the Optimum Funds group. Prior to October 2006, he served as a director of ISO New England, the organization responsible for the operation of the electric generation system in the New England states. Prior to 2000, Mr. Leibler was a director of the Investment Company Institute in Washington, D.C.
40
Prior to January 2005, Mr. Leibler served as Chairman and Chief Executive Officer of the Boston Stock Exchange. Prior to January 2000, he served as President and Chief Executive Officer of Liberty Financial Companies, a publicly traded diversified asset management organization. Prior to June 1990, he served as President and Chief Operating Officer of the American Stock Exchange (AMEX), and at the time was the youngest person in AMEX history to hold the title of President. Prior to serving as AMEX President, he held the position of Chief Financial Officer and headed its management and marketing operations. Mr. Leibler graduated magna cum laude with a degree in economics from Syracuse University, where he was elected Phi Beta Kappa.
Robert E. Patterson (Born 1945), Trustee since 1984
Mr. Patterson is Senior Partner of Cabot Properties, L.P. and Chairman of Cabot Properties, Inc. (a private equity firm investing in commercial real estate).
Mr. Patterson serves as Chairman Emeritus and Trustee of the Joslin Diabetes Center. Prior to June 2003, he was a Trustee of Sea Education Association. Prior to December 2001, he was President and Trustee of Cabot Industrial Trust (a publicly traded real estate investment trust). Prior to February 1998, he was Executive Vice President and Director of Acquisitions of Cabot Partners Limited Partnership (a registered investment adviser involved in institutional real estate investments). Prior to 1990, he served as Executive Vice President of Cabot, Cabot & Forbes Realty Advisors, Inc. (the predecessor company of Cabot Partners).
Mr. Patterson practiced law and held various positions in state government and was the founding Executive Director of the Massachusetts Industrial Finance Agency. Mr. Patterson is a graduate of Harvard College and Harvard Law School.
George Putnam, III (Born 1951), Trustee since 1984
Mr. Putnam is Chairman of New Generation Research, Inc. (a publisher of financial advisory and other research services), and President of New Generation Advisers, Inc. (a registered investment advisor to private funds). Mr. Putnam founded the New Generation companies in 1986.
Mr. Putnam is a Director of The Boston Family Office, LLC (a registered investment adviser). He is a Trustee of St. Mark’s School. Until 2006, he was a Trustee of Shore Country Day School, and until 2002 was a Trustee of the Sea Education Association.
Mr. Putnam previously worked as an attorney with the law firm of Dechert LLP (formerly known as Dechert Price & Rhoads) in Philadelphia. He is a graduate of Harvard College, Harvard Business School and Harvard Law School.
W. Thomas Stephens (Born 1942), Trustee since 1997
Mr. Stephens is Chairman and Chief Executive Officer of Boise Cascade, L.L.C. (a paper, forest products and timberland assets company).
Mr. Stephens is a Director of TransCanadaPipelines, Ltd. (an energy infrastructure company). Until 2004, Mr. Stephens was a Director of Xcel Energy Incorporated (a public utility company), Qwest Communications, and Norske Canada, Inc. (a paper manufacturer). Until 2003, Mr. Stephens was a Director of Mail-Well, Inc. (a diversified printing company). He served as Chairman of Mail-Well until 2001 and as CEO of MacMillan-Bloedel, Ltd. (a forest products company) until 1999.
Prior to 1996, Mr. Stephens was Chairman and Chief Executive Officer of Johns Manville Corporation. He holds B.S. and M.S. degrees from the University of Arkansas.
Richard B. Worley (Born 1945), Trustee since 2004
Mr. Worley is Managing Partner of Permit Capital LLC, an investment management firm.
Mr. Worley serves as a Trustee of the University of Pennsylvania Medical Center, The Robert Wood Johnson Foundation (a philanthropic organization devoted to health care issues), and the National Constitution Center. He is also a Director of The Colonial Williamsburg Foundation (a historical preservation organization) and the Philadelphia Orchestra Association. Mr. Worley also serves on the investment committees of Mount Holyoke College and World Wildlife Fund (a wildlife conservation organization).
Prior to joining Permit Capital LLC in 2002, Mr. Worley served as Chief Strategic Officer of Morgan Stanley Investment Management. He previously served as President, Chief Executive Officer and Chief Investment Officer of Morgan Stanley Dean Witter Investment Management and as a Managing Director of Morgan Stanley, a financial services firm. Mr. Worley also was the Chairman of Miller Anderson & Sherrerd, an investment management firm.
Mr. Worley holds a B.S. degree from the University of Tennessee and pursued graduate studies in economics at the University of Texas.
41
Charles E. Haldeman, Jr.* (Born 1948), Trustee since 2004 and President of the Funds since 2007
Mr. Haldeman is President and Chief Executive Officer of Putnam, LLC (“Putnam Investments”) and President of the Putnam Funds. He is a member of Putnam Investments’ Executive Board of Directors and Advisory Council. Prior to November 2003, Mr. Haldeman served as Co-Head of Putnam Investments’ Investment Division.
Prior to joining Putnam Investments in 2002, Mr. Haldeman held executive positions in the investment management industry. He previously served as Chief Executive Officer of Delaware Investments and President and Chief Operating Officer of United Asset Management. Mr. Haldeman was also a partner and director of Cooke & Bieler, Inc. (an investment management firm).
Mr. Haldeman currently serves on the Board of Governors of the Investment Company Institute and as Chair of the Board of Trustees of Dartmouth College. He also serves on the Partners HealthCare Investment Committee, the Tuck School of Business and Dartmouth College Board of Overseers, and the Harvard Business School Board of Dean’s Advisors. He is a graduate of Dartmouth College, Harvard Law School and Harvard Business School. Mr. Haldeman is also a Chartered Financial Analyst (CFA) charterholder.
The address of each Trustee is One Post Office Square, Boston, MA 02109.
As of September 30, 2007, there were 103 Putnam funds. All Trustees serve as Trustees of all Putnam funds.
Each Trustee serves for an indefinite term, until his or her resignation, retirement at age 72, death, or removal.
* Trustee who is an “interested person” (as defined in the Investment Company Act of 1940) of the fund, Putnam Management, and/or Putnam Retail Management. Mr. Haldeman is the President of your fund and each of the other Putnam funds, and is President and Chief Executive Officer of Putnam Investments.
42
Officers
In addition to Charles E. Haldeman, Jr., the other officers of the fund are shown below:
Charles E. Porter (Born 1938)
Executive Vice President, Principal Executive Officer, Associate
Treasurer, and Compliance Liaison
Since 1989
Jonathan S. Horwitz (Born 1955)
Senior Vice President and Treasurer
Since 2004
Prior to 2004, Managing Director,
Putnam Investments
Steven D. Krichmar (Born 1958)
Vice President and Principal Financial Officer
Since 2002
Senior Managing Director, Putnam Investments
Janet C. Smith (Born 1965)
Vice President, Principal Accounting Officer and Assistant Treasurer
Since 2007
Managing Director, Putnam Investments and Putnam Management
Susan G. Malloy (Born 1957)
Vice President and Assistant Treasurer
Since 2007
Managing Director, Putnam Investments
Beth S. Mazor (Born 1958)
Vice President
Since 2002
Managing Director, Putnam Investments
James P. Pappas (Born 1953)
Vice President
Since 2004
Managing Director, Putnam Investments and Putnam Management. During 2002, Chief Operating Officer, Atalanta/Sosnoff Management Corporation
Richard S. Robie, III (Born 1960)
Vice President
Since 2004
Senior Managing Director, Putnam Investments, Putnam Management and Putnam Retail Management. Prior to 2003, Senior Vice President, United Asset Management Corporation
Francis J. McNamara, III (Born 1955)
Vice President and Chief Legal Officer
Since 2004
Senior Managing Director, Putnam Investments, Putnam Management and Putnam Retail Management. Prior to 2004, General Counsel, State Street Research & Management Company
Robert R. Leveille (Born 1969)
Vice President and Chief Compliance Officer
Since 2007
Managing Director, Putnam Investments, Putnam Management, and Putnam Retail Management. Prior to 2004, member of Bell Boyd & Lloyd LLC. Prior to 2003, Vice President and Senior Counsel, Liberty Funds Group LLC
Mark C. Trenchard (Born 1962)
Vice President and BSA Compliance Officer
Since 2002
Managing Director, Putnam Investments
Judith Cohen (Born 1945)
Vice President, Clerk and Assistant Treasurer
Since 1993
Wanda M. McManus (Born 1947)
Vice President, Senior Associate Treasurer and Assistant Clerk
Since 2005
Nancy E. Florek (Born 1957)
Vice President, Assistant Clerk, Assistant Treasurer
and Proxy Manager
Since 2005
The address of each Officer is One Post Office Square, Boston, MA 02109.
43
The Putnam Family of Funds
The following is a list of Putnam’s open-end mutual funds offered to the public. Investors should carefully consider the investment objective, risks, charges, and expenses of a fund before investing. For a prospectus containing this and other information for any Putnam fund or product, call your financial advisor at 1-800-225-1581 and ask for a prospectus. Please read the prospectus carefully before investing.
Growth funds
Discovery Growth Fund
Growth Opportunities Fund
Health Sciences Trust
International New Opportunities Fund*
New Opportunities Fund
OTC & Emerging Growth Fund
Small Cap Growth Fund*
Vista Fund
Voyager Fund
Blend funds
Capital Appreciation Fund
Capital Opportunities Fund*
Europe Equity Fund*
Global Equity Fund*
Global Natural Resources Fund*
International Capital Opportunities Fund*
International Equity Fund*
Investors Fund
Research Fund
Tax Smart Equity Fund®
Utilities Growth and Income Fund
Value funds
Classic Equity Fund
Convertible Income-Growth Trust
Equity Income Fund
The George Putnam Fund of Boston
The Putnam Fund for Growth and Income
International Growth and Income Fund*
Mid Cap Value Fund
New Value Fund
Small Cap Value Fund*
Income funds
American Government Income Fund
Diversified Income Trust
Floating Rate Income Fund
Global Income Trust*
High Yield Advantage Fund*
High Yield Trust*
Income Fund
Limited Duration Government Income Fund
Money Market Fund†
U.S. Government Income Trust
Tax-free income funds
AMT-Free Insured Municipal Fund
Tax Exempt Income Fund
Tax Exempt Money Market Fund§
Tax-Free High Yield Fund
State tax-free income funds:
Arizona, California, Massachusetts, Michigan, Minnesota,
New Jersey, New York, Ohio, and Pennsylvania
Asset allocation funds
Income Strategies Fund
Putnam Asset Allocation Funds — three investment portfolios that
spread your money across a variety of stocks, bonds, and money
market investments.
The three portfolios:
Asset Allocation: Balanced Portfolio
Asset Allocation: Conservative Portfolio
Asset Allocation: Growth Portfolio
Putnam RetirementReady® Funds
Putnam RetirementReady Funds — ten investment portfolios that
offer diversification among stocks, bonds, and money market instru-
ments and adjust to become more conservative over time based on a
target date for withdrawing assets.
The ten funds:
Putnam RetirementReady 2050 Fund
Putnam RetirementReady 2045 Fund
Putnam RetirementReady 2040 Fund
Putnam RetirementReady 2035 Fund
Putnam RetirementReady 2030 Fund
Putnam RetirementReady 2025 Fund
Putnam RetirementReady 2020 Fund
Putnam RetirementReady 2015 Fund
Putnam RetirementReady 2010 Fund
Putnam RetirementReady Maturity Fund
* A 1% redemption fee on total assets redeemed or exchanged within 90 days of purchase may be imposed for all share classes of these funds.
† An investment in a money market fund is not insured or guaranteed by the Federal Deposit Insurance Corporation or any other government agency. Although the fund seeks to preserve your investment at $1.00 per share, it is possible to lose money by investing in the fund.
With the exception of money market funds, a 1% redemption fee may be applied to shares exchanged or sold within 7 days of purchase (90 days, for certain funds).
Check your account balances and the most recent month-end performance at www.putnam.com.
44
Fund information
Founded 70 years ago, Putnam Investments was built around the concept that a balance between risk and reward is the hallmark of a well-rounded financial program. We manage over 100 mutual funds in growth, value, blend, fixed income, and international.
| Investment Manager | Officers | Wanda M. McManus |
| Putnam Investment | Charles E. Haldeman, Jr. | Vice President, Senior Associate Treasurer |
| Management, LLC | President | and Assistant Clerk |
| One Post Office Square | ||
| Boston, MA 02109 | Charles E. Porter | Nancy E. Florek |
| Executive Vice President, Principal | Vice President, Assistant Clerk, | |
| Marketing Services | Executive Officer, Associate Treasurer | Assistant Treasurer and Proxy Manager |
| Putnam Retail Management | and Compliance Liaison | |
| One Post Office Square | ||
| Boston, MA 02109 | Jonathan S. Horwitz | |
| Senior Vice President and Treasurer | ||
| Custodian | ||
| State Street Bank and Trust Company | Steven D. Krichmar | |
| Vice President and Principal Financial Officer | ||
| Legal Counsel | ||
| Ropes & Gray LLP | Janet C. Smith | |
| Vice President, Principal Accounting Officer | ||
| Independent Registered Public | and Assistant Treasurer | |
| Accounting Firm | ||
| PricewaterhouseCoopers LLP | Susan G. Malloy | |
| Vice President and Assistant Treasurer | ||
| Trustees | ||
| John A. Hill, Chairman | Beth S. Mazor | |
| Jameson Adkins Baxter, Vice Chairman | Vice President | |
| Charles B. Curtis | ||
| Robert J. Darretta | James P. Pappas | |
| Myra R. Drucker | Vice President | |
| Charles E. Haldeman, Jr. | ||
| Paul L. Joskow | Richard S. Robie, III | |
| Elizabeth T. Kennan | Vice President | |
| Kenneth R. Leibler | ||
| Robert E. Patterson | Francis J. McNamara, III | |
| George Putnam, III | Vice President and Chief Legal Officer | |
| W. Thomas Stephens | ||
| Richard B. Worley | Robert R. Leveille | |
| Vice President and Chief Compliance Officer | ||
| Mark C. Trenchard | ||
| Vice President and BSA Compliance Officer | ||
| Judith Cohen | ||
| Vice President, Clerk and Assistant Treasurer |
This report is for the information of shareholders of Putnam Money Market Fund. It may also be used as sales literature when preceded or accompanied by the current prospectus, the most recent copy of Putnam’s Quarterly Performance Summary, and Putnam’s Quarterly Ranking Summary. For more recent performance, please visit www.putnam.com. Investors should carefully consider the investment objective, risks, charges, and expenses of a fund, which are described in its prospectus. For this and other information or to request a prospectus, call 1-800-225-1581 toll free. Please read the prospectus carefully before investing. The fund’s Statement of Additional Information contains additional information about the fund’s Trustees and is available without charge upon request by calling 1-800-225-1581.

Item 2. Code of Ethics:
(a) The fund’s principal executive, financial and accounting officers are employees of Putnam Investment Management, LLC, the Fund's investment manager. As such they are subject to a comprehensive Code of Ethics adopted and administered by Putnam Investments which is designed to protect the interests of the firm and its clients. The Fund has adopted a Code of Ethics which incorporates the Code of Ethics of Putnam Investments with respect to all of its officers and Trustees who are employees of Putnam Investment Management, LLC. For this reason, the Fund has not adopted a separate code of ethics governing its principal executive, financial and accounting officers.
(c) In August 2007, the Code of Ethics of Putnam Investment Management, LLC was amended to reflect the change in ownership of Putnam Investments Trust, the parent company of Putnam Investment Management, LLC, from Marsh & McLennan Companies, Inc. (“MMC”) to Great-West Lifeco Inc., a subsidiary of Power Financial Corporation. In addition to administrative and non-substantive changes, the Code of Ethics was amended to remove a prohibition, which applied to members of Putnam Investments’ Executive Board and senior members of the staff of the Chief Financial Officer of Putnam Investments, on transactions in MMC securities during the period between the end of a calendar quarter and the public announcement of MMC’s earnings for that quarter.
Item 3. Audit Committee Financial Expert:
The Funds' Audit and Compliance Committee is comprised solely of Trustees who are "independent" (as such term has been defined by the Securities and Exchange Commission ("SEC") in regulations implementing Section 407 of the Sarbanes-Oxley Act (the "Regulations")). The Trustees believe that each of the members of the Audit and Compliance Committee also possess a combination of knowledge and experience with respect to financial accounting matters, as well as other attributes, that qualify them for service on the Committee. In addition, the Trustees have determined that each of Mr. Patterson, Mr. Stephens, Mr. Leibler, Mr. Hill and Mr. Darretta meets the financial literacy requirements of the New York Stock Exchange's rules and qualifies as an "audit committee financial expert" (as such term has been defined by the Regulations) based on their review of his pertinent experience and education. Certain other Trustees, although not on the Audit and Compliance Committee, would also qualify as "audit committee financial experts." The SEC has stated that the designation or identification of a person as an audit committee financial expert pursuant to this Item 3 of Form N-CSR does not impose on such person any duties, obligations or liability that are greater than the duties, obligations and liability imposed on such person as a member of the Audit and Compliance Committee and the Board of Trustees in the absence of such designation or identification.
Item 4. Principal Accountant Fees and Services:
The following table presents fees billed in each of the last two fiscal years for services rendered to the fund by the fund’s independent auditor:
| Fiscal | Audit- | |||
| year | Audit | Related | Tax | All Other |
| ended | Fees | Fees | Fees | Fees |
| September 30, 2007 | $119,165 | $352 | $3,274 | $1,123* |
| September 30, 2006 | $91,511* | $877 | $2,415 | $1,970 |
* Includes fees of $823 and $2,985 billed by the fund’s independent auditor to the fund for procedures necessitated by regulatory and litigation matters for the fiscal years ended September
30, 2007 and September 30, 2006, respectively. These fees were reimbursed to the fund by Putnam Investment Management, LLC (“Putnam Management”).
For the fiscal years ended September 30, 2007and September 30, 2006, the fund’s independent auditor billed aggregate non-audit fees in the amounts of $107,956 and $286,942 respectively, to the fund, Putnam Management and any entity controlling, controlled by or under common control with Putnam Management that provides ongoing services to the fund.
Audit Fees represent fees billed for the fund’s last two fiscal years.
Audit-Related Fees represent fees billed in the fund’s last two fiscal years for services traditionally performed by the fund’s auditor, including accounting consultation for proposed transactions or concerning financial accounting and reporting standards and other audit or attest services not required by statute or regulation.
Tax Fees represent fees billed in the fund’s last two fiscal years for tax compliance, tax planning and tax advice services. Tax planning and tax advice services include assistance with tax audits, employee benefit plans and requests for rulings or technical advice from taxing authorities.
All Other Fees represent fees billed for services relating to an analysis of recordkeeping fees.
Pre-Approval Policies of the Audit and Compliance Committee. The Audit and Compliance Committee of the Putnam funds has determined that, as a matter of policy, all work performed for the funds by the funds’ independent auditors will be pre-approved by the Committee itself and thus will generally not be subject to pre-approval procedures.
The Audit and Compliance Committee also has adopted a policy to pre-approve the engagement by Putnam Management and certain of its affiliates of the funds’ independent auditors, even in circumstances where pre-approval is not required by applicable law. Any such requests by Putnam Management or certain of its affiliates are typically submitted in writing to the Committee and explain, among other things, the nature of the proposed engagement, the estimated fees, and why this work should be performed by that particular audit firm as opposed to another one. In reviewing such requests, the Committee considers, among other things, whether the provision of such services by the audit firm are compatible with the independence of the audit firm.
The following table presents fees billed by the fund’s independent auditor for services required to be approved pursuant to paragraph (c)(7)(ii) of Rule 2-01 of Regulation S-X.
| Fiscal | Audit- | All | Total | |
| year | Related | Tax | Other | Non-Audit |
| ended | Fees | Fees | Fees | Fees |
| September 30, | ||||
| 2007 | $ - | $ 26,129 | $ - | $ - |
| September 30, | ||||
| 2006 | $ - | $153,160 | $ - | $ - |
Item 5. Audit Committee of Listed Registrants
Not applicable
Item 6. Schedule of Investments:
The registrant’s schedule of investments in unaffiliated issuers is included in the report to shareholders in Item 1 above.
Item 7. Disclosure of Proxy Voting Policies and Procedures For Closed-End Management Investment Companies:
Not applicable
Item 8. Portfolio Managers of Closed-End Investment Companies
Not Applicable
Item 9. Purchases of Equity Securities by Closed-End Management Investment Companies and Affiliated Purchasers:
Not applicable
Item 10. Submission of Matters to a Vote of Security Holders:
Not applicable
Item 11. Controls and Procedures:
(a) The registrant's principal executive officer and principal financial officer have concluded, based on their evaluation of the effectiveness of the design and operation of the registrant's disclosure controls and procedures as of a date within 90 days of the filing date of this report, that the design and operation of such procedures are generally effective to provide reasonable assurance that information required to be disclosed by the registrant in this report is recorded, processed, summarized and reported within the time periods specified in the Commission's rules and forms.
(b) Changes in internal control over financial reporting: During the period, Putnam Fiduciary Trust Company, the fund's transfer agent, began utilizing shareholder systems and systems support provided by DST Systems, Inc. and certain of its affiliates.
Item 12. Exhibits:
(a)(1) The Code of Ethics of The Putnam Funds, which incorporates the Code of Ethics of Putnam Investments, is filed herewith.
(a)(2) Separate certifications for the principal executive officer and principal financial officer of the registrant as required by Rule 30a-2(a) under the Investment Company Act of 1940, as amended, are filed herewith.
(b) The certifications required by Rule 30a-2(b) under the Investment Company Act of 1940, as amended, are filed herewith.
SIGNATURES
Pursuant to the requirements of the Securities Exchange Act of 1934 and the Investment Company Act of 1940, the registrant has duly caused this report to be signed on its behalf by the undersigned, thereunto duly authorized.
Putnam Money Market Fund
By (Signature and Title):
/s/Janet C. Smith
Janet C. Smith
Principal Accounting Officer
Date: November 29, 2007
Pursuant to the requirements of the Securities Exchange Act of 1934 and the Investment Company Act of 1940, this report has been signed below by the following persons on behalf of the registrant and in the capacities and on the dates indicated.
By (Signature and Title):
/s/Charles E. Porter
Charles E. Porter
Principal Executive Officer
Date: November 29, 2007
By (Signature and Title):
/s/Steven D. Krichmar
Steven D. Krichmar
Principal Financial Officer
Date: November 29, 2007