| | |
| UNITED STATES |
| SECURITIES AND EXCHANGE COMMISSION |
| Washington, D.C. 20549 |
| |
| FORM N-CSR |
| |
| CERTIFIED SHAREHOLDER REPORT OF REGISTERED |
| MANAGEMENT INVESTMENT COMPANIES |
| |
| Investment Company Act file number: (811- 00058) |
| | |
| Exact name of registrant as specified in charter: | The George Putnam Fund of Boston |
| |
| Address of principal executive offices: One Post Office Square, Boston, Massachusetts 02109 |
| | |
| Name and address of agent for service: | Beth S. Mazor, Vice President |
| | One Post Office Square |
| | Boston, Massachusetts 02109 |
| | |
| Copy to: | John W. Gerstmayr, Esq. |
| | Ropes & Gray LLP |
| | One International Place |
| | Boston, Massachusetts 02110 |
| | |
| Registrant’s telephone number, including area code: | (617) 292-1000 |
| | | |
| Date of fiscal year end: July 31, 2008 | | |
| |
| Date of reporting period: August 1, 2007 — January 31, 2008 |
Item 1. Report to Stockholders:
The following is a copy of the report transmitted to stockholders pursuant to Rule 30e-1 under the Investment Company Act of 1940:

What makes Putnam different?

In 1830, Massachusetts Supreme Judicial Court Justice Samuel Putnam established The Prudent Man Rule, a legal foundation for responsible money management.
THE PRUDENT MAN RULE
All that can be required of a trustee to invest is that he shall conduct himself faithfully and exercise a sound discretion. He is to observe how men of prudence, discretion, and intelligence manage their own affairs, not in regard to speculation, but in regard to the permanent disposition of their funds, considering the probable income, as well as the probable safety of the capital to be invested.

A time-honored tradition in money management
Since 1937, our values have been rooted in a profound sense of responsibility for the money entrusted to us.
A prudent approach to investing
We use a research-driven team approach to seek consistent, dependable, superior investment results over time, although there is no guarantee a fund will meet its objectives.
Funds for every investment goal
We offer a broad range of mutual funds and other financial products so investors and their financial representatives can build diversified portfolios.
A commitment to doing what’s right for investors
With a focus on investment performance, below-average expenses, and in-depth information about our funds, we put the interests of investors first and seek to set the standard for integrity and service.
Industry-leading service
We help investors, along with their financial representatives, make informed investment decisions with confidence.
The George
Putnam Fund
of Boston
1| 31| 08
Semiannual Report
| |
| Message from the Trustees | 2 |
| About the fund | 4 |
| Performance snapshot | 6 |
| Interview with your fund’s Portfolio Leader | 7 |
| Performance in depth | 13 |
| Expenses | 17 |
| Portfolio turnover | 19 |
| Risk | 20 |
| Your fund’s management | 21 |
| Terms and definitions | 23 |
| Trustee approval of management contract | 25 |
| Other information for shareholders | 30 |
| Financial statements | 31 |
| Brokerage commissions | 105 |
Cover photograph: © White-Packert Photography
Message from the Trustees
Dear Fellow Shareholder:
In early 2008, financial markets face clear challenges. What began as a rise in defaults for a limited segment of the U.S. mortgage market has spread across the global financial sector and produced a significant tightening of credit conditions. Forecasts for global growth have been reduced as a result, and markets have reacted by sending stock prices lower. In the United States, the economy weakened sharply in late 2007, raising the chance of a recession this year. Fortunately, policymakers have taken action to stimulate growth: The Federal Reserve Board cut interest rates, and federal lawmakers, working with the president, approved a $168 billion fiscal stimulus plan.
As investors, it is natural to feel discouraged by disappointing short-term results. During these challenging times, it is important to remember the value of a long-term perspective and the counsel of your financial representative. The normal condition of the economy and corporate earnings is one of growth, albeit with occasional interruptions. As in the past, after a period of weakness the economy is likely to regain its momentum and produce the growth and corporate earnings that investors expect.
Starting this month, we have changed the portfolio manager’s commentary in this report to a question-and-answer format. We feel that this makes the information more readable and accessible, and we hope you think so as well.
2
Lastly, we note that Putnam Investments celebrated its 70th anniversary in November. From modest beginnings in Boston, Massachusetts, the company has grown into a global asset manager that serves millions of investors worldwide. Although the mutual fund industry has undergone many changes since George Putnam introduced his innovative balanced fund in 1937, Putnam’s guiding principles have not. As we celebrate this 70-year milestone, we look forward to Putnam continuing its long tradition of prudent money management. Thank you for your support of the Putnam funds.

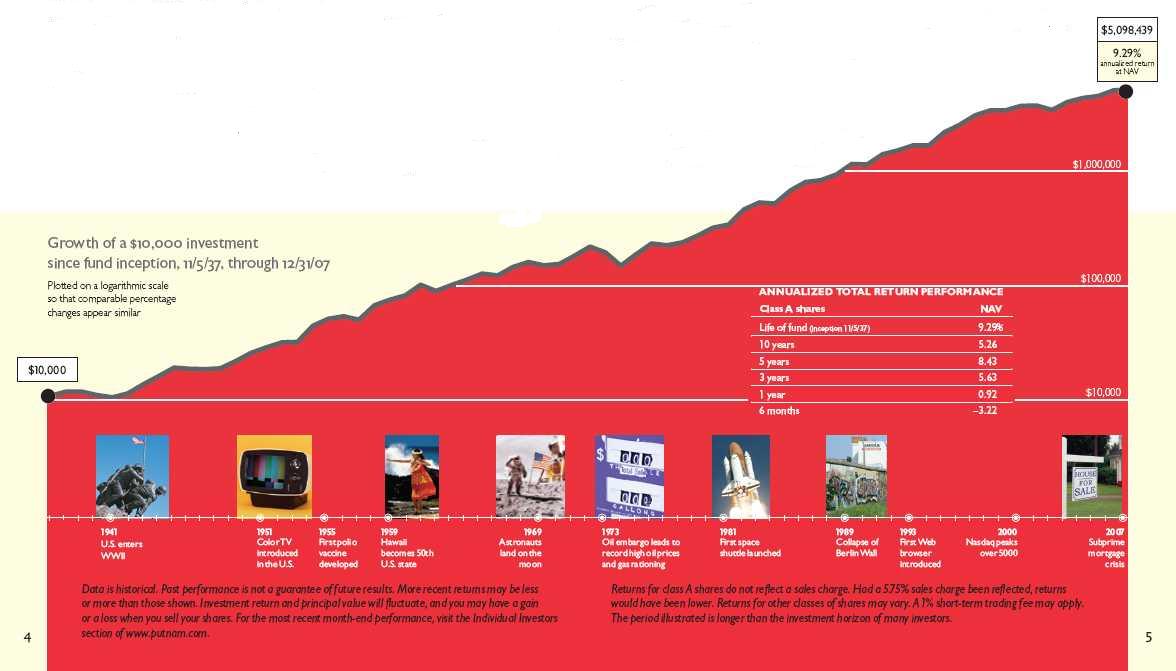
The George Putnam Fund of Boston: Providing the
benefits of balanced investing for 70 years
Your fund launched in 1937 when George Putnam, a Boston investment manager, decided to start a fund with an innovative approach — a balance of stocks to seek capital appreciation and bonds to help provide current income. The original portfolio featured industrial stocks, such as U.S. Smelting, Refining, & Mining Co., and railroad bonds.
This balanced approach made sense then, and we believe it continues to make sense now. In the late 1930s, the stock market experienced dramatic swings as businesses struggled to recover from the Great Depression and as the shadow of war began to spread across Europe and Asia. Today, global political and economic uncertainties also challenge investors.
Although the fund has experienced volatility at times, its balanced approach has kept it on course. When stocks were weak, the fund’s bonds helped results. Similarly, stocks have often provided leadership when bonds were hurt by rising interest rates or inflation.
In a letter to shareholders dated July 12, 1938, George Putnam articulated the balanced strategy: “Successful investing calls not so much for some clairvoyant ability to read the future as for the courage to stick to tested, common sense policies in the face of the unreliable emotional stresses and strains that constantly sweep the market place.” Putnam remains committed to this prudent approach to investing today.
The fund may invest a portion of its assets in small and/or midsize companies. Such investments increase the risk of greater price fluctuations.
The use of derivatives involves special risks and may result in losses.
The fund may have a significant portion of its holdings in bonds. Mutual funds that invest in bonds are subject to certain risks including interest-rate risk, credit risk, and inflation risk. As interest rates rise, the prices of bonds fall. Long-term bonds are more exposed to interest-rate risk than short-term bonds. Unlike bonds, bond funds have ongoing fees and expenses.
Value investing seeks underpriced stocks, but there is no guarantee that a stock’s price will rise.
Over seven eventful decades, the fund’s balance of stocks and bonds has served shareholders by providing income and building wealth.
Performance snapshot
The George Putnam Fund of Boston
Current performance may be lower or higher than the quoted past performance, which cannot guarantee future results. Share price, principal value, and return will fluctuate, and you may have a gain or a loss when you sell your shares. Performance of class A shares assumes reinvestment of distributions and does not account for taxes. Fund returns in the bar chart do not reflect a sales charge of 5.75%; had they, returns would have been lower. See pages 7 and 13–16 for additional performance information. For a portion of the periods, this fund may have limited expenses, without which returns would have been lower. A 1% short-term trading fee may apply. To obtain the most recent month-end performance, visit the Individual Investors section of www.putnam.com.
* The benchmark and Lipper group were not in existence at the time of the fund’s inception. The George Putnam Blended Index commenced 6/30/95. The Lipper average commenced 12/31/59.
† Returns for the six-month period are not annualized, but cumulative.
6

The period in review
Jeanne, how did the fund perform during the first half of its 2008 fiscal year?
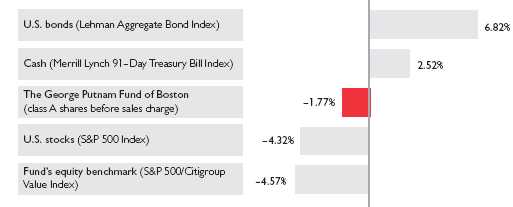
The fund’s class A shares posted a slight loss of 1.77% for the six-month period, which ended January 31, 2008. Although disappointing, this return reflects the strength of the fund’s bond holdings at a time when many stocks fell sharply. The S&P 500 Index, a traditional measure of U.S. stock market performance, fell 4.32% during this same period.
What prompted the decline in stocks?
The dominant theme was a wave of investor anxiety in response to severe weakness in the housing market. What began as a rising level of defaults in the subprime portion of the market — loans made to borrowers with poor credit histories — spread throughout the financials sector and led to what’s known as a “credit crunch,” a rapid pullback of liquidity and a tightening of lending standards throughout the system.
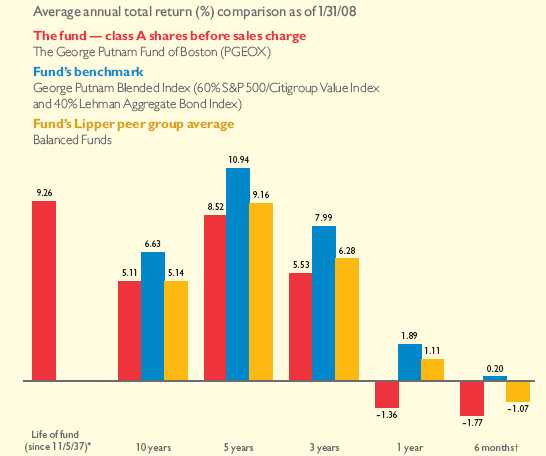
Broad market index and fund performance
This comparison shows your fund’s performance in the context of broad market indexes for the six months ended 1/31/08. See page 6 and pages 13–16 for additional fund performance information. Index descriptions can be found on page 24.
7
The fund underperformed its benchmark index and peer group average during the period. Was this related to the subprime mortgage crisis?
Actually, no. The fund held relatively fewer of the financial-related stocks that were most affected by the subprime issues. These stocks were sharply negative during the period and pulled down the fund’s stated return, but relative to the index, we performed better in that area.
The primary reason the fund trailed its blended benchmark (60% S&P 500/ Citigroup Value Index and 40% Lehman Aggregate Bond Index) was our overweight position in airline stocks, which performed poorly during the period. The chief reason we lagged our Lipper peer group average was that, unlike many of our competitors, we typically do not own international stocks. These stocks gave many balanced funds a boost in a period when the U.S. market was declining and a weaker dollar supported returns on international investments. The other factor related to our Lipper peer group is that we invest in a value style while some of our competitors invest in growth stocks, which outperformed during the period.
Have you modified the fund’s approach in light of recent events?
In managing the fund, we take a much longer view than six months. It’s important to remember that the
Top equity holdings
This table shows the fund’s top 10 equity holdings and the percentage of the fund’s net assets that each represented as of 1/31/08. Also shown is each holding’s market sector and the specific industry within that sector. Holdings will vary over time.
| | |
| HOLDING (percentage of fund’s net assets) | SECTOR | INDUSTRY |
|
| General Electric Co. (2.7%) | Conglomerates | Conglomerates |
|
| Bank of America Corp. (2.2%) | Financials | Banking |
|
| AT&T, Inc. (1.9%) | Communication services | Telephone |
|
| JPMorgan Chase & Co. (1.7%) | Financials | Financials |
|
| Citigroup, Inc. (1.5%) | Financials | Financials |
|
| Pfizer, Inc. (1.3%) | Health care | Pharmaceuticals |
|
| Verizon Communications, Inc. (1.1%) | Communication services | Regional Bells |
|
| Wachovia Corp. (1.0%) | Financials | Banking |
|
| Wells Fargo & Co. (0.9%) | Financials | Banking |
|
| Hewlett-Packard Co. (0.9%) | Technology | Computers |
|
8
fund is designed to provide a conservative, balanced approach to participating in the financial markets. As such, we typically steer clear of international stock markets, and focus on stocks of U.S. companies that we believe are temporarily out of favor with investors. Numerous studies have shown that investing in “undervalued” stocks has provided superior returns over time relative to other strategies, as investors come to realize their true worth. However, long-term success does not ensure success over short time periods.
The fund’s roughly 40% weighting in bonds is designed to provide stability during periods of short-term weakness in the stock market. We invest mostly in high-quality bonds rated BBB or better by Standard & Poor’s. In fact, over 80% of our bond holdings were rated A– or higher at the end of the period. As the mortgage crisis unfolded in the summer of 2007, the fund’s bond portfolio benefited from owning more of the highest-quality mortgage-backed securities and from being somewhat underweight to the mortgage sector overall. This balanced approach has
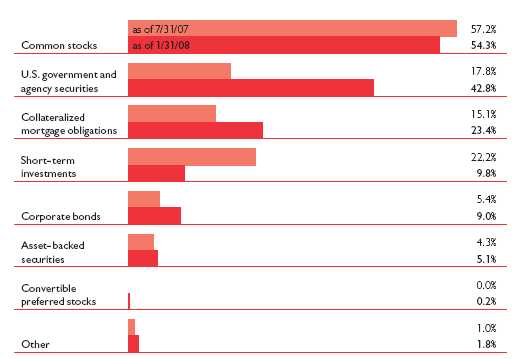
Portfolio composition comparison
This chart shows how the fund’s weightings have changed over the past six months. Weightings are shown as a percentage of net assets. Holdings will vary over time.
9
provided solid, relatively consistent returns to investors in the fund since 1937. We expect it will continue to serve investors well in the future.
What strategies or individual holdings helped performance during the period?
Our focus in 2007 on basic materials, capital goods, and energy continued to serve the fund well during the six-month period. Terra Industries is one example of a strong performer in the basic materials area of this focus. Fueled by strong business demand, the company, which produces nitrogen- and methanol-based fertilizers and other products for the agricultural and industrial markets, saw its stock price double during the period. FirstEnergy Corporation was a strong performer in the utilities sector, and Nucor Corporation, a North Carolina manufacturer of steel and steel products, also contributed positively to fund performance.
Relative to our benchmark index, the fund also benefited from being underweight certain sectors such as communications services and financials. In the former category, telecommunications firms such as Sprint/Nextel fell sharply on prospects for weaker consumer spending on nonessentials. Sprint’s troubles were compounded by its purchase of Nextel, whose customer base was found to have weaker credit histories. After not owning the company for much of the period, we began to build a position with the view that it may now have the makings of a turnaround. In financials, we were underweight some of the big names affected by the mortgage crisis, including FNMA, Freddie Mac (FHLMC), and Washington Mutual.
What strategies or individual holdings held back performance?
Our biggest detractor during the period was our overweight position in airline stocks, including U.S. Airways. Our case for investing in these companies was based on the potential for consolidation in the industry. In our view, excess capacity is coming out of the industry, the business world is operating more globally and thus flying more, and flights are full. The foil in our plan was the rising price of oil, which cut profits considerably and sent share prices tumbling.
Outside of the airline industry, several technology holdings that had performed well during the first half of 2007, including Apple and SanDisk, declined toward the end of the year as investors predicted weaker spending on unnecessary items.
Have you sold any of these holdings?
We retained our positions in the airlines because we continue to believe that consolidation will occur. In fact, after the close of the period, Delta was in merger talks with Northwest Airlines, and Continental was in talks with American. Elsewhere, however, we sold stocks, including Bear Stearns in the financials sector.
10
Jeanne, what is your outlook for 2008?
The big question for 2008 is at what point does one take bigger positions in financials and consumer cyclicals. Financial stocks have been severely punished, and there are clearly some opportunities emerging because investors tend to push down entire sectors indiscriminately when there is uncertainty. In view of these opportunities, we have begun to cautiously add names, such as JPMorgan Chase, Lehman Brothers, Merrill Lynch, and Goldman Sachs.
At a broader level, we believe the markets will respond favorably to clear direction in the economy, even if the news is that we are in a recession. Long-term investors are surprisingly resilient to bad news in the short term. Uncertainty is far more vexing. Once investors see the landscape for what it is, they can begin to look forward. We also note that financial conditions are quickly improving for the U.S. market, thanks to interest-rate cuts and currency weakness. We have added on the margin to our holdings in some retailers and consumer cyclicals companies as we look to better times ahead.
Thanks for speaking with us today, Jeanne.
I N V E S T M E N T I N S I G H T
An economic recession, according to the National Bureau of Economic Research (NBER), is a significant decline in economic activity spread across the economy and lasting more than a few months. The symptoms of this decline are normally visible in data that tracks income, employment, industrial production, and sales. Compared with expansions, most recessions are brief. The seven recessions since 1960 have lasted an average of 11 months, versus 64 months for the average expansion. Recessions, also defined by some as two consecutive quarters of contracting GDP, have become increasingly rare in recent decades, as the Federal Reserve has become more adept at avoiding them and as technology has enabled businesses to adjust more rapidly to changing market conditions.
Of special interest
We are pleased to report that your fund’s dividend has increased due to an increase in interest income and prepayment gains. The new dividend rate of $0.126 per share, paid quarterly, reflects a 6.78% increase over the prior rate.
The views expressed in this report are exclusively those of Putnam Management. They are not meant as investment advice.
11
The fund may invest a portion of its assets in small and/or midsize companies. Such investments increase the risk of greater price fluctuations. The use of derivatives involves special risks and may result in losses. The fund may have a significant portion of its holdings in bonds. Mutual funds that invest in bonds are subject to certain risks including interest rate risk, credit risk, and inflation risk. As interest rates rise, the prices of bonds fall. Long-term bonds are more exposed to interest-rate risk than short-term bonds. Unlike bonds, bond funds have ongoing fees and expenses. Value investing seeks underpriced stocks, but there is no guarantee that a stock’s price will rise.
Please note that the holdings discussed in this report may not have been held by the fund for the entire period. Portfolio composition is subject to review in accordance with the fund’s investment strategy and may vary in the future.
12
Your fund’s performance
This section shows your fund’s performance, price, and distribution information for periods ended January 31, 2008, the end of the first half of its current fiscal year. In accordance with regulatory requirements for mutual funds, we also include performance as of the most recent calendar quarter-end and expense information taken from the fund’s current prospectus. Performance should always be considered in light of a fund’s investment strategy. Data represents past performance. Past performance does not guarantee future results. More recent returns may be less or more than those shown. Investment return and principal value will fluctuate, and you may have a gain or a loss when you sell your shares. Performance information does not reflect any deduction for taxes a shareholder may owe on fund distributions or on the redemption of fund shares. For the most recent month-end performance, please visit the Individual Investors section of www.putnam.com or call Putnam at 1-800-225-1581. Class Y shares are generally only available to corporate and institutional clients and clients in other approved programs. See the Terms and definitions section in this report for definitions of the share classes offered by your fund.
Fund performance
Total return for periods ended 1/31/08
| | | | | | | | | | |
| | Class A | | Class B | | Class C | | Class M | | Class R | Class Y |
| (inception dates) | (11/5/37) | | (4/27/92) | | (7/26/99) | | (12/1/94) | | (1/21/03) | (3/31/94) |
| | NAV | POP | NAV | CDSC | NAV | CDSC | NAV | POP | NAV | NAV |
|
| Annual average | | | | | | | | | | |
| (life of fund) | 9.26% | 9.17% | 8.24% | 8.24% | 8.44% | 8.44% | 8.51% | 8.46% | 8.99% | 9.32% |
|
| 10 years | 64.61 | 55.14 | 52.70 | 52.70 | 52.60 | 52.60 | 56.69 | 51.19 | 60.61 | 68.82 |
| Annual average | 5.11 | 4.49 | 4.32 | 4.32 | 4.32 | 4.32 | 4.59 | 4.22 | 4.85 | 5.38 |
|
| 5 years | 50.53 | 41.86 | 44.94 | 42.94 | 44.91 | 44.91 | 46.81 | 41.71 | 48.70 | 52.39 |
| Annual average | 8.52 | 7.24 | 7.71 | 7.41 | 7.70 | 7.70 | 7.98 | 7.22 | 8.26 | 8.79 |
|
| 3 years | 17.52 | 10.78 | 14.89 | 12.23 | 14.89 | 14.89 | 15.78 | 11.74 | 16.66 | 18.44 |
| Annual average | 5.53 | 3.47 | 4.74 | 3.92 | 4.74 | 4.74 | 5.01 | 3.77 | 5.27 | 5.80 |
|
| 1 year | –1.36 | –7.01 | –2.14 | –6.49 | –2.14 | –3.01 | –1.89 | –5.30 | –1.62 | –1.10 |
|
| 6 months | –1.77 | –7.40 | –2.16 | –6.55 | –2.14 | –3.01 | –2.01 | –5.45 | –1.91 | –1.63 |
|
Current performance may be lower or higher than the quoted past performance, which cannot guarantee future results. After sales charge returns (public offering price, or POP) for class A and M shares reflect a maximum 5.75% and 3.50% load, respectively, as of 1/2/08. Class B share returns reflect the applicable contingent deferred sales charge (CDSC), which is 5% in the first year, declining to 1% in the sixth year, and is eliminated thereafter. Class C shares reflect a 1% CDSC for the first year and is eliminated thereafter. Class R and Y shares have no initial sales charge or CDSC. Performance for class B, C, M, R, and Y shares before their inception is derived from the historical performance of class A shares, adjusted for the applicable sales charge (or CDSC) and, except for class Y shares, the higher operating expenses for such shares.
For a portion of the periods, this fund may have limited expenses, without which returns would have been lower.
A 1% short-term trading fee may be applied to shares exchanged or sold within 7 days of purchase.
13
Comparative index returns
For periods ended 1/31/08
| | | | |
| | | | | Lipper |
| | S&P 500/ | Lehman | | Balanced |
| | Citigroup | Aggregate | George Putnam | Funds category |
| | Value Index | Bond Index | Blended Index† | average‡ |
|
| Annual average | | | | |
| (life of fund) | —* | —* | —* | —* |
|
| 10 years | 85.80% | 79.33% | 90.04% | 67.03% |
| Annual average | 6.39 | 6.01 | 6.63 | 5.14 |
|
| 5 years | 99.26 | 26.15 | 68.06 | 55.42 |
| Annual average | 14.78 | 4.75 | 10.94 | 9.16 |
|
| 3 years | 31.74 | 15.51 | 25.94 | 20.15 |
| Annual average | 9.62 | 4.92 | 7.99 | 6.28 |
|
| 1 year | –3.27 | 8.81 | 1.89 | 1.11 |
|
| 6 months | -4.57 | 6.82 | 0.20 | -1.07 |
|
Index and Lipper results should be compared to fund performance at net asset value.
* The benchmarks were not in existence at the time of the fund’s inception. The S&P 500/Citigroup Value Index commenced 6/30/95. The Lehman Aggregate Bond Index commenced 12/31/75. The George Putnam Blended Index commenced 6/30/95. The Lipper average commenced 12/31/59.
† The Blended Index is composed of 60% S&P 500/Citigroup Value Index and 40% Lehman Aggregate Bond Index.
‡ Over the 6-month, 1-year, 3-year, 5-year, and 10-year periods ended 1/31/08, there were 848, 828, 614, 443, and 254 funds, respectively, in this Lipper category.
14
Fund price and distribution information
For the six-month period ended 1/31/08
| | | | | | | | | | | | |
| | | | | | | |
| | | | | | |
| Distributions | Class A | | Class B | | Class C | | Class M | | Class R | | Class Y | |
|
| Number | 2 | 2 | 2 | 2 | 2 | 2 |
|
| Income | $0.358 | $0.282 | $0.286 | $0.310 | $0.335 | $0.382 |
|
| Capital gains | | | | | | |
|
| Long-term | 0.943 | 0.943 | 0.943 | 0.943 | 0.943 | 0.943 |
|
| Short-term | 0.586 | 0.586 | 0.586 | 0.586 | 0.586 | 0.586 |
|
| Total | $1.887 | $1.811 | $1.815 | $1.839 | $1.864 | $1.911 |
| |
| Share value: | NAV | POP* | NAV | NAV | NAV | POP* | NAV | NAV |
|
| 7/31/07 | $18.10 | $19.20 | $17.90 | $17.97 | $17.89 | $18.54 | $18.04 | $18.15 |
|
| 1/31/08 | 15.88 | 16.85 | 15.69 | 15.76 | 15.68 | 16.25 | 15.82 | 15.93 |
| |
| Current yield | | | | | | |
| (end of period) | | | | | | |
|
| Current | | | | | | |
| dividend rate1 | 2.97% | 2.80% | 2.07% | 2.11% | 2.42% | 2.34% | 2.71% | 3.26% |
|
| Current 30-day | | | | | | |
| SEC yield2,3 | | | | | | |
| (with expense | | | | | | |
| limitation) | — | 3.13 | 2.59 | 2.59 | — | 2.73 | 3.08 | 3.57 |
|
| Current 30-day | | | | | | |
| SEC yield3 | | | | | | |
| (without | | | | | | |
| expense | | | | | | |
| limitation) | — | 3.13 | 2.58 | 2.59 | — | 2.73 | 3.08 | 3.57 |
|
The classification of distributions, if any, is an estimate. Final distribution information will appear on your year-end tax forms.
* Reflects an increase in sales charges that took effect on 1/2/08.
1 Most recent distribution, excluding capital gains, annualized and divided by NAV or POP at the end of the period.
2 For a portion of the periods, this fund limited expenses, without which yields would have been lower.
3 Based only on investment income and calculated using the maximum offering price for each share class, in accordance with SEC guidelines.
15
Fund performance as of most recent calendar quarter
Total return for periods ended 12/31/07
| | | | | | | | | | |
| | Class A | | Class B | | Class C | | Class M | | Class R | Class Y |
| (inception dates) | (11/5/37) | | (4/27/92) | | (7/26/99) | | (12/1/94) | | (1/21/03) | (3/31/94) |
| | NAV | POP | NAV | CDSC | NAV | CDSC | NAV | POP | NAV | NAV |
|
| Annual average | | | | | | | | | | |
| (life of fund) | 9.29% | 9.20% | 8.27% | 8.27% | 8.47% | 8.47% | 8.54% | 8.49% | 9.02% | 9.35% |
|
| 10 years | 66.95 | 57.31 | 54.81 | 54.81 | 54.86 | 54.86 | 58.94 | 53.35 | 62.99 | 71.21 |
| Annual average | 5.26 | 4.63 | 4.47 | 4.47 | 4.47 | 4.47 | 4.74 | 4.37 | 5.01 | 5.52 |
|
| 5 years | 49.87 | 41.28 | 44.30 | 42.29 | 44.46 | 44.46 | 46.26 | 41.15 | 48.16 | 51.83 |
| Annual average | 8.43 | 7.16 | 7.61 | 7.31 | 7.63 | 7.63 | 7.90 | 7.14 | 8.18 | 8.71 |
|
| 3 years | 17.86 | 11.10 | 15.17 | 12.51 | 15.25 | 15.25 | 16.13 | 12.06 | 17.01 | 18.72 |
| Annual average | 5.63 | 3.57 | 4.82 | 4.01 | 4.84 | 4.84 | 5.11 | 3.87 | 5.38 | 5.89 |
|
| 1 year | 0.92 | –4.88 | 0.15 | –4.29 | 0.21 | –0.68 | 0.46 | –3.07 | 0.73 | 1.18 |
|
| 6 months | –3.22 | –8.77 | –3.62 | –7.94 | –3.58 | –4.44 | –3.47 | –6.86 | –3.30 | –3.08 |
|
Fund’s annual operating expenses
For the fiscal year ended 7/31/07
| | | | | | |
| | Class A | Class B | Class C | Class M | Class R | Class Y |
|
| Total annual fund | | | | | | |
| operating expenses | 0.98% | 1.73% | 1.73% | 1.48% | 1.23% | 0.73% |
|
Expense information in this table is taken from the most recent prospectus, is subject to change, and may differ from that shown in the next section and in the financial highlights of this report. Expenses are shown as a percentage of average net assets.
16
Your fund’s expenses
As a mutual fund investor, you pay ongoing expenses, such as management fees, distribution fees (12b-1 fees), and other expenses. In the most recent six-month period, your fund limited these expenses; had it not done so, expenses would have been higher. Using the information below, you can estimate how these expenses affect your investment and compare them with the expenses of other funds. You may also pay one-time transaction expenses, including sales charges (loads) and redemption fees, which are not shown in this section and would have resulted in higher total expenses. For more information, see your fund’s prospectus or talk to your financial representative.
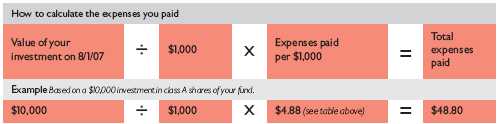
Review your fund’s expenses
The table below shows the expenses you would have paid on a $1,000 investment in The George Putnam Fund of Boston from August 1, 2007, to January 31, 2008. It also shows how much a $1,000 investment would be worth at the close of the period, assuming actual returns and expenses.
| | | | | | |
| | Class A | Class B | Class C | Class M | Class R | Class Y |
|
| Expenses paid per $1,000* | $ 4.88 | $ 8.60 | $ 8.60 | $ 7.37 | $ 6.12 | $ 3.64 |
|
| Ending value (after expenses) | $982.30 | $978.40 | $978.60 | $979.90 | $980.90 | $983.70 |
|
* Expenses for each share class are calculated using the fund’s annualized expense ratio for each class, which represents the ongoing expenses as a percentage of average net assets for the six months ended 1/31/08. The expense ratio may differ for each share class (see the last table in this section). Expenses are calculated by multiplying the expense ratio by the average account value for the period; then multiplying the result by the number of days in the period; and then dividing that result by the number of days in the year.
Estimate the expenses you paid
To estimate the ongoing expenses you paid for the six months ended January 31, 2008, use the calculation method below. To find the value of your investment on August 1, 2007, call Putnam at 1-800-225-1581.
17
Compare expenses using the SEC’s method
The Securities and Exchange Commission (SEC) has established guidelines to help investors assess fund expenses. Per these guidelines, the table below shows your fund’s expenses based on a $1,000 investment, assuming a hypothetical 5% annualized return. You can use this information to compare the ongoing expenses (but not transaction expenses or total costs) of investing in the fund with those of other funds. All mutual fund shareholder reports will provide this information to help you make this comparison. Please note that you cannot use this information to estimate your actual ending account balance and expenses paid during the period.
| | | | | | |
| | Class A | Class B | Class C | Class M | Class R | Class Y |
|
| Expenses paid per $1,000* | $ 4.98 | $ 8.77 | $ 8.77 | $ 7.51 | $ 6.24 | $ 3.71 |
|
| Ending value (after expenses) | $1,020.21 | $1,016.44 | $1,016.44 | $1,017.70 | $1,018.95 | $1,021.47 |
|
* Expenses for each share class are calculated using the fund’s annualized expense ratio for each class, which represents the ongoing expenses as a percentage of average net assets for the six months ended 1/31/08. The expense ratio may differ for each share class (see the last table in this section). Expenses are calculated by multiplying the expense ratio by the average account value for the period; then multiplying the result by the number of days in the period; and then dividing that result by the number of days in the year.
Compare expenses using industry averages
You can also compare your fund’s expenses with the average of its peer group, as defined by Lipper, an independent fund-rating agency that ranks funds relative to others that Lipper considers to have similar investment styles or objectives. The expense ratio for each share class shown below indicates how much of your fund’s average net assets have been used to pay ongoing expenses during the period.
| | | | | | |
| | Class A | Class B | Class C | Class M | Class R | Class Y |
|
| Your fund’s annualized | | | | | | |
| expense ratio | 0.98% | 1.73% | 1.73% | 1.48% | 1.23% | 0.73% |
|
| Average annualized expense | | | | | | |
| ratio for Lipper peer group* | 1.24% | 1.99% | 1.99% | 1.74% | 1.49% | 0.99% |
|
* Putnam is committed to keeping fund expenses below the Lipper peer group average expense ratio and will limit fund expenses if they exceed the Lipper average. The Lipper average is a simple average of front-end load funds in the peer group that excludes 12b-1 fees as well as any expense offset and brokerage service arrangements that may reduce fund expenses. To facilitate the comparison in this presentation, Putnam has adjusted the Lipper average to reflect the 12b-1 fees carried by each class of shares other than class Y shares, which do not incur 12b-1 fees. Investors should note that the other funds in the peer group may be significantly smaller or larger than the fund, and that an asset-weighted average would likely be lower than the simple average. Also, the fund and Lipper report expense data at different times and for different periods. The fund’s expense ratio shown here is annualized data for the most rec ent six-month period, while the quarterly updated Lipper average is based on the most recent fiscal year-end data available for the peer group funds as of 12/31/07.
18
Your fund’s portfolio turnover
Putnam funds are actively managed by teams of experts who buy and sell securities based on intensive analysis of companies, industries, economies, and markets. Portfolio turnover is a measure of how often a fund’s managers buy and sell securities for your fund. A portfolio turnover of 100%, for example, means that the managers sold and replaced securities valued at 100% of a fund’s average portfolio value within a given period. Funds with high turnover may be more likely to generate capital gains that must be distributed to shareholders as taxable income. High turnover may also cause a fund to pay more brokerage commissions and other transaction costs, which may detract from performance.
Funds that invest in bonds or other fixed-income instruments may have higher turnover than funds that invest only in stocks. Short-term bond funds tend to have higher turnover than longer-term bond funds, because shorter-term bonds will mature or be sold more frequently than longer-term bonds. You can use the table below to compare your fund’s turnover with the average turnover for funds in its Lipper category.
Turnover comparisons
Percentage of holdings that change every year
| | | | | |
| | 2007 | 2006 | 2005 | 2004 | 2003 |
|
| The George Putnam | | | | | |
| Fund of Boston | 144%* | 117%* | 169%* | 166% | 121%† |
|
| Lipper Balanced Funds | 62% | 70% | 72% | 74% | 81% |
|
Turnover data for the fund is calculated based on the fund’s fiscal-year period, which ends on July 31. Turnover data for the fund’s Lipper category is calculated based on the average of the turnover of each fund in the category for its fiscal year ended during the indicated year. Fiscal years vary across funds in the Lipper category, which may limit the comparability of the fund’s portfolio turnover rate to the Lipper average. Comparative data for 2007 is based on information available as of 12/31/07.
* Portfolio turnover excludes dollar roll transactions.
† Portfolio turnover excludes certain Treasury note transactions executed in connection with a short-term trading strategy, as well as the impact of assets received from the acquisition of Putnam Balanced Fund and Putnam Balanced Retirement Fund.
19
Your fund’s risk
This risk comparison is designed to help you understand how your fund compares with other funds. The comparison utilizes a risk measure developed by Morningstar, an independent fund-rating agency. This risk measure is referred to as the fund’s Morningstar Risk.
Your fund’s Morningstar® Risk
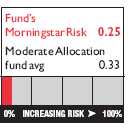
Your fund’s Morningstar Risk is shown alongside that of the average fund in its Morningstar category. The risk bar broadens the comparison by translating the fund’s Morningstar Risk into a percentile, which is based on the fund’s ranking among all funds rated by Morningstar as of December 31, 2007. A higher Morningstar Risk generally indicates that a fund’s monthly returns have varied more widely.
Morningstar determines a fund’s Morningstar Risk by assessing variations in the fund’s monthly returns — with an emphasis on downside variations — over a 3-year period, if available. Those measures are weighted and averaged to produce the fund’s Morningstar Risk. The information shown is provided for the fund’s class A shares only; information for other classes may vary. Morningstar Risk is based on historical data and does not indicate future results. Morningstar does not purport to measure the risk associated with a current investment in a fund, either on an absolute basis or on a relative basis. Low Morningstar Risk does not mean that you cannot lose money on an investment in a fund. Copyright 2007 Morningstar, Inc. All Rights Reserved. The information contained herein (1) is proprietary to Morningstar and/or its content providers; (2) may not be copied or distributed; and (3) is not warranted to be accurate, complete, or timely. Neither Morningstar nor its content providers are responsible for any damages or losses arising from any use of this information.
20
Your fund’s management
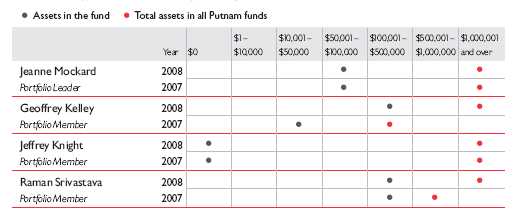
Your fund is managed by the members of the Putnam Large-Cap Value, Core Fixed-Income, and Global Asset Allocation teams. Jeanne Mockard is the Portfolio Leader of the fund. Geoffrey Kelley, Jeffrey Knight, and Raman Srivastava are Portfolio Members. The Portfolio Leader and Portfolio Members coordinate the teams’ management of the fund.
For a complete listing of the members of the Putnam Large-Cap Value, Core Fixed-Income, and Global Asset Allocation teams, including those who are not Portfolio Leaders or Portfolio Members of your fund, visit Putnam’s Individual Investors Web site at www.putnam.com.
Investment team fund ownership
The table below shows how much the fund’s current Portfolio Leader and Portfolio Members have invested in the fund and in all Putnam mutual funds (in dollar ranges). Information shown is as of January 31, 2008, and January 31, 2007.
Trustee and Putnam employee fund ownership
As of January 31, 2008, all of the Trustees of the Putnam funds owned fund shares. The table below shows the approximate value of investments in the fund and all Putnam funds as of that date by the Trustees and Putnam employees. These amounts include investments by the Trustees’ and employees’ immediate family members and investments through retirement and deferred compensation plans.
| | |
| | | Total assets in |
| | Assets in the fund | all Putnam funds |
|
| Trustees | $1,054,000 | $ 90,000,000 |
|
| Putnam employees | $7,235,000 | $669,000,000 |
|
21
Other Putnam funds managed by the Portfolio Leader and Portfolio Members
Jeffrey Knight is also a Portfolio Leader of the Putnam Asset Allocation Funds (Growth, Balanced, and Conservative Portfolios), Putnam Income Strategies Fund, Putnam Voyager Fund, and Putnam Growth Opportunities Fund, and a Portfolio Member of Putnam Discovery Growth Fund.
Raman Srivastava is also a Portfolio Member of Putnam Income Fund and Putnam Global Income Trust.
Jeanne Mockard, Geoffrey Kelley, Jeffrey Knight, and Raman Srivastava may also manage other accounts and variable trust funds advised by Putnam Management or an affiliate.
22
Terms and definitions
Important terms
Total return shows how the value of the fund’s shares changed over time, assuming you held the shares through the entire period and reinvested all distributions in the fund.
Net asset value (NAV) is the price, or value, of one share of a mutual fund, without a sales charge. NAVs fluctuate with market conditions. NAV is calculated by dividing the net assets of each class of shares by the number of outstanding shares in the class.
Public offering price (POP) is the price of a mutual fund share plus the maximum sales charge levied at the time of purchase. POP performance figures shown here assume the 5.75% maximum sales charge for class A shares and 3.50% for class M shares.
Contingent deferred sales charge (CDSC) is generally a charge applied at the time of the redemption of class B or C shares and assumes redemption at the end of the period. Your fund’s class B CDSC declines from a 5% maximum during the first year to 1% during the sixth year. After the sixth year, the CDSC no longer applies. The CDSC for class C shares is 1% for one year after purchase.
Share classes
Class A shares are generally subject to an initial sales charge and no CDSC (except on certain redemptions of shares bought without an initial sales charge).
Class B shares are not subject to an initial sales charge. They may be subject to a CDSC.
Class C shares are not subject to an initial sales charge and are subject to a CDSC only if the shares are redeemed during the first year.
Class M shares have a lower initial sales charge and a higher 12b-1 fee than class A shares and no CDSC (except on certain redemptions of shares bought without an initial sales charge).
Class R shares are not subject to an initial sales charge or CDSC and are available only to certain defined contribution plans.
Class Y shares are not subject to an initial sales charge or CDSC, and carry no 12b-1 fee. They are generally only available to corporate and institutional clients and clients in other approved programs.
23
Comparative indexes
George Putnam Blended Index is an unmanaged index administered by Putnam Management, 60% of which is the Standard and Poor’s 500/Citigroup Value Index and 40% of which is the Lehman Aggregate Bond Index.
Lehman Aggregate Bond Index is an unmanaged index of U.S. investment-grade fixed-income securities.
Merrill Lynch 91-Day Treasury Bill Index is an unmanaged index that seeks to measure the performance of U.S. Treasury bills available in the marketplace.
S&P 500 Index is an unmanaged index of common stock performance.
S&P 500/Citigroup Value Index is an unmanaged capitalization-weighted index of large-cap stocks chosen for their value orientation.
Indexes assume reinvestment of all distributions and do not account for fees. Securities and performance of a fund and an index will differ. You cannot invest directly in an index.
Lipper is a third-party industry-ranking entity that ranks mutual funds. Its rankings do not reflect sales charges. Lipper rankings are based on total return at net asset value relative to other funds that have similar current investment styles or objectives as determined by Lipper. Lipper may change a fund’s category assignment at its discretion. Lipper category averages reflect performance trends for funds within a category.
24
Trustee approval of management contract
General conclusions
The Board of Trustees of the Putnam funds oversees the management of each fund and, as required by law, determines annually whether to approve the continuance of your fund’s management contract with Putnam Investment Management (“Putnam Management”). In this regard, the Board of Trustees, with the assistance of its Contract Committee consisting solely of Trustees who are not “interested persons” (as such term is defined in the Investment Company Act of 1940, as amended) of the Putnam funds (the “Independent Trustees”), requests and evaluates all information it deems reasonably necessary under the circumstances. Over the course of several months ending in June 2007, the Contract Committee met several times to consider the information provided by Putnam Management and other information developed with the assistance of the Board’s independent counsel and independent staff. The Contract Committee reviewed and discussed key aspects of this information with all of the Independent Trustees. The Contract Committee recommended, and the Independent Trustees approved, the continuance of your fund’s management contract, effective July 1, 2007.
In addition, in anticipation of the sale of Putnam Investments to Great-West Lifeco, at a series of meetings ending in March 2007, the Trustees reviewed and approved new management and distribution arrangements to take effect upon the change of control. Shareholders of all funds approved the management contracts in May 2007, and the change of control transaction was completed on August 3, 2007. Upon the change of control, the management contracts that were approved by the Trustees in June 2007 automatically terminated and were replaced by new contracts that had been approved by shareholders. In connection with their review for the June 2007 continuance of the Putnam funds’ management contracts, the Trustees did not identify any facts or circumstances that would alter the substance of the conclusions and recommendations they made in their review of the contracts to take effect upon the change of control.
The Independent Trustees’ approval was based on the following conclusions:
• That the fee schedule in effect for your fund represented reasonable compensation in light of the nature and quality of the services being provided to the fund, the fees paid by competitive funds and the costs incurred by Putnam Management in providing such services, and
• That this fee schedule represented an appropriate sharing between fund shareholders and Putnam Management of such economies of scale as may exist in the management of the fund at current asset levels.
These conclusions were based on a comprehensive consideration of all information provided to the Trustees and were not the result of any single factor. Some of the factors that figured particularly in the Trustees’ deliberations and how the Trustees considered these factors are described below, although individual Trustees may have evaluated the information presented differently, giving different weights to various factors. It is also important to recognize that the fee arrangements for your fund and the other Putnam funds are the result of many years of review and discussion between the Independent Trustees and Putnam Management, that
25
certain aspects of such arrangements may receive greater scrutiny in some years than others, and that the Trustees’ conclusions may be based, in part, on their consideration of these same arrangements in prior years.
Management fee schedules and categories; total expenses
The Trustees reviewed the management fee schedules in effect for all Putnam funds, including fee levels and breakpoints, and the assignment of funds to particular fee categories. In reviewing fees and expenses, the Trustees generally focused their attention on material changes in circumstances — for example, changes in a fund’s size or investment style, changes in Putnam Management’s operating costs or responsibilities, or changes in competitive practices in the mutual fund industry — that suggest that consideration of fee changes might be warranted. The Trustees concluded that the circumstances did not warrant changes to the management fee structure of your fund, which had been carefully developed over the years, re-examined on many occasions and adjusted where appropriate. The Trustees focused on two areas of particular interest, as discussed further below:
• Competitiveness. The Trustees reviewed comparative fee and expense information for competitive funds, which indicated that, in a custom peer group of competitive funds selected by Lipper Inc., your fund ranked in the 28th percentile in management fees and in the 17th percentile in total expenses (less any applicable 12b-1 fees) as of December 31, 2006 (the first percentile being the least expensive funds and the 100th percentile being the most expensive funds). (Because the fund’s custom peer group is smaller than the fund’s broad Lipper Inc. peer group, this expense information may differ from the Lipper peer expense information found elsewhere in this report.) The Trustees noted that expense ratios for a number of Putnam funds, which show the percentage of fund assets used to pay for management and administrative services, distributio n (12b-1) fees and other expenses, had been increasing recently as a result of declining net assets and the natural operation of fee breakpoints.
The Trustees noted that the expense ratio increases described above were currently being controlled by expense limitations implemented in January 2004 and which Putnam Management had committed to maintain at least through 2007. In anticipation of the change of control of Putnam Investments, the Trustees requested, and received a commitment from Putnam Management and Great-West Lifeco, to extend this program through at least June 30, 2009. These expense limitations give effect to a commitment by Putnam Management that the expense ratio of each open-end fund would be no higher than the average expense ratio of the competitive funds included in the fund’s relevant Lipper universe (exclusive of any applicable 12b-1 charges in each case). The Trustees observed that this commitment to limit fund expenses has served shareholders well since its inception.
In order to ensure that the expenses of the Putnam funds continue to meet evolving competitive standards, the Trustees requested, and Putnam Management agreed, to extend for the twelve months beginning July 1, 2007, an additional expense limitation for certain funds at an
26
amount equal to the average expense ratio (exclusive of 12b-1 charges) of a custom peer group of competitive funds selected by Lipper to correspond to the size of the fund. This additional expense limitation will be applied to those open-end funds that had above-average expense ratios (exclusive of 12b-1 charges) based on the custom peer group data for the period ended December 31, 2006. This additional expense limitation will not be applied to your fund because it had a below-average expense ratio relative to its custom peer group.
• Economies of scale. Your fund currently has the benefit of breakpoints in its management fee that provide shareholders with significant economies of scale, which means that the effective management fee rate of a fund (as a percentage of fund assets) declines as a fund grows in size and crosses specified asset thresholds. Conversely, as a fund shrinks in size — as has been the case for many Putnam funds in recent years — these breakpoints result in increasing fee levels. In recent years, the Trustees have examined the operation of the existing breakpoint structure during periods of both growth and decline in asset levels. The Trustees concluded that the fee schedules in effect for the funds represented an appropriate sharing of economies of scale at current asset levels. In reaching this conclusion, the Trustees considered the Contract C ommittee’s stated intent to continue to work with Putnam Management to plan for an eventual resumption in the growth of assets, and to consider the potential economies that might be produced under various growth assumptions.
In connection with their review of the management fees and total expenses of the Putnam funds, the Trustees also reviewed the costs of the services to be provided and profits to be realized by Putnam Management and its affiliates from the relationship with the funds. This information included trends in revenues, expenses and profitability of Putnam Management and its affiliates relating to the investment management and distribution services provided to the funds. In this regard, the Trustees also reviewed an analysis of Putnam Management’s revenues, expenses and profitability with respect to the funds’ management contracts, allocated on a fund-by-fund basis.
Investment performance
The quality of the investment process provided by Putnam Management represented a major factor in the Trustees’ evaluation of the quality of services provided by Putnam Management under your fund’s management contract. The Trustees were assisted in their review of the Putnam funds’ investment process and performance by the work of the Investment Process Committee of the Trustees and the Investment Oversight Committees of the Trustees, which had met on a regular monthly basis with the funds’ portfolio teams throughout the year. The Trustees concluded that Putnam Management generally provides a high-quality investment process — as measured by the experience and skills of the individuals assigned to the management of fund portfolios, the resources made available to such personnel, and in general the ability of Putnam Management to attract and retain high-quality personnel — but also recognized that this does not guarantee favorable investm ent results for every fund in every time period. The Trustees considered the investment performance of each fund over multiple
27
time periods and considered information comparing each fund’s performance with various benchmarks and with the performance of competitive funds.
The Trustees noted the satisfactory investment performance of many Putnam funds. They also noted the disappointing investment performance of certain funds in recent years and discussed with senior management of Putnam Management the factors contributing to such underperformance and actions being taken to improve performance. The Trustees recognized that, in recent years, Putnam Management has made significant changes in its investment personnel and processes and in the fund product line to address areas of underperformance. In particular, they noted the important contributions of Putnam Management’s leadership in attracting, retaining and supporting high-quality investment professionals and in systematically implementing an investment process that seeks to merge the best features of fundamental and quantitative analysis. The Trustees indicated their intention to continue to monitor performance trends to assess the effectiveness of these changes and to evaluate whether additional changes to address areas of underperformance are warranted.
In the case of your fund, the Trustees considered that your fund’s class A share cumulative total return performance at net asset value was in the following percentiles of its Lipper Inc. peer group (Lipper Balanced Funds) for the one-, three- and five-year periods ended March 31, 2007 (the first percentile being the best-performing funds and the 100th percentile being the worst-performing funds):
| | |
| One-year period | Three-year period | Five-year period |
|
| 8th | 46th | 42nd |
(Because of the passage of time, these performance results may differ from the performance results for more recent periods shown elsewhere in this report. Over the one-, three- and five-year periods ended March 31, 2007, there were 729, 560, and 405 funds, respectively, in your fund’s Lipper peer group.* Past performance is no guarantee of future returns.)
As a general matter, the Trustees concluded that cooperative efforts between the Trustees and Putnam Management represent the most effective way to address investment performance problems. The Trustees noted that investors in the Putnam funds have, in effect, placed their trust in the Putnam organization, under the oversight of the funds’ Trustees, to make appropriate decisions regarding the management of the funds. Based on the responsiveness of Putnam Management in the recent past to Trustee concerns about investment performance, the Trustees concluded that it is preferable to seek change within Putnam Management to address performance shortcomings. In the Trustees’ view, the alternative of terminating a management contract and engaging a new investment adviser for an underperforming fund
* The percentile rankings for your fund’s class A share annualized total return performance in the Lipper Balanced Funds category for the one-, five-, and ten-year periods ended December 31, 2007, were 95%, 78%, and 61%, respectively. Over the one-, five-, and ten-year periods ended December 31, 2007, the fund ranked 767th out of 814, 344th out of 441, and 149th out of 245 funds, respectively. Note that this more recent information was not available when the Trustees approved the continuance of your fund’s management contract.
28
would entail significant disruptions and would not provide any greater assurance of improved investment performance.
Brokerage and soft-dollar allocations; other benefits
The Trustees considered various potential benefits that Putnam Management may receive in connection with the services it provides under the management contract with your fund. These include benefits related to brokerage and soft-dollar allocations, whereby a portion of the commissions paid by a fund for brokerage may be used to acquire research services that may be useful to Putnam Management in managing the assets of the fund and of other clients. The Trustees indicated their continued intent to monitor the potential benefits associated with the allocation of fund brokerage to ensure that the principle of seeking “best price and execution” remains paramount in the portfolio trading process.
The Trustees’ annual review of your fund’s management contract also included the review of its distributor’s contract and distribution plan with Putnam Retail Management Limited Partnership and the custodian agreement and investor servicing agreement with Putnam Fiduciary Trust Company (“PFTC”), each of which provides benefits to affiliates of Putnam Management. In the case of the custodian agreement, the Trustees considered that, effective January 1, 2007, the Putnam funds had engaged State Street Bank and Trust Company as custodian and began to transition the responsibility for providing custody services away from PFTC.
Comparison of retail and institutional fee schedules
The information examined by the Trustees as part of their annual contract review has included for many years information regarding fees charged by Putnam Management and its affiliates to institutional clients such as defined benefit pension plans, college endowments, etc. This information included comparison of such fees with fees charged to the funds, as well as a detailed assessment of the differences in the services provided to these two types of clients. The Trustees observed, in this regard, that the differences in fee rates between institutional clients and the funds are by no means uniform when examined by individual asset sectors, suggesting that differences in the pricing of investment management services to these types of clients reflect to a substantial degree historical competitive forces operating in separate market places. The Trustees considered the fact that fee rates across all asset sectors are higher on average for funds than for institutional cli ents, as well as the differences between the services that Putnam Management provides to the Putnam funds and those that it provides to institutional clients of the firm, but did not rely on such comparisons to any significant extent in concluding that the management fees paid by your fund are reasonable.
29
Other information for shareholders
Important notice regarding delivery of shareholder documents
In accordance with SEC regulations, Putnam sends a single copy of annual and semiannual shareholder reports, prospectuses, and proxy statements to Putnam shareholders who share the same address, unless a shareholder requests otherwise. If you prefer to receive your own copy of these documents, please call Putnam at 1-800-225-1581, and Putnam will begin sending individual copies within 30 days.
Proxy voting
Putnam is committed to managing our mutual funds in the best interests of our shareholders. The Putnam funds’ proxy voting guidelines and procedures, as well as information regarding how your fund voted proxies relating to portfolio securities during the 12-month period ended June 30, 2007, are available on the Putnam Individual Investor Web site, www.putnam.com/individual, and on the SEC’s Web site, www.sec.gov. If you have questions about finding forms on the SEC’s Web site, you may call the SEC at 1-800-SEC-0330. You may also obtain the Putnam funds’ proxy voting guidelines and procedures at no charge by calling Putnam’s Shareholder Services at 1-800-225-1581.
Fund portfolio holdings
The fund will file a complete schedule of its portfolio holdings with the SEC for the first and third quarters of each fiscal year on Form N-Q. Shareholders may obtain the fund’s Forms N-Q on the SEC’s Web site at www.sec.gov. In addition, the fund’s Forms N-Q may be reviewed and copied at the SEC’s Public Reference Room in Washington, D.C. You may call the SEC at 1-800-SEC-0330 for information about the SEC’s Web site or the operation of the Public Reference Room.
30
Financial statements
A guide to financial statements
These sections of the report, as well as the accompanying Notes, constitute the fund’s financial statements.
The fund’s portfolio lists all the fund’s investments and their values as of the last day of the reporting period. Holdings are organized by asset type and industry sector, country, or state to show areas of concentration and diversification.
Statement of assets and liabilities shows how the fund’s net assets and share price are determined. All investment and noninvestment assets are added together. Any unpaid expenses and other liabilities are subtracted from this total. The result is divided by the number of shares to determine the net asset value per share, which is calculated separately for each class of shares. (For funds with preferred shares, the amount subtracted from total assets includes the liquidation preference of preferred shares.)
Statement of operations shows the fund’s net investment gain or loss. This is done by first adding up all the fund’s earnings — from dividends and interest income — and subtracting its operating expenses to determine net investment income (or loss). Then, any net gain or loss the fund realized on the sales of its holdings — as well as any unrealized gains or losses over the period — is added to or subtracted from the net investment result to determine the fund’s net gain or loss for the fiscal period.
Statement of changes in net assets shows how the fund’s net assets were affected by the fund’s net investment gain or loss, by distributions to shareholders, and by changes in the number of the fund’s shares. It lists distributions and their sources (net investment income or realized capital gains) over the current reporting period and the most recent fiscal year-end. The distributions listed here may not match the sources listed in the Statement of operations because the distributions are determined on a tax basis and may be paid in a different period from the one in which they were earned. Dividend sources are estimated at the time of declaration. Actual results may vary. Any non-taxable return of capital cannot be determined until final tax calculations are completed after the end of the fund’s fiscal year.
Financial highlights provide an overview of the fund’s investment results, per-share distributions, expense ratios, net investment income ratios, and portfolio turnover in one summary table, reflecting the five most recent reporting periods. In a semiannual report, the highlight table also includes the current reporting period.
31
The fund’s portfolio 1/31/08 (Unaudited)
| | | |
| COMMON STOCKS (54.3%)* | | | |
| |
| | Shares | | Value |
|
| Banking (3.8%) | | | |
| Bank of America Corp. | 1,893,900 | $ | 83,994,465 |
| BB&T Corp. | 129,700 | | 4,705,516 |
| KeyCorp | 424,100 | | 11,090,215 |
| Marshall & Ilsley Corp. | 329,499 | | 9,193,022 |
| National City Corp. | 271,000 | | 4,821,090 |
| PNC Financial Services Group | 128,300 | | 8,419,046 |
| SunTrust Banks, Inc. (S) | 37,600 | | 2,592,520 |
| U.S. Bancorp | 195,800 | | 6,647,410 |
| Washington Mutual, Inc. | 123,700 | | 2,464,104 |
| Zions Bancorp. (S) | 117,900 | | 6,453,846 |
| | | | 140,381,234 |
|
| |
| Basic Materials (3.0%) | | | |
| Cytec Industries, Inc. | 97,800 | | 5,536,458 |
| Dow Chemical Co. (The) (S) | 207,800 | | 8,033,548 |
| E.I. du Pont de Nemours & Co. | 174,300 | | 7,874,874 |
| Freeport-McMoRan Copper & Gold, Inc. Class B (S) | 158,792 | | 14,137,252 |
| Lubrizol Corp. (The) | 167,400 | | 8,806,914 |
| Nucor Corp. | 189,300 | | 10,941,540 |
| Packaging Corp. of America | 292,500 | | 7,090,200 |
| PPG Industries, Inc. | 213,200 | | 14,090,388 |
| Reliance Steel & Aluminum Co. (S) | 113,600 | | 5,590,256 |
| Southern Copper Corp. (S) | 62,800 | | 5,893,152 |
| Terra Industries, Inc. † (S) | 404,000 | | 18,208,280 |
| United States Steel Corp. (S) | 66,800 | | 6,820,948 |
| | | | 113,023,810 |
|
| |
| Capital Goods (3.5%) | | | |
| Ball Corp. (S) | 105,100 | | 4,823,039 |
| Boeing Co. (The) | 212,000 | | 17,634,160 |
| Caterpillar, Inc. (S) | 246,300 | | 17,521,782 |
| Cummins, Inc. | 88,100 | | 4,253,468 |
| DRS Technologies, Inc. (S) | 64,800 | | 3,477,816 |
| Eaton Corp. | 23,100 | | 1,911,756 |
| Gardner Denver, Inc. † | 195,600 | | 6,345,264 |
| General Dynamics Corp. | 81,400 | | 6,875,044 |
| L-3 Communications Holdings, Inc. | 90,200 | | 9,996,866 |
| Lockheed Martin Corp. | 87,100 | | 9,399,832 |
| Northrop Grumman Corp. | 213,700 | | 16,959,232 |
| Precision Castparts Corp. | 54,200 | | 6,167,960 |
| Raytheon Co. | 188,100 | | 12,252,834 |
| Roper Industries, Inc. | 34,500 | | 1,929,240 |
| Teleflex, Inc. | 35,800 | | 2,116,496 |
| Waste Management, Inc. | 92,000 | | 2,984,480 |
| WESCO International, Inc. † | 158,200 | | 6,682,368 |
| | | | 131,331,637 |
32
| | | |
| COMMON STOCKS (54.3%)* continued | | | |
|
| | Shares | | Value |
|
| Communication Services (3.7%) | | | |
| AT&T, Inc. # | 1,810,482 | $ | 69,685,452 |
| CenturyTel, Inc. | 298,300 | | 11,010,253 |
| Embarq Corp. | 132,700 | | 6,011,310 |
| NeuStar, Inc. Class A † (S) | 230,300 | | 6,842,213 |
| Sprint Nextel Corp. | 329,300 | | 3,467,529 |
| Verizon Communications, Inc. | 1,054,600 | | 40,960,664 |
| | | | 137,977,421 |
|
| |
| Conglomerates (3.1%) | | | |
| General Electric Co. | 2,848,800 | | 100,876,008 |
| Honeywell International, Inc. | 286,600 | | 16,929,462 |
| | | | 117,805,470 |
|
| |
| Consumer Cyclicals (2.9%) | | | |
| Amazon.com, Inc. † (S) | 74,300 | | 5,773,110 |
| AutoZone, Inc. † | 18,100 | | 2,187,928 |
| Big Lots, Inc. † (S) | 386,900 | | 6,716,584 |
| Black & Decker Manufacturing Co. | 49,600 | | 3,597,984 |
| Carnival Corp. (S) | 163,100 | | 7,256,319 |
| Deluxe Corp. | 106,700 | | 2,594,944 |
| GameStop Corp. † | 108,800 | | 5,628,224 |
| JC Penney Co., Inc. (Holding Co.) | 68,800 | | 3,261,808 |
| Lennar Corp. | 371,600 | | 7,654,960 |
| Lowe’s Cos., Inc. (S) | 275,600 | | 7,286,864 |
| Macy’s, Inc. (S) | 219,600 | | 6,069,744 |
| Manpower, Inc. | 110,500 | | 6,216,730 |
| NBTY, Inc. † | 102,300 | | 2,477,706 |
| Nordstrom, Inc. (S) | 96,000 | | 3,734,400 |
| R. H. Donnelley Corp. † (S) | 430,900 | | 12,957,163 |
| RadioShack Corp. | 144,400 | | 2,505,340 |
| Regal Entertainment Group Class A (S) | 686,400 | | 12,725,856 |
| Whirlpool Corp. (S) | 118,200 | | 10,060,002 |
| | | | 108,705,666 |
|
| |
| Consumer Staples (5.7%) | | | |
| Altria Group, Inc. (S) # | 355,000 | | 26,916,100 |
| American Greetings Corp. Class A (S) | 279,600 | | 5,737,392 |
| Blyth Industries, Inc. | 285,100 | | 6,212,329 |
| Clorox Co. | 114,100 | | 6,996,612 |
| Corn Products International, Inc. | 91,500 | | 3,092,700 |
| Darden Restaurants, Inc. | 176,200 | | 4,989,984 |
| Energizer Holdings, Inc. † (S) | 18,700 | | 1,750,694 |
| General Mills, Inc. | 241,500 | | 13,188,315 |
| Getty Images, Inc. † | 223,000 | | 5,575,000 |
| H.J. Heinz Co. | 59,500 | | 2,532,320 |
| ITT Educational Services, Inc. † (S) | 191,600 | | 17,502,660 |
| JM Smucker Co. (The) | 128,000 | | 5,981,440 |
| Kimberly-Clark Corp. | 74,700 | | 4,904,055 |
| Kraft Foods, Inc. Class A | 171,443 | | 5,016,422 |
33
| | | |
| COMMON STOCKS (54.3%)* continued | | | |
|
| | Shares | | Value |
|
| Consumer Staples continued | | | |
| Kroger Co. | 218,000 | $ | 5,548,100 |
| Loews Corp. — Carolina Group | 71,200 | | 5,847,656 |
| McDonald’s Corp. | 62,500 | | 3,346,875 |
| MPS Group, Inc. † | 204,700 | | 2,057,235 |
| Newell Rubbermaid, Inc. (S) | 332,900 | | 8,029,548 |
| Nutri/System, Inc. † (S) | 235,000 | | 6,725,700 |
| Pepsi Bottling Group, Inc. (The) | 399,500 | | 13,922,575 |
| Procter & Gamble Co. (The) | 378,600 | | 24,968,670 |
| Robert Half International, Inc. | 269,800 | | 7,495,044 |
| Ruby Tuesday, Inc. | 542,400 | | 4,171,056 |
| SYSCO Corp. | 68,100 | | 1,978,305 |
| Tyson Foods, Inc. Class A | 357,400 | | 5,092,950 |
| Universal Corp. | 128,100 | | 6,380,661 |
| Walt Disney Co. (The) | 256,700 | | 7,683,031 |
| | | | 213,643,429 |
|
| |
| Energy (2.9%) | | | |
| Chevron Corp. | 257,100 | | 21,724,950 |
| ConocoPhillips | 208,400 | | 16,738,688 |
| Exxon Mobil Corp. | 94,900 | | 8,199,360 |
| Frontier Oil Corp. (S) | 138,800 | | 4,895,476 |
| Global Industries, Ltd. † | 307,500 | | 5,430,450 |
| Hess Corp. (S) | 110,300 | | 10,018,549 |
| Marathon Oil Corp. | 159,900 | | 7,491,315 |
| National-Oilwell Varco, Inc. † (S) | 86,500 | | 5,209,895 |
| Sunoco, Inc. | 57,800 | | 3,595,160 |
| Tesoro Corp. (S) | 108,900 | | 4,252,545 |
| Valero Energy Corp. | 371,900 | | 22,012,761 |
| | | | 109,569,149 |
|
| |
| Financial (7.7%) | | | |
| American International Group, Inc. | 88,800 | | 4,898,208 |
| Chubb Corp. (The) | 149,200 | | 7,727,068 |
| Citigroup, Inc. # | 2,015,400 | | 56,874,588 |
| Freddie Mac | 460,800 | | 14,003,712 |
| Goldman Sachs Group, Inc. (The) | 72,600 | | 14,575,902 |
| Hospitality Properties Trust (R) | 104,300 | | 3,540,985 |
| HRPT Properties Trust (R) | 342,100 | | 2,719,695 |
| JPMorgan Chase & Co. | 1,326,000 | | 63,051,300 |
| Lehman Brothers Holdings, Inc. | 186,000 | | 11,935,620 |
| Merrill Lynch & Co., Inc. | 303,500 | | 17,117,400 |
| Nasdaq OMX Group, Inc. (The) † | 138,800 | | 6,422,276 |
| ProLogis Trust (R) | 98,200 | | 5,828,170 |
| Travelers Cos., Inc. (The) | 159,200 | | 7,657,520 |
| Wachovia Corp. | 953,000 | | 37,100,290 |
| Wells Fargo & Co. | 1,033,100 | | 35,135,731 |
| | | | 288,588,465 |
34
| | | |
| COMMON STOCKS (54.3%)* continued | | | |
|
| | Shares | | Value |
|
| Health Care (5.9%) | | | |
| Aetna, Inc. | 108,500 | $ | 5,778,710 |
| AmerisourceBergen Corp. | 281,900 | | 13,150,635 |
| Apria Healthcare Group, Inc. † | 170,600 | | 3,620,132 |
| Baxter International, Inc. | 150,200 | | 9,123,148 |
| Boston Scientific Corp. † (S) | 271,200 | | 3,289,656 |
| Bristol-Myers Squibb Co. | 169,400 | | 3,928,386 |
| Coventry Health Care, Inc. † | 118,700 | | 6,716,046 |
| Covidien, Ltd. | 274,912 | | 12,269,323 |
| DaVita, Inc. † | 106,000 | | 5,655,100 |
| Endo Pharmaceuticals Holdings, Inc. † | 233,500 | | 6,103,690 |
| Express Scripts, Inc. † (S) | 141,500 | | 9,549,835 |
| Humana, Inc. † | 109,200 | | 8,768,760 |
| King Pharmaceuticals, Inc. † (S) | 703,900 | | 7,383,911 |
| McKesson Corp. | 302,400 | | 18,987,696 |
| Medco Health Solutions, Inc. † | 150,000 | | 7,512,000 |
| Merck & Co., Inc. | 439,900 | | 20,358,572 |
| Par Pharmaceutical Cos., Inc. † | 141,700 | | 2,717,806 |
| Pfizer, Inc. | 2,062,300 | | 48,237,197 |
| UnitedHealth Group, Inc. | 82,000 | | 4,168,880 |
| WellPoint, Inc. † | 282,200 | | 22,068,040 |
| | | | 219,387,523 |
|
| |
| Insurance (1.8%) | | | |
| Allied World Assurance Company Holdings, Ltd. (Bermuda) | 127,200 | | 6,058,536 |
| Allstate Corp. (The) | 162,300 | | 7,996,521 |
| Axis Capital Holdings, Ltd. (Bermuda) | 301,111 | | 12,056,484 |
| Endurance Specialty Holdings, Ltd. (Bermuda) | 153,100 | | 6,203,612 |
| Everest Re Group, Ltd. (Barbados) | 39,700 | | 4,037,093 |
| Hartford Financial Services Group, Inc. (The) | 45,054 | | 3,639,012 |
| RenaissanceRe Holdings, Ltd. (Bermuda) | 220,300 | | 12,554,897 |
| W.R. Berkley Corp. | 173,000 | | 5,234,980 |
| XL Capital, Ltd. Class A (Bermuda) | 184,000 | | 8,280,000 |
| | | | 66,061,135 |
|
| |
| Investment Banking/Brokerage (0.9%) | | | |
| American Capital Strategies, Ltd. | 257,500 | | 9,056,275 |
| BlackRock, Inc. | 10,700 | | 2,365,770 |
| Morgan Stanley | 420,100 | | 20,765,543 |
| | | | 32,187,588 |
|
| |
| Real Estate (0.9%) | | | |
| CB Richard Ellis Group, Inc. Class A † | 351,500 | | 6,822,615 |
| CBL & Associates Properties (R) | 346,100 | | 9,199,338 |
| General Growth Properties, Inc. (R) | 61,400 | | 2,242,328 |
| Jones Lang LaSalle, Inc. | 89,200 | | 6,939,760 |
| NVR, Inc. † (S) | 14,856 | | 9,381,564 |
| | | | 34,585,605 |
35
| | | |
| COMMON STOCKS (54.3%)* continued | | | |
|
| | Shares | | Value |
|
| Technology (5.1%) | | | |
| Accenture, Ltd. Class A (Bermuda) | 519,600 | $ | 17,988,552 |
| Apple Computer, Inc. † | 14,100 | | 1,908,576 |
| Applied Materials, Inc. | 731,900 | | 13,115,648 |
| Arrow Electronics, Inc. † (S) | 129,100 | | 4,417,802 |
| Atmel Corp. † | 1,410,200 | | 4,456,232 |
| Avnet, Inc. † (S) | 124,000 | | 4,415,640 |
| BMC Software, Inc. † | 60,900 | | 1,951,236 |
| Computer Sciences Corp. † | 40,600 | | 1,718,192 |
| Dell, Inc. † | 267,400 | | 5,358,696 |
| Digital River, Inc. † | 65,100 | | 2,441,250 |
| DST Systems, Inc. † (S) | 75,400 | | 5,391,100 |
| eBay, Inc. † (S) | 158,700 | | 4,267,443 |
| Fidelity National Information Services, Inc. | 177,000 | | 7,513,650 |
| Google, Inc. Class A † (S) | 7,000 | | 3,950,100 |
| Harris Corp. | 59,400 | | 3,248,586 |
| Hewlett-Packard Co. (S) | 736,900 | | 32,239,375 |
| IBM Corp. | 188,300 | | 20,212,122 |
| Intel Corp. | 974,800 | | 20,665,760 |
| Oracle Corp. † (S) | 302,100 | | 6,208,155 |
| SanDisk Corp. † (S) | 269,400 | | 6,856,230 |
| Seagate Technology (Cayman Islands) | 232,200 | | 4,706,694 |
| Thermo Electron Corp. † (S) | 238,600 | | 12,285,514 |
| Xerox Corp. | 425,000 | | 6,545,000 |
| | | | 191,861,553 |
|
| |
| Transportation (0.7%) | | | |
| AMR Corp. † (S) | 432,100 | | 6,023,474 |
| UAL Corp. (S) | 140,000 | | 5,313,000 |
| Union Pacific Corp. | 16,300 | | 2,037,989 |
| US Airways Group, Inc. † | 845,800 | | 11,680,498 |
| | | | 25,054,961 |
|
| |
| Utilities & Power (2.7%) | | | |
| Atmos Energy Corp. | 236,600 | | 6,795,152 |
| Black Hills Corp. | 136,000 | | 5,268,640 |
| Dominion Resources, Inc. | 53,600 | | 2,304,800 |
| DTE Energy Co. | 127,300 | | 5,429,345 |
| Duke Energy Corp. | 324,200 | | 6,049,572 |
| Edison International (S) | 291,900 | | 15,225,504 |
| Energen Corp. | 99,900 | | 6,283,710 |
| Entergy Corp. | 48,400 | | 5,235,912 |
| FirstEnergy Corp. | 124,400 | | 8,859,768 |
| FPL Group, Inc. | 85,100 | | 5,487,248 |
| PG&E Corp. | 343,750 | | 14,107,500 |
| Sempra Energy | 81,900 | | 4,578,210 |
| Southern Union Co. | 185,200 | | 5,033,736 |
| Wisconsin Energy Corp. | 208,000 | | 9,470,240 |
| | | | 100,129,337 |
|
| |
| Total common stocks (cost $1,937,345,584) | | $ | 2,030,293,983 |
36
| | | | |
| U.S. GOVERNMENT AND AGENCY MORTGAGE OBLIGATIONS (42.8%)* | | |
|
| | | Principal amount | | Value |
|
| U.S. Government Guaranteed Mortgage Obligations (1.0%) | | | | |
| Government National Mortgage Association Pass-Through | | | | |
| Certificates 6 1/2s, with due dates from January 20, 2034 to | | | | |
| November 20, 2037 | $ | 34,460,024 | $ | 35,806,360 |
|
| |
| U.S. Government Agency Mortgage Obligations (41.8%) | | | | |
| Federal Home Loan Mortgage Corporation | | | | |
| Pass-Through Certificates | | | | |
| 8 3/4s, with due dates from May 1, 2009 to June 1, 2009 | | 42,331 | | 43,264 |
| 6s, March 1, 2035 | | 26,104 | | 26,854 |
| 5 1/2s, June 1, 2035 | | 2,160,122 | | 2,189,064 |
| 5 1/2s, July 1, 2016 | | 332,506 | | 344,329 |
| Federal National Mortgage Association Pass-Through Certificates | | | | |
| 9s, with due dates from January 1, 2027 to April 1, 2032 | | 203,951 | | 232,038 |
| 8s, with due dates from August 1, 2026 to March 1, 2033 | | 787,704 | | 823,616 |
| 7 1/2s, with due dates from August 1, 2028 to July 1, 2033 | | 499,763 | | 536,936 |
| 7s, with due dates from February 1, 2033 to January 1, 2036 | | 3,791,484 | | 4,010,457 |
| 7s, with due dates from July 1, 2014 to December 1, 2014 | | 585,735 | | 620,742 |
| 6 1/2s, with due dates from June 1, 2036 to December 1, 2037 | | 4,654,882 | | 4,833,078 |
| 6 1/2s, with due dates from September 1, 2010 to May 1, 2011 | | 79,573 | | 83,039 |
| 6 1/2s, TBA, March 1, 2038 | | 66,000,000 | | 68,356,405 |
| 6 1/2s, TBA, February 1, 2038 | | 66,000,000 | | 68,459,530 |
| 6s, with due dates from September 1, 2035 to | | | | |
| September 1, 2037 | | 35,058,917 | | 35,986,550 |
| 6s, with due dates from October 1, 2011 to | | | | |
| September 1, 2021 | | 1,278,031 | | 1,322,364 |
| 5 1/2s, with due dates from January 1, 2037 | | | | |
| to December 1, 2037 | | 22,979,357 | | 23,292,630 |
| 5 1/2s, with due dates from November 1, 2020 | | | | |
| to October 1, 2022 | | 61,776,409 | | 63,337,922 |
| 5 1/2s, TBA, March 1, 2038 | | 580,000,000 | | 586,434,404 |
| 5 1/2s, TBA, February 1, 2038 | | 600,000,000 | | 607,734,360 |
| 5s, with due dates from June 1, 2021 to May 1, 2036 | | 18,469,269 | | 18,401,216 |
| 5s, April 1, 2021 | | 215,162 | | 218,163 |
| 5s, TBA, March 1, 2038 | | 7,000,000 | | 6,953,516 |
| 5s, TBA, February 1, 2038 | | 7,000,000 | | 6,966,093 |
| 4 1/2s, with due dates from July 1, 2020 to October 1, 2022 | | 61,679,039 | | 61,833,419 |
| 4s, with due dates from May 1, 2019 to August 1, 2020 | | 753,398 | | 743,193 |
| | | | | 1,563,783,182 |
|
| |
| Total U.S. government and agency mortgage obligations (cost $1,586,168,112) | $ | 1,599,589,542 |
37
| | | | |
| COLLATERALIZED MORTGAGE OBLIGATIONS (23.4%)* | | | | |
|
| | | Principal amount | | Value |
|
| Adjustable Rate Mortgage Trust FRB Ser. 04-5, Class 3A1, | | | | |
| 4.959s, 2035 | $ | 2,880,776 | $ | 2,882,887 |
| Asset Backed Funding Certificates 144A FRB Ser. 06-OPT3, | | | | |
| Class B, 5.876s, 2036 | | 157,000 | | 13,825 |
| Asset Securitization Corp. | | | | |
| Ser. 96-MD6, Class A7, 8.631s, 2029 | | 1,610,783 | | 1,729,769 |
| FRB Ser. 97-D5, Class A5, 7.184s, 2043 | | 325,000 | | 353,229 |
| Banc of America Commercial Mortgage, Inc. | | | | |
| Ser. 01-1, Class G, 7.324s, 2036 | | 950,000 | | 1,003,013 |
| Ser. 07-5, Class XW, Interest Only (IO), 7 1/4s, 2051 | | 33,996,082 | | 940,944 |
| FRB Ser. 07-3, Class A3, 5.659s, 2049 | | 1,200,000 | | 1,233,230 |
| Ser. 07-2, Class A2, 5.634s, 2049 (F) | | 1,198,000 | | 1,212,950 |
| Ser. 04-3, Class A5, 5.494s, 2039 | | 4,690,000 | | 4,760,350 |
| FRB Ser. 05-1, Class A5, 5.085s, 2042 | | 252,000 | | 256,226 |
| Ser. 07-1, Class XW, IO, 0.465s, 2049 | | 17,082,690 | | 331,109 |
| Ser. 06-1, Class XC, IO, 0.064s, 2045 | | 40,818,229 | | 263,649 |
| Banc of America Commercial Mortgage, Inc. 144A | | | | |
| Ser. 01-PB1, Class K, 6.15s, 2035 | | 715,000 | | 713,765 |
| Ser. 02-PB2, Class XC, IO, 0.225s, 2035 (F) | | 9,171,028 | | 162,318 |
| Ser. 04-4, Class XC, IO, 0.17s, 2042 | | 30,343,046 | | 454,760 |
| Ser. 04-5, Class XC, IO, 0.15s, 2041 | | 48,937,213 | | 604,113 |
| Ser. 05-1, Class XW, IO, 0.137s, 2042 | | 244,161,704 | | 730,047 |
| Ser. 06-4, Class XC, IO, 0.077s, 2046 | | 49,807,367 | | 608,646 |
| Ser. 05-4, Class XC, IO, 0.077s, 2045 | | 82,263,909 | | 552,371 |
| Ser. 06-5, Class XC, IO, 0.071s, 2016 | | 100,259,430 | | 1,395,873 |
| Banc of America Funding Corp. Ser. 07-4, Class 4A2, IO, | | | | |
| 5 1/2s, 2034 | | 1,321,525 | | 248,690 |
| Banc of America Large Loan | | | | |
| FRB Ser. 04-BBA4, Class H, 5.186s, 2018 | | 142,000 | | 139,515 |
| FRB Ser. 04-BBA4, Class G, 4.936s, 2018 | | 449,000 | | 447,343 |
| Banc of America Large Loan 144A | | | | |
| FRB Ser. 05-MIB1, Class K, 6.236s, 2022 | | 496,000 | | 481,059 |
| FRB Ser. 05-MIB1, Class J, 5.286s, 2022 | | 1,400,000 | | 1,281,000 |
| Ser. 03-BBA2, Class X1A, IO, 0.175s, 2015 (F) | | 4,621,138 | | — |
| Banc of America Mortgage Securities | | | | |
| FRB Ser. 03-F, Class 2A1, 3.734s, 2033 | | 468,652 | | 463,188 |
| Ser. 04-D, Class 2A, IO, 0.32s, 2034 | | 12,102,295 | | 21,509 |
| Ser. 05-E, Class 2, IO, 0.304s, 2035 | | 32,344,921 | | 133,297 |
| Banc of America Structured Security Trust 144A Ser. 02-X1, | | | | |
| Class A3, 5.436s, 2033 | | 1,598,532 | | 1,621,589 |
| Bayview Commercial Asset Trust 144A | | | | |
| FRB Ser. 05-1A, Class A1, 3.676s, 2035 | | 1,273,613 | | 1,197,196 |
| Ser. 04-2, IO, 1.72s, 2034 | | 5,374,098 | | 300,949 |
| Ser. 05-3A, IO, 1.6s, 2035 | | 16,181,776 | | 1,150,524 |
| Ser. 05-1A, IO, 1.6s, 2035 | | 5,495,185 | | 338,503 |
| Ser. 04-3, IO, 1.6s, 2035 | | 3,750,275 | | 198,765 |
| Ser. 07-5A, IO, 1.55s, 2037 | | 13,482,300 | | 1,940,103 |
| Ser. 07-2A, IO, 1.3s, 2037 | | 15,410,076 | | 1,853,832 |
| Ser. 07-1, Class S, IO, 1.211s, 2037 | | 13,334,081 | | 1,432,080 |
38
| | | | |
| COLLATERALIZED MORTGAGE OBLIGATIONS (23.4%)* continued | | | |
|
| | | Principal amount | | Value |
|
| Bayview Commercial Asset Trust 144A | | | | |
| Ser. 06-4A, Class IO, IO, 1.14s, 2036 | $ | 2,186,794 | $ | 249,732 |
| Ser. 06-2A, IO, 0.879s, 2036 | | 2,954,205 | | 246,972 |
| Bear Stearns Alternate Trust Ser. 04-9, Class 1A1, 7.237s, 2034 | | 170,329 | | 170,309 |
| Bear Stearns Commercial Mortgage Securities, Inc. | | | | |
| FRB Ser. 00-WF2, Class F, 8.19s, 2032 | | 456,000 | | 485,317 |
| Ser. 07-PW17, Class A3, 5.736s, 2050 | | 14,895,000 | | 14,482,111 |
| Ser. 05-PWR9, Class X1, IO, 0.111s, 2042 | | 40,908,379 | | 357,404 |
| Ser. 04-PR3I, Class X1, IO, 0.091s, 2041 | | 14,498,688 | | 258,019 |
| Bear Stearns Commercial Mortgage Securities, Inc. 144A | | | | |
| Ser. 06-PW14, Class XW, IO, 0.884s, 2038 | | 18,165,147 | | 792,504 |
| Ser. 06-PW14, Class X1, IO, 0.092s, 2038 | | 19,534,994 | | 316,014 |
| Ser. 07-PW15, Class X1, IO, 0.045s, 2044 | | 64,378,340 | | 720,722 |
| Ser. 05-PW10, Class X1, IO, 0.032s, 2040 | | 63,471,290 | | 246,503 |
| Ser. 07-PW16, Class X, IO, 0.032s, 2040 | | 143,776,707 | | 157,263 |
| Bear Stearns Small Balance Commercial Trust 144A Ser. 06-1A, | | | | |
| Class AIO, IO, 1s, 2034 | | 7,445,600 | | 112,816 |
| Chase Commercial Mortgage Securities Corp. Ser. 00-3, | | | | |
| Class A2, 7.319s, 2032 | | 553,000 | | 583,525 |
| Chase Commercial Mortgage Securities Corp. 144A | | | | |
| Ser. 98-1, Class F, 6.56s, 2030 | | 4,600,000 | | 4,716,681 |
| Ser. 98-1, Class G, 6.56s, 2030 | | 1,171,000 | | 1,185,603 |
| Ser. 98-1, Class H, 6.34s, 2030 | | 1,761,000 | | 1,634,520 |
| Citigroup Commercial Mortgage Trust 144A | | | | |
| Ser. 05-C3, Class XC, IO, 0 1/8s, 2043 | | 116,265,910 | | 1,248,950 |
| Ser. 06-C5, Class XC, IO, 0.069s, 2049 | | 123,041,909 | | 1,893,692 |
| Citigroup Mortgage Loan Trust, Inc. IFB Ser. 07-6, Class 2A5, IO, | | | |
| 3.274s, 2037 | | 4,738,363 | | 323,952 |
| Citigroup/Deutsche Bank Commercial Mortgage Trust | | | | |
| Ser. 06-CD3, Class A4, 5.658s, 2048 | | 759,000 | | 778,851 |
| Citigroup/Deutsche Bank Commercial Mortgage Trust 144A | | | | |
| Ser. 07-CD4, Class XW, IO, 0.561s, 2049 | | 26,681,290 | | 695,173 |
| Ser. 06-CD2, Class X, IO, 0.129s, 2046 | | 76,329,598 | | 375,694 |
| Ser. 07-CD4, Class XC, IO, 0.044s, 2049 | | 89,225,270 | | 902,709 |
| Commercial Mortgage Acceptance Corp. 144A | | | | |
| Ser. 98-C1, Class F, 6.23s, 2031 | | 2,013,000 | | 2,077,575 |
| Ser. 98-C2, Class F, 5.44s, 2030 | | 3,255,000 | | 3,291,357 |
| Commercial Mortgage Pass-Through Certificates 144A | | | | |
| Ser. 06-CN2A, Class H, 5.756s, 2019 | | 939,000 | | 798,187 |
| Ser. 06-CN2A, Class J, 5.756s, 2019 | | 751,000 | | 622,068 |
| FRB Ser. 01-J2A, Class A2F, 4.581s, 2034 (F) | | 1,590,000 | | 1,566,171 |
| Ser. 03-LB1A, Class X1, IO, 0.533s, 2038 | | 8,629,621 | | 329,531 |
| Ser. 05-LP5, Class XC, IO, 0.094s, 2043 | | 71,234,397 | | 642,748 |
| Ser. 06-C8, Class XS, IO, 0.064s, 2046 | | 57,677,020 | | 660,113 |
| Ser. 05-C6, Class XC, IO, 0.059s, 2044 | | 66,992,322 | | 421,315 |
| Countrywide Alternative Loan Trust Ser. 05-24, Class 1AX, IO, | | | | |
| 1.231s, 2035 | | 10,780,486 | | 242,561 |
| Countrywide Home Loans | | | | |
| Ser. 05-9, Class 1X, IO, 2.109s, 2035 | | 9,733,300 | | 255,499 |
| Ser. 05-2, Class 2X, IO, 1.16s, 2035 | | 9,678,842 | | 226,318 |
39
| | | | |
| COLLATERALIZED MORTGAGE OBLIGATIONS (23.4%)* continued | | | |
|
| | | Principal amount | | Value |
|
| Countrywide Home Loans 144A | | | | |
| IFB Ser. 05-R2, Class 2A3, 8s, 2035 | $ | 1,022,654 | $ | 1,116,554 |
| IFB Ser. 05-R1, Class 1AS, IO, 1.236s, 2035 | | 7,307,590 | | 543,443 |
| IFB Ser. 05-R2, Class 1AS, IO, 0.859s, 2035 | | 7,017,594 | | 407,412 |
| Credit Suisse Mortgage Capital Certificates | | | | |
| FRB Ser. 07-C4, Class A2, 5.811s, 2039 | | 4,505,000 | | 4,559,330 |
| Ser. 06-C5, Class AX, IO, 0.111s, 2039 | | 36,661,825 | | 559,093 |
| Credit Suisse Mortgage Capital Certificates 144A | | | | |
| Ser. 07-C2, Class AX, IO, 0.28s, 2049 | | 121,930,759 | | 1,151,758 |
| Ser. 06-C4, Class AX, IO, 0.106s, 2039 | | 76,745,403 | | 1,147,874 |
| Ser. 07-C1, Class AX, IO, 0.057s, 2040 | | 80,687,834 | | 764,437 |
| Ser. 06-C3, Class AX, IO, 0.033s, 2038 | | 102,844,015 | | 71,991 |
| CRESI Finance Limited Partnership 144A | | | | |
| FRB Ser. 06-A, Class D, 4.176s, 2017 | | 232,000 | | 218,305 |
| FRB Ser. 06-A, Class C, 3.976s, 2017 | | 688,000 | | 652,784 |
| Criimi Mae Commercial Mortgage Trust 144A Ser. 98-C1, | | | | |
| Class B, 7s, 2033 | | 3,385,000 | | 3,390,755 |
| Crown Castle Towers, LLC 144A Ser. 05-1A, Class D, | | | | |
| 5.612s, 2035 | | 2,903,000 | | 2,852,430 |
| CS First Boston Mortgage Securities Corp. | | | | |
| Ser. 97-C2, Class F, 7.46s, 2035 | | 1,239,000 | | 1,371,957 |
| Ser. 04-C2, Class A2, 5.416s, 2036 (F) | | 5,070,000 | | 5,178,245 |
| FRB Ser. 04-C3, Class A5, 5.113s, 2036 | | 92,000 | | 91,575 |
| Ser. 04-C3, Class A3, 4.302s, 2036 | | 196,000 | | 193,889 |
| CS First Boston Mortgage Securities Corp. 144A | | | | |
| FRB Ser. 05-TFLA, Class J, 5.186s, 2020 | | 259,000 | | 250,583 |
| FRB Ser. 04-TF2A, Class J, 5.186s, 2016 | | 313,000 | | 298,915 |
| FRB Ser. 05-TF2A, Class J, 5.136s, 2020 | | 407,807 | | 388,436 |
| FRB Ser. 04-TF2A, Class H, 4.936s, 2019 | | 627,000 | | 605,055 |
| Ser. 01-CK1, Class AY, IO, 0.892s, 2035 (F) | | 67,313,969 | | 1,088,456 |
| Ser. 03-C3, Class AX, IO, 0.671s, 2038 | | 55,704,128 | | 2,239,798 |
| Ser. 02-CP3, Class AX, IO, 0.402s, 2035 | | 20,749,275 | | 762,904 |
| Ser. 04-C4, Class AX, IO, 0.287s, 2039 | | 11,626,595 | | 249,890 |
| Ser. 05-C2, Class AX, IO, 0.15s, 2037 | | 75,690,643 | | 1,027,728 |
| DLJ Commercial Mortgage Corp. | | | | |
| Ser. 00-CF1, Class A1B, 7.62s, 2033 | | 2,149,854 | | 2,261,259 |
| Ser. 99-CG2, Class B3, 6.1s, 2032 | | 1,752,000 | | 1,784,713 |
| Ser. 99-CG2, Class B4, 6.1s, 2032 | | 2,785,000 | | 2,742,167 |
| Ser. 98-CF2, Class B3, 6.04s, 2031 | | 814,188 | | 830,713 |
| Fannie Mae | | | | |
| IFB Ser. 06-70, Class SM, 26.127s, 2036 | | 369,741 | | 487,937 |
| IFB Ser. 07-75, Class JS, 25.35s, 2037 | | 2,338,251 | | 3,290,293 |
| IFB Ser. 07-80, Class AS, 22.35s, 2037 | | 963,415 | | 1,311,863 |
| IFB Ser. 07-75, Class CS, 21.866s, 2037 | | 1,499,421 | | 2,191,360 |
| IFB Ser. 06-62, Class PS, 19.643s, 2036 | | 1,437,990 | | 1,950,526 |
| IFB Ser. 07-60, Class SB, 19.343s, 2037 | | 817,917 | | 1,032,094 |
| IFB Ser. 06-76, Class QB, 19.343s, 2036 | | 1,547,006 | | 2,105,795 |
| IFB Ser. 06-48, Class TQ, 19.343s, 2036 | | 2,824,981 | | 3,694,678 |
| IFB Ser. 06-63, Class SP, 19.043s, 2036 | | 1,688,463 | | 2,268,659 |
| IFB Ser. 07-W7, Class 1A4, 18.923s, 2037 | | 1,473,221 | | 1,950,914 |
40
| | | | |
| COLLATERALIZED MORTGAGE OBLIGATIONS (23.4%)* continued | | | |
|
| | | Principal amount | | Value |
|
| Fannie Mae | | | | |
| IFB Ser. 07-81, Class SC, 17.543s, 2037 | $ | 1,315,966 | $ | 1,681,231 |
| IFB Ser. 07-1, Class NK, 17.181s, 2037 | | 3,863,336 | | 5,047,702 |
| IFB Ser. 06-104, Class GS, 17.116s, 2036 | | 1,022,158 | | 1,332,736 |
| IFB Ser. 06-104, Class ES, 16.569s, 2036 | | 1,915,345 | | 2,463,551 |
| IFB Ser. 05-37, Class SU, 15.695s, 2035 | | 2,438,585 | | 3,055,864 |
| IFB Ser. 06-49, Class SE, 15.495s, 2036 | | 2,513,383 | | 3,141,506 |
| IFB Ser. 06-60, Class AK, 15.295s, 2036 | | 1,212,481 | | 1,534,698 |
| IFB Ser. 06-60, Class TK, 15.095s, 2036 | | 807,634 | | 1,004,729 |
| IFB Ser. 06-104, Class CS, 14.507s, 2036 | | 2,050,639 | | 2,498,050 |
| IFB Ser. 07-30, Class FS, 14.19s, 2037 | | 3,841,340 | | 4,672,060 |
| IFB Ser. 07-96, Class AS, 13.269s, 2037 | | 1,863,559 | | 2,217,643 |
| IFB Ser. 06-115, Class ES, 13.055s, 2036 | | 1,582,761 | | 1,967,411 |
| IFB Ser. 06-8, Class PK, 12.895s, 2036 | | 2,719,756 | | 3,225,418 |
| IFB Ser. 05-57, Class CD, 12.464s, 2035 | | 1,269,356 | | 1,500,061 |
| IFB Ser. 05-74, Class CP, 12.37s, 2035 | | 1,452,887 | | 1,768,546 |
| IFB Ser. 05-115, Class NQ, 12.277s, 2036 | | 807,576 | | 944,792 |
| IFB Ser. 06-27, Class SP, 12.187s, 2036 | | 2,143,000 | | 2,600,520 |
| IFB Ser. 06-8, Class HP, 12.187s, 2036 | | 2,297,476 | | 2,788,942 |
| IFB Ser. 06-8, Class WK, 12.187s, 2036 | | 3,659,968 | | 4,404,604 |
| IFB Ser. 05-106, Class US, 12.187s, 2035 | | 3,489,575 | | 4,248,724 |
| IFB Ser. 05-99, Class SA, 12.187s, 2035 | | 1,719,703 | | 2,024,418 |
| IFB Ser. 05-45, Class DA, 12.04s, 2035 | | 2,753,433 | | 3,314,641 |
| IFB Ser. 05-74, Class DM, 12.004s, 2035 | | 3,344,546 | | 4,007,405 |
| IFB Ser. 05-45, Class DC, 11.93s, 2035 | | 2,147,648 | | 2,578,620 |
| IFB Ser. 06-60, Class CS, 11.71s, 2036 | | 771,439 | | 880,317 |
| IFB Ser. 05-74, Class SK, 10.845s, 2035 | | 2,677,900 | | 3,122,110 |
| IFB Ser. 05-57, Class DC, 10.802s, 2034 | | 2,174,271 | | 2,523,876 |
| IFB Ser. 05-74, Class CS, 10.735s, 2035 | | 1,656,932 | | 1,925,463 |
| IFB Ser. 05-114, Class SP, 10.295s, 2036 | | 1,011,154 | | 1,117,233 |
| IFB Ser. 05-45, Class PC, 10.121s, 2034 | | 1,143,779 | | 1,309,400 |
| Ser. 03-W6, Class PT1, 10.043s, 2042 | | 213,448 | | 243,681 |
| IFB Ser. 05-95, Class OP, 9.927s, 2035 | | 1,019,299 | | 1,141,685 |
| IFB Ser. 05-95, Class CP, 9.848s, 2035 | | 260,261 | | 298,490 |
| IFB Ser. 05-106, Class JC, 9.655s, 2035 | | 701,807 | | 768,138 |
| Ser. 02-T12, Class A4, 9 1/2s, 2042 | | 193,174 | | 216,420 |
| Ser. 02-T4, Class A4, 9 1/2s, 2041 | | 1,064,782 | | 1,182,674 |
| Ser. 02-T6, Class A3, 9 1/2s, 2041 | | 392,494 | | 436,147 |
| Ser. 04-T3, Class PT1, 9.027s, 2044 | | 559,683 | | 617,789 |
| IFB Ser. 05-83, Class QP, 8.616s, 2034 | | 585,478 | | 632,503 |
| IFB Ser. 05-72, Class SB, 8.434s, 2035 | | 1,704,815 | | 1,844,578 |
| IFB Ser. 06-62, Class NS, 7.56s, 2036 | | 983,563 | | 1,013,070 |
| Ser. 02-26, Class A2, 7 1/2s, 2048 | | 1,759,009 | | 1,897,991 |
| Ser. 04-T3, Class 1A4, 7 1/2s, 2044 | | 51,756 | | 56,747 |
| Ser. 04-T2, Class 1A4, 7 1/2s, 2043 | | 807,242 | | 885,117 |
| Ser. 03-W1, Class 2A, 7 1/2s, 2042 | | 1,561,576 | | 1,694,225 |
| Ser. 02-T19, Class A3, 7 1/2s, 2042 | | 1,153,582 | | 1,267,435 |
| Ser. 02-T12, Class A3, 7 1/2s, 2042 | | 316,338 | | 341,921 |
| Ser. 02-14, Class A2, 7 1/2s, 2042 | | 620,433 | | 670,174 |
| Ser. 01-T10, Class A2, 7 1/2s, 2041 | | 1,962,533 | | 2,126,332 |
41
| | | | |
| COLLATERALIZED MORTGAGE OBLIGATIONS (23.4%)* continued | | | | |
| |
| | | Principal amount | | Value |
|
| Fannie Mae | | | | |
| Ser. 02-T4, Class A3, 7 1/2s, 2041 | $ | 338,280 | $ | 364,077 |
| Ser. 01-T12, Class A2, 7 1/2s, 2041 | | 1,716,108 | | 1,850,893 |
| Ser. 01-T3, Class A1, 7 1/2s, 2040 | | 295,521 | | 317,988 |
| Ser. 01-T1, Class A1, 7 1/2s, 2040 | | 636,790 | | 693,072 |
| Ser. 99-T2, Class A1, 7 1/2s, 2039 | | 176,639 | | 195,443 |
| Ser. 03-W10, Class 1A1, 7 1/2s, 2032 | | 735,125 | | 794,798 |
| Ser. 02-T1, Class A3, 7 1/2s, 2031 | | 514,845 | | 556,465 |
| Ser. 00-T6, Class A1, 7 1/2s, 2030 | | 1,537,760 | | 1,644,049 |
| Ser. 01-T5, Class A3, 7 1/2s, 2030 | | 175,996 | | 189,359 |
| Ser. 01-T4, Class A1, 7 1/2s, 2028 | | 3,652,988 | | 4,025,078 |
| Ser. 02-26, Class A1, 7s, 2048 | | 1,159,594 | | 1,245,551 |
| Ser. 04-T3, Class 1A3, 7s, 2044 | | 529,909 | | 575,053 |
| Ser. 03-W3, Class 1A2, 7s, 2042 | | 536,280 | | 576,769 |
| Ser. 02-T16, Class A2, 7s, 2042 | | 1,100,746 | | 1,177,089 |
| Ser. 02-14, Class A1, 7s, 2042 | | 97,155 | | 104,036 |
| Ser. 02-T4, Class A2, 7s, 2041 | | 625,437 | | 667,658 |
| Ser. 01-W3, Class A, 7s, 2041 | | 370,072 | | 399,571 |
| Ser. 04-W1, Class 2A2, 7s, 2033 | | 5,459,029 | | 5,917,063 |
| Ser. 380, Class 2, IO, 6 1/2s, 2037 ## | | 4,710,247 | | 809,301 |
| Ser. 381, Class 14, IO, 6 1/2s, 2037 | | 2,097,339 | | 330,711 |
| Ser. 381, Class 16, IO, 6 1/2s, 2037 | | 415,029 | | 64,338 |
| Ser. 381, Class 15, IO, 6 1/2s, 2037 | | 887,648 | | 146,833 |
| Ser. 371, Class 2, IO, 6 1/2s, 2036 | | 14,705,757 | | 2,710,040 |
| IFB Ser. 07-W6, Class 6A2, IO, 4.424s, 2037 | | 2,140,705 | | 253,011 |
| IFB Ser. 06-90, Class SE, IO, 4.424s, 2036 | | 2,084,346 | | 287,467 |
| IFB Ser. 03-66, Class SA, IO, 4.274s, 2033 | | 2,897,382 | | 315,822 |
| IFB Ser. 07-W6, Class 5A2, IO, 3.914s, 2037 | | 2,840,059 | | 320,637 |
| IFB Ser. 07-W4, Class 4A2, IO, 3.904s, 2037 | | 13,049,759 | | 1,394,221 |
| IFB Ser. 07-W2, Class 3A2, IO, 3.904s, 2037 | | 3,866,301 | | 420,226 |
| IFB Ser. 06-115, Class BI, IO, 3.884s, 2036 | | 3,721,413 | | 308,868 |
| IFB Ser. 05-113, Class AI, IO, 3.854s, 2036 | | 678,536 | | 80,258 |
| IFB Ser. 05-113, Class DI, IO, 3.854s, 2036 | | 21,423,757 | | 2,058,036 |
| IFB Ser. 05-52, Class DC, IO, 3.824s, 2035 | | 1,765,002 | | 254,175 |
| IFB Ser. 06-60, Class SI, IO, 3.774s, 2036 | | 3,768,958 | | 434,365 |
| IFB Ser. 06-60, Class UI, IO, 3.774s, 2036 | | 1,536,922 | | 183,350 |
| IFB Ser. 04-24, Class CS, IO, 3.774s, 2034 | | 4,009,774 | | 416,377 |
| IFB Ser. 07-W7, Class 3A2, IO, 3.754s, 2037 | | 4,954,608 | | 510,542 |
| IFB Ser. 06-74, Class SN, IO, 3.724s, 2036 | | 3,244,452 | | 219,644 |
| IFB Ser. 03-122, Class SA, IO, 3.724s, 2028 | | 5,169,238 | | 403,100 |
| IFB Ser. 03-122, Class SJ, IO, 3.724s, 2028 | | 5,428,691 | | 427,635 |
| IFB Ser. 06-60, Class DI, IO, 3.694s, 2035 | | 1,942,876 | | 172,401 |
| IFB Ser. 04-60, Class SW, IO, 3.674s, 2034 | | 7,416,627 | | 883,981 |
| IFB Ser. 05-65, Class KI, IO, 3.624s, 2035 | | 14,350,167 | | 1,415,920 |
| IFB Ser. 07-23, Class SI, IO, 3.394s, 2037 | | 3,144,125 | | 290,122 |
| IFB Ser. 07-54, Class CI, IO, 3.384s, 2037 | | 2,440,096 | | 251,836 |
| IFB Ser. 07-39, Class PI, IO, 3.384s, 2037 | | 2,399,257 | | 236,488 |
| IFB Ser. 07-30, Class WI, IO, 3.384s, 2037 | | 20,673,486 | | 1,851,282 |
| IFB Ser. 07-28, Class SE, IO, 3.374s, 2037 | | 2,601,610 | | 265,783 |
| IFB Ser. 06-128, Class SH, IO, 3.374s, 2037 | | 2,951,478 | | 274,203 |
42
| | | | |
| COLLATERALIZED MORTGAGE OBLIGATIONS (23.4%)* continued | | | | |
| |
| | | Principal amount | | Value |
|
| Fannie Mae | | | | |
| IFB Ser. 06-56, Class SM, IO, 3.374s, 2036 | $ | 7,407,822 | $ | 715,269 |
| IFB Ser. 06-12, Class SD, IO, 3.374s, 2035 | | 10,964,755 | | 1,281,953 |
| IFB Ser. 05-73, Class SI, IO, 3.374s, 2035 | | 1,615,448 | | 144,715 |
| IFB Ser. 05-17, Class ES, IO, 3.374s, 2035 | | 3,278,227 | | 371,733 |
| IFB Ser. 05-17, Class SY, IO, 3.374s, 2035 | | 1,505,201 | | 166,686 |
| IFB Ser. 07-W5, Class 2A2, IO, 3.364s, 2037 | | 1,229,065 | | 111,847 |
| IFB Ser. 07-30, Class IE, IO, 3.364s, 2037 | | 6,948,350 | | 831,411 |
| IFB Ser. 06-123, Class CI, IO, 3.364s, 2037 | | 5,878,550 | | 583,250 |
| IFB Ser. 06-123, Class UI, IO, 3.364s, 2037 | | 2,562,852 | | 253,861 |
| IFB Ser. 05-82, Class SY, IO, 3.354s, 2035 | | 6,546,604 | | 593,253 |
| IFB Ser. 05-45, Class SR, IO, 3.344s, 2035 | | 9,014,095 | | 817,500 |
| IFB Ser. 07-15, Class BI, IO, 3.324s, 2037 | | 4,276,983 | | 428,675 |
| IFB Ser. 06-16, Class SM, IO, 3.324s, 2036 | | 2,258,601 | | 235,703 |
| IFB Ser. 05-95, Class CI, IO, 3.324s, 2035 | | 3,757,938 | | 403,592 |
| IFB Ser. 05-84, Class SG, IO, 3.324s, 2035 | | 6,205,488 | | 669,989 |
| IFB Ser. 05-57, Class NI, IO, 3.324s, 2035 | | 1,331,542 | | 136,766 |
| IFB Ser. 05-54, Class SA, IO, 3.324s, 2035 | | 6,398,765 | | 600,869 |
| IFB Ser. 05-23, Class SG, IO, 3.324s, 2035 | | 4,894,722 | | 519,753 |
| IFB Ser. 05-104, Class NI, IO, 3.324s, 2035 | | 4,286,580 | | 472,160 |
| IFB Ser. 05-17, Class SA, IO, 3.324s, 2035 | | 4,253,254 | | 457,389 |
| IFB Ser. 05-17, Class SE, IO, 3.324s, 2035 | | 4,576,516 | | 483,560 |
| IFB Ser. 05-57, Class DI, IO, 3.324s, 2035 | | 9,972,446 | | 923,188 |
| IFB Ser. 05-83, Class QI, IO, 3.314s, 2035 | | 1,000,339 | | 116,497 |
| IFB Ser. 06-128, Class GS, IO, 3.304s, 2037 | | 2,765,888 | | 279,785 |
| IFB Ser. 05-83, Class SL, IO, 3.294s, 2035 | | 10,886,800 | | 930,326 |
| Ser. 06-116, Class ES, IO, 3.274s, 2036 | | 1,788,085 | | 163,081 |
| IFB Ser. 06-114, Class IS, IO, 3.274s, 2036 | | 3,000,634 | | 265,180 |
| IFB Ser. 06-115, Class GI, IO, 3.264s, 2036 | | 2,672,234 | | 263,030 |
| IFB Ser. 06-115, Class IE, IO, 3.264s, 2036 | | 2,268,381 | | 253,145 |
| IFB Ser. 06-117, Class SA, IO, 3.264s, 2036 | | 3,444,322 | | 306,725 |
| IFB Ser. 06-121, Class SD, IO, 3.264s, 2036 | | 5,689,704 | | 515,271 |
| IFB Ser. 06-109, Class SG, IO, 3.254s, 2036 | | 4,034,752 | | 366,249 |
| IFB Ser. 06-104, Class IM, IO, 3.244s, 2036 | | 860,724 | | 83,899 |
| IFB Ser. 06-104, Class SY, IO, 3.244s, 2036 | | 1,863,267 | | 164,996 |
| IFB Ser. 06-109, Class SH, IO, 3.244s, 2036 | | 2,926,830 | | 338,560 |
| Ser. 06-104, Class SG, IO, 3.224s, 2036 | | 3,689,089 | | 291,726 |
| IFB Ser. 07-W6, Class 4A2, IO, 3.224s, 2037 | | 11,485,293 | | 1,065,710 |
| IFB Ser. 06-128, Class SC, IO, 3.224s, 2037 | | 9,693,475 | | 888,532 |
| IFB Ser. 06-44, Class IS, IO, 3.224s, 2036 | | 4,117,195 | | 391,959 |
| IFB Ser. 06-8, Class JH, IO, 3.224s, 2036 | | 10,330,953 | | 1,097,150 |
| IFB Ser. 05-122, Class SG, IO, 3.224s, 2035 | | 2,278,386 | | 246,226 |
| IFB Ser. 05-95, Class OI, IO, 3.214s, 2035 | | 559,049 | | 68,149 |
| IFB Ser. 06-92, Class JI, IO, 3.204s, 2036 | | 2,060,719 | | 190,218 |
| IFB Ser. 06-92, Class LI, IO, 3.204s, 2036 | | 3,338,499 | | 307,225 |
| IFB Ser. 06-96, Class ES, IO, 3.204s, 2036 | | 3,722,619 | | 330,601 |
| IFB Ser. 06-99, Class AS, IO, 3.204s, 2036 | | 2,394,206 | | 226,507 |
| IFB Ser. 06-85, Class TS, IO, 3.184s, 2036 | | 5,232,307 | | 457,603 |
| IFB Ser. 06-61, Class SE, IO, 3.174s, 2036 | | 4,948,180 | | 364,771 |
| IFB Ser. 07-75, Class PI, IO, 3.164s, 2037 | | 3,893,874 | | 356,526 |
43
| | | | |
| COLLATERALIZED MORTGAGE OBLIGATIONS (23.4%)* continued | | | | |
| |
| | | Principal amount | | Value |
|
| Fannie Mae | | | | |
| IFB Ser. 07-76, Class SA, IO, 3.164s, 2037 | $ | 3,604,916 | $ | 212,994 |
| IFB Ser. 07-W7, Class 2A2, IO, 3.154s, 2037 | | 9,131,423 | | 827,477 |
| IFB Ser. 07-90, Class S, IO, 3.134s, 2037 | | 6,107,040 | | 353,205 |
| Ser. 06-94, Class NI, IO, 3.124s, 2036 | | 1,804,131 | | 138,517 |
| IFB Ser. 07-116, Class IA, IO, 3.124s, 2037 | | 13,497,604 | | 1,144,821 |
| IFB Ser. 07-103, Class AI, IO, 3.124s, 2037 | | 15,612,666 | | 1,394,456 |
| IFB Ser. 07-1, Class NI, IO, 3.124s, 2037 | | 8,983,056 | | 818,388 |
| IFB Ser. 07-15, Class NI, IO, 3.124s, 2022 | | 4,585,243 | | 367,070 |
| IFB Ser. 07-109, Class XI, IO, 3.074s, 2037 | | 2,278,770 | | 213,049 |
| IFB Ser. 07-109, Class YI, IO, 3.074s, 2037 | | 3,580,449 | | 309,255 |
| IFB Ser. 07-W8, Class 2A2, IO, 3.074s, 2037 | | 6,209,636 | | 579,085 |
| IFB Ser. 07-54, Class KI, IO, 3.064s, 2037 | | 1,856,672 | | 160,543 |
| IFB Ser. 07-30, Class JS, IO, 3.064s, 2037 | | 6,043,788 | | 555,178 |
| IFB Ser. 07-30, Class LI, IO, 3.064s, 2037 | | 9,139,245 | | 849,679 |
| IFB Ser. 07-W2, Class 1A2, IO, 3.054s, 2037 | | 2,633,038 | | 225,293 |
| IFB Ser. 07-106, Class SN, IO, 3.034s, 2037 | | 3,902,681 | | 314,654 |
| IFB Ser. 07-54, Class IA, IO, 3.034s, 2037 | | 3,187,642 | | 293,381 |
| IFB Ser. 07-54, Class IB, IO, 3.034s, 2037 | | 3,187,642 | | 293,381 |
| IFB Ser. 07-54, Class IC, IO, 3.034s, 2037 | | 3,187,642 | | 293,381 |
| IFB Ser. 07-54, Class ID, IO, 3.034s, 2037 | | 3,187,642 | | 293,381 |
| IFB Ser. 07-54, Class IE, IO, 3.034s, 2037 | | 3,187,642 | | 293,381 |
| IFB Ser. 07-54, Class IF, IO, 3.034s, 2037 | | 4,742,933 | | 436,525 |
| IFB Ser. 07-54, Class UI, IO, 3.034s, 2037 | | 3,747,095 | | 374,307 |
| IFB Ser. 07-109, Class AI, IO, 3.024s, 2037 | | 12,023,029 | | 1,037,587 |
| IFB Ser. 07-91, Class AS, IO, 3.024s, 2037 | | 2,554,628 | | 216,139 |
| IFB Ser. 07-91, Class HS, IO, 3.024s, 2037 | | 2,719,426 | | 240,768 |
| IFB Ser. 07-15, Class CI, IO, 3.004s, 2037 | | 10,860,265 | | 984,582 |
| IFB Ser. 06-123, Class BI, IO, 3.004s, 2037 | | 14,276,479 | | 1,243,140 |
| IFB Ser. 06-115, Class JI, IO, 3.004s, 2036 | | 7,916,051 | | 713,404 |
| IFB Ser. 06-123, Class LI, IO, 2.944s, 2037 | | 5,286,275 | | 450,900 |
| IFB Ser. 07-116, Class BI, IO, 2.874s, 2037 | | 12,457,218 | | 966,929 |
| IFB Ser. 07-39, Class AI, IO, 2.744s, 2037 | | 5,525,097 | | 440,736 |
| IFB Ser. 07-32, Class SD, IO, 2.734s, 2037 | | 3,784,250 | | 307,148 |
| IFB Ser. 07-33, Class SD, IO, 2.734s, 2037 | | 10,598,668 | | 806,122 |
| IFB Ser. 07-30, Class UI, IO, 2.724s, 2037 | | 3,092,486 | | 264,508 |
| IFB Ser. 07-32, Class SC, IO, 2.724s, 2037 | | 5,024,396 | | 414,016 |
| IFB Ser. 08-01, Class GI, IO, 2.724s, 2037 | | 14,390,000 | | 1,469,442 |
| IFB Ser. 07-1, Class CI, IO, 2.724s, 2037 | | 3,626,287 | | 299,395 |
| IFB Ser. 05-74, Class SE, IO, 2.724s, 2035 | | 13,455,888 | | 952,693 |
| IFB Ser. 05-82, Class SI, IO, 2.724s, 2035 | | 12,616,589 | | 914,102 |
| IFB Ser. 05-58, Class IK, IO, 2.624s, 2035 | | 4,317,620 | | 381,860 |
| IFB Ser. 07-75, Class ID, IO, 2.494s, 2037 | | 3,030,000 | | 242,742 |
| Ser. 08-10, Class CI, 2.28s, 2038 ## | | 6,697,000 | | 409,145 |
| IFB Ser. 08-1, Class NI, IO, 2 1/4s, 2037 | | 6,354,000 | | 452,678 |
| Ser. 03-W12, Class 2, IO, 2.224s, 2043 | | 7,426,160 | | 402,942 |
| IFB Ser. 08-01, Class AI, IO, 2.014s, 2037 | | 17,215,000 | | 1,392,342 |
| IFB Ser. 08-1, Class HI, IO, 1.964s, 2037 | | 8,154,000 | | 633,055 |
| Ser. 03-W10, Class 1, IO, 1.93s, 2043 | | 23,152,023 | | 1,059,087 |
| Ser. 03-W10, Class 3, IO, 1.929s, 2043 | | 5,833,267 | | 267,145 |
44
| | | | |
| COLLATERALIZED MORTGAGE OBLIGATIONS (23.4%)* continued | | | |
| |
| | | Principal amount | | Value |
|
| Fannie Mae | | | | |
| Ser. 03-W8, Class 12, IO, 1.635s, 2042 | $ | 23,777,400 | $ | 979,300 |
| FRB Ser. 03-W17, Class 12, IO, 1.151s, 2033 | | 7,325,658 | | 257,151 |
| Ser. 03-T2, Class 2, IO, 0.818s, 2042 | | 34,171,302 | | 802,778 |
| Ser. 03-W6, Class 51, IO, 0.683s, 2042 | | 9,819,665 | | 177,636 |
| Ser. 03-W3, Class 2IO1, IO, 0.682s, 2042 | | 3,159,203 | | 52,508 |
| Ser. 06-W3, Class 1AS, IO, 0.662s, 2046 | | 12,919,858 | | 866,967 |
| Ser. 01-T12, Class IO, 0.565s, 2041 | | 20,167,888 | | 269,088 |
| Ser. 03-W2, Class 1, IO, 0.47s, 2042 | | 18,150,928 | | 226,327 |
| Ser. 02-T4, IO, 0.451s, 2041 | | 7,233,261 | | 76,996 |
| Ser. 03-W3, Class 1, IO, 0.441s, 2042 | | 24,459,973 | | 291,243 |
| Ser. 02-T1, Class IO, IO, 0.427s, 2031 | | 19,429,411 | | 210,614 |
| Ser. 03-W6, Class 3, IO, 0.366s, 2042 | | 13,398,632 | | 122,728 |
| Ser. 03-W6, Class 23, IO, 0.351s, 2042 | | 14,343,558 | | 149,270 |
| Ser. 03-W4, Class 3A, IO, 0.35s, 2042 | | 12,971,830 | | 137,809 |
| Ser. 01-79, Class BI, IO, 0.335s, 2045 | | 3,710,148 | | 30,167 |
| Ser. 07-64, Class LO, Principal Only (PO), zero %, 2037 | | 1,551,577 | | 1,333,386 |
| Ser. 06-84, Class OP, PO, zero %, 2036 | | 20,683 | | 20,591 |
| Ser. 372, Class 1, PO, zero %, 2036 | | 17,643,927 | | 15,094,942 |
| Ser. 06-56, Class XF, zero %, 2036 | | 236,346 | | 235,641 |
| Ser. 370, Class 1, PO, zero %, 2036 | | 7,597,834 | | 6,491,579 |
| Ser. 04-38, Class AO, PO, zero %, 2034 | | 4,049,534 | | 3,068,114 |
| Ser. 04-61, Class CO, PO, zero %, 2031 | | 2,981,654 | | 2,679,764 |
| Ser. 07-31, Class TS, IO, zero %, 2009 | | 9,152,512 | | 299,617 |
| Ser. 07-15, Class IM, IO, zero %, 2009 | | 3,546,607 | | 105,979 |
| Ser. 07-16, Class TS, IO, zero %, 2009 | | 14,529,923 | | 383,273 |
| FRB Ser. 07-76, Class SF, zero %, 2037 | | 198,138 | | 196,931 |
| FRB Ser. 06-115, Class SN, zero %, 2036 | | 1,231,092 | | 1,264,910 |
| FRB Ser. 06-104, Class EK, zero %, 2036 | | 316,878 | | 315,477 |
| FRB Ser. 05-117, Class GF, zero %, 2036 | | 237,478 | | 228,541 |
| FRB Ser. 05-65, Class ER, zero %, 2035 | | 2,572,426 | | 2,509,043 |
| FRB Ser. 05-57, Class UL, zero %, 2035 | | 2,449,483 | | 2,397,503 |
| FRB Ser. 05-36, Class QA, zero %, 2035 | | 475,135 | | 452,541 |
| FRB Ser. 05-65, Class CU, zero %, 2034 | | 338,501 | | 367,181 |
| FRB Ser. 05-81, Class DF, zero %, 2033 | | 277,339 | | 276,573 |
| FRB Ser. 06-1, Class HF, zero %, 2032 | | 247,042 | | 242,966 |
| IFB Ser. 06-75, Class FY, zero %, 2036 | | 554,674 | | 546,073 |
| Federal Home Loan Mortgage Corp. Structured Pass Through | | | | |
| Securities IFB Ser. T-56, Class 2ASI, IO, 4.724s, 2043 | | 1,884,400 | | 228,483 |
| Federal Home Loan Mortgage Corp. Structured | | | | |
| Pass-Through Securities | | | | |
| Ser. T-42, Class A6, 9 1/2s, 2042 | | 199,648 | | 219,897 |
| Ser. T-58, Class 4A, 7 1/2s, 2043 | | 507,962 | | 554,141 |
| Ser. T-51, Class 2A, 7 1/2s, 2042 | | 530,974 | | 573,858 |
| Ser. T-42, Class A5, 7 1/2s, 2042 | | 847,140 | | 910,184 |
| Ser. T-60, Class 1A2, 7s, 2044 | | 3,653,375 | | 3,967,612 |
| Ser. T-41, Class 2A, 7s, 2032 | | 81,961 | | 87,685 |
| Ser. T-56, Class A, IO, 0.524s, 2043 | | 8,529,386 | | 110,995 |
| Ser. T-56, Class 3, IO, 0.373s, 2043 | | 10,283,826 | | 15,373 |
45
| | | | |
| COLLATERALIZED MORTGAGE OBLIGATIONS (23.4%)* continued | | | |
| |
| | | Principal amount | | Value |
|
| Federal Home Loan Mortgage Corp. Structured | | | | |
| Pass-Through Securities | | | | |
| Ser. T-56, Class 1, IO, 0.286s, 2043 | $ | 13,158,604 | $ | 101,760 |
| Ser. T-56, Class 2, IO, 0.035s, 2043 | | 11,912,619 | | 33,212 |
| FFCA Secured Lending Corp. 144A Ser. 00-1, Class A2, | | | | |
| 7.77s, 2027 | | 4,466,698 | | 5,067,076 |
| First Horizon Alternative Mortgage Securities FRB Ser. 05-AA10, | | | |
| Class 2A1, 5.754s, 2035 | | 1,961,166 | | 1,976,302 |
| First Union National Bank-Bank of America Commercial Mortgage | | | |
| 144A Ser. 01-C1, Class 3, IO, 1.947s, 2033 | | 30,451,859 | | 1,211,019 |
| First Union-Lehman Brothers Commercial Mortgage Trust II | | | | |
| Ser. 97-C2, Class F, 7 1/2s, 2029 | | 2,726,000 | | 2,951,760 |
| Ser. 97-C2, Class G, 7 1/2s, 2029 | | 832,000 | | 910,967 |
| First Union-Lehman Brothers-Bank of America 144A Ser. 98-C2, | | | |
| Class G, 7s, 2035 | | 3,410,000 | | 3,478,541 |
| Freddie Mac | | | | |
| IFB Ser. 3339, Class WS, 15.706s, 2037 | | 1,431,102 | | 2,078,687 |
| IFB Ser. 3339, Class JS, 15.299s, 2037 | | 1,285,019 | | 1,714,397 |
| IFB Ser. 3360, Class SB, 14 3/4s, 2037 | | 875,851 | | 1,275,799 |
| IFB Ser. 3202, Class PS, 13.822s, 2036 | | 975,816 | | 1,303,358 |
| IFB Ser. 3349, Class SA, 13.583s, 2037 | | 4,968,455 | | 6,618,640 |
| IFB Ser. 3331, Class SE, 13.583s, 2037 | | 1,235,470 | | 1,579,040 |
| IFB Ser. 3202, Class HM, 12.069s, 2036 | | 641,556 | | 830,121 |
| IFB Ser. 3153, Class SX, 12.069s, 2036 | | 842,744 | | 1,075,779 |
| IFB Ser. 3182, Class PS, 11.655s, 2032 | | 2,148,257 | | 2,787,719 |
| IFB Ser. 3081, Class DC, 10.097s, 2035 | | 1,372,977 | | 1,685,909 |
| IFB Ser. 3114, Class GK, 9.455s, 2036 | | 905,201 | | 1,105,164 |
| IFB Ser. 2976, Class KL, 8.85s, 2035 | | 2,565,186 | | 3,042,987 |
| IFB Ser. 3408, Class EK, 8.747s, 2037 | | 4,128,000 | | 4,702,700 |
| IFB Ser. 2990, Class DP, 8.74s, 2034 | | 2,182,160 | | 2,511,178 |
| IFB Ser. 2979, Class AS, 8.74s, 2034 | | 621,605 | | 713,886 |
| IFB Ser. 3153, Class UT, 8.484s, 2036 | | 499,685 | | 575,516 |
| IFB Ser. 3360, Class SC, 8.308s, 2037 | | 2,029,123 | | 2,349,021 |
| IFB Ser. 3149, Class SU, 8.013s, 2036 | | 1,080,766 | | 1,192,813 |
| IFB Ser. 3065, Class DC, 7.151s, 2035 | | 2,210,259 | | 2,449,229 |
| IFB Ser. 2990, Class LB, 6.118s, 2034 | | 2,693,941 | | 2,854,612 |
| IFB Ser. 2990, Class WP, 6.098s, 2035 | | 1,589,090 | | 1,725,152 |
| IFB Ser. 2927, Class SI, IO, 4.264s, 2035 | | 3,629,482 | | 516,235 |
| IFB Ser. 2828, Class GI, IO, 3.264s, 2034 | | 4,188,665 | | 559,106 |
| IFB Ser. 3184, Class SP, IO, 3.114s, 2033 | | 3,842,034 | | 406,403 |
| IFB Ser. 2869, Class SH, IO, 3.064s, 2034 | | 1,997,619 | | 170,382 |
| IFB Ser. 2869, Class JS, IO, 3.014s, 2034 | | 9,524,300 | | 808,196 |
| IFB Ser. 3203, Class SH, IO, 2.904s, 2036 | | 2,187,523 | | 258,078 |
| IFB Ser. 2815, Class PT, IO, 2.814s, 2032 | | 4,158,160 | | 441,299 |
| IFB Ser. 2828, Class TI, IO, 2.814s, 2030 | | 1,954,507 | | 198,066 |
| IFB Ser. 3297, Class BI, IO, 2.524s, 2037 | | 9,522,363 | | 997,007 |
| IFB Ser. 3284, Class IV, IO, 2.514s, 2037 | | 2,471,134 | | 263,315 |
| IFB Ser. 3287, Class SD, IO, 2.514s, 2037 | | 3,778,056 | | 361,410 |
| IFB Ser. 3281, Class BI, IO, 2.514s, 2037 | | 1,842,372 | | 180,864 |
| IFB Ser. 3249, Class SI, IO, 2.514s, 2036 | | 1,611,611 | | 182,110 |
46
| | | | |
| COLLATERALIZED MORTGAGE OBLIGATIONS (23.4%)* continued | | | | |
| |
| | | Principal amount | | Value |
|
| Freddie Mac | | | | |
| IFB Ser. 3028, Class ES, IO, 2.514s, 2035 | $ | 10,810,336 | $ | 1,200,654 |
| IFB Ser. 2922, Class SE, IO, 2.514s, 2035 | | 5,129,039 | | 467,830 |
| IFB Ser. 3045, Class DI, IO, 2.494s, 2035 | | 17,543,260 | | 1,502,231 |
| Ser. 3236, Class ES, IO, 2.464s, 2036 | | 3,492,900 | | 309,775 |
| IFB Ser. 3136, Class NS, IO, 2.464s, 2036 | | 5,815,019 | | 584,032 |
| IFB Ser. 3118, Class SD, IO, 2.464s, 2036 | | 8,290,857 | | 745,055 |
| IFB Ser. 3054, Class CS, IO, 2.464s, 2035 | | 2,171,366 | | 166,020 |
| IFB Ser. 3107, Class DC, IO, 2.464s, 2035 | | 10,509,552 | | 1,213,073 |
| IFB Ser. 3066, Class SI, IO, 2.464s, 2035 | | 7,039,185 | | 800,527 |
| IFB Ser. 2927, Class ES, IO, 2.464s, 2035 | | 2,865,912 | | 227,949 |
| IFB Ser. 2950, Class SM, IO, 2.464s, 2016 | | 5,542,543 | | 539,706 |
| IFB Ser. 3256, Class S, IO, 2.454s, 2036 | | 4,223,926 | | 426,292 |
| IFB Ser. 3031, Class BI, IO, 2.454s, 2035 | | 2,012,208 | | 238,806 |
| IFB Ser. 3244, Class SB, IO, 2.424s, 2036 | | 2,664,996 | | 250,930 |
| IFB Ser. 3244, Class SG, IO, 2.424s, 2036 | | 3,043,035 | | 309,206 |
| IFB Ser. 3236, Class IS, IO, 2.414s, 2036 | | 4,930,127 | | 442,520 |
| IFB Ser. 2962, Class BS, IO, 2.414s, 2035 | | 12,116,209 | | 941,071 |
| IFB Ser. 3114, Class TS, IO, 2.414s, 2030 | | 13,451,451 | | 765,922 |
| IFB Ser. 3128, Class JI, IO, 2.394s, 2036 | | 6,238,506 | | 626,663 |
| IFB Ser. 2990, Class LI, IO, 2.394s, 2034 | | 3,972,078 | | 409,270 |
| IFB Ser. 3240, Class S, IO, 2.384s, 2036 | | 9,196,513 | | 849,018 |
| IFB Ser. 3229, Class BI, IO, 2.384s, 2036 | | 707,115 | | 61,509 |
| IFB Ser. 3153, Class JI, IO, 2.384s, 2036 | | 4,583,662 | | 395,265 |
| IFB Ser. 3065, Class DI, IO, 2.384s, 2035 | | 1,539,881 | | 182,741 |
| IFB Ser. 3145, Class GI, IO, 2.364s, 2036 | | 5,108,753 | | 555,800 |
| IFB Ser. 3114, Class GI, IO, 2.364s, 2036 | | 2,162,260 | | 267,350 |
| IFB Ser. 3339, Class JI, IO, 2.354s, 2037 | | 9,741,270 | | 729,379 |
| IFB Ser. 3218, Class AS, IO, 2.344s, 2036 | | 3,311,938 | | 276,632 |
| IFB Ser. 3221, Class SI, IO, 2.344s, 2036 | | 4,002,505 | | 347,795 |
| IFB Ser. 3153, Class UI, IO, 2.334s, 2036 | | 3,750,048 | | 449,372 |
| IFB Ser. 3202, Class PI, IO, 2.304s, 2036 | | 10,857,286 | | 985,842 |
| IFB Ser. 3355, Class MI, IO, 2.264s, 2037 | | 2,722,387 | | 241,822 |
| IFB Ser. 3355, Class LI, IO, 2.264s, 2037 | | 3,254,887 | | 190,414 |
| IFB Ser. 3201, Class SG, IO, 2.264s, 2036 | | 5,019,444 | | 458,877 |
| IFB Ser. 3203, Class SE, IO, 2.264s, 2036 | | 4,539,301 | | 397,951 |
| IFB Ser. 3171, Class PS, IO, 2.249s, 2036 | | 4,187,746 | | 410,022 |
| IFB Ser. 3152, Class SY, IO, 2.244s, 2036 | | 4,708,243 | | 483,212 |
| IFB Ser. 3284, Class BI, IO, 2.214s, 2037 | | 3,028,874 | | 262,570 |
| IFB Ser. 3260, Class SA, IO, 2.214s, 2037 | | 3,110,471 | | 211,347 |
| IFB Ser. 3199, Class S, IO, 2.214s, 2036 | | 2,557,266 | | 234,205 |
| IFB Ser. 3284, Class LI, IO, 2.204s, 2037 | | 12,201,865 | | 1,091,870 |
| IFB Ser. 3281, Class AI, IO, 2.194s, 2037 | | 11,001,565 | | 1,001,298 |
| IFB Ser. 3311, Class IA, IO, 2.174s, 2037 | | 4,498,799 | | 429,105 |
| IFB Ser. 3311, Class IB, IO, 2.174s, 2037 | | 4,498,799 | | 429,105 |
| IFB Ser. 3311, Class IC, IO, 2.174s, 2037 | | 4,498,799 | | 429,105 |
| IFB Ser. 3311, Class ID, IO, 2.174s, 2037 | | 4,498,799 | | 429,105 |
| IFB Ser. 3311, Class IE, IO, 2.174s, 2037 | | 6,420,892 | | 612,438 |
| IFB Ser. 3240, Class GS, IO, 2.144s, 2036 | | 5,556,072 | | 495,507 |
| IFB Ser. 3339, Class TI, IO, 1.904s, 2037 | | 4,723,691 | | 409,376 |
47
| | | | |
| COLLATERALIZED MORTGAGE OBLIGATIONS (23.4%)* continued | | | |
| |
| | | Principal amount | | Value |
|
| Freddie Mac | | | | |
| IFB Ser. 3284, Class CI, IO, 1.884s, 2037 | $ | 8,370,294 | $ | 699,341 |
| IFB Ser. 3291, Class SA, IO, 1.874s, 2037 | | 5,298,380 | | 389,184 |
| IFB Ser. 3016, Class SQ, IO, 1.874s, 2035 | | 4,142,649 | | 256,161 |
| IFB Ser. 3284, Class WI, IO, 1.864s, 2037 | | 13,902,455 | | 1,117,299 |
| Ser. 246, PO, zero %, 2037 | | 13,915,039 | | 12,021,883 |
| Ser. 3300, PO, zero %, 2037 | | 2,438,306 | | 2,110,520 |
| Ser. 242, PO, zero %, 2036 | | 21,642,136 | | 18,745,206 |
| Ser. 239, PO, zero %, 2036 | | 8,612,047 | | 7,308,000 |
| Ser. 236, PO, zero %, 2036 | | 5,112,883 | | 4,371,237 |
| FRB Ser. 3349, Class DO, zero %, 2037 | | 547,098 | | 553,180 |
| FRB Ser. 3327, Class YF, zero %, 2037 | | 1,048,558 | | 1,051,018 |
| FRB Ser. 3326, Class XF, zero %, 2037 | | 1,548,631 | | 1,503,040 |
| FRB Ser. 3326, Class YF, zero %, 2037 | | 3,985,460 | | 4,030,062 |
| FRB Ser. 3263, Class TA, zero %, 2037 | | 345,565 | | 360,344 |
| FRB Ser. 3239, Class BF, zero %, 2036 | | 1,330,418 | | 1,394,372 |
| FRB Ser. 3341, Class FA, zero %, 2036 | | 135,475 | | 133,722 |
| FRB Ser. 3228, Class BF, zero %, 2036 | | 507,081 | | 508,596 |
| FRB Ser. 3231, Class XB, zero %, 2036 | | 905,581 | | 898,296 |
| FRB Ser. 3283, Class HF, zero %, 2036 | | 154,501 | | 155,263 |
| FRB Ser. 3174, Class SF, zero %, 2036 | | 596,703 | | 600,441 |
| FRB Ser. 3231, Class X, zero %, 2036 | | 369,244 | | 371,897 |
| FRB Ser. 3147, Class SF, zero %, 2036 | | 1,531,899 | | 1,548,813 |
| FRB Ser. 3117, Class AF, zero %, 2036 | | 206,815 | | 218,167 |
| FRB Ser. 3326, Class WF, zero %, 2035 | | 2,210,813 | | 2,145,066 |
| FRB Ser. 3036, Class AS, zero %, 2035 | | 193,233 | | 189,706 |
| FRB Ser. 3003, Class XF, zero %, 2035 | | 2,068,102 | | 2,000,284 |
| GE Capital Commercial Mortgage Corp. 144A | | | | |
| Ser. 05-C2, Class XC, IO, 0.084s, 2043 | | 85,697,318 | | 591,768 |
| Ser. 05-C3, Class XC, IO, 0.073s, 2045 | | 230,323,244 | | 1,088,738 |
| Ser. 07-C1, Class XC, IO, 0.047s, 2019 | | 184,378,284 | | 1,186,320 |
| GMAC Commercial Mortgage Securities, Inc. | | | | |
| Ser. 99-C3, Class F, 8.095s, 2036 | | 592,000 | | 623,254 |
| Ser. 97-C1, Class X, IO, 1.344s, 2029 | | 3,618,065 | | 196,503 |
| Ser. 05-C1, Class X1, IO, 0.166s, 2043 | | 93,516,922 | | 1,183,550 |
| GMAC Commercial Mortgage Securities, Inc. 144A | | | | |
| Ser. 99-C3, Class G, 6.974s, 2036 | | 1,614,303 | | 1,603,847 |
| Ser. 06-C1, Class XC, IO, 0.056s, 2045 | | 127,738,077 | | 818,290 |
| Government National Mortgage Association | | | | |
| IFB Ser. 07-26, Class WS, 26.895s, 2037 | | 3,399,034 | | 5,600,243 |
| IFB Ser. 07-38, Class AS, 19.03s, 2037 | | 3,089,028 | | 4,348,111 |
| IFB Ser. 06-34, Class SA, 15.788s, 2036 | | 363,096 | | 464,819 |
| IFB Ser. 07-44, Class SP, 15.763s, 2036 | | 1,465,717 | | 1,926,096 |
| IFB Ser. 07-51, Class SP, 15.728s, 2037 | | 1,106,029 | | 1,394,078 |
| IFB Ser. 07-67, Class SB, 15.308s, 2037 | | 1,614,640 | | 2,002,912 |
| IFB Ser. 07-35, Class DK, 13.236s, 2035 | | 767,000 | | 960,732 |
| IFB Ser. 07-64, Class AM, 12.956s, 2037 | | 1,714,908 | | 2,020,340 |
| IFB Ser. 05-7, Class JM, 7.741s, 2034 | | 2,588,628 | | 2,850,873 |
| IFB Ser. 05-66, Class SP, 7.229s, 2035 | | 1,323,407 | | 1,437,820 |
| IFB Ser. 06-62, Class SI, IO, 3.421s, 2036 | | 3,817,815 | | 302,895 |
48
| | | | |
| COLLATERALIZED MORTGAGE OBLIGATIONS (23.4%)* continued | | | | |
| |
| | | Principal amount | | Value |
|
| Government National Mortgage Association | | | | |
| IFB Ser. 07-1, Class SL, IO, 3.401s, 2037 | $ | 1,748,445 | $ | 154,037 |
| IFB Ser. 07-1, Class SM, IO, 3.391s, 2037 | | 1,748,445 | | 153,616 |
| IFB Ser. 04-59, Class SC, IO, 3.119s, 2034 | | 2,080,959 | | 218,733 |
| IFB Ser. 07-26, Class SG, IO, 2.891s, 2037 | | 5,100,527 | | 465,500 |
| IFB Ser. 07-9, Class BI, IO, 2.861s, 2037 | | 11,402,543 | | 832,490 |
| IFB Ser. 07-31, Class CI, IO, 2.851s, 2037 | | 3,074,681 | | 235,990 |
| IFB Ser. 07-25, Class SA, IO, 2.841s, 2037 | | 4,032,564 | | 297,766 |
| IFB Ser. 07-25, Class SB, IO, 2.841s, 2037 | | 7,864,608 | | 580,726 |
| IFB Ser. 07-22, Class S, IO, 2.841s, 2037 | | 2,741,397 | | 281,927 |
| IFB Ser. 07-11, Class SA, IO, 2.841s, 2037 | | 2,765,382 | | 245,359 |
| IFB Ser. 07-14, Class SB, IO, 2.841s, 2037 | | 2,629,591 | | 223,484 |
| IFB Ser. 07-51, Class SJ, IO, 2.791s, 2037 | | 3,104,982 | | 345,729 |
| IFB Ser. 07-58, Class PS, IO, 2.741s, 2037 | | 5,285,187 | | 505,356 |
| IFB Ser. 07-26, Class SD, IO, 2.719s, 2037 | | 5,586,654 | | 464,353 |
| IFB Ser. 07-26, Class SL, IO, 2.719s, 2037 | | 241,998 | | 22,318 |
| IFB Ser. 07-59, Class PS, IO, 2.711s, 2037 | | 2,397,577 | | 222,293 |
| IFB Ser. 07-59, Class SP, IO, 2.711s, 2037 | | 4,860,624 | | 450,313 |
| IFB Ser. 07-68, Class PI, IO, 2.691s, 2037 | | 4,379,227 | | 427,339 |
| IFB Ser. 06-38, Class SG, IO, 2.691s, 2033 | | 11,701,559 | | 664,763 |
| IFB Ser. 07-53, Class SG, IO, 2.641s, 2037 | | 2,136,357 | | 152,153 |
| IFB Ser. 07-79, Class SY, IO, 2.591s, 2037 | | 12,043,339 | | 791,405 |
| IFB Ser. 07-64, Class AI, IO, 2.591s, 2037 | | 13,528,715 | | 891,867 |
| IFB Ser. 07-53, Class ES, IO, 2.591s, 2037 | | 3,454,442 | | 217,805 |
| IFB Ser. 07-48, Class SB, IO, 2.569s, 2037 | | 4,807,027 | | 335,380 |
| IFB Ser. 07-9, Class DI, IO, 2.551s, 2037 | | 5,750,026 | | 384,311 |
| IFB Ser. 07-57, Class QA, IO, 2.541s, 2037 | | 7,367,107 | | 473,117 |
| IFB Ser. 07-58, Class SA, IO, 2.541s, 2037 | | 9,930,901 | | 667,123 |
| IFB Ser. 07-58, Class SC, IO, 2.541s, 2037 | | 6,262,378 | | 375,034 |
| IFB Ser. 07-61, Class SA, IO, 2.541s, 2037 | | 3,905,247 | | 248,193 |
| IFB Ser. 07-53, Class SC, IO, 2.541s, 2037 | | 3,781,411 | | 228,612 |
| IFB Ser. 06-28, Class GI, IO, 2.541s, 2035 | | 4,220,820 | | 317,360 |
| IFB Ser. 07-58, Class SD, IO, 2.531s, 2037 | | 5,945,088 | | 369,474 |
| IFB Ser. 07-59, Class SD, IO, 2.511s, 2037 | | 9,375,452 | | 580,790 |
| IFB Ser. 07-17, Class AI, IO, 2.469s, 2037 | | 11,436,322 | | 971,376 |
| IFB Ser. 07-9, Class AI, IO, 2.419s, 2037 | | 4,454,736 | | 342,956 |
| IFB Ser. 05-65, Class SI, IO, 2.391s, 2035 | | 4,626,402 | | 352,195 |
| IFB Ser. 07-17, Class IB, IO, 2.291s, 2037 | | 2,469,499 | | 185,247 |
| IFB Ser. 06-14, Class S, IO, 2.291s, 2036 | | 4,047,431 | | 279,297 |
| IFB Ser. 06-11, Class ST, IO, 2.281s, 2036 | | 2,511,940 | | 176,344 |
| IFB Ser. 07-27, Class SD, IO, 2.241s, 2037 | | 2,872,575 | | 174,643 |
| IFB Ser. 07-19, Class SJ, IO, 2.241s, 2037 | | 4,879,316 | | 281,721 |
| IFB Ser. 07-23, Class ST, IO, 2.241s, 2037 | | 5,938,848 | | 314,383 |
| IFB Ser. 07-8, Class SA, IO, 2.241s, 2037 | | 3,946,096 | | 281,202 |
| IFB Ser. 07-9, Class CI, IO, 2.241s, 2037 | | 7,469,590 | | 439,203 |
| IFB Ser. 07-7, Class EI, IO, 2.241s, 2037 | | 5,015,867 | | 300,676 |
| IFB Ser. 07-7, Class JI, IO, 2.241s, 2037 | | 7,357,016 | | 502,832 |
| IFB Ser. 07-1, Class S, IO, 2.241s, 2037 | | 6,382,184 | | 363,458 |
| IFB Ser. 07-3, Class SA, IO, 2.241s, 2037 | | 6,087,928 | | 346,364 |
| IFB Ser. 07-17, Class IC, IO, 2.169s, 2037 | | 5,936,896 | | 451,076 |
49
| | | | |
| COLLATERALIZED MORTGAGE OBLIGATIONS (23.4%)* continued | | | |
| |
| | | Principal amount | | Value |
|
| Government National Mortgage Association | | | | |
| IFB Ser. 07-21, Class S, IO, 2.119s, 2037 | $ | 6,147,623 | $ | 420,283 |
| IFB Ser. 07-31, Class AI, IO, 2.099s, 2037 | | 3,055,600 | | 339,869 |
| IFB Ser. 07-73, Class MI, IO, 2.041s, 2037 | | 10,292,982 | | 563,611 |
| IFB Ser. 07-43, Class SC, IO, 2.019s, 2037 | | 3,923,371 | | 242,308 |
| IFB Ser. 08-3, Class SA, IO, 2.01s, 2038 (F) | | 6,626,000 | | 396,956 |
| IFB Ser. 08-4, Class SA, IO, 2.001s, 2038 | | 13,320,000 | | 885,572 |
| IFB Ser. 07-67, Class EI, IO, 0.02s, 2037 | | 5,234,559 | | 2,070 |
| IFB Ser. 07-67, Class GI, IO, 0.02s, 2037 | | 15,326,541 | | 6,046 |
| Ser. 07-73, Class MO, PO, zero %, 2037 | | 791,768 | | 651,547 |
| FRB Ser. 07-73, Class KI, IO, zero %, 2037 | | 7,917,679 | | 135,713 |
| FRB Ser. 07-73, Class KM, zero %, 2037 | | 791,768 | | 804,961 |
| FRB Ser. 07-49, Class UF, zero %, 2037 | | 368,292 | | 363,641 |
| FRB Ser. 07-35, Class UF, zero %, 2037 | | 432,387 | | 448,456 |
| FRB Ser. 07-22, Class TA, zero %, 2037 | | 342,352 | | 351,744 |
| FRB Ser. 98-2, Class EA, PO, zero %, 2028 | | 103,162 | | 88,861 |
| Government National Mortgage Association 144A IFB | | | | |
| Ser. 06-GG8, Class X, IO, 0.857s, 2039 (F) | | 26,425,854 | | 969,594 |
| Greenpoint Mortgage Funding Trust Ser. 05-AR1, Class X1, IO, | | | | |
| 2.496s, 2045 | | 6,520,254 | | 217,003 |
| Greenwich Capital Commercial Funding Corp. Ser. 05-GG5, | | | | |
| Class XC, IO, 0.072s, 2037 (F) | | 183,806,377 | | 709,062 |
| Greenwich Capital Commercial Funding Corp. 144A | | | | |
| Ser. 07-GG9, Class X, IO, 0.512s, 2039 | | 29,440,794 | | 607,216 |
| Ser. 05-GG3, Class XC, IO, 0.153s, 2042 | | 136,565,678 | | 2,069,824 |
| GS Mortgage Securities Corp. II | | | | |
| FRB Ser. 07-GG10, Class A3, 5.799s, 2045 | | 2,285,000 | | 2,266,036 |
| Ser. 06-GG6, Class A2, 5.506s, 2038 (F) | | 2,998,000 | | 3,045,795 |
| Ser. 05-GG4, Class A4, 4.761s, 2039 | | 197,000 | | 190,292 |
| GS Mortgage Securities Corp. II 144A | | | | |
| Ser. 98-C1, Class F, 6s, 2030 | | 1,286,000 | | 1,286,116 |
| FRB Ser. 07-EOP, Class J, 5.39s, 2009 | | 428,000 | | 401,250 |
| Ser. 03-C1, Class X1, IO, 0.458s, 2040 | | 22,073,525 | | 398,095 |
| Ser. 04-C1, Class X1, IO, 0.379s, 2028 (F) | | 33,708,114 | | 180,608 |
| Ser. 05-GG4, Class XC, IO, 0.221s, 2039 (F) | | 107,357,557 | | 1,835,244 |
| Ser. 06-GG6, Class XC, IO, 0.051s, 2038 (F) | | 52,771,539 | | 163,980 |
| GSMPS Mortgage Loan Trust | | | | |
| Ser. 05-RP3, Class 1A4, 8 1/2s, 2035 | | 266,845 | | 291,304 |
| Ser. 05-RP3, Class 1A3, 8s, 2035 | | 777,618 | | 843,000 |
| Ser. 05-RP3, Class 1A2, 7 1/2s, 2035 | | 702,465 | | 754,538 |
| GSMPS Mortgage Loan Trust 144A | | | | |
| Ser. 05-RP2, Class 1A3, 8s, 2035 | | 955,388 | | 1,035,584 |
| Ser. 05-RP1, Class 1A3, 8s, 2035 | | 122,709 | | 133,020 |
| Ser. 05-RP2, Class 1A2, 7 1/2s, 2035 | | 1,073,128 | | 1,152,583 |
| IFB Ser. 04-4, Class 1AS, IO, 1.24s, 2034 | | 11,942,496 | | 821,017 |
| GSR Mortgage Loan Trust Ser. 05-AR2, Class 2A1, 4.835s, 2035 | 1,781,869 | | 1,750,419 |
| HASCO NIM Trust 144A Ser. 05-OP1A, Class A, 6 1/4s, 2035 | | | | |
| (Cayman Islands) | | 404,284 | | 121,285 |
| IMPAC Secured Assets Corp. FRB Ser. 07-2, Class 1A1A, | | | | |
| 3.486s, 2037 | | 5,301,582 | | 4,976,860 |
50
| | | | |
| COLLATERALIZED MORTGAGE OBLIGATIONS (23.4%)* continued | | | | |
| |
| | | Principal amount | | Value |
|
| JPMorgan Chase Commercial Mortgage Securities Corp. | | | | |
| Ser. 97-C5, Class F, 7.561s, 2029 | $ | 911,000 | $ | 974,715 |
| FRB Ser. 07-LD12, Class AM, 6.059s, 2051 | | 5,510,000 | | 5,595,405 |
| FRB Ser. 07-LD12, Class A3, 5.987s, 2051 | | 26,282,000 | | 26,581,615 |
| FRB Ser. 07-LD11, Class A3, 5.819s, 2049 | | 2,850,000 | | 2,756,891 |
| Ser. 07-CB20, Class A3, 5.863s, 2051 | | 5,740,000 | | 5,692,358 |
| Ser. 06-CB15, Class A4, 5.814s, 2043 | | 4,443,000 | | 4,545,313 |
| Ser. 07-CB20, Class A4, 5.794s, 2051 | | 3,738,000 | | 3,831,450 |
| FRB Ser. 04-PNC1, Class A4, 5.371s, 2041 (F) | | 75,000 | | 76,704 |
| Ser. 06-CB14, Class A4, 5.481s, 2044 | | 4,125,000 | | 4,165,425 |
| Ser. 05-CB12, Class A4, 4.895s, 2037 (F) | | 198,000 | | 194,415 |
| Ser. 04-C3, Class A5, 4.878s, 2042 (F) | | 189,000 | | 186,194 |
| Ser. 05-LDP2, Class AM, 4.78s, 2042 | | 1,990,000 | | 1,860,080 |
| Ser. 06-LDP8, Class X, IO, 0.763s, 2045 | | 35,054,227 | | 1,483,495 |
| Ser. 06-CB17, Class X, IO, 0.702s, 2043 | | 42,875,620 | | 1,540,950 |
| Ser. 06-LDP9, Class X, IO, 0.642s, 2047 | | 9,823,827 | | 300,118 |
| Ser. 07-LDPX, Class X, IO, 0.526s, 2049 | | 54,555,663 | | 1,489,370 |
| Ser. 06-CB16, Class X1, IO, 0.065s, 2045 | | 39,985,902 | | 612,584 |
| Ser. 06-LDP7, Class X, IO, 0.02s, 2045 | | 228,579,791 | | 196,437 |
| JPMorgan Chase Commercial Mortgage Securities Corp. 144A | | | | |
| Ser. 06-FL2A, Class X1, IO, 0.869s, 2018 | | 13,121,502 | | 27,555 |
| Ser. 03-ML1A, Class X1, IO, 0.798s, 2039 (F) | | 47,173,280 | | 1,672,416 |
| Ser. 05-LDP2, Class X1, IO, 0.159s, 2042 | | 166,356,105 | | 2,343,438 |
| Ser. 05-LDP1, Class X1, IO, 0.122s, 2046 | | 54,998,201 | | 507,015 |
| Ser. 05-CB12, Class X1, IO, 0.12s, 2037 | | 54,511,472 | | 530,209 |
| Ser. 05-LDP3, Class X1, IO, 0.077s, 2042 | | 81,759,978 | | 657,913 |
| Ser. 05-LDP5, Class X1, IO, 0.068s, 2044 | | 345,110,137 | | 1,671,627 |
| Ser. 06-LDP6, Class X1, IO, 0.062s, 2043 | | 68,415,684 | | 382,166 |
| Ser. 07-CB20, Class X1, IO, 0.059s, 2051 | | 89,136,691 | | 1,141,841 |
| LB Commercial Conduit Mortgage Trust 144A | | | | |
| Ser. 99-C1, Class F, 6.41s, 2031 (F) | | 715,303 | | 723,764 |
| Ser. 99-C1, Class G, 6.41s, 2031 | | 765,731 | | 793,351 |
| Ser. 98-C4, Class G, 5.6s, 2035 | | 634,000 | | 624,520 |
| Ser. 98-C4, Class H, 5.6s, 2035 | | 1,074,000 | | 1,084,295 |
| LB-UBS Commercial Mortgage Trust | | | | |
| Ser. 01-C3, Class A2, 6.365s, 2028 | | 67,000 | | 69,952 |
| Ser. 07-C6, Class A2, 5.845s, 2012 | | 8,188,000 | | 8,458,771 |
| Ser. 04-C7, Class A6, 4.786s, 2029 | | 1,733,000 | | 1,701,632 |
| Ser. 07-C2, Class XW, IO, 0.73s, 2040 | | 11,767,052 | | 410,875 |
| LB-UBS Commercial Mortgage Trust 144A | | | | |
| Ser. 03-C5, Class XCL, IO, 0.982s, 2037 | | 27,372,886 | | 382,009 |
| Ser. 06-C7, Class XW, IO, 0.914s, 2038 | | 30,468,793 | | 1,319,464 |
| Ser. 05-C3, Class XCL, IO, 0.178s, 2040 | | 66,695,975 | | 1,340,717 |
| Ser. 05-C2, Class XCL, IO, 0.152s, 2040 | | 123,393,090 | | 1,277,158 |
| Ser. 05-C5, Class XCL, IO, 0.142s, 2020 | | 69,744,344 | | 934,322 |
| Ser. 05-C7, Class XCL, IO, 0.122s, 2040 | | 83,356,812 | | 668,802 |
| Ser. 06-C7, Class XCL, IO, 0.095s, 2038 | | 47,068,261 | | 768,952 |
| Ser. 06-C1, Class XCL, IO, 0.08s, 2041 | | 66,708,770 | | 681,122 |
| Ser. 07-C2, Class XCL, IO, 0.074s, 2040 | | 101,115,296 | | 1,316,521 |
51
| | | | |
| COLLATERALIZED MORTGAGE OBLIGATIONS (23.4%)* continued | | | |
| |
| | | Principal amount | | Value |
|
| Lehman Brothers Floating Rate Commercial Mortgage Trust 144A | | | |
| FRB Ser. 04-LLFA, Class H, 5.186s, 2017 | $ | 733,000 | $ | 711,010 |
| FRB Ser. 05-LLFA, 5.036s, 2018 | | 423,000 | | 401,850 |
| Lehman Mortgage Trust | | | | |
| IFB Ser. 06-7, Class 1A9, 20.663s, 2036 | | 790,807 | | 1,013,504 |
| IFB Ser. 07-5, Class 4A3, 19.823s, 2036 | | 2,126,737 | | 2,728,836 |
| IFB Ser. 06-7, Class 4A2, IO, 4.374s, 2036 | | 3,444,684 | | 330,623 |
| IFB Ser. 07-5, Class 8A2, IO, 4.344s, 2036 | | 3,633,053 | | 308,101 |
| Ser. 07-1, Class 3A2, IO, 3.874s, 2037 | | 3,955,877 | | 429,112 |
| IFB Ser. 06-9, Class 3A2, IO, 3.854s, 2037 | | 2,451,930 | | 250,791 |
| IFB Ser. 07-4, Class 3A2, IO, 3.824s, 2037 | | 3,007,267 | | 267,105 |
| IFB Ser. 06-5, Class 2A2, IO, 3.774s, 2036 | | 7,392,315 | | 524,068 |
| IFB Ser. 07-2, Class 2A13, IO, 3.314s, 2037 | | 5,597,146 | | 445,530 |
| IFB Ser. 07-4, Class 2A2, IO, 3.294s, 2037 | | 12,848,104 | | 1,063,561 |
| IFB Ser. 07-1, Class 2A3, IO, 3.254s, 2037 | | 6,578,492 | | 630,430 |
| Ser. 06-9, Class 2A3, IO, 3.244s, 2036 | | 8,105,548 | | 735,276 |
| IFB Ser. 06-9, Class 2A2, IO, 3.244s, 2037 | | 5,767,666 | | 527,179 |
| IFB Ser. 06-7, Class 2A4, IO, 3.174s, 2036 | | 11,626,819 | | 713,810 |
| IFB Ser. 06-7, Class 2A5, IO, 3.174s, 2036 | | 10,583,247 | | 883,211 |
| IFB Ser. 06-6, Class 1A2, IO, 3.124s, 2036 | | 4,274,646 | | 262,447 |
| IFB Ser. 06-6, Class 1A3, IO, 3.124s, 2036 | | 6,029,297 | | 435,966 |
| IFB Ser. 07-5, Class 10A2, IO, 2.964s, 2037 | | 6,413,014 | | 393,661 |
| IFB Ser. 06-5, Class 1A3, IO, 2.024s, 2036 | | 1,973,001 | | 35,096 |
| IFB Ser. 06-4, Class 1A3, IO, 2.024s, 2036 | | 1,659,977 | | 43,982 |
| IFB Ser. 06-7, Class 1A3, IO, 1.974s, 2036 | | 4,985,365 | | 89,482 |
| IFB Ser. 06-9, Class 1A6, IO, 1.774s, 2037 | | 4,160,231 | | 67,536 |
| Local Insight Media Finance, LLC Ser. 07-1W, Class A1, | | | | |
| 5.53s, 2012 | | 5,162,000 | | 5,007,759 |
| MASTR Adjustable Rate Mortgages Trust | | | | |
| Ser. 04-7, Class 2A1, 7.227s, 2034 | | 188,912 | | 186,138 |
| FRB Ser. 04-13, Class 3A6, 3.786s, 2034 | | 2,253,000 | | 2,251,340 |
| Ser. 04-03, Class 4AX, IO, 1.417s, 2034 | | 2,238,496 | | 24,705 |
| Ser. 05-2, Class 7AX, IO, 0.168s, 2035 | | 5,670,343 | | 11,788 |
| MASTR Reperforming Loan Trust 144A | | | | |
| Ser. 05-2, Class 1A3, 7 1/2s, 2035 | | 684,486 | | 746,624 |
| Ser. 05-1, Class 1A4, 7 1/2s, 2034 | | 1,660,804 | | 1,818,945 |
| Merit Securities Corp. 144A FRB Ser. 11PA, | | | | |
| Class 3A1, 3.864s, 2027 | | 4,936,380 | | 4,590,834 |
| Merrill Lynch Capital Funding Corp. Ser. 06-4, Class XC, IO, | | | | |
| 0.062s, 2049 | | 89,543,472 | | 1,301,179 |
| Merrill Lynch Floating Trust 144A | | | | |
| FRB Ser. 06-1, Class TM, 4.736s, 2022 | | 1,019,621 | | 1,010,834 |
| Ser. 06-1, Class X1A, IO, 1.478s, 2022 | | 19,346,246 | | 230,220 |
| Merrill Lynch Mortgage Investors, Inc. | | | | |
| FRB Ser. 98-C3, Class E, 7.108s, 2030 | | 644,000 | | 677,825 |
| FRB Ser. 05-A9, Class 3A1, 5.278s, 2035 | | 3,694,376 | | 3,729,549 |
| Merrill Lynch Mortgage Trust | | | | |
| FRB Ser. 07-C1, Class A3, 5.829s, 2050 | | 1,576,000 | | 1,609,915 |
| FRB Ser. 07-C1, Class A4, 5.829s, 2050 | | 1,777,000 | | 1,844,164 |
| FRB Ser. 04-BPC1, Class A5, 4.855s, 2041 | | 193,000 | | 188,833 |
52
| | | | |
| COLLATERALIZED MORTGAGE OBLIGATIONS (23.4%)* continued | | | |
| |
| | | Principal amount | | Value |
|
| Merrill Lynch Mortgage Trust | | | | |
| FRB Ser. 05-MCP1, Class A4, 4.747s, 2043 (F) | $ | 187,000 | $ | 182,290 |
| Ser. 05-MCP1, Class XC, IO, 0.129s, 2043 | | 70,208,069 | | 880,343 |
| Merrill Lynch Mortgage Trust 144A | | | | |
| Ser. 05-LC1, Class X, IO, 0.236s, 2044 | | 36,863,650 | | 299,517 |
| Ser. 04-KEY2, Class XC, IO, 0.212s, 2039 | | 16,004,448 | | 345,096 |
| Merrill Lynch/Countrywide Commercial Mortgage Trust | | | | |
| FRB Ser. 07-8, Class A3, 5.957s, 2049 | | 9,050,000 | | 9,309,399 |
| FRB Ser. 07-8, Class A2, 5.92s, 2049 | | 2,784,000 | | 2,826,961 |
| Ser. 07-9, Class A4, 5.748s, 2049 | | 9,050,000 | | 9,282,831 |
| Merrill Lynch/Countrywide Commercial Mortgage Trust 144A | | | | |
| Ser. 06-1, Class X, IO, 0.134s, 2039 | | 30,042,438 | | 140,824 |
| Ser. 06-3, Class XC, IO, 0.079s, 2046 | | 53,112,553 | | 861,486 |
| Ser. 07-7, Class X, IO, 0.02s, 2050 | | 192,618,252 | | 692,222 |
| Mezz Cap Commercial Mortgage Trust 144A | | | | |
| Ser. 04-C1, Class X, IO, 8.008s, 2037 | | 3,072,900 | | 881,538 |
| Ser. 04-C2, Class X, IO, 6.004s, 2040 | | 2,508,217 | | 708,571 |
| Ser. 05-C3, Class X, IO, 5.555s, 2044 | | 2,848,194 | | 793,934 |
| Ser. 06-C4, Class X, IO, 5.477s, 2016 | | 8,743,430 | | 2,837,516 |
| Morgan Stanley Capital 144A Ser. 05-RR6, Class X, IO, | | | | |
| 1.721s, 2043 (F) | | 10,482,890 | | 484,930 |
| Morgan Stanley Capital I | | | | |
| FRB Ser. 06-IQ11, Class A4, 5.772s, 2042 | | 4,443,000 | | 4,598,411 |
| FRB Ser. 07-IQ14, Class AM, 5.691s, 2049 | | 1,732,000 | | 1,676,736 |
| Ser. 05-HQ6, Class A4A, 4.989s, 2042 | | 3,963,000 | | 3,963,504 |
| Ser. 04-HQ4, Class A7, 4.97s, 2040 (F) | | 2,047,000 | | 2,038,222 |
| Morgan Stanley Capital I 144A | | | | |
| Ser. 98-HF1, Class F, 7.18s, 2030 | | 440,509 | | 440,264 |
| Ser. 04-RR, Class F5, 6s, 2039 (F) | | 1,000,000 | | 736,227 |
| Ser. 04-RR, Class F6, 6s, 2039 (F) | | 1,700,000 | | 1,115,440 |
| Ser. 07-HQ13, Class X1, IO, 0.824s, 2044 | | 59,954,347 | | 1,938,924 |
| Ser. 05-HQ6, Class X1, IO, 0.119s, 2042 | | 76,029,761 | | 717,346 |
| Ser. 05-HQ5, Class X1, IO, 0.107s, 2042 | | 22,757,644 | | 167,269 |
| Morgan Stanley Mortgage Loan Trust Ser. 05-5AR, Class 2A1, | | | | |
| 5.289s, 2035 | | 4,328,075 | | 4,301,070 |
| Mortgage Capital Funding, Inc. FRB Ser. 98-MC2, Class E, | | | | |
| 7.26s, 2030 | | 1,020,000 | | 1,035,284 |
| Nomura Asset Acceptance Corp. Ser. 04-R3, Class PT, | | | | |
| 7.731s, 2035 | | 456,584 | | 437,919 |
| Nomura Asset Acceptance Corp. 144A Ser. 04-R2, Class PT, | | | | |
| 9.087s, 2034 | | 384,728 | | 424,555 |
| Permanent Financing PLC FRB Ser. 8, Class 2C, 5.546s, 2042 | | | | |
| (United Kingdom) | | 2,054,000 | | 2,042,968 |
| Permanent Financing PLC 144A FRB Ser. 9A, Class 3A, 5.246s, | | | | |
| 2033 (United Kingdom) | | 3,285,000 | | 3,129,028 |
| Permanent Master Issuer PLC FRB Ser. 07-1, Class 4A, 4.338s, | | | | |
| 2033 (United Kingdom) | | 3,990,000 | | 3,850,430 |
| PNC Mortgage Acceptance Corp. 144A | | | | |
| Ser. 99-CM1, Class B3, 7.1s, 2032 | | 3,870,000 | | 3,930,101 |
| Ser. 00-C1, Class J, 6 5/8s, 2010 | | 456,000 | | 412,903 |
| Ser. 00-C2, Class J, 6.22s, 2033 (F) | | 1,113,000 | | 1,114,961 |
53
| | | | |
| COLLATERALIZED MORTGAGE OBLIGATIONS (23.4%)* continued | | | |
| |
| | | Principal amount | | Value |
|
| Residential Asset Securitization Trust | | | | |
| IFB Ser. 07-A3, Class 2A2, IO, 3.314s, 2037 | $ | 12,995,765 | $ | 1,053,690 |
| IFB Ser. 06-A7CB, Class 1A6, IO, 2.174s, 2036 | | 1,226,743 | | 43,175 |
| Residential Funding Mortgage Securities I | | | | |
| Ser. 04-S5, Class 2A1, 4 1/2s, 2019 | | 2,596,535 | | 2,590,781 |
| Saco I Trust FRB Ser. 05-10, Class 1A1, 3.636s, 2033 | | 1,112,884 | | 945,951 |
| Salomon Brothers Mortgage Securities VII 144A Ser. 02-KEY2, | | | | |
| Class X1, IO, 0.824s, 2036 | | 23,684,692 | | 1,144,511 |
| SBA CMBS Trust 144A Ser. 05-1A, Class D, 6.219s, 2035 | | 600,000 | | 600,300 |
| STRIPS 144A | | | | |
| Ser. 03-1A, Class L, 5s, 2018 (Cayman Islands) | | 757,000 | | 669,354 |
| Ser. 03-1A, Class M, 5s, 2018 (Cayman Islands) | | 513,000 | | 437,072 |
| Ser. 04-1A, Class L, 5s, 2018 (Cayman Islands) | | 337,000 | | 312,554 |
| Structured Adjustable Rate Mortgage Loan Trust | | | | |
| Ser. 04-8, Class 1A3, 6.871s, 2034 | | 13,433 | | 13,610 |
| FRB Ser. 07-8, Class 1A2, 6 1/4s, 2037 | | 10,566,045 | | 10,695,163 |
| FRB Ser. 05-18, Class 6A1, 5.247s, 2035 | | 2,067,860 | | 2,079,419 |
| Ser. 05-9, Class AX, IO, 1.364s, 2035 | | 22,670,326 | | 531,347 |
| Structured Adjustable Rate Mortgage Loan Trust 144A | | | | |
| Ser. 04-NP2, Class A, 5.215s, 2034 | | 690,330 | | 666,169 |
| Structured Asset Securities Corp. | | | | |
| IFB Ser. 07-4, Class 1A3, IO, 2.965s, 2037 | | 48,100,822 | | 3,596,427 |
| Ser. 07-4, Class 1A4, IO, 1s, 2037 | | 50,950,186 | | 1,331,733 |
| Structured Asset Securities Corp. 144A | | | | |
| Ser. 98-RF3, Class A, IO, 6.1s, 2028 | | 2,847,618 | | 257,915 |
| Ser. 07-RF1, Class 1A, IO, 0.936s, 2037 | | 12,757,211 | | 678,854 |
| Ser. 06-RF4, Class 1A, IO, 0.356s, 2036 | | 6,738,517 | | 376,929 |
| Wachovia Bank Commercial Mortgage Trust | | | | |
| Ser. 07-C30, Class A3, 5.246s, 2043 | | 1,903,000 | | 1,879,441 |
| Ser. 04-C15, Class A4, 4.803s, 2041 | | 3,055,000 | | 2,993,755 |
| Ser. 06-C28, Class XC, IO, 0.564s, 2048 | | 23,370,025 | | 552,000 |
| Ser. 06-C29, IO, 0.529s, 2048 | | 97,754,871 | | 2,504,480 |
| Ser. 07-C34, IO, 0.521s, 2046 | | 24,036,923 | | 617,509 |
| Wachovia Bank Commercial Mortgage Trust 144A | | | | |
| FRB Ser. 05-WL5A, Class L, 7.536s, 2018 | | 771,000 | | 717,030 |
| Ser. 03-C3, Class IOI, IO, 0.536s, 2035 | | 16,068,751 | | 465,415 |
| Ser. 07-C31, IO, 0.435s, 2047 | | 91,588,070 | | 1,596,380 |
| Ser. 06-C27, Class XC, IO, 0.073s, 2045 | | 45,671,466 | | 517,001 |
| Ser. 06-C23, Class XC, IO, 0.066s, 2045 | | 90,403,531 | | 505,356 |
| Ser. 06-C26, Class XC, IO, 0.054s, 2045 | | 34,482,093 | | 122,067 |
| Washington Mutual Commercial Mortgage Securities Trust 144A | | | | |
| Ser. 07-SL2, Class X, IO, 0.852s, 2049 | | 15,080,742 | | 610,318 |
| Ser. 06-SL1, Class X, IO, 0.938s, 2043 | | 7,667,092 | | 349,849 |
| Ser. 05-C1A, Class G, 5.72s, 2036 | | 222,000 | | 174,725 |
| Washington Mutual Mortgage Pass-Through Certificates | | | | |
| FRB Ser. 04-AR1, Class A, 4.229s, 2034 | | 421,213 | | 419,877 |
| Ser. 07-2, Class CX, IO, 7s, 2037 | | 943,441 | | 152,488 |
54
| | | | |
| COLLATERALIZED MORTGAGE OBLIGATIONS (23.4%)* continued | | | | |
| |
| | | Principal amount | | Value |
|
| Washington Mutual Multi-Fam., Mtge. 144A Ser. 01-1, Class B5, | | | | |
| 7.189s, 2031 (Cayman Islands) | $ | 1,305,000 | $ | 1,232,653 |
| Wells Fargo Mortgage Backed Securities Trust | | | | |
| Ser. 06-AR10, Class 3A1, 5.283s, 2036 | | 2,633,836 | | 2,631,749 |
| Ser. 05-AR2, Class 2A1, 4.544s, 2035 | | 1,331,103 | | 1,327,660 |
| Ser. 05-AR9, Class 1A2, 4.38s, 2035 | | 1,715,676 | | 1,710,735 |
| Ser. 04-R, Class 2A1, 4.37s, 2034 | | 1,322,163 | | 1,315,868 |
| Ser. 05-AR12, Class 2A5, 4.323s, 2035 | | 21,411,000 | | 21,362,491 |
| Ser. 05-AR10, Class 2A18, IO, 0.61s, 2035 | | 44,983,000 | | 284,649 |
|
| Total collateralized mortgage obligations (cost $796,217,824) | | | $ | 876,481,781 |
| |
| |
| |
| CORPORATE BONDS AND NOTES (9.0%)* | | | | |
|
| | | Principal amount | | Value |
|
| Basic Materials (0.2%) | | | | |
| Domtar Corp. company guaranty Ser. *, 7 7/8s, 2011 (Canada) | $ | 310,000 | $ | 314,650 |
| Dow Chemical Co. (The) Pass Through Trust 144A company | | | | |
| guaranty 4.027s, 2009 | | 1,510,000 | | 1,530,582 |
| E.I. du Pont de Nemours & Co. sr. unsec. 5s, 2013 | | 560,000 | | 580,785 |
| Georgia-Pacific Corp. debs. 9 1/2s, 2011 | | 556,000 | | 578,240 |
| Georgia-Pacific Corp. notes 8 1/8s, 2011 | | 635,000 | | 635,000 |
| Lubrizol Corp. (The) sr. notes 5 1/2s, 2014 | | 470,000 | | 476,756 |
| Nucor Corp. sr. unsec. 5s, 2012 | | 535,000 | | 549,716 |
| Potash Corp. of Saskatchewan notes 5 7/8s, 2036 (Canada) | | 785,000 | | 738,328 |
| Steel Dynamics, Inc. company guaranty sr. unsec. unsub. notes | | | | |
| 6 3/4s, 2015 | | 1,080,000 | | 1,044,900 |
| Steel Dynamics, Inc. 144A sr. notes 7 3/8s, 2012 | | 700,000 | | 698,250 |
| Vulcan Materials Co. sr. unsub. 5.6s, 2012 | | 875,000 | | 900,778 |
| Westvaco Corp. unsec. notes 7 1/2s, 2027 | | 175,000 | | 178,150 |
| Xstrata Finance Canada, Ltd. 144A company guaranty 5.8s, | | | | |
| 2016 (Canada) | | 735,000 | | 701,570 |
| | | | | 8,927,705 |
|
| |
| Capital Goods (0.2%) | | | | |
| Caterpillar Financial Services Corp. sr. unsec. 4.85s, 2012 (S) | | 820,000 | | 838,803 |
| Caterpillar Financial Services Corp. sr. unsec. notes Ser. MTN, | | | | |
| 5.85s, 2017 | | 1,505,000 | | 1,589,649 |
| L-3 Communications Corp. company guaranty Ser. B, | | | | |
| 6 3/8s, 2015 | | 595,000 | | 590,538 |
| L-3 Communications Corp. sr. sub. notes 5 7/8s, 2015 | | 435,000 | | 423,038 |
| Legrand SA debs. 8 1/2s, 2025 (France) | | 860,000 | | 1,001,132 |
| United Technologies Corp. sr. unsec. notes 5 3/8s, 2017 | | 1,310,000 | | 1,360,228 |
| | | | | 5,803,388 |
|
| |
| Communication Services (1.2%) | | | | |
| American Tower Corp. 144A sr. notes 7s, 2017 | | 1,250,000 | | 1,237,500 |
| Ameritech Capital Funding company guaranty 6 1/4s, 2009 | | 200,000 | | 207,794 |
| AT&T Wireless Services, Inc. sr. notes 8 3/4s, 2031 | | 1,139,000 | | 1,429,865 |
| AT&T, Inc. bonds 5 1/2s, 2018 | | 245,000 | | 245,820 |
55
| | | | |
| CORPORATE BONDS AND NOTES (9.0%)* continued | | | | |
| |
| | | Principal amount | | Value |
|
| Communication Services continued | | | | |
| AT&T, Inc. sr. unsec. 6.3s, 2038 (S) | $ | 3,645,000 | $ | 3,631,869 |
| AT&T, Inc. sr. unsec. 4.95s, 2013 | | 1,135,000 | | 1,158,762 |
| Bellsouth Capital Funding unsec. notes 7 7/8s, 2030 | | 1,800,000 | | 2,064,022 |
| British Telecommunications PLC sr. unsec. 5.15s, 2013 | | | | |
| (United Kingdom) | | 1,875,000 | | 1,916,588 |
| Cox Communications, Inc. notes 7 1/8s, 2012 | | 890,000 | | 963,389 |
| Cox Communications, Inc. 144A notes 5 7/8s, 2016 (S) | | 1,155,000 | | 1,161,643 |
| France Telecom notes 8 1/2s, 2031 (France) | | 180,000 | | 229,331 |
| Nextel Communications, Inc. sr. notes Ser. E, 6 7/8s, 2013 | | 600,000 | | 559,714 |
| Nextel Communications, Inc. sr. notes Ser. F, 5.95s, 2014 | | 2,655,000 | | 2,342,206 |
| Rogers Wireless, Inc. sec. notes 6 3/8s, 2014 (Canada) | | 1,025,000 | | 1,068,785 |
| Southwestern Bell Telephone debs. 7s, 2027 | | 1,075,000 | | 1,104,913 |
| Sprint Capital Corp. company guaranty 6.9s, 2019 | | 190,000 | | 173,664 |
| Sprint Capital Corp. company guaranty 6 7/8s, 2028 | | 1,965,000 | | 1,648,619 |
| TCI Communications, Inc. company guaranty 7 7/8s, 2026 | | 2,170,000 | | 2,372,101 |
| TCI Communications, Inc. debs. 9.8s, 2012 | | 1,870,000 | | 2,173,340 |
| TCI Communications, Inc. debs. 7 7/8s, 2013 | | 1,240,000 | | 1,371,410 |
| Telecom Italia Capital SA company guaranty 7.2s, | | | | |
| 2036 (Luxembourg) | | 350,000 | | 372,470 |
| Telecom Italia Capital SA company guaranty 5 1/4s, | | | | |
| 2015 (Luxembourg) | | 965,000 | | 942,605 |
| Telecom Italia Capital SA company guaranty 5 1/4s, | | | | |
| 2013 (Luxembourg) | | 515,000 | | 517,325 |
| Telecom Italia Capital SA company guaranty 4s, | | | | |
| 2010 (Luxembourg) | | 60,000 | | 59,426 |
| Telefonica Emisones SAU company guaranty 7.045s, 2036 (Spain) | | 690,000 | | 760,893 |
| Telefonica Emisones SAU company guaranty 6.421s, 2016 (Spain) | | 270,000 | | 288,179 |
| Telefonica Emisones SAU company guaranty 6.221s, 2017 (Spain) | | 385,000 | | 404,120 |
| Telefonica Europe BV company guaranty 8 1/4s, 2030 | | | | |
| (Netherlands) | | 595,000 | | 729,485 |
| Telus Corp. notes 8s, 2011 (Canada) | | 1,055,000 | | 1,161,952 |
| Time Warner Cable, Inc. company guaranty 6.55s, 2037 | | 690,000 | | 683,522 |
| Time Warner Cable, Inc. company guaranty 5.85s, 2017 | | 475,000 | | 475,420 |
| Time Warner Entertainment Co., LP debs. 8 3/8s, 2023 | | 170,000 | | 195,160 |
| Time Warner, Inc. debs. 9.15s, 2023 | | 340,000 | | 406,056 |
| Time Warner, Inc. debs. 9 1/8s, 2013 | | 2,435,000 | | 2,789,047 |
| Verizon Communications, Inc. sr. unsec 5.55s, 2016 | | 1,460,000 | | 1,489,707 |
| Verizon Communications, Inc. sr. unsec. bonds 5 1/2s, 2017 | | 1,075,000 | | 1,092,226 |
| Verizon New England, Inc. sr. notes 6 1/2s, 2011 | | 2,285,000 | | 2,419,459 |
| Verizon New Jersey, Inc. debs. 8s, 2022 | | 770,000 | | 884,144 |
| Verizon Pennsylvania, Inc. debs. 8.35s, 2030 | | 980,000 | | 1,173,980 |
| Vodafone Group PLC unsec. notes 6.15s, 2037 | | | | |
| (United Kingdom) (S) | | 1,550,000 | | 1,512,676 |
| | | | | 45,419,187 |
56
| | | | |
| CORPORATE BONDS AND NOTES (9.0%)* continued | | | | |
| |
| | | Principal amount | | Value |
|
| Conglomerates (0.1%) | | | | |
| General Electric Co. sr. unsec. 5 1/4s, 2017 | $ | 720,000 | $ | 726,339 |
| Siemens Financieringsmaatschappij 144A notes 5 3/4s, | | | | |
| 2016 (Netherlands) | | 680,000 | | 704,115 |
| Textron, Inc. sr. unsec. 5.6s, 2017 | | 1,400,000 | | 1,445,440 |
| | | | | 2,875,894 |
|
| |
| Consumer Cyclicals (0.4%) | | | | |
| D.R. Horton, Inc. sr. notes 7 7/8s, 2011 | | 565,000 | | 541,079 |
| D.R. Horton, Inc. sr. notes 5 7/8s, 2013 | | 660,000 | | 600,600 |
| DaimlerChrysler NA Holding Corp. company guaranty | | | | |
| 7.2s, 2009 | | 1,545,000 | | 1,615,736 |
| DaimlerChrysler NA Holding Corp. company guaranty | | | | |
| 6 1/2s, 2013 | | 565,000 | | 605,985 |
| DaimlerChrysler NA Holding Corp. notes Ser. MTN, | | | | |
| 5 3/4s, 2011 | | 1,730,000 | | 1,799,257 |
| Ford Motor Credit Co., LLC notes 6 3/8s, 2008 | | 980,000 | | 966,854 |
| Harley-Davidson Funding Corp. company guaranty 5 1/4s, 2012 | | 1,250,000 | | 1,270,966 |
| JC Penney Co., Inc. debs. 7.65s, 2016 | | 110,000 | | 117,511 |
| JC Penney Co., Inc. notes 6 7/8s, 2015 | | 910,000 | | 934,949 |
| JC Penney Co., Inc. sr. notes 6 3/8s, 2036 | | 555,000 | | 489,983 |
| Marriott International, Inc. notes 6 3/8s, 2017 | | 926,000 | | 945,895 |
| Marriott International, Inc. sr. unsec. Ser. J, 5 5/8s, 2013 | | 150,000 | | 153,062 |
| Office Depot, Inc. notes 6 1/4s, 2013 | | 563,000 | | 598,803 |
| Omnicom Group, Inc. sr. notes 5.9s, 2016 | | 635,000 | | 660,430 |
| Starwood Hotels & Resorts Worldwide, Inc. sr. unsec | | | | |
| 6 1/4s, 2013 | | 1,445,000 | | 1,475,686 |
| Target Corp. bonds 6 1/2s, 2037 (S) | | 1,705,000 | | 1,673,964 |
| VF Corp. sr. unsec. 5.95s, 2017 | | 730,000 | | 736,907 |
| | | | | 15,187,667 |
|
| |
| Consumer Staples (0.8%) | | | | |
| Campbell Soup Co. debs. 8 7/8s, 2021 | | 855,000 | | 1,168,863 |
| ConAgra Foods, Inc. unsec. notes 7 7/8s, 2010 | | 2,750,000 | | 2,999,783 |
| Cox Enterprises, Inc. 144A notes 7 7/8s, 2010 | | 1,045,000 | | 1,131,571 |
| CVS Caremark, Corp. sr. unsec. FRN 6.302s, 2037 | | 1,715,000 | | 1,597,848 |
| CVS Caremark, Corp. 144A pass-through certificates | | | | |
| 6.117s, 2013 | | 1,981,595 | | 2,007,178 |
| Delhaize Group sr. unsub. 6 1/2s, 2017 (Belgium) | | 565,000 | | 577,409 |
| Diageo Capital PLC company guaranty 5 3/4s, 2017 | | | | |
| (United Kingdom) | | 925,000 | | 949,211 |
| Diageo Capital PLC company guaranty 5.2s, 2013 | | | | |
| (United Kingdom) | | 395,000 | | 406,043 |
| Diageo PLC company guaranty 8s, 2022 | | 760,000 | | 923,924 |
| Estee Lauder Cos., Inc. (The) sr. unsec. 6s, 2037 | | 1,040,000 | | 1,011,948 |
| Estee Lauder Cos., Inc. (The) sr. unsec. 5.55s, 2017 | | 280,000 | | 286,289 |
| General Mills, Inc. sr. unsub. 5.65s, 2012 | | 1,470,000 | | 1,527,052 |
| Kellogg Co. sr. unsub. 5 1/8s, 2012 | | 165,000 | | 171,314 |
| Kroger Co. company guaranty 6 3/4s, 2012 | | 275,000 | | 295,670 |
| Kroger Co. company guaranty 6.4s, 2017 | | 995,000 | | 1,057,667 |
57
| | | | |
| CORPORATE BONDS AND NOTES (9.0%)* continued | | | | |
| |
| | | Principal amount | | Value |
|
| Consumer Staples continued | | | | |
| McDonald’s Corp. sr. unsec. 6.3s, 2037 | $ | 860,000 | $ | 880,980 |
| McDonald’s Corp. sr. unsec. 5.8s, 2017 | | 435,000 | | 461,121 |
| News America Holdings, Inc. company guaranty 7 3/4s, 2024 | | 1,045,000 | | 1,163,752 |
| News America Holdings, Inc. debs. 7 3/4s, 2045 | | 1,955,000 | | 2,108,575 |
| PepsiCo, Inc. sr. unsec. 4.65s, 2013 | | 845,000 | | 879,855 |
| Sara Lee Corp. notes 6 1/4s, 2011 | | 865,000 | | 920,815 |
| Tesco PLC 144A notes 6.15s, 2037 (United Kingdom) | | 1,710,000 | | 1,644,016 |
| Viacom, Inc. sr. notes 5 3/4s, 2011 | | 610,000 | | 625,163 |
| Walt Disney Co. (The) sr. unsec. 4.7s, 2012 | | 2,115,000 | | 2,162,478 |
| Yum! Brands, Inc. sr. unsec. 6 7/8s, 2037 | | 775,000 | | 753,327 |
| Yum! Brands, Inc. sr. unsec. 6 1/4s, 2018 | | 660,000 | | 680,418 |
| | | | | 28,392,270 |
|
| |
| Energy (0.4%) | | | | |
| Anadarko Petroleum Corp. sr. notes 6.45s, 2036 | | 730,000 | | 744,839 |
| Anadarko Petroleum Corp. sr. notes 5.95s, 2016 | | 355,000 | | 364,850 |
| Chesapeake Energy Corp. sr. unsec. notes 7 5/8s, 2013 | | 1,010,000 | | 1,042,825 |
| Enterprise Products Operating LP company guaranty FRB | | | | |
| 8 3/8s, 2066 | | 1,945,000 | | 1,943,683 |
| Enterprise Products Operating LP company guaranty FRB | | | | |
| 7.034s, 2068 | | 55,000 | | 48,859 |
| EOG Resources, Inc. sr. unsec 5 7/8s, 2017 | | 645,000 | | 676,272 |
| Forest Oil Corp. sr. notes 8s, 2011 | | 610,000 | | 632,875 |
| Hess Corp. bonds 7 7/8s, 2029 | | 1,160,000 | | 1,383,459 |
| Motiva Enterprises, LLC 144A sr. notes 5.2s, 2012 | | 225,000 | | 238,700 |
| Newfield Exploration Co. sr. sub. notes 6 5/8s, 2016 | | 650,000 | | 641,875 |
| Nexen, Inc. bonds 6.4s, 2037 (Canada) | | 595,000 | | 575,701 |
| Peabody Energy Corp. sr. notes 5 7/8s, 2016 | | 805,000 | | 748,650 |
| Premcor Refining Group, Inc. sr. notes 7 1/2s, 2015 | | 1,330,000 | | 1,400,586 |
| Sunoco, Inc. notes 4 7/8s, 2014 | | 590,000 | | 574,384 |
| Tesoro Corp. company guaranty 6 1/2s, 2017 (S) | | 1,025,000 | | 999,375 |
| Valero Energy Corp. sr. notes 6 1/8s, 2017 | | 160,000 | | 164,373 |
| Valero Energy Corp. sr. unsec. notes 7 1/2s, 2032 | | 755,000 | | 812,486 |
| Weatherford International, Inc. company guaranty sr. unsec. | | | | |
| unsub. bonds 6.8s, 2037 | | 245,000 | | 253,895 |
| Weatherford International, Inc. company guaranty sr. unsec. | | | | |
| unsub. bonds 6.35s, 2017 | | 280,000 | | 294,697 |
| Weatherford International, Ltd. company guaranty 6 1/2s, 2036 | | 855,000 | | 850,597 |
| Weatherford International, Ltd. sr. notes 5 1/2s, 2016 | | 455,000 | | 459,398 |
| | | | | 14,852,379 |
|
| |
| Financial (3.7%) | | | | |
| AGFC Capital Trust I company guaranty 6s, 2067 | | 620,000 | | 575,780 |
| American Express Bank FSB notes Ser. BKN1, 5.55s, 2012 | | 2,465,000 | | 2,556,799 |
| American Express Co. sr. unsec. notes 6.15s, 2017 | | 1,275,000 | | 1,316,370 |
| American International Group, Inc. jr. sub. bond 6 1/4s, 2037 | | 2,075,000 | | 1,834,745 |
| Ameriprise Financial, Inc. jr. sub. FRN 7.518s, 2066 | | 1,740,000 | | 1,711,541 |
| Amvescap PLC company guaranty 5 5/8s, 2012 | | 520,000 | | 516,432 |
| Bank of New York Mellon Corp./The sr. unsec. 4.95s, 2012 | | 600,000 | | 615,158 |
58
| | | | |
| CORPORATE BONDS AND NOTES (9.0%)* continued | | | | |
| |
| | | Principal amount | | Value |
|
| Financial continued | | | | |
| Barclays Bank PLC FRB 6.278s, 2049 (United Kingdom) (S) | $ | 1,110,000 | $ | 959,129 |
| Bear Stearns Cos., Inc. (The) notes Ser. MTN, 6.95s, 2012 | | 1,715,000 | | 1,774,946 |
| Bear Stearns Cos., Inc. (The) sr. notes 6.4s, 2017 (S) | | 1,590,000 | | 1,531,249 |
| Bear Stearns Cos., Inc. (The) sr. unsec. notes 7 1/4s, 2018 | | 645,000 | | 644,976 |
| Bosphorus Financial Services, Ltd. 144A sec. sr. notes FRN | | | | |
| 6.669s, 2012 (Cayman Islands) | | 2,378,000 | | 2,358,305 |
| Brandywine Operating Partnership LP sr. unsec. 5.7s, 2017 (R) | | 840,000 | | 765,850 |
| Camden Property Trust notes 5.7s, 2017 (R) | | 785,000 | | 718,123 |
| Capital One Capital III company guaranty 7.686s, 2036 | | 1,790,000 | | 1,354,869 |
| Chubb Corp. (The) sr. notes 6s, 2037 | | 670,000 | | 630,033 |
| CIT Group, Inc. jr. sub. FRN 6.1s, 2067 | | 3,330,000 | | 2,369,578 |
| CIT Group, Inc. sr. notes 5.4s, 2013 | | 155,000 | | 136,953 |
| CIT Group, Inc. sr. notes 5s, 2015 | | 170,000 | | 139,029 |
| CIT Group, Inc. sr. notes 5s, 2014 (S) | | 1,210,000 | | 1,009,865 |
| Citigroup, Inc. sub. notes 5s, 2014 | | 4,045,000 | | 3,937,613 |
| CNA Financial Corp. unsec. notes 6 1/2s, 2016 | | 730,000 | | 745,842 |
| CNA Financial Corp. unsec. notes 6s, 2011 | | 730,000 | | 755,090 |
| Colonial Properties Trust notes 6 1/4s, 2014 (R) | | 730,000 | | 690,263 |
| Credit Suisse Guernsey Ltd. jr. sub. FRN 5.86s, 2049 (Guernsey) | | 1,416,000 | | 1,299,367 |
| Deutsche Bank Capital Funding Trust VII 144A FRB | | | | |
| 5.628s, 2049 | | 1,145,000 | | 1,052,761 |
| Developers Diversified Realty Corp. unsec. notes 5 3/8s, 2012 (R) | | 385,000 | | 355,956 |
| Dresdner Funding Trust I 144A bonds 8.151s, 2031 | | 1,250,000 | | 1,249,711 |
| Duke Realty LP sr. unsec 6 1/2s, 2018 | | 1,445,000 | | 1,396,331 |
| Equity One, Inc. notes 5 3/8s, 2015 (R) | | 695,000 | | 663,567 |
| Erac USA Finance Co. 144A company guaranty 6 3/8s, 2017 R | | 1,120,000 | | 1,102,033 |
| ERP Operating LP notes 5 3/4s, 2017 | | 840,000 | | 773,804 |
| Fleet Capital Trust V bank guaranty FRN 5.966s, 2028 | | 935,000 | | 909,019 |
| Fund American Cos., Inc. notes 5 7/8s, 2013 | | 1,370,000 | | 1,421,106 |
| GATX Financial Corp. notes 5.8s, 2016 | | 560,000 | | 539,401 |
| General Electric Capital Corp. sr. unsec 5 5/8s, 2017 | | 3,520,000 | | 3,633,210 |
| General Electric Capital Corp. sr. unsec. 5 7/8s, 2038 | | 2,880,000 | | 2,814,440 |
| General Electric Capital Corp. sub. notes FRN 6 3/8s, 2067 | | 1,420,000 | | 1,476,259 |
| GMAC LLC bonds 8s, 2031 (S) | | 845,000 | | 700,301 |
| GMAC LLC notes 7s, 2012 | | 845,000 | | 727,479 |
| GMAC LLC unsub. notes FRN 6.119s, 2009 | | 2,920,000 | | 2,726,074 |
| Goldman Sachs Group, Inc (The) sub. notes 6 3/4s, 2037 | | 2,990,000 | | 2,924,041 |
| Goldman Sachs Group, Inc. (The) sr. notes 5.45s, 2012 (S) | | 1,210,000 | | 1,262,104 |
| HCP, Inc. sr. unsec. Ser. MTN, 6.7s, 2018 (R) | | 1,015,000 | | 943,822 |
| Health Care REIT, Inc. sr. notes 6s, 2013 (R) | | 385,000 | | 363,270 |
| Highwood Properties, Inc. sr. unsec. bonds 5.85s, 2017 (R) | | 1,005,000 | | 899,541 |
| Hospitality Properties Trust notes 6 3/4s, 2013 (R) | | 780,000 | | 812,995 |
| Hospitality Properties Trust sr. unsec. 6.7s, 2018 (R) | | 565,000 | | 543,330 |
| HRPT Properties Trust bonds 5 3/4s, 2014 (R) | | 530,000 | | 498,119 |
| HRPT Properties Trust notes 6 1/4s, 2016 (R) | | 525,000 | | 497,636 |
| HSBC Finance Capital Trust IX FRN 5.911s, 2035 | | 3,300,000 | | 3,069,855 |
| HSBC Holdings PLC sub. notes 6 1/2s, 2037 (United Kingdom) (S) | | 3,555,000 | | 3,481,525 |
| ILFC E-Capital Trust II 144A FRB 6 1/4s, 2065 | | 2,560,000 | | 2,439,120 |
| iStar Financial, Inc. sr. unsec. notes 5 7/8s, 2016 (R) | | 1,630,000 | | 1,340,158 |
59
| | | | |
| CORPORATE BONDS AND NOTES (9.0%)* continued | | | | |
| |
| | | Principal amount | | Value |
|
| Financial continued | | | | |
| JPMorgan Chase & Co. sr. notes 6s, 2018 ## | $ | 2,665,000 | $ | 2,765,742 |
| JPMorgan Chase Capital XVIII bonds Ser. R, 6.95s, 2036 | | 1,996,000 | | 1,923,691 |
| JPMorgan Chase Capital XXV bonds 6.8s, 2037 | | 780,000 | | 737,162 |
| Kimco Realty Corp. sr. sub. notes 5.7s, 2017 (R) | | 600,000 | | 563,220 |
| Lehman Brothers Holdings, Inc. sr. unsec. notes 5 5/8s, 2013 | | 925,000 | | 939,619 |
| Lehman Brothers Holdings, Inc. sr. unsec. notes Ser. I, 6.2s, 2014 | | 1,660,000 | | 1,708,402 |
| Lehman Brothers Holdings, Inc. sub. notes 6 3/4s, 2017 | | 3,295,000 | | 3,415,765 |
| Lehman Brothers Holdings, Inc. sub. notes 5 3/4s, 2017 | | 160,000 | | 156,610 |
| Liberty Mutual Insurance 144A notes 7.697s, 2097 | | 2,160,000 | | 2,029,679 |
| Lincoln National Corp. FRB 7s, 2066 | | 787,000 | | 782,696 |
| Lincoln National Corp. sr. unsec. 6.3s, 2037 | | 480,000 | | 459,787 |
| Loews Corp. notes 5 1/4s, 2016 | | 510,000 | | 510,303 |
| Marsh & McLennan Cos., Inc. sr. unsec. notes 6 1/4s, 2012 | | 1,620,000 | | 1,705,980 |
| Marsh & McLennan Cos., Inc. sr. unsec. notes 5 3/8s, 2014 | | 980,000 | | 983,471 |
| Merrill Lynch & Co., Inc. notes 5.45s, 2013 | | 2,775,000 | | 2,776,343 |
| MetLife Capital Trust IV jr. sub. debs. 7 7/8s, 2067 | | 6,400,000 | | 6,314,342 |
| Nationwide Financial Services, Inc. notes 5 5/8s, 2015 | | 465,000 | | 491,447 |
| Nationwide Health Properties, Inc. notes 6 1/2s, 2011 (R) | | 650,000 | | 689,734 |
| Nationwide Health Properties, Inc. unsec. notes 6 1/4s, 2013 (R) | | 1,130,000 | | 1,148,874 |
| Nationwide Mutual Insurance Co. 144A notes 8 1/4s, 2031 | | 375,000 | | 448,732 |
| NB Capital Trust IV company guaranty 8 1/4s, 2027 (S) | | 5,540,000 | | 5,764,453 |
| Nuveen Investments, Inc. sr. notes 5 1/2s, 2015 | | 505,000 | | 343,400 |
| OneAmerica Financial Partners, Inc. 144A bonds 7s, 2033 | | 1,240,000 | | 1,324,879 |
| ProLogis Trust sr. notes 5 3/4s, 2016 (R) | | 905,000 | | 839,746 |
| Prudential Financial, Inc. notes Ser. MTN, 6s, 2017 | | 845,000 | | 864,465 |
| Prudential Holdings LLC 144A bonds 8.695s, 2023 | | 1,510,000 | | 1,868,353 |
| RBS Capital Trust IV company guaranty FRN 5.63s, 2049 | | 1,290,000 | | 1,100,668 |
| Regency Centers LP sr. unsec. 5 7/8s, 2017 | | 650,000 | | 626,576 |
| Rouse Co LP/TRC Co-Issuer Inc. 144A sr. notes 6 3/4s, 2013 (R) | | 695,000 | | 658,405 |
| Rouse Co. (The) notes 7.2s, 2012 (R) | | 645,000 | | 617,979 |
| Royal Bank of Scotland Group PLC FRB 7.648s, 2049 | | | | |
| (United Kingdom) | | 400,000 | | 415,314 |
| Royal Bank of Scotland Group PLC jr. sub. notes FRN Ser. MTN, | | | | |
| 7.64s, 2049 (United Kingdom) | | 700,000 | | 723,808 |
| Simon Property Group LP unsub. bonds 5 3/4s, 2015 (R) | | 371,000 | | 354,987 |
| SLM Corp. notes Ser. MTNA, 4 1/2s, 2010 | | 1,285,000 | | 1,183,157 |
| Sovereign Bancorp, Inc. sr. notes 4.8s, 2010 | | 730,000 | | 715,017 |
| Swiss Re Capital I LP 144A FRN 6.854s, 2049 (United Kingdom) | | 850,000 | | 844,300 |
| Travelers Cos., Inc. (The) sr. unsec. notes 6 1/4s, 2037 | | 730,000 | | 717,862 |
| Tyco Electronics Group S company guaranty 6s, 2012 | | | | |
| (Luxembourg) | | 1,150,000 | | 1,202,797 |
| UBS AG/Jersey Branch FRN 7.926s, 2008 (Jersey) | | 3,020,000 | | 3,065,300 |
| Unitrin, Inc. sr. notes 6s, 2017 | | 740,000 | | 727,691 |
| Wachovia Bank NA sub. notes Ser. BKNT, 6s, 2017 | | 2,310,000 | | 2,359,824 |
| Wachovia Corp. notes 5 3/4s, 2018 | | 415,000 | | 411,288 |
| Washington Mutual Bank/Henderson NV sub. notes Ser. BKNT, | | | | |
| 5.95s, 2013 | | 1,030,000 | | 939,318 |
| Wells Fargo & Co. sr.not 4 3/8s, 2013 | | 2,120,000 | | 2,119,430 |
60
| | | | |
| CORPORATE BONDS AND NOTES (9.0%)* continued | | | | |
| |
| | | Principal amount | | Value |
|
| Financial continued | | | | |
| Westfield Group sr. notes 5.7s, 2016 (Australia) | $ | 875,000 | $ | 827,690 |
| Westpac Capital Trust III 144A sub. notes FRN 5.819s, | | | | |
| 2049 (Australia) | | 1,010,000 | | 968,136 |
| Willis Group North America, Inc. company guaranty 6.2s, 2017 | | 605,000 | | 615,921 |
| ZFS Finance USA Trust I 144A bonds FRB 6 1/2s, 2037 | | 2,130,000 | | 2,011,023 |
| | | | | 136,328,259 |
|
| |
| Health Care (0.3%) | | | | |
| Aetna, Inc. sr. unsec. 6 3/4s, 2037 | | 5,050,000 | | 5,084,103 |
| AstraZeneca PLC sr. unsub. 5.9s, 2017 (United Kingdom) | | 1,805,000 | | 1,911,273 |
| Bayer Corp. 144A FRB 6.2s, 2008 | | 845,000 | | 845,549 |
| Covidien International Finance SA 144A company guaranty 6.55s, | | | | |
| 2037 (Luxembourg) | | 505,000 | | 514,606 |
| Covidien International Finance SA 144A company guaranty 6s, | | | | |
| 2017 (Luxembourg) | | 585,000 | | 616,165 |
| Hospira, Inc. sr. notes 6.05s, 2017 | | 560,000 | | 578,211 |
| Hospira, Inc. sr. notes 5.55s, 2012 | | 785,000 | | 817,061 |
| UnitedHealth Group, Inc. 144A bonds 5 1/2s, 2012 | | 755,000 | | 782,814 |
| Ventas Realty LP/Capital Corp. sr. notes 6 3/4s, 2017 (R) | | 470,000 | | 472,350 |
| | | | | 11,622,132 |
|
| |
| Technology (0.2%) | | | | |
| Arrow Electronics, Inc. debs. 7 1/2s, 2027 | | 760,000 | | 807,758 |
| Avnet, Inc. notes 6s, 2015 | | 765,000 | | 778,200 |
| Fiserv, Inc. company guaranty 6.8s, 2017 | | 760,000 | | 798,123 |
| Fiserv, Inc. company guaranty 6 1/8s, 2012 | | 760,000 | | 790,714 |
| IBM Corp. sr. unsec 5.7s, 2017 | | 1,820,000 | | 1,910,571 |
| Motorola, Inc. sr. unsec. 6 5/8s, 2037 | | 1,160,000 | | 1,017,124 |
| Motorola, Inc. sr. unsec. 6s, 2017 | | 530,000 | | 507,805 |
| Xerox Corp. sr. notes 6.4s, 2016 | | 1,030,000 | | 1,060,332 |
| | | | | 7,670,627 |
|
| |
| Transportation (0.2%) | | | | |
| American Airlines, Inc. pass-through certificates Ser. 01-1, | | | | |
| 6.817s, 2011 | | 100,000 | | 95,250 |
| American Airlines, Inc. pass-through certificates Ser. 01-2, | | | | |
| 7.858s, 2011 | | 525,000 | | 540,750 |
| Continental Airlines, Inc. pass-through certificates Ser. 98-3, | | | | |
| 6.32s, 2008 | | 2,895,000 | | 2,880,525 |
| Delta Air Lines, Inc. 144A collateralized 6.821s, 2022 | | 925,000 | | 878,750 |
| Northwest Airlines Corp. pass-through certificates Ser. 00-1, | | | | |
| 7.15s, 2019 | | 1,545,189 | | 1,552,915 |
| Southwest Airlines Co. pass-through certificates 6.15s, 2022 | | 860,000 | | 889,401 |
| Union Pacific Corp. sr. unsub. 5 3/4s, 2017 | | 750,000 | | 756,062 |
| Union Pacific Corp. 144A pass-through certificates 5.214s, 2014 | | 590,000 | | 613,954 |
| United AirLines, Inc. pass-through certificates 6.636s, 2022 | | 695,564 | | 655,569 |
| | | | | 8,863,176 |
61
| | | | |
| CORPORATE BONDS AND NOTES (9.0%)* continued | | | | |
| |
| | | Principal amount | | Value |
| |
| Utilities & Power (1.3%) | | | | |
| AEP Texas North Co. sr. notes Ser. B, 5 1/2s, 2013 | $ | 905,000 | $ | 932,898 |
| American Water Capital Corp. 144A bonds 6.593s, 2037 | | 455,000 | | 451,608 |
| American Water Capital Corp. 144A bonds 6.085s, 2017 | | 510,000 | | 522,898 |
| Appalachian Power Co. sr. notes 5.8s, 2035 | | 510,000 | | 467,313 |
| Arizona Public Services Co. notes 6 1/2s, 2012 | | 1,040,000 | | 1,104,371 |
| Atmos Energy Corp. sr. unsub. 6.35s, 2017 | | 905,000 | | 931,530 |
| Beaver Valley II Funding debs. 9s, 2017 | | 1,436,000 | | 1,543,700 |
| Boardwalk Pipelines LP company guaranty 5 7/8s, 2016 | | 1,950,000 | | 1,967,831 |
| Bruce Mansfield Unit pass-through certificates 6.85s, 2034 | | 2,390,000 | | 2,635,567 |
| CenterPoint Energy Houston Electric, LLC general ref. mtge. | | | | |
| Ser. M2, 5 3/4s, 2014 | | 110,000 | | 112,571 |
| CenterPoint Energy Resources Corp. notes 7 3/4s, 2011 | | 1,060,000 | | 1,151,573 |
| CenterPoint Energy Resources Corp. sr. unsec. 6 1/8s, 2017 | | 480,000 | | 493,601 |
| CMS Energy Corp. unsub. notes 6.55s, 2017 | | 50,000 | | 48,813 |
| Commonwealth Edison Co. 1st mtge. 6.15s, 2017 | | 275,000 | | 286,322 |
| Commonwealth Edison Co. 1st mtge. 5.9s, 2036 | | 1,145,000 | | 1,068,987 |
| Consolidated Natural Gas Co. sr. notes 5s, 2014 | | 530,000 | | 521,373 |
| Dayton Power & Light Co. (The) 1st mtge. 5 1/8s, 2013 | | 975,000 | | 999,834 |
| Dominion Resources, Inc. jr. sub. notes FRN 6.3s, 2066 | | 3,085,000 | | 2,929,936 |
| Duke Energy Carolinas LLC 1st mtge. 6s, 2038 | | 605,000 | | 611,555 |
| El Paso Natural Gas Co. sr. unsec. 5.95s, 2017 | | 120,000 | | 120,527 |
| Entergy Gulf States, Inc. 1st mtge. 5 1/4s, 2015 | | 985,000 | | 957,201 |
| Florida Power Corp. 1st mtge. 6.35s, 2037 | | 1,040,000 | | 1,097,214 |
| Indianapolis Power & Light 144A 1st mtge. 6.3s, 2013 | | 515,000 | | 547,192 |
| Indiantown Cogeneration LP 1st mtge. Ser. A-10, 9.77s, 2020 | | 775,000 | | 887,088 |
| Ipalco Enterprises, Inc. sec. notes 8 3/8s, 2008 | | 280,000 | | 285,600 |
| ITC Holdings Corp. 144A notes 5 7/8s, 2016 | | 1,090,000 | | 1,085,451 |
| ITC Holdings Corp. 144A sr. unsec. notes 6.05s, 2018 | | 365,000 | | 365,209 |
| Kansas Gas & Electric bonds 5.647s, 2021 | | 388,342 | | 395,849 |
| Kinder Morgan, Inc. notes 6s, 2017 | | 545,000 | | 551,048 |
| Kinder Morgan, Inc. sr. notes 6 1/2s, 2012 | | 685,000 | | 676,438 |
| MidAmerican Energy Holdings Co. bonds 6 1/8s, 2036 | | 2,345,000 | | 2,330,133 |
| MidAmerican Energy Holdings Co. sr. unsec. 6 1/2s, 2037 | | 380,000 | | 392,605 |
| National Fuel Gas Co. notes 5 1/4s, 2013 | | 545,000 | | 555,730 |
| Nevada Power Co. general ref. mtge. Ser. L, 5 7/8s, 2015 | | 525,000 | | 528,513 |
| Northwestern Corp. sec. notes 5 7/8s, 2014 | | 1,090,000 | | 1,092,226 |
| Oncor Electric Delivery Co. debs. 7s, 2022 | | 675,000 | | 693,480 |
| Oncor Electric Delivery Co. sec. notes 7 1/4s, 2033 | | 820,000 | | 863,777 |
| Pacific Gas & Electric Co. sr. unsub. 5.8s, 2037 | | 775,000 | | 746,013 |
| Pacific Gas & Electric Co. unsec. bonds 4.2s, 2011 | | 95,000 | | 95,380 |
| PacifiCorp Sinking Fund 1st mtge. 6 1/4s, 2037 | | 520,000 | | 537,718 |
| Potomac Edison Co. 144A 1st mtge. 5.8s, 2016 | | 1,085,000 | | 1,134,654 |
| Power Receivable Finance, LLC 144A sr. notes 6.29s, 2012 | | 856,129 | | 907,068 |
| PPL Energy Supply LLC bonds Ser. A, 5.7s, 2015 | | 640,000 | | 635,385 |
| Public Service Co. of Colorado sr. notes Ser. A, 6 7/8s, 2009 | | 375,000 | | 389,883 |
| Public Service Co. of New Mexico sr. notes 4.4s, 2008 | | 570,000 | | 570,058 |
| Puget Sound Energy, Inc. jr. sub. FRN Ser. A, 6.974s, 2067 | | 1,185,000 | | 1,106,757 |
| Sierra Pacific Power Co. general ref. mtge. Ser. P, 6 3/4s, 2037 (S) | | 1,760,000 | | 1,807,383 |
| Southern California Edison Co. 1st mtge. Ser. 06-E, 5.55s, 2037 | | 895,000 | | 845,584 |
62
| | | | |
| CORPORATE BONDS AND NOTES (9.0%)* continued | | | | |
| |
| | | Principal amount | | Value |
|
| Utilities & Power continued | | | | |
| Southern California Edison Co. notes 6.65s, 2029 | $ | 1,030,000 | $ | 1,087,611 |
| Southern Natural Gas. Co. 144A notes 5.9s, 2017 | | 460,000 | | 460,298 |
| Spectra Energy Capital, LLC sr. notes 8s, 2019 | | 780,000 | | 902,997 |
| Teco Finance, Inc. unsub. notes 7.2s, 2011 | | 1,070,000 | | 1,157,509 |
| TEPPCO Partners LP company guaranty FRB 7s, 2067 | | 595,000 | | 525,674 |
| TransAlta Corp. notes 5 3/4s, 2013 (Canada) | | 665,000 | | 685,393 |
| TransCanada Pipelines, Ltd. jr. sub. FRN 6.35s, 2067 (Canada) | | 520,000 | | 484,203 |
| TransCanada Pipelines, Ltd. sr. unsec. 6.2s, 2037 (Canada) | | 890,000 | | 882,499 |
| West Penn Power Co. 1st mtge. 5.95s, 2017 | | 995,000 | | 1,018,036 |
| Westar Energy, Inc. 1st mtge. 5.15s, 2017 | | 75,000 | | 73,757 |
| Westar Energy, Inc. 1st mtge. 5.1s, 2020 | | 800,000 | | 772,386 |
| | | | | 49,033,808 |
|
| |
| Total corporate bonds and notes (cost $338,428,389) | | | $ | 334,976,492 |
| |
| |
| |
| ASSET-BACKED SECURITIES (5.1%)* | | | | |
| |
| | | Principal amount | | Value |
|
| Accredited Mortgage Loan Trust | | | | |
| FRB Ser. 05-1, Class M2, 4.066s, 2035 | $ | 349,000 | $ | 282,690 |
| FRB Ser. 05-4, Class A2C, 3.586s, 2035 | | 302,000 | | 275,243 |
| Ace Securities Corp. | | | | |
| FRB Ser. 06-OP2, Class A2C, 3.526s, 2036 | | 759,000 | | 538,890 |
| FRB Ser. 06-HE3, Class A2C, 3.526s, 2036 | | 1,021,000 | | 880,689 |
| Advanta Business Card Master Trust FRB Ser. 04-C1, Class C, | | | | |
| 4.984s, 2013 | | 210,000 | | 193,425 |
| Aegis Asset Backed Securities Trust 144A | | | | |
| Ser. 04-5N, Class Note, 5s, 2034 | | 70,213 | | 22 |
| Ser. 04-6N, Class Note, 4 3/4s, 2035 | | 59,595 | | 19 |
| AFC Home Equity Loan Trust Ser. 99-2, Class 1A, 5.275s, 2029 | | 2,387,862 | | 2,394,726 |
| American Express Credit Account Master Trust 144A Ser. 04-C, | | | | |
| Class C, 4.736s, 2012 | | 2,781,117 | | 2,745,483 |
| Ameriquest Mortgage Securities, Inc. | | | | |
| FRB Ser. 06-R1, Class M10, 5.876s, 2036 | | 902,000 | | 90,200 |
| FRB Ser. 03-8, Class M2, 5.126s, 2033 | | 535,151 | | 133,788 |
| AMP CMBS 144A FRB Ser. 06-1A, Class A, 5.741s, 2047 | | | | |
| (Cayman Islands) (F) | | 1,910,000 | | 1,243,421 |
| Arcap REIT, Inc. 144A | | | | |
| Ser. 03-1A, Class E, 7.11s, 2038 | | 1,283,000 | | 1,267,421 |
| Ser. 04-1A, Class E, 6.42s, 2039 | | 1,112,000 | | 1,020,144 |
| Argent Securities, Inc. | | | | |
| FRB Ser. 03-W3, Class M3, 6.785s, 2033 | | 59,215 | | 10,659 |
| FRB Ser. 06-W4, Class A2C, 3.536s, 2036 | | 1,813,000 | | 1,504,790 |
| Asset Backed Funding Certificates | | | | |
| FRB Ser. 04-OPT2, Class M2, 4.376s, 2033 | | 551,000 | | 429,780 |
| FRB Ser. 05-WMC1, Class M1, 3.816s, 2035 | | 564,000 | | 487,860 |
| Asset Backed Funding Corp. NIM Trust 144A FRB Ser. 05-OPT1, | | | | |
| Class B1, 5.876s, 2035 | | 407,000 | | 147,448 |
63
| | | | |
| ASSET-BACKED SECURITIES (5.1%)* continued | | | | |
| |
| | | Principal amount | | Value |
|
| Asset Backed Securities Corp. Home Equity Loan Trust | | | | |
| FRB Ser. 06-HE2, Class A3, 3.566s, 2036 | $ | 483,917 | $ | 442,371 |
| FRB Ser. 06-HE4, Class A5, 3.536s, 2036 | | 1,346,000 | | 1,084,868 |
| FRB Ser. 06-HE7, Class A4, 3.516s, 2036 | | 529,000 | | 444,857 |
| Aviation Capital Group Trust 144A FRB Ser. 03-2A, Class G1, | | | | |
| 4.634s, 2033 | | 866,373 | | 840,382 |
| Bank One Issuance Trust FRB Ser. 03-C4, Class C4, | | | | |
| 5.266s, 2011 (F) | | 210,000 | | 208,568 |
| Bay View Auto Trust Ser. 05-LJ2, Class D, 5.27s, 2014 | | 420,000 | | 404,641 |
| Bayview Financial Acquisition Trust | | | | |
| Ser. 04-B, Class A1, 5.355s, 2039 | | 4,211,489 | | 4,074,519 |
| FRB Ser. 04-D, Class A, 3.675s, 2044 | | 1,297,362 | | 1,128,705 |
| Bayview Financial Acquisition Trust 144A FRN Ser. 04-B, | | | | |
| Class M2, 5.185s, 2039 | | 200,000 | | 185,485 |
| Bayview Financial Asset Trust 144A | | | | |
| FRB Ser. 03-SSRA, Class M, 4.726s, 2038 | | 753,423 | | 693,150 |
| FRB Ser. 03-SSRA, Class A, 4.076s, 2038 | | 635,459 | | 611,947 |
| FRB Ser. 04-SSRA, Class A1, 3.976s, 2039 | | 840,075 | | 806,472 |
| Bear Stearns Asset Backed Securities, Inc. | | | | |
| FRB Ser. 06-EC1, Class M9, 5.376s, 2035 | | 698,000 | | 70,673 |
| FRB Ser. 06-PC1, Class M9, 5.126s, 2035 | | 414,000 | | 58,478 |
| FRB Ser. 05-HE1, Class M3, 4.306s, 2035 | | 489,000 | | 371,640 |
| FRB Ser. 03-3, Class A2, 3.966s, 2043 | | 2,095,155 | | 1,919,358 |
| FRB Ser. 03-1, Class A1, 3.876s, 2042 | | 518,761 | | 480,259 |
| FRB Ser. 05-3, Class A1, 3.826s, 2035 | | 490,254 | | 422,099 |
| Bear Stearns Asset Backed Securities, Inc. 144A FRB Ser. 06-HE2, | | | | |
| Class M10, 5.626s, 2036 | | 251,000 | | 35,454 |
| Capital Auto Receivables Asset Trust 144A | | | | |
| Ser. 06-1, Class D, 7.16s, 2013 | | 500,000 | | 507,207 |
| Ser. 05-1, Class D, 6 1/2s, 2011 | | 1,442,000 | | 1,445,042 |
| CARMAX Auto Owner Trust Ser. 04-2, Class D, 3.67s, 2011 | | 93,746 | | 92,569 |
| Chase Credit Card Master Trust FRB Ser. 03-3, Class C, | | | | |
| 5.316s, 2010 | | 1,730,000 | | 1,721,068 |
| Chase Funding Net Interest Margin 144A Ser. 04-OPT1, | | | | |
| Class Note, 4.458s, 2034 | | 23,074 | | 21,228 |
| Citigroup Mortgage Loan Trust, Inc. FRB Ser. 05-OPT1, Class M1, | | | | |
| 3.796s, 2035 | | 359,000 | | 281,068 |
| Conseco Finance Securitizations Corp. | | | | |
| Ser. 02-2, Class A, IO, 8 1/2s, 2033 | | 5,849,966 | | 572,805 |
| Ser. 00-4, Class A6, 8.31s, 2032 | | 8,211,545 | | 6,815,582 |
| Ser. 00-5, Class A6, 7.96s, 2032 | | 3,727,000 | | 3,185,750 |
| Ser. 02-1, Class M1F, 7.954s, 2033 | | 1,004,000 | | 990,457 |
| Ser. 01-4, Class A4, 7.36s, 2033 | | 4,996,199 | | 5,175,433 |
| Ser. 00-6, Class A5, 7.27s, 2031 | | 1,007,776 | | 962,075 |
| Ser. 01-1, Class A5, 6.99s, 2032 | | 6,653,163 | | 6,496,813 |
| Ser. 01-3, Class A4, 6.91s, 2033 | | 7,266,471 | | 7,168,439 |
| Ser. 02-1, Class A, 6.681s, 2033 | | 5,556,480 | | 5,851,877 |
64
| | | | |
| ASSET-BACKED SECURITIES (5.1%)* continued | | | | |
| |
| | | Principal amount | | Value |
|
| Countrywide Asset Backed Certificates | | | | |
| FRB Ser. 05-BC3, Class M1, 3.896s, 2035 | $ | 332,000 | $ | 282,200 |
| FRB Ser. 04-6, Class 2A5, 3.766s, 2034 | | 888,046 | | 754,839 |
| FRB Ser. 05-14, Class 3A2, 3.616s, 2036 | | 227,982 | | 213,913 |
| Countrywide Asset Backed NIM Certificates 144A | | | | |
| Ser. 04-BC1N, Class Note, 5 1/2s, 2035 (F) | | 833 | | 167 |
| Credit-Based Asset Servicing and Securitization 144A | | | | |
| Ser. 06-MH1, Class B1, 6 1/4s, 2036 | | 359,000 | | 287,351 |
| Crest, Ltd. 144A Ser. 03-2A, Class D2, 6.723s, 2038 | | | | |
| (Cayman Islands) | | 1,617,000 | | 1,245,090 |
| CS First Boston Mortgage Securities Corp. 144A Ser. 04-FR1N, | | | | |
| Class A, 5s, 2034 | | 170,790 | | 93,934 |
| DB Master Finance, LLC 144A Ser. 06-1, Class M1, 8.285s, 2031 | | 373,000 | | 365,204 |
| Equifirst Mortgage Loan Trust FRB Ser. 05-1, Class M5, | | | | |
| 4.046s, 2035 | | 201,000 | | 152,760 |
| Fieldstone Mortgage Investment Corp. FRB Ser. 05-1, Class M3, | | | | |
| 3.916s, 2035 | | 700,000 | | 632,258 |
| Finance America NIM Trust 144A Ser. 04-1, Class A, 5 1/4s, | | | | |
| 2034 (In default) † | | 78,556 | | 102 |
| First Franklin Mortgage Loan Asset Backed Certificates FRB | | | | |
| Ser. 06-FF7, Class 2A3, 3.526s, 2036 | | 1,203,000 | | 1,015,837 |
| First Plus Home Loan Trust Ser. 97-3, Class B1, 7.79s, 2023 | | 305,828 | | 296,653 |
| Fort Point CDO, Ltd. FRB Ser. 03-2A, Class A2, 6.174s, 2038 | | | | |
| (Cayman Islands) | | 616,000 | | 160,160 |
| Foxe Basin, Ltd. 144A FRB Ser. 03-1A, Class A1, 5.491s, 2015 | | | | |
| (Cayman Islands) | | 2,000,000 | | 1,949,600 |
| Fremont Home Loan Trust | | | | |
| FRB Ser. 05-E, Class 2A4, 3.706s, 2036 | | 1,688,000 | | 1,418,629 |
| FRB Ser. 06-2, Class 2A3, 3.546s, 2036 | | 3,141,000 | | 2,585,985 |
| Fremont NIM Trust 144A | | | | |
| Ser. 04-3, Class B, 7 1/2s, 2034 (In default) † | | 201,495 | | 504 |
| Ser. 04-3, Class A, 4 1/2s, 2034 (In default) † | | 5,626 | | 28 |
| G-Star, Ltd. 144A FRB Ser. 02-2A, Class BFL, 5.376s, 2037 | | | | |
| (Cayman Islands) | | 308,000 | | 279,695 |
| GE Corporate Aircraft Financing, LLC 144A | | | | |
| FRB Ser. 05-1A, Class C, 4.676s, 2019 | | 1,680,000 | | 1,438,080 |
| Ser. 04-1A, Class B, 4.226s, 2018 | | 73,747 | | 72,744 |
| Gears Auto Owner Trust 144A Ser. 05-AA, Class E1, 8.22s, 2012 | | 1,962,000 | | 1,899,699 |
| GEBL 144A | | | | |
| Ser. 04-2, Class D, 6.986s, 2032 | | 597,645 | | 418,351 |
| Ser. 04-2, Class C, 5.086s, 2032 | | 223,935 | | 167,951 |
| Green Tree Financial Corp. | | | | |
| Ser. 96-5, Class M1, 8.05s, 2027 | | 512,386 | | 489,049 |
| Ser. 99-5, Class A5, 7.86s, 2030 | | 15,340,053 | | 13,806,047 |
| Ser. 97-2, Class A7, 7.62s, 2028 | | 335,450 | | 365,277 |
| Ser. 97-4, Class A7, 7.36s, 2029 | | 517,806 | | 527,268 |
| Ser. 95-8, Class B1, 7.3s, 2026 | | 362,579 | | 337,686 |
| Ser. 96-10, Class M1, 7.24s, 2028 | | 972,000 | | 903,960 |
| Ser. 97-3, Class A5, 7.14s, 2028 | | 441,569 | | 458,763 |
| Ser. 98-4, Class A7, 6.87s, 2030 | | 308,565 | | 315,074 |
65
| | | | |
| ASSET-BACKED SECURITIES (5.1%)* continued | | | | |
| |
| | | Principal amount | | Value |
|
| Green Tree Financial Corp. | | | | |
| Ser. 97-7, Class A8, 6.86s, 2029 | $ | 344,432 | $ | 344,162 |
| Ser. 99-3, Class A6, 6 1/2s, 2031 | | 642,939 | | 623,651 |
| Ser. 98-6, Class A7, 6.45s, 2030 | | 456,408 | | 465,044 |
| Ser. 99-2, Class A7, 6.44s, 2030 | | 1,171,720 | | 1,151,306 |
| Ser. 99-1, Class A6, 6.37s, 2025 | | 1,023,000 | | 1,017,885 |
| Greenpoint Manufactured Housing | | | | |
| Ser. 00-3, Class IA, 8.45s, 2031 | | 3,941,138 | | 3,733,802 |
| Ser. 99-5, Class M1A, 8.3s, 2026 | | 488,000 | | 368,811 |
| GS Auto Loan Trust 144A Ser. 04-1, Class D, 5s, 2011 | | 1,156,849 | | 1,157,843 |
| GSAMP Trust FRB Ser. 06-HE5, Class A2C, 3.526s, 2036 | | 4,677,000 | | 3,454,858 |
| Guggenheim Structured Real Estate Funding, Ltd. 144A | | | | |
| FRB Ser. 05-2A, Class D, 4.926s, 2030 (Cayman Islands) | | 1,141,000 | | 829,279 |
| FRB Ser. 05-1A, Class D, 4.906s, 2030 (Cayman Islands) | | 502,743 | | 402,194 |
| High Income Trust Securities 144A FRB Ser. 03-1A, Class A, | | | | |
| 5.378s, 2036 (Cayman Islands) | | 1,600,695 | | 1,280,556 |
| Home Equity Asset Trust FRB Ser. 06-1, Class 2A4, 3.706s, 2036 | | 848,000 | | 636,000 |
| Hyundai Auto Receivables Trust Ser. 04-A, Class D, 4.1s, 2011 | | 192,235 | | 191,851 |
| JPMorgan Mortgage Acquisition Corp. | | | | |
| FRB Ser. 05-OPT2, Class M11, 5.626s, 2035 | | 645,000 | | 64,500 |
| FRB Ser. 06-FRE1, Class A4, 3.666s, 2035 | | 716,000 | | 623,794 |
| Lehman Manufactured Housing Ser. 98-1, Class 1, IO, | | | | |
| 0.807s, 2028 | | 15,807,329 | | 197,908 |
| Lehman XS Trust | | | | |
| Ser. 07-6, Class 3A6, 6 1/2s, 2037 | | 12,492,497 | | 12,715,026 |
| FRB Ser. 07-6, Class 2A1, 3.586s, 2037 | | 9,292,124 | | 8,182,831 |
| IFB Ser. 07-3, Class 4B, IO, 3.314s, 2037 | | 4,697,647 | | 412,100 |
| LNR CDO, Ltd. 144A | | | | |
| FRB Ser. 03-1A, Class EFL, 6.903s, 2036 (Cayman Islands) | | 2,585,000 | | 1,982,372 |
| FRB Ser. 02-1A, Class FFL, 6.524s, 2037 (Cayman Islands) | | 5,220,000 | | 3,559,518 |
| Long Beach Mortgage Loan Trust | | | | |
| FRB Ser. 05-2, Class M4, 3.996s, 2035 | | 558,000 | | 334,800 |
| FRB Ser. 06-4, Class 2A4, 3.636s, 2036 | | 813,000 | | 522,285 |
| FRB Ser. 06-1, Class 2A3, 3.566s, 2036 | | 1,433,000 | | 1,289,700 |
| Madison Avenue Manufactured Housing Contract | | | | |
| FRB Ser. 02-A, Class B1, 6.626s, 2032 | | 4,059,503 | | 3,085,222 |
| FRB Ser. 02-A, Class M2, 5.626s, 2032 | | 278,000 | | 259,876 |
| Ser. 02-A IO, 0.3s, 2032 | | 129,597,686 | | 1,334,506 |
| Marriott Vacation Club Owner Trust 144A | | | | |
| Ser. 05-2, Class D, 6.205s, 2027 | | 97,376 | | 97,377 |
| Ser. 04-2A, Class D, 5.389s, 2026 | | 90,403 | | 92,754 |
| Ser. 04-2A, Class C, 4.741s, 2026 | | 83,170 | | 85,542 |
| FRB Ser. 02-1A, Class A1, 4.659s, 2024 | | 850,770 | | 820,077 |
| MASTR Asset Backed Securities Trust FRB Ser. 06-FRE2, | | | | |
| Class A4, 3.526s, 2036 | | 424,000 | | 339,662 |
| MBNA Credit Card Master Note Trust FRB Ser. 03-C5, Class C5, | | | | |
| 5.416s, 2010 | | 1,730,000 | | 1,724,224 |
66
| | | | |
| ASSET-BACKED SECURITIES (5.1%)* continued | | | | |
|
| | | Principal amount | | Value |
|
| Merrill Lynch Mortgage Investors, Inc. 144A | | | | |
| Ser. 05-WM1N, Class N1, 5s, 2035 | $ | 12,636 | $ | 10,875 |
| Ser. 04-WM3N, Class N1, 4 1/2s, 2035 (In default) † | | 44,508 | | 10,682 |
| Ser. 04-WM1N, Class N1, 4 1/2s, 2034 (In default) † | | 1,921 | | 5 |
| Mid-State Trust | | | | |
| Ser. 11, Class B, 8.221s, 2038 | | 345,824 | | 316,828 |
| Ser. 10, Class B, 7.54s, 2036 | | 644,720 | | 544,458 |
| Morgan Stanley ABS Capital I | | | | |
| FRB Ser. 05-HE2, Class M5, 4.056s, 2035 | | 349,000 | | 191,950 |
| FRB Ser. 05-HE1, Class M3, 3.896s, 2034 | | 349,000 | | 282,690 |
| FRB Ser. 06-NC4, Class M2, 3.676s, 2036 | | 489,000 | | 254,280 |
| N-Star Real Estate CDO, Ltd. 144A FRB Ser. 04-2A, Class C1, | | | | |
| 5.244s, 2039 (Cayman Islands) | | 544,000 | | 440,912 |
| Navigator CDO, Ltd. 144A FRB Ser. 03-1A, Class A1, 5.359s, | | | | |
| 2015 (Cayman Islands) | | 500,282 | | 489,926 |
| Navistar Financial Corp. Owner Trust | | | | |
| Ser. 05-A, Class C, 4.84s, 2014 | | 398,451 | | 382,001 |
| Ser. 04-B, Class C, 3.93s, 2012 | | 163,691 | | 152,282 |
| New Century Home Equity Loan Trust | | | | |
| FRB Ser. 03-4, Class M3, 5.426s, 2033 | | 34,109 | | 9,892 |
| Ser. 03-5, Class AI7, 5.15s, 2033 | | 1,594,618 | | 1,519,448 |
| Novastar Home Equity Loan | | | | |
| FRB Ser. 06-1, Class A2C, 3.536s, 2036 | | 1,010,000 | | 879,932 |
| FRB Ser. 06-2, Class A2C, 3.526s, 2036 | | 1,010,000 | | 842,516 |
| Oakwood Mortgage Investors, Inc. | | | | |
| Ser. 00-D, Class A3, 6.99s, 2022 | | 78,277 | | 74,459 |
| Ser. 01-D, Class A3, 5.9s, 2022 | | 157,661 | | 127,434 |
| Ser. 02-C, Class A1, 5.41s, 2032 | | 3,775,932 | | 3,420,069 |
| Oakwood Mortgage Investors, Inc. 144A | | | | |
| Ser. 01-B, Class A4, 7.21s, 2030 | | 552,863 | | 489,286 |
| Ser. 01-B, Class A3, 6.535s, 2023 | | 160,048 | | 149,742 |
| Ocean Star PLC 144A | | | | |
| FRB Ser. 04, Class D, 7.179s, 2018 (Ireland) | | 623,000 | | 573,160 |
| FRB Ser. 05-A, Class D, 6.379s, 2012 (Ireland) | | 696,000 | | 577,680 |
| Option One Mortgage Loan Trust FRB Ser. 05-4, Class M11, | | | | |
| 5.876s, 2035 | | 216,000 | | 43,200 |
| Origen Manufactured Housing Ser. 04-B, Class A2, 3.79s, 2017 | | 190,169 | | 190,258 |
| Park Place Securities, Inc. | | | | |
| FRB Ser. 05-WCH1, Class M4, 4.206s, 2036 | | 227,000 | | 160,035 |
| FRB Ser. 04-WHQ2, Class A3A, 3.726s, 2035 | | 206,128 | | 170,140 |
| Park Place Securities, Inc. 144A FRB Ser. 04-MHQ1, Class M10, | | | | |
| 5.876s, 2034 | | 203,191 | | 20,319 |
| People’s Choice Net Interest Margin Note 144A Ser. 04-2, | | | | |
| Class B, 5s, 2034 (In default) † | | 19,925 | | 199 |
| People’s Financial Realty Mortgage Securities Trust FRB Ser. 06-1, | | | | |
| Class 1A2, 3.506s, 2036 | | 1,587,000 | | 1,456,674 |
| Permanent Financing PLC FRB Ser. 3, Class 3C, 6.296s, 2042 | | | | |
| (United Kingdom) | | 1,300,000 | | 1,282,124 |
67
| | | | |
| ASSET-BACKED SECURITIES (5.1%)* continued | | | | |
| |
| | | Principal amount | | Value |
|
| Pillar Funding PLC 144A | | | | |
| FRB Ser. 04-1A, Class C1, 5.941s, 2011 (United Kingdom) | $ | 657,000 | $ | 604,189 |
| FRB Ser. 04-2A, Class C, 5.871s, 2011 (United Kingdom) | | 912,000 | | 824,355 |
| Residential Asset Mortgage Products, Inc. | | | | |
| FRB Ser. 06-NC3, Class A2, 3.566s, 2036 | | 1,724,000 | | 1,607,201 |
| FRB Ser. 07-RZ1, Class A2, 3.536s, 2037 | | 1,562,000 | | 1,340,203 |
| Residential Asset Securities Corp. FRB Ser. 05-EMX1, Class M2, | | | | |
| 4.106s, 2035 | | 793,000 | | 559,065 |
| Residential Asset Securities Corp. 144A | | | | |
| FRB Ser. 05-KS10, Class B, 6.126s, 2035 | | 1,165,000 | | 116,500 |
| Ser. 04-NT, Class Note, 4 1/2s, 2034 | | 76,375 | | 19,094 |
| SAIL Net Interest Margin Notes 144A | | | | |
| Ser. 03-3, Class A, 7 3/4s, 2033 (Cayman Islands) (In default) † | | 22,036 | | 22 |
| Ser. 03-BC2A, Class A, 7 3/4s, 2033 (Cayman Islands) | | | | |
| (In default) † | | 133,867 | | 4,016 |
| Ser. 04-4A, Class B, 7 1/2s, 2034 (Cayman Islands) | | | | |
| (In default) † | | 214,965 | | 22 |
| Ser. 03-5, Class A, 7.35s, 2033 (Cayman Islands) (In default) † | | 8,252 | | 165 |
| Ser. 03-8A, Class A, 7s, 2033 (Cayman Islands) (In default) † | | 48,411 | | 145 |
| Ser. 03-9A, Class A, 7s, 2033 (Cayman Islands) (In default) † | | 65,758 | | 66 |
| Ser. 03-6A, Class A, 7s, 2033 (Cayman Islands) (In default) † | | 12,564 | | 126 |
| Ser. 03-7A, Class A, 7s, 2033 (Cayman Islands) (In default) † | | 19,639 | | 39 |
| Securitized Asset Backed Receivables, LLC | | | | |
| FRB Ser. 05-HE1, Class M2, 4.026s, 2035 | | 349,000 | | 179,735 |
| FRB Ser. 07-NC2, Class A2B, 3.516s, 2037 | | 1,468,000 | | 1,247,800 |
| SG Mortgage Securities Trust | | | | |
| FRB Ser. 06-OPT2, Class A3D, PO, 3.586s, 2036 | | 1,718,000 | | 1,256,236 |
| FRB Ser. 06-FRE1, Class A2B, 3.556s, 2036 | | 807,000 | | 632,577 |
| Sharps SP I, LLC Net Interest Margin Trust 144A Ser. 04-HE1N, | | | | |
| Class Note, 4.94s, 2034 (Cayman Islands) (In default) † | | 144,254 | | — |
| Soundview Home Equity Loan Trust | | | | |
| FRB Ser. 06-OPT3, Class 2A3, 3.546s, 2036 | | 814,000 | | 704,712 |
| FRB Ser. 06-3, Class A3, 3.536s, 2036 | | 4,702,000 | | 3,881,362 |
| Soundview Home Equity Loan Trust 144A FRB Ser. 05-CTX1, | | | | |
| Class B1, 5.876s, 2035 | | 466,000 | | 116,500 |
| South Coast Funding 144A FRB Ser. 3A, Class A2, 6.087s, 2038 | | | | |
| (Cayman Islands) | | 470,000 | | 70,500 |
| Structured Asset Investment Loan Trust FRB Ser. 06-BNC2, | | | | |
| Class A6, 3.636s, 2036 | | 814,000 | | 513,075 |
| Structured Asset Investment Loan Trust 144A FRB Ser. 05-HE3, | | | | |
| Class M11, 5.831s, 2035 | | 974,000 | | 48,700 |
| Structured Asset Receivables Trust 144A FRB Ser. 05-1, | | | | |
| 5.87s, 2015 | | 5,223,336 | | 5,092,752 |
| TIAA Real Estate CDO, Ltd. Ser. 03-1A, Class E, 8s, 2038 | | | | |
| (Cayman Islands) | | 1,698,000 | | 1,318,446 |
| Wells Fargo Home Equity Trust FRB Ser. 07-1, Class A3, | | | | |
| 3.696s, 2037 | | 359,000 | | 212,900 |
68
| | | | | |
| ASSET-BACKED SECURITIES (5.1%)* continued | | | | | |
|
| | | | Principal amount | | Value |
|
| WFS Financial Owner Trust | | | | | |
| Ser. 05-1, Class D, 4.09s, 2012 | | $ | 219,269 | $ | 217,076 |
| Ser. 04-3, Class D, 4.07s, 2012 | | | 115,680 | | 115,544 |
| Ser. 04-4, Class D, 3.58s, 2012 (F) | | | 56,793 | | 56,382 |
| Whinstone Capital Management, Ltd. 144A FRB Ser. 1A, | | | | |
| Class B3, 4.231s, 2044 (United Kingdom) | | | 847,536 | | 678,029 |
|
| Total asset-backed securities (cost $215,144,881) | | | $ | 192,015,201 |
| |
| |
| |
| PURCHASED OPTIONS OUTSTANDING (1.6%)* | | | | |
|
| | Expiration date/ | | Contract | | |
| | strike price | | amount | | Value |
|
| Option on an interest rate swap with Lehman | | | | | |
| Brothers Special Financing, Inc. for the right to | | | | | |
| receive a fixed rate of 5.37% versus the three | | | | | |
| month USD-LIBOR-BBA maturing | | | | | |
| November 12, 2019. | Nov-09/5.37 | $ | 117,731,000 | $ | 8,089,297 |
| Option on an interest rate swap with JPMorgan | | | | | |
| Chase Bank, N.A. for the right to receive a | | | | | |
| fixed rate of 5.355% versus the three month | | | | | |
| USD-LIBOR-BBA maturing on | | | | | |
| November 12, 2019. | Nov-09/5.355 | | 117,731,000 | | 7,999,821 |
| Option on an interest rate swap with Goldman | | | | | |
| Sachs International for the right to receive | | | | | |
| a fixed rate of 5.355% versus the three | | | | | |
| month USD-LIBOR-BBA maturing | | | | | |
| November 12, 2019. | Nov-09/5.355 | | 117,731,000 | | 7,999,821 |
| Option on an interest rate swap with Goldman | | | | | |
| Sachs International for the right to pay a fixed | | | | | |
| rate of 5.355% versus the three month | | | | | |
| USD-LIBOR-BBA maturing on | | | | | |
| November 12, 2019. | Nov-09/5.355 | | 117,731,000 | | 2,783,161 |
| Option on an interest rate swap with Lehman | | | | | |
| Brothers Special Financing, Inc. for the right to | | | | | |
| pay a fixed rate of 5.37% versus the three | | | | | |
| month USD-LIBOR-BBA maturing | | | | | |
| November 12, 2019. | Nov-09/5.37 | | 117,731,000 | | 2,738,423 |
| Option on an interest rate swap with JPMorgan | | | | | |
| Chase Bank, N.A. for the right to receive a | | | | | |
| fixed rate of 5.34% versus the three month | | | | | |
| USD-LIBOR-BBA maturing on | | | | | |
| February 15, 2018. | Feb-08/5.34 | | 17,320,000 | | 1,531,261 |
| Option on an interest rate swap with JPMorgan | | | | | |
| Chase Bank, N.A. for the right to pay a fixed | | | | | |
| rate of 5.34% versus the three month | | | | | |
| USD-LIBOR-BBA maturing on | | | | | |
| February 15, 2018. | Feb-08/5.34 | | 17,320,000 | | 2 |
69
| | | | | |
| PURCHASED OPTIONS OUTSTANDING (1.6%)* continued | | | | |
| |
| | Expiration date/ | | Contract | | |
| | strike price | | amount | | Value |
|
| Option on an interest rate swap with JPMorgan | | | | | |
| Chase Bank, N.A. for the right to pay a fixed | | | | | |
| rate of 5.355% versus the three month | | | | | |
| USD-LIBOR-BBA maturing | | | | | |
| November 12, 2019. | Nov-09/5.355 | $ | 117,731,000 | $ | 2,783,161 |
| Option on an interest rate swap with Lehman | | | | | |
| Brothers Special Financing, Inc. for the right to | | | | | |
| receive a fixed rate of 4.405% versus the three | | | | | |
| month USD-LIBOR-BBA maturing on | | | | | |
| April 16, 2018. | Apr-08/4.405 | | 15,365,000 | | 359,848 |
| Option on an interest rate swap with Lehman | | | | | |
| Brothers Special Financing, Inc. for the right to | | | | | |
| pay a fixed rate of 4.405% versus the three | | | | | |
| month USD-LIBOR-BBA maturing | | | | | |
| April 16, 2018. | Apr-08/4.405 | | 15,365,000 | | 231,243 |
| Option on an interest rate swap with Goldman | | | | | |
| Sachs International for the right to receive a | | | | | |
| fixed rate of 4.965% versus the three month | | | | | |
| USD-LIBOR-BBA maturing April 29, 2013. | Apr-08/4.965 | | 184,000,000 | | 11,477,920 |
| Option on an interest rate swap with Goldman | | | | | |
| Sachs International for the right to receive a | | | | | |
| fixed rate of 5.325% versus the three month | | | | | |
| USD-LIBOR-BBA maturing April 08, 2019. | Apr-09/5.325 | | 54,984,000 | | 3,936,305 |
| Option on an interest rate swap with JPMorgan | | | | | |
| Chase Bank, N.A. for the right to receive a | | | | | |
| fixed rate of 5.315% versus the three month | | | | | |
| USD-LIBOR-BBA maturing on April 08, 2019. | Apr-09/5.315 | | 54,984,000 | | 3,904,964 |
| Option on an interest rate swap with | | | | | |
| Deutschbank for the right to receive a fixed | | | | | |
| rate of 5.385% versus the three month | | | | | |
| USD-LIBOR-BBA maturing April 16, 2019. | Apr-09/5.385 | | 43,245,000 | | 3,237,321 |
| Option on an interest rate swap with Goldman | | | | | |
| Sachs International for the right to receive a | | | | | |
| fixed rate of 5.1975% versus the three month | | | | | |
| USD-LIBOR-BBA maturing on May 14, 2018. | May-08/5.198 | | 21,602,000 | | 1,593,148 |
| Option on an interest rate swap with JPMorgan | | | | | |
| Chase Bank, N.A. for the right to pay a fixed | | | | | |
| rate of 5.315% versus the three month | | | | | |
| USD-LIBOR-BBA maturing on April 08, 2019. | Apr-09/5.315 | | 54,984,000 | | 847,303 |
| Option on an interest rate swap with Goldman | | | | | |
| Sachs International for the right to pay a fixed | | | | | |
| rate of 5.325% versus the three month | | | | | |
| USD-LIBOR-BBA maturing April 08, 2019. | Apr-09/5.325 | | 54,984,000 | | 835,757 |
70
| | | | | |
| PURCHASED OPTIONS OUTSTANDING (1.6%)* continued | | | | |
|
| | Expiration date/ | Contract | | |
| | strike price | | amount | | Value |
|
| Option on an interest rate swap with | | | | | |
| Deutschbank for the right to pay a fixed rate | | | | | |
| of 5.385% versus the three month | | | | | |
| USD-LIBOR-BBA maturing April 16, 2019. | Apr-09/5.385 | $ | 43,245,000 | $ | 620,566 |
| Option on an interest rate swap with Goldman | | | | | |
| Sachs International for the right to pay a fixed | | | | | |
| rate of 4.965% versus the three month | | | | | |
| USD-LIBOR-BBA maturing April 29, 2013. | Apr-08/4.965 | 184,000,000 | | 73,600 |
| Option on an interest rate swap with Goldman | | | | | |
| Sachs International for the right to pay a fixed | | | | | |
| rate of 5.1975% versus the three month | | | | | |
| USD-LIBOR-BBA maturing on May 14, 2018. | May-08/5.198 | 21,602,000 | | 52,709 |
|
| Total purchased options outstanding (cost $41,007,938) | | | $ | 61,095,631 |
| |
| |
| CONVERTIBLE PREFERRED STOCKS (0.2%)* (cost $5,194,500) | | | |
| |
| | | | Shares | | Value |
|
| Citigroup, Inc. Ser. T, $3.25 cv. pfd. | | | 103,890 | $ | 5,649,019 |
|
| |
| |
| CONVERTIBLE BONDS AND NOTES (0.1%)* (cost $4,519,000) | | | |
| |
| | | | Principal amount | | Value |
|
| Ford Motor Co. cv. sr. notes 4 1/4s, 2036 | | $ | 4,519,000 | $ | 4,513,351 |
|
| |
| |
| MUNICIPAL BONDS AND NOTES (0.1%)* | | | | | |
| |
| | Rating** | | Principal amount | | Value |
|
| MI Tobacco Settlement Fin. Auth. Rev. Bonds, | | | | | |
| Ser. A, 7.309s, 6/1/34 | Baa3 | $ | 1,005,000 | $ | 977,322 |
| Tobacco Settlement Fin. Auth. of WVA Rev. | | | | | |
| Bonds, Ser. A, 7.467s, 6/1/47 | Baa3 | | 1,460,000 | | 1,440,246 |
|
| Total municipal bonds and notes (cost $2,464,892) | | | $ | 2,417,568 |
| |
| |
| WARRANTS (—%)* † (cost $0) | | | | | |
|
| | Expiration | Strike | | | |
| | date | price | Warrants | | Value |
|
| Raytheon Co. | 6/16/11 | $37.50 | 29,195 | $ | 833,809 |
71
| | | |
| SHORT-TERM INVESTMENTS (9.8%)* | | | |
| |
| | Principal amount/shares | | Value |
|
| Short-term investments held as collateral for loaned | | | |
| securities with yields ranging from 2.60% to 5.25% and due | | | |
| dates ranging from February 1, 2008 to March 24, 2008 (d) | $ 249,482,667 | $ | 249,122,924 |
| Putnam Prime Money Market Fund (e) | 117,426,556 | | 117,426,556 |
|
| Total short-term investments (cost $366,549,480) | | $ | 366,549,480 |
| |
| |
| TOTAL INVESTMENTS | | | |
|
| Total investments (cost $5,293,040,600) | | $ | 5,474,415,857 |
* Percentages indicated are based on net assets of $3,739,059,379.
** The Moody’s or Standard & Poor’s ratings indicated are believed to be the most recent ratings available at January 31, 2008 for the securities listed. Ratings are generally ascribed to securities at the time of issuance. While the agencies may from time to time revise such ratings, they undertake no obligation to do so, and the ratings do not necessarily represent what the agencies would ascribe to these securities at January 31, 2008. Securities rated by Putnam are indicated by “/P.” Securities rated by Fitch are indicated by “/F.” Security ratings are defined in the Statement of Additional Information.
† Non-income-producing security.
# A portion of these securities were pledged and segregated with the custodian to cover margin requirements for futures contracts at January 31, 2008.
## Forward commitments, in part or in entirety (Note 1).
(d) See Note 1 to the financial statements.
(e) See Note 5 to the financial statements regarding investments in Putnam Prime Money Market Fund.
(F) Is valued at fair value following procedures approved by the Trustees.
(R) Real Estate Investment Trust.
(S) Securities on loan, in part or in entirety, at January 31, 2008.
At January 31, 2008, liquid assets totaling $1,526,007,108 have been designated as collateral for open forward commitments, swap contracts and futures contracts.
144A after the name of an issuer represents securities exempt from registration under Rule 144A under the Securities Act of 1933, as amended. These securities may be resold in transactions exempt from registration, normally to qualified institutional buyers.
TBA after the name of a security represents to be announced securities (Note 1).
The rates shown on Floating Rate Bonds (FRB) and Floating Rate Notes (FRN) are the current interest rates at January 31, 2008.
The dates shown on debt obligations are the original maturity dates.
Inverse Floating Rate Bonds (IFB) are securities that pay interest rates that vary inversely to changes in the market interest rates. As interest rates rise, inverse floaters produce less current income. The interest rates shown are the current interest rates at January 31, 2008.
| | | | | |
| FUTURES CONTRACTS OUTSTANDING at 1/31/08 (Unaudited) | | | |
| |
| | | | | | Unrealized |
| | Number of | | | Expiration | appreciation/ |
| | contracts | Value | | date | (depreciation) |
|
| Euro-Dollar 90 day (Long) | 1,659 | $402,701,513 | | Mar-08 | $ 8,103,851 |
| Euro-Dollar 90 day (Long) | 817 | 197,908,038 | | Sep-09 | 3,399,666 |
| Euro-Dollar 90 day (Short) | 1,808 | 440,745,200 | | Jun-08 | (10,119,630) |
| Euro-Dollar 90 day (Short) | 3,138 | 765,318,975 | | Sep-08 | (17,431,173) |
| S&P 500 Index E-Mini (Long) | 3,548 | 244,723,300 | | Mar-08 | 9,627,049 |
| U.S. Treasury Bond 20 yr (Long) | 916 | 109,290,250 | | Mar-08 | 2,257,263 |
72
| | | | | |
| FUTURES CONTRACTS OUTSTANDING at 1/31/08 (Unaudited) continued | | | |
|
| | | | | | Unrealized |
| | Number of | | | Expiration | appreciation/ |
| | contracts | Value | | date | (depreciation) |
|
| U.S. Treasury Note 2 yr (Short) | 4,378 | $933,471,688 | | Mar-08 | $ (8,952,026) |
| U.S. Treasury Note 5 yr (Short) | 2,725 | 307,925,000 | | Mar-08 | (1,837,138) |
| U.S. Treasury Note 10 yr (Long) | 5,992 | 699,378,750 | | Mar-08 | 14,367,781 |
|
| Total | | | | | $ (584,357) |
| | |
| | | | |
| WRITTEN OPTIONS OUTSTANDING at 1/31/08 (premiums received $23,677,401) (Unaudited) | |
|
| | Contract | | Expiration date/ | |
| | amount | | strike price | Value |
|
| Option on an interest rate swap with Lehman | | | | |
| Brothers Special Financing, Inc. for the obligation to | | | | |
| receive a fixed rate of 5.95% versus the three month | | | | |
| USD-LIBOR-BBA maturing June 16, 2018. | $204,503,000 | | Jun-08/5.95 | $ 94,071 |
| Option on an interest rate swap with Lehman | | | | |
| Brothers Special Financing, Inc. for the obligation to | | | | |
| pay a fixed rate of 5.95% versus the three month | | | | |
| USD-LIBOR-BBA maturing June 16, 2018. | 204,503,000 | | Jun-08/5.95 | 26,691,732 |
| Option on an interest rate swap with Lehman | | | | |
| Brothers Special Financing, Inc. for the obligation to | | | | |
| pay a fixed rate of 5.31% versus the three month | | | | |
| USD-LIBOR-BBA maturing on August 29, 2018. | 130,817,000 | | Aug-08/5.31 | 10,225,965 |
| Option on an interest rate swap with Lehman | | | | |
| Brothers Special Financing, Inc. for the obligation to | | | | |
| receive a fixed rate of 5.31% versus the three month | | | | |
| USD-LIBOR-BBA maturing on August 29, 2018. | 130,817,000 | | Aug-08/5.31 | 743,041 |
| Option on an interest rate swap with JPMorgan Chase | | | | |
| Bank, N.A. for the obligation to pay a fixed rate | | | | |
| of 5.00% versus the three month USD-LIBOR-BBA | | | | |
| maturing on December 19, 2018. | 92,650,000 | | Dec-08/5.00 | 5,180,062 |
| Option on an interest rate swap with JPMorgan Chase | | | | |
| Bank, N.A. for the obligation to receive a fixed rate | | | | |
| of 5.00% versus the three month USD-LIBOR-BBA | | | | |
| maturing on December 19, 2018. | 92,650,000 | | Dec-08/5.00 | 1,574,124 |
| Option on an interest rate swap with JPMorgan Chase | | | | |
| Bank, N.A. for the obligation to pay a fixed rate | | | | |
| of 5.51% versus the three month USD-LIBOR-BBA | | | | |
| maturing on May 14, 2022. | 20,548,000 | | May-12/5.51 | 1,262,477 |
| Option on an interest rate swap with JPMorgan Chase | | | | |
| Bank, N.A. for the obligation to receive a fixed rate | | | | |
| of 5.51% versus the three month USD-LIBOR-BBA | | | | |
| maturing on May 14, 2022. | 20,548,000 | | May-12/5.51 | 923,865 |
| Option on an interest rate swap with Lehman | | | | |
| Brothers Special Financing, Inc. for the obligation to | | | | |
| pay a fixed rate of 5.515% versus the three month | | | | |
| USD-LIBOR-BBA maturing on May 14, 2022. | 10,274,000 | | May-12/5.515 | 628,152 |
73
| | | | |
| WRITTEN OPTIONS OUTSTANDING at 1/31/08 (premiums received $23,677,401) (Unaudited) continued |
|
| | Contract | | Expiration date/ | |
| | amount | | strike price | Value |
|
| Option on an interest rate swap with Lehman | | | | |
| Brothers Special Financing, Inc. for the obligation to | | | | |
| receive a fixed rate of 5.515% versus the three month | | | | |
| USD-LIBOR-BBA maturing on May 14, 2022. | $ 10,274,000 | | May-12/5.515 | $ 450,001 |
| Option on an interest rate swap with Lehman | | | | |
| Brothers Special Financing, Inc. for the obligation to | | | | |
| pay a fixed rate of 5.52% versus the three month | | | | |
| USD-LIBOR-BBA maturing on May 14, 2022. | 4,109,500 | | May-12/5.52 | 251,543 |
| Option on an interest rate swap with Lehman | | | | |
| Brothers Special Financing, Inc. for the obligation to | | | | |
| receive a fixed rate of 5.52% versus the three month | | | | |
| USD-LIBOR-BBA maturing on May 14, 2022. | 4,109,500 | | May-12/5.52 | 186,890 |
|
| Total | | | | $48,211,923 |
|
| |
| TBA SALE COMMITMENTS OUTSTANDING at 1/31/08 (proceeds receivable $685,572,578) (Unaudited) |
|
| | Principal | | Settlement | |
| Agency | amount | | date | Value |
|
| FNMA, 6 1/2s, February 1, 2038 | $ 66,000,000 | | 2/12/08 | $ 68,459,530 |
| FNMA, 5 1/2s, March 1, 2038 | 4,000,000 | | 3/12/08 | 4,044,375 |
| FNMA, 5 1/2s, February 1, 2038 | 600,000,000 | | 2/12/08 | 607,734,360 |
| FNMA, 5s, February 1, 2038 | 7,000,000 | | 2/12/08 | 6,966,118 |
|
| Total | | | | $687,204,383 |
| | |
| | | | |
| INTEREST RATE SWAP CONTRACTS OUTSTANDING at 1/31/08 (Unaudited) | |
|
| | | Payments | Payments | Unrealized |
| Swap counterparty / | Termination | made by | received by | appreciation/ |
| Notional amount | date | fund per annum | fund per annum | (depreciation) |
|
| Bank of America, N.A. | | | | |
| $102,075,000 | 12/22/09 | 3.965% | 3 month USD-LIBOR-BBA | $ (1,756,140) |
|
| 4,636,000 | 10/3/16 | 5.1563% | 3 month USD-LIBOR-BBA | (402,933) |
|
| 3,720,000 | 6/24/15 | 4.39% | 3 month USD-LIBOR-BBA | (91,963) |
|
| 84,900,000 | 4/6/10 | 4.6375% | 3 month USD-LIBOR-BBA | (3,869,860) |
|
| 20,610,000 | 6/17/15 | 4.555% | 3 month USD-LIBOR-BBA | (735,165) |
|
| 53,000,000 | 10/21/15 | 4.943% | 3 month USD-LIBOR-BBA | (3,914,668) |
|
| 3,070,000 | 6/23/15 | 4.45% | 3 month USD-LIBOR-BBA | (87,995) |
|
| 7,440,000 | 6/23/15 | 4.466% | 3 month USD-LIBOR-BBA | (221,112) |
|
| 700,000 | 9/1/15 | 3 month USD-LIBOR-BBA | 4.53% | 31,023 |
|
| 87,100,000 | 1/14/10 | 3 month USD-LIBOR-BBA | 4.106% | 1,845,693 |
|
| 970,000 | 9/24/09 | 3 month USD-LIBOR-BBA | 4.7375% | 39,093 |
|
| 82,772,000 | 1/28/24 | 3 month USD-LIBOR-BBA | 5.2125% | 5,439,276 |
|
| Bear Stearns Bank plc | | | | |
| 63,600,000 | 4/24/12 | 5.027% | 3 month USD-LIBOR-BBA | (4,858,968) |
|
| Citibank, N.A. | | | | |
| 2,700,000 | 11/9/17 | 3 month USD-LIBOR-BBA | 5.07641% | 182,165 |
|
| 9,733,000 | 12/24/27 | 4.9425% | 3 month USD-LIBOR-BBA | (227,938) |
|
74
| | | | |
| INTEREST RATE SWAP CONTRACTS OUTSTANDING at 1/31/08 (Unaudited) continued | |
| |
| | | Payments | Payments | Unrealized |
| Swap counterparty / | Termination | made by | received by | appreciation/ |
| Notional amount | date | fund per annum | fund per annum | (depreciation) |
|
| Citibank, N.A. continued | | | | |
| $ 51,736,000 | 12/24/09 | 3 month USD-LIBOR-BBA | 3.8675% | $ 794,365 |
|
| 56,920,000 | 7/27/09 | 5.504% | 3 month USD-LIBOR-BBA | (2,267,593) |
|
| 4,380,000 | 4/7/14 | 5.377% | 3 month USD-LIBOR-BBA | (438,840) |
|
| 41,870,000 | 11/23/17 | 4.885% | 3 month USD-LIBOR-BBA | (2,111,748) |
|
| 10,114,000 | 10/26/12 | 4.6275% | 3 month USD-LIBOR-BBA | (620,909) |
|
| 90,203,000 | 11/9/17 | 5.0825% | 3 month USD-LIBOR-BBA | (6,132,200) |
|
| 87,779,000 | 11/9/09 | 4.387% | 3 month USD-LIBOR-BBA | (2,225,025) |
|
| Credit Suisse First Boston International | | | |
| 6,600,000 | 11/17/09 | 3.947% | 3 month USD-LIBOR-BBA | (111,880) |
|
| Credit Suisse International | | | | |
| 3,843,000 | 3/21/16 | 3 month USD-LIBOR-BBA | 5.20497% | 348,127 |
|
| 80,000,000 | 1/9/09 | 3 month USD-LIBOR-BBA | 5.145% | 1,564,129 |
|
| 6,762,000 | 9/28/16 | 5.10886% | 3 month USD-LIBOR-BBA | (561,025) |
|
| 3,922,000 | 8/29/12 | 5.04556% | 3 month USD-LIBOR-BBA | (307,620) |
|
| 7,071,000 | 10/16/17 | 3 month USD-LIBOR-BBA | 5.297% | 689,687 |
|
| Deutsche Bank AG | | | | |
| 11,100,000 | 11/7/17 | 3 month USD-LIBOR-BBA | 5.056% | 732,950 |
|
| 16,169,000 | 10/16/17 | 3 month USD-LIBOR-BBA | 5.297% | 1,577,082 |
|
| Goldman Sachs International | | | | |
| 205,784,000 | 1/16/18 | 5.790% | 3 month USD-LIBOR-BBA | (25,673,669) |
|
| 158,394,000 | 11/21/08 | 5.0925% | 3 month USD-LIBOR-BBA | (2,719,359) |
|
| 22,090,000 | 1/8/12 | 3 month USD-LIBOR-BBA | 4.98% | 1,301,359 |
|
| 18,233,000 | 12/20/16 | 3 month USD-LIBOR-BBA | 5.074% | 1,226,800 |
|
| 13,380,000 | 4/7/14 | 5.33842% | 3 month USD-LIBOR-BBA | (1,309,726) |
|
| 4,968,000 | 5/3/16 | 5.565% | 3 month USD-LIBOR-BBA | (531,086) |
|
| 17,771,000 | 9/29/16 | 3 month USD-LIBOR-BBA | 5.1275% | 1,506,015 |
|
| 4,331,000 | 10/19/16 | 5.32413% | 3 month USD-LIBOR-BBA | (436,926) |
|
| 55,949,000 | 9/29/08 | 5.085% | 3 month USD-LIBOR-BBA | (1,399,867) |
|
| 36,385,000 | 11/20/26 | 3 month USD-LIBOR-BBA | 5.261% | 2,477,123 |
|
| 161,722,000 | 11/20/08 | 5.16% | 3 month USD-LIBOR-BBA | (2,893,482) |
|
| 35,081,000 | 11/21/26 | 3 month USD-LIBOR-BBA | 5.2075% | 2,141,061 |
|
| 30,314,000 | 9/21/17 | 5.149% | 3 month USD-LIBOR-BBA | (2,555,327) |
|
| 108,912,400 | 9/21/09 | 3 month USD-LIBOR-BBA | 4.60% | 4,073,626 |
|
| 7,071,000 | 9/14/17 | 5.0625% | 3 month USD-LIBOR-BBA | (546,460) |
|
| 14,495,000 | 9/14/14 | 4.906% | 3 month USD-LIBOR-BBA | (1,046,774) |
|
| 34,600,000 | 7/25/09 | 5.327% | 3 month USD-LIBOR-BBA | (1,288,161) |
|
| 1,990,000 | 11/9/17 | 3 month USD-LIBOR-BBA | 5.08% | 134,875 |
|
| 3,930,000 | 11/9/17 | 3 month USD-LIBOR-BBA | 5.071% | 263,412 |
|
| 12,500,000 | 10/1/17 | 3 month USD-LIBOR-BBA | 5.253% | 1,164,867 |
|
| 72,398,100 | 9/19/09 | 3 month USD-LIBOR-BBA | 4.763% | 2,953,483 |
|
| JPMorgan Chase Bank, N.A. | | | | |
| 167,546,000 | 1/31/18 | 3 month USD-LIBOR-BBA | 4.25% | (146,110) |
|
| 9,733,000 | 12/24/27 | 4.9675% | 3 month USD-LIBOR-BBA | (260,112) |
|
| 7,412,000 | 1/24/18 | 4.175% | 3 month USD-LIBOR-BBA | 60,810 |
|
| 7,412,000 | 1/24/18 | 4.1625% | 3 month USD-LIBOR-BBA | 68,463 |
|
75
| | | | |
| INTEREST RATE SWAP CONTRACTS OUTSTANDING at 1/31/08 (Unaudited) continued | |
| |
| | | Payments | Payments | Unrealized |
| Swap counterparty / | Termination | made by | received by | appreciation/ |
| Notional amount | date | fund per annum | fund per annum | (depreciation) |
|
| JPMorgan Chase Bank, N.A. continued | | | |
| $ 5,559,000 | 1/24/18 | 4.135% | 3 month USD-LIBOR-BBA | $ 63,996 |
|
| 72,119,000 | 1/18/18 | 4.27625% | 3 month USD-LIBOR-BBA | 8,827 |
|
| 57,843,000 | 12/11/17 | 3 month USD-LIBOR-BBA | 4.65% | 1,721,470 |
|
| 17,930,000 | 6/16/15 | 4.538% | 3 month USD-LIBOR-BBA | (619,832) |
|
| 36,282,000 | 11/20/26 | 3 month USD-LIBOR-BBA | 5.266% | 2,493,327 |
|
| 5,472,000 | 12/19/16 | 5.0595% | 3 month USD-LIBOR-BBA | (362,211) |
|
| 94,000,000 | 3/30/16 | 3 month USD-LIBOR-BBA | 5.2755% | 9,109,661 |
|
| 81,200,000 | 8/4/16 | 3 month USD-LIBOR-BBA | 5.5195% | 9,543,284 |
|
| 170,000,000 | 3/30/08 | 3 month USD-LIBOR-BBA | 5.163% | 2,365,876 |
|
| 156,100,000 | 8/4/08 | 3 month USD-LIBOR-BBA | 5.40% | 4,125,289 |
|
| 9,442,000 | 1/19/17 | 3 month USD-LIBOR-BBA | 5.249% | 767,452 |
|
| 37,105,000 | 1/19/09 | 5.24% | 3 month USD-LIBOR-BBA | (822,559) |
|
| 40,500,000 | 4/23/17 | 5.186% | 3 month USD-LIBOR-BBA | (3,612,421) |
|
| 4,639,000 | 9/18/16 | 5.291% | 3 month USD-LIBOR-BBA | (450,908) |
|
| 89,553,000 | 3/8/17 | 3 month USD-LIBOR-BBA | 5.28% | 8,610,841 |
|
| 20,829,000 | 9/28/16 | 3 month USD-LIBOR-BBA | 5.1223% | 1,748,036 |
|
| 61,990,000 | 10/10/13 | 5.09% | 3 month USD-LIBOR-BBA | (5,151,438) |
|
| 4,470,000 | 6/24/15 | 4.387% | 3 month USD-LIBOR-BBA | (109,596) |
|
| 10,430,000 | 8/2/15 | 3 month USD-LIBOR-BBA | 4.6570% | 577,565 |
|
| 44,550,000 | 10/10/13 | 5.054% | 3 month USD-LIBOR-BBA | (3,605,436) |
|
| 63,370,000 | 6/29/15 | 3 month USD-LIBOR-BBA | 4.296% | 1,188,568 |
|
| 183,000,000 | 1/17/16 | 4.946% | 3 month USD-LIBOR-BBA | (11,180,901) |
|
| 65,346,000 | 1/31/17 | 3 month USD-LIBOR-BBA | 5.415% | 6,139,931 |
|
| 161,308,000 | 11/20/08 | 5.165% | 3 month USD-LIBOR-BBA | (2,894,118) |
|
| 126,500,000 | 3/7/15 | 3 month USD-LIBOR-BBA | 4.798% | 8,157,973 |
|
| 57,486,000 | 8/15/11 | 5.412% | 3 month USD-LIBOR-BBA | (4,999,349) |
|
| 47,810,000 | 10/21/15 | 4.916% | 3 month USD-LIBOR-BBA | (3,441,240) |
|
| 65,551,000 | 9/28/08 | 5.096% | 3 month USD-LIBOR-BBA | (1,621,296) |
|
| 179,500,000 | 8/13/12 | 3 month USD-LIBOR-BBA | 5.2% | 15,545,346 |
|
| 6,980,000 | 11/7/17 | 3 month USD-LIBOR-BBA | 5.05771% | 461,905 |
|
| 1,775,000 | 10/30/12 | 4.68375% | 3 month USD-LIBOR-BBA | (113,385) |
|
| 32,041,000 | 8/29/17 | 5.2925% | 3 month USD-LIBOR-BBA | (3,121,025) |
|
| 8,923,000 | 8/29/17 | 5.263% | 3 month USD-LIBOR-BBA | (848,869) |
|
| 5,900,000 | 7/25/17 | 3 month USD-LIBOR-BBA | 5.652% | 672,743 |
|
| 76,820,000 | 7/5/17 | 3 month USD-LIBOR-BBA | 4.55% | 1,872,624 |
|
| 90,203,000 | 11/9/17 | 5.0895% | 3 month USD-LIBOR-BBA | (6,184,152) |
|
| 87,779,000 | 11/9/09 | 4.3975% | 3 month USD-LIBOR-BBA | (2,242,924) |
|
| 10,596,000 | 9/27/17 | 5.2335% | 3 month USD-LIBOR-BBA | (967,828) |
|
| 61,200,000 | 6/27/17 | 3 month USD-LIBOR-BBA | 5.712% | 7,121,518 |
|
| 30,314,000 | 9/21/17 | 5.15% | 3 month USD-LIBOR-BBA | (2,557,862) |
|
| 108,912,400 | 9/21/09 | 3 month USD-LIBOR-BBA | 4.6125% | 4,100,325 |
|
| Lehman Brothers Special Financing, Inc. | | | |
| 51,736,000 | 12/24/09 | 3 month USD-LIBOR-BBA | 3.84625% | 773,058 |
|
| 40,788,000 | 12/11/17 | 3 month USD-LIBOR-BBA | 4.839% | 1,854,446 |
|
| 60,099,000 | 1/18/18 | 4.2925% | 3 month USD-LIBOR-BBA | (73,529) |
|
76
| | | | | |
| INTEREST RATE SWAP CONTRACTS OUTSTANDING at 1/31/08 (Unaudited) continued | |
| |
| | | | Payments | Payments | Unrealized |
| Swap counterparty / | Termination | made by | received by | appreciation/ |
| Notional amount | date | fund per annum | fund per annum | (depreciation) |
|
| Lehman Brothers Special Financing, Inc. continued | | |
| $ 40,000 | 1/16/18 | 4.375% | 3 month USD-LIBOR-BBA | $ (315) |
|
| 150,213,000 | 8/3/11 | 5.445% | 3 month USD-LIBOR-BBA | (13,331,362) |
|
| 267,010,000 | 8/3/16 | 5.5675% | 3 month USD-LIBOR-BBA | (32,485,883) |
|
| 153,985,000 | 8/3/08 | 3 month USD-LIBOR-BBA | 5.425% | 4,177,741 |
|
| 91,930,000 | 12/28/16 | 5.084% | 3 month USD-LIBOR-BBA | (6,232,150) |
|
| 111,090,000 | 9/29/13 | 5.0555% | 3 month USD-LIBOR-BBA | (9,033,797) |
|
| 18,884,000 | 10/23/16 | 5.325% | 3 month USD-LIBOR-BBA | (1,898,483) |
|
| 135,710,000 | 9/8/16 | 5.3275% | 3 month USD-LIBOR-BBA | (13,573,662) |
|
| 18,884,000 | 10/23/16 | 3 month USD-LIBOR-BBA | 5.3275% | 1,902,200 |
|
| 46,981,000 | 10/23/08 | 3 month USD-LIBOR-BBA | 5.26% | 1,371,705 |
|
| 46,981,000 | 10/23/08 | 5.255% | 3 month USD-LIBOR-BBA | (1,369,656) |
|
| 86,483,000 | 3/15/09 | 4.9298% | 3 month USD-LIBOR-BBA | (2,944,997) |
|
| 26,033,000 | 4/12/12 | 3 month USD-LIBOR-BBA | 5.087% | 2,027,811 |
|
| 18,115,000 | 9/11/17 | 5.0525% | 3 month USD-LIBOR-BBA | (1,384,226) |
|
| 4,000,000 | 11/7/17 | 3 month USD-LIBOR-BBA | 5.05521% | 263,879 |
|
| 39,298,515 | 8/29/09 | 5.005% | 3 month USD-LIBOR-BBA | (1,768,171) |
|
| 2,443,839 | 8/29/17 | 3 month USD-LIBOR-BBA | 5.32% | 244,172 |
|
| 75,305,000 | 8/29/09 | 5.001% | 3 month USD-LIBOR-BBA | (3,392,222) |
|
| 10,252,000 | 8/29/17 | 5.3187% | 3 month USD-LIBOR-BBA | (1,024,255) |
|
| 8,974,000 | 8/29/17 | 5.29125% | 3 month USD-LIBOR-BBA | (875,880) |
|
| 10,100,871 | 8/29/12 | 5.075% | 3 month USD-LIBOR-BBA | (808,260) |
|
| 18,940,000 | 8/24/12 | 5.085% | 3 month USD-LIBOR-BBA | (1,527,603) |
|
| 10,114,000 | 10/26/12 | 4.61375% | 3 month USD-LIBOR-BBA | (614,474) |
|
| 30,314,000 | 9/24/17 | 5.285% | 3 month USD-LIBOR-BBA | (2,902,674) |
|
| 86,500,000 | 5/29/12 | 5.28% | 3 month USD-LIBOR-BBA | (6,446,364) |
|
| 3,470,000 | 11/9/17 | 3 month USD-LIBOR-BBA | 5.068% | 231,689 |
|
| 87,779,000 | 11/9/09 | 4.403% | 3 month USD-LIBOR-BBA | (2,251,924) |
|
| 90,203,000 | 11/9/17 | 5.067% | 3 month USD-LIBOR-BBA | (6,015,360) |
|
| 48,265,400 | 9/19/09 | 3 month USD-LIBOR-BBA | 4.755% | 1,961,298 |
|
| 108,912,400 | 9/24/09 | 3 month USD-LIBOR-BBA | 4.695% | 4,299,011 |
|
| Merrill Lynch Capital Services, Inc. | | | |
| 10,114,000 | 10/26/12 | 4.6165% | 3 month USD-LIBOR-BBA | (615,761) |
|
| 18,100,000 | 11/6/17 | 5.00693% | 3 month USD-LIBOR-BBA | (1,122,168) |
|
| Morgan Stanley Capital Services, Inc. | | | |
| 3,674,000 | 2/20/17 | 5.192% | 3 month USD-LIBOR-BBA | (332,444) |
|
| 3,161,000 | 8/29/17 | 5.26021% | 3 month USD-LIBOR-BBA | (299,950) |
|
| Total | | | | | $(102,864,510) |
77
| | | | |
| TOTAL RETURN SWAP CONTRACTS OUTSTANDING at 1/31/08 (Unaudited) | |
| |
| |
| | | Fixed payments | Total return | Unrealized |
| Swap counterparty / | Termination | received (paid) by | received by | appreciation/ |
| Notional amount | date | fund per annum | or paid by fund | (depreciation) |
|
| Bank of America, N.A. | | | | |
| $55,310,000 (F) | 5/2/08 | 5 bp plus change | The spread | $(4,422,311) |
| | | in spread | return of Banc | |
| | | of Banc | of America | |
| | | of America | Securities- CMBS | |
| | | Securities AAA | AAA 10 year Index | |
| 10 yr Index | | |
| multiplied by | | |
| the modified | | |
| | | duration factor | | |
|
| 17,620,000 (F) | 5/2/08 | 10 bp plus | The spread | (1,383,029) |
| | | change in spread | return of Banc | |
| | | of Banc | of America | |
| | | of America | Securities- CMBS | |
| | | Securities AAA | AAA 10 year Index | |
| 10 yr Index | | |
| multiplied by | | |
| the modified | | |
| | | duration factor | | |
|
| 34,620,000 (F) | 3/3/08 | (Banc | The spread | 1,707,008 |
| | | of America | return of Banc | |
| | | Securities AAA | of America | |
| | | 10 yr Index | Securities- CMBS | |
| | | multiplied by | AAA 10 year Index | |
| the modified | | |
| | | duration factor | | |
| minus 250 bp) | | |
|
| 24,130,000 (F) | 7/2/08 | (Banc of America | The spread | 1,291,027 |
| | | Securities AAA | return of Banc | |
| | | 10 yr Index | of America | |
| | | multiplied by | Securities- CMBS | |
| | | the modified | AAA 10 year Index | |
| | | duration factor | | |
| minus 150 bp) | | |
|
| 16,800,000 (F) | 5/2/08 | Banc of America | The spread | (1,000,658) |
| | | Securities AAA | return of Banc | |
| | | 10 yr Index | of America | |
| | | multiplied by | Securities- CMBS | |
| | | the modified | AAA 10 year Index | |
| | | duration factor | | |
|
| Citibank, N.A. | | | | |
| 16,550,000 (F) | 5/2/08 | 12.5 bp plus | The spread | (1,295,176) |
| | | change in spread | return of Banc | |
| | | of Banc | of America | |
| | | of America | Securities- CMBS | |
| | | Securities AAA | AAA 10 year Index | |
| 10 yr Index | | |
| multiplied by | | |
| the modified | | |
| | | duration factor | | |
|
78
| | | | |
| TOTAL RETURN SWAP CONTRACTS OUTSTANDING at 1/31/08 (Unaudited) continued | |
| |
| |
| | | Fixed payments | Total return | Unrealized |
| Swap counterparty / | Termination | received (paid) by | received by | appreciation/ |
| Notional amount | date | fund per annum | or paid by fund | (depreciation) |
|
| Deutsche Bank AG | | | | |
| $12,524,000 | 2/1/08 | 30 bp plus | The spread | $ (850,745) |
| | | beginning | return of Lehman | |
| | | of period nominal | Brothers AAA | |
| | | spread of Lehman | 8.5+ CMBS Index | |
| | | Brothers AAA | adjusted by modified | |
| | | 8.5+ Commercial | duration factor | |
| | | Mortgage Backed | | |
| | | Securities Index | | |
|
| Goldman Sachs International | | | | |
| 18,240,000 (F) | 11/2/08 | 20 bp plus | The spread | (773,048) |
| | | change in spread | return of Banc | |
| | | of Banc | of America | |
| | | of America | Securities- CMBS | |
| | | Securities AAA | AAA 10 year Index | |
| 10 yr Index | | |
| multiplied by | | |
| the modified | | |
| | duration factor | | |
| | | | | |
|
| 21,110,000 (F) | 5/1/08 | 10 bp plus | The spread | (944,124) |
| | | change in spread | return of Banc | |
| | | of Banc | of America | |
| | | of America | Securities- CMBS | |
| | | Securities AAA | AAA 10 year Index | |
| 10 yr Index | | |
| | multiplied by | | |
| | the modified | | |
| | | duration factor | | |
|
| 82,140,000 (F) | 7/2/08 | (Banc | The spread | 4,333,296 |
| | | of America | return of Banc | |
| | | Securities AAA | of America | |
| | | 10 yr Index | Securities- CMBS | |
| | | multiplied by | AAA 10 year Index | |
| the modified | | |
| | duration factor | | |
| | | minus 125 bp) | | |
|
|
| 3,843,000 (F) | 9/15/11 | 678 bp (1 month | Ford Credit Auto | 42,323 |
| | | USD-LIBOR-BBA) | Owner Trust | |
| | | | Series 2005-B | |
| | | | Class D | |
|
| JPMorgan Chase Bank, N.A. | | | | |
| 7,146,000 (F) | 4/30/08 | 110 bp plus Banc | The spread | (321,406) |
| | | of America | return of Banc | |
| | | Securities AAA | of America | |
| | | 10 yr Index | Securities- CMBS | |
| | | multiplied by | AAA 10 year Index | |
| the modified | | |
| | | duration factor | | |
|
| 18,686,000 (F) | 2/1/08 | 25 bp plus | The spread | (1,293,146) |
| | | beginning | return of Lehman | |
| | | of period nominal | Brothers AAA | |
| | | spread of Lehman | 8.5+ CMBS Index | |
| | | Brothers AAA | adjusted by | |
| | | 8.5+ Commercial | modified | |
| | | Mortgage Backed | duration factor | |
| | | Securities Index | | |
|
79
| | | | |
| TOTAL RETURN SWAP CONTRACTS OUTSTANDING at 1/31/08 (Unaudited) continued | |
|
| |
| | | Fixed payments | Total return | Unrealized |
| Swap counterparty / | Termination | received (paid) by | received by | appreciation/ |
| Notional amount | date | fund per annum | or paid by fund | (depreciation) |
|
| JPMorgan Chase Bank, N.A. continued | | | | |
| |
| $14,595,000 (F) | 8/1/08 | Change in spread | The spread | $(1,387,080) |
| | | of Lehman | return of Lehman | |
| | | Brothers AAA | Brothers AAA | |
| | | 8.5+ Commercial | 8.5+ CMBS Index | |
| | | Mortgage Backed | adjusted by | |
| | | Securities Index | modified | |
| | | minus 17.5 bp | duration factor | |
|
| Lehman Brothers Special Financing, Inc. | | | | |
| 33,764,000 | 6/2/08 | (Beginning | The spread | 2,529,261 |
| | | of period nominal | return of Lehman | |
| | | spread of Lehman | Brothers AAA | |
| | | Brothers AAA | 8.5+ CMBS Index | |
| | | 8.5+ Commercial | adjusted by | |
| | | Mortgage Backed | modified | |
| | | Securities Index | duration factor | |
| minus 175 bp) | | |
|
| 48,840,000 (F) | 7/2/08 | (Beginning | The spread | 3,688,836 |
| | | of period nominal | return of Lehman | |
| | | spread of Lehman | Brothers AAA | |
| | | Brothers AAA | 8.5+ CMBS Index | |
| | | 8.5+ Commercial | adjusted by | |
| | | Mortgage Backed | modified | |
| | | Securities Index | duration factor | |
| minus 230 bp) | | |
|
| 29,840,000 | 6/1/08 | Beginning | The spread | 2,150,903 |
| | | of period nominal | return of Lehman | |
| | | spread of Lehman | Brothers AAA | |
| | | Brothers AAA | 8.5+ CMBS Index | |
| | | 8.5+ Commercial | adjusted by | |
| | | Mortgage Backed | modified | |
| | | Securities Index | duration factor | |
| minus 500 bp | | |
|
| 17,825,000 (F) | 6/2/08 | (Beginning | The spread | 1,051,051 |
| | | of period nominal | return of Lehman | |
| | | spread of Lehman | Brothers AAA | |
| | | Brothers AAA | 8.5+ CMBS Index | |
| | | 8.5+ Commercial | adjusted by | |
| | | Mortgage Backed | modified | |
| | | Securities Index | duration factor | |
| minus 300 bp) | | |
|
| 7,840,000 | 6/1/08 | (20 bp plus | The spread | 445,100 |
| | | beginning | return of Lehman | |
| | | of period nominal | Brothers AAA | |
| | | spread of Lehman | 8.5+ CMBS Index | |
| | | Brothers AAA | adjusted by | |
| | | 8.5+ Commercial | modified | |
| | | Mortgage Backed | duration factor | |
| | | Securities Index) | | |
|
| 15,640,000 | 5/1/08 | (Beginning | The spread | 1,056,696 |
| | | of period nominal | return of Lehman | |
| | | spread of Lehman | Brothers AAA | |
| | | Brothers AAA | 8.5+ CMBS Index | |
| | | 8.5+ Commercial | adjusted by | |
| | | Mortgage Backed | modified | |
| | | Securities Index | duration factor | |
| minus 175 bp) | | |
|
80
| | | | |
| TOTAL RETURN SWAP CONTRACTS OUTSTANDING at 1/31/08 (Unaudited) continued | |
| |
| |
| | | Fixed payments | Total return | Unrealized |
| Swap counterparty / | Termination | received (paid) by | received by | appreciation/ |
| Notional amount | date | fund per annum | or paid by fund | (depreciation) |
|
| Lehman Brothers Special Financing, Inc. continued | | | |
| |
| $31,970,000 | 5/1/08 | (Beginning | The spread | $ 2,100,995 |
| | | of period nominal | return of Lehman | |
| | | spread of Lehman | Brothers AAA | |
| | | Brothers AAA | 8.5+ CMBS Index | |
| | | 8.5+ Commercial | adjusted by | |
| | | Mortgage Backed | modified | |
| | | Securities Index | duration factor | |
| | | minus 218.75 bp) | | |
|
| 27,656,000 | 4/1/08 | Beginning | The spread | (2,681,233) |
| | | of period nominal | return of Lehman | |
| | | spread of Lehman | Brothers AAA | |
| | | Brothers AAA | 8.5+ CMBS Index | |
| | | 8.5+ Commercial | adjusted by | |
| | | Mortgage Backed | modified | |
| | | Securities Index | duration factor | |
| minus 10 bp | | |
|
| 63,100,000 | 4/1/08 | (Beginning | The spread | 5,999,617 |
| | | of period nominal | return of Lehman | |
| | | spread of Lehman | Brothers AAA | |
| | | Brothers AAA | 8.5+ CMBS Index | |
| | | 8.5+ Commercial | adjusted by | |
| | | Mortgage Backed | modified | |
| | | Securities Index | duration factor | |
| minus 175 bp) | | |
|
| 63,100,000 (F) | 9/1/08 | 66.7 bp plus beginning | The spread | (5,784,125) |
| | | of period nominal | return of Lehman | |
| | | spread of Lehman | Brothers AAA | |
| | | Brothers AAA | 8.5+ CMBS Index | |
| | | 8.5+ Commercial | adjusted by | |
| | | Mortgage Backed | modified | |
| | | Securities Index | duration factor | |
|
| 54,927,000 | 3/1/08 | (2.5 bp plus | The spread | 4,790,233 |
| | | beginning | return of Lehman | |
| | | of period nominal | Brothers AAA | |
| | | spread of Lehman | 8.5+ CMBS Index | |
| | | Brothers AAA | adjusted by | |
| | | 8.5+ Commercial | modified | |
| | | Mortgage Backed | duration factor | |
| | | Securities Index) | | |
|
| 32,150,000 | 3/1/08 | Beginning | The spread | (2,626,549) |
| | | of period nominal | return of Lehman | |
| | | spread of Lehman | Brothers AAA | |
| | | Brothers AAA | 8.5+ CMBS Index | |
| | | 8.5+ Commercial | adjusted by | |
| | | Mortgage Backed | modified | |
| | | Securities Index | duration factor | |
| minus 70 bp | | |
|
| 48,791,000 | 3/1/08 | (Beginning | The spread | 4,068,442 |
| | | of period nominal | return of Lehman | |
| | | spread of Lehman | Brothers AAA | |
| | | Brothers AAA | 8.5+ CMBS Index | |
| | | 8.5+ Commercial | adjusted by | |
| | | Mortgage Backed | modified | |
| | | Securities Index | duration factor | |
| minus 120 bp) | | |
|
81
| | | | |
| TOTAL RETURN SWAP CONTRACTS OUTSTANDING at 1/31/08 (Unaudited) continued | |
| |
| |
| | | Fixed payments | Total return | Unrealized |
| Swap counterparty / | Termination | received (paid) by | received by | appreciation/ |
| Notional amount | date | fund per annum | or paid by fund | (depreciation) |
|
| Lehman Brothers Special Financing, Inc. continued | | | |
| |
| $65,083,000 | 2/1/08 | (Beginning | The spread | $ 4,527,994 |
| | | of period nominal | return of Lehman | |
| | | spread of Lehman | Brothers AAA | |
| | | Brothers AAA | 8.5+ CMBS Index | |
| | | 8.5+ Commercial | adjusted by | |
| | | Mortgage Backed | modified | |
| | | Securities Index | duration factor | |
| minus 100 bp) | | |
|
| 1,042,000 | 2/1/08 | (Beginning | The spread | 74,851 |
| | | of period nominal | return of Lehman | |
| | | spread of Lehman | Brothers AAA | |
| | | Brothers AAA | 8.5+ CMBS Index | |
| | | 8.5+ Commercial | adjusted by | |
| | | Mortgage Backed | modified | |
| | | Securities Index | duration factor | |
| minus 45 bp) | | |
|
| 73,243,000 | 2/1/08 | 30 bp plus | The spread | (5,051,211) |
| | | beginning | return of Lehman | |
| | | of period nominal | Brothers AAA | |
| | | spread of Lehman | 8.5+ CMBS Index | |
| | | Brothers AAA | adjusted by | |
| | | 8.5+ Commercial | modified | |
| | | Mortgage Backed | duration factor | |
| | | Securities Index | | |
|
| 12,529,000 | 2/1/08 | Beginning | The spread | (895,499) |
| | | of period nominal | return of Lehman | |
| | | spread of Lehman | Brothers AAA | |
| | | Brothers AAA | 8.5+ CMBS Index | |
| | | 8.5+ Commercial | adjusted by | |
| | | Mortgage Backed | modified | |
| | | Securities Index | duration factor | |
| minus 50 bp | | |
|
| 24,706,000 | 2/1/08 | 57.5 bp plus | The spread | (1,840,587) |
| | | beginning | return of Lehman | |
| | | of period nominal | Brothers AAA | |
| | | spread of Lehman | 8.5+ CMBS Index | |
| | | Brothers AAA | adjusted by | |
| | | 8.5+ Commercial | modified | |
| | | Mortgage Backed | duration factor | |
| | | Securities Index | | |
|
| Morgan Stanley Capital Services, Inc. | | | | |
| 17,825,000 (F) | 5/31/08 | (Banc of America | The spread | 737,189 |
| | | Securities AAA | return of Banc | |
| | | 10 yr Index | of America | |
| | | multiplied by | Securities- CMBS | |
| | | the modified | AAA 10 year Index | |
| | | duration factor | | |
| minus 250 bp) | | |
|
| 24,212,000 (F) | 5/2/08 | 10 bp plus Banc | The spread | (1,377,978) |
| | | of America | return of Banc | |
| | | Securities AAA | of America | |
| | | 10 yr Index | Securities- CMBS | |
| | | multiplied by | AAA 10 year Index | |
| the modified | | |
| | | duration factor | | |
|
82
| | | | |
| TOTAL RETURN SWAP CONTRACTS OUTSTANDING at 1/31/08 (Unaudited) continued | |
| |
| |
| | | Fixed payments | Total return | Unrealized |
| Swap counterparty / | Termination | received (paid) by | received by | appreciation/ |
| Notional amount | date | fund per annum | or paid by fund | (depreciation) |
|
| Morgan Stanley Capital Services, Inc. continued | | | |
| |
| $13,870,000 (F) | 4/30/08 | Change in spread | The spread | $ (847,138) |
| | | of Banc | return of Banc | |
| | | of America | of America | |
| | | Securities AAA | Securities- CMBS | |
| | | 10 yr Index | AAA 10 year Index | |
| multiplied by | | |
| the modified | | |
| | | duration factor | | |
| minus 15 bp | | |
|
| 20,040,000 (F) | 4/2/08 | (Beginning | The spread | 1,305,426 |
| | | of period nominal | return of Lehman | |
| | | spread of Lehman | Brothers AAA | |
| | | Brothers AAA | 8.5+ CMBS Index | |
| | | 8.5+ Commercial | adjusted by | |
| | | Mortgage Backed | modified | |
| | | Securities Index | duration factor | |
| minus 235 bp) | | |
|
| 58,992,000 | 1/31/08 | Change in spread | The spread | (4,536,278) |
| | | of Lehman | return of Lehman | |
| | | Brothers AAA | Brothers AAA | |
| | | 8.5+ Commercial | 8.5+ CMBS Index | |
| | | Mortgage Backed | adjusted by | |
| | | Securities Index | modified | |
| | | minus 110 bp | duration factor | |
|
| 10,651,000 (F) | 1/31/08 | Change in spread | The spread | (632,179) |
| | | of Banc | return of Banc | |
| | | of America | of America | |
| | | Securities AAA | Securities- CMBS | |
| | | 10 yr Index | AAA 10 year Index | |
| multiplied by | | |
| the modified | | |
| | | duration factor | | |
| minus 80 bp | | |
|
| 10,651,000 | 1/31/08 | Change in spread | The spread | (798,551) |
| | | of Lehman | return of Lehman | |
| | | Brothers AAA | Brothers AAA | |
| | | 8.5+ Commercial | 8.5+ CMBS Index | |
| | | Mortgage Backed | adjusted by | |
| | | Securities Index | modified | |
| | | minus 70 bp | duration factor | |
|
| 56,500,000 | 1/31/08 | 40 bp plus | The spread | (4,419,797) |
| | | beginning | return of Lehman | |
| | | of period nominal | Brothers Aaa | |
| | | spread of Lehman | 8.5+ CMBS Index | |
| | | Brothers AAA | adjusted by | |
| | | 8.5+ Commercial | modified | |
| | | Mortgage Backed | duration factor | |
| | | Securities Index | | |
|
| |
| Total | | | | $(3,261,600) |
(F) Is valued at fair value following procedures approved by the Trustees.
83
| | | | | | | |
| CREDIT DEFAULT CONTRACTS OUTSTANDING at 1/31/08 (Unaudited) | | |
| |
| | | Upfront | | | | Fixed payments | Unrealized |
| Swap counterparty / | | premium | Notional | | Termination | received (paid) by | appreciation/ |
| Referenced debt* | received (paid)** | amount | | date | fund per annum | (depreciation) |
|
| Bank of America, N.A. | | | | | | | |
| DJ ABX NA CMBX BBB Index | $ 4,742 | $ 6,896,783 | | 10/12/52 | (134 bp) | $ 2,154,831 |
|
| DJ CDX NA IG Series 8 | | | | | | | |
| Index | | (17,052) | 29,405,000 | | 6/20/17 | (60 bp) | 1,239,815 |
|
| DJ CDX NA IG Series 8 | | | | | | | |
| Index | | (224,334) | 61,605,000 | | 6/20/17 | (60 bp) | 2,408,869 |
|
| Marsh & Mclennan Co. | | | | | | | |
| Inc., 5 3/8%, 7/15/14 | | — | 1,620,000 | | 3/20/13 | 95 bp | (971) |
|
| Financial Security | | | | | | | |
| Assurance Inc. | | — | 330,000 | (F) | 12/20/12 | 95 bp | (12,936) |
|
| L-3 Communications | | | | | | | |
| Corp. 7 5/8%, 6/15/12 | | — | 295,000 | | 6/20/11 | (101 bp) | 1,480 |
|
| Bear Stearns International, Ltd. | | | | | | |
| DJ ABX NA CMBX BBB Index | 50,153 | 10,355,408 | | 10/12/52 | (134 bp) | 3,496,206 |
|
| Citibank, N.A. | | | | | | | |
| Arrow Electronic Inc., | | | | | | | |
| 6 7/8%, 6/1/18 | | — | 730,000 | | 3/20/13 | (43 bp) | 12,867 |
|
| CMS Energy Corp., | | | | | | | |
| 6.875%, 12/15/15 | | — | 1,550,000 | | 6/20/12 | 57 bp | (52,646) |
|
| Conagra Foods Inc., 7%, | | | | | | | |
| 10/1/28 | | — | 3,025,000 | | 9/20/10 | (27 bp) | 2,034 |
|
| DJ CDX NA HY Series 9 | | | | | | | |
| Index, 35-100% tranche | | — | 132,500,000 | | 12/20/12 | 112 bp | (2,360,119) |
|
| Marsh & Mclennan Co. | | | | | | | |
| Inc., 5 3/8%, 7/15/14 | | — | 980,000 | | 9/20/14 | (105 bp) | (7) |
|
| Motorola, Inc., 6.5%, | | | | | | | |
| 9/1/25 | | — | 820,000 | | 3/20/13 | (79 bp) | 29,238 |
|
| Sara Lee Corp., 6 1/8%, | | | | | | | |
| 11/1/32 | | — | 865,000 | | 9/20/11 | (43 bp) | 3,750 |
|
| Valero Energy Corp., | | | | | | | |
| 9.5%, 2/1/13 | | — | 1,380,000 | | 3/20/13 | (69.5 bp) | 9,439 |
|
| Yum! Brands Inc., 8 | | | | | | | |
| 7/8%, 4/15/11 | | — | 880,000 | | 3/20/13 | (65 bp) | 11,584 |
|
| Credit Suisse International | | | | | | | |
| Sprint Capital Corp, 8 | | | | | | | |
| 3/8%, 3/15/12 | | — | 2,655,000 | | 6/20/12 | (59 bp) | 208,749 |
|
| Deutsche Bank AG | | | | | | | |
| DJ ABX NA CMBX AAA Index | 146,502 | 2,570,000 | | 2/17/51 | 35 bp | (15,772) |
|
| DJ CDX NA IG Series 9 | | | | | | | |
| Index | | (267,009) | 59,660,000 | | 12/20/12 | (60 bp) | 906,106 |
|
| DJ CDX NA IG Series 9 | | | | | | | |
| Index 30-100% tranche | | — | 31,320,000 | | 12/20/12 | (27.2 bp) | (9,647) |
|
| DJ LCDX NA Series 9.1 | | | | | | | |
| Index 15-100% tranche | | — | 8,525,000 | (F) | 12/20/12 | 61.56 bp | (215,245) |
|
| France Telecom, 7.25%, | | | | | | | |
| 1/28/13 | | — | 1,870,000 | | 6/20/16 | 70 bp | (12,256) |
|
84
| | | | | | | |
| CREDIT DEFAULT CONTRACTS OUTSTANDING at 1/31/08 (Unaudited) continued | |
| |
| | | Upfront | | | | Fixed payments | Unrealized |
| Swap counterparty / | premium | Notional | | Termination | received (paid) by | appreciation/ |
| Referenced debt* | received (paid)** | amount | | date | fund per annum | (depreciation) |
|
| Goldman Sachs International | | | | | | | |
| Any one of the | | | | | | | |
| underlying securities | | | | | | | |
| in the basket of BB | | | | | | | |
| CMBS securities | $ | — | $ 8,582,000 | | (a) | 2.461% | $ (594,647) |
|
| DJ ABX HE A Index | 1,048,040 | 1,564,000 | | 1/25/38 | 369 bp | (72,087) |
|
| DJ ABX HE AAA Index | 367,573 | 1,564,000 | | 1/25/38 | 76 bp | (101,429) |
|
| DJ CDX NA CMBX AAA Index | | 65,836 | 1,800,000 | | 3/15/49 | 7 bp | (56,284) |
|
| DJ CDX NA HY Series 9 | | | | | | | |
| Index 25-35% tranche | | — | 31,320,000 | | 12/20/10 | 249 bp | (175,183) |
|
| DJ CDX NA HY Series 9 | | | | | | | |
| Index 25-35% tranche | | — | 8,420,000 | | 12/20/10 | 108.65 bp | (369,488) |
|
| DJ CDX NA IG Series 8 | | | | | | | |
| Index | | (23) | 29,410,000 | | 6/20/17 | (60 bp) | 1,257,058 |
|
| DJ CDX NA IG Series 8 | | | | | | | |
| Index | 1,387,511 | 92,280,000 | | 6/20/12 | 35 bp | (1,661,599) |
|
| DJ CDX NA IG Series 8 | | | | | | | |
| Index | (241,326) | 57,335,000 | | 6/20/17 | (60 bp) | 2,209,363 |
|
| DJ CDX NA IG Series 9 | | | | | | | |
| Index | (480,280) | 145,370,000 | | 12/20/12 | (60 bp) | (3,338,739) |
|
| DJ CDX NA IG Series 9 | | | | | | | |
| Index 30-100% tranche | | — | 62,640,000 | | 12/20/12 | (28.5 bp) | (60,539) |
|
| DJ CDX NA IG Series 9 | | | | | | | |
| Index 30-100% tranche | | — | 31,320,000 | | 12/20/12 | (26.75 bp) | (6,442) |
|
| Lehman Brothers | | | | | | | |
| Holdings, 6 5/8%, | | | | | | | |
| 1/18/12 | | — | 1,585,000 | | 9/20/17 | (67.8 bp) | 67,410 |
|
| Merrill Lynch & Co., | | | | | | | |
| 5%, 1/15/15 | | — | 1,585,000 | | 9/20/17 | (59.8 bp) | 62,890 |
|
| MetLife Inc., 5%, | | | | | | | |
| 6/15/15 | | — | 200,000 | | 9/20/11 | (50 bp) | 852 |
|
| JPMorgan Chase Bank, N.A. | | | | | | | |
| DJ CDX NA HY Series 9 | | | | | | | |
| Index 25-35% tranche | | — | 8,633,000 | | 12/20/10 | 105.5 bp | (386,585) |
|
| DJ CDX NA IG Series 9 | | | | | | | |
| Index | | — | 139,160,000 | (F) | 12/20/12 | (13.55 bp) | 891,619 |
|
| DJ CDX NA IG Series 9 | | | | | | | |
| Index | | (52,165) | 2,570,000 | | 12/20/17 | (80 bp) | 312 |
|
| DJ CDX NA IG Series 9 | | | | | | | |
| Index 30-100% tranche | | — | 27,245,000 | (F) | 12/20/12 | (5.8 bp) | 256,559 |
|
| Lehman Brothers Special Financing, Inc. | | | | | |
| Bear Stearns Co. Inc., | | | | | | | |
| 5.3%, 10/30/15 | | — | 1,585,000 | | 9/20/17 | (77 bp) | 148,404 |
|
| CMS Energy Corp., | | | | | | | |
| 6.875%, 12/15/15 | | — | 390,000 | | 6/20/12 | 62 bp | (14,090) |
|
| DJ ABX HE A Index | 1,089,065 | 1,567,000 | | 1/25/38 | 369 bp | (33,322) |
|
| DJ ABX HE A Index | 1,048,040 | 1,564,000 | | 1/25/38 | 369 bp | (72,087) |
|
| DJ ABX HE AAA Index | 438,760 | 1,567,000 | | 1/25/38 | 76 bp | (19,588) |
|
| DJ ABX HE AAA Index | 367,573 | 1,564,000 | | 1/25/38 | 76 bp | (89,684) |
|
| DJ CDX NA CMBX AA Index | | (76,552) | 2,416,000 | (F) | 3/15/49 | (15 bp) | 404,731 |
|
85
| | | | | | | |
| CREDIT DEFAULT CONTRACTS OUTSTANDING at 1/31/08 (Unaudited) continued | |
| |
| | | Upfront | | | | Fixed payments | Unrealized |
| Swap counterparty / | | premium | Notional | | Termination | received (paid) by | appreciation/ |
| Referenced debt* | received (paid)** | amount | | date | fund per annum | (depreciation) |
|
| Lehman Brothers Special Financing, Inc. continued | | | | | |
| DJ CDX NA HY Series 8 | | | | | | | |
| Index 35-60% tranche | $ | — | $ 30,983,000 | | 6/20/12 | 104 bp | $(2,130,481) |
|
| DJ CDX NA HY Series 9 | | | | | | | |
| Index 25-35% tranche | | — | 31,320,000 | | 12/20/10 | 266 bp | (29,180) |
|
| DJ CDX NA HY Series 9 | | | | | | | |
| Index 25-35% tranche | | — | 62,640,000 | | 12/20/10 | 295 bp | 437,558 |
|
| DJ CDX NA HY Series 9 | | | | | | | |
| Index 25-35% tranche | | — | 34,100,000 | | 12/20/10 | 90 bp | (1,678,232) |
|
| DJ CDX NA HY Series 9 | | | | | | | |
| Index 25-35% tranche | | — | 34,100,000 | | 12/20/10 | 104.5 bp | (1,536,949) |
|
| DJ CDX NA IG Series 8 | | | | | | | |
| Index | | 248,847 | 15,924,000 | | 6/20/12 | 35 bp | (277,313) |
|
| DJ CDX NA IG Series 8 | | | | | | | |
| Index 30-100% tranche | | — | 48,198,150 | | 6/20/12 | (3.125 bp) | 431,846 |
|
| DJ CDX NA IG Series 8 | | | | | | | |
| Index 30-100% tranche | | — | 39,434,850 | | 6/20/12 | (8 bp) | 268,175 |
|
| DJ CDX NA IG Series 9 | | | | | | | |
| Index | | 25,174 | 4,920,000 | | 12/20/12 | 60 bp | (71,570) |
|
| DJ CDX NA IG Series 9 | | | | | | | |
| Index | | (105,327) | 45,580,000 | | 12/20/17 | (80 bp) | 795,992 |
|
| DJ CDX NA IG Series 9 | | | | | | | |
| Index | | (230,499) | 6,645,000 | | 12/20/17 | (80 bp) | (94,077) |
|
| DJ CDX NA IG Series 9 | | | | | | | |
| Index | | (300,969) | 13,290,000 | | 12/20/17 | (80 bp) | (29,602) |
|
| DJ CDX NA IG Series 9 | | | | | | | |
| Index | | (199,175) | 40,252,000 | | 12/20/12 | (60 bp) | (990,663) |
|
| DJ CDX NA IG Series 9 | | | | | | | |
| Index | | (159,218) | 22,632,000 | | 12/20/12 | 60 bp | (604,239) |
|
| DJ LCDX NA Series 9.1 | | | | | | | |
| Index 15-100% tranche | | — | 8,525,000 | (F) | 12/20/12 | 59.3 bp | (220,488) |
|
| Domtar Corp., 7 1/8%, | | | | | | | |
| 8/15/15 | | — | 310,000 | | 12/20/11 | (250 bp) | 6,468 |
|
| Goldman Sachs Group, | | | | | | | |
| Inc., 6.6%, 1/15/12 | | — | 1,585,000 | | 9/20/17 | (58 bp) | 20,220 |
|
| Morgan Stanley Dean | | | | | | | |
| Witter, 6.6%, 4/1/12 | | — | 1,585,000 | | 9/20/12 | 48 bp | (47,608) |
|
| Morgan Stanley Dean | | | | | | | |
| Witter, 6.6%, 4/1/12 | | — | 1,585,000 | | 9/20/17 | (60.5 bp) | 43,029 |
|
| Morgan Stanley Capital Services, Inc. | | | | | | |
| DJ ABX NA CMBX AAA Index | 1,683,772 | 21,365,000 | | 12/13/49 | 8 bp | — |
|
| DJ ABX NA CMBX AAA Index | | 708,939 | 13,290,000 | | 2/17/51 | 35 bp | (130,210) |
|
| DJ ABX NA CMBX AAA Index | 1,520,729 | 21,365,000 | | 3/15/49 | 7 bp | — |
|
| DJ CDX NA CMBX AAA Index | 2,246,157 | 36,010,000 | | 12/13/49 | 8 bp | (591,768) |
|
| DJ CDX NA CMBX AAAA | | | | | | | |
| Index | | 839,083 | 31,970,000 | | 2/17/51 | 35 bp | (1,181,723) |
|
| DJ CDX NA IG Series 8 | | | | | | | |
| Index | | 668,488 | 55,600,000 | | 6/20/12 | 35 bp | (1,168,644) |
|
| DJ CDX NA IG Series 8 | | | | | | | |
| Index | | — | 29,370,000 | | 6/20/17 | (60 bp) | 1,255,372 |
|
86
| | | | | | | |
| CREDIT DEFAULT CONTRACTS OUTSTANDING at 1/31/08 (Unaudited) continued | |
| |
| | | Upfront | | | | Fixed payments | Unrealized |
| Swap counterparty / | | premium | Notional | | Termination | received (paid) by | appreciation/ |
| Referenced debt* | received (paid)** | amount | | date | fund per annum | (depreciation) |
|
| Morgan Stanley Capital Services, Inc. continued | | | | | |
| DJ CDX NA IG Series 9 | | | | | | | |
| Index | | $ (249,775) | $ 13,290,000 | | 12/20/17 | (80 bp) | $ 21,592 |
|
| DJ CDX NA IG Series 9 | | | | | | | |
| Index | | (134,495) | 30,050,000 | | 12/20/12 | (60 bp) | 456,389 |
|
| DJ ABX NA CMBX AAA Index | 752,810 | 13,290,000 | | 2/17/51 | 35 bp | (81,558) |
|
| DJ ABX NA CMBX AAA Index | 496,006 | 6,645,000 | | 2/17/51 | 35 bp | 76,106 |
|
| Total | | | | | | | $ (998,784) |
* Payments related to the reference debt are made upon a credit default event.
** Upfront premium is based on the difference between the original spread on issue and the market spread on day of execution.
(a) Terminating on the date on which the notional amount is reduced to zero or the date on which the assets securing the reference entity are liquidated.
(F) Is valued at fair value following procedures approved by the Trustees.
The accompanying notes are an integral part of these financial statements.
87
Statement of assets and liabilities 1/31/08 (Unaudited)
| |
| ASSETS | |
|
| Investment in securities, at value, including $242,322,117 of securities on loan (Note 1): | |
| Unaffiliated issuers (identified cost $5,175,614,044) | $5,356,989,301 |
| Affiliated issuers (identified cost $117,426,556) (Note 5) | 117,426,556 |
|
| Cash | 468,461 |
|
| Dividends, interest and other receivables | 16,365,113 |
|
| Receivable for shares of the fund sold | 1,848,398 |
|
| Receivable for securities sold | 31,260,318 |
|
| Receivable for sales of delayed delivery securities (Note 1) | 686,729,411 |
|
| Receivable from Manager (Note 2) | 410,886 |
|
| Unrealized appreciation on swap contracts (Note 1) | 197,616,212 |
|
| Premium paid on swap contracts (Note 1) | 2,738,199 |
|
| Receivable for variation margin (Note 1) | 6,983,722 |
|
| Receivable for open swap contracts (Note 1) | 5,106,059 |
|
| Receivable for closed swap contracts (Note 1) | 35,598 |
|
| Total assets | 6,423,978,234 |
| |
| |
| LIABILITIES | |
|
| Payable for securities purchased | 14,089,640 |
|
| Payable for purchases of delayed delivery securities (Note 1) | 1,345,021,037 |
|
| Payable for shares of the fund repurchased | 13,915,864 |
|
| Payable for compensation of Manager (Notes 2 and 5) | 4,839,901 |
|
| Payable for investor servicing fees (Note 2) | 586,113 |
|
| Payable for Trustee compensation and expenses (Note 2) | 474,501 |
|
| Payable for administrative services (Note 2) | 4,665 |
|
| Payable for distribution fees (Note 2) | 1,029,509 |
|
| Payable for closed swap contracts (Note 1) | 59,445 |
|
| Premiums received on swap contracts (Note 1) | 15,203,800 |
|
| Written options outstanding, at value (premiums received $23,677,401) (Notes 1 and 3) | 48,211,923 |
|
| Unrealized depreciation on swap contracts (Note 1) | 304,741,106 |
|
| TBA sales commitments, at value (proceeds receivable $685,572,578) (Note 1) | 687,204,383 |
|
| Collateral on securities loaned, at value (Note 1) | 249,122,924 |
|
| Other accrued expenses | 414,044 |
|
| Total liabilities | 2,684,918,855 |
|
| Net assets | $3,739,059,379 |
(Continued on next page)
88
Statement of assets and liabilities (Continued)
| |
| REPRESENTED BY | |
|
| Paid-in capital (Unlimited shares authorized) (Notes 1 and 4) | $3,656,815,114 |
|
| Distributions in excess of net investment income (Note 1) | (124,351) |
|
| Accumulated net realized gain on investments (Note 1) | 34,868,937 |
|
| Net unrealized appreciation of investments | 47,499,679 |
|
| Total — Representing net assets applicable to capital shares outstanding | $3,739,059,379 |
| |
| |
| COMPUTATION OF NET ASSET VALUE AND OFFERING PRICE | |
|
| Net asset value and redemption price per class A share | |
| ($2,875,370,723 divided by 181,114,616 shares) | $15.88 |
|
| Offering price per class A share | |
| (100/94.25 of $15.88)* | $16.85 |
|
| Net asset value and offering price per class B share | |
| ($310,704,351 divided by 19,800,220 shares)** | $15.69 |
|
| Net asset value and offering price per class C share | |
| ($61,893,225 divided by 3,926,455 shares)** | $15.76 |
|
| Net asset value and redemption price per class M share | |
| ($158,116,092 divided by 10,083,873 shares) | $15.68 |
|
| Offering price per class M share | |
| (100/96.50 of $15.68)* | $16.25 |
|
| Net asset value, offering price and redemption price per class R share | |
| ($2,027,766 divided by 128,187 shares) | $15.82 |
|
| Net asset value, offering price and redemption price per class Y share | |
| ($330,947,222 divided by 20,780,269 shares) | $15.93 |
* On single retail sales of less than $50,000. On sales of $50,000 or more the offering price is reduced.
** Redemption price per share is equal to net asset value less any applicable contingent deferred sales charge.
The accompanying notes are an integral part of these financial statements.
89
Statement of operations Six months ended 1/31/08 (Unaudited)
| | |
| INVESTMENT INCOME | | |
|
| Interest (including interest income of $3,348,880 | | |
| from investments in affiliated issuers) (Note 5) | $ | 51,937,242 |
|
| Dividends | | 28,960,177 |
|
| Securities lending | | 247,991 |
|
| Total investment income | | 81,145,410 |
| |
| |
| EXPENSES | | |
|
| Compensation of Manager (Note 2) | | 10,091,407 |
|
| Investor servicing fees (Note 2) | | 4,204,041 |
|
| Custodian fees (Note 2) | | 89,634 |
|
| Trustee compensation and expenses (Note 2) | | 58,761 |
|
| Administrative services (Note 2) | | 28,117 |
|
| Distribution fees — Class A (Note 2) | | 3,902,503 |
|
| Distribution fees — Class B (Note 2) | | 1,847,696 |
|
| Distribution fees — Class C (Note 2) | | 342,779 |
|
| Distribution fees — Class M (Note 2) | | 649,702 |
|
| Distribution fees — Class R (Note 2) | | 5,143 |
|
| Other | | 467,101 |
|
| Non-recurring costs (Notes 2 and 6) | | 7,057 |
|
| Costs assumed by Manager (Notes 2 and 6) | | (7,057) |
|
| Fees waived and reimbursed by Manager (Note 5) | | (55,054) |
|
| Total expenses | | 21,631,830 |
|
| Expense reduction (Note 2) | | (792,095) |
|
| Net expenses | | 20,839,735 |
|
| Net investment income | | 60,305,675 |
|
| Net realized gain on investments (Notes 1 and 3) | | 73,907,762 |
|
| Net increase from payments by affiliates (Note 2) | | 868,965 |
|
| Net realized gain on swap contracts (Note 1) | | 9,177,813 |
|
| Net realized gain on futures contracts (Note 1) | | 20,163,594 |
|
| Net realized gain on written options (Notes 1 and 3) | | 6,769,309 |
|
| Net unrealized depreciation of investments, futures contracts, swap contracts, | | |
| written options, and TBA sale commitments during the period | | (242,150,038) |
|
| Net loss on investments | | (131,262,595) |
|
| Net decrease in net assets resulting from operations | $ | (70,956,920) |
The accompanying notes are an integral part of these financial statements.
90
Statement of changes in net assets
| | | |
| DECREASE IN NET ASSETS | | | |
| |
| | Six months ended | Year ended |
| | | 1/31/08* | 7/31/07 |
|
| Operations: | | | |
| Net investment income | $ | 60,305,675 | $ 113,445,000 |
|
| Net realized gain on investments | | 110,887,443 | 487,497,756 |
|
| Net unrealized depreciation of investments | | (242,150,038) | (121,479,001) |
|
| Net increase (decrease) in net assets resulting from operations | (70,956,920) | 479,463,755 |
|
| Distributions to shareholders (Note 1): | | | |
|
| From ordinary income | | | |
|
| Net investment income | | | |
|
| Class A | | (61,679,366) | (91,249,673) |
|
| Class B | | (5,843,722) | (10,953,381) |
|
| Class C | | (1,087,447) | (1,475,085) |
|
| Class M | | (2,998,594) | (4,389,598) |
|
| Class R | | (37,615) | (46,016) |
|
| Class Y | | (7,955,234) | (14,027,385) |
|
| Net realized short-term gain on investments | | | |
|
| Class A | | (100,322,461) | (49,126,952) |
|
| Class B | | (11,660,603) | (8,659,988) |
|
| Class C | | (2,208,422) | (1,078,286) |
|
| Class M | | (5,622,961) | (2,920,573) |
|
| Class R | | (65,959) | (25,984) |
|
| Class Y | | (12,111,817) | (7,848,561) |
|
| From net realized long-term gain on investments | | | |
|
| Class A | | (161,440,412) | (209,675,856) |
|
| Class B | | (18,764,418) | (36,961,186) |
|
| Class C | | (3,553,826) | (4,602,171) |
|
| Class M | | (9,048,552) | (12,465,127) |
|
| Class R | | (106,143) | (110,903) |
|
| Class Y | | (19,490,519) | (33,497,980) |
|
| Redemption fees (Note 1) | | 2,513 | 9,895 |
|
| Increase (decrease) from capital share transactions (Note 4) | | 1,917,840 | (291,093,564) |
|
| Total decrease in net assets | | (493,034,638) | (300,734,619) |
|
| |
| NET ASSETS | | | |
|
| Beginning of period | | 4,232,094,017 | 4,532,828,636 |
|
| End of period (including distributions in excess of net investment | | |
| income and undistributed net investment income of $124,351 | | | |
| and $19,171,952, respectively) | $3,739,059,379 | $4,232,094,017 |
* Unaudited
The accompanying notes are an integral part of these financial statements.
91
Financial highlights (For a common share outstanding throughout the period)
| | | | | | | | | | | | | | |
| INVESTMENT OPERATIONS: | | | | LESS DISTRIBUTIONS: | | | | | RATIOS AND SUPPLEMENTAL DATA: | |
|
| | | | Net | | | | | | | Total | | | Ratio of net | |
| | Net asset | | realized and | Total | From | From | | | Net asset | return | Net | Ratio of | investment | |
| | value, | Net | unrealized | from | net | net realized | | | value, | at net | assets, | expenses to | income (loss) | Portfolio |
| | beginning | investment | gain (loss) on | investment | investment | gain on | Total | Redemption | end | asset | end of period | average net | to average | turnover |
| Period ended | of period | income (loss)(a) | investments | operations | income | investments | distributions | fees | of period | value (%)(b) | (in thousands) | assets (%)(c) | net assets (%) | (%) |
|
| CLASS A | | | | | | | | | | | | | | |
| January 31, 2008** | $18.10 | .26(d) | (.59) | (.33) | (.36) | (1.53) | (1.89) | —(g) | $15.88 | (1.77)* | $2,875,371 | .49*(d) | 1.52*(d) | 76.40*(h) |
| July 31, 2007 | 18.21 | .48(d) | 1.46 | 1.94 | (.52) | (1.53) | (2.05) | —(g) | 18.10 | 10.99 | 3,184,271 | .96(d) | 2.61(d) | 144.33(h) |
| July 31, 2006 | 18.40 | .42(d,e) | .27 | .69 | (.50) | (.38) | (.88) | —(g) | 18.21 | 3.89(e) | 3,155,761 | .90(d,e) | 2.31(d,e) | 117.11(h) |
| July 31, 2005 | 16.91 | .35(d,f) | 1.47 | 1.82 | (.33) | — | (.33) | —(g) | 18.40 | 10.89 | 3,458,405 | .98(d) | 1.97(d,f) | 169.29(h) |
| July 31, 2004 | 15.72 | .32(d) | 1.20 | 1.52 | (.33) | — | (.33) | —(g) | 16.91 | 9.77 | 3,322,532 | 1.00(d) | 1.90(d) | 165.66 |
| July 31, 2003 | 15.02 | .37 | .81 | 1.18 | (.48) | — | (.48) | — | 15.72 | 8.06 | 3,784,601 | .99 | 2.50 | 121.38(i,j) |
|
| |
| CLASS B | | | | | | | | | | | | | | |
| January 31, 2008** | $17.90 | .20(d) | (.60) | (.40) | (.28) | (1.53) | (1.81) | —(g) | $15.69 | (2.16)* | $310,704 | .87*(d) | 1.15*(d) | 76.40*(h) |
| July 31, 2007 | 18.02 | .33(d) | 1.46 | 1.79 | (.38) | (1.53) | (1.91) | —(g) | 17.90 | 10.15 | 413,532 | 1.71(d) | 1.82(d) | 144.33(h) |
| July 31, 2006 | 18.22 | .28(d,e) | .26 | .54 | (.36) | (.38) | (.74) | —(g) | 18.02 | 3.05(e) | 624,026 | 1.65(d,e) | 1.58(d,e) | 117.11(h) |
| July 31, 2005 | 16.73 | .21(d,f) | 1.48 | 1.69 | (.20) | — | (.20) | —(g) | 18.22 | 10.17 | 917,951 | 1.73(d) | 1.22(d,f) | 169.29(h) |
| July 31, 2004 | 15.56 | .19(d) | 1.19 | 1.38 | (.21) | — | (.21) | —(g) | 16.73 | 8.88 | 1,095,665 | 1.75(d) | 1.16(d) | 165.66 |
| July 31, 2003 | 14.87 | .26 | .80 | 1.06 | (.37) | — | (.37) | — | 15.56 | 7.25 | 1,308,605 | 1.74 | 1.75 | 121.38(i,j) |
|
| |
| CLASS C | | | | | | | | | | | | | | |
| January 31, 2008** | $17.97 | .20(d) | (.59) | (.39) | (.29) | (1.53) | (1.82) | —(g) | $15.76 | (2.14)* | $61,893 | .87*(d) | 1.14*(d) | 76.40*(h) |
| July 31, 2007 | 18.09 | .34(d) | 1.45 | 1.79 | (.38) | (1.53) | (1.91) | —(g) | 17.97 | 10.16 | 69,893 | 1.71(d) | 1.86(d) | 144.33(h) |
| July 31, 2006 | 18.30 | .28(d,e) | .25 | .53 | (.36) | (.38) | (.74) | —(g) | 18.09 | 3.01(e) | 70,192 | 1.65(d,e) | 1.56(d,e) | 117.11(h) |
| July 31, 2005 | 16.81 | .21(d,f) | 1.48 | 1.69 | (.20) | — | (.20) | —(g) | 18.30 | 10.14 | 77,024 | 1.73(d) | 1.22(d,f) | 169.29(h) |
| July 31, 2004 | 15.63 | .19(d) | 1.20 | 1.39 | (.21) | — | (.21) | —(g) | 16.81 | 8.92 | 75,185 | 1.75(d) | 1.16(d) | 165.66 |
| July 31, 2003 | 14.94 | .26 | .80 | 1.06 | (.37) | — | (.37) | — | 15.63 | 7.25 | 91,282 | 1.74 | 1.73 | 121.38(i,j) |
|
| |
| CLASS M | | | | | | | | | | | | | | |
| January 31, 2008** | $17.89 | .22(d) | (.59) | (.37) | (.31) | (1.53) | (1.84) | —(g) | $15.68 | (2.01)* | $158,116 | .74*(d) | 1.27*(d) | 76.40*(h) |
| July 31, 2007 | 18.02 | .38(d) | 1.45 | 1.83 | (.43) | (1.53) | (1.96) | —(g) | 17.89 | 10.42 | 176,993 | 1.46(d) | 2.10(d) | 144.33(h) |
| July 31, 2006 | 18.22 | .33(d,e) | .26 | .59 | (.41) | (.38) | (.79) | —(g) | 18.02 | 3.34(e) | 187,338 | 1.40(d,e) | 1.81(d,e) | 117.11(h) |
| July 31, 2005 | 16.74 | .26(d,f) | 1.47 | 1.73 | (.25) | — | (.25) | —(g) | 18.22 | 10.39 | 215,816 | 1.48(d) | 1.47(d,f) | 169.29(h) |
| July 31, 2004 | 15.57 | .23(d) | 1.19 | 1.42 | (.25) | — | (.25) | —(g) | 16.74 | 9.18 | 217,046 | 1.50(d) | 1.40(d) | 165.66 |
| July 31, 2003 | 14.87 | .30 | .80 | 1.10 | (.40) | — | (.40) | — | 15.57 | 7.58 | 239,662 | 1.49 | 2.02 | 121.38(i,j) |
|
| |
| CLASS R | | | | | | | | | | | | | | |
| January 31, 2008** | $18.04 | .24(d) | (.59) | (.35) | (.34) | (1.53) | (1.87) | —(g) | $15.82 | (1.91)* | $2,028 | .62*(d) | 1.39*(d) | 76.40*(h) |
| July 31, 2007 | 18.15 | .44(d) | 1.46 | 1.90 | (.48) | (1.53) | (2.01) | —(g) | 18.04 | 10.76 | 2,044 | 1.21(d) | 2.38(d) | 144.33(h) |
| July 31, 2006 | 18.36 | .36(d,e) | .27 | .63 | (.46) | (.38) | (.84) | —(g) | 18.15 | 3.57(e) | 1,525 | 1.15(d,e) | 2.00(d,e) | 117.11(h) |
| July 31, 2005 | 16.89 | .30(d,f) | 1.48 | 1.78 | (.31) | — | (.31) | —(g) | 18.36 | 10.63 | 726 | 1.23(d) | 1.67(d,f) | 169.29(h) |
| July 31, 2004 | 15.70 | .21(d) | 1.29 | 1.50 | (.31) | — | (.31) | —(g) | 16.89 | 9.60 | 127 | 1.25(d) | 1.33(d) | 165.66 |
| July 31, 2003† | 15.05 | .17 | .65 | .82 | (.17) | — | (.17) | — | 15.70 | 5.52* | 1 | .65* | 1.18* | 121.38(i,j) |
|
| |
| CLASS Y | | | | | | | | | | | | | | |
| January 31, 2008** | $18.15 | .29(d) | (.60) | (.31) | (.38) | (1.53) | (1.91) | —(g) | $15.93 | (1.63)* | $330,947 | .37*(d) | 1.65*(d) | 76.40*(h) |
| July 31, 2007 | 18.26 | .53(d) | 1.46 | 1.99 | (.57) | (1.53) | (2.10) | —(g) | 18.15 | 11.24 | 385,361 | .71(d) | 2.86(d) | 144.33(h) |
| July 31, 2006 | 18.46 | .47(d,e) | .26 | .73 | (.55) | (.38) | (.93) | —(g) | 18.26 | 4.09(e) | 493,985 | .65(d,e) | 2.59(d,e) | 117.11(h) |
| July 31, 2005 | 16.95 | .40(d,f) | 1.49 | 1.89 | (.38) | — | (.38) | —(g) | 18.46 | 11.26 | 660,532 | .73(d) | 2.23(d,f) | 169.29(h) |
| July 31, 2004 | 15.76 | .36(d) | 1.21 | 1.57 | (.38) | — | (.38) | —(g) | 16.95 | 10.03 | 848,161 | .75(d) | 2.16(d) | 165.66 |
| July 31, 2003 | 15.05 | .41 | .82 | 1.23 | (.52) | — | (.52) | — | 15.76 | 8.38 | 880,435 | .74 | 2.76 | 121.38(i,j) |
|
See notes to financial highlights at the end of this section.
The accompanying notes are an integral part of these financial statements.
Financial highlights (Continued)
* Not annualized
** Unaudited.
† For the period January 21, 2003 (commencement of operations) to July 31, 2003.
(a) Per share net investment income (loss) has been determined on the basis of the weighted average number of shares outstanding during the period.
(b) Total return assumes dividend reinvestment and does not reflect the effect of sales charges.
(c) Includes amounts paid through expense offset and brokerage service arrangements (Note 2).
(d) Reflects an involuntary contractual expense limitation and/or waivers of certain fund expenses in connection with investments in Putnam Prime Money Market Fund in effect during the period. As a result of such limitation and/or waivers, the expenses of each class reflect a reduction of the following amounts (Notes 2 and 5):
| |
| | Percentage |
| | of average |
| | net assets |
|
| January 31, 2008 | <0.01% |
|
| July 31, 2007 | <0.01 |
|
| July 31, 2006 | 0.01 |
|
| July 31, 2005 | 0.01 |
|
| July 31, 2004 | <0.01 |
|
(e) Reflects a non-recurring reimbursement from Putnam Investments relating to the calculation of certain amounts paid by the fund to Putnam in previous years for transfer agent services, which amounted to $0.01 per share and 0.05% of average net assets for the period ended July 31, 2006.
(f) Reflects a non-recurring accrual related to Putnam Management’s settlement with the SEC regarding brokerage allocation practices, which amounted to the following amounts:
| | |
| | | Percentage |
| | | of average |
| | Per share | net assets |
|
| Class A | <$0.01 | 0.02% |
|
| Class B | <0.01 | 0.02 |
|
| Class C | <0.01 | 0.02 |
|
| Class M | <0.01 | 0.02 |
|
| Class R | <0.01 | 0.02 |
|
| Class Y | <0.01 | 0.02 |
|
(g) Amount represents less than $0.01 per share.
(h) Portfolio turnover excludes dollar roll transactions.
(i) Portfolio turnover excludes certain treasury note transactions executed in connection with a short-term trading strategy.
(j) Portfolio turnover excludes the impact of assets received from the acquisition of Putnam Balanced Fund and Putnam Balanced Retirement Fund.
The accompanying notes are an integral part of these financial statements.
94
Notes to financial statements 1/31/08 (Unaudited)
Note 1: Significant accounting policies
The George Putnam Fund of Boston (the “fund”), a Massachusetts business trust, is registered under the Investment Company Act of 1940, as amended, as a diversified, open-end management investment company. The fund seeks to provide a balanced investment comprised of a well-diversified portfolio of stocks and bonds, which will produce both capital growth and current income. The fund may invest a significant portion of their assets in securitized debt instruments, including mortgage-backed and asset-backed investments. The yields and values of these investments are sensitive to changes in interest rates, the rate of principal payments on the underlying assets and the market’s perception of the issuers. The market for these investments may be volatile and limited, which may make them difficult to buy or sell.
The fund offers class A, class B, class C, class M, class R and class Y shares. Class A and class M shares are sold with a maximum front-end sales charge of 5.75% and 3.50%, respectively, and generally do not pay a contingent deferred sales charge. Class B shares, which convert to class A shares after approximately eight years, do not pay a front-end sales charge and are subject to a contingent deferred sales charge, if those shares are redeemed within six years of purchase. Class C shares have a one-year 1.00% contingent deferred sales charge and do not convert to class A shares. Class R shares, which are offered to qualified employee-benefit plans, are sold at net asset value. The expenses for class A, class B, class C, class M and class R shares may differ based on the distribution fee of each class, which is identified in Note 2. Class Y shares, which are sold at net asset value, are generally subject to the same expenses as class A, class B, class C, class M an d class R shares, but do not bear a distribution fee. Class Y shares are generally only available to corporate and institutional clients and clients in other approved programs.
A 1.00% redemption fee may apply on any shares that are redeemed (either by selling or exchanging into another fund) within 7 days of purchase. The redemption fee is accounted for as an addition to paid-in-capital.
Investment income, realized and unrealized gains and losses and expenses of the fund are borne pro-rata based on the relative net assets of each class to the total net assets of the fund, except that each class bears expenses unique to that class (including the distribution fees applicable to such classes). Each class votes as a class only with respect to its own distribution plan or other matters on which a class vote is required by law or determined by the Trustees. If the fund were liquidated, shares of each class would receive their pro-rata share of the net assets of the fund. In addition, the Trustees declare separate dividends on each class of shares.
In the normal course of business, the fund enters into contracts that may include agreements to indemnify another party under given circumstances. The fund’s maximum exposure under these arrangements is unknown as this would involve future claims that may be, but have not yet been, made against the fund. However, the fund expects the risk of material loss to be remote.
The following is a summary of significant accounting policies consistently followed by the fund in the preparation of its financial statements. The preparation of financial statements is in conformity with accounting principles generally accepted in the United States of America and requires management to make estimates and assumptions that affect the reported amounts of assets and liabilities in the financial statements and the reported amounts of increases and decreases in net assets from operations during the reporting period. Actual results could differ from those estimates.
A) Security valuation Investments for which market quotations are readily available are valued at the last reported sales price on their principal exchange, or official closing price for certain markets. If no sales are reported — as in the case
95
of some securities traded over-the-counter— a security is valued at its last reported bid price. Market quotations are not considered to be readily available for certain debt obligations; such investments are valued on the basis of valuations furnished by an independent pricing service approved by the Trustees or dealers selected by Putnam Investment Management, LLC (“Putnam Management”), the fund’s manager, a wholly-owned subsidiary of Putnam, LLC. Such services or dealers determine valuations for normal institutional-size trading units of such securities using methods based on market transactions for comparable securities and various relationships, generally recognized by institutional traders, between securities. Many securities markets and exchanges outside the U.S. close prior to the close of the New York Stock Exchange and therefore the closing prices for securities in such markets or on such exchanges may not fully reflect events that occu r after such close but before the close of the New York Stock Exchange. Accordingly, on certain days, the fund will fair value foreign equity securities taking into account multiple factors, including movements in the U.S. securities markets. The number of days on which fair value prices will be used will depend on market activity and it is possible that fair value prices will be used by the fund to a significant extent. Securities quoted in foreign currencies, if any, are translated into U.S. dollars at the current exchange rate. Certain investments, including certain restricted securities and derivatives, are also valued at fair value following procedures approved by the Trustees. Such valuations and procedures are reviewed periodically by the Trustees. Certain securities may be valued on the basis of a price provided by a single source. The fair value of securities is generally determined as the amount that the fund could reasonably expect to realize from an orderly disposition of such securities over a r easonable period of time. By its nature, a fair value price is a good faith estimate of the value of a security at a given point in time and does not reflect an actual market price, which may be different by a material amount.
B) Joint trading account Pursuant to an exemptive order from the Securities and Exchange Commission (the “SEC”), the fund may transfer uninvested cash balances, including cash collateral received under security lending arrangements, into a joint trading account along with the cash of other registered investment companies and certain other accounts managed by Putnam Management. These balances may be invested in issues of short-term investments having maturities of up to 397 days for collateral received under security lending arrangements and up to 90 days for other cash investments.
C) Repurchase agreements The fund, or any joint trading account, through its custodian, receives delivery of the underlying securities, the market value of which at the time of purchase is required to be in an amount at least equal to the resale price, including accrued interest. Collateral for certain tri-party repurchase agreements is held at the counterparty’s custodian in a segregated account for the benefit of the fund and the counterparty. Putnam Management is responsible for determining that the value of these underlying securities is at all times at least equal to the resale price, including accrued interest.
D) Security transactions and related investment income Security transactions are recorded on the trade date (the date the order to buy or sell is executed). Gains or losses on securities sold are determined on the identified cost basis.
Interest income is recorded on the accrual basis. Dividend income, net of applicable withholding taxes, is recognized on the ex-dividend date except that certain dividends from foreign securities, if any, are recognized as soon as the fund is informed of the ex-dividend date. Non-cash dividends, if any, are recorded at the fair market value of the securities received. Dividends representing a return of capital or capital gains, if any, are reflected as a reduction of cost and/or as a realized gain. All premiums/discounts are amortized/accreted on a yield-to-maturity basis.
96
Securities purchased or sold on a delayed delivery or a forward commitment basis may be settled a month or more after the trade date; interest income is accrued based on the terms of the securities. Losses may arise due to changes in the market value of the underlying securities or if the counterparty does not perform under the contract.
E) Stripped securities The fund may invest in stripped securities which represent a participation in securities that may be structured in classes with rights to receive different portions of the interest and principal. Interest-only securities receive all of the interest and principal-only securities receive all of the principal. If the interest-only securities experience greater than anticipated prepayments of principal, the fund may fail to recoup fully its initial investment in these securities. Conversely, principal-only securities increase in value if prepayments are greater than anticipated and decline if prepayments are slower than anticipated. The market value of these securities is highly sensitive to changes in interest rates.
F) Futures and options contracts The fund may use futures and options contracts to hedge against changes in the values of securities the fund owns, owned or expects to purchase, or for other investment purposes. The fund may also write options on swaps or securities it owns or in which it may invest to increase its current returns.
The potential risk to the fund is that the change in value of futures and options contracts may not correspond to the change in value of the hedged instruments. In addition, losses may arise from changes in the value of the underlying instruments, if there is an illiquid secondary market for the contracts, or if the counterparty to the contract is unable to perform. Risks may exceed amounts recognized on the Statement of assets and liabilities. When the contract is closed, the fund records a realized gain or loss equal to the difference between the value of the contract at the time it was opened and the value at the time it was closed. Realized gains and losses on purchased options are included in realized gains and losses on investment securities. If a written call option is exercised, the premium originally received is recorded as an addition to sales proceeds. If a written put option is exercised, the premium originally receive d is recorded as a reduction to the cost of investments.
Futures contracts are valued at the quoted daily settlement prices established by the exchange on which they trade. The fund and the broker agree to exchange an amount of cash equal to the daily fluctuation in the value of the futures contract. Such receipts or payments are known as “variation margin.” Exchange traded options are valued at the last sale price or, if no sales are reported, the last bid price for purchased options and the last ask price for written options. Options traded over-the-counter are valued using prices supplied by dealers. Futures and written option contracts outstanding at period end, if any, are listed after the fund’s portfolio.
G) Total return swap contracts The fund may enter into total return swap contracts, which are arrangements to exchange a market linked return for a periodic payment, both based on a notional principal amount. To the extent that the total return of the security, index or other financial measure underlying the transaction exceeds or falls short of the offsetting interest rate obligation, the fund will receive a payment from or make a payment to the counterparty. Total return swap contracts are marked to market daily based upon quotations from market makers and the change, if any, is recorded as an unrealized gain or loss. Payments received or made are recorded as a realized gains or loss. Certain total return swap contracts may include extended effective dates. Income related to these swap contracts is accrued based on the terms of the contract. The fund could be exposed to credit or market risk due to unfavorable changes in the fluctuation of interest rates or in the price of the underlying security or index, the possibility that there is no liquid market for these agreements or that the counterparty may default on its obligation to perform. Risk of
97
loss may exceed amounts recognized on the Statement of assets and liabilities. Total return swap contracts outstanding at period end, if any, are listed after the fund’s portfolio.
H) Interest rate swap contracts The fund may enter into interest rate swap contracts, which are arrangements between two parties to exchange cash flows based on a notional principal amount, to manage the fund’s exposure to interest rates. Interest rate swap contracts are marked to market daily based upon quotations from an independent pricing service or market makers and the change, if any, is recorded as an unrealized gain or loss. Payments received or made are recorded as a realized gains or loss. Certain interest rate swap contracts may include extended effective dates. Income related to these swap contracts is accrued based on the terms of the contract. The fund could be exposed to credit or market risk due to unfavorable changes in the fluctuation of interest rates or if the counterparty defaults on its obligation to perform. Risk of loss may exceed amounts recognized on the Statement of assets and liabilities. In terest rate swap contracts outstanding at period end, if any, are listed after the fund’s portfolio.
I) Credit default contracts The fund may enter into credit default contracts where one party, the protection buyer, makes an upfront or periodic payment to a counterparty, the protection seller, in exchange for the right to receive a contingent payment. The maximum amount of the payment may equal the notional amount, at par, of the underlying index or security as a result of a related credit event. Payments are made upon a credit default event of the disclosed primary referenced obligation or all other equally ranked obligations of the reference entity. An upfront payment received by the fund, as the protection seller, is recorded as a liability on the fund’s books. An upfront payment made by the fund, as the protection buyer, is recorded as an asset on the fund’s books. Periodic payments received or paid by the fund are recorded as realized gains or losses. The credit default contracts are marked to market daily based upon quotations from an independent pricing service or market makers and the change, if any, is recorded as an unrealized gain or loss. Payments received or made as a result of a credit event or termination of the contract are recognized, net of a proportional amount of the upfront payment, as realized gains or losses. In addition to bearing the risk that the credit event will occur, the fund could be exposed to market risk due to unfavorable changes in interest rates or in the price of the underlying security or index, the possibility that the fund may be unable to close out its position at the same time or at the same price as if it had purchased comparable publicly traded securities or that the counterparty may default on its obligation to perform. Risks of loss may exceed amounts recognized on the Statement of assets and liabilities. Credit default contracts outstanding at period end, if any, are listed after the fund’s portfolio.
J) TBA purchase commitments The fund may enter into “TBA” (to be announced) commitments to purchase securities for a fixed unit price at a future date beyond customary settlement time. Although the unit price has been established, the principal value has not been finalized. However, the amount of the commitments will not significantly differ from the principal amount. The fund holds, and maintains until settlement date, cash or high-grade debt obligations in an amount sufficient to meet the purchase price, or the fund may enter into offsetting contracts for the forward sale of other securities it owns. Income on the securities will not be earned until settlement date. TBA purchase commitments may be considered securities themselves, and involve a risk of loss if the value of the security to be purchased declines prior to the settlement date, which risk is in addition to the risk of decline in the value of the fund ’s other assets. Unsettled TBA purchase commitments are valued at fair value of the underlying securities, according to the procedures described under “Security valuation” above. The contract is marked to market daily and the change in market value is recorded by the fund as an unrealized gain or loss.
98
Although the fund will generally enter into TBA purchase commitments with the intention of acquiring securities for its portfolio or for delivery pursuant to options contracts it has entered into, the fund may dispose of a commitment prior to settlement if Putnam Management deems it appropriate to do so.
K) TBA sale commitments The fund may enter into TBA sale commitments to hedge its portfolio positions or to sell mortgage-backed securities it owns under delayed delivery arrangements. Proceeds of TBA sale commitments are not received until the contractual settlement date. During the time a TBA sale commitment is outstanding, equivalent deliverable securities or an offsetting TBA purchase commitment deliverable on or before the sale commitment date, are held as “cover” for the transaction.
Unsettled TBA sale commitments are valued at the fair value of the underlying securities, generally according to the procedures described under “Security valuation” above. The contract is marked to market daily and the change in market value is recorded by the fund as an unrealized gain or loss. If the TBA sale commitment is closed through the acquisition of an offsetting TBA purchase commitment, the fund realizes a gain or loss. If the fund delivers securities under the commitment, the fund realizes a gain or a loss from the sale of the securities based upon the unit price established at the date the commitment was entered into. TBA sale commitments outstanding at period end, if any, are listed after the fund’s portfolio.
L) Dollar rolls To enhance returns, the fund may enter into dollar rolls (principally using TBAs) in which the fund sells securities for delivery in the current month and simultaneously contracts to purchase similar securities on a specified future date. During the period between the sale and subsequent purchase, the fund will not be entitled to receive income and principal payments on the securities sold. The fund will, however, retain the difference between the initial sales price and the forward price for the future purchase. The fund will also be able to earn interest on the cash proceeds that are received from the initial sale, on settlement date. The fund may be exposed to market or credit risk if the price of the security changes unfavorably or the counterparty fails to perform under the terms of the agreement.
M) Securities lending The fund may lend securities, through its agents, to qualified borrowers in order to earn additional income. The loans are collateralized by cash and/or securities in an amount at least equal to the market value of the securities loaned. The market value of securities loaned is determined daily and any additional required collateral is allocated to the fund on the next business day. The risk of borrower default will be borne by the fund’s agents; the fund will bear the risk of loss with respect to the investment of the cash collateral. Income from securities lending is included in investment income on the Statement of operations. At January 31, 2008, the value of securities loaned amounted to $242,322,117. The fund received cash collateral of $249,122,924 which is pooled with collateral of other Putnam funds into 51 issues of short-term investments.
N) Federal taxes It is the policy of the fund to distribute all of its taxable income within the prescribed time and otherwise comply with the provisions of the Internal Revenue Code of 1986 (the “Code”), as amended, applicable to regulated investment companies. It is also the intention of the fund to distribute an amount sufficient to avoid imposition of any excise tax under Section 4982 of the Code, as amended. Therefore, no provision has been made for federal taxes on income, capital gains or unrealized appreciation on securities held nor for excise tax on income and capital gains.
At July 31, 2007, the fund had a capital loss carryover of $23,801,180 available to the extent allowed by the Code to offset future net capital gain, if any. The amount of the carryover and the expiration dates are:
99
| | |
| Loss Carryover | Expiration | |
| |
| $17,850,860 | July 31, 2010 | |
| |
| 5,950,320 | July 31, 2011 | |
| |
The aggregate identified cost on a tax basis is $5,319,598,486, resulting in gross unrealized appreciation and depreciation of $374,719,266 and $219,901,895, respectively, or net unrealized appreciation of $154,817,371.
O) Distributions to shareholders Distributions to shareholders from net investment income are recorded by the fund on the ex-dividend date. Distributions from capital gains, if any, are recorded on the ex-dividend date and paid at least annually. The amount and character of income and gains to be distributed are determined in accordance with income tax regulations, which may differ from generally accepted accounting principles. Dividend sources are estimated at the time of declaration. Actual results may vary. Any non-taxable return of capital cannot be determined until final tax calculations are completed after the end of the fund’s fiscal year. Reclassifications are made to the fund’s capital accounts to reflect income and gains available for distribution (or available capital loss carryovers) under income tax regulations.
Note 2: Management fee, administrative
services and other transactions
Putnam Management is paid for management and investment advisory services quarterly based on the average net assets of the fund. Such fee is based on the following annual rates: 0.65% of the first $500 million of average net assets, 0.55% of the next $500 million, 0.50% of the next $500 million, 0.45% of the next $5 billion, 0.425% of the next $5 billion, 0.405% of the next $5 billion, 0.39% of the next $5 billion and 0.38% thereafter.
Putnam Management has agreed to waive fees and reimburse expenses of the fund through June 30, 2009 to the extent necessary to ensure that the fund’s expenses do not exceed the simple average of the expenses of all front-end load funds viewed by Lipper Inc. as having the same investment classification or objective as the fund. The expense reimbursement is based on a comparison of the fund’s expenses with the average annualized operating expenses of the funds in its Lipper peer group for each calendar quarter during the fund’s last fiscal year, excluding 12b-1 fees and without giving effect to any expense offset and brokerage service arrangements that may reduce fund expenses.
For the period ended January 31, 2008, Putnam Management did not waive any of its management fee from the fund. For the period ended January 31, 2008, Putnam Management has assumed $7,057 of legal, shareholder servicing and communication, audit and Trustee fees incurred by the fund in connection with certain legal and regulatory matters (including those described in Note 6).
In October 2007, Putnam Management agreed to reimburse the fund in the amount of $868,965 in connection with the misidentification in 2006 of the characteristics of certain securities in the fund’s portfolio. The reimbursement by Putnam Management had less than a 0.01% impact on total return during the period.
The fund reimburses Putnam Management an allocated amount for the compensation and related expenses of certain officers of the fund and their staff who provide administrative services to the fund. The aggregate amount of all such reimbursements is determined annually by the Trustees.
Custodial services for the fund’s assets were provided by Putnam Fiduciary Trust Company (“PFTC”), an affiliate of Putnam Management, and by State Street Bank and Trust Company (“State Street”). Custody fees are based on the fund’s asset level, the number of its security holdings, transaction volumes and with respect to PFTC, certain fees related to the transition of assets to State Street. Putnam Investor Services, a division of PFTC, provided investor servicing agent
100
functions to the fund. Putnam Investor Services received fees for investor servicing, subject to certain limitations, based on the number of shareholder accounts in the fund and the level of defined contribution plan assets in the fund. During the period ended January 31, 2008, the fund incurred $4,237,169 for custody and investor servicing agent functions provided by PFTC.
The fund has entered into arrangements with PFTC and State Street whereby PFTC’s and State Street’s fees are reduced by credits allowed on cash balances. The fund also reduced expenses through brokerage service arrangements. For the six months ended January 31, 2008, the fund’s expenses were reduced by $792,095 under these arrangements.
Each independent Trustee of the fund receives an annual Trustee fee, of which $1,068, as a quarterly retainer, has been allocated to the fund, and an additional fee for each Trustees meeting attended. Trustees receive additional fees for attendance at certain committee meetings and industry seminars and for certain compliance-related matters. Trustees also are reimbursed for expenses they incur relating to their services as Trustees.
The fund has adopted a Trustee Fee Deferral Plan (the “Deferral Plan”) which allows the Trustees to defer the receipt of all or a portion of Trustees fees payable on or after July 1, 1995. The deferred fees remain invested in certain Putnam funds until distribution in accordance with the Deferral Plan.
The fund has adopted an unfunded noncontributory defined benefit pension plan (the “Pension Plan”) covering all Trustees of the fund who have served as a Trustee for at least five years and were first elected prior to 2004. Benefits under the Pension Plan are equal to 50% of the Trustee’s average annual attendance and retainer fees for the three years ended December 31, 2005. The retirement benefit is payable during a Trustee’s lifetime, beginning the year following retirement, for the number of years of service through December 31, 2006. Pension expense for the fund is included in Trustee compensation and expenses in the Statement of operations. Accrued pension liability is included in Payable for Trustee compensation and expenses in the Statement of assets and liabilities. The Trustees have terminated the Pension Plan with respect to any Trustee first elected after 2003.
The fund has adopted distribution plans (the “Plans”) with respect to its class A, class B, class C, class M and class R shares pursuant to Rule 12b-1 under the Investment Company Act of 1940. The purpose of the Plans is to compensate Putnam Retail Management, a wholly-owned subsidiary of Putnam, LLC and Putnam Retail Management GP, Inc., for services provided and expenses incurred in distributing shares of the fund. The Plans provide for payments by the fund to Putnam Retail Management at an annual rate of up to 0.35%, 1.00%, 1.00%, 1.00% and 1.00% of the average net assets attributable to class A, class B, class C, class M and class R shares, respectively. The Trustees have approved payment by the fund at an annual rate of 0.25%, 1.00%, 1.00%, 0.75% and 0.50% of the average net assets attributable to class A, class B, class C, class M and class R shares, respectively.
For the six months ended January 31, 2008, Putnam Retail Management, acting as underwriter, received net commissions of $55,322 and $698 from the sale of class A and class M shares, respectively, and received $150,162 and $1,998 in contingent deferred sales charges from redemptions of class B and class C shares, respectively.
A deferred sales charge of up to 1.00% and 0.65% is assessed on certain redemptions of class A and class M shares, respectively. For the six months ended January 31, 2008, Putnam Retail Management, acting as underwriter, received $1,162 and no monies on class A and class M redemptions, respectively.
101
Note 3: Purchases and sales of securities
During the six months ended January 31, 2008, cost of purchases and proceeds from sales of investment securities other than U.S. government securities and short-term investments aggregated $3,214,567,283 and $2,969,685,441, respectively. Purchases and sales of U.S. government securities aggregated $1,834,594 and $1,833,482, respectively.
Written option transactions during the six months ended January 31, 2008 are summarized as follows:
| | | |
| | | Contract | Premiums |
| | | Amounts | Received |
|
| Written options | | | |
| outstanding at | | | |
| beginning of period | $ | 955,599,000 | $20,599,166 |
|
| Options opened | | 446,934,000 | 12,063,606 |
| Options exercised | | — | — |
| Options expired | | (411,568,000) | (6,729,137) |
| Options closed | | (65,162,000) | (2,256,234) |
|
| Written options | | | |
| outstanding at | | | |
| end of period | $ | 925,803,000 | $23,677,401 |
Note 4: Capital shares
At January 31, 2008, there was an unlimited number of shares of beneficial interest authorized. Transactions in capital shares were as follows:
| | | |
| CLASS A | Shares | | Amount |
|
| Six months ended 1/31/08: | | |
| Shares sold | 8,652,153 | $ | 150,468,462 |
|
| Shares issued | | | |
| in connection | | | |
| with reinvestment | | | |
| of distributions | 19,092,580 | | 302,971,734 |
|
| | 27,744,733 | | 453,440,196 |
|
| Shares | | | |
| repurchased | (22,602,560) | | (385,150,353) |
|
| Net increase | 5,142,173 | $ | 68,289,843 |
| |
| Year ended 7/31/07: | | | |
| Shares sold | 23,421,130 | $ | 433,162,178 |
|
| Shares issued | | | |
| in connection | | | |
| with reinvestment | | | |
| of distributions | 18,272,904 | | 327,594,319 |
|
| | 41,694,034 | | 760,756,497 |
|
| Shares | | | |
| repurchased | (39,049,327) | | (721,568,081) |
|
| Net increase | 2,644,707 | $ | 39,188,416 |
|
| |
| CLASS B | Shares | | Amount |
|
| Six months ended 1/31/08: | | |
| Shares sold | 556,305 | $ | 9,523,993 |
|
| Shares issued | | | |
| in connection | | | |
| with reinvestment | | | |
| of distributions | 2,192,231 | | 34,349,421 |
|
| | 2,748,536 | | 43,873,414 |
|
| Shares | | | |
| repurchased | (6,052,556) | | (103,710,994) |
|
| Net decrease | (3,304,020) | $ | (59,837,580) |
| |
| Year ended 7/31/07: | | | |
| Shares sold | 1,887,613 | $ | 34,439,247 |
|
| Shares issued | | | |
| in connection | | | |
| with reinvestment | | | |
| of distributions | 3,010,636 | | 53,337,927 |
|
| | 4,898,249 | | 87,777,174 |
|
| Shares | | | |
| repurchased | (16,425,410) | | (301,276,907) |
|
| Net decrease | (11,527,161) | $(213,499,733) |
102
| | | |
| CLASS C | Shares | | Amount |
|
| Six months ended 1/31/08: | | |
| Shares sold | 209,297 | $ | 3,616,524 |
|
| Shares issued | | | |
| in connection | | | |
| with reinvestment | | | |
| of distributions | 381,228 | | 5,996,760 |
|
| | 590,525 | | 9,613,284 |
|
| Shares | | | |
| repurchased | (553,131) | | (9,303,150) |
|
| Net increase | 37,394 | $ | 310,134 |
| |
| Year ended 7/31/07: | | | |
| Shares sold | 531,413 | $ | 9,727,607 |
|
| Shares issued | | | |
| in connection | | | |
| with reinvestment | | | |
| of distributions | 355,895 | | 6,334,457 |
|
| | 887,308 | | 16,062,064 |
|
| Shares | | | |
| repurchased | (877,503) | | (16,137,789) |
|
| Net increase/(decrease) | 9,805 | $ | (75,725) |
|
| |
| CLASS M | Shares | | Amount |
|
| Six months ended 1/31/08: | | |
| Shares sold | 437,597 | $ | 7,530,073 |
|
| Shares issued | | | |
| in connection | | | |
| with reinvestment | | | |
| of distributions | 1,115,715 | | 17,475,872 |
|
| | 1,553,312 | | 25,005,945 |
|
| Shares | | | |
| repurchased | (1,361,651) | | (22,871,384) |
|
| Net increase | 191,661 | $ | 2,134,561 |
| |
| Year ended 7/31/07: | | | |
| Shares sold | 1,119,120 | $ | 20,403,582 |
|
| Shares issued | | | |
| in connection | | | |
| with reinvestment | | | |
| of distributions | 1,102,506 | | 19,543,155 |
|
| | 2,221,626 | | 39,946,737 |
|
| Shares | | | |
| repurchased | (2,724,559) | | (49,604,364) |
|
| Net decrease | (502,933) | $ | (9,657,627) |
| | | |
| CLASS R | Shares | | Amount |
|
| Six months ended 1/31/08: | | |
| Shares sold | 26,257 | $ | 440,912 |
|
| Shares issued | | | |
| in connection | | | |
| with reinvestment | | | |
| of distributions | 13,269 | | 209,715 |
|
| | 39,526 | | 650,627 |
|
| Shares | | | |
| repurchased | (24,670) | | (437,000) |
|
| Net increase | 14,856 | $ | 213,627 |
| |
| Year ended 7/31/07: | | | |
| Shares sold | 86,222 | $ 1,563,590 |
|
| Shares issued | | | |
| in connection | | | |
| with reinvestment | | | |
| of distributions | 10,185 | | 182,106 |
|
| | 96,407 | | 1,745,696 |
|
| Shares | | | |
| repurchased | (67,100) | (1,193,503) |
|
| Net increase | 29,307 | $ | 552,193 |
|
| |
| CLASS Y | Shares | Amount |
|
| Six months ended 1/31/08: | | |
| Shares sold | 1,467,514 | $ | 25,415,423 |
|
| Shares issued | | | |
| in connection | | | |
| with reinvestment | | | |
| of distributions | 2,484,080 | 39,557,570 |
|
| | 3,951,594 | 64,972,993 |
|
| Shares | | | |
| repurchased | (4,403,332) | (74,165,738) |
|
| Net decrease | (451,738) | $ | (9,192,745) |
| |
| Year ended 7/31/07: | | | |
| Shares sold | 4,345,678 | $ | 80,647,628 |
|
| Shares issued | | | |
| in connection | | | |
| with reinvestment | | | |
| of distributions | 3,083,571 | 55,373,926 |
|
| | 7,429,249 | 136,021,554 |
|
| Shares | | | |
| repurchased | (13,254,383) | (243,622,642) |
|
| Net decrease | (5,825,134) | $(107,601,088) |
103
Note 5: Investment in Putnam Prime
Money Market Fund
The fund invests in Putnam Prime Money Market Fund, an open-end management investment company managed by Putnam Management. Investments in Putnam Prime Money Market Fund are valued at its closing net asset value each business day. Management fees paid by the fund are reduced by an amount equal to the management fees paid by Putnam Prime Money Market Fund with respect to assets invested by the fund in Putnam Prime Money Market Fund. For the period ended January 31, 2008, management fees paid were reduced by $55,054 relating to the fund’s investment in Putnam Prime Money Market Fund. Income distributions earned by the fund are recorded as income in the Statement of operations and totaled $3,348,880 for the period ended January 31, 2008. During the period ended January 31, 2008, cost of purchases and proceeds of sales of investments in Putnam Prime Money Market Fund aggregated $551,371,891 and $851,656,680, respectively.
Note 6: Regulatory matters and litigation
In late 2003 and 2004, Putnam Management settled charges brought by the SEC and the Massachusetts Securities Division in connection with excessive short-term trading in Putnam funds. Payments from Putnam Management will be distributed to certain open-end Putnam funds and their shareholders. These allegations and related matters have served as the general basis for certain lawsuits, including purported class action lawsuits against Putnam Management and, in a limited number of cases, some Putnam funds. Putnam Management believes that these lawsuits will have no material adverse effect on the funds or on Putnam Management’s ability to provide investment management services. In addition, Putnam Management has agreed to bear any costs incurred by the Putnam funds as a result of these matters.
Putnam Management and Putnam Retail Management are named as defendants in a civil suit in which the plaintiffs allege that the management and distribution fees paid by certain Putnam funds were excessive and seek recovery under the Investment Company Act of 1940. Putnam Management and Putnam Retail Management have contested the plaintiffs’ claims and the matter is currently pending in the U.S. District Court for the District of Massachusetts. Based on currently available information, Putnam Management believes that this action is without merit and that it is unlikely to have a material effect on Putnam Management’s and Putnam Retail Management’s ability to provide services to their clients, including the fund.
Note 7: New accounting pronouncements
In June 2006, the Financial Accounting Standards Board (“FASB”) issued Interpretation No. 48, Accounting for Uncertainty in Income Taxes (the “Interpretation”). The Interpretation prescribes a minimum threshold for financial statement recognition of the benefit of a tax position taken or expected to be taken by a filer in the filer’s tax return. Upon adoption, the Interpretation did not have a material effect on the fund’s financial statements. However, the conclusions regarding the Interpretation may be subject to review and adjustment at a later date based on factors including, but not limited to, further implementation guidance expected from the FASB, and on-going analysis of tax laws, regulations and interpretations thereof.
In September 2006, the FASB issued Statement of Financial Accounting Standards No. 157, Fair Value Measurements (the “Standard”). The Standard defines fair value, sets out a framework for measuring fair value and requires additional disclosures about fair value measurements. The Standard applies to fair value measurements already required or permitted by existing standards. The Standard is effective for financial statements issued for fiscal years beginning after November 15, 2007 and interim periods within those fiscal years. Putnam Management is currently evaluating what impact the adoption of the Standard will have on the fund’s financial statements.
104
Brokerage commissions
(unaudited)
Brokerage commissions are paid to firms that execute trades on behalf of your fund. When choosing these firms, Putnam is required by law to seek the best execution of the trades, taking all relevant factors into consideration, including expected quality of execution and commission rate. Listed below are the largest relationships based upon brokerage commissions for your fund and the other funds in Putnam’s Large-Cap Value group for the year ended January 31, 2008. The Putnam mutual funds in this group are The George Putnam Fund of Boston, Putnam Classic Equity Fund, Putnam Convertible Income-Growth Trust, Putnam Equity Income Fund, The Putnam Fund for Growth and Income, Putnam New Value Fund, Putnam VT Equity Income Fund, Putnam VT The George Putnam Fund of Boston, Putnam VT Growth and Income Fund, and Putnam VT New Value Fund.
The top five firms that received brokerage commissions for trades executed for the Large-Cap Value group are (in descending order) Goldman Sachs, Merrill Lynch, Citigroup Global Markets, UBS Warburg, and Morgan Stanley Dean Witter. Commissions paid to these firms together represented approximately 46% of the total brokerage commissions paid for the year ended January 31, 2008.
Commissions paid to the next 10 firms together represented approximately 39% of the total brokerage commissions paid during the period. These firms are (in alphabetical order) Bear Stearns & Company, Credit Suisse First Boston, Deutsche Bank Securities, JPMorgan Clearing, Lazard Freres & Co., Lehman Brothers, Pipeline, RBC Capital Markets, Sanford Bernstein, and Wachovia Securities.
Commission amounts do not include “mark-ups” paid on bond or derivative trades made directly with a dealer. Additional information about brokerage commissions is available on the Securities and Exchange Commission (SEC) Web site at www.sec.gov. Putnam funds disclose commissions by firm to the SEC in semiannual filings on Form N-SAR.
105
The Putnam family of funds
The following is a list of Putnam’s open-end mutual funds offered to the public. Investors should carefully consider the investment objective, risks, charges, and expenses of a fund before investing. For a prospectus containing this and other information for any Putnam fund or product, call your financial advisor at 1-800-225-1581 and ask for a prospectus. Please read the prospectus carefully before investing.
Growth funds
Discovery Growth Fund
Growth Opportunities Fund
Health Sciences Trust
International New Opportunities Fund*
New Opportunities Fund
OTC & Emerging Growth Fund
Small Cap Growth Fund*
Vista Fund
Voyager Fund
Blend funds
Capital Appreciation Fund
Capital Opportunities Fund*
Europe Equity Fund*
Global Equity Fund*
Global Natural Resources Fund*
International Capital
Opportunities Fund*
International Equity Fund*
Investors Fund
Research Fund
Tax Smart Equity Fund®
Utilities Growth and Income Fund
Value funds
Classic Equity Fund
Convertible Income-Growth Trust
Equity Income Fund
The George Putnam Fund of Boston
The Putnam Fund for Growth
and Income
International Growth and Income Fund*
Mid Cap Value Fund
New Value Fund
Small Cap Value Fund*
Income funds
American Government Income Fund
Diversified Income Trust
Floating Rate Income Fund
Global Income Trust*
High Yield Advantage Fund*
High Yield Trust*
Income Fund
Money Market Fund†
U.S. Government Income Trust
* A 1% redemption fee on total assets redeemed or exchanged within 90 days of purchase may be imposed for all share classes of these funds.
† An investment in a money market fund is not insured or guaranteed by the Federal Deposit Insurance Corporation or any other government agency. Although the fund seeks to preserve the value of your investment at $1.00 per share, it is possible to lose money by investing in the fund.
106
Tax-free income funds
AMT-Free Insured Municipal Fund
Tax Exempt Income Fund
Tax Exempt Money Market Fund†
Tax-Free High Yield Fund
State tax-free income funds:
Arizona, California, Massachusetts, Michigan, Minnesota, New Jersey, New York, Ohio, and Pennsylvania
Asset allocation funds
Income Strategies Fund
Putnam Asset Allocation Funds — three investment portfolios that spread your money across a variety of stocks, bonds, and money market investments.
The three portfolios:
Asset Allocation: Balanced Portfolio
Asset Allocation: Conservative Portfolio
Asset Allocation: Growth Portfolio
Putnam RetirementReady® Funds
Putnam RetirementReady Funds — ten investment portfolios that offer diversification among stocks, bonds, and money market instruments and adjust to become more conservative over time based on a target date for withdrawing assets.
The ten funds:
Putnam RetirementReady 2050 Fund
Putnam RetirementReady 2045 Fund
Putnam RetirementReady 2040 Fund
Putnam RetirementReady 2035 Fund
Putnam RetirementReady 2030 Fund
Putnam RetirementReady 2025 Fund
Putnam RetirementReady 2020 Fund
Putnam RetirementReady 2015 Fund
Putnam RetirementReady 2010 Fund
Putnam RetirementReady Maturity Fund
With the exception of money market funds, a 1% redemption fee may be applied to shares exchanged or sold within 7 days of purchase (90 days, for certain funds).
Check your account balances and the most recent month-end performance at www.putnam.com.
107
Putnam puts your interests first
In January 2004, Putnam began introducing a number of voluntary initiatives designed to reduce fund expenses, provide investors with more useful information, and help safeguard the interests of all Putnam investors. Visit www.putnam.com for details.
Cost-cutting initiatives
Ongoing expenses will be limited Through calendar 2008, total ongoing expenses, including management fees for all funds, will be maintained at or below the average of each fund’s industry peers in its Lipper load-fund universe. For more information, please see the Statement of Additional information.
Lower class B purchase limit To help ensure that investors are in the most cost-effective share class, the maximum amount that can be invested in class B shares has been reduced to $100,000. (Larger trades or accumulated amounts will be refused.)
Improved disclosure
Putnam fund prospectuses and shareholder reports have been revised to disclose additional information that will help shareholders compare funds and weigh their costs and risks along with their potential benefits. Shareholders will find easy-to-understand information about fund expense ratios, portfolio manager compensation, risk comparisons, turnover comparisons, brokerage commissions, and employee and trustee ownership of Putnam funds. Disclosure of breakpoint discounts has also been enhanced to alert investors to potential cost savings.
Protecting investors’ interests
Short-term trading fee introduced To discourage short-term trading, which can interfere with a fund’s long-term strategy, a 1% short-term trading fee may be imposed on any Putnam fund shares (other than money market funds) redeemed or exchanged within seven calendar days of purchase (for certain funds, this fee applies for 90 days).
108
Fund information
Founded over 70 years ago, Putnam Investments was built around the concept that a balance between risk and reward is the hallmark of a well-rounded financial program. We manage over 100 mutual funds in growth, value, blend, fixed income, and international.
| | |
| Investment Manager | Officers | Francis J. McNamara, III |
| Putnam Investment | Charles E. Haldeman, Jr. | Vice President and |
| Management, LLC | President | Chief Legal Officer |
| One Post Office Square | | |
| Boston, MA 02109 | Charles E. Porter | Robert R. Leveille |
| Executive Vice President, | Vice President and |
| Marketing Services | Principal Executive Officer, | Chief Compliance Officer |
| Putnam Retail Management | Associate Treasurer and | |
| One Post Office Square | Compliance Liaison | Mark C. Trenchard |
| Boston, MA 02109 | | Vice President and |
| Jonathan S. Horwitz | BSA Compliance Officer |
| Custodian | Senior Vice President | |
| State Street Bank | and Treasurer | Judith Cohen |
| and Trust Company | | Vice President, Clerk and |
| Steven D. Krichmar | Assistant Treasurer |
| Legal Counsel | Vice President and | |
| Ropes & Gray LLP | Principal Financial Officer | Wanda M. McManus |
| | Vice President, Senior Associate |
| Trustees | Janet C. Smith | Treasurer and Assistant Clerk |
| John A. Hill, Chairman | Vice President, Principal | |
| Jameson Adkins Baxter, | Accounting Officer and | Nancy E. Florek |
| Vice Chairman | Assistant Treasurer | Vice President, Assistant Clerk, |
| Charles B. Curtis | | Assistant Treasurer and |
| Robert J. Darretta | Susan G. Malloy | Proxy Manager |
| Myra R. Drucker | Vice President and | |
| Charles E. Haldeman, Jr. | Assistant Treasurer | |
| Paul L. Joskow | | |
| Elizabeth T. Kennan | Beth S. Mazor | |
| Kenneth R. Leibler | Vice President | |
| Robert E. Patterson | | |
| George Putnam, III | James P. Pappas | |
| W. Thomas Stephens | Vice President | |
| Richard B. Worley | | |
| | |
| | |
This report is for the information of shareholders of The George Putnam Fund of Boston. It may also be used as sales literature when preceded or accompanied by the current prospectus, the most recent copy of Putnam’s Quarterly Performance Summary, and Putnam’s Quarterly Ranking Summary. For more recent performance, please visit www.putnam.com. Investors should carefully consider the investment objective, risks, charges, and expenses of a fund, which are described in its prospectus. For this and other information or to request a prospectus, call 1-800-225-1581 toll free. Please read the prospectus carefully before investing. The fund’s Statement of Additional Information contains additional information about the fund’s Trustees and is available without charge upon request by calling 1-800-225-1581.

Item 2. Code of Ethics:
Not applicable
Item 3. Audit Committee Financial Expert:
Not applicable
Item 4. Principal Accountant Fees and Services:
Not applicable
Item 5. Audit Committee of Listed Registrants
Not applicable
Item 6. Schedule of Investments:
The registrant’s schedule of investments in unaffiliated issuers is included in the report to shareholders in Item 1 above.
Item 7. Disclosure of Proxy Voting Policies and Procedures For Closed-End Management Investment Companies:
Not applicable
Item 8. Portfolio Managers of Closed-End Investment Companies
Not Applicable
Item 9. Purchases of Equity Securities by Closed-End Management Investment Companies and Affiliated Purchasers:
Not applicable
Item 10. Submission of Matters to a Vote of Security Holders:
Not applicable
Item 11. Controls and Procedures:
(a) The registrant's principal executive officer and principal financial officer have concluded, based on their evaluation of the effectiveness of the design and operation of the registrant's disclosure controls and procedures as of a date within 90 days of the filing date of this report, that the design and operation of such procedures are generally effective to provide reasonable assurance that information required to be disclosed by the registrant in this report is recorded, processed, summarized and reported within the time periods specified in the Commission's rules and forms.
(b) Changes in internal control over financial reporting: Not applicable
Item 12. Exhibits:
(a)(1) Not applicable
(a)(2) Separate certifications for the principal executive officer and principal financial officer of the registrant as required by Rule 30a-2(a) under the Investment Company Act of 1940, as amended, are filed herewith.
(b) The certifications required by Rule 30a-2(b) under the Investment Company Act of 1940, as amended, are filed herewith.
SIGNATURES
Pursuant to the requirements of the Securities Exchange Act of 1934 and the Investment Company Act of 1940, the registrant has duly caused this report to be signed on its behalf by the undersigned, thereunto duly authorized.
The George Putnam Fund of Boston
By (Signature and Title):
/s/Janet C. Smith
Janet C. Smith
Principal Accounting Officer
Date: March 31, 2008
Pursuant to the requirements of the Securities Exchange Act of 1934 and the Investment Company Act of 1940, this report has been signed below by the following persons on behalf of the registrant and in the capacities and on the dates indicated.
By (Signature and Title):
/s/Charles E. Porter
Charles E. Porter
Principal Executive Officer
Date: March 31, 2008
By (Signature and Title):
/s/Steven D. Krichmar
Steven D. Krichmar
Principal Financial Officer
Date: March 31, 2008