| | | |
| | |
| UNITED STATES |
| SECURITIES AND EXCHANGE COMMISSION |
| Washington, D.C. 20549 |
| |
| FORM N-CSR |
| |
| CERTIFIED SHAREHOLDER REPORT OF REGISTERED |
| MANAGEMENT INVESTMENT COMPANIES |
| | |
| Investment Company Act file number: (811- 00058) | |
| | |
| Exact name of registrant as specified in charter: | The George Putnam Fund of Boston |
| |
| Address of principal executive offices: One Post Office Square, Boston, Massachusetts 02109 |
| | | |
| Name and address of agent for service: | | Beth S. Mazor, Vice President |
| | One Post Office Square |
| | Boston, Massachusetts 02109 |
| | | |
| Copy to: | | John W. Gerstmayr, Esq. |
| | Ropes & Gray LLP |
| | One International Place |
| | Boston, Massachusetts 02110 |
| | |
| Registrant’s telephone number, including area code: | (617) 292-1000 |
| | | |
| Date of fiscal year end: July 31, 2009 | | |
| |
| Date of reporting period: August 1, 2008 — January 31, 2009 |
Item 1. Report to Stockholders:
The following is a copy of the report transmitted to stockholders pursuant to Rule 30e-1 under the Investment Company Act of 1940:
Since 1937, when George Putnam created a prudent mix of stocks and bonds in a single, professionally managed portfolio, we have championed the wisdom of the balanced approach. Today, we offer investors a world of equity, fixed-income, multi-asset, and absolute-return portfolios so investors can pursue a range of financial goals. Our seasoned portfolio managers seek superior results over time, backed by original, fundamental research on a global scale. We believe in service excellence, in the value of experienced financial advice, and in putting clients first in everything we do.
Not FDIC insured
May lose value
No bank guarantee
In 1830, Massachusetts Supreme Judicial Court Justice Samuel Putnam established The Prudent Man Rule, a legal foundation for responsible money management.

THE PRUDENT MAN RULE
All that can be required of a trustee to invest is that he shall conduct himself faithfully and exercise a sound discretion. He is to observe how men of prudence, discretion, and intelligence manage their own affairs, not in regard to speculation, but in regard to the permanent disposition of their funds, considering the probable income, as well as the probable safety of the capital to be invested.

The George
Putnam Fund
of Boston
1 | 31 | 09
Semiannual Report
| |
| Message from the Trustees | 2 |
| About the fund | 4 |
| Performance snapshot | 6 |
| Interview with your fund’s Portfolio Managers | 7 |
| Performance in depth | 12 |
| Expenses | 15 |
| Portfolio turnover | 16 |
| Your fund’s management | 17 |
| Terms and definitions | 18 |
| Trustee approval of management contract | 19 |
| Other information for shareholders | 25 |
| Financial statements | 26 |
| Brokerage commissions | 93 |
Cover photograph: © White-Packert Photography
Message from the Trustees
Dear Fellow Shareholder:
Financial markets have experienced significant upheaval for well over a year now. Responses by governmental and financial authorities, including the recent passage of a nearly $800 billion economic stimulus plan by Congress, have been rapid and often unprecedented in scale. Although history reminds us that stability and optimism have always returned to the markets, investors should expect continued volatility in the near term, for we are in the midst of a deep and painful bear market.
Under President and Chief Executive Officer Robert L. Reynolds, Putnam Investments is making the most of these challenging times by instituting several important changes designed to prepare Putnam for the eventual recovery. Key among them has been replacing a team management structure within Putnam equity funds with a more nimble decision-making process that vests responsibility with fewer fund managers.
Your fund’s portfolio managers are David Calabro and Raman Srivastava. David joined Putnam’s U.S. Equities Group in December and has 27 years of investment industry experience. Raman has managed the fixed-income portion of your fund since 2004 and has worked at Putnam since 1999. You will hear from both managers in the interview section that begins on page 7. In other moves aimed at achieving performance excellence, Putnam has affirmed a fundamental approach to investing, simplified its equity fund lineup, and hired nearly 20 seasoned equity analysts.
2
We would like to take this opportunity to welcome new shareholders to the fund and to thank all of our investors for your continued confidence in Putnam. Although the markets have presented investors with extraordinary challenges, it is Putnam’s belief that the seeds of opportunity are often sown during difficult times like these.
Respectfully yours,

About the fund
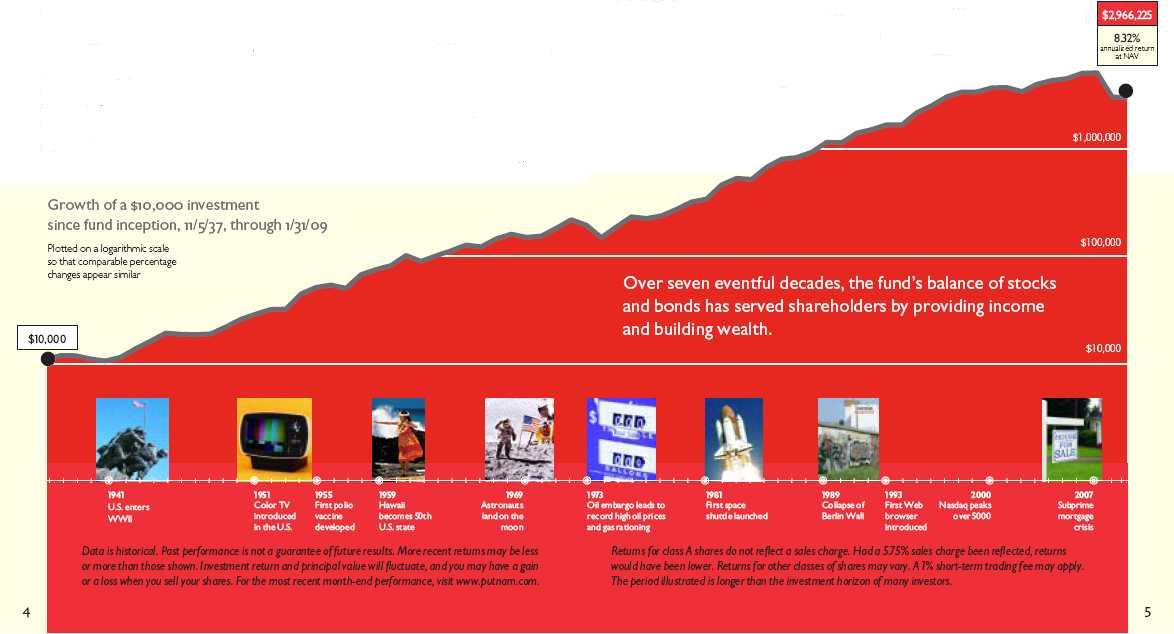
Providing the benefits of balanced investing for over 70 years
Your fund launched in 1937 when George Putnam, a Boston investment manager, decided to start a fund with an innovative approach — a balance of stocks to seek capital appreciation and bonds to help provide current income. The original portfolio featured industrial stocks, such as U.S. Smelting, Refining, & Mining Co., and railroad bonds.
This balanced approach made sense then, and we believe it continues to make sense now. In the late 1930s, the stock market experienced dramatic swings as businesses struggled to recover from the Great Depression and the shadow of war began to spread across Europe and Asia. Today, the credit crisis and economic uncertainties also challenge investors.
Although the fund has experienced volatility at times, its balanced approach has kept it on course. When stocks were weak, the fund’s bonds helped results. Similarly, stocks have often provided leadership when bonds were hurt by rising interest rates or inflation.
In a letter to shareholders dated July 12, 1938, George Putnam articulated the balanced strategy this way: “Successful investing calls not so much for some clairvoyant ability to read the future as for the courage to stick to tested, commonsense policies in the face of the unreliable emotional stresses and strains that constantly sweep the market place.”
Putnam remains committed to this prudent approach to investing today.
The fund may invest a portion of its assets in small and/or midsize companies. Such investments increase the risk of greater price fluctuations.
The use of derivatives involves special risks and may result in losses.
The fund may have a significant portion of its holdings in bonds. Mutual funds that invest in bonds are subject to certain risks including interest-rate risk, credit risk, and inflation risk.
As interest rates rise, the prices of bonds fall. Long-term bonds are more exposed to interest-rate risk than short-term bonds. Unlike bonds, bond funds have ongoing fees and expenses. Funds that invest in government securities are not guaranteed. Mortgage-backed securities are subject to prepayment risk.
Value investing seeks underpriced stocks, but there is no guarantee that a stock’s price will rise.
Performance snapshot
Current performance may be lower or higher than the quoted past performance, which cannot guarantee future results. Share price, principal value, and return will fluctuate, and you may have a gain or a loss when you sell your shares. Performance of class A shares assumes reinvestment of distributions and does not account for taxes. Fund returns in the bar chart do not reflect a sales charge of 5.75%; had they, returns would have been lower. See pages 7 and 12–14 for additional performance information. For a portion of the periods, this fund may have limited expenses, without which returns would have been lower. A 1% short-term trading fee may apply. To obtain the most recent month-end performance, visit www.putnam.com.
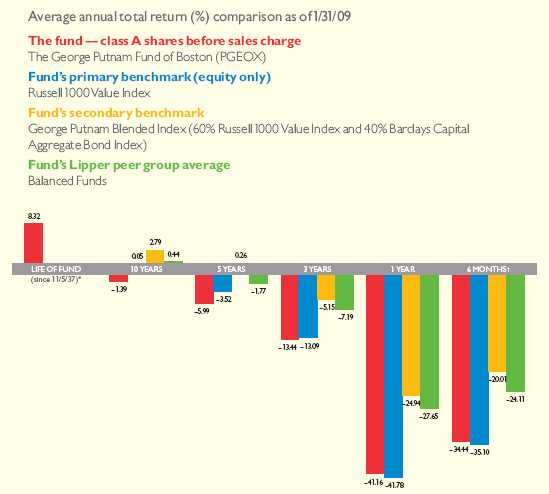
Putnam Management has recently undertaken a review of the fund’s benchmark. The Russell 1000 Value Index replaces the S&P 500/Citigroup Value Index as the primary benchmark for this fund because, in Putnam Management’s opinion, the securities tracked by this index more accurately reflect the types of securities that generally will be held by the fund.
* The benchmarks and Lipper group were not in existence at the time of the fund’s inception. The Russell 1000 Value Index and the George Putnam Blended Index commenced 12/31/78. The Lipper average commenced 12/31/59.
�� Returns for the six-month period are not annualized, but cumulative.
6
Interview with your
fund’s Portfolio Managers
David Calabro and Raman Srivastava
David, the past six months have presented a series of economic and investment challenges. Can you provide some background?
The period marked an acceleration of the difficulties we have seen for the better part of a year. A number of once-venerable financial institutions failed, merged, or filed for bankruptcy as real estate-related losses mounted. Consumers pulled back sharply on spending, and businesses across the economy announced layoffs and disappointing earnings. Last year will certainly go down in history as being one of the worst for investors.
How did the fund perform?
Regrettably, the fund’s class A shares delivered a return of –34.44% during this difficult period. This result was only slightly better than the Russell 1000 Value Index, the fund’s unmanaged benchmark, and a good deal worse than the average balanced fund, which returned –24.11% as measured by Lipper.
On the stock side of the fund, the biggest detractors were financial services companies such as Goldman Sachs and JPMorgan Chase, and companies in commodities-based fields, including U.S. Steel and Freeport-McMoRan.
Broad market index and fund performance
This comparison shows your fund’s performance in the context of broad market indexes for the six months ended 1/31/09. See page 6 and pages 12–14 for additional fund performance information. Index descriptions can be found on page 18.

7
Although financial stocks traditionally have been an important sector in the value-investing universe and an attractive source of dividend income for the fund, even the strongest names could not withstand 2008’s downturn. Commodity-related stocks fell sharply when it became apparent late in the year that the credit crisis was leading to a severe global recession, and that demand for raw materials would slow.
Raman, did the fund’s bonds help provide a buffer for falling stock prices?
Whereas under normal circumstances the fund’s bond holdings might have helped mitigate the impact of price volatility in stocks, we held a number of bond positions recently that were at the heart of the financial crisis.
At Putnam, we have researched the various sectors of the bond market for many years, and our investment thesis was based on owning the highest-grade securities available. We believed we had found compelling opportunities in the distressed sectors of the mortgage-backed market, particularly among Aaa-rated securitized investment vehicles such as commercial mortgage-backed securities (CMBS), interest-only CMBS, and collateralized mortgage pass-through bonds backed by U.S. government agencies, such as the Federal National Mortgage Association.
Although these bonds continued to pay a healthy level of interest and were not in default, investors drove down prices to distressed levels. In fact, as investors largely avoided risky investments, all fixed-income sectors struggled, except for U.S. Treasury bonds. The dramatic selling of even high-quality bonds
Equity sector allocations as of 1/31/09
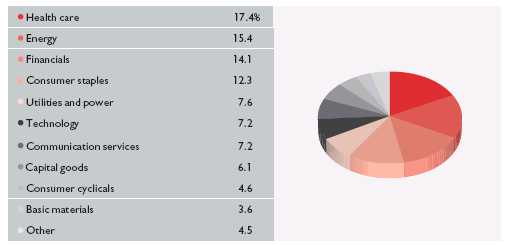
Allocations are represented as a percentage of total common stocks. Holdings and allocations may vary over time.
8
adversely affected the bond portion of the fund.
Were there fixed-income strategies that helped performance?
Absolutely. We reduced our overall exposure to longer-term bonds since these tend to be more sensitive to changes in interest rates and prevailing yields, and invested in shorter-term securities. This strategy helped as the Federal Reserve Board’s aggressive cuts in the federal funds rate and the selling by investors combined to “steepen” the yield curve. Our decision to underweight and effectively diversify the fund’s exposure to corporate bonds was also beneficial in that it helped to sidestep numerous defaults, particularly in the financials sector.
David, you’re new to the fund. Can you tell us how you are approaching management of this flagship fund?
The fund’s stated objective is to provide capital appreciation plus current
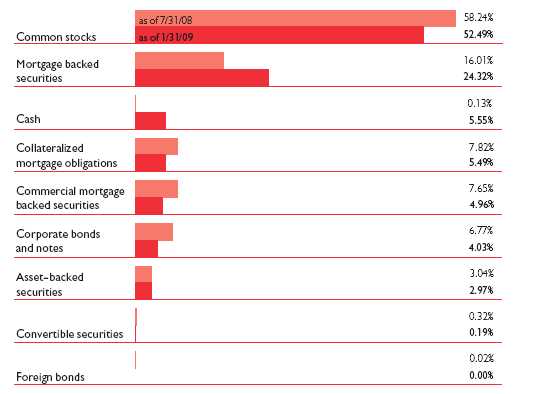
Portfolio composition comparison
This chart shows how the fund’s weightings have changed over the past six months. Weightings are shown as a percentage of net assets and will vary over time.
9
income. However, in this environment, investors clearly are looking for more consistent returns over time. So within the guidelines of the fund’s prospectus, we want the fund to have lower volatility than similar funds.
What strategies are you pursuing on the equity side?
With economic growth slowing, we reduced the fund’s exposure to consumer cyclical stocks, which tend to flourish in times of economic prosperity. Instead, we’re investing in consumer staples stocks such as General Mills and Procter & Gamble. These companies sell the kinds of low-cost, high-volume products — cereal and toothpaste, for example — that people depend on even in the toughest of times. Similarly, we have increased the fund’s allocation to health-care-related stocks, which have the benefit of stable revenue streams in lean times. Examples of these allocations include drug makers Pfizer and Wyeth — which recently announced their agreement to merge — as w ell as McKesson, Baxter International, and Johnson & Johnson. We have also increased the fund’s exposure to energy stocks such as Exxon Mobil, Chevron, EOG Resources, and Occidental Petroleum, given their now considerably more attractive prices and favorable supply-and-demand trends.
I N T H E N E W S
Congress passed a $787 billion stimulus plan on February 13, 2009, with the goals of creating jobs, helping the unemployed, and cultivating economic growth. Tens of billions of dollars will be spent over the next two years to support Medicaid, help local school districts, and extend jobless benefits. Billions of dollars also will fund job-creating investments in“green” technologies, computerizing the nation’s medical-records system, biomedical research, and public works-style construction projects. The balance of the package is devoted to tax cuts for businesses and individuals, including a $400 payroll tax holiday for workers (married couples filing jointly for less than $150,000 get up to $800). The plan is one of the largest of its kind since Franklin D. Roosevelt launched the New Deal in 1933.
Raman, what kinds of strategies are you pursuing on the bond side?
The mortgage-related positions that disappointed in 2008 have begun to perform strongly in 2009, so our weighting in these issues remains high. However, as the fund books gains, I am taking opportunities to reduce complexity in the fund’s fixed-income portfolio. We have reduced exposure to collateralized mortgage obligations (CMOs) and have also reduced some of
10
our asset-backed (ABS) and commercial mortgage-backed positions (CMBS).
We have used the cash from these sales to participate in the new issue market of investment-grade corporate bonds, and to buy shorter-maturity FDIC guaranteed debt (as an alternative to Treasury bonds) and FNMA mortgage pools. We will continue to hold overweight positions in CMO/ABS/CMBS, but will aim to continue to reduce these as the market stabilizes, with the goal of reducing the overall volatility of the fixed-income portfolio. I am also trying to reduce the use of derivatives where possible. For example, since the close of the reporting period, I’ve eliminated virtually all of our index derivative positions.
One of the outcomes of that concentration on shorter maturities is that the fund’s quarterly dividend will be reduced to $0.129 per share from $0.157 per share, since short-term, low-risk bonds pay less interest than long-term bonds. A corresponding reduction in traditionally high-yielding financial stocks also factored into our decision to reduce the fund’s dividend at this time.
David, what should investors expect in the year ahead?
With consumers and companies both cutting back on spending, the burden falls to the federal government to try to pick up the slack. The nearly $800 billion stimulus package that passed in February should help jolt the economy, but investors should not expect a quick recovery in stock prices. Market volatility will persist, we believe, until there is evidence to suggest that profits have stabilized. In our view, such stabilization is likely to occur first in the health-care and technology sectors, as well as in areas favored by the fiscal-stimulus package, such as energy. With so much uncertainty in the financials sector, we expect to be underweight financials for some time.
A long recession may be in the cards. Opportunistic, long-term investors may wish to use this period as a time to accumulate shares at lower prices, but only investors, with the help of their financial advisors, can determine a level of investment risk that is right for them. In the meantime, we will do our best to find the relative values in the marketplace and to look for signs of recovery. Eventually, capital markets will stabilize, and investors will begin to capitalize on the value embedded in those markets.
Thank you both.
The views expressed in this report are exclusively those of Putnam Management. They are not meant as investment advice.
Please note that the holdings discussed in this report may not have been held by the fund for the entire period. Portfolio composition is subject to review in accordance with the fund’s investment strategy and may vary in the future.
11
Your fund’s performance
This section shows your fund’s performance, price, and distribution information for periods ended January 31, 2009, the end of the first half of its current fiscal year. In accordance with regulatory requirements for mutual funds, we also include performance as of the most recent calendar quarter-end and expense information taken from the fund’s current prospectus. Performance should always be considered in light of a fund’s investment strategy. Data represents past performance. Past performance does not guarantee future results. More recent returns may be less or more than those shown. Investment return and principal value will fluctuate, and you may have a gain or a loss when you sell your shares. Performance information does not reflect any deduction for taxes a shareholder may owe on fund distributions or on the redemption of fund shares. For the most recent month-end performance, please visit the Individual Investors section of www.putnam.com or call Putnam at 1-800-225-1581. Class Y shares are generally only available to corporate and institutional clients and clients in other approved programs. See the Terms and Definitions section in this report for definitions of the share classes offered by your fund.
| | | | | | | | | | |
| Fund performance Total return for periods ended 1/31/09 | | | | |
|
| | Class A | Class B | Class C | Class M | Class R | Class Y |
| (inception dates) | (11/5/37) | (4/27/92) | (7/26/99) | (12/1/94) | (1/21/03) | (3/31/94) |
|
| | NAV | POP | NAV | CDSC | NAV | CDSC | NAV | POP | NAV | NAV |
|
| Annual average | | | | | | | | | | |
| (life of fund) | 8.32% | 8.23% | 7.30% | 7.30% | 7.50% | 7.50% | 7.58% | 7.52% | 8.05% | 8.38% |
|
| 10 years | –13.05 | –18.05 | –19.36 | –19.36 | –19.38 | –19.38 | –17.25 | –20.16 | –15.12 | –10.81 |
| Annual average | –1.39 | –1.97 | –2.13 | –2.13 | –2.13 | –2.13 | –1.88 | –2.23 | –1.63 | –1.14 |
|
| 5 years | –26.59 | –30.82 | –29.37 | –30.39 | –29.33 | –29.33 | –28.42 | –30.94 | –27.51 | –25.66 |
| Annual average | –5.99 | –7.10 | –6.72 | –6.99 | –6.71 | –6.71 | –6.47 | –7.14 | –6.23 | –5.76 |
|
| 3 years | –35.14 | –38.87 | –36.63 | –38.08 | –36.62 | –36.62 | –36.13 | –38.35 | –35.61 | –34.63 |
| Annual average | –13.44 | –15.13 | –14.11 | –14.77 | –14.10 | –14.10 | –13.88 | –14.89 | –13.65 | –13.21 |
|
| 1 year | –41.16 | –44.55 | –41.61 | –44.39 | –41.61 | –42.16 | –41.44 | –43.50 | –41.27 | –40.99 |
|
| 6 months | –34.44 | –38.19 | –34.71 | –37.86 | –34.75 | –35.38 | –34.62 | –36.91 | –34.51 | –34.36 |
|
Current performance may be lower or higher than the quoted past performance, which cannot guarantee future results. After sales charge returns (public offering price, or POP) for class A and M shares reflect a maximum 5.75% and 3.50% load, respectively. Class B share returns reflect the applicable contingent deferred sales charge (CDSC), which is 5% in the first year, declining to 1% in the sixth year, and is eliminated thereafter. Class C shares reflect a 1% CDSC for the first year that is eliminated thereafter. Class R and Y shares have no initial sales charge or CDSC. Performance for class B, C, M, R, and Y shares before their inception is derived from the historical performance of class A shares, adjusted for the applicable sales charge (or CDSC) and, except for class Y shares, the higher operating expenses for such shares.
For a portion of the periods, this fund may have limited expenses, without which returns would have been lower.
A 1% short-term trading fee may be applied to shares exchanged or sold within 7 days of purchase.
12
| | | | | |
| Comparative index returns For periods ended 1/31/09 | | |
|
| | | | Barclays Capital | | Lipper Balanced |
| | Russell 1000 | S&P 500/Citigroup | Aggregate | George Putnam | Funds Category |
| | Value Index | Value Index | Bond Index | Blended Index † | Average †† |
|
| Annual average | | | | | |
| (life of fund) | —* | —* | —* | —* | —* |
|
| 10 years | 0.53% | –14.32% | 70.23% | 31.67% | 6.06% |
| Annual average | 0.05 | –1.53 | 5.46 | 2.79 | 0.44 |
|
| 5 years | –16.41 | –19.05 | 23.42 | 1.29 | –8.15 |
| Annual average | –3.52 | –4.14 | 4.30 | 0.26 | –1.77 |
|
| 3 years | –34.35 | –36.13 | 16.41 | –14.66 | –19.83 |
| Annual average | –13.09 | –13.88 | 5.19 | –5.15 | –7.19 |
|
| 1 year | –41.78 | –44.68 | 2.59 | –24.94 | –27.65 |
|
| 6 months | –35.10 | –37.26 | 3.23 | –20.01 | –24.11 |
|
Index and Lipper results should be compared to fund performance at net asset value.
Putnam Management has recently undertaken a review of the fund’s benchmark. The Russell 1000 Value Index replaces the S&P 500/Citigroup Value Index as the primary benchmark for this fund because, in Putnam Management’s opinion, the securities tracked by this index more accurately reflect the types of securities that generally will be held by the fund.
* The benchmarks were not in existence at the time of the fund’s inception. The Russell 1000 Value Index and the George Putnam Blended Index commenced 12/31/78. The S&P 500/Citigroup Value Index commenced 6/30/95. The Barclays Capital Aggregate Bond Index commenced 12/31/75. The Lipper Balanced Funds category average commenced 12/31/59.
† The Blended Index is composed of 60% Russell 1000 Value Index and 40% Barclays Capital Aggregate Bond Index.
†† Over the 6-month, 1-year, 3-year, 5-year, and 10-year periods ended 1/31/09, there were 855, 847, 673, 503, and 280 funds, respectively, in this Lipper category.
| | | | | | |
| Fund’s annual operating expenses For the fiscal year ended 7/31/08 | | |
|
| | Class A | Class B | Class C | Class M | Class R | Class Y |
|
| Total annual fund operating expenses | 1.02% | 1.77% | 1.77% | 1.52% | 1.27% | 0.77% |
|
Expense information in this table is taken from the most recent prospectus, is subject to change, and may differ from that shown in the next section and in the financial highlights of this report. Expenses are shown as a percentage of average net assets.
13
Fund price and distribution information For the six-month period ended 1/31/09
| | | | | | | | |
| Distributions | Class A | Class B | Class C | Class M | Class R | Class Y |
|
| Number | 2 | 2 | 2 | 2 | 2 | 2 |
|
| Income | $0.314 | $0.263 | $0.263 | $0.282 | $0.300 | $0.331 |
|
| Capital gains — Long-term | 0.094 | 0.094 | 0.094 | 0.094 | 0.094 | 0.094 |
|
| Capital gains — Short-term | — | — | — | — | — | — |
|
| Total | $0.408 | $0.357 | $0.357 | $0.376 | $0.394 | $0.425 |
|
| Share value | NAV | POP | NAV | NAV | NAV | POP | NAV | NAV |
|
| 7/31/08 | $13.99 | $14.84 | $13.83 | $13.90 | $13.82 | $14.32 | $13.94 | $14.04 |
|
| 1/31/09 | 8.81 | 9.35 | 8.71 | 8.75 | 8.70 | 9.02 | 8.78 | 8.84 |
|
| Current yield (end of period) | NAV | POP | NAV | NAV | NAV | POP | NAV | NAV |
|
| Current dividend rate 1 | 7.13% | 6.72% | 6.15% | 6.13% | 6.57% | 6.34% | 6.83% | 7.47% |
|
| Current 30-day SEC yield 2,3 | N/A | 5.29 | 4.84 | 4.84 | N/A | 4.91 | 5.36 | 5.87 |
|
| Current 30-day SEC yield | | | | | | | | |
| (without expense limitation 3 | N/A | 5.10 | 4.64 | 4.64 | N/A | 4.72 | 5.16 | 5.67 |
|
The classification of distributions, if any, is an estimate. Final distribution information will appear on your year-end tax forms.
1 Most recent distribution, excluding capital gains, annualized and divided by NAV or POP at end of period.
2 For a portion of the period, this fund limited expenses, without which yields would have been lower.
3 Based only on investment income and calculated using the maximum offering price for each share class, in accordance with SEC guidelines.
Fund performance as of the most recent calendar quarter
Total return for periods ended 12/31/08
| | | | | | | | | | |
| | Class A | Class B | Class C | Class M | Class R | Class Y |
| (inception dates) | (11/5/37) | (4/27/92) | (7/26/99) | (12/1/94) | (1/21/03) | (3/31/94) |
|
| | NAV | POP | NAV | CDSC | NAV | CDSC | NAV | POP | NAV | NAV |
|
| Annual average | | | | | | | | | | |
| (life of fund) | 8.37% | 8.28% | 7.35% | 7.35% | 7.55% | 7.55% | 7.63% | 7.57% | 8.10% | 8.43% |
|
| 10 years | –9.89 | –15.07 | –16.40 | –16.40 | –16.38 | –16.38 | –14.15 | –17.16 | –11.94 | –7.59 |
| Annual average | –1.04 | –1.62 | –1.78 | –1.78 | –1.77 | –1.77 | –1.51 | –1.86 | –1.26 | –0.79 |
|
| 5 years | –23.79 | –28.19 | –26.60 | –27.66 | –26.57 | –26.57 | –25.62 | –28.22 | –24.61 | –22.78 |
| Annual average | –5.29 | –6.41 | –6.00 | –6.27 | –5.99 | –5.99 | –5.75 | –6.42 | –5.49 | –5.04 |
|
| 3 years | –32.37 | –36.25 | –33.89 | –35.40 | –33.86 | –33.86 | –33.33 | –35.65 | –32.78 | –31.85 |
| Annual average | –12.22 | –13.93 | –12.89 | –13.55 | –12.87 | –12.87 | –12.64 | –13.67 | –12.40 | –12.00 |
|
| 1 year | –40.30 | –43.73 | –40.72 | –43.54 | –40.76 | –41.32 | –40.55 | –42.65 | –40.38 | –40.13 |
|
| 6 months | –33.01 | –36.88 | –33.25 | –36.47 | –33.25 | –33.90 | –33.11 | –35.44 | –33.00 | –32.89 |
|
14
Your fund’s expenses
As a mutual fund investor, you pay ongoing expenses, such as management fees, distribution fees (12b-1 fees), and other expenses. In the most recent six-month period, your fund limited these expenses; had it not done so, expenses would have been higher. Using the following information, you can estimate how these expenses affect your investment and compare them with the expenses of other funds. You may also pay one-time transaction expenses, including sales charges (loads) and redemption fees, which are not shown in this section and would have resulted in higher total expenses. For more information, see your fund’s prospectus or talk to your financial representative.
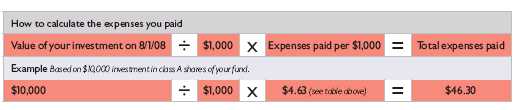
Review your fund’s expenses
The following table shows the expenses you would have paid on a $1,000 investment in The George Putnam Fund of Boston from August 1, 2008, to January 31, 2009. It also shows how much a $1,000 investment would be worth at the close of the period, assuming actual returns and expenses.
| | | | | | |
| | Class A | Class B | Class C | Class M | Class R | Class Y |
|
| Expenses paid per $1,000* | $4.63 | $7.75 | $7.75 | $6.71 | $5.67 | $3.59 |
|
| Ending value (after expenses) | $655.60 | $652.90 | $652.50 | $653.80 | $654.90 | $656.40 |
|
* Expenses for each share class are calculated using the fund’s annualized expense ratio for each class, which represents the ongoing expenses as a percentage of average net assets for the six months ended 1/31/09. The expense ratio may differ for each share class (see the last table in this section). Expenses are calculated by multiplying the expense ratio by the average account value for the period; then multiplying the result by the number of days in the period; and then dividing that result by the number of days in the year.
Estimate the expenses you paid
To estimate the ongoing expenses you paid for the six months ended January 31, 2009, use the following calculation method. To find the value of your investment on August 1, 2008, call Putnam at 1-800-225-1581.
Compare expenses using the SEC’s method
The Securities and Exchange Commission (SEC) has established guidelines to help investors assess fund expenses. Per these guidelines, the following table shows your fund’s expenses based on a $1,000 investment, assuming a hypothetical 5% annualized return. You can use this information to compare the ongoing expenses (but not transaction expenses or total costs) of investing in the fund with those of other funds. All mutual fund shareholder reports will provide this information to help you make this comparison. Please note that you cannot use this information to estimate your actual ending account balance and expenses paid during the period.
15
| | | | | | |
| | Class A | Class B | Class C | Class M | Class R | Class Y |
|
| Expenses paid per $1,000* | $5.65 | $9.45 | $9.45 | $8.19 | $6.92 | $4.38 |
|
| Ending value (after expenses) | $1,019.61 | $1,015.83 | $1,015.83 | $1,017.09 | $1,018.35 | $1,020.87 |
|
* Expenses for each share class are calculated using the fund’s annualized expense ratio for each class, which represents the ongoing expenses as a percentage of average net assets for the six months ended 1/31/09. The expense ratio may differ for each share class (see the last table in this section). Expenses are calculated by multiplying the expense ratio by the average account value for the period; then multiplying the result by the number of days in the period; and then dividing that result by the number of days in the year.
Compare expenses using industry averages
You can also compare your fund’s expenses with the average of its peer group, as defined by Lipper, an independent fund-rating agency that ranks funds relative to others that Lipper considers to have similar investment styles or objectives. The expense ratio for each share class shown indicates how much of your fund’s average net assets have been used to pay ongoing expenses during the period.
| | | | | | |
| | Class A | Class B | Class C | Class M | Class R | Class Y |
|
| Your fund’s annualized | | | | | | |
| expense ratio | 1.11% | 1.86% | 1.86% | 1.61% | 1.36% | 0.86% |
|
| Average annualized expense | | | | | | |
| ratio for Lipper peer group* | 1.19% | 1.94% | 1.94% | 1.69% | 1.44% | 0.94% |
|
* Putnam keeps fund expenses below the Lipper peer group average expense ratio by limiting our fund expenses if they exceed the Lipper average. The Lipper average is a simple average of front-end load funds in the peer group that excludes 12b-1 fees as well as any expense offset and brokerage/service arrangements that may reduce fund expenses. To facilitate the comparison in this presentation, Putnam has adjusted the Lipper average to reflect 12b-1 fees. Investors should note that the other funds in the peer group may be significantly smaller or larger than the fund, and that an asset-weighted average would likely be lower than the simple average. Also, the fund and Lipper report expense data at different times; the fund’s expense ratio shown here is annualized data for the most recent six-month period, while the quarterly updated Lipper average is based on the most recent fiscal year-end data available for the peer group funds as of 12/31/08.
Your fund’s portfolio turnover
Putnam funds are actively managed by experts who buy and sell securities based on intensive analysis of companies, industries, economies, and markets. Portfolio turnover is a measure of how often a fund’s managers buy and sell securities for your fund. A portfolio turnover of 100%, for example, means that the managers sold and replaced securities valued at 100% of a fund’s average portfolio value within a given period. Funds with high turnover may be more likely to generate capital gains that must be distributed to shareholders as taxable income. High turnover may also cause a fund to pay more brokerage commissions and other transaction costs, which may detract from performance.
You can use the following table to compare your fund’s turnover with the average turnover for funds in its Lipper category.
16
Turnover comparisons Percentage of holdings that change every year
| | | | | |
| | 2008 | 2007 | 2006 | 2005 | 2004 |
|
| The George Putnam Fund of Boston | 124% | 144% | 117% | 169% | 166% |
|
| Lipper Balanced Funds | | | | | |
| category average | 62% | 62% | 70% | 72% | 74% |
|
Turnover data for the fund is calculated based on the fund’s fiscal-year period, which ends on July 31. Turnover data for the fund’s Lipper category is calculated based on the average of the turnover of each fund in the category for its fiscal year ended during the indicated year. Fiscal years vary across funds in the Lipper category, which may limit the comparability of the fund’s portfolio turnover rate to the Lipper average. Comparative data for 2008 is based on information available as of 12/31/08.
Your fund’s management
Your fund’s Portfolio Managers are David Calabro and Raman Srivastava.
Portfolio management fund ownership
The following table shows how much the fund’s current Portfolio Managers have invested in the fund and in all Putnam mutual funds (in dollar ranges). Information shown is as of January 31, 2009, and January 31, 2008.
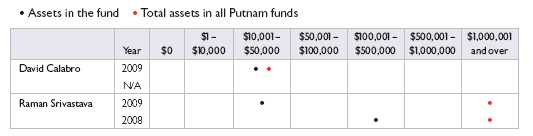
N/A indicates the individual was not a Portfolio Manager as of 1/31/08.
Trustee and Putnam employee fund ownership
As of January 31, 2009, all of the Trustees of the Putnam funds owned fund shares. The following table shows the approximate value of investments in the fund and all Putnam funds as of that date by the Trustees and Putnam employees. These amounts include investments by the Trustees’ and employees’ immediate family members and investments through retirement and deferred compensation plans.
| | |
| | Assets in the fund | Total assets in all Putnam funds |
|
| Trustees | $733,000 | $31,000,000 |
|
| Putnam employees | $3,843,000 | $342,000,000 |
|
Other Putnam funds managed by the Portfolio Managers
Raman Srivastava is also a Portfolio Manager of Putnam Income Fund, Putnam Global Income Trust, Putnam Absolute Return 100 Fund, and Putnam Absolute Return 300 Fund.
David Calabro and Raman Srivastava may also manage other accounts and variable trust funds advised by Putnam Management or an affiliate.
17
Terms and definitions
Important terms
Total return shows how the value of the fund’s shares changed over time, assuming you held the shares through the entire period and reinvested all distributions in the fund.
Net asset value (NAV) is the price, or value, of one share of a mutual fund, without a sales charge. NAVs fluctuate with market conditions. NAV is calculated by dividing the net assets of each class of shares by the number of outstanding shares in the class.
Public offering price (POP) is the price of a mutual fund share plus the maximum sales charge levied at the time of purchase. POP performance figures shown here assume the 5.75% maximum sales charge for class A shares and 3.50% for class M shares.
Contingent deferred sales charge (CDSC) is generally a charge applied at the time of the redemption of class B or C shares and assumes redemption at the end of the period. Your fund’s class B CDSC declines from a 5% maximum during the first year to 1% during the sixth year. After the sixth year, the CDSC no longer applies. The CDSC for class C shares is 1% for one year after purchase.
Share classes
Class A shares are generally subject to an initial sales charge and no CDSC (except on certain redemptions of shares bought without an initial sales charge).
Class B shares are not subject to an initial sales charge. They may be subject to a CDSC.
Class C shares are not subject to an initial sales charge and are subject to a CDSC only if the shares are redeemed during the first year.
Class M shares have a lower initial sales charge and a higher 12b-1 fee than class A shares and no CDSC (except on certain redemptions of shares bought without an initial sales charge).
Class R shares are not subject to an initial sales charge or CDSC and are available only to certain defined contribution plans.
Class Y shares are not subject to an initial sales charge or CDSC, and carry no 12b-1 fee. They are generally only available to corporate and institutional clients and clients in other approved programs.
Comparative indexes
Barclays Capital Aggregate Bond Index is an unmanaged index of U.S. investment-grade fixed-income securities.
The George Putnam Blended Index is composed of 60% Russell 1000 Value Index and 40% Barclays Capital Aggregate Bond Index.
Merrill Lynch U.S. 3-Month Treasury Bill Index is an unmanaged index that seeks to measure the performance of U.S. Treasury bills available in the marketplace.
Russell 1000 Value Index is an unmanaged index of those companies in the large-cap Russell 1000 Index chosen for their value orientation.
S&P 500 Index is an unmanaged index of common stock performance.
S&P 500/Citigroup Value Index is an unmanaged capitalization-weighted index of large-cap stocks chosen for their value orientation.
Indexes assume reinvestment of all distributions and do not account for fees. Securities and performance of a fund and an index will differ. You cannot invest directly in an index.
Lipper is a third-party industry-ranking entity that ranks mutual funds. Its rankings do not reflect sales charges. Lipper rankings are based on total return at net asset value relative to other funds that have similar current investment styles or objectives as determined by Lipper. Lipper may change a fund’s category assignment at its discretion. Lipper category averages reflect performance trends for funds within a category.
18
Trustee approval of management contract
General conclusions
The Board of Trustees of the Putnam funds oversees the management of each fund and, as required by law, determines annually whether to approve the continuance of your fund’s management contract with Putnam Investment Management (“Putnam Management”). In November 2008, the Board of Trustees also approved a new sub-management contract, in respect of your fund, between Putnam Management’s affiliate, Putnam Investments Limited (“PIL”), and Putnam Management. In this regard, the Board of Trustees, with the assistance of its Contract Committee consisting solely of Trustees who are not “interested persons” (as such term is defined in the Investment Company Act of 1940, as amended) of the Putnam funds (the “Independent Trustees”), requests and evaluates all information it deems reasonably necessary under the circumstances. Over the course of several months ending in June 2008, the Contract Committee met several times to consider the information provided by Putnam Management and other information developed with the assistance of the Board’s independent counsel and independent staff. The Contract Committee reviewed and discussed key aspects of this information with all of the Independent Trustees. The Contract Committee recommended, and the Independent Trustees approved, the continuance of your fund’s management contract, effective July 1, 2008. (Because PIL is an affiliate of Putnam Management and Putnam Management remains fully responsible for all services provided by PIL, the Trustees have not evaluated PIL as a separate entity, except as otherwise indicated below, and all subsequent references to Putnam Management below should be deemed to include reference to PIL as necessary or appropriate in the context.)
The Independent Trustees’ approval was based on the following conclusions:
• That the fee schedule in effect for your fund represented reasonable compensation in light of the nature and quality of the services being provided to the fund, the fees paid by competitive funds and the costs incurred by Putnam Management in providing such services, and
• That this fee schedule represented an appropriate sharing between fund shareholders and Putnam Management of such economies of scale as may exist in the management of the fund at current asset levels.
These conclusions were based on a comprehensive consideration of all information provided to the Trustees, were subject to the continued application of certain expense reductions and waivers and other considerations noted below, and were not the result of any single factor. Some of the factors that figured particularly in the Trustees’ deliberations and how the Trustees considered these factors are described below, although individual Trustees may have evaluated the information presented differently, giving different weights to various factors. It is also important to recognize that the fee arrangements for your fund and the other Putnam funds are the result of many years of review and discussion between the Independent Trustees and Putnam Management, that certain aspects of such arrangements may receive greater scrutiny in some years than others, and that the Trustees’ conclusions may be based, in part, on their consideration of these same arrangements in prio r years.
19
Management fee schedules and categories; total expenses
The Trustees reviewed the management fee schedules in effect for all Putnam funds, including fee levels and breakpoints, and the assignment of funds to particular fee categories. In reviewing fees and expenses, the Trustees generally focused their attention on material changes in circumstances — for example, changes in a fund’s size or investment style, changes in Putnam Management’s operating costs or responsibilities, or changes in competitive practices in the mutual fund industry — that suggest that consideration of fee changes might be warranted. The Trustees concluded that the circumstances did not warrant changes to the management fee structure of your fund, which had been carefully developed over the years, re-examined on many occasions and adjusted where appropriate. In this regard, the Trustees also noted that shareholders of your fund voted in 2007 to approve new management contracts containing an identical fee structure. The Trustees focuse d on two areas of particular interest, as discussed further below:
• Competitiveness. The Trustees reviewed comparative fee and expense information for competitive funds, which indicated that, in a custom peer group of competitive funds selected by Lipper Inc., your fund ranked in the 34th percentile in management fees and in the 31st percentile in total expenses (less any applicable 12b-1 fees) as of December 31, 2007 (the first percentile being the least expensive funds and the 100th percentile being the most expensive funds). (Because the fund’s custom peer group is smaller than the fund’s broad Lipper Inc. peer group, this expense information may differ from the Lipper peer expense information found elsewhere in this report.) The Trustees noted that expense ratios for a number of Putnam funds, which show the percentage of fund assets used to pay for management and administrative services, distribution (12b-1) fees and o ther expenses, had been increasing recently as a result of declining net assets and the natural operation of fee breakpoints.
The Trustees noted that the expense ratio increases described above were currently being controlled by expense limitations initially implemented in January 2004. The Trustees have received a commitment from Putnam Management and its parent company to continue this program through at least June 30, 2009. These expense limitations give effect to a commitment by Putnam Management that the expense ratio of each open-end fund would be no higher than the average expense ratio of the competitive funds included in the fund’s relevant Lipper universe (exclusive of any applicable 12b-1 charges in each case). The Trustees observed that this commitment to limit fund expenses has served shareholders well since its inception.
In order to ensure that the expenses of the Putnam funds continue to meet evolving competitive standards, the Trustees requested, and Putnam Management agreed, to extend for the twelve months beginning July 1, 2008, an additional expense limitation for certain funds at an amount equal to the average expense ratio (exclusive of 12b-1 charges) of a custom peer group of competitive funds selected by Lipper to correspond to the size of the fund. This additional expense limitation will be applied to those open-end funds that had above-average expense ratios (exclusive of 12b-1 charges) based on the custom peer group data for the period ended December 31, 2007. This additional expense limitation will not be applied to your fund because it had a below-average expense ratio relative to its custom peer group.
In addition, the Trustees devoted particular attention to analyzing the Putnam funds’ fees and expenses relative to those of competitors
20
in fund complexes of comparable size and with a comparable mix of asset categories. The Trustees concluded that this analysis did not reveal any matters requiring further attention at the current time.
• Economies of scale. Your fund currently has the benefit of breakpoints in its management fee that provide shareholders with significant economies of scale, which means that the effective management fee rate of the fund (as a percentage of fund assets) declines as the fund grows in size and crosses specified asset thresholds. Conversely, if the fund shrinks in size — as has been the case for many Putnam funds in recent years — these breakpoints result in increasing fee levels. In recent years, the Trustees have examined the operation of the existing breakpoint structure during periods of both growth and decline in asset levels. The Trustees concluded that the fee schedule in effect for your fund represented an appropriate sharing of economies of scale at current asset levels.
In connection with their review of the management fees and total expenses of the Putnam funds, the Trustees also reviewed the costs of the services to be provided and profits to be realized by Putnam Management and its affiliates from the relationship with the funds. This information included trends in revenues, expenses and profitability of Putnam Management and its affiliates relating to the investment management and distribution services provided to the funds. In this regard, the Trustees also reviewed an analysis of Putnam Management’s revenues, expenses and profitability with respect to the funds’ management contracts, allocated on a fund-by-fund basis.
Investment performance
The quality of the investment process provided by Putnam Management represented a major factor in the Trustees’ evaluation of the quality of services provided by Putnam Management under your fund’s management contract. The Trustees were assisted in their review of the Putnam funds’ investment process and performance by the work of the Investment Oversight Coordinating Committee of the Trustees and the Investment Oversight Committees of the Trustees, which had met on a regular monthly basis with the funds’ portfolio teams throughout the year. The Trustees concluded that Putnam Management generally provides a high-quality investment process — as measured by the experience and skills of the individuals assigned to the management of fund portfolios, the resources made available to such personnel, and in general the ability of Putnam Management to attract and retain high-quality personnel — but also recognized that this does not guarantee favorable investment results for every fund in every time period. The Trustees considered the investment performance of each fund over multiple time periods and considered information comparing each fund’s performance with various benchmarks and with the performance of competitive funds.
While the Trustees noted the satisfactory investment performance of certain Putnam funds, they considered the disappointing investment performance of many funds in recent periods, particularly over periods in 2007 and 2008. They discussed with senior management of Putnam Management the factors contributing to such underperformance and actions being taken to improve performance. The Trustees recognized that, in recent years, Putnam Management has taken steps to strengthen its investment personnel and processes to address areas of underperformance, including recent efforts to further centralize Putnam Management’s equity research function. In this regard, the Trustees took into consideration efforts by Putnam Management to improve its ability to assess and mitigate investment risk in individual funds, across asset classes, and
21
across the complex as a whole. The Trustees indicated their intention to continue to monitor performance trends to assess the effectiveness of these efforts and to evaluate whether additional changes to address areas of underperformance are warranted.
In the case of your fund, the Trustees considered that your fund’s class A share cumulative total return performance at net asset value was in the following percentiles of its Lipper Inc. peer group (Lipper Balanced Funds) for the one-year, three-year and five-year periods ended December 31, 2007 (the first percentile being the best-performing funds and the 100th percentile being the worst-performing funds):
| | |
| One-year period | 95th | |
| |
| Three-year period | 84th | |
| |
| Five-year period | 79th | |
| |
(Because of the passage of time, these performance results may differ from the performance results for more recent periods shown elsewhere in this report.) Over the one-year, three-year and five-year periods ended December 31, 2007, there were 814, 614, and 441 funds, respectively, in your fund’s Lipper peer group.* Past performance is no guarantee of future returns.
The Trustees noted the disappointing performance for your fund for the one-year, three-year, and five-year periods ended December 31, 2007. In this regard, the Trustees considered that, similar to the experience of certain other Putnam funds with exposure to the large-cap equity space, your fund’s performance would have been materially better over these periods but for the performance of a limited number of portfolio choices in the financial sector that experienced extreme distress in the market turmoil that began in the summer of 2007. In addition, following leadership and portfolio management team changes, Putnam Management continues to make efforts to enhance the strength of the Large Cap Equities team, and Putnam Management has centralized the equity research structure. These changes were made to strengthen the investment process, which focuses on a blend of quantitative techniques and fundamental analysis, and to enhance the perfo rmance potential for Putnam funds with exposure to the large-cap equity space.
As a general matter, the Trustees believe that cooperative efforts between the Trustees and Putnam Management represent the most effective way to address investment performance problems. The Trustees noted that investors in the Putnam funds have, in effect, placed their trust in the Putnam organization, under the oversight of the funds’ Trustees, to make appropriate decisions regarding the management of the funds. Based on the responsiveness of Putnam Management in the recent past to Trustee concerns about investment performance, the Trustees concluded that it is preferable to seek change within Putnam Management to address performance shortcomings. In the Trustees’ view, the alternative of engaging a new investment adviser for an underperforming fund would entail significant disruptions and would not provide any greater assurance of improved investment performance.
* The percentile rankings for your fund’s class A share annualized total return performance in the Lipper Balanced Funds category for the one-year, five-year, and ten-year periods ended December 31, 2008, were 99%, 96%, and 88%, respectively. Over the one-year, five-year, and ten-year periods ended December 31, 2008, your fund ranked 838th out of 850, 481st out of 501, and 244th out of 279 funds, respectively. Note that this more recent information was not available when theTrustees approved the continuance of your fund’s management contract.
22
Brokerage and soft-dollar allocations; other benefits
The Trustees considered various potential benefits that Putnam Management may receive in connection with the services it provides under the management contract with your fund. These include benefits related to brokerage and soft-dollar allocations, whereby a portion of the commissions paid by a fund for brokerage may be used to acquire research services that may be useful to Putnam Management in managing the assets of the fund and of other clients. The Trustees considered changes made in 2008, at Putnam Management’s request, to the Putnam funds’ brokerage allocation policy, which expanded the permitted categories of brokerage and research services payable with soft dollars and increased the permitted soft dollar allocation to third-party services over what had been authorized in previous years. The Trustees indicated their continued intent to monitor the potential benefits associated with the allocation of fund brokerage and trends in industry practice to ensur e that the principle of seeking “best price and execution” remains paramount in the portfolio trading process.
The Trustees’ annual review of your fund’s management contract arrangements also included the review of its distributor’s contract and distribution plan with Putnam Retail Management Limited Partnership and the investor servicing agreement with Putnam Fiduciary Trust Company (“PFTC”), each of which provides benefits to affiliates of Putnam Management. In the case of the investor servicing agreement, the Trustees considered that certain shareholder servicing functions were shifted to a third-party service provider by PFTC in 2007.
Comparison of retail and institutional fee schedules
The information examined by the Trustees as part of their annual contract review has included for many years information regarding fees charged by Putnam Management and its affiliates to institutional clients such as defined benefit pension plans, college endowments, etc. This information included comparisons of such fees with fees charged to the funds, as well as a detailed assessment of the differences in the services provided to these two types of clients. The Trustees observed, in this regard, that the differences in fee rates between institutional clients and mutual funds are by no means uniform when examined by individual asset sectors, suggesting that differences in the pricing of investment management services to these types of clients reflect to a substantial degree historical competitive forces operating in separate market places. The Trustees considered the fact that fee rates across different asset classes are typically higher on average for mutual funds than for institutional clients, as well as the differences between the services that Putnam Management provides to the Putnam funds and those that it provides to institutional clients of the firm, but did not rely on such comparisons to any significant extent in concluding that the management fees paid by your fund are reasonable.
Approval of the Sub-Management Contract between Putnam Management and Putnam Investments Limited
In November 2008, the Trustees approved a sub-management contract between Putnam Management and PIL in respect of your fund, under which PIL’s London office would manage a separate portion of the assets of the fund. The Contract Committee reviewed information
23
provided by Putnam Management and PIL and, upon completion of this review, recommended, and the Independent Trustees and the full Board of Trustees approved, the sub-management contract in respect of your fund, effective November 30, 2008.
The Trustees considered numerous factors they believed relevant in approving your fund’s sub-management contract, including Putnam Management’s belief that the interest of shareholders would be best served by utilizing investment professionals in PIL’s London office to manage a portion of your fund’s assets and PIL’s expertise in managing assets invested in European markets. The Trustees also considered that applicable securities laws require a sub-advisory relationship between Putnam Management and PIL in order for Putnam’s investment professionals in London to be involved in the management of your fund. The Trustees noted that Putnam Management, and not your fund, would pay the sub-management fee to PIL for its services, and that the sub-management relationship with PIL will not reduce the nature, quality or overall level of service provided to your fund.
24
Other information for shareholders
Important notice regarding delivery of shareholder documents
In accordance with SEC regulations, Putnam sends a single copy of annual and semiannual shareholder reports, prospectuses, and proxy statements to Putnam shareholders who share the same address, unless a shareholder requests otherwise. If you prefer to receive your own copy of these documents, please call Putnam at 1-800-225-1581, and Putnam will begin sending individual copies within 30 days.
Proxy voting
Putnam is committed to managing our mutual funds in the best interests of our shareholders. The Putnam funds’ proxy voting guidelines and procedures, as well as information regarding how your fund voted proxies relating to portfolio securities during the 12-month period ended June 30, 2008, are available in the Individual
Investors section of www.putnam.com, and on the SEC’s Web site, www.sec.gov. If you have questions about finding forms on the SEC’s Web site, you may call the SEC at 1-800-SEC-0330. You may also obtain the Putnam funds’ proxy voting guidelines and procedures at no charge by calling Putnam’s Shareholder Services at 1-800-225-1581.
Fund portfolio holdings
The fund will file a complete schedule of its portfolio holdings with the SEC for the first and third quarters of each fiscal year on Form N-Q. Shareholders may obtain the fund’s Forms N-Q on the SEC’s Web site at www.sec.gov. In addition, the fund’s Forms N-Q may be reviewed and copied at the SEC’s Public Reference Room in Washington, D.C. You may call the SEC at 1-800-SEC-0330 for information about the SEC’s Web site or the operation of the Public Reference Room.
25
Financial statements
A guide to financial statements
These sections of the report, as well as the accompanying Notes, constitute the fund’s financial statements.
The fund’s portfolio lists all the fund’s investments and their values as of the last day of the reporting period. Holdings are organized by asset type and industry sector, country, or state to show areas of concentration and diversification.
Statement of assets and liabilities shows how the fund’s net assets and share price are determined. All investment and noninvestment assets are added together. Any unpaid expenses and other liabilities are subtracted from this total. The result is divided by the number of shares to determine the net asset value per share, which is calculated separately for each class of shares. (For funds with preferred shares, the amount subtracted from total assets includes the liquidation preference of preferred shares.)
Statement of operations shows the fund’s net investment gain or loss. This is done by first adding up all the fund’s earnings —from dividends and interest income — and subtracting its operating expenses to determine net investment income (or loss). Then, any net gain or loss the fund realized on the sales of its holdings — as well as any unrealized gains or losses over the period — is added to or subtracted from the net investment result to determine the fund’s net gain or loss for the fiscal period.
Statement of changes in net assets shows how the fund’s net assets were affected by the fund’s net investment gain or loss, by distributions to shareholders, and by changes in the number of the fund’s shares. It lists distributions and their sources (net investment income or realized capital gains) over the current reporting period and the most recent fiscal year-end. The distributions listed here may not match the sources listed in the Statement of operations because the distributions are determined on a tax basis and may be paid in a different period from the one in which they were earned. Dividend sources are estimated at the time of declaration. Actual results may vary. Any non-taxable return of capital cannot be determined until final tax calculations are completed after the end of the fund’s fiscal year.
Financial highlights provide an overview of the fund’s investment results, per-share distributions, expense ratios, net investment income ratios, and portfolio turnover in one summary table, reflecting the five most recent reporting periods. In a semiannual report, the highlight table also includes the current reporting period.
26
| | |
| The fund’s portfolio 1/31/09 (Unaudited) | | |
| |
| U.S. GOVERNMENT AND AGENCY | | |
| MORTGAGE OBLIGATIONS (108.9%)* | Principal amount | Value |
|
| U.S. Government Guaranteed Mortgage Obligations (2.1%) | | |
| Government National Mortgage Association | | |
| Pass-Through Certificates 6 1/2s, TBA, | | |
| February 1, 2039 | $28,000,000 | $29,028,126 |
|
| | | 29,028,126 |
| U.S. Government Agency Mortgage Obligations (106.8%) | | |
| Federal Home Loan Mortgage Corporation 8 3/4s, | | |
| May 1, 2009 | 1,769 | 1,768 |
|
| Federal Home Loan Mortgage Corporation | | |
| Pass-Through Certificates | | |
| 6s, March 1, 2035 | 22,513 | 23,368 |
| 5 1/2s, TBA, February 1, 2039 | 2,000,000 | 2,045,938 |
|
| Federal National Mortgage Association | | |
| Pass-Through Certificates | | |
| 7s, TBA, February 1, 2039 | 3,000,000 | 3,153,750 |
| 6 1/2s, TBA, March 1, 2039 | 70,000,000 | 72,635,934 |
| 6 1/2s, TBA, February 1, 2039 | 70,000,000 | 72,909,375 |
| 6s, TBA, February 1, 2024 | 1,000,000 | 1,040,313 |
| 5 1/2s, TBA, February 1, 2039 | 118,000,000 | 120,765,625 |
| 5 1/2s, TBA, February 1, 2024 | 25,000,000 | 25,765,625 |
| 5s, TBA, March 1, 2039 | 175,000,000 | 177,303,718 |
| 5s, TBA, February 1, 2039 | 622,000,000 | 632,107,500 |
| 4 1/2s, TBA, March 1, 2039 | 64,000,000 | 64,182,502 |
| 4 1/2s, TBA, February 1, 2039 | 283,000,000 | 284,768,750 |
| 4 1/2s, TBA, February 1, 2024 | 55,000,000 | 55,739,063 |
|
| | | 1,512,443,229 |
| Total U.S. government and agency mortgage obligations (cost $1,555,165,378) | $1,541,471,355 |
| |
| |
| COMMON STOCKS (52.6%)* | Shares | Value |
|
| Basic materials (1.9%) | | |
| Alcoa, Inc. | 227,700 | $1,773,783 |
|
| Dow Chemical Co. (The) | 93,000 | 1,077,870 |
|
| E.I. du Pont de Nemours & Co. | 273,500 | 6,279,560 |
|
| Nucor Corp. | 128,000 | 5,221,120 |
|
| Potash Corp. of Saskatchewan, Inc. (Canada) | 33,700 | 2,522,782 |
|
| PPG Industries, Inc. | 97,600 | 3,667,808 |
|
| United States Steel Corp. | 24,300 | 729,729 |
|
| Weyerhaeuser Co. | 189,200 | 5,172,728 |
|
| | | 26,445,380 |
| Capital goods (3.2%) | | |
| Autoliv, Inc. (Sweden) | 40,100 | 737,439 |
|
| Avery Dennison Corp. | 40,900 | 991,007 |
|
| Boeing Co. (The) | 71,700 | 3,033,627 |
|
| Caterpillar, Inc. | 76,200 | 2,350,770 |
|
| Deere (John) & Co. | 94,800 | 3,293,352 |
|
| Eaton Corp. | 20,900 | 920,018 |
|
| Emerson Electric Co. | 118,600 | 3,878,220 |
|
| General Dynamics Corp. | 21,900 | 1,242,387 |
|
| Lockheed Martin Corp. | 173,500 | 14,233,940 |
|
27
| | |
| COMMON STOCKS (52.6%)* cont. | Shares | Value |
|
| Capital goods cont. | | |
| Northrop Grumman Corp. | 41,200 | $1,982,544 |
|
| Parker-Hannifin Corp. | 80,900 | 3,091,189 |
|
| Raytheon Co. | 79,000 | 3,998,980 |
|
| United Technologies Corp. | 114,200 | 5,480,458 |
|
| | | 45,233,931 |
| Communication services (3.8%) | | |
| AT&T, Inc. | 892,582 | 21,975,369 |
|
| Comcast Corp. Class A | 352,500 | 5,164,125 |
|
| Qwest Communications International, Inc. | 182,000 | 586,040 |
|
| Verizon Communications, Inc. | 800,500 | 23,910,935 |
|
| Vodafone Group PLC ADR (United Kingdom) | 89,200 | 1,658,228 |
|
| | | 53,294,697 |
| Conglomerates (1.6%) | | |
| 3M Co. | 47,200 | 2,538,888 |
|
| General Electric Co. | 1,357,400 | 16,465,262 |
|
| Honeywell International, Inc. | 129,200 | 4,239,052 |
|
| | | 23,243,202 |
| Consumer cyclicals (2.4%) | | |
| Amazon.com, Inc. † | 27,200 | 1,599,904 |
|
| D.R. Horton, Inc. | 128,600 | 766,456 |
|
| Home Depot, Inc. (The) | 268,500 | 5,780,805 |
|
| JC Penney Co., Inc. (Holding Co.) | 47,600 | 797,300 |
|
| Lowe’s Cos., Inc. | 85,100 | 1,554,777 |
|
| Marriott International, Inc. Class A | 116,900 | 1,906,639 |
|
| Staples, Inc. | 146,200 | 2,330,428 |
|
| TJX Cos., Inc. (The) | 360,300 | 6,997,026 |
|
| Viacom, Inc. Class B † | 243,200 | 3,587,200 |
|
| Wal-Mart Stores, Inc. | 106,100 | 4,999,432 |
|
| Walt Disney Co. (The) | 151,200 | 3,126,816 |
|
| Whirlpool Corp. | 19,100 | 638,513 |
|
| | | 34,085,296 |
| Consumer staples (6.5%) | | |
| BJ’s Wholesale Club, Inc. † | 57,400 | 1,646,232 |
|
| Clorox Co. | 173,600 | 8,706,040 |
|
| CVS Caremark Corp. | 361,100 | 9,706,368 |
|
| Energizer Holdings, Inc. † | 17,000 | 809,710 |
|
| Estee Lauder Cos., Inc. (The) Class A | 27,900 | 732,375 |
|
| General Mills, Inc. | 138,700 | 8,204,105 |
|
| Genuine Parts Co. | 16,000 | 512,320 |
|
| H.J. Heinz Co. | 53,400 | 1,949,100 |
|
| Kimberly-Clark Corp. | 166,200 | 8,554,314 |
|
| Kraft Foods, Inc. Class A | 334,162 | 9,373,244 |
|
| Kroger Co. | 337,900 | 7,602,750 |
|
| McDonald’s Corp. | 21,400 | 1,241,628 |
|
| Newell Rubbermaid, Inc. | 271,200 | 2,191,296 |
|
| Philip Morris International, Inc. | 327,500 | 12,166,625 |
|
| Procter & Gamble Co. (The) | 221,200 | 12,055,400 |
|
| Safeway, Inc. | 98,900 | 2,119,427 |
|
| SYSCO Corp. | 61,300 | 1,366,377 |
|
| Yum! Brands, Inc. | 105,900 | 3,030,858 |
|
| | | 91,968,169 |
28
| | |
| COMMON STOCKS (52.6%)* cont. | Shares | Value |
|
| Energy (8.1%) | | |
| Chevron Corp. | 386,000 | $27,220,720 |
|
| ConocoPhillips | 172,000 | 8,175,160 |
|
| Devon Energy Corp. | 138,600 | 8,537,760 |
|
| EOG Resources, Inc. | 87,200 | 5,909,544 |
|
| Exxon Mobil Corp. | 381,800 | 29,200,064 |
|
| Hess Corp. | 58,700 | 3,264,307 |
|
| Marathon Oil Corp. | 375,100 | 10,213,973 |
|
| National-Oilwell Varco, Inc. † | 57,800 | 1,528,232 |
|
| Noble Corp. | 62,400 | 1,694,160 |
|
| Occidental Petroleum Corp. | 156,400 | 8,531,620 |
|
| Schlumberger, Ltd. | 32,600 | 1,330,406 |
|
| Total SA ADR (France) | 184,600 | 9,189,388 |
|
| | | 114,795,334 |
| Financials (7.4%) | | |
| ACE, Ltd. (Switzerland) | 119,700 | 5,226,102 |
|
| Allstate Corp. (The) | 220,800 | 4,784,736 |
|
| Axis Capital Holdings, Ltd. (Bermuda) | 29,727 | 721,177 |
|
| Bank of America Corp. | 860,800 | 5,664,064 |
|
| Bank of New York Mellon Corp. (The) | 234,600 | 6,038,604 |
|
| BB&T Corp. | 204,900 | 4,054,971 |
|
| Chubb Corp. (The) | 164,800 | 7,017,184 |
|
| Equity Residential Properties Trust R | 21,948 | 525,216 |
|
| Everest Re Group, Ltd. (Bermuda) | 38,400 | 2,419,200 |
|
| Goldman Sachs Group, Inc. (The) | 170,210 | 13,741,053 |
|
| JPMorgan Chase & Co. | 686,200 | 17,504,962 |
|
| PNC Financial Services Group | 66,300 | 2,156,076 |
|
| RenaissanceRe Holdings, Ltd. (Bermuda) | 100,800 | 4,504,752 |
|
| T. Rowe Price Group, Inc. | 145,600 | 4,015,648 |
|
| Travelers Cos., Inc. (The) | 259,600 | 10,030,944 |
|
| U.S. Bancorp | 90,000 | 1,335,600 |
|
| W.R. Berkley Corp. | 59,800 | 1,583,504 |
|
| Wells Fargo & Co. | 707,000 | 13,362,300 |
|
| | | 104,686,093 |
| Health care (9.1%) | | |
| AmerisourceBergen Corp. | 77,500 | 2,814,800 |
|
| Baxter International, Inc. | 116,600 | 6,838,590 |
|
| Boston Scientific Corp. † | 475,000 | 4,213,250 |
|
| Bristol-Myers Squibb Co. | 182,100 | 3,898,761 |
|
| Covidien, Ltd. (Bermuda) | 237,512 | 9,106,210 |
|
| Eli Lilly & Co. | 64,000 | 2,356,480 |
|
| Forest Laboratories, Inc. † | 16,600 | 415,664 |
|
| Hospira, Inc. † | 312,200 | 7,773,780 |
|
| Johnson & Johnson | 292,100 | 16,851,249 |
|
| McKesson Corp. | 202,000 | 8,928,400 |
|
| Medco Health Solutions, Inc. † | 51,100 | 2,295,923 |
|
29
| | |
| COMMON STOCKS (52.6%)* cont. | Shares | Value |
|
| Health care cont. | | |
| Medtronic, Inc. | 204,000 | $6,831,960 |
|
| Merck & Co., Inc. | 430,200 | 12,282,210 |
|
| Pfizer, Inc. | 1,428,000 | 20,820,240 |
|
| UnitedHealth Group, Inc. | 73,600 | 2,085,088 |
|
| WellPoint, Inc. † | 148,100 | 6,138,745 |
|
| Wyeth | 368,700 | 15,843,039 |
|
| | | 129,494,389 |
| Technology (3.8%) | | |
| Accenture, Ltd. Class A (Bermuda) | 146,200 | 4,614,072 |
|
| Applied Materials, Inc. | 632,600 | 5,927,462 |
|
| Atmel Corp. † | 479,400 | 1,601,196 |
|
| Cisco Systems, Inc. † | 129,800 | 1,943,106 |
|
| eBay, Inc. † | 41,300 | 496,426 |
|
| Electronic Arts, Inc. † | 159,200 | 2,458,048 |
|
| EMC Corp. † | 312,700 | 3,452,208 |
|
| Hewlett-Packard Co. | 140,900 | 4,896,275 |
|
| IBM Corp. | 116,300 | 10,658,895 |
|
| Intel Corp. | 231,100 | 2,981,190 |
|
| Microsoft Corp. | 429,800 | 7,349,580 |
|
| Nokia OYJ ADR (Finland) | 409,900 | 5,029,473 |
|
| Oracle Corp. † | 89,400 | 1,504,602 |
|
| Texas Instruments, Inc. | 56,500 | 844,675 |
|
| | | 53,757,208 |
| Transportation (0.8%) | | |
| AMR Corp. † | 101,500 | 602,910 |
|
| Burlington Northern Santa Fe Corp. | 54,500 | 3,610,625 |
|
| Union Pacific Corp. | 39,200 | 1,716,568 |
|
| United Parcel Service, Inc. Class B | 121,900 | 5,179,531 |
|
| US Airways Group, Inc. † | 55,500 | 314,685 |
|
| | | 11,424,319 |
| Utilities and power (4.0%) | | |
| Dominion Resources, Inc. | 48,200 | 1,695,676 |
|
| DTE Energy Co. | 64,700 | 2,232,150 |
|
| Duke Energy Corp. | 181,300 | 2,746,695 |
|
| Edison International | 314,400 | 10,240,008 |
|
| Energen Corp. | 46,800 | 1,367,028 |
|
| Entergy Corp. | 114,100 | 8,712,676 |
|
| Exelon Corp. | 55,400 | 3,003,788 |
|
| FirstEnergy Corp. | 107,600 | 5,378,924 |
|
| FPL Group, Inc. | 62,400 | 3,216,720 |
|
| PG&E Corp. | 260,750 | 10,083,203 |
|
| Sempra Energy | 73,500 | 3,222,240 |
|
| Wisconsin Energy Corp. | 102,600 | 4,573,908 |
|
| | | 56,473,016 |
| Total common stocks (cost $911,843,994) | | $744,901,034 |
30
| | |
| COLLATERALIZED MORTGAGE OBLIGATIONS (23.7%)* | Principal amount | Value |
|
| Adjustable Rate Mortgage Trust FRB Ser. 04-5, | | |
| Class 3A1, 4.95s, 2035 | $2,527,150 | $1,516,290 |
|
| Asset Securitization Corp. | | |
| Ser. 96-MD6, Class A7, 8.631s, 2029 | 1,413,067 | 1,500,038 |
| FRB Ser. 97-D5, Class A5, 7.168s, 2043 | 325,000 | 205,250 |
|
| Banc of America Commercial Mortgage, Inc. | | |
| Ser. 01-1, Class G, 7.324s, 2036 | 950,000 | 781,561 |
| FRB Ser. 07-3, Class A3, 5.658s, 2049 | 1,200,000 | 760,046 |
| Ser. 04-3, Class A5, 5.319s, 2039 | 4,690,000 | 3,969,302 |
| FRB Ser. 05-1, Class A5, 5.084s, 2042 | 252,000 | 196,583 |
| Ser. 07-5, Class XW, Interest Only (IO), 0.44s, 2051 | 33,893,040 | 522,113 |
| Ser. 07-1, Class XW, IO, 0.291s, 2049 | 16,896,091 | 198,208 |
| Ser. 06-1, Class XC, IO, 0.067s, 2045 | 40,480,634 | 167,545 |
|
| Banc of America Commercial Mortgage, Inc. 144A | | |
| Ser. 01-PB1, Class K, 6.15s, 2035 | 715,000 | 462,543 |
| Ser. 04-4, Class XC, IO, 0.284s, 2042 | 29,725,708 | 298,506 |
| Ser. 04-5, Class XC, IO, 0.202s, 2041 | 48,330,830 | 381,113 |
| Ser. 02-PB2, Class XC, IO, 0.182s, 2035 | 8,261,474 | 133,836 |
| Ser. 05-1, Class XW, IO, 0.101s, 2042 | 241,859,994 | 431,380 |
| Ser. 06-5, Class XC, IO, 0.101s, 2016 | 99,881,896 | 844,142 |
| Ser. 06-4, Class XC, IO, 0.088s, 2046 | 49,668,499 | 339,986 |
| Ser. 05-4, Class XC, IO, 0.082s, 2045 | 81,407,127 | 345,549 |
|
| Banc of America Funding Corp. FRB Ser. 06-D, | | |
| Class 6A1, 5.981s, 2036 | 571,052 | 285,526 |
|
| Banc of America Large Loan | | |
| FRB Ser. 04-BBA4, Class H, 1.283s, 2018 | 142,000 | 118,537 |
| FRB Ser. 04-BBA4, Class G, 1.033s, 2018 | 449,000 | 434,109 |
|
| Banc of America Large Loan 144A | | |
| FRB Ser. 05-MIB1, Class K, 2.333s, 2022 | 496,000 | 376,690 |
| FRB Ser. 05-MIB1, Class J, 1.383s, 2022 | 1,400,000 | 555,520 |
|
| Banc of America Mortgage Securities | | |
| FRB Ser. 03-F, Class 2A1, 4.67s, 2033 | 320,165 | 236,922 |
| Ser. 05-E, Class 2, IO, 0.3s, 2035 | 28,189,311 | 77,080 |
| Ser. 04-D, Class 2A, IO, 0.15s, 2034 | 9,404,249 | 3,306 |
|
| Banc of America Structured Security Trust 144A | | |
| Ser. 02-X1, Class A3, 5.436s, 2033 | 791,763 | 785,680 |
|
| Bayview Commercial Asset Trust 144A | | |
| Ser. 07-1, Class S, IO, 2.477s, 2037 | 12,621,323 | 777,473 |
| Ser. 06-4A, IO, 2.331s, 2036 | 2,000,757 | 192,473 |
| Ser. 04-2, IO, 2.22s, 2034 | 4,051,693 | 131,680 |
| Ser. 05-1A, IO, 2.15s, 2035 | 4,455,554 | 153,717 |
| Ser. 04-3, IO, 2.15s, 2035 | 2,876,905 | 93,499 |
| Ser. 06-2A, IO, 1.798s, 2036 | 2,578,291 | 154,697 |
| Ser. 05-3A, IO, 1.6s, 2035 | 13,489,429 | 809,366 |
| Ser. 07-5A, IO, 1.55s, 2037 | 9,158,156 | 690,525 |
| Ser. 07-2A, IO, 1.3s, 2037 | 14,793,498 | 1,136,141 |
| FRB Ser. 05-1A, Class A1, 0.689s, 2035 | 1,037,599 | 767,823 |
|
| Bear Stearns Alternate Trust | | |
| FRB Ser. 06-5, Class 2A2, 6 1/4s, 2036 | 6,710,991 | 2,348,847 |
| FRB Ser. 06-6, Class 2A1, 5.89s, 2036 | 88,615 | 46,149 |
| Ser. 04-9, Class 1A1, 5.86s, 2034 | 125,583 | 75,692 |
| FRB Ser. 05-7, Class 23A1, 5.649s, 2035 | 190,804 | 98,122 |
|
31
| | |
| COLLATERALIZED MORTGAGE OBLIGATIONS (23.7%)* cont. | Principal amount | Value |
|
| Bear Stearns Commercial Mortgage Securities, Inc. | | |
| FRB Ser. 00-WF2, Class F, 8.187s, 2032 | $456,000 | $332,311 |
| Ser. 04-PR3I, Class X1, IO, 0.324s, 2041 | 13,333,379 | 158,161 |
| Ser. 05-PWR9, Class X1, IO, 0.11s, 2042 | 40,425,479 | 212,638 |
|
| Bear Stearns Commercial Mortgage Securities, Inc. 144A | | |
| Ser. 06-PW14, Class XW, IO, 0.689s, 2038 | 18,057,721 | 465,709 |
| Ser. 06-PW14, Class X1, IO, 0.117s, 2038 | 19,419,467 | 172,445 |
| Ser. 07-PW15, Class X1, IO, 0.065s, 2044 | 64,112,658 | 396,857 |
| Ser. 05-PW10, Class X1, IO, 0.06s, 2040 | 62,798,314 | 146,320 |
|
| Bear Stearns Small Balance Commercial Trust 144A | | |
| Ser. 06-1A, Class AIO, IO, 1s, 2034 | 5,584,200 | 51,043 |
|
| Chase Commercial Mortgage Securities Corp. | | |
| Ser. 00-3, Class A2, 7.319s, 2032 | 490,172 | 493,747 |
|
| Chase Commercial Mortgage Securities Corp. 144A | | |
| Ser. 98-1, Class G, 6.56s, 2030 | 1,171,000 | 1,005,344 |
| Ser. 98-1, Class H, 6.34s, 2030 | 1,761,000 | 1,311,079 |
|
| Citigroup Commercial Mortgage Trust | | |
| Ser. 08-C7, Class A3, 6.096s, 2014 | 190,000 | 117,076 |
| Ser. 08-C7, Class A2A, 6.034s, 2049 | 105,000 | 79,714 |
|
| Citigroup Mortgage Loan Trust, Inc. | | |
| IFB Ser. 07-6, Class 2A5, IO, 6.261s, 2037 | 4,285,055 | 289,241 |
| FRB Ser. 06-AR5, Class 2A5A, 6.198s, 2036 | 127,725 | 66,325 |
| FRB Ser. 06-AR7, Class 2A2A, 5.648s, 2036 | 1,002,314 | 461,064 |
|
| Citigroup/Deutsche Bank Commercial Mortgage Trust 144A | | |
| Ser. 07-CD4, Class XW, IO, 0.376s, 2049 | 26,633,999 | 399,510 |
| Ser. 06-CD2, Class X, IO, 0.086s, 2046 | 75,959,047 | 182,706 |
| Ser. 07-CD4, Class XC, IO, 0.059s, 2049 | 89,067,124 | 418,615 |
|
| Commercial Mortgage Acceptance Corp. 144A | | |
| Ser. 98-C1, Class F, 6.23s, 2031 | 2,013,000 | 1,656,885 |
| Ser. 98-C2, Class F, 5.44s, 2030 | 3,255,000 | 2,399,944 |
|
| Commercial Mortgage Loan Trust Ser. 08-LS1, | | |
| Class A4B, 6.02s, 2017 | 1,806,000 | 1,180,579 |
|
| Commercial Mortgage Pass-Through Certificates 144A | | |
| Ser. 06-CN2A, Class H, 5.57s, 2019 | 939,000 | 407,689 |
| Ser. 06-CN2A, Class J, 5.57s, 2019 | 751,000 | 323,762 |
| FRB Ser. 01-J2A, Class A2F, 0.829s, 2034 | 1,590,000 | 1,208,400 |
| Ser. 03-LB1A, Class X1, IO, 0.488s, 2038 | 8,236,490 | 249,236 |
| Ser. 05-LP5, Class XC, IO, 0.104s, 2043 | 69,832,917 | 331,926 |
| Ser. 06-C8, Class XS, IO, 0.085s, 2046 | 57,354,514 | 242,023 |
| Ser. 05-C6, Class XC, IO, 0.064s, 2044 | 66,532,018 | 205,861 |
|
| Countrywide Alternative Loan Trust | | |
| IFB Ser. 04-2CB, Class 1A5, IO, 7.211s, 2034 | 86,848 | 4,342 |
| Ser. 06-45T1, Class 2A2, 6s, 2037 | 263,818 | 115,173 |
| Ser. 06-J8, Class A4, 6s, 2037 | 217,749 | 90,706 |
| Ser. 07-HY5R, Class 2A1A, 5.544s, 2047 | 115,036 | 80,732 |
| Ser. 05-24, Class 1AX, IO, 0.737s, 2035 | 9,125,789 | 111,934 |
|
| Countrywide Home Loans | | |
| Ser. 05-9, Class 1X, IO, 3.126s, 2035 | 7,956,261 | 111,263 |
| Ser. 05-2, Class 2X, IO, 1.16s, 2035 | 7,759,428 | 106,389 |
|
32
| | |
| COLLATERALIZED MORTGAGE OBLIGATIONS (23.7%)* cont. | Principal amount | Value |
|
| Countrywide Home Loans 144A | | |
| IFB Ser. 05-R2, Class 2A3, 8s, 2035 | $876,530 | $827,859 |
| IFB Ser. 05-R1, Class 1AS, IO, 5.431s, 2035 | 6,387,237 | 431,138 |
| IFB Ser. 05-R2, Class 1AS, IO, 5.091s, 2035 | 6,158,119 | 388,577 |
|
| Credit Suisse Mortgage Capital Certificates | | |
| FRB Ser. 07-C4, Class A2, 5.81s, 2039 | 4,505,000 | 3,165,426 |
| Ser. 06-C5, Class AX, IO, 0.121s, 2039 | 36,561,240 | 230,263 |
|
| Credit Suisse Mortgage Capital Certificates 144A | | |
| Ser. 07-C2, Class AX, IO, 0.114s, 2049 | 121,768,943 | 633,199 |
| Ser. 06-C4, Class AX, IO, 0.113s, 2039 | 76,480,425 | 700,958 |
| Ser. 07-C1, Class AX, IO, 0.07s, 2040 | 80,487,927 | 319,698 |
|
| CRESI Finance Limited Partnership 144A | | |
| FRB Ser. 06-A, Class D, 1.189s, 2017 | 232,000 | 114,585 |
| FRB Ser. 06-A, Class C, 0.989s, 2017 | 688,000 | 456,626 |
|
| Criimi Mae Commercial Mortgage Trust 144A | | |
| Ser. 98-C1, Class B, 7s, 2033 | 1,655,399 | 1,558,996 |
|
| CS First Boston Mortgage Securities Corp. | | |
| Ser. 97-C2, Class F, 7.46s, 2035 | 1,239,000 | 1,259,751 |
| Ser. 04-C2, Class A2, 5.416s, 2036 | 5,070,000 | 3,935,334 |
| FRB Ser. 04-C3, Class A5, 5.113s, 2036 | 92,000 | 79,083 |
| Ser. 04-C3, Class A3, 4.302s, 2036 | 142,035 | 140,616 |
|
| CS First Boston Mortgage Securities Corp. 144A | | |
| FRB Ser. 05-TFLA, Class J, 1.283s, 2020 | 259,000 | 168,350 |
| FRB Ser. 04-TF2A, Class J, 1.283s, 2016 | 313,000 | 172,150 |
| FRB Ser. 05-TF2A, Class J, 1.233s, 2020 | 407,807 | 224,294 |
| FRB Ser. 04-TF2A, Class H, 1.033s, 2019 | 627,000 | 407,550 |
| Ser. 01-CK1, Class AY, IO, 0.78s, 2035 | 59,847,907 | 628,403 |
| Ser. 04-C4, Class AX, IO, 0.53s, 2039 | 11,425,445 | 155,146 |
| Ser. 02-CP3, Class AX, IO, 0.422s, 2035 | 20,431,733 | 602,583 |
|
| DLJ Commercial Mortgage Corp. | | |
| Ser. 00-CF1, Class A1B, 7.62s, 2033 | 2,108,943 | 2,129,560 |
| Ser. 99-CG2, Class B3, 6.1s, 2032 | 1,752,000 | 1,677,325 |
| Ser. 99-CG2, Class B4, 6.1s, 2032 | 2,785,000 | 974,750 |
| Ser. 98-CF2, Class B3, 6.04s, 2031 | 814,188 | 775,295 |
|
| Fannie Mae | | |
| IFB Ser. 06-70, Class SM, 51.515s, 2036 | 313,623 | 424,423 |
| IFB Ser. 07-80, Class AS, 46.245s, 2037 | 840,538 | 1,128,842 |
| IFB Ser. 07-1, Class NR, 44.541s, 2037 | 70,579 | 79,709 |
| IFB Ser. 06-62, Class PS, 37.564s, 2036 | 1,261,846 | 1,666,817 |
| IFB Ser. 07-W7, Class 1A4, 36.844s, 2037 | 1,402,300 | 1,647,703 |
| IFB Ser. 06-104, Class GS, 32.591s, 2036 | 898,958 | 1,088,849 |
| IFB Ser. 06-60, Class AK, 27.242s, 2036 | 1,080,727 | 1,297,186 |
| IFB Ser. 06-115, Class ES, 25.002s, 2036 | 1,382,248 | 1,620,335 |
| IFB Ser. 05-57, Class CD, 23.665s, 2035 | 1,083,648 | 1,213,467 |
| IFB Ser. 05-115, Class NQ, 23.477s, 2036 | 714,332 | 779,803 |
| IFB Ser. 05-74, Class CP, 23.322s, 2035 | 1,272,012 | 1,353,175 |
| IFB Ser. 05-45, Class DC, 22.882s, 2035 | 1,901,519 | 2,211,029 |
| IFB Ser. 05-57, Class DC, 20.51s, 2034 | 1,742,239 | 1,971,699 |
| IFB Ser. 05-95, Class OP, 19.152s, 2035 | 944,957 | 941,659 |
| IFB Ser. 05-45, Class PC, 19.082s, 2034 | 931,356 | 948,374 |
| IFB Ser. 05-74, Class CS, 18.949s, 2035 | 1,450,654 | 1,631,543 |
| IFB Ser. 05-106, Class JC, 18.917s, 2035 | 650,562 | 688,066 |
33
| | |
| COLLATERALIZED MORTGAGE OBLIGATIONS (23.7%)* cont. | Principal amount | Value |
|
| Fannie Mae | | |
| IFB Ser. 05-95, Class CP, 18.698s, 2035 | $213,049 | $214,893 |
| IFB Ser. 05-114, Class SP, 18.509s, 2036 | 894,226 | 937,587 |
| IFB Ser. 05-83, Class QP, 16.382s, 2034 | 523,812 | 538,075 |
| IFB Ser. 05-72, Class SB, 15.902s, 2035 | 1,469,034 | 1,545,011 |
| IFB Ser. 07-W6, Class 6A2, IO, 7.411s, 2037 | 1,671,218 | 156,760 |
| IFB Ser. 06-90, Class SE, IO, 7.411s, 2036 | 1,848,666 | 189,174 |
| IFB Ser. 04-51, Class XP, IO, 7.311s, 2034 | 118,453 | 9,985 |
| IFB Ser. 03-66, Class SA, IO, 7.261s, 2033 | 2,550,045 | 205,595 |
| IFB Ser. 04-17, Class ST, IO, 7.211s, 2034 | 132,808 | 16,264 |
| IFB Ser. 07-W6, Class 5A2, IO, 6.901s, 2037 | 2,586,236 | 222,934 |
| IFB Ser. 07-W4, Class 4A2, IO, 6.891s, 2037 | 11,551,602 | 995,748 |
| IFB Ser. 07-W2, Class 3A2, IO, 6.891s, 2037 | 3,158,586 | 272,270 |
| IFB Ser. 06-115, Class BI, IO, 6.871s, 2036 | 3,026,633 | 239,040 |
| IFB Ser. 05-113, Class AI, IO, 6.841s, 2036 | 583,976 | 45,207 |
| IFB Ser. 05-52, Class DC, IO, 6.811s, 2035 | 1,719,116 | 137,041 |
| IFB Ser. 06-60, Class SI, IO, 6.761s, 2036 | 3,325,391 | 315,912 |
| IFB Ser. 06-60, Class UI, IO, 6.761s, 2036 | 1,349,686 | 99,666 |
| IFB Ser. 04-12, Class WS, IO, 6.761s, 2033 | 100,407 | 7,244 |
| IFB Ser. 07-W7, Class 3A2, IO, 6.741s, 2037 | 4,239,295 | 440,641 |
| IFB Ser. 03-122, Class SA, IO, 6.711s, 2028 | 4,343,753 | 231,735 |
| IFB Ser. 03-122, Class SJ, IO, 6.711s, 2028 | 4,472,469 | 235,801 |
| IFB Ser. 06-60, Class DI, IO, 6.681s, 2035 | 1,653,322 | 137,391 |
| IFB Ser. 04-60, Class SW, IO, 6.661s, 2034 | 6,594,107 | 597,426 |
| IFB Ser. 05-65, Class KI, IO, 6.611s, 2035 | 12,181,384 | 974,511 |
| IFB Ser. 08-10, Class LI, IO, 6.591s, 2038 | 347,767 | 31,716 |
| IFB Ser. 08-01, Class GI, IO, 6.571s, 2037 | 13,522,119 | 1,216,991 |
| IFB Ser. 05-42, Class SA, IO, 6.411s, 2035 | 192,923 | 13,640 |
| IFB Ser. 07-32, Class JS, IO, 6.401s, 2037 | 586,506 | 49,907 |
| IFB Ser. 07-39, Class LI, IO, 6.381s, 2037 | 189,092 | 17,665 |
| IFB Ser. 07-23, Class SI, IO, 6.381s, 2037 | 2,663,889 | 180,355 |
| IFB Ser. 07-54, Class CI, IO, 6.371s, 2037 | 2,178,950 | 185,287 |
| IFB Ser. 07-39, Class PI, IO, 6.371s, 2037 | 2,085,716 | 144,000 |
| IFB Ser. 07-28, Class SE, IO, 6.361s, 2037 | 2,314,358 | 195,586 |
| IFB Ser. 06-128, Class SH, IO, 6.361s, 2037 | 2,549,063 | 179,427 |
| IFB Ser. 06-56, Class SM, IO, 6.361s, 2036 | 6,320,082 | 498,692 |
| IFB Ser. 05-73, Class SI, IO, 6.361s, 2035 | 1,454,017 | 98,376 |
| IFB Ser. 05-12, Class SC, IO, 6.361s, 2035 | 2,121,481 | 192,909 |
| IFB Ser. 05-17, Class ES, IO, 6.361s, 2035 | 2,843,681 | 255,137 |
| IFB Ser. 05-17, Class SY, IO, 6.361s, 2035 | 1,312,758 | 117,839 |
| IFB Ser. 05-45, Class PL, IO, 6.361s, 2034 | 198,101 | 16,403 |
| IFB Ser. 07-W5, Class 2A2, IO, 6.351s, 2037 F | 1,116,862 | 115,328 |
| IFB Ser. 07-30, Class IE, IO, 6.351s, 2037 | 6,444,526 | 730,777 |
| IFB Ser. 06-123, Class CI, IO, 6.351s, 2037 | 5,158,584 | 429,385 |
| IFB Ser. 06-123, Class UI, IO, 6.351s, 2037 | 2,296,348 | 200,930 |
| IFB Ser. 05-82, Class SY, IO, 6.341s, 2035 | 5,651,962 | 445,375 |
| IFB Ser. 05-45, Class EW, IO, 6.331s, 2035 | 2,522,921 | 184,496 |
| IFB Ser. 05-45, Class SR, IO, 6.331s, 2035 | 7,763,294 | 557,583 |
| IFB Ser. 07-15, Class BI, IO, 6.311s, 2037 | 3,704,626 | 310,159 |
| IFB Ser. 06-126, Class CS, IO, 6.311s, 2037 | 1,455,179 | 113,853 |
| IFB Ser. 06-16, Class SM, IO, 6.311s, 2036 | 1,937,817 | 179,795 |
| IFB Ser. 05-95, Class CI, IO, 6.311s, 2035 | 3,377,710 | 305,662 |
34
| | |
| COLLATERALIZED MORTGAGE OBLIGATIONS (23.7%)* cont. | Principal amount | Value |
|
| Fannie Mae | | |
| IFB Ser. 05-84, Class SG, IO, 6.311s, 2035 | $5,537,148 | $484,500 |
| IFB Ser. 05-57, Class NI, IO, 6.311s, 2035 | 1,165,156 | 87,122 |
| IFB Ser. 05-54, Class SA, IO, 6.311s, 2035 | 5,436,147 | 392,430 |
| IFB Ser. 05-23, Class SG, IO, 6.311s, 2035 | 4,268,681 | 350,539 |
| IFB Ser. 05-29, Class SX, IO, 6.311s, 2035 | 70,975 | 5,350 |
| IFB Ser. 05-17, Class SA, IO, 6.311s, 2035 | 3,767,112 | 323,135 |
| IFB Ser. 05-17, Class SE, IO, 6.311s, 2035 | 4,091,979 | 327,508 |
| IFB Ser. 05-7, Class SC, IO, 6.311s, 2035 | 230,067 | 16,089 |
| IFB Ser. 05-83, Class QI, IO, 6.301s, 2035 | 926,678 | 80,112 |
| IFB Ser. 06-128, Class GS, IO, 6.291s, 2037 | 2,431,109 | 202,011 |
| IFB Ser. 06-114, Class IS, IO, 6.261s, 2036 | 2,609,421 | 205,468 |
| IFB Ser. 06-116, Class ES, IO, 6.261s, 2036 | 1,560,615 | 115,239 |
| IFB Ser. 06-116, Class LS, IO, 6.261s, 2036 | 197,375 | 17,143 |
| IFB Ser. 06-115, Class GI, IO, 6.251s, 2036 | 2,526,299 | 196,293 |
| IFB Ser. 06-115, Class IE, IO, 6.251s, 2036 | 1,981,010 | 188,916 |
| IFB Ser. 06-117, Class SA, IO, 6.251s, 2036 | 2,971,362 | 234,417 |
| IFB Ser. 06-121, Class SD, IO, 6.251s, 2036 | 4,906,562 | 417,058 |
| IFB Ser. 06-109, Class SG, IO, 6.241s, 2036 | 3,518,625 | 294,861 |
| IFB Ser. 06-104, Class IM, IO, 6.231s, 2036 | 777,983 | 55,369 |
| IFB Ser. 06-104, Class SY, IO, 6.231s, 2036 | 1,627,547 | 118,311 |
| IFB Ser. 06-109, Class SH, IO, 6.231s, 2036 | 2,649,139 | 255,308 |
| IFB Ser. 06-111, Class SA, IO, 6.231s, 2036 | 707,537 | 59,182 |
| IFB Ser. 06-104, Class SG, IO, 6.211s, 2036 | 3,145,415 | 218,978 |
| IFB Ser. 07-W6, Class 4A2, IO, 6.211s, 2037 | 10,736,899 | 906,194 |
| IFB Ser. 06-128, Class SC, IO, 6.211s, 2037 | 8,293,342 | 665,308 |
| IFB Ser. 06-43, Class SI, IO, 6.211s, 2036 | 3,937,072 | 311,682 |
| IFB Ser. 06-44, Class IS, IO, 6.211s, 2036 | 3,612,126 | 315,920 |
| IFB Ser. 06-8, Class JH, IO, 6.211s, 2036 | 9,146,449 | 729,843 |
| IFB Ser. 05-122, Class SG, IO, 6.211s, 2035 | 1,978,415 | 194,499 |
| IFB Ser. 05-57, Class MS, IO, 6.211s, 2035 | 169,184 | 10,654 |
| IFB Ser. 05-95, Class OI, IO, 6.201s, 2035 | 527,234 | 37,954 |
| IFB Ser. 06-92, Class JI, IO, 6.191s, 2036 | 1,845,702 | 141,533 |
| IFB Ser. 06-92, Class LI, IO, 6.191s, 2036 | 2,933,320 | 231,468 |
| IFB Ser. 06-96, Class ES, IO, 6.191s, 2036 | 3,180,897 | 224,002 |
| IFB Ser. 06-99, Class AS, IO, 6.191s, 2036 | 2,107,153 | 183,112 |
| IFB Ser. 06-60, Class YI, IO, 6.181s, 2036 | 2,631,644 | 273,633 |
| IFB Ser. 06-85, Class TS, IO, 6.171s, 2036 | 4,591,743 | 337,089 |
| IFB Ser. 06-61, Class SE, IO, 6.161s, 2036 | 4,275,238 | 294,491 |
| IFB Ser. 07-75, Class PI, IO, 6.151s, 2037 | 3,420,493 | 255,490 |
| IFB Ser. 07-W7, Class 2A2, IO, 6.141s, 2037 | 8,498,868 | 785,827 |
| IFB Ser. 07-88, Class MI, IO, 6.131s, 2037 | 1,073,248 | 91,647 |
| Ser. 06-94, Class NI, IO, 6.111s, 2036 | 1,537,468 | 113,465 |
| IFB Ser. 07-116, Class IA, IO, 6.111s, 2037 | 12,310,026 | 984,802 |
| IFB Ser. 07-103, Class AI, IO, 6.111s, 2037 | 14,454,059 | 1,003,628 |
| IFB Ser. 07-1, Class NI, IO, 6.111s, 2037 | 7,704,980 | 647,688 |
| IFB Ser. 07-15, Class NI, IO, 6.111s, 2022 | 3,783,981 | 331,098 |
| IFB Ser. 08-3, Class SC, IO, 6.061s, 2038 | 1,812,259 | 171,881 |
| IFB Ser. 07-109, Class XI, IO, 6.061s, 2037 | 2,195,712 | 196,257 |
| IFB Ser. 07-109, Class YI, IO, 6.061s, 2037 | 3,144,064 | 227,986 |
| IFB Ser. 07-W8, Class 2A2, IO, 6.061s, 2037 | 5,746,417 | 369,098 |
| IFB Ser. 07-88, Class JI, IO, 6.061s, 2037 | 4,244,012 | 335,977 |
35
| | |
| COLLATERALIZED MORTGAGE OBLIGATIONS (23.7%)* cont. | Principal amount | Value |
|
| Fannie Mae | | |
| IFB Ser. 06-79, Class SH, IO, 6.061s, 2036 | $202,045 | $16,607 |
| IFB Ser. 07-54, Class KI, IO, 6.051s, 2037 | 1,606,036 | 103,031 |
| IFB Ser. 07-30, Class JS, IO, 6.051s, 2037 | 5,302,525 | 437,458 |
| IFB Ser. 07-30, Class LI, IO, 6.051s, 2037 | 6,923,728 | 582,469 |
| IFB Ser. 07-W2, Class 1A2, IO, 6.041s, 2037 | 2,460,575 | 178,485 |
| IFB Ser. 07-106, Class SN, IO, 6.021s, 2037 | 3,402,891 | 245,485 |
| IFB Ser. 07-54, Class IA, IO, 6.021s, 2037 | 2,842,075 | 223,117 |
| IFB Ser. 07-54, Class IB, IO, 6.021s, 2037 | 2,842,075 | 223,117 |
| IFB Ser. 07-54, Class IC, IO, 6.021s, 2037 | 2,842,075 | 223,117 |
| IFB Ser. 07-54, Class ID, IO, 6.021s, 2037 | 2,842,075 | 223,117 |
| IFB Ser. 07-54, Class IE, IO, 6.021s, 2037 | 2,842,075 | 223,117 |
| IFB Ser. 07-54, Class IF, IO, 6.021s, 2037 | 4,228,760 | 354,169 |
| IFB Ser. 07-54, Class NI, IO, 6.021s, 2037 | 2,586,773 | 186,918 |
| IFB Ser. 07-54, Class UI, IO, 6.021s, 2037 | 3,487,215 | 316,722 |
| IFB Ser. 07-109, Class AI, IO, 6.011s, 2037 | 11,339,255 | 850,444 |
| IFB Ser. 07-91, Class AS, IO, 6.011s, 2037 | 2,221,891 | 165,158 |
| IFB Ser. 07-91, Class HS, IO, 6.011s, 2037 | 2,378,842 | 205,918 |
| IFB Ser. 07-15, Class CI, IO, 5.991s, 2037 | 9,612,213 | 751,637 |
| IFB Ser. 06-115, Class JI, IO, 5.991s, 2036 | 6,966,053 | 574,699 |
| IFB Ser. 07-109, Class PI, IO, 5.961s, 2037 | 3,560,968 | 240,123 |
| IFB Ser. 06-123, Class LI, IO, 5.931s, 2037 | 4,638,847 | 351,046 |
| IFB Ser. 07-81, Class IS, IO, 5.911s, 2037 | 7,128,305 | 626,488 |
| IFB Ser. 08-1, Class NI, IO, 5.861s, 2037 | 5,792,649 | 430,973 |
| IFB Ser. 07-116, Class BI, IO, 5.861s, 2037 | 11,252,423 | 837,180 |
| IFB Ser. 08-01, Class AI, IO, 5.861s, 2037 | 16,495,796 | 1,037,157 |
| IFB Ser. 08-10, Class GI, IO, 5.841s, 2038 | 4,148,301 | 313,305 |
| IFB Ser. 08-13, Class SA, IO, 5.831s, 2038 | 386,936 | 27,522 |
| IFB Ser. 08-1, Class HI, IO, 5.811s, 2037 | 7,662,221 | 473,847 |
| IFB Ser. 07-39, Class AI, IO, 5.731s, 2037 | 4,880,881 | 361,794 |
| IFB Ser. 07-32, Class SD, IO, 5.721s, 2037 | 3,366,036 | 280,722 |
| IFB Ser. 07-30, Class UI, IO, 5.711s, 2037 | 2,758,634 | 230,318 |
| IFB Ser. 07-1, Class CI, IO, 5.711s, 2037 | 3,214,218 | 236,216 |
| IFB Ser. 05-92, Class US, IO, 5.711s, 2025 | 510,851 | 30,038 |
| IFB Ser. 05-14, Class SE, IO, 5.661s, 2035 | 2,179,912 | 137,507 |
| IFB Ser. 05-58, Class IK, IO, 5.611s, 2035 | 4,317,620 | 325,983 |
| IFB Ser. 08-1, Class BI, IO, 5.521s, 2038 | 8,752,177 | 566,826 |
| Ser. 06-W3, Class 1AS, IO, 5.517s, 2046 | 11,170,961 | 760,742 |
| IFB Ser. 07-75, Class ID, IO, 5.481s, 2037 | 2,767,091 | 199,117 |
| Ser. 09-12, Class AI, 5s, 2039 ## | 9,585,000 | 946,854 |
| Ser. 09-12, Class BI, 5s, 2039 ## | 2,850,000 | 327,935 |
| Ser. 09-12, Class DI, 5s, 2039 ## | 8,354,000 | 698,303 |
| Ser. 03-W12, Class 2, IO, 2.219s, 2043 | 6,466,538 | 224,585 |
| Ser. 03-W10, Class 3, IO, 1.935s, 2043 | 5,006,960 | 148,569 |
| Ser. 03-W10, Class 1, IO, 1.91s, 2043 | 20,187,495 | 585,688 |
| Ser. 03-W8, Class 12, IO, 1.634s, 2042 | 20,906,117 | 752,049 |
| Ser. 03-W17, Class 12, IO, 1.146s, 2033 | 6,405,776 | 162,850 |
| Ser. 03-T2, Class 2, IO, 0.809s, 2042 | 29,760,022 | 536,552 |
| Ser. 03-W3, Class 2IO1, IO, 0.68s, 2042 | 2,735,041 | 42,071 |
| Ser. 03-W6, Class 51, IO, 0.672s, 2042 | 8,409,670 | 136,882 |
| Ser. 01-T12, Class IO, 0.565s, 2041 | 17,435,178 | 245,353 |
| Ser. 03-W2, Class 1, IO, 0.466s, 2042 | 15,496,718 | 165,722 |
36
| | |
| COLLATERALIZED MORTGAGE OBLIGATIONS (23.7%)* cont. | Principal amount | Value |
|
| Fannie Mae | | |
| Ser. 02-T4, IO, 0.449s, 2041 | $6,249,215 | $67,548 |
| Ser. 03-W3, Class 1, IO, 0.439s, 2042 | 21,041,711 | 212,738 |
| Ser. 02-T1, Class IO, IO, 0.426s, 2031 | 16,911,519 | 151,712 |
| Ser. 03-W6, Class 3, IO, 0.368s, 2042 | 11,909,889 | 96,144 |
| Ser. 03-W6, Class 23, IO, 0.352s, 2042 | 12,577,902 | 97,213 |
| Ser. 03-W4, Class 3A, IO, 0.35s, 2042 | 11,490,991 | 63,938 |
| Ser. 01-79, Class BI, IO, 0.327s, 2045 | 3,193,403 | 21,108 |
| Ser. 07-47, Class B0, Principal Only (PO), zero %, 2037 | 138,113 | 124,805 |
| Ser. 07-14, Class KO, PO, zero %, 2037 | 323,357 | 262,497 |
| Ser. 06-125, Class OX, PO, zero %, 2037 | 131,891 | 117,442 |
| Ser. 06-84, Class OT, PO, zero %, 2036 | 67,898 | 61,638 |
| Ser. 06-56, Class XF, zero %, 2036 | 218,715 | 210,303 |
| Ser. 06-46, Class OC, PO, zero %, 2036 | 118,349 | 107,146 |
| Ser. 07-15, Class IM, IO, zero %, 2009 | 3,069,862 | 240 |
| Ser. 07-16, Class TS, IO, zero %, 2009 | 12,768,610 | 998 |
| FRB Ser. 07-76, Class SF, zero %, 2037 | 165,199 | 153,899 |
| FRB Ser. 06-115, Class SN, zero %, 2036 | 1,083,349 | 794,495 |
| FRB Ser. 06-104, Class EK, zero %, 2036 | 252,162 | 214,527 |
| FRB Ser. 05-117, Class GF, zero %, 2036 | 201,491 | 173,096 |
| FRB Ser. 05-57, Class UL, zero %, 2035 | 2,204,279 | 2,128,927 |
| FRB Ser. 05-36, Class QA, zero %, 2035 | 465,890 | 434,137 |
| FRB Ser. 05-65, Class CU, zero %, 2034 | 307,490 | 280,295 |
| FRB Ser. 05-81, Class DF, zero %, 2033 | 242,412 | 232,367 |
| FRB Ser. 06-1, Class HF, zero %, 2032 | 186,401 | 179,859 |
| IFB Ser. 06-75, Class FY, zero %, 2036 | 431,555 | 402,580 |
|
| Federal Home Loan Mortgage Corp. Structured | | |
| Pass-Through Securities | | |
| IFB Ser. T-56, Class 2ASI, IO, 7.711s, 2043 | 1,667,348 | 170,903 |
| Ser. T-56, Class A, IO, 0.524s, 2043 | 7,515,941 | 88,163 |
| Ser. T-56, Class 3, IO, 0.352s, 2043 | 8,943,614 | 88,138 |
| Ser. T-56, Class 1, IO, 0.283s, 2043 | 11,666,254 | 76,885 |
| Ser. T-56, Class 2, IO, 0.019s, 2043 | 10,543,365 | 18,173 |
|
| FFCA Secured Lending Corp. 144A Ser. 00-1, Class A2, | | |
| 7.77s, 2027 | 2,686,304 | 1,880,413 |
|
| First Horizon Alternative Mortgage Securities FRB | | |
| Ser. 05-AA10, Class 2A1, 5.739s, 2035 | 1,676,715 | 821,590 |
|
| First Union National Bank-Bank of America Commercial | | |
| Mortgage 144A Ser. 01-C1, Class 3, IO, 1.682s, 2033 | 29,328,247 | 680,246 |
|
| First Union-Lehman Brothers Commercial Mortgage | | |
| Trust II | | |
| Ser. 97-C2, Class F, 7 1/2s, 2029 | 2,726,000 | 2,663,930 |
| Ser. 97-C2, Class G, 7 1/2s, 2029 | 832,000 | 374,400 |
|
| Freddie Mac | | |
| IFB Ser. 3339, Class JS, 40.67s, 2037 | 1,112,118 | 1,434,300 |
| IFB Ser. 3202, Class HM, 31.584s, 2036 | 563,197 | 675,743 |
| IFB Ser. 3153, Class SX, 31.584s, 2036 | 743,393 | 936,974 |
| IFB Ser. 2979, Class AS, 23.052s, 2034 | 545,929 | 607,482 |
| IFB Ser. 3012, Class FS, 16.042s, 2035 | 70,702 | 72,716 |
| IFB Ser. 2828, Class GI, IO, 7.167s, 2034 | 3,737,008 | 341,103 |
| IFB Ser. 3184, Class SP, IO, 7.017s, 2033 | 3,351,004 | 288,186 |
| IFB Ser. 2927, Class SI, IO, 7s, 2035 | 3,123,392 | 238,930 |
37
| | |
| COLLATERALIZED MORTGAGE OBLIGATIONS (23.7%)* cont. | Principal amount | Value |
|
| Freddie Mac | | |
| IFB Ser. 2869, Class SH, IO, 6.967s, 2034 | $1,646,554 | $92,784 |
| IFB Ser. 2869, Class JS, IO, 6.917s, 2034 | 7,850,482 | 523,682 |
| IFB Ser. 2882, Class LS, IO, 6.867s, 2034 | 1,640,477 | 141,435 |
| IFB Ser. 3149, Class SE, IO, 6.817s, 2036 | 2,658,245 | 317,056 |
| IFB Ser. 3203, Class SH, IO, 6.807s, 2036 | 1,928,787 | 175,840 |
| IFB Ser. 2815, Class PT, IO, 6.717s, 2032 | 3,689,060 | 246,589 |
| IFB Ser. 2828, Class TI, IO, 6.717s, 2030 | 1,689,249 | 152,683 |
| IFB Ser. 3397, Class GS, IO, 6.667s, 2037 | 2,012,677 | 163,317 |
| IFB Ser. 3297, Class BI, IO, 6.427s, 2037 | 8,430,134 | 707,255 |
| IFB Ser. 3287, Class SD, IO, 6.417s, 2037 | 3,298,179 | 272,433 |
| IFB Ser. 3281, Class BI, IO, 6.417s, 2037 | 1,620,329 | 121,416 |
| IFB Ser. 3281, Class CI, IO, 6.417s, 2037 | 1,309,629 | 98,019 |
| IFB Ser. 3249, Class SI, IO, 6.417s, 2036 | 1,467,698 | 115,489 |
| IFB Ser. 2990, Class TS, IO, 6.417s, 2035 | 197,231 | 10,788 |
| IFB Ser. 2922, Class SE, IO, 6.417s, 2035 | 4,365,456 | 382,862 |
| IFB Ser. 3236, Class ES, IO, 6.367s, 2036 | 3,014,591 | 221,606 |
| IFB Ser. 3136, Class NS, IO, 6.367s, 2036 | 4,917,171 | 423,904 |
| IFB Ser. 3118, Class SD, IO, 6.367s, 2036 | 7,038,779 | 554,029 |
| IFB Ser. 2927, Class ES, IO, 6.367s, 2035 | 2,424,833 | 134,140 |
| IFB Ser. 2950, Class SM, IO, 6.367s, 2016 | 4,767,086 | 359,963 |
| IFB Ser. 3256, Class S, IO, 6.357s, 2036 | 3,682,805 | 322,245 |
| IFB Ser. 3031, Class BI, IO, 6.357s, 2035 | 1,849,888 | 142,100 |
| IFB Ser. 3370, Class TS, IO, 6.337s, 2037 | 215,447 | 19,289 |
| IFB Ser. 3244, Class SB, IO, 6.327s, 2036 | 2,315,947 | 176,335 |
| IFB Ser. 3244, Class SG, IO, 6.327s, 2036 | 2,697,736 | 220,011 |
| IFB Ser. 3236, Class IS, IO, 6.317s, 2036 | 4,179,693 | 331,868 |
| IFB Ser. 3033, Class SG, IO, 6.317s, 2035 | 84,600 | 6,665 |
| IFB Ser. 2962, Class BS, IO, 6.317s, 2035 | 10,495,303 | 767,207 |
| IFB Ser. 3114, Class TS, IO, 6.317s, 2030 | 11,311,178 | 848,508 |
| IFB Ser. 3128, Class JI, IO, 6.297s, 2036 | 5,580,357 | 474,330 |
| IFB Ser. 2990, Class LI, IO, 6.297s, 2034 | 3,610,051 | 300,499 |
| IFB Ser. 3240, Class S, IO, 6.287s, 2036 | 7,997,182 | 618,910 |
| IFB Ser. 3229, Class BI, IO, 6.287s, 2036 | 620,210 | 41,330 |
| IFB Ser. 3153, Class JI, IO, 6.287s, 2036 | 3,917,280 | 278,910 |
| IFB Ser. 3065, Class DI, IO, 6.287s, 2035 | 1,400,629 | 116,198 |
| IFB Ser. 3145, Class GI, IO, 6.267s, 2036 | 4,594,786 | 402,044 |
| IFB Ser. 3114, Class GI, IO, 6.267s, 2036 | 1,972,971 | 143,820 |
| IFB Ser. 3339, Class JI, IO, 6.257s, 2037 | 8,430,574 | 606,158 |
| IFB Ser. 3218, Class AS, IO, 6.247s, 2036 | 2,865,267 | 214,889 |
| IFB Ser. 3221, Class SI, IO, 6.247s, 2036 | 3,372,065 | 253,890 |
| IFB Ser. 3153, Class UI, IO, 6.237s, 2036 | 3,406,801 | 364,405 |
| IFB Ser. 3153, Class QI, IO, 6.217s, 2036 | 1,688,694 | 194,214 |
| IFB Ser. 3202, Class PI, IO, 6.207s, 2036 | 14,496,266 | 1,120,663 |
| IFB Ser. 3355, Class MI, IO, 6.167s, 2037 | 2,369,220 | 170,871 |
| IFB Ser. 3201, Class SG, IO, 6.167s, 2036 | 4,316,570 | 387,635 |
| IFB Ser. 3203, Class SE, IO, 6.167s, 2036 | 3,863,804 | 330,623 |
| IFB Ser. 3238, Class LI, IO, 6.157s, 2036 | 155,140 | 12,299 |
| IFB Ser. 3171, Class PS, IO, 6.152s, 2036 | 3,644,806 | 302,883 |
| IFB Ser. 3152, Class SY, IO, 6.147s, 2036 | 4,208,705 | 378,322 |
| IFB Ser. 3366, Class SA, IO, 6.117s, 2037 | 282,830 | 22,552 |
| IFB Ser. 3284, Class BI, IO, 6.117s, 2037 | 2,652,319 | 181,396 |
38
| | |
| COLLATERALIZED MORTGAGE OBLIGATIONS (23.7%)* cont. | Principal amount | Value |
|
| Freddie Mac | | |
| IFB Ser. 3260, Class SA, IO, 6.117s, 2037 | $2,553,368 | $168,160 |
| IFB Ser. 3199, Class S, IO, 6.117s, 2036 | 2,247,250 | 180,853 |
| IFB Ser. 3284, Class LI, IO, 6.107s, 2037 | 10,651,826 | 811,435 |
| IFB Ser. 3281, Class AI, IO, 6.097s, 2037 | 9,736,046 | 793,372 |
| IFB Ser. 3311, Class EI, IO, 6.077s, 2037 | 2,906,324 | 201,189 |
| IFB Ser. 3311, Class IA, IO, 6.077s, 2037 | 4,008,547 | 338,087 |
| IFB Ser. 3311, Class IB, IO, 6.077s, 2037 | 4,008,547 | 338,087 |
| IFB Ser. 3311, Class IC, IO, 6.077s, 2037 | 4,008,547 | 338,087 |
| IFB Ser. 3311, Class ID, IO, 6.077s, 2037 | 4,008,547 | 338,087 |
| IFB Ser. 3311, Class IE, IO, 6.077s, 2037 | 5,721,182 | 482,534 |
| IFB Ser. 3382, Class SI, IO, 6.067s, 2037 | 567,525 | 46,529 |
| IFB Ser. 3375, Class MS, IO, 6.067s, 2037 | 319,056 | 22,858 |
| IFB Ser. 3240, Class GS, IO, 6.047s, 2036 | 4,843,431 | 385,067 |
| IFB Ser. 3257, Class SI, IO, 5.987s, 2036 | 2,095,036 | 141,088 |
| IFB Ser. 3225, Class JY, IO, 5.957s, 2036 | 9,131,380 | 666,965 |
| IFB Ser. 3416, Class BI, IO, 5.917s, 2038 | 602,771 | 47,797 |
| IFB Ser. 2967, Class SA, IO, 5.817s, 2035 | 217,181 | 10,366 |
| IFB Ser. 3339, Class TI, IO, 5.807s, 2037 | 4,230,723 | 327,159 |
| IFB Ser. 3284, Class CI, IO, 5.787s, 2037 | 7,438,176 | 540,465 |
| IFB Ser. 3016, Class SQ, IO, 5.777s, 2035 | 3,559,650 | 203,089 |
| IFB Ser. 3397, Class SQ, IO, 5.637s, 2037 | 5,004,464 | 354,982 |
| IFB Ser. 3235, Class SA, IO, 5.617s, 2036 | 455,196 | 34,907 |
| IFB Ser. 248, IO, 5 1/2s, 2037 | 424,483 | 45,505 |
| IFB Ser. 3424, Class UI, IO, 5.427s, 2037 | 212,006 | 15,980 |
| Ser. 3510, Class BI, 5s, 2039 ## | 8,494,000 | 644,159 |
| Ser. 3510, Class CI, 5s, 2039 ## | 8,972,000 | 834,252 |
| Ser. 3510, Class DI, 5s, 2039 ## | 5,510,000 | 514,083 |
| Ser. 3510, Class IA, 5s, 2039 ## | 6,483,000 | 577,324 |
| Ser. 3510, Class IB, 5s, 2039 ## | 3,297,000 | 353,455 |
| Ser. 3403, PO, zero %, 2037 | 88,913 | 75,974 |
| Ser. 3369, Class BO, PO, zero %, 2037 | 82,912 | 69,959 |
| Ser. 3327, Class IF, IO, zero %, 2037 | 914,930 | 18,299 |
| Ser. 3391, PO, zero %, 2037 | 424,738 | 339,454 |
| Ser. 3292, Class DO, PO, zero %, 2037 | 261,773 | 238,276 |
| Ser. 3296, Class OK, PO, zero %, 2037 | 156,833 | 140,732 |
| Ser. 3274, Class MO, PO, zero %, 2037 | 83,957 | 72,982 |
| Ser. 3252, Class LO, PO, zero %, 2036 | 614,086 | 530,620 |
| Ser. 3218, Class AO, PO, zero %, 2036 | 210,329 | 165,379 |
| Ser. 3206, Class EO, PO, zero %, 2036 | 76,313 | 68,405 |
| Ser. 3175, Class MO, PO, zero %, 2036 | 387,183 | 319,967 |
| Ser. 3210, PO, zero %, 2036 | 157,505 | 130,346 |
| Ser. 3139, Class CO, PO, zero %, 2036 | 456,648 | 410,243 |
| FRB Ser. 3349, Class DO, zero %, 2037 | 218,505 | 199,034 |
| FRB Ser. 3326, Class XF, zero %, 2037 | 1,403,003 | 1,307,636 |
| FRB Ser. 3326, Class YF, zero %, 2037 | 2,738,273 | 2,577,441 |
| FRB Ser. 3263, Class TA, zero %, 2037 | 287,875 | 254,067 |
| FRB Ser. 3241, Class FH, zero %, 2036 | 557,271 | 540,453 |
| FRB Ser. 3341, Class FA, zero %, 2036 | 79,884 | 77,929 |
| FRB Ser. 3231, Class XB, zero %, 2036 | 380,674 | 375,559 |
| FRB Ser. 3283, Class HF, zero %, 2036 | 105,956 | 103,227 |
| FRB Ser. 3231, Class X, zero %, 2036 | 289,342 | 274,967 |
39
| | |
| COLLATERALIZED MORTGAGE OBLIGATIONS (23.7%)* cont. | Principal amount | Value |
|
| Freddie Mac | | |
| FRB Ser. 3147, Class SF, zero %, 2036 | $1,334,157 | $942,373 |
| FRB Ser. 3130, Class JF, zero %, 2036 | 53,018 | 50,535 |
| FRB Ser. 3117, Class AF, zero %, 2036 | 184,323 | 174,538 |
| FRB Ser. 3326, Class WF, zero %, 2035 | 2,121,858 | 1,882,192 |
| FRB Ser. 3036, Class AS, zero %, 2035 | 191,217 | 166,607 |
| FRB Ser. 3003, Class XF, zero %, 2035 | 2,047,169 | 1,803,529 |
|
| GE Capital Commercial Mortgage Corp. 144A | | |
| Ser. 07-C1, Class XC, IO, 0.093s, 2019 | 183,408,499 | 596,774 |
| Ser. 05-C2, Class XC, IO, 0.083s, 2043 | 84,379,022 | 391,190 |
| Ser. 05-C3, Class XC, IO, 0.064s, 2045 | 228,853,903 | 568,686 |
|
| GMAC Commercial Mortgage Securities, Inc. | | |
| Ser. 99-C3, Class F, 7.897s, 2036 | 592,000 | 590,186 |
| Ser. 97-C1, Class X, IO, 1.358s, 2029 | 3,193,678 | 126,150 |
| Ser. 05-C1, Class X1, IO, 0.216s, 2043 | 91,312,544 | 620,743 |
|
| GMAC Commercial Mortgage Securities, Inc. 144A | | |
| Ser. 99-C3, Class G, 6.974s, 2036 | 1,614,303 | 484,291 |
| Ser. 06-C1, Class XC, IO, 0.07s, 2045 | 126,858,942 | 335,841 |
|
| Government National Mortgage Association | | |
| IFB Ser. 07-51, Class SP, 37.478s, 2037 | 821,859 | 1,015,040 |
| IFB Ser. 06-34, Class SA, 37.384s, 2036 | 302,771 | 368,182 |
| IFB Ser. 07-44, Class SP, 34.676s, 2036 | 1,332,538 | 1,620,794 |
| IFB Ser. 05-66, Class SP, 19.738s, 2035 | 1,178,569 | 1,253,308 |
| Ser. 07-17, Class CI, IO, 7 1/2s, 2037 | 89,301 | 8,930 |
| IFB Ser. 08-29, Class SA, IO, 7.446s, 2038 | 354,963 | 24,272 |
| IFB Ser. 06-69, Class SI, IO, 7.046s, 2036 | 175,418 | 12,603 |
| IFB Ser. 06-62, Class SI, IO, 7.046s, 2036 | 2,882,854 | 180,565 |
| IFB Ser. 06-61, Class SM, IO, 7.021s, 2036 | 118,909 | 8,686 |
| IFB Ser. 07-1, Class SL, IO, 7.001s, 2037 | 1,308,648 | 95,363 |
| IFB Ser. 07-1, Class SM, IO, 6.991s, 2037 | 1,308,648 | 95,202 |
| IFB Ser. 05-68, Class PU, IO, 6.941s, 2032 | 153,094 | 17,005 |
| IFB Ser. 04-59, Class SH, IO, 6.921s, 2034 | 82,766 | 9,386 |
| IFB Ser. 04-59, Class SC, IO, 6.871s, 2034 | 1,759,528 | 139,061 |
| IFB Ser. 04-26, Class IS, IO, 6.871s, 2034 | 66,402 | 5,072 |
| IFB Ser. 07-47, Class SA, IO, 6.771s, 2036 | 83,233 | 7,880 |
| IFB Ser. 07-49, Class NY, IO, 6.741s, 2035 | 11,034,259 | 736,162 |
| IFB Ser. 07-35, Class NY, IO, 6.571s, 2035 | 123,864 | 11,410 |
| IFB Ser. 07-35, Class TY, IO, 6.566s, 2035 | 3,293,375 | 216,965 |
| IFB Ser. 07-26, Class SG, IO, 6.516s, 2037 | 4,405,119 | 264,998 |
| IFB Ser. 07-26, Class SD, IO, 6.471s, 2037 | 4,293,251 | 287,218 |
| IFB Ser. 07-26, Class SL, IO, 6.471s, 2037 | 204,287 | 20,846 |
| IFB Ser. 07-25, Class SA, IO, 6.466s, 2037 | 2,952,482 | 176,369 |
| IFB Ser. 07-25, Class SB, IO, 6.466s, 2037 | 5,758,152 | 353,910 |
| IFB Ser. 07-11, Class SA, IO, 6.466s, 2037 | 2,282,998 | 163,431 |
| IFB Ser. 06-69, Class SA, IO, 6.466s, 2036 | 334,804 | 22,002 |
| IFB Ser. 07-31, Class CI, IO, 6.451s, 2037 | 2,247,818 | 141,746 |
| IFB Ser. 07-22, Class S, IO, 6.441s, 2037 | 2,518,943 | 190,450 |
| IFB Ser. 07-14, Class SB, IO, 6.441s, 2037 | 2,455,070 | 145,915 |
| IFB Ser. 05-84, Class AS, IO, 6.441s, 2035 | 170,063 | 15,246 |
| IFB Ser. 07-51, Class SJ, IO, 6.416s, 2037 | 2,903,083 | 219,573 |
| IFB Ser. 07-53, Class SY, IO, 6.376s, 2037 | 146,839 | 10,889 |
| IFB Ser. 04-17, Class QN, IO, 6.371s, 2034 | 105,700 | 8,904 |
40
| | |
| COLLATERALIZED MORTGAGE OBLIGATIONS (23.7%)* cont. | Principal amount | Value |
|
| Government National Mortgage Association | | |
| IFB Ser. 07-58, Class PS, IO, 6.366s, 2037 | $4,968,043 | $337,693 |
| IFB Ser. 04-88, Class S, IO, 6.341s, 2032 | 81,036 | 5,171 |
| IFB Ser. 07-59, Class PS, IO, 6.336s, 2037 | 2,257,558 | 144,576 |
| IFB Ser. 07-59, Class SP, IO, 6.336s, 2037 | 4,576,763 | 300,478 |
| IFB Ser. 07-48, Class SB, IO, 6.321s, 2037 | 3,320,727 | 189,846 |
| IFB Ser. 07-68, Class PI, IO, 6.316s, 2037 | 4,152,213 | 299,289 |
| IFB Ser. 06-38, Class SG, IO, 6.316s, 2033 | 8,682,013 | 453,227 |
| IFB Ser. 07-53, Class SG, IO, 6.241s, 2037 | 1,586,620 | 101,199 |
| IFB Ser. 07-74, Class SI, IO, 6.241s, 2037 | 92,934 | 4,672 |
| IFB Ser. 07-17, Class AI, IO, 6.221s, 2037 | 9,550,882 | 655,869 |
| IFB Ser. 08-3, Class SA, IO, 6.216s, 2038 | 5,031,702 | 273,899 |
| IFB Ser. 08-2, Class SV, IO, 6.191s, 2038 | 1,297,345 | 87,219 |
| IFB Ser. 07-79, Class SY, IO, 6.191s, 2037 | 8,695,921 | 581,757 |
| IFB Ser. 07-53, Class ES, IO, 6.191s, 2037 | 2,170,303 | 126,135 |
| IFB Ser. 08-2, Class SM, IO, 6.171s, 2038 | 230,700 | 14,466 |
| IFB Ser. 07-9, Class AI, IO, 6.171s, 2037 | 3,675,708 | 229,787 |
| IFB Ser. 07-58, Class SA, IO, 6.166s, 2037 | 7,343,902 | 393,780 |
| IFB Ser. 07-61, Class SA, IO, 6.166s, 2037 | 2,922,417 | 145,501 |
| IFB Ser. 07-27, Class S, IO, 6.166s, 2037 | 1,425,772 | 100,470 |
| IFB Ser. 06-28, Class GI, IO, 6.166s, 2035 | 3,739,103 | 271,215 |
| IFB Ser. 07-10, Class SB, IO, 6.161s, 2037 | 967,497 | 54,380 |
| IFB Ser. 07-67, Class SI, IO, 6.151s, 2037 | 7,249,709 | 382,248 |
| IFB Ser. 07-9, Class DI, IO, 6.151s, 2037 | 4,253,773 | 278,994 |
| IFB Ser. 07-28, Class SG, IO, 6.141s, 2037 | 1,254,530 | 86,510 |
| IFB Ser. 08-34, Class SH, IO, 6.141s, 2037 | 111,413 | 8,544 |
| IFB Ser. 06-26, Class S, IO, 6.141s, 2036 | 502,530 | 30,968 |
| IFB Ser. 07-59, Class SD, IO, 6.136s, 2037 | 6,972,762 | 364,522 |
| IFB Ser. 06-49, Class SA, IO, 6.126s, 2036 | 400,591 | 21,686 |
| IFB Ser. 07-36, Class SA, IO, 6.111s, 2037 | 672,074 | 46,612 |
| IFB Ser. 07-36, Class SG, IO, 6.111s, 2037 | 1,025,033 | 71,360 |
| IFB Ser. 05-92, Class S, IO, 6.066s, 2032 | 296,423 | 20,182 |
| IFB Ser. 05-71, Class SA, IO, 6.031s, 2035 | 220,451 | 14,854 |
| IFB Ser. 05-65, Class SI, IO, 5.991s, 2035 | 3,927,057 | 241,513 |
| IFB Ser. 08-15, Class PI, IO, 5.966s, 2035 | 129,351 | 9,392 |
| IFB Ser. 06-16, Class SX, IO, 5.956s, 2036 | 176,813 | 10,273 |
| IFB Ser. 07-17, Class IC, IO, 5.921s, 2037 | 4,934,435 | 334,984 |
| IFB Ser. 07-17, Class IB, IO, 5.916s, 2037 | 2,046,931 | 151,235 |
| IFB Ser. 06-14, Class S, IO, 5.916s, 2036 | 3,424,973 | 192,833 |
| IFB Ser. 05-57, Class PS, IO, 5.916s, 2035 | 79,107 | 7,201 |
| IFB Ser. 06-11, Class ST, IO, 5.881s, 2036 | 2,148,420 | 122,258 |
| IFB Ser. 07-25, Class KS, IO, 5.871s, 2037 | 918,529 | 71,646 |
| IFB Ser. 07-21, Class S, IO, 5.871s, 2037 | 5,002,416 | 277,199 |
| IFB Ser. 07-27, Class SD, IO, 5.866s, 2037 | 2,127,253 | 116,277 |
| IFB Ser. 07-19, Class SJ, IO, 5.866s, 2037 | 3,615,589 | 185,339 |
| IFB Ser. 07-8, Class SA, IO, 5.866s, 2037 | 3,255,185 | 169,550 |
| IFB Ser. 07-31, Class AI, IO, 5.851s, 2037 | 2,845,826 | 214,994 |
| IFB Ser. 07-23, Class ST, IO, 5.841s, 2037 | 4,487,816 | 218,301 |
| IFB Ser. 07-9, Class CI, IO, 5.841s, 2037 | 5,523,573 | 274,387 |
| IFB Ser. 07-7, Class EI, IO, 5.841s, 2037 | 3,741,296 | 191,592 |
| IFB Ser. 07-7, Class JI, IO, 5.841s, 2037 | 5,996,092 | 333,383 |
| IFB Ser. 07-1, Class S, IO, 5.841s, 2037 | 4,721,769 | 243,204 |
41
| | |
| COLLATERALIZED MORTGAGE OBLIGATIONS (23.7%)* cont. | Principal amount | Value |
|
| Government National Mortgage Association | | |
| IFB Ser. 07-3, Class SA, IO, 5.841s, 2037 | $4,510,577 | $231,208 |
| IFB Ser. 07-62, Class S, IO, 5.821s, 2037 | 105,128 | 5,945 |
| IFB Ser. 05-17, Class S, IO, 5.821s, 2035 | 90,668 | 5,205 |
| IFB Ser. 07-43, Class SC, IO, 5.771s, 2037 | 3,102,196 | 166,569 |
| IFB Ser. 05-3, Class SN, IO, 5.766s, 2035 | 256,934 | 20,203 |
| IFB Ser. 07-73, Class MI, IO, 5.641s, 2037 | 7,452,519 | 341,974 |
| IFB Ser. 04-41, Class SG, IO, 5.641s, 2034 | 234,328 | 13,042 |
| IFB Ser. 07-67, Class EI, IO, 0.02s, 2037 | 3,917,181 | 1,427 |
| IFB Ser. 07-67, Class GI, IO, 0.02s, 2037 | 11,469,323 | 4,177 |
| Ser. 07-73, Class MO, PO, zero %, 2037 | 573,271 | 487,887 |
| FRB Ser. 07-73, Class KI, IO, zero %, 2037 | 5,732,707 | 31,117 |
| FRB Ser. 07-73, Class KM, zero %, 2037 | 573,271 | 420,611 |
| FRB Ser. 07-49, Class UF, zero %, 2037 | 183,452 | 172,795 |
| FRB Ser. 07-33, Class TB, zero %, 2037 | 54,211 | 52,518 |
| FRB Ser. 07-35, Class UF, zero %, 2037 | 334,212 | 290,496 |
| FRB Ser. 07-22, Class TA, zero %, 2037 | 216,529 | 208,217 |
| FRB Ser. 98-2, Class EA, PO, zero %, 2028 | 88,123 | 70,159 |
|
| Greenpoint Mortgage Funding Trust Ser. 05-AR1, | | |
| Class X1, IO, 3.271s, 2045 | 5,068,168 | 139,375 |
|
| Greenwich Capital Commercial Funding Corp. | | |
| Ser. 05-GG5, Class XC, IO, 0.066s, 2037 | 182,584,559 | 438,203 |
|
| Greenwich Capital Commercial Funding Corp. 144A | | |
| Ser. 07-GG9, Class X, IO, 0.324s, 2039 | 29,415,972 | 308,868 |
|
| GS Mortgage Securities Corp. II | | |
| FRB Ser. 07-GG10, Class A3, 5.799s, 2045 | 2,285,000 | 1,486,573 |
| Ser. 05-GG4, Class A4, 4.761s, 2039 | 197,000 | 161,881 |
|
| GS Mortgage Securities Corp. II 144A | | |
| Ser. 98-C1, Class F, 6s, 2030 | 1,286,000 | 1,015,940 |
| FRB Ser. 07-EOP, Class J, 1.28s, 2009 | 428,000 | 256,800 |
| Ser. 06-GG8, Class X, IO, 0.666s, 2039 | 26,330,971 | 539,785 |
| Ser. 04-C1, Class X1, IO, 0.496s, 2028 | 16,217,669 | 63,249 |
| Ser. 03-C1, Class X1, IO, 0.233s, 2040 | 19,236,015 | 312,964 |
| Ser. 05-GG4, Class XC, IO, 0.212s, 2039 | 105,274,709 | 1,421,209 |
| Ser. 06-GG6, Class XC, IO, 0.046s, 2038 | 52,481,569 | 94,467 |
|
| GSMPS Mortgage Loan Trust | | |
| Ser. 05-RP3, Class 1A4, 8 1/2s, 2035 | 216,496 | 200,328 |
| Ser. 05-RP3, Class 1A3, 8s, 2035 | 682,768 | 622,005 |
| Ser. 05-RP3, Class 1A2, 7 1/2s, 2035 | 611,091 | 550,863 |
|
| GSMPS Mortgage Loan Trust 144A | | |
| Ser. 05-RP2, Class 1A3, 8s, 2035 | 823,010 | 795,670 |
| Ser. 05-RP1, Class 1A3, 8s, 2035 | 108,643 | 97,194 |
| Ser. 05-RP2, Class 1A2, 7 1/2s, 2035 | 898,588 | 858,908 |
| IFB Ser. 04-4, Class 1AS, IO, 5.637s, 2034 | 10,357,609 | 718,818 |
|
| GSR Mortgage Loan Trust Ser. 05-AR2, Class 2A1, | | |
| 4.832s, 2035 | 1,518,386 | 941,400 |
|
| HASCO NIM Trust 144A Ser. 05-OP1A, Class A, 6 1/4s, | | |
| 2035 (Cayman Islands) | 242,459 | 4,849 |
|
| IMPAC Secured Assets Corp. FRB Ser. 07-2, | | |
| Class 1A1A, 0.499s, 2037 | 4,213,111 | 2,854,383 |
|
42
| | |
| COLLATERALIZED MORTGAGE OBLIGATIONS (23.7%)* cont. | Principal amount | Value |
|
| IndyMac Indx Mortgage Loan Trust | | |
| FRB Ser. 06-AR25, Class 5A1, 6.257s, 2036 | $82,186 | $42,360 |
| FRB Ser. 07-AR15, Class 1A1, 6.143s, 2037 | 272,909 | 133,725 |
| FRB Ser. 07-AR9, Class 2A1, 5.921s, 2037 | 281,484 | 143,557 |
| FRB Ser. 05-AR5, Class 4A1, 5.486s, 2035 | 225,586 | 123,800 |
|
| JPMorgan Alternative Loan Trust | | |
| FRB Ser. 06-A3, Class 2A1, 6.066s, 2036 | 110,344 | 60,093 |
| FRB Ser. 06-A1, Class 5A1, 5.938s, 2036 | 193,950 | 102,793 |
| FRB Ser. 06-A6, Class 1A1, 0.549s, 2036 | 127,452 | 57,173 |
|
| JPMorgan Chase Commercial Mortgage | | |
| Securities Corp. | | |
| Ser. 97-C5, Class F, 7.561s, 2029 | 911,000 | 592,150 |
| FRB Ser. 07-LD12, Class AM, 6.062s, 2051 | 5,510,000 | 2,252,429 |
| FRB Ser. 07-LD12, Class A3, 5.99s, 2051 | 15,986,000 | 10,263,185 |
| FRB Ser. 07-LD11, Class A3, 5.819s, 2049 | 2,850,000 | 1,826,850 |
| Ser. 06-CB15, Class A4, 5.814s, 2043 | 4,443,000 | 3,448,713 |
| Ser. 07-CB20, Class A4, 5.794s, 2051 | 1,278,000 | 767,812 |
| FRB Ser. 04-PNC1, Class A4, 5.406s, 2041 | 75,000 | 64,215 |
| Ser. 05-CB12, Class A4, 4.895s, 2037 | 198,000 | 158,796 |
| Ser. 04-C3, Class A5, 4.878s, 2042 | 189,000 | 157,475 |
| Ser. 05-LDP2, Class AM, 4.78s, 2042 | 1,990,000 | 1,177,235 |
| Ser. 06-LDP8, Class X, IO, 0.573s, 2045 | 34,981,328 | 754,337 |
| Ser. 06-CB17, Class X, IO, 0.513s, 2043 F | 42,724,379 | 859,382 |
| Ser. 06-LDP9, Class X, IO, 0.455s, 2047 F | 9,797,122 | 160,775 |
| Ser. 07-LDPX, Class X, IO, 0.347s, 2049 F | 54,471,037 | 623,613 |
| Ser. 06-CB16, Class X1, IO, 0.092s, 2045 | 39,829,354 | 345,540 |
|
| JPMorgan Chase Commercial Mortgage | | |
| Securities Corp. 144A | | |
| Ser. 03-ML1A, Class X1, IO, 0.57s, 2039 | 38,035,244 | 1,122,040 |
| Ser. 05-CB12, Class X1, IO, 0.106s, 2037 F | 54,024,464 | 331,070 |
| Ser. 05-LDP3, Class X1, IO, 0.084s, 2042 F | 81,021,634 | 401,134 |
| Ser. 07-CB20, Class X1, IO, 0.073s, 2051 F | 88,969,318 | 603,027 |
| Ser. 05-LDP5, Class X1, IO, 0.072s, 2044 F | 343,048,059 | 1,043,775 |
| Ser. 06-LDP6, Class X1, IO, 0.062s, 2043 F | 68,059,455 | 210,915 |
|
| LB Commercial Conduit Mortgage Trust 144A | | |
| Ser. 99-C1, Class F, 6.41s, 2031 | 715,303 | 572,242 |
| Ser. 99-C1, Class G, 6.41s, 2031 | 765,731 | 268,006 |
| Ser. 98-C4, Class G, 5.6s, 2035 | 634,000 | 568,522 |
| Ser. 98-C4, Class H, 5.6s, 2035 | 1,074,000 | 204,071 |
|
| LB-UBS Commercial Mortgage Trust | | |
| Ser. 01-C3, Class A2, 6.365s, 2028 | 67,000 | 63,934 |
| Ser. 04-C7, Class A6, 4.786s, 2029 | 1,733,000 | 1,372,152 |
| Ser. 07-C2, Class XW, IO, 0.537s, 2040 | 11,757,015 | 240,506 |
|
| LB-UBS Commercial Mortgage Trust 144A | | |
| Ser. 06-C7, Class XW, IO, 0.718s, 2038 | 30,412,230 | 776,576 |
| Ser. 03-C5, Class XCL, IO, 0.248s, 2037 | 16,005,139 | 241,037 |
| Ser. 05-C3, Class XCL, IO, 0.206s, 2040 | 66,041,069 | 852,729 |
| Ser. 05-C2, Class XCL, IO, 0.166s, 2040 | 122,127,433 | 800,667 |
| Ser. 05-C7, Class XCL, IO, 0.142s, 2040 | 82,300,276 | 424,439 |
| Ser. 05-C5, Class XCL, IO, 0.138s, 2020 | 69,046,793 | 578,792 |
| Ser. 06-C7, Class XCL, IO, 0.117s, 2038 | 46,980,883 | 461,667 |
| Ser. 07-C2, Class XCL, IO, 0.084s, 2040 | 101,029,042 | 713,902 |
| Ser. 06-C1, Class XCL, IO, 0.055s, 2041 | 66,270,981 | 426,566 |
|
43
| | |
| COLLATERALIZED MORTGAGE OBLIGATIONS (23.7%)* cont. | Principal amount | Value |
|
| Lehman Brothers Floating Rate Commercial Mortgage | | |
| Trust 144A | | |
| FRB Ser. 04-LLFA, Class H, 1.283s, 2017 | $733,000 | $549,750 |
| FRB Ser. 05-LLFA, Class J, 1.133s, 2018 | 423,000 | 317,250 |
|
| Lehman Mortgage Trust | | |
| IFB Ser. 06-7, Class 1A9, 38.584s, 2036 | 615,813 | 799,403 |
| IFB Ser. 07-5, Class 4A3, 37.744s, 2037 | 1,897,298 | 1,916,271 |
| IFB Ser. 06-7, Class 4A2, IO, 7.361s, 2036 | 3,053,624 | 425,592 |
| IFB Ser. 07-5, Class 8A2, IO, 7.331s, 2036 | 3,048,823 | 264,465 |
| Ser. 07-1, Class 3A2, IO, 6.861s, 2037 | 3,724,565 | 509,208 |
| IFB Ser. 06-9, Class 3A2, IO, 6.841s, 2037 | 2,142,438 | 168,717 |
| IFB Ser. 07-4, Class 3A2, IO, 6.811s, 2037 | 2,940,621 | 256,584 |
| IFB Ser. 06-5, Class 2A2, IO, 6.761s, 2036 | 6,481,984 | 502,354 |
| IFB Ser. 07-2, Class 2A13, IO, 6.301s, 2037 | 5,368,563 | 389,221 |
| IFB Ser. 07-4, Class 2A2, IO, 6.281s, 2037 | 12,339,590 | 848,347 |
| IFB Ser. 07-1, Class 2A3, IO, 6.241s, 2037 | 6,294,692 | 456,365 |
| Ser. 06-9, Class 2A3, IO, 6.231s, 2036 | 7,365,879 | 632,725 |
| IFB Ser. 06-9, Class 2A2, IO, 6.231s, 2037 | 5,410,850 | 457,019 |
| IFB Ser. 06-7, Class 2A4, IO, 6.161s, 2036 | 10,598,580 | 768,341 |
| IFB Ser. 06-7, Class 2A5, IO, 6.161s, 2036 | 9,918,992 | 700,529 |
| IFB Ser. 06-6, Class 1A2, IO, 6.111s, 2036 | 3,861,074 | 270,275 |
| IFB Ser. 06-6, Class 1A3, IO, 6.111s, 2036 | 5,717,291 | 407,357 |
| IFB Ser. 07-5, Class 10A2, IO, 5.951s, 2037 | 6,012,846 | 420,899 |
|
| MASTR Adjustable Rate Mortgages Trust | | |
| Ser. 04-7, Class 2A1, 5.544s, 2034 | 128,290 | 79,056 |
| FRB Ser. 04-13, Class 3A6, 3.788s, 2034 | 2,253,000 | 1,832,972 |
| Ser. 04-03, Class 4AX, IO, 0.376s, 2034 | 1,767,339 | 7,511 |
| Ser. 05-2, Class 7AX, IO, 0.17s, 2035 | 4,935,696 | 13,820 |
|
| MASTR Alternative Loans Trust Ser. 06-3, Class 1A1, | | |
| 6 1/4s, 2036 | 173,173 | 95,245 |
|
| MASTR Reperforming Loan Trust 144A | | |
| Ser. 05-2, Class 1A3, 7 1/2s, 2035 | 601,864 | 592,588 |
| Ser. 05-1, Class 1A4, 7 1/2s, 2034 | 1,464,874 | 1,353,890 |
|
| Merit Securities Corp. 144A FRB Ser. 11PA, | | |
| Class 3A1, 1.029s, 2027 | 4,330,826 | 2,785,360 |
|
| Merrill Lynch Capital Funding Corp. Ser. 06-4, | | |
| Class XC, IO, 0.148s, 2049 | 89,232,597 | 641,475 |
|
| Merrill Lynch Floating Trust 144A FRB Ser. 06-1, | | |
| Class TM, 0.833s, 2022 | 1,019,621 | 627,067 |
|
| Merrill Lynch Mortgage Investors, Inc. | | |
| FRB Ser. 98-C3, Class E, 6.997s, 2030 | 644,000 | 597,655 |
| FRB Ser. 05-A9, Class 3A1, 5.271s, 2035 | 3,252,130 | 2,388,185 |
|
| Merrill Lynch Mortgage Trust | | |
| FRB Ser. 07-C1, Class A3, 5.829s, 2050 | 1,576,000 | 1,012,550 |
| FRB Ser. 07-C1, Class A4, 5.829s, 2050 | 1,777,000 | 1,249,730 |
| FRB Ser. 04-BPC1, Class A5, 4.855s, 2041 | 193,000 | 160,727 |
| FRB Ser. 05-MCP1, Class A4, 4.747s, 2043 | 187,000 | 153,321 |
| Ser. 05-MCP1, Class XC, IO, 0.137s, 2043 | 69,474,715 | 543,757 |
|
| Merrill Lynch Mortgage Trust 144A | | |
| Ser. 04-KEY2, Class XC, IO, 0.253s, 2039 | 15,267,547 | 219,885 |
| Ser. 05-LC1, Class X, IO, 0.1s, 2044 | 36,320,252 | 171,742 |
|
44
| | |
| COLLATERALIZED MORTGAGE OBLIGATIONS (23.7%)* cont. | Principal amount | Value |
|
| Merrill Lynch/Countrywide Commercial Mortgage Trust | | |
| FRB Ser. 07-8, Class A3, 5.957s, 2049 | $4,551,000 | $3,187,590 |
| FRB Ser. 07-8, Class A2, 5.92s, 2049 | 2,784,000 | 1,793,197 |
|
| Merrill Lynch/Countrywide Commercial Mortgage Trust | | |
| 144A Ser. 07-7, Class X, IO, 0.019s, 2050 | 191,790,721 | 353,390 |
|
| Mezz Cap Commercial Mortgage Trust 144A | | |
| Ser. 04-C1, Class X, IO, 8.006s, 2037 | 3,061,899 | 409,712 |
| Ser. 04-C2, Class X, IO, 6.004s, 2040 | 2,421,123 | 295,823 |
| Ser. 05-C3, Class X, IO, 5.555s, 2044 | 2,823,684 | 266,690 |
| Ser. 06-C4, Class X, IO, 5.454s, 2016 | 8,500,260 | 920,101 |
|
| Morgan Stanley Capital 144A Ser. 05-RR6, Class X, | | |
| IO, 1.632s, 2043 | 9,593,887 | 224,401 |
|
| Morgan Stanley Capital I | | |
| FRB Ser. 08-T29, Class A3, 6.28s, 2043 | 1,316,000 | 937,979 |
| FRB Ser. 07-IQ14, Class AM, 5.691s, 2049 | 1,732,000 | 814,546 |
| Ser. 05-HQ6, Class A4A, 4.989s, 2042 | 3,963,000 | 3,125,990 |
| Ser. 04-HQ4, Class A7, 4.97s, 2040 | 2,047,000 | 1,668,510 |
|
| Morgan Stanley Capital I 144A | | |
| Ser. 04-RR, Class F5, 6s, 2039 | 1,000,000 | 80,000 |
| Ser. 04-RR, Class F6, 6s, 2039 | 1,700,000 | 119,000 |
| Ser. 05-HQ6, Class X1, IO, 0.114s, 2042 | 75,328,881 | 461,480 |
| Ser. 05-HQ5, Class X1, IO, 0.093s, 2042 | 21,488,791 | 94,766 |
|
| Morgan Stanley Mortgage Loan Trust Ser. 05-5AR, | | |
| Class 2A1, 4.855s, 2035 | 3,553,998 | 1,848,079 |
|
| Mortgage Capital Funding, Inc. FRB Ser. 98-MC2, | | |
| Class E, 7.093s, 2030 | 1,020,000 | 612,000 |
|
| Nomura Asset Acceptance Corp. Ser. 04-R3, Class PT, | | |
| 7.327s, 2035 | 410,733 | 368,592 |
|
| Nomura Asset Acceptance Corp. 144A Ser. 04-R2, | | |
| Class PT, 9.087s, 2034 | 335,736 | 313,330 |
|
| PNC Mortgage Acceptance Corp. 144A | | |
| Ser. 00-C1, Class J, 6 5/8s, 2010 | 456,000 | 135,117 |
| Ser. 00-C2, Class J, 6.22s, 2033 | 1,113,000 | 705,419 |
|
| Residential Asset Securitization Trust IFB | | |
| Ser. 07-A3, Class 2A2, IO, 6.301s, 2037 | 12,317,710 | 862,240 |
|
| Residential Funding Mortgage Securities I | | |
| Ser. 04-S5, Class 2A1, 4 1/2s, 2019 | 2,264,468 | 2,182,381 |
|
| Saco I Trust FRB Ser. 05-10, Class 1A1, 0.649s, 2033 | 874,474 | 314,811 |
|
| Salomon Brothers Mortgage Securities VII 144A | | |
| Ser. 02-KEY2, Class X1, IO, 0.656s, 2036 | 22,630,884 | 792,081 |
|
| SBA CMBS Trust 144A Ser. 05-1A, Class D, 6.219s, 2035 | 600,000 | 439,482 |
|
| STRIPS 144A | | |
| Ser. 03-1A, Class L, 5s, 2018 (Cayman Islands) | 757,000 | 552,610 |
| Ser. 03-1A, Class M, 5s, 2018 (Cayman Islands) | 513,000 | 282,150 |
| Ser. 04-1A, Class L, 5s, 2018 (Cayman Islands) | 337,000 | 188,720 |
|
| Structured Adjustable Rate Mortgage Loan Trust | | |
| FRB Ser. 07-8, Class 1A2, 6 1/4s, 2037 | 9,304,747 | 4,559,326 |
| FRB Ser. 06-9, Class 1A1, 5.692s, 2036 | 91,115 | 49,812 |
| Ser. 04-8, Class 1A3, 5.359s, 2034 | 9,228 | 4,273 |
| FRB Ser. 05-18, Class 6A1, 5.254s, 2035 | 1,866,698 | 1,138,686 |
| Ser. 05-9, Class AX, IO, 1.485s, 2035 | 18,268,852 | 310,570 |
|
45
| | |
| COLLATERALIZED MORTGAGE OBLIGATIONS (23.7%)* cont. | Principal amount | Value |
|
| Structured Adjustable Rate Mortgage Loan Trust 144A | | |
| Ser. 04-NP2, Class A, 0.739s, 2034 | $554,449 | $421,381 |
|
| Structured Asset Securities Corp. | | |
| IFB Ser. 07-4, Class 1A3, IO, 5.841s, 2037 | 41,256,886 | 2,991,124 |
| Ser. 07-4, Class 1A4, IO, 1s, 2037 | 43,700,834 | 437,008 |
|
| Structured Asset Securities Corp. 144A | | |
| Ser. 07-RF1, Class 1A, IO, 5.306s, 2037 | 11,492,756 | 740,134 |
| Ser. 06-RF4, Class 1A, IO, 0.356s, 2036 | 6,174,481 | 751,213 |
|
| Wachovia Bank Commercial Mortgage Trust | | |
| FRB Ser. 07-C33, Class A3, 5.902s, 2051 | 3,570,000 | 2,279,502 |
| Ser. 07-C30, Class A3, 5.246s, 2043 | 5,721,000 | 4,309,429 |
| Ser. 06-C28, Class XC, IO, 0.38s, 2048 | 23,288,117 | 295,526 |
| Ser. 06-C29, IO, 0.374s, 2048 | 97,682,422 | 1,465,236 |
| Ser. 07-C34, IO, 0.355s, 2046 | 23,980,829 | 371,463 |
|
| Wachovia Bank Commercial Mortgage Trust 144A | | |
| FRB Ser. 05-WL5A, Class L, 3.633s, 2018 | 771,000 | 470,310 |
| Ser. 03-C3, Class IOI, IO, 0.413s, 2035 | 15,773,619 | 331,782 |
| Ser. 07-C31, IO, 0.261s, 2047 | 91,480,084 | 898,334 |
| Ser. 06-C27, Class XC, IO, 0.078s, 2045 | 45,456,164 | 221,372 |
| Ser. 06-C23, Class XC, IO, 0.055s, 2045 | 89,812,130 | 266,742 |
| Ser. 06-C26, Class XC, IO, 0.04s, 2045 | 34,274,723 | 62,380 |
|
| WAMU Commercial Mortgage Securities Trust 144A | | |
| Ser. 05-C1A, Class G, 5.72s, 2036 | 222,000 | 43,328 |
| Ser. 06-SL1, Class X, IO, 0.936s, 2043 | 7,510,354 | 194,218 |
| Ser. 07-SL2, Class X, IO, 0.85s, 2049 | 14,795,168 | 340,733 |
|
| WAMU Mortgage Pass-Through Certificates FRB | | |
| Ser. 04-AR1, Class A, 4.229s, 2034 | 317,382 | 253,906 |
|
| Washington Mutual Mortgage Pass-Through Certificates | | |
| Ser. 07-2, Class CX, IO, 7s, 2037 | 817,217 | 75,593 |
|
| Washington Mutual Multi-Fam., Mtge. 144A Ser. 01-1, | | |
| Class B5, 7.188s, 2031 (Cayman Islands) | 1,305,000 | 924,772 |
|
| Wells Fargo Mortgage Backed Securities Trust | | |
| Ser. 05-AR10, Class 2A18, IO, 0.61s, 2035 | 44,983,000 | 42,690 |
|
| Total collateralized mortgage obligations (cost $351,081,701) | | $335,210,500 |
| |
| |
| CORPORATE BONDS AND NOTES (8.9%)* | Principal amount | Value |
|
| Basic materials (0.4%) | | |
| Domtar Corp. company guaranty Ser. *, 7 7/8s, 2011 | | |
| (Canada) | $310,000 | $286,750 |
|
| Dow Chemical Co. (The) Pass Through Trust 144A | | |
| company guaranty 4.027s, 2009 | 1,554,000 | 1,529,530 |
|
| Freeport-McMoRan Copper & Gold, Inc. sr. unsec. | | |
| notes 8 3/8s, 2017 | 763,000 | 631,383 |
|
| Georgia-Pacific Corp. notes 8 1/8s, 2011 | 635,000 | 612,775 |
|
| Hanson PLC company guaranty 6 1/8s, 2016 | | |
| (United Kingdom) | 175,000 | 74,599 |
|
| Mosaic Co. (The) 144A sr. unsec. | | |
| unsub. notes 7 5/8s, 2016 | 208,000 | 195,520 |
|
| Packaging Corp. of America unsec. | | |
| unsub. notes 5 3/4s, 2013 | 345,000 | 302,919 |
|
| PPG Industries, Inc. sr. unsec. unsub. notes | | |
| 6.65s, 2018 | 185,000 | 175,993 |
|
46
| | | |
| CORPORATE BONDS AND NOTES (8.9%)* cont. | Principal amount | Value |
|
| Basic materials cont. | | | |
| Rhodia SA 144A company guaranty unsec. | | | |
| sr. notes 5.362s, 2013 (France) | EUR | 265,000 | $165,447 |
|
| Sealed Air Corp. 144A notes 5 5/8s, 2013 | | $210,000 | 178,916 |
|
| Steel Dynamics, Inc. company guaranty sr. unsec. | | | |
| unsub. notes 6 3/4s, 2015 | | 570,000 | 451,725 |
|
| Westvaco Corp. unsec. notes 7 1/2s, 2027 | | 12,000 | 10,471 |
|
| Xstrata Finance Canada, Ltd. 144A company | | | |
| guaranty 5.8s, 2016 (Canada) | | 735,000 | 515,928 |
|
| | | | 5,131,956 |
| Capital goods (0.4%) | | | |
| Caterpillar Financial Services Corp. sr. unsec. | | | |
| notes 4.85s, 2012 | | 820,000 | 824,178 |
|
| Caterpillar Financial Services Corp. sr. unsec. | | | |
| notes Ser. MTN, 5.85s, 2017 | | 376,000 | 364,202 |
|
| Caterpillar Financial Services Corp. sr. unsec. | | | |
| notes Ser. MTN, 5.45s, 2018 | | 340,000 | 316,992 |
|
| Eaton Corp. notes 5.6s, 2018 | | 152,000 | 144,360 |
|
| John Deere Capital Corp. sr. unsec. notes Ser. MTN, | | | |
| 5.35s, 2018 | | 335,000 | 321,567 |
|
| L-3 Communications Corp. company guaranty Ser. B, | | | |
| 6 3/8s, 2015 | | 595,000 | 557,813 |
|
| L-3 Communications Corp. sr. sub. notes 5 7/8s, 2015 | | 435,000 | 398,025 |
|
| Legrand SA unsec. unsub. debs. 8 1/2s, 2025 (France) | | 767,000 | 604,453 |
|
| Parker Hannifin Corp. sr. unsec. | | | |
| unsub. notes 6 1/4s, 2038 | | 975,000 | 915,349 |
|
| Pitney Bowes, Inc. sr. unsec. notes 5.6s, 2018 | | 125,000 | 122,033 |
|
| United Technologies Corp. sr. unsec. notes 6 1/8s, 2038 | | 430,000 | 441,970 |
|
| United Technologies Corp. sr. unsec. notes 5 3/8s, 2017 | | 328,000 | 335,708 |
|
| | | | 5,346,650 |
| Communication services (1.1%) | | | |
| American Tower Corp. 144A sr. notes 7s, 2017 | | 312,000 | 299,520 |
|
| Ameritech Capital Funding company guaranty 6 1/4s, 2009 | | 200,000 | 201,948 |
|
| AT&T Wireless Services, Inc. sr. notes 8 3/4s, 2031 | | 285,000 | 336,006 |
|
| AT&T Wireless Services, Inc. sr. notes 7 7/8s, 2011 | | 185,000 | 198,924 |
|
| AT&T, Inc. sr. unsec. bond 6.55s, 2039 | | 350,000 | 348,712 |
|
| AT&T, Inc. sr. unsec. unsub. bonds 5 1/2s, 2018 | | 245,000 | 243,388 |
|
| AT&T, Inc. sr. unsec. unsub. notes 6.3s, 2038 | | 2,369,000 | 2,300,296 |
|
| AT&T, Inc. sr. unsec. unsub. notes 4.95s, 2013 | | 283,000 | 288,468 |
|
| Bellsouth Capital Funding unsec. notes 7 7/8s, 2030 | | 450,000 | 473,689 |
|
| CenturyTel, Inc. sr. unsec. notes 5 1/2s, 2013 | | 65,000 | 58,500 |
|
| Comcast Cable Communications company | | | |
| guaranty sr. unsub. notes 8 7/8s, 2017 | | 290,000 | 305,503 |
|
| Comcast Corp. company guaranty sr. unsec. | | | |
| unsub. notes 6.95s, 2037 | | 225,000 | 229,850 |
|
| Comcast Corp. unsec. bonds 6.4s, 2038 | | 314,000 | 299,701 |
|
| Cox Communications, Inc. notes 7 1/8s, 2012 | | 745,000 | 734,513 |
|
| Cox Communications, Inc. 144A notes 5 7/8s, 2016 | | 289,000 | 261,183 |
|
| France Telecom notes 8 1/2s, 2031 (France) | | 180,000 | 229,979 |
|
| Rogers Wireless, Inc. sec. notes 6 3/8s, 2014 (Canada) | | 122,000 | 118,720 |
|
| Southwestern Bell Telephone debs. 7s, 2027 | | 269,000 | 246,310 |
|
47
| | |
| CORPORATE BONDS AND NOTES (8.9%)* cont. | Principal amount | Value |
|
| Communication services cont. | | |
| TCI Communications, Inc. company guaranty 7 7/8s, 2026 | $1,085,000 | $1,104,870 |
|
| TCI Communications, Inc. debs. 9.8s, 2012 | 467,000 | 502,497 |
|
| Telecom Italia Capital SA company guaranty 5 1/4s, | | |
| 2015 (Luxembourg) | 400,000 | 340,434 |
|
| Telecom Italia Capital SA company guaranty 5 1/4s, | | |
| 2013 (Luxembourg) | 515,000 | 463,129 |
|
| Telecom Italia Capital SA company guaranty 4s, 2010 | | |
| (Luxembourg) | 60,000 | 58,744 |
|
| Telecom Italia Capital SA company | | |
| guaranty sr. unsec. notes FRN 1.753s, 2011 | | |
| (Luxembourg) | 465,000 | 394,734 |
|
| Telefonica Emisones SAU company guaranty 6.221s, | | |
| 2017 (Spain) | 385,000 | 404,958 |
|
| Telefonica Europe BV company guaranty 8 1/4s, 2030 | | |
| (Netherlands) | 595,000 | 693,552 |
|
| Time Warner Cable, Inc. company | | |
| guaranty sr. notes 7.3s, 2038 | 640,000 | 661,803 |
|
| Verizon Communications, Inc. sr. unsec. | | |
| unsub. notes 8 3/4s, 2018 | 110,000 | 128,142 |
|
| Verizon New England, Inc. sr. notes 6 1/2s, 2011 | 742,000 | 755,197 |
|
| Verizon New Jersey, Inc. debs. 8s, 2022 | 770,000 | 777,531 |
|
| Verizon Pennsylvania, Inc. debs. 8.35s, 2030 | 980,000 | 972,255 |
|
| Verizon Wireless, Inc. 144A notes 5.55s, 2014 | 690,000 | 685,584 |
|
| Vodafone Group PLC unsec. notes 6.15s, 2037 | | |
| (United Kingdom) | 387,000 | 375,522 |
|
| | | 15,494,162 |
| Conglomerates (0.1%) | | |
| Honeywell International, Inc. sr. unsec. notes 5.3s, 2018 | 455,000 | 460,778 |
|
| Siemens Financieringsmaatschappij 144A notes 5 3/4s, | | |
| 2016 (Netherlands) | 680,000 | 673,938 |
|
| Tyco International Finance SA company | | |
| guaranty sr. unsec. unsub. notes 8 1/2s, 2019 | | |
| (Luxembourg) | 280,000 | 297,294 |
|
| | | 1,432,010 |
| Consumer cyclicals (0.5%) | | |
| DaimlerChrysler NA Holding Corp. company | | |
| guaranty 6 1/2s, 2013 | 565,000 | 541,258 |
|
| DaimlerChrysler NA Holding Corp. company | | |
| guaranty unsec. unsub. notes Ser. MTN, 5 3/4s, 2011 | 432,000 | 410,483 |
|
| Federated Department Stores, Inc. company | | |
| guaranty sr. unsec. notes 6 5/8s, 2011 | 60,000 | 50,786 |
|
| JC Penney Co., Inc. debs. 7.65s, 2016 | 110,000 | 87,303 |
|
| JC Penney Co., Inc. notes 6 7/8s, 2015 | 910,000 | 710,406 |
|
| Marriott International, Inc. sr. unsec. Ser. J, | | |
| 5 5/8s, 2013 | 150,000 | 130,933 |
|
| Mattel, Inc. sr. unsec. notes 5 5/8s, 2013 | 330,000 | 305,027 |
|
| MGM Mirage, Inc. company guaranty 8 1/2s, 2010 | 130,000 | 104,650 |
|
| Mohawk Industries, Inc. sr. unsec. notes 6 1/8s, 2016 | 235,000 | 186,273 |
|
| News America Holdings, Inc. company guaranty | | |
| 7 3/4s, 2024 | 1,045,000 | 990,707 |
|
| News America Holdings, Inc. debs. 7 3/4s, 2045 | 600,000 | 609,101 |
|
48
| | |
| CORPORATE BONDS AND NOTES (8.9%)* cont. | Principal amount | Value |
|
| Consumer cyclicals cont. | | |
| Omnicom Group, Inc. sr. notes 5.9s, 2016 | $635,000 | $533,692 |
|
| Starwood Hotels & Resorts Worldwide, Inc. company | | |
| guaranty 7 7/8s, 2012 | 710,000 | 617,700 |
|
| Target Corp. bonds 6 1/2s, 2037 | 405,000 | 373,952 |
|
| Time Warner Entertainment Co., LP debs. 8 3/8s, 2023 | 170,000 | 171,332 |
|
| Time Warner, Inc. debs. 9.15s, 2023 | 340,000 | 359,945 |
|
| Time Warner, Inc. debs. 9 1/8s, 2013 | 1,217,000 | 1,296,089 |
|
| | | 7,479,637 |
| Consumer staples (0.8%) | | |
| Altria Group, Inc. company guaranty sr. unsec. | | |
| unsub. notes 8 1/2s, 2013 | 275,000 | 302,372 |
|
| Anheuser-Busch Cos., Inc. sr. unsec. notes 5.6s, 2017 | 215,000 | 192,496 |
|
| Anheuser-Busch InBev Worldwide, Inc. 144A company | | |
| guaranty sr. notes 8.2s, 2039 | 165,000 | 166,273 |
|
| Cadbury Schweppes US Finance LLC 144A company | | |
| guaranty sr. unsec. notes 5 1/8s, 2013 | 230,000 | 213,861 |
|
| Campbell Soup Co. debs. 8 7/8s, 2021 | 855,000 | 1,054,059 |
|
| CVS Caremark, Corp. sr. unsec. FRN 6.302s, 2037 | 1,243,000 | 677,435 |
|
| CVS Caremark, Corp. 144A pass-through certificates | | |
| 6.117s, 2013 | 500,445 | 506,121 |
|
| Delhaize Group sr. unsub. notes 6 1/2s, 2017 | | |
| (Belgium) | 565,000 | 554,613 |
|
| Diageo Capital PLC company guaranty 5.2s, 2013 | | |
| (United Kingdom) | 395,000 | 401,962 |
|
| Diageo PLC company guaranty 8s, 2022 | 760,000 | 829,083 |
|
| Estee Lauder Cos., Inc. (The) sr. unsec. notes 6s, 2037 | 669,000 | 512,034 |
|
| General Mills, Inc. sr. unsec. notes 5.65s, 2019 | 130,000 | 132,260 |
|
| Kellogg Co. sr. unsub. 5 1/8s, 2012 | 165,000 | 175,179 |
|
| Kraft Foods, Inc. notes 6 1/8s, 2018 | 765,000 | 773,356 |
|
| Kroger Co. company guaranty 6 3/4s, 2012 | 275,000 | 289,729 |
|
| Kroger Co. company guaranty 6.4s, 2017 | 500,000 | 506,865 |
|
| McDonald’s Corp. sr. unsec. Ser. MTN, 6.3s, 2038 | 535,000 | 586,474 |
|
| McDonald’s Corp. sr. unsec. notes 5.7s, 2039 | 600,000 | 610,932 |
|
| Newell Rubbermaid, Inc. sr. unsec. notes 5 1/2s, 2013 | 160,000 | 143,795 |
|
| Reynolds American, Inc. company guaranty 7 1/4s, 2013 | 695,000 | 658,237 |
|
| SABMiller PLC 144A notes 6 1/2s, 2018 | | |
| (United Kingdom) | 540,000 | 502,502 |
|
| Sara Lee Corp. sr. unsec. unsub. notes 6 1/4s, 2011 | 865,000 | 882,982 |
|
| Supervalu, Inc. notes 7 7/8s, 2009 | 520,000 | 518,700 |
|
| | | 11,191,320 |
| Energy (0.5%) | | |
| Amerada Hess Corp. unsub notes 6.65s, 2011 | 185,000 | 187,202 |
|
| Anadarko Petroleum Corp. sr. notes 5.95s, 2016 | 575,000 | 520,152 |
|
| Chesapeake Energy Corp. sr. unsec. notes 7 5/8s, 2013 | 10,000 | 9,200 |
|
| ConocoPhillips company guaranty sr. unsec. bond | | |
| 5.9s, 2038 | 45,000 | 43,043 |
|
| ConocoPhillips company guaranty sr. unsec. | | |
| notes 5.2s, 2018 | 20,000 | 19,535 |
|
| ConocoPhillips notes 6 1/2s, 2039 | 265,000 | 261,184 |
|
| Devon Energy Corp. sr. notes 6.3s, 2019 | 265,000 | 265,174 |
|
49
| | |
| CORPORATE BONDS AND NOTES (8.9%)* cont. | Principal amount | Value |
|
| Energy cont. | | |
| EOG Resources, Inc. sr. unsec. notes 5 7/8s, 2017 | $645,000 | $646,290 |
|
| Forest Oil Corp. sr. notes 8s, 2011 | 610,000 | 587,125 |
|
| Motiva Enterprises, LLC 144A sr. notes 5.2s, 2012 | 225,000 | 233,894 |
|
| Newfield Exploration Co. sr. sub. notes 6 5/8s, 2016 | 650,000 | 576,875 |
|
| Nexen, Inc. unsec. unsub. notes 6.4s, 2037 (Canada) | 595,000 | 438,301 |
|
| Peabody Energy Corp. sr. notes 5 7/8s, 2016 | 805,000 | 724,500 |
|
| Petro-Canada sr. unsec. unsub. notes 6.05s, 2018 | | |
| (Canada) | 200,000 | 164,864 |
|
| Premcor Refining Group, Inc. sr. notes 7 1/2s, 2015 | 332,000 | 313,630 |
|
| Sunoco, Inc. notes 4 7/8s, 2014 | 590,000 | 504,368 |
|
| Tesoro Corp. company guaranty 6 1/2s, 2017 | 235,000 | 175,075 |
|
| Weatherford International, Inc. company | | |
| guaranty sr. unsec. unsub. bonds 6.8s, 2037 | 245,000 | 171,653 |
|
| Weatherford International, Inc. company | | |
| guaranty sr. unsec. unsub. bonds 6.35s, 2017 | 280,000 | 233,382 |
|
| Weatherford International, Ltd. company | | |
| guaranty 6 1/2s, 2036 | 855,000 | 598,031 |
|
| Weatherford International, Ltd. sr. notes 5 1/2s, 2016 | 455,000 | 371,378 |
|
| XTO Energy, Inc. sr. unsec. notes 6 3/4s, 2037 | 225,000 | 204,528 |
|
| XTO Energy, Inc. sr. unsec. unsub. notes 6 1/2s, 2018 | 180,000 | 178,178 |
|
| | | 7,427,562 |
| Financials (2.7%) | | |
| AGFC Capital Trust I company guaranty 6s, 2067 | 620,000 | 111,600 |
|
| Allstate Life Global Funding Trusts notes Ser. MTN, | | |
| 5 3/8s, 2013 | 326,000 | 328,861 |
|
| American Express Bank FSB notes Ser. BKN1, 5.55s, | | |
| 2012 | 1,160,000 | 1,114,654 |
|
| American Express Bank FSB sr. unsec. FRN Ser. BKNT, | | |
| 0.686s, 2017 | 545,000 | 318,100 |
|
| American International Group, Inc. jr. sub. bond | | |
| 6 1/4s, 2037 | 1,075,000 | 387,000 |
|
| Amvescap PLC company guaranty 5 5/8s, 2012 | 520,000 | 408,895 |
|
| Bank of America NA sub. notes 5.3s, 2017 | 315,000 | 276,520 |
|
| Bank of New York Mellon Corp. (The) sr. unsec. | | |
| unsub. notes Ser. G, 4.95s, 2012 | 600,000 | 610,967 |
|
| BankAmerica Capital III bank guaranty jr. unsec. FRN | | |
| Ser. *, 1.664s, 2027 | 2,710,000 | 1,412,238 |
|
| Barclays Bank PLC unsec. FRN 3.313s, 2049 | | |
| (United Kingdom) | 2,290,000 | 1,190,800 |
|
| Barclays Bank PLC 144A sub. bonds FRB 7.7s, 2049 | | |
| (United Kingdom) | 280,000 | 127,026 |
|
| Bear Stearns Cos., Inc. (The) notes Ser. MTN, | | |
| 6.95s, 2012 | 440,000 | 461,295 |
|
| Bear Stearns Cos., Inc. (The) sr. notes 6.4s, 2017 | 370,000 | 371,616 |
|
| Bear Stearns Cos., Inc. (The) sr. unsec. | | |
| notes 7 1/4s, 2018 | 331,000 | 352,333 |
|
| Block Financial Corp. notes 5 1/8s, 2014 | 205,000 | 176,046 |
|
| Bosphorus Financial Services, Ltd. 144A sec. | | |
| sr. notes FRN 3.949s, 2012 (Cayman Islands) | 1,932,125 | 1,650,158 |
|
| Capital One Capital III company guaranty 7.686s, 2036 | 320,000 | 160,697 |
|
50
| | |
| CORPORATE BONDS AND NOTES (8.9%)* cont. | Principal amount | Value |
|
| Financials cont. | | |
| Capital One Financial Corp. sr. unsec. | | |
| unsub. notes FRN Ser. MTN, 2.469s, 2009 | $240,000 | $231,627 |
|
| Chubb Corp. (The) sr. notes 6 1/2s, 2038 | 765,000 | 733,108 |
|
| CIT Group, Inc. jr. sub. FRN 6.1s, 2067 | 1,998,000 | 509,490 |
|
| CIT Group, Inc. sr. notes 5.4s, 2013 | 155,000 | 118,022 |
|
| CIT Group, Inc. sr. notes 5s, 2015 | 170,000 | 112,254 |
|
| CIT Group, Inc. sr. notes 5s, 2014 | 110,000 | 74,336 |
|
| Citigroup, Inc. sr. notes 6 1/2s, 2013 | 977,000 | 933,532 |
|
| Citigroup, Inc. sr. unsec. notes 6 1/8s, 2018 | 422,000 | 382,889 |
|
| Citigroup, Inc. sub. notes 5s, 2014 | 324,000 | 262,100 |
|
| CNA Financial Corp. unsec. notes 6 1/2s, 2016 | 1,015,000 | 734,881 |
|
| CNA Financial Corp. unsec. notes 6s, 2011 | 730,000 | 560,325 |
|
| Credit Suisse Guernsey Ltd. jr. sub. FRN 5.86s, 2049 | | |
| (Guernsey) | 354,000 | 129,136 |
|
| Deutsche Bank AG/London notes 4 7/8s, 2013 (Germany) | 575,000 | 562,099 |
|
| Deutsche Bank Capital Funding Trust VII 144A FRB | | |
| 5.628s, 2049 | 286,000 | 101,672 |
|
| Dresdner Funding Trust I 144A bonds 8.151s, 2031 | 350,000 | 132,472 |
|
| Duke Realty LP sr. unsec. notes 6 1/2s, 2018 | 361,000 | 227,400 |
|
| Duke Realty LP sr. unsec. notes 6 1/4s, 2013 | 35,000 | 24,859 |
|
| Fleet Capital Trust V bank guaranty FRN 2.848s, 2028 | 305,000 | 214,156 |
|
| Fund American Cos., Inc. notes 5 7/8s, 2013 | 272,000 | 202,097 |
|
| GATX Financial Corp. notes 5.8s, 2016 | 560,000 | 458,918 |
|
| General Electric Capital Corp. sr. unsec. FRN | | |
| Ser. MTN, 2.435s, 2016 | 455,000 | 340,349 |
|
| General Electric Capital Corp. sr. unsec. | | |
| notes Ser. MTN, 6 7/8s, 2039 | 1,589,000 | 1,403,995 |
|
| General Electric Capital Corp. sub. notes FRN | | |
| 6 3/8s, 2067 | 355,000 | 229,960 |
|
| Genworth Financial, Inc. sr. unsec. Ser. MTN, | | |
| 6.515s, 2018 | 220,000 | 81,400 |
|
| Goldman Sachs Group, Inc. (The) sr. notes | | |
| 7 1/2s, 2019 | 760,000 | 742,148 |
|
| Goldman Sachs Group, Inc. (The) sr. notes 5.45s, 2012 | 302,000 | 292,387 |
|
| Goldman Sachs Group, Inc. (The) sub. notes | | |
| 6 3/4s, 2037 | 745,000 | 572,119 |
|
| HCP, Inc. sr. unsec. Ser. MTN, 6.7s, 2018 R | 15,000 | 9,907 |
|
| Health Care Property Investors, Inc. sr. unsec. | | |
| notes 6s, 2017 | 295,000 | 182,183 |
|
| Health Care REIT, Inc. sr. notes 6s, 2013 R | 385,000 | 284,892 |
|
| Highwood Properties, Inc. sr. unsec. bonds | | |
| 5.85s, 2017 R | 1,005,000 | 593,991 |
|
| Hospitality Properties Trust notes 6 3/4s, 2013 R | 323,000 | 211,524 |
|
| HSBC Finance Capital Trust IX FRN 5.911s, 2035 | 2,000,000 | 774,400 |
|
| HSBC Holdings PLC sub. notes 6 1/2s, 2037 | | |
| (United Kingdom) | 905,000 | 825,506 |
|
| ILFC E-Capital Trust II 144A FRB 6 1/4s, 2065 | 1,360,000 | 540,600 |
|
| International Lease Finance Corp. sr. unsec. | | |
| 6 3/8s, 2013 | 210,000 | 154,350 |
|
51
| | |
| CORPORATE BONDS AND NOTES (8.9%)* cont. | Principal amount | Value |
|
| Financials cont. | | |
| International Lease Finance Corp. sr. unsec. | | |
| Ser. MTN, 6 5/8s, 2013 | $75,000 | $54,750 |
|
| JPMorgan Chase & Co. sr. notes 6s, 2018 | 130,000 | 130,530 |
|
| JPMorgan Chase Bank NA sub. notes 6s, 2017 | 1,000,000 | 974,268 |
|
| JPMorgan Chase Capital XVIII bonds Ser. R, 6.95s, | | |
| 2036 | 499,000 | 398,421 |
|
| JPMorgan Chase Capital XXV bonds 6.8s, 2037 | 780,000 | 615,762 |
|
| Liberty Mutual Group 144A company guaranty FRB | | |
| 10 3/4s, 2058 | 1,289,000 | 742,307 |
|
| Liberty Mutual Insurance 144A notes 7.697s, 2097 | 1,060,000 | 658,749 |
|
| Merrill Lynch & Co., Inc. jr. sub. bonds 7 3/4s, 2038 | 1,565,000 | 1,483,208 |
|
| Merrill Lynch & Co., Inc. notes FRN Ser. MTN, | | |
| 1.359s, 2011 | 835,000 | 748,125 |
|
| MetLife Capital Trust IV jr. sub. debs. 7 7/8s, 2067 | 1,300,000 | 864,811 |
|
| Monumental Global Funding, Ltd. 144A notes 5 1/2s, | | |
| 2013 (Cayman Islands) | 352,000 | 320,249 |
|
| Nationwide Financial Services, Inc. notes 5 5/8s, 2015 | 465,000 | 386,945 |
|
| Nationwide Health Properties, Inc. notes 6 1/2s, 2011 R | 650,000 | 586,830 |
|
| Nationwide Health Properties, Inc. unsec. | | |
| notes 6 1/4s, 2013 R | 282,000 | 232,816 |
|
| Nationwide Mutual Insurance Co. 144A notes 8 1/4s, 2031 | 375,000 | 221,109 |
|
| Nuveen Investments, Inc. sr. unsec. notes 5 1/2s, 2015 | 505,000 | 109,838 |
|
| OneAmerica Financial Partners, Inc. 144A bonds 7s, 2033 | 310,000 | 258,660 |
|
| Prudential Holdings LLC 144A bonds 8.695s, 2023 | 410,000 | 356,282 |
|
| Rouse Co. (The) notes 7.2s, 2012 R | 645,000 | 217,688 |
|
| Royal Bank of Scotland Group PLC jr. sub. notes FRN | | |
| Ser. MTN, 7.64s, 2049 (United Kingdom) | 700,000 | 126,000 |
|
| Simon Property Group LP unsub. bonds 5 3/4s, 2015 R | 371,000 | 282,970 |
|
| SLM Corp. notes Ser. MTNA, 4 1/2s, 2010 | 381,000 | 354,292 |
|
| Sovereign Bancorp, Inc. sr. notes 4.8s, 2010 | 730,000 | 707,301 |
|
| State Street Capital Trust IV company guaranty jr. | | |
| unsec. sub. bond FRB 2.996s, 2037 | 925,000 | 376,817 |
|
| Wachovia Bank NA sr. unsec. sub. notes 6.6s, 2038 | 693,000 | 677,308 |
|
| Wachovia Bank NA sub. notes Ser. BKNT, 6s, 2017 | 1,060,000 | 1,006,529 |
|
| Wells Fargo & Co. sr. notes 4 3/8s, 2013 | 1,060,000 | 1,031,796 |
|
| Wells Fargo Capital XV jr. sub. unsec. company | | |
| guaranty FRN 9 3/4s, 2049 | 435,000 | 406,725 |
|
| Westpac Capital Trust III 144A sub. notes FRN | | |
| 5.819s, 2049 (Australia) | 1,010,000 | 435,674 |
|
| ZFS Finance USA Trust I 144A bonds FRB 6 1/2s, 2037 | 630,000 | 288,225 |
|
| | | 38,458,875 |
| Health care (0.2%) | | |
| Aetna, Inc. sr. unsec. unsub. notes 6 3/4s, 2037 | 95,000 | 84,829 |
|
| AmerisourceBergen Corp. company guaranty sr. unsec. | | |
| notes 5 5/8s, 2012 | 20,000 | 19,031 |
|
| AstraZeneca PLC sr. unsub. notes 5.9s, 2017 | | |
| (United Kingdom) | 451,000 | 485,177 |
|
| Cardinal Health, Inc. sr. unsec. | | |
| unsub. notes 5 1/2s, 2013 | 330,000 | 313,877 |
|
52
| | |
| CORPORATE BONDS AND NOTES (8.9%)* cont. | Principal amount | Value |
|
| Health care cont. | | |
| GlaxoSmith Kline Capital Inc, company | | |
| guaranty sr. notes 5.65s, 2018 | $460,000 | $492,884 |
|
| Hospira, Inc. sr. notes 5.55s, 2012 | 400,000 | 385,404 |
|
| UnitedHealth Group, Inc. sr. unsec. notes 5.8s, 2036 | 180,000 | 138,224 |
|
| UnitedHealth Group, Inc. sr. unsec. notes 5 1/2s, 2012 | 755,000 | 756,095 |
|
| Ventas Realty LP/Capital Corp. sr. notes 6 3/4s, 2017 R | 470,000 | 392,450 |
|
| | | 3,067,971 |
| Technology (0.3%) | | |
| Computer Sciences Corp. sr. unsec. unsub. | | |
| notes 5s, 2013 | 65,000 | 60,912 |
|
| Expedia, Inc. sr. unsec. notes company | | |
| guaranty 7.456s, 2018 | 100,000 | 81,000 |
|
| Fiserv, Inc. sr. unsec. unsub. notes company | | |
| guaranty 6.8s, 2017 | 760,000 | 670,673 |
|
| IBM Corp. sr. unsec. notes 5.7s, 2017 | 320,000 | 344,244 |
|
| Lexmark International Inc, sr. unsec. notes | | |
| 5.9s, 2013 | 2,200,000 | 1,844,152 |
|
| Motorola, Inc. sr. notes 8s, 2011 | 205,000 | 176,616 |
|
| Tyco Electronics Group SA company guaranty 6.55s, | | |
| 2017 (Luxembourg) | 180,000 | 148,692 |
|
| Tyco Electronics Group SA sr. unsec. notes company | | |
| guaranty 6s, 2012 (Luxembourg) | 288,000 | 266,640 |
|
| Xerox Corp. sr. notes 6.4s, 2016 | 1,030,000 | 883,225 |
|
| | | 4,476,154 |
| Transportation (0.3%) | | |
| American Airlines, Inc. pass-through certificates | | |
| Ser. 01-1, 6.817s, 2011 | 100,000 | 74,000 |
|
| Burlington Northern Santa Fe Corp. sr. unsec. | | |
| notes 7s, 2014 | 275,000 | 290,835 |
|
| Canadian National Railway Co. sr. unsec. | | |
| unsub. notes 5.55s, 2018 (Canada) | 625,000 | 592,622 |
|
| Northwest Airlines Corp. pass-through certificates | | |
| Ser. 00-1, 7.15s, 2019 | 1,483,335 | 1,053,168 |
|
| Ryder System, Inc. sr. unsec. unsub. notes Ser. MTN, | | |
| 6s, 2013 | 330,000 | 284,582 |
|
| Southwest Airlines Co. pass-through certificates | | |
| 6.15s, 2022 | 831,398 | 683,541 |
|
| Southwest Airlines Co. sr. unsec. | | |
| unsub. notes 6 1/2s, 2012 | 55,000 | 51,111 |
|
| Union Pacific Corp. sr. unsub. notes 5 3/4s, 2017 | 750,000 | 718,076 |
|
| Union Pacific Corp. 144A pass-through certificates | | |
| 5.214s, 2014 | 590,000 | 544,788 |
|
| | | 4,292,723 |
| Utilities and power (1.6%) | | |
| AEP Texas North Co. sr. notes Ser. B, 5 1/2s, 2013 | 500,000 | 481,252 |
|
| Appalachian Power Co. sr. notes 5.8s, 2035 | 510,000 | 399,559 |
|
| Atmos Energy Corp. sr. unsub. notes 6.35s, 2017 | 905,000 | 817,948 |
|
| Beaver Valley II Funding debs. 9s, 2017 | 332,000 | 316,652 |
|
| Boardwalk Pipelines LP company guaranty 5 7/8s, 2016 | 975,000 | 776,990 |
|
| Bruce Mansfield Unit pass-through certificates | | |
| 6.85s, 2034 | 1,194,000 | 903,910 |
|
53
| | |
| CORPORATE BONDS AND NOTES (8.9%)* cont. | Principal amount | Value |
|
| Utilities and power cont. | | |
| CMS Energy Corp. unsub. notes 6.55s, 2017 | $50,000 | $44,500 |
|
| Commonwealth Edison Co. 1st mtge. 6.15s, 2017 | 275,000 | 267,083 |
|
| Commonwealth Edison Co. 1st mtge. sec. bonds | | |
| 5 7/8s, 2033 | 500,000 | 425,950 |
|
| Commonwealth Edison Co. 1st mtge. sec. bonds | | |
| 5.8s, 2018 | 495,000 | 476,537 |
|
| Consolidated Natural Gas Co. sr. notes 5s, 2014 | 530,000 | 503,922 |
|
| Dominion Resources, Inc. jr. sub. notes FRN | | |
| 6.3s, 2066 | 1,851,000 | 981,030 |
|
| Dominion Resources, Inc. sr. unsec. | | |
| unsub. notes Ser. 07-A, 6s, 2017 | 10,000 | 9,769 |
|
| Duke Energy Corp. sr. unsec. notes 6 1/4s, 2018 | 419,000 | 407,639 |
|
| El Paso Natural Gas Co. sr. unsec. notes 5.95s, 2017 | 120,000 | 105,300 |
|
| Electricite de France 144A notes 6.95s, 2039 (France) | 655,000 | 675,345 |
|
| Entergy Gulf States, Inc. 1st mtge. 5 1/4s, 2015 | 985,000 | 875,326 |
|
| Enterprise Products Operating LP company | | |
| guaranty FRB 8 3/8s, 2066 | 915,000 | 576,450 |
|
| Enterprise Products Operating LP company | | |
| guaranty FRB 7.034s, 2068 | 55,000 | 30,800 |
|
| Enterprise Products Operating, LLC company | | |
| guaranty sr. notes 6 1/2s, 2019 | 340,000 | 315,489 |
|
| Indianapolis Power & Light 144A 1st mtge. 6.3s, 2013 | 515,000 | 523,618 |
|
| Indiantown Cogeneration LP 1st mtge. Ser. A-10, | | |
| 9.77s, 2020 | 775,000 | 604,624 |
|
| Ipalco Enterprises, Inc. 144A sr. sec. notes 7 1/4s, 2016 | 170,000 | 157,250 |
|
| ITC Holdings Corp. 144A notes 5 7/8s, 2016 | 272,000 | 250,379 |
|
| ITC Holdings Corp. 144A sr. unsec. notes 6.05s, 2018 | 365,000 | 336,546 |
|
| Kansas Gas & Electric bonds 5.647s, 2021 | 369,671 | 332,427 |
|
| Kinder Morgan, Inc. notes 6s, 2017 | 545,000 | 471,613 |
|
| Kinder Morgan, Inc. sr. notes 6 1/2s, 2012 | 558,000 | 518,940 |
|
| Northwestern Corp. sec. notes 5 7/8s, 2014 | 272,000 | 244,098 |
|
| Oncor Electric Delivery Co. debs. 7s, 2022 | 292,000 | 280,200 |
|
| Pacific Gas & Electric Co. sr. unsec. notes 6.35s, 2038 | 350,000 | 372,573 |
|
| Pacific Gas & Electric Co. sr. unsub. 5.8s, 2037 | 775,000 | 726,760 |
|
| Potomac Edison Co. 144A 1st mtge. 5.8s, 2016 | 271,000 | 243,746 |
|
| Power Receivable Finance, LLC 144A sr. notes | | |
| 6.29s, 2012 | 661,258 | 647,265 |
|
| Public Service Co. of Colorado sr. notes Ser. A, | | |
| 6 7/8s, 2009 | 375,000 | 379,789 |
|
| Puget Sound Energy, Inc. jr. sub. FRN Ser. A, | | |
| 6.974s, 2067 | 296,000 | 150,220 |
|
| Rockies Express Pipeline, LLC 144A sr. notes | | |
| 7 1/2s, 2038 | 202,000 | 191,184 |
|
| Southern Natural Gas. Co. 144A notes 5.9s, 2017 | 460,000 | 382,440 |
|
| Spectra Energy Capital, LLC company | | |
| guaranty sr. unsec. unsub. notes 6.2s, 2018 | 1,080,000 | 965,153 |
|
| Spectra Energy Capital, LLC sr. notes 8s, 2019 | 780,000 | 774,803 |
|
| Spectra Energy Capital, LLC sr. unsec. | | |
| unsub. notes 5.668s, 2014 | 330,000 | 290,126 |
|
54
| | |
| CORPORATE BONDS AND NOTES (8.9%)* cont. | Principal amount | Value |
|
| Utilities and power cont. | | |
| Teco Finance, Inc. company guaranty sr. unsec. | | |
| unsub. notes 7.2s, 2011 | $1,070,000 | $1,033,465 |
|
| TEPPCO Partners LP company guaranty FRB 7s, 2067 | 595,000 | 307,135 |
|
| TransAlta Corp. notes 5 3/4s, 2013 (Canada) | 665,000 | 616,897 |
|
| TransAlta Corp. sr. unsec. notes 6.65s, 2018 (Canada) | 540,000 | 486,775 |
|
| TransCanada Pipelines, Ltd. jr. sub. FRN 6.35s, 2067 | | |
| (Canada) | 520,000 | 295,922 |
|
| TransCanada Pipelines, Ltd. sr. unsec. | | |
| unsub. notes 6 1/2s, 2018 (Canada) | 285,000 | 284,151 |
|
| Union Electric Co. 1st mtge. sr. sec. bond 6.7s, 2019 | 960,000 | 897,587 |
|
| | | 22,157,137 |
| Total corporate bonds and notes (cost $150,964,947) | | $125,956,157 |
|
| |
| ASSET-BACKED SECURITIES (7.5%)* | Principal amount | Value |
|
| Accredited Mortgage Loan Trust | | |
| FRB Ser. 05-1, Class M2, 1.079s, 2035 | $216,615 | $32,492 |
| FRB Ser. 05-4, Class A2C, 0.599s, 2035 | 295,676 | 243,932 |
|
| Ace Securities Corp. | | |
| FRB Ser. 06-OP2, Class A2C, 0.539s, 2036 | 759,000 | 375,705 |
| FRB Ser. 06-HE3, Class A2C, 0.539s, 2036 | 1,021,000 | 352,530 |
|
| Ace Securities Corp. 144A Ser. 03-MH1, Class M2, | | |
| 6 1/2s, 2030 | 459,197 | 283,525 |
|
| Advanta Business Card Master Trust FRB Ser. 04-C1, | | |
| Class C, 1.409s, 2013 | 210,000 | 76,976 |
|
| Aegis Asset Backed Securities Trust 144A Ser. 04-6N, | | |
| Class Note, 4 3/4s, 2035 | 59,595 | 6 |
|
| AFC Home Equity Loan Trust Ser. 99-2, Class 1A, | | |
| 0.799s, 2029 | 2,051,662 | 833,507 |
|
| American Express Credit Account Master Trust 144A | | |
| Ser. 04-C, Class C, 0.833s, 2012 | 431,181 | 376,217 |
|
| Ameriquest Mortgage Securities, Inc. | | |
| FRB Ser. 06-R1, Class M10, 2.889s, 2036 | 902,000 | 16,056 |
| FRB Ser. 03-8, Class M2, 2.139s, 2033 | 449,029 | 26,942 |
|
| AMP CMBS 144A FRB Ser. 06-1A, Class A, 2.746s, 2047 | | |
| (Cayman Islands) | 1,910,000 | 286,949 |
|
| Arcap REIT, Inc. 144A | | |
| Ser. 03-1A, Class E, 7.11s, 2038 | 1,283,000 | 423,390 |
| Ser. 04-1A, Class E, 6.42s, 2039 | 1,112,000 | 278,000 |
|
| Argent Securities, Inc. | | |
| FRB Ser. 03-W3, Class M3, 2.659s, 2033 | 53,237 | 1,065 |
| FRB Ser. 06-W4, Class A2C, 0.549s, 2036 | 1,813,000 | 725,200 |
|
| Asset Backed Funding Certificates | | |
| FRB Ser. 04-OPT2, Class M2, 1.389s, 2033 | 439,904 | 202,356 |
| FRB Ser. 05-WMC1, Class M1, 0.829s, 2035 | 564,000 | 332,760 |
|
| Asset Backed Securities Corp. Home Equity Loan Trust | | |
| FRB Ser. 06-HE2, Class A3, 0.579s, 2036 | 313,794 | 188,617 |
| FRB Ser. 06-HE4, Class A5, 0.549s, 2036 | 1,231,632 | 665,081 |
| FRB Ser. 06-HE7, Class A4, 0.529s, 2036 | 529,000 | 134,013 |
|
55
| | |
| ASSET-BACKED SECURITIES (7.5%)* cont. | Principal amount | Value |
|
| Aviation Capital Group Trust 144A FRB Ser. 03-2A, | | |
| Class G1, 1.059s, 2033 | $816,585 | $204,146 |
|
| BankAmerica Manufactured Housing Contract Trust | | |
| Ser. 97-2, Class M, 6.9s, 2028 | 732,000 | 596,793 |
|
| Bay View Auto Trust Ser. 05-LJ2, Class D, 5.27s, 2014 | 420,000 | 344,823 |
|
| Bayview Financial Acquisition Trust | | |
| Ser. 04-B, Class A1, 1.471s, 2039 | 3,594,322 | 2,519,260 |
| FRB Ser. 04-D, Class A, 0.799s, 2044 | 966,547 | 857,491 |
|
| Bayview Financial Acquisition Trust 144A FRN | | |
| Ser. 04-B, Class M2, 4.209s, 2039 | 170,691 | 112,771 |
|
| Bayview Financial Asset Trust 144A | | |
| FRB Ser. 03-SSRA, Class M, 1.739s, 2038 | 583,440 | 390,905 |
| FRB Ser. 03-SSRA, Class A, 1.089s, 2038 | 492,090 | 359,226 |
| FRB Ser. 04-SSRA, Class A1, 0.989s, 2039 | 693,628 | 443,922 |
|
| Bear Stearns Asset Backed Securities, Inc. | | |
| FRB Ser. 06-EC1, Class M9, 2.389s, 2035 | 85,625 | 214 |
| FRB Ser. 06-PC1, Class M9, 2.139s, 2035 | 414,000 | 4,140 |
| FRB Ser. 05-HE1, Class M3, 1.319s, 2035 | 489,000 | 24,450 |
| FRB Ser. 03-3, Class A2, 0.979s, 2043 | 1,737,046 | 1,419,061 |
| FRB Ser. 03-1, Class A1, 0.889s, 2042 | 404,812 | 284,489 |
| FRB Ser. 05-3, Class A1, 0.839s, 2035 | 340,557 | 314,217 |
|
| Bear Stearns Asset Backed Securities, Inc. 144A FRB | | |
| Ser. 06-HE2, Class M10, 2.639s, 2036 | 46,691 | 82 |
|
| Capital Auto Receivables Asset Trust 144A | | |
| Ser. 06-1, Class D, 7.16s, 2013 | 500,000 | 382,402 |
| Ser. 05-1, Class D, 6 1/2s, 2011 | 1,442,000 | 1,229,474 |
|
| Citigroup Mortgage Loan Trust, Inc. FRB | | |
| Ser. 05-OPT1, Class M1, 0.809s, 2035 | 324,987 | 145,869 |
|
| Conseco Finance Securitizations Corp. | | |
| Ser. 02-2, Class A, IO, 8 1/2s, 2033 | 5,114,996 | 465,255 |
| Ser. 00-4, Class A6, 8.31s, 2032 | 7,480,267 | 3,814,936 |
| Ser. 00-5, Class A6, 7.96s, 2032 | 3,054,773 | 1,876,581 |
| Ser. 02-1, Class M1F, 7.954s, 2033 | 1,004,000 | 502,302 |
| Ser. 01-4, Class A4, 7.36s, 2033 | 4,271,971 | 3,083,863 |
| Ser. 00-6, Class A5, 7.27s, 2031 | 886,294 | 595,561 |
| Ser. 01-1, Class A5, 6.99s, 2032 | 5,800,957 | 3,611,096 |
| Ser. 01-3, Class A4, 6.91s, 2033 | 6,361,243 | 4,315,225 |
| Ser. 02-1, Class A, 6.681s, 2033 | 4,271,903 | 3,536,687 |
|
| Countrywide Asset Backed Certificates | | |
| FRB Ser. 05-BC3, Class M1, 0.909s, 2035 | 332,000 | 204,180 |
| FRB Ser. 04-6, Class 2A5, 0.779s, 2034 | 863,016 | 634,317 |
| FRB Ser. 05-14, Class 3A2, 0.629s, 2036 | 166,696 | 138,358 |
|
| Credit-Based Asset Servicing and Securitization 144A | | |
| Ser. 06-MH1, Class B1, 6 1/4s, 2036 | 359,000 | 145,651 |
| Ser. 06-MH1, Class M1, 6 1/4s, 2036 | 485,000 | 278,875 |
| Ser. 06-MH1, Class M2, 6 1/4s, 2036 | 214,000 | 130,551 |
|
| Crest, Ltd. 144A Ser. 03-2A, Class D2, 6.723s, 2038 | | |
| (Cayman Islands) | 1,617,000 | 485,100 |
|
| CS First Boston Mortgage Securities Corp. 144A | | |
| Ser. 04-FR1N, Class A, 5s, 2034 | 152,004 | — |
|
56
| | |
| ASSET-BACKED SECURITIES (7.5%)* cont. | Principal amount | Value |
|
| Equifirst Mortgage Loan Trust FRB Ser. 05-1, | | |
| Class M5, 1.059s, 2035 | $201,000 | $10,050 |
|
| Fieldstone Mortgage Investment Corp. FRB Ser. 05-1, | | |
| Class M3, 0.929s, 2035 | 700,000 | 651,764 |
|
| First Franklin Mortgage Loan Asset Backed | | |
| Certificates FRB Ser. 06-FF7, Class 2A3, 0.539s, | | |
| 2036 | 1,203,000 | 479,031 |
|
| First Plus Home Loan Trust Ser. 97-3, Class B1, | | |
| 7.79s, 2023 | 229,623 | 215,260 |
|
| Fort Point CDO, Ltd. FRB Ser. 03-2A, Class A2, | | |
| 3.267s, 2038 (Cayman Islands) | 616,000 | 18,480 |
|
| Foxe Basin, Ltd. 144A FRB Ser. 03-1A, Class A1, | | |
| 2.496s, 2015 (Cayman Islands) | 2,000,000 | 1,703,200 |
|
| Fremont Home Loan Trust | | |
| FRB Ser. 05-E, Class 2A4, 0.719s, 2036 | 1,688,000 | 1,021,240 |
| FRB Ser. 06-2, Class 2A3, 0.559s, 2036 | 3,141,000 | 1,664,730 |
|
| G-Star, Ltd. 144A FRB Ser. 02-2A, Class BFL, 2.389s, | | |
| 2037 (Cayman Islands) | 308,000 | 92,400 |
|
| GE Corporate Aircraft Financing, LLC 144A | | |
| FRB Ser. 05-1A, Class C, 1.689s, 2019 | 1,680,000 | 672,000 |
| Ser. 04-1A, Class B, 1.239s, 2018 | 44,932 | 33,025 |
|
| Gears Auto Owner Trust 144A Ser. 05-AA, Class E1, | | |
| 8.22s, 2012 | 1,962,000 | 1,771,200 |
|
| GEBL 144A | | |
| Ser. 04-2, Class D, 3.083s, 2032 | 534,950 | 53,495 |
| Ser. 04-2, Class C, 1.183s, 2032 | 200,444 | 92,705 |
|
| Green Tree Financial Corp. | | |
| Ser. 96-5, Class M1, 8.05s, 2027 | 512,386 | 268,146 |
| Ser. 99-5, Class A5, 7.86s, 2030 | 13,970,730 | 8,600,926 |
| Ser. 97-2, Class A7, 7.62s, 2028 | 278,793 | 227,970 |
| Ser. 97-4, Class A7, 7.36s, 2029 | 430,601 | 354,088 |
| Ser. 95-8, Class B1, 7.3s, 2026 | 362,579 | 210,488 |
| Ser. 96-10, Class M1, 7.24s, 2028 | 972,000 | 538,487 |
| Ser. 97-3, Class A5, 7.14s, 2028 | 373,947 | 293,891 |
| Ser. 98-4, Class A7, 6.87s, 2030 | 268,886 | 176,137 |
| Ser. 97-7, Class A8, 6.86s, 2029 | 264,090 | 221,875 |
| Ser. 98-6, Class A7, 6.45s, 2030 | 273,801 | 255,801 |
| Ser. 99-2, Class A7, 6.44s, 2030 | 1,036,631 | 659,218 |
| Ser. 99-1, Class A6, 6.37s, 2025 | 1,023,000 | 812,031 |
|
| Greenpoint Manufactured Housing | | |
| Ser. 00-3, Class IA, 8.45s, 2031 | 10,078,060 | 6,306,054 |
| Ser. 99-5, Class M1A, 8.3s, 2026 | 488,000 | 267,034 |
|
| GS Auto Loan Trust 144A Ser. 04-1, Class D, 5s, 2011F | 1,156,849 | 1,098,965 |
|
| GSAMP Trust FRB Ser. 06-HE5, Class A2C, 0.539s, 2036 | 4,677,000 | 2,210,991 |
|
| Guggenheim Structured Real Estate Funding, Ltd. 144A | | |
| FRB Ser. 05-2A, Class D, 1.939s, 2030 | | |
| (Cayman Islands) | 1,141,000 | 205,380 |
| FRB Ser. 05-1A, Class D, 1.919s, 2030 | | |
| (Cayman Islands) | 502,743 | 251,371 |
|
| High Income Trust Securities 144A FRB Ser. 03-1A, | | |
| Class A, 2.888s, 2036 (Cayman Islands) | 1,376,040 | 509,135 |
|
57
| | |
| ASSET-BACKED SECURITIES (7.5%)* cont. | Principal amount | Value |
|
| Home Equity Asset Trust FRB Ser. 06-1, Class 2A4, | | |
| 0.719s, 2036 | $848,000 | $415,520 |
|
| JPMorgan Mortgage Acquisition Corp. | | |
| FRB Ser. 05-OPT2, Class M11, 2.639s, 2035 F | 645,000 | 14,084 |
| FRB Ser. 06-FRE1, Class A4, 0.679s, 2035 | 716,000 | 385,745 |
|
| Lehman Manufactured Housing Ser. 98-1, Class 1, IO, | | |
| 0.807s, 2028 | 12,663,428 | 205,591 |
|
| Lehman XS Trust | | |
| Ser. 07-6, Class 3A6, 6 1/2s, 2037 | 11,232,203 | 4,717,525 |
| IFB Ser. 07-3, Class 4B, IO, 6.301s, 2037 | 4,279,376 | 518,006 |
|
| LNR CDO, Ltd. 144A | | |
| FRB Ser. 03-1A, Class EFL, 3.356s, 2036 | | |
| (Cayman Islands) | 2,585,000 | 206,800 |
| FRB Ser. 02-1A, Class FFL, 3.139s, 2037 | | |
| (Cayman Islands) | 5,220,000 | 1,044,000 |
|
| Local Insight Media Finance, LLC Ser. 07-1W, | | |
| Class A1, 5.53s, 2012 F | 5,006,782 | 3,254,408 |
|
| Long Beach Mortgage Loan Trust | | |
| FRB Ser. 05-2, Class M4, 1.009s, 2035 | 558,000 | 83,700 |
| FRB Ser. 06-4, Class 2A4, 0.649s, 2036 | 813,000 | 261,127 |
| FRB Ser. 06-1, Class 2A3, 0.579s, 2036 | 1,345,459 | 618,911 |
|
| Madison Avenue Manufactured Housing Contract | | |
| FRB Ser. 02-A, Class B1, 3.639s, 2032 | 4,059,503 | 1,975,695 |
| FRB Ser. 02-A, Class M2, 2.639s, 2032 | 278,000 | 130,317 |
| Ser. 02-A IO, 0.3s, 2032 | 115,307,535 | 1,103,262 |
|
| Marriott Vacation Club Owner Trust 144A | | |
| Ser. 05-2, Class D, 6.205s, 2027 | 75,459 | 47,539 |
| Ser. 04-2A, Class D, 5.389s, 2026 | 71,284 | 44,909 |
| Ser. 04-2A, Class C, 4.741s, 2026 | 65,581 | 42,628 |
| FRB Ser. 02-1A, Class A1, 1.059s, 2024 | 563,489 | 478,966 |
|
| MASTR Asset Backed Securities Trust FRB | | |
| Ser. 06-FRE2, Class A4, 0.539s, 2036 | 424,000 | 175,842 |
|
| Mid-State Trust | | |
| Ser. 11, Class B, 8.221s, 2038 | 323,855 | 222,489 |
| Ser. 10, Class B, 7.54s, 2036 | 586,920 | 384,846 |
|
| Morgan Stanley ABS Capital I | | |
| FRB Ser. 05-HE2, Class M5, 1.069s, 2035 | 349,000 | 3,490 |
| FRB Ser. 05-HE1, Class M3, 0.909s, 2034 | 349,000 | 55,840 |
| FRB Ser. 06-NC4, Class M2, 0.689s, 2036 | 489,000 | 34,230 |
|
| N-Star Real Estate CDO, Ltd. 144A FRB Ser. 04-2A, | | |
| Class C1, 2.409s, 2039 (Cayman Islands) | 544,000 | 435,200 |
|
| Navigator CDO, Ltd. 144A FRB Ser. 03-1A, Class A1, | | |
| 2.639s, 2015 (Cayman Islands) | 301,334 | 267,042 |
|
| Navistar Financial Corp. Owner Trust | | |
| Ser. 05-A, Class C, 4.84s, 2014 | 175,909 | 157,380 |
| Ser. 04-B, Class C, 3.93s, 2012 | 106,853 | 90,816 |
|
| New Century Home Equity Loan Trust | | |
| Ser. 03-5, Class AI7, 5.15s, 2033 | 1,519,334 | 1,223,064 |
| FRB Ser. 03-4, Class M3, 2.439s, 2033 | 28,986 | 435 |
|
| Novastar Home Equity Loan | | |
| FRB Ser. 06-1, Class A2C, 0.549s, 2036 | 1,010,000 | 593,375 |
| FRB Ser. 06-2, Class A2C, 0.539s, 2036 | 1,010,000 | 455,483 |
|
58
| | |
| ASSET-BACKED SECURITIES (7.5%)* cont. | Principal amount | Value |
|
| Oakwood Mortgage Investors, Inc. | | |
| Ser. 00-D, Class A3, 6.99s, 2022 | $43,782 | $39,577 |
| Ser. 01-D, Class A3, 5.9s, 2022 | 145,308 | 78,153 |
| Ser. 02-C, Class A1, 5.41s, 2032 | 3,346,749 | 1,773,777 |
|
| Oakwood Mortgage Investors, Inc. 144A | | |
| Ser. 01-B, Class A4, 7.21s, 2030 | 475,258 | 313,016 |
| Ser. 01-B, Class A3, 6.535s, 2023 | 137,582 | 87,804 |
|
| Option One Mortgage Loan Trust FRB Ser. 05-4, | | |
| Class M11, 2.889s, 2035 | 163,658 | 2,046 |
|
| Origen Manufactured Housing Ser. 04-B, Class A2, | | |
| 3.79s, 2017 | 38,960 | 37,155 |
|
| Park Place Securities, Inc. | | |
| FRB Ser. 05-WCH1, Class M4, 1.219s, 2036 | 227,000 | 13,620 |
| FRB Ser. 04-WHQ2, Class A3A, 0.739s, 2035 | 132,939 | 122,304 |
|
| Park Place Securities, Inc. 144A FRB Ser. 04-MHQ1, | | |
| Class M10, 2.889s, 2034 F | 14,828 | 56 |
|
| People’s Financial Realty Mortgage Securities Trust | | |
| FRB Ser. 06-1, Class 1A2, 0.519s, 2036 | 1,587,000 | 827,293 |
|
| Pillar Funding PLC 144A | | |
| FRB Ser. 04-1A, Class C1, 2.996s, 2011 | | |
| (United Kingdom) | 657,000 | 574,125 |
| FRB Ser. 04-2A, Class C, 2.876s, 2011 | | |
| (United Kingdom) | 912,000 | 725,164 |
|
| Residential Asset Mortgage Products, Inc. | | |
| FRB Ser. 06-NC3, Class A2, 0.579s, 2036 | 1,259,898 | 911,529 |
| FRB Ser. 07-RZ1, Class A2, 0.549s, 2037 | 1,562,000 | 562,884 |
|
| Residential Asset Securities Corp. FRB Ser. 05-EMX1, | | |
| Class M2, 1.119s, 2035 | 793,000 | 79,300 |
|
| Residential Asset Securities Corp. 144A Ser. 04-NT, | | |
| Class Note, 4 1/2s, 2034 (In default) † | 76,375 | 382 |
|
| SAIL Net Interest Margin Notes 144A Ser. 04-4A, | | |
| Class B, 7 1/2s, 2034 (Cayman Islands) (In default) † | 214,965 | 2 |
|
| Securitized Asset Backed Receivables, LLC | | |
| FRB Ser. 05-HE1, Class M2, 1.039s, 2035 | 349,000 | 10,470 |
| FRB Ser. 07-NC2, Class A2B, 0.529s, 2037 | 1,468,000 | 601,880 |
|
| SG Mortgage Securities Trust | | |
| FRB Ser. 06-OPT2, Class A3D, PO, 0.599s, 2036 | 1,718,000 | 558,350 |
| FRB Ser. 06-FRE1, Class A2B, 0.569s, 2036 | 807,000 | 468,060 |
|
| Soundview Home Equity Loan Trust | | |
| FRB Ser. 06-OPT3, Class 2A3, 0.559s, 2036 | 814,000 | 338,624 |
| FRB Ser. 06-3, Class A3, 0.549s, 2036 | 4,702,000 | 2,713,096 |
|
| Soundview Home Equity Loan Trust 144A FRB | | |
| Ser. 05-CTX1, Class B1, 2.889s, 2035 | 326,210 | 3,262 |
|
| South Coast Funding 144A FRB Ser. 3A, Class A2, | | |
| 3.588s, 2038 (Cayman Islands) | 470,000 | 3,666 |
|
| Structured Asset Investment Loan Trust FRB | | |
| Ser. 06-BNC2, Class A6, 0.649s, 2036 | 814,000 | 70,425 |
|
| Structured Asset Receivables Trust 144A FRB | | |
| Ser. 05-1, 1.633s, 2015 F | 5,175,714 | 3,500,990 |
|
| Structured Asset Securities Corp. 144A Ser. 98-RF3, | | |
| Class A, IO, 6.1s, 2028 | 2,459,863 | 224,340 |
|
59
| | | |
| ASSET-BACKED SECURITIES (7.5%)* cont. | Principal amount | Value |
|
| TIAA Real Estate CDO, Ltd. Ser. 03-1A, Class E, | | | |
| 8s, 2038 | | $1,698,000 | $212,250 |
|
| Wells Fargo Home Equity Trust FRB Ser. 07-1, | | | |
| Class A3, 0.709s, 2037 | | 359,000 | 120,529 |
|
| Whinstone Capital Management, Ltd. 144A FRB Ser. 1A, | | | |
| Class B3, 2.059s, 2044 (United Kingdom) | | 591,276 | 70,953 |
|
| Total asset-backed securities (cost $188,166,993) | | | $105,947,507 |
|
| |
| PURCHASED OPTIONS | Expiration date/ | Contract | |
| OUTSTANDING (3.8%)* | strike price | amount | Value |
|
| Option on an interest rate swap with JPMorgan | | | |
| Chase Bank, N.A. for the right to receive a | | | |
| fixed rate of 5.355% versus the three month | | | |
| USD-LIBOR-BBA maturing on November 12, 2019. | Nov-09/5.355 | $117,731,000 | $21,107,991 |
|
| Option on an interest rate swap with JPMorgan | | | |
| Chase Bank, N.A. for the right to pay a fixed | | | |
| rate of 5.355% versus the three month | | | |
| USD-LIBOR-BBA maturing November 12, 2019. | Nov-09/5.355 | 117,731,000 | 460,328 |
|
| Option on an interest rate swap with JPMorgan | | | |
| Chase Bank, N.A. for the right to receive a | | | |
| fixed rate of 5.03% versus the three month | | | |
| USD-LIBOR-BBA maturing on February 16, 2020. | Feb-10/5.03 | 81,840,000 | 12,179,429 |
|
| Option on an interest rate swap with JPMorgan | | | |
| Chase Bank, N.A. for the right to receive a | | | |
| fixed rate of 5.315% versus the three month | | | |
| USD-LIBOR-BBA maturing on April 08, 2019. | Apr-09/5.315 | 54,984,000 | 10,471,703 |
|
| Option on an interest rate swap with Deutschbank | | | |
| for the right to receive a fixed rate of 5.385% | | | |
| versus the three month USD-LIBOR-BBA maturing | | | |
| April 16, 2019. | Apr-09/5.385 | 43,245,000 | 8,470,398 |
|
| Option on an interest rate swap with JPMorgan | | | |
| Chase Bank, N.A. for the right to pay a fixed | | | |
| rate of 5.03% versus the three month | | | |
| USD-LIBOR-BBA maturing on February 16, 2020. | Feb-10/5.03 | 81,840,000 | 682,546 |
|
| Option on an interest rate swap with Deutschbank | | | |
| for the right to pay a fixed rate of 5.385% | | | |
| versus the three month USD-LIBOR-BBA maturing | | | |
| April 16, 2019. | Apr-09/5.385 | 43,245,000 | 7,784 |
|
| Option on an interest rate swap with JPMorgan | | | |
| Chase Bank, N.A. for the right to pay a fixed | | | |
| rate of 5.315% versus the three month | | | |
| USD-LIBOR-BBA maturing on April 08, 2019. | Apr-09/5.315 | 54,984,000 | 7,698 |
|
| Total purchased options outstanding (cost $21,742,538) | | | $53,387,877 |
|
| |
| SENIOR LOANS (0.8%)* c | Principal amount | Value |
|
| Basic materials (—%) | | | |
| Aleris International, Inc. bank term loan FRN | | | |
| Ser. B, 2 3/8s, 2013 | | $214,135 | $75,406 |
|
| Georgia-Pacific, LLC bank term loan FRN Ser. B, | | | |
| 4.189s, 2013 | | 193,416 | 166,519 |
|
| NewPage Holding Corp. bank term loan FRN 5.313s, 2014 | | 479,110 | 272,294 |
|
| | | | 514,219 |
60
| | |
| SENIOR LOANS (0.8%)* c cont. | Principal amount | Value |
|
| Capital goods (0.1%) | | |
| Hawker Beechcraft Acquisition Co., LLC bank term | | |
| loan FRN 3.459s, 2014 | $33,423 | $18,104 |
|
| Hawker Beechcraft Acquisition Co., LLC bank term | | |
| loan FRN Ser. B, 2.789s, 2014 | 569,187 | 308,310 |
|
| Polypore, Inc. bank term loan FRN Ser. B, | | |
| 2.45s, 2014 | 617,729 | 410,790 |
|
| Sequa Corp. bank term loan FRN 3.688s, 2014 | 856,718 | 526,881 |
|
| | | 1,264,085 |
| Communication services (0.2%) | | |
| Cablevision Systems Corp. bank term loan FRN | | |
| 2.083s, 2013 | 617,649 | 554,854 |
|
| Cricket Communications, Inc. bank term loan FRN | | |
| Ser. B, 6 1/2s, 2013 | 137,430 | 125,191 |
|
| Crown Castle International Corp. bank term loan FRN | | |
| 5.376s, 2014 | 231,642 | 202,918 |
|
| Intelsat Corp. bank term loan FRN Ser. B2, | | |
| 3.925s, 2011 | 163,674 | 140,175 |
|
| Intelsat Corp. bank term loan FRN Ser. B2-A, | | |
| 3.925s, 2013 | 163,723 | 140,217 |
|
| Intelsat Corp. bank term loan FRN Ser. B2-C, | | |
| 3.925s, 2013 | 163,674 | 140,175 |
|
| Level 3 Communications, Inc. bank term loan FRN | | |
| 3.255s, 2014 | 624,000 | 450,840 |
|
| MetroPCS Wireless, Inc. bank term loan FRN | | |
| 4.508s, 2013 | 247,073 | 214,696 |
|
| PAETEC Holding Corp. bank term loan FRN Ser. B1, | | |
| 2.961s, 2013 | 605,362 | 377,342 |
|
| Time Warner Telecom, Inc. bank term loan FRN Ser. B, | | |
| 3.043s, 2013 | 308,849 | 265,996 |
|
| | | 2,612,404 |
| Consumer cyclicals (0.3%) | | |
| Affinion Group, Inc. bank term loan FRN Ser. B, | | |
| 4.645s, 2013 | 624,000 | 446,940 |
|
| Allison Transmission bank term loan FRN Ser. B, | | |
| 3.169s, 2014 | 609,219 | 392,075 |
|
| Dana Corp. bank term loan FRN 7 1/4s, 2015 | 552,469 | 233,878 |
|
| DirecTV Holdings, LLC bank term loan FRN 5 1/4s, 2013 | 671,625 | 643,640 |
|
| Goodman Global Holdings, Inc. bank term loan FRN | | |
| Ser. B, 7.708s, 2011 | 490,220 | 397,078 |
|
| Harrah’s Operating Co., Inc. bank term loan FRN | | |
| Ser. B2, 4.16s, 2015 | 619,320 | 384,260 |
|
| Idearc, Inc. bank term loan FRN Ser. B, 3.417s, 2014 | 617,697 | 208,782 |
|
| Lear Corp bank term loan FRN 3.243s, 2013 | 620,222 | 278,411 |
|
| National Bedding Co. bank term loan FRN 3.009s, 2011 | 287,071 | 123,082 |
|
| Navistar Financial Corp. bank term loan FRN | | |
| 4.358s, 2012 | 166,400 | 117,589 |
|
| Navistar International Corp. bank term loan FRN | | |
| 3.721s, 2012 | 457,600 | 323,371 |
|
| Yankee Candle Co., Inc. bank term loan FRN 3.4s, 2014 | 370,000 | 199,800 |
|
| | | 3,748,906 |
61
| | |
| SENIOR LOANS (0.8%)* c cont. | Principal amount | Value |
|
| Consumer staples (0.1%) | | |
| Pinnacle Foods Holding Corp. bank term loan FRN | | |
| Ser. B, 3.198s, 2014 | $617,729 | $481,657 |
|
| Spectrum Brands, Inc. bank term loan FRN 0.298s, 2013 | 39,838 | 24,434 |
|
| Spectrum Brands, Inc. bank term loan FRN Ser. B1, | | |
| 5.897s, 2013 | 578,280 | 354,678 |
|
| | | 860,769 |
| Financials (—%) | | |
| Lender Processing Services, Inc. bank term loan FRN | | |
| Ser. B, 2.961s, 2014 | 835,800 | 800,279 |
|
| | | 800,279 |
| Health care (0.1%) | | |
| Health Management Associates, Inc. bank term loan | | |
| FRN 3.209s, 2014 | 589,821 | 417,509 |
|
| IASIS Healthcare, LLC/IASIS Capital Corp. bank term | | |
| loan FRN 7.62s, 2014 | 39,891 | 34,007 |
|
| IASIS Healthcare, LLC/IASIS Capital Corp. bank term | | |
| loan FRN Ser. B, 2.461s, 2014 | 430,140 | 366,695 |
|
| IASIS Healthcare, LLC/IASIS Capital Corp. bank term | | |
| loan FRN Ser. DD, 2.461s, 2014 | 148,843 | 126,888 |
|
| Sun Healthcare Group, Inc. bank term loan FRN | | |
| 3.662s, 2014 | 104,035 | 84,789 |
|
| Sun Healthcare Group, Inc. bank term loan FRN | | |
| Ser. B, 3.597s, 2014 | 368,013 | 299,930 |
|
| | | 1,329,818 |
| Technology (—%) | | |
| First Data Corp. bank term loan FRN Ser. B1, | | |
| 3.144s, 2014 | 271,690 | 171,368 |
|
| Freescale Semiconductor, Inc. bank term loan FRN | | |
| Ser. B, 3.931s, 2013 | 408,828 | 205,890 |
|
| SunGard Data Systems, Inc. bank term loan FRN | | |
| 3.707s, 2014 | 308,849 | 239,137 |
|
| Travelport bank term loan FRN Ser. B, 3.074s, 2013 | 249,280 | 140,843 |
|
| Travelport bank term loan FRN Ser. DD, 3.709s, 2013 | 141,536 | 78,552 |
|
| | | 835,790 |
| Transportation (—%) | | |
| Ceva Group PLC bank term loan FRN Ser. B, 6.18s, | | |
| 2015 (Netherlands) F | 165,000 | 59,872 |
|
| | | 59,872 |
| Total senior loans (cost $16,043,393) | | $12,026,142 |
|
| |
| CONVERTIBLE PREFERRED STOCKS (0.2%)* | Shares | Value |
|
| Freeport-McMoRan Copper & Gold, Inc. $6.75 cv. pfd. | 57,699 | $2,683,004 |
|
| Total convertible preferred stocks (cost $4,517,640) | | $2,683,004 |
|
| |
| MUNICIPAL BONDS AND NOTES (0.2%)* | Principal amount | Value |
|
| Chicago, Transit Auth. Transfer Tax Receipts Rev. | | |
| Bonds, Ser. B, 6.899s, 12/1/40 | $945,000 | $974,418 |
|
| MI Tobacco Settlement Fin. Auth. Rev. Bonds, | | |
| Ser. A, 7.309s, 6/1/34 | 980,000 | 588,539 |
|
| Tobacco Settlement Fin. Auth. of WVA Rev. Bonds, | | |
| Ser. A, 7.467s, 6/1/47 | 1,440,000 | 861,898 |
|
| Total municipal bonds and notes (cost $3,364,896) | | $2,424,855 |
62
| | |
| SHORT-TERM INVESTMENTS (26.5%)* | Principal amount/shares | Value |
|
| Federated Prime Obligations Fund | 332,863,416 | $332,863,416 |
|
| Interest in $300,000,000 joint tri-party repurchase | | |
| agreement dated January 30, 2009 with Deutsche Bank | | |
| Securities due February 2, 2009 — maturity value | | |
| of $9,500,230 for an effective coupon rate of 0.29% | | |
| (collateralized by various mortgage-backed | | |
| securities with yields ranging from 5.0% to 5.5% | | |
| and due dates ranging from April 1, 2036 to June 1, | | |
| 2038, valued at $306,000,000) | $9,500,000 | 9,500,000 |
|
| Gemini Securitization Corp. for an effective yield | | |
| of 0.73%, maturity date March 16, 2009 | 20,000,000 | 19,982,083 |
|
| U.S. Treasury Bills with effective yields ranging | | |
| from 0.33% to 0.47%, maturity date | | |
| November 19, 2009 # | 13,290,000 | 13,222,859 |
|
| Total short-term investments (cost $375,589,875) | | $375,568,358 |
| |
| |
| TOTAL INVESTMENTS | | |
|
| Total investments (cost $3,578,481,355) | | $3,299,576,789 |
| |
| Key to holding’s currency abbreviations |
| EUR | Euro |
| USD/$ | United States Dollar |
* Percentages indicated are based on net assets of $1,416,052,493.
† Non-income-producing security.
# This security was pledged and segregated with the custodian to cover margin requirements for futures contracts at January 31, 2009.
## Forward commitments, in part or in entirety (Note 1).
c Senior loans are exempt from registration under the Securities Act of 1933, as amended, but contain certain restrictions on resale and cannot be sold publicly. These loans pay interest at rates which adjust periodically. The interest rates shown for senior loans are the current interest rates at January 31, 2009. Senior loans are also subject to mandatory and/or optional prepayment which cannot be predicted. As a result, the remaining maturity may be substantially less than the stated maturity shown (Notes 1 and 6).
F Is valued at fair value following procedures approved by the Trustees. Securities may be classified as a Level 2 or Level 3 for FASB 157 disclosures based on the securities valuation inputs.
R Real Estate Investment Trust.
At January 31, 2009, liquid assets totaling $895,333,777 have been designated as collateral for open forward commitments, swap contracts and forward contracts.
Debt obligations are considered secured unless otherwise indicated.
144A after the name of an issuer represents securities exempt from registration under Rule 144A under the Securities Act of 1933, as amended. These securities may be resold in transactions exempt from registration, normally to qualified institutional buyers.
ADR after the name of a foreign holding stands for American Depository Receipts representing ownership of foreign securities on deposit with a custodian bank.
TBA after the name of a security represents to be announced securities (Note 1).
Inverse Floating Rate Bonds (IFB) are securities that pay interest rates that vary inversely to changes in the market interest rates. As interest rates rise, inverse floaters produce less current income. The interest rates shown are the current interest rates at January 31, 2009.
63
The rates shown on Floating Rate Bonds (FRB) and Floating Rate Notes (FRN) are the current interest rates at January 31, 2009.
The dates shown on debt obligations are the original maturity dates.
| | | | | |
| FORWARD CURRENCY CONTRACTS TO SELL at 1/31/09 (Unaudited) | | | |
| |
| | | Aggregate | | Delivery | Unrealized |
| | Value | face value | | date | appreciation |
|
| Euro | $307,934 | $330,729 | | 2/18/09 | $22,795 |
|
| Total | | | | | $22,795 |
|
| |
| FUTURES CONTRACTS OUTSTANDING at 1/31/09 (Unaudited) | | | |
| |
| | | | | | Unrealized |
| | Number of | | | Expiration | appreciation/ |
| | contracts | Value | | date | (depreciation) |
|
| Euro-Dollar 90 day (Short) | 483 | $119,222,513 | | Jun-09 | $(1,781,927) |
|
| Euro-Dollar 90 day (Short) | 1,442 | 355,579,175 | | Sep-09 | (5,843,420) |
|
| Euro-Dollar 90 day (Short) | 1,347 | 331,530,375 | | Dec-09 | (5,555,289) |
|
| Euro-Dollar 90 day (Short) | 81 | 19,902,713 | | Mar-10 | (397,796) |
|
| U.S. Treasury Bond 20 yr (Short) | 32 | 4,054,500 | | Mar-09 | 451,662 |
|
| U.S. Treasury Note 2 yr (Short) | 2,926 | 636,770,750 | | Mar-09 | (568,750) |
|
| U.S. Treasury Note 5 yr (Short) | 177 | 20,916,422 | | Mar-09 | 170,982 |
|
| U.S. Treasury Note 10 yr (Short) | 1,475 | 180,941,016 | | Mar-09 | 2,922,772 |
|
| Total | | | | | $(10,601,766) |
| | | |
| | | | |
| WRITTEN OPTIONS OUTSTANDING at 1/31/09 (premiums received $29,229,511) (Unaudited) | |
| |
| | Contract | | Expiration date/ | |
| | amount | | strike price | Value |
|
| Option on an interest rate swap with JPMorgan Chase | | | | |
| Bank, N.A. for the obligation to pay a fixed rate of 5.215% | | | | |
| versus the three month USD-LIBOR-BBA maturing | | | | |
| on February 18, 2020. | $111,851,000 | | Feb-10/5.215 | $18,205,987 |
|
| Option on an interest rate swap with JPMorgan Chase | | | | |
| Bank, N.A. for the obligation to pay a fixed rate of 5.22% | | | | |
| versus the three month USD-LIBOR-BBA maturing | | | | |
| on February 24, 2020. | 71,681,000 | | Feb-10/5.22 | 11,676,118 |
|
| Option on an interest rate swap with JPMorgan Chase | | | | |
| Bank for the obligation to pay a fixed rate of 4.40% | | | | |
| versus the three month USD-LIBOR-BBA maturing | | | | |
| November 9, 2019. | 31,796,000 | | Nov-09/4.40 | 3,395,813 |
|
| Option on an interest rate swap with JPMorgan Chase | | | | |
| Bank for the obligation to receive a fixed rate of 4.40% | | | | |
| versus the three month USD-LIBOR-BBA maturing | | | | |
| November 9, 2019. | 31,796,000 | | Nov-09/4.40 | 393,317 |
|
| Option on an interest rate swap with JPMorgan Chase | | | | |
| Bank, N.A. for the obligation to pay a fixed rate of 5.08% | | | | |
| versus the three month USD-LIBOR-BBA maturing | | | | |
| on February 24, 2020. | 71,681,000 | | Feb-10/5.08 | 10,914,866 |
|
| Option on an interest rate swap with JPMorgan Chase | | | | |
| Bank, N.A. for the obligation to pay a fixed rate of 5.51% | | | | |
| versus the three month USD-LIBOR-BBA maturing | | | | |
| on May 14, 2022. | 20,548,000 | | May-12/5.51 | 3,260,351 |
|
64
| | | | |
| WRITTEN OPTIONS OUTSTANDING at 1/31/09 (premiums received $29,229,511) (Unaudited) cont. |
| |
| | Contract | | Expiration date/ |
| | amount | | strike price | Value |
|
| Option on an interest rate swap with JPMorgan Chase | | | | |
| Bank, N.A. for the obligation to receive a fixed rate of 5.215% | | | | |
| versus the three month USD-LIBOR-BBA maturing | | | | |
| on February 18, 2020. | $111,851,000 | | Feb-10/5.215 | $770,653 |
|
| Option on an interest rate swap with JPMorgan Chase | | | | |
| Bank, N.A. for the obligation to receive a fixed rate of 5.08% | | | | |
| versus the three month USD-LIBOR-BBA maturing | | | | |
| on February 24, 2020. | 71,681,000 | | Feb-10/5.08 | 589,218 |
|
| Option on an interest rate swap with JPMorgan Chase | | | | |
| Bank, N.A. for the obligation to receive a fixed rate of 5.22% | | | | |
| versus the three month USD-LIBOR-BBA maturing | | | | |
| on February 24, 2020. | 71,681,000 | | Feb-10/5.22 | 505,351 |
|
| Option on an interest rate swap with JPMorgan Chase | | | | |
| Bank, N.A. for the obligation to receive a fixed rate of 5.51% | | | | |
| versus the three month USD-LIBOR-BBA maturing | | | | |
| on May 14, 2022. | 20,548,000 | | May-12/5.51 | 439,680 |
|
| Total | | | | $50,151,354 |
| |
| |
| TBA SALE COMMITMENTS OUTSTANDING at 1/31/09 (proceeds receivable $675,856,094) (Unaudited) |
|
| | Principal | | Settlement | |
| Agency | amount | | date | Value |
|
| FNMA, 6 1/2s, February 1, 2039 | $70,000,000 | | 2/12/09 | $72,909,375 |
|
| FNMA, 5 1/2s, February 1, 2039 | 60,000,000 | | 2/12/09 | 61,406,250 |
|
| FNMA, 5s, February 1, 2039 | 410,000,000 | | 2/12/09 | 416,662,500 |
|
| FNMA, 4 1/2s, February 1, 2039 | 119,000,000 | | 2/12/09 | 119,743,750 |
|
| Total | | | | $670,721,875 |
| | | |
| | | | | | |
| INTEREST RATE SWAP CONTRACTS OUTSTANDING at 1/31/09 (Unaudited) | |
| |
| | Upfront | | | Payments | Payments | Unrealized |
| Swap counterparty / | premium | Termination | | made by | received by | appreciation/ |
| Notional amount | received (paid) | date | | fund per annum | fund per annum | (depreciation) |
|
| Bank of America, N.A. | | | | | | |
| $34,964,000 | $— | 5/23/10 | | 3 month USD- | | |
| | | | | LIBOR-BBA | 3.155% | $836,513 |
|
| 14,800,000 | — | 7/18/13 | | 4.14688% | 3 month USD- | |
| | | | | | LIBOR-BBA | (1,124,153) |
|
| 39,950,000 | — | 8/26/18 | | 3 month USD- | | |
| | | | | LIBOR-BBA | 4.54375% | 5,709,537 |
|
| 437,762,000 | — | 9/10/10 | | 3 month USD- | | |
| | | | | LIBOR-BBA | 3.22969% | 15,648,400 |
|
| 1,007,000 | — | 9/18/38 | | 4.36125% | 3 month USD- | |
| | | | | | LIBOR-BBA | (199,601) |
|
| 986,640,000 | — | 9/18/10 | | 3 month USD- | | |
| | | | | LIBOR-BBA | 2.86667% | 28,880,312 |
|
| 46,930,000 | 146,490 | 10/1/18 | | 3 month USD- | | |
| | | | | LIBOR-BBA | 4.30% | 5,800,499 |
|
| 170,477,000 | 960,746 | 10/14/18 | | 3 month USD- | | |
| | | | | LIBOR-BBA | 4.30% | 21,440,243 |
|
| 200,780,000 | 501,348 | 10/14/38 | | 4.25% | 3 month USD- | |
| | | | | | LIBOR-BBA | (34,968,838) |
|
65
| | | | | | |
| INTEREST RATE SWAP CONTRACTS OUTSTANDING at 1/31/09 (Unaudited) cont. | |
| |
| | Upfront | | | Payments | Payments | Unrealized |
| Swap counterparty / | premium | Termination | | made by | received by | appreciation/ |
| Notional amount | received (paid) | date | | fund per annum | fund per annum | (depreciation) |
|
| Bank of America, N.A. cont. | | | | | |
| $84,099,000 | $31,743 | 10/20/18 | | 3 month USD- | | |
| | | | | LIBOR-BBA | 4.60% | $12,320,686 |
|
| 311,159,000 | (282,859) | 10/20/10 | | 3.00% | 3 month USD- | |
| | | | | | LIBOR-BBA | (10,503,136) |
|
| 35,934,000 | — | 5/8/28 | | 4.95% | 3 month USD- | |
| | | | | | LIBOR-BBA | (8,265,646) |
|
| Barclays Bank PLC | | | | | | |
| 552,632,000 | — | 12/9/10 | | 3 month USD- | | |
| | | | | LIBOR-BBA | 2.005% | 3,326,174 |
|
| 83,342,000 | — | 12/9/20 | | 3 month USD- | | |
| | | | | LIBOR-BBA | 2.91875% | (2,231,271) |
|
| 743,141,000 | — | 12/17/13 | | 2.42875% | 3 month USD- | |
| | | | | | LIBOR-BBA | 1,369,289 |
|
| Citibank, N.A. | | | | | | |
| 82,939,000 | — | 9/16/10 | | 3.175% | 3 month USD- | |
| | | | | | LIBOR-BBA | (2,919,283) |
|
| 317,224,000 | — | 9/17/13 | | 3 month USD- | | |
| | | | | LIBOR-BBA | 3.4975% | 18,163,431 |
|
| 189,783,000 | — | 9/18/38 | | 4.45155% | 3 month USD- | |
| | | | | | LIBOR-BBA | (40,908,984) |
|
| 480,165,000 | — | 9/18/10 | | 3 month USD- | | |
| | | | | LIBOR-BBA | 2.92486% | 14,609,672 |
|
| 73,654,000 | — | 6/29/18 | | 2.477% | 3 month USD- | |
| | | | | | LIBOR-BBA | 3,202,698 |
|
| Credit Suisse International | | | | | |
| 6,183,900 | — | 9/16/10 | | 3.143% | 3 month USD- | |
| | | | | | LIBOR-BBA | (213,765) |
|
| 197,328,000 | — | 9/18/10 | | 3 month USD- | | |
| | | | | LIBOR-BBA | 2.91916% | 5,982,058 |
|
| 88,743,000 | — | 9/23/10 | | 3 month USD- | | |
| | | | | LIBOR-BBA | 3.32% | 3,457,477 |
|
| 144,979,000 | — | 10/9/10 | | 3 month USD- | | |
| | | | | LIBOR-BBA | 2.81% | 4,173,855 |
|
| 84,619,000 | 80,443 | 10/31/18 | | 4.35% | 3 month USD- | |
| | | | | | LIBOR-BBA | (10,366,668) |
|
| 99,000,000 | — | 12/5/20 | | 3 month USD- | | |
| | | | | LIBOR-BBA | 3.01% | (1,712,129) |
|
| 118,329,000 | — | 9/23/38 | | 4.7375% | 3 month USD- | |
| | | | | | LIBOR-BBA | (32,056,575) |
|
| 167,500,000 | (1,790,313) | 12/10/38 | | 2.69% | 3 month USD- | |
| | | | | | LIBOR-BBA | 20,065,492 |
|
| 110,620,000 | 1,182,355 | 12/10/38 | | 3 month USD- | | |
| | | | | LIBOR-BBA | 2.69% | (13,251,610) |
|
| 44,815,000 | — | 1/13/14 | | 3 month USD- | | |
| | | | | LIBOR-BBA | 2.095% | (788,632) |
|
| 45,088,000 | — | 1/16/19 | | 3 month USD- | | |
| | | | | LIBOR-BBA | 2.32% | (2,844,802) |
|
66
| | | | | | |
| INTEREST RATE SWAP CONTRACTS OUTSTANDING at 1/31/09 (Unaudited) cont. | |
| |
| | Upfront | | | Payments | Payments | Unrealized |
| Swap counterparty / | premium | Termination | | made by | received by | appreciation/ |
| Notional amount | received (paid) | date | | fund per annum | fund per annum | (depreciation) |
|
| Deutsche Bank AG | | | | | | |
| $87,029,000 | $— | 1/30/11 | | 1.45% | 3 month USD- | |
| | | | | | LIBOR-BBA | $350,289 |
|
| 82,582,000 | — | 9/24/10 | | 3 month USD- | | |
| | | | | LIBOR-BBA | 3.395% | 3,344,436 |
|
| 49,357,000 | — | 10/17/18 | | 4.585% | 3 month USD- | |
| | | | | | LIBOR-BBA | (7,162,428) |
|
| 661,444,000 | — | 10/24/10 | | 3 month USD- | | |
| | | | | LIBOR-BBA | 2.604% | 16,505,081 |
|
| 3,548,000 | — | 11/21/18 | | 3.75% | 3 month USD- | |
| | | | | | LIBOR-BBA | (224,080) |
|
| 124,641,000 | (106,745) | 11/21/10 | | 3 month USD- | | |
| | | | | LIBOR-BBA | 2.25% | 1,310,423 |
|
| 117,829,000 | — | 11/28/13 | | 3 month USD- | | |
| | | | | LIBOR-BBA | 2.8725% | 2,305,738 |
|
| 302,096,000 | — | 12/5/13 | | 2.590625% | 3 month USD- | |
| | | | | | LIBOR-BBA | (1,719,954) |
|
| 207,237,000 | — | 12/9/13 | | 3 month USD- | | |
| | | | | LIBOR-BBA | 2.5225% | 469,426 |
|
| 87,091,000 | — | 12/11/18 | | 2.94% | 3 month USD- | |
| | | | | | LIBOR-BBA | 803,160 |
|
| 138,675,000 | — | 12/15/18 | | 3 month USD- | | |
| | | | | LIBOR-BBA | 2.80776% | (2,873,897) |
|
| 69,486,000 | — | 12/16/28 | | 3 month USD- | | |
| | | | | LIBOR-BBA | 2.845% | (5,520,805) |
|
| 536,000,000 | — | 12/17/13 | | 3 month USD- | | |
| | | | | LIBOR-BBA | 2.39% | (1,972,443) |
|
| 267,567,000 | — | 12/17/23 | | 3 month USD- | | |
| | | | | LIBOR-BBA | 2.81682% | (16,230,149) |
|
| 891,471,000 | — | 12/19/10 | | 3 month USD- | | |
| | | | | LIBOR-BBA | 1.53429% | (1,754,460) |
|
| 51,968,000 | — | 12/24/13 | | 2.165% | 3 month USD- | |
| | | | | | LIBOR-BBA | 712,133 |
|
| 217,019,000 | — | 12/30/13 | | 2.15633% | 3 month USD- | |
| | | | | | LIBOR-BBA | 3,124,720 |
|
| 211,400,000 | — | 1/8/29 | | 3 month USD- | | |
| | | | | LIBOR-BBA | 3.19625% | (5,811,129) |
|
| 676,000,000 | — | 1/8/14 | | 2.375% | 3 month USD- | |
| | | | | | LIBOR-BBA | 3,010,547 |
|
| 85,766,000 | — | 1/9/14 | | 3 month USD- | | |
| | | | | LIBOR-BBA | 2.165% | (1,236,728) |
|
| 24,223,000 | — | 1/13/19 | | 3 month USD- | | |
| | | | | LIBOR-BBA | 2.52438% | (1,102,699) |
|
| 40,777,000 | — | 1/20/19 | | 3 month USD- | | |
| | | | | LIBOR-BBA | 2.347% | (2,495,703) |
|
| 875,376,000 | — | 1/27/16 | | 2.51064% | 3 month USD- | |
| | | | | | LIBOR-BBA | 14,849,400 |
|
| 341,607,000 | — | 1/27/39 | | 3 month USD- | | |
| | | | | LIBOR-BBA | 3.12% | (16,583,567) |
|
67
| | | | | | |
| INTEREST RATE SWAP CONTRACTS OUTSTANDING at 1/31/09 (Unaudited) cont. | |
| |
| | Upfront | | | Payments | Payments | Unrealized |
| Swap counterparty / | premium | Termination | | made by | received by | appreciation/ |
| Notional amount | received (paid) | date | | fund per annum | fund per annum | (depreciation) |
|
| Deutsche Bank AG cont. | | | | | | |
| $28,130,000 | $— | 1/28/29 | | 3 month USD- | | |
| | | | | LIBOR-BBA | 3.1785% | $(862,372) |
|
| 192,000,000 | 443,000 | 1/30/29 | | 3.11% | 3 month USD- | |
| | | | | | LIBOR-BBA | 8,284,060 |
|
| 78,237,000 | — | 2/3/19 | | 3.01% | 3 month USD- | |
| | | | | | LIBOR-BBA | — |
|
| Goldman Sachs International | | | | | |
| 69,773,000 | — | 4/8/10 | | 3 month USD- | | |
| | | | | LIBOR-BBA | 2.64% | 1,524,947 |
|
| 43,068,000 | — | 4/23/18 | | 4.43% | 3 month USD- | |
| | | | | | LIBOR-BBA | (5,577,716) |
|
| 59,528,000 | — | 5/19/18 | | 4.525% | 3 month USD- | |
| | | | | | LIBOR-BBA | (7,702,216) |
|
| 71,732,000 | — | 5/30/28 | | 5.014% | 3 month USD- | |
| | | | | | LIBOR-BBA | (17,105,653) |
|
| 159,007,000 | 74,929 | 10/24/10 | | 3 month USD- | | |
| | | | | LIBOR-BBA | 2.60% | 4,029,803 |
|
| 161,174,000 | (997,650) | 11/18/18 | | 3 month USD- | | |
| | | | | LIBOR-BBA | 4.10% | 14,153,517 |
|
| 160,624,000 | (585,267) | 11/18/13 | | 3 month USD- | | |
| | | | | LIBOR-BBA | 3.45% | 7,019,795 |
|
| 265,181,000 | (72,938) | 11/18/10 | | 3 month USD- | | |
| | | | | LIBOR-BBA | 2.35% | 3,460,977 |
|
| 184,000,000 | — | 12/16/18 | | 3 month USD- | | |
| | | | | LIBOR-BBA | 2.78% | (4,230,767) |
|
| JPMorgan Chase Bank, N.A. | | | | | |
| 5,125,000 | — | 2/15/13 | | 3 month USD- | | |
| | | | | LIBOR-BBA | 3.585% | 313,981 |
|
| 306,762,000 | — | 3/5/18 | | 4.325% | 3 month USD- | |
| | | | | | LIBOR-BBA | (37,283,385) |
|
| 63,909,000 | — | 3/7/18 | | 4.45% | 3 month USD- | |
| | | | | | LIBOR-BBA | (8,424,276) |
|
| 50,608,000 | — | 3/12/18 | | 3 month USD- | | |
| | | | | LIBOR-BBA | 4.4525% | 6,679,533 |
|
| 15,899,000 | — | 3/11/38 | | 5.0025% | 3 month USD- | |
| | | | | | LIBOR-BBA | (5,059,360) |
|
| 113,217,000 | — | 3/11/38 | | 5.03% | 3 month USD- | |
| | | | | | LIBOR-BBA | (36,620,683) |
|
| 230,165,000 | — | 3/15/10 | | 3 month USD- | | |
| | | | | LIBOR-BBA | 2.5% | 4,274,803 |
|
| 111,087,000 | — | 3/20/13 | | 3 month USD- | | |
| | | | | LIBOR-BBA | 3.145% | 4,649,300 |
|
| 157,185,000 | — | 3/20/13 | | 3 month USD- | | |
| | | | | LIBOR-BBA | 3.13% | 6,477,441 |
|
| 55,034,000 | — | 3/25/10 | | 3 month USD- | | |
| | | | | LIBOR-BBA | 2.325% | 956,090 |
|
| 92,513,000 | — | 3/26/10 | | 3 month USD- | | |
| | | | | LIBOR-BBA | 2.33375% | 1,614,214 |
|
68
| | | | | | |
| INTEREST RATE SWAP CONTRACTS OUTSTANDING at 1/31/09 (Unaudited) cont. | |
| |
| | Upfront | | | Payments | Payments | Unrealized |
| Swap counterparty / | premium | Termination | | made by | received by | appreciation/ |
| Notional amount | received (paid) | date | | fund per annum | fund per annum | (depreciation) |
|
| JPMorgan Chase Bank, N.A. cont. | | | | | |
| $154,761,000 | $— | 4/8/13 | | 3 month USD- | | |
| | | | | LIBOR-BBA | 3.58406% | $9,315,458 |
|
| 58,275,000 | — | 5/23/10 | | 3 month USD- | | |
| | | | | LIBOR-BBA | 3.16% | 1,398,266 |
|
| 60,000,000 | — | 6/13/13 | | 4.47% | 3 month USD- | |
| | | | | | LIBOR-BBA | (5,385,000) |
|
| 35,000,000 | — | 6/27/18 | | 3 month USD- | | |
| | | | | LIBOR-BBA | 4.8305% | 5,378,765 |
|
| 134,430,000 | — | 7/16/10 | | 3 month USD- | | |
| | | | | LIBOR-BBA | 3.384% | 3,907,730 |
|
| 59,604,000 | — | 7/22/10 | | 3 month USD- | | |
| | | | | LIBOR-BBA | 3.565% | 1,879,281 |
|
| 58,390,000 | — | 10/23/13 | | 3 month USD- | | |
| | | | | LIBOR-BBA | 3.535% | 3,436,940 |
|
| 24,473,000 | 73,803 | 11/4/18 | | 4.45% | 3 month USD- | |
| | | | | | LIBOR-BBA | (2,956,263) |
|
| 2,085,000 | 9,901 | 11/4/13 | | 3.85% | 3 month USD- | |
| | | | | | LIBOR-BBA | (125,963) |
|
| 16,000,000 | — | 12/11/18 | | 3 month USD- | | |
| | | | | LIBOR-BBA | 2.941% | (146,091) |
|
| 92,650,000 | — | 12/19/18 | | 5% | 3 month USD- | |
| | | | | | LIBOR-BBA | (15,944,627) |
|
| 101,030,000 | — | 1/26/39 | | 3 month USD- | | |
| | | | | LIBOR-BBA | 3.05% | (6,237,554) |
|
| 349,719,000 | — | 1/26/14 | | 2.2156% | 3 month USD- | |
| | | | | | LIBOR-BBA | 4,327,950 |
|
| Merrill Lynch Capital Services, Inc. | | | | | |
| 10,114,000 | — | 10/26/12 | | 4.6165% | 3 month USD- | |
| | | | | | LIBOR-BBA | (989,867) |
|
| 223,165,000 | — | 5/19/10 | | 3.2925% | 3 month USD- | |
| | | | | | LIBOR-BBA | (5,758,355) |
|
| 74,426,000 | — | 7/22/10 | | 3 month USD- | | |
| | | | | LIBOR-BBA | 3.5375% | 2,316,328 |
|
| UBS AG | | | | | | |
| 1,793,207,000 | — | 10/29/10 | | 2.75% | 3 month USD- | |
| | | | | | LIBOR-BBA | (49,437,066) |
|
| 25,738,000 | 855,575 | 11/10/28 | | 4.45% | 3 month USD- | |
| | | | | | LIBOR-BBA | (3,249,327) |
|
| 328,941,000 | (8,356,303) | 11/10/18 | | 3 month USD- | | |
| | | | | LIBOR-BBA | 4.45% | 32,763,949 |
|
| 12,667,000 | — | 11/24/10 | | 3 month USD- | | |
| | | | | LIBOR-BBA | 2.05% | 93,844 |
|
| 349,000,000 | 674,028 | 12/19/20 | | 3 month USD- | | |
| | | | | LIBOR-BBA | 2.34% | (28,910,024) |
|
| Total | | | | | | $(129,021,039) |
69
| | | | | | | |
| CREDIT DEFAULT CONTRACTS OUTSTANDING at 1/31/09 (Unaudited) | | |
|
| | | Upfront | | | | Fixed payments | |
| | premium | | | Termi- | received | Unrealized |
| Swap counterparty / | | received | Notional | | nation | (paid) by fund | appreciation/ |
| Referenced debt* | Rating*** | (paid)** | amount | | date | per annum | (depreciation) |
| Bank of America, N.A. | | | | | | | |
|
| DJ ABX CMBX BBB | | | | | | | |
| Index | — | $3,986 | $5,796,783 | F | 10/12/52 | (134 bp) | $3,968,768 |
|
| Financial Security | | | | | | | |
| Assurance Holdings, | | | | | | | |
| Ltd, 6.4%, 12/15/66 | Baa1 | — | 330,000 | | 12/20/12 | 95 bp | (108,467) |
|
| International Lease | | | | | | | |
| Finance Corp., | | | | | | | |
| 4.15%, 1/20/15 | — | (7,500) | 75,000 | | 12/20/13 | (500 bp) | (279) |
|
| Mattel, Inc., | | | | | | | |
| 7 1/4%, 7/9/12 | — | — | 330,000 | | 3/20/13 | (157.2 bp) | 2,277 |
|
| Meadwestvaco Corp., | | | | | | | |
| 6.85%, 4/1/12 | — | — | 12,000 | | 3/20/18 | (177 bp) | 96 |
|
| MetLife Inc., 5%, | | | | | | | |
| 6/15/15 | — | — | 1,240,000 | | 12/20/13 | (384 bp) | 70,416 |
|
| Motorola, Inc., | | | | | | | |
| 6.5%, 9/1/25 | — | — | 205,000 | | 11/20/11 | (240 bp) | 14,486 |
|
| Ryder System Inc., | | | | | | | |
| 6.95%, 12/1/25 | — | — | 330,000 | | 3/20/13 | (135 bp) | 21,167 |
|
| Sealed Air Corp., | | | | | | | |
| 5 5/8%, 7/15/13 | — | — | 210,000 | | 9/20/13 | (169 bp) | 24,813 |
|
| Spectra Energy | | | | | | | |
| Capital, 6 1/4%, | | | | | | | |
| 2/15/13 | — | — | 330,000 | | 9/20/14 | (115 bp) | 5,227 |
|
| Citibank, N.A. | | | | | | | |
| Arrow Electronic | | | | | | | |
| Inc., 6 7/8%, 6/1/18 | — | — | 730,000 | | 3/20/13 | (43 bp) | 42,932 |
|
| International Lease | | | | | | | |
| Finance Corp., | | | | | | | |
| 4.15%, 1/20/15 | — | — | 210,000 | | 6/20/13 | (222.50 bp) | 38,967 |
|
| Lexmark | | | | | | | |
| International, | | | | | | | |
| Inc., 5.9%, 6/1/13 | Baa2 | — | 80,000 | | 6/20/13 | 108.5 bp | 6,924 |
|
| Lighthouse | | | | | | | |
| International Co., | | | | | | | |
| SA, 8%, 4/30/14 | B3 | — | EUR 55,000 | | 3/20/13 | 815 bp | (16,173) |
|
| Macy’s Retail | | | | | | | |
| Holdings, Inc., | | | | | | | |
| 6 5/8%, 4/1/11 | — | — | $60,000 | | 6/20/11 | (162 bp) | 6,423 |
|
| Mohawk Industries, | | | | | | | |
| Inc., 7.2%, 4/15/12 | — | — | 235,000 | | 3/20/16 | (140 bp) | 23,816 |
|
| Newell Rubbermaid, | | | | | | | |
| Inc., 6.35%, 7/15/28 | — | — | 160,000 | | 6/20/13 | (85 bp) | 8,490 |
|
| Sara Lee Corp., | | | | | | | |
| 6 1/8%, 11/1/32 | — | — | 865,000 | | 9/20/11 | (43 bp) | 3,893 |
|
| Telecom Italia SPA. | | | | | | | |
| 5 3/8%, 1/29/19 | — | — | 445,000 | | 9/20/11 | (218 bp) | 14,702 |
|
70
| | | | | | | |
| CREDIT DEFAULT CONTRACTS OUTSTANDING at 1/31/09 (Unaudited) cont. | |
|
| | | Upfront | | | | Fixed payments | |
| | | premium | | | Termi- | received | Unrealized |
| Swap counterparty / | | received | Notional | | nation | (paid) by fund | appreciation/ |
| Referenced debt* | Rating*** | (paid)** | amount | | date | per annum | (depreciation) |
|
| Credit Suisse International | | | | | | | |
| DJ CDX NA IG Series | | | | | | | |
| 11 Index | — | $(31,689) | $1,340,000 | | 12/20/13 | (150 bp) | $(6,588) |
|
| DJ CMB NA CMBX AAA | | | | | | | |
| Index | AAA | 6,576,591 | 39,512,000 | | 12/13/49 | 8 bp | (6,384,838) |
|
| DJ CMB NA CMBX AAA | | | | | | | |
| Index | AAA | 7,733,350 | 49,365,000 | | 2/17/51 | 35 bp | (8,681,760) |
|
| DJ CMB NA CMBX AAA | | | | | | | |
| Index | — | (18,205) | 219,000 | | 12/13/49 | (8 bp) | 53,635 |
|
| DJ CMB NA CMBX AAA | | | | | | | |
| Index | — | (89,032) | 1,185,000 | | 2/17/51 | (35 bp) | 305,010 |
|
| DJ CMB NA CMBX AAA | | | | | | | |
| Index | — | (4,460,462) | 39,129,000 | | 2/17/51 | (35 bp) | 8,550,920 |
|
| DJ CMB NA CMBX AAA | | | | | | | |
| Index | — | (301,735) | 3,842,000 | | 2/17/51 | (35 bp) | 975,827 |
|
| DJ CMB NA CMBX AAA | | | | | | | |
| Index | — | (143,273) | 1,921,000 | | 2/17/51 | (35 bp) | 495,507 |
|
| DJ CMB NA CMBX AAA | | | | | | | |
| Index | — | (1,578,928) | 11,282,000 | | 2/17/51 | (35 bp) | 2,172,623 |
|
| DJ CMB NA CMBX AJ | | | | | | | |
| Index | — | (1,174,174) | 3,652,000 | | 2/17/51 | (96 bp) | 1,108,267 |
|
| General Electric | | | | | | | |
| Capital Corp., | | | | | | | |
| 5 5/8%, 9/15/17 | Aaa | — | 410,000 | | 12/20/13 | 530 bp | 22,302 |
|
| Liberty Mutual | | | | | | | |
| Insurance, 7 7/8%, | | | | | | | |
| 10/15/26 | — | — | 2,755,000 | | 12/20/13 | (210 bp) | 4,427 |
|
| Southwest Airlines, | | | | | | | |
| 5 1/4%, 10/1/14 | — | — | 55,000 | | 3/20/12 | (190 bp) | 2,605 |
|
| Deutsche Bank AG | | | | | | | |
| Cadbury Schweppes | | | | | | | |
| US Finance LLC, | | | | | | | |
| 5 1/8%, 10/1/13 | — | — | 230,000 | | 12/20/13 | (86 bp) | (2,994) |
|
| CNA Financial | | | | | | | |
| Corp., 5.85%, | | | | | | | |
| 12/15/14 | — | — | 285,000 | | 9/20/16 | (155 bp) | 24,041 |
|
| DJ ABX CMBX AAA | | | | | | | |
| Index | AAA | 154,944 | 2,570,000 | F | 2/17/51 | 35 bp | (700,033) |
|
| DJ CDX NA IG Series | | | | | | | |
| 11 Index | BBB+ | 244,057 | 15,215,000 | | 12/20/13 | 150 bp | (40,945) |
|
| DJ iTraxx Europe | | | | | | | |
| Series 8 Version 1 | — | (6,235) | EUR 65,000 | | 12/20/12 | (375 bp) | 11,471 |
|
| DJ iTraxx Europe | | | | | | | |
| Series 9 Version 1 | — | 15,712 | EUR 230,000 | | 6/20/13 | (650 bp) | 58,586 |
|
| Expedia Inc., | | | | | | | |
| 7.456%, 8/15/18 | — | — | $60,000 | | 12/20/13 | (310 bp) | 5,077 |
|
71
| | | | | | | |
| CREDIT DEFAULT CONTRACTS OUTSTANDING at 1/31/09 (Unaudited) cont. | |
| |
| | | Upfront | | | | Fixed payments | |
| | | premium | | | Termi- | received | Unrealized |
| Swap counterparty / | | received | Notional | | nation | (paid) by fund | appreciation/ |
| Referenced debt* | Rating*** | (paid)** | amount | | date | per annum | (depreciation) |
|
| Deutsche Bank AG cont. | | | | | | | |
| General Electric | | | | | | | |
| Capital Corp., 6%, | | | | | | | |
| 6/15/12 | Aaa | $— | $1,745,000 | | 9/20/13 | 109 bp | $(200,201) |
|
| Genworth Financial | | | | | | | |
| Inc., 5 3/4%, | | | | | | | |
| 6/15/14 | — | — | 210,000 | | 6/20/18 | (143 bp) | 98,847 |
|
| Grohe Holding Gmbh, | | | | | | | |
| 8 5/8%, 10/1/14 | B3 | — | EUR 15,000 | | 6/20/09 | 400 bp | (1,763) |
|
| Grohe Holding Gmbh, | | | | | | | |
| 8 5/8%, 10/1/14 | B3 | — | EUR 55,000 | | 6/20/09 | 400 bp | (6,464) |
|
| Hanson PLC., | | | | | | | |
| 7 7/8%, 9/27/10 | — | — | $50,000 | | 9/20/16 | (255 bp) | 23,207 |
|
| iStar Financial, | | | | | | | |
| Inc., 6%, 12/15/10 | Ba3 | 39,151 | 580,000 | | 3/20/09 | 500 bp | (14,128) |
|
| Pacific Gas & | | | | | | | |
| Electric Co., 4.8%, | | | | | | | |
| 3/1/14 | A3 | — | 35,000 | | 12/20/13 | 112 bp | (3,536) |
|
| Packaging | | | | | | | |
| Corporation of | | | | | | | |
| America, 5 3/4%, | | | | | | | |
| 8/1/13 | — | — | 345,000 | | 9/20/13 | (129 bp) | 8,970 |
|
| Pitney Bowes, Inc., | | | | | | | |
| 4 5/8%, 10/1/12 | — | — | 125,000 | | 3/20/18 | (95 bp) | 344 |
|
| PPG Industries, | | | | | | | |
| Inc., 7.05%, 8/15/09 | — | — | 185,000 | | 3/20/18 | (154 bp) | 13,743 |
|
| Reynolds American, | | | | | | | |
| Inc., 7 5/8%, 6/1/16 | — | — | 695,000 | | 6/20/13 | (105 bp) | 62,178 |
|
| Tyco Electronics | | | | | | | |
| Group, 6.55%, | | | | | | | |
| 10/1/17 | — | — | 180,000 | | 12/20/17 | (125.5 bp) | 11,186 |
|
| Goldman Sachs International | | | | | | | |
| CVS Caremark Corp., | | | | | | | |
| 4 7/8%, 9/15/14 | — | — | 15,000 | | 9/20/13 | (59 bp) | 197 |
|
| CVS Caremark Corp., | | | | | | | |
| 4 7/8%, 9/15/14 | — | — | 20,000 | | 9/20/11 | (50 bp) | 257 |
|
| DJ CDX NA CMBX AAA | | | | | | | |
| Index | AAA | 65,836 | 1,800,000 | | 3/15/49 | 7 bp | (408,719) |
|
| DJ CDX NA HY Series | | | | | | | |
| 9 Index 25-35% | | | | | | | |
| tranche | BBB+ | — | 8,723,000 | F | 12/20/10 | 305 bp | (1,424,989) |
|
| DJ CDX NA HY Series | | | | | | | |
| 9 Index 35-100% | | | | | | | |
| tranche | AAA | — | 8,021,748 | | 12/20/10 | 153.5 bp | (160,129) |
|
| DJ CDX NA IG Series | | | | | | | |
| 11 Index | — | (2,774,427) | 109,523,000 | | 12/20/18 | (140 bp) | (1,922,824) |
|
| DJ CMB NA CMBX AAA | | | | | | | |
| Index | — | (526,385) | 7,131,000 | | 2/17/51 | (35 bp) | 1,861,987 |
|
72
| | | | | | | |
| CREDIT DEFAULT CONTRACTS OUTSTANDING at 1/31/09 (Unaudited) cont. | |
| |
| | | Upfront | | | | Fixed payments | |
| | premium | | | Termi- | received | Unrealized |
| Swap counterparty / | | received | Notional | | nation | (paid) by fund | appreciation/ |
| Referenced debt* | Rating*** | (paid)** | amount | | date | per annum | (depreciation) |
|
| Goldman Sachs International cont. | | | | | | |
| Lighthouse | | | | | | | |
| International Co, | | | | | | | |
| SA, 8%, 4/30/14 | B3 | $— | EUR 45,000 | | 3/20/13 | 680 bp | $(15,260) |
|
| Rhodia SA, | | | | | | | |
| Euribor+275, | | | | | | | |
| 10/15/13 | — | — | EUR 265,000 | | 9/20/13 | (387 bp) | 109,406 |
|
| Southern California | | | | | | | |
| Edison Co., 7 5/8%, | | | | | | | |
| 1/15/10 | A3 | — | $60,000 | | 12/20/13 | 118.1 bp | (5,892) |
|
| JPMorgan Chase Bank, N.A. | | | | | | | |
| Anheuser-Busch Co., | | | | | | | |
| Inc. 5 5/8%, 10/1/10 | — | — | 215,000 | | 3/20/17 | (133 bp) | (5,247) |
|
| CenturyTel. Inc., | | | | | | | |
| 6%, 4/1/17 | — | — | 65,000 | | 6/20/13 | (95 bp) | 196 |
|
| Codere Finance | | | | | | | |
| (Luxembourg) S.A., | | | | | | | |
| 8.25%, 6/15/15 | B+ | — | EUR 45,000 | | 3/20/13 | 795 bp | (12,960) |
|
| DJ CDX NA IG Series | | | | | | | |
| 11 Index | — | (6,799) | $310,000 | | 12/20/13 | (150 bp) | (992) |
|
| DJ CMB NA CMBX AAA | | | | | | | |
| Index | AAA | 677,817 | 5,680,000 | | 2/17/51 | 35 bp | (1,204,165) |
|
| DJ CMB NA CMBX AAA | | | | | | | |
| Index | AAA | 892,815 | 7,133,000 | | 12/13/49 | 8 bp | (1,463,633) |
|
| DJ CMB NA CMBX AAA | | | | | | | |
| Index | AAA | 111,819 | 1,024,000 | | 2/17/51 | 35 bp | (227,468) |
|
| DJ CMB NA CMBX AAA | | | | | | | |
| Index | — | (668,539) | 8,306,000 | | 2/17/51 | (35 bp) | 2,083,529 |
|
| DJ CMB NA CMBX AAA | | | | | | | |
| Index | — | (149,449) | 1,919,000 | | 2/17/51 | (35 bp) | 486,383 |
|
| DJ iTraxx Europe | | | | | | | |
| Crossover Series 8 | | | | | | | |
| Version 1 | — | (17,237) | EUR 129,000 | | 12/20/12 | (375 bp) | 17,302 |
|
| Domtar Corp., | | | | | | | |
| 7 1/8%, 8/15/15 | — | — | $310,000 | | 12/20/11 | (500 bp) | 14,246 |
|
| Expedia, Inc., | | | | | | | |
| 7.456%, 8/15/18 | — | — | 40,000 | | 9/20/13 | (300 bp) | 3,403 |
|
| Freeport-McMoRan | | | | | | | |
| Copper & Gold, | | | | | | | |
| Inc., 8 3/8%, 4/1/17 | — | — | 120,000 | | 6/20/12 | (145 bp) | 21,433 |
|
| GATX Corp., 8.875%, | | | | | | | |
| 6/1/09 | — | — | 560,000 | | 3/20/16 | (100 bp) | 71,137 |
|
| General Growth | | | | | | | |
| Properties, conv. | | | | | | | |
| bond 3.98%, 4/15/27 | CC- | — | 100,000 | | 6/20/12 | 750 bp | (72,041) |
|
| General Growth | | | | | | | |
| Properties, conv. | | | | | | | |
| bond 3.98%, 4/15/27 | CC- | — | 25,000 | | 9/20/13 | 775 bp | (18,283) |
|
73
| | | | | | | |
| CREDIT DEFAULT CONTRACTS OUTSTANDING at 1/31/09 (Unaudited) cont. | |
|
| | | Upfront | | | | Fixed payments | |
| | | premium | | | Termi- | received | Unrealized |
| Swap counterparty / | | received | Notional | | nation | (paid) by fund | appreciation/ |
| Referenced debt* | Rating*** | (paid)** | amount | | date | per annum | (depreciation) |
|
| JPMorgan Chase Bank, N.A. cont. | | | | | | |
| GMAC, LLC, 6 7/8%, | | | | | | | |
| 8/28/12 | C | $23,000 | $400,000 | | 3/20/09 | 500 bp | $20,394 |
|
| iStar Financial, | | | | | | | |
| Inc., 6%, 12/15/10 | Ba3 | 39,200 | 560,000 | | 3/20/09 | 500 bp | (17,722) |
|
| Lexmark | | | | | | | |
| International, | | | | | | | |
| Inc., 5.9%, 6/1/13 | — | — | 75,000 | | 6/20/13 | (113 bp) | 6,359 |
|
| Lexmark | | | | | | | |
| International, | | | | | | | |
| Inc., 5.9%, 6/1/13 | — | — | 1,905,000 | | 6/20/13 | (113 bp) | 161,512 |
|
| Lexmark | | | | | | | |
| International, | | | | | | | |
| Inc., 5.9%, 6/1/13 | — | — | 140,000 | | 6/20/13 | (113 bp) | 11,870 |
|
| Merrill Lynch Capital Services, Inc. | | | | | | |
| Pacific Gas & | | | | | | | |
| Electric Co., 4.8%, | | | | | | | |
| 3/1/14 | A3 | — | 35,000 | | 12/20/13 | 113 bp | (3,521) |
|
| Merrill Lynch International | | | | | | | |
| AmerisourceBergen | | | | | | | |
| Corp., 5 7/8%, | | | | | | | |
| 9/15/15 | — | — | 20,000 | | 9/20/12 | (65 bp) | 50 |
|
| Block Financial | | | | | | | |
| LLC. 5 1/8%, | | | | | | | |
| 10/30/14 | — | — | 195,000 | | 12/20/14 | (69 bp) | 2,739 |
|
| Computer Sciences | | | | | | | |
| Corp, 5%, 2/15/13 | — | — | 65,000 | | 3/20/13 | (66 bp) | 470 |
|
| Kinder Morgan, | | | | | | | |
| Inc., 6 1/2%, 9/1/12 | — | — | 558,000 | | 9/20/12 | (128 bp) | 28,431 |
|
| MGM Mirage Inc., | | | | | | | |
| 5 7/8%, 2/27/14 | — | — | 130,000 | | 9/20/10 | (470 bp) | 31,835 |
|
| Supervalu, Inc., | | | | | | | |
| 7 1/2%, 05/15/12 | — | — | 520,000 | | 8/1/09 | (90 bp) | 6,898 |
|
| Morgan Stanley Capital Services, Inc. | | | | | | |
| DJ ABX CMBX AAA | | | | | | | |
| Index | AAA | 1,520,729 | 21,365,000 | F | 3/15/49 | 7 bp | (4,094,593) |
|
| DJ CMB NA CMBX AAA | | | | | | | |
| Index | — | (59,516) | 920,000 | F | 12/13/49 | (8 bp) | 245,639 |
|
| DJ CMB NA CMBX AAA | | | | | | | |
| Index | — | (90) | 1,000 | F | 2/17/51 | (35 bp) | 243 |
|
| DJ CMB NA CMBX AAA | | | | | | | |
| Index | AAA | 122 | 1,000 | | 2/17/51 | 35 bp | (206) |
|
| DJ CMB NA CMBX AAA | | | | | | | |
| Index | AAA | 122,467 | 920,000 | F | 12/13/49 | 8 bp | (181,529) |
|
| UBS, AG | | | | | | | |
| Cardinal Health | | | | | | | |
| Inc., 5.85%, | | | | | | | |
| 12/15/17 | — | — | 330,000 | | 6/20/13 | (49 bp) | 2,809 |
|
74
| | | | | | | |
| CREDIT DEFAULT CONTRACTS OUTSTANDING at 1/31/09 (Unaudited) cont. | |
| |
| | | Upfront | | | | Fixed payments | |
| | premium | | | Termi- | received | Unrealized |
| Swap counterparty / | | received | Notional | | nation | (paid) by fund | appreciation/ |
| Referenced debt* | Rating*** | (paid)** | amount | | date | per annum | (depreciation) |
|
| UBS AG cont. | | | | | | | |
| Hanson PLC., | | | | | | | |
| 7 7/8%, 9/27/10 | — | $— | $125,000 | | 9/20/16 | (250 bp) | $58,215 |
|
| Starwood Hotels & | | | | | | | |
| Resorts Worldwide, | | | | | | | |
| Inc., 7 7/8%, 5/1/12 | — | — | 710,000 | | 6/20/12 | (195 bp) | 93,499 |
|
| Total | | | | | | | $(3,805,733) |
* Payments related to the reference debt are made upon a credit default event.
**Upfront premium is based on the difference between the original spread on issue and the market spread on day of execution.
*** Ratings are presented for credit default contracts in which the fund has sold protection on the underlying referenced debt. Ratings for an underlying index represents the average of the ratings of all the securities included in that index. The Moody’s or Standard & Poor’s ratings are believed to be the most recent ratings available at January 31, 2009.
F Is valued at fair value following procedures approved by the Trustees. Securities may be classified as a Level 2 or Level 3 for FASB 157 disclosures based on securities valuation inputs.
In September 2006, the FASB issued Statement of Financial Accounting Standards No. 157, Fair Value Measurements (SFAS 157). SFAS 157 is effective for financial statements issued for fiscal years beginning after November 15, 2007 and interim periods within those fiscal years. While the adoption of SFAS 157 does not have a material effect on the fund’s net asset value, it does require additional disclosures about fair value measurements. The Standard establishes a three-level hierarchy for disclosure of fair value measurements. The valuation hierarchy is based upon the transparency of inputs to the valuation of the fund’s investments. The three levels are defined as follows:
Level 1 — Valuations based on quoted prices for identical securities in active markets.
Level 2 — Valuations based on quoted prices in markets that are not active or for which all significant inputs are observable, either directly or indirectly.
Level 3 — Valuations based on inputs that are unobservable and significant to the fair value measurement.
The following is a summary of the inputs used to value the fund’s net assets as of January 31, 2009:
| | | |
| Valuation inputs | Investments in securities | Other financial instruments | |
| |
| Level 1 | $1,077,764,450 | $(10,601,766) | |
| |
| Level 2 | 2,209,534,945 | (148,591,601) | |
| |
| Level 3 | 12,277,394 | — | |
| |
| Total | $3,299,576,789 | $(159,193,367) | |
Other financial instruments include futures, written options, TBA sale commitments, swaps and forward contracts which are valued at the unrealized appreciation/(depreciation) on the instrument.
The following is a reconciliation of Level 3 assets as of January 31, 2009:
| | | |
| | | Investment in securities | |
| |
| Balance as of July 31, 2008 | | $1,678,803 | |
| |
| Accrued discounts/premiums | | — | |
| |
| Realized gain/loss | | — | |
| |
| Change in net unrealized appreciation/(depreciation) | | — | |
| |
| Net purchases/sales | | — | |
| |
| Net transfers in and/or out of Level 3 | | 10,598,591 | |
| |
| Balance as of January 31, 2009 | | $12,277,394 | |
The accompanying notes are an integral part of these financial statements.
75
| |
| Statement of assets and liabilities 1/31/09 (Unaudited) | |
| |
| |
| ASSETS | |
|
| Investment in securities, at value (Note 1): | |
| Unaffiliated issuers (identified cost $3,578,481,355) | $3,299,576,789 |
|
| Dividends, interest and other receivables | 11,593,677 |
|
| Receivable for shares of the fund sold | 899,777 |
|
| Receivable for securities sold | 47,828,645 |
|
| Receivable for sales of delayed delivery securities (Notes 1 and 6) | 676,885,970 |
|
| Unrealized appreciation on swap contracts (Note 1) | 363,631,270 |
|
| Receivable for variation margin (Note 1) | 1,623,828 |
|
| Receivable for open forward currency contracts (Note 1) | 22,795 |
|
| Receivable for closed forward currency contracts (Note 1) | 711 |
|
| Receivable for open swap contracts (Note 1) | 17,968 |
|
| Receivable for closed swap contracts (Note 1) | 18,472,792 |
|
| Premium paid on swap contracts (Note 1) | 24,205,750 |
|
| Total assets | 4,444,759,972 |
|
| |
| LIABILITIES | |
|
| Payable to custodian (Note 2) | 31,608,104 |
|
| Payable for securities purchased | 21,994,227 |
|
| Payable for purchases of delayed delivery securities (Notes 1 and 6) | 1,559,899,917 |
|
| Payable for shares of the fund repurchased | 7,397,075 |
|
| Payable for compensation of Manager (Note 2) | 2,091,767 |
|
| Payable for investor servicing fees (Note 2) | 431,415 |
|
| Payable for custodian fees (Note 2) | 33,327 |
|
| Payable for Trustee compensation and expenses (Note 2) | 370,025 |
|
| Payable for administrative services (Note 2) | 4,470 |
|
| Payable for distribution fees (Note 2) | 399,540 |
|
| Payable for open swap contracts (Note 1) | 13,680 |
|
| Payable for closed swap contracts (Note 1) | 162,401,278 |
|
| Payable for receivable purchase agreement (Note 2) | 1,064,282 |
|
| Written options outstanding, at value (premiums received $29,229,511) (Notes 1 and 3) | 50,151,354 |
|
| Premium received on swap contracts (Note 1) | 23,255,957 |
|
| Unrealized depreciation on swap contracts (Note 1) | 496,458,042 |
|
| TBA sales commitments, at value (proceeds receivable $675,856,094) (Note 1) | 670,721,875 |
|
| Other accrued expenses | 411,144 |
|
| Total liabilities | 3,028,707,479 |
| |
| Net assets | $1,416,052,493 |
|
| |
| REPRESENTED BY | |
|
| Paid-in capital (Unlimited shares authorized) (Notes 1 and 4) | $2,741,492,854 |
|
| Distributions in excess of net investment income (Note 1) | (31,138,935) |
|
| Accumulated net realized loss on investments and foreign | |
| currency transactions (Note 1) | (857,792,693) |
|
| Net unrealized depreciation of investments and assets and | |
| liabilities in foreign currencies | (436,508,733) |
|
| Total — Representing net assets applicable to capital shares outstanding | $1,416,052,493 |
| |
| (Continued on next page) | |
76
| |
| Statement of assets and liabilities (Continued) | |
|
| |
| COMPUTATION OF NET ASSET VALUE AND OFFERING PRICE | |
|
| Net asset value and redemption price per class A share ($1,096,372,127 divided by 124,490,074 shares) | $8.81 |
|
| Offering price per class A share (100/94.25 of $8.81)* | $9.35 |
|
| Net asset value and offering price per class B share ($98,590,979 divided by 11,320,586 shares)** | $8.71 |
|
| Net asset value and offering price per class C share ($23,444,368 divided by 2,678,847 shares)** | $8.75 |
|
| Net asset value and redemption price per class M share ($73,347,927 divided by 8,430,347 shares) | $8.70 |
|
| Offering price per class M share (100/96.50 of $8.70)* | $9.02 |
|
| Net asset value, offering price and redemption price per class R share | |
| ($1,291,126 divided by 147,063 shares) | $8.78 |
|
| Net asset value, offering price and redemption price per class Y share | |
| ($123,005,966 divided by 13,920,531 shares) | $8.84 |
|
* On single retail sales of less than $50,000. On sales of $50,000 or more the offering price is reduced.
** Redemption price per share is equal to net asset value less any applicable contingent deferred sales charge.
The accompanying notes are an integral part of these financial statements.
77
| |
| Statement of operations Six months ended 1/31/09 (Unaudited) | |
|
| |
| INVESTMENT INCOME | |
|
| Dividends (net of foreign tax of $16,748) | $17,323,363 |
|
| Interest (including interest income of $26,421 from investments in affiliated issuers) (Note 5) | 15,996,806 |
|
| Securities lending | 311,504 |
|
| Total investment income | 33,631,673 |
|
| |
| EXPENSES | |
|
| Compensation of Manager (Note 2) | 5,471,476 |
|
| Investor servicing fees (Note 2) | 2,938,168 |
|
| Custodian fees (Note 2) | 69,701 |
|
| Trustee compensation and expenses (Note 2) | 53,428 |
|
| Administrative services (Note 2) | 26,815 |
|
| Distribution fees — Class A (Note 2) | 1,976,373 |
|
| Distribution fees — Class B (Note 2) | 715,739 |
|
| Distribution fees — Class C (Note 2) | 166,249 |
|
| Distribution fees — Class M (Note 2) | 362,389 |
|
| Distribution fees — Class R (Note 2) | 7,131 |
|
| Other | 405,691 |
|
| Fees waived and reimbursed by Manager (Notes 2 and 5) | (127,677) |
| |
| Total expenses | 12,065,483 |
| | |
| Expense reduction (Note 2) | (127,271) |
|
| Net expenses | 11,938,212 |
| |
| Net investment income | 21,693,461 |
|
| |
| Net realized loss on investments (Notes 1 and 3) | (460,574,754) |
|
| Net realized loss on swap contracts (Note 1) | (156,906,428) |
|
| Net realized loss on futures contracts (Note 1) | (212,572,708) |
|
| Net realized gain on foreign currency transactions (Note 1) | 39,301 |
|
| Net realized gain on written options (Notes 1 and 3) | 13,401,947 |
|
| Net unrealized appreciation of assets and liabilities in | |
| foreign currencies during the period | 87,574 |
|
| Net unrealized depreciation of investments, futures contracts, swap contracts, | |
| written options, and TBA sale commitments during the period | (116,717,485) |
|
| Net loss on investments | (933,242,553) |
| |
| Net decrease in net assets resulting from operations | $(911,549,092) |
|
The accompanying notes are an integral part of these financial statements.
78
| | |
| Statement of changes in net assets | | |
|
| |
| DECREASE IN NET ASSETS | Six months ended 1/31/09* | Year ended 7/31/08 |
|
| Operations: | | |
| Net investment income | $21,693,461 | $136,983,756 |
|
| Net realized gain (loss) on investments and foreign | | |
| currency transactions | (816,612,642) | 43,219,832 |
|
| Net unrealized depreciation of investments and assets and | | |
| liabilities in foreign currencies | (116,629,911) | (609,528,539) |
|
| Net decrease in net assets resulting from operations | (911,549,092) | (429,324,951) |
|
| Distributions to shareholders (Note 1): | | |
| From ordinary income | | |
| Net investment income | | |
|
| Class A | (45,852,121) | (110,582,286) |
|
| Class B | (3,505,352) | (9,668,928) |
|
| Class C | (807,736) | (1,904,069) |
|
| Class M | (2,514,495) | (5,379,758) |
|
| Class R | (89,557) | (75,390) |
|
| Class Y | (5,852,682) | (14,153,388) |
|
| Net realized short-term gain on investments | | |
|
| Class A | — | (100,322,461) |
|
| Class B | — | (11,660,603) |
|
| Class C | — | (2,208,422) |
|
| Class M | — | (5,622,960) |
|
| Class R | — | (65,959) |
|
| Class Y | — | (12,111,818) |
|
| From net realized long-term gain on investments | | |
| Class A | (13,098,235) | (161,440,412) |
|
| Class B | (1,164,432) | (18,764,418) |
|
| Class C | (272,167) | (3,553,826) |
|
| Class M | (814,268) | (9,048,552) |
|
| Class R | (27,166) | (106,143) |
|
| Class Y | (1,610,915) | (19,490,519) |
|
| Redemption fees (Note 1) | 2,838 | 5,227 |
|
| Decrease from capital share transactions (Note 4) | (412,313,375) | (501,093,133) |
|
| Total decrease in net assets | (1,399,468,755) | (1,416,572,769) |
| |
| NET ASSETS | | |
|
| Beginning of period | 2,815,521,248 | 4,232,094,017 |
|
| End of period (including distributions in excess of net investment | | |
| income of $31,138,935 and undistributed net investment income | | |
| of $5,789,547, respectively) | $1,416,052,493 | $2,815,521,248 |
|
| * Unaudited | | |
The accompanying notes are an integral part of these financial statements.
79
Financial highlights (For a common share outstanding throughout the period)
| | | | | | | | | | | | | | |
| INVESTMENT OPERATIONS: | | | | LESS DISTRIBUTIONS: | | | | | RATIOS AND SUPPLEMENTAL DATA: | |
|
| | | | | | | | | | | | | Ratio | Ratio of net | |
| | | | Net realized | | | | | | | | | of expenses | investment | |
| | Net asset value, | | and unrealized | Total from | From net | From net | | | | Total return | Net assets, | to average | income (loss) | |
| | beginning | Net investment | gain (loss) on | investment | investment | realized gain on | Total | Redemption | Net asset value, | at net asset | end of period | net assets | to average | Portfolio |
| Period ended | of period | income (loss) a ,b | investments | operations | income | investments | distributions | fees c | end of period | value (%) d | (in thousands) | (%) e,b | net assets (%) b | turnover (%) |
|
| Class A | | | | | | | | | | | | | | |
| January 31, 2009 ** | $13.99 | .12 | (4.90) | (4.78) | (.31) | (.09) | (.40) | — | $8.81 | (34.44) * | $1,096,372 | .56 * | 1.10 * | 107.32 *h |
| July 31, 2008 | 18.10 | .61 | (2.55) | (1.94) | (.64) | (1.53) | (2.17) | — | 13.99 | (11.84) | 2,173,291 | 1.00 | 3.80 | 123.75 h |
| July 31, 2007 | 18.21 | .48 | 1.46 | 1.94 | (.52) | (1.53) | (2.05) | — | 18.10 | 10.99 | 3,184,271 | .96 | 2.61 | 144.33 h |
| July 31, 2006 | 18.40 | .42 f | .27 | .69 | (.50) | (.38) | (.88) | — | 18.21 | 3.89 f | 3,155,761 | .90 f | 2.31 f | 117.11 h |
| July 31, 2005 | 16.91 | .35 g | 1.47 | 1.82 | (.33) | — | (.33) | — | 18.40 | 10.89 | 3,458,405 | .98 | 1.97 g | 169.29 h |
| July 31, 2004 | 15.72 | .32 | 1.20 | 1.52 | (.33) | — | (.33) | — | 16.91 | 9.77 | 3,322,532 | 1.00 | 1.90 | 165.66 |
|
| Class B | | | | | | | | | | | | | | |
| January 31, 2009 ** | $13.83 | .08 | (4.85) | (4.77) | (.26) | (.09) | (.35) | — | $8.71 | (34.71) * | $98,591 | .94 * | .71 * | 107.32 *h |
| July 31, 2008 | 17.90 | .48 | (2.52) | (2.04) | (.50) | (1.53) | (2.03) | — | 13.83 | (12.50) | 206,269 | 1.75 | 2.99 | 123.75 h |
| July 31, 2007 | 18.02 | .33 | 1.46 | 1.79 | (.38) | (1.53) | (1.91) | — | 17.90 | 10.15 | 413,532 | 1.71 | 1.82 | 144.33 h |
| July 31, 2006 | 18.22 | .28 f | .26 | .54 | (.36) | (.38) | (.74) | — | 18.02 | 3.05 f | 624,026 | 1.65 f | 1.58 f | 117.11 h |
| July 31, 2005 | 16.73 | .21 g | 1.48 | 1.69 | (.20) | — | (.20) | — | 18.22 | 10.17 | 917,951 | 1.73 | 1.22 g | 169.29 h |
| July 31, 2004 | 15.56 | .19 | 1.19 | 1.38 | (.21) | — | (.21) | — | 16.73 | 8.88 | 1,095,665 | 1.75 | 1.16 | 165.66 |
|
| Class C | | | | | | | | | | | | | | |
| January 31, 2009 ** | $13.90 | .08 | (4.88) | (4.80) | (.26) | (.09) | (.35) | — | $8.75 | (34.75) * | $23,444 | .94 * | .70 * | 107.32 *h |
| July 31, 2008 | 17.97 | .49 | (2.52) | (2.03) | (.51) | (1.53) | (2.04) | — | 13.90 | (12.41) | 46,134 | 1.75 | 3.03 | 123.75 h |
| July 31, 2007 | 18.09 | .34 | 1.45 | 1.79 | (.38) | (1.53) | (1.91) | — | 17.97 | 10.16 | 69,893 | 1.71 | 1.86 | 144.33 h |
| July 31, 2006 | 18.30 | .28 f | .25 | .53 | (.36) | (.38) | (.74) | — | 18.09 | 3.01 f | 70,192 | 1.65 f | 1.56 f | 117.11 h |
| July 31, 2005 | 16.81 | .21 g | 1.48 | 1.69 | (.20) | — | (.20) | — | 18.30 | 10.14 | 77,024 | 1.73 | 1.22 g | 169.29 h |
| July 31, 2004 | 15.63 | .19 | 1.20 | 1.39 | (.21) | — | (.21) | — | 16.81 | 8.92 | 75,185 | 1.75 | 1.16 | 165.66 |
|
| Class M | | | | | | | | | | | | | | |
| January 31, 2009 ** | $13.82 | .09 | (4.84) | (4.75) | (.28) | (.09) | (.37) | — | $8.70 | (34.62) * | $73,348 | .81 * | .80 * | 107.32 *h |
| July 31, 2008 | 17.89 | .53 | (2.52) | (1.99) | (.55) | (1.53) | (2.08) | — | 13.82 | (12.23) | 128,094 | 1.50 | 3.31 | 123.75 h |
| July 31, 2007 | 18.02 | .38 | 1.45 | 1.83 | (.43) | (1.53) | (1.96) | — | 17.89 | 10.42 | 176,993 | 1.46 | 2.10 | 144.33 h |
| July 31, 2006 | 18.22 | .33 f | .26 | .59 | (.41) | (.38) | (.79) | — | 18.02 | 3.34 f | 187,338 | 1.40 f | 1.81 f | 117.11 h |
| July 31, 2005 | 16.74 | .26 g | 1.47 | 1.73 | (.25) | — | (.25) | — | 18.22 | 10.39 | 215,816 | 1.48 | 1.47 g | 169.29 h |
| July 31, 2004 | 15.57 | .23 | 1.19 | 1.42 | (.25) | — | (.25) | — | 16.74 | 9.18 | 217,046 | 1.50 | 1.40 | 165.66 |
|
| Class R | | | | | | | | | | | | | | |
| January 31, 2009 ** | $13.94 | .11 | (4.88) | (4.77) | (.30) | (.09) | (.39) | — | $8.78 | (34.51) * | $1,291 | .69 * | .99 * | 107.32 *h |
| July 31, 2008 | 18.04 | .57 | (2.54) | (1.97) | (.60) | (1.53) | (2.13) | — | 13.94 | (12.04) | 4,274 | 1.25 | 3.66 | 123.75 h |
| July 31, 2007 | 18.15 | .44 | 1.46 | 1.90 | (.48) | (1.53) | (2.01) | — | 18.04 | 10.76 | 2,044 | 1.21 | 2.38 | 144.33 h |
| July 31, 2006 | 18.36 | .36 f | .27 | .63 | (.46) | (.38) | (.84) | — | 18.15 | 3.57 f | 1,525 | 1.15 f | 2.00 f | 117.11 h |
| July 31, 2005 | 16.89 | .30 g | 1.48 | 1.78 | (.31) | — | (.31) | — | 18.36 | 10.63 | 726 | 1.23 | 1.67 g | 169.29 h |
| July 31, 2004 | 15.70 | .21 | 1.29 | 1.50 | (.31) | — | (.31) | — | 16.89 | 9.60 | 127 | 1.25 | 1.33 | 165.66 |
|
| Class Y | | | | | | | | | | | | | | |
| January 31, 2009 ** | $14.04 | .14 | (4.92) | (4.78) | (.33) | (.09) | (.42) | — | $8.84 | (34.36) * | $123,006 | .43 * | 1.24 * | 107.32 *h |
| July 31, 2008 | 18.15 | .66 | (2.55) | (1.89) | (.69) | (1.53) | (2.22) | — | 14.04 | (11.57) | 257,459 | .75 | 4.05 | 123.75 h |
| July 31, 2007 | 18.26 | .53 | 1.46 | 1.99 | (.57) | (1.53) | (2.10) | — | 18.15 | 11.24 | 385,361 | .71 | 2.86 | 144.33 h |
| July 31, 2006 | 18.46 | .47 f | .26 | .73 | (.55) | (.38) | (.93) | — | 18.26 | 4.09 f | 493,985 | .65 f | 2.59 f | 117.11 h |
| July 31, 2005 | 16.95 | .40 g | 1.49 | 1.89 | (.38) | — | (.38) | — | 18.46 | 11.26 | 660,532 | .73 | 2.23 g | 169.29 h |
| July 31, 2004 | 15.76 | .36 | 1.21 | 1.57 | (.38) | — | (.38) | — | 16.95 | 10.03 | 848,161 | .75 | 2.16 | 165.66 |
|
See notes to financial highlights at the end of this section.
The accompanying notes are an integral part of these financial statements.
Financial highlights (Continued)
* Not annualized.
** Unaudited.
a Per share net investment income (loss) has been determined on the basis of the weighted average number of shares outstanding during the period.
b Reflects an involuntary contractual expense limitation and/or waivers of certain fund expenses in connection with investments in Putnam Prime Money Market Fund in effect during the period. As a result of such limitation and/or waivers, the expenses of each class reflect a reduction of the following amounts (Notes 2 and 5):
| |
| | Percentage of |
| | average net assets |
|
| January 31, 2009 | 0.01% |
|
| July 31, 2008 | <0.01 |
|
| July 31, 2007 | <0.01 |
|
| July 31, 2006 | 0.01 |
|
| July 31, 2005 | 0.01 |
|
| July 31, 2004 | <0.01 |
|
c Amount represents less than $0.01 per share.
d Total return assumes dividend reinvestment and does not reflect the effect of sales charges.
e Includes amounts paid through expense offset and brokerage/service arrangements (Note 2).
f Reflects a non-recurring reimbursement from Putnam Investments relating to the calculation of certain amounts paid by the fund to Putnam in previous years for transfer agent services, which amounted to $0.01 per share and 0.05% of average net assets for the period ended July 31, 2006.
g Reflects a non-recurring accrual related to Putnam Management’s settlement with the SEC regarding brokerage allocation practices, which amounted to less than $0.01 per share and 0.02% of average net assets.
h Portfolio turnover excludes dollar roll transactions.
The accompanying notes are an integral part of these financial statements.
82
Notes to financial statements 1/31/09 (Unaudited)
Note 1: Significant accounting policies
The George Putnam Fund of Boston (the “fund”), a Massachusetts business trust, is registered under the Investment Company Act of 1940, as amended, as a diversified, open-end management investment company. The fund seeks to provide a balanced investment comprised of a well-diversified portfolio of stocks and bonds, which will produce both capital growth and current income. The fund may invest a significant portion of its assets in securitized debt instruments, including mortgage-backed and asset-backed investments. The yields and values of these investments are sensitive to changes in interest rates, the rate of principal payments on the underlying assets and the market’s perception of the issuers. The market for these investments may be volatile and limited, which may make them difficult to buy or sell.
The fund offers class A, class B, class C, class M, class R and class Y shares. Class A and class M shares are sold with a maximum front-end sales charge of 5.75% and 3.50%, respectively, and generally do not pay a contingent deferred sales charge. Class B shares, which convert to class A shares after approximately eight years, do not pay a front-end sales charge and are subject to a contingent deferred sales charge, if those shares are redeemed within six years of purchase. Class C shares have a one-year 1.00% contingent deferred sales charge and do not convert to class A shares. Class R shares, which are offered to qualified employee-benefit plans, are sold at net asset value. The expenses for class A, class B, class C, class M and class R shares may differ based on the distribution fee of each class, which is identified in Note 2. Class Y shares, which are sold at net asset value, are generally subject to the same expenses as class A, class B, class C, class M an d class R shares, but do not bear a distribution fee. Class Y shares are generally only available to corporate and institutional clients and clients in other approved programs.
A 1.00% redemption fee may apply on any shares that are redeemed (either by selling or exchanging into another fund) within 7 days of purchase. The redemption fee is accounted for as an addition to paid-in-capital.
Investment income, realized and unrealized gains and losses and expenses of the fund are borne pro-rata based on the relative net assets of each class to the total net assets of the fund, except that each class bears expenses unique to that class (including the distribution fees applicable to such classes). Each class votes as a class only with respect to its own distribution plan or other matters on which a class vote is required by law or determined by the Trustees. If the fund were liquidated, shares of each class would receive their pro-rata share of the net assets of the fund. In addition, the Trustees declare separate dividends on each class of shares.
In the normal course of business, the fund enters into contracts that may include agreements to indemnify another party under given circumstances. The fund’s maximum exposure under these arrangements is unknown as this would involve future claims that may be, but have not yet been, made against the fund. However, the fund’s management team expects the risk of material loss to be remote.
The following is a summary of significant accounting policies consistently followed by the fund in the preparation of its financial statements. The preparation of financial statements is in conformity with accounting principles generally accepted in the United States of America and requires management to make estimates and assumptions that affect the reported amounts of assets and liabilities in the financial statements and the reported amounts of increases and decreases in net assets from operations during the reporting period. Actual results could differ from those estimates.
A) Security valuation Investments for which market quotations are readily available are valued at the last reported sales price on their principal exchange, or official closing price for certain markets. If no sales are reported — as in the case of some securities traded over-the-counter — a security is valued at its last reported bid price. Market quotations are not considered to be readily available for certain debt obligations; such investments are valued on the basis of valuations furnished by an independent pricing service approved by the Trustees or dealers selected by Putnam Investment Management, LLC (“Putnam Management”), the fund’s manager, a wholly-owned subsidiary of Putnam Investments, LLC. Such services or dealers determine valuations for normal institutional-size trading units of such securities using methods based on market transactions for comparable securities and various relations hips, generally recognized by institutional traders, between securities. Many securities markets and exchanges outside the U.S. close prior to
83
the close of the New York Stock Exchange and therefore the closing prices for securities in such markets or on such exchanges may not fully reflect events that occur after such close but before the close of the New York Stock Exchange. Accordingly, on certain days, the fund will fair value foreign equity securities taking into account multiple factors, including movements in the U.S. securities markets. The number of days on which fair value prices will be used will depend on market activity and it is possible that fair value prices will be used by the fund to a significant extent. Securities quoted in foreign currencies, if any, are translated into U.S. dollars at the current exchange rate. To the extent a pricing service or dealer is unable to value a security or provides a valuation which Putnam Management does not believe accurately reflects the security’s fair value, the security will be valued at fair value by Putnam Management. Certain investments, inclu ding certain restricted and illiquid securities and derivatives, are also valued at fair value following procedures approved by the Trustees. Such valuations and procedures are reviewed periodically by the Trustees. Certain securities may be valued on the basis of a price provided by a single source. The fair value of securities is generally determined as the amount that the fund could reasonably expect to realize from an orderly disposition of such securities over a reasonable period of time. By its nature, a fair value price is a good faith estimate of the value of a security at a given point in time and does not reflect an actual market price, which may be different by a material amount.
Tax-exempt bonds and notes are generally valued on the basis of valuations provided by an independent pricing service approved by the Trustees. Such services use information with respect to transactions in bonds, quotations from bond dealers, market transactions in comparable securities and various relationships between securities in determining value.
B) Joint trading account Pursuant to an exemptive order from the Securities and Exchange Commission (the “SEC”), the fund may transfer uninvested cash balances, including cash collateral received under security lending arrangements, into a joint trading account along with the cash of other registered investment companies and certain other accounts managed by Putnam Management. These balances may be invested in issues of short-term investments having maturities of up to 397 days for collateral received under security lending arrangements and up to 90 days for other cash investments.
C) Repurchase agreements The fund, or any joint trading account, through its custodian, receives delivery of the underlying securities, the market value of which at the time of purchase is required to be in an amount at least equal to the resale price, including accrued interest. Collateral for certain tri-party repurchase agreements is held at the counterparty’s custodian in a segregated account for the benefit of the fund and the counterparty. Putnam Management is responsible for determining that the value of these underlying securities is at all times at least equal to the resale price, including accrued interest.
D) Security transactions and related investment income Security transactions are recorded on the trade date (the date the order to buy or sell is executed). Gains or losses on securities sold are determined on the identified cost basis. Interest income is recorded on the accrual basis. Dividend income, net of applicable withholding taxes, is recognized on the ex-dividend date except that certain dividends from foreign securities, if any, are recognized as soon as the fund is informed of the ex-dividend date. Non-cash dividends, if any, are recorded at the fair market value of the securities received. Dividends representing a return of capital or capital gains, if any, are reflected as a reduction of cost and/or as a realized gain. All premiums/discounts are amortized/accreted on a yield-to-maturity basis.
Securities purchased or sold on a forward commitment or delayed delivery basis may be settled a month or more after the trade date; interest income is accrued based on the terms of the securities. Losses may arise due to changes in the market value of the underlying securities or if the counterparty does not perform under the contract.
The fund earned certain fees in connection with its senior loan purchasing activities. These fees are treated as market discount and are recorded as income in the Statement of operations.
E) Stripped securities The fund may invest in stripped securities which represent a participation in securities that may be structured in classes with rights to receive different portions of the interest and principal. Interest-only securities receive all of the interest and principal-only securities receive all of the principal. If the interest-only securities experience greater than anticipated prepayments of principal, the fund may fail to recoup fully its initial investment in these securities. Conversely, principal-only securities increase in value if prepayments are greater than anticipated and decline if prepayments are slower than anticipated. The market
84
value of these securities is highly sensitive to changes in interest rates.
F) Foreign currency translation The accounting records of the fund are maintained in U.S. dollars. The market value of foreign securities, currency holdings, and other assets and liabilities is recorded in the books and records of the fund after translation to U.S. dollars based on the exchange rates on that day. The cost of each security is determined using historical exchange rates. Income and withholding taxes are translated at prevailing exchange rates when earned or incurred.The fund does not isolate that portion of realized or unrealized gains or losses resulting from changes in the foreign exchange rate on investments from fluctuations arising from changes in the market prices of the securities. Such gains and losses are included with the net realized and unrealized gain or loss on investments. Net realized gains and losses on foreign currency transactions represent net realized exchange gains or losses on closed for ward currency contracts, disposition of foreign currencies, currency gains and losses realized between the trade and settlement dates on securities transactions and the difference between the amount of investment income and foreign withholding taxes recorded on the fund’s books and the U.S. dollar equivalent amounts actually received or paid. Net unrealized appreciation and depreciation of assets and liabilities in foreign currencies arise from changes in the value of open forward currency contracts and assets and liabilities other than investments at the period end, resulting from changes in the exchange rate. Investments in foreign securities involve certain risks, including those related to economic instability, unfavorable political developments, and currency fluctuations, not present with domestic investments.
G) Forward currency contracts The fund may buy and sell forward currency contracts, which are agreements between two parties to buy and sell currencies at a set price on a future date. These contracts are used to protect against a decline in value relative to the U.S. dollar of the currencies in which its portfolio securities are denominated or quoted (or an increase in the value of a currency in which securities a fund intends to buy are denominated, when a fund holds cash reserves and short term investments), or for other investment purposes. The U.S. dollar value of forward currency contracts is determined using current forward currency exchange rates supplied by a quotation service. The market value of the contract will fluctuate with changes in currency exchange rates. The contract is marked to market daily and the change in market value is recorded as an unrealized gain or loss. When the contract is closed, the fund records a realized gain or loss equal to the difference between the value of the contract at the time it was opened and the value at the time it was closed. The fund could be exposed to risk if the value of the currency changes unfavorably, if the counterparties to the contracts are unable to meet the terms of their contracts or if the fund is unable to enter into a closing position. Risks may exceed amounts recognized on the Statement of assets and liabilities. Forward currency contracts outstanding at period end, if any, are listed after the fund’s portfolio.
H) Futures and options contracts The fund may use futures and options contracts to hedge against changes in the values of securities the fund owns, owned or expects to purchase, or for other investment purposes. The fund may also write options on swaps or securities it owns or in which it may invest to increase its current returns.
The potential risk to the fund is that the change in value of futures and options contracts may not correspond to the change in value of the hedged instruments. In addition, losses may arise from changes in the value of the underlying instruments, if there is an illiquid secondary market for the contracts, or if the counterparty to the contract is unable to perform. Risks may exceed amounts recognized on the Statement of assets and liabilities.When the contract is closed, the fund records a realized gain or loss equal to the difference between the value of the contract at the time it was opened and the value at the time it was closed. Realized gains and losses on purchased options are included in realized gains and losses on investment securities. If a written call option is exercised, the premium originally received is recorded as an addition to sales proceeds. If a written put option is exercised, the premium originally received is recorded as a reduction to the c ost of investments.
Futures contracts are valued at the quoted daily settlement prices established by the exchange on which they trade. The fund and the broker agree to exchange an amount of cash equal to the daily fluctuation in the value of the futures contract. Such receipts or payments are known as “variation margin.” Exchange traded options are valued at the last sale price or, if no sales are reported, the last bid price for purchased options and the last ask price for written options. Options traded over-the-counter are valued using prices supplied by dealers. Futures and written option contracts outstanding at period end, if any, are listed after the fund’s portfolio.
I) Total return swap contracts The fund may enter into total return swap contracts, which are arrangements
85
to exchange a market linked return for a periodic payment, both based on a notional principal amount. To the extent that the total return of the security, index or other financial measure underlying the transaction exceeds or falls short of the offsetting interest rate obligation, the fund will receive a payment from or make a payment to the counterparty. Total return swap contracts are marked to market daily based upon quotations from market makers and the change, if any, is recorded as an unrealized gain or loss. Payments received or made are recorded as realized gains or losses. Certain total return swap contracts may include extended effective dates. Payments related to these swap contracts are accrued based on the terms of the contract. The fund could be exposed to credit or market risk due to unfavorable changes in the fluctua-tion of interest rates or in the price of the underlying security or index, the possibility that there is no liquid market for these ag reements or that the counterparty may default on its obligation to perform. Risk of loss may exceed amounts recognized on the Statement of assets and liabilities. Total return swap contracts outstanding at period end, if any, are listed after the fund’s portfolio.
J) Interest rate swap contracts The fund may enter into interest rate swap contracts, which are arrangements between two parties to exchange cash flows based on a notional principal amount, to manage the fund’s exposure to interest rates. An interest rate swap can be purchased or sold with an upfront premium. An upfront payment received by the fund is recorded as a liability on the fund’s books. An upfront payment made by the fund is recorded as an asset on the fund’s books. Interest rate swap contracts are marked to market daily based upon quotations from an independent pricing service or market makers and the change, if any, is recorded as an unrealized gain or loss. Payments received or made are recorded as realized gains or losses. Certain interest rate swap contracts may include extended effective dates. Payments related to these swap contracts are accrued based on the terms of the contract. The f und could be exposed to credit or market risk due to unfavorable changes in the fluctuation of interest rates or if the counterparty defaults on its obligation to perform. Risk of loss may exceed amounts recognized on the Statement of assets and liabilities. Interest rate swap contracts outstanding at period end, if any, are listed after the fund’s portfolio.
K) Credit default contracts The fund may enter into credit default contracts to provide a measure of protection against risk of loss following a default, or other credit event in respect of issuers within an underlying index or a single issuer, or to gain credit exposure to an underlying index or issuer. In a credit default contract, the protection buyer typically makes an up front payment and a periodic stream of payments to a counterparty, the protection seller, in exchange for the right to receive a contingent payment upon the occurrence of a credit event on the reference obligation or all other equally ranked obligations of the reference entity. Credit events are contract specific but may include bankruptcy, failure to pay, restructuring and obligation acceleration. An upfront payment received by the fund, as the protection seller, is recorded as a liability on the fund’s books. An upfront payment made by the fund, as the protection buyer, is recorded as an asset on the fund’s books. Periodic payments received or paid by the fund are recorded as realized gains or losses. The credit default contracts are marked to market daily based upon quotations from an independent pricing service or market makers and the change, if any, is recorded as an unrealized gain or loss. Upon the occurrence of a credit event, the difference between the par value and market value of the reference obligation, net of any proportional amount of the upfront payment, is recorded as a realized gain or loss.
In addition to bearing the risk that the credit event will occur, the fund could be exposed to market risk due to unfavorable changes in interest rates or in the price of the underlying security or index or the possibility that the fund may be unable to close out its position at the same time or at the same price as if it had purchased the underlying reference obligations. In certain circumstances, the fund may enter into offsetting credit default contracts which would mitigate its risk of loss. Risks of loss may exceed amounts recognized on the Statement of assets and liabilities. The fund’s maximum risk of loss from counterparty risk, either as the protection seller or as the protection buyer, is the fair value of the contract. This risk is mitigated by having a master netting arrangement between the fund and the counterparty. Where the fund is a seller of protection, the maximum potential amount of future payments the fund may be required to make is equal to the notional amount of the relevant credit default contract. Credit default contracts outstanding, including their respective notional amounts at period end, if any, are listed after the fund’s portfolio.
L) TBA purchase commitments The fund may enter into “TBA” (to be announced) commitments to purchase securities for a fixed unit price at a future date beyond customary settlement time. Although the unit price has been established, the principal value
86
has not been finalized. However, the amount of the commitments will not significantly differ from the principal amount. The fund holds, and maintains until settlement date, cash or high-grade debt obligations in an amount sufficient to meet the purchase price, or the fund may enter into offsetting contracts for the forward sale of other securities it owns. Income on the securities will not be earned until settlement date. TBA purchase commitments may be considered securities themselves, and involve a risk of loss if the value of the security to be purchased declines prior to the settlement date, which risk is in addition to the risk of decline in the value of the fund’s other assets. Unsettled TBA purchase commitments are valued at fair value of the underlying securities, according to the procedures described under “Security valuation” above. The contract is marked to market daily and the change in market value is recorded by the fund as an unrealized gain or loss.
Although the fund will generally enter into TBA purchase commitments with the intention of acquiring securities for its portfolio or for delivery pursuant to options contracts it has entered into, the fund may dispose of a commitment prior to settlement if Putnam Management deems it appropriate to do so.
M) TBA sale commitments The fund may enter into TBA sale commitments to hedge its portfolio positions or to sell mortgage-backed securities it owns under delayed delivery arrangements. Proceeds of TBA sale commitments are not received until the contractual settlement date. During the time a TBA sale commitment is outstanding, equivalent deliverable securities or an offsettingTBA purchase commitment deliverable on or before the sale commitment date, are held as “cover” for the transaction.
Unsettled TBA sale commitments are valued at the fair value of the underlying securities, generally according to the procedures described under “Security valuation” above. The contract is marked to market daily and the change in market value is recorded by the fund as an unrealized gain or loss. If the TBA sale commitment is closed through the acquisition of an offsetting TBA purchase commitment, the fund realizes a gain or loss. If the fund delivers securities under the commitment, the fund realizes a gain or a loss from the sale of the securities based upon the unit price established at the date the commitment was entered into. TBA sale commitments outstanding at period end, if any, are listed after the fund’s portfolio.
N) Dollar rolls To enhance returns, the fund may enter into dollar rolls (principally using TBAs) in which the fund sells securities for delivery in the current month and simultaneously contracts to purchase similar securities on a specified future date. During the period between the sale and subsequent purchase, the fund will not be entitled to receive income and principal payments on the securities sold.The fund will, however, retain the difference between the initial sales price and the forward price for the future purchase. The fund will also be able to earn interest on the cash proceeds that are received from the initial sale, on settlement date. The fund may be exposed to market or credit risk if the price of the security changes unfavorably or the counterparty fails to perform under the terms of the agreement.
O) Securities lending The fund may lend securities, through its agents, to qualified borrowers in order to earn additional income. The loans are collateralized by cash and/or securities in an amount at least equal to the market value of the securities loaned. The market value of securities loaned is determined daily and any additional required collateral is allocated to the fund on the next business day. The risk of borrower default will be borne by the fund’s agents; the fund will bear the risk of loss with respect to the investment of the cash collateral. Income from securities lending is included in investment income on the Statement of operations. At January 31, 2009, the fund had no securities out on loan.
P) Federal taxes It is the policy of the fund to distribute all of its taxable income within the prescribed time and otherwise comply with the provisions of the Internal Revenue Code of 1986, as amended (the “Code”), applicable to regulated investment companies. It is also the intention of the fund to distribute an amount sufficient to avoid imposition of any excise tax under Section 4982 of the Code. The fund is subject to the provisions of FASB Interpretation No. 48, Accounting for Uncertainties in Income Taxes (“FIN 48”). FIN 48 sets forth a minimum threshold for financial statement recognition of the benefit of a tax position taken or expected to be taken in a tax return. The fund did not have any unrecognized tax benefits in the accompanying financial statements. Therefore, no provision has been made for federal taxes on income, capital gains or unrealized appreciation on securities held nor for exc ise tax on income and capital gains. Each of the fund’s federal tax returns for the prior three fiscal years remains subject to examination by the Internal Revenue Service.
At July 31, 2008, the fund had a capital loss carryover of $17,850,860 available to the extent allowed by the Code
87
to offset future net capital gain, if any. The amount of the carryover and the expiration dates are:
| | | |
| Loss Carryover | | Expiration | |
| |
| $11,900,540 | | July 31, 2010 | |
| |
| 5,950,320 | | July 31, 2011 | |
| |
The aggregate identified cost on a tax basis is $3,546,460,624, resulting in gross unrealized appreciation and depreciation of $185,466,656 and $432,350,491, respectively, or net unrealized depreciation of $246,883,835.
Q) Distributions to shareholders Distributions to shareholders from net investment income are recorded by the fund on the ex-dividend date. Distributions from capital gains, if any, are recorded on the ex-dividend date and paid at least annually. The amount and character of income and gains to be distributed are determined in accordance with income tax regulations, which may differ from generally accepted accounting principles. Dividend sources are estimated at the time of declaration. Actual results may vary. Any non-taxable return of capital cannot be determined until final tax calculations are completed after the end of the fund’s fiscal year. Reclassifications are made to the fund’s capital accounts to reflect income and gains available for distribution (or available capital loss carryovers) under income tax regulations.
Note 2: Management fee, administrative services and other transactions
The fund pays Putnam Management for management and investment advisory services quarterly based on the average net assets of the fund. Such fee is based on the following annual rates: 0.65% of the first $500 million of average net assets, 0.55% of the next $500 million, 0.50% of the next $500 million, 0.45% of the next $5 billion, 0.425% of the next $5 billion, 0.405% of the next $5 billion, 0.39% of the next $5 billion and 0.38% thereafter.
Putnam Management has agreed to waive fees and reimburse expenses of the fund through June 30, 2009 to the extent necessary to ensure that the fund’s expenses do not exceed the simple average of the expenses of all front-end load funds viewed by Lipper Inc. as having the same investment classification or objective as the fund. The expense reimbursement is based on a comparison of the fund’s expenses with the average annualized operating expenses of the funds in its Lipper peer group for each calendar quarter during the fund’s last fiscal year, excluding 12b-1 fees and without giving effect to any expense offset and brokerage/service arrangements that may reduce fund expenses. For the period ended January 31, 2009, Putnam Management waived $124,893 of its management fee from the fund.
Putnam Investments Limited (“PIL”), an affiliate of Putnam Management, is authorized by the Trustees to manage a separate portion of the assets of the fund as determined by Putnam Management from time to time. Putnam Management pays a quarterly sub-management fee to PIL for its services at an annual rate of 0.40% of the average net assets of the portion of the fund managed by PIL.
On September 26, 2008, the fund entered into Agreements with other registered investment companies (each a“Seller”) managed by Putnam Management. Under the Agreements, the Seller sold to the fund the right to receive, in the aggregate, $4,129,699 in net payments from Lehman Brothers Special Financing, Inc. in connection with certain terminated derivatives transactions (the“Receivable”), in each case in exchange for an initial payment plus (or minus) additional amounts based on the fund’s ultimate realized gain (or loss) with respect to the Receivable. The Receivable will be offset against the fund’s net payable to Lehman Brothers Special Financing, Inc. and is included in the Statement of assets and liabilities within Payable for closed swap contracts. Future payments under the Agreements are valued at fair value following procedures approved by the Trustees and are included in the Statement of assets and liabilities. All remaining paym ents under the Agreements will be recorded as realized gain or loss.
The fund reimburses Putnam Management an allocated amount for the compensation and related expenses of certain officers of the fund and their staff who provide administrative services to the fund. The aggregate amount of all such reimbursements is determined annually by the Trustees.
Custodial functions for the fund’s assets were provided by State Street Bank andTrust Company (“State Street”). Custody fees are based on the fund’s asset level, the number of its security holdings and transaction volumes.
Putnam Investor Services, Inc., an affiliate of Putnam Management, provided investor servicing agent functions to the fund. Prior to December 31, 2008, these services were provided by Putnam Investor Services, a division of Putnam Fiduciary Trust Company (“PFTC”), which is an affiliate of Putnam Management. Putnam Investor Services, Inc. and Putnam Investor Services
88
received fees for investor servicing, subject to certain limitations, based on the number of shareholder accounts in the fund and the level of defined contribution plan assets in the fund. The amounts incurred for investor servicing agent functions provided by affiliates of Putnam Management during the six months ended January 31, 2009 are included in Investor servicing fees in the Statement of operations.
Under the custodian contract between the fund and State Street, the custodian bank has a lien on the securities of the fund to the extent permitted by the fund’s investment restrictions to cover any advances made by the custodian bank for the settlement of securities purchased by the fund. At January 31, 2009, the payable to the custodian bank represents the amount due for cash advanced for the settlement of securities purchased.
The fund has entered into expense offset arrangements with PFTC and State Street whereby PFTC’s and State Street’s fees are reduced by credits allowed on cash balances. The fund also reduced expenses through brokerage/service arrangements. For the six months ended January 31, 2009, the fund’s expenses were reduced by $65,609 under the expense offset arrangements and by $61,662 under the brokerage/ service arrangements.
Each independent Trustee of the fund receives an annual Trustee fee, of which $935, as a quarterly retainer, has been allocated to the fund, and an additional fee for each Trustees meeting attended. Trustees receive additional fees for attendance at certain committee meetings and industry seminars and for certain compliance-related matters. Trustees also are reimbursed for expenses they incur relating to their services as Trustees.
The fund has adopted a Trustee Fee Deferral Plan (the “Deferral Plan”) which allows the Trustees to defer the receipt of all or a portion of Trustees fees payable on or after July 1, 1995. The deferred fees remain invested in certain Putnam funds until distribution in accordance with the Deferral Plan.
The fund has adopted an unfunded noncontributory defined benefit pension plan (the “Pension Plan”) covering all Trustees of the fund who have served as a Trustee for at least five years and were first elected prior to 2004. Benefits under the Pension Plan are equal to 50% of the Trustee’s average annual attendance and retainer fees for the three years ended December 31, 2005. The retirement benefit is payable during a Trustee’s lifetime, beginning the year following retirement, for the number of years of service through December 31, 2006. Pension expense for the fund is included in Trustee compensation and expenses in the Statement of operations. Accrued pension liability is included in Payable for Trustee compensation and expenses in the Statement of assets and liabilities. The Trustees have terminated the Pension Plan with respect to any Trustee first elected after 2003.
The fund has adopted distribution plans (the “Plans”) with respect to its class A, class B, class C, class M and class R shares pursuant to Rule 12b-1 under the Investment Company Act of 1940. The purpose of the Plans is to compensate Putnam Retail Management Limited Partnership, a wholly-owned subsidiary of Putnam Investments, LLC and Putnam Retail Management GP, Inc., for services provided and expenses incurred in distributing shares of the fund. The Plans provide for payments by the fund to Putnam Retail Management Limited Partnership at an annual rate of up to 0.35%, 1.00%, 1.00%, 1.00% and 1.00% of the average net assets attributable to class A, class B, class C, class M and class R shares, respectively. The Trustees have approved payment by the fund at an annual rate of 0.25%, 1.00%, 1.00%, 0.75% and 0.50% of the average net assets attributable to class A, class B, class C, class M and class R shares, respectively.
For the six months ended January 31, 2009, Putnam Retail Management Limited Partnership, acting as underwriter, received net commissions of $40,855 and $295 from the sale of class A and class M shares, respectively, and received $73,831 and $761 in contingent deferred sales charges from redemptions of class B and class C shares, respectively.
A deferred sales charge of up to 1.00% and 0.65% is assessed on certain redemptions of class A and class M shares, respectively. For the six months ended January 31, 2009, Putnam Retail Management Limited Partnership, acting as underwriter, received $32 and no monies on class A and class M redemptions, respectively.
Note 3: Purchases and sales of securities
During the six months ended January 31, 2009, cost of purchases and proceeds from sales of investment securities other than short-term investments aggregated $2,358,717,951 and $3,257,777,707, respectively. There were no purchases or sales of U.S. government securities.
Written option transactions during the period ended January 31, 2009 are summarized as follows:
89
| | | | |
| | Contract | Premiums | | |
| | Amounts | Received | | |
| | |
| Written options | | | | |
| outstanding at | | | | |
| beginning of period | $1,545,477,000 | $43,872,569 | | |
| | |
| Options opened | 155,090,000 | 5,821,600 | | |
| Options exercised | — | — | | |
| Options expired | (446,934,000) | (12,063,606) | | |
| Options closed | (638,519,000) | (8,401,052) | | |
| | |
| Written options | | | | |
| outstanding at | | | | |
| end of period | $615,114,000 | $29,229,511 | | |
| | |
Note 4: Capital shares
At January 31, 2009, there was an unlimited number of shares of beneficial interest authorized. Transactions in capital shares were as follows:
| | | | |
| | Six months ended 1/31/09 | Year ended 7/31/08 |
|
| Class A | Shares | Amount | Shares | Amount |
|
| Shares sold | 6,495,974 | $68,042,544 | 16,056,731 | $261,006,315 |
|
| Shares issued in connection with | 5,357,713 | 54,130,460 | 22,051,614 | 347,975,308 |
| reinvestment of distributions | | | | |
|
| | 11,853,687 | 122,173,004 | 38,108,345 | 608,981,623 |
|
| Shares repurchased | (42,655,658) | (435,384,546) | (58,788,743) | (919,327,285) |
|
| Net decrease | (30,801,971) | $(313,211,542) | (20,680,398) | $(310,345,662) |
|
| |
| | Six months ended 1/31/09 | Year ended 7/31/08 |
|
| Class B | Shares | Amount | Shares | Amount |
|
| Shares sold | 370,898 | $3,775,866 | 917,379 | $14,859,933 |
|
| Shares issued in connection with | 444,924 | 4,429,593 | 2,432,178 | 37,962,145 |
| reinvestment of distributions | | | | |
|
| | 815,822 | 8,205,459 | 3,349,557 | 52,822,078 |
|
| Shares repurchased | (4,405,094) | (47,561,992) | (11,543,939) | (184,505,086) |
|
| Net decrease | (3,589,272) | $(39,356,533) | (8,194,382) | $(131,683,008) |
|
| |
| | Six months ended 1/31/09 | Year ended 7/31/08 |
|
| Class C | Shares | Amount | Shares | Amount |
|
| Shares sold | 108,521 | $1,161,693 | 308,883 | $5,097,974 |
|
| Shares issued in connection with | 97,048 | 966,186 | 428,594 | 6,712,587 |
| reinvestment of distributions | | | | |
|
| | 205,569 | 2,127,879 | 737,477 | 11,810,561 |
|
| Shares repurchased | (846,475) | (8,879,463) | (1,306,785) | (20,413,790) |
|
| Net decrease | (640,906) | $(6,751,584) | (569,308) | $(8,603,229) |
|
90
| | | | |
| | Six months ended 1/31/09 | Year ended 7/31/08 |
|
| Class M | Shares | Amount | Shares | Amount |
|
| Shares sold | 481,742 | $4,942,155 | 854,157 | $13,662,326 |
|
| Shares issued in connection with | 331,910 | 3,282,968 | 1,271,984 | 19,823,462 |
| reinvestment of distributions | | | | |
|
| | 813,652 | 8,225,123 | 2,126,141 | 33,485,788 |
|
| Shares repurchased | (1,650,965) | (17,336,053) | (2,750,693) | (43,141,801) |
|
| Net decrease | (837,313) | $(9,110,930) | (624,552) | $(9,656,013) |
|
| |
| | Six months ended 1/31/09 | Year ended 7/31/08 |
|
| Class R | Shares | Amount | Shares | Amount |
|
| Shares sold | 23,635 | $252,284 | 253,697 | $3,765,550 |
|
| Shares issued in connection with | 11,634 | 116,721 | 15,766 | 247,492 |
| reinvestment of distributions | | | | |
|
| | 35,269 | 369,005 | 269,463 | 4,013,042 |
|
| Shares repurchased | (194,770) | (1,786,051) | (76,230) | (1,193,862) |
|
| Net increase (decrease) | (159,501) | $(1,417,046) | 193,233 | $2,819,180 |
|
| |
| | Six months ended 1/31/09 | Year ended 7/31/08 |
|
| Class Y | Shares | Amount | Shares | Amount |
|
| Shares sold | 4,464,669 | $45,838,807 | 4,457,341 | $69,571,597 |
|
| Shares issued in connection with | 736,333 | 7,463,597 | 2,890,613 | 45,755,725 |
| reinvestment of distributions | | | | |
|
| | 5,201,002 | 53,302,404 | 7,347,954 | 115,327,322 |
|
| Shares repurchased | (9,618,329) | (95,768,144) | (10,242,103) | (158,951,723) |
|
| Net decrease | (4,417,327) | $(42,465,740) | (2,894,149) | $(43,624,401) |
|
Note 5: Investment in Putnam Prime
Money Market Fund
The fund invested in Putnam Prime Money Market Fund, an open-end management investment company managed by Putnam Management. Investments in Putnam Prime Money Market Fund were valued at its closing net asset value each business day. Management fees paid by the fund were reduced by an amount equal to the management fees paid by Putnam Prime Money Market Fund with respect to assets invested by the fund in Putnam Prime Money Market Fund. For the period ended January 31, 2009, management fees paid were reduced by $2,784 relating to the fund’s investment in Putnam Prime Money Market Fund. Income distributions earned by the fund were recorded as interest income in the Statement of operations and totaled $26,421 for the period ended January 31, 2009. During the period ended January 31, 2009, cost of purchases and proceeds of sales of investments in Putnam Prime Money Market Fund aggregated $73,164,134 and $120,358,864, respectively.
On September 17, 2008, the Trustees of the Putnam Prime Money Market Fund voted to close that fund effective September 17, 2008. On September 24, 2008, the fund received shares of Federated Prime Obligations Fund, an unaffiliated management investment company registered under the Investment Company Act of 1940, in liquidation of its shares of Putnam Prime Money Market Fund.
Note 6: Senior loan commitments
Senior loans are purchased or sold on a when-issued or delayed delivery basis and may be settled a month or more after the trade date, which from time to time can delay the actual investment of available cash balances; interest income is accrued based on the terms of the securities. Senior loans can be acquired through an agent, by assignment from another holder of the loan, or as a participation interest in another holder’s portion of the loan. When the fund invests in a loan or participation, the fund is subject to the risk that an intermediate participant between the fund and the borrower will fail to meet its obligations to the fund, in addition to the risk that the borrower under the loan may default on its obligations.
91
Note 7: Regulatory matters and litigation
In late 2003 and 2004, Putnam Management settled charges brought by the SEC and the Massachusetts Securities Division in connection with excessive short-term trading in Putnam funds. Distribution of payments from Putnam Management to certain open-end Putnam funds and their shareholders is expected to be completed in the next several months. These allegations and related matters have served as the general basis for certain lawsuits, including purported class action lawsuits against Putnam Management and, in a limited number of cases, some Putnam funds. Putnam Management believes that these lawsuits will have no material adverse effect on the funds or on Putnam Management’s ability to provide investment management services. In addition, Putnam Management has agreed to bear any costs incurred by the Putnam funds as a result of these matters.
Note 8: New accounting pronouncement
In March 2008, Statement of Financial Accounting Standards No. 161, Disclosures about Derivative Instruments and Hedging Activities (“SFAS 161”) — an amendment of FASB Statement No. 133, was issued and is effective for fiscal years and interim periods beginning after November 15, 2008. SFAS 161 requires enhanced disclosures about how and why an entity uses derivative instruments and how derivative instruments affect an entity’s financial position. Putnam Management is currently evaluating the impact the adoption of SFAS 161 will have on the fund’s financial statement disclosures.
Note 9: Market and credit risk
In the normal course of business, the fund trades finan-cial instruments and enters into financial transactions where risk of potential loss exists due to changes in the market (market risk) or failure of the contracting party to the transaction to perform (credit risk). The fund may be exposed to additional credit risk that an institution or other entity with which the funds have unsettled or open transactions will default.
Note 10: Other items
The fund is a party to ISDA (International Swap and Derivatives Association, Inc.) Master Agreements with certain counterparties that govern OTC derivative and foreign exchange contracts entered into from time to time. As of January 31, 2009, due to a decrease in the fund’s net asset value during the year, such counterparties were entitled to elect, but had not yet elected, to terminate early, and cause settlement of all derivative and foreign exchange contracts outstanding under the applicable Master Agreements, including the payment by the fund of any losses and costs resulting from such early termination, as reasonably determined by such counterparty. Any decision by the counterparty to elect early termination could impact the fund’s future derivative activity. At January 31, 2009, the fund had net unrealized gains/ (losses) on derivative contracts subject to the Master Agreements of $42,107,935 and $(174,911,912), respectively. The fund intends to seek a waiver of, or other relief from this provision, from the counterparties.
92
Brokerage commissions (unaudited)
Brokerage commissions are paid to firms that execute trades on behalf of your fund. When choosing these firms, Putnam is required by law to seek the best execution of the trades, taking all relevant factors into consideration, including expected quality of execution and commission rate. Listed below are the largest relationships based upon brokerage commissions for your fund and the other funds in Putnam’s Large-Cap Value group for the year ended January 31, 2009. The Putnam mutual funds in this group are The George Putnam Fund of Boston, Putnam Convertible Income-Growth Trust, Putnam Equity Income Fund, The Putnam Fund for Growth and Income, Putnam VT Equity Income Fund, Putnam VT The George Putnam Fund of Boston, and Putnam VT Growth and Income Fund.
The top five firms that received brokerage commissions for trades executed for the Large-Cap Value group are (in descending order) Morgan Stanley & Co. Inc., Merrill Lynch, Weeden & Co. L.P., Goldman Sachs & Co., and RBC Capital Markets. Commissions paid to these firms together represented approximately 44% of the total brokerage commissions paid for the year ended January 31, 2009.
Commissions paid to the next 10 firms together represented approximately 33% of the total brokerage commissions paid during the period. These firms are Barclays Capital, Sanford Bernstein, Citigroup Global Markets, Credit Suisse First Boston, Deutsche Bank Securities, Lehman Brothers, JPMorgan Clearing, Pulse Trading, UBS Securities, and Wachovia Securities.
Commission amounts do not include “mark-ups” paid on bond or derivative trades made directly with a dealer. Additional information about brokerage commissions is available on the Securities and Exchange Commission (SEC) Web site at www.sec.gov. Putnam funds disclose commissions by firm to the SEC in semiannual filings on Form N-SAR.
93
The Putnam family of funds
The following is a list of Putnam’s open-end mutual funds offered to the public. Investors should carefully consider the investment objective, risks, charges, and expenses of a fund before investing. For a prospectus containing this and other information for any Putnam fund or product, call your financial advisor at 1-800-225-1581 and ask for a prospectus. Please read the prospectus carefully before investing.
| |
| Growth | Value |
| Growth Opportunities Fund | Convertible Income-Growth Trust |
| International New Opportunities Fund* | Equity Income Fund |
| New Opportunities Fund | The George Putnam Fund of Boston |
| Small Cap Growth Fund* | The Putnam Fund for Growth and Income |
| Vista Fund | International Growth and Income Fund* |
| Voyager Fund | Mid Cap Value Fund |
| Small Cap Value Fund* |
| Blend | |
| Capital Opportunities Fund* | Income |
| Europe Equity Fund* | American Government Income Fund |
| Global Equity Fund* | Diversified Income Trust |
| Global Natural Resources Fund* | Floating Rate Income Fund |
| International Capital Opportunities Fund* | Global Income Trust* |
| International Equity Fund* | High Yield Advantage Fund* |
| Investors Fund | High Yield Trust* |
| Research Fund | Income Fund |
| | Money Market Fund† |
| | U.S. Government Income Trust |
* A 1% redemption fee on total assets redeemed or exchanged within 90 days of purchase may be imposed for all share classes of these funds.
† An investment in a money market fund is not insured or guaranteed by the Federal Deposit Insurance Corporation or any other government agency. Although the fund seeks to preserve the value of your investment at $1.00 per share, it is possible to lose money by investing in the fund.
94
| |
| Tax-free income | Asset allocation |
| AMT-Free Municipal Fund‡ | Income Strategies Fund |
| Tax Exempt Income Fund | Putnam Asset Allocation Funds — three investment |
| Tax Exempt Money Market Fund† | portfolios that spread your money across a variety |
| Tax-Free High Yield Fund | of stocks, bonds, and money market investments. |
| |
| State tax-free income funds: | The three portfolios: |
| Arizona, California, Massachusetts, Michigan, | Asset Allocation: Balanced Portfolio |
| Minnesota, New Jersey, New York, Ohio, | Asset Allocation: Conservative Portfolio |
| and Pennsylvania | Asset Allocation: Growth Portfolio |
| |
| Absolute Return | Putnam RetirementReady® |
| Absolute Return 100 Fund | Putnam RetirementReady Funds — 10 investment |
| Absolute Return 300 Fund | portfolios that offer diversification among stocks, |
| Absolute Return 500 Fund | bonds, and money market instruments and adjust |
| Absolute Return 700 Fund | to become more conservative over time based |
| on a target date for withdrawing assets. |
| Global Sector | |
| Global Consumer Fund | The 10 funds: |
| Global Energy Fund | Putnam RetirementReady 2050 Fund |
| Global Financials Fund | Putnam RetirementReady 2045 Fund |
| Global Health Care Fund** | Putnam RetirementReady 2040 Fund |
| Global Industrials Fund | Putnam RetirementReady 2035 Fund |
| Global Natural Resources Fund | Putnam RetirementReady 2030 Fund |
| Global Technology Fund | Putnam RetirementReady 2025 Fund |
| Global Telecommunications Fund | Putnam RetirementReady 2020 Fund |
| Global Utilities Fund†† | Putnam RetirementReady 2015 Fund |
| | Putnam RetirementReady 2010 Fund |
| | Putnam RetirementReady Maturity Fund |
‡ Prior to November 30, 2008, the fund was known as Putnam AMT-Free Insured Municipal Fund.
** Prior to January 2, 2009, the fund was known as Putnam Health Sciences Trust.
†† Prior to January 2, 2009, the fund was known as Putnam Utilities Growth and Income Fund.
With the exception of money market funds, a 1% redemption fee may be applied to shares exchanged or sold within 7 days of purchase (90 days, for certain funds).
Check your account balances and the most recent month-end performance in the Individual Investors section at www.putnam.com.
95
Putnam puts your interests first
Putnam has introduced a number of voluntary initiatives designed to reduce fund expenses, provide investors with more useful information, and help safeguard the interests of all Putnam investors. Visit the Individual Investors section at www.putnam.com for details.
Cost-cutting initiatives
Ongoing expenses will be limited Through June 30, 2009, total ongoing expenses, including management fees for all funds, will be maintained at or below the average of each fund’s industry peers in its Lipper load-fund universe. For more information, please see the Statement of Additional information.
Lower class B purchase limit To help ensure that investors are in the most cost-effective share class, the maximum amount that can be invested in class B shares has been reduced to $100,000. (Larger trades or accumulated amounts will be refused.)
Improved disclosure
Putnam fund prospectuses and shareholder reports have been revised to disclose additional information that will help shareholders compare funds and weigh their costs and risks along with their potential benefits. Shareholders will find easy-to-understand information about fund expense ratios, portfolio manager compensation, risk comparisons, turnover comparisons, brokerage commissions, and employee and trustee ownership of Putnam funds. Disclosure of breakpoint discounts has also been enhanced to alert investors to potential cost savings.
Protecting investors’ interests
Short-term trading fee introduced To discourage short-term trading, which can interfere with a fund’s long-term strategy, a 1% short-term trading fee may be imposed on any Putnam fund shares (other than money market funds) redeemed or exchanged within 7 calendar days of purchase (for certain funds, this fee applies for 90 days).
96
Fund information
Founded over 70 years ago, Putnam Investments was built around the concept that a balance between risk and reward is the hallmark of a well-rounded financial program. We manage over mutual funds across income, value, blend, growth, asset allocation, absolute return, and global sector categories.
| Investment Manager | Paul L. Joskow | Susan G. Malloy |
| Putnam Investment | Elizabeth T. Kennan | Vice President and |
| Management, LLC | Kenneth R. Leibler | Assistant Treasurer |
| One Post Office Square | Robert E. Patterson | |
| Boston, MA 02109 | George Putnam, III | Beth S. Mazor |
| Robert L. Reynolds | Vice President |
| Investment Sub-Manager | Richard B. Worley | |
| Putnam Investments Limited | | James P. Pappas |
| 57–59 St James’s Street | Officers | Vice President |
| London, England SW1A1LD | Charles E. Haldeman, Jr. | |
| President | Francis J. McNamara, III |
| Marketing Services | | Vice President and |
| Putnam Retail Management | Charles E. Porter | Chief Legal Officer |
| One Post Office Square | Executive Vice President, | |
| Boston, MA 02109 | Principal Executive Officer, | Robert R. Leveille |
| Associate Treasurer and | Vice President and |
| Custodian | Compliance Liaison | Chief Compliance Officer |
| State Street Bank and | | |
| Trust Company | Jonathan S. Horwitz | Mark C. Trenchard |
| Senior Vice President | Vice President and |
| Legal Counsel | and Treasurer | BSA Compliance Officer |
| Ropes & Gray LLP | | |
| | Steven D. Krichmar | Judith Cohen |
| Trustees | Vice President and | Vice President, Clerk and |
| John A. Hill, Chairman | Principal Financial Officer | Assistant Treasurer |
| Jameson A. Baxter, | | |
| Vice Chairman | Janet C. Smith | Wanda M. McManus |
| Charles B. Curtis | Vice President, Principal | Vice President, Senior Associate |
| Robert J. Darretta | Accounting Officer and | Treasurer and Assistant Clerk |
| Myra R. Drucker | Assistant Treasurer | |
| Charles E. Haldeman, Jr. | | Nancy E. Florek |
| | | Vice President, Assistant Clerk, |
| | Assistant Treasurer and |
| | | Proxy Manager |
| | |
This report is for the information of shareholders of The George Putnam Fund of Boston. It may also be used as sales literature when preceded or accompanied by the current prospectus, the most recent copy of Putnam’s Quarterly Performance Summary, and Putnam’s Quarterly Ranking Summary. For more recent performance, please visit www.putnam.com. Investors should carefully consider the investment objective, risks, charges, and expenses of a fund, which are described in its prospectus. For this and other information or to request a prospectus, call 1-800-225-1581 toll free. Please read the prospectus carefully before investing. The fund’s Statement of Additional Information contains additional information about the fund’s Trustees and is available without charge upon request by calling 1-800-225-1581.

Item 2. Code of Ethics:
Not applicable
Item 3. Audit Committee Financial Expert:
Not applicable
Item 4. Principal Accountant Fees and Services:
Not applicable
Item 5. Audit Committee of Listed Registrants
Not applicable
Item 6. Schedule of Investments:
The registrant’s schedule of investments in unaffiliated issuers is included in the report to shareholders in Item 1 above.
Item 7. Disclosure of Proxy Voting Policies and Procedures For Closed-End Management Investment Companies:
Not applicable
Item 8. Portfolio Managers of Closed-End Investment Companies
Not Applicable
Item 9. Purchases of Equity Securities by Closed-End Management Investment Companies and Affiliated Purchasers:
Not applicable
Item 10. Submission of Matters to a Vote of Security Holders:
Not applicable
Item 11. Controls and Procedures:
(a) The registrant's principal executive officer and principal financial officer have concluded, based on their evaluation of the effectiveness of the design and operation of the registrant's disclosure controls and procedures as of a date within 90 days of the filing date of this report, that the design and operation of such procedures are generally effective to provide reasonable assurance that information required to be disclosed by the registrant in this report is recorded, processed, summarized and reported within the time periods specified in the Commission's rules and forms.
(b) Changes in internal control over financial reporting: Not applicable
Item 12. Exhibits:
(a)(1) Not applicable
(a)(2) Separate certifications for the principal executive officer and principal financial officer of the registrant as required by Rule 30a-2(a) under the Investment Company Act of 1940, as amended, are filed herewith.
(b) The certifications required by Rule 30a-2(b) under the Investment Company Act of 1940, as amended, are filed herewith.
SIGNATURES
Pursuant to the requirements of the Securities Exchange Act of 1934 and the Investment Company Act of 1940, the registrant has duly caused this report to be signed on its behalf by the undersigned, thereunto duly authorized.
The George Putnam Fund of Boston
By (Signature and Title):
/s/Janet C. Smith
Janet C. Smith
Principal Accounting Officer
Date: March 31, 2009
Pursuant to the requirements of the Securities Exchange Act of 1934 and the Investment Company Act of 1940, this report has been signed below by the following persons on behalf of the registrant and in the capacities and on the dates indicated.
By (Signature and Title):
/s/Charles E. Porter
Charles E. Porter
Principal Executive Officer
Date: March 31, 2009
By (Signature and Title):
/s/Steven D. Krichmar
Steven D. Krichmar
Principal Financial Officer
Date: March 31, 2009